biogas - CiteSeerX
189
-
Upload
khangminh22 -
Category
Documents
-
view
1 -
download
0
Transcript of biogas - CiteSeerX

BIOGAS
As Renewable Source of Energy in Nepal Theory and Development
Edited by
Dr. Amrit B. Karki Prof. Jagan Nath Shrestha
Mr. Sundar Bajgain
July 2005

BIOGAS As Renewable Source of Energy in Nepal Theory and Development
ISBN: 99946-34-76-3
Edited by: Dr. Amrit B. Karki Prof. Jagan Nath Shrestha Mr. Sundar Bajgain
Copyright 2005
No part of this publication may be reproduced in any form of medium [print, audio, or electronic] without permission of BSP-Nepal.
Published by: BSP-Nepal P. 0. Box 9751, Kathmandu. Nepal Tel. : 977-1-5529840/5524665 Fax. : 977-1-5524755 e-Mail : [email protected]
Printed in Kathmandu.

FOREWORD
I have the pleasure to go through the manuscript of Biogas as Renewable Source of Energy in Nepal: Theory and Development edited by Prof. Dr. Amrit B. Karki, Prof. Jagan Nath Shrestha and Mr. Sundar Bajgain. Compared to other sources of renewable energy, biogas technology introduced in 1955 in Nepal, has now developed in a remarkable way. Its development as renewable sources of energy in Nepal has been attributed to the efforts and contribution of innumerable national and internationals organizations and individuals that were involved directly and indirectly in the promotion of biogas sector. Specifically, with the establishment of Biogas Support Programme (BSP) under the Nederland's Development Organization (SNV) in 1992 and creation of the Alternative Energy Promotion Centre (AEPC) in 1996 under the umbrella of Ministry of Science and Technology (MOST), the biogas development in Nepal has taken desired momentum.
Being aware of the necessity to harness alternative sources of energy in Nepal, a plan for installation of biogas plants was first incorporated in a national plan document (the Seventh Five Year Plan, 1985-1990). The policy emphasis as well as magnitude of the target were increased progressively in the Eighth, Ninth and Tenth Five Year Plan, respectively. As a consequence of this, a total of 134,570 biogas plants have been installed in the Kingdom of Nepal covering 66 districts by the end of December 2004. Since reliable fuel and fertilizer are produced by processing animal wastes in anaerobic bio-digester, promotion and development of biogas in Nepal has created an impact in the rural community. It has helped in uplifting the quality of life of the rural people especially the women who are relieved from obnoxious smoke produced from firewood burning.
Frankly speaking, there has been a dearth of literature that deals with biogas technology not only in the context of Nepal but also in the perspective of other developing and developed countries. I am confident that this book published by BSP-Nepal will be highly useful not only to the national and international institutions and/or professionals concerned with the promotion and development of biogas technology in Nepal but also it will be an asset for those who want to carry out R & D activities in the field of biogas technology.
I would like to take this opportunity to congratulate the editors of this book and BSP-Nepal for the commendable effort to bring out the book in this form.

FOREWORD
According to 2001 population census, 65 percent of 4.17 million Nepalese households are using fuel wood for cooking purposes. As a result, 5.4 million tons of fuel wood is being burnt annually in Nepal. Harmful gases produced by burning fuel wood cause severe indoor air pollution, which is responsible for many acute respiratory and eye diseases, especially among the women who do most of the cooking. In fact, heavy air pollution in the kitchen is considered to be one of the major killer diseases in the developing countries. Similarly, the agriculture census 2001 indicates that there are 3.8 million cattle in Nepal. They produce about 38 million kg of dung. When exposed to open atmosphere, dung emits a lot of methane gas, which is 320 times more harmful to human health man carbon dioxide. Minimization of indoor air pollution and methane emission are some of the challenges that need to be addressed to ensure environmental sustainability, which is one of the eight Millennium Development Goals set by the UN. The present book titled "Biogas as Renewable Source of Energy in Nepal: Theory and Development" has tried to provide answers to many questions related to these issues.
The book contains valuable information on different aspects of biogas technology in Nepal, including a detail account of the historical background of its development. Sincere efforts of many individuals, national and international organizations involved directly or indirectly in the promotion of biogas sector have contributed to the remarkable development of biogas technology as renewable sources of energy in Nepal. T am fully convinced that this book will be highly useful to all concerned in R & D, promotion, extension and dissemination of biogas as renewable sources of energy in Nepal and elsewhere.
I would like to congratulate the members of the Editorial Board, Prof. Dr. Amrit B. Karki, Prof. Jagan Nath Shrestha and Mr. Sundar Bajgain, for editing the book to the present shape and BSP-Nepal for publishing it.
Prof. Dr. Dayananda Bajracharya Vice-Chancellor Royal Nepal Academy of Science and Technology Khumultar, Lalitpur, Nepal

EDITORS NOTE
Since its inception from 1992, SNV/Biogas Support Programme (SNV/BSP) has been attaching great importance in bringing forth publications concerning various aspects of biogas technology. Until this date, the documents published by SNV/BSP exceed more than 300. The principal aim of bringing out this book titled Biogas as Renewable Source of Energy in Nepal: Theory and Development by BSP-Nepal is to consolidate and compile valuable information contained in published and non-published forms on biogas technology in Nepal and elsewhere.
As will be seen, the book embraces altogether 21 chapters and is divided into two parts. The first part of this book deals with theoretical aspects of biogas technology, while the second one is consecrated on biogas development aspects particularly, in die context of Nepal. Based upon the research works carried out in Nepal and elsewhere, the authors have made an attempt to include as much information as possible in this book. Theoretical as well as practical information has been embedded in this book so as to acquaint the readers with latest development in biogas technology. However, biogas technology being so vast subject, the information provided in this book is not claimed to be exhaustive.
The Editorial Board is of the opinion that this book will be useful not only to the national and international institutions and/or professionals concerned with the promotion and development of biogas technology in Nepal but also to those who want to carry out R & D activities in the field of biogas technology. Furthermore, the book can serve as a text and/or reference book to the Renewable Energy Courses offered by the colleges or universities in Nepal and elsewhere.
As a matter of fact, the subject matter dealt with in this book has been derived from the work of innumerable researchers and organizations that are associated directly and indirectly with biogas programme in Nepal. Hence, we would like to express our sincere thanks to all of them. We are especially indebted to Prof. Upendra Man Malla, Dr. Mangala Shrestha and Mr. Ajoy Karki for their efforts to revise or rewrite some of the important chapters of this book. We take pride in compiling the book in this shape under the framework of BSP-Nepal.
Last but not the least, we would like to invite comments and feedback from the readers and practitioners and assure them that we shall take care of their valid suggestions in the second edition of this book.
Editorial Board Prof. Dr. AmritB. Karki Prof. Jagan Nath Shrestha Mr. Sundar Bajgain

LIST OF ABBREVIATIONS
ADB/N AEPC AEPDF AFPRO AIC ASS ATC ATF BCC BDC BGH BGP BNRM BOQ BPI BRTC BSP BTI BTTC BYS C/N CDM CEC CENAP CES CMS DCS DOA EIRRs ERDG FAO FGD FIRRs FS FY FYM g-C GGC GHG GI GJ GO GWC HH HMG/N HPP hr HRD HRT
- - - - - - - - - - - - - - - - - - - - - - - - - - - - - - - - - - - - - - - - - - - - - - - - - - -
Agricultural Development Bank Alternative Energy Promotion Centre Alternative Energy Promotion and Development Forum Action for Food Production Agricultural Inputs Corporation After Sale Service Agricultural Technology Centre Agricultural Tool Factory Biogas Coordination Committee Biogas Development Committee Biogas Plants Installed Households Biogas Plant Biogas and Natural Resources Management Bill of Quantities Biogas Performance Index Biogas Research and Training Centre Biogas Support Programme Butwal Technical Institute Balaju Technical Training Centre Balaju Yantra Shala Carbon-nitrogen Clean Development Mechanism Cation Exchange Capacity Centre National d'Agro-pedologie Centre for Energy Studies Consolidated Management Services Nepal (P) Ltd Development and Consulting Services Department of Agriculture Economic Rates of Return Energy Research and Development Group Food and Agricultural Organization of the United Nations Focus Group Discussion Financial Rates of Return Faecal Sludge Fiscal Year Farm Yard Manure Gram Carbon Gobar Gas and Agricultural Equipment Development Company Greenhouse Gases Galvanized Iron Gigajoules Government Organisation Global Warming Commitment Household His Majesty's Government of Nepal High Power Phase Hour Human Resource Development Hydraulic Retention Time
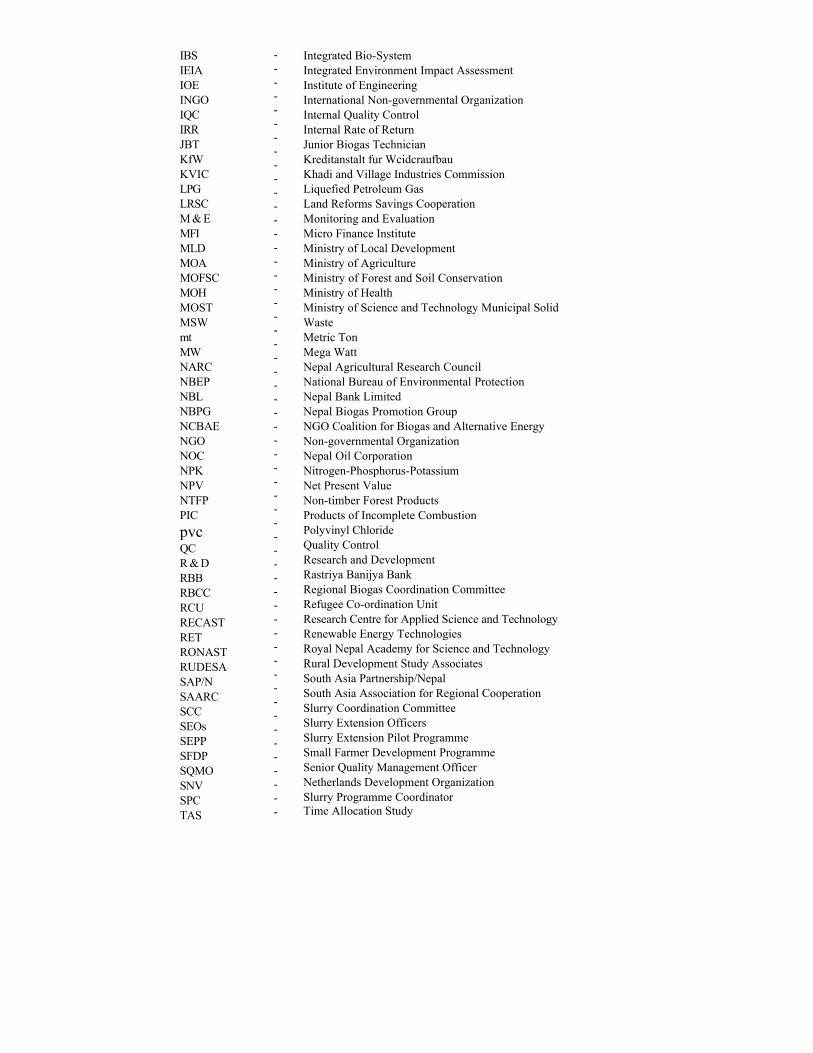
IBS IEIA IOE INGO IQC IRR JBT KfW KVIC LPG LRSC M & E MFI MLD MOA MOFSC MOH MOST MSW mt MW NARC NBEP NBL NBPG NCBAE NGO NOC NPK NPV NTFP PIC pvc QC R & D RBB RBCC RCU RECAST RET RONAST RUDESA SAP/N SAARC SCC SEOs SEPP SFDP SQMO SNV SPC TAS
- - - - - - - - - - - - - - - - - - - - - - - - - - - - - - - - - - - - - - - - - - - - - - - - - - - - - - - -
Integrated Bio-System Integrated Environment Impact Assessment Institute of Engineering International Non-governmental Organization Internal Quality Control Internal Rate of Return Junior Biogas Technician Kreditanstalt fur Wcidcraufbau Khadi and Village Industries Commission Liquefied Petroleum Gas Land Reforms Savings Cooperation Monitoring and Evaluation Micro Finance Institute Ministry of Local Development Ministry of Agriculture Ministry of Forest and Soil Conservation Ministry of Health Ministry of Science and Technology Municipal Solid Waste Metric Ton Mega Watt Nepal Agricultural Research Council National Bureau of Environmental Protection Nepal Bank Limited Nepal Biogas Promotion Group NGO Coalition for Biogas and Alternative Energy Non-governmental Organization Nepal Oil Corporation Nitrogen-Phosphorus-Potassium Net Present Value Non-timber Forest Products Products of Incomplete Combustion Polyvinyl Chloride Quality Control Research and Development Rastriya Banijya Bank Regional Biogas Coordination Committee Refugee Co-ordination Unit Research Centre for Applied Science and Technology Renewable Energy Technologies Royal Nepal Academy for Science and Technology Rural Development Study Associates South Asia Partnership/Nepal South Asia Association for Regional Cooperation Slurry Coordination Committee Slurry Extension Officers Slurry Extension Pilot Programme Small Farmer Development Programme Senior Quality Management Officer Netherlands Development Organization Slurry Programme Coordinator Time Allocation Study

TCN - Timber Corporation of Nepal TS - Total Solids TSP - Total Suspended Particles TU - Tribhuwan University UMN - United Mission to Nepal UNCDF - United Nations Capital Development Fund UNHCR - United Nations High Commissioner for Refugees UNICEF - United Nations Children Educational Fund USAB - Upflow Anaerobic Sludge Blanket USAID - United States Agency for International Development VDC - Village Development Committee WECS - Water Energy Commission Secretariat

TABLE CONTENTS
FOREWORD EDITOR'S NOTE LIST OF ABBREVIATIONS
Chapter I Characteristics of Biogas and Necessary Conditions for its Formation 1 1.1 Characteristics of Biogas 1 1.2 Necessary Conditions for Anaerobic Digestion of Organic Wastes 1 References 4
Chapter II Design Concept and Related Parameters of Biogas Plant 5 2.1 Background and Introduction 5 2.2 Plant Types 5 2.3 Site Selection 12 2.4 Design Parameters for Sizing of Biogas Plants 13 2.5 Examples of Sizing Biogas Plants 14 2.6 Design and Construction Aspects 16 References 20
Chapter III Microbial Activities in Anaerobic Digester. 21 3.1 Historical Aspects of Methane Gas 21 3.2 Biochemical Process of Anaerobic Digestion 21 3.3 Stages of Anaerobic Digestion Process 22 3.4 Factors Affecting Microbial Activities in Digester 25 References . 26
Chapter IV Various Uses of Biogas and its Merits and Demerits 27 4.1 Various Uses of Biogas 27 4.2 Merits and Demerits of Biogas 32 References 35
Chapter V Production of Biogas in Cold Climate 36 5.1 Introduction 36 5.2 Calculation for Theoretical Heating Requirements 36 5.3 Treatment of Biodigester in Cold Climate 37 5.4 High Altitude Biogas Reactor in Khumbu Region 40 5.5 Integrated Bio-System 41 References 44
Chapter VI Biogas in Relation to other Discipline 45 6.1 Biogas and Agriculture 45 6.2 Biogas and Women 46 6.3 Biogas versus Ecology and Environment 48 6.4 Biogas in Relation to Pathogens and Sanitation 48 References 49
Chapter VII Bio-slurry as Feed and Fertilizer 50 7.1 Rationale for Utilization of Bio-slurry 50 7.2 Nitrogen Cycle 51 7.3 Relationship Between Biogas and Agriculture in a Fanning 51 7.4 Quality and Manorial Value of Different Organic Fertilizers 52 7.5 Utilization of Slurry in the Field in Different Forms 54 7.6 Effect of Digester Manure on Physical and Chemical Properties of Soil 55
7.7 Value of Different Form of Slurry 56 7.8 Experiences of Various Countries on Slurry Utilization 56 7.9 Utilization of Bio-slurry as Animal Feed 61 7.10 Utilization of Bio-slurry for Fish Culture 62 References 63
Chapter VIII Biogas Production from Latrine Attached Plants 65 8.1 Social Acceptance of the Use of Human Waste 65 8.2 Pathogens in the Digested Sludge 65 8.3 Calculation for Establishment of Night Biodigester in a School 65 8.4 Installation of Community Latrine-cum-Biodigester 67 References 71
Chapter IX Biogas Production from Kitchen Waste 72 9.1 Production of Biogas from Kitchen Waste at Household Level 72 9.2 Vegetable and Kitchen Wastes with or without Cow Dung 75 References 78
Chapter X Implications of Biogas on Energy use and Environment 79 10.1 Implication on Energy use 79 10.2 Gas Productions and Consumption 79 10.3 Replacement Values of Biogas 80 10.4 Merits of Biogas 80 10.5 Implication on Environment 81 10.6 Carbon Emission Saved from the Substitution of Traditional and Commercial 82 Fuels by Biogas 10.7 Carbon Emission Saved from the Decrease in Use of Fuelwood .82 10.8 Carbon Emission Saved from the Decrease in Use of Agricultural Residues 83 10.9 Carbon Emission Saved from the Decrease in Use of Dung 83 10.10 Carbon Emission Saved from the Decrease in Use of Kerosene Consumption 83 References 83
Chapter XI Role of Management, Communication and Professional Development in 84 Biogas Technology
11.1 Introduction 84 11.2 Management 84 11.3 Communication 89 11.4 Professional Development 91 11.5 Conclusion 92 References 93
Chapter XII Biogas Installation Cost and Financial Viability 94 12.1 Introduction 94 12.2 Objectives 95 12.3 Methodology 96 12.4 Method of Analysis 96 12.5 Data Collections 97 12.6 Conclusion 104 References 105
Chapter XIII Biogas Potential and Future Perspective 106 13.1 Biogas Potential 106 13.2 Future Perspective in Nepal 110 13.3 Prospective Plan for 20 Years (2000 - 2020) 111 13.4 Calendar of Twenty Year's Perspective Programme (2000 - 2020) in Nepal 113

13.5 Long-term Government Policy 113 References 115
Chapter XIV Role of Various Actors in Biogas Development 116 14.1 Institutional Growth 116 14.2 HMG-Nepal Involvement 116 14.3 Biogas Support Programme 117 14.4 Financial Institutions 119 14.5 (I)NGOs and others 119 14.6 Biogas Companies 119 References 120
Chapter XV Quality Control System of Biogas Plants 121 15.1 Why Quality Control? 121 15.2 How Do We Do? 121 15.3 National Quality Review Meeting 121 15.4 Penalties and Bonuses 122 15.5 Biogas Performance Index (Bpi©) 122 15.6 Conclusion 123 References 123
Chapter XVI Impact of Biogas on Users 124 16.1 Characteristics of Biogas Fanners 124 16.2 Satisfied Users, Use of Gas and Slurry and Attachment of Latrine 125 16.3 Performance and Operation and Maintenance of the Biogas Plants 125 16.4 Role of Companies in Biogas Promotion 126 16.5 Utilization of Sluny 126 16.6 Impact of Biogas 127 16.7 Insufficiency of Gas 127 References 127
Chapter XVII Impact of Biogas on Health and Sanitation 128 17.1 Types of Toilet 128 17.2 Motivation to Build a Toilet 129 17.3 Impact of Biogas on Various Smoke-borne Diseases 129 17.4 Episodes of Symptomatic Eye Infection for the Last Three Years 130 17.5 Respiratory Diseases 130 17.6 Status of Cough for the Last Three Years 131 17.7 Status of Diarrhoeal Episodes for the Last Three Years 131 17.8 Dysentery 132 17.9 Status of Tapeworm for the Last Three Years 132 17.10 Parasitical Test of Toilet Attached Slurry 132 17.11 Condition of Burned Case of the Last Three Years 133 17.12 User's Perception about Safety Measure of Biogas over Fuelwood 133 17.13 Breeding of Mosquitoes 134 References 134
Chapter XVIII Impacts of Biogas on Energy Use and Environment 135 18.1 Energy Use 135 18.2 Environment 148 References 151
Chapter XIX Workload of Women and Gender's Role in Biogas 152 19.1 Introduction 152 19.2 Effects of Biogas on Workload of Women 152

19.3 Studies of Biogas Users with Focus on Gender Issues 156 References 161
Chapter XX Financing of Biogas Plants 162 20.1 Introduction 162 20.2 Role of Commercial Banks 162 20.3 Repayment of Loan 163 20.4 Interest Rate 163 20.5 Subsidy 163 20.6 Chanelization of Subsidy 164 References 164
Chapter XXI Constrants and Problems of Biogas Technology 166
21.1 Costly Plant Design 166 21.2 Lack of Collateral 166 21.3 Ethnic Groups Benefiting from Biogas 166 21.4 Quality of Biogas Appliances 166 21.5 After-Sale-Service und Repair and Maintenance 167 21.6 Lacks of Appropriate Research and Development 167
Bibliography 169

LIST OF TABLES, FIGURES AND ANNEXES List of Tables
Table 1.1 Table 1.2 Table 2.1 Table 2.2 Table 2.3 Table 3.1 Table 4.1 Table 6.1 Table 6.2 Table 6.3 Table 7.1 Table 7.2 Table 7.3 Table 7.4 Table 7.5 Table 7.6 Table 7.7 Table 7.8 Table 7.9 Table 8.1 Table 12.1 Table 12.2 Table 12.3 Table 12.4 Table 12.5
Table 12.6
Table 12.7
Table 12.8 Table 13.1 Table 16.1 Table 17.1 Table 17.2 Table 17.3 Table 17.4 Table 17.5 Table 17.6 Table 17.7 Table 17.8 Table 17.9 Table 18.1 Table 18.2 Table 18.3 Table 18.4 Table 18.5 Table 18.6
Average Composition of Biogas C/N Ratio of some Organic Materials Plant Dimensions for 4 m3 - 20 m3 GGC Biogas Plants Design Parameters for Sizing of a Biogas Plant Loading Rate for various Plant Size Caron Substrates Oxidized by Methanogenic Bacteria Biogas Requirements for Various Appliances Impact of Biogas on various Smoke-borne Diseases Average Effects a Biogas Plant on the Workload of a Household Average Time Allocated to Different Biogas Related Activities Before and After Installation of Biogas Plant Average Constitution of Fresh Dung, Dung Slurry and Digested Slurry Nutrients Available in Composted Manure, FYM, and Digested Slurry Quality and Composition of Human Faeces and Urine Composition of spent slurry from Night Soil Biogas Plant Effect of Digester Manure on Physical and Chemical Properties of Soil Average Value of Different Forms of Slurry Average Yields of Vegetables with Bio-slurry Application Comparative Effect on Different Crops in Sixteen Counties of the Municipalities of Sichuan Province Average Yields of Vegetables with Slurry Application Quantity of Faecal Sludge at Blooming Lotus School Summary of Financial Rates of Return (FIRRs) of various sized Biogas Plants in Hills Summary of Financial Rates of Return (FIRRs) of Various Sized Biogas Plants in Terai Summary of Financial Rates of Return (FIRRs) of Various Sized Biogas Plants in Hills Summary of Financial Rates of Return (FIRRs) of Various Sized Biogas Plants in Terai Financial Rates of Return (FIRRs) by Subsidy Amounts and the Life of an 8 cu.m. Plant (Hills) Financial Rates of Return (FIRRs) by Subsidy Amounts and the Life of an 8 cu.m. Plant (Terai) Financial Rates of Return (FIRRs) by Subsidy Amounts and the Life of an 8 cu.m. Plant (Hills) Financial Rates of Return (FIRRs) by Subsidy Amounts and the Life of an 8 cu.m. Plant (Terai) Biogas Potential Annual Income from Different Sources Types of Toilet Motivation to Build a Toilet Episodes of Eye Infection for the Last Three Years Respiratory Diseases Status of cough for the last Three years Condition of Diarrhoea Dysentery Status of Tapeworm Infection for the Last Three Years Condition of Burned Case Sampling of Biogas Households Age of the Sampled Biogas Plants Status of Biogas Plants Reasons for Non-operation Number of Biogas Stoves Number of Biogas Lamps

Table 18.7 Table 18.8 Table 18.9 Table 18.10 Table 18.11 Table 18.12 Table 18.13 Table 18.14 Table 18.15 Table 18.16 Table 18.17 Table 18.18 Table 18.19 Table 18.20 Table 18.21 Table 18.22 Table 18.23 Table 18.24 Table 18.25 Table 18.26 Table 18.27 Table 19.1 Table 19.2 Table 19.3
List of FiguresFigure 1.1 Figure 2.1 Figure 2.2 Figure 2.3 Figure 2.4 Figure 2.5 Figure 2.6 Figure 2.7 Figure 2.8 Figure 2.9 Figure 2.10 Figure 2.11 Figure 2.12 Figure 2.13 Figure 3.1 Figure 4.1 Figure 4.2 Figure 4.3 Figure 4.4 Figure 4.5 Figure 4.6 Figure 4.7 Figure 5.1 Figure 5.2 Figure 5.3 Figure 5.4 Figure 5.5
Frequency of Dung Feeding Distribution of the Size of Surveyed Biogas Plants Feeding Capacity of Biogas Plants Gas Consumption in Cooking Gas Consumption in Lighting Status of Gas Production and Consumption Comparison of the Use of Fuelwood before and after the Installation of BGP Money Saved in Fuelwood after Installation of Biogas Plants Comparison of the Use of Agricultural Residue as Fuel Comparison of the Use of Dung as Fuel before and after the Installation of BGP Change in Use of Kerosene after the Installation of BGP Money Saved in Kerosene after Installation of Biogas Plants Comparison of the Use of LPG before and after the Installation of BGP Change in Use of Cooking Devices after the Installation of BGP Fuelwood Replacement at National Level Kerosene Replacement at National Level Carbon Emission Saved from the Decrease in Use of Fuelwood Carbon Emission Saved from the Decrease in Kerosene Consumption Carbon Emission Saved from the Decrease in Use of Agricultural Residues Carbon Emission Saved from the Decrease in Use of Dung Carbon Dioxide Emission Saved from the Decrease in Use of Conventional Fuels Ownership of Assets of the Biogas User Households Ownership of Assets of the Biogas User Households Decision Making Production of Gas in Function of Time and Temperature KVIC Floating Gas Holder System Chinese Model Fix Dome Biogas Plant GGC Concrete Model Biogas Plant Deenbandhu Biogas Plant (3 m3 Gas Production/Day) Taiwanese PVC Bag Digester PVC Bag Digester Tested by GGC in Nepal Plug Flow Digester Anaerobic Filter Tunnel Type Plant Upflow Anaerobic Sludge Blanket (USAB) Chinese Model Biogas Plant Dimensions Loads Acting on the Concrete Dome Forces and Pressure Acting on the Digester Wall A Single Stage Anaerobic Digestion Process Possible Uses of Biogas as Energy Biogas Burner Manufactured by GGC Workshop at Butwal, Nepal Biogas Burner with Two Mouths Manufactured in India Sketch of Typical Biogas Lamp Manufactured in India Sketch of Ujeli Biogas Lamp Manufactured at BTTC, Kathmandu, Nepal Design of Biogas Burner Adapted to Run Kerosene Refrigerator Pumping of River Water by 5HP Duel Fuel Engine Polythene Hut Erected over the Biodigester Increasing Biogas Production through Solar Heater Biodigester with External Heating System Biodigester with Composting System on its Top Schematic Diagram of High Altitude Biogas Reactor Installed at Lukla-Mosi

Figure 5.6 Figure 5.7 Figure 5.8 Figure 5.9 Figure 6.1 Figure 6.2 Figure 7.1 Figure 7.2 Figure 7.3 Figure 7.4 Figure 8.1 Figure 8.2 Figure 8.3 Figure 9.1 Figure 9.2 Figure 10.1 Figure 11.1 Figure 11.2 Figure 11.3 Figure 13.1 Figure 13.2 Figure 13.3 Figure 13.4 Figure 13.5 Figure 13.6 Figure 13.7 Figure 16.1 Figure 17.1 Figure 17.2 Figure 17.3
The Configuration of the Energy-ecology Ecosystem The Cross Section of the Pig House The Flat View of the Pig House The Flat View of the Animal House Integration of Biogas with Agriculture Integrated (VACB) Model The Nitrogen Cycle in Nature Relationship between Biogas and Agriculture in a Fanning Major Plant Nutrients in Different Sources of Organic Fertilizers Model for Integrating Fish Farming The Concept of the Production of Biogas and Stabilized Compost from Community Latrines at Pathari VDC of Morang District Layout Showing 15 m? Biodigester, Inlet, Outlet and Compost Pits Engineering Drawing of Community Latrines 200 Litre Capacity Demonstration Model Biogas Plant (Dimensions in cm) Laboratory Model Bioreactor having 100 Litre Capacity The Contribution from each of the Anthropogenic GHGs to the Change in Radiative Forcing from 1980-1990 Management Process Organization in the Open System Model Subsystems that Make-up an Organization Energy Consumption in Nepal Energy Sources in Nepal Energy Consumption Development in Nepal Current Biogas Saturation in Nepal Cost of Energy Production of Biogas in Comparison with Hydro Project Projected Biogas Production (2003 - 2009) Forecast Biogas Saturation (2003 - 2009) Performance of Biogas Plants Perceived Reduction in Smoke after BGP Safety of Biogas Stove over Fuel wood Stove in Biogas and Non-Biogas Household Breeding of Mosquito after BGP Installation
List of Annexes
Annex I 20 Years' Perspective Plan in Biogas Sector (Master Plan) Annex II Biogas Installation from 1973/74 to 30lh June 2003

PART ONE
THEORETICAL ASPECTS OF BIOGAS TECHNOLOGY

1
CHAPTER I CHARACTERISTICS OF BIOGAS AND NECESSARY
CONDITIONS FOR ITS FORMATION
1.1 CHARACTERISTICS OF BIOGAS
Biogas is a combustible gas produced by anaerobic fermentation of organic materials by the action of methanogenic bacteria. This gas is principally composed of methane and carbon dioxide. The approximate composition of biogas, which could vary according to the experimental condition, is given in Table 1.1.
Table 1.1: Average Composition of Biogas
Substance Symbol Percentage Methane CH4 50 - 70 Carbon dioxide CO2 30 - 40 Hydrogen H2 5 - 10 Nitrogen N2 1 - 2 Water Vapour N2O 0.3 Hydrogen Sulphide H2S Traces
Methane is virtually odourless and is invisible in bright daylight. It bums with a clear blue flame without smoke and is non-toxic. It produces more heat than kerosene, wood, charcoal, cow-dung chips etc.
The specific gravity of methane (relative to air) is 0.55, critical temperature = 82.5°C and pressure for liquefaction 5000 psi. Air requirement for combustion (m3/m3) is 9.33 and the ignition temperature 650°C.
1.2 NECESSARY CONDITIONS FOR ANAEROBIC DIGESTION OF ORGANIC WASTES
1.2.1 Loading Rate Loading rate is the amount of raw material fed to the digester per day per unit volume of digester capacity. The digester load (DL, measured in kg digested TS (VSJ/m1 Vd x day) serves as a measure of digester efficiency. The digester load is primarily dependent upon four factors: substrate, temperature, volumetric burden and type of plant. For a typical agricultural biogas plant of simple design, the upper limit for DL is roughly 1.5 kg VS/m3 x day (Werner, Stohr and Hees, 1989).
In case of cow-dung plant, the thumb rule is to put 6 kg of fresh dung per m3 size of biodigester. For example, if the size of biogas plant is 10 m3, about 60 kg of dung is required to be loaded per day for optimum gas production. In fact, the correct rate of loading is essential for efficient gas production. If the plant is overfed, acidity will accumulate and methane production will be inhibited; if the loading rate is lower, there will be less gas (CMS, 1996). 1.2.2 Retention Time
Retention time (also detention time) is the average duration of time a sample remains in the digester. In a cow-dung plant, the detention time is calculated by dividing the total volume of the digester by the volume of slurry added daily. Usually, for a cow-dung plant a detention time of 40 to 60 days is required depending upon the temperature. Thus, the fermenting pit should have a volume of from 40 to 60 times the slurry added daily. But for a night-soil digester, a longer detention time (70 to 90 days) is needed in order to kill the pathogens present in human faeces.
1.23 Dilution and Consistency of Inputs
Before feeding the digester, the excreta such as fresh cattle dung has to be mixed thoroughly with water. For proper solubilization of organic materials, the ratio between solid and water should be 1:1 on unit volume basis (i.e. same volume of water for a given volume of solid) when the domestic wastes are used. However,

2
if he dung is in dry form (that has to be crushed before putting into the digester), the quantity of water has to be increased accordingly to arrive at the desired consistency of the inputs (e.g. ratio could vary from 1:1.25 to even 1:2). The dilution should be made to maintain the total solids (TS) from 5 to 10 percent. If the slurry mixture is too diluted, the solid particles can precipitate at the bottom of the digester and if it too thick, the flow of gas can be impeded. In both cases, gas production will be less than optimum. Generally the users have the tendency to over dilute the slurry. For thorough mixing of the cow dung and water (slurry), a Slurry Mixture Machine can be fitted in the inlet of a digester.
1.2.4 pH Value
The pH of the input mixture plays very important role in methane formation. The acidic condition is not favourable for methanogenic process. The optimum biogas production is achieved when the pH value of input mixture in the digester is between 6 and 7. The pH in a biogas digester is also a function of the retention time. In the initial period of fermentation, as large amounts of organic acids are produced by acid forming bacteria, the pH inside the digester can decrease to below 5. This inhibits or even stops the digestion or fermentation process. Methanogenic bacteria are very sensitive to pH and do not thrive below a value of 6.0. Later, as the digestion process continues, concentration of NH4 increases due to digestion of nitrogen, which can increase the pH value to above 8. When the methane production level is stabilised, the pH range remains buffered between 7.2 and 8.2. However, some of the feeding materials especially industrial waste, have tendency of decreasing pH of the digestion slurry. In such case the pH can be adjusted by the addition of calculated amount of lime (CaCO3). Over liming is harmful to the bacteria.
When nitrogenous materials are used for feeding, nitrogen is liberated in the corm of ammonium hydroxide during the process of methane formation. This causes an increase in pH value of the media. If such condition appears, addition of straw would help ameliorate the pH.
1.2.5 Temperature
Enzymatic activity of the bacteria largely depends upon temperature, which is critical factor for methane production. The methanogens are inactive in extreme high and low temperatures. Once metabolism occurs exothermic reaction is helpful for the methane production. In case of mesophilic digestion, temperature range should be maintained between 30 and 40°C. Satisfactory gas production takes place in the mesophilic range, the optimum temperature being 35 C. Therefore, in cold climate the temperature of fermenting substances in the digester needs to be raised up to 35°C. Gas production can be augmented significantly by increasing the temperature up to 55°C beyond which the production falls because of destruction of bacterial enzyme by elevated temperature. Thus, In case of thermopile digestion, it should be between 45 and 55°C. On the other hand, when the ambient temperature goes down to 10°C, gas production virtually stops. Gas production can be increased in the cold climate by means of proper insulation of digester (see Chapter V).
Effect of various ranges of temperature (i.e., 25°C, 35°C and 45°C) has been graphically represented by Figure 1.1 (Lagrange, 1979).
3
Figure 1.1 clearly indicates that the production of gas is dependant upon temperature. With an increase in temperature, the time of digestion (retention period) can be decreased considerably. This means shorter retention time is needed in case the temperature of the digester is augmented to a desired level, for example, from mesophilic to thermopile range. 1.2.6 Carbon-nitrogen (C:N) Ratio
Necessary elements such as carbon, hydrogen, nitrogen, phosphorus and many other microelements must be present in adequate quantities for the normal growth of the micro-organisms.
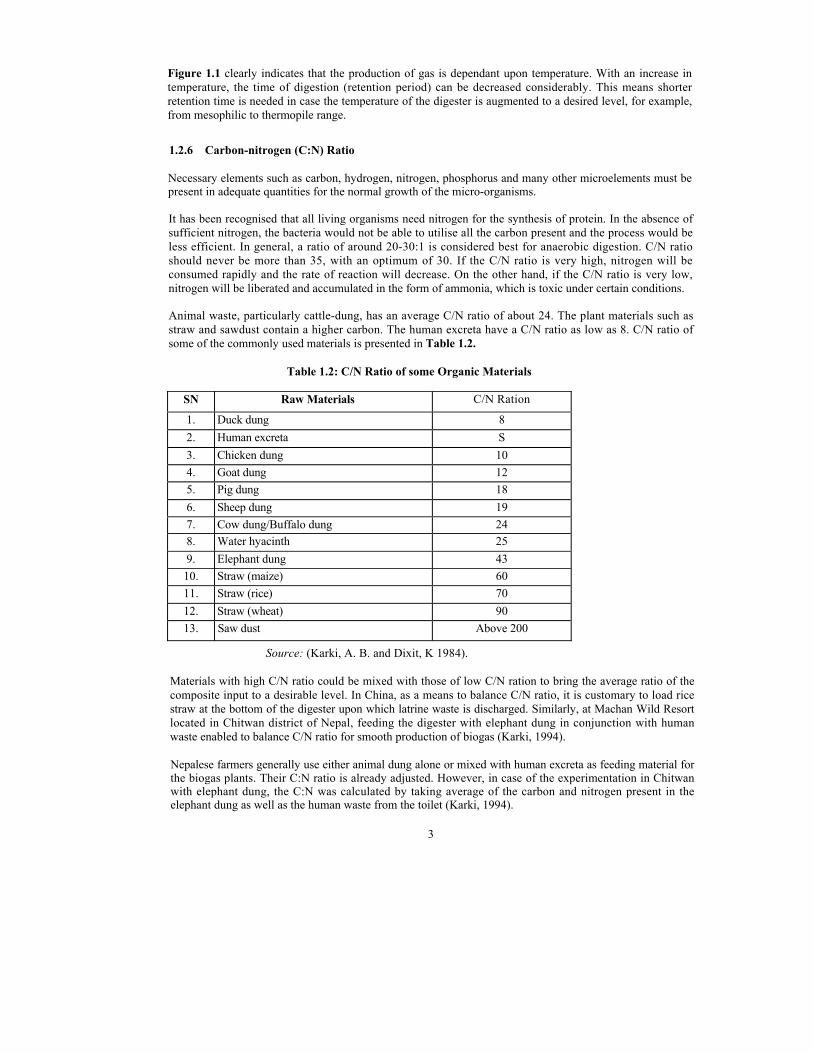
It has been recognised that all living organisms need nitrogen for the synthesis of protein. In the absence of sufficient nitrogen, the bacteria would not be able to utilise all the carbon present and the process would be less efficient. In general, a ratio of around 20-30:1 is considered best for anaerobic digestion. C/N ratio should never be more than 35, with an optimum of 30. If the C/N ratio is very high, nitrogen will be consumed rapidly and the rate of reaction will decrease. On the other hand, if the C/N ratio is very low, nitrogen will be liberated and accumulated in the form of ammonia, which is toxic under certain conditions.
Animal waste, particularly cattle-dung, has an average C/N ratio of about 24. The plant materials such as straw and sawdust contain a higher carbon. The human excreta have a C/N ratio as low as 8. C/N ratio of some of the commonly used materials is presented in Table 1.2.
Table 1.2: C/N Ratio of some Organic Materials
SN Raw Materials C/N Ration 1. Duck dung 8 2. Human excreta S 3. Chicken dung 10 4. Goat dung 12 5. Pig dung 18 6. Sheep dung 19 7. Cow dung/Buffalo dung 24 8. Water hyacinth 25 9. Elephant dung 43 10. Straw (maize) 60 11. Straw (rice) 70 12. Straw (wheat) 90 13. Saw dust Above 200
Source: (Karki, A. B. and Dixit, K 1984).
Materials with high C/N ratio could be mixed with those of low C/N ration to bring the average ratio of the composite input to a desirable level. In China, as a means to balance C/N ratio, it is customary to load rice straw at the bottom of the digester upon which latrine waste is discharged. Similarly, at Machan Wild Resort located in Chitwan district of Nepal, feeding the digester with elephant dung in conjunction with human waste enabled to balance C/N ratio for smooth production of biogas (Karki, 1994).
Nepalese farmers generally use either animal dung alone or mixed with human excreta as feeding material for the biogas plants. Their C:N ratio is already adjusted. However, in case of the experimentation in Chitwan with elephant dung, the C:N was calculated by taking average of the carbon and nitrogen present in the elephant dung as well as the human waste from the toilet (Karki, 1994).

4
1.2.7 Toxicity
Mineral ions, heavy metals and the detergents are some of the toxic materials that inhibit the normal growth of pathogens in the digester. Small quantity of mineral ions (e.g. sodium, potassium, calcium, magnesium,ammonium and sulphur) also stimulates the growth of bacteria, while very heavy concentration of these ions will have toxic effect. For example, presence of NH4 from 50 to 200 mg/1 stimulates the growth of microbes, whereas its concentration above 1,500 mg/1 produces toxicity (CMS, 1996).
REFERENCES
[1] CMS (1996) Biogas Technology: A Training Manual for Extension, Food and Agriculture Organization of the United Nations. Support for Development of National Biogas Programme(FAO/TCP/Nep/4451-T).
[2] Karki, A. B. and K. Dixit (1984) Biogas Fieldbook. Sahayogi Press, Kathmandu, Nepal. [3] Karki, A. (1994) Biogas Installation with Elephant Dung at Machan Wildlife Resort, Chitwan,
Nepal. In. Biogas Newsletter, No.45, April 1994. [4] Lagrange, B. (1979) Biomethane 2. Principes-techniques Utilisations. EDISUD. La Calade, 13100
Aix-en-Provence [5] Werner,U.;U. Stohr and N. Hees (1989) Biogas Plants in Animal Husbandry. GATE/(GTZ) GmbH.

5
CHAPTER II
DESIGN CONCEPT AND RELATED PARAMETERS OF BIOGAS PLANT1
2.1 BACKGROUND AND INTRODUCTION
The history of worldwide biogas development shows hundreds of designs of biogas plants experimented by various scientists, engineers and academicians. For example, the designs of the digesters have been horizontal, rectangle, spherical, underground, above ground, etc. Similarly, the construction materials vary from mild steel to plastic sheet and masonry works (bricks, cement, concrete, etc). In this chapter an attempt has been made to depict some of the well known classical and non-classical designs experimented and adopted in the developed and developing countries around world.
Among other site specific factors, the criteria for the selection of an ideal design should be based on the following considerations:
■ It should be simple in terms of construction and operation, ■ It should be cost effective and durable so that the general population is able to embrace this
technology ■ It should be efficient, i.e., the gas production should be optimum per unit volume of a biogas plant for
given type and quantity of input ■ It should be constructed using of local materials as far as possible; and ■ Repair and maintenance requirement should be minimal.
Biogas plant can be defined as a physical structure where methane gas (i.e. biogas) is produced by anaerobic digestion of organic matter. Anaerobic digestion of organic matter takes place by the action of methanogenic bacteria, which thrive in an environment that lacks air (oxygen) but has favorable temperature. The anaerobic digestion process is discussed in detail in Chapter I.
In the literature the biogas plant is also commonly known as a bio-digester, bioreactor or anaerobic reactor. In principle a biogas plant should have three essential components as follows:
Digestion Chamber: Anaerobic reaction or digestion of organic matter by methanogenic bacteria takes place in the digestion chamber. Since such reaction can occur only in the absence of air, this chamber needs to be airtight.
Inlet: An inlet structure is required to feed the organic matter into the digestion chamber via the inlet.
Outlet: An outlet structure is required to remove the digested organic matter, i.e., the effluent from the digestion chamber. The outlet level is always lower than the inlet level to ensure one-way flow of the digested slurry (effluent).
Any design that satisfies the above three criteria can produce biogas if it is fed with organic matter and the ambient temperature is favorable.
2.2 PLANT TYPES :
Although, various types of biogas plants have been developed, there are three practical models of biogas plant in the context of developing countries (CMS, 1996). These are briefly discussed below.
1 This chapter is based upon the presentation of lecture made by Mr. Ajoy Karki, Engineer, in course of Advanced Biogas Technology Training organized by Centre for Energy Studies, Institute of Engineering, Pulchok, Lalitpur, Nepal (CES/IOE, 2001).
6
2.2.1 Floating Drum Digester .
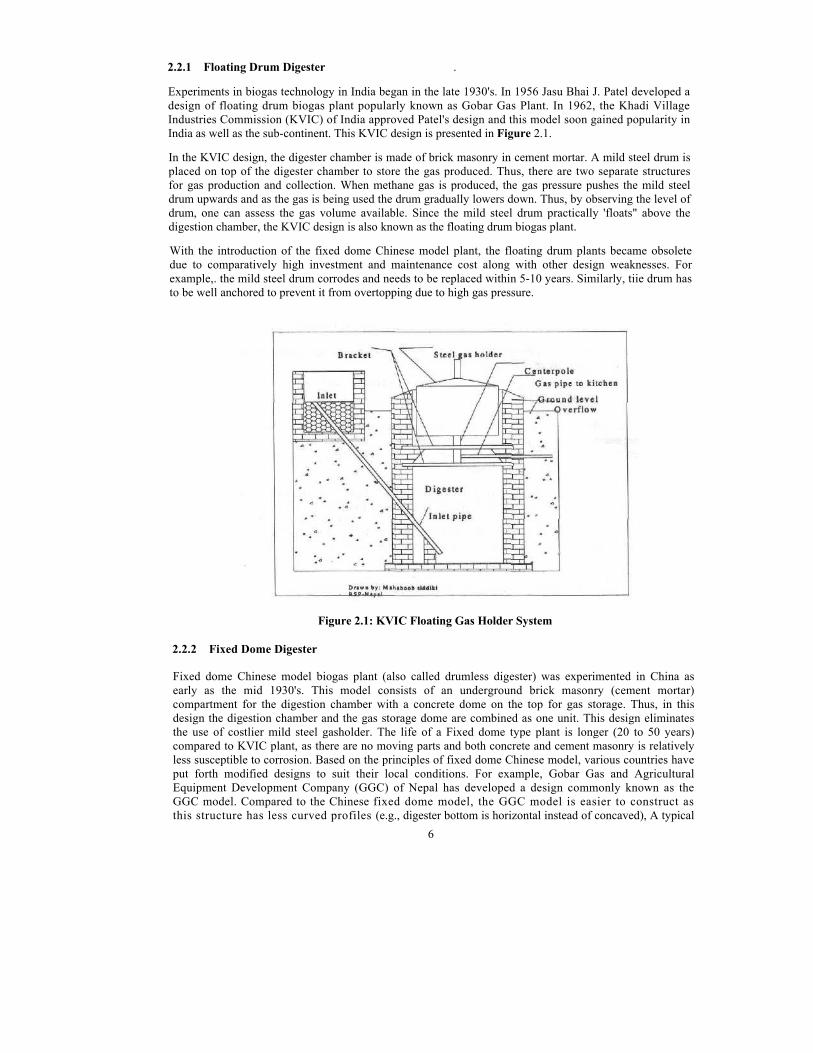
Experiments in biogas technology in India began in the late 1930's. In 1956 Jasu Bhai J. Patel developed a design of floating drum biogas plant popularly known as Gobar Gas Plant. In 1962, the Khadi Village Industries Commission (KVIC) of India approved Patel's design and this model soon gained popularity in India as well as the sub-continent. This KVIC design is presented in Figure 2.1.
In the KVIC design, the digester chamber is made of brick masonry in cement mortar. A mild steel drum is placed on top of the digester chamber to store the gas produced. Thus, there are two separate structures for gas production and collection. When methane gas is produced, the gas pressure pushes the mild steel drum upwards and as the gas is being used the drum gradually lowers down. Thus, by observing the level of drum, one can assess the gas volume available. Since the mild steel drum practically 'floats" above the digestion chamber, the KVIC design is also known as the floating drum biogas plant.
With the introduction of the fixed dome Chinese model plant, the floating drum plants became obsolete due to comparatively high investment and maintenance cost along with other design weaknesses. For example,. the mild steel drum corrodes and needs to be replaced within 5-10 years. Similarly, tiie drum has to be well anchored to prevent it from overtopping due to high gas pressure.
Figure 2.1: KVIC Floating Gas Holder System
2.2.2 Fixed Dome Digester
Fixed dome Chinese model biogas plant (also called drumless digester) was experimented in China as early as the mid 1930's. This model consists of an underground brick masonry (cement mortar) compartment for the digestion chamber with a concrete dome on the top for gas storage. Thus, in this design the digestion chamber and the gas storage dome are combined as one unit. This design eliminates the use of costlier mild steel gasholder. The life of a Fixed dome type plant is longer (20 to 50 years) compared to KVIC plant, as there are no moving parts and both concrete and cement masonry is relatively less susceptible to corrosion. Based on the principles of fixed dome Chinese model, various countries have put forth modified designs to suit their local conditions. For example, Gobar Gas and Agricultural Equipment Development Company (GGC) of Nepal has developed a design commonly known as the GGC model. Compared to the Chinese fixed dome model, the GGC model is easier to construct as this structure has less curved profiles (e.g., digester bottom is horizontal instead of concaved), A typical
7
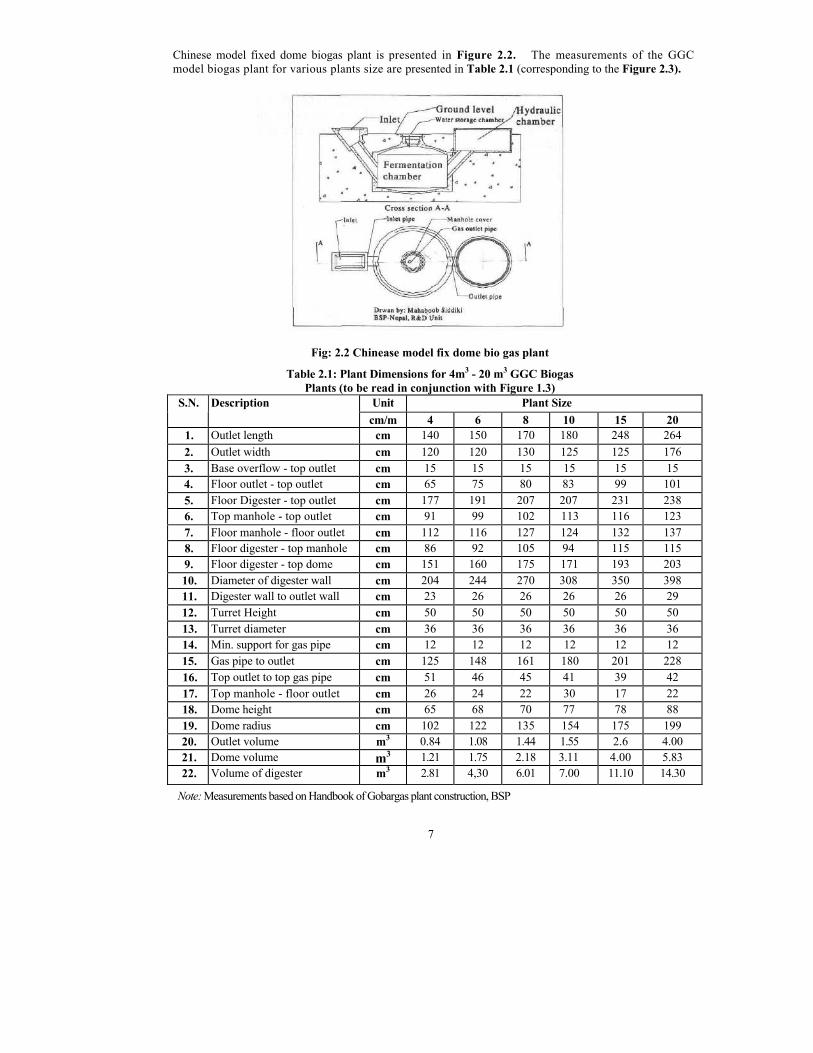
Chinese model fixed dome biogas plant is presented in Figure 2.2. The measurements of the GGC model biogas plant for various plants size are presented in Table 2.1 (corresponding to the Figure 2.3).
Fig: 2.2 Chinease model fix dome bio gas plant Table 2.1: Plant Dimensions for 4m3 - 20 m3 GGC Biogas
Plants (to be read in conjunction with Figure 1.3) Unit Plant Size S.N. Description
cm/m 4 6 8 10 15 20 1. Outlet length cm 140 150 170 180 248 264 2. Outlet width cm 120 120 130 125 125 176 3. Base overflow - top outlet cm 15 15 15 15 15 15 4. Floor outlet - top outlet cm 65 75 80 83 99 101 5. Floor Digester - top outlet cm 177 191 207 207 231 238 6. Top manhole - top outlet cm 91 99 102 113 116 123 7. Floor manhole - floor outlet cm 112 116 127 124 132 137 8. Floor digester - top manhole cm 86 92 105 94 115 115 9. Floor digester - top dome cm 151 160 175 171 193 203 10. Diameter of digester wall cm 204 244 270 308 350 398 11. Digester wall to outlet wall cm 23 26 26 26 26 29 12. Turret Height cm 50 50 50 50 50 50 13. Turret diameter cm 36 36 36 36 36 36 14. Min. support for gas pipe cm 12 12 12 12 12 12 15. Gas pipe to outlet cm 125 148 161 180 201 228 16. Top outlet to top gas pipe cm 51 46 45 41 39 42 17. Top manhole - floor outlet cm 26 24 22 30 17 22 18. Dome height cm 65 68 70 77 78 88 19. Dome radius cm 102 122 135 154 175 199 20. Outlet volume m3 0.84 1.08 1.44 1.55 2.6 4.00 21. Dome volume m3 1.21 1.75 2.18 3.11 4.00 5.83 22. Volume of digester m3 2.81 4,30 6.01 7.00 11.10 14.30
Note: Measurements based on Handbook of Gobargas plant construction, BSP
8
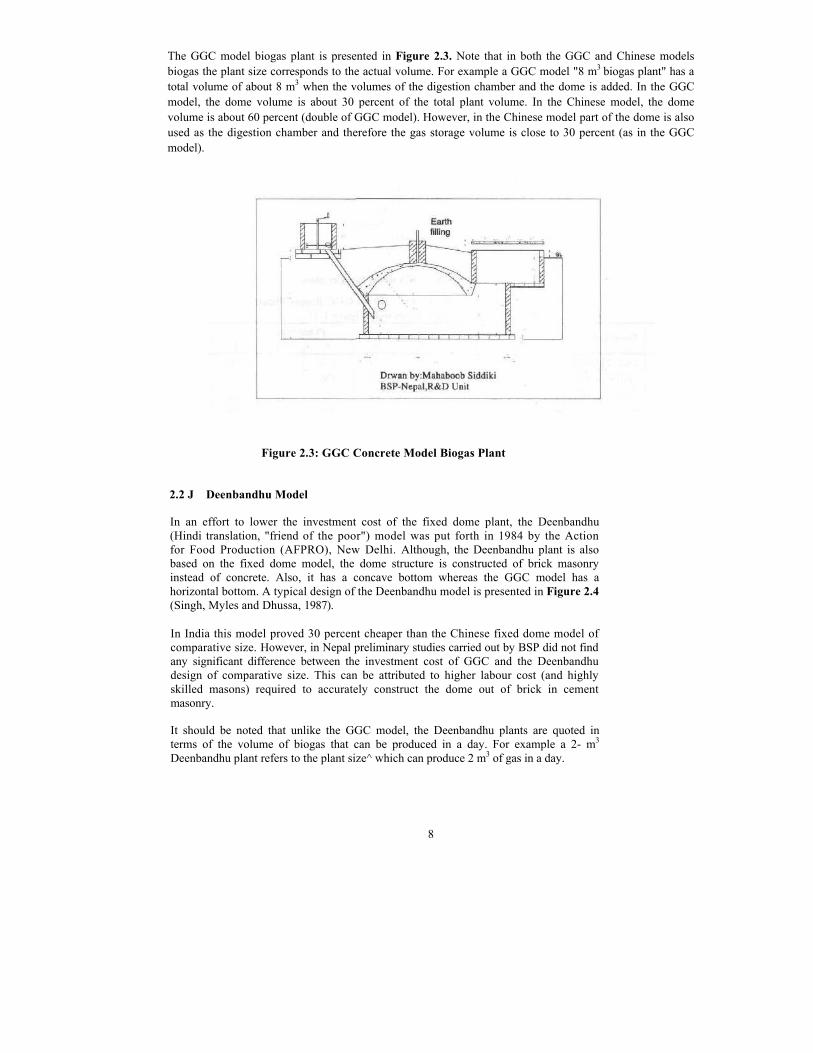
The GGC model biogas plant is presented in Figure 2.3. Note that in both the GGC and Chinese models biogas the plant size corresponds to the actual volume. For example a GGC model "8 m3 biogas plant" has a total volume of about 8 m3 when the volumes of the digestion chamber and the dome is added. In the GGC model, the dome volume is about 30 percent of the total plant volume. In the Chinese model, the dome volume is about 60 percent (double of GGC model). However, in the Chinese model part of the dome is also used as the digestion chamber and therefore the gas storage volume is close to 30 percent (as in the GGC model).
Figure 2.3: GGC Concrete Model Biogas Plant
2.2 J Deenbandhu Model
In an effort to lower the investment cost of the fixed dome plant, the Deenbandhu (Hindi translation, "friend of the poor") model was put forth in 1984 by the Action for Food Production (AFPRO), New Delhi. Although, the Deenbandhu plant is also based on the fixed dome model, the dome structure is constructed of brick masonry instead of concrete. Also, it has a concave bottom whereas the GGC model has a horizontal bottom. A typical design of the Deenbandhu model is presented in Figure 2.4 (Singh, Myles and Dhussa, 1987).
In India this model proved 30 percent cheaper than the Chinese fixed dome model of comparative size. However, in Nepal preliminary studies carried out by BSP did not find any significant difference between the investment cost of GGC and the Deenbandhu design of comparative size. This can be attributed to higher labour cost (and highly skilled masons) required to accurately construct the dome out of brick in cement masonry.
It should be noted that unlike the GGC model, the Deenbandhu plants are quoted in terms of the volume of biogas that can be produced in a day. For example a 2- m3 Deenbandhu plant refers to the plant size^ which can produce 2 m3 of gas in a day.

9
Figure 2.4: Deenbandhu Biogas Plant (3 m3 Gas Production/Day)
2.2.4 Other Designs
In addition to the 3 designs discussed above, there are also other designs that have been experimented in various countries. These models are briefly described below.
PVC Bag Digester: This design was developed in Taiwan in 1960s. It consists of a long PVC (plastic) cylinder as can be seen in Figure 2.5. This type of digester was developed to replace bricks/stone masonry or mild steel.
Figure 2.5: Taiwanese PVC Bag Digester
A PVC plastic bag digester procured by GGC with support from UN1CEF and ADB/N was tested by Gobar Gas and Agricultural Equipment Development Company (GGC) in Butwal, Nepal from April to June 1986 (see Figure 2.6). A 5 m length tunnel type cavity was dug in the ground for the digestion chamber. The plastic sheet was fixed with the help of ¾" G.I. pipe and several hooks fixed in the wooden plank. At the top of the digester, another PVC plastic sheet was fixed in the same way as the lower end. The upper PVC plastic was used for gas storage. To maintain the pressure inside the digester, several small bags of sand were filled around the edge of the plastic (which is always immersed into the slurry) and weight was placed on top. The size of the plant was 3.5 m .

10
Figure 2.6: PVC Bag Digester Tested by GGC in Nepal
From this study, it was concluded that the plastic bag biodigester could be successful only where PVC plastic bags capable of withstanding gas pressure are easily available and welding facilities are provided. Because of these factors, this type of biodigester did not gain popularity in Nepal (Biogas Newsletter, Number 23, November 1986).
Plug Flow Digester: The plug flow design is similar to the bag digester. It consists of a concrete lined (or lined using an impermeable member) trench that is considerably larger than the width or the depth. The reactor is covered with a flexible gasholder, concrete or galvanized iron (GI) sheet. The Plug flow digester is shown in Figure 2.7.
Figure 2.7: Plug Flow Digester
Research at Cornell University indicated that significantly more gas per kg. of dung input can be obtained with a plug flow plant under conditions experienced in USA (Biogas Newsletter Number 13,1981).
11
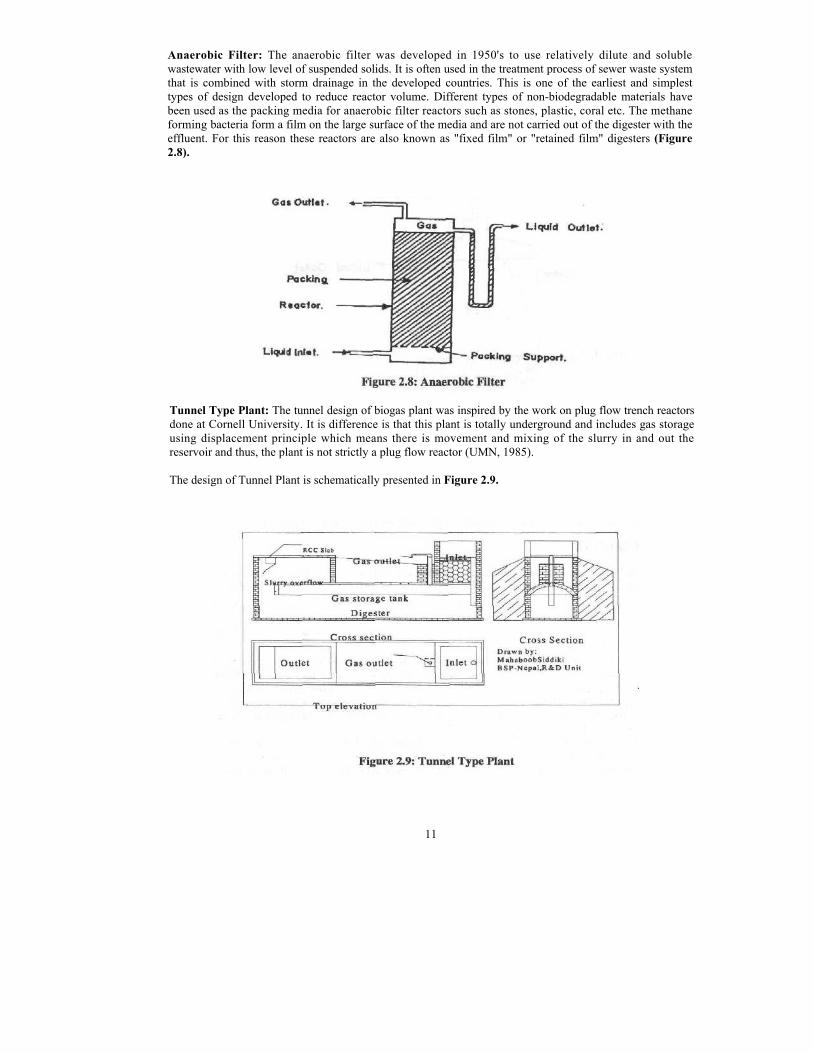
Anaerobic Filter: The anaerobic filter was developed in 1950's to use relatively dilute and soluble wastewater with low level of suspended solids. It is often used in the treatment process of sewer waste system that is combined with storm drainage in the developed countries. This is one of the earliest and simplest types of design developed to reduce reactor volume. Different types of non-biodegradable materials have been used as the packing media for anaerobic filter reactors such as stones, plastic, coral etc. The methane forming bacteria form a film on the large surface of the media and are not carried out of the digester with the effluent. For this reason these reactors are also known as "fixed film" or "retained film" digesters (Figure 2.8).
Tunnel Type Plant: The tunnel design of biogas plant was inspired by the work on plug flow trench reactors done at Cornell University. It is difference is that this plant is totally underground and includes gas storage using displacement principle which means there is movement and mixing of the slurry in and out the reservoir and thus, the plant is not strictly a plug flow reactor (UMN, 1985).
The design of Tunnel Plant is schematically presented in Figure 2.9.
12
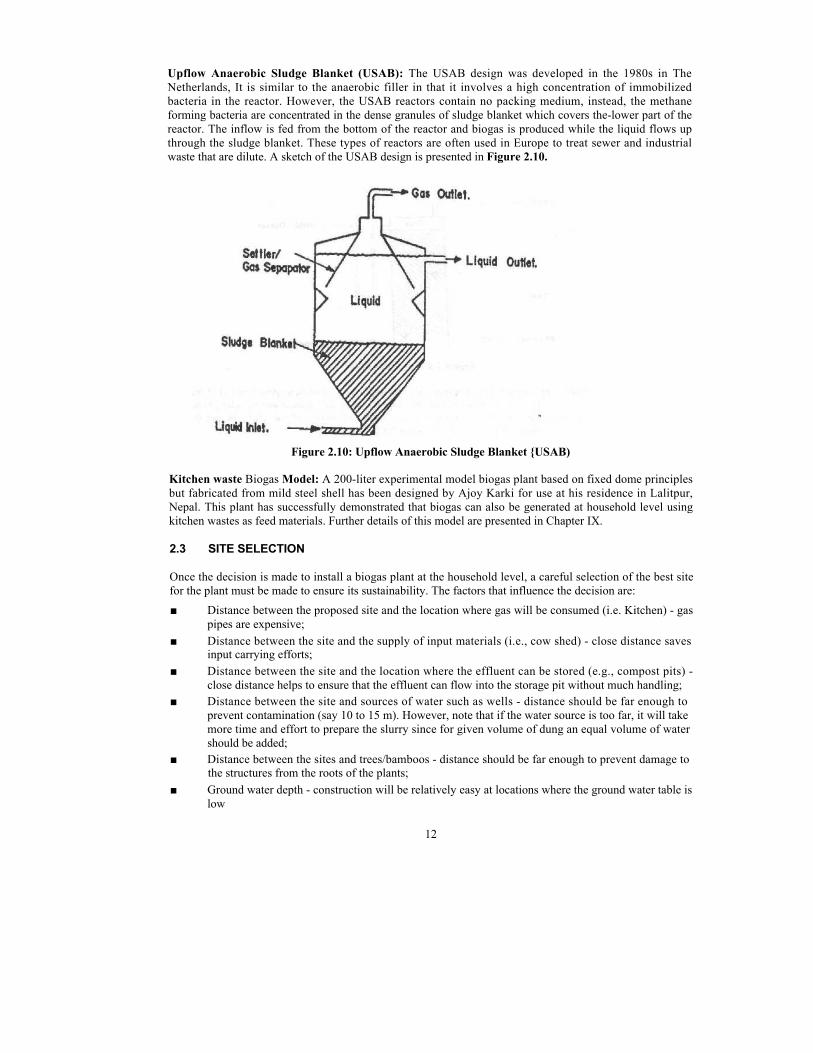
Upflow Anaerobic Sludge Blanket (USAB): The USAB design was developed in the 1980s in The Netherlands, It is similar to the anaerobic filler in that it involves a high concentration of immobilized bacteria in the reactor. However, the USAB reactors contain no packing medium, instead, the methane forming bacteria are concentrated in the dense granules of sludge blanket which covers the-lower part of the reactor. The inflow is fed from the bottom of the reactor and biogas is produced while the liquid flows up through the sludge blanket. These types of reactors are often used in Europe to treat sewer and industrial waste that are dilute. A sketch of the USAB design is presented in Figure 2.10.
Figure 2.10: Upflow Anaerobic Sludge Blanket {USAB)
Kitchen waste Biogas Model: A 200-liter experimental model biogas plant based on fixed dome principles but fabricated from mild steel shell has been designed by Ajoy Karki for use at his residence in Lalitpur, Nepal. This plant has successfully demonstrated that biogas can also be generated at household level using kitchen wastes as feed materials. Further details of this model are presented in Chapter IX.
2.3 SITE SELECTION
Once the decision is made to install a biogas plant at the household level, a careful selection of the best site for the plant must be made to ensure its sustainability. The factors that influence the decision are: ■ Distance between the proposed site and the location where gas will be consumed (i.e. Kitchen) - gas
pipes are expensive; ■ Distance between the site and the supply of input materials (i.e., cow shed) - close distance saves
input carrying efforts; ■ Distance between the site and the location where the effluent can be stored (e.g., compost pits) -
close distance helps to ensure that the effluent can flow into the storage pit without much handling; ■ Distance between the site and sources of water such as wells - distance should be far enough to
prevent contamination (say 10 to 15 m). However, note that if the water source is too far, it will take more time and effort to prepare the slurry since for given volume of dung an equal volume of water should be added;
■ Distance between the sites and trees/bamboos - distance should be far enough to prevent damage to the structures from the roots of the plants;
■ Ground water depth - construction will be relatively easy at locations where the ground water table is low

13
■ Suitable foundation condition - the ultimate bearing pressure of the foundation should be adequate to support the load of the biogas plant and the slurry inside.
At any particular site it may not be possible to fulfill all of the above criteria. However, efforts should be made to meet as many of the above listed criteria as possible such that the cost is lowered and the plant operation becomes less cumbersome.
2.4 DESIGN PARAMETERS FOR SIZING OF BIOGAS PLANTS
Relevant design parameters required for sizing a biogas plant are summarized in Table 2.2 (and explained afterwards).
Table 2.2: Design Parameters for Sizing of a Biogas Plant
S.N. Parameter Value 1. C/N Ratio 20-30 2. pH 6-7 3. Digestion temperature 20-35 4. Retention time (HRT) 40 - 100 days 5. Biogas energy content 6 kWh/m3 6. One cow yield 9-15 kg dung/day 7. Gas production per kg of cow dung 0.023 - 0.04 m3 8. Gas production per kg of pig dung 0.04 - 0.059 m3 9. Gas production per kg of chicken dung 0.065 -0.116 m3 10. Gas production per kg of human excreta 0.020-0.028 m3 11. Gas requirement for cooking 0.2 - 0.3 m3 person 12. Gas requirement for lighting one lamp 0.1 -0.15 m3/hr
Source: Werner, Stohr ami Hccs (1989)
C/N Ratio: This is the ratio of carbon to nitrogen present in the organic matter. Gas production is optimum when C/N ratio of the input is between 20 and 30. C/N ratio of cow/buffalo dung is about 25 and hence ideal for biogas production. C/N ratios of various other inputs arc cited in Chapter I (sec Table 1.2). As will be discussed later, C/N ratio can be brought within the optimum range by mixing different inputs (in certain ratios).
pH: pH is the measure of acidity/alkalinity of the input. A pH value of 7 is neutral; pH less than 7 is acidic and higher than 7 is alkaline. Optimum gas production occurs when the pH value of the input is 6-7.
Digestion Temperature: Optimum gas production occurs at 35°C. Below 20°C the gas production is significantly reduced. Hence, this technology in its simple form is not viable in cold climates. If the ambient temperature is 10°C or lower, gas production stops. Even a sudden fall of temperature by 2 to 3°C significantly reduces gas production. Insulation of the digester helps to increase gas production in the cold climates.
Retention Time: The retention time is defined as the average time that a given quantity of input remains in the digester. It is also known as the hydraulic retention time. The retention time is calculated by dividing the total volume of digester by the volume of inputs added daily.
The retention time is also a function of the type of input and the ambient temperature. For cow/buffalo dung input. Biogas Support Programme (BSP) recommends a retention time of 70 days in the hills and 55 days in the Terai (warmer climate). These loading rates translate into 7.5 kg of cow dung per m3 plant size per day in Terai and 6 in the hills. These loading rates for various plant sizes are recommended in Table 2.3.

14
Table 2,3: Loading Rate for various Plant Size
Daily Loading Rate (kg) Plant Size Cm3) Hills Terai
4 24 30 6 36 45 8 48 60
10 60 75 15 90 110 20 120 150
Since human excreta contain more pathogens (disease vectors) than most domestic animal dung, 90-100 days retention time is recommended when this is used as input.
Consistency: The slurry inside the biogas plant needs to be consistent for optimum gas production. If the slurry is too thick, it will settle at the bottom of digester and be pushed out by gas pressure before being completely digested. On the other hand if it is too thin, additional dead space in the digester chamber is occupied by water. In case of cow/buffalo dung for a given volume of fresh input an equal volume of water should be added and the slurry should be well mixed.
Other parameters presented in Table 2.2 are self-explanatory.
2.5 EXAMPLES OF SIZING BIOGAS PLANTS
Some examples of sizing of biogas plants (using the above parameters) are given below:
- Example 2.5.1
Calculate the amount of cow dung required to generate 1 m3 of gas per day.
Solution:
From Table 2.2: 1 kg of cow dung produces 0.023 - 0.04 m3 of gas Average value = (0.023 + 0.04)/2 = 0,032 m3
- Or 0.032 m3 of gas is produce from 1 kg of dung - to produce 1 m3 of gas: 1/0.032 kg of dung is required = 31.3 kg of dung
■ Example 2.5.2
What is the appropriate plant size required in Example 5.1'?
From Table 2.4: for loading rate of 31 kg or dung, the required plant size is 4 m3 if the plant is located in Terai (30 kg) and 6 m3 (36) for hills
- Example 2.5.3
How many cows will the farmer need in the above examples (i.e. to produce 1 m3 of gas)?

15
Solution:
From Table 2.2: 1 cow yields 9 - 15 kg of dung per day (depending on whether it is stall fed or grazed) - Average value: (9 + 15)/2 = 12 kg/day assuming animals are partly grazed and partly stall-fed - to produce 31.3 kg of dung he will need 31.3/12 = 2.6 3 cows
In practice, a farmer has a fixed number of animals and wants to find out the plant size required and the gas produced to meet his energy demand. Also, farmers are advised to weigh the dung produced daily a few times to determine the appropriate plant size.
■ Example 2.5.4
Suppose a farmer has:
2 cows each producing about 10 kg/day of dung
3 buffaloes, each producing 16 kg/day of dung
Can he meet the energy demand to cook for a family of 6 and light one lamp for 4 hours per day?
Solution:
Total dung available: 2 x 10 + 3 x 16 = 68 kg/day 68 kg/day of dung produces: 0.032 niVkg x 68 kg/day = 2.2 m3 of gas/day
- From: Table 2.4, he will need a plant size of 8 m3 to 10 m3
Gas required for cooking: Table 2.2: 0.25 m3 /person (average) For a family of 6: cooking requirements = 6 x 0.25 = 1.5 m3
- Gas required for lighting: Table 2.2: 0.125 m3 (average) - Lighting requirements: 4 x 0.125 = 0.5 m3 - Total gas requirement = 1.5 + 0.5 = 2 m3 /day
Since his gas requirement (2 m /day) is slightly less than his gas production rate (2.2 m3/day), yes, he can meet his energy demand.
■ Example 2.5.5
Optimizing C/N ratio:-
Note that as discussed earlier C/N ratio of human excreta is about 8 and that of rice straw is 73. Also, optimum gas production occurs when the C/N ratio is between 20 and 30. Therefore, for 1 kg of human excreta, how much rice straw should be mixed?
Solution:
Aim for a C/N ratio of 25 (average): l[kg] x 8[C/N] + R[kg] x 73[C/N] = (1 + R )[kg] x 25[C] (where R is the weight of rice straw in kg)
OR, 8 + 73R = (l+R)x25 48R=17 R= 0.35 ke
Therefore for each kg of human excreta 0.35 kg (350 gm) of rice straw should be mixed).

16
■ Example 2.5.6
Suppose a farmer has:
20 pigs each producing about 3 kg/day of dung 2 cows each producing 10 kg/day of dung
He has to cook for a household of 7 and he wants 3 lights, each for 4 hours per day? He has plenty of water Does he have enough input to meet these energy demands and what plant should he choose?
Solution:
Potential gas production
- Pig dung available 20 x 3 = 60 kg/day Gas available from pig dung 60 kg/day x 0.05 m3/kg = 3.0 m3/day (Table 2.2)
- Cow dung available 2 x 10 = 20 kg/day - Gas available from cow dung 20 kg/day x 0.032 m3/kg = 0.64 m3/day
Total gas available 3.0 + 0.64 = 3.64 m3/day Total dung available 60 + 20 = SO kg
Gas requirements
- Lighting: 3 (lights) x 4 hr/day x 0.125 m3/hr = 1.5m3/day - Cooking: 7 (persons) x 0.25/ m3/person per day = 1.75 m3/day - Total gas requirement: 1.5 + 1.75 = 3.25 m3/day
Since the potential gas production is slightly higher than the requirements, yes the farmer has enough inputs to meet the energy demand.
Plant size required:
From Table 2.3: for 80 kg inputs/day he will need 10 m3 plant in Terai (slightly overfed) and 15 m3
(underfed) in Hills
2.6 DESIGN AND CONSTRUCTION ASPECTS
2.6.1 Construction Details
Some construction details of GGC model biogas plants are as follows:
• The digester wall is constructed of either brick or stone masonry depending on the local availability of these materials. In case of brick masonry, the wall thickness is 12 cm and the mortar consists of 1:4 (i.e., 1 part cement and 4 parts sand). Then, a 10 mm thick plaster is applied (1:3) on the internal surface. If stone masonry is used, the wall thickness is 23 cm and 1:6 mortars are used. Similarly a 10 thick plaster (1:3) is applied on the internal surface. These plasters are applied to ensure that [he structure is water-tight.
• The dome is constructed out of plain cement concrete at 1:3:3 ratio (i.e. 1 part cement, 3 part sand and 3 part gravel). Once the dome is cured (it is kept moist for 7 days such as by covering with jute bags and sprinkling water each day); a 10 mm thick plaster (1:1) is applied on the internal surface. Then another 5 mm thick plaster (1:1) is applied. Further, a first coal of emulsion colour (1.5:20 emulsion to cement ratio) followed by a 1:2 ratio second coat are also applied in the internal surface of the dome. These plasters and colour coats are applied to ensure that the dome is airtight.

17
2.6.2 Volume Calculations for Chinese Model Plants
The dimensions for the GGC model have been specified for all plant sizes (4-20 rn3) for ease of construction as can be seen in Table 2.1. Furthermore, for each plant size, the outlet, dome and digester volumes are given. The volume of the plant is approximately equal to the dome plus digester volume. Various dimensions of Chinese model biogas plant are given in Figure 2.11.The volumes of the of this model are based on the following equations:
• Volume of the Dome
V1 = Πf1(D2/8 + f12 06)
where: f1 is die height of the dome and D is the diameter.
• Volume of the Middle Cylindrical Section of the Digester
V2 = Π [{(D+D0/2}2/4](0.5) Where D1 is the diameter of the concave bottom
• Volume of the Concave Bottom
V3 =Πf2(D12/8 + f2
2/6) Where f2 is the height of the concave bottom
A quick check for the 10 m3 Chinese plant (see Figure 2.11) is presented below:
V1 = Πf1(D2/8 + fi2/6) = Π.45(2.92/8 + 1.452/6) = 6.39
V2 = Π [{(D+ D,)/2J 2/4] (0.5) =Π [((2.9 + 2.7)/2) 2/4] (0.5) = 3.08
V3 = Πf2(Di2/8 + f22/6) = Π0.034(2.72/8 + 0.0342/6) = 0.10
Total volume = V, + V2 + V3 = 9.57m3 ~ 10 m3 Similarly, the 6, 8 and 12 nr1 plants' volume can be verified using the above equations.

18
2.6.3 Structural Design Aspect
The principles behind the design of the fixed dome biogas plant arc outlined below:
• The Concrete Dome
Structurally, a concrete/masonry dome is strong in compression (due to arch action) and weak in tension. Hence, this structure should always be in compression, i.e. the load (force) acting on the outside surface of the dome should be higher than the force generated due to gas pressure in the inside surface.
The internal pressure (from the built up of biogas) in the concrete dome can be 0.1 to 0.15 bar. This translates to 1000 kg/m2 to 1500 kg /m2 of pressure. In a conventional biogas plant such as the fixed dome GGC model, the dome is not reinforced with steel bars (unlike floor slabs in buildings), Therefore, even nominal tensile force can damage (crack) the dome. This is why compacted earth is placed over the dome as a precautionary measure. Note that 50 cm of compacted earth provides about 900-1000 kg/cm2 and the balance can be easily met by the weight of the dome.
The various loads on the dome are schematically shown below:
Figure 2.12: Loads Acting on the Concrete Dome
q! = dead load, i.e. weight of the dome q2 = load due to the compacted earth q3 = load above the dome, such as due to people, cattle etc. q4 = load due to gas pressure
• The Digester Wall
The loads acting on the digester wall are as follows:
Earth pressure acting on the outside surface:

19
The resultant force is as follows: F1 =(γearthh2)/2 where: γearth is the unit weight of earth = 1800 kg/m3 when the soil is partially saturated and h is the height of the digester wall. Note; Active earth pressure coefficient (Ka) has been neglected, as this is dependent on soil properties (i.e., angle of friction). Typical values of Ka may vary between 0.3 and 0.4 and therefore the actual earth pressure and the resultant force would be 0.3 to 0.4 times less than the value calculated above. Thus, neglecting Ka results in a conservative value of the force - Slurry pressure acting on the inside surface: The resultant force is as follows: F2 =(γearthh2)/2 where: γearth is the unit weight of slurry = 1500 kg/m3 (approximate; since unit weight of water is 1000 kg/m3 and the partially digested slurry may add 50% weight) and h is the height of the slurry inside the digester. Note that the height of the slurry is less than the total height of the digester wall.
Note that the critical condition occurs when the digester is empty. In this case the counter balance force provided by the slurry is absent. The forces and pressure diagram for both cases are presented in Figure 2.13 below:
Figure 2.13: Forces and Pressure Acting on the Digester Wall
Note that for both cases (digester full and empty), the earth pressure is higher (even when Ka is accounted for since the maximum slurry height is about 50 to 55 percent of the total wall height - bottom to the top of the dome) which ensure that the digester wall is in compression. Similar to the dome the circular cement masonry digester is strong in compression and weak in tension. Hence, the entire fixed dome biogas plant is buried (i.e., it is not only to save space). For a-20 m3 biogas plant, as can be seen from Table 1.1, the height from the floor of the plant to the top of the dome is 203 cm (2.03 m). Thus, the maximum compressive stress at the bottom of the wall when the plant is empty would be:
σ = γearth (σ is the compressive stress, h = 203 cm, assume γearth =1800 kg/ m3 as discussed earlier and Ka has been neglected) σ = 1800 x 2.03 = 3654 kg/m2 or 36.5 kN/m2

20
The compressive stress of about 36.5 kN/m2 calculated above can be safely carried by the 12 cm thick brick masonry or 23 cm thick stone masonry walls. Also note that the largest biogas plant design (GGC model) is limited to 20 m3. Biogas plants larger than 20 m3 will require thicker dome and wall sections verified by detailed structural design.
REFERENCES
[1] CES/IOE (2001) Design Concept and Other Parameters of Biogas Plants. In: Advanced Course in Biogas Technology. Centre for Energy Studies, Institute of Engineering, Pulchowk Campus, Tribhuwan University, Nepal.
[2] Chengdu-Seminar (1979) Biogas Technology and Utilization, Sichuan Provincial Office of Biogas Development. China.
[3] CMS (1996) Biogas Technology: A Training Manual for Extension, Food and Agriculture Organization of the United Nations. Support for Development of National Biogas Programme (FAO/TCP/Nep/4451-T).
[4] Devkota, G.P. (1986) Plastic Bag Digester. In: Biogas Newsletter, No.23. [5] Finely, J.H. (1981) Tunnel Plant-Under Development. In: Biogas Newsletter, No.13. Summer 1981 [6] Karki, A.B. and K. Dixit (1984) What is Biogas and How is it Formed? In: Biogas
Fieldbook, Sahayogi Press, Kathmandu, Nepal [7] K.C. Hari Bahadur (undated) Handbbok of Gobargas Plant Construction, Biogas Support
Programme. Undated. [8] Singh, J.B., M. Myles and A. Dhussa (1987) Manual on Deenbandhu Biogas Plant, Tata
McGraw-Hill Publishing Company Limited. [9] UMN (1985) Tunnel Plant. Biogas. In: Challenges and Experience from Nepal Vol. 1. pp4.1-4.15

21
CHAPTER III
MICROBIAL ACTIVITIES IN ANAEROBIC DIGESTER
3.1 HISTORICAL ASPECTS OF METHANE GAS
"Marsh gas" was discovered by Shirley in 1667. In 1630, Van Helmont pointed out the existence of an inflammable gas in putrefying waste and in the rumen of animals by examining 15 different gases. For the first time, it was only in 1776 that Volta recognized the presence of methane gas in the marsh or swampy place. Pristely mentioned about this gas in 1790 and Dalton tried to find out its chemical formula in 1804.
In 1808, Humphrey Davy studied the fermentation of the mixture of water and cow dung and collected one litre of gas. The gas so collected contained 60 percent carbon-dioxide and the rest comprised of a mixture of gas which was rich in methane and nitrogen. Bui Davy was interested only in the fertilizer aspect but not in the potential of this gas as energy. After a lapse of 60 years that is in 1868, Reiset indicated the presence of methane in the heap of farm yard manure.
In February 1884, Louis Pasteur presented the work of his student Ulysse Gayon in the Academy of Science and concluded fermentation of animal dung could become a source that could be utilized for heating and lighting. Thereafter, many other scientists namely Schloesing, Omeliansky, Deherain and Dupoint made valuable contribution about the production of methane through fermentation of organic materials (Lagrange, 1979).
3.2 BIOCHEMICAL PROCESS OF ANAEROBIC DIGESTION
The waste materials of plant and animal origins consist mainly of carbohydrates, lipids, proteins and small amounts of metabolites, and most of them are insoluble in water. All organic (biodegradable) materials undergo decomposition. If these materials are incubated in anaerobic condition, a combustible gas chemically known as methane is produced by the action of bacteria. Biogas can be generated from human excreta, wastewater from the industries, food industries, municipal waste, energy crops like water hyacinth and various organic side products. But generally, when we deal with the biogas we talk about the gas produced from the animal dung. The anaerobic digestion process that ultimately results into methane formation undergoes three stages of process as explained later in this text.
3.2.1 Anaerobic Digester2
Anaerobic digestion is carried out in an airtight cylindrical tank that is known as digester. A digester is made up of concrete bricks and cement, PVC or steel. It has a side opening (charge pit) into which organic materials for digestion is incorporated. There lies a cylindrical container above the digester to collect the gas.
In this sub-continent, single stage digester is set up in biogas plant, However in other countries single stage, double and multistage digester(s) are set up to accomplish digestion at high rate. A single stage anaerobic digestion process for biogas production has been schematically presented in Figure 3.1.
In biogas plant, a concrete tank is built up which has the concrete inlet and outlet basins. Fresh cattle dung is deposited into a charge pit, which leads into the digestion tank. Dung remains in lank. After a lapse of time depending upon ambient temperature, sufficient amount of gas is accumulated in gas tank, which is used For household purposes. Digested sludge is removed from the basin and is used as fertilizer. Usually digesters are buried in soil in order to benefit from insulation provided by soil. In cold climate digester can be heated by the installations provided from composting for the agricultural wastes.
2 Anaerobic digester is known by various names such as Gobar Gas Plant, Biogas Plant, Digester, Biodigester, Bioreactor, Anaerobic Reactor etc

22
Figure 3.1: A Single Stage Anaerobic Digestion Process
3.3 STAGES OF ANAEROBIC DIGESTION PROCESS
Anaerobic digestion is accomplished in three stages as explained below:
3.3.1 Solubilization or Hydrolysis
In the initial stage, feedstock is solubilized by water and enzymes. The feedstock (cattle dung and other organic polymers) is dissolved in water to make slurry. The complex polymers are hydrolysed into organic acids and alcohols by hydrolytic fermentative bacteria, which are mostly anaerobes.
The microbial cell is impermeable to the cellulose molecule so the organism must excrete extracellular enzymes in order to make the carbon source available. The extra cellar catalysts act hydrolytically, converting the insoluble materials to soluble sugars that penetrate the cell membrane. The large molecular complex

23
substances are solubilized into simpler ones (especially volatile acids, which are low molecular weight organic acids) with the help of extracellular enzyme excreted by the acid forming bacteria. The phase is also known as polymer breakdown stage. For example, the cellulose consisting of polymerised glucose units are first broken down to dimers (disaccharides), and then to monomers (monosaccharides) such as glucose by cellulolytic bacteria, which excrete enzyme called cellulose. The most common anaerobic cellulose fermenters in nature appear to be members of the genus Clostridium. These bacteria are found in soil, compost, manure, river mud, sewage, etc.
3.3.2 Acidogenesis
During acidogenesis (conversion of high volatile acid to acetic acid and CO;), the second group of3 bacteria i.e. facultative anaerobic and hydrogen producing acidogenic bacteria convert the simple organic materials via oxidation-reduction reactions into acetate, hydrogen and carbon dioxide. These substances serve as food for the final stage. Fatty acid is converted into acetate. H2 and CO;, via acetogenic dehydrogenation by obligate H2 producing acetogenic bacteria. There is other group of acetogenic bacteria, which produce acetate and other acids from H3 and via acetogenic hydrogenation.
The monomer such as glucose, which is produced in stage 1, is fermented under anaerobic condition into various organic acids with the help of enzymes produced by the acid forming bacteria. At this stage, the acid forming bacteria break down molecules of six atoms of carbon (glucose) into molecules of less atoms (acids) which are more reduced state than glucose. The principal acids produced in this process are acetic acid, propionic acid, butyric acid and ethanol. The bacteria involved in acidification are Bacillus cereus, Bacillus megathorium, Closdtridium carnofeetidium, Psedomonas formacans etc.
3.3.3 Methanogenesis or Methanisation
This is the final stage of anaerobic digestion where acetate and H3 plus CO2 are converted by methane producing bacteria (methanogens) into methane, carbon dioxide, water and other products.
The principal acids produced by acid forming bacteria in stage 2 are processed by methane producing bacteria to produce methane. The reaction that takes place in this process of methane production is called methanisation and expressed by the following equation:
C H 3 C O O H → Acetic acid
CH4 Methane
+ CO2 Carbon dioxide
2CH3CHaOH + Ethanol
CO2 Carbon dioxide
→ CH4 + Methane
2CH3COOH Acetic acid3
CO2 + Carbon dioxide
4H2 Hydrogen
→ CH4 + Methane
2H2O Water
The above equation shows that many products, by products and intermediates are produced in the process of digestion of inputs in an anaerobic before the final product (methane) is produced.
Different species of methanogens are involved in breakdown of complex organic matter into acetate or other organic acids. Acetate is one of the substrates of methanogenic bacteria. Hydrogen with CO2 is a general substrate for methanogenesis. Numbers of these bacteria differ with type of substrates. For example counts of 10-106 per ml and 105-108 per ml of hydrogen utilizing bacteria were determined from the pig waste and sewage sludge digesters respectively.
a. Microbial Activities of Metbanogenic Bacteria Methanogens are a unique group of bacteria. They are obligate anaerobes and have slow growth rate. They play a major role in breakdown of substrate into gas form. They are the only organisms that can anaerobically
3

24
catabolize acetate and H2 to gaseous products in the absence of exogenous electron accepiors other than CO2 or light energy. In their absence effective degradation would cease because of accumulation of non gaseous reduced fatty acid and alcohol products of the fermentative and other H2 using bacteria that have almost the same energy content as the original organic matter.
In morphology they are of different types of such as cocci, bacilli, spiralli and sarcinea. In 1940, Barker isolated a pure culture of Methanobacterium omehanskii capable of reducing carbon dioxide into methane. In 1956, based upon morphology, Barker classified the methane producing bacteria into the following four groups. Carbon substrates are oxidized by methogenic bacteria to form methane as given in Table 3.1.
Table 3.1: Caron Substrates Oxidized by Methanogenic Bacteria
S.N. Genus Morphology Substrates Used End Products
1. Methanobacterium Rods (variable) Formate CH4 + HCO3
2. Methanobacillus Cocci Formate CH4 + HCO3
3. Methanococcus Vibrios Formate CH4+HCO3
4. Methanosarcina Cocci in regular
Cubical packages
Acetate, Methnol CH4 + HCO3
Active species of methanogenic bacteria are widely distributed in nature such as water-logged soils, marshes swamps, manure piles, marine and fresh water sediments and intestines of higher animals
b. Mechanism of Methane Formation
Metabolically the Methanogens arc very peculiar. Carbon dioxide fixations, Calvin cycle, serine or hexulose pathways are absents in them. The mechanism of methane formation is not well understood. Several new coenzymes are involved which are not present in any other group of bacteria. These coenzymes are methylcoenzymes. M hydroxy methyl coenzyme, M coenzyme, F 420 coenzyme, F 430 component, B corrinoids, Methanofuran of carbon dioxide reducing factor, Methanopterin and formaldehyde activating factor.
Primary reaction in which carbon monoxide takes part is as below:
CO+H3O → CO2+H2
The secondary reaction takes lace in the presence of sufficient hydrogen:
CO + 4H2O → CO2+4H2
Other reactions showing methane formation from various substrates are given below:
4CH3 + 4OH → 3CH4+CO2+2H2O (Methanol) 4HCOOH → CH4+3CO2+2H2O (Formate)
12CH3COOH →12CH4+12CO2 (Acetate)

25
3.4 FACTORS AFFECTING MICROBIAL ACTIVITIES IN DIGESTER
3.4.1 Slurry
For proper solubilization of organic materials, the ratio between solid and water should be 1:1 when the domestic wastes are used (see Chapter II).
3.4.2 Seeding or Bacterial Population
Acetogenic (acid forming bacteria) and methanogenic are naturally present in cow dung. However, their number is quite small. Acid forming bacteria proliferate fast and increase their number, while methanogenic bactera develop very slowly. Therefore, for die initial reaction, small amount of sludge of another digester is generally used as seeding or inoculum. This sludge contains high concentration of acetogenic and methanogenic bacteria, which could enhance the process of anaerobic digestion of organic materials.
Some study has shown that the seeding materials can be mixed with the input slurry up to the ratio of 30 to 50 percent. If inoculum is increased further, less volume of gas is obtained due to reduced inputs fed to the digester.
3.4.3 Stabilization of pH Value
Methane producing bacteria are very sensitive to pH level. For high amount of methane, optimum pH of digester should be maintained between 6 and 8. The acidic condition lowers down methane formation (see Chapter I).
3.4.4 Temperature
Temperature factor is critical value in the beginning of methane formation. Once metabolism occurs exothermic reaction is helpful for the methane production. In case of mesophilic digestion, temperature range should be maintained between 30 to 40°C. In case of thermophilic digestion, it should be between 45 to 60 °C. In cold climate, the temperature of digester area should be raised upto 35 °C (see Chapter I).
3.4.5 Nitrogen Concentration
Methane production is the activity of Carbon metabolism, thus excess amount of nitrogen inhibits the bacterial metabolism and lower down the methane production.
3.4.6 Carbon-Nitrogen (C:N) Ratio
C:N ratio is one of the important factors in digester for methane production. High metabolism occurs when C:N ratio is 30:1. The ratio is only maintained when other substrates are used ratlier man the cow dung or other animal dung (see Chapter I).
3.4.7 Maintain of Anaerobiosis
Methanogenic bacteria are anaerobic organisms. In aerobic condition, most of these bacteria are inactive in metabolism, thus digesters should be totally airtight to maintain strictly anaerobic condition. In many places, digesters are buried in the Earth to maintain anaerobiosis condition.
3.4.8 Addition of Succulent Plant or Algae
For the effective and high production of biogas from cow dung and animal dung many succulent plants or algae are added. Green algae, water hyacinth and lemon grass are added in the digester. The amount of biogas produced from the algae was twice (344 ml/g dry algae) of that obtained from cow dung (179/g dry cow dung) alone. Also, the duration of gas evolution increased with increasing the proportion of slurry. The calorific value of the gas was 4800 K cal/m3 and the percentage of methane was 55.4 percent.
26
REFERENCES
[1] Alexander, M. (1961) Introduction to Soil Microbiology. John Wiley & Sons, Inc. [2] CMS (1996) Biogas Technology: A Training Manual for Extension. Food and Agriculture
Organization of the United Nations. Support for Development of National Biogas Programme (FAO/TCP/Nep/4451-T).
[3] Karki, A. B. and K. Dixit (1984) Biogas Fietdbook, Sahayogi Press, Kathmandu, Nepal. [4] Lagrange, B. (1979) Biomethane 2. Principes-techniques Utilisations, EDISUD. La Calade, 13100
Aix-en-Provence. [5] Sathianathan, M.A (1975) Biogas Achievements and Challenges, Association of
Voluntary Agencies of Rural Development, New Delhi, India.

27
CHAPTER IV
VARIOUS USES OF BIOGAS AND ITS MERITS AND DEMERITS
4.1 VARIOUS USES OF BIOGAS
Like any other fuel, biogas can be used for household and industrial purposes; the main prerequisite being the availability of especially designed biogas burners or modified consumer appliances. Possible use of biogas as energy source is shown in Figure 4.1 (Ni Jit Quin and Nyns, 1993).
4.1.1 Cooking
Cooking is by far the most important use of biogas in the developing world. Biogas burners or stoves for domestic cooking work satisfactorily under a water pressure of 75 to 85 mm. The stoves may be single (Figure 4.2) or double (Figure 4.3) varying in capacity from 0.22 to 1.10 m3 gas consumption per hour. Generally, stoves of 0.22 and 0.44 m3 (8 and 16 cft) capacity are more popular. A 1.10 m3 (40 cft) burner is recommended for a bigger family with larger plant size.

28
Gas requirement for cooking purposes has been estimated to be 0.33 m3 per person per day under Indian or Nepalese conditions (see Table 2.2). If a family of 6 members owns a plant producing 2 m" of gas per day, usually two stoves (one with 0.22 m3 and the other with 0.44 m3 per hour capacity) can be used for one and half hours each in the morning and the evening to meet all cooking requirements of the family (Karki and Dixit, 1984).
4.1.2 Lighting
Biogas can be used for lighting in non-electrified rural areas. Special types of gauze mantle lamps consuming 0.07 to 0.14 m3 of gas per hour are used for household lighting. Several companies in India manufacture a great variety of lamps, which have single or double mantles. Generally, 1-mantle lamp is used for indoor purposes and 2-manlle lamps for outdoors. Such lamps emit clear and bright light equivalent to 40 to 100 candle powers. These are generally strong, well built, bright, efficient and easy to adjust. Compared to stoves, lamps arc more difficult to operate and maintain. The lamps work satisfactorily under a water pressure of 70 to 84 mm (Karki and Dixit, 1984). A sketch of the typical biogas lamp manufactured in India is given in Figure 4.4.
Figure 4.4: Sketch of Typical Biogas Lamp Manufactured in India
Different types of lamps are in use in China. They are simple in operation and easy to manufacture and are low priced. In remote places, clay lamps that do not need much skill to manufacture are still being used by Chinese fanners.
In India there are numerous workshops that manufacture biogas appliances and accessories. Some years ago, biogas appliances especially biogas lamps were not manufactured in Nepal and used to be imported from several companies in India. But at present, there exists a total of 13-biogas appliances workshop in Nepal. (BSP, 2003). In 1996, with support from Biogas Support Programme, Balaju Technical Training Centre (BTTC), Kathmandu started manufactured biogas lamp under the name of Ujeli. The sketch of Ujeli Biogas Lamp is shown in Figure 4.5.
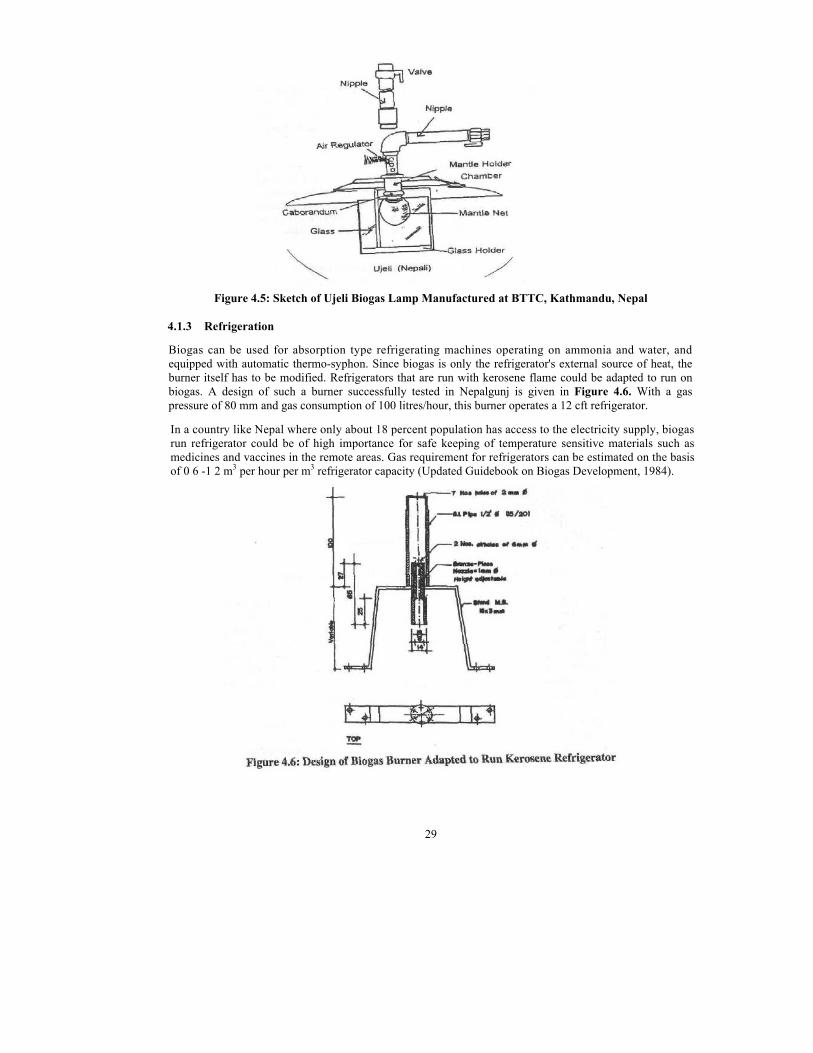
29
Figure 4.5: Sketch of Ujeli Biogas Lamp Manufactured at BTTC, Kathmandu, Nepal
4.1.3 Refrigeration
Biogas can be used for absorption type refrigerating machines operating on ammonia and water, and equipped with automatic thermo-syphon. Since biogas is only the refrigerator's external source of heat, the burner itself has to be modified. Refrigerators that are run with kerosene flame could be adapted to run on biogas. A design of such a burner successfully tested in Nepalgunj is given in Figure 4.6. With a gas pressure of 80 mm and gas consumption of 100 litres/hour, this burner operates a 12 cft refrigerator.
In a country like Nepal where only about 18 percent population has access to the electricity supply, biogas run refrigerator could be of high importance for safe keeping of temperature sensitive materials such as medicines and vaccines in the remote areas. Gas requirement for refrigerators can be estimated on the basis of 0 6 -1 2 m3 per hour per m3 refrigerator capacity (Updated Guidebook on Biogas Development, 1984).

30
4.1.4 Biogas-fueled Engines
Biogas can be used to operate four stroke diesel and spark ignition engines. Biogas engines are generally suitable for powering vehicles like tractors and light duty trucks as has been successfully experimented in China. When biogas is used to fuel such engines, it may be necessary to reduce the hydrogen sulphide content if it is more than 2 percent. Using biogas to fuel vehicles is not so much of an attractive proposition as it would require carrying huge gas tanks on the vehicle.
One of the uses of biogas, which has wide application in Nepal, is to fuel engines to run irrigation pumps. A dual-fuel engine is available in India, which will run on a mixture of biogas and diesel (80% biogas and 20% diesel). In these engines, biogas is used as the main fuel while diesel is used for ignition. When gas runs out, the duel fuel engine can be switched back to run fully on diesel. Pre-converted dual engines are available in the market. Such engines could be used for pumping water both for drinking and irrigation purposes. This utility is of high importance in hilly areas where rivers flow nearby, while the adjacent field dries up due to lack of irrigation.
A biogas plant was built for a farmer in Parwanipur, near Birgunj, to fuel a dual engine that pumps water into an irrigation canal. The gas plant is sited so that the slurry coming out from the outlet flows into a mixing basin in the irrigation canal and is washed directly to the crops in the fields (see Figure 4.7).
Figure 4.7: Pumping of River Water by 5HP Duel Fuel Engine
The dung of the biogas plant is obtained from a herd of about 24 buffalo in a cattle shed sited about 100 meters from the plant. The 350 kg of dung required by the plant per day is brought to the 500 cu ft (14 m3 of gas, nominally, per day) biogas plant by wheelbarrow. The gas is fed, via water outlet and an underground GI gas pipeline, to the dual-fuel engine in an engine shed sited about three meters below the flume. The 5 HP Kirloskar dual-fuel engine can run for about eight hours a day on the 14 m3 of gas nominally produced by the biogas plant. The engine also requires about 1 liter of diesel per day to run, and about 1 liter of engine oil every week. Since the farm is nearby to several small industries owed by the same person, maintenance of the engine is done by the mechanics that maintain the machinery in the factories.
The 5 HP engine drives a 3 inch (75 mm inlet and outlet pipes) Kirloskar water pump that is capable of lifting about 50 liters of water per minute up the 7 meters head, from the stream running four metes below the engine shed to the irrigation flume 3 meters above it. The stream is about 2 meters wide and about 1.5 meters deep, running steep banks, and it runs all the year around.

31
The volume of water form the 5 HP pump (about 20 liters per second) can flood about 1 ½ bhigas (appr. 1 hectare) of land to a depth of 2.5 cm (1") in 10 hours. This is about the amount of water required by a paddy field in Parwanipur once a week, so the 5 HP pump should be able to irrigate 10 bhigas (6.78 ha) of paddy. Maize, which is also grown in Parwanipur, requires less water and this pump should be able to irrigate 15 bhigas (10.2 ha) of maize (Biogas Newsletter, 1981).
4.1.5 Electricity Generation
Generating electricity is a much more efficient use of biogas than using it for gas light. From energy utilization point of view, it is more economical to use biogas lo generate electricity for lighting. In this process, the gas consumption is about 0.75 m3 per kW hour with which 25 40-watt lamps can be lighted for one hour, whereas the same volume of biogas can serve only seven lamps for one hour (BRTC, 1989).
Small internal combustion engines with generator can be used lo produce electricity in the rural areas with clustered dwellings. Biodigesters can be used to treat municipal waste and generate electricity. The anaerobic digestion process provides energy in the form of biogas per ton of organic municipal solid waste (MSW) digested. One of the options to utilize biogas is to produce electricity using a gas engine or gas turbine (ETSU, 1994).
4.1.6 Biogas Requirements for Various Appliances
Biogas requirements for various appliances are indicated in Table 4.1 (Karki and Dixit, 1984).
Table 4.1: Biogas Requirements for Various Appliances
S.N. Description Size Rate of Gas Consumption (m3/hour) 1. Stove 2" diameter 0.33 2. Stove 4" diameter 0.44 3. Stove 6" diameter 0.57 4. Lamp 1 mantle 0.07 - 0.08 5. Lamp 2 mantle 0.14 6. Refrigerator 18"xl8"x 18" 0.07 7. Incubator 18" x 18"xl8" 0.06 8. Table Fan 12" diameter 0.17 9. Room Healer 12" diameter 0.15
10. Running Engine per HP/hour 0.40 11, Electricity Generation per unit 0.56
4.1.7 Efficiency Measurement of Biogas, Kerosene and LPG Stoves
Efficiency of cook stoves could be calculated by several methods. In this case efficiency of cook stoves was determined by calculating the heat gained by the water subjected for heating and amount of fuel consumed during this process. Heating process is classified as Low Power Phase and High Power Phase. Heating of water from initial water (subject to boiling) temperature T|°C to boiling point is termed as High Power Phase (HPP). During this phase water in vessel gains energy from fuel with the help of burning stove and that value of energy is equivalent to energy required to raise the temperature weight of water at boiling point was subjected to boil for five minutes and energy gained by this water is calculated by multiplying latent heat of vaporisation ( Lwboi) of water and mass of vaporised water. Fuel consumed during each process is the input energy for these phases. Overall efficiency is calculated by dividing output energy by input energy. In this process we have to include the head gained by vessel in which water was boiled (CES/IOE, 2001).

32
Hence,
Heat gained by vessel = Mv * Sv * (Tb - T{) Joule Heat gained by water in HPP = Mw * Sw * (Tb - T}) Joule Heat gained by water in LPP = (MSIeam* Lwboil) Joule Energy of fuel = (Mfuel * Kfuel) Jules
Where,
Mv = Mass of vessel Sv = Specific heat capacity of vessel (Tb-T1) = Change in temperature (from Tl to boiling Point) Mw = Mass of water Sw = Specific heat capacity of waterMSIeam = Mass of evaporated water during LPP Lwboil = Latent heat of boiling of waterMfuel = Mass of consumed fuel Kfuel = Calorific values of fuel^
Efficiency (overall) = {Mw * Sw * (Tb – T1} + MSIeam * Lwboil + Mv* Sv* (Tb – T1)}/ (Mfuel * Kfuel)Efficiency (overall) - {Heat gained by water in HPP + Heal gained water in LPP + Heat gained by
vessel} /{Quantity of fuel consumed * unit calorific values of fuel}
Hence, heat gained vessel (made from aluminium) is equal to heat gained from T1°C to Tboil°C and heat gained by water is equal to the summation of heat gained during High Power and Low Power Phase.
Fuels like LPG and kerosene could be weighted by weighting machines. Mass of cylinder or stove before and after experiment gives the mass of fuel consumed. But for biogas, measurement of flow of gas is essential, which gives the amount of biogas consumed during experiments.
The efficiency of biogas stove calculated as per adopted methodology mentioned above is found to be 49.44 percent, 43.80 percent and 32.26 percent for perfectly controlled, semi-controlled and uncontrolled conditions respectively. The efficiency of a given stove is not constant. It could vary on the basis of surrounding conditions andquality of fuel used. A high value of efficiency could be obtained under controlled conditions. But in practice this value is normally lower than the value found in the controlled laboratory condition(CES/IOE, 2001).
4.2 MERITS AND DEMERITS OF BIOGAS Like other equipments, biogas plant has both merits and demerits (more merits than few demerits). Themerits and demerits identified so far are described below: 4.2.1 Merits of Biogas a. Energy Available As biogas plant utilizes locally available raw materials, the gas obtained from it can be cheaper and reliable.Biogas can be used for following purposes to save energy: ■ Fuelwood can be saved while using if for cooking ■ Kerosene can be saved while using it for lighting and refrigeration;■ Diesel can be saved while using it for running ■ Electricity will be generated while using it for electricity generation.

33
b. Availability of Fertilizer
Cattle dung used as a raw material in biogas plant is digested during gas production and the digested slurry comes out from the outlet as a by product. Thus, biogas replaces the dung cake which otherwise is being used as a fuel for cooking and produces digested slurry that can be used as a manure in the field. Digested slurry contains plant nutrients in more concentrated form than raw materials and are in an easily available form compared to the traditional compost.
The humus contained in digested slurry improves the physical properties of soil like water holding capacity, aeration, water stable aggregates and increases the crop production up to 20-30 percent. The readers arc referred to see Chapter VII for detailed knowledge about the use of digested slurry as feed and fertilizer compared to cooking with firewood.
c. Time Save Use of biogas saves time in following way:
■ Time is saved as it is very easy to ignite biogas compared to bum firewood; ■ Biogas generates higher temperature and requires less time for cooking; ■ Cleaning utensils is easy as the biogas does not produce soot and thereby reduces the workload of
housewives; ■ Farther the forest, longer the time required for firewood collection. Therefore it saves considerable
time required for collecting and chopping of wood; and ■ Saves time for cleaning the clothes and houses as it does not produce smoke and ash.
d. Health and Sanitation
Biogas helps to improve health and hygiene of the housewives and children in the following manner:
■ Smoke from the firewood, dung cake and plant residues induces respiratory and eye disease especially to the housewives. Biogas, being smokeless, reduces infestation of such diseases;
■ Biogas light, being bright enough for reading and minute works, helps reduce the eye disease of the children; and
■. If the latrine is attached to the plant, it will reduce the infestation of various water-borne diseases as 90-95 percent of parasitic eggs are destroyed at die mesophilic temperature in the digester.
e. Cleanliness ■ Biogas helps keep clean within and outside the house in following manner: ■ The house, particularly the kitchen, will be free from the ash, charcoal and the dirt as produced by
fuel wood; ■ If latrine is attached to the biogas plant, the surrounding of the house will be free from faeces that
harbours pathogens; and ■ Smoke from the firewood turns the walls black and the clothes brown. With biogas, the walls and
clothes remain clean. .
f. Reduction in Expenses
Although biogas does not generate direct cash income, it reduces user expenses in a number of ways as described below:
■ It reduces the cleaning expenditure by keeping the house and the clothes clean from smoke induced dirt;
■ It reduces the medical expenses by reducing the smoke induced respiratory and eye diseases; ■ It reduces the medical expenses by reducing the infestation of various water-borne diseases, provided the latrine is attached to the plant; ■ It reduces cooking fuel expenses; and ■ It reduces kerosene expenses for lighting.
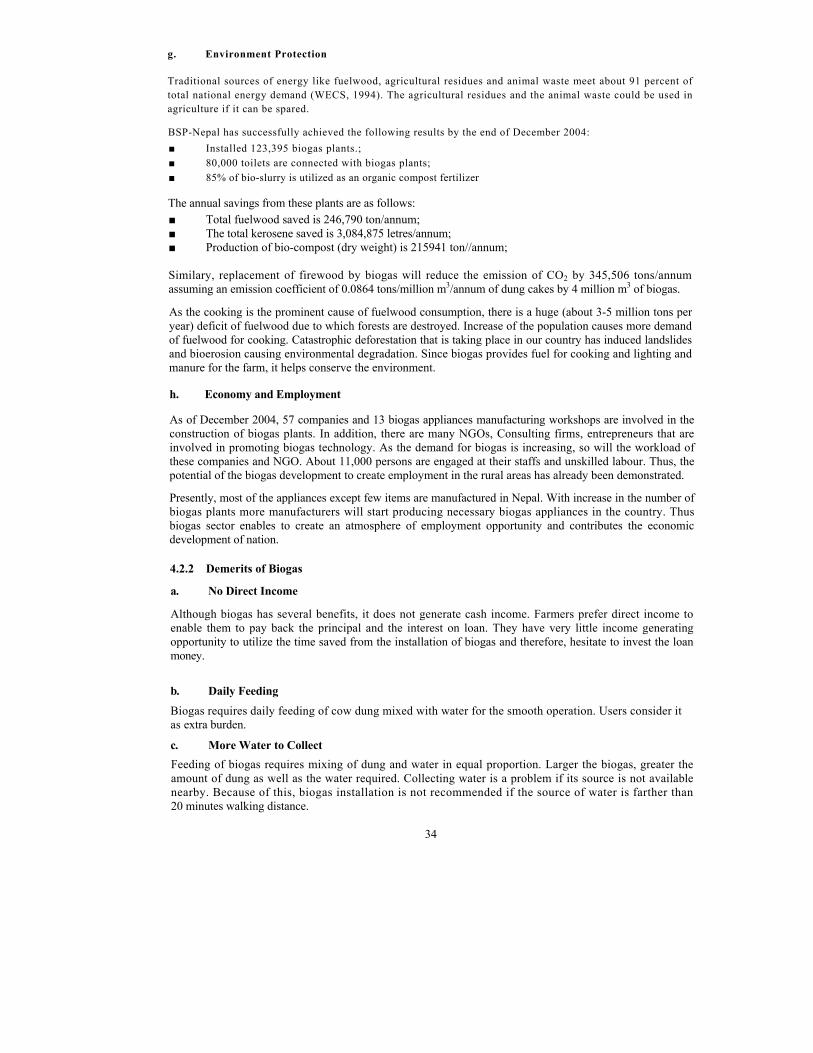
34
g. Environment Protection
Traditional sources of energy like fuelwood, agricultural residues and animal waste meet about 91 percent of total national energy demand (WECS, 1994). The agricultural residues and the animal waste could be used in agriculture if it can be spared.
BSP-Nepal has successfully achieved the following results by the end of December 2004: ■ Installed 123,395 biogas plants.; ■ 80,000 toilets are connected with biogas plants; ■ 85% of bio-slurry is utilized as an organic compost fertilizer
The annual savings from these plants are as follows: ■ Total fuelwood saved is 246,790 ton/annum; ■ The total kerosene saved is 3,084,875 letres/annum; ■ Production of bio-compost (dry weight) is 215941 ton//annum;
Similary, replacement of firewood by biogas will reduce the emission of CO2 by 345,506 tons/annum assuming an emission coefficient of 0.0864 tons/million m3/annum of dung cakes by 4 million m3 of biogas.
As the cooking is the prominent cause of fuelwood consumption, there is a huge (about 3-5 million tons per year) deficit of fuelwood due to which forests are destroyed. Increase of the population causes more demand of fuelwood for cooking. Catastrophic deforestation that is taking place in our country has induced landslides and bioerosion causing environmental degradation. Since biogas provides fuel for cooking and lighting and manure for the farm, it helps conserve the environment.
h. Economy and Employment
As of December 2004, 57 companies and 13 biogas appliances manufacturing workshops are involved in the construction of biogas plants. In addition, there are many NGOs, Consulting firms, entrepreneurs that are involved in promoting biogas technology. As the demand for biogas is increasing, so will the workload of these companies and NGO. About 11,000 persons are engaged at their staffs and unskilled labour. Thus, the potential of the biogas development to create employment in the rural areas has already been demonstrated.
Presently, most of the appliances except few items are manufactured in Nepal. With increase in the number of biogas plants more manufacturers will start producing necessary biogas appliances in the country. Thus biogas sector enables to create an atmosphere of employment opportunity and contributes the economic development of nation.
4.2.2 Demerits of Biogas
a. No Direct Income
Although biogas has several benefits, it does not generate cash income. Farmers prefer direct income to enable them to pay back the principal and the interest on loan. They have very little income generating opportunity to utilize the time saved from the installation of biogas and therefore, hesitate to invest the loan money.
b. Daily Feeding Biogas requires daily feeding of cow dung mixed with water for the smooth operation. Users consider it as extra burden. c. More Water to Collect Feeding of biogas requires mixing of dung and water in equal proportion. Larger the biogas, greater the amount of dung as well as the water required. Collecting water is a problem if its source is not available nearby. Because of this, biogas installation is not recommended if the source of water is farther than 20 minutes walking distance.

35
d. Needs Match Sticks
More matchsticks are needed to light the biogas frequently. Thus, compared to cooking with firewood the users need to spend little bit more money on the purchase of matchbox?
e. Damage of Wooden Ceiling
In traditional rural households, the ceiling of the room is made with woods that are protected against insects due to deposition of soot produced from firewood burning. As biogas produces smoke free flame, the wooden ceiling are liable to be damaged by insects such as ants, termite etc.
f. Increase in Mosquito Breeding
In many biogas survey carried out by different organizations, it is found that there is an increase in the population of mosquito due to installation of biogas plants.
REFERENCES
[1] Biogas Newsletter (1981) Gobar Gas Irrigation in Nepal, Number 13, Summer. Pp6-7. [21 BSP (2003) Biogas Nepal 200,. Biogas Support Programme. [3] CES/IOE (2001)4 Studies Report on Efficiency Measurement of Biogas, Kerosene and LPG Stoves, Biogas Support Programme. [4] CMS (1996) Biogas Technology: A Training Manual for Extension,,Faod and Agriculture Organization of the United Nations. Support for Development of National Biogas Programme (FAO/TCP/Nep/4451-T) [5] ETSU (1994) Biogas from Municipal Waste - Overview of
Systems and Markets for Anaerobic Digestion ofMSW, Harwell, United Kingdom. [6] Karki, A. B. and K. Dixil (1984) Biogas Fieldbook, Sahayogi Press, Kathmandu, Nepal. [7] Ni Ji Qin and Myns (1993) Bio-methanization -A Developing Technology Association (BORDA) [8] United Nations (1984) Updated Guidebook on Biogas Development Energy Resources Development Series, No. 27, United Nations. New York, USA. [9] WECS (1994) Energy Synopsis Report Nepal 1992/93. Perspective Energy Plan. Supporting Document, No. 1, Report No. 4/4270494/1/1 Seq. No. 451.

36
C H A P T E R V
PRODUCTION OF BIOGAS IN COLD CLIMATE
5.1 INTRODUCTION
One of the inherent limitations or constraints of biogas technology is that the production of biogas by anaerobic digestion process through methanogenic bacteria is greatly influenced by temperature. The optimum temperature for satisfactory gas production is said to be 30-35°C. However, such temperature is difficult to attain in hilly countries or at temperate zone. During winter season and at the higher altitude, production of biogas is drastically reduced due to decreased temperature. For example, Kathmandu valley, which lies at 1300 meter altitude, experiences a below zero temperature and as low as 15°C maximum during particularly winter days. Indian drum-type plants have been known to stop gas production in Kathmandu during winter, while the underground dome types register as much as 75 percent drop in gas production (Biogas Newsletter, Number 17,1983).
In order to cope with this problem, the scientists from different parts of the world have made various attempts to increase the biogas production in cold season through physical, chemical and biological method. Till this date, no breakthrough has been achieved in this endeavor.
This chapter deals with production of biogas in cold temperature though integration of different systems into the biodigester, It should be noted that some systems are simple but less effective, while some others are more effective and costly, which is beyond the reach of ordinary people. On the other hand, the technology becomes viable if costlier or sophisticated system is introduced for business purpose, for example, in a tourist hotel, say in Mustang region in Nepal (see Section 5.4).
5.2 CALCULATION FOR THEORETICAL HEATING REQUIREMENTS
During cold weather digester operation, the mixed-liquor-heating requirements will be significant for rising temperature of the digester. The total amount of energy required for maintaining the mixed - liquor at the desired operating temperature is the sum of (a) heat losses through the digester walls, roof and floor; and (b) heal required to raise the temperature of the digester influent to the desired operating temperature.
In order to assess the accuracy of using heat-transfer theory to estimate digester heating requirements, the heating requirement necessary to replace wall, roof and floor losses and to raise the temperature of the raw manure effluent has to be calculated.
The total digester healing requirements can be represented by the following equation:
Or = QL+Q1 .............................................................. (1)
In which
QT = rate at which heat energy must be supplied to the digester mixed liquor (energy/ time) QL = rate of heat loss through digester waits, floor and roof (energy / lime)
Q1 = rate of heat transfer to raw manure influent, (energy / time)
5.2.1 Digester Heat Losses
All heat losses from the digester were assumed to be by conductive heat transfer. The general equation for steady-state one dimension conductive heat transfer is:
QL = U * A * ( T 2 - T 1) ......................................................(2)

37
In which Q = rate of heat loss, (energy/ time) U = overall coefficient of thermal conductivity, (energy/time-area-temperature) A = area normal to the direction of heat flow Tl = mixed-liquor temperature T2 = air temperature outside the digester
5.2.2 Influent Heating
The heat required raising the temperature of the raw manure influent to the digester operating temperature is calculated by:
Q, = W*C*(T1-T1) ............................................................(3)
In which Q1 = rate of heat transfer to raw manure influent, (energy / time) W = weight of influent added C = specific heat of influent, (energy/weight-temperature) T1 = mixed liquor temperature T1 = influent temperature
Calculation for digester with composite structure
For composite wall, roof and floor materials made of structural material and a layer of insulation, the overall coefficient of thermal conductivity, U, is a function of the unlil-surface conductance inside and outside plus the thermal resistance of each of the materials as described by,
In which
x = materials thickness, (length) k = materials coefficient of thermal conductivity, (Energy/time-length-temperature) h1 and h0 = inside and outside unit-surface conductance, (Energy/time-length-temperature) , ka = coefficient of conductivity of air and gas, (Energy/time-length-temperature)
5.3 TREATMENT OF BIODIGESTER IN COLD CLIMATE
5.3.1 Biological and Enzymatic Treatment
Much of the current interest in bio-conversion technologies has been focused on the conversion of cellulose material to readily useable fuel products such as ethanol or methane. These technologies have traditionally been two-step processes in which the cellulose material is first hydrolyzed to glucose monomers and is then biologically converted to the final fuel product. Since the efficiency of the biological conversion process is highly dependent on the feedstock supplied to the organism, various hydrolyzing techniques on improving the yield of readily metabolization of the feedstock into simple sugars have been focused. The application of enzymatic hydrolyses into the anaerobic digester helps degrade the material rapidly into biogas. There are number of methods for hydrolysis of the substrates.

38
Microorganisms play a vital role in the process of production of biogas. There are mainly three types of microorganisms categorized according to their habit of growth temperature. They are as follows: ■ Physophillic bacteria, which grow below IO°C; ■ Mesophilic bacteria, which grow between 25°C - 35°C; and ■ Thermophylic bacteria, which grow within the range of 45°C - 55°C.
In 1947-49 an American biologist K.C. Hartlrode, who had long experience in the treatment of water in purifying the pollution, succeeded to develop a biological compound in a dried form from natural elements and he call it Actizyme. To-day this improved compound industrially produced by Actizyme CO. U.S.A. contains per gram more than ten billion bacteria obtained and selected through successive mutation matched with their biological catalyscrs, high quality enzymes and co-enzymes. A trail of Actizyme was made In Nepal at Dandapakhar on the road from Lamosangu to Jiri at an altitude of 1800 m. Actizyme was mixed with slurry and was introduced into the pit. Within a few days gas began to form, and soon the plant was in full operation (Biogas Newsletter, Number 1, 1979).
Apart from biological methods, external heating of the substrate (e.g. slurry) inside biodigester has been tried for maintaining thermophylic condition. It can also be achieved by using a part of biogas for heating biodigester.
5.3.2 Solar Energy
a. Solar Hut i
Solar hut is a simple way of preserving solar energy inside the simply made green house. Especially for the cold climate, a black plastic hut is built over the dome of the biogas digester in order to absorb and conserve the solar heat on the dome in view of increasing the temperature inside the digester.
Figure 5.1: Polythene Hut Erected over the Biodigester

39
b. Integration of Solar Energy
Integration of solar energy in the biodigester for the production of biogas during winter time has been practiced in some parts of the world. The solar water heating system is applied into the biogas digester through a long coil of pipe inserted inside the digester (see Figure 5.2). However, during cold season, when water start freezing, this system can create a problem due to water freezing inside the pipe. Therefore, for such areas, a low boiling liquid has to be used instead of water. Through the integration of solar system in the digester, the temperature inside the digester can be raised to 25°C-30°C, which is optimum or above to enhance biogas production. However, cost of the system can become a barrier as a result of addition of solar system into the biodigester.
Figure 5.2: Increasing Biogas Production through Solar Heater
5-3.3 Biomass Fuel Integration in the Biodigester For heating the substrate inside the biodigester, there are possibilities of using various kinds of external heating devices, for example, a biomass stove as shown in Figure 5.3.
Figure 5.3: Biodigester with External Heating System

40
Some people have practiced the painting of the dome of biogas digester with black paint for absorption of solar heat. This method also helps increase the temperature of the digester to some extend. Instead of paint, some people also used charcoal to cover the dome. Charcoal also helps retain the heat for some time. This method had been reported to be in practice by some institute in Solan, India. 5.3.4 Composting Pile
A composting pile can be built on the top of the digester dome in order to conserve heat loss from the dome surface. During the composting, heat is generated due to metabolic process. This heat also helps conserve the temperature inside the dome. Mostly, farm residues are piled on the top of the digester. It is then covered with the layer of straw to conserve the heat inside the digester. The pile is then covered with black plastic sheet which not only conserve the heat generated through composting metabolism but also help absorb solar heat during sunny days (Figure 5.4).
Figure 5.4: Biodigester with Composting System on its Top
Ms Mamie Wong carried out experimental trials in the winter of 1983 in functioning plants in Kathmandu to enhance biogas production at low temperatures with special emphasis on composting. She presented her findings at the COSTED/UNESCO sponsored workshop on Microbiological Aspect of Biogas Production held in Kathamndu (Biogas Newsletter, Number 16,1983).
It was discovered, for example that composting heaps piled on the top of an underground Chinese-type plant could enhance gas production in winter by over 54 percent compared to an uninsulated plant. Insulation and heat generation from the compost is however not necessary in summer when the compost pile may actually prevent the penetration of insolation. Ms Wong recommends that the compost be piled on the top of the plant at the tail end of the monsoon season so that the fermentation can get well underway with the moist organic matter at a time when temperatures are still quite high. By the time winter sets in, the compost heap would then be active.
5.4 HIGH ALTITUDE BIOGAS REACTOR IN KHUMBU REGION
Two high altitude biogas reactors (6m3-capacity) were built in June 2000 by SNV/BSP; one at Lukla/Mosi (8,000 ft or 2634 m) and another at Khumjung (11,800 ft or 3882m) in Khumbu region of Nepal. The first digester was located near the farmhouse of Mr. Lamu (monk) in Mosi, a small farming hamlet a half-hour walking distance from Lukla airport and the second at Khumjung Hotel in Khumjung village, a settlement located at a day and half trekking distance from Lukla airport.
SNV/BSP staff indicated that a new and upgraded reactor with greenhouse would cost on an average NRs 75,000 equivalent to Euro 1,000.
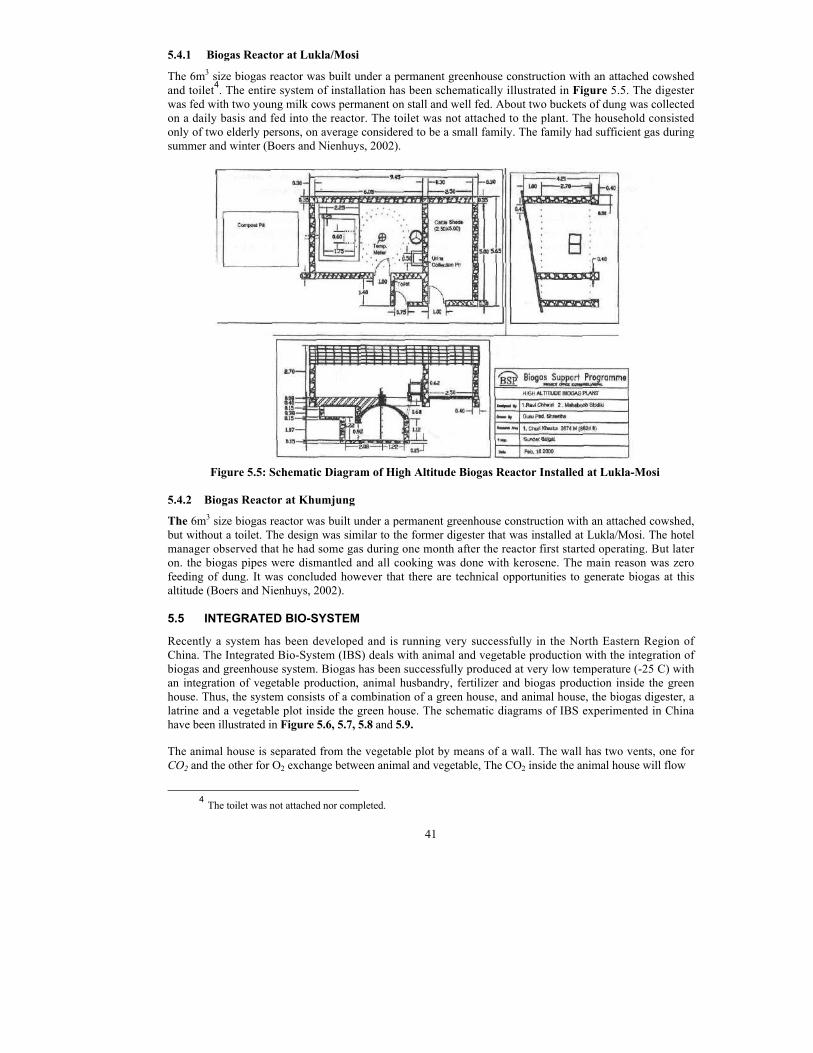
41
5.4.1 Biogas Reactor at Lukla/Mosi The 6m3 size biogas reactor was built under a permanent greenhouse construction with an attached cowshed and toilet4. The entire system of installation has been schematically illustrated in Figure 5.5. The digester was fed with two young milk cows permanent on stall and well fed. About two buckets of dung was collected on a daily basis and fed into the reactor. The toilet was not attached to the plant. The household consisted only of two elderly persons, on average considered to be a small family. The family had sufficient gas during summer and winter (Boers and Nienhuys, 2002).
Figure 5.5: Schematic Diagram of High Altitude Biogas Reactor Installed at Lukla-Mosi
5.4.2 Biogas Reactor at Khumjung The 6m3 size biogas reactor was built under a permanent greenhouse construction with an attached cowshed, but without a toilet. The design was similar to the former digester that was installed at Lukla/Mosi. The hotel manager observed that he had some gas during one month after the reactor first started operating. But later on. the biogas pipes were dismantled and all cooking was done with kerosene. The main reason was zero feeding of dung. It was concluded however that there are technical opportunities to generate biogas at this altitude (Boers and Nienhuys, 2002).
5.5 INTEGRATED BIO-SYSTEM
Recently a system has been developed and is running very successfully in the North Eastern Region of China. The Integrated Bio-System (IBS) deals with animal and vegetable production with the integration of biogas and greenhouse system. Biogas has been successfully produced at very low temperature (-25 C) with an integration of vegetable production, animal husbandry, fertilizer and biogas production inside the green house. Thus, the system consists of a combination of a green house, and animal house, the biogas digester, a latrine and a vegetable plot inside the green house. The schematic diagrams of IBS experimented in China have been illustrated in Figure 5.6, 5.7, 5.8 and 5.9.
The animal house is separated from the vegetable plot by means of a wall. The wall has two vents, one for CO2 and the other for O2 exchange between animal and vegetable, The CO2 inside the animal house will flow
4 The toilet was not attached nor completed.
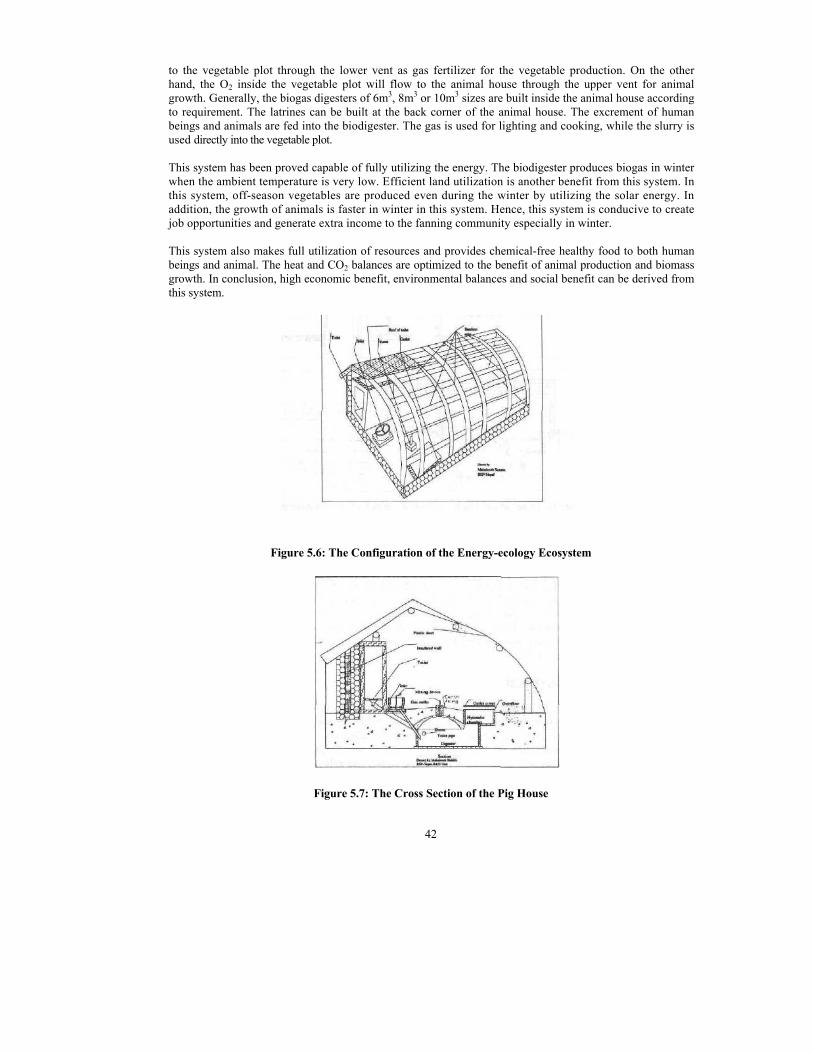
42
to the vegetable plot through the lower vent as gas fertilizer for the vegetable production. On the other hand, the O2 inside the vegetable plot will flow to the animal house through the upper vent for animal growth. Generally, the biogas digesters of 6m3, 8m3 or 10m3 sizes are built inside the animal house according to requirement. The latrines can be built at the back corner of the animal house. The excrement of human beings and animals are fed into the biodigester. The gas is used for lighting and cooking, while the slurry is used directly into the vegetable plot.
This system has been proved capable of fully utilizing the energy. The biodigester produces biogas in winter when the ambient temperature is very low. Efficient land utilization is another benefit from this system. In this system, off-season vegetables are produced even during the winter by utilizing the solar energy. In addition, the growth of animals is faster in winter in this system. Hence, this system is conducive to create job opportunities and generate extra income to the fanning community especially in winter.
This system also makes full utilization of resources and provides chemical-free healthy food to both human beings and animal. The heat and CO2 balances are optimized to the benefit of animal production and biomass growth. In conclusion, high economic benefit, environmental balances and social benefit can be derived from this system.
Figure 5.6: The Configuration of the Energy-ecology Ecosystem
Figure 5.7: The Cross Section of the Pig House

43
Figure 5.8: The Flat View of the Pig House
Figure 5.9: The Flat View of the Animal House

44
REFERENCES
[1] Biogas in Cold Climate (1979) In; Biogas Newsletter. Number 1, pp 5-6,1979. [2] Fighting the Chill (1983). In; Biogas Newsletter. Number 17. ppl, 1983. [3] Boers, W. and S. Nienhuys (2002) Mission Report of the High Altitude Biogas Reactor in the Khumbu Region, Nepal, Field Visit-October 2002. Biogas Support Programme. [4] CES/IOE (2001) Production of Biogas in Cold Climate. In: Advanced Course in Biogas Technology. Biogas Support Programme. [5] Mamie, W. (1983) Compost Cover to Heat and Insulate Dome Plants. In: Biogas Newsletter, Number 16, pp4, 1983.

45
CHAPTER VI
BIOGAS IN RELATION TO OTHER DISCIPLINE (ENVIRONMENT, ECOLOGY, AGRICULTURE AND HEALTH)
6.1 BIOGAS AND AGRICULTURE
Biogas is closely related to agriculture, as anaerobic digestion system produces not only reliable fuel for cooking, lighting, etc, but also high quality bio-fertilizer which is needed by the farming community to fertilize their soils (see Chapter VII).
In many parts of the developing countries, the productivity of soil is declining mainly because of continuous cropping without the use of quality manure and fertilizer in required quantities. Some of the countries like Nepal does not produce any chemical fertilizer and has fully relied on imports. Because of the declining net profit from agricultural enterprises and increasing prices of imported fertilizer, many fanners can not afford to use chemical fertilizer to replenish the soil nutrients. Also, the availability of chemical fertilizer at the lime of need in the required quantity and the desired form can not be ensured. In this context, the role of biogas technology for agricultural purposes has become more prominent as a means to produce easily available localized organic manure at low cost.
Integration of biogas with agriculture put forth by N. A. de Silva in 1993 for use in the Latin America is shown in Figure 6.1 (Ni Ji.-Qin and Nyns, 1993).
Another integrated (VACB) model has been schematically described in Figure 6.2, which is self-explanatory.
Figure 6.1: Integration of Biogas with Agriculture
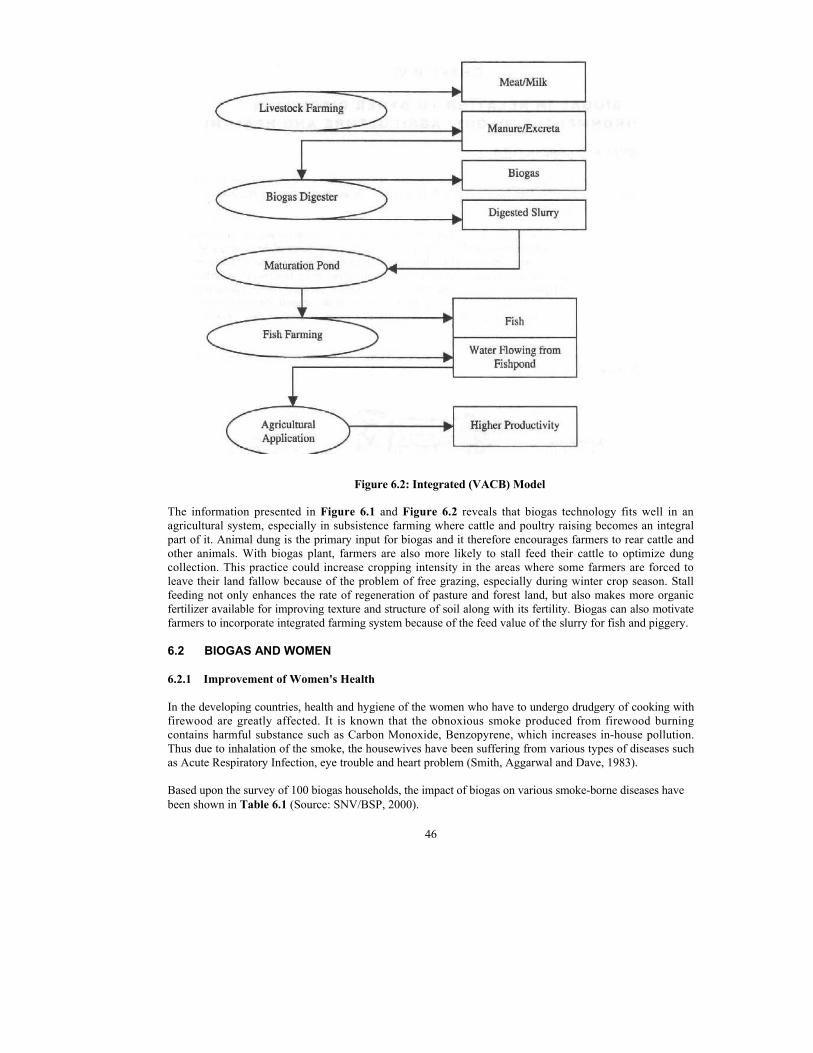
46
Figure 6.2: Integrated (VACB) Model
The information presented in Figure 6.1 and Figure 6.2 reveals that biogas technology fits well in an agricultural system, especially in subsistence farming where cattle and poultry raising becomes an integral part of it. Animal dung is the primary input for biogas and it therefore encourages farmers to rear cattle and other animals. With biogas plant, farmers are also more likely to stall feed their cattle to optimize dung collection. This practice could increase cropping intensity in the areas where some farmers are forced to leave their land fallow because of the problem of free grazing, especially during winter crop season. Stall feeding not only enhances the rate of regeneration of pasture and forest land, but also makes more organic fertilizer available for improving texture and structure of soil along with its fertility. Biogas can also motivate farmers to incorporate integrated farming system because of the feed value of the slurry for fish and piggery.
6.2 BIOGAS AND WOMEN
6.2.1 Improvement of Women's Health
In the developing countries, health and hygiene of the women who have to undergo drudgery of cooking with firewood are greatly affected. It is known that the obnoxious smoke produced from firewood burning contains harmful substance such as Carbon Monoxide, Benzopyrene, which increases in-house pollution. Thus due to inhalation of the smoke, the housewives have been suffering from various types of diseases such as Acute Respiratory Infection, eye trouble and heart problem (Smith, Aggarwal and Dave, 1983).
Based upon the survey of 100 biogas households, the impact of biogas on various smoke-borne diseases have been shown in Table 6.1 (Source: SNV/BSP, 2000).

47
Table 6.1: Impact of Biogas on various Smoke-borne Diseases
Problem in the Past (Households)
Condition at Present (Households)**
S.N. Disease/Problem
Yes No Improved Same1. Eye illness 61 39 60 1 2. Eye burn 39 61 38 1 3. TB and lung problem 6 94 6 0 4. Problem in respiration 50 50 49 15. Asthma 8 92 7 1 6. Dizziness/headache 34 66 17 17 7. Intestinal/diahorrea 50 50 20 30
** in those households where there were problems in the past
Table 6.1 reveals that as a result of biogas installation, the households reported an improvement in respiratory problem, asthma, TB and lung problem, eye bum and eye illness. Above study revealed that there has been much improvement in health, hygiene and environmental sanitation, as more than 50 percent of the households have connected their toilet to the biogas plant. Surrounding became cleaner due to biogas installation. The households reported that the frequency of their visits to the hospital was diminished with a decrease in the quantity of medicine they were using in the past. Biogas facility particularly enabled to reduce the number of burning cases, and also there was reduction in in-house pollution caused due to the smell of kerosene or smoke. It has been reported that in some cases older women, who were no longer able to cook on firewood, began to cook again when biogas was introduced. Cooking, working and reading in the clear and bright light of biogas lamp is quite comfortable compared to kerosene lamp that causes pollution.
6.2.2 Reduction of Workload of Women
The heavy reliance on fulewood has caused not only irreparable damage to the sustainability of agriculture and ecosystems in Nepal but also has increased the workload of 7K percent of rural women and a large number of children, mostly girls, who have to allocate 20 percent of their work time for fuelwood collection (WECS, 1995).
Comprehensive studies on women's workload in different parts of Nepal conclude that a day's work consists of 9 to 11 hours. A study by BSP conducted in 1992 estimates that almost 75 percent of households spent more time collecting firewood in 1988 than in 1993. Two-third of them spent about six hours a day (Britt, 1994). van Vliet and van Nes (1993) studied the effect of biogas on the women's workload in Rupandehi district in Nepal. They concluded that the reduction in workload of women as a result of installing biogas plants amounts a minimum of 2 hours and maximum of 7 hours per family per day. When pressed with the labour shortage for such works in a family, it is the female children who have to forego their schooling.
A study of 100 biogas households carried out by EastConsult in 1994 in 16 districts of Nepal has shown a net saving on workload of 3.06 hours/household/day as a result of installing a biogas plant (see Table 6.2).
Table 6.2; Average Effects a Biogas Plant on the Workload of a Household
S.N. Activity Saving in Time (Hour/Day) 1. Collection of water (-) 0:24 2. Mixing of water and dung (-)0:15 3. Collection of firewood (+) 0:24 4. Cooking (+) 1:42 5. Cleaning of cooking utensils (+) 0:39
Total (+) 3:06

48
Similarly, Devpart (2000) conducted a detailed study on the average time allocation for different biogas related activities before and after installation of biogas plant. The results of this study indicated that on an average a household saves 2.38 hours/day (see Table 6.3).
Table 6.3: Average Time Allocated to Different Biogas Related Activities Before and After Installation of Biogas Plant
Activity Saving in Time (Hour/Day) Cattle Care (-) 0.01 Collection of water (-) 0.35Collection of dung (-) 0.07 Mixing of water and dung (-)0.15Cooking (+H-I1 Cleaning cooking utensils (+) 0.39 Lighting fuel collection (+) 0.09 Collection of firewood (+) 1-38 Total saving of time 2.38 hours/day/family
6.3 BIOGAS VERSUS ECOLOGY AND ENVIRONMENT
However, the important benefit of biogas, in broader sense, is the conservation of environment due to saving of the forest. The saving of forest improves the environment by checking natural calamities such as soil erosion, floods, landslides, etc. The following calculation will reveal how important is the role of biogas to conserve forest wealth or ecology of the nation.
Suppose, 8 to 10 m3 size of biogas plant will yield, on an average, 2.5 m3 of gas per day. Assuming that 1 m3 of gas is equivalent to 3.5 kg of firewood, installation of 1.3 million plants (potential) will save about 4 million tons of firewood per year. However, comprehensive data are not available to quantify the overall impact of biogas adoption on the nearby forest. However, as result of a case study conducted in 1994 at two Village Development Committees (VDCs) in Chitwan district, Mr. Binod P. Devkota, Forest Officer, has come up with the following Findings (CMS, 1996).
■ The number of animal heads kept by a farming decreased after installation of a biogas plant, compared to non-adopters;
■ Biogas technology led to the adoption of stall feeding practices which reduced the pressure on nearby forest and pasture land by animals grazing there; and
■ Biogas replaces 80 to 85 percent of firewood consumption of a family.
These preliminary findings exhibit the positive impact of biogas installation on the regenerative capacity of existing forest and pasture lands along with the qualitative improvement in animal husbandry.
6.4 BIOGAS IN RELATION TO PATHOGENS AND SANITATION
As pointed out earlier, smoke is the main cause for lung and eyes diseases in the rural community. As a result of biogas installation, improvement in the health and hygiene has been reported by the housewives (see Table 6.1).
Infestation of various water-borne diseases occurs due to faecal contamination such as worms (hook worms, round worms), bacterial infections (typhoid fever, paratyphoid, dysentery, cholera) and viral infections (gastro-enteritis in diarrhea and vomiting, hepatitis). The anaerobic digestion process has proved effective in reducing the number of pathogens present in the faecal matters to a considerable extent. Studies carried out in China on the survival of pathogens showed that about 90 to 95 percent of parasitic eggs are destroyed at the mesophilic temperature while at times ascaris are reduced by 30 to 40 percent (UNEP, 1981).
49
Chinese experience shows that if the faeces are fed into the digester at one feeding (without daily addition of fresh faeces) and kept fermenting for a reasonable retention time, satisfactory, results of faeces treatment are achieved. On the other hand, if faeces are added to the digester every day, the effluent has to be used only after it has been treated by ovicide and bactericide. Treatments with Calcium Cyanide, Calcium Hydroxide and Caustic Hydroxide and Caustic Soda have been found to be effective. However, manure treated with Caustic Soda is not recommended for use as fertilizer (UNEP, 1981).
In the Nepalese context, there are only a few ethnic groups (e.g. Pode) who are accustomed to handling night soil, whereas a larger section of the population still faces social or cultural resistance towards such as activity and cooking food with biogas produced from human faeces. These days, because of increasing cost of the conventional fuel, the biogas users are forced to connect their biogas plant with latrines. Around 35 percent of the biogas plants presently installed are found to be connected to latrines and this tendency is likely to increase in the future because of fuel scarcity (NEPECON, 2001).
REFERENCES
[1] Britt, C. (1994) The Effects of Biogas on Women's Workload in Nepal: An overview of Studies Conducted for the Biogas Support Programme, Biogas Support Programme. [2] CMS (1996) Biogas Technology; A Training Manual for Extension, Food and Agriculture Organization of the United Nations. Support for Development of National Biogas Programme (FAO/TCP/Nep/4451-T). [3] DevPart (1998) Biogas Users Survey 1997/98, Biogas Support Programme. [4] EastConsult (1994) BSP Biogas Users Survey 1992/1993, Biogas Support Programme. |5] NEPECON (2001) Biogas Users Survey 2001/2001, Biogas Support Programme, [6] Ni Ji-Qin and E. J. Nyns (1993) Biomethanization - A Developing Technology in Latin America. Bremen Overseas Research and Development Association (BORDA). [7] Smith, K.; A. L. Aggrawal and R. M. Dave (1983) Air Pollution and Rural Biomass Fuels in Developing Countries: A Pilot Study in India and Implications for Research Policy, Atmospheric Environment, 17(11). [8] UNEP (1981) Biogas Fertilizer System. In: Technical Report on a Training Seminar in China: United Nations Environmental Programme. Nairobi, Kenya. [9] van Vliet, M. and W. J. van Nes (1993) Effect of Biogas on the Workload of Women in Rupandehi District in Nepal, Biogas Support Programme. [10] WECS (1995) Alternate Energy Technology: An overview and Assessment. Perspective Energy Plan, Supporting Document No. 3. Report No. 2/1/010595/2/9 Seq. No. 468.
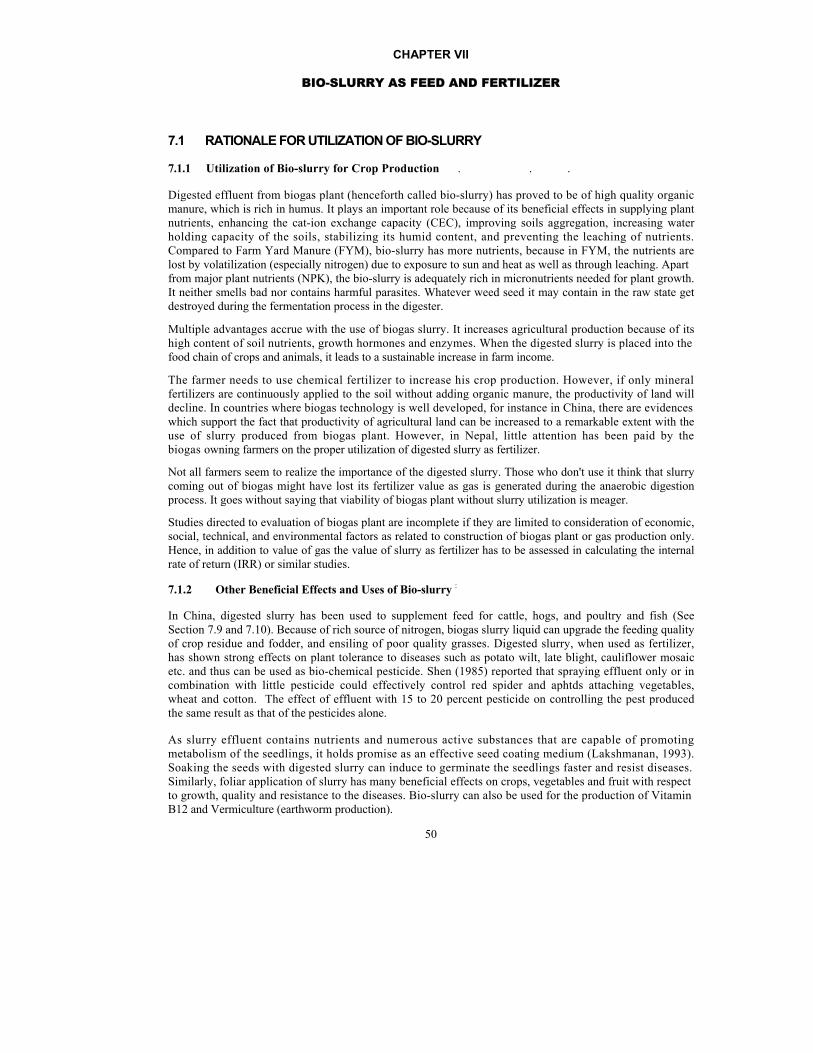
50
CHAPTER VII
BIO-SLURRY AS FEED AND FERTILIZER
7.1 RATIONALE FOR UTILIZATION OF BIO-SLURRY
7.1.1 Utilization of Bio-slurry for Crop Production . . .
Digested effluent from biogas plant (henceforth called bio-slurry) has proved to be of high quality organic manure, which is rich in humus. It plays an important role because of its beneficial effects in supplying plant nutrients, enhancing the cat-ion exchange capacity (CEC), improving soils aggregation, increasing water holding capacity of the soils, stabilizing its humid content, and preventing the leaching of nutrients. Compared to Farm Yard Manure (FYM), bio-slurry has more nutrients, because in FYM, the nutrients are lost by volatilization (especially nitrogen) due to exposure to sun and heat as well as through leaching. Apart from major plant nutrients (NPK), the bio-slurry is adequately rich in micronutrients needed for plant growth. It neither smells bad nor contains harmful parasites. Whatever weed seed it may contain in the raw state get destroyed during the fermentation process in the digester.
Multiple advantages accrue with the use of biogas slurry. It increases agricultural production because of its high content of soil nutrients, growth hormones and enzymes. When the digested slurry is placed into the food chain of crops and animals, it leads to a sustainable increase in farm income.
The farmer needs to use chemical fertilizer to increase his crop production. However, if only mineral fertilizers are continuously applied to the soil without adding organic manure, the productivity of land will decline. In countries where biogas technology is well developed, for instance in China, there are evidences which support the fact that productivity of agricultural land can be increased to a remarkable extent with the use of slurry produced from biogas plant. However, in Nepal, little attention has been paid by the biogas owning farmers on the proper utilization of digested slurry as fertilizer.
Not all farmers seem to realize the importance of the digested slurry. Those who don't use it think that slurry coming out of biogas might have lost its fertilizer value as gas is generated during the anaerobic digestion process. It goes without saying that viability of biogas plant without slurry utilization is meager.
Studies directed to evaluation of biogas plant are incomplete if they are limited to consideration of economic, social, technical, and environmental factors as related to construction of biogas plant or gas production only. Hence, in addition to value of gas the value of slurry as fertilizer has to be assessed in calculating the internal rate of return (IRR) or similar studies.
7.1.2 Other Beneficial Effects and Uses of Bio-slurry :
In China, digested slurry has been used to supplement feed for cattle, hogs, and poultry and fish (See Section 7.9 and 7.10). Because of rich source of nitrogen, biogas slurry liquid can upgrade the feeding quality of crop residue and fodder, and ensiling of poor quality grasses. Digested slurry, when used as fertilizer, has shown strong effects on plant tolerance to diseases such as potato wilt, late blight, cauliflower mosaic etc. and thus can be used as bio-chemical pesticide. Shen (1985) reported that spraying effluent only or in combination with little pesticide could effectively control red spider and aphtds attaching vegetables, wheat and cotton. The effect of effluent with 15 to 20 percent pesticide on controlling the pest produced the same result as that of the pesticides alone.
As slurry effluent contains nutrients and numerous active substances that are capable of promoting metabolism of the seedlings, it holds promise as an effective seed coating medium (Lakshmanan, 1993). Soaking the seeds with digested slurry can induce to germinate the seedlings faster and resist diseases. Similarly, foliar application of slurry has many beneficial effects on crops, vegetables and fruit with respect to growth, quality and resistance to the diseases. Bio-slurry can also be used for the production of Vitamin B12 and Vermiculture (earthworm production).

51
7.2 NITROGEN CYCLE
Bio-slurry is rich in plant nutrient especially nitrogen compared to Farm Yard Manure and Compost (see Figure 7.3). Among the major plant nutrients (NPK), nitrogen is required in greatest quantity. It serves as the keystone of the protcinaceous matter of living tissues. It is assimilated almost entirely in the inorganic state, as nitrate or ammonium. The conversion of organic nitrogen to the more mobile, inorganic state is known as nitrogen mineralization (Alexander 1967). The nitrogen cycle is illustrated in the Figure 7.1.
Figure 7.1: The Nitrogen Cycle in Nature
7.3 RELATIONSHIP BETWEEN BIOGAS AND AGRICULTURE IN A FARMING
Bio-slurry, as one of the outputs of anaerobic digestion system, can profitably be returned to the agricultural system. In most cases this is not emphasized enough but very recently it is getting importance. The close relation between biogas and agriculture can be taken as an indicator of "environmental friendly" nature of the technology as shown in Figure 7.2 (CMS, 1996).
(Household use for cooking, lighting, heating, etc.)
(Energy)
Figure 7.2: Relationship between Biogas and Agriculture in a Farming
7.4 QUALITY AND MANORIAL VALUE OF DIFFERENT ORGANIC FERTILIZERS

52
To derive maximum benefit from the use of organic manure, it should be well decomposed and be of superior quality. It is known that application of under-decomposed manure produces many harmful effects on soils. It attracts insects-pests due mainly to high crude fiber-content and takes longer time to release plant nutrients in readily available form. Therefore, it is necessary to know before applying whether the manure is well matured or not. In practice, well-decomposed manure can be identified easily. It is dark brown in color with friable consistency, whereas undecomposed manure is of light brown or green color and lumpy. If air bubbles are seen to evolve in the compost pit, it indicates incomplete decomposition. When fully digested, the slurry from a biogas plant or composted manure becomes odorless and does not attract insects or flies.
7.4.1 Composition of Fresh Dung, Dung Slurry1 and Digested Slurry
Cattle dung is an excellent source of organic fertilizer. The composition of slurry depends upon several factors such as the condition of cattle dung before mixing with water, breed and age of animal (cattle, buffalo, horse, elephant, etc.), type of feeds fed to the animals, exposure to sun, anaerobic digestion process brought about by the bacterial action, etc. Hence an attempt has been made here to compare different constituents found in the fresh cattle dung, dung slurry and the digested slurry. The relevant data in this connection have been presented in Table 7.1.
Table 7.1: Average Constitution of Fresh Dung, Dung Slurry and Digested Slurry*
Fresh Dung Dung Mixed with Water Slurry Constituent &/kg % Wet
Base % Dry Base
g/2kg %Wet Base
%Dry Base
g/2kg % Wet Base
% Dry Base
Water 800 80 - 1800 90 - 1820 93 - Dry matter 200 20 100 200 10 100 140 7 100Org. matter 150 15 75 150 7.5 75 90 4.5 64 Inorg. Matter 50 5 25 50 2.5 25 50 2.5 36Total N 5 0.50 2.50 5 0.25 2.5 5 0.25 3.60 Mineral N 1 0.10 0.50 1 0.05 0.50 2 0.10 1.40Organic N 4 0.40 2 4 0.20 2 3 0.15 2.20 Phosphorus 2.50 0.25 1.25 2.50 0.13 1.25 2.5 0.13 1.80Potassium 5 0.50 2.50 5 0.25 2.50 5 0.25 3.60
Source: van Nes, undated; Based on calculations
Table 7.1 shows that on an average, the fresh dung contains about 20 percent dry matter. Mixing water in equal proportion before feeding will reduce it to 10 percent. During anaerobic digestion, about 30 percent of organic matter is decomposed and hence the dry matter will be reduced to 7 percent in the slurry. Nitrogen content in the fresh dung is about 1 percent. Although no new nitrogen is formed during anaerobic digestion, its concentration rises to about 1.40 percent due to 30 percent loss of organic matter. In anaerobic condition most of the nitrogen is converted to ammonium, which is readily available for plant growth. Whereas in the case of dung, it has first to be biologically transferred in the soil and only then the plant nutrients get gradually released for plant use. Thus application of undigested organic manure produces residual effects causing the nutrients to become available to the next crop.
1 Dung slurry means fresh dung mixed with water at the ratio of 1:1
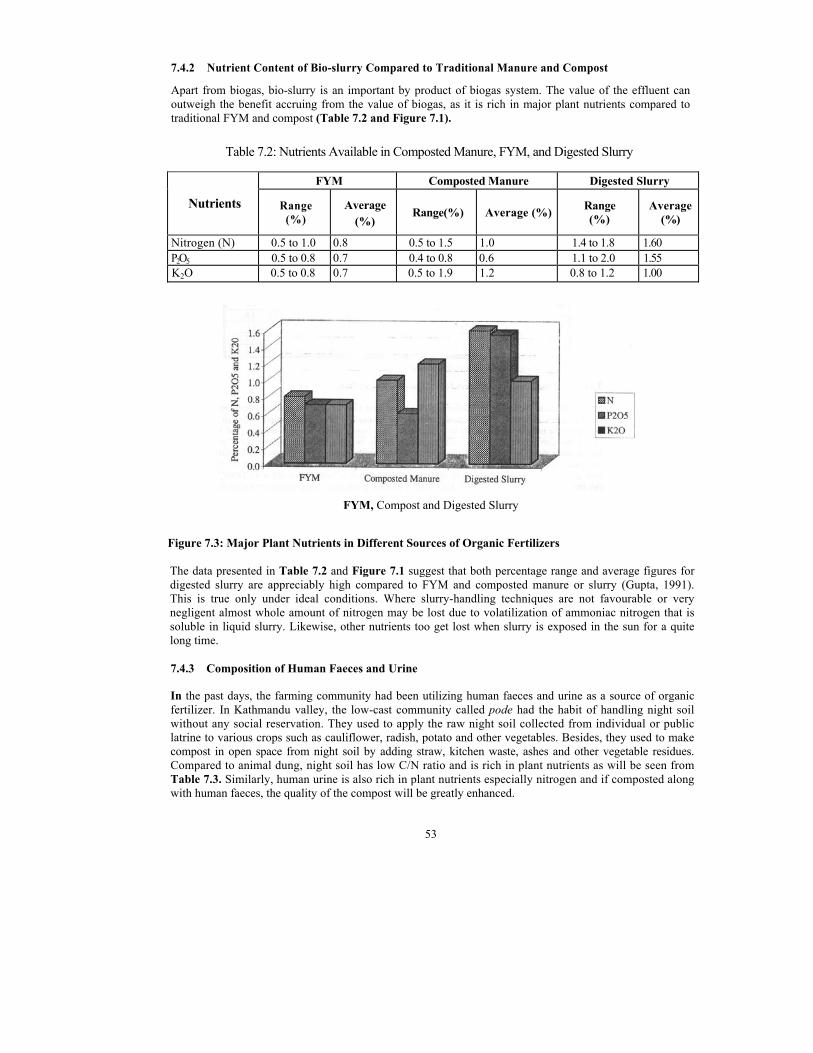
53
7.4.2 Nutrient Content of Bio-slurry Compared to Traditional Manure and Compost
Apart from biogas, bio-slurry is an important by product of biogas system. The value of the effluent can outweigh the benefit accruing from the value of biogas, as it is rich in major plant nutrients compared to traditional FYM and compost (Table 7.2 and Figure 7.1).
Table 7.2: Nutrients Available in Composted Manure, FYM, and Digested Slurry
FYM Composted Manure Digested Slurry Nutrients Range
(%) Average
(%) Range(%) Average (%) Range (%)
Average (%)
Nitrogen (N) 0.5 to 1.0 0.8 0.5 to 1.5 1.0 1.4 to 1.8 1.60 P2O5 0.5 to 0.8 0.7 0.4 to 0.8 0.6 1.1 to 2.0 1.55 K2O 0.5 to 0.8 0.7 0.5 to 1.9 1.2 0.8 to 1.2 1.00
FYM, Compost and Digested Slurry
Figure 7.3: Major Plant Nutrients in Different Sources of Organic Fertilizers
The data presented in Table 7.2 and Figure 7.1 suggest that both percentage range and average figures for digested slurry are appreciably high compared to FYM and composted manure or slurry (Gupta, 1991). This is true only under ideal conditions. Where slurry-handling techniques are not favourable or very negligent almost whole amount of nitrogen may be lost due to volatilization of ammoniac nitrogen that is soluble in liquid slurry. Likewise, other nutrients too get lost when slurry is exposed in the sun for a quite long time.
7.4.3 Composition of Human Faeces and Urine
In the past days, the farming community had been utilizing human faeces and urine as a source of organic fertilizer. In Kathmandu valley, the low-cast community called pode had the habit of handling night soil without any social reservation. They used to apply the raw night soil collected from individual or public latrine to various crops such as cauliflower, radish, potato and other vegetables. Besides, they used to make compost in open space from night soil by adding straw, kitchen waste, ashes and other vegetable residues. Compared to animal dung, night soil has low C/N ratio and is rich in plant nutrients as will be seen from Table 7.3. Similarly, human urine is also rich in plant nutrients especially nitrogen and if composted along with human faeces, the quality of the compost will be greatly enhanced.
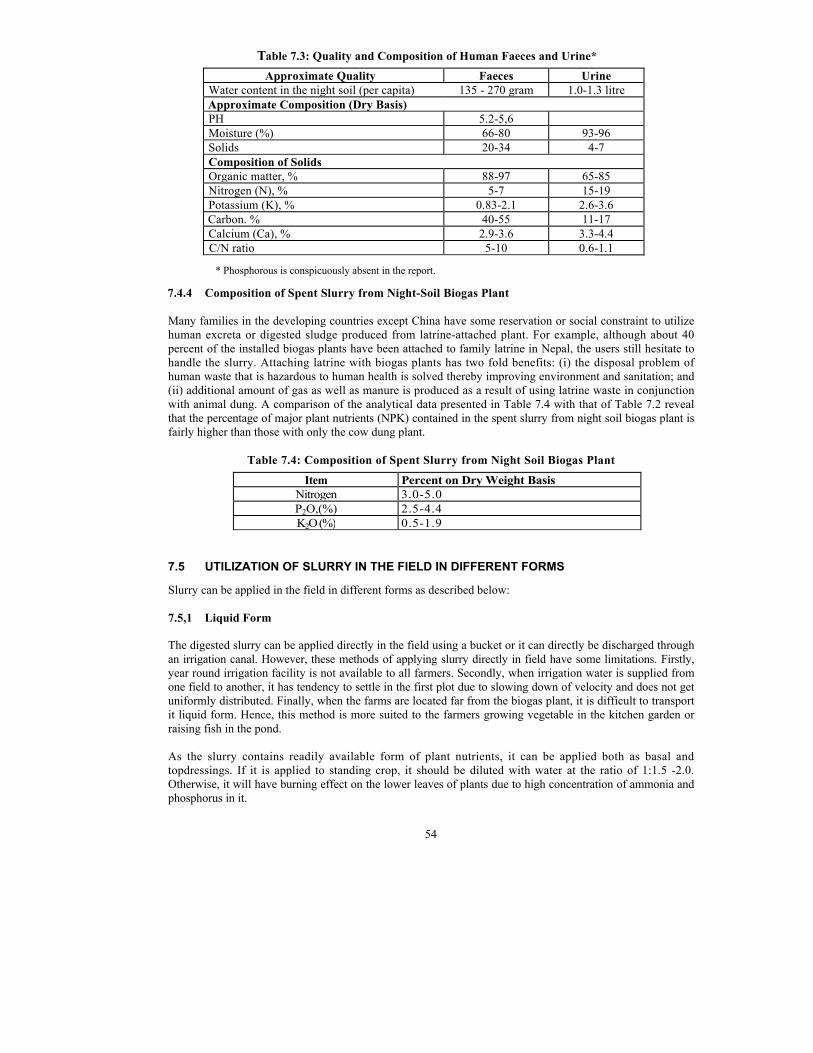
54
Table 7.3: Quality and Composition of Human Faeces and Urine* Approximate Quality Faeces Urine
Water content in the night soil (per capita) 135 - 270 gram 1.0-1.3 litre Approximate Composition (Dry Basis)PH 5.2-5,6Moisture (%) 66-80 93-96 Solids 20-34 4-7 Composition of Solids Organic matter, % 88-97 65-85 Nitrogen (N), % 5-7 15-19 Potassium (K), % 0.83-2.1 2.6-3.6 Carbon. % 40-55 11-17 Calcium (Ca), % 2.9-3.6 3.3-4.4 C/N ratio 5-10 0.6-1.1
* Phosphorous is conspicuously absent in the report.
7.4.4 Composition of Spent Slurry from Night-Soil Biogas Plant
Many families in the developing countries except China have some reservation or social constraint to utilize human excreta or digested sludge produced from latrine-attached plant. For example, although about 40 percent of the installed biogas plants have been attached to family latrine in Nepal, the users still hesitate to handle the slurry. Attaching latrine with biogas plants has two fold benefits: (i) the disposal problem of human waste that is hazardous to human health is solved thereby improving environment and sanitation; and (ii) additional amount of gas as well as manure is produced as a result of using latrine waste in conjunction with animal dung. A comparison of the analytical data presented in Table 7.4 with that of Table 7.2 reveal that the percentage of major plant nutrients (NPK) contained in the spent slurry from night soil biogas plant is fairly higher than those with only the cow dung plant.
Table 7.4: Composition of Spent Slurry from Night Soil Biogas Plant
Item Percent on Dry Weight BasisNitrogen 3.0-5.0P2O,(%) 2.5-4.4K2O (%) 0.5-1.9
7.5 UTILIZATION OF SLURRY IN THE FIELD IN DIFFERENT FORMS
Slurry can be applied in the field in different forms as described below:
7.5,1 Liquid Form
The digested slurry can be applied directly in the field using a bucket or it can directly be discharged through an irrigation canal. However, these methods of applying slurry directly in field have some limitations. Firstly, year round irrigation facility is not available to all farmers. Secondly, when irrigation water is supplied from one field to another, it has tendency to settle in the first plot due to slowing down of velocity and does not get uniformly distributed. Finally, when the farms are located far from the biogas plant, it is difficult to transport it liquid form. Hence, this method is more suited to the farmers growing vegetable in the kitchen garden or raising fish in the pond.
As the slurry contains readily available form of plant nutrients, it can be applied both as basal and topdressings. If it is applied to standing crop, it should be diluted with water at the ratio of 1:1.5 -2.0. Otherwise, it will have burning effect on the lower leaves of plants due to high concentration of ammonia and phosphorus in it.
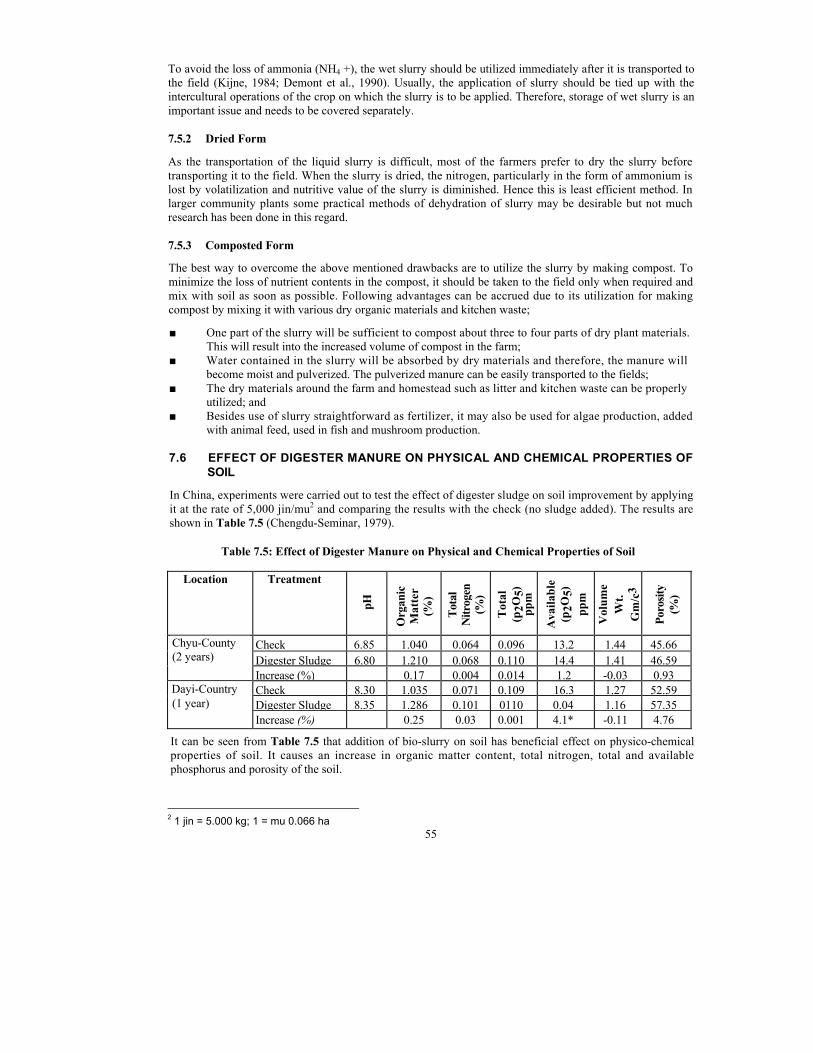
55
To avoid the loss of ammonia (NH4 +), the wet slurry should be utilized immediately after it is transported to the field (Kijne, 1984; Demont et al., 1990). Usually, the application of slurry should be tied up with the intercultural operations of the crop on which the slurry is to be applied. Therefore, storage of wet slurry is an important issue and needs to be covered separately.
7.5.2 Dried Form
As the transportation of the liquid slurry is difficult, most of the farmers prefer to dry the slurry before transporting it to the field. When the slurry is dried, the nitrogen, particularly in the form of ammonium is lost by volatilization and nutritive value of the slurry is diminished. Hence this is least efficient method. In larger community plants some practical methods of dehydration of slurry may be desirable but not much research has been done in this regard.
7.5.3 Composted Form
The best way to overcome the above mentioned drawbacks are to utilize the slurry by making compost. To minimize the loss of nutrient contents in the compost, it should be taken to the field only when required and mix with soil as soon as possible. Following advantages can be accrued due to its utilization for making compost by mixing it with various dry organic materials and kitchen waste;
■ One part of the slurry will be sufficient to compost about three to four parts of dry plant materials. This will result into the increased volume of compost in the farm;
■ Water contained in the slurry will be absorbed by dry materials and therefore, the manure will become moist and pulverized. The pulverized manure can be easily transported to the fields;
■ The dry materials around the farm and homestead such as litter and kitchen waste can be properly utilized; and
■ Besides use of slurry straightforward as fertilizer, it may also be used for algae production, added with animal feed, used in fish and mushroom production.
7.6 EFFECT OF DIGESTER MANURE ON PHYSICAL AND CHEMICAL PROPERTIES OF SOIL
In China, experiments were carried out to test the effect of digester sludge on soil improvement by applying it at the rate of 5,000 jin/mu2 and comparing the results with the check (no sludge added). The results are shown in Table 7.5 (Chengdu-Seminar, 1979).
Table 7.5: Effect of Digester Manure on Physical and Chemical Properties of Soil
Location Treatment
pH
Org
anic
M
atte
r (%
)
Tota
l N
itrog
en
(%)
Tot
al
(p2O
5)
ppm
Ava
ilabl
e (p
2O5)
pp
m
Vol
ume
Wt.
Gm
/c3
Poro
sity
(%)
Check 6.85 1.040 0.064 0.096 13.2 1.44 45.66Digester Sludge 6.80 1.210 0.068 0.110 14.4 1.41 46.59
Chyu-County (2 years)
Increase (%) 0.17 0.004 0.014 1.2 -0.03 0.93Check 8.30 1.035 0.071 0.109 16.3 1.27 52.59Digester Sludge 8.35 1.286 0.101 0110 0.04 1.16 57.35
Dayi-Country (1 year)
Increase (%) 0.25 0.03 0.001 4.1* -0.11 4.76
It can be seen from Table 7.5 that addition of bio-slurry on soil has beneficial effect on physico-chemical properties of soil. It causes an increase in organic matter content, total nitrogen, total and available phosphorus and porosity of the soil.
2 1 jin = 5.000 kg; 1 = mu 0.066 ha

56
7.7 VALUE OF DIFFERENT FORM OF SLURRY
The average composition of different forms of bio-slurry has been presented in
Table 7.6 Table 7.6: Average Value of Different Forms of Slurry
Particulars pH Moisture%
TotalN %
O.M. %
C:N ratio
Phosphorus P2O5 %
Potassium K2O%
Remarks
Slurry-compost 7.82 ----
65.02 ----
1.31 3.75
25.07 71.70
11 11
1.18 3.37
0.88 2.52
Wet basis Dry basis
Sun-dried slurry
7.44 ----
40.66 ----
1.73 2.92
24.53 41.46
8 8
0.69 1.17
0.68 1.15
Wet basis Dry basis
Fresh-dung 8.11 ----
81.25 ----
0.30 1.60
15.47 82.46
30 30
0.78 4.16
0.42 2.24
Wet basis Dry basis
Fresh-slurry 7.16 ----
93.07 ----
0.06 0.87
4.55 65.66
44 44
0.04 0.58
0.06 0.87
Wet basis Dry basis
Source: D.L. Bajracharya, ATC, Pulchowk Above data suggest normal ranges for the pH value and other nutrient content of slurry-compost, sun dried slurry and fresh-dung. Calculated on wet basis, the major plant nutrients (NPK) were found more in slurry compost compared to other forms except fresh dung in which phosphorus content was found slightly more than slurry compost, However, fresh slurry seems to be low in nutrient content. On the other hand, CYN ratio seems to be low in sun dried slurry and high in fresh slurry.
7.8 EXPERIENCES OF VARIOUS COUNTRIES ON SLURRY UTILIZATION
Voluminous literature exists worldwide regarding various utilizations of digested slurry produced from biogas plant (Gurung, 1997). To get overall picture on the effect of bio-slurry on crop production, an attempt has been made here to incorporate the results of selected studies conducted by some developing countries where biogas technology is well developed.
7.8.1 Nepal
Effect of Bioslurry on Crops and Vegetables
Soil Science and Agricultural Chemistry Division of the Department of Agriculture, HMG/N had conducted preliminary field trials with wet biogas effluent in some crops and vegetables such as rice, tomato, cauliflower and French bean in 1977. The average yield increase with or without effluent is given in Table 7.7 (Biogas Newsletter, 1978).
Table 7.7: Average Yields of Vegetables with Bio-slurry Application
Name of Crops Yield of Crops and Vegetables {in tons/ha) Increment in Yield overand Vegetables Without Bio-slurry (Control) With Bio-slurry the Control (%)
Rice 2.7 3.0 10.0 Tomato 15.0 17.8 15.7 Cauliflower 4.6 5.6 17.8 French bean 0.3 1.0 70.0
Nitrogen was applied at 100 kg/ha through effluent assuming it contained 2 percent nitrogen. The data presented in Table 7.7 indicates that the increment in the yield of paddy due to slurry application is 10 percent, while it is around 16 and 18 percent in case of tomato and cauliflower. Very encouraging results has been observed in case of French bean (70%). However, conducting in-depth fertility experiment by the use of slurry could reconfirm the above data.
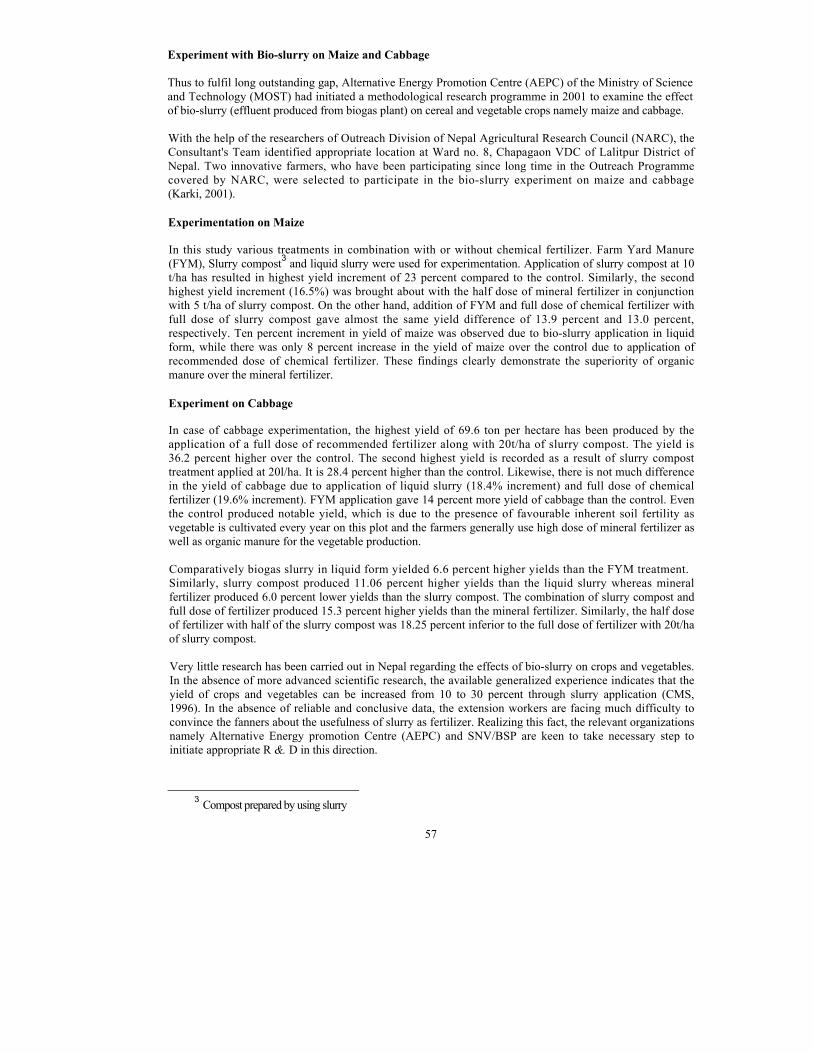
57
Experiment with Bio-slurry on Maize and Cabbage
Thus to fulfil long outstanding gap, Alternative Energy Promotion Centre (AEPC) of the Ministry of Science and Technology (MOST) had initiated a methodological research programme in 2001 to examine the effect of bio-slurry (effluent produced from biogas plant) on cereal and vegetable crops namely maize and cabbage.
With the help of the researchers of Outreach Division of Nepal Agricultural Research Council (NARC), the Consultant's Team identified appropriate location at Ward no. 8, Chapagaon VDC of Lalitpur District of Nepal. Two innovative farmers, who have been participating since long time in the Outreach Programme covered by NARC, were selected to participate in the bio-slurry experiment on maize and cabbage (Karki, 2001).
Experimentation on Maize
In this study various treatments in combination with or without chemical fertilizer. Farm Yard Manure (FYM), Slurry compost3 and liquid slurry were used for experimentation. Application of slurry compost at 10 t/ha has resulted in highest yield increment of 23 percent compared to the control. Similarly, the second highest yield increment (16.5%) was brought about with the half dose of mineral fertilizer in conjunction with 5 t/ha of slurry compost. On the other hand, addition of FYM and full dose of chemical fertilizer with full dose of slurry compost gave almost the same yield difference of 13.9 percent and 13.0 percent, respectively. Ten percent increment in yield of maize was observed due to bio-slurry application in liquid form, while there was only 8 percent increase in the yield of maize over the control due to application of recommended dose of chemical fertilizer. These findings clearly demonstrate the superiority of organic manure over the mineral fertilizer.
Experiment on Cabbage
In case of cabbage experimentation, the highest yield of 69.6 ton per hectare has been produced by the application of a full dose of recommended fertilizer along with 20t/ha of slurry compost. The yield is 36.2 percent higher over the control. The second highest yield is recorded as a result of slurry compost treatment applied at 20l/ha. It is 28.4 percent higher than the control. Likewise, there is not much difference in the yield of cabbage due to application of liquid slurry (18.4% increment) and full dose of chemical fertilizer (19.6% increment). FYM application gave 14 percent more yield of cabbage than the control. Even the control produced notable yield, which is due to the presence of favourable inherent soil fertility as vegetable is cultivated every year on this plot and the farmers generally use high dose of mineral fertilizer as well as organic manure for the vegetable production.
Comparatively biogas slurry in liquid form yielded 6.6 percent higher yields than the FYM treatment. Similarly, slurry compost produced 11.06 percent higher yields than the liquid slurry whereas mineral fertilizer produced 6.0 percent lower yields than the slurry compost. The combination of slurry compost and full dose of fertilizer produced 15.3 percent higher yields than the mineral fertilizer. Similarly, the half dose of fertilizer with half of the slurry compost was 18.25 percent inferior to the full dose of fertilizer with 20t/ha of slurry compost.
Very little research has been carried out in Nepal regarding the effects of bio-slurry on crops and vegetables. In the absence of more advanced scientific research, the available generalized experience indicates that the yield of crops and vegetables can be increased from 10 to 30 percent through slurry application (CMS, 1996). In the absence of reliable and conclusive data, the extension workers are facing much difficulty to convince the fanners about the usefulness of slurry as fertilizer. Realizing this fact, the relevant organizations namely Alternative Energy promotion Centre (AEPC) and SNV/BSP are keen to take necessary step to initiate appropriate R &. D in this direction.
3 Compost prepared by using slurry

58
Present Institutional Set-up of Slurry Programme in Nepal
Presently Nepal's Slurry Extension Programme is being implemented by BSP-Nepal by appointing a Slurry Coordinator. The programme is launch with the help of recognized biogas companies.
With the help of Slurry Technician, who is the employee of the Biogas Company, the Slurry Coordinator launches demonstration programme. Usually, the demonstration programme consists of the methods for compost making in the pit of suitable dimension with the use of slurry and available organic residues. Apart from demonstrating compost-making technology, field trials are carried out at farmer's field on major crops with the use of slurry compost. The extension strategy " Seeing is Believing" is followed, as the farmer can assess himself the differences in crop yield with or without slurry compost.
7.8.2 India
In fact, not much work has been carried out on the quality of the solid output from an anaerobic digester in terms of fertilizer value. This remains largely true even for today. In China, where millions of biogas plants are established, more emphasis has been given to promote the utilization of bio-slurry rather than energy aspect. Both China and India have been focusing their efforts to conduct research on the composting aspect of biogas slurry utilization. Indian Agricultural Research Institute (IARI), India's premier research institution of that kind, has given academic research to the fertilizer value of anaerobic digestion comparing with other types of manure (Van Brakel, 1980).
Research in IARI shows that digested slurry had narrower C:N ratio (25) as compared to farmyard manure (38) and the former gave better crop yield than the latter. These data are comparable with the research data produced elsewhere like from the University of Gottengen, in Germany (Schulz, 1990). This report includes the results of experiments conducted during the period 1950-55. The extent of weed and pathogen destruction during digestion was also studied, as compared to other manure processing system. The same types of study conducted in Poland did not reveal definite superiority of the bio-slurry over ordinary farm manure after methane fermentation (Van Barkcl, 1980).
FYM is generally prepared by aerobic decomposition, whereas anucrohk- digestion takes place in the biogas plant. Therefore, the quality of the two products varies greatly (Adwrya, 1961). In a pot experiment conducted with digested liquid manure and FYM applied at the rate ol' 100 1b nitrogen per acre, four weeks before sowing, the yield of wheat, finger millet and sunhemp were compared with ammonium sulphate with the same amount of N. Although ammonium sulphate produced superior yield over the other two treatments,it was not significantly different.
The wet slurry is reported to contain around 1.6 percent of the nitrogen in the form of readily available ammonia and the dry slurry less than 0.5 percent (Karki, 1997). On the other hand, on percentage basis, liquid slurry has very little ammonia and lower total nitrogen. Maximum benefit is obtained when slurry is used in liquid form as it comes out of plant (Khandelwa and Mahdi, 1986).Sometimes the poor effect shown by wet slurry has been presumed to be the effect of toxic materials like hydrogen sulphide and others.
Over 3000 slurry demonstrations were conducted all over India on two plots of equal size with the same crop sown. In one plot biogas slurry was applied at the rate of 10 tones per hectare in irrigated land and 5 tones per hectare in non- irrigated areas. On maturity, crops from both the plots were harvested and yields compared. The crops were grown on different agro-climatic zones and soil types. Four to forty percent differences on the yield of various 12 cereals and vegetable crops were observed. In addition to crop yields, the quality of vegetables like size and shape were also observed. There were fewer weeds, low number of pest and diseases attack including improvement on soil physico-chemical properties where biogas slurry was applied. It also helped in the reduction of mineral fertilizer (Tripathi, 1993).
Dhussa (1985) compiled the results of some of the experiments, conducted up to the mid-eighties to study the effects of biogas effluent on the yield of rice, wheat, maize, cotton, cucumber, tomato, mug bean, and sunflower. The results indicated that wheat and cotton yields were increased by 15 and 16 percent whereas maize and rice increased by 9 and 7 percent respectively. In another report, Dhusha (1986)

59
stated that cucumber yielded double than control with the application of biogas slurry at the rate of 15 tons/ha, Amount higher than 15 tons/ha reduced cucumber yield. The same author mentioned that application of slurry at the rate of l0t/ha in combination with NPK (45:60:30) produced the best results.
The studies conducted in Sukhadia University of Udaipur revealed that there was a notable change on NPK content in the soil following biogas slurry application as residual fertilizer value. Both N and P content of the soil increased after slurry application. The report includes the results on the effect of various fertilizers on the yield of cabbage, mustard and potato. Biogas slurry produced significantly higher yield over control and FYM (Gupta, 1991). Gupta (1991) also reports the results of 15 demonstrations launched during Kharif. Overall percentage increment in yield from crops treated with biogas slurry came around 40 percent. The application of biogas slurry manure gave best results in vegetable crops such as tomato and brinjal followed by crops like maize and pigeonpea. Percentage increases in crops like bajra, rice, groundnuts were found modest. The other crops like chillies showed no effect.
Widespread demonstrations using biogas slurry were conducted over the Central, East and Northeast States of India. The increase in yields on cereals was considered substantial, as there was no extra cost for the fertilizer material used. The response was better in dry areas with low soil fertility levels. Average increase over control due to slurry application was found to be 23 percent. Average yield of Rabi crops in comparison with the Kharif crops as reported earlier is modest. Since Kharif crops are generally grown in fertile soils under irrigated condition, the response is less impressive compared to Rabi crops. It is still a substantive increment (Singh, 1990). The responses were moderate in irrigated wet areas coupled with higher doses of fertilizer application such as in the State of Punjab, Madhya Pradesh, Haryana and North Bihar (Singh, 1990; Gupta, 1991). On the other hand, Singh (1991) noted that biogas slurry demonstration cannot be very scientific, and ought to be simple on-farm participatory trials in which the participating farmers could see for themselves and assess the performance in yields.
In addition to some of the experimental results reviewed earlier, sun-dried slurry out-performed control, FYM and chemical fertilizer in all the three categories of plant growth i.e. root length, shoot length and dry plant weight (Gupta, 1991).
Singh et al (1995) reported that the combination of chemical fertilizer and digester effluent substantially increased the yield of both rice and maize. Based upon the analysis of these results and depending upon the crops, soil types and agro-climatic conditions, 25 to 100 percent replacements of chemical fertilizers with bio-slurry have been recommended in India. The same authors explain the results of study on the effect of biodigesled slurry for raising pea (Pisum sativum 1.), okra (Abelmoschestus sculentus L.), soybean (Glycine max L.) and maize (Zea mays L.) in the hilly condition of Kangra district in Himanchal Pradesh (Alt: 500-5500m amsl) similar to the Nepalese hilly region. According to Singh et al (1995), lower crop yields were obtained with 12.5 tons/ha of digested slurry probably because of non-availability of N to the crops al critical stages due to slow rate of release. He also concluded that biogas slurry was better organic manure than FYM for obtaining higher yield in pea, okra, soybean and maize. In comparison to FYM, use of biogas slurry in combination with the recommended doses of chemical fertilizer gave better crop yield. Thus, biogas slurry was concluded to be superior to FYM for raising crops. In all the crops, the yield corresponded with plant height and length of pods/cobs.
7.8.3 China The application of the residue after biogas fermentation to crops has gained considerable effect of increasing production in the context of China. A large-scale demonstration on 106 hectares of fertile fields was conducted in Dongxu village of Jinagsu province in China. Biogas slurry was applied for six successive years from 1982 to 1988 and results reported. The report did not mention the amount and form of bio-slurry used. It was reported that the grain yield doubled in sixth year compared to the yield obtained in the first year. Soil organic matter content rose to 2.7 percent in 1988 from 1.3 percent in 1982. Compared to the amount used in 1982, the amount of chemical fertilizer application, too dropped by 86 percent. The net income per hectare was reportedly four times higher than the one obtained in the neighbouring villages that did not use biogas fertilizers (Keyun et al, 1990). On an average, 10 to 20 percent increase in yield due to bio-slurry application has been reported for China.

60
A study was carried out in 16 counties of the municipalities of Sichuan Province of China in view of assessing the comparative effect of digester effluent and open-air pool manure on different crops such as rice, corn, wheat, cotton and rape (Chengdu-Seminar, 1979). The results of the study are summarized in Table 7.8.
Table 7.8: Comparative Effect on Different Crops in Sixteen Counties of the Municipalities of Sichuan Province
Yield of crops in Jin/mu Name of Crops
Fertilizer (Digester) Fertilizer (Open Tank)
Increase in yield (Jin/mu)
Percentage Increment
Rice 636.4 597.5 38.9 6.5Corn 555.9 510.4 45.5 8.9Wheat 450.0 390.5 59.5 15.2Cotton 154.5 133.5 21.0 15.7Rape 258.4 233.6 24.8 10.6
Table 7.8 shows mat the increment in the yield of different crops due to biodigester slurry application compared to open tank bio fertilizer ranges from 6.5 to 15.7 percent. Wheat and cotton seem more responsive than rice, com and rape. Based on these data, it had been concluded that the digested effluent was better than open-air pool manure regardless of the kinds of soils and crops.
Air-dried digester sludge was also reported to have increased soil fertility and crop yield in China. The air-dried digested sludge, on an average, increased yield by approximately 10 percent over the control as compared lo about 15 percent in the case of fresh effluent. The application of fresh effluent in combination with ammonium bicarbonate [(NH4) HCO3] has increased crop yield and also ameliorated the soil structure deteriorated as a result of continuous use of large doses of mineral fertilizer in China (Chengdu-Seminar, 1979).
7.8.4 Benin
An agronomical field trial was conducted at the Centre National d'Agro-pedologie (CENAP) at Godomey, 15 km North-west of Cotonou, Benin (West Africa) in order to study the influence of biodigester effluent on tomato, capsicum, lettuce and cauliflower. The response of these vegetables to the application of biofertilizer (effluent) as compared to control is shown in Table 7.9.
Table 7.9: Average Yields of Vegetables with Slurry Application
Yield of Vegetables in tons/ha Treatment Tomato Capsicum Lettuce CauliflowerControl 2 4 26 23Mineral Fertilizer (80-90-90 NPK/ha) 13 6 56 36Effluents (5 tons dry matter/ha) 22 13 130 48
The above-mentioned table clearly reveals the superiority of biodigesler effluent over control as well as mineral fertilizer (Biogas Newsletter, Number 25 November 1987).
In another experiment carried out in Peru (Vargas, 1986)4 during 1983-85 with biol5 and biosol6 on alfalfa and maize, it was found that biol and biosol increased yield of Ihese crops considerably as compared to the control.
4 Personal communication 5 Biol means liquid portion of biogas slurry 6 Biosol means solid sludge of biogas slurry

61
7.8.5 Philippines
In the Philippines, Maramba (1978) conducted a pot experiment on wheat using biogas slurry that was mixed with feedstock containing higher percentage of phosphorous than either nitrogen or potassium. The effluent was compared to ammonium sulphate and di-sodium phosphate. Application of effluent gave higher yield of wheat than mineral fertilizers. The negative effect of higher amount of effluent could be due to the production of H2S gas that could have acted as toxic to the wheat plants (Sathianathan, 1978).
7.8.6 Thailand
In Thailand, digested pig manure was compared with chemical fertilizer for the yield performance of vegetable, maize, mugbean and morning glory. The results of this study concluded that slurry utilization in crop production could be as effective as chemical fertilizers. The digested pig manure contained 0.4 percent total nitrogen. Effluent was applied as top dressing throughout the growth. The amount of nitrogen supplied through the effluent was 50 percent, 100 percent, and 200. Chemical fertilizer was applied al the rate of 124-52-124 kg/ha for vegetable, corn, mungbeans, and morning glory, respectively. The treatment supplying 100 percent N as effluent gave significantly better performance and was at par with chemical fertilizer. For mungbeans, increasing application did not increase the yield significantly (Tentscher, 1986). The yield performance of the treatment with 50 percent N was as good as chemical fertilizer. In the case of morning glory, plant height increased significantly with the treatment involving the supply of 100 percent and 200 percent N, but it was significantly more so at 200 percent N (at par with chemical fertilizer). Dhussa (1985) also reported similar findings.
7.9 UTILIZATION OF BIO-SLURRY AS ANIMAL FEED
Results from Maya Farms in the Philippines showed that in addition to the plant nutrients, considerable quantity of Vitamin B12 (over 3,000 mg BIZ per kg of dry sludge are synthesized in the process of anaerobic digestion). The experiment has revealed that the digested slurry from biogas plant provides 10 to 15 percent of the total feed requirement of swine and cattle, and 50 percent for ducks (Gunnerson and Stuckey, 1986). Dried sludge could be substituted in cattle feed with satisfactory weight gains and savings of 50 percent in the feed concentrate used (Alviar, et. al., 1980). The growth and development of Salmonella chlorcasuis and Coli bacillus were inhibited under anaerobic fermentation.
This is also relevant in Nepal, since about one-third of the livestock are generally underfed (Pariyar, 1993). The low availability of good quality forage is the result of low productivity of rangeland as well as limited access to it. Only 37 percent of rangelands are accessible for forage collection (HMG/AsDB/FINNIDA, 1988). Therefore, addition of dried sludge in cattle feed would improve the nutrient value of the available poor forage.
An experiment was carried out at BRTC, Chengdu, China in 1990 to study the effects of anaerobically digested slurry on pigs when used as food supplement. Effluent (digested slurry) was added at the rate of 0.37 to 1.12 litres to one kg of normal mixed feed rations. The pigs were fed with this ration until their body weight reached 90 kg. The piglets in this experiment grew faster and showed better food conversion than the control group. Negative effects on the flavour or hygienic quality of the meat were not noticed (Tong, 1995). Subject to further trials, digested slurry might be safe as animal feed.
A national conference was called in May 1991 to discuss ecological agriculture in China and draft a nation-wide plan to promote ecological farming practices. Fundamental feature of the discussion was concentrated on the use of raw materials such as manure from cattle, hogs, and chicken and other organic waste products (e. g. night soil, crop residue) for allowing them to ferment in anaerobiose. The fermentation process enabled a more efficient conversion of raw materials into energy. Methane so obtained from biogas plant was used as fuel for kitchen and other household uses. The slurry-sludge was used as bio-fertilizer or as a food for plankton, which in turn, is eaten by fish. Besides, it was also used as an ingredient in hog and cattle rations up to 15 to 30 percent of concentration (Xu, et al 1992).
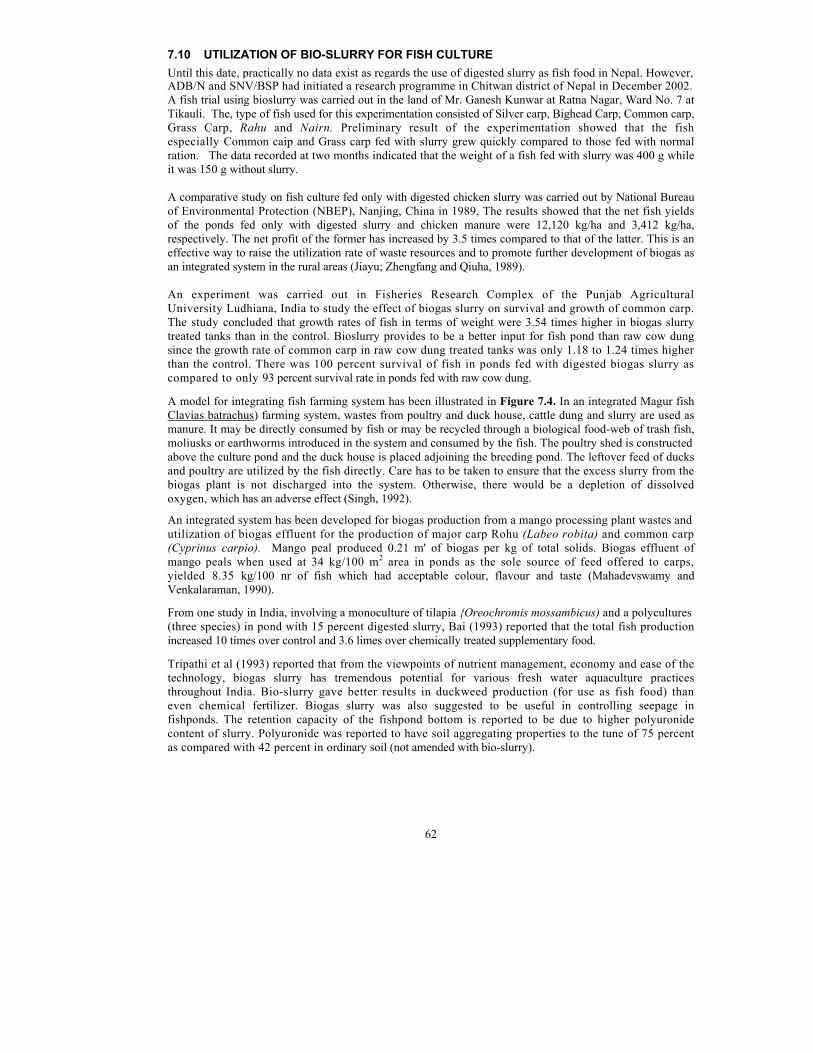
62
7.10 UTILIZATION OF BIO-SLURRY FOR FISH CULTURE Until this date, practically no data exist as regards the use of digested slurry as fish food in Nepal. However, ADB/N and SNV/BSP had initiated a research programme in Chitwan district of Nepal in December 2002. A fish trial using bioslurry was carried out in the land of Mr. Ganesh Kunwar at Ratna Nagar, Ward No. 7 at Tikauli. The, type of fish used for this experimentation consisted of Silver carp, Bighead Carp, Common carp, Grass Carp, Rahu and Nairn. Preliminary result of the experimentation showed that the fish especially Common caip and Grass carp fed with slurry grew quickly compared to those fed with normal ration. The data recorded at two months indicated that the weight of a fish fed with slurry was 400 g while it was 150 g without slurry.
A comparative study on fish culture fed only with digested chicken slurry was carried out by National Bureau of Environmental Protection (NBEP), Nanjing, China in 1989, The results showed that the net fish yields of the ponds fed only with digested slurry and chicken manure were 12,120 kg/ha and 3,412 kg/ha, respectively. The net profit of the former has increased by 3.5 times compared to that of the latter. This is an effective way to raise the utilization rate of waste resources and to promote further development of biogas as an integrated system in the rural areas (Jiayu; Zhengfang and Qiuha, 1989).
An experiment was carried out in Fisheries Research Complex of the Punjab Agricultural University Ludhiana, India to study the effect of biogas slurry on survival and growth of common carp. The study concluded that growth rates of fish in terms of weight were 3.54 times higher in biogas slurry treated tanks than in the control. Bioslurry provides to be a better input for fish pond than raw cow dung since the growth rate of common carp in raw cow dung treated tanks was only 1.18 to 1.24 times higher than the control. There was 100 percent survival of fish in ponds fed with digested biogas slurry as compared to only 93 percent survival rate in ponds fed with raw cow dung.
A model for integrating fish farming system has been illustrated in Figure 7.4. In an integrated Magur fish Clavias batrachus) farming system, wastes from poultry and duck house, cattle dung and slurry are used as manure. It may be directly consumed by fish or may be recycled through a biological food-web of trash fish, moliusks or earthworms introduced in the system and consumed by the fish. The poultry shed is constructed above the culture pond and the duck house is placed adjoining the breeding pond. The leftover feed of ducks and poultry are utilized by the fish directly. Care has to be taken to ensure that the excess slurry from the biogas plant is not discharged into the system. Otherwise, there would be a depletion of dissolved oxygen, which has an adverse effect (Singh, 1992).
An integrated system has been developed for biogas production from a mango processing plant wastes and utilization of biogas effluent for the production of major carp Rohu (Labeo robita) and common carp (Cyprinus carpio). Mango peal produced 0.21 m' of biogas per kg of total solids. Biogas effluent of mango peals when used at 34 kg/100 m2 area in ponds as the sole source of feed offered to carps, yielded 8.35 kg/100 nr of fish which had acceptable colour, flavour and taste (Mahadevswamy and Venkalaraman, 1990).
From one study in India, involving a monoculture of tilapia {Oreochromis mossambicus) and a polycultures (three species) in pond with 15 percent digested slurry, Bai (1993) reported that the total fish production increased 10 times over control and 3.6 limes over chemically treated supplementary food.
Tripathi et al (1993) reported that from the viewpoints of nutrient management, economy and ease of the technology, biogas slurry has tremendous potential for various fresh water aquaculture practices throughout India. Bio-slurry gave better results in duckweed production (for use as fish food) than even chemical fertilizer. Biogas slurry was also suggested to be useful in controlling seepage in fishponds. The retention capacity of the fishpond bottom is reported to be due to higher polyuronide content of slurry. Polyuronide was reported to have soil aggregating properties to the tune of 75 percent as compared with 42 percent in ordinary soil (not amended with bio-slurry).

63
Cross Section—B-B Figure
7.4: Model for Integrating Fish Farming
REFERENCES
[I] Acharya, C.N. (1961) Preparation of Fuel Gas and Manure by Anaerobic Fermentation of Organic Materials, New Delhi, Indian Agriculture Research Institute.
[2] Alexander, M. (1967) Introduction to Soil Microbiology, John Wiley & Sons, Inc. New York. [3] Alviar, C.J. et al. (1980) Cow Manure Biogas Production and Utilization in an Integrated System at the Alabang Dairy Project, Paper presented at the 47th Annual Convention of Philippines Veterinary Medical Association. [4] Manurial Value of Slurry (1978) in: Biogas Newsletter. Number I/Summer. [5] Biogas Newsletter (1987) Biodigester Effluent Boosts up Vegetable Production in Benin, Number 25, November 1987. [6] Chengdu- Seminar (1979) Biogas Technology and Utilization, Sichuan Provincial Office of Biogas Development. Page 12. |7| CMS (1996) Biogas Technology: A Training Manual for Extension, Food and Agriculture Organization of the United Nations. Support for Development of National Biogas Programme (FAO/TCP/Nep/4451-T). [8] Demont, D., A. Sckeyde, and D A. Ulrich (1990) Possible Applications of Bioslurry for the Purposes of Fertilization. Biogas Forum, vol. 1 Special. [9] Dhussa, A.K. (1986) Night-soil Based BiogasPlants, Biogas from Human Waste. CORT: Delhi [10] Dhussa, A.K. (1985) Biogas Plant Effluent Handling and Utilization, Changing Villages Vol. 7, No. 1. [11] Gupta, D.R. (1991) Bio-Fertilizer from Biogas plants, Changing Villages, Vol. 10, No.l Jan-Mar.,
1991.

64
[12] Gunnerson, C.G and D.V. Stuckey (1986) Integrated Resource Recovery Anaerobic Digestion.
Principles and Practices for Biogas Systems, World Bank Technical Paper Number 49. [13] Gurung, J.B. (1997) Review of Literature on Effects of Slurry Use on Crop Production, Final Report. Biogas Support Programme. [14] HMG/AsDB/FINNIDA (1988), Kathmandu, Nepal. [15] Jiayu, M., L.Zhengfang and W. Quihua (1989) Studies on the Design and Construction of Fish Culture fed only with Digested Liquid Slurry. Rural-Eco-Environment, China, No.2, pp 12-17. [16] Karki, K.B. (2001) Response to Bio-slurry Application on Maize and Cabbage in Lalitpur District. Alternative Energy Promotion Centre.[17] Karki, K. B. (1997) Estimation of Plant Nutrient toss from Biogas Slurry, Biogas Support Programme. [18] Keyun, Deng and Choi Yunchu (1990) China Actively Promotes the Development of
Biogas Technology, International Conference of Biogas: Technology and Implementation
Strategies (Conference Report, Pune India: a Joint Initiative of FRG and Republic of India, Jan. 10th lo 15th, 1990). [19] Khandelwal, K.C. and S.S. Mahdi (1986) Biogas Technology: A practical Handbook, Vol. 1. New Delhi: Tata McGraw. [20] Kijne, E. (1984) Biogas in Asia, Ultrecht, Holland: CDP (Consultants for Management of
Development). [21] Lakshmanan, A.R. and A. Jeyabal (1993) Use of Biogas Effluents as Seed Coating Media for Successful Crop Production, Biogas Slurry Utilization, New Delhi: CORT.[22] Mahadevaswami, M. and L.V. Venkataraman (1990) Integrated Utilization of Fruit Processing Waste for Biogas and Fish Production, Biol.Waste : 32: 2430251.[23] Maramba, Felix D. (1978) Biogas and Waste Recycling: The Philippine Experience, Manila: Maya Flour Division, Liberty Flower Mills.[24] Sathianathan, M.A. (1975) Biogas Achievements and Challenges, Association of Voluntary
Agencies of Rural Development, New Delhi, India. [25] Schutz, H. (1990) Agriculture Biogas Plants and Use of Slurry as Fertilizer in the Federal Republic of Germany, International Conference on Biogas Technologies and Implementation Strategies Report. January 10-15, Pune, India. [26] Singh, J.B. (1990) Biogas Slurry Manure. In: Changing Villages. Vol. 9, No.3. [27] Singh, J.B. (1991) Biogas Slurry Manure. In: Changing Villages, Vol.10, No.l. [28] Singh, et al (1995) Effect of Biogas Digested Slurry on Pea, Okra, soybean and Maize. In: Biogas Forum, Vol. IV, No.63, 1995.[29] Singh, R.B. (1992) Integrated Farming with Magur Fish is Profitable to the Farmers. In: Indian Farming. [30] Shen, R.Z. (1985) The Utilization of Biogas Digester in China. In: Aerobic Digestion, Proceeding
of the 4th International Symposium on Anerobic Digestion. Ghogzou, China. [31] Tenscher, W. (1986) Digested Effluent as Fertilizer. Anaerobic Digestion. In: MIRCEN, Vol.3, No.2, PP 136. [32] Tong, W. (1995) Research on Feeding Pigs with Anaerobic Digested Effluent as Supplementation of Mixed Concentrate Rations. In: Biogas Forum, Vol. IV, No.63 pp8-15. [33] Tripathi, A.K. (1993) Biogas Slurry - A Boon for Agriculture Crops. Biogas Slurry Utilisation, New Delhi: CORT. [34] Van Brakel, I. (1980) The Ignis Fatuus of Biogas. Small Scale Anaerobic digesters (Biogas Plants): A Critical Review of the Pre-1970 Literature, Delft, The Netherlands. Delft University Press. [35] Xu, C. H., Chunru and D.C. Taylor 1992 Sustainable Agricultural Development in China, 20
(8):1127-1144, World Development Pergamon Press, G. Britain.
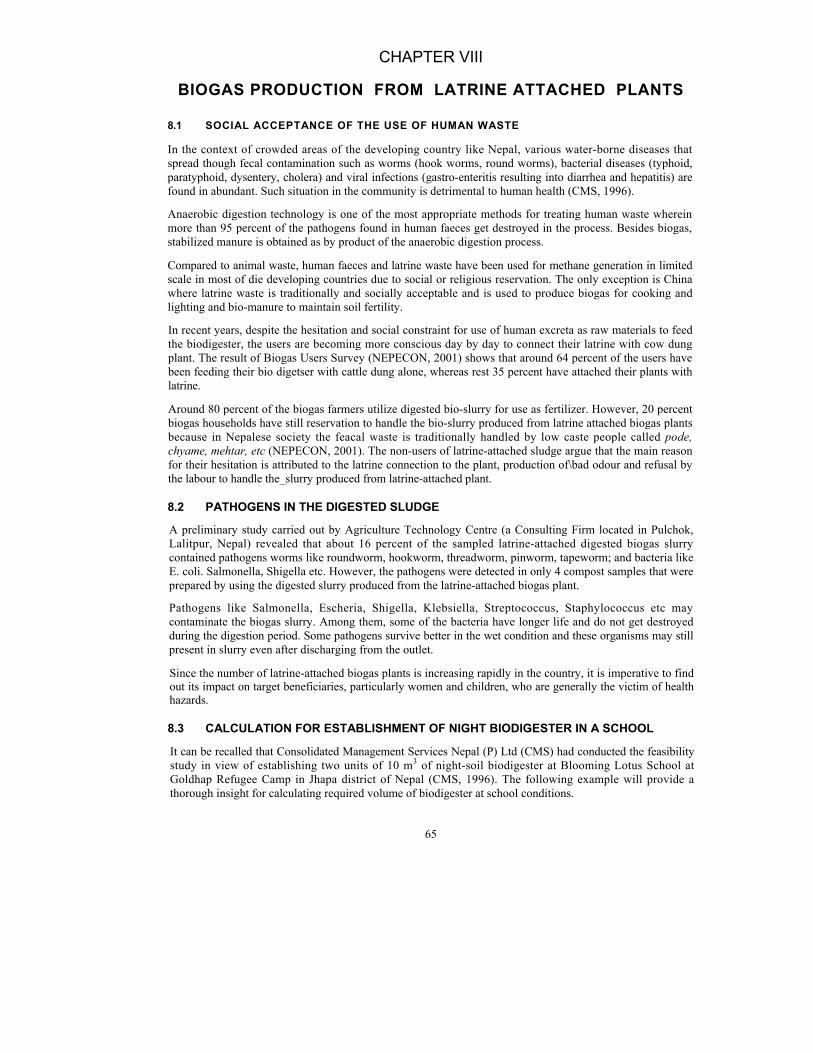
65
CHAPTER VIII
BIOGAS PRODUCTION FROM LATRINE ATTACHED PLANTS
8.1 SOCIAL ACCEPTANCE OF THE USE OF HUMAN WASTE
In the context of crowded areas of the developing country like Nepal, various water-borne diseases that spread though fecal contamination such as worms (hook worms, round worms), bacterial diseases (typhoid, paratyphoid, dysentery, cholera) and viral infections (gastro-enteritis resulting into diarrhea and hepatitis) are found in abundant. Such situation in the community is detrimental to human health (CMS, 1996).
Anaerobic digestion technology is one of the most appropriate methods for treating human waste wherein more than 95 percent of the pathogens found in human faeces get destroyed in the process. Besides biogas, stabilized manure is obtained as by product of the anaerobic digestion process.
Compared to animal waste, human faeces and latrine waste have been used for methane generation in limited scale in most of die developing countries due to social or religious reservation. The only exception is China where latrine waste is traditionally and socially acceptable and is used to produce biogas for cooking and lighting and bio-manure to maintain soil fertility.
In recent years, despite the hesitation and social constraint for use of human excreta as raw materials to feed the biodigester, the users are becoming more conscious day by day to connect their latrine with cow dung plant. The result of Biogas Users Survey (NEPECON, 2001) shows that around 64 percent of the users have been feeding their bio digetser with cattle dung alone, whereas rest 35 percent have attached their plants with latrine.
Around 80 percent of the biogas farmers utilize digested bio-slurry for use as fertilizer. However, 20 percent biogas households have still reservation to handle the bio-slurry produced from latrine attached biogas plants because in Nepalese society the feacal waste is traditionally handled by low caste people called pode, chyame, mehtar, etc (NEPECON, 2001). The non-users of latrine-attached sludge argue that the main reason for their hesitation is attributed to the latrine connection to the plant, production of\bad odour and refusal by the labour to handle the_slurry produced from latrine-attached plant.
8.2 PATHOGENS IN THE DIGESTED SLUDGE
A preliminary study carried out by Agriculture Technology Centre (a Consulting Firm located in Pulchok, Lalitpur, Nepal) revealed that about 16 percent of the sampled latrine-attached digested biogas slurry contained pathogens worms like roundworm, hookworm, threadworm, pinworm, tapeworm; and bacteria like E. coli. Salmonella, Shigella etc. However, the pathogens were detected in only 4 compost samples that were prepared by using the digested slurry produced from the latrine-attached biogas plant.
Pathogens like Salmonella, Escheria, Shigella, Klebsiella, Streptococcus, Staphylococcus etc may contaminate the biogas slurry. Among them, some of the bacteria have longer life and do not get destroyed during the digestion period. Some pathogens survive better in the wet condition and these organisms may still present in slurry even after discharging from the outlet.
Since the number of latrine-attached biogas plants is increasing rapidly in the country, it is imperative to find out its impact on target beneficiaries, particularly women and children, who are generally the victim of health hazards.
8.3 CALCULATION FOR ESTABLISHMENT OF NIGHT BIODIGESTER IN A SCHOOL
It can be recalled that Consolidated Management Services Nepal (P) Ltd (CMS) had conducted the feasibility study in view of establishing two units of 10 m3 of night-soil biodigester at Blooming Lotus School at Goldhap Refugee Camp in Jhapa district of Nepal (CMS, 1996). The following example will provide a thorough insight for calculating required volume of biodigester at school conditions.

66
8.3.1 Calculation of the Required Volume of Biodigester
Before calculating the required volume of the biodigester, it is necessary to assess the quantity of focal sludge produced per day.
Focal Sludge (FS) Quantities: Daily per capita FS production or, rather, daily volumes of FS collected and discharged per person served, are essential data for planning and designing improved FS treatment and disposal systems. Compared to the daily per capita sewage production, FS quantities, as collected and discharged in a plant or elsewhere, are dependent on a multitude of factors and thus difficult to estimate.
The collected or collectable daily per capita FS quantities arc dependent on the following factors.
■ Latrine or septic tank emptying practice (frequency, ease and depth of emptying, water quantities used for dilution during emptying).
■ Groundwater level: high levels during the rainy season may for example limit the infiltration capacity of soakaways and call for more frequent tank emptying. ■ Capacity of soakaways (clogging leads to back up problems). ■ Origin of FS: septic tanks, latrines, public toilet vaults, etc.
It is not surprising that the per capital quantities, as reported in the literature, vary widely. Figures for collected septate, i.e., fecal sludge stored in septic tanks, can be as low as 0.3 litre/persons/day and as high as 131/litres/person/day. Most of the reported values vary between 0.5 and 1 litres/person/day (EAWAG, 1995).
The following assumptions have been made to calculate the volume of excreta available in the context of Bhutanese Refugee camps in Nepal for the proposed bio digester installation.
Age group Excreta production/day Adult (15 years or above) 0.4 kg (based on literature review) 10 to 15 years 0.3 kg (interpolated/estimated) 6 to 10 years 0.2 kg (interpolated/estimated)
The current population of the school and the corresponding excreta production per week (based on the above assumptions) are presented in Table 8.1.
Table 8.1: Quantity of Faecal Sludge at Blooming Lotus School
Age Group (Years) Number Excreta in One Week (kg)6-10 1400 1400x0.2x0.5 =28010-15 1030 1030x0.4x2x0.5 = 309
Above 15 513 + 62 (teachers) + 5 (non-teaching staff) 580x0.4x2x0.5 =232Total 3010 821
Further assumptions and calculations are as follows:
■ One kg of human excreta produces 0.05 m3 of biogas.
■ Hydraulic Retention Time (HRT) of 70 days ensure that most of the pathogens are destroyed. ■ One student uses 0.5 litre of water for anal cleaning. ■ (This water volume can be controlled by providing 0.5 litre capacity cans or jars. Even if some students used more water, this would be compensated by school holidays e.g. festivals and terms
breaks)

67
■ Excreta available /day = 821/7 = 117.3 kg. ■ Volume of water used/day = 3010 x 0.5 lit x 2/7 = 430 litres.
■ 1 kg of feces occupies 1 litre of volume. Total volume/day = 430 + 117.3 = 547 litres.
Gas Production/day- 117.3 kg x 0.05 m3/kg = 5.8 m3
With HRT of 70 days and storage for 1/3 of daily gas production, total volume of storage required = (547.3/1000) x 70 + 5.7/3 = 40.2 m3 Thus, if all the fecal sludge excluding urine were collected and processed into a biodigester, there is a possibility of establishing two units of 20 m3 plant (i.e. one for male and another for female) which would generate about 5.8 in of gas per day. From a structural and constructional viewpoint, usually biogas plants larger than 25 nr1 is not recommended. Digester design is based upon drawing as shown in Figure 8.2.
8.4 INSTALLATION OF COMMUNITY LATRINE-CUM-BIODIGESTER
Ward No.l of Pathari Village Development Committee (VDC) of Morang district of Eastern Nepal happens to be one of the most polluted areas in Nepal. One of the main reasons behind pollution is attributed to the increasing pressure of population and lack of proper sanitation. Basically, local inhabitants, passers-by and the Bhulanese refugees are responsible for causing environment pollution in this area. The landless people and other local inhabitants have been rearing the pigs without proper shed and management. Thus, owing to haphazard disposal of human and animal wastes (particularly pig excreta) in the surroundings, health, hygiene and sanitation has been affected to a greater extend.
To ameliorate the situation, CMS with financial assistance of UNIICR had implemented a project at Ward No.l of Pathari VDC in 1997- 1998 in which a community latrine-cum-biogas plant was successfully established.
After inspecting the three sites by the Consultants along with the UNHCR officials, VDC members and local people, the team jointly agreed on a site located at 74 m north of the East-West Highway. This new site is situated at 180 m from the previous site at Hatiya Bazaar and is within Ward No. 1 of Pathari VDC. The other two sites did not appear suitable since they were located close to the river bank and apart from flood hazards, these areas have scattered houses (i.e., limited use of the latrine due to sparse population). This newly proposed site was justified from following point of view:
■ Majority of the households located close to the site do not possess private latrines. Thus, they are forced to defecate on open place thereby polluting the area. They will be the permanent users of the latrine. This will alleviate the sanilalion problems faced by the nearby households.
■ At present, due to lack of latrines, most inhabitants of Hatiya Bazaar and the visitors to the market area have to walk up to I km (in the forest area) for defecation. Since the site is situated at a distance of 180 m from the Hatiya Bazaar, the inhabitants of-Hatiya Bazaar and the people visiting for market will also be the secondary users of the latrines.
■ The new site is situated close to the bus stop (for buses travelling along the East-West Highway) and the open space of this site is being currently used for defecation by the bus passengers. Therefore, this site is more likely to be used after the construction of the Latrine-cum-Biodigester.
■ Biogas generated at this site can be used by nearby households (located less than 40 m from the site). One household willing to use the gas for cooking is located at 46 m from the project site.
The ground profile of the newly located site gently slopes southwards which will simplify the layout of the drain pipes and the surface runoff can be diverted.
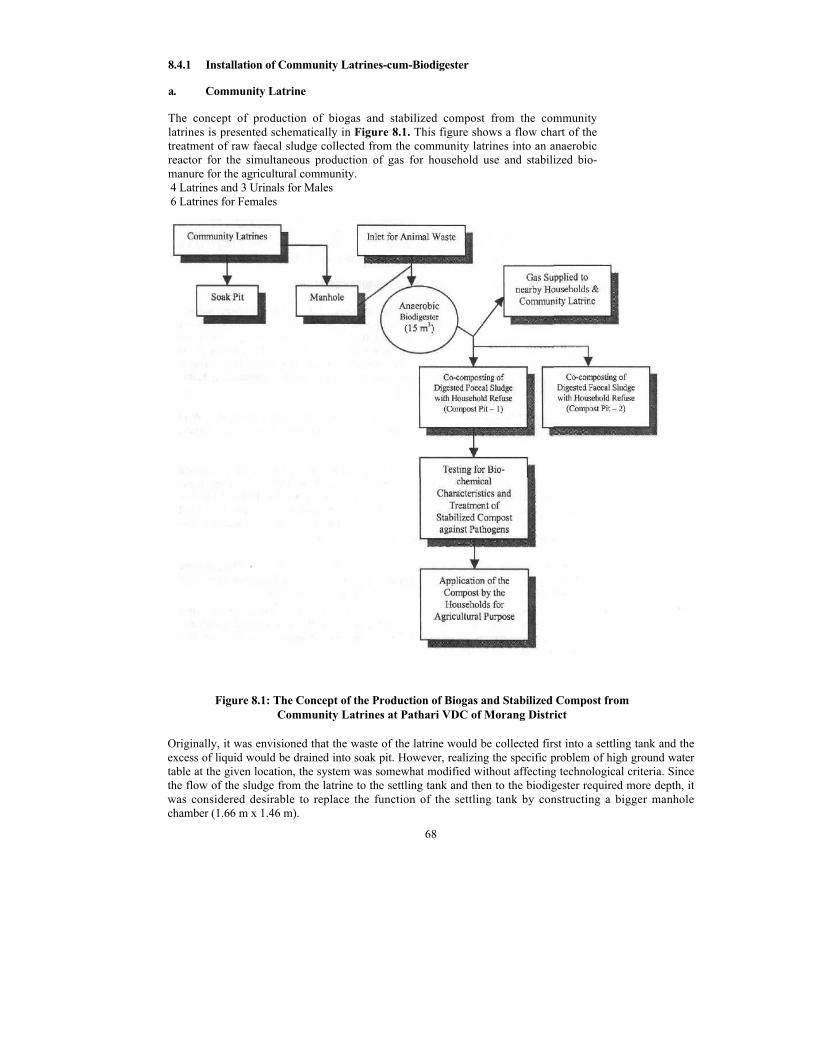
68
8.4.1 Installation of Community Latrines-cum-Biodigester
a. Community Latrine
The concept of production of biogas and stabilized compost from the community latrines is presented schematically in Figure 8.1. This figure shows a flow chart of the treatment of raw faecal sludge collected from the community latrines into an anaerobic reactor for the simultaneous production of gas for household use and stabilized bio-manure for the agricultural community. 4 Latrines and 3 Urinals for Males 6 Latrines for Females
Figure 8.1: The Concept of the Production of Biogas and Stabilized Compost from
Community Latrines at Pathari VDC of Morang District
Originally, it was envisioned that the waste of the latrine would be collected first into a settling tank and the excess of liquid would be drained into soak pit. However, realizing the specific problem of high ground water table at the given location, the system was somewhat modified without affecting technological criteria. Since the flow of the sludge from the latrine to the settling tank and then to the biodigester required more depth, it was considered desirable to replace the function of the settling tank by constructing a bigger manhole chamber (1.66 m x 1.46 m).
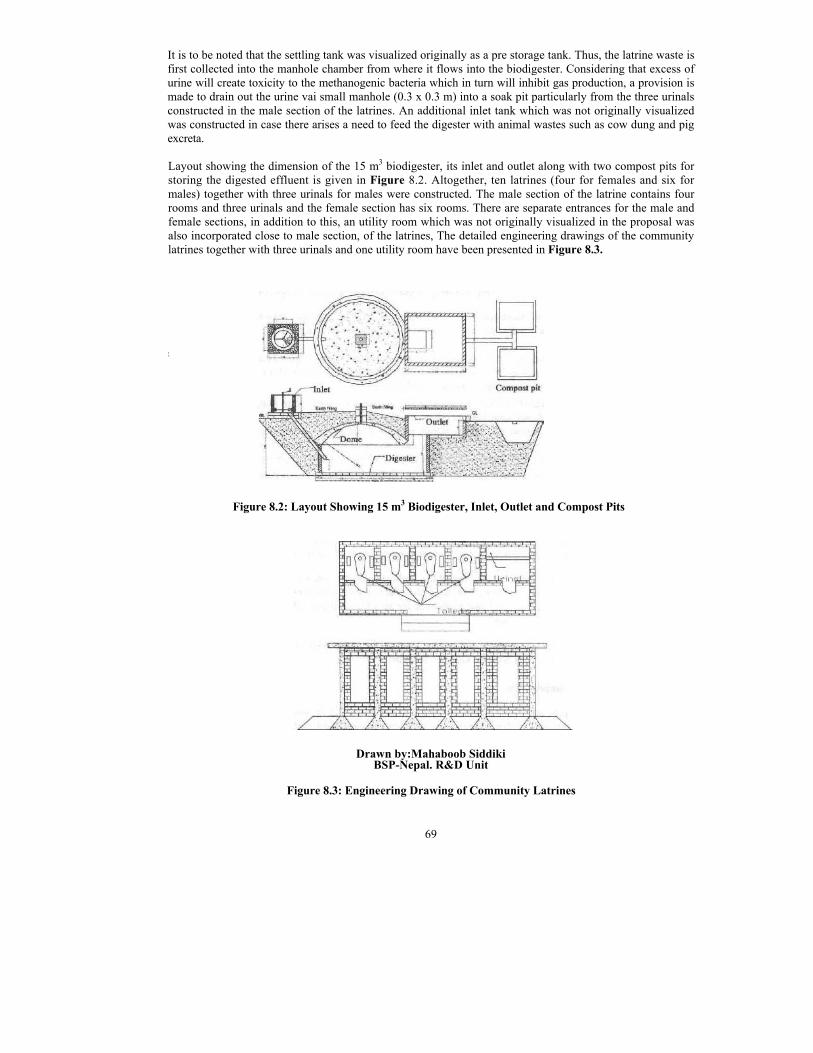
69
It is to be noted that the settling tank was visualized originally as a pre storage tank. Thus, the latrine waste is first collected into the manhole chamber from where it flows into the biodigester. Considering that excess of urine will create toxicity to the methanogenic bacteria which in turn will inhibit gas production, a provision is made to drain out the urine vai small manhole (0.3 x 0.3 m) into a soak pit particularly from the three urinals constructed in the male section of the latrines. An additional inlet tank which was not originally visualized was constructed in case there arises a need to feed the digester with animal wastes such as cow dung and pig excreta.
Layout showing the dimension of the 15 m3 biodigester, its inlet and outlet along with two compost pits for storing the digested effluent is given in Figure 8.2. Altogether, ten latrines (four for females and six for males) together with three urinals for males were constructed. The male section of the latrine contains four rooms and three urinals and the female section has six rooms. There are separate entrances for the male and female sections, in addition to this, an utility room which was not originally visualized in the proposal was also incorporated close to male section, of the latrines, The detailed engineering drawings of the community latrines together with three urinals and one utility room have been presented in Figure 8.3.
:
Figure 8.2: Layout Showing 15 m3 Biodigester, Inlet, Outlet and Compost Pits
Drawn by:Mahaboob Siddiki BSP-Nepal. R&D Unit
Figure 8.3: Engineering Drawing of Community Latrines

70
Based upon the actual Bill of Quantities (BOQ), the construction of the community latrines was awarded by the Consultant to a local contractor named Baral Construction at NRs. 365,507. To ensure that the quality control and quality assurance criteria were followed, the Consultant had specified the construction materials and the procedures in the Contract. During the construction phase, a well qualified civil engineer was based at the site and the Project Coordinator and other professionals made frequent site visits for supervision, quality control and monitoring of the project activities.
It is to be noted that the construction of the latrines as per engineering drawings furnished by the Consultant was successfully constructed by the local contractor within the prescribed time schedule.
b. Installation of Biodigester
A 15 m3 capacity Gobar Gas and Agricultural Equipment Development Company (GGC) fixed dome biodigester (based on Chinese design) as approved by the Biogas Support Programme (BSP) of the Netherlands Development Organization (SNV/Nepal) was installed at the southern end of the latrine (see Figure 8.2).
The Consultant had entrusted the responsibility of constructing the 15 m3 biogas plant to GGC.
The construction of 15 m biodigester by GGC was delayed. The principal reasons for the unforeseen delay in the construction of the biodigester are attributed to the followings factors:
■ The land chosen by VDC belonged to the Forestry Department. Thus, it took additional time (two weeks) for the VDC Chairman to receive official approval to procure this site for the construction of the community latrines and biodigester.
■ The specific location allocated by VDC for biodigester construction happened to be on high water table area. The Consultant had no other choice but to accept this as a challenge and to proceed with the programme. However, this required additional time since dewatering was required during the excavation phase. It should be noted that prior to this, GGC had constructed biogas plant only in dry areas (low water table) and hence did not have expertise to build a digester in high water table areas.
■ In above backdrop, the Consultant had to assign a knowledge civil engineer who had previous experience in the construction work especially in areas of high water table. It took some time to regularize the process.
■ As this was entirely a new venture to GGC, the work had to be done methodologically and cautiously so as to gain confidence to achieve required quality work.
For achieving quality masonry work in the process of building the biodigester, continuous dewatering had to be done with the help of a pump to remove the accumulated water inside the digester.
After completion of the masonry work and casting of the dome, the interior parts of the digester interior parts of the digester and the outlet were plastered following the standard norms as prescribed by SNV/BSP. The interior portion of the dome was plastered twice followed by an additional coat of acrylic emulsion paint to ensure water and air-tightness of the plant.
After completion of the construction work and before loading the plant with cow dung, measurement of different parts of the biogas plant was done by GGC technician.
8.4.2 Construction of Compost Pits
As planned, two compost pits, each with dimension of 1.0 m x 1.2 m x 0.8 m, were constructed close to the biodigester to collect the digested sludge. It is expected that the biodegradable substances such as plant and vegetable materials including household refuges will be co-composted with faecal effluents of the biodigester in order to prepare high quality organic fertilizer which can be utilized by the farming community. The construction of twin compost pits enables to fill and empty each pit alternatively.
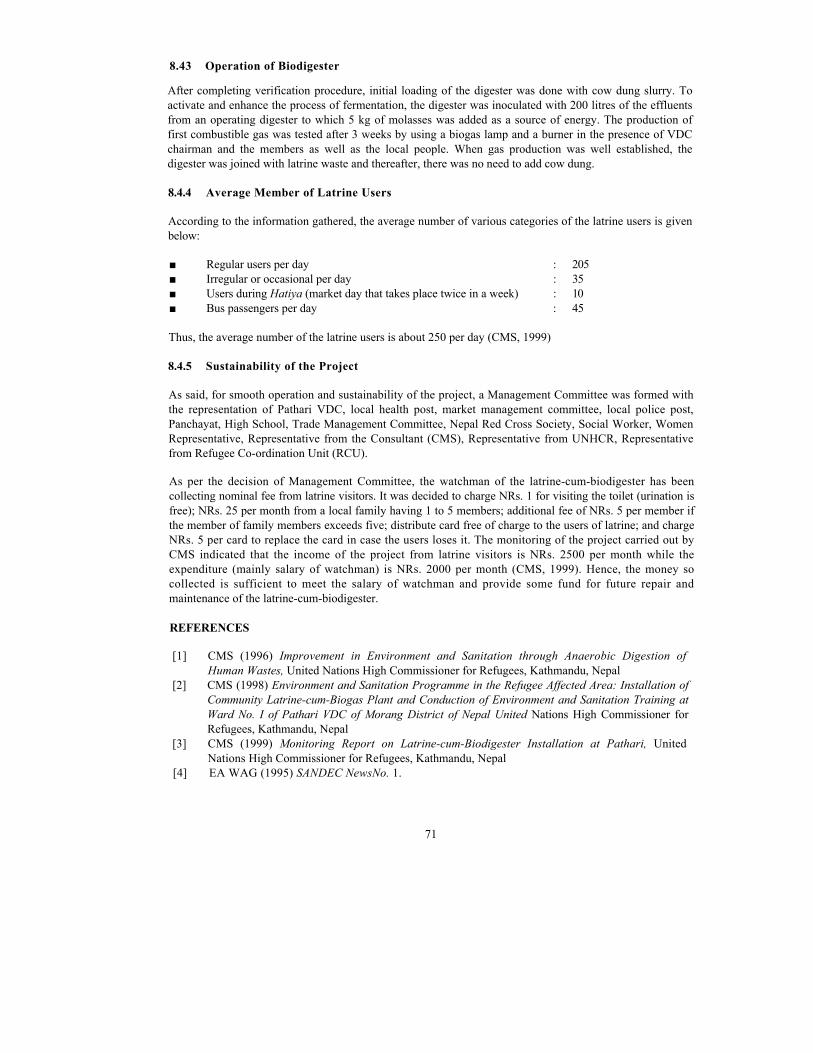
71
8.43 Operation of Biodigester
After completing verification procedure, initial loading of the digester was done with cow dung slurry. To activate and enhance the process of fermentation, the digester was inoculated with 200 litres of the effluents from an operating digester to which 5 kg of molasses was added as a source of energy. The production of first combustible gas was tested after 3 weeks by using a biogas lamp and a burner in the presence of VDC chairman and the members as well as the local people. When gas production was well established, the digester was joined with latrine waste and thereafter, there was no need to add cow dung.
8.4.4 Average Member of Latrine Users
According to the information gathered, the average number of various categories of the latrine users is given below:
■ Regular users per day : 205 ■ Irregular or occasional per day : 35 ■ Users during Hatiya (market day that takes place twice in a week) : 10 ■ Bus passengers per day : 45
Thus, the average number of the latrine users is about 250 per day (CMS, 1999)
8.4.5 Sustainability of the Project
As said, for smooth operation and sustainability of the project, a Management Committee was formed with the representation of Pathari VDC, local health post, market management committee, local police post, Panchayat, High School, Trade Management Committee, Nepal Red Cross Society, Social Worker, Women Representative, Representative from the Consultant (CMS), Representative from UNHCR, Representative from Refugee Co-ordination Unit (RCU).
As per the decision of Management Committee, the watchman of the latrine-cum-biodigester has been collecting nominal fee from latrine visitors. It was decided to charge NRs. 1 for visiting the toilet (urination is free); NRs. 25 per month from a local family having 1 to 5 members; additional fee of NRs. 5 per member if the member of family members exceeds five; distribute card free of charge to the users of latrine; and charge NRs. 5 per card to replace the card in case the users loses it. The monitoring of the project carried out by CMS indicated that the income of the project from latrine visitors is NRs. 2500 per month while the expenditure (mainly salary of watchman) is NRs. 2000 per month (CMS, 1999). Hence, the money so collected is sufficient to meet the salary of watchman and provide some fund for future repair and maintenance of the latrine-cum-biodigester.
REFERENCES
[1] CMS (1996) Improvement in Environment and Sanitation through Anaerobic Digestion of Human Wastes, United Nations High Commissioner for Refugees, Kathmandu, Nepal
[2] CMS (1998) Environment and Sanitation Programme in the Refugee Affected Area: Installation of Community Latrine-cum-Biogas Plant and Conduction of Environment and Sanitation Training at Ward No. I of Pathari VDC of Morang District of Nepal United Nations High Commissioner for Refugees, Kathmandu, Nepal
[3] CMS (1999) Monitoring Report on Latrine-cum-Biodigester Installation at Pathari, United Nations High Commissioner for Refugees, Kathmandu, Nepal
[4] EA WAG (1995) SANDEC NewsNo. 1.

72
CHAPTER IX
BIOGAS PRODUCTION FROM KITCHEN WASTE
As discussed in the earlier chapters, most conventional biogas plants in Nepal, India and other developing countries use either cow or buffalo dung as input. However, a few pilot projects have been implemented in Nepal which uses other organic matter as input such as elephant dung in conjunction with human waste in Machan Wild Life Resort, Chitwan (Karki, 1994) and human faeces in Pathari Village Development Committee (VDC), Morang (CMS, 1998). Apart from this, there has not been much diversification in this area. Hence, any additional data obtained regarding gas production using various types inputs will be valuable.
Production of biogas (Methane) from food waste is not a new concept. It has been successfully implemented in China, India and other countries. Often, kitchen waste is fed into the biodigetser as a secondary input along with other organic matter (e.g. cow dung). Literature regarding use of kitchen wastes only as input for biogas generation at household level is difficult to find.
9.1 PRODUCTION OF BIOGAS FROM KITCHEN WASTE AT HOUSEHOLD LEVEL
This part of the chapter is based on the experimental model biogas plant designed by Ajoy Karki (Engineer) to study biogas generation using kitchen waste only. This plant is located in his residence at Dhobighat, Lalitpur, Nepal. The study is being undertaken to investigate the practicability of such a system and to make available basic data such as volume of gas generated for given input of kitchen waste, optimum retention time and optimum storage volume required for given volume of slurry in the plant. This demonstration model has been in operation for about nine month (BNRM, No.75, 2002). Design details and initial findings are discussed in the following sub-sections.
9.1.1 System Designing
A 200-liter volume (usable) biogas plant, as shown in the Figure 9.1 was designed by Ajoy Karki and manufactured at the workshop of Equipment Maintenance Center (EMC), Kathmandu, Nepal. The design is partially based on fixed dome Chinese model plant but fabricated out of mild steel sheet. Gas storage space is provided at the upper dome, which is fixed and the input is fed from the inlet as shown in the Figure. However, unlike the conventional fixed dome model where the digested effluent is pushed out automatically by the gas pressure built inside the digester (and the domo), in this demonstration plant, the effluent has to be manually removed by opening the bulb valve at the outlet.

73
9.1.2 Raw Materials Utilized for Feeding the Reactor:
The raw materials (input) used for the demonstration model consisted of kitchen wastes comprising of uncooked vegetable wastes such as potato peels, banana peels, vegetable stems, as well as cooked food wastes that otherwise could be thrown away. In principle, any biodegradable materials, if fermented under anaerobic condition, can produce biogas by the action of methanogenic bacteria. The process of fermentation of animal waste such as cow dung or buffalo dung is easier as they naturally contain methanogenic bacteria and can be mixed well with water. Thus, retention time for cow or buffalo dung is less compared to kitchen waste. Vegetable materials should be chopped into small pieces and left for pre-fermentation (20-30 days) in a closed bin so that the acidic phase occurs before the waste is fed into the biogas plant. This decreases the retention time required in the biogas plant and thus, a smaller plant can be used for biogas generation at similar rate. Depending upon ambient temperature, the first biogas can be produced from cow dung plant within one month whereas in case of the reactor with vegetable waste, one may have to wait for even 3 to 4 months for the first production of biogas.
9.1.3 Initial Loading of the Digester
As said, the total volume of the experimental model biodigester is 200 litre. 150 litres have been allotted for the fermenting material (slurry) inside the digester, and around 50 litres is left for gas storage. Therefore, for initial loading around 150 litre of pre-digested material is required for the model shown in Figure 9.1. Furthermore, it should be noted that for the initial feeding of the kitchen waste biogas plant, it is essential to inoculate the materials with digested slurry from an operating biogas plant, since methanogenic bacteria are almost non-existent in kitchen waste. After the initial feeding to the plant, there is no need for additional inoculum. The inoculum should occupy about 10 to 20 percent of the total volume of the input in the plant for efficiently accelerate gas production (i.e., 15-30 litres in this case). Incase pre-fermented kitchen waste mixed with inoculum is fed into the plant (for the initial feeding), noticeable volume of biogas (i.e., such that it burns with a blue flame) would be generated between 40 days to 60 days depending upon the ambient temperature.
Apart from chopping the vegetable wastes into small pieces, the materials should be mixed with equal volume of water to enhance the pre-fermentation process. Stirring the substrate from time to time also facilitates the pre-fermentation process. At the end of the acidic phase (i.e., pre-fermentation), the substrate should be of thick consistency and should have a foul smell (i.e., rotten smell), but it should still be possible to identify the parent materials in the mix.
After loading the pre-fermented materials inside the reactor, anaerobic digestion occurs. It can be observed that in the beginning, the pH of the media is acidic but gradually pH tends to increase and when gas production is stabilized, it remains buffered around 7.5 to 8.0.
Once the system is balanced, for a given volume of input fed into the plant, an equal volume of digested slurry is removed by opening the outlet valve. In a balanced system, when gas (methane) is produced, the pressure pushes the slurry upwards such that the slurry reaches the top level at the inlet chamber (this can be visibly observed). Once gas is used, the pressure reduces and thus the slurry level also reduces. This reduction in slurry level can be seen at the inlet when the gas is being used. If the plant is overfed, as pressure builds up during the methane formation process, the slurry will overflow from the intake chamber.
This bio-reactor has been designed to operate both as continuous and batch feeding system. If, each day for a given input, an equal volume of digested output is removed it would be a continuous system. Conversely, if the plant is fed fully and, once gas production diminishes drastically or even ceases it is completely emptied, it would be a batch fed system. The design allows the plant to operate under both systems since unlike conventional biogas plants where the gas pressure governs the slurry outflow; a valve is used to remove the digested slurry. In this study, the plant is being used as a semi-continuous (or semi-batch) system.
The total cost of the plant including all valves and the burner was about 4,000 Nepalese Rupees (US$51).
74
9.1.4 Regular Feeding of the Reactor
Once the initial loading is done and biogas production is stabilized, it is necessary to devise appropriate process to continue the system. Two 50-litre plastic bins will be required for storage and fermentation of kitchen waste by turn. In the beginning, the kitchen waste produced daily is filled in the first bin. As said, care should be taken to mix the material with equal volume of water. When the first bin is almost full, it is left for pre fermentation for about 20 to 40 days depending upon ambient temperature so that pre-digestion (i.e., acid formation stage) lakes place here. The pre-fermented materials thus prepared can now be loaded daily at the rate of 1.5 litre per day (continuous system) or 10 litre per week (semi-continuous) for the design in Figure 9.1 as will be convenient to the users.
It should be noted that for a given input placed in the plant an equal volume of effluent should be removed immediately by opening the bulb valve. Unlike the pre-fermented input, the digested effluent should not have any foul odour. The presence of pungent smell in the effluent is an indication that the retention time is not adequate. Should this occur, the feeding and removal of input/digested effluent should be stopped for such time until such smell is not noticeable in the digested slurry.
When the material of the first bin is pre-fermented, one should start the adding fresh kitchen waste in the second bin. The fermentation procedure is same as in case of first bin. By synchronizing the time, the user should be able to manage continuous feeding of the digester using two bins.
9.1.5 Utilization of Gas and Bio manure
The gas generated is delivered to the biogas burner into the kitchen via a flexible (fibre reinforced) plastic pipe. There are two control valves to regulate the flow of gas to the burner; the main gas valve is located just above the dome and the other one at the biogas burner. The biogas stove is kept in the kitchen and is used mainly to prepare tea, omelette and warm food to supplement the use of Liquefied Petroleum Gas (LPG).
In addition to gas, this plant provides digested effluent (in semi-liquid form), which is used to fertilize vegetables and flowers plants. The establishment of the portable kitchen waste fed bioreactor at the households seems more justified from bio manure point of view than energy generation.
9.1.6 Initial Results
As said, the bioreactor has been put into operation for about nine months. The initial results are as follows: On average 30-40 litre of methane is generated per day (during the summer days) from the plant, which is sufficient to boil 8-10 cups of tea (i.e., 1.1-1.4 litre of water starting from 20°C). When the slurry level reaches the top level of the inlet chamber due to gas pressure (with 150 litre of slurry in the plant), about 25 litre of gas is available.
■ The digested slurry removed form the biogas plant is visibly different than the pre-digested kitchen waste fed into the plant. The pre-digested kitchen waste has a smell of rotten vegetables, takes the colour of the input material used and the type of vegetables and fruits can still be identified in the mix. The digested slurry is practically odorless and blackish in colour; the parent materials (as well as any solids) are no longer visible. It is being used as organic fertilizer in the kitchen garden. There was remarkable growth of cauliflower and leafy vegetables such as mustard plant (Rayo ko saag) due to its application compared to non-fertilized plants.
■ The gas is practically odorless and burns with a blue flame. A slight hissing sound can heard during the initial opening of the valve at the gas burner. This is due to accumulation of condensed water in the pipe, which needs to be drained out from time to time.
9.1.7 Other Possible Uses
Apart from serving as a demonstration model, this plant could be used for research purposes as discussed herein. In developing countries, data regarding the volume of gas that can be generated from the organic contents in municipal wastes is not available. It should be noted that the organic contents (in municipal wastes) is mainly composed of kitchen wastes. A small demonstration plant, which can be used under control conditions (with both batch and continuous feeding systems), could provide data on optimum gas production parameters such as retention time as a function of temperature and nature of inputs. This would

75
help design large anaerobic digesters to process organic wastes in municipal wastes as an alternative to landfill disposal. The digested effluent could also be used as fertilizer rather than occupying space in the landfills. It should also be noted that the digested slurry has low volume of solids and once dried, there will be significant volume reduction.
9.2 VEGETABLE AND KITCHEN WASTES WITH OR WITHOUT COW DUNG
The first part of this chapter dealt with biogas production experimentation at the household level, whereas this part includes the findings carried out at laboratory scale. The findings reported herein are based on the M.Sc. Thesis presented at the Central Department of Microbiology, Tribhuwan University, Kathmandu, Nepal (Dhakal, 2002),
9.2.1 Rationale of the Study
Microbiological methods of recycling of biodegradable waste materials that have been in use are composting and biogas production. More attention is being paid towards composting whereas biogas production has got less attention because it is thought to be technically more difficult and more expensive. However, the reality is that the biogas production through anaerobic digestion of the biodegradable portion of waste is a continuous and self-sustained process, which once established, having an array of advantages. It becomes cost effective in the long run because it continuously yields a clean burning fuel and a high quality fertilizer from the low value waste (Chawla, 1986). It also saves the expenditure involved in the hauling of waste to the landfill site as well as increases the life span of landfill site as the amount of waste at the landfill site can be reduced significantly.
As mentioned earlier, conventional biogas plants established to date have been using only cattle dung as feed material. Although some of these plants are also connected to toilets and thus use human faces in conjunction with cattle dung, use of other organic wastes for methane generation is almost non-existent. There are numerous farmers in the rural and suburban areas wanting to install biogas plants but have insufficient number of cattle and /or people to produce sufficient amount of raw material (dung and/or faeces) to run the plants. If use of organic wastes and plant residue is encouraged, they will be greatly benefited.
The study reported herein aimed to evaluate the use of vegetable and kitchen wastes for biogas production in natural condition. Such feasibility studies are important not only in biogas production but also for at source management of biodegradable municipal solid wastes. It is hoped that the study directly benefits the implementers, especially farmers intending to establish biogas plants. It is believed that such integrated studies on appropriate technologies may play valuable role for uplift of socio-economic life standards of the people in developing countries.
9.2.2 Designing and Construction of Biodigester
Designing of biodigester was done with certain modifications in Gobar Gas and Agricultural Equipment Development Company (GGC) model of Nepal as can be seen in Figure 9.2. Two biodigesters of mild steel sheet of 100-liter capacity were fabricated. The biodigester consisted of a cylindrical tank with internal diameter 46 cm and height 64 cm as can be seen in Figure 9.2. It had dome-shaped roof and slightly curved base. Hanging internally from the central axis of dome-shaped roof was a stirrer with four arms of length 20 cm, lying perpendicular to each other. An outlet for gas was placed 12 cm near the central apex of dome A port for temperature probe was constructed at the side of cylindrical body, 15 cm above its base.
A rectangular (25 cm x 20 cm x 20 cm) inlet pan of 10-liter capacity and with outer and inner caps were fitted at the top of inlet pipe with internal diameter 8 cm that entered into the digester 15 cm above its base. The outlet pipe with internal diameter of 12 cm located just above the base level of the digester, in the opposite side of the inlet pipe led to a rectangular (30 cm x 25 cm x 20 cm) outlet pan of 15-liter capacity. The digester consisted three 10 cm high legs.

76
9.2.3 Collection of Vegetable and Kitchen Wastes
As said, vegetable and kitchen wastes were used as a raw material (input material) for the production of biogas. They consisted of vegetable peelings, fruit peelings and wastes, food wastes; damaged vegetables and fruits and left over food. The vegetable and fruit wastes were collected from the local market and households as well as from the university canteens and were carried to the Research Centre for Applied Science and Technology (RECAST) laboratory. Non-biodegradable components such as plastics, metal foils, wooden pieces, pebbles etc, contained in the biodegradable portion of kitchen wastes were sorted out. Some larger vegetable and fruit pieces were cut into smaller ones of size less than or equal to 20-50 mm to allow faster biodegradation.
9.2.4 Pre-fermentation of the Waste
The prepared material was then put into a polythene drum for a period of 20 to 40 days for pre-fermentation as in the case of A. Karki's design. It was agitated periodically using wooden sticks.
9.2.5 Loading into the Biodigesters
At the time of the loading into the biodigesters, some amount of fresh cow dung was also collected. In one digester, equal amount (1:1 mixture) of pre-fermented vegetable and kitchen waste and cow dung was loaded. In the other digester, only pre-fermented vegetable and kitchen waste was loaded with 10 percent inoculum of cow dung. The feed materials were diluted double fold with water and both the digesters were filled only up to 2/3rd of the total volume.

77
Inlet and outlet of the biodigesters were properly covered with metal plates to prevent the entry of rainwater and any other foreign matter into the digesters. Pipelines and stopcock were fitted at the gas outlets of both the digesters so that the produced gas can be collected into a single drum without mixing, that is, turn by turn. The drum had two inlets for gas from two digesters and a single outlet to pass the gas towards gas meter and biogas stove.
9.2.6 Daily Monitoring
The contents of both the biodigesters were mixed daily by rotating the stirrer at the rate of 30 revolutions /minute for about 2-3 minutes. The mixing facilitated homogenization of the contents and thus enhanced the rate of bio digestion. At the end of every day's operation, the gas from the gas outlet was tested for flammability by burning in a biogas stove.
9.2.7 Physical Analysis of Digesting Slurry
The pH and the total solid contents were the two physical parameters that were analyzed in this study. The results are discussed herein.
a. Measurement of pH
The pH of the fermenting material inside biodigester was measured every week using a pH meter. For this, slurry was taken out from the bottom of both the biodigesters inserting two separate pipes and poured in beakers. Then the pH meter was dipped in the slurry and readings were noted down. The quality of pH meter was maintained regularly by calibrating it with the help of standard buffer solutions of pH 4, 7 and 10.
b. Estimation of Total Solids
The slurry samples from the biodigesters were transported to the laboratory of Central Department of Microbiology for the estimation of moisture and total solid content. A clean, dry and pre-weighed watch glass was taken and about 10 gm aliquot of the sample was accurately weighed. It was dried in hot air oven at 105°C for 5 hours. It was then cooled in a desiccator and weighed. The heating at 105o C, cooling in a desiccator and weighing were repeated to get the constant weight. Percent total solid content and percent moisture was calculated using following formula: Weight of empty watch glass = A Weight of watch glass + sample = B Weight of watch glass + sample after drying at 105°C to constant weight = C
C-A % Total solids = ---------- X 100
B - A B-C
% Moisture = ---------X 100 B-A
c. Measurement of Biogas Production
The produced biogas was measured in terms of gas burning lime per day by using a biogas stove. The weekly averages of gas burning time (minutes) per day were recorded.
d. Microbiological Analysis of the Preformatted Material
Microbiological analysis of preformatted vegetable and kitchen wastes was aimed at isolation and identification of aerobic/facultative bacteria capable of hydrolyzing complex organic substrates, namely, cellulose, starch, proteins and lipids. The isolation methods usually involve separating micro organisms into individual cells that are then allowed to form clones of single micro organism (Atlas, 1989). Common

78
methods for isolating pure cultures of micro organisms are pour plate, streak plate and spread plate. Pour plate technique was employed in this study for the isolation of different groups of bacteria. Before charging into the biodigester, microbiological analysis of the preformatted waste was carried out for the isolation of different types of bacteria capable of utilizing cellulose, starch, gelatin and Tween 80.
9.2.7 Results of the Study
A total of 89 isolates, belonging to four major substrate viz. cellulose, starch, gelatin and Tween 80-utilizing groups, were isolated and identified from prefermented feed materials. The isolates belong to 13 genera of bacteria viz. Aeromonas, Alcaligenes, Bacillus, Cellulomonas, Corynebacterium, Chromobacteriumx Flavobacterium, Lactobacillus, Micrococcus, Proteus, Pseudomonas, Serratia and Staphylococcus; 3 isolates belong to yeast and 4 isolates belong to actinomycetes. In substrate utilizing enzymatic activity tests, different isolates of genus Bacillus showed highest cellulolytic, amylolytic and proteolytic activity separately; while an isolate of genus Micrococcus showed highest lipolytic activity.
As discussed earlier, anaerobic digestion was parallelly run in two biodigesters using equivolume mixture of pre-fermented vegetable and kitchen wastes and cowdung in one unit (Dl) and only prefermented vegetable and kitchen waste in another (D2), as feed material. Percentage of total solid content was adjusted to 7.5 and 8.3 in Dl and D2 respectively. The progressive increase in pH of slurry up to certain limit was experienced in both biodigesters and biogas production was started when pH reached up to 6.4 and 6.0 in Dl and D2 respectively. The overall higher pH of slurry was observed in Dl than that in D2. The gas production was started earlier from Dl than from D2 and it was more uniform from the former than the latter. Of the two major groups of anaerobic microorganisms isolated, the cellulolytic organisms were Clostridium, Eubacterium and Ruminococcus, while the methanogenic organisms were Methanobacterium, Methanobrevibacter, Methanogenium, Methanomicrobium and Methanosarcina.
The study concluded that the equivalence mixture of cow dung and vegetable and kitchen wastes is an effective feed material compared to kitchen wastes only for increased yield of biogas, which is beneficial especially for marginal farmers. If the ambient temperature is suitable, biogas can be produced easily even at outdoor environment. Alternatively, vegetable and kitchen wastes can replace the use of animal and human excreta for biogas production. The use of such feed materials can initiate the at source management of biodegradable solid waste in urban areas. At the same time, along with alternative energy production high quality fertilizer also becomes available.
REFERENCES [1] Atlas, R. M. (1989) Microbiology: Fundamentals and Applications, Second edition. Macmillan
Publishing Company. [2] BSP (2002) The data personally obtained from record section of Biogas Support Programme. [3] Chawla O.P. (1986) Advances in Biogas Technology, Publication and Information Division, Indian
Council of Agricultural Research, New Delhi. [4] CMS (1998) Environment and Sanitation Programme in the Refugee Affected Area:
Installation of Community Latrine-cum-Biogas Plant and Conduction of Environment and Sanitation Training at Ward No. 1 of Pathari VDC of Morang District of Nepal, United Nations High Commissioner for Refugees, Kathmandu, Nepal
[5] CMS (1996) Biogas Technology: A Training Manual for Extension, Food and Agriculture Organization of the United Nations Support for Development of National Biogas Programme (FAO/TCP/Nep/4451-T).
[6] Dhakal, N. R. (2002) Microbial Digestion of Vegetable and Kitchen Waste for Biogas Production. In: M.Sc. Thesis presented at Central Department of Microbiology. Tribhuwan University, Kirtipur Kathmandu, Nepal
[7] Karki, A. (2002) From Kitchen Waste to Biogas: An Empirical Experience. In: BNRM, No. 75. [8] Karki, A. (1994) Biogas Installation with Elephant Dung at Machan Wildlife Resort, Chitwan,
Nepal. In: Biogas Newsletter, No. 45.

79
CHAPTER X
IMPLICATIONS OF BIOGAS ON ENERGY USE AND ENVIRONMENT
10.1 IMPLICATION ON ENERGY USE
There is no denying to the indispensable role energy plays in running the wheels of the economy of any country and more importantly in the lives and livelihoods of its people. The correlation between energy consumption and the level of economic prosperity within a given society is well established and so is the correlation between poverty and insufficient access to energy for productive purposes. The lack of access to affordable and efficient energy keeps huge mass of people in the developing world trapped in the vicious circle of poverty. It is obvious that the energy consumption pattern is subject to the economic conditions of a country. The quantity of energy consumption will increase with an increment in the per capita income in a country and the improvement in economic conditions will also lead to the shift from more traditional energy sources to commercial and alternative energy sources. Very high cost and nominal penetration of commercial energy sources often result in the population of the developing countries like Nepal depending upon the primitive traditional energy sources7
Fuelwood being the principal energy source among these biomass fuels, its demand far exceeds the sustainable supply (Rijal, 1998). It consists of 78 percent of the total fuel consumption in developing country like Nepal (UNEP, 2001). The overt impact of this situation is manifested in the increasing pressure on the already depleting forest resources of the country. As fuelwood is becoming scarce and time spent for its collection is increasing, the cases of transition within biomass fuel sources, i.e. shift from fuelwood to crop residues and animal dung, are also evident. The use of crop residues and animal dung as fuel sources has manifold disadvantages. Firstly, they are inferior fuels with greater Greenhouse Commitments (Smith et al 2000) and secondly, their use as fuels restricts their use as fertilizers thus causing significant losses in agricultural productivity. In addition, there are other socio-economic and health related adverse impacts, many of which are disproportionately suffered by the women and the poorest of the poor.
Due to these manifold adverse impacts associated with traditional biomass fuels, there have been efforts from all sides to substitute these traditional energy sources, with alternative energy sources, which are cleaner and greener. Biogas is one such alternative energy source, which has established itself as a viable and feasible technology, especially in the rural settings (CMS, 1996).
10.2 GAS PRODUCTIONS AND CONSUMPTION
10.2.1 Gas Production
As per the BSP study results, under right conditions one kilogram of dung produces 40 litres of biogas during summer and about 60-80 percent of the aforementioned optimum production during winter depending upon the site selection and coverage of the dome with earth.
10.2.2 Gas Consumption
There are a number of scenarios for the calculation of the daily biogas consumption rate of a biogas stove, out of which two have been discussed here. The first scenario (Scenario I) is the BSP study result, which suggests that when used at full capacity, the most commonly used locally produced biogas stoves will consume approximately 400 litres of gas per hour (BSP, 2002). The study carried out by DevPart (2001), which is the second scenario (Scenario II), suggests that a biogas stove consumes a maximum of 443 litres of biogas per hour.
7 Note: Some transition economics and the OECD average are included for comparison purposes. Source: IEA analysis; income statistics form the World Development Indictors, 2001.

80
Similarly, in case of biogas consumption in lighting, the BSP study suggests that the widely available Ujeii lamps consume between 150 and 200 litres of biogas per hour. The study carried out by DevPart (2001) has suggested the biogas consumption rate of 166 litres per hour in lighting, which is more or less similar to the average figure of the first.
10.3 REPLACEMENT VALUES OF BIOGAS
The introduction of comparatively cheaper and environmental friendly biogas technology has a potential of replacing other commonly used biomass and fossil fuels. Such replacement not only contributes to the environment but also to the economy, both at national and household scale. It has been established that 1 kg of cow dung produces 0.023-0.04 m" of gas and that gas requirement for cooking is 0.2 to 0.3 m3 / person and for lighting 1 lamp is 0.1-0.15 m3 /hr (see Table 2.2).
10.4 MERITS OF BIOGAS
Biogas is a potential rural energy source that could avoid increased biomass and fossil fuel dependency in rural areas. There are a number of benefits, both socio-economic as well as environmental, of using biogas as an energy source rather than other traditional and commercial energy sources. However, in this chapter only those benefits relating to the impact on energy use have been elaborated.
10.4.1 Increase in Cooking Efficiency
The substitution of traditional stoves and the kerosene stoves by the biogas stoves will increase the cooking efficiency since the biogas stoves have a higher efficiency of combustion man the traditional biomass stoves and the fossil fuel stoves (kerosene/LPG stoves) (Smith et al, 2000). As a result they contribute by far the lowest to the greenhouse gases (GHG). Studies have indicated that a biogas stove is 1.07 times more efficient than LPG stove, 1.22 times more efficient than a kerosene stove, 3.15 times more efficient than wood burning traditional mud stove, 4,63 limes more efficient than a traditional stove burning agriculture residue and 6.52 times more efficient than a traditional stove burning dung (Smith et al, 2000). Hence the substitution of the latter by the biogas stoves can be taken as a positive indicator of cooking efficiency. Furthermore, they are less hazardous to health with a potential of contributing towards the prevention of forest degradation, decreasing physical workload of fuelwood collection as well as foreign currency saving when substituting fossil fuels. These facts further support the efficiency of biogas as compared to the traditional biomass and the fossil fuel stoves.
10.4.2 Replacement of Fuelwood
The decrease in fuelwood consumption due to its substitution by biogas stoves has threefold benefit. Firstly, at individual scale it has financial gains to the households as they can save some money, which otherwise they would have to spend in purchasing the fuelwood. Similarly, the substitution of fuelwood by biogas also saves time and effort required on fuelwood collection, which in some cases could even be many hours of daily work. Secondly, at national level the decrease in the use of fuelwood also contributes to some extent in reducing the prevailing high rate of deforestation of the country thereby increasing the carbon sink. However, it needs to be noted that there is a considerable difference in reduction of GHGs if the fuelwood is produced on a sustainable basis. Moreover, even though the fuelwood in question has been consumed in a sustainable manner, the prevalence of thermally inefficient traditional mud stoves could result in the production of PICs. These PICs could again have further GWC. The possibility of substantial fuelwood replacement by the biogas plants, hence, can avert this phenomenon as well. Thirdly, global scale it contributes significantly in reducing the Greenhouse gases (GHGs) since the global warming commitment (GWC) of fuelwood is much higher as compared to biogas stoves. Saving fuelwood means saving forests, which play very important role in the Carbon-di-oxide balance of any vegetation (Kojima, 1998).

81
10.43 Substitution of Agricultural Residue as Fuel
Because of the lack of easy access of other fuels as well as economic compulsions, some households in rural country like Nepal still are forced to use agricultural residues as fuel. However, the advent of biogas plants has succeeded in substituting this primitive fuel by more environment friendly biogas stoves.
10.4.4 Availability of Slurry
Biogas replaces the dung cake which otherwise is being used as a fuel for cooking. This substitution is on the one hand is environmentally healthy. On the other hand, the digested slurry, which is produced in the process of biogas formation, can be used as excellent organic manure in the field, thus, increasing the crop yield.
10.4.5 Saving of Kerosene
The decrease in kerosene consumption has a twofold benefits. Firstly, kerosene is comparatively a costly fuel and its reduction can result in a significant financial saving. Since kerosene is an import commodity, its reduction also contributes in reducing the foreign exchange out-flows. Secondly, kerosene is one of the high PIC emitting fuels; hence, its reduction also contributes towards decreasing the Greenhouse Commitment.
10.4.6 Economic Gains
As biogas plant utilizes locally available raw materials, the gas obtained from it can be cheaper compared to using other traditional and commercial fuels. In case of Nepal, an economic analysis of the entire BSP I and II results in an estimated EIRR of 11 percent when only the benefits of fuelwood and kerosene savings are accounted for. If the benefits of saved labour are added, the EIRR rises to 15 percent. Adding the total value of the nutrients saved by the BSP increases the EIRR to 32 percent. Including the conservation estimates for the health benefits of smoke reduction (US$ 6.67 / household / year) increases the EIRR to 36 percent. Finally, adding the value of the reduced carbon provides an EIRR of 50 percent (Mendis and van Nes, 1999).
10.5 IMPLICATION ON ENVIRONMENT
The world is presently witnessing an avalanche of new environmental issues entirely different from the ones of the past decades, both in physical extent and complexity. As the number of new environmental issues increased, so did their geographic extent and, reaching regional and often global proportions. The potential dangers of global warming and the ensuring climate change due to the accumulation of carbon dioxide in the atmosphere is one such adverse example of environmental transformation brought about by human society's interference. Once, all climate changes occurred naturally. However, the onset of the Industrial Revolution led to the beginning of altering of our environment and climate through changing agricultural and industrial practices. The ever increasing population explosion, fossil fuel burning, and deforestation has resulted in the alteration of the chemical composition of the atmosphere through the build-up of greenhouse gases -primarily carbon dioxide, CFCs, methane and nitrous oxide. The increased atmospheric concentration of these greenhouse gases has significantly raised the threat of global warming. Studies have indicated that the global mean surface temperatures have increased 0.5-1.0°F since the late 19th century. The 20th century's 10 warmest years all occurred in the last 15 years of the century8 It has been calculated that a doubling of carbon dioxide concentration would lead to an increase in temperature ranging anywhere from 1.5°C to 4. 5°C (Kojima, 1998). Such observations and predictions have succeeded in projecting global warming as one of the most serious environmental problem facing the world today.
There has been a real, but irregular, increase in global surface temperature since the late nineteenth century. Several other form of scientific evidence confirms the general belief that progressive warming is caused by increasing GHGs concentrations in the atmosphere (TERI, 1996). However, there is considerable uncertainty regarding the extent of temperature rise, scale, timing, regional distribution, and related issues.
8 http://www.epa.gov/globalwarming/

82
A wide range of natural and human activities release GHGs into the atmosphere. Even though the net contribution from anthropogenic activities is relatively small as compared to the natural activities, it is enough to significantly modify the natural balance. Figure 10.1 shows that among the anthropogenic GHGs emission, CO2, is the largest contributor to the total increase in climate forcing, followed by CFCs, CH4 and N2O (TERI, 1996).
Figure 10.1: The Contribution from each of the Anthropogenic GHGs to the Change in Radiative Forcing from 1980-1990
Growing concern about the effects of climate change has led to increasing research, policy initiatives, and development of innovative programmes and projects around the world. One such mitigating measure is the substitution of biomass and fossil fuels with alternative energy sources with lower global warming commitment. Biogas is one such alternative, especially in the rural communities, which offer the opportunity of providing a renewable source of household energy with extremely low global warming commitment (Smith et. al. 2000).
10.6 CARBON EMISSION SAVED FROM THE SUBSTITUTION OF TRADITIONAL AND COMMERCIAL FUELS BY BIOGAS
As a consequence of the substitution of traditional fuels such as fuelwood, crop residue and dung, and commercial fuels such as kerosene and LPG to some extent by the biogas plants has a great potential of reducing Carbon emission into the atmosphere. Such reduction when seen at the nationwide perspective can be very significant even though at the household level it might seem not so significant.
A study carried out in India in the year 2000 very explicitly highlights the amount of carbon emission generated when burning various biomass and fossil fuels. The study clearly indicates how much Carbon emission is saved when biogas replaces these fuels (Smith et. al. 2000).
10.7 CARBON EMISSION SAVED FROM THE DECREASE IN USE OF FUELWOOD
Because of their poor combustion conditions, the traditional stoves using fuelwood are thermally inefficient and thus divert a significant portion of the fuel carbon into products of incomplete combustion (PICs), which generally have a greater impact on climate than CO2. A study done by Smith et al (2000) indicates that a kilogram of wood burned in a traditional mud stove generates 418 gram Carbon (g-C) equivalent of Carbon emission9.
9 The figure is for Africa.

83
10.8 CARBON EMISSION SAVED FROM THE DECREASE IN USE OF AGRICULTURAL RESIDUES
The decrease in consumption of agricultural residues as fuel contributes significantly in reducing the Greenhouse gases (GHGs) as the global warming commitment (GWC) of using agricultural residues, as fuel is much higher as compared to biogas stoves. Studies have shown that a kilogram of agricultural residue, namely rice straw burned in a traditional mud stove generates 381 gram Carbon (g-C) equivalent of Carbon emission (Smith el. al., 2000).
10.9 CARBON EMISSION SAVED FROM THE DECREASE IN USE OF DUNG
Dung is considered as the lowest quality fuel in the 'household energy ladder' (Smith et al 2000) with the highest global warming commitment (GWC) among the common household fuels. A study carried out by Smith et. al, (2000) has concluded that a kilogram of dung burned in a traditional mud stove generates 334 gram Carbon (g-C) equivalent of Carbon emission.
10.10 CARBON EMISSION SAVED FROM THE DECREASE IN USE OF KEROSENE CONSUMPTION
A study carried out by Smith et al (2000) indicates that a kilogram of kerosene burned in a pressure stove generates 843 gram Carbon (g-C) equivalent of Carbon.
REFERENCES
[1] BSP (2002) An Integrated Environment Assessment, Biogas Support Programme.
[2] CMS (1996) Biogas Technology: A Training Manual for Extension, Food and Agriculture
Organization of the United Nations. Support for Development of National Biogas Programme
(FAO/TCP/Nep/4451 -T).
[3] DevPart (2001) Research Study on Optimal Biogas Plant size. Daily Consumption Pattern andConventional Fuel Saving, Biogas Support Programme. April.
[4] Kojima, T (1998) The Carbon Dioxide Problem: Integrating Energy and Environmental Policies forthe 21s' Century, Amsterdam. Gordon and Branch Science Publishers.
[5] Mendis, M.S. and Van nes (1999) The Nepal Biogas Support Program: Elements for Success inRural Households Energy Supply. Policy and Best Practice Document 4, Ministry of Foreign, Affairs, The Hague. Netherlands.
[6] Rijal, K. (1999) Renewable Energy Technologies-A Brighter Future, ICIMOD, Kathmandu.
[7] Smith, K.R., Uma, R., Kishore, V.V.N., Zhang, J., Joshi, V. and Khalil, M.A.K. (2000) Greenhouse Implications of Household Stoves: An Analysis for India. In; Annual Reviews Energy Environment 25:741-763
[8] UNEP (2001) Nepal: State of the Environment 2001, United Nations Environment Programme, March 2001.
[9] TERI (1996) How Global is Global and How Warm is Warming?, New Delhi. Tata Energy Research Institute.

84
CHAPTER XI R O L E O F M A N A G E M E N T , C O M M U N I C A T I O N A N D
P R O F E S S I O N A L D EV EL O P M E N T I N B I O G A S T E C H N O L O G Y 10
11.1 INTRODUCTION
No organization can run without management. It is the nerve centre of any organization. It is the process through which human beings are mobilized, relevant materials are utilized and information source is properly tapped for a successful achievement of the desired objectives by a proper integration, which is effected primarily (a) through appropriate manpower; (b) by proven techniques; (c) in the well-managed organization; and (d) towards the targeted objectives.
The development of organization depends mainly upon management, communication and professional development of the employees of the organization.
11.2 MANAGEMENT
Broadly speaking, management refers to getting the job done by working with and through people by motivating and mobilizing them for achieving the desired objectives of the organization. The jobs are accomplished through planning, organizing, staffing, directing and controlling.
11.2.1 Approach to Management
In earlier times management was an exercise in trial and error. With the advent of industrial revolution, entrepreneurs felt the need for improving management. As business continued to grow in size and complexity, emphasis shifted from the firm to the activities within the firm e.g. processes, layout, location, technique, incentive system etc.
At present a number of approaches (Traditional Approach; Behavioural Approach; Quantitative Approach; System Approach; and Contingency Approach) have emerged and each of them is associated with a clearly identifiable stream of management thought.
11.2.2 Traditional Approach
Many managers take the traditional principles as important points of reference. This approach has a few models.
a. Scientific Management Model
This model is primarily concerned with specific techniques such as production planning and control, plant layout, wage incentives and personnel management all centering on efficiency and production. The emphasis is laid on planning, standardizing and improving the efficiency of work.
Under this approach, scientific analyses and various specific studies and lessons from past experiences are taken as the main bases. Workers would be scientifically selected, trained and posted in work for which they were found to be best suited. Both management and labour cooperate and share equal responsibility. Greater economic rewards motivate the workers.
b. Management Process Model
The Management Process Model (see Figure 11.1) is primarily concerned with process involved in managing. Management is viewed as a universal process regardless of its sphere of operation: governmental,
10 This chapter is based upon the presentation of lecture made by Professor Upendra Man Malla in course of Advanced Biogas Technology Training organized by Centre for Energy Studies, Institute of Engineering, Pulchok, Lalitpur, Nepal (CES/IOE, 2001).

85
industrial, military or other organization. The process is analyzed in terms of planning, organizing, staffing, directing and controlling.
FOCUS
Figure 11.1: Management Process
Planning involves in fixing the objectives and formulating the strategies, policies, programme and procedures for achieving them. It makes an attempt to discover alternative courses of action and consciously chooses one of them. Plans become frames of reference for decisions to be made in future. Organizing involves structure and process of allocating jobs for achieving those objectives. Structures are established, activities are grouped, authority relationships are defined and provision is made for coordination. It involves differentiation as well as integration of activities. Staffing involves manning the positions in the organization. The process involves defining manpower requirements, recruiting and selecting candidates for the position, training and developing employees, promoting and retiring. Directing involves guiding and leading subordinates towards the achievement of objectives, i.e. putting into effect the plans, programmes and decisions. Communication is the essence of effective directing. The subject of directing is people in organizational setting. The behavioral aspects, therefore, are important in this process. Controlling involves measuring and correcting actual performance to assure that the predetermined standards are met. Compelling events to confirm to plan action mean location and analyzing deviation and then taking the corrective steps to improve performance. The management process model has developed certain generalizations and the most important of them are: • Unity of Command: No member of organization should report to more than one superior. Orders
should be received from one superior only. Otherwise as they say, "too many cooks spoil the broth"; • Management by Exception: Recurring problems should be handled in a routine manner by lower
level managers, whereas exceptional problems should be referred to higher levels for decision making. This serves as a basis for delegation of authority in organization;
• Span of Control: There should be a limit to the number of subordinates that one superior should supervise directly;
• Scalar Principle: Authority and responsibility should flow in a clear line from the highest executive to the lowest. Responsibility should commensurate with authority. This is also known as "chain of

86
command" principle where one top executive is the source of authority; • Departmentalization: Activities should be divided and formed into specialized groups based on
purpose, process, persons and place. ■ Decentralization: This is a process of allowing decision lo be made even at lower levels of the
organization; ■ Pyramidal Structure; The organizational structure should look like a pyramid, with a broad base of
low level workers; and ■ Line-Staff Dichotomy: Line positions have general authority over lower-level
positions in the hierarchy. Staff positions are purely advisory to line position.
The above principles generally serve as basic framework in the design of organizations and the practice of management. 11.2.3 Bureaucratic Model
It is recognized as a rational, legal model for managing complex organizations. It consists of the following major characteristics:
■ Division of labour based upon functional classification; ■ Well defined hierarchy of authority; ■ System of rules covering the rights and duties of positional incumbents; ■ System of procedures for dealing with work situations; ■ Impersonality of interpersonnel relations; and ■ Promotion and selection for employment strictly based on technical competence.
The application of this Bureaucratic Model may be appropriate for routine organizational activities where productivity is the major objective. However, it is not appropriate for highly flexible organizations where non-routine activities, innovation and creativity are important. The model has led to many dysfunctional elements.
11.2.4 Behavioural Approach
This approach recognizes the centrality of individual in organizational endeavours. Since managers get things done by working with and through people, management must be centered on people and their interpersonal relation in organizational environments. This approach concentrates on psychological system and human aspects of management. The emphasis is on the way people behave in actual organizations. Most social sciences, especially psychology, sociology, social psychology and anthropology have converged to develop this approach.
This approach to management concentrates on people related variables such as group dynamics, individual needs, perception, cognition, motivation, status, roles, informal organization, leadership, conflict, change, values, power equalization, communication and other aspects of human behaviour.
The behavioural approach depreciates economic and technical considerations while appreciating humanistic orientations. However, in certain situations, techno-economical consideration may be overriding. This approach seems to have exerted proposed impact on management practices.
11.2.5 Quantitative Approach
This approach emphasizes quantification, mathematical models and the application of computer technology for rational decision making. It is a modified extension of scientific management model with primary emphasis on techno-economical rationality. With the aid of normative models, it aims at optimizing performance and maximizing efficiency. It emphasizes objective rather than subjective judgement. Intra-disciplinary teams are utilized for problem solving. This is also known as management science operation research approach to management.
The numbers of techniques that have developed with the quantitative approach are growing

87
rapidly. The techniques that have found wider applications are linear programming, Programme Evaluation Review Technique (PERT), statistical models, decision theory, replacement theory, information theory, system analysis, inventory models, cost effective analysis, network analysis, planning, programme - budgeting etc. All these techniques are based on some assumptions and the real life situations, such assumption may not be so realistic. However, uncertainty is the major problem facing management and these techniques help to reduce it. But, "Communication Gaps" have been emerging between the advocate of quantitative approach and the practicing managers, especially due to the constraining assumptions in qualifying decision making and control processes.
11.2.6 Systems Approach
This approach provides an integrative framework for modem organization theory and management practice. It is a new way of thinking about management and facilitates the understanding of important forces affecting in a dynamic and complex environment.
A system is an organized, unitary whole composed of interrelated parts or sub-systems and delineated by identifiable boundaries from its environmental supra system. Under the systems approach an organization is looked upon as a dynamic man-mechanic system composed of interrelated and interacting parts unified by design to accomplish desired objective. It considers interrelationship among sub-systems as well as interactions between the system and its supra-systems and also provides a means of understanding synergistic aspects.
A system can be called closed or open on the basis of its interaction with its environment. Closed system thinking is applicable to mechanistic self contained and detenninistic system. The open system has a dynamic relationship with its environment, and receives inputs, transforms them to produce outputs. The inputs may be received in the form of materials, energy and information.
Socio-technical organizations are open systems consisting of the following characteristics;-
■ They are purposive and are designed to accomplish certain objectives;
■ They have definite organization structure where all the parts fil into an established arrangement i.e. there is a hierarchy of systems;
■ They are open not only in relation to their environment but also in relation to themselves as parts of the total system. Through the process of feedback they continually adapt to their environment;
■ The process of flow of material-energy-information is more important in the system; and
■ Optimization of total system is more important than the sub-optimization of any sub-system, i.e. they operate in a synergistic framework (the whole is greater than the sum of its parts).
The Figure 11.2 shows organization in the open system model.
Figure 11.2: Organization in the Open System Model
For business organizations, society provides inputs in terms of physical, human and information resources. These inputs are transformed into outputs of goods and services. The amount of profit of the share of market or some other indicators provides the feedback. The resources get recycled between the firm and its environment. The organization system consists of the following major subsystems which revolve around goal

88
accomplishment (Figure 11.3): ■ Technical : Knowledge and techniques required for transforming inputs into outputs ■ People : Individual and groups in interaction ■ Structure : Differentiation of tasks and integration ■ Managerial : Organizational well being
Figure 11.3: Subsystems that Make-up an Organization
Systems approach does not do away with the basic management process of planning, implementing and controlling. However, it implies a change in emphasis - what is best for the one may not necessarily be the best for other as well. There is no room for microscopic and myopic thinking because attention is focused on the totality of system. In terms of management, this approach can be viewed in the following ways:
■ Management philosophy of integration and unification;
■ Organization in the form of hierarchy of subsystems;
■ Systems analysis for strategic decision making;
■ New Management method e.g. Project Management Approach; and
■ Management Science tools and techniques.
During the last decade, systems approach has emerged as the modern view of organization and management. It is increasingly being realized that organizations are composed of many subsystems whose interrelationships have to be well recognized. It facilitates the proper understanding of important forces affecting the organizations.
Simply speaking, a system is an aggregation of interrelated parts, each of which, in turn can be viewed as a subsystem. Thus a system approach will help to understand various aspects of biogas technology and its relevance to other sectors at different levels of operation. Figure 11.3 shows inner and extended system of the biogas technology. It depicts various subsystems through which biogas could be affected and influence the socio-economic well-being of a society. Such an understanding is necessary for being able to manipulated different elements of the biogas system to make the optimum, use of the technology in different situations.

89
11.2.7 Contingency Approach
The essence of the approach is that there is no "one best way" and that there is a via media ground. It is basically situational approach to management. It seeks to understand the relationships within and among subsystems as well as between the organization and its environment to define patterns of relationships. It attempts to understand how organizations operate under varying conditions and in specific circumstances and how the management practice can be improved.
Contingency approach to management is ultimately directed toward suggesting organizational designs and managerial actions most appropriate for specific situations. Rather than searching for panacea of the one best way to manage under all conditions, it examines the functioning of management in relation to the needs of organization and the situations confronting them. The way to manage depends on a number of interrelated external and internal variables in given situations. There is no one optimum type of management system. Management must be guided by the sense of situation.
11.2.8 Which Approach to Management?
All the approaches mentioned are by no means exclusive. In one way or another they still serve as important points of reference when it comes to the practice of management.
Definitely there is not one best way. An effective manager makes a judicious mix of all the above approaches for achieving desired objective in the light of situations confronting him. The practice of management therefore needs to be very much situation oriented. Managers must adapt themselves to the changing forces in the environmental milieu and the changing demand of the situations.
Managers must strike a judicious balance between their concern for production and concern for people in the context of accomplishing desired goals in organizational situations. They must, therefore, make the management most effective in getting the jobs done.
11.3 COMMUNICATION
Communication is a very important aspect of management since it is an indispensable ingredient in the function of 'directing' which as mentioned earlier is one of the essential means of management. Communication is the transfer of information from a person to another person whether from a superior personnel to a lower staff or from a teacher to the student and vice versa. Among the people in general it may be in the form any means of transmission for example, human speech among the men of today or the beating of drums among the primitives, It may also be in a form that requires sight such as written description, pictorial charts, signal flags and articulated gestures.
11.3.1 Language and Gesture in Communication
Language and the ability to use it differentiate human beings from other animals. From the Stone Age to the present age, man has shown a definite urge to communicate over distances; he has wanted to reach across time as well as space to other communities and to other men with the development of transportation and opportunities of meeting people who were instrumental in the spread of language and therefore in communication.
Generally speaking, the deaf people are dumb. Even a dumb person can produce some sound but he cannot use the sound in producing intelligible words.
But in communication besides speeches there are other means. Sometimes among people muscle reading or the perception of meaning in attitude and movements can be taken to be as good as language as a means of communication. A Boy Scout manual lists some 630 meanings conveyed by gestures and signs and suggests that most of these would be used for several words of like meaning according to context. The finger language designed for the deaf came later after the alphabets were in use, They are real alphabetical signal codes rather than a form of muscle reading.

90
In this age of modern science and technology communication can be established between people who are far apart from each other through telephone. Today we have communication even by means of radio and television. Modern development in technology has developed many communication devices utilizing both sight and sound transmission in a variety of ways.
11.3.2 Communication to the General Mass
In the context of the present training the trainees should have the knowledge of communicating to the villagers or users as well as to so many other people who will come into contact with them regarding the installation of the bio-gas plants, the selection of the site, proper checking of the digestive, dome, turret, outlet, compost pits, template, etc. in such a manner as to make the installation and operation of the whole plant a success. Not only from the point of view of producing the necessary amount of energy but also to take the best possible advantage of the plant by utilizing the slurry for feeding as well as for restoration of fertility in soil and thus effectively substituting the undesirable chemical fertilizers which are these days known to be very bad environmental pollutants careful communication is very important. In addition they may have to make telephone calls, provide information, verbally receive written complaint of users, discuss problems and issues with the top management, participate in social activities, attend formal meetings, and dissolve conflict between partners and so many other things which demand a good skill of articulate communication.
11.3.3 Communication: A Two Way Process without any Misunderstanding
Sometimes it so happens that some careless gestures and hurriedly made efforts may have unintended results. There is a well known story usually heard on different occasions. A certain health educationist very much enthusiastic in the pursuit of an effective communication with the help of a poster, in Africa, happened to share the picture of a mosquito. It was an enlarged picture to enable the viewers to see clearly every part of the insect including its sharp nozzle with which it would pierce the skin of the human victim and inject the malarial parasites and infect the person with malaria. He was very happy with the feeling that he was definitely very clever, to use the device to bring home to the people the real cause of the disease and to get rid of the mosquitoes and save themselves from the deadly malaria. But to his bitter disappointment he happened to hear the people talking to each other after the delivery of his lecture that they were fortunate enough to be in Africa where they did not have so big mosquitoes as shown in the poster and hence they did not have to worry about contracting the disease. This is an example of a message which was rightly communicated but wrongly received and interpreted indicating that the communicators have to be very careful in the use of devices in their communication.
This incident clearly calls for two-way process in communication. It should not be delivered in the manner of one way traffic without paying heed to the reaction from the trainees who are being told what to do to make their job effective and fruitful.
11.3.4 Telephone and other Communication
While communicating by telephone the telephone courtesy should be maintained and the most effective techniques of delivery which should be very clear and audible should be adopted. While receiving complaints from the users of biogas plants they should cultivate the habit of careful listening and develop the skill of paraphrasing and analyzing the message received and understood through careful interpretations. One should be able to entertain the answers to questions as who, what, where, when, why and how. A good communication will be useful in resolving the conflict between partners and if the main problem at the root of the conflict is properly understood then the Biogas Managers will be successful in resolving the problem to the satisfaction of both the parties so that the optimal situation of conflict resolution will be resulted in the form of win-win versus win-lose. For good communication participation in social activities is also a very important task for all the people who have to live in a society and work successfully with its members. Popularity among the people will definitely pave the way to a successful accomplishment of the mission. Nepal is a tiny country with a huge variety of ethnic groups with their distinct cultures. In every society they have some norms and rules of do's and don'ts. Any body who aims at successfully working with the local members of the society should be aware of such practices in the society where he lives. Similarly he will

91
have to deal not only with one level of society. He has to work at the grass-root level and he will have to convey what he would find at the grass root level to his immediate superior in the management. He should be interactive in his participation, to show his own talent and respect the talent of others and be to the point in his expressions during discussion. While discussing with his superiors he should cultivate the skill of looking at problems in their clear and correct perspective, presenting them logically without any hesitation but with reasonable courtesy. For this he will be able to prioritise the problems and issues. Correct communication is necessary in making various requests to the administration on the one hand and in letting people know about the management and its principles and policies on the other.
11.3.5 Reporting
Another important area is the task of reporting. Reporting itself is in a way a part of the broad area of communication. Although some reporting can be done verbally, much of it is done in writing. It is to be understood that probably all writing even a personal diary is meant to be read by other people, but reports are always so intended. It is true that some personal diaries of some young people may be kept secret with all sorts of code languages difficult to decipher, the autobiographies or even biographies are based partially, if not entirely, upon such personal diaries of the dignitaries. Since the reports are written by the person who reports with an intention that people should read it, the success of a report is judged by the interest it is able to arouse in the reader. So the style should be simple, straightforward and to the point. It is not an informational essay to be written in a form containing flowery language wreathed in bombastic words. It should not be written in a staid and stiff manner either. Otherwise it will admirably succeed in boring the readers who have the misfortune of going through it.
11.3.6 Reporting at Regular Intervals
Reporting at regular intervals highlights the strength and weaknesses of the biogas plant and allow all the concerned people to arrange timely interventions to prevent disasters and to improve performances. Apart from the various reports, monthly reports will be useful in discussion regarding the financial and technical issues. On the basis of the annual reports elaborate discussion can be made for any future course of action to improve plant performance. The idea behind preparing and analyzing comprehensive reports is to assist the manager or owner:
■ In deciding what future steps to take;
■ Finding and reducing undue expenditure;
■ Finding ways to improve income and surface quality, and
■ Ascertaining whether is plant is operating at its best
11.4 PROFESSIONAL DEVELOPMENT
It is only recently that management in Nepal has started paying some attention to the professional development of the employees, although it is very important aspects of management since it is the most important ingredient that can make the organization succeed or fail in attaining its objectives.
As a matter of fact every employee should be aware that he has to render a unique, definite and essential service with an adequate knowledge, both theoretical and practical, of what he is expected to do.
However, it is always necessary and always fruitful that for any specific task should be given opportunity of professional development particularly at the present time when everything is changing so fast and if such opportunities will not be available they will soon be fossilized.
It is for this reason that the personnel should be able to equip themselves with up-to-date knowledge of their area. Such an opportunity of learning new things and applying the knowledge should be available throughout the employee's career from the time of initial training and qualification, through to retirement if he decides to stay in the same field of expertise. For Biogas personnel such professional development training should be directed toward development of competencies in providing the most appropriate services promptly as demanded in the delivery of duties in the field or at the office. While they are supposed to know the current policies regarding subsidy and institutional financing, they also should be refreshed about the methods of field observations, extension services and extension methods etc.
92
In course of their professional development or upgrading professionalism consultation with senior colleagues, reading various newsletters, reports and other important journals, books, getting in touch with experts of related professionals and studying whatever is placed on the notice board from time to time are essential. For example, the Center for Energy Studies (CES) of the Tribhuwan University brings out a quarterly publication called CES Bulletin which contains information on current problems in the energy sector since CES has been making attempts to enhance promotion and development of Renewable Energy Technologies (RET) through study, Research, Human Resource Development (HRD) at various levels. It has strong relations with different Organizations, Private Agencies and Professionals. Through the medium of CES, therefore, we can benefit much from the academic research as well as field level activities for the development of RETs including Biogas Technology.
Biogas and Natural Resources Management (BNRM) Newsletter published by Consolidated Management Services Nepal Ltd. is also a very popular publication. If we go through all the publications we will be getting quite a revealing glimpse of the development of Biogas Technology in Nepal. FAO has published a Training Manual for Extension of Biogas Technology in 1996. Although the Manual is seven years old, it contains very important information regarding system approaches to Biogas Technology, Relevance of Biology Technology, and Various Biogas Programmes with a brief but quite interesting history of Biogas development in Nepal, utilization of slurry as feed and fertilizer, installation cost and financial viability. Subsidy and Institutional Financing, Field Visit Programme, Extension Support Service for Biogas, Quality Standards, and Monitoring and Evaluation at different levels, namely, user level, company level, programme level, national level etc (CMS, 1996). SNV-Biogas Support Programme also has several documents such as Implementation Document, Different Phases of BSP programmes which can be used by the Technicians to refresh and add to the knowledge of the subject that they have been gaining from time to time. Besides what have been mentioned here there are many other publication on the experiences of other countries such as China and India.
11.5 CONCLUSION
The success of management lies in coordinating resources for getting the job done by working with and through people for achieving the organizational objectives. Managerial functions consist of planning, organizing, staffing, directing and controlling.
Management is not a static concept; it is a dynamic one. Approaches to Management have differed with the changing demands of forces in the environment. The traditional approach was mechanistic with primary emphasis on efficiency. Generalized principles of management were regarded universal. The behavioral approach concentrates on people-related variable in organizational settings. People are looked upon as the major concern of management. The quantitative approach emphasizes rational decision making with the aid of normative models. The system approach provides an integrative framework for understanding the important environmental forces affecting organizations. It emphasizes totality of the system rather than its parts. The contingency approach emphasizes organizational designs and management practices appropriate for specific situations. There is no one best way. The best way depends on the demand of situation.
Various approaches to management are by no means mutually exclusive. Effective management practices must make use of a judicious mix of various approaches for accomplishing the desired objectives.
Unfortunately management in Nepal can be called to be a feudocratic -mechanistic system with little concern both for the people and for the efficiency. Old management approach is deeply entrenched in the functioning of Nepalese Managers. Professionalism has only slowly being regarded important in management.
Men and organizations of men must be prepared to adapt to the changing forces of environment. Management in Nepal must, therefore, modernize itself through an increasing awareness of professionalism in order lo meet the changing demands of the forces in this environment milieu of Nepal.
// must be remembered that effective managers are made but not born.

93
REFERENCES
[1] CES/IOE (2001) Role of Management, Communication and Professional Development in Biogas Technology. In: Advanced Course in Biogas Technology, Biogas Support Programme.
[21 CMS (1996) Biogas Technology: A Training Manual for Extension, Food and Agriculture Organization of the United Nations. Support for Development of National Biogas Programme (FAO/TCP/Nep/4451-T).

94
CHAPTER XII BIOGAS INSTALLATION COST AND FINANCIAL VIABILITY11
12.1 INTRODUCTION
Decisions about capital investment in different projects or assets involve comparisons of payments of money at different points of time. Whether to invest on a particular project depends upon the costs involved in that activity and the benefits derived from it. The simple decision rule is that if the benefits exceed the costs, the project is worth undertaking; otherwise not.
Costs and benefits are of two types: private and social. The cost that only the individual decision maker bears is the private cost. Likewise, the gains/benefits received only by the decision makers is the private benefit. Besides private costs and private benefits, the same activity may also impose some costs or provide benefits to others as well. The sum of private costs and the costs to others is social costs. Similarly, the sum of private benefits and the benefits obtained by others is the social benefits.
Let us take an example of private/social costs and benefits. Cost of transporting goods to market is a private cost, while the depreciation of road and the effect of pollution to the community should also be included while calculating social costs. Similarly, the benefits that a horticulturist gets from his apple farm is his private benefits, while the benefits that a bee farmer may get from that farm should be included while calculating social benefits.
12.1.1 The Discount Rate and the Net Present Value
In general, the value of one hundred rupees paid in the future is less than one hundred rupees today. Why? Because, you can earn interest on that money by putting it in a bank! If the interest rate is 10 percent per annum, you will get Rs 110 after one year if you put Rs 100 in a bank now. So, Rs 100 today is equivalent to Rs 110 after one year. In other words, if you put Rs 90.91 today in a bank earning 10 percent year, at the end of the year you will have exactly Rs 100. That is, Rs 90.91 plus interest payments of Rs 9.09 (Rs 90.91 times 0.10 rounded to the nearest paisa) equal Rs 100.
The process of translating a future payment into a value in the present is called discounting. The value in the present of a future payment is called the net present value (NPV).12 The interest rate used to do the discounting is called the discount rate. In the preceding example, a future payment of Rs 100 has a net present value of Rs 90.91, and the discount rate is 10 percent. If the discount rate were 20 percent, the net present value of a future payment of Rs 100 would be Rs 83.33. It follows that the higher the discount rate, the lower the net present value of a future payment.
It follows from the above discussions that
payment in one year
(1 + the discount rate)
where NPV is the net present value, F is the future payments, and r is the discount rate.
To obtain the formula for the case where the payment is two years in the future, we have to do the discounting twice so that the corresponding formula for NPV would be
11 This chapter is based upon the presentation of lecture made by Professor Dr. Nav R. Kanel in course of
Training for the Trainers of Junior Biogas Technology organized by Biogas Support Programme (17-20 May 2000) 12 Net present value is also called present discounted value.
Net present value =
F 1+ r
Or, NPV =

95
.
Internal rates of return (IRRS) are of two types - financial and economic. Financial rates of return (FIRRs) are calculated only by considering private benefits and private costs, while economic rates of return (EIRRs) are calculated by considering social benefits and social costs. FIRRs refer to the internal rates or return from user's point of view while EIRRs refer to the internal rates of return from economic point of view.
However, IRR itself does not, on its own, provide a criterion for selection of projects. It also has to be compared with market rate of interest, or social rate of interest. In this case, the following decision rule can be applicable:
■ Select a single project if IRR is greater than market rate of interest or social discount rate; and
■ In case of more than one project, rank the projects in descending order of IRR values and select the projects for which IRRs are greater, subject to fund availability.
12.2 OBJECTIVES
The general objective of this section is to discuss about the methodology that is adopted to evaluate the viability of a project, with special reference to biogas plants. The methodology of calculating internal rate of return (IRR) is discussed and IRRs are calculated for biogas plants.

96
12.3 METHODOLOGY
To fulfill above objective the methodology is focused to assess the Financial and economic viability of biogas plants. Therefore, cost-benefit analyses of biogas plants are discussed and the internal rates of return (IRRs) of such plants are also calculated. Economic and financial rates of return are calculated for this purpose. Basically, financial internal rate of return measures the private cost-benefit aspects of a project whereas economic internal rate of return measures the social cost-benefit of the project. The discussion and calculations are performed with and without subsidy provisions, and the results obtained so are compared. The example of the analysis of biogas plants in Nepal is based upon the study carried out in 1999 (Kanel, 1999).
12.4 METHOD OF ANALYSIS
The method of analysis employed here is the cost-benefit analysis. Internal rate of return (IRR) is a methodology of cost-benefit analysis. Cost-benefit analysis involves the consideration of all costs involved in and benefits derived from an investment decision. If benefits exceed costs or benefit-cost ratio is greater than one, the project is worth undertaking; otherwise not.
Internal rates of return (fRRs) of different sized plants are calculated for that purpose. Internal rate of return (IRR) is a method of calculating the expected profitability of an item of capital investment by measuring the time it will take to produce a cash income equal to the capital cost of investment. It is a measure of using discounted cash flow for arriving at the worth of the project. It finds out that rate of return at which NPV is zero or the benefit-cost ratio is one. The TRR is a discount rate, which represents the average earning power of money in a project life. The basic rule for die application of the IRR method is that the IRR should be higher than the market rate of interest if the project is to be undertaken.
Microsoft Excel computer package was used to calculate the financial and economic internal rates of return.
12.4.1 General Assumptions for the Calculation of IRRs
The general assumptions made in this case are as follows: ■ It is assumed that one cubic meters of biogas saves, on the average, 375 kg of firewood and 6 liters of
kerosene and that 70 percent of the gas produced is used for cooking and the rest 30 percent for lighting (WECS, 1995).
■ The plant construction period is generally about one month. When the construction is completed, it is counted as period zero and the life of the plant is counted from that period, and the rates of return are, therefore, calculated accordingly;
■ No discounting is allowed for the expenses incurred during different dates of the plant construction period;
■ All calculations are done as per the prices and costs of the first week of March 1999. If the prices and costs of the items/headings included in this analysis change, the rates of return will also change accordingly;
■ The benefits from and maintenance cost of a plant are assumed to remain constant throughout the life of the plant;
■ Benefits such as saving in time as well as improvement in the hygienic and sanitation condition of the household are not included in the analysis;
■ All benefits from and (maintenance) costs of the plants are assumed to have accrued at the end of the year so as to simplify the calculation of internal rates of return; and
■ Costs of installation of biogas are categorized into (a) appliances, (b) GI pipe and fittings, (c) construction and technical service, (d). three-year guarantee, (e) promotion fee (BSP), and (f) materials managed by farmers.

97
Other assumptions made while calculating the internal rates of return, both financial and economic are as follows: ■ Dung was not priced because dung, whether it is used for biogas plants or not, would be used as
farmyard manure anyway. If a biogas plant is installed, the sludge from the biogas plant is still used as manure, but with increased plant nutrients;
■ Household labour used in the biogas plant construction is not priced because the family labour is usually either unemployed or under employed;
■ The costs of plant construction are those as quoted by Nepal Biogas Promotion Group (NBPG) for the fiscal year 2055/56 (1998/99);
■ Maintenance cost is taken as NRs 45/cubic meters/year;13 ■ Only quantifiable benefits, such as firewood, kerosene and the incremental Nitrogen-Phosphorus-
Potassium (NPK), are considered while calculating returns; ■ The kerosene and firewood prices used in the analysis are those quoted by Nepal Oil Corporation
(NOC) and Timber Corporation of Nepal (TCN), respectively; ■ The plant is operated all year round; ■ The economic life of a plant is assumed to be 20 years; ■ The interest rate charged on the loan for plant installations is 16 percent per annum;14 and ■ The volumes of all plants are measured in cubic meters.
12.5 DATA COLLECTIONS
For calculating the EIRR and FIRR it required some data and information to fulfill the objectives as spelled out in the beginning of this chapter. The study required information on (a) plant cost, (b) prices of Nitrogen-Phosphorus-Potassium (NPK), (c) prices of kerosene and firewood, (d) maintenance cost, (e) interest rates on loans, and (f) subsidy rates, to make the assessment and analysis as mentioned in the opening paragraph of this chapter.
These information along with other necessary data were collected from BSP office at Jhamsikhel, Agricultural Inputs Corporation (AIC), Ministry of Local Development (MLD), National Planning Commission (Energy Section), Timber Corporation of Nepal (TCN), and Agricultural Development Bank (ADB/N) and other commercial banks involved in providing loans for biogas plants.
Secondary sources were also used to generate some data. Information on size-wise annual firewood and kerosene savings and nutrients saved, for example, were taken from study reports and published sources. These values have been assumed to remain the same; hence they are used as parameters in this study. Current prices of the concerned variables were used along with those parameters to calculate the total value of savings. The data thus generated are used in die present study.
12.5.1 Further Assumptions in Financial Analysis ■ Price quotation of Nepal Biogas Promotion Group (NBPG) for Terai and Hills has been used for the
calculation of investment costs; ■ Life of biogas plants is taken as 10 years and 20 years; ■ Prices of firewood are taken as NRs 1.86/kg (for hills) and NRs 1.23/kg (for Terai),15 and that of
kerosene is taken as NRs 10.50/liter; 13 The maintenance cost has been calculated by adding expenditures on repair works as reported in DevPart
Consult- Nepal (1998: Table I9(b), p. 23) and a regular service charge of NRs 300 per year per plant (of average size 8 cubic meters).
14 This is the interest rate that ADB/N charges on biogas loans. 15 The prices of firewood are taken as quoted by Timber Corporation of Nepal (TCN). The quoted prices of
firewood for household purposes are: NRs 1.86/kg in Kathmandu, Pokhara, and other hills; and NRs 1 -23/kg in Terai. But the prices are higher for industrial purposes and lower for religious purposes.
98
■ Price of NPK saved is based on prices of urea, DAP and MoP, i.e., NRs 16.09/kg of Nitrogen, NRs 40.37/kg of Phosphorus, and NRs 15.58/kg of Potassium;16
■ Plant nutrients present in the dung is assumed, following CODEX (1995: 10-11), to be N = 0.5%; P = 0.25%; and K = 0.5%;
■ Savings from un-burning of dung and non-leaching of dung nutrients are taken as 9 percent and 50 percent, respectively; and
■ A flat subsidy of NRs 6,000 for all sizes of plants in Terai and some hilly municipalities, and NRs 9,000 in hills has been taken into consideration.
12.5.2 Further Assumptions in Economic Analysis
■ The life of biogas plants taken as 10 years and 20 years;
■ Saving in kerosene has been adjusted by adding the subsidy amount of NRs 3.20 on the ongoing NRs 10.50 per liter, i.e. NRs 13.70 per liter;
■ Price of NPK saved is based on prices of urea, DAP and MoP and 27 percent subsidy in urea, i.e., NRs 22.02/kg of Nitrogen, NRs 40.37/kg of Phosphorus, and NRs 15.58/kg of Potassium;
■ Conversion of firewood saved into forest area can be done, if we intend to do so, at the rate of 32.7 metric tons of firewood harvest per hectare per annum (IUCN, 1995: Annex 10); and
■ NRs 1,100 (guarantee charge of NRs 600 and promotion fee of NRs 500) are deducted from the aggregate financial investment costs while calculating the aggregate economic investment cost of the BSP installed biogas plants.
Two separate sets of analyses arc carried out with these assumptions; (i) EIRR and FIRR with NRs 1,000 across the board reduction on the ongoing subsidy rates, and (ii) EIRR and FIRR with different subsidy rates for a typical 8 cubic meter plant. The analyses are separately conducted for Terai and Hills. Remote Hills are not included in the analysis because the price quotation for the construction of biogas plants is not available for that region. The biogas company owners say that only the transportation cost is higher for the remote hills, while other costs of the plant installations are the same as for the hills.
12.5.3 Values of Internal Rates of Return (IRRs)
The geographical division of the country is taken as classified by BSP and followed by Nepal Biogas Promotion Group (NBPG) in its quotation of the costs for the construction of biogas plants for the fiscal year 2055/56 (BS). NBPG has quoted the construction costs for the Terai and hills. It did not have any price quotations for the remote hills.
Three scenarios have been presented in this paper. The first scenario is the one with no subsidy and no consideration of the increased nutrients (NPK) in the biogas slurry. The second scenario is the one where the proposed new subsidy rates (NRs 9,000 for hills and NRs 6,000 for the Terai) are incorporated, but with the exclusion of incorporating increased nutrients in the slurry, The third scenario is the one where the proposed subsidy rates as meniioned in [he second case have been incorporated along with the inclusion of increased nutrients. All these scenarios have been presented for both the hills and the Terai.
The summaries of the financial internal rates of return for hill and the Terai under different scenarios are presented in Table 12.1 and Table 12.2.
16 The prices of chemical fertilizers are taken as quoted by Agricultural Inputs Corporation (A1C). The quoted
prices are as follows: Urea (containing 46 percent Nitrogen) NRs 7,400 plus a subsidy of NRs 2,728/mt; DAP (containing 18 percent Nitrogen and 46 percent Phosphorus) NRs 18,570/mt; MoP (containing 60 percent Potash) NRs 9,350/mt; and Ammonium Sulphate (containing 21 percent Nitrogen) NRs 6,900/mt.

99
Table 12.1: Summary of Financial Rates of Return (FIRRs) of Various Sized Biogas Plants in Hills Without Subsidy # With Subsidy @ Size
20 Years 10 Years 20 Years 10 Years NPK Excluded 4 cu.m.
13.54 7.70 27.12 24.22
6 cu.m. 18.74 14.26 32.48 30.28 8 cu.m. 21.51 17.63 33.43 31.34 10 cu.m. 24.22 20.85 35.43 33.54 15 cu.m 28.96 26.32 38.50 36.89 20 cu.m. 31.23 28.88 39.02 37.45 NPK Included* 4 cu.m.
40.18
38.71
6 cu.m. 47.78 46.77 8 cu.m. 49.31 48.38 10 cu.m. 52.12 51.31
15 cu. M.
56.55 55.89 20 cu.m. 57.38 56.75
Note: # Without subsidy case includes the value of firewood and kerosene at the market rates as faced by tine consumers (Rs. 1.86/kg for firewood and Rs. 10.50/liter for kerosene).
@ With subsidy case includes # above and a subsidy of Rs. 9,000 per plant. * NPK included incorporates the value of nutrients saved from stopping the burning of dung cakes and
checking the leaching of the dung nutrients which would occur in the absence of a biogas plant.
Table 12.2: Summary of Financial Rates of Return (FIRRs) of Various Sized Biogas Plants in Terai Without Subsidy # With Subsidy @ Size
20 Years 10 Years 20 Years 10 Years NPK Excluded 4 cu.m.
7.77 0.02 13.41 7.52
6 cu.m. 11.73 5.33 17.41 13.61 8 cu.m. 13.97 8.26 19.41 14.75 10 cu.m. 15.84 10.76 20.80 16.78 15 cu.m 19.47 15.15 23.72 20.26 20 cu.m. 20.98 16.99 24.48 21.15 NPK Included* 4 cu.m.
24.53
21.21
6 cu.m. 30.63 28.21 8 cu. m. 33.51 31.42 10 cu.m. 36.10 34.28 15 cu.m 40.79 39.36 20 cu.m. 42.10 40.76
Note: # Without subsidy case includes the value of firewood and kerosene at the market rates as faced by the
consumers (Rs. 1.23/kg for firewood and Rs. 10.50/liter for kerosene). @ With subsidy case includes # above and a subsidy of Rs. 6,000 per plant. * NPK included incorporates the value of nutrients saved from stopping the burning of dung cakes and checking
the leaching of the dung nutrients, which would occur in the absence of a biogas plant.

100
It can be seen from Table 12.1 and Table 12.2 that the financial rates of return increase as the size of the plant increases. This is because the returns from biogas plants (savings in kerosene, firewood, and increased nutrients in the slurry from a biogas plant) increase proportionately with the size of the plant, but the cost of the plant do not increase at the same rate. In other words, though the construction costs of biogas plants increase with their size, cost increments are less than proportionate with respect to the size of a plant. Therefore, the lifetime returns from biogas plants increase with the size of plants.
The rates of return are higher if the life of a biogas plant were 20 years rather than 10 years. This is because, with a constant annual yield of a project but with longer life of the project, the NPV of the total returns from the project will be higher implying higher rates of return. This will lead to a higher rate of return. Tables 12.1 and 12.2 support our argument. When the life of a plant is higher, then the net present value of the lifetime (net) returns from the plant is higher than in the case when the life of the plant is shorter. This will lead to a higher rate of return.
The internal rates of return for hills are higher than for the Terai. This is because the costs of the plant construction in the hills are higher by an amount (ranging from NRs 320 to NRs 960) smaller than the savings in kerosene. Besides, higher price of firewood in hilly areas than in the Terai has shot up the total savings in kerosene and firewood, which has increased the profitability of biogas plants in hilly areas. Similarly, the economic rates of return are higher than the financial returns because the subsidy of NRs 3.20 per liter of kerosene and a reduction of NRs 1,100 in the construction of a plant are also incorporated in the economic analyses. Incorporation of subsidy increases the total cash inflows whereas the reduction in the cost decreases die total cash outflows. Their combined effect always leads to an increase in the economic rates of return.
Similarly, the summaries of the economic internal rates of return for hills and the Terai under different scenarios are presented in Table 12.3 and Table 12.4.
Table 12.3: Summary of Financial Rates of Return (FIRRs) of Various Sized Biogas Plants in Hills
Without Subsidy With Subsidy Size 20 Years 10 Years 20 Years 10 Years
NPK Excluded 4 cu.m.
15.03 9.61 31.24 28.90
6 cu.m. 20.41 16.30 36.45 34.668 cu.m. 23.17 19.61 36.73 34.97 10 cu.m. 25.93 22.85 38.51 36.9015 cu.m 30.70 28.29 41.18 39.7820 cu.m. 32.89 30.74 41.32 39.92NPK Included4 cu.m.
47.40
46.37
6 cu.m. 55.02 54.318 cu.m. 55.61 54.9210 cu.m. 58.17 57.5615 cu.m 62.11 61.6020 cu.m. 62.40 61.90
Note: Same as Table 12.1, except that the price of kerosene is taken as Rs. 13,70/literand Rs. 1,100 is deducted from the aggregate financial investment costs.

101
Table 12.4: Summary of Financial Rates of Return (FIRRs) of Various Sized Biogas Plants
in Terai Without Subsidy With Subsidy
Size 20 Years 10 Years 20 Years 10 Years NPK Excluded 4 cu.m.
9.12
1.86
15.65
10.40
6 cu.m. 13.21 7.27 19.72 15.468 cu.m. 15.47 10.16 21.30 17.37
10 cu.m. 17.46 12.67 22.90 19.29 15 cu.m 21.03 17.05 25.72 22.60 20 cu.m. 22.49 18.79 26.29 23.26
NPK Included 4 cu.m.
28.84
26.19
6 cu.m. 35.33 33.44 8 cu.m. 38.09 36.44
10 cu.m. 40.69 39.2415 cu.m 45.37 44.2320 cu.m. 46.41 45.33
Note: Same as Table 12.2, except that the price of kerosene is taken as Rs. 13.70/liler and Rs. 1,100 is deducted from the aggregate financial investment costs.
The internal rates of return, both the financial and economic, were found to be higher for the third case than for the second case, which was also higher than for the first case for both hills and the Terai. This is because the total cash outflows of a biogas plant will decrease due to subsidy, as a result of which the total lifetime net present value of the project will increase, which in turn increase the internal rate of return of the project. Similarly, inclusion of the monetary value of increased nutrients along with subsidy will increase the total cash inflows on one hand and decrease the total cash outflows on the other hand so that the net cash inflows will increase because of the effects of both of these reasons. This will increase the net present value of the project, which in turn will yield high internal rates of return.
Similarly, the IRRs, bom financial and economic, with various subsidy levels for a typical 8 cubic meter plant in the hills and Terai were also calculated. The values of financial internal rates of return (FIRRs) are presented in Table 12.5 and Table 12.6, while the economic internal rates of return are presented in Table 12.7 and Table 12.8.
Table 12.5: Financial Rates of Return (FIRRs) by Subsidy Amounts and the Life of an 8 cu.m. Plant
(Hills) 10 Years of Life 20 Years of Life Subsidy
Amount W/o NPK W/NPK W/o NPK W/NPK- 17.63 29.95 21.51 32.18
500 18.17 30.66 21.96 32.82 1,000 18.73 31.40 22.43 33.48 1,500 19.31 32.16 22.92 34.18 2,000 19.91 32.96 23.43 34.90 2,500 20.53 33.78 23.95 35.64 3,000 21.18 34.63 24.50 36.43 3,500 21.84 35.52 25.07 37.24 4,000 22.54 36.45 25.67 38.09 4,500 23.26 37.41 26.29 38.98 5,000 24.01 38.42 26.94 39.92

102
5,500 24.79 39.47 27.61 40.89 6,000 25,60 40.56 28.33 41.92 6,500 26.45 41.71 29.07 42.99 7,000 27.34 42.91 29.85 44.13 7,500 28.27 44.18 30.68 45.32 8,000 29.24 45.50 31.55 46.58 8,500 30.26 46,90 32.46 47.91 9,000 31.34 48.38 33.43 49.31 9,500 32.47 49.93 34.45 50.80 10,000 33.66 51.58 35.54 52.39
Table 12.6: Financial Rates of Return (FIRRs) by Subsidy Amounts and the Life of an 8 cu.m. Plant (Terai)
10 Years of Life 20 Years of Life Subsidy Amount W/o NPK W/NPK W/o NPK W/NPK
- 8.26 22.23 13.97 25.40 500 8.70 22.85 14.32 25.93
1,000 9.16 23.49 14.68 26.49 1,500 9.64 24.15 15.05 27.06 2,000 10.13 24,48 15.44 27.66 2,500 10.63 25.55 15.84 28.26 3,000 11.16 29.29 16.25 28.93 3,500 11.70 27.06 16.68 29.61 4,000 12.56 27.86 17.13 30.32 4,500 12.85 28.70 17.60 31.06 5,000 13.46 29.57 18.09 31.84 5,500 14.09 30.48 18.60 32.65 6,000 14.75 31.42 19.14 33.51 6,500 15.43 32.42 19.70 34.40 7,000 16.15 33.46 20.29 35.35 7,500 16.89 34.55 20.90 36.35 8,000 17.68 35.70 21.55 37.40 8,500 18.50 36.91 22.24 38.52 9,000 19.36 38.18 22.95 39.70 9,500 20.27 39.53 23.73 40.95 10,000 21.22 40.96 24.54 42.29
Tables 12.5 through Table 12.8 show that both the financial and economic rates of return increase as the subsidy amount increases. Rates of return are higher if the life of the plant is taken as 20 years as compared to 10 years. Moreover, both the rates of return are higher if we include the monetary value of the increased nutrients available in the biogas slurry. Obviously, the economic returns are higher than the financial returns because of the inclusion of subsidies on kerosene and urea as the benefits from biogas plants.
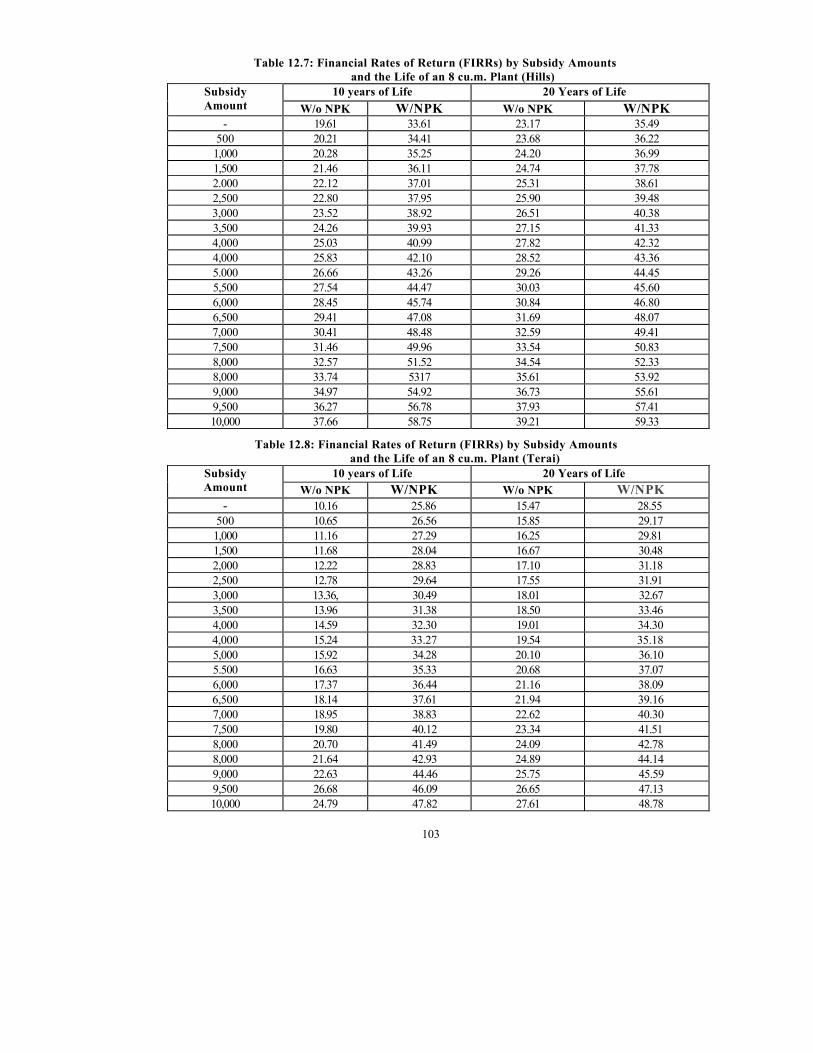
103
Table 12.7: Financial Rates of Return (FIRRs) by Subsidy Amounts and the Life of an 8 cu.m. Plant (Hills)
10 years of Life 20 Years of Life Subsidy Amount W/o NPK W/NPK W/o NPK W/NPK
- 19.61 33.61 23.17 35.49 500 20.21 34.41 23.68 36.22 1,000 20.28 35.25 24.20 36.99 1,500 21.46 36.11 24.74 37.78 2.000 22.12 37.01 25.31 38.61 2,500 22.80 37.95 25.90 39.48 3,000 23.52 38.92 26.51 40.38 3,500 24.26 39.93 27.15 41.33 4,000 25.03 40.99 27.82 42.32 4,000 25.83 42.10 28.52 43.36 5.000 26.66 43.26 29.26 44.45 5,500 27.54 44.47 30.03 45.60 6,000 28.45 45.74 30.84 46.80 6,500 29.41 47.08 31.69 48.07 7,000 30.41 48.48 32.59 49.41 7,500 31.46 49.96 33.54 50.83 8,000 32.57 51.52 34.54 52.33 8,000 33.74 5317 35.61 53.92 9,000 34.97 54.92 36.73 55.61 9,500 36.27 56.78 37.93 57.41 10,000 37.66 58.75 39.21 59.33
Table 12.8: Financial Rates of Return (FIRRs) by Subsidy Amounts and the Life of an 8 cu.m. Plant (Terai)
10 years of Life 20 Years of Life Subsidy Amount W/o NPK W/NPK W/o NPK W/NPK
- 10.16 25.86 15.47 28.55 500 10.65 26.56 15.85 29.17 1,000 11.16 27.29 16.25 29.81 1,500 11.68 28.04 16.67 30.48 2,000 12.22 28.83 17.10 31.18 2,500 12.78 29.64 17.55 31.91 3,000 13.36, 30.49 18.01 32.67 3,500 13.96 31.38 18.50 33.46 4,000 14.59 32.30 19.01 34.30 4,000 15.24 33.27 19.54 35.18 5,000 15.92 34.28 20.10 36.10 5.500 16.63 35.33 20.68 37.07 6,000 17.37 36.44 21.16 38.09 6,500 18.14 37.61 21.94 39.16 7,000 18.95 38.83 22.62 40.30 7,500 19.80 40.12 23.34 41.51 8,000 20.70 41.49 24.09 42.78 8,000 21.64 42.93 24.89 44.14 9,000 22.63 44.46 25.75 45.59 9,500 26.68 46.09 26.65 47.13 10,000 24.79 47.82 27.61 48.78

104
All these findings show that both the financial and economic internal rates of return from biogas plants are high showing that biogas plant is very profitable in Nepal. The economic returns are higher than the financial returns because of the incorporation of subsidies being given in kerosene and urea. The prices of kerosene, urea and firewood were taken from as quoted by the respective corporations of the government. Experts on forestry argue that the official rate of firewood, which is NRs 1.23/kg in Terai and NRs 1.86/kg in hills, is quite below the market price. If we allow for "real price" of firewood, which will obviously be higher than the current rate, the economic rates of return will be still higher. The calculated financial and economic rates of return are well above the market interest rate, which indicates the profitability of biogas investment.
The other benefits, not included in economic and financial analysis, are the health aspects of the persons involved in cooking. Use of biogas in kitchen helps the housewives to refrain from smoke, which directly affects their eyes and lungs. This is the most perceived benefit of biogas as felt by housewives. Saving in time that would have been spent for fetching firewood can be utilized in other income generating activities and/or to improve the hygienic and sanitation condition of its household members.
Similarly, the rates of return are higher when the life of a plant is 20 years than when it is 10 years. The figures also exhibit that the gap between IRRs, both economic and financial, for 20-year and 10-year life span of a plant decreases as the subsidy amount increases.
Therefore, three conclusions can be drawn from these figures:
■ Economic returns (EIRRs) are always greater than the financial returns (FTRRs);
■ Internal rates of return (IRRs), both financial and economic, are always greater with the inclusion of NPK than without it, and
■ Internal rates of return (IRRs), bom financial and economic, are always greater when the life of a plant is taken 20 years than when it is 10 years.
Experts on forestry opine that the current price of firewood as quoted by the Timber Corporation of Nepal (TCN) does not reflect the real price of firewood. They have a strong view that the real price of firewood should be more than the present market price. They have a best guess that its price should be around NRs 3.00/kg (in hills) and NRs 2.25/kg (in the Terai). Though the government is not providing any subsidy on firewood, the TCN is in fact providing subsidy on this product. Therefore, if we allow for these higher prices for firewood the economic returns of the biogas plants would be still higher.
12.6 CONCLUSIONS
The analysis of financial and economic viability shows that installation of biogas plants is very profitable in the developing country like Nepal. This is shown by high internal rates of return, both financial and economic, even with a decline on the ongoing subsidy rates by a flat amount of NRs 1,000 per plant. A study on the IRR values with different subsidy rates for an 8 cubic meter plant also shows that biogas plants are profitable in Nepal. This is mainly due to high kerosene and firewood prices prevailing in the market, as the direct cause. The rates of return, both financial and economic, increase with the size of a biogas plant.
Another reason for high profitability of biogas plants is the high fertilizer price in the market and the presence of increased nutrients in the biogas slurry. This is the indirect cause that many farmers may not think about.
Economic rates of returns are found to be higher than the financial rates of return. It is because subsidies of 27 percent in urea and NRs 3.20 per liter in kerosene are also incorporated in the calculation of economic rates of return. Nevertheless, the real price of firewood, as estimated by forestry experts, is not incorporated in the analysis. If we allow for higher firewood prices the economic rates of return would be still higher.
Internal rates of return in the case of subsidies are higher than in the case of without subsidies because the net present value of the total costs incurred by the fanners is less in the former case than in the latter. IRRs increase with the amount of subsidy.

105
IRRs are higher when increased nutrients (in the biogas slurry) are included than in the case when they are excluded. This is because when we include NPK in our cost-benefit analysis, the benefits will increase as a result of which the IRRs also will increase.
The economic rates of return are higher than the financial rates of return because of the inclusion of subsidy given in kerosene and the exclusion of guarantee charge and promotion fee. These factors have widened the gap between total cash inflows and total cash outflows. This widened gap means an increase in the net present value of the net benefits derived from the plant, and hence an increase in the internal rates of return.
The return from a biogas plant is greater than the market interest rate, which has been taken as 16 percent per annum, when we include the proposed subsidy per plant and the increased NPK in the biogas slurry. From this finding, we can conclude that biogas plants are very profitable in Nepal.
REFERENCES
[1] Boyle, G. (1996) Renewable Energy-Power for a Sustainable Future, Oxford University Press in
Association with the Open University. U.K.
[2] Karki, A. B. (2000) Training Manual in Biogas Technology for the Trainers of Junior Biogas Technology, Biogas Support Progarmme.
[3] Kanel, N.R. ((1999) An Evaluation of BSP Subsidy Scheme for Biogas Plants, Biogas Support Programme.
[4] Franklin, J and Stermate, J.M (1996) Economic Evaluation and Investment Decision Methods, Investment Evaluation Corporation, U.S.A.

105
PART TWO
BIOGAS DEVELOPMENT ASPECTS IN
NEPAL

106
CHAPTER XIII
BIOGAS POTENTIAL AND FUTURE PERSPECTIVE1
13.1 BIOGAS POTENTIAL
13.1.1 Nepal's Energy Situation Energy is a necessity for basic human activities. The correlation between energy consumption and the level of economic activity within a given society is well established. So is the correlation between poverty and insufficient access to energy for productive purposes. The lack of access to affordable and efficient energy keeps huge mass of people in the developing world in a poverty trap. Obviously, the quantity of energy consumption would increase with an increment in the per capita income in a country. In a country where energy is not obviously accessible and energy cost is high, people tend to use efficient and least cost energy options. In developing country, because of many reasons, people still have to depend upon traditional energy to fulfill most of their energy needs. This is because of very nominal penetration of commercial energy sources like electricity. Per capita consumption of primary energy in Nepal is estimated to be 14 gigajoules (GJ) in 1992/93. Out of this, traditional sources (fuelwood, agricultural residues and dung cake) make up about 91 percent. Almost 35 percent Nepal's export earning is needed for the import of petroleum products and coal which together meet about 8 percent of the total energy demand, while share of alternative energy is 1 percent (see Figure 13.1).
Figure 13.1: Energy Consumption in Nepal
The total energy consumption in Nepal for 1992/93 amounted to 271 million GJ, of which 247 GJ (91%) was used in the residential sector. Figure 13.2 shows that fuelwood (72%) was used most, followed by agricultural waste (16%), animal waste (9%), kerosene (2%), electricity (0.4%) and LPG (0.1%). Energy use in this sector is mainly for cooking (80%).
Figure 13.2: Energy Sources in Nepal
1 This chapter is based upon the original handouts and presentation of lecture made by Mr. Felix ter Heedge, Energy Advisor of SNV/Nepal in course of Advanced Biogas Technology Training organized by Centre for Energy Studies, Institute of Engineering, Pulchowk, Lalitpur, Nepal (CES/IOE, 2001).

107
Taking into account the population growth at 2.5 percent and energy consumption growth 5 percent, the trends on Energy Consumption Development pattern from 1992 to 1999 has been illustrated as given in Figure 13.3.
Figure 13.3: Energy Consumption Development in Nepal
Nepal has an estimated area of 9.2 million hectares of potentially productive forest, shrub and grassland, of which 3.4 million hectares are considered to be accessible for fuelwood collection, Sustainable yield from this accessible area is estimated to be about 7.5 million tonnes while total fuelwood consumption in 1992/93 was about 11 million tonnes. These figures indicate, with some carefulness, a non-sustainable wood harvesting of about 30 percent. Fuelwood is not the only factor in (over-) exploitation of forests in Nepal, Other factors include expansion of agricultural land, fodder collection, resettlement programmes, industrial use, etc.
The use of agricultural and animal waste for cooking purposes rather than being used as organic fertilizer obviously results in decreasing soil fertility and reduced crop yields.
Kerosene and electricity are mainly used for lighting, LPG for cooking in urban areas only. In rural areas, traditional energy sources will remain the main supplier of energy in the foreseeable future. Biogas produced from cattle and buffalo dung may be one of the most appropriate alternate sources.
13.1.2 Biogas Potential and Current Biogas Saturation in Nepal
The technical potential for biogas production in Nepal is based upon the number of cattle/buffalo in the country, or specifically on the quantity of dung that could be available for biogas, and the micro-climatic pockets in different parts of the country. The potential for biogas generation based on the number of cattle and buffalo in 1997/98 is presented in Table 13.1 (CMS, 1999).
Table 13.1: Biogas Potential
Animal Number (Million)
Dung Available/ Animal/Day (kg)
Total Dung Available/Day (ton)
Biogas Yield per Kg of Dung m3 Day
Gas Volume (m3) /Day
Cattle 7.0 10 70,000.00 0.036 2,520,000.00 Buffalo 3.4 15 51,000.00 0.036 1,836,000.00 Total 10.4 | 121,000.001 4,356,000.00
The daily dung production from cattle and buffalo alone is about 121,000 tons, which has theoretically a potential to produce 4,356,000 m3 of biogas. Practically, only 75 percent of the potential, i.e., 3,282,000 in3,

108
would be available since the number of animals also include households with only one cattle or buffalo and hence do not have enough dung volume to feed the smallest size biogas plant (4 m3) which requires 24 kg of dung per day. These calculations do not take account of the dung available from poultry and other domestic animals such as pigs and goats. A quick review on above data will reveal that there would be potential of 2.9 million biogas plants in Nepal. In 1992, based upon the potential of biogas plants in the plains, hills and mountain, Wim J. van Nes had calculated the potential of establishing 1.3 million in the Kingdom of Nepal. On the other hand, although the assumptions on the technical potential may range between 1.3 and 2.9 million plants (CMS and SNV/BSP), the economical potential is considered to be 600,000 plants.
Introduced in Nepal in the 1950's, biogas technology has spread rapidly in 66 districts out of 75 during the last few years, increasing the cumulative number of plants installed to 1,23,395 by 31 December 2004. Thus, considering the economic potential and number of biogas installed up to 1999, there is a long way to go as vast number of potential (87.6 percent) still remains to be trapped (see Figure 13.4). While such a huge energy potential remains unused which otherwise could have enhanced the rate of employment and the level of rural income, the rural communities continue to face energy starvation with an estimated economic potential of 600,000 units.
Figure 13.4: Current Biogas Saturation in Nepal
13.1.3 Biogas Production
a. Biogas Production
As of December 2004, total number of biogas installed in the Kingdom of Nepal was around 1,23,395 out of which 62,160 plants were installed under the umbrella of BSP. The survey carried out by SNV/BSP indicates that the average plant volume has been decreasing since 1992 and is around 7 m3 at the present moment (Felix ter Heedge, SNV/BSP). Mr. Felix made following assumptions for calculating the total installed volume of biogas plants in Nepal:
■ Average feeding = 6.72 kg per m3; ■ Average gas production = 0.036 m3 /kg of dung; ■ Average feeding = 82%; ■ Season correction = 90%; and ■ Rate of operation = 97%
b. Cost of Energy Option
As for the cost of energy option, the cost of energy production of biogas per MW has been compared with the hydropower schemes, for example, Modo Khola Hydro Project and Arun 3 Hydro Project. The data presented in Figure 13.5 reveals that in case of biogas, the cost of production per MW is NRs 79.4 million, whereas Modi Khola Hydro Project and Arun 3 Hydro Project cost NRS 143 million and NRs 238 million respectively. This shows clearly that biogas is the cheapest option so far as cost of energy option is concerned.

109
13.1.4 Projected Development Figure 13.6 presents the vision for projected development of biogas after the termination of BSP in 2003. It is envisioned to establish 200,000 biogas plants over 6-year period from 2003/4 to 2008/9.
As said earlier; if additional 200,000 biogas plants would be established by the year 2009, about 36 percent (that also included 14 percent potential achieved under BSP programme) of the minimum economic potential would be exploited as illustrated in Figure 13.7. This would result into the annual energy production of approximate 2.6 million GJ or installed power equivalent to 82.5 MW. Total installation cost @ 2000 levels would be approximately NRs 8,000 million and total saving would amount to NRs 6,000 million.

110
13.2 FUTURE PERSPECTIVE IN NEPAL
13.2.1 Financial
The present financial system of subsidy should be phased out. The government should formulate a strategy that the farmers should understand the importance of biogas plant and its role in community development. When they know its importance the farmers who can afford should be encouraged but with the soft loan. In the long run, when the foreign assistance will come to an end, the present system will no longer be sustainable. Analyzing the economic situation of the farmers a kind of subsidy should be given but not to every one. The present system is helping the rich farmers only. To encourage the small farmers groups and the landless farmers who have to cook food should have some kind of facilities.
13.2.2 Legal
So far there is no any act passed on this regard. However, the forest legal action may be implemented so that the farmers will be compelled to adopt the biogas for cooking and forest will be saved. However consumer protection right may be implemented and certain legality should be developed in this field.
13.2.3 Institutional
Alternative Energy Promotion Centre (AEPC) of the Ministry of Science and Technology (MOST) as governmental agency and Biogas Support Programme (BSP), established under Netherlands Development Organization (SNV), are engaged actively in development and promotion of biogas sector in Nepal. There are other equally important institutions like universities, which should have been involved in the research and development aspect of biogas plants and its other component. Biogas should be included in the curriculum at least in the university degree courses so that the student will put certain interest in basic and applied research. So far the institutes engaged are the commercial ones. When the development aid is stopped these commercial companies will be collapsed. Therefore, the government should think in developing the local institution to develop and implement the programme needed by the local communities.
13.2.4 Environmental
When the potentials of the biogas plants are explored there will be substantial increase in the forest cover. This increase will revert ecologically fragile lands to forestry. The CO2 increased due to increase in the population will be absorbed by the increase in forest cover. Therefore, it is expected that there will be substantial different in the present environment and the future.
13.2.5 Research and Development (R & D)
So far little attention has been paid on the Research and Development (R&D) of biogas technology in Nepal and the promoters have been mainly concerned in extension and dissemination aspects. Some areas of R&D that need immediate attention have been outlines as follows (see Chapter XXI):
■ Low-Cost Designs of Biogas Plants; ■ Cold Weather Biogas Plant; ■ Slurry Utilization; ■ Health, Environment and Sanitation aspects; ■ Alternative Feed-stocks; and ■ Manufacture of Quality Biogas Appliances and Accessories.
13.2.6 Human Resource Development (HRD)
Since the opening of the People Republic of China for the external tourist in mid 70s, there has been number of high level technicians and planners visiting this country to gather knowledge in biogas technology. But the visits have been only for the sake of visit and training. No substantial improvement has been made in its
111
development. Due to emergence of BSP since 1992, middle and low-level technicians have been developed As a results there are 1600 masons actively involved in the construction of biogas plants in the country. In addition, 20 middle level technicians have been actively participating in the design and quality control of the constructed biogas plants.
So far we have been adopting the design and knowledge developed elsewhere outside the country. Considering the need to developing our own design and the availability of nature of feedstock, we have to carry out our own basic research in our country. Although there have been substantial number of low level technicians, efforts have not been done as yet to produce middle and high level technicians in sufficient number. Therefore, a serious thought should be given in this regard so that adequate basic research could be carried out in our own country.
13.2.7 Entrepreneurship Development
Based on the government policy to develop private enterprises more than 50 NGOs and private companies have come forward in constructing the biogas plant. Almost all the entrepreneurs have put their interest in profit. But these agencies are not sustainable. They remain active as long as BSP helps in financing the biogas plants construction. To make it sustainable, the government should formulate a policy to give certain facilities to the construction companies for reduction of income tax and other facilities. Then only the private entrepreneurs will flourish and can afford to provide adequate services to their clients.
13.2.8 Information Dissemination
Biogas Support Programme has so far allotted some amount in the dissemination of information regarding the biogas technology. Radio Nepal and Nepal Television have some programme to broadcast. However, it is not enough. More pamphlets, posters and other forms of advertisement are needed to inform the farmers about the importance of biogas technology. The agriculture extension network of the Department of Agriculture should be involved in the dissemination of biogas technology. The private companies should allocate some fund from their earning in advertising their products and activities.
13.3 PROSPECTIVE PLAN FOR 20 YEARS (2000 - 2020)
Biogas which started for the first time as crash programme in 1974/75 during "Agriculture Year" further gained momentum as a result of the establishment of Biogas Support Programme under the Netherlands Development Organization in 1992. As a result of the concerted efforts of various actors, Biogas as a renewable energy resource, has flourished in Nepal with the establishment of 60,321 plants by 31 August 1999 covering 64 districts of Nepal2. It is envisioned to establish 100,000 biogas plants by the end of BSP's Third Phase programme, which will terminate in 2003.
It is apparent that with the termination of BSP's programme in 2009, the subsidy on biogas could not be provided any more. It is but natural that non-availability of subsidy will decrease the rate of biogas plant construction in Nepal. However, due to ever increasing price of the fuel, those people who possess livestock and afford to install biogas will be interested irrespective of the fact whether subsidy is provided or not.
Thus, keeping the above fact into consideration, Prospective Plan for 20 Years has been formulated. It is envisioned that the commercial banks will continue for financing biogas and Biogas Construction Companies will continue to install the plants as per demand of the farmers. It is also expected that the government line agencies particularly AEPC will continue to play active role in launching and coordinating biogas programme in Nepal.
As pointed out earlier, much attention has been given about the promotion and diffusion of biogas plants in Nepal whereas, little effort has been done by the promotional organizations to conduct appropriate Research and Development programme in Nepalese context. Hence realizing the gap, this aspect has been emphasized in the prospective plan for twenty years.
2 The readers are advised to refer to Annex II of this book for updated data.

112
13.3.1 Institutional Strengthening
The government has to provide necessary facilities for institutional strengthening to the various organizations, which are directly or indirectly concerned with the promotion of biogas in Nepal. As said, AEPC being the nodal organization should liaise with other government line agencies such as Ministry of Agriculture (MOA), Ministry of Soil Conservation and Forest (MOFSC), Ministry of Health (MOH) etc. It is also essential to strengthen commercial banks such as Agriculture Development Bank of Nepal (ADB/N), Nepal Bank Limited (NBL) and Rastriya Banijya Bank (RBB), etc. Similarly, there is a need to strengthen the NGOs, Biogas Construction Companies and other promotional organizations involved in biogas sector.
13.3.2 Training Various types of training offered by SNV/BSP and other organizations have helped to a great extent, to develop and promote biogas programme in Nepal. Therefore, for continuation of the programme, it is imperative to focus attention on different kinds of training notably: ■ Masons training; ■ Training of the staff of line agencies; ■ Training of the staff of banks, NGOs, Biogas Construction Companies, etc.
13.3.3 Extension
Biogas programme will be considered successful only when the beneficiaries are completely satisfied with the outcome of the technology. Therefore, the beneficiaries who are farmers in majority should derive maximum benefit from the use of gas as well as slurry. Despite the fact that programme has been launched regarding the utilization of slurry as fertilizer, majority of the farmers have not been benefited from the extension service provided in this area. As yet, they are not fully aware of the importance and value of bio-slurry as fertilizer. Therefore, this aspect has to be strengthened by involving the appropriate line agencies, i.e., the extension service of the Ministry of Agriculture.
13.3.4 Techno-socio-economic studies
Various types of technical, social and economic studies need to be conducted in Nepal for the overall development of biogas programme in Nepal. The constraints of the technology have to be identified and necessary steps have to be taken to mitigate them.
13.3.5 Monitoring and Evaluation
The Monitoring and Evaluation (M & E) activities have to be continued by the government line agencies namely AEPC. The feedback received from M & E studies will be highly useful for planning further strategy for biogas development in Nepal. 13.3.6 Information Dissemination and Publicity
Along with the construction of biogas plants, it is also essential to carry out activities regarding information dissemination and publicity of biogas technology. By doing so, many potential users will be attracted towards this technology. Therefore, the authority concerned should pay attention to conduct workshop, seminar and conferences in the subject of biogas technology. Similarly, production of video-cassettes, diffusion of the technology through radio and TV, publications of manuals, booklets, posters, calendars, etc would be highly useful for information dissemination of biogas technology in Nepal.
13.3.7 Research and Development
As said earlier, appropriate research on biogas technology is still overdue in Nepal. Following areas have been considered worth for conducting the appropriate research. It is suggested to conduct R&D in collaboration with recognized institutions having adequate facilities and trained manpower for carrying out research work (see Section 13.2.5).

113
a. Low-Cost Biogas Plant
The GGC-concrete model biogas plant, which has been popularized since more than 2 decades in Nepal is costly to an average farmer. Deenbandbu model biogas plan, which proved to be low cost biogas plant in India were experimented in Nepal but it could not be popularized in Nepal. Therefore, it has been imperative to evolve low-cost biogas plant that is affordable to the average farmer.
h. Cold Weather Biogas Plant
Production of biogas is significantly affected due to drop of temperature. Thus, until now, this technology has been of little use in the higher altitude or cold climate. Therefore, research work needs to be initiated in view of increasing the efficiency of gas at the cold climate or in higher altitudes.
c. Use of Biogas Slurry as Feed and Fertilizer
So far, biogas users have been paying attention only towards the utilization of gas and they have been neglecting the use of digested effluent as fertilizer. As chemical fertilizer is costly, imported and is not available on time, proper utilization of this locally available resource should be given top-priority. The farmers have to be convinced about the use of slurry by conducting appropriate research and field experimentation. Similarly, possibility of utilizing bio-slurry as feed and food for animals, poultry birds and fish needs to be explored.
d. Alternative Feedstock for Biogas Production
Until this date, it is mostly cattle and buffalo dung that are used commonly for biogas production in the rural community. In order to increase the scope of biogas production, it is advisable to use various other local alternative feed stocks for biogas generation. For example, biogas can profitably be produced from the obnoxious weeds such as Banmara (Eupatorium Adenophorum) and Water Hyacinth.
e. Production of Biogas from Municipal Solid Waste
Municipal solid waste if disposed improperly can create problems due to pollution and as such could be detrimental to human health. But on the other hand, some countries have already benefited by processing the MSW into anaerobic reactors in view of production of energy and bio-fertilizer. In the context of Nepal, it is worth to carry out pilot programme in this subject.
13.4 CALENDAR OF TWENTY YEARS'S PERSPECTIVE PROGRAMME (2000 TO 2020) IN NEPAL
20 years' perspective plan has been elaborated in Annex I of this publication.
13.5 LONG-TERM GOVERNMENT POLICY
Considering the popularity of biogas plants, its huge potentiality and its benefits, the present subsidy policy is likely to be continued with the support of other donors and potential investors, even after the closing of present biogas support programme being implemented as a joint venture of HMG, KfW and SNV. The present subsidy policy is limited to less than 10 m3 plants of family size. However, the Government of Nepal has a provision for feasibility study of community biogas plants based upon biomass products and solid waste beside cow dung with the objective of supplying gas and electricity to neighbouring areas (AEPC. 2000).
13.5.1 Objectives of Tenth Plan
■ Helping increase the consuming capacity of rural families by developing and extending the alternative energy as a powerful tool in poverty alleviation.
■ Supplying energy for commercialization of domestic needs and the profession of the rural people by developing alternative energy technologies based on the local resources and tools.
114
■ Reducing dependency on imported energies and reducing negative environmental effects by the proper use of resources and tools of local energy and by improving and increasing the energy use competency.
■ Increasing the access of rural people by reducing the cost of development and installation of alternative energy.
The result- oriented target regarding biogas plants in Tenth Plan is production of 44MW energy by installing 200,000 biogas plants in 65 districts (NPC, 2003).
13.5.2 The Priority- Based Strategies
■ As per the concept of improving living standard of rural people, priority will be given to the programmes that are carried out in an integrated way to help in economic, social and environmental sustainability while developing and expanding the alternative energy.
■ Emphasis will be given for necessary, research and technology handover that are required to reduce the investment in the alternative energy technology and to increase the capacity so as to create an atmosphere where maximum number of rural people can use.
■ A separate Rural Energy Fund will be set up for the sustainable development of rural energy. This fund will expand to the district and village levels.
13.5.3 Policies and Strategies ;
Development and expansion of energy will be carried out with high priority to ensure the fulfilment of minimum energy supply of energy that has remained as the basic need of the rural population and to help develop the rural economy. ■ Consumers and local people will be participated in the plan framing, formation and conduct of energy
management to give sustainability to rural energy production, distribution and its use through social mobilization by encouraging group formation.
■ Dependency on imported energy will be slowly reduced through proper use of alternative energy resources.
■ Necessary reforms will be made in grants policies and management with a view to achieving maximum benefit by increasing access of the rural families and communities to alternative energy and technology.
■ Necessary financial assistance will be released for the sustainability of energy development by completing the task of setting up the Rural Energy Fund. This will ensure increase in the access of poor and downtrodden communities to alternative energy through group collateral scheme, set-up of rolling fund and release of loans in less interest.
■ Participation of educational institutions, local bodies, private sector and national and international non-governmental organizations will be increased at the maximum and they will be made more active so as to carry out study, research and development works on various titles such as development of alternative technologies, its expansion and reducing investment.
13.5.4 Programmes
Programme on Biogas: Popularity of biogas is increasing due to its diverse benefits in the rural families. Therefore, biogas plants will be expanded so that it saves firewood, reduces dependency on imported energy, there will be no negative impact in the people's health, there will be no environmental pollution and the slurry coming out from the plan shall be used as one of the best fertilizers in the agriculture purpose. So, during the plan implementation period, it is targeted that a total of 200,000 biogas plants including 100,500 domestic biogas plants and 500 community biogas plants will be installed. Priority will be given to suitable but relatively smaller size of plants and necessary researches and cost-reduction tasks will be carried out for its development in the high-altitude Himali region.
Setting up Rural Energy Fund: In the context of huge investment required while initiating alternative energies and competition with already established traditional energies, the Rural Energy Fund will be set up

115
in order to regulate grants and loans and mobilize them in simplified way. REFERENCES
[I] AEPC (2000) Subsidy for Renewable Energy, Alternative Energy Promotion Centre, Lalitpur. [2] BSP (1994) Mid-Term Evaluation of the Biogas Support Programme, Biogas Support Programme. [3] BSP (1997) Biogas Support Programme Phase I and Phase II-Development Through The Market,
Biogas Support Programme[4] CMS (1998) Mid-Term Evaluation of the BSP Slurry Extension Programme, Biogas Support
Programme. [5] CMS (1999) Biogas Users Survey 1998/99, Alternative Energy Promotion Centre. [6] DevPart (1998) Biogas Users Survey 1997/98, Biogas Support Programme. [7] CMS (1996) Biogas Technology: A Training Manual for Extension, Food and Agriculture Organization of the United Nations. Support for Development of National Biogas Programme (FAO<TCP/Nep/4451 -T). [8] Godfrey, B. (1996) Renewable Energy Power for a Sustainable Future, Oxford University Press. [9] Green COM (1997) Forest Management by Nepali Communities, USAID. [10] HMG/N (1997) Environment Protection Act-2053.[II] HMG/NADB/FINNIDA (1998) Executive Summary In: Master Plan for the Forestry Sector Nepal. [12] Howes, M. and P, Endagama (1995) Farmers, Forests and Fuel, Intermediate Technology Publications. [13] Hurst, C and A. Barnett (1990) The Energy Dimension-A Practical Guide to Energy in Rural
Development Programmes, Intermediate Technology Publications.[14] Joshi, A. L. (1998) Forest Users Groups: Self-Governing Institutions for Managing the Forest of
Nepal. [15] Karki, A. B., K.M. Gautam and A. Karki (1994) Biogas Installation from Elephant dung at Machan
Wildlife Resort, Chitwan Nepal. In: Biogas Newsletter, Issue No. 45[16] Karki, A. B., K. M. Gautam and S. R. Joshi (1993) Future Structure of Biogas Sector in Nepal,
Biogas Support Programme. [17] Karki, A. B., K. M. Gautam and S. R. Joshi (1993) Present Structure of Biogas Sector in Nepal,
Biogas Support Programme.
[18] Karki, A.B. and K. Dixit (1984) Biogas Field book. Sahayogi Prakashan, Tripureshwar, Kathmandu, Nepal. [19] NPC (2003) Tenth Five-Year Plan, Kathmandu.

116
CHAPTER XIV
R O L E O F V A R I O U S A C T O R S I N B I O G A S D E V E L O P M E N T
14.1 INSTITUTIONAL GROWTH
The first biogas plant in Nepal was introduced in 1955 by a schoolteacher (late Father B R Saubolle) out of a used 200-liter oil drum at St. Xavier's School, Godavari in Kathmandu. Only a few individuals were involved in biogas technology until the World Energy crisis of 1973, which then triggered a global interest in this sector. This crisis caused the formation of a Biogas Development Committee (BDC) as a part of the Energy Research and Development Group (ERDG) under Tribhuwan University in 1975 (Karki and Dixit, 1984).
The Ministry of Agriculture (MOA) observed the fiscal year 1975/76 as the "Agriculture Year". Biogas was included as a special programme for its effectiveness in controlling deforestation and preventing burning of cow dung which otherwise could be used as fertilizer. Interest-free loans were provided to the farmers willing to install biogas plants. Private contractors under the supervision of the Department of Agriculture (DOA) constructed the first 250 family size plants during the year 1975/76. All these plants were of floating drum type design based upon Khadi and Village Industries Commission (KVIC) of India.
Agricultural Development Bank of Nepal (ADB/N) have been playing an active role in the promotion of biogas technology since 1974/75 by disbursing loans to the interested individuals for installing biogas plants. Besides lending money, the bank is also active in carrying out promotional activities such as training and information dissemination. Similarly, Development and Consulting Services (DCS) of the United Mission to Nepal (UMN), Balaju Yantra Shala (BYS) and Agricultural Tool Factory (ATF) were also amongst the pioneering agencies to make the biogas programme a success (Karki and Dixit, 1984).
A project entitled "Study on Energy Needs into Food System" was undertaken in 1976. This project was sponsored by USAID and executed jointly by DOA and US Peace Corps/Nepal. Under this project, a few Nepalese experts and American Peace Corps volunteers were trained; a few pilot digesters were constructed; and a night-soil community biogas plant was also installed at Tyagol Tole of Lalitpur District.
Gobar Gas and Agricultural Equipment Development Company (GGC) was established in 1977 as a private company (a joint enterprise consisting of DCS of UMN, ADB/N and the Fuel Corporation) with an objective of promoting biogas technology in the country. For about 15 years from its establishment, GGC remained the only organization involved in the promotion of this technology. Besides constructing biogas plants, it has also been involved in providing training to the masons, users and its staff (CMS, 1996).
The main actors involved in biogas development are presented below:
14.2 HMG-NEPAL INVOLVEMENT
As said earlier, government interest to support biogas programme was noticed first following the World Energy crisis of 1973. Thus, the first ever subsidy on biogas came in 1975/1976 as interest free loan for plant installation. In the following year, the incentive was changed to a preferential loan at six percent (subsidized) interest rate. In 1982/83, a subsidy of NRs 5,500 was provided to each plant constructed in some specified districts only.
The government plan for the construction of biogas plants was first included in the Seventh Five Year Plan (1985-90) with a target to construct 4,000 plants during the project period. It was considered an ambitious plan but was easily achieved mainly due to the effort of GGC. During this period, the government had decided to provide a subsidy of 25 percent on the construction cost and 50 percent on the interest of loan from Agricultural Development Bank of Nepal (ADB/N). But these policy provisions were removed in 1990/91 in favor of the general policy to do away with all types of subsidies. These frequent policy changes
117
and their inconsistency created confusions and hampered the development of biogas programme. Realizing the necessity to promote rapid development of biogas sector in Nepal, the government had set a target of commissioning 30,000 plants during the Eighth Five Year Plan (1992-97). The subsidy policy after 1992 has been stable and quite conducive to the rapid development of biogas programme in Nepal. In 1992, following the establishment of SNV7BSP, the government had fixed a subsidy amount of NRs 7,000 in Terai districts and NRs 10,000 in hill districts. Because of the government policy to encourage the privatization in biogas sector, many new companies and NGOs came into being to participate in the programme. Thus, the target set by the government to construct 30,000 biogas plants in the Eighth Five Year Plan was fully achieved even before the end of the planned period.
The subsidy policy was further revised in the Fiscal Year 1995/96. Accordingly, the government has been disbursing subsidy amount at the rate of (a) NRs 7,000 in the Terai; (b) NRs 10,000 in the hills connected with roads; and (c) NRs 12,000 in the remote hills that are not connected with roads. These subsidies are provided irrespective of the plant size. However, based upon the Mid-term Report of SNV/BSP, these rates have been effectively reduced with Rs 1,000 across the board from July 1999 onwards (Kanel, 1999).
Encouraged with the achievement of biogas development programme in Nepal, the government has fixed a target of installing 100,000 plants during the Ninth Five Year Plan period (1998-2002) with assistance from the SNV/Nepal and co-funding of Kreditanstalt fur Weideraufbau (KfW), a development bank of Germany.
14.3 BIOGAS SUPPORT PROGRAMME
In November 1992, an agreement was signed between the Ministry of Finance on behalf of HMG/N and SNV/N on behalf of DGIS regarding the establishment and implementation of Biogas Support Programme (BSP). The long-term objectives of BSP were formulated as follows (BSP, 1992):
■ To reduce the rate of deforestation and environmental deterioration by providing biogas as a substitute for fuelwood and dung cakes to meet the energy demand of the rural population;
■ To improve health and sanitation of the rural population, especially women, by eliminating smoke produced during cooking on firewood, by reducing the hardship concerning the collection of firewood and by stimulation of a better management with regard to dung and night-soil; and
■ To increase the agricultural production by promoting an optimal use of digested dung as organic fertiliser.
Both HMG/N and SNV/Nepal understood that (private) parties other then GGC and ADB/N were eventually required to tap the huge potential of biogas. However, the terms and conditions for their involvement still had to be worked out and hence the programme was divided into two phases.
BSP Phase 1
The first phase of BSP was supposed to cover the period from July 1992 to July 1994 and pursued the following short term-objectives.
■ To construct 7,000 biogas plants; ■ To make biogas more attractive to smaller farmers and farmers in the Hills; and ■ To formulate recommendations on the privatisation of the biogas sector in Nepal.
The major implementing agencies were ADB/N, GGC and SNV/Nepal. The first two mentioned objectives were met by providing a flat rate subsidy of NRs 7,000 in the Terai districts and NRs 10,000 in the Hill districts. The additional subsidy amount of NRs 3,000 in the latter districts was meant as a contribution to the higher transportation costs of construction materials.
BSP Phase II
The second phase of BSP was designed to cover the period from July 1994 to July 1997 and aimed:
118
■ To construct 13,000 biogas plant; ■ To make biogas more attractive lo smaller farmers in the Hills; and ■ To support the establishment of an apex body to co-ordinate the different actors in the biogas sector.
The major implementing agencies were the ADB/N and two other banks (NBL and RBB), GGC and other (private) biogas companies, and SNV/Nepal. Gradually, also (I)NGOs started to play an important role in the promotion of biogas in their working areas.
Maintaining the subsidy level as applied in BSP I the first two objectives were pursued. From 1995/1996 onwards, a third subsidy rate of NRs 12,000 was introduced for Remote Hills districts the headquarters of which were not connected by a road.
The numerical objective was reached ahead of time, i.e. in February 1997. The installation of a government apex body was slightly delayed, but finally materialised with HMG's formation order in September 1996 for the Alternative Energy Promotion Centre (AEPC).
BSP Phase III
Following the recommendations of the mid-term evaluation of 1994 (de Castro et al, 1994), a formulation team was formed in November/December 1995 for the third phase of BSP. A delegation of the Kreditanstalt fur Wiederaufbau (KfW) undertook the appraisal of a possible German financial contribution to BSP III in January/February 1996. Based on the
findings of the missions and a numerous discussions held with Nepali (governmental) institutions, the third phase of BSP was designed for the period from March 1997 up to June 2003 (BSP, 1997; de Castro et al, 1999).
BSP Ill's overall objective is to further develop and disseminate biogas as an indigenous, sustainable energy source in rural areas of Nepal, whereby more specifically the following is aimed for:
■ To develop a commercially viable, market oriented biogas industry; ■ To increase the number of quality, small(er)-sized biogas plants with 100,000. ■ To ensure the continued operation of all biogas plants installed under BSP; ■ To conduct applied R&D, particularly the development and local production of a high quality gas
main valve, gas tap and lamp; ■ To maximise the benefits of the operated biogas plants, in particular the optimum use of biogas
slurry; and ■ To strengthen and facilitate establishment of institutions for the continued and sustained development
of the biogas sector. From a single biogas company/single financing institute/single donor-programme, the institutional set-up for phase III matured significantly, with the Nepalese Government, three main Nepali banks, foreign organisations, biogas companies and (I)NGOs co-operating in the programme (BSP, 2002).
SNV/BSP created with support from SNV/Nepal has been the principal donor that has been involved in the promotion of biogas programme since 1992. The First and Second Phase of BSP programme (1992 to 1997) was successfully completed by the construction of 20,200 plants against a target of 20,000-plant construction.
The BSP's Third Phase programme plans to construct additional 100,000 biogas plants in Nepal. Under the framework of SNV/BSP a total of 101,950 biogas plants have been established in the Kingdom of Nepal from 1992 to 30th April 2003 due to the concerted efforts of SNV/BSP and its partners. The figures exclude 8,920 plants that were commissioned during Pre-BSP period (1973/74 to 1991/92). The year-wise installation figure has been graphically presented in Annex II of this document.
119
BSP is overall responsible for the implementation of the biogas programme. Its main responsibilities are quality assurance/control and maintenance of constructed plants, operation and maintenance training to the biogas users, technical training to the company staff, subsidy administration, overall biogas promotion and marketing, research and development, and institutional strengthening.
Proposed BSP Phase IV
Phase IV is planned from 1 July 2003 to June 2009 with the following objectives (BSP. 2003):
The overall objective of BSP-IV is to further develop and disseminate biogas as a mainstream Renewable Energy Technology in the rural areas of Nepal. The specific objectives contributing to its overall objectives are:
■ To develop a commercially viable and market-oriented biogas industry; ■ To further strengthen institutions for sustainable development of the biogas sector; ■ To stimulate internalisation of all benefits of the biogas plant, focusing on gender related impacts of
the technology; ■ To implement Clean Development Mechanisms (CDM) arrangements for biogas sector in Nepal; ■ To increase the number of quality biogas plants with 200,000; ■ To ensure the continued operation of all biogas plants installed under BSP; and ■ To conduct applied R & D in order to optimise plant operation.
14.4 FINANCIAL INSTITUTIONS
As said, mainly three banks namely Agricultural Development Bank (ADB/N), Nepal Bank Limited (NBL), and Rastriya Banijya Bank (RBB) are involved in providing the loans to farmers for the construction of biogas plants. ADB/N has been the pioneering institution involved in financing biogas programme. Established in 1968, it has a network of more than 700 offices spread strategically all over the country to provide its services at grass-root level. It has been providing services in biogas sector right from the very start of the programme in 1974/75. After 1995, above-mentioned two commercial banks (NBL and RBB) have joined in providing the loans to farmers for the construction of biogas plants. The annual interest rates charged by these three banks on biogas sectors also vary to some extent.
Currently, about 60 local based Micro Finance Institutes (MFI) are involved in lending biogas loans to the poorer section of society with lower interest rates. Involvement of MFIs in biogas lending and promotion seems promising (BSP, 2003).
14.5 (I)NGOS AND OTHERS
As the SNV/BSP's third phase programme was planned to be terminated by the end of 2002, it is imperative that appropriate institutions should be involved to lake up its activities. Thus keeping this view in mind, SNV/BSP has supported the establishment of NPBG as an umbrella organization of biogas companies, which is already been involved in biogas promotional activities. Some (I)NGOs are also involved in biogas promotion.
Various donors such as United Nations Children Educational Fund (UNICEF), UNCDF (United Nations Capital Development Fund), Save the Children/USA, Plan International and FAO, etc had been involved in the past to promote biogas technology in Nepal. Their involvement was mainly for providing financial support and the necessary technical assistance.
14.6 BIOGAS COMPANIES
While BSP was established, it started opening the opportunities for private sector for biogas construction. Currently, 57 biogas companies have been involved in biogas plant construction and maintenance. Biogas companies also provide training to the users on operation and maintenance and training on maximum

120
utilization of bio-slurry as fertilizer.
REFERENCES
[1] BSP (1992) Implementation Document, ADB/N, GGC and SNV. [2] BSP (1997) Final Report on the Biogas Support Programme Phase-I and II Development through the Market. [3] BSP (2003) Biogas Nepal 2002, Biogas Support Programme. [4] CMS (1996) Biogas Technology: A Training Manual for Extension, Food and Agriculture Organization of the United Nations, Support for Development of National Biogas Programme (FAO/TCP/Nep/4451-T). [5] de Castro J.F.M., A.K. Dhussa, J.H.M. Opdam and B.B. Silwal (1994) Mid-term Evaluation of the Biogas Support Programme, DGIS. [6] de Castro J.F.M., N.R. Kanel and P. Jha (1999) Mid-term Review of the Biogas Support Programme. Part of Phase III, Biogas Support Programme. [7| Karki, A. B. and K. Dixit (1984) Biogas Field book, Sahayogi Press, Tripureshwor, Kathmandu, Nepal. [8] Kanel, N.R. (1999) An Evaluation of BSP Subsidy Scheme for Biogas plants, Biogas Support Programme. [9] NPC (1992) The Eight Five- Year Plan 1992-1997, National Planning Commission, Kathmandu, Nepal.
121
CHAPTER XV
Q U A L I T Y C O N T R O L S Y S T E M O F B I O G A S P L A N T S 15.1 WHY QUALITY CONTROL?
As per General Quality Manual of BSP, Quality Control is part of quality management focused for fulfilling quality requirements. Quality control is a regulatory process through which we measure actual quality performance, compare it with quality goals and act on the difference. The quality of information, design,construction, operation and after sales service is the main tasks related to this. 15.2 HOW DO WE DO? The biogas companies are responsible to construct plants as per the quality standards. They use quality biogas appliances and provide guarantee on both appliances and structure. After the completion of the plants the companies send the completion report to BSP as well as the yearly maintenance report. Only a biogas plant in its first year can be checked or controlled for construction. It will be a final product audit for AfterSale Service (ASS) the next year. For construction control at least 5 percent of the plants from random sampling are controlled with a minimum of two plants per branch for both filled and non-filled plants. Similarly, there is a provision of control of ASS plants that has guarantee time. The ASS is also linked with random sampling of 5 percent, which is the average of the last two years construction related to the guaranteeperiod.
The process for controlling these plants is that two technicians comprising of one team go with at least one company representative to the sampled biogas plant. After introducing with the respondent one of the technicians fill in the core data of the questionnaires through interview while the other handles the observation and measurement part. When the questionnaire is totally filled in, both the technicians sign and hand over the questionnaire to the company representative. The company representative also signs if he agrees with the findings. The technicians also give advice on the findings to the company representative and the owner of the plant during the visit. The visit to the specific biogas plant is recorded in the biogas owner's manual. For construction control the task is related to three questionnaires, the data of which are linked with BPIcalculation. (i) Filled-this is a biogas plant constructed as per construction manual and quality standards. The plant is
filled with dung up to the top of manhole or bottom of outlet. (ii) Non-Filled Long-a biogas plant under construction where the dome has already been cast though
outlet, inlet, pipeline; water drain pit etc may still be under construction. (iii) Non-filled short- a biogas plant under construction where dome has not been yet cast, Similarly, two questionnaires are related to final product audit for ASS, which is compiled in one paper. (i) ASS form (ii) Slurry form The ASS questionnaire is linked with random sampling and is included in the BPI© while the data of slurry is not. 15.3 NATIONAL QUALITY REVIEW MEETING The findings of the control trip must be reported during the three weekly cycle meeting on Friday when thetechnicians are back in the office after a two-week control field trip. The participants of this meeting are, the Senior Quality Management Officer (SQMO), quality control team members, the representatives from AEPC

122
and NBPG. Sometimes a company may be asked to represent at the meeting to clarify certain issues related to the company. The SQMO is the chairperson of this meeting. One of the members from each team that went for control in the previous two weeks must submit their findings in their field report. The other issues that are discussed at this meeting are: ■ Action Items of previous meeting ■ List of decisions taken ■ Improvement Plans ■ Planning of field trip ■ Technical Issues ■ Administrative issues ■ Any other relevant business The minutes of the meeting are taken by one of the staff from any team, which is distributed, to all the participants. The SQMO officially files the minutes as well as the Agenda and the field report. The SQMO writes to the concerned companies who have not fulfilled their obligations as per the findings for necessary corrections. 15.4 PENALTIES AND BONUSES The control questionnaires for both construction (New) and ASS are filled in database of BSP. With this database the performance of the companies are evaluated and the performance trend within the sector is analyzed. The companies are imposed penalties when the constructed biogas plants do not meet the required quality standards and are not constructed as per the construction manual. This way the companies are held responsible for the quality of the work and not the users. Seriousness of defaults is the governing factor on the weight of the penalty. There are four types of defaults as per their severity or seriousness. " Defaults causing penalty of full subsidy amount • Defaults causing penalty of lesser amount • Defaults that do not carry a penalty " Defaults recorded but not counted Similarly, well performing companies are awarded with bonuses after their overall performances (grading). After the termination of the fiscal year, the total penalty and bonus amount per company is calculated. The payments are made by BSP and money is reimbursed. 15.5 BIOGAS PERFORMANCE INDEX (BPI©) The BPI© is a relative index system where all key indicators are equally valued. The BPI© is calculated company-wise on the following 7 quality indicators; (i) Production: No of plants constructed by the company (ii) Average Default: Average default on construction by the company (iii) Average Penalty: Average penalty on construction by the company (iv) Average Feeding %: Average feeding % of the company (average of BOJ (v) Accuracy: Accuracy on ASS reporting of all FY (vi) Maintenance: Maintenance points of all FY (vii) ASS Progress: Percentage of ASS obligations fulfilled per April the 15th (present FY) The data on the quality indicators are as per the findings and observations of the quality control team of BSP. The company BPI© is calculated by taking the average of the Indicator Prefixes. The BPI© calculation is used to give the biogas company a grade. The class indexing forms the foundation for the grading system. Companies are graded in 5 categories, "A" (Excellent) to "E" (very poor) as per the results of the PERFEX calculation. At the end of the construction year calculation is done to grade the companies. In the new agreement with companies, the allocation of quota, penalty enforcement, quality control by companies, certification, training etc are directly related to the grading system.

123
15.6 CONCLUSION Due to very stringent quality control system, it has been found that the overall performance of construction of biogas plants has been an immense success story in Nepal. The following are the reasons to validate the truth regarding this. ■ Successful implementation of Quality Control by BSP ■ High success rate for operation of the plant (98%) ■ High rate of client satisfaction on quality of constructed plants and the quality of instruction provided
to the farmers (96%) ■ Longer life of plants due to Quality Control ■ Successful slurry program REFERENCES [1] BSP (1998) BSP Quality Control on Construction and After-Sales-Services 2054/05 under GGC. [2] CES/IOE (2001) Advanced Course in Biogas Technology, Biogas Support Programme. [3] CMS (1996) Biogas Technology: A Training Manual for Extension, Food and Agriculture
Organization of the United Nations. Support for Development of National Biogas Programme (FAO/TCP/Nep/4451-T). [4] Lam, J. and W.J. van Nes (1994) Enforcement of Quality
Standards upon Biogas Plants in Nepal. In; Biogas Forum, Vol. II, No. 57.
123
124
CHAPTERXVI
IMPACT OF BIOGAS ON USERS
The ultimate beneficiaries of biogas technology are the farmers, especially women who have to undergo the drudgery of cooking. The programme will be considered successful only when they are satisfied with the performance of their installation. Keeping these viewpoints into consideration, various biogas users surveys had been carried out under the framework of BSP and AEPC on routine basis by different organizations involved in the promotion of biogas in Nepal. The feedbacks of the evaluation so received from the users have permitted both SNV/BSP and AEPC to take necessary actions to launch suitable programmes to tackle problems experienced by the users in the field. In order to get a complete picture about the impact of biogas on users, this chapter reviews and discusses the main highlights and striking points revealed by various biogas users surveys that were carried out by the reputed organizations from 1992/1993 to 2000/2001 (NEPECON, 2001).
16.1 CHARACTERISTICS OF BIOGAS FARMERS
16.1.1 Ethnicity, Occupation, Cattle Holding and Literacy Status of the Biogas Users
The review of biogas users survey carried out from 1992/93 to 2000/2001 on ethnicity, main occupation, cattle holding and educational status revealed that Brahmins and Chettries dominate over other ethnic groups regarding the installation of biogas plants. In different surveys, their number fluctuates from 61 to 83 percent, while the number of other ethnic groups ranges from 17 to 29 percent only. The average of 7 years" data (1992/93 to 2000/2001) showed that the combined percentage of Brahmins and Chettries consists of 76, while that of other castes is 24 percent only. On an average, agriculture is the main occupation f o r 9 3 p e r c e n t p l a n t o w n e r s , a s a l l o f t h e m p o s s e s s l a n d h o l d i n g a n d l i v e s t o c k (5.48 cattle/household). With regard to the education status of the biogas owners, 79 percent are literate, while 21 percent are illiterate.
16.1.2 Average Income of Biogas Households from Different Sources
An attempt was made to assess the average income of the sampled biogas households in nine districts of the country representing five development regions. The result of the study has been presented in Table 16.1 (NEPECON, 2001).
Table 16.1: Annual Income from Different Sources
S.N. Activity Percentage Average of Annual Income (Rs.)1. Farming 21.75 16,800 2. Farm Labour 0.65 510 3. Skilled Labour 4.00 3,100 4. Wage Labour 1.10 850 5. Governmental Service 26.10 20,180 6. Non-governmental Service 7.67 5,930 7. Foreign Service 20.57 15,900 8. Trade 18.16 14,040
Total 77,310 The average annual income of the sampled biogas users from different sources was found to be Rs 77,310, which is quite higher than the average national household income of the country (around Rs 42,000). As regards to the different income sources, largest share is contributed by services (54%), while farming contributes to about 22 percent in total income of the household. Similarly, trade accounts for 18 percent and the remaining 6 percent is generated by means of labour.

125
16.2 SATISFIED USERS, USE OF GAS AND SLURRY AND ATTACHMENT OF LATRINE The result of 7 years of survey has remarkably revealed that the number of Satisfied Users ranges from 94 percent to 98 percent in different years, the average satisfaction rate being 96 percent. Except a negligible percent of biogas households, almost all the plant owners are satisfied with their plant.
Cooking is the primary need for majority of the households followed by lighting. As regards to the attachment of latrines, the percentage of latrine-attached users ranges from 27 to 48 in different years, the average figure being 34 percent.
The figure for slurry using farmers differs in various surveys. In the biogas users survey conducted by NEPECON (2001), the percentage was found to be 75. However, the average of 7 years is 49 percent. There is an increasing trend in slurry utilization by the biogas farmers owing to fact that both government (i.e., AEPC) and donor agency (i.e., SNV/BSP) have stressed much importance for simultaneous promotion of biogas and slurry in an integrated manner.
16.3 PERFORMANCE AND OPERATION AND MAINTENANCE OF THE BIOGAS PLANTS
16.3.1 Performance of Biogas Plants
To assess the users' viewpoint about the performance of their biogas plants, the findings of the last three Biogas Users Survey implemented by SNV/BSP and AEPC (CMS, 1999; IDRS, 2001; NEPECON, 2001) were reviewed. For this assessment, the performance of biogas plants as judged by the users was rated in three categories such as good, satisfactory and poor. According to the average value presented in Figure 16.1, 67 percent of the respondents rated the performance of their plants in good category, while 29 rated them in satisfactory category and the rest 4 percent as poor.
Figure 16.1: Performance of Biogas Plants
16.3.2 Operation and Maintenance Aspects According to the survey conducted by IDRS (2000), 52 percent of the sampled plant owners were found using cattle dung with night soil whereas 37 percent used only cattle dung. Similarly, 7 percent fed their plants with, cattle dung in conjunction with available plant residues. The remaining 4 percent used combination of cattle dung with pig excreta as feeding materials for the plant.
87 percent of the sample households reported the plant to be in smooth operation and maintenance. The remaining 13 percent of the sample households had some problems in the operation of lighting appliances due to inferior quality of gas lamps and frequent breakage of mantle.
The average quantity of dung fed into the plant was estimated to be 49.35 kg for the average plant size of 8.91 nv\ It was found that only 5 percent of the total sample households were feeding the prescribed quantity

126
of dung, On the other hand, 33 percent of the households were feeding more than die prescribed quantity (overfeeding), while 62 percent were feeding less than the prescribed quantity (underfeeding). 20 percent of the sampled owners reported leakage of gas from gas taps and 10 percent faced problems of cracks in rubber hosepipe. However, it was reported that 72 percent have not incurred any expenditure since installation of the plants. The average cash amount incurred for the maintenance was within the range of Rs. 300 to Rs. 600 per year. However, the spot observation found that 53 plants still needed maintenance for optimal utilization of the plant. It was reported that 90 percent of the plant owners were satisfied with after-sales-services provided by the companies whereas the remaining 10 percent had some complaints. 82 percent of the sampled households have received instruction from the companies on the appropriate use of slurry whereas the remaining 18 percent have not received such instruction (IDRS, 2000). Out of the total sampled biogas households, 69 percent female members have received 1 to 2 days' training on operation and maintenance of the plants whereas 31 percent have not received such training. Out of 69 trainees, 53 percent appeared satisfied and the rest 47 percent were discontented. 16.4 ROLE OF COMPANIES IN BIOGAS PROMOTION In 1999, 39 biogas construction companies3 have been involved to provide their services in biogas sector in Nepal. Through the years, the services rendered by the biogas companies have been improving, as around 70 percent of the users are satisfied with the after-sale-service for their respective companies. But there is still a lack of commitment from the company staff as 30 percent of the users are dissatisfied with their follow up services (CMS, 1999). Status of visit by the company on request/routine shows positive results with 33 percent responding to routine visit by the company at least once, 29 percent responding twice and 14 percent responding thrice and more. The time required by a company to respond for maintenance is directly dependent upon the distance of the plant from the nearest motarable road, as 73 percent of the sites were located at a distance of less than 30 minutes walk from the motarable road (CMS, 1999). Although the company provides trained masons and supplies quality materials for plant construction, some cases have been reported where the users have expressed their dissatisfaction over the quality of materials used and masonry work. Some respondents felt that there is an inadequacy in the supply of biogas equipment and fittings. The companies have also been providing user's training on maintenance of the plant as well as management and utilization of slurry. In this connection, only 65 percent of the respondents stated that they have benefited from the training offered by the companies, while the rest 35 percent were deprived of it. 16.5 UTILIZATION OF SLURRY Out of the 38 percent biogas households that use slurry in the form of compost from the latrine connected plant, 34 percent have been making compost within the period of 3 to 4 months, while 13 percent households was found not considering the time seriously for compost making. Similarly, 48 percent households was found using slurry in dry form and another 43 percent made compost out of slurry. On other hand, the users of slurry in wet form are found to be 5 percent and remaining 4 percent did not use the slurry at all (CMS, 1999). Compost pit is an essential requirement of biogas plant for collection of slurry. The availability of compost pit facilitates the protection of slurry from surface flow and sunshine and also assists in the process of decomposition. The biogas owners followed to some extent the high priority accorded by Slurry Extension Programme in digging compost pit in accordance with plant size. It has been suggested by SNV/BSP to construct at least two compost pits beside the biogas plants for using them alternately. It was found that 48 percent of the users have constructed two slurry pits adjacent to their plants, while 50 percent of them have constructed only one slurry pit and the rest 2 percent did not construct the it at all (CMS, 1999).
3 The number of the Biogas Companies can vary every year.
127
16.6 IMPACT OF BIOGAS The findings of biogas users survey have shown that the demand of firewood has decreased to about 40 percent after installation of biogas plant (CMS, 1999). Similarly, the demand for kerosene has reduced to as much as 56 percent. On an average, a biogas household saves 990 kg of firewood and 6 litres of kerosene per annum as a result of biogas installation. Hence, a household saves Rs 257 per month on expenses for purchasing fuel (firewood and kerosene) or Rs 3,084 per year due to installation of biogas plant. Similarly, the average time saving of the sampled biogas households for performing various biogas related activities amounts to about 1.31 hours/day (1 hour 18 minutes/day) or 478 hr per year. With this calculation in saving, a daily wage labour can earn around Rs 4,180 per year.
The survey also reveals that 77 percent farmers have installed the plant for cooking convenience owing to shortage of firewood. About 75 percent have installed biogas for cooking alone, while the rest 25 percent both for cooking and lighting purposes. Other principal benefits as perceived by about 60 percent respondents were: time saving, smokeless cooking, money saving and production of high quality organic fertilizer (CMS, 1999).
Nearly all the respondents (97 to 98%) have reported that the major benefit of biogas is the saving on time so far as cooking and cleaning of utensils are concerned. Similarly, 82 percent respondents expressed that time saving in firewood collection was also among the principal benefits of this technology.
The installation of biogas plant has shown to influence the household towards keeping a clean and smoke free environment, Improved hygienic conditions would automatically lead to better health and sanitation among the users. There is 20 to 50 percent decrease in respiratory diseases, cough, and headache and eye infection because of biogas installation.
About 75 percent users have reported a decreased visit to health posts for minor health problems after biogas installation. On the other hand, around 20 percent of the respondents said that they did not notice any change in this respect due to biogas installation (CMS, 1999).
16.7 INSUFFICIENCY OF GAS
86 percent of the respondents who used the gas for cooking and both for cooking and lighting had sufficient gas, while 14 percent of those who used biogas only for cooking (9%) and lighting (5%) purpose have experienced insufficiency of gas in their plants. The insufficiency of gas has been found to occur only in the winter months of December and January. It has also been reported that most of the users substitute this insufficiency by burning firewood and kerosene (CMS, 1999). .
REFERENCES
[I] CMS (1999) Biogas Users Survey 1998/1999. Biogas Support Programme.
|2| IDRS (2000) Biogas Users Survey 1998/1999, Biogas Support Programme.
[3] NEPECON (2001) Biogas Users Survey 2000/2001, Biogas Support Programme.
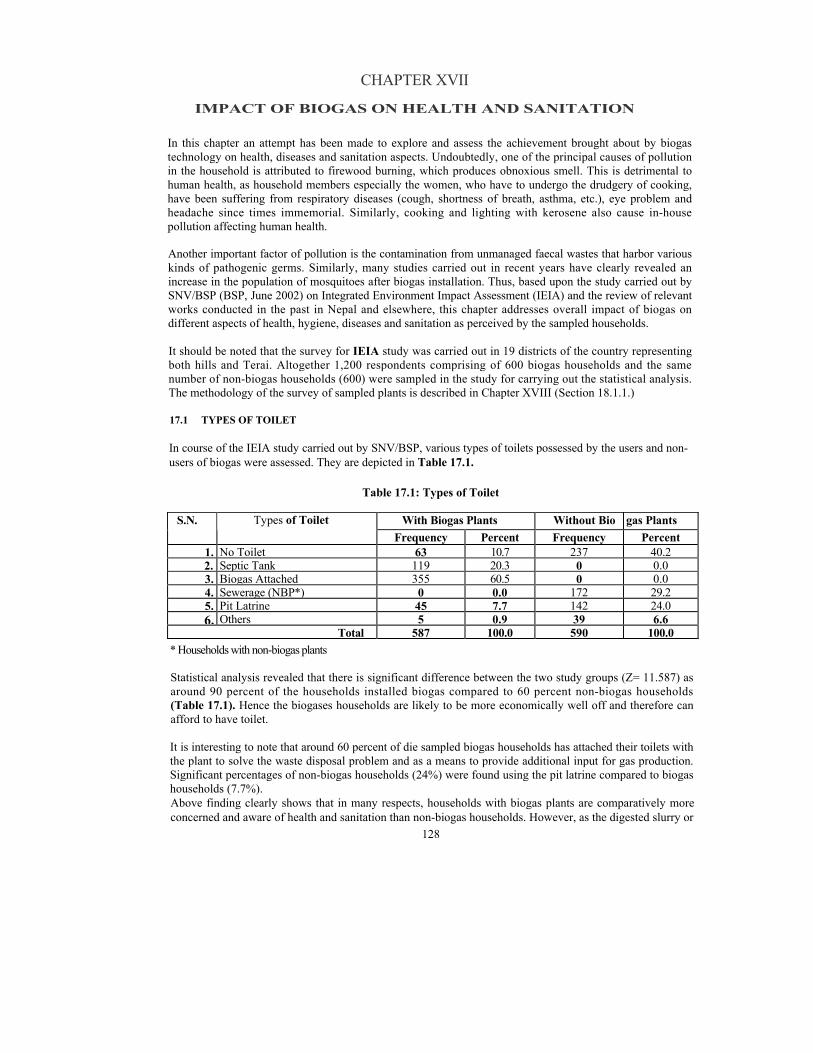
128
CHAPTER XVII
IMPACT OF BIOGAS ON HEALTH AND SANITATION
In this chapter an attempt has been made to explore and assess the achievement brought about by biogas technology on health, diseases and sanitation aspects. Undoubtedly, one of the principal causes of pollution in the household is attributed to firewood burning, which produces obnoxious smell. This is detrimental to human health, as household members especially the women, who have to undergo the drudgery of cooking, have been suffering from respiratory diseases (cough, shortness of breath, asthma, etc.), eye problem and headache since times immemorial. Similarly, cooking and lighting with kerosene also cause in-house pollution affecting human health.
Another important factor of pollution is the contamination from unmanaged faecal wastes that harbor various kinds of pathogenic germs. Similarly, many studies carried out in recent years have clearly revealed an increase in the population of mosquitoes after biogas installation. Thus, based upon the study carried out by SNV/BSP (BSP, June 2002) on Integrated Environment Impact Assessment (IEIA) and the review of relevant works conducted in the past in Nepal and elsewhere, this chapter addresses overall impact of biogas on different aspects of health, hygiene, diseases and sanitation as perceived by the sampled households.
It should be noted that the survey for IEIA study was carried out in 19 districts of the country representing both hills and Terai. Altogether 1,200 respondents comprising of 600 biogas households and the same number of non-biogas households (600) were sampled in the study for carrying out the statistical analysis. The methodology of the survey of sampled plants is described in Chapter XVIII (Section 18.1.1.)
17.1 TYPES OF TOILET
In course of the IEIA study carried out by SNV/BSP, various types of toilets possessed by the users and non-users of biogas were assessed. They are depicted in Table 17.1.
Table 17.1: Types of Toilet
With Biogas Plants Without Bio gas Plants S.N. Types of Toilet Frequency Percent Frequency Percent
1. No Toilet 63 10.7 237 40.22. Septic Tank 119 20.3 0 0.03. Biogas Attached 355 60.5 0 0.04. Sewerage (NBP*) 0 0.0 172 29.25. Pit Latrine 45 7.7 142 24.06. Others 5 0.9 39 6.6
Total 587 100.0 590 100.0* Households with non-biogas plants
Statistical analysis revealed that there is significant difference between the two study groups (Z= 11.587) as around 90 percent of the households installed biogas compared to 60 percent non-biogas households (Table 17.1). Hence the biogases households are likely to be more economically well off and therefore can afford to have toilet.
It is interesting to note that around 60 percent of die sampled biogas households has attached their toilets with the plant to solve the waste disposal problem and as a means to provide additional input for gas production. Significant percentages of non-biogas households (24%) were found using the pit latrine compared to biogas households (7.7%). Above finding clearly shows that in many respects, households with biogas plants are comparatively more concerned and aware of health and sanitation than non-biogas households. However, as the digested slurry or

129
slurry compost prepared from latrine attached plant may harbour pathogens or parasitic worms, it is necessary that the biogas households be instructed to adopt necessary protective hygienic measures while handling the waste output.
17.2 MOTIVATION TO BUILD A TOILET
Motivation is considered to be among the important factors for convincing the people to adopt desired innovation in the society. Some people are self-motivated, while some others can be influenced by friends and neighbours. In many respects biogas companies and NGOs also play a vital role in this respect (Table 17.2).
Tablel7.2: Motivation to Build a Toilet With Biogas Plants Without Biogas Plants S.N. Types of Toilet
Frequency Percent Frequency Percent 1. Self 321 61.7 310 89.1 2. Biogas Company 144 27.7 0 0.0 3. Family Members/ Neighbours 41 7.9 27 7.84. NGO 14 2.7 11 3,2
Total 520 100.0 348 100.0
According to Table 17.2, the percentage of self-motivated households to build toilet are significantly higher (Z=8.864) in non-biogas households (89.1%) than biogas households (61.7%). On the other hand, biogas companies appear to have played significant role in motivating to build the toilet in biogas households, as 27.7 percent of the households were motivated by their efforts. The findings are statistically significant at 0.05 (Z=10.749). Both the categories of households seem to have less motivated by family members, neighbours and NGO.
17.3 IMPACT OF BIOGAS ON VARIOUS SMOKE-BORNE DISEASES
The results of the survey of 100 biogas households on the impact of biogas on various smoke-borne diseases as investigated by SNV/BSP were described in Chapter VI. Accordingly, there was significant improvement in the smoke-borne diseases such as eye illness, eye bum, respiratory problem, headache and diahorrea as a result of cooking with biogas. Cooking with clean and odourless flame of biogas enabled to reduce in-house pollution caused due to the smell of kerosene or smoke (SNV/BSP, 2000). Furthermore, connection of toilet to the biogas plant has been conducive in improving the health and hygiene of the family members by making clean environment.
Before biogas installation, the people in the rural communities were mostly dependent upon biomass such as firewood, agricultural residues, dung cake etc. for their domestic cooking. These substances produce smoke and in poorly ventilated kitchens, the amount of smoke inhaled by women and children increases. The levels of smoke in kitchens are a serious health problem, leading to respiratory and heart disease. The estimated annual dose of women cooking in kitchens in Gujarat villages of India was found to be 5,800 mg of Total Suspended Particles (TSP) and 3,200 mg of Benzopyrene. The Benzopyrene figure is equivalent to smoking 20 packets of cigarettes per day (Smith et al 19831'
It is in above context that biogas users' viewpoints were sought in view of exploring their perception regarding the degree of reduction in the amount of kitchen smoke after installation of biogas plants (Figure 17.1).
Very large proportion of the households with biogas plants (85%) perceived a remarkable decrease in kitchen smoke after they have had the biogas plants. However, 9 percent respondents still realized the decrease in smoke to some extent, while the rest 5 percent did not find any reduction in the amount of smoke even after biogas installation. This finding may be attributed to either some technical defects in the plants or insufficiency of gas produced due to which they were compelled to use other sources of smoke producing fuels such as cow dung cake, straw, firewood, other agricultural residues, etc.

130
Figure 17.1: Perceived Reduction in Smoke after BGP
17.4 EPISODES OF SYMPTOMATIC EYE INFECTION FOR THE LAST THREE YEARS Exposure to kitchen smoke for prolonged time may produce symptoms like red eye, water discharge or plus discharge from the eyes. Thus an attempt was made to explore the episodes of eye infection for last three years of the households under study with and without biogas plants (Table 17.3).
Table 17.3: Episodes of Eye Infection for the Last Three Years
With Biogas Plants Without Biogas Plants S.N. Status of Infection Frequency Percent Frequency Percent
1. Increased 20 29.9 42 40.82. Same 40 59.7 53 51.53. Decreased 7 10.4 8 7.8
Total 67 100.0 103 100.0
Around 41 percent of non-biogas households had perceived 'increased eye infection' within last three years, compared to 30 percent in case of biogas households. However, the difference was not statistically significant (2=1.446). In the same manner, no significant difference was found between the two study groups perceiving 'decreased eye infection' or 'same conditions'. It should be noted that among other factors, the eye problem might be related also to the hygiene of the women.
17.5 RESPIRATORY DISEASES4
Table 17.4 illustrates the responses the respiratory diseases of the households under examination with and without biogas plants.
Table 17.4: Respiratory Diseases
With Biogas Plants Without Biogas Plants S.N. Status of Infection Frequency Percent Frequency Percent
1. Presence of Respiratory Disease 50 8.3 73 12.2 2. Absence of Respiratory Disease 550 91.7 526 87.8
Total 600 100.0 599 100.0
4 Includes cough, shortness of breath, asthma, etc.

131
There seems very less difference between the biogas and non-biogas households stating presence and absence of the respiratory diseases. In this connection, some 92 percent of biogas households had not reported any respiratory diseases, whereas this figure was 88 percent in case of non-biogas households. This means the presence of respiratory diseases was found 4 percent higher in non-adopter of biogas than the adopter. However, this result is statistically insignificant at 0.05 level (Z= 1.199).
17.6 STATUS OF COUGH FOR THE LAST THREE YEARS
This study presents the result of survey about the status of cough in biogas and non-biogas households as reported by the respondents for the last three years (Table 17.5).
Table 17.5: Status of Cough for the Last Three Years
S.N. Condition With Biogas Plants (%) Without Biogas Plants (%) 1. Increased 20.5 23.4 2. Same 45.8 64.1 3. Decreased 33.7 12.5
Total 100.0 100.0
In biogas group, the respondents perceiving increased cough were 3 percent less in comparison to non-biogas group. This difference is not statistically significant (Z=1.202). Interestingly, the percentage of 'decreased cough' was reported to be almost three times higher in biogas households than non-biogas households. Statistical analysis revealed Z = 8.666, which is significant at 0.05. Similarly, the percentage of respondents reporting no difference (Same) in the status of cough was 18.3 higher in non-biogas group than biogas households. Statistical analysis revealed that the difference between the two study groups is significant (Z=6.359).
The above findings are in agreement with the study conducted in Kaski and Tanahu districts (RUDESA, April 2002). The study has revealed significant percentage of reduction in cough, eye infection and headache after biogas installation. The female respondents had perceived more reduction (64%) in such diseases than their male counterparts (47%).
These findings confirm the general belief as well as previous studies that biogas is quite helpful in decreasing the cough of the family members especially women who are able to cook their food in healthy atmosphere with clean and smokeless biogas.
The particulate carbon matter and toxic substances like carbon monoxide in the smoke produced by firewood can also cause allergic cough asthma, bronchitis, etc. Other factors like pre-existing respiratory problems and smoking habit have not been analyzed.
17.7 STATUS OF DIARRHOEAL EPISODES FOR THE LAST THREE YEARS
Table 17.6 expresses the status of diarrhoea for the last three years of the households under study with and without biogas plants.
Table 17.6: Condition of Diarrhoea
With Biogas Plants Without Biogas Plants Condition Frequency Percent Frequency Percent
Increased 14 27.0 19 42.2Same 32 61.5 22 48.9Decreased 6 11.5 4 8.9
Total 52 100.0 45 100.0

132
27 percent of households with biogas plants reported an increment in diarrhoea, while it was 42 percent in case of non-biogas households. This shows that 'increased diarrhoeal' episode in non-biogas households was 15.2 percent higher than that of biogas households. However, statistical analysis did not reveal any significant difference at 0.05 (2=1.586). Similarly, the 'decreased diarrhoeal' episodes exceeded by 2.6 percent in biogas households compared to non-biogas households. Again, the difference is not statistically significant (Z=0.428). Likewise, 61.5 percent of biogas households and 48.9 percent non-biogas households did not notice any difference in diarrhoeal episodes for the last three years. The difference between the two study groups in this case is not statistically significant (Z=1.251).
It appears that biogas users are more informed and aware of health and hygiene like use of toilets, cooking stove, cleanliness and safe drinking water. These all may contribute to decreased diarrhoeal episodes.
17.8 DYSENTERY
Table 17.7 illustrates the responses about the dysentery of the households under examination with and without biogas plants.
Table 17.7: Dysentery
With Biogas Plants Without Bio ;as Plants S.N. Dysentery Frequency Percent Frequency Percent
1. Presence of Dysentery 33 5.5 63 10.52. Absence of Dysentery 567 94.5 536 89.5
Total 600 100.00 599 100.0
94.5 percent of biogas households did no find any dysentery, whereas the figure was 89.5 percent for non-biogas households. In other words, 10.5 percent of non-biogas households reported dysentery compared to 5.5 percent biogas households. Statistical analysis revealed that Z = 3.201, which is significant at 0.05. It implies that in terms of the diarrhoeal problems, the installation of biogas plants has some significance.
17.9 STATUS OF TAPEWORM FOR THE LAST THREE YEARS
Table 17.8 reveals the status of tapeworm for the last three years of the households under survey with and without biogas plants.
Table 17.8: Status of Tapeworm Infection for the Last Three Years
With Biogas Plants Without Bio gas Plants S.N. Status Frequency Percent Frequency Percent
1. Increased 3 10.3 9 20.9 2. Same 21 72.4 30 69.8 3. Decreased 5 17.2 4 9.3
Total 29 100.0 43 100.0
About 10 percent of biogas households reported an increase of tapeworm infection, while it was 21 percent in case of non-biogas households. However, statistical analysis revealed that the difference between two groups was insignificant (Z=1.182). Likewise, the percentage of biogas households stating 'decreased tapeworm infestation' was around 8 percent higher than non-biogas households, Statistical analysis revealed that Z=0.999, which is not significant at 0.05. Hence there is no significant difference between two study groups.
17.10 PARASITICAL TEST OF TOILET ATTACHED SLURRY
Despite the hesitation and social constraint for use of human excreta as raw materials to feed the biodigester, the users are becoming more conscious to connect their latrine with cow dung plant. The result of the biogas survey shows that around 40 percent of the installed biogas plants were connected to the latrine.

133
It has become essential to assess the health risks produced due to vectors/pathogens likely to be present in slurry (fresh and digested) and slurry compost and present solutions to minimize those risks for people and cattle. No substantial work has been done in Nepalese context in this matter. However, it is worth to quote the work carried out by Agricultural Technology Centre (ATC) with support from SNV/BSP (ATC, 1997). ATC reported the results of parasitical test of 50 samples collected from toilet-attached biogas plants. The study revealed the presence of various parasites in about 16 percent of the samples. Thus, ova of Ascaris lumbricoides, Trichuris trichura, and Hookworm and Giardia lamblia were detected in the samples. However, in case of the slurry compost prepared by using the digested slurry produced from the latrine-attached biogas plant, pathogens were detected in only 8 percent samples.
This being a sensitive issue for public health, it is, therefore, suggested to carry out systematic and in-depth research in this subject in an immediate future.
17.11 CONDITION OF BURNED CASE OF THE LAST THREE YEARS
There is a high danger of burning cases in the households without biogas plant due to firewood burning, kerosene stove and other cooking devices. In this connection, this study attempts to reveal the status of burning case in biogas and non-biogas households for the last three years, as shown in Table 17.90.
Table 17.9: Condition of Burned Case
With Biogas Plants Without Bio ;as Plants S.N. Condition Frequency Percent Frequency Percent
1. Increased 0 0.0 7 77.8 2. Same 2 66.7 1 11.1 3. Decreased 1 33.3 1 11.1
Total 3 100.0 9 100.0
None of biogas households reported an increase in the burned cases, while substantial percentage of respondents in non-biogas households (78%) disclosed such problem. Similarly, the 'decreased percentage' of this case in biogas households is found to be three times more than that of non-biogas households. It is evident from finding that biogas has an impact to control the burning cases that takes place accidentally in the house.
17.12 USER'S PERCEPTION ABOUT SAFETY MEASURE OF BIOGAS OVER FUELWOOD
Figure 17.2 shows the degree of safety on the use of biogas stove over fuelwood.

134
Majority of biogas households (95.5%) perceived a very high degree of safety on the use of biogas stove after they have had the biogas plants. Only 1.2 and 3.3 percent of the households ranked the safety of biogas stove as moderate and no difference respectively. Thus, it is clear that biogas stove is safer than kerosene stove, firewood stove and other available stoves. In the survey area, there is also an example of a member of non-biogas households being killed because of kerosene-stove burst.
17.13 BREEDING OF MOSQUITOES
Various studies conducted in recent years have indicated that there is an increment in the population of mosquitoes after biogas installation. In this connection, the status of mosquito breeding after the introduction of biogas has been revealed in Figure 17.3.
Figure 17.3: Breeding of Mosquito after BGP Installation
Around 70 percent of biogas households reported that mosquito breeding had increased after the installation of biogas whereas 28.6 percent households were of the opinion that mosquito breeding remained the same and only 1.5 perceived its decrease after biogas plant. Similar findings were also revealed in course of the study reported by NEPECON (2001). The principal reasons for mosquito proliferation may be attributed to the followings:
■ Observation indicates that the probable cause of mosquito breeding in biogas plant may be due to availability of moist space in the upper part of the outlet of biogas plant; and
■ If firewood is burnt inside the kitchen, the smoke produced from it drives out mosquitoes. On the other hand, in clear illumination of biogas lamp or electric bulb, there is every risk of mosquito bite.
However, the above observation needs to be confirmed by appropriate research. Simultaneously, it is also essential to suggest suitable methods to the biogas households for the control and destruction of mosquito to avoid the risk of fatal diseases due to mosquito bite.
REFERENCES
[1] ATC (1997) Analysis of Toilet Attached Biogas Slurry-Compost, Biogas Support Programme. [2] NEPECON (2001) Biogas Users Survey 2000/2001, Alternative Energy Promotion Centre. [3] RUDESA (2002) A Study of Biogas Users with Focus on Gender Issues (Kaski and Tanahu Districts), Alternative Energy Promotion Centre. [4] Smith, K., A.L. Aggarwal and R.M. Dave (1983) Air Pollution and Rural Biomass Fuels in Developing Countries. A Pilot Study in India and Implications for Research Policy, In: Atmospheric Environment, 17 (11). [5] SNV/BSP (2002) An Integrated Environment Impact Assessment..

135
CHAPTER XVIII
I M P A C T O F B I O G A S O N E N E R G Y U S E A N D E N V I R O N M E N T
18.1 ENERGY USE
This chapter aims at analyzing the impacts of biogas plants on energy use and environment in Nepal. The findings presented in this chapter are based on the IEIA study carried out by SNV/BSP in biogas and non-biogas households selected on random basis in different parts of Nepal in 2002, as elaborated in Section 18.1.1 (BSP, 2002).
The following parameters were selected in order to come to significant conclusions regarding the energy use: ■ Operational status of the biogas plants; ■ Average biogas stoves / lamps per biogas plant; ■ Dung availability and frequency of feeding; ■ Average plant size; ■ Feeding capacity; ■ Gas production and consumption; ■ Change in use of traditional biomass fuels (fuelwood / agricultural residues / animal dung) and fossil
fuels (Kerosene/LPG); ■ Cooking efficiency; and ■ Replacement of conventional fuels by biogas at national level.
18.1.1 Methodology of Survey of Sampled Biogas Plants
The study is based primarily on the results of an extensive households survey and is supplemented by the review of relevant literature. Out of the 65 biogas-installed districts of Nepal, 19 districts were chosen for sampling purpose as shown in Table 18.1. The sampled districts represented both Hills and Terai and were based on the high/low biogas penetration looking into its technical potentialities (High potential but low penetration and high potential and high penetration).
Village Development Committees (VDCs) were sampled from each district based upon high number of plants constructed in cluster. Individual biogas household was sampled from the VDC by random sampling method depending upon the information obtained from the BSP computerized database. Non-biogas households was identified by the field survey team on the spot, nearest to the sampled biogas households taking into consideration the similarity of socio-economic conditions of biogas households. Altogether 1,200 respondents comprising of 600 biogas households and the same number of non-biogas households (600) were sampled in the study for carrying out the statistical analysis. Table 18.1 presents the detail of sampling of the randomly selected biogas households in accordance with Development Regions.

136
Table 18,1: Sampling of Biogas Households Development Region Sampling District Frequency Percent
- Jhapa(T) 28 4.7 - Dhankuta (H) 30 5.0
Eastern Development Region (EDR)
- Saptari (T) 10 1.7 Subtotal of EDR 68 11.4
- Sarlahi(T) 41 6.8 - Kavre(H) 46 7.7 - Makawanpur (H) 44 7.3 - Chitwan(T) 48 8.0
Central Development Region (CDR)
- Dhading(H) 5 0.8 - Nuwakot (H) 8 1.3 - Kathmandu (H) 5 0.8
Subtotal of CDR 197 32.7 Nawalparasi (T) 30 5.0 Tanahu (H) 39 6.5 Kaski (H) 46 7.7 Syanja (H) 55 9.2 Palpa (H) 44 7.3
- Rupandchi (T) 20 3.3
Western Development Region (WDR)
Kapilbastu (T) 29 4.9 Subtotal of WDR 263 43.9 Banke (T) 17 2.8 Mid Western Development Region
(MWDR) Dang (T) 55 9.2 Subtotal of MWDR 72 12.0
Grand Total 600 100 H = Hills, T = Terai It is obvious from Table 18.1 that out of the 19 districts chosen for sampling, 10 districts comprise of Hills and 9 of Terai. Out of the 600 sampled biogas households, 322 (54%) falls in the Hills and the rest 278 (46%) in the Terai indicating that percentage of sampling in Hills exceeded by 8 percent compared to Terai. Such sampling difference between Hills and Terai seems well justified as the construction record of biogas plants until May 20, 2001 indicates that in Hills, the installation is 24 percent higher than that of Terai. Above table also shows that the distribution of sample in EDR and MWDR is 11.4 and 12.0 percent, while it is 32.7 percent in CDR and 43.8 percent in WDR.
Age of the sampled biogas plants or plant completion year is given in Tablel8.2. Table 18.2: Age of the Sampled Biogas Plants
S.N. Year of Completion Frequency Percentage1. 2049 1 0.22. 2050 2 0.33. 2051 28 4.74. 2052 29 4.8 5. 2053 53 8.86. 2054 104 17.37. 2055 92 15.3 8. 2056 117 19.59. 2057 165 27.510 2058 9 1.5
Total 600 100.0

137
Table 18.2 shows that above 80 percent of the sampled biogas plants were commissioned from 1997 to 2000 indicating that they were 5 to 8 years old. Realizing the life span of a biogas plants ranging between 20 to 30 years depending upon repair and maintenance, the selection of the age of the sampled plants seems well justified.
Tools of Data Collection -
Following categories of structured questionnaires and checklists were prepared for administrating to the targeted households.
■ Questionnaire for Biogas households ■ Questionnaire for Non-biogas households ■ Checklists for Community Level
The questionnaires A and B were mainly administered to the household head his/her spouse together. With the help of community level checklists (Questionnaire C), the field survey team conducted Focus Group Discussions (FGD) with altogether 60 communities in selected VDCs. The participation of farmers, Government official, NGO representative, social worker, schoolteacher, health worker etc was sought in FGD so organized. The main theme of the discussion was focused on the impact of biogas on environmental and ecological aspects.
18.1.2 Number of Operational Biogas Plants
Status of sampled biogas plants has been presented in Table 18.3.
Table 18.3: Status of Biogas Plants Non-operating since last 1 to 60 days
Biogas Plants Surveyed
Operating Non-operating
1-5 6-30 31-60 600 584 (97.3 %) 16 (2.7 %) 5 6 5
Note: Figures in parentheses are the percentage figures of the total
Table 18.3 shows that out of the total 600-biogas plants installed households (BGHs), 584 (97.3 %) mentioned that their plants are operational as of the date of the survey. Among the 16 (2.7 %) BGHs, which mentioned their plants to be non-operational, 5 stated mat their plants have been non-operational since last 1 to 5 days. Similarly, 6 said that they are non-operational since last 6 to 30 days and 5 since last 31 to 60 days.
The reasons for non-operation of the sampled plants have been elucidated in Table 18*4.
Table 18.4: Reasons for Non-operation BGPs Non-operating at Present
BGPs that had been Non-operational in the Past
Reasons
No of Cases % No of Cases % No feeding 1 6.2 11 11.8 Appliance failure 5 31.3 43 46.2 Civil structure damage 2 12.5 13 14.0 Do not know 8 50.0 21 22.6 NA - - 5 5.4
Total 16 100.0 93 100.0
Table 18.4 shows that out of the 16 non-operating BGHs, the reasons for non-operation are known for only 8 BGHs. Among these 8 BGHs, 5 cited appliance failure, 2 cited civil structure damage and 1 cited no feeding
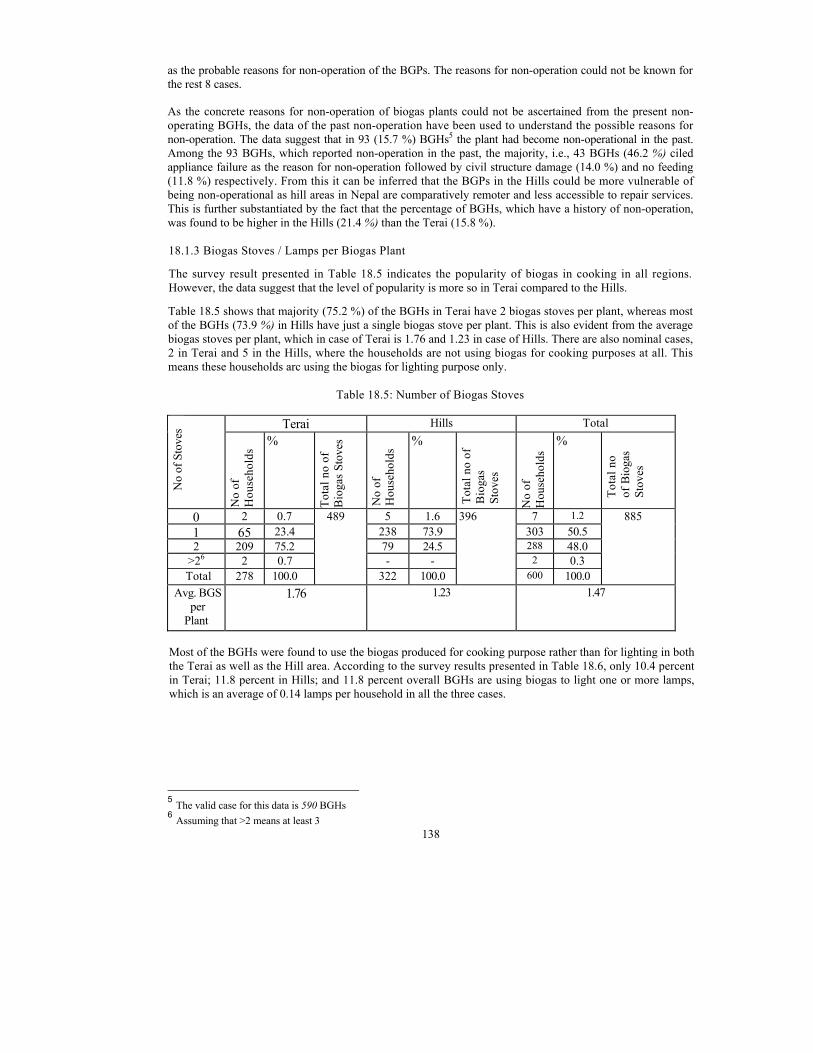
138
as the probable reasons for non-operation of the BGPs. The reasons for non-operation could not be known for the rest 8 cases.
As the concrete reasons for non-operation of biogas plants could not be ascertained from the present non-operating BGHs, the data of the past non-operation have been used to understand the possible reasons for non-operation. The data suggest that in 93 (15.7 %) BGHs5 the plant had become non-operational in the past. Among the 93 BGHs, which reported non-operation in the past, the majority, i.e., 43 BGHs (46.2 %) ciled appliance failure as the reason for non-operation followed by civil structure damage (14.0 %) and no feeding (11.8 %) respectively. From this it can be inferred that the BGPs in the Hills could be more vulnerable of being non-operational as hill areas in Nepal are comparatively remoter and less accessible to repair services. This is further substantiated by the fact that the percentage of BGHs, which have a history of non-operation, was found to be higher in the Hills (21.4 %) than the Terai (15.8 %).
18.1.3 Biogas Stoves / Lamps per Biogas Plant
The survey result presented in Table 18.5 indicates the popularity of biogas in cooking in all regions. However, the data suggest that the level of popularity is more so in Terai compared to the Hills.
Table 18.5 shows that majority (75.2 %) of the BGHs in Terai have 2 biogas stoves per plant, whereas most of the BGHs (73.9 %) in Hills have just a single biogas stove per plant. This is also evident from the average biogas stoves per plant, which in case of Terai is 1.76 and 1.23 in case of Hills. There are also nominal cases, 2 in Terai and 5 in the Hills, where the households are not using biogas for cooking purposes at all. This means these households arc using the biogas for lighting purpose only.
Table 18.5: Number of Biogas Stoves
Terai Hills Total
No
of S
tove
s
No
of
Hou
seho
lds %
Tota
l no
of
Bio
gas S
tove
s
No
of
Hou
seho
lds %
Tota
l no
of
Bio
gas
Stov
es
No
of
Hou
seho
lds
%
Tota
l no
of B
ioga
s St
oves
0 2 0.7 5 1.6 7 1.2 1 65 23.4 238 73.9 303 50.5 2 209 75.2 79 24.5 288 48.0
>26 2 0.7 - - 2 0.3 Total 278 100.0
489
322 100.0
396
600 100.0
885
Avg. BGS per
Plant
1.76 1.23 1.47
Most of the BGHs were found to use the biogas produced for cooking purpose rather than for lighting in both the Terai as well as the Hill area. According to the survey results presented in Table 18.6, only 10.4 percent in Terai; 11.8 percent in Hills; and 11.8 percent overall BGHs are using biogas to light one or more lamps, which is an average of 0.14 lamps per household in all the three cases.
5 The valid case for this data is 590 BGHs 6 Assuming that >2 means at least 3

139
Table 18.6: Number of Biogas Lamps
Terai Hills Total No of Lamps No of
House holds
% Total No of Biogas Lamps
No of House holds
% Total No of Biogas Lamps
No of House holds
% Total No of Biogas Lamps
0 249 89.6 284 88.2 533 8S.S 1 21 7.5 31 9.6 52 8.7 2 6 2.2 7 2.2 13 2.2
>27 2 0.7 - 2 0.3 Total 278 100.0
39
322 100.0
45
600 100.0
84
Avg. BGL per
Plant
0:14 0.14 0.14
18.1.4 Frequency of Dung Feeding
The pertinent data on frequency of dung feeding into biodigester are shown in Table 18.7.
Table 18.7: Frequency of Dung Feeding
Terai Hills Total Frequency of Dung Feeding
No of Plants
Dung Fed per
Feeding (kg)
Total Dung
Fed per day (kg)
No of Plants
Dung Fed per
Feeding (kg)
Total Dung Fed
per day(kg)
No of Plants
Dung Fed per
Feeding (kg)
Total Dung Fedper day
(kg)'
Twice a day
135 30.57 6976.45 132 19.45 5052.96 267 25.27 12029.4 1
Once a day
124 32.48 4027.52 146 21.29 3108.34 270 26,43 7135.86
Every second day
3 31.67 47.49 20 29.80 298.00 23 30.04 345.49
Every third day
3 40.00 39.99 4 29.75 39.68 7 34.14 79.67
Twice a week
1 20.00 5.70 7 24.86 49.70 9 24.25 55.40
Weekly - - - 6 27.50 23.70 6 27.50 23.52 Total 266 - 11096.15 315 21.36 8572.38 581 - 19668.53
Average quantity of available dung per BGP per day (kg)
41.71 2721 33.85
7 Assuming that >2 means at least 3

140
Table 18.7 shows that majority of the BGHs feed their plants once a day (46.5 %) or twice a day (45.9 %). In case of Terai most of the BGHs (51 %) feed twice a day whereas in case of the Hills the majority of the BGHs (46%) feed once a day. This could be due to the availability of excess dung in the Terai owing to its larger livestock population as compared to the Hills. This can further be substantiated from the fact that the average amount of dung fed into the plant per feeding in case of Terai is 31.5 kg as compared to 21.4 kg in case of the Hills. The above table also indicates that the total quantity of dung available per day in the total surveyed BGHs8
amounts to 19668.53 kg. In Terai, the total quantity of dung available is 11096.15 kg and it is 8572.38 kg in case of the Hills. This leads to the conclusion that the overall average quantity of dung available per day per BGH is 33.85 kg and the similar figures for the Terai and the Hills are 41.71 kg and 27.21 kg respectively. 18.1.5 Average Size of Biogas Plant The distribution of the sizes of the surveyed biogas plants is given in Table 18.8. It can be seen from Table 18.8 that among the 600 sampled biogas households, about 54 percent of the plants are located in Terai and the rest 46 percent in the Hills. Regarding size distribution, about 43 percent of the sampled plants consists of 6 m3 followed by 8 m3 which comprises 32 percent. Likewise, 10 m size consists of 14 percent and 4 m310 percent, while the percentage of 15 m3 size of plant seems very low or negligible.
Table 18.8: Distribution of the Size of Surveyed Biogas Plants Terai Hills Overall Size in m3
No of Biogas Plants
% No of Biogas Plants
% No of Biogas Plants
% of Total
4 9 3.2 50 15.5 59 9.96 87 31.3 171 53.2 258 43.08 115 41.4 76 23.6 191 31.810 60 21.6 24 7.4 84 14.015 7 2.5 1 0.3 8 1.3
Total 278 100.0 322 100.0 600 100.0% of BGP 47 53 100
Average plant size (m3)
7.85 6.49 7.12
From the above table, it can be deduced that the overall average size of a biogas plant is 7.12 m3. However, the average plant size varies regionally to some extent from the overall average. The average biogas plant size in Terai is 7.85 m3 and in case of the Hills it is 6.49 m3. In case of Terai majority of the biogas plants are of 8m3 size (41%) followed by 6m3 plants. However, the situation is reverse in the Hills as majority of the plants (53%) are of 6m" size followed by those of 8m3 size. The main reason behind the popularity of bigger size plants in Terai than in the Hills could be the availability of greater quality of dung in the former. 18.1.6 Feeding Capacity of Biogas Plants For the calculation of feeding capacity of the biogas plants, it has been assumed that a plant with a capacity of 1 m3 requires 7.5 kg dung per day in Terai and 6 kg per day in Hill (BSP, 1997). Table 18.9 presents data on feeding capacity or practices adopted by the surveyed biogas households.
Table 18.9: Feeding Capacity of Biogas Plants
Region Average Size of Biogas Plant
(m3)
Recommended Dung Feeding for an Average Sized Plant per day (kg)
Actual Dung Fed per day
(kg)
Deficiency of Dung per day
(kg)
Feeding Percentage
(%)
Terai 7.85 58.87 41.71 17.16 70.85Hills 6.49 38.94 27.21 11.73 69.88
8 581 valid cases

141
Considering that the average size of the biogas plant in Terai and Hills is 7.85 m3 and 6.49 m3 respectively (see Table 18.9), it can be concluded that the recommended dung feeding per day is 58.87 kg for Terai and 38.94 kg for Hills. However, the survey data have indicated that the actual feeding per day is much lower than the recommended values. The survey results indicate that the actual feeding per day is 41.71 kg in case of Terai and 27.21 kg in case of Hills, which means there is dung deficiency of 17.16 kg and 11.73 kg in case of Terai and Hills respectively. The available data, hence, indicate that the feeding percentage in case of Terai and Hills is 70.85 percent and 69.88 percent respectively.
18.1.7 Gas Productions and Consumption
■ Gas Production
As per the BSP study results, under right conditions one kg of dung produces 40 litres of biogas during summer and about 70 percent of the aforementioned production, i.e. about 28 litres of biogas, during winter. Since in the Terai dung fed per plant per day is about 42 kg, assuming the conditions to be optimum, in case of the Terai, it can be expected that about 1680 litres of biogas is daily produced per plant during summer and about 1180 litres during winter. Similarly, as the daily dung fed per plant in case of the Hills is about 27 kg, again assuming the conditions to be optimum, «t can be expected that the daily production of biogas in the Hills is about 1080 litres during summer and 750 litres during winter.
■ Gas Consumption
For the calculation of the daily biogas consumption rate of a biogas stove two different scenarios have been used. For the first scenario (Scenario I) the BSP study result has been taken as a reference, which suggests that when used at full capacity, the most commonly used locally produced biogas stoves will consume approximately 400 litres of gas per hour. The study carried out by DevPart (2001) is the basis for the second scenario (Scenario II). The outcome of the study suggested that a biogas stove consumes a maximum of 443 litres of biogas per hour. The same study also suggested the hourly average biogas consumption by a biogas stove to be 290 litres. However, this average figure seems to be too low, hence, this average figure has not been used in the assessment of the biogas consumption. One probable reason of this extremely low flow rate could be due to the faulty calibration of the measuring instrument (the gas flow meter).
From the present study it was observed that the daily average cooking hours per plant for Terai and the Hills is estimated to be 3 and 2.2 during summer and 2.9 and 2.2 during winter respectively. Considering these average cooking hour figures and the aforementioned scenarios, the daily biogas consumption rate has been calculated in Table 18.10.
Table 18.10: Gas Consumption in Cooking
Summer Winter Region Scenario I Scenario II Scenario I Scenario II
Terai 1200 1350 1190 1300Hills 880 990 880 990
Note: The consumption rates are in litres per day per plant.
Similarly, in case of biogas consumption in lighting, the BSP study suggests that the widely available Ujeli lamps consume between 150 and 200 litres of biogas per hour. The study carried out by DevPart (2001) has suggested the biogas consumption rate of 166 litres per hour in lighting, which is more or less similar to the average figure of the first. Hence, in case of biogas consumption in lighting, a constant figure of 175 litres has been considered for further calculation instead of considering two scenarios as in case of biogas consumption in cooking.
The present study also indicates that the total daily lighting hour per biogas plant for Terai and the Hills is 0.19 and 0.15. Unlike the cooking hours, the average lighting hour does not experience any seasonal

142
variations. Assuming that 1 hour of lighting consumes 175 litres of biogas as explained above, the total gas produced per plant per day in case of Terai is 35 litres and 25 litres in case of the Hills for all seasons. It needs to be noted that the gas consumption in lighting is negligible as compared to the gas production in cooking, which further confirms the aforementioned observation (see Table 18.11} that claims the popularity of biogas in cooking rather than in lighting.
Table 18.11: Gas Consumption in Lighting
Region Summer WinterTerai 35 35Hills 25 25
Note: The consumption rates are in litres per day per plant.
» The Difference Table 18.12 shows the expected biogas production rate, different scenarios of total consumption rate, inclusive of gas consumed in cooling and lightening, and the difference in production and consumption.
Table 18.12: Status of Gas Production and Consumption
Terai Hills Summer Winter Summer Winter
Production 1680 1180 1080 750 Scenario I 1235 1225 905 905Consumption Scenario II 1385 1335 1015 1015Scenario I 445 -45 175 -155Difference (Production - Consumption) Scenario II 295 -155 65 -265
Note: All the figures ate in litres per day per biogas plant The above figures suggest that during summer, both in the Terai and the Hills, die production of biogas far exceeds the consumption rate. The production rates here have been calculated on the assumption that the conditions are right for biogas production, which in fact may not be so in reality. It is possible that the biogas plants produce less gas than expected production values due to the unavailability of perfectly favourable conditions. If this really is the case, there seems to be a requirement of assessing why the conditions are not favourable for maximum gas production. However, during winters the biogas production does not seem to be able to fulfill the consumption rate. This deficiency means during winter biogas alone is not able to fulfill the fuel demands, which is justified, as there seems to be increase in use of other fuel sources during winter (see Table 18.10 to 18.13). 18.1.8 Change in Use of Fuelwood The traditional hearth, which burns fuelwood, is still the most popular mode for cooking, especially in most of the rural areas of Nepal. However, in the households with biogas plants, biogas stoves have substituted traditional mud stoves that burn fuelwood. As a result there has been a significant decrease in the use of fuelwood both in Terai as well as in the Hills. The survey data in this connection have been described in Table 18.13.
Table 18.13: Comparison of the Use of Fuelwood before and after the Installation of BGP Fuelwood Used per BGH/day (in kg) Terai Hills
Status
In Summer In Winter In Summer In WinterBefore installation of BGP 7.84 13.64 10.15 13.33After installation of BG P 3.45 6.09 4.61 6.86Decrease after installation of BGP 3.39 7.55 5.54 6.47Decrease rate (%) 43.23 55.35 54.58 48.54 Fuelwood Used per NBG/day (in kg) Fuelwood consumption by an average non-biogas household
10 20 12 16

143
Table 18.13 clearly shows that, in Terai, there has been a decrease of 3.39 kg fuelwood per household (BGH) per day in summer and 7.55 kg fuelwood per household per day in winter. The corresponding figures for the Hills are 5.54 kg and 6.47 kg in summer and in winter respectively.
The decrease of fuelwood per household per day by about 49 percent in Terai and 51 percent in the Hills is definitely a remarkable achievement. The decrease in the use of fuelwood in winter is more pronounced in case of Terai. There has been a decrease of fuelwood use per household per day by 55 percent in Terai as compared to 48 percent in the Hills. However, the scenario is reversed in summer when the decrease rate is 43 percent and 54 percent for Terai and the Hills respectively.
The query on the fuelwood consumption rate for the non-biogas households indicated that an average non-biogas household in Terai consumed about 10 kg of fuelwood in summer and 20 kg in winter. The similar figures for the Hills are estimated to be 12 kg and 16 kg in summer and winter respectively {Table 18.13), These figures indicate that the non-biogas households in Terai consume about four limes more fuelwood than the biogas households. Similarly, in case of the Hills the non-biogas households have been found to consume more than twice as much fuelwood as used by the biogas households. This considerable difference in fuelwood consumption between the biogas and non-biogas households further supports the fuelwood replacement capacity of the biogas plants.
The decrease in fuelwood consumption has threefold benefit. First of all it has financial gains to the households as they can save some money, which otherwise they would have to spend in purchasing the fuelwood. Secondly, it contributes significantly in reducing the Greenhouse gases (GHOs) since the global warming commitment (GWC) of fuelwood is much higher as compared to biogas stoves. Thirdly, the decrease in the use of fuelwood also contributes to some extent in reducing the prevailing high rate of deforestation of the country thereby increasing the carbon sink. However, it needs to be noted that there is a considerable difference in reduction of GHGs if the fuelwood is produced on a sustainable basis. From the current study it cannot be ascertained whether the consumption of fuelwood has been on a sustainable basis or not. Even though the fuelwood in question has been consumed in a sustainable manner, the prevalence of thermally inefficient traditional mud stoves (see Table 18.14) could result in the production of PICs. These PICs could again have further GWC. The possibility of substantial fuelwood replacement by the biogas plants, hence, can avert this phenomenon as well.
Table 18.14: Money Saved in Fuelwood after Installation of Biogas Plants9
Money Saved per day per Household (Rs.) Region In Summer | In Winter
Terai 5.47 12.18 Hills 8.94 10.44
From the monetary point of view, the decrease in fuelwood consumption contributes to the daily saving of Rs. 5.47 in summer and Rs. 12.18 in winter per household (Table 18.14) in Terai. Similarly, in case of the Hills there has been a daily saving of Rs. 8.94 and Rs. 10.44 per household. This is a monthly saving of about Rs. 265 in Terai and Rs. 290 in the Hills, which in rural areas can be a significant amount.
18.1.9 Change in Use of Agricultural Residues as Fuel
Because of the lack of easy access of other fuels as well as economic compulsions, some households in rural Nepal still are forced to use agricultural residues as fuel. However, the advent of biogas plants has succeeded in substituting this primitive fuel by more environment friendly biogas stoves. The relevant data in this connection have been presented in Table 18.15.
9 Assuming that the price of 1 bhari of fuelwood = Rs 63.22 and 1 bhari of fuelwood = 39.19 kg. Hence, price of I kg of fuelwood = Rs. 1.61 (From Q 506)
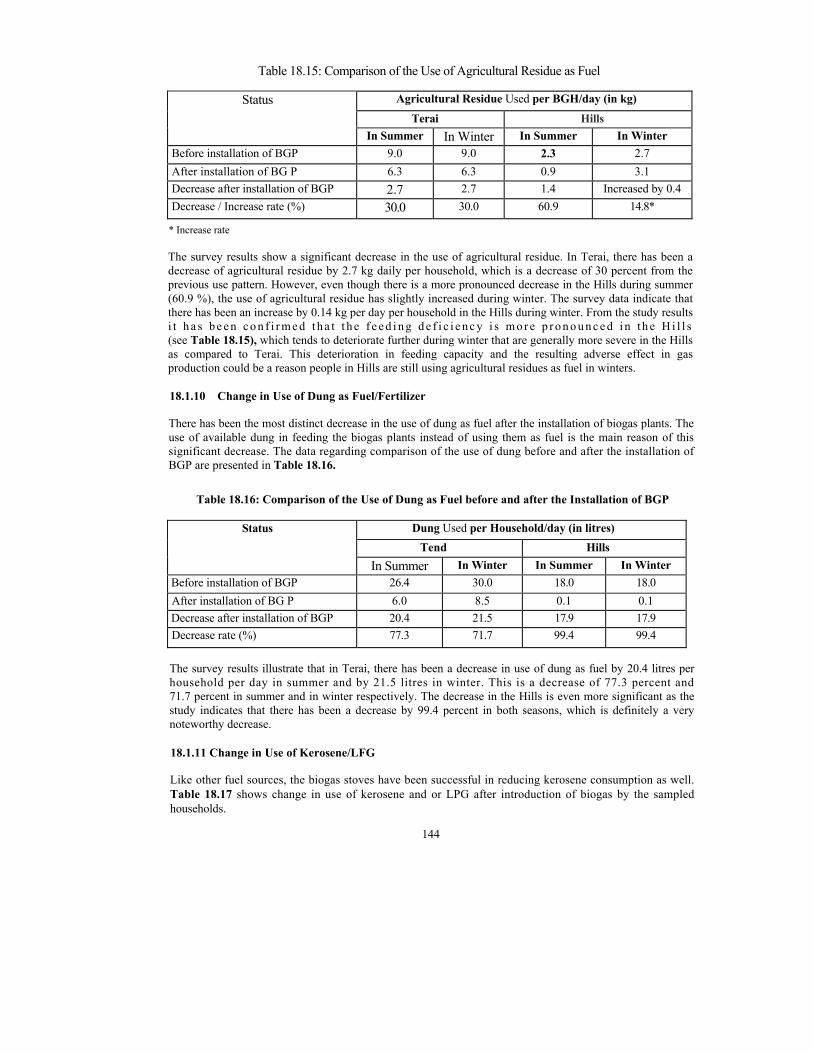
144
Table 18.15: Comparison of the Use of Agricultural Residue as Fuel
Agricultural Residue Used per BGH/day (in kg) Terai Hills
Status
In Summer In Winter In Summer In Winter Before installation of BGP 9.0 9.0 2.3 2.7 After installation of BG P 6.3 6.3 0.9 3.1 Decrease after installation of BGP 2.7 2.7 1.4 Increased by 0.4 Decrease / Increase rate (%) 30.0 30.0 60.9 14.8*
* Increase rate
The survey results show a significant decrease in the use of agricultural residue. In Terai, there has been a decrease of agricultural residue by 2.7 kg daily per household, which is a decrease of 30 percent from the previous use pattern. However, even though there is a more pronounced decrease in the Hills during summer (60.9 %), the use of agricultural residue has slightly increased during winter. The survey data indicate that there has been an increase by 0.14 kg per day per household in the Hills during winter. From the study results i t h a s b e e n c o n f i r m e d t h a t t h e f e e d i n g d e f i c i e n c y i s m o r e p r o n o u n c e d i n t h e H i l l s (see Table 18.15), which tends to deteriorate further during winter that are generally more severe in the Hills as compared to Terai. This deterioration in feeding capacity and the resulting adverse effect in gas production could be a reason people in Hills are still using agricultural residues as fuel in winters.
18.1.10 Change in Use of Dung as Fuel/Fertilizer
There has been the most distinct decrease in the use of dung as fuel after the installation of biogas plants. The use of available dung in feeding the biogas plants instead of using them as fuel is the main reason of this significant decrease. The data regarding comparison of the use of dung before and after the installation of BGP are presented in Table 18.16.
Table 18.16: Comparison of the Use of Dung as Fuel before and after the Installation of BGP
Dung Used per Household/day (in litres) Tend Hills
Status
In Summer In Winter In Summer In Winter Before installation of BGP 26.4 30.0 18.0 18.0 After installation of BG P 6.0 8.5 0.1 0.1 Decrease after installation of BGP 20.4 21.5 17.9 17.9 Decrease rate (%) 77.3 71.7 99.4 99.4
The survey results illustrate that in Terai, there has been a decrease in use of dung as fuel by 20.4 litres per household per day in summer and by 21.5 litres in winter. This is a decrease of 77.3 percent and 71.7 percent in summer and in winter respectively. The decrease in the Hills is even more significant as the study indicates that there has been a decrease by 99.4 percent in both seasons, which is definitely a very noteworthy decrease.
18.1.11 Change in Use of Kerosene/LFG
Like other fuel sources, the biogas stoves have been successful in reducing kerosene consumption as well. Table 18.17 shows change in use of kerosene and or LPG after introduction of biogas by the sampled households.

145
Table 18.17: Change in Use of Kerosene after the Installation of BGP
Kerosene Used per BGH/day (in litres) Terai Hills
Status
In Summer In Winter In Summer In Winter Before installation of BGP 0.50 0.58 0.56 0.60After installation of BGP 0.20 0.25 0.20 0.23Decrease after installation of BGP 0.30 0.33 0.36 0.37Decrease rate (%) 60.0 56.9 64.3 61.7 Kerosene Used per non-BGH / day (in litres) Kerosene consumption by an average non-biogas household
0.49 0.53 0.17 0.27
After the introduction of biogas plants, the consumption of kerosene has been reduced by 0.30 litres and 0.33 litres per day per household in Terai in summer and winter respectively. The decrease in kerosene consumption is even more significant in the Hills. The BGHs in the Hilts have experienced a decrease by 0.36 litres per day per household in summer and 0.37 litres in winter. The decrease in kerosene consumption by more than 50 percent in all the cases is yet another positive impact of biogas plants.
The query about the kerosene consumption rate in the non-biogas households has reflected that in case of the Terai the daily consumption rates are more or less similar to those of the biogas households prior to the installation of the biogas plants. This indicates that as in case of the biogas households of Terai, even in the non-biogas households the biogas plants have a potential to replace significant consumption of kerosene. However, it is interesting to note that in case of the Hills the kerosene consumption rate in the non-biogas households is lower than the consumption rate in the biogas households. Since the kerosene consumption rates in the non-biogas households are more or less similar to (he kerosene used by the biogas households even after the installation of biogas plants, it might seem that the biogas plants do not have a potential of replacing kerosene in the Hills. But, when assessing the kerosene replaced by the biogas plants in the biogas households, which indicate even more replacement potential than in the Terai (Table 18.17), this inference proves to be false. One of the probable reason of less kerosene use in non-biogas households in the Hills could be that these households are comparatively less economically endowed than the biogas households. As kerosene can be very expensive in the Hills due to the inclusion of transportation costs, it is very possible that only a few households can afford to use it as fuel.
The decrease in kerosene consumption has a twofold benefits. Firstly, kerosene is comparatively a costly fuel and its reduction can result in a significant financial saving. Since kerosene is an import commodity, its reduction also contributes in reducing the foreign exchange out-flows. Secondly, kerosene is one of the high PIC emitting fuels, hence, its reduction also contributes towards decreasing the Greenhouse commitment.
Table 18.18 presents survey results about money saved in the purchase of kerosene after BGP installation.
Table 18.18: Money Saved in Kerosene after Installation or Biogas Plants10
Money Saved per day per Household (Rs.) Region In Summer In Winter
Terai 5.62 6.18 Hills 6.75 6.93
From the monetary point of view, the decrease by 0.30 litres in summer and 0.33 litres in winter in case of Terai is equivalent to the daily saving of Rs. 5.62 in summer and Rs. 6.18 in winter per household. Tin's is a saving of about Rs. 177 in a month. Similarly, in case of the Hills the reduction in kerosene consumption
10 Assuming 1 litre of kerosene costs Rs. 18.74.

146
contributes to the saving of Rs. 6.75 and Rs. 6.93 in summer and in winter respectively. This is a saving of approximately Rs. 205 in a month. The installation of biogas plants has also seemed to contribute in changing the consumption of LPG gas to some extent. The data in this connection are presented in Table 18.19.
Table 18.19: Comparison of the Use of LPG before and after the Installation of BGP
LPG Cylinders Used per BGH/year Terai Hills
Status
In Summer In Winter In Summer In Winter Before installation of BGP 2.4 2,4 4.0 4.0 After installation of BGP 1.4 1.5 6.0 6,0 Decrease after installation of BGP
1.0 0,9 Increased by 2.0 Increased by 2.0
Decrease rate (%) 41,7 37.5 Increased by 50 % Increased by 50 %
The reduction in LPG consumption is only evident in Terai, whereas in the Hills there has been an increase in its consumption regardless of the biogas stoves. The study reflects that the consumption of LPG in BGHs of Terai has reduced by 1.0 cylinder per household per year in summer and by 0.9 cylinders in winter. The scenario in case of the Hills is opposite as it shows an annual increase in LPG consumption by 2 cylinders per household. However, as the households using LPG is negligible (1 % overall) compared to other fuel sources, the change in consumption pattern of LPG docs not have significant implications in financial saving or in Greenhouse gas emission at present.
18.1.12 Change in Cooking Efficiency
Prior to the installation of the Biogas plants, majority of the households were dependent upon the traditional cooking stoves followed by the kerosene stoves (Table 18.20). At present, with the installation of BGPs, the biogas stoves have substituted the traditional stoves and the kerosene stoves to a great extent.
Table 18.20: Change in Use of Cooking Devices after the Installation of BGP
Before the Installation of BGP Present Status Types of Stoves No. of Stoves %of
Household No. of Stoves %of
Household
Change in Use of
Cooking Devices
Biogas stove 0 0.0 582 97.0 582 LPG stove 15 2.5 6 1.0 -9 Kerosene stove 128 21.3 77 12.8 -51 Improved stove 7 1.2 9 1.5 2Traditional stove 580 96.7 325 54.2 -255 Husk stove 10 1.7 2 0.3 -8
The result shows that that there has been a saving of 9 LPG cylinders and 51 kerosene stoves per 600 households, which is a positive indicator. A decrease of LPG stoves by 60 percent and the kerosene stoves by almost 40 percent after the installation of BGPs is an encouraging result. There has also been a slight decrease among the users of husk stove as well. This again could be taken as a positive indicator as husks could be used as a much-needed building material in the rural areas.
There has been a slight increase in the use of improved stoves from which it can be inferred that the BGP holders are familiar with other energy saving devices as well. However, it has to be noted that, due to the insignificant number of the improved stoves in the surveyed households, the comparison of BGP with an improved wood stove is not relevant. The use of traditional stoves has seen the most drastic change after the

147
installation of BGPs. Before the installation of BGPs, 96.7 percent of the households were using traditional stoves but at present only 54.2 percent are found to be using them. 235 households have completely stopped the use of traditional stoves, which is a remarkable achievement. However, despite of the fact that 97.0 percent of households are using biogas stoves at present, as 54.2 percent households arc still using the traditional stoves, it indicates that some BGHs could still be partially using these traditional stoves.
Biogas stoves have a higher efficiency of combustion than the traditional biomass stoves and the fossil fuel stoves (kerosene / LPG stoves) (Smith el. al. 2000). As a result they contribute by far the lowest to the greenhouse gases (GHG). Studies have indicated that a biogas stove is 1.07 times more efficient than LPG stove, 1.22 times more efficient than a kerosene stove, 3.15 times more efficient than wood burning traditional mud stove, 4.63 times more efficient than a traditional stove burning agriculture residue and 6,52 times more efficient than a traditional stove burning dung (Smith et al, 2000). Hence, the substitution of the latter by the biogas stoves can be taken as a positive indicator of cooking efficiency. Furthermore, they are less hazardous to health with a potential of contributing towards the prevention of forest degradation, decreasing physical workload of fuel wood collection as well as foreign currency saving when substituting fossil fuels. These facts further support the efficiency of biogas as compared to the traditional biomass and the fossil fuel stoves.
18.1.13 Replacement of Conventional Fuels by Biogas at National Level
The replacement of various conventional fuels after the introduction of biogas at the household level has already been dealt with in the previous paragraphs. On the basis of these household - level replacement values, the potential replacement values at the national level has been assessed for three different scenarios. The first {Scenario I) is for the present scenario with about 86,000 installed biogas plants. The second (Scenario II) focuses on the targets of the third phase of BSP, which is 100,000 biogas plants. Finally, the third (Scenario IN) is a long-term scenario focusing on the future situation when the technically feasible 1,3-million biogas plants will be installed.
18.1.14 Fuelwood Replacement
The average fuelwood saved per day per household after the introduction of the biogas is 5.7 kg. This shows that at present (Scenario I) 490 tonnes of fuelwood is being replaced daily at the national level, which is a saving of about Rs. 790,000 daily (assuming average cost of fuelwood as Rs 1.61/kg). Once the BSP III targets are achieved (Scenario II), there would be a daily saving of 570 tonnes of fuelwood, which al present rates would worth Rs. 920,000. Similarly, when all the technically feasible biogas plants will be installed (Scenario III), these plants will lead to the saving of 7410 tonnes of fuelwood per day. This saving of fuelwood is worth Rs. 11.93 million at current prices (see Table 18.21).
Table 18.21: Fuelwood Replacement at National Level Scenarios Amount of Fuelwood
Replaced (tonnes / day) Money Saved
(Mil. Rs. / day) Scenario I 490 0.79 Scenario 11 570 0.92Scenario III 7410 11.93
18.1.15 Kerosene Replacement
The average kerosene saved per household after the introduction of the biogas is 0.34 litres per day, This shows that at present (Scenario 1) 29,240 litres of kerosene is being replaced daily at the national level, which is a saving of about Rs. 550,000 daily. Once the BSP III targets are achieved (Scenario II), there would be a daily saving of 34,000 litres of kerosene, which at present rates would worth about Rs. 640,000. Similarly, when all the technically feasible biogas plants will be installed (Scenario III), these plants will lead to the saving of 442,000 litres of per day. This saving of kerosene is worth Rs. 8.28 million at current prices (see Table 18.22).

148
Table 18.22: Kerosene Replacement at National Level
Scenarios Amount of Kerosene Replaced (tonnes / day)
Money Saved (Mil. Rs. / day)
Scenario I 29,240 0.55 Scenario II 34,000 0.64 Scenario III 442,000 8.28
18.2 ENVIRONMENT
Nepal's contribution to global warming is rather insignificant. In particular, the emission of Carbon dioxide' and other global warring gases due to combustion of fossils is even more negligible. Petroleum, coal and other forms of hydrocarbon energy do not even meet 5 percent of the nation's energy demand; hence, their negligible impact can be easily perceived (WECS, 1995). A rough estimate by ESCAP put Nepal's yearly emission11 of carbon at 200,000 tonnes for the year 19861, which compared to other developing countries, is negligible. However, even though Nepal's emission of greenhouse gases through fossil fuel consumption is of little environmental concern globally at present, the potential of rapid escalation of such emissions in future cannot be undermined. Gradual substitution of fuels with high Greenhouse commitment by more environmentally sound energy sources, such as biogas should be made a priority in order to check future increase in carbon emission. This section aims at assessing the carbon emissions saved after the substitution of various traditional biomass fuels and fossil fuels by biogas.
18.2.1 Carbon Emission Saved from the Decrease in Use of Fuelwood
Because of their poor combustion conditions, the traditional stoves using fuelwood are thermally inefficient and thus divert a significant portion of the fuel carbon into products of incomplete combustion (PICs), which generally have a greater impact on climate than CO2. A study done by Smith et. al. (2000) indicates that a kilogram of wood burned in a traditional mud stove generates 418 gram Carbon (g-C) equivalent of Carbon emission". Hence, the decrease of fuelwood by 3.39 kg in summer and 7.55 kg in winter, in case of Terai, corresponds to the reduction of 1419 g-C and 3160 g-C equivalent of Carbon emission per day per household in summer and in winter respectively. Similarly, in case of the Hills there has been a reduction of 2319 g-C and 2708 g-C equivalent of Carbon emission per day per household in summer and in winter respectively. The regional variation of Carbon emission saved and its break-up into different Carbon forms is shown in Table 18.23.
Table 18.23: Carbon Emission Saved from the Decrease in Use of Fuelwood Carbon Saved per day per Household (g-C i
CO* Carbon PIC Carbon TSP Carbon Char/Ash Total Carbon Region
In S
umm
er
In S
umm
er
In S
umm
er
In W
inte
r
In S
umm
er
In W
inte
r
In S
umm
er
In W
inte
r
In S
umm
er
In W
inte
r
Terai 1286 2865 124 276 3 7 5 12 1419 3160 Hills 2102 2455 202 236 5 6 9 10 2319 2708
The study assessed the carbon emission saved from the decrease in kerosene consumption, which is presented in Table 18.24.
11 The figure is for Acacia.

149
Table 18.24: Carbon Emission Saved from the Decrease in Kerosene Consumption Carbon Emission Saved per day per Household (g-C)
CO2 Carbon PIC Carbon TSP Carbon Char/Ash Total CarbonRegion
In S
umm
er
In W
inte
r
In S
umm
er
In W
inte
r
In S
umm
er
In W
inte
r
In S
umm
er
In W
inte
r
In S
umm
er
In W
inte
r
Terai 241 265 12 13 0.2 0.2 0 0 253 278 Hills 289 297 14 15 0.3 0.3 0 0 304 312
18.2.2 Carbon Emission Saved from the Decrease in Use of Kerosene A study carried out by Smith et. al. (2000) indicates that a kilogram of kerosene burned in a pressure stove generates 843 gram Carbon (g-C) equivalent of Carbon. Hence, the decrease in kerosene consumption by 0.30 and 0.33 kg in Terai during summer and winter respectively corresponds to the reduction of 253 and 278 g-C equivalent of Carbon per day per household. Similarly, in the Hills the decrease in kerosene consumption contributes to the reduction of 304 and 312 g-C equivalent of Carbon per day per household in summer and in winter respectively. 18.2.3 Carbon Emission Saved from the Decrease in Use of Agricultural Residues The decrease in consumption of agricultural residues as fuel contributes significantly in reducing the Greenhouse gases (GHGs) as the global warming commitment (GWC) of using agricultural residues, as fuel is much higher as compared to biogas stoves. Studies have shown mat a kilogram of agricultural residue12 burned in a traditional mud stove generates 381 gram Carbon (g -C) equivalent of Carbon emission (Smith et al, 2000). The study result is shown in Table 18.25.
Table 18.25: Carbon Emission Saved from the Decrease in Use of Agricultural Residues
Carbon Emission Saved per day per household (R-C) CO2 Carbon PIC Carbon TSP Carbon Char/Ash Total Carbon
Region
In S
umm
er
In W
inte
r
In S
umm
er
In W
inte
r
In S
umm
er
In W
inte
r
In S
umm
er
In W
inte
r
In S
umm
er
In W
inte
r
Terai 1283 1283 111 111 3 3 2 2 1399 1399 Hills 665 -190 57 -16 2 -1 1 -1 725 -207
Above findings show that the decrease of agricultural residue by 2.7 kg in Terai corresponds to the reduction of 1399 g -C equivalent of Carbon per day per household. Similarly, in the Hills during summer the decrease of agricultural residues by 1.4 kg is equal to the reduction of 725 g -C equivalent of Carbon per day per household. However, during winters the Hills experience an increase in Carbon emission from agricultural residues by 207 g -C equivalent of Carbon per day per household.
18,2.4 Carbon Emission Saved from the Decrease in Use of Dung
Dung is considered as the lowest quality fuel in the household energy ladder' (Smith et. al. 2000) with the highest global warming commitment (GWC) among the common household fuels. A study carried out by Smith et al (2000) has concluded that a kilogram of dung burned in a traditional mud stove generates 334 gram Carbon (g-C) equivalent of Carbon emission.
12 The figures are for rice stalks

150
The survey results on Carbon emission saved from the decrease in use of dung have been presented in Table 18.26.
Table 18.26: Carbon Emission Saved from the Decrease in Use of Dung
Carbon Emission Saved per day per Household (g-C) CO2 Carbon PIC Carbon TSP Carbon Char/Ash Total Carbon
Region
In u
mm
er
In W
inte
r
In S
umm
er
In W
inte
r
In S
umm
er
In W
inte
r
In S
umm
er
In W
inte
r
In S
umm
er
In W
inte
r
Terai 5714 6022 111 819 33 35 294 310 6818 7186 Hills 5014 5014 682 682 29 29 258 258 5982 5982
It can be revealed from above data that the decrease in use of dung by 20.4 kg and 21.5 kg in Terai during summer and winter respectively corresponds to the reduction of 6818 and 7186 g-C equivalent of Carbon per day per household. Similarly, in the Hills the decrease in use of dung by 17.9 kg is equal to the reduction of 5982 g-C equivalent of Carbon per day per household.
18.2.5 Carbon Dioxide Emission Reduction at National Level
The reduction in carbon emission from the reduction of various conventional fuels after the introduction of biogas at the household level has already been dealt with in the previous paragraphs. On the basis of these household - level replacement values, the potential replacement values at the national level has been assessed for three different scenarios (Table 18.27). The first (Scenario I) is for the present scenario wilh about 86,000 installed biogas plats. The second (Scenario II) focuses on the target of the third phase of BSP, which is 100,000 biogas plants. Finally, the third (Scenario III) is a long-term scenario focusing on the future situation when the technically feasible 1.3 million biogas plants will be installed.
Table 18.27: Carbon Dioxide Emission Saved from the Decrease in Use of Conventional Fuels
CO2 reduction at national level (mil. K-C / day)
Fuels Average daily CO2 reduction per household (g-C)
Scenario I Scenario II Scenario III Fuel wood 2,177 187 218 2,830 Agricultural residue 760 65 76 990Dung 5,440 468 544 7,070 Kerosene 213 18 21 280
Total - 738 859 11,170
Table 18.27 shows that at present (Scenario 1) 738 million-gram equivalent of Carbon dioxide emission is being reduced everyday at the national level. Once the BSP I I I targets are achieved (Scenario II), there would be a daily saving of about 859 million-gram equivalent of Carbon dioxide emission. Similarly, when all the technically feasible biogas plants will be installed (Scenario III), these plants will lead to the daily saving of 11,170 million-gram equivalent of Carbon dioxide emission.
Table 18.27 also clearly indicates that, in case of Nepal, the replacement of animal dung as fuel has contributed to the maximum reduction in Carbon dioxide emission followed by the reduction in use of fuelwood. From the above results it can be concluded that replacement of kerosene by the biogas plants has not contributed much in the reduction carbon dioxide. However, it needs to be noted that kerosene has much more Carbon dioxide emission per unit fuel input than all other conventional fuels (Smith et. al. 2000). As at present the use of kerosene is negligible as compared to the use of other conventional fuels. Carbon

151
dioxide reduction by kerosene may seem to be insignificant. Bui if the biogas plants had not been introduced, it is very probable that with increasing scarcity of fuelwood and easy access of kerosene in future, many households would have shifted to kerosene as a fuel source; thus causing high carbon dioxide emission. When analyzed from this point of view, biogas plants can be accredited with a potential of even greater carbon dioxide emission saving.
REFERENCES
[1] BSP (2002) An Integrated Environment Impact Assessment, Biogas Support Programme. [2] Commission for Environmental Impact Assessment (2001) Advice for Terms of Reference for an Integrated Environmental Impact Assessment for the Biogas Programme in Nepal, Utrecht, The Netherlands. [31 Kojima, T (1998) The Carbon Dioxide Problem: Integrating Energy and Environmental Policies for the 21s' Century, Amsterdam. Gordon and Branch Science Publishers. [4] Smith, K.R., A.L. Aggarwal, and R.M. Dave (1983) Air Pollution and Rural Biomass Fuels in Developing Countries: A Pilot Study in India and Implications for Research and Policy, Atmospheric Environment, 17(11), pp23-2362. [51 Smith et al (2000) Greenhouse Implications of Household Stoves: An Analysis for India, Annual Reviews Energy Environment 25: 741-763 [6] WECS (1995) An Overview of Environmental Concerns in Energy Development. Perspective Energy Plan - 1994/1995, Supporting Document No, 7. Report No. 2/1/010595/5/9 Seq. No. 471
152
CHAPTER XIX
W O R K L O A D O F W O M E N A N D G E N D E R ' S R O L E I N B I O G A S
19.1 INTRODUCTION
Biogas is a promising technology for Nepal. It is a renewable, relatively inexpensive, decentralized energy source which can help to meet energy demands in rural areas while lessening reliance on other resources for cooking fuel - especially, wood and dung. Also, since women are often responsible for collecting fuel wood, in some circumstances the introduction of an alternative fuel (like biogas) can have the positive effect of reducing women's workloads vis-a-vis biogas in certain cultural and ecological context (Britt and Kapoor 1994).
Women and men could be addressed equally in the extension of biogas programme. Nowadays the information supply goes mainly via male members of the family. If women would be involved from the very beginning in the extension programme, they probably would be able to oversee all the consequences better. Likewise, she would be better informed, for example, about the advantages and disadvantages of biogas and about the instructions how to feed and utilise the biogas plant. Lack of information would be avoided and she can equally take part in the decision-making process.
Women in Nepal are confronted with a high workload. They carry out not only almost all domestic works, but also the major part of the work related to agricultural production. The workload of women has increased due to deforestation, since more time has to be spent on collection of firewood and fodder f Keizer. 1994). Under the framework of Biogas Support Programme and Alternate Energy Promotion Centre, several studies have been carried out by the researchers lo gather information related to the effects of biogas on workload of women. The findings of the four studies dealing with the effects of biogas on the workload of women have been summarized in first part of this chapter. Out of the four studies two were conducted in hi l ls (Nuwakot and Palpa) and the other two in Terai (Chitwan and Mahottari) districts. Similarly, the second part of this chapter highlights the study of biogas users with a focus on gender issues.
19.2 EFFECT OF BIOGAS ON WORKLOAD OF WOMEN
19.2.1 Effect of Biogas on the Workload of Women in Nuwakot District
Methodology
The research area was Nuwakot, a hilly district of Nepal, situated north of the Kathmandu Valley. The climate being sub-tropical is suitable for the biogas production. In view of obtaining relevant information, interviews were conducted with female users of 50 biogas plants with the help of structured questionnaires. All biogas plants in this research were fixed concrete dome plants constructed by Gobar Gas and Agricultural Equipment Development Company (GGC). Most of them (80%) had a size of 10 in3. On the average, the plants were 3 years old. Impact of Biogas Regarding division of labour tasks related to biogas, women carried out 56 percent work, while men were responsible only for 11 percent of the tasks. Other family members and servants did the remaining task (33%). This research revealed that biogas influences women's workload positively. The quality of the work got improved: activities as cooking, cleaning the cooking pots became easier and it was felt very pleasant to cook in a clean environment. Less Firewood was needed to be collected which in general is a tedious task.

153
The physical condition of women using biogas got improved, because cooking on biogas did not cause headache, lung diseases and problems with eyes. Interestingly, even old asthmatic women not able to cook on wood anymore, were able to cook again on biogas.
Because women have to work many hours a day, saving time is regarded as workload reduction. The data in this research showed that biogas reduced the lime spent on daily activities with approximately 2 hours and 30 minutes per household. On a whole working day, for activities to be done every day, this result, is regarded as rather significant.
19.2.2 Effects of Biogas on the Workload of Women in the Village of Madan Pokhara in Palpa District
Methodology
Based upon the criteria fixed for the selection of village and sampled biogas households, the study was carried out in Madan Pokhara village situated in Palpa district. GGC provided the list of a total of 19 families in Madan Pokhara using biogas for at least one year out of which four biogas households were visited for interviews with the help of questionnaire. The effect of biogas was measured in two different manners. Firstly, all female users were interviewed about the time allocation to the defined activities before and after the installation of biogas plant. Secondly, women in more or less similar households but without biogas plant were interviewed on the time allocation. The observation time for this research was limited to two days per household.
Effect of Biogas on the Workload of Women
The result of the study revealed that collection of water and cooking fuel, cooking and cleaning of cooking vessels were the activities mostly influenced by the use of biogas.
Feeding of the plant is the additional activity to be performed in biogas family. Collection of extra water is needed to mix it with the dung to make slurry. Time allocation for collection of water to feed the plant is totally dependent upon the water supply system. Out of the four studied biogas households, especially Family No. 2 spent a lot of t ime on this activity . If the distance to the water tap had been double (30 minutes), the total effect of biogas on the workload would have been negative. It should be remarked here that Family No. 3 fed without any reason more water than prescribed. Proper instruction could have saved time for them. Compared to the research done in Rupandehi district, collection of water proved to be more critical. Supply of water in the Terai is probably less problematic than that of Hills. Mixing of dung and water required only little time, which complies with the results of the Rupandehi research.
All families needed less Firewood for cooking. This resulted automatically in less collection of firewood. Family No. l collected as much firewood as before, but sold it. This has to be considered as a possible method to repay the loan of the biogas plant. Sale of firewood might be elsewhere less attractive than in Madan Pokhara (NRs. 1.5 per kg).
Family No.4 bought firewood before the introduction of biogas plant, but after biogas installation purchase of firewood was not needed anywhere. They saved money in this way, enabling them to repay the loan taken on the plant.
Saving on cooking time by biogas was a clear result achieved and perceived by all families. Though Families No.2 and No. 3 slated to use biogas in first instance for lighting, their saving on cooking time was still significant.
The possible saving in time needed to clean vessels used for cooking remained unclear. All families said that cleaning was quicker with the use of biogas compared lo cooking with firewood. However, such statement was insufficiently confirmed by the observation data of both biogas and non-biogas households. The results of this research are in agreement with those of Rupandehi finding in which the households saved da i ly 2.2 hours on cooking and cleaning.

154
Looking into the division of activities between men and women, it was evident in the research that collection of water, cooking and cleaning of cooking vessels were exclusively done by women. Respondents said that all family members participated in collection of water, while observation revealed that only women and children performed this task. Both male and female were involved in mixing o(" water and dung. The effect of biogas on the workload of women is estimated by deducting the total time saving with 50 percent of the time saved on collection of cooking fuel. The best result was observed for the women in Family No. l they saved more than 2 hours a day, while Family No.2 saved least lime i.e., about one hour a day.
Other Effects :
Apart from workload, most of the other effects were positive. Cooking on gas was felt much easier than cooking on firewood. This included the possibility to leave the kitchen for a while the food is being cooked. The respondents mentioned also advantages like no smoke in the kitchen, no need lo blow the fire, less heat from the stove, improved health (no eye problems, no headache and no cough anymore) due to pollution free environment in the kitchen.
Two families used biogas also for lighting in the house, thereby saving some money on (he purchase of kerosene (NRs. 1.0-1.5 per day). The related effect on time allocation is rather small since kerosene was always bought in combination with other commodities. The quality of the light of the biogas lamps was much better than that of the kerosene lamps resulting into decreased in-house pollution. One lamp was almost always used in the kitchen to have light while cooking and eating.
Three households had so far good experience with the digested slurry as fertiliser, while farmyard manure was preferred by one household (Family No. l).
19.2.3 Effect of Biogas on the Workload of Women in Pithuwa Village in Chitwan District
Methodology
This report contains the results of a research on the effect of biogas on the workload of women conducted in Pithuwa, a "typical" Terai village in Chitwan district, Nepal. The methodology relates to village profiling, analysing the gender relations in the community and selecting case-study households. Several methods were used, in combination, to get the maximum number of opinions in order to cross check the accuracy of the information, such as: direct observation, group discussion, key informant discussions and informal and guided interviews with individuals.
Women's Workload in Sampled Households
Women have to work for many hours in rural Nepal. In this research it became apparent that a working day of approximately 12 hours is the daily reality for women in the selected households. Analysing gender relations indicated that women are almost fully responsible for the reproductive activities such as cooking (100%), washing pots and dishes (100%), water (75%) and fuel (75%) and fodder collection (63%). In the productive activities women are responsible for the time-consuming/manual activities as planting, weeding and food processing. Land preparation and marketing are mainly male activities. Livestock production was again mainly a female responsibility (75%). Impact of Biogas on Women's Workload As biogas in the first place affects the activities in the reproductive spheres, it reinforces the idea that the use of biogas has effect on the workload of women. The impact of biogas on the workload of women is indeed labour saving. The differences between "biogas households" and "non-biogas households" were compared by observations. The results for 'biogas households" showed that it took about 45 minutes less time in collecting cooking fuel, while feeding the biogas plant took 33 minutes more lime. Similarly, ii took 56 minutes less time in cooking two meals and 16 minutes less time in cleaning dishes and pots. Hence total time saving effect of biogas for women in biogas-related activities was 1 hour and 24 minutes. The positive attitude

155
towards biogas was especially existent in household with sufficient cash flow. The "smaller farmers" households using biogas were far more critical towards biogas. Paying-off a loans for a biogas plant, which was in principle not income generating, was considered as very difficult. Considering the total workload of women, biogas as a "new technology" does not affect traditional working patterns. This means that introducing labour saving technologies does not automatically imply that workload as a whole is reduced as well.
19.2.4 Effects of Biogas on Women's Workloads in Hathilet Village in Mahottari
District Methodology
Encouraged by the relative emphasis on field time, this was consciously designed to incorporate both qualitative and quantitative data in collection, analysis and writ-up. Before fieldwork an orientation on the basic aspects of biogas technology in Nepal was given at the Regional Headquarters of Gobar Gas and Agricultural Equipment Development Company (GGC) in Butwal. The village chosen for this study was meant to represent a "typical" Terai village, situated near the Indian border without electricity. The village called Hathilet in Mahotiari district, Janakpur zone, Central Development Region that was situated at six kilometres from the highway met the required criteria. Semi-structured interviews oriented by questions listed in the survey questionnaire were used lo elicit information about activities related to workload and biogas use. These interviews were informal and open-ended, yet guided. Two set of questionnaire were formulated: one for biogas plant owners and the other for non-users of biogas. Eight households were selected for intensive study, four with biogas plants and four without. This research is essentially a comparative study. Supporting data came principally from fieldwork. Quantitative and qualitative data are articulated and triangulated, when feasible. Interviews (oriented by question listed in the survey questionnaires) and a time allocation study (TAS) were used to elicit information about workload and biogas. . Women's Workload in Sampled Households The findings from the TAS indicate that women's workloads—when divided by female labour actors—are not reduced by the introduction of biogas in Hathilet. Labour estimates for women, men and servants in biogas and non-biogas households give the appearance that biogas households spend less lime on most activities. These results, however, provide aggregated totals by labour minutes; the effect on individual workloads changes markedly when the total amount of time is dis-aggregated by labour actors. When broken down by labour actors, the appearance of time savings effects from biogas are practically negated-—with the exception of men, when considering general labour activities. Women in biogas households spend, on average per person, 1 hour and 8 minutes longer on general labour and fifteen minutes more time on biogas-related activities than individual women in non-biogas families. Men in biogas households, on the other hand, spend 1 hour and 23 minutes less time on general labour and about an equal amount of time on biogas-related activities than their counterparts in non-biogas households, on average per person. The servants in biogas households expend, on average per person, 3 hours and 34 minutes more time on general labour activities and 22 minutes longer on biogas related labour than their equivalents in non-biogas households. The above findings are in line with qualitative inferences. The general consensus from respondent accounts is that workloads have cither increased or stayed the same (that is, changed only in terms of activities or actors but not in the total time expended), Since Hathilet has unfavourable conditions for both realising and reaping the benefits of biogas, this outcome is not surprising. Finally, however, these results have to also be understood against the backdrop of the limitations of the research design and other circumstances. The quantitative findings from this research should therefore be considered "tentative" for the following reasons: (a) The sample size is small; (b) The TAS observations periods were limited to 12 hours per household; and (c) The season in which general labour activities were observed is not the most problematic.

156
19.3 STUDIES OF BIOGAS USERS WITH FOCUS ON GENDER ISSUES
193.1 A Study of Biogas Users with Focus on Gender Issues (Jhapa District)
Methodology
AEPC entrusted Rural Development Study Associates (RUDESA) to undertake the study. Based upon the review of the previous studies, the tools of data collection such as structured biogas user questionnaire and focal group discussion checklists were framed. The questionnaires were pre-tested in Nuwakot district, which lies adjacent to Kathmandu valley. The pre-tested questionnaires were then finalised after the discussion with AEPC official.
There are 3,758 biogas users in Jhapa district. A total 27 biogas users were interviewed; the samples were 5, 5, 2, 7, 4 and 4 from Sanischare, Arjundhara, Charpane, Chandragadhi, Gauradaha and Maharani VDCs respectively. In addition, four focus group discussions were held.
Assets Ownership and Role of Women in Management
Gender-wise ownership of various assets of the biogas user households in Jhapa District has been shown in Table 19.1.
Table 19.1: Ownership of Assets of the Biogas User Households
S.N. Ownership of Resources Male(%) Female (%) Both {%) Total (%) 1. Biogas Plant 92.6 7.4 0 100 2. Land 63,0 15.0 22.0 100 3. Cattle/Livestock 51.9 7.4 40.7 1004. Irrigation - - - - 5. House 70.4 11.1 18.5 1006. Vehicle/Tractor/Cycle 94,4 5.6 0 100 7. Bank Account 81.3 12.5 6.2 100
Table 19.1 shows that among the surveyed households female ownership of biogas, land, livestock and house is estimated at 7.4, 15.0, 7.4 and 11.1 respectively. Among the surveyed households 22.0, 40.7 and 18.5 percent jointly own the assets like land, livestock and house respectively. A total of 94.4 and 81.3 percent of male possessed the cycles and bank account, suggesting in general a highly male dominant ownership pattern of the assets. Though women have significant role in installation of the biogas plant and in taking care of the plant and latrine attachment with biogas plant jointly, men lead important role and women work as their supporter in the decision making process of biogas installation in general.
Male played lead and main role in management of all phases including planning, resource mobilisation, implementation and supervision. In general women's role was more supportive rather than lead role. In order to identify needs of women and deliver them the benefits of the technology, the programme should endeavour maximum participation of women at all stages of management. Majority of women were in Mothers Group, Forest Management Group, Saving Credit Group etc organised by different (I)NGOs. Though they are in various organisations but still they are not in decision-making level because of their education status and knowledge.
Impact of Biogas on Men and Women
Both skilled and unskilled labourers are required for the construction of the biogas plant; women's participation was limited to unskilled job. Ways may be explored to provide training to women as well for the skilled job so that they can participate in the skilled job during the construction phase of the biogas plant.

157
The total cost of installation ranges from Rs 12,000 to Rs 28,000 for 4 to 15 m3 capacity. Among the sample user households only 20 borrowed, and all the user households obtained a subsidy of Rs.7, 000 irrespective of the size of the plant. Seven borrowed from Agricultural Development Bank of Nepal (ADB/N), 10 borrowed from Nepal Bank Limited, Number of instalments varied, but there was not a single borrower who delayed the payment. Hence, the finance side both from the point of view of users and bank is free of problems.
All 27 households reported using slurry in the field, and 24 reported composted slurry being applied in the field. Seventeen out of 24 biogas user households used chemical fertiliser in the field after the installation of biogas, which was just 10 in number before. In total 10 users used an average of 194 kg gross weight of fertiliser before, which increased to 17 users with an average of 216 kg after the installation of biogas, consequently increasing fertiliser by 22 kg. It can be hypothesised that slurry production has raised awareness of soil nutrient, which raised the number of fertiliser users and their doses of use. However, gender wise feeling and awareness regarding the slurry use could not be incorporated in this study.
The women have definitely benefited compared to men with the installation of biogas. In total women were found to save 49 minutes of time. Women have saved significant time in cooking food, washing cooking vessels and collecting fuel wood in die order of importance. Like men counterparts they require more time mixing slurry.
It was found that 7 biogas users households were involved in additional income generation activities because of time saved from the installation of biogas. Three of the households reported participation in savings mobilisation and the rest 5 households joined Chandrodaya Farmers Association. Further, the respondent households were asked to report which member of die household benefited in particular from the new activity. Three reported male and remaining 4 reported female as the beneficiary. In this regard it is suggested that the government with financial institutions and the company jointly identify and implement income generating activities that benefit biogas user households further.
Among others the most important factor biogas contributes towards environment is attributed to saving in fuel wood consumption by the households. Each household saved about 12.5 Bharis (= approximately 30kg/Bhari) that is 375 kg per month or 4.5 ml of fuelwood per year. In rural areas trees are cut from the forest regularly to meet the fuel wood requirements, therefore introduction of biogas contributes significantly to preserve the forest and ecosystem. Also about 0.4 litre of kerosene was saved per household per month.
Some changes have been identified to occur in the food habits of the users. It was difficult to cook cereals before the biogas plant now they started to cook cereals frequently and have fresh and nutritious food regularly,
It is generally observed that biogas technology help reduce diseases in their houses due to pollution free environment after plant installation. Significantly more women members compared to men reported decrease in smoke related diseases showing women to have been benefited more than men in this regard.
Focus Group Discussion.
Focus Group Discussion (FGD) revealed that women users perceived easy cooking, smokeless environment and reduced daily workload as the main benefits as a result of biogas installation in their house. Saving of firewood, saving of kerosene, positive impact in health of family members and clean and healthy household environment were other frequently quoted benefits of biogas.
Biogas users women perceived that biogas technology is still expensive for general people; it has limited use because it is only used for cooking; and lacks adequate training for maintenance and repair as the main demerits or constraints of biogas installation.
In spite of all these it was identified that women benefited more from biogas in comparison to men. For wider application of biogas it was suggested that women group should be formed to install biogas in

158
co-operative manner so that the weaker section of the society should also get benefit from it. In such circumstances only they expressed the poor people and low-income group of society can successfully benefit from biogas technology. Women biogas users expressed their experience that in winter season because of cold, production and supply of gas declines. 19.3.2 A Study of Biogas Users with Focus on Gender Issues (Chitwan and Makwanpur Districts)
Methodology
AEPC entrusted RUDESA lo undertake the study. Based upon the review of the previous studies, the Consultant framed tools of data collection such as structured biogas user questionnaire and focal group discussion checklist. The questionnaires were pre-tested in Nuwakot district, which lies adjacent to Kathmandu valley. The pre-tested questionnaires were then finalised after the discussion with AEPC official. The present study covers the two districts namely Chitwan and Makwanpur of Central Development Region. Al present there are 5,336 and 4,800 biogas users in Chitwan and Makwanpur district respectively. A total of 24-biogas users were interviewed, 13 from Chitwan district and 11 from Makwanpur district, to obtain the information. In addition, five focal group discussions were held from selected municipalities and VDCs of Chitwan and Makwanpur district.
Assets Ownership and Role of Women in Management Gender-wise ownership of various assets of the biogas user households in Chitwan and Makwanpur districts has been shown in Table 19.2.
Table 19.2: Ownership of Assets of the Biogas User Households (in Percentage)
S.N. Ownership of Resources Male Female Both Total 1. Biogas Plant 87.5 12.5 0 100 2. Land 66.7 20.8 12.5 100 3. Cattle/Livestock 37.5 16.7 45.8 100 4. Irrigation - - - - 5. House 66.7 20.8 12.5 100 6. Cycle 100 0 0 100 7. Bank Deposit 88.9 11.1 0 100
Among the surveyed households female ownership of biogas, land, livestock and house is estimated at 12.5, 20.8, 16.7 and 20.8 respectively. Among the surveyed households 12.5, 45.8 and 12.5 percent jointly own the assets like land, livestock and house respectively. A total of 100 and 88.9 percent of male among the responding households possessed cycles and bank account, suggesting in general a highly male dominant ownership pattern of these assets. The number of households having bank account and cycles were 18 and 6 respectively. It was found that 17 out of 24 sample households have attached latrine with biogas plant. This shows a very positive attitude of users towards latrine attachment with biogas plants. Significant proportion of joint decision of both men and women has been reported in latrine attachment with biogas plant (in case if latrine is attached with biogas plant), in taking care of the plant, first installation of plant and cattle shed construction; which shows that women are even taking lead role in the decision making process.. of biogas installation.
Male played lead and main role in management of all phases including planning, resource mobilisation, implementation and supervision. In general women's role was more supportive rather than lead role. In order to identify needs of women and deliver them the benefits of the technology, the programme should endeavour maximum participation of women at all stages of management. Majority of women were in Mothers Group, Forest Management Group, Saving Credit Group etc organised by different (I) NGOs. Though they are in various organisations but still they are not in decision-making level because of their education status and knowledge.

159
Unlike at the stage of decision-making, it is interesting that many women arc responsible for the operation of biogas. The biogas companies are aware of the fact and have imparted biogas operation training to majority of women. But the training should also focus on repair and maintenance in addition to operation.
Impact of Biogas on Men and Women
Both skilled and unskilled labourers are required for the construction of the biogas plant; women's participation was limited to unskilled job. Ways may be explored to provide training to women as well for the skilled job so that (hey can participate in the skilled job during the construction phase of the biogas plant.
The total cost of installation ranges from Rs 13,667 to Rs 24,167 for 4 to 8 m3 capacity. The loan component was equivalent to Rs. 25,500 and 18,800 for 8 and 6m3 capacity respectively. It was interesting that loan and subsidy together constitute more than average cost of construction, and this is not matter of concern until the users pay loan on time. Most of the lower capacity plants like 4 m3 were built without loan; subsidy was enough to cover costs when family labour was used for construction.
Slurry is an important by product of biogas, which properly composted and applied in crops, should increase productivity significantly. Accordingly all 24 households reported using slurry in the field, and 20 reported composted slurry being applied in the field. Slurry production and use has raised soil nutrient awareness among the biogas user households.
The women have definitely benefited more compared to men with the installation of biogas. In total women were found to save 66 minutes of time after biogas installation. Women have saved significant lime in collecting fuel wood, cooking food and washing cooking vessels in the order of importance. Like men counterparts they require more time mixing slurry.
It was found that one biogas user households was involved in additional income generation activities as agricultural labourer because of time saved from the installation of biogas. In this regard it is suggested that the government with financial institutions and the company jointly identify and implement income generating activities so that a maximum numbers of biogas user households are further benefited.
The respondents were asked how they like to utilise their saved time after the installation of the biogas. Eleven respondents pointed that number one priority as domestic works and another 10 pointed agricultural production and 2 pointed income-generating activity as first priority. In the second priority livestock was much favoured and in the third it was again domestic work, which was most favoured. These are the important factors, which need to be considered while framing the income-generating program.
Among others the most important factor biogas contributes towards environment is attributed to saving in fuel wood consumption by the households. Each household saved about 8 Bharis (=approximately 3Clkg/Bhari) that is 240 Kg per month or 2.88 mt of fuel wood per year. In rural areas trees are cut from the forest regularly to meet the fuel wood requirements, therefore introduction of biogas contributes significantly to preserve the forest and ecosystem, Also about 1.6 litre of kerosene per household was saved per month. It is generally observed that biogas technology help to reduce diseases in their houses due to pollution free environment after plant installation.
Some changes have been identified to occur in the food habits of the users. It was difficult to cook cereals before the biogas plant now they started to cook cereals frequently and have fresh and nutritious food regularly.
Focus Group Discussion
Focus Group Discussion (FGD) revealed that women users perceived easy cooking, smokeless environment and reduced daily workload as the main benefits as a result of biogas installation in their house. Saving of firewood collection time, noiseless cooking stove, positive impact in health of family members and clean and healthy household environment were other frequently quoted benefits of biogas.

160
Biogas user women perceived that biogas technology is still expensive for general people and has limited use because it is only used for cooking. They conceive that lack of adequate training for operation, maintenance and repair of biogas plant are the principal drawbacks or constraints of this technology.
In spite of all these it was identified that women benefited more from biogas in comparison to men. For wider application of biogas it was suggested that women group should be formed to install biogas in co-operative manner so that the weaker section of the society should also get benefit from it. In such circumstances only they expressed the poor people and low-income group of society can successfully benefit from biogas technology. Women biogas users expressed their experience that in winter season because of cold, production and supply of gas declines. This is supported by the fact that size of livestock holding remained very low for the biogas user households.
19,3.3 Decision Making
It is important to know who plays decision-making role between wife and husband in the management of household affairs or other matter whether it is related to biogas or not. Experience shows that sometimes wife can play better role than husband in decision-making and still it is considered better if the mailer is thoroughly discussed between them before taking concrete decision. In this connection, gender's role on biogas related decision has been presented in Table 19.3.
According to Table 19.3, about 93 percent of the sampled female respondents expressed that the matter was discussed between male and female before installation of the plant. The first initiation and or leading role played by male and female in different matter related to biogas installation, financing, after-sale-services, latrine attachment to the plant, care and maintenance of biogas plant etc has been summarized in Table 19.3 ( NEPECON, 2001/2002).
Table 19.3: Decision Making
S.N Kinds of Decisions Male (%) Female (%) Both (%) Total! %) 1. First installation of biogas plant 61 10 29 100 2. More inclination for plant installation 43 22 35 100 3. Leading person for arranging finance for
plant installation 82 7 11 100
4. Leading person for selecting Company for plant installation
80 8 12 100
5. Leading person for latrine attachment 33 6 61 100 6. Leading person for site selection 71 7 22 100 7. Leading person for cattle shed construction 56 8 36 100 8. Leading person for taking care of the plant 81 12 7 100
The data presented in Table 19.2 reveals that mostly there is the dominance of the male's role in decision-making over the female. However, joint decision of both the sexes has been reflected regarding the initiation and inclination towards plant installation, site selection, and latrine connection to biogas plant and cattle-shed construction, The result also indicates that male plays leading role in the management of finance (82%), selection and dealing with Company.

161
REFERENCES
[1] Britt, C. (1994) The Effects of Biogas on Women's Workloads in Nepal: An Overview of Studies, Biogas Support Programme.
[2] Britt, C and Kapoor, S. (1994) Biogas Support Programme. The Effects of Biogas on Women, Workloads and Division of Labour hi Hathilet, Janakpur Zone, Nepal, Biogas Support Programme.
[3] Keizer, C. (1993) Effect of Biogas on the Workload of Women in Nuwakot District in Nepal, Biogas Support Programme.
[4] Keizer, C. (1994) Effect of Biogas on the Workload of Women from a Gender Perspective, Biogas Support Programme.
[5] van Vliet, M, (1993) Effects of Biogas on the Workload of Women in the Village of Madan Pokhara in Palpa District in Nepal, Biogas Support Programme.
[61 RUDESA (2002) A Study of Biogas Users with Focus on Gender Issues (Jhapa District), Final Report. Alternative Energy Promotion Centre.
[7] RUDESA (2002) A Study of Biogas Users with Focus on Gender Issues (Chitwan and Makwanpur Districts), Alternative Energy Promotion Centre.
[8] NEPECON (2001) Biogas Users Survey 2000/2001, Alternative Energy Promotion Centre.

162
CHAPTER XX FINANCING OF BIOGAS PLANTS13
20.1 INTRODUCTION
Financing of the biogas plants is the most important part, since the decisions to invest in a new project necessitates financing the investment. Affordable financing is the key element in the promotion of biogas plants. Financing procedure is two-fold process; one with provision of direct financing in cash and the other through loans from the banks. In the first case the household desiring to install a biogas plant approaches recognized Biogas Company and pay the cash amount claimed by the concerned company. The planning of construction schedule for implementation proceeds thereafter. The total cost incurred for installation is calculated for the settlements of the accounts after the deduction of subsidy. This is followed by claim to be made for reimbursement to BSP by the company. In the second case, the interested household approaches for loan from the commercial banks.
20.2 ROLE OF COMMERCIAL BANKS
Commercial banks play important roles in financing biogas plants to the interested farmers/people to install biogas plant. In Nepal, the three commercial banks namely Agricultural Development of Nepal (ADB/N), Rastriya Banijya Bank (RBB) and Nepal Bank Limited (NBL) and other financing companies have been involved in providing loan for installation of biogas plants. Formally rural financing began with the phased implementation of the land reform programme in the mid 1960's in the form of Land Reform Savings Cooperation (LRSC). However, this institution had a narrow financing mandate. With a broader financing mandate including individual households, Agricultural Development Bank Act was enacted in 1967. ADB/N began its rural financing operations from 1968. LSRC was also merged into ADB/N within few years of its operation, Over the past few years, two major commercial banks NBL and RBB also came up with its own Banking for the Poor (BWP) programme. These banks are active in the alternate energy technology sector including credit programme in biogas sector mainly stimulated through the priority sector credit programme. These commercial banks provided loans for installation of biogas plants. Bank credit mixed with government subsidy has made the biogas technology very popular among the people, especially for the people residing in the rural areas of the country. More than 80 percent of the biogas plants were installed under the financing mechanism; that- is loan and subsidy programme in Nepal. These banks provide loans to the farmers for the construction of biogas plants. The construction companies collect demands from interested households to install biogas plant with all the required documents and collateral approach (along with quotation). The bank approves the loan based on the quotation of the company and issues coupon to the concerned company for the construction of the biogas plants. Finally, the bank credits the amount in the name of the household by deducting the subsidy amount.
20.2.1 Agriculture Development Banks of Nepal (ADB/N)
ADB/N is the largest financing institution in providing rural finance services including loan to the biogas plants. To implement the biogas programme more efficiently Gobar Gas and Agricultural Equipment Development Company (GGC) was established in 1977 under a joint venture of Agricultural Development Bank (ADB/N) and United Mission to Nepal (UMN). The credit programme from ADB/N started for the first lime in 1983 with the subsidy programme from UNDP to the community biogas. Since then, ADB/N has been involved in administrating loan and subsidies in biogas sector, It provided loan to install the biogas plants according to loan disbursement regulation. Of the total provided loan to the biogas plants, the share of ADB/N is about 92 percent. As said in the preceding chapters, ADB/N has also been involved in the promotional activities mainly in information dissemination and training in addition to channelling loan and subsidies.
13 This chapter is based upon the write, up of-Dr: Mangala Shrestha, Associate Professor, Patan Multiple Campus, Tribhuwan University, Nepal.

163
20.2.2 Rastriya Banijya Bank Rastriya Banijya Bank (RBB) is one of the financing institutions providing loans to the people in the rural as well as urban areas for the various purposes. In this connection, it is also being served as loan providers for those willing install biogas plants in their houses. It provided loans to the farmers for the construction of biogas plants since the year 1995. In the year 1998, it invested about 10 million rupees for commissioning about 400 biogas plants. 20.2.3 Nepal Bank Limited Nepal Bank Ltd. (NBL) is also playing an important role in financing development projects of the country including small loans to the individual farmers. It was involved in financing biogas programme since the year 1994/95. Up to the year 1999, the bank has financed about 340 biogas plants and the total out standing loan in this sector was reached to about 8.72 million rupees in 1999. At present, NBL and RBB are found less interested in the promotional activities of biogas plants except for providing loan. 20.3 REPAYMENT OF LOAN One of the important features of the BSP has been its innovative financial engineering and judicious application of consumer subsidies to help develop the market for biogas plants. With this provision of loan, biogas installation has been quite attractive to the construction companies as well as to the farmers. Commercial banks feel comfortable, as repayment of loan in biogas is high compared to other loans. Biogas loan ranks as second good loan after tea and coffee. Commercial banks feel comfortable in collection of lent money (repayment), The loan repayment period ranges from 5 to 7 years. The repayment rate is fixed to the collection as a percentage of disbursement. However, the lengthy and cumbersome procedure still adopted by the banks in loan approval needs to be simplified. 20.4 INTEREST RATE The annual interest rates charged by three commercial banks (ADB/N, NBL and RBB) on biogas sectors vary. ADB/N charges interest at the rate of 16 percent, while NBL and RBB charge 11.5 and 15 percent respectively. All three banks have also rebate schemes if the interest amounts are paid on time. ADB/N provides a rebate of 10 percent on the interest amount if it is paid on monthly basis. Similarly, NBL and RBB provide a rebate of 1 percent if the interest is paid quarterly. Therefore, if the interest amounts are paid regularly and on time the effective interests are 14.4 percent for ADB/N loans, 10.5 percent for NBL loans, and 14 percent for RBB loans (Kane!, 1999). 20.5 SUBSIDY In the beginning, the biogas programme was primarily based on external assistance. This included community biogas plants built under Small Farmer Development Programme (SFDP) of ADB/N, which were funded by UNDP, UNICEF, USAID and UMN. The government of Nepal for the first time announced a provision of subsidy on biogas plant in 1975 on 'Agricultural Year'. The subsidy was 50 percent on the interest of bank loan. A grant was made available from the UNDP to provide subsidy on community biogas plants for the year 1983, 1984 and implemented under the ADB/N credit programme. During fiscal year 1985 and 1986, a 50 percent interest subsidy was provided on bank loans, but this provision was discontinued in fiscal year 1987. Again, a 25 percent capital subsidy for 6 and 10 m3 plants was available during fiscal year 1988 and 1989, and it too was withdrawn in fiscal year 1990 during the interim government after the advent of multi-party democracy. The fund for the subsidy programmes was available from the UNCDF, Asian Development Bank, Manila (ADB/M), Funded Forestry Programme and own resources of HMG/N. Realizing the necessity to promote rapid development of biogas sector in Nepal, the government had set a target of commissioning 30,000 plants during the Eighth Five Year Plan (1992-97). With the introduction of SNV/BSP in fiscal year 1992, the subsidy was fixed at three levels (for the Terai, Hill and Remote Hill districts). The announcement of a flat capital subsidy of NRs 7000 and NRs 10,000 in the Terai and Hills, the installation rate for all sizes of biogas plants increased rapidly. The subsidy on biogas meets a substantial

164
portion of the construction cost of the plants. This flat rate capital subsidy also brought down the cost of energy produced from small-sized plants to almost the same level as that of big plants. This type of subsidy scheme encouraged farmers to install small plants, which were less susceptible to underfeeding as well as being affordable to middle income farmers. The higher rate of subsidy resulted in a higher rate of installation of biogas plants in Hills (Rijal, 1999).
As pointed out in the preceding chapters, the subsidy policy was further revised in the Fiscal Year 1995/96. According to the BSP Phase III Implementation Document, the subsidy will have to be reduced across the board by NRs. 1,000 to be applied for the F/Y 1999/2000 and onwards (Kanel, 1999). The findings from financial and economic rates of return of this study do not detect any problem with that proposal. Besides, this study has also considered about another option-suggesting new subsidy rates according to geographical division and size of plants.
20.6 CHANELIZATION OF SUBSIDY
A loan and subsidy programme was structured that is targeted at supporting the small and medium-scale rural farmers. This subsidy programme has been a very popular for the installation of biogas plants. The donor agents provided funds to HMG/N, which in turn sanctioned the funds through Alternative Energy Promotion Center (AEPC) with the recommendation of BSP-Nepal to the implementing biogas companies which ultimately reaches to the biogas farmers. The flow of subsidy has been presented in Figure 20.1.
REFERENCES
[1] ADB/N (2003) Rural Finance in Nepal, ADB/N, Kathmandu. [2] AEPC (2000) Subsidy for Renewable Energy, Alternative Energy Promotion Centre, Lalitpur. [3] BSP (1999) Course Outline for ASS Technician Training: Developed by a Workshop on Training of
Trainers for After-Sales-Services Technicians, 9-13 August, Kathmandu. [4] CES/IOE (2000) Present Structure of Biogas Sector in Nepal and Vision for Perspective Plan for
Twenty Years. Consolidated Management Services. [5] CES/IOE (2000) Renewable Energy Perspective Plan of Nepal (REPPON) 2000-2020:An
Approach, Alternative Energy Promotion Centre. [6] CMS (1998) Sustainable Approach on Quality Control of Biogas Plants, AEPC. [7] CMS (1999) Biogas Users Survey 1998-1999, Biogas Support Programme. [8] Devpart (1998) Biogas Users Surrey 1997-1998, Biogas Support Programme. [9] DevPart (1997) Biogas Users Survey-1996/1997, Biogas Support programme, Kathmandu, March.

165
[10] Kanel, N. R. (1999) An Evaluation of BSP Subsidy Scheme for Biogas Plants, Biogas Support Programme, Kathmandu. [ l l ] Karki, A. B. (1997) Training Manual in Biogas Technology for the Trainers of Junior Biogas Technology, Biogas Support Programme. . . [12] NPC (2003) Tenth Five-Year Plan, Kathmandu. [13] Rijal, K. (1999) Renewable Energy Technologies-A Brighter Future, ICIMOD, Kathmandu. [14] UNIDO (1980) Manual for Evaluation of Industrial Projects, Oxford and IBH Publishing Co. Pvt.
Ltd., India.

166
CHAPTER XXI
CONSTRAINTS AND PROBLEMS OF BIOGAS TECHNOLOGY
By going through preceding chapters one can realize that though biogas is a simple technology, innumerable problems are bound lo occur because of the ignorance and lack of appropriate training on the part of users and also due lo inadequate follow up and after-sale-services to be rendered to the client on the part of construction companies. On the other hand, biogas technology has some inherent constraints, for example, gas production is diminished significantly in cold climate or at higher altitude, while the methodology for warming the digester lo raise the temperature seems sophisticated, costly and unaffordable to the ordinary people. Similarly, so far mostly rich or medium families possessing sufficient landholding and cattle heads have benefited from this technology while disadvantaged sector of the society and ethnic groups other than Brahmins and Chettries have got less benefit from this technology. It is evident that both the promoters and users of biogas technology have so far emphasized more on the use of biogas as fuel and have paid less attention regarding the proper utilization of slurry as fertilizer.
Realizing above facts, an effort has been made in this chapter lo expose some of the key constraints and problems of biogas technology, which has hampered the rapid diffusion of this technology in the country as a whole.
21.1 COSTLY PLANT DESIGN
One of the main constraints that hinder the rapid diffusion of biogas technology is that its cost is high and is therefore beyond the reach of an ordinary farmer. In fact, the present pace of biogas development in Nepal is attributed lo the bank loan and attractive subsidy provided by the government, which meets around 30 to 40 percent of the capital cost of plant. Given that government subsidy cannot be provided forever and is likely to be stopped in foreseeable future, the interested person has to invest his or her own resources to install biogas plant. In that case, the momentum of biogas development will not be the same as before.
The next important fact is that only the people from rich and medium socio-economic brackets have benefited from this technology whereas large section of the disadvantaged people have not been able to harness this technology so far mainly due to financial constraints. The design propagated in Nepal is costly and no substantial research has been initiated to lower its cost for wider application of the technology (see Section 21.6.1).
21.2 LACK OF COLLATERAL
Although commercial banks provide loan and the government provides subsidy for biogas installation, the farmer may not possess sufficient landholding for collateral purpose, which is the prerequisite for sanctioning the loan by the banks. Such situation also limits the development of biogas amongst small farmers or disadvantaged group of people.
21.3 ETHNIC GROUPS BENEFITING FROM BIOGAS
Several studies carried out by SNV/BSP, AEPC and other organizations (see Chapter XVI) have clearly revealed that amongst various ethnic groups it is mostly Brahmins and Chettries (74%) who have much benefited from biogas technology compared to other castes (24%). It does not seem fair from equity point of view, as every ethnic group needs to be provided equal opportunity to reap the fruit of development.
21.4 QUALITY OF BIOGAS APPLIANCES
Initially when biogas programme was introduced in Nepal, all biogas equipments such as burners and lamps and other accessories used to be imported from our neighbouring country, India. These days biogas burners

167
and lamps are being successfully manufactured and tested by several companies in Nepal (see Chapter IV). However, it was reported that biogas lamps imported especially from some Indian companies were of inferior quality, which results into leakage of gas. Other problems associated with them are frequent breakage of gas mantle. Similarly, the main gas valve imported from India is of low quality whereas high quality gas valve imported from the Netherlands is costly.
21.5 AFTER-SALE-SERVICE AND REPAIR AND MAINTENANCE
Various biogas users surveys conducted in the past have shown that the level of after-sale-services provided by the company has been improving significantly these days compared to the past situation. However, stillaround 30 percent customers are found dissatisfied with the services of the company (see Chapter XVI). Similarly, from time to time, the plant owner faces the problem of Repair and Maintenance (R & M) in theplant and due to lack of knowledge; he or she has to depend upon the services of company. Hence lack ofefficient after-sale-service including timely R & M of the plant hinders the development of this technology to a great extent.
21.6 LACK OF APPROPRIATE RESEARCH AND DEVELOPMENT
The information presented in the preceding chapters will disclose that so far little attention has been paid on the Research and Development (R&D) aspects of biogas technology in Nepal and it appears that the promoters of the technology are satisfied only with extension and dissemination aspects. Hence lack of sufficient research in Nepalese context has also hampered the development of biogas technology in this country.
Some of the constraints realized in the field of R&D of biogas technology have been discussed below:
21.6.1 Low Cost Design of Biogas Plant
To date, little attention has been given to evolve low cost designs of biogas plants in Nepal. A concretemodel fixed dome biogas plant that has been promoted by GGC has been in use without any modificationsince about one and half decades. Brick type biogas plants (called Deenbandhu Plant in India) have been introduced in Nepal by some NGOs and private organizations and are still under experimental phase. Further research in this area could lower the plant construction cost.
21.6.2 Alternative Feedstock for Biogas plants
To date, cattle and buffalo dung has mainly been used as raw material to feed the biodigester. Apart fromanimal dung, use of other organic materials such as vegetable waste, municipal solid waste, industrial wastes, etc have not been so far examined for methane generation in the context of Nepal. Along with the development of biogas technology, it is imperative to tap various possible biodegradable wastes for the production of biogas and bio-fertilizer and to safeguard the polluted environment. This approach can alsosignificantly lower the volume of chemical fertilizer that needs to be exported.
21.6.3 Hygienic and Sanitation Aspects of Latrine-attached Biogas Plants
Biogas technology plays a vital role in improving the health and sanitation of the rural community. Animal and human faeces harbor pathogens that are detrimental to human health. At present, about 30 to 45 percent of the biogas plants are found connected with latrines. Therefore, it is imperative to find out whether the slurry coming out from night-soil attached plant still contains a significant amount of pathogenic or not. If so, it has to be further treated to avoid health hazards. Further research in this area would be to determine the optimum retention time at which the amount of pathogenic germs becomes negligible.
168
21.6.4 Mosquito Breeding after Biogas Installation
Several studies carried out in the past have confirmed that there is an increase in mosquito breeding after the installation of biogas. Therefore, serious thinking needs to be given to solve this problem because of the fact that fatal disease like malaria can occur in the community due to unwanted proliferation of mosquitoes {seeChapter XVII). In this regard, it is worth mentioning that in Tanahun district of Nepal, mosquito proliferationhas been reported as a result of establishment of latrine attached biogas plants.
21.6.5 Reduced Gas Production in Cold Climate
In cold weather or at higher altitude, the biogas technology has not been feasible due to considerable reduction in gas production because of low temperature. As discussed in Chapter V, various attempts were made by the scientists all over world to increase the gas production in the cold season through physical, chemical and biological methods. At times, the suggested methods are cumbersome, sophisticated and expensive from Nepalese perspective. In short, real breakthrough is awaited in this area, which is a subject of global concern.
21.6.6 Unawareness for Slurry
Still there is less awareness amongst the farming community pertaining to the utilization of bio-slurry as fertilizer. This aspect appears to be neglected. Chemical fertilizers are imported in Nepal. They are expensive and at times, are not available. On the other hand, slurry as a by-product of the anaerobic digestion process can locally be produced and used to increase soil fertility. However, field observations and reports indicate that the biogas plant owners pay more attention towards gas production and neglect the slurry utilization aspect. As yet, agriculturists and biogas promoters have not carried out sufficient demonstrations and experiments to convince the farmers about the added benefits of slurry as an organic fertilizer compared to Farm Yard Manure. Little scientific or agronomic data have been generated in this subject in the Nepalese context (see Chapter VII).
169
BIBLIOGRAPHY
[1] Acharya, C.N. (1961) Preparation of Fuel Gas and Manure by Anaerobic Fermentation of Organic Materials, New Delhi, Indian Agriculture Research Institute. [2] ADB/N (2003) Rural Finance in Nepal, ADB/N. Kathmandu. [3] AEPC (2000) Subsidy for Renewable Energy, Alternative Energy Promotion Centre, Lalitpur. [4] Alexander, M. (1967) Introduction to Soil Microbiology, John Wiley & Sons, Inc. New York. [5] Alviar, CJ. et al (1980) Cow Manure Biogas Production and Utilization in an Integrated System at the Alabang Dairy Project, Paper presented at the 47Ih Annual Convention of Philippines Veterinary Medical Association, [6] ATC (1997) Analysis of Toilet Attached Biogas Slurry-Compost, Biogas Support Programme. [7] Atlas, R. M. (1989) Microbiology: Fundamentals and Applications, Second edition. Macmilhin Publishing Company. [8] Biogas in Cold Climate (1979) In: Biogas Newsletter, Number 1, pp 5-6, 1979. [9] Biogas Newsletter (1981) Gobar Gas Irrigation in Nepal, Number !3, Summer. Pp6-7. [10] Biogas Newsletter (1987) Biodigester Effluent Boosts up Vegetable Production in Benin, Number 25, November 1987. [11] Boers, W. and S. Nienhuys (2002) Mission Report of the High Altitude Biogas Reactor in the Region, Nepal, Field Visit-October 2002. Biogas Support Programme. [12] Boyle, G. (1996) Renewable Energy-Power for a Sustainable Future, Oxford University Press in Association with the Open University. U.K. [13] Britt, C and Kapoor, S. (1994) Biogas Support Programme. The Effects of Biogas on Women, Workloads and Division of Labour in Hathilel, Janakpur Zone, Nepal, Biogas Support Programme. [14] Britt, C. (1994) Tfie Effects of Biogas on Women's Workloads in Nepal: An Overview of Studies, Biogas Support Programme. [15] BRTC (1989) The Biogas Technology in China, Chengdu Biogas Research Institute, Agrictural Publishing House, Chegdu, China. [16] BSP (1992) Implementation Document. ADB/N, GGC and SNV. [17] BSP (1994) Mid-Term Evaluation of the Biogas Support Programme, Biogas Support Programme. [18] BSP (1997) Biogas Support Programme Phase I and Phase Il-Development Through The Market, Biogas Support Programme [19] BSP (1998) BSP Quality Control on Construction and After-Sales-Services 2054/05 under GGC. [20]
BSP (1999) Course Outline for ASS Technician Training: Developed by a Workshop on Training of Trainers for After-Sale s-Services Technicians, 9-13 August, Kathmandu. [21] BSP (2002) An Integrated Environment Impact Assessment, Biogas support Programme. [22] BSP (2002) The data personally obtained from record section of Biogas Support Programme. [23] BSP (2002) Abstracts of Biogas Related Publications (1992-2002), Biogas Support Programme. [24] BSP (2003) Biogas Nepal 2002, Biogas Support Programme. [25] CES/IOE (2000) Present Structure of Biogas Sector in Nepal and Vision for Perspective Plan for Twenty Years, Consolidated Management Services. [26] CES/IOE (2001) A Studies Report on Efficiency Measurement of Biogas, Kerosene and LPG Stoves, Biogas Support Programme. [27] CES/IOE (2001) Design Concept and Other Parameters of Biogas Plants. In: Advanced Course in Biogas Technology, Biogas Support Programme. [281 CES/IOE (2001) Production of Biogas in Cold Climate. In; Advanced Course in Biogas Technology, Biogas Support Programme. [29] CES/IOE (2001) Role of Management, Communication and Professional Development in Biogas Technology, In: Advanced Course in Biogas Technology, Biogas Support Programme. [30] Chawla O.P. (1986) Advances in Biogas Technology, Publication and Information Division, Indian Council of Agricultural Research, New Delhi. [31] Chengdu-Seminar (1979) Biogas Technology and Utilization, Sichuan Provincial Office of Biogas Development. China. [32] CMS (1996) Biogas Technology: A Training Manual for Extension, Food and Agriculture Organization of the United Nations. Support for Development of National Biogas Programme

170
(FAOm:P/Nep/4451-T). [33] CMS (1996) Improvement in Environment and Sanitation through Anaerobic Digestion of Human Wastes, United Nations High Commissioner for Refugees, Kathmandu, Nepal [34] CMS (1998) Environment and Sanitation Programme in the Refugee Affected Area: Installation of Community Latrine-cum-Biogas Plant and Conduction of Environment and Sanitation Training at Ward No. I of Pathari VDC of Morang District -of Nepal, United Nations High Commissioner for Refugees, Kathmandu, Nepal [35] CMS (1998) Environment and Sanitation Programme in the Refugee Affected Area: Installation of Community iMtrine-cum-Biogas Plant and Conduction of Environment and Sanitation Training at Ward No. I of Pathari VDC of Morang District of Nepal, United Nations High Commissioner for Refugees, Kathmandu, Nepal [36] CMS (1998) Mid-Term Evaluation of the BSP Slurry Extension Programme, Biogas Support Programme. [37] CMS (1998) Sustainable Approach on Quality Control of Biogas Plants, Alternative Energy Promotion Centre. [38] CMS (1999) Biogas Users Survey 1998/1999, Biogas Support Programme. [39] CMS (1999) Monitoring Report on Latrine-cum-Biodigester Installation at Pathati, United Nations High Commissioner for Refugees, Kathmandu, Nepal [40] Commission for Environmental Impact Assessment (2001) Advice for Terms of Reference for an Integrated Environmental Impact Assessment for the Biogas Programme in Nepal, Utrecht, The Netherlands. [41] de Castro J.F.M., A.K. Dhussa, J.H.M. Opdam and B.B. Silwal (1994) Mid-term Evaluation of the Biogas Support Programme, Final Report, DGIS. [42] de Castro J.F.M., N.R. Kanel and P. Jha (1999) Mid-term Review of the Biogas Support Programme. Part of Phase III, Biogas Support Programme. [43] Demont, D., A. Sckeyde, and D A. Ulrich (1990) Possible Applications of Bioslurry for the Purposes of Fertilization. In: Biogas Forum, vol. 1 Special. [44] Devkota, G.P. (1986) Plastic Bag Digester. In: Biogas Newsletter, No.23. [45] DevPart (1997) Biogas Users Survey-1996/1997, Biogas Support programme, Kathmandu, March. 46] DevPart (1998) Biogas Users Sun'ey 1997/98, Biogas Support Programme. [47] DevPart (2001) Research Study on Optimal Biogas Plant size, Daily Consumption Pattern and Conventional Fuel Saving, Biogas Support Programme. April. [48] Dhakal, N. R. (2002) Microbial Digestion of Vegetable and Kitchen Waste for Biogas Production. In: M.Sc. Thesis presented at Central Department of Microbiology. Tribhuwan University, Kirtipur, Kathmandu, Nepal. [49] Dhussa, A.K. (1985) Biogas Plant Effluent Handling and Utilization, Changing Villages Vol. 7, No. 1. [50] Dhussa, A.K. (1986) Night-soil Based BiogasPlants, Biogas from Human Waste. CORT: Delhi [51]
EastConsult (1994) BSP Biogas Users Survey 1992/1993, Biogas Support Programme. [52] EAWAG (1995) SANDEC News No. 1. [53] ETSU (1994) Biogas from Municipal Waste-Overview of Systems and Markets for Anaerobic Digestion ofMSW, Harwell, United Kingdom. [54] Fighting the Chill (1983). In: Biogas Newsletter, Number 17. ppl, 1983. [55] Finely, J.H. (1981) Tunnel Plant-Under Development. In: Biogas Newsletter, No.13. Summer 1981 [56] Franklin,J. and Stermate, J.M (1996) Economic Evaluation and Investment Decision Methods, Investment Evaluation Corporation, U.S.A. [57] Godfrey, B. (1996) Renewable Energy Power for a Sustainable Future, Oxford University Press. [58] GreenCOM (1997) Forest Management by Nepali Communities, USAID. [59] Gunnerson, C.G and D.V. Stucfcey (1986) Integrated Resource Recovery Anaerobic Digestion. Principles and Practices for Biogas Systems, World Bank Technical Paper Number 49. [60] Gupta, D.R. (1991) Bio-Fertilizer from Biogas plants, Changing Villages, Vol. 10, No.l Jan-Mar., 1991. [61] Gurung, J.B. (1997) Review of Literature on Effects of Slurry Use on Crop Production, Biogas Support Programme.
171
[62] HMG/N (1997) Environment Protection Act-2053. [63] HMG/NADB/FINNIDA (1998) Executive Summary In: Master Plan for the Forestry Sector Nepal. [64] Howes, M and P. Endagama (1995) Farmers, Forests and Fuel, Intermediate Technoiogy Publications. [65] Hurst, C and A. Barnett (1990) The Energy Dimension-A Practical Guide to Energy in Rural Development Programmes, Intermediate Technology Publications. [66] IDRS (2000) Biogas Users Survey 1998/1999, Biogas Support Programme. [67] Jiayu, M., L.Zhengfang and W. Quihua (1989) Studies on the Design and Construction of Fish Culture fed only with Digested Liquid Slurry. Rural-Eco-Environment, China, No.2, pp 12-17. [68]
Joshi, A. L. (1998) Forest Users Groups: Self Governing Institutions for Managing the Forest of Nepal. [69] K.C. Hari Bahadur (undated) Handbbok of Gobargas Plant Construction, Biogas Support Programme. Undated. [70] Kanel, N. R. (1999) An Evaluation of BSP Subsidy Scheme for Biogas Plants, Biogas Support Programme, Kathmandu. [71] Karki, A. (1994) Biogas Installation with Elephant Dung at Machan Wildlife Resort, Chitwan, Nepal. In; Biogas Newsletter, No.45, April 1994. [72] Karki, A. (2002) From Kitchen Waste to Biogas: An Empirical Experience. In: BNRM, No. 75. [73]
Karki, A. B. (1997) Training Manual in Biogas Technology for the Trainers of Junior Biogas Technology, Biogas Support Programme. [74] Karki, A. B., K. M. Gautam and S. R. Joshi (1993) Future Structure of Biogas Sector in Nepal, Biogas Support Programme. [75] Karki, A. B., K.M. Gautam and A. Karki (1994) Biogas Installation from Elephant dung at Machan Wildlife Resort, Chitwan Nepal. In: Biogas News Letter, Issue No. 45 [76] Karki, A.B. and K. Dixit (1984) Biogas Fieldbook, Sahayogi Prakashan, Tripurcshwar, Kathmandu, Nepal. [77] Karki, K. B. (1997) Estimation of Plant Nutrient Loss from Biogas Slurry, Biogas Support Programme. [78] Karki, K.B. (2001) Response to Bio-slurry Application on Maize and Cabbage in Lalitpur District, Alternative Energy Promotion Centre. [79] Keizer, C. (1993) Effect of Biogas on the Workload of Women in Nuwakot District in Nepal, Biogas Support Programme. [80] Keizer, C. (1994) Effect of Biogas on the Workload of Women from a Gender Perspective, Biogas Support Programme. [81] Keyun, Deng and Choi Yunchu (1990) China Actively Promotes the Development of Biogas Technology, International Conference of Biogas: Technology and Implementation Strategies (Conference Report, Pune India: a Joint Initiative of FRG and Republic of India, Jan. 10!il to 15th, 1990). [82] Khandelwal, K.C. and S.S. Mahdi (1986) Biogas Technology: A practical Handbook, Vol. 1. New Delhi: Tata McGraw. [83] Kijne, E. (1984) Biogas in Asia, Ultrecht, Holland: CDP (Consultants for Management of Development). [84] Kojima, T (1998) The Carbon Dioxide Problem: Integrating Energy and
Environmental Policies for the 21s' Century, Amsterdam. Gordon and Branch Science Publishers. [85] Lagrange, B. (1979)
Biomethane 2. Principes-techniques Utilisations, EDISUD. La Calade, 13100 Aix-en-Provence [86] Lakshmanan, A.R. and A. Jeyabal (1993) Use of Biogas Effluents as Seed Coating Media for Successful Crop Production, Biogas Slurry Utilization, New Delhi: CORT. [87] Lam, J. and W.J, van Nes (1994) Enforcement of Quality Standards upon Biogas Plants in Nepal.In: Biogas Forum, Vol II, No. 57. [88] Mahadevaswami, M. and L.V. Venkataraman (1990) Integrated Utilization of Fruit Processing Waste for Biogas and Fish Production. In: Biol. Waste 32: 2430251.