PRACTICAL BIOGAS PLANT DEVELOPMENT HANDBOOK
126
PRACTICAL BIOGAS PLANT DEVELOPMENT HANDBOOK Potential Biogas resources, Legal Review, and Good Practice of Biogas Construction in Cambodia Prepared by:
-
Upload
khangminh22 -
Category
Documents
-
view
0 -
download
0
Transcript of PRACTICAL BIOGAS PLANT DEVELOPMENT HANDBOOK

PRACTICAL BIOGAS PLANTDEVELOPMENT HANDBOOK Potential Biogas resources, Legal Review,
and Good Practice of Biogas Construction
in Cambodia
Prepared by:

i
PRACTICAL BIOGAS PLANT DEVELOPMENT
HANDBOOK: Potential Biogas resources, Legal Review,
and Good Practice of Biogas Construction in Cambodia
Authors: Lay Makara, Lor Lytour, and Mean Chanmakara
Date: 06 September 2021
Edited by: Bart Frederiks
Kong Rachana
Prepared by: Biogas Technology and Information Center (BTIC)
Supported by: The United Nations Industrial Development
Organization (UNIDO) under the framework of
project “Reduction of GHG Emissions through the
promotion of commercial biogas plants”
Financed by: The Global Environment Facility (GEF)

i
LIST OF ABRREVIATIONS
ABP Anaerobic bio-gasification potential
ABR Anaerobic Baffled Reactor
AC Anaerobic contact
AD Anaerobic digestion
BCAs Biodigester Construction Agents
BIOMA Biogas Institute of Ministry of Agriculture and Rural Affairs
BOD biological (biochemical) oxygen demand
BSE Bovine Spongiform Encephalopathy
BTIC Biogas Technology and Information Center
CAMDA China Agricultural Machinery Distribution Association
CAPEX Capital expense
CEDAC The Cambodian center for study and development in
Agriculture
CHP Combined heat and power
CNG Compression natural gas COD Chemical oxygen demand
COMFAR Computer Model for Feasibility Analysis and Reporting
CSP Chemical scrubbing process
C/N Carbon to nitrogen
DAL Department of Agricultural Legislation
DM Dry matter
CS Cryogenic separation
CSP Chemical scrubbing process
ERDI Energy Development and Research Institute of Chiang Mai
University, Thailand
FM Fresh manure
FTB The Foreign Trade Bank of Cambodia
FvB German Biogas Association
GEEW Gender equality and the empowerment of women
GEF Global Environment Facility
GHG Green House Gas

ii
HPWS High pressure water scrubbing
HRT Hydraulic retention time
IFAD International Fund for agricultural Development
IRR Internal rate of return
KEPCO Korean Electric Power Corporation
MAFF Ministry of Agriculture, Forestry and Fisheries
MEF Ministry of Economy and Finance
MIH Ministry of Industry and Handicraft
MoE Ministry of Environment
MME Ministry of Mines and Energy
MS Membrane separation
MSW Municipal solid waste
NBP National biogas program
NPV Net present value
LCA Life cycle assessment
LoA Letter of Agreement
LPG Liquefied petroleum gas
ODM Organic dry matter
OFMSW Organic fraction of municipal solid waste
OLR Organic loading rate
OM Organic matter
OPEX Operating expense
PBPO Provincial Biodigester Program offices
Ppm Part per millions
PSA Pressure swing adsorption
RE Renewable Energy
RETs Renewable Energy Technologies
RUA Royal University of Agriculture
SNV Stichting Nederlandse Vrijwilligers
S-RET Scaling-up of Renewable Energy Technologies
SRT Solid retention time
TKN Total Kjeldahl nitrogen
TSS Total suspended solid
TU Technical University of Vienna

iii
TWAS Thickened Waste Activated Sludge
UNIDO The United Nations Industrial Development Organization
VS Volatile solids
VFAs Volatile fatty acids
VSS Volatile suspended solid
Wh/y Watt hour per year
LIST OF SYMBOLS
Ca(OH)2 Calcium hydroxide
CH4 Methane
CO Carbon mono oxide
CO2 Carbon dioxide
Fe2O3 Iron oxide or ferrous oxide
Fe(NH4)2(SO4)2 Ferrous ammonium sulfate
H2 Hydrogen
H2S Hydrogen sulfide
H2SO4 Sulfuric acid
K2Cr2O7 Potassium dichromate
N2 Nitrogen
Na2CO3 Sodium carbonate
NaOH Sodium hydroxide
NH3 Ammonia
PAHs Polycyclic aromatic hydrocarbons
SO2 Sulfur dioxide
ZnO Zinc oxide

iv
LIST OF FIGURES
Figure 1 Anaerobic pathway of digestion of organic material. ..................................... 4
Figure 2 Energy supply in Cambodia from 1995 to 2018 by sources: Oil, solar, hydro,
biofuel, and coal. .......................................................................................................... 12
Figure 3 Electricity consumption in Cambodia from 1995 to 2018. ........................... 13
Figure 4 The potential crop production in Cambodia from 2000 to 2018. .................. 22
Figure 5 Generalized soil fertility potential map of Cambodia (Vang 2015). ............. 22
Figure 6 (a) Anaerobic covered lagoon technology and (b) biogas production process.
...................................................................................................................................... 58
Figure 7 Biogas pre-treatment unit at M’s Pig farm. ................................................... 65
Figure 8 Schematic overview on biogas production and use technologies at industrial
scale: (1) Different feedstocks, (2) safety equipment, (3) anaerobic digester, (4) gas
storage, (5) sanitation, (6) gas cleaning system for desulfurization, (7) combined heat
and power unit (CHP), (8) gas treatment system for biogas upgrading (fuel and CNG),
(9) Digestate storage, and (10) digestate upgrading (optional). ................................... 66
Figure 9 An enclosed flare from CAMDA. ................................................................. 71
Figure 10 Schematic representation of the closed cycle of anaerobic digestion of
biogenic waste, AD, and quality management of digestate. ........................................ 76
Figure 11 Digestate processing, treatment, and applications (Möller and Müller
2012). ........................................................................................................................... 79
Figure 12 General procedure for techno-economic analysis. ...................................... 88
Figure 13 Investment and operation costs of biogas plant (Zhao et al. 2016). ............ 90
Figure 14 Schematic representation of the steps of the methodology used for the risk
assessment (Scarponi et al. 2015). ............................................................................... 99
Figure 15 Hazards of the biogas plant. ...................................................................... 100
Figure 16 Overview of hazards and safety systems in biogas production and utilization
(Westenbroek and Martin 2019). ............................................................................... 102

v
LIST OF TABLES
Table 1 Number of biogas installations (Langeveld et al. 2016). .................................. 2
Table 2 Construction cost of household biodigester in Cambodia (NBP 2019). ......... 16
Table 3 Commercial farms and their animal production in 2016 (Borany 2016). ....... 19
Table 4 Classification of the farm size from different animal types (NBP 2019). ...... 19
Table 5 SWOT analysis for commercial biogas in Cambodia. .................................... 23
Table 6 Biogas and methane production potential for different AD feedstocks
(Langeveld and Peterson 2018). .................................................................................. 29
Table 7 Maximum gas yields and theoretical methane contents (Weiland 2010). ...... 40
Table 8 Comparison of anaerobic processes for wastewater treatment (Deublein and
Steinhauser 2010)......................................................................................................... 52
Table 9 Ideal operating ranges for methane fermentation (Bowman and Dahab 2002).
...................................................................................................................................... 57
Table 10 Biogas quality before and after pre-treatment with ferrous pellets. ............. 66
Table 11 The compositions of biogas versus biomethane. .......................................... 70
Table 12 Estimation of electric production and lagoon size from the total wastewater in
farm A in Kampong Speu Province, Cambodia........................................................... 88
Table 13 Overview of the investment cost of farm A in Cambodia. ........................... 92
Table 14 Cash flow of the investment. ........................................................................ 93

vi
ACKNOWLEDGEMENT
We would like to take this opportunity thanks to collaborators and other
contributions such as the German Biogas Association (FvB); Biogas Institute of
Ministry of Agriculture and Rural Affairs (BIOMA), China; Energy Development and
Research Institute (ERDI) of Chiang Mai University, Thailand; Technical University
(TU) of Vienna, Austria; the Cambodian Ministry of Environment, the Ministry of
Agriculture, Forestry and Fisheries (MAFF); the General Secretariat of the National
Council for Sustainable Development, the General Directorate of Animal Health and
Production (DAHP); and provincial governments in the department of Animal
Production; for their collaborations and supports in training, technical and consultancy
services, data collection, and loan to the animal farmers to build biogas plant in
Cambodia.
Specially thanks to the United Nations Industrial Development Organization
(UNIDO) for the financial support regarding the project “Reduction of GHG Emissions
through the promotion of commercial biogas plants,” financed by the Global
Environment Facility (GEF). Through this project, the RUA and UNIDO signed an
agreement to operate the Biogas Technology and Information Center (BTIC) on 28
September 2017 with support from the project covering two expected outcomes: 1.)
Global Climate Change and 2.) Human and institutional collaboratively with the
National Council for Sustainable Development and other relevant departments, which
share the mandate of creating awareness on climate change issues and commercial
biogas promotion.
We are thankful to the authors Dr. Lay Makara for writing chapters 1 – 4 and 6
– 8, Mr. Mean Chanmakara (chapter 5), Mr. Lor Lytour (chapter 9) for their efforts and
distributions, and BTIC’s members for their supports. We also would like to extend our
appreciation to the reviewers, Mr. Bart Frederiks (Senior International Biogas Expert)
and Mrs. Kong Rachana (National project coordinator) of UNIDO, who, despite their
busy schedule helping us on constructing the global content and providing their critical
comments to improve this handbook.

vii
PREFACE
Cambodia is working on a RE strategy that lays down the policy intention,
objectives, and guidelines for developing the requisite infrastructure for providing
renewable electricity services in rural areas. The development of bioenergy offers
significant possibilities for reducing greenhouse gas (GHG) emissions and fossil fuel
dependency. New regulations for environmental protection have promoted the biogas
plant using anaerobic digestion (AD) from organic wastes such as animal manure and
crop residues and organic residues from food and agro-industries to generate renewable
energy. As feedstocks become the dominant source of biogas, reducing energy used
and GHG emissions will benefit everyone, especially farm owners, developers, and
communities.
Stichting Nederlandse Vrijwilligers (SNV) had been working on disseminating
household-sized biodigesters and supporting the National Biodigester Programme
(NBP) in distributing more than 10,000 biodigesters across the country. According to
the report from UNIDO, all pig farms and agro-industry in Cambodia can produce
electricity around 60 Twh/y and 2,070 Twh/h through the biogas project. Recently, the
commercials farm and agro-industry have dramatically increased. UNIDO supports the
farms that plan to build commercial biogas plants through the global environmental
facility (GEF) project’s “Reduction of GHG emission through promoting commercial
biogas plants in Cambodia.” Based on the feasibility studies of NBP and BTIC (Biogas
Technology and Information Center), there are many potential farms and industrial
waste that can produce biogas and electricity through commercial biogas plant. The
present volume on biogas would assist the scientific and industrial communities in
further developing this industry worldwide.
This biogas handbook mainly focuses on the practical biogas plant for further
development of commercial biogas plant in Cambodia. This book also describes
potential resources, biogas technology, legal review, and good practice of biogas
construction. The handbook is divided into nine chapters, which target readers, such as
researchers, farm owners, investigators, developers, policymakers, and financial
institutions. Chapter 1 gives an overview of biogas plant and biogas production. The
benefits and limitations of the biogas plant are discussed. Chapter 2 provides the biogas
status and general information about the biogas systems and technologies used in
Cambodia. Strength, Weakness, Opportunities, and Threats (SWOT) analysis of

viii
commercial biogas in Cambodia is discussed. Chapter 3 describes how the biogas
system works (from feedstock to biogas generation and electricity conversion). The
three main categories of biogas resources (agriculture, municipal, and agro-processing
industry wastes) and their composition, quality, availability are presented. Chapter 4
focuses on planning, design, and suitable technology and selecting the size of
equipment for the biogas resource to reduce financial investment and get more
economic benefit from the biogas project. Chapter 5 discusses the utilization of biogas
as electricity, heat, and biofuel, whereas the utilization of by-products of biogas
(digestate) as organic fertilizer in Cambodia is highlighted in Chapter 6. An example of
electricity production from an existing biogas plant in Cambodia is also given in this
chapter. Chapter 7 indicates the economic assessment and financial analysis of biogas
projects such as total investment cost, revenue, internal rate of return (IRR), and
payback period. A feasibility study from BTIC on the technical and financial
assessment of a pig farm is also discussed. Chapter 8 describes the number of risks, risk
assessment, and safety of biogas production. Health and safety issues, and safety
systems, guidelines, and documents are included. Finally, chapter 9 highlights the legal
aspects (frameworks and policy), environmental aspects (regulations and impacts), and
social aspects.
Phnom Penh, Cambodia Dr. Lay Makara
Researcher of BTIC in Cambodia

ix
TABLE OF CONTENTS
LIST OF ABRREVIATIONS ......................................................................................... I
LIST OF SYMBOLS ................................................................................................... III
LIST OF FIGURES ..................................................................................................... IV
LIST OF TABLES ........................................................................................................ V
ACKNOWLEDGEMENT ........................................................................................... VI
PREFACE .................................................................................................................. VII
TABLE OF CONTENTS ............................................................................................. IX
CHAPTER 1: INTRODUCTION TO BIOGAS PLANT FUNDAMENTALS ............ 1
1.1 Overview of biogas ........................................................................................... 1
1.2 Basic conditions for biogas production............................................................. 3
1.3 Biogas system ................................................................................................... 5
1.4 Advantages of biogas ........................................................................................... 6
1.4.1 Benefits for environmental protection .......................................................... 6
1.4.2 Financial and economic benefits ................................................................... 6
1.4.3 Farmers and society benefits ......................................................................... 7
1.5 Limitations of biogas ........................................................................................... 7
REFERENCES .............................................................................................................. 8
CHAPTER 2: BIOGAS STATUS IN CAMBODIA ................................................... 11
2.1 Key challenges and sustainable strategy in the energy sector in Cambodia ...... 11
2.2 General information of biogas (biodigester) in Cambodia ................................ 13
2.3 Biogas household ............................................................................................... 15
2.4 Commercial biogas plant ................................................................................... 16
2.5 Potential feedstocks in Cambodia ...................................................................... 18
2.5.1 Livestock ..................................................................................................... 18
2.5.2 Agricultural waste ....................................................................................... 20
2.5.3 Agro-processing industry ............................................................................ 21
2.6 SWOT analysis for commercial biogas in Cambodia ........................................ 22
REFERENCES ............................................................................................................ 23
CHAPTER 3: BIOGAS PROCESS AND PRODUCTION ........................................ 26

x
3.1 Anaerobic digestion ........................................................................................... 26
3.2 Biogas feedstocks............................................................................................... 28
3.2.1 Overview of biogas resource ...................................................................... 28
Types of biogas feedstocks .................................................................................. 30
(a) Agriculture waste ........................................................................................ 30
(b) Municipal waste ......................................................................................... 30
(c) Industrial waste ........................................................................................... 31
Barrier of feedstocks ............................................................................................ 32
3.3 Characteristics and Analysis of biogas feedstocks ............................................ 32
3.3.1 Preparation of sampling .............................................................................. 33
3.3.2 Laboratory analysis of feedstocks ............................................................... 34
(a) Total solids (TS) and volatile solid (VS) .................................................... 34
(b) Chemical oxygen demand .......................................................................... 35
(c) Nitrogen content ......................................................................................... 36
3.3.3 Biochemical methane potential ................................................................... 37
3.4 Component affecting biogas production ............................................................ 38
3.4.1 Temperature and pH ................................................................................... 38
3.4.2 Moisture ...................................................................................................... 39
3.4.3 Raw material composition .......................................................................... 40
3.4.4 Total solids and volatile solids .................................................................... 40
3.4.5 Chemical and biological demand ................................................................ 41
3.4.6 Carbon/nitrogen ratio .................................................................................. 41
REFERENCES ............................................................................................................ 42
CHAPTER 4 BIOGAS PLANNING, DESIGN, AND TECHNOLOGY ................... 47
4.1 Basic steps in the planning of a biogas plant ..................................................... 47
4.1.1 Feasibility study .......................................................................................... 48
4.2 Design of biogas plant ....................................................................................... 48
4.3 Reactor volume .................................................................................................. 49
4.3.1 Hydraulic retention time ............................................................................. 49
4.3.2 Organic loading rate .................................................................................... 50
4.4 Type of co-digesters ........................................................................................... 51
4.4.1 Continuous stirred tank reactor ................................................................... 53
4.4.2 Up-flow Anaerobic Sludge Blanket ............................................................ 54

xi
4.4.3 Up-flow anaerobic filter .............................................................................. 54
4.4.4 Anaerobic Baffled digesters ........................................................................ 55
4.5 Anaerobic lagoon ............................................................................................... 56
4.5.1 Simple covered lagoon ................................................................................ 56
4.5.2 Improved covered lagoon ........................................................................... 57
4.5.3 Design and construction cost of the covered lagoon .................................. 57
4.5.4 Operation and maintenance ......................................................................... 58
4.5.5 Advantages and disadvantages of anaerobic lagoons ................................. 58
REFERENCES ............................................................................................................ 59
CHAPTER 5 BIOGAS PRODUCTION AND UTILIZATION .................................. 63
5.1 Biogas properties ............................................................................................... 63
5.2 Biogas pre-treatment ....................................................................................... 64
5.2.1 Iron oxide pellets......................................................................................... 64
5.2.2 Case study of biogas pre-treatment system in M’s pig farm in Cambodia . 65
5.3 Biogas Utilization ........................................................................................... 66
5.3.1 Electricity production.................................................................................. 67
5.3.2 Combined heat and Power .......................................................................... 68
5.3.3 Heat Utilization ........................................................................................... 68
5.3.4 Biomethane production and CNG ............................................................... 69
5.4 Flaring ................................................................................................................ 70
5.4.1 Operation, caution, inspection, and maintenance ....................................... 71
REFERENCES ............................................................................................................ 72
CHAPTER 6 UTILIZATION OF DIGESTATE ......................................................... 74
6.1 Digestate properties ........................................................................................... 74
6.2 Digestate quality and management .................................................................... 74
6.3 Digestate preserving and characteristic condition ............................................. 76
6.4 Digestate treatment and upgrading .................................................................... 77
6.5 Standardization and regulation of digestate ....................................................... 79
6.6 Utilization of digestate as organic fertilizer ....................................................... 81
6.7 Application of fertilizer and potential use of organic fertilizer in Cambodia .... 82
6.7.1 Nutrient requirement for agriculture in Cambodia ..................................... 83
REFERENCES ............................................................................................................ 84

xii
CHAPTER 7 ECONOMIC ASPECTS ........................................................................ 86
7.1 Typical economic and financial benefits ........................................................... 86
7.2 Techno-economic assessment ............................................................................ 87
7.3 Financial analysis ............................................................................................... 89
7.3.1 Financial Feasibility .................................................................................... 90
7.3.2 Calculation of Financial investment cost .................................................... 92
7.3.3 Cash flow and financial indicators .............................................................. 93
REFERENCES ............................................................................................................ 93
CHAPTER 8: RISK ASSESSMENT AND SAFETY OF BIOGAS PROJECT ......... 95
8.1 Introduction to risk assessment .......................................................................... 95
8.1.1 Overview of qualitative risk analysis and assessment ................................ 95
8.1.2 Hazard identification and risk estimation ................................................... 97
8.1.3 Risk assessment on biogas production and upgrading ................................ 98
8.2 Health and safety issues ..................................................................................... 99
8.2.1 Fire and explosion hazards ........................................................................ 100
8.2.2 Risk of asphyxiation and chemical and disease hazards ........................... 100
8.3 Safety systems .................................................................................................. 101
8.4 Safety guidelines and documents ..................................................................... 101
References .............................................................................................................. 102
CHAPTER 9 LEGAL, ENVIRONMENTAL, AND SOCIAL ASPECTS OF BIOGAS
PROJECTS ................................................................................................................ 104
9.1 General legal terms and requirements for biogas project ................................ 104
9.1.1 Legal frameworks and policy for the development of biogas plant in
Cambodia ........................................................................................................... 105
9.2 Environmental aspects ..................................................................................... 106
9.2.1 Environment regulation ............................................................................ 106
9.2.2 Environment impacts of biogas production and utilization ...................... 108
9.3 Social aspects ................................................................................................... 109
9.3.1 Social conditions and gender consideration .............................................. 110
9.3.2 Social impacts ........................................................................................... 111
REFERENCES .......................................................................................................... 111

1
CHAPTER 1: INTRODUCTION TO BIOGAS PLANT FUNDAMENTALS
This chapter gives an overview of biogas and a perspective of biogas and
describes all essential conditions for biogas production. Two central biogas systems,
household biogas and commercial biogas plant, and their biogas production and
utilization are introduced. Biogas has advantages and limitations, so the benefits of
biogas production on the environment, companies, and farmers are included in this
chapter.
1.1 Overview of biogas
Biogas is formed naturally from biogenic matter under anaerobic conditions. In
nature, this occurring biogas escapes into the atmosphere, where methane’s main
component contributes to global warming. Since the 1930s, a standard biogas process
from sewage sludge has been used in household and farm-scale applications. Since the
start of the twenty-first century, policymakers have recognized that biogas production
can answer some challenges in reducing greenhouse gas (GHG) emissions such as
methane from slurry storage and impacts of pollution by waste disposal. Mainly, it can
provide a renewable source of energy. This recognition has led to the rapid growth of
the biogas sector and has been promoted through legislation with various targets set
worldwide for renewable energy and reduced GHG emissions (Gomez and Costa 2013).
Although biogas becomes a vital energy component for sustainability transition, the
total production volume of biogas is still relatively low compared to other renewable
energy such as solar cell and wind power. Both developed and developing countries
face some barriers, including technical, economic, market, institutional, socio-cultural,
and environmental, that hinder the widespread adoption of biogas as a source of energy.
The biogas industry faces the most frequent and crucial constraints that were identified
and integrated into a systematic classification (Nevzorova and Kutcherov 2019).
Given the potential and clear perspective for converting biomass residues and
other organic material into bioenergy, it is no surprise that biogas production is
growing. The number of biogas installations is estimated at more than 35 million, most
of which are household installations located in China and India. In contrast, large farm
digesters, primarily found in Europe and North America, and industrial facilities have
a much larger average capacity (Langeveld et al. 2016). It has been estimated that
biomethane production by the year 2020 will achieve 250 billion standard cubic meters

2
(Nm3) (Matheri et al. 2017). Therefore, biomethane has become one of the most used
biofuels for power generation and heating purposes in society today.
Anaerobic digestion (AD) has emerged as one of the established, clean, and
renewable energy technology for the production of methane-rich biogas (Rana et al.
2020). A proper biogas facility of the biogas process can be fully contained, controlled,
optimized, and commercially viable industry.
Table 1 Number of biogas installations (Langeveld et al. 2016).
Region Number of
installations
(Year)
Region Number of
installations (Year)
Europe
Asia
Austria 337 (2013) China 30 million (2010)
Denmark 154 (2012) India 4.2 million (2011)
Germany 7,850 (2013) Nepal 1.3 million (2012)
Italy 1,264 (2013) Pakistan 5,360 (2008)
Netherland 252 (2013) South Korea 82 (2013)
Sweden 264 (2013) Vietnam 23,300 (2012)
Switzerland 606 (2013) Africa
UK 634 (2013) Burkina Faso 3,500 (2015)
Europe (all) 14,563 (2013) Ethiopia 10,109 (2015)
America
Kenya 14,112 (2015)
United States 2,116 (2014) Tanzania 10,000 (2015)
Brazil 25 (2012)
Biogas is a product of the biochemical decomposition of organic materials. It
consists mainly of methane (50–75%), carbon dioxide (25–50%), and water vapor. It
may also contain small quantities of nitrogen, hydrogen sulfide, ammonia, and other
trace gases. Such elements like Nota Bene (NB), N2, and O2 are there if air has been
introduced in the gas holder, as there are naturally not produced through AD. Sulfur
can be found in the sludge but not in the biogas. H2 is an intermediary product in the
AD process, not typically in the end product. For certain gases (e.g., landfill gas),
siloxanes and dust can be found. Components like CO, Polycyclic aromatic
hydrocarbons (PAHs), and halogens are usually below the detection limits (Ullah Khan

3
et al. 2017). The percentage of biogas production is dependent on the various feedstock
characteristics. Many materials, including agricultural wastes (biomass), food waste,
industrial waste, and wastewater, are feedstocks for biogas production.
However, not all waste products and crops are equally suitable for biogas
production, and in some cases, biogas production might not be profitable. To assess the
suitability of biogas feedstocks, a reliable way of characterizing and analyzing
feedstocks is necessary. A preliminary feedstock assessment can be carried out using
data available in literature combined with feedstock process and production data. Legal
issues should also be considered, such as environmental and safety laws regulating the
use of waste products. A detailed laboratory analysis should follow if the preliminary
assessment indicates that the feedstock might be suitable (Drosg et al. 2013).
Concise information about the different analysis methods such as total solids
(TS), volatile solids (VS), chemical oxygen demand (COD), biological (bio-chemical)
oxygen demand (BOD), nitrogen content, C/N ratio, and presence of inhibitory
substance needs to be carried out. The type of biogas plant, such as reactor design and
operational conditions, needs to be designed based on the available feedstocks. Biogas
production potential should also be investigated through various methods as a crucial
step in planning a biogas plant (Jingura and Kamusoko 2017).
1.2 Basic conditions for biogas production
Biogas is produced during the breakdown of organic matter in the absence of
oxygen (anaerobically). Biogas has from anaerobic digestion with methanogen or
anaerobic organisms, which digest material inside a closed system or ferment
biodegradable materials. This closed system is called an anaerobic digester, biodigester,
or bioreactor. Biogas can be produced through anaerobic digestion (AD) by consortia
of bacteria and archaebacteria (Ghodrat et al. 2018).
The process of anaerobic decomposition involves a series of metabolic reactions
comprising (1) hydrolysis, (2) acidogenesis, (3) acetogenesis, and (4) methanogenesis
(Figure 1). The initial hydrolysis and the acid-producing stages separate from
methanogenesis. The degradation of organic matter (OM) occurs in individual steps
carried out by different microorganisms in different requirements in the fermentation
environment (Demirel and Yenigün 2002). The early stages require acidic operating
conditions, while CH4 produces in later neutral conditions (Jingura and Kamusoko
2017). Initially, the complex biopolymers (carbohydrates, proteins) and other large

4
molecules (fats) are broken down into simpler molecules (sugars, fatty acids, and amino
acids) in a hydrolysis step. Bacteria known as acidogenic in an acidogenesis action
produce volatile fatty acids (VFA) and alcohols and other by-products such as sulfide,
carbon dioxide, and ammonia. Methanogenesis is a critical step in the entire AD process
as it is the slowest biochemical reaction. At the final stage, methanogens utilize H2,
CO2, and acetate, which are produced during acidogenesis and acetogenesis steps, to
produce methane in two ways: using cleavage of two acetic acid molecules to generate
CH4 and CO2, or by reducing CO2 with H2 (Monnet 2003). In AD, the acid-forming
and the methane-forming microorganisms differ widely in physiology, nutritional
needs, growth kinetics, and sensitivity to environmental conditions (Chen et al. 2008).
Failure to balance these two groups of microorganisms is the primary cause of reactor
instability (Demirel and Yenigün 2002). Inhibitory substances in sludges or wastewater
are often the leading cause of anaerobic reactor upset and failure. A wide variety of
substances such as arsenic, mercury, silver, and uranium have been reported to inhibit
the AD processes (Mudhoo and Kumar 2013). Material may judge inhibitory when it
causes an adverse shift in the microbial population or inhibition of bacterial growth.
Inhibition is usually indicated by a decrease in the steady-state rate of methane gas
production and accumulation of organic acid (Jingura and Kamusoko 2017).
Figure 1 Anaerobic pathway of digestion of organic material.

5
1.3 Biogas system
Biogas plants categorize into small and large-scale plants. Small-scale biogas
plants can be domestic, household, decentralized, farm, or communal biogas. These
plants are employed mainly in rural areas and have low investment costs. There are
three central systems for household biogas: fixed dome plant, floating drum plant, and
balloon/bag digester (Huber 2019). Small-scale biogas production units can be
designed and successfully operated even in settings where means for advanced
technology equipment are low and institutional capacities are limited. The household
accesses sufficient organic feedstocks such as cattle, pig, and chicken manure or human
waste and kitchen waste. They are considering the biogas yield of different livestock.
Biogas is used as gas for stove-top cooking, whereas digestate has high quality liquid
fertilizer. It is mainly in emerging and developing economies, where it helps households
through its numerous social, environmental, health, and economic benefits. Biogas
reduces workload, mainly for women, in firewood collection and cooking and saves
money (Patinvoh 2017; Nevzorova and Kutcherov 2019).
On the contrary, large-scale plants or commercial biogas plants require
significant feedstock obtained from large-scale agricultural waste, municipal organic
waste, industrial waste, or energy crops. Commercial biogas plants have high
investment costs depending on the scale. These plants also require high technology, and
financial, economic, legal, environmental, and social aspects need to be considered
prior to start biogas plant construction. Based on the available feedstocks, the biogas
and electricity production, payback period, and total investment cost can be estimated
through feasibility studies from a biogas consultant. Proper planning of a biogas project
is essential to ensure that the owners have enough finance to build the biogas plant and
get profit from that project. Biogas often uses for producing electricity and heat
depending on the demand. A transport fuel biogas must be upgraded to at least 95%
methane by volume in vehicles or filling stations. In the case of biogas for cooking
purposes, the biogas needs to be distributed to single households by filling and
transporting the biogas or biomethane in biogas backpacks, in high-pressure gas
cylinders, or by biogas pipelines. The by-product of biogas uses as organic fertilizer or
soil improver that returns essential nutrients to the soil (Bolin 2009).

6
1.4 Advantages of biogas
Biogas systems turn the cost of waste management into a revenue opportunity
for farms, dairies, and industries. Converting waste into electricity, heat, or vehicle fuel
provides a renewable energy source that can reduce dependence on foreign oil imports,
reduce greenhouse gas emissions, improve environmental quality, and create local jobs.
Biogas systems also provide an opportunity to recycle nutrients to the food supply
system, reducing the need for both petrochemical and mined fertilizers. Biogas adds
value to organic wastes and by-products and contributes to energy supply in the
country, opportunities for the agricultural sector, and technology supply sector. Biogas
plants have many benefits to the users, farm owners, investors, and society.
1.4.1 Benefits for environmental protection
Biogas serves its best for environmental protection such as GHG reduction,
avoidance of methane emissions, the substitution of fossil energy, nutrient recycling,
and odor reduction. Gas generated through bio-digestion is non-polluting; it reduces
greenhouse emissions. Although CO2 forms when biogas is combusted, this amount
equals the amount of CO2 used to produce the organic material converted during the
anaerobic digestion process. There is zero emission of greenhouse gasses to the
atmosphere; therefore, using gas from waste as a form of energy is a great way to
combat global warming. Concern for the environment is a significant reason why the
use of biogas has become more widespread. Biogas plants significantly curb the
greenhouse effect: they lower methane emissions by capturing this harmful gas and
using it as fuel. Biogas generation helps reduce reliance on fossil fuels, such as oil and
coal (Seadi et al. 2008). The climatic protection goal (reduced GHG emission and
mitigation of global warming) is effectively supported by biogas production (Deublein
and Steinhauser 2010).
1.4.2 Financial and economic benefits
Production of biogas from AD requires work power for production, collection,
and transport of AD feedstock, manufacture of technical equipment, construction,
operation, and maintenance of biogas plants. It will create a business opportunity for a
company to establish new enterprises on the biogas project. On the other hand, it can
benefit the project owner to add value from waste products by turning to electricity and
organic fertilizer, thus reducing energy costs and the return on their investment (Seadi
et al. 2008).

7
1.4.3 Farmers and society benefits
Biogas from biomasses and manure wastes use as electricity and heat for the
farm owners or communities in rural areas that do not have access to the electricity grid
(Gomiero 2016). Waste collection and management significantly improve in areas with
biogas plants. It improves hygienic conditions because AD deactivates pathogens,
parasites, and worm eggs and flies, reducing waterborne diseases. Landfill areas will
decrease due to cutting down overflowing landfills that spread foul smells and allow
toxic liquids to drain into underground water sources. The by-product of the biogas
generation process enriches organic (digestate), which is a substitute for chemical
fertilizers. The fertilizer discharge from the digester can accelerate plant growth and
resilience to diseases. On the contrary, commercial fertilizers contain chemicals that
have toxic effects and can cause food poisoning, among other things (Baredar et al.
2020). Significantly, digestate from animal manure has improved fertilizer efficiency
compared to raw animal manure due to higher homogeneity and nutrient availability.
This digestate is a valuable soil fertilizer, rich in nitrogen, phosphorus, potassium, and
micronutrients, which apply to soils with the standard equipment for applying liquid
manure. If plants use as co-substrates for biogas production and the residues recycle for
agriculture, no mineral fertilizer is needed. Their nutrients can recycle while reducing
nitrate leaching. Plant compatibility and plant health improve, and therefore biogas
production is subsidized in many countries, giving the farmer an additional income
(Deublein and Steinhauser 2010).
1.5 Limitations of biogas
Biogas technology has many competitors such as micro hydropower, solar
systems, and other renewable energy due to the lack of advanced technology and
investment cost. Biogas technology today is not a universally applicable technology. It
is challenging to introduce biogas technology to a large share of the population. Some
types of biogas systems, for example, lagoons, require large land. Not all organic wastes
are equally suitable for biogas production, and in some cases, biogas production might
not be profitable. There are only a few that can convert into simple and low-cost biogas
systems. Advanced biogas systems are more complex and have high investment costs.
The investment cost is high compared to diesel from fossil fuel, especially for
the small biogas plant. Especially smaller biogas systems have a long payback period,

8
making the farmers or investors hesitate to invest in the biogas plant. Operation and
maintenance costs are relatively high, and the life span of some equipment is limited.
Depending on the local conditions and the available feedstocks, the electricity from
biogas may not be competitive with grid electricity. Alternative means of biogas use
(e.g., upgrading and bottling) are hampered by market demand and thus limit the
widespread application and promotion of biogas production (Khayal 2019).
References
Bolin L (2009) Environmental impact assessment of energy recovery from food waste
in Singapore – Comparing biogas production to incineration. Swedish University
of Agricultural Sciences
Casals E, Barrena R, García A, et al (2014) Programmed iron oxide nanoparticles
disintegration in anaerobic digesters boosts biogas production. Small 10:2801–
2808.
Chen Y, Cheng JJ, Creamer KS (2008) Inhibition of anaerobic digestion process: a
review. Bioresour Technol 99:4044–4064.
Demirel B, Yenigün O (2002) Two-phase anaerobic digestion processes: A review. J
Chem Technol Biotechnol 77:743–755.
Deublein D, Steinhauser A (2010) Biogas from waste and renewable sources: an
intronduction. Wiley-VCH Verlag GmbH & Co. KGaA, Weinheim, Germany
Drosg B, Braun R, Bochmann G, Saedi T (2013) Analysis and characterisation of
biogas feedstocks. In: Wellinger A, Murphy J, Baxter D (eds) The biogas
handbook: Science, production and applications. Wiley-VCH Verlag GmbH &
Co. KGaA, UK, pp 52–82
Ghodrat AG, Tabatabaei M, Aghbashlo M, Mussatto SI (2018) Waste Management
Strategies; the State of the Art. In: Tabatabaei M, Ganavati H (eds) Biogas
Fundamentals, Process, and Operation. Springer Publishing AG, Cham, pp 1–34
Gomez C, Costa D (2013) Biogas as an energy option: an overview. In: Wellinger A,
Murphy J, Baxter D (eds) The biogas handbook: Science, production and
applications. Woodhead Publishing Series in Energy, UK, pp 1–51
Gomiero T (2016) Soil degradation, land scarcity, and food security: Reviewing a
complex challenge. Sustain 8:1–41.
Huber S (2019) Small-scale biogas production from organic waste and application in
mid-income countries – a case study of a Lebanese community. Uppsala

9
University
Jingura RM, Kamusoko R (2017) Methods for determination of biomethane potential
of feedstocks: a review. Biofuel Res J 4:573–586.
Kavitha S, Schikaran M, Yukesh Kannah R, et al (2019) Nanoparticle induced
biological disintegration: A new phase separated pretreatment strategy on
microalgal biomass for profitable biomethane recovery. Bioresour Technol
289:121624.
Khayal O (2019) Advantages and limitations of Biogas Technologies. Atbara
Langeveld JW., Guisson R, Stichnothe H (2016) Mobilising Sustainable Supply Chains
– Biogas Cases Biogas Production From Municipal Solid Mobilising Sustainable
Supply Chains – Biogas Cases.
Matheri AN, Ndiweni SN, Belaid M, et al (2017) Optimising biogas production from
anaerobic co-digestion of chicken manure and organic fraction of municipal solid
waste. Renew Sustain Energy Rev 80:756–764.
Monnet F (2003) An Introduction to Anaerobic Digestion of Organic Wastes.
Mudhoo A, Kumar S (2013) Effects of heavy metals as stress factors on anaerobic
digestion processes and biogas production from biomass. Int J Environ Sci
Technol 10:1383–1398.
Nevzorova T, Kutcherov V (2019) Barriers to the wider implementation of biogas as a
source of energy: A state-of-the-art review. Energy Strateg Rev 26:100414.
Nizami AS, Rehan M (2018) Towards nanotechnology-based biofuel industry. Biofuel
Res J 5:798–799.
Patinvoh RJ (2017) Biological pretreatment and dry digestion processes for biogas
production. University of Borås
Rana MS, Bhushan S, Prajapati SK (2020) New insights on improved growth and
biogas production potential of Chlorella pyrenoidosa through intermittent iron
oxide nanoparticle supplementation. Sci Rep 10:1–13.
Seadi T Al, Rutz D, Prassl H, et al (2008) Biogas Handbook. University of Southern
Denmark, Esbjerg, Denmark
Ullah Khan I, Hafiz Dzarfan Othman M, Hashim H, et al (2017) Biogas as a renewable
energy fuel – A review of biogas upgrading, utilisation and storage. Energy
Convers Manag 150:277–294.
Zaidi AA, RuiZhe F, Shi Y, et al (2018) Nanoparticles augmentation on biogas yield
from microalgal biomass anaerobic digestion. Int J Hydrogen Energy 43:14202–
14213.

11
CHAPTER 2: BIOGAS STATUS IN CAMBODIA
This chapter indicates the critical challenges in energy production and general
information about establishing biogas systems in Cambodia. The two central biogas
systems existing in Cambodia are household and commercial biogas plants. This
chapter emphasizes biogas status and commercial biogas perspective in rural areas and
highlights SWOT analysis for commercial biogas in Cambodia.
2.1 Key challenges and sustainable strategy in the energy sector in Cambodia
Cambodia has undergone rapid economic development in recent decades;
however, the country still lacks the infrastructure required for the energy sector to
match the pace of development. Cambodia’s energy production relies heavily on
imported fossil fuel and imported electricity from nearby countries such as Vietnam,
Thailand, Laos, and other electricity resources: hydropower, solar, and biofuels from
biomass and biogas (Figure 2). Electricity prices are high compared to the region,
especially in the rural areas where diesel generators use as a power source. Electricity
demands are increasing at a surprising rate in many districts and provinces serviced by
Government coordinated electrification programs. The basis for this progress is a ready
market for the sale of electricity by the local entrepreneurs, but the state electricity
companies alone cannot meet the increasing electricity demand (Mika et al. 2021).
As the population increases and industry expands, Cambodia’s electricity
consumption increases (Figure 3) (MME 2016). For sustained economic and industrial
development, it needs a good forecast of long-term energy demand. Energy supply
options must also review to ensure adequate energy supply capacity to major strategic
industrial zones. According to World Bank and KEPCO (Korean Electric Power
Corporation), the electricity demand projection in Cambodia in 2024 will be 3,045 MW
and 16,244 GWh for capacity and electric energy, respectively (Gutaman et al. 2006).
Energy security facilitates a country’s socio-economic growth and sustainability.
Energy supply and access are fundamental to achieving developmental goals. Options
such as hydropower and coal-fired power plants can have a high environmental impact.
On the other hand, renewable energy from biogas is clean and significantly curbs the
greenhouse effect (lower methane emissions). So, bioenergy development offers
significant possibilities for reducing GHG emissions and fossil fuel dependency
(Kumar 2019).

12
The laws and policies on the development of the energy sector must adapt to the
energy demand. On the other hand, cooperation and participation from stakeholders,
including ministries and other governmental agencies, development partners, and
private investors, have played a significant role. This strategy exploits new
opportunities driven by rapid urbanization and growing middle-class with high
disposable income, developing and modernizing the agricultural sector. New regulation
for environmental protection promotes the biogas plant using AD of organic waste of
farm origins such as manure, crop residues, and organic residues from food and agro-
industries to generate renewable energy and control the application of land animal
manure. The manure residues have long been identified as a major source of
environmental pollution. The animal farms release unpleasant smell which affects the
neighboring farmers and pollutes the environment. These wastes traditionally have
been disposed of, directly or after composting, as soil amendments in agriculture. The
AD process can reduce environmental pollution by preventing methane into the
atmosphere while burning methane and releasing carbon-neutral carbon dioxide (no net
effect on atmospheric carbon dioxide (CO2) and other GHG). As manure feedstocks
become the dominant source of biogas over decades, reducing energy used and GHG
emissions will benefit everyone, especially farm owners and people in rural
Figure 2 Energy supply in Cambodia from 1995 to 2018 by
sources: Oil, solar, hydro, biofuel, and coal.

13
communities. Farmers could save hundreds to thousands of dollars every year from
reduced energy use by installing biogas plants at their farms (NBP 2019).
2.2 General information of biogas (biodigester) in Cambodia
Biodigesters play an essential role in reducing GHG emissions from animal
production into the environment by managing animal livestock waste. Cambodia has a
favorable environment and conditions for disseminating biogas Technology, yet this
potential has not been achieved. This technology is relatively new in Cambodia in
comparison to its neighboring countries. There was a lack of technical and financial
support, knowledge, experience, skilled personnel, and manufacture. Therefore, to
develop biogas projects, investors need to import most of the equipment and expertise
from other countries leading to relatively higher investment costs and making a
challenge in operation and maintenance of the equipment. From 1986 to 2005, 400
domestic digesters were built in Cambodia by international aid agencies. Most of these
digesters were plastic tube types, either comprehensively subsidized or wholly paid for
by contributors or foreign agencies (McIntroh 2004). These digesters have a brief life
span, and because of a lack of technical support, and a practical, marketable model,
most of these digesters went quickly out of operation.
Figure 3 Electricity consumption in Cambodia from 1995 to
2018.

14
For this reason, in 2006, the Cambodian National Biodigester Program (NBP),
one of the first large-scale biogas projects, has been implemented in the history of
unsuccessful biodigester in the past. This program was managed by MAFF and SNV
Netherlands development organization and executed by the Department of Animal
Production and Health (Patinvoh and Taherzadeh 2019). This offset project investment
is needed to make biogas installations available in Cambodia to increase rural access to
a sustainable clean energy supply. The NBP’s original goal was to create a self-
financing biodigester market in Cambodia. The long-term goal was to build national
capacity to technically and financially carry forward the project without SNV
(Buysman 2015).
According to the development of animal husbandry, the management of
feedstock is highly considered through the extension of animal raising and the building
of biodigesters at animal farms and families raising animals. All relevant stakeholders
were encouraged to participate in implementing policy on biodigester development to
make farmers and rural communities get healthy, better livelihood. It expects to provide
environmental sustainability by scaling up animal production and biodigesters in
Cambodia (Hyman and Bailis 2018). The progress of biodigester introduction has gone
through many stages of development. A national non-governmental organization, the
Cambodian center for study and development in Agriculture (CEDAC), hosted four
additional provincial offices, which created 14 Provincial Biodigester Program offices
(PBPO) nationwide. These offices are responsible for the training of Biodigester
Construction Agents (BCAs) and engage microfinance institutions to access loans for
the farmers (Hyman and Bailis 2018).
In 2015, MAFF set a technical working group for preparing strategic
frameworks and policies on biodigester development to promote biodigester
construction with animal production and enhance biodigester technology extension and
the operation of biodigesters. The procedures and strategies aim to respond to the
context of progress and actual demand related to promoting biodigester development
and practical and sustainable use. Four strategic measures are imposed, including 1)
increase the education and dissemination to all animal farm owners about the benefits
of biodigester on social and economic welfare and on the environment; 2) Encourage
farm owners to build the standard biodigester; 3) Inspire farm owners to apply
development approach “Linkage of animal farms with the integrated farming system”
to improve the animal production and organic agricultural production, and 4) increase

15
incentives to farm owners via providing of certificate of appreciation depending to the
standard of their applied biodigesters. Promoting commercial biogas plants will help
Cambodia intelligently utilize biogas to produce electricity and reduce GHG emissions
to support the country’s sustainable development (MAFF 2016).
2.3 Biogas household
In rural areas (around 80% of the total population), Cambodians have less
access to modern energy sources such as gas and electricity. The primary fuels used
for cooking and lighting in households are firewood (83.6%), charcoal (7.5%), and
LPG. Women and children are strongly affected by indoor air pollution, causing a
range of diseases due to the prevalent use of traditional cooking techniques.
Therefore, arguments for promoting biodigester programs include reducing the
burden of women’s work (SNV 2006; MAFF 2016). The family system in rural areas
is an integrated livestock-rice cultivation system, where rice production relies on
draught animal power (cattle or buffaloes). Most families have at least a few chickens
and pigs or cow, and a tremendous potential for biogas of around 1 million domestic
biodigesters was estimated (Kooijman 2014). Domestic biodigesters are a simple
construction that can covert human excrement, biomass, or animal dung into small
but valuable quantities of biogas. Among domestic or household digesters, fixed
dome digesters are the most popular design in Cambodia because of their low
maintenance requirement, reliability, and ease of construction using stones, brick,
clay, and cement. Lifespan is more than 20 years as the constructed underground can
protect it from physical damage or erosion (Hessen 2014).
In December 2018, over 27,000 fixed dome biodigesters were constructed in 15
provinces. The trend of biodigesters among rural farmers has slightly increased (Hyman
and Bailis 2018). Critical success factors are the construction services, technical after-
care, and access to finance. Biogas loans can make through a special agreement from
local banks and credit unions. Since 2010, over 70% of households have used a biogas
loan to finance their biodigester within two years of the payback period.
Furthermore, the NBP project has granted 15% of total biodigesters
construction to more than 3,500 households. Therefore, the farmer’s expenditure
reduces through building biodigesters. The total construction cost and the biogas
production depend on biodigester size (Table 2). Other development partners have been

16
concerned with implementing NBP and increasing resources, both technical and
financial support.
Table 2 Construction cost of household biodigester in Cambodia (NBP 2019).
Biodigester
size (m3)
Construction
cost (USD)
Subsidy from
NBP (USD)
Farmer’s
expenditure
(USD)
Time for
one stove
(hour)
Time for
one lamp
(hour)
2 304 150 154 1 – 2 4 – 8
3 381 150 231 2 – 3 8 – 12
4 490 150 340 2 – 4 8 –16
6 550 150 400 4 – 6 16 –24
8 720 150 570 6 – 8 24 – 32
10 810 150 660 8 – 10 32 – 40
15 1100 150 950 10 – 15 40 –60
Biodigesters International ATEC (supporting from the Private Financing
Advisory Network (PFAN) in 2017) is a Cambodia-based social enterprise that
provides high-quality, prefabricated biodigesters to rural households. A 4m3 digester
can accommodate waste from 2 to 3 cows or 4–6 pigs, and it can provide enough gas
to meet all daily cooking needs and produce 20 tons of high-quality organic fertilizer
per year. The units help farmers save up to $521 per year on gas and fertilizer, reducing
their dependence on firewood and preventing deforestation (ATEC 2021).
2.4 Commercial biogas plant
Commercial biogas plants were expected to install across the country to provide
electricity in rural areas without the national grid. NBP has reported that there are 44
commercial biogas plants in Cambodia. Most of them are used in mixed farms,
fattening, dairy and pig farms, and the starch industry (NBP 2019). The biogas
technology used is mainly simple and improved covered lagoons due to the low
investment and maintenance costs. However, this number is relatively low in
comparison to the potential number of installations in Cambodia. Progress in
biodigester implementation is constrained by a few challenges, such as lacking
technical data and technical assessment, limited local and international suppliers active
in Cambodia, and substantial knowledge of operation and maintenance in compliance
with the standards.

17
There is a need for biodigester protocols, performance standards, new models,
and dissemination methods to enter the biodigester into the market. In this context,
strategies on sustainable biodigester development are required to integrate national
policy and build national capacity to offer technical, economic, and financial
assessment to support the farm owners (MAFF 2016). Recently, multiple government-
supported programs provide full-service to the project owners to establish biogas
investment (Hyman and Bailis 2018). In 2015, under a GEF project on reducing GHG
emission through promoting commercial biogas plants in Cambodia, over USD 1.5
million of funding has been provided to promote investments in biogas-based rural
electricity systems, particularly in piggery farms. UNIDO supported financing the
incremental costs of demonstration and promotion of commercial biogas plants as a
financially viable, reliable, effective, and sustainable mechanism to achieve rural
electrification. On promoting investments in a commercial biogas plant, the project
works with the private sector to demonstrate biogas projects for cumulative at least 1
MW installed capacity in Cambodia (UNIDO 2020).
Within the context of the GEF project, the Biogas Technology and Information
Center Cambodia (BTIC) was established in 2016 under collaboration between UNIDO
and RUA to provide technical and financial advice to the potential animal farms and
agro-processing factories to engage them in large-scale biogas projects (UNIDO
2015a). The BTIC has a strong network with other biogas centers, researchers, project
developers, and suppliers of biogas systems across the region. The center has provided
technical training and capacity building related to commercial biogas project
development to more than 500 participants from various stakeholders such as pig
farmers, project developers and investors, policymakers, financial institutions,
researchers, and local engineering companies. It has established a database (https://btic-
rua.org/pages/) supplier with confirmed biogas suppliers mainly from China and
Malaysia, and other countries such as India, Singapore, and Thailand.
The BTIC can estimate biogas production and electricity generation based on
the composition of the available feedstocks and the farm’s size and estimate investment
cost and return on investment. This estimation will help the farm owner decide on the
proper system scale and the investment of the commercial biogas plant. The center
helps determine the suitable equipment such as gas pipe size and the right generator
capacity from suppliers for biogas plant and electricity conversion. The key elements
to maximize biodigesters’ benefits are to reducing the cost of construction and

18
improving biodigesters’ quality. For instance, by being incorporated with BTIC, M’s
pig farm can save approximately 24,000 USD a year from biogas investment, and
electricity production can meet around 70% of the total annual electricity demand in
the farm (UNIDO 2020). With technical and financial support, farm owners and other
stakeholders showed their interest in biogas investment. Recently, there has been an
increase in the number of biogas projects in farms and factories. In the long run, the
BTIC has the mandate to build human and institutional capacity for continuous
development and sustainable operation and maintenance of commercial biogas projects.
BTIC is also needed to create awareness and develop policymakers, project developers,
and financial institutions to promote commercial biogas systems in animal farms. With
the knowledge and skills gained to BTIC will serve as a repository center of the nation.
2.5 Potential feedstocks in Cambodia
Commercial biogas systems typically use animal manure as feedstock. Other
potential feedstocks from slaughterhouses, agriculture wastes, and wastewaters from
agro-industry, such as rubber and cassava, could also be used as substrates for biogas
production.
2.5.1 Livestock
Animal production in Cambodia was 40.3 million heads in 2015, and this
number rose to 42.2 million heads a year later. The buffaloes, pigs, and poultry
production jumped by 41%, 7.1%, and 3.5%, respectively. The family pig production
increased to 2.33 million pigs in 2017. As an emerging economic growth and changing
of people’s habit in eating meat, the livestock production industry is crucial in providing
food security for the nation. Some farms switched from conventional to commercial
scale. Commercial animal production, particularly pig and chickens, has been
noticeably increasing, matching domestic demand and exports. The commercial pig
farms were 599,341 heads in 2016 and rose by 30% in 2018 (MAFF 2019). Table 3
lists other commercial farms, and the farm’s size is classified by the number of animals,
as indicated in Table 4. At least 43 farms were reported as potential farms for biogas
production (MAFF 2018). This number will increase as the number of farms keeps
rising every year. According to feasibility studies from BTIC, the commercial farms
with above 3000 pigs have a high potential for biogas production with a payback period
of less than five years. Besides, buffalo farms with more than 1000 heads also have the
potential for biogas projects. Estimating biogas production and electricity generation

19
from different substrates in Cambodia is available on BTIC’s website (https://btic-
rua.org/pages/cal_bio). However, each farm is unique, and the actual biogas production
can vary. The potential biogas production for a specific farm should be determined
based on substrates’ confirmed availability and properties. The characteristics and
analysis of biogas feedstocks will detail in Chapter 3.
In addition, the slaughterhouse waste from those animals also has a great
potential for methane production due to the large amounts of solid wastes. Remarkably,
most waste from a slaughterhouse has not yet been adequately managed, leading to
surrounding environmental pollution. Such slaughterhouse waste management requires
great attention from slaughterhouse owners. Within this context, the MAFF imposed
three necessary policy measures, which are: 1) Increasing the dissemination of benefits
and use of biodigesters to slaughterhouse owners countrywide; 2) Promoting the
construction of biodigester in slaughterhouse according to standard set; and 3)
Increasing support and incentives to slaughterhouse owners via providing of certificate
of appreciation depending to the standard of their applied biodigesters (MAFF 2019).
It is a good opportunity for companies that want to invest in biogas production from the
slaughterhouse.
Table 3 Commercial farms and their animal production in 2016 (Borany 2016).
Animal types Number of farms (Head)
Cattle 93 23,188
Pig 575 599,341
Chicken-meat 320 2,767466
Chicken-egg 300 1,185,800
Table 4 Classification of the farm size from different animal types (NBP 2019).
Animal types Small farm
(Head)
Medium farm
(Head)
Large farm
(Head)
Cattle/buffalo-meat 100 – 300 300 – 1,000 >1,000
Cattle/buffalo-milk 20 – 100 100 – 300 >300
Pig fattening (meat) 100 – 1,000 1,000 – 5,000 >5,000
Pig sow (breed) 50 – 200 200 – 500 >500

20
Goat/sheep/monkey/rabbit 300 – 1,000 1,000 – 5,000 >5,000
Chicken-egg 2,000 – 20,000 20,000 – 50,000 >50,000
Chicken-meat 5,000 – 30,000 30,000 – 50,000 >50,000
Chicken-breed 1,000 – 5,000 5,000 – 20,000 >20,000
Duck 5,000 – 20,000 20,000 – 50,000 >50,000
2.5.2 Agricultural waste
In 2015, agricultural production accounted for 35.6% of Cambodia’s GDP, of
which half of it was made up of rice paddy. The main products are rice, rubber, maize,
cassava, and sugarcane which amount to approximately 20 million tons (Figure 4). The
increase of the production due to the rise of the land area of harvest and the growth of
yield, resulting in improved technologies, more irrigation systems, and better access to
mechanized services.
The largest concentration of cultivation is around Tonle Sap, the Tonle-Bassac
River, the Mekong River, and the provinces of Battambang, Kampong Thom, Kampong
Cham, Kandal, Prey Veng, and Svay Rieng, which are rich in fertile and medium fertile
soils (Figure 5) (Vang 2015). Rice straw, the rice by-products produced when
harvesting paddy, is considered as wastes. Each kg of milled rice produced results in
roughly 0.7–1.4 kg of rice straw depending on varieties, cutting height of the stubbles,
and moisture content during harvest. Managing rice straw remains a challenge. Rice
straw remains typically in the fields after harvest because it is costly to gather up. The
widespread burning of rice straw in the field is a major contributor to dangerously high
levels of GHG emission and air pollution (Gummert et al. 2020). With the development
of recent technologies, rice straw can be processed and managed using better practices.
Rice straw bales were compressed in some provinces in Cambodia, such as Svay Rieng,
Kampong Thom, and Takeo provinces. The collection of rice straw from the field will
help farmers use it for non-energy such as growing mushrooms, mulching for other
crops, and bioenergy production such as ethanol, combustion, and biogas production.
A range of alternative uses of rice straw will turn into a commodity around and benefit
rural people. If market prices of rice straw increase, other areas in Cambodia will make
rice straw bales to fulfill the market demand for biogas production.
However, the production of biogas from rice straw feedstock faces some
challenges compared to other agriculture wastes. To enhance the fermentation stability
of the lignocellulosic biomass, it requires reducing lignin content and cellulosic

21
crystallinity (inhabitation of degradation of cellulosic) by pretreatments such as NaOH
or enzyme using steam explosion method and co-digestion (CSTR unit) (Zhou et al.
2017), in particular, combining agricultural straw with animal manures significantly
enhanced methane production (Tsapekos et al. 2017).
2.5.3 Agro-processing industry
In the light of agriculture’s technological advancement and integration into
production chains and networks of industrial interdependencies, agro-industry and
agro-processing industries are considered to improve the quality of agricultural
products. There are four mains agro-processing industries in Cambodia: rice milling,
cassava, sugar, and rubber factory. Commercial rice mill is less than 1000 among the
24,048 mills in 2008 (Pode et al. 2015). Cassava, the second largest agricultural crop
after rice, could have substantial social and economic gains if it receives the right level
of public commitment and investment. In the second half of 2018, the Cambodian
government has officially launched a new strategy for the cassava production and
processing industry to produce value-added cassava products, mainly cassava starch,
cassava flour, and cassava chips, and export to Vietnam and China. The wastewater
from those processing industries contents carbohydrates, proteins, fats, cellulose, and
lignocellulose that can convert into biogas through an anaerobic process.
Bagasse waste from sugarcane factories is around 260 kg per ton of cane, and
the methane production is approximately 200 m3 per ton of bagasse (Janke et al. 2015).
Its low lignin content can be also used as pre-treatment feedstocks with animal manure.
On the contrary, wastewater from latex has relatively low methane production in which
1 ton of the concentrated rubber latex can produce about 70 m3 methane (Chaiprapat et
al. 2014). These wastewaters are still being laboratory research. Besides, cassava
approximately 60,000 L of effluent generate from each ton of cassava tubers process,
and the methane production is 15 m3/teffluent (Zeolite and Additives 2020). SOMA
energy produces 37,905 m3/day biogas using wastewater from the cassava starch
factory in Kam Rieng District, Battambang province.

22
2.6 SWOT analysis for commercial biogas in Cambodia
Table 5 presents a strategic analysis connected with the strengths, weaknesses,
opportunities, and threats (SWOT) of commercial biogas under current conditions in
Cambodia.
Figure 4 The potential crop production in Cambodia from
2000 to 2018.
Figure 5 Generalized soil fertility potential map of
Cambodia (Vang 2015).

23
Table 5 SWOT analysis for commercial biogas in Cambodia.
Strengths:
- Potential for converting waste to
biogas, electricity, and bio-fertilizer
- Applicable for a variety of
feedstocks: manure, slaughterhouse,
and wastewater from agro-industry
such as cassava starch, ethanol
production, rice flour production
- Suitable climatic conditions for
biogas production
- Low production cost of electricity
- Existing biogas plant technology
- Available biogas equipment
suppliers
Weaknesses:
- High investment cost for biogas
construction
- High O&M cost
- Long payback period
- Biodigester technology is still
limited
- Limitation of technology supplier
- Competition for biomass (use for
other purposes instead of biogas)
- Lacking marketable RE
technologies/business models
- Lack of data from other biogas
resources such as municipal waste,
slaughterhouse, and other biogas
resources
Opportunities:
- Growing energy demand
- Animal raising is increasing,
therefore increase potential farms
for biogas production
- Policy on biodigester (support from
government, GEF, and UNIDO)
- Biogas expert from BTIC could
help design biogas plant and biogas
technology and estimate investment
cost and payback period.
- Create jobs in the rural areas
- Reduce GHG emissions
Threats:
- Lacking waste management, for
instance, municipal waste and
household waste
- Lacking the organizational structure
to establish an entity or institute of
research and development of
biodigester.
- Lacking institutional and
educational capacities
- Lacking public awareness for energy
efficiency and renewable energies
- Loan is not available yet for
commercial biogas
References
ATEC (2021) ATEC of Cambodia raises ¤1.6 million to expand access to clean biogas.
In: PFAN Accelerating Invest. Clim. Clean Energy. https://pfan.net/news/atec-of-
cambodia-raises-1-6-billion-in-series-b-equity-to-expand-access-to-clean-
biogas/.
Borany K (2016) Static of farm and location in Cambodia 2016. Phnom Penh
Buysman E (2015) Biogas and household air quality: Study on Household Air Quality

24
and estimated health improvement of users of biogas stoves versus wood-fired
stoves in rural Cambodia.
Chaiprapat S, Wongchana S, Loykulnant S (2014) Evaluating sulfuric acid reduction,
substitution, and recovery to improve environmental performance and biogas
productivity in rubber. Process Saf Environ Prot 94:420–429.
Gummert M, Hung N Van, Chivenge P, Douthwaite B (2020) Sustainable Rice Straw
Management.
Gutaman F, Porter I, Delvoie C, et al. (2006) Cambodia Energy Sector Strategy Review
Issues Paper.
Hessen J Van (2014) An Assessment of Small-Scale biodigester Programmes in the
Developing World: The SNV and Hivos Approach. Amsterdam
Hyman J, Bailis R (2018) Assessment of the Cambodian National Biodigester Program.
Energy Sustain Dev 46:11–22.
Janke L, Leite A, Nikolausz M, et al (2015) Biogas Production from Sugarcane Waste :
Assessment on Kinetic Challenges for Process Designing. 20685–20703.
Kooijman P (2014) Pro-poor Biodigester-Crabon Baseline & Market study. Phnom
Penh
Kumar M (2019) Social, Economic, and Environmental Impacts of Renewable Energy
Resources. In: Okedu KE, Tahour A, Aissaoui AG (eds) Wind Solar Hybrid
Renewable Energy System. INTECH, pp 1–11
MAFF (2016) Policy on Biodigester Development in Cambodia 2016 - 2025.
MAFF (2019) MAFF Annual Report 2018-2019. Phnom Penh
MAFF (2018) Prakas 549. Phnom Penh
McIntroh B (2004) Review and Recommendations for Household Bio-digesters in
Cambodia. Phnom Penh
Mika K, Minna M, Noora V, et al (2021) Situation analysis of energy use and
consumption in Cambodia: household access to energy. Environ Dev Sustain. doi:
10.1007/s10668-021-01443-8
MME (2016) Cambodia National Energy Statistics 2016.
NBP (2019) Market study on medium-scale and large-scale biogas in Cambodia.
Patinvoh RJ, Taherzadeh MJ (2019) Challenges of biogas implementation in
developing countries. Curr Opin Environ Sci Heal 12:30–37.
Pode R, Diouf B, Pode G (2015) Sustainable rural electrification using rice husk
biomass energy : A case study of Cambodia. Renew Sustain Energy Rev 44:530–

25
542.
SNV (2006) Programme arrangement and implementation document national
biodigester program in Cambodia. Phnom Penh
Tsapekos P, Kougias PG, Treu L, et al (2017) Process performance and comparative
metagenomic analysis during co-digestion of manure and lignocellulosic biomass
for biogas production. Appl Energy 185:126–135.
UNIDO (2020) Reduction of GHG Emission Through Promotion of Commercial
Biogas Plants: The 7th issue of Biogas Project Newsletter. Phnom Penh,
Cambodia
Vang S (2015) CAMBODIA-Soil Resources_Workshop on Sustainable Management
and Protection of Soil Resources. Bangkok, Thailand
Zeolite U, Additives B (2020) Enhanced Biogas Production of Cassava Wastewater.
Zhou J, Yang J, Yu Q, et al (2017) Different organic loading rates on the biogas
production during the anaerobic digestion of rice straw: A pilot study. Bioresour
Technol 244:865–871.

26
CHAPTER 3: BIOGAS PROCESS AND PRODUCTION
This chapter describes the biochemical process of anaerobic digestion (AD)
converting feedstocks to biogas. It is crucial to analyze the composition and quality of
the feedstocks to estimate the potential biogas production. Parameters of biogas
feedstocks are presented, including their suitability, availability, digestibility, and
purity and factors affecting the rate of biogas production. Three main categories of
biogas resources will be highlighted, including their merits and limitations. A
preliminary feedstock assessment will be given using data available in literature
combined with feedstock process and production data to assess the suitability and
profitability of biogas feedstocks. The compositions of feedstocks are essential for the
Biochemical Methane Potential (BMP). Therefore, laboratory analysis methods for
determining TS or DM, VS or ODM, COD, N, C/N ratio, and BMP are discussed in
this section.
3.1 Anaerobic digestion
Anaerobic digestion (AD) is the micro-bacterial conversion of organic material
in the absence of oxygen. AD is applicable for commercial and pilot anaerobic
digestion plant designs using various raw materials, including municipal, agricultural,
industrial waste, plant residues, and animal manures (Khalid et al. 2011). AD is a
biochemical process involving multiple steps with different groups of microorganisms
contributing to the degradation and stabilization of organic materials, leading to biogas
(a mixture of CO2 and CH4) and microbial biomass (Chen et al. 2008).
Over the last decades, the AD process has been investigated comprehensively
for waste/wastewater treatment and renewable energy production in both the industrial
and agricultural sectors (Lindmark et al. 2014). The growth and activity of anaerobic
microorganisms, i.e., the beating heart of the AD process, and consequently the
efficiency of the process is significantly impacted by some main parameters. Therefore,
it is crucial to ensure that these parameters are optimized as much as possible. These
parameters include constant temperature values favoring microbial growth, pH value,
sufficient nutrient supply (substrate composition and C/N ratio), mixing intensity,
retention time as well as presence and number of inhibitors (e.g., ammonia and heavy
metals) (Seadi et al. 2008).
In anaerobic digestion, organic material is converted to biogas by a series of
bacteria groups into methane and carbon dioxide. The majority of commercially

27
operating digesters are plug flow and complete-mix reactors operating at mesophilic
temperatures. The type of digester used varies with the consistency and solids content
of the feedstock, with capital investment factors, and with the primary purpose of
digestion. The fresh animal manure stores in a collection tank before processing. The
homogenization tank is equipped with a mixer to facilitate homogenization of the waste
stream. The uniformly mixed waste is passed through a macerator to obtain a uniform
particle size of 5-10 mm and pumped into suitable-capacity anaerobic digesters where
organic waste stabilizes.
It is vital to know the potential production of biogas for a given feedstock to
optimize the AD process. There is a considerable variation in the composition and
quality of the feedstocks offered to AD managers and owners, which can be a
significant barrier for managers who need to make tremendous efforts to ensure that
the installation is fed with feedstock of sufficient quality (Langeveld et al. 2010). The
predictability of biogas yield potential based on the quality of feedstocks is essential.
Anaerobic bio-gasification potential (ABP) and biomethane potential (BMP) are
parameters used to evaluate biogas and methane potential. There is a high correlation
between VS and both ABP and BMP (Mayer et al. 2014). ABP is a regression model
to predict the potential of biomethane through chemical composition or biological
analysis, but it is not widely used (Schievano et al. 2008). BMP defines the yield of
CH4 (per g of VS) of organic substrates in AD (Schievano et al. 2009). BMP is a critical
test for the anaerobic degradability and acceptability of a feedstock. Jingura and
Kamusoko (2017) summarized the available methods, both experimental and
theoretical or novel approaches to determine the BMP and ascertain the effectiveness
of the AD process and the biodegradability of organic substrates. These methods use
the same principle, but the technical approaches and experimental setups may be
different. The BMP test has several variants. Several trials have defined a standard
protocol for the ultimate BMP test to achieve comparable results. Despite the wide use
of the BMP test, no commonly accepted experimental procedure yet exists. AD is a
complex and dynamic system that closely relates microbiological, biochemical, and
physicochemical characteristics (Angelidaki et al. 2009). However, three commonly
used methods including the German standard procedure, Verein Deutscher Ingenieure
(VDI 4630), and the Møller and the Hansen methods (Pham et al. 2013).

28
3.2 Biogas feedstocks
The substrates used in practice for biogas production are selected based on their
suitability and availability. The suitability of feedstocks for biogas production is
defined from several characteristics and parameters such as the content of easily
digestible organic matter, methane potential, particle size, dry matter content, pH, C:N
ratio, and macro-and microelements, etc. Availability means that the feedstock is easily
accessible for biogas plant operators with sufficient amounts regularly (Drosg et al.
2013).
3.2.1 Overview of biogas resource
Significant sources of biogas feedstocks are agricultural (animal manures and
slurries, vegetable by-products and residues, energy crops), industrial (organic wastes,
by-products, and residues from agro-industries, food industries, fodder, and brewery
industries, organic-loaded wastewaters and sludges from industrial processes, organic
by-products from biofuel production and biorefineries, etc.), and municipal (source-
separated household waste, sewage sludge, municipal solid waste, and food residues)
operations (Langeveld and Peterson 2018).
A variety of organic feedstocks consisting of animal manure, municipal waste,
and agro-industrial waste has a significant variation in the composition and quality of
the feedstocks offered to AD (Langeveld et al. 2010). Other compositional elements
may seriously limit their potential biogas production. As aforementioned, yield
expresses as biogas or pure methane (CH4), produced per VS, TS, or fresh matter (FM)
unit. Thus, the TS and VS values are crucial data accompanying biogas yield data for
accurate conversion and comparison with their literature values. Table 6 presents the
classification of the biogas plant. The values indicate that biogas yields can be high or
low, depending on the composition of the solids (Langeveld and Peterson 2018).
However, the biogas yield varies from region and country, especially from animal
manure and agriculture residue. Three major biogas yield categories per ton of VS can
be distinguished: low: <300 m3 (lignocellulose, cattle, and pig manures); modest: 300–
500 m3 (chicken manure, MSW, and banana stalks); and high: >500 m3 (abattoir
effluents and potato starch effluents) (Langeveld and Peterson 2018).

29
Table 6 Biogas and methane production potential for different AD feedstocks
(Langeveld and Peterson 2018).
Liquid feedstocks m3 CH4/ton
VS
m3 CH4/ton
TS
m3 CH4/m3
effluent
Potato effluent 611 550 22
Pome 562 483 15
Abattoir wastewater 700 560 84
Cattle slurry 234* 192* 21*
Pig slurry 201* 181* 13*
Solid feedstocks m3 CH4/ton
VS
m3 CH4/ton
TS
m3 CH4/m3
effluent
Food residues 260 239 48
Chicken manure 309* 252* 101*
Cattle manure 236* 180* 45*
MSW 386* 348* 70*
Lignocellulosic Feedstocks m3 CH4/ton
VS
m3 CH4/ton
TS
m3 CH4/ m3
effluent
Bagasse 122 119 112
Pre-treated bagasse (NaOH) 177 172 162
Forest residues 214 137 103
Pre-treated forest residues 266 170 128
Banana stalks 347 13 0.1
Banana stalks (sundried) 236 196 180
Coffee pulp 131 119 66
Pre-treated coffee pulp (NaOH) 174 158 88
Wheat straw 282 265 260
Corn stover 296 288 268
Maize silage 259 396* 139*
Grass silage 344−383 330* 180*
*Methane estimated as 60% of reported biogas yield values

30
Types of biogas feedstocks
(a) Agriculture waste
Biomass resources suitable as biogas feedstock include various organic
materials originating from agriculture, such as crop residues like stalks, leaves, husks,
cobs, and industrial and municipal residues and wastes. Biomass is the general term
used to describe all biologically produced matter and therefore includes all kinds of
materials and substances derived from living organisms. Agricultural lands occupy
37% of the earth's surface, accounting for 52% and 84% of global anthropogenic
methane and nitrous oxide emissions. Apart from this, animal farming accounts for 18%
of worldwide GHG emissions. Most of these emissions originate from the 13 billion
tons of animal manure and slurries estimated to produce annually worldwide. Many
agricultural practices such as water and rice management, set-aside, land-use change
and agroforestry, livestock management, and manure management for biogas
feedstocks can potentially mitigate GHG emissions (Smith et al. 2008). Agricultural
wastes for AD feedstocks have also been associated with the treatment of animal
manure and slurries and the stabilization treatment of sewage sludge from wastewater
plants (Biosantech et al. 2013).
Animal manure is one of the most common substrates for biogas production in the AD
process, even though only a tiny fraction of the global production is currently digested
in biogas installations. The global forecast for manure availability is some 28 billion
tons by 2050, of which an estimated 50% can be recovered. Manure is a mixture of
faces and urine, and its chemical composition varies markedly depending on the species
of origin and the quality of the animal feed. Animal manure comprises huge amounts
of lignocelluloses, polysaccharides, proteins, and other biomaterials (Jingura and
Kamusoko 2017). Dry matter or total solid contents of solid farmyard manure is 10–
30%, and the liquid slurry is below 10%. Manures and slurries from pigs, cattle, poultry,
horses, and many others can be used as substrates for biogas production. Cow and pig
manures are promising feedstocks for AD as they are rich in various nutrients necessary
for the growth of anaerobic microorganisms. They also have a high buffer capacity
which can stabilize the AD process in a significant pH decrease inside the digester.
(b) Municipal waste
Municipal wastes refer to the source-separated household waste, sewage sludge,

31
municipal solid waste (MSW), food residues, garden waste, and other similar organic
wastes. The organic fraction of MSW is biodegradable and defines as organic waste or
biowaste. In many cases, MSW is usually brought to landfills; therefore, an increasing
effort is made to valorize this potentially valuable feedstock for high-quality compost
and biogas chains. In the anaerobic stages of MSW, retention time is more than 15 days
at 35 ºC (Deublein and Steinhauser 2011). In Europe, biowaste is shifted away from
landfills, leading to the selection of biogas production, which estimated the digestion
of 3−4% of EU biowaste. Food processing waste varies between 250 and 800 kg per
ton of raw food, and biodegradable urban waste can be as high as 70 kg per person per
year. Worldwide, 6 billion tons of urban waste are expected to be produced each year
by 2025. As some 1 billion tons of this will be biodegradable, the biogas production
potential amounts to 86 million average cubic meters (Nm3) with an equivalent energy
content of 1.8 Exajoule (EJ) (Langeveld et al. 2016). Increasingly high amounts of
household wastes generated in society indicate a very high AD potential. Organic
household wastes have a high biodegradability and methane yield, and their nutrient
content is well balanced and favorable for the metabolism of anaerobic microorganisms
(Zhang et al. 2007).
(c) Industrial waste
Massive amounts of organic wastes, by-products, and residues are produced in
agro-industries, food industries, fodder, and brewery industries, including organic by-
products and organic-loaded wastewaters sludges from biorefineries that need to be
treated or disposed of. These organic wastes can use a wide range of organic feedstocks
for AD such as pomace from winemaking, animal feed, breweries, sugar refineries, and
fruits processing plants, or even the wastewater from dairies or waste from
slaughterhouses can be used for the production of bioenergy (Deublein and Steinhauser
2011). In grain-processing bio-ethanol industries, all silage fractions become more
prominent for integrating the industrial AD process. Worldwide bio-ethanol production
was about 95 million m3 in 2010. One significant drawback is that high volumes of bio-
ethanol produce high amounts of effluents. These large quantities will demand proper
strategies for using and treating the anaerobic digestion effluent (Drosg et al. 2013).

32
Barrier of feedstocks
Biogas from agricultural substrates contributes likewise only little to the energy
system. The agricultural sector observed the trend and accepted it conditionally since
the biogas facilities did not work profitably, mainly because of the high construction
costs. The facilities ran economically only after the farmers had learned to work
themselves and pool their experience (Deublein and Steinhauser 2011). Animal slurries
have a low DM content (3–5% for pig slurries and 6–9% for cattle slurries). They will
give a low methane yield per unit volume of digested feedstock, ranging between 10
and 20 m3 methane per cubic meter of digested slurry, while biomass transport costs
are high (Angelikaki and Ahring 2000).
On the other hand, the main limitation of using municipal wastes and organic
wastes for biogas production is their potential content of undesirable matter such as
biological, physical, or even chemical pollutants. For example, household waste
contains various pathogens, fungi, and other contamination substances (chemical and
biological). In contrast, industrial wastes contain physical impurities, pathogens, heavy
metals, or persistent organic compounds in such amounts that they could become
sources of environmental pollution or pose health risks for humans and animals when
the produced digestate uses as fertilizer. The required content of foreign materials may
not exceed 0.1% to prevent a negative impact on the utilization of digestate as fertilizer.
Therefore, specific materials, such as food residues, MSW, household, and
slaughterhouse, must be sanitized to react to the pathogenic matter prior to AD
effectively. The method to separate the collection of organic matter from those residues
is relatively high cost. Another critical limitation is a shortage of organic waste,
especially methane boosters, in countries with well-developed biogas markets.
Industrial organic wastes will likely continue to use when available because of their
high methane yields, especially as co-substrates for animal manure. The environmental
benefits of AD and the high costs of other disposal methods are further incentives in
favor of using suitable industrial organic wastes, by-products, and residues as biogas
feedstocks (Biosantech et al. 2013).
3.3 Characteristics and Analysis of biogas feedstocks
The digestion type and size selections are based on the substrate's
characterization to be treated, the investment capital required, the target outcome
power, etc. Besides, feedstock selection should also consider optimizing other aspects

33
of performance, such as digestate quality and biogas production (Banks and Ven 2013).
It is essential to know that some feedstocks are difficult or unsuitable for producing
biogas because of their unfavorable C/N ratios or high lipid content. Different
feedstocks may have to be blended or pretreated to obtain a composition suitable for
biogas production. For instance, a mixture of slaughterhouse wastes with animal
slurries or MSW(Alvarez and Lidén 2008) or the treatment or digestion of livestock
manures with cheese whey (Kavacik and Topaloglu 2010) or glycerol (Astals et al.
2011) can resolve any imbalances and improve the volume of methane productivity.
Therefore, the proper characterization of feedstocks' physical and chemical
composition can determine feedstock selection for biogas production.
3.3.1 Preparation of sampling
The quality of feedstocks can differ depending on the time and sampling
location. The sample taker’s experience and knowledge of the overall process of taking,
transporting, and storing sampling are essential. According to VDI 4630, to obtain the
best results, the rationale for and methodology of selection needs to be clarified in
advance, to include the aim of investigation, type of feedstocks, expected sample
characteristic, variation of sample characteristics with time and location of sample
taking, and parameter to be analyzed. Details on biogas feedstocks' sampling are
generally described in standard VDI 4630, and the selection of sludges and wastewater
is defined in ISO 5667-13.
A representative sampling procedure is essential for obtaining accurate data or
minor errors, as many substrates have inhomogeneous consistency. Generally, physical
impurities can be sorted out from the sample, but their amount and mass must be
documented. Samples can be dried before an analysis but are suitable when non-volatile
substances are being measured. It can cause the loss of some volatile components and,
therefore, a false result. For homogeneous material, one sample is generally sufficient
for a representative analysis, whereas for material with inhomogeneous phases, at least
one sample should be drawn from every step. If the material is very inhomogeneous
and no stages can be located, samples should be drawn either from different locations
and depths of the material or from mixed material. The liquid material requires an
additional stirring process, store in the bottle, and submerge into the liquid for sampling
well before sampling. If a sampling valve is used, the first material leaving the valve
should be rejected to allow cleaning of the sampling valve. If a sample is taken from a

34
pipe where the material passes at different flow rates and compositions, a sample
proportional to flow rate or volume can be taken. In addition, sampling in a pipe is
preferably carried out in a vertical pipe or a pipe with a turbulent flow to avoid
problematic sediments (Drosg et al. 2013).
After sampling, clean re-sealable sampling vials made of inert plastic, glass, or
steel should be used, and the vials must be labeled. If poor biologic stability of the
sample is assumed, samples must be cooled to 4 ºC during transport. All samplings
should be stored in a cooling chamber at 4 ºC until analysis. Obviously, short storage
times before analysis are preferable to long storage times. If longer storage times are
expected, samples can also be stored at 20 ºC, although this might produce changes in
the degradability of the substrate.
3.3.2 Laboratory analysis of feedstocks
The characteristics and compositions of the feedstock affect the configuration,
design, and operational parameters of an anaerobic digester. The feedstock also
determines the quality and quantity of biogas and digestate produced and therefore
directly impacts the overall economy of the biogas plant. The composition of the
feedstock that is to be digested is one of the essential elements in determining the size
of the digester and thus the investment cost of the plant, as longer retention times require
a larger digester volume. The feedstock supplied determines to a large extent the main
objective of the AD treatment. A laboratory analysis is done to determine the
biophysical characteristics, and a BMP assay is used to measure anaerobic biogas
production. The biophysical characteristics involve analysis of TS or DM, VS, organic
dry mass (ODM), chemical oxygen demand (COD), nitrogen content, and
carbon/nitrogen ratios.
(a) Total solids (TS) and volatile solid (VS)
TS and VS tests are conducted to determine the percentages of dried solids
content and organic dried solids content in the substrates. These percentage values are
important to decide on the quantity of the substrates required in the BMP Test. TS is
the amount of solid remaining after heating the feedstock sample so that water is
allowed to evaporate. The amount of sample typically required is only 0.25–1 g for
solid samples, 1–2.5 g for slurry samples, and 5 mL for liquid samples. It should be
filtered using a 0.2 μm pore size filter before TS analysis (Mahmoodi et al. 2018). If
feedstocks have high TS content, adding freshwater or other liquid feedstocks to the
35
biogas plant is necessary and vice versa for a low TS content of feedstocks. However,
this method has a drawback for wastewater and industrial by-products wastes because
such volatile acids and alcohols substances, which represent a considerable percentage
of the energy in the feedstocks, cannot be determined. For the TS test, samples at least
in triple are dried in a vacuum oven at (1055) ºC for at least 4 h until obtaining constant
weight at according to standards SS-EN 12880-20f00 (Murphy and Thamsiroj 2013).
The constant mass is reached when, during the drying process, the difference between
two successive weighings of the sample, first heated, then cooled to room temperature
and with an interval of 1 h between them, does not exceed 0.5 % (m/m) of the last
determined mass. The masses before and after the drying process are used to calculate
the dry residue and the water content. The average TS percentage of the feedstock is
calculated in Equation 1.
%𝑇𝑆 =𝐷𝑟𝑖𝑒𝑑 𝑤𝑒𝑖𝑔ℎ𝑡
𝑊𝑒𝑡 𝑤𝑒𝑖𝑔ℎ𝑡× 100% (1)
In many cases, it will be sufficient to determine the VS to estimate the energy
content. The 105 ºC-dried sample is burned into the constant weight in a furnace at
550 ºC for at least 2 h until the constant mass is achieved (Tabatabaei et al. 2018).
The ash was kept in a desiccator to prevent moisture absorption and weighed. The
percentage of VS is calculated in Equation 2.
%𝑉𝑆 =𝐷𝑟𝑖𝑒𝑑 𝑤𝑒𝑖𝑔ℎ𝑡 − 𝐴𝑠ℎ 𝑤𝑒𝑖𝑔ℎ𝑡
𝐷𝑟𝑖𝑒𝑑 𝑤𝑒𝑖𝑔ℎ𝑡× 100% (2)
Although this is a valuable and straightforward analysis, it is important to note
that the amount of organic matter in a sample does not directly give sufficient
information on the anaerobic degradability of the feedstock. As aforementioned, some
volatile substances might leave the sample during the first drying at (1055) ºC.
(b) Chemical oxygen demand
A chemically oxidizable material is determined by measuring the COD of a
feedstock. COD represents the maximum chemical energy present in the feedstock.
Since microbes convert chemical energy to methane, this is also the maximum energy
recovered as biogas. However, losses for the energy demand of the microbes
themselves have to be subtracted and for material that is not degradable by anaerobic

36
microorganisms (e.g., lignocellulosic material). This amount of energy is thus the
absolute maximum of energy that could be recovered by biogas. However, under
chemical conditions, some substances can be oxidized that are not accessible under
biological conditions and will therefore remain in the digestate. Using continuous
fermentation trials, the residual COD in the effluent of a stable process can be measured,
and consequently, the exact COD degradation is determined. In this analysis, the sample
is refluxed in a boiling mixture of sulfuric acid and a known excess of potassium
dichromate (K2Cr2O7). A silver sulfate catalyst can be added for improved oxidation
performance. Apart from that, mercury nitrate can be added to counteract the
interference of chloride ions by forming complexes with them. In the next step, the
remaining unreduced potassium dichromate is titrated with ferrous ammonium sulfate
(Fe(NH4)2(SO4)2), which allows the determination of the consumed oxygen equivalents
according to Standards DIN 38 414. COD can be calculated in Equation 3.
𝑚𝑔. 𝐿−1𝐶𝑂𝐷 =[(𝐴 − 𝐵)𝐶 × 8000] − 50𝐷
𝑚𝐿 𝑜𝑓 𝑠𝑎𝑚𝑝𝑙𝑒× 1.2 (3)
Where A and B (in mL) are Fe(NH4)2(SO4)2 for blank and sample, respectively; C is
the normality of Fe(NH4)2(SO4)2; D is chloride correction, and 1.2 is compensation
factor to account for the extend of chloride oxidation which is dissimilar in systems
containing organic and non-organic material. However, this method can give relatively
high errors due to sample inhomogeneity and the many sample treatment steps required
(dilution, weighing, and titration). For biogas feedstocks containing high concentrated
OM and bulky material, drying and milling of samples can improve reproducibility. It
is also important to be aware of the toxic components (potassium dichromate, mercury
nitrate) used in COD measurements and their proper disposal.
(c) Nitrogen content
Nitrogen is essential for protein synthesis and is primarily required as a nutrient
by the microorganisms in anaerobic digestion. The nitrogen content of a feedstock can
be determined by the Total Kjeldahl Nitrogen (TKN) determination. TKN in a sample
is used to evaluate the nitrogen available for the growth of anaerobic bacteria. In this
analysis, organic nitrogen is converted to ammonia and nitrogen by boiling the
feedstock sample in sulfuric acid and a catalyst. A base is added, and ammonia is

37
distilled from the alkaline solution to an acid solution where ammonia is absorbed
quantitatively (Drosg et al. 2013). The amount of ammonia can be determined by
potentiometric acid titration or the photometric phenate method (ISO 5663 and 11261).
In the form of ammonium, nitrogen contributes to stabilizing the pH value in the
bioreactor during the process, and microorganisms assimilate ammonium to produce
new cell mass.
In most cases, there will be excessive nitrogen in the biogas reactor, and it can
be assumed that 60–80% of the TKN will be degraded to ammonia during AD.
Ammonia in high concentration in digester will lead to the inhibition of the biological
and methanogenesis process (Khalid et al. 2011). Sterling et al. (2001) found that the
amount of ammonia in the digester may also affect the production of hydrogen and the
removal of volatile solids. Total biogas production was unaffected by slight increases
in ammonia nitrogen, while higher increases reduced biogas production by 50% of the
original rate.
3.3.3 Biochemical methane potential
Biochemical methane potential tests are mainly used to determine the possible
methane yield of a feedstock. These tests also provide information on the anaerobic
degradability of a feedstock, including the degradation rate. Numerous alternative
options have been proposed to estimate the BMP of organic substrates (Hansen et al.
2004). The methods use the same principle, but the technical approaches and
experimental setups may differ (Rodriguez 2011). Most experimental techniques are
batch methods. Jingura and Kamusoko (2017) reported the number of practical ways
with various feedstocks to estimate BMP. They stated that the BMP values affect by
the factors of raw material composition, total and volatile solids, chemical and
biological oxygen demand, C/N ratio, inhibitory substances, and agronomic practices.
On the other hand, novel approaches to determine BMP are required since the
current protocols are expensive and time-wasting (Triolo et al. 2011). As such, cost and
time are critical parameters in the choice of method. The experimental set-up of the
simplified BMP test was reported by (Drosg et al. 2013). The expensive eudiometer
gas measuring devices are replaced by simple water displacement bottles, making the
test more practical. In addition, a bottle with an alkaline solution is placed after the
digester vessel to absorb the produced carbon dioxide and allow direct methane
measurement.

38
3.4 Component affecting biogas production
The anaerobic digestion of organic material is a complex process involving
many different degradation steps. The micro-organisms that participate in the process
may be specific for each degradation step and thus have additional environmental
requirements. Certain primary conditions such as the absence of oxygen (anaerobic
conditions), uniform temperature, optimum nutrient supply, and optimum and constant
pH must be met to enable the bacteria to degrade the substrate efficiently (Gomez and
Costa 2013). Besides, feedstocks for biogas production vary significantly in terms of
composition, digestibility, methane potential, dry matter content, the content of
nutrients, and other characteristics. The methods of biogas production can fully
understand the correlation between a given feedstock and its potential biogas yield, the
number of process steps, the process temperature, pH, and physicochemical properties,
including moisture content and available organic materials, which are necessary to
describe them. The description, advantages, and disadvantages of each method were
summarized by (Ghodrat et al. 2018), and the characterization standards were listed by
(Drosg et al. 2013). Most AD processes run optimally at neutral pH and a C:N ratio of
the substrate mixture between 20:1 and 30:1. The anaerobic microorganisms inside the
digester need to supply some basic ingredients necessary for their metabolism.
Therefore, mixing more than one feedstock (co-digestion) is common to obtain a
balanced substrate composition and a synergic effect of improved process stability and
higher methane yield (Biosantech et al. 2013).
3.4.1 Temperature and pH
Temperature has a significant effect on the microbial community, process
kinetics and stability, and methane yield. Lower temperature decreases microbial
growth, substrate utilization rates, and biogas production during the process, resulting
in cell energy exhaustion, leakage of intracellular substances, or complete lysis. On the
contrary, high-temperature results in lower biogas yield due to ammonia's volatile
gases, suppressing methanogenic activities (Khalid et al. 2011).
AD occurs under two main temperature ranges, which are mesophilic (25−40 ºC) and
thermophilic conditions (45−65 ºC). A temperature range between 35–37 °C is
considered suitable for methane production under mesophilic conditions (Moset et al.
2015). Castillo et al. (2006) indicated that the best operational temperature of
mesophilic and thermophilic was 35 °C and 55 ºC, with the retention time range from

39
15 to 30 days and 12 to 14 days, respectively. The optimum digestion temperature may
vary depending on feedstock composition and the type of digester. In most AD
processes, it should be maintained relatively constant to sustain the gas production rate.
A constant temperature is required for optimized process stability and efficient biogas
plant operation, as shocks and fluctuations can disturb the performance and changes in
the microbial community structure. Most AD plants operate at mesophilic temperatures.
Their operating range is more stable, requires less energy for heating, and has a broader
range of activity and lower risk of ammonia inhibition and process failure than the
thermophilic process. However, thermophilic digesters are more efficient in retention
time, loading rate, and nominally gas production (Gao et al. 2011).
The pH value determines the acidity or basicity of an aqueous solution. The pH
value can be measured in a liquid feedstock with a standard potentiometric electrode
(standards EN 12176). In semi-solid or solid feedstocks, the sample can be mixed with
water and then analyzed. The optimal pH ranges of the hydrolysis and acidogenesis
stages are 5.0–6.0 and 5.5–6.5, respectively, whereas the ideal pH range for
methanogenic bacteria is 6.8–7.2 (Ward et al. 2008). Similarly, a narrow range of
suitable pH values has been found between 6.5 and 7.5 to attain maximal biogas yield
in AD (Liu et al. 2008). The pH value in anaerobic fermentation is usually above
neutral. The buffer capacity depends on CO2 concentration in the gas phase, the
ammonia concentration in the liquid phase, and water content. It is preferable to have a
neutralization step before feeding to the biogas plant. If slight acidification occurs
during AD, the pH can be increased by adding a base, for instance, Ca(OH)2, Na2CO3,
or NaOH, in the reactor (Drosg et al. 2013; (Ghanavati 2018).
3.4.2 Moisture
High moisture contents usually facilitate the AD process and likely affect the
process performance by dissolving readily degradable organic matter. The high yield
of methane production occurs at 60–80% of humidity (Bouallagui et al. 2003).
However, it is difficult to maintain the same water availability throughout the digestion
cycle because the water added at a high rate is initially dropped to a lower level as
anaerobic digestion proceeds. Hernández-Berriel et al. (2008) studied methanogenesis
processes at 70% and 80% moisture levels during anaerobic digestion. They found that
bioreactors at similar ratios of biochemical oxygen demand (BOD) to chemical oxygen
demand (COD), AD under the 70% moisture regime produced stronger leachate and a
higher methane production rate. 83 mL methane per gram dry matter was produced at

40
the 70% moisture level, while 71 mL methane was made with 80% moisture.
Besides, the rate of AD is strongly affected by the substrate's type, availability,
and complexity (Ghaniyari-Benis et al. 2009). Before starting a digestion process, the
composition of the substrate, such as carbohydrate, lipid, protein, and fiber contents,
should be characterized for the quantity of methane that can potentially produce under
AD conditions (Lesteur et al. 2010). The initial concentration, total solid content,
chemical and biological demand, and carbon/nitrogen (C/N) ratio of the substrate in the
digester can significantly affect the performance of the process and the amount of
methane produced during the process (Fernández et al. 2008).
3.4.3 Raw material composition
Methane yield varies for different chemical constituents or the same biomass
feedstock (Mayer et al. 2014). Weiland (2010) indicates that fats and proteins produce
more methane than carbohydrates and lignin, which are not biodegradable under AD
(Table 7).
Table 7 Maximum gas yields and theoretical methane contents (Weiland 2010).
Substrate Biogas (Nm3 t-1
TS)
CH4 (%) CO2 (%)
Raw fat 1200 – 1250 67 – 68 32 – 33
Carbohydrates 790 – 800 50 50
Raw protein 700 70 – 71 29 – 30
3.4.4 Total solids and volatile solids
Total solids (TS) indicate an organic and inorganic portion of matter. The TS
content of the feedstock is analyzed by drying the sample to constant weight in a drying
chamber at 105 ºC. TS content of feedstock influences AD performance, especially
biogas production efficiency. Systems used in AD are classified according to the
percentage of TS in the feedstock. Three main types of AD technologies that work
according to the TS content of feedstocks are ≤10%, 10–20%, and ≥20% TS for
conventional wet, semi-dry, and modern dry processes, respectively (Yi et al. 2014).
Total methane yield decreases typically with an increase of TS contents from 10% to
25% in batch AD under mesophilic conditions (Abbassi-Guendouz et al. 2012). There
is evidence that biomethane yield is also affected by VS content; therefore, BMP can

41
be predicted with reasonable accuracy using solely the VS content (Schievano et al.
2009).
3.4.5 Chemical and biological demand
Chemical oxygen demand (COD) quantifies the amount of organic matter (OM)
in feedstocks. COD is a parameter that indicates the total chemically oxidizable material
in the sample and represents the maximum chemical energy present in the feedstock.
Since microbes convert chemical energy to methane, biogas can be calculated.
Theoretical CH4 production is 0.35–0.5 Nm3/kg COD removal; thus, biogas production
will be higher as CH4 is only part of the biogas (Angelidaki et al. 2009). Biological
oxygen demand (BOD) measures oxygen used by microorganisms to decompose OM.
Typical BOD values are: pig slurry 20,000–30,000, cattle slurry 10,000–20,000, and
wastewater 1,000–5,000 mg L-1 (Korres et al. 2013).
Chemically oxidizable material can be determined by measuring the COD
content of a feedstock. This amount of energy is the absolute maximum of energy that
could be recovered by biogas. However, some substances can be oxidized under
chemical conditions, but they are not accessible under biological conditions and remain
in the digestate. Using continuous fermentation trials, the residual COD in the effluent
of a stable process can be measured, and consequently, the exact COD degradation can
be determined. The relationship between BOD and COD varies among types of
wastewaters from the activities of industries. Wastewater contains a higher level of
oxidizable chemical substances than biodegradable organic matter. The biodegradable
index or biodegradation capacity (BOD/COD ratio) is typically 0.3:0.8 and 0.5:1 for
untreated municipal and raw domestic wastewaters, respectively (Al-Sulaiman and
Khudair 2013).
3.4.6 Carbon/nitrogen ratio
There is an interactive effect between temperature and C/N on AD performance.
The C/N ratio represents the relationship between nitrogen and carbon in a feedstock
(Wang et al. 2014). A low ratio means that the material is protein-rich. AD of such
material results in increased free ammonia content that causes high pH leading to
methanogenic inhibition (Khalid et al. 2011). Therefore, a higher C/N ratio would be
required to reduce the risk of ammonia inhibition when the temperature is increased.
However, a high ratio causes rapid depletion of nitrogen needed for the reproduction of
the bacteria, causing lower gas production. A comparable range of C/N ratios for waste

42
digestion 10:1 to 45:1 for the hydrolysis step and 20:1 to 30:1 for the methanogenesis
step (Drosg et al. 2013). (Dioha et al. 2013) gave typical C/N ratios for some feedstocks:
cattle manure 13:1, chicken manure 15:1, grass silage 25:1, rice husks 47:1, while 25:1
is a broad practice value.
References
Abbassi-Guendouz A, Brockmann D, Trably E, et al. (2012) Total solids content drives
high solid anaerobic digestion via mass transfer limitation. Bioresour Technol
111:55–61.
Al-Sulaiman AM, Khudair BH (2013) Correlation between BOD and COD for al-
diwaniyah wastewater treatment plant to obtain the biodegradability indices.
Pakistan J Biotechnol 53:1689–1699.
Alvarez R, Lidén G (2008) Semi-continuous co-digestion of solid slaughterhouse
waste, manure, and fruit and vegetable waste. Renew Energy 33:726–734.
Angelidaki I, Alves M, Bolzonella D, et al (2009) Defining the biomethane potential
(BMP) of solid organic wastes and energy crops: A proposed protocol for batch
assays. Water Sci Technol 59:927–934.
Angelikaki I, Ahring B. (2000) Methods for increasing the biogas potential from
recalcitrant organic matter contained in manure. Water Sci Technol 41:189–194.
Astals S, Ariso M, Galí A, Mata-Alvarez J (2011) Co-digestion of pig manure and
glycerine: Experimental and modelling study. J Environ Manage 92:1091–1096.
Banks CJ, Ven SH (2013) Optimisation of biogas yields from anaerobic digestion by
feedstock type. In: The biogas handbook: Science, production and applications. pp
131–165.
Biosantech TAS, Rutz D, Janssen R, Drosg B (2013) Biomass resources for biogas
production. In: Wellinger A, Murphy J, Baxter D (eds) The biogas handbook:
Science, production and applications. Woodhead Publishing Series in Energy,
Cambridge, UK, pp 19–51.
Bouallagui H, Ben Cheikh R, Marouani L, Hamdi M (2003) Mesophilic biogas
production from fruit and vegetable waste in a tubular digester. Bioresour Technol
86:85–89.
Castillo EF, Cristancho DE, Arellano V (2006) Study of the operational conditions for
anaerobic digestion of urban solid wastes. Waste Manag 26:546–556.
Chen Y, Cheng JJ, Creamer KS (2008) Inhibition of anaerobic digestion process: a

43
review. Bioresour Technol 99:4044–4064.
Deublein D, Steinhauser A (2011) Biogas from Waste and Renewable Resources.
Wiley-VCH Verlag GmbH & Co. KGaA, Weinheim, Germany.
Dioha IJ, Ikeme C., Nafi’u T, et al (2013) Effect of Carbon To Nitrogen Ratio on Biogas
Production. Int Res J Nat Sci 1:1–10.
Drosg B, Braun R, Bochmann G, Saedi T (2013) Analysis and characterisation of
biogas feedstocks. In: Wellinger A, Murphy J, Baxter D (eds) The biogas
handbook: Science, production and applications. Wiley-VCH Verlag GmbH &
Co. KGaA, UK, pp 52–82
Fernández J, Pérez M, Romero LI (2008) Effect of substrate concentration on dry
mesophilic anaerobic digestion of organic fraction of municipal solid waste
(OFMSW). Bioresour Technol 99:6075–6080.
Gao WJ, Leung KT, Qin WS, Liao BQ (2011) Effects of temperature and temperature
shock on the performance and microbial community structure of a submerged
anaerobic membrane bioreactor. Bioresour Technol 102:8733–8740.
Ghanavati H (2018) Biogas Production Systems: Operation, Process Control, and
Troubleshooting. In: Tabatabaei M, Ghanavati H (eds) Biogas Fundamentals,
Process, and Operation. Springer International Publishing AG, Cham,
Switzerland, pp 199–220.
Ghaniyari-Benis S, Borja R, Monemian S., Goodarzi V (2009) Anaerobic treatment of
synthetic medium-strength wastewater using a multistage biofilm reactor.
Bioresour Technol 100:31740–1745.
Ghodrat AG, Tabatabaei M, Aghbashlo M, Mussatto SI (2018) Waste Management
Strategies; the State of the Art. In: Tabatabaei M, Ganavati H (eds) Biogas
Fundamentals, Process, and Operation. Springer Publishing AG, Cham, pp 1–34.
Gomez C, Costa D (2013) Biogas as an energy option: an overview. In: Wellinger A,
Murphy J, Baxter D (eds) The biogas handbook: Science, production and
applications. Woodhead Publishing Series in Energy, UK, pp 1–51.
Hansen TL, Schmidt JE, Angelidaki I, et al. (2004) Method for determination of
methane potentials of solid organic waste. Waste Manag 24:393–400.
Hernández-Berriel MC, Márquez-Benavides L, González-Pérez DJ, Buenrostro-
Delgado O (2008) The effect of moisture regimes on the anaerobic degradation of
municipal solid waste from Metepec (México). Waste Manag 28:14–20.
Jingura RM, Kamusoko R (2017) Methods for determination of biomethane potential

44
of feedstocks: a review. Biofuel Res J 4:573–586.
Kavacik B, Topaloglu B (2010) Biogas production from co-digestion of a mixture of
cheese whey and dairy manure. Biomass and Bioenergy 34:1321–1329.
Khalid A, Arshad M, Anjum M, et al. (2011) The anaerobic digestion of solid organic
waste. Waste Manag 31:1737–1744.
Korres NE, O’Kiely P, Benzie JA., West JS (2013) Bioenergy Production by Anaerobic
Digestion: Using agricultural biomass and organic wastes. Taylor & Francis,
London
Langeveld JW., Guisson R, Stichnothe H (2016) Mobilising Sustainable Supply Chains
– Biogas Cases Biogas Production From Municipal Solid Mobilising Sustainable
Supply Chains – Biogas Cases.
Langeveld JW., Kalf R, Elbersen HW (2010) Bioenergy production chain development
in the netherlands: key factors for success. Biofuels, Bioprod Biorefining 4:484–
493.
Langeveld JWA, Peterson EC (2018) Feedstocks for Biogas Production: Biogas and
Electricity Generation Potentials. In: Tabatabaei M, Ghanavati H (eds) Biogas
Fundamentals, Process, and Operation. Springer Publishing AG, Cham,
Switzerland, pp 35–50.
Lesteur M, Bellon-Maurel V, Gozalez C, et al (2010) Alternative methods for
determining anaerobic biodegradability: A review. Process Biochem 45:431–440.
Liu C fang, Yuan X Zhong, Zeng G ming, et al (2008) Prediction of methane yield at
optimum pH for anaerobic digestion of organic fraction of municipal solid waste.
Bioresour Technol 99:882–888.
Mahmoodi P, Farmanbordar S, Karimi K (2018) Analytical Methods in Biogas
Production. In: Tabatabaei M, Ghanavati H (eds) Biogas Fundamentals, Process,
and Operation. Springer Publishing AG, Cham, Switzerland, pp 221–238.
Mayer F, Gerin PA, Noo A, et al (2014) Assessment of factors influencing the
biomethane yield of maize silages. Bioresour Technol 153:260–268.
Moset V, Poulsen M, Wahid R, et al (2015) Mesophilic versus thermophilic anaerobic
digestion of cattle manure: Methane productivity and microbial ecology. Microb
Biotechnol 8:787–800.
Murphy J, Thamsiroj T (2013) Fundamental science and engineering of the anaerobic
digestion process for biogas production. In: Wellinger A, Murphy J, Baxter D (eds)
The biogas handbook: Science, production and applications. Woodhead

45
Publishing Series in Energy, UK, pp 104–130.
Pham CH, Triolo JM, Cu TTT, et al (2013) Validation and recommendation of methods
to measure biogas production potential of animal manure. Asian-Australasian J
Anim Sci 26:864–873.
Rodriguez L (2011) Methane potential of sewage sludge to increase biogas production.
Royal Institute of Technology (KTH), Sweden.
Schievano A, Pognani M, D’Imporzano G, Adani F (2008) Predicting anaerobic
biogasification potential of DIgestates and digestates of a full-scale biogas plant
using chemical and biological parameters. Bioresour Technol 99:8112–8117.
Schievano A, Scaglia B, D’Imporzano G, et al (2009) Prediction of biogas potentials
using quick laboratory analyses: Upgrading previous models for application to
heterogeneous organic matrices. Bioresour Technol 100:5777–5782.
Seadi T Al, Rutz D, Prassl H, et al (2008) Biogas Handbook. University of Southern
Denmark, Esbjerg, Denmark.
Smith P, Martino D, Cai Z, et al (2008) Greenhouse gas mitigation in agriculture. Philos
Trans R Soc B Biol Sci 363:789–813.
Sterling MC, Lacey RE, Engler CR, Ricke SC (2001) Effects of ammonia and nitrogen
on H2S and CH4 production. Bioresour Technol 77:9–18.
Tabatabaei M, Valijanian E, Aghbashlo M, et al (2018) Prominent Parameters in Biogas
Production Systems. In: Tabatabaei M, Ghanavati H (eds) Biogas Fundamentals,
Process, and Operation. Springer Publishing AG, Cham, Switzerland, p 141.
Triolo JM, Sommer SG, Møller HB, et al (2011) A new algorithm to characterize
biodegradability of biomass during anaerobic digestion: Influence of lignin
concentration on methane production potential. Bioresour Technol 102:9395–
9402.
Wang X, Lu X, Li F, Yang G (2014) Effects of temperature and Carbon-Nitrogen (C/N)
ratio on the performance of anaerobic co-digestion of dairy manure, chicken
manure and rice straw: Focusing on ammonia inhibition. PLoS One 9:1–7.
Ward AJ, Hobbs PJ, Holliman PJ, Jones DL (2008) Optimisation of the anaerobic
digestion of agricultural resources. Bioresour Technol 99:7928–7940.
Weiland P (2010) Biogas production: Current state and perspectives. Appl Microbiol
Biotechnol 85:849–860.
Yi J, Dong B, Jin J, Dai X (2014) Effect of increasing total solids contents on anaerobic
digestion of food waste under mesophilic conditions: Performance and microbial

46
characteristics analysis. PLoS One 9:e102548.
Zhang R, El-Mashad HM, Hartman K, et al (2007) Characterization of food waste as
feedstock for anaerobic digestion. Bioresour Technol 98:929–935.

47
CHAPTER 4 BIOGAS PLANNING, DESIGN, AND TECHNOLOGY
The planning, design, and technology selection of a biogas plant must be made
to ensure the economic operation of the biogas plant with the available feedstock. The
planning includes pre-feasibility and feasibility studies that aim to estimate the
feedstocks available for biogas production, energy, investment costs, and the
economics of a biogas project. The biogas plant design includes determining the reactor
type and volume and the capacity of biogas utilization systems. The last section presents
lagoon technology already used for biogas production at a commercial scale in
Cambodia.
4.1 Basic steps in the planning of a biogas plant
Farmers and farmers' organizations, organic waste producers and collectors,
municipalities, and other stakeholders are the usual initiators of biogas projects. From
the vital spark of a biogas project idea to the end of its lifetime, the process generally
undergoes the following steps: (1) Project idea; (2) Pre-feasibility study; (3) Feasibility
study; (4) Detailed planning of the biogas plant; (5) Permission procedure; (6)
Construction of the biogas plant; (7) Operation and maintenance; (8) Re-investment
and replacement; and (9) Demolition or refurbishment (Seadi et al. 2008). The process
starts with the project idea and the first pre-feasibility to estimate the biogas production.
For this purpose, online biogas calculators can be used from BTIC’s website
(http://btic-rua.org/pages/service#). The reports of preliminary planning summing up
all boundary conditions like technical aspects and investment budget should be handed
out to potential financiers like banks, institutional investors, private persons, or groups
of private persons (Seadi et al. 2008).
There are different successful models of setting up a biogas project, depending
on the feedstock availability, options for biogas utilization, and the financial capability
of the investors. If the project initiator and the investor arrive at the point of decision
making, an experienced biogas consulting company or institution could be involved.
The biogas consultant helps the farm owners and investors to estimate the biogas
amount and select the technology (wet or dry digestion, process temperature, type of
digesters, size of the digester, types of biogas utilization CHP generation, biogas
upgrading, and electricity generation), and estimate the detailed cost budget for the
investment and operation of the plant (cost of individual components, labor costs,

48
maintenance and repair, interest from bank, financing/permitting, and
planning/engineering costs (Gupta 2020).
4.1.1 Feasibility study
Most farms are unique, so consulting with a biogas expert for a field visit is
essential to ensure a proper biogas system design. The feasibility study is to create an
economically profitable model for a biogas plant investment. The typical data for a
range of, for instance, animal farms such as the number of livestock, manure per day,
DM, and the data from laboratory analysis of feedstocks allows the biogas expert to
estimate the biogas production and electricity generation (Langeveld and Peterson
2018). Based on the amount of potential feedstock to be used in the biodigester, the
selection of technology, and the biogas utilization, the dimension and size of the biogas
plant can be designed and constructed. Finally, the economics of the biogas plant is
analyzed based on the investment costs, the operating costs, and the financial benefits.
The planning process for constructing a biogas plant is complex and time-consuming.
Before, during, and after the construction, a wide range of financial, economic,
environmental, and social issues need to be considered (more detail in Chapter 7).
4.2 Design of biogas plant
For designing an anaerobic digestion plant, it is important to accurately establish
the technology to be used and the volume required for digestion. Every biogas plant
design should start from the selection and analysis of the feedstocks available. The
knowledge needed on the substrate should not be limited to the time of analyzing the
project but should also consider future changes. The best scenario is to have a complete
picture of the situation faced by acquiring and the following data: (i) available quantity
of feedstocks per day, per year and receiving frequency; (ii) quality of the feedstocks
in terms of TS, VS, and other substances; and (iii) suggested HRT, OLR, and
temperature of digestion (Ghodrat et al. 2018). The calculation of the volume is
generally performed after deciding on the other configurations and operating conditions
of the plant, mainly (1) available feedstocks, quantity, and characteristics (wet or dry
digestion); (2) process conditions (temperature of digestion, for instance, mesophilic or
thermophilic); (3) reactor control or volume; and (4) technology (from a batch process
to continuous process, for instance, plug-flow, CSTR, USAB, lagoon, etc.). The first
two parameters have been described in Chapter 3. This section presents the reactor
volume by determining the value of HRT and OLR and types of co-digestion. Also, the

49
possibility of co-digestion should be considered, as this can lead to increased biogas
production scale.
4.3 Reactor volume
The total digestion volume is defined by the hydraulic retention time (HRT) or
the organic loading rate (OLR). The reactor volume generally needs to be adapted to
the amount of feedstock, the critical substrates' degradation rate, and the anaerobic
bacteria's propagation speed. Micro-organisms must have sufficient time for the
degradation process, which sets a particular minimum retention time. The concentration
of organic matter must not be of a level that leads to overfeeding the microbes and thus
processes inhibition, which sets a certain maximum OLR. The HRT and OLR are used
to calculate the digester volume (Sarker et al. 2019).
4.3.1 Hydraulic retention time
Retention time is an important parameter used for the design and optimization
of anaerobic digestion. The retention times of given feedstocks depend on the digestion
temperature and eventually on the pre-treatment (Talia 2018). It mainly depends on
the type of reactor to be used and the type of substrate. Retention time refers to HRT
and solid retention time (SRT). HRT represents the retention time of the liquid phase,
whereas SRT denotes the retention of the microbial culture in the digester. In an
anaerobic reactor system where the feedstock (food waste, kitchen waste, and MSW)
and mixed microbial cultures are present at the same phase, the HRT is essentially SRT
and vice-versa. In contrast, for substrates like waste-activated sludge and primary
sludge, the interaction between solids and microbial cultures is biphasic, making HRT
and SRT different (Sarker et al. 2019). Sludge blanket and anaerobic film reactors,
suitable for low-strength waste waters, typically have a low HRT and high SRT.
The HRT describes the theoretical time the substrates stay in the digester, and
the mean retention time deviates from this value. The HRT is a statistical and
calculative value from the active volume of the biogas plant and the volume of added
substrate per day, as shown in Equation 3 (Rosato 2018).
𝐻𝑅𝑇 (𝑑𝑎𝑦𝑠) =𝑁𝑒𝑡 𝑑𝑖𝑔𝑒𝑠𝑡𝑒𝑟 𝑣𝑜𝑙𝑢𝑚𝑒 (𝑚3)
𝑆𝑢𝑏𝑠𝑡𝑟𝑎𝑡𝑒 𝑖𝑛𝑝𝑢𝑡 (𝑚3 𝑑𝑎𝑦)⁄ (3)
The selection of HRT value must allow adequate substrate degradation without
increasing the digester volume too much. Washout of the microbes must be avoided;

50
therefore, the HRT must not be below 10 days (Gomez and Costa 2013). The choice of
HRT differs based on feedstock composition, processes, and temperature. The HRT on
the methanogenesis is related to the operating temperature. Biogas and methane
production in thermophilic conditions have higher production rates than in mesophilic
states. Kim et al. (2006) indicated that the HRT ranged from 8 to 12 days with
temperature between 30 C to 55 C. Substrates rich in starch and sugar can be easily
digested, resulting in shorter retention times. Still, fiber and cellulose plant matters like
corn stalk and rice straw require longer retention times as hydrolysis of these substrates
occurs at a slow rate. However, shorter HRT risks bacterial mobilization, including the
build-up of higher molecular weight VFAs (volatile fatty acids) and consequently
elevated stress to the methanogens.
Conversely, a longer HRT increases the digester size; therefore, the optimal
operational HRT is usually neither too long nor too short. In the case of different AD
phases, a longer HRT is typically preferred for methanogenesis to match the slower
growth rate of methanogens compared to acidogenesis. Some digesters are designed in
a multi-stage so that acidogenesis and methanogenesis can be separated into two
different volumes, allowing each group of microorganisms to operate at the optimal
conditions (Sarker et al. 2019). The optimization strategy for the digester might need to
increase the VS content of the substrate (very low slurry) by dewatering until reaching
the limit value for the HRT (Banks and Ven 2013).
4.3.2 Organic loading rate
The organic loading rate (OLR) is the amount of organic matter added to an AD
system per day per unit of reactor volume. OLR is a measure of the biological
conversion capacity of the AD system. Its value is estimated based on the different
biological parameters and represents the loading stress value of the digester. It is
possible to increase the OLR if the substrate is easy to digest by the microbial
populations and the conditions for digestion are optimal. At the same time, it should be
kept at a lower level if the digestion process of recalcitrant substrates is intended (Talia
2018). OLR is a crucial control parameter in continuous systems. Many plants have
reported system failure due to overloading.
Feeding the system above its sustainable OLR results in low biogas yield due to
the accumulation of inhibiting substances in the digester slurry (e.g., fatty acids). High
organic loads lead to higher biogas production and higher instability due to changes in

51
a composition and an accumulation of VFA. The change of VFA from low to high
molecular weight eventually promotes methane inhibition. The accumulation of VFA
interferes with the balance of the microorganisms involved in the decomposition
organic materials and methane production. The high concentration of VFA decreases
pH, resulting in the inhibition of the methanogens, and the subsequent reduction or stop
of methane production and a subsequent further accumulation of VFA. The feeding rate
of the system must reduce under such circumstances. A low organic load prevents
overloading and process failure. However, it also results in low biogas output, resulting
in an uneconomical operating point of the digester. Therefore, it is vital to determine a
proper OLR to maximize biogas production for each AD system (Sarker et al. 2019).
An adequate OLR of a system directly depends on the digester design, substrate
concentration, and retention time (Rodriguez 2011). OLR can be calculated in Equation
4 and expressed in kg COD per cubic meter of the reactor for wastewater and kg VS
per cubic meter for high solid substrates (Monnet 2003).
𝑂𝐿𝑅 = 𝐶𝑂𝐷 𝐻𝑅𝑇⁄ 𝑜𝑟 𝑉𝑆 𝐻𝑅𝑇⁄ (4)
4.4 Type of co-digesters
Co-digestion is carried out in a wet single-step process. The selected digester
type typically depends on the characteristics of the major feedstock used, mainly TS,
digestibility, BMP, and C:N ratio. The proper selection of co-digestion for the available
feedstock can enhance biogas yield per m3 of the reactor, with consequent financial
benefits for the plant operator. Rabii et al. (2019) reported the suitable type of anaerobic
co-digestion systems with different multi-feedstocks to increase the yield of biogas and
biomethane. Sarker et al. (2019) summarized the biogas production rate or biogas yield
using different reactor configurations concerning operation parameters such as reactor
size, type of feedstocks, reactor temperature, pH, OLR, and HRT. Five types of co-
digestions, which are Continuously Stirred Tank Reactors (CSTR), Up-flow Anaerobic
Sludge Blanket (UASB) reactors, Up-flow Anaerobic Filter (UAF) digesters,
Anaerobic Baffled reactor (ABR), and anaerobic lagoon, are described. Wet systems
are advantageous when the substrate can directly apply to the fields without separating
the solid fraction. For example, feedstocks with high TS concentrations and slurry are
mainly treated in CSTRs, while soluble organic wastes are digested in UAF and UASB
reactors (Langeveld and Peterson 2018). Table 8 gives the comparison of the anaerobic

52
process of wastewater with different co-digesters (Woodard 2006).
Table 8 Comparison of anaerobic processes for wastewater treatment (Deublein and
Steinhauser 2010).
Reactors Advantages Disadvantages KgCOD/m3.d
ay
CSTR . Intensive contact between bacteria
and substrate
. Good decomposition of the
suspended material.
. Biomass does not need sediment
well
1 – 5 kg
VS/ m3.day
UASB . Low residence times of 48 h.
. No plugging, Natural mixing, and
good sedimentation of the sludge.
. High amount of
washout of active
biomass, depending on
the reactor design;
recirculation necessary,
depending on the
substrate; Problems
when no granules
appear; Sensitive with
high concentrations of
insoluble organic
material
UAF . Robust process
. No negative effect of irregularities
. Good retainment of the
microorganisms
. Low cost, no agitator
required
. Plug flow
. Precipitation of
inorganics
. Filter plugging
possible
. Short circuit stream
possible
. High-pressure drop
. High demand on
construction
. Low-stress load of the
sludge
10 – 20

53
. Not suitable for high
sludge
concentrations
ABR . Long contact time
. Advantageous when plug flow
supports the anaerobic
decomposition
. Low volume load
. Not much experience
available
Anaerobic
lagoon
. Decomposition of suspended solids
over long periods
. Possible to work as buffers cheap
and straightforward process
. Requires big area
required for at least 7 –
30 days residence time
. Potential heat loss
. Requires periodic
sludge removal
<0.5
4.4.1 Continuous stirred tank reactor
Continuous stirred tank reactor (CSTR), known as back mixed reactor or mixed
flow reactor, is a continuous wet process that facilitates rapid dilution of reagents
through mixing. The mixing system is a crucial design element of this process, and the
mixing technology used in this reactor guarantees high efficiency of VSS digestion
compared with other methods, but the investment cost of this system is usually higher
than the others. At present, 90% of reactors for digestion of high-solid substrates,
sludges, and slurries are vertically mounted CSTR-type digesters operating at
mesophilic temperatures. This type of reactor suits many of the currently available
digestion of a wide variety of substrates from agricultural waste to industrial waste or
energy crops with total solid content between 2 and 12% TS. TS values exceeding 15
% can lead to stirring problems in conventional CSTR.
CSTR designs always result in a proportion of bypass, and where this is
undesirable. For example, in energy crop digestion, having primary and secondary
digesters in series has been shown to maximize specific methane yield (Banks and Ven
2013). The reactor typically has a cylindrical shape with a mixing system, and it can be
operated at different temperatures and OLRs around 2–5 kg VS/m3/day. Liquid
digestate can be recycled from the second vessel to the first step. This recycling is a
valuable tool in the system as it allows for dilution of feedstock and balances the system
(Murphy and Thamsiroj 2013).

54
4.4.2 Up-flow Anaerobic Sludge Blanket
Up-flow Anaerobic Sludge Blanket (UASB) is one of the reactor types where
the process is a combination of physical and biological methods. The main feature of
the physical process is the separation of solids and gases from the liquid, and that of the
biological process is the degradation of decomposable organic matter under anaerobic
conditions (Bal and Dhagat 2001). UASB reactors are widely used for the anaerobic
treatment of wastewater (Bodkhe 2009). This reactor utilizes methanogenic bacteria or
anaerobic microorganisms which form granules as a medium to decompose organic
matter into methane and carbon dioxide. The feedstocks flow upwards through the
granular sludge blanket in this reactor and kept in suspension in the tank. The combined
action of the upward flow of the substrate and the gravity suspends the substrate in the
sludge blanket of the reactor. The blanket begins to reach maturity at around three
months (Nugroho and Santoso 2019). This reactor is used for domestic and industrial
wastewater digestion with low total suspended solid (TSS) because it allows the
retention of the anaerobic biomass. UASB reactor belongs to high-rate systems, able to
perform anaerobic reactions at reduced HRT (Mainardis et al. 2020). The HRT of 1 day
was sufficient to remove more significant than 70% of COD which corresponds to 89%
methane concentration for cattle, slaughterhouse, and wastewater (Musa et al. 2018).
However, the overcapacity of biomass inside the reactor or the operation during the
start-up of granular reactors can reduce the process performance. The flow rate affects
biomass content, and a suitable flow rate is vital for the UASB reactor.
4.4.3 Up-flow anaerobic filter
In up-flow anaerobic filter (UFA) reactors, a microbial film (biofilm) grows on
an inert support. The biofilm is retained within the reactor on media made from
ceramics, glass, engineered plastics, or wood. The filter material typically occupies
60%–70% of the reactor volume. When the water flows through the fixed bed, organic
pollution is destroyed by the bacteria that grow inside this fixed bed (Moran 2018).
UAF is simple and robust, but care should be taken to maintain the biofilm in optimal
condition. The bioreactor operates in both down-flow and up-flow modes. Down-flow
is less common but better suited to effluent containing high suspended solid levels. Up-
flow mode is used for preventing clogging, channeling, and biomass washout. Thanks
to its high separation capacity and good performance in terms of achievable TSS, these
reactors are particularly efficient for treating high pollutant content wastewaters such
as antibiotic fermentation wastes, yeast production wastewater, brewery, and winery

55
wastewater, pharmaceutical waste, chemical processing waste, domestic effluent,
landfill leachate, and food canning and soft drinks waste (Stanbury et al. 2017). These
reactors require a smaller area than CSTRs or lagoons because of their low HRT.
4.4.4 Anaerobic Baffled digesters
Anaerobic Baffled Reactor (ABR) is simple technology with low investment
costs. It is typically constructed concrete tanks without mixing systems and possibly
internal baffles to differentiate the hydrolysis phase. ABR initially receives the organic
fraction of municipal solid waste (OFMSW), liquid effluent from farm or wastewater
followed by decomposition process of the materials and eventually produces biogas by
microorganisms’ activities (Malakahmad et al. 2008). In an up-flow mode, it baffles the
direct flow of wastewater through a series of sludge blanket reactors after being
transported to the compartment's bottom. The sludge in the reactor rises and falls with
gas production and flows through the reactors slowly (Ahmed 2019). ABR does not
require the sludge to granulate to perform effectively, although granulation does occur
over time (Skiadas et al. 2000). The reactor design has several advantages over well-
established systems such as the UASB and UFA, including their simple design, high
void volume, reduced clogging, reduced sludge bed expansion, low capital, and low
operating cost (Dahlan et al. 2020). Therefore, they give better resilience to hydraulic
and organic shock loadings, longer solid retention times, lower sludge yield, and the
ability to separate between the various phases of anaerobic catabolism partially. The
latter causes a shift in bacterial populations, allowing increased protection against toxic
materials and higher resistance to changes in environmental parameters such as pH and
temperature. The physical structure of ABR enables important modifications to be
made such as the implementing of an aerobic polishing stage, resulting in a reactor that
can treat difficult wastewaters which currently require several units, ultimately
significantly reducing capital costs (Ahmed 2019).
The process is very stable under shock loads due to its compartmentalized
structure; therefore, it is more tolerant to non-settling particles than the UASB while
providing long solid retention times. Various modifications have been made to the ABR
to improve performance. A modified design of ABR using different combinations of
feedstocks can achieve high biogas production and methane generation in the shortest
time. Malakahmad et al. (2008) found that the combination of 75% of kitchen waste
and 25% of activated sewage sludge produced biogas with a methane content of 74%.
Moreover, the addition of polymer amended reactor shows higher methane yield

56
compared to the control reactor. Polymer additive could enhance granule formation in
the ABR, which promotes phase separation, thus results in a high degree of biomass
retention and low solids washout from the ABR. The granulation allows high biomass
concentrations in continuous reactors to internal physicochemical gradients within the
aggregates and heterogeneous structured populations of syntrophic micro-organisms
(Uyanik et al. 2002).
4.5 Anaerobic lagoon
Anaerobic lagoons are used to treat animal wastes or industrial wastes and
subjected to high organic loading that anaerobic conditions prevail throughout the entire
volume. The biological treatment processes that take place are the same as those that
take place in anaerobic digesters. However, it holds longer times for the degradation of
compounds that have relatively slow reaction rates. There is no mixing, no heating, and
no attempt to control or manage the size or location of the “clumps” of biological solids
that develop (Woodard 2006). There are two types of anaerobic lagoons which are
simple covered lagoon and improved lagoon.
4.5.1 Simple covered lagoon
Typically, covered lagoons use effluent from 0.5 to 2% solids (Abbasi et al.
2012). OLR and retention time are related to the temperature of the lagoons. For
instance, OLR is higher for preheated feedstocks before adding them into lagoons. The
OLR loading rates reported for anaerobic lagoons have varied from 0.05 kg/m3 to 2.5
kg/m3 with various digestion temperatures from 10 ℃ to 40 ℃. The HRT is changed
from 4 to 250 days, typically 30 to 50 days, and is longer in colder climates. Minimum
HRT is 30 days for a simple covered lagoon in Cambodia. The chosen design loading
rate depends on the stressed treatment objectives, such as maximizing pollutant
reduction, reducing odors, or minimizing sludge production. The minimum treatment
volume is based on volatile solids content. Volatile acid concentration is an indicator
of process performance because the acids convert to methane at the same rate as formed
if an equilibrium is maintained. The lagoon system works well with low volatile acid
concentrations (less than 500 mg/L). Inhibition occurs at volatile acid concentrations
excess of 2,000 mg/L. The pH value above 8 favors more ammonia emissions, while
below pH 6 favor more hydrogen sulfide and carbon dioxide emissions. All the
parameters for obtaining the optimum and extreme operating ranges for methane
formation from these digesters are listed in Table 9 (Bowman and Dahab 2002).

57
Table 9 Ideal operating ranges for methane fermentation (Bowman and Dahab 2002).
Parameter Optimum Extreme
Temperature (℃) 30 – 35 25 – 40
pH 6.6 – 7.6 6.2 – 8.0
Alkalinity (mg/L) 2,000 – 3,000 1,000 – 5,000
Volatile acids (mg/L) 50 – 500 2,000
4.5.2 Improved covered lagoon
The improved lagoon functions are similar to UASB, in which the wastewater
is inserted, distributed over the bottom but lower investment cost (Mainardis et al.
2020). The improved lagoon controls the physical, chemical, and biological
environments to achieve high degradation efficiency, high biogas production, and
process stability (Schmidt et al. 2019).
4.5.3 Design and construction cost of the covered lagoon
The covered lagoon's design is simple compared to other digester models,
consisting of one or more lined, in-ground lagoons with flexible gas covers to collect
rising biogas and a pond to store the digested waste (Figure 6). Raw wastewater or other
effluents enter near the pond's bottom and mix with the active microbial mass in the
lagoon. Covered lagoons are rarely heated or insulated. A typical anaerobic lagoon is a
relatively deep earthen basin with an inlet, an outlet, and a low surface-to-volume ratio,
permitting settable solids' sedimentation to digest the retained sludge.
This system allows anaerobically reduce some of the soluble organic substrates.
If the basin is not excavated from the soil of very low permeability, it must be lined to
protect the groundwater below. The lagoon should be lined with an impermeable
material such as plastic, rubber, clay, or cement. Covers are most often manufactured
from HDPE and must be strong to resist rain or storm on the lagoon surface and
freeboard. Lagoons vary in depth from 2.5 to 9 m and build as deep as the local
geography allows to minimize the surface area and reduce odor emissions. Depth
approaching 6 m is recommended to reduce the surface area and to conserve heat in the
lagoon. The lagoon should be designed to avoid short-circuiting feedstock and
incorporate a minimum freeboard of 0.9 m (Bowman and Dahab 2002).
The direct cost of constructing an anaerobic lagoon is the cost of the land, the
excavation of the lagoon, and the cover. Costs for forming the embankment,

58
compacting, lining, service road, fencing, and materials like clay, concrete, piping, and
pumps must also be considered.
4.5.4 Operation and maintenance
The operation and maintenance requirements of a lagoon are minimal. A daily
grab sample of influent and effluent should be taken and analyzed to ensure proper
operation. All the parameters should be in the operating ranges for methane formation,
as indicated in Table 9. A rate outside of these extreme ranges will decrease the rate of
methane formation. Aside from sampling, analysis, and general upkeep, the system is
virtually maintenance-free. Solids accumulate in the lagoon bottom and require
removal on an infrequent basis (5 – 10 years), depending on the inert material in the
influent and the temperature. Sludge depth should monitors annually (Bowman and
Dahab 2002).
4.5.5 Advantages and disadvantages of anaerobic lagoons
The advantages of lagoon systems include designing a large volume system at
a relatively low investment cost. Low construction and operating costs make anaerobic
lagoons financially attractive alternatives to other treatment systems, although sludge
must occasionally be removed. This system is particularly interested in low TS/energy
content substrates like industrial wastewaters, municipal wastewater, or liquid manure
Figure 6 (a) Anaerobic covered lagoon technology and (b) biogas production process.

59
(Talia 2018). It is the cheapest solution for anaerobic digestion process application and
is easy to operate. Covered lagoons are a good way to recover methane gas and control
ammonia and other odorous gases. In some cases, the layer of solids that forms on the
lagoon's surface due to floating greases, oils, and the products of microbial metabolism
(the scum layer) has successfully prevented intolerable odor problems.
However, there are disadvantages like the high tendency to form sedimented
layers at the bottom of the system. It might necessitate opening and emptying the system
imposing high maintenance costs. Other disadvantages include huge area necessary,
low efficiency due to non-controlled temperature of digestion, possible technical
problems due to high volume of gas storage, leakage, etc. Anaerobic lagoon technology
has been shown to emit pollutant substances (through gas emissions and lagoon
overflow pathways) that can cause adverse environmental and health effects. Moreover,
anaerobic lagoons do not apply to many situations because of extensive land
requirements, poor process control, sensitivity to environmental conditions, and
objectionable odors. The anaerobic process may require long retention times, and
anaerobic bacteria are ineffective below 15 ℃, which reduces the rate of methane
production. The low temperature has a negative impact on degradation efficiency,
biogas production, and process stability (Schmidt et al. 2019). Therefore, anaerobic
lagoons are not efficient biogas producers in cold climates.
References
Abbasi T, Tauseef S., Abbasi S. (2012) Biogas Energy. Springer, New York
Ahmed H (2019) Applications of Anaerobic Baffled Reactor in Wastewater Treatment
using Agriculture Wastes. Int Res J Eng Technol 1288–1293.
Bal AS, Dhagat NN (2001) Upflow anaerobic sludge blanket reactor-a review. Indian
J Environ Health 43:1–82.
Banks CJ, Ven SH (2013) Optimisation of biogas yields from anaerobic digestion by
feedstock type. In: The biogas handbook: Science, production and applications. pp
131–165
Bodkhe SY (2009) A modified anaerobic baffled reactor for municipal wastewater
treatment. J Environ Manage 90:2488–2493.
Bowman RH, Dahab M (2002) Wastewater Technology Fact Sheet Anaerobic Lagoons.
New York
Dahlan I, Hassan SR, Lee WJ (2020) Modeling of modified anaerobic baffled reactor

60
for recycled paper mill effluent treatment using response surface methodology and
artificial neural network. Sep Sci Technol 00:1–12.
Deublein D, Steinhauser A (2010) Biogas from waste and renewable sources: an
intronduction. Wiley-VCH Verlag GmbH & Co. KGaA, Weinheim, Germany
Ghodrat AG, Tabatabaei M, Aghbashlo M, Mussatto SI (2018) Waste Management
Strategies; the State of the Art. In: Tabatabaei M, Ganavati H (eds) Biogas
Fundamentals, Process, and Operation. Springer Publishing AG, Cham, pp 1–34
Gomez C, Costa D (2013) Biogas as an energy option: an overview. In: Wellinger A,
Murphy J, Baxter D (eds) The biogas handbook: Science, production and
applications. Woodhead Publishing Series in Energy, UK, pp 1–51
Gupta AS (2020) Feasibility Study for Production of Biogas from Wastewater and
Sewage Sludge-Development of a Sustainability Assessment Framework and its
Application. KTH Royal Institute of Technology
Kim JK, Oh BR, Chun YN, Kim SW (2006) Effects of temperature and hydraulic
retention time on anaerobic digestion of food waste. J Biosci Bioeng 102:328–332.
Langeveld JWA, Peterson EC (2018) Feedstocks for Biogas Production: Biogas and
Electricity Generation Potentials. In: Tabatabaei M, Ghanavati H (eds) Biogas
Fundamentals, Process, and Operation. Springer Publishing AG, Cham,
Switzerland, pp 35–50
Mainardis M, Buttazzoni M, Goi D (2020) Up-flow anaerobic sludge blanket (USAB)
technology for energy recovery: A review on state-of-the-art and recent
technological advances. Bioengineering. doi: 10.3390/bioengineering7020043
Malakahmad A, Ahmad Basri N, Zain SM (2008) An application of anaerobic baffled
reactor to produce biogas from kitchen waste. WIT Trans Ecol Environ 109:655–
664.
Monnet F (2003) An Introduction to Anaerobic Digestion of Organic Wastes.
Moran S (2018) Dirty water unit operation design: biological processes. In: An Applied
Guide to Water and Effluent Treatment Plant Design. Elsevier Inc., MA, USA, pp
171–202
Murphy J, Thamsiroj T (2013) Fundamental science and engineering of the anaerobic
digestion process for biogas production. In: Wellinger A, Murphy J, Baxter D (eds)
The biogas handbook: Science, production and applications. Woodhead
Publishing Series in Energy, UK, pp 104–130
Musa MA, Idrus S, Hasfalina CM, Daud NNN (2018) Effect of organic loading rate on

61
anaerobic digestion performance of mesophilic (UASB) reactor using cattle
slaughterhouse wastewater as substrate. Int J Environ Res Public Health. doi:
10.3390/ijerph15102220
Nugroho G, Santoso SA (2019) Dynamical modeling of substrate and biomass effluents
in up-flow anaerobic sludge blanket (UASB) biogas reactor. Int J Ind Chem
10:311–319.
Rabii A, Aldin S, Dahman Y, Elbeshbishy E (2019) A Review on Anaerobic Co-
Digestion with a Focus on the Microbial Populations and the Effect of Multi-Stage
Digester Configuration. Energies 12:1106.
Rodriguez L (2011) Methane potential of sewage sludge to increase biogas production.
Royal Institute of Technology (KTH)
Rosato MA (2018) Managing Biogas Plants. Taylor & Francis, New York
Sarker S, Lamb JJ, Hjelme DR, Lien KM (2019) A review of the role of critical
parameters in the design and operation of biogas production plants. Appl Sci
9:1915 (1–38).
Schmidt T, Harris P, Lee S, McCabe BK (2019) Investigating the impact of seasonal
temperature variation on biogas production from covered anaerobic lagoons
treating slaughterhouse wastewater using lab scale studies. J Environ Chem Eng
7:103077.
Seadi T Al, Rutz D, Prassl H, et al (2008) Biogas Handbook. University of Southern
Denmark, Esbjerg, Denmark
Skiadas I V., Gavala HN, Lyberatos G (2000) Modelling of the periodic anaerobic
baffled reactor (PABR) based on the retaining factor concept. Water Res 34:3725–
3736.
Stanbury PF, Whitaker A, Hall SJ (2017) Principles of Fermentation Technology: Third
Edition. In: Stanbury PF, Whitaker A, Hall SJ (eds) Principles of Fermentation
Technology: Third Edition, third. Elsevier, MA, USA, pp 687–723
Talia L (2018) Biogas Plants: Design and Fabrication. In: Tabatabaei M, Ghanavati H
(eds) Biogas Fundamentals, Process, and Operation. Springer Publishing AG,
Cham, Switzerland, pp 51–94
Uyanik S, Sallis PJ, Anderson GK (2002) The effect of polymer addition on granulation
in an anaerobic baffled reactor (ABR). Part I: Process performance. Water Res
36:933–943.
Woodard F (2006) Methods for Treating Wastewaters from Industry. In: Industrial

62
Waste Treatment Handbook, second. Butterworth-Heinemann, UK, pp 149–334

63
CHAPTER 5 BIOGAS PRODUCTION AND UTILIZATION
The main components of biogas production, biogas pre-treatment, and biogas
upgrading are discussed. Biogas utilization for the production of electricity, heat, and
fuel is highlighted. Biogas flares are used for safety and environmental reasons, and
some critical parameters for flare design and its operation and maintenance will be
discussed.
5.1 Biogas properties
The energy content of biogas from AD is chemically bounded in methane. The
composition and properties of biogas vary to some degree depending on feedstock
types, biogas technology, digestion systems, temperature, retention time, etc. (Seadi et
al. 2008). Biogas mainly consists of combustible CH4 and non-combustible CO2, H2O,
and traces of NH3, H2S, and other trace gases. The CH4 content makes it suitable for
various energy uses. Table 6 in Chapter 3 shows potential methane yields for different
feedstocks, and its yield from other feedstocks can be found in a previous study (Seadi
et al. 2008). Some impurities such as H2S and NH3 need to be reduced to allowable
levels. Typical H2S levels allowed for combustion engines or generators and natural
gas upgrading are < 200 ppm and <10 ppm, respectively. Unfortunately, H2S content
in biogas is usually at concentrations between 10 – 10,000 ppm depending on the
feedstocks (Allegue and Hinge 2014). For instance, H2S content from organic waste
varies from 10 to 2,000 ppm, whereas its value is relatively low for biogas from sewage
sources (Rasi et al. 2007). In Cambodia, biogas production from piggery farms contains
H2S around 2,000 – 3,000 ppm (Lyhour, 2020). This H2S is harmful to humans and the
environment and corrodes equipment such as biogas storage tanks and containers,
pipelines, compressors, engines, etc. H2S can be oxidized to sulfur dioxide (SO2)
combustion. SO2 in high concentrations affects breathing and may aggravate existing
respiratory and cardiovascular diseases. SO2 is also a primary contributor to sulfuric
acid (H2SO4), which is high toxicity at low concentrations and leads to corrosion in
appliances.
Furthermore, a high concentration of H2S in biogas is undesirable because
releasing this gas during biogas collection may lead to pulmonary edema for humans.
It has been stated that the concentration of H2S between 500 – 1,000 ppm possibly

64
affects with rapid loss of consciousness and death, and its content of more than 1,000
ppm causes instantaneous human death on first breath (Doujaiji and Al-Tawfiq 2010)
(Sawalha et al. 2020). Therefore, it is recommended to remove or reduce its content
directly in the digester during the AD process or treat the raw biogas before utilization
or upgrading. In the digester, H2S separation can be carried out by adding oxygen in
the digester to induce biological desulphurization (microorganisms consuming oxygen)
and convert H2S to elementary sulfur. Other options are also possible to separate H2S,
e.g., by adding iron salts into the substrate. However, the pre-treatment process is the
most commonly used method.
5.2 Biogas pre-treatment
Biogas pre-treatment is a process to remove H2S, NH3, siloxanes, and other
unwanted constituents. The technologies used to remove H2S can be divided into
physical, chemical, and biological methods (Wellinger et al. 2013). The physical-
chemical desulphurization method typically involves technologies that employ physical
or chemical phenomena in preventing or limiting the formation of H2S during the
anaerobic digestion process (Okoro and Sun 2019). This method typically uses
adsorption like activated carbon (Sawalha et al. 2020), iron oxides, zinc oxides (ZnO),
absorption/scrubbing, biotechnological (air/oxygen injection into the digester).
Additionally, the combination of two or more processes can achieve high efficiency of
H2S removal. The combined physical-chemical and biotechnological by using chemical
absorption with iron salts and the microbial regeneration of the solution has been
developed and described in the literature (Allegue and Hinge 2014).
5.2.1 Iron oxide pellets
Reaction with iron oxide or ferrous oxide (Fe2O3), usually absorbed in pellets
or other carrier materials, is a type of chemical treatment method which is low cost and
gives high efficiency of H2S removal. The iron oxide reacts with the H2S to produce
iron sulfide, in which the S element remains on the surface covers the active iron oxide
surface. The iron oxide pellets, or wood chips impregnated with iron oxide, known as
iron sponge, are the most recognized adsorbent in the industry with potential H2S
reductions > 99.9%. This adsorbent can operate in conjunction with a small airflow into
the system and the biogas input to promote continuous regeneration. The H2S removal
rate is up to 2.5 kg/kg Fe2O3 for continuously regenerated systems with <1% oxygen
input (Axelsson et al. 2012). The proprietary iron oxide-based scrubbing systems can

65
remove up to 2000 ppm of H2S at 40 ℃, with a biogas flow rate of 1,000 Nm3/h in a
full-scale AD system, resulting in 2 Nm3 of H2S removed per hour (2.9 kg H2S/h). The
biogas should not be too dry because the reaction needs water. It should avoid
condensation because the iron oxide material can stick with water, reducing the reactive
surface (Choudhury et al. 2019).
5.2.2 Case study of biogas pre-treatment system in M’s pig farm in Cambodia
The electricity generation from biogas at M’s pig farm has been up and running in
the farm; however, the corrosion from H2S led to rapid deterioration of the generator
engines, increased maintenance costs, and short lifespan of the generators. A biogas
pre-treatment system was purchased from CAMDA (China Agricultural Machinery
Distribution Association), China, installed in December 2019. It consists of four
desulfurized tanks (22 parallel tanks connected in series), a blower, a moisture
separator, and an electrical panel (Figure 7). First, biogas enters two desulfurized tanks,
passes the blower to stabilize the pressure, and maintains a constant biogas flow. Then
it passes through the second set of desulphurization tanks and finally via a moisture
separator to remove moisture and dust with a cyclone. According to CAMDA’s
technical standard, its biogas treatment capacity is 250 Nm3/h with an H2S content of
2000 ppm. The pressure at the outlet can be set between 4 – 40 kPa. Ferrous oxide pellet
adsorbent was used to remove H2S from raw biogas. Each tank is filled with 600 kg of
pellets and changed every 720 working hours. The efficiency of H2S reduction is up to
97.3% (Table 10).
Figure 7 Biogas pre-treatment unit at M’s Pig farm.

66
Table 10 Biogas quality before and after pre-treatment with ferrous pellets.
Biogas composition Before pre-treatment After pre-treatment
CH4 (%) 66 68.1
CO2 (%) 28.4 29.1
O2 (%) 0.8 0.3
H2S (ppm) 2,266 59
Balance (%) 4.9 2.5
5.3 Biogas Utilization
AD systems produce raw biogas and by-products (liquid digestate). Biogas is a
methane-rich gas that can produce energy when combusted. The energy content of the
gas is mainly based on its methane content. A certain carbon dioxide and water vapor
content are unavoidable, and H2S content must be minimized. The impurities can affect
the equipment for biogas utilization by causing problems such as corrosion and
mechanical wear and lead to unwanted emissions when the biogas is combusted. There
are different aspects of quality demands for biogas utilization. Biogas, therefore, may
need to be cleaned or processed before end-use as combined heat and power (CHP) or
biomethane.
For instance, biogas can be converted to electricity using an electrical generator.
In contrast, biogas upgrading produces biomethane as fuel for combustion engines or
compression natural gas (CNG) in gas cylinders or pipes for household or filling
stations (Holm-Nielsen et al. 2009). Figure 8 illustrates the schematic of biogas
production and utilization.
Figure 8 Schematic overview on biogas production and use technologies at industrial
scale: (1) Different feedstocks, (2) safety equipment, (3) anaerobic digester, (4) gas
storage, (5) sanitation, (6) gas cleaning system for desulfurization, (7) combined heat and
power unit (CHP), (8) gas treatment system for biogas upgrading (fuel and CNG), (9)
Digestate storage, and (10) digestate upgrading (optional).

67
5.3.1 Electricity production
Biogas can be converted directly into electricity by using gas turbines, fuel cells,
or electric generators. Besides using biogas in conventional reciprocating internal
combustion engines, it can also be used in gas turbines. The biogas is mixed with air
and pressed into a combustion chamber at high pressure in a gas turbine. The air-biogas
mixture is burned, causing a temperature increase, and the hot gases are released
through a turbine connected to the electricity generator. However, this technique
typically has a capacity to energy below 200 kW, and the cost of micro-turbine is
relatively high.
Another option for converting biogas to electricity is using fuel cells. Fuel cells
are electrochemical devices converting chemical energy directly into electrical energy.
The fuel cell structure consists of a porous anode and cathode and an electrolyte layer
in contact between them. When biogas is fed to continue to the anode, and oxygen is
fed to the cathode, an electrochemical reaction occurs at the electrodes, producing an
electric current. The conversion efficiency depends on the selection of electrolyte
membrane (Seadi et al. 2008). However, the fuel cell process is expensive and requires
very clean gas. On the contrary, converting biogas to electric power by a generator set
is more practical since the raw biogas does not need to be just as clean. It is important
to note that selecting generator capacity for a biogas plant can give high electricity
conversion efficiency and minimize the equipment and operation cost. Generator
efficiency is a function of scale and loading rate.

68
A case study of electric production at M’s Pig farm: Four simple covered lagoon
(76,000 m3), located at Keo Pos, Steung Hav, Preah Sihanouk, with a total pig of 41,100
heads indicated that the biogas production is 4,860 Nm3/d, and it requires two
generators with each sized 800 kVA to generate the electricity. Due to the conversion
loss, 1 m3 biogas can convert to approximately 1.7 kWh of energy. The total electricity
production covers about 80% of the annual farm electricity demand
5.3.2 Combined heat and Power
The combined heat and power (CHP) generation is a standard utilization of biogas
from AD, which is a very efficient method for producing electricity and heat from a
renewable energy source. An engine-based CHP power plant can efficiently up to 90%,
producing up to 35% electricity and 65% heat. In this case, the Gas-Otto engine is a
part of electricity generators specifically used for biogas (minimum 45% CH4)
operating with air surplus to minimize carbon mono oxide (CO) emission. It leads to
lower gas consumption and reduced motor performance using an exhaust turbocharger
(Seadi et al. 2008). The produced electricity from biogas as energy for electrical
equipment in the farm or industry, and the excess electricity can sell to the grid.
5.3.3 Heat Utilization
Besides the CHP process, heat can be produced by burning biogas in boilers
either on-site or transported by pipeline to the end-users. Biogas does not need any
upgrading, and the contamination level does not restrict the gas utilization as much as
in other applications. Biogas generally does need particulate removal, compression,
cooling, and drying. However, many biogas plants have been established exclusively
for electricity production, without consideration for using the produced heat. An
important issue for the energy and economic efficiency of a biogas plant is utilizing the
produced heat. Therefore, newly established biogas plants should include heat
utilization in the overall plant design (Seadi et al. 2008). Usually, a part of the heat is
used to heat the digesters (process heating). The rest can be used for external needs such
as industrial processes and agricultural activities (drying crops). Heat is also used in
power heat cooling coupling by converting input energy into cooling through
absorption.
A case study on biogas heat utilization in Cambodia: A local heat demand in
Cambodia is given at facilities for food processing and industrial companies. Coal is
used in boilers for producing steam or hot water. The retail coal price in Cambodia is
about 0.37 US$/kg, which is equal to a price of 0.046 US$/kWh. Heat supply from

69
biogas plants with a capacity of 100 Nm3/h and 10 Nm3/h cost 0.03 and 0.05 US$/kWh,
respectively. On the other hand, biogas use for heat supply and transport in biogas
pipelines (< 5 km by distance) costs 0.047 US$/kWh (Scholwin and Hofmann 2019).
Based on the economic evaluation, heat supply (nearby or transport in biogas pipeline)
for industrial purposes from large scale biogas plants can be an alternative utilization
pathway.
5.3.4 Biomethane production and CNG
Biogas utilization as a substitute for natural gas has gained importance due to
the depletion and low quality of natural gas resources (Ullah Khan et al. 2017). CH4
can make clean fuel, but CO2, a non-combustible part of the biogas, leads to a lower
calorific value. For example, 55% CH4 has a calorific value of 19.7 MJ/Nm3, while
pure CH4 has 35.8 MJ/Nm3 (Abderezzak et al. 2012). Therefore, biogas cleaning and
upgrading are necessary to increase the gas's calorific value and reduce the
contamination of technically or environmentally hazardous components. Some
impurities, e.g., H2S, are harmful to the upgrading process and must be removed
(Wellinger et al. 2013). Impurities are removed in the upgrading step to obtain the
composition requirements, as stated in Table 11, but depending on which upgrading
technology is used. The equipment for biogas upgrading to natural gas quality needs
additional investment. Biogas upgrading technologies such as pressure swing
adsorption (PSA), high pressure water scrubbing (HPWS), organic physical scrubbing
(OPS), chemical scrubbing process (CSP), membrane separation, and cryogenic
separation have been used. The selection of an efficient method for upgrading biogas is
critical to be of equal quality as natural gas and to minimize the production cost and
GHG emissions. Ullah Khan et al. (2017) studied different technologies of biomethane
production and their advantages and disadvantages in terms of the technical features of
upgrading technologies, various specific requirements for biogas utilization, and the
appropriate investment and operating and maintenance costs. In general, membrane
separation technology has better performance in terms of economic and environmental
aspects in comparison to traditional separation processes. The future membrane
material development could bring down biomethane production costs.
On the other hand, the capital and operating costs of biogas upgrading
technologies largely depend on the selected process, quality of raw biogas, desired
product quality, and more importantly, the capacity of the plant, e.g., the bigger the
capacity, the higher the specific investment cost (Bauer et al. 2013). Biomethane

70
production has developed mainly in countries with a strong economy in general and
with high goals regarding greening the economy and cases where a specific biogas
capacity (mostly above 500 m3/h biogas) can be realized at a production site (Backman
and Rogulska 2016).
Biomethane can be compressed to form CNG (Compressed natural gas) and
used as fuel to power motor vehicles. The costs mainly depend on the volume rate, in
which 500 Nm3/h is considered the lowest economic scale. A recent study by FvB
(2018) showed that CNG from biomethane is unsuitable for Cambodia due to biogas
capacity and lack of filling stations. Moreover, LPG price is lower than CNG from
biogas upgrading, e.g., LPG price is 0.58 US/kg (equaling to 0.045 US/kWh), whereas
CNG is 0.053 US/kWh and 0.089 US/kWh for 100 Nm3/h and 10 Nm3/h of biogas
production.
Table 11 The compositions of biogas versus biomethane.
Biogas composition Biogas Biomethane
CH4 (%) 50 – 70 > 97
CO2 (%) 30 – 45 < 3
H2S (ppm) < 6,000 < 5
5.4 Flaring
Biogas flares are used to safely burn biogas surplus to the demand of the biogas
utilization system or where biogas consumption is interrupted. They may also provide
the only means of safely disposing of biogas produced by anaerobic bioprocesses where
the economics of energy recovery have proved unfeasible (Caine 2000; Seadi et al.
2008). There is a risk for fire or explosion when methane concentration is in the range
of 5 – 15% in the air. Flaring of biogas is the oxidation of methane in an open flame,
resulting in the emission of carbon dioxide rather than methane, which has a global
warming potential of more than 25 times CO2. Complete combustion of one mole of
methane requires two moles of oxygen (Equation 5). However, in the air, 5.8 volume
of air containing 21% v/v to complete combustion of 1 volume of biogas containing
60% v/v methane. In theory, providing excess air (10 Vair to 1 VCH4) achieves the
combustion and cools the flame. The design of biogas flare is based on the biogas
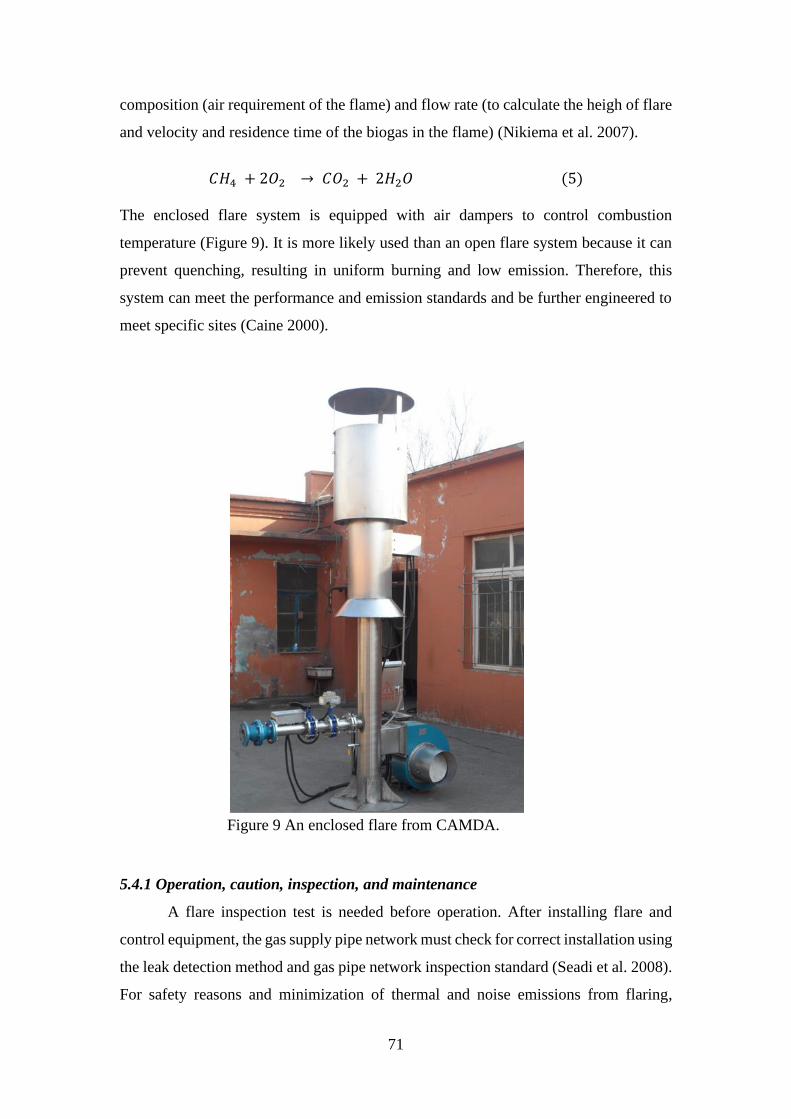
71
composition (air requirement of the flame) and flow rate (to calculate the heigh of flare
and velocity and residence time of the biogas in the flame) (Nikiema et al. 2007).
𝐶𝐻4 + 2𝑂2 → 𝐶𝑂2 + 2𝐻2𝑂 (5)
The enclosed flare system is equipped with air dampers to control combustion
temperature (Figure 9). It is more likely used than an open flare system because it can
prevent quenching, resulting in uniform burning and low emission. Therefore, this
system can meet the performance and emission standards and be further engineered to
meet specific sites (Caine 2000).
5.4.1 Operation, caution, inspection, and maintenance
A flare inspection test is needed before operation. After installing flare and
control equipment, the gas supply pipe network must check for correct installation using
the leak detection method and gas pipe network inspection standard (Seadi et al. 2008).
For safety reasons and minimization of thermal and noise emissions from flaring,
Figure 9 An enclosed flare from CAMDA.

72
installing a flare tower should be installed at a safety distance of at least 20 meters. The
flare, including the heated kinetic energy equipment, should be installed in ventilated
and away from flammable and explosive objects. The methane content of biogas should
be regularly tested. The equipment cannot be turned on when methane content is less
than 35%.
The electric valve of the flare (flow control valve) is a key component for
supplying and cutting off the gas. Therefore, the electric valve should regularly be
inspected and maintenance no longer than three months. Leakage of the electric valve
can cause accidents, and its damage or blockage results in fuel not being supplied to the
burner.
References
Abderezzak B, Khelidj B, Kellaci A, Abbes MT (2012) The Smart Use of Biogas:
Decision Support Tool. AASRI Procedia 2:156–162.
Allegue LB, Hinge J (2014) Biogas upgrading Evaluation of methods for H2S removal.
Danish Technol Inst 31.
Axelsson L, Franzén M, Ostwald M, et al (2012) Perspective: Jatropha cultivation in
southern India: Assessing farmers’ experiences. Biofuels, Bioprod Biorefining
6:246–256.
Backman M, Rogulska M (2016) Biomethane use in Sweden. Arch Motoryz 71:7–19.
Bauer AS, Singh AK, Amanatullah D, et al (2013) Free Vascularized Fibular Transfer
With Langenskiöld Procedure for the Treatment of Congenital Pseudarthrosis of
the Forearm.
Caine M (2000) Biogas Flares: State of the Art and Market Review.
Choudhury A, Shelford T, Felton G, et al (2019) Evaluation of hydrogen sulfide
scrubbing systems for anaerobic digesters on two U.S. Dairy farms.
Doujaiji B, Al-Tawfiq JA (2010) Hydrogen sulfide exposure in an adult male. Ann
Saudi Med 30:76–80.
Holm-Nielsen JB, Al Seadi T, Oleskowicz-Popiel P (2009) The future of anaerobic
digestion and biogas utilization. Bioresour Technol 100:5478–5484.
Nikiema J, Brrzezinski R, Heitz M (2007) Elimination of methane generated from
landfills by biofiltration : a review. Rev Environ Sci Bio/Technology 6:261–284.
Okoro OV, Sun Z (2019) Desulphurisation of biogas: A systematic qualitative and
economic-based quantitative review of alternative strategies. ChemEngineering

73
3:1–29.
Rasi S, Veijanen A, Rintala J (2007) Trace compounds of biogas from different biogas
production plants. Energy 32:1375–1380.
Sawalha H, Maghalseh M, Qutaina J, et al (2020) Removal of hydrogen sulfide from
biogas using activated carbon synthesized from different locally available biomass
wastes - a case study from Palestine. Bioengineered 11:607–618.
Scholwin F, Hofmann F (2019) Provision of services: Analysis of alternative uses for
biogas in Cambodia. Phnom Penh
Seadi T Al, Rutz D, Prassl H, et al (2008) Biogas Handbook. University of Southern
Denmark, Esbjerg, Denmark
Ullah Khan I, Hafiz Dzarfan Othman M, Hashim H, et al (2017) Biogas as a renewable
energy fuel – A review of biogas upgrading, utilisation and storage. Energy
Convers Manag 150:277–294.
Wellinger A, Murphy J, Baxter D (2013) Biogas utilisation: international experience
and best practice. In: Wellinger A, Murphy J, Baxter D (eds) The biogas
handbook: Science, production and applications. Woodhead Publishing,
Cambridge, UK, pp 327–460

74
CHAPTER 6 UTILIZATION OF DIGESTATE
Digestate properties (the nutrient quantity) and quality of digestate and quality
management will be discussed in this chapter. Also, digestate upgrading and advantages
of this technology are reviewed. The standardization of digestate is given, and the
utilization of digestate as organic fertilizer in Cambodia is highlighted.
6.1 Digestate properties
Digestate, a by-product of AD, consists of a solid and a liquid fraction and can
be used as fertilizer on the fields to improve plant nutrients utilization, reduce mineral
fertilizer consumption, and reduce water pollution. Recycling digestate to land is the
best practicable environmental option in most circumstances, completing natural
nutrient cycles. Digestate is a valuable source of significant plant nutrients. The
nutrients such as N, P (refer to P2O5), K (refer to K2O), S (refer to SO3), and other
elements present in the biogas feedstock will remain in the process and be available in
the digestate. These nutrients are essential for plant growth and sustainable crop
production (Chambers and Taylor 2013). The nutrients compositions of digestate
remain the same as feedstocks, but they have better-fertilizing quality because the
organic molecules are digested, and part of the nutrients are mineralized.
6.2 Digestate quality and management
The amount of nutrients in the digestate is much dependent on feedstocks, and
therefore the quality of fertilizer differs. High-quality digestate fits for use as fertilizer
is defined by essential features such as declared content of nutrients, pH, dry matter and
organic dry matter content, homogeneity, purity (free of inorganic impurities such as
plastic, stones, glass, etc.), sanitized and safe for living organisms and the environment
with respect to its content of biological (pathogenic) material and of chemical pollutants
(organic and inorganic) (Seadi et al. 2012). The digestate can be recycled as excellent
fertilizer but is limited by insufficient confidence in its quality, impacting food safety,
health, and the environment. Inappropriate handling, storage, and application of
digestate as fertilizer can cause ammonia emissions, nitrate leaching, and overloading
of phosphorus. Periodical sampling and analyzing the nutrients content must be done
before integrating on the field to ensure that the standardization of digestate can be met.
Therefore, the application of digestate as fertilizer must be made on the basis of
digestate quality control and management (Holm-Nielsen et al. 2009).

75
The quality management of digestate guarantees that digestate is safe for use
and contributes to the perception of digestate as a safe and healthy product. The ultimate
aim is to enhance digestate utilization as fertilizer and provide incentives for further
developing biogas technologies, which are environmentally sound and veterinary safe
treatment options for animal manures and suitable organic wastes (Seadi et al. 2012).
Quality requirements necessarily imply adopting a unified approach and a system of
quality parameters to measure and guarantee quality. Digestate quality management is
implemented through various means: standards of digestate quality, digestate
certification systems, nutrient regulations, and legislative frameworks, and most
important, through ongoing quality control practices along the whole digestate
production cycle. The production and recycling of digestate as fertilizer requires quality
management and quality control throughout the entire closed process of AD, from the
output of the AD feedstocks until the final utilization of digestate as fertilizer (Figure
10).
The increasingly strict environmental legislation introduced in most countries
aims to address pollution of all kinds and losses of biodiversity and minimize any
current and future hazards for living organisms. Legal frameworks and quality
standards for digestate used as fertilizer provide confidence in digestate quality and
safety and contribute to a sound and stable market for digestate. Such regulations,
introduced by an increasing number of countries, include standards of digestate quality,
digestate certification schemes, guidelines for recommended practices for digestate
utilization, and positive lists of materials suitable for use as AD feedstock. The rigorous
selection and strict quality control of the materials used as feedstock for AD is the first
and most crucial step of digestate quality management, ensuring maximum ecological
and economic benefits from digestate as a fertilizer (Mucha et al. 2019). The unsuitable
waste categories containing heavy metals, persistent organic compounds, pathogen
contamination, and other potential hazards cannot degrade during the digestion process.
It is needed to remove those unwanted compounds (AD feedstocks treatment) and treat
the digestate (Holm-Nielsen et al. 2009). The main aspects of quality management of
AD residues (digestates) such as chemical, biological and physical impurities are listed
in the literature (Seadi et al. 2012).

76
Good practice in digestate quality management improves overall confidence in
digestate and veterinary safety, prevents health and environmental hazards, positively
affects food safety and better market conditions for high-quality digestate, and creates
incentives for AD development. The displacement of mineral fertilizers by organic
fertilizer lowers the negative impact on the environment (breaking the chain of
pathogen transmission). It increases the recycling of organic matter, nutrients, and
conservation of natural resources. In addition, it offers cost savings to farmers by
reducing purchases of mineral fertilizer but gives higher nutrient efficiency through
enhanced use of own resources (Seadi 2001).
6.3 Digestate preserving and characteristic condition
Unlike raw animal manure and other AD feedstock, sanitized digestate poses
minimal risk of pathogen transfer through handling and application. It is essential to
avoid recontamination from raw manure and slurries, re-growth of bacteria in biowaste
Figure 10 Schematic representation of the closed cycle of anaerobic digestion
of biogenic waste, AD, and quality management of digestate.

77
after pasteurization and digestion, and other un-sanitized materials and sources (Bagge
et al. 2005). Precautions must be taken at the biogas plant and other digestate storage
areas to preserve the high quality of digestate until its final utilization as fertilizer. The
proper storage, handling, and application of digestate preserve its value and qualities as
fertilizer. It helps prevent losses of ammonia and methane to the atmosphere, nutrient
leakage, runoff, and emissions of unpleasant odors. Digestate can be stored at the biogas
plant, or even better, at a convenient location close to the fields where it will be applied
as fertilizer. Independent of site, digestate stores are usually above-ground storage
tanks. Lagoons and storage bags can also be used. In all cases, it is imperative to cover
the storage facilities as this prevents nutrient losses and pollution through ammonia
emissions and from residual methane production and digestate dilution by rainwater
(Mucha et al. 2019).
Before digestate is used as a fertilizer, its composition should be analyzed and
declared according to best farming practices. It also applies to digestate produced and
used on a single farm. Declaration of macro-and micro-nutrients and dry matter content
is part of the quality assurance schemes for digestate in many countries (Seadi et al.
2012). Usually, large-scale biogas plants install a small laboratory on-site for measuring
the dry matter content, the dry organic matter, and the pH of samples from all loads of
digestate. Accredited laboratories can analyze more complex nutrient content. Specific
protocols should stipulate the frequency and the procedure for sampling and analysis to
avoid uncertainty.
Digestate can be used as fertilizer without further treatment after its removal
from the digester and after the necessary cooling. When used as fertilizer, digestate is
transported away from the biogas plant, through pipelines or with special vacuum
tankers, and temporarily stored in storage tanks placed, e.g., out in the fields, where the
digestate is applied. The total capacity of these facilities must be enough to keep the
production of digestate for several months. In many European countries, agricultural
legislation requires six to nine months storage capacity for animal manure, slurry, and
digestate to ensure their optimal and efficient utilization as fertilizer (Seadi et al. 2008).
6.4 Digestate treatment and upgrading
The carbon content in the digestate is significantly reduced during AD since the
organic matter is transformed into CH4 and CO2. A part of organically bound nitrogen
is mineralized, and ammonia in the digestate is higher than other organic fertilizers.

78
Storage can cause a decrease in the total solids, chemical oxygen demand, and alkalinity
of the digestate (Laureni et al. 2013). An excess of nutrients present in the digestate can
cause environmental problems. As digestate usually has low dry matter content, its
storage, transport, and application are expensive. It makes digestate processing and
volume reduction an attractive option. Thus, the digestate needs to be processed to
manage its volume (Möller and Müller 2012).
Digestate processing can involve many different treatments and technologies
depending on local needs, for instance, enhancing the quality and marketability of the
digestate, producing standardized fertilizers, or removing nutrients and organic matter
from the effluent (Figure 11). Treatment technologies include physical (e.g., solid-
liquid separation), chemical (e.g., flocculation, precipitation), and biological (e.g.,
composting) approaches. Digestate processing can be partial or complete by separating
the digestate into solid fibers, fertilizer concentrates, and pure water (Seadi et al. 2012).
The first step of each digestate treatment procedure is the physical solid-liquid
separation. This partial processing uses relatively simple and cheap technologies, e.g.,
screw-press separators or decanter centrifuges, to obtain high DM (20–25%) solid
manure and low DM (5–7%) liquid manure. The composition of separated solid
digestates dramatically varies, as stated in a previous study (Möller and Müller 2012).
Decanter centrifuges separate most phosphorus in the digestate into the fiber fraction
(Seadi et al. 2008). The Phosphorus separation improves the management of
macronutrients because it enables the separate application of phosphorus and nitrogen.
Removal of particulate nitrogen can be performed by solid-liquid separation, while
ammonia removal can be achieved through chemical/physical and biological processes
(Mucha et al. 2019).

79
The solid fraction can be applied directly as fertilizer in agriculture or dried for
intermediate storage for enhanced transportability. The solid fraction can also sell as a
phosphorus-rich fertilizer without any further treatment. The liquid fraction, containing
the main part of N and K, can be applied as liquid fertilizer. Additional treatments, such
as drying solid digestate or water removal from liquid manure by membrane
technologies to produce concentrates, are not widespread (Möller and Müller 2012).
6.5 Standardization and regulation of digestate
The use of digestate in agriculture as fertilizer or the land application as a soil
conditioner has important advantages, such as reducing dependence on chemical
fertilizers and peat and closing the cycle of nutrients. Good management in the end
destination of digestate will reduce the climate change impact of the waste. However,
some health and environmental concerns over the amount and composition of digestate
to the selected end destination have been identified (Theng et al. 2014). The use of
quality standards for organic materials in agricultural land must follow the regulation
to prevent any potential negative effects on soil, vegetation, and animal and human
health. Although the strategic framework and the policy on biodigester development in
Cambodia have been set to promote and support waste to energy through digester
Figure 11 Digestate processing, treatment, and applications
(Möller and Müller 2012).

80
technology, yet the standardization (quality and utilization) and regulation system on
by-products (digestates) from biodigester remain unclear. In addition, lacking the
equipment required to conduct chemical testing to ensure the rigorous quality control
of fertilizers is another factor that affects fertilizer management and usage. The limited
inspection and certification capacity of the Department of Agricultural Legislation
(DAL) and MAFF inspectors is a problem that needs to be urgently addressed to control
the quality of fertilizer and its market. Therefore, digestate management and utilization
need to be included in the digester framework and policy.
Lesson learned from Europe: In 2002, the regulation for animal by-products
treatment, including the requirements for their safe application to land, was introduced,
following the European outbreaks of Bovine Spongiform Encephalopathy (BSE). The
Regulation 1774/2002, known as the Animal By-Products (ABP) Regulation and
superseded by the current Council Regulation 1069/2009, stipulates the categories of
animal by-products and the condition in which these can be used as feedstock for AD
(Seadi et al. 2012). When the digestate is used as fertilizer, the regulation of this end
destination has three approaches. One describes the requirements for waste to become
a product according to a waste law or environmental regulation. Another approach is
based on the evaluation of digestate and end destination, taking into account the
characteristics of the soil and application rate, among other parameters, according to
recognized protocols and standards. Finally, the use in agriculture requires previous
registration as a fertilizer according to fertilizer regulation. The animal by-products
regulation also applies as a guideline to the digestate production and end destination
because these are potential feedstocks and influence digestate composition Mucha et al.
(2019).
One of the critical aspects regarding recycling digestate is the load of nutrients
on farmland. Nitrate leaching or phosphorus overloading can occur due to inappropriate
handling, storage, and application of digestate as fertilizer. In Europe, the Nitrate
Directive (91/676/EEC) restricts nitrogen input on farmland to protect the ground and
surface water from nitrate pollution and allows a maximum of 170 kg N/ha/year.
Nutrient loading on farmland is regulated by national legislation in most European
countries (Seadi et al. 2008).

81
6.6 Utilization of digestate as organic fertilizer
Organic fertilizer is a component of sustainable agriculture apart from soil
mineral provision, which contributes to soil quality by improving soil structure,
chemistry, and biological level. The utilization of digestate as organic fertilizers can
improve soil fertility and produce healthy crops with high yields. It helps to enhance
and shape the overall health of agricultural soils (Jaja and Barber 2017). Organic matter
from digestates improves soil aeration and water infiltration, and it also enhances both
the water and nutrient holding capacity of soils. It also increases water retention by the
soil and is essential in maintaining soil tilth. Organic fertilizers are responsible for the
formation of soil aggregates which are very necessary for maintaining soil fertility. It
is needed for plant growth not only crops grown that year but will continue to influence
crops in the succeeding years because decomposition of the organic matter is not
completed with one year. The utilization of organic fertilizers provides growth-
regulating substances and improves soil's physical, chemical, and microbial properties
(Jaja and Barber 2017).
However, the application of organic fertilizer must be based on a proper
fertilizer plan to get more benefits in terms of high crop yields, higher cost-
effectiveness, and environmental aspects. The fertilizer plan is elaborated for each
agricultural field, according to the type of crop, the planned crop yield, the anticipated
utilization percentage of nutrients in digestate, the type of soil (texture, structure,
quality, pH), the existing reserve of macro and micronutrients in the soil, the pre-crop
and the irrigation conditions and the geographic area. Experience from Europe indicates
that the most economical and environmentally friendly strategy of applying digestate
as fertilizer is by fulfilling the phosphorus requirement of the crops with phosphorus
from digestate. Application of digestate to fulfill the phosphorus requirement also
implies a partial fulfillment of the nitrogen requirement of the crops. The remaining
nitrogen requirement can be completed by applying mineral fertilizer (Seadi et al.
2008). However, the specific content of those organic fertilizers highly depends on the
soil nutrient in different locations and countries. Soil nutrients in other areas and
nutrients requirements for agriculture in Cambodia are discussed in section 6.7.1.
Besides the requirements of nutrients for specific soil and crop types, for
optimum utilization of digestate as organic fertilizers, good agriculture practice
guidelines are required. Storage capacity for digestate should be a minimum of 6

82
months, and application techniques minimize N loss. For example, optimum weather
conditions for applications of digestate are rainy, high humidity, and no wind.
Application as top fertilizer on crops in rich vegetation offers little concern about the
loss of N. In the case of the application on the surface of the soil, the fertilizer
immediately incorporates in soil or directly inject in the soil after dragging from storage
tank or pipes (Seadi et al. 2008).
Like any other fertilizer, digestate must be applied during the growing season
to ensure the optimum uptake of the plant nutrients and avoid groundwater pollution.
Digestate must be integrated into the fertilization plan of the farm in the same way as
mineral fertilizers. It must be applied at accurate rates, with equipment that ensures
even application throughout the whole fertilized area. The suitable application methods
are the same as those used for applying raw, untreated slurry, except for splash plate
spreading, which causes pollution and losses of valuable nutrients. Because of the
significant pollution caused by splash plate spreading, this method is banned in
countries with modern agriculture and environmental protection legislation. The
equipment used for applying digestate should minimize the surface area exposed to air
and ensure rapid incorporation of digestate into the soil. For these reasons, digestate is
best applied with trailing hoses, trailing shoes, or by direct injection into the topsoil.
These methods of application minimize ammonia volatilization (Lukehurst et al. 2010).
6.7 Application of fertilizer and potential use of organic fertilizer in Cambodia
The agricultural sector remains a crucial part of economic growth and poverty
reduction in Cambodia. Crops contribute largely to farm growth and promote food
security. Increasing crop production through the expansion of cultivation areas is not
feasible because of population growth. Therefore, future increases in agricultural
productivity are expected to come mainly from agricultural intensification, and
fertilizer will play a vital role in raising crop yields and sustaining the natural resources
of farming land (Theng et al. 2014). The fertilizer industry in Cambodia has evolved
rapidly into farm demand, and the overwhelming majority of rice and vegetable farmers
use fertilizers. It indicates a positive development of the fertilizer industry and the
adoption of fertilizer use in the country. The key constraints affecting fertilizer demand
and supplying should be addressed for strengthening trade competition and widening
market operations, which, in turn, would bring down prices and increase the quality of
products delivered to farmers.

83
Since 2013, Cambodia has had a chemical fertilizer blending plant in Kandal
province. It is a joint venture between Vietnam’s Five Star International Ground and
Cambodia's Investment and Development Company. This plant is not yet operating at
full capacity; therefore, fertilizers are still imported from Vietnam and Thailand, the
European Union, or the United States. The supply of fertilizers has increased rapidly in
response to agricultural intensification. Among the suppliers, 11 companies import
organic fertilizers. Organic fertilizers often cost significantly more than inorganic
fertilizers, but the benefits may outweigh these extra costs over time. Organic fertilizers
continue to improve the soil long after the plants have taken the nutrients they need.
Therefore, the longer the soil is fed with organic fertilizers, the better its composition
and texture. On the contrary, while inorganic fertilizer is cheaper in the short term, it
adds less to the soil in a long time.
Furthermore, there is a high potential for producing organic fertilizer from
commercial biogas plants in Cambodia. Based on BTIC’s study, each ton of digestate
from liquid pig manure of 4% TS contains 6.7 kg N, 2.8 kg P2O5, and 1.9 kg K2O. As
more farm owners and project developers show their interest in biogas plant investment,
the enhancement of utilization of organic fertilizer produced through the digestate
process can be further studied and commercialized to be used across the country in the
future. The use of organic fertilizer will help make farming more economical by
reducing mineral fertilizer consumption, protecting the environment (lower GHG than
inorganic fertilizer), and improving the public image of the farming and fertilizer
industry in Cambodia. It will also benefit the farm owners, the communities, and the
country (Möller and Müller 2012).
6.7.1 Nutrient requirement for agriculture in Cambodia
Cambodia has abundant fertile agricultural land, accounting for about 4 million
ha in 2012, of which 3 million ha is under rice crop production. Wet season rice
occupies about 83 percent (2.5 million ha) of rice farming (MAFF 2013). Soils used for
rice production in Cambodia vary largely in their physical and chemical properties. In
most rainfed lowlands of Cambodia, soils used for rice cultivation are low in available
NPK and organic matter content. Rice is highly variable in its response to fertilizer
application, depending on soil type. Therefore, incorrect application of fertilizers may
lead to financial or crop losses and environmental damage. Careful consideration must
be given to several factors when the rate and timing of fertilizer are being decided.
Farmers implicitly consider some of these factors, such as risk associated with erratic

84
rainfall, when deciding on fertilizer use (Seng et al. 2001). Recommended fertilizer
rates (in kg ha-1) for rice vary for the different nutrients: 20 – 120 for N, 4 – 15 for P,
and 0 – 33 for K. For example, the NPK need for planting rice at Bakan, Siem Reap
province are 75 kg, 13 kg, and 25 kg/ha (Seng et al. 2001). Recommendations are made
for each soil type identified in the Cambodian agronomic soil classification system. The
economic profitability of fertilizer application in rice was stated by Theng et al. (2014).
References
Bagge E, Sahlström L, Albihn A (2005) The effect of hygienic treatment on the
microbial flora of biowaste at biogas plants. Water Res 39:4879–4886.
Chambers BJ, Taylor M (2013) Bioenergy Production by Anaerobic Digestion: Using
agricultural biomass and organic wastes. Taylor & Francis, New York
Holm-Nielsen JB, Al Seadi T, Oleskowicz-Popiel P (2009) The future of anaerobic
digestion and biogas utilization. Bioresour Technol 100:5478–5484.
Jaja ET, Barber LI (2017) Organic and Inorganic Fertilizers in Food Production System
in Nigeria. J Biol Agric Healthc 7:51–55.
Laureni M, Palatsi J, Llovera M, Bonmatí A (2013) Influence of pig slurry
characteristics on ammonia stripping efficiencies and quality of the recovered
ammonium-sulfate solution. J Chem Technol Biotechnol 88:1654–1662.
Lukehurst C, Frost P, Seadi T AL (2010) Utilisation of digestate from biogas plants as
biofertilser.
Möller K, Müller T (2012) Effects of anaerobic digestion on digestate nutrient
availability and crop growth: A review. Eng Life Sci 12:242–257.
Mucha AP, Dragisa S, Dror I, et al (2019) Re-use of digestate and reconvery techniques.
In: Fermoso FG, Hullebusch E van, Collins G, et al. (eds) Trace Elements in
Anaerobic Biotechnologies. IWA Publishing,
Seadi T Al (2001) Good Practice in Quality Management of AD residues from biogas
production.
Seadi T Al, Lukehurst C, Saedi T Al, et al (2012) Quality management of digestate
from biogas plants used as fertiliser. IEA Bioenergy 40.
Seadi T Al, Rutz D, Prassl H, et al (2008) Biogas Handbook. University of Southern
Denmark, Esbjerg, Denmark
Seng Y, Ros C, Beil RW, et al (2001) Nutrient Requirements of Rainfed Lowland Rice
in Cambodia. In: Fukai S, Basnayake J (eds) Increased Lowland Rice Production

85
in The Mekong Regiong. Vientiane, Laos, pp 169–178
Theng V, Khiev P, Phon D (2014) Development of the Fertiliser Industry in Cambodia:
Structure of the Market, Challenges in the Demand and Supply Sides, and the Way
Forward. CDRI Work Pap Ser 1–56.

86
CHAPTER 7 ECONOMIC ASPECTS
Like any industrial construction and investment, a biogas plant's economic
assessment and profitability analysis should be done before construction to ensure
economically. This chapter covers the general project development roadmaps on
economic performance and the main project costs (investment and operation costs). The
economic evaluation of typical economic and financial benefits, revenue, payback
period, internal rate of return (IRR), and net present value (NPV) are indicated.
7.1 Typical economic and financial benefits
Biogas plants can create economic opportunities in markets where energy costs
(electricity grid or diesel) and waste disposal costs are relatively high. The aim of
establishing a biogas plant can vary from environmental protection and waste reduction
to renewable energy production and can include financial and non-financial objectives.
It becomes economically interesting to divert the organic fraction from conventional
waste disposal towards AD, producing affordable renewable energy. Local farmers and
farmers' organizations, organic waste producers and collectors, municipalities, energy
producers, and other involved actors are the usual initiators of biogas projects. It is an
opportunity to drive biogas projects from the available substrates in animal farms or
agro-industry. However, the farm owners or project developers must control substrates'
quantities and compositions to ensure economical (Camirand 2019). It requires a proper
plan before starting the biogas project, as indicated in Chapter 4. Important key aspects
to be considered include (1) defining and evaluating a business plan and a financing
strategy and (2) involving financing companies or financial support from the
government in the early stages of the projects. These key aspects ensure the project's
long-term success when engaging banks or microfinance institutions for loans.
There are different successful models of setting up a biogas project, depending
on the feedstock's availability and the investors' financial capability. Seadi et al. (2008)
gave an example of a block diagram showing the main steps of a biogas project. A
technical assessment must be done to estimate the biogas production and electricity
generation so that revenues can be calculated based on the actual price from the
electricity grid or diesel. In addition, the financial assessment allows estimating the
payback period and IRR based on the principal investment cost (construction,
equipment, operation and maintenance, and others), operating costs, and revenues. For

87
example, if the IRR rate is higher than 15%, the premise is a good investment, and it is
worth continuing the project and moving to the next planning phase. In the next step, it
is essential to compare the assumptions with the material reality, which helps get a
realistic idea of the biogas plant, the needed space, the actual mass flows, and the total
building costs. Finally, the main investment cost and financial analysis will be
estimated (Camirand 2019).
7.2 Techno-economic assessment
The techno-economic analysis is the conceptual design of the processes
involved in biogas production and utilization, e.g., determination of the required
equipment and their sequences, and many other details about the process involved, as
shown in Figure 12. The economic assessment and profitability analysis will also be
applied (Tao et al. 2013).
The next step is the feasibility study which allows estimating the electricity
production in the farms based on the available substrates. The estimated revenue is
obtained by multiply the electricity production by the cost of the electricity grid per
kW. The total amount of effluent, e.g., total wastewater used, urine, and dung per day
in the farm, or only wastewater for organic waste from the agro-industry can be
calculated. The evaporation rate of wastewater is considered in calculating the final
wastewater, although the rate is low compared to the total water used. Considering the
technology selected (lagoon biogas, which is usually more economical), the pond sizes
for lagoon and digestate are calculated from the total wastewater per day and HRT
(section 4.3.1). The minimum HRT for a wet digester is 30 days; therefore, the
minimum lagoon size is at least 30 times the wastewater production per day. The
construction cost of the lagoon depends on the materials used (e.g., high density
polyethylene (HDPE) material) and types of lagoon technology. The improved lagoon
requires inner lining using the same materials as the lagoon cover; therefore, it will add
extra cost, while a simple covered lagoon can be constructed without inner lining.
However, the lifespan of an improved lagoon is at least 20 years, while it is between 5
– 10 years in the case of a simple covered lagoon, depending on the quality of land,
embankment, and compaction.

88
Table 12 indicates a technical assessment of pig farm A in Cambodia, which
BTIC biogas experts conducted. The electricity generation can meet 70% of the annual
energy demand for the evaporative cooling system or other equipment such as pumping,
lighting, and others on the farm. Based on the electricity production per day and grid
electricity price of 0.185 USD/kWh, the estimated annual revenue is approximately
42,000 USD. The minimum lagoon size is around 9,150 m3, and the cost assessment of
the lagoon is 79,000 USD which is based on the quotation from biogas suppliers (costs
of materials used) and the contractor (cost of construction).
Table 12 Estimation of electric production and lagoon size from the total wastewater in
farm A in Kampong Speu Province, Cambodia.
Source Unit Average
Water t/d 216
Figure 12 General procedure for techno-economic analysis.

89
Dung (fresh) t/d 10.8
Urine t/d 18.8
Evaporation t/d 4.5
Total wastewater t/d 240
DM content % 0.9
Total DM t/d 2.16
Biogas Nm3/d 713
Electricity production kWh/d 1069
Electricity demand kWh/d 1125
Lagoon size m3 9150
7.3 Financial analysis
The financial analysis is conducted to calculate the total budget for the biogas
project, payback period, and the investment's internal rate of return (IRR). The IRR is
the profitability of the potential investment. The payback period is when the biogas
project benefits based on the total investment cost and net cash flow. The net cash flow
is proportional to the total cash-in (revenue and residual equipment value) minus the
total cash-out (the investment on the equipment and O&M costs). The total budget
depends on the investment and operation costs, as indicated in Figure 13. The
investment cost on equipment, construction, and others must pay in the year of the
biogas investment. Operating expenses on staff salaries and maintenance (annually
charge 2 – 30%), etc., can be paid monthly, annually, and few yearly (depending on the
life span of equipment), respectively. However, all items in the lists might not be
applied to all farms in Cambodia. The farm owners or project developers should consult
with a biogas expert and an experienced biogas company to conduct financial feasibility
and calculate financial investment (Karellas et al. 2010). In addition, the concrete
financial situation, such as evaluating a business plan, a financing strategy, and the
advantages and risks of the investment, must be considered. The farm owners should
seek financial or non-financial incentives for establishing the biogas plant. In case that
they cannot self-finance, banks or external financers must be involved. However, there
are no financial institutions that finance biogas projects in Cambodia. There is still an
ongoing discussion between BTIC, NBP, and stakeholders to provide the market size of the

90
commercial biogas in Cambodia to attract banks and microfinance institutions in
developing loans for biogas projects. For example, investors should give information on
the project features (potential of biogas production and profitability) or business plans of
commercial biogas plants to ensure that the borrowers could pay back the loan.
7.3.1 Financial Feasibility
Biogas plants are usually financed from the owner’s resources, credit, and
public promotion. Some farms have installed biogas plants with grant support from
UNIDO under the GEF-5 project. Farm owners could get incentives up to 20–25% of
the total investment or a max of 45,000 USD per project, depending on the scale and
type of project. However, this support grant had a limited budget. The installation of
the systems was only supported for proposals that have a positive feasibility study
available and fulfill the eligibility criteria at the time of contract closure with UNIDO.
A financial feasibility study convinces investors and creditors of the technical
feasibility, economy, environmental compatibility, and general creditworthiness
(Deublein and Steinhauser 2010). The success of the project depends on some factors
that can be controlled and influenced by strategic decisions concerning investment and
operational costs, as stated in Figure 13 (Zhao et al. 2016). Therefore, the following
questions must be answered:
Figure 13 Investment and operation costs of biogas plant (Zhao et al. 2016).

91
- Will the plant work economically, based on a turnover and a profit projection
with the cost-benefit calculation?
- Is there a detailed plan for the financing (own resources, guarantees, and
collateral)?
- How to get a loan with low interest from banks or microfinance institutions for
a biogas plant project?
- Is annual income from biogas investment sufficient to cover the operation costs
and loan repayment (in the case of the farms’ owner loan from the Bank)?
- Is the overall risk to the biogas project clear and acceptable?
A financial feasibility assessment must be conducted to find in detail the annual
cash flows in the project. It is a critical step in assessing the practicality of a proposed
project. The financing options depend significantly on local conditions and the situation
of the project initiator, so there are no universal guidelines for this (Seadi et al. 2008).
In addition, the economic feasibility and efficiency should be investigated to find the
hot spots of cost accounting. Currency outflows for initial construction and installation
and maintenance costs and other operating costs should be considered. Moreover, both
actual and potential monetary inflows for the substitute benefits of biogas products
should be listed. It would be crucial to construct an economic framework to understand
the money flows and find the key to optimize economic feasibility (Chen et al. 2017).
In the case of conducting the analysis, a few software have been developed.
COMFAR III EXPERT (Computer Model for Feasibility Analysis and Reporting) is
among the most promising ones. UNIDO has developed this tool based on the
experience, recommendations, comments, and needs of more than 7000 users in 160
countries. Since its release, the software has been upgraded yearly to meet the technical
developments and users’ requests (Ghodrat et al. 2018).
In Cambodia, on the other hand, BTIC offers consultancy services on the
financial feasibility and investment costs to farm owners and investors, and BTIC can
answer those questions mentioned above. BTIC also helps on (1) technical assessment
and performance improvement of biogas system; (2) development of a bankable
proposal and access to credit; (3) assistance investors on preparing a proposal for the
grant if it is available; (4) supporting in Engineering, Procurement, and Construction
Management (EPCM); and (5) training related to commercial biogas for stakeholders
such as safety, operation, and maintenance of commercial biogas systems, construction
and commissioning, etc. (http://btic-rua.org/). As mentioned in section 2.4, M’s pig

92
farm successfully operated the first commercial biogas plant that received technical
support from BTIC. In addition, financial feasibility assessments were conducted at
more than 30 farms and agro-industries. The following section will discuss the
calculation of financial investment cost, cash flow, and economic indicators of pig farm
A conducted by BTIC.
7.3.2 Calculation of Financial investment cost
The calculations in this section are formulated based on the experience of biogas
experts from BTIC in Cambodia. The investment costs concern equipment such as
lagoon (including materials and construction costs), genset, gas treatment, flow meter
& gas flare, tubing and cabling, equipment transportation and installation,
commissioning, and operator training. The costs for equipment and installation are
based on a quotation from equipment suppliers, and costs for equipment housing are
estimated. In addition, estimates of equipment-related costs such as O&M costs and
equipment depreciation are indicated in Table 13. The cost of the lagoon has a
significant impact on the total capital investment cost. As wastewater lagoon is a part
of normal farm operations, the entire investment cost can be reduced by more than 30%.
Table 13 Overview of the investment cost of farm A in Cambodia.
Investment costs Price
(USD)
O&M (%) Lifespan
(year)
Depreciation (USD)
Lagoon 79,000 2 20 3,950
Generator house 10,000 2 20 500
Gas treatment 5,000 30 10 600
Genset (second
hand)
32,000 15 4 8,000
Flow meter 980 5 5 196
Manual flare 450 5 5 90
Tubing and cabling 1,000 5 10 100
Transportation 1,500
Installation costs 5,000 10 500
Sub-total 134,930 13,836
Total project budget 148,423 15,185

93
7.3.3 Cash flow and financial indicators
Table 14 indicates cash flow Error! Reference source not found.for 10 years p
eriod in the whole production scenario. The expense of 148,423 USD in the first year
(year 0) is the total investment cost. It’s a long leap from lifespan to re-investments to
the same net cash flows. The calculated net annual savings (revenue – O&M annual) is
around 35,857 USD. The cumulative cash balance after 10 years is 189,212 USD, which
is calculated from the net annual cash flows and the remained 44,500 USD from
residual equipment values. With a discount rate of 14%, the project net present value
(NPV) is 15,992 USD.
Financial indicators can be calculated from the annual cash flows. The IRR is
16.9%, which is slightly above the chosen depreciation rate of 14%. The payback period
is 4 years which is long for a commercial biogas project. However, because the farm
owner gets an incentive of 24,000 USD from UNIDO to support the biogas investment,
the payback period is down to 3.4 years. IRR and NPV are 21.9% and 37,045 USD,
respectively.
Table 14 Cash flow of the investment.
Years
0 1 4 5 8
Cash-out
Investments 148,423
32,000 1,430 32,000
O&M costs
6,101 6,101 6,101 6,101
Total cash outflow 148,423 6,101 38,101 7,531 38,101
Cash-in
Electricity bill savings 41,958 41,958 41,958 41,958
Total cash inflow - 41,958 41,958 41,958 41,958
Net Cash flow -148,423 35,856 3,856 34,426 3,856
References
Camirand E (2019) Biogas Plant Development Handbook.
Chen B, Hayat T, Alsaedi A (2017) Biogas systems in China. Springer Nature
Deublein D, Steinhauser A (2010) Biogas from waste and renewable sources: an
introduction. Wiley-VCH Verlag GmbH & Co. KGaA, Weinheim, Germany

94
Ghodrat AG, Tabatabaei M, Aghbashlo M, Mussatto SI (2018) Waste Management
Strategies; the State of the Art. In: Tabatabaei M, Ganavati H (eds) Biogas
Fundamentals, Process, and Operation. Springer Publishing AG, Cham, pp 1–34
Karellas S, Boukis I, Kontopoulos G (2010) Development of an investment decision
tool for biogas production from agricultural waste. Renew Sustain Energy Rev
14:1273–1282.
Seadi T Al, Rutz D, Prassl H, et al (2008) Biogas Handbook. University of Southern
Denmark, Esbjerg, Denmark
Zhao X, Jiang G, Li A, Wang L (2016) Economic analysis of waste to energy industry
in China. Waste Manag 48:604–618.

95
CHAPTER 8: RISK ASSESSMENT AND SAFETY OF BIOGAS PROJECT
This chapter presents an overview of qualitative risk analysis and assessment of
biogas projects. Some hazard identifications on biogas production and upgrading and
risk estimation are given. The safety of biogas projects, including safety systems and
safety guidelines, and documents for preventing risks and hazards, is also discussed.
8.1 Introduction to risk assessment
Biogas plants should undergo a formal risk assessment consisting of the
systematic identification of risks and descriptions of the technical and non-technical
measures undertaken to control the identified risks. Anaerobic digestion is a chemical
process with all the associated risks, e.g., interaction with other operating plants or
contractors, hazardous areas, flammable gas, fire and explosion, hazardous substances,
pressure systems, gas handling, gas storage, and use of un-odorized gas. In addition,
human failures in operating the biogas system are a key determinant in risk control,
centered around procedures and maintenance issues (Inspectorate 2018).
Risk assessments allow to control the issues from hazards and risks of biogas
plant such as (1) What potential hazards are present?, (2) What potential causes and
consequences are associated with those hazards?, (3) How significant are the potential
impacts?, (4) What effects might flow from these hazards?, (5) What is the likely risk
in qualitative terms on a range of risk receptors such as people, the plant itself or the
environment?; and (6) What potential design guidelines and system controls are needed
to maintain risk to as low as reasonably possible? Therefore, thorough safety
assessments must be carried out at each project stage from design to installation,
commissioning, implementation, and operation. The standard hazard identification
processes are used to elicit and document the hazards and their potential for harm to
people, plant facilities, and the environment. Taking proper precautions and safety
measurements contribute to ensuring a safe operation of the plant. Application of
inherently safer design practice can help bring risks to as low as reasonably practicable
through the complete elimination of hazards. It should be the aim of all designs and
operational considerations around biogas production and use (Seadi et al. 2008).
8.1.1 Overview of qualitative risk analysis and assessment
A qualitative assessment is made on biogas facilities' individual and overall
risks and hazards impacts, which considers the identified hazards arising from the

96
release of biogas from containment, either at the covered anaerobic lagoons (CALs) or
within the gas transmission system or end-user facilities. It gives clear hazard
identification and consequence analysis that affect distances for the events, given the
location of the operation. Many events from gas releases that generate fires have
localized effects. The failure rates leading to loss of containment in gas transmission
systems are meager, particularly for commercial piping and equipment such as valves
and blowers. However, the effect of human failures can be significant, as key
contributors to loss of containment, either at the system's design phase or through poor
training and poor procedural practice. These human factors must be expressly
considered and managed within a facility to minimize the hazard potential (Dow 1994).
There are some more significant biogas releases from the CALs that could,
under certain restrictive circumstances, affect distances of more than 50 m. This type
of event might have some implications for facilities located close to other operations or
land uses. For specific plant locations and surrounding sensitive land uses, a quantified
risk assessment would be required to assess the imposed risks and adequacy of the
proposed design and operations (AMPC 2016).
On the other hand, the growing use of biogas to generate electricity on-site has
led to generator sets, usually installed in enclosed structures for noise control and
security reasons. It poses a unique risk of explosion of released gas within the enclosure
and amplification of blast pressure compared to open systems. There are potentially
more severe impacts on-site in the case of large releases of gas from CALs, and the
possibility of explosion impacts from enclosed space ignition of biogas in generator set
installations. Multiple failures can occur in gas detection and ventilation systems that
permit explosive atmospheres to form within these facilities. The physical location of
the facility on the site is important to mitigate possible impacts from explosions. Where
appropriate, the use of open areas is an inherently safer design option than the covered
areas. Besides, ventilation systems, interlocks, and gas detection mean that initial events
can often not propagate to an explosive situation. It is worth considering the use of open
structures to avoid explosive overpressures if systems fail. Other minor events are
possible, but again the effects are small and localized to the operation. The propagation
of events must be promptly addressed, as escalation could generate severe outcomes on
the site (Hughes 2006).

97
8.1.2 Hazard identification and risk estimation
This section analyzes the possible physical effects of events occurring to
provide information on impact zones affecting people, the environment, and the
associated biogas plant. The risks related to people on-site consider a probability of
exposure people to the hazardous event and gas ignition when flammable gas releases
were involved. The potential impact both on-site and off-site is primarily related to the
hazardous properties of the biogas and the release locations. Since biogas consists
mainly of CH4, CO2, H2S, and other trace compounds, it is flammable and potentially
explosive. These types of events within the biogas system need control, using both
installed safety systems and physical separation of plants from vulnerable resources. A
biogas system is often composed of (1) Influent feed system, (2) CALs, (3) Biogas
transfer system, (4) Flare systems, and (5) Biogas utilization systems. Off-site
individual risks would usually assume constant exposure to any risks generated from
biogas operations. However, given the general location of biogas facilities and the use
of separation distances between biogas facilities and sensitive land uses, the risks to the
public are likely low. The estimation of risk impacts of the above biogas systems on
hazard, possible causes, possible consequences, protection measurement, and residual
risks to people, environment, and assets have been listed in AMPC (2016).
The key hazards related to gas releases, possible fires, and explosions are
considered by applying consequence analysis, where predictive models were used to
estimate the impact of such events. For example, the consequence analyses consider
dangerous phenomena such as fires associated with cover failures and other loss of
containment events from equipment items. It also covers potential open flammable
cloud flash fires and/or explosions by biogas releases from (1) CAL cover, subsequent
jet fires (JF) and flash fire (FF), (2) transmission systems (JF and FF), (3) generator
facility such vapor cloud explosion (VCE) and JF, and (4) release of biogas and
downwind impacts of H2S. The threshold values for damage distance evaluation can be
found in Tugnoli and Cozzani (2007).
Analysis of H2S releases indicates that on-site and off-site impacts could occur
under a range of release scenarios. For example, the loss of containment of biogas
containing large amounts of H2S beyond 0.2% (2000 ppm) can cause significant health
risks, especially at night, where effect distances can be greater than 500 m from the
release point. Therefore, these scenarios require the application of inherently safer
design principles and, where necessary, the implementation of independent protection

98
layers, including emergency response procedures, to be in place to eliminate or mitigate
the loss of containment impacts. The sequence estimates show that there is little
potential for major off-site impacts from fires and explosions. Hence the risks beyond
the boundary from these events are low. It is particularly the case given the general
siting of these operations away from residential areas. The basic assumptions used in
predicting the downwind concentration of H2S was indicated in the literature (AMPC
2016).
8.1.3 Risk assessment on biogas production and upgrading
The risks associated with biogas production and upgrading to biomethane are
investigated step by step, as illustrated in Figure 14. The first step involves identifying
the equipment present in the process and the related operative conditions such as
pressure, temperature, involved substance, and hold-up. After that, a set of credible
critical events referred to as Losses of Containment (LOCs) such as a small leak, pipe
leak, and rupture is assigned to each Process Unit. A set of possible loss of containments
for each equipment unit can be potentially dangerous phenomena such as gas fire and
explosion.
The impact of such phenomena was assessed in terms of damage distances and
hazard indexes. The damage distances are defined as the maximum distance where the
physical effect of a scenario such as thermal radiation, overpressure, or toxic
concentration reaches the threshold value. The damage distance can be calculated using
consequence analysis models based on the LOC characterization. Several models and
commercial software tools are available in the literature for consequence analysis
(Haimes 2009) (Aven 2011). The calculation of the equipment hazard indexes requires
the estimation of a parameter representing the severity of each scenario that the
identified LOC events may trigger. The damage distances corresponding to a given
effect threshold were calculated to obtain a homogeneous severity parameter of each
scenario. Different types of physical effects are compared in the analysis. (Scarponi et
al. 2015).

99
8.2 Health and safety issues
The target for biogas plant is to ensure the highest possible level of safety for
humans and the environment. Safety regulations must be understood by those who are
expected to observe them and that they can be applied in the applicable economic
framework. Some hazards can occur in connection with the mechanical operation of
biogas plants or the uncontrolled escape of biogas. The relevant regulations for device
and product safety and health and safety must be observed during the construction and
operation of a biogas plant (Wellinger et al. 2013). For health and safety reasons, all
risks and hazards of biogas are considered at all phases of a biogas project development.
The construction and operation of a biogas plant, including biogas production and
upgrading, face typical health and safety issues. It is due to the number of risks and
hazards, such as biogas fire and explosion, LOCs to the atmospheres, and other hazards,
as shown in Figure 15. The most critical safety and mechanical issues are fire and
explosion, H2S and NH3 poisoning, asphyxiation, and diseases (Peters et al. 2003).
Figure 14 Schematic representation of the steps of the methodology used for the risk
assessment (Scarponi et al. 2015).

100
8.2.1 Fire and explosion hazards
In combination with air (oxygen) and an ignition source, combined gas can form
an explosive gas mixture under certain conditions, depending on CH4 content. Besides,
excess H2S and NH3 are potentially explosive. The risk of fire and explosion is
particularly high close to digesters and gas reservoirs. It can also occur because of a gas
leak, the creation of an explosive zone, welding, clogged or frozen pipes, or others.
Therefore, around the biogas digesters, gas pipes, CHP units, gas flares, and gas storage
tanks, collectively called Ex-Zones. All types of safety measures related to explosions
should be considered, including installing and using acceptable devices (Westenbroek
and Martin 2019).
8.2.2 Risk of asphyxiation and chemical and disease hazards
Biogas generation, transportation, and flaring can lead to oxygen-deficient
atmospheres. The biogas accumulation in a confined space can significantly reduce the
level of oxygen (anoxia) and result in poisoning or asphyxiation symptoms, even death.
The minimum regulatory oxygen content is 19%. The asphyxiants that are typical
constituents of biogas are CO2 and CH4. Due to their toxicological properties, NH3,
H2S, or CO2 expose operators to safety hazards. Someone exposed to H2S
concentrations of over 50 ppm can get serious injuries, e.g., exposure to concentrations
higher than 1,000 ppm cause immediate death. Such concentrations also cause pipes or
steel tanks corrosion or breakdowns of the biogas engine. The substrates in biogas
plants may contain pathogens, such as bacteria, viruses, and parasites that may cause
disease in man, animals, or plants. This fear is not at all unfounded at first sight. The
Figure 15 Hazards of the biogas plant.

101
general public often discusses the risk of pathogenic germs spreading with the digestion
residue in fields (Wellinger et al. 2013).
It is essential to monitor gas regularly, e.g., biogas measurement, gas leakage,
pipes, and operation and maintenance of equipment at different locations for the
efficient and proper functioning of the process and to reduce the risks and hazards. In
addition, it is essential to install safety systems and provide safety guidelines and
documentation in the biogas plant (Hofmann 2016).
8.3 Safety systems
According to ATEX classification on explosion-safe products, explosion-proof
equipment, electrical service, and non-sparking tools should be installed around
digesters and biogas storage. There must be no smoking near the digester or related
biogas lines. Large engines and electric generators must be suitable for the environment
so a spark will not ignite the gas (Westenbroek and Martin 2019). The key safety
systems typically deployed for biogas generation and use such as:
1. Pressure relief on CAL covers via hydraulic dip legs cover spears or weighted
flap valves.
2. Moisture knock-out pots to ensure no significant carry-over of liquids into
the biogas transport system.
3. In-line methane analyzers to continuously read methane content.
4. Deployment of methane gas sensors as part of the instrumented safety system
for power generation.
5. Ventilation of enclosed spaces occupying engine-generator sets.
6. Use of flare systems to burn unwanted biogas and for over-pressure relief of
the transport systems.
7. Biogas flaring systems: burner management with safety interlocks (AMPC
2016).
8.4 Safety guidelines and documents
Operating staff and owners need proper training from biogas experts to ensure
that they can understand the operating instructions for a biogas system in regular
operation and are aware of biogas hazards and safety in the biogas plant. They must
determine, evaluate, and minimize the dangers. They must consider the acquired
knowledge by setting protocols describing response in case of accidents and providing

102
safety training to the biogas operators and owners. On the other hand, the operators
need to monitor biogas systems: (1) daily (monitor digestor temperature, record gas
meter reading, check the motor oil level and airflow injected for desulfurization, etc.);
(2) weekly (check fill level in the overpressure and under-pressure protectors, inspect
the motor and lines, and check gas magnet valve for function and contamination); (3)
monthly (actuate all scrapers to ensure no struck and remove oil deposits in the CHP
unit); (4) twice a year (check ventilation, inspect the electrical systems for damage, and
check the function of gas sensor and fire detector); (5) annually check gas-carrying
system parts for damage and corrosion and calibrate the gas sensor), and (6) check the
fire extinguishers in every 2 years. The details of safety guidelines can be found in this
report (Findeisen 2015). On the other hand, it requires keeping the documents such as
manual/guidelines and O&M available in the biogas plant and labels the biogas hazards,
safety, and protection as shown in Figure 16 (Westenbroek and Martin 2019).
References
AMPC (2016) Appendix 2 : Hazard and Risk Assessment - Biogas Systems.
Aven T (2011) Quantitative risk assessment. Cambridge University Press, New York
Dow CC (1994) Fire & Explosion Index Hazard Classification Guide, Seventh.
American Institute of Chemical Engineers
Figure 16 Overview of hazards and safety systems in biogas production and utilization
(Westenbroek and Martin 2019).

103
Findeisen C (2015) The importance of safety standards, risk assessment and operators
training for a successful biogas market development Content.
Haimes YY (2009) Risk modeling, assessment, and management, third. A John Wiley
and Sons, Ltd., New Jersey
Hofmann F (2016) FvB Biogas Safety Guidelines – Deep Dive Session on Crucial
points. Germany
Hughes G (2006) The safe isolation of plant and equipment. Health and Safety
Executive
Inspectorate P and G (2018) Guideline for operating plant - Biogas.
Peters M, Timmerhaus K, West R (2003) Plant design and economics for chemical
engineers, 5th edn. McGraw-Hill Education
Scarponi GE, Guglielmi D, Casson Moreno V, Cozzani V (2015) Risk assessment of a
biogas production and upgrading plant. Chem Eng Trans 43:1921–1926.
Seadi T Al, Rutz D, Prassl H, et al (2008) Biogas Handbook. University of Southern
Denmark, Esbjerg, Denmark
Tugnoli A, Cozzani V (2007) A consequence based approach to the quantitative
assessment of inherent safety. AIChE J 53:215–228.
Wellinger A, Murphy J, Baxter D (2013) Biogas utilisation: international experience
and best practice. In: Wellinger A, Murphy J, Baxter D (eds) The biogas
handbook: Science, production and applications. Woodhead Publishing,
Cambridge, UK, pp 327–460
Westenbroek PA, Martin J (2019) Anaerobic Digesters and Biogas Safety.

104
CHAPTER 9 LEGAL, ENVIRONMENTAL, AND SOCIAL ASPECTS OF
BIOGAS PROJECTS
This chapter describes the legal requirements and documents that investors need
for their investment in a biogas plant. Legal frameworks and guidelines for the
development of biogas plant in Cambodia are discussed. The environmental and social
aspects of the biogas project are also discussed.
9.1 General legal terms and requirements for biogas project
The procedure, criteria, and documentation needed to get a biogas plant building
permit differs from one country. The investor must document the project's compliance
with national legislation concerning handling and recycling of manure and organic
wastes, emissions regulations (exhaust, noise, and odors emission), impact on
groundwater, protection of landscape, work safety, buildings safety, etc. It is very
important to contact local government authorities in an early stage of the project,
provide them first-hand information, and require help with the permitting process and
project implementation (Wellinger et al. 2013). Fulfilling essential safety issues and
stipulating straightforward prevention, protection, and damage control measures are
conditions for obtaining the building permit (Seadi et al. 2008). When permits for plants
are granted, it needs to be ensured that the permit applicant has a sufficient land area at
its disposal for spreading nutrient-rich digestates. Involving an experienced planning
company in getting the building permit can be helpful or necessary, depending on the
local situation. For instance, they might know how long it takes for permitting
procedures to build and operate a biogas plant (Camirand 2019).
In addition, legislation (regulation and permission) and guidelines for biogas
projects (before and during the operation) below those investors need to follow:
− Local regulation regarding anaerobic digestion
− Permitting authority from the environmental and health protection agency.
− Safety of products, services, and industrial activities.
− Biogas building permits from the authority.
− Business plan and risk assessment.
− Available professional technical biogas in-house for O&M.
− Local restrictions on selling electricity to the grid or community when
electric production is higher than the demand. However, most of the existing

105
biogas systems in Cambodia cover around 80% of the total electricity
demand in their farm.
− Feedstock description and declaration (an official document that should be
archived at the biogas plant).
− All feedstock types should be analyzed and tested regularly to maintain
quality standards and adhere to the legal requirements for feedstock quality.
− Legislation and the authorities ensure that nutrients in the digestate spread
to cultivated fields are fully accounted for and monitored.
− Waste reduction and recycling regulation.
− Work Health and Safety protection.
9.1.1 Legal frameworks and policy for the development of biogas plant in Cambodia
Legal frameworks: Unlike other countries where the legislation for developing
biogas plants already exists, there is a lack of legal terms and frameworks on the
procedure and standard requirements for registration for investing in this technology in
Cambodia. Currently, suppose investors, farm owners, or project developers are
planning a biogas project. In that case, it is recommended to contact BTIC center or
NBP for helping all the procedures, such as Engineering, Procurement and Construction
Management (EPCM), economic assessment, and assisting the application for
incentives from the government NGOs or development partners if it is available. They
also provide technical and consulting services and documentation on biogas regulation
and guidelines of biogas safety and O&M. However, there is a need for biogas
legislation and policies and roadmaps to support further and effectively implement
biogas plants in Cambodia in the future. In this regard, governments can support biogas
technology use by forming regulations that favor the sustainability of biogas plants. In
addition, funds from development partners and the government constitute a significant
resource to support NBP and BTIC in the long-term sustainability of biodigester
development. Creating a favorable climate for biogas dissemination depends almost
always on a whole range of decision-makers (MAFF 2016).
Biodigester policy on biogas plant: Recently, MAFF created a national
technical working group to provide technical support to biogas projects and revise the
existing documentation on biodigester development policy and legal framework (2021
– 2030). MAFF will establish a National Advisory Committee for effective
coordination of the implementation of the biodigester development policy. In addition,

106
a Provincial-municipal Technical Working group will be created to coordinate and
implement activities at a local level, contributing to the implementation of biodigester
development policy (MAFF 2016). On the other hand, biogas programs should attempt
to lobby for biogas at various entry points of the government system (cooperation
among ministries) simultaneously. For example:
1) MEF: decision on subsidies and tax waivers for biogas investors and users.
2) MOE: propose laws regarding the feeding of biogas-produced electricity into
the farms or community.
3) MAFF: prepare a curriculum of biogas training to extension officers,
agricultural colleges, and agriculture and livestock investors.
Scaling-up of Renewable Energy Technologies (S-RET) project promoted
renewable energies (biogas, solar) for application in agriculture products such as solar
pumping, solar incubator, etc. The project phase has been completed; however, the
donor IFAD (International Fund for Agricultural Development) considers the project's
second phase.
9.2 Environmental aspects
Biogas is a form of renewable energy and is considered a green solution is
transforming organic residues and wastes into valuable products such as electricity,
heat, biofuel, and organic fertilizer. However, if a biogas plant is not well located,
designed, and operated, it can harm the environment and surrounding residence and
community. Following the environmental regulations and guidelines, e.g., where to
place biogas plants and recommended distance to the nearest neighbor in the city area
or communities in rural areas, biogas storage and fertilizer use, can avoid environmental
issues (Hus 2020).
9.2.1 Environment regulation
Environmental regulations for factories are provided under
Instruction/Sechkdey Nainoam No. 87 on Factory Hazardous Waste Management,
including standards for the following: (1) desludging and sludge storage; (2) prohibition
of disposal of factory sludge with household waste; (3) prohibition of discharging of
sludge to water bodies; (4) the need for permission to transport sludge; (5) managing
hazardous waste and persistent organic pollutants, environmental quality and effluent
standards, and (6) water emissions standards to be released into the environment,
including requirements to treat waste products such that emissions standards are met

107
(Lord and Leang 2021). Prakas No 387 Br.KB, MOE launches standards of the number
of toxic chemicals or hazardous substances contained in hazardous wastes allowed to
be disposed of in sanitary landfills and soils (MOE 2015). Air and noise pollution
standards are provided under Sub-decree #42 under-declaration/Prakas No. 83
(Government 1999). According to Prakas No 549, commercial animal farms are
recommended to manage their waste correctly by converting it into biogas to reduce
environmental impact from animal wastes (MAFF 2018). However, the environmental
regulations and policies for the biogas industry in Cambodia are not set. MAFF, MoE,
and MME should work together to implement the existing regulations and prepare new
regulations on environmental pollution control (water, air, and soil), type of feedstocks,
and overall environmental impact assessment (EIA) on biogas plants. In particular, the
regulations should also apply to the utilization of digestate as organic fertilizers.
Lesson learned from Europe: The environmental regulations on biogas
development in other countries, especially European countries where biogas plants
have existed for decades, stipulate that biogas investors must apply for a permit. The
environmental permits on biogas plants are based on the law of Environmental
Protection. Professional handling of waste triggers the environmental license of biogas
plants, e.g., large-scale animal farming needs an environmental permit, but when
biomass waste of own farm is treated, the permit can be integrated into the
environmental license of the farm. Similarly, farm owners need to submit a document
containing a plan for constructing the biogas system to get licenses for biogas
investment.
The standard requirements include reception and storage of manure and other
types of biomasses, anaerobic digestion, separation of digestate and storage of the
separated biomasses and upgrading, and storage of biogas. The regulated environmental
issues include air emissions (odor, H2S, dust, and NH3), noise, and soil and groundwater
or surface water pollution. The permitting authority shall use the standard requirements
as a basis for the permit. Still, it is possible to set other requirements if they are not
balanced between environmental effect and economics (European Parliament and
Council 2009). Different standards are applicable for constructing a biogas plant and
raw materials and products depending on the feedstocks produced and plant operations.
Below are some requirements for other feedstocks and the use of digester as organic
fertilizer.

108
Animal manure feedstocks: The animal by-products regulation generally states
the terms for preventing the spread of diseases within the processes of moving materials
of animal origin not intended for human consumption. It says that treatment in biogas
plants can be suitable for several such products.
Organic Fertilizers: open digestate storage is banned to prevent methane
emissions and regulating digestate spreading onto land to minimize emissions of
ammonia and related environmental impacts (Fusi et al. 2016). Organic fertilizer
products placed in the market must be investigated to ensure that they are safe in
marking, packaging, transport, storage, use, good quality, and suitable for plant
production (European Parliament and Council 2009).
9.2.2 Environment impacts of biogas production and utilization
Using heat and electricity from biogas would significantly improve
environmental sustainability, reduce global warming, and deplete abiotic resources and
the ozone layer. Grope et al. (2019) indicated that a 1 MWe biogas plant could reduce
approximately 7,000 tons of CO2 emission per year compared to fossil fuels' electricity
production. However, the social acceptance of biogas is often hampered by
environmental and health concerns. Biogas, generated by the biogas project, can
significantly contribute to abate GHG emissions, namely CO2, CH4, NH3, and N2O. The
environmental impact induced by feedstock, biogas upgrading, digestate storage and
treatment, and the final use of digestate is critically discussed. Attention must be paid
to undesired emissions of CH4 and N2O. Among all the gaseous pollutants considered
indirect emission from biogas combustion, nitrogen oxides (NOx) level was the worst
environmental concern (Paolini et al. 2018).
Impact of feedstocks and biogas upgrading: The effect of a biogas plant on
GHG emission is heavily influenced by feedstock storage. Most N2O can be lessened
when closed storage is used for manure. Emissions from uncovered biomass storage are
also the primary NH3 source along the biogas production chain (Sommer 1997). On the
other hand, feedstocks from MSW highly influence the impact of the whole plant as
they are: (1) the features of degradation of the fermentable fraction; (2) the collection
efficiency of gas streams released by biological operations; (3) the abatement
effectiveness of collected pollutants; and (4) NOx emission rate from biogas
combustion (Beylot et al. 2015).
Using biomethane as an alternative to fossil fuel generally improves local air
quality and reduces GHG emissions. However, CH4 losses can affect the sustainability

109
of the whole process. The equivalent CO2 saving raises considerably if CH4 slip is
limited to 0.05%, but the process is no longer sustainable when methane losses reach
4% (Paolini et al. 2018).
Impact of digestate storage and utilization: Utilization of digestate as organic
fertilizer can release nitrogen and ammonia emissions into the atmosphere and
groundwater, which has long-term effects on sustainability in terms of soil fertility and
environmental impact. Uncovered digestate storage has been identified as the main
ammonia emission source. Proper management of digestate can mitigate its
environmental impact by reducing ammonia emission rates. The importance of a gas-
tight tank for digestate storage can reduce GHG emissions by up to 36.5% (Battini et
al. 2014). The main critical issue in the final use of digestate is nitrogen release into the
environment, which can be reduced by applying best practices for preserving soil
quality. However, managing nitrogen dosage is difficult because of the feedstock
variability (Paolini et al. 2018).
N2O and CH4 emissions from digestate utilization are not critical in comparison
to those of untreated biomass and fresh slurry manure. In particular, adding digestate to
paddy increases the CH4 emission rate from 17 to 30 g m-2, but no significant effect is
observed for N2O (Win et al. 2014). Regarding pesticides, heavy metals, and harmful
microorganisms in the digestate are generally considered to pose a low risk of food
chain contamination. However, the soil burden of persistent organic pollutants caused
using digestate still needs to be fully assessed (Suominen et al. 2014). It is important to
note that fugitive emissions from digestate storage are generally more important than
those released by its use into the soil (Buratti et al. 2013).
9.3 Social aspects
Like the legislation and environmental aspects, social regulation and impacts of
the biogas plant site must be integrated into the project approach when planning a
biogas installation. It is strongly associated with land use and social conditions related
to community empowerment. It is important to determine whether social conditions are
suitable for biogas plant project implementation. The following information should be
considered: (1) social needs (heat, electricity, and organic fertilizers) and concerns
(odor, waste disposal problems, etc.) and (2) the location of the biogas plant.
Determining heat, electricity, and digestate requirements are needed (Pandyaswargo et
al. 2019). Besides, people are very concerned about impacts such as odor, noise, and

110
undesired landscape changes, and the appearance of bad examples in the media
amplifies these fears. Determining whether a location is rural or urban is essential in
estimating the appropriate scale and technologies for a project. In particular, zone
conformity and distances to buildings, forests, rivers, lakes, or sources must carefully
measure to prevent the risk of biogas production. Therefore, early contact with the
municipality and the regional permission authorities can be helpful and prevent
conflicts with community and local businesses, e.g., electricity distributors (Wellinger
et al. 2013).
9.3.1 Social conditions and gender consideration
Social conditions should be identified, and authorities should strive to address
all regulations related to the biogas plant. Regarding social factors, the farmers’
education level plays a vital role in adopting biogas plants, concerning their ability to
foresee the benefits and operate the biogas plant. However, the farmers in Cambodia
have limited knowledge of and information about biogas. Therefore, local political
governance is regarded as an essential factor in disseminating, training and
implementing biogas energy policies at a local level (Yang et al. 2021).
On the other hand, social challenges identify the use of local labor, guaranteeing
safety, ease of operations, aesthetic considerations, and consideration of ethical
barriers. Working conditions should be improved by strengthening the regulations
regarding the casual daily laborer, such as improvements in wage and benefits, health
and safety standards, and rights for collective bargaining and biogas operators.
Guaranteeing safety is always a central concern when new technologies are
implemented. By equipping operators with technical maintenance capacities, such
problems can be addressed, and the presence of a similar facility in each area can
improve the acceptability of adopted technologies (Chingono and Mbohwa 2016).
The involvement of local labor is more accessible on technical assistance and
affordable services. Social regulations for the division of labor should follow gender
considerations (a division of labor between sexes). The sustainability strategy includes
monitoring, evaluation, and promoting gender equality and the empowerment of
women (GEEW) in participation in biogas training (Mohanty 2017). The existing social
regulations on the division of labor represent a framework that is difficult to determine.
Different models should be considered according to the standing of women in society.
Women should be involved in decision-making committees. For example, when there
are problems with the plant, the women can be a stabilizing element. As they are more

111
affected by malfunctioning of the plant, they are more interested than men in, e.g., a
well-functioning repair service. It indicates that GEEW has a significant positive impact
on sustained economic growth and sustainable industrial development, which are
drivers of poverty reduction, social integration, and environmental sustainability
(UNIDO 2015b).
9.3.2 Social impacts
The development of biogas technology is a vital component of alternative rural
energy programs, whose potential is yet to be exploited. Biogas plants can have many
positive social effects by creating employment for appropriately trained students,
unemployed youth, and entrepreneurs through regular follow-up service, maintenance,
and repairs. Coordination of production and use of biogas, fertilizer, and pollution
control can optimize the promotion and development of agriculture and animal
husbandry in rural areas. Biogas technology creates new workplaces and employment
in communities. Generally, there is an employment of skilled, semi-skilled, and
unskilled persons in the building and construction of the plant. It improves living
facilities in villages, thus less migration to the city. The investment in biogas plants
provides additional income-earning activities from improved yields of agriculture
products using organic fertilizers. It gives energy self-sufficiency to the farms or
internal local community (Omer 2015).
Although biogas plants implement new solutions and technologies of renewable
energy in the market with good protection of the environment and climate, they also
have some drawbacks. Concerning the negative impacts on the well-being of local
communities, the government must take measures to fully recognize and protect the
rights of local communities that might be threatened by the expansion of biogas
production and its environmental hazards and implications (Chingono and Mbohwa
2016). Moreover, odor and other waste management-related social problems must be
identified. Odor prevention methods may be introduced when problems are anticipated
or exist in each area. Those who handle waste should also be identified to determine
which stakeholders to target when socialized waste separation systems (Pandyaswargo
et al. 2019).
References
Battini F, Agostini A, Boulamanti AK, et al (2014) Mitigating the environmental
impacts of milk production via anaerobic digestion of manure: Case study of a

112
dairy farm in the Po Valley. Sci Total Environ 481:196–208.
Beylot A, Vaxelaire S, Zdanevitch I, et al (2015) Life Cycle Assessment of mechanical
biological pre-treatment of Municipal Solid Waste: A case study. Waste Manag
39:287–294.
Buratti C, Barbanera M, Fantozzi F (2013) Assessment of GHG emissions of
biomethane from energy cereal crops in Umbria, Italy. Appl Energy 108:128–136.
Camirand E (2019) Biogas Plant Development Handbook.
Chingono T, Mbohwa C (2016) Social and environmental impact for sustainable bio-
gas production by the city of johannesburg. Proc Int Conf Ind Eng Oper Manag
1047–1050.
European Parliament and Council (2009) Regulation (EC) No 1069/2009. Off J Eur
Union 300:1–33.
Fusi A, Bacenetti J, Fiala M, Azapagic A (2016) Life cycle environmental impacts of
electricity from biogas produced by anaerobic digestion. Front Bioeng Biotechnol.
doi: 10.3389/fbioe.2016.00026
Government R (1999) SUB-DECREE on Solid Waste Management. Phnom Penh
Grope J, Scholwin F, Hofmann F (2019) Provision of services: Analysis of alternative
uses for biogas in Cambodia.
Hus N (2020) BAT in smaller biogas plants in the nordic countries. Copenhagen
Lord F, Leang S (2021) Sustainable Consumption and Production roadmap in
Cambodia. Phnom Penh
MAFF (2016) Policy on Biodigester Development in Cambodia 2016 - 2025.
MOE (2015) Prakas (Declaration) 387 on the Launch of Standards of the Quantity of
Toxins or Hazardous Substances Allowed to be Disposed.
Mohanty B (2017) Establishment of Biogas Technology & Information Center (BTIC)
in Cambodia. Final Report.
Omer AM (2015) Biogas Technology for Sustainable Energy Generation :
Development and Perspectives Abstract : 1:22–40.
Pandyaswargo AH, Gamaralalage PJD, Liu C, et al (2019) Challenges and an
implementation framework for sustainable municipal organic waste management
using biogas technology in Emerging Asian Countries. Sustain. doi:
10.3390/su11226331
Paolini V, Petracchini F, Segreto M, et al (2018) Environmental impact of biogas: A
short review of current knowledge. J Environ Sci Heal - Part A Toxic/Hazardous

113
Subst Environ Eng 53:899–906.
Seadi T Al, Rutz D, Prassl H, et al (2008) Biogas Handbook. University of Southern
Denmark, Esbjerg, Denmark
Sommer SG (1997) Ammonia volatilization from farm tanks containing anaerobically
digested animal slurry. Atmos Environ 31:863–868.
Suominen K, Verta M, Marttinen S (2014) Hazardous organic compounds in biogas
plant end products-Soil burden and risk to food safety. Sci Total Environ 491–
492:192–199.
UNIDO (2015) Policy on gender equality and the empowerment of women.
Wellinger A, Murphy J, Baxter D (2013) Biogas utilisation: international experience
and best practice. In: Wellinger A, Murphy J, Baxter D (eds) The biogas
handbook: Science, production and applications. Woodhead Publishing,
Cambridge, UK, pp 327–460
Win AT, Toyota K, Win KT, et al (2014) Effect of biogas slurry application on CH4
and N2O emissions, Cu and Zn uptakes by whole crop rice in a paddy field in
Japan. Soil Sci Plant Nutr 60:411–422.
Yang X, Liu Y, Thrän D, et al (2021) Effects of the German Renewable Energy Sources
Act and environmental, social and economic factors on biogas plant adoption and
agricultural land use change. Energy Sustain Soc 11:1–22.