BIOGAS PRODUCTION FROM WASTE TEA LEAVES AS A ...
66
BIOGAS PRODUCTION FROM WASTE TEA LEAVES AS A WASTE MANAGEMENT STRATEGY AT DL KOISAGAT TEA FACTORY NANDI HILLS (KENYA) ISAACK KIPKEMEI A THESIS SUBMITTED IN PARTIAL FULFILMENT OF THE REQUIREMENTS FOR THE DEGREE OF MASTERS OF SCIENCE IN ENVIRONMENTAL HEALTH, IN THE SCHOOL OF ENVIRONMENTAL STUDIES OF UNIVERSITY OF ELDORET, KENYA 2019
-
Upload
khangminh22 -
Category
Documents
-
view
0 -
download
0
Transcript of BIOGAS PRODUCTION FROM WASTE TEA LEAVES AS A ...
BIOGAS PRODUCTION FROM WASTE TEA LEAVES AS A WASTE
MANAGEMENT STRATEGY AT DL KOISAGAT TEA FACTORY
NANDI HILLS (KENYA)
ISAACK KIPKEMEI
A THESIS SUBMITTED IN PARTIAL FULFILMENT OF THE
REQUIREMENTS FOR THE DEGREE OF MASTERS OF SCIENCE IN
ENVIRONMENTAL HEALTH, IN THE SCHOOL OF ENVIRONMENTAL
STUDIES OF UNIVERSITY OF ELDORET, KENYA
2019
ii
DECLARATION
Declaration by the Candidate
This thesis is my original work and has not been submitted for the award of degree in any
other institution. No part of this thesis may be reproduced without the prior written
permission of the author and/or University of Eldoret.
Isaack Kipkemei
______________________________ __________________________
(SES/PGH/002/15) Date
Declaration by Supervisors
This thesis has been submitted for examination with our approval as University
Supervisors.
______________________________ __________________________
Prof. Gelas M. Simiyu Date
Department of Environmental Biology and Health
University of Eldoret, Eldoret Kenya
______________________________ __________________________
Dr. Mary Rono Date
Department of Environmental Biology and Health
University of Eldoret, Eldoret, Kenya

iii
DEDICATION
I would like to dedicate this work to my family and classmates for their invaluable
support during my study period.
iv
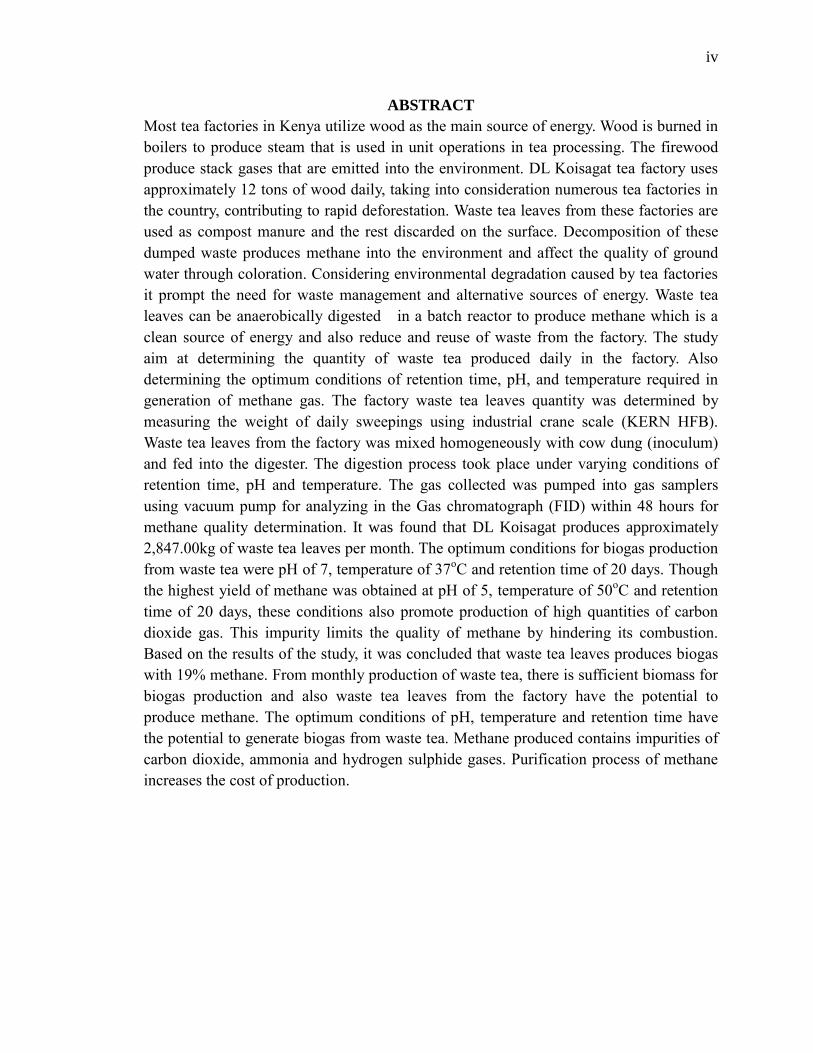
ABSTRACT
Most tea factories in Kenya utilize wood as the main source of energy. Wood is burned in
boilers to produce steam that is used in unit operations in tea processing. The firewood
produce stack gases that are emitted into the environment. DL Koisagat tea factory uses
approximately 12 tons of wood daily, taking into consideration numerous tea factories in
the country, contributing to rapid deforestation. Waste tea leaves from these factories are
used as compost manure and the rest discarded on the surface. Decomposition of these
dumped waste produces methane into the environment and affect the quality of ground
water through coloration. Considering environmental degradation caused by tea factories
it prompt the need for waste management and alternative sources of energy. Waste tea
leaves can be anaerobically digested in a batch reactor to produce methane which is a
clean source of energy and also reduce and reuse of waste from the factory. The study
aim at determining the quantity of waste tea produced daily in the factory. Also
determining the optimum conditions of retention time, pH, and temperature required in
generation of methane gas. The factory waste tea leaves quantity was determined by
measuring the weight of daily sweepings using industrial crane scale (KERN HFB).
Waste tea leaves from the factory was mixed homogeneously with cow dung (inoculum)
and fed into the digester. The digestion process took place under varying conditions of
retention time, pH and temperature. The gas collected was pumped into gas samplers
using vacuum pump for analyzing in the Gas chromatograph (FID) within 48 hours for
methane quality determination. It was found that DL Koisagat produces approximately
2,847.00kg of waste tea leaves per month. The optimum conditions for biogas production
from waste tea were pH of 7, temperature of 37oC and retention time of 20 days. Though
the highest yield of methane was obtained at pH of 5, temperature of 50oC and retention
time of 20 days, these conditions also promote production of high quantities of carbon
dioxide gas. This impurity limits the quality of methane by hindering its combustion.
Based on the results of the study, it was concluded that waste tea leaves produces biogas
with 19% methane. From monthly production of waste tea, there is sufficient biomass for
biogas production and also waste tea leaves from the factory have the potential to
produce methane. The optimum conditions of pH, temperature and retention time have
the potential to generate biogas from waste tea. Methane produced contains impurities of
carbon dioxide, ammonia and hydrogen sulphide gases. Purification process of methane
increases the cost of production.
v
TABLE OF CONTENTS
DECLARATION ................................................................................................................ ii
DEDICATION ................................................................................................................... iii
ABSTRACT ....................................................................................................................... iv
TABLE OF CONTENTS .................................................................................................... v
LIST OF TABLES ............................................................................................................ vii
LIST OF FIGURES ......................................................................................................... viii
LIST OF MAPS ................................................................................................................. ix
LIST OF ACRONYMNS ................................................................................................... x
ACKNOWLEDGEMENTS ............................................................................................... xi
CHAPTER ONE ............................................................................................................... 1
1.1 INTRODUCTION ................................................................................................... 1
1.2 Statement of Problem ................................................................................................ 7
1.3 Project Justification ................................................................................................... 8
1.4 Objectives .................................................................................................................. 9
1.4.1 Specific Objectives ............................................................................................. 9
1.5 Research Questions ................................................................................................. 10
CHAPTER TWO ............................................................................................................ 11
LITERATURE REVIEW ........................................................................................... 11
2.1 Introduction ......................................................................................................... 11
2.2 Environmental Management System ................................................................... 12
2.3 Policy and Legal Framework that exist ............................................................... 13
2.4 Solid Waste Management........................................................................................ 14
2.5 Reduce, Reuse, Recycle....................................................................................... 15
2.5.1 Types of Waste Tea leaves ............................................................................... 19
2.5.2 Optimum Conditions for Biogas Production from Waste Tea Leaves ............. 21
2.6 Anaerobic Biochemistry ...................................................................................... 22
2.7 Bacteria Involved in Anaerobic Digestion .......................................................... 25
CHAPTER THREE ........................................................................................................ 27
RESEARCH METHODOLOGY .................................................................................. 27
3.1 Study Area ............................................................................................................... 27
vi
3.2 Research Design ...................................................................................................... 29
3.3 Field Collection ....................................................................................................... 29
3.3.1 Procedure of Waste Tea Leaves Quantity Estimation .......................................... 30
3.3.2 Procedure Used for Biogas Production ................................................................ 31
3.3.3 Determination of Gas Quality .............................................................................. 33
CHAPTER FOUR ........................................................................................................... 36
RESULTS AND INTERPRETATION ......................................................................... 36
4.1 Quantity of Waste Tea Leaves Produced at DL Koisagat Tea Factory .................. 36
4.1.1 Optimum Conditions of Temperature, pH and Retention Time of Biogas
Production ..................................................................................................................... 37
4.2 Effect of pH on Volume of Biogas ...................................................................... 38
4.2.1 Effect of Temperature on Volume of Biogas ................................................... 39
4.2.2 Effect of Retention Time on Volume of Biogas ............................................... 40
4.2.3 Factor Analysis ..................................................................................................... 41
CHAPTER FIVE ............................................................................................................ 43
DISCUSSION .................................................................................................................. 43
CHAPTER SIX ............................................................................................................... 46
CONCLUSION AND RECOMMENDATIONS .......................................................... 46
6.1 Introduction ............................................................................................................. 46
6.2 Summary ................................................................................................................. 46
6.3 Conclusions ............................................................................................................. 47
6.4 Recommendations ................................................................................................... 48
REFERENCES ................................................................................................................ 49
APPENDICES ................................................................................................................. 53
Appendix I: Quantity of waste tea ............................................................................. 53
Appendix II: Percentage by Volume ......................................................................... 53
Appendix III: Similarity Index/Anti-Plagiarism Report ............................................ 55

vii
LIST OF TABLES
Table 4.1 KMO and Bartlett’s test .................................................................................... 41
Table 4.2 Correlation Matrix ............................................................................................ 42
viii
LIST OF FIGURES
Figure 4.1: Content % of biogas composition on the three experimental set ups ............. 37
Figure 4.2: Effect of pH on Volume of Biogas ................................................................. 38
Figure 4.3: Temp vs Volume ............................................................................................ 39
Figure 4.4. Retention time vs. Biogas volume .................................................................. 40

ix
LIST OF MAPS
Map 3.1: Map of Nandi County on Kenya’s Map .......................................................... 287
Map 3.2: Map of Nandi County ...................................................................................... 287
Map 3.3: Map of DL Koisagat Tea factory in Nandi Hills ............................................. 298
x
LIST OF ACRONYMNS
MSW Municipal Solid Waste
DCTW Decaffeinate Tea Waste
FTW Factory Tea Waste
NEMA National Environment Management Authority
EMCA Environment Management and Coordination Act
EMS Environment Management System
RET Renewable Energy Technology
MT Made Tea
BOD Biochemical Oxygen Demand
COD Chemical Oxygen Demand
CTC Cut Tear Curl
GC Gas Chromatograph
FID Flame Ionization Detector
SOP Standard Operation Procedure
pH Measure of the molar concentration of Hydrogen ions in solution
MS Mass Spectrometer
xi
ACKNOWLEDGEMENTS
With great humility and profound gratitude, I thank my supervisors: Prof. Gelas Simiyu
and Dr. Mary Rono for excellent scientific guidance, encouragement and in general
interest in my project.
I also express my in-depth acknowledgement and appreciation to Collins Anditi, Hezron
(Toxicologists) Government Chemist, Doreen Meso and Kimulwo (Biotechnology
laboratory, University of Eldoret) for their useful first hand advice and support in sample
analysis.
It is my greatest pleasure to thank Mr. Kemei, (General Manager) DL Koisagat Tea
Factory for excellent assistance and concern for my education.
1
CHAPTER ONE
1.1 INTRODUCTION
Waste is regarded as unusable or unwanted substance and also referred as a material that
is of no purpose to the user. Wastes which exist in environment are also known as
garbage. Waste production can be from households, factories, or in business operations.
Most waste is produced from production processes where raw materials are transformed
to finished products (Battista et al, 2016). Wastes that are generated from industries,
schools, households, hospitals and farms are classified as non-toxic, fluids, solid and
hazardous. Societies are prone to problems associated with waste disposal. Waste
handling depend on many factors which include characteristics and source of waste, as
well as the state or local regulations that govern the management of waste. Waste
management practices vary depending on the place of production like developing and
developed countries, industries and residences, rural and urban areas. Municipal solid
waste are mainly those wastes collected from hospitals, school, residential areas, light
industries operations and commercial buildings (Chowdhury et al, 2016). This municipal
solid waste (MSW) mainly contain food wastes, containers, yard trimmings, paper,
inorganic wastes and containers. Some MSW contain industrial sludge which can be
categorized as non- hazardous or hazardous, its main source being manufacturing
processes, mining and construction.
There are other types of waste which include hazardous waste and e-waste. Solid, gas or
liquid waste that is highly corrosive, toxic, flammable or reactive is known as hazardous
waste (Cornejo & Wilkie, 2010). Though mainly the term hazardous is symbolize with
two cross-bones with skull, these hazardous substance include products used in day-to-
2
day activities such as detergents used in laundry, car oils, shoe polish, paints and
batteries. Also some components used in everyday life produce hazardous waste during
their use. E-waste are mainly electronic devices that are used by individuals or businesses
which are approaching the end of their usefulness. They include televisions, phones,
printers, scanners, shredders, faxing machines, keyboards and computers (Faerber &
Herzog, 2010).
Waste from agricultural sector comes from farms or any agricultural related processes
that are used in processing agricultural products to finished usable products. For instance,
any crop processing procedure must have some residues that are treated as waste. This
waste can contain some harmful chemicals or other residual substances arising from the
processing itself (Hilkiah, 2008). Coffee, tea, cotton and other agricultural products have
waste generated and this at some point may not be pure from the crop residues as at some
point the chemicals used in the processes may remain in the waste produced.
Agriculture and food bio-wastes present an opportunity for conversion into methane,
which is clean source of energy, through anaerobic digestion. Biogas has the
characteristics of being colorless and odorless gas with calorific value of 20 MJ/m3 and
ignition temperature range of 650 to 750 and burns at approximately 60% efficiency
(Maile et al, 2017). Biogas presents an opportunity as an alternative fuel for heating and
cooking purposes as well as combined power generation and has been increasingly been
recommended for adoption as a clean source of energy. Biogas generation is mainly
conducted under mesophilic conditions in dome shaped bio digesters. Biogas and
anaerobic digestate, also termed bio solids which can be further processed for fertilizer
usage are obtained. The biogas produced is rich in bio-methane with compositions
3
ranging from 55% to 70% and the other major component is carbon dioxide with
composition ranging from 25% to 35%. The biogas calorific value can be enhanced by
applying purifying techniques such as adsorption which separates the carbon dioxide to
have bio methane content with more than 90% (Ziauddin & Rajesh, 2015).
Waste requires to be handled with care through management practices so as avoid
environmental pollution of any kind. Waste management is the process of collection,
transportation and disposal of sewage, garbage and other waste materials (Macharia,
2015). Waste management includes management of all stages and resources for proper
handling of waste products, from maintenance of vehicles used to transport waste and
dumping sites to compliance with health codes and environmental regulations (Savage,
2002). Waste management is mainly achieved through the 3R’s which are; Reduce,
Reuse, and Recycle. The 3R’s are meant to reduce the quantity of waste that is produced
while reducing their impact on the environment. The first R is reducing waste where the
waste is produced and what is required for use is significant to the waste management
(Savage, 2002). It implies that, when less waste is produce there is also minimum to reuse
and to recycle. Reduction process of waste starts with examination of what is used for
and what is being used. The second R is reusing where waste is taken back for reuse
before disposing off it. This includes that waste which still has some value and in most
cases is when they can be used for another purpose than the original one (Ziauddin &
Rajesh, 2015.). For example after using cooking fat/oil in a container, then the container
is converted into other uses of storing items such as grains, water or washing bucket. This
will limit the quantity of waste dispose by making use of it. On the other hand, recycling
4
is the third step in waste management. Recycling is the process of molding back the
waste product to become the raw material of a new item.
The challenge facing recycling process is that, while the communities are willing to
collect and sort the waste there are no proper plants to undertake the recycling process of
transforming the waste into raw materials. (Thomsen et al, 2004). Efforts are underway to
bring together the factories that produce waste and the industries to convert the waste into
raw materials, for example detergent industry and oil industry. This will be achieved
through incentive credits and agreement.
This study, focus on waste generated after processing takes place in the factory which is
treated as an agricultural waste. Tea is one of the major cash crops in Kenya which plays
a major role in economy. Most areas in the Rift valley region having embraced tea
farming amongst other areas like Mount Kenya areas of Kiambu, Murang’a and other
areas with favorable climate in the country. Various tea processing plants have been set
across the country to help the farmers’ process their product before taking it to the
market. Most of tea factories in the country do not comply with the Kenya Tea Board
regulations on disposal of tea waste. Tea factories produce waste tea mainly used as
manure in tea farms because of less effective management technologies available. Waste
can be converted into a useful resource that enable both waste management and
production of clean source of energy. Tea wastes are the waste derived from tea factories
as a result of tea losses and these include buds, leaves discarded and tender stems of tea
plant. (Meres et al, 2004). Tea waste if not properly dispose off will cause result in
environmental pollution on ground water will be colored increasing its turbidity, soil
structure and texture will also be affected and increase dust in air.
5
According to Kenya Tea Board regulations, before holding, selling or exporting stock of
waste tea, it has to be admix with urea of not less than five percent, slack lime, cow dung
or any other denaturant that may be specified by the Board to denature it. Most solid
waste of tea industries are tea waste which are sometimes used to extract caffeine (Liu et
al, 2010). There are two types of tea waste that are produced these are; Factory Tea
Waste (FTW) and Decaffeinated Tea Waste (DCTW). The fiber part of leaves is not used
during tea processing hence removed and discarded because they affect tea quality. This
waste sometimes contains leaves and dust hence causing environmental pollution. Tannic
acid present in FTW limit the use of this tea by-product as pig and poultry feed which is
much prevalent in the country (Faerber & Herzog, 2010). On the other hand
Decaffeinated Tea Waste (DCTW) that is obtained after caffeine extraction from waste
tea contains less quantities of tannic acid because most of the acid have been extracted.
1.1.1 Sources of biogas
Wastes that are rich for biogas production include: municipal and domestic wastes,
agricultural and excreta wastes and industrial wastes. Methane is produced from
decomposing landfills, thermal cracking of hydro-carbons, incomplete combustion of
biomass, livestock gut, incomplete combustion of biofuels, wetlands and rice paddy fields
and termites gut. (Bousquet et al, 2010)
1.1.2 Biogas Production from Waste Tea Leaves
In Kenya, tea industries are the major contributors to economy in agro-based sector. Tea
waste can also be recycled through various processes like biogas production which is a
source of clean/non-fossil energy through anaerobic degradation. Anaerobic digestion is
achieved in absence of oxygen and is one of the best approaches to deal with tea waste
6
issue by converting the waste tea leaves to biogas, and fertilizer as a by‐product (Kumar,
2004). The waste materials including municipal waste and cellulosic material waste (e.g.
wood and waste textiles) are examples of bio waste that can be used in the production of
biogas as raw materials. Tea leaves contain many chemical compounds which can be
extracted, when these compounds are broken down, they form complexes and other new
compounds. Tea leaves are mainly composed of water, when plucked, these leaves starts
to lose water and therefore wilt and this process known as withering in the tea processing
plants. When tea leaves undergo withering process, their cells become flaccid and walls
breakdown this leads oxygen coming into contact with the chemical compound inside the
leaf, resulting oxidation reaction.
Gasification and pyrolysis methods can be used in generation of bio-char and bio-oil
from processed tea waste as raw material. In pyrolysis process, a liquid fuel bio-diesel is
produced. This can be used in running engines, in static heating and generation of
electricity in turbines. While gasification process involves production of a fuel gas which
can be burn to run engines or generation of electricity in turbines or heat generation.
(Demirbas, 2010).
Thermo-chemical conversion of biomass is achieved through two main processes.
Fluidized Bed Pyrolysis (FBP) method and Circulating Fluidized Bed (CFB) are the
techniques that are used in conversion of biomass to thermally degraded products. These
processes take place in limited supply of oxygen and varying operating temperatures.
Primary vapors from pyrolysis process are adiabatically quenched to produce bio-oil.
High quality bio-oil is obtained from Fluidized Bed technique since it has maximum
potential. Oils obtained from biomass pyrolysis tend to have a number of complex
7
organic chemicals. This enable them to have higher calorific value enabling to be used in
industrial combustion systems. Gases obtained from biomass have energy content that
range from 3.5–5.0 MJ/m3 which can be used in industrial combustion by firing of
furnace and power generation in diesel engines. Tea seed can be utilized as a fuel to fire
cyclone boilers and for firing pulverized coal for power generation (Neves et al, 2011).
Polyphenols, enzymes amino acids, carbohydrates, minerals methylxanthines, pigments
and many aromatic compounds and volatile flavor are the compounds that give the fresh
tea leaves aroma, taste, flavor and appearance when processed. The chemical
composition of tea leaves gives it an advantage of producing biogas through anaerobic
digestion thus presenting a good opportunity to recycle the waste (Cheng, 2010).
Therefore, the fact that tea leaves can produce biogas from its chemical composition
through anaerobic digestion prompted this study to determine the production of biogas
from tea waste as an integrated waste management approach at DL Koisagat Tea Factory.
1.1.3 Uses of Methane
Methane gas can be easily compressed into liquid form, stored and exported. Other
applications include domestic use in homes for cooking and industrial use for generation
of electricity in both external and internal combustion engines.
1.2 Statement of Problem
Tea factories produces a large quantities of waste tea leaves, but tea waste management
system is less effective in the country. These wastes accumulate in the factory dump sites
to large quantities of waste tea leaves. This can cause pollution of ground water as it may
alters water turbidity. Also presents of waste tea leaves in water bodies can lead to change
8
in water composition. This tea waste may be reduced by transforming into use by
anaerobic digestion to provide clean source of energy and also improve environmental
conservation through waste management. The waste tea leaves disposed off to the
environment decay resulting in change in soil quality. Dust from waste tea when blown
by the wind can cause air pollution.
DL Koisagat uses various sources of energy like biofuels and electricity which are quite
expensive. The fact that the factory uses 12 metric tons of wood daily as source of energy,
exposes the environment to the danger of degradation from heavy logging which is a
double cut to the environment. Considering numerous tea factories in Kenya operating at
the same rate pose environmental danger. Use of biofuels like diesel is also a source of
pollution which also calls for attention of an alternative energy source to the factory. The
fact that there is tea waste that causes harm to the environment offers a solution from the
fact that through anaerobic digestion, the factory can generate biogas which can provide
other source of energy to replace wood and biofuels used. The utilization of tea waste
reduces direct pollution from the waste as well as the indirect pollution from wood and
biofuels used. Therefore, use of wood to provide factory’s energy and disposal of waste
tea to the environment are major sources of pollution from the factory. Therefore, the
study investigates the production of biogas from tea waste as an integrated waste
management approach at DL Koisagat Tea Factory.
1.3 Project Justification
Industrialization may cause pollution, tea factories emit dust, produce waste tea leaves,
uses wood as the main source of energy and emission of organic gases from generators.
The study will be beneficial to numerous stakeholders. The tea factories owners being the
9
first group to gain from the outcome of this study in that they will be in a position to
implement the model of biogas production which will help them reduce energy costs of
running the factories using available waste as raw materials. The surrounding community
will benefit from limited pollution from the factory and also supply of surplus of clean
energy. The factory will be able to meet Environmental Act 2015 requirements of
attaining minimum waste production released to the environment from the factory
through the 3R’s; reusing the waste, reducing and recycling. Also, the production of
renewable energy will also offer an alternative solution to the use of wood and biofuels.
Despite production of GHGs (CO2 and water vapor) during combustion of methane,
forest conservation acts as sinks. The model of biogas production will also be beneficial
to the national and county government as it will be able to implement it in a bid to reduce
tea waste pollution in tea growing areas.
1.4 Objectives
The main objective of this study is to investigate the potential for biogas production using
waste tea leaves at DL Koisagat Tea factory.
1.4.1 Specific Objectives
The research was carried out with the following specific objectives
1. To estimate the quantity of tea waste produced from DL Koisagat Tea Factory.
2. To determine the optimum condition of temperature, pH and retention time on
production of biogas from waste tea leaves.
3. To estimate the potential of biogas production at DL Koisagat Tea Factory.
10
1.5 Research Questions
1. What is the amount of waste tea leaves generated at DL Koisagat Tea Factory?
2. What is optimum temperature, pH and retention time for biogas production from
waste tea leaves?
3. What is the potential of biogas production at DL Koisagat Tea Factory?
11
CHAPTER TWO
LITERATURE REVIEW
2.1 Introduction
Concerns for environmental pollution, energy conservation and the availability of
agricultural organic wastes in Kenya as waste materials, have made a renewed interest in
the processing of these wastes for energy recovery and waste management. Of the several
available types of energy conversion processes, anaerobic fermentation has been proved
to be the best technique for many agricultural operations (Islam et al, 2016). Anaerobic
degradation can transform most of agricultural wastes to produce biogas or methane gas.
Anaerobic digestion is a designed methanogenic transformation of organic material in
absence or limited supply of oxygen and involves numerous different species of
anaerobic micro‐organisms that convert organic matter into biogas (Laskri et al, 2015).
Anaerobic digestion uses in waste management results in importance that go beyond
basic waste treatment. This importance includes energy conservation and energy
production. In waste treatment, anaerobic digestion promotes environmental benefits
which include, conservation of nutrients pathogen control, reduction of odor and
reduction in greenhouse emissions (Islam et al, 2016).
Renewable resources use results in a closed carbon cycle and hence does not lead to
increase in concentrations of carbon dioxide in the atmosphere compare with fossil fuel.
Also renewable resources cut atmospheric pollutants which leads to acid rain which are
mainly contributed by fossils. Therefore, anaerobic digestion is both a waste management
method which enhance production of clean energy and improve environmental
conservation.
12
2.2 Environmental Management System
Environmental Management System (EMS) is a set of control methods and sequence that
enable a firm to minimize, manage and analyze its products, services and activities which
causes environmental degradation so that the operate with high efficiency. EMS is
universal, it is applicable in both private and public sector, small or bigger sizes
organizations. EMS is built on ISO 14001 model that is designed to help one to
sequentially control, identify and monitor environmental issues (Faerber & Herzog,
2010).
Most industries are changing towards cleaner production and ISO certification. In order
for the companies to accomplish an integrated waste management, accurate data on the
amount and quality of waste is needed. Reliable data and amount of waste produced
determine the planning and success of operation of waste management system. (Faerber
& Herzog, 2010). Designing proper pollution control methods, evaluation and
formulation of waste management policy requires knowledge on composition and
quantity of waste. Other factors that are considered include equipment needed to estimate
the thermal chemical and physical properties of the waste, facilitate design process,
identify the source of waste production and estimate product recovery potential and also
align with the policy and legal framework.
Due to limited budget and improper management of records which have led to missing of
data or lack of data update on waste composition and generation have resulted in lack of
waste information from various sources. Without a proper estimate of amount of waste
that can be projected, decisions about equipment and landfill space and recycling
capacity within the factories cannot be well formulated. Developing countries have
13
challenges in solid waste management an aspect that has contributed to environmental
pollution due to the properties of solid waste which is not the same to that found in
developed countries. About 0.4-0.6 kg per day of solid waste is generated in low income
countries as opposed to 0.7 to 1.8kg per day in developed nations (Drapcho et al, 2008).
The transportation of waste from industries and other sources of waste production is also
a challenge. The issue of urbanization has compromised planning and limited time to
accommodate swelling urban population. The garbage dumps have increased an aspect
that has contributed to health concerns as well as environmental pollution.
2.3 Policy and Legal Framework that exist
In 2002, the Government of Kenya establish Vision 2030 which is a blueprint long-term
plan in achieving and transforming Kenya to a middle level income country. This
transformation is attainable through industrialization. Also essential to this is having a
safe and clean environment. The Waste Management Regulations of 2006 offers
comprehensive management practices of all wastes in the country. It is a requirement
now that waste generators separate their waste as non-hazardous and hazardous waste and
then disposing off the waste in an environmentally acceptable manner (Kumar et al,
2004). Also it is a requirement under the regulation to transport the waste in a vehicle
licensed by NEMA as Waste Transporter.
In Kenya, Environmental Management and Coordination Act 1999/amended 2015
provides legal framework for institutional coordination in environmental management.
Standard Enforcement Review Committee formation is provided in Section 70. This
committee with the consultation with other relevant authorities advises National
Environment Management Authority to develop methods for determining the quality
14
water. Section 72 of the EMCA prohibits the discharge of radioactive and noxious waste
into water bodies this contradicts the water pollution control standards. A person
contravening this provision is liable to imprisonment for a term not exceeding two years
or a fine not exceeding one million shillings, or both when convicted. Also it is the
polluter responsibility to pay for restoration and removal cost which will include
compensation of any aggrieved parties at the time of pollution of water body, reparation
or restituting as in EMCA 1999.These policies and frameworks are important to the DL
Koisagat tea factory as it taken as a guideline to dispose its waste generated from tea
processing an aspect that would be key to observe during this study.
2.4 Solid Waste Management
Solid material that is useless or unwanted that is produced from combined commercial
activities and residential is known as solid waste. Solid waste is classified according to its
source, contents and potential hazard. Solid waste management promotes human and
environmental health by reducing or eliminating adverse impacts on environment
therefore enhance economic development (Faerber & Herzog, 2010). Solid waste
management involves a number of stages such as collection, monitoring, recycling,
processing, disposal and transportation.
Solid waste management methods differ from country to country depending on the levels
of economic growth, population intensity and physical geographical (Afroz and Masud,
2011). Industrialized countries have systematic methods of disposal and collection of
solid waste. Waste disposal regulations require disposal sites to have environmental
conservation technologies. In developing countries, this regulation does not apply
equally. They provide formal disposal and collection methods to a certain population.
15
The rural and urban poor population does not receive formal services of waste
management or proper designated dumping sites (Jantsh and Mattiason, 2004). Even
with designated site as dumping area, it is often open and unprotected area which poses
serious threats to environment and public health.
2.5 Reduce, Reuse, Recycle
Waste management is achieved through the 3R’s; waste reuse, waste reduce and
recycling of waste. The use of these methods derive many environmental gains. (Shalini
et al, 2000). Reduction of waste minimize pollutants, save energy, conserve resources,
prevent greenhouse gas emission also limit requirement for landfill and treatment of
waste.
Both waste reuse and reduction of materials are waste prevention methods. These
methods ensure that no waste is generated at the source therefore reducing the
requirements for waste management technologies. Waste reduction methods include
practices such as choosing of reusable glass and plastic containers, donating unusable
material rather than disposing off it as waste, manufacturing products with minimal
packing materials, promoting public awareness to choose reusable materials. (Marcia et
al, 2007). The most efficient method to manage waste is through reduction at the source
of generation
Manufacturers are expected to produce less waste at their facilities which means they
have to design products that have the minimal number of packaging which meets the
consumer needs by making the product safe and it should be of high quality. All the
techniques of waste control requires public participation for their input. (Oriere, 2014).
The public should know their role in waste prevention though educational programs and
16
training. Also policy making is the government responsibility to regulate quantity of
packaging and the type used by manufacturers by ensuring that biodegradable materials
are used.
Recycling is the conversion of waste into raw material by a manufacturer of a new
product. There are three recycling phases; first phase is the sorting of waste and
recyclables collected which are turned to starting materials of another process. Sorting is
done at the source. Collected waste is turned into raw materials which are used in making
other products (Walker et al, 2009). These wastes are processed in industry then
transform into other different products or similar. Recycling includes both post-
consumer waste such as plastic bottles, newspapers, aluminium cans and cardboard and
pre-consumer waste which include shavings and factory cuttings. Recycling is a resource
conservation method as well as energy saving
The process of solid waste management is very critical in this study in supporting the
recycling process of waste tea leaves in Koisagat tea factory. This gives an insight on the
processes of managing factory waste through various practices. Recycling is the main
practice of solid waste management in tea industries as the waste tea leaves becomes the
raw material for biogas generation thus eliminating the discharge of the waste into the
environment.
According to the study of Impact of Industrial Pollution on Rural Communities on
Environment and Accountability (Battista et al, 2016). In determining the impact of water
pollution on human health, agriculture, livestock and the rural communities. The authors
found that there was connection between industrialization and industrial pollution,
17
damage to plants, changes in local environment, damage to animal husbandry which
impacted negatively on the sanitation and health of local community.
In the study of Impacts of Effluent from Kapkoros Tea Factory discharged into Kipsonoi
River on the local community (Tonui, 2018), the study used a descriptive survey design
and a sample of 363 respondents was selected using random simple sampling. The data
collected using the constructed questionnaires were well organized and analyzed using
SPSS program. The findings revealed that the Kapkoros Tea Factory produces solid
wastes from different stages of production like tea leaves from offloading bay, firing,
withering, packaging and processing. Also liquid wastes are produced during factory
cleaning process. Thermal wastes are as a result of heat loss to the surrounding. These
wastes make the local communities surrounding to the factory vulnerable to diseases like
cholera and typhoid. It was recommended that industrial effluent is mainly as a result of
agro-industrial industries. Developing countries are facing myriad challenges as a result
of poor waste management which impacted negatively on human and environment health.
Chowdhury (2016) studied tea waste management from West Bengal, India by selecting
20 sites of study out of 30 tea industries by employing random cluster sampling
technique. These industries are spread within the major tea producing regions of Cooch
Behar, Darjeeling, Alipurduar and Jalpaiguri. During data collection, primary and
secondary data were documented using interviews, questionnaires, photographs and
observation were taken. The author’s main objective was to bring out waste management.
The study recommended that waste tea was having socio-economic value that can
improve the livelihood of gardeners. The waste can be used in extraction of caffeine, as
pig and poultry feed and compost manure in gardens.
18
Developing countries are vulnerable to diseases resulting from pollution due to
environmental degradation (Cornejo, 2010). Diarrhea is the most common that 3-5
million cases are reported yearly. This leads to loss of working days because of workers
absence from duty. Developing countries are prone to water-borne disorders due to
unsafe drinking water as a result of industrial pollution.
Inoti (2016) estimated the potential of renewable energy utilization within a tea factory.
Biodegradable waste thermal potential was estimated as a result of amount of waste
produced while the monthly wind and solar data for Nyeri was sourced from Renewable
Energy Technology (RET) screen 4 software data base. RET screen software was used to
model and carry out financial analysis of the renewable resources identified in the tea
factories. The results of the study show energy intensities ranged from 32.40 MJ per kg
Made Tea (MT) to 38.31 MJ per kg MT and cost intensities from USD 163.05 to 214.72
per ton of MT.
Continuous disposal of industrial waste on land and water bodies leads to increase in
pollution load which result in pollution of ground water (Speece, 1996). In the
Mettupalayam taluk Tamilnadu study, he postulated that shallow open wells surrounding
the industrial places had their water quality deteriorated and when this polluted water is
used for irrigation, it resulted in increase in soil salinity.
The assessment of waste management structures for tea factories in Nyasiongo tea factory
in Kisii Kenya (Tonui, 2018) found the sources and types of thermal, solid and liquid.
These wastes produced during tea processing were identified through observation. Solid
wastes produced at every processing stage were identified, sampled, weighed while
recording their weights. Liquid waste which is mainly water was sampled for
19
experimental analysis for pH, COD, electrical conductivity and BOD. For thermal source,
boiler was sampled and analysed to determine its efficiency. The authors found that
Nyansiongo tea factory produces solid waste of 0.01% of the total tea processed. Also
found that the minimum solid waste is produced at the off-loading bay while the highest
is the withering compartment due to spillage of leaves. The factory had no proper
mechanism of disposing off solid waste produced in the factory and the wastes were not
well separated for different disposal methods.
Aksay et al (2018) sought to develop ways of disposing off and reuse of tea waste from
households. A co-digestion was used to determine the potential of biogas production
from household tea waste. Co-digestion was carried out in a laboratory scale batch
digester under mesophilic conditions for 80 days. The digesters were fed with wastes
with different mixing ratio and varying stirring speed. Results obtained revealed that
digestion has positive results on biogas generation and methane yield. 296.89mL/g VS of
biogas was obtained at optimum conditions and digester with 25% tea waste and 75%
cattle manure and stirring speed of 100rpm yield 77.10% methane. From the results, co-
digestion of household waste tea and cattle manure have positive impact in production of
biogas and methane yield.
2.5.1 Types of Waste Tea leaves
Tea is one of the Kenya’s leading cash crops and makes important contribution to the
country economy. 399 metric tonnes of black tea were produced in 2010 and the figure
has since then increased. Over 95% of the tea that was exported in bulky earning over 97
billion in foreign exchange (Kenya Tea Directorate, 2011). The tea products are
commercially available and are dictated by the method of processing. The two most
20
common varieties of tea products are Instant tea and black tea. Black tea is produced by
Cut, Tear and Curl (CTC) method of manufacture which accounts for 99% of the tea
produced in the country. DL Koisagat tea factory produces black tea which makes it a
typical factory in the country. Instant tea accounts for the remainder (Islam et al., 2016).
The production of tea from the factory gives forth to tea waste which can be classified
into various types. Most waste from tea factories are as a result of by-products. These
waste can be used to extract caffeine.
Macharia (2015) indicated that solid waste is collected from the packaging and sorting
area and the dry leaves from the weighing section in the factories. The highest amount of
solid waste is produced from the withering process due to spillages, and at the offloading
area. Solid waste produced from factories may be poorly disposed off and not properly
separated. The biodegradable and non-biodegradable waste is collected together and has
no clear tracking of the amount generated. The main source of liquid waste in tea
industries is from cleaning processes. It is estimated that during major clean-ups in the
factories 40m3
of waste water is produced. Most tea industries in Kenya do not have
proper Effluent Treatment Plants (ETPs) and the water is discharged into nearby rivers
causing pollution. For instance, an experimental analysis of wastewater for Nyansiongo
Tea Factory found out that BOD5 levels measured 150 mg/L while the COD levels
measured 505.5 mg/L against the NEMA recommended maximum discharge limits of 30
mg/L and 50 mg/L respectively.
There are two types of tea waste that is produced and they are: Decaffeinated Tea Waste
and Factory Tea Waste (Islam et al., 2016). In the factory during tea processing operation
fiber part is remove and disposed in turn this fiber contains dust and small parts of the
21
leaf. Factory Tea Waste (FTW) have some quantities of tannic acid which limit its
application for use as pig and poultry feed which is much prevalent in the country (Islam
et al., 2016). Decaffeinated Tea Waste (DCTW) is mainly available after extraction of
caffeine in caffeine industries.
2.5.2 Optimum Conditions for Biogas Production from Waste Tea Leaves
2.5.2.1 pH
The pH range of about 6.8-8.0 work best for anaerobic digestion i.e. near neutral.
Extreme pH of both alkalinity and acidity retard fermentation process. Most biomass
when introduced into the digester, lower the pH since they are acidic in nature. This will
retard digestion rate until when the acids have been consumed by the bacteria (Laskri et
al, 2015). Carbon dioxide production is promoted by high pH. Acidic medium affects
methanogens more than acidogenic bacteria.
2.5.2.2 Carbon: Nitrogen ratio
Carbon intake is higher than nitrogen therefore the ratio of carbon to nitrogen in biomass
is set at 30:1 for high yield of methane. Lower ratio make nitrogen available after all
carbon has been consumed (Inoti, 2016). The residual nitrogen then dissolves digestate
thus affecting fertilizer quality. While high ratio of carbon to nitrogen makes the bacteria
to die due to nitrogen starvation. This makes the bacteria return nitrogen into the
substrate thus retarding the rate of the process.
2.5.2.3 Temperature
Mesophilic bacteria work best at a temperature of between 290C and 41
0C while
thermophilic bacteria work best at a temperature of between 490C and 60
0C. At these
temperature range, bacteria reproduce at a high rate resulting in more rapid digestion
22
(Laskri et al, 2015). Temperatures of between 320C and 37
0C has been proven to produce
the highest yield of methane but above or below this range, biogas will constitute of
mainly carbon dioxide and other gases. At thermophilic condition, the digester operates at
high loading rate and also desirable for pathogen destruction. This result in shorter
retention time but this condition has disadvantage of being easily contaminated by
toxicants.
2.5.2.4 Retention time
Retention time of anaerobic process is influenced by some factors such as environmental
conditions and characteristics of organic waste. Hydraulic retention time (HRT) should
not be short to allow bacteria enough time to digester the biomass (Ziauddin & Rajesh,
2015). Retantion time of most thermophilic and mesophilic range between 25 days and
30 days.
2.6 Anaerobic Biochemistry
Anaerobic digestion (AD) is the degradation of organic materials by micro‐organisms in
the absence of oxygen. From the process engineering point of view, anaerobic digestion
is relatively simple. Since the process uses a ‘mixed culture’ of ubiquitous organisms, no
sterilization steps are required and product separation is unnecessary as the biogas
separates itself from the aqueous phase. Indeed, since the methane produced is relatively
insoluble, it does not accumulate to inhibitory concentrations in the fermentation mixture.
However, the biochemical processes involved are very complex.
It is a multi‐step biological process where the organic carbon is mainly converted to
carbon dioxide and methane
23
(Angelidaki et al., 2003). The process can be divided into four steps: hydrolysis,
acidogenesis, acetogenesis and methanogenesis.
Hydrolysis
Hydrolysis is the first step in anaerobic digestion processes. During the hydrolysis step,
complex organic matters, such as carbohydrates, proteins and lipids are hydrolyzed into
soluble organic molecules such as sugars, amino acids and fatty acids by extracellular
enzyme, i.e. cellulase, amylase, protease or lipase (Parawira et al., 2005). Hydrolytic
bacteria, which hydrolyze the substrate with these extracellular enzymes, are facultative
anaerobes. Hydrolysis can be the rate‐limiting step if the substrate contains large
molecules (particulates) with a low surface‐to volume ratio (Vavilin et al., 1996). While
if the substrate is readily degradable, the rate‐limiting step will be acetogenesis and
methanogenesis (Björnsson et al., 2001). When the substrate is hydrolyzed, it becomes
available for cell transport and can be degraded by fermentative bacteria in the following
acidogenesis step.
Acidogenesis
In the acidogenesis step, the soluble organic molecules from hydrolysis are utilized by
fermentative bacteria or anaerobic oxidizers (Garcia‐Heras, 2003).
These microorganisms are both obligate and facultative anaerobes. In a stable anaerobic
digester, the main degradation path way results in acetate, carbon dioxide and hydrogen.
The intermediates, such as volatile fatty acids and alcohols, play a minor role. This
degradation path way gives higher energy yield for the microorganisms and the products
can be utilized directly by methanogenic microorganisms (Schink, 1997). However, when
the concentration of hydrogen and formate is high, the fermentative bacteria will shift the
24
path way to produce more reduced metabolites (Angelidaki et al., 2002). The products
from acidogenesis step consist of approximately 51% acetate, 19% H2/CO2, and 30%
reduced products, such as higher VFA, alcohols or lactate (Angelidaki et al, 2002).
Acidogenesis step is usually considered the fastest step in anaerobic digestion of complex
organic matter (Vavilin et al, 1996).
Acetogenesis
Intermediates formed during acidogenesis, consist of fatty acids longer than two carbon
atoms, alcohols longer than one carbon atom and branched‐chain and aromatic fatty
acids. These products cannot be directly used in methanogenesis and have to be further
oxidized to acetate and H2 in acetogenesis step by obligated proton reducing bacteria in a
syntrophic relationship with hydrogen utilizers. Low H2 partial pressure is essential for
acetogenic reactions to be thermodynamically favourable (Schink, 1997). The products
from acetogenesis are then the substrates for the last step of anaerobic digestion, which is
called methanogenesis
Methanogenesis
In methanogenesis step, acetate and H2/CO2 are converted to CH4 and CO2 by
methanogenic archaea. The methanogenic archaea are able to grow directly on H2/CO2,
acetate and other one‐carbon compound, such as formate and methanol (Schink, 1997). In
the normal anaerobic digesters, acetate is the precursor for up to 70% of total methane
formation while the remaining 30% originates from H2/CO2. Moreover, the inter‐
conversion between hydrogen and acetate, catalyzed by homoacetogenic bacteria, also
plays an important role in the methane formation pathway. Homoacetogens can either
oxidize or synthesize acetate depending on the hydrogen concentration in the system.
25
Hydrogenotrophic methanogenesis functions better at high hydrogen partial pressure,
while aceticlastic methanogenesis is independent on hydrogen partial pressure. At higher
temperatures, the acetate oxidation pathway becomes more favourable (Schink, 1997). It
has been reported that methane formation through acetate oxidation can contribute up
to14% of total acetate conversion to methane under thermophilic conditions (60°C).
2.7 Bacteria Involved in Anaerobic Digestion
Consortia of microorganisms, mostly bacteria, are involved in the transformation of
complex high‐molecular‐weight organic compounds to methane. Furthermore, there are
synergistic interactions between the various groups of bacteria implicated in anaerobic
digestion of wastes. Although some fungi and protozoa can be found in anaerobic
digesters, bacteria are undoubtedly the dominant microorganisms. Large numbers of strict
and facultative anaerobic bacteria are involved in the hydrolysis and fermentation of
organic compounds. There are four categories of bacteria that are involved in the
transformation of complex materials into simple molecules such as methane and carbon
dioxide. These bacterial groups operate in a synergistic relationship in as much as group
1 has to perform its metabolic action before group 2 can take over,
Group 1: Hydrolytic Bacteria ‐ Consortia of anaerobic bacteria break down complex
organic molecules (proteins, cellulose and lipids) into soluble monomer molecules such
as amino acids, glucose, fatty acids, and glycerol. The monomers are directly available to
the next group of bacteria. Hydrolysis of the complex molecules is catalyzed by extra
cellular enzymes such as cellulases, proteases, and lipases. However, the hydrolytic phase
is relatively slow and can be limiting in anaerobic digestion of waste such as raw
cellulolytic wastes, which contain lignin.
26
Group 2: Fermentative Acidogenic Bacteria ‐ Acidogenic (i.e. acid‐forming) bacteria
convert sugars, amino acids, and fatty acids to organic acids (e.g., acetic, propionic,
formic, lactic, butyric, or succinic acids), alcohols and ketones (e.g., ethanol, methanol,
glycerol, and acetone), acetate, CO2, and H2. Acetate is the main product of carbohydrate
fermentation. The products formed vary with the type of bacteria as well as with culture
conditions (temperature, pH, redox potential).
Group 3: Acetogenic Bacteria ‐ Acetogenic bacteria convert fatty acids (e.g. propionic
acid, butyric acid) and alcohols into acetate, hydrogen, and carbon dioxide, which are
used by the methanogens. This group requires low hydrogen tensions for fatty acid
conversion; and therefore a close monitoring of hydrogen concentrations is necessary.
Under relatively high H2 partial pressure, acetate formation is reduced and the substrate is
converted to propionic acid, butyric acid and ethanol rather than methane.
Group 4: Methanogens ‐ Anaerobic digestion of organic matter in the environment
releases 500‐800 million tons [453.6 ‐ 725.75 metric tons] of methane per year into the
atmosphere and this represents 0.5% of the organic matter derived from photosynthesis.
This group of bacteria is composed of both gram‐positive and gram‐negative bacteria
with a wide variety of shapes. About two thirds of methane is derived from acetate
conversion by methanogens. The other third is the result of carbon dioxide reduction by
hydrogen.
27
CHAPTER THREE
RESEARCH METHODOLOGY
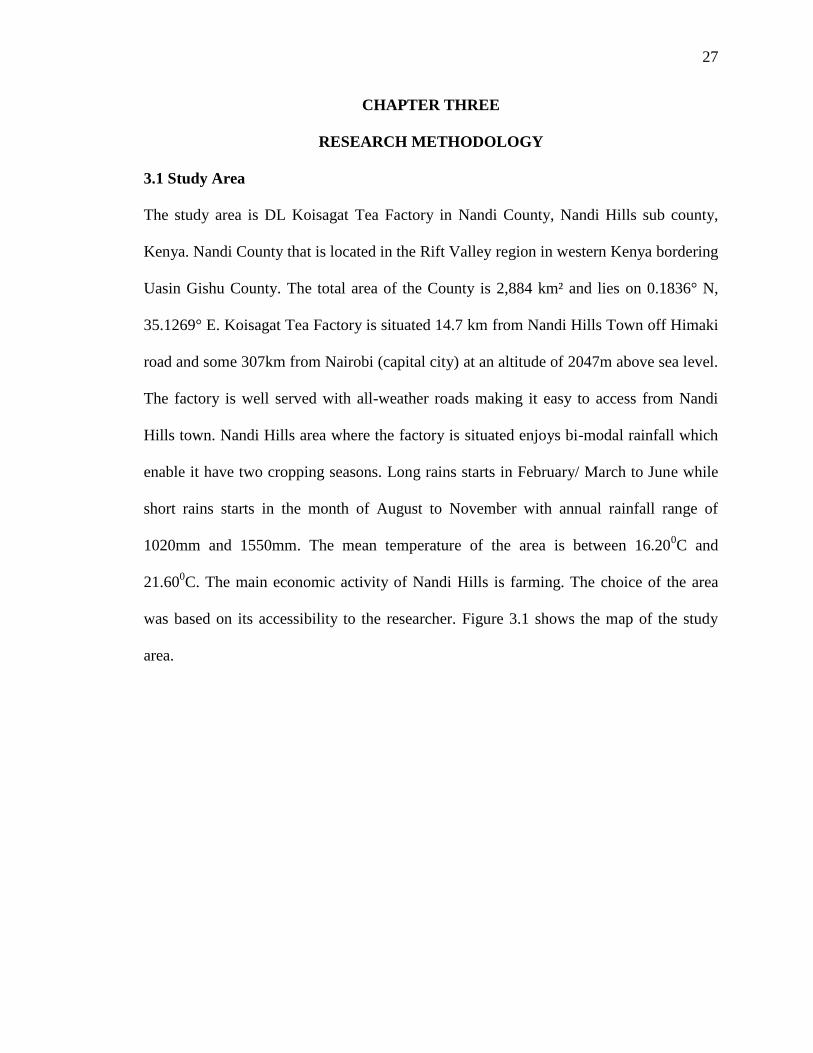
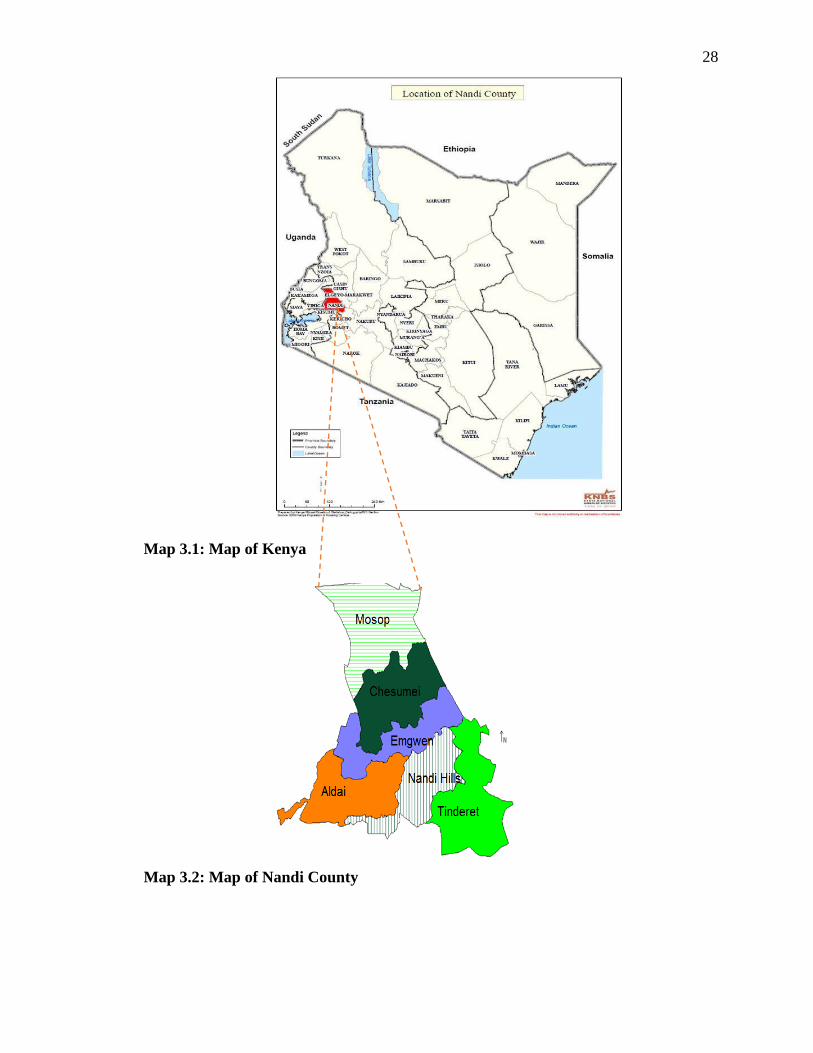
3.1 Study Area
The study area is DL Koisagat Tea Factory in Nandi County, Nandi Hills sub county,
Kenya. Nandi County that is located in the Rift Valley region in western Kenya bordering
Uasin Gishu County. The total area of the County is 2,884 km² and lies on 0.1836° N,
35.1269° E. Koisagat Tea Factory is situated 14.7 km from Nandi Hills Town off Himaki
road and some 307km from Nairobi (capital city) at an altitude of 2047m above sea level.
The factory is well served with all-weather roads making it easy to access from Nandi
Hills town. Nandi Hills area where the factory is situated enjoys bi-modal rainfall which
enable it have two cropping seasons. Long rains starts in February/ March to June while
short rains starts in the month of August to November with annual rainfall range of
1020mm and 1550mm. The mean temperature of the area is between 16.200C and
21.600C. The main economic activity of Nandi Hills is farming. The choice of the area
was based on its accessibility to the researcher. Figure 3.1 shows the map of the study
area.
28
Map 3.1: Map of Kenya
Map 3.2: Map of Nandi County
29
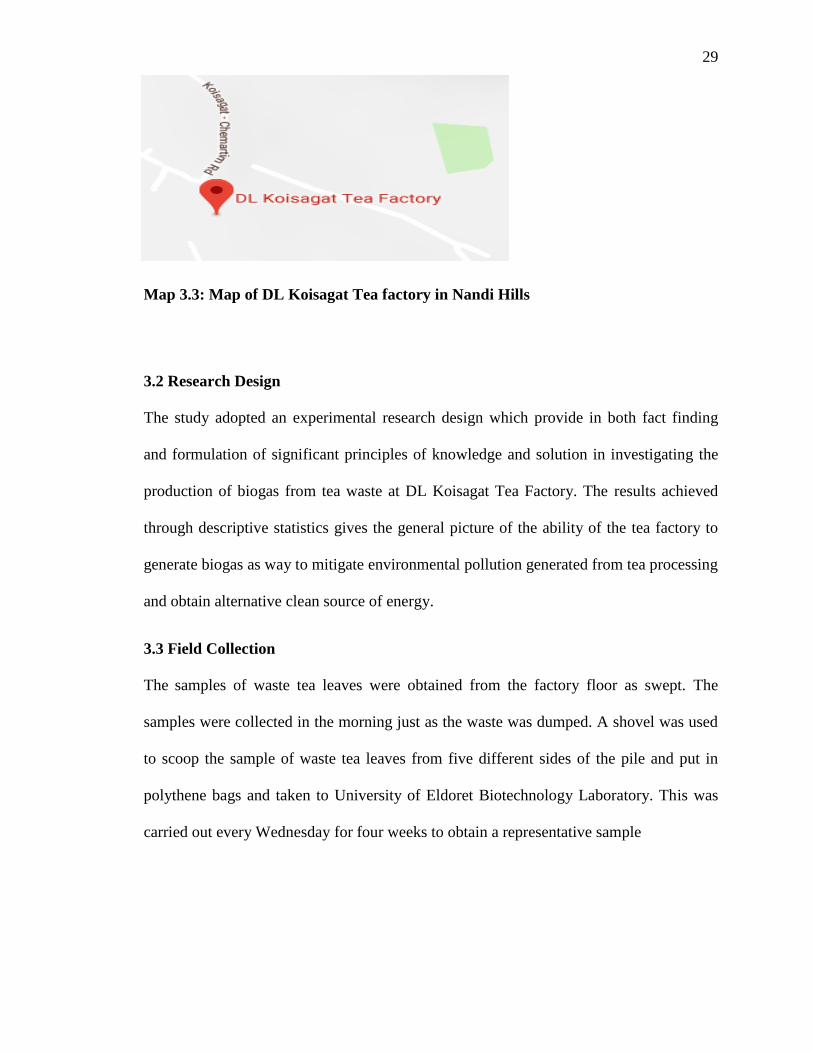
Map 3.3: Map of DL Koisagat Tea factory in Nandi Hills
3.2 Research Design
The study adopted an experimental research design which provide in both fact finding
and formulation of significant principles of knowledge and solution in investigating the
production of biogas from tea waste at DL Koisagat Tea Factory. The results achieved
through descriptive statistics gives the general picture of the ability of the tea factory to
generate biogas as way to mitigate environmental pollution generated from tea processing
and obtain alternative clean source of energy.
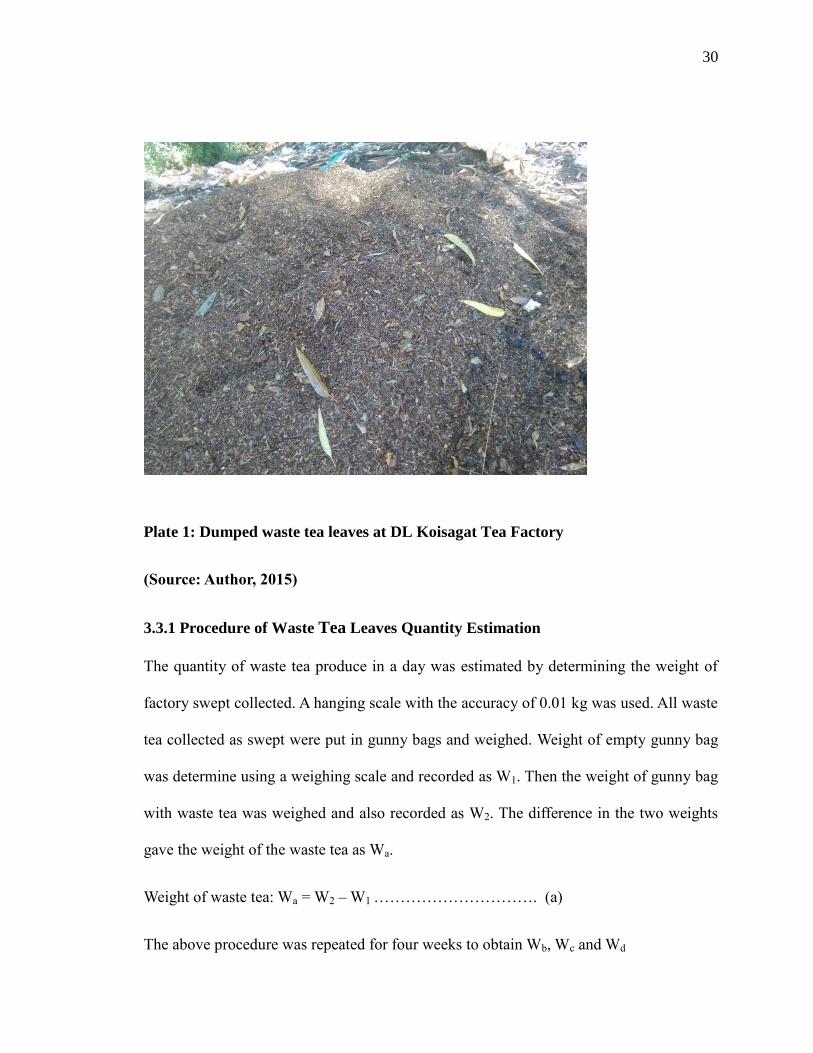
3.3 Field Collection
The samples of waste tea leaves were obtained from the factory floor as swept. The
samples were collected in the morning just as the waste was dumped. A shovel was used
to scoop the sample of waste tea leaves from five different sides of the pile and put in
polythene bags and taken to University of Eldoret Biotechnology Laboratory. This was
carried out every Wednesday for four weeks to obtain a representative sample
30
Plate 1: Dumped waste tea leaves at DL Koisagat Tea Factory
(Source: Author, 2015)
3.3.1 Procedure of Waste Tea Leaves Quantity Estimation
The quantity of waste tea produce in a day was estimated by determining the weight of
factory swept collected. A hanging scale with the accuracy of 0.01 kg was used. All waste
tea collected as swept were put in gunny bags and weighed. Weight of empty gunny bag
was determine using a weighing scale and recorded as W1. Then the weight of gunny bag
with waste tea was weighed and also recorded as W2. The difference in the two weights
gave the weight of the waste tea as Wa.
Weight of waste tea: Wa = W2 – W1 …………………………. (a)
The above procedure was repeated for four weeks to obtain Wb, Wc and Wd
31
The mean weight is used in determination of average production of waste tea leaves at
the factory. To obtain the average quantity produced, arithmetic mean is used.
The daily estimate of waste tea generated in the factory was determined by obtaining the
mean. The mean of the waste tea distribution �̅� is the sum of all weight ∑ 𝑊 obtained in
different days and divided by the number of days (n). This is obtained using equation 1
below:
𝑊 =𝑊𝑎+𝑊𝑏+𝑊𝑐+𝑊𝑑…..𝑊𝑖
𝑛 𝑜𝑟 𝑊 =
∑ 𝑊
𝑛 Equation 1
Where:
W= Distribution individual value
Σ𝑊= Sum of the values of W
n = Number of values present in distribution
𝑊=The mean value
3.3.2 Procedure Used for Biogas Production
Biogas production procedure was obtained from Standard Operation Procedure (SOP)
Laboratory for Environmental Engineering (Biolley; 2014).
Apparatus
The following apparatus were used during the study
Measuring cylinder, Water bath / incubator, Oven, two-liter plastic bottles with corks,
weighing balance, Bags: 100kg and 2kg, Gas Chromatograph (FID), NaOH, Inoculum,
NaCl, HCl, PVC tubes, Shove, Vacuum pump, Personal protection equipment (gloves,
32
glasses, dust coat and safety boots.), 100 mL Beaker with 50 mL distilled water,100 mL
Beaker with 30-50 mL Acetone, , and 100-250 mL Wastewater beaker.
Procedure
The contaminants in waste tea (substrate) were removed using physical separation
method mainly screening. Self-activity of the inoculum (control) was carried out in the
ratio of 1:1 (Inoculum + water). Weight of 4.5kgs of waste tea was measure using bench
scale. Then the substrate preparation was done by mixing Inoculum + water + substrate.
Then labelling of the reactor bottles for identification and drilling of bottle cocks using
bit drill to enable fixing of PVC tube was done in the lab. Then cutting of PVC tube each
into 50cm and fixing into the cork and paste to avoid gas leakage.
Water was filled into the incubator and its temperature set at 500C. The reactor bottles
were checked for cracks and other damages. The mixture of inoculum, substrate and
water was filled to 1.6L mark in the reactors where the pH and temperature of each
reactor was adjusted. The reactor bottles were cocked then shaken gently to prevent
clumping.
A total of 27 experimental sets were tested after being set at various pH, temperature and
retention time. The tests were done at a temperature interval of 25, 37 and 50 degrees
Celsius. pH values were set at 5, 7 and 9 where the retention time was set at 10, 20 and
30 days. These parameters were done to estimate the optimum biogas production at
various set of conditions.
Each gas tubing was connected tightly using rubber band to a balloon for holding the gas
generated in the reactor. Shaking of reactors and checking water level in incubator was
done every morning.
33
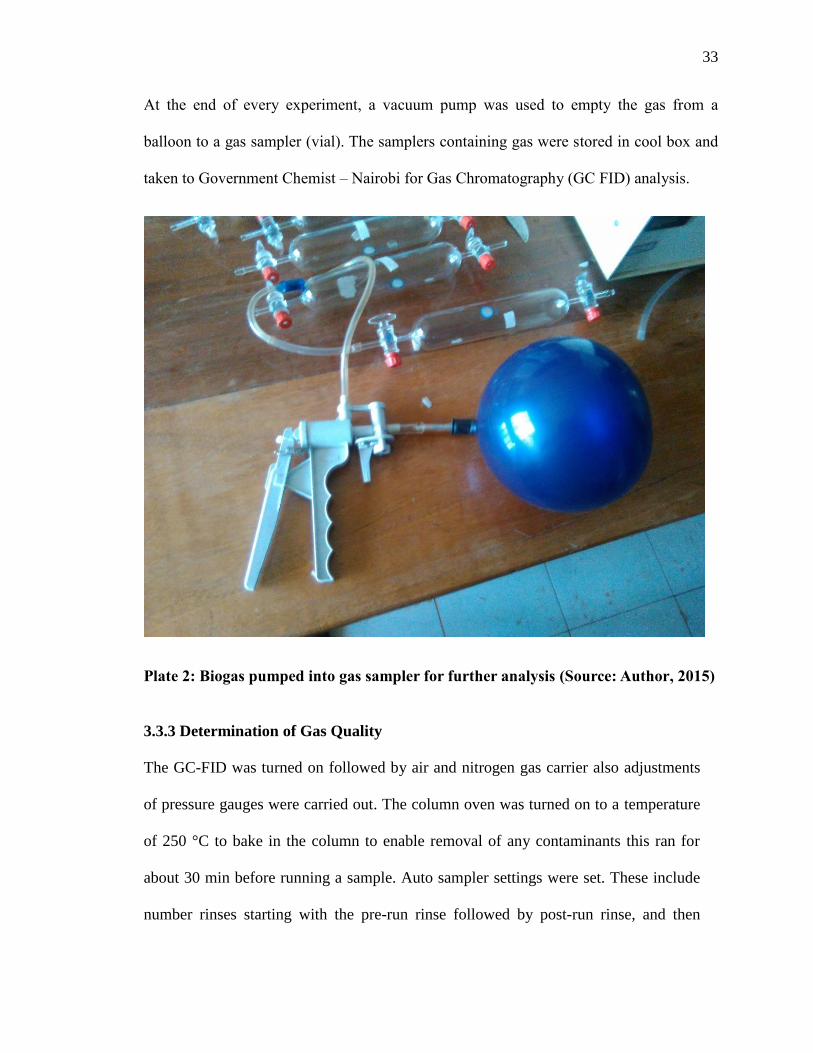
At the end of every experiment, a vacuum pump was used to empty the gas from a
balloon to a gas sampler (vial). The samplers containing gas were stored in cool box and
taken to Government Chemist – Nairobi for Gas Chromatography (GC FID) analysis.
Plate 2: Biogas pumped into gas sampler for further analysis (Source: Author, 2015)
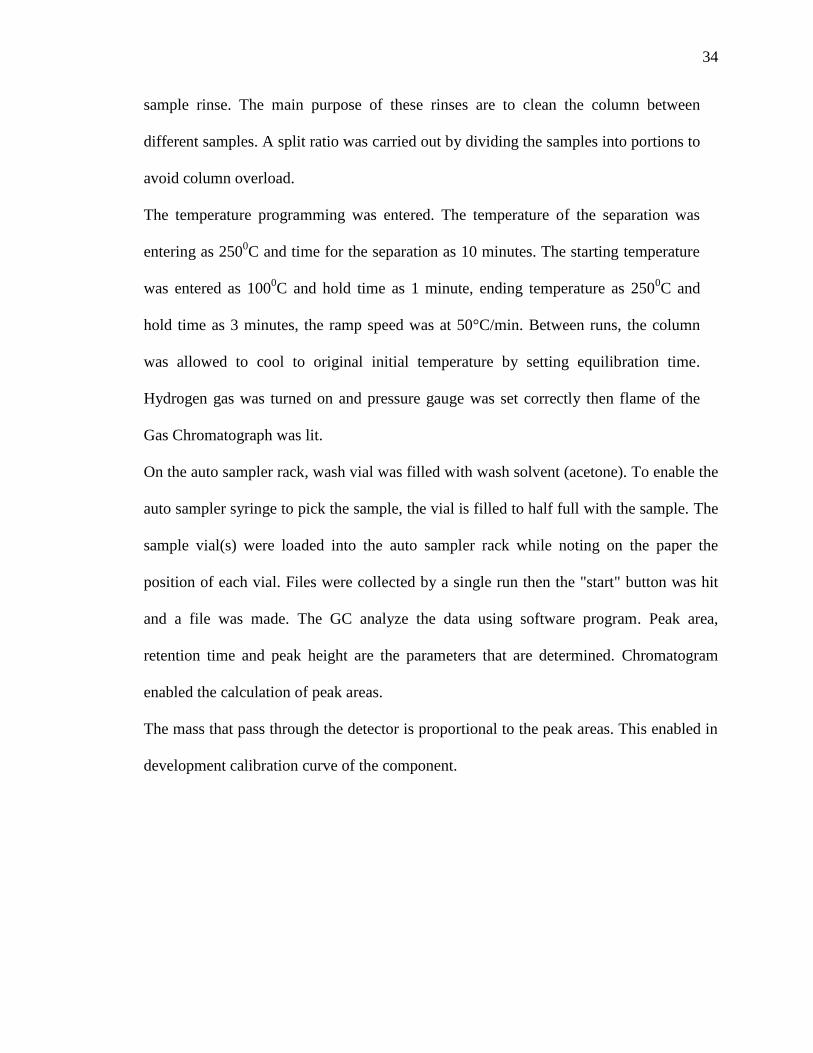
3.3.3 Determination of Gas Quality
The GC-FID was turned on followed by air and nitrogen gas carrier also adjustments
of pressure gauges were carried out. The column oven was turned on to a temperature
of 250 °C to bake in the column to enable removal of any contaminants this ran for
about 30 min before running a sample. Auto sampler settings were set. These include
number rinses starting with the pre-run rinse followed by post-run rinse, and then
34
sample rinse. The main purpose of these rinses are to clean the column between
different samples. A split ratio was carried out by dividing the samples into portions to
avoid column overload.
The temperature programming was entered. The temperature of the separation was
entering as 2500C and time for the separation as 10 minutes. The starting temperature
was entered as 1000C and hold time as 1 minute, ending temperature as 250
0C and
hold time as 3 minutes, the ramp speed was at 50°C/min. Between runs, the column
was allowed to cool to original initial temperature by setting equilibration time.
Hydrogen gas was turned on and pressure gauge was set correctly then flame of the
Gas Chromatograph was lit.
On the auto sampler rack, wash vial was filled with wash solvent (acetone). To enable the
auto sampler syringe to pick the sample, the vial is filled to half full with the sample. The
sample vial(s) were loaded into the auto sampler rack while noting on the paper the
position of each vial. Files were collected by a single run then the "start" button was hit
and a file was made. The GC analyze the data using software program. Peak area,
retention time and peak height are the parameters that are determined. Chromatogram
enabled the calculation of peak areas.
The mass that pass through the detector is proportional to the peak areas. This enabled in
development calibration curve of the component.
35
Plate 3: Gas Chromatography-FID at Government Chemist (Source: Author, 2015)
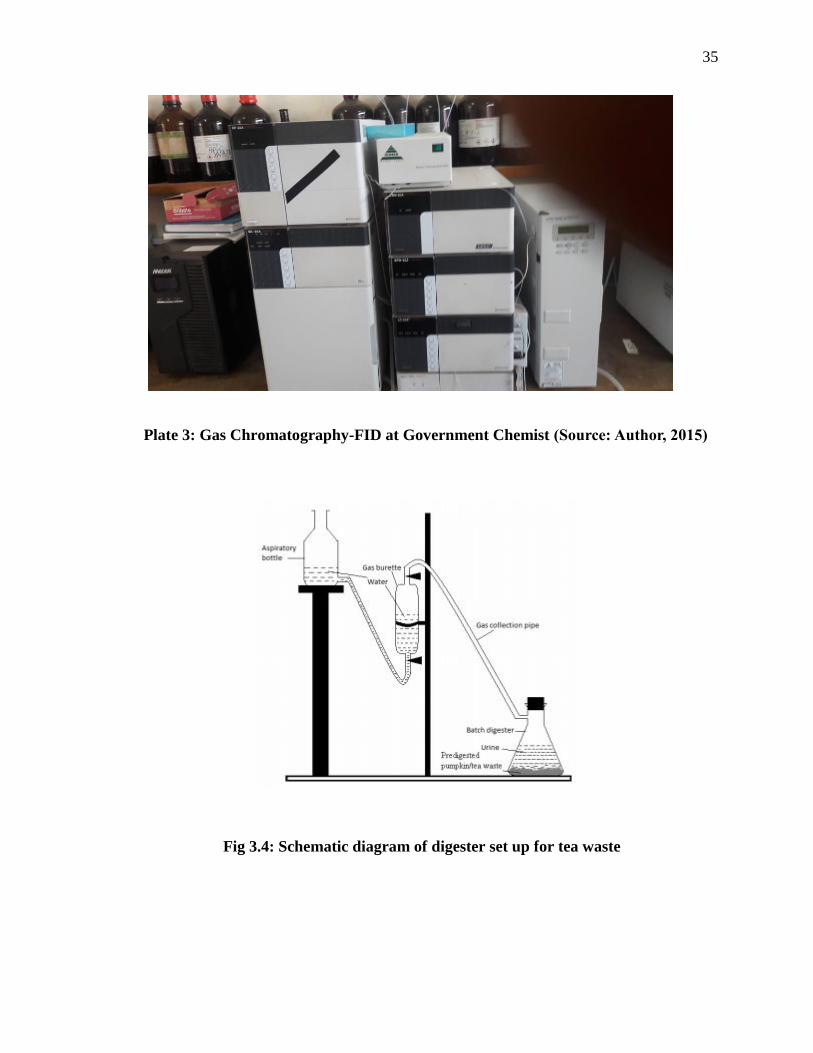
Fig 3.4: Schematic diagram of digester set up for tea waste
36
CHAPTER FOUR
RESULTS AND INTERPRETATION
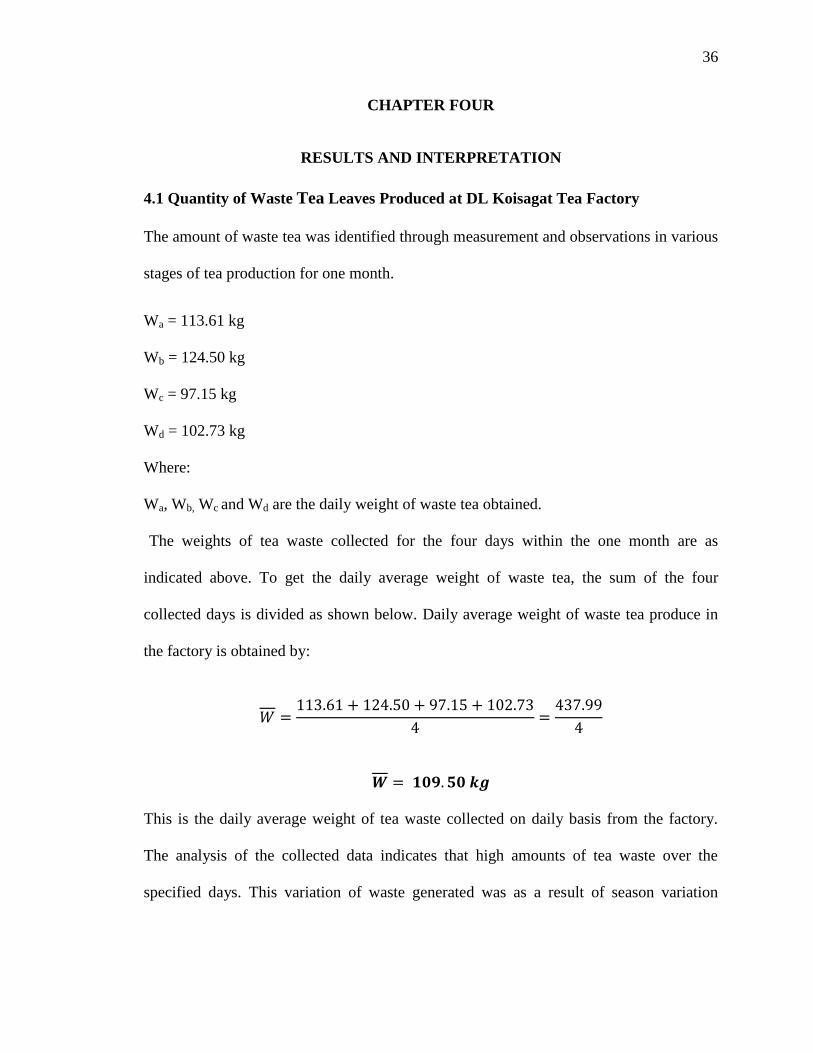
4.1 Quantity of Waste Tea Leaves Produced at DL Koisagat Tea Factory
The amount of waste tea was identified through measurement and observations in various
stages of tea production for one month.
Wa = 113.61 kg
Wb = 124.50 kg
Wc = 97.15 kg
Wd = 102.73 kg
Where:
Wa, Wb, Wc and Wd are the daily weight of waste tea obtained.
The weights of tea waste collected for the four days within the one month are as
indicated above. To get the daily average weight of waste tea, the sum of the four
collected days is divided as shown below. Daily average weight of waste tea produce in
the factory is obtained by:
𝑊 =113.61 + 124.50 + 97.15 + 102.73
4=
437.99
4
𝑾 = 𝟏𝟎𝟗. 𝟓𝟎 𝒌𝒈
This is the daily average weight of tea waste collected on daily basis from the factory.
The analysis of the collected data indicates that high amounts of tea waste over the
specified days. This variation of waste generated was as a result of season variation
37
through the year. During the peak season of tea production, the waste generated is
expected to be high as well as low amounts when there is low tea production.
4.1.1 Optimum Conditions of Temperature, pH and Retention Time of Biogas
Production
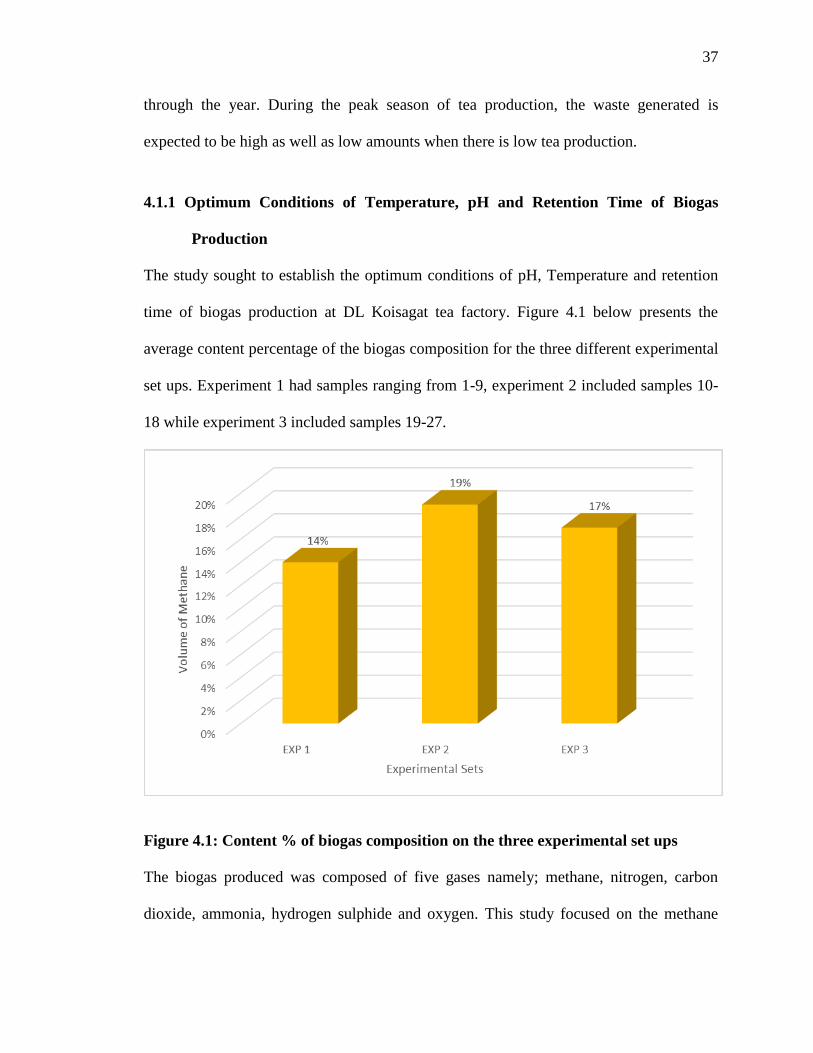
The study sought to establish the optimum conditions of pH, Temperature and retention
time of biogas production at DL Koisagat tea factory. Figure 4.1 below presents the
average content percentage of the biogas composition for the three different experimental
set ups. Experiment 1 had samples ranging from 1-9, experiment 2 included samples 10-
18 while experiment 3 included samples 19-27.
Figure 4.1: Content % of biogas composition on the three experimental set ups
The biogas produced was composed of five gases namely; methane, nitrogen, carbon
dioxide, ammonia, hydrogen sulphide and oxygen. This study focused on the methane
38
gas. In set 1, the temperature was maintained constant at 25 oC set 2 at 37
oC while set 3
was maintained at 50 o
C. Figure 4.1 above presents the averages in percentage volume of
the methane gas. Figure 4.1 indicates that experiment 1-9 had an average of 19% methane
followed by experiment 3 which had an average of 17% while experiment 2 recorded
14% methane content. Other gases including carbon dioxide, Nitrogen, Ammonia,
Hydrogen sulphide and oxygen were produced but were not the interest of the study. The
means are calculated under all the set conditions of temperature pH and retention time.
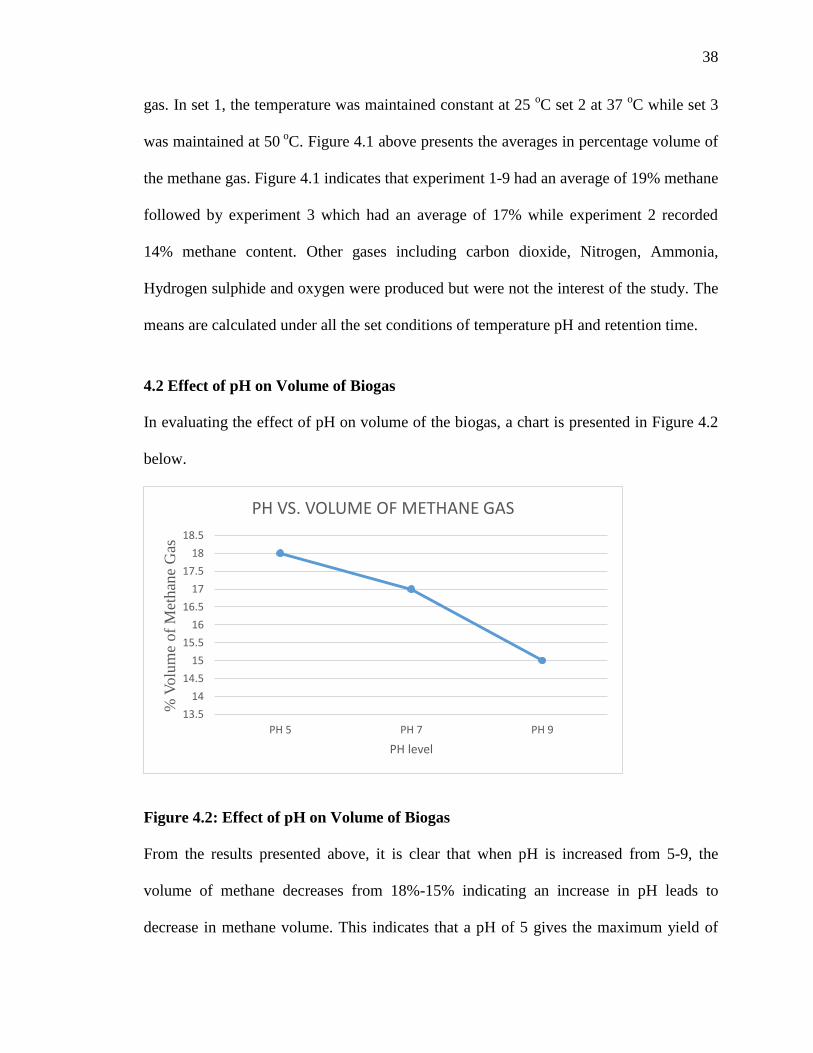
4.2 Effect of pH on Volume of Biogas
In evaluating the effect of pH on volume of the biogas, a chart is presented in Figure 4.2
below.
Figure 4.2: Effect of pH on Volume of Biogas
From the results presented above, it is clear that when pH is increased from 5-9, the
volume of methane decreases from 18%-15% indicating an increase in pH leads to
decrease in methane volume. This indicates that a pH of 5 gives the maximum yield of
13.5
14
14.5
15
15.5
16
16.5
17
17.5
18
18.5
PH 5 PH 7 PH 9
% V
olu
me
of
Met
han
e G
as
PH level
PH VS. VOLUME OF METHANE GAS
39
methane while an increase reduces its volume. Extremes of both acidity and alkalinity
affects the methane bacteria. Therefore the optimum pH value range between 6.6 to 7.6.
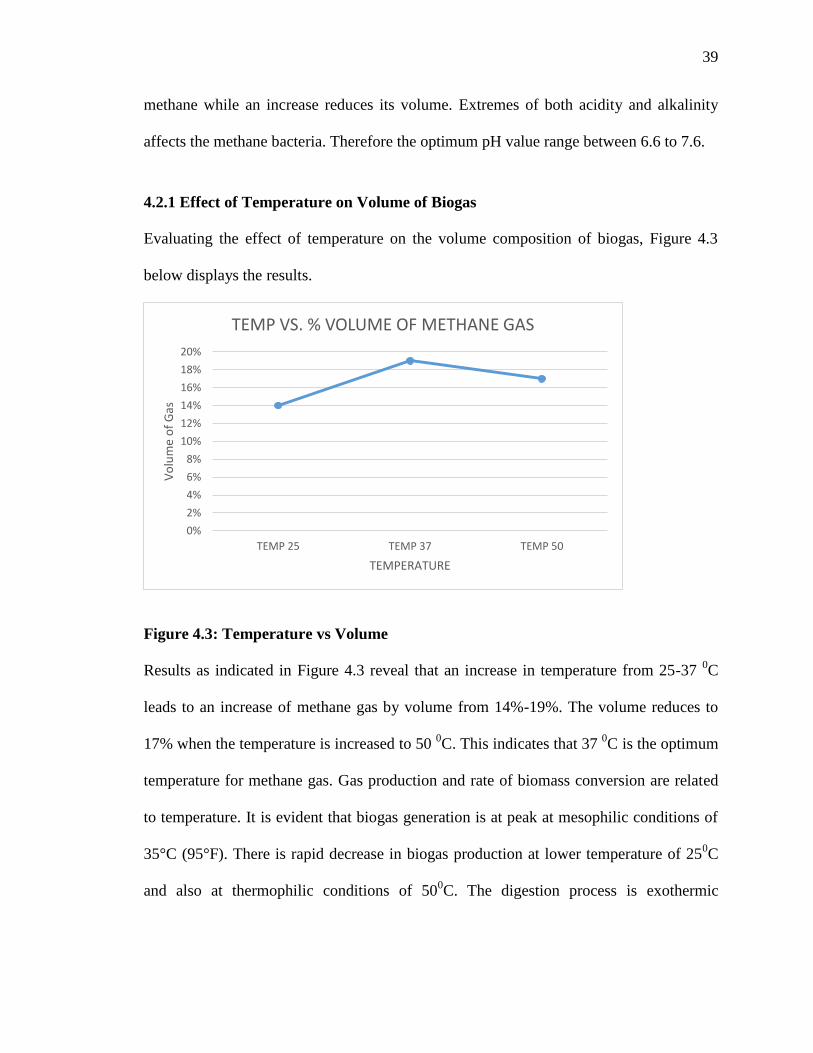
4.2.1 Effect of Temperature on Volume of Biogas
Evaluating the effect of temperature on the volume composition of biogas, Figure 4.3
below displays the results.
Figure 4.3: Temperature vs Volume
Results as indicated in Figure 4.3 reveal that an increase in temperature from 25-37 0C
leads to an increase of methane gas by volume from 14%-19%. The volume reduces to
17% when the temperature is increased to 50 0C. This indicates that 37
0C is the optimum
temperature for methane gas. Gas production and rate of biomass conversion are related
to temperature. It is evident that biogas generation is at peak at mesophilic conditions of
35°C (95°F). There is rapid decrease in biogas production at lower temperature of 250C
and also at thermophilic conditions of 500C. The digestion process is exothermic
0%
2%
4%
6%
8%
10%
12%
14%
16%
18%
20%
TEMP 25 TEMP 37 TEMP 50
Vo
lum
e o
f G
as
TEMPERATURE
TEMP VS. % VOLUME OF METHANE GAS
40
therefore heat is released, to attain the mesophilic conditions less heat is required.
Mesophilic bacteria is more stable than thermophilic bacteria.
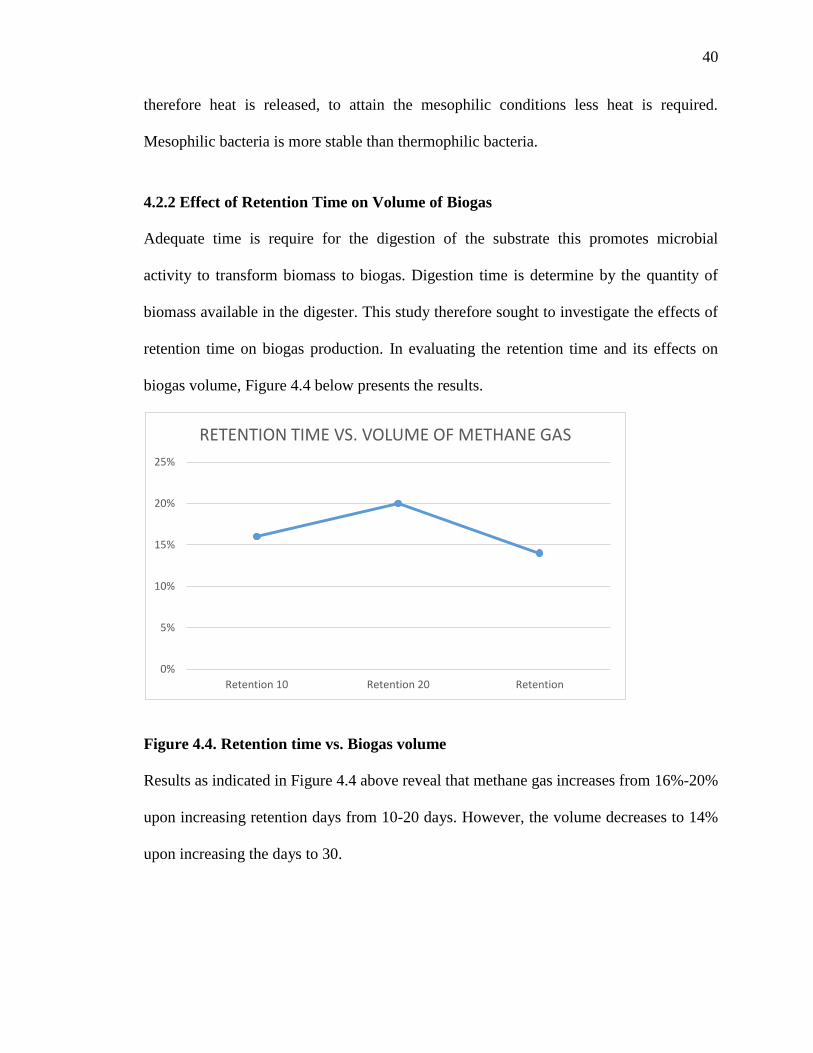
4.2.2 Effect of Retention Time on Volume of Biogas
Adequate time is require for the digestion of the substrate this promotes microbial
activity to transform biomass to biogas. Digestion time is determine by the quantity of
biomass available in the digester. This study therefore sought to investigate the effects of
retention time on biogas production. In evaluating the retention time and its effects on
biogas volume, Figure 4.4 below presents the results.
Figure 4.4. Retention time vs. Biogas volume
Results as indicated in Figure 4.4 above reveal that methane gas increases from 16%-20%
upon increasing retention days from 10-20 days. However, the volume decreases to 14%
upon increasing the days to 30.
0%
5%
10%
15%
20%
25%
Retention 10 Retention 20 Retention
RETENTION TIME VS. VOLUME OF METHANE GAS

41
4.2.3 Factor Analysis
Factor analysis was used reduce the large number of variables from the sample tests that
were done at various temperatures, pH, and retention time. There were 27 sets of
experiments done on the samples. The factor analysis utilized principal component
analysis as the extraction method.
Table 4.3 below presents the results.
Table 4.1 KMO and Bartlett’s test
KMO and Bartlett's Test
Kaiser-Meyer-Olkin Measure of Sampling Adequacy. .483
Bartlett's Test of Sphericity Approx. Chi-Square 2.020
df 26
Sig. .918
Results presented in Table 4.2 reveal that there is no significant effect of retention time,
temperature and pH as the p-value is .918 which is greater than 0.05 significance value.
Kaiser-Meyer-Olkin Measure of Sampling Adequacy value is 0.483 which is lower the
minimum 0.6 which is suggested. Bartlett's Test of Sphericity value is 2.02 which
indicates that the identity matrix has failed and thus the test fails for these variables to
support the production of biogas in the samples collected.
42
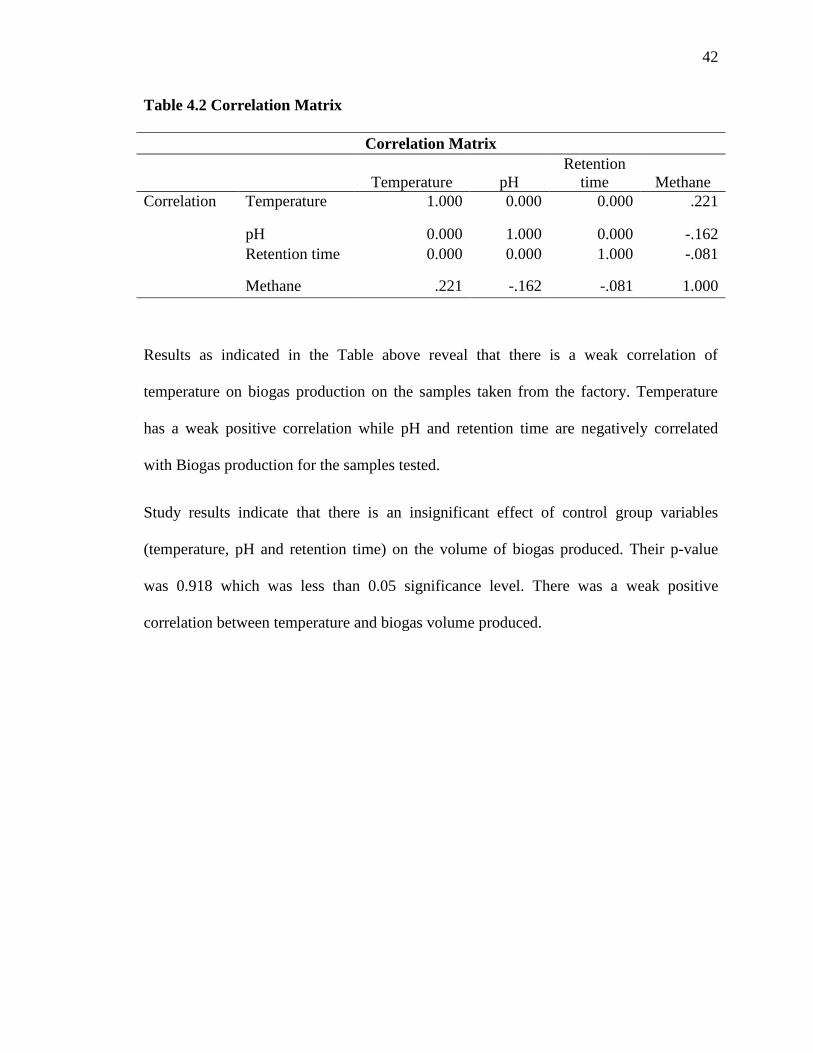
Table 4.2 Correlation Matrix
Correlation Matrix
Temperature pH
Retention
time Methane
Correlation Temperature 1.000 0.000 0.000 .221
pH 0.000 1.000 0.000 -.162
Retention time 0.000 0.000 1.000 -.081
Methane .221 -.162 -.081 1.000
Results as indicated in the Table above reveal that there is a weak correlation of
temperature on biogas production on the samples taken from the factory. Temperature
has a weak positive correlation while pH and retention time are negatively correlated
with Biogas production for the samples tested.
Study results indicate that there is an insignificant effect of control group variables
(temperature, pH and retention time) on the volume of biogas produced. Their p-value
was 0.918 which was less than 0.05 significance level. There was a weak positive
correlation between temperature and biogas volume produced.
43
CHAPTER FIVE
DISCUSSION
The study sought to investigate the production of biogas from tea waste at DL Koisagat
tea factory. The objectives guiding the study focused on estimating the quantity of tea
waste at the factory, determine the optimum conditions of Temperature, pH and retention
time on biogas production and estimate the potential of biogas production at the factory.
In estimating the quantity of tea waste produced at the factory, the study found out that
the factory had a daily average of waste tea produced of 109.50kgs. This indicated that
the amount of tea waste produced by the factory was high enough to be utilized in biogas
generation. In establishing the optimum conditions of biogas production, the study found
out that three conditions were most prevalent and would have an impact on biogas
production. The study found out that temperature, retention time and pH played a role in
biogas production since it utilized anaerobic digestion process which works on limited
conditions. The study tested samples and carried out the process of biogas production at
varied conditions of temperature, pH and retention time. It was found out from the
research that an optimum pH of 7 yielded the highest amounts of biogas while a
temperature of 25-370C was found to yield more volumes. An increase in temperature
was found to reduce the biogas volumes. The optimum retention time was found to be
between 10-20 days as this yielded the maximum biogas volumes while an increase in
days above 20 had no effect on the volumes produced.
Production of biogas from waste tea leaves is a viable process, at pH 5 the production is
higher compare with pH of 7 and 9. At this pH of 5 also oxygen, nitrogen and ammonia
44
are relatively higher than methane. Growth of micro-organisms in anaerobic digester is
affected by pH. Therefore to promote the rate of biogas generation, the digester is
maintained at optimum pH of between 6.8-7.2 by monitoring loading rate. As
fermentation process takes place CO2 and fatty acids produced as by-products of the
process lower the digester pH.
Methane gas is highly produced at the temperature of 37 0
C compared with temperatures
of 250C and 50
0 C, although oxygen, nitrogen and ammonia are still higher. The findings
concur with (Trowbridge, 2013), that the digester temperature affects the quantity of
biogas produced. Within the three temperature ranges of thermophilic, mesophilic and
psychrophilic, mesophilic works best for digester microbes.
Waste tea leaves substrate at retention time of 20 days produces relatively high methane.
This indicates that micro-organisms and substrate are at equilibrium. Efficiency of
methane gas can be improved by removing the gas mixture. Ammonia can be remove by
condensation of the gas mixture through cooling water to absorb ammonia gas. Carbon
dioxide will be separated by passing the gas through NaOH solution to absorb it. While
hydrogen sulphide will be eliminated by scrubbing the gas using Iron or Steel wool.
Oxygen is removed by passing the gas through Iron (II) oxide which gets oxidized by
consuming oxygen. Nitrogen is eliminated by contacting the gaseous mixture with
lithium.
For longer retention time, large volume digesters are required which increase the capital
investment costs, while short retention time can cause washout of active micro-organism
population. For optimum conditions of production, medium digesters are best because of
cost and proper utilization of microbes.
45
In establishing the potential of the tea factory to produce biogas, the study findings
reported that the tested samples yielded very little gas volumes as the three optimum
conditions reached had no significant influence on the increase on gas volumes. The
samples taken in this case despite the optimum conditions, resulted to low percentage of
methane gas that would allow large scale production of biogas. The results clearly reveals
that essential benefits will be achieved if conditions favoring optimum gas yield are met.
Thus, the temperature, retention period and pH of the tea waste should be set for
optimum biogas production.
46
CHAPTER SIX
CONCLUSION AND RECOMMENDATIONS
6.1 Introduction
This section presents the summary and conclusion of the results that were obtained in the
study. The study aimed at investigating the production of biogas from tea waste at DL
Koisagat Tea factory. The study focused on three key objectives which included;
estimating the amount of waste produced at the factory, determining the optimum
conditions of temperature, pH and retention time on biogas production and estimating the
potential of biogas production at the factory.
6.2 Summary
The study sought to investigate the production of biogas from waste tea leaves at DL
Koisagat Tea Factory in Nandi hills. The study was guided by three objectives which
included; estimating the amount of waste tea produce at the factory, determining the
optimum conditions of temperature, pH and retention time of biogas production and
estimating the potential of biogas production at the factory.
The study findings established that the daily average weight of tea waste collected on
daily basis from the factory was 109.5 kgs. The study findings revealed that the biogas
produced was composed of five gases namely; methane, nitrogen, carbon dioxide,
ammonia, hydrogen sulphide and oxygen. Nitrogen and Ammonia with 25% while
oxygen (23%) are the gases with highest volume in the biogas. Hydrogen sulphide has
the lowest with 17%. The means are calculated under all the set conditions of
temperature, pH and retention time. An increase in pH led to decrease in methane
47
volume. This indicated that a pH of 7 gave the maximum yield of methane while an
increase reduces its volume. On evaluating the effect of temperature on biogas
production, the study revealed that an increase in temperature from 25-370C leads to an
increase of methane gas by volume from 14%-19%. The volume reduces to 17% when
the temperature is increased to 500C. This indicates that 37
0C is the optimum temperature
for methane gas. The findings also established that methane gas increases from 16%-20%
upon increasing retention days from 10-20 days. However, the volume decreased to 14%
upon increasing the days to 30. Results from the factor analysis indicated that there was
no significant effect of the optimum conditions on volume of biogas produced from the
tested samples. The volumes of methane were found to be too low to allow commercial
production of the gas.
6.3 Conclusions
As per the results reported in this study, the factory produces approximately 2847.00kgs
per month. This quantity of waste is sufficient to cause environmental degradation. Also
the factory produces enough biomass for generation of biogas. The highest yield was
obtained at 37 degrees Celsius, pH of 7 and retention time of 20days. This was attributed
to the rapid growth of bacteria required to breakdown organic matter into biogas and also
the digester stability. The highest quantity of methane was achieved at pH of 7,
temperature of 50oC and retention time of 20 days but also with high impurity of carbon
dioxide which inhibits combustion.
Biogas technology from tea waste provides a very attractive way of utilizing certain
groups of agricultural biomass for satisfying energy needs. Proper biogas systems provide
solution to environmental degradation due to tea industry solid wastes and also enhance
48
clean energy source. Biogas is produced from anaerobic degradation which is an ancient
technology used in industrial waste treatment and sludge stabilization. The anaerobic
digestion process involve a group of microorganisms which depend on other factors such
as pH, retention time and temperature making the process slower. Other limitations of the
digester include low loading rate, Lack of process stability and time taken to recover after
failure. Based on this, the anaerobic digestion process is a slow process prompting design
of large digester hence increasing cost.
6.4 Recommendations
The quantity of waste generated from the factory on daily average was a significant
amount enough to cause environmental degradation if not properly disposed. Therefore,
the factory management should ensure that there are proper solid waste management
practices that will help in preventing possible pollution from such waste. However, upon
carrying out various tests, the waste tea had potential to produce 19% of methane.
Comparing the quantity of methane produced with its use as a source of energy, methane
generation with purification will enable the factory to save the cost of energy and also
conserve environment. The study findings therefore recommend that the tea waste
produced to be mixed with other materials to increase the methane gas volume to allow
biogas production from the plant. Also, the study recommends that the factory should
consider employing cleaner production techniques like waste segregation and waste
reduction at the source. For a proper reuse of the tea waste, the factory management can
also consider solidifying and using the tea waste as fuel in the factory. Additionally, there
is need for further research to improve on the gas quality of methane.
49
REFERENCES
Afroz, R., & Masud, M. M. (2011). Using a contingent valuation approach for improved
solid waste management facility: Evidence from Kuala Lumpur, Malaysia. Waste
management, 31(4), 800-808.
Aksay, M. V., Ozkaymak, M., & Calhan, R. (2018). Co-digestion of Cattle Manure and
Tea Waste for Biogas Production. International Journal of Renewable Energy
Research (IJRER), 8(3), 1246-1353.
Angelidaki, L., Ellegaard L. & Ahring BK. (2003).Applications of the anaerobic
digestion process. Advance Biochemical Engineering Biotechnology, 2003;82:1-
33
Battista, F., Fino, D., & Mancini, G. (2016). Optimization of biogas production from
coffee production waste. Bioresource Technology, 200, 884-890. doi:
10.1016/j.biortech.2015.11.020
Bousquet, P., Ringeval, B., & Brunke, E-G. (2010). Sources attribution of the changes in
atmospheric methane for 2006-2008. ACPD, 10, 27603-27630
Bjornsson, L., Murto, M., & Mattiasson, B.(2001). Impact of food industrial waste on
anaerobic co-digestion of sewage sludge and pig manure. Water Science
Technology
Cheng, J. (2010). Anaerobic digestion for biogas production. In J. Cheng (Ed.), Biomass
to renewable energy processes (pp. 151-208). Boca Raton, FL: CRC Press.
Chowdhury, A., Sarkar, S., Chowdhury, A., Bardhan, S., Mandal, P., & Chowdhury, M.
(2016). Tea waste management: a case study from West Bengal, India. Indian
Journal of Science and Technology, 9(42), 1-6.
Cornejo, C. & Wilkie, A.C. (2010). Greenhouse gas emissions and biogas potential from
livestock in Ecuador. Energy for Sustainable Development.
Demirbas, A. (2010). Tea seed upgrading facilities and economic assessment of biodiesel
production from tea seed oil. Energy Conversion and Management, 51(12), 2595-
2599.
Drapcho, C. M., Nhuan, N. P., & Walker, T. H. (2008). Biofuels engineering process
technology. New York, New York: McGraw-Hill Companies Inc.
50
Faerber, T., & Herzog, J. (2010). Solid waste management and environmental
remediation. New York: Nova Science Publishers.
Garcia, H., (2003). Application of Anaerobic Processes. Process Integration
Hilkiah Igoni, M. F. N. Abowei, M. J. Ayotamuno & C. L. Eze (2008), Effect of Total
Solids Concentration of Municipal Solid Waste on the Biogas Produced in an
Anaerobic Continuous Digester.
Inoti M.J. (2016). Analysis of energy utilization and renewable energy potential in KTDA
region two tea factories in Kenya (Doctoral dissertation, Jomo Kenyatta
University of Agriculture and Technology).
Islam, M., Yaseen, T., Traversa, A., Ben Kheder, M., Brunetti, G., & Cocozza, C. (2016).
Effects of the main extraction parameters on chemical and microbial
characteristics of compost tea. Waste Management, 52, 62-68. doi:
10.1016/j.wasman.2016.03.042
Jantsch, T.G & Matttiason, B. (2004). An automated spectropphoyometric system for
monitoring buffer capacity in anaerobic digestion processes. Water Research. 38:
3645-3650.
Kumar, S., Gaikwad, S.A., Shekdar, A.K., Kshirsagar, P.K., & Singh, R.N. (2004).
Estimation method for national methane emission from solid waste landfills.
Atmospheric Environment. 38: 3481–3487.
Laskri, N., Hamdaoui, O., & Nedjah, N. (2015). Anaerobic Digestion of Waste Organic
Matter and Biogas Production. Journal of Clean Energy Technologies, 3(3), 181-
184. doi: 10.7763/jocet. 2015.v3.192
Liu, X. Y., Ding H. B., & Wang, J. Y. (2010). Food waste to bioenergy. In S. K. Khanal,
R. Y. Surampalli, T. C. Zhang, B. P. Lamsal, R. D. Tyagi & C. M. Kao (Eds.),
Bioenergy and biofuel from biowastes and biomass (pp. 43-70). Reston, Virginia:
American Society of Civil Engineers.
Macharia, A. (2015). Environmental issues in the tea value chain.
Maile, O. I., Muzenda, E., & Tesfagiorgis, H. (2017) “Chemical adsorption of carbon
dioxide in biogas purification”, Proceedia Manufacturing, 7, 639-646.

51
Marcia R., Maria E.F., Helder M.F., & Cristina M.A, (2007) Chemical Composition of
green tea (Camellia sinensis) infusions commercialized in Portugal. Plant food
nutrition.
Meres, M., Szczepaniec-Cieciak, E., Sadowska, A., Piejko, K., Oczyszczania, M.P., &
Szafnicki, K. (2004). Operational and meteorological influence on the utilized
biogas composition at the Barycz landfill site in Cracow, Poland. Waste
Management Resource. 22: 195–201.
Neves, D., Thunman, H., Matos, A., Tarelho, L., & Gómez-Barea, A. (2011).
Characterization and prediction of biomass pyrolysis products. Progress in energy
and combustion Science, 37(5), 611-630.
Oriere, S. B. "Assessment of waste management structures for tea factories in Kenya: a
case study of Nyansiongo tea factory." Scientific Conference Proceedings. 2014.
Parawira, W., Murto, M., Zvauya, R., & Mattiasson, B.(2005). Profile of hydrolases and
biogas production during two-stage mesophilic anaerobic digestion of solid potato
waste. Process Biochemistry 40(9).P 2945-2952
Savage, G. (2002). Integrated Solid Waste Management: A Life Cycle Inventory. Waste
Management, 22(6), 691. doi: 10.1016/s0956-053x(02)00032-6
Schink, B. (1997).Anaerobic Digestion model. Anaerobic Digestion Processess
Shalini Sing, Sushil kumar, M.C. Jain, & Dinesh kumar (2000), the increased biogas
production using microbial stimulants.
Speece, R.E (1996) Anaerobic biotechnology for industrial wastewaters. Archae Press,
Nashville Tennesse
Thomsen, A.B., Lissens, G., Baere, L., Verstraete, W., Ahring, B. (2004). Thermal wet
oxidation improves anaerobic biodegradability of raw and digested biowaste.
Environmental Science and Technology.38: 3418-3424.
Tonui, P. K. (2018). Impacts of Effluent Discharge from Kapkoros Tea Factory into
Kipsonoi River on the Local Community of Bomet County, Kenya (Doctoral
dissertation, Kenyatta University).
Trowbridge, J. (2013). Thermophilic anaerobic digestion of brewery wastewater and
food waste (Unpublished research paper). Appalachian State University, Boone,
NC.
52
Vavilin VA. (1996). A distributed model of solid waste anaerobic digestion. Sensitivity
analysis, 48(4): 147-540A
Veiga, M. C., Soto, M., Méndez, R., & Lema, J. M. (1990). A new device for
measurement and control of gas production by bench scale anaerobic digesters.
Water research, 24(12), 1551–1554.
Walker, M., Zhang, Y., Heaven, S., & Banks, C. (2009). Potential errors in the
quantitative evaluation of biogas production in anaerobic digestion processes.
Bioresource Technology, 100(24), 6339–6346. doi:
10.1016/j.biortech.2009.07.018
Ziauddin, Z., & Rajesh, P. (2015). “Production and analysis of biogas from kitchen
waste,” International Research Journal of Engineering and Technology 2 (4),
622-632.
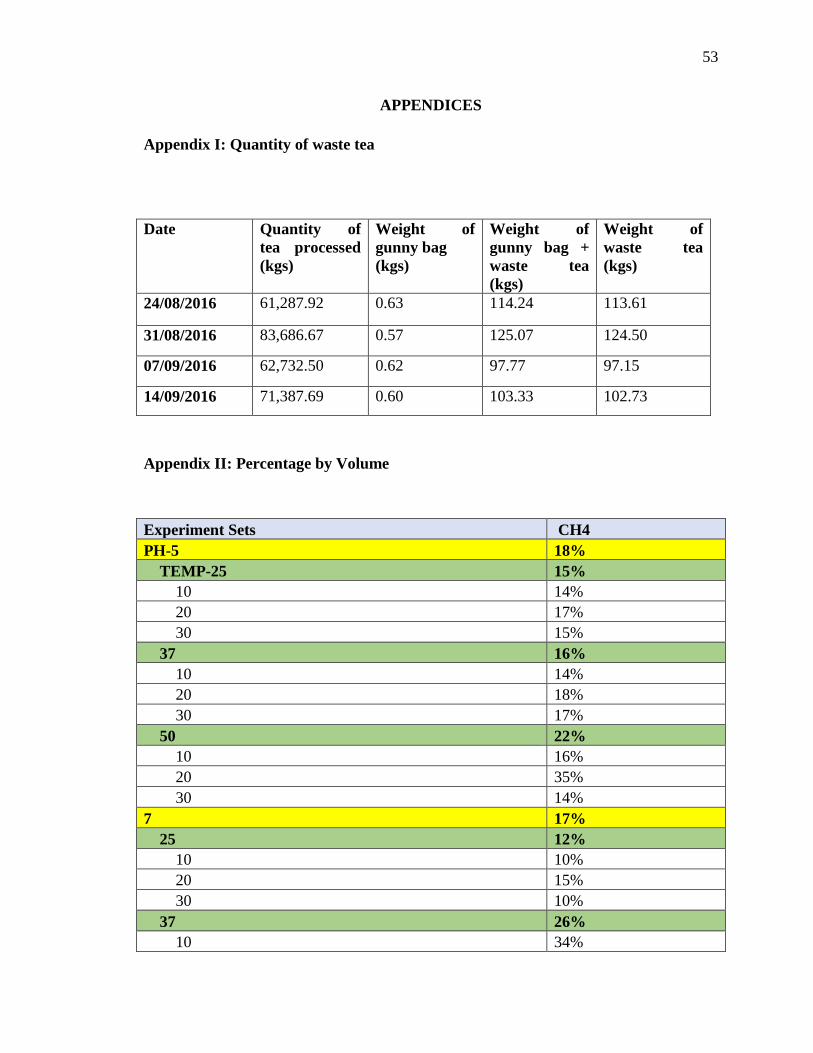
53
APPENDICES
Appendix I: Quantity of waste tea
Date Quantity of
tea processed
(kgs)
Weight of
gunny bag
(kgs)
Weight of
gunny bag +
waste tea
(kgs)
Weight of
waste tea
(kgs)
24/08/2016 61,287.92 0.63 114.24 113.61
31/08/2016 83,686.67 0.57 125.07 124.50
07/09/2016 62,732.50 0.62 97.77 97.15
14/09/2016 71,387.69 0.60 103.33 102.73
Appendix II: Percentage by Volume
Experiment Sets CH4
PH-5 18%
TEMP-25 15%
10 14%
20 17%
30 15%
37 16%
10 14%
20 18%
30 17%
50 22%
10 16%
20 35%
30 14%
7 17%
25 12%
10 10%
20 15%
30 10%
37 26%
10 34%
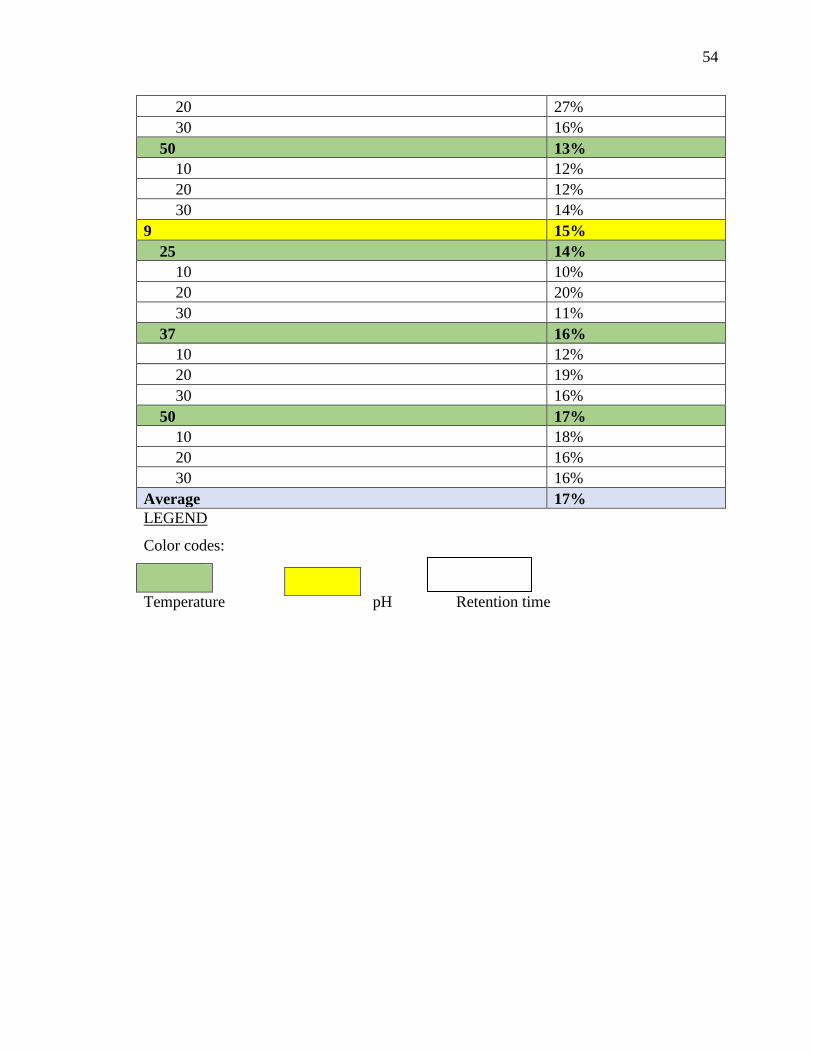
54
20 27%
30 16%
50 13%
10 12%
20 12%
30 14%
9 15%
25 14%
10 10%
20 20%
30 11%
37 16%
10 12%
20 19%
30 16%
50 17%
10 18%
20 16%
30 16%
Average 17%
LEGEND
Color codes:
Temperature pH Retention time
55
Appendix III: Similarity Index/Anti-Plagiarism Report