Real-Time and Post-hoc-Visualizations of Keyboard ...
49
Visualization Research Center of the University of Stuttgart (VISUS) Bachelorarbeit Real-Time and Post-hoc-Visualizations of Keyboard Performances as a Support for Music Education Florian Bauer Course of Study: Medieninformatik Examiner: Jun.-Prof. Dr. Michael Sedlmair Supervisor: Frank Heyen, M.Sc. Commenced: May 26, 2020 Completed: November 26, 2020
-
Upload
khangminh22 -
Category
Documents
-
view
4 -
download
0
Transcript of Real-Time and Post-hoc-Visualizations of Keyboard ...

Visualization Research Center of the University of Stuttgart (VISUS)
Bachelorarbeit
Real-Time andPost-hoc-Visualizations of KeyboardPerformances as a Support for Music
Education
Florian Bauer
Course of Study: Medieninformatik
Examiner: Jun.-Prof. Dr. Michael Sedlmair
Supervisor: Frank Heyen, M.Sc.
Commenced: May 26, 2020
Completed: November 26, 2020

Abstract
We have developed a prototype for the visualization of errors while practicing the piano. Thisprototype will help piano beginners who do not yet have a well developed hearing to get started andto better recognize their own mistakes. In our visualizations, notes can be displayed in classicalnotation, in block notation, or as a piano roll. Notes in the block notation have the shape of a rectanglewith rounded corners and are drawn in place of classical note heads with a length corresponding totheir duration. The user can visualize their piano playing live, or save it and analyze the recordingslater. Recording and ground truth notes are visualized through different encodings leveragingeither juxtaposition or superposition. We designed an algorithm that matches recorded and groundtruth notes to allow for color-encoded error values. Based on piano roll, we designed a heat mapvisualization, where all pitches are divided into time slices and these slices get different colorsdepending on whether the recording and the ground truth note is in the same time slice. In ourevaluation through case study, we came to the conclusion that only the piano roll notation is suitablefor visualizing several recordings at once. The block notation is useful for the display of singlerecording comparison. Furthermore, the classical notation is generally unsuitable at this stage,because several notes in a narrow range quickly become confusing. The Error Analysis Algorithmserves its purpose when the specified tempo is maintained. Otherwise it can happen that notes areassigned incorrectly.
3


Contents
1 Introduction 11
2 Background 132.1 Music Theory . . . . . . . . . . . . . . . . . . . . . . . . . . . . . . . . . . . 132.2 MIDI . . . . . . . . . . . . . . . . . . . . . . . . . . . . . . . . . . . . . . . . 152.3 Piano . . . . . . . . . . . . . . . . . . . . . . . . . . . . . . . . . . . . . . . . 16
3 Related Work 193.1 Piano Learning Tools . . . . . . . . . . . . . . . . . . . . . . . . . . . . . . . 193.2 Scientific Approaches . . . . . . . . . . . . . . . . . . . . . . . . . . . . . . . 21
4 Design 254.1 Requirements . . . . . . . . . . . . . . . . . . . . . . . . . . . . . . . . . . . 254.2 Modes . . . . . . . . . . . . . . . . . . . . . . . . . . . . . . . . . . . . . . . 254.3 Display Types . . . . . . . . . . . . . . . . . . . . . . . . . . . . . . . . . . . 294.4 Error Visualization . . . . . . . . . . . . . . . . . . . . . . . . . . . . . . . . . 31
5 Implementation 355.1 Backend . . . . . . . . . . . . . . . . . . . . . . . . . . . . . . . . . . . . . . 355.2 Frontend . . . . . . . . . . . . . . . . . . . . . . . . . . . . . . . . . . . . . . 35
6 Evaluation 376.1 Display Types . . . . . . . . . . . . . . . . . . . . . . . . . . . . . . . . . . . 376.2 Error Visualization . . . . . . . . . . . . . . . . . . . . . . . . . . . . . . . . . 376.3 Practice and Recording . . . . . . . . . . . . . . . . . . . . . . . . . . . . . . 406.4 Analysis of Multiple Recordings . . . . . . . . . . . . . . . . . . . . . . . . . 41
7 Limitations and Discussion 43
8 Conclusion and Future Work 45
Bibliography 47
5


List of Figures
1.1 Our four different error visualizations. . . . . . . . . . . . . . . . . . . . . . . . 12
2.1 Whole note to sixty-four note. . . . . . . . . . . . . . . . . . . . . . . . . . . . 142.2 The C major scale in eight notes. . . . . . . . . . . . . . . . . . . . . . . . . . . 142.3 The 88 keys of a piano with their note name and octave. . . . . . . . . . . . . . . 172.4 Piano roll notation in Synthesia. . . . . . . . . . . . . . . . . . . . . . . . . . . 17
3.1 Enhanced notation in Yousician. . . . . . . . . . . . . . . . . . . . . . . . . . . 203.2 Noteflight SoundChecks feedback graph. . . . . . . . . . . . . . . . . . . . . . . 203.3 P.I.A.N.O. music notation projection. . . . . . . . . . . . . . . . . . . . . . . . . 22
4.1 User Interface of the play mode. . . . . . . . . . . . . . . . . . . . . . . . . . . 264.2 User Interface of the analyze mode. . . . . . . . . . . . . . . . . . . . . . . . . 284.3 The C major scale in modern staff notation. . . . . . . . . . . . . . . . . . . . . 294.4 The C major scale in block notation. . . . . . . . . . . . . . . . . . . . . . . . . 304.5 The C major scale in piano roll notation. . . . . . . . . . . . . . . . . . . . . . . 304.6 Superimposed comparison of six recordings. . . . . . . . . . . . . . . . . . . . . 324.7 Color gradient used for error visualization. . . . . . . . . . . . . . . . . . . . . . 334.8 Color visualization applied on six recordings. . . . . . . . . . . . . . . . . . . . 334.9 Heat map visualization with six recordings. . . . . . . . . . . . . . . . . . . . . 34
6.1 Complex songs in different notations. . . . . . . . . . . . . . . . . . . . . . . . 386.2 Nine different comparison visualizations. . . . . . . . . . . . . . . . . . . . . . 396.3 Weakness of the matching algorithm. . . . . . . . . . . . . . . . . . . . . . . . . 396.4 Visualization of three different playing attempts. . . . . . . . . . . . . . . . . . . 406.5 Examples for the visualization of three recordings. . . . . . . . . . . . . . . . . . 41
7


List of Tables
2.1 Note names, their MIDI number, and frequency. . . . . . . . . . . . . . . . . . . 132.2 Division of data and status by values. . . . . . . . . . . . . . . . . . . . . . . . . 152.3 MIDI commands: Note Off and Note On. . . . . . . . . . . . . . . . . . . . . . 16
9


1 Introduction
We are confident that music education can benefit from the use of modern technologies. Manypeople, regardless of age, would like to learn a musical instrument. The choice often falls to thepiano or keyboard. But just as with any other instrument, this requires a great deal of time and themotivation to stick to it. If there is no visible progress, especially in the beginning, then this canquickly lead to frustration and the instrument might be abandoned. We have asked ourselves thequestion how the piano lessons of tomorrow can be made more effective with the help of moderntechnologies. In particular: How can visualization support the learning process?
The scope of this thesis is to conceptualize and implement a prototype that enables users to analysetheir learning progress. Besides having lessons with a teacher, there is always the possibility to tryout self-study, either in addition as a homework, or as a completely self-taught study, for examplewhen students cannot afford a teacher. There are already some applications that support the user, afew examples thereof and why they are not already enough for our target use cases are presentedin the Related Work chapter. Some of these applications are also used in addition to the classicallessons. Still, most of the time the student has individual or group lessons with a teacher and theteacher instructs the student how to play, if the posture is correct and points out which mistakeshave been made.
When it comes to recognizing wrong notes or patterns, the beginners mostly rely on the teacher’ssense of hearing. However, since vision is the primary sense of human beings and has a much higherresolution and parallelism than the sense of hearing, it seems reasonable to support the processof error detection through visualization. This also allows the teacher to concentrate more on thestudent’s playing technique and evaluate errors afterwards, or even as a summary. In addition, theerrors could be worked out in much more detail and accelerate the learning process.
The goal of this work is to develop a usable software that implements different visualizations toavoid complexity, we base our approach on MIDI recordings instead of audio, which any keyboardshould be able to produce. To allow for using own exercises it is possible for the teacher to addnew songs as Musical Instrument Digital Interface (MIDI) files. The errors should be displayedin different ways and it should be possible to put several recordings on top of each other to makethe difference clear. Furthermore, it should be possible to display a chronological sequence of theerrors. This can also be used for practicing at home and to keep motivation at a high level when theprogress is more obvious. Dividing mistakes into different categories can also be very helpful.
In the course of this thesis we present the prototype that we have developed, implemented, andevaluated. Figure 1.1 shows the four different error visualizations we have developed and the threedifferent note visualizations we created based on them. In the top left (Figure 1.1a), the notes aredrawn in classical notation, the ground truth notes are drawn in black, and four different recordingsare drawn in different colors. Next, Figure 1.1b shows the block notation in which one recording isvisualized by comparing its notes with the ground truth notes and coloring the ground truth notesdifferently depending on how well they are hit.
11

1 Introduction
Figure 1.1c uses the same comparison algorithm, this time the piano roll notation is used andinstead of the ground truth notes the notes of the four recordings are colored in. Finally, the heatmap visualization in Figure 1.1d is used, again using the piano roll notation with the same fourrecordings. The block height shows in how many recordings the note was held at that time andthe color indicates whether the note was hit (black), played within the error threshold (yellow), ormissed (red). The first three visualization modes can be used on all three notations, the heat map isonly available in the piano roll notation.
(a) (b)
(c) (d)
Figure 1.1: This figure shows our different error visualizations. Top left: Four recordings in differentcolors are visualized in the classical notation, the black notes represent the groundtruth. Because of the close proximity of the notes, this visualization is difficult to readwith more than one recording. Top right: Notes displayed using the block notation arecolored depending on how well the recording hit them. The four recordings from (a)are also visualized in the two piano roll notations. Bottom left: The recordings aredrawn stacked on top of frames for the ground truth notes and their notes are coloreddepending on how well they were hit. Bottom right: The recordings are merged anddrawn into the piano roll as heat map visualization.
12

2 Background
In this chapter we will go into the basics that will contribute to understand the work. First there willbe some general music theory, where concepts such as tones and notation are introduced. This isfollowed by a section on the MIDI standard, in which we show how a MIDI message is structuredand how we use it. And finally the piano as an instrument is introduced.
2.1 Music Theory
In the following section we will explain a few basics of music theory. First, we will discuss in generalterms how a tone is defined and how many notes there are. Then, we will show what classical musicnotation looks like and what it can contain.
Note name MIDI number FrequencyC4 60 261.63C#4 61 277.18D4 62 293.67D#4 63 311.13E4 64 329.63F4 65 349.23F#4 66 369.99G4 67 392.00G#4 68 415.30A4 69 440.00A#4 70 466.16B4 71 493.88C5 72 523.25
Table 2.1: Note names, their MIDI number, and frequency.
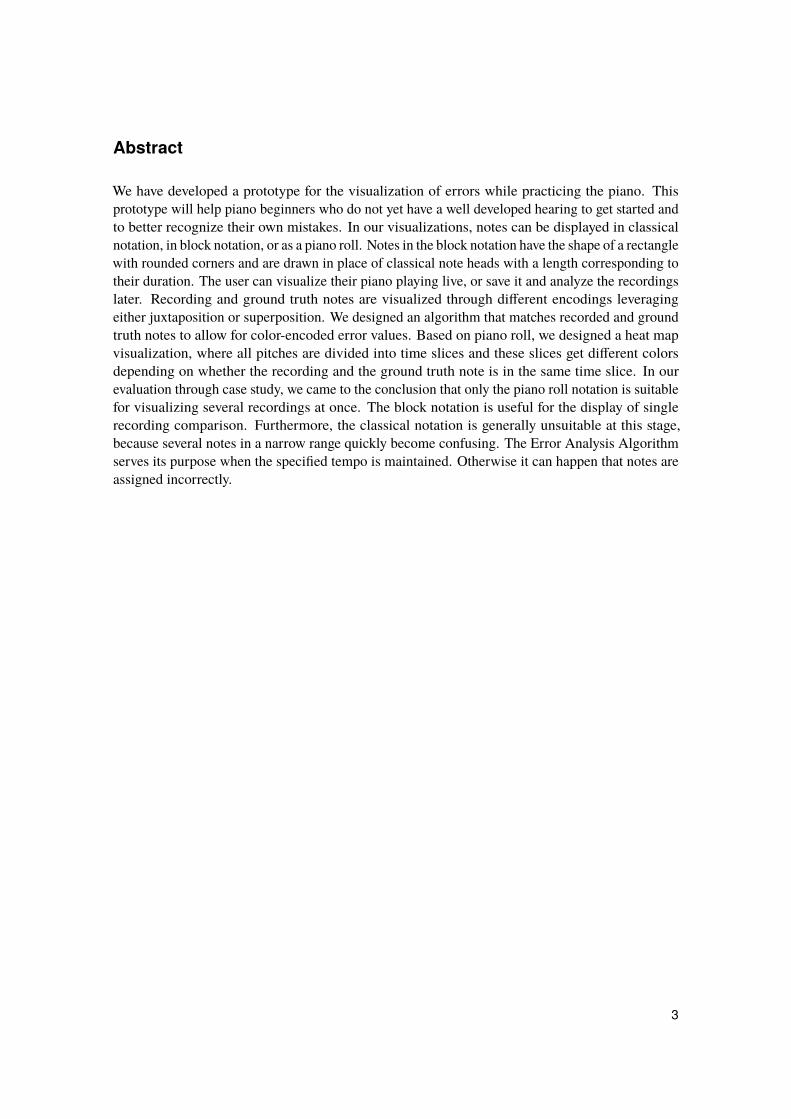
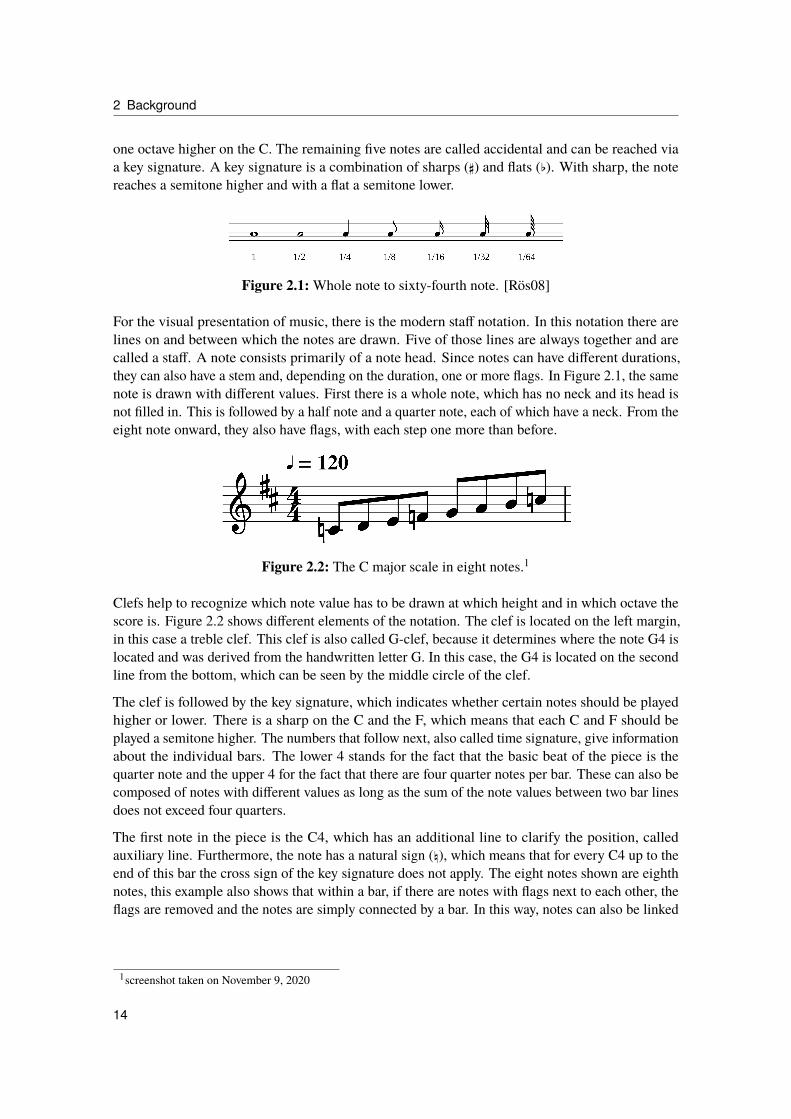
Tones are ultimately nothing more than sound waves. They each have a harmonic waveform and afixed frequency, also called pitch. A higher tone is reached with a higher frequency and a lowertone with a lower frequency. The frequency 440 Hz is known as the concert pitch and has the notename A4. If this frequency is doubled, the same note is heard, but one octave higher. Figure 2.1shows that the frequency between the two Cs doubles. By dividing an octave into 12 intervals,the maximum number of melodious note pairs could be obtained. This is why the system has 12different notes at the end. The smallest step between two different notes is called a semitone or halftone. Seven of them are natural notes, which are called “A” to “G”. In Western music the diatonicscale is used, which means that the octaves begin with the C and end on the B before continuing
13
2 Background
one octave higher on the C. The remaining five notes are called accidental and can be reached viaa key signature. A key signature is a combination of sharps (\) and flats (Z). With sharp, the notereaches a semitone higher and with a flat a semitone lower.
Figure 2.1: Whole note to sixty-fourth note. [Rös08]
For the visual presentation of music, there is the modern staff notation. In this notation there arelines on and between which the notes are drawn. Five of those lines are always together and arecalled a staff. A note consists primarily of a note head. Since notes can have different durations,they can also have a stem and, depending on the duration, one or more flags. In Figure 2.1, the samenote is drawn with different values. First there is a whole note, which has no neck and its head isnot filled in. This is followed by a half note and a quarter note, each of which have a neck. From theeight note onward, they also have flags, with each step one more than before.
Figure 2.2: The C major scale in eight notes.1
Clefs help to recognize which note value has to be drawn at which height and in which octave thescore is. Figure 2.2 shows different elements of the notation. The clef is located on the left margin,in this case a treble clef. This clef is also called G-clef, because it determines where the note G4 islocated and was derived from the handwritten letter G. In this case, the G4 is located on the secondline from the bottom, which can be seen by the middle circle of the clef.
The clef is followed by the key signature, which indicates whether certain notes should be playedhigher or lower. There is a sharp on the C and the F, which means that each C and F should beplayed a semitone higher. The numbers that follow next, also called time signature, give informationabout the individual bars. The lower 4 stands for the fact that the basic beat of the piece is thequarter note and the upper 4 for the fact that there are four quarter notes per bar. These can also becomposed of notes with different values as long as the sum of the note values between two bar linesdoes not exceed four quarters.
The first note in the piece is the C4, which has an additional line to clarify the position, calledauxiliary line. Furthermore, the note has a natural sign (^), which means that for every C4 up to theend of this bar the cross sign of the key signature does not apply. The eight notes shown are eighthnotes, this example also shows that within a bar, if there are notes with flags next to each other, theflags are removed and the notes are simply connected by a bar. In this way, notes can also be linked
1screenshot taken on November 9, 2020
14

2.2 MIDI
with several flags, which will then have more bars. It is also possible to include a note with moreflags, in such a way that the missing flags are added to the note so that it has the correct number ofbars but that they do not touch the other notes.
After the notes there is a bar line which separates this first bar from the next bar. The tempo inwhich the piece should be played is indicated by the note with the number 120 behind it that isplaced on the left side over the staff. In this case the tempo is 120 beats per minute (BPM). Thequarter note before this number means that the tempo is related to the quarter note duration, so aquarter note should last half a second.
2.2 MIDI
Musical Instrument Digital Interface2, or MIDI for short, is an industry standard which allowsfor a connection between electronic musical instruments and computers on both the hardware andsoftware level. MIDI was developed by Dave Smith and the first version was introduced in 1982. TheMIDI protocol is used to send and receive messages between compatible devices. These messagesconsist of a MIDI command and the MIDI data parameters and are also called MIDI messages.They have a length of one to three bytes, depending on the content. A byte consists of 8 bits andcovers values between 0 and 255 in decimal. Data bytes take on values between 0 and 127 andstatus bytes values between 128 and 255. In the bit representation, this can also be distinguished bythe leading bit, for data bytes it is 0 and for status bytes it is 1. The division of data and status bytescan also be seen in Table 2.2, as well as the corresponding hexadecimal values.
Data bytes Status bytesHexadecimal 00 - 7F 80 - FFBinary 00000000 - 01111111 10000000 - 11111111Decimal 0 - 127 128 - 255
Table 2.2: Division of data and status by values.
Let’s take a closer look at the status byte and see that it is split into two parts again. The first fourbits represent the MIDI command and the last four bits represent the channel on which it is sent. Intotal there are seven MIDI commands which can be sent on 16 different channels. The remaining16 values are non-musical commands such as instrument changes. We use two of the seven MIDIcommands, the “Note On” and the “Note Off” command. Both commands have a similar structureand are each three bytes long. These three bytes contain the command, the channel, the note, andthe velocity.
Note Off This type of MIDI message is sent when a key is released. It contains the correspondingchannel, the note number, and the velocity at which the key is released. A Note On messagewith velocity 0 is also considered a Note Off message.
Note On This type of MIDI message is sent when a key is pressed. It contains the correspondingchannel, the note number, and the velocity with which the note is played.
2https://www.midi.org/
15
2 Background
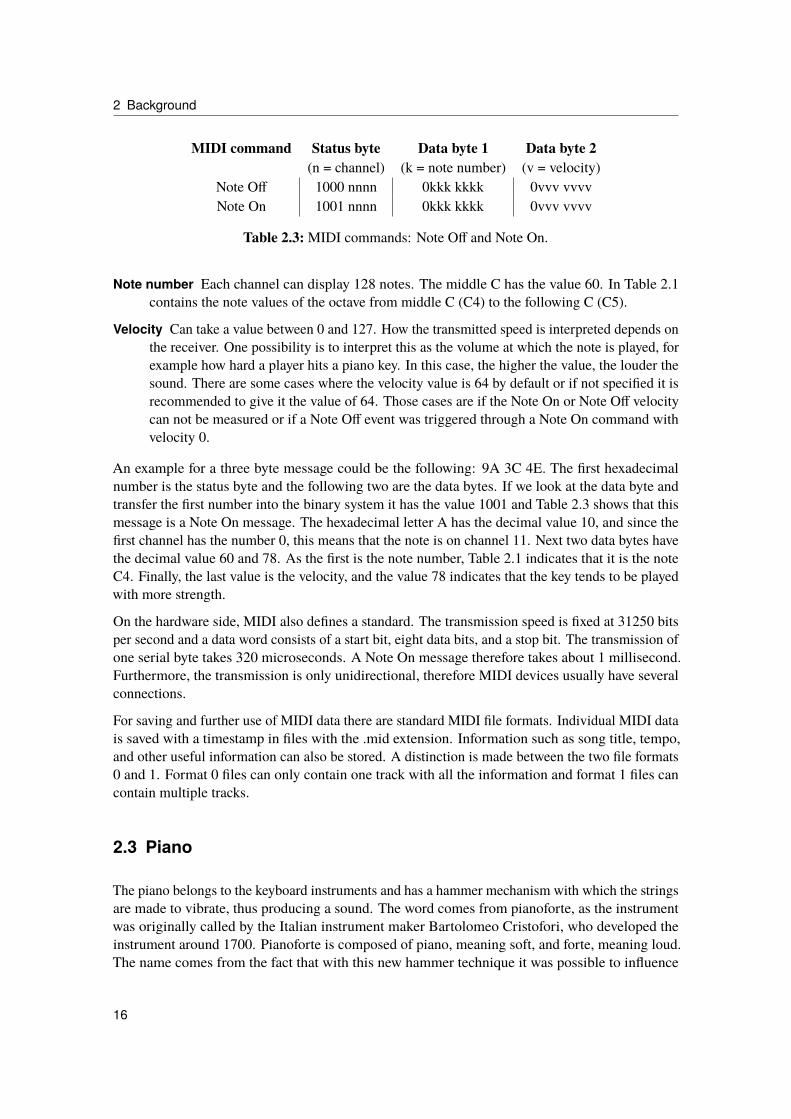
MIDI command Status byte Data byte 1 Data byte 2(n = channel) (k = note number) (v = velocity)
Note Off 1000 nnnn 0kkk kkkk 0vvv vvvvNote On 1001 nnnn 0kkk kkkk 0vvv vvvv
Table 2.3: MIDI commands: Note Off and Note On.
Note number Each channel can display 128 notes. The middle C has the value 60. In Table 2.1contains the note values of the octave from middle C (C4) to the following C (C5).
Velocity Can take a value between 0 and 127. How the transmitted speed is interpreted depends onthe receiver. One possibility is to interpret this as the volume at which the note is played, forexample how hard a player hits a piano key. In this case, the higher the value, the louder thesound. There are some cases where the velocity value is 64 by default or if not specified it isrecommended to give it the value of 64. Those cases are if the Note On or Note Off velocitycan not be measured or if a Note Off event was triggered through a Note On command withvelocity 0.
An example for a three byte message could be the following: 9A 3C 4E. The first hexadecimalnumber is the status byte and the following two are the data bytes. If we look at the data byte andtransfer the first number into the binary system it has the value 1001 and Table 2.3 shows that thismessage is a Note On message. The hexadecimal letter A has the decimal value 10, and since thefirst channel has the number 0, this means that the note is on channel 11. Next two data bytes havethe decimal value 60 and 78. As the first is the note number, Table 2.1 indicates that it is the noteC4. Finally, the last value is the velocity, and the value 78 indicates that the key tends to be playedwith more strength.
On the hardware side, MIDI also defines a standard. The transmission speed is fixed at 31250 bitsper second and a data word consists of a start bit, eight data bits, and a stop bit. The transmission ofone serial byte takes 320 microseconds. A Note On message therefore takes about 1 millisecond.Furthermore, the transmission is only unidirectional, therefore MIDI devices usually have severalconnections.
For saving and further use of MIDI data there are standard MIDI file formats. Individual MIDI datais saved with a timestamp in files with the .mid extension. Information such as song title, tempo,and other useful information can also be stored. A distinction is made between the two file formats0 and 1. Format 0 files can only contain one track with all the information and format 1 files cancontain multiple tracks.
2.3 Piano
The piano belongs to the keyboard instruments and has a hammer mechanism with which the stringsare made to vibrate, thus producing a sound. The word comes from pianoforte, as the instrumentwas originally called by the Italian instrument maker Bartolomeo Cristofori, who developed theinstrument around 1700. Pianoforte is composed of piano, meaning soft, and forte, meaning loud.The name comes from the fact that with this new hammer technique it was possible to influence
16

2.3 Piano
the volume of the sound by the strength of the keystroke. Over the centuries the piano has beenimproved again and again, so that nowadays it usually has two pedals in addition. These pedalscan be used to dampen the volume or to let the sound carry on. The exact process of producingsound is as follows: when a key is pressed, a mechanism inside the piano strikes up to three stringswith a hammer and makes them vibrate, producing sound waves. The felt on these hammers helpsto prevent the hammers from swinging back too much and producing a metallic sound. Usually apiano has a keyboard with 88 keys of which 52 are white and 36 are black. Figure 2.3 shows thekeyboard, which has a range of 7 octaves. The white keys represent the C major scale and the blackkeys the accidentals.
Figure 2.3: The 88 keys of a piano with their note name and octave.3
There is a notation called piano roll, which is often used to visualize MIDI notes. This notation isusually found in a digital audio workstation (DAW), an application used to produce music, or invarious piano learning applications (see Figure 2.4). Individual notes are displayed as bars, whichare drawn at different heights depending on the note value and whose length depends on the notelength. Originally the name comes from self-playing pianos, so-called pianolas or player pianos.These are pianos built so that a mechanism moves the correct keys and plays notes. The piece ofmusic to be played was read in through perforated strips on paper, which were then called pianorolls.
Figure 2.4: Piano roll notation in Synthesia.4
There are several ways to get MIDI data when playing the piano. We use digital pianos which can beconnected to the computer with a suitable cable and thus transmit the MIDI information. Comparedto a classical piano, a digital piano has no strings and no hammer action. However, in order notto lose the feeling of playing, a special mechanism was developed for the keys of a digital piano,so that they feel weighted. Depending on the price category and manufacturer varying qualities
3screenshot taken on November 11, 20204screenshot taken on November 9, 2020
17

2 Background
are implemented. This means that there is also a difference in how precisely a key is recognized inwhich position it is currently located and whether the corresponding note is already activated ornot. There are also differences as to whether a digital piano itself can reproduce the sound directly,either with built-in loudspeakers or headphones, or whether it can only generate MIDI files whichmust then be read and interpreted with an external device.
18
3 Related Work
In this chapter we will show some existing tools and scientific approaches about the topic whichhelp us to design and shape the final product. For a better overview, we split the related work chapterinto piano learning tools and scientific approaches.
3.1 Piano Learning Tools
There are already a lot of different tools on the market that try to support users in becoming thenext Lang Lang1. We had a look at them to see what they can do, what is great about them, andwhat we could improve on.
First on the list is Synthesia2, a program where users can choose between pre-loaded tracks andalso load their own MIDI tracks. There users have three different modes to approach a song theywould like to learn or improve on. They are: Melody, where the song stops at every note until itis played; Rhythm, where the notes will progress in a tempo of their choice; and Concert, wherethe song is played in the tempo it is supposed to be played. In each mode they can choose to playwith one hand or with both at the same time. They receive a rating depending on how well theyplayed. This score is stored with a timestamp and in addition to that Synthesia also records howmany notes they played, how many mistakes they made and how close they were to the concertspeed. They can compare their scoring online with other players yet they are not able to checkon their previous mistakes and where they can improve afterwards. The game view consists of aprogress bar, a display of the note sheet, and, most prominently, a digital keyboard at the bottomwhere the notes in form of blocks drop on.
Next is Piano Marvel3, a learning platform. It has a different feel and approach to it. While Synthesiais more of a game, this platform focuses on supporting the learning and teaching process. Whenusers want to learn a song it only shows the music sheet and a line indicates were they currentlyare. Depending on whether they prepare or assess, the line will stop at each note until they playedthe correct one or it will move in the tempo they choose. After finishing the song or stopping theassessment it shows all the notes they have played during the time as note heads on the note sheettogether with the original notes. Those new note heads are then colored either green if they weresupposed to be played or otherwise in red, at the exact time they played them. Furthermore, PianoMarvel gives them a score up to 100% depending on how many notes they played and how many ofthem were correct. Users can’t access the display of played notes afterwards and it does not accountfor the note value while scoring their play.
1piano virtuoso of our time2https://synthesiagame.com/3https://pianomarvel.com/
19

3 Related Work
Figure 3.1: Enhanced notation in Yousician.4
Another program is Yousician5, which is available as desktop or mobile app. The playing visu-alization there consists of side-scrolling staves, a piano keyboard, and a progress bar which alsoshows the notes of the song in the form of a piano roll. For the notation in the staves users candecide between normal notes and colored notes with colors that match a display of which fingerthey should use for them. In addition Yousician has an enhanced notation as seen in Figure 3.1which shows the notes just as blocks instead of notes with the name of the note in them and alsocolored. While playing, the notes colors change too either green or red after users passed them,depending on if they hit them or not. When they finish a song their score is saved in the scoreboard,but there is also no way for them to see what mistakes they made afterwards.
Figure 3.2: Noteflight SoundChecks feedback graph.6
We also had a look at Noteflight SoundCheck7. There users can record their playing and get a lot ofdifferent feedback on it. Figure 3.2 shows that under the staves the sound-wave of the recordingis displayed and on top is a line graph with a red-yellow-green color scheme. While the color ofthe line indicates pitch errors, the movement indicates rhythm errors. When users are too fast in asection the line goes up and if they are to slow the line goes down. In the end there is also a scoringin the categories correct note lengths, correct pitches, and correct rhythm. The pitch and rhythmscores are also combined into one total score.
As an alternative to these learning programs, there are also software solutions that can generatestaff notations or piano rolls from MIDI files. Not only listening to the music but also having someform of notation available helps to understand more quickly which notes exactly have to be played.A free solution for the staff notation is MuseScore8 and a piano roll view can be generated with theMidiEditor9.
4screenshot taken on November 6, 20205https://yousician.com/piano6screenshot taken on November 6, 20207https://www.noteflight.com/soundcheck8https://musescore.org/en9https://www.midieditor.org/
20
3.2 Scientific Approaches
3.2 Scientific Approaches
We are considering different scientific approaches for this work. On the one hand, we look at theextent to which the use of technology, especially visualization, in learning an instrument has alreadybeen investigated. And on the other hand, we checked in how far color can be used for musicvisualization. We also look at what concrete research has already been done on the topic of visualsupport for learning to play the piano and what the principles of visual comparison are.
3.2.1 Benefits of Visualization in Music Education
In “Visual Feedback in Higher Education Piano Learning and Teaching” [Ham17] Luciana Hamondinvestigated in how far visual feedback can support learning progress in piano learning. She useda DAW software that showed the user what they were playing as a piano roll. In her publication,she also refers to other studies that have been done on this topic and concludes that the benefits ofvisual feedback are usually still dependent on the individual student. However, it was shown thatvisualization has made students more aware of their own learning progress and that future workshould explore further how technology can improve traditional one-to-one teaching.
Micheloni et al. [MTRC19] published a case study with the title “Playing to play: a piano-baseduser interface for music education video-games” in 2018, in which they examined whether the useof a piano keyboard can be learned through a video game. In the study 51 children aged 6 to 11participated and played a computer game called Musa10 in which they could control a characterby pressing the correct piano keys. The result of the study was that the participants were able toimprove their understanding of the piano within two sessions and that this affected participants withand without previous knowledge of the piano equally.
Trujillo et al. [TBBS20] present a web app they developed to help students with autism learn to playthe piano. The prototypes they have developed focus on introducing students to the basic conceptsof music. In addition, it is possible to create a learning environment that is adapted to the student,allowing them to collaborate with classmates. The study they have conducted with their app has ledto the conclusion that technology plays a key role in facilitating the learning process for studentswith autism.
3.2.2 Visual Support Systems for Piano Playing
In 2014, two papers were published independently of each other which have a very similar approachto supporting piano playing through Augmented Reality, i.e. by displaying things in the real worldthat do not exist in this way. In both cases a projector was used to project notes in piano roll notationin an area behind and on the piano keyboard, as can be seen in Figure 3.3.
Raymaekers et al. [RVLC14] focus on the playful aspect in their work “Game of Tones: Learningto Play Songs on a Piano Using Projected Instructions and Games”. They have used projection toproject Synthesia directly onto the piano, but they have also developed a game called Piano Attackin which the user has to press the right keys at the right time to defend their piano from aliens.
10https://www.playmusa.com/
21
3 Related Work
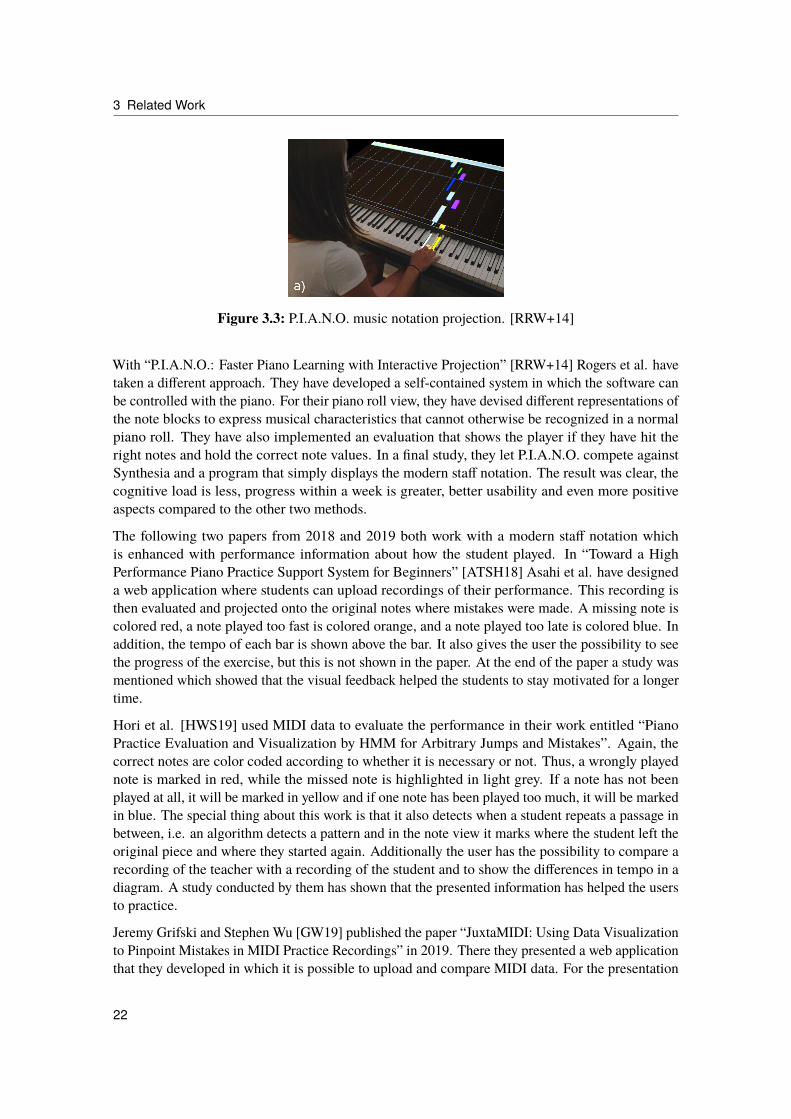
Figure 3.3: P.I.A.N.O. music notation projection. [RRW+14]
With “P.I.A.N.O.: Faster Piano Learning with Interactive Projection” [RRW+14] Rogers et al. havetaken a different approach. They have developed a self-contained system in which the software canbe controlled with the piano. For their piano roll view, they have devised different representations ofthe note blocks to express musical characteristics that cannot otherwise be recognized in a normalpiano roll. They have also implemented an evaluation that shows the player if they have hit theright notes and hold the correct note values. In a final study, they let P.I.A.N.O. compete againstSynthesia and a program that simply displays the modern staff notation. The result was clear, thecognitive load is less, progress within a week is greater, better usability and even more positiveaspects compared to the other two methods.
The following two papers from 2018 and 2019 both work with a modern staff notation whichis enhanced with performance information about how the student played. In “Toward a HighPerformance Piano Practice Support System for Beginners” [ATSH18] Asahi et al. have designeda web application where students can upload recordings of their performance. This recording isthen evaluated and projected onto the original notes where mistakes were made. A missing note iscolored red, a note played too fast is colored orange, and a note played too late is colored blue. Inaddition, the tempo of each bar is shown above the bar. It also gives the user the possibility to seethe progress of the exercise, but this is not shown in the paper. At the end of the paper a study wasmentioned which showed that the visual feedback helped the students to stay motivated for a longertime.
Hori et al. [HWS19] used MIDI data to evaluate the performance in their work entitled “PianoPractice Evaluation and Visualization by HMM for Arbitrary Jumps and Mistakes”. Again, thecorrect notes are color coded according to whether it is necessary or not. Thus, a wrongly playednote is marked in red, while the missed note is highlighted in light grey. If a note has not beenplayed at all, it will be marked in yellow and if one note has been played too much, it will be markedin blue. The special thing about this work is that it also detects when a student repeats a passage inbetween, i.e. an algorithm detects a pattern and in the note view it marks where the student left theoriginal piece and where they started again. Additionally the user has the possibility to compare arecording of the teacher with a recording of the student and to show the differences in tempo in adiagram. A study conducted by them has shown that the presented information has helped the usersto practice.
Jeremy Grifski and Stephen Wu [GW19] published the paper “JuxtaMIDI: Using Data Visualizationto Pinpoint Mistakes in MIDI Practice Recordings” in 2019. There they presented a web applicationthat they developed in which it is possible to upload and compare MIDI data. For the presentation
22

3.2 Scientific Approaches
of the data they implemented three different graphs. One of them shows the notes against time,basically the piano roll notation. On of the other two graphs show the notes frequency, as in howoften each note appeared in the song and the last one the velocity over time.
3.2.3 Music Visualization
How concurrent tones in music can be visualized was researched by Ciuha et al. [CKS10] in 2010.In their paper, they present a new way to visualize different characteristics of music. This can helpto gain a better understanding of a piece of music, which in turn helps to learn it.
In 2015 Maladrino et al. [MPZZ15] researched how color visualization can help to better understandharmonic structures in musical compositions. They wanted to simplify the process of understandingand learning classical notation. The visualization they have implemented colors areas in stavesdepending on the harmony in that area. A user study that they conducted to evaluate their approachshowed promising results.
3.2.4 Design Principles for Visual Comparison
In “Visual comparison for information visualization” [GAW+11] Gleicher et al. present a systemfor how a data comparison can be structured. Two of the three design principles that we find mostuseful are juxtaposition and superposition. In juxtaposition, two or more elements are displayedside by side for visual comparison, whereas in superposition, several elements are drawn on top ofeach other.
3.2.5 Technologies
The extent to which Web MIDI technology has already been developed to create web-based musicapplications was investigated in 2017 by Luca Ludovico [Lud17] in “The Web MIDI API in On-Line Applications for Music Education”. One advantage of this technology is that there are lessincompatibilities between different browsers, because there is no need to use plug-ins anymore. SinceMIDI only sends commands and no audio signals, the data is much more compact. A disadvantageis that MIDI is not a notation format, so notes can only be displayed in a simplified way, as forexample with a piano roll notation.
23


4 Design
In this chapter we will present the design of our application. First, we will explain the requirementswe defined for our system, followed by an explanation of the two modes we considered. Afterthat,we will explain how we displayed the notes and finally, we will look at the error visualization.
4.1 Requirements
Since piano beginners usually cannot yet rely on their hearing to detect mistakes, we want to helpthem with our system to become aware of their mistakes when practicing alone. The system canalso be used to support the piano teacher when necessary. Different components are needed for thedesign of such a visualization system.
The system must be able to show what is to be played and what has been played. It must also givethe user visual clues as to where the recording differs from the original. Furthermore, it is helpfulto not only look at the current performance but also to compare several attempts. This allows theuser to identify areas of the song that are particularly prone to errors and to practice them in atargeted manner. The progress over time can also be displayed with this information, which can bean advantage in maintaining motivation.
In the course of the work, we have repeatedly revised and optimised the design of the software. Sothe focus of the note display was first to realize a familiar staff notation and later the block and pianoroll notation was added. The user interface has also evolved over time. The following sections willexplain all parts of our system in detail.
4.2 Modes
We have divided the recording of new performances and the analysis of old performances into twodifferent modes. So when the user opens the application, they can first select a song that is alreadyin the database, and then choose between the play and analyze mode. In the play mode they canpractice, record, and analyze the song they choose. Through the analyze mode they can access alltheir recordings again and analyze multiple recordings at the same time to see their progress.
A usual workflow could be that the user chooses the song they currently want to practice. So theyselect the song and press the play button, which leads them to the play mode. There they wouldpractice the song a few times in different tempi, check how they are doing, and then attempt to playat the original tempo. After they finished this version they are going to save it and switch to theanalyze mode, where they can check how they performed in comparison to other attempts on thissong. We will describe the user interfaces of the two modes in more details in the next to sections.
25
4 Design
4.2.1 Play Mode
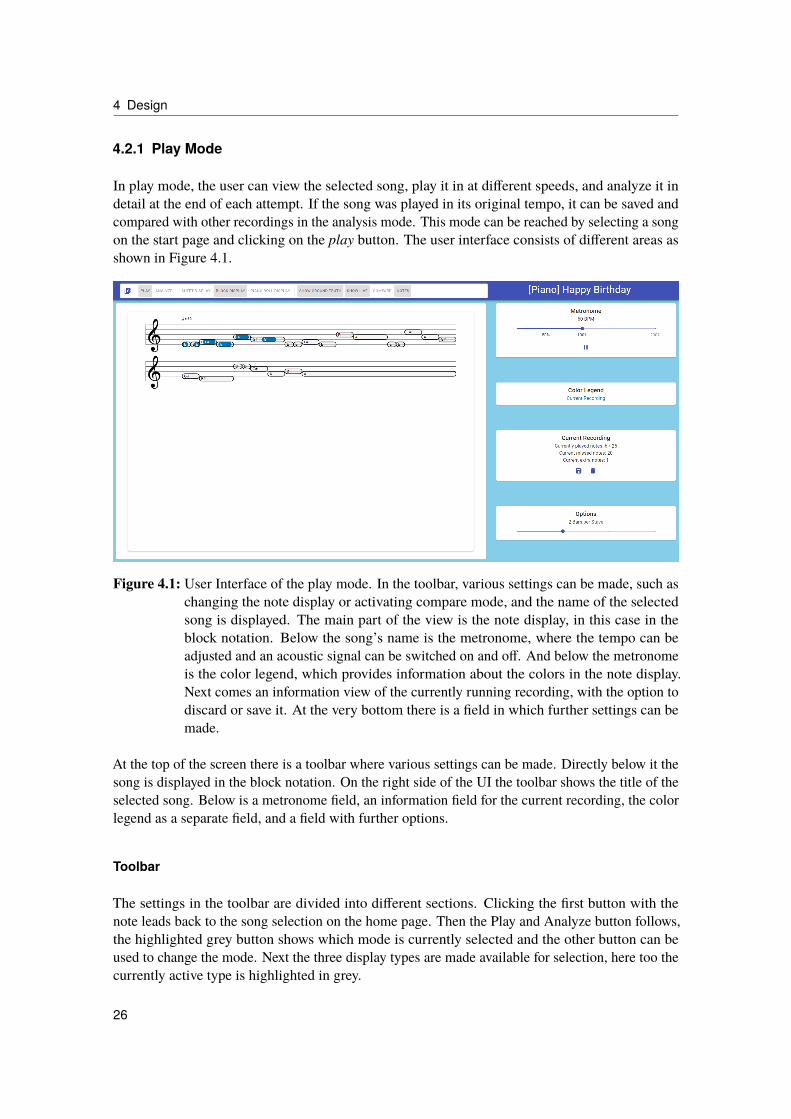
In play mode, the user can view the selected song, play it in at different speeds, and analyze it indetail at the end of each attempt. If the song was played in its original tempo, it can be saved andcompared with other recordings in the analysis mode. This mode can be reached by selecting a songon the start page and clicking on the play button. The user interface consists of different areas asshown in Figure 4.1.
Figure 4.1: User Interface of the play mode. In the toolbar, various settings can be made, such aschanging the note display or activating compare mode, and the name of the selectedsong is displayed. The main part of the view is the note display, in this case in theblock notation. Below the song’s name is the metronome, where the tempo can beadjusted and an acoustic signal can be switched on and off. And below the metronomeis the color legend, which provides information about the colors in the note display.Next comes an information view of the currently running recording, with the option todiscard or save it. At the very bottom there is a field in which further settings can bemade.
At the top of the screen there is a toolbar where various settings can be made. Directly below it thesong is displayed in the block notation. On the right side of the UI the toolbar shows the title of theselected song. Below is a metronome field, an information field for the current recording, the colorlegend as a separate field, and a field with further options.
Toolbar
The settings in the toolbar are divided into different sections. Clicking the first button with thenote leads back to the song selection on the home page. Then the Play and Analyze button follows,the highlighted grey button shows which mode is currently selected and the other button can beused to change the mode. Next the three display types are made available for selection, here too thecurrently active type is highlighted in grey.
26

4.2 Modes
In the last area, depending on the display type and the type of error analysis, three to five furthersetting options are given. The first two buttons are used to fade in and out the ground truth notes andto do the same with the live notes. The compare button activates the comparison of the ground truthand live notes and this will be visually highlighted in the note display. In the block and piano rolldisplay follows the note button, with this it is possible to switch between showing the note names ordrawn notes with note head and stem, respectively MIDI numbers. The last button is a color button,which is displayed as soon as it is relevant for the visualization. This button changes the colors forcompletely wrong notes from red to yellow, so that color-blind people can better distinguish themfrom other notes.
Metronome
The first button with the note leads back to the song selection on the start page. The slider belowcan be used to adjust the speed according to the learning progress. It is possible to select between10 and 200 percent of the original speed in steps of ten. By changing the speed, the live MIDI notesare adjusted so that they can be compared with the ground truth notes. With the start button anacoustic metronome can be started. As soon as it is played the button changes into a stop button.
Color Legend
The color legend shows what the colors in the note display encode. If only the live notes are drawn in,they will have a blue color and the legend will show “Current Recording” written in the same shadeof blue. In compare mode the color gradient is shown, in which the notes are colored accordingto their time difference, and the colors are explained. When differences in piano roll notation arecolored in heat map mode, the legend explains the three colors that are used.
Current Recording
The current recording contains statistics. It shows how many notes must be played and how manyhave already been played. Since the notes played do not necessarily have to be the correct ones,there are two additional counters. So the current missing note counter shows how many of theground truth notes have not yet been played, this can be different from the difference between thetwo values in currently played notes. The current extra note counter shows how many notes wereplayed that are not in the ground truth.
Under the counters there are two buttons. The button with the memory icon can be used to save thecurrent recording. But this only works if the metronome is set to 100%, otherwise the button isgreyed out. If this button is pressed, a pop up window will show that a song is currently being savedand asks for permission to do so. Canceling this process will also directly discard the recording.The second button with the delete icon is for discarding the recording directly and can be pressed atany time.
27

4 Design
Options
In Options, further settings can be adjusted using two sliders. The reason that these options are notshown together with the others is purely due to the visual composition, to reduce visual clutter, andkeep the user interface more simple. The first slider is responsible for the error threshold, with thisslider the user can set the error tolerance they want to have when comparing. Its value is given inmilliseconds (ms) and the current value is displayed. This option is only shown if the comparisonmode is activated. The second slider changes the display of the notation. With it, the user can sethow many bars within a row should be visible on the note display.
4.2.2 Analyze Mode
In the Analyze mode, all stored recordings can be compared again with the ground truth. It ispossible to select only one recording or to display several recordings at once. The structure isidentical to the play mode, only a few components differ.
Figure 4.2: User Interface of the analyze mode. It is structured similarly to the UI of the play mode,in the toolbar the options and the song title can be found again. In the left area there isthe note display again, in this case in the piano roll notation and with two recordingsdrawn in. The color legend is beneath the song title on the right side. Underneath thecolor legend is a table with all recordings found for this song. These are listed withdate and further information and can be sorted by each attribute. Here any number ofrecordings can be selected. Further options are located at the bottom right.
28

4.3 Display Types
Similarities and Differences to the Play Mode
In the upper area is a similar toolbar to the one in the play mode, with the setting buttons and thesong title. Only the name of the “Show Live” button changes to “Show Recording(s)”. On the leftside is the note display. Next to it are the three areas color legend, recordings, and options. A moredetailed explanation of the toolbar, color legend and options can be found in the play mode section.If one or more recordings are selected without the comparison being activated, they are colored indifferent colors and the legend shows which recording has which color.
Recordings
In this section all recordings of this song are listed in table form. In total there are six columns foreach recording. In the first column there is a checkbox to select the recording. After that follows thethe date and time of the recording. Missed Notes shows number of notes that were not played. ExtraNotes the number of notes that were played, but are not in the ground truth. Actual Speed shows therelation of the ground truth BPM and the calculated BPM of the recording. The last column showshow long the recording is in seconds (s).
4.3 Display Types
In this section we will discuss which display types we would like to use to display the songs. Theseare the modern staff notation, the block notation, and the piano roll notation.
4.3.1 Modern Staff Notation
It was important for us to have the modern staff notation as display type, because many piano playersuse it to learn and play songs. Throughout this thesis, we also refer to it as classical notation.Despite the weaknesses of the MIDI file format not to be a notation format, as Ludovico [Lud17]pointed out, we have implemented this display type. Some parts of the classic notation have alreadybeen introduced in detail in Chapter 2. Nevertheless, we will briefly go into the special features ofour design here.
Figure 4.3: The C major scale in modern staff notation.
Figure 4.3 shows how notes are drawn into the staves depending on their start time, so the lines ofthe staves serve as a timeline. In addition, when notes with flags follow each other within a bar, theflags are not replaced by a bar that connects these notes. If recorded notes are displayed, the groundtruth notes become transparent so that it is easier to recognize which note is a recorded note. It ispossible to select the number of bars to be displayed side by side between 1 and 4.
29

4 Design
4.3.2 Block Notation
The block notation has its inspiration from the “enhanced” notation from Yousician. It can be seenin a way as a hybrid between the classical notation and the piano roll notation. This is useful ifthe user cannot read notes yet, but wants to get to it. The notes are drawn as blocks on the staves,starting in the position where the note head would normally be drawn. In addition, they will bemarked with their note name. Alternatively to the note name the drawn notes can also be displayedIn this case the bar serves to recognize faster what the duration of the note is.
Figure 4.4: The C major scale in block notation.
Figure 4.4 shows what these block notes look like. They are colored white, have a black frame, andare labelled with their note names on the left side. Accidentals can be distinguished, apart from thesharp sign in their names, by the fact that they are colored black and their note names are written inwhite. When recordings are displayed, only the frame and name of the ground truth notes are drawnin the foreground. The recording notes are drawn onto the staves without frames.
4.3.3 Piano Roll Notation
In the piano roll notation, notes have the form of a rectangle. Natural notes (notes without accidentals)have a black border and a filling that is light-grey, almost white. Accidentals are half as high asthe natural notes and are completely black, this can be seen in Figure 4.5. Unlike the classical andblock notation, they are not drawn onto staves but in a coordinate system.
Figure 4.5: The C major scale in piano roll notation.
The Y axis represents the pitches that occur in the song and only the range of pitches that arecurrently needed is displayed here. It starts with the lowest pitch of the song at the bottom of theaxis and the highest pitch at the top and between those all pitches are displayed. The user can decidewhether they want to have the ticks labeled with either the note names or their MIDI number.
30

4.4 Error Visualization
The X axis represents the time in seconds, that means that the width of a note rectangle representsits duration. The bar lines are also drawn, to simplify visual alignment to bars. In an earlier designstage, we used different shades of grey as background for each bar, but because this interfered withthe color perception of the error visualization, we decided to go with a plain white background andjust add small bar lines.
As soon as recording notes are also displayed, the filling of the ground truth gets smaller. In caseof three recordings, the height of the ground truth note filling shrinks to one fourth, each of therecordings note has the height of one fourth of a normal ground truth note and in the last fourth theground truth note is drawn. But the border of the ground truth note stays intact. The only exceptionis the heat map visualization, which will be described later. There, the ground truth notes have nofilling at all, just a border is drawn for them.
4.4 Error Visualization
In this section we show the different ways of error display that we have designed. Since we haveworked a lot with colors, Tim Levine’s [Lev09] paper on the use of color in illustrations was veryhelpful. Also chapters from the book “Fundamentals of Data Visualization” [Wil19] by Claus O.Wilke were of great use. One point that was important to us when choosing the colors is that oursoftware can also be used by color-blind people without any restrictions. How we have implementedthis in the respective visualizations is described in their sections.
4.4.1 Superimposed Recording Notes
One way to compare the recordings with the ground truth and detect errors is to draw the differentversions in different colors juxtaposed or superimposed. This helps to see in which areas the notesare close together and in which areas they are more scattered. To distinguish the ground truth notesfrom the other notes in general, the outlines of the ground truth notes are drawn onto the foregroundin the block and piano roll notation. In the modern sheet notation, the ground truth note is drawncompletely in the foreground.
As color palette for the different photos we took a color set from Okabe and Ito [OI02]. This setconsists of 8 different colors and has the special feature that even color-blind people can tell themapart. Besides the fact that more colors would make it more complicated for color blind people,there should not be more than eight different color categories. Ideally the number of color categoriesshould be limited to be between 3 and 5. We leave it up to the user to choose up to eight recordings,each with its own color category.
Figure 4.6a shows how this visualization looks like in the modern sheet notation. The black notesin the front are the ground truth notes and each of the six recordings has its own color. As all therecordings start at zero seconds, the first notes are all in one place. At the third note the distributionof the notes is the most spread out. It is also visible that the blue recording was played slower thanthe rest of the recordings.
31

4 Design
(a) The black notes are the ground truth notes. Therecordings of the third note are the most widelyscattered, indicating that the user makes largererrors here.
(b) The black frames show the ground truth notes andthe colored rectangles are the different recordings.In this display, more information about the dura-tion of each note is visible, because each recordinghas its own position.
Figure 4.6: Superimposed comparison of six recordings in modern staff and piano roll notation.Each recording has its own color so that they can be distinguished from each other.
4.4.2 Notes Colored by Start Time Difference
In this compare mode, the notes of the recording are matched with the ground truth notes. In thematching process each recording note will be compared with all ground truth notes that have thesame pitch. It then will be matched to the ground truth note to which it has the lowest start timedifference and the time difference will be used to determine whether the recording note should bethere or not. Because of this kind of comparison it is necessary that the tempo of the ground truthand the tempo of the recording is as close as possible. The result of this comparison can either bedisplayed on the recording notes or, if only one recording is selected and it is not displayed on thecorresponding ground truth notes, on the recording notes. Here it is possible to see if a note was hit,missed, or not played. If a note was hit, the timing is shown by further coloring.
For this purpose we use a color gradient which goes over three colors. If a note is played too early,its coloring approaches the left edge of the gradient and the later it is played, the more it approachesthe right edge. When the outer limits of the color gradient are reached depends on the thresholdthat the user can choose. That means it is up to the user to decide how many milliseconds tolerancethey want to have.
At first, we wanted to use a color gradient from dark blue via green to dark red. However, withsuch a gradient in this use case, it is difficult for color-blind people to see where on the scale thecoloring of the note is located. We have tried this with tools that simulate color blindness. Since alltypes of color blindness can distinguish the colors blue and red very well, we have stuck to thesetwo colors, only different shapes used to distinguish something would be even better. [JK07] Thesecolors can also be easily associated with their statements, for example red is associated with energyand movement, while blue is associated with calm.[Sch79] So in our case the color red with itsenergy association stands for being too fast. And blue with its association as calm stands for beingtoo slow. These decisions make the use of the comparison more intuitive.
32

4.4 Error Visualization
So our second choice was a color gradient from dark red to white to dark blue. The fact that thecorrect notes were drawn in white and the background is white as well led to a bad contrast and itwas hard to see that a note was drawn there. The idea of simply making the background darker wasquickly discarded, as this would have a negative effect on the contrast with other colors we use. In alast step, we inverted our gradient so that it now goes from turquoise to black to a bright orangecolor, as can be seen in Figure 4.7.
Figure 4.7: Color gradient used for error visualization. Towards the orange end indicates that thenotes were played too early, and towards the blue end they were played too slow.
Notes that were either not played at all or were played too far off are displayed in red or yellow,depending on whether the color-blind mode is active. We make this distinction here, as we considerred to be useful to make it clear that there is a note that should not be there. However, red for acolor-blind person differs little or not at all from colors that appear in the gradient, which is why wehave yellow as a second option.
Figure 4.8: Color mapping applied to the same recordings and notes as before. Dark colored notesindicate that the user played on time or close to it. The red colored notes indicate thatthe note was played outside the threshold.
This comparison type can be used in all three display types. Users can also display several recordings,but it is only possible to distinguish which note belongs to which recording in the piano roll notation.The advantage of this is that in the area around the ground truth notes it is possible to see whetherthe tendency is towards notes in the blue or orange area. This helps the user to recognize whetherthey play too slow or too fast, or whether this varies from section to section. Outliers can also bedetected more quickly by the red or yellow coloring.
In Figure 4.8, the first four notes of a C major scale are displayed in the piano roll notation. The sixblocks in each note are six different recordings where each note is compared with the ground truthnote and colored according to the difference. The first recording has two red notes, starting on the
33

4 Design
left of the ground truth note which indicates that this recording was played way too fast. And thelast recording was the complete opposite with one light blue and two red notes starting way in theground truth note. We can also see that the third recording played the forth note twice.
4.4.3 Heat Map
The heat map visualization differs from the other visualization types in that all selected recordingsare bundled together and then compared with the ground truth notes. So for each pitch along thetimeline, the system looks in which areas it was played by how many recordings. This is displayedby the height of the color block drawn in this section. In a first iteration the frequency of notesplayed at that time was encoded through the block’s opacity, but this was problematic since it washard to tell if the two different colors had the same opacity or not, as can be seen in Figure 4.9a.
The color is determined by whether this pitch also exists in the ground truth during this time period.If this is the case, this area is colored black. However, if the pitch is not played at this time, butis within the threshold range, the area is colored yellow. Finally, if this pitch is not found in thenearer surroundings, the area will be colored red. Areas in which neither the pitch was played in arecording nor in the ground truth version, are not colored at all.
(a) Old heat map visualization with opacity asrepresentation of frequency of notes played at thattime.
(b) New heat map visualization with bar height asrepresentation of frequency of notes played at thattime.
Figure 4.9: Heat map visualization applied to the same recordings again.The declining volume of black filling in each note shows that every note was hit worsethan the one before.
Figure 4.9 shows how the heat map looks like on the first four notes of the C major scale. Theseare the same six recordings as in the other examples. Through the height of the bars it can be seenthat with every note the area in which all six recordings meet the ground truth at the same time isgetting smaller. Furthermore, there is a tendency that from note to note these are played too lateand are also held too long.
34

5 Implementation
We decided to implement the prototype for the application as a web app. The advantage of this wasthat due to the large number of frameworks and application programming interfaces (API) availablefor web development it is easy and quick to implement a working prototype. In general a web apphas the advantage that it can be used from any device that has a browser that supports the necessaryAPIs. In this chapter we will show which framework, which libraries, and which APIs we use. Wehave divided the application into two components and named them backend and frontend.
5.1 Backend
In the backend we use Node.js1, a JavaScript runtime environment that allows us to execute JavaScriptcode outside of a browser. In this component the ground truth data is stored as MIDI files. The userof the program has access to this data and can add any other songs in form of MIDI files. In thebackground chapter we have shown how MIDI data is structured.
In addition to the ground truth data, the saved recordings are stored here in the form of JSONfiles. JSON stands for JavaScript Object Notation, which is a standard format for storing to storedata objects in readable text form and to transfer them between different applications. For thecommunication between the backend and the frontend we use the express backend web applicationframework of Node.js. With this framework requests can be made to this backend server and datacan be transferred in both directions.
5.2 Frontend
To simplify the whole programming process, we use the framework React2 that contains ready-madefunctions for reactive UI updates and makes it easy to separate views into components. With thehelp of the design language Material Design it is easier to create a web app design that adapts todifferent conditions, such as screen size. This was developed by Google in 2014 and with MaterialUI3 we used a React Library which allows us to implement material design in the app.
1https://nodejs.org/en/2https://reactjs.org/3https://material-ui.com/
35

5 Implementation
5.2.1 Note Objects
The information of the ground truth MIDI notes we receive by requesting them from the backend isstored in an array of note objects. A note object has the attributes pitch, start, velocity, channel, andend. This information is used to draw the notes in the different displays and compare them witheach other. The data of the live notes are read out via the Web MIDI API4 and also saved as anarray of note objects. For this, a digital piano, capable of producing MIDI, must be connected tothe device on which the application is running and the browser must support the Web MIDI API.
5.2.2 Note displays
The staves, notes, and block notes are drawn using Scalable Vector Graphics (SVG). Within theSVG tag in HTML we can draw lines and ellipses and we compute at which position what has to bedrawn. The clefs themselves are finished images that we draw in at a calculated position. The pianoroll view is based on a graph that shows the time on the X axis and the pitch on the Y axis. To drawthis, we used the functions of the Data-Driven Documents (D3)5 JavaScript library.
5.2.3 Note comparison
The comparison between ground truth notes and recording notes is implemented as follows: Therecording notes are scanned note by note and it is checked if the same pitch exists in the groundtruth. If this is the case, the current note is matched with the ground truth note with the start valueclosest to the own start value. The calculated distance together with the adjusted error threshholdwill give the coloring for the current note.
In the case of the heat map comparison, the first step is to determine which pitches occur acrossall selected recordings and the ground truth and these are stored in an array. Afterwards a map iscreated for each selected recording, which contains all the pitches in the array as keys. For each ofthese keys an array is created with a length depending on the longest recording or the ground truth ifno recording is longer. Each of these fields then covers 10ms of the song and is filled with a 1 or a 0depending on whether the note was played during this time period or not. Such a map is also createdfor the ground truth. If more than one recording is selected, then the maps of these recordings willbe combined again. After this step, there is only one map for all recordings, in whose fields valuesbetween 0 and 1 can be found, depending on how many recordings the respective note was playedat this moment. While drawing, the system looks in which areas values above 0 can be found inthe recordings map. Depending on whether a 1 is found in the corresponding field in the groundtruth map or not, or in a field whose distance lies within the error threshold, the bars are colored inblack, yellow, or red. The value at this position in the recording map indicates how high the bar isdrawn.
4https://www.w3.org/TR/webmidi/5https://d3js.org/
36

6 Evaluation
We decided to conduct a case study to evaluate the functionality of our application. This type ofstudies are increasingly used in the field of visual research. A study with participants would alsohave been practical, but we have decided not to carry out such a study due to the current crisissituation caused by the corona virus. Now we will describe how a potential user could perceive theapp and how they would use it.
6.1 Display Types
When the user selects a song from the list on the start page and then switches to play mode, thereare three ways in which the user can view the notes. These are classical notes on staves, blocks thatare drawn instead of normal notes, or the piano roll notation. Figure 6.1 shows what a section of“Comptine d’Un Autre Été” looks like in the three different display types. Each of them shows fouridentical bars, so it is easy to see how differently the notes can be perceived.
The classical notation is shown in Figure 6.1a. Since notes with flags are not connected andaccidentals are not drawn in, it is difficult to have an overview of which notes have to be played.Below is the block notation, shown in Figure 6.1b. As no note necks are drawn in and accidentalsare highlighted in black, this view is clearer than the normal notation. The clef at the beginninghelps to know which octave we are in and the note names can help a beginner recognize the notefaster. Finally, the piano roll notation in Figure 6.1c is also clearer, because there is more space forthe individual notes.
6.2 Error Visualization
When the user has recorded an attempt at playing a piece, they have nine different possibilitiesto display the notes and to highlight the errors. These possibilities are shown in Figure 6.2. Thethree different display types are shown by row. In the first column only the current recording isdrawn in a different color behind the ground truth notes. So here only the live view is activated.After that a column follows in which the notes are compared and depending on the difference of thestart time the recorded notes are colored. In this case, the live view and the comparison view isactive. The last column has different approaches depending on the display type. In the classicaland block notation the comparison is applied again and the ground truth notes are colored in thecorresponding color, the recording notes are not drawn in at all. But the piano roll notation showsthe heat map visualization. Here only the comparison mode is activated and not the live view.
37

6 Evaluation
(a) This figure shows the classical notation, because of the large number of notes it looks rather confusing.The key signature, the time signature, and ledger lines are missing. Notes with flags are not connected,if they are located one after the other within a bar, as they would be in sheet music. The melody andaccompaniment are difficult to distinguish.
(b) The block notation is clearer. Accidentals can be recognized pre-attentively by their note names and theblack color. Additionally, the duration of a note and the relation between notes of different lengths can beseen more quickly than in the classical notation.
(c) This is the piano roll notation, which also has black colored accidentals. Compared to the block notationthe notes have more space and are not squeezed together so much. But they are not labelled with theirnote name, which instead is located on the left edge at the height of the corresponding note.
Figure 6.1: Four bars of “Comptine d’Un Autre Été” displayed in the three different display types:classical notation, block notation, and piano roll notation.
Figure 6.2a and 6.2b show that classical notation quickly becomes confusing if there are too manynotes in one place. It is also difficult to see how the note values differ when the note was playedat about the right time but held too short or too long. In the block notation the whole thing isa somewhat clearer, also the duration of a single note can be compared to the ground truth noteduration. Nevertheless, the overlapping of individual notes makes it difficult to keep track of thewhole. If a note is well hit and therefore colored in a dark tone, but held too long, the boundaries ofthe ground truth notes are difficult to detect, as can be seen on the right edge of Figure 6.2e.
The visualizations in piano roll notation are the clearest, as shown in Figure 6.2g, 6.2h, and 6.2i. Itis easy to see where the ground truth notes are and how good the attempt was. Using the coloring inFigure 6.2h helps to judge even better how much the notes were missed. The heat map in Figure 6.2ihelps to see how much of the duration of each note was played outside the error threshold. Visualisingthe errors in Figure 6.2c and 6.2f helps to get a quick overview of how well the notes were hit inwhich area, but does not give any information about the duration of the notes.
38

6.2 Error Visualization
(a) (b) (c)
(d) (e) (f)
(g) (h) (i)
Figure 6.2: This figure shows what the same bar with the same recording looks like in different errorvisualizations. The rows from top to bottom include classical notation, block notation,and piano roll notation. In the first two columns, the respective notation always has thesame type of recording visualization. Column one shows ground truth and recordingin black and pink. Column two colors the recording notes depending on the distanceof their corresponding ground truth note. The first two rows in column three color theground truth note in this color instead and hide the recording note. Figure 6.2i showsthe heat map visualization in the matching area in black, areas in the error threshold inyellow, and outside in red.
Figure 6.3: This figure shows a weakness of the matching algorithm. The colors give the impressionthat three out of four notes in the recording are played close to their matching groundtruth notes. But the truth is that each of the notes is off by almost twice its duration.
Figure 6.3 shows an example which reveals the flaws of the matching algorithm. The colors of thefirst three recording notes give the impression that they were played approximately on time. Infact, in this section the notes were played so late that they were compared to the following note.Songs, that have several passages in which the same notes follow each other, may appear in thevisualization as if the tempo had been well maintained.
In summary, the error visualizations in the piano roll notation, and one case each in normal andblock notation (Figure 6.2c, 6.2f, 6.2g, 6.2h, and 6.2i) are useful to pinpoint errors. And the rest ofthe visualizations (Figure 6.2a, 6.2b, 6.2d, and 6.2e) can be left out. Even though we have no colorvisualization for the notes duration, they can still be compared when using the block or piano rollnotation. It is nevertheless useful that all these versions have been implemented because the pianoroll notation is most different from the classical notation and therefore not as intuitive. Here wemake a trade-off between intuitiveness and effectiveness.
39

6 Evaluation
6.3 Practice and Recording
In play mode, it is possible to try to play the song again and again and then analyze how well thecurrent attempt went and what can be improved. For practising, it is also possible to set differenttempi. When the user has played the song in the original tempo, they can decide to save therecording.
Figure 6.4 shows the same section of a song from three different attempts. In Figure 6.4a thecoloring of the notes shows that the user has not hit the right tempo and has become faster andfaster. The red notes indicate that they were played outside the error threshold or not played at all.However, the second attempt in Figure 6.4c worked better, here the melody was played in a goodtempo and the accompanying voice was a bit too fast, so that some notes have the red color. In thethird attempt it worked out well. The notes all have a very dark color, which only here and theretakes on a lighter shade of blue, which means that the user played a little too slowly.
(a) The first attempt to play the song. At this part the player lost the tempo and played too fast. The darknotes are on time and the lighter the color gets, the more they were too fast. Red notes have a timing errorlarger than the specified threshold.
(b) The second attempt by the player, where they hit more notes. Only the lower notes towards the end weremissed.
(c) The third attempt by the player. This time they achieved a good tempo. Still, the blueish color indicatesthat they were a little to slow at some notes.
Figure 6.4: This figure shows an extract from three different attempts to play the song “Comptined’Un Autre Été”. It shows that the user performed better in each attempt than in theprevious one.
If the live notes are activated while the user is playing the song, they are drawn directly into thevisualization. In general, this has the advantage that the user can see which notes they have justplayed and how well they are performing over time. One problem is that the system cannot keepup when too many notes are played in a short time. The system does not crash, but the live notesare displayed with a long delay and depending on the number of notes, the user has to wait a fewminutes after they finish the song, until the display is up to date. In addition, the note view doesnot scroll automatically. So in the current state, only a song can be followed which can be viewedcompletely without scrolling, or another person must scroll manually while the user is playing.
40

6.4 Analysis of Multiple Recordings
6.4 Analysis of Multiple Recordings
(a) This visualization can be used to see the distribution of the notes from the recordings around the respectiveground truth note. However, in areas where there are many ground truth notes in a confined space, thiswill quickly become confusing.
(b) As the recordings are all drawn on top of each other, it is not possible to see when each note was playedin the different recordings.
(c) The three recordings each have a block height of a quarter ground truth note and are drawn below eachother at their respective positions, oldest to newest from top to bottom. Which recording has which colorcan be looked up in a color legend when using the application. We can see that the first recording wasplayed a little too fast, the second recording was better, except for four notes in the last bar, and the thirdrecording was played a little too slow.
(d) In this figure, the three recordings are shown in the heat map visualization. It is noticeable that the notesin the first two bars were hit better than in the following two bars.
Figure 6.5: This figure contains four error visualizations of three recordings in piano roll notation.The two visualizations in the top show that the classical and block notation are notsuited to analyze several recordings at once. Visualizing multiple recordings in thepiano roll notation is more useful, this can be seen in the third and fourth visualization.
41

6 Evaluation
Of the nine error visualization types shown in Figure 6.2, seven can be used to visualize severalrecordings at once. These are two of the three visualizations in the classical and block notation(Figure 6.2a, 6.2b, 6.2d, and 6.2e), and all three visualizations in the piano roll notation (Figure 6.2g,6.2h, and 6.2i). Of these, the three methods with the piano roll can be used well and the methodswith classical notation and block notation are less or not at all usable.
Figure 6.5 shows four different ways to visualize three recordings at the same time. All of themdisplay the same three recordings. In Figure 6.5a and 6.5b the classical and block notation are used asnote display. It can be observed that, especially in block notation, there is no use in displaying theserecordings at the same time, they only cover each other. However, the visualization in Figure 6.5a isuseful to get information such as an overview of the note distribution.
In Figure 6.5c and 6.5d two of the three piano roll visualizations are displayed. The advantage ofthe piano roll visualization is that the recordings can be drawn next to each other and can thereforebe easily distinguished. In addition, Figure 6.5c it can be seen that on the first recording, the noteswere always played a little too early. During the second recording, they were well hit, except forfour notes in the last bar which were played completely wrong, and in the third recording the noteswere always played a little too late. The heat map in Figure 6.5d shows that the notes were mostlyhit well throughout all recordings, but were sometimes held too long.
42

7 Limitations and Discussion
We designed a visualization system that could support students and teachers in learning and teachingpiano playing. Our main focus was to visualize different recordings at the same time, so that theycan be compared with each other, and to highlight where the tempo of the performance deviatesfrom the correct one. During the design and implementation, we encountered numerous challengesand limitations. In this chapter we will explain and discuss them.
A first point is the question of the utility of such an application, as many musicians are of the opinionthat an instrument can only be learned properly through classical music lessons and through thespecific training of the hearing, among other things. With our application, we do not want to replacethis, but rather find solutions that augment and support the classical approach. The idea behind thisis to take advantage of the fact that seeing is the primary sensory system of the human being and ismuch more developed than hearing. Through various visualizations, we want to make it easier forbeginners to get started, especially if their hearing is not yet well trained.
We continue with limitations of our implementation. Our system is based on the user being able tomaintain a fixed tempo throughout the entire song. This leads to the fact that as soon as the userdoes not follow the tempo at one point, and does not catch up at the right time, all notes can bedisplayed as incorrectly played. A solution to this problem could be to either manually align parts ofthe song or to automatically detect where the user has left the song and where they have re-entered.However, this is outside the scope and time budget of this thesis.
This limitation leads straight to the next point, the assignment of individual notes. In our system,notes are assigned to the nearest note in the ground truth based on their pitch and the start time.This way, several notes in the recording can be assigned to the same ground truth note, which causesmissleading visualizations. An improvement would be to assign each ground truth note to the onerecording note that makes the most sense in the overall context.
To come back to the topic of tempo, here is the limitation that our system currently only supportsaving recordings in the original tempo. Since we want to address beginners with our system, andthey usually need a while before they can play a song fluently in the original tempo, it would bebetter if the recordings could be saved with other tempi as well and still used later in the analysis,together with recordings with other tempi. One possibility that is currently available would be tosave the ground truth of the song in different tempi in the backend, but this is not very convenient inthe long run. Therefore a feature that allows to save the tempo or re-scale the recording to matchthe original tempo would be helpful.
A final limitation of our implementation is the scope of data presentation. We have focused onthe correct starting times of the notes and apart from drawing next to or on top of each other, wehave not made any specific evaluation of the duration of an individual note. This could also beconsidered additionally and visualized alongside the other features.
43

7 Limitations and Discussion
The biggest technical limitation we have encountered is that we have focused on MIDI data for theground truth notes. Since this file format does not contain detailed information for drawing staves,it is complicated to display notes in a classical way with the given information. This problem couldbe avoided in the future by including MusicXML files, which contain information for classicalnotation but are more complex to parse and handle.
44

8 Conclusion and Future Work
In this thesis, we developed a prototype for a tool that should support piano lessons by visualizingthe errors made by the student. Our motivation was to visually support piano beginners in learning,based on the fact that vision is our primary sensory system. As background knowledge for our workwe have provided some music theory, an explanation of the MIDI standard, and a short overview ofthe piano.
Before we designed our own concept, we researched related work in the scientific literature andinvestigated, which ready-to-use visualization systems already exist. Specifically, we wanted tosee what benefits of visual support for learning an instrument had already been researched, whattypes of visualization had already been developed, and what needs to be taken into account for thiskind of visualization. We came across papers describing studies that show that visualization has apositive effect on learning speed and motivation.
There are also numerous design ideas and concepts of visualization tools for piano lessons. Thesewere used as a reference point to develop our own concept. We have designed an application thatallows to practice, record, and compare songs with previous recordings and ground truth. Thefunctionality is realized in two different modes, the play and the analyzing mode. These modesallow the user to display the notes in classical, block, or piano roll notation.
We have designed three options for the visualization of errors. The selected recordings can be drawntogether with the ground truth notes in a note display, each recording gets its own color. Errors canbe highlighted by comparing the recording notes with the ground truth notes and depending onhow long the interval between their start times is, the notes will be colored in a certain color. Athird option, available only in piano roll notation, is the heat map visualization. Here, a timeline iscreated for each note which is divided into small steps and whose fields are colored, depending onhow the union of recording and ground truth note is in this time period.
We implemented our prototype as a web application using the React framework, the WebMIDI API,and the visualization library D3.
Next we evaluated our visualizations in a case study. The results of this study showed that thevisualizations work well, as long as the specified tempo is maintained while playing. In addition, theblock and piano roll notation make it possible to compare note lengths, and the piano roll notationis the only notation that is useful for comparing several recordings, as the other notations becometoo cluttered. Another result was that our application is only partially suitable for live visualization,due to performance issues when drawing lots of notes and because the note display does not scrollautomatically.
In conclusion, we are confident that our approach is a step in the right direction. The limitationsthat our application has can be revised in future versions.
45

8 Conclusion and Future Work
In the future, our approach could be evaluated, extended, and improved through the followingideas:
An user study should be conducted to evaluate how effective and usable our approach really is. Thiscan be done by looking at the progress different participants make with and without the applicationover a certain period of time. We could also analyze how users with different skill levels can benefitfrom it.
Furthermore, we propose to implement the features discussed in Chapter 7 for a better user experienceand error analysis. The parsing of MusicXML files should be added for an enhanced display of theclassical notation. A note matching algorithm that matches each ground truth note with exactly onerecording note of each recording is also necessary in order to better visualize the errors. Through anote pattern recognition, recording and ground truth can be compared bar by bar, this could help tosolve problems with changes in the tempo.
We also recommend to research the approach of an application that automatically detects in whichareas the user has difficulties and lets the user repeat them again and again. In addition, it shouldbe explored how our visualizations can be extended and used in virtual and augmented realityenvironments.
46

Bibliography
[ATSH18] S. Asahi, S. Tamura, Y. Sugiyama, S. Hayamizu. “Toward a High Performance PianoPractice Support System for Beginners”. In: Proc. 10th APSIPA Annual Summit andConf. (APSIPA ASC). 2018, pp. 73–79. doi: 10.23919/APSIPA.2018.8659463 (cit. onp. 22).
[CKS10] P. Ciuha, B. Klemenc, F. Solina. “Visualization of concurrent tones in music withcolours”. In: Proc. 18th International Conf. Multimedia (Multimedia), ACM. 2010,pp. 1677–1680. doi: 10.1145/1873951.1874320 (cit. on p. 23).
[GAW+11] M. Gleicher, D. Albers, R. Walker, I. Jusufi, C. D. Hansen, J. C. Roberts. “Visualcomparison for information visualization”. In: Information Visualization 10.4 (2011),pp. 289–309. doi: 10.1177/1473871611416549 (cit. on p. 23).
[GW19] J. Grifski, S. Wu. JuxtaMIDI: Using Data Visualization to Pinpoint Mistakes in MIDIPractice Recordings. 2019. url: https://jrg94.github.io/JuxtaMIDI/docs/report.pdf (cit. on p. 22).
[Ham17] L. F. Hamond. “Visual Feedback in Higher Education Piano Learning and Teaching”.In: Proc. 10th International Conf. Students of Systematic Musicology (SysMus). 2017,pp. 43–48. doi: 10.5281/zenodo.1211652 (cit. on p. 21).
[HWS19] M. Hori, C. M. Wilk, S. Sagayama. “Piano Practice Evaluation and Visualization byHMM for Arbitrary Jumps and Mistakes”. In: Proc. 53rd Annual Conf. InformationSciences and Systems (CISS), IEEE. 2019, pp. 1–5. doi: 10.1109/CISS.2019.8692813(cit. on p. 22).
[JK07] B. Jenny, N. V. Kelso. “Color Design for the Color Vision Impaired”. In: CartographicPerspectives 58 (2007), pp. 61–67. doi: 10.14714/CP58.270 (cit. on p. 32).
[Lev09] T. Levine. “Using colour in figures: let’s agree to differ”. In: Traffic 10.3 (2009),pp. 344–347. doi: 10.1111/j.1600-0854.2008.00863.x (cit. on p. 31).
[Lud17] L. A. Ludovico. “The Web MIDI API in On-Line Applications for Music Education”.In: Proc. 9th International Conf. Mobile, Hybrid, and On-line Learning (eLmL),IARIA XPS. 2017, pp. 72–77. doi: 10.13140/RG.2.2.20181.58083 (cit. on pp. 23, 29).
[MPZZ15] D. Malandrino, D. Pirozzi, G. Zaccagnino, R. Zaccagnino. “A color-based visualiza-tion approach to understand harmonic structures of musical compositions”. In: Proc.19th International Conf. Information Visualisation (IV), IEEE. 2015, pp. 56–61. doi:10.1109/iV.2015.21 (cit. on p. 23).
[MTRC19] E. Micheloni, M. Tramarin, A. Rodà, F. Chiaravalli. “Playing to play: a piano-baseduser interface for music education video-games”. In: Multimedia Tools and Appli-cations 78.10 (2019), pp. 13713–13730. doi: 10.1007/s11042-018-6917-1 (cit. onp. 21).
47

[OI02] M. Okabe, K. Ito. How to make figures and presentations that are friendly to colorblind people. 2002. url: https://jfly.uni-koeln.de/color/ (cit. on p. 31).
[Rös08] J. Rössel. Notes of different durations. 2008. url: https://commons.wikimedia.org/wiki/File:Music_notes.svg (cit. on p. 14).
[RRW+14] K. Rogers, A. Röhlig, M. Weing, J. Gugenheimer, B. Könings, M. Klepsch, F. Schaub,E. Rukzio, T. Seufert, M. Weber. “P.I.A.N.O.: Faster Piano Learning with InteractiveProjection”. In: Proc. Ninth International Conf. Interactive Tabletops and Surfaces(ITS), ACM. 2014, pp. 149–158. doi: 10.1145/2669485.2669514 (cit. on p. 22).
[RVLC14] L. Raymaekers, J. Vermeulen, K. Luyten, K. Coninx. “Game of Tones: Learningto Play Songs on a Piano Using Projected Instructions and Games”. In: Proc. 32ndInternational Conf. Human Factors in Computing Systems (CHI), ACM. 2014, pp. 411–414. doi: 10.1145/2559206.2574799 (cit. on p. 21).
[Sch79] A. G. Schauss. “Tranquilizing effect of color reduces aggressive behavior and potentialviolence”. In: Journal of Orthomolecular Psychiatry 8.4 (1979), pp. 218–221 (cit. onp. 32).
[TBBS20] A. Trujillo, M. C. Buzzi, M. Buzzi, C. Senette. “A Web App for Teaching Piano toStudents with Autism”. In: Proc. International Conf. Advanced Visual Interfaces(AVI), ACM. 2020, pp. 1–3. doi: 10.1145/3399715.3399946 (cit. on p. 21).
[Wil19] C. O. Wilke. “Fundamentals of Data Visualization”. In: O’Reilly, 2019. Chap. 19,pp. 233–242. url: https://clauswilke.com/dataviz/color-pitfalls.html (cit. onp. 31).
All links were last followed on November 24, 2020.

Declaration
I hereby declare that the work presented in this thesis is entirelymy own and that I did not use any other sources and referencesthan the listed ones. I have marked all direct or indirect statementsfrom other sources contained therein as quotations. Neither thiswork nor significant parts of it were part of another examinationprocedure. I have not published this work in whole or in part before.The electronic copy is consistent with all submitted copies.
place, date, signature