Taste, Nutrition and Health - MDPI
352
Taste, Nutrition and Health Printed Edition of the Special Issue Published in Nutrients www.mdpi.com/journal/nutrients Beverly J. Tepper and Iole Tomassini Barbarossa Edited by
-
Upload
khangminh22 -
Category
Documents
-
view
0 -
download
0
Transcript of Taste, Nutrition and Health - MDPI

Taste, Nutrition and Health
Printed Edition of the Special Issue Published in Nutrients
www.mdpi.com/journal/nutrients
Beverly J. Tepper and Iole Tomassini BarbarossaEdited by
Taste, Nutrition and H
ealth • Beverly J. Tepper and Iole Tomassini Barbarossa

Taste, Nutrition and Health


Taste, Nutrition and Health
Special Issue Editors
Beverly J. Tepper
Iole Tomassini Barbarossa
MDPI • Basel • Beijing • Wuhan • Barcelona • Belgrade • Manchester • Tokyo • Cluj • Tianjin

Iole Tomassini Barbarossa
University of Cagliari
Italy
Special Issue Editors Beverly J. Tepper
The State University of New Jersey
USA
Editorial Office
MDPISt. Alban-Anlage 66
4052 Basel, Switzerland
This is a reprint of articles from the Special Issue published online in the open access journal
Nutrients (ISSN 2072-6643) (available at: https://www.mdpi.com/journal/nutrients/special issues/
Taste Nutrition Health).
For citation purposes, cite each article independently as indicated on the article page online and as
indicated below:
LastName, A.A.; LastName, B.B.; LastName, C.C. Article Title. Journal Name Year, Article Number,
Page Range.
ISBN 978-3-03928-444-3 (Pbk)
ISBN 978-3-03928-445-0 (PDF)
Cover image courtesy of Iole Tomassini Barbarossa.
c© 2020 by the authors. Articles in this book are Open Access and distributed under the Creative
Commons Attribution (CC BY) license, which allows users to download, copy and build upon
published articles, as long as the author and publisher are properly credited, which ensures maximum
dissemination and a wider impact of our publications.
The book as a whole is distributed by MDPI under the terms and conditions of the Creative Commons
license CC BY-NC-ND.

Contents
About the Special Issue Editors . . . . . . . . . . . . . . . . . . . . . . . . . . . . . . . . . . . . . ix
Beverly J Tepper and Iole Tomassini Barbarossa
Taste, Nutrition, and HealthReprinted from: Nutrients 2020, 12, 155, doi:10.3390/nu12010155 . . . . . . . . . . . . . . . . . . . 1
Sze-Yen Tan and Robin M. Tucker
Sweet Taste as a Predictor of Dietary Intake: A Systematic ReviewReprinted from: Nutrients 2019, 11, 94, doi:10.3390/nu11010094 . . . . . . . . . . . . . . . . . . . 7
Vasiliki Iatridi, John E. Hayes and Martin R. Yeomans
Quantifying Sweet Taste Liker Phenotypes: Time for Some Consistency in the Classification CriteriaReprinted from: Nutrients 2019, 11, 129, doi:10.3390/nu11010129 . . . . . . . . . . . . . . . . . . . 23
May Wee, Vicki Tan and Ciaran Forde
A Comparison of Psychophysical Dose-Response Behaviour across 16 SweetenersReprinted from: Nutrients 2018, 10, 1632, doi:10.3390/nu10111632 . . . . . . . . . . . . . . . . . . 47
Uracha Wanich, Dhoungsiri Sayompark, Lynn Riddell, Sara Cicerale, Djin Gie Liem, Mohammadreza Mohebbi, Susie Macfarlane and Russell Keast
Assessing Food Liking: Comparison of Food Liking Questionnaires and Direct Food Tasting in Two CulturesReprinted from: Nutrients 2018, 10, 1957, doi:10.3390/nu10121957 . . . . . . . . . . . . . . . . . . 63
Hannah Jilani, Hermann Pohlabeln, Stefaan De Henauw, Gabriele Eiben, Monica Hunsberger, Denes Molnar, Luis A. Moreno, Valeria Pala, Paola Russo, Antonia Solea, Toomas Veidebaum, Wolfgang Ahrens, Antje Hebestreit and on behalf of the IDEFICS and I.Family consortia
Relative Validity of a Food and Beverage Preference Questionnaire to Characterize Taste Phenotypes in Children Adolescents and AdultsReprinted from: Nutrients 2019, 11, 1453, doi:10.3390/nu11071453 . . . . . . . . . . . . . . . . . . 75
Kathleen L. Keller, Samantha M. R. Kling, Bari Fuchs, Alaina L. Pearce, Nicole A. Reigh,
Travis Masterson and Kara Hickok
A Biopsychosocial Model of Sex Differences in Children’s Eating BehaviorsReprinted from: Nutrients 2019, 11, 682, doi:10.3390/nu11030682 . . . . . . . . . . . . . . . . . . . 87
Alessandra De Toffoli, Sara Spinelli, Erminio Monteleone, Elena Arena, Rossella Di Monaco,
Isabella Endrizzi, Tullia Gallina Toschi, Monica Laureati, Fabio Napolitano, Luisa Torri and
Caterina Dinnella
Influences of Psychological Traits and PROP Taster Status on Familiarity with and Choice ofPhenol-Rich Foods and BeveragesReprinted from: Nutrients 2019, 11, 1329, doi:10.3390/nu11061329 . . . . . . . . . . . . . . . . . . 109
Antonietta Robino, Maria Pina Concas, Eulalia Catamo and Paolo Gasparini
A Brief Review of Genetic Approaches to the Study of Food Preferences: Current Knowledgeand Future DirectionsReprinted from: Nutrients 2019, 11, 1735, doi:10.3390/nu11081735 . . . . . . . . . . . . . . . . . . 133
v

Giorgia Sollai, Melania Melis, Mariano Mastinu, Danilo Pani, Piero Cosseddu, Annalisa Bonfiglio, Roberto Crnjar, Beverly J. Tepper and Iole Tomassini Barbarossa
Human Tongue Electrophysiological Response to Oleic Acid and Its Associations with PROP Taster Status and the CD36 Polymorphism (rs1761667)Reprinted from: Nutrients 2019, 11, 315, doi:10.3390/nu11020315 . . . . . . . . . . . . . . . . . . . 147
Yvan Peterschmitt, Souleymane Abdoul-Azize, Babar Murtaza, Marie Barbier, Amira Sayed Khan, Jean-Louis Millot and Naim Akhtar Khan
Fatty Acid Lingual Application Activates Gustatory and Reward Brain Circuits in the MouseReprinted from: Nutrients 2018, 10, 1246, doi:10.3390/nu10091246 . . . . . . . . . . . . . . . . . . 163
Isabella E Hartley, Djin Gie Liem and Russell Keast
Umami as an ‘Alimentary’ Taste. A New Perspective on Taste ClassificationReprinted from: Nutrients 2019, 11, 182, doi:10.3390/nu11010182 . . . . . . . . . . . . . . . . . . . 173
Preet Bano Singh, Alix Young, Amin Homayouni, Lene Hystad Hove, Beata Eva Petrovski,
Bente Brokstad Herlofson, Øyvind Palm, Morten Rykke and Janicke Liaaen Jensen
Distorted Taste and Impaired Oral Health in Patients with Sicca ComplaintsReprinted from: Nutrients 2019, 11, 264, doi:10.3390/nu11020264 . . . . . . . . . . . . . . . . . . . 191
Cristina Proserpio, Ella Pagliarini, Juri Zuvadelli, Sabrina Paci, Alice Re Dionigi, Giuseppe Banderali, Camilla Cattaneo and Elvira Verduci
Exploring Drivers of Liking of Low-Phenylalanine Products in Subjects with Phenyilketonuria Using Check-All-That-Apply MethodReprinted from: Nutrients 2018, 10, 1179, doi:10.3390/nu10091179 . . . . . . . . . . . . . . . . . . 207
Arnaud Bernard, Deborah Ancel, Audrey M. Neyrinck, Aurelie Dastugue, Laure B. Bindels,
Nathalie M. Delzenne and Philippe Besnard
A Preventive Prebiotic Supplementation Improves the Sweet Taste Perception in Diet-InducedObese MiceReprinted from: Nutrients 2019, 11, 549, doi:10.3390/nu11030549 . . . . . . . . . . . . . . . . . . . 221
Tim Klaassen, Annick M. E. Alleleyn, Mark van Avesaat, Freddy J. Troost, Daniel Keszthelyi and Adrian A. M. Masclee
Intraintestinal Delivery of Tastants Using a Naso-Duodenal-Ileal Catheter Does Not Influence Food Intake or SatietyReprinted from: Nutrients 2019, 11, 472, doi:10.3390/nu11020472 . . . . . . . . . . . . . . . . . . . 235
Laura Gramling, Eleni Kapoulea and Claire Murphy
Taste Perception and Caffeine Consumption: An fMRI StudyReprinted from: Nutrients 2019, 11, 34, doi:10.3390/nu11010034 . . . . . . . . . . . . . . . . . . . 245
Emma L. Feeney, Laura Leacy, Mark O’Kelly, Niamh Leacy, Abbie Phelan, Leah Crowley,
Emily Stynes, Aude de Casanove and Katy Horner
Sweet and Umami Taste Perception Differs with Habitual Exercise in MalesReprinted from: Nutrients 2019, 11, 155, doi:10.3390/nu12010155 . . . . . . . . . . . . . . . . . . . 261
Brittany A. Larsen, Mark D. Litt, Tania B. Huedo-Medina and Valerie B. Duffy
Modeling Associations between Chemosensation, Liking for Fats and Sweets, Dietary Behaviorsand Body Mass Index in Chronic SmokersReprinted from: Nutrients 2019, 11, 271, doi:10.3390/nu11020271 . . . . . . . . . . . . . . . . . . . 275
vi

Andries G. S. Gous, Valerie L. Almli, Vinet Coetzee and Henrietta L. de Kock
Effects of Varying the Color, Aroma, Bitter, and Sweet Levels of a Grapefruit-Like ModelBeverage on the Sensory Properties and Liking of the ConsumerReprinted from: Nutrients 2019, 11, 464, doi:10.3390/nu11020464 . . . . . . . . . . . . . . . . . . . 293
Melanie Franks, Peter Lawrence, Alireza Abbaspourrad and Robin Dando
The Influence of Water Composition on Flavor and Nutrient Extraction in Green and Black TeaReprinted from: Nutrients 2019, 11, 80, doi:10.3390/nu11010080 . . . . . . . . . . . . . . . . . . . 309
Richard Hochenberger and Kathrin Ohla
Estimation of Olfactory Sensitivity Using a Bayesian Adaptive MethodReprinted from: Nutrients 2019, 11, 1278, doi:10.3390/nu11061278 . . . . . . . . . . . . . . . . . . 323
vii


About the Special Issue Editors
Beverly J. Tepper Ph.D., is Professor of Sensory Science at the Department of Food Science,
Rutgers, The State University of New Jersey, USA, where she directs the Sensory Evaluation
Laboratory. Her research program combines food sensory science with nutritional science and
psychology to better understand the links between taste, diet, and health. Specific research areas
include the influence of genetic variation in taste perception on the pathways linking oral sensations
to food preferences, diet selection, and body weight; the role of salivary proteins in sensory
perception and oral health; the influence of personal traits on consumer behavior; and sensory
evaluation and consumer testing of natural products and novel food ingredients and technologies.
She is also the co-founder and director of the Center for Sensory Sciences & Innovation (CSSI) at
Rutgers, where she conducts basic and applied research in partnership with the food industry.
Dr. Tepper is a Fellow of the Institute of Food Technologists.
Iole Tomassini Barbarossa is a Full Professor of Physiology at the Department of Biomedical
Sciences, University of Cagliari, Italy. During the last 10 years, she has built a strong and
internationally recognized research profile, mainly due to her role as the principal investigator in
multidisciplinary studies aimed at analyzing the physiology of the sense of taste and its role in food
preferences, nutritional status, and human health. By integrating psychophysics, molecular biology,
neurobiology, genetics, nutrition, and electrophysiology methods, these studies have focused on the
identification of the physiological basis of individual taste variability; the relationships between taste
sensitivity, food behavior, and nutritional status; and on modifications of taste perception. Recently,
she designed and patented a new technique based on electrophysiological recordings of the bioelectric
potentials generated in the taste cells of the human tongue by taste stimulation, thus providing a
direct, objective, and quantitative measure of the peripheral taste function.
ix


nutrients
Editorial
Taste, Nutrition, and Health
Beverly J Tepper 1,* and Iole Tomassini Barbarossa 2
1 Department of Food Science, School of Environmental and Biological Sciences, Rutgers University,New Brunswick, NJ 08901-8520, USA
2 Department of Biomedical Sciences, University of Cagliari, 09042 Monserrato, Italy; [email protected]* Correspondence: [email protected]
Received: 16 December 2019; Accepted: 16 December 2019; Published: 6 January 2020
Abstract: The sensation of flavour reflects the complex integration of aroma, taste, texture, andchemesthetic (oral and nasal irritation cues) from a food or food component. Flavour is a majordeterminant of food palatability—the extent to which a food is accepted or rejected—and canprofoundly influence diet selection, nutrition, and health. Despite recent progress, there are still gapsin knowledge on how taste and flavour cues are detected at the periphery, conveyed by the brainstemto higher cortical levels and then interpreted as a conscious sensation. Taste signals are also projectedto central feeding centers where they can regulate hunger and fullness. Individual differences insensory perceptions are also well known and can arise from genetic variation, environmental causes,or a variety of metabolic diseases, such as obesity, metabolic syndrome, and cancer. Genetic taste/smellvariation could predispose individuals to these same diseases. Recent findings have also openednew avenues of inquiry, suggesting that fatty acids and carbohydrates may provide nutrient-specificsignals informing the gut and brain of the nature of the ingested nutrients. This special issue on“Taste, Nutrition, and Health” presents original research communications and comprehensive reviewson topics of broad interest to researchers and educators in sensory science, nutrition, physiology,public health, and health care.
1. Sweet Taste
Understanding the role of sweet taste in health and nutrition has been a major focus ofchemosensory research for more than 50 years. Although significant strides have been made inthis area, a complete understanding of the complex links between sweet taste perception, liking, andintake remains elusive. Tan and Tucker [1] reviewed the current state of knowledge in this area,concluding that current measures of sweet taste perception and liking may have limited capacity topredict dietary behaviours. The characterization of individuals as “sweet likers” or “sweet dislikers” hasbeen a useful concept for understanding person-to-person differences in hedonic reactions to sweetnessacross a range of intensities. Building on their previous work, Iatridi, Hayes, and Yeomans [2] presenteda new methodological approach for fine-tuning sweet-liker/-disliker classifications. These advancesare taking place against a backdrop of escalating public health concerns about excess sugar in the dietand are reflected in current dietary guidelines in the United States [3] and many other countries acrossthe globe [4], which now limit daily sugar consumption. To achieve the goal of sugar reduction at thepopulation level, consumers would need to change their behaviours by making different diet choices,selecting sugar-reduced products, or a combination of these activities. Sugar reduction has been anongoing focus of the food industry. Wee, Tan, and Forde’s [5] study of 16 sweeteners provides anup-to-date and comprehensive guide for comparing the potencies of several classes of sweeteners tosucrose, the goal standard. Sweetener classes include, e.g., saccharides and polyols, non-nutritivesynthetics (e.g., aspartame, sucralose), and non-nutritive naturals such as stevia.
Nutrients 2020, 12, 155; doi:10.3390/nu12010155 www.mdpi.com/journal/nutrients1

Nutrients 2020, 12, 155
2. Food Preferences/Individual Differences
Understanding individual differences in food preferences and eating behaviours has importantimplications for both food research and nutrition monitoring. Many of the contributions in this issueexamine individual differences, from a variety of perspectives such as age, gender, culture/ethnicity,and genetic variation. For example, to gain insight into food preferences in a cross-cultural context,Wanich et al. [6] compared liking ratings for foods tasted in the laboratory to general liking responsesobtained by questionnaire. Jilani et al. [7] studied a large European family cohort (>12,000 respondents)to establish the validity of a single instrument collecting food preference data from children, adolescents,and adults. The review by Keller et al. [8] presents a new conceptual model and fresh look at sexdifferences in eating behaviours in children. Two papers address the role of genetic variation in foodpreferences and choice. De Toffoli et al. [9] examined the interaction between PROP taste sensitivity(a marker for bitter taste) and psychological traits on the selection of astringent, polyphenol-rich foods,while the short review by Robino et al. [10] proposes that other genes and phenotypes (in addition totraditional taste-modifying genes) may play a role in food preferences.
3. Umami and Fat Taste
The role of other taste sensations in nutrition and health remains a vibrant and active area ofresearch interest. Two contributions in this issue focus on fatty acid taste sensations. Sollai et al. [11]utilized a novel technique to measure electrophysiological responses from the gustatory cells of thehuman tongue following the direct application of oleic acid. They report strong associations betweenphysiological signals and self-reports of fat taste sensations, demonstrating the reliability of thistechnique. Furthermore, Peterschmitt et al. [12] showed that direct lingual application of long-chainfatty acid to the circumvallate papillae of the mouse activated brain circuits involved in taste signaling,reward, and memory. Together, these studies reveal important features of the gustatory, peripheral,and central mechanisms involved in fat taste that are relevant to both animals and humans.
Finally, Hartley, Liem, and Keast [13] re-examine the notion that umami qualifies as a basic taste.They argue that umami meets most of the criteria for a basic taste—it is elicited by a distinct classof stimuli (e.g., L-glutamate), it activates specific receptor(s), (e.g., T1R1/T1R3), etc., but it does notgenerate a unique taste quality. They propose a new subclassification called “alimentary taste” forumami, and other taste qualities (such as fat) that may be more important signals for regulatingpostingestive metabolism than as sensory cues for the presence of specific nutrients in foods.
4. Disease States and Role of the Gut
Alterations in taste or smell are well-known features of a variety of metabolic diseases andpathological states. However, for many of these conditions, data from well-described clinicalpopulations are scarce. In this issue, Singh et al. [14] present comprehensive findings on tastedisruptions and oral complaints in patients with Sjögren’s syndrome, an autoimmune disease affectingexocrine glands, such as the salivary glands, which results in dry mouth, burning mouth, and poor oralhealth. Importantly, this study included patients with Sjögren’s syndrome, individuals with so-called“sicca” complaints who do not meet the diagnostic criteria for the disease (and are rarely studied),and healthy controls. There is also a critical need to develop food products that help patients withnutritional diseases to adhere to prescribed diets. Proserpio et al. [15] assessed the acceptability ofdifferent formulations of low-phenylalanine foods using a check-all-that-apply (CATA) methodologyin individuals with phenylketonuria.
Obesity is increasingly characterized as an inflammatory disease arising from gut dysbiosisassociated with an obesogenic diet. In the study by Bernard et al. [16], mice chronically fed a high-fatdiet exhibited a blunted preference for sucrose that was partially corrected by supplementing thediet with a prebiotic (10% inulin-type fructan). Examination of caecal contents showed a greaterabundance of beneficial bacteria in the diet-induced obese mice fed the prebiotic supplement. These
2

Nutrients 2020, 12, 155
interesting findings suggest that prebiotic supplementation warrants more attention as an aid to thedietary management of obesity.
Lastly, taste receptors are expressed throughout the gastrointestinal tract and are known to releasesatiety hormones such as GLP-1, CCK, and PYY. In a single-blind, crossover trial, Klaassen et al. [17]delivered a tastant mixture via a naso-duodenal-ileal catheter to healthy participants and measuredfood intake and satiety from a subsequent meal. However, no differences in outcome measures wereobserved as a function of duodenal (proximal) or ileal (distal) infusions.
5. Lifestyle Factors
Two papers examine the extent to which lifestyle factors influence taste perception and foodpreferences in healthy individuals. Using fMRI, Gramling, Kapoulea, and Murphy [18] demonstratethat chronic caffeine consumers and nonconsumers experience differential activation in neuronal areasinvolved in reward, memory, and information processing when they are exposed to bitter and sweettastants. Likewise, Feeney et al. [19] showed that in men, habitual physical activity selectively alterstaste perceptions. Specifically, active men gave higher intensity ratings to sweet and umami solutionsin comparison to nonactive men.
The study by Larsen et al. [20] examined the complex interrelationships between taste and diet ina cohort of chronic smokers who were also overweight or obese. Because obese smokers reportedlyuse smoking as a means of controlling their appetite and weight [21], gaining greater insights into tastechanges and smoking-related dietary behaviors in this population may have important implicationsfor treatment and prevention. Notably, participants also rated a liking for sweet e-juice, which is usedto flavor e-cigarettes, a popular alternative to tobacco cigarettes. Using structural modeling, Larsenet al. [20] showed that taste (including e-juice liking) was associated with body mass index (BMI)in chronic smokers through liking of fats/carbohydrates and that smoking-related dietary behaviors(assessed by questionnaire) could influence BMI by a separate pathway. These novel findings couldhelp to inform the development of new smoking intervention strategies.
6. New Product Formulations
This volume would not be complete without addressing consumer acceptance of new products andformulations designed to enhance health and wellbeing. Grapefruit is rich in vitamins, antioxidants,and anti-inflammatory compounds, but is rejected by many consumers due to its bitter taste. Gouset al. [22] developed 36 model grapefruit beverages varying in taste, aroma, flavor, and color tocharacterize their sensory profiles and to identify the formulations best-liked by consumers. Franks etal. [23] present unique findings showing that the type of water (tap, bottled, or deionized) used tobrew tea influences sensory characteristics and nutrient extraction. Color, flavor, and epigallocatechingallate (EGCG) extraction were higher for teas (especially green tea) made with purified water, butconsumer liking was higher for less intensely flavored green tea made with tap water. These findingssuggest that the consumer’s choice of water source can maximize the flavor or health benefits of teaaccording to their personal preferences.
7. Olfaction
The determination of the odor detection threshold is a classic technique for assessing smellfunction, but such methodology is time-consuming and not well suited to diagnostic evaluation in theclinical setting or in the field with a large number of subjects. Using Sniffin’ Sticks (odour-impregnatedpens) and a Bayesian adaptive algorithm (QUEST protocol), Höchenberger and Ohla [24] established arapid method with reduced testing duration and less variability between measurements.
Author Contributions: B.J.T. and I.T.B. wrote the Editorial. All authors have read and agreed to the publishedversion of the manuscript.
Funding: This research received no external funding.
3

Nutrients 2020, 12, 155
Conflicts of Interest: The authors declare no conflict of interest.
References
1. Tan, S.-Y.; Tucker, R.M. Sweet Taste as a Predictor of Dietary Intake: A Systematic Review. Nutrients 2019,11, 94. [CrossRef] [PubMed]
2. Iatridi, V.; Hayes, J.E.; Yeomans, M.R. Quantifying Sweet Taste Liker Phenotypes: Time for Some Consistencyin the Classification Criteria. Nutrients 2019, 11, 129. [CrossRef] [PubMed]
3. McGuire, S. U.S. Department of Agriculture and U.S. Department of Health and Human Services, DietaryGuidelines for Americans, 2010. 7th Edition, Washington, DC: U.S. Government Printing Office, January2011. Adv. Nutr. 2011, 2, 4–293. [CrossRef] [PubMed]
4. World Health Organization. Guideline: Sugars Intake for Adults and Children; World Health Organization:Geneva, Switzerland, 2015.
5. Wee, M.; Tan, V.; Forde, C. A Comparison of Psychophysical Dose-Response Behaviour across 16 Sweeteners.Nutrients 2018, 10, 1632. [CrossRef] [PubMed]
6. Wanich, U.; Sayompark, D.; Riddell, L.; Cicerale, S.; Liem, D.G.; Mohebbi, M.; Macfarlane, S.; Keast, R.Assessing Food Liking: Comparison of Food Liking Questionnaires and Direct Food Tasting in Two Cultures.Nutrients 2018, 10, 1957. [CrossRef] [PubMed]
7. Jilani, H.; Pohlabeln, H.; De Henauw, S.; Eiben, G.; Hunsberger, M.; Molnar, D.; Moreno, L.A.; Pala, V.;Russo, P.; Solea, A.; et al. Relative Validity of a Food and Beverage Preference Questionnaire to CharacterizeTaste Phenotypes in Children Adolescents and Adults. Nutrients 2019, 11, 1453. [CrossRef]
8. Keller, K.L.; Kling, S.M.R.; Fuchs, B.; Pearce, A.L.; Reigh, N.A.; Masterson, T.; Hickok, K. A BiopsychosocialModel of Sex Differences in Children’s Eating Behaviors. Nutrients 2019, 11, 682. [CrossRef]
9. De Toffoli, A.; Spinelli, S.; Monteleone, E.; Arena, E.; Di Monaco, R.; Endrizzi, I.; Gallina Toschi, T.; Laureati, M.;Napolitano, F.; Torri, L.; et al. Influences of Psychological Traits and PROP Taster Status on Familiarity withand Choice of Phenol-Rich Foods and Beverages. Nutrients 2019, 11, 1329. [CrossRef]
10. Robino, A.; Concas, M.P.; Catamo, E.; Gasparini, P. A Brief Review of Genetic Approaches to the Study ofFood Preferences: Current Knowledge and Future Directions. Nutrients 2019, 11, 1735. [CrossRef]
11. Sollai, G.; Melis, M.; Mastinu, M.; Pani, D.; Cosseddu, P.; Bonfiglio, A.; Crnjar, R.; Tepper, B.J.; TomassiniBarbarossa, I. Human Tongue Electrophysiological Response to Oleic Acid and Its Associations with PROPTaster Status and the CD36 Polymorphism (rs1761667). Nutrients 2019, 11, 315. [CrossRef]
12. Peterschmitt, Y.; Abdoul-Azize, S.; Murtaza, B.; Barbier, M.; Khan, A.S.; Millot, J.-L.; Khan, N.A. Fatty AcidLingual Application Activates Gustatory and Reward Brain Circuits in the Mouse. Nutrients 2018, 10, 1246.[CrossRef] [PubMed]
13. Hartley, I.E.; Liem, D.G.; Keast, R. Umami as an ‘Alimentary’ Taste. A New Perspective on Taste Classification.Nutrients 2019, 11, 182. [CrossRef] [PubMed]
14. Singh, P.B.; Young, A.; Homayouni, A.; Hove, L.H.; Petrovski, B.É.; Herlofson, B.B.; Palm, Ø.; Rykke, M.;Jensen, J.L. Distorted Taste and Impaired Oral Health in Patients with Sicca Complaints. Nutrients 2019, 11,264. [CrossRef] [PubMed]
15. Proserpio, C.; Pagliarini, E.; Zuvadelli, J.; Paci, S.; Re Dionigi, A.; Banderali, G.; Cattaneo, C.; Verduci, E.Exploring Drivers of Liking of Low-Phenylalanine Products in Subjects with Phenyilketonuria UsingCheck-All-That-Apply Method. Nutrients 2018, 10, 1179. [CrossRef]
16. Bernard, A.; Ancel, D.; Neyrinck, A.M.; Dastugue, A.; Bindels, L.B.; Delzenne, N.M.; Besnard, P. A PreventivePrebiotic Supplementation Improves the Sweet Taste Perception in Diet-Induced Obese Mice. Nutrients 2019,11, 549. [CrossRef]
17. Klaassen, T.; Alleleyn, A.M.E.; van Avesaat, M.; Troost, F.J.; Keszthelyi, D.; Masclee, A.A.M. IntraintestinalDelivery of Tastants Using a Naso-Duodenal-Ileal Catheter Does Not Influence Food Intake or Satiety.Nutrients 2019, 11, 472. [CrossRef]
18. Gramling, L.; Kapoulea, E.; Murphy, C. Taste Perception and Caffeine Consumption: An fMRI Study.Nutrients 2018, 11, 34. [CrossRef]
19. Feeney, E.L.; Leacy, L.; O’Kelly, M.; Leacy, N.; Phelan, A.; Crowley, L.; Stynes, E.; de Casanove, A.; Horner, K.Sweet and Umami Taste Perception Differs with Habitual Exercise in Males. Nutrients 2019, 11, 155. [CrossRef]
4

Nutrients 2020, 12, 155
20. Larsen, B.A.; Litt, M.D.; Huedo-Medina, T.B.; Duffy, V.B. Modeling Associations between Chemosensation,Liking for Fats and Sweets, Dietary Behaviors and Body Mass Index in Chronic Smokers. Nutrients 2019, 11,271. [CrossRef]
21. Rupprecht, L.E.; Donny, E.C.; Sved, A.F. Obese Smokers as a Potential Subpopulation of Risk in TobaccoReduction Policy. Yale J. Biol. Med. 2015, 88, 94–289.
22. Gous, A.G.S.; Almli, V.L.; Coetzee, V.; de Kock, H.L. Effects of Varying the Color, Aroma, Bitter, and SweetLevels of a Grapefruit-Like Model Beverage on the Sensory Properties and Liking of the Consumer. Nutrients2019, 11, 464. [CrossRef] [PubMed]
23. Franks, M.; Lawrence, P.; Abbaspourrad, A.; Dando, R. The Influence of Water Composition on Flavor andNutrient Extraction in Green and Black Tea. Nutrients 2019, 11, 80. [CrossRef] [PubMed]
24. Höchenberger, R.; Ohla, K. Estimation of Olfactory Sensitivity Using a Bayesian Adaptive Method. Nutrients2019, 11, 1278. [CrossRef] [PubMed]
© 2020 by the authors. Licensee MDPI, Basel, Switzerland. This article is an open accessarticle distributed under the terms and conditions of the Creative Commons Attribution(CC BY) license (http://creativecommons.org/licenses/by/4.0/).
5


nutrients
Review
Sweet Taste as a Predictor of Dietary Intake:A Systematic Review
Sze-Yen Tan 1 and Robin M. Tucker 2,*
1 Institute for Physical Activity and Nutrition (IPAN), School of Exercise and Nutrition Sciences,Deakin University, Geelong, IC 3220, Australia; [email protected]
2 Department of Food Science and Human Nutrition, Michigan State University, 2110 S. Anthony Hall, 474 S.Shaw Ln, East Lansing, MI 48824, USA
* Correspondence: [email protected]; Tel.: +1-517-353-3408
Received: 7 December 2018; Accepted: 4 January 2019; Published: 5 January 2019
Abstract: Taste is frequently cited as an important factor in food choice, and while a number of studieshave attempted to identify relationships between taste function and dietary intake, a systematicreview of these studies has been lacking. This review identified studies that examined associationsbetween taste function or taste perception and dietary intake. The purpose was to determinewhich taste measure was most closely associated with dietary intake in healthy adults. Studies thatmeasured some component of dietary intake, either acutely or longer-term, were eligible for inclusion.Studies were grouped into three categories: those that measured sensitivity (thresholds), intensity, orhedonic responses to sweet stimuli. Sensitivity and intensity studies demonstrated little associationwith dietary intake measures. Hedonic measurements were more likely to be associated with dietaryintake, especially if sweet likers were analyzed separately from sweet dislikers, but the degree ofheterogeneity among stimulus concentrations and dietary measures as well as small sample sizeslikely obscured more consistent relationships between hedonic evaluation and dietary intake. Due tothe potential for within-day and between-day variability in both taste function and dietary intake,future work should explore obtaining more than one taste measurement before comparing results tolonger-term dietary assessments and attempts to standardize methods.
Keywords: sweet taste; psychophysics; nutrition; diet; threshold; intensity; liking
1. Introduction
The sense of taste is commonly referred to as the “gatekeeper” of food intake [1]. This concept issupported by consumer surveys that report food choices are made primarily based on the flavor of theselected foods, with considerations about healthfulness or cost typically rated as less important [2].Taste is an important component of the chemosensory attributes (taste, smell, chemesthesis or chemicalirritation) that comprise flavor [3], and thus, guide food selection and intake. Dietary intake, in turn,influences nutritional status and body composition. Thus, individual differences in taste function andperception may lead to differences in dietary behaviors and risk of chronic disease [4].
Each taste quality has been associated with specific nutrients that are important to health andwell-being. For example, sweet taste is commonly thought to help identify sources of carbohydrate,sour taste with the presence of vitamins, salty taste with essential electrolytes, and umami withprotein [5]. Bitter taste likely serves as a warning against potentially dangerous compounds [5]. If thesepurported functions are accurate, then positive associations between taste function and/or preferencefor these taste qualities and related nutrient intake should exist.
Research regarding taste is typically concerned with one of two questions. First, how well does thesystem function? Sensitivity testing, which involves determining the absolute minimum concentrationof a stimulus that can be reliably detected (detection threshold) or recognized (recognition threshold), is
Nutrients 2019, 11, 94; doi:10.3390/nu11010094 www.mdpi.com/journal/nutrients7

Nutrients 2019, 11, 94
frequently performed, but perceived intensity measurements of suprathreshold concentrations are alsoused. Threshold measurements can take several forms, but these tests usually involve presenting theparticipant with several samples – only one of which contains the stimulus of interest. The participantis required to identify the sample that contains the stimulus. A variety of approaches in terms ofthe number of samples to present and number of correct answers needed to stop the experimentexist [6]. Intensity measurements typically involve presenting a stimulus to the participant and askingfor a rating of the intensity. Scales commonly used include a visual analog scale [7], a categoryscale [8], or a general Labeled Magnitude Scale [9]. The second question typically assesses a hedonicaspect, such as, how much is the stimulus liked, the preferred stimulus when a participant is asked tocompare two or more stimuli of different concentrations, or the optimal stimulus concentration—oftendetermined using an adjustment method where the participant increases or decreases the concentrationof the taste quality. All of the taste measures just described are considered to be independent of eachother, providing separate but complementary information about how the stimulus is detected andperceived [10].
When research is conducted on a specific taste quality, model stimuli, often consisting of aprototypical stimulus dissolved in deionized water, are typically used. For example, commonly usedprototypical stimuli for sweet taste include sucrose or glucose solutions; whereas, sodium chloridesolutions comprise the typical salty stimulus. Participants usually swish and then expectorate theliquid samples, but other approaches, including filter paper impregnated with stimuli [11], cottonswabs [12], edible wafers [13], or edible films [14] have been used. The simplicity of model systemsallows for attention to be focused on the taste quality of interest with minimal distraction, but theobvious drawback of the model system is that it does not reflect the complex sensory experiencesprovided by foods and beverages. Thus, the question that arises is: how closely do taste test resultsusing model systems correlate with dietary intake?
Given their simplicity but seemingly limited ecological validity [15], the ability of taste testsusing model solutions to adequately predict dietary intake was previously considered limited [16,17].However, few studies had adequately assessed intake when this question was first considered [16].The question remains relevant, as recent work has examined how results from taste testing areassociated with dietary intake. For example, the proposal of “fat” as another taste quality has led torenewed interest in connecting taste measurements to dietary intake and weight status (for a recentmeta-analysis, see [18]). This suggests that relationships between taste measures and intake remain ofinterest to taste researchers.
In recent years, sugar intake has been proposed as a potential cause of the increasing prevalenceof obesity globally [19,20]. The relationship is especially strong between intake of sugar-sweetenedbeverages and obesity [21]. As a result, recommendations that added sugar in habitual diets shouldnot exceed 10% of total daily energy intake have been made by a number of governmental andnon-governmental organizations including the United States Dietary Guidelines for Americans [22],the Australian Dietary Guidelines [23], and the World Health Organization [24]. Mechanistically,scientists posit that sugar consumption is driven by hedonics, i.e., its pleasant sweet taste, andevidence also suggests that sweet taste enhances the liking and wanting of sweet-tasting foods [25].Some studies further demonstrated that sugar activates the opioid (e.g., nucleus accumbens) anddopaminergic (e.g., ventral tegmental area and right amygdala) reward centers in the brain [26,27],leading to the notion that sugar is ‘addictive’ and leads to excessive food intake and subsequent weightgain. Together, these mechanistic studies appear to suggest that sweet taste triggers food seekingbehaviors and dietary intake. Although a number of individual studies have performed sweet tastetesting using model systems and assessed associations with intake, to our knowledge, a systematicreview summarizing these findings has not been undertaken. Therefore, the purpose of this reviewwas to determine if psychophysical tests for sweet taste were associated with dietary intake and, ifpossible, to determine which test is the most closely associated with dietary intake.
8

Nutrients 2019, 11, 94
2. Materials and Methods
A systematic literature search of the electronic databases PubMed, PsycInfo, Web of Science, andCINAHL was conducted. The search string used in PubMed was (“Taste” (Mesh)) AND (“Diet, Food,and Nutrition” (Mesh)); filters included Adult 19+, English, and Human. These filters were used inthe other databases when available. Review articles that were identified were searched to identifyarticles that the searchers missed. Studies that recruited generally healthy individuals and collected atleast one psychophysical measure of sweet taste and reported some sort of dietary intake measure,either acute or long-term were included. There was no restriction on adiposity, that is, all categoriesof body mass index were accepted. Studies were excluded if the populations were currently or hadpreviously been ill, for example diabetes, alcoholism, or eating disorders; had known changes ordeficits in chemosensory function, for example gastric bypass surgery patients; were pregnant; or weresmokers. The review protocol was registered with PROSPERO, review #CRD42018111833.
After the initial searches were completed and duplicate entries removed, all potential studies wereentered into a master database. Initial screenings by title and abstract were completed by the authors.In the case that a determination to include or exclude could not be made based on the abstract, the fullpaper was reviewed. The authors discussed questions about inclusion or exclusion until consensuswas reached. The authors searched the reference lists of relevant articles to identify potential articles(n = 2) that were missed by the systematic search.
3. Results
In total, 3206 publications were identified and 17 were included in this review (Figure 1).Studies were placed into three categories based on psychophysical method utilized: (1) sensitivitymeasurements consisting of detection and recognition thresholds (n = 6), (2) intensity measures (n = 8),and (3) hedonic evaluations, namely liking and preference (n = 13). Some studies used more than onemethod; those that did were examined multiple times. Given the heterogeneity of psychophysicalmeasures [10] and stimuli concentrations [28] as well as differences in stimuli tested (glucose vs.sucrose vs. non-nutritive sweeteners) [29] and dietary intake assessment methods [30], a meta-analysiscould not be attempted.
Figure 1. A total of 17 articles meeting the inclusion criteria were identified.
9

Nutrients 2019, 11, 94
3.1. Sensitivity Testing
A total of six studies examined relationships between taste sensitivity and dietary intake [9,16,29,31–33](Table 1). Studies varied in terms of the stimuli used, e.g., glucose vs. sucrose vs. non-nutritivesweeteners, the ranges of concentration tested, and the dietary assessment methods employed.Sensitivity was measured based on detection threshold [9,29,31,32], recognition threshold [9,16,29],and/or ability to correctly identify a 9 mM sucrose solution three times in a row using a triangletest [33]; individuals who could perform this task correctly were classified as “highly sensitive”. Of thesix studies identified, only two observed significant associations between sweet taste thresholds anddietary intake [32,33]. One of the studies (n = 30) was an acute experimental study that reportedthat individuals who were highly sensitive to a 9 mM sucrose solution consumed significantly lesscarbohydrate and more non-sweet foods, dietary protein, and protein as a percent of energy at an adlibitum feeding opportunity 60 min after exposure to either a sweet, non-sweet (umami), or “no-taste”soup [33]. The use of a 9 mM sucrose solution to establish sweet taste sensitivity is not an approachthat was used by any other study in this review, and the validity of this approach has not beenestablished. The second study (n = 56) reported that aspartame threshold was negatively associatedwith energy intake as assessed by a 7-day food diary [32]. However, the association was very weak,albeit statistically significant, and may have limited implications (beta coefficient = −0.003, p < 0.0009);no further association between sucrose threshold and any diet measures were observed. Anotherstudy examining non-nutritive sweetener thresholds did not identify diet-taste relationships [29].Differences in diet assessment methods (FFQ [29] vs. 7-day food diaries [32]) could contribute to thesedisparate results.
To summarize, most available studies failed to observe a significant relationship between sweetsensitivity and dietary intake, suggesting that testing for sweet taste threshold is not likely to bepredictive of dietary intake. The only studies that reported an association found that sweet-sensitiveindividuals consumed less carbohydrate and more non-sweet foods [33]. The methodologicallimitations and small samples sizes of these studies also limit the generalizability of the findings.
10

Nutrients 2019, 11, 94
Ta
ble
1.
Sens
itiv
ity
Stud
ies
Exam
inin
gTa
ste-
Die
tRel
atio
nshi
ps.
Au
tho
r(Y
ea
r)S
ub
ject
sT
ast
eT
est
Sw
ee
tS
tim
uli
Sti
mu
liC
on
cen
tra
tio
ns
Die
tary
Ass
ess
me
nt
Me
tho
ds
Ke
yF
ind
ing
s
Mat
tes
(198
5)[1
6]n
=35
(17
M,1
8F)
Age
=18
–42
year
sol
dR
TSu
cros
eSe
rial
half
dilu
tions
ofsu
cros
e:1.
2×
10−5
Mto
0.8
M7-
day
diet
reco
rdw
ith
pred
omin
antt
aste
reco
rded
Swee
ttas
teth
resh
old
and
inte
nsity
did
notc
orre
late
wit
hsw
eetE
,CH
O,P
RO
and
fati
ntak
e.
Mar
tine
z-C
orde
ro(2
015)
[32]
n=
56(3
0M
,26
F)A
ge=
32.9±
7.9
year
sol
dD
TSu
cros
eA
spar
tam
e
Sucr
ose—
14[]
from
4.09
×10
−1M
to1.
63×
102
MA
spar
tam
e—14
[]fr
om0.
82×
10−3
Mto
3.27
×10
−1M
Both
at0.
2lo
gdi
luti
ons
per
succ
essi
veso
luti
on
7-da
yfo
oddi
arie
s
Asp
arta
me
thre
shol
dw
asne
gati
vely
asso
ciat
edw
ithE
inta
ke(B
=−0
.003
±0.
001;
p<
0.00
09).
No
asso
ciat
ion
betw
een
sucr
ose
thre
shol
dan
ddi
etar
yin
take
.
Low
(201
6)[2
9]n
=60
Age
=26
.5±
1.0
year
sol
dD
T;R
T
Glu
cose
mon
o-hy
drat
eFr
ucto
seSu
cros
eSu
cral
ose
Erit
hrit
olR
ebau
dio-
side
A
Var
ying
conc
entr
atio
nsfo
rea
ch
Val
idat
edFF
Q;a
lso
asse
ssed
cons
umpt
ion
offo
ods
and/
orbe
vera
ges
swee
tene
dw
ith
high
-int
ensi
tysw
eete
ners
No
asso
ciat
ion
betw
een
thre
shol
dm
easu
res
and
diet
ary
mea
sure
s.
Smit
h(2
016)
[31]
n=
51(9
M,4
2F)
Age
=25
±8y
DT
Sucr
ose
2.1%
w/v
sucr
ose
Qua
rter
-log
step
dilu
tion
s24
-hou
rre
call
No
asso
ciat
ion
betw
een
thre
shol
dm
easu
res
and
diet
ary
inta
ke.
Han
(201
7)[3
3]n
=30
(16
M,1
4F)
Age
=24
–34
year
sol
d(M
),20
–37
year
sol
d(F
)Se
nsi-
tivity
Sucr
ose
9m
MA
dlib
itum
inta
keaf
ter
soup
prel
oad
(one
swee
t,on
eum
ami,
one
no-t
aste
ener
gyco
ntro
l)
Hig
hly-
sens
itiv
eco
nsum
edm
ore
non-
swee
tfoo
ds,P
RO
,%E
from
PRO
,an
d%
Efr
omfa
t(af
ter
non-
swee
tsou
pon
ly)(
p<
0.05
for
all)
.H
ighl
y-se
nsit
ive
cons
umed
less
CH
Oas
%E
(p=
0.02
).
Jaya
sing
he(2
017)
[9]
n=
42(a
llF)
Age
=28
±63
4ye
ars
old
DT;
RT
Glu
cose
15,3
0,45
,60,
90,1
20,1
50,1
80m
M
4-da
yw
eigh
edfo
odre
cord
Swee
tfoo
dFF
QSw
eetb
ever
age
likin
gqu
esti
onna
ire
No
asso
ciat
ion
betw
een
thre
shol
dm
easu
res
and
diet
ary
inta
ke.
Abb
revi
atio
ns:[
]con
cent
ratio
n,C
HO
=ca
rboh
ydra
te,D
T=
dete
ctio
nth
resh
old,
E=
ener
gy,F
FQ=
food
freq
uenc
yqu
estio
nnai
re,F
=fe
mal
e,M
=m
ale,
PRO
=pr
otei
n,R
T=
reco
gniti
onth
resh
old,
w/v
=w
eigh
tfor
volu
me.
11

Nutrients 2019, 11, 94
3.2. Intensity Testing
Eight studies examined relationships between measures of sweet taste intensity and dietaryintake [7,9,16,29,34–37] (Table 2). As with the sensitivity studies, stimuli and concentrations testedalso varied widely. Only two of the ten studies observed significant relationships [9,29]. The firststudy (n = 42) reported negative associations between diet and intensity ratings for a 250 mM glucosestimulus [9]. Intensity was negatively correlated with total energy, carbohydrate (starch as well astotal sugar, glucose, and fructose), but not sucrose intake. Sweet food intake was also negativelyassociated with intensity ratings of the 500 mM and 1000 mM samples. In this study, dietary intakewas measured both by 4-day weighed food records as well as by an unvalidated sweet food FFQand a sweet beverage liking questionnaire. The second study (n = 60) reported that intensity ratingsfor Rebaudioside A and sucralose, both non-nutritive sweeteners, were positively associated withmean total energy intake (p < 0.01 for both) [29]. No associations between intensity ratings and otherdietary measures, including carbohydrate, sugar, or starch were observed, and no associations withthe other sweet stimuli tested (glucose monohydrate, fructose, sucrose, or sucralose) were noted [29].This study relied on the validated Cancer Council of Victoria Food Frequency Questionnaire [38] toassess dietary intake.
In conclusion, only two studies demonstrated the utility of sweet taste intensity ratings inreflecting dietary intake, and neither study used sucrose—a prototypical sweet taste stimulus.The negative association between sweet taste intensity rating of glucose and energy as wellas carbohydrate intake was consistent with the findings from the sensitivity studies that alsoreported significant negative associations [9,29]. On the other hand, associations with non-nutritivesweeteners (Rebaudioside A and sucralose) were present but positively associated with dietaryintake. Further study is needed to understand the underlying mechanisms that contribute to thesedistinct relationships.
12

Nutrients 2019, 11, 94
Ta
ble
2.
Inte
nsit
ySt
udie
sEx
amin
ing
Tast
e-D
ietR
elat
ions
hips
.
Au
tho
r(Y
ear)
Su
bje
cts
Tast
eT
est
Sw
eet
Sti
mu
liS
tim
uli
Co
nce
ntr
ati
on
sD
ieta
ryA
ssess
men
tM
eth
od
sK
ey
Fin
din
gs
Mat
tes
(198
5)[1
6]n
=35
(17
M,1
8F)
Age
=18
–42
year
sol
dIn
tens
ity
Sucr
ose
5co
ncen
trat
ions
rang
ing
from
0.05
Mto
0.80
M7-
day
diet
reco
rds
No
asso
ciat
ion
betw
een
inte
nsit
ym
easu
res
and
diet
ary
inta
ke.
Hol
t(20
00)[
37]
n=
132,
Aus
tral
ian
27M
,42
FM
alay
sian
29M
,34
F;A
ustr
alia
n22
.8±
4.3
year
sol
dM
alay
sian
21.5±
1.2
year
sol
d
Inte
nsit
ySu
cros
e2,
4,8,
16an
d32
%v/
vSe
para
teFF
Qfo
rth
eA
ustr
alia
nan
dM
alay
sian
part
icip
ants
No
asso
ciat
ion
betw
een
inte
nsit
ym
easu
res
and
diet
ary
inta
ke.
Sart
or(2
011)
[34]
n=
12(7
M,5
F)A
ge=
26±
6ye
ars
old
Inte
nsit
ySu
cros
e0,−0
.5,−
0.75
,−1,−1
.25,
−1.5
,−1.
75,−
2,−2
.25,−2
.5,
−2.7
5lo
g(su
cros
e)m
ol/L
14di
etdi
arie
son
rand
omda
ysN
oas
soci
atio
nbe
twee
nin
tens
ity
mea
sure
san
ddi
etar
yin
take
.
Cic
eral
e(2
012)
[35]
n=
85(8
9%F)
Age
=21
±4
year
sol
dIn
tens
ity
Sucr
ose
200
mM
Food
&di
etqu
esti
onna
ire
Food
vari
ety
surv
ey2×
24-h
our
food
diar
ies
No
asso
ciat
ion
betw
een
inte
nsit
yan
dan
ydi
etm
easu
res.
Low
(201
6)[2
9]n
=60
Age
=26
.5±
1.0
year
sol
d(S
EM)
Inte
nsit
y
Glu
cose
mon
o-hy
drat
eFr
ucto
seSu
cros
eSu
cral
ose
Erit
hrit
olR
ebau
d-io
side
A
Var
ying
conc
entr
atio
nsV
alid
ated
FFQ
;als
oas
sess
edco
nsum
ptio
nof
food
san
d/or
beve
rage
ssw
eete
ned
wit
hhi
gh-i
nten
sity
swee
tene
rs
Inte
nsit
yan
ddi
etar
yin
take
asso
ciat
ions
vari
edby
swee
tene
r.R
ebau
dios
ide
Aan
dsu
cral
ose
inte
nsit
yra
ting
sw
ere
posi
tive
lyas
soci
ated
wit
hm
ean
tota
lEin
take
(p<
0.01
for
both
).
Stev
enso
n(2
016)
[36]
n=
87(3
8M
,49
F)A
ge=
21±
3ye
ars
old
(18–
31ye
ars
old)
Inte
nsit
ySu
cros
e0.
03M
and
0.36
M
26-i
tem
Die
tary
Fata
ndSu
gar
ques
tion
nair
e(D
FS)d
esig
ned
toid
enti
fyva
riat
ion
insa
tura
ted
fata
ndad
ded
suga
rin
take
No
asso
ciat
ion
betw
een
inte
nsit
yan
dan
ydi
etm
easu
res.
Jaya
sing
he(2
017)
[9]
n=
42(a
llF)
Age
=28
±6
year
sol
dIn
tens
ity
Glu
cose
125,
250,
500,
1000
mM
4-da
yw
eigh
edfo
odre
cord
Swee
tfoo
dFF
QSw
eetb
ever
age
likin
gqu
esti
onna
ire
Inte
nsit
yat
250
mM
orhi
gher
corr
elat
edne
gati
vely
wit
hto
talE
,CH
O(s
tarc
h,to
tal
suga
r,fr
ucto
se,g
luco
se)b
utno
tsuc
rose
inta
ke(p
<0.
05fo
ral
l).I
nten
sity
also
nega
tive
lyas
soci
ated
wit
hto
tals
wee
tfo
odin
take
(p<
0.05
for
all)
.
Leon
g(2
018)
[7]
n=
100
(50
M,5
0F)
Age
=25
.7±
4.2
year
sol
d(M
),25
.7±
5.1
year
sol
d(F
)In
tens
ity
Sucr
ose
12.0
%w
/v2×
24-h
our
food
reca
llsN
oas
soci
atio
nbe
twee
nin
tens
ity
and
any
diet
mea
sure
s.
Abb
revi
atio
ns:C
HO
=ca
rboh
ydra
te,E
=en
ergy
,FFQ
=fo
odfr
eque
ncy
ques
tion
nair
e,F
=fe
mal
e,M
=m
ale,
v/v
=vo
lum
efo
rvo
lum
e,w
/v=
wei
ghtf
orvo
lum
e.
13

Nutrients 2019, 11, 94
3.3. Hedonic Testing
A total of 13 papers examined relationships between hedonic evaluation and dietary intake [7–9,16,28,31,34,36,37,39–42]. As before, the concentrations of sweet solution used in these studies variedconsiderably as did dietary assessment methods (Table 3). In contrast to the sensitivity and intensitystudies, all but one [9] used sucrose. Hedonic measurements included determining the preferredconcentration out of a range of stimuli [31] or through an adjustment task [16,42] or a rating of howmuch the stimulus was liked, typically using either a visual analog [7,28,37,40,41], labelled magnitudescale [9,34,36], or likert-style hedonic scales [8,39]. Five of the studies that measured hedonics alsoclassified participants as sweet “likers” or “dislikers” [28,34,37,40,41]. A sweet liking phenotype hasbeen associated with different hedonic responses to sweetness (for a recent review, see [37]), so failure toidentify sweet liker phenotype could influence findings. That is, if the study population was comprisedpredominantly of sweet likers or dislikers, results could be skewed. Therefore, these studies are presentedseparately from the others. One study analyzed the data with and without sweet liker classification [37],so it is reported twice – both with those studies that did and did not identify sweet likers.
3.3.1. Studies that Determined Sweet Liking Phenotypes
Among the five studies that distinguished between sweet likers and dislikers, the classificationmethods used to determine sweet liker status varied greatly [28,34,37,40,41]. Classification was performedby hierarchical cluster analysis [28,41]; by preferred concentration cut-off, i.e., favorable ratings above aspecific concentration [34,40]; a mean favorable rating over all concentrations tested [41]; and a pattern ofincreasing hedonic scores [37]. Among these six papers, three observed relationships between hedonicsand dietary intake measures [28,37,40]. Among the studies demonstrating associations with sweet likerstatus and intake, one (n = 418) reported that energy intake from sugar-sweetened beverages was higheramong likers compared to dislikers (p = 0.008) based on a beverage food frequency questionnaire [28].A second study (n = 196) that examined sweet liker and PROP taster status combinations observedthat individuals who were both sweet likers and PROP tasters reported consuming more energy frombeverages and fiber as measured by two 24-h recalls [40]. The last study (n = 132) reported positiveassociations between the preferred level of sucrose and frequency of sweet food consumption, intake ofrefined sugars, and total sugars [37]. Two studies did not observe taste-diet relationships, but the reportedsample sizes raise questions about the power of these studies to detect relationships (n = 12 (6 sweetlikers) [34] and n = 36 (12 sweet likers)) [41]. Overall, sweet likers appear to consume more energy fromsugar-sweetened beverages and more energy from refined and total sugars. It appears that identifyingan individual’s sweet liking phenotype may increase the likelihood that relationships between hedonicscores and dietary intake will be observed, especially if sample sizes are sufficiently large enough.
3.3.2. Studies that Did Not Determine Sweet Liking Phenotypes
Among the nine studies that did not classify sweet likers, associations between hedonic responsesand intake were observed in five [9,16,31,37,42] but not in the other four [7,8,36,39] (Table 3).Preferred sweetness concentration was associated with greater total energy intake [31], carbohydrateintake [31,42], percent of sweet calories consumed [37,42], refined and total sugars [37], and frequency ofcarbohydrate-rich food selections [42], while one study observed positive associations with liking ratingsof glucose at 500 mM and 1000 mM and total energy and carbohydrate (total sugar, fructose, glucose)but not starch and sucrose intake [9]. One study observed a negative association between preferredsweetness concentration and carbohydrate intake [16]. The studies finding associations between hedonicevaluations and dietary intake used one 24-h recall [31], 4-day weighed food records [9], and 7-daydiet records [16,42]. Sample sizes for these studies ranged from n = 25 [42] to n = 51 [31]. Studies notobserving associations reported sample sizes ranging from n = 17 [8] to n = 100 [7]. In summary, hedonicmeasures appear to be better correlated with dietary intake, and these relationships are strengthenedwhen sweet likers are analyzed separately.
14
Nutrients 2019, 11, 94
Ta
ble
3.
Hed
onic
Stud
ies
Exam
inin
gTa
ste-
Die
tRel
atio
nshi
ps.
Au
tho
r(Y
ea
r)S
ub
ject
sT
ast
eT
est
Sw
ee
tS
tim
uli
Sti
mu
liC
on
cen
tra
tio
ns
Die
tary
Ass
ess
me
nt
Me
tho
ds
Ke
yF
ind
ing
s
Wei
zenb
aum
(198
0)[8
]n
=17
(5M
,12
F)A
ge=
18.6
y(M
),19
.7ye
ars
old
(F)
Plea
sant
ness
Sucr
ose
0.01
,0.0
23,0
.046
,0.1
,0.2
3,0.
46,1
.0M
Ad
libitu
min
take
ofsa
lted
pean
uts
and
cand
ies
afte
rte
stin
gN
ore
lati
onsh
ipbe
twee
npl
easa
ntne
ssan
dam
ount
offo
odco
nsum
ed.
Mat
tes
(198
5)[1
6]n
=35
(17
M,1
8F)
Age
=18
–42
year
sol
d
Pref
erre
dco
ncen
trat
ion
ofsw
eetn
ess
Sucr
ose
Self
-adj
uste
d(d
iluti
on)
7-da
ydi
etre
cord
sPr
efer
red
conc
entr
atio
nof
swee
tsol
utio
nne
gati
vely
corr
elat
ed(r
=−0
.36,
p=
0.04
)wit
hC
HO
inta
ke.
Mat
tes
(198
6)[4
2]n
=25
(all
M)
Age
=17
–34
year
sol
d
Pref
erre
dco
ncen
trat
ion
ofsw
eetn
ess
usin
gan
adju
stm
entt
ask
Sucr
ose
0M&
1.0
Mso
luti
ons
wer
epr
ovid
ed.
Subj
ects
mod
ified
the
sam
ples
unti
lth
epr
efer
red
swee
tnes
sw
asre
ache
d.Pr
efer
red
swee
tnes
sle
vels
from
both
the
unsw
eete
ned
and
swee
tene
dba
selin
est
imul
iwer
eav
erag
ed.
7-da
ydi
etre
cord
s
Mea
npr
efer
red
conc
entr
atio
nw
aspo
siti
vely
corr
elat
edw
ith
%C
HO
inta
ke(r
=0.
637,
p<
0.00
1).P
refe
rred
conc
entr
atio
nof
the
1.0
Msu
cros
esa
mpl
esw
ere
posi
tivel
yco
rrel
ated
with
%C
HO
inta
ke(r
=0.
748,
p<
0.00
1),%
swee
tca
lori
ein
take
(r=
0.50
4,p
<0.
001)
,and
freq
uenc
yof
sele
ctio
nof
carb
ohyd
rate
-ric
hfo
ods
(r=
0.53
2,p
<0.
01).
Dre
wno
wsk
i(19
99)
[39]
n=
159
(all
F)A
ge=
27.0±
0.7
year
sol
d(S
EM)
Liki
ngSu
cros
e5
[]ra
ngin
gfr
om2%
to32
%w
/v3-
day
food
reco
rds;
171-
item
food
pref
eren
cech
eckl
ist
No
asso
ciat
ions
betw
een
likin
gan
ddi
etar
yin
take
mea
sure
s,bu
thig
her
hedo
nic
rati
ngs
for
sucr
ose
wer
eas
soci
ated
wit
hhi
gher
rati
ngs
for
suga
rin
tea
and
man
ysw
eetd
esse
rts.
Hol
t(20
00)[
37]
n=
132,
sepa
rate
din
toA
ustr
alia
n-bo
rnC
auca
sian
and
Mal
aysi
anbo
rn;A
ustr
alia
n:27
M,4
2F
Mal
aysi
an:2
9M
,34
F;A
ustr
alia
n:22
.8±
4.3
year
sol
dM
alay
sian
:21.
5±
1.2
year
sol
d
Liki
ngSu
cros
e2,
4,8,
16an
d32
%v/
vSe
para
teFF
Qs
for
the
Aus
tral
ian
and
Mal
aysi
ansu
bjec
ts
Refi
ned
suga
rin
take
was
high
erin
swee
tlik
ers
com
-par
edto
disl
iker
s.N
oot
her
diff
eren
ces
wer
eob
serv
ed.F
oral
lpar
tici
pant
s,po
siti
veas
soci
atio
nsbe
twee
nth
epr
efer
red
leve
lof
sucr
ose
and
freq
uenc
yof
swee
tfoo
dco
nsum
ptio
n,in
take
ofre
fined
suga
rs,a
ndto
tal
suga
rsw
ere
obse
rved
(p<
0.05
).
Sart
or(2
011)
[34]
n=
12(7
M,5
F)A
ge=
26±
6ye
ars
old
Plea
sant
ness
Pref
eren
ceSu
cros
e
Plea
sant
ness
11[]
:0,−
0.5,−0
.75,−1
,−1
.25,−1
.5,−
1.75
,−2,−2
.25,−2
.5,
−2.7
5lo
g(su
cros
e)M
Pref
eren
ce:1
0ra
ndom
pres
enta
tions
ofpa
irs
of0,−0
.5,−
0.75
,−1
and−1
.25
log(
sucr
ose)
M
14di
etdi
arie
son
rand
omda
ysN
oas
soci
atio
nsbe
twee
nta
ste
mea
sure
san
ddi
etar
yin
take
.
Turn
er-M
cGri
evy
(201
3)[4
0]n
=19
6(8
5%F)
Age
=42
.6±
11.0
year
sol
dLi
king
Sucr
ose
0.05
,0.1
0,0.
21,0
.42,
and
0.83
M.
Part
icip
ants
who
liked
the
0.83
Msu
cros
eso
luti
onth
ebe
stw
ere
clas
sifie
das
swee
tlik
ers
2×
24-h
our
food
reca
llsT
hose
who
wer
esw
eetl
iker
sco
nsum
edm
ore
Efr
ombe
vera
ges
and
less
fiber
(p<
0.05
).
Met
hven
(201
6)[4
1]n
=36
(12
M,2
3F,
1un
know
n)A
ge=
26ye
ars
old
(med
ian)
Liki
ngSu
cros
e3%
,6%
,12%
,24%
,36%
FFQ
used
byEP
ICIn
take
did
notd
iffer
betw
een
swee
tlik
ers
and
disl
iker
s.
Smit
h(2
016)
[31]
n=
51(9
M,4
2F)
Age
=25
±8
year
sol
d
Pref
erre
dco
ncen
trat
ion
ofsw
eetn
ess
Sucr
ose
2.1%
w/v
stoc
kso
luti
onQ
uart
er-l
ogst
epdi
luti
ons
24-h
our
reca
ll
Swee
tpre
fere
nce
afte
rsh
ort-
slee
pw
aspo
siti
vely
corr
elat
edw
ith
Ein
take
(r=
0.31
,p=
0.04
3)an
dC
HO
inta
ke(r
=0.
32,p
=0.
34),
but
nota
fter
habi
tual
slee
p.
Stev
enso
n(2
016)
[36]
n=
87(3
8M
,49
F)A
ge=
21±
3ye
ars
old
(18–
31ye
ars
old)
Liki
ngSu
cros
e0.
03&
0.36
M
26-i
tem
Die
tary
Fata
ndSu
gar
ques
tion
nair
e(D
FS)d
esig
ned
toid
enti
fyva
riat
ion
insa
tura
ted
fat
and
adde
dsu
gar
inta
ke.
No
asso
ciat
ion
betw
een
likin
gan
dan
ydi
etm
easu
res.
15

Nutrients 2019, 11, 94
Ta
ble
3.
Con
t.
Au
tho
r(Y
ea
r)S
ub
ject
sT
ast
eT
est
Sw
ee
tS
tim
uli
Sti
mu
liC
on
cen
tra
tio
ns
Die
tary
Ass
ess
me
nt
Me
tho
ds
Ke
yF
ind
ing
s
Jaya
sing
he(2
017)
[9]
n=
42(a
llF)
Age
=28
±6
year
sol
dLi
king
Glu
cose
125,
250,
500,
1000
mM
4-da
yw
eigh
edfo
odre
cord
;Sw
eetf
ood
FFQ
;Sw
eetb
ever
age
likin
gqu
esti
onna
ire
Swee
ttas
telik
ing
at50
0m
Mor
high
erco
rrel
ated
posi
tive
lyw
ith
tota
lE,C
HO
(tot
alsu
gar,
fruc
tose
,glu
cose
)(p
<0.
05fo
ral
l)bu
tnot
star
chan
dsu
cros
ein
take
.
Gar
neau
(201
8)[2
8]n
=41
8Li
king
Sucr
ose
5[]
rang
ing
from
0%w
/vto
13.7
%w
/vV
alid
ated
beve
rage
FFQ
(BEV
Q-1
5)
Mea
nE
inta
kefr
omal
lbev
erag
esw
ashi
gher
amon
glik
ers
com
pare
dto
neut
rals
(p=
0.00
4).
Tota
lEin
take
bydi
slik
ers
did
notd
iffer
from
the
othe
rgr
oups
.E
inta
kefr
omsu
gar-
swee
tene
dbe
vera
ges
was
high
eram
ong
liker
sco
mpa
red
todi
slik
ers
(p=
0.00
8).N
eutr
als
did
notd
iffer
from
the
othe
rgr
oups
.
Leon
g(2
018)
[7]
n=
100
(50
M,5
0F)
Age
=25
.7±
4.2
year
sol
d(M
),25
.7±
5.1
year
sol
d(F
)Li
king
Sucr
ose
12.0
%w
/v2×
24-h
our
food
reca
llsN
oas
soci
atio
nw
ith
likin
gan
ddi
etar
yin
take
.
Abb
revi
atio
ns:[
]=co
ncen
trat
ion,
CH
O=
carb
ohyd
rate
,EPI
C=
Euro
pean
Pros
pect
ive
Inve
stig
atio
nin
toC
ance
ran
dN
utri
tion
stud
y,E
=en
ergy
,FFQ
=fo
odfr
eque
ncy
ques
tionn
aire
,F=
fem
ale,
M=
mal
e,w
/v=
wei
ghtf
orvo
lum
e.
16

Nutrients 2019, 11, 94
4. Discussion
The sensory properties of food, including taste, play an important role in food selection andintake [2]. Psychophysical studies exploring taste function and perception have sought to determineif responses obtained in these studies can be associated with dietary intake. Given the challenges ofassessing dietary intake [43], a proxy measure that is a simple, quick, and reliable predictor of intakewould be welcomed.
Of the taste testing methods used—sensitivity testing, intensity measures, or hedonicevaluation—hedonic ratings proved to be superior in their ability to correlate with dietary intake,although these studies also did not report consistent findings. The fact that sensitivity was not areliable indicator of dietary intake was not unexpected, as others have noted that an individual’ssensitivity to a taste quality often fails to predict intake since these exposures can be quite dissimilar tothe suprathreshold exposures experienced while eating [16,44]. Intensity measures lacked predictivepower as well. One study observed positive associations between dietary intake and hedonic evaluationbut not with intensity [37]. Another study reported that intensity evaluations between sweet likersand dislikers did not differ [28]. These results further support the argument that measuring sensitivity,intensity, and hedonic responses provides distinct but complementary information about the tastesensations experienced by an individual [10], but that, based on the available data, hedonic evaluationmay provide a more reliable indication of dietary intake.
Further, among the studies that classified sweet likers and dislikers, three of the five studiesreported that sweet likers were more likely to demonstrate associations between dietary intakemeasures and hedonic evaluations. Sweet likers are typically classified by increasingly favorablehedonic responses to increasingly sweeter stimuli [45]. Thus, the positive associations betweenhedonic responses and intake of sugar sweetened beverages and sugar intake make intuitive sense.The two studies [34,41] that failed to see associations between hedonic responses and intake in sweetlikers had small sample sizes of sweet likers (n ≤ 12). Intriguingly, while the methods used to assesssweet liking phenotype differed, results were consistent across studies. This agrees with others whoreported that among these methods, no single classification approach demonstrated superiority [45].
The differences in both taste and diet measurements likely contribute to the discrepancies reported.First, a discussion of the taste measurement differences. The stimuli and concentrations used willhave a direct impact on results. While different nutritive sweeteners were noted to have detectionand recognition thresholds as well as intensity scores that were correlated with each other, actualvalues differed [46]. This is unsurprising, as different sugars have different potencies; sucrose, forexample, is sweeter than glucose at the same concentration [47]. Further, the human sweet receptorresponds to many compounds besides mono- and disaccharides, including amino acids, proteins, andnon-nutritive sweeteners [48]. Sucrose and glucose are presumed to be the best stimuli to correlatewith dietary intake, but this has not been tested, and one study reported that the threshold for thenon-nutritive sweetener aspartame was negatively associated with energy intake, unlike sucrose [32].The concentrations of the sweet stimulus presented to a participant can also influence taste results.Smaller differences between successive concentrations will allow for more precise determination ofthe taste threshold, but additional trials add to participant burden and increase the risk of fatigue.There is no standardized procedure for determining the difference in concentration between onestimuli and the next. The range of concentrations presented to participants in order to determine sweetliker/disliker phenotypes also varied by study [28]. It is conceivable that some individuals couldbe classified as sweet likers with one set of concentrations and sweet dislikers if the concentrationspresented were higher. This is especially true if sweet liker phenotype is determined by the responseto one concentration. Thus, if individuals were misclassified, results could change.
In terms of dietary assessment, it is well known that self-reported dietary information is subjectto over- and under-reporting [49]. Over- or under-reporting could obscure taste-diet relationships.In addition, due to the high degree of variability in intake from one day to the next, depending on thenutrient of interest, many days of intake in the form of diet diaries or records must be recorded [50].
17

Nutrients 2019, 11, 94
For example, at minimum, two weeks of intake records are needed to estimate average energy intake inan individual, which is impractical for many studies, and accuracy declines over time [51]. This numberfalls to three days when estimating energy intake for groups of people [50]. Even with this reduction,dietary record keeping can be burdensome for participants [43] and items consumed can be poorlyestimated or forgotten entirely.
There are two main approaches to reduce participant burden when assessing dietary intake.These include the 24-hour diet recall, where participants are asked to remember what they ate duringthe previous day rather than recording it as each food and beverage is consumed, or a food frequencyquestionnaire (FFQ) [43]. The 24-h recall allows dietary information to be recorded at one time point,but accurate information collection relies on trained staff and suffers from recall bias [43]. FFQs employa checklist approach, where participants can indicate how much and/or how often they consumecertain foods. The main drawback of this approach is that the ability to accurately remember andquantify intake is severely compromised [43]. While both approaches are valuable, diet diaries areconsidered to be more accurate measures [43].
Based on the studies examined, there was no clearly superior method of dietary assessmentthat was more likely to identify taste-diet relationships. For the sensitivity studies, among thestudies observing relationships, one utilized an acute intake measurement, i.e., consumptionfollowing a pre-load [33], while the other used 7-day food diaries [32]. Studies not observingrelationships between taste sensitivity and dietary intake relied on 4-day weighed food records [9],food frequency questionnaires [9,29], 24-hour recall [31], and 7-day food diaries with predominanttaste recorded [16]. For intensity, studies that observed relationships between taste and diet used4-day weighed food records as well as an unvalidated sweet food FFQ and a sweet beverageliking questionnaire [9] and a validated FFQ not used by any other of the studies included in thisreview [29]. Studies failing to find associations between intensity measures and diet used two 24-hfood recalls [7], multiple (3–14) day diet records [16,34,35,39], ad libitum intake of specific test foods [8],and various food frequency questionnaires [35,36,39]. Studies measuring hedonic responses thatobserved associations used multiple day (3–7) food records [9,16,42], 24-hour recalls [31,40], and foodfrequency questionnaires [9,28]. Studies that did not find associations used multiple day (3–14) foodrecords [34,39], food frequency questionnaires [36,41], 24-h recalls [7], and food preference surveys [39].At this time, it is not possible to make a recommendation for one dietary assessment method overthe other.
The majority of the studies relied on a one-time measure of taste response and attempted tomap this response to dietary intake that spanned over days or months—a further limitation of theliterature. Taste responses can vary throughout the day [52] or across days [31], posing problems interms of test-retest reliability [53]. Day-to-day variability in both taste responses and dietary intakecould obscure more immediate or acute relationships. One study noted that taste-diet relationshipswere observed after a night of sleep that lasted less than 7 h but saw no relationships after a night oflonger sleep [31]. Sleep or other confounding variables may obscure taste-diet relationships. One ofthe two studies that did assess acute intake observed that sweet taste sensitivity correlated witha greater amount of non-sweet foods, protein, and protein as a percent of energy consumed byhighly sensitive participants, and those participants also consumed less carbohydrate as a percent ofenergy [33]. The other study that assessed acute intake observed no relationships between intensityand hedonics [8]. The selection of the foods available for ad libitum intake could influence intake; thus,in addition to the different taste measures, it is difficult to compare these studies. Further explorationof whether taste measures are superior predictors of acute intake compared to longer-term intakeneeds to be undertaken.
There are several limitations to this review. As with all systematic reviews and meta-analyses, theinclusion criteria dictate the findings. While all studies were considered, taste testing studies are athigh risk of bias due to the reliance on non-random selection of subjects and failure or inability to blindresearchers and participants to the test stimuli or purpose of the study. The decision to focus solely
18

Nutrients 2019, 11, 94
on sweet taste limits generalizability to other taste qualities. The heterogeneity of taste testing anddietary assessment methods makes definitive conclusions difficult. Further work examining taste-dietrelationships in children and populations with chronic conditions should be undertaken.
5. Conclusions
In conclusion, only a small proportion of available studies reported significant associationsbetween taste sensitivity, intensity, and hedonics with dietary intake. However, of those that reportedsignificant associations, sensitivity and intensity measurements (sensory function) were negativelyassociated with intake, while liking and preferred concentration measurements (hedonics) werepositively associated with intake in all but one study. Measures of taste liking and preference appearto provide relatively superior insight into dietary behaviors compared to sensitivity and intensitymeasures. Future considerations regarding standardizing methods are imperative.
Author Contributions: Conceptualization, S-Y.T. and R.M.T.; methodology, S-Y.T. and R.M.T.; validation, S-Y.T.and R.M.T.; formal analysis, S-Y.T. and R.M.T.; data curation, S-Y.T. and R.M.T.; writing—original draft preparation,R.M.T.; writing—review and editing, S-Y.T. and R.M.T.; supervision, S-Y.T. and R.M.T.; project administration,S-Y.T. and R.M.T.; funding acquisition, none.
Funding: This work received no external funding.
Conflicts of Interest: The authors declare no conflict of interest.
References
1. Feeney, E.; O’Brien, S.; Scannell, A.; Markey, A.; Gibney, E.R. Genetic variation in taste perception: Does ithave a role in healthy eating? Proc. Nutr. Soc. 2011, 70, 135–143. [CrossRef] [PubMed]
2. Glanz, K.; Basil, M. Why Americans eat what they do: Taste, nutrition, cost, convenience, and weight controlconcerns. J. Am. Diet. Assoc. 1998, 98, 1118–1126. [CrossRef]
3. Keast, R.S.J.; Dalton, P.H.; Breslin, P.A.S. Flavor interactions at the sensory level. In Flavor Perception;Taylor, A.J., Roberts, D.D., Eds.; Blackwell Publishing Ltd.: Oxford, UK, 2004; ISBN 978-1-4051-5001-9.
4. Garcia-Bailo, B.; Toguri, C.; Eny, K.M.; El-Sohemy, A. Genetic variation in taste and its influence on foodselection. OMICS J. Integr. Biol. 2009, 13, 69–80. [CrossRef]
5. Tucker, R.M.; Mattes, R.D. Are free fatty acids effective taste stimuli in humans? Presented at the symposium“The taste for fat: New discoveries on the role of fat in sensory perception, metabolism, sensory pleasure andbeyond” held at the Institute of Food Technologists 2011 Annual Meeting, New Orleans, LA., 12 June 2011.J. Food Sci. 2012, 77, S148–S151. [PubMed]
6. Lawless, H.T.; Heymann, H. Sensory Evaluation of Food: Principles and Practices, 2nd ed.; Springer: New York,NY, USA, 2010.
7. Leong, C.S.-F.; Forde, C.G.; Tey, S.L.; Henry, C.J. Taste perception and diet in people of Chinese ancestry. AsiaPac. J. Clin. Nutr. 2018, 27, 478.
8. Weizenbaum, F.; Benson, B.; Solomon, L.; Brehony, K. Relationship among reproductive variables, sucrosetaste reactivity and feeding behavior in humans. Physiol. Behav. 1980, 24, 1053–1056. [CrossRef]
9. Jayasinghe, S.N.; Kruger, R.; Walsh, D.C.; Cao, G.; Rivers, S.; Richter, M.; Breier, B.H. Is sweet taste perceptionassociated with sweet food liking and intake? Nutrients 2017, 9, 750. [CrossRef] [PubMed]
10. Webb, J.; Bolhuis, D.P.; Cicerale, S.; Hayes, J.E.; Keast, R. The relationships between common measurementsof taste function. Chemosens. Percept. 2015, 8, 11–18. [CrossRef] [PubMed]
11. Landis, B.N.; Welge-Luessen, A.; Bramerson, A.; Bende, M.; Mueller, C.A.; Nordin, S.; Hummel, T. “TasteStrips”—A rapid, lateralized, gustatory bedside identification test based on impregnated filter papers.J. Neurol. 2009, 256, 242–248. [CrossRef]
12. Green, B.G. Studying taste as a cutaneous sense. Food Qual. Prefer. 2003, 14, 99–109. [CrossRef]13. Hummel, T.; Erras, A.; Kobal, G. A test for screening of taste function. Rhinology 1997, 35, 146–148. [PubMed]14. Smutzer, G.; Lam, S.; Hastings, L.; Desai, H.; Abarintos, R.A.; Sobel, M.; Sayed, N. A test for measuring
gustatory function. Laryngoscope 2008, 118, 1411–1416. [CrossRef] [PubMed]15. Duffy, V.B.; Peterson, J.M.; Dinehart, M.E.; Bartoshuk, L.M. Genetic and environmental variation in taste:
Associations with sweet intensity, preference, and intake. Top. Clin. Nutr. 2003, 18, 209–220. [CrossRef]
19

Nutrients 2019, 11, 94
16. Mattes, R.D. Gustation as a determinant of ingestion: Methodological issues. Am. J. Clin. Nutr. 1985, 41,672–683. [CrossRef] [PubMed]
17. Lucas, F.; Bellisle, F. The measurement of food preferences in humans: Do taste-and-spit tests predictconsumption? Physiol. Behav. 1987, 39, 739–743. [CrossRef]
18. Tucker, R.M.; Kaiser, K.A.; Parman, M.A.; George, B.J.; Allison, D.B.; Mattes, R.D. Comparisons of fattyacid taste detection thresholds in people who are lean vs. overweight or obese: A systematic review andmeta-analysis. PLoS ONE 2017, 12, e0169583. [CrossRef]
19. Johnson, R.J.; Segal, M.S.; Sautin, Y.; Nakagawa, T.; Feig, D.I.; Kang, D.-H.; Gersch, M.S.; Benner, S.;Sanchez-Lozada, L.G. Potential role of sugar (fructose) in the epidemic of hypertension, obesity and themetabolic syndrome, diabetes, kidney disease, and cardiovascular disease. Am. J. Clin. Nutr. 2007, 86,899–906.
20. Johnson, R.J.; Nakagawa, T.; Sanchez-Lozada, L.G.; Shafiu, M.; Sundaram, S.; Le, M.; Ishimoto, T.; Sautin, Y.Y.;Lanaspa, M.A. Sugar, uric acid, and the etiology of diabetes and obesity. Diabetes 2013, 62, 3307–3315.[CrossRef]
21. Malik, V.; Hu, F. Sweeteners and risk of obesity and type 2 diabetes: The role of sugar-sweetened beverages.Curr. Diab. Rep. 2012, 12, 195–203. [CrossRef]
22. Dietary Guidelines Advisory Committee. Scientific Report of the 2015 Dietary Guidelines Advisory Committee;USDA and US Department of Health and Human Services: Washington, DC, USA, 2015.
23. Australian National Health and Medical Research Council. Eat for Health: Australian Dietary Guidelines;Australian Government: Canberra, Australia, 2013.
24. World Health Organization. Guideline: Sugars Intake for Adults and Children; World Health Organization:Geneva, Switzerland, 2015.
25. Berridge, K.C.; Robinson, T.E.; Aldridge, J.W. Dissecting components of reward: ‘Liking’, ‘wanting’, andlearning. Curr. Opin. Pharmacol. 2009, 9, 65–73. [CrossRef]
26. Peciña, S. Opioid reward ‘liking’ and ‘wanting’ in the nucleus accumbens. Physiol. Behav. 2008, 94, 675–680.[CrossRef] [PubMed]
27. Green, E.; Murphy, C. Altered processing of sweet taste in the brain of diet soda drinkers. Physiol. Behav.2012, 107, 560–567. [CrossRef]
28. Garneau, N.L.; Nuessle, T.M.; Mendelsberg, B.J.; Shepard, S.; Tucker, R.M. Sweet liker status in children andadults: Consequences for beverage intake in adults. Food Qual. Prefer. 2018, 65, 175–180. [CrossRef]
29. Low, J.Y.Q.; Lacy, K.E.; McBride, R.; Keast, R.S.J. The association between sweet taste function, anthropometry,and dietary intake in adults. Nutrients 2016, 8, 241. [CrossRef] [PubMed]
30. Hjartåker, A.; Andersen, L.F.; Lund, E. Comparison of diet measures from a food-frequency questionnairewith measures from repeated 24-hour dietary recalls. The Norwegian Women and Cancer Study. PublicHealth Nutr. 2007, 10, 1094–1103. [CrossRef]
31. Smith, S.L.; Ludy, M.-J.; Tucker, R.M. Changes in taste preference and steps taken after sleep curtailment.Physiol. Behav. 2016, 163, 228–233. [CrossRef] [PubMed]
32. Martinez-Cordero, E.; Malacara-Hernandez, J.M.; Martinez-Cordero, C. Taste perception in normal andoverweight Mexican adults. Appetite 2015, 89, 192–195. [CrossRef]
33. Han, P.; Keast, R.S.; Roura, E. Salivary leptin and TAS1R2/TAS1R3 polymorphisms are related to sweettaste sensitivity and carbohydrate intake from a buffet meal in healthy young adults. Br. J. Nutr. 2017, 118,763–770. [CrossRef]
34. Sartor, F.; Donaldson, L.F.; Markland, D.A.; Loveday, H.; Jackson, M.J.; Kubis, H.P. Taste perception andimplicit attitude toward sweet index and soft drink supplementation. Appetite 2011, 57, 237–246. [CrossRef]
35. Cicerale, S.; Riddell, L.J.; Keast, R.S. The association between perceived sweetness intensity and dietaryintake in young adults. J. Food Sci. 2012, 77, H31–H35. [CrossRef]
36. Stevenson, R.J.; Boakes, R.A.; Oaten, M.J.; Yeomans, M.R.; Mahmut, M.; Francis, H.M. Chemosensory abilitiesin consumers of a western-style diet. Chem. Senses 2016, 41, 505–513. [CrossRef]
37. Holt, S.H.A.; Cobiac, L.; Beaumont-Smith, N.E.; Easton, K.; Best, D.J. Dietary habits and the perception andliking of sweetness among Australian and Malaysian students: A cross-cultural study. Food Qual. Prefer.2000, 11, 299–312. [CrossRef]
20

Nutrients 2019, 11, 94
38. Hodge, A.; Patterson, A.J.; Brown, W.J.; Ireland, P.; Giles, G. The Anti Cancer Council of Victoria FFQ:Relative validity of nutrient intakes compared with weighed food records in young to middle-aged womenin a study of iron supplementation. Aust. N. Z. J. Public Health 2000, 24, 576–583. [CrossRef] [PubMed]
39. Drewnowski, A.; Henderson, S.A.; Levine, A.; Hann, C. Taste and food preferences as predictors of dietarypractices in young women. Public Health Nutr. 1999, 2, 513–519. [CrossRef] [PubMed]
40. Turner-McGrievy, G.; Tate, D.F.; Moore, D.; Popkin, B. Taking the bitter with the sweet: Relationship ofsupertasting and sweet preference with metabolic syndrome and dietary intake. J. Food Sci. 2013, 78,S336–S342. [CrossRef] [PubMed]
41. Methven, L.; Xiao, C.; Cai, M.; Prescott, J. Rejection thresholds (RjT) of sweet likers and dislikers. Food Qual.Prefer. 2016, 52, 74–80. [CrossRef]
42. Mattes, R.D.; Mela, D.J. Relationships between and among selected measures of sweet-taste preference anddietary intake. Chem. Senses 1986, 11, 523–539. [CrossRef]
43. Thompson, F.E.; Byers, T. Dietary assessment resource manual. J. Nutr. 1994, 124, 2245s–2317s.44. Bartoshuk, L.M. Methodological problems in psychophysical testing of taste and smell. In Special Senses in
Aging: A Current Biological Assessment; Han, S.S., Coons, D.H., Eds.; University of Michigan: Ann Arbor, MI,USA, 1979.
45. Iatridi, V.; Hayes, J.E.; Yeomans, M.R. Reconsidering the classification of sweet taste liker phenotypes:A methodological review. Food Qual. Prefer. 2018. [CrossRef]
46. Low, J.Y.Q.; McBride, R.L.; Lacy, K.E.; Keast, R.S.J. Psychophysical evaluation of sweetness functions acrossmultiple sweeteners. Chem. Senses 2017, 42, 111–120. [CrossRef]
47. Pangborn, R.M. Relative taste intensities of selected sugars and organic acids. J. Food Sci. 1963, 28, 726–733.[CrossRef]
48. Li, X.; Staszewski, L.; Xu, H.; Durick, K.; Zoller, M.; Adler, E. Human receptors for sweet and umami taste.Proc. Natl. Acad. Sci. USA 2002, 99, 4692–4696. [CrossRef]
49. Trabulsi, J.; Schoeller, D.A. Evaluation of dietary assessment instruments against doubly labeled water, abiomarker of habitual energy intake. Am. J. Physiol. Endocrinol. Metab. 2001, 281, E891–E899. [CrossRef][PubMed]
50. Basiotis, P.P.; Welsh, S.O.; Cronin, F.J.; Kelsay, J.L.; Mertz, W. Number of days of food intake records requiredto estimate individual and group nutrient intakes with defined confidence. J. Nutr. 1987, 117, 1638–1641.[CrossRef] [PubMed]
51. Gersovitz, M.; Madden, J.P.; Smiciklas-Wright, H. Validity of the 24-h. dietary recall and seven-day recordfor group comparisons. J. Am. Diet. Assoc. 1978, 73, 48–55.
52. Nakamura, Y.; Sanematsu, K.; Ohta, R.; Shirosaki, S.; Koyano, K.; Nonaka, K.; Shigemura, N.; Ninomiya, Y.Diurnal variation of human sweet taste recognition thresholds is correlated with plasma leptin levels.Diabetes 2008, 57, 2661–2665. [CrossRef] [PubMed]
53. Stevens, J.C.; Cruz, L.A.; Hoffman, J.M.; Patterson, M.Q. Taste sensitivity and aging: High incidence ofdecline revealed by repeated threshold measures. Chem. Senses 1995, 20, 451–459. [CrossRef] [PubMed]
© 2019 by the authors. Licensee MDPI, Basel, Switzerland. This article is an open accessarticle distributed under the terms and conditions of the Creative Commons Attribution(CC BY) license (http://creativecommons.org/licenses/by/4.0/).
21


nutrients
Article
Quantifying Sweet Taste Liker Phenotypes: Time forSome Consistency in the Classification Criteria
Vasiliki Iatridi 1,*, John E. Hayes 2,3 and Martin R. Yeomans 1
1 School of Psychology, University of Sussex, Falmer BN1 9QH, UK; [email protected] Department of Food Science, College of Agricultural Sciences, The Pennsylvania State University,
University Park, PA 16802, USA; [email protected] Sensory Evaluation Center, College of Agricultural Sciences, The Pennsylvania State University,
University Park, PA 16802, USA* Correspondence: [email protected]; Tel.: +44-1273-67-8916
Received: 17 December 2018; Accepted: 4 January 2019; Published: 10 January 2019
Abstract: Taste hedonics is a well-documented driver of food consumption. The role of sweetness indirecting ingestive behavior is largely rooted in biology. One can then intuit that individual differencesin sweet-liking may constitute an indicator of variations in the susceptibility to diet-related healthoutcomes. Despite half a century of research on sweet-liking, the best method to identify the distinctresponses to sweet taste is still debated. To help resolve this issue, liking and intensity ratings foreight sucrose solutions ranging from 0 to 1 M were collected from 148 young adults (29% men).Hierarchical cluster analysis (HCA) revealed three response patterns: a sweet-liker (SL) phenotypecharacterized by a rise in liking as concentration increased, an inverted U-shaped phenotype withmaximum liking at 0.25 M, and a sweet-disliker (SD) phenotype characterized by a decline in likingas a function of concentration. Based on sensitivity and specificity analyses, present data suggest theclearest discrimination between phenotypes is seen with 1.0 M sucrose, where a liking rating between−15 and +15 on a −50/+50 scale reliably distinguished individuals with an inverted U-shapedresponse from the SLs and the SDs. If the efficacy of this approach is confirmed in other populations,the discrimination criteria identified here can serve as the basis for a standard method for classifyingsweet taste liker phenotypes in adults.
Keywords: sweet taste; hedonics; sweetness; taste test; individual differences; classification method
1. Introduction
Hedonic responses to taste stimuli are dissociable construct from motivation or a desire toeat (i.e., “liking” vs. “wanting”) as proposed by Berridge [1], and these responses influence dietaryintake [2–4]. Elsewhere, a conceptual model linking sensation to intake via affective/hedonic responseshas also been proposed [5]. Under these models, it is highly plausible that interpersonal variations inhedonic responses to sweet taste—in conjunction with genetic and epigenetic inputs, environmentalforces, and other acquired individual characteristic—may contribute to variations in the susceptibilityfor obesity and obesity-related diseases. For almost half a century, observations of distinct individualliking patterns to sweet taste stimuli have repeatedly been made, thereby challenging the widespreadbelief that sweetness is universally highly liked. Witherly and colleagues, for example, speculatedthat humans exhibit up to four distinguishable responses to various sweetened beverages [6], which,as was also illustrated later by Drewnowski [7], could be described as a rise in liking with increasingsweetener concentration followed by a decline (Type I), a rise and then a plateau (Type II), a monotonicdecline (Type III), and a non-systematic change in liking (Type IV).
Since the pioneering work of Pangborn [8], sensory scientists using simple sucrose solutionsand multiple different scaling methods in laboratory settings have similarly identified at least four
Nutrients 2019, 11, 129; doi:10.3390/nu11010129 www.mdpi.com/journal/nutrients23

Nutrients 2019, 11, 129
different sweet taste liker phenotypes. As summarized in Figure 1, the associated response patterns arecharacterized by either a positive slope, a horizontal (“flat”) slope, an inverted U-shape, or a negativeslope. Simpler schemes also exist, where participants are dichotomized into sweet likers (SLs) andsweet dislikers (SDs). The SL phenotype (sometimes reported as the Type II phenotype) generally refersto liking for ever-higher sweetness (e.g., in References [9,10]) and accounts for 48.5% of the publishedliterature [11]. In contrast, the SD phenotype, which shares a very similar distribution (48.2%) withthe SL phenotype [11], has been defined differently across various studies: it can describe either asa monotonically decreasing liking as sucrose concentration increases (e.g., in References [12,13]),or a liking for moderate levels of sweetness, which is graphically presented as an inverted U(e.g., in Reference [14]) and sometimes also called Type I phenotype (e.g., in References [15,16]).To note, a few studies identifying both subtypes of the SD response pattern classified them into a singlegroup reported as SD phenotype, as well (e.g., in References [17,18]).
Figure 1. Graphical representation of the most commonly reported sweet taste liker phenotypes.The green line corresponds to a phenotype characterized by a rise in liking with increasing sucroseconcentration (e.g., sweet liker phenotype), yellow line illustrates an inverted U-shaped hedonicresponse as a function of sucrose concentration (e.g., inverted-U phenotype), grey line represents aninsensitive response to changes in sucrose concentration, and red line corresponds to a phenotypecharacterized by a decline in liking as sucrose concentration increases (e.g., sweet disliker phenotype).Adapted with permission from Reference [11].
Accordingly, an important question to be addressed is how these distinct hedonic responses tosweet taste can be defined and identified. Among 71 studies we recently reviewed [11], four mainphenotyping methods (each relying on different classification criteria) were identified: the visual oralgorithmic interpretation of hedonic responses from multiple sucrose concentrations (Method 1a andMethod 1b, respectively), the “highest preference using ratings” method that dichotomizes participantsbased on whether they like the highest sucrose concentration tested the most (Method 2), the “averageliking above mid-point” or “positive/negative liking” method where liking ratings are compared toone or two predefined cut-off scores (Method 3), and the “highest preference via paired comparisons”method that categorizes participants based on which sucrose concentration they prefer the most(Method 4). As detailed in our recent review [11], Method 2 and Method 3 suffer from arbitrariness
24
Nutrients 2019, 11, 129
associated with the strength of the taste stimuli and/or the classification rating thresholds, and bothmethods are prone to misclassification. The dependence on visual inspection in Method 1a raises thepotential for subjective interpretation, and Method 4 involves a choice paradigm based on preferencerather than liking per se.
Considering these methodological challenges, along with the ongoing debate over the role ofsugar intake as a factor in obesity [19–22], there is strong need for a more precise and consistentmethod to identify sweet taste phenotypes. The numerous prior studies that have investigated thepresence of different sweet taste liker phenotypes and their potential relationship to dietary intake(e.g., in References [14,18,23]) or to body mass index (BMI: e.g., in References [13,16,24–26]) have usedwidely different methods to define phenotypes; presumably, this has contributed to the inconsistenciesreported across studies. Accordingly, in our recent review [11], we suggested that a rapid andreliable phenotyping method is needed to facilitate comparisons across future studies. In our review,we proposed that an optimal sucrose concentration be identified that best separates distinct sweet tasteliker phenotypes, in terms of sensitivity and specificity. In 2015, Asao et al. [27] piloted this idea in orderto discriminate SLs from SDs. However, as commonly happens with small pilot studies, their samplesize likely affected the phenotyping process, potentially leading to an underestimation of the truenumber of distinct response patterns, a limitation the authors noted in their report. Further, the totalnumber of stimuli they used was rather large [27], raising additional issues of fatigue, adaptation,and inattentiveness. Finally, their participants were tested after they had fasted for an average of12.1 h [27], which may influence the appetitiveness of the stimuli.
The present study aimed to extend the approach used by Asao et al. [27] while also eliminatingsome of the methodological issues mentioned above toward a goal of defining a new standardizedphenotyping method. We had three aims. First, we identified different sweet taste liker phenotypesstatistically. Second, we analyzed these phenotyping data to identify a single sucrose concentrationwhere an application of one or two specific cut-off liking scores ensures the most reliable andreplicable definition of each of the identified phenotypes. Last, potential relationships betweenthe motivational state and baseline characteristics of our participants with these sweet taste likerphenotypes were explored.
2. Materials and Methods
2.1. Participants
A total of 148 non-diabetic participants aged 18–34 were recruited from students and staff at theUniversity of Sussex between September and December 2017 (Table 1). Cohort size was determined bythe suggested minimum of 100 participants in our recent methodological review for the successfulidentification of the main sweet taste liker phenotypes [11], which was further increased to adjust forthe expected underrepresentation of the SD phenotype in our young adult population. Inclusion criteriacomprised being medication free (other than oral contraception), smoking less than five cigarettes aweek, and having no history of diagnosed eating disorders. Individuals with a current respiratoryillness or having recently (less than two weeks) undergone a dental procedure, those being on a weightloss or a medically induced special diet, and women with an irregular menstrual cycle were alsoexcluded. At enrollment, participants gave their written informed consent for inclusion in the study,but they were naive to the study’s hypothesis until they had completed all tasks (debriefing provided).The University of Sussex Science and Technology Cross-Schools Research Ethics Committee approvedthe protocol on the 22 September 2017 (ER/VI40/1), and the study was conducted in accordance withthe 1964 Declaration of Helsinki.
25

Nutrients 2019, 11, 129
Table 1. Participant characteristics.
Total
Sweet Taste Like Phenotype 1,2
Sweet LikerInverted
U-ShapedSweet Disliker
n = 148 n = 46 n = 73 n = 27
Gender, N (%)Woman 105 (70.9) 33 (71.7) 48 (65.8) 22 (81.5)Man 43 (29.1) 13 (28.3) 25 (34.2) 5 (18.5)
Ethnicity, N (%)Caucasian 112 (75.7) 39 (84.8) 53 (72.6) 19 (70.4)Asian 14 (9.4) 2 (4.3) 9 (12.3) 3 (11.1)Other 22 (14.9) 5 (10.9) 11 (15.1) 5 (18.5)
Dieting, N (%)Once or more times in the past 52 (35.6) 15 (32.6) 23 (31.9) 12 (46.2)Never 94 (64.4) 31 (67.4) 49 (68.1) 14 (53.8)
Added sugar in drinks/cereals, N (%)More when being younger 72 (48.6) 18 (39.1) 39 (53.4) 14 (51.9)Same as when being younger 27 (18.2) 11 (23.9) 9 (12.3) 7 (25.9)Never 49 (33.1) 17 (37.0) 25 (34.3) 6 (22.2)
Age range (median) in years 18.2–34.0 (20.2) 18.3–32.8 (19.8) 18.2–34.0 (20.2) 18.2–34.0 (20.9)
BMI range (median) in kg/m2 17.8–32.4 (22.1) 17.9–29.1 (23.0) 17.8–32.4 (21.6) 18.2–30.3 (22.7)
BMI, body mass index; Q1, 25th percentile; Q3, 75th percentile. All frequencies reported refer to valid percentages.1 Participants demonstrating erratic responses to sweet stimuli (n = 2) were excluded from this analysis. 2 p > 0.05for all between group comparisons performed with chi-square or Kruskal Wallis tests.
2.2. Taste Test
2.2.1. Taste Stimuli
To ensure sufficient individual ratings for the development of hedonic curves while trying tominimize confounding effects of adaptation [28] and sensory specific satiety [29], the taste test consistedof seven different aqueous sucrose solutions (0.03125, 0.0625, 0.125, 0.25, 0.5, 0.67, and 1 M) and onewater blank, replicated in two separate blocks, for a total of 16 tastings.
The particular concentration range tested was equivalent to sucrose solutions between 1.07% and34.23% (w/v) based on density at 20 ◦C [30], and were chosen to reflect four different considerations:(1) previously reported effects of age on sucrose recognition thresholds [31–33]; (2) the most commonlyused sucrose concentrations in prior relevant studies (reviewed in Reference [11]); (3) the sweetnesstypically encountered in sugar-sweetened beverages [34]; and (4) a compromise between equal logspacing and serial dilution for sample preparation.
All sweet stimuli were prepared at least 24 hours in advance by dissolving food-grade sucrose inmineral water at room temperature. Solutions were stored at 4 ◦C until used. On the experimental day,solutions were allowed to warm up to room temperature prior to presentation, and were presented as10 mL samples in transparent 60 mL glass cups labelled with random three digit codes. For the soluteand rinsing, we used a commercial mineral water with the lowest dry residue concentration availableat the time (Volvic, Danone Waters London and Ireland Ltd., London, U.K.).
2.2.2. Rating Scales
Participants evaluated liking and intensity for each stimulus using a horizontal visual analoguescale (VAS) end-anchored with “dislike extremely” (scored −50) and “like extremely” (scored +50)and a vertical generalized labeled magnitude scale (gLMS) with properly positioned descriptorsranging from “no sensation” (scored 0) to “strongest imaginable sensation of any kind” (scored +100),respectively. To ensure within and between-subjects compliance, training for both scales was provided.The practice session for VAS involved rating liking for a series of non-food items, while training in theuse of gLMS was applied by evaluating responses to noise and light [35].
26

Nutrients 2019, 11, 129
On the basis of Cabanac’s theory regarding possible enhancement of stimulus value by internalstate (“alliesthesia” [36]), two series of VAS appetite ratings [37] were completed before the first andafter the second taste test block. All ratings were collected using the Sussex Ingestion Pattern Monitor(SIPM version 2.0.13, University of Sussex, Falmer, U.K.), a computer-based system developed torecord and score rating data.
2.2.3. Procedure
The taste test was conducted approximately 2 h after breakfast (between 09.30 am and 12.30 pmdepending on each participant’s personal routine). Participants were also asked to abstain fromsmoking, chewing gum, and tooth brushing for the 2 h prior to testing; no restrictions applied to waterconsumption. During both taste test blocks, a “sip and spit” protocol was followed: participants wereinstructed to place the entire 10-mL solution in their mouth, swirl it around for 10 s, and expectorateit. They then rated their liking and sweetness intensity before rinsing their mouth with water andproceeding to the next sample. Stimuli were presented in randomized order with participants blindedto the concentration of sucrose tasted each time. After the taste test was complete, demographic(date of birth, sex, and ethnicity) and lifestyle characteristics (“Have you ever been on a diet in orderto lose weight?” with possible answers “Yes, one or more times in the past” or “Never,” and “Did youusually add more sugar in your coffee, tea or cereals when you were younger?” with possible answers“Yes, I used to add more sugar in my coffee, tea or cereals when I was younger,” or “No, I add thesame sugar as I did in the past,” or “Never added sugar in my coffee, tea or cereals”) were collected.
2.3. Anthropometry
To minimize any possible interactions between the sensory ratings and anthropometricmeasures, participants revisited the laboratory for a separate early morning session (08:30–10:30)for anthropometry; this visit was scheduled between two days and two weeks after the taste test.Height was measured to the nearest 0.1 cm using a stadiometer and weight to the nearest 0.1 kgusing a calibrated body composition analyzer (MC-780MA P, TANITA, Tokyo, Japan). Standardizedprocedures were followed, including wearing light clothing and no shoes [38].
2.4. Statistical Analysis
Our primary goals were to (a) algorithmically identify the different sweet taste liker phenotypesin our study cohort and (b) to determine the specific sucrose concentration and associated cut-offscore(s) for liking ratings that most reliably allowed for the identification of those distinct phenotypes.Assumptions of normality were tested prior to the main statistical analyses using visual inspection(histograms, Q-Q plots, and bloxplots), and summary statistics (skewness and kurtosis z-scorescomputed by dividing skewness or kurtosis values with the associated standard errors). Z-scores(absolute values) larger than 1.96 were indicative of a normal distribution. All ratings are reported asmeans and standard errors (normally distributed), while medians and ranges are used for age andBMI (not normally distributed); categorical characteristics are expressed as percentages.
Interclass correlation coefficients (ICCs) were calculated to assess test–retest reliability of likingratings over the two taste test blocks. Given our experimental design, an average measures absoluteagreement two-way mixed-effects model was selected [39]. Per the guidelines, an ICC value lessthan 0.5 indicates poor reliability, values between 0.5 and 0.75 reflect moderate reliability, and valuesbetween 0.75 and 0.9 indicate good reliability [40].
As the first step to achieve the principle aim of the current study, an agglomerative hierarchicalcluster analysis (HCA) was performed and meaningful groups (clusters) of participants who sharedsimilar liking patterns within each group but were heterogeneous in the between-group contrasts wereidentified. The mean liking ratings from the eight replicated concentrations in the two taste test blockswere treated as the dimensions for the HCA. The squared Euclidean distance between pairs of cases orclusters and the between-groups (average) linkage method were selected to assist with the merging
27

Nutrients 2019, 11, 129
process [41]. The final decision on the true number of clusters in our dataset was dictated graphicallyby interpreting the scree plot of coefficients of the agglomeration schedule we designed (Office Excel2013 for Windows, Microsoft, Washington, DC, USA) and then applying this information (“stoppingrule”) to the dendrogram provided by the statistical software on the HCA output [41].
We then implemented a two-by-two cross tabulation function to estimate the dyads of sucroseconcentration and liking score with the highest sensitivity and specificity in predicting the threedistinct sweet taste liker phenotypes. In each two-by-two cross tabulation table, the phenotypingresults emerged when a specific dyad of sucrose concentration and liking score was used as theclassification criteria for the identification of the sweet taste liker phenotype under investigationwere contrasted with the associated phenotyping results suggested by the HCA. The number oftrue positives (e.g., classified as SL by both the dyad tested and the HCA) and the number of truenegatives (e.g., not classified as SL by both the dyad tested and the HCA) indicated the sensitivityand specificity attached to that particular dyad of sucrose concentration and liking score, respectively.Reported liking ratings for stimuli from 0.03125 M to 1.0 M sucrose and potential cut-off values rangingbetween −20 and +20 in 5-point increments were tested for their prediction value. A K-1 series ofsensitivity-specificity tests were conducted, where k represents the number of main clusters previouslyidentified in the HCA.
To test the hypothesis that the sucrose concentration (within subject factor) and the initial clustersor subsequent sweet taste liker phenotypes (between subject factor), as well as their interaction,affect liking and intensity ratings of the presented sweet taste stimuli, two-way mixed ANOVAs withGreenhouse-Geisser correction were carried out. We also employed separate one-way ANOVAs tocontrast liking and intensity (both mean ratings and ratings across each of the eight concentrations) bysweet taste liker phenotype. In cases of violation of the equal variances assumption, Brown–Forsythetests were applied, instead [42]. Post hoc Fisher’s least significant difference (LSD) and Games-Howelltests were used as appropriate to further understand the nature of specific paired comparisons.
Nonparametric (Mann–Whitney) tests for the previously reported not normally distributed continuesvariables (age and BMI) and Pearson’s chi-square tests for the categorical variables (gender, ethnicity,dieting history, and habitual use of table sugar) were used to investigate for differences in participantcharacteristics across the distinct sweet taste liker phenotypes. To explore whether there were also genderdifferences in measures of interest, additional chi-square tests were performed. Phi symmetric measuresinstead of Pearson’s results are reported in cases of cells with an expected count less than 5.
To ensure participants’ compliance with the taste test protocol, changes in hunger and thirst beforeand after delivering the taste test were explored using paired t-tests. We also calculated multiple linearregressions to investigate the degree to which pre- and post-test hunger and thirst predicted likingand intensity ratings across the study sample. The influence of pre- and post-test levels of hungerand thirst was further explored using either one-way ANOVAs or Brown–Forsythe tests [42] to detectdifferences across the distinct sweet taste liker phenotypes.
The extent to which our method for the identification of the distinct sweet taste liker phenotypesagrees with those in previous literature (see Introduction for details) was assessed by Cohen’s Kappasand 95% confidence intervals (CIs) based on the “Estimate ± 1.96 × Standard Error” formula [43];participants exhibiting an inverted U-shaped response were excluded from this analysis due to thebimodal nature of the phenotyping results elicited by Method 2 and 3. The relevant frequencydistributions were also estimated. For the comparison with Method 2 participants who rated thehighest sucrose concentration, namely the 1 M solution, as the most pleasant were considered as SLs,whilst all remainder liking patterns were classified into the SD phenotype [44,45]. The agreement withMethod 3 was tested using the 0.5 M sucrose solution and the corresponding neutral cut-off hedonicscore of 0 (zero) as the classification criteria to discriminate SLs from SDs [23].
Unless otherwise stated, data were analyzed using SPSS Statistics for Windows, version 24.0(IBM Corp., Armonk, NY, USA). An alpha level of 0.05 was set as the threshold for statistical significanceand all performed statistical tests were two-tailed.
28

Nutrients 2019, 11, 129
3. Results
3.1. Participant Characteristics
Participant characteristics are summarized in Table 1; three (two women and one man) failed toreport to the laboratory for both sessions. As a whole the cohort tested here was relatively young andlean (Mdn = 20.2 years and Mdn = 22.1 kg/m2, respectively) and was mainly comprised of women(70.9%); most self-identified as Caucasian (75.7%). Nearly half of the participants reported that theycurrently add less sugar in their drinks and cereals than when they were younger, and one in threehad been on a diet for weight loss at least once in the past. Overall, the women were slightly youngerthan the men (Mdn = 21.1 years for men and Mdn = 20.1 years for women; U = 1454.5, Z = −3.263,p = 0.001), and had a lower average BMI (Mdn = 23.4 kg/m2 for men and Mdn = 21.6 kg/m2 forwomen; U = 1475.5, Z = −2.861, p = 0.004). This was expected, as it reflects the typical differences inBMI between men and women and the differences in BMI across different age groups in the U.K. [46].
3.2. Taste Test
Test-retest reliability analysis comparing liking ratings across the two taste test blocks indicatedmoderate to good reproducibility based on the ICC cut-offs suggested by Portney and Watkins [40]for all but the 0.125 M solution (Figure 2). The two highest sucrose concentrations (0.67 and 1.0 M),and water were associated with the strongest agreement between the two repetitions. As expected,there was a main effect of concentration on liking across all participants with significantly differentmean hedonic scores reported for different solutions (F(2.12, 312.15) = 10.65, p < 0.001, ηp2 = 0.068).
Figure 2. Interclass correlation coefficient (ICC) scores (95% confidence interval) for liking ratings fromthe two taste test blocks across the different taste stimuli.
3.2.1. Identifying Distinct Responses to Sweet Taste: HCA
HCA resulted in ten subgroups of distinct responses to sweet taste with a significant effect ofcluster on liking (p < 0.001 for all eight sucrose concentrations and effect sizes ranged from 0.22 forthe 0.125 M solution to 0.80 for the 1.0 M solution). Three main clusters that accounted for 92% ofthe study sample were observed. Cluster 1 (n = 44) and cluster 3 (n = 22) described hedonic responsepatterns consistent with the sweet liker (SL) and sweet disliker (SD) phenotypes. Both trends wereparticularly evident for solutions with added sucrose above 0.125 M. Notably however, almost half ofthe study sample fell into cluster 2 (n = 70), where liking increased modestly with concentration up toan intermediate level of sucrose (0.25 M) and then decreased as the concentration continued to increase.Remarkably, participants who were classified into cluster 2 rated both the lowest (M = 1.0, SEM = 0.76
29

Nutrients 2019, 11, 129
for 0.03125 M) and the highest (M = −1.5, SEM = 1.44 for 1.0 M) sucrose concentration as neutral; thatis, they neither liked them nor disliked them (t(69) = 1.46, p = 0.148 for the paired comparison betweenthe lowest versus the highest concentration).
Regarding the 12 participants classified into one of the remaining clusters (clusters 4 to 10),plotting liking as a function of concentration revealed that participants in cluster 9 (n = 2) and thosein cluster 10 (n = 3) followed a classical SL and a SD liking pattern, respectively. Their ratingsfrom the eight different sucrose concentrations resulted, however, in steeper liking curves (“extreme”responses) than those in our main SL and SD clusters, which explains why they emerged as separategroups during the clustering procedure. Indeed, before we applied the “stopping rule” as appropriate(see Section 2.4 for details), participants grouped into clusters 9 and 10 and those grouped into clusters1 and 3, respectively, had been considered as homogenous only subsequent to the inverted U-shapedphenotype merged with the SL phenotype. Likewise, an inverted U-shaped response correspondingto corresponding to that of cluster 2 was observed for participants classified into cluster 4 (n = 2),cluster 7 (n = 2), and cluster 8 (n = 1): among the heterogeneous mean liking ratings to those of cluster2, a different optimal sweetness (0.5 M for cluster 4 and 0.67 M for cluster 8) and a higher ratingfor the breakpoint concentration of 0.25 M sucrose (M = 8.9, SEM = 1.15 for cluster 2 and M = 28.5,SEM = 4.50 for cluster 7, t(70) = −2.84, p = 0.006) stand out. Two single cases of erratic responses werealso identified and eliminated from further analysis (cluster 5 and cluster 6).
3.2.2. Identifying Distinct Sweet Taste Like Phenotypes: New Classification Criteria
With regard to the specific sucrose concentration and liking thresholds that best discriminatedbetween the three main clusters, the 1 M solution and liking scores of −15 or lower for the identificationof SDs and +15 or higher for the identification of SLs were associated with the lowest number of falsenegative classifications (90.9 and 97.7 percentage sensitivity for SDs and SLs, respectively) and thelowest number of false positive classifications (93.9 and 93.5 percentage specificity for SDs and SLs,respectively). The results are shown in Tables 2 and 3.
Table 2. Sensitivity and specificity checks to discriminate sweet dislikers (cluster 3) from the rest ofsweet taste liker phenotypes.
Liking Cut-Off Scores
Sucrose Concentration (M)
0.25 0.5 0.67 1.0
Sensitivity(%)
Specificity(%)
Sensitivity(%)
Specificity(%)
Sensitivity(%)
Specificity(%)
Sensitivity(%)
Specificity(%)
−20 13.6 100.0 36.4 100.0 45.5 99.1 81.8 96.5−15 13.6 100.0 54.5 97.4 68.2 95.6 90.9 * 93.9 *−10 27.3 99.1 63.6 94.7 77.3 92.1 95.5 87.7−5 50.0 94.7 77.3 93.0 95.5 86.0 100.0 77.20 59.1 89.5 90.9 86.8 100.0 76.3 100.0 68.4
Percentages (%) with an asterisk (*) indicate the dyad of sucrose concentration and liking cut-off score with thehighest combined sensitivity and specificity for the prediction of the sweet disliker phenotype across all dyads tested.
We then applied these classification criteria individually to participants who were assigned to theremaining clusters. The revised grouping (SL phenotype: n = 46; 31.5%, inverted U-shaped phenotype:n = 73; 50%, SD phenotype: n = 27; 18.5%) was in agreement with the classification suggested by thevisual interpretation of the shape of the relevant liking curves in all participants except those initiallyclassified into cluster 4. Those participants met the new SD phenotype criteria rather the criteriaassociated with the inverted U-shaped response pattern. A closer inspection of their hedonic responsesrevealed that they actually had rated all sucrose solutions as neutral or unpleasant. In addition,integrating the very small clusters into the main groups of responses reduced overfitting and allowedfor the subsequent statistical analyses required.
30
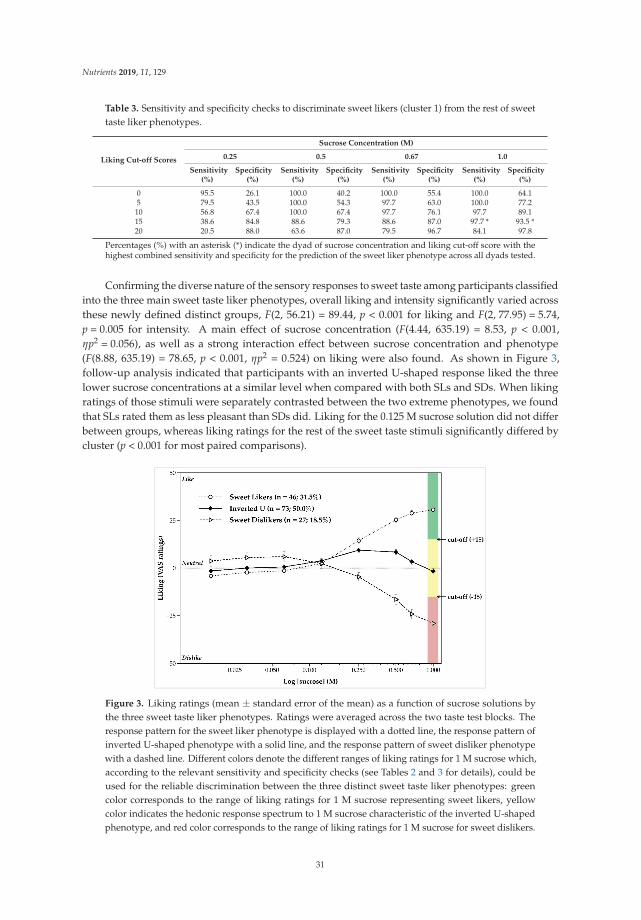
Nutrients 2019, 11, 129
Table 3. Sensitivity and specificity checks to discriminate sweet likers (cluster 1) from the rest of sweettaste liker phenotypes.
Liking Cut-off Scores
Sucrose Concentration (M)
0.25 0.5 0.67 1.0
Sensitivity(%)
Specificity(%)
Sensitivity(%)
Specificity(%)
Sensitivity(%)
Specificity(%)
Sensitivity(%)
Specificity(%)
0 95.5 26.1 100.0 40.2 100.0 55.4 100.0 64.15 79.5 43.5 100.0 54.3 97.7 63.0 100.0 77.210 56.8 67.4 100.0 67.4 97.7 76.1 97.7 89.115 38.6 84.8 88.6 79.3 88.6 87.0 97.7 * 93.5 *20 20.5 88.0 63.6 87.0 79.5 96.7 84.1 97.8
Percentages (%) with an asterisk (*) indicate the dyad of sucrose concentration and liking cut-off score with thehighest combined sensitivity and specificity for the prediction of the sweet liker phenotype across all dyads tested.
Confirming the diverse nature of the sensory responses to sweet taste among participants classifiedinto the three main sweet taste liker phenotypes, overall liking and intensity significantly varied acrossthese newly defined distinct groups, F(2, 56.21) = 89.44, p < 0.001 for liking and F(2, 77.95) = 5.74,p = 0.005 for intensity. A main effect of sucrose concentration (F(4.44, 635.19) = 8.53, p < 0.001,ηp2 = 0.056), as well as a strong interaction effect between sucrose concentration and phenotype(F(8.88, 635.19) = 78.65, p < 0.001, ηp2 = 0.524) on liking were also found. As shown in Figure 3,follow-up analysis indicated that participants with an inverted U-shaped response liked the threelower sucrose concentrations at a similar level when compared with both SLs and SDs. When likingratings of those stimuli were separately contrasted between the two extreme phenotypes, we foundthat SLs rated them as less pleasant than SDs did. Liking for the 0.125 M sucrose solution did not differbetween groups, whereas liking ratings for the rest of the sweet taste stimuli significantly differed bycluster (p < 0.001 for most paired comparisons).
Figure 3. Liking ratings (mean ± standard error of the mean) as a function of sucrose solutions bythe three sweet taste liker phenotypes. Ratings were averaged across the two taste test blocks. Theresponse pattern for the sweet liker phenotype is displayed with a dotted line, the response pattern ofinverted U-shaped phenotype with a solid line, and the response pattern of sweet disliker phenotypewith a dashed line. Different colors denote the different ranges of liking ratings for 1 M sucrose which,according to the relevant sensitivity and specificity checks (see Tables 2 and 3 for details), could beused for the reliable discrimination between the three distinct sweet taste liker phenotypes: greencolor corresponds to the range of liking ratings for 1 M sucrose representing sweet likers, yellowcolor indicates the hedonic response spectrum to 1 M sucrose characteristic of the inverted U-shapedphenotype, and red color corresponds to the range of liking ratings for 1 M sucrose for sweet dislikers.
31

Nutrients 2019, 11, 129
We next sought to examine the perceived variations in sweetness for the different stimuli betweenthe three sweet liker phenotypes. Paired comparisons between the intensity ratings for each successiveconcentration and the intensity ratings for the previous indicated that participants were clearly ableto distinguish between the different sucrose concentrations (p = 0.002 for water and 0.03125 M, andp’s < 0.001 for all remainder pairs). Rated intensity also increased as sucrose concentration increasedacross all three sweet taste like phenotypes, F(2.32, 336.30) = 535.25, p < 0.001, ηp2 = 0.787 (Figure 4).SDs overall perceived the taste stimuli as sweeter (M = 23.3, SEM = 1.62) than both SLs (M = 17.2,SEM = 0.73; p = 0.001) and participants classified in the inverted U-shaped phenotype (M = 19.2,SEM = 0.96; p = 0.015). No interaction effect between concentration and sweet taste like phenotype onintensity was, however, observed, F(4.67, 333.68) = 521.10, p = 0.082, ηp2 = 0.027.
Figure 4. Intensity ratings (mean ± standard error of the mean) as a function of sucrose solutions by thethree sweet taste liker phenotypes. Ratings are averaged across the two taste test blocks. The intensitycurve of the sweet liker phenotype is displayed with a dotted line, the intensity curve of the invertedU-shaped phenotype with a solid line, and the intensity curve of the sweet disliker phenotype with adashed line.
To explore whether the identified sweet taste liker phenotypes were merely indirect consequencesof differences in perceived intensity rather than true differences in hedonics per se, liking ratings werealso plotted as a function of intensity separately for the three main clusters. As shown in Figure 5a–c,no such indication was found.
3.2.3. Pre- and Post-Test Levels of Hunger and Thirst
Pre-test levels of hunger (M = −7.5, SEM = 2.11) and thirst (M = 0.3, SEM = 1.68) confirmedparticipants’ compliance with the taste test preparation instructions, whereas the increase in hunger(t(147) = −3.25, p = 0.001) and decrease in thirst (t(147) = 2.32, p = 0.022) over time was also in linewith the effects of the “sip and spit” and “mouth rinsing with water” parts of the taste protocol.Neither hunger nor thirst ratings before taste test block 1 or after taste test block 2 predicted liking(F(2, 145) = 2.065, p = 0.130 for pre-test levels of hunger and thirst; F(2, 145) = 0.607, p = 0.546 forpost-test levels of hunger and thirst) or intensity (F(2, 145) = 1.041, p = 0.356 for pre-test levels of hungerand thirst; F(2, 145) = 0.403, p = 0.669 for post-test levels of hunger and thirst) across the study sample.When ratings of hunger and thirst were examined against the three distinct sweet taste liker phenotypes,non-significant differences were found (F(2, 143) = 2.410, p = 0.093, and F(2, 143) = 0.094, p = 0.910 forpre-test levels of hunger and thirst, respectively; F(2, 76.22) = 0.986, p = 0.378, and F(2, 143) = 0.107,
32

Nutrients 2019, 11, 129
p = 0.899 for post-test levels of hunger and thirst, respectively). These data clearly show that the groupdifferences in sweet liking cannot be attributed to the observed changes in hunger or thirst.
(a)
(b)
(c)
Figure 5. Individual ratings of liking as a function of perceived intensity for the sweet taste stimuliin (a) sweet likers, (b) individuals exhibiting an inverted U-shaped hedonic response, and (c) sweetdislikers. Lines represent the average ratings across individuals classified within each phenotype.
3.3. Participant Characteristics by Sweet Taste Liker Phenotype
Possible variations in participant characteristics relative to sweet taste liker phenotype were alsoexamined. Gender (χ2(2, N = 146) = 2.39, p = 0.302), ethnicity (φ = 0.152, p = 0.496), dieting history(χ2(2, N = 144) = 1.84, p = 0.400), habitual use of table sugar (φ = 0.194, p = 0.240), age (H(2) = 2.60,
33

Nutrients 2019, 11, 129
p = 0.273) and BMI (H(2) = 0.67, p = 0.717) did not differ between groups. All associated values byphenotype are summarized in Table 1.
3.4. Comparison to Existing Classification Methods
When Method 2 (rating the 1 M sucrose solution or not as the most pleasant) and Method 3 (ratingthe 0.5 M sucrose solution higher than 0 or not) were used to distinguish the different sweet tasteliker phenotypes, the proportions of SD and the SL were respectively overestimated: 113 participantswere classified as SDs according to Method 2 and 108 as SLs according to Method 3. Compared withour phenotyping method, in both cases, the majority of those participants (56.6% of SDs in Method 2and 53.7% of SLs in Method 3) exhibited an inverted U-shaped response. Focusing on Method’s 2phenotypic classification, all 27 participants classified as SDs using our method were also identifiedas SDs using Method 2. Regarding the SL phenotype, 22 out of 46 participants initially fell into theSL phenotype were classified as SDs using Method 2. Those 22 participants liked the 1 M sucrosesolution significantly lower than the previous concentration (M = 25.3 for 1 M versus M = 30.6 for0.67 M, p = 0.014), while no significant difference was observed when compared with the third highersucrose concentration (M = 25.3 for 1 M versus M = 28.4 for 0.5 M, p = 0.222). The kappa coefficient wasaccordingly low at 0.447 (95% CI: 0.286 to 0.608). In contrast, the agreement with Method 3 was goodwith a Kappa coefficient at 0.879 (95% CI: 0.764 to 0.993). All SLs identified using our method werealso classified as SLs by Method 3. The two phenotyping approaches were also in line regarding theSD phenotype: only four SDs using our method were discordantly classified as SLs using Method 3.Those participants had a mean liking for the 0.5 M barely over the neutral point (M = 1.1) and theirliking rating for the 1 M, which was our concentration of choice for distinguishing sweet taste likerphenotypes, was as low as −28.7. A graphical representation of the level of consistency/disagreementamong the methods compared here is provided in Figure 6.
Figure 6. Comparison of the distribution of sweet taste liker phenotypes in our study sample whendifferent classification methods were used. Method 2 (rating the 1 M sucrose solution or not as the mostpleasant) and Method 3 (rating the 0.5 M sucrose solution higher than 0 or not) were, by definition,limited to a two-response group phenotyping outcome (binomial distribution), while HCA method(rating the 1 M sucrose solutions higher than +15, lower than −15, or between −15 and +15) allowedfor the identification of three distinct sweet taste liker phenotypes. 133 participants (77.4%) versus27 (18.5%) were classified as SDs and 108 participants (74.0%) versus 46 (31.5%) were classifiedas SLs when Method 2 and Method 3 were contrasted with the method we proposed here (HCAmethod), respectively. Different colors of the stacked columns and the associated data labels (numbers)correspond to the number of participants classified into the phenotype of the same color when theHCA method was used. Data labels (numbers) within each column add up to the total number ofparticipants classified into the phenotype illustrated at the upper end of the relevant column. Asterisks(*/**) denote alternatives to our definition for SLs and SDs. SDs, sweet dislikers; SLs, sweet likers.
34

Nutrients 2019, 11, 129
4. Discussion
4.1. General Findings
The present report describes how hedonic responses to taste stimuli of varied sweetness can bealgorithmically interpreted using HCA, and clustered into groups that represent similar sweet-likingpatterns. For the current dataset, consistent differences in liking ratings across the eight sucrosesolutions were found, which then allowed a clear characterization of participants as SLs, those withan inverted U-shaped response, or as SDs. Another key feature of the study was the subsequentidentification of the 1 M aqueous sucrose solution and the VAS-based cut-off liking scores of −15 and+15 as the statistically reliable criteria to efficiently categorize individuals into these three differentsweet taste liker phenotypes.
4.2. HCA Selection Advantages
Regarding our decision to use HCA for the identification of different sweet taste liker phenotypes,this was principally driven by the need for a statistically robust and unbiased merging of individualsinto groups. Indeed, using an advanced statistical clustering technique allowed the three sweet tasteliker phenotypes to emerge, whereas this would have been difficult to discern using more traditionalvisual inspection methods, particularly if the inspector was assuming a simple dichotomous mode.HCA is also based on hedonic responses across multiple stimuli rather than based on an arbitrarilyselected single liking rating or the average value of hedonic scores of different stimuli. Accordingly,most elements of subjectivity and arbitrariness noted in the other phenotyping methods discussedearlier were controlled for. When we re-analyzed our current data using other widely used methods(defined as Methods 2 and 3 in the introduction, and in our recent review [11]), many participants weremisclassified relative to the cluster analysis performed here, as the bimodal phenotyping approach inthose methods assumes a priori that there are only two distinct response patterns. Critically, the HCAanalysis shown here, as well as other recent studies [9,13], all suggest that response patterns for sweetstimuli are better described by three distinct phenotypes. Regarding the observed overestimationof SDs by Method 2 and of SLs by Method 3, this was a consistent feature of those methods in ourrecent evaluation of the impact of different sweet taste liker classification approaches [11]. In contrast,discriminating participants between the different sweet taste liker phenotypes based on a singlesucrose concentration and predetermined cut-off liking scores as used in Method 3, led to the leastmisclassifications, further supporting the utility of such a phenotyping approach.
4.3. Phenotyping Results
Our findings confirm some [8,9,13,47,48] but not all, studies using phenotyping methods thatallowed for a non-dichotomous identification of sweet-liking patterns. Indeed, in some publishedreports, participants with an inverted U-shaped response were considered as outliers [12,15,17], whilstelsewhere they were treated as homogeneous with the SDs [49–51]. Here, the generated icicle plot ofour statistical output (not shown) revealed that during the final stages of the clustering process, SLsmerged with those from the inverted U-shaped phenotype before SDs joined them both, uncoveringa greater resemblance of the SL rather than of the SD phenotype to the inverted U-shaped responsegroup. It is then plausible to assume that eliminating or misclassifying this intermediate phenotypeis problematic and possibly obfuscates potential relationships between sweet taste liker phenotypesand health outcomes of interest. We also noticed that the sucrose concentration associated withthe highest liking in the inverted U-shaped response group (i.e., the 0.25 M), was in line with theconcentration observed in most previous work [15–18,27,52,53], although lower values have also beenreported [8,14,48,54]. Practically speaking, this commonly identified 0.21–0.3 M range of sucroseconcentration threshold in individuals who like intermediate levels of sweetness is lower than thesugars composition of the commercially available sweetened beverages [34]. This may potentiate theargument for reexamining the utility of sugar-tax policies [55]. The multisensory aspects of tasting
35

Nutrients 2019, 11, 129
real-life products should not, however, be disregarded [56], as well as the possible attenuating orenhancing effects of other flavor components on perceived sweetness in complex products [57–60].As sagely noted by Pangborn, “a change in one ingredient can cause multiple physical-chemicalinteractions which alter several sensory attributes simultaneously: appearance, aroma, texture, tasteetc.” [61] (p. 65).
Turning now to the frequency distribution of the identified sweet taste liker phenotypes, one thirdof our participants were classified as SLs, a proportion consistent with observations by others who alsoused HCA as their phenotyping method of choice [9,13,14]. Conversely, results in Asao et al. [27] andKim et al. [62] indicate that this sweet-liking pattern accounted for roughly 50% of their study samples.Two possible explanations can be considered. First, the absence of a monotonically negative slopeimplies that individuals in both cohorts generally exhibited stronger liking for sweetness. Notably,in Kim et al. [62], two thirds of those classified in the inverted U-shaped phenotype rated 0.7 M asthe most liked, a sucrose concentration breakpoint twice as high as the concentration we identified.Second, in those studies, sweet-liking was assessed under extreme motivational states with participants’hunger [27,62] and/or satiety [62] being manipulated. Critically, when the same Korean researchersreplicated their study using a more typical pretest protocol (i.e., refraining from eating for one totwo hours prior to the taste test), their measures generally correspond with the data shown here.Focusing on the frequency distribution of the monotonically negative slope regardless of the SD label,our findings disagree with previous observations. For example, of the 650 age diverse adults testedby Garneau et al. [13], only 55 exhibited decreasing liking as concentration increased. Presumably,this is due to the relatively low sucrose concentrations they used; indeed, the highest concentrationthey used (0.40 M) fell near the concentration breakpoint we identified for our inverted U-shapedphenotype. In contrast, SDs in Kim et al. [9] were approximately as frequent as SLs and as participantsin the inverted U-shaped phenotype (31.7, 32.5, and 35.8%, respectively). Nonetheless, they reportedthat, for the purposes of the study, two distinct clusters were treated as a single sweet-liking patternrepresenting the SD phenotype, with no further information provided; each of those clusters accountedfor 10 and 21.7% of the total sample, respectively [9].
Here, despite the similar liking ratings of the lowest and the highest sucrose concentration byparticipants classified into the inverted U-shaped phenotype, perceived sweetness varied considerablywhen intensity ratings of those stimuli were contrasted. Therefore, this type of response cannotbe attributed to reduced sensitivity to taste stimuli or from differences in recognition thresholds;rather, it appears to reflect a distinct liking pattern. Figure 5a,c indicated that this is also truefor the SL and the SD phenotype, since inclusion of intensity ratings in the liking plots generatedthe expected liking patterns. In previous research, any differences in sweetness intensity betweenparticipants, when reported, were interpreted independent of the associated phenotyping results(e.g., in References [45,63,64]). The few studies that have contrasted sweetness intensity between thedefined sweet taste liker phenotypes have had mixed outcomes: some studies report greater overallsweetness intensity in SDs than in SLs and/or than in other phenotypes in line with what we observedhere [12,15,49,65], but the majority found no differences in sweet taste perception [10,13,16,66–71].These inconsistencies could arise from several factors including the phenotyping methods and thestimuli concentrations used in these studies. Many of the most relevant studies did not, however,specifically report differences in sweetness intensity between their defined sweet taste liker phenotypes,limiting meaningful contrasts between our findings and prior work.
4.4. Recommended Criteria for the Identification of Distinct Sweet Taste Liker Phenotypes
Except for a pilot experiment [27], this is the first study suggesting specific criteria for theidentification of the distinct sweet taste liker phenotypes that could be considered as both statisticallyrobust and easy-to-apply. One core element of the proposed simpler approach is the administration ofa single sucrose concentration that allows for both a less time-consuming and resource-demandingassessment process and for elimination of potential issues from the contrast effects which are
36

Nutrients 2019, 11, 129
“hard-wired” to longer protocols [72]. Within the taste literature, this in a not a novel concept.In 1980, Lawless addressed the need to identify an efficient classification method that could be used torapidly screen large cohorts in terms of bitter taste phenotypes for phenylthiocarbamide (PTC) and6-n-propylthiouracil (PROP), i.e., thiourea tasters and nontasters [73]. After using multiple approacheswithin the same study cohort, he concluded intensity ratings (on a 7-point scale) for a single antimodalconcentration of PTC or PROP presented in a two-series taste test allowed for a rapid and reliableseparation of the tasters from the nontasters [73].
Despite using a similar analysis to that of Asao et al. [27], we concluded that approximately twicethe concentration of sucrose, compared to the concentration they proposed, is required to deliver thehighest sensitivity and specificity in the discrimination between distinct sweet taste liker phenotypes.A small sample size, dichotomous grouping, and participants’ pre-test fasting state in the earlierpilot experiment [27] raise questions about the broader applicability of the concentration (0.598 Msucrose) recommended in their study. Indeed, other studies using multiple sweet taste stimuli identifiedconcentrations ranging from 0.83 M (e.g., in References [66,74–78]) to 0.99 M (e.g., in References [79–81]).Moreover, the 0.6 M sucrose solution referred in Tuorila et al. [23] was actually shortlisted from theirprevious work where two additional lower concentrations were tested but not any higher [82]. Finally,the replication in our sample of the proposed by Asao and colleagues’ U-shaped association betweensucrose concentration and reproducibility of the liking ratings across the repeated blocks of the tastetest [27] may also bear critically upon sweet-liking protocols based on intermediate concentrations.Indeed, taste measures for about 40% of the adult sample in Garneau et al. [13] indicated indifferentresponses to a range of stimuli between 0 M and 0.4 M sucrose.
Considering the comparatively less sophisticated and less restrictive concepts of the VAScompared to the labelled magnitude or Likert-type scales, the decision to record liking on an analoguescale further strengthens our classification criteria proposal. In particular, VAS-based ratings areindependent of the range of prior sensory experiences and of the assumption that the same descriptors(labels) reflect equivalent meaning across different responders [83,84]. That said, in our lab, we haverepeatedly observed that participants find VAS to be more straightforward than gLMS, although whenwe directly contrasted the two scales in a sample of young educated adults, VAS and gLMS yieldedsimilar results [17]. Additionally, VAS is appropriate for recording the multi-dimensional continuumof human responses that a fixed pre-coded format does not by principle permit [85]. Clearly, no scalingapproach is perfect: the “anchor effect” phenomenon (centering bias) characterized by less use ofthe extreme response has been associated with most rating scales, the VAS included [72]. Overall,we propose that utilizing VAS for sweet-liking assessment when phenotyping protocols are applied togroups of diverse characteristics is likely to come with the least challenges.
4.5. Controlling for Protocol Conditions
Although previous research presents an inconclusive picture [16,62,86], some studies report aneffect of hunger [10,87,88] and thirst [89] on liking for sweet taste stimuli. It was thereby critical toensure that recorded sensory responses were not driven by participants’ motivational state and thatthe motivational state did not differ between the contrasted sweet taste liker phenotypes. Analysisof the pre- and post-test levels of hunger and thirst across our study sample and between-groupsconfirmed this was not so.
The nature of changes in levels of hunger and thirst over the test period (increased and decreasedby 15.2% and 10.1%, respectively) also indicated little or no likely influence of post-ingestive effectsof sucrose on the sensory-related measures [90], suggesting the “sip and spit” protocol worked asexpected. Notably, Running and Hayes [91] observed no significant differences in the rated intensityof a 0.5 M sucrose solution when “sip and spit” and “sip and swallow” protocols were contrasted.Nonetheless, the differences in the density of taste buds [92] and in the associated saliva [93] across thedifferent regions of the oral cavity and the known role of gastrointestinal tract’s sweet taste receptors inmetabolic regulation [94,95], suggest a need for both explicit instructions and subsequent compliance
37
Nutrients 2019, 11, 129
checks in sensory evaluations, particularly when a wide range of concentrations or a relatively strongsolution are being tested.
4.6. No Effect of Sweet Taste Liker Phenotype on Participant Characteristics
Analysis of this young healthy sample found no effect of sweet taste liker phenotype on thefew demographic, lifestyle, and anthropometric characteristics we examined. First, the frequencydistribution of the SL phenotype did not differ between women and men. With the exception ofthe multi-ethnic cohort of Thai et al. [53], lack of sex differences in sweet-liking is consistent withprevious published work focusing on sweet taste liker phenotypes generated from simple sucrosesolution-based taste tests and where women and men were represented equally [27,49,52,64,66,77].In his recent review, Spence [96] argues that individual differences rather than sex differences mightbe the most important influence on shaping our taste worlds, particularly when the hedonic aspectsof taste are studied. Animal models provide equivocal results on sucrose sensory properties bysex [97]. These findings fail to support Katz’s theory of “gendered eating patterns” generated byeither evolution or, according to others, by cultural norms [98], as well as baseline reports from theNutriNet-Santé study where, remarkably, men and not women liked sweet tastes more [99]. It is worthstressing though that sensory data in the French cohort were collected indirectly using “Pref-Quest,”a proxy of laboratory-based taste tests that measures recalled liking for different taste modalities viaasking questions on selective food items and eating habits [100]. In the present work, we also failedto observe an effect of age on hedonic responses to sweet taste. This stands in direct contrast to thefairly consistent effect of age on sweet-liking whenever children or adolescents were compared withadult populations [101–104], and may be due to the relatively restricted age range tested here. To note,in some [13,16,74,76,78,105–108] but not all [13,81,109–111] studies testing middle-aged or older adults,SDs and those with an inverted U-shaped response outnumbered SLs. Critically, methodologicallimitations that may lead to possible overestimation of the SD phenotype in prior studies cannot alsobe overlooked [11].
Other factors worth exploring with regard to humans’ responses to sweet taste are dietingand BMI. Regarding attempts to investigate how being on a weight loss diet affects classificationinto the distinct sweet taste liker phenotypes, evidence has been loose and is drawn on researchon sweet-liking either as a continuous measure (e.g., in References [112–114]) or assessed viaquestionnaires instead of laboratory-based taste tests [99]. As discussed in a recent review, bariatricsurgery is also likely to augment gustatory sensitivity to sweet taste and to attenuate relevant hedonicresponses post-operatively [115]. In our study, being a former dieter was more apparent in SDs.This may seem counterintuitive to the sensory specific satiety theory (decline in pleasantness for afood stimulus subsequent to consumption compared with the uneaten [29]), but could be backedup within the hedonic hunger context (motivation to consume palatable foods in the absence offood deprivation [116]). Nonetheless, no explicit information on the timing, duration, or modeof the dietary regime or the extent of weight loss and weight regain was collected. Additionally,considering the small size of this particular subgroup and the subsequent lack of significance, cautionis advised in interpreting this observation until replicated. BMI, on the other hand, did not differacross the three sweet taste liker phenotypes. Although one can argue that this was due to thelimited range of BMI in our sample, our finding was consistent with a sizable body of publishedevidence [13–15,17,24,49,53,66,69,76,106,117–119]. It is also of note that some early reports testingindividuals of greater BMIs showed that obese were more often classified into the SD phenotypethan normal-weight participants [16,26,54,120,121]; only one study of 12 participants has providedsuggestive evidence for the opposite association [25].
4.7. Potential Mechanisms
Different mechanisms may account for the observed variations in affective responses to sweet taste,and fundamental biology likely plays a part. Sweet tasting substances activate various neural circuits
38

Nutrients 2019, 11, 129
including some associated with dopamine-linked reward centers in the prefrontal cortex [122–124].This activation accommodates the urge to meet physiological needs such as the central nervoussystem’s energy supply (e.g., in Reference [125]). Internal state-specific factors (“homeostasis”) havealso been implicated in explaining the variation of hedonic responses to sweet taste as a function ofdeprivation state. In this context enhanced sweet-liking in fetuses [126,127] and infants [128–130] mayrelate to the increased needs for energy during the stages of rapid growth [131]. Likewise, Coldwelland colleagues reported that SL adolescents had higher levels of a bone growth factor compared withtheir SD peers [49]. Similarly, negative gustatory alliesthesia, which refers to diminishing liking as aresponse to internal energy abundance (as in satiety or obesity) [36], has been proposed to contributeto the apparent inverse relationship between BMI and sweet-liking.
Later advances have implicated taste genetics with sweetness, both directly and indirectly.TAS1R2 and TAS1R3 taste receptor genes have directly been linked to sweet taste perception [132–134].The heterodimeric protein encoded by these genes is expressed in taste receptor cells in the oral cavity,providing the mechanism by which sweet taste occurs [135]; subsequently, these receptors have alsobeen found in extra oral tissues [123]. Salivary glucose levels and salivary protein profile have recentlyidentified as additional potential determinants of sweet taste perception [136]. Finally, some reportssuggest that differences in the density of structures that house taste cells (i.e., fungiform papillae) mayexplain differences in suprathreshold taste intensity, including sweetness [92,137], although othersaccount conflict with this explanation [138–141].
4.8. Limitations
The present study has some limitations that require further confirmatory analyses in differentpopulations to allow the proposed method to be applied universally. First, we had a gender-imbalancedsample of young adults primarily from European Caucasian ancestry. Past literature has partlyidentified more SLs than SDs when direct contrasts between younger and older adults wereperformed [16,26,47,77]. Whether sweet taste liker phenotypes vary by ethnic group is, however,not yet well understood [18,23,49,53,76,107]. Nevertheless, due to the higher risk of manynon-Caucasian ethnic groups and of older versus much younger individuals in developed countries fornon-communicable diseases [142], this research area is worthy of further investigation. Our findingsmay also not translate to populations with a different habitual intake of sugar. Studies in theU.S., for example, suggest a slightly higher daily intake of free sugars [143] compared withU.K.-based cohorts [144], whereas the recommended daily allowance [145] is also double the U.K.recommendations [146]. On the basis of the conflicting evidence surrounding the influence of exposurein sweet-tasting foods on hedonic responses to sweetness [147,148], this limitation may leave particularpopulations vulnerable to any possible interplay between sweet-liking patterns and eating patternsand therefore much still need to be learned. Moreover, women and men in our sample were not ofa representative BMI for their age-matched group [46]. Whilst this is presumably a caveat for thegeneralizability of our results, the reader is advised to consider that, as noted earlier, both in our studyand elsewhere, BMI did not differ by sweet taste liker phenotype. Still, the fact that the observedproportion of SDs was relatively low, although it was expected from phenotyping results from priorstudies using HCA (see Section 4.3 for details), it also means that group contrasts need to be treatedwith some caution. Finally, no phenotyping method is beyond limitations. The one inherent in usingHCA is the lack of a formal “stopping rule” in the clustering process; the researcher is called to indicatethe number of stages displayed in the agglomeration schedule that need to be eliminated from furthermerging and then manually incorporate this decision on the generated dendogram [41].
5. Conclusions
The present study confirms that the expression of sweet-liking is not universal but responsesto sweet taste stimuli vary considerably across people. What is new is the statistical determinationof some robust but concurrently usable classification criteria for the identification of the different
39

Nutrients 2019, 11, 129
sweet taste liker phenotypes in a large-scale study. Despite limitations arising mainly from participantcharacteristics, there is good reason to believe that our approach might still be widely applicable asHCA-based liking patterns between our U.K. based study and those by American [13] and Korean [9]researchers largely align. Conceivably, the potential of a broader use of the psychophysical comparisonswe delivered herein in epidemiological studies and clinical trials could have a fruitful impact onresearch associated with health and wellbeing. Accordingly, we may now have appropriate tools tofinally address a longstanding issue first Mattes noted over 30 years ago, that is: “The question remainswhether individual responsiveness to sweet taste can tell us anything about the individual, his or herphysiological or nutritional status, or the likely patterns of food selection.” [149].
Author Contributions: Conceptualization, V.I., M.R.Y., and J.E.H.; methodology, V.I., and M.R.Y.; software,V.I.; validation, V.I., and M.R.Y.; formal analysis, V.I.; investigation, V.I.; resources, M.R.Y.; data curation, V.I.;writing—original draft preparation, V.I.; writing—review and editing, M.R.Y., and J.E.H.; visualization, V.I., andJ.E.H.; supervision, M.R.Y.; project administration, V.I., and M.R.Y.; funding acquisition, M.R.Y.
Funding: This research was funded by the World Sugar Research Organization (WSRO) and the Doctoral School ofthe University of Sussex. J.E.H. also receives salary support from United States Department of Agriculture HatchAct funds [PEN04565] and the Pennsylvania State University. M.R.Y. is employed as a Professor at Universityof Sussex.
Acknowledgments: The authors would like to thank Rosalie Considine-Moore (University of Sussex) for hercontribution to data collection.
Conflicts of Interest: V.I. declares no conflict of interest. J.E.H. has received speaker fees, travel reimbursements,and/or consulting fees from federal agencies, nonprofit organizations, trade/commodity groups, and corporateclients in the food industry. M.R.Y has received direct research funding from numerous sources including nationaland international companies, as well as speaker fees, travel reimbursements, and consultancy fees from variouscompanies, none of which impact on the work reported here. The funders had no role in the design of the study;in the collection, analyses, or interpretation of data; in the writing of the manuscript; or in the decision to publishthe results.
References
1. Berridge, K.C. Food reward: Brain substrates of wanting and liking. Neurosci. Biobehav. Rev. 1996, 20, 1–25.[CrossRef]
2. De Graaf, C.; Boesveldt, S. The chemical senses and nutrition: The role of taste and smell in the regulationof food intake. In Flavor, Satiety and Food Intake; Tepper, B., Yeomans, M., Eds.; John Wiley & Sons, Inc.:Chichester, UK; Hoboken, NJ, USA, 2017.
3. Finlayson, G.; Dalton, M. Hedonics of Food Consumption: Are Food ‘Liking’ and ‘Wanting’ Viable Targetsfor Appetite Control in the Obese? Curr. Obes. Rep. 2012, 1, 42–49. [CrossRef]
4. Duffy, V.B. Variation in oral sensation: Implications for diet and health. Curr. Opin. Gastroenterol. 2007, 23,171–177. [CrossRef] [PubMed]
5. Hayes, J. Measuring sensory perception in relation to consumer behavior. In Rapid Sensory Profiling Techniques;Delarue, J., Lawlor, B., Rogeaux, M., Eds.; Woodhead Publishing: Cambridge, UK, 2015; pp. 53–69.
6. Witherly, S.A.; Pangborn, R.M.; Stern, J.S. Gustatory responses and eating duration of obese and lean adults.Appetite 1980, 1, 53–63. [CrossRef]
7. Drewnowski, A. Sweetness and Obesity. In Sweetness; Dobbing, J., Ed.; Springer: Berlin, Germany, 1987;pp. 177–192.
8. Pangborn, R.M. Individual variation in affective responses to taste stimuli. Psychon. Sci. 1970, 21, 125–126.[CrossRef]
9. Kim, J.-Y.; Prescott, J.; Kim, K.-O. Emotional responses to sweet foods according to sweet liker status.Food Qual. Prefer. 2017, 59, 1–7. [CrossRef]
10. Looy, H.; Weingarten, H.P. Effects of metabolic state on sweet taste reactivity in humans depend onunderlying hedonic response profile. Chem. Senses 1991, 16, 123–130. [CrossRef]
11. Iatridi, V.; Hayes, J.E.; Yeomans, M.R. Reconsidering the classification of sweet taste liker phenotypes:A methodological review. Food Qual. Prefer. 2019, 72, 56–76. [CrossRef]
12. Drewnowski, A.; Henderson, S.A.; Shore, A.B. Genetic sensitivity to 6-n-propylthiouracil (PROP) andhedonic responses to bitter and sweet tastes. Chem. Senses 1997, 22, 27–37. [CrossRef]
40

Nutrients 2019, 11, 129
13. Garneau, N.L.; Nuessle, T.M.; Mendelsberg, B.J.; Shepard, S.; Tucker, R.M. Sweet liker status in children andadults: Consequences for beverage intake in adults. Food Qual. Prefer. 2018, 65, 175–180. [CrossRef]
14. Methven, L.; Xiao, C.; Cai, M.; Prescott, J. Rejection thresholds (RjT) of sweet likers and dislikers. Food Qual. Prefer.2016, 52, 74–80. [CrossRef]
15. Drewnowski, A.; Schwartz, M. Invisible fats: Sensory assessment of sugar/fat mixtures. Appetite 1990, 14,203–217. [CrossRef]
16. Thompson, D.A.; Moskowitz, H.R.; Campbell, R.G. Effects of body weight and food intake on pleasantnessratings for a sweet stimulus. J. Appl. Physiol. 1976, 41, 77–83. [CrossRef] [PubMed]
17. Yeomans, M.R.; Tepper, B.J.; Rietzschel, J.; Prescott, J. Human hedonic responses to sweetness: Role of tastegenetics and anatomy. Physiol. Behav. 2007, 91, 264–273. [CrossRef] [PubMed]
18. Holt, S.H.A.; Cobiac, L.; Beaumont-Smith, N.E.; Easton, K.; Best, D.J. Dietary habits and the perception andliking of sweetness among Australian and Malaysian students: A cross-cultural study. Food Qual. Prefer.2000, 11, 299–312. [CrossRef]
19. Hu, F.B. Resolved: There is sufficient scientific evidence that decreasing sugar-sweetened beverageconsumption will reduce the prevalence of obesity and obesity-related diseases. Obes. Rev. 2013, 14, 606–619.[CrossRef]
20. Khan, T.A.; Sievenpiper, J.L. Controversies about sugars: Results from systematic reviews and meta-analyseson obesity, cardiometabolic disease and diabetes. Eur. J. Nutr. 2016, 55, 25–43. [CrossRef] [PubMed]
21. Stanhope, K.L. Sugar consumption, metabolic disease and obesity: The state of the controversy. Crit. Rev.Clin. Lab. Sci. 2016, 53, 52–67. [CrossRef]
22. Te Morenga, L.; Mallard, S.; Mann, J. Dietary sugars and body weight: Systematic review and meta-analysesof randomised controlled trials and cohort studies. Br. Med. J. 2013, 346. [CrossRef]
23. Tuorila, H.; Keskitalo-Vuokko, K.; Perola, M.; Spector, T.; Kaprio, J. Affective responses to sweet productsand sweet solution in British and Finnish adults. Food Qual. Prefer. 2017, 62, 128–136. [CrossRef]
24. Mennella, J.A.; Finkbeiner, S.; Lipchock, S.V.; Hwang, L.-D.; Reed, D.R. Preferences for Salty and SweetTastes Are Elevated and Related to Each Other during Childhood. PLoS ONE 2014, 9, e92201. [CrossRef][PubMed]
25. Sartor, F.; Donaldson, L.F.; Markland, D.A.; Loveday, H.; Jackson, M.J.; Kubis, H.-P. Taste perception andimplicit attitude toward sweet related to body mass index and soft drink supplementation. Appetite 2011, 57,237–246. [CrossRef] [PubMed]
26. Grinker, J.A. Effects of metabolic state on taste parameters and intake: Comparisons of human and animalobesity. In Taste and Development: The Genesis of Sweet Preferenc; Weiffenbach, J.M., Ed.; US Department ofHealth, Education, and Welfare: Washington, DC, USA, 1977; pp. 309–327.
27. Asao, K.; Miller, J.; Arcori, L.; Lumeng, J.; Han-Markey, T.; Herman, W. Patterns of Sweet Taste Liking:A Pilot Study. Nutrients 2015, 7, 7298–7311. [CrossRef] [PubMed]
28. Lawless, H.T.; Heymann, H. Physiological and Psychological Foundations of Sensory Function. In SensoryEvaluation of Food: Principles and Practices; Springer: New York, NY, USA, USA; 2010; pp. 19–56.
29. Rolls, B.J.; Rolls, E.T.; Rowe, E.A.; Sweeney, K. Sensory specific satiety in man. Physiol. Behav. 1981, 27,137–142. [CrossRef]
30. Haynes, W.M. Handbook of Chemistry and Physics, 97th ed.; CRC Press: Boca Raton, FL, USA, 2016.31. Easterby-Smith, V.; Besford, J.; Heath, M.R. The effect of age on the recognition thresholds of three sweeteners:
Sucrose, saccharin and aspartame. Gerodontology 1994, 11, 39–45. [CrossRef]32. Wiriyawattana, P.; Suwonsichon, S.; Suwonsichon, T. Effects of aging on taste thresholds: A case of Asian
people. J. Sens. Stud. 2018, 33, e12436. [CrossRef]33. Kennedy, O.; Law, C.; Methven, L.; Mottram, D.; Gosney, M. Investigating age-related changes in taste and
affects on sensory perceptions of oral nutritional supplements. Age Ageing 2010, 39, 733–738. [CrossRef]34. Ventura, E.E.; Davis, J.N.; Goran, M.I. Sugar Content of Popular Sweetened Beverages Based on Objective
Laboratory Analysis: Focus on Fructose Content. Obesity 2012, 19, 868–874. [CrossRef]35. Green, B.G.; Dalton, P.; Cowart, B.; Shaffer, G.; Rankin, K.; Higgins, J. Evaluating the ’Labeled Magnitude
Scale’ for measuring sensations of taste and smell. Chem. Senses 1996, 21, 323–334. [CrossRef]36. Cabanac, M. Physiological Role of Pleasure. Science 1971, 173, 1103–1107. [CrossRef]
41

Nutrients 2019, 11, 129
37. Stubbs, R.J.; Hughes, D.A.; Johnstone, A.M.; Rowley, E.; Reid, C.; Elia, M.; Stratton, R.; Delargy, H.; King, N.;Blundell, J.E. The use of visual analogue scales to assess motivation to eat in human subjects: A reviewof their reliability and validity with an evaluation of new hand-held computerized systems for temporaltracking of appetite ratings. Br. J. Nutr. 2000, 84, 405–415. [CrossRef]
38. WHO. Physical status: The Use of and Interpretation of Anthropometry, Report of a WHO Expert Committee.Available online: http://www.who.int/childgrowth/publications/physical_status/en/ (accessed on 14 July 2017).
39. Trevethan, R. Intraclass correlation coefficients: Clearing the air, extending some cautions, and making somerequests. Health Serv. Outcomes Res. Methodol. 2017, 17, 127–143. [CrossRef]
40. Portney, L.G.; Watkins, M.P. Foundations of Clinical Research: Applications to Practice, 3rd ed.; Pearson Education:Upper Saddle River, NJ, USA, 2009.
41. Yim, O.; Ramdeen, K.T. Hierarchical Cluster Analysis: Comparison of Three Linkage Measures andApplication to Psychological Data. Quant. Methods Psychol. 2015, 11, 8–21. [CrossRef]
42. Tomarken, A.J.; Serlin, R.C. Comparison of ANOVA alternatives under variance heterogeneity and specificnoncentrality structures. Psychol. Bull. 1986, 99, 90–99. [CrossRef]
43. Landis, J.R.; Koch, G.G. The Measurement of Observer Agreement for Categorical Data. Biometrics 1977, 33,159–174. [CrossRef] [PubMed]
44. Kampov-Polevoy, A.B.; Eick, C.; Boland, G.; Khalitov, E.; Crews, F.T. Sweet Liking, Novelty Seeking, andGender Predict Alcoholic Status. Alcohol. Clin. Exp. Res. 2004, 28, 1291–1298. [CrossRef] [PubMed]
45. Kampov-Polevoy, A.B.; Ziedonis, D.; Steinberg, M.L.; Pinsky, I.; Krejci, J.; Eick, C.; Boland, G.; Khalitov, E.;Crews, F.T. Association Between Sweet Preference and Paternal History of Alcoholism in Psychiatric andSubstance Abuse Patients. Alcohol. Clin. Exp. Res. 2003, 27, 1929–1936. [CrossRef]
46. Conolly, A.; Saunders, C. Health Survey for England 2016: Adult Overweight and Obesity. Availableonline: https://digital.nhs.uk/data-and-information/publications/statistical/health-survey-for-england/health-survey-for-england-2016 (accessed on 3 October 2018).
47. Enns, M.P.; Van Itallie, T.B.; Grinker, J.A. Contributions of age, sex and degree of fatness on preferences andmagnitude estimations for sucrose in humans. Physiol. Behav. 1979, 22, 999–1003. [CrossRef]
48. Franko, D.L.; Wolfe, B.E.; Jimerson, D.C. Elevated sweet taste pleasantness ratings in bulimia nervosa.Physiol. Behav. 1994, 56, 969–973. [CrossRef]
49. Coldwell, S.E.; Oswald, T.K.; Reed, D.R. A marker of growth differs between adolescents with high vs. lowsugar preference. Physiol. Behav. 2009, 96, 574–580. [CrossRef]
50. Drewnowski, A.; Henderson, S.A.; Shore, A.B.; Barratt-Fornell, A. Sensory Responses to 6-n-Propylthiouracil(PROP) or Sucrose Solutions and Food Preferences in Young Womena. Ann. N. Y. Acad. Sci. 1998, 855,797–801. [CrossRef] [PubMed]
51. Looy, H.; Callaghan, S.; Weingarten, H.P. Hedonic response of sucrose likers and dislikers to other gustatorystimuli. Physiol. Behav. 1992, 52, 219–225. [CrossRef]
52. Oleson, S.; Murphy, C. Prediction of Stevia Liking by Sucrose Liking: Effects of Beverage Background.Chemosens. Percept. 2017, 10, 49–59. [CrossRef]
53. Thai, P.-K.; Tan, E.-C.; Tan, W.-L.; Tey, T.-H.; Kaur, H.; Say, Y.-H. Sweetness intensity perception andpleasantness ratings of sucrose, aspartame solutions and cola among multi-ethnic Malaysian subjects.Food Qual. Prefer. 2011, 22, 281–289. [CrossRef]
54. Grinker, J.; Hirsch, J. Metabolic and behavioural correlates of obesity. Ciba Found. Symp. 1972, 8, 349–369.55. Thow, A.M.; Downs, S.M.; Mayes, C.; Trevena, H.; Waqanivalu, T.; Cawley, J. Fiscal policy to improve
diets and prevent noncommunicable diseases: From recommendations to action. Bull. World Health Organ.2018, 96, 201–210. [CrossRef]
56. Piqueras-Fiszman, B.; Spence, C. 1—Introduction. In Multisensory Flavor Perception; Piqueras-Fiszman, B.,Spence, C., Eds.; Woodhead Publishing: Cambridge, UK, 2016; pp. 1–13.
57. Hayes, J.E.; Duffy, V.B. Revisiting Sugar–Fat Mixtures: Sweetness and Creaminess Vary with PhenotypicMarkers of Oral Sensation. Chem. Senses 2007, 32, 225–236. [CrossRef] [PubMed]
58. Hayes, J.E.; Duffy, V.B. Oral sensory phenotype identifies level of sugar and fat required for maximal liking.Physiol. Behav. 2008, 95, 77–87. [CrossRef]
59. Drewnowski, A.; Almiron-Roig, E. Human Perceptions and Preferences for Fat-Rich Foods. In Fat Detection:Taste, Texture, and Post Ingestive Effects; Montmayeur, J.-P., Le Coutre, J., Eds.; CRC Press: Boca Raton, FL,USA, 2010; pp. 265–291.
42

Nutrients 2019, 11, 129
60. Mennella, J.A.; Finkbeiner, S.; Reed, D.R. The proof is in the pudding: Children prefer lower fat but highersugar than do mothers. Int. J. Obes. 2012, 36, 1285–1291. [CrossRef]
61. Pangborn, R.M. Selected factors influencing sensory perception of sweetness. In Sweetness; Dobbing, J., Ed.;Springer: Berlin, Germany, 1987; pp. 49–66.
62. Kim, J.-Y.; Prescott, J.; Kim, K.-O. Patterns of sweet liking in sucrose solutions and beverages. Food Qual. Prefer.2014, 36, 96–103. [CrossRef]
63. Kampov-Polevoy, A.B.; Alterman, A.; Khalitov, E.; Garbutt, J.C. Sweet preference predicts mood alteringeffect of and impaired control over eating sweet foods. Eat. Behav. 2006, 7, 181–187. [CrossRef] [PubMed]
64. Kranzler, H.R.; Sandstrom, K.A.; Van Kirk, J. Sweet taste preference as a risk factor for alcohol dependence.Am. J. Psychiatry 2001, 158, 813–815. [CrossRef]
65. Looy, H.; Weingarten, H.P. Facial expressions and genetic sensitivity to 6-n-propylthiouracil predict hedonicresponse to sweet. Physiol. Behav. 1992, 52, 75–82. [CrossRef]
66. Weafer, J.; Lyon, N.; Hedeker, D.; de Wit, H. Sweet taste liking is associated with subjective response toamphetamine in women but not men. Psychopharmacology 2017, 234, 3185–3194. [CrossRef] [PubMed]
67. Kampov-Polevoy, A.; Lange, L.; Bobashev, G.; Eggleston, B.; Root, T.; Garbutt, J.C. Sweet-liking is associatedwith transformation of heavy drinking into alcohol-related problems in young adults with high noveltyseeking. Alcohol. Clin. Exp. Res. 2014, 38, 2119–2126. [CrossRef] [PubMed]
68. Lange, L.A.; Kampov-Polevoy, A.B.; Garbutt, J.C. Sweet liking and high novelty seeking: Independentphenotypes associated with alcohol-related problems. Alcohol Alcohol. 2010, 45, 431–436. [CrossRef]
69. Thompson, D.A.; Moskowitz, H.R.; Campbell, R.G. Taste and olfaction in human obesity. Physiol. Behav.1977, 19, 335–337. [CrossRef]
70. Yeomans, M.R.; Mobini, S.; Elliman, T.D.; Walker, H.C.; Stevenson, R.J. Hedonic and sensory characteristicsof odors conditioned by pairing with tastants in humans. J. Exp. Psychol. Anim. Behav. Process 2006, 32,215–228. [CrossRef]
71. Yeomans, M.R.; Prescott, J.; Gould, N.J. Acquired hedonic and sensory characteristics of odours: Influence ofsweet liker and propylthiouracil taster status. Q. J. Exp. Psychol. 2009, 62, 1648–1664. [CrossRef]
72. Lim, J. Hedonic scaling: A review of methods and theory. Food Qual. Prefer. 2011, 22, 733–747. [CrossRef]73. Lawless, H. A comparison of different methods used to assess sensitivity to the taste of phenylthiocarbamide
(PTC). Chem. Senses 1980, 5, 247–256. [CrossRef]74. Kampov-Polevoy, A.B.; Garbutt, J.C.; Davis, C.E.; Janowsky, D.S. Preference for Higher Sugar Concentrations
and Tridimensional Personality Questionnaire Scores in Alcoholic and Nonalcoholic Men. Alcohol. Clin.Exp. Res. 1998, 22, 610–614. [CrossRef] [PubMed]
75. Eiler, W.J.A.; Dzemidzic, M.; Soeurt, C.M.; Carron, C.R.; Oberlin, B.G.; Considine, R.V.; Harezlak, J.;Kareken, D.A. Family history of alcoholism and the human brain response to oral sucrose. NeuroImage:Clinical 2018, 17, 1036–1046. [CrossRef] [PubMed]
76. Turner-McGrievy, G.; Tate, D.F.; Moore, D.; Popkin, B. Taking the Bitter with the Sweet: Relationship ofSupertasting and Sweet Preference with Metabolic Syndrome and Dietary Intake. J. Food Sci. 2013, 78, 3363.[CrossRef] [PubMed]
77. Tremblay, K.A.; Bona, J.M.; Kranzler, H.R. Effects of a Diagnosis or Family History of Alcoholism on theTaste Intensity and Hedonic Value of Sucrose. Am. J. Addict. 2009, 18, 494–499. [CrossRef] [PubMed]
78. Garbutt, J.C.; Kampov-Polevoy, A.B.; Kalka-Juhl, L.S.; Gallop, R.J. Association of the Sweet-LikingPhenotype and Craving for Alcohol With the Response to Naltrexone Treatment in Alcohol Dependence.JAMA Psychiatry 2016, 73, 1056. [CrossRef] [PubMed]
79. Swiecicki, L.; Zatorski, P.; Bzinkowska, D.; Sienkiewicz-Jarosz, H.; Szyndler, J.; Scinska, A. Gustatoryand olfactory function in patients with unipolar and bipolar depression. Prog. Neuropsychopharmacol.Biol. Psychiatry 2009, 33, 827–834. [CrossRef]
80. Sienkiewicz-Jarosz, H.; Scinska, A.; Swiecicki, L.; Lipczynska-Lojkowska, W.; Kuran, W.; Ryglewicz, D.;Kolaczkowski, M.; Samochowiec, J.; Bienkowski, P. Sweet liking in patients with Parkinson’s disease.J. Neurol. Sci. 2013, 329, 17–22. [CrossRef] [PubMed]
81. Wronski, M.; Skrok-Wolska, D.; Samochowiec, J.; Ziolkowski, M.; Swiecicki, L.; Bienkowski, P.; Korkosz, A.;Zatorski, P.; Kukwa, W.; Scinska, A. Perceived intensity and pleasantness of sucrose taste in male alcoholics.Alcohol Alcohol. 2006, 42, 75–79. [CrossRef]
43

Nutrients 2019, 11, 129
82. Keskitalo, K.; Tuorila, H.; Spector, T.D.; Cherkas, L.F.; Knaapila, A.; Silventoinen, K.; Perola, M. Same geneticcomponents underlie different measures of sweet taste preference. Am J Clin Nutr. 2007, 86, 1663–1669.[CrossRef]
83. Hayes, J.E.; Allen, A.L.; Bennett, S.M. Direct comparison of the generalized Visual Analog Scale (gVAS) andgeneral Labeled Magnitude Scale (gLMS). Food Qual. Prefer. 2013, 28, 36–44. [CrossRef] [PubMed]
84. Bartoshuk, L.M.; Duffy, V.B.; Fast, K.; Green, B.G.; Prutkin, J.; Snyder, D.J. Labeled scales (e.g., category,Likert, VAS) and invalid across-group comparisons: What we have learned from genetic variation in taste.Food Qual. Prefer. 2003, 14, 125–138. [CrossRef]
85. Ho, G.W.K. Examining Perceptions and Attitudes: A Review of Likert-Type Scales Versus Q-Methodology.West. J. Nurs. Res. 2016, 39, 674–689. [CrossRef] [PubMed]
86. Moskowitz, H.R.; Kumraiah, V.; Sharma, K.N.; Jacobs, H.L.; Sharma, S.D. Effects of hunger, satiety andglucose load upon taste intensity and taste hedonics. Physiol. Behav. 1976, 16, 471–475. [CrossRef]
87. Yeomans, M.R.; Mobini, S. Hunger alters the expression of acquired hedonic but not sensory qualities offood-paired odors in humans. J. Exp. Psychol. Anim. Behav. Process. 2006, 32, 460–466. [CrossRef]
88. Rolls, E.T.; Rolls, B.J.; Rowe, E.A. Sensory-specific and motivation-specific satiety for the sight and taste offood and water in man. Physiol. Behav. 1983, 30, 185–192. [CrossRef]
89. Winkielman, P.; Berridge, K.C.; Wilbarger, J.L. Unconscious Affective Reactions to Masked Happy VersusAngry Faces Influence Consumption Behavior and Judgments of Value. Pers. Soc. Psychol. Bull. 2005, 31,121–135. [CrossRef] [PubMed]
90. Sclafani, A. Psychobiology of food preferences. Int. J. Obes. Relat. Metab. Disord. 2001, 25 (Suppl. 5), S13–S16.[CrossRef]
91. Running, C.A.; Hayes, J.E. Sip and spit or sip and swallow: Choice of method differentially alters tasteintensity estimates across stimuli. Physiol. Behav. 2017, 181, 95–99. [CrossRef] [PubMed]
92. Miller, I.J.; Bartoshuk, L.M. Taste perception, taste bud distribution, and spatial relationships. In Smell andTaste in Health and Disease; Getchell, T.V., Ed.; Raven Press: New York, NY, USA, 1991; pp. 205–233.
93. Schmale, H.; Ahlers, C.; Blaker, M.; Kock, K.; Spielman, A.I. Perireceptor events in taste. In The MolecularBasis of Smell and Taste Transduction; Chadwick, J.D., Marsh, J., Goode, A.J., Eds.; John Wiley & Sons, Ltd.:Chichester, UK, 2007; pp. 167–185.
94. Low, Y.Q.; Lacy, K.; Keast, R. The role of sweet taste in satiation and satiety. Nutrients 2014, 6, 3431–3450.[CrossRef]
95. Sclafani, A. Sweet taste signaling in the gut. Proc. Natl. Acad. Sci. USA 2007, 104, 14887–14888. [CrossRef][PubMed]
96. Spence, C. Do men and women really live in different taste worlds? Food Qual. Prefer. 2019, 73, 38–45.[CrossRef]
97. McCaughey, S.A. The taste of sugars. Neurosci. Biobehav. Rev. 2008, 32, 1024–1043. [CrossRef]98. Bell, D.; Hollows, J. Ordinary Lifestyles: Popular Media, Consumption and Taste; Open University Press:
Maidenhead, UK, 2005.99. Lampuré, A.; Schlich, P.; Deglaire, A.; Castetbon, K.; Péneau, S.; Hercberg, S.; Méjean, C. Sociodemographic,
Psychological, and Lifestyle Characteristics Are Associated with a Liking for Salty and Sweet Tastes inFrench Adults. J. Nutr. 2015, 145, 587–594. [CrossRef] [PubMed]
100. Deglaire, A.; Méjean, C.; Castetbon, K.; Kesse-Guyot, E.; Urbano, C.; Hercberg, S.; Schlich, P. Development ofa questionnaire to assay recalled liking for salt, sweet and fat. Food Qual. Prefer. 2012, 23, 110–124. [CrossRef]
101. Bobowski, N.; Mennella, J.A. Personal Variation in Preference for Sweetness: Effects of Age and Obesity.Child. Obes. 2017, 13, 369–376. [CrossRef] [PubMed]
102. De Graaf, C.; Zandstra, E.H. Sweetness intensity and pleasantness in children, adolescents, and adults.Physiol. Behav. 1999, 67, 513–520. [CrossRef]
103. Mennella, J.A.; Bobowski, N.K. The sweetness and bitterness of childhood: Insights from basic research ontaste preferences. Physiol. Behav. 2015, 152, 502–507. [CrossRef] [PubMed]
104. Desor, J.A.; Beauchamp, G.K. Longitudinal changes in sweet preferences in humans. Physiol. Behav. 1987, 39,639–641. [CrossRef]
105. Travers, J.B.; Akey, L.R.; Chen, S.C.; Rosen, S.; Paulson, G.; Travers, S.P. Taste preferences in Parkinson’sdisease patients. Chem. Senses 1993, 18, 47–55. [CrossRef]
44

Nutrients 2019, 11, 129
106. Goodman, E.L.; Breithaupt, L.; Watson, H.J.; Peat, C.M.; Baker, J.H.; Bulik, C.M.; Brownley, K.A. Sweet tastepreference in binge-eating disorder: A preliminary investigation. Eat. Behav. 2018, 28, 8–15. [CrossRef][PubMed]
107. Turner-McGrievy, G.; Wang, X.; Popkin, B.; Tate, D.F. Tasting profile affects adoption of caloric beveragereduction in a randomized weight loss intervention. Obes. Sci. Pract. 2016, 2, 392–398. [CrossRef]
108. Garbutt, J.C.; Osborne, M.; Gallop, R.; Barkenbus, J.; Grace, K.; Cody, M.; Flannery, B.; Kampov-Polevoy, A.B.Sweet Liking Phenotype, Alcohol Craving and Response to Naltrexone Treatment in Alcohol Dependence.Alcohol Alcohol. 2009, 44, 293–300. [CrossRef] [PubMed]
109. Swiecicki, L.; Scinska, A.; Bzinkowska, D.; Torbinski, J.; Sienkiewicz-Jarosz, H.; Samochowiec, J.;Bienkowski, P. Intensity and pleasantness of sucrose taste in patients with winter depression. Nutr. Neurosci.2015, 18, 186–191. [CrossRef] [PubMed]
110. Kampov-Polevoy, A.B.; Garbutt, J.C.; Janowsky, D.S. Evidence of preference for a high-concentration sucrosesolution in alcoholic men. Am. J. Psychiatry 1997, 154, 269–270. [CrossRef]
111. Bogucka-Bonikowska, A.; Scinska, A.; Koros, E.; Polanowska, E.; Habrat, B.; Woronowicz, B.; Kukwa, A.;Kostowski, W.; Bienkowski, P. Taste responses in alcohol-dependent men. Alcohol Alcohol. 2001, 36, 516–519.[CrossRef] [PubMed]
112. Asao, K.; Rothberg, A.E.; Arcori, L.; Kaur, M.; Fowler, C.E.; Herman, W.H. Sweet taste preferences beforeand after an intensive medical weight loss intervention. Obes. Sci. Pract. 2016, 2, 189–195. [CrossRef]
113. Burgess, B.; Rao, S.P.; Tepper, B.J. Changes in liking for sweet and fatty foods following weight loss in womenare related to prop phenotype but not to diet. Obesity 2016, 24, 1867–1873. [CrossRef]
114. Kleifield, E.I.; Lowe, M.R. Weight loss and sweetness preferences: The effects of recent versus past weightloss. Physiol. Behav. 1991, 49, 1037–1042. [CrossRef]
115. Ahmed, K.; Penney, N.; Darzi, A.; Purkayastha, S. Taste Changes after Bariatric Surgery: A SystematicReview. Obes. Surg. 2018, 28, 3321–3332. [CrossRef]
116. Lowe, M.R.; Butryn, M.L. Hedonic hunger: A new dimension of appetite? Physiol. Behav. 2007, 91, 432–439.[CrossRef]
117. Yeomans, M.R.; Prescott, J. Smelling the goodness: Sniffing as a behavioral measure of learned odor hedonics.J. Exp. Psychol. Anim. Learn. Cogn. 2016, 42, 391–400. [CrossRef] [PubMed]
118. Eikemo, M.; Løseth, G.E.; Johnstone, T.; Gjerstad, J.; Willoch, F.; Leknes, S. Sweet taste pleasantness ismodulated by morphine and naltrexone. Psychopharmacology 2016, 233, 3711–3723. [CrossRef] [PubMed]
119. Drewnowski, A.; Henderson, S.A.; Shore, A.B.; Barratt-Fornell, A. Nontasters, Tasters, and Supertasters of6-n-Propylthiouracil (PROP) and Hedonic Response to Sweet. Physiol. Behav. 1997, 62, 649–655. [CrossRef]
120. Malcolm, R.; O’Neil, P.; Hirsch, A.A.; Currey, H.; Moskowitz, G. Taste hedonics and thresholds in obesity.Int. J. Obes. 1980, 4, 203–212. [PubMed]
121. Johnson, W.G.; Keane, T.M.; Bonar, J.R.; Downey, C. Hedonic ratings of sucrose solutions: Effects of bodyweight, weight loss and dietary restriction. Addict. Behav. 1979, 4, 231–236. [CrossRef]
122. Berridge, K.C.; Kringelbach, M.L. Pleasure systems in the brain. Neuron 2015, 86, 646–664. [CrossRef]123. Fernstrom, J.D.; Munger, S.D.; Sclafani, A.; de Araujo, I.E.; Roberts, A.; Molinary, S. Mechanisms for
sweetness. J. Nutr. 2012, 142, 1134S–1141S. [CrossRef]124. Katz, D.B.; Sadacca, B.F. Taste. In Neurobiology of Sensation and Reward; Gottfried, J.A., Ed.; Boca Raton, CRC
Press: Boca Raton, FL, USA, 2011.125. Mergenthaler, P.; Lindauer, U.; Dienel, G.A.; Meisel, A. Sugar for the brain: The role of glucose in
physiological and pathological brain function. Trends Neurosci. 2013, 36, 587–597. [CrossRef]126. De Snoo, K. Das trinkende Kind im Uterus. Gynecol. Obstet. Invest. 1937, 105, 88–97. [CrossRef]127. Liley, A.W. The Foetus as a Personality. Aust. N. Z. J. Psychiatry 1972, 6, 99–105. [CrossRef] [PubMed]128. Steiner, J.E. Human Facial Expressions in Response to Taste and Smell Stimulation. 1979, 257–295. [CrossRef]129. Steiner, J.E.; Glaser, D.; Hawilo, M.E.; Berridge, K.C. Comparative expression of hedonic impact: Affective
reactions to taste by human infants and other primates. Neurosci. Biobehav. Rev. 2001, 25, 53–74. [CrossRef]130. Desor, J.A.; Maller, O.; Turner, R.E. Taste in acceptance of sugars by human infants. J. Comp. Physiol. Psychol.
1973, 84, 496–501. [CrossRef]131. Mennella, J.A.; Bobowski, N.K.; Reed, D.R. The development of sweet taste: From biology to hedonics.
Rev. Endocr. Metab. Disord. 2016, 17, 171–178. [CrossRef] [PubMed]
45

Nutrients 2019, 11, 129
132. Bachmanov, A.A.; Bosak, N.P.; Floriano, W.B.; Inoue, M.; Li, X.; Lin, C.; Murovets, V.O.; Reed, D.R.;Zolotarev, V.A.; Beauchamp, G.K. Genetics of sweet taste preferences. Flavour Frag. J. 2011, 26, 286–294.[CrossRef]
133. Chamoun, E.; Carroll, N.A.; Duizer, L.M.; Qi, W.; Feng, Z.; Darlington, G.; Duncan, A.M.; Haines, J.;Ma, D.W.L. The Relationship between Single Nucleotide Polymorphisms in Taste Receptor Genes, TasteFunction and Dietary Intake in Preschool-Aged Children and Adults in the Guelph Family Health Study.Nutrients 2018, 10. [CrossRef]
134. Dias, A.G.; Eny, K.M.; Cockburn, M.; Chiu, W.; Nielsen, D.E.; Duizer, L.; El-Sohemy, A. Variation in theTAS1R2 Gene, Sweet Taste Perception and Intake of Sugars. J. Nutrigenet. Nutrigen. 2015, 8, 81–90. [CrossRef][PubMed]
135. Nelson, G.; Hoon, M.A.; Chandrashekar, J.; Zhang, Y.; Ryba, N.J.; Zuker, C.S. Mammalian sweet tastereceptors. Cell 2001, 106, 381–390. [CrossRef]
136. Rodrigues, L.; Costa, G.; Cordeiro, C.; Pinheiro, C.; Amado, F.; Lamy, E. Salivary proteome and glucose levelsare related with sweet taste sensitivity in young adults. Food Nutr. Res. 2017, 61. [CrossRef]
137. Miller, I.J., Jr.; Reedy, F.E., Jr. Variations in human taste bud density and taste intensity perception.Physiol. Behav. 1990, 47, 1213–1219. [CrossRef]
138. Fischer, M.E.; Cruickshanks, K.J.; Schubert, C.R.; Pinto, A.; Klein, R.; Pankratz, N.; Pankow, J.S.; Huang, G.H.Factors related to fungiform papillae density: The beaver dam offspring study. Chem. Senses 2013, 38,669–677. [CrossRef] [PubMed]
139. Dinnella, C.; Monteleone, E.; Piochi, M.; Spinelli, S.; Prescott, J.; Pierguidi, L.; Gasperi, F.; Laureati, M.;Pagliarini, E.; Predieri, S.; et al. Individual Variation in PROP Status, Fungiform Papillae Density, andResponsiveness to Taste Stimuli in a Large Population Sample. Chem. Senses 2018, 43, 697–710. [CrossRef][PubMed]
140. Webb, J.; Bolhuis, D.P.; Cicerale, S.; Hayes, J.E.; Keast, R. The Relationships Between Common Measurementsof Taste Function. Chemosens. Percept. 2015, 8, 11–18. [CrossRef] [PubMed]
141. Feeney, E.L.; Hayes, J.E. Regional differences in suprathreshold intensity for bitter and umami stimuli.Chemosens. Percept. 2014, 7, 147–157. [CrossRef] [PubMed]
142. Bollyky, T.J.; Templin, T.; Cohen, M.; Dieleman, J.L. Lower-Income Countries That Face The Most RapidShift In Noncommunicable Disease Burden Are Also The Least Prepared. Health Aff. 2017, 36, 1866–1875.[CrossRef]
143. Bowman, S.A.; Clemens, J.C.; Martin, C.L.; Anand, J.; Steinfeldt, L.C.; Moshfegh, A.J. Added Sugars Intakeof Americans: What We Eat in America, NHANES 2013–2014; Food Surveys Research Group, United StatesDepartment of Agriculture: Beltsville, MD, USA, 2017.
144. NDNS. Results of the National Diet and Nutrition Survey (NDNS) Rolling Programme for 2014 to 2015 and2015 to 2016. Available online: https://www.gov.uk/government/statistics/ndns-results-from-years-7-and-8-combined (accessed on 3 October 2018).
145. HHS; USDA. 2015–2020 Dietary Guidelines for Americans. Available online: https://health.gov/dietaryguidelines/2015/guidelines/ (accessed on 3 October 2018).
146. SACN. The Scientific Advisory Committee on Nutrition Recommendations on Carbohydrates, IncludingSugars and Fibre. Available online: https://www.gov.uk/government/publications/sacn-carbohydrates-and-health-report (accessed on 3 October 2018).
147. Appleton, K.M.; Tuorila, H.; Bertenshaw, E.J.; de Graaf, C.; Mela, D.J. Sweet taste exposure and the subsequentacceptance and preference for sweet taste in the diet: Systematic review of the published literature. Am. J.Clin. Nutr. 2018, 107, 405–419. [CrossRef]
148. Keast, R.S.J. Effects of sugar and fat consumption on sweet and fat taste. Curr. Opin. Behav. Sci. 2016, 9,55–60. [CrossRef]
149. Mattes, R.D. Gustation as a determinant of ingestion: Methodological issues. Am. J. Clin. Nutr. 1985, 41,672–683. [CrossRef] [PubMed]
© 2019 by the authors. Licensee MDPI, Basel, Switzerland. This article is an open accessarticle distributed under the terms and conditions of the Creative Commons Attribution(CC BY) license (http://creativecommons.org/licenses/by/4.0/).
46

nutrients
Article
A Comparison of Psychophysical Dose-ResponseBehaviour across 16 Sweeteners
May Wee 1, Vicki Tan 1 and Ciarán Forde 1,2,*
1 Clinical Nutrition Research Centre (CNRC), Singapore Institute for Clinical Sciences, Agency for Science,Technology and Research (A*STAR), Singapore 117599, Singapore; [email protected] (M.W.);[email protected] (V.T.)
2 Department of Physiology, Yong Loo Lin School of Medicine, National University of Singapore,Singapore 117593, Singapore
* Correspondence: [email protected]; Tel.: +65-6407-0104
Received: 4 September 2018; Accepted: 26 October 2018; Published: 2 November 2018
Abstract: Reduction or replacement of sucrose while maintaining sweetness in foods is challenging,but today there are many sweeteners with diverse physical and caloric compositions to choose from.The choice of sweetener can be adapted to match reformulation goals whether these are to reducecalories, lower the glycaemic response, provide bulk or meet criteria as a natural ingredient. Thecurrent study sought to describe and compare the sweetness intensity dose-response, sweetnessgrowth rate, sweetness potency, and potential for calorie reduction across 16 different sweetenersincluding sucrose. Sweetness growth rate was defined as the rate of change in sweetness intensityper unit of sweetener concentration. Sweetness potency was defined as the ratio of the concentrationof a sweetener to that of sucrose at equivalent sweetness intensity, whereas the potential for caloriereduction is the caloric value of a sweetener compared to sucrose at matched sweetness intensities.Sweeteners were drawn from a range of nutritive saccharide (sucrose, dextrose, fructose, allulose(D-psicose), palatinose (isomaltulose), and a sucrose–allulose mixture), nutritive polyol (maltitol,erythritol, mannitol, xylitol, sorbitol), non-nutritive synthetic (aspartame, acesulfame-K, sucralose)and non-nutritive natural sweeteners stevia (rebaudioside A), luo han guo (mogroside V). Sweetnessintensities of the 16 sweeteners were compared with a sensory panel of 40 participants (n = 40;28 females). Participants were asked to rate perceived sweetness intensity for each sweetenerseries across a range of concentrations using psychophysical ratings taken on a general labelledmagnitude scale (gLMS). All sweeteners exhibited sigmoidal dose-response behaviours and matchedthe ‘moderate’ sweetness intensity of sucrose (10% w/v). Fructose, xylitol and sucralose had peaksweetness intensities greater than sucrose at the upper concentrations tested, while acesulfame-K andstevia (rebA) were markedly lower. Independent of sweetener concentration, the nutritive sweetenershad similar sweetness growth rates to sucrose and were greater than the non-nutritive sweeteners.Non-nutritive sweeteners on the other hand had higher potencies relative to sucrose, which decreaseswhen matching at higher sweetness intensities. With the exception of dextrose and palatinose, allsweeteners matched the sweetness intensity of sucrose across the measured range (3.8–25% w/vsucrose) with fewer calories. Overall, the sucrose–allulose mixture, maltitol and xylitol sweetenerswere most similar to sucrose in terms of dose-response behaviour, growth rate and potency, andshowed the most potential for sugar replacement within the range of sweetness intensities tested.
Keywords: sweeteners; sugar reduction; psychophysical dose-response; sweetness growth rate;sweetness potency
Nutrients 2018, 10, 1632; doi:10.3390/nu10111632 www.mdpi.com/journal/nutrients47

Nutrients 2018, 10, 1632
1. Introduction
Sweetness is a key driver of liking in food products and a heightened liking for sweet tastes hasbeen associated with increased intakes of foods with added sucrose [1]. The rising incidence of obesityand type-2 diabetes has been linked with excessive sucrose intake, and fuelled the need for reducingadded sucrose in food products [2,3]. Countries such as the United Kingdom and Singapore havepledged to cut sucrose to either 5% free sugars in foods [4] or a 25% sucrose reduction from the currentlevels [5], namely through reducing added sucrose, using non-nutritive sweeteners and public healtheducation. Sweetness intensity is associated with liking and reducing sucrose can negatively impactthe hedonic appeal of a product and consumer acceptance of reformulated products, thereby limitingthe widespread reduction of sucrose to achieve these public health goals. Non-nutritive sweeteners canbe used to maintain product sweetness, while reducing the negative health impact of excessive sucroseintake, including increased body weight and risk of type-2 diabetes and cardiovascular diseases [6–8].Sweet taste intensity has been shown to be associated with sucrose content of a product, but notwith its energy content [9,10] thus creating an opportunity to reduce energy whilst matching sweettaste intensity and liking through the use of lower calorie sweeteners. As such, there has been arising trend in the use of non-nutritive sweeteners such as sucralose and aspartame, in line withan increasing consumer demand for reduced-calorie foods. In the United States, 1 in 4 consumersinclude non-nutritive sweeteners in their diets based on a 24-hour diet recall [11]. This may be aneffective strategy to improve public health, and a recent meta-analysis has shown that transition tolower-energy sweeteners in place of sucrose leads to reduced energy intake and body weight in bothchildren and adults, as energy reductions associated with the intake of these sweeteners is often notfully compensated for during subsequent eating episodes [7].
Synthetic non-nutritive sweeteners like aspartame and sucralose are still the most widelyconsumed due to their low cost, quality of their sweet taste and calorie-free advantage, although theirlong-term metabolic impacts are still being investigated [8]. In addition to reduced sucrose and calories,in recent years there has been a rise in consumer demand for ‘natural’ and clean-label ingredients [11].As a result, many food manufacturers have shifted towards the use of natural sweeteners such asplant-based glycoside extracts from stevia (rebaudioside, stevioside) and monk fruit (luo han guo;mogroside V). Alternative sugars such as the rare sugar D-psicose (allulose) and the isomerized sucroseisomaltulose (palatinose) have also gained interest due to their natural source, clean sweet taste andpost-ingestive anti-glycaemic effects [12–14]. Polyol sweeteners are a group of sugar alcohols thathave been reported to have excellent sweetness quality [15], fewer calories than sucrose and can alsoact as bulking agents in low sucrose foods, giving them an advantage over several non-nutritivesweeteners [16,17]. To date, the sweetness intensity and dose-response behaviour of many of thesemore recent sweeteners such as allulose, palatinose, a sucrose–allulose mixture and luo han guo, havenot been compared alongside sucrose and other sweeteners.
Dose-response relationships have previously been reported for a range of different commercialsweeteners using, for example, the magnitude estimation or spectrum scaling method standardisedwith reference sucrose solutions [18–21]. This method obtains relative perceived sweetness intensityvalues but the comparison to other studies as is highly dependent on the reference solution, scalingmethod and extent of participant training [21,22]. More recently, psychophysical approaches havecompared perceived sweetness intensity using ratings made on the general labelled magnitude scale(gLMS) [23–25]. This technique allows for relative comparisons of perceived sweetness intensitybetween sweeteners across concentrations, and can be useful for determining sweetening capabilitiesof a novel sweetener in relation to sucrose and other sweeteners [24].
The current study sought to characterise the perceived sweetness intensity of a wide range ofdifferent sweeteners to sucrose using a contemporary psychophysical approach. Based on the changein sweetness intensity across a range of concentrations, the dose-response behaviour of each sweetenerwas compared for their sweetness growth rate, sweetness potency, and potential to support caloriereduction at an equivalent sweetness intensity. These sweetness characteristics can be used as indices
48

Nutrients 2018, 10, 1632
to gauge the sweetness and concentration-dependency of a sweetener in relation to sucrose. Thesweetness growth rate is the Stevens’ power law exponent in psychophysical terms, and is definedas the slope of the psychophysical relationship describing the rate of change in sweetness intensitywith the rate of change in concentration [19]. Sweetness potency was defined as the ratio of theconcentration of a sweetener to that of sucrose at an equivalent sweetness intensity [24], whereas thepotential for calorie reduction is the caloric value of a sweetener compared to sucrose at matchedsweetness intensities. These characteristics were examined across the selected sweeteners to comparesweetener suitability when attempting to reduce or replace sucrose.
2. Materials and Methods
2.1. Materials
A wide range of different sweeteners was selected to represent a diverse sample of commoncommercially available sweeteners. The sweeteners used in this study were sucrose (SIS, NTUCFairprice Supermarket, Singapore), dextrose monohydrate (Suntop Enterprise, Singapore), fructose(Suntop Enterprise, Singapore), allulose (D-psicose; Matsutani Co., Osaka, Japan), palatinose(isomaltulose; Beneo, Singapore), xylitol (Roquette, Lille, France), sorbitol (Suntop Enterprise,Singapore), mannitol (Roquette, Lille, France), erythritol (iHerb, Perris, CA, USA), acesulfame-K(Celanese, Irving, Texas, USA), sucralose (Tate & Lyle, McIntosh, AL, USA), aspartame (SuntopEnterprise, Singapore), luo han guo extract (50.6% mogroside V; Hunan Huacheng Biotech Inc., Hunan,China) and stevia (68.0% rebaudioside A; Suntop Enterprise, Singapore). The sucrose–allulose mixturewas prepared as a 1:1 blend of sucrose and allulose by weight. Table 1 summarises these sweetenerproperties including energy density, glycaemic index and bulk properties.
Table 1. Characteristics of the 16 sweeteners used.
Sweetener Kcal (kcal/g) Glycaemic Index Provides Bulk High Potency Natural
Acesulfame-K 0.0 0 �Allulose 0.2 0 � �
Aspartame 4.0 0 �Dextrose 3.4 100 � �Erythritol 0.2 0 � �Fructose 3.7 19–23 � �
Luo han guo 0.0 0 � �Maltitol 2.7 36 �
Mannitol 1.5 0 �Mixture ‡ 2.1 - � �Palatinose 4.0 32 � �
Sorbitol 2.5 9 �Stevia (RebA) 0.0 0 � �
Sucralose 0.0 0 �Sucrose 4.0 60 � �Xylitol 2.5 13 �
‡ 1:1 sucrose−allulose mixture (weight basis). A � indicates that the sweetener belongs to the respective category.
2.2. Participants
Forty healthy adult participants (12 males and 28 females; mean age: 26 ± 6 years) were recruitedfrom the campus of the National University of Singapore (NUS) and surrounding areas. Participantswere pre-screened for eligibility, basic taste sensitivity and recruitment criteria including being agedbetween 21 and 50 years old, normal weight (body mass index (BMI) 20–25 kg/m2), non-smoker,non-denture wearer, no self-reported sinus, taste or smell dysfunction, not currently following aspecial diet, no specific food dislikes, allergies or intolerances and not phenylketonuric, diabetic orpregnant. Eligible participants provided informed consent and were compensated for their time. Thisstudy (reference: 2017/00787) was approved by the Domain Specific Review Board of the National
49

Nutrients 2018, 10, 1632
Healthcare Group, Singapore and complies with the Declaration of Helsinki for research involvinghuman subjects.
2.3. Training and Test Procedure
All participants underwent a total of 5 one-hour sessions on separate days, including 1 trainingsession and 4 test sessions. During training, participants familiarised themselves with rating perceivedsweetness intensity using the general Labelled Magnitude Scale (gLMS), based on a previouslypublished approach [25]. Participants were asked to rate the overall taste intensity for seven imaginedand/or recalled sensations described verbally including the warmth of lukewarm water and thepain from biting their tongue. Thereafter, participants were presented with four basic taste samplesand asked to rate sweet (sucrose), salty (NaCl), sour (citric acid) and bitter (caffeine) to ensure theyunderstood how to use the line scale and practice making ratings using the gLMS.
During each test session, participants rated the sweetness intensities of four sweetener sets, witheight samples for each sweetener set. The order of sweetener presented was randomised and balancedacross participants and test sessions using a William’s (Latin Square) design. The order of samplepresentation within each sweetener set was also randomised. Participants rated a total of 16 sweetenersets over 4 test sessions. For each sweetener set, there is a water sample, six different concentrations ofthe sweetener (Table 2), and a warm-up sample with a duplicate concentration to one of the samples(sample 4/5; Table 1). The warm-up sample was presented at the beginning to reduce first order effects(data not included in analysis). The concentrations used in this study are by weight basis (% w/v)presented in Table 2, and the same concentrations expressed in molarity (mmol/L) are provided in thesupplementary material (Table S1). For ease of interpretation of the calorie reduction potential andapplication to product re-formulation, the dose-response behaviour of the sweeteners was expressedon a weight basis in the current study, in line with previous reports [18,21,24]. Therefore, discussionsmade in this study are based on weight of sweeteners and not by molarity.
Table 2. Concentrations tested for each of the sweetener set by weight basis (% w/v).
Sweetener AbbreviationConcentration (% w/v)
Sample 1 Sample 2 Sample 3 Sample 4, 5 Sample 6 Sample 7 Sample 8
Acesulfame-K (ACE) 0 0.0100 0.0219 0.0478 0.105 0.229 0.500Allulose (ALL) 0 3.80 5.50 8.00 11.7 17.1 25.0
Aspartame (ASP) 0 0.0100 0.0197 0.0390 0.0770 0.152 0.300Dextrose (DEX) 0 3.80 5.50 8.00 11.7 17.1 25.0Erythritol (ERY) 0 3.80 5.50 8.00 11.7 17.1 25.0Fructose (FRU) 0 3.80 5.50 8.00 11.7 17.1 25.0
Luo han guo (LHG) 0 0.0100 0.0197 0.0390 0.0770 0.152 0.300Maltitol (MAL) 0 3.80 5.50 8.00 11.7 17.1 25.0
Mannitol (MAN) 0 3.80 5.50 8.00 11.7 17.1 25.0Mixture ‡ (MIX) 0 3.80 5.50 8.00 11.7 17.1 25.0Palatinose (PAL) 0 3.80 6.30 10.6 17.7 29.8 50.0
Sorbitol (SOR) 0 3.80 5.50 8.00 11.7 17.1 25.0Stevia (STE) 0 0.00400 0.00830 0.017 0.0352 0.0727 0.150
Sucralose (SCL) 0 0.0100 0.0204 0.0415 0.0844 0.172 0.350Sucrose (SUC) 0 3.80 5.50 8.00 11.7 17.1 25.0Xylitol (XYL) 0 3.80 5.50 8.00 11.7 17.1 25.0
‡ 1:1 sucrose–allulose mixture (weight basis).
All data were collected using Compusense Cloud software as part of the Compusense AcademicConsortium (Compusense Inc., Guleph, ON, Canada), in sensory booths under red lights whichconform to international standards for the design of test rooms [26]. Participants were instructedto take the sample (15 mL) in their mouth, hold it for 5 s, and rate the sweetness intensity beforeexpectorating. Between samples, participants were instructed to rinse their mouth with filteredwater during the mandatory 45-second inter-stimulus interval, to reduce carryover between samples.Solutions were prepared at least 24 h prior to sensory testing using filtered water and stored atrefrigeration temperature. The concentration ranges chosen were based on previously published
50

Nutrients 2018, 10, 1632
results for each sweetener [23,27,28], and to reflect the sweetness intensities encountered in commercialfood and beverage products. Preliminary testing was done to confirm that the sweetness intensitiesrated for each sweetener were comparable to one another.
2.4. Psychophysical Scaling
Perceived sweetness intensity was rated using a general labelled magnitude scale(gLMS) [22,29,30]. The scale is partitioned by descriptors: no sensation (0), barely detectable (1.5), weak(6), moderate (17), strong (35), very strong (52) and strongest imaginable sensation (100). Individualscaling behaviours for gLMS ratings were standardized within participants using a previouslypublished weight comparison modality matching task [25,31]. All participants were asked to makeintensity ratings using the gLMS across a series of different weight stimuli while holding the containeron the palm of their non-dominant hand. There was a significant correlation between the overallsweetness ratings and overall mean heaviness ratings (r = 0.472, p < 0.05). Assuming the intensityratings of sweetener samples and the heaviness of the bottles were unrelated, the significant correlationindicated that gLMS ratings were due to individual scale-use rather than differences in sweeteners,and thus required standardization across participants. For each participant, a personal standardizationfactor was obtained using the grand mean for heaviness ratings across weights and participantsdivided by the individual’s average heaviness ratings. The sweetness intensity rankings for eachparticipant were then multiplied by their individual personal standardization factor to correct foridiosyncratic differences in scale use.
2.5. Mathematical Modelling and Data Analysis
2.5.1. Dose-Response Curves
Dose-response curves were fitted using the software Origin Pro 8.1 (OriginLab, Northampton,MA, USA) with the Hill equation for sigmoidal curves:
R = Rmin +Rmax − Rmin
1 + 10(logEC50−C)×HillSlope(1)
where R is the predicted sweetness intensity, and C is the sweetener concentration expressed in % w/v.Rmin is the minimum sweetness which was constrained to zero, and Rmax is the predicted maximumsweetness achievable. The midway point between Rmin and Rmax is EC50, and the slope of the linearportion of the model is the Hill slope [23]. The fitted parameters are summarised in the supplementarymaterial (Table S2).
2.5.2. Sweetness Growth Rate
Dose-response curves were also converted to log sweetness intensity vs. log concentration plots,which were originally derived from the power law function R = kCn in the linear form:
log R = n log C + log k (2)
where R is the predicted sweetness intensity, C is the sweetener concentration expressed in % w/v, n isthe sweetness growth rate (slope of the line or Stevens’ power law exponent), and k is the constant(intercept). The sweetness growth rate provides an overall average index of the rate of change forsweetness intensity with change in sweetener concentration. A sweetener with a steep slope (>1)increases in their perceived intensity at a rate that is faster than changes in concentration, whereas forflatter slopes (<1), greater increases in sweetener concentration are required to produce an equivalentchange in sweetness intensity. The log k (intercept) values also refer to the log sweetness intensity ofthe sweetener at a concentration of 1% w/v.
51

Nutrients 2018, 10, 1632
2.5.3. Sweetness Potency
Sweetness potency is the ratio of the concentration of sucrose to that of a sweetener at equivalentsweetness intensities (Equation (3)). A sweetness potency of >1 indicates that a smaller concentrationof a sweetener is required to achieve the same sweetness intensity at a particular sucrose concentrationand, therefore, the sweetener could be considered as ‘more potent’ than sucrose. Sweetness potencyis often quoted as a single value e.g., ‘acesulfame-K is 120 times sweeter than sucrose’, however thisvalue should always be reported with the concentration of sucrose at which it was calculated, sincesweeteners often have different sweetness growth rates to sucrose.
Sweetness Potency =Concentration of sucrose
Concentration of sweetener at equi − sweetness intensity to sucrose(3)
2.5.4. Statistical Analysis
A two-way analysis of variance (ANOVA) was run to confirm absence of first-order and carryovereffects. A one-way repeated measures ANOVA analysis was used to test the effect of sweetener typeand effect of concentration and statistical significance was set at 5% (α = 0.05). Post hoc pairwisecomparisons, using Bonferroni corrections, were used to compare differences in sweetness intensityscores across sweeteners (16 levels) and concentration of sweeteners (6 levels) using the statisticalanalysis software SPSS (IBM SPSS Statistics for Windows, Version 22.0, IBM Corporation, Armonk,NY, USA).
3. Results
The dose-response for all sweeteners are illustrated on semi-log curves (Figure 1A–C) and fittedwith the Hill equation (Equation (1)) with r2 ≥ 0.95 for all sweeteners. The fitting parameters arelisted in Table S2. Repeated-measures ANOVA confirmed that all sweeteners exhibited a concentrationdose-dependency for sweetness intensity (F5,39 = 142.12, p < 0.001). Sweetener type had a significanteffect on sweetness intensity as concentrations increased (F15,39 = 18.05, p < 0.001) and this wasconfirmed as a significant interaction between concentration and sweetener type (F75,39 = 4.20,p < 0.001).
3.1. Concentration Dose-Response of Sweeteners
The sweetness intensity of sucrose ranged from ‘barely detectable’ (3) to ‘strong’ (33) on the gLMSfor the concentration range of 3.8 to 25% w/v. Nutritive saccharide and polyol sweeteners sucrose,dextrose, allulose, palatinose, maltitol, sorbitol, mannitol, xylitol and erythritol exhibited sigmoidaldose-response functions. By contrast, fructose displayed a more linear response and had a highersweetness intensity than sucrose and other nutritive sweeteners, across all sucrose concentrations(Figure 1A,B). The sucrose–allulose mixture, maltitol and xylitol had dose-response curves closelymatched to sucrose within the range of 3.8 to 25% w/v sucrose. The dose-response curve for xylitolwas similar to sucrose at lower concentrations but had higher sweetness intensity above 11.7% w/v.Allulose was perceived as less sweet than sucrose at equivalent concentrations, but when allulose andsucrose were blended in a 1:1 mixture, this blend achieved a near identical dose-response curve tosucrose. Palatinose required the highest concentration to match the sweetness intensity of sucrose,and only produced a noticeable rise in sweetness intensity as the concentration went above 10% w/v.Dextrose, erythritol, sorbitol and mannitol all had lower sweetness intensities than sucrose across theconcentration range tested.
Non-nutritive sweeteners exhibited sigmoidal dose-response functions (Figure 1C) and stevia(rebA) and acesulfame-K had flatter responses at low and high concentrations, where increasedconcentration produced smaller increments in perceived sweetness intensity. In addition, maximumsweetness for these sweeteners peaked below sucrose at ‘moderate’ (25). Sucralose had a higher peaksweetness intensity (35) compared to sucrose (33) at the highest concentration, and was higher than
52

Nutrients 2018, 10, 1632
the other non-nutritive sweeteners across equivalent concentrations. Aspartame and luo han guo bothhad similar peak sweetness to sucrose, and their dose-response curves were similar to each other.Their sweetness intensities were weaker than stevia (rebA) at low concentrations (0.01–0.1% w/v) butstronger at higher concentrations (>0.1% w/v) when the sweetness intensity of stevia (rebA) plateaued.
Figure 1. Sweetness intensity with concentration for (A) saccharide, (B) polyol and (C) non-nutritivesweeteners (sucrose is plotted using the secondary x-axis below (0.1–100% w/v)).
53

Nutrients 2018, 10, 1632
3.2. Comparison of Sweetness Growth Rates across Sweeteners
The sweetness growth rate is represented by the slope of the log-log sweetness intensityconcentration curves (% w/v basis) (Figure 2 and Table 3). Sucrose had a sweetness growth rate of 1.31whereas saccharide sweeteners (dextrose, palatinose, fructose, allulose, sucrose–allulose mixture,) hadsweetness growth rates >1, ranging from 1.08 (fructose) to 1.46 (sorbitol). The bulk polyol sweeteners(sorbitol, xylitol, mannitol and erythritol) had sweetness growth rates with similar slopes to sucrose(~1.3–1.4), indicating a similar growth rate to sucrose such that changes in concentration producesimilar changes in sweetness intensity. Palatinose and fructose yielded much flatter sweetness growthrates (slopes ≈ 1) amongst the nutritive sweeteners, with 1.10 and 1.08 respectively. By contrast,non-nutritive sweeteners had compressed sweetness growth rates < 1, ranging from 0.65 (sucralose) to0.84 (aspartame).
Figure 2. Log sweetness intensity vs. log concentration for 16 sweeteners.
Table 3. Slope and y-intercept values of linear fit between log sweetness intensity and log concentration(% w/v).
Sweetener. Slope (n) Y-Intercept (log k)
Acesulfame-K 0.68 1.65Allulose 1.41 −0.58
Aspartame 0.84 1.90Dextrose 1.40 −0.63Erythritol 1.45 −0.6Fructose 1.08 0.04
Luo han guo 0.70 1.78Maltitol 1.42 −0.51
Mannitol 1.38 −0.59Mixture ‡ 1.24 −0.23Palatinose 1.10 −0.51
Sorbitol 1.46 −0.63Stevia 0.71 1.93
Sucralose 0.65 1.89Sucrose 1.31 −0.33Xylitol 1.30 −0.29
‡ 1:1 sucrose–allulose mixture (weight basis).
54

Nutrients 2018, 10, 1632
3.3. Sweetness Potency of Sweeteners Relative to Sucrose
Sweetness potency as well as the concentration of sweetener required to achieve equivalentsweetness intensity to sucrose concentrations at 5%, 10% and 15% w/v are summarised in Table 4.Saccharide and polyol sweeteners had sweetness potencies <1, with the exception of xylitol (at15% w/v sucrose) and fructose. Sweetness potency values for allulose increased from 5% to 15%w/v sucrose respectively, whereas the sweetness potency for maltitol, xylitol and sucrose–allulosemixture were closer to sucrose across sucrose concentrations, emphasising the similarity of theirdose-response functions (Figure 1). Non-nutritive sweeteners had decreasing sweetness potencies atincreasing sucrose concentrations. Sucralose has the highest sweetness potency across all sweeteners,but also the largest decline, from sweetness potency of 521 at 5% w/v, to 201 at 15% w/v sucrose.Aspartame had the smallest decline in sweetness potency among the non-nutritive sweeteners athigher sucrose concentrations.
Table 4. Concentrations matching for equi-sweetness and sweetness potency of 15 sweeteners to 5%,10% and 15% w/v sucrose.
SweetenerEqui-Sweet Concentrations (% w/v) Sweetness Potency
5% SUC 10% SUC 15% SUC 5% SUC 10% SUC 15% SUC
Acesulfame-K 0.0293 0.0832 0.170 171 120 88.1Allulose 7.1 13.3 18.9 0.71 0.75 0.80
Aspartame 0.0290 0.0827 0.134 173 121 112Dextrose 7.8 15.5 21.6 0.64 0.64 0.69Erythritol 6.9 13.3 17.8 0.72 0.75 0.84Fructose 4.0 7.4 11.2 1.25 1.36 1.34
Luo han guo 0.0191 0.0694 0.141 262 144 106Maltitol 5.6 11.2 15.8 0.93 0.89 0.95
Mannitol 8.6 14.6 18.6 0.58 0.68 0.81Mixture ‡ 5.0 10.7 14.3 0.99 0.93 1.05Palatinose 12.7 26.4 34.6 0.39 0.38 0.43
Sorbitol 6.3 13.7 17.9 0.80 0.72 0.83Stevia 0.0144 0.0395 0.0828 348 253 181
Sucralose 0.0096 0.0387 0.0748 521 258 201Sucrose 5 10 15 1 1 1Xylitol 5.1 9.9 13.3 0.98 1.01 1.12
‡ 1:1 sucrose–allulose mixture (weight basis).
3.4. Potential for Calorie Reduction across Sweeteners
Figure 3 shows the caloric value across the different nutritive sweeteners at sweetness intensitiesranging from weak (6) to strong (35). The equivalent sweetness intensity to sucrose per unit calorieprovides a summary of the calorie saving potential across the different sweeteners. With the exceptionof dextrose and palatinose, all of the other nutritive sweeteners enable calorie saving at an equivalentperceived sweetness intensity to 10% sucrose (indicated by red line on Figure 3). Allulose and erythritolhave the lowest energy densities (0.2 kcal/g) and can achieve an equivalent sweetness intensity to10% sucrose with very few calories (~95% reduction). For example, a product with 10% w/v sucrosecould potentially be reduced from 40 kcal to <5 kcal/100ml by substituting with allulose or erythritol.Mannitol, sucrose–allulose mixture, xylitol, fructose, maltitol and sorbitol provide about 5–20 kcal/100mL savings in terms of energy required to achieve equivalent sweetness to 10% sucrose.
55

Nutrients 2018, 10, 1632
Figure 3. Energy content (kcal/100 mL) of nutritive saccharide and polyol sweeteners to achievesweetness intensities ranging from weak (6) to strong (35).
4. Discussion
In order to support sugar reduction, sweeteners must first match the sweetness intensity ofsucrose across the range of perceived intensities commonly encountered in foods and beverages. Froma public health perspective, the reduction in sucrose should also support calorie reduction whilemaintaining consumer appeal beyond sensory-matching perceived sweetness. In addition to theirsweetening capacity, sweeteners that can confer additional functionality such as acting as bulkingagents, supporting clean labelling or providing an additional anti-glycaemic effect are also highlydesirable. A wide variety of sweeteners are currently available and the present study sought toevaluate the sweetening capabilities of these sweeteners in comparison to sucrose based on theirdose-response behaviour, sweetness growth rate, sweetness potency and potential calorie savings atequal sweetness intensities.
All sweeteners exhibited sigmoidal dose-response behaviours although fructose displayed amore linear response across the concentration range tested. This sigmoidal relationship betweenconcentration and perceived intensity is the result of the binding kinetics of the sweetener moleculesto taste receptors, which plateaus at higher concentration when receptors become saturated [32,33].From the dose-response curves, all sweeteners were found to match the perceived sweetness intensityof a 10% w/v sucrose solution, which represents a ‘moderate’ sweetness associated with 10% sugarthat is frequently found in many commercially available sweetened and carbonated beverages (e.g.,Arizona Ice Tea 10.1 g/100 mL) [34]. This aligns with similar findings from other studies, wherethe sweetness intensity of ~10% w/v sucrose was also found to be of ‘moderate’ intensity withrating scores approximately 15 to 20 on the gLMS [23–25]. Interestingly, the perceived sweetnessintensity of the sucrose–allulose mixture (1:1) was nearly identical to that of sucrose by weight basis,although allulose on its own had consistently lower sweetness intensity than sucrose across theconcentrations tested. Previous research has demonstrated that the sweetness intensity of binary
56

Nutrients 2018, 10, 1632
mixtures of sweeteners is often an intermediate of the two compounds when tasted alone and atthe same total molarity as the mixtures [35,36]. Since the weight of allulose (monosaccharide) ishalf that of sucrose (disaccharide), the dose-response behaviour of the sucrose–allulose mixture wasexpected to be between that of sucrose and allulose when expressed in terms of total molarity. Othernutritive sweeteners with smaller molecular weights than sucrose, such as fructose or xylitol, wouldbe relatively even less sweet than sucrose on a molarity basis as compared to weight basis [37].Nonetheless, for purposes of sweetener application to product re-formulation and interpretation ofthe calorie reduction potential, the dose-response behaviour of the sweeteners were expressed ona weight basis in the current study, in line with previous reports [18,21,24]. Fructose, xylitol andsucralose were the only sweeteners which had greater peak sweetness intensities than sucrose at thehighest concentrations tested, and this has previously been demonstrated across a range of previousstudies [23,38,39]. This suggests that ‘high-intensity’ sweeteners such as aspartame and sucralose maybe more accurately described as ‘high-potency’ sweeteners, as proposed previously by Antenucci andHayes [23]. The peak sweetness intensities for the non-nutritive sweeteners acesulfame-K and stevia(rebA) were markedly lower than that of sucrose, reaffirming that these high-intensity sweeteners arenot necessarily higher in perceived sweetness intensity than sucrose. Further concentration incrementsof acesulfame-K, stevia (rebA) and sucralose have been shown to produce a further decrease insweetness intensity [23,24], which was likely due to bitter taste antagonism at higher concentrationamong these sweeteners [40]. This decrease in sweetness was not observed for any sweeteners atthe concentrations used in the current study. The low peak sweetness of acesulfame-K and stevia(rebA) could limit their use in foods where higher sweetness intensities are required. Nevertheless, it isdifficult to determine the true peak sweetness achievable unless a plateau in sweetness can be clearlyobserved [21], on the condition that the intensity scaling method is not limited by a ceiling effect [29,41].The concentration ranges for the sweeteners were selected prior to the study based on literature andpreliminary experiments, although we acknowledge that further concentration increments wouldlikely result in greater perceived sweetness for some sweeteners. In this case, comparing the sweetnessgrowth rate would be a better indicator of the dose-response trajectory rather than the peak sweetnessof each sweetener, to understand whether they are likely to match or surpass the sweetness of sucrose.
The sweetness growth rate is the Stevens’ power law exponent or slope of the log relationshipbetween changing concentration and the perceived sweetness. It should be noted that the sweetnessgrowth rate obtained in this study is a product of the concentration ranges from which they are derived.These range effects mean that sweetness growth rates can change to be higher or lower dependingon the range of concentrations tested, and a higher sweetness growth rate is obtained with a smallerconcentration range [42]. Sucrose had a sweetness growth rate of 1.3 which is consistent with previousfindings which reported sweetness growth rates of 1.15 to 1.3 [18–20,24]. The sweetness growth rates ofsucralose, stevia (rebA), dextrose and mannitol were also found to be comparable to those previouslyreported [18,24] and collectively these findings highlight that sucrose, and other nutritive sweetenersexhibit sweetness growth rates greater than non-nutritive sweeteners. This appears counterintuitivesince only a small quantity of non-nutritive sweetener is required to impart an intense sweetness,which should be perceived as a higher growth rate. However, sweetness growth rates are based onsweetness intensity changes per unit log-concentration, and in relative terms greater quantities ofnon-nutritive sweeteners are required to achieve a proportional increment in perceived sweetness.This may also be due to the emergence of bitter side-tastes and taste–taste antagonism at higherconcentrations [40], or different binding mechanisms across sweeteners, which often remain poorlyunderstood [43]. Sweeteners with lower sweetness growth rates to sucrose are capable of matchingthe sweetness intensity, albeit over a limited concentration range. The implication is that sweetnessgrowth rates should be considered when estimating the predicted sweetness intensity of a sweetener atconcentrations beyond those reported in the dose-response curves. For example, sucralose matched thesweetness intensity of sucrose to an upper concentration of 25% w/v, but displayed a smaller growthrate, suggesting that the peak sweetness intensity for sucralose would be lower than that of sucrose.
57

Nutrients 2018, 10, 1632
This is further supported by the flatter dose-response curve for sucralose at higher concentrations(0.172–0.350% w/v).
Sweeteners with the same growth rate as sucrose will increase in perceived sweetness intensitywith equal increases per unit concentration. Sweetness potency or relative concentration of sweetenerrequired to produce an equi-intense sweetness to sucrose would, therefore, be similar across a rangeof different concentrations. By contrast, sweeteners with growth rates that differ significantly fromsucrose would have sweetness potencies that vary with sucrose concentration, as demonstratedpreviously [19,20,24,44]. While sweetness growth rate and sweetness potency are closely relatedindices, sweetness potency is more often used as a quick indication of the quantity required toachieve an equi-intense sweetness to sucrose at a given concentration. Non-nutritive sweeteners havegrowth rates significantly lower than sucrose, and therefore their sweetness potency is also highlyconcentration-dependent. The sweetness potency values reported for non-nutritive sweeteners inthe current trial were not fully consistent those reported previously. For example, aspartame wasfound to be 128 and 185 times more potent than sucrose at 5 and 10% sucrose equivalence by Tunaley,Thomson and McEwan [45], and Cardello et. al. [20] respectively, as compared to the 173 (5% w/v)and 121 (10% w/v) found in our study. Differences were also found for sweetness potencies of stevia(rebA) and sucralose [24]. Sucrose–allulose mixture, xylitol and maltitol have sweetness potenciesclosest to 1, indicating that the quantities required to achieve an equivalent sweetness intensity on aweight basis are similar to sucrose. This is an important consideration when the replacement sweeteneris also required to substitute some of the bulking properties of the removed sucrose. When caloriereduction without the addition of bulk is the main goal of sucrose reduction, low calorie and/or highpotency sweeteners may be more effective, particularly among certain products (i.e., beverages) aslower concentrations are required to match sweetness intensity.
With the inclusion of several low-calorie nutritive sweeteners in the study, it is still possibleto achieve calorie reduction while maintaining sweetness, even when sweetness potency was notequivalent or higher than sucrose. With the exception of dextrose and palatinose, the nutritivesweeteners profiled supported reductions in total calories to varying extents while meeting theequivalent sweetness intensity of a 10% sucrose solution. Allulose and erythritol in particularhave the lowest calories at a sweetness intensity equivalent to 10% sucrose, and could be usedto support substantial calorie savings. When allulose was mixed 1:1 to partially replace sucrose, thesucrose–allulose mixture showed very similar sweetening properties to sucrose, while supportingsignificant reduction in overall calories. Considering the sweetness intensity, sweetness growth rate,sweetness potency and potential calorie reduction together, the sucrose–allulose mixture, maltitol andxylitol were most similar to sucrose, across the concentrations studied. All three sweeteners can providebulk, support a clean label, reduce total calories for equivalent sweetness intensity and in the caseof sucrose–allulose mixture, also impart an additional anti-glycaemic effect post-ingestively [12,14].When selecting the appropriate sweetener for use in sugar reduction, the sensory, physical, nutrientand metabolic impact of the selected sweetener should be considered, and in some cases sweetenerswill have desirable characteristics for some properties but not others. For example, palatinose hasan anti-glycaemic benefit which is desirable for products that support the management of glucosehomeostasis, but it is required at a greater concentration and energy content to achieve an equi-intensesweetness intensity to sucrose [13]. Non-nutritive sweeteners are calorie-free but may have certainundesirable side-taste attributes, especially at higher concentrations [23,24,40,46] which may limit theirusage. With these factors considered, it may be judicious to blend sweeteners with sucrose to optimisethe sensory profile and sweetening capacity, and compromise on some elements of the nutrient ormetabolic profile. Results from the current study demonstrate that blends like the sucrose–allulosemixture provide encouraging results with excellent sweetness characteristics in line with sucrose, at afraction of the calories and a potential post-consumption anti-glycaemic benefit.
Findings from the current study are aligned with previously reported differences in sweetnessdose–response, growth rate and potency, although some subtle differences were observed in
58

Nutrients 2018, 10, 1632
the absolute values reported. These are likely to be due to differences in methodologicalapproach, individual variability, sweetener source, matrix effects, concentration range used, pHand temperature [20,21,23,25,47]. Our findings are most closely aligned with those previously reportedby Antenucci and Hayes which were collected using the same standardised gLMS approach to ratesweetness intensity. This approach minimises ceiling effects and produced comparable intensityratings for many of the same sweeteners [23]. There is currently no official standardised approach toquantify the perceived sweetness intensity of a sweetener, although the comparability of results wouldbe greatly enhanced if future efforts adopt a consistent objective approach, such as used in the currentand previous studies [23–25].
In choosing to focus on sweetness intensity alone, we have not accounted for other temporal andqualitative taste differences between the sweeteners reported elsewhere [46]. In addition, perceivedsweetness intensity rated in water does not account for matrix effects or taste–taste interaction thatwould occur when these same sweeteners and concentrations are used in foods and beverages [48,49].The current findings present an overview of the psychophysical dose-response behaviour of a widerange of different sweeteners, and provides guidance on the similarity of various sweeteners to sucroseand the likely calorie savings that could be achieved if they are used to reduce or replace sugar. Futureresearch should aim to extend this further by profiling the temporal and qualitative differences betweensweeteners and characterising their performance in food and beverages.
5. Conclusions
The current paper characterized the psychophysical dose-response behaviour of 16 sweetenersand identified differences in the peak sweetness, sweetness potency and sweetness growth rate.Sucrose—allulose mixture, maltitol and xylitol exhibited similar psychophysical behaviours to sucrosein terms of peak sweetness intensity, sweetness growth rate and sweetness potency, and showed thegreatest potential to match the sweetness of sugar, for significantly fewer calories. Non-nutritivesweeteners offer significant calorie savings, but had lower peak sweetness intensities and lowersweetness growth rates, which may not limit their ability to match sweetness intensity over a widerrange of sucrose concentrations. Differences in the psychophysical relationships identified in thecurrent paper should be considered when selecting sweeteners to support sucrose reduction orreplacement, and offer significant opportunities to match the perceived sweetness of sugar, whilesupporting energy density reductions.
Supplementary Materials: The following are available online at http://www.mdpi.com/2072-6643/10/11/1632/s1, Table S1: Concentrations tested for each of the sweetener tastant series in molarity (mmol/L), Table S2: Fittingparameters for dose-response of sweeteners using the Hill equation.
Author Contributions: C.F. conceived and planned the experiments. M.W. and V.T. collected the data. M.W. andC.F. analysed the data and prepared the manuscript. All authors approved the final version of the manuscript.
Funding: Research supported by Biomedical Science Institute Strategic Positioning Fund Grant (G00067;BMSI/13-80048C-SICS: (Sensory Nutritional Science; PI: C. Forde).
Acknowledgments: We would like to thank the following companies for providing some of the sweetener samplesfor this study: Roquette, Matsutani and Beneo. The Compusense Cloud software was also used as part of theCompusense Academic Consortium (Compusense Inc., Guleph, ON, Canada).
Conflicts of Interest: C.F. has received reimbursements for speaking at conferences sponsored by companiesselling food ingredients and nutritional products, and currently serves on the scientific advisory council of acommercial ingredient manufacturer. None of these organizations had any influence on the design or interpretationof the findings in the current study. All other authors declare no conflicts of interest.
References
1. Drewnowski, A.; Mennella, J.A.; Johnson, S.L.; Bellisle, F. Sweetness and Food Preference–3. J. Nutr. 2012,142, 1142S–1148S. [CrossRef] [PubMed]
59

Nutrients 2018, 10, 1632
2. Malik, V.S.; Popkin, B.M.; Bray, G.A.; Després, J.-P.; Willett, W.C.; Hu, F.B. Sugar-sweetened beveragesand risk of metabolic syndrome and type 2 diabetes: A meta-analysis. Diabetes Care 2010, 33, 2477–2483.[CrossRef] [PubMed]
3. Malik, V.S.; Schulze, M.B.; Hu, F.B. Intake of sugar-sweetened beverages and weight gain: A systematicreview. Am. J. Clin. Nutr. 2006, 84, 274–288. [CrossRef] [PubMed]
4. Gibson, S.; Ashwell, M.; Arthur, J.; Bagley, L.; Lennox, A.; Rogers, P.J.; Stanner, S. What can the food and drinkindustry do to help achieve the 5% free sugars goal? Perspect. Public Health 2017, 137, 237–247. [CrossRef][PubMed]
5. Phua, R. In HPB Aims to Cut Singaporeans’ Sugar Intake by a Quarter. Available online: https://www.channelnewsasia.com/news/health/hpb-aims-to-cut-singaporeans-sugar-intake-by-a-quarter-9931662(accessed on 3 August 2018).
6. Raben, A.; Richelsen, B. Artificial sweeteners: A place in the field of functional foods? Focus on obesity andrelated metabolic disorders. Curr. Opin. Clin. Nutr. Metab. Care 2012, 15, 597–604. [CrossRef] [PubMed]
7. Rogers, P.; Hogenkamp, P.; De Graaf, C.; Higgs, S.; Lluch, A.; Ness, A.; Penfold, C.; Perry, R.; Putz, P.;Yeomans, M. Does low-energy sweetener consumption affect energy intake and body weight? A systematicreview, including meta-analyses, of the evidence from human and animal studies. Int. J. Obes. 2016, 40,381–394. [CrossRef] [PubMed]
8. Glendinning, J.I. Oral post-oral actions of low-calorie sweeteners: A tale of contradictions and controversies.Obesity 2018, 26, S9–S17. [CrossRef] [PubMed]
9. Lease, H.; Hendrie, G.A.; Poelman, A.A.; Delahunty, C.; Cox, D.N. A sensory-diet database: A tool tocharacterise the sensory qualities of diets. Food Qual. Prefer. 2016, 49, 20–32. [CrossRef]
10. Van Langeveld, A.W.; Gibbons, S.; Koelliker, Y.; Civille, G.V.; de Vries, J.H.; de Graaf, C.; Mars, M. Therelationship between taste and nutrient content in commercially available foods from the United States. FoodQual. Prefer. 2017, 57, 1–7. [CrossRef]
11. Sylvetsky, A.C.; Rother, K.I. Trends in the consumption of low-calorie sweeteners. Physiol. Behav. 2016, 164,446–450. [CrossRef] [PubMed]
12. Hayashi, N.; Iida, T.; Yamada, T.; Okuma, K.; Takehara, I.; Yamamoto, T.; Yamada, K.; Tokuda, M. Studyon the postprandial blood glucose suppression effect of D-psicose in borderline diabetes and the safety oflong-term ingestion by normal human subjects. Biosci. Biotechnol. Biochem. 2010, 74, 510–519. [CrossRef][PubMed]
13. Holub, I.; Gostner, A.; Theis, S.; Nosek, L.; Kudlich, T.; Melcher, R.; Scheppach, W. Novel findings on themetabolic effects of the low glycaemic carbohydrate isomaltulose (Palatinose™). Br. J. Nutr. 2010, 103,1730–1737. [CrossRef] [PubMed]
14. Iida, T.; Kishimoto, Y.; Yoshikawa, Y.; Hayashi, N.; Okuma, K.; Tohi, M.; Yagi, K.; Matsuo, T.; Izumori, K.Acute D-psicose administration decreases the glycemic responses to an oral maltodextrin tolerance test innormal adults. J. Nutr. Sci. Vitaminol. 2008, 54, 511–514. [CrossRef] [PubMed]
15. Grembecka, M. Sugar alcohols—Their role in the modern world of sweeteners: A review. Eur. Food Res.Technol. 2015, 241, 1–14. [CrossRef]
16. Livesey, G. Tolerance of low-digestible carbohydrates: A general view. Br. J. Nutr. 2001, 85, S7–S16.[CrossRef] [PubMed]
17. Zumbe, A.; Lee, A.; Storey, D. Polyols in confectionery: The route to sugar-free, reduced sugar and reducedcalorie confectionery. Br. J. Nutr. 2001, 85, S31–S45. [CrossRef] [PubMed]
18. Moskowitz, H.R. Ratio scales of sugar sweetness. Percept. Psychophys. 1970, 7, 315–320. [CrossRef]19. Wiet, S.G.; Beyts, P.K. Sensory characteristics of sucralose and other high intensity sweeteners. J. Food Sci.
1992, 57, 1014–1019. [CrossRef]20. Cardello, H.; Da Silva, M.; Damasio, M. Measurement of the relative sweetness of stevia extract, aspartame
and cyclamate/saccharin blend as compared to sucrose at different concentrations. Plant Foods Hum. Nutr.1999, 54, 119–129. [CrossRef] [PubMed]
21. DuBois, G.E.; Walters, D.E.; Schiffman, S.S.; Warwick, Z.S.; Booth, B.J.; Pecore, S.D.; Gibes, K.; Carr, B.T.;Brands, L.M. Concentration-response relationships of sweeteners: A systematic study. ACS Symp. Ser. 1991,450, 261–276.
60

Nutrients 2018, 10, 1632
22. Bartoshuk, L.M.; Duffy, V.B.; Green, B.G.; Hoffman, H.J.; Ko, C.W.; Lucchina, L.A.; Marks, L.E.; Snyder, D.J.;Weiffenbach, J.M. Valid across-group comparisons with labeled scales: The gLMS versus magnitude matching.Physiol. Behav. 2004, 82, 109–114. [CrossRef] [PubMed]
23. Antenucci, R.G.; Hayes, J.E. Nonnutritive sweeteners are not supernormal stimuli. Int. J. Obes. 2015, 39,254–259. [CrossRef] [PubMed]
24. Fujimaru, T.; Park, J.H.; Lim, J. Sensory characteristics and relative sweetness of tagatose and othersweeteners. J. Food Sci. 2012, 77, S323–S328. [CrossRef] [PubMed]
25. Low, J.; McBride, R.; Lacy, K.; Keast, R. Psychophysical evaluation of sweetness functions across multiplesweeteners. Chem. Senses 2017, 42, 111–120. [CrossRef] [PubMed]
26. International Organization for Standardization. Sensory Analysis: General Guidance for The Design of TestRooms; International Organization for Standardization: Geneva, Switzerland, 1988.
27. Kim, M.-J.; Yoo, S.-H.; Jung, S.; Park, M.-K.; Hong, J.-H. Relative sweetness, sweetness quality, and temporalprofile of xylooligosaccharides and luo han guo (Siraitia grosvenorii) extract. Food Sci. Biotechnol. 2015, 24,965–973. [CrossRef]
28. Portmann, M.O.; Birch, G. Sweet taste and solution properties of α, α-trehalose. J. Sci. Food Agric. 1995, 69,275–281. [CrossRef]
29. Green, B.G.; Dalton, P.; Cowart, B.; Shaffer, G.; Rankin, K.; Higgins, J. Evaluating the ‘Labeled MagnitudeScale’ for measuring sensations of taste and smell. Chem. Senses 1996, 21, 323–334. [CrossRef] [PubMed]
30. Hayes, J.E.; Allen, A.L.; Bennett, S.M. Direct comparison of the generalized visual analog scale (gVAS) andgeneral labeled magnitude scale (gLMS). Food Qual. Prefer. 2013, 28, 36–44. [CrossRef] [PubMed]
31. Delwiche, J.F.; Buletic, Z.; Breslin, P.A. Relationship of papillae number to bitter intensity of quinine andPROP within and between individuals. Physiol. Behav. 2001, 74, 329–337. [CrossRef]
32. Li, X.; Staszewski, L.; Xu, H.; Durick, K.; Zoller, M.; Adler, E. Human receptors for sweet and umami taste.Proc. Natl. Acad. Sci. USA 2002, 99, 4692–4696. [CrossRef] [PubMed]
33. Xu, H.; Staszewski, L.; Tang, H.; Adler, E.; Zoller, M.; Li, X. Different functional roles of T1R subunits in theheteromeric taste receptors. Proc. Natl. Acad. Sci. USA 2004, 101, 14258–14263. [CrossRef] [PubMed]
34. Ventura, E.E.; Davis, J.N.; Goran, M.I. Sugar content of popular sweetened beverages based on objectivelaboratory analysis: Focus on fructose content. Obesity 2011, 19, 868–874. [CrossRef] [PubMed]
35. Frijters, J.E.; de Graaf, C. The equiratio taste mixture model successfully predicts the sensory response tothe sweetness intensity of complex mixtures of sugars and sugar alcohols. Perception 1987, 16, 615–628.[CrossRef] [PubMed]
36. Graaf, C.D.; Frijters, J.E. Sweetness intensity of a binary sugar mixture lies between intensities of itscomponents, when each is tasted alone and at the same total molarity as the mixture. Chem. Senses1987, 12, 113–129. [CrossRef]
37. Lawless, H.T. Laboratory Exercises for Sensory Evaluation, 1st ed.; Springer: Manhattan, NY, USA, 2012.38. Moskowitz, H.R. The sweetness and pleasantness of sugars. Am. J. Psychol. 1971, 84, 387–405. [CrossRef]
[PubMed]39. Yamaguchi, S.; Yoshikawa, T.; Ikeda, S.; Ninomiya, T. Studies on the taste of some sweet substances: Part I.
Measurement of the relative sweetness part II. Interrelationships among them. Agric. Biol. Chem. 1970, 34,181–197. [CrossRef]
40. Schiffman, S.S.; Booth, B.J.; Losee, M.L.; Pecore, S.D.; Warwick, Z.S. Bitterness of sweeteners as a function ofconcentration. Brain Res. Bull. 1995, 36, 505–513. [CrossRef]
41. Prescott, J.; Ripandelli, N.; Wakeling, I. Binary taste mixture interactions in prop non-tasters, medium-tastersand super-tasters. Chem. Senses 2001, 26, 993–1003. [CrossRef] [PubMed]
42. Lawless, H.T.; Horne, J.; Spiers, W. Contrast and range effects for category, magnitude and labeled magnitudescales in judgements of sweetness intensity. Chem. Senses 2000, 25, 85–92. [CrossRef] [PubMed]
43. DuBois, G.E. Molecular mechanism of sweetness sensation. Physiol. Behav. 2016, 164, 453–463. [CrossRef][PubMed]
44. Swiader, K.; Waszkiewicz-Robak, B.; Swiderski, F.; Kostyra, E. Sensory properties of some synthetichigh-intensity sweeteners in water solutions. J. Sci. Food Agric. 2009, 89, 2030–2038. [CrossRef]
45. Tunaley, A.; Thomson, D.; McEwan, J. Determination of equi-sweet concentrations of nine sweeteners usinga relative rating technique. Int. J. Food Sci. Technol. 1987, 22, 627–635. [CrossRef]
61

Nutrients 2018, 10, 1632
46. Reyes, M.; Castura, J.; Hayes, J. Characterizing dynamic sensory properties of nutritive and nonnutritivesweeteners with temporal check-all-that-apply. J. Sens. Stud. 2017, 32. [CrossRef] [PubMed]
47. Clemens, R.A.; Jones, J.M.; Kern, M.; Lee, S.Y.; Mayhew, E.J.; Slavin, J.L.; Zivanovic, S. Functionality of sugarsin foods and health. Compr. Rev. Food Sci. Food Saf. 2016, 15, 433–470. [CrossRef]
48. Cadena, R.S.; Bolini, H.M.A. Ideal and relative sweetness of high intensity sweeteners in mango nectar.J. Food Sci. Technol. 2012, 47, 991–996. [CrossRef]
49. Miele, N.A.; Cabisidan, E.K.; Plaza, A.G.; Masi, P.; Cavella, S.; Di Monaco, R. Carbohydrate sweetenerreduction in beverages through the use of high potency sweeteners: Trends and new perspectives from asensory point of view. Trends Food Sci. Technol. 2017, 64, 87–93. [CrossRef]
© 2018 by the authors. Licensee MDPI, Basel, Switzerland. This article is an open accessarticle distributed under the terms and conditions of the Creative Commons Attribution(CC BY) license (http://creativecommons.org/licenses/by/4.0/).
62

nutrients
Article
Assessing Food Liking: Comparison of Food LikingQuestionnaires and Direct Food Tasting inTwo Cultures
Uracha Wanich 1, Dhoungsiri Sayompark 2, Lynn Riddell 3, Sara Cicerale 1, Djin Gie Liem 1,
Mohammadreza Mohebbi 4, Susie Macfarlane 5 and Russell Keast 1,*
1 Centre for Advanced Sensory Sciences, School of Exercise and Nutrition Sciences, Deakin University,1 Gheringhap Street, Geelong 3220, Australia; [email protected] (U.W.);[email protected] (S.C.); [email protected] (D.G.L.)
2 Faculty of Science and Technology, Rajamangala University of Technology Tawan-ok,Chonburi 20110, Thailand; [email protected]
3 Institute for Nutrition and Physical Activity Research, School of Exercise and Nutrition Sciences,Deakin University, 1 Gheringhap Street, Geelong 3220, Australia; [email protected]
4 Biostatistics Unit, Faculty of Health, Deakin University, 1 Gheringhap Street, Geelong 3220, Australia;[email protected]
5 Deakin Learning Futures, Health Pod, Deakin University, 1 Gheringhap Street, Geelong 3220, Australia;[email protected]
* Correspondence: [email protected]; Tel.: +61-3-924-46944
Received: 17 October 2018; Accepted: 7 December 2018; Published: 11 December 2018
Abstract: Food liking can be directly measured in specialised sensory testing facilities; however,this method is not feasible for large population samples. The aim of the study was to compare aFood Liking Questionnaire (FLQ) against lab-based sensory testing in two countries. The study wasconducted with 70 Australian and Thai participants (35 Australian, 35 Thai, mean (SD) age 19 (3.01)years, 51% men). Participants completed a FLQ (consisting of 73 food items Australia, 89 Thai) andthen, after tasting the food, rated their liking of a selection of 10 commercially available food itemsusing a nine-point hedonic scale. Both tasks were completed on the same day and were repeated oneweek later. The reliability of and a comparison between methods was determined using Intra-ClassCorrelation Coefficients (ICC), and the difference was assessed using an independent sample t-test.The results indicate that the test-retest reliability of FLQ and the laboratory-based liking assessmentrange was moderate (0.40–0.59) to excellent (0.75–1.00). There were significant differences for theFLQ and the laboratory-based liking assessment between countries for three food items: soft drink,instant vegetable soup, and broccoli (p < 0.01). However, the data produced from the FLQ reflectsthe laboratory-based liking assessment. Therefore, it provides representative liking data in largepopulation-based studies including cross-cultural studies.
Keywords: cross-cultural; food liking; sensory; questionnaire; hedonic
1. Introduction
Obesity represents the largest preventable disease worldwide and is a contributor to ill-healthoutcomes including cardiovascular disease, stroke, type 2 diabetes, hypertension, arthritis, respiratorydisorders, and certain cancers [1]. Whilst the causes of obesity are multi-factorial and complex,they are embedded within energy imbalances brought about by psychological, cultural, personal,environmental, lifestyle, and dietary factors which favour excessive energy intake coupled withsedentary behaviour [2]. Energy imbalances due to overconsumption of food are common, especially,
Nutrients 2018, 10, 1957; doi:10.3390/nu10121957 www.mdpi.com/journal/nutrients63

Nutrients 2018, 10, 1957
given discretionary foods high in palatable fat, sugar, and salt are increasing in abundance in bothdeveloped and developing nations [3,4].
An individual’s response to food is multi-dimensional and dynamic. Environment, experience,and physical state are all factors that may influence liking decisions at any point in time [5]. It is theliking or prospective liking of a food that is one of the key drivers of consumption [5,6]. The impactof taste and food preference on food intake is also influenced by age and sex and can be modified bydistorted eating behaviours [6–9].
In adults, food flavour has an important influence on food choice [10]. Liking a food’s flavouris an important driver of short-term food consumption, as those adults who enjoy the food they areconsuming tend to eat more of it [5]. This can result in health issues related to the overconsumptionof food [5]. For example, an individual’s flavour preferences can have an effect on disease risk byinfluencing food consumption, particularly the consumption of foods high in fat, sugar, and salt.A study by Duffy et al. [11] demonstrated that the liking of fatty foods was positively correlatedwith fat intake and the liking for fibre-rich foods was positively correlated with fibre intake. Further,a positive relationship between the liking for fatty foods, body weight, and systolic blood pressurewas found. This relationship between food liking and dietary intake was also observed in a largestudy by Mejean et al. Those with a higher liking for fatty foods had an increased intake of totalenergy, fat, and certain foods (high in fat) such as meat, butter, desserts, and pastries [12] and a positiverelationship between the liking for fatty foods and obesity risk was observed.
There is a paucity of research comparing Food Liking Questionnaires (FLQ) and laboratory-basedfood acceptance. Cardello and Maller [13] examined the relationship between FLQ and laboratoryacceptance testing both using a nine-point hedonic scale with the authors observing higher ratings inthe laboratory acceptance testing compared with the FLQ. The authors also found positive, but mostlyweak to moderate, correlations between the two methods. In addition, FLQ can be used to explorethe relationship between food liking and food consumption. For example, Duffy et al. [14] useda questionnaire to determine food preference and intake to predict the dietary determinants ofcardiovascular disease risk factors in 422 US male adults. This study showed that the preferencefor fatty food, intake of low-fibre food, and alcohol was associated with cardiovascular disease riskfactors. Carbonneau et al. [15] developed and validated a food liking questionnaire which aimed topredict the influence of food liking on food and energy intake. A significant correlation was observedbetween liking scores in the FLQ and self-reported frequency of food consumption (r = 0.19–0.39,p < 0.05). French et al. [16] have used a self-report measure of the liking and wanting of high-fat food(among other measures such as the three-factor eating questionnaire) to investigate the association withenergy intake and individual differences in eating behaviours. This study demonstrated a significantassociation between eating behaviours and energy intake. Furthermore, Pallister et al. [17] used aliking questionnaire in a UK twin cohort study to evaluate its usefulness to investigate the interactionbetween genetics and the liking of different fruits, vegetables, meats, and different tastes.
The liking of a specific food or set of foods primarily reflects the cultural environment in whichan individual is brought up in and their individual experiences with such food [18]. However,the globalization of the food supply and the increase in disposable income has resulted in a dietwhere more products are derived from animals and energy dense sources, and the proliferation ofWestern-style highly palatable foods such as hamburgers, soft drinks, and pizza has created multipleproblems in both developed and developing nations [19]. Such issues appear to be increasing indeveloping countries and include an increased prevalence of overweight and obese children andadolescents [20]. There appears to be a dramatic transition of food consumption patterns in a numberof developing nations [21].
Exploring the relationship between the liking of food and dietary intake has not been widelystudied; however, as indicated in the aforementioned studies, liking of a food appears to be oneof the key factors influencing intake. To enable us to effectively use and interpret a FLQ it is firstnecessary to determine if a FLQ can appropriately measure food liking when compared to more
64

Nutrients 2018, 10, 1957
established laboratory assessment methods in our two cultures population groups that have neverbeen investigated. Therefore, the aim of this study is to compare a food liking questionnaire with foodliking measured in a laboratory setting in a sample of Thai and Australian adults.
2. Materials and Methods
2.1. Participants
Seventy Australian and Thai non-smoking participants (35 Australian, 35 Thai, with a mean(SD) of 19.9 (3.0) years), 51% of which were male in both countries, were recruited to take part in thestudy. Australian participants were recruited from undergraduate courses at Deakin University,Melbourne, Australia using a range of strategies. Posters were distributed around campus andadvertising material was distributed by study personnel to potential participants at locations aroundthe campus. Presentations were also made to first-year undergraduate students enrolled in coursesoffered within the School of Exercise and Nutrition Sciences at Deakin University. Lastly, the studywas advertised through social media. Thai participants were recruited via presentations to first-yearundergraduate students enrolled in the Faculty of Science and Technology courses at RajamangalaUniversity of Technology Tawan-ok, Thailand.
Participants were eligible if they were non-smokers, aged over 18 years, in good health, and hadno allergies to any foods or food products, as determined through self-report using a short screeningquestionnaire prior to testing. Ethics approval was obtained from the Human Research EthicsCommittee at Deakin University (HEAG-H 102_2016) and all participants who agreed to participate inthe study provided written informed consent.
2.2. Procedure and Design
Data for the laboratory-based liking assessment were collected using the Compusense® Cloud(Guelph, ON, Canada) for Australian samples. Hard copy paper questionnaires were used for the Thaisample. Participants were tested in individual booths with white lights and controlled air conditionsin the sensory laboratories located at both the Centre for Advanced Sensory Science located withinDeakin University and the Faculty of Science and Technology located within Rajamangala Universityof Technology. Participants were asked to refrain from eating, drinking (except room temperaturewater), brushing their teeth, and chewing gum for one hour prior to testing.
The participants first completed the food liking questionnaire (FLQ), then tasted and ratedtheir liking of a selection of ten commercially available food items listed on the FLQ, see Table 1.The food items were selected to be representative of the commonly consumed foods within each foodgroup. For example, for the FLQ group ‘soft drink’ orange Fanta was used in the laboratory testing,and for ‘potatoes chips’ Smith original chips were used for the Australian testing and Lay’s originalfor Thai. For both the questionnaire and laboratory-based liking assessment, liking was measuredusing a nine-point hedonic scale. This scale consists of a series of nine verbal categories representingdegrees of liking from ‘dislike extremely’ to ‘like extremely’. For subsequent quantitative and statisticalanalysis, all verbal categories were converted to numerical values: ‘like extremely’ was coded as ‘9’,‘dislike extremely’ as ‘1’. Participants rated their imagined (for FLQ) and experienced hedonic responsefor the food items on a nine-point hedonic scale. Both tasks were completed on the same day and alltests were repeated one week after the original session.
65

Nutrients 2018, 10, 1957
Table 1. Food items on the questionnaire and commercial foods.
Food Items on Questionnaire Commercial Foods
Sweet biscuit Chocolate biscuit (Arnott’s Tim Tam original)
Soft drink Orange soft drink (The Coca-Cola Company)
Vegetable soup Instant vegetable soup (Continental Homestyle vegetable)
Potato chips Potato chips (for Australia: Smith; for Thai: Lay’s original)
Ice cream Ice cream (for Australia: A2 milk classic vanilla ice cream; for Thai NewZealand Natural Premium Ice Cream classic vanilla ice cream)
Butter Butter (Beautifully Butterfully butter, salt block)
Broccoli Broccoli (boiled, fresh)
Apple Apple puree (Sweet Valley)
The heat/burn of a spicy meal Chilli sauce (Mars Food Australia hot chilli (under the MasterFoodsbrand)) and Tom yum soup (Roi Thai tomyum soup with coconut milk)
2.3. Food Liking Questionnaire
A modified version of a FLQ from Duffy et al. [11] was adapted for culturally relevant Australianand Thai foods. The Australian version of the questionnaire contained 73 food items, and the Thaiquestionnaire contained 89 food items. As many foods as possible were kept consistent betweenthe Australian and Thai questionnaires to allow for a direct comparison. Examples of foods usedin both questionnaires included: beef, cornflakes, potato chips, strawberries, pizza, and chocolate.The Australian questionnaire included the following culturally specific foods: Kentucky Fried Chicken(KFC) and rotisserie chicken. The Thai questionnaire included the following culturally specific foods:chilli dip, fermented fish, foods that have coconut milk/oil, spicy curry, Tom yum, sticky rice,Thai dessert made from egg yolk and sugar, fruit in thick syrup, and sweet test fruits. Both FLQscontained the instruction “if you have never eaten a particular food, or never experienced one of the listed items,please rate the item as ‘neutral’”. The Thai questionnaire was translated directly into Thai, see Table 2,by the lead author, a Thai researcher based in Australia, and was reviewed by one co-author, a Thairesearcher based in Thailand, to ensure cultural appropriateness and accuracy.
Table 2. The nine-point hedonic scale direct translation in to Thai.
Englishdislike
extremelydislike
very muchdislike
moderatelydislikeslightly
neitherlike ordislike
likeslightly
likemoderately
like verymuch
likeextremely
Thai
2.4. Statistical Analyses
Statistical analyses were carried out using SPSS version 25.0 (IBM Corporation, Armonk, NY, USA).In order to detect a minimum of one unit mean difference on the nine-point hedonic scale betweenAustralian and Thai samples with 80% power and a standard deviation of 1.5, a sample size of 35 pergroup was needed. Three different sets of Intra-Class Correlation Coefficients (ICC) were calculated.The first set of ICC was used to determine the comparability between test and re-test results of theFLQ. The second set of ICC was used to determine the comparability between test and re-test results ofthe laboratory-based liking assessment. The third set of ICC was used to determine the comparabilitybetween the results of the FLQ and the laboratory-based liking assessment. The ICC values wereinterpreted as poor (<0.40), moderate (0.40–0.59), good (0.60–0.74), and excellent (0.75–1.0) [22].An independent sample t-test was used to compare the food liking groups between countries. A valueof p < 0.05 was considered statistically significant.
66

Nutrients 2018, 10, 1957
3. Results
3.1. Test-Retest Food Liking Questionnaire and Laboratory-Based Liking Assessment Reliability
The level of ICC between test–retest of FLQ are reported in Table 3. Reliability for all the fooditems in FLQ was in the moderate range (0.40–0.59), except for broccoli which was in the excellentrange (0.75–1.0).
The level of ICC between test–retest of the laboratory-based liking assessment, ranged from 0.55to 0.85, as shown in Table 3. The degree of reliability was excellent (0.75–1.00) for instant vegetablesoup and broccoli, good (0.60–0.74) for Tim Tam, orange Fanta, ice cream, apple puree, chilli sauce,and Tom yum soup, and moderate (0.40–0.59) for potato chips and butter.
3.2. Food Items Liking Comparability between the Questionnaire and Laboratory-Based Liking Assessment
The level of ICC between the FLQ and the representative food in the laboratory-based likingassessment ranged from 0.22 to 0.82, see Table 4. The degree of comparability was excellent (0.75–1.00)for broccoli; good (0.60–0.74) for potato chips and butter; and moderate (0.40–0.59) for sweet biscuits,soft drink, vegetable soup, and ice cream. The degree of comparability was poor (<0.40) for apple puree,chilli sauce, and Tom yum soup. When the analyses were repeated for men and women separatelyin Australian and Thai samples, the degree of comparability of FLQ and laboratory-based likingassessment was similar (data not shown).
3.3. Using the Food Liking Questionnaire to Discriminate between Thai and Australian Cultures
Independent sample t-tests were used to compare FLQ and a laboratory-based liking assessmentbetween Australian and Thai samples, see Table 5. Statistically significant mean differences (p < 0.05)were observed in three food items: soft drink (mean difference (MD) −1.47 Australian vs. Thai),vegetable soup (MD = 1.58), and broccoli (MD = 1.36). Furthermore, the laboratory-based likingassessment found statistically significant differences in an additional four food items compared to theFLQ: Tim Tams (MD = 0.63), potato chips (MD = −0.542), apple puree (MD = 2.11), and chilli sauce(MD = 1.70).
67

Nutrients 2018, 10, 1957
Ta
ble
3.
Com
pari
ngm
ean
scor
ebe
twee
nte
stan
dre
-tes
tand
relia
bilit
yof
Intr
a-C
lass
Cor
rela
tion
Coe
ffici
ents
(IC
C)o
ffoo
dlik
ing
ques
tionn
aire
and
labo
rato
ry-b
ased
likin
gas
sess
men
t.
Fo
od
Item
sin
FL
QT
est
(n=
70)
Re-T
est
(n=
70)
95%
CI
of
the
Dif
fere
nce
ICC
Fo
od
Item
sin
Sen
sory
Lab
ora
tory
Test
ing
Test
(n=
70)
Re-t
est
(n=
70)
95%
CI
of
the
Dif
fere
nce
ICC
M±
SD
M±
SD
M±
SD
M±
SD
Swee
tbis
cuit
7.50
±1.
477.
64±
1.51
−0.4
7,0.
190.
58Ti
mTa
m8.
01±
1.50
8.33
±1.
05−0
.54,−0
.09
0.73
Soft
drin
k6.
30±
2.19
6.51
±2.
01−0
.68,
0.25
0.57
Ora
nge
Fant
a7.
14±
1.65
7.31
±1.
46−0
.48,
0.14
0.66
Vege
tabl
eso
up6.
41±
1.92
6.31
±2.
00−0
.36,
0.56
0.51
Inst
antv
eget
able
soup
5.24
±2.
435.
23±
2.30
−0.3
7,0.
400.
77Po
tato
chip
7.44
±1.
287.
73±
1.28
−0.5
7,0.
000.
56Po
tato
chip
s7.
83±
1.25
7.80
±1.
17−0
.23,
0.29
0.59
Ice
crea
m8.
16±
1.29
8.01
±1.
17−0
.18,
0.46
0.41
Ice
crea
m8.
06±
1.21
8.16
±1.
15−0
.34,
0.14
0.64
Butt
er6.
39±
1.78
6.46
±1.
93−0
.52,
0.38
0.48
Butt
er5.
99±
1.81
6.40
±1.
84−0
.83,
0.00
0.55
Broc
coli
6.60
±2.
096.
41±
2.37
−0.1
9,0.
560.
75Br
occo
li5.
93±
2.52
5.89
±2.
51−0
.29,
0.37
0.85
App
le7.
56±
1.11
7.54
±1.
00−0
.24,
0.27
0.50
App
lepu
ree
5.27
±2.
475.
67±
2.43
−0.8
3,0.
030.
72T
hehe
at/b
urn
ofa
spic
ym
eal
6.61
±2.
056.
46±
2.10
−0.3
3,0.
640.
52C
hilli
sauc
e3.
79±
2.45
4.00
±2.
32−0
.69,
0.26
0.65
Tom
yum
soup
4.07
±2.
324.
20±
2.57
−0.5
8,0.
320.
71
Not
e:C
lass
ifica
tion
ofIC
Cva
lue:
<0.4
0=
poor
;0.4
0–0.
59=
mod
erat
e;0.
60–0
.74
=go
od;0
.75–
1=ex
celle
nt.S
tand
ard
Dev
iati
on(S
D),
Con
fiden
tInt
erva
l(C
I).
Ta
ble
4.
Com
pari
ngm
ean
scor
ean
dre
liabi
lity
(IC
C)b
etw
een
food
likin
gqu
esti
onna
ire
and
labo
rato
ry-b
ased
likin
gas
sess
men
t.
Fo
od
Ite
ms
inF
LQ
M±
SD
(n=
70
)F
oo
dIt
em
sin
Se
nso
ryL
ab
ora
tory
Te
stin
gM
±S
D(n
=7
0)
95
%C
Io
fth
eD
iffe
ren
ceIC
C
Swee
tbis
cuit
7.57
±1.
33Ti
mTa
m8.
17±
1.20
0.22
,0.6
10.
43So
ftdr
ink
6.41
±1.
86O
rang
eFa
nta
7.23
±1.
420.
41,0
.72
0.59
Vege
tabl
eso
up6.
36±
1.70
Inst
antv
eget
able
soup
5.24
±2.
230.
37,0
.70
0.56
Pota
toch
ip7.
59±
1.13
Pota
toch
ips
7.81
±1.
080.
59,0
.82
0.73
Ice
crea
m8.
09±
1.04
Ice
crea
m8.
11±
1.07
0.31
,0.6
60.
51Bu
tter
6.42
±1.
60Bu
tter
6.19
±1.
610.
46,0
.75
0.62
Broc
coli
6.51
±2.
09Br
occo
li5.
91±
2.42
0.72
,0.8
80.
82A
pple
7.55
±0.
92A
pple
pure
e5.
47±
2.28
−0.0
2,0.
430.
22Th
ehe
at/b
urn
ofa
spic
ym
eal
6.54
±1.
81C
hilli
sauc
e3.
89±
2.17
0.06
,0.4
90.
29To
myu
mso
up4.
14±
2.26
0.09
,0.5
10.
31
Not
e:C
lass
ifica
tion
ofIC
Cva
lue:
<0.4
0=
poor
;0.4
0–0.
59=
mod
erat
e;0.
60–0
.74
=go
od;0
.75–
1=
exce
llent
.
68

Nutrients 2018, 10, 1957
Ta
ble
5.
Com
pari
son
betw
een
the
food
likin
gqu
esti
onna
ire
and
labo
rato
ry-b
ased
likin
gas
sess
men
trat
ing
betw
een
Aus
tral
ian
and
Tha
isam
ples
Fo
od
Item
inF
LQ
Au
stra
lian
n=
35
Th
ai
n=
35
95%
CI
of
the
Dif
fere
nce
Fo
od
Item
sin
Sen
sory
Lab
ora
tory
Test
ing
Au
stra
lian
n=
35
Th
ai
n=
35
95%
CI
of
the
Dif
fere
nce
M±
SD
M±
SD
tM
±S
DM
±S
Dt
Swee
tbis
cuit
7.94
±0.
827.
20±
1.53
−0.5
0,0.
670.
29n.
s.Ti
mTa
m8.
48±
0.60
7.85
±1.
530.
07,1
.18
2.25
**
Soft
drin
k5.
67±
1.74
7.14
±1.
68−2
.29,−0
.65
−3.5
8**
Ora
nge
Fant
a6.
58±
1.40
7.87
±1.
12−1
.89,−0
.67
−4.2
3**
*Ve
geta
ble
soup
7.15
±0.
875.
57±
1.95
0.86
,2.3
04.
37**
Inst
antv
eget
able
soup
6.18
±1.
374.
28±
2.51
0.93
,2.8
63.
926
***
Pota
toch
ips
7.57
±1.
237.
60±
1.03
−0.5
7,0.
51−0
.10
n.s.
Pota
toch
ips
7.54
±1.
138.
08±
0.96
−1.0
4,−0
.04
−2.1
5**
Ice
crea
m8.
14±
0.80
8.02
±1.
23−0
.38,
0.61
0.45
n.s.
Ice
crea
m8.
00±
1.07
8.21
±1.
07−0
.72,
0.29
−0.8
3n.
s.
Butt
er6.
42±
1.62
6.41
±1.
59−0
.75,
0.78
0.03
n.s.
Butt
er6.
50±
1.51
5.88
±1.
66−0
.14,
1.37
1.61
n.s.
Broc
coli
7.18
±1.
145.
82±
2.57
0.40
,2.2
32.
84**
Broc
coli
6.48
±1.
735.
32±
2.85
0.02
,2.2
82.
04*
App
le7.
65±
0.87
7.44
±0.
96−0
.22,
0.65
0.97
n.s.
App
lepu
ree
6.52
±1.
894.
41±
2.15
1.14
,3.0
84.
36**
*Th
ehe
at/b
urn
ofa
spic
ym
eal
6.52
±1.
366.
54±
2.19
−0.8
8,0.
85−0
.03
n.s.
Chi
llisa
uce
4.74
±2.
223.
04±
1.76
0.74
,2.6
53.
54**
*
Tom
yum
soup
4.44
±2.
343.
87±
2.17
1.14
,1.6
00.
97n.
s.
Not
e:D
efini
tion
s—St
and
ard
Dev
iati
on(S
D),
mea
n(M
),nu
mbe
rof
part
icip
ants
inea
chgr
oup
(n).
*p
valu
esar
efo
rth
eco
mpa
riso
nfo
odlik
ing
rati
ngbe
twee
nA
ust
ralia
nan
dT
hai
sam
ples
wer
ede
term
ined
usin
gin
depe
nden
tsam
ple
t-te
sts.
Sign
ifica
nce
indi
cate
dth
e*
p<
0.05
,**
p<
0.01
,***
p<
0.00
1,an
dn.
s.in
dica
tes
nots
igni
fican
tatp
>0.
05.
69
Nutrients 2018, 10, 1957
4. Discussion
The objective of this study was to compare a FLQ with a laboratory-based liking assessment of tenrepresentative foods in Australian and Thai settings, in order to determine whether the FLQ will be asuitable measurement tool in large-scale studies to compare food liking across cultures. The test–retestreliability of the FLQ and laboratory-based liking assessment were found to be moderate to excellentfor both the FLQ and laboratory-based liking assessment, with an ICC range of 0.41–0.85 [22].
When comparing the FLQ with a laboratory-based liking assessment of individual food items,the comparability was moderate or high for seven food items (ICC range 0.43–0.82). However,comparability was poor for three food items: liking for apple measured on the FLQ compared withapple puree in the laboratory testing (ICC 0.22), the heat/burn of a spicy meal measured on theFLQ compared with chilli sauce (ICC 0.29), and Tom yum soup (ICC 0.31) in the laboratory tastetesting. These comparability results may be explained by the differences in the food items assessed.The laboratory-based liking assessment asked subjects to rate their liking of a number of specificfoods immediately after tasting. Conversely, the FLQ asked subjects to rate their liking of a number offoods without tasting the foods and this method may be more of a reflection of past experiences andmemories of the food items [5,18]. Laboratory food testing provides a direct measure of liking of thefood as consumed [13], with little influence of memory [5,18]. For example, a liking of apple may notequate to a liking of apple in puree form and a liking of the heat burn of a spicy meal, may not translateto a liking of chilli sauce eaten independently of the whole meal. These three food items deviated themost between the FLQ representative food and the actual food tasted in the laboratory and this mayexplain the poor comparability between methods. Taken as a whole, the results obtained indicate thatwhile the FLQ appears an effective measurement tool to determine the liking across general food itemsin larger-scale studies, a laboratory-based sensory assessment may be necessary for measuring likingof the specific food products and laboratory testing will be required for direct product comparison.Similar results have been observed in previous studies comparing FLQ and a laboratory-based likingassessment. Deglaire et al. [23] reported on the reliability of utilising a food liking questionnaireto assess liking for salty, sweet, and fatty foods in a large population study. Deglaire observed thatthe questionnaire-based assessment of food liking was a robust method to collect liking data fromlarge population studies. However, the authors noted that a liking value based on laboratory testinggives a direct measure of a liking value of the perceived flavour of the foods that are actually tasted,as opposed to a questionnaire where the liking value is based on the subject’s memories or experience.Cardello and Maller [13] noted that the liking response on the questionnaire was driven more onexperience or memory of food, whereas the laboratory-based liking was based on the actual tasting offood samples.
The current results, combined with those of Duffy et al., Deglaire, and Cardello and Maller [11–13]indicate that for larger population studies, using a questionnaire to assess food liking is an appropriatedata collection tool as it is reliable and is comparable with laboratory taste testing. In addition,the questionnaire has a significant benefit when assessing links of food liking with diet andanthropometry in that it has the potential to provide a representative view of an individual’s liking ofa broad range of food groups, compared with what an individual may rate for a specific tasted food.This may provide a benefit when assessing links of food liking with diet and health indices.
One of the aims of our ongoing research program is to explore cultural differences in food likingin similarly aged sample populations. Therefore, we explored the ability of the FLQ to distinguishfood liking between two sample populations. The FLQ was able to detect significant differences infood liking observed between Australian and Thai subjects using both FLQ and the laboratory-basedsensory assessment. This indicates that the FLQ is able to discriminate between cultural differences infood liking, providing further confidence in its usefulness in exploring cultural differences in largestudies. There was a significant difference in food liking identified in the FLQ and the laboratory-basedliking assessment for three food items, including soft drink, vegetable soup, and broccoli. However,the laboratory testing found differences in an additional four food items compared to the FLQ.
70

Nutrients 2018, 10, 1957
These items include Tim Tams, potato chips, apple puree, and chilli sauce. The differences in the likingof these four food items might be due to a greater familiarity with these foods within Australia andless familiarity within Thailand. For example, Thai participants’ liking ratings during the laboratorytesting of Tim Tams and apple puree were significantly lower compared to the Australian subjects.This finding supports other research studies that show a lack of familiarity may influence the liking ofa food [24–28].
The present study has a number of limitations that should be noted. The reliability betweenthe FLQ and laboratory-based liking assessment was completed in participants from Australia andThailand using foods specific to their culture. Therefore, the results may not be generalizable toother population groups. Further, only a representative number of food items were used in thelaboratory-based liking assessment.
The present study used a relatively small sample size, which was based on an estimated differenceof one unit on a nine-point hedonic scale. As such, the present study can be seen as the first step in ourunderstanding of the relationship between the food liking questionnaire and direct sensory testing in across-cultural sample and sets the stage for larger studies. It is important to note that the present studydid not aim to develop a method to replace the sensory evaluation of taste liking; rather, it aimedto propose an alternative method to obtain a general liking of food when an actual measurement isnot possible.
5. Conclusions
The findings of this study demonstrated that the FLQ reflects the liking ratings in laboratorytaste-testing and is an appropriate method to investigate food liking in large population groupsincluding cross-cultural studies. The test-retest reliability of the FLQ and laboratory taste-testing werealso assessed. This study concludes that the FLQ is also able to detect differences in liking betweenthe Australian and Thai populations. Laboratory-based sensory testing remains the recommendedmethod for direct product comparison.
Author Contributions: U.W., D.S, L.R., D.G.L., S.M. and R.K. conceived and designed the study; U.W. conductedthe experimental methods; U.W., L.R. and M.M. conducted the statistical analyses; U.W., L.R., D.G.L., S.C., M.M.and R.K. interpreted the data; U.W. wrote the manuscript; all authors reviewed the manuscript.
Acknowledgments: The authors express their gratitude to the participants for their involvement in the study,Tom Latimer for editing assistance. The present study was supported by Centre for Advanced Sensory Science,Deakin University and school of Exercise and Nutrition science. Faculty of Science and Technology, RajamangalaUniversity of Technology, Chonburi, Thailand supporting the facility collecting data in Thailand.
Conflicts of Interest: The authors declare no conflict of interest. The founding sponsors had no role in the designof the study; in the collection, analyses, or interpretation of data; in the writing of the manuscript, and in thedecision to publish the results.
References
1. Haslam, D.W.; James, W.P. Obesity. Lancet 2005, 366, 1197–1209. [CrossRef]2. Robertson, A.; Lobstein, T.; Knai, C. Obesity and Socio-Economic Groups in Europe: Evidence Review and
Implications for Action. 2007. Available online: http://ec.europa.eu/health/ph_determinants/life_style/nutrition/documents/ev20081028_rep_en.pdf (accessed on 10 July 2018).
3. Chaput, J.P.; Klingenberg, L.; Astrup, A.; Sjödin, A.M. Modern sedentary activities promote overconsumptionof food in our current obesogenic environment. Obes. Rev. 2011, 12, e12–e20. [CrossRef] [PubMed]
4. Popkin, B.M.; Adair, L.S.; Ng, S.W. Global nutrition transition and the pandemic of obesity in developingcountries. Nutr. Rev. 2012, 70, 3–21. [CrossRef] [PubMed]
5. Yeomans, M.R. Understanding individual differences in acquired flavour liking in humans. Chemosens Percept.2010, 3, 34–41. [CrossRef]
6. Rajagopal, R.; Naylor, R.W.; Hoyer, W.D. The unhealthy = Tasty intuition and its effects on taste inferences,enjoyment, and choice of food products. J. Mark. 2006, 70, 170–184.
71

Nutrients 2018, 10, 1957
7. Clark, J.E. Taste and flavour: Their importance in food choice and acceptance. Proc. Nutr. Soc. 1998, 57,639–643. [CrossRef]
8. Drewnowski, A. Taste preferences and food intake. Ann. Rev.Nutr. 1997, 17, 237–253. [CrossRef]9. Hebden, L.; Chan, H.N.; Louie, J.C.; Rangan, A.; Allman-Farinelli, M. You are what you choose to eat:
Factors influencing young adults’ food selection behaviour. J. Hum. Nutr. Diet. 2015, 28, 401–408. [CrossRef]10. Prescott, J. Multisensory processes in flavour perception and their influence on food choice. Curr. Opin.
Food Sci. 2015, 3, 47–52. [CrossRef]11. Duffy, V.B.; Hayes, J.E.; Sullivan, B.S.; Faghri, P. Surveying food and beverage liking: A tool for
epidemiological studies to connect chemosensation with health outcomes. Ann. N. Y. Acad. Sci. 2009,1170, 558–568. [CrossRef]
12. Deglaire, A.; Méjean, C.; Castetbon, K.; Kesse-Guyot, E.; Hercberg, S.; Schlich, P. Associations betweenweight status and liking scores for sweet, salt and fat according to the gender in adults (the Nutrinet—SanteStudy). Eur. J. Clin. Nutr. 2015, 69, 40. [CrossRef] [PubMed]
13. Cardello, A.V.; Maller, O. Relationships between food preferences and food acceptance ratings. J. Food Sci.1982, 47, 1553–1557. [CrossRef]
14. Duffy, V.B.; Lanier, S.A.; Hutchins, H.L.; Pescatello, L.S.; Johnson, M.K.; Bartoshuk, L.M. Food preferencequestionnaire as a screening tool for assessing dietary risk of cardiovascular disease within health riskappraisals. J. Am. Diet. Assoc. 2007, 107, 237–245. [CrossRef] [PubMed]
15. Carbonneau, E.; Bradette-Laplante, M.; Lamarche, B.; Provencher, V.; Bégin, C.; Robitaille, J.; Desroches, S.;Vohl, M.C.; Corneau, L.; Lemieux, S. Development and Validation of the Food Liking Questionnaire in aFrench—Canadian Population. Nutrients 2017, 9. [CrossRef] [PubMed]
16. French, S.A.; Mitchell, N.R.; Finlayson, G.; Blundell, J.E.; Jeffery, R.W. Questionnaire and laboratory measuresof eating behavior. Associations with energy intake and bmi in a community sample of working adults.Appetite 2014, 72, 50–58. [CrossRef] [PubMed]
17. Pallister, T.; Sharafi, M.; Lachance, G.; Pirastu, N.; Mohney, R.P.; MacGregor, A.; Feskens, E.J.; Duffy, V.;Spector, T.D.; Menni, C. Food preference patterns in a uk twin cohort. Twin Res. Hum. Genet. 2015, 18,793–805. [CrossRef]
18. Frewer, L.J.; Risvik, E.; Schifferstein, H. Food, People and Society: A European Perspective of Consumers’ FoodChoices; Springer Science & Business Media: Berlin, Germany, 2013.
19. Popkin, B.M. Technology, transport, globalization and the nutrition transition food policy. Food Policy 2006,31, 554–569. [CrossRef]
20. Kosulwat, V. The nutrition and health transition in Thailand. Public Health Nutr. 2002, 5, 183–189. [CrossRef]21. Hawks, S.R.; Merrill, R.M.; Madanat, H.N.; Miyagawa, T.; Suwanteerangkul, J.; Guarin, C.M.; Chen, S.
Intuitive eating and the nutrition transition in Asia. Asia Pac. J. Clin. Nutr. 2004, 13, 194–203.22. Cicchetti, D.V. Guidelines, criteria, and rules of thumb for evaluating normed and standardized assessment
instruments in psychology. Psychol. Assess. 1994, 6, 284. [CrossRef]23. Deglaire, A.; Méjean, C.; Castetbon, K.; Kesse-Guyot, E.; Urbano, C.; Hercberg, S.; Schlich, P. Development of
a questionnaire to assay recalled liking for salt, sweet and fat. Food Qual. Prefer. 2012, 23, 110–124. [CrossRef]24. Prescott, J.; Bell, G. Cross-cultural determinants of food acceptability: Recent research on sensory perceptions
and preferences. Trends Food Sci. Technol. 1995, 6, 201–205. [CrossRef]25. Pagès, J.; Bertrand, C.; Ali, R.; Husson, F.; Lê, S. Sensory analysis comparison of eight biscuits by French and
Pakistani panels. J. Sens. Stud. 2007, 22, 665–686. [CrossRef]26. Vu, T.M.H.; Tu, V.P.; Duerrschmid, K. Gazing behavior reactions of vietnamese and austrian consumers to
austrian wafers and their relations to wanting, expected and tasted liking. Food Res. Int. 2018, 107, 639–648.[CrossRef] [PubMed]
72

Nutrients 2018, 10, 1957
27. Kim, Y.-K.; Jombart, L.; Valentin, D.; Kim, K.-O. Familiarity and liking playing a role on the perception oftrained panelists: A cross-cultural study on teas. Food Res. Int. 2015, 71, 155–164. [CrossRef]
28. Prescott, J.; Young, O.; Zhang, S.; Cummings, T. Effects of added “Flavour Principles” on liking and familiarityof a sheepmeat product: A comparison of Singaporean and New Zealand consumers. Food Qual. Prefer. 2004,15, 187–194. [CrossRef]
© 2018 by the authors. Licensee MDPI, Basel, Switzerland. This article is an open accessarticle distributed under the terms and conditions of the Creative Commons Attribution(CC BY) license (http://creativecommons.org/licenses/by/4.0/).
73


nutrients
Article
Relative Validity of a Food and Beverage PreferenceQuestionnaire to Characterize Taste Phenotypes inChildren Adolescents and Adults
Hannah Jilani 1,2, Hermann Pohlabeln 1, Stefaan De Henauw 3, Gabriele Eiben 4,
Monica Hunsberger 5, Dénes Molnar 6, Luis A. Moreno 7, Valeria Pala 8, Paola Russo 9,
Antonia Solea 10, Toomas Veidebaum 11, Wolfgang Ahrens 1,12, Antje Hebestreit 1,* and on behalf
of the IDEFICS and I.Family consortia
1 Leibniz Institute for Prevention Research and Epidemiology—BIPS, 28359 Bremen, Germany2 Institute for Public Health and Nursing Science, University of Bremen, 28359 Bremen, Germany3 Department of Public Health, Ghent University, B-9000 Ghent, Belgium4 Department of Biomedicine and Public Health, School of Health and Education, University of Skövde,
54128 Skövde, Sweden5 Department of Public Health and Community Medicine, University of Gothenburg, 40530 Gothenburg,
Sweden6 Department of Pediatrics, Medical School, University of Pécs, 7623 Pécs, Hungary7 GENUD (Growth, Exercise, Nutrition and Development) Research Group, Faculty of Health Sciences,
University of Zaragoza, 50009 Zaragoza, Spain8 Department of Research, Epidemiology and Prevention Unit, Fondazione IRCCS Istituto Nazionale dei
Tumori, 20133 Milan Italy9 Institute of Food Sciences, National Research Council, 83100 Avellino, Italy10 Research and Education Institute of Child Health, 2035 Strovolos, Cyprus11 Department of Chronic Diseases, National Institute for Health Development, 11619 Tallin, Estonia12 Institute of Statistics, Faculty of Mathematics and Computer Science, University of Bremen, 28359 Bremen,
Germany* Correspondence: [email protected]; Tel.: +49-421-218.56849
Received: 6 June 2019; Accepted: 23 June 2019; Published: 27 June 2019
Abstract: To assess the relative validity of our food and beverage preference questionnaire weinvestigated the association between sweet and fatty taste preference scores (assessed using a foodand beverage preference questionnaire) and sweet and fatty food propensity scores (derived froma food frequency questionnaire). In I.Family, a large European multi-country cohort study, 12,207participants from Cyprus, Estonia, Germany, Hungary, Italy, Spain and Sweden, including 5291 adults,3082 adolescents, and 3834 children, completed a food and beverage preference questionnaire with 63items. Cumulative preference scores for sweet and fatty taste were calculated from the single itemranking ranging from 1 to 5. The relative consumption frequency of foods classified as sweet and fattywas used to calculate the corresponding consumption propensities, a continuous variable rangingfrom 0 to 100. We conducted regression analyses to investigate the association between sweet andfatty taste preference scores and sweet and fatty food propensity scores, respectively, separately foradults, adolescents ≥12 years, and for children <12 years. The overall sweet taste preference score waspositively associated with the sweet food consumption propensity score (β = 2.4, 95% CI: 2.1;2.7) andthe fatty taste preference score was positively associated with the fatty food consumption propensityscore (β = 2.0, 95% CI: 1.8;2.2). After stratification for age (children <12 years, adolescents ≥12 years,and adults), the effect remained significant in all age groups and was strongest in adolescents andadults. We conclude that our food and beverage preference questionnaire is a useful instrument forepidemiological studies on sensory perception and health outcomes and for the characterization ofsensory taste phenotypes.
Keywords: taste preference questionnaire; validation; European children; adolescents; adults
Nutrients 2019, 11, 1453; doi:10.3390/nu11071453 www.mdpi.com/journal/nutrients75

Nutrients 2019, 11, 1453
1. Introduction
Methods to accurately measure sensory taste perception are often laborious. A high degree ofstandardization of the assessment method is a prerequisite for valid results. In large multi-countryepidemiological studies it is often not feasible to conduct sensory perception tests according tothe standards that can only be reached in a laboratory setting. As an alternative, taste preferencequestionnaires have previously been applied to investigate the association between taste preferencesand health outcomes [1–3]. Only one questionnaire, originally developed for French adults, has so farbeen developed for a large epidemiological study [4]. While the first part of the questionnaire assessesstandard taste preferences, it also assesses the liking of seasoning and whole dishes, for example, inlater parts. As this questionnaire is quite elaborate and includes many items that are specific to France,it might not be suitable for children and adolescents in general and also not for use throughout Europe.To date, no study has applied a food and beverage preference questionnaire in both children and theirparents at the same time.
The purpose of this study was to analyze the validity of data obtained using a food and beveragepreference questionnaire (FBPQ) developed in the context of I.Family, a large pan-European studycomprising children, adolescents, and adults. Determining the validity of the questionnaire will helpfurther the investigation of the association between taste preferences and health outcomes. To this endwe developed a FBPQ for children, adolescents, and adults and applied it in I.Family. As a measure ofthe relative validity of the questionnaire, we analyzed the association between self-reported sweet andfatty taste preferences assessed by the FBPQ and self-reported food consumption frequencies of sweetand fatty foods assessed by a food frequency questionnaire (FFQ).
2. Materials and Methods
I.Family is a large multi-country longitudinal cohort study and the follow-up study of the IDEFICS(Identification and prevention of Dietary- and lifestyle-induced health Effects in Children and infantS)study [5,6]. Between March 2013 and April 2014, all children that participated in the IDEFICS studywere invited to a follow-up examination together with their siblings and parents. In the sensory tasteperception module, we included all participants aged six years and above. This resulted in a studysample of 12,207 participants from Cyprus, Estonia, Germany, Hungary, Italy, Spain, and Sweden whocompleted the food and beverage preference questionnaire and provided all co-variables.
Each study center obtained ethical approval from its local institutional review board (e.g., CyprusNational Bioethics Committee, Nicosia, Cyprus; Tallinn Medical Research Ethics Committee, Tallinn,Estonia; Ethics Committee of the University of Bremen, Bremen, Germany; Egészségügyi TudományosTanács, Pécs, Hungary; Azienda Sanitaria Locale Avellino Comitato Etico, Avellino, Italy; RegionalaEtikprövningsnämnden i Göteborg, Gothenburg, Sweden; Comité Ético de Investigación Clínica deAragón, Zaragoza, Spain). Parents gave written informed consent for themselves and for their youngchildren (up to 11 years). Adolescents 12 years and older gave their own written informed consent. Allchildren were informed orally and gave their oral consent to participate in the study.
2.1. Food and Beverage Preference Questionnaire
Based on two existing tools, we developed an FBPQ suitable for assessment in children from theage of six years. One of the tools was administered to children and tested for reliability [7] and theother was administered to adults and internally validated [4]. A detailed description of the FBPQ hasbeen published elsewhere [8]. The questionnaire consisted of 63 pictures of single foods (e.g., banana,spinach), mixed foods (e.g., hot dog, kebab), condiments (e.g., jam, mayonnaise) and drinks (e.g., coke,lemonade). A pre-test was conducted in every country to ensure the feasibility of all food items acrosscountries and to find out how long participants would require to complete the questionnaire. The
76

Nutrients 2019, 11, 1453
estimated time for the completion of the food and beverage preference questionnaire was 7 min. Eachsubject ranked his/her own preference for the taste of the respective food or drink on a 5-point Likert(smiley-) scale, with 1 meaning “do not like at all” and 5 meaning “like very much”. Subjects couldindicate if they did not know or had never tasted a given food item.
Sensory Taste Preference Score
Cumulative preference scores for sweet, fatty, salty, and bitter tastes were calculated from thesingle item rankings, as described in a previous publication [8]. First, we excluded foods that wererated by less than 75% of the participants. Further, data of participants with more than 20 missing or“Never tried/Don’t know” answers were excluded. In principle, “Never tried/Don’t know” responseswere set to “missing”. A latent variable exploratory factor analysis was then conducted [9] to assessthe associations between foods and beverages. The age- and sex-specific factor analysis was conductedfor the strata boys <12 years, girls <12 years, boys ≥12 years, girls ≥12 years, and adults ≥18 years. Afood or drink item was considered to belong to a particular factor if the factor loading was greater than0.30 on the specific factor. Thereafter, a content analysis was conducted to assign the factors to the tastemodalities sweet, salty, fatty, and bitter (Table 1). Food and drink items with no load on one or more ofthe factors were not included in further analyses.
Table 1. Food and drinks representing the four taste modalities [8].
Boys <12 Years Girls <12 Years Boys ≥12 Years Girls ≥12 Years Fathers Mothers
Sweet
Milk chocolate X X X X X X
Chocolate bar X X X X X X
Lemonade X X X X X
Coke X X X X X X
Diet coke X X X X X
Donut X X X X X
Jam X X X X X
Honey X X X X X X
Plain croissant X X X X X
Chocolate croissant X X X X X
Cornflakes X X X X X X
Chocolate crispies X X X X X
Chocolate spread X X X X X X
Banana X X X X
Fruit yoghurt X X X X X X
Yoghurt X X X X X
Fruit juice X X X X X X
Chocolate pudding X X
Gateau X X X
Ice tea X
Ice cream X X
Water X
Wholemeal bread X
77

Nutrients 2019, 11, 1453
Table 1. Cont.
Boys <12 Years Girls <12 Years Boys ≥12 Years Girls ≥12 Years Fathers Mothers
Salty
Salt X
Salted nuts X X X X X X
Salted pistachios X X X X X X
Savoury biscuits X X X X X X
Salty sticks X x X X X X
Olives X
Feta X
Fatty
Hamburger X X X X X X
Hot Dog X X X X X X
Fried chicken X X X X X
Steak X X X
French fries X X X X X
Chips X X X X X
Sausage X X X X X X
Salami X X X X
Butter X X X X X X
Mayonnaise X X X X X
Milk X X X
Cream X X X X
Mashed potatoes X
Kebab X X X
Nachos X X
Chili sauce X X
Bitter
Broccoli X X X X X X
Spinach X X X X X X
Lettuce X X
Olives X X X
Lasagne X
Red cabbage X X
Sprouts X X
Asparagus X X
Grapefruit X
Steak X
Taste preference scores were calculated separately for each stratum, based on the mean liking ofthe foods and drinks assigned to each of the 4 taste modalities. To this end, the sum of the ratingsfor the foods and drinks was calculated and divided by the number of foods and drinks that wereincluded in the specific taste modality group. In the present analysis, only the sweet and fatty tastepreference scores were considered.
2.2. Food Frequency Questionnaire
In I.Family, each participant completed the adapted version of the validated [10,11] andreproducibility tested [12] FFQ used in the IDEFICS study. Parents completed the FFQ for children
78

Nutrients 2019, 11, 1453
below the age of 12 years as it has been shown that they might be unreliable reporters of theirdiet [13]. Parents and adolescents 12 years and older reported on their own diet. The FFQ contained59 items including 19 fatty items (fried potatoes, whole fat milk, whole fat yoghurt, fried fish, coldcuts/sausages, fried meat, fried poultry, fried eggs, mayonnaise and mayonnaise based products,cheese, chocolate- or nut-based spread, butter/margarine on bread, oil, nuts and seeds, salty snacks,savoury pastries, chocolate-based candies, cake/pudding/cookies, and ice cream) and 16 sweet items(fresh fruit with added sugar, fruit juices, carbonated sugar sweetened drinks, sugar sweeteneddrinks not carbonated, sweetened coffee, sweetened tea, sweetened or sugar added breakfast cereals,sweetened and/or flavored milk, sweetened and/or flavored yoghurt, jam, honey, chocolate or nut basedspreads, chocolate-based candies, non-fat candies, cake/pudding/cookies, and ice cream). The responsecategories were “1–3 times a week”, “4–6 times a week”, “1 time/day”, “2 times a day”, “3 times a day”and “Never/less than once a week”. The obtained answers were converted into weekly consumptionfrequency, ranging from 0 to 28. The weekly consumption frequencies of named fatty foods, sweetfoods, and of all foods included in the FFQ were summed up. The sweet and fatty food propensityscores in terms of the relative consumption frequency of named sweet or fatty foods were calculated.This was done by dividing the consumption frequency of the sweet and fatty foods by the consumptionfrequency of all foods included in the FFQ multiplied by 100. This resulted in a continuous variable,indicating the sweet and fatty food propensity scores ranging from 0% to 100% [14,15]. Thus, the scoresreflect the proportion of sweet and fatty foods in the whole diet. For example, a sweet propensityscore of 25 indicates that 1/4 of all food items consumed in one week were foods high in sugar. Asthe ultimate aim of the IDEFICS Study and I.Family was to investigate risk factors for child andadolescent health, such as obesity and to describe the obesogenic food environment and healthy orunhealthy food choices, the FFQ was designed to measure consumption frequency of obesogenic foods,which primarily contain sugar and fat. Hence, the FFQ was designed to allow the expression of theconsumption frequency of sweet and fatty foods rather than of bitter and salty foods and may beused to describe the tendency to choose sweet or fatty food alternatives over foods lower in sugaror fat. Whenever the FFQ contained a sweetened and an unsweetened alternative of a food group(e.g., sweetened vs. unsweetened milk products or sweetened fruits vs. unsweetened fresh fruits),the sweetened alternative was included in the food consumption propensity score. This was done todescribe the behavior to choose the sweetened alternative over the unsweetened alternative.
2.3. Questionnaires and Anthropometry
Self-completion questionnaires were used to assess age, sex, country of residence, and highestlevel of education. For each parent we categorized the highest educational level acquired according tothe International Standard Classification of Education (ISCED), ranging from 1 (low education) to 8(high education) [16]. For the present analysis, the education level was grouped into three categories;“low education” (ISCED level 0–2), “medium education” (ISCED level 3–5) and “high education”(ISCED level 6–8). The family affiliation was assessed using a kinship interview. Parents completedquestionnaires for themselves as well as for their children under the age of 12 years. Adolescents 12years and older completed the questionnaire on their own.
The height and weight of all participants were measured in a fasting state. The body mass index(BMI) was calculated for all participants and converted into age-and sex-specific z-scores for all childrenand adolescents [17]. For adults, the cut off of 25 kg/m2 was chosen to classify parents as overweight,including obese [18].
2.4. Statistical Analysis
We calculated the characteristics of the study sample separately for adults, adolescents ≥12 years,and for children < 2 years. For further descriptive analysis we categorized the sweet and fatty tastepreference score into 4 categories separately for sweet and fatty. In category 1 we assigned all tastepreference scores ranging from 1 to <2, in category 2 all taste preference scores ranging from 2 to <3,
79

Nutrients 2019, 11, 1453
in category 3 all taste preference scores ranging from 3 to <4 and in category 4 all taste preferencescores ranging from 4 to 5. After this, we calculated the mean, standard deviation, and lower andupper quartiles (p25, p75) for the sweet food propensity score (stratified by sweet taste preference scorecategories), as well as for the mean fatty food propensity score (stratified by fatty taste preference scorecategories) separately for adults, adolescents ≥12 years, and for children <12 years. We conductedregression analyses to investigate the association between sweet and fatty taste preference scores andsweet and fatty food propensity scores, respectively, separately for adults, adolescents≥12 years, and forchildren <12 years. This we did separately for adults, adolescents ≥12 years, and for children <12 years.In the regression model we included the sweet and fatty taste preference scores as non-categorizedindependent variables, whereas the sweet and fatty food propensity scores were considered as thedependent variables. We adjusted all models for sex, age, BMI (for children and adolescents: BMIz-score), highest education level, and country of residence as fixed factors and family affiliation as arandom factor. As associations between weight status and food intake have been described in previousstudies [19,20], it is important to conduct stratified analyses. Thus, we investigated data not only inthe full sample (including all individuals), but also separately for underweight and overweight/obeseparticipants. Further stratified analyses were performed according to sex, country, and education level.
All regression analyses were carried out using PROC MIXED (SAS version 9.3). Effect estimateswere presented with the corresponding 95% confidence intervals (95% CI) and p-values.
3. Results
The study sample consisted of 5291 adults, 3082 adolescents, and 3834 children. The mean ageof the total sample was 24.8 years and 40% were overweight or obese. The highest proportion ofparticipants was from Cyprus (21.5%) and the smallest from Spain (6.7%). The mean sweet andfatty taste preference scores for the total sample were 3.8 for each of the tastes. The mean sweetfood propensity score was 21.3 and the mean fatty food propensity score was 24.2. More detailedcharacteristics can be found in Table 2.
In Table 3 the mean sweet and fatty food propensity scores within each sweet and fatty tastepreference category are displayed separately for adults, adolescents ≥12 years, and for children <12years. The results show that the consumption of sweet and fatty foods generally increased as the sweetand fatty taste preference scores increased, respectively. It is only in children that the mean sweet andfatty food propensity scores in the lowest sweet and fatty preference score categories were higher thanin the other sweet and fatty preference score categories, respectively.
Table 3 shows the effect estimates of the association between sweet and fatty taste preferencescores and sweet and fatty food propensity scores, respectively, separately for adults, adolescents≥12 years and for children <12 years. A positive association could be seen for sweet and fatty taste inadults (sweet: β = 3.1, 95% CI: 2.7; 3.5, fatty: β = 2.3, 95% CI: 2.0; 2.6) and adolescents (sweet: β =3.0, 95% CI: 2.3; 3.6, fatty: β = 2.9, 95% CI: 2.4; 3.4). The association in children was weaker but stillpositive (sweet: 0.8, 95% CI: 0.3; 1.2, fatty: β = 0.5, 95CI: 0.1; 0.9). In the overall sample, the sweettaste preference score was positively associated with the sweet food propensity score (β = 2.4, 95% CI:2.1; 2.7) and the fatty taste preference score was positively associated with the fatty food propensityscore (β = 2.0, 95% CI: 1.8; 2.2). Further, the Table S1 (see supplement) shows the effect of all includedco-variables on the sweet and fatty food consumption frequencies.
80

Nutrients 2019, 11, 1453
Table 2. Characteristics of the study sample.
Adults n = 5291 Adolescents n = 3082 Children n = 3834 Total n = 12,207
Mean (SD)(p25; p75)
Mean (SD)(p25; p75)
Mean (SD)(p25; p75)
Mean (SD)(p25; p75)
Age 42.4 (5.8)(38.4; 46.2)
13.6 (1.0)(12.8; 14.0)
9.6 (1.6)(8.8; 10.8)
24.8 (15.9)(11.0; 41.0)
Sweet food propensity score 18.3 (11.5)(9.4; 25.5)
24.5 (11.1)(16.5; 31.1)
22.9 (10.3)(15.7; 29.0)
21.3 (11.3)(13.0; 28.4)
Fatty food propensity score 22.0 (9.1)(15.6; 28.2)
24.5 (9.1)(18.3; 30.1)
27.0 (8.9)(21.2; 32.5)
24.2 (9.3)(17.8; 30.2)
Sweet preference score 3.5 (0.7)(3.0; 4.0)
4.0 (0.6)(3.6; 4.4)
4.1 (0.6)(3.4; 4.6)
3.8 (0.7)(3.3; 4.4)
Fatty preference score 3.5 (0.8)(3.0; 4.0)
4.0 (0.6)(3.6; 4.4)
4.1 (0.6)(3.8; 4.6)
3.8 (0.7)(3.3; 4.4)
N (%) N (%) N (%) N (%)
Female 3490 (66.0) 1584 (51.4) 1896 (49.5) 7242 (57.0)
Overweight/obese 2988 (56.5) 857 (27.8) 1046 (27.3) 4891 (40.1)
All countries
Cyprus 1151 (21.8) 691 (22.4) 781 (20.4) 2623 (21.5)
Estonia 761 (14.4) 478 (15.5) 580 (15.1) 1819 (14.9)
Germany 834 (15.8) 466 (15.1) 550 (14.4) 1850 (15.2)
Hungary 988 (18.7) 434 (14.1) 512 (13.4) 1934 (15.8)
Italy 720 (13.6) 589 (19.1) 682 (17.8) 1991 (16.3)
Spain 346 (6.5) 168 (5.5) 306 (8.0) 820 (6.7)
Sweden 491 (9.3) 256 (8.3) 423 (11.0) 1170 (9.6)
Abbreviations: n = number, SD = standard deviation, p = percentile.
Stratified analyses by country, sex, weight status, and education level showed that the associationbetween taste preference scores and food propensity scores remained stable within the strata (Table 4).A few differences could be observed, however. When stratifying the regression analyses by sex, nodifferences were observed between female and male adolescents and adults. Among children, on theother hand, the association was stronger in girls than in boys. When stratifying the regression analysesby country, the associations were again present and positive in all countries for adolescents and adults.For children, the associations were not positive for sweet in Sweden and Hungary and for fatty in Italy,Estonia, and Sweden. When stratifying by weight status and education level, the same patterns asin the full sample could be seen. The association was present and positive in adolescents and adults.While the association was still positive for children, for the fatty taste it was no longer significant foroverweight children and children with parents with low/medium or high education.
81

Nutrients 2019, 11, 1453
Table 3. Mean sweet and fatty food propensity scores within sweet and fatty taste preference scoregroups and β estimates for the association between sweet and fatty taste preference scores and sweetand fatty food propensity scores.
Adults Adolescents Children Total
Sweet preference score category (range) Sweet propensity score (mean (SD)) (n)
1 (1–<2) 13.7 (12.1)(109)
17.7 (5.7)(6)
23.6 (11.9)(12)
14.8 (12.2)(127)
2 (2–<3) 15.3 (10.7)(1108)
21.2 (11.3)(181)
20.3 (9.7)(188)
16.6 (10.9)(1477)
3 (3–<-4) 18.3 (11.3)(2785)
23.1 (10.9)(1167)
22.3 (10.1)(1169)
20.3 (11.1)(5121)
4 (4–≤5) 21.1 (11.8)(1289)
25.8 (11.0)(1728)
23.5 (10.4)(2464)
23.6 (11.0)(5481)
β (95% CI) 1,2
p-value3.1 (2.7;3.5)p < 0.0001
3.0 (2.3;3.6)p < 0.0001
0.8 (0.3;1.2)p = 0.001
2.4 (2.1;2.7)p < 0.0001
Fatty preference score category (range) Fat propensity score (mean (SD)) (n)
1 (1–<2) 15.7 (8.0)(185)
16.8 (11.8)(6)
27.7 (10.2)(14)
16.5 (8.8)(205)
2 (2–<3) 19.7 (8.8)(1066)
20.1 (9.3)(183)
26.0 (9.2)(168)
20.5 (9.1)(1417)
3 (3–<4) 22.3 (8.9)(2553)
23.0 (8.8)(1156)
26.7 (9.1)(1087)
23.5 (9.1)(4796)
4 (4–≤5) 23.8 (9.1)(1487)
26.1 (8.9)(1737)
27.2 (8.7)(2565)
26.0 (9.0)(5789)
β (95% CI) 1,2
p-value2.3 (2.0;2.6)p < 0.0001
2.9 (2.4;3.4)p < 0.0001
0.5 (0.1;0.9)p = 0.02
2.0 (1.8;2.2)p < 0.0001
CI: Confidence interval; 1: Sweet and fatty preference scores entered the regression models as continuous variable;2: Regression models were adjusted for sex, age, BMI, highest education level, and country of residence as fixedfactors and family affiliation as random factor.
Table 4. Stratified results of the association between sweet and fatty taste preference and sweet andfatty food propensity scores (β estimates and 95% CI).
Adults Adolescents Children
Sweet food consumption score β (95% CI)
Male and Female3.1
(2.7;3.5)3.0
(2.3;3.6)0.8
(0.3;1.2)
Male2.8
(2.0; 3.6)2.7
(1.8; 3.6)0.4
(−0.1; 1.3)
Female3.1
(2.6; 3.6)3.2
(2.3; 4.2)0.8
(0.2; 1.5)
Under-/normal weight3.2
(2.6; 3.9)2.7
(1.9; 3.5)0.6
(0.1; 1.2)
Overweight/Obese2.9
(2.3; 3.4)3.4
(2.2; 4.7)1.0
(0.01; 2.0)
Low/mediumeducation level
2.9(2.3; 3.5)
3.2(2.3; 4.2)
1.0(0.3; 1.7)
Higheducation level
3.1(2.6; 3.7)
2.6(1.7; 3.6)
0.6(−0.0; 1.2)
82

Nutrients 2019, 11, 1453
Table 4. Cont.
Adults Adolescents Children
Fatty food consumption score β (95% CI)
Male and Female2.3
(2.0;2.6)2.9
(2.4;3.4)0.5
(0.1;0.9)
Male2.2
(1.7; 2.8)2.4
(1.6; 3.2)0.4
(−0.3; 1.0)
Female2.2
(1.8; 2.5)3.2
(2.6; 4.0)0.7
(0.1; 1.2)
Under-/normal weight2.6
(2.1; 3.0)3.0
(2.3; 3.6)0.7
(0.2; 1.1)
Overweight/Obese1.9
(1.5; 2.3)2.8
(1.8; 3.9)0.4
(−0.5; 1.3)
Low/mediumeducation level
2.3(1.9; 2.8)
2.8(2.0; 3.5)
0.4(−0.2; 1.1)
Higheducation level
2.1(1.6; 2.5)
3.1(2.4; 3.9)
0.5(−0.0; 1.0)
4. Discussion
Self-reported sweet and fatty taste preferences were positively associated with self-reported sweetand fatty food propensity scores, respectively, in children, adolescents, and adults. This indicates thattaste preferences are indeed associated with actual food choices; the higher the sweet or fatty preferencescore, the higher the sweet or fatty propensity score, respectively. Overall the consumption of sweetand fatty foods increased by 2% per unit increase of the sweet and fatty preference score category. Foradolescents and parents, the increase was 3% and for children it was between 0.5% and 1% per unitincrease. The strength of the association was strongest for adults and adolescents. The estimates forchildren 6 to 12 years old were weaker, suggesting that younger children consume food and drinkoffered at home by their parents. As parents act as gatekeepers with regard to the availability of foodand drink [21] children might not be able to consume only what their taste preferences would implybut rather what their parents want them to consume. This might have attenuated the investigatedassociation in the group of children. Our FBPQ may thus be considered as a useful instrument toprovide valid data on self-reported sweet and fatty taste preferences for multi-country epidemiologicalfield studies.
The questionnaire used in I.Family to assess taste preference in children, adolescents, and theirparents was developed on the basis of two existing tools. As no questionnaire for taste preferenceassessment in children, adolescents, and adults across Europe existed, there was a need to developand test the validity of the I.Family FBPQ. Two recent studies validated their food and beveragepreference questionnaires to administer to adults across two cultures; English and Arab [22] andAustralian and Thai [23]. Besides questionnaires for observation studies, food and beverage preferencequestionnaires were tested for reliability and validity both in a laboratory setting [24] and underfree-living conditions [24–26]. Thus, validated preference questionnaires exist, but the present studycontributes a validated questionnaire allowing for investigating associations between sensory tastepreferences and health outcomes, even in a cross-cultural setting including a wide range of age-groups.
As we had no objective measurement to validate the FBPQ, we used the self-reported foodconsumption frequencies for the validation. The validity of the FFQ itself could be questioned due tosocial desirability or recall bias and misclassification may potentially attenuate the observed associations.While we acknowledge the possible attenuation, we nevertheless believe that our FFQ provides usefulinformation since it has been previously validated [10,11] and tested for reproducibility [12].
83

Nutrients 2019, 11, 1453
In comparison to the FFQ, the FBPQ is a tool especially designed to assess taste preferences.It has been analyzed before and has been found to be applicable in children from the age of six yearsupward [8]. This instrument is easy to apply and faster to complete compared to an FFQ. Further, as itis not necessary to recall the diet of the previous month, it is likely to provide more robust informationwith regard to recall bias.
The confirmation of the relative validity of the FBPQ is important as the tool can be used in futurestudies to investigate additional aspects of taste preferences, such as the longitudinal developmentof taste preferences and possible associations with health outcomes in young European populations.With respect to so-called “upstream factors” of taste preference development, studies investigatingregional or temporal changes of determinants will also be able to make use of the present results.Further, the associations observed in this study will contribute toward the development of successfulinterventions, health programs, and policies aiming at improving the dietary behavior of children aswell as adolescents and adults.
Limitations and Strengths
Our study has some limitations that need to be addressed. The FFQ for children below the ageof 12 years was proxy-reported by the parents, hence social desirability potentially affected our data.Parents might have responded to the questions of the FFQ in a way they thought to be more sociallyacceptable. This might have led to an attenuation of the studied association. In addition, as the numberof children in the lowest sweet and fatty taste preference score category was very small, the calculationof sweet and fatty food propensity scores within those categories was based on very small numbers andwas thus not representative for this age-group. Despite this potential limitation, we are neverthelessconvinced that the results presented in the current paper provide important information for publichealth stakeholders, policy makers, and researchers.
In the present study, information on restrained eating could not be considered. This could possiblyhave led to an attenuation of our results regarding the association between taste preferences andfood consumption frequency. We obtained information on current dieting only for adolescents. In asensitivity analysis within the group of adolescents, we adjusted the regression analysis for currentlybeing on a diet and could see that the associations under investigation remained positive and significant.Unfortunately, we could not adjust the whole analysis for restrained eating, but the results of thesensitivity analysis suggest that this does not alter the investigated association.
Another limitation concerns the unequal distribution of the sexes within the group of adults,whereby the majority was female. The stratified results, however, showed no differences between menand women.
The strengths of our study are the large multi-country study sample and the broad age-rangeof participants. Due to the large study sample and the assessment of a broad range of health-relatedinformation, we were able to adjust the analysis for several covariates, such as sex, weight status,country, and education level. Further, we were even able to also include data of underweightand overweight/obese participants. In order to account for the bidirectional association betweenweight status and food consumption/energy intake, we analyzed the data stratified by weight status.The studied associations were positive and significant for under-/normal weight as well as foroverweight/obese participants. The finding, which was that the association for fatty taste was notsignificant in children, could be due to the fact that parents of overweight/obese children are morerestrictive with regard to sweet and fatty foods. This would then lead to the observed attenuation ofthe association between taste preferences and food consumption frequencies.
5. Conclusions
Although food choices are influenced by various factors, we were able to show a positiveassociation between sweet and fatty taste preferences, assessed via an FBPQ, and sweet and fattyfood propensity scores, assessed via a validated FFQ, in a large multi-country epidemiological cohort
84
Nutrients 2019, 11, 1453
study in children, adolescents, and adults. We conclude that our FBPQ is a valid instrument forepidemiological field studies aiming to characterize taste phenotypes.
Supplementary Materials: The following are available online at http://www.mdpi.com/2072-6643/11/7/1453/s1,Table S1: Estimates of fixed effect sizes with reference category in parentheses in relation to sweet and fatty foodconsumption frequencies in adults, adolescents and children.
Author Contributions: Conceptualization, W.A.; data curation, H.J. and V.P.; formal analysis, H.J. and H.P.;funding acquisition, W.A.; methodology, H.J., G.E., V.P., and A.H.; supervision, W.A. and A.H.; writing—originaldraft, H.J.; writing—review and editing, H.P., S.D.H., G.E., M.H., D.M., L.A.M., V.P., P.R., A.S., T.V., W.A., and A.H.
Funding: This work was done as part of the I.Family Study (http://www.ifamilystudy.eu/). We gratefullyacknowledge the financial support of the European Community within the Seventh RTD Framework ProgrammeContract No. 266044. The publication of this article was funded by the Open Access Fund of the Leibniz Association.
Acknowledgments: We gratefully acknowledge the participation of all children, adolescents and parents inour study.
Conflicts of Interest: The authors declare no conflict of interest.
References
1. Deglaire, A.; Méjean, C.; Castetbon, K.; Kesse-Guyot, E.; Hercberg, S.; Schlich, P. Associations betweenweight status and liking scores for sweet, salt and fat according to the gender in adults (The Nutrinet-SanteStudy). Eur. J. Clin. Nutr. 2015, 69, 40–46. [CrossRef] [PubMed]
2. Duffy, V.B.; Hayes, J.E.; Bartoshuk, L.M. Surveying food and beverage liking a tool for epidemiologicalstudies to connect. chemosensation with health outcomes. Int. Symp. Olfaction Taste 2009, 1170, 558–568.
3. Méjean, C.; Deglaire, A.; Kesse-Guyot, E.; Hercberg, S.; Schlich, P.; Castetbon, K. Association between intakeof nutrients and food groups and liking for fat (The Nutrinet-Santé Study). Appetite 2014, 78, 147–155.[CrossRef]
4. Deglaire, A.; Méjean, C.; Castetbon, K.; Kesse-Guyot, E.; Urbano, C.; Hercberg, S.; Schlich, P. Development ofa questionnaire to assay recalled liking for salt, sweet and fat. Food Qual. Prefer. 2012, 23, 110–124. [CrossRef]
5. Ahrens, W.; on behalf of the IDEFICS consortium; Bammann, K.; Siani, A.; Buchecker, K.; De Henauw, S.;Iacoviello, L.; Hebestreit, A.; Krogh, V.; Lissner, L.; et al. The IDEFICS cohort: Design, characteristics andparticipation in the baseline survey. Int. J. Obes. 2011, 35, S3–S15. [CrossRef] [PubMed]
6. Ahrens, W.; Siani, A.; Adan, R.; De Henauw, S.; Eiben, G.; Gwozdz, W.; Hebestreit, A.; Hunsberger, M.;Kaprio, J.; Krogh, V.; et al. Cohort Profile: The transition from childhood to adolescence in Europeanchildren–How I. Family extends the IDEFICS cohort. Int. J. Epidemiol. 2017, 46, 1394–1395. [CrossRef][PubMed]
7. Vereecken, C.; Covents, M.; Parmentier, J.; Maes, L. Test-retest reliability and agreement between children’sand parents’ reports of a computerized food preferences tool. Public Health Nutr. 2013, 16, 8–14. [CrossRef]
8. Jilani, H.S.; on behalf of the I.Family Consortium; Intemann, T.; Bogl, L.H.; Eiben, G.; Molnar, D.; Moreno, L.A.;Pala, V.; Russo, P.; Siani, A.; et al. Familial aggregation and socio-demographic correlates of taste preferencesin European children. BMC Nutr. 2017, 3, 87. [CrossRef]
9. Wardle, J.; Sanderson, S.; Gibson, E.L.; Rapoport, L. Factor-analytic structure of food preferences infour-year-old children in the UK. Appetite 2001, 37, 217–223. [CrossRef]
10. Bel-Serrat, S.; Mouratidou, T.; Pala, V.; Huybrechts, I.; Börnhorst, C.; Fernandez-Alvira, J.M.; Molnar, D.Relative validity of the Children’s Eating habits questionnaire—Food frequency section among youngEuropean children: The IDEFICS Study. Public Health Nutr. 2014, 17, 266–276. [CrossRef]
11. Huybrechts, I.; Börnhorst, C.; Pala, V.; Moreno, L.A.; Barba, G.; Lissner, L.; Ottevaere, C. Evaluation of thechildren’s eating habits questionnaire used in the IDEFICS study by relating urinary calcium and potassiumto milk consumption frequencies among European children. Int. J. Obesity 2011, 35, S69–S78. [CrossRef][PubMed]
12. Lanfer, A.; Hebestreit, A.; Ahrens, W.; Krogh, V.; Sieri, S.; Lissner, L.; Papoutsou, S. Reproducibility of foodconsumption frequencies derived from the children’s eating habits questionnaire used in the IDEFICS study.Int. J. Obesity 2011, 35, S61–S68. [CrossRef] [PubMed]
13. Livingstone, M.B.E.; Robson, P.J. Measurement of dietary intake in children. Proc. Nutr. Soc. 2000, 59,279–293. [CrossRef] [PubMed]
85

Nutrients 2019, 11, 1453
14. Arvidsson, L.; IDEFICS consortium; Eiben, G.; Hunsberger, M.; De Bourdeaudhuij, I.; Molnar, D.; Jilani, H.;Thumann, B.; Veidebaum, T.; Russo, P.; et al. Bidirectional associations between psychosocial well-being andadherence to healthy dietary guidelines in European children: prospective findings from the IDEFICS study.BMC Public Heal. 2017, 17, 926. [CrossRef]
15. Jilani, H.S.; Pohlabeln, H.; Buchecker, K.; Gwozdz, W.; De Henauw, S.; Eiben, G.; Molnar, D.; Moreno, L.A.;Pala, V.; Reisch, L.; et al. Association between parental consumer attitudes with their children’s sensory tastepreferences as well as their food choice. PLoS ONE 2018, 13, e0200413. [CrossRef] [PubMed]
16. UNESCO. International Standard Classification of Education 2012. Available online: http://uis.unesco.org/sites/default/files/documents/international-standard-classification-of-education-isced-2011-en.pdf (accessedon 7 February 2019).
17. Lobstein, T.; Cole, T.J. Extended international (IOTF) body mass index cut-offs for thinness, overweight andobesity. Pediatr. Obes. 2012, 7, 284–294.
18. Organisation, W.H. The International Classification of Adult Underweight, Overweight and ObesityAccording to BMI 2004. Available online: http://apps.who.int/bmi/index.jsp?introPage=intro_3.html(accessed on 18 December 2018).
19. Boonchoo, W.; Takemi, Y.; Hayashi, F.; Koiwai, K.; Ogata, H. Dietary intake and weight status of urban Thaipreadolescents in the context of food environment. Prev. Med. Rep. 2017, 8, 153–157. [CrossRef] [PubMed]
20. Vieira-Ribeiro, S.; Andreoli, C.; Fonseca, P.; Hermsdorff, H.M.; Pereira, P.; Ribeiro, A.; Priore, S.; Franceschini, S.Dietary patterns and body adiposity in children in Brazil: A cross-sectional study. Public Heal. 2019, 166,140–147. [CrossRef] [PubMed]
21. John, D.R. Consumer socialization of children: A retrospective look at twenty-five years of research. J. Consum.Res. 1999, 26, 183–213. [CrossRef]
22. A Alkahtni, S.; Dalton, M.; Abuzaid, O.; Obeid, O.; Finlayson, G. Validation of the leeds food preferencequestionnaire in Arabs. Asia Pac. J. Clin. Nutr. 2016, 25, 257–264. [PubMed]
23. Wanich, U.; Sayompark, D.; Riddell, L.; Cicerale, S.; Liem, D.G.; Mohebbi, M.; Macfarlane, S.; Keast, R.Assessing food liking: Comparison of food liking questionnaires and direct food tasting in two cultures.Nutrients 2018, 10, 1957. [CrossRef] [PubMed]
24. Ledikwe, J.H.; Ello-Martin, J.; Pelkman, C.L.; Birch, L.L.; Mannino, M.L.; Rolls, B.J. A reliable, validquestionnaire indicates that preference for dietary fat declines when following a reduced-fat diet. Appetite2007, 49, 74–83. [CrossRef] [PubMed]
25. Carbonneau, E.; Bradette-Laplante, M.; Lamarche, B.; Provencher, V.; Bégin, C.; Robitaille, J.; Desroches, S.;Vohl, M.-C.; Corneau, L.; Lemieux, S. Development and validation of the food liking questionnaire in aFrench-Canadian population. Nutrients 2017, 9, 1337. [CrossRef] [PubMed]
26. Zoghbi, M.; Stone, A.; Papsavas, P.; Swede, H.; Hubert, P.; Tisher, D.; Duffy, V.B. Evaluating taste preferencesand dietary quality with a simple liking survey: Application in bariatric treatment settings. Bariatr. Surg.Pract. Patient Care 2017, 14, 41–48. [CrossRef]
© 2019 by the authors. Licensee MDPI, Basel, Switzerland. This article is an open accessarticle distributed under the terms and conditions of the Creative Commons Attribution(CC BY) license (http://creativecommons.org/licenses/by/4.0/).
86

nutrients
Review
A Biopsychosocial Model of Sex Differences inChildren’s Eating Behaviors
Kathleen L. Keller 1,2,*, Samantha M. R. Kling 1, Bari Fuchs 1, Alaina L. Pearce 1,
Nicole A. Reigh 1, Travis Masterson 3 and Kara Hickok 1
1 Department of Nutritional Science, The Pennsylvania State University, University Park, PA 16802, USA;[email protected] (S.M.R.K.); [email protected] (B.F.); [email protected] (A.L.P.); [email protected] (N.A.R.);[email protected] (K.H.)
2 Department of Food Science, The Pennsylvania State University, University Park, PA 16803, USA3 Department of Epidemiology, Geisel School of Medicine at Dartmouth College, Hanover, NH 03756, USA;
[email protected]* Correspondence: [email protected]; Tel.: +1-814-863-2915; Fax: +1-814-863-6103
Received: 17 January 2019; Accepted: 19 March 2019; Published: 22 March 2019
Abstract: The prevalence of obesity and eating disorders varies by sex, but the extent to which sexinfluences eating behaviors, especially in childhood, has received less attention. The purpose of thispaper is to critically discuss the literature on sex differences in eating behavior in children and presentnew findings supporting the role of sex in child appetitive traits and neural responses to food cues.In children, the literature shows sex differences in food acceptance, food intake, appetitive traits,eating-related compensation, and eating speed. New analyses demonstrate that sex interacts withchild weight status to differentially influence appetitive traits. Further, results from neuroimagingsuggest that obesity in female children is positively related to neural reactivity to higher-energy-densefood cues in regions involved with contextual processing and object recognition, while the oppositewas found in males. In addition to differences in how the brain processes information about food,other factors that may contribute to sex differences include parental feeding practices, societalemphasis on dieting, and peer influences. Future studies are needed to confirm these findings, as theymay have implications for the development of effective intervention programs to improve dietarybehaviors and prevent obesity.
Keywords: sex differences; eating behavior; food intake; biopsychosocial; children; brain imaging
1. Introduction
Sex and gender are important characteristics that contribute to individual variability in thedevelopment of disordered eating and obesity, but the extent to which they impact eating behaviorsin children is less clear. It has been assumed that sex differences in eating behavior arise inadolescence because of the physiological changes and sociocultural pressures experienced duringthis developmental period. Prior to adolescence, sex-based influences on eating behavior have beenthought to be minimal. However, there are both biological (e.g., sexual dimorphic patterns of inutero neural development and genetics) and psychosocial (e.g., parental feeding practices and societalbody ideals) factors that may affect the way children eat prior to puberty. Despite these potentialinfluences, this period of development has received little attention in the literature. Because of thesex differences that occur in the prevalence of both disordered eating [1–3] and obesity [4,5], there isa need to understand the role of sex in the development of behaviors involved with the etiology ofthese diseases prior to puberty. To call attention to this gap, this paper reviews the extant literatureand presents new data demonstrating that sex differences in eating behavior arise prior to puberty andhave effects on children’s appetitive traits and neural responses to food cues.
Nutrients 2019, 11, 682; doi:10.3390/nu11030682 www.mdpi.com/journal/nutrients87
Nutrients 2019, 11, 682
The National Academy of Sciences has outlined rationale for when sex differences should bestudied [6]. Several of their criteria apply to eating and weight disorders and therefore are relevantto the current paper. The first criterion is if there are known sex differences in the prevalence orincidence of a disease. Eating disorders occur nearly eight times more frequently in females thanmales [1–3]. At the same time, data from the National Health and Nutrition Examination Survey(NHANES) show across all age groups a higher prevalence of obesity among male children comparedto females [7]. These striking statistics provide support for studying the role of sex in eating behaviorsbecause they are integral to the development of these conditions. Another criterion outlined in thisreport is if there are known sex differences in disease severity, progression, or outcome. In the caseof obesity, there are well-described differences in body composition, with adult males carrying fataround the abdomen and chest (i.e., visceral adipose tissue), which is associated with higher metabolicrisk, while some pre-menopausal adult females are metabolically protected by accumulating fat inthe lower extremities [8,9]. In addition, males tend to have more fat free mass than females. Thesedifferences are present in infancy [10–12] and persist throughout development, becoming more robustat puberty [13]. Furthermore, symptomology associated with binge eating (i.e., frequency and level ofdistress) is more severe in females relative to males [14]. A final criterion suggested in the report is ifsex influences the success or outcome of interventions [6]. In both children [15] and adults [16], malestend to be more responsive to weight loss interventions than females. With the potential promiseof personalized medicine for treatment of complex diseases such as obesity, understanding how sexinfluences response to treatment could highlight novel therapies that could specifically be targeted tomales or females.
Before reviewing the literature, it is worth noting that much of the research in this area has notdistinguished between the constructs of “sex” and “gender”. Sex refers to the biological classificationof male or female according to chromosomes and reproductive organs. Gender, on the other hand,refers to one’s self-representation, which is influenced by sociological and cultural factors [17]. Oftenone’s biological sex matches with self-assigned gender, but this is not always the case. The multitude offactors influencing both sex and gender have made the study of individual differences between malesand females complicated. Because we are applying a biopsychosocial framework to describing howsex influences eating behavior, we include discussion of biological factors more likely to influence sexand social and psychological factors more likely to influence gender. However, as most prior studiesdo not clarify whether they distinguished between the two constructs when collecting participant data,it is not possible to make clear distinctions about how the terminology is used when referring to thesestudies. To avoid switching between “sex” and “gender” throughout the paper, we use the term “sex”as a combined term that includes not only biological, but also social and psychological influences.
The goal of this paper is to present evidence that sex influences eating behaviors in childhoodand to examine the source of these influences using a biopsychosocial framework. In the last sectionof the paper, we present new data analyses that have been informed by the biopsychosocial model.This paper is not intended to be a systematic review, but rather is a starting point for framing researchquestions that can systematically address the role of sex in childhood eating behavior. To supportthe argument that sex differences in childhood eating behavior are relevant to the development ofeating and weight-disorders, we have selectively focused on some aspects of eating behavior (i.e., foodacceptance, food intake, picky eating, appetitive traits, eating compensation, eating in the absence ofhunger, and meal-specific microstructural patterns (e.g., bite rate and eating speed)). However, otherimportant contributors to eating behavior that may not as directly impact risk for eating and weightdisorders (e.g., oral sensory responses and olfactory sensations) have been omitted. Additionally,to avoid the inclusion of effects on eating behavior that could be influenced by the physiological andhormonal events related to puberty, to the extent possible, the literature review focuses on children age11 years and younger, although it is recognized that this may not fully eliminate pubertal influences.However, due to the paucity of evidence in some sections, we have included a few studies that reporton an age range beyond 11 years, although we recognize that the results may be influenced by pubertal
88

Nutrients 2019, 11, 682
development. Within the age group of children discussed, infants are defined as <1 year, toddlers as1–2 years, preschool children as 3–5 years, and middle childhood as 6–11 years.
2. Evidence for Sex Differences in Children’s Eating Behavior
The first part of the paper provides an overview of the available literature to support the roleof sex in childhood eating behaviors. This section is divided into studies that have examined sexdifferences in food acceptance, food intake, appetitive traits, eating-related compensation, eating in theabsence of hunger, and meal-specific microstructure.
2.1. Sex Differences in Food Acceptance/Preference
The literature has consistently shown sex differences in children’s food acceptance and preferencepatterns, particularly for foods that impact weight status and overall dietary quality (i.e., fruits,vegetables, proteins, etc.). For food acceptance patterns, Cooke and colleagues [18] found that females(ages 4–7 years) liked a greater number of foods than male children. With regards to specific foods orfood groups, studies including children from various countries have shown that females rate liking offruits [18–21] and vegetables [18–24] higher than males, while male children report higher liking formeat, fish, poultry, and high-fat foods compared to females [18–20,25]. Furthermore, male childrenin middle childhood have higher acceptance of fatty and sugary foods [18] and foods and beveragescharacterized as “unhealthy” (e.g., sweet snacks, savory snacks, and sugar sweetened beverages)compared to female children [20]. Additionally, females in middle childhood show increased liking forvegetables [22] while males have greater liking for meat products [18].
While the aforementioned studies demonstrate sex differences in food acceptance in middlechildhood, studies in toddlers and preschool-aged children have shown no differences [26,27].However, it is not clear if null findings are in part due to a lack of sensitivity in the methods availableto measure liking in preschool children (i.e., hedonic facial scales and parental report). These resultsdemonstrate that. in middle childhood, females typically like or prefer foods that are often regarded aslower in energy and nutrient dense, such as fruits and vegetables, whereas males tend to like meats,meat products, and foods high in fat and sugar. The sensory and/or nutritional characteristics of thefoods that drive these sex-effects are not known.
2.2. Sex Differences in Dietary Patterns
As liking and preference are primary determinants of what children eat [28,29], it is likely thatsex also influences children’s dietary intake. This is especially apparent for fruits and vegetables [28].In children as young as two years, intake of vegetables [30–33], fruits [24,31,32,34] and fruits andvegetables combined [31,35–37] is higher among females than males. Female children have similarlyreported greater intake of foods classified as “healthy” and lower intake of “unhealthy” foods whencompared to males [32]. Since these studies used self- and parentally-reported measures of food intake,there is potential for response bias as fruit and vegetable intake is a socially desirable behavior.However, studies using more objective assessment methods in schools have also observed thatfemale students are more likely to consume from a salad bar than males [38,39]. The alignmentwith observational data strengthens the findings from questionnaires, suggesting that female childrentend to consume more fruits and vegetables than males.
In addition to fruits and vegetables, self-reported intake of other foods and food groups alsovaries by sex. In cohorts of European children, males report consuming more sugar and sweets [36,40],breakfast cereals, full-fat milk, meats/meat products, and baked beans while females consumed moreoily fish, eggs, and cheese [36]. In the United States, male children tend to have higher intake of mostfood groups, as well as higher overall energy intake [37,41], although overall variety of foods consumedtends to be higher in females [42]. This finding supports the previously discussed observations thatfound females also liked a greater number of foods than male children [18]. Although these studiesprovide support for the notion that sex differences in eating behavior arise in childhood, not all
89

Nutrients 2019, 11, 682
studies agree [27,43]. Inconsistencies across studies could be due to variability in how dietary intake ismeasured (e.g., 24-h recall, food frequency, and direct observation), who is reporting dietary intake(e.g., parent vs. child), and the age and cognitive abilities of the child being studied [44]. There is a needto conduct more observational studies where food intake is directly measured to confirm sex-effects onreported intake in children.
2.3. Sex Differences in Questionnaire Measures of Appetitive Traits
The literature reviewed in the preceding sections on both food acceptance and intake supports thenotion that female children like and consume more foods that are typically thought to be protectiveagainst excess weight, e.g. fruits and vegetables. However, these associations between sex andliking/preference do not provide insight into why females are at greater risk for eating and weightdisorders. An additional possibility is that females differ from males in appetitive traits that mightmake them more susceptible to eating in response to external food cues or less susceptible to feedbackfrom internal satiety cues. In the following section, evidence for sex differences in parentally reportedmeasures of eating behaviors and appetitive traits are presented.
2.3.1. Picky Eating
Picky eating is commonly observed in young children [45] and is associated with lowerconsumption of fruits and vegetables [30,46]. In the literature, picky eating has been conceptualizedby two related constructs: (1) food neophobia, which is the rejection of novel or unknown foods;and (2) food fussiness, which is the rejection of many known, familiar foods. Whether the prevalenceof picky eating differs by sex is unclear. No sex differences were evident for picky eating, moregenerally, in a sample of Canadian preschool-aged children [47] or in a review of studies in toddlers(≤30 months) [45]. For food neophobia, a study in French toddlers found males to have higherneophobia than females [48], however, other studies did not find sex differences [49,50]. In contrast,food fussiness, an eating trait assessed with the Children’s Eating Behavior Questionnaire (CEBQ) [51],has shown more consistent sex differences, however, the pattern of results is inconsistent. Males havebeen reported as fussier eaters than females in a cohort of 2–7-year-olds from the United Kingdom [23]and in 6–7-year-olds from the Netherlands [52], while, in toddlers from China, females were reportedto be fussier eaters [53]. In general, there appears to be greater evidence for picky eating in malesthan females, but the inconsistent findings emphasize the need to delineate the underlying constructs,examine potential confounding factors (e.g., parental characteristics, and child age and temperament),and have appropriately powered samples (i.e., not over or under powered).
2.3.2. Appetitive Traits
Other studies have investigated whether there are sex differences among other appetitive traitsassessed by the CEBQ [51]. Using this instrument, some investigators have divided appetitivetraits into those related to food avoidance (i.e., slowness in eating, satiety responsiveness, emotionalundereating, and food fussiness) and those related to food approach (i.e., enjoyment of food, foodresponsiveness, desire to drink, and emotional overeating) [51]. Higher scores on food approachrelated subscales and lower scores on food avoidant related subscales have been positively associatedwith weight status in children [46,54–56]. While generally most studies have not shown systematicdifferences in appetitive traits between male and female children, a few studies have reported sexdifferences. For example, in a cohort study of middle childhood, males from Thailand had greaterenjoyment of food than females [57], however the opposite was found in a cohort of 6–7-year-oldDutch children (i.e., females higher than males) [52]. When looking more broadly across appetitivetraits, male children showed greater desire to drink [57], emotional overeating [52], and foodresponsiveness [53]. In contrast, females showed greater avoidance behaviors (e.g., slowness ofeating and satiety responsiveness) [46,58].
90

Nutrients 2019, 11, 682
Evidence of greater food approach behaviors among male compared to female children may bein part due to differential parent feeding strategies that reinforce these behaviors. Mothers of femalechildren report greater concern about them putting on weight [59], and therefore they may encouragegreater food avoidant strategies. On the other hand, male children receive greater encouragement toeat [60,61] and are served larger portion sizes from a virtual buffet than female children [62]. Thesedomain-specific parenting strategies [63] may encourage the development of more avid appetitesamong males and more food avoidant strategies among females. Therefore, it is critical for futurestudies to take into account the role of parents in the development of eating behaviors in malesand females.
2.4. Evidence of Sex-Effects on Laboratory Measures of Self-Regulatory Eating
The literature reviewed in the previous section indicates few systematic sex differences inparent-reported measures of children’s appetite. While questionnaires are convenient for capturing anoverview of child behaviors, responses may be affected by the biases parents have about feeding maleversus female children. Objective measures are necessary to provide additional support for the roleof sex in childhood eating behaviors. In the following section, results are reviewed from studies thathave used laboratory methods to characterize “self-regulatory eating”, broadly defined in this contextas the ability to regulate energy consumption in response to internal or external signals.
2.4.1. Compensation Protocols
One of the most frequently used methods to assess self-regulatory eating is the compensationor preloading paradigm. Using a crossover design, children consume appetizers or “preloads” ontwo separate visits. Preloads are matched for taste, sensory characteristics, and often volume, but arecovertly manipulated to vary in energy density (kcal per weight or volume of food or beverage)and/or macronutrient content. Participants are compelled to finish the preload and are served anad libitum meal some time later (often 25–30 min with children) to measure consumption. Childrenwho have “good” energy compensation can adjust their intake at the subsequent meal based on theenergy content of the preload [64,65]. Poorer compensation ability has been associated with higherweight status in children [66–68], suggesting that performance on this measure may generalize toeating regulation more broadly. Several studies that have used this protocol in preschool childrenfound that males have better energy compensation than females [66,67,69,70], which is consistentwith some studies in adults [71,72]. Notably, other studies in preschool children do not report sexdifferences [73–77] and the individual variability in this measure is poorly understood. Of note, all thestudies that have found that males compensate better than females have used beverages as a preload,raising the possibility that sex differences in energy compensation may be specific to the ability toregulate calories in liquid rather than solid form.
The notion that sex differences around eating self-regulation are specific to beverages is furthersupported by studies that have tested the effect of varying the energy density of a beverage servedwithin a meal. Whereas the traditional preloading study measures “satiety” by testing the extentto which a preload or snack delays hunger at the following meal, serving a beverage within a mealcaptures “satiation” by determining the effect of varying energy content on total meal intake. Kling andcolleagues [78] tested the effect of varying the energy density (ED) of milk on satiation by conductinga crossover study where either lower—(1% fat) or higher—(3.25% fat) ED milk was served to childrenwith a typical preschool meal served in a childcare setting. When the higher-ED milk was served, malesdecreased their intake of the other meal items, whereas females did not. Thus, compared to males,females were less accurate at adjusting their intake to account for additional energy consumed fromthe higher-ED milk. These sex differences were independent of possible confounders, including thetype of milk children consumed at home, child age and body size, milk liking and preference ratings,children’s appetitive traits, and parent feeding practices. The pattern of sex differences observed inboth satiety and satiation studies challenges the notion that compensatory responses are solely due to
91

Nutrients 2019, 11, 682
the delay between the preload and subsequent meal that allows for the release of sensory and nutrientsignals that influence fullness.
2.4.2. Eating in the Absence of Hunger
Eating in the absence of hunger (EAH) is a standard paradigm to assess hedonic eating [79–81].It is thought to be stable through childhood [82], and is considered a phenotypic characteristic ofchildhood obesity [83]. Studies in preschoolers [75,83] and middle childhood [84] have found greatereating in the absence of hunger in males compared to females. However, in 5–18-year-old Hispanicchildren from the United States, sex differences did not persist after adjusting for energy needs [85].Although individual differences in EAH may be partially driven by child energy needs, there isevidence that sex may moderate the relationship between EAH and outcomes such as child weightstatus [68,84,86,87], parental dieting characteristics, and feeding practices [80,86]. For example, somematernal behaviors such as dietary disinhibition [86] and restriction [88] are more predictive of EAH infemales than in males. On the other hand, greater use of pressure to eat has been found to be a strongerpredictor of EAH in males than in females [89,90]. These findings highlight the need to model therelationships between child level (i.e., sex and weight status) and parent level (i.e., feeding practices,eating styles, sex, and weight status) variables to elucidate the pathways leading to excess energyconsumption in males and females.
2.4.3. Meal-Related Microstructure
Although not specifically related to the ability to regulate food intake, some investigators havereferred to eating behaviors that make up meal microstructure (e.g., bite rate, eating rate, and bitesize) as indicators of satiety responsiveness [91]. Of these characteristics, eating rate has been mostconsistently associated with weight status in adults [92] and children [93], and is therefore a target forinterventions to treat obesity [94]. Observational coding of meal-time behaviors in the GUSTO cohortfrom Singapore showed that male children have faster eating rate (g/min), larger bite size (g/bite),and shorter oral exposure (min) than female children [95]. Similar findings have been reported inadolescents [96,97]. As masticatory development has been thought to be similar in males and femalesbefore puberty [98], it is unlikely that faster eating speed among male children can be attributed tostronger muscular force supporting the jaws. It has also been reported that eating rate has a geneticcomponent, which may help to shed light on these differences [99]. While the research in this area islimited, the observation of sex differences in eating speed and oral processing time prior to pubertyhas implications for the development of personalized interventions to reduce overeating in malesand females.
In addition to the aforementioned paradigms, other measures have been considered to assessself-regulatory eating in children, for example measuring children’s intake in response to manipulationsin food portion size [100,101], energy density [102], or self-serving conditions [103]. To the best of ourknowledge, sex differences have not been observed in self-regulatory eating using these assessments,thus they are not discussed further in this paper.
While there is a lack of investigations that have included sex as a primary determinant of eatingbehaviors, the studies reviewed are suggestive of male–female differences in food liking and intake,appetitive traits, self-regulatory eating, and meal-related microstructure. In addition, there is evidencethat child weight status may moderate the relationship between sex and eating in the absence ofhunger. Since these differences could impact the success of dietary and behavioral interventions [15],additional research focused on clarifying the pathways by which eating behaviors develop in malesand females is needed.
3. Biopsychosocial Contributions to Sex Differences
This section explores possible mechanisms for the observed sex differences in children’s eatingbehaviors. The scope of the discussion has been limited to: (1) neural responses to food cues (a potential
92

Nutrients 2019, 11, 682
biological influence); (2) body image and weight concerns (potential psychological influences); and (3)parental feeding attitudes and practices (potential social influences). Additional potential influenceswithin these biological, psychological, and social constructs are presented in Figure 1, but are notexplored at length in this paper. For additional insight on mechanistic pathways in the developmentof childhood eating behaviors, the reader is directed to recent reviews [104,105].
In addition to serving as a framework for presenting potential mechanisms that influence thedevelopment of eating behaviors in males and females, the biopsychosocial model can help guidethe planning of new studies. The model can provide insight to help in the generation of newhypotheses that can be tested to further understanding of how eating behaviors develop in males andfemales. In addition, it can inform the types of questionnaires and measures that should be includedwhen planning a study and can suggest potential interactions between variables to query duringstatistical analyses.
Figure 1. Biopsychosocial model of sex effects on children’s eating behaviors. Potential biologicalinfluences could come from differences in brain anatomy or brain function that arise early indevelopment, effects due to sex chromosomes, temperament, genes, or differences in body compositionand/or weight status that can influence food intake regulation. Psychological influences include bodyimage concerns, dieting, and cognitive restraint and disinhibition, typically observed more frequentlyin females than males. Social influences include differences in parental feeding practices directed atmales and females, parental dieting, peer influences, and societal emphasis on “thinness” in femalesand “bigness” in males.
3.1. Neural Differences in the Response to Food Cues
One potential contribution to differences in eating behavior between male and female children isvariation in neural processing of food cues. Food cues elicit responses in brain regions implicated inexecutive function, subjective valuation (e.g., orbitofrontal cortex), and visual processing (e.g., fusiformgyrus) [106] that are correlated with eating behaviors [107,108]. Several studies have observed sexdifferences in neural response to food cues. For example, in adult samples that have used functionalmagnetic resonance imaging (fMRI) to assess food cue reactivity, females show greater activationthan males in a number of brain regions associated with executive function (i.e., dorsolateral andventromedial prefrontal cortex) [109,110], visual processing [111] (e.g., fusiform gyrus), taste andinteroceptive processing [111] (e.g., insula), and reward (e.g., caudate) [112]. To date, only one studyhas reported sex differences in children, although the findings contradict those from adults. Luo andcolleagues [113] found that, compared to females, 7–11-year-old males had greater activation to food
93

Nutrients 2019, 11, 682
relative to non-food images in the right posterior hippocampus and temporal occipital fusiform cortex,regions implicated in memory and visual processing. To date, the developmental trajectory of neuralresponse to food cues remains unclear, making it difficult to interpret the inconsistent patterns of sexdifferences between adult and child samples.
3.2. Body Image and Weight Concerns
From a young age, individual differences in eating behaviors may in part be driven by sexdifferences in perceived ideal and preferred body size. Sex differences in dieting and body imageconcerns have been consistently documented in children as young as eight years [114]; however,differences in younger children are less consistent [114–116]. Compared to males, school-aged femalesreport higher levels of weight-related behaviors and concerns, including desire to lose weight [117],dieting behavior [115], level of worry about weight and thoughts about which foods might promoteweight gain [115,118,119], and feelings of guilt over eating too much [118]. Females also tend to be moredissatisfied with their bodies [116,117,120–122] and have lower self-esteems [121,123,124]. By eightyears of age, females have greater body dissatisfaction than males [114,116–118,122,124,125] and thistends to increase during middle childhood [124]. Overall, greater emphasis on the maintenance of anideal body weight in females than males may encourage sex differences in eating behaviors that areadopted to achieve “the perfect figure”.
3.3. Parental Feeding Styles and Practices
The greater emphasis on “thinness” as a cultural ideal in females likely encourages sex differencesin parental feeding practices and attitudes directed at children. In general, parents are more concernedabout weight status in female children than they are in males [63,117]; thus, they are more likely toassume an active role in training, redirecting, and encouraging desired eating behaviors in femalechildren [63,117]. Studies have also found that male children are encouraged to eat more than femalechildren [60,61], while females are more likely to seek parental praise and approval for meal-timebehaviors [60]. In response to maternal concerns, female children are more likely than male childrento change eating behaviors [125,126]. These observations could partially explain sex differences infood acceptance and intake, whereby female children show more nutritious food intake patterns thanmales [32]. Greater need for external attentions, such as praise, among females could mean that theyare less attentive to internal signals of hunger and fullness when compared to males, which mayincrease their risk for disordered eating behaviors.
The influence of controlling feeding practices, such as restriction and pressure-to-eat, have alsobeen found to vary depending on the sex of the child. Observational coding of meals in Singaporerevealed that mothers respond to faster eating in females by using more restriction and control-relatedprompts, but similar relationships were not found in males [127]. Greater laboratory [80,128] andparentally-reported restriction [67,129,130] have been associated with higher weight status in primarilyCaucasian females, but not males. In addition, Arredondo and colleagues [131] found in Latino familiesthat greater parental control over feeding is associated with increased reported intake of “unhealthy”foods (e.g., sodas, sugar sweetened beverages, chips, and sweetened cereals) in females, but not males.In general, mothers tend to use greater feeding control with female than male children [132]. Increaseduse of parental control, specifically within the domain of feeding, may weaken females’ ability to eat inresponse to internal satiety signals, which may ultimately increase weight gain and risk for disorderedeating. Notably, these patterns have not been consistently observed across studies. Studies in bothpreschool children [89] and a Dutch sample in middle childhood [90] found that controlling feedingpractices were associated with greater eating in the absence of hunger [89] and external and emotionaleating [90] in males, but not females. Overall, the influence of child age, ethnicity, and socioeconomicstatus, as well as parental factors including education, weight status, and general parenting style havenot been clarified and require additional investigation.
94
Nutrients 2019, 11, 682
3.4. Peer and Social Influences
In addition to parental influences, societal ideals related to expectations about what and howmales and females should eat may also engender different eating behaviors in children. A feminineidentity is characterized by eating smaller portions, consuming less meat, and preferring healthieroptions to maintain appearance, while a masculine eating identify is characterized by feeling full,with a focus on physical performance [133,134]. Within these ideals, female children are seen as moreeffective at modeling healthy behaviors than males [135,136]. Furthermore, females are also more likelyto respond to modeled eating behaviors including vegetable acceptance [135] and fruit and vegetableintake [137]. The higher success of modeling and dietary interventions among females suggests agreater awareness of social expectations related to eating [138]. Moreover, greater self-control amongfemales [139,140] may help facilitate greater uptake of these behaviors.
4. Applying the Biopsychosocial Model to Interpret Evidence of Sex Differences in Children’sEating Behaviors
In the prior two sections of the paper, we reviewed evidence from the literature of sex differencesin children’s eating behaviors and provided a biopsychosocial model as a framework for understandinghow eating behaviors develop in males and females. A theme across the various studies reviewedis that the relationship between weight status and eating behaviors differs in males and females,and these differences may stem in part from parental feeding practices and societal pressures onideal/acceptable body weights that differ by sex. Adding to this theme, the last section of the paperpresents previously unpublished, secondary data analyses to determine the influence of sex and weightstatus on children’s appetitive traits and neural response to food cues.
4.1. Case Study #1. Influence of Age, Sex, and Adiposity on Appetitive Traits
Although previous studies found higher food approach related behaviors among males thanfemales [52,53,57], it is unclear how age and/or development might influence the relationship betweenappetitive traits and sex, as children might show higher food approach related behaviors during timesrapid growth. For this reason, it is essential to understand whether the relationship between appetitivetraits differs by child age and weight status. To shed light on this relationship, we examined CEBQscores from 11 datasets collected from studies conducted at the Children’s Eating Behavior Laboratoryat The Pennsylvania State University during 2012–2018. A total of 263 (M = 133; 50.6%) 3–12-year-oldchildren had complete parent-reported anthropomorphic and CEBQ data as well as measured childanthropometrics. Males and females did not differ by age (t(260) = 0.553, p = 0.581, d = 0.07), body massindex (BMI)-for-age percentile (BMI%; t(260) = −0.859, p = 0.391; d = 0.11), race (Fisher’s p = 0.276),ethnicity (Fisher’s p = 0.999), maternal education (t(260) = 0.551, p = 0.58, d = 0.07;), or CEBQ subscales(p values ranging 0.073–0.681; see Supplementary Materials, Table S1). Although maternal educationdid not differ by child sex, it was used as a proxy for socioeconomic status as maternal education hasbeen shown to be more highly associated with adiposity than income [141]. Child weight status wasassessed by measuring height and weight on a digital scale (Tanita, Arlington Heights, IL, USA) andstadiometer (SECA, Chino, CA, USA) and children were categorized as either having healthy weight(BMI-for-age < 85th percentile) or overweight/obesity (BMI-for-age ≥ 85th percentile) (Table 1).
95

Nutrients 2019, 11, 682
Table 1. Demographic Characteristics of children enrolled in studies that assessed sex differences inappetitive traitsa and neural responses to food cuesb.
CEBQ a Fmri b
Males(n = 133)
Females(n = 130)
Males(n = 20)
Females(n = 25)
Age (years) 7.40 (2.28) 7.56 (2.10) 8.75(0.99) 9.06(1.34)BMI percentile 61.53 (29.06) 58.50 (28.20) 52.50(27.12) 53.57(30.93)Maternal Ed. (years) 16.19 (2.63) 16.35 (2.71) 16.91(2.49) 16.88(1.90)
Weight Status (n)Obese/Overweight 43 27 3 6Healthy Weight 90 103 19 19Ethnicity (n)Not Hispanic/Latinx 94 84 20 25Hispanic/Latinx 4 4 1 0Not Reported 35 35 1 0
Race (n)Black/African American 6 2 2 0White 119 112 19 25Other 7 4 1 0Not Reported 1 2 0 0
SES (n)>$100,000 16 19 7 5$51,000–$100,000 30 29 11 15≤$50,000 18 18 3 5Not Reported 69 64 1 0
Means (SD) reported for Age, BMI percentile, and Maternal Education. Weight Status categories defined by BMIpercentile: Obese/Overweight ≥ 85th percentile; Healthy Weight < 85th percentile. BMI, body-mass index; CEBQ,Child Eating Behaviors Questionnaire Sample; fMRI, functional Magnetic Resonance Imaging Sample. a Sampleassessing appetitive traits in case study #1; b Sample assessing neural responses to food cues in Case Study #2.
Food approach and avoidance, as measured with CEBQ, were examined separately using thesame hierarchical model steps: (1) child age and maternal education; (2) a quadratic age term; (3) childsex and adiposity; (4) a sex X age interaction; and (5) a sex X adiposity interaction (Table 2). The changein model fit, R2, was tested at each step to determine whether the model explained significantly morevariance with the added terms. Once the best model was identified, exploratory analyses examined thecomponent subscales that contribute to the food avoidance and approach scores to determine whetherthe effect seen was consistent across subscales or driven by an individual subscale.
Individual differences in CEBQ avoidance and approach behaviors were best fit by differentmodels. Child sex was not a significant predictor of avoidance for any of the models where it wasincluded. In contrast, food approach was best modeled by including the interaction between childsex and weight status (Table 2). The interaction between sex and weight status was significant suchthat the association between having overweight or obesity and greater food approach was strongerfor females than males. This suggests that weight status may be more predictive of food approachbehaviors in females than in males. Exploratory analyses of approach subscales indicated that thisfinding was primarily driven by the food responsiveness subscale, which showed a suggested sexby weight status interaction (β(SE) = −0.36 (0.20), p = 0.073). The interactions between weight statusand other CEBQ approach subscales were not significant (p values ranging from 0.155–0.255). Overall,these results suggest that, in female children, food responsiveness could be a better predictor of weightstatus than other CEBQ approach subscales, and therefore may be a target for intervention studies inthis population.
96

Nutrients 2019, 11, 682
Ta
ble
2.
Hie
rarc
hica
lReg
ress
ion
for
App
roac
han
dA
void
ance
Scal
esof
the
Chi
ldEa
ting
Beha
vior
Que
stio
nnai
re.
Fo
od
Ap
pro
ach
12
34
5
BS
Eβ
BS
Eβ
BS
Eβ
BS
Eβ
BS
Eβ
Mat
erna
lEdu
cati
on−0
.005
0.01
−0.0
27−0
.005
0.01
−0.0
28−0
.005
0.01
−0.0
25−0
.005
0.01
−0.0
25−0
.003
0.01
−0.0
15A
ge0.
008
0.01
0.03
4−0
.003
0.09
−0.0
150.
0003
0.01
−0.0
010.
001
0.02
0.00
3−0
.002
0.01
−0.0
08A
ge-s
quar
ed0.
001
0.01
0.05
0–
––
––
––
––
Wei
ghtS
tatu
s0.
288
0.07
0.57
2**
*0.
288
0.07
0.28
8**
*0.
455
0.11
0.90
2**
*Se
x−0
.119
0.06
−0.0
02−0
.107
0.22
−0.2
37−0
.046
0.07
−0.0
91Se
xX
Age
−0.0
020.
03−0
.007
––
–Se
xX
Wei
ghtS
tatu
s−0
.286
0.14
−0.5
67*
R2
0.00
20.
002
0.07
10.
071
0.08
6Δ
R2
F1
0.01
71
9.59
***
30.
003
34.
21*
Food
Avo
idan
ce
Mat
erna
lEdu
cati
on0.
017
0.01
0.09
40.
016
0.01
0.09
30.
017
0.01
0.09
40.
017
0.01
0.09
70.
017
0.01
0.09
3A
ge−0
.029
0.01
−0.1
37*
−0.0
720.
08−0
.339
−0.0
270.
01−0
.126
*−0
.035
0.02
−0.1
65−0
.026
0.01
−0.1
25*
Age
-squ
ared
0.00
30.
010.
205
--
--
--
--
-W
eigh
tSta
tus
−0.0
730.
07−0
.156
−0.0
710.
070.
151
−0.0
870.
10−0
.184
Sex
0.06
80.
060.
143
−0.0
490.
210.
143
--
-Se
xX
Age
0.01
50.
030.
072
0.06
20.
070.
131
Sex
XW
eigh
tSta
tus
0.02
30.
130.
049
R2
0.02
90.
030
0.03
80.
039
0.03
8Δ
R2
F1
0.30
31
1.13
71
0.0.
871
0.76
5
Stan
dard
ized
coef
ficie
nts
(B)a
ndst
anda
rder
rors
are
pres
ente
dal
ong
wit
hth
eun
stan
dard
ized
coef
ficie
nts
(β)f
orm
odel
Step
s1–
5.Fo
rch
ange
inR
-squ
are,
the
num
ber
inth
ebr
acke
tsin
dica
tew
hich
mod
elst
epit
was
test
edag
ains
t.*
p<
0.05
,***
p<
0.00
1.1
Mod
elw
aste
sted
agai
nstm
odel
1;3
Mod
elw
aste
sted
agai
nstm
odel
3
97

Nutrients 2019, 11, 682
4.2. Case Study #2. Influence of Sex on Neural Food Cue Responsivity
In a separate dataset of 7–11-year-old children who had participated in a study on the neuraldeterminants of food portion size and energy density [108,142], we followed up findings from Luo andcolleagues [113] to investigate potential sex differences in children’s food cue reactivity. As with thefirst case study, child weight status was treated as a key moderating factor. Males (N = 22) and females(N = 25) did not differ by age (t(45) = 0.89, p = 0.378, d = 0.260), BMI-for-age percentile (t(45) = 0.125,p = 0.901, d = 0.036), race (Fisher’s p = 0.095), ethnicity (Fisher’s p = 0.456), or maternal years ofeducation (t(45) = −0.045, p = 0.964, d = 0.013) (Table 1).
On the day of the MRI, children arrived after a 2-h fast and were scanned during a usual meal-time.Before and after the scan, children rated fullness level on a validated, pictorial visual analog scale [143].Children were imaged at 3T (MAGNETOM Trio) with a T1-weighted structural (MPRAGE) sequenceand a T2*-sensitive gradient echo pulse sequence (see Supplementary Materials for image acquisitionparameters). Food images were presented using MATLAB Version 8 [144] and viewed through amirror mounted on the head coil using a magnet-compatible projector. The protocol for task designand image development has been reported elsewhere [108,142]. In brief, children viewed a total of 180images (120 food, 30 furniture, and 30 scrambled images) presented in block design. The food cuesdiffered in portion size (large or small) and energy density (high-ED or low-ED). High-ED foods were>1.5 kcal/gram and included French fries, chicken nuggets, cookies, and pizza. Low-ED foods were<1.5 kcal/gram and included grilled chicken, carrots, broccoli, and apples. Data were preprocessed andanalyzed using Analysis of Functional NeuroImages (AFNI) [145] using standard preprocessing steps(see Supplementary Materials for details). Four participants (3 male and 1 female) were excluded dueto excessive motion (defined as fewer than 4/6 usable runs; see Supplementary Materials for motionand outlier criteria). For each subject, a general linear model was constructed including 6 parametersof interest (i.e., one for each image condition) and 12 parameters of no-interest to control for motion(see Supplementary Materials). Group analyses were then conducted using energy density contrasts(high-ED – low-ED) derived from parameter estimates for each portion size condition separately,as well as a composite (i.e., across both portion sizes). Multiple comparisons were controlled by usingMonte-Carlo simulations ([146] p < 0.001; k = 29) using AFNI’s 3dClustSim to achieve a final p < 0.05.
As there was no main effect of portion size, or a portion size × sex interaction on neural responseto high- or low-ED cues (see Supplementary Materials), the remaining group analyses focused onthe ED contrast collapsed across portion size. An analysis of covariance (ANCOVA; 3dMVM [147])showed a significant sex × BMI z-score interaction in right superior temporal gyrus, extending toboth parahippocampal and fusiform gyri F(1,39) = 29.21; peak: x = −37.5, y = 37.5, z = 7.5; k-173;Figure 2A). Post-hoc correlations confirmed a significant positive association between BMI z-scoreand neural response to higher than lower ED food images in females (r = 0.598; p = 0.002), while inmales this relationship was negative (r = −0.667; p = 0.002) (Figure 2B). There was no evidence for amain effect of BMI z-score or sex. Although pre- and post-scan fullness differed in males and females,the same pattern of results was seen when controlling for fullness ratings and when analyses includedED contrasts for each portion size (see Supplementary Materials Figure S1) (Figure 2A,B).
Although preliminary, these results suggest that increased weight status in female children ispositively related to neural engagement to high- relative to low-ED food cues in regions typicallyassociated with contextual processing (i.e., parahippocampal gyrus) and visual object recognition(i.e., fusiform gyrus), while in male children the opposite pattern was observed. While additionalstudies are needed to confirm these findings, they suggest that weight status in female children maybe more associated with differential patterns of food-cue related brain activation than weight status inmale children. Questions for additional investigation include determining whether brain alterationsprecede or follow the development of excess weight and understanding the behavioral implicationsfor these neural responses.
98

Nutrients 2019, 11, 682
(A) (B)
Figure 2. (A) Statistical parametric map (F-statistic) of the interaction between BMIz and child sex onneural responses to high-ED compared to Low-ED food cues. Cluster extends from the right superiortemporal gyrus into the parahippocampal and fusiform gyri. (B) Extracted energy density contrast(high-ED–low-ED) parameter estimates, illustrating increased activation to high-ED compared tolow-ED food cues for girls with BMIz greater than the 50th percentile and increased activation tohigh-ED compared to low-ED food cues for boys with BMIz greater below the 50th percentile.
5. Summary and Conclusions
In this paper, we review evidence of sex differences in children’s eating behaviors and presentnew data showing that sex and weight status interact to differentially influence appetitive traits andneural response to food images in males and females. In the reviewed literature, we identified sexdifferences in food acceptance, food intake, appetitive traits, and laboratory measures of self-regulatoryeating. In addition, new analyses showed that child weight status interacts with sex to influenceappetitive traits such that food approach behaviors (i.e., food responsiveness) are stronger predictorsof increased weight status in females than in males. Similarly, in a separate cohort of 7–11-year-olds,we found that sex and weight status interact to influence children’s neural responses to food imagesthat vary in energy density. In females, greater activation to higher energy food cues in brain regionsimplicated in contextual processing, memory, and object recognition was positively related to weightstatus, while the opposite pattern was observed in males. Although we cannot fully discount thepossibility that some of the observed differences are driven by physiological changes that occur withpuberty, the focus on children under 11 years of age likely reduces these influences. The evidencepresented underscores the need to study the etiology and implications of sex differences in children’seating behaviors.
Despite inconsistencies across the literature, a few consistent themes are apparent. First, sexdifferences in children’s eating behaviors were more often found in school-aged children. Fewconsistent differences in eating behaviors were identified among infants and toddlers. It is possiblethat differences are present in younger children but are unable to be measured due to methodologicallimitations. Perhaps more likely, however, is that these patterns arise during childhood due todifferential parenting practices and social influences directed at males and females. Second, femalechildren tend to report liking and eating more foods that are lower in energy density and higher incritical nutrients (i.e., fruits and vegetables) than males. Due to the lack of clear biological differencesin taste anatomy [148], these differences are also likely to be influenced by parent, peer, and societalfactors. Importantly, the self-report nature of most of this literature highlights the need to confirm thesefindings with more objective measures of eating behavior. Third, sex differences in appetitive traits,
99

Nutrients 2019, 11, 682
EAH, and parental feeding attitudes are influenced by complex interactions with child weight status.In general, parents are more concerned about excess weight in female compared to male children. As aresult, they likely feed children differently depending not only on the sex of the child, but also theirperception that the child is at risk for developing overweight. It is likely that parental characteristics,such as dieting history, cognitive restraint, socioeconomic status, and weight status, influence therelationship between child sex and eating behaviors, highlighting the need to conduct larger studiesthat are sufficiently powered to query three-way interactions (e.g., child sex × child weight status ×parent weight history).
6. Recommendations for Future Research
When planning and reporting on future studies, it is important that researchers clearly define theconstructs of sex and gender, in terms of how they are measured and reported. In addition, in studiesthat statistically control for sex as a covariate, it would be helpful for researchers to report applicableestimates, coefficients, and p-values for covariates, either in the manuscript or in Supplementary Data.This would facilitate the ability to conduct systematic reviews on this topic. Moreover, research inchildren, especially infants and preschool children, should utilize objective and observational measuresof children’s eating behaviors and intake when possible to limit the influence of parental beliefs andperceptions along with probable response bias for questionnaires. Lastly, in regards to interventionefforts for obesity, sex or gender should be considered when determining target behaviors as wellas evaluating the impact of the intervention on primary and secondary outcomes. Together, theserecommendations will help advance our understanding of the role that sex and gender play in thedevelopment of weight and eating disorders.
Caution is recommended when interpreting the findings discussed, both from the literature andthe new analyses presented. First, the majority of studies that have reported sex differences were notdesigned to detect sex as a primary determinant of outcomes; thus, it is not possible to rule out chancefindings. Second, among the studies that did not report differences, sex was often controlled for as acovariate, but results for main outcomes were not stratified and reported by sex. This makes it difficultto determine whether primary eating behavior outcomes differed in males and females and limits theability to conduct meta-analyses across studies. Third, determining the underlying mechanisms for sexdifferences in eating behavior is complicated by the lack of clarity in how sex and gender are defined inthe literature. A concern moving forward is that researchers will overgeneralize findings by developingseparate intervention approaches for males and females without considering that sex and gender arenon-binary, multidimensional constructs. To avoid this type of overgeneralization, we caution againstusing sex or gender as the basis to group participants prior to assigning treatments. Instead, sex andgender should be measured and considered such as other individual subject characteristics and usedto provide information to help phenotype risk groups.
Supplementary Materials: The following are available online at http://www.mdpi.com/2072-6643/11/3/682/s1,Table S1: Parent Report for Child Eating Behaviors Questionnaire, Figure S1: Overlap of significant clusters fromthe four analyses: (1) ANCOVA with overall ED contrast (red), (2) Linear mixed effects model with ED contrastsfor each portion size (yellow), (3) ANCOVA with overall ED contrast and pre-MRI fullness covariate (cyan), (4)ANCOVA with overall ED contrast and post-MRI fullness covariate (blue).
Author Contributions: Conceptualization, K.L.K. and S.M.R.K.; Methodology, T.M., K.L.K., and N.A.R.; Software,T.M., B.F., and A.L.P.; Validation, K.L.K., T.M., A.L.P., and B.F.; Formal Analysis, A.L.P., B.F., and T.M.; Investigation,T.M. and N.A.R.; Resources, K.L.K.; Data Curation, A.L.P., B.F., T.M., and K.L.K.; Writing—Original DraftPreparation, K.L.K., S.M.R.K., A.L.P., B.F., and N.A.R.; Writing—Review and Editing, K.L.K., S.M.R.K., B.F., A.L.P.,N.A.R., T.M., and K.H.; Visualization, K.L.K.; Supervision, K.L.K.; Project Administration, K.L.K.; and FundingAcquisition, K.L.K.
Funding: This study was supported by the Penn State Social Sciences Research Institute, National Center ofResearch Resources and the National Center for Advancing Translational Sciences, NIH, Grant UL1TR000127and by R01 DK110060 (Keller). The doctoral training of TM was supported by the USDA Childhood ObesityPrevention Training Grant #2011670013011. Imaging was conducted at the Penn State Social, Life, & EngineeringSciences Imaging Center, 3T MRI Facility.
100

Nutrients 2019, 11, 682
Conflicts of Interest: The authors declare no conflict of interest.
References
1. Kessler, R.C.; Berglund, P.A.; Chiu, W.T.; Deitz, A.C.; Hudson, J.I.; Shahly, V.; Aguilar-Gaxiola, S.; Alonso, J.;Angermeyer, M.C.; Benjet, C.; et al. The prevalence and correlates of binge eating disorder in the WorldHealth Organization World Mental Health Surveys. Biol. Psychiatry 2013, 73, 904–914. [CrossRef]
2. Hay, P.J.; Mond, J.; Buttner, P.; Darby, A. Eating disorder behaviors are increasing: Findings from twosequential community surveys in South Australia. PLoS ONE 2008, 3, e1541. [CrossRef]
3. Hammerle, F.; Huss, M.; Ernst, V.; Bürger, A. Thinking dimensional: Prevalence of DSM-5 early adolescentfull syndrome, partial and subthreshold eating disorders in a cross-sectional survey in German schools.BMJ Open 2016, 6, e010843. [CrossRef]
4. Garawi, F.; Devries, K.M.; Thorogood, N.; Uauy, R. Global differences between women and men in theprevalence of obesity: Is there an association with gender inequality? Eur. J. Clin. Nutr. 2014, 68, 1101–1106.[CrossRef]
5. The Center’s for Disease Control and Prevention. National Center for Health Statistics. National Health andNutrition Examination Survey Data; The Center’s for Disease Control and Prevention: Atlanta, GA, USA,2007–2008.
6. Institute of Medicine. Sex Differences and Implications for Translational Neuroscience Research: Workshop Summary;The National Academies Press: Washington, DC, USA, 2011; p. 110.
7. Ogden, C.L.; Carroll, M.D.; Kit, B.K.; Flegal, K.M. Prevalence of obesity and trends in body mass indexamong US children and adolescents, 1999–2010. JAMA 2012, 307, 483–490. [CrossRef]
8. Bredella, M.A. Sex differences in body composition. In Sex and Gender Factors Affecting Metabolic Homeostasis,Diabetes and Obesity; Mauvais-Jarvis, F., Ed.; Springer International Publishing: Cham, Switzerland, 2017;pp. 9–27.
9. Schorr, M.; Dichtel, L.E.; Gerweck, A.V.; Valera, R.D.; Torriani, M.; Miller, K.K.; Bredella, M.A. Sex differencesin body composition and association with cardiometabolic risk. Biol. Sex Differ. 2018, 9, 28. [CrossRef][PubMed]
10. Dunger, D.B.; Salgin, B.; Ong, K.K. Session 7: Early nutrition and later health Early developmental pathwaysof obesity and diabetes risk: Symposium on ‘Nutrition in early life: New horizons in a new century’. Proc.Nutr. Soc. 2007, 66, 451–457. [CrossRef]
11. Whitaker, R.C.; Dietz, W.H. Role of the prenatal environment in the development of obesity. J. Pediatr. 1998,132, 768–776. [CrossRef]
12. Szabo, A.; Szabo, O. Placental free-fatty-acid transfer and fetal adipose-tissue development: An explanationof fetal adiposity in infants of diabetic mothers. Lancet 1974, 304, 498–499. [CrossRef]
13. Weber, D.R.; Leonard, M.B.; Zemel, B.S. Body composition analysis in the pediatric population.Pediatr. Endocrinol. Rev. 2012, 10, 130–239.
14. Guerdukova, A.J.; Mori, N.; Casuto, L.S.; McElroy, S.L. Binge Eating Disorder. Psychiatr. Clin. N. Am. 2017,40, 255–266. [CrossRef] [PubMed]
15. Epstein, L.H.; Paluch, R.A.; Raynor, H.A. Sex Differences in Obese Children and Siblings in Family-basedObesity Treatment. Obes. Res. 2001, 9, 746–753. [CrossRef]
16. Stroebele-Benschop, N.; Damms-Machado, A.; Milan, F.M.P.; Hilzendegren, C.; Bischoff, S.C. Genderdifferences in the outcomes of obesity treatments and weight loss maintenance-A systematic review. J. Obes.Weight Loss Ther. 2013, 3, 1–11.
17. What Do We Mean by “Sex” and “Gender”. Available online: https://www.legal-tools.org/doc/a33dc3/pdf/(accessed on 22 March 2019).
18. Cooke, L.J.; Wardle, J. Age and gender differences in children’s food preferences. Br. J. Nutr. 2005, 93,741–746. [CrossRef]
19. Caine-Bish, N.L.; Scheule, B. Gender Differences in Food Preferences of School-Aged Children andAdolescents. J. Sch. Health 2009, 79, 532–540. [CrossRef] [PubMed]
20. Rodenburg, G.; Oenema, A.; Pasma, M.; Kremers, S.P.J.; van de Mheen, D. Clustering of food and activitypreferences in primary school children. Appetite 2013, 60, 123–132. [CrossRef] [PubMed]
101
Nutrients 2019, 11, 682
21. Jaramillo, S.J.; Yang, S.-J.; Hughes, S.O.; Fisher, J.O.; Morales, M.; Nicklas, T.A. Interactive computerized fruitand vegetable preference measure for African-American and Hispanic preschoolers. J. Nutr. Educ. Behav.2006, 38, 352–359. [CrossRef] [PubMed]
22. Lehto, E.; Ray, C.; Haukkala, A.; Yngve, A.; Thorsdottir, I.; Roos, E. Predicting gender differences in liking forvegetables and preference for a variety of vegetables among 11-year-old children. Appetite 2015, 95, 285–292.[CrossRef]
23. Breen, F.M.; Plomin, R.; Wardle, J. Heritability of food preferences in young children. Physiol. Behav. 2006, 88,443–447. [CrossRef]
24. Le Bigot Macaux, A. Eat To Live or Live To Eat? Do Parents and Children Agree? Public Health Nutr. 2001, 4,141–146. [CrossRef] [PubMed]
25. Kimura, S.; Endo, Y.; Minamimae, K.; Kanzaki, S.; Hanaki, K. Gender differences in childhood food preference:Evaluation using a subjective picture choice method. Pediatr. Int. 2013, 56, 389–394. [CrossRef]
26. Russell, C.G.; Worsley, A. Do children’s food preferences align with dietary recommendations?Public Health Nutr. 2007, 10, 1223–1233. [CrossRef]
27. Fletcher, S.; Wright, C.; Jones, A.; Parkinson, K.; Adamson, A. Tracking of toddler fruit and vegetablepreferences to intake and adiposity later in childhood. Matern. Child Nutr. 2017, 13, e12290. [CrossRef]
28. Brug, J.; Tak, N.I.; te Velde, S.J.; Bere, E.; de Bourdeaudhuij, I. Taste preferences, liking and other factorsrelated to fruit and vegetable intakes among schoolchildren: Results from observational studies. Br. J. Nutr.2008, 99, S7–S14. [CrossRef]
29. Birch, L.L. Development of food preferences. Annu. Rev. Nutr. 1999, 19, 41–62. [CrossRef]30. Cooke, L.J.; Wardle, J.; Gibson, E.L.; Sapochnik, M.; Sheiham, A.; Lawson, M. Demographic, familial and trait
predictors of fruit and vegetable consumption by pre-school children. Public Health Nutr. 2004, 7, 295–302.[CrossRef]
31. Reynolds, K.D.; Baranowski, T.; Bishop, D.B.; Farris, R.P.; Binkley, D.; Nicklas, T.A.; Elmer, P.J. Patterns inchild and adolescent consumption of fruit and vegetables: Effects of gender and ethnicity across four sites.J. Am. Coll. Nutr. 1999, 18, 248–254. [CrossRef]
32. Boddy, L.M.; Abayomi, J.; Johnson, B.; Hackett, A.F.; Stratton, G. Ten-year changes in positive and negativemarker food, fruit, vegetables, and salad intake in 9–10 year olds: S ports L inx 2000–2001 to 2010–2011.J. Hum. Nutr. Diet. 2013, 27, 236–241. [CrossRef]
33. Johnson, B.; Hackett, A.F. Trends in fruit, vegetable and salad intakes in 9–10-year-old schoolchildren livingin Liverpool, 2000–2005. Public Health Nutr. 2007, 10, 252–255. [CrossRef]
34. Kristjansdottir, A.G.; De Bourdeaudhuij, I.; Klepp, K.-I.; Thorsdottir, I. Children’s and parents’ perceptions ofthe determinants of children’s fruit and vegetable intake in a low-intake population. Public Health Nutr. 2009,12, 1224–1233. [CrossRef]
35. Keyte, J.; Harris, S.; Margetts, B.; Robinson, S.; Baird, J. Engagement with the National Healthy SchoolsProgramme is associated with higher fruit and vegetable consumption in primary school children. J. Hum.Nutr. Diet. 2011, 25, 155–160. [CrossRef] [PubMed]
36. Glynn, L.; Emmett, P.; Rogers, I. Food and nutrient intakes of a population sample of 7-year-old children inthe south-west of England in 1999/2000—What difference does gender make? J. Hum. Nutr. Diet. 2005, 18,7–19. [CrossRef] [PubMed]
37. McCrory, M.A.; Jaret, C.L.; Kim, J.H.; Reitzes, D.C. Dietary Patterns among Vietnamese and HispanicImmigrant Elementary School Children Participating in an after School Program. Nutrients 2017, 9, 460.[CrossRef] [PubMed]
38. Spruance, L.A.; Myers, L.; O’Malley, K.; Rose, D.; Johnson, C.C. Individual- and School-Level Factors Relatedto School-Based Salad Bar Use Among Children and Adolescents. Health Educ. Behav. 2017, 44, 885–897.[CrossRef] [PubMed]
39. Slusser, W.M.; Cumberland, W.G.; Browdy, B.L.; Lange, L.; Neumann, C. A school salad bar increasesfrequency of fruit and vegetable consumption among children living in low-income households.Public Health Nutr. 2007, 10, 1490–1496. [CrossRef] [PubMed]
40. RÄSÄNen, M.; Lehtinen, J.-C.; Niinikoski, H.; Keskinen, S.; Ruottinen, S.; Salminen, M.; RÖNnemaa, T.;Viikari, J.; Simell, O. Dietary Patterns and Nutrient Intakes of 7-Year-Old Children Taking Part in anAtherosclerosis Prevention Project in Finland. J. Am. Diet. Assoc. 2002, 102, 518–524. [CrossRef]
102

Nutrients 2019, 11, 682
41. United States Department of Agriculture. What We Eat in America, NHANES 2013–2014, Individuals 2 Yearsand Over (Exluding Breastfed Children); United States Department of Agriculture: Washington, DC, USA, 2016.
42. Nicklaus, S.; Chabanet, C.; Boggio, V.; Issanchou, S. Food choices at lunch during the third year of life:Increase in energy intake but decrease in variety. Acta Paediatr. 2005, 94, 1023–1029. [CrossRef]
43. Robinson, C.H.; Thomas, S.P. The Interaction Model of Client Health Behavior as a Conceptual Guide in theExplanation of Children’s Health Behaviors. Public Health Nurs. 2004, 21, 73–84. [CrossRef] [PubMed]
44. Foster, E.; Adamson, A. Challenges involved in measuring intake in early life: Focus on methods.Proc. Nutr. Soc. 2014, 73, 201–209. [CrossRef] [PubMed]
45. Cole, N.C.; An, R.; Lee, S.-Y.; Donovan, S.M. Correlates of picky eating and food neophobia in young children:A systematic review and meta-analysis. Nutr. Rev. 2017, 75, 516–532. [CrossRef]
46. Carnell, S.; Wardle, J. Appetite and adiposity in children: Evidence for a behavioral susceptibility theory ofobesity. Am. J. Clin. Nutr. 2008, 88, 22–29. [CrossRef] [PubMed]
47. Dubois, L.; Farmer, A.; Girard, M.; Peterson, K.; Tatone-Tokuda, F. Problem eating behaviors related to socialfactors and body weight in preschool children: A longitudinal study. Int. J. Behav. Nutr. Phys. Act. 2007, 4, 9.[CrossRef] [PubMed]
48. Rigal, N.; Chabanet, C.; Issanchou, S.; Monnery-Patris, S. Links between maternal feeding practices andchildren’s eating difficulties. Validation of French tools. Appetite 2012, 58, 629–637. [CrossRef]
49. Koivisto, U.-K.; SjÖDÉN, P.-O. Food and General Neophobia in Swedish Families: Parent–Child Comparisonsand Relationships with Serving Specific Foods. Appetite 1996, 26, 107–118. [CrossRef]
50. Tsuji, M.; Nakamura, K.; Tamai, Y.; Wada, K.; Sahashi, Y.; Watanabe, K.; Ohtsuchi, S.; Ando, K.; Nagata, C.Relationship of intake of plant-based foods with 6-n-propylthiouracil sensitivity and food neophobia inJapanese preschool children. Eur. J. Clin. Nutr. 2011, 66, 47–52. [CrossRef] [PubMed]
51. Wardle, J.; Guthrie, C.A.; Sanderson, S.; Rapoport, L. Development of the Children’s Eating BehaviourQuestionnaire. J. Child Psychol. Psychiatry 2003, 42, 963–970. [CrossRef]
52. Sleddens, E.F.; Kremers, S.P.; Thijs, C. The children’s eating behaviour questionnaire: Factorial validity andassociation with Body Mass Index in Dutch children aged 6–7. Int. J. Behav. Nutr. Phys. Act. 2008, 5, 49.[CrossRef] [PubMed]
53. Cao, Y.-T.; Svensson, V.; Marcus, C.; Zhang, J.; Zhang, J.-D.; Sobko, T. Eating behaviour patterns in Chinesechildren aged 12–18 months and association with relative weight—Factorial validation of the Children’sEating Behaviour Questionnaire. Int. J. Behav. Nutr. Phys. Act. 2012, 9, 5. [CrossRef]
54. Webber, L.; Hill, C.; Saxton, J.; Van Jaarsveld, C.H.M.; Wardle, J. Eating behaviour and weight in children.Int. J. Obes. 2009, 33, 21–28. [CrossRef]
55. Boutelle, K.N.; Peterson, C.B.; Crosby, R.D.; Rydell, S.A.; Zucker, N.; Harnack, L. Overeating phenotypes inoverweight and obese children. Appetite 2014, 76, 95–100. [CrossRef]
56. Viana, V.; Sinde, S.; Saxton, J.C. Children’s Eating Behaviour Questionnaire: Associations with BMI inPortuguese children. Br. J. Nutr. 2008, 100, 445–450. [CrossRef]
57. Sirirassamee, T.; Hunchangsith, P. Children’s eating behavior questionnaire: Factorial validation anddifferences in sex and educational level in thai school-age children. Southeast Asian J. Trop. Med. Public Health2016, 47, 1325–1334.
58. Jalkanen, H.; Lindi, V.; Schwab, U.; Kiiskinen, S.; Venäläinen, T.; Karhunen, L.; Lakka, T.A.; Eloranta, A.M.Eating behaviour is associated with eating frequency and food consumption in 6–8 year-old children: ThePhysical Activity and Nutrition in Children (PANIC) study. Appetite 2017, 114, 28–37. [CrossRef] [PubMed]
59. Tiggemann, M.; Lowes, J. Predictors of maternal control over children’s eating behaviour. Appetite 2002, 39,1–7. [CrossRef]
60. Orrell-Valente, J.K.; Hill, L.G.; Brechwald, W.A.; Dodge, K.A.; Pettit, G.S.; Bates, J.E. “Just three more bites”:An observational analysis of parents’ socialization of children’s eating at mealtime. Appetite 2007, 48, 37–45.[CrossRef] [PubMed]
61. Olvera-Ezzell, N.; Power, T.G.; Cousins, J.H. Maternal Socialization of Children’s Eating Habits: StrategiesUsed by Obese Mexican-American Mothers. Child Dev. 1990, 61, 395–400. [CrossRef]
62. Bouhlal, S.; McBride, C.M.; Ward, D.S.; Persky, S. Drivers of overweight mothers’ food choice behaviorsdepend on child gender. Appetite 2015, 84, 154–160. [CrossRef] [PubMed]
63. Costanzo, P.R.; Woody, E.Z. Parental perspectives on obesity in children: The importance of sex differences.J. Soc. Clin. Psychol. 1984, 2, 305–313. [CrossRef]
103
Nutrients 2019, 11, 682
64. Blundell, J.; de Graaf, C.; Hulshof, T.; Jebb, S.; Livingstone, B.; Lluch, A.; Mela, D.; Salah, S.; Schuring, E.; vander Knaap, H.; et al. Appetite control: Methodological aspects of the evaluation of foods. Obes. Rev. 2010, 11,251–270. [CrossRef]
65. Birch, L.L.; Deysher, M. Caloric compensation and sensory specific satiety: Evidence for self-regulation offood intake by young children. Appetite 1986, 7, 323–331. [PubMed]
66. Faith, M.S.; Pietrobelli, A.; Heo, M.; Johnson, S.L.; Keller, K.L.; Heymsfield, S.B.; Allison, D.B. A twinstudy of self-regulatory eating in early childhood: Estimates of genetic and environmental influence, andmeasurement considerations. Int. J. Obes. 2012, 36, 931–937. [CrossRef]
67. Johnson, S.L.; Birch, L.L. Parents’ and Children’s Adiposity and Eating Style. Pediatrics 1994, 94, 653–661.[PubMed]
68. Kral, T.V.E.; Allison, D.B.; Birch, L.L.; Stallings, V.A.; Moore, R.H.; Faith, M.S. Caloric compensation andeating in the absence of hunger in 5- to 12-y-old weight-discordant siblings. Am. J. Clin. Nutr. 2012, 96,574–583. [CrossRef]
69. Kane, L.; Wright, C.; Fariza, W.F.; Hetherington, M. Energy compensation in enterally fed children. Appetite2011, 56, 205–209. [CrossRef] [PubMed]
70. Johnson, S.L. Improving Preschoolers’ Self-Regulation of Energy Intake. Pediatrics 2000, 106, 1429–1435.[CrossRef] [PubMed]
71. Ranawana, D.V.; Henry, C.J.K. Are caloric beverages compensated for in the short-term by young adults? Aninvestigation with particular focus on gender differences. Appetite 2010, 55, 137–146. [CrossRef] [PubMed]
72. Davy, B.M.; Van Walleghen, E.L.; Orr, J.S. Sex differences in acute energy intake regulation. Appetite 2007, 49,141–147. [CrossRef] [PubMed]
73. Taylor-Holloway, L.A.; Johnson, S.L. Non-Hispanic white and Hispanic elementary school children’sself-regulation of energy intake. Am. J. Clin. Nutr. 2006, 83, 1276–1282.
74. Carnell, S.; Wardle, J. Measuring behavioural susceptibility to obesity: Validation of the child eatingbehaviour questionnaire. Appetite 2007, 48, 104–113. [CrossRef]
75. Remy, E.; Issanchou, S.; Chabanet, C.; Boggio, V.; Nicklaus, S. Impact of adiposity, age, sex and maternalfeeding practices on eating in the absence of hunger and caloric compensation in preschool children.Int. J. Obes. 2015, 39, 925–930. [CrossRef]
76. Faith, M.S.; Keller, K.L.; Johnson, S.L.; Pietrobelli, A.; Matz, P.E.; Must, S.; Jorge, M.A.; Cooperberg, J.;Heymsfield, S.B.; Allison, D.B. Familial aggregation of energy intake in children. Am. J. Clin. Nutr. 2004, 79,844–850. [CrossRef] [PubMed]
77. Hetherington, M.M.; Wood, C.; Lyburn, S.C. Response to energy diluation in the short term: Evidence ofnutritional wisdom in young children. Nutr. Neurosci. 2000, 3, 321–329. [CrossRef] [PubMed]
78. Kling, S.M.R.; Roe, L.S.; Sanchez, C.E.; Rolls, B.J. Does milk matter: Is children’s intake affected by the typeor amount of milk served at a meal? Appetite 2016, 105, 509–518. [CrossRef] [PubMed]
79. Birch, L.L.; Fisher, J.O.; Davison, K.K. Learning to overeat: Maternal use of restrictive feeding practicespromotes girls’ eating in the absence of hunger. Am. J. Clin. Nutr. 2003, 78, 215–220. [CrossRef] [PubMed]
80. Fisher, J.O.; Birch, L.L. Restricting Access to Foods and Children’s Eating. Appetite 1999, 32, 405–419.[CrossRef] [PubMed]
81. Fisher, J.O.; Birch, L.L. Eating in the absence of hunger and overweight in girls from 5 to 7 year of age. Am. J.Clin. Nutr. 2002, 76, 226–231. [CrossRef]
82. Fogel, A.; McCrickerd, K.; Fries, L.R.; Goh, A.T.; Quah, P.L.; Chan, M.J.; Toh, J.Y.; Chong, Y.-S.; Tan, K.H.;Yap, F.; et al. Eating in the absence of hunger: Stability over time and associations with eating behavioursand body composition in children. Physiol. Behav. 2018, 192, 82–89. [CrossRef] [PubMed]
83. Faith, M.S.; Berkowitz, R.I.; Stallings, V.A.; Kerns, J.; Storey, M.; Stunkard, A.J. Eating in the Absence ofHunger: A Genetic Marker for Childhood Obesity in Prepubertal Boys? Obesity 2012, 14, 131–138. [CrossRef][PubMed]
84. Hill, C.; Llewellyn, C.H.; Saxton, J.; Webber, L.; Semmler, C.; Carnell, S.; van Jaarsveld, C.H.M.; Boniface, D.;Wardle, J. Adiposity and ‘eating in the absence of hunger’ in children. Int. J. Obes. 2008, 32, 1499. [CrossRef][PubMed]
85. Fisher, J.O.; Cai, G.; Jaramillo, S.J.; Cole, S.A.; Comuzzie, A.G.; Butte, N.F. Heritability of Hyperphagic EatingBehavior and Appetite-Related Hormones among Hispanic Children. Obesity 2007, 15, 1484–1495. [CrossRef]
104

Nutrients 2019, 11, 682
86. Cutting, T.M.; Fisher, J.O.; Grimm-Thomas, K.; Birch, L.L. Like mother, like daughter: Familial patterns ofoverweight are mediated by mothers’ dietary disinhibition. Am. J. Clin. Nutr. 1999, 69, 608–613. [CrossRef]
87. Moens, E.; Braet, C. Predictors of disinhibited eating in children with and without overweight. Behav. Res. Ther.2007, 45, 1357–1368. [CrossRef] [PubMed]
88. Faith, M.S.; Berkowitz, R.I.; Stallings, V.A.; Kerns, J.; Storey, M.; Stunkard, A.J. Parental Feeding Attitudesand Styles and Child Body Mass Index: Prospective Analysis of a Gene-Environment Interaction. Pediatrics2004, 114, e429–e436. [CrossRef] [PubMed]
89. Harris, H.; Mallan, K.M.; Nambiar, S.; Daniels, L.A. The relationship between controlling feeding practicesand boys’ and girls’ eating in the absence of hunger. Eat. Behav. 2014, 15, 519–522. [CrossRef]
90. van Strien, T.; Bazelier, F.G. Perceived parental control of food intake is related to external, restrained andemotional eating in 7–12-year-old boys and girls. Appetite 2007, 49, 618–625. [CrossRef] [PubMed]
91. Carnell, S.; Wardle, J. Appetitive traits and child obesity: Measurement, origins and implications forintervention. Proc. Nutr. Soc. 2008, 67, 343–355. [CrossRef] [PubMed]
92. Ohkuma, T.; Hirakawa, Y.; Nakamura, U.; Kiyohara, Y.; Kitazono, T.; Ninomiya, T. Association betweeneating rate and obesity: A systematic review and meta-analysis. Int. J. Obes. 2015, 39, 1589–1596. [CrossRef][PubMed]
93. Fogel, A.; Goh, A.T.; Fries, L.R.; Sadananthan, S.A.; Velan, S.S.; Michael, N.; Tint, M.-T.; Fortier, M.V.;Chan, M.J.; Toh, J.Y.; et al. Faster eating rates are associated with higher energy intakes during an adlibitum meal, higher BMI and greater adiposity among 4·5-year-old children: Results from the GrowingUp in Singapore Towards Healthy Outcomes (GUSTO) cohort. Br. J. Nutr. 2017, 117, 1042–1051. [CrossRef][PubMed]
94. Faith, M.S.; Diewald, L.K.; Crabbe, S.; Burgess, B.; Berkowitz, R.I. Reduced Eating Pace (RePace) BehavioralIntervention for Children Prone to or with Obesity: Does the Turtle Win the Race? Obesity 2019, 27, 121–129.[CrossRef] [PubMed]
95. Fogel, A.; Goh, A.T.; Fries, L.R.; Sadananthan, S.A.; Velan, S.S.; Michael, N.; Tint, M.T.; Fortier, M.V.;Chan, M.J.; Toh, J.Y.; et al. A description of an ‘obesogenic’ eating style that promotes higher energyintake and is associated with greater adiposity in 4.5year-old children: Results from the GUSTO cohort.Physiol. Behav. 2017, 176, 107–116. [CrossRef] [PubMed]
96. Son, S.; Ro, Y.; Hyun, H.; Lee, H.; Song, K. A comparative study on dietary behavior, nutritional knowledgeand life stress between Korean and Chinese female high school students. Nutr. Res. Pract. 2014, 8, 205–212.[CrossRef]
97. de Oliveira Scudine, K.G.; Pedroni-Pereira, A.; Araujo, D.S.; de Almeida Prado, D.G.; Rossi, A.C.; Castelo, P.M.Assessment of the differences in masticatory behavior between male and female adolescents. Physiol. Behav.2016, 163, 115–122. [CrossRef]
98. Le Révérend, B.J.D.; Edelson, L.R.; Loret, C. Anatomical, functional, physiological and behavioural aspectsof the development of mastication in early childhood. Br. J. Nutr. 2014, 111, 403–414. [CrossRef]
99. Llewellyn, C.H.; van Jaarsveld, C.H.; Boniface, D.; Carnell, S.; Wardle, J. Eating rate is a heritable phenotyperelated to weight in children. Am. J. Clin. Nutr. 2008, 88, 1560–1566. [CrossRef] [PubMed]
100. Fisher, J.O.; Kral, T.V.E. Super-size me: Portion size effects on young children’s eating. Physiol. Behav. 2008,94, 39–47. [CrossRef] [PubMed]
101. Kling, S.M.R.; Roe, L.S.; Keller, K.L.; Rolls, B.J. Double trouble: Portion size and energy density combine toincrease preschool children’s lunch intake. Physiol. Behav. 2016, 162, 18–26. [CrossRef]
102. Smethers, A.D.; Roe, L.S.; Sanchez, C.E.; Zuraikat, F.M.; Keller, K.L.; Rolls, B.J. Both increases and decreasesin energy density lead to sustained changes in preschool children’s energy intake over 5days. Physiol. Behav.2019, 204, 210–218. [CrossRef] [PubMed]
103. Fisher, J.O.; Haisfield, L.; Marini, M.; Savage, J.S.; Birch, L.L. Do children eat less at meals when allowed toserve themselves? Am. J. Clin. Nutr. 2012, 96, 36–43.
104. Wisniewski, A.B.; Chernausek, S.D. Gender in childhood obesity: Family environment, hormones, and genes.Gend. Med. 2009, 6, 76–85. [CrossRef] [PubMed]
105. Russell, C.G.; Russell, A. Biological and Psychosocial Processes in the Development of Children’s AppetitiveTraits: Insights from Developmental Theory and Research. Nutrients 2018, 10, 692. [CrossRef]
105

Nutrients 2019, 11, 682
106. van der Laan, L.N.; de Ridder, D.T.D.; Viergever, M.A.; Smeets, P.A.M. The first taste is always with theeyes: A meta-analysis on the neural correlates of processing visual food cues. Neuroimage 2011, 55, 296–303.[CrossRef] [PubMed]
107. Masterson, T.D.; Stein, W.M.; Beidler, E.; Bermudez, M.; English, L.K.; Keller, K.L. Brain response to foodbrands correlates with increased intake from branded meals in children: An fMRI study. Brain Imaging Behav.2018, 1–14. [CrossRef] [PubMed]
108. Keller, K.L.; English, L.K.; Fearnbach, S.N.; Lasschuijt, M.; Anderson, K.; Bermudez, M.; Fisher, J.O.; Rolls, B.J.;Wilson, S.J. Brain response to food cues varying in portion size is associated with individual differences inthe portion size effect in children. Appetite 2018, 125, 139–151. [CrossRef] [PubMed]
109. Killgore, W.D.S.; Yurgelun-Todd, D.A. Sex differences in cerebral responses to images of high versuslow-calorie food. Neuroreport 2010, 21, 354–358. [CrossRef]
110. Cornier, M.-A.; Salzberg, A.K.; Endly, D.C.; Bessesen, D.H.; Tregellas, J.R. Sex-based differences in thebehavioral and neuronal responses to food. Physiol. Behav. 2010, 99, 538–543. [CrossRef]
111. Uher, R.; Treasure, J.; Heining, M.; Brammer, M.J.; Campbell, I.C. Cerebral processing of food-related stimuli:Effects of fasting and gender. Behav. Brain Res. 2006, 169, 111–119. [CrossRef] [PubMed]
112. Geliebter, A.; Pantazatos, S.P.; McOuatt, H.; Puma, L.; Gibson, C.D.; Atalayer, D. Sex-based fMRI differencesin obese humans in response to high vs. low energy food cues. Behav. Brain Res. 2013, 243, 91–96. [CrossRef]
113. Luo, S.; Alves, J.; Hardy, K.; Wang, X.; Monterosso, J.; Xiang, A.H.; Page, K.A. Neural processing of food cuesin pre-pubertal children. Pediatr. Obes. 2019, 14, e12435. [CrossRef]
114. Ricciardelli, L.A.; McCabe, M.P. Children’s body image concerns and eating disturbance: A review of theliterature. Clin. Psychol. Rev. 2001, 21, 325–344. [CrossRef]
115. Elfhag, K.; Tholin, S.; Rasmussen, F. Consumption of fruit, vegetables, sweets and soft drinks areassociated with psychological dimensions of eating behaviour in parents and their 12-year-old children.Public Health Nutr. 2008, 11, 914–923. [CrossRef]
116. Williamson, S.; Delin, C. Young children’s figural selections: Accuracy of reporting and body sizedissatisfaction. Int. J. Eat. Disord. 2001, 29, 80–84. [CrossRef]
117. Phares, V.; Steinberg, A.R.; Thompson, J.K. Gender Differences in Peer and Parental Influences: Body ImageDisturbance, Self-Worth, and Psychological Functioning in Preadolescent Children. J. Youth Adolesc. 2004, 33,421–429. [CrossRef]
118. Gustafson-Larson, A.M.; Terry, R.D. Weight-related behaviors and concerns of fourth-grade children. J. Am.Diet. Assoc. 1992, 92, 818–822.
119. Shapiro, S.; Newcomb, M.; Loeb, T.B. Fear of fat, disregulated-restrained eating, and body-esteem: Prevalenceand gender differences among eight- to ten-year-old children. J. Clin. Child. Psychol. 1997, 26, 358–365.[CrossRef]
120. Gardner, R.M.; Stark, K.; Friedman, B.N.; Jackson, N.A. Predictors of eating disorder scores in children ages6 through 14: A longitudinal study. J. Psychosom. Res. 2000, 49, 199–205. [CrossRef]
121. Wood, K.C.; Becker, J.A.; Thompson, J.K. Body image dissatisfaction in preadolescent children. J. Appl.Dev. Psychol. 1996, 17, 85–100. [CrossRef]
122. Robinson, T.N.; Chang, J.Y.; Haydel, K.F.; Killen, J.D. Overweight concerns and body dissatisfaction amongthird-grade children: The impacts of ethnicity and socioeconomic status. J. Pediatr. 2001, 138, 181–187.[CrossRef]
123. Mendelson, B.K.; White, D.R.; Mendelson, M.J. Self-esteem and body esteem: Effects of gender, age, andweight. J. Appl. Dev. Psychol. 1996, 17, 321–346. [CrossRef]
124. Collins, M.E. Body figure perceptions and preferences among preadolescent children. Int. J. Eat. Disord.1991, 10, 199–208. [CrossRef]
125. Thelen, M.H.; Cormier, J.F. Desire to be thinner and weight control among children and their parents.Behav. Ther. 1995, 26, 85–99. [CrossRef]
126. Smolak, L.; Levine, M.P.; Schermer, F. Parental input and weight concerns among elementary school children.Int. J. Eat. Disord. 1999, 25, 263–271. [CrossRef]
127. Fogel, A.; Fries, L.R.; McCrickerd, K.; Goh, A.T.; Chan, M.J.; Toh, J.Y.; Chong, Y.-S.; Tan, K.H.; Yap, F.;Shek, L.P.; et al. Prospective associations between parental feeding practices and children’s oral processingbehaviours. Matern. Child Nutr. 2019, 15, e12635. [CrossRef] [PubMed]
106
Nutrients 2019, 11, 682
128. Fisher, J.O.; Birch, L.L. Restricting access to palatable foods affects children’s behavioral response, foodselection, and intake. Am. J. Clin. Nutr. 1999, 69, 1264–1272. [CrossRef] [PubMed]
129. Birch, L.L.; Fisher, J.O. Mothers’ child-feeding practices influence daughters’ eating and weight. Am. J.Clin. Nutr. 2000, 71, 1054–1061. [CrossRef] [PubMed]
130. Johannsen, D.L.; Johannsen, N.M.; Specker, B.L. Influence of Parents’ Eating Behaviors and Child FeedingPractices on Children’s Weight Status. Obesity 2006, 14, 431–439. [CrossRef] [PubMed]
131. Arredondo, E.M.; Elder, J.P.; Ayala, G.X.; Campbell, N.; Baquero, B.; Duerksen, S. Is parenting style relatedto children’s healthy eating and physical activity in Latino families? Health Educ. Res. 2006, 21, 862–871.[CrossRef]
132. Pomerantz, E.M.; Ruble, D.N. The Role of Maternal Control in the Development of Sex Differences in ChildSelf-Evaluative Factors. Child Dev. 1998, 69, 458–478. [CrossRef] [PubMed]
133. McKinley, M.C.; Lowis, C.; Robson, P.J.; Wallace, J.M.W.; Morrissey, M.; Moran, A.; Livingstone, M.B.E. It’sgood to talk: Children’s views on food and nutrition. Eur. J. Clin. Nutr. 2005, 59, 542. [CrossRef]
134. Turner, K.; Jeffries, A.; Beaton, S.; Ferguson, S.; Craig, J. Gendered identity negotiations through foodconsumption. Young Consum. 2013, 14, 280–288. [CrossRef]
135. Hendy, H.M. Effectiveness of trained peer models to encourage food acceptance in preschool children.Appetite 2002, 39, 217–225. [CrossRef]
136. Oliver, K.K.; Thelen, M.H. Children’s perceptions of peer influence on eating concerns. Behav. Ther. 1996, 27,25–39. [CrossRef]
137. Belot, M.; James, J.; Nolen, P. Incentives and children’s dietary choices: A field experiment in primary schools.J. Health Econ. 2016, 50, 213–229. [CrossRef] [PubMed]
138. Cusumano, D.L.; Thompson, J.K. Media influence and body image in 8–11-year-old boys and girls: Apreliminary report on the multidimensional media influence scale. Int. J. Eat. Disord. 2001, 29, 37–44.[CrossRef]
139. Francis, L.A.; Susman, E.J. Self-regulation and rapid weight gain in children from age 3 to 12 years.Arch. Pediatr. Adolesc. Med. 2009, 163, 297–302. [CrossRef] [PubMed]
140. Kochanska, G.; Aksan, N. Children’s Conscience and Self-Regulation. J. Personal. 2006, 74, 1587–1618.[CrossRef]
141. Shrewsbury, V.; Wardle, J. Socioeconomic Status and Adiposity in Childhood: A Systematic Review ofCross-sectional Studies 1990–2005. Obesity 2008, 16, 275–284. [CrossRef] [PubMed]
142. English, L.K.; Fearnbach, S.N.; Wilson, S.J.; Fisher, J.O.; Savage, J.S.; Rolls, B.J.; Keller, K.L. Food portionsize and energy density evoke different patterns of brain activation in children. Am. J. Clin. Nutr. 2017, 105,295–305. [CrossRef]
143. Keller, K.L.; Assur, S.A.; Torres, M.; Lofink, H.E.; Thornton, J.C.; Faith, M.S.; Kissileff, H.R. Potential of ananalog scaling device for measuring fullness in children: Development and preliminary testing. Appetite2006, 47, 233–243. [CrossRef] [PubMed]
144. MATLAB and Statistics Toolbox Release 2012b; The Mathworks, Inc.: Natick, MA, USA, 2012.145. Cox, R.W. AFNI: Software for analysis and visualization of functional magnetic resonance neuroimages.
Comput. Biomed. Res. 1996, 29, 162–173. [CrossRef]146. Cox, R.W.; Reynolds, R.C.; Taylor, P.A. AFNI and Clustering: False Positive Rates Redux. bioRxiv 2016,
065862. [CrossRef] [PubMed]147. Chen, G.; Adleman, N.E.; Saad, Z.S.; Leibenluft, E.; Cox, R.W. Applications of multivariate modeling to
neuroimaging group analysis: A comprehensive alternative to univariate general linear model. Neuroimage2014, 99, 571–588. [CrossRef] [PubMed]
148. Jilani, H.; Ahrens, W.; Buchecker, K.; Russo, P.; Hebestreit, A. Association between the number of fungiformpapillae on the tip of the tongue and sensory taste perception in children. Food Nutr. Res. 2017, 61, 1348865.[CrossRef] [PubMed]
© 2019 by the authors. Licensee MDPI, Basel, Switzerland. This article is an open accessarticle distributed under the terms and conditions of the Creative Commons Attribution(CC BY) license (http://creativecommons.org/licenses/by/4.0/).
107


nutrients
Article
Influences of Psychological Traits and PROP TasterStatus on Familiarity with and Choice of Phenol-RichFoods and Beverages
Alessandra De Toffoli 1, Sara Spinelli 1, Erminio Monteleone 1,*, Elena Arena 2,
Rossella Di Monaco 3, Isabella Endrizzi 4, Tullia Gallina Toschi 5, Monica Laureati 6,
Fabio Napolitano 7, Luisa Torri 8 and Caterina Dinnella 1
1 Department of Agricultural, Food, Environment and Forestry Science and Technology (DAGRI),University of Florence, 50144 Florence, Italy; [email protected] (A.D.T.);[email protected] (S.S.); [email protected] (C.D.)
2 Department of Agriculture, Food and Environment (Di3A), University of Catania, 95123 Catania, Italy;[email protected]
3 Department of Agriculture Sciences, University of Naples Federico II, 80055 Naples, Italy;[email protected]
4 Fondazione Edmund Mach, 38010 San Michele all’Adige (TN), Italy; [email protected] Department of Agricultural and Food Sciences (DISTAL), University of Bologna—Alma Mater Studiorum,
40127 Bologna, Italy; [email protected] Department of Food, Environmental and Nutritional Sciences (DeFENS), University of Milan,
20133 Milan, Italy; [email protected] School of Agricultural, Forestry and Environmental Sciences (SAFE), University of Basilicata,
85100 Basilicata, Italy; [email protected] University of Gastronomic Sciences, 12042 Pollenzo (CN), Italy; [email protected]* Correspondence: [email protected]
Received: 12 March 2019; Accepted: 5 June 2019; Published: 13 June 2019
Abstract: Plant phenolics are powerful antioxidants and free radical scavengers that can contribute tothe healthy functional properties of plant-based food and beverages. Thus, dietary behaviours rich inplant-based food and beverages are encouraged. However, it is well-known that the bitter taste andother low-appealing sensory properties that characterize vegetables and some other plant-based foodsact as an innate barrier for their acceptance. The aim of this study was to investigate the influence ofpsychological traits and PROP status (the responsiveness to bitter taste of 6-n- propylthiouracil) onthe choice of and familiarity with phenol-rich vegetables and beverages varying in recalled level ofbitterness and astringency. Study 1 aimed at assessing the variations of the sensory properties ofvegetable and coffee/tea items with two check-all-that-apply (CATA) questionnaires (n = 201 andn = 188 individuals, respectively). Study 2 aimed at investigating how sensitivity to punishment,to reward, and to disgust, food neophobia, private body consciousness, alexithymia, and PROPresponsiveness affect choice and familiarity with phenol-rich foods (n = 1200 individuals). A ChoiceIndex was calculated for vegetables (CV) and coffee/tea (CC) as a mean of the choices of the morebitter/astringent option of the pairs and four Familiarity Indices were computed for vegetables (FV)and coffee/tea (FC), higher (+) or lower (-) in bitterness and astringency. Subjects higher in foodneophobia, sensitivity to punishment or sensitivity to disgust reported significantly lower choiceindices than individuals lower in these traits, meaning that they systematically opted for the leastbitter/astringent option within the pairs. Familiarity with vegetables was lower in individuals highin sensitivity to punishment, in food neophobia and in alexithymia, irrespective of their sensoryproperties. The Familiarity Index with coffee/tea characterized by higher bitterness and astringencywas lower in individuals high in food neophobia, sensitivity to disgust, and alexithymia. Nosignificant effect of PROP was found on any indices. The proposed approach based on productgrouping according to differences in bitterness and astringency allowed the investigation of the role
Nutrients 2019, 11, 1329; doi:10.3390/nu11061329 www.mdpi.com/journal/nutrients109

Nutrients 2019, 11, 1329
of individual differences in chemosensory perception and of psychological traits as modulators ofphenol-rich foods preference and consumption.
Keywords: choice; familiarity; PROP; food neophobia; sensitivity to disgust; sensitivity to punishment;vegetables; caffeinated beverages; bitterness; astringency
1. Introduction
Diets rich in plant-based food and beverages are encouraged, given general agreement on theirpositive health outcomes. Meta-analyses of the effects of such foods indicate that a reduced riskof coronary heart disease, stroke, and diabetes are associated with a regular intake of non-starchyvegetables and moderate consumption of tea and coffee [1].
Plant phenolics are powerful antioxidants and free radical scavengers that can contribute to thehealthy functional properties of plant-based food and beverages [2]. However, phenol compounds fromvegetable sources are characterized by bitterness, astringency, and pungency [3–5], sensations that maylimit food acceptability [6,7]. Human beings, long sensitized to the bitter taste of plant toxins, considerexcessive bitterness the principal reason for food rejection [8]. The tactile sensation of astringencydiscourages animals from ingesting foods too high in tannins, thus protecting them from the tannin’spotential harmful anti-nutritional effects [9]. A high intensity of perceived astringency negativelyimpacts the acceptance for high phenol containing foods [3]. The high phenol binding proteins fromparotid glands exert a protective role against dietary phenols, and astringency arises from phenolinteractions with the adsorbed glycoprotein layer, with the consequent oral cavity delubrication [10,11].
Sensory properties drive liking for vegetables [12], and it is well-known that bitterness and otherunpalatable sensory properties may act as a barrier for vegetable acceptance [8,9,13,14]. Moreover,while bitterness and astringency are important qualities in tea and coffee, and may contribute toconsumer appreciation of these products [15,16], in actual consumption conditions, masking ingredients(sweeteners, milk) are often used to modify these sensations to levels compatible with individualpreferences [17].
Healthy individuals substantially differ in chemosensory perception, and such variability hasbeen extensively studied in recent years. Most notably, the inherited capacity to perceive the bitternessof propylthiouracil (PROP) is considered a reliable broad marker for individual differences in tasteresponsiveness that may influence food preferences and eating behaviour [18]. The effect of the PROPphenotype (PROP bitterness ratings on the generalized Labeled Magnitude Scale (gLMS):≤17, non-taster(NT); 18–52, medium taster (MT); and ≥53, supertaster (ST), according to Hayes et al. and Fischeret al. [19,20]) on the intake and preference of bitter foods and beverages has been examined in severalstudies, with mixed results, mainly because demographics, genetics, and other environmental factorsmay influence both phenotypic responses to oral stimulation and affective response to food [21,22].Those who are insensitive to PROP bitterness (non-tasters) were found to consume more vegetables andmore bitter vegetables than the other taster phenotypes, PROP medium-tasters and super-tasters [23,24].The super-taster PROP phenotype was associated with a lower preference for bitter vegetables [25]. Onthe other hand, no differences between PROP phenotypes were found in preferences for plant-basedbitter foods [26] or for actual vegetable intake in children [27–29]. PROP supertasters gave higherbitterness, sourness, and astringency ratings for coffee, but these did not significantly affect liking [17]or consumption [30]. In general, these results are inconsistent and the causal models envisagingstraight associations of variations in taste abilities with food perception and choice show a weakpredictive power.
Recent studies have shown that personality has a hugely important role in preferences and choicesand, in some cases, in determining sensory responses to foods. One such key personality variable isthe trait of food neophobia (FN), originally defined as the reluctance to try or eat unfamiliar foods.
110

Nutrients 2019, 11, 1329
High levels of food neophobia have been associated with reduced preference and intake for manyfood products belonging to different categories, including fruits and vegetables, in adults [31,32] andchildren [33]. In particular, food neophobia was found to affect the liking of foods and beveragescharacterized by high intensities of bitterness, astringency, sourness, and pungency. Those high infood neophobia (neophobics) reported liking such vegetables, beverages, fruits, and spicy foods lessthan those low in food neophobia (neophilics). Conversely, few differences between food neophobiagroups were found for the liking of bland vegetables and beverages, or for sweets and desserts [32,34].Neophobics perceive pungency and astringency in food products as more intense, and like the mostpungent and astringent samples less than neophilics [34,35].
Other personality traits have been found to be associated with lower preferences for pungentfoods. Individuals highly sensitive to visceral disgust (disgust related to rotten food, vermin, and bodyfluids) [36,37] find pungent foods more intense and like and choose them less [35]. Two other personalitytraits, sensitivity to punishment and sensitivity to reward, describe individual differences in reactivityand responsivity to the behavioural inhibition and activation systems, respectively [38]. Sensitivity topunishment was found to be negatively associated with liking of spicy foods [39] and pungent foodchoice in females [35]. Sensitivity to reward was found to be positively associated with chili intake,liking of spicy foods, and choice of pungent foods [35,39,40]. Recent studies have also highlighted anassociation between sensitivity to reward and unhealthier food behaviours, such as a preference forsweet and fatty foods, higher fat intake, higher alcohol consumption, and smoking frequency [41–43].Alexithymia, defined as the inability of individuals to identify and name their emotional states [44],was found to be associated with food preferences, with high alexithymia associated with a liking foralcohol, sweets, and fats/meats, and lower alexithymia with a liking for vegetables, condiments, andstrong cheeses [45].
The complexity of these factors and the sometimes mixed reports on their effects indicate thatthe interplay of several dimensions, such as gender, age, personality traits, and taste responsiveness,influence choice and intake of foods and beverages. In addition, food products are selected based onculture, which means that some products are far more contextually appropriate and/or familiar thanothers. While a positive relationship between familiarity and choice can be expected, the strength of thisrelationship is unclear. Many contextual situational factors may play a role in choice, while familiaritycovers both features of frequency of consumption (occasional and regular) and levels of knowledge(from product name to product taste) that are less affected by contextual factors (see, for example, thescale developed by Tuorila and colleagues [46]). In addition, it is not known if, or in what way, therelationship between choice and familiarity is affected by personality traits or taste responsiveness.Although some studies have investigated how taste responsiveness affects food familiarity or foodchoice, the literature on the role of psychological traits is quite limited, and the relationships betweenthese variables remain little explored [35]. Exploring the factors that influence choice of and familiaritywith phenol-rich foods and beverages is of interest to better understand food behaviour and to shedlight on the role of personality traits and taste responsiveness as barriers to heathy eating.
The grouping of food and beverages based on their overall sensory characteristics has already beenused to explore individual differences in preferences and consumption. PROP status only marginallyaffects the preference expressed for specific foods selected to represent sensations generally dislikedby PROP supertasters, such as bitterness and pungency [26]. Food neophobia level significantlyinfluenced preference for and familiarity with food and beverages categorized as “mild” and “strong”flavors [34]. Grouping vegetables as having low and high appeal was used to investigate demographicand attitudinal variables affecting vegetable consumption in European adolescents [14]. Existing datafrom sensory evaluations of trained and untrained assessors, as well as the chemical composition, werethe criteria generally used for grouping the foods [12,14,47–51].
In the present study, an original approach to phenol-rich product grouping based on differencesin bitterness and astringency is proposed. This approach was used to investigate the influence ofindividual variation in psychological traits and PROP status on choice of and familiarity with phenol-rich
111

Nutrients 2019, 11, 1329
vegetables and beverages, varying in recalled levels of bitterness and astringency. Furthermore, therelationship between familiarity with and choice of phenol-rich vegetables and beverages with ahigh recalled level of bitterness and astringency as a function of personality traits and PROP statuswas investigated.
2. Materials and Methods
The experimental plan consisted of two independent studies: one preliminary study and one mainstudy, conducted with two different subject groups. The preliminary study was conducted in order tovalidate the differences in expected level of bitterness and astringency within each pair included in thevegetable choice questionnaire (V-IT-FCQ) and coffee/tea choice questionnaire (C-IT-FCQ) used in themain study. The main study aimed at investigating how PROP responsiveness and psychological traitsaffect familiarity with, and choice of, vegetables and coffee/tea, presented in pairs with two optionswith different levels of bitterness and astringency. The studies were conducted in agreement with theItalian ethical requirements on research activities and personal data protection (D.L. 30.6.03 n. 196)and the respondents gave their written informed consent at the beginning of the study. The protocol ofthe studies was approved by the Ethics Committee of Trieste University. The respondents gave theirwritten informed consent at the beginning of the test, according to the principles of the Declarationof Helsinki.
2.1. Participants
Participants were recruited on a national basis by means of announcements published on socialnetworks (Facebook), articles published in national newspapers, and in magazines. Furthermore,each research unit recruited subjects locally by means of social networks, mailing lists, pamphletdistribution, and word of mouth. The exclusion criteria were pregnancy and not having lived in Italyfor at least 20 years.
2.1.1. Preliminary Study—Validation of the Differences in Bitterness and Astringency within Pairs ofthe Choice Questionnaires used in the Main Study
Subjects completed an online questionnaire aimed at measuring the sensory response (bitternessand astringency) to vegetables (201 subjects: 77.7% females; age range 18–70; mean age 40.3 ± SD14.1) and coffee/tea (188 subjects: 75.4% females; age range 19–68; mean age 40.1 ± SD 14.3) products(presented with names) selected for the questionnaires used in the main study (§ 2.1.2).
2.1.2. Large Scale Data Collection
Data were collected on 1200 Italian subjects (58% females; age range 18–60 years; male mean age35.9 years ± SD 12.8; female mean age: 35.2 years ± SD 12.9) on a national basis. In order to explorepossible age-related differences, subjects were divided into three age groups: 18–30 years (45.6%),31–45 years (28.0%), 46–60 years (26.4%).
2.2. Procedure
2.2.1. Preliminary Study—Validation of the Differences in Bitterness and Astringency within Pairs ofthe Choice Questionnaires
Two check-all-that-apply (CATA) questionnaires [52] with forced choice (yes/no) were developedto describe the sensory properties of items to be included in the vegetable food choice questionnaire(V-IT-FCQ) and coffee/tea choice questionnaire (C-IT-FCQ) used in the main study. The vegetableCATA questionnaire included fourteen items: “pumpkin risotto”, “risotto with radicchio”, “lettuceand valerian salad” (Valerianella locusta, also known as corn salad or mâche), “radicchio and rocketsalad”, “green salad”, “bean sprout salad”, “chard”, “chicory”, “zucchini”, “asparagus”, “carrots”,“cauliflowers”, “cucumber”, and “radish”. The coffee/tea CATA questionnaire included coffee and tea
112

Nutrients 2019, 11, 1329
items with/without ingredients (milk and sugar) masking the perception of bitterness and astringency.The coffee/tea CATA questionnaire included six items: “coffee with sugar”; “coffee without sugar”;“tea with sugar”; “tea without sugar”, “macchiato”, and “cappuccino”. The list of sensory propertiesincluded 19 and 13 descriptors in the vegetable and coffee/tea questionnaires, respectively, but inthe present paper only bitterness and astringency were considered. Both the products and thesensory properties were presented using words in a randomized order. The participants filled in thequestionnaire online. The online platform SurveyGizmo (surveygizmo.eu) was used for data collection.
2.2.2. Large Scale Data Collection
Participants were asked to fill in an online questionnaire, and they then attended a session at thelaboratory. Socio-demographic (gender, age, education) information and familiarity with foods werecollected through online questionnaires before the test sessions. In the lab session, participants wereasked to fill in a set of questionnaires to measure personality and psychological traits and to completethe choice questionnaires. PROP responsiveness was also measured. The study included sensory tests,questionnaires, and the collection of other data (see Monteleone et al., [53] for a complete overview ofdata collection), but only a selection of variables are presented here.
Psychological Traits
Sensitivity to punishment (SP) and sensitivity to reward (SR), related to responsiveness ofbehavioural inhibition and activation systems, were quantified using the sensitivity to punishmentand sensitivity to reward questionnaire (SPSRQ) questionnaire developed by Torrubia, Ávila, Moltó,and Caseras [54]. Items 4, 8, 16, 25, 32, 34, and 36 were discarded based on the validation of thequestionnaire in Italian (see Spinelli et al 2018 [36]). The sensitivity to punishment and sensitivityto reward scales were scored with a yes/no format. For each subject, sensitivity to punishment andsensitivity to reward scores were computed by summing up the yes answers (SP score range 0–23; SRscore range 0–18), so that a higher score indicated a higher sensitivity to punishment and to reward.
Food neophobia (FN), defined as the reluctance to try and eat unfamiliar foods, was quantifiedusing the 10-statement scale developed by Pliner and Hobden [55] and validated in Italian by Laureatiand colleagues [34]. Individual food neophobia scores were computed as the sum of ratings givento the 10 statements, after reversing the neophilic items (using a seven point Likert scale: disagreestrongly/agree strongly). The scores ranged from 10 to 70, with higher scores corresponding to higherfood neophobia.
Sensitivity to disgust (DS), defined as the responsivity to core-visceral disgust (rotten food, vermin,body fluids), was quantified using the eight-item short form of the disgust sensitivity scale developedby Inbar, Pizarro, and Bloom [56] and validated in Italian by Spinelli and colleagues [35]. The scaleincludes two subscales, each presented with a specific scale ranging from 1 = strongly disagree (veryuntrue about me) to 5 = strongly agree (very true about me) (subscale 1) and from 1 = not at alldisgusting to 5 = extremely disgusting (subscale 2). The individual scores ranged from 5 to 40, withhigher scores reflecting a higher sensitivity to disgust.
Private body consciousness (PBC), defined as the disposition to focus on internal bodily sensations(awareness of internal sensations), was quantified using the five-item instrument developed by Miller,Murphy, and Buss [57]. The individual score was computed as the sum of the ratings given for the fivestatements (using a five-point scale: extremely uncharacteristic/extremely characteristic). The scoresranged from 5 to 25, with higher scores reflecting higher private body consciousness levels.
Alexithymia (TAS), defined as a specific disturbance in psychic functioning, characterized bydifficulties in the capacity to verbalize affect and to elaborate fantasies, was quantified using theToronto Alexithymia Scale (TAS) developed by Parker, Bagby, Taylor, Endler, and Schmitz [58] andvalidated in Italian by Bressi and colleagues [59]. The individual alexithymia total score was computedas the sum of ratings given to the 20 statements (using a five-point Likert scale: disagree strongly/agree
113

Nutrients 2019, 11, 1329
strongly). The alexithymia total scores ranged from 20 to 100, with a higher score indicating a greaterlevel of alexithymia.
PROP Phenotyping
PROP taster status was assessed using a 3.2 mM PROP solution, prepared by dissolving 0.545 g/Lof 6-n-propyl-2-thiouracil (European Pharmacopoeia Reference Standard, Sigma Aldrich, Milano,Italy) in deionized water [60]. Subjects were presented with two identical 10 mL samples, each codedwith a three-digit code. Subjects were instructed to hold each sample in their mouth for 10 s, then toexpectorate, wait 20 s, and evaluate the intensity of bitterness using the general label magnitude scale(gLMS; 0 = no sensation–100 = the strongest imaginable sensation of any kind) [61]. Verbal instructionswere given that the top of the scale represented the most intense sensation that subjects could everimagine experiencing. To ensure appropriate use of this scale, practise using a variety of rememberedsensations from different modalities, including loudness, oral pain/irritation, and tastes, was provided.Subjects had a 90 s break to control for carry-over effects after the first sample evaluation. During thebreak, subjects adopted a washing procedure to rinse their mouth with distilled water for 30 s, atesome plain crackers for 30 s, and finally rinsed with water for a further 30 s before they evaluated thesecond PROP sample [5]. PROP taster status was based on the average rating of the two replicates andgroupings were based on previously published cut-offs [19,20]: PROP non-tasters (NT) ≤17 (n = 274);PROP medium tasters (MT), 18–52 (n = 505); and PROP supertasters (ST) ≥53 (n = 421) on the gLMS.
Choice of and Familiarity with Vegetable and Coffee/Tea items
The choice of phenol-rich vegetables and coffee/tea between pairs of two food items characterizedby different levels of bitterness and astringency was assessed with the V-IT-FCQ and C-IT- FCQ(Table 1). Vegetable and coffee/tea pairs in the choice questionnaires were selected so that the optionsin each pair significantly differed for bitterness and astringency, based on the results of the preliminaryCATA study. V-IT FCQ consisted of seven pairs of vegetables, selected to represent possible optionsfor the same main dish (risotto with different condiments: pumpkin or zucchini) and for similar sidedishes consisting of raw (leafy/green salads: lettuce and valerian or radicchio and rockets; green salador bean sprouts; salad ingredients: cucumbers or radishes) or cooked (leafy green: chard or chicory;others: zucchini or asparagus; carrot or cauliflower) vegetables. Similarly, coffee and tea options wereselected to represent possible alternatives of the same hot beverage, including or excluding ingredientsmasking the perception of bitterness and astringency (i.e., milk and sweeteners).
Table 1. Pairs of food items included in the vegetable choice questionnaire (V-IT-FCQ) and coffee/teachoice questionnaire (C-IT-FCQ).
Vegetable Choice Questionnaire (V-IT-FCQ).
0: Options lower in bitterness and astringency 1: Options higher in bitterness and astringency
Pumpkin risotto Risotto with radicchioLettuce and valerian salad Radicchio and rocket saladGreen salad Bean sprout saladChard ChicoryZucchini AsparagusCarrots CauliflowerCucumber Radish
Coffee/Tea Choice Questionnaire (C-IT-FCQ)
Macchiato Coffee
Coffee with sugar Coffee without sugar
Cappuccino Coffee
Tea with sugar Tea without sugar
114

Nutrients 2019, 11, 1329
For each pair, participants were asked to indicate which food they would ideally choose, pointingout that the answer would describe not what they usually choose but rather what they would liketo choose in a situation of absence of restrictions (e.g., due to health or weight concerns). The choicefor vegetables was asked in the context of a main meal and the choice for coffee/tea was asked in thecontext of breakfast. Options within the pairs were coded as “0” for the lowest level of bitterness andastringency and “1” for the highest level of bitterness and astringency. Here, for each subject, a choiceindex was calculated for vegetables (CV) and coffee/tea (CC) as a mean of the choices of the morebitter/astringent option (range from 0 to 1). Transformation in continuous variables of the binary datahas been proposed in order to simplify analysis and use standard statistical methods frequently usedfor sensory data [62,63]. The approach for the calculation of a choice index as a sum of the options 1(within the pairs) was already used in Spinelli et al. [35].
Familiarity with vegetables and coffee/tea items was assessed by a five-point labelled scale (1 = Ido not recognize it; 2 = I recognize it, but I have never tasted it; 3 = I have tasted it, but I don’t eat it;4 = I occasionally eat it; 5 = I regularly eat it) developed by Tuorila and colleagues [46]. Two indices offamiliarity with vegetables and coffee/tea higher in bitterness and astringency (+) were obtained bythe sum of ratings of familiarity with the items that, within each pair, were higher in these sensations,based on the results of the preliminary study: FV+: risotto with radicchio, radicchio and rocket salad,bean sprout salad, chicory, asparagus, cauliflower, radish; ranging from 7 to 35; FC+: coffee and teawithout sugar; ranging from 2 to 10. Two indices of familiarity with vegetables and coffee/tea lower inbitterness and astringency, respectively, were obtained by the sum of ratings of familiarity with theitems that, within each pair, showed a lower level of bitterness and astringency (-), based on the resultsof the preliminary study: FV-: pumpkin risotto, lettuce and valerian salad, chard, zucchini, carrots,cucumber; ranging from 6 to 30; FC-: coffee and tea with sugar; ranging from 2 to 10.
The presentation order of the food items in the familiarity and choice questionnaires wasrandomized across participants.
2.3. Data Analysis
2.3.1. Preliminary study—Validation of the Differences in Bitterness and Astringency within Pairs ofthe Choice Questionnaires
Cochran Q-tests were performed to assess the differences between the frequency of selectionof bitterness and astringency within the pairs of the V-IT-FCQ and C-IT-FCQ. Post-hoc pairwisecomparisons were calculated using the McNemar procedure and the level of significance was set at5% [43,52].
2.3.2. Large Scale Study
Cronbach’s α was computed to check for the internal reliability of each psychological traitquestionnaire. Two-way ANOVA models were used to determine the main effects of gender (males;females) and age class (18–30; 31–45; 46–60) and their interactions on psychological trait scores andon PROP bitterness intensity. Three-way ANOVA models were used to test the effects of gender, age,and psychological trait level (low, medium, and high) and PROP status (NT, MT, and ST) and theirinteractions on choice (CV and CC) and familiarity (FV+, FV-, FC+, FC-) indices.
The robustness of the ANOVA models was verified; the residuals of each ANOVA model wereinspected for normality by histograms and Q–Q plots and for heteroscedasticity using Levene’stest. A p-value of 0.05 was considered the threshold for statistical significance and post-hoc usingthe Bonferroni test adjusted for multiple comparisons were used. Pearson’s correlation coefficientswere computed to explore the association between familiarity and choice (FV+ and CV; and FC+and CC, respectively) in subject groups with different levels of expression of psychological traits (L,M, and H) and PROP status (NT, MT, and ST). A p-value of 0.05 was considered the threshold for
115

Nutrients 2019, 11, 1329
statistical significance. Fisher’s r to z transformation was used on the correlation coefficient to assessthe significance of the differences (p-value of 0.05).
The XLSTAT statistical software package version 19.02 (Addinsoft) was used for data analysis.
3. Results
3.1. Preliminary Study—Validation of the Differences in Bitterness and Astringency within Pairs of theChoice Questionnaires
Significant differences were found between the items of each pair belonging to the vegetable choicequestionnaire (V-IT-FCQ) and to the coffee/tea choice questionnaire (C-IT-FCQ) in both bitterness andastringency frequency of selection, with the exception of green salad/bean sprout salad in bitterness(p = 0.262) and carrots and cauliflower in astringency (p = 0.827) (Table 2).
Table 2. Percentage of participants who selected the terms “bitterness” and “astringency” in thecheck-all-that-apply (CATA) experiment. Cochran’s Q test was used to determine significant differencesbetween samples.
Vegetable Choice Questionnaire (V-IT-FCQ)
Option 0 (lower inbitterness and astringency)
Option 1 (higher inbitterness and astringency)
Bitterness (%) Astringency (%)
p option 0 option 1 p option 0 option 1
Pumpkin risotto Risotto with radicchio ** 1.6 69.9 ** 7.1 21.9Lettuce and valerian salad Radicchio and rocket salad ** 18.9 82.1 ** 6.5 27.9
Green salad Bean sprout salad 16.4 12.9 * 6.0 13.4Chard Chicory ** 27.4 81.6 ** 13.4 30.3
Zucchini Asparagus ** 11.9 34.8 ** 5.0 13.4Carrots Cauliflower ** 3.0 16.9 7.5 7.0
Cucumber Radish ** 31.3 46.3 * 19.4 29.9
Coffee/Tea Choice Questionnaire (C-IT-FCQ)
Option 0 (lower inbitterness and astringency)
Option 1 (higher inbitterness and astringency)
Bitterness (%) Astringency (%)
p option 0 option 1 p option 0 option 1
Macchiato Coffee * 50.5 97.9 * 13.3 41.0Coffee with sugar Coffee without sugar * 19.7 97.9 * 20.2 41.0
Cappuccino Coffee * 21.8 97.9 * 6.4 41.0Tea with sugar Tea without sugar * 4.3 67.0 * 30.3 44.1
* p ≤ 0.01, ** p ≤ 0.001.
3.2. Large Study on Familiarity with and Choice of Phenol-Rich Foods and Beverages
3.2.1. Personality Trait Questionnaires
The internal reliability of the questionnaires measuring psychological traits was satisfactory, withCronbach’s alpha ranging from 0.86 to 0.70 (Table 3). Based on the percentile limits, the populationwas grouped into Low-L (1◦ quartile), Medium-M (interquartile), and High-H (3◦ quartile) levels ofexpression of each trait (Table 3).
116

Nutrients 2019, 11, 1329
Table 3. Psychological traits: internal reliability (Cronbach’s α–α), limits of the first (1st Q) and thethird (3rd Q) quartiles, number of observations for each group (Low, Medium, High).
Trait α 1st Q 3rd Qn
Lown
Mediumn
High
Sensitivity toPunishment 0.85 5 13 310 537 353
Sensitivity to Reward 0.77 3 9 329 540 331Food Neophobia 0.86 18 36 334 558 308Sensitivity to Disgust 0.70 25 33 303 533 364Private BodyConsciousness 0.71 16 21 368 490 334
Alexithymia 0.82 38 55 314 567 312
Both gender and age affected individual variation in personality traits (Table 4). A significantgender effect was found for private body consciousness, sensitivity to punishment, sensitivity toreward, and sensitivity to disgust. Females were significantly higher in private body consciousness,sensitivity to punishment, and sensitivity to disgust than males, while males were more sensitiveto reward. A significant effect of age was found for sensitivity to punishment, sensitivity to reward,sensitivity to disgust, alexithymia, and food neophobia. Sensitivity to punishment, sensitivity toreward, and alexithymia decreased with age, while food neophobia and sensitivity to disgust increasedwith age. The effect was further characterized by an interaction in the case of gender with privatebody consciousness: a decrease in private body consciousness with age was found in males, but notin females.
Table 4. Two-way ANOVA: gender, age and their interaction effect on psychological traits and onpropylthiouracil (PROP) bitterness scores. F, p, and mean values.
Trait Gender Age Gender × Age
F p-Value Mean Values F p-Value Mean Values F p-value
Females Males 18–30 31–45 46–60
Sensitivity toPunishment 37.1 <0.0001 9.9 8.0 32.4 <0.0001 10.5 (a) 8.2 (b) 8.2 (b) 1.6 0.2058
Sensitivity to Reward 72.7 <0.0001 5.1 6.8 85.8 <0.0001 7.6 (a) 5.6 (b) 4.7 (c) 0.8 0.4343Food Neophobia 0.5 0.4701 27.2 27.7 10.0 <0.0001 26.1 (b) 26.6 (b) 29.7 (a) 0.2 0.8198Sensitivity to Disgust 90.1 <0.0001 30.6 27.6 14.6 <0.0001 28.0 (b) 29.2 (a) 30.1 (a) 3.0 0.0513Private BodyConsciousness 25.3 <0.0001 18.7 17.4 1.1 0.3410 18.2 18.1 17.7 7.2 0.0008
Alexithymia 0.1 0.7899 46.0 46.2 37.9 <0.0001 49.8 (a) 43.4 (b) 45.0 (b) 0.4 0.6821PROP 22.8 <0.0001 44.6 36.9 12.6 <0.0001 45.2 (a) 41.3 (a) 35.6 (b) 3.0 0.0495
Different letters indicate significantly different values (p ≤ 0.05).
3.2.2. PROP Responsiveness
Effects of both gender and age were found on responsiveness to PROP (Table 4). The effects werefurther characterized by an interaction with gender, in that females were more responsive to PROP.PROP responsiveness decreased from the age class 18–30 to 31–45 and then remained stable in females,while a decrease in PROP responsiveness in males was reported in the age class 46–60.
3.2.3. Vegetable Choice Index (CV) and Coffee/Tea Choice Index (CC)
The effects of individual variation in psychological traits and PROP status, gender, age, and theirinteractions on choice indices are reported in Table 5.
117

Nutrients 2019, 11, 1329
Table 5. Three-way ANOVA. Psychological trait level (high, medium, and low), PROP Status (NT,MT, ST), gender, age, and relevant two-way interaction effects on the choice index for vegetables (CV),choice index for coffee/tea (CC), indices for familiarity with vegetables with high (FV+) and low (FV-)bitterness and astringency and indices for familiarity with coffee/tea with high (FC+) and low (FC-)bitterness and astringency. F and p values. Significant differences (p ≤ 0.05) are emboldened.
Choice Indexfor Vegetables
Choice Indexfor
Coffee/Tea
Familiarity withVegetables Higherin Bitterness and
Astringency
Familiarity withVegetables Lower in
Bitterness andAstringency
Familiarity withCoffee/Tea Higher in
Bitterness andAstringency
Familiarity withCoffee/Tea Lower in
Bitterness andAstringency
F p F p F p F p F p F p
Sensitivity toPunishment 6.4 0.0017 3.4 0.0323 11.5 <0.0001 4.4 0.0122 2.1 0.1259 1.6 0.2055
Gender 21.2 <0.0001 0.6 0.4306 9.3 0.0024 64.7 <0.0001 0.3 0.5740 0.0 0.9520Age 33.0 <0.0001 2.2 0.1085 31.4 <0.0001 10.8 <0.0001 0.0 0.9862 0.6 0.5285
Gender × SP 0.0 0.9683 2.0 0.1414 0.3 0.7644 0.5 0.6182 2.8 0.0628 0.8 0.4683Age × SP 1.8 0.1286 0.8 0.5416 1.0 0.4138 1.7 0.1581 0.5 0.7620 0.5 0.7682
Sensitivity toReward 0.8 0.4392 1.3 0.2696 0.1 0.9507 0.1 0.9164 0.1 0.9186 0.1 0.9351
Gender 25.4 <0.0001 0.4 0.5273 4.4 0.0369 56.3 <0.0001 0.8 0.3789 0.0 0.8636Age 36.2 <0.0001 1.8 0.1607 37.8 <0.0001 12.6 <0.0001 0.2 0.8098 0.1 0.9339
Gender × SR 1.7 0.1766 0.6 0.5717 0.5 0.6215 0.3 0.7440 1.5 0.2328 0.3 0.7591Age × SR 0.2 0.9501 0.6 0.6883 1.0 0.4203 0.2 0.9312 1.4 0.2288 0.4 0.7848
Food Neophobia 11.7 <0.0001 6.8 0.0012 34.1 <0.0001 14.9 <0.0001 16.1 <0.0001 5.4 0.0048
Gender 32.0 <0.0001 0.2 0.6378 3.6 0.0595 58.5 <0.0001 0.1 0.7986 0.0 0.8339Age 40.0 <0.0001 4.2 0.0159 47.9 <0.0001 18.3 <0.0001 0.7 0.5207 0.3 0.7172
Gender × FN 1.5 0.2130 0.4 0.6563 0.8 0.4484 1.3 0.2825 1.1 0.3275 0.2 0.8262Age × FN 0.2 0.9313 2.0 0.0967 1.0 0.4138 0.8 0.5048 0.9 0.4711 0.7 0.5971
Sensitivity toDisgust 13.0 <0.0001 4.2 0.0154 10.1 <0.0001 2.9 0.0545 3.8 0.0233 2.2 0.1071
Gender 14.4 0.0002 0.8 0.3572 9.6 0.0019 58.8 <0.0001 2.9 0.0894 0.1 0.7851Age 45.7 <0.0001 3.9 0.0201 49.6 <0.0001 16.9 <0.0001 0.6 0.5310 0.5 0.6163
Gender × DS 0.2 0.7832 0.3 0.7663 0.2 0.8558 0.7 0.4758 1.3 0.2706 0.9 0.4071Age × DS 0.7 0.6250 1.4 0.2469 1.8 0.1198 1.0 0.3823 1.4 0.2297 1.1 0.3743
Private BodyConsc. 0.9 0.4203 0.0 0.9670 4.4 0.0123 1.7 0.1773 2.0 0.1346 1.2 0.2918
Gender 24.4 <0.0001 0.4 0.5240 3.9 0.0489 49.3 <0.0001 0.3 0.5837 0.0 0.8951Age 40.1 <0.0001 2.4 0.0889 42.9 <0.0001 15.5 <0.0001 0.7 0.4892 0.4 0.6871
Gender × PBC 3.6 0.0267 0.2 0.8372 2.2 0.1113 0.4 0.7034 0.2 0.8094 1.7 0.1922Age × PBC 2.0 0.0905 1.5 0.1919 2.3 0.0603 0.8 0.5297 1.3 0.2852 0.7 0.6041
Alexithymia 2.1 0.1184 2.9 0.0547 7.7 0.0005 5.4 0.0046 3.5 0.0292 1.5 0.2127Gender 20.8 <0.0001 1.2 0.2750 5.5 0.0195 56.3 <0.0001 0.7 0.4148 0.2 0.6722
Age 30.5 <0.0001 2.0 0.1400 32.2 <0.0001 10.0 <0.0001 0.0 0.9958 0.4 0.6632Gender × TAS 0.8 0.4407 3.0 0.0504 0.4 0.6933 0.0 0.9542 2.0 0.1423 1.4 0.2358
Age × TAS 1.3 0.2528 1.2 0.3312 0.1 0.9693 0.3 0.8856 0.6 0.6304 0.3 0.8903
PROP 0.5 0.5969 0.6 0.5439 0.1 0.8819 0.0 0.9585 0.3 0.7432 1.5 0.2324Gender 25.7 <0.0001 0.8 0.3615 7.4 0.0067 67.0 <0.0001 1.1 0.2856 0.0 0.9142
Age 33.2 <0.0001 2.5 0.0848 39.2 <0.0001 14.1 <0.0001 0.4 0.6744 0.4 0.6583Gender × PROP 1.2 0.2968 0.2 0.8411 3.0 0.0526 5.5 0.0042 1.8 0.1711 0.0 0.9752
Age × PROP 0.9 0.4888 0.5 0.7087 0.7 0.6255 0.2 0.9591 0.3 0.8853 1.7 0.1386
SP: Sensitivity to punishment; SR: Sensitivity to reward; FN: Food neophobia; DS: Sensitivity to disgust; PBC:Private Body consciousness; TAS: Alexithymia; PROP: PROP taster status.
A significant effect of both gender and age was found for the vegetable choice index in eachANOVA model. The coffee/tea choice index was significantly affected by age only in the food neophobiaand sensitivity to disgust models, while no effect of gender on the coffee/tea choice index was reported.These effects were not further characterized by an interaction between gender and age. The vegetablechoice index was higher in males and increased with age. When the effect was found to be significant,the coffee/tea choice index increased with age.
The effect of food neophobia, sensitivity to punishment, and sensitivity to disgust was significantfor both the vegetable choice index and coffee/tea choice index. These effects were not furthercharacterized by interactions with age and gender. Individuals who scored higher in food neophobia,sensitivity to punishment, or sensitivity to disgust reported significantly lower choice indices thanindividuals low in these traits, meaning that they systematically opted for the least bitter/astringentoption within the pairs (Figure 1a–b).
118

Nutrients 2019, 11, 1329
Fig
ure
1.
(a)Eff
ects
ofps
ycho
logi
calt
rait
s(s
ensi
tivi
tyto
puni
shm
ent,
SP;s
ensi
tivi
tyto
rew
ard
,SR
;foo
dne
opho
bia,
FN;s
ensi
tivi
tyto
dis
gust
,DS;
priv
ate
bod
yco
nsci
ousn
ess,
PBC
;and
alex
ithym
ia,T
AS)
onth
ech
oice
inde
xfo
rve
geta
bles
(CV
Inde
x).(
b)Eff
ects
ofps
ycho
logi
calt
raits
(sen
sitiv
ityto
puni
shm
ent,
SP;s
ensi
tivity
tore
war
d,S
R;f
ood
neop
hobi
a,FN
;sen
siti
vity
tod
isgu
st,D
S;p
riva
tebo
dy
cons
ciou
snes
s,P
BC
;and
alex
ithy
mia
,TA
S)on
the
choi
cein
dex
for
coff
ee/t
ea(C
C).
Diff
eren
tlet
ters
repr
esen
tsig
nific
antl
ydiff
eren
tval
ues
(p≤0
.05)
.n.s
.=no
n-si
gnifi
cant
(p>
0.05
).
119

Nutrients 2019, 11, 1329
A significant interaction was found for alexithymia (TAS) and gender (coffee/tea choice index),but no significant difference was found in a Bonferroni pairwise comparison. A significant interactionwas found for private body consciousness (PBC) and gender (vegetable choice index), with malesmedium and high in private body consciousness reporting a higher choice index than females mediumand high in private body consciousness.
PROP responsiveness. No effect of PROP responsiveness was found on either choice index.
3.2.4. Familiarity with Vegetables (FV+ and FV-)
Individual variation in psychological traits significantly affected familiarity with vegetables inthe case of sensitivity to punishment (F = 9.6; p < 0.0001), food neophobia (F = 30.1; p < 0.0001),disgust sensitivity (F = 7.8 p = 0.0004), and alexithymia (F = 8; p = 0.0003). Higher levels in these traitscorresponded to a lower familiarity with vegetables. This was further investigated, considering thevegetable groups varying in bitter and astringency. Table 5 reports the effects of individual variation inpsychological traits and PROP status, gender, age, and their interactions on familiarity indices withvegetables high (+) and low (-) in bitterness and astringency.
A significant effect for both age and gender was found on the familiarity index for vegetableshigher in bitterness and astringency and the familiarity index for vegetables lower in bitterness andastringency in each ANOVA model, with the only exception being gender in the model with foodneophobia. These effects were not further characterized by an interaction (gender and age). Femaleswere more familiar with vegetables irrespective to their bitterness and astringency level. Both vegetablefamiliarity indices increased with age.
A significant effect for food neophobia, alexithymia, and sensitivity to punishment was found onboth indices, while a significant effect for private body consciousness and sensitivity to disgust wasfound only on the familiarity index with vegetables higher in bitterness and astringency. These effectswere not further characterized by an interaction with age or gender. Both familiarity indices werelower in neophobics, in individuals higher in sensitivity to punishment and higher in alexithymia.The familiarity index with vegetables characterized by high unappealing sensations was lower inindividuals higher in sensitivity to disgust. For private body consciousness, the post hoc test did notshow significant differences between individuals high and low in this trait. The effect of individualvariation in psychological traits on the familiarity index for vegetables high in bitterness and astringencyis reported in Figure 2.
Figure 2. Effect of psychological traits (sensitivity to punishment, SP; sensitivity to reward, SR; foodneophobia, FN; sensitivity to disgust, DS; private body consciousness, PBC; and alexithymia, TAS) onthe familiarity index with vegetables higher in bitter and astringency (FV+). Different letters representsignificant different values (p ≤ 0.05). n.s.= non-significant (p > 0.05).
120

Nutrients 2019, 11, 1329
No effect of PROP responsiveness was found on either index, while a significant interactionbetween PROP and gender was observed on the familiarity index with vegetables lower in bitternessand astringency, confirming that females were more familiar than males with vegetables lower inbitterness and astringency, irrespective of PROP status.
3.2.5. Familiarity with Coffee/Tea (FC+ and FC-)
No effect of age, gender, or their interaction was found on the familiarity index with coffee/teacharacterized by high or low bitterness and astringency in any model.
A significant effect of food neophobia was found on both indices. Neophobic subjects were lessfamiliar with coffee/tea without sugar and more familiar with their version with sugar. Neophilicsubjects showed a median familiarity score for this beverage group of eight; this means that, at leastoccasionally, they consumed both unsweetened coffee and tea or that they regularly consumed onlyone of these beverages. Neophobic subjects showed a median familiarity value of seven, indicating thatthey do not consume one of the items and only occasionally consume the other. Individual variationsin sensitivity to disgust and alexithymia significantly affected the familiarity index, with coffee/teacharacterized by highly unappealing sensations. Subjects with high sensitivity to disgust and highalexithymia were found to be less familiar with the without sugar coffee/tea group of products. Theeffect of individual variation in psychological traits on the familiarity index for coffee/tea high inbitterness and astringency level is reported in Figure 3.
No significant effect of PROP was found on either index of familiarity.
Figure 3. Effect of psychological traits (sensitivity to punishment, SP; sensitivity to reward, SR; foodneophobia, FN; sensitivity to disgust, DS; private body consciousness, PBC; and alexithymia, TAS)on the familiarity index with coffee/tea higher in bitterness and astringency (FC+). Different lettersrepresent significant different values (p ≤ 0.05).
3.2.6. Correlation between Choice of and Familiarity with Bitter/Astringent Option
Significant positive correlations between the vegetable choice index and familiarity index withvegetables higher in bitterness and astringency, and between the coffee/tea choice index and familiarityindex with coffee/tea higher in bitterness and astringency, were found in each subgroup of individuals(low, medium, and high) for each personality trait and in each PROP status class (NT, MT, and ST). The
121

Nutrients 2019, 11, 1329
correlation coefficient ranged from 0.25 to 0.41 in the case of vegetables and from 0.42 to 0.57 in thecase of beverages (Table 6).
Table 6. Pearson correlation coefficients between the vegetable choice index (CV) and familiarity indexwith vegetables higher in bitterness and astringency (FV+) and the Pearson correlation coefficientsbetween the coffee/tea choice index (CC) and familiarity index with coffee/tea higher in bitterness andastringency (FC+) within the three levels (low, medium, high) of each psychological trait and PROPstatus (NT, MT, ST).
Vegetable Choice Index/Familiarity Index with Vegetables Higher in Bitterness and Astringency (CV/FV+)
Trait Low Medium HighDiff. among
groups
Sensitivity to Punishment 0.25 0.38 0.38 *Sensitivity to Reward 0.28 0.40 0.37 *
Food Neophobia 0.25 0.37 0.41 *Sensitivity to Disgust 0.34 0.39 0.32 n.s.
Private Body Consciousness 0.34 0.41 0.32 n.s.Alexithymia 0.33 0.36 0.37 n.s.
PROP status NT MT ST
PROP 0.30 0.38 0.37 n.s.
Coffee/tea choice index/familiarity index with coffee/tea higher in bitterness and astringency (CC/FC+)
Trait Low Medium HighDiff. among
groups
Sensitivity to Punishment 0.49 0.50 0.56 n.s.
Sensitivity to Reward 0.56 0.51 0.49 n.s.
Food Neophobia 0.57 0.53 0.42 *
Sensitivity to Disgust 0.55 0.51 0.50 n.s.
Private Body Consciousness 0.54 0.49 0.54 n.s.
Alexithymia 0.55 0.52 0.48 n.s.
PROP status NT MT ST
PROP 0.49 0.49 0.57 *
All correlations are significant (p ≤ 0.05). * significant pairwise differences. Vegetables—Sensitivity to Punishment:Low–Medium (p = 0.02), Low–High (p = 0.03); Sensitivity to Reward: Low–Medium (p = 0.03); Food Neophobia:Low–Medium (p = 0.03), Low–High (p = 0.01). Coffee/tea—Food Neophobia Low–High (p = 0.01), Medium–High(p = 0.02), PROP status: Medium–High (p = 0.05). n.s. = non-significant (p > 0.05).
Individuals lower in food neophobia, sensitivity to punishment, and sensitivity to reward reportedsignificantly lower correlations between the vegetable choice index and familiarity index with vegetableshigher in bitterness and astringency compared to individuals higher in these traits. Individuals lowerin food neophobia reported a significantly higher correlation coefficient between the coffee/tea choiceindex/familiarity index with coffee/tea higher in bitterness and astringency compared to individualshigher in food neophobia. The correlation coefficients for the coffee/tea choice index/familiarity indexwith coffee/tea higher in bitterness and astringency increased in ST compared to NT and MT.
4. Discussion
The selection of food and beverages to be included in the CATA questionnaire was performed basedon pre-existing sensory data from consumers and trained panels. The vegetable CATA questionnaireincluded vegetables described by potentially unpleasant sensory properties due to their chemicalcomposition, such as a bitter taste, astringent sensations, objectionable flavours, and a dark, unattractivecolour (radicchio, rocket, chicory, asparagus, and radish) [64–68] and vegetables characterized bya sweet taste, delicate flavour, and a bright, appealing colour (pumpkin, lettuce, valerian, greensalad, chard, and zucchini) [69–72]. The range of differences between the two options in each pairwas relatively high, with the exception of two pairs (carrot versus cauliflower, and lettuce versusbean sprout), for which these sensory properties were checked by less than 20% of the respondents
122

Nutrients 2019, 11, 1329
and a significant difference was found for only one of the two sensory properties. These pairswere included in Study 2 based on the fact that a subtle but significant difference was found forat least one of these sensations (carrot versus cauliflower for bitterness and lettuce versus beansprout for astringency). The coffee/tea CATA questionnaires included versions of the of the same hotbeverage varying in bitter and astringency due to the inclusion or exclusion of ingredients maskingthe perception of bitterness and astringency (i.e., milk and sweeteners). Findings from the CATAquestionnaires confirmed that vegetable and coffee/tea items included in the choice and familiarityindices significantly varied in bitterness and astringency. This substantiates the screening of itemsbased on the hypothesis that they should represent phenol-rich dishes/beverages varying in the levelof bitterness and astringency sensations.
Based on the results from the two CATA questionnaires, it was possible to divide questionnaireitems into two groups, each representing the lower and higher bitterness/astringency option forvegetable-based dishes or for coffee/tea beverages, according to consumer expectations. Two mainfeatures characterized the approach for food grouping proposed in the present paper: (1) sensorydifferences between selected vegetable/beverages items were defined according to the response ofthe target population rather than derived from existing data on other consumer groups (e.g., otherfood cultures or trained panels); (2) the individual propensity to prefer more or less bitter/astringentoptions of the phenol-rich foods and beverages was investigated by means of indices computed onchoice of and familiarity responses with vegetable and coffee/tea groups rather than consideringthe response to specific single food/beverage items. These features allowed the highlighting of theimportance of individual differences in psychological traits and chemosensory ability in affectingfamiliarity with, and choice for, phenol-rich foods. The approach based on CATAs to group foodsdiffering in bitter and astringency limits bias due to misinterpretation of the consumer expectation forsensory differences between foods. Furthermore, the computation of indices minimized the impact ofindividual preferences for specific food/beverages items (for example, a specific bitter vegetable mightbe very popular and well accepted in some regions and not in others).
The characteristics of the population participating in the study confirmed existing data on genderand age effects on psychological traits and PROP status. We found no effect of gender on neophobia, inline with previous findings that reported no [73] or small [53] effects, and we confirmed an increase inneophobia with age [46,74,75]. The gender effect for the other traits was also consistent with previousresults, with females more sensitive to punishment than males, and males more sensitive to rewardthan females [54,76], females more sensitive to disgust [36], and no gender effect on alexithymia [59].For age, with some exceptions, comparisons with previous studies are more limited, considering thatmuch of the extant literature involved younger individuals or a specific age class. In our sample, wefound a decrease in alexithymia with age, in contrast to findings in an adult population in Finland [77].
Results from this study confirmed previous findings on the age and gender effect on PROPresponsiveness, with aging negatively associated with PROP responsiveness [21,53,78–80]. Femalesrated PROP bitterness higher than males, confirming other results showing that females are moresensitive to PROP than males, and more likely to be tasters [53,80,81]. While females were more familiarwith vegetables, independent of their bitterness and astringency, the choice of the most bitter andastringent vegetable option was higher in males than females and increased with aging, irrespective oftheir psychological traits. A higher preference for sweetness in females is well documented [82] andthis may explain our results in the choice test.
The comparison of choice and familiarity indices for vegetables indicated that bitterness andastringency did not represent a barrier to vegetable consumption in females. At the same time, thechoice for bitter/astringent food did not appear a reliable predictor of vegetable consumption in males.A greater appreciation of health-related food aspects, greater nutritional and culinary knowledge, andan increased interest in preparing home-cooked meals are all positively associated with vegetableconsumption [83] and were likely to be responsible for the higher familiarity for vegetables in femalesthan in males in the current study.
123

Nutrients 2019, 11, 1329
The positive association of aging with the choice of vegetables higher in bitterness and astringencycan be explained by the repeated exposure—an effect that may allow initial avoidance to be overcome,at least partly through “learned safety” [84]. Thus, a food that is initially disliked could become familiarand potentially preferred [85,86]. Furthermore, the increased attention to the health-related aspects ofeating associated with aging [53,87] might further help in promoting choices for healthier vegetableoptions, even if they are less palatable initially.
Neither choice of nor familiarity with vegetables was affected by PROP status, consistent with theresults of previous study showing a lack of association of bitter vegetable preference with responsivenessto PROP bitterness [24,26,34]. Evidence from recent studies highlighted that a complex network of bothgenetic and environmental factors appears to influence responsiveness to PROP [18,21]. However, thisphenotype is still widely used, with the purpose of exploring the associations of chemosensory abilityand vegetable preferences [24,26,88]. Among the several alternative methods for evaluating PROP anddetermining group assignment, in this study we opted for the one solution test [60,89] and the a prioricut-offs for non-tasters (from 0 to 17), medium tasters (MT from 18 to 52), and supertasters (from 53to 100) [19,20], widely documented in the literature. Alternative chemosensory indices taking intoaccount broader differences in taste systems might offer a new perspective in looking at the associationof dietary style and taste responsiveness phenotypes [90,91]. However, based on the results from thepresent study, and in line with the newer multidimensional models of food preference and choice,environmental factors might mitigate the impact of biology in determining food preferences, such thatphenotype differences in responsiveness to bitterness may not be enough to influence food choice andintake [92].
In general, data on choice of and familiarity with vegetables indicated the relevant roles offood neophobia, sensitivity to punishment, and sensitivity to disgust as determinants of vegetableeating. These psychological traits were negatively associated with both the choice of vegetables withhigher bitterness and astringency and the familiarity with vegetables in general, irrespective of theirsensory properties. This is in line with previous findings, which show that food neophobia in adults isassociated with a reduced dietary variety, which is most evident in a lower acceptability and intake,particularly of vegetables, fruits, and protein foods [31,93]. Our findings align also with the hypothesisthat higher punishment sensitivity is associated with more unhealthy behaviours, as it was foundpreviously to be associated with a higher sugar intake [43]. Individuals with higher alexithymiadeclared a lower familiarity with vegetables independently of their bitterness and astringency, whileno effect on choice was reported. Similarly, Robino and colleagues [45] reported a negative relationshipbetween alexithymia and stated liking for vegetables. The fact that we did not find an effect of thistrait on choice may suggest that this trait modulates vegetable consumption independently from thesensory characteristics of vegetables and thus affects the whole product category.
The correlation between choice and familiarity indices significantly varied according to the levelof food neophobia and sensitivity to punishment, thus indicating potential differences between whatindividuals would like to choose and what they declare they consume normally. The correlation valuedecreased with neophobia and sensitivity to punishment, indicating that low food neophobia andsensitivity to punishment individuals were likely to have a wider vegetable repertoire. In older adults,a positive association between the willingness to try new foods and a wider variety of consumedvegetables has already been observed [94]. On the other hand, the high level of food neophobia andsensitivity to punishment traits were associated with an increased correlation between choice andfamiliarity. Neophobic individuals tended to be more consistent with what they preferred and whatthey declared to consume, and this possibly indicates a restricted spectrum of vegetables included intheir daily diet.
These findings, taken together, confirm the hypothesis that personality variables—specificallyfood neophobia, sensitivity to punishment, and sensitivity to disgust—may act to facilitate or inhibitthe preference and intake of vegetables characterized by unpleasant sensations, consistent with what
124

Nutrients 2019, 11, 1329
has been previously found for pungency [35] and, in the case of food neophobia, for bitterness andastringency [34].
Aging was positively associated with the choice of the more bitter/astringent coffee/tea options,suggesting the effects over time of learned positive flavour–flavour and/or flavour consequenceconditioning via the stimulatory impact of caffeine, leading to the bitter taste of coffee/tea becomingacceptable [95,96]. Taste motives are among the main reasons for caffeinated beverages consumption [97]and a bitter taste contributes to the appreciation for caffeinated beverages drinkers [15].
PROP status did not affect choice and familiarity with coffee/tea items, thus adding to the negativefindings in data on causal relationships between PROP bitterness perception and coffee/tea preferenceand consumption [17,98]. Several factors other than sensory properties, such as functional motives,health beliefs, tradition, and culture, shape the personal preferences for caffeinated beverages [97].Recent findings on genetic of bitterness perception indicate an opposite causal relationship betweenPROP responsiveness and coffee and tea consumption [98]. This possibly further accounts for the lackof significant effect of PROP status on choice and familiarity indices, since they are based on responsesto both tea and coffee. However, differences in correlations between choice and familiarity indicesindicated that ST, more than MT and NT subjects, tended to consume the most preferred option. Thismay imply that these subjects, more sensitive than the rest of the population to unappealing sensations,tended to adopt more strictly the consumption conditions that better adapt to their personal preference.
Food neophobia, sensitivity to punishment, and sensitivity to disgust appeared to act as barriersto the choice of the more bitter/astringent coffee/tea options. High food neophobia and sensitivity todisgust levels were associated with a lower familiarity with the unsweetened version of coffee/teaitems and to a higher familiarity with the least bitter/astringent option for neophobic subjects only. Alower preference for coffee has been already reported for individuals higher in neophobia [93].
Food neophobia significantly affected the strength of the correlation between the choice andfamiliarity indices of the most astringent/bitter coffee/tea options. The correlation value was significantlyhigher in subjects with lower than with higher food neophobia. Habit, defined as a ritual or adaily routine, was one of the main motivational factors for caffeinated beverages consumption [15],but neophobic subjects were less familiar with coffee/tea and were only occasional consumers ofunsweetened coffee/tea beverages, and this could account for the weaker correlation between choiceand familiarity for unsweetened coffee/tea indices. It has been shown that a variety of motivationsplay a role in the consumption of coffee beverages [99] and that sensory properties are more relevantfor individuals who consume more coffee daily and with a faster caffeine metabolism index [100].We may hypothesise, therefore, that while for individuals lower in neophobia the sensory propertiesare of importance, thus explaining their preference for the unsweetened options, for those higher inneophobia, coffee preference may be more explained by situational and social factors (e.g., social rituals).
While this study benefits from a large sample and the study of the impact of psychological traitson choice, some aspects have remained underexplored. Thus, the foods and beverages considered inthe study might differ for properties other than bitterness and astringency, such as texture or energycontent. Differences in these aspects might have a role in choice and familiarity that has not beentaken into account in the present paper, thus possibly limiting the interpretation of the results. Furtherstudies are encouraged, taking into account a larger variety of dimensions.
5. Conclusions
The approach proposed in this study for product grouping based on sensory properties waseffective and allowed the investigation of the role of individual differences in chemosensory perceptionand psychological traits as modulators of phenol-rich foods preference and consumption. Individualdifferences in psychological traits (food neophobia, sensitivity to punishment, and sensitivity todisgust), rather than responsiveness to PROP, influenced both the preference and consumption ofphenol-rich foods. Furthermore, psychological traits significantly affected the degree of coherence
125

Nutrients 2019, 11, 1329
between what individuals preferred and what they consumed in their daily life, thus, in the ultimateanalysis, determining their diet variety.
A positive correlation between familiarity and choice was confirmed, but the two measures werefound to provide different information. While in vegetables the traits food neophobia, sensitivityto punishment, and sensitivity to disgust were found to be associated with a lower familiarity withvegetables independent of their sensory properties, in coffee/tea, food neophobia, sensitivity to disgust,and alexithymia were associated with a lower familiarity with the unsweetened options. To build onthese interpretations of food preference and consumption behaviour, the systematic explorations ofindividual differences in psychological traits should also take place in applied settings.
Author Contributions: A.D.T. undertook the analyses and wrote the manuscript in collaboration with S.S. andC.D.; C.D., S.S., A.D.T. and E.M. contributed to plan the analyses; C.D., S.S., A.D.T. and E.M. discussed theinterpretation of the results; all authors collaborated in the design of the project, helped with data collection, andoffered critical comments on the manuscript.
Funding: This research was funded by the Ministero dell’Istruzione, dell’Università e della Ricerca (MIUR),ITALY—Research Project: 20158YJW3W Programmi di Ricerca Scientifica di Rilevante Interesse Nazionale—PRIN2015: “Individual differences in the acceptability of healthy foods: focus on phenol and fat content”.
Conflicts of Interest: The authors declare no conflict of interest.
Abbreviations
DS: Sensitivity to Core Disgust; FN: Food Neophobia; PBC: Private Body Consciousness; SP: Sensitivity toPunishment; SR: Sensitivity to Reward; TAS: Alexithymia; V-IT-FCQ: Vegetable Choice Questionnaire; C-IT-FCQ:Coffee/Tea Choice Questionnaire; CV: Vegetable Choice Index; CC: Coffee/Tea Choice Index; FV+/FV-: Indicesof Familiarity with vegetables high (+) or low (-) in bitterness and astringency sensations; FC+/FC-: Indices ofFamiliarity with coffee/tea high (+) or low (-) in bitterness and astringency sensations
References
1. Mozaffarian, D. Dietary and policy priorities for cardiovascular disease, diabetes, and obesity. Circulation2016, 133, 187–225. [CrossRef] [PubMed]
2. Shahidi, F.; Ambigaipalan, P. Phenolics and polyphenolics in foods, beverages and spices: Antioxidantactivity and health effects—A review. J. Funct. Foods 2015, 18, 820–897. [CrossRef]
3. Lesschaeve, I.; Noble, A.C. Polyphenols: Factors influencing their sensory properties and their effects onfood and beverage preferences. Am. J. Clin. Nutr. 2005, 81, 330S–335S. [CrossRef] [PubMed]
4. De Toffoli, A.; Monteleone, E.; Bucalossi, G.; Veneziani, G.; Fia, G.; Servili, M.; Zanoni, B.; Pagliarini, E.;Gallina Toschi, T.; Dinnella, C. Sensory and chemical profile of a phenolic extract from olive mill waste watersin plant-based food with varied macro-composition. Food Res. Int. 2019, 119, 236–243. [CrossRef] [PubMed]
5. Monteleone, E.; Condelli, N.; Dinnella, C.; Bertuccioli, M. Prediction of perceived astringency induced byphenolic compounds. Food Qual. Prefer. 2004, 15, 761–769. [CrossRef]
6. Köster, E.P. Diversity in the determinants of food choice: A psychological perspective. Food Qual. Prefer.2009, 20, 70–82. [CrossRef]
7. Prescott, J. Taste Matters. Why We Like the Foods We Do; Reaktion Books: London, UK, 2012.8. Drewnowski, A.; Gomez-Carneros, C. Bitter taste, phytonutrients, and the consumer: A review. Am. J.
Clin. Nutr. 2000, 72, 1424–1435. [CrossRef]9. Shimada, T. Salivary Proteins as a Defense Against Dietary Tannins. J. Chem. Ecol. 2006, 32, 1149–1163.
[CrossRef]10. Nayak, A.; Carpenter, G.H. A physiological model of tea-induced astringency. Physiol. Behav. 2008, 95,
290–294. [CrossRef]11. Dinnella, C.; Recchia, A.; Fia, G.; Bertuccioli, M.; Monteleone, E. Saliva Characteristics and Individual
Sensitivity to Phenolic Astringent Stimuli. Chem. Senses 2009, 34, 295–304. [CrossRef]12. Dinnella, C.; Morizet, D.; Masi, C.; Cliceri, D.; Depezay, L.; Appleton, K.M.; Giboreau, A.; Perez-Cueto, F.J.A.;
Hartwell, H.; Monteleone, E. Sensory determinants of stated liking for vegetable names and actual likingfor canned vegetables: A cross-country study among European adolescents. Appetite 2016, 107, 339–347.[CrossRef] [PubMed]
126

Nutrients 2019, 11, 1329
13. Drewnowski, A. Taste Preferences and Food Intake. Annu. Rev. Nutr. 1997, 17, 237–253. [CrossRef] [PubMed]14. Appleton, K.M.; Dinnella, C.; Spinelli, S.; Morizet, D.; Saulais, L.; Hemingway, A.; Monteleone, E.; Depezay, L.;
Perez-Cueto, F.J.A.; Hartwell, H. Liking and consumption of vegetables with more appealing and lessappealing sensory properties: Associations with attitudes, food neophobia and food choice motivations inEuropean adolescents. Food Qual. Prefer. 2019, 75, 179–186. [CrossRef]
15. Ágoston, C.; Urbán, R.; Király, O.; Griffiths, M.D.; Rogers, P.J.; Demetrovics, Z. Why Do You Drink Caffeine?The Development of the Motives for Caffeine Consumption Questionnaire (MCCQ) and Its Relationshipwith Gender, Age and the Types of Caffeinated Beverages. Int. J. Ment. Health Addict. 2018, 16, 981–999.[CrossRef] [PubMed]
16. Giacalone, D.; Degn, T.K.; Yang, N.; Liu, C.; Fisk, I.; Münchow, M. Common roasting defects in coffee:Aroma composition, sensory characterization and consumer perception. Food Qual. Prefer. 2019, 71, 463–474.[CrossRef]
17. Masi, C.; Dinnella, C.; Monteleone, E.; Prescott, J. The impact of individual variations in taste sensitivity oncoffee perceptions and preferences. Physiol. Behav. 2015, 138, 219–226. [CrossRef] [PubMed]
18. Tepper, B.J.; Banni, S.; Melis, M.; Crnjar, R.; Barbarossa, I.T. Genetic sensitivity to the bitter taste of6-n-propylthiouracil (PROP) and its association with physiological mechanisms controlling Body Mass Index(BMI). Nutrients 2014, 6, 3363–3381. [CrossRef] [PubMed]
19. Hayes, J.E.; Sullivan, B.S.; Duffy, V.B. Explaining variability in sodium intake through oral sensory phenotype,salt sensation and liking. Physiol. Behav. 2010, 100, 369–380. [CrossRef] [PubMed]
20. Fischer, M.E.; Cruickshanks, K.J.; Schubert, C.R.; Pinto, A.; Klein, R.; Pankratz, N.; Pankow, J.S.; Huang, G.H.Factors related to fungiform papillae density: The beaver dam offspring study. Chem. Senses 2013, 38,669–677. [CrossRef]
21. Tepper, B.J.; Melis, M.; Koelliker, Y.; Gasparini, P.; Ahijevych, K.L.; Barbarossa, I.T. Factors influencing thephenotypic characterization of the oral marker, PROP. Nutrients 2017, 9, 1275. [CrossRef]
22. Piochi, M.; Dinnella, C.; Prescott, J.; Monteleone, E. Associations between human fungiform papillae andresponsiveness to oral stimuli: Effects of individual variability, population characteristics, and methods forpapillae quantification. Chem. Senses 2018, 43, 313–327. [CrossRef] [PubMed]
23. Bell, K.I.; Tepper, B.J. Short-term vegetable intake by young children classified by 6-n-propylthoiuracilbitter-taste phenotype. Am. J. Clin. Nutr. 2006, 84, 245–251.
24. Shen, Y.; Kennedy, O.B.; Methven, L. Exploring the effects of genotypical and phenotypical variations inbitter taste sensitivity on perception, liking and intake of brassica vegetables in the UK. Food Qual. Prefer.2016, 50, 71–81. [CrossRef]
25. Drewnowski, A.; Henderson, S.A.; Levine, A.; Hann, C. Taste and food preferences as predictors of dietarypractices in young women. Public Health Nutr. 1999, 2, 513–519. [CrossRef] [PubMed]
26. Catanzaro, D.; Chesbro, E.C.; Velkey, A.J. Relationship between food preferences and PROP taster status ofcollege students. Appetite 2013, 68, 124–131. [CrossRef] [PubMed]
27. Baranowski, T.; Baranowski, J.C.; Watson, K.B.; Jago, R.; Islam, N.; Beltran, A.; Martin, S.J.; Nguyen, N.;Tepper, B.J. 6-n-Propylthiouracil taster status not related to reported cruciferous vegetable intake amongethnically diverse children. Nutr. Res. 2011, 31, 594–600. [CrossRef] [PubMed]
28. Keller, K.L.; Tepper, B.J. Inherited taste sensitivity to 6-n-propylthiouracil in diet and body weight in children.Obes. Res. 2004, 12, 904–912. [CrossRef]
29. Lumeng, J.C.; Cardinal, T.M.; Sitto, J.R.; Kannan, S. Ability to taste 6-n-propylthiouracil and BMI inlow-income preschool-aged children. Obesity 2008, 16, 1522–1528. [CrossRef]
30. Ly, A.; Drewnowski, A. PROP (6-n-Propylthiouracil) tasting and sensory responses to caffeine, sucrose,neohesperidin dihydrochalcone and chocolate. Chem. Senses 2001, 26, 41–47. [CrossRef]
31. Knaapila, A.; Silventoinen, K.; Broms, U.; Rose, R.J.; Perola, M.; Kaprio, J.; Tuorila, H.M. Food neophobia inyoung adults: Genetic architecture and relation to personality, pleasantness and use frequency of foods, andbody mass index-A twin study. Behav. Genet. 2011, 41, 512–521. [CrossRef]
32. Törnwall, O.; Silventoinen, K.; Hiekkalinna, T.; Perola, M.; Tuorila, H.; Kaprio, J. Identifying flavor preferencesubgroups. Genetic basis and related eating behavior traits. Appetite 2014, 75, 1–10. [CrossRef] [PubMed]
33. Kral, T.V.E. Food neophobia and its association with diet quality and weight status in children. In FoodNeophobia; Reilly, S., Ed.; Woodhead Publishing: Sawston, UK, 2018; pp. 287–303. ISBN 9780081019313.
127

Nutrients 2019, 11, 1329
34. Laureati, M.; Spinelli, S.; Monteleone, E.; Dinnella, C.; Prescott, J.; Cattaneo, C.; Proserpio, C.; De Toffoli, A.;Gasperi, F.; Endrizzi, I.; et al. Associations between food neophobia and responsiveness to “warning”chemosensory sensations in food products in a large population sample. Food Qual. Prefer. 2018, 68, 113–124.[CrossRef]
35. Spinelli, S.; De Toffoli, A.; Dinnella, C.; Laureati, M.; Pagliarini, E.; Bendini, A.; Braghieri, A.; Gallina, T.;Sinesio, F.; Torri, L.; et al. Personality traits and gender influence liking and choice of food pungency. FoodQual. Prefer. 2018, 66, 113–126. [CrossRef]
36. Herz, R.S. PROP taste sensitivity is related to visceral but not moral disgust. Chemosens. Percept. 2011, 4,72–79. [CrossRef]
37. Herz, R.S. Verbal priming and taste sensitivity make moral transgressions gross. Behav. Neurosci. 2014, 128,20–28. [CrossRef] [PubMed]
38. Gray, J.A.; McNaughton, N. The Neuropsychology of Anxiety: An Enquiry into the Function of the Septo-HippocampalSystem; Oxford University Press: Oxford, UK, 2003; ISBN 9780191712517.
39. Byrnes, N.K.; Hayes, J.E. Personality factors predict spicy food liking and intake. Food Qual. Prefer. 2013, 28,213–221. [CrossRef] [PubMed]
40. Byrnes, N.K.; Hayes, J.E. Gender differences in the influence of personality traits on spicy food liking andintake. Food Qual. Prefer. 2015, 42, 12–19. [CrossRef]
41. Davis, C.; Patte, K.; Levitan, R.; Reid, C.; Tweed, S.; Curtis, C. From motivation to behaviour: A model ofreward sensitivity, overeating, and food preferences in the risk profile for obesity. Appetite 2007, 48, 12–19.[CrossRef]
42. Morris, D.H.; Treloar, H.; Tsai, C.L.; McCarty, K.N.; McCarthy, D.M. Acute subjective response to alcohol as afunction of reward and punishment sensitivity. Addict. Behav. 2016, 60, 90–96. [CrossRef]
43. Tapper, K.; Baker, L.; Jiga-Boy, G.; Haddock, G.; Maio, G.R. Sensitivity to reward and punishment: Associationswith diet, alcohol consumption, and smoking. Pers. Individ. Dif. 2015, 72, 79–84. [CrossRef]
44. Nemiah, J.C.; Freyberger, H.; Sifneos, P.E. Alexithymia: A view of the psychosomatic process. In ModernTrends in Psychosomatic Medicine (Vol. 3); Hill, O.W., Ed.; Butterworths: London, UK, 1976; pp. 430–439.
45. Robino, A.; Mezzavilla, M.; Pirastu, N.; La Bianca, M.; Gasparini, P.; Carlino, D.; Tepper, B.J. Understandingthe role of personality and alexithymia in food preferences and PROP taste perception. Physiol. Behav. 2016,157, 72–78. [CrossRef]
46. Tuorila, H.; Lähteenmäki, L.; Pohjalainen, L.; Lotti, L. Food neophobia among the Finns and related responsesto familiar and unfamiliar foods. Food Qual. Prefer. 2001, 12, 29–37. [CrossRef]
47. Dinehart, M.E.; Hayes, J.E.; Bartoshuk, L.M.; Lanier, S.L.; Duffy, V.B. Bitter taste markers explain variabilityin vegetable sweetness, bitterness, and intake. Physiol. Behav. 2006, 87, 304–313. [CrossRef] [PubMed]
48. Cox, D.N.; Melo, L.; Zabaras, D.; Delahunty, C.M. Acceptance of health-promoting Brassica vegetables: Theinfluence of taste perception, information and attitudes. Public Health Nutr. 2012, 15, 1474–1482. [CrossRef]
49. Wiener, A.; Shudler, M.; Levit, A.; Niv, M.Y. BitterDB: A database of bitter compounds. Nucleic Acids Res.2012, 40, D413–D419. [CrossRef] [PubMed]
50. Dinnella, C.; Recchia, A.; Tuorila, H.; Monteleone, E. Individual astringency responsiveness affects theacceptance of phenol-rich foods. Appetite 2011, 56, 633–642. [CrossRef] [PubMed]
51. Lease, H.; Hendrie, G.A.; Poelman, A.A.M.; Delahunty, C.; Cox, D.N. A Sensory-Diet database: A tool tocharacterise the sensory qualities of diets. Food Qual. Prefer. 2016, 49, 20–32. [CrossRef]
52. Jaeger, S.R.; Chheang, S.L.; Yin, J.; Bava, C.M.; Gimenez, A.; Vidal, L.; Ares, G. Check-all-that-apply(CATA) responses elicited by consumers: Within-assessor reproducibility and stability of sensory productcharacterizations. Food Qual. Prefer. 2013, 30, 56–67. [CrossRef]
53. Monteleone, E.; Spinelli, S.; Dinnella, C.; Endrizzi, I.; Laureati, M.; Pagliarini, E.; Sinesio, F.; Gasperi, F.;Torri, L.; Aprea, E.; et al. Exploring influences on food choice in a large population sample: The Italian Tasteproject. Food Qual. Prefer. 2017, 59, 123–140. [CrossRef]
54. Torrubia, R.; Ávila, C.; Moltó, J.; Caseras, X. The Sensitivity to Punishment and Sensitivity to RewardQuestionnaire (SPSRQ) as a measure of Gray’s anxiety and impulsivity dimensions. Pers. Individ. Dif. 2001,31, 837–862. [CrossRef]
55. Pliner, P.; Hobden, K. Development of a scale to measure the trait of food neophobia in humans. Appetite1992, 19, 105–120. [CrossRef]
128

Nutrients 2019, 11, 1329
56. Inbar, Y.; Pizarro, D.A.; Bloom, P. Conservatives are more easily disgusted than liberals. Cogn. Emot. 2009, 23,714–725. [CrossRef]
57. Miller, L.C.; Murphy, R.; Buss, A.H. Consciousness of body: Private and public. J. Pers. Soc. Psychol. 1981, 41,397–406. [CrossRef]
58. Parker, J.D.; Bagby, R.M.; Taylor, G.J.; Endler, N.S.; Schmitz, P. Factorial validity of the 20-item TorontoAlexithymia Scale. Eur. J. Pers. 1993, 7, 221–232. [CrossRef]
59. Bressi, C.; Taylor, G.; Parker, J.; Bressi, S.; Brambilla, V.; Aguglia, E.; Allegranti, I.; Bongiorno, A.; Giberti, F.;Bucca, M.; et al. Cross validation of the factor structure of the 20-item Toronto Alexithymia Scale: An Italianmulticenter study. J. Psychosom. Res. 1996, 41, 551–559. [CrossRef]
60. Prescott, J.; Soo, J.; Campbell, H.; Roberts, C. Responses of PROP taster groups to variations in sensoryqualities within foods and beverages. Physiol. Behav. 2004, 82, 459–469. [CrossRef]
61. Bartoshuk, L.M. Comparing Sensory Experiences Across Individuals: Recent Psychophysical AdvancesIlluminate Genetic Variation in Taste Perception. Chem. Senses 2000, 25, 447–460. [CrossRef]
62. Dinnella, C.; Masi, C.; Naes, T.; Monteleone, E. A new approach in TDS data analysis: A case study onsweetened coffee. Food Qual. Prefer. 2013, 30, 33–46. [CrossRef]
63. Lepage, M.; Neville, T.; Rytz, A.; Schlich, P.; Martin, N.; Pineau, N. Panel performance for TemporalDominance of Sensations. Food Qual. Prefer. 2014, 38, 24–29. [CrossRef]
64. Schonhof, I.; Krumbein, A.; Brückner, B. Genotypic effects on glucosinolates and sensory properties ofbroccoli and cauliflower. Nahrung Food 2004, 48, 25–33. [CrossRef]
65. Cozzolino, R.; Martignetti, A.; Pellicano, M.P.; Stocchero, M.; Cefola, M.; Pace, B.; De Giulio, B. Characterisationof volatile profile and sensory analysis of fresh-cut “Radicchio di Chioggia” stored in air or modifiedatmosphere. Food Chem. 2016, 192, 603–611. [CrossRef] [PubMed]
66. Pasini, F.; Verardo, V.; Cerretani, L.; Caboni, M.F.; D’Antuono, L.F. Rocket salad (Diplotaxis and Eruca spp.)sensory analysis and relation with glucosinolate and phenolic content. J. Sci. Food Agric. 2011, 91, 2858–2864.[CrossRef] [PubMed]
67. Abdullah, A.; Baldwin, R.E.; Fields, M.; Karr, A.L. Sensory Attributes and Safety Aspects of GerminatedSmall-Seeded Soybeans and Mungbeans. J. Food Prot. 2016, 47, 434–437. [CrossRef] [PubMed]
68. Dawid, C.; Hofmann, T. Identification of sensory-active phytochemicals in asparagus (Asparagus officinalisL.). J. Agric. Food Chem. 2012, 60, 11877–11888. [CrossRef] [PubMed]
69. Baxter, I.A.; Schröder, M.J.A.; Bower, J.A. Children’s perceptions of and preference for vegetables in the westof Scotland: The role of demographic factors. J. Sens. Stud. 2000, 15, 361–381. [CrossRef]
70. Engel, E.; Martin, N.; Issanchou, S. Sensitivity to allyl isothiocyanate, dimethyl trisulfide, sinigrin, andcooked cauliflower consumption. Appetite 2006, 46, 263–269. [CrossRef] [PubMed]
71. Poelman, A.A.M.; Delahunty, C.M.; de Graaf, C. Vegetables and other core food groups: A comparison ofkey flavour and texture properties. Food Qual. Prefer. 2017, 56, 1–7. [CrossRef]
72. Zeinstra, G.G.; Koelen, M.A.; Kok, F.J.; de Graaf, C. Cognitive development and children’s perceptions offruit and vegetables; a qualitative study. Int. J. Behav. Nutr. Phys. Act. 2007, 4, 30. [CrossRef] [PubMed]
73. Knaapila, A.J.; Sandell, M.A.; Vaarno, J.; Hoppu, U.; Puolimatka, T.; Kaljonen, A.; Lagstrom, H. Foodneophobia associates with lower dietary quality and higher BMI in Finnish adults. Public Health Nutr. 2015,18, 2161–2171. [CrossRef]
74. Meiselman, H.L.; King, S.C.; Gillette, M. The demographics of neophobia in a large commercial US sample.Food Qual. Prefer. 2010, 21, 893–897. [CrossRef]
75. Siegrist, M.; Hartmann, C.; Keller, C. Antecedents of food neophobia and its association with eating behaviorand food choices. Food Qual. Prefer. 2013, 30, 293–298. [CrossRef]
76. Caseras, X.; Ávila, C.; Torrubia, R. The measurement of individual differences in behavioural inhibition andbehavioural activation systems: A comparison of personality scales. Pers. Individ. Dif. 2003, 34, 999–1013.[CrossRef]
77. Mattila, A.K.; Salminen, J.K.; Nummi, T.; Joukamaa, M. Age is strongly associated with alexithymia in thegeneral population. J. Psychosom. Res. 2006, 61, 629–635. [CrossRef] [PubMed]
78. Mennella, J.A.; Pepino, M.Y.; Duke, F.F.; Reed, D.R. Age modifies the genotype-phenotype relationship forthe bitter receptor TAS2R38. BMC Genet. 2010, 11, 60–69. [CrossRef] [PubMed]
129

Nutrients 2019, 11, 1329
79. Dinnella, C.; Monteleone, E.; Piochi, M.; Spinelli, S.; Prescott, J.; Pierguidi, L.; Gasperi, F.; Laureati, M.;Pagliarini, E.; Predieri, S.; et al. Individual Variation in PROP Status, Fungiform Papillae Density, andResponsiveness to Taste Stimuli in a Large Population Sample. Chem. Senses 2018, 43, 697–710. [CrossRef][PubMed]
80. Bartoshuk, L.M.; Duffy, V.B.; Miller, I.J. PTC/PROP tasting: Anatomy, psychophysics, and sex effects.Physiol. Behav. 1994, 56, 1165–1171. [CrossRef]
81. Zhao, L.; Tepper, B.J. Perception and acceptance of selected high-intensity sweeteners and blends in modelsoft drinks by propylthiouracil (PROP) non-tasters and super-tasters. Food Qual. Prefer. 2007, 18, 531–540.[CrossRef]
82. Tuorila, H.; Keskitalo-Vuokko, K.; Perola, M.; Spector, T.; Kaprio, J. Affective responses to sweet productsand sweet solution in British and Finnish adults. Food Qual. Prefer. 2017, 62, 128–136. [CrossRef]
83. Appleton, K.M.; Hemingway, A.; Saulais, L.; Dinnella, C.; Monteleone, E.; Depezay, L.; Morizet, D.; ArmandoPerez-Cueto, F.J.; Bevan, A.; Hartwell, H. Increasing vegetable intakes: Rationale and systematic review ofpublished interventions. Eur. J. Nutr. 2016, 55, 1–28. [CrossRef]
84. Kalat, J.W.; Rozin, P. “Learned safety” as a mechanism in long-delay taste-aversion learning in rats. J. Comp.Physiol. Psychol. 1973, 83, 198–207. [CrossRef]
85. Aldridge, V.; Dovey, T.M.; Halford, J.C.G. The role of familiarity in dietary development. Dev. Rev. 2009, 29,32–44. [CrossRef]
86. Methven, L.; Langreney, E.; Prescott, J. Changes in liking for a no added salt soup as a function of exposure.Food Qual. Prefer. 2012, 26, 135–140. [CrossRef]
87. Saba, A.; Sinesio, F.; Moneta, E.; Dinnella, C.; Laureati, M.; Torri, L.; Peparaio, M.; Saggia Civitelli, E.; Endrizzi, I.;Gasperi, F.; et al. Measuring consumers attitudes towards health and taste and their association with food-relatedlife-styles and preferences. Food Qual. Prefer. 2019, 73, 25–37. [CrossRef]
88. Mezzavilla, M.; Notarangelo, M.; Concas, M.P.; Catamo, E.; Gasparini, P.; Grillotti, M.G.; Robino, A.Investigation of the link between PROP taste perception and vegetables consumption using FAOSTAT data.Int. J. Food Sci. Nutr. 2019, 70, 484–490. [CrossRef] [PubMed]
89. Yang, Q.; Kraft, M.; Shen, Y.; MacFie, H.; Ford, R. Sweet Liking Status and PROP Taster Status impactemotional response to sweetened beverage. Food Qual. Prefer. 2019, 75, 133–144. [CrossRef]
90. Sharafi, M.; Rawal, S.; Fernandez, M.L.; Huedo-Medina, T.B.; Duffy, V.B. Taste phenotype associates withcardiovascular disease risk factors via diet quality in multivariate modeling. Physiol. Behav. 2018, 194,103–112. [CrossRef] [PubMed]
91. Sobal, J.; Bisogni, C.A.; Jastran, M. Food Choice Is Multifaceted, Contextual, Dynamic, Multilevel, Integrated,and Diverse. Mind Brain Educ. 2014, 8, 6–12. [CrossRef]
92. Hayes, J.E.; Feeney, E.L.; Allen, A.L. Do polymorphisms in chemosensory genes matter for human ingestivebehavior? Food Qual. Prefer. 2013, 30, 202–216. [CrossRef]
93. Jaeger, S.R.; Rasmussen, M.A.; Prescott, J. Relationships between food neophobia and food intake andpreferences: Findings from a sample of New Zealand adults. Appetite 2017, 116, 410–422. [CrossRef]
94. Appleton, K.; Dinnella, C.; Spinelli, S.; Morizet, D.; Saulais, L.; Hemingway, A.; Monteleone, E.; Depezay, L.;Perez-Cueto, F.; Hartwell, H. Consumption of a High Quantity and a Wide Variety of Vegetables ArePredicted by Different Food Choice Motives in Older Adults from France, Italy and the UK. Nutrients 2017,9, 923. [CrossRef]
95. Tinley, E.M.; Yeomans, M.R.; Durlach, P.J. Caffeine reinforces flavour preference in caffeine-dependent, butnot long-term withdrawn, caffeine consumers. Psychopharmacology (Berl.) 2003, 166, 416–423. [CrossRef][PubMed]
96. Rogers, P.J.; Smith, J.E. Caffeine, Mood and Cognition; Woodhead Publishing Limited: Sawston, UK, 2011;ISBN 9781845697525.
97. Samoggia, A.; Riedel, B. Coffee consumption and purchasing behavior review: Insights for further research.Appetite 2018, 129, 70–81. [CrossRef] [PubMed]
98. Ong, J.S.; Hwang, D.L.D.; Zhong, V.W.; An, J.; Gharahkhani, P.; Breslin, P.A.S.; Wright, M.J.; Lawlor, D.A.;Whitfield, J.; MacGregor, S.; et al. Understanding the role of bitter taste perception in coffee, tea and alcoholconsumption through Mendelian randomization. Sci. Rep. 2018, 8, 16414. [CrossRef] [PubMed]
130

Nutrients 2019, 11, 1329
99. Labbe, D.; Ferrage, A.; Rytz, A.; Pace, J.; Martin, N. Pleasantness, emotions and perceptions induced bycoffee beverage experience depend on the consumption motivation (hedonic or utilitarian). Food Qual. Prefer.2015, 44, 56–61. [CrossRef]
100. Spinelli, S.; Dinnella, C.; Masi, C.; Zoboli, G.P.; Prescott, J.; Monteleone, E. Investigating preferred coffeeconsumption contexts using open-ended questions. Food Qual. Prefer. 2017, 61, 63–73. [CrossRef]
© 2019 by the authors. Licensee MDPI, Basel, Switzerland. This article is an open accessarticle distributed under the terms and conditions of the Creative Commons Attribution(CC BY) license (http://creativecommons.org/licenses/by/4.0/).
131


nutrients
Communication
A Brief Review of Genetic Approaches to the Study ofFood Preferences: Current Knowledge andFuture Directions
Antonietta Robino 1,*, Maria Pina Concas 1, Eulalia Catamo 1 and Paolo Gasparini 1,2
1 Institute for Maternal and Child Health, IRCCS “Burlo Garofolo”, Via dell’Istria 65/1, 34137 Trieste, Italy2 Department of Medical Sciences, University of Trieste, Strada di Fiume, 447, 34149 Trieste, Italy* Correspondence: [email protected]
Received: 24 January 2019; Accepted: 25 July 2019; Published: 26 July 2019
Abstract: Genetic variation plays a crucial role in individual differences in food preferences whichultimately influence food selection and health. Our current understanding of this pathway has beeninformed through twin studies (to assess the heritability of food preferences), candidate gene studies,and genome-wide association studies (GWAS). However, most of this literature is mainly focusedon genes previously identified as having taste or smell functions. New data suggests that genesnot associated with taste or smell perception may be involved in food preferences and contributeto health outcomes. This review highlights these emerging findings and suggests a polygenic riskassessment approach to explore new relationships between food preferences and health risks.
Keywords: genetics; food preferences; heritability; candidate gene; GWAS; adiposity; polygenic risk score
1. Introduction
Food preferences are shaped by a high number of environmental, cultural, and nutritional factors,including genetic ones. The first evidence for genetic influences on food preferences came from familyand twin studies [1–12]. However, over the last few decades, rapid advances in molecular geneticshave revolutionized the understanding of individual differences in many aspects of human behavior.These advances give researchers the tools to conduct genetic association studies on a large scale tobetter understand the role of specific gene loci in sensory perceptions, food liking/disliking, preference,and intake, as well as on food-related habits [13–18].
To date, the vast majority of studies on food liking and preference have focused on identifyingspecific genes and traits associated with sensory perceptions (mainly taste and smell perception).The effects of taste and smell genes on food habits [19–36] and health status [30,31,37–48] have alsobeen extensively investigated. However, gaps in understanding still exist, and emerging evidencesuggests that novel genes (not necessarily related to taste or smell perception) may play a critical rolein these relationships [13–16].
Thus, a potential new area in nutrition research is the investigation of the genetic bases of foodpreferences, broadly defined to include both taste/smell-related and non-related genes.
Obtaining a comprehensive picture of genetic effects on food preferences and habits and theirconsequences for food-related diseases, such as being overweight or obesity, is of considerable publichealth importance and interest to the food industry.
This review focused on current knowledge, linking genetic variability to food preferences.Specifically, we reviewed studies on food preferences (defined as the selection of one food rather thananother) and food liking (meaning the degree of liking or disliking towards a food).
Nutrients 2019, 11, 1735; doi:10.3390/nu11081735 www.mdpi.com/journal/nutrients133

Nutrients 2019, 11, 1735
2. Genetic Dissection of Food Preferences
The genetic background of a trait can be investigated through several methods. Firstly, heritabilityanalysis allows one to estimate the proportion of variation of a phenotype, which is due to geneticdifferences between individuals. However, heritability studies do not provide any information onspecific genes and polymorphisms related to a given trait. Specific information can be identifiedthrough genetic association analysis such as candidate gene and genome-wide approaches. A candidategene study investigates variations within specific genes of interest selected on the basis of existingknowledge or hypotheses. In contrast, a Genome-Wide Association Study (GWAS) is conductedwithout suppositions or previous knowledge and the whole genome is scanned so that new geneticvariants may be discovered [49–51].
Here, we report different approaches through which the genetics of food preferences can bedissected. Firstly, we review studies that provide evidence for a genetic basis of food preferences(heritability studies) and then studies that identified underlying genes (candidate genes andgenome-wide association). Finally, we describe the possible relationships between genes linked to foodpreferences and health status, and we present an example of the predictive power of polymorphismsassociated with vegetable liking on adiposity measures.
2.1. Heritability Studies
Heritability is the proportion of the phenotypic variation in a population explained by geneticeffects; it is a measure of the inheritance of a trait. Usually, heritability estimation requires data wherefamilial relationships are known (twins or family studies) and does not provide information aboutwhich genes are responsible for the trait. Heritability has been widely estimated in twin studies,where monozygotic twins (identical twins with almost no differences in their DNA) are compared todizygotic twins (fraternal twins who share, on average, half of their DNA). This comparison allowsone to evaluate the proportion of variation of a trait ascribable to genetic factors, while the remainingvariance is assumed to derive from environmental factors. Heritability estimation ranges from 0 to1: a high value indicates that genetics plays a major role, while low values indicate that most of thevariation is due to environmental factors. High heritability does not necessarily imply that a singlegene is the cause of trait variation. It is possible that multiple genes, each of them having a small effect,contribute to this variation [52].
Evidence on the heritability of food preferences has been reported in both adult and childrentwin studies. For example, studies of 3–5 year-old children provide evidence for high or moderateheritability for liking of vegetables (from 0.37 and 0.54), fruits (from 0.51 to 0.53), and proteins (from0.48 to 0.78) [4,5]. Moderate heritability for specific food preferences such as vegetables (0.54), fruits(0.49), meat or fish (0.49), and dairy (0.44) has also been observed in adolescents (18–19 years of age) [6].Similar findings have been reported in adults. In a cohort of ~600 adult female twins in the UK,Keskitalo and colleagues reported that 0.49, 0.54, and 0.53 of the variation in liking for a sweet solution,liking and use-frequency of different sweet foods (sweet desserts, sweets, sweet pastry, ice cream,hard candy, and chocolate), respectively, was explained by genetic factors [8,9]. Similarly, a study inyoung adult Finnish twins showed that genetic effects account for 0.18–0.58 of the variation in thepleasantness of oral pungency, spicy foods, and pungent sensations [10]. In the same cohort, geneticinfluences on sour foods were studied, and 0.14 and 0.31 of the variation in pleasantness and intensityof orange juice spiked with citric acid was reported [11]. Moreover, these same authors also foundthat genetic effects accounted for 0.34–0.50 of the variation in pleasantness and use-frequency of sourfoods categorized into three groups as follows: sour fruits and berries (red currant, red currant juice,cranberry, lingonberry, lemon, and rhubarb), sour dairy products (natural cultured milk, natural yogurt,and sour milk), and less-sour berries and fruits (strawberry, orange, blueberry, peach, and banana) [11].
Differences in heritability results across studies can be explained by the small sample size of moststudies and by the minimal number of foods analyzed (i.e., different from study to study and mainlyfocused on the taste perception of foods). Moreover, differences in the data collection and analysis (i.e.,
134

Nutrients 2019, 11, 1735
age differences of participants, use of different questionnaires and measurements, analysis of singlefoods or a set of clustered foods) could also be responsible for this variability.
More recently, a large study of more than 2000 UK twins analyzed the heritability of different likingpatterns using data from an online food liking–disliking questionnaire including 87 different foodsand beverages. This study revealed four food-liking patterns by principal component analysis (PCA):fruit and vegetables; sweet and high carbohydrates; meat; distinctive tastes (including chili pepper,garlic, or other foods with strong taste). Moderate heritabilities were obtained for all of them (fruit andvegetables: 0.36; sweet and high carbohydrates: 0.52; meat: 0.44; distinctive tastes: 0.58), corroboratingpast works on genetic influences of food liking–disliking [12]. However, similar heritability estimatesreached by studies with both large and small sample size suggest that environmental factors also playa crucial role.
Overall, these studies are useful in providing a quantitative estimate of the heritability of foodpreferences and in supporting the idea that genetic determinants play a role. However, as alreadymentioned, they do not give information concerning specific genes accounting for food preferences.
2.2. Candidate Gene Studies
A candidate gene study requires an “a priori” hypothesis based on a potential role of a given geneon a given trait of interest [53]. Regarding food preferences, this approach has been used to examinethe possible role of polymorphisms in genes already known to be involved in taste or smell perceptions.These two senses allow us to recognize and to discriminate foods and are among the most importantdeterminants of food liking/disliking [54–56]. For these reasons, DNA polymorphisms in taste andsmell genes have played an important role in individual variability on food choices.
2.2.1. Taste Receptor Genes
It is well known that genetic factors influence taste perception. Genes encoding taste receptorshave been identified and genetic variability of sweet, umami, and bitter perceptions have been intenselyinvestigated, although knowledge gaps exist for sour and salty perception [19–37]. As stated above,comprehensive reviews have already been published on the relationship between variations in tastereceptors and food preferences [38–44], thus in the present review, we only present a few examples.
A very well-known example is that of the TAS2R38 bitter receptor, a major contributor to individualdifferences in bitter taste perception of PROP (6-n-propylthiouracil) or PTC (phenylthiocarbamide).About 30%–40% of the European population is taste-blind to these compounds or perceive them asweakly bitter (so-called non tasters), while the remaining 70%–60% can perceive them as moderatelyor intensely bitter (so-called tasters). Three SNPs (Single Nucleotide Polymorphisms) in the TAS2R38gene (rs1726866, rs10246939, rs713598) result in three amino acid substitutions defining two mainhaplotypes, namely AVI and PAV, that confer differences in the ability to taste PTC/PROP. Indeed,individuals homozygous for the AVI haplotype are mainly non tasters, while homozygous for the PAVhaplotype and heterozygous individuals are likely to be tasters [19,20,57,58].
Although controversial results have emerged in the literature, the variation in the ability toperceive PROP has been widely related to preferences for different foods such as brassica vegetables,other bitter foods, sweets, added fat, spicy foods, and alcoholic beverages [37,38,59–62]. For example,Mennella and collaborators showed that in children, but not in adults, TAS2R38 variations partiallyexplained individual preferences for sucrose or beverages and cereals with a high sugar content [63].A study in Malaysian adults showed mixed results. Specifically, they reported that aversions toindividual foods such as green tea, mayonnaise, and whipped cream were associated with TAS2R38genotypes, while no associations were observed for vegetables and sweet/fatty foods [64]. Morerecently, a study by Shen et al. showed that AVI/AVI subjects liked brassica vegetables more thanPAV/AVI and PAV/PAV individuals [65]. In another recent work, Perna and collaborators reportedthat one specific polymorphism in the TAS2R38 gene was associated with preferences for beer, butter,and cured meat [66]. However, a link between TAS2R38 genetic variants and food liking has not been
135

Nutrients 2019, 11, 1735
observed in other studies and several reasons could be responsible for the inconsistent findings suchas food assessment methods, sample size, cultural habits, or other environmental factors that mayinfluence the association.
Evidence for a relationship between other bitter taste receptor genes and liking of common foodsand beverages have also been reported. For example, variation in the TAS2R19 bitter-taste gene showedassociations with grapefruit juice bitterness and liking [37], while another bitter-taste gene, TAS2R43,has been related to coffee liking [67]. Data also suggested a possible influence of genetic variationin the TAS1R3 sweet receptor gene on sweet preferences in children [68], as well as a link betweenvariations in the CD36 gene (responsible for fat taste perception) and fat preferences [31].
The studies reviewed above have limited implications for general food preferences because theyonly analyze one or few genes (or SNPs) and they examine liking for just one or few foods. To addressthis shortcoming, our group examined the relationship between a broad spectrum of food preferencesand DNA variants in several taste and olfaction genes in a large cohort of >400 individuals. Statisticallysignificant associations were identified for genes involved in chemosensory functions (i.e., TRPV1 andTAS1R2) or in signal transduction (i.e., PLCβ2 and ITPR3). One of the most interesting associations wasfound between the TAS1R2 gene (coding for a sweet taste receptor) and liking of alcoholic beverages,according to data reporting a link between ethanol preference and liking for sweet taste. Specifically,the lower frequent allele for two different SNPs (rs3935570 and rs4920566) in the TAS1R2 gene werepositively associated with the liking of vodka and white wine. Another noteworthy association wasdetected for tea and the PLCβ2 gene, a marker for type II taste bud cells, which is involved in thecaffeine response and is also expressed in the sensory cells of the olfactory epithelium. In this case,the rarest allele of rs2290550 SNP was negatively correlated with tea liking [15].
2.2.2. Olfactory Receptor Genes
Humans vary in their capacity to perceive several odors, and their variation in olfactory receptor(OR) genes may be responsible for these differences [69,70]. Despite more than 400 genes/receptorsbeing involved in smell perception, little is known about the link between these genes and specificodorants as well as their possible influence on food preferences. One of the most recognized examplesis the role of the olfactory receptor gene OR7D4, which is partially responsible for individual differencesin the ability to smell androsterone [69]. Androsterone is undetectable for some people, others defineit as foul smelling or urine and sweat smelling, while others describe it as sweet or floral smelling.Two SNPs in the OR7D4 gene are responsible for two amino acid substitutions that impair the abilityto perceive androstenone [70]. Androstenone is present in the meat of male pigs. A recent studyconfirmed that OR7D4 variants were associated with the sensory perception of pork meat containingandrostenone as well as lower liking for the flavor and odor of pork meat by androstenone-sensitiveindividuals [71].
Another example is the OR2J3 gene, which is associated with individual differences in detectingCis-3-hexen-1-ol (C3HEX), an odorant with a green/grassy smell and is present in several fruits andvegetables. Polymorphisms in this gene are responsible for amino acid substitutions impairing the abilityto smell C3HEX. Subjects can be classified as C3HEX-sensitive or C3HEX-insensitive [72,73]. Moreover,foods spiked with C3HEX were less acceptable than the unspiked foods; however, the reductions inacceptability were more marked in C3HEX-sensitive individuals if compared to C3HEX-insensitiveindividuals [74].
Finally, studies examined variation in the OR5A1 gene, related to β-ionone odor sensitivity.β-ionone aroma is a fruity/floral aroma that is present in several foods and beverages [75–78]. A seriesof studies by Jaeger and co-workers showed that a DNA variation (rs6591536 SNP) in the OR5A1 geneis the causal variant for β-ionone odor sensitivity, explaining 96.3% of the phenotypic variation. Theyalso reported that β-ionone sensitive individuals can easily differentiate between foods (such as milkchocolate or apple juice) with and without added β-ionone, and they can also recognize β-ionone
136

Nutrients 2019, 11, 1735
in foods when compared to less-sensitive individuals. Moreover, sensitive individuals prefer foodswithout β-ionone rather than with β-ionone [79].
2.3. GWA Studies
Over the past decade, the GWAS approach has become one of the most common tools for theidentification of genes associated with complex traits and diseases. In these studies, a large number ofparticipants are genotyped for a large number of genetic markers (usually SNPs) covering the wholegenome and their relationships with the trait of interest are examined, allowing for the identification ofnovel gene variants and genomic loci [80].
To date, very few GWAS have been conducted on food preferences, which are summarizedin Table 1. Although a genome-wide scan typically analyzes thousands or even millions of SNPs,Table 1 reports only GWAS significant SNPs with p-value < 5 × 10⁻⁸. This p-value is equivalent tothe Bonferroni-corrected threshold (α = 0.05) for 1 million independent variants (approximately thenumber of independent SNPs analyzed in a GWAS).
The first GWAS was carried out on cilantro (or coriander) liking in a large cohort of unrelatedEuropean subjects belonging to the 23andMe cohort [81], who responded to an online questionnaireasking whether they taste cilantro as soapy and whether they like it. An association among thers72921001 SNP, soapy taste, and disliking of cilantro was found. This SNP falls within a cluster ofeight olfactory receptor genes on chromosome 11. Among them, the authors suggested that a goodcandidate for cilantro preferences could be the OR6A2 gene coding for a receptor that can be activatedby several aldehydes responsible for the characteristic odor of cilantro [18].
More recently, we conducted the first GWAS on red and white wine preference assessedby survey-reported food liking in 3885 adults coming from different geographic areas (Italy, theNetherlands, and Central Asia). In this work, we detected a significant association between whitewine liking and rs9276975 SNP in the HLA-DOA gene, encoding for a non-canonical MHC (majorhistocompatibility complex) II molecule. Although the mechanism of how MHC could be linked towine preferences is unknown, the possible involvement of the olfactory system was hypothesized [16].Moreover, another GWAS on the liking of 20 different foods was carried out on a large cohort of4611 individuals, which identified 15 novel significant variants associated with 12 different foods.Some of these variants are located within genes that might represent good candidates for food choices.Interestingly, none of them belong to taste or olfactory receptor gene families, but are likely to beinvolved in reward response to food (i.e., BPNT1, IRX4, CNTN5, and CSMD1 genes). For example, anassociation was detected between the liking of bacon and rs140738262 SNP in the CNTN5 gene. Thispolymorphism also showed marginal association with the liking of other fatty foods such as lamb, porkchops, and goat cheese. This gene is expressed in the brain and has previously been associated withanorexia nervosa, suggesting a possible link with preferences for palatable food and the responsivityof the brain reward system to these foods. For vegetables, an association between chicory liking andrs138369603 SNP in the CSMD1 gene has emerged. We hypothesized a possible role of this gene in theregulation of the food reward response since its variants were linked to differential activation of thecuneus, an area possibly involved in central reward processing [17].
Overall, these results represent a step in understanding the biological bases of food likingand suggest that the GWAS approach may be useful in identifying novel candidate genes for foodpreferences. Nowadays, thanks to the reduction of SNP genotyping costs as well as to the existenceof large population biobanks, GWA studies could contribute to identifying many more loci, whichwill enhance insight into the genetic architecture of food preferences. Thus, further studies should beconducted to confirm previous findings, to extend the range of examined foods, and to also analyzeother food groups.
137
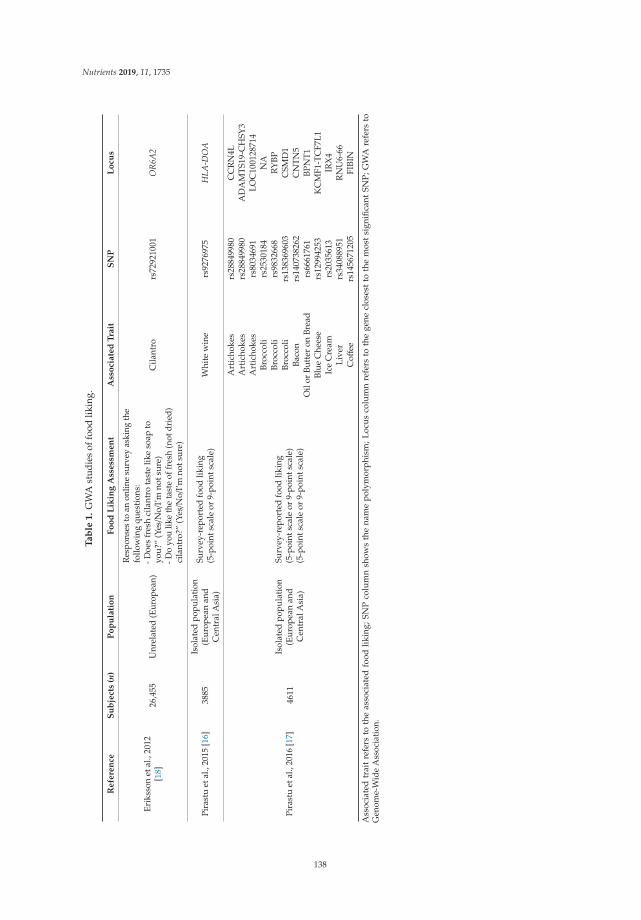
Nutrients 2019, 11, 1735
Ta
ble
1.
GW
Ast
udie
sof
food
likin
g.
Refe
ren
ceS
ub
ject
s(n
)P
op
ula
tio
nF
oo
dL
ikin
gA
ssess
men
tA
sso
ciate
dT
rait
SN
PL
ocu
s
Erik
sson
etal
.,20
12[1
8]26
,455
Unr
elat
ed(E
urop
ean)
Res
pons
esto
anon
line
surv
eyas
king
the
follo
win
gqu
esti
ons:
-Doe
sfr
esh
cila
ntro
tast
elik
eso
apto
you?
”(Y
es/N
o/I’
mno
tsur
e)-D
oyo
ulik
eth
eta
ste
offr
esh
(not
drie
d)ci
lant
ro?”
(Yes/N
o/I’
mno
tsur
e)
Cila
ntro
rs72
9210
01O
R6A
2
Pira
stu
etal
.,20
15[1
6]38
85Is
olat
edpo
pula
tion
(Eur
opea
nan
dC
entr
alA
sia)
Surv
ey-r
epor
ted
food
likin
g(5
-poi
ntsc
ale
or9-
poin
tsca
le)
Whi
tew
ine
rs92
7697
5H
LA-D
OA
Pira
stu
etal
.,20
16[1
7]46
11Is
olat
edpo
pula
tion
(Eur
opea
nan
dC
entr
alA
sia)
Surv
ey-r
epor
ted
food
likin
g(5
-poi
ntsc
ale
or9-
poin
tsca
le)
(5-p
oint
scal
eor
9-po
ints
cale
)
Art
icho
kes
rs28
8499
80C
CR
N4L
Art
icho
kes
rs28
8499
80A
DA
MTS
19-C
HSY
3A
rtic
hoke
srs
8034
691
LOC
1001
2871
4Br
occo
lirs
2530
184
NA
Broc
coli
rs98
3266
8R
YBP
Broc
coli
rs13
8369
603
CSM
D1
Baco
nrs
1407
3826
2C
NTN
5O
ilor
Butt
eron
Brea
drs
6661
761
BPN
T1Bl
ueC
hees
ers
1299
4253
KC
MF1
-TC
F7L1
Ice
Cre
amrs
2035
613
IRX
4Li
ver
rs34
0889
51R
NU
6-66
Coff
eers
1456
7120
5FI
BIN
Ass
ocia
ted
trai
tre
fers
toth
eas
soci
ated
food
likin
g;SN
Pco
lum
nsh
ows
the
nam
ep
olym
orp
hism
;Loc
us
colu
mn
refe
rsto
the
gene
clos
est
toth
em
ost
sign
ifica
ntSN
P;G
WA
refe
rsto
Gen
ome-
Wid
eA
ssoc
iati
on.
138

Nutrients 2019, 11, 1735
3. From genetic Variations in Food Preference Genes to Health
There is a well-developed body of research examining the relationships between taste receptorgenes and their downstream effects on food preferences and intake, which may in turn affect nutritionaland health status [31,43–48]. These studies are reviewed elsewhere [82], however a few salient examplesare discussed here. For instance, SNPs in the TAS1R2 and TAS1R3 genes, which codify for sweet tastereceptors and are related to a higher preference and intake of sweet foods, have also been associatedwith increased dental caries [46,83,84]. Another example is the relationship between variations inthe TAS2R38 bitter taste gene and eating behavior as well as anthropometric and adiposity measures.Increased disinhibition has been described in women carrying the PROP-insensitive allele for thers1726866 SNP [85]; while another finding reported higher BMI and waist circumference among PROPnon-taster women with low dietary restraint [86]. In another study, differences in body fat percentagewere associated with the three TAS2R38 genetic variants, while no significant relationships with BMIand eating behavior were found [87]. Other studies did not support a relationship between TAS2R38variants and adiposity measures [64,86–88]. These inconsistent results could be ascribed to the presenceof several confounding factors (i.e., sex, age, ethnicity, etc.) that may modulate the relationship amongtaste receptors and health status parameters.
Differences in bitter taste perception have also been associated with bitter taste receptor mRNAlevels in taste cells [89,90], suggesting that gene expression is another factor to consider when therelationship with health measures is studied. Moreover, recent findings showed that the gene expressionprofile of fungiform taste papillae differs between lean and obese subjects [91]. Together, these findingshighlight the need to conduct future studies to clarify their association.
Recent evidence also raises the possibility that taste and smell receptors residing in differentbodily tissues may have multiple functions in health and disease. For example, taste receptors are alsoexpressed in extra-oral tissues, such as the gastrointestinal tract, where they seem to be involved indigestive functions or homeostasis and energy metabolism [92–103].
It is also well known that the sense of smell is impaired in neurodegenerative diseases [104,105]and associations between olfactory genes (expressed in olfactory and non-olfactory tissues) anddiet-related diseases such as obesity have also been demonstrated [104,106,107]. Notably, the OR7D4gene, recently related to preference for pork meat containing androstenone (described in [71]), waspreviously associated with adiposity, cognitive dietary restraint, and susceptibility to hunger inanother study [108].
Despite these positive findings, very large GWAS on BMI or other health-related parameters havenot found associations with SNPs in chemosensory genes [109–111], suggesting that their effects arelikely to be very small and limited in predictive power.
Combining Several Genetic Variants: The Polygenic Risk Score
The evidence presented above suggests that a new paradigm may be needed to accelerate progressin understanding the relationships between food preferences and nutrition and health. Our findings [17]using the GWAS approach identified novel genes associated with food preferences with no knowneffects on chemosensory function. Thus, looking beyond the involvement of traditional chemosensorygenes in food preferences may be important for gaining new insights.
Although GWA studies have led to progress in identifying common variations associated withmany complex traits, the modest effect sizes have prevented risk prediction based on single geneticvariants. More recently, polygenic risk score analyses that combine the effects of several genetic variantshave shown some predictive ability for a wide range of complex traits [112]. In polygenic score (PGS)analysis, a set of SNPs identified in a GWAS is used to construct a polygenic score that is used forassociation testing or risk prediction.
To the best of our knowledge, polygenic risk score analyses for food preferences have not yetbeen conducted. Although the link between vegetable intake and adiposity measures was widelyinvestigated [113–115], few studies focusing on the relationship between hedonic measures and
139

Nutrients 2019, 11, 1735
adiposity have been conducted. These studies have found no or weak association [116–118], suggestingthat this complex relationship could be modulated by several factors, including genetic ones. Therefore,here, we report the data obtained from a PGS analysis to evaluate the predictive power of SNPsassociated with food liking on adiposity measures (BMI and fat mass). Data was collected from 1140individuals belonging to two Italian cohorts (Friuli Venezia Giulia and Val Borbera). Further details ondata collection, sample characteristics, and polygenic score analysis are reported in supplementarymaterials (File S1).
We constructed a PGS for vegetables (PGS-vegetables) based on 6 SNPs significantly associatedwith preferences for different vegetables in our previous work: rs28849980, rs10050951, rs8034691 forartichokes, rs2530184, rs9832668 for broccoli, and rs138369603 for chicory (see Table 2 in [17]).
For each individual, PGS-vegetables represents vegetable preference predicted by the combinationof the above mentioned 6 SNPs. In the first step, the allele count for each SNP was weighted byits per-allele association with food preferences. Specifically, for each identified SNP, an individual’sgenotypic score (0, 1, or 2 for genotyped SNPs, or any value between 0–2 for imputed SNPs) wasmultiplied by the effect size. SNPs were weighted such that a higher weight was associated witha higher preference for the associated vegetable. The final score (PGS-vegetables) was calculatedfor each individual by summing the values obtained in the first step across all six SNPs. Linearregression analysis was conducted to test the associations between adiposity measures (BMI andfat mass as dependent variables) and PGS-vegetables as the predictor variable, in models adjustedfor sex, age, education level (as number of years of completed schooling), and physical activity(never/light/moderate/intense). Information on sample collection, genotyping, imputation, andphenotypes were reported in our previous works [16,17]. Table 2 shows that PGS-vegetables was asignificant negative predictor of BMI and fat mass (p-value < 0.05), in addition to sex, age, education,and physical activity. Specifically, higher PGS-vegetables (corresponding to higher preferences forvegetable foods) was predictive of lower BMI and fat mass.
Table 2. Results of polygenic risk score analysis.
Predictor Variables BMI, Kg/m2 Fat Mass, Kg
Sex, male 2.85 (<0.0001) −0.67 (0.2)Age, years 0.04 (<0.0001) 0.09 (<0.0001)
Education level, years −0.14 (<0.001) −0.26 (0.002)
Physical activity −1.19 (<0.0001) −2.56 (<0.0001)
Vegetables PGS −0.98 (0.028) −2.08 (0.023)
Beta and p-value in brackets are shown. In bold: significant results (p-value < 0.05). BMI = Body MassIndex; PGS = Polygenic Score.
Although the PGS-vegetables variable accounted for only 0.28% of the variation in BMI and 0.33%of the variation in fat mass, the low number of SNPs included in the study could explain this finding.
These results on PGS represent a starting point in studying the polygenic effects of food preferenceson health status. As the number of GWAS of food preferences increase, further studies consideringmore SNPs and other food categories should be conducted. Adopting the PGS approach would allowthe development of more powerful genetic profiles to better predict the risk of disease.
4. Conclusions
In conclusion, the data reviewed here highlight the role of genetic variations in food preferencesand their important contributions to nutrition and health.
There is a need to identify and investigate other genes involved in food preferences, besides thosealready implicated in olfactory and taste perception. These novel genes can be discovered throughGWAS or other genomic approaches.
The use of polygenic risk analysis to assess associations between food preferences and diseaseoutcomes could lead to important new insights in nutrition research.
140

Nutrients 2019, 11, 1735
Supplementary Materials: The following are available online at http://www.mdpi.com/2072-6643/11/8/1735/s1,File S1: Data collection and polygenic score analysis.
Author Contributions: Conception and design of the review, A.R. and P.G., analysis and interpretation of data A.R.,P.G., and M.P.C., writing the article and final approval of the version to be published, A.R., P.G., M.P.C., and E.C.
Funding: This research was funded by the Italian Ministry of Health (5x1000 to Institute for Maternal and ChildHealth IRCCS Burlo Garofolo). The funders had no role in the design of the study, data collection and analysis,decision to publish, or preparation of the manuscript.
Acknowledgments: A sincere thank you to Martina Bradaschia for her proofreading of this manuscript.
Conflicts of Interest: The authors declare that they have no competing interests.
References
1. Faust, J. A Twin Study of Personal Preferences. J. Biosoc. Sci. 1974, 6, 75–91. [CrossRef]2. Birch, L.L. The relationship between children’s food preferences and those of their parents. J. Nutr. Educ.
1980, 12, 14–18. [CrossRef]3. Falciglia, G.A.; Norton, P.A. Evidence for a genetic influence on preference for some foods. J. Am. Diet. Assoc.
1994, 94, 154–158. [CrossRef]4. Breen, F.; Plomin, R.; Wardle, J. Heritability of food preferences in young children. Physiol. Behav. 2006,
88, 443–447. [CrossRef]5. Fildes, A.; Van Jaarsveld, C.H.; Llewellyn, C.H.; Fisher, A.; Cooke, L.; Wardle, J. Nature and nurture in
children’s food preferences. Am. J. Clin. Nutr. 2014, 99, 911–917. [CrossRef]6. Smith, A.D.; Fildes, A.; Cooke, L.; Herle, M.; Shakeshaft, N.; Plomin, R.; Llewellyn, C. Genetic and
environmental influences on food preferences in adolescence. Am. J. Clin. Nutr. 2016, 104, 446–453.[CrossRef]
7. Reed, D.R.; Bachmanov, A.A.; Beauchamp, G.K.; Tordoff, M.G.; Price, R.A. Heritable Variation in FoodPreferences and Their Contribution to Obesity. Behav. Genet. 1997, 27, 373–387. [CrossRef]
8. Keskitalo, K.; Knaapila, A.; Kallela, M.; Palotie, A.; Wessman, M.; Sammalisto, S.; Peltonen, L.; Tuorila, H.;Perola, M. Sweet taste preferences are partly genetically determined: Identification of a trait locus onchromosome 16. Am. J. Clin. Nutr. 2007, 86, 55–63. [CrossRef]
9. Keskitalo, K.; Tuorila, H.; Spector, T.D.; Cherkas, L.F.; Knaapila, A.; Silventoinen, K.; Perola, M. Same geneticcomponents underlie different measures of sweet taste preference. Am. J. Clin. Nutr. 2007, 86, 1663–1669.[CrossRef]
10. Törnwall, O.; Silventoinen, K.; Kaprio, J.; Tuorila, H. Why do some like it hot? Genetic and environmentalcontributions to the pleasantness of oral pungency. Physiol. Behav. 2012, 107, 381–389. [CrossRef]
11. Törnwall, O.; Silventoinen, K.; Keskitalo-Vuokko, K.; Perola, M.; Kaprio, J.; Tuorila, H. Genetic contributionto sour taste preference. Appetite 2012, 58, 687–694. [CrossRef]
12. Pallister, T.; Sharafi, M.; Lachance, G.; Pirastu, N.; Mohney, R.P.; MacGregor, A.; Feskens, E.J.M.; Duffy, V.;Spector, T.D.; Menni, C. Food Preference Patterns in a UK Twin Cohort. Twin Res. Hum. Genet. 2015,18, 793–805. [CrossRef]
13. Reed, D.R.; Zhu, G.; Breslin, P.A.; Duke, F.F.; Henders, A.K.; Campbell, M.J.; Montgomery, G.W.; Medland, S.E.;Martin, N.G.; Wright, M.J. The perception of quinine taste intensity is associated with common geneticvariants in a bitter receptor cluster on chromosome 12. Hum. Mol. Genet. 2010, 19, 4278–4285. [CrossRef]
14. Hwang, L.-D.; Lin, C.; Gharahkhani, P.; Cuellar-Partida, G.; Ong, J.-S.; An, J.; Gordon, S.D.; Zhu, G.;MacGregor, S.; Lawlor, D.A.; et al. New insight into human sweet taste: A genome-wide association study ofthe perception and intake of sweet substances. Am. J. Clin. Nutr. 2019, 109, 1724–1737. [CrossRef]
15. Pirastu, N.; Robino, A.; Lanzara, C.; Athanasakis, E.; Esposito, L.; Tepper, B.J.; Gasparini, P. Genetics of FoodPreferences: A First View from Silk Road Populations. J. Food Sci. 2012, 77, S413–S418. [CrossRef]
16. Pirastu, N.; Kooyman, M.; Traglia, M.; Robino, A.; Willems, S.M.; Pistis, G.; Amin, N.; Sala, C.; Karssen, L.C.;Van Duijn, C.M.; et al. Genome-wide association analysis on five isolated populations identifies variants ofthe HLA-DOA gene associated with white wine liking. Eur. J. Hum. Genet. 2015, 23, 1717–1722. [CrossRef]
17. Pirastu, N.; Kooyman, M.; Traglia, M.; Robino, A.; Willems, S.M.; Pistis, G.; Amin, N.; Sala, C.; Karssen, L.C.;Van Duijn, C.; et al. A Genome-Wide Association Study in isolated populations reveals new genes associatedto common food likings. Rev. Endocr. Metab. Disord. 2016, 17, 209–219. [CrossRef]
141

Nutrients 2019, 11, 1735
18. Eriksson, N.; Wu, S.; Do, C.B.; Kiefer, A.K.; Tung, J.Y.; Mountain, J.L.; Hinds, D.A.; Francke, U. A geneticvariant near olfactory receptor genes influences cilantro preference. Flavour 2012, 1, 22. [CrossRef]
19. Kim, U.-K.; Jorgenson, E.; Coon, H.; Leppert, M.; Risch, N.; Drayna, D. Positional Cloning of the HumanQuantitative Trait Locus Underlying Taste Sensitivity to Phenylthiocarbamide. Science 2003, 299, 1221–1225.[CrossRef]
20. Guo, S.-W.; Reed, D.R. The genetics of phenylthiocarbamide perception. Ann. Hum. Biol. 2001, 28, 111–142.21. Bufe, B.; Hofmann, T.; Krautwurst, D.; Raguse, J.D.; Meyerhof, W. The human TAS2R16 receptor mediates
bitter taste in response to beta-glucopyranosides. Nat. Genet. 2002, 32, 397–401. [CrossRef]22. Kuhn, C.; Bufe, B.; Winnig, M.; Hofmann, T.; Frank, O.; Behrens, M.; Lewtschenko, T.; Slack, J.P.; Ward, C.D.;
Meyerhof, W. Bitter Taste Receptors for Saccharin and Acesulfame K. J. Neurosci. 2004, 24, 10260–10265.[CrossRef]
23. Pronin, A.N.; Xu, H.; Tang, H.; Zhang, L.; Li, Q.; Li, X. Specific Alleles of Bitter Receptor Genes InfluenceHuman Sensitivity to the Bitterness of Aloin and Saccharin. Curr. Biol. 2007, 17, 1403–1408. [CrossRef]
24. Behrens, M.; Meyerhof, W. Bitter taste receptors and human bitter taste perception. Cell Mol. Life Sci. 2006,63, 1501–1509. [CrossRef]
25. Mainland, J.D.; Matsunami, H. Taste Perception: How sweet it is (To be transcribed by you). Curr. Biol. 2009,19, R655–R656. [CrossRef]
26. Fushan, A.A.; Simons, C.T.; Slack, J.P.; Manichaikul, A.; Drayna, D. Allelic Polymorphism within the TAS1R3Promoter is Associated with Human Taste Sensitivity to Sucrose. Curr. Biol. 2009, 19, 1288–1293. [CrossRef]
27. Shigemura, N.; Shirosaki, S.; Sanematsu, K.; Yoshida, R.; Ninomiya, Y. Genetic and Molecular Basis ofIndividual Differences in Human Umami Taste Perception. PLoS ONE 2009, 4, e6717. [CrossRef]
28. Shigemura, N.; Shirosaki, S.; Ohkuri, T.; Sanematsu, K.; Islam, A.S.; Ogiwara, Y.; Kawai, M.; Yoshida, R.;Ninomiya, Y. Variation in umami perception and in candidate genes for the umami receptor in mice andhumans. Am. J. Clin. Nutr. 2009, 90, 764S–769S. [CrossRef]
29. Dias, A.G.; Rousseau, D.; Duizer, L.; Cockburn, M.; Chiu, W.; Nielsen, D.; El-Sohemy, A. Genetic variation inputative salt taste receptors and salt taste perception in humans. Chem. Sens. 2013, 38, 137–145. [CrossRef]
30. Laugerette, F.; Passilly-Degrace, P.; Patris, B.; Niot, I.; Febbraio, M.; Montmayeur, J.-P.; Besnard, P. CD36involvement in orosensory detection of dietary lipids, spontaneous fat preference, and digestive secretions.J. Clin. Investig. 2005, 115, 3177–3184. [CrossRef]
31. Keller, K.L.; Liang, L.C.H.; Sakimura, J.; May, D.; van Belle, C.; Breen, C.; Driggin, E.; Tepper, B.J.; Lanzano, P.C.;Deng, L.; et al. Common variants in the CD36 gene are associated with oral fat perception, fat preferences,and obesity in African Americans. Obesity 2012, 20, 1066–1073. [CrossRef]
32. Reed, D.R.; Xia, M.B. Recent Advances in Fatty Acid Perception and Genetics. Adv. Nutr. 2015, 6, 353S–360S.[CrossRef]
33. Ugawa, S. Identification of sour-taste receptor genes. Anat. Sci. Int. 2003, 78, 205–210. [CrossRef]34. Ishimaru, Y.; Matsunami, H. Transient Receptor Potential (TRP) Channels and Taste Sensation. J. Dent. Res.
2009, 88, 212–218. [CrossRef]35. Bachmanov, A.A.; Beauchamp, G.K. Taste receptor genes. Annu. Rev. Nutr. 2007, 27, 389–414. [CrossRef]36. Bachmanov, A.A.; Bosak, N.P.; Lin, C.; Matsumoto, I.; Ohmoto, M.; Reed, D.R.; Nelson, T.M. Genetics of taste
receptors. Curr. Pharm. Des. 2014, 20, 2669–2683. [CrossRef]37. Hayes, J.E.; Wallace, M.R.; Knopik, V.S.; Herbstman, D.M.; Bartoshuk, L.M.; Duffy, V.B. Allelic variation in
TAS2R bitter receptor genes associates with variation in sensations from and ingestive behaviors towardcommon bitter beverages in adults. Chem. Sens. 2011, 36, 311–319. [CrossRef]
38. Tepper, B.J. Nutritional Implications of Genetic Taste Variation: The Role of PROP Sensitivity and OtherTaste Phenotypes. Annu. Rev. Nutr. 2008, 28, 367–388. [CrossRef]
39. Feeney, E. The impact of bitter perception and genotypic variation of TAS2R38 on food choice. Nutr. Bull.2011, 36, 20–33. [CrossRef]
40. Hayes, J.E.; Feeney, E.L.; Allen, A.L. Do polymorphisms in chemosensory genes matter for human ingestivebehavior? Food Qual. Prefer. 2013, 30, 202–216. [CrossRef]
41. Feeney, E.; O’Brien, S.; Scannell, A.; Markey, A.; Gibney, E.R. Genetic variation in taste perception: Does ithave a role in healthy eating? Proc. Nutr. Soc. 2011, 70, 135–143. [CrossRef]
142

Nutrients 2019, 11, 1735
42. Negri, R.; Di Feola, M.; Di Domenico, S.; Scala, M.G.; Artesi, G.; Valente, S.; Smarrazzo, A.; Turco, F.;Morini, G.; Greco, L. Taste perception and food choices. J. Pediatr. Gastroenterol. Nutr. 2012, 54, 624–629.[CrossRef]
43. García-Bailo, B.; Toguri, C.; Eny, K.M.; El-Sohemy, A. Genetic Variation in Taste and Its Influence on FoodSelection. OMICS 2009, 13, 69–80. [CrossRef]
44. Chamoun, E.; Mutch, D.M.; Allen-Vercoe, E.; Buchholz, A.C.; Duncan, A.M.; Spriet, L.L.; Haines, J.; Ma, D.W.L.Guelph Family Health Study. A review of the associations between single nucleotide polymorphisms intaste receptors, eating behaviors, and health. Crit. Rev. Food Sci. Nutr. 2018, 58, 194–207. [CrossRef]
45. Eny, K.M.; Wolever, T.M.; Corey, P.N.; El-Sohemy, A. Genetic variation in TAS1R2 (Ile191Val) is associatedwith consumption of sugars in overweight and obese individuals in 2 distinct populations. Am. J. Clin. Nutr.2010, 92, 1501–1510. [CrossRef]
46. Kulkarni, G.; Chng, T.; Eny, K.; Nielsen, D.; Wessman, C.; El-Sohemy, A. Association of GLUT2 and TAS1R2Genotypes with Risk for Dental Caries. Caries Res. 2013, 47, 219–225. [CrossRef]
47. Ma, X.; Bacci, S.; Mlynarski, W.; Gottardo, L.; Soccio, T.; Menzaghi, C.; Iori, E.; Lager, R.A.; Shroff, A.R.;Gervino, E.V.; et al. A common haplotype at the CD36 locus is associated with high free fatty acid levels andincreased cardiovascular risk in Caucasians. Hum. Mol. Genet. 2004, 13, 2197–2205. [CrossRef]
48. Dotson, C.D.; Vigues, S.; Steinle, N.I.; Munger, S.D. T1R and T2R receptors: The modulation of incretinhormones and potential targets for the treatment of type 2 diabetes mellitus. Curr. Opin. Investig. Drugs2010, 11, 447–454.
49. Mackay, T.F. The genetic architecture of quantitative traits. Annu. Rev. Genet. 2001, 35, 303–339. [CrossRef]50. Yang, J.; Manolio, T.A.; Pasquale, L.R.; Boerwinkle, E.; Caporaso, N.; Cunningham, J.M.; de Andrade, M.;
Feenstra, B.; Feingold, E.; Hayes, M.G.; et al. Genome partitioning of genetic variation for complex traitsusing common SNPs. Nat. Genet. 2011, 43, 519–525. [CrossRef]
51. Rao, D. An Overview of the Genetic Dissection of Complex Traits. Adv. Genet. 2008, 60, 3–34.52. Visscher, P.M.; Hill, W.G.; Wray, N.R. Heritability in the genomics era—Concepts and misconceptions.
Nat. Rev. Genet. 2008, 9, 255–266. [CrossRef]53. Zhu, M. Candidate Gene Identification Approach: Progress and Challenges. Int. J. Biol. Sci. 2007, 3, 420–427.
[CrossRef]54. Glanz, K.; Basil, M.; Maibach, E.; Goldberg, J.; Snyder, D. Why Americans eat what they do: Taste, nutrition,
cost, convenience, and weight control concerns as influences on food consumption. J. Am. Diet. Assoc. 1998,98, 1118–1126. [CrossRef]
55. Drewnowski, A.; Henderson, S.A.; Levine, A.; Hann, C. Taste and food preferences as predictors of dietarypractices in young women. Public Health Nutr. 1999, 2, 513–519. [CrossRef]
56. Boesveldt, S.; De Graaf, K. The Differential Role of Smell and Taste For Eating Behavior. Perception 2017,46, 307–319. [CrossRef]
57. Kim, U.K.; Drayna, D. Genetics of individual differences in bitter taste perception: Lessons from the PTCgene. Clin. Genet. 2005, 67, 275–280. [CrossRef]
58. Bufe, B.; Breslin, P.A.S.; Kühn, C.; Reed, D.R.; Tharp, C.D.; Slack, J.P.; Kim, U.-K.; Drayna, D.; Meyerhof, W.The Molecular Basis of Individual Differences in Phenylthiocarbamide and Propylthiouracil BitternessPerception. Curr. Biol. 2005, 15, 322–327. [CrossRef]
59. Dinehart, M.; Hayes, J.; Bartoshuk, L.; Lanier, S.; Duffy, V. Bitter taste markers explain variability in vegetablesweetness, bitterness, and intake. Physiol. Behav. 2006, 87, 304–313. [CrossRef]
60. Keller, K.L.; Steinmann, L.; Nurse, R.J.; Tepper, B.J. Genetic taste sensitivity to 6-n-propylthiouracil influencesfood preference and reported intake in preschool children. Appetite 2002, 38, 3–12. [CrossRef]
61. Ullrich, N.V.; Touger-Decker, R.; O’sullivan-Maillet, J.; Tepper, B.J. PROP taster status and self-perceived foodadventurousness influence food preferences. J. Am. Diet. Assoc. 2004, 104, 543–549. [CrossRef] [PubMed]
62. Hayes, J.E.; Duffy, V.B. Oral sensory phenotype identifies level of sugar and fat required for maximal liking.Physiol. Behav. 2008, 95, 77–87. [CrossRef] [PubMed]
63. Mennella, J.A.; Pepino, M.Y.; Reed, D.R. Genetic and environmental determinants of bitter perception andsweet preferences. Pediatrics 2005, 115, e216–e222. [CrossRef] [PubMed]
64. Ooi, S.-X.; Lee, P.-L.; Law, H.-Y.; Say, Y.-H. Bitter receptor gene (TAS2R38) P49A genotypes and theirassociations with aversion to vegetables and sweet/fat foods in Malaysian subjects. Asia Pac. J. Clin. Nutr.2010, 19, 491–498. [PubMed]
143

Nutrients 2019, 11, 1735
65. Shen, Y.; Kennedy, O.B.; Methven, L. Exploring the effects of genotypical and phenotypical variations inbitter taste sensitivity on perception, liking and intake of brassica vegetables in the UK. Food Qual. Prefer.2016, 50, 71–81. [CrossRef]
66. Perna, S.; Riva, A.; Nicosanti, G.; Carrai, M.; Barale, R.; Vigo, B.; Allegrini, P.; Rondanelli, M. Associationof the bitter taste receptor gene TAS2R38 (polymorphism RS713598) with sensory responsiveness, foodpreferences, biochemical parameters and body-composition markers. A cross-sectional study in Italy. Int. J.Food Sci. Nutr. 2018, 69, 245–252. [CrossRef] [PubMed]
67. Pirastu, N.; Kooyman, M.; Traglia, M.; Robino, A.; Willems, S.M.; Pistis, G.; D’Adamo, P.; Amin, N.;D’Eustacchio, A.; Navarini, L.; et al. Association Analysis of Bitter Receptor Genes in Five IsolatedPopulations Identifies a Significant Correlation between TAS2R43 Variants and Coffee Liking. PLoS ONE2014, 9, e92065. [CrossRef] [PubMed]
68. Mennella, J.A.; Finkbeiner, S.; Reed, D.R. The proof is in the pudding: Children prefer lower fat but highersugar than do mothers. Int. J. Obes. 2012, 36, 1285–1291. [CrossRef] [PubMed]
69. Wysocki, C.J.; Beauchamp, G.K. Ability to smell androstenone is genetically determined. Proc. Natl. Acad.Sci. USA 1984, 81, 4899–4902. [CrossRef] [PubMed]
70. Keller, A.; Zhuang, H.; Chi, Q.; Vosshall, L.B.; Matsunami, H. Genetic variation in a human odorant receptoralters odour perception. Nature 2007, 449, 468–472. [CrossRef] [PubMed]
71. Lunde, K.; Egelandsdal, B.; Skuterud, E.; Mainland, J.D.; Lea, T.; Hersleth, M.; Matsunami, H. GeneticVariation of an Odorant Receptor OR7D4 and Sensory Perception of Cooked Meat Containing Androstenone.PLoS ONE 2012, 7, e35259. [CrossRef] [PubMed]
72. Jaeger, S.R.; McRae, J.F.; Salzman, Y.; Williams, L.; Newcomb, R.D. A preliminary investigation into a geneticbasis for cis-3-hexen-1-ol odour perception: A genome-wide association approach. Food Qual. Prefer. 2010,21, 121–131. [CrossRef]
73. McRae, J.F.; Mainland, J.D.; Jaeger, S.R.; Adipietro, K.A.; Matsunami, H.; Newcomb, R.D. Genetic variation inthe odorant receptor OR2J3 is associated with the ability to detect the “grassy” smelling odor, cis-3-hexen-1-ol.Chem. Senses 2012, 37, 585–593. [CrossRef] [PubMed]
74. Jaeger, S.R.; Pineau, B.; Bava, C.M.; Atkinson, K.R.; AMcRae, J.F.; Axten, L.G.; Chheang, S.L.; Beresford, M.K.;Peng, M.; Paisley, A.G.; et al. Investigation of the impact of sensitivity to cis-3-hexen-1-ol (green/grassy) onfood acceptability and selection. Food Qual. Prefer. 2012, 24, 230–242. [CrossRef]
75. Etiévant, P.X.; Issanchou, S.N.; Bayonove, C.L. The flavour of muscat wine: The sensory contribution of somevolatile compounds. J. Sci. Food Agric. 1983, 34, 497–504. [CrossRef]
76. Larsen, M.; Poll, L.; Callesen, O.; Lewis, M. Relations between the content of aroma compounds and thesensory evaluation of 10 raspberry varieties (Rubus idaeus L). Acta Agric. Scand. 1991, 41, 447–454. [CrossRef]
77. Tandon, K.; Baldwin, E.; Shewfelt, R. Aroma perception of individual volatile compounds in fresh tomatoes(Lycopersicon esculentum, Mill.) as affected by the medium of evaluation. Postharvest Biol. Technol. 2000,20, 261–268. [CrossRef]
78. Mahattanatawee, K.; Rouseff, R.; Valim, M.F.; Naim, M. Identification and Aroma Impact of Norisoprenoidsin Orange Juice. J. Agric. Food Chem. 2005, 53, 393–397. [CrossRef]
79. Jaeger, S.R.; McRae, J.F.; Bava, C.M.; Beresford, M.K.; Hunter, D.; Jia, Y.; Chheang, S.L.; Jin, D.; Peng, M.;Gamble, J.C.; et al. A Mendelian trait for olfactory sensitivity affects odor experience and food selection.Curr. Biol. 2013, 23, 1601–1605. [CrossRef]
80. Visscher, P.M.; Wray, N.R.; Zhang, Q.; Sklar, P.; McCarthy, M.I.; Brown, M.A.; Yang, J. 10 Years of GWASDiscovery: Biology, Function, and Translation. Am. J. Hum. Genet. 2017, 101, 5–22. [CrossRef]
81. Eriksson, N.; MacPherson, J.M.; Tung, J.Y.; Hon, L.S.; Naughton, B.; Saxonov, S.; Avey, L.; Wojcicki, A.;Pe’Er, I.; Mountain, J. Web-Based, Participant-Driven Studies Yield Novel Genetic Associations for CommonTraits. PLoS Genet. 2010, 6, e1000993. [CrossRef] [PubMed]
82. Precone, V.; Beccari, T.; Stuppia, L.; Baglivo, M.; Paolacci, S.; Manara, E.; Miggiano, G.A.D.; Falsini, B.;Trifirò, A.; Zanlari, A.; et al. Taste, olfactory and texture related genes and food choices: Implications onhealth status. Eur. Rev. Med. Pharmacol. Sci. 2019, 23, 1305–1321. [PubMed]
83. Haznedaroglu, E.; Bakir-Coskun, N.; Bozkus, H.M.; Mentes, A. Association of Sweet Taste Receptor GenePolymorphisms with Dental Caries Experience in School Children. Caries Res. 2015, 49, 275–281. [CrossRef][PubMed]
144

Nutrients 2019, 11, 1735
84. Robino, A.; Bevilacqua, L.; Pirastu, N.; Situlin, R.; Di Lenarda, R.; Gasparini, P.; Navarra, C.O. Polymorphismsin sweet taste genes (TAS1R2 and GLUT2), sweet liking, and dental caries prevalence in an adult Italianpopulation. Genes Nutr. 2015, 10, 485. [CrossRef] [PubMed]
85. Dotson, C.D.; Shaw, H.L.; Mitchell, B.D.; Munger, S.D.; Steinle, N.I. Variation in the gene TAS2R38 isassociated with the eating behavior disinhibition in Old OrderAmish women. Appetite 2010, 54, 93–99.[CrossRef] [PubMed]
86. Tepper, B.J.; Koelliker, Y.; Zhao, L.; Ullrich, N.V.; Lanzara, C.; D’Adamo, P.; Ferrara, A.; Ulivi, S.; Esposito, L.;Gasparini, P.; et al. Variation in the Bitter-taste Receptor GeneTAS2R38, and Adiposity in a GeneticallyIsolated Population in Southern Italy. Obesity 2008, 16, 2289–2295. [CrossRef]
87. Keller, M.; Liu, X.; Wohland, T.; Rohde, K.; Gast, M.-T.; Stumvoll, M.; Kovács, P.; Tonjes, A.; Böttcher, Y.TAS2R38 and Its Influence on Smoking Behavior and Glucose Homeostasis in the German Sorbs. PLoS ONE2013, 8, e80512. [CrossRef]
88. Timpson, N.J.; Christensen, M.; Lawlor, D.A.; Gaunt, T.R.; Day, I.N.; Ebrahim, S.; Davey Smith, G. TAS2R38(phenylthiocarba-mide) haplotypes, coronary heart disease traits, and eating behavior in the British Women’sHeart and Health Study. Am. J. Clin. Nutr. 2005, 81, 1005–1011. [CrossRef]
89. Lipchock, S.V.; Mennella, J.A.; Spielman, A.I.; Reed, D.R. Human bitter perception correlates with bitterreceptor messenger RNA expression in taste cells. Am. J. Clin. Nutr. 2013, 98, 1136–1143. [CrossRef]
90. Lipchock, S.V.; Spielman, A.I.; Mennella, J.A.; Mansfield, C.J.; Hwang, L.-D.; Douglas, J.E.; Reed, D.R. CaffeineBitterness is Related to Daily Caffeine Intake and Bitter Receptor mRNA Abundance in Human Taste Tissue.Perception 2017, 46, 245–256. [CrossRef]
91. Archer, N.; Shaw, J.; Cochet-Broch, M.; Bunch, R.; Poelman, A.; Barendse, W.; Duesing, K. Obesity is associatedwith altered gene expression in human tastebuds. Int. J. Obes. 2019, 43, 1475–1484. [CrossRef] [PubMed]
92. Wu, S.V.; Rozengurt, N.; Yang, M.; Young, S.H.; Sinnett-Smith, J.; Rozengurt, E. Expression of bitter tastereceptors of the T2R family in the gastrointestinal tract and enteroendocrine STC-1 cells. Proc. Natl. Acad.Sci. USA 2002, 99, 2392–2397. [CrossRef] [PubMed]
93. Kokrashvili, Z.; Mosinger, B.; Margolskee, R.F. Taste signaling elements expressed in gut enteroendocrinecells regulate nutrient-responsive secretion of gut hormones1234. Am. J. Clin. Nutr. 2009, 90, 822S–825S.[CrossRef]
94. Pham, H.; Hui, H.; Morvaridi, S.; Cai, J.; Zhang, S.; Tan, J.; Wu, V.; Levin, N.; Knudsen, B.; Goddard, W.A., 3rd;et al. A bitter pill for type 2 diabetes? The activation of bitter taste receptor TAS2R38 can stimulate GLP-1release from enteroendocrine L-cells. Biochem. Biophys. Res. Commun. 2016, 475, 295–300. [CrossRef]
95. Kok, B.P.; Galmozzi, A.; Littlejohn, N.K.; Albert, V.; Godio, C.; Kim, W.; Kim, S.M.; Bland, J.S.; Grayson, N.;Fang, M.; et al. Intestinal bitter taste receptor activation alters hormone secretion and imparts metabolicbenefits. Mol. Metab. 2018, 16, 76–87. [CrossRef]
96. Avau, B.; Rotondo, A.; Thijs, T.; Andrews, C.N.; Janssen, P.; Tack, J.; Depoortere, I. Targeting extra-oralbitter taste receptors modulates gastrointestinal motility with effects on satiation. Sci. Rep. 2015, 6, 15985.[CrossRef] [PubMed]
97. Jang, H.J.; Kokrashvili, Z.; Theodorakis, M.J.; Carlson, O.D.; Kim, B.J.; Zhou, J.; Kim, H.H.; Xu, X.; Chan, S.L.;Juhaszova, M.; et al. Gut-expressed gustducin and taste receptors regulate secretion of glucagon-likepeptide-1. Proc. Natl. Acad. Sci. USA 2007, 104, 15069–15074. [CrossRef] [PubMed]
98. Behrens, M.; Meyerhof, W. Oral and Extraoral Bitter Taste Receptors. Results Probl. Cell Differ. 2010, 52, 87–99.99. Finger, T.E.; Kinnamon, S.C. Taste isn’t just for taste buds anymore. F1000 Biol. Rep. 2011, 3. [CrossRef]100. Depoortere, I. Taste receptors of the gut: Emerging roles in health and disease. Gut 2014, 63, 179–190.
[CrossRef]101. Avau, B.; Depoortere, I. The bitter truth about bitter taste receptors: Beyond sensing bitter in the oral cavity.
Acta Physiol. 2016, 216, 407–420. [CrossRef] [PubMed]102. Feng, R.; Qian, C.; Liu, Q.; Jin, Y.; Liu, L.; Li, S.; Liao, Y.; Zhou, H.; Liu, W.; Rayner, C.K.; et al. Expression of
sweet taste receptor and gut hormone secretion in modelled type 2 diabetes. Gen. Comp. Endocrinol. 2017,252, 142–149. [CrossRef] [PubMed]
103. Lee, S.-J.; Depoortere, I.; Hatt, H. Therapeutic potential of ectopic olfactory and taste receptors. Nat. Rev.Drug Discov. 2018, 18, 116–138. [CrossRef] [PubMed]
104. Doty, R.L. Olfactory dysfunction in neurodegenerative diseases: Is there a common pathological substrate?Lancet Neurol. 2017, 16, 478–488. [CrossRef]
145

Nutrients 2019, 11, 1735
105. Marin, C.; Vilas, D.; Langdon, C.; Alobid, I.; López-Chacón, M.; Haehner, A.; Hummel, T.; Mullol, J. OlfactoryDysfunction in Neurodegenerative Diseases. Curr. Allergy Asthma Rep. 2018, 18, 42. [CrossRef] [PubMed]
106. Riera, C.E.; Tsaousidou, E.; Halloran, J.; Follett, P.; Hahn, O.; Pereira, M.M.; Ruud, L.E.; Alber, J.; Tharp, K.;Anderson, C.M.; et al. The Sense of Smell Impacts Metabolic Health and Obesity. Cell Metab. 2017, 26, 198–211.[CrossRef] [PubMed]
107. Mariman, E.C.M.; Szklarczyk, R.; Bouwman, F.G.; Aller, E.E.J.G.; Van Baak, M.A.; Wang, P. Olfactory receptorgenes cooperate with protocadherin genes in human extreme obesity. Genes Nutr. 2015, 10, 465. [CrossRef][PubMed]
108. Choquette, A.C.; Bouchard, L.; Drapeau, V.; Lemieux, S.; Tremblay, A.; Bouchard, C.; Vohl, M.-C.; Perusse, L.Association between olfactory receptor genes, eating behavior traits and adiposity: Results from the QuebecFamily Study. Physiol. Behav. 2012, 105, 772–776. [CrossRef]
109. Locke, A.E.; Kahali, B.; Berndt, S.I.; Justice, A.E.; Pers, T.H.; Day, F.R.; Powell, C.; Vedantam, S.;Buchkovich, M.L.; Yang, J.; et al. Genetic studies of body mass index yield new insights for obesitybiology. Nature 2015, 518, 197–206. [CrossRef]
110. Yengo, L.; Sidorenko, J.; Kemper, K.E.; Zheng, Z.; Wood, A.R.; Weedon, M.N.; Frayling, T.M.; Hirschhorn, J.;Yang, J.; Visscher, P.M. GIANT Consortium. Meta-analysis of genome-wide association studies for heightand body mass index in ∼700000 individuals of European ancestry. Hum. Mol. Genet. 2018, 27, 3641–3649.[CrossRef]
111. Evangelou, E.; Warren, H.R.; Mosen-Ansorena, D.; Mifsud, B.; Pazoki, R.; Gao, H.; Ntritsos, G.; Dimou, N.;Cabrera, C.P.; Karaman, I.; et al. Genetic analysis of over 1 million people identifies 535 new loci associatedwith blood pressure traits. Nat. Genet. 2018, 50, 1755. [CrossRef] [PubMed]
112. Torkamani, A.; Wineinger, N.E.; Topol, E.J. The personal and clinical utility of polygenic risk scores.Nat. Rev. Genet. 2018, 19, 581–590. [CrossRef] [PubMed]
113. Ledoux, T.A.; Hingle, M.D.; Baranowski, T. Relationship of fruit and vegetable intake with adiposity: Asystematic review. Obes. Rev. 2011, 12, e143–e150. [CrossRef]
114. Schwingshackl, L.; Hoffmann, G.; Kalle-Uhlmann, T.; Arregui, M.; Buijsse, B.; Boeing, H. Fruit and VegetableConsumption and Changes in Anthropometric Variables in Adult Populations: A Systematic Review andMeta-Analysis of Prospective Cohort Studies. PLoS ONE 2015, 10, e0140846. [CrossRef] [PubMed]
115. Nour, M.; Lutze, S.A.; Grech, A.; Allman-Farinelli, M. The Relationship between Vegetable Intake and WeightOutcomes: A Systematic Review of Cohort Studies. Nutrients 2018, 10, 1626. [CrossRef] [PubMed]
116. Duffy, V.B.; Hayes, J.E.; Sullivan, B.S.; Faghri, P. Surveying food and beverage liking. Ann. N. Y. Acad. Sci.2009, 1170, 558–568. [CrossRef] [PubMed]
117. Laureati, M.; Bertolia, S.; Bergamaschi, V.; Leone, A.; Lewandowski, L.; Giussani, B.; Battezzati, A.;Pagliarini, E. Food neophobia and liking for fruits and vegetables are not related to Italian children’soverweight. Food Qual. Prefer. 2015, 40, 125–131. [CrossRef]
118. Concas, M.P.; Catamo, E.; Biino, G.; Toniolo, D.; Gasparini, P.; Robino, A. Factors associated with food likingand their relationship with metabolic traits in Italian cohorts. Food Qual. Prefer. 2019, 75, 64–70. [CrossRef]
© 2019 by the authors. Licensee MDPI, Basel, Switzerland. This article is an open accessarticle distributed under the terms and conditions of the Creative Commons Attribution(CC BY) license (http://creativecommons.org/licenses/by/4.0/).
146

nutrients
Article
Human Tongue Electrophysiological Response toOleic Acid and Its Associations with PROP TasterStatus and the CD36 Polymorphism (rs1761667)
Giorgia Sollai 1,†, Melania Melis 1,†, Mariano Mastinu 1, Danilo Pani 2, Piero Cosseddu 2,
Annalisa Bonfiglio 2, Roberto Crnjar 1, Beverly J. Tepper 3 and Iole Tomassini Barbarossa 1,*
1 Department of Biomedical Sciences, University of Cagliari, Monserrato, CA 09042, Italy;[email protected] (G.S.); [email protected] (M.M.); [email protected] (M.M.);[email protected] (R.C.)
2 Department of Electrical and Electronic Engineering, University of Cagliari, Piazza d’Armi, Cagliari 09123,Italy; [email protected] (D.P.); [email protected] (P.C.); [email protected] (A.B.)
3 Department of Food Science, School of Environmental and Biological Sciences, Rutgers University,New Brunswick, NJ 08901-8520, USA; [email protected]
* Correspondence: [email protected]; Tel.: +39-070-6754144† These authors contributed equally to this study
Received: 26 November 2018; Accepted: 30 January 2019; Published: 1 February 2019
Abstract: The perception of fat varies among individuals and has also been associated with CD36rs1761667 polymorphism and genetic ability to perceive oral marker 6-n-propylthiouracil (PROP).Nevertheless, data in the literature are controversial. We present direct measures for the activationof the peripheral taste system in response to oleic acid by electrophysiological recordings from thetongue of 35 volunteers classified for PROP taster status and genotyped for CD36. The waveform ofbiopotentials was analyzed and values of amplitude and rate of potential variation were measured.Oleic acid stimulations evoked positive monophasic potentials, which represent the summatedvoltage change consequent to the response of the stimulated taste cells. Bio-electrical measurementswere fully consistent with the perceived intensity during stimulation, which was verbally reportedby the volunteers. ANOVA revealed that the amplitude of signals was directly associated, mostly inthe last part of the response, with the CD36 genotypes and PROP taster status (which was directlyassociated with the density of papillae). The rate of potential variation was associated only withCD36, primarily in the first part of the response. In conclusion, our results provide direct evidenceof the relationship between fat perception and rs1761667 polymorphism of the CD36 gene andPROP phenotype.
Keywords: electrophysiological recording from human tongue; fat perception; CD36; PROP tasting
1. Introduction
Over the last decade, multiple effects of dietary fatty acids as regulators of lipid and energymetabolism in human health and disease outcomes have been pointed out [1]. Therefore, the capabilityto distinguish them in a diet can have important nutritional implications for the health of volunteers,and studies aiming to analyze the fat perception and discrimination are important to understand themechanisms involved in the choice of fat-rich foods [2].
Dietary fats were traditionally thought to have no ‘taste’ of their own, but rather to be sensedthrough their textural and odorant properties [3]. Emerging findings have since disputed thisunderstanding by demonstrating an important involvement of taste in fat detection, which has beenproposed as a sixth primary taste quality [2–6]. Although dietary lipids are mostly triglycerides, freelong-chain fatty acids released from dietary lipids during oral processing seem to be accountable
Nutrients 2019, 11, 315; doi:10.3390/nu11020315 www.mdpi.com/journal/nutrients147

Nutrients 2019, 11, 315
for fat taste perception [7,8]. In fact, the cleavage of triglycerides into free fatty acids by a linguallipase has been shown both in rodents [9] and in humans [5]. Various classes of fatty acid receptorshave been proposed for the taste transduction of lipids [10,11], including the multifunctional CD36scavenger receptor [11–16], which is primarily responsible for the detection of long chain fatty acidson the tongue [5,17,18]. CD36 is a membrane glycosylated protein whose expression is controlled bythe CD36 gene and regulated by its allelic diversity [19]. The exchange of A for G in the rs1761667single nucleotide polymorphism (SNP) has been shown to decrease protein expression [19], and isassociated with a reduced oral ability to perceive fatty acids [5,20,21]. Ethnic-specific effects were alsoobserved in one experiment where East Asians, but not Caucasians, with the AA genotype showeda reduced ability to perceive fatty acids [22]. The substitution of A for G in this SNP has also beenshown to influence fat preference [23]. In addition, recent results suggest that this SNP is differentiallyrelated with body composition and endocannabinoid levels in lean and obese volunteers [24].
Some studies have also shown that changes in taste sensitivity to fats could be related to differencesin general taste sensitivity as indicated by variations in the salivary protein expression of gustin(carbonic anhydrase VI), which has been associated with both taste perception [25], density of papillaeand function [26,27]. In addition, it is known that sensitivity to and preference for fat has alsobeen associated with the genetic ability to perceive the oral marker stimulus, 6-n-propylthiouracil(PROP) [21,28–33]. Specifically, volunteers who are very sensitive to PROP (super-tasters) and havea higher fungiform papillae density on their tongues [26,34–38], seem to have a higher sensitivityand a lower preference for high-fat foods [28,30,31,39–43], compared to those who taste PROP onlyat high concentrations or not at all (non-tasters) and show a higher preference for fat-rich foods.These considerations support the hypothesis that PROP sensitivity is negatively related to calorieconsumption and body weight, as several studies have reported [30,41,44–48]. Besides, PROP tasterstatus can affect lipid metabolism in normal weight [49] and obese [50] volunteers. However, the roleof the PROP phenotype in fat perception is debatable [51–56]. Divergent results may be due to the factthat psychophysical methods which are based on self-reports can produce subjective evaluations.
Based on these statements and given the nutritional value of dietary fats, it is of great importanceto characterize factors that may contribute to individual differences in fat taste perception with theaim of better understanding the mechanisms involved in the choice of fat-rich foods. We analyzedthe relationships between oleic acid taste perception and rs1761667 SNP in the CD36 gene and PROPphenotype by direct evaluation of the degree of activation of the peripheral taste system in responseto the oleic acid taste stimulation. These measures were carried out by means of electrophysiologicalrecordings from the human tongue (Electrotastegrams, ETG), which yield data that are not influencedby the individual’s subjective biases [57,58].
2. Materials and Methods
2.1. Participants
Thirty-five Caucasian and non-smoker volunteers (15 males, 20 females, age 28.6 ± 0.86 years)were recruited according to standard procedures at Cagliari University. All volunteers were originallyfrom Sardinia island, Italy. No statistical analyses were performed to pre-determine the size of thesample. However, several guiding criteria were used. First, our sample size is comparable to thosetypically employed in electrophysiological recording experiments since they provide a direct measureof the degree of activation of the receptors or neurons under study [57]. Due to the high frequencyof AG heterozygotes at the rs1761667 SNP in the CD36 gene among American Caucasian [22] andEuropean populations reported in 1000 Genomes (dbSNP Short Genetic Variations, 2017), it was notpossible to construct equal sample sizes within each of the genotype/phenotype subgroups. Therefore,volunteers were recruited to form three roughly equal-sized PROP-taster groups that were matchedfor age and gender. Volunteers had a normal body mass index (BMI) of 20.2 to 25.2 kg/m2. None weredieting, taking medications that might interfere with oral sensory perception or had food allergies.
148
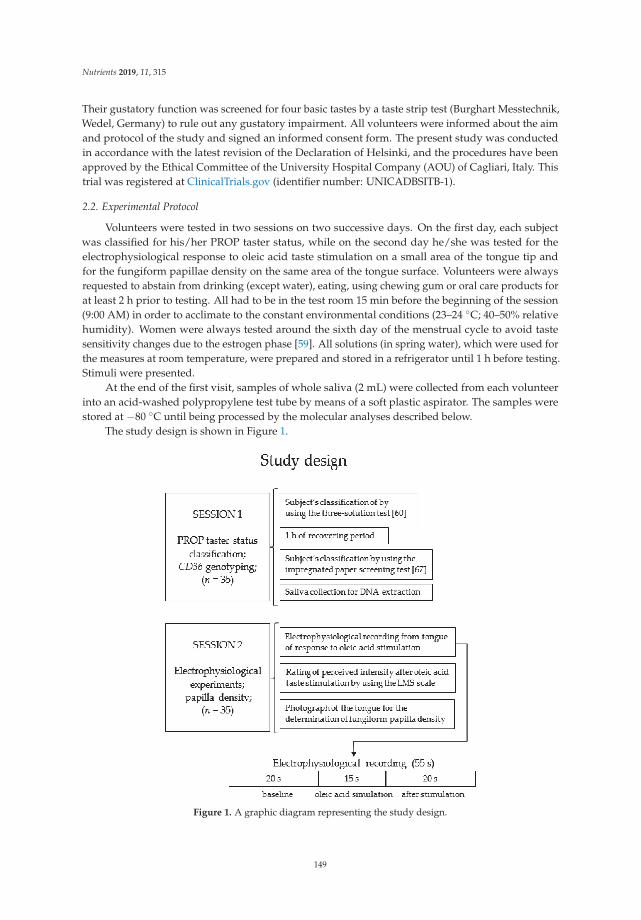
Nutrients 2019, 11, 315
Their gustatory function was screened for four basic tastes by a taste strip test (Burghart Messtechnik,Wedel, Germany) to rule out any gustatory impairment. All volunteers were informed about the aimand protocol of the study and signed an informed consent form. The present study was conductedin accordance with the latest revision of the Declaration of Helsinki, and the procedures have beenapproved by the Ethical Committee of the University Hospital Company (AOU) of Cagliari, Italy. Thistrial was registered at ClinicalTrials.gov (identifier number: UNICADBSITB-1).
2.2. Experimental Protocol
Volunteers were tested in two sessions on two successive days. On the first day, each subjectwas classified for his/her PROP taster status, while on the second day he/she was tested for theelectrophysiological response to oleic acid taste stimulation on a small area of the tongue tip andfor the fungiform papillae density on the same area of the tongue surface. Volunteers were alwaysrequested to abstain from drinking (except water), eating, using chewing gum or oral care products forat least 2 h prior to testing. All had to be in the test room 15 min before the beginning of the session(9:00 AM) in order to acclimate to the constant environmental conditions (23–24 ◦C; 40–50% relativehumidity). Women were always tested around the sixth day of the menstrual cycle to avoid tastesensitivity changes due to the estrogen phase [59]. All solutions (in spring water), which were used forthe measures at room temperature, were prepared and stored in a refrigerator until 1 h before testing.Stimuli were presented.
At the end of the first visit, samples of whole saliva (2 mL) were collected from each volunteerinto an acid-washed polypropylene test tube by means of a soft plastic aspirator. The samples werestored at −80 ◦C until being processed by the molecular analyses described below.
The study design is shown in Figure 1.
Figure 1. A graphic diagram representing the study design.
149

Nutrients 2019, 11, 315
2.3. PROP Taster Status Classification
Volunteers were classified for their PROP taster status by two scaling measurements. All werefirst assessed using the three-solution test [60], which has been validated in numerous studies [61–65].The perceived taste intensity ratings to PROP (0.032, 0.32, and 3.2 mmol/L) (Sigma-Aldrich, Milan,Italy) and sodium chloride (NaCl; 0.01, 0.1, 1.0 mol/L) (Sigma-Aldrich, Milan, Italy) solutions werecollected by using the Labeled Magnitude Scale (LMS) [66]. The use of this scale gave the volunteersthe freedom to evaluate the PROP bitterness intensity relative to the “strongest imaginable” oralstimulus ever perceived in their life. LMS is a semi-logarithmic 100-mm scale in which seven labelverbal descriptors are arranged, in semilog intervals, along the length of the scale. The verbal labelsand their positions on the LMS are: barely detectable, 1.4; weak, 6.1; moderate, 17.2; strong, 35.4; verystrong, 53.3; and strongest imaginable, 100.
NaCl was used as a control because taste intensity to NaCl does not change with PROP taster statusin this procedure [60]. Concentrations (10 mL samples) were presented in a random order. Volunteerswho gave lower intensity ratings to PROP than to NaCl were classified as PROP non-tasters, thosewho gave overlapping ratings to both PROP and NaCl were classified as medium tasters, and thosewho gave higher ratings to PROP than to NaCl were classified as super-tasters. The classification ofeach subject as belonging to a PROP taster group (super-taster, medium-taster, or non-taster) wasconfirmed using the impregnated paper screening test [27,67] after a 1-h period. With this method,the two stimuli were presented sequentially to each subject by placing the paper disks on the tip ofthe tongue for 30 s; the first one was impregnated with PROP solution (50 mmol/L) and the secondwith NaCl (1.0 mol/L). The ratings of the perceived intensity on each paper disk were obtained byusing the LMS scale (described above). Volunteers who rated the PROP disk lower than 15 mm onthe LMS were categorized as non-tasters; those who rated the PROP disk higher than 67 on the LMSwere categorized as super-tasters; all others were classified as medium tasters [67]. Volunteers whowere classified differently by two methods were excluded from other tests. Based on the classification,which was documented by three-way ANOVA, 12 volunteers (5 males, 7 females, age 26.5 ± 2.6 years)were classified as non-taster (34.29 %), 13 (6 males, 7 females, age 29.2 ± 1.8 years) were medium taster(37.14 %) and 10 (4 males, 6 females, age 25.2 ± 2.6 years) were super-taster (28.57 %) (Table S1).
2.4. Molecular Analysis
Volunteers were genotyped for the rs1761667 (G/A) single nucleotide polymorphism (SNP) ofCD36, located at the —31118 promoter region of exon 1A. Briefly, analyses were performed by PCRfollowed by analysis with restriction enzyme (HhaI) of the fragments obtained according to Banerjeeet al. 2010 [68]. This method has been validated by numerous studies [21,24,33]. The products ofdigestion were separated by electrophoresis on a 2% agarose gel and the bands of DNA were visualizedby ethidium bromide staining and ultraviolet light to score the deletion. PCR 50 bp Low Ladder DNAwas used as a molecular mass marker (Gene Ruler™-Thermo Scientific, Waltham, MA, USA).
Volunteers were also genotyped for the three SNPs of TAS2R38 (gene which expresses the specificreceptor of PROP [69]), that give rise to two major haplotypes, the taster variant (PAV) and thenon-taster variant (AVI), and three rare ones (PVI, AAI, and AAV). Molecular analyses of TAS2R38locus were performed by Taqman® SNP Genotyping Assays (Applied Biosystems by Life-TechnologiesItalia, Europe BV) [57].
2.5. Electrophysiological Recordings
Differential electrophysiological recordings from the tongues of volunteers were performedaccording to Sollai et al. 2017 [57]. Briefly, two silver electrodes were used, one in contact with thetongue ventral surface and the other in perfect adhesion with the dorsal surface. The first electrodewas a silver wire (0.50 mm) with the distal terminal rolled up to form a ball (about 5 mm of diameter)to obtain a good electrical contact and make the electrode safe for the sublingual mucosa. The second
150

Nutrients 2019, 11, 315
one (patent WO 2017/212377) was made by depositing a silver film (100 nm thick) on a very thin (13μm) polyimide layer (Kapton ©, DuPont, Wilmington, DE, USA) by means of evaporation in highvacuum. A film of insulating and biocompatible material (Parylene C, 2 μM thick) covered both sidesof the electrode except for the area which must be in electrical contact with the tongue. The extremesuppleness of this electrode allows its perfect adhesion with the dorsal surface of the tongue. The distalpart of this electrode had a circular hole which leaves a small area (6 mm of diameter) uncovered onthe left side of the tongue surface tip when it is positioned on the tongue surface. This is the areaof the tongue where oleic acid stimulation was delivered during the electrophysiological recordings,and the fungiform papillae density is calculated as described below. A third disposable adhesiveelectrode used as the ground terminal of the measuring instrument, was placed in an electricallyneutral position (CDES003545, SpesMedica, Italy). After positioning the electrodes and verifying theelectrical contact, the bio-potential recording started when a stable baseline was observed. Signalsdetected by the electrodes were recorded by a high input impedance polygraph for human use (Porti7portable physiological measurement system; TMS International B.V., The Netherlands), which is anisolated certified Class IIa medical device. Signals were digitized, recorded and visualized in real timeon a PC by PolyBench software (TMSI, Oldenzaal, The Netherlands). For each subject, the recordinglasted 55 s (20 s baseline, 15 s during oleic acid simulation and 20 s after stimulation). Afterwards,the waveform of bio-potentials was analyzed (Clampfit 10.0 software, Berkeley, CA, USA) and themeasures of voltage changes with respect to baseline in response to oleic acid (amplitude values) weredetermined at 2.5, 5, 10, and 15 s from stimulation onset. The rate of potential variation (mV/s) wasalso calculated at the same time intervals.
2.6. Oleic acid Taste Stimulations
The oleic acid taste stimulation was delivered by placing for 15 s a paper disk (6 mm dia)impregnated with 30 μL of oleic on the circular area of the tongue surface that was left free by the holeof the second electrode. Each volunteer was instructed to rate the perceived intensity by using theLMS scale [66]. Dry paper disks were also used as control.
2.7. Density Measurements of Fungiform Papillae
Fungiform papillae density was measured in the small circular area of the left side, close to themidline of the anterior surface of the tip of the tongue where oleic acid stimulation was deliveredduring the electrophysiological recordings according to our previous work [57]. Briefly, volunteerssat on a chair supporting their head with their hands in order to minimize movements. The areaof the tongue was first dried and then stained by placing a circle of filter paper (6 mm in diameter)impregnated with a blue food dye (E133, Modecor Italiana, Italy) on the specified area. Photographsof the stained area of the tongue surface were taken for each volunteer using a Canon EOS D400(10 megapixels) camera with lens EFS 55–250 mm. The digital images were analyzed using a “zoom”option in the Adobe Photoshop 7.0 program. The fungiform papillae were separately identified andcounted by three trained operators who were uninformed of the PROP taster status and CD36 genotypeof volunteers [26,37,57]. The density/cm2 was calculated.
2.8. Statistical Analysis
Simple linear correlation analysis was used to investigate the relationship between the densityof fungiform papillae and perceived intensity in response to oleic acid taste stimulation. Linearcorrelation analysis was also used to elucidate the relationships between signal amplitude (mV) andbiopotential variation rate (mV/s) with density of fungiform papillae, or perceived taste intensityof oleic acid. Fisher’s method (Genopop software version 4.0) [70] was used to test CD36 genotypedistribution and allele frequencies according to PROP taster status. One-way ANOVA was usedacross PROP taster groups, TAS2R38 genotype groups, CD36 genotype groups or gender, to comparemean values ± SEM of the perceived taste intensity, density of fungiform papillae, signal amplitude
151

Nutrients 2019, 11, 315
(mV), and biopotential variation rate (mV/s). Repeated measures ANOVA was used across PROPtaster groups or CD36 genotype groups, to evaluate the differences of mean values ± SEM of thesignal amplitude (mV) and biopotential variation rate (mV/s), at 2.5, 5, 10, and 15 s after theapplication of oleic acid stimulation. Data were verified for the assumptions of homogeneity ofvariance, normality and sphericity (when applicable). To determine if the sphericity assumptionwas violated, a Greenhouse–Geisser correction or Huynh–Feldt correction was applied. Post-hoccomparisons were conducted with the Fisher LDS test, unless the assumption of homogeneity ofvariance was violated, in which case the Duncan’s test was used. Statistical analyses were conductedusing STATISTICA for WINDOWS (version 7; StatSoft Inc, Tulsa, OK, USA). p values ≤ 0.05 wereconsidered significant.
3. Results
3.1. CD36 Genotyping and Phenotyping
Linear correlation analysis showed that the density of fungiform papillae in the small circular areaof the tongue where oleic acid stimulation was delivered during the electrophysiological recordings islinearly correlated with the perceived taste intensity by volunteers (r = 0.477; p = 0.005).
Molecular analysis at the CD36 (SNP: rs1761667) gene identified 6 AA homozygous (3 males,3 females, age 29.2 ± 2.9 years), 20 heterozygous (9 males, 11 females, age 26.1 ± 1.5 years), and 9 GGhomozygous volunteers (3 males, 6 females, age 29.7 ± 3.4 years). PROP taster groups did not differstatistically based on genotype distribution and haplotype frequency of the CD36 gene (χ2 > 0.665;p < 0.71; Fisher’s test).
Mean values ± SEM of perceived intensity after taste stimulation with oleic acid in volunteersclassified by their PROP taster status and genotyped for the rs1761667SNP of CD36 gene are shownin Figure 2. The perceived intensity ratings to oleic acid stimulation were associated with PROPtaster status. Specifically, the perceived intensity was higher in the super-taster volunteers than innon-taster or medium-taster ones (p ≤ 0.046; Duncan’s test subsequent to one-way ANOVA; F2,32
= 3.138; p = 0.054). No differences in intensity ratings between the medium-taster and non-tastervolunteers were found (p > 0.05). In addition, volunteers with the GG genotype gave intensity ratingshigher than volunteers with the AA genotype (p = 0.047 Fisher LDS test). No differences between theheterozygous and homozygous volunteers were found (p > 0.05).
Figure 2. Box-and-whisker plots showing the minimum, first quartile, median, third quartile, andmaximum of each set of perceived intensity data evoked by taste stimulation with oleic acid (30 μL) insuper-tasters (ST; n = 10), medium-tasters (MT; n=13) and non-tasters (NT; n = 12) and in volunteerswith genotypes GG (n = 9), GA (n = 20) and AA (n = 6) of CD36. Different letters indicate a significantdifference (p ≤ 0.046; Duncan’s test and p = 0.047 Fisher LDS test, subsequent one-way ANOVA).
Fungiform papillae density varied with PROP taster status (F2,32 = 18.712; p < 0.001) (Figure 3).Super-tasters showed a higher density than medium-tasters (p < 0.001; Duncan’s test), whose valueswere higher than those of non-tasters (p = 0.032; Duncan’s test). No differences in fungiform papillaedensity related to the CD36 polymorphism were found (p < 0.05).
152

Nutrients 2019, 11, 315
Figure 3. Box-and-whisker plots showing the minimum, first quartile, median, third quartile, andmaximum of each set of density of fungiform papillae data in super-tasters (ST; n = 10), medium-tasters(MT; n = 13) and non-tasters (NT; n=12) and in volunteers with genotypes GG (n = 9), GA (n = 20)and AA (n = 6) of CD36. Different letters indicate a significant difference (p ≤ 0.032; Duncan’s testsubsequent one-way ANOVA).
3.2. Electrophysiolgical Responses to Taste Stimulation with Oleic Acid
The electrophysiological recording from the human tongue allowed us to determine bioelectricalpotential changes in response to oleic acid taste stimulation. The analysis of the waveform ofbioelectrical potentials showed that the oleic acid stimulation evoked positive monophasic potentialscharacterized by a faster initial rise followed by a slower phase, which continued for the whole durationof stimulation. The variation in voltage with respect to baseline (i.e., the amplitude of these signals,as well as the hyperpolarization rate) was highly variable among volunteers. The values of amplitudevaried from a minimum of 0.64 mM (measured in a non-taster volunteer with the AA genotype in theCD36 polymorphism) to a maximum of 91.99 mV (determined in a super-taster volunteer with the GGgenotype in the CD36 polymorphism). Examples of this variability are shown in Figure 4.
Figure 4. Examples of electrophysiological recordings in response to oleic acid (30 μL) taste stimulationin representative super-tasters, medium-tasters and non-tasters with different genotypes of the CD36gene. The very first data point on the left side of each electrophysiological recording represents thebaseline. Numbers within parentheses on the left of each trace indicate the density of fungiformpapillae (No./cm2) of each subject calculated in the small circular area of the tongue where oleic acidstimulation was applied.
Linear correlation analysis showed that signal amplitude, as well as hyperpolarization rate, werelinearly correlated to the density of fungiform papillae (r = 0.394; p = 0.028 and r = 0.410; p = 0.019,
153

Nutrients 2019, 11, 315
respectively). No such correlation was found between the two electrophysiological parameters andperceived taste intensity (r < 0.251; p > 0.06).
Mean values ± SEM of the amplitude and hyperpolarization rate of signals recorded in response tooleic acid taste stimulation in volunteers categorized for their PROP taster status and genotyped for thers1761667 SNP of the CD36 gene are shown in Figure 5. Values determined in super-taster volunteerswere significantly higher than those measured in non-tasters, although they are at the limits of statisticalsignificance (p = 0.052; Duncan’s test subsequent one-way ANOVA), while medium-tasters showedbiopotential changes which were not different from those of the other two taster groups (p > 0.05).In addition, the values determined in homozygous GG volunteers were higher than those of volunteerswith the AA genotype (p = 0.043; Fisher LDS test subsequent one-way ANOVA). No differencesbetween heterozygous and homozygous volunteers were found (p > 0.05). Volunteers with the GGgenotype also showed higher values of hyperpolarization rate than volunteers with the AA genotype(p = 0.028; Fisher LDS test subsequent one-way ANOVA), while heterozygous volunteers did notshow different hyperpolarization rate values from the other groups (p > 0.05). No differences in therate values related to PROP taster status were found (p > 0.05). One-way ANOVA also showed thatno differences in the amplitude and hyperpolarization rate of signals were found in relation to theTAS2R38 genotype (Figure S1) or gender (p > 0.05).
Figure 5. Box-and-whisker plots showing the minimum, first quartile, median, third quartile, andmaximum of each data set of amplitude and rate of signals evoked in super-tasters (ST; n = 10), mediumtasters (MT; n = 13) and non-tasters (NT; n = 12); and in volunteers with genotypes GG (n = 9), GA (n =20) and AA (n = 6) of CD36 by oleic acid (30 μL) taste stimulation. Different letters indicate a significantdifference (p ≤ 0.05; Fisher LDS or Duncan’s test subsequent one-way ANOVA).
The same data from Figures 2, 3 and 5 are also reported as distributions of the original points andmean values ± SEM for each PROP taster and CD36 genotype group as shown in Figures S2–S4.
Mean values ± SEM of signal amplitude and hyperpolarization rate, determined after 2.5, 5,10, and 15 s after the application of oleic acid taste stimulation according to PROP taster status andCD36 polymorphisms, are shown in Figure 6. The time course of the hyperpolarization amplitudeand variation rate were different in volunteers with different PROP phenotypes or CD36 genotypes.
154
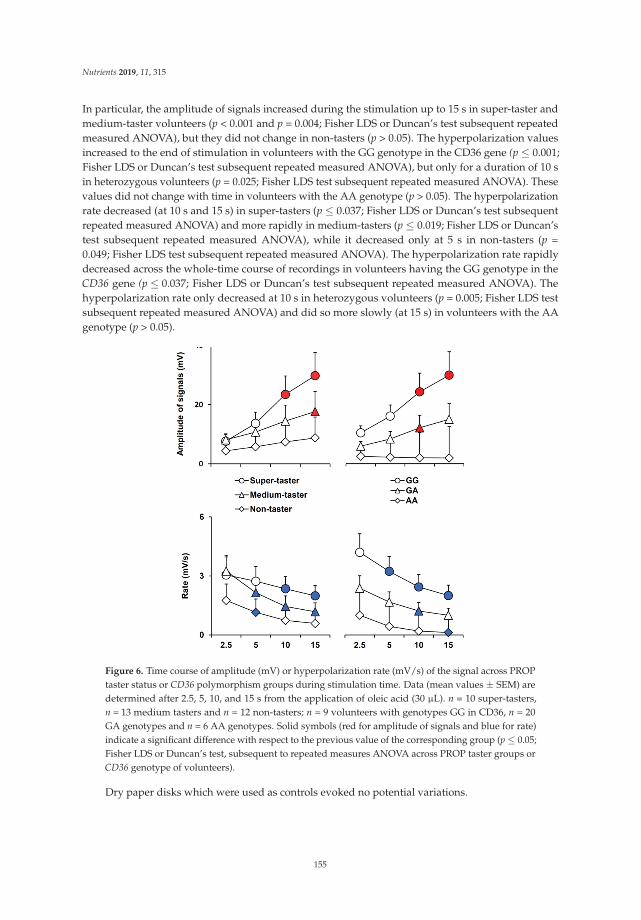
Nutrients 2019, 11, 315
In particular, the amplitude of signals increased during the stimulation up to 15 s in super-taster andmedium-taster volunteers (p < 0.001 and p = 0.004; Fisher LDS or Duncan’s test subsequent repeatedmeasured ANOVA), but they did not change in non-tasters (p > 0.05). The hyperpolarization valuesincreased to the end of stimulation in volunteers with the GG genotype in the CD36 gene (p ≤ 0.001;Fisher LDS or Duncan’s test subsequent repeated measured ANOVA), but only for a duration of 10 sin heterozygous volunteers (p = 0.025; Fisher LDS test subsequent repeated measured ANOVA). Thesevalues did not change with time in volunteers with the AA genotype (p > 0.05). The hyperpolarizationrate decreased (at 10 s and 15 s) in super-tasters (p ≤ 0.037; Fisher LDS or Duncan’s test subsequentrepeated measured ANOVA) and more rapidly in medium-tasters (p ≤ 0.019; Fisher LDS or Duncan’stest subsequent repeated measured ANOVA), while it decreased only at 5 s in non-tasters (p =0.049; Fisher LDS test subsequent repeated measured ANOVA). The hyperpolarization rate rapidlydecreased across the whole-time course of recordings in volunteers having the GG genotype in theCD36 gene (p ≤ 0.037; Fisher LDS or Duncan’s test subsequent repeated measured ANOVA). Thehyperpolarization rate only decreased at 10 s in heterozygous volunteers (p = 0.005; Fisher LDS testsubsequent repeated measured ANOVA) and did so more slowly (at 15 s) in volunteers with the AAgenotype (p > 0.05).
Figure 6. Time course of amplitude (mV) or hyperpolarization rate (mV/s) of the signal across PROPtaster status or CD36 polymorphism groups during stimulation time. Data (mean values ± SEM) aredetermined after 2.5, 5, 10, and 15 s from the application of oleic acid (30 μL). n = 10 super-tasters,n = 13 medium tasters and n = 12 non-tasters; n = 9 volunteers with genotypes GG in CD36, n = 20GA genotypes and n = 6 AA genotypes. Solid symbols (red for amplitude of signals and blue for rate)indicate a significant difference with respect to the previous value of the corresponding group (p ≤ 0.05;Fisher LDS or Duncan’s test, subsequent to repeated measures ANOVA across PROP taster groups orCD36 genotype of volunteers).
Dry paper disks which were used as controls evoked no potential variations.
155

Nutrients 2019, 11, 315
4. Discussion
A great deal of conflicting data has been collected over the last decade on individualdifferences in fat perception, preference and consumption related to genetic variation in PROPtaste sensitivity [23,51–56,71]. Emerging evidence suggests that variation in other genes suchas polymorphisms in the gene of the CD36 scavenger protein, may also be involved in fatperception [5,20,21]. The present study provides the first direct demonstration of the roles of PROPphenotype and a CD36 polymorphism in individual variability in fat perception. In fact, the highlyreliable ETG method used here, allowed us to obtain direct and quantitative data that are free fromindividual subjective responses.
We found that oleic acid taste stimulation evoked positive monophasic potentials, which lastedfor the entire duration of the stimulation and, in most recordings, even longer. On the other hand, thecontrol stimulations were ineffective in evoking this response. The extended activation that we found inresponse to oleic acid could reflect the persistence of stimulation over time (a limitation of our methodis that the stimulus cannot to be removed), and its slow increase of amplitude could depend on thehigh surface tension of lipid molecules. The biopotential variations recorded in response to oleic acidpossibly represent a measure of the summated voltage change resulting from the response of stimulatedtaste cells, as already shown in response to other stimuli in our previous study [57]. These variationsare also similar to those recorded from the olfactory epithelium [72,73], where the electrical activityhas been reported as the summated generated potential by the population of stimulated olfactoryneurons [74]. The fact that the recorded signals effectively correspond to the summated response ofstimulated taste cells seems to be confirmed by the changes of the amplitude of signals among thePROP taster groups, which vary in density of papillae. This interpretation is further supported by thedirect and linear correlation found between the amplitude and rate of signals and density of fungiformpapillae. Density of papillae at the tongue tip, which is highly correlated with their total number onthe tongue [37], was also positively correlated with the perceived taste intensity by the volunteers.
In addition, our results show a direct relationship between the amplitude of biopotentials recordedand PROP phenotype. Specifically, we recorded the largest amplitude values in PROP super-tasterswho had the highest density of fungiform papillae in the same area of the tongue where oleic acidstimulation was delivered during the recordings. Likewise, the smallest amplitude values wererecorded in non-tasters who had the lowest density of papillae, and intermediate amplitudes wererecorded in medium-tasters with an intermediate density of papillae. These results strongly supportprevious psychophysical experiments showing a direct relationship between fat perception and PROPtaster status, [21,29–31,48,75] that can be linked to differences in the density of papillae across thethree PROP taster categories [26,34–38]. In fact, no differences in electrophysiological responses tooleic acid were found in relation to TAS2R38 polymorphisms. This suggests that the phenotypicexpression of the trait, which is strongly associated with papillae density, is a critical determinant ofelectrophysiological responses to fatty acids on the tongue rather than strictly the presence or absenceof specific genetic variants in TAS2R38. This is consistent with data from another study, showing thatthe PROP phenotype is a better predictor of adiposity in women than the TAS2R38 genotype, which isunrelated to adiposity [46]. Importantly, the signal amplitudes that we recorded in the PROP tastergroups, as well as in the CD36 genotype groups, agree with the perceived intensities reported by thevolunteers during oleic acid stimulation, thus indicating that our bioelectrical measurements are fullyconsistent with common human psychophysical observations. The lack of a direct linear correlationbetween the electrophysiological and psychophysical measurements may simply reflect the presenceof background ‘noise’ in the electrophysiological measures, and further refinement of the recordingprocedure will presumably reduce this noise.
Another important physiological feature we observed was a relationship between the valuesof the hyperpolarization amplitude and rate, and the rs1761667 polymorphism of the CD36 gene.In agreement with evidence showing that the presence of the homozygous AA genotype at this locationof the CD36 gene is characterized by reduced protein expression [19] and low taste sensitivity to
156

Nutrients 2019, 11, 315
fats [5,20–22], we measured the lowest amplitude values and biopotential variation rates in volunteerscarrying two A alleles who verbally reported the lowest values of perceived intensity. Likewise,we measured the highest bioelectrical values in volunteers with the GG genotype who perceivedthe highest intensity of oleic acid and intermediate values in heterozygous volunteers who reportedintermediate values of perceived intensity. As expected, no variations in the density of papillae relatedto CD36 genotypes were found.
The analysis of the time course of the responses showed that the amplitude of the signal increasedduring stimulation, mostly in the last portion of the response, and this effect was most prominent inPROP tasters who had a higher number of papillae, and in volunteers having at least one G allelein CD36, which is known to be associated with an increase of receptor expression [19]. On thecontrary, signal amplitude did not change in PROP non-tasters who had a low number of papillaeand in volunteers homozygous for the non-tasting (AA) form of this polymorphism in CD36, which isassociated with reduced protein expression [19]. In addition, the hyperpolarization rate rapidlydecreased across the whole time course of recordings in volunteers with two tasting (GG) alleles,who showed at 2.5 s after stimulus onset, values about twice as high as those of the volunteers withonly a single G allele. In turn, the hyperpolarization rate slowly decreased in both heterozygous (GA)volunteers and in volunteers with two non-taster variants in CD36. All these results suggest that thepresence of the tasting variant in the specific receptor is the most important condition to elicit a promptresponse and, in addition, turns out to be the most important condition to evoke an intense perceptionwhen the volunteers have a high number of fungiform papillae in their tongue.
Future studies should confirm the results in a larger population (with a higher number of subjectsin each study groups). In fact, a limitation of this work is the small size of the examined sample mostlyregarding the group of subjects with the homozygous AA genotype at this CD36 locus.
5. Conclusions
In conclusion, the present work builds on our previous psychophysical studies documenting a rolefor rs1761667 polymorphism in CD36 and polymorphisms in the TAS2R38 gene (indexed by PROPphenotype in the current study) in the perception of oleic acid [21]. Here, we used a novel physiologicalrecording technique [57] to directly measure the degree of activation of the peripheral gustatory systemin response to taste stimulation with oleic acid on a localized area of the tongue. We found that bothgenes contributed to variations in the perception of oleic acid, but they had somewhat different effectson specific features of the electrophysiological response. Rate variation seemed to be influenced mostlyby the CD36 gene, early in the time course, whereas signal amplitude was more influenced by PROPstatus during the latter part of the time course. The influence of PROP status on signal amplitudemay reflect a summation effect associated with higher density of papillae, a well-known anatomicalcharacteristic of PROP-tasting volunteers [26,34–38], although other authors did not find links betweenthe density of papillae and PROP status [76]. Our findings support the notion that several overlappingmechanisms are involved in fat perception, one related to PROP status and papillae density, andanother related to CD36 genotypes. Undoubtedly, other gene effects play a role as well. Furtherinvestigation of these mechanisms using both electrophysiological and psychophysical methods couldshed important light on how dietary fats are perceived and their contribution to food choice andnutritional status.
Supplementary Materials: The following are available online at http://www.mdpi.com/2072-6643/11/2/315/s1,Table S1: Ratings of perceived taste intensity in response to three concentrations of PROP and NaCl in the tastergroups. Figure S1: Box-and-whisker plots showing the minimum, first quartile, median, third quartile, andmaximum of each set data of amplitude and rate of signals evoked by oleic acid (30 μL) taste stimulation inindividuals with genotypes PAV/PAV (n = 7), PAV/AVI (n = 16), AVI/AVI (n = 10) and rare genotypes (n = 2) ofTAS2R38. One-way ANOVA showed no difference of amplitude and hyperpolarization rate related to TAS2R38genotype (p > 0.05). Figure S2: Distribution of data of the perceived intensity after taste stimulation with oleicacid (30 μL) in super-tasters (ST; n = 10), medium-tasters (MT; n = 13) and non-tasters (NT; n = 12) and involunteers with genotypes GG (n = 9), GA (n = 20) and AA (n = 6) of CD36. Mean values ± SEM are also shown.Different letters indicate a significant difference (p ≤ 0.046; Duncan’s test and p = 0.047 Fisher LDS test, subsequent
157

Nutrients 2019, 11, 315
one-way ANOVA). Figure S3: Distribution of data of the density of fungiform papillae in super-tasters (ST; n = 10),medium-tasters (MT; n = 13) and non-tasters (NT; n = 12) and in volunteers with genotypes GG (n = 9), GA (n = 20)and AA (n = 6) of CD36. Mean values ± SEM are also shown. Different letters indicate a significant difference (p ≤0.032; Duncan’s test subsequent one-way ANOVA). Figure S4: Distribution of data of amplitude and rate of signalsevoked in super-tasters (ST; n = 10), medium-tasters (MT; n = 13) and non-tasters (NT; n = 12) and in volunteerswith genotypes GG (n = 9), GA (n = 20) and AA (n = 6) of CD36. Mean values ± SEM are also shown. Differentletters indicate a significant difference (p ≤ 0.05; Fisher LDS or Duncan’s test subsequent one-way ANOVA).
Author Contributions: Conceptualization, I.T.B.; methodology, G.S., Me.M., Ma.M., D.P., P.C..; formal analysis,G.S., Me.M., I.T.B; investigation, G.S., Me.M., Ma.M., D.P., P.C..; data curation, G.S., Me.M., I.T.B; writing—originaldraft preparation I.T.B.; writing—review and editing, G.S., Me.M., D.P., A.B., R.C., B.J.T.; supervision, B.J.T., I.T.B..;funding acquisition, D.P., A.B., R.C., I.T.B..
Funding: This study was supported by a grant from the University of Cagliari (Fondo Integrativo per la Ricerca,FIR 2017-2018).
Acknowledgments: The authors thank the volunteers, without whose contribution this study would not havebeen possible. We also thank Caterina Chillotti for running the clinical trials.
Conflicts of Interest: The authors declare no conflict of interest.
References
1. Smit, L.A.; Mozaffarian, D.; Willett, W. Review of fat and fatty acid requirements and criteria for developingdietary guidelines. Ann. Nutr. Metab. 2009, 55, 44–55. [CrossRef] [PubMed]
2. Ebba, S.; Abarintos, R.A.; Kim, D.G.; Tiyouh, M.; Stull, J.C.; Movalia, A.; Smutzer, G. The examination offatty acid taste with edible strips. Physiol. Behav. 2012, 106, 579–586. [CrossRef]
3. Mattes, R.D. Is there a fatty acid taste? Annu. Rev. Nutr. 2009, 29, 305–327. [CrossRef] [PubMed]4. Mattes, R.D. Fat Taste in Humans: Is It a Primary? In Fat Detection: Taste, Texture, and Post Ingestive Effects;
Montmayeur, J.P., le Coutre, J., Eds.; CRC Press: Boca Raton, FL, USA, 2010; pp. 167–193.5. Pepino, M.Y.; Love-Gregory, L.; Klein, S.; Abumrad, N.A. The fatty acid translocase gene CD36 and lingual
lipase influence oral sensitivity to fat in obese subjects. J. Lipid Res. 2012, 53, 561–566. [CrossRef]6. Chalé-Rush, A.; Burgess, J.R.; Mattes, R.D. Multiple routes of chemosensitivity to free fatty acids in humans.
Am. J. Physiol. Gastrointest. Liver Physiol. 2007, 292, G1206–G1212. [CrossRef] [PubMed]7. Fukuwatari, T.; Shibata, K.; Iguchi, K.; Saeki, T.; Iwata, A.; Tani, K.; Sugimoto, E.; Fushiki, T. Role of gustation
in the recognition of oleate and triolein in anosmic rats. Physiol. Behav. 2003, 78, 579–583. [CrossRef]8. Smith, J.C.; Fisher, E.M.; Maleszewski, V.; McClain, B. Orosensory factors in the ingestion of corn oil/sucrose
mixtures by the rat. Physiol. Behav. 2000, 69, 135–146. [CrossRef]9. Kawai, T.; Fushiki, T. Importance of lipolysis in oral cavity for orosensory detection of fat. Am. J. Physiol.
Regul. Integr. Comp. Physiol. 2003, 285, R447–R454. [CrossRef]10. Cartoni, C.; Yasumatsu, K.; Ohkuri, T.; Shigemura, N.; Yoshida, R.; Godinot, N.; le Coutre, J.; Ninomiya, Y.;
Damak, S. Taste Preference for Fatty Acids Is Mediated by GPR40 and GPR120. J. Neurosci. 2010,30, 8376–8382. [CrossRef] [PubMed]
11. Khan, N.A.; Besnard, P. Oro-sensory perception of dietary lipids: New insights into the fat taste transduction.Biochim. Biophys. Acta 2009, 1791, 149–155. [CrossRef]
12. Martin, C.; Chevrot, M.; Poirier, H.; Passilly-Degrace, P.; Niot, I.; Besnard, P. CD36 as a lipid sensor.Physiol. Behav. 2011, 105, 36–42. [CrossRef] [PubMed]
13. Laugerette, F.; Passilly-Degrace, P.; Patris, B.; Niot, I.; Febbraio, M.; Montmayeur, J.P.; Besnard, P. CD36involvement in orosensory detection of dietary lipids, spontaneous fat preference, and digestive secretions.J. Clin. Invest. 2005, 115, 3177–3184. [CrossRef] [PubMed]
14. Ibrahimi, A.; Abumrad, N.A. Role of CD36 in membrane transport of long-chain fatty acids. Curr. Opin. Clin.Nutr. Metab. Care 2002, 5, 139–145. [CrossRef] [PubMed]
15. Gaillard, D.; Laugerette, F.; Darcel, N.; El-Yassimi, A.; Passilly-Degrace, P.; Hichami, A.; Khan, N.A.;Montmayeur, J.P.; Besnard, P. The gustatory pathway is involved in CD36-mediated orosensory perceptionof long-chain fatty acids in the mouse. FASEB J. 2008, 22, 1458–1468. [CrossRef] [PubMed]
16. El-Yassimi, A.; Hichami, A.; Besnard, P.; Khan, N.A. Linoleic acid induces calcium signaling, Src kinasephosphorylation, and neurotransmitter release in mouse CD36-positive gustatory cells. J. Biol. Chem. 2008,283, 12949–12959. [CrossRef] [PubMed]
158

Nutrients 2019, 11, 315
17. Ozdener, M.H.; Subramaniam, S.; Sundaresan, S.; Sery, O.; Hashimoto, T.; Asakawa, Y.; Besnard, P.;Abumrad, N.A.; Khan, N.A. CD36- and GPR120-mediated Ca(2)(+) signaling in human taste bud cellsmediates differential responses to fatty acids and is altered in obese mice. Gastroenterology 2014, 146, 995–1005.[CrossRef]
18. Reed, D.R.; Xia, M.B. Recent advances in fatty acid perception and genetics. Adv. Nutr. 2015, 6, 353s–360s.[CrossRef]
19. Love-Gregory, L.; Sherva, R.; Schappe, T.; Qi, J.S.; McCrea, J.; Klein, S.; Connelly, M.A.; Abumrad, N.A.Common CD36 SNPs reduce protein expression and may contribute to a protective atherogenic profile.Hum. Mol. Genet. 2011, 20, 193–201. [CrossRef]
20. Mrizak, I.; Sery, O.; Plesnik, J.; Arfa, A.; Fekih, M.; Bouslema, A.; Zaouali, M.; Tabka, Z.; Khan, N.A. The Aallele of cluster of differentiation 36 (CD36) SNP 1761667 associates with decreased lipid taste perception inobese Tunisian women. Br. J. Nutr. 2015, 113, 1330–1337. [CrossRef]
21. Melis, M.; Sollai, G.; Muroni, P.; Crnjar, R.; Barbarossa, I.T. Associations between orosensory perception ofoleic acid, the common single nucleotide polymorphisms (rs1761667 and rs1527483) in the CD36 gene, and6-n-propylthiouracil (PROP) tasting. Nutrients 2015, 7, 2068–2084. [CrossRef]
22. Burgess, B.; Melis, M.; Scoular, K.; Driver, M.; Schaich, K.M.; Keller, K.L.; Tomassini Barbarossa, I.; Tepper, B.J.Effects of CD36 Genotype on Oral Perception of Oleic Acid Supplemented Safflower Oil Emulsions in TwoEthnic Groups: A Preliminary Study. J. Food Sci. 2018, 83, 1373–1380. [CrossRef] [PubMed]
23. Keller, K.L.; Liang, L.C.; Sakimura, J.; May, D.; van Belle, C.; Breen, C.; Driggin, E.; Tepper, B.J.; Lanzano, P.C.;Deng, L.; et al. Common variants in the CD36 gene are associated with oral fat perception, fat preferences,and obesity in African Americans. Obesity 2012, 20, 1066–1073. [CrossRef] [PubMed]
24. Melis, M.; Carta, G.; Pintus, S.; Pintus, P.; Piras, C.A.; Murru, E.; Manca, C.; Di Marzo, V.; Banni, S.; TomassiniBarbarossa, I. Polymorphism rs1761667 in the CD36 Gene Is Associated to Changes in Fatty Acid Metabolismand Circulating Endocannabinoid Levels Distinctively in Normal Weight and Obese Subjects. Front. Physiol.2017, 8, 1006. [CrossRef] [PubMed]
25. Mounayar, R.; Morzel, M.; Brignot, H.; Tremblay-Franco, M.; Canlet, C.; Lucchi, G.; Ducoroy, P.; Feron, G.;Neyraud, E. Salivary markers of taste sensitivity to oleic acid: A combined proteomics and metabolomicsapproach. Metabolomics 2014, 10, 688–696. [CrossRef]
26. Melis, M.; Atzori, E.; Cabras, S.; Zonza, A.; Calò, C.; Muroni, P.; Nieddu, M.; Padiglia, A.; Sogos, V.;Tepper, B.J.; et al. The gustin (CA6) gene polymorphism, rs2274333 (A/G), as a mechanistic link betweenPROP tasting and fungiform taste papilla density and maintenance. PLoS ONE 2013, 8, e74151. [CrossRef][PubMed]
27. Barbarossa, I.T.; Melis, M.; Mattes, M.Z.; Calò, C.; Muroni, P.; Crnjar, R.; Tepper, B.J. The gustin (CA6) genepolymorphism, rs2274333 (A/G), is associated with fungiform papilla density, whereas PROP bitternessis mostly due to TAS2R38 in an ethnically-mixed population. Physiol. Behav. 2015, 138, 6–12. [CrossRef][PubMed]
28. Tepper, B.J.; Nurse, R.J. PROP taster status is related to the perception and preference for fat. Ann. N. Y.Acad. Sci. 1998, 855, 802–804. [CrossRef]
29. Tepper, B.J.; Banni, S.; Melis, M.; Crnjar, R.; Tomassini Barbarossa, I. Genetic sensitivity to the bitter taste of6-n-propylthiouracil (PROP) and its association with physiological mechanisms controlling body mass index(BMI). Nutrients 2014, 6, 3363–3381. [CrossRef]
30. Tepper, B.J. Nutritional implications of genetic taste variation: The role of PROP sensitivity and other tastephenotypes. Annu. Rev. Nutr. 2008, 28, 367–388. [CrossRef]
31. Hayes, J.E.; Duffy, V.B. Revisiting sugar-fat mixtures: Sweetness and creaminess vary with phenotypicmarkers of oral sensation. Chem. Senses 2007, 32, 225–236. [CrossRef]
32. Tepper, B.J.; Nurse, R.J. Fat perception is related to PROP taster status. Physiol. Behav. 1997, 61, 949–954.[CrossRef]
33. Melis, M.; Mastinu, M.; Arca, M.; Crnjar, R.; Tomassini Barbarossa, I. Effect of chemical interaction betweenoleic acid and L-Arginine on oral perception, as a function of polymorphisms of CD36 and OBPIIa andgenetic ability to taste 6-n-propylthiouracil. PLoS ONE 2018, 13, e0194953. [CrossRef] [PubMed]
34. Yeomans, M.R.; Tepper, B.J.; Rietzschel, J.; Prescott, J. Human hedonic responses to sweetness: Role of tastegenetics and anatomy. Physiol. Behav. 2007, 91, 264–273. [CrossRef] [PubMed]
159

Nutrients 2019, 11, 315
35. Bartoshuk, L.M.; Duffy, V.B.; Miller, I.J. PTC/PROP tasting: Anatomy, psychophysics, and sex effects.Physiol. Behav. 1994, 56, 1165–1171. [CrossRef]
36. Essick, G.; Chopra, A.; Guest, S.; McGlone, F. Lingual tactile acuity, taste perception, and the density anddiameter of fungiform papillae in female subjects. Physiol. Behav. 2003, 80, 289–302. [CrossRef] [PubMed]
37. Shahbake, M.; Hutchinson, I.; Laing, D.G.; Jinks, A.L. Rapid quantitative assessment of fungiform papillaedensity in the human tongue. Brain Res. 2005, 1052, 196–201. [CrossRef] [PubMed]
38. Bajec, M.R.; Pickering, G.J. Thermal taste, PROP responsiveness, and perception of oral sensations.Physiol. Behav. 2008, 95, 581–590. [CrossRef] [PubMed]
39. Keller, K.L.; Steinmann, L.; Nurse, R.J.; Tepper, B.J. Genetic taste sensitivity to 6-n-propylthiouracil influencesfood preference and reported intake in preschool children. Appetite 2002, 38, 3–12. [CrossRef]
40. Duffy, V.B.; Bartoshuk, L.M. Food acceptance and genetic variation in taste. J. Am. Diet. Assoc. 2000,100, 647–655. [CrossRef]
41. Tepper, B.J.; Neilland, M.; Ullrich, N.V.; Koelliker, Y.; Belzer, L.M. Greater energy intake from a buffet meal inlean, young women is associated with the 6-n-propylthiouracil (PROP) non-taster phenotype. Appetite 2011,56, 104–110. [CrossRef]
42. Duffy, V.B.; Davidson, A.C.; Kidd, J.R.; Kidd, K.K.; Speed, W.C.; Pakstis, A.J.; Reed, D.R.; Snyder, D.J.;Bartoshuk, L.M. Bitter Receptor Gene (TAS2R38), 6-n-Propylthiouracil (PROP) Bitterness and Alcohol Intake.Alcohol. Clin. Exp. Res. 2004, 28, 1629–1637. [CrossRef] [PubMed]
43. Hayes, J.E.; Duffy, V.B. Oral sensory phenotype identifies level of sugar and fat required for maximal liking.Physiol. Behav. 2008, 95, 77–87. [CrossRef] [PubMed]
44. Tepper, B.J.; Ullrich, N.V. Influence of genetic taste sensitivity to 6-n-propylthiouracil (PROP), dietaryrestraint and disinhibition on body mass index in middle-aged women. Physiol. Behav. 2002, 75, 305–312.[CrossRef]
45. Goldstein, G.L.; Daun, H.; Tepper, B.J. Influence of PROP taster status and maternal variables on energyintake and body weight of pre-adolescents. Physiol. Behav. 2007, 90, 809–817. [CrossRef] [PubMed]
46. Tepper, B.J.; Koelliker, Y.; Zhao, L.; Ullrich, N.V.; Lanzara, C.; d’Adamo, P.; Ferrara, A.; Ulivi, S.; Esposito, L.;Gasparini, P. Variation in the bitter-taste receptor gene TAS2R38, and adiposity in a genetically isolatedpopulation in Southern Italy. Obesity 2008, 16, 2289–2295. [CrossRef]
47. Shafaie, Y.; Koelliker, Y.; Hoffman, D.J.; Tepper, B.J. Energy intake and diet selection during buffetconsumption in women classified by the 6-n-propylthiouracil bitter taste phenotype. Am. J. Clin. Nutr. 2013,98, 1583–1591. [CrossRef] [PubMed]
48. Tepper, B.J.; Melis, M.; Koelliker, Y.; Gasparini, P.; Ahijevych, K.L.; Tomassini Barbarossa, I. FactorsInfluencing the Phenotypic Characterization of the Oral Marker, PROP. Nutrients 2017, 9, 1275. [CrossRef]
49. Tomassini Barbarossa, I.; Carta, G.; Murru, E.; Melis, M.; Zonza, A.; Vacca, C.; Muroni, P.; Di Marzo, V.;Banni, S. Taste sensitivity to 6-n-propylthiouracil is associated with endocannabinoid plasma levels innormal-weight individuals. Nutrition 2013, 29, 531–536. [CrossRef]
50. Carta, G.; Melis, M.; Pintus, S.; Pintus, P.; Piras, C.A.; Muredda, L.; Demurtas, D.; Di Marzo, V.;Banni, S.; Barbarossa, I.T. Participants with Normal Weight or with Obesity Show Different Relationships of6-n-Propylthiouracil (PROP) Taster Status with BMI and Plasma Endocannabinoids. Sci. Rep. 2017, 7, 1361.[CrossRef]
51. Drewnowski, A.; Henderson, S.A.; Cockroft, J.E. Genetic Sensitivity to 6-n-Propylthiouracil Has No Influenceon Dietary Patterns, Body Mass Indexes, or Plasma Lipid Profiles of Women. J. Am. Diet. Assoc. 2007,107, 1340–1348. [CrossRef]
52. Gorovic, N.; Afzal, S.; Tjonneland, A.; Overvad, K.; Vogel, U.; Albrechtsen, C.; Poulsen, H.E. Genetic variationin the hTAS2R38 taste receptor and brassica vegetable intake. Scand. J. Clin. Lab. Investig. 2011, 71, 274–279.[CrossRef] [PubMed]
53. O’Brien, S.A.; Feeney, E.L.; Scannell, A.G.; Markey, A.; Gibney, E.R. Bitter taste perception and dietary intakepatterns in irish children. J. Nutr. Nutr. 2013, 6, 43–58. [CrossRef] [PubMed]
54. Timpson, N.J.; Christensen, M.; Lawlor, D.A.; Gaunt, T.R.; Day, I.N.; Ebrahim, S.; Davey Smith, G. TAS2R38(phenylthiocarbamide) haplotypes, coronary heart disease traits, and eating behavior in the British Women’sHeart and Health Study. Am. J. Clin. Nutr. 2005, 81, 1005–1011. [CrossRef] [PubMed]
55. Yackinous, C.A.; Guinard, J.X. Relation between PROP (6-n-propylthiouracil) taster status, taste anatomyand dietary intake measures for young men and women. Appetite 2002, 38, 201–209. [CrossRef]
160

Nutrients 2019, 11, 315
56. Drewnowski, A.; Henderson, S.A.; Barratt-Fornell, A. Genetic sensitivity to 6-n-propylthiouracil and sensoryresponses to sugar and fat mixtures. Physiol. Behav. 1998, 63, 771–777. [CrossRef]
57. Sollai, G.; Melis, M.; Pani, D.; Cosseddu, P.; Usai, I.; Crnjar, R.; Bonfiglio, A.; Tomassini Barbarossa, I. Firstobjective evaluation of taste sensitivity to 6-n-propylthiouracil (PROP), a paradigm gustatory stimulus inhumans. Sci. Rep. 2017, 7, 40353. [CrossRef]
58. Pani, D.; Usai, I.; Cosseddu, P.; Melis, M.; Sollai, G.; Crnjar, R.; Tomassini Barbarossa, I.; Raffo, L.; Bonfiglio, A.An automated system for the objective evaluation of human gustatory sensitivity using tongue biopotentialrecordings. PLoS ONE 2017, 12, e0177246. [CrossRef]
59. Glanville, E.V.; Kaplan, A.R. Taste Perception and the Menstrual Cycle. Nature 1965, 205, 930–931. [CrossRef]60. Tepper, B.J.; Christensen, C.M.; Cao, J. Development of brief methods to classify individuals by PROP taster
status. Physiol. Behav. 2001, 73, 571–577. [CrossRef]61. Calò, C.; Padiglia, A.; Zonza, A.; Corrias, L.; Contu, P.; Tepper, B.J.; Barbarossa, I.T. Polymorphisms in
TAS2R38 and the taste bud trophic factor, gustin gene co-operate in modulating PROP taste phenotype.Physiol. Behav. 2011, 104, 1065–1071. [CrossRef]
62. Padiglia, A.; Zonza, A.; Atzori, E.; Chillotti, C.; Calò, C.; Tepper, B.J.; Barbarossa, I.T. Sensitivity to6-n-propylthiouracil is associated with gustin (carbonic anhydrase VI) gene polymorphism, salivary zinc,and body mass index in humans. Am. J. Clin. Nutr. 2010, 92, 539–545. [CrossRef] [PubMed]
63. Melis, M.; Aragoni, M.C.; Arca, M.; Cabras, T.; Caltagirone, C.; Castagnola, M.; Crnjar, R.; Messana, I.;Tepper, B.J.; Barbarossa, I.T. Marked increase in PROP taste responsiveness following oral supplementationwith selected salivary proteins or their related free amino acids. PLoS ONE 2013, 8, e59810. [CrossRef][PubMed]
64. Melis, M.; Tomassini Barbarossa, I. Taste Perception of Sweet, Sour, Salty, Bitter, and Umami and ChangesDue to l-Arginine Supplementation, as a Function of Genetic Ability to Taste 6-n-Propylthiouracil. Nutrients2017, 9, 541. [CrossRef] [PubMed]
65. Melis, M.; Arca, M.; Aragoni, M.C.; Cabras, T.; Caltagirone, C.; Castagnola, M.; Crnjar, R.; Messana, I.;Tepper, B.J.; Tomassini Barbarossa, I. Dose-Dependent Effects of L-Arginine on PROP Bitterness Intensityand Latency and Characteristics of the Chemical Interaction between PROP and L-Arginine. PLoS ONE 2015,10, e0131104. [CrossRef] [PubMed]
66. Green, B.G.; Shaffer, G.S.; Gilmore, M.M. Derivation and evaluation of a semantic scale of oral sensationmagnitude with apparent ratio properties. Chem. Senses 1993, 18, 683–702. [CrossRef]
67. Zhao, L.; Kirkmeyer, S.V.; Tepper, B.J. A paper screening test to assess genetic taste sensitivity to6-n-propylthiouracil. Physiol. Behav. 2003, 78, 625–633. [CrossRef]
68. Banerjee, M.; Gautam, S.; Saxena, M.; Bid, H.K.; Agrawal, C.G. Association of CD36 gene variants rs1761667(G > A) and rs1527483 (C > T) with Type 2 diabetes in North Indian population. Int. J. Diabetes Mellit. 2010,2, 179–183. [CrossRef]
69. Kim, U.K.; Jorgenson, E.; Coon, H.; Leppert, M.; Risch, N.; Drayna, D. Positional cloning of the humanquantitative trait locus underlying taste sensitivity to phenylthiocarbamide. Science 2003, 299, 1221–1225.[CrossRef]
70. Rousset, F. GENEPOP’007: A complete re-implementation of the GENEPOP software for Windows andLinux. Mol. Ecol. Resour. 2008, 8, 103–106. [CrossRef]
71. Keller, K.L.; Olsen, A.; Cravener, T.L.; Bloom, R.; Chung, W.K.; Deng, L.; Lanzano, P.; Meyermann, K. Bittertaste phenotype and body weight predict children’s selection of sweet and savory foods at a palatabletest-meal. Appetite 2014, 77, 113–121. [CrossRef]
72. Flock, A.; Flock, B. Hydrops in the cochlea can be induced by sound as well as by static pressure. Hear. Res.2000, 150, 175–188. [CrossRef]
73. Holder, G.E. Pattern electroretinography (PERG) and an integrated approach to visual pathway diagnosis.Prog. Retin Eye Res. 2001, 20, 531–561. [CrossRef]
74. Scott, J.W.; Scott-Johnson, P.E. The electroolfactogram: A review of its history and uses. Microsc. Res. Tech.2002, 58, 152–160. [CrossRef] [PubMed]
161

Nutrients 2019, 11, 315
75. Kirkmeyer, S.V.; Tepper, B.J. Understanding creaminess perception of dairy products using free-choiceprofiling and genetic responsivity to 6-n-propylthiouracil. Chem. Senses 2003, 28, 527–536. [CrossRef]
76. Dinnella, C.; Monteleone, E.; Piochi, M.; Spinelli, S.; Prescott, J.; Pierguidi, L.; Gasperi, F.; Laureati, M.;Pagliarini, E.; Predieri, S.; et al. Individual Variation in PROP Status, Fungiform Papillae Density, andResponsiveness to Taste Stimuli in a Large Population Sample. Chem. Senses 2018, 43, 697–710. [CrossRef][PubMed]
© 2019 by the authors. Licensee MDPI, Basel, Switzerland. This article is an open accessarticle distributed under the terms and conditions of the Creative Commons Attribution(CC BY) license (http://creativecommons.org/licenses/by/4.0/).
162

nutrients
Article
Fatty Acid Lingual Application Activates Gustatoryand Reward Brain Circuits in the Mouse
Yvan Peterschmitt 1, Souleymane Abdoul-Azize 2, Babar Murtaza 3, Marie Barbier 1,
Amira Sayed Khan 3, Jean-Louis Millot 1,† and Naim Akhtar Khan 3,*
1 Neurosciences Intégratives et Cliniques EA481, Université de Bourgogne Franche-Comté (UBFC),25000 Besançon, France; [email protected] (Y.P.); [email protected] (M.B.)
2 Unité Inserm U1234, Université de Rouen/IRIB, Faculté de Médecine et Pharmacie,76183 Rouen CEDEX, France; [email protected]
3 Physiologie de la Nutrition & Toxicologie (NUTox), Agro-Sup, UMR U1231 INSERM/Université deBourgogne Franche-Comté (UBFC), 6, Boulevard Gabriel, 21000 Dijon, France;[email protected] (B.M.); [email protected] (A.S.K.)
* Correspondance: [email protected]; Tel.: +33-38-039-6312; Fax: +33-38-039-6330† Deceased
Received: 12 August 2018; Accepted: 4 September 2018; Published: 6 September 2018
Abstract: The origin of spontaneous preference for dietary lipids in humans and rodents isdebated, though recent compelling evidence has shown the existence of fat taste that might beconsidered a sixth taste quality. We investigated the implication of gustatory and reward braincircuits, triggered by linoleic acid (LA), a long-chain fatty acid. The LA was applied onto thecircumvallate papillae for 30 min in conscious C57BL/6J mice, and neuronal activation was assessedusing c-Fos immunohistochemistry. By using real-time reverse transcription polymerase chainreaction (RT-qPCR), we also studied the expression of mRNA encoding brain-derived neurotrophicfactor (BDNF), Zif-268, and Glut-1 in some brain areas of these animals. LA induced a significantincrease in c-Fos expression in the nucleus of solitary tract (NST), parabrachial nucleus (PBN), andventroposterior medialis parvocellularis (VPMPC) of the thalamus, which are the regions knownto be activated by gustatory signals. LA also triggered c-Fos expression in the central amygdalaand ventral tegmental area (VTA), involved in food reward, in conjunction with emotional traits.Interestingly, we noticed a high expression of BDNF, Zif-268, and Glut-1 mRNA in the arcuate nucleus(Arc) and hippocampus (Hipp), where neuronal activation leads to memory formation. Our studydemonstrates that oral lipid taste perception might trigger the activation of canonical gustatory andreward pathways.
Keywords: linoleic acid; gustation; hedonic; BDNF; fat taste; c-Fos; Zif-268; Glut-1
1. Introduction
Taste modality serves as an important factor for food choice and for appreciating its hedonicvalue [1]. There are five basic taste qualities known hitherto in rodents and humans: sweet, sour, bitter,salty, and umami [2]. The specific receptors and cells for each of the five basic taste modalities havebeen identified and characterized [3]. The series of events that occur before and after the ingestionof food, leading to taste perception and preference, are a topic of wide interest. Recently, convincingevidence has started to accumulate in favor of fat as the sixth fat taste quality in rodents and humans [4].The two principal receptors of fat taste, CD36 and GPR120, have finally been identified in humantaste bud cells, and their sensitivity to fatty acid stimuli has been shown to be altered in obesity [5].The cellular and molecular mechanisms of fat taste perception have recently been elucidated [4,6].
Nutrients 2018, 10, 1246; doi:10.3390/nu10091246 www.mdpi.com/journal/nutrients163

Nutrients 2018, 10, 1246
There are a few studies that have shed light on fat-eating behavior and brain activity. Ourlaboratory has demonstrated that the addition of a fatty acid on mouse tongues induced the expressionof c-Fos immunoreactivity in the nucleus of the solitary tract (NST), the first gustatory relay in thebrain [7]. We did not address the question of whether other parts of the brain are also activatedduring this experimental approach, though several investigators, by employing different methods,have concluded that the primary taste cortex, orbitofrontal cortex, and amygdala are activated by theperception of dietary lipids [8–11]. Tzieropoulos et al. (2013) reported that dietary fat was able toinduce sustained reward response in human brains. Eldeghaidy et al. [12] used functional magneticresonance imaging (fMRI) in human subjects, and suggested that taste, appetite, and reward-relatedbrain areas were responsive to nutritional status and received sensory and interoceptive signals ofmotivation and hedonic value in response to a fat-rich diet. Other fMRI studies in humans havealso demonstrated that administration of dietary lipids activates cerebral taste, texture, and rewardareas [13–16].
The abovementioned studies show that different brain areas might be activated by dietary fat;however, there is a dearth of information on the identification of sequential activation of cerebralareas/pathways that are activated in response to taste bud stimulation by dietary fat prior to ingestionof the bolus. Information on this subject would be crucial not only to better understand the fundamentalmechanisms of fat intake and its related addiction, but also to modulate fat-eating behavior that isaltered in obese subjects [17]. Keeping this argument in view, we designed the present study whereinwe added linoleic acid (LA), a long-chain fatty acid, on the circumvallate papillae, which are rich infat taste receptors, of conscious mice and assessed the neural activity using immunocytochemicallocalization of c-Fos protein in different brain areas. We also analyzed the mRNA expression ofbrain-derived neurotrophic factor (BDNF), involved in synaptic plasticity and memory processes,Zif-268, an immediate-early gene, and Glut-1, another marker of neuronal activation during enhancedglucose demand in three brain areas of these animals [18].
2. Materials and Methods
2.1. Animals and Experimental Set-Up
Experiments were carried out on 6–10-week-old C57BL/6J male mice (Janvier, Le Genest-St-Isle,Mayenne, France). Animals were group-housed under standard laboratory conditions (12 h:12 h,light/dark cycle; 22 ± 2 ◦C, 50–60% humidity) and fed with standard pelleted food (Scientific AnimalFood & Engineering, Augy, France) and water ad libitum. All experiments were designed to minimizeanimal suffering and the number of animals. The protocols were approved by the regional ethicalcommittee of Burgundy University in compliance with European guidelines for the use and care oflaboratory animals.
In the first set of experiments, the neuronal activation along the canonical gustatory pathwaywas systematically assessed after oral lipid stimulation using c-Fos immunohistochemistry. In orderto avoid any stressful situation, the mice were accustomed to gentle handling for 5 days in order toapply the fatty acid. On the 6th day, they were gently handled similarly and linoleic acid (LA, 18:2 n-6)(Sigma-Aldrich, St. Louis, MO, USA) at 50 μM in 70 μl (w/v) was slowly placed with the help ofa spatula for 30 min on the circumvallate papillae. Xanthan gum (0.3% w/v, Sigma-Aldrich USA),which mimics lipid texture, was similarly applied onto the circumvallate papillae of control animals.At the end of oral stimulation, the animals were injected, intraperitoneally, with sodium pentobarbital(40 mg/kg), the thoracic cavity was opened, and mice were perfused intracardially with 50 mL ofice-cold saline (NaCl, 0.9%), followed by 50 ml of ice-cold 4% paraformaldehyde in 0.1 M phosphatebuffer, pH 7.4. The entire brain was removed and post-fixed by incubation in 4% paraformaldehydefor 2 h. Samples were cryoprotected by overnight incubation in 30% sucrose in 0.1 M phosphate buffer.Brain samples were embedded in a Tissue-Tek®OCT compound (Sakura FineTek, Torrance, CA, USA),frozen on dry ice, and stored at −20 ◦C before c-Fos immunohistochemical processing.
164

Nutrients 2018, 10, 1246
In the second set of experiments, using real-time reverse transcription polymerase chainreaction (RT-qPCR), we investigated the downstream molecular pathways/candidates in NTS,arcuate nucleus, and hippocampus at mRNA level. The total RNA from different brain areas wasisolated by Trizol Reagent (Invitrogen, Thermo Fisher Scientific, Waltham, MA, USA). The qualityof isolated RNA was determined using denaturing agarose gel electrophoresis. Then, the RNAwas quantified by determining its UV absorbance at 260 nm. Five hundred nanograms of totalRNA was reverse-transcribed with an iScript cDNA synthesis kit according to the manufacturer’sinstructions (Bio-Rad, Berkeley, CA, USA). RT-PCR was performed on the iCycler iQ real-timedetection system, and amplification was undertaken using SYBR Green detection. Primers againstthe genes of interest were as follow: BDNF (forward 5′-TTGGATGCCGCAAACATGTC-3′; reverse,5′-CTGCCGCTGTGACCCACTC-3′), Zif-268 (forward, 5′-GCGAACAACCCTATGAGC-3′; reverse,5′-GGTCGGAGGATTGGTC-3′), Glut-1 (forward, 5′-GCTGTGCTTATGGGCTTCTC-3′; reverse,5′-CACATACATGGGCACAAAGC-3′). The cycling conditions used were: 95 ◦C for 10 min; and40 cycles of 95 ◦C for 15 s, 60 ◦C for 1 min. The amplification was carried out in a total volume of 20 μL,which contained 10.0 μL SYBR Green Supermix buffer (50 mMKCl; 20 mMTris-HCl (pH 8.4); 3 mMMgCl2; 0.2 mM of each dNTP, 0.63 U iTaq DNA polymerase, and SYBR Green 1.0 nM fluorescein),0.75 μL (0.3 mM) of each primer, and 1.5 μL diluted cDNA. Results were evaluated using iCycleriQsoftware, and a relative quantification of mRNA in different groups was determined. The relativeamounts of RNA were normalized to the amount of the endogenous control 18S using StepOnesoftware version 2.2-2010 (Applied Biosystems, Thermo Fisher Scientific, Waltham, MA, USA) and theΔ Ct method.
2.2. Immunohistochemistry
Fos Immunostaining
Fifty μm coronal sections were cut with a cryostat at −20 ◦C through the NST (nucleus of thesolitary tract, bregma −0.48 to −7.08 mm), PBN (parabrachial nucleus, bregma −4.96 to −5.32 mm),VPM (ventral posteromedial thalamic nucleus, bregma −1.58 to −2.46 mm), VPMPC (ventroposteriormedialis parvocellularis, bregma −1.94 to −2.30 mm), CeA (central amygdaloid nucleus, bregma−0.94 to −1.82 mm), PSTN/CbN (parasubthalamic nucleus/calbindin nucleus, bregma −2.06 to−2.54 mm), AI (agranular insular cortex, bregma −0.94 to +1.54 mm), GI/DI (granular/dysgranularinsular cortex, bregma −0.94 to +1.54 mm), Hipp (hippocampus, bregma −1.22 to −2.18 mm),BLA (basolateral amygdaloid nucleus, bregma −1.70 to +1.82 mm), VTA (ventral tegmental area,bregma −2.92 to +3.88 mm), Acb (accumbens nucleus, bregma +1.70 to +0.98 mm), mPFC (medialprefrontal cortex, bregma +1.98 to +1.54 mm), Arc (arcuate nucleus, −1.46 to −2.46 mm caudalto bregma), and Hbn (habenula, bregma −1.22 to −2.18 mm), according to the atlas of Paxinos &Franklin (2001) [19]. Free-floating sections were then collected in 0.1 M phosphate buffer, pH 7.4, andprocessed for c-Fos immunohistochemistry. Sections were incubated overnight with rabbit anti-c-Fos(1:20,000, Calbiochem®, Paris, France) primary antibodies diluted in 0.1 M phosphate buffer at pH7.4, containing 0.3% Triton X100 and 3% normal goat serum (v/v). Subsequently, sections wereincubated for 2 h at room temperature with the biotinylated goat antirabbit secondary antibodies(1:4000, Vector laboratories, Burlingame, CA, USA). The formed antigen–antibody complexes werevisualized through the avidin–biotin–horseradish peroxidase procedure (Vectastain Elite ABC kit;Vector Laboratories, USA), using 3,3′-diaminobenzidine (0.04%) as the chromogen. Sections weremounted on gelatin-coated slides, dehydrated, and coverslipped with DePeX (VWR International Ltd.,Poole, UK) mountant.
2.3. Quantification of c-Fos Immunopositive Neurons
Sections were analyzed under a 40× objective of a light-optical microscope (Nikon EclipseE600, Nikon Instruments Inc., Melville, NY, USA) equipped with a digital camera (Nikon Digital
165

Nutrients 2018, 10, 1246
Sight DS-Fi1). c-Fos immunoreactive nuclei were quantified on photomicrographs of the regionsof interest (ROI) using the imaging software Image J (National Institutes of Health, Bethesda, MD,USA). A cell was considered as labeled (positive) for c-Fos when the brown-black DAB-staining wasunambiguously darker than the background, and this included all cells from low to high intensities ofstaining. Thresholds over the background section and the size of the particles were determined by theexperimenter. The entire region for each area was traced, and mean densities of c-Fos-immunopositiveneurons (number of c-Fos positive cells/mm2) for each ROI were calculated according to theirrespective areas.
2.4. Statistical Analysis
Data are presented as means ± standard error of the mean (SEM). Statistical analysis wasperformed using GraphPad Prism version 5.00 for Windows (GraphPad Software, La Jolla, CA,USA). For the immunohistochemical experiment, the Kolmogorov–Smirnov test revealed parametric(normal) distribution for the c-Fos data for most brain regions. Therefore, differences between groupswere assessed using unpaired one-sided t-tests. The level of significance was set at p < 0.05.
3. Results
3.1. Lingual LA Stimulation Triggers Neuronal Activation of the Canonical Central Cerebral GustatoryReward Pathway
Figure 1A shows the c-Fos expression in the NST, arcuate nucleus (Arc), and hippocampus(Hipp) in LA-stimulated and control mice. Quantitative analysis of the immunohistochemical datarevealed that oral LA application produced a robust increase in c-Fos expression in most brainregions explored along the putative pathway for gustatory lipid perception (Figures 1A,B and 2).More precisely, unpaired one-sided t-tests show a significant effect of the treatment in the NST(t(10) = 2.252; p = 0.0240), PBN (t(9) = 3.992; p = 0.0016), VPMPC (t(9) = 3.153; p = 0.0058), CeA(t(10) = 2.380; p = 0.0193), PSTN/CbN (t(9) = 3.037; p = 0.0070), and VTA (t(10) = 2.309; p = 0.0218),but the differences did not reach statistical significance either at the cortical level (AI (t(10) = 0.3142;p = 0.3799), GI/DI (t(10) = 0.05505; p = 0.4786), mPFC (t(10) = 0.8558; p = 0.2061) and HIPP (t(9) = 0.3831;p = 0.3553)) or in the non-gustatory-related thalamus VPM(t(9) = 1.377; p = 0.1009), BLA (t(10) = 0.2419;p = 0.4069), Acb (t(10) = 0.06695; p = 0.4740), Hbn (t(10) = 0.4021; p = 0.3480) or Arc (t(9) = 1.052;p = 0.1602) (Figures 1A,B and 2).
Figure 1. Linoleic acid deposition on the tongue induces c-Fos expression in the major cerebralstructures of the canonical gustatory pathway. (A) Typical photomicrographs of the NST, Arc, andHipp, showing c-Fos immunoreactivity in mice subjected to oral stimulation with linoleic acid orxanthan gum (XG, 0.3%, w/v) to mimic the texture of lipids. The dotted lines circumscribe the regions
166
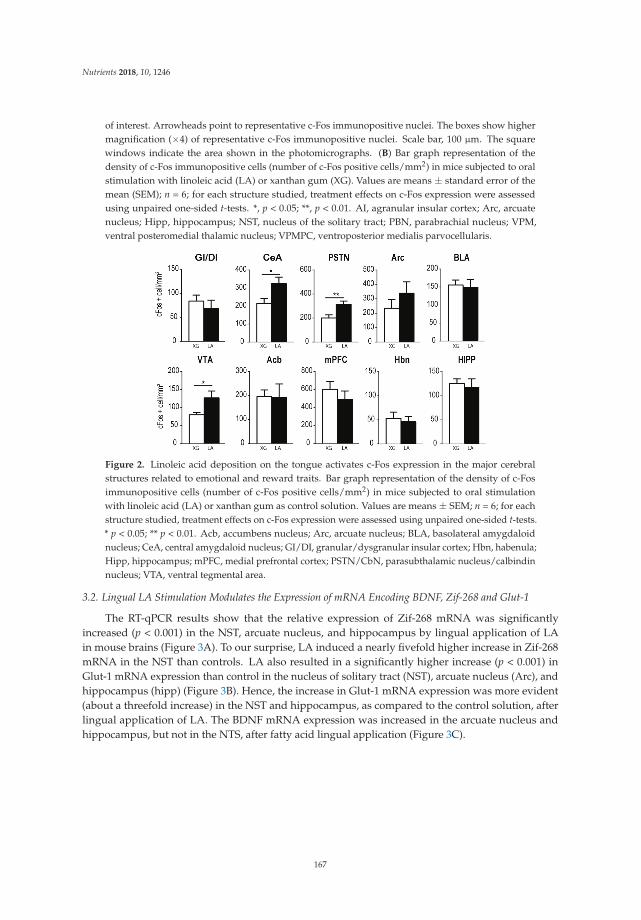
Nutrients 2018, 10, 1246
of interest. Arrowheads point to representative c-Fos immunopositive nuclei. The boxes show highermagnification (×4) of representative c-Fos immunopositive nuclei. Scale bar, 100 μm. The squarewindows indicate the area shown in the photomicrographs. (B) Bar graph representation of thedensity of c-Fos immunopositive cells (number of c-Fos positive cells/mm2) in mice subjected to oralstimulation with linoleic acid (LA) or xanthan gum (XG). Values are means ± standard error of themean (SEM); n = 6; for each structure studied, treatment effects on c-Fos expression were assessedusing unpaired one-sided t-tests. *, p < 0.05; **, p < 0.01. AI, agranular insular cortex; Arc, arcuatenucleus; Hipp, hippocampus; NST, nucleus of the solitary tract; PBN, parabrachial nucleus; VPM,ventral posteromedial thalamic nucleus; VPMPC, ventroposterior medialis parvocellularis.
Figure 2. Linoleic acid deposition on the tongue activates c-Fos expression in the major cerebralstructures related to emotional and reward traits. Bar graph representation of the density of c-Fosimmunopositive cells (number of c-Fos positive cells/mm2) in mice subjected to oral stimulationwith linoleic acid (LA) or xanthan gum as control solution. Values are means ± SEM; n = 6; for eachstructure studied, treatment effects on c-Fos expression were assessed using unpaired one-sided t-tests.* p < 0.05; ** p < 0.01. Acb, accumbens nucleus; Arc, arcuate nucleus; BLA, basolateral amygdaloidnucleus; CeA, central amygdaloid nucleus; GI/DI, granular/dysgranular insular cortex; Hbn, habenula;Hipp, hippocampus; mPFC, medial prefrontal cortex; PSTN/CbN, parasubthalamic nucleus/calbindinnucleus; VTA, ventral tegmental area.
3.2. Lingual LA Stimulation Modulates the Expression of mRNA Encoding BDNF, Zif-268 and Glut-1
The RT-qPCR results show that the relative expression of Zif-268 mRNA was significantlyincreased (p < 0.001) in the NST, arcuate nucleus, and hippocampus by lingual application of LAin mouse brains (Figure 3A). To our surprise, LA induced a nearly fivefold higher increase in Zif-268mRNA in the NST than controls. LA also resulted in a significantly higher increase (p < 0.001) inGlut-1 mRNA expression than control in the nucleus of solitary tract (NST), arcuate nucleus (Arc), andhippocampus (hipp) (Figure 3B). Hence, the increase in Glut-1 mRNA expression was more evident(about a threefold increase) in the NST and hippocampus, as compared to the control solution, afterlingual application of LA. The BDNF mRNA expression was increased in the arcuate nucleus andhippocampus, but not in the NTS, after fatty acid lingual application (Figure 3C).
167

Nutrients 2018, 10, 1246
Figure 3. Lingual application of LA modulates brain-derived neurotrophic factor (BDNF), Zif-268, andGlut-1 mRNA expression in the mouse brain. Bar graphs represent the relative increase in mRNAexpression (Zif-268 in (A), Glut-1 in (B), BDNF in (C)) in mice subjected to oral stimulation with linoleicacid (LA) or xanthan gum as control solution. Values are means ± SEM; n = 6; for each structurestudied, treatment effects on Zif-268 and Glut-1 mRNA expression were assessed using unpairedone-sided t-tests. NST, nucleus of solitary tract; Arc, arcuate nucleus; Hipp, hippocampus.
4. Discussion
Gene transcription during memory consolidation is a very dynamic and complex process,depending on the type of learning involved. Hence, many types of mRNAs are transcribed, such asfor the transcription factors, c-Fos, Zif-268, and the effector genes, like BDNF [20]. The c-Fos, both atmRNA and protein levels, is generally among the first to be expressed and, therefore, referred to asan immediate early gene (IEG) and considered to serve as a marker of the neuronal activity in theneuroendocrine systems [21].
Central gustatory pathways have been well studied in murine models [22]. Branches of the facial(chorda tympani and greater superficial petrosal), glossopharyngeal, and vagus (superior laryngeal)nerves, which establish synaptic contacts with receptor cells in the taste buds, convey taste messages tothe first relay nucleus, that is, the rostral part of the nucleus of the solitary tract (NST). The second relaynucleus for ascending taste inputs is the parabrachial nucleus (PBN) of the pons. The third relay stationis the ventroposterior medialis parvocellularis (VPMPC) of the thalamus. This thalamic nucleus sendstaste information to the insular cortex (IC) [22]. In most of the experiments/observations reported sofar, the prominent neurochemical changes in the brain areas take place immediately following training,but in some instances, there are waves from 3 h to 6 h and/or at 24 h following training. In the presentstudy, we were interested in elucidating the early brain responses to short-term application, that is,30 min, of a long-chain fatty acid, that is, linoleic acid (LA). We applied LA onto the circumvallatepapillae as they have been reported to contain more CD36, a lipid receptor, than fungiform papillae [23].Our results demonstrate that acute lingual application of LA resulted in a significant increase in c-Fosexpression in the NST, PBN, and VPMPC in the mouse brain. However, the increase in c-Fos expressionin VPM was not significantly higher in fatty-acid-treated mice than control animals, suggesting thatVPMPC, but not VPM, is involved in the transfer of lipid taste messages from the PBN to the insularcortical areas (AI, GI/DI), though LA failed to induce c-Fos expression in latter areas of the brain.
The ventral tegmental area (VTA), nucleus accumbens (NAcb), and ventral pallidum (situatedbetween the NAcb and lateral hypothalamus) are the essential components of the brain rewardsystem [24]. Acute application of LA resulted in a significant increase in c-Fos expression in the VTA,which constitutes the mesolimbic dopaminergic system. However, no significant difference in c-Fosexpression was observed in the NAcb after the application of the fatty acid. Our observations can be
168

Nutrients 2018, 10, 1246
supported by the study of Dela Cruz et al. [25], who have shown that fat intake is associated withthe activation of the VTA in the mouse brain [25]. Reward is closely related to hedonic stimuli andour results, showing c-Fos activation in the CEA and PSTN, support previous reports describingthe activation of the PSTN, the major target for projection from the CeA [26] in response to hedonictaste [27].
In order to correlate c-Fos findings, we further quantified the mRNA expression of BDNF, Zif-268,and Glut-1 in three areas of the brain, that is, the NTS, arcuate nucleus, and hippocampus, as peripheralsignals go through the NTS and arcuate nucleus to the hippocampus, involved in multimodal learningand memory. BDNF is a small dimeric protein that is widely expressed in the adult mammalian brainand extensively involved in synaptic plasticity and memory processes [28]. We observed that BDNFmRNA was highly induced in the arcuate nucleus and hippocampus, but not in the NTS. In fact,this growth factor is more involved in learning and memory rather than the transfer of peripheralsignals, as is the case of the NTS. Alonso et al. [29] have demonstrated that BDNF is involved notonly in memory consolidation, but also in long-term memory formation in the CA1 region of thehippocampus. Genoud et al. [30] have clearly shown that BDNF is mandatory to induce formationof activity-dependent synapses in cerebral cortex. However, there are regional and task-dependentdifferences underlying differential mechanisms of BDNF and its receptor function [28].
Zif-268 belongs to the regulatory transcription factor family, responsible for inducing transcriptionof late-response genes [31]. Induction of memory in the hippocampus has been shown to increase theexpression of Zif-268 mRNA, and Zif-268 knock-out mice had deficits in long-term memory for sociallytransmitted food preference and object recognition [32]. As far as Glut-1 is concerned, we would liketo state that glucose is an important source of energy for the brain and glucose transporters (Glut)enable passage of glucose across both the endothelial cells of the blood–brain barrier and the plasmamembranes of neurons and glia [33]. Glut-1 is present at high levels in brain endothelial cells [34].We observed that lingual application of LA resulted in a significantly increased expression of Zif-268and Glut-1 mRNA in the NST and arcuate nucleus, as well as in the hippocampus. Surprisingly,the number of c-Fos immunopositive neurons was not significantly increased in the arcuate nucleusand hippocampus by acute application of LA. We would like to mention that, under some conditions,the concomitant activation of these two markers (c-Fos and Zif-268) is not seen. Barbosa et al. [35] haveshown that Zif-268 was increased in the dorsal CA1 region of the hippocampus, while there was noc-Fos activation in the experiments conducted to assess episodic-like memory in rats. Furthermore,we elucidated the Zif-268 expression in the whole hippocampus, and it is possible that, in differentsubregions, there might be a differential expression of Zif-268 mRNA. It is also worth mentioningthat c-Fos is well correlated with neuronal activity, whereas Zif-268 is more related to memorizationmechanisms, such as long-term potentiation [36,37]. As far as Glut-1 is concerned, we would liketo state that sometimes there is no direct correlation between Glut-1 and c-Fos expression. Glut-1 isactivated immediately as per energetic demand of the cells, whereas c-Fos might be activated at a laterstage. Indeed, Hauguel-de Mouzon et al. [38] have shown that Glut1 mRNA, but not c-Fos levels,is subjected to the variations in glucose concentrations in human placental cells, and this differentialregulation of Glut1 and c-Fos genes could be relevant to, respectively, metabolic and mitogenicpathways. In fact, high glucose concentrations are supposed to upregulate c-Fos expression [39]and downregulate Glut-1 levels [36]. It is possible that, in response to lipid gustatory informationcoming from tongue to brain, the hippocampus is in high requirement of glucose due to high glucoseutilization, and this would result in high GLUT-1 and low c-Fos mRNA expression in this region ofthe brain.
On the basis of our observations, we provide a schematic representation of the gustatory pathway,depicting the major central synaptic relays and its connections with structures involved in metabolic,reward, learning, and memory processes in response to fatty acid stimulation (Figure 4). Thus, lipidtaste perception relies on systematic activation of the major cerebral structures of the canonicalgustatory pathway, ranging from the first central synaptic relay NST in the brain stem to the PBN,
169

Nutrients 2018, 10, 1246
reaching the gustatory part of the thalamus (VPMPC), up to the gustatory insular cortical areas(AI, GI/DI) with modulatory influences of the central amygdaloid nucleus (CeA) and the posteriorpart of the lateral hypothalamus, that is, the parasubthalamic nucleus/calbindin nucleus (PSTN/CbN).It is worth noting that, at this early stage of lipid oral stimulation, the reward circuit is already involved,mainly through the VTA. It is not well understood, in the present study, how the arcuate nucleus (Arc),which is sensitive to peripheral postingestive signals, is activated (as evidenced by high BDNF, Zif-268and Glut-1 mRNA levels). Indeed, the feeding behavior is also regulated by circulating hormonalsignals, released by nutrients in the gut, such as cholecystokinin (CCK) and glucagon-like-peptide 1(GLP-1), released as a result of postingestive/postoral activation of the gastrointestinal tract. Furtherphysiological studies are required to assess the effects of these and other circulating factors that mightregulate fat-eating behavior either via the arcuate nucleus or via the vagal nerve X. Nonetheless, ours isthe first report to demonstrate that the application of a long-chain fatty acid like linoleic acid wouldactivate a long chain of events in the conscious brain of the mouse.
Figure 4. Schematic representation of the gustatory pathway, depicting the major central synapticrelays and their connections with structures involved in metabolic, reward and learning, and memoryprocesses. The lingual application of a long-chain fatty acid will trigger signaling events via CD36,localized in the circumvallate papillae. The gustatory information on dietary lipids will be conveyedto the NST via cranial nerves VII and IX. The NST that serves as the relay structure of the peripheralinformation will send the gustatory information to different brain areas, as mentioned in the Discussionsection. Acb, accumbens nucleus; AI, agranular insular cortex; Arc, arcuate nucleus; BLA, basolateralamygdaloid nucleus; CeA, central amygdaloid nucleus; GI/DI, granular/dysgranular insular cortex;Hbn, habenula; Hipp, hippocampus; mPFC, medial prefrontal cortex; NST, nucleus of the solitary tract;PBN, parabrachial nucleus; PSTN/CbN, parasubthalamic nucleus/calbindin nucleus; VPM, ventralposteromedial thalamic nucleus; VPMPC, ventroposterior medialis parvocellularis; VTA, ventraltegmental area (adapted from Reference [27]).
Author Contributions: Y.P., J.-L.M. and N.A.K. designed the study. S.A.-A. and Y.P. conducted the experiments.Y.P., N.A.K., B.M. and A.S.K. were involved in writing and statistical analysis.
Funding: This work was financed by a contingent grant from Bourgogne-Franche-Comté Région to encourage thebilateral collaboration between two universities (AAP/BQR/PRES).
Acknowledgments: Authors are thankful to the PRES–Bourgogne-Franche-Comté for the contingent grant.
Conflicts of Interest: All the authors declare that they have nothing to disclose.
References
1. Hess, M.A. Resetting the American table—Creating a new alliance of taste and health. J. Am. Diet. Assoc.1991, 91, 228–230. [PubMed]
2. Chandrashekar, J.; Hoon, M.A.; Ryba, N.J.; Zuker, C.S. The receptors and cells for mammalian taste. Nature2006, 444, 288–294. [CrossRef] [PubMed]
170

Nutrients 2018, 10, 1246
3. Roper, S.D. Signal transduction and information processing in mammalian taste buds. Pflugers Arch. 2007,454, 759–776. [CrossRef] [PubMed]
4. Besnard, P.; Passilly-Degrace, P.; Khan, N.A. Taste of fat: A sixth taste modality? Physiol. Rev. 2016, 96,151–176. [CrossRef] [PubMed]
5. Ozdener, M.H.; Subramaniam, S.; Sundaresan, S.; Sery, O.; Hashimoto, T.; Asakawa, Y.; Besnard, P.;Abumrad, N.A.; Khan, N.A. CD36-and GPR120-mediated Ca2+ signaling in human taste bud cells mediatesdifferential responses to fatty acids and is altered in obese mice. Gastroenterology 2014, 146, 995–1005.[CrossRef] [PubMed]
6. Gilbertson, T.A.; Khan, N.A. Cell signaling mechanisms of oro-gustatory detection of dietary fat: Advancesand challenges. Prog. Lipid Res. 2014, 53, 82–92. [CrossRef] [PubMed]
7. Gaillard, D.; Laugerette, F.; Darcel, N.; El-Yassimi, A.; Passilly-Degrace, P.; Hichami, A.; Khan, N.A.;Montmayeur, J.-P.; Besnard, P. The gustatory pathway is involved in CD36-mediated orosensory perceptionof long-chain fatty acids in the mouse. FASEB J. 2008, 22, 1458–1468. [CrossRef] [PubMed]
8. Kadohisa, M.; Verhagen, J.; Rolls, E. The primate amygdala: Neuronal representations of the viscosity, fattexture, temperature, grittiness and taste of foods. Neuroscience 2005, 132, 33–48. [CrossRef] [PubMed]
9. Verhagen, J.V.; Rolls, E.T.; Kadohisa, M. Neurons in the primate orbitofrontal cortex respond to fat textureindependently of viscosity. J. Neurophysiol. 2003, 90, 1514–1525. [CrossRef] [PubMed]
10. Rolls, E. Taste, olfactory and food texture reward processing in the brain and obesity. Int. J. Obes. 2011, 35,550–561. [CrossRef] [PubMed]
11. Verhagen, J.V.; Kadohisa, M.; Rolls, E.T. Primate insular/opercular taste cortex: Neuronal representationsof the viscosity, fat texture, grittiness, temperature, and taste of foods. J. Neurophysiol. 2004, 92, 1685–1699.[CrossRef] [PubMed]
12. Eldeghaidy, S.; Marciani, L.; Hort, J.; Hollowood, T.; Singh, G.; Bush, D.; Foster, T.; Taylor, A.J.; Busch, J.;Spiller, R.C. Prior consumption of a fat meal in healthy adults modulates the brain’s response to fat. J. Nutr.2016, 146, 2187–2198. [CrossRef] [PubMed]
13. De Araujo, I.E.; Rolls, E.T. Representation in the human brain of food texture and oral fat. J. Neurosci. 2004,24, 3086–3093. [CrossRef] [PubMed]
14. Eldeghaidy, S.; Marciani, L.; McGlone, F.; Hollowood, T.; Hort, J.; Head, K.; Taylor, A.J.; Busch, J.; Spiller, R.C.;Gowland, P.A. The cortical response to the oral perception of fat emulsions and the effect of taster status.J. Neurophysiol. 2011, 105, 2572–2581. [CrossRef] [PubMed]
15. Grabenhorst, F.; Rolls, E.T.; Parris, B.A.; d’Souza, A.A. How the brain represents the reward value of fat inthe mouth. Cereb. Cortex 2010, 20, 1082–1091. [CrossRef] [PubMed]
16. Stice, E.; Burger, K.S.; Yokum, S. Relative ability of fat and sugar tastes to activate reward, gustatory, andsomatosensory regions. Am. J. Clin. Nutr. 2013, 98, 1377–1384. [CrossRef] [PubMed]
17. Liu, D.; Archer, N.; Duesing, K.; Hannan, G.; Keast, R. Mechanism of fat taste perception: Association withdiet and obesity. Prog. Lipid Res. 2016, 63, 41–49. [CrossRef] [PubMed]
18. Hichami, A.; Datiche, F.; Ullah, S.; Liénard, F.; Chardigny, J.-M.; Cattarelli, M.; Khan, N.A. Olfactorydiscrimination ability and brain expression of c-Fos, Gir and Glut1 mRNA are altered in n-3 fattyacid-depleted rats. Behav. Brain Res. 2007, 184, 1–10. [CrossRef] [PubMed]
19. Paxinos, G.; Franklin, K. The Mouse Brain Atlas in Stereotaxic Coordinates; Academic Press: San Diego, CA,USA, 2001.
20. Gal-Ben-Ari, S.; Kenney, J.W.; Ounalla-Saad, H.; Taha, E.; David, O.; Levitan, D.; Gildish, I.; Panja, D.; Pai, B.;Wibrand, K. Consolidation and translation regulation. Learn. Mem. 2012, 19, 410–422. [CrossRef] [PubMed]
21. Hoffman, G.E.; Smith, M.S.; Verbalis, J.G. C-fos and related immediate early gene products as markers ofactivity in neuroendocrine systems. Front. Neuroendocrinol. 1993, 14, 173–213. [CrossRef] [PubMed]
22. Morin, J.P.; Quiroz, C.; Mendoza-Viveros, L.; Ramirez-Amaya, V.; Bermudez-Rattoni, F. Familiar taste induceshigher dendritic levels of activity-regulated cytoskeleton-associated protein in the insular cortex than a novelone. Learn. Mem. 2011, 18, 610–616. [CrossRef] [PubMed]
23. Laugerette, F.; Passilly-Degrace, P.; Patris, B.; Niot, I.; Febbraio, M.; Montmayeur, J.-P.; Besnard, P. CD36involvement in orosensory detection of dietary lipids, spontaneous fat preference, and digestive secretions.J. Clin. Investig. 2005, 115, 3177–3184. [CrossRef] [PubMed]
24. Wise, R.A. Brain reward circuitry: Insights from unsensed incentives. Neuron 2002, 36, 229–240. [CrossRef]
171

Nutrients 2018, 10, 1246
25. Dela Cruz, J.A.; Coke, T.; Bodnar, R.J. Simultaneous detection of c-fos activation from mesolimbic andmesocortical dopamine reward sites following naive sugar and fat ingestion in rats. J. Vis. Exp. 2016, 114,e53897. [CrossRef] [PubMed]
26. Chometton, S.; Pedron, S.; Peterschmitt, Y.; Van Waes, V.; Fellmann, D.; Risold, PY. A premammillary lateralhypothalamic nuclear complex responds to hedonic but not aversive tastes in the male rat. Brain Struct.Funct. 2016, 221, 2183–2208. [CrossRef] [PubMed]
27. Barbier, M.; Chometton, S.; Peterschmitt, Y.; Fellmann, D.; Risold, P.Y. Parasubthalamic and calbindin nucleiin the posterior lateral hypothalamus are the major hypothalamic targets for projections from the central andanterior basomedial nuclei of the amygdala. Brain Struct. Funct. 2017, 222, 2961–2991. [CrossRef] [PubMed]
28. Murer, M.G.; Yan, Q.; Raisman-Vozari, R. Brain-derived neurotrophic factor in the control human brain, andin alzheimer’s disease and parkinson’s disease. Prog. Neurobiol. 2001, 63, 71–124. [CrossRef]
29. Alonso, M.; Vianna, M.R.; Depino, A.M.; Mello e Souza, T.; Pereira, P.; Szapiro, G.; Viola, H.; Pitossi, F.;Izquierdo, I.; Medina, J.H. Bdnf-triggered events in the rat hippocampus are required for both short- andlong-term memory formation. Hippocampus 2002, 12, 551–560. [CrossRef] [PubMed]
30. Genoud, C.; Knott, G.W.; Sakata, K.; Lu, B.; Welker, E. Altered synapse formation in the adult somatosensorycortex of brain-derived neurotrophic factor heterozygote mice. J. Neurosci. 2004, 24, 2394–2400. [CrossRef][PubMed]
31. Lonergan, M.E.; Gafford, G.M.; Jarome, T.J.; Helmstetter, F.J. Time-dependent expression of arc and zif268after acquisition of fear conditioning. Neural. Plast. 2010, 2010. [CrossRef] [PubMed]
32. Jones, M.; Errington, M.; French, P.; Fine, A.; Bliss, T.; Garel, S.; Charnay, P.; Bozon, B.; Laroche, S.; Davis, S.A requirement for the immediate early gene zif268 in the expression of late ltp and long-term memories.Nat. Neurosci. 2001, 4, 289–296. [CrossRef] [PubMed]
33. Maher, F.; Davies-Hill, T.M.; Lysko, P.G.; Henneberry, R.C.; Simpson, I.A. Expression of two glucosetransporters, glut1 and glut3, in cultured cerebellar neurons: Evidence for neuron-specific expressionof glut3. Mol. Cell Neurosci. 1991, 2, 351–360. [CrossRef]
34. Seidner, G.; Alvarez, M.G.; Yeh, J.-I.; O’Driscoll, K.R.; Klepper, J.; Stump, T.S.; Wang, D.; Spinner, N.B.;Birnbaum, M.J.; Darryl, C. Glut-1 deficiency syndrome caused by haploinsufficiency of the blood-brainbarrier hexose carrier. Nat. Genet. 1998, 18, 188–191. [CrossRef] [PubMed]
35. Barbosa, F.F.; Santos, J.R.; Meurer, Y.S.; Macedo, P.T.; Ferreira, L.M.; Pontes, I.M.; Ribeiro, A.M.; Silva, R.H.Differential cortical c-fos and zif-268 expression after object and spatial memory processing in a standard orepisodic-like object recognition task. Front. Behav. Neurosci. 2013, 7, 112. [CrossRef] [PubMed]
36. Soares, J.G.; Pereira, A.C.; Botelho, E.P.; Pereira, S.S.; Fiorani, M.; Gattass, R. Differential expression of zif268and c-fos in the primary visual cortex and lateral geniculate nucleus of normal cebus monkeys and aftermonocular lesions. J. Comp. Neurol. 2005, 482, 166–175. [CrossRef] [PubMed]
37. Aydin-Abidin, S.; Trippe, J.; Funke, K.; Eysel, U.T.; Benali, A. High-and low-frequency repetitive transcranialmagnetic stimulation differentially activates c-fos and zif268 protein expression in the rat brain. Exp. Brain Res.2008, 188, 249–261. [CrossRef] [PubMed]
38. Hauguel-de Mouzon, S.; Leturque, A.; Alsat, E.; Loizeau, M.; Evain-Brion, D.; Girard, J. Developmentalexpression of glut1 glucose transporter and c-fos genes in human placental cells. Placenta 1994, 15, 35–46.[CrossRef]
39. Kreisberg, J.I.; Radnik, R.A.; Ayo, S.H.; Garoni, J.; Saikumar, P. High glucose elevates c-fos and c-juntranscripts and proteins in mesangial cell cultures. Kidney Int. 1994, 46, 105–112. [CrossRef] [PubMed]
© 2018 by the authors. Licensee MDPI, Basel, Switzerland. This article is an open accessarticle distributed under the terms and conditions of the Creative Commons Attribution(CC BY) license (http://creativecommons.org/licenses/by/4.0/).
172

nutrients
Review
Umami as an ‘Alimentary’ Taste. A New Perspectiveon Taste Classification
Isabella E Hartley, Djin Gie Liem and Russell Keast *
Centre for Advanced Sensory Science, School of Exercise and Nutrition Sciences, Deakin University,1 Gheringhap Street, Geelong 3220, Australia; [email protected] (I.E.H.); [email protected] (D.G.L.)* Correspondence: [email protected]; Tel.: +61-3-9244-6944
Received: 15 December 2018; Accepted: 10 January 2019; Published: 16 January 2019
Abstract: Applied taste research is increasingly focusing on the relationship with diet and health,and understanding the role the sense of taste plays in encouraging or discouraging consumption.The concept of basic tastes dates as far back 3000 years, where perception dominated classificationwith sweet, sour, salty, and bitter consistently featuring on basic taste lists throughout history.Advances in molecular biology and the recent discovery of taste receptors and ligands has increasedthe basic taste list to include umami and fat taste. There is potential for a plethora of other new basictastes pending the discovery of taste receptors and ligands. Due to the possibility for an ever-growinglist of basic tastes it is pertinent to critically evaluate whether new tastes, including umami, aresuitably positioned with the four classic basic tastes (sweet, sour, salty, and bitter). The reviewcritically examines the evidence that umami, and by inference other new tastes, fulfils the criteria fora basic taste, and proposes a subclass named ‘alimentary’ for tastes not meeting basic criteria.
Keywords: basic tastes; taste; taste reception; umami
1. Introduction
The relationship between individual variation in taste perception, food choice and intake, andultimately diet related disease, provides a framework for applied taste research. A taste perceptionarises from the interaction of non-volatile, saliva soluble chemicals with taste receptors on the tonguewithin the oral cavity. This interaction initiates a signal transduction to processing regions of thebrain, resulting in the formation of a taste perception. The taste perception formed could include theperception of one of the basic tastes: sweet, sour, salty, bitter, umami [1], or fat [2]; or a perception ofother putative taste qualities including, but not limited to, kokumi (rich, mouthful, thick, delicioustaste) [3,4], carbohydrate [5], calcium [6], or metallic tastes [7]. Detection and perception of basictastes is hypothesised to exist for species’ survival throughout evolution to prevent the consumptionof potential noxious food, and promote consumption of nutritious food, a nutrient–toxin detectionsystem [8–11].
Basic tastes have perceptual independence, that is, they do not elicit a taste perception similarto that of any other basic tastes and cannot be produced from a combination of other tastes [12–14].The concept of basic tastes dates back as far 384–322 B.C. when Aristotle originally listed the seventastes he proposed as basics, these included sweet, sour, salty, and bitter as well as astringent, pungent,and harsh [15]. Throughout history the lists of tastes have been extended, or reduced, depending onthe prevailing thought of the time, with the only consistency being the inclusion of sweet, sour, salty,and bitter in basic taste lists [15]. Research during the 1800’s separated olfaction and tactile perceptionsfrom tastes. The development and advancement of science and technology, including psychophysicaltesting led to sweet, sour, salty, and bitter tastes being confirmed as basics as evidenced throughoutpublished literature [16].
Nutrients 2019, 11, 182; doi:10.3390/nu11010182 www.mdpi.com/journal/nutrients173

Nutrients 2019, 11, 182
Advances in molecular biology, and the recent discovery of taste receptors and ligands hasincreased the basic taste list to include umami and fat taste [17–20]. The existence of specific tastereceptors responsive to a single compound that elicits a taste is often suggested as a key piece ofevidence for basic tastes classification, with literature citing this as the key evidence in the case ofumami [14]. Due to these recent advances, there is the potential for a plethora of new tastes to bediscovered, and potentially classified as a basic taste if receptors on taste cells are found to respondto ligands. The current possibilities include, but are certainly not limited to kokumi, carbohydrate,calcium, and metallic tastes.
Thus, due to advances in knowledge, and the possibility for an ever-growing list of basic tastes, itis pertinent to critically evaluate whether new tastes, including umami, are suitably positioned withthe four classic basic tastes (sweet, sour, salty, and bitter). This is of importance for three predominantreasons, first, there is historical and academic relevance to determine whether umami, and by inferenceother new tastes, should in-fact be considered in the same category as sweet, sour, salty, and bitter.Second, understanding individual variation in taste perception, perceptual associations with otherbasic tastes, and physiological responses resulting from detection of specific tastants, may enhanceour understanding of the complex relationship between taste, dietary choice and intake, and dietrelated health related outcomes. Third, the classic basic tastes have significant immediate influenceon whether to swallow or not swallow a potential food, while the more recent tastes such as umamiand fat may have more post-ingestive relevance and determine extent of consumption and ultimatelyhealth. The review that follows will critically evaluate the evidence that umami fulfils criteria forclassification as a basic taste.
2. Basic Taste Criteria
Criteria that a stimulus must fulfil for it to be classified as a basic taste has been proposed, althoughthese criteria have not been consistent [12,13]. Kurihara and Kashiwayanagi (2000) suggested that for acompound to be considered a basic taste it should fulfil the following criteria. The proposed basic tasteis (1) different to any other basic taste; (2) not replicated by combining other basic tastes and; (3) a tastewhich is commonly consumed and induced by common components of food [13]. The requirement fora basic taste to have an identified receptor was recently added to this set of criteria [14]. The argumentcould then be put forward that the discovery of a receptor-ligand complex alone is not reason to justifya taste as a basic taste. Whether the detection of the stimulus from that receptor is transduced andforms a unique perceptible experience may be of higher importance. That is, if a taste receptor isidentified, but no unique perceptible experience occurs from the activation of that receptor, then is itappropriate to classify the stimulus as eliciting a basic taste?
A more comprehensive set of criteria have been outlined, covering both unique effective stimuli,transduction (receptors), neurotransmission, and finally, perception [12]. These criteria have been usedpreviously to investigate the appropriateness of other new tastes, specifically fat taste; in this reviewthe following criteria will be used to specifically investigate umami as a basic taste [10,12]. We extendthis criterion to involve hedonic responses occurring from tasting the effective stimuli. The criteria areas follows:
1. A distinct class of effective stimuli must exist.2. Detection of effective stimuli must have an evolutionary benefit.3. Transduction mechanisms that can convert the chemical code of the effective stimuli into an
electrical signal, including receptors, must exist.4. Neurotransmission of this electrical signal to taste processing regions of the brain must occur.5. Perceptual quality arising from this processing must be independent from other taste qualities.6. Hedonic responses occur from taste perception.7. Physiological and/or behavioural responses must occur following the activation of taste bud
cells by the effective stimuli.
174

Nutrients 2019, 11, 182
3. Umami Taste and Unique Class of Umami Effective Stimuli
Umami was initially discovered by Ikeda who isolated glutamic acid from kombu (seaweed),finding that the salts of glutamic acid, particularly the sodium salt, monosodium glutamate (MSG),gave the seaweed its specific flavour (translated in [21]). Thus, free L-glutamate (glutamic acid) is thepredominant umami effective stimuli, and MSG is the predominant prototypical umami stimuli usedin psychophysical testing. It was later discovered that the taste of L-glutamate could be synergisticallyincreased through the addition of disodium 5’ribonucleic acids, specifically disodium 5’inosinatemonophosphate (IMP) and disodium 5’guanylate monophosphate (GMP) [22]. When tasted in isolationIMP elicits a minimal to weak umami taste hypothesised to occur due to the interaction of IMP withsubthreshold concentrations of L-glutamate in humans’ saliva, demonstrating that IMP and GMPrequire L-glutamate for an umami taste perception to occur [23]. In human psychophysical studies, theaddition of 0.5 mM IMP significantly reduces the concentration of MSG required for participants toreach RT (7.66 mM and 0.20 mM MSG respectively) due to the taste potentiation produced when IMPis applied with MSG [24].
Free L-glutamate is naturally present in high concentrations in a wide variety of foods includingcertain vegetables (and fruits i.e., tomato), seaweeds, aged cheese, seafood, fish and soy sauce, eggyolks, and human breast milk [14,25–27]. Whereas, IMP is found predominately in animal productssuch as chicken, pork, beef, and tuna, and GMP in dried mushrooms such as shitake [14,25,26].The curing, ageing, heat treatment, and fermenting of certain foods results in an increase in free aminoacids, including L-glutamate, and often an increase in umami potentiating ribonucleotides (IMP and/orGMP) [14,26]. Specifically, in animal products such as beef, pork, chicken, and fish that contain highconcentrations of protein, which is essentially tasteless, proteolysis occurring from fermentation, curing,or heat treatment releases a complex mixture of amino acids, including L-glutamate. As these animalproducts naturally contain high concentrations of IMP the umami taste potentiation between IMP andL-glutamate can occur [14,26]. For example, during the process of ageing beef the concentration offree L-glutamate has been shown to increase by approximately 33% over eight days, and when this iscombined with naturally present IMP, umami taste potentiation can occur [26].
The increase of tastants occurring from fermenting, curing, heat treatment or ageing is notunique to specifically umami taste quality, with kokumi taste (rich, mouthful, thick, delicious taste)peptides similarly increasing through these same processes. Kokumi tasting compounds include certainγ-glutamyl peptides and during the ageing of dairy products [28] and in fermented products includingsoy or fish sauce [4,29] the concentrations of γ-glutamyl peptides increases. This ageing/fermentingprocess results in an accumulation of peptides including γ-glutamic acid that forms a peptide bondwith an amino group of a non-polar amino acid [30]. Additionally, glutathione (GSH) a tripeptidemade up of glutamic acid, cysteine, and glycine, which elicits a kokumi taste, similarly increases inconcentration through fermentation of certain foods. Kokumi stimuli including GSH, similar to IMP,elicit little taste in isolation, but when combined with an umami solution enhances the mouthful,continuity, and thickness, thus enhancing the kokumi aspects of the umami solution [4]. Similar toumami effective stimuli, GSH and other γ-glutamyl peptides are common in a number of high proteinfoods, such as beef, chicken, and ham, and in low protein foods such as tomato juice, and red wine,at concentrations above GSH DTs [4]. This suggests that there is an association between the effectivestimuli eliciting both umami and kokumi tastes in food, namely the involvement of glutamic acidderivatives in both umami and kokumi effective stimuli [30].
4. Umami Taste from an Evolutionary Perspective
In humans, the ability to detect chemicals in the oral cavity prior to ingestion, and interpretsalient perceptions of sweet, sour, salty, and bitter allows for rapid evaluation of a food, identifyingwhether it is acceptable (swallow), or unacceptable and potentially harmful (expectorate), whichwas essential for species survival [11,31–33]. Sweet taste is stimulated by simple carbohydrates,believed to indicate the presence of readily usable energy, eliciting appetitive hedonic responses
175

Nutrients 2019, 11, 182
and thereby encouraging consumption [11,31]. Similarly, the detection of complex carbohydratesmay also encourage consumption by signaling information regarding the carbohydrate and energycontent of food [20]. Excess bitterness indicates the presence of potential toxins within food, ultimatelyencouraging rejection of the food [8,11,31]. Excess sourness can indicate off or spoilt foods, and isavoided to ensure the body’s acid–base balance is maintained [8,31]. Salt taste perception is positedto be for maintenance of the body’s electrolyte balance [9], for example, at high concentrations salttaste may play a role in the immediate analysis of whether to swallow or expectorate food, perhapsto avoid acute disturbance in the body’s osmotic balance [11]. The ability to detect fat taste may beless important for the rapid evaluation of food and more closely related to activating physiologicalresponses related to digestion and food intake regulation [18,34].
Umami taste has previously been hypothesised to signal the presence of amino acids and protein,promoting consumption of certain protein containing foods. Conversely, many foods naturallyhigh in free L-glutamate are not typically high in protein, for example, peas, corn, red grapes, andtomatoes [14,35]. Along the same line, high protein foods, including beef, pork, and chicken do notcontain high concentrations of free L-glutamate [26]. As previously mentioned, protein is essentiallytasteless, it is the proteolysis of protein within these foods occurring from fermentation, curing, or heattreatment, that releases amino acids and peptides that can stimulate taste responses. Thus, umamitaste perception may indicate the presence of accessible, rather than protein bound amino acids, infoods that have been released during proteolysis occurring through various cooking processes [11].During proteolysis it is important to consider that the amino acids released are not solely umamitasting (L-glutamate), the release of bitter tasting (i.e., L-Leucine, -Phenylalanine, -Tryptophan) andsweet tasting (i.e., L-Glycine, -Alanine, -Proline) amino acids also occurs in different concentrationsdepending on the specific food [36]. Thus raising the question of whether it is appropriate to designatethe evolutionary purpose of umami taste perception to signal protein content of food, when proteolysisin certain foods results in a complex mixture of taste active amino acids, including sweet and bittertasting amino acids.
Following on from this, nutritional status, specifically protein-calorie deficiency does not appearto feedback onto preferences for umami tasting stimuli, as both malnourished (protein-caloriemalnourished) and healthy infants showed preference for soup containing MSG to the same soupwithout MSG [37,38]. When the soup was provided in combination with casein hydrolysate, whichcontains a mixture of amino acids where a bitter taste dominates, the malnourished infants preferredthe casein hydrolysate soup whereas the healthy infants did not [38]. Protein deficiency in infantsincreases consumption of protein containing food independent of the taste profile; the hypothesis thatumami taste exists to signal the presence of protein is not supported.
Glutamate receptors (T1R1/T1R3 and mGluR1) exist throughout the gastrointestinal tract [39,40],and stimulation of these receptors has been suggested to affect nutrient absorption through regulatingsatiety hormones including cholecystokinin (CCK) [40–42]. Moreover, consumption of umamistimuli (MSG) appears to be involved in appetite stimulation and satiety regulation regardless ofthe macronutrient (i.e., protein and carbohydrate) consumed in human behavioural studies [43](for further discussion please see section Behavioural and physiological responses to umami effective stimuli).Perhaps umami is less involved in the rapid analysis of food in the oral cavity, and more involved inincreasing appetite to promote consumption, whilst simultaneously assisting in regulation of proteindigestion through signaling mechanisms that promote gastric secretion.
5. Unique Receptor and Neural Transmission of Umami Effective Stimuli
5.1. Unique Receptors for L-glutamate
As previously discussed, taste receptors on the tongue detect saliva soluble, non-volatile chemicalsfrom foods in the oral cavity. Of the basic tastes, sweet, bitter, and umami tastes are mediated viaG-protein-coupled receptors, T1Rs and T2Rs, found in type II taste receptor cells [44]. Bitter ligands are
176

Nutrients 2019, 11, 182
detected by T2R of which there are currently over 25 genes encoding the T2Rs [44,45]. Salty and sourtaste have been suggested to be modulated by specialised ion channels. Salty taste has been proposedto involve the selective epithelial type sodium channel (ENaC), and putative sour taste receptorsinclude H+ ions permeating type III sour sensing cells resulting in type III sour cells depolarising andreaching action potential [8,44,45], see Roper et al (2017) for a recent comprehensive review on tastereceptor mechanisms.
Umami was widely accepted as a basic taste based on the discovery that the heterodimericG-protein-coupled receptors, T1R1/T1R3 mediate umami taste detection [17,46,47]. The umami tasteheterodimer complex, T1R1/T1R3, shares a common receptor subunit (T1R3) with sweet taste detectedby the heterodimeric G-protein-coupled receptors, T1R2/T1R3 [9,44]. T1R1/T1R3 heterodimericreceptor is specific to detecting umami-tasting stimuli (L-amino acids), as it is non-responsive to sweetstimuli but responsive to umami stimuli (MSG and L-glutamate) in vitro [17,46]. T1R1/T1R3 wasconfirmed to respond to umami-tasting stimuli upon the discovery that T1R1, T1R3, and T1R1/T1R3knockout mice lack, or have attenuated taste responses to umami stimuli (MSG) [47], and humanT1R1/T1R3 receptors responded when L-glutamate was applied in vitro [46]. Although, studieshave found in T1R1 and T1R3 knockout mice that a reduced, but not abolished, taste response toumami stimuli (MSG and MPG) occurs, indicating that other receptors responding to umami stimuliexist [48–51].
When investigating the umami taste synergism occurring from the mixing of IMP/GMP withMSG, T1R3 knockout mice had only moderately reduced taste responses, both neural and behavioural,although the contribution of Na+ was not eliminated in this study, so remaining taste responses inthese knockout mice is likely due to the Na+ [48]. Zhao and colleagues showed, in independentlygenerated T1R3 knockout mice, that when the contribution of Na+ was reduced with amiloride, theT1R3 knockout mice lacked responses to IMP with MSG, where responses in control mice remained,highlighting the importance of the T1R3 subunit in umami taste synergism [47]. Similarly, in T1R1knockout mice the umami synergy when IMP was applied with MSG was abolished [52]. All of thisshows that the T1R1/T1R3 umami receptors are important, if not essential, for the synergistic effect ofIMP/GMP when applied with MSG, but for MSG in isolation an umami taste response, albeit reduced,remains in the absence of the T1R1/T1R3 umami receptors [53]. This suggests that additional receptorsrespond to umami taste stimuli, which was supported by studies finding putative umami receptors,metabotropic glutamate receptor 1 and 4 (mGluR1, mGluR4) were activated by concentrations ofumami stimuli (MPG) commonly found in food in an in vitro assay [51], and mGluR4 knockout micehad reduced neural responses in vivo to umami stimuli (MPG) [54].
Finally, the discovery of single nucleotide polymorphisms on human TAS1R1, and TAS1R3receptor genes, and their association with individual variation in umami (MSG, MPG, and MSG+IMP)taste perception phenotypes, provided further evidence for T1R1/T1R3 contributing to umami tastedetection in humans [24,55,56].
5.2. Neural Responses to Umami Stimuli
When taste receptor cells detect chemicals in the oral cavity a neurotransmitter (ATP) is releasedonto afferent gustatory fibres, three predominant gustatory afferent nerves transmit informationfrom taste buds to the brain [8]. The 7th cranial nerve, chorda tympani (CT), innervates the anteriortwo thirds of the tongue, and the 9th cranial nerve, glossopharyngeal (GL), innervates the posteriorthird, and the 10th cranial nerve, vagus nerve, similarly innervates the posterior of the tongue.The information transmitted for umami taste is then processed in the primary and secondary gustatorycortex [57].
Studies investigating responses of the CT in both wild-type mice (not genetically modified),and T1R3 knockout mice, have shown that there are two predominant fibre groups in the CT [58].These fibres noted are sucrose best (S) and MPG best, or L-glutamate best (M) fibres, each of these fibreshave sub-groups (S1, S2, and M1, M2) [58]. S1 and M1 show synergism between L-glutamate and IMP,
177

Nutrients 2019, 11, 182
whereas S2 and M2 do not display this synergism [58]. In T1R3 knockout mice S1 fibres were lacking,and no synergistic effect between MPG and IMP was observed [58]. Similarly, whole CT responsesin T1R3 knockout mice showed the synergism between IMP mixed with MSG is attenuated [48], oreliminated [47], demonstrating the importance of the T1R3 subunit for the synergistic effect betweenL-glutamate and IMP in the CT nerve. In response to MSG in isolation, T1R3 knockout mice showedreduced CT responses only at the highest MSG concentration [48]. This reduced response did notoccur in the GL nerve, indicating that perhaps other receptors mediate umami responses from theGL nerve, for example, the mGluR4 receptor [48]. Supporting this, mGluR4 knockout mice displayedreduced responses to umami stimuli (MPG) in both the CT and GL nerves, these receptors may notbe innervated by S1, or S2 fibres [54]. Whether the transduction of umami taste results in a uniquelyperceptible experience will be discussed below.
6. Perceptual Independence of Umami Taste
Perception is input from the senses giving rise to a conscious experience of the particularstimulus [11]. Basic tastes should elicit perceptions independent to other basic tastes, and should not beproduced by combination of existing basic tastes, or other sensory systems, such as the somatosensorysystem (i.e., mouthfeel or mouthfullness) [10,12]. The detection of a compound by taste receptors, andtransduction to gustatory processing areas may produce a taste perception, but this taste perceptionmay not always be a perceptually salient experience.
An important point to note regarding perceptual independence of umami is that the compoundresponsible, L-glutamate, is not used in the glutamic acid form as it is sour, so the sodium salt form isprimarily used in psychophysical studies, meaning some potential overlap with salt taste (please seeUmami and salty section).
Describing the perception arising from tasting umami effective stimuli becomes difficult due tothe absence of a clear set of lexicon for describing umami, thus, whether umami is perceptually salientis not clear. Throughout the literature, a multitudinous lexicon has been used to describe umami taste,ranging from meaty, savoury, brothy, mouthfullness, and delicious [35,55,59]. Familiarisation or alearning effect for umami taste perception is not consistent within the literature, for example, a learningeffect for umami hypotasters occurred after repeated exposure [60], contrary to this, umami tastesensitivity either increased or decreased depending on participants’ age over repeated measures [61].Using familiarisation or repeated exposure for improving perceptual salience of umami taste requiresfurther research, as the current literature is inconclusive. The question that remains is whether a basictaste should require familiarisation for a perceptually salient experience to occur? Additionally, thecommon description of umami flavour as ‘mouthfeel’ [62] implies a tactile component to umami taste,similar to the description used for kokumi taste. Descriptions for umami taste cited within the literatureare similar to those used to describe kokumi taste. Kokumi descriptions include deliciousness, rich,continuity, and mouthfullness [63]. Although kokumi is not a basic taste, there are similarities in botheffective stimuli (glutamic acid derivatives) and descriptions of perceptual experiences arising fromtasting both kokumi and umami stimuli suggests these taste qualities have perceptual similarities.
Considering L-glutamate is the predominant umami stimuli that is detected by glutamatereceptors [17], it may be suitable to predict that foods containing high concentrations of free L-glutamatewould ultimately lead to an experience that is perceived, and described, as umami or savoury.Although, it is important to note that taste perception of whole foods is indeed complex, withcontribution of many tastants within the one food resulting in the overall taste perception produced.Nevertheless, in foods including seaweed and specific mushrooms, for example shitake, that containhigh concentrations of L-glutamate, these are typically described as umami tasting. Contrary to this,there is a number of natural foods containing high concentrations of free L-glutamate that are notdescribed as having an umami taste, for example peas (200 mg/10 g), corn (140 mg/100 g), red grapes(184 mg/100 g), or tomatoes (140 mg/100 g) [14,64,65]. Similar to sweet and sour tastants in the
178
Nutrients 2019, 11, 182
previously mentioned foods, the presence of L-glutamate in these foods is an important compound toproduce the overall flavour of these foods, rather than eliciting a clear perceptible umami taste [36,66].
Umami (MSG) has been shown to exhibit partially independent taste perception, as previousstudies using multidimensional scaling have found that umami lies perceptually outside of the fourbasic tastes (sweet, sour, salty, and bitter) (cited in [25]), and that the taste perception of umamiis predominately due to the anion (L-glutamate), albeit a small effect of the cation needs to beconsidered [23]. Perceptual associations between umami and salty taste exist as thresholds for thetwo tastes were found to correlate in participants classified as umami hypotasters [60]. Perceptualassociations may similarly exist for umami and sweet tastes possibly due to the shared taste receptorsubunit (T1R3). For example, rodents have reduced discrimination ability between sucrose and MSGwhen the sodium in MSG is neutralised using a salt taste blocker (amiloride) [49]. Furthermore,in humans, perceptual associations have been found between umami and sweet tastes in umamihyposensitive participants [67]. Therefore, it is pertinent to consider the perceptual relationshipbetween umami taste and basic tastes, specifically salty and sweet tastes.
6.1. Umami and Salty
Glutamate in isolation from the sodium ion is glutamic acid, and has been described ashaving a sour taste [14]. The sodium salt of L-glutamate, MSG, produces an umami taste,and is the predominant prototypical umami stimulus used in psychophysical testing [60,67–69].MSG potentiating 5’ribonucleotides are similarly tasted in their disodium salt form [13,22] complicatingthe perceptual independence of umami from salt taste in psychophysical testing [60,67–69]. Participantsconfuse umami with salty taste [68], and food (soup) containing MSG+IMP has been perceived assaltier, but not more savoury, than soups without MSG+IMP [43]. To overcome the sodium componentof MSG, MPG is used in some psychophysical studies as a sodium free umami stimuli [55], althoughpotassium also imparts salty, bitter, and metallic tastes, thus for all psychophysical testing L-glutamaterequires a cation to produce a perceptible umami taste [14,23].
Through measuring DT and suprathreshold intensity for umami (MSG) and salty (NaCl), Lugaz,Pillias and Faurion (2002) found that 27% of their study population were classified as putative umamihypotasters. This proportion of umami hypotasters is consistent throughout the literature, with 28% offemale participants [67], and 21% of participants [55], having a reduced ability to discriminate between29 mM MSG and 29 mM NaCl. Using a filter paper disk method, 24% of female Japanese subjects hadumami taste thresholds above 50 mM MSG, and were considered hypotasters [69]. The remainder ofparticipants were classified as either semi-discriminators [67], or were able to discriminate betweenNaCl and MSG at the level of significance and were considered umami tasters [55,60]. Althougha very low percentage of the population, 3.5% of a French [60], 3.2% of a German, and 4.6% of aNorwegian population [70] had no ability to discriminate between 29 mM NaCl and 29 mM MSG.These participants were unable to taste the L-glutamate in MSG and were considered non-tasters.Whether a similar proportion of subjects would be found to be umami non-tasters and tasters innon-European populations, or populations with high MSG intake, requires further research.
In individuals with an ability to taste L-glutamate, umami and salty taste perception areindependent, conversely, in participants considered umami hypotasters, umami and salty tasteperception are associated. Lugaz and colleagues (2002) found a positive correlation (r = 0.75)between individual salty (NaCl), and umami taste (MSG) thresholds in hypotasters, indicating thatthe hypotasters were likely to be perceiving only the sodium cation of the MSG. Along the same line,Pepino and colleagues (2010) found that participants classified as umami hypotasters (referred to asnon-discriminators), perceived significantly more saltiness, and significantly less savouriness in MSGat suprathreshold concentrations, than umami tasters. There was no significant difference betweenumami tasters and hypotasters umami (MSG) DT [67], suggesting different mechanisms may mediateumami DT and suprathreshold taste dimensions supporting Lugaz and colleagues’ (2002) findingsthat thresholds and intensity perception for umami do not necessarily co-vary. Associations between
179

Nutrients 2019, 11, 182
umami DT and salty DT were not investigated, therefore, it is unknown if an association would haveoccurred between salty and umami DT in this female population group [67].
The difficulty with confirming umami taste perception independent from salt taste perception liesin the sodium cation in MSG. This can be overcome in part by the use of MPG, potassium, however hassalty, bitter, and metallic taste characteristics [71], and therefore MPG taste perceptions cannot be solelyattributed to L-glutamate. The contribution of the sodium ion in MSG can be reduced with the additionof IMP, nevertheless, IMP is tasted in disodium form and although IMP is added to MSG/MPG atsubthreshold NaCl concentrations, the presence of sodium cannot be completely negated. Perceptualassociations between umami and salty tastes appear to occur specifically in participants classifiedas umami hypotasters, but not in umami tasters. That is, for umami hyposensitive or non-tastingparticipants they are predominately sensing the sodium cation within MSG, resulting in associationsbetween salty and umami taste perception for these participants.
6.2. Umami and Sweet
Umami and sweet taste share a common taste receptor subunit, T1R3, therefore there ispotential for perceptual associations to exist [67,69]. Mice are capable of discriminating betweenMSG and sucrose [49], but when amiloride (a sodium blocker) is applied to neutralise the Na+ inMSG, a significant reduction in discrimination ability occurs [49]. Although significantly reduced,discrimination ability of the mice was still above chance, nevertheless, MSG and sucrose have someperceptual associations in rodents when the perceptual influence of Na+ is eliminated [49].
Interestingly, in human studies, umami hypotasters (non-discriminators) (27%, n = 16), haveboth significantly lower umami, and significantly lower sweet taste perception at suprathresholdconcentrations, compared to umami tasters (discriminators) [67]. At DT, no association betweenumami (MSG) and sweet (sucrose) DT was found, again indicating different mechanisms may mediatesuprathreshold and DT taste perception [67]. Similarly, umami (MSG) hypotasters (23.8%, n = 10)have a significantly lower sweet taste sensitivity at RT than umami tasters (n = 32) [69]. This suggestsa relationship between umami and sweet taste perception. Contrary to these studies, Chen andcolleagues (2009) found no significant difference in sweet taste intensity ratings in umami (MPG)insensitive (n = 5), and umami sensitive (n = 5) subjects. Mixed results could be attributed to differentprototypical umami stimulus used (MPG or MSG), or due to the relatively low number of participants(n = 10), compared to previous psychophysical studies [67,69]. Similar to the associations betweensalty and umami taste, sweet and umami taste perception has been found to be perceptually associatedin participants considered umami hypotasters, but not in umami tasters. Although the literature is notconsistent, the associations found in some studies could conceivably be due to the shared receptorsubunit between sweet and umami tastes, T1R3.
There is enough evidence to question whether umami is perceptually salient, particularly owingto the lexicon used to describe umami taste perception, and the similarities of these descriptions tokokumi taste. Perceptual independence of umami from salty, and sweet, is also unclear as associationsexist between umami and salty, and umami and sweet tastes specifically in umami hypotasters. Theseassociations are found across multiple taste dimensions, including DT, RT, and suprathreshold intensity.
7. Umami and Hedonics
MSG in an aqueous solution does not taste pleasant, however, when added to a complex foodsuch as broth, it enhances palatability. For example, in infants the presence of high concentrationsof L-glutamate in a breast milk matrix may increase the milks palatability and acceptability [25], andMSG added to a food matrix (soup) is preferred, but in an aqueous solution MSG is aversive [37].As previously mentioned, free L-glutamate and IMP/GMP are naturally present in a range of foods.Across many cuisines mixtures of foods containing high concentrations of free L-glutamate arecombined with foods containing high concentrations IMP/GMP thereby promoting the umamitaste synergism and palatability [1]. For example, in Italian cuisine the combination of parmesan
180

Nutrients 2019, 11, 182
(1200 mg/100 g L-glutamate) and beef/pork mince sauce (70 mg and 200 mg/100 g IMP respectively)or parmesan and tomato (120 mg/100 g L-glutamate). Or in Asian cuisines the combination offish sauce (ranging from 620–1380 mg/100 g L-glutamate) and meat or fish products (ranging from70–285 mg/100 g IMP) is frequently seen (see [25] for further examples). This combining of foods forenhanced palatability does not often come independent of sodium and kokumi peptides. Taking theprevious example, parmesan contains high concentrations of sodium, and kokumi peptides [72], asdoes soy sauce [73]. Likewise, in studies where ingredients were omitted to determine key taste activecompounds within a food, sodium, and free L-glutamate (along with other taste active amino acids)were common key tastants (reviewed in [74]).
The combination of added MSG and salt (NaCl) increases the acceptance of some foods, includingvarious soup/stocks [75] and rice dishes [76] at certain ratios (usually between 0.1% and 0.8% byweight [66]) depending on the foodstuff and culture. For example, in European populations this maybe higher (between 0.6 to 1.2%), possibly owing to the reduced familiarity of umami taste in Westernpopulations [77]. The addition of MSG to improve palatability has been successfully used to reducethe sodium concentration in food without implicating the sensory properties of the foods [75,76], thus,displaying that in certain foods L-glutamate, IMP, sodium and kokumi effective peptides all contributeto the development of flavour and palatability in commonly consumed foods globally.
8. Relationship between Receptor, Perception, and Behavioural Responses of Umami andSweet Taste
Perceptual associations between sweet and umami taste exist and may be due to behaviouralfactors including MSG and sucrose consumption [69,78], potentially owing to expression or sensitivityof the shared common receptor subunit T1R3 [17]. In vitro when MSG and sucrose are co-applied tosweet taste receptor cells, the response of the sweet taste receptor cells to sucrose is weakened [79].Response from sweet taste receptor cells is also significantly weakened when glutamyl dipeptides areco-applied with sucrose [79]. When the umami tasting compounds are applied with lactisole, whichinhibits activation of T1R3, a more severe reduction in the response from sweet taste receptors occurs.If umami tasting compounds and lactisole interacted with the same transmembrane domain of theT1R3, a synergistic reduction would not be expected, as the two stimuli would be competing for thesame transmembrane domain. This suggests an interaction between umami peptides and MSG withsweet taste receptors, preventing sweet substances binding to an alternative domain, potentially T1R2extracellular domain rather than the T1R3 domain [79].
Interestingly, in a human intervention study, prolonged consumption of MSG significantly reducedfemale participants’ umami suprathreshold intensity perception, and similarly reduced (trendingtowards significant, p = 0.06) sweet taste suprathreshold intensity perception [78]. Similarly, Kubotaand colleagues (2018) found that umami hypotasters also had a decreased sweet taste sensitivity,and consumed more sugar than umami tasters, although causation cannot be inferred betweenumami perception, sweet taste perception and sugar intake. It was not investigated whether umamihypotasters simply had a lower taste sensitivity overall compared to umami tasters, although this isunlikely as no significant differences in bitter taste sensitivity between umami tasters, and non-tasterswas found [69].
Increased consumption has been linked with decreased receptor expression for other basic tastes,for example, increased consumption of fat was associated with decreased fat taste perception anddecreased expression of fat taste receptor CD36 [18,80]. It would be interesting to know if increasedintake of umami and sweet tastes decreases both taste perception of sweet and umami tastes andexpression of the shared receptor subunit, T1R3. Alternatively, it is possible that increased intakeof L-glutamate may decrease expression of T1R1, mGluR1, or mGluR4 taste receptors, althoughthis does not account for the reduction in sweet taste perception found in previous psychophysicalstudies [69,78]. Considering umami stimuli may interact with the T1R2 extracellular domain [79],it would be interesting to investigate the influence of oral exposure to umami on T1R2 receptor
181

Nutrients 2019, 11, 182
expression. Although further research into receptor expression is required, dietary intake of bothsweet and umami stimuli appear to influence both umami and sweet taste perception in a similardirection, showing an interesting association between receptor, perception, and intake for umami andsweet tastes.
9. Behavioural and Physiological Responses to Umami Effective Stimuli
A key aspect of taste and taste receptor activation is the physiological responses initiated from oraltaste receptor activation, and the influence on behavioural responses in human studies, for exampleincreasing satiation and satiety [41,81]. The commencement of digestion is initiated through thesecretion of saliva, the presence of MSG in the oral cavity stimulates a strong response of salivaryrelease through a vagal efferent activation, assisting in initiating this digestion [40,82]. L-glutamateis not only detected in the oral cavity, but also in the gastrointestinal tract where T1R1/T1R3 arefound [40,42,83]. T1R1/T1R3 heterodimer has been suggested to affect nutrient absorption throughregulation of a peptide transporter through the activation by L-glutamate (reviewed in [42]). Daly andcolleagues (2013) found in rodents’ gastrointestinal tract T1R1/T1R3 are expressed and activation byL-glutamate results in CCK secretion in vitro, which is enhanced by IMP. CCK is involved in digestiveprocesses, including slowing gastric emptying, and has also been suggested to inhibit food intake, thushas a satiety-like action through activating vagal afferent fibres that innervate the stomach and upperintestine (reviewed in [84]).
This enhanced satiety-like action from glutamate consumption has been demonstrated in humanbehavioural studies where the return of hunger after eating is slowed down after participants consumesoup containing MSG, compared to soup without MSG [85], and soup containing protein and MSGcompared to other treatments [86]. Similarly, in infants, consumption is decreased and satiation andsatiety is increased when infants are fed formula supplemented with MSG, compared with standardcow’s milk formula with the same concentration of protein [87]. Masic et al (2014) postulated thatumami flavour may play a role in the satiating effects of protein, through sensory-nutrient interactions.Conversely, pre-load soups all containing MSG + IMP in conjunction with either low-energy,high-energy carbohydrate, or high-energy protein, all reduced consumption at a subsequent test mealcompared to the same pre-load soups without added MSG + IMP [43]. The presence of MSG + IMPalone reduced consumption, irrespective of the protein content of the preload soup [43]. It is plausiblethat the presence of MSG + IMP enhanced the post-ingestive release of CCK in the gastrointestinaltract, influencing gastric emptying for all soup pre-load conditions, enhancing satiety, and reducingsubsequent intake, although this requires further research. The effect of MSG on satiety is not consistentin the literature, as pre-load soups containing MSG improved energy compensation at a subsequenttest meal but did not reduce hunger ratings or total energy intake compared to pre-load soups withoutMSG [88]. This indicates the importance of IMP in conjunction with MSG, for satiety-like responsesand potentially CCK secretion, and considering MSG and IMP are often consumed together in animalprotein and other common food combinations, this provides evidence for the importance of umamitaste detection and perception in physiological processes and behavioural outcomes.
Interestingly, when a combination of tastants (sweet, bitter, and umami) were infused directly intothe duodenum, increased satiety and decreased hunger responses were observed, as was a reductionin consumption of an ad libitum meal [89]. When umami was infused in isolation this reduction inhunger and increase in satiety was still observed, but not when sweet or bitter were infused alone,demonstrating the results from the combination of tastants were predominately driven by umami,with the exception of reducing energy intake at an ad libitum meal. Interestingly, the infusion of allindividual tastants and combination of tastants did not influence the secretion of gastrointestinalpeptides in comparison to the placebo infusion. It would be interesting to investigate the interaction ofumami stimuli with taste receptors in the oral cavity without subsequent consumption, and whetherindividual variation in umami taste sensitivity is associated with the previously discussed physiological(satiety hormone release) and behavioural responses (satiety, satiation and intake). Although further
182

Nutrients 2019, 11, 182
research is required, the consumption of MSG and IMP and the discovery of glutamate receptors in thegastrointestinal tract provides evidence for the role of umami effective stimuli detection stimulatingphysiological responses which may translate into behavioural responses in human studies.
10. Summary—Is Umami A Basic Taste?
For the past 3000 years four tastes (sweet, sour, salty, and bitter) have been included in all listsof basic tastes, predominantly based on perception. While these lists changed significantly in otherattributes listed, often dependent on current thinking at that time, sweet, sour, salty, and bitter havebeen consistent. The recent advancements of technology and knowledge has led to the discovery oftaste receptors and ligands, extending this basic taste list to include umami and fat as basic tastes.Thus, the basic taste list has grown and has the potential to include a plethora of other tastes includingkokumi, carbohydrate, calcium and metallic tastes. With the potential of an ever-growing list of basictastes in the current day it is pertinent to evaluate the current evidence and the ‘moment in time’approach to naming basic tastes. It seems reasonable for new basic tastes, including umami, to considerif they belong in the same category as sweet, sour, salty, and bitter. Below is a summary of the evidenceof umami as a basic taste, including an overview of basic and new tastes, against the proposed tastecriteria, see Figure 1.
1. Having an evolutionary or adaptive advantage: Yes. Umami taste appears to have a biphasic effectdue to its involvement in appetite stimulation and then digestion regulation. This occurs throughboth increasing satiety [43], and the presence of glutamate receptors in the gastrointestinaltract stimulating the release of digestive hormones [40–42], providing evidence for umami tasteperception existing for evolutionary purposes.
2. A distinct class of effective stimuli must exist: Yes. Unique umami effective stimuli found in foodincludes free L-glutamate, and 5’ribonucleotides, and the prototypical umami taste stimuli arethe salts of glutamic acid, MSG or MPG, and disodium salts of IMP and GMP [14,23]. There area number of foods high in free L-glutamate that would not commonly be described as umami,raising the question of whether high concentrations of naturally occurring L-glutamate elicitsan umami like taste in all foods [14,64,65]. Although, common food processing such as curing,and ageing, can increase free L-glutamate and IMP in certain foods, enhancing the umami tastethrough the glutamate and IMP synergism [26]. Finally, there is similarity between kokumi andumami stimuli, predominately due to the involvement of glutamic acid derivatives [30].
3. Transduction mechanisms that can convert the chemical code of the stimulus into an electrical signal isrequired, including receptors: Yes. Glutamate taste receptors have been identified (T1R1/T1R3,mGluR1, and mGluR4), and these respond to umami stimuli [17,46,47]. This glutamate tastereceptor heterodimer (T1R1/T1R3), shares a receptor subunit with the sweet taste receptor(T1R2/T1R3) which has been hypothesised to relate to the perceptual associations that has beenfound between sweet and umami taste [69,78].
4. Neurotransmission of this electrical signal to processing regions of the brain must occur: Yes.Neurotransmission of signals transduced from glutamate receptors occurs, interestingly evidencesuggests that different stimuli (MSG, MPG, MSG+IMP) are transduced by different gustatoryafferent nerves (CT, GL) for umami taste.
5. Perceptual experience arising from this processing must be independent from other taste qualities: No.Studies using multidimensional scaling have found that umami lies perceptually outside of thefour basic tastes (sweet, sour, salty, and bitter) (cited in [25]), and individual variation in tasteperception across multiple taste dimensions has been established. Nevertheless, prototypicalumami stimuli (L-glutamate or IMP/GMP) require cations to produce an umami taste, regardlessof whether this cation is sodium or potassium, the additional taste that is imparted is difficult tonegate in psychophysical testing. Studies have found perceptual associations with umami andsalty taste, specifically in participants considered umami hypotasters at DT [60], and increased
183
Nutrients 2019, 11, 182
saltiness perception of MSG at suprathreshold concentrations [67]. For umami and sweet taste,associations have similarly been found at DT [67] and RT [69], possibly owing to the sharedreceptor subunit T1R3. Considering current research finds perceptual associations betweenumami, other basic tastes (salty and sweet) and putative tastes (kokumi), it is relevant to questionumami’s classification as a basic taste. Perhaps umami taste fits into a taste classification withother basics (fat) or putative tastes including carbohydrate, kokumi, metallic, and calcium tastesthat do elicit a taste perception when presented at high enough concentrations in the oral cavitybut this is not necessarily a unique or perceptually salient taste experience.
6. Hedonic response from tasting umami stimuli: Yes. Although in aqueous solution MSG is not pleasantin taste, when mixed to certain foods it enhances palatability. The combination of L-glutamate,IMP, sodium, and often kokumi peptides is important in enhancing palatability of certain foodsand is found across many cuisines globally.
7. Physiological effects must occur following activation of taste bud cells: Yes. Free L-glutamate is not onlydetected in the oral cavity, but also in the gastrointestinal tract where glutamate taste receptors(T1R1/T1R3) are present [40,42,83]. Glutamate taste receptor heterodimers have been suggestedto affect nutrient absorption through regulation of a peptide transporter and glucose transporterthrough the activation of T1R1/T1R3 by L-glutamate (reviewed in [42]), which also results in CCKsecretion in vitro [41]. Although the findings in the literature is mixed, behavioural studies haveshown that consumption of MSG and particularly MSG+IMP influences satiety, satiation, andfood intake, possibly owing to the secretion of digestive peptides upon stimulation of glutamatereceptors in the gastrointestinal tract.
184

Nutrients 2019, 11, 182
Figure 1. Criteria for tastes to fulfil to be classified as either basic tastes, or within a new taste subgroup.At the first criteria that a taste does not fulfil it is placed on the left-hand side of the model in the ‘NO’section, those that fulfil the criteria remain on the right-hand side in the ‘YES’ criteria. * ENaC knockoutmice have eliminated taste and neural responses to NaCl providing evidence for ENaC as the salt tastereceptor [90], human studies have not yet confirmed the ENaC channel for salt taste detection. For thereceptor criterion the ENaC receptor for salt taste, albeit in mice, has supporting evidence. * Type IIIsour sensing cells have been shown depolarise and reach action potential due to influx of H+ ions,providing evidence for sour taste detection, the specific proton channel responsible for this remains tobe confirmed [45].
185

Nutrients 2019, 11, 182
11. A New Class for New Tastes: Alimentary Taste
Current advances in knowledge and technology has led to the discovery of taste receptors, whichhas broadened the stimuli that could potentially be considered basic tastes, including kokumi, calcium,and likely many more to be discovered, for example, receptors responding to carbohydrate andmetallic taste ligands. So, this ‘moment in time’ list of basic tastes has begun to expand with theaddition of umami and fat, and others on the horizon such as carbohydrate and kokumi. Shouldkokumi, fat, or even umami be classified in the same category as sweet, sour, salty, and bitter, allof which have lingered throughout history? Is it enough to have identified receptors on taste cellsfor new tastes to be considered a basic taste, if the activation of these receptors does not result in aperceptually independent (umami) or perceptually salient (umami and fat) experience? An example ofthe identification of receptors with an absence of perceptual salience is fat taste, conceivably umamimay fall into a similar category. Due to their unquestionable perceptual salience, sweet, sour, salty,and bitter have importance for immediate decision making; do we ingest or reject, that is, these tastesare critical during pre-ingestive taste detection. Many of the new and putative tastes may have fargreater importance on post-ingestive consequences of nutrients that are detected not only in the oralcavity, but throughout the alimentary canal. Perhaps it is important, particularly in the context ofapplied taste research, that we consider umami and fat in a new subgroup of tastes. We propose anew structure of taste classification, with the four traditional tastes remaining as basic tastes due totheir critical function during pre-ingestive taste detection, and new tastes becoming ‘alimentary’ tastes,including umami and fat, which have greater importance for post-ingestive functioning.
Author Contributions: R.K. Conceptualisation of the manuscript; I.E.H. Writing—original draft preparation; R.K.,D.G.L. Writing—reviewing and editing; all authors reviewed the manuscript.
Funding: This research received no external funding.
Conflicts of Interest: The authors declare no conflict of interest.
References
1. Kurihara, K. Glutamate: From discovery as a food flavor to role as a basic taste (umami). Am. J. Clin. Nutr.2009, 90, 719S–722S. [CrossRef] [PubMed]
2. Newman, L.; Keast, R. The Test–Retest Reliability of Fatty Acid Taste Thresholds. Chemosens. Percept. 2013, 6,70–77. [CrossRef]
3. Dunkel, A.; Köster, J.; Hofmann, T. Molecular and Sensory Characterization of γ-Glutamyl Peptides asKey Contributors to the Kokumi Taste of Edible Beans (Phaseolus vulgaris L.). J. Agric. Food Chem. 2007, 55,6712–6719. [CrossRef]
4. Ueda, Y.; Yonemitsu, M.; Tsubuku, T.; Sakaguchi, M.; Miyajima, R. Flavor Characteristics of Glutathione inRaw and Cooked Foodstuffs. Biosci. Biotechnol. Biochem. 1997, 61, 1977–1980. [CrossRef]
5. Low, J.Y.Q.; Lacy, K.E.; McBride, R.L.; Keast, R.S.J. Evidence supporting oral sensitivity to complexcarbohydrates independent of sweet taste sensitivity in humans. PLOS ONE 2017, 12, e0188784. [CrossRef][PubMed]
6. Tordoff, M.G. Calcium: Taste, intake, and appetite. Physiol. Rev. 2001, 81, 1567–1597. [CrossRef] [PubMed]7. Lawless, H.T.; Stevens, D.A.; Chapman, K.W.; Kurtz, A. Metallic taste from electrical and chemical
stimulation. Chem. Senses 2005, 30, 185–194. [CrossRef] [PubMed]8. Chaudhari, N.; Roper, S.D. The cell biology of taste. J. Cell Biol. 2010, 190, 285. [CrossRef]9. Chandrashekar, J.; Hoon, M.A.; Ryba, N.J.P.; Zuker, C.S. The receptors and cells for mammalian taste. Nature
2006, 444, 288. [CrossRef] [PubMed]10. Keast, R.S.; Costanzo, A. Is fat the sixth taste primary? Evidence and implications. Flavour 2015, 4, 5.
[CrossRef]11. Breslin, P.A.S. An Evolutionary Perspective on Food Review and Human Taste. Curr. Biol. 2013, 23, 409–418.
[CrossRef] [PubMed]12. Mattes, R.D. Accumulating Evidence Supports a Taste Component for Free Fatty Acids in Humans.
Physiol. Behav. 2011, 104, 624–631. [CrossRef]
186

Nutrients 2019, 11, 182
13. Kurihara, K.; Kashiwayanagi, M. Physiological Studies on Umami Taste. J. Nutr. 2000, 130, 931S–934S.[CrossRef]
14. Kurihara, K. Umami the Fifth Basic Taste: History of Studies on Receptor Mechanisms and Role as a FoodFlavor. BioMed Res. Int. 2015, 2015, 189402. [CrossRef]
15. Bartoshuk, L.M. History of Taste Research; Carterette, E.C., Friedman, M.P., Eds.; Academic Press: New York,NY, USA, 1978.
16. McBurney, D.H.; Gent, J.F. On the nature of taste qualities. Psychol. Bull. 1979, 86, 151–167. [CrossRef][PubMed]
17. Nelson, G.; Chandrashekar, J.; Hoon, M.A.; Feng, L.; Zhao, G.; Ryba, N.J.P.; Zuker, C.S. An amino-acid tastereceptor. Nature 2002, 416, 199. [CrossRef]
18. Liu, D.; Archer, N.; Duesing, K.; Hannan, G.; Keast, R. Mechanism of fat taste perception: Association withdiet and obesity. Prog. Lipid Res. 2016, 63, 41–49. [CrossRef]
19. Ohsu, T.; Amino, Y.; Nagasaki, H.; Yamanaka, T.; Takeshita, S.; Hatanaka, T.; Maruyama, Y.; Miyamura, N.;Eto, Y. Involvement of the Calcium-sensing Receptor in Human Taste Perception. J. Biol. Chem. 2010, 285,1016–1022. [CrossRef] [PubMed]
20. Low, J.Y.Q.; Lacy, K.E.; McBride, R.L.; Keast, R.S.J. Carbohydrate Taste Sensitivity Is Associated with StarchIntake and Waist Circumference in Adults. J. Nutr. 2017, 147, 2235–2242. [CrossRef]
21. Ikeda, K. New Seasonings. Chem. Senses 2002, 27, 847–849. [CrossRef]22. Yamaguchi, S. The Synergistic Taste Effect of Monosodium Glutamate and Disodium 5′-Inosinate. J. Food Sci.
1967, 32, 473–478. [CrossRef]23. Yamaguchi, S. Basic properties of umami and effects on humans. Physiol. Behav. 1991, 49, 833–841. [CrossRef]24. Shigemura, N.; Shirosaki, S.; Sanematsu, K.; Yoshida, R.; Ninomiya, Y. Genetic and molecular basis of
individual differences in human umami taste perception. PLoS ONE 2009, 4. [CrossRef]25. Yamaguchi, S.; Ninomiya, K. Umami and Food Palatability. J. Nutr. 2000, 130, 921S–926S. [CrossRef]
[PubMed]26. Ninomiya, K. Natural occurrence. Food Rev. Int. 1998, 14, 177–211. [CrossRef]27. Agostoni, C.; Carratu, B.; Boniglia, C.; Lammardo, A.M.; Riva, E.; Sanzini, E. Free glutamine and glutamic
acid increase in human milk through a three-month lactation period. J. Pediatr. Gastroenterol. Nutr. 2000, 31,508–512. [CrossRef]
28. Toelstede, S.; Hofmann, T. Kokumi-Active Glutamyl Peptides in Cheeses and Their Biogeneration byPenicillium roquefortii. J. Agric. Food Chem. 2009, 57, 3738–3748. [CrossRef]
29. Kuroda, M.; Kato, Y.; Yamazaki, J.; Kai, Y.; Mizukoshi, T.; Miyano, H.; Eto, Y. Determination andQuantification of γ-Glutamyl-valyl-glycine in Commercial Fish Sauces. J. Agric. Food Chem. 2012, 60,7291–7296. [CrossRef]
30. Paolella, S.; Prandi, B.; Falavigna, C.; Buhler, S.; Dossena, A.; Sforza, S.; Galaverna, G. Occurrence ofnon-proteolytic amino acyl derivatives in dry-cured ham. Food Res. Int. 2018, 114, 38–46. [CrossRef][PubMed]
31. Steiner, J.E.; Glaser, D.; Hawilo, M.E.; Berridge, K.C. Comparative expression of hedonic impact: Affectivereactions to taste by human infants and other primates. Neurosci. Biobehav. Rev. 2001, 25, 53–74. [CrossRef]
32. Peng, Y.; Gillis-Smith, S.; Jin, H.; Tränkner, D.; Ryba, N.J.; Zuker, C.S. Sweet and bitter taste in the brain ofawake behaving animals. Nature 2015, 527, 512. [CrossRef]
33. Beauchamp, G.K. Why do we like sweet taste: A bitter tale? Physiol. Behav. 2016, 164, 432–437. [CrossRef]34. Newman, L.; Haryono, R.; Keast, R. Functionality of Fatty Acid Chemoreception: A Potential Factor in the
Development of Obesity? Nutrients 2013, 5. [CrossRef] [PubMed]35. Beauchamp, G.K. Sensory and receptor responses to umami: An overview of pioneering work. Am. J.
Clin. Nutr. 2009, 90, 723S–727S. [CrossRef] [PubMed]36. Ninomiya, K. Umami: A universal taste. Food Rev. Int. 2002, 18, 23–38. [CrossRef]37. Vazquez, M.; Pearson, P.B.; Beauchamp, G.K. Flavor preferences in malnourished Mexican infants.
Physiol. Behav. 1982, 28, 513–519. [CrossRef]38. Beauchamp, G.K.; Pearson, P. Human development and umami taste. Physiol. Behav. 1991, 49, 1009–1012.
[CrossRef]39. Kondoh, T.; Mallick, H.N.; Torii, K. Activation of the gut-brain axis by dietary glutamate and physiologic
significance in energy homeostasis. Am. J. Clin. Nutr. 2009, 90, 832S–837S. [CrossRef]
187

Nutrients 2019, 11, 182
40. San Gabriel, A.; Uneyama, H. Amino acid sensing in the gastrointestinal tract. Amino Acids 2013, 45, 451–461.[CrossRef]
41. Daly, K.; Al-Rammahi, M.; Moran, A.; Marcello, M.; Ninomiya, Y.; Shirazi-Beechey, S.P. Sensing of aminoacids by the gut-expressed taste receptor T1R1–T1R3 stimulates CCK secretion. Am. J. Physiol. 2013, 304,G271–G282. [CrossRef]
42. Wauson, E.M.; Lorente-Rodríguez, A.; Cobb, M.H. Minireview: Nutrient Sensing by G Protein-CoupledReceptors. Mol. Endocrinol. 2013, 27, 1188–1197. [CrossRef] [PubMed]
43. Masic, U.; Yeomans, M.R. Umami flavor enhances appetite but also increases satiety. Am. J. Clin. Nutr. 2014,100, 532–538. [CrossRef] [PubMed]
44. Bachmanov, A.A.; Beauchamp, G.K. Taste Receptor Genes. Annu. Rev. Nutr. 2007, 27, 389–414. [CrossRef][PubMed]
45. Roper, S.D.; Chaudhari, N. Taste buds: Cells, signals and synapses. Nat. Rev. Neurosci. 2017, 18, 485.[CrossRef] [PubMed]
46. Li, X.; Staszewski, L.; Xu, H.; Durick, K.; Zoller, M.; Adler, E. Human receptors for sweet and umami taste.Proc. Natl. Acad. Sci. USA 2002, 99, 4692–4696. [CrossRef]
47. Zhao, G.Q.; Zhang, Y.; Hoon, M.A.; Chandrashekar, J.; Erlenbach, I.; Ryba, N.J.P.; Zuker, C.S. The receptorsfor mammalian sweet and umami taste. Cell 2003, 115, 255–266. [CrossRef]
48. Damak, S.; Rong, M.; Yasumatsu, K.; Kokrashvili, Z.; Varadarajan, V.; Zou, S.; Jiang, P.; Ninomiya, Y.;Margolskee, R.F. Detection of sweet and umami taste in the absence of taste receptor T1r3. Science 2003, 301,850–853. [CrossRef] [PubMed]
49. Delay, E.R.; Hernandez, N.P.; Bromley, K.; Margolskee, R.F. Sucrose and monosodium glutamate tastethresholds and discrimination ability of T1R3 knockout mice. Chem. Senses 2006, 31, 351–357. [CrossRef][PubMed]
50. Maruyama, Y.; Pereira, E.; Margolskee, R.F.; Chaudhari, N.; Roper, S.D. Umami Responses in Mouse TasteCells Indicate More than One Receptor. J. Neurosci. 2006, 26, 2227–2234. [CrossRef]
51. Pal Choudhuri, S.; Delay, R.J.; Delay, E.R. Metabotropic glutamate receptors are involved in the detection ofIMP and l-amino acids by mouse taste sensory cells. Neuroscience 2016, 316, 94–108. [CrossRef] [PubMed]
52. Kusuhara, Y.; Yoshida, R.; Ohkuri, T.; Yasumatsu, K.; Voigt, A.; Hübner, S.; Maeda, K.; Boehm, U.;Meyerhof, W.; Ninomiya, Y. Taste responses in mice lacking taste receptor subunit T1R1. J. Physiol. 2013, 591,1967–1985. [CrossRef] [PubMed]
53. Blonde, G.D.; Travers, S.P.; Spector, A.C. Taste sensitivity to a mixture of monosodium glutamate andinosine 5′-monophosphate by mice lacking both subunits of the T1R1+T1R3 amino acid receptor. Am. J.Physiol.-Regul. Integr. Comp. Physiol. 2018, 314, R802–R810. [CrossRef]
54. Yasumatsu, K.; Manabe, T.; Yoshida, R.; Iwatsuki, K.; Uneyama, H.; Takahashi, I.; Ninomiya, Y. Involvementof multiple taste receptors in umami taste: Analysis of gustatory nerve responses in metabotropic glutamatereceptor 4 knockout mice. J. Physiol. 2014, 593, 1021–1034. [CrossRef] [PubMed]
55. Chen, Q.-Y.; Alarcon, S.; Tharp, A.; Ahmed, O.M.; Estrella, N.L.; Greene, T.A.; Rucker, J.; Breslin, P.A.S.Perceptual variation in umami taste and polymorphisms in TAS1R taste receptor genes. Am. J. Clin. Nutr.2009, 90, 770S–779S. [CrossRef]
56. Raliou, M.; Grauso, M.; Hoffmann, B.; Schlegel–Le-Poupon, C.; Nespoulous, C.; Débat, H.; Belloir, C.;Wiencis, A.; Sigoillot, M.; Preet Bano, S.; et al. Human Genetic Polymorphisms in T1R1 and T1R3 TasteReceptor Subunits Affect Their Function. Chem. Senses 2011, 36, 527–537. [CrossRef] [PubMed]
57. De Araujo, I.E.T.; Kringelbach, M.L.; Rolls, E.T.; Hobden, P. Representation of umami taste in the humanbrain. J. Neurophysiol. 2003, 90, 313–319. [CrossRef] [PubMed]
58. Yasumatsu, K.; Ogiwara, Y.; Takai, S.; Yoshida, R.; Iwatsuki, K.; Torii, K.; Margolskee, R.F.; Ninomiya, Y.Umami taste in mice uses multiple receptors and transduction pathways. J. Physiol. 2012, 590, 1155–1170.[CrossRef]
59. Chaudhari, N.; Pereira, E.; Roper, S.D. Taste receptors for umami: The case for multiple receptors. Am. J.Clin. Nutr. 2009, 90, 738S–742S. [CrossRef]
60. Lugaz, O.; Pillias, A.M.; Faurion, A. A new specific ageusia: Some humans cannot taste L-glutamate.Chem. Senses 2002, 27, 105–115. [CrossRef]
61. Mojet, J.; Christ-Hazelhof, E.; Heidema, J. Taste perception with age: Generic or specific losses in thresholdsensitivity to the five basic tastes? Chem. Senses 2001, 26, 845–860. [CrossRef]
188

Nutrients 2019, 11, 182
62. Prescott, J. Effects of added glutamate on liking for novel food flavors. Appetite 2004, 42, 143–150. [CrossRef]63. Yamamoto, T.; Watanabe, U.; Fujimoto, M.; Sako, N. Taste preference and nerve response to 5′-inosine
monophosphate are enhanced by glutathione in mice. Chem. Senses 2009, 34, 809–818. [CrossRef]64. Löliger, J.R. Function and Importance of Glutamate for Savory Foods. J. Nutr. 2000, 130, 915S–920S. [CrossRef]
[PubMed]65. Giacometti, T. Free and Bound Glutamate in Natural Products. In Glutamic Acid; Raven Press: New York, NY,
USA, 1979; pp. 25–34.66. Jinap, S.; Hajeb, P. Glutamate. Its applications in food and contribution to health. Appetite 2010, 55, 1–10.
[CrossRef] [PubMed]67. Pepino, M.Y.; Finkbeiner, S.; Beauchamp, G.K.; Mennella, J.A. Obese Women Have Lower Monosodium
Glutamate Taste Sensitivity and Prefer Higher Concentrations Than Do Normal-weight Women. Obesity2010, 18, 959–965. [CrossRef] [PubMed]
68. Overberg, J.; Hummel, T.; Krude, H.; Wiegand, S. Differences in taste sensitivity between obese and non-obesechildren and adolescents. Arch. Dis. Child. 2012, 97, 1048. [CrossRef]
69. Kubota, M.; Toda, C.; Nagai-Moriyama, A. Relationship between umami taste acuity with sweet or bittertaste acuity and food selection in Japanese women university students. Asia Pac. J. Clin. Nutr. 2018, 27,107–112. [CrossRef]
70. Singh, P.B.; Schuster, B.; Seo, H.S. Variation in umami taste perception in the German and Norwegianpopulation. Eur. J. Clin. Nutr. 2010, 64, 1248–1250. [CrossRef]
71. Sinopoli, D.A.; Lawless, H.T. Taste Properties of Potassium Chloride Alone and in Mixtures with SodiumChloride Using a Check-All-That-Apply Method. J. Food Sci. 2012, 77, S319–S322. [CrossRef]
72. Sforza, S.; Cavatorta, V.; Galaverna, G.; Dossena, A.; Marchelli, R. Accumulation of non-proteolytic aminoacylderivatives in Parmigiano-Reggiano cheese during ripening. Int. Dairy J. 2009, 19, 582–587. [CrossRef]
73. Kuroda, M.; Kato, Y.; Yamazaki, J.; Kai, Y.; Mizukoshi, T.; Miyano, H.; Eto, Y. Determination and quantificationof the kokumi peptide, gamma-glutamyl-valyl-glycine, in commercial soy sauces. Food Chem. 2013, 141,823–828. [CrossRef] [PubMed]
74. Fuke, S.; Konosu, S. Taste-active components in some foods: A review of Japanese research. Physiol. Behav.1991, 49, 863–868. [CrossRef]
75. Jinap, S.; Hajeb, P.; Karim, R.; Norliana, S.; Yibadatihan, S.; Abdul-Kadir, R. Reduction of sodium content inspicy soups using monosodium glutamate. Food Nutr. Res. 2016, 60, 30463. [CrossRef]
76. Leong, J.; Kasamatsu, C.; Ong, E.; Hoi, J.T.; Loong, M.N. A study on sensory properties of sodium reductionand replacement in Asian food using difference-from—Control test. Food Sci. Nutr. 2016, 4, 469–478.[CrossRef] [PubMed]
77. Bellisle, F. Experimental studies of food choices and palatability responses in European subjects exposed tothe Umami taste. Asia Pac. J. Clin. Nutr. 2008, 17 (Suppl. 1), 376–379.
78. Noel, C.A.; Finlayson, G.; Dando, R. Prolonged Exposure to Monosodium Glutamate in Healthy YoungAdults Decreases Perceived Umami Taste and Diminishes Appetite for Savory Foods. J. Nutr. 2018, 148,980–988. [CrossRef] [PubMed]
79. Shim, J.; Son, H.J.; Kim, Y.; Kim, K.H.; Kim, J.T.; Moon, H.; Kim, M.J.; Misaka, T.; Rhyu, M.R. Modulation ofsweet taste by umami compounds via sweet taste receptor. PLoS ONE 2015, 10. [CrossRef] [PubMed]
80. Costanzo, A.; Nowson, C.; Orellana, L.; Bolhuis, D.; Duesing, K.; Keast, R. Effect of dietary fat intake andgenetics on fat taste sensitivity: A co-twin randomized controlled trial. Am. J. Clin. Nutr. 2018, 107, 683–694.[CrossRef]
81. Kitamura, A.; Tsurugizawa, T.; Torii, K. Biological Significance of Glutamate Signaling during Digestion ofFood through the Gut-Brain Axis. Digestion 2011, 83 (Suppl. 1), 37–43. [CrossRef]
82. Hodson, N.A.; Linden, R.W.A. The effect of monosodium glutamate on parotid salivary flow in comparisonto the response to representatives of the other four basic tastes. Physiol. Behav. 2006, 89, 711–717. [CrossRef]
83. Norton, M.; Murphy, K.G. Targeting gastrointestinal nutrient sensing mechanisms to treat obesity.Curr. Opin. Pharmacol. 2017, 37, 16–23. [CrossRef] [PubMed]
84. Moran, T.H. Gut peptides in the control of food intake. Int. J. Obes. 2009, 33, S7. [CrossRef] [PubMed]85. Masic, U.; Yeomans, M.R. Does monosodium glutamate interact with macronutrient composition to influence
subsequent appetite? Physiol. Behav. 2013, 116–117, 23–29. [CrossRef]
189

Nutrients 2019, 11, 182
86. Anderson, G.H.; Fabek, H.; Akilen, R.; Chatterjee, D.; Kubant, R. Acute effects of monosodium glutamateaddition to whey protein on appetite, food intake, blood glucose, insulin and gut hormones in healthy youngmen. Appetite 2018, 120, 92–99. [CrossRef] [PubMed]
87. Ventura, A.K.; Beauchamp, G.K.; Mennella, J.A. Infant regulation of intake: The effect of free glutamatecontent in infant formulas. Am. J. Clin. Nutr. 2012, 95, 875–881. [CrossRef]
88. Masic, U.; Yeomans, M.R. Monosodium glutamate delivered in a protein-rich soup improves subsequentenergy compensation. J. Nutr. Sci. 2014, 3, e15. [CrossRef]
89. van Avesaat, M.; Troost, F.J.; Ripken, D.; Peters, J.; Hendriks, H.F.J.; Masclee, A.A.M. Intraduodenal infusionof a combination of tastants decreases food intake in humans. Am. J. Clin. Nutr. 2015, 102, 729–735.[CrossRef]
90. Chandrashekar, J.; Kuhn, C.; Oka, Y.; Yarmolinsky, D.A.; Hummler, E.; Ryba, N.J.; Zuker, C.S. The cells andperipheral representation of sodium taste in mice. Nature 2010, 464, 297–301. [CrossRef]
© 2019 by the authors. Licensee MDPI, Basel, Switzerland. This article is an open accessarticle distributed under the terms and conditions of the Creative Commons Attribution(CC BY) license (http://creativecommons.org/licenses/by/4.0/).
190
nutrients
Article
Distorted Taste and Impaired Oral Health in Patientswith Sicca Complaints
Preet Bano Singh 1,*, Alix Young 2, Amin Homayouni 2, Lene Hystad Hove 2,
Beáta Éva Petrovski 3, Bente Brokstad Herlofson 1, Øyvind Palm 4, Morten Rykke 2 and
Janicke Liaaen Jensen 1
1 Department of Oral Surgery and Oral Medicine, Faculty of Dentistry, University of Oslo, 0317 Oslo, Norway;[email protected] (B.B.H.); [email protected] (J.L.J.)
2 Department of Cariology and Gerodontology, Faculty of Dentistry, University of Oslo, 0317 Oslo, Norway;[email protected] (A.Y.); [email protected] (A.H.); [email protected] (L.H.H.);[email protected] (M.R.)
3 Dentistry Administration, Faculty of Dentistry, University of Oslo, 0317 Oslo, Norway;[email protected]
4 Department of Rheumatology, Oslo University Hospital, 0317 Oslo, Norway; [email protected]* Correspondence: [email protected]; Tel.: +47-22-852-051
Received: 15 December 2018; Accepted: 21 January 2019; Published: 24 January 2019
Abstract: Senses of smell and taste, saliva flow, and dental status are considered as important factorsfor the maintenance of a good nutritional status. Salivary secretory rates, chemosensory function,burning mouth sensation, halitosis and dental status were investigated in 58 patients with primarySjögren’s syndrome (pSS), 22 non-Sjögren’s syndrome sicca (non-SS) patients, and 57 age-matchedhealthy controls. A significantly greater proportion of patients with pSS and non-SS had ageusia,dysgeusia, burning mouth sensation, and halitosis compared to controls. Patients with pSS hadsignificantly lower olfactory and gustatory scores, and significantly higher caries experience comparedto controls. Patients with pSS and non-SS patients had significantly lower unstimulated andstimulated whole saliva secretory rates compared to controls. The findings indicated that severaldifferent aspects of oral health were compromised in both, patients with pSS and non-SS, and thismay affect their food intake and, hence, their nutritional status. Although non-SS patients do notfulfill Sjögren’s syndrome classification criteria, they have similar or, in some cases, even worse oralcomplaints than the patients with pSS. Further studies are needed to investigate food preferences,dietary intake, and nutritional status in these two patient groups in relation to their health condition.
Keywords: taste; smell; dysgeusia; burning sensation; halitosis; saliva; caries; primary Sjögren’s syndrome;non-SS sicca syndrome
1. Introduction
Nutritional status is closely associated with health status, and decline in dietary intake can leadto weight loss and increased risk for disease [1]. The senses of smell and taste are important fornutrition—smell is vital in identifying potential dietary substances in the environment, while tasteis instrumental in voluntary ingestion and early digestion of these dietary substances [2]. Saliva andnasal mucus are important for maintaining normal function of the taste buds imbedded in the oralepithelium and olfactory cells found in the nasal cavity [3]. Patients with reduced salivary secretionare known to have taste and smell abnormalities [3,4]. Furthermore, nutritional status is impaired inpatients with taste and smell disorders [5]. Most studies showing taste and smell abnormalities inpatients with dry mouth are reported from patients with Sjögren’s syndrome. Little is known about
Nutrients 2019, 11, 264; doi:10.3390/nu11020264 www.mdpi.com/journal/nutrients191

Nutrients 2019, 11, 264
patients having similar symptoms of severe dry mouth and dry eyes, but not fulfilling the classificationcriteria for Sjögren’s syndrome.
Sjögren’s syndrome (SS) is an autoimmune connective tissue disorder of the exocrine glands,primarily the salivary and lacrimal glands [6]. A long-lasting inflammatory process in glandular tissuecan lead to the loss of glandular cells, resulting in reduction or, in the worst cases, even complete lossof saliva and tear secretions [7]. The disorder has an unknown etiology, and mainly affects women [8].The female to male ratio has been reported to be nine to one [8].
To be classified for SS diagnosis, patients have to fulfill at least four out of six classificationcriteria [9]. These criteria include symptoms of dry mouth and dry eyes; reduced tear secretion; reducedsaliva secretion; histopathology of minor salivary glands showing infiltrates of lymphocytes; and thepresence of autoantibodies directed against Ro/SSA (anti-Sjögren’s-syndrome-related antigen A,also called anti-Ro) and/or La/SSB (anti-Sjögren’s-syndrome-related antigen B, also called anti-La) [9].As long as either serological or histopathological tests are positive, the presence of any four out of sixsymptoms indicates SS. If three out of four objective symptoms are present, it also justifies classifyingthe patient with SS. Patients complaining of dry eyes and dry mouth, but not fulfilling all the requiredcriteria, are referred to as non-Sjögren’s syndrome sicca (non-SS) patients.
Sjögren’s syndrome can be subdivided into primary and secondary Sjögren’s syndrome. PrimarySjögren’s syndrome (pSS) is a diagnosis given to patients with manifest symptoms of dryness in theabsence of other connective tissue diseases. Secondary Sjögren’s syndrome (sSS) describes patientswith symptoms of dryness, in the setting of another connective tissue disease or chronic inflammatoryprocess, such as rheumatoid arthritis, systemic lupus erythematosus, diagnosed prior to developing SSsymptoms [10]. The prevalence of pSS has been reported to range from 0.03% to 2.7% worldwide whendifferent classification criteria were applied [11]. When applying the criteria of the American–EuropeanConsensus Group, the prevalence of pSS in the Norwegian population is estimated at 0.05% [12].
Patients with pSS and non-SS display a wide range of similar symptoms; among these arexerostomia—the subjective sensation of oral dryness. Symptoms of dry mouth often include frequentfeeling of thirst, feeling of dryness in the mouth and throat, and ulcers may occur in the oral cavity [13].Patients with dry mouth often have problems with decreased taste sensitivity and chewing in additionto difficulties with articulation [14]. Although, patients categorized as non-SS have similar complaintsas patients with pSS, there is a risk that they do not receive appropriate medical care by the healthauthorities because of lacking diagnosis of SS.
Olfactory and gustatory disorders, also known as chemosensory disorders, are the disorders affectingthe senses of smell and taste. Chemosensory disorders are categorized into quantitative and qualitativedisorders, depending on whether the senses are reduced or distorted, respectively. Following thiscategorization, olfactory disorders are classified into anosmia (complete loss of smell), hyposmia (reducedability to smell), and dysosmia (distorted sense of smell) [15]. Similarly, gustatory disorders are classifiedas ageusia (complete loss of taste), hypogeusia (reduced ability to taste), and dysgeusia (distorted taste,for example, metallic taste perception) [16]. Patients with a normal sense of smell and taste are categorizedas normosmic and normogeusic, respectively. Other oral disorders, like halitosis/oral malodor and burningsensation/numbness in the oral cavity, are often observed in patients with chemosensory disorders [4].About 50% of patients with chemosensory disorders have reported a negative impact on (i) appetite andbody weight, (ii) quality of life, and (iii) psychological well-being [17].
There is evidence that patients with SS have a poor dental status [18]. In a cross-sectional studyof Chilean SS-patients, as many as 60% had dental caries, a higher prevalence than the generalpopulation [18]. However, in another study, no significant differences could be detected in the dentalcaries experience of Swedish SS patients compared to dry mouth controls [18,19]. Patients with pSSare also reported to have a significantly higher dental caries experience, also called DMFT (DMFT:decayed, missing, and filled teeth) than healthy controls, mainly due to a higher number of filled andmissing teeth [20]. A change in a patient’s dental caries status has been suggested as one of severalpotential markers of the extent of autoimmune-mediated salivary gland dysfunction in pSS [20].
192

Nutrients 2019, 11, 264
The aim of this study was to compare salivary flow, olfactory and gustatory function, burningmouth sensation, halitosis, and dental status in patients with pSS, non-SS sicca patients, and healthyage-matched controls, to gain more insight into the oral status of non-SS sicca patients.
2. Materials and Methods
2.1. Participants
The study was conducted at the Dry Mouth Clinic at the University of Oslo (UiO), Norway,and was approved by the Norwegian Regional Committee for Research Ethics (REK 2015/363).Another study has previously been published with the same REK number which includes 31 femalepatients with pSS and 33 gender-matched controls [4]. The present study presents an additional patientgroup (22 non-SS patients), and a higher number of patients, in both pSS group (58 patients with pSS)and healthy control group (57 healthy controls). Moreover, different parameters have been investigatedin the two studies. The data presented in this study has not been published before. Participantcharacteristics are presented in Table 1. Written informed consent was obtained from all participantsprior to examination. Most patients with pSS were referred from the Department of Rheumatologyat Oslo University Hospital (OUS), where they were classified according to the American–EuropeanConsensus Group criteria (13). Non-SS patients were referred to the last author J.L.J for salivary glandbiopsies [13]. They all had sicca complaints, but anti-Ro/SSA were absent, and the histopathologyof their salivary gland biopsies were not consistent with pSS. The exclusion criteria for controls weremouth and eye dryness, chronic diseases, and use of medications that could affect the salivary glands.The participants were instructed to refrain from eating, drinking, and smoking one hour prior toexamination. The assessments of salivary secretory rates, olfaction, gustation, oral malodor, and dentalstatus were carried out by a team of calibrated dental practitioners and specialists.
Table 1. Participant characteristics.
Non-SS(N = 22)
pSS(N = 58)
Controls(N = 57)
p-Value
Age (year)
Mean ± SD 52.0 ± 10.4 52.9 ± 13.4 49.7 ± 16.5 NSRange 34–76 26–75 20–79
Gender
Female % (N) 100 (22) 96.5 (56) 73.7 (42) <0.001Male % (N) 0 3.5 (2) 26.3 (15)
Ethnicity
Caucasian % (N) 90.9 (20) 98.3 (57) 93.0 (53) NSNon-Caucasian % (N) 9.1 (2) 1.7 (1) 7 (4)
Height (cm)
Mean ± SD 166.7 ± 5.3 169.5 ± 7.1 170.9 ± 7.1 0.049Range 158–178 153–190 157–187
Weight (kg)
Mean ± SD 72.3 ± 16.3 71.6 ± 13.8 69.1 ± 11.7 NSRange 51–120 49–120 50–90
non-SS: non-Sjögren’s sicca patients, pSS: primary Sjögren’s syndrome patients; Fischer’s-exact test, One-WayANOVA, NS = Not Significant.
2.2. Saliva Assessment
Summated Xerostomia Inventory-Dutch (SXI-D) version was used to assess participants’self-reported perception of dry mouth [21]. SXI-D is a shortened version of the Xerostomia Inventory
193

Nutrients 2019, 11, 264
(XI) [22] and consists of five statements that are used to determine the severity of xerostomia. The SXI-Dsum score ranges from 5 to 15, where 15 = very severe problems related to xerostomia. Thereafter,unstimulated (UWS) and chewing-stimulated (SWS) whole saliva were collected from all participantsto determine salivary secretory rates. Unstimulated whole saliva was collected first for 15 min, andthen SWS for 5 min. Saliva samples were weighed and secretory rates were calculated for UWS andSWS (g/min = mL/min). UWS secretory rate was considered normal if ≥ 0.1mL/min, and SWSsecretion rate was considered normal if ≥ 0.7 mL/min [23].
2.3. Olfactory Assessment
Self-reported perception of sense of smell was obtained prior to olfactory testing. Participantswere asked to score their own subjective smell perception on a visual analogue scale (VAS) from0 to 10, where 0 = no smell perception, and 10 = very good smell perception. Cognitive olfactoryfunction was measured using twelve-stick identification test (Burghart Messtechnik, Wedel, Germany).The participants were instructed to choose from four possible answers on a multiple choice-scoringcard. The answers were recorded, and the data were summarized for each participant. A normativeclassification [24] was used to define anosmic (score 0–5), hyposmic (score 6–9), and normosmic(score 10–12) participants.
2.4. Gustatory Assessment
Self-reported perception of sense of taste was obtained prior to gustatory testing. Participantswere asked to score their own subjective taste perception on a visual analogue scale (VAS) from 0 to 10,where 0 = no taste perception, and 10 = very good sense of taste. Gustatory function was evaluatedusing taste strips (Burghart Messtechnik, Wedel, Germany) with four basic taste qualities; sweet,sour, salty, and bitter, each tested at 4 different concentrations. The taste qualities were presentedin a random manner, starting with the weakest concentrations. This protocol resulted in a total of32 values for each participant, as both sides of the tongue were tested. A normative classification [25]was followed to distinguish between ageusic (score 0–12), hypogeusic (score 13–18), and normogeusic(score 19–32) participants.
2.5. Assessment of Dysgeusia, Burning Mouth Sensation, and Halitosis
A questionnaire was designed for use in this study to assess participants’ experience of dysgeusia,burning mouth sensation (BMS), and halitosis (Table 2). The present questionnaire is a modifiedversion of a questionnaire that we have published in a previous study [4]. Both patients with pSS andnon-SS reported that they had periods when their disease symptoms were more pronounced (“badperiods”) and periods when the symptoms were less pronounced (“good periods”).
2.6. Oral Malodor Assessment
Self-reported perception of halitosis was obtained prior to oral gas sampling. Participants wereasked to score their own subjective perception of oral malodor on a scale from 0 to 5, where 0 = noappreciable odor, and 5 = extremely foul odor. Halitosis was measured using both organoleptic andobjective methods. The organoleptic measurements were performed by instructing the participants toexhale briefly through the mouth at three different distances (100, 30, and 10 cm) from the nose of theorganoleptic judge. The level of malodor was recorded using the same scale as for the self-reportedperception of halitosis [26]. Levels of volatile sulfur compounds (VSC) in the mouth air of theparticipants were measured by gas chromatography (GC: OralChroma™, Nissha FIS, Inc., Osaka,Japan). Mouth air samples from the participants were obtained using a standardized procedureaccording to the user manual. A 1.0 mL syringe was inserted into the oral cavity until the stopperwas in contact with the lips and the syringe could be held gently between the teeth without thetongue touching the tip of the syringe. After the syringe was held in this position for 30 s, a mouthair sample was withdrawn using the syringe, and was immediately injected into the OralChroma™.
194

Nutrients 2019, 11, 264
Analysis of VSC started automatically, and the levels of hydrogen sulfide (H2S) and methyl mercaptan(CH3SH) determined. The olfactory threshold levels (in parts per billion, ppb) indicating oral malodorwere considered either high (H2S > 112 ppb and CH3SH > 26 ppb) or low (H2S < 112 ppb andCH3SH < 26 ppb), as recommended by the manufacturer and used in other studies [27].
Table 2. Questionnaire used to assess participants’ complaints of dysgeusia, burning mouth sensation,and halitosis, and their impact on quality of life.
Dysgeusia
1. Do you experience bad taste on the tongue? Yes No2. If yes, can you describe the taste? Metallic Sour Rotten Bitter Other
3. How often do you experience bad taste? Constantly Daily Sometimes In badperiods * Other
4. Is the bad taste related to meals? Duringmeals
In betweenmeals Constantly
Burning Mouth Sensation
5. Do you experience burning mouth sensation? Yes No6. Where in your mouth do you experience
burning sensation?Wholetongue
Anteriortongue Lips Palate Other
7. How often do you experienceburning sensation? Constantly Daily Sometimes In bad
periods * Other
8. Is the burning sensation related to meals? Duringmeals
In betweenmeals Constantly
9. Do you have to refrain from certain fooditems due to burning sensation? Yes No
10. If yes, what kind of food items do you haveto avoid? Spicy Sweet Sour Salty Bitter
Halitosis
11. Do you have complaints of bad breath? Yes No
12. How often do you have these complaints? Constantly Daily Sometimes In badperiods * Other
Quality of Life (QoL)
13. Which of the disturbances have a negativeimpact on your QoL?
Burningmouth
Reducedtaste/smell
Distortedtaste Bad breath Dry
Mouth
* Bad periods: periods when disease symptoms are more pronounced.
2.7. Dental Assessment
Self-reported perception of dental health and general health was obtained from the participantsprior to clinical and radiological examination of the teeth. Participants were asked to score theirown subjective assessment of their dental and general health status on a scale from 0 to 5,where 0 = very poor, and 5 = excellent. A thorough dental examination, consisting of clinical andradiological examination of the oral cavity, was conducted by general dental practitioners. The numberof decayed, missing, or filled teeth (DMFT) and only filled teeth (FT) were recorded [23].
2.8. Statistical Analyses
Descriptive statistical analysis was performed, and the results are presented in percentages,median/interquartile range (IQR)/ranges. Normality of continuous variables was tested on histogram,Q–Q plot, and by Shapiro–Wilk test. Due to the low sample size and non-normal distribution of thecontinuous variables, Kruskal–Wallis ANOVA and Mann–Whitney U test was used to detect mediandifferences of continuous, numerical variables between the two or three groups (control, non-SS, pSS).Chi-square (χ2) test and Fischer’s-exact test was used to test the differences of the distribution ofcategorical variables. Point-biserial and Spearman correlations were used to measure the strength anddirection of the association between the one continuous and one dichotomous variable, and betweentwo continuous variables respectively. All differences were considered significant at p < 0.05. StatisticalPackage for STATA (Stata version 14.0; College Station, TX, USA) and SPSS (SPSS version 24, IBM,Armonk, NY, USA) were used for the statistical analyses.
195

Nutrients 2019, 11, 264
3. Results
3.1. Dysgeusia, Burning Mouth Sensation, and Halitosis
Self-reported complaints of dysgeusia, burning mouth sensation, and halitosis in the three groupsare shown in Table 3. The completion rate for Yes/No questions in the questionnaire was 100% in thethree groups. The frequency of dysgeusia, burning sensation, and halitosis was significantly higherin the non-SS and pSS groups versus controls, and these self-reported complaints showed significantassociation with the disease (p < 0.001).
Table 3. Overview of self-reported complaints of dysgeusia, burning mouth sensation, and halitosis inthe three groups.
Non-SS(N = 22)
pSS(N = 58)
Controls(N = 57)
p-Value
Dysgeusia % (N) 77.3 (17) 60.3 (35) 3.5 (2) <0.001Burning Mouth Sensation % (N) 59.1 (13) 50.0 (29) 3.5 (2) <0.001
Halitosis % (N) 59.1 (13) 37.9 (22) 1.8 (1) <0.001
non-SS: non-Sjögren’s sicca patients, pSS: primary Sjögren’s patients; Chi-square test.
Fifteen patients with non-SS, thirty-one patients with pSS and one participant in the controlgroup, who experienced dysgeusia, answered further questions. Metallic taste dysgeusia was themost common complaint both in the non-SS and pSS groups. Other taste distortions were describedas “rotten” and “bitter”, in addition to “other” taste distortions which the participants were not ableto describe in words. Distorted taste was significantly more common in the non-SS and pSS groups,compared to controls (p < 0.001) (Table 4).
Table 4. Participants experiencing distorted taste.
Non-SS(N = 22)
pSS(N = 58)
Controls(N = 57)
p-Value
Metallic % (N) 63.2 (12) 20.4 (10) 0Rotten % (N) 15.8 (3) 16.3 (8) 0 <0.001Bitter % (N) 0 14.3 (7) 0Other % (N) 0 12.2 (6) 1.8 (1)
non-SS: non-Sjögren’s sicca patients, pSS: primary Sjögren’s patients; Fischer’s-exact test.
Some patients with pSS and non-SS described that they had good and bad periods, where thedisease symptoms were less pronounced in good periods and more pronounced in bad periods.The duration of good and bad periods varied between individuals. Dysgeusia was experienced either“constantly”, “daily”, “sometimes, or “in bad periods”. The perceived distorted taste was significantlymore frequent in the non-SS and pSS groups, compared to controls (p < 0.001) (Table 5).
Table 5. Overview showing how often participants experienced distorted taste.
Non-SS(N = 22)
pSS(N = 58)
Controls(N = 57)
p-Value
Constantly % (N) 9.1 (2) 10.3 (6) 0Daily % (N) 9.1 (2) 12.1 (7) 0 <0.001
Sometimes % (N) 18.2 (4) 20.7 (12) 1.8 (1)In bad periods % (N) 31.8 (7) 8.6 (5) 0
non-SS: non-Sjögren’s sicca patients, pSS: primary Sjögren’s patients; Fischer’s-exact test.
196

Nutrients 2019, 11, 264
When answering the question “is bad taste related to meals?”, some participants reporteddysgeusia “during meals”, others experienced it “in between meals”, while some reported “constant”lingering of bad taste in the mouth. Only patients with pSS reported that bad taste was morepronounced “during meals”, resulting in foul-tasting meals. One of the patients with pSS reportedthat even water had a metallic taste. Moreover, “constant” perception of dysgeusia was also foundonly in the pSS group (Table 6).
Table 6. Participants reporting whether dysgeusia was related to meals.
Non-SS(N = 22)
pSS(N = 58)
Controls(N = 57)
p-Value
During meals % (N) 0 6.9 (4) 0In between meals % (N) 9.1 (2) 13.8 (8) 1.8 (1) <0.001
Constantly % (N) 0 10.3 (6) 0
non-SS: non-Sjögren’s sicca patients, pSS: primary Sjögren’s patients; Fischer’s-exact test.
The response rate for the multiple choice questions for burning mouth sensation among theparticipants experiencing burning mouth, was almost 30% in the non-SS group, 65% in the pSS groupand 50.0% controls. Majority of these participants experienced a burning sensation on the “wholetongue”, while some patients experienced this only on the “anterior tongue”. Only one patient withpSS experienced a burning sensation on the “lips and palate” in addition to the tongue. A significantlyhigher proportion of participants experienced burning mouth sensation on the tongue, compared tocontrols (p < 0.001) (Table 7). An overview of how often participants in the three groups experiencedburning mouth sensation is shown in Table 8.
Table 7. Location of burning mouth sensation experienced in the oral cavity.
Non-SS(N = 22)
pSS(N = 58)
Controls(N = 57)
p-Value
Whole tongue % (N) 40.9 (9) 36.2 (21) 1.8 (1)Anterior tongue % (N) 9.1 (2) 3.4 (2) 0 <0.001
Lips, palate% (N) 0 1.7 (1) 0
non-SS: non-Sjögren’s sicca patients, pSS: primary Sjögren’s patients; Fischer’s-exact test.
Table 8. Overview showing how often participants experienced burning mouth sensation.
Non-SS(N = 22)
pSS(N = 58)
Controls(N = 57)
p-Value
Constantly % (N) 9.1 (2) 5.2 (3) 0Daily % (N) 13.6 (3) 10.3 (6) 0 <0.001
Sometimes % (N) 4.5 (1) 19.0 (11) 1.8 (1)In bad periods % (N) 22.7 (5) 3.4 (2) 0
non-SS: non-Sjögren’s sicca patients, pSS: primary Sjögren’s patients; Fischer’s-exact test.
For some of the patients complaining of burning mouth sensation, it was reported to be worst“during meals” in the non-SS and pSS groups (Table 9). Twenty-seven percent of non-SS patients and24% of patients with pSS reported that they had to refrain from food items like spicy food, sour fooditems, sour fruits, and beverages like soft drinks, juices, and wine, because of burning mouth sensation.
197

Nutrients 2019, 11, 264
Table 9. Participants reporting whether burning sensation was related to meals.
Non-SS(N = 22)
pSS(N = 58)
Controls(N = 57)
p-Value
During meals % (N) 22.7 (5) 25.9 (15) 0In between meals % (N) 9.1 (2) 1.7 (1) 0 <0.001
Constantly % (N) 4.5 (1) 1.7 (1) 0
non-SS: non-Sjögren’s sicca patients, pSS: primary Sjögren’s patients; Fischer’s-exact test.
Among participants complaining of halitosis, non-SS patients were more affected than patientswith pSS, while none of controls complained of oral malodor. Table 10 shows how often participantsexperienced oral malodor. Some patients reported that they avoided drinking tea or coffee becauseof perceived risk of getting halitosis. When answering “which of the disturbances have a negativeeffect on your quality of life?”, both non-SS patients and patients with pSS reported burning mouthsensation and distorted taste as major factors affecting their quality of life.
Table 10. Overview showing how often participants experienced halitosis.
Non-SS(N = 22)
pSS(N = 58)
Controls(N = 57)
p-Value
Constantly % (N) 4.5 (1) 8.6 (5) 0Daily % (N) 18.2 (4) 6.9 (4) 0
Sometimes % (N) 13.6 (3) 8.6 (5) 0 <0.001In bad periods %
(N)After meals % (N)13.6 (3)4.5 (1)
3.4 (2)1.7 (1)
00
non-SS: non-Sjögren’s sicca patients, pSS: primary Sjögren’s patients; Fischer’s-exact test.
3.2. Gustatory Function
The results of the Kruskal–Wallis ANOVA and the Mann–Whitney U test showed that themeasured median gustatory scores (median (IQR), range) were significantly lower in the pSSgroup (20.0 (16.0–26.0), 2.0–32.0) than in the control group (26.0 (22.0–28.0), 12.0–32.0) (p = 0.001).No significant differences were observed between the non-SS (24.0 (20.0–26.0), 2.0–32.0) and the controlgroup (Figure 1a). Participants’ self-reported taste scores also revealed a significantly lower meanperception of taste in the pSS group (7.0 (5.0–9.0), 0.0–10.0) compared to the control group (8.0 (8.0–10.0),3.0–10.0), (p = 0.009). No significant difference was found comparing the non-SS group (8.0 (5.0–9.0),3.0–10.0) with controls (Figure 1b). Chi-square tests showed that a significantly higher percentage ofpSS and non-SS patients had ageusia compared to controls (Table 11).
198

Nutrients 2019, 11, 264
Figure 1. Measured and self-reported taste score in the three groups. Boxplots illustrating (a) measuredtaste scores and (b) participants’ self-reported taste score in controls, primary Sjögren’s patients(pSS), and non-Sjögren’s sicca patients (non-SS). (Kruskal–Wallis ANOVA and Mann–Whitney U test;** p < 0.01.). Dots in the figures represent the outliers.
Table 11. Percentage of participants with ageusia (no taste perception) and hypogeusia (reduced tasteperception) among participants.
Non-SS(N = 22)
pSS(N = 58)
Controls(N = 57)
p-Value
Ageusia % (N) 14.3 (3) 15.5 (9) 1.8 (1) 0.031 *Hypogeusia % (N) 9.1 (2) 25.9 (15) 12.3 (7) 0.084
non-SS: non-Sjögren’s sicca patients, pSS: primary Sjögren’s patients; Chi-square test. * p < 0.5.
3.3. Olfactory Function
The results of the Kruskal–Wallis ANOVA and the Mann–Whitney U test showed that themeasured median olfactory scores (median (IQR), range) were significantly lower in the pSS group(10.0 (9.0–11.0), 0.0–12.0) than in the control group (11.0 (9.0–11.0), 3.0–12.0), (p = 0.007). No significantdifferences were observed between the non-SS (10.0 (9.0–11.0), 6.0–16.0) and the control group(Figure 2a). Participants’ self-reported smell scores did not reveal any significant differences betweenthe three groups (Figure 2b).
Figure 2. Measured and self-reported smell score in the three groups. Boxplots illustrating median,interquartile ranges (IQRs), and ranges of (a) measured smell scores (0–12) and (b) participants’self-reported smell scores (0–10) in controls, primary Sjögren’s patients (pSS), and non-Sjögren’s siccapatients (non-SS). (Kruskal–Wallis ANOVA and Mann–Whitney U test; ** p < 0.01.). Dots in the figuresrepresent the outliers.
199

Nutrients 2019, 11, 264
3.4. Oral Malodor Results
Gas chromatographic analysis (median (IQR), range) revealed the following H2S-values (ppb):control group (33.5 (8.7–141.0), 0.0–2885.0), pSS group (27.5 (15.7–96.2), 0.0–458.0), and non-SS group(41.0 (13.5–84.0), 0–803.0). The results for CH3SH (ppb) were as follows: control group (8.0 (3.0–26.5),0–193.0), and for the pSS and non-SS groups were (6.0 (2.0–13.2), 0–75.0) and (5.0 (0–13.2), 0–83.0),respectively. There were no significant differences in H2S and CH3SH levels between the groups.
There was no significant correlation between the self-reported perception of halitosis and theorganoleptic measurements. The self-reported perceived halitosis scores (median (IQR), range) forthe control group were (0.0 (0.0–1.0), 0–3), while the scores for the pSS group and non-SS group were(1.0 (0.0–2.0), 0–4) and (2.0 (1.0–3.0), 0–5), respectively. Organoleptic judge scores were (0.0 (0.0–1.0),0–2) for the control group, (0.0 (0.0–1.0), 0–3) for the pSS group, and (0.0 (0.0–1.0), 0–2) for the non-SSgroup. No significant differences were found between groups in self-reported perception of halitosisand organoleptic measurements.
3.5. Saliva and SXI-D
The results of the Kruskal–Wallis ANOVA and the Mann–Whitney U test showed that the UWSsecretory rates (mL/min) were significantly lower in the pSS group (0.1 (0.0–0.1), 0.0–0.4) and non-SSgroup (0.1 (0.0–0.2), 0.0–0.6) compared to the control group (0.3 (0.2–0.4), 0.0–0.8), (p < 0.001) (Figure 3a).Also, SWS secretory rates were significantly lower in the pSS group (0.7 (0.4–1.0), 0.0–1.5) and non-SSgroup (0.9 (0.6–1.3), 0.3–1.8) compared to controls (1.6 (1.1–2.4), 0.5–3.5), (p < 0.001) (Figure 3a).The results of participants’ self-reported perception of xerostomia showed significantly higher SXI-Dscores in both the pSS group (12.0 (10.0–14.0), 6.0–15.0) and the non-SS group (12.0 (11.0–14.0), 9.0–15.0)compared to controls (6.0 (5.0–7.0), 5.0–9.0), (p < 0.001) (Figure 3b). No significant differences wereobserved between pSS and non-SS groups, for either salivary secretory rates or SXI-D score.
Figure 3. Measured saliva secretory rate and self-reported perception of xerostomia in the threegroups. Boxplots illustrate median, IQRs, and ranges of (a) saliva secretion rates (mL/min) and(b) SXI-D: Summated Xerostomia Inventory-Dutch scores in controls, primary Sjögren’s patients(pSS), and non-Sjögren’s sicca patients (non-SS). (Kruskal–Wallis ANOVA and Mann–Whitney U test;*** p < 0.001.)
Pathologically low saliva secretory rates for UWS (≤ 0.1 mL/min) and SWS (≤ 0.7 mL/minwere analyzed among the participants. A significantly higher proportion of patients with pSS hadsaliva secretory level below the threshold level for both UWS and SWS (Table 12). Furthermore,moderate, significant correlations were found between salivary secretory values (USW and SWS) anddysgeusia, burning mouth sensation, halitosis, taste score, DMFT, and FT, when all the participantswere considered together (Table 13).
200

Nutrients 2019, 11, 264
Table 12. Correlations between pathologically low UWS/SWS and the three groups.
Non-SS(N = 22)
pSS(N = 58)
Controls(N = 57)
p-Value
UWS (below threshold)% (N) 59.1 (13) 74.1 (43) 8.8 (5) <0.001 ***
SWS (below threshold)% (N) 31.8 (7) 65.5 (38) 5.3 (3) <0.001 ***
non-SS: non-Sjögren’s sicca patients, pSS: primary Sjögren’s patients. UWS: unstimulated whole saliva, belowthreshold (≤0.1 mL/min); SWS: stimulated whole saliva (≤0.7 mL/min); Chi-square test. *** p < 0.001.
Table 13. Correlations between UWS and SWS and dysgeusia, burning mouth sensation, halitosis, tastescore, DMFT and FT.
UWS(N = 137)
r
SWS(N = 137)
r
Dysgeusia −0.37 *** −0.37 ***Burning Mouth Sensation −0.29 *** −0.39 ***
Halitosis −0.27 ** −0.27 **Taste Score 0.21 * 0.21 *
DMFT −0.30 *** −0.27 **FT −0.26 ** −0.21 **
non-SS: non-Sjögren’s sicca patients, pSS: primary Sjögren’s patients. UWS: unstimulated whole saliva, SWS:stimulated whole saliva, Pearson’s point-biserial correlation coefficient. *** p <0.001, ** p < 0.01; * p < 0.05.
3.6. DMFT/FT
Caries experience as measured by DMFT (median (IQR), range) was significantly higher in the pSSgroup (18.0 (11.0–23.0), 0.0–28.0) compared to the control group (12.0 (6.5–18.0), 1.0–27.0), (p = 0.005).The DMFT in the non-SS group (16.0 (12.8–19.3), 0.0–28.0) did not differ from that of the control group(p = 0.3) or the pSS group (p = 1.0) (Figure 4a).
Figure 4. DMFT and FT results from the three groups. Boxplots illustrate median, IQRs, and rangesof (a) DMFT: decayed, missing, and filled tooth surfaces and (b) FT: filled teeth in controls, primarySjögren’s patients (pSS), and non-Sjögren’s sicca patients (non-SS). (Kruskal–Wallis ANOVA andMann–Whitney U test; ** p < 0.01.)
Similarly, the FT component of the DMFT index (median (IQR), range) was significantly higher inthe pSS group (14.0 (10.0–20.0), 1.0–27.0) than the control group (11.0 (5.0–17.0), 0.0–24.0), (p = 0.030).The FT score in the non-SS group (15.5 (11.8–18.2), 0.0–24.0) did not differ from that of the controlgroup (p = 0.241) or the pSS group (p = 1.0) (Figure 4b).
201

Nutrients 2019, 11, 264
3.7. General Health Status and Dental Status
Statistically significant differences were found in self-reported general health status (median(IQR), range) between patients with pSS (2.0 (1.0–3.0), 0–4.0), non-SS patients (1.5 (1.0–2.0), 0–3.0),and controls (4.0 (3.0–4.0), 2.0–4.0), p < 0.0001 (Figure 5b). Similar statistically significant differenceswere found between patients with pSS (2.0 (1.0–3.0), 0–4.0), non-SS patients (1.0 (1.0–2.0), 0–3.0),and controls (3.0 (3.0–4.0), 2.0–4.0), p < 0.0001, when participants scored their own dental health status(Figure 5a). Spearman’s test showed that when all participants were considered together, participantsself-reported dental health status was found to be significantly, negatively correlated to dental statusDMFT (r = −0.27, p = 0.001) and FT (r = −0.18, p = 0.04). Furthermore, significant positive correlationswere found between participants’ dental and general health status (r = 0.58, p < 0.001).
Figure 5. Self-reported dental and general health status in the three groups. Boxplots illustrate median,IQRs, and ranges of (a) self-reported dental status (0–5) and (b) self-reported general health status (0–5)in controls, primary Sjögren’s patients (pSS), and non-Sjögren’s sicca patients (non-SS). (Kruskal–WallisANOVA and Mann–Whitney U test; *** p < 0.001.)
4. Discussion
The present study revealed that the non-SS patients have similar or even worse oral health thanpatients with Sjögren’s syndrome. In general, patients with sicca symptoms, suspected to have SS butnot fulfilling the classification criteria for SS, far outnumber the patients who fulfill the criteria. Still,only patients who fulfill the criteria are usually included in studies [28]. Thus, non-SS patients areleft both without a diagnosis and are often not considered to be of interest for researchers. Therefore,the main focus in this study was the oral health status of the sicca patients without a Sjögren’s diagnosis.
In the present study, we found that complaints of dysgeusia, burning mouth sensation,and halitosis were common in the non-SS group. It has previously been shown that patientswith pSS have a high percentage of complaints of dysgeusia, burning sensation on the tongue,and halitosis, and that about 50% of patients with pSS report these disorders [4]. In the presentstudy, when comparing non-SS patients with patients with pSS, it was found that non-SS patientshad a much higher occurrence of dysgeusia, burning mouth sensation, and halitosis. In the literature,there are no studies available to compare our current findings with results from other studies onnon-SS patients. To our knowledge, this is the first study comprehensively evaluating oral health inpatients with sicca symptoms without an SS diagnosis. Since many of the patients avoided certainfood items due to problems with dysgeusia and burning sensations, it may affect their dietary intake.This is consistent with the literature, where decreased appetite has been reported in 30% of patientsand decreased enjoyment of food in 70% of patients complaining of dysgeusia [29]. About 60% ofdysgeusia patients have been reported to change their eating patterns and 40% to modify their useof seasonings [29].
In addition to distorted taste, reduced taste function was observed in both non-SS and patientswith pSS. Ageusia, a condition characterizing complete absence of taste perception, is a very seldom
202

Nutrients 2019, 11, 264
condition and accounts for less than 1% of patients referred to taste and smell research centers [5,17].When taste function was measured, almost 15% of non-SS and patients with pSS were found tohave ageusia in this study. Loss of appetite has been reported in patients suffering from ageusia [5].Furthermore, about 10% of non-SS patients and 26% of patients with pSS were found to be hypogeusic.The incidence of this taste disorder is also low in the general population, and some but not all patientssuffering from hypogeusia report decreased enjoyment of food and decreased appetite [5]. However,hypogeusia in combination with other disorders, like dysgeusia and burning sensations, mightexacerbate the changes in dietary intake [30]. Therefore, dietary intake monitoring and counselling isvery important in those patients with pSS and non-SS patients that suffer from both qualitative andquantitative taste disorders.
Smell and taste disorders are common in the general population, however, patients are frustrateddue to the lack of appropriate medical attention and care [17,31]. This may partly be a result ofa lack of knowledge and focus on appropriate tools required to assess disorders involving chemicalsenses among medical practitioners. In this paper, we present a novel questionnaire that can be usedto assess (i) patient’s chemosensory and trigeminal disorders, (ii) their duration, (iii) their effect onfood preferences, and (iv) the effect on patient’s quality of life. This questionnaire may be helpfulfor nutritionists and other health professionals in getting an overview of patients’ oral disturbances.This will further be beneficial in managing patients’ dietary intake. The questionnaire consists ofquestions with yes and no answers, supplemented with multiple choice questions, and with the option“other”, for open-ended answers. It is easy to fill in and not time-consuming. Therefore, it is practicalfor use both in clinical and research settings. One of the limitations in the present study is that we didnot attain a full rate of completion of the questionnaire, as it was first introduced when we realized thatpatients were having major issues with dietary intake due to their oral health complications. Furtherstudies are needed to validate this questionnaire.
A large proportion of patients reported dietary limitations because of either dysgeusia, burningmouth sensation, halitosis, dry mouth, or a combination of these different oral problems. A synergeticrelationship between oral health and nutrition has been suggested [32], in other words, the relationshipmay be considered as a positive feedback or a vicious circle. Oral conditions, caused by either local orsystemic diseases, impact the functional ability to eat and vice versa, and decline in dietary intake canlead to progression of oral diseases [32]. However, little is known about dietary implications and oraldisorders in patients with dry mouth symptoms without SS diagnosis. Further studies are needed togain better insight into mechanisms leading to oral disorders in this group of patients.
In the present study, there were no significant differences in salivary secretory rates betweenthe two patient groups, indicating that both patient groups have similar problems with dryness ofthe mouth. Results from self-reported mouth dryness scores and measured salivary secretory rateswere also well correlated in this study, indicating severe mouth dryness. Furthermore, significantassociations were found in this study, among participants with pathologically low salivary flow ratesand oral disorders (chemosensory disturbances, trigeminal disorders, halitosis, and DMFT), consistentwith other studies [3,33,34]. These oral disturbances can affect the integrity of the oral cavity and,hence, lead to malnutrition [32].
Patients with pSS had a significantly higher number of decayed, filled, or missing teeth comparedto non-SS patients and controls. The dental treatments performed on patients included dental fillings,crowns, and bridges. The reason behind extensive dental treatment may be related to low salivarysecretory rates, presence of oral disorders, and/or dietary preferences. Interestingly, non-SS patientsshare similar symptoms with patients with pSS regarding salivary flow rates and oral disorders, but thesame degree of dental treatment was not observed in this group. Other systemic, inflammatory causesin SS may therefore be considered as a potential cause of high caries experience in patients with pSS.These findings are consistent with other studies where dental caries status has been suggested asone of several potential markers of the extent of autoimmune-mediated salivary gland dysfunctionin pSS [20].
203

Nutrients 2019, 11, 264
About 60% of non-SS patients and 40% of patients with pSS reported halitosis when answering thequestionnaire. However, no significant differences were observed between these two groups regardingsubjective and objective measurements of oral malodor. Halitosis experienced in these patients couldtherefore neither be confirmed by organoleptic assessment, nor by analysis of VSC levels measuredby gas chromatography. The difficulty in the self-assessment of breath odor has been discussed byRosenberg [35]. Furthermore, organoleptic assessments may assess foul-smelling gases other thanthose containing sulfur (VSC), and this may explain the difference between organoleptic scores andVSC levels measured by GC. These findings are consistent with other studies where clinicians havereported that one-third of the patients seeking treatment for halitosis do not actually have genuinehalitosis [36]. The presence of taste and smell dysfunction has been suggested as an alternativeexplanation for halitosis [36], which might also be the case in the patient groups in this study.
The main limitation of this study is the small sample size, especially for non-SS patients.The prevalence of SS has been reported to be 0.05% in the Norwegian population [12]. The lowprevalence of SS is also reflected in our study with low sample sizes of both patients with pSS andnon-SS. For reasons not clear to us, non-SS patients were more difficult to recruit to the study thanpatients with pSS. Another limitation of this study is the lack of assessments of dietary intake andbody composition of the participants. We continue the inclusion of patients in these categories in ourstudies at the Dry Mouth Clinic and plan to introduce more dietary assessments in the future.
5. Conclusions
In conclusion, this study demonstrated significantly high occurrence of dysgeusia, burning mouthsensation, halitosis, reduced taste, and mouth dryness in non-SS patients and patients with pSS.Impaired smell function and caries experience were more severe in patients with pSS than non-SSpatients. Associations were found between participants’ self-reported dental health status and generalhealth status indicating a clear synergy between oral and general health.
Author Contributions: Conceptualization J.L.J., P.B.S.; methodology, P.B.S., A.Y., A.H., L.H.H., B.É.P., M.R., B.B.H.,Ø.P., J.L.J.; formal analysis, P.B.S., B.É.P.; investigation, P.B.S., A.Y., A.H., L.H.H., M.R., B.B.H., J.L.J.; resources, J.L.J.Ø.P.; writing—original draft preparation, P.B.S.; writing—review and editing, A.Y., A.H., L.H.H., M.R., Ø.P., B.É.P.,B.B.H., J.L.J.; visualization, P.B.S. J.L.J.; supervision, J.L.J.; project administration, J.L.J.; funding acquisition, J.L.J.
Funding: This research received no external funding.
Acknowledgments: The authors express their sincere gratitude to all the staff members involved at the researchand clinical institutions for their efforts. Thanks are also due to patients and controls who participated in this study.
Conflicts of Interest: The authors declare no conflict of interest.
References
1. Hutton, J.L.; Baracos, V.E.; Wismer, W.V. Chemosensory dysfunction is a primary factor in the evolution ofdeclining nutritional status and quality of life in patients with advanced cancer. J. Pain Symptom Manage.2007, 33, 156–165. [CrossRef] [PubMed]
2. Mattes, R.D. Nutritional implications of taste and smell. In Handbook of Olfaction and Gustation; CRC Press,Marcel Dekker: New York, NY, USA, 2003; pp. 1516–1551.
3. Henkin, R.I.; Talal, N.N.; Larson, A.L.; Mattern, C.T. Abnormalities of taste and smell in Sjogren’s syndrome.Ann. Intern. Med. 1972, 76, 375–383. [CrossRef] [PubMed]
4. Rusthen, S.; Young, A.; Herlofson, B.B.; Aqrawi, L.A.; Rykke, M.; Hove, L.H.; Palm, O.; Jensen, J.L.; Singh, P.B.Oral disorders, saliva secretion, and oral health-related quality of life in patients with primary Sjogren’ssyndrome. Eur. J. Oral. Sci. 2017, 125, 265–271. [CrossRef] [PubMed]
5. Ferris, A.; Schlitzer, J.; Schierberl, M. Nutrition and taste and smell deficits: A risk factor or an adjustment. ClinicalMeasurement of Taste and Smell; Meiselman, H.L., Rivlin, R.S., Eds.; Collamore Press: Lexington, MA, USA,1986; pp. 264–278.
6. Fox, P.C. Autoimmune Diseases and Sjögren’s Syndrome. Ann. N.Y. Acad. Sci. 2007, 1098, 15–21. [CrossRef][PubMed]
204

Nutrients 2019, 11, 264
7. Fox, P.C.; Bowman, S.J.; Segal, B.; Vivino, F.B.; Murukutla, N.; Choueiri, K.; Ogale, S.; McLean, L. Oralinvolvement in primary Sjögren syndrome. J. Am. Dent. Assoc. 2008, 139, 1592–1601. [CrossRef] [PubMed]
8. Fox, R.I. Sjögren’s syndrome. Lancet 2005, 366, 321–331. [CrossRef]9. Vitali, C.; Bombardieri, S.; Jonsson, R.; Moutsopoulos, H.M.; Alexander, E.L.; Carsons, S.E.; Daniels, T.E.;
Fox, P.C.; Fox, R.I.; Kassan, S.S.; et al. Classification criteria for Sjogren’s syndrome: A revised version ofthe European criteria proposed by the American-European Consensus Group. Ann. Rheum. Dis. 2002, 61,554–558. [CrossRef] [PubMed]
10. St. Clair, E.W.; Lackey, V.D. Chapter 73—Sjögren’s Syndrome. In Kelley and Firestein’s Textbook of Rheumatology,10th ed.; Firestein, G.S., Budd, R.C., Gabriel, S.E., McInnes, I.B., O’Dell, J.R., Eds.; Elsevier: Philadelphia,PA, USA, 2017; pp. 1221–1244.
11. Patel, R.; Shahane, A. The epidemiology of Sjögren’s syndrome. Clin. Epidemiol 2014, 6, 247–255. [CrossRef][PubMed]
12. Gøransson, L.G.; Haldorsen, K.; Brun, J.G.; Harboe, E.; Jonsson, M.V.; Skarstein, K.; Time, K.; Omdal, R. The pointprevalence of clinically relevant primary Sjögren’s syndrome in two Norwegian counties. Scand. J. Rheumatol. 2011,40, 221–224. [CrossRef] [PubMed]
13. Ettinger, R.L. Review: Xerostomia: A Symptom which acts like a Disease. Age Ageing 1996, 25, 409–412.[CrossRef] [PubMed]
14. Cassolato, S.F.; Turnbull, R.S. Xerostomia: Clinical Aspects and Treatment. Gerodontology 2003, 20, 64–77.[CrossRef] [PubMed]
15. Murphy, C.; Doty, R.L.; Duncan, H.J. Clinical disorders of olfaction. In Handbook of Olfaction and Gustation;CRC Press, Marcel Dekker: New York, NY, USA, 2003; pp. 822–849.
16. Bromley, S.M.; Doty, R.L. Clinical disorders affecting taste: Evaluation and management. In Handbook ofOlfaction and Gustation; CRC Press, Marcel Dekker: New York, NY, USA, 2003; pp. 1598–1637.
17. Deems, D.A.; Doty, R.L.; Settle, R.; Moore-Gillon, V.; Shaman, P.; Mester, A.F.; Kimmelman, C.P.;Brightman, V.J.; Snow, J.B.Jr. Smell and taste disorders, a study of 750 patients from the university ofpennsylvania smell and taste center. Arch. Otolaryngol. Head Neck. Surg. 1991, 117, 519–528. [CrossRef][PubMed]
18. Olate, S.; Muñoz, D.; Neumann, S.; Pozzer, L.; Cavalieri-Pereira, L.; de Moraes, M. A descriptive study of theoral status in subjects with Sjögren’s syndrome. Int J Clin Exp Med. 2014, 7, 1140–1144. [PubMed]
19. Boutsi, E.A.; Paikos, S.; Dafni, U.G.; Moutsopoulos, H.M.; Skopouli, F.N. Dental and periodontal status ofSjogren’s syndrome. J. Clin. Periodontal. 2000, 27, 231–235. [CrossRef]
20. Pedersen, A.M.L.; Bardow, A.; Nauntofte, B. Salivary changes and dental caries as potential oral markersof autoimmune salivary gland dysfunction in primary Sjogren’s syndrome. BMC Clin. Pathol. 2005, 5, 4.[CrossRef] [PubMed]
21. Thomson, W.M.; van der Putten, G.J.; de Baat, C.; Ikebe, K.; Matsuda, K.; Enoki, K.; Hopcraft, M.S.; Ling, G.Y.Shortening the xerostomia inventory. Oral Surg. Oral Med. Oral Pathol. Oral Radiol. Endod. 2011, 112, 322–327.[CrossRef] [PubMed]
22. Thomson, W.M.; Chalmers, J.M.; Spencer, A.J.; Williams, S.M. The Xerostomia Inventory: A multi-itemapproach to measuring dry mouth. Community Dent. Health 1999, 16, 12–17. [PubMed]
23. Axelsson, P. Diagnosis and Risk Prediction of Dental Caries; Quintessence Pub. Co.: Chicago, IL, USA, 2000.24. Hummel, T.; Kobal, G.; Gudziol, H.; Mackay-Sim, A. Normative data for the “Sniffin’ Sticks” including tests
of odor identification, odor discrimination, and olfactory thresholds: An upgrade based on a group of morethan 3,000 subjects. Eur. Arch. Otorhinolaryngol. 2007, 264, 237–243. [CrossRef] [PubMed]
25. Mueller, C.; Kallert, S.; Renner, B.; Stiassny, K.; Temmel, A.; Hummel, T.; Kobal, G. Quantitative assessment ofgustatory function in a clinical context using impregnated” taste strips”. Rhinology 2003, 41, 2–6. [PubMed]
26. Rosenberg, M.; Septon, I.; Eli, I.; Bar-Ness, R.; Gelernter, I.; Brenner, S.; Gabbay, J. Halitosis measurement byan industrial sulphide monitor. J Periodontal. 1991, 62, 487–489. [CrossRef] [PubMed]
27. Erovic Ademovski, S.; Lingstrom, P.; Renvert, S. The effect of different mouth rinse products on intra-oralhalitosis. Int. J. Dent. Hyg. 2016, 14, 117–123. [CrossRef] [PubMed]
28. Shiboski, S.C.; Shiboski, C.H.; Criswell, L.A.; Baer, A.N.; Challacombe, S.; Lanfranchi, H.; Schiødt, M.;Umehara, H.; Vivino, F.; Zhao, Y.; et al. American College of Rheumatology classification criteria forSjögren’s syndrome: A data-driven, expert consensus approach in the Sjögren’s International CollaborativeClinical Alliance cohort. Arthritis Care Res. (Hoboken). 2012, 64, 475–487. [CrossRef] [PubMed]
205

Nutrients 2019, 11, 264
29. Mattes, R.D.; Cowart, B.J. Dietary assessment of patients with chemosensory disorders. J Am. Diet. Assoc.1994, 94, 50–56. [CrossRef]
30. Mattes-Kulig, D.A.; Henkin, R.I. Energy and nutrient consumption of patients with dysgeusia. J Am. Diet. Assoc.1985, 85, 822–826. [PubMed]
31. Hoffman, H.J.; Ishii, E.K.; MacTurk, R.H. Age-related changes in the prevalence of smell/taste problemsamong the United States adult population. Results of the 1994 disability supplement to the National HealthInterview Survey (NHIS). Ann. NY Acad. Sci. 1998, 855, 716–722. [CrossRef] [PubMed]
32. Touger-Decker, R.; Mobley, C. Position of the Academy of Nutrition and Dietetics: Oral health and nutrition.J. Acad. Nutr. Diet. 2013, 113, 693–701. [CrossRef] [PubMed]
33. Kamel, U.F.; Maddison, P.; Whitaker, R. Impact of primary Sjogren’s syndrome on smell and taste: Effect onquality of life. Rheumatology (Oxford) 2009, 48, 1512–1514. [CrossRef] [PubMed]
34. Poon, R.; Su, N.; Ching, V.; Darling, M.; Grushka, M. Reduction in unstimulated salivary flow rate in burningmouth syndrome. Br. Den. J. 2014, 217, E14. [CrossRef] [PubMed]
35. Rosenberg, M. Clinical assessment of bad breath: Current concepts. J. Am. Dent. Assoc. 1996, 127, 475–482.[CrossRef] [PubMed]
36. Falcao, D.P.; Vieira, C.N.; Batista de Amorim, R.F. Breaking paradigms: A new definition for halitosis in thecontext of pseudo-halitosis and halitophobia. J. breath Res. 2012, 6, 017105. [CrossRef] [PubMed]
© 2019 by the authors. Licensee MDPI, Basel, Switzerland. This article is an open accessarticle distributed under the terms and conditions of the Creative Commons Attribution(CC BY) license (http://creativecommons.org/licenses/by/4.0/).
206

nutrients
Article
Exploring Drivers of Liking of Low-PhenylalanineProducts in Subjects with Phenyilketonuria UsingCheck-All-That-Apply Method
Cristina Proserpio 1,*, Ella Pagliarini 1, Juri Zuvadelli 2, Sabrina Paci 2, Alice Re Dionigi 2,
Giuseppe Banderali 2, Camilla Cattaneo 1 and Elvira Verduci 2
1 Department of Food, Environmental and Nutritional Sciences (DeFENS), University of Milan,20133 Milan, Italy; [email protected] (E.P.); [email protected] (C.C.)
2 Department of Paediatrics, San Paolo Hospital, Department of Health Sciences, University of Milan,20142 Milan, Italy; [email protected] (J.Z.); [email protected] (S.P.);[email protected] (A.R.D.); [email protected] (G.B.); [email protected] (E.V.)
* Correspondence: [email protected]; Tel.: +39-025-031-9175
Received: 3 August 2018; Accepted: 24 August 2018; Published: 28 August 2018
Abstract: The aim of the present study was to apply the Check-all-that-apply (CATA) method in anambulatory context involving subjects with phenylketonuria (PKU) to obtain a sensory descriptionand to find the drivers of liking of low-phenylalanine products (Glycomacropeptide vs. L-aminoacids formulas). 86 subjects with PKU (age range: 8–55 years) evaluated 8 samples: 4 L-amino acidformulas and 4 Glycomacropeptide (GMP) formulas, flavored with neutral, chocolate, strawberryand tomato aromas. Participants were asked to indicate which sensory attributes characterized eachformulations and to score the overall liking. Significant differences were found regarding liking scores(F = 65.29; p < 0.001). GMP samples flavored with chocolate and strawberry, described as sweets,with a mild and natural taste and odor, were the most appreciated. Overall, GMP formulas obtainedhigher liking scores compared to L-amino acid formulas. Tomato flavored samples, described asbitter, salty, with artificial color, with strong taste and odor, obtained the lowest scores. In conclusion,CATA questionnaire seems to be a suitable method also in ambulatory context since this approachsuggested that different foods and beverages with GMP could be developed to improve dietarytreatment compliance of subjects with PKU from school age onwards.
Keywords: acceptability; food development; sensory attributes; CATA; dietotherapy; aromas
1. Introduction
Phenylketonuria (PKU; Online Mendelian Inheritance in Man, OMIM 261,600) is an autosomalrecessive disorder of phenylalanine (Phe) metabolism [1], primarily due to mutations in Phehydroxylase (PAH) gene, which facilitates conversion of the essential amino acid Phe to tyrosine.Loss of PAH activity results in increased Phe concentrations in the blood (hyperphenylalaninaemia,HPA) and therefore in toxic concentrations in the brain. The main goal of treatment for PKU is tomaintain the blood Phe within safe limits to prevent mental retardation and ensure normal growthand life with good health through adulthood. The dietary treatment usually begins immediately afterconfirmation of PKU diagnosis in newborns and should be continued throughout their lifetime inpatients with untreated phenylalanine levels more than 600 μmol/L. Compliance with treatment isadequate in infancy and childhood, however difficulties in maintaining a PKU diet in adolescent andadulthood are reported [2]. Patients with PKU have to avoid foods rich in protein (e.g., meat, fish anddairy products), thus the diet consists mainly of low-protein natural foods (vegetables, fruits) andspecial low protein products, such as bread and pasta with a protein content <1 g/100 g. The required
Nutrients 2018, 10, 1179; doi:10.3390/nu10091179 www.mdpi.com/journal/nutrients207

Nutrients 2018, 10, 1179
amount of daily protein is obtained from Phe-free protein substitutes providing essential amino acidsin suitable proportions [3]. The number of protein substitutes (mixtures of amino acids that are freefrom or low in Phe) available for PKU patients is increasing constantly over time [4,5].
Even if improvements in the palatability, presentation, convenience and nutritional compositionof substitutes have helped to improve long-term compliance with PKU diet, the acceptability of thesesubstitutes remains a critical point, thus further improvement in this area is needed.
Casein Glycomacropeptide (GMP) is a protein derived from cheese whey that is rich in specificessential amino acids but it is the only known natural protein that in its purified form is free of tyrosine,tryptophan and phenylalanine. Therefore, GMP could provide an alternative protein source for PKUindividuals when manufactured to sufficient purity to ensure the absence of Phe [6].
Studies in literature that consider the sensory analysis of low protein recipes for PKU dietotherapyare scarce. Moreover, these researches generally focused only on the overall acceptability of GMPproducts applying unsuitable hedonic methods [7,8]. Indeed, in the mentioned studies PKU subjects’sample size was not appropriate to perform a hedonic evaluation, since the subjects involved wereless than the required number. The lack of empirical studies regarding the patients’ satisfaction ofthe low-phenylalanine products and the requirement of new approaches for dietary management ofPKU, reinforce the need to evaluate methods for studying PKU patients’ perception about the sensorycharacteristics of low protein products. In this context, the Check-all-that-apply (CATA) questionnairecould be an alternative approach for this purpose, since it has been proposed as a valid and rapidmethod for obtain a descriptive profile from consumers [9]. Indeed, with this exploratory approach alarger number of attributes, compared to other sensory evaluation such as the Just-about-right scaleperformed on a set of well-known products focusing on few attributes, can be evaluated to identifythose with greatest impact on hedonic product performance [10].
To our knowledge, there are no studies using valid method to evaluate and obtain a sensorycharacterization of low-phenylalanine products, especially in an ambulatory context.
The first aim of this study was to investigate the liking of low-phenylalanine products comparingL-amino acid formulas and GMP formulas. The second aim was to obtain a sensory descriptionof the desirable and undesirable sensory properties of these products. For this purpose, the CATAquestionnaire was used to identify PKU subjects’ drivers of liking.
2. Materials and Methods
2.1. Participants
A total of 86 subjects with PKU (range age: 8–55 years), 45 males and 41 females, were recruitedamong patients referred to the Department of Pediatrics, San Paolo Hospital (Milan, Italy).
All participants had a biochemical diagnosis confirmed by genetic investigation and 6 participantswere late diagnosed while for all others neonatal screening was made. The characteristics of thepopulation are summarized in Table 1.
All participants were following a low-phenylalanine diet (84% of the participants were followinga diet mainly based on L-amino acid formulas, 7% of the participants were not using a medicalintegration, 8% of the participant were following a diet based on both L-amino acid formulas and GMP,only one participant was using GMP). PKU children were defined as compliant to the diet when theannual mean Phe levels, monitored monthly by the Guthrie test, was within the range 120–360 mmol/Lin childhood (<12 years) and 120–600 mmol/L in adolescence and adult age (>12 years) [2].
208
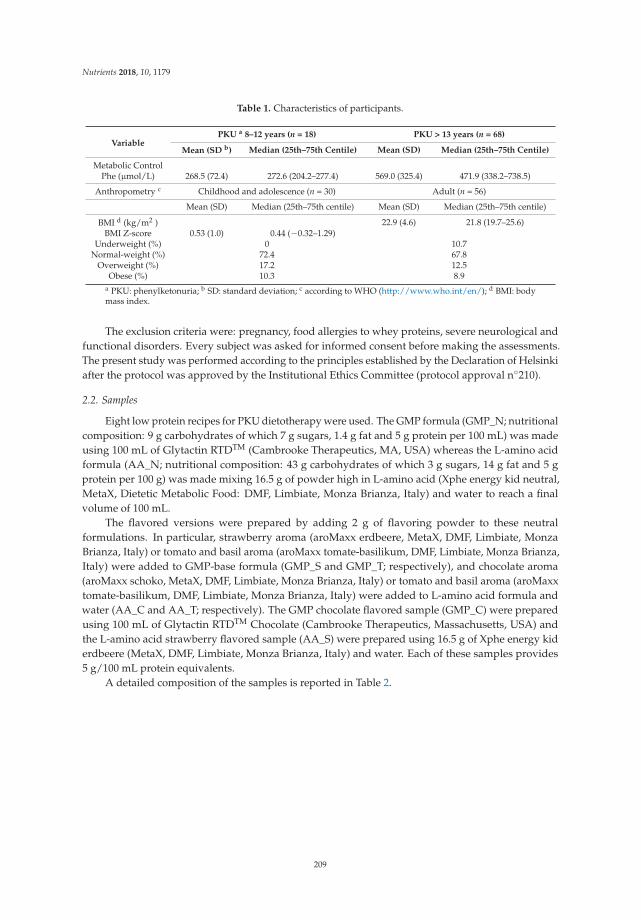
Nutrients 2018, 10, 1179
Table 1. Characteristics of participants.
VariablePKU a 8–12 years (n = 18) PKU > 13 years (n = 68)
Mean (SD b) Median (25th–75th Centile) Mean (SD) Median (25th–75th Centile)
Metabolic ControlPhe (μmol/L) 268.5 (72.4) 272.6 (204.2–277.4) 569.0 (325.4) 471.9 (338.2–738.5)
Anthropometry c Childhood and adolescence (n = 30) Adult (n = 56)
Mean (SD) Median (25th–75th centile) Mean (SD) Median (25th–75th centile)
BMI d (kg/m2 ) 22.9 (4.6) 21.8 (19.7–25.6)BMI Z-score 0.53 (1.0) 0.44 (−0.32–1.29)
Underweight (%) 0 10.7Normal-weight (%) 72.4 67.8
Overweight (%) 17.2 12.5Obese (%) 10.3 8.9
a PKU: phenylketonuria; b SD: standard deviation; c according to WHO (http://www.who.int/en/); d BMI: bodymass index.
The exclusion criteria were: pregnancy, food allergies to whey proteins, severe neurological andfunctional disorders. Every subject was asked for informed consent before making the assessments.The present study was performed according to the principles established by the Declaration of Helsinkiafter the protocol was approved by the Institutional Ethics Committee (protocol approval n◦210).
2.2. Samples
Eight low protein recipes for PKU dietotherapy were used. The GMP formula (GMP_N; nutritionalcomposition: 9 g carbohydrates of which 7 g sugars, 1.4 g fat and 5 g protein per 100 mL) was madeusing 100 mL of Glytactin RTDTM (Cambrooke Therapeutics, MA, USA) whereas the L-amino acidformula (AA_N; nutritional composition: 43 g carbohydrates of which 3 g sugars, 14 g fat and 5 gprotein per 100 g) was made mixing 16.5 g of powder high in L-amino acid (Xphe energy kid neutral,MetaX, Dietetic Metabolic Food: DMF, Limbiate, Monza Brianza, Italy) and water to reach a finalvolume of 100 mL.
The flavored versions were prepared by adding 2 g of flavoring powder to these neutralformulations. In particular, strawberry aroma (aroMaxx erdbeere, MetaX, DMF, Limbiate, MonzaBrianza, Italy) or tomato and basil aroma (aroMaxx tomate-basilikum, DMF, Limbiate, Monza Brianza,Italy) were added to GMP-base formula (GMP_S and GMP_T; respectively), and chocolate aroma(aroMaxx schoko, MetaX, DMF, Limbiate, Monza Brianza, Italy) or tomato and basil aroma (aroMaxxtomate-basilikum, DMF, Limbiate, Monza Brianza, Italy) were added to L-amino acid formula andwater (AA_C and AA_T; respectively). The GMP chocolate flavored sample (GMP_C) were preparedusing 100 mL of Glytactin RTDTM Chocolate (Cambrooke Therapeutics, Massachusetts, USA) andthe L-amino acid strawberry flavored sample (AA_S) were prepared using 16.5 g of Xphe energy kiderdbeere (MetaX, DMF, Limbiate, Monza Brianza, Italy) and water. Each of these samples provides5 g/100 mL protein equivalents.
A detailed composition of the samples is reported in Table 2.
209

Nutrients 2018, 10, 1179
Table 2. Compositions of the eight samples.
Samples Composition
GMP a formulas
GMP_N 50 mL Glytactin 10 RTD b neutral + 50 mL Glytactin 15 RTD neutralGMP_C 50 mL Glytactin 10 RTD chocolate + 50 mL Glytactin 15 RTD chocolate
GMP_S 50 mL Glytactin 10 RTD neutral + 50 mL Glytactin 15 RTD neutral + 2 gstrawberry aroma
GMP_T 50 mL Glytactin 10 RTD neutral + 50 mL Glytactin 15 RTD neutral + 2 gtomato and basil aroma
L-amino acid formulasAA_N 16.5 g Xphe energy kid neutral + waterAA_C 16.5 g Xphe energy kid neutral + 2 g chocolate aroma + waterAA_S 16.5 g Xphe energy kid erdbeere + waterAA_T 16.5 g Xphe energy kid neutral + 2 g tomato and basil aroma + water
a GMP: glycomacropeptide; b RTD: ready to drink.
The eight samples were presented as beverages to participants following a randomized andbalanced order for each participant. Approximately 30 mL of each sample were presented to theparticipants monadically in plastic cups labelled with three-digit codes. Water was available for rinsingthe palate.
2.3. Experimental Procedure
All the evaluations were performed in a quiet room and all the participants were tested at thesame time (10:30–12:30). They were asked to refrain from consuming anything but water for 2 h beforethe test (hungry state). For each sample, subjects had to score their overall liking and to answer acheck-all-that-apply (CATA) questionnaire.
2.4. Liking Assessment
Participants were asked to taste the products monadically and to express their liking scores.Children (aged 8–12 years) were asked to express their liking through a vertical 7-point facial hedonicscale, from “super good” (7) to “super bad” (1) [11], whereas subjects aged between 13 and 65 yearsrated their liking using a 10cm Visual Analogue Scale (VAS) anchored by the extremes “extremelydisliked” (rated 0) and “extremely liked” (rated 10).
2.5. Check-All-That-Apply (CATA) Assessment
The CATA questionnaire consisted on a list of 27 sensory attributes including appearance, odor,taste, flavor and texture terms. Participants were asked to check from the list all the terms that theyconsidered appropriate to describe each of the samples. The terms considered were the following:10 for the appearance (light brown, dark brown, light yellow, dark yellow, light pink, dark pink, naturalcolor, artificial color, brightness and opaque), 6 for the odor (natural odor, artificial odor, mild odor,strong odor, milk odor and vanilla odor), 8 for the taste/flavor (sweet, bitter, salty, sour, mild taste,strong taste, milk flavor and vanilla flavor) and 3 for the texture (thin, thick and floury). The positionof attributes was randomized using the “to assessor” list order allocation scheme [12].
A separate group of 12 untrained PKU subjects aged 20–40 years’ old took part in a pilot test,wherein judges used a free listing questionnaire to establish the appropriate terms to describe thesamples [13]. They were provided with the eight formulations and for each sample, they were asked topay attention to the sensory characteristics and to write all terms for describing their color, appearance,odor, taste, flavor and texture. An open discussion followed the development of lexicon. Then theexperimenters finalized the list of terms, selecting the most mentioned and the most common word inorder to avoid synonymous [14].
210
Nutrients 2018, 10, 1179
2.6. Data Analysis
A mixed ANOVA was carried out on overall liking data considering ‘samples’ (GMP_N; GMP_S;GMP_C; GMP_T; AA_N; AA_S; AA_C and AA_T), ‘gender’ (women and men), ‘age’ (young: <21 yearsold; adults: ≥21 years old) and their two-way interaction (‘sample’ × ‘gender’; ‘sample’ × ‘age’)as fixed factors. Liking provided by children where adjusted by using a proportion in order tohave results comparable to those provided by adults. In order to examine how the adherence to thedietotherapy affects the liking of the evaluated low-phenylalanine formulas a model was constructedwith ‘adherence to diet’ (‘good adherence’ = Phe levels 120–360 mmol/L in children < 12 years,and 120–600 mmol/L in adolescence and adult age >12 years; ‘scarse adherence’ = Phe levels >360 mmol/L in children < 12years, and >600 mmol/L in adolescence and adult age > 12 years)(van Spronsen et al. 2017) and ‘samples category’ (GMP and AA) and their two-way interaction asfixed factors. This analysis has also been performed considering only GMP samples which obtainedthe higher liking scores and the L-amino acid samples flavored with the same aroma. Thus, a modelwas constructed with ‘adherence to diet’ and ‘samples’ (GMP_S; GMP_C; AA_S; AA_C) and theirtwo-way interaction as fixed factors. Participants were added as random factor in all the analyses.When a significant difference (p < 0.05) was found, least significant difference (LSD) post hoc test wasused. These statistical analyses were performed using IBM SPSS Statistics for Windows, Version 24.0(IBM Corp., Armonk, NY, USA).
For the CATA question, frequency of mention for each term was determined by counting thenumber of participants that used that term to describe each sample. Cochran’s Q test was carriedout for each of the 27 terms to detect differences in participants’ perception of the evaluated samples.Correspondence analysis (CA) was performed to study the relationship between CATA questions andliking data. CA was performed on the frequency table containing responses to the CATA questions,considering the average liking scores by product as supplementary variable. These statistical analyseswere performed using XLSTAT-Sensory® software for Windows, Version 2015.6.01 (Addinsoft™, Paris,France). A p-value of <0.05 was considered significant.
3. Results
3.1. Liking Assessment
The mean liking scores by samples are provided in Figure 1. The main factor ‘samples’ wasfound to have a significant effect on liking (F(7,581) = 65.29, p < 0.001). Overall, GMP formulas obtainedhigher liking scores (M = 4.84 ± 0.18) compared to the L-amino acid formulas (M = 3.06 ± 0.18).In particular, GMP_S (M = 6.27 ± 0.26) and GMP_C (M = 6.27 ± 0.26), which were comparable to eachother, obtained the highest liking scores. GMP_T (M = 2.06 ± 0.26), AA_T (1.81 ± 0.26) and AA_N(M = 2.15 ± 0.26), which were comparable to each other, obtained the lowest hedonic ratings and werenot acceptable since they were below the middle of the scale.
211

Nutrients 2018, 10, 1179
Figure 1. Liking score ± standard error mean (SEM) by samples. Different letters indicate significantdifferences according to post hoc test (Patients n = 86).
The main factor ‘age’ was found to have a significant effect on liking (F(1,83) = 5.96, p = 0.02).Overall, the young participants provided higher liking scores (M = 4.31 ± 0.21) to the samplescompared to the adult participants (M = 3.59 ± 0.21). Moreover, the interaction ‘samples’ × ‘age’ hada significant effect on liking scores (F(7,581) = 2.45, p = 0.02). As shown in Figure 2, considering the lesspreferred samples (GMP_T, AA_T, AA_N, AA_C) young participants gave significant higher likingscores (p < 0.05) compared to adult participants.
Figure 2. Liking score ± SEM by samples × age. Significant difference for * p < 0.05 (Young patientsn = 43; Adult patients n = 43).
The main factor ‘gender’ and the interactions ‘sample’ × ‘gender’ were not significant(F(1,83) = 0.07, p = 0.80; F(7,581) = 0.45, p = 0.87, respectively).
A significant effect of the main factor ‘adherence to diet’ on liking scores was found (F(1,84) = 6.10,p = 0.02). Generally, participants with ‘scarce adherence’ to the dietotherapy gave significant lower
212

Nutrients 2018, 10, 1179
liking scores (M = 3,63 ± 0.19) compared to participants with ‘good adherence’ (M = 4.37 ± 0.23).Moreover, the interaction ‘adherence to diet’ × ‘samples category’ had a significant effect on liking(F(1,600) = 5.06, p = 0.02). In particular, as shown in Figure 3, participants characterized by ‘scarceadherence’ gave significant higher liking scores to the GMP formulas (M = 3.74 ± 0.27) compared tothe L-amino acid formulas (M = 2.55 ± 0.24).
Figure 3. Liking score ± SEM by ‘adherence to diet’ × ‘samples category’. Significant difference for* p < 0.05 (Patients with scarce adherence n = 49, Patients with high adherence n = 37).
Considering only GMP samples which obtained the higher liking scores (GMP_C and GMP_S)and the L-amino acid samples flavored with the same aroma (AA_C and AA_S) and the ‘adherence todiet’ a significant ‘sample’ effect was found (F(1,256) = 64.83, p < 0.001). As shown in Figure 4 patientscharacterized by a scarce adherence to diet gave comparable liking scores to GMP samples comparedto patients with high adherence to the diet. Contrarily, patients with scarce adherence to diet gavesignificant (p < 0.05) lower liking scores to AA samples compared to subjects with high adherence todiet. The main factor ‘adherence to diet’ and the interaction ‘adherence to diet’ × ‘samples category’were not significant (F(1,84) = 1.99, p = 0.16; F(1,256) = 3.75, p = 0.06, respectively).
Figure 4. Liking score ± SEM by ‘adherence to diet’ × ‘samples’ (AA_C, AA_S, GMP_C, GMP_S).Significant difference for * p < 0.05. (Patients with scarce adherence n = 49, Patients with high adherencen = 37).
213

Nutrients 2018, 10, 1179
3.2. CATA Assessment
The frequency table of terms checked by patients to describe the eight samples is reportedin Table 3.
As shown in Table 3 significant differences were found in the frequency for 25 out of 27 termswithin the five categories considered, suggesting that participants perceived differences betweensamples in terms of their sensory characteristics. The sensory attributes that were not useful in orderto discriminate samples were ‘artificial color’ and ‘natural odor’. Indeed, looking at the frequency ofmention of these attributes these terms were used quite homogeneously and were checked by less halfof the respondents, indicating that the participants’ consensus was low.
Table 3. Frequency mention of sensory attributes associated with each samples.
Sensory Modality Sensory Attributes
Frequency of Mention
Samples
AA_C AA_S AA_N AA_T GMP_C GMP_S GMP_N GMP_T
Appearance
Artificial color n.s. 19 26 17 19 18 18 19 25natural color *** 11 10 27 10 20 10 23 8light yellow *** 0 0 14 1 22 0 34 3dark yellow *** 0 0 1 0 21 0 4 4
brightness * 8 20 14 15 13 10 19 14light brown *** 5 0 0 62 25 0 3 61dark brown *** 81 0 0 14 3 0 0 7
opaque *** 28 9 14 15 22 14 20 17light pink *** 0 79 0 0 0 23 0 4dark pink *** 0 6 0 0 0 60 0 2
Odor
artificial odor * 32 28 36 33 19 22 23 31mild odor *** 20 34 12 5 27 29 31 7milk odor *** 4 3 16 1 25 7 30 7
vanilla odor *** 2 9 4 2 17 9 20 3strong odor *** 22 15 21 56 16 17 12 53natural odor n.s. 13 11 10 8 16 16 12 5
Taste
sweet *** 27 43 9 5 54 70 34 10sour *** 13 19 29 24 4 6 4 31salty *** 11 9 23 55 4 1 5 49bitter *** 32 14 37 32 1 3 13 20
mild taste *** 17 23 5 3 42 46 38 9strong taste *** 42 39 47 59 9 17 18 55
Flavormilk flavor *** 10 8 7 1 32 12 38 7
vanilla flavor *** 4 7 4 2 29 5 15 4
Texturethin *** 18 50 33 24 31 33 44 37thick *** 38 4 27 24 17 20 14 13
floury *** 25 2 18 14 12 10 14 10n.s., non-significant difference according to Cochran’s Q test. significant difference for * p < 0.05; *** p < 0.001.
3.3. Relating Sensory Profiling (CATA) with Liking
The purpose of this calculation was to establish which sensory attributes are mainly related to theoverall liking of the samples and to obtain a perceptual map of the products based on both liking andsensory profiling.
The CA performed on the total frequency participants counts for each attributes resulted in twodimensions accounting for 60.43% of variance in the data. As inferred from the product plot (Figure 5),samples were discriminated according to their flavor, with samples with strawberry aroma (AA_Sand GMP_S) in the upper right side of the map while the samples added with tomato aroma werepositioned in the upper left side of the map (AA_T and GMP_T). Looking at the lower part of the mapGMP formulas without aroma (GMP_N) and the chocolate one (GMP_C) are well distinguished fromthe L-amino acid formulas with the same aromas (AA_N and AA_C).
214

Nutrients 2018, 10, 1179
Figure 5. Products plot obtained from Check-all-that-apply (CATA).
The relation between sensory terms and overall liking of the eight samples is reported in Figure 6.
Figure 6. Attributes plot obtained from CATA total frequency counts and liking. Underline termsdescribed samples that obtained higher liking scores while terms in italic describe mainly thedisliked samples.
Comparing Figures 5 and 6, it is possible to see that participants liking was oriented towardGMP_C and GMP_S on the right side of the map, which were mainly associated with the sensory
215

Nutrients 2018, 10, 1179
attributes ‘sweet taste’, ‘mild taste’ and ‘mild odor’, and ‘natural odor’. Liking was negative relatedto ‘bitter taste’, ‘strong taste’, ‘salty’, ‘strong odor’, ‘artificial odor’, ‘light brown’ and ‘artificial color’,which described the samples that obtained the lowest liking scores (GMP_T, AA_T and AA_N).
4. Discussion
The aim of the present study was to perform the Check-all-that-apply (CATA) method in anambulatory context involving subjects with phenylketonuria (PKU) to obtain a sensory descriptionand to find the drivers of liking of low-phenylalanine products (Glycomacropeptide vs. L-aminoacids formulas).
We demonstrated a greater acceptability of GMP beverages compared to the amino acid formulascurrently required as the primary source of protein in the PKU diet [15]. Moreover, GMP samplesflavored with chocolate and strawberry, described as sweets, with a mild and natural taste and odor,were the most appreciated. Contrarily, tomato flavored samples, described as bitter, salty, with artificialcolor, with strong taste and odor, obtained the lowest liking scores.
Liking scores between women and men were comparable to each other while young subjectsprovided generally higher liking scores compared to the adults. Accordingly, it is well known thatsubjects become more critical in their food choices and preferences with increasing age [16], maybedue to a greater exposure to a wide range of food products.
Previous studies explored the overall acceptability of GMP products, but no one investigatedwhich sensory properties characterized these products [7,8,17]. None of the mentioned studiesmeasured acceptability with an appropriate method or with a representative sample size. Indeed,Lim and collaborators (2007) showed that a GMP chocolate beverage was significantly more acceptablecompared to the same flavored amino acid beverage. However, PKU subjects’ sample size was notappropriate to perform a hedonic evaluation, since the subjects involved were less than the requirednumber. Similarly, van Calcar and colleagues [8] concluded that, in a group of only 10 subjects involvedin an 8-day inpatient metabolic study, the GMP products were better tasting compared with usualamino acid formulas, both consumed during the treatments. Again, this assumption was not supportedby a proper hedonic evaluation, since, besides the small group of subjects recruited, any quantitativesensory evaluation was performed. Recently, Ney and colleagues (2016) in a randomized crossovertrial with 30 early-treated phenylketonuria subjects found, using a questionnaire, that GMP sampleswere generally more acceptable than AA formulas. However, a sensory evaluation was not performedto confirm these results. From a methodological point of view, this is the first study that included anadequate sample of subjects with PKU and fulfilled the requirements to perform a sensory descriptionof products using the CATA approach [9]. In line with the literature data, an appropriate samplesize was recruited [18] and a suitable list of CATA questions was used. Indeed, in order to considerconsumer heterogeneity and avoiding a dilution effect of the responses, it has been reported that aminimum of 10 to a maximum of 40 terms should be comprised in the list [14,19].
Subjects’ CATA counts were significantly different for the evaluated samples suggesting that thistechnique was able to detect differences in subjects’ perception of low protein products. Thus, CATAquestionnaire may represent an alternative and rapid method for the description of products’ sensorycharacteristics, when it is difficult to apply traditional sensory descriptive analyses (e.g., sensoryprofile). This new approach has been already successfully applied to evaluate sensory perception of afood product in particular context or with specific group of subjects [20,21]. Indeed, De Pelsmaekerand collaborators [20] used this method with 8- to 13-year-old children to obtain emotional profiles offood, and Laureati and collaborators [21] tested CATA questions in a natural context (e.g., school) asan alternative approach to descriptive methods in food product development with a young panel.
Present results support the feasibility of GMP in making a great selection of palatable foods andbeverages to improve the taste, variety and compliance of the PKU diet, with a positive impact on it.In addition, it has been suggested the ability of GMP to promote a greater satiety when compared toamino acid-based formulas and to suppress plasma ghrelin levels in individuals with PKU [8,22].
216
Nutrients 2018, 10, 1179
Regarding variety, one the biggest obstacle to following the PKU diet is that the amino acidmixtures are usually available and consumed as a liquid formula [23]. On the contrary, GMPis well suited for use not only in beverages but also in semi-solid foods [24]. Indeed, variouslow-phenylalanine products such as beverages, pudding and crackers has been developed [15], due toits functional properties including good heat stability and solubility in acid [25].
Moreover, the main goal in PKU treatments is to facilitate long-term dietary compliance and toultimately improve quality of life and metabolic control for individuals with PKU. Indeed, data inliterature shown that compliance with treatment seems to be adequate in infancy and childhood [26]but scarce adherence and difficulties in maintaining PKU diet have been reported in patients above16 years of age, in whom Phe values were within or below guideline goals [27]. Even if, evidencessuggested that GMP is more acceptable than the traditional amino acid mixtures it is not an easy taskto change patients’ food habits trough these new formulations. Indeed, it is well known that foodhabits are difficult to be changed and PKU patients are used to drink amino acid mixtures since infancy.PKU is an extreme example of a well-established eating pattern. This suggests that subjects with PKUwho are compliant with consuming AA formulas are imprinted with a preference for the taste andemotional components associated with lifelong consumption these formulas [17]. Indeed, Ney andcolleagues (2016) showed that patients used to consumed the amino acid mixtures stated that GMPtasted better but that they still craved AA formulas. Moreover, even if it has been shown that in PKUmouse model the ingestion of GMP decreased Phe concentrations in blood and increased the braintissue, researches are ongoing to evaluate the long-term safety and efficacy of GMP in the nutritionalmanagement of PKU [2,28].
The present data suggested that subjects with a scarce adherence to diet preferred generallythe GMP formulas compared to the commonly amino acid mixtures, supporting the hypothesis thatthe implementation of the diet with more appreciated products could maybe enhance their dietarycompliance, improving also subjects’ health status, especially in adults.
5. Conclusions
In conclusion, the sensory approach through the CATA method could be useful to understandhow implements dietotherapy of subjects with PKU, considering their satisfaction as one of the mainaspects during the product development. As future perspective, it could be useful for industries todevelop new GMP products taking into account the information related to the sensory perception,specially to taste and odor attributes, in order to satisfying at the same time both nutritional andsensory aspects. Thus, the low-Phe formulas should have mild odor and taste, they should be sweetand with a more natural odor compared to the traditional mixtures.
Author Contributions: Conceptualization, C.P., E.P. and E.V.; Data curation, C.P., E.P. and E.V.; Formal analysis,C.P.; Investigation, C.P., J.Z., S.P., A.R.D. and C.C.; Project administration, E.P. and E.V.; Supervision, E.P., G.B. andE.V.; Writing—original draft, C.P. and C.C.; Writing—review & editing, E.P. and E.V.
Funding: No funding was received for this research.
Acknowledgments: We would like to express our thanks to Dietetic Metabolic food (DMF, Limbiate, MonzaBrianza) and Cambrooke Therapeutics (MA, USA) for supplying the samples. A special thanks to the studentsValerio Rusconi e Sabrina Chirone for their help in the experimental phases.
Conflicts of Interest: The authors declare no conflict of interest.
References
1. Blau, N. Genetics of phenylketonuria: Then and now. Hum. Mutat. 2016, 37, 508–515. [CrossRef] [PubMed]2. van Spronsen, F.J.; van Wegberg, A.M.; Ahring, K.; Bélanger-Quintana, A.; Blau, N.; Bosch, A.M.; Burlina, A.;
Campistol, J.; Feillet, F.; Gizewska, M.; et al. Key European guidelines for the diagnosis and management ofpatients with phenylketonuria. Lancet Diabetes Endocrinol. 2017, 5, 743–756. [CrossRef]
3. Giovannini, M.; Verduci, E.; Salvatici, E.; Paci, S.; Riva, E. Phenylketonuria: Nutritional advances andchallenges. Nutr. Metab. 2012, 9, 7. [CrossRef] [PubMed]
217

Nutrients 2018, 10, 1179
4. Cleary, M.A.; Feillet, F.; White, F.J.; Vidailhet, M.; Macdonald, A.; Grimsley, A.; Maurin, N.; de OgierBaulny, H.; Rutherford, P.J. Randomised controlled trial of essential fatty acid supplementation inphenylketonuria. Eur. J. Clin. Nutr. 2006, 60, 915–920. [CrossRef] [PubMed]
5. Feillet, F.; Agostoni, C. Nutritional issues in treating phenylketonuria. J. Inherit. Metab. Dis. 2010, 33, 659–664.[CrossRef] [PubMed]
6. Laclair, C.E.; Ney, D.M.; MacLeod, E.L.; Etzel, M.R. Purification and use of glycomacropeptide for nutritionalmanagement of phenylketonuria. J. Food Sci. 2009, 74, 199–206. [CrossRef]
7. Lim, K.; van Calcar, S.C.; Nelson, K.L.; Gleason, S.T.; Ney, D.M. Acceptable low-phenylalanine foods andbeverages can be made from glycomacropeptide from cheese whey for individuals with PKU. Mol. Genet.Metab. 2007, 92, 176–178. [CrossRef] [PubMed]
8. van Calcar, S.C.; MacLeod, E.L.; Gleason, S.T.; Etzel, M.R.; Clayton, M.K.; Wolff, J.A.; Ney, D.M. Improvednutritional management of phenylketonuria by using a diet containing glycomacropeptide compared withamino acids. Am. J. Clin. Nutr. 2009, 89, 1068–1077. [CrossRef] [PubMed]
9. Varela, P.; Ares, G. Sensory profiling, the blurred line between sensory and consumer science. A review ofnovel methods for product characterization. Food Res. Int. 2012, 48, 893–908. [CrossRef]
10. Ares, G.; de Andrade, J.C.; Antúnez, L.; Alcaire, F.; Swaney-Stueve, M.; Gordon, S.; Jaeger, S.R. Hedonicproduct optimisation: CATA questions as alternatives to JAR scales. Food Qual. Prefer. 2017, 55, 67–78.[CrossRef]
11. Pagliarini, E.; Gabbiadini, N.; Ratti, S. Consumer testing with children on food combinations for schoollunch. Food Qual. Prefer. 2005, 16, 131–138. [CrossRef]
12. Meyners, M.; Castura, J.C. Randomization of CATA attributes: Should attribute lists be allocated to assessorsor to samples? Food Qual. Prefer. 2016, 48, 210–215. [CrossRef]
13. Ares, G.; Deliza, R.; Barreiro, C.; Gimenez, A.; Gambaro, A. Comparison of two sensory profiling techniquesbased on consumer perception. Food Qual. Prefer. 2010, 21, 417–426. [CrossRef]
14. Jaeger, S.R.; Beresford, M.K.; Paisley, A.G.; Antunez, L.; Vidal, L.; Cadena, R.S.; Giménez, A.; Gastón, A.Check-all-that-apply (CATA) questions for sensory product characterization by consumers: Investigationsinto the number of terms used in CATA questions. Food Qual. Prefer. 2015, 42, 154–164. [CrossRef]
15. van Calcar, S.C.; Ney, D.M. Food products made with glycomacropeptide, a low-phenylalanine whey protein,provide a new alternative to amino acid-based medical foods for nutrition management of phenylketonuria.J. Acad. Nutr. Diet. 2012, 112, 1201–1210. [CrossRef] [PubMed]
16. Cooke, L.J.; Wardle, J. Age and gender differences in children’s food preferences. Br. J. Nutr. 2005, 93, 741–746.[CrossRef] [PubMed]
17. Ney, D.M.; Stroup, B.M.; Clayton, M.K.; Murali, S.G.; Rice, G.M.; Rohr, F.; Levy, H.L. Glycomacropeptide fornutritional management of phenylketonuria: A randomized, controlled, crossover trial. Am. J. Clin. Nutr.2016, 104, 334–345. [CrossRef] [PubMed]
18. Ares, G.; Tárrega, A.; Izquierdo, L.; Jaeger, S.R. Investigation of the number of consumers necessary to obtainstable sample and descriptor configurations from check-all-that-apply (CATA) questions. Food Qual. Prefer.2014, 31, 135–141. [CrossRef]
19. Ares, G.; Jaeger, S.R. Examination of sensory product characterization bias when check-all-that-apply (CATA)questions are used concurrently with hedonic assessments. Food Qual. Prefer. 2015, 40, 199–208. [CrossRef]
20. De Pelsmaeker, S.; Schouteten, J.; Gellynck, X. The consumption of flavored milk among a children population.The influence of beliefs and the association of brands with emotions. Appetite 2013, 71, 279–286. [CrossRef][PubMed]
21. Laureati, M.; Cattaneo, C.; Lavelli, V.; Bergamaschi, V.; Riso, P.; Pagliarini, E. Application of thecheck-all-that-apply method (CATA) to get insights on children’s drivers of liking of fiber-enriched applepurees. J. Sens. Stud. 2017, 32, 12253. [CrossRef]
22. MacLeod, E.L.; Clayton, M.K.; van Calcar, S.C.; Ney, D.M. Breakfast with glycomacropeptide compared withamino acids suppresses plasma ghrelin levels in individuals with phenylketonuria. Mol. Genet. Metab. 2010,100, 303–308. [CrossRef] [PubMed]
23. Duran, G.P.; Rohr, F.J.; Slonimm, A. Necessity of complete intake of phenylalanine-free amino acid mixturefor metabolic control of phenylketonuria. J. Am. Diet. Assoc. 1999, 99, 1559–1563. [CrossRef]
24. Giovannini, M.; Verduci, E.; Salvatici, E.; Fiori, L.; Riva, E. Phenylketonuria: Dietary and therapeuticchallenges. J. Inherit. Metab. Dis. 2007, 30, 145–152. [CrossRef] [PubMed]
218

Nutrients 2018, 10, 1179
25. Etzel, M.R. Manufacture and use of dairy protein fractions. J. Nutr. 2004, 134, 996–1002. [CrossRef] [PubMed]26. Blau, N.; van Spronsen, F.J.; Levy, H.L. Phenylketonuria. Lancet 2010, 376, 1417–1427. [CrossRef]27. Ahring, K.; Bélanger-Quintana, A.; Dokoupil, K.; Gokmen-Ozel, H.; Lammardo, A.M.; MacDonald, A.;
Motzfeldt, K.; Nowacka, M.; Robert, M.; van Rijn, M. Blood phenylalanine control in phenylketonuria:A survey of 10 European centres. Eur. J. Clin. Nutr. 2011, 65, 275–278. [CrossRef] [PubMed]
28. Ney, D.M.; Gleason, S.T.; Van Calcar, S.C.; MacLeod, E.L.; Nelson, K.L.; Etzel, M.R.; Wolff, J.A. Nutritionalmanagement of PKU with glycomacropeptide from cheese whey. J. Inherit. Metab. Dis. 2009, 32, 32–39.[CrossRef] [PubMed]
© 2018 by the authors. Licensee MDPI, Basel, Switzerland. This article is an open accessarticle distributed under the terms and conditions of the Creative Commons Attribution(CC BY) license (http://creativecommons.org/licenses/by/4.0/).
219

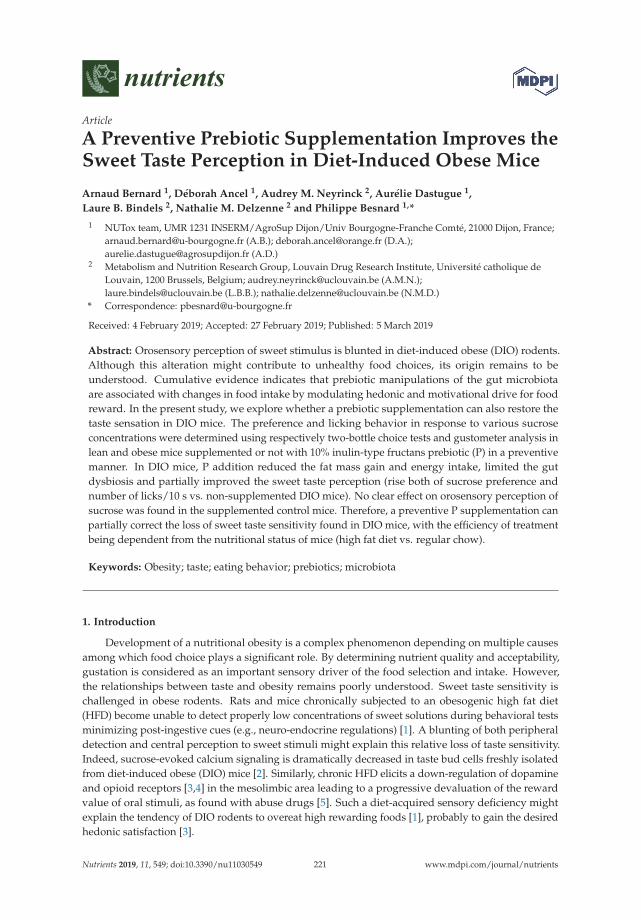
nutrients
Article
A Preventive Prebiotic Supplementation Improves theSweet Taste Perception in Diet-Induced Obese Mice
Arnaud Bernard 1, Déborah Ancel 1, Audrey M. Neyrinck 2, Aurélie Dastugue 1,
Laure B. Bindels 2, Nathalie M. Delzenne 2 and Philippe Besnard 1,*
1 NUTox team, UMR 1231 INSERM/AgroSup Dijon/Univ Bourgogne-Franche Comté, 21000 Dijon, France;[email protected] (A.B.); [email protected] (D.A.);[email protected] (A.D.)
2 Metabolism and Nutrition Research Group, Louvain Drug Research Institute, Université catholique deLouvain, 1200 Brussels, Belgium; [email protected] (A.M.N.);[email protected] (L.B.B.); [email protected] (N.M.D.)
* Correspondence: [email protected]
Received: 4 February 2019; Accepted: 27 February 2019; Published: 5 March 2019
Abstract: Orosensory perception of sweet stimulus is blunted in diet-induced obese (DIO) rodents.Although this alteration might contribute to unhealthy food choices, its origin remains to beunderstood. Cumulative evidence indicates that prebiotic manipulations of the gut microbiotaare associated with changes in food intake by modulating hedonic and motivational drive for foodreward. In the present study, we explore whether a prebiotic supplementation can also restore thetaste sensation in DIO mice. The preference and licking behavior in response to various sucroseconcentrations were determined using respectively two-bottle choice tests and gustometer analysis inlean and obese mice supplemented or not with 10% inulin-type fructans prebiotic (P) in a preventivemanner. In DIO mice, P addition reduced the fat mass gain and energy intake, limited the gutdysbiosis and partially improved the sweet taste perception (rise both of sucrose preference andnumber of licks/10 s vs. non-supplemented DIO mice). No clear effect on orosensory perception ofsucrose was found in the supplemented control mice. Therefore, a preventive P supplementation canpartially correct the loss of sweet taste sensitivity found in DIO mice, with the efficiency of treatmentbeing dependent from the nutritional status of mice (high fat diet vs. regular chow).
Keywords: Obesity; taste; eating behavior; prebiotics; microbiota
1. Introduction
Development of a nutritional obesity is a complex phenomenon depending on multiple causesamong which food choice plays a significant role. By determining nutrient quality and acceptability,gustation is considered as an important sensory driver of the food selection and intake. However,the relationships between taste and obesity remains poorly understood. Sweet taste sensitivity ischallenged in obese rodents. Rats and mice chronically subjected to an obesogenic high fat diet(HFD) become unable to detect properly low concentrations of sweet solutions during behavioral testsminimizing post-ingestive cues (e.g., neuro-endocrine regulations) [1]. A blunting of both peripheraldetection and central perception to sweet stimuli might explain this relative loss of taste sensitivity.Indeed, sucrose-evoked calcium signaling is dramatically decreased in taste bud cells freshly isolatedfrom diet-induced obese (DIO) mice [2]. Similarly, chronic HFD elicits a down-regulation of dopamineand opioid receptors [3,4] in the mesolimbic area leading to a progressive devaluation of the rewardvalue of oral stimuli, as found with abuse drugs [5]. Such a diet-acquired sensory deficiency mightexplain the tendency of DIO rodents to overeat high rewarding foods [1], probably to gain the desiredhedonic satisfaction [3].
Nutrients 2019, 11, 549; doi:10.3390/nu11030549 www.mdpi.com/journal/nutrients221

Nutrients 2019, 11, 549
This diet-induced gustatory disorder is widely corrected in rodents after bariatric surgery,leading to healthier food choices [6–8]. Understanding how this improvement of the sweet tastesensitivity takes place might open new insights in obesity treatment. In rats, Roux-en-Y gastricby-pass is associated with changes in gut microbiota similar to those found after a prebiotic (P)supplementation [9], known to affect the production of hormones controlling the eating behavior,such as glucagon-like peptide-1 (GLP-1) which has an anorexigenic effect. Interestingly, behavioralresponses to sweet compounds (i.e., number of licks per 10 s) are reduced in GLP-1 receptor-nullmice (GLP-1 R), as compared to wild-type animals [10]. Intestinal dysbiosis is also associated with achronic low-grade metabolic inflammation by promoting intestinal permeation of lipopolysaccharides(LPS) derived from the outer membrane of Gram-negative bacteria [11,12]. These endotoxins promotethe release of pro-inflammatory cytokines in various tissues by activating members of the Toll-likereceptors (TRL). A set of observations suggests that this inflammatory environment might play a role inthe change of taste sensitivity in DIO mice. Indeed, taste buds express the TLR4 signaling cascade and,thus, are LPS responsive [13]. Moreover, a chronic consumption of a HFD rich in saturated fatty acidselicits a pro-inflammatory gene profile in the gustatory papillae [14]. Finally, chronic endotoxemiareduces the number of taste buds in obese mice [15]. Collectively, these findings suggest an implicationof the intestinal dysbiosis in the impairment of the sweet taste sensitivity observed in DIO mice thatcould be improved by a prebiotic supplementation.
To explore this hypothesis, the impact of a preventive prebiotic supplementation on the orosensoryperception of a sweet stimulus was compared in lean and DIO mice. Specific gut bacteria, known tobe involved in the regulation of the gut peptide production and/or the gut barrier function such asBifidobacterium spp. and Akkermansia muciniphila [16,17], were analyzed in the caecal content of mice tohighlight the prebiotic effect of inulin in our model.
2. Materials & Methods
2.1. Animals
This study was carried out in the strict accordance with European guidelines for the care and useof laboratory animals and protocol approved by the French National Animal Ethic Committee (CNEAn◦105). Six-weeks-old C57Bl/6 male mice were purchased from Charles River Laboratories (France).Animals were individually housed in a controlled environment (constant temperature and humidity,dark period from 7 p.m. to 7 a.m.) and had free access to tap water and chow. Experiments took placeafter a one-week acclimatization period. To study the impact of a preventive prebiotic treatment on theorosensory perception of sucrose during a diet-induced obesity, standard laboratory chow or customhigh fat diet (Table 1) were supplemented with 10% prebiotic (P) and mice were split in four groups(n = 8–10): lean controls fed regular chow (C), lean controls fed supplemented regular chow (C+P),diet-induced obese mice (DIO) and supplemented diet-induced obese mice (DIO+P). Mice were fedad libitum for 12 weeks. Inulin-type fructans (P—Fibruline®, Cosucra, Pecq, Belgium) was used asprebiotic. We have chosen a 10% prebiotic enrichment since this supplementation is known to promotemetabolic [18] and cognitive benefits [19].
Evolution of the body composition (i.e., fat mass) was determined by nuclear magnetic resonancerelaxometry (EchoMRI—Echo Medical Systems, Houston, TX, USA).
222

Nutrients 2019, 11, 549
Table 1. Composition of the diets.
Contents (% w/w)Control Diet
(4RF21 Mucedola)Control Diet +
Prebiotic
High Fat Diet(4RF25 Mucedola +
palm oil)
High Fat Diet +Prebiotic
Proteins 18,5 16,65 15 13,5Carbohydrates
Starch 53,5 48,15 34,4 30,96Lipids
Soybean oil 3,0 2,7 2,4 2,16Palm oil 0,0 0,0 31,8 28,62
Saturated fatty acids 0,5 0,45 16,7 15,03Mono-unsaturated
fatty acids 0,5 0,45 13,0 11,7
Poly-unsaturatedfatty acids 1,3 1,17 4,5 4,05
PrebioticInulin-type fructan 0,0 10 0,0 10
Energy (Kcal/100 g) 315,0 315,2 505,8 506,0
2.2. Two-Bottle Choice Tests
Tests were performed for 12 h at the beginning of the dark period in individually housed mice.Animals were food restricted during the duration of the experiment [20]. This protocol providesbehavioral data combining orosensory sensations (i.e., oral detection and central perception) andpost-ingestive cues. Mice were subjected to a choice between a control solution (0.3% xanthan gumin water to minimize textural influences) or a 1% sucrose in control solution. At the end of the test,fluid intake was measured for each bottle and the preference (i.e., ratio between experimental solutionconsumption and total intake) was calculated.
2.3. Gustometer
Licking behavior was studied using an original octagonal shaped gustometer of which eachside has a computer-controlled shutter giving random access during a short time (10 s in the presentstudy) to a bottle filled with a specific solution. All the bottles (five in the present study) are equippedwith a lickometer. This original design, which forces the animal to move to access to the drinkingsource, allows a simultaneous analysis of the licking behavior, which mirrors the immediate pleasuregained from the consumption of a rewarding stimulus (i.e., “liking”) and the motivation to drink(i.e., “wanting”). Concept and procedures are detailed in [21].
In brief, 20 h water-deprived mice were subjected to two training sessions before the taste-testingsessions (30 min, each). During the first training, all the doors were opened so that the mouse had freeaccess to all the bottles filled with water. It was a time of habituation to a new environment. Duringtraining two, the mouse learned to drink according to the protocol used during the brief-access tastetesting (i.e., random opening of shutters), all the bottles being filled with the control solution (i.e., water).Each mouse had access to a first bottle for 10 s after the first lick. After this trial, all doors remainedclosed for 10 s before another one was opened among the 4 remaining shutters, in a randomizedmanner. The program continued until the animal had licked all five bottles. This event constituteda block. At the end of one block, another block started, so that the number of blocks mirrored themotivation for the stimulus. A taste-testing session was performed in water and food deprived mice toexplore their licking responsiveness to a set of sweet stimuli (0.01, 0.2, 0.6, 1.0 M sucrose).
2.4. Blood Analysis
Freshly drawn blood samples from fasted animals were centrifuged at 6000 g for 15 min (4 ◦C).Plasma was collected and kept at −80 ◦C. Glucose, total cholesterol and triglycerides were assayed in
223

Nutrients 2019, 11, 549
plasma samples using commercial kits certified for in vitro diagnosis (colorimetric assays, ref#981780,981786 and 981813) on Indiko device from Thermo (Waltham, MA, USA).
2.5. Gut Microbiota Analysis
Genomic DNA was extracted from the caecal content using a silica membrane-based purificationtechnique with QIAamp DNA Stool Mini Kits (Qiagen, Hilden, Germany) according to themanufacturer’s instructions, including a bead-beating step. Total bacteria, Bifidobacterium spp. andAkkermansia spp. were analyzed by quantitative PCR, as previously described [22].
2.6. Statistics
Results are expressed as Means ± SEM. The significance of differences between groups wasevaluated with R software (v3.4.4; The R Foundation, Vienna, Austria). We first checked that the datafor each group were normally distributed and that variances were equal. We then carried out eithera Student’s t-test or a Two-way ANOVA with the Tukey HSD post-hoc test. A principal componentanalysis (PCA), normalized and centered, was done with R software and the R-commander package(v2.4.4) on the different parameters studied.
3. Results
3.1. Prebiotic Supplementation Attenuates the Negative Effects Elicited by a Diet-Induced Obesity
Four groups of mice, subjected for 12 weeks to distinct diets (regulatory chow or obesogenic dietalone or supplemented with 10% P), were used to explore putative changes in orosensory perceptionof sweet stimuli (Figure 1A).
w e e k s
Bo
dy
ma
ss
(g
)
0 1 2 3 4 5 6 7 8 9 1 0 1 1 1 2
ns
En
erg
y i
nta
ke
(kC
al/
da
y)
C C + P D IO D IO + P
w e e k s
Fa
t m
as
s(%
of
bo
dy
ma
ss
)
0 1 2 3 4 5 6 7 8 9 1 0 1 1 1 2
ns
Pla
sm
atr
igly
ce
rid
es
(g
/L)
C C + P D IO D IO + P
Pla
sm
ac
ho
les
tero
l (g
/L)
C C + P D IO D IO + P
A
B C D
E F G
Pla
sm
a g
lyc
em
ia(m
mo
l/L
)
C C + P D I O D IO + P
A
Figure 1. Comparison of body and biochemical parameters in mice subjected for 12 weeks to aregulatory chow or an obesogenic diet alone (C and DIO) or supplemented with 10% Prebiotic (C+Pand DIO+P). (A) Time course of the experiment; (B,C) Evolution of the body and fat; (D) Daily energyintake; (E) Blood glucose; (F,G) Plasma triglyceride and cholesterol levels. Mean ± SEM, differentletters indicate a statistical difference between groups. Significance was achieved at p < 0.05. C, C+P,DIO, n = 10. DIO+P, n = 8.
224
Nutrients 2019, 11, 549
To verify the efficiency of this experimental design, body mass and composition, energy intake,various blood parameters, cecal tissue mass, mass of cecal content and cecal bacteria were analyzed.As expected, mice fed with the HFD displayed a greater gain in body weight and fat mass thananimals fed the regular chow (Figure 1B). Prebiotic addition to the HFD led to a lower body massgain as compared to DIO mice (Figure 1B) mainly attributable to a diminution in the relative fatmass (Figure 1C). Such a phenomenon was not observed in lean mice (Figure 1B,C). Prebioticsupplementation elicited a slight decrease in the energy intake whatever the diet, but this effectwas insignificant (Figure 1D). According to previous data [23], blood glucose, plasma triglycerides andcholesterol levels were increased in DIO mice (Figure 1E–G). Surprisingly in our hands, these systemicchanges were not improved in prebiotic-treated mice.
In agreement with the literature [23], chronic prebiotic consumption increased the caecal tissuemass and, in a lower extent, the fecal mass in caecum (Figure 2A,B). Prebiotic supplementationis known to modify gut microbiota composition [24]. To explore whether the bacterial signaturewas modified by our treatment, cecal bacterial content was studied by qPCR. As shown in Figure 2C,prebiotic supplementation tended to increase the cecal content of total bacteria whatever the diet. Whenabundance of selected bacterial displaying beneficial health effect was measured, a rise of Bifidobacteriaand Akkermansia abundance was found in the DIO+P group (Figure 2D,E). We have previouslydescribed that ITF feeding promotes endogenous GLP-1 production through higher expression ofproglucagon in the colon [25,26]. In the present study, we showed that the higher level of its expressionwas found in the cecal tissue from DIO+P mice (Figure 2F). Collectively, these data demonstrate theefficiency of our prebiotic protocol on DIO mice.
To
tal
ba
cte
ria
C C + P D IO D IO + P
C D E
AR
Nm
Pro
glu
ca
go
n
C C + P D IO D IO + P
F
Ca
ec
al
co
nte
nt
(g)
C C + P D IO D IO + P
B
Ca
ec
al
tis
su
e (
g)
C C + P D IO D IO + P
A
Bif
ido
ba
cte
riu
m
C C + P D IO D IO + P
Ak
ke
rma
ns
ia
C C + P D IO D IO + P
Figure 2. Comparison of bacterial parameters in mice subjected for 12 weeks to a regulatory chow oran obesogenic diet alone (C and DIO) or supplemented with 10% Prebiotic (C+P and DIO+P). (A) Cecaltissue mass; (B) Fecal mass in caecum; (C) total cecal bacteria; (D) Bifidobacterium; (E) Akkermansiamuciniphilla; (F) relative proglucagon mRNA levels in caecum in reference to a housekeeper gene(RPL19). Mean ± SEM, different letters indicate a statistical difference between groups. Significancewas achieved at p < 0.05. C, C+P, DIO, n = 10. DIO+P, n = 8.
225

Nutrients 2019, 11, 549
3.2. The Lower Sucrose Preference Found in DIO Mice Was Improved in Presence of Prebiotic
The preference for a sweet stimulus was explored using a two-bottle choice test. Consistent withprevious published data [27], DIO mice subjected to a long-term (12 h) two-bottle preference testshowed a significant lower intake (Figure 3A) and preference for 1% sucrose solution than C or C+Pgroups (Figure 3B), suggesting a diet-induced modification of the orosensory perception of the sweetsensation. The prebiotic attenuated the effect of the DIO. Indeed, sucrose intake was higher in DIO-Pgroup than DIO mice, this change improving their preference score to a level similar to C and C+Pmice (Figure 3B).
Sucrose (1%)
Inta
ke
(g
/12
h/m
ou
se
)
C o n trol
T e s t
C o n trol
T e s t
C o n trol
T e s t
C o n trol
T e s t
A B Sucrose (1%)
Pre
fere
nc
e (
%)
C C + P D IO D IO + P
Figure 3. Two-bottle choice test analysis of orosensory perception of a sweet stimulus in mice subjectedto a regulatory chow or an obesogenic diet alone (C and DIO) or supplemented with 10% Prebiotic(C+P and DIO+P). Animals were simultaneously subjected for 12 h to a control solution (0.3% xanthangum in water, w/v) and a test solution containing 1% sucrose (w/v) in the control solution. (A) Finalconsumption of control and experimental solution; (B) Preference i.e., ratio of the final consumptionof control or experimental solution upon the final total liquid intake. Mean ± SEM. (A) Student ttest: ** P < 0.01, *** P < 0.001; (B) 2-way ANOVA + Tukey HSD: different letters indicate a statisticaldifference between groups. Significance was achieved at p < 0.05. C, C+P, DIO, n = 10. DIO+P, n = 8.The dotted line represents the 50% preference.
3.3. Prebiotic Supplementation Improves the Licking Behavior in Response to Sucrose Stimulus in DIO Mice
Licking behavior was studied by using the gustometer FRM8 [21]. Training sessions failed toreveal any behavioral differences between mice suggesting that DIO and/or prebiotic supplementationdid not affect animal adaptability to a new environment (training 1—Figure 4A) neither their ability tolearn how the device works (training 2—Figure 4B). The fact that the number of total licks was similarbetween groups attests that mice did not present any oromotor or mobility defect (Figure 4C).
226

Nutrients 2019, 11, 549
Figure 4. Gustometer analysis: training sessions in mice subjected to a regulatory chow or an obesogenicdiet alone (C and DIO) or supplemented with 10% Prebiotic (C+P and DIO+P). 20 h water-deprivedmice were subjected to 2 training sessions before the taste-testing sessions (30 min, each). (A) Training1: Each mouse had a free access to the 5 bottles filled with water in order to determine the lickingrate/bottle/30 min. It is time of adaptation to a new environment; (B) Training 2: Each learned todrink water according to the protocol used during the brief-access taste testing, i.e., a random andintermittent opening of shutters. The licking rate/bottle/30 min was determined; (C) Total licks for30 min during the training 1 and 2. Mean ± SEM. 2-way ANOVA + Tukey HSD. ns non-significant.C, C+P, DIO, n = 10. DIO+P, n = 8.
In control mice, licking activity (licks/10 s) showed a typical dose-response curve in responseto growing concentrations of sucrose, with a maximal frequency around 60 licks/10 s (Figure 5A).According to previous data [1], the number of licks/10 s elicited by sweet solutions was dramaticallyreduced in DIO mice as compared to controls (Figure 5A). Consistent with this observation, total licks(i.e., immediate pleasure gained from the consumption of a rewarding stimulus or “liking”) andnumber of blocks (i.e., motivation to drink, “wanting”) during the taste testing session (30 min) weresignificantly lower in DIO mice as compared to controls (Figure 5B,C). Altogether, these data confirmthe existence of substantial differences in the licking responses to a sweet stimulus between C andDIO mice. A licking rate improvement was found in the prebiotic supplemented groups (Figure 5A).In response to the higher sucrose concentration, DIO+P mice displayed a similar licking responsethan C group, (Figure 5A), suggesting that this prebiotic treatment is able to counteract partiallythe orosensory deficit found in DIO mice. Despite of this significant improvement, only an upwardtrend in the total number of licks differentiated the DIO+P group from the DIO group (Figure 5B),the number of blocks remaining unchanged (Figure 5C).
227

Nutrients 2019, 11, 549
S u c ro s e (M )
Lic
ks
/10
se
c
Blo
ck
s n
um
be
r
C C + P D IO D IO + P
To
tal
lic
ks
/ 3
0 m
in
C C + P D IO D IO + P
A B CSucrose Sucrose
Motivation
Number of blocks
Immediate pleasure
Number of licks
Figure 5. Gustometer analysis of orosensory perception in response to various concentration of sucrosein mice subjected to a regulatory chow or an obesogenic diet alone (C and DIO) or supplemented with10% Prebiotic (C+P and DIO+P). (A) Brief-access taste testing responses (licks/10 s) of naïve mice tocontrol solution (0.3% xanthan gum in water) and ascending concentrations of sucrose (0.01, 0.3, 0.6, 1.0M). Random access to bottles was computer controlled. Zero on the x-axis represents the licking rateobtained in response to the control solution; (B,C) Total number of licks (representative of the “Liking”component) and number of blocks (representative of the “Wanting” component) performed for 30 min.Mean ± SEM. 2-way ANOVA + Tukey HSD, significance was achieved at p < 0.05. Different lettersindicate a statistical difference between groups, ns non-significant, C, C+P, DIO, n = 10. DIO+P, n = 8.
3.4. Prebiotic Supplementation Brings the DIO Group Closer to Control Group
In order to better delineate the global impact of a prebiotic supplementation in control and DIOmice, a multivariate analysis (principal component analysis—PCA) was performed from variablevalues at the time of behavioral phenotyping (Figure 1A). Values on the x-axis represent the componentscore for the dimension 1, and those on the y-axis for dimensions 2- and 3, accounting for 40.50,16.63 and 11.32% of the inertia (total = 68.45%), respectively.
Confidence ellipse analysis highlighted that C and C+P groups were partly overlappingsuggesting that prebiotic supplementation did not induce any discriminant change in lean miceaccording to the variables studied (Figure 6A,C). They were mostly defined on the dimensions 1 and 2by variables related to efficient taste sensations (positive correlation with high number of licks, blocksand preference) and cecal bacteria content (Figure 6B,E).
As expected, they were clearly different from the DIO group, which was mainly characterizedby variables linked to obesity (cholesterol, body mass, fat mass, energy intake, glycaemia andtriglycerides—Figure 6E) on the dimension 1. The third group representing the DIO+P group was foundin an intermediate position between lean and obese mice suggesting that the prebiotic supplementationimproved the health status of DIO mice (Figure 6A,C). Interestingly, on the dimensions 2 and 3,the DIO+P group was positively correlated with variables linked to the high caecal bacteria contentand related to taste sensations (Figure 6D,E). In brief: DIO+P mice exhibited a healthier pattern thanDIO mice and were closer to C & C+P mice.
228

Nutrients 2019, 11, 549
C C+P DIO DIO+P
A C
E
B D
Posi
tive
corr
elat
ion
C C+P DIO DIO+P
Figure 6. Principal component analysis performed from studied variables in mice subjected to aregulatory chow or an obesogenic diet alone (C and DIO) or supplemented with 10% Prebiotic (C+Pand DIO+P). (A) Confidence ellipse analysis. Cluster distribution along the dimension 1 & 2. Each dotrepresents a mouse; (B) Arrows represent the direction of each variable in the 2-dimensional PCA space;(C) Cluster distribution along the dimension 1 & 3. Each dot represents a mouse; (D) Arrows representthe direction of each variable in the 2-dimensional PCA space; (E) Variables significantly representativeof the 4 clusters (ranking in descending order of importance) and their respective abbreviations.
4. Discussion
Deciphering the functional links between the nutritional obesity, taste sensitivity and eatingbehavior is a challenge that might open new corrective nutritional and/or pharmacologicalinterventions to fight obesity. Nevertheless, how diet-induced obesity affects the taste perception isnot yet fully understood.
Chronic consumption of an obesogenic diet (e.g., saturated high fat diet) leads to a shift in the gutmicrobiota composition and a progressive accumulation of body fat. These changes might promote achronic low-grade inflammation (e.g., endotoxin release and production of pro-inflammatory cytokines)and a new endocrine balance (e.g., drop of GLP-1 and rise of leptin) decreasing the orosensory acuity (attaste bud level) and related reward response (corticomesolimbic level). Taken together these alterationsmight promote an over-consumption of energy-dense foods to compensate the sensory deficit.
According to our present knowledge, the following scenario has been proposed [28]. Gut dysbiosisand increased fat mass elicited by the chronic consumption of an obesogenic diet, induce a low-gradeinflammation (e.g., LPS release and proflammatory cytokines) associated with an endocrine unbalance
229

Nutrients 2019, 11, 549
(e.g., low GLP-1 and high leptin levels). Collectively, these systemic changes might blunt both the tasteacuity (taste bud level) and the taste-driven reward behavior (corticomesolimbic level), modifyingfood choices to reach an expected hedonic satisfaction. This new gustatory phenotype might lead toa preferential consumption of highly palatable foods, rich in sugar and fat, and thus to a growingobesity (Figure 7). Especially, the putative role of the gut microbiota on the taste efficiency remains tobe established.
Obesogenic diets
Ob
LOW GRADE INFLAMMATION
+ ENDOCRINE CHANGES
Increased fat mass:
Cytokines,Leptin,…
PREFERENTIAL CONSUMPTION
OF ENERGY-DENSE FOODS
Gut dysbiosisLPS, GLP-1,…
Prebiotic improvement
Figure 7. Functional relationships between diet-induced obesity and taste sensitivity in the mouse:Working model.
In the present study, we explored the impact of a preventive prebiotic supplementation on theorosensory responsiveness to a prototypical tastant (i.e., sucrose) in mice fed a standard chow or anobesogenic diet. Multivariate analysis clearly shows that the prebiotic supplementation poorly affectsstudied variables in lean mice, C and C+P groups being partially overlapping in contrast to what wasfound in obese (DIO) mice. Indeed, DIO+P group appeared as an independent cluster found in anintermediate position between lean and obese mice, suggesting that addition of prebiotic partiallycounteracts the deleterious effects of HFD. Interestingly, DIO+P group was found to be mainly depictedby variables related to gut microbiota and taste sensations. Addition of 10% inulin, not only correctedthe negative effects of HFD on gut microbiota in DIO mice, but also improved their orosensoryresponse to sweet stimuli. This last prebiotic-mediated change was found using two complementarybehavioral approaches (two-bottle choice test and gustometer exploration). Collectively, our behavioraldata reported a partial covery of the sweet taste sensitivity in DIO+P mice, as compared to controls,in relation with a better hedonic response to sweet stimuli (i.e., rise of lick number = “liking”) withoutmotivational change (i.e., same block number = “wanting”) resulting in a correction of the preferencedeficit observed in DIO mice. A distinct impact of P supplementation on “liking” and “wanting”component of the food reward was also reported using an operant-responding performance test inDIO mice [29]. Altogether, our data raise the question of the implied mechanisms.
GLP-1 is produce in the gut by the enteroendocrine L Cells via a differential post-transcriptionalprocessing of the proglucagon gene. This peptide hormone regulates the digestive tract (ileal brake),glucose homeostasis (incretin action) and appetite/satiation (anorexigen effect) [30]. It is known thatP increase the number of endocrine L cells in the jejunum and in the colon of rodents and promotethe production and release of the active forms of GLP-1, thereby decreasing glycaemia [31]. Severallines of evidence support an implication of GLP-1 in the improvement of sweet taste sensitivity after
230

Nutrients 2019, 11, 549
microbiota manipulation. Firstly, GLP-1 R is found both in afferent fibers innerving the gustatorypapillae [32] and mesolimbic areas involved in the reward pathway (i.e., ventral tegmental area—VTAand nucleus accumbens—NAc) [33]. Secondly, GLP-1 R-null mice display a reduced response tosweet tastants during behavioral tests, suggesting that the GLP-1 signaling enhances the sweet tastesensitivity in this species [32]. Thirdly, GLP-1 reduces hedonic value of food by suppressing VTAand NAc dopamine signaling [34]. Finally, a rise of the proglucagon mRNA levels was specificallyfound in the caecum from DIO+P mice. Therefore, an involvement of prebiotic-induced GLP-1 releasein regulation of sweet taste sensitivity is likely. Further studies combining GLP-1 R-null mice andprebiotic manipulations are required to fully establish the causal role of GLP-1 in the prebiotic impacton the gustation.
Obesity-induced endotoxemia is an alternative, but not exclusive, possible cause of implicationof gut microbiota in the taste dysfunction since gustatory papillae are LPS-sensitive and display apro-inflammatory gene profile in DIO mice [14]. However, a chronic infusion of LPS at a level similarto that observed in DIO mice was not sufficient to alter the spontaneous preference for oily solutionin lean mice subjected to two-bottle choice tests. Although, the response to a sweet tastant was notanalyzed in this study, it is likely that a LPS-induced low-grade endotoxemia alone does not explainthe change in the orosensory perception observed in DIO mice [14].
In conclusion, this study brings the first demonstration that a gut microbiota manipulation canaffect the orosensory perception of sweet compounds. These results are consistent with a recent studyrevealing that human volunteers shifting their habits towards a diet based on the daily consumptionof P-rich vegetables showed a reduced desire to eat sweet, fatty, and salty foods, together with anincreased hedonic attitude for some inulin-rich vegetables [30]. The present study also helps to revealthe complexity of the homeostatic system responsible for the proper functioning of the taste systemwhose disruption, undoubtedly, contributes to the establishment of nutritional obesity.
Author Contributions: Conceptualization, A.M.N., N.M.D. and P.B.; Data curation, A.B.; Formal analysis, A.M.N.,N.M.D. and P.B.; Funding acquisition, N.M.D. and P.B.; Investigation, A.B., D.A., A.M.N., A.D. and L.B.B.;Methodology, A.B., D.A., A.D. and L.B.B.; Project administration, A.B. and P.B.; Supervision, P.B.; Writing—originaldraft, P.B.; Writing—review & editing, A.B., A.M.N., N.M.D. and P.B.
Funding: This study was supported by grants from the French National Research Agency: sensoFAT-2 projectANR-12-BSV1-0027-01 and ANR-11-LABX-0021-LipSTIC. NMD is a recipient of FRS-FNRS grants and of grantfrom Wallonia (FOOD4GUT project, convention 1318148).
Acknowledgments: We thank Jean-Christophe Blanchard, Guillaume Maquart and Jean-François Merlin foranimal management and technical assistance.
Conflicts of Interest: None to disclose.
Abbreviations
DIO diet-induced obesityGLP-1 glucagon-like peptide-1GLP-1 R GLP-1 receptorHFD high fat dietLPS lipopolysaccharidesP prebioticPCA principal component analysisTLR toll-like receptorVTA ventral tegmental areaNAc nucleus accumbens
231

Nutrients 2019, 11, 549
References
1. Shin, A.C.; Townsend, R.L.; Patterson, L.M.; Berthoud, H.R. “Liking” and “wanting” of sweet and oily foodstimuli as affected by high-fat diet-induced obesity, weight loss, leptin, and genetic predisposition. Am. J.Physiol. Regul. Integr. Comp. Physiol. 2011, 301, R1267–R1280. [CrossRef] [PubMed]
2. Maliphol, A.B.; Garth, D.J.; Medler, K.F. Diet-induced obesity reduces the responsiveness of the peripheraltaste receptor cells. PLoS ONE 2013, 8, e79403. [CrossRef] [PubMed]
3. Johnson, P.M.; Kenny, P.J. Dopamine D2 receptors in addiction-like reward dysfunction and compulsiveeating in obese rats. Nat. Neurosci. 2010, 13, 635–641. [CrossRef] [PubMed]
4. Vucetic, Z.; Kimmel, J.; Reyes, T.M. Chronic high-fat diet drives postnatal epigenetic regulation of mu-opioidreceptor in the brain. Neuropsychopharmacology 2011, 36, 1199–1206. [CrossRef] [PubMed]
5. Volkow, N.D.; Wang, G.J.; Tomasi, D.; Baler, R.D. Obesity and addiction: Neurobiological overlaps. Obes. Rev.2013, 14, 2–18. [CrossRef] [PubMed]
6. Berthoud, H.R.; Zheng, H.; Shin, A.C. Food reward in the obese and after weight loss induced by calorierestriction and bariatric surgery. Ann. N. Y. Acad. Sci. 2012, 1264, 36–48. [CrossRef] [PubMed]
7. le Roux, C.W.; Bueter, M.; Theis, N.; Werling, M.; Ashrafian, H.; Lowenstein, C.; Athanasiou, T.; Bloom, S.R.;Spector, A.C.; Olbers, T.; et al. Gastric bypass reduces fat intake and preference. Am. J. Physiol. Regul. Integr.Comp. Physiol. 2011, 301, R1057–R1066. [CrossRef] [PubMed]
8. Zheng, H.; Shin, A.C.; Lenard, N.R.; Townsend, R.L.; Patterson, L.M.; Sigalet, D.L.; Berthoud, H.R. Mealpatterns, satiety, and food choice in a rat model of Roux-en-Y gastric bypass surgery. Am. J. Physiol. Regul.Integr. Comp. Physiol. 2009, 297, R1273–R1282. [CrossRef] [PubMed]
9. Osto, M.; Abegg, K.; Bueter, M.; le Roux, C.W.; Cani, P.D.; Lutz, T.A. Roux-en-Y gastric bypass surgery inrats alters gut microbiota profile along the intestine. Physiol. Behav. 2013, 119, 92–96. [CrossRef] [PubMed]
10. Takai, S.; Yasumatsu, K.; Inoue, M.; Iwata, S.; Yoshida, R.; Shigemura, N.; Yanagawa, Y.; Drucker, D.J.;Margolskee, R.F.; Ninomiya, Y. Glucagon-like peptide-1 is specifically involved in sweet taste transmission.FASEB J. 2015, 29, 2268–2280. [CrossRef] [PubMed]
11. Cani, P.D.; Amar, J.; Iglesias, M.A.; Poggi, M.; Knauf, C.; Bastelica, D.; Neyrinck, A.M.; Fava, F.; Tuohy, K.M.;Chabo, C.; et al. Metabolic endotoxemia initiates obesity and insulin resistance. Diabetes 2007, 56, 1761–1772.[CrossRef] [PubMed]
12. Cani, P.D.; Bibiloni, R.; Knauf, C.; Waget, A.; Neyrinck, A.M.; Delzenne, N.M.; Burcelin, R. Changes ingut microbiota control metabolic endotoxemia-induced inflammation in high-fat diet-induced obesity anddiabetes in mice. Diabetes 2008, 57, 1470–1481. [CrossRef] [PubMed]
13. Wang, H.; Zhou, M.; Brand, J.; Huang, L. Inflammation and taste disorders: Mechanisms in taste buds. Ann.N. Y. Acad. Sci. 2009, 1170, 596–603. [CrossRef] [PubMed]
14. Bernard, A.; Ancel, D.; Passilly-Degrace, P.; Landrier, J.F.; Lagrost, L.; Besnard, P. A chronic LPS-inducedlow-grade inflammation fails to reproduce in lean mice the impairment of preference for oily solution foundin diet-induced obese mice. Biochimie 2018. [CrossRef] [PubMed]
15. Kaufman, A.; Choo, E.; Koh, A.; Dando, R. Inflammation arising from obesity reduces taste bud abundanceand inhibits renewal. PLoS Biol. 2018, 16, e2001959. [CrossRef] [PubMed]
16. Delzenne, N.M.; Neyrinck, A.M.; Backhed, F.; Cani, P.D. Targeting gut microbiota in obesity: Effects ofprebiotics and probiotics. Nat. Rev. Endocrinol. 2011, 7, 639–646. [CrossRef] [PubMed]
17. Plovier, H.; Everard, A.; Druart, C.; Depommier, C.; Van Hul, M.; Geurts, L.; Chilloux, J.; Ottman, N.;Duparc, T.; Lichtenstein, L.; et al. A purified membrane protein from Akkermansia muciniphila or thepasteurized bacterium improves metabolism in obese and diabetic mice. Nat. Med. 2017, 23, 107–113.[CrossRef] [PubMed]
18. Delzenne, N.M.; Neyrinck, A.M.; Cani, P.D. Gut microbiota and metabolic disorders: How prebiotic canwork? Br. J. Nutr. 2013, 109 (Suppl 2), S81–S85. [CrossRef]
19. Messaoudi, M.; Rozan, P.; Nejdi, A.; Hidalgo, S.; Desor, D. Behavioural and cognitive effects ofoligofructose-enriched inulin in rats. Br. J. Nutr. 2005, 93 (Suppl. 1), S27–S30. [CrossRef]
20. Chevrot, M.; Bernard, A.; Ancel, D.; Buttet, M.; Martin, C.; Abdoul-Azize, S.; Merlin, J.F.; Poirier, H.; Niot, I.;Khan, N.A.; et al. Obesity alters the gustatory perception of lipids in the mouse: Plausible involvement oflingual CD36. J. Lipid Res. 2013, 54, 2485–2494. [CrossRef] [PubMed]
232

Nutrients 2019, 11, 549
21. Dastugue, A.; Merlin, J.F.; Maquart, G.; Bernard, A.; Besnard, P. A New Method for Studying LickingBehavior Determinants in Rodents: Application to Diet-Induced Obese Mice. Obesity (Silver Spring) 2018, 26,1905–1914. [CrossRef] [PubMed]
22. Suriano, F.; Neyrinck, A.M.; Verspreet, J.; Olivares, M.; Leclercq, S.; de Wiele, T.V.; Courtin, C.M.; Cani, P.D.;Bindels, L.B.; Delzenne, N.M. Particle size determines the anti-inflammatory effect of wheat bran in a modelof fructose over-consumption: Implication of the gut microbiota. J. Funct. Foods 2018, 41, 155–162. [CrossRef]
23. Panchal, S.K.; Brown, L. Rodent models for metabolic syndrome research. J. Biomed. Biotechnol. 2011, 2011, 351982.[CrossRef] [PubMed]
24. Roberfroid, M.; Gibson, G.R.; Hoyles, L.; McCartney, A.L.; Rastall, R.; Rowland, I.; Wolvers, D.; Watzl, B.;Szajewska, H.; Stahl, B.; et al. Prebiotic effects: Metabolic and health benefits. Br. J. Nutr. 2010, 104 (Suppl. 2),S1–S63. [CrossRef]
25. Cani, P.D.; Dewever, C.; Delzenne, N.M. Inulin-type fructans modulate gastrointestinal peptides involved inappetite regulation (glucagon-like peptide-1 and ghrelin) in rats. Br. J. Nutr. 2004, 92, 521–526. [CrossRef][PubMed]
26. Cani, P.D.; Hoste, S.; Guiot, Y.; Delzenne, N.M. Dietary non-digestible carbohydrates promote L-celldifferentiation in the proximal colon of rats. Br. J. Nutr. 2007, 98, 32–37. [CrossRef] [PubMed]
27. Takase, K.; Tsuneoka, Y.; Oda, S.; Kuroda, M.; Funato, H. High-fat diet feeding alters olfactory-, social-, andreward-related behaviors of mice independent of obesity. Obesity (Silver Spring) 2016, 24, 886–894. [CrossRef][PubMed]
28. Besnard, P. Lipids and obesity: Also a matter of taste? Rev. Endocr. Metab. Disord. 2016, 17, 159–170.[CrossRef] [PubMed]
29. Delbes, A.S.; Castel, J.; Denis, R.G.P.; Morel, C.; Quinones, M.; Everard, A.; Cani, P.D.; Massiera, F.;Luquet, S.H. Prebiotics Supplementation Impact on the Reinforcing and Motivational Aspect of Feeding.Front. Endocrinol. (Lausanne) 2018, 9, 273. [CrossRef] [PubMed]
30. Holst, J.J. The physiology of glucagon-like peptide 1. Physiol. Rev. 2007, 87, 1409–1439. [CrossRef] [PubMed]31. Delzenne, N.M.; Cani, P.D.; Everard, A.; Neyrinck, A.M.; Bindels, L.B. Gut microorganisms as promising
targets for the management of type 2 diabetes. Diabetologia 2015, 58, 2206–2217. [CrossRef] [PubMed]32. Shin, Y.K.; Martin, B.; Golden, E.; Dotson, C.D.; Maudsley, S.; Kim, W.; Jang, H.J.; Mattson, M.P.; Drucker, D.J.;
Egan, J.M.; et al. Modulation of taste sensitivity by GLP-1 signaling. J. Neurochem. 2008, 106, 455–463.[CrossRef] [PubMed]
33. Merchenthaler, I.; Lane, M.; Shughrue, P. Distribution of pre-pro-glucagon and glucagon-like peptide-1receptor messenger RNAs in the rat central nervous system. J. Comp. Neurol. 1999, 403, 261–280. [CrossRef]
34. Wang, X.F.; Liu, J.J.; Xia, J.; Liu, J.; Mirabella, V.; Pang, Z.P. Endogenous Glucagon-like Peptide-1 SuppressesHigh-Fat Food Intake by Reducing Synaptic Drive onto Mesolimbic Dopamine Neurons. Cell Rep. 2015, 12,726–733. [CrossRef] [PubMed]
© 2019 by the authors. Licensee MDPI, Basel, Switzerland. This article is an open accessarticle distributed under the terms and conditions of the Creative Commons Attribution(CC BY) license (http://creativecommons.org/licenses/by/4.0/).
233


nutrients
Article
Intraintestinal Delivery of Tastants Using aNaso-Duodenal-Ileal Catheter Does Not InfluenceFood Intake or Satiety
Tim Klaassen 1,2,*, Annick M. E. Alleleyn 1, Mark van Avesaat 1, Freddy J. Troost 1,2,
Daniel Keszthelyi 1 and Adrian A. M. Masclee 1
1 Division of Gastroenterology-Hepatology, Department of Internal Medicine, School of Nutrition andTranslational Research in Metabolism, Maastricht University Medical Center+, P.O. Box 5800,6202 AZ Maastricht, The Netherlands; [email protected] (A.M.E.A.);[email protected] (M.v.A.); [email protected] (F.J.T.); [email protected] (D.K.);[email protected] (A.A.M.M.)
2 Food Innovation and Health, Center for Healthy Eating and Food Innovation, Maastricht University,5911 AA Venlo, The Netherlands
* Correspondence: [email protected]
Received: 18 December 2018; Accepted: 20 February 2019; Published: 23 February 2019
Abstract: Intraduodenal activity of taste receptors reduces food intake. Taste receptors are expressedthroughout the entire gastrointestinal tract. Currently, there are no data available on the effectsof distal taste receptor activation. In this study, we investigate the effect of intraduodenal and/orintraileal activation of taste receptors on food intake and satiety. In a single-blind randomizedcrossover trial, fourteen participants were intubated with a naso-duodenal-ileal catheter and receivedfour infusion regimens: duodenal placebo and ileal placebo (DPIP), duodenal tastants and ilealplacebo (DTIP), duodenal placebo and ileal tastants (DPIT), duodenal tastants and ileal tastants(DTIT). Fifteen minutes after cessation of infusion, subjects received an ad libitum meal to measurefood intake. Visual analog scale scores for satiety feelings were collected at regular intervals. Nodifferences in food intake were observed between the various interventions (DPIP: 786.6 ± 79.2 Kcal,DTIP: 803.3 ± 69.0 Kcal, DPIT: 814.7 ± 77.3 Kcal, DTIT: 834.8 ± 59.2 Kcal, p = 0.59). No differences insatiety feelings were observed. Intestinal infusion of tastants using a naso-duodenal-ileal catheter didnot influence food intake or satiety feelings. Possibly, the burden of the four-day naso-duodenal-ilealintubation masked a small effect that tastants might have on food intake and satiety.
Keywords: satiety; tastants; food intake; intraduodenal infusion; intraileal infusion; overweight;weight management
1. Introduction
Obesity is considered a major healthcare problem with worldwide obesity almost being tripledsince 1975 [1]. Therefore, there is an increasing need for non-invasive therapies for weight management.Gastrointestinal (GI) hormones, such as cholecystokinin (CCK) and glucagon-like peptide-1 (GLP-1),have been shown to reduce food intake and hunger after intravenous administration [2–4]. Therefore,the GI-tract is an interesting target for non-invasive therapies to reduce food intake and inducesatiety/satiation.
Intestinal macronutrient infusion decreases food intake and induces the release of CCK, GLP-1,and peptide YY (PYY) [5]. This mechanism is commonly referred to as intestinal- or ileal brake [6,7].A recent review proposed a proximal to the distal gradient in the small intestine, where a moreprofound effect on food intake can be found after distal compared to proximal macronutrient
Nutrients 2019, 11, 472; doi:10.3390/nu11020472 www.mdpi.com/journal/nutrients235

Nutrients 2019, 11, 472
infusion [8]. Previous studies have demonstrated that besides macronutrients, substances referred to astastants are able to activate certain taste receptors in the GI-tract which are coupled to enteroendocrinecells (EEC), and can trigger the release of satiety hormones (i.e., CCK, GLP-1, and PYY) [9–13]. Thesetaste receptors can be found throughout the entire GI-tract. Expression levels for the various tastereceptor differ throughout the gut. Table 1 gives a simplified visual representation of the relativeexpression of taste receptors throughout the human gut based on current literature [14–17].
In a recent study, van Avesaat et al. have shown that duodenal infusion of a combination of sweet,bitter, and umami tastants significantly decreased ad libitum meal intake, whilst increasing satietyand decreasing hunger feelings. These effects were not accompanied by changes in systemic levels ofGLP-1, PYY, and CCK [18]. Up to now, no data are available on the effect of activation of taste receptorsin the more distal small intestine. Since one of the functions of taste receptors in the gut is to sensefood being present in the lumen, it should be investigated whether the beforementioned proximal todistal gradient found for the intestinal brake is operative for taste receptor activation.
Therefore, in the present study, we compared the effects of intraduodenal infusion versus intrailealinfusion of a combination of tastants (sweet, bitter, and umami) on ad libitum food intake, satiation,and GI-complaints in healthy subjects. Since sweet and umami taste are sensed by various subtypes ofthe taste receptor family 1 (TAS1R) and bitter taste is sensed by the taste receptor family 2 (TAS2R),the combination will activate a wide range of taste receptors. We hypothesized that infusing tastantsat both infusion sites (duodenum and ileum) will decrease food intake and increase satiation to thegreatest extent when compared with infusion of placebo or single port infusion. Infusing in solelythe duodenum or the ileum will also decrease food intake and increase satiation when compared toplacebo, albeit to a lesser degree than infusing at both infusion sites simultaneously. Furthermore, weexpect intraileal delivery of tastants will decrease food intake and increase satiation to a greater extentwhen compared with intraduodenal delivery of tastants.
Table 1. A simplified visual representation of the relative expression of taste receptors and gustducinthroughout the human GI-tract.
Stomach Duodenum Jejunum Ileum Colon
TAS1R1(Bezencon et al. [14]) ++ + ++ + +/−
TAS1R2(Bezencon et al. [14]) − ++ + +/− +
TAS1R2(Young et al. [15]) −− $ + ++ # N/A N/A
TAS1R3(Bezencon et al. [14]) + ++ ++ + +
TAS1R3(van der Wielen et al. [16]) N/A + + + +
TAS1R3(Young et al. [15]) + $ ++ ++ # N/A N/A
TAS2R102–TAS2R144(Gu et al. [17]) * N/A + + + N/A
Gustducin(Bezencon et al. [14]) −− ++ ++ + −
Gustducin(Young et al. [15]) − $ + ++ # N/A N/A
Expression levels are relative to each other and a simplified visual representation with ++ indicating very highexpression, + indicating high expression, +/− indicating medium expression, − indicating low expression, and−− indicating very low expression. $ Young et al. displayed the stomach as fundus, body, and antrum. For details,please refer to Young et al. [15]. # Young et al. displayed jejunum as proximal jejunum and distal jejunum. For details,please refer to Young et al. [15]. N/A: not available. * T2R family is expressed throughout the entire small intestinein a comparable fashion with some subtypes more abundant proximally and some distally. For details, please referto Gu et al. [17].
236

Nutrients 2019, 11, 472
2. Materials and Methods
This study was approved by the Medical Ethics Committee of the Maastricht UniversityMedical Center+ (MUMC+), Maastricht, The Netherlands, and performed in full accordance withthe Declaration of Helsinki (latest amendment by the World Medic Association in 2013) and DutchRegulations on Medical Research Involving Human Subjects (WMO, 1998). This study was registeredin the US National Library of Medicine (http://www.clinicaltrials.gov, ID NCT03140930). All subjectsgave written informed consent before screening.
2.1. Subjects
Healthy men and women were recruited by local advertisements. Inclusion criteria were agebetween 18 and 65 years, a body mass index (BMI) between 18 and 25 kg/m2, with a stable weight overthe past six months (<5% body weight change). Exclusion criteria were gastrointestinal complaints,history of chronic or severe disease, use of medication influencing endpoints within 14 days priorto testing, administration of investigational drugs which interfere with this study, major abdominalsurgery, dieting, pregnancy or lactation, excessive alcohol consumption (>20 alcoholic consumptionsper week), smoking, weight <60 kg, non-tasters of sweet, bitter or umami stimuli, evidence ofmonosodium glutamate (MSG)-hypersensitivity.
Prior to testing, screening was performed where abovementioned inclusion and exclusion criteriawere checked, and a taste perception test was performed. Subjects tasted quinine (0.5 mmol/L),Reb A (50 mmol/L), MSG (50 mmol/L), and tap water blindly and had to indicate their sense of taste.Subjects had to identify each taste correctly in order to be eligible for the study. Furthermore, theirlength and weight were measured to calculate their BMI.
A sample size calculation was based on the difference in meal intake between duodenal infusionof a combination of tastants and duodenal infusion of placebo as reported by van Avesaat et al. [18].Using a difference in means of 64 Kcal, a standard deviation of difference of 63, a power of 80%, andan alpha of 1.67%, a total number of 13 subjects were needed. An alpha of 1.67% was used to correctfor multiple testing.
2.2. Study Design
In this single-blind randomized, placebo-controlled crossover study, subjects received thecombination of tastants (sweet, bitter, and umami) and/or placebo (tap water) in the duodenumand/or the ileum for four consecutive test days. This results in four combinations which were infusedon the various test days: duodenal placebo and ileal placebo (DPIP), duodenal tastants and ilealplacebo (DTIP), duodenal placebo and ileal tastants (DPIT), duodenal tastants and ileal tastants (DTIT).
2.3. Catheter Positioning
A 305 cm long silicon 9-lumen (8-lumen, 1 balloon inflation channel, the outer diameter of 3.5 mm)custom-made naso-ileal reusable catheter (Dentsleeve International, Mui Scientific, Mississauga,Canada) was used for intubation.
One day prior to the first test day, subjects arrived at 7:40 AM at the Maastricht University MedicalCenter+ (MUMC+) after an overnight fast. If preferred by the subject, local anesthesia of nasal mucosausing xylocaine (10% spray, AstraZeneca, Zoetermeer, The Netherlands) was applied. After placementof the catheter in the stomach, the catheter was guided through the pylorus and into the duodenumunder intermittent fluoroscopic control. Progression of the catheter from duodenum to ileum wasperformed as described earlier [19]. Fluoroscopy was used to check the positioning of the catheter onthe first and the last test day. Radio-opaque markers were added to the infusion ports on the catheter,which accounted for the determination of the catheter position. On all test days, intestinal fluid wassampled from various infusion ports, and pH was measured using pH strips (MColorpHast™, Merck,Darmstadt, Germany) in order to estimate the catheter positioning.
237

Nutrients 2019, 11, 472
2.4. Preparation and Infusion of Tastants
The combination of three tastants was infused in the duodenum, the ileum, or both the duodenumand the ileum. In order to prevent side effects from occurring, 75% of acceptable daily intake(ADI) of these tastants was infused. 540 mg Rebaudioside A (Reb A, Stevija Natuurlijk, Drachten,The Netherlands), 75 mg Quinine (Arnold Suhr, Hilversum, The Netherlands), and 2 g MonosodiumGlutamate (MSG, Ajinomoto, Hamburg, Germany) were dissolved in 120 mL tap water and was usedas tastant mixture for infusion, as was done by van Avesaat et al. [18]. All tastants used were non-caloricand yielded no nutritional value. The placebo infusion consisted of 120 mL of tap water. A magneticstirrer was used to dissolve the tastants. The mixture was infused over a 60-min period with aninfusion rate of 2 mL/min. This was consistent with the infusion rate of van Avesaat et al. mimickingthe slow influx from the stomach to duodenum and slow transit through the gut in the ileum.
2.5. Protocol
On each test day, after an 8 h overnight fast, subjects arrived at 8:00 AM at the MUMC+. Subjectswere instructed to consume the same habitual meal on the evening prior to testing. Hereafter, att = 0 min, a standardized liquid breakfast meal (250 mL Goedemorgen drinkontbijt (Vifit); energy145 Kcal per portion, 20.25 g carbohydrates, 8.5 g protein, and 2 g fat) was consumed. One hundredand fifty min (at t = 150 min) after breakfast consumption, a syringe containing the mixture for infusionwas connected to the duodenal and ileal infusion port. The infusion was performed in 60 min at aninfusion rate of 2 mL/min. Subjects received a standardized ad libitum lunch meal (Lasagna Bolognese(Plus supermarket); energy density per 100 g: 152 Kcal, 11 g carbohydrates, 7.1 g protein, and 8.6 gfat) fifteen min (at t = 225 min) after cessation of the infusion. The test meal was offered in excess andsubjects were instructed to eat until they felt satiated.
2.6. VAS for Satiation and GI-Complaints
Feelings of satiation-/satiety feelings and GI-complaints (e.g., satiety, hunger, stomach pain, andnausea) were measured using visual analog scales (VAS, 0–100 mm) scores at various time points(t = −30, 30, 90, 150, 165, 180, 195, 210, and 240 min) during the day. Subjects were asked to indicate ona line, anchored at the low end with the lowest intensity feelings, with opposing terms at the high end,which place on the scale best reflected their feeling at that moment [20].
2.7. Statistical Analyses
Data were analyzed using IBM SPSS statistics 24 (IBM Corporation, Armonk, NY, USA). A visualcheck of the normality of the data was performed. The primary outcome of this study was the amountof food intake in Kcal during an ad libitum lunch meal. Secondary outcomes were VAS scores forsatiation-/satiety feelings and GI-complaints.
Age, BMI, and gender were calculated by descriptive statistics. Food intake in Kcal and areaunder the curve (AUC) for VAS scores were compared using a linear mixed model with intervention(DTIP, DPIT, and DTIT, and DPIP), test day and the interaction of intervention × test day as fixedfactors. When no significant interaction was found, the interaction was removed from the model to getthe best model fit.
For VAS scores, a linear mixed model that included abovementioned fixed factors with theaddition of fixed factors time and time × treatment interaction was also performed.
Data are presented as mean ± standard error of the mean (SEM) (unless specified otherwise), anda p < 0.05 was considered statistically significant.
238

Nutrients 2019, 11, 472
3. Results
3.1. Subjects
In total, 19 subjects met the inclusion and exclusion criteria. Two subjects dropped out due todiscomfort induced by the naso-ileal catheter, two subjects dropped out due to incorrect positionof the catheter on the first test day, and one subject was excluded after not properly following theinstructions for the ad libitum meal on the first test day. Therefore, 14 healthy volunteers (11 female,age 25.6 ± 10.5 years, BMI 22.3 ± 1.7 kg/m2) completed the study protocol and were included inthe analyses.
3.2. Food Intake
No intervention × test day interaction was found. No differences in ad libitum food intake in Kcalwere observed after intraduodenal, intraileal or combined infusion of tastants versus placebo infusion(DPIP: 786.6 ± 79.2 Kcal, DTIP: 803.3 ± 69.0 Kcal, DPIT: 814.7 ± 77.3 Kcal, DTIT: 834.8 ± 59.2 Kcal;p = 0.59) (Figure 1). Furthermore, as depicted in Figure 2, no trends in individual responses were found.
Figure 1. The amount eaten in Kcal (mean + SEM) 15 min after cessation of the infusion of placeboboth intraduodenal and intraileal (DPIP), tastants intraduodenal and placebo intraileal (DTIP), placebointraduodenal and tastants intraileal (DPIT), and tastants both intraduodenal and intraileal (DTIT).Based on a linear mixed model, no difference in food intake was observed between the conditions(p = 0.59).
Figure 2. An individual representation per subject of amount eaten in Kcal 15 min after cessation ofthe infusion of placebo both intraduodenal and intraileal (DPIP), tastants intraduodenal and placebointraileal (DTIP), placebo intraduodenal and tastants intraileal (DPIT), and tastants both intraduodenaland intraileal (DTIT). Treatment order was randomized for each subject. Each line with a uniquesymbol represents an individual subject. Based on a linear mixed model, no difference in food intakewas observed between the conditions (p = 0.59).
3.3. Satiation/Satiety Scores
The mean VAS scores for the desire to eat, hunger, satiety, and fullness are depicted in Figure 3.No differences in area under the curve (AUC150–210) for these VAS scores were observed between the
239

Nutrients 2019, 11, 472
various interventions. Furthermore, no intervention × timepoint interactions were found for theseVAS scores.
Figure 3. VAS scores for desire to eat (A), hunger (B), satiety (C), and fullness (D) (mean + SEM)before, during, and after the infusion of placebo both intraduodenal and intraileal (DPIP), tastantsintraduodenal and placebo intraileal (DTIP), placebo intraduodenal and tastants intraileal (DPIT),and tastants both intraduodenal and intraileal (DTIT). VAS scores were measured at t = −30, 30, 90,150, 165, 180, 195, 210, and 240 min. No VAS scores were taken at t = 225 min. At t = 0 min, subjectsreceived a standardized breakfast, infusion of mixtures was performed from t = 150 until t = 210 min,and ad libitum test meal was presented at t = 225. Based on a linear mixed model of mean scores andarea under the curve (AUC150–210), no differences in desire to eat, hunger, satiety, and fullness wereobserved between the various conditions.
3.4. GI-Complaints
The mean VAS scores for stomach pain, bloating, and nausea are depicted in Figure 4. Nodifferences in area under the curve (AUC150–210) for these VAS scores were observed between thevarious interventions. Furthermore, no intervention × timepoint interactions were found for theseVAS scores.
Figure 4. Cont.
240

Nutrients 2019, 11, 472
Figure 4. VAS scores for stomach pain (A), bloating (B), and nausea (C) (mean + SEM) before, during,and after the infusion of placebo both intraduodenal and intraileal (DPIP), tastants intraduodenaland placebo intraileal (DTIP), placebo intraduodenal and tastants intraileal (DPIT), and tastants bothintraduodenal and intraileal (DTIT). t = −30, 30, 90, 150, 165, 180, 195, 210, and 240 min. No VAS scoreswere taken at t = 225 min. At t = 0 min, subjects received a standardized breakfast, infusion of mixtureswas performed from t = 150 until t = 210 min, and ad libitum test meal was presented at t = 225 min.Based on a linear mixed model of mean scores and area under the curve (AUC150–210), no differences instomach pain, bloating, and nausea were observed between the various conditions.
4. Discussion
Our results do not reveal any difference in satiety or food intake between duodenal administration,ileal administration or combined duodenal administration of a tastant mixture (sweet, bitter, andumami) or infusion of placebo. Moreover, no GI-complaints were caused by infusing tastants orplacebo into the duodenum and/or the ileum.
Van Avesaat et al. have investigated the effect of intraduodenal infusion of the same tastantmixture on food intake [18]. In that study, intraduodenal infusion of this combination of tastants, insimilar study design, using the same amount of tastants significantly reduced food intake by 64 Kcaland was accompanied by changes in satiation/satiety feelings. However, it must be noted that this is asmall difference, which on its own might not be clinically significant. Repeating this effect multipletimes per day with each meal might result in a clinically significant decrease of caloric intake. Thisdifference in results of food intake between the two studies may be related to differences in studydesign. In the study of van Avesaat et al., the subjects were intubated with a naso-duodenal catheteron every test day for the administration of tastants. The catheter was removed immediately thereafterbefore the subjects were presented with the ad libitum test meal. In the present study, subjects wereintubated for several days with a naso-ileal catheter, and therefore this catheter was present whilemeals were offered and ingested. We hypothesize that having a naso-ileal catheter in situ for multipledays negatively influences meal ingestion to such a degree that this masks the smaller magnitude ofeffect that infusion of non-caloric tastants into the intestine has. On the other hand, mean caloric intakeshowed no major differences between the two studies.
Previous studies from our group investigating the ‘intestinal brake’ by infusing macronutrientsin the ileum have repeatedly shown that infusion of even low doses of macronutrients results in asignificant reduction of food intake, ranging between 64–188 Kcal, corresponding to a percentualdecrease of 11.7%–32% of caloric intake during a single meal [5,21]. This indicates a negative feedbackmechanism on food intake that arises from nutrient sensing. These data demonstrate that magnitudeof the effect of macronutrient infusion on food intake is greater than the effects of infusing tastants.
Conclusively, studies investigating differences in food intake should be aware that naso-ilealintubation might mask a small effect. Therefore, other delivery options, such as encapsulation, shouldbe considered in the future.
Results of studies investigating the effects of single tastants on food intake, satiation/satiety, andGI peptides are not consistent. An initial strong decrease of hunger with a steep increase thereafter hasbeen observed after administration of a non-caloric sweetener [22]. Ingestion of low caloric sweetenersdid not influence energy intake compared with a control condition (intake of water) [23]. Adding an
241

Nutrients 2019, 11, 472
umami tastant to a meal did not affect appetite sensations, but has been shown to result in an increaseof subsequent food intake [24]. Recently, increased attention has been given to the effects of bittersubstances on satiety and food intake. Intake or infusion of bitter substances (quinine, denatoniumbenzoate) not only reduced antral motility [25,26] but also increased satiety scores and resulted in asignificant decrease in food intake [27]. A possible mechanism explaining the strong aversive effects ofbitter tastants is that bitter taste is evolutionarily linked to toxic substances, as has been showed bypresenting newborn infants with bitter substances [28].
Alleleyn et al. have shown that the inhibition of food intake shows a proximal to the distalgradient, with higher effects observed after distal versus proximal administration of nutrients [8].Based on our data, such a gradient was not observed for intestinally administered tastants. Intestinaltaste receptor expression varies for various taste receptors, where some taste receptors are moreprofound proximally in the GI-tract, while expression of other taste receptors is higher in the moredistal intestine [14–17].
We thought the proximal to distal gradient found for macronutrient infusion might be operablefor taste receptor activation, which was clearly not the case. It is possible that taste receptors inhibitfood intake in a different fashion than macronutrients. For instance, it has been speculated that tastereceptors function by sensing the type of food (i.e., sweet for carbohydrates, umami for amino acids,and bitter for toxic substances) [29]. Since bitter tastants are linked to toxic substances, another workingmechanism for bitter tastants could be through an aversive reaction of subsequent food intake.
From an evolutionary perspective, a more pronounced inhibitory or aversive effect for toxicsubstances could be expected to occur in the most proximal parts of the GI tract. However, there areno data available with respect to activation of oral (bitter) taste receptors on subsequent food intake. Itis therefore unclear, whether activation of more proximal taste receptors will reveal more pronouncedeffects on food intake and satiation/satiety. Consequently, further studies are needed to investigatewhether more proximal activation of taste receptors results in a stronger decrease in food intake.
Published data on the role of GI peptides in the regulation of food intake after administrationof tastants are not in line. Van Avesaat et al. found a clear effect of intraduodenal administrationof tastants on food intake that was not accompanied by changes in GLP-1- or PYY level [18]. Otherstudies, however, did show a decrease in systemic ghrelin- and motilin levels [25,26] and an increasein systemic CCK levels [27] after administration of a bitter tastant.
A limitation of our study is that the wash-out period consisted of only one day. Prolonging thewash-out period over one day would have resulted in a longer period of naso-ileal catheter intubationincreasing the discomfort to our volunteers. No interaction effect between intervention and testday was found on food intake, satiety scores or GI-complaints, indicating that no carry-over effectwas present.
Another limitation of the present study was the absence of systemic GI hormone measurements.This would have provided a complete analysis of the effects of intestinal tastant administration oneating behavior. However, van Avesaat et al. showed a decrease in food intake and an increase insatiety scores, which was not accompanied by changes in systemic GI hormone levels [18]. Therefore,no systemic GI hormone measurement was conducted in the present study.
It has to be noted that the ideal duration of administration of the intervention and of the timingbetween intervention and serving the ad libitum meal is unknown. We employed a design similar tothat of van Avesaat et al. based on their positive results [18]. Future research protocols should considerthese factors.
Studies investigating the effects of tastants on food intake up to now focus on only acute effectsin a single ad libitum meal. It is not known whether repetitive or chronic administration of tastantswill lead to other results. More data are needed on the long-term effects of tastants, especially on dailyenergy intake.
242

Nutrients 2019, 11, 472
Author Contributions: The authors’ responsibilities were as follows: Conceptualization, D.K. and A.A.M.M.;methodology, T.K., D.K., F.J.T. and A.A.M.M.; formal analysis, T.K.; investigation, T.K., A.M.E.A. and M.v.A.;resources, T.K. and F.J.T.; writing-original draft preparation, T.K.; writing-review and editing, T.K., A.M.E.A.,D.K. and A.A.M.M.; supervision, D.K. and A.A.M.M.; project administration, T.K.; funding acquisition, D.K. andA.A.M.M.
Funding: This study was an investigator-initiated study. Will Pharma B.V. received funding from ‘Subsidie MKBInnovatiestimulering Topsectoren’ (MIT), grant number MTHLA16192, and covered all relevant costs related tothe execution of the study.
Acknowledgments: We thank all the volunteers for participating in this study.
Conflicts of Interest: The funders had no role in the design of the study; in the collection, analyses, orinterpretation of data; in the writing of the manuscript or in the decision to publish the results. No specificgrant was received for open access publication. T.K. received a salary from Will Pharma BV as part of the ‘SubsidieMKB Innovatiestimulering Topsectoren’ (MIT) for the period related to the execution of the present study. D.K.and A.A.M.M. have received an unrestricted grant from Will Pharma B.V. for execution of a study unrelated to thepresent study. A.M.E.A., M.v.A., F.J.T. reported no conflicts of interest.
References
1. WHO. Obesity and Overweight 2018. Available online: http://www.who.int/en/news-room/fact-sheets/detail/obesity-and-overweight (accessed on 3 August 2018).
2. Lieverse, R.J.; Jansen, J.B.; Masclee, A.A.; Lamers, C.B. Satiety effects of a physiological dose ofcholecystokinin in humans. Gut 1995, 36, 176–179. [CrossRef] [PubMed]
3. Lieverse, R.J.; Jansen, J.B.; van de Zwan, A.; Samson, L.; Masclee, A.A.; Lamers, C.B. Effects of a physiologicaldose of cholecystokinin on food intake and postprandial satiation in man. Regul. Pept. 1993, 43, 83–89.[CrossRef]
4. Verdich, C.; Flint, A.; Gutzwiller, J.P.; Naslund, E.; Beglinger, C.; Hellstrom, P.M.; Long, S.J.; Morgan, L.M.;Holst, J.J.; Astrup, A. A meta-analysis of the effect of glucagon-like peptide-1 (7-36) amide on ad libitumenergy intake in humans. J. Clin. Endocrinol. Metab. 2001, 86, 4382–4389. [CrossRef] [PubMed]
5. van Avesaat, M.; Troost, F.J.; Ripken, D.; Hendriks, H.F.; Masclee, A.A. Ileal brake activation:Macronutrient-specific effects on eating behavior? Int. J. Obes. 2015, 39, 235–243. [CrossRef] [PubMed]
6. Maljaars, P.W.; Peters, H.P.; Mela, D.J.; Masclee, A.A. Ileal brake: A sensible food target for appetite control.A review. Physiol. Behav. 2008, 95, 271–281. [CrossRef] [PubMed]
7. Shin, H.S.; Ingram, J.R.; McGill, A.T.; Poppitt, S.D. Lipids, CHOs, proteins: Can all macronutrients put a‘brake’ on eating? Physiol. Behav. 2013, 120, 114–123. [CrossRef] [PubMed]
8. Alleleyn, A.M.; van Avesaat, M.; Troost, F.J.; Masclee, A.A. Gastrointestinal Nutrient Infusion Site and EatingBehavior: Evidence for A Proximal to Distal Gradient within the Small Intestine? Nutrients 2016, 8, 117.[CrossRef] [PubMed]
9. Sternini, C.; Anselmi, L.; Rozengurt, E. Enteroendocrine cells: A site of ‘taste’ in gastrointestinalchemosensing. Curr. Opin. Endocrinol. Diabetes Obes. 2008, 15, 73–78. [CrossRef] [PubMed]
10. Jang, H.J.; Kokrashvili, Z.; Theodorakis, M.J.; Carlson, O.D.; Kim, B.J.; Zhou, J.; Kim, H.H.; Xu, X.; Chan, S.L.;Juhaszova, M.; et al. Gut-expressed gustducin and taste receptors regulate secretion of glucagon-likepeptide-1. Proc. Natl. Acad. Sci. USA 2007, 104, 15069–15074. [CrossRef] [PubMed]
11. Rozengurt, N.; Wu, S.V.; Chen, M.C.; Huang, C.; Sternini, C.; Rozengurt, E. Colocalization of thealpha-subunit of gustducin with PYY and GLP-1 in L cells of human colon. Am. J. physiol. Gastrointest.Liver Physiol. 2006, 291, G792–G802. [CrossRef] [PubMed]
12. Sutherland, K.; Young, R.L.; Cooper, N.J.; Horowitz, M.; Blackshaw, L.A. Phenotypic characterization oftaste cells of the mouse small intestine. Am. J. Physiol. Gastrointest. Liver Physiol. 2007, 292, G1420–G1428.[CrossRef] [PubMed]
13. Wu, S.V.; Rozengurt, N.; Yang, M.; Young, S.H.; Sinnett-Smith, J.; Rozengurt, E. Expression of bitter tastereceptors of the T2R family in the gastrointestinal tract and enteroendocrine STC-1 cells. Proc. Natl. Acad.Sci. USA 2002, 99, 2392–2397. [CrossRef] [PubMed]
14. Bezencon, C.; le Coutre, J.; Damak, S. Taste-signaling proteins are coexpressed in solitary intestinal epithelialcells. Chem. Senses 2007, 32, 41–49. [CrossRef] [PubMed]
243
Nutrients 2019, 11, 472
15. Young, R.L.; Sutherland, K.; Pezos, N.; Brierley, S.M.; Horowitz, M.; Rayner, C.K.; Blackshaw, L.A. Expressionof taste molecules in the upper gastrointestinal tract in humans with and without type 2 diabetes. Gut 2009,58, 337–346. [CrossRef] [PubMed]
16. van der Wielen, N.; van Avesaat, M.; de Wit, N.J.; Vogels, J.T.; Troost, F.; Masclee, A.; Koopmans, S.-J.;van der Meulen, J.; Boekschoten, M.V.; Müller, M.; et al. Cross-species comparison of genes related tonutrient sensing mechanisms expressed along the intestine. PLoS ONE 2014, 9, e107531. [CrossRef] [PubMed]
17. Gu, F.; Liu, X.; Liang, J.; Chen, J.Y.; Chen, F.X.; Li, F. Bitter taste receptor mTas2r105 is expressed in smallintestinal villus and crypts. Biochemical and biophysical research communications. 2015, 463, 934–941. [CrossRef][PubMed]
18. van Avesaat, M.; Troost, F.J.; Ripken, D.; Peters, J.; Hendriks, H.F.; Masclee, A.A. Intraduodenal infusion of acombination of tastants decreases food intake in humans. Am. J. Clin. Nutr. 2015, 102, 729–735. [CrossRef][PubMed]
19. Maljaars, P.W.; Symersky, T.; Kee, B.C.; Haddeman, E.; Peters, H.P.; Masclee, A.A. Effect of ileal fat perfusionon satiety and hormone release in healthy volunteers. Int. J. Obes. 2008, 32, 1633–1639. [CrossRef] [PubMed]
20. Parker, B.A.; Sturm, K.; MacIntosh, C.G.; Feinle, C.; Horowitz, M.; Chapman, I.M. Relation between foodintake and visual analogue scale ratings of appetite and other sensations in healthy older and young subjects.Eur. J. Clin. Nutr. 2004, 58, 212–218. [CrossRef] [PubMed]
21. van Avesaat, M.; Ripken, D.; Hendriks, H.F.; Masclee, A.A.; Troost, F.J. Small intestinal protein infusionin humans: Evidence for a location-specific gradient in intestinal feedback on food intake and GI peptiderelease. Int. J. Obes. 2017, 41, 217–224. [CrossRef] [PubMed]
22. Meyer-Gerspach, A.C.; Biesiekierski, J.R.; Deloose, E.; Clevers, E.; Rotondo, A.; Rehfeld, J.F.; Depoortere, I.;Van Oudenhove, L.; Tack, J. Effects of caloric and noncaloric sweeteners on antroduodenal motility,gastrointestinal hormone secretion and appetite-related sensations in healthy subjects. Am. J. Clin. Nutr.2018, 107, 707–716. [CrossRef] [PubMed]
23. Fantino, M.; Fantino, A.; Matray, M.; Mistretta, F. Beverages containing low energy sweeteners do not differfrom water in their effects on appetite, energy intake and food choices in healthy, non-obese French adults.Appetite 2018, 125, 557–565. [CrossRef] [PubMed]
24. Luscombe-Marsh, N.D.; Smeets, A.J.; Westerterp-Plantenga, M.S. The addition of monosodium glutamateand inosine monophosphate-5 to high-protein meals: Effects on satiety, and energy and macronutrientintakes. Br. J. Nutr. 2009, 102, 929–937. [CrossRef] [PubMed]
25. Deloose, E.; Corsetti, M.; Van Oudenhove, L.; Depoortere, I.; Tack, J. Intragastric infusion of the bitter tastantquinine suppresses hormone release and antral motility during the fasting state in healthy female volunteers.Neurogastroent. Motil. 2017. [CrossRef] [PubMed]
26. Deloose, E.; Janssen, P.; Corsetti, M.; Biesiekierski, J.; Masuy, I.; Rotondo, A.; Van Oudenhove, L.;Depoortere, I.; Tack, J. Intragastric infusion of denatonium benzoate attenuates interdigestive gastric motilityand hunger scores in healthy female volunteers. Am. J. Clin. Nutr. 2017, 105, 580–588. [CrossRef] [PubMed]
27. Andreozzi, P.; Sarnelli, G.; Pesce, M.; Zito, F.P.; Alessandro, A.D.; Verlezza, V.; Palumbo, I.; Turco, F.;Esposito, K.; Cuomo, R. The Bitter Taste Receptor Agonist Quinine Reduces Calorie Intake and Increases thePostprandial Release of Cholecystokinin in Healthy Subjects. J. Neurogastroenterol. Motil. 2015, 21, 511–519.[CrossRef] [PubMed]
28. Steiner, J.E.; Glaser, D.; Hawilo, M.E.; Berridge, K.C. Comparative expression of hedonic impact: Affectivereactions to taste by human infants and other primates. Neurosci. Biobehav. Rev. 2001, 25, 53–74. [CrossRef]
29. Breslin, P.A.; Spector, A.C. Mammalian taste perception. Curr. Biol. 2008, 18, R148–R155. [CrossRef][PubMed]
© 2019 by the authors. Licensee MDPI, Basel, Switzerland. This article is an open accessarticle distributed under the terms and conditions of the Creative Commons Attribution(CC BY) license (http://creativecommons.org/licenses/by/4.0/).
244

nutrients
Article
Taste Perception and Caffeine Consumption:An fMRI Study
Laura Gramling 1,†, Eleni Kapoulea 1 and Claire Murphy 1,2,3,*
1 Department of Psychology, San Diego State University, San Diego, CA 92182, USA;[email protected] (L.G.); [email protected] (E.K.)
2 San Diego State University/University of California, San Diego Joint Doctoral Program, San Diego,CA 92120, USA
3 Department of Psychiatry, University of California, San Diego, CA 92093, USA* Correspondence: [email protected]† Current address: Palo Alto University, Palo Alto, CA 94304, USA.
Received: 9 October 2018; Accepted: 18 December 2018; Published: 24 December 2018
Abstract: Caffeine is ubiquitous, yet its impact on central taste processing is not well understood.Although there has been considerable research on caffeine’s physiological and cognitive effects,there is a paucity of research investigating the effects of caffeine on taste. Here we used functionalmagnetic resonance imaging (fMRI) to investigate group differences between caffeine consumers andnon-consumers in blood-oxygenation-level-dependent (BOLD) activation during hedonic evaluationof taste. We scanned 14 caffeine consumers and 14 caffeine non-consumers at 3 Tesla, while theyrated three tastes: caffeine (bitter), sucrose (sweet), and saccharin (sweet with bitter after taste),in aqueous solutions. Differences in BOLD activation were analyzed using voxel wise independentsamples t-tests within Analysis of Functional Neuroimage (AFNI). Results indicated that duringthe hedonic evaluation of caffeine or sucrose, caffeine non-consumers had significantly greateractivation in neuronal areas associated with memory and reward. During the hedonic evaluationof saccharin, caffeine consumers had significantly greater activation in areas associated withmemory and information processing. The findings suggest caffeine consumption is associated withdifferential activation in neuronal areas involved in reward, memory, and information processing.Further research on intensity and hedonics of bitter and sweet stimuli in caffeine consumers andnon-consumers will be of great interest to better understand the nature of differences in tasteperception between caffeine consumers and non-consumers.
Keywords: fMRI; caffeine; taste; memory
1. Introduction
Caffeine consumption is ubiquitous. It currently ranks as the most popular psychostimulant inthe world [1]. Eighty-five percent of the United States’ population consumes at least one caffeinatedbeverage daily [2]. Many beverages contain caffeine, including coffee, the most widely consumedbeverage after water [3]. Other widely consumed caffeinated beverages are tea and energy drinks,which typically contain a high caffeine content, as well as a high glucose content [2,4]. Despite caffeine’sbitter taste and the fact that bitter tastes often discourage intake, coffee and tea remain two of the mostwidely ingested beverages [5]. Caffeine’s widespread consumption warrants a better understanding ofits effects.
Evidence supporting caffeine’s ability to exert beneficial effects is abundant [6]. When consumedin moderate amounts, caffeine has been reported to decrease fatigue and increase energy [6]. Caffeinehas also been reported to increase motor performance on sustained response tasks. For example,participants randomly assigned in a double-blind study to either consume a drink containing 40 mg
Nutrients 2019, 11, 34; doi:10.3390/nu11010034 www.mdpi.com/journal/nutrients245
Nutrients 2019, 11, 34
of caffeine or placebo, showed enhanced performance on a selective attention task when exposed tothe experimental condition [7]. Further, caffeine produces mild autonomic nervous system arousaland improved mood when compared to a non-caffeinated placebo [8]. During a visuomotor task,participants demonstrated increased blood-oxygenation-level-dependent (BOLD) activation in theputamen and insula after consuming 200 mg of caffeine [9]. The putamen is part of the basal ganglia,an area that has been shown to modulate the top-down influence of the prefrontal cortex on sensoryprocessing in humans [10]. Increased activation in the striatum following caffeine consumptionsuggests that caffeine can act as a cognitive enhancer by modulating these attentional areas [9].
While caffeine consumed at moderate doses may provide consumers with a number of favorableeffects, research suggests negative consequences as a result of caffeine consumed at higher doses [8,11].Increasing caffeine consumption can exert dose-dependent effects on a number of acute autonomicresponses, including increased blood pressure [8]. Caffeine consumed at 300–800 mg can induceanxiety, nervousness, and insomnia [11]. Further, withdrawal from caffeine is detectable overnight,and causes fatigue, stress, as well as decreased alertness and clear-headedness in heavy caffeineconsumers [12–14].
The motivational desire to ingest a certain food incorporates a combination of flavor, learnedassociations, and physiological state that integrate to produce a food reward [15,16]. Since bittertaste is typically avoided by many species and may be an adaptation to protect them from adversephysiological effects, repeated consumption of caffeine may be a learned process [5]. The choice toconsume caffeine may occur as a result of altered activation in brain areas related to reward pathways,particularly in areas associated with processing food rewards. Previous studies have reported thataltered neuronal processing can occur as a consequence of repeated ingestion of a substance [17,18].For example, habitual consumption of non-nutritive sweeteners has been associated with alteredprocessing of sweet taste in individuals who regularly consume diet soda [17]. When compared tonon-diet soda drinkers, diet soda drinkers demonstrated greater activation in areas related to rewardprocessing, such as the dopaminergic midbrain, in response to sweet taste. Diet soda drinkers alsoexhibited greater activation in orbitofrontal cortex (OFC) Brodmann Area (BA) 47, an area relatedto pleasantness evaluation, when rating saccharin. Therefore, food consumption choices may beassociated with altered neuronal activation.
The effects of caffeine consumption on central aspects of taste perception are not well understood.In addition to caffeine’s bitter taste [5], there is some suggestion from psychophysical studies thatcaffeine, which is an adenosine-receptor antagonist, may influence perception of some sweetenersthrough its action on adenosine receptors in sweet-sensitive taste cells [5,19,20]. The current studyinvestigates differences between habitual caffeine consumers and non-consumers on brain activationduring hedonic evaluation of taste, rather than the acute effects of caffeine consumption or withdrawalfrom caffeine consumption [21,22].
The purpose of the current study was to test the hypothesis that caffeine consumers andnon-consumers may show differential brain activation, assessed with functional magnetic resonanceimaging (fMRI), during hedonic evaluation of a bitter taste (caffeine), a sweet taste (sucrose),and a sweet taste with bitter after taste (saccharin). Results suggesting differential brain activationin association with caffeine consumption and different taste stimuli adds to preceding literatureregarding caffeine’s influences on taste perception. Since caffeine consumption was a defining factorin group membership, it was chosen as the representation for bitter taste. Sweet taste was alsochosen as a taste stimulus in response to preceding literature suggesting that caffeine may influenceperception of sweet taste [5,19,20]. Saccharin was chosen as the third taste stimulus since it evokes acombination of bitter and sweet taste and may result in differential activation during taste processingin comparison to caffeine and/or sucrose. We aimed to investigate differential brain activation duringthe hedonic evaluation of taste to determine (1) whether caffeine consumers have greater activationthan non-consumers in areas related to reward processing (e.g., nucleus accumbens, OFC BA 10);(2) whether caffeine non-consumers have greater neuronal activation than consumers in memory
246

Nutrients 2019, 11, 34
pathways, such as areas in the medial temporal lobe (MTL); and (3) whether caffeine non-consumersmay rely upon activation of a larger network than consumers in order to perform the task.
2. Methods
2.1. Participants
The current sample (n = 28) consisted of 12 males and 16 females. Participants were divided intoone of two groups: caffeine non-consumer (n = 14) and caffeine consumer (n = 14). Participants weredivided into these groups based on answers to a survey that was administered after study completion.Participants who reported they not drink caffeinated beverages were labeled as caffeine non-consumers.Participants who responded that they did consume caffeinated beverages constituted the consumersgroup. Groups were matched on age, body mass index (BMI), and gender. Participants were part of alarger study investigating fMRI and taste processing. The Institutional Review Boards at San DiegoState University and University of California, San Diego approved the study. All participants gaveinformed consent and were given monetary compensation for their participation.
2.2. Screening Session
The current study used the methodology described in detail in Haase, Cerf-Ducastel, Buracas,and Murphy (2007) [23]. All participants completed one screening session and one event-relatedfMRI session. At the initial screening, participant information, height, and weight were recorded.Participants were screened for metal in their body for the fMRI scan, as well as ageusia and anosmiawith forced choice taste and odor threshold measures [24]. Being left-handed was an exclusionarycriterion to avoid differential lateral activation in hemispheres due to handedness [25]. Participantswho met the study criteria returned to complete one fMRI scan.
2.3. Odor and Taste Threshold Measures
In order to screen for anosmia, odor thresholds for the odor n-butyl alcohol (butanol) wereassessed for each nostril monorhinically using a forced choice, ascending methods of limits test [24].The solutions were in a series of 10; each dilution was one-third the concentration of the solutionpreceding it. On each trial the participant was presented with two bottles: one containing distilledwater and the other containing the odor stimulus. The participant was asked to decide which bottlecontained an odor. There was a 45 s inter-stimulus interval between each stimulus delivery to avoidadaptation [26]. If the participant chose the incorrect bottle, a higher concentration was given on thenext trial. Once the participant met the criterion of choosing correctly on five successive trials the odorthreshold was determined.
In order to screen for ageusia, taste thresholds for sucrose were assessed using a sip and spit,forced choice staircase procedure [24]. Stimuli were presented in 14 concentrations of sucrose, rangingfrom 0.0032 to 0.36 M in geometrical progression. All stimuli were presented at room temperaturein distilled water [24]. The experimenter presented the participants with two cups, one containingdistilled water and the other containing sucrose solution. The stimulus was sipped, held in the mouthfor 10 s, and expectorated. After the participant sampled 10 ml of water and solution, he (she) wasasked to select the stimulus with the sweet taste. The experimenter increased the concentration untilthe participant consistently (twice in a row) chose the stronger stimulus. This procedure was thenreversed to a descending series until the participant failed to choose the correct stimulus. Participantswere required to rinse with distilled water before each stimulus to avoid adaptation and waited aminimum of 30 s between each stimulus. Testing continued for five reversals with the mean of the lastfour reversals taken as the threshold.
247

Nutrients 2019, 11, 34
2.4. Neuroimaging Procedure
Functional MRI data were collected in order to investigate brain response of caffeine consumerand caffeine non-consumer groups to stimuli during the physiological state of hunger. All scanningsessions occurred in the morning, and participants were instructed to fast 12 h prior to the scan.When stimuli were presented, participants used a joystick to rate pleasantness on a modified generalLabeled Magnitude Scale. The scale was projected on a screen visible to the participant through amirror attached to the head coil [23,27].
2.5. Stimulus Delivery
The stimuli used in this study were pure tastes delivered in aqueous solutions: 0.04 M caffeine,0.64 M sucrose, and 0.028 M saccharin. These concentrations were chosen based on a previous studyfrom our laboratory reporting how stimulus delivery method impacted the slopes of taste intensityfunctions for these stimuli [28]. The simulated stimulus delivery system was shown to producepsychophysical functions with slopes that were generally lower than experiments conducted with thesip and spit technique and that were similar to slopes of intensity functions associated with the dorsalflow procedure [28]. The concentrations chosen for the present study reflect the highest concentrationsof each stimulus tested in Reference [28].
Stimuli were presented orally and presentations were randomized during functional dataacquisition through the use of a computer-controlled delivery system (Figure 1). All taste stimuli werepresented while the participant was inside the scanner, where the participant lay supine with a bitebar, which was positioned comfortably between the lips so that the tubes delivered stimuli to the tipof the tongue. Immediately before, during, and after the scan, participants rated the pleasantnessand intensity of each stimulus. The taste stimuli and water were delivered at room temperature eachthrough a unique 25-ft long plastic tube, which was connected to a different computer-programmablesyringe pump. The pumps were programmed to present 0.3 mL of solution in 1 s.
Figure 1. Stimulus delivery paradigm. Reprinted with permission from Haase et al. (2007) [23].
The imaging session consisted of two functional runs. During the functional runs, each stimuluswas presented in 0.3 mL of solution for a total of 16 times with a 10 s inter-stimulus interval. Participantswere presented with water twice; first as a rinse, and then as a baseline to be used in data analysis.A complete outline of the stimulus delivery protocol used in the fMRI sessions is described in theJournal of Neuroscience Methods [23].
2.6. Imaging Acquisition
Functional MRI sessions took place at the Center for Functional Magnetic Resonance Imaging atthe University of California, San Diego. All data were collected using a 3T General Electric Signa Exciteshort-bore scanner (GE Healthcare, Chicago, IL, USA). Structural data were acquired for anatomical
248

Nutrients 2019, 11, 34
localization of the functional images. Parameters used to acquire structural images were as follows:T1—weighted whole-brain fast spoiled gradient echo (FSPGR) sequences, field of view (FOV) = 25.6 cm,slice thickness = 1 mm, resolution = 1 × 1 × 1 mm3, echo time (TE) = 30 ms, Locs per slab = 190,flip angle = 15◦. Parameters used to acquire functional images were as follows: T2*—weighted images,32 axial slices, FOV = 19.2 cm, matrix size = 64 × 64, resolution = 3 × 3 × 3 mm3, flip angle = 90◦,echo time (TE) = 30 ms, repetition time (TR) = 2000 ms.
2.7. Imaging Analysis
Imaging data were processed using FMRIB Software Library (FSL, Analysis Group, FMRIB,Oxford, UK) and Analysis of Functional NeuroImage (AFNI, open source software) [29,30]. Data werepreprocessed to correct head movement and alignment as well as to concatenate the runs. Temporaland spatial smoothing of the brain images were also applied. Images were spatially smoothed to fourfull widths at half maximum (FWHM), auto-masked to remove voxels located outside of the brain,and normalized into Talairach space to control for individual variation in structural differences.
We conducted the analyses within AFNI, using 3dDeconvolve, on each participant’s concatenatedruns based on the specified contrast (e.g., activation during evaluation of caffeine minus activationduring evaluation of water) that accounted for the timing of delivery of the stimulus and thewater baseline, which served as a control for identifying non-gustatory intra-oral stimulation [30,31].Deconvolution estimates the hemodynamic response per voxel in a participant’s concatenated runsgiven the experimental paradigm (i.e., stimulus onset timing) using ordinary least squares regression.The output from 3dDeconvolve contains fit coefficients (i.e., beta weights) for each voxel, indicatingthe amplitude of the signal model for each contrast, and corresponding t-statistics.
Several thresholding steps were taken in an attempt to control for Type I error in all group analyses.Individual voxels were thresholded at p ≤ 0.015. To protect a whole-brain probability of false positivesat an overall alpha of 0.05, group statistical maps were corrected for multiple comparisons at the clusterlevel using the AFNI program ClustSim [31]. ClustSim uses Monte Carlo simulations to computethe probability of generating a random “significant” cluster of noise (i.e., a false positive) given theindividual voxel threshold, the voxel connection radius, the amount of blurring, and the search volume(i.e., overall dataset size). For an overall alpha level of 0.05, a cluster threshold of 21 contiguous voxelswas applied. Neuronal activation in the caffeine consumers group during hedonic evaluation of theindividual taste stimuli was subtracted from activation in the caffeine non-consumers group.
2.8. Demographic Data Analysis
To examine potential demographic differences between caffeine consumers and caffeinenon-consumers, multivariate analyses of variance (MANOVA) were performed using caffeine statusas an independent variable. Age, gender group, body mass index (BMI), taste threshold, right odorthreshold, and left odor threshold were dependent variables. The results can be found in Table 1.
Table 1. Participant characteristics for caffeine non-consumers and matched caffeine consumers.
Caffeine Non-Consumers Caffeine Consumers
Demographics Mean SD Mean SD F p
Age 56.786 15.837 45.00 18.925 3.193 0.086Gender 0.571 0.514 0.571 0.514 0.000 1.000
BMI 29.564 6.783 29.654 6.208 0.001 0.972Taste Threshold 0.005 0.005 0.006 0.011 0.169 0.684
Odor Threshold R 6.000 1.797 7.000 1.240 2.935 0.099Odor Threshold L 6.140 1.875 6.786 1.051 1.252 0.273
BMI: body mass index.
249

Nutrients 2019, 11, 34
2.9. Psychophysical Data Analysis
The general Labeled Magnitude Scale (gLMS) was used to collect intensity ratings and a modifiedversion of the gLMS was used to collect hedonic ratings for caffeine, sucrose, and saccharin tastebefore and after each scan [27]. To examine between group differences in psychophysical ratings,a MANOVA was performed using caffeine status as an independent variable. Results are shown inTables 2 and 3. Repeated measures analyses of variance (RM-ANOVA) were performed to examinepossible differences between hedonic and intensity ratings of each taste before and after stimuli werepresented during the scan.
Table 2. Hedonic ratings for caffeine non-consumers and matched caffeine consumers.
Caffeine Non-Consumers Caffeine Consumers
Hedonic Ratings Mean SD Mean SD F p
Caffeine Pre 35.286 16.973 39.357 15.619 0.436 0.515Caffeine Post 26.357 16.284 38.214 14.766 4.073 0.054Sucrose Pre 58.786 11.943 61.929 10.095 0.565 0.459Sucrose Post 52.929 18.512 60.500 9.053 1.890 0.181Saccharin Pre 51.429 15.500 55.357 7.938 0.712 0.406Saccharin Post 47.429 18.793 53.360 9.740 1.098 0.304
Table 3. Intensity ratings for caffeine non-consumers and matched caffeine consumers.
Caffeine Non-Consumers Caffeine Consumers
Intensity Ratings Mean SD Mean SD F p
Caffeine Pre 29.429 20.470 35.929 27.280 0.508 0.482Caffeine Post 53.786 31.499 34.929 24.656 3.111 0.090Sucrose Pre 41.786 24.974 28.071 12.982 3.324 0.080
Sucrose Post * 52.000 30.894 32.929 14.334 4.390 0.046Saccharin Pre 35.071 23.206 34.214 16.348 0.013 0.911
Saccharin Post * 52.357 26.401 31.000 13.278 7.312 0.012
* Significant difference between caffeine consumers and caffeine non-consumers.
3. Results
3.1. Demographic
There were no significant differences in age (F (1, 26) = 3.193, p = 0.086), BMI (F (1, 26) = 0.001,p = 0.972) or gender (F (1, 26) < 0.001, p = 1.000). There were also no significant differences in tastethreshold (F (1, 26) = 0.169, p = 0.684) or in the odor threshold for the right nostril (F (1, 26) = 2.935,p = 0.099) or for the odor threshold for the left nostril (F (1, 26) = 1.252, p = 0.273).
3.2. Psychophysical Data
A MANOVA was performed to examine between group differences of hedonic and intensityratings (Tables 2 and 3). Caffeine non-consumers demonstrated significantly higher ratings forpost-scan intensity ratings for sucrose (F (1, 26) = 4.390, p = 0.046) and saccharin (F (1, 26) = 7.312,p = 0.012) when compared to the post-scan intensity ratings for caffeine consumers.
There were no significant differences between caffeine consumers and non-consumers inpleasantness ratings of caffeine (F (1, 26) = 1.3686, p = 0.253), saccharin (F (1, 26) = 0.094, p = 0.762),or sucrose (F (1, 26) = 0.392 p = 0.537). There were also no significant differences between sucroseintensity ratings before and after stimuli were presented during the scan (F (1, 26) = 0.442, p = 0.512).There were significant differences between intensity ratings before and after the scan for caffeine(F (1, 26) = 10.173, p = 0.004) and saccharin (F (1, 26) = 6.558, p = 0.016). For caffeine consumers,neither saccharin intensity ratings (F (1, 13) = 0.568, p = 0.464) nor caffeine intensity ratings
250

Nutrients 2019, 11, 34
(F (1, 13) = 0.077, p = 0.786) were significantly different before and after taste was presented during thescan. For caffeine non-consumers, caffeine intensity ratings (F (1, 13) = 11.833, p = 0.004) and saccharinintensity ratings (F (1, 13) = 6.551, p = 0.024), were significantly different before and after the taste waspresented. Intensity ratings for caffeine non-consumers were significantly higher after the stimuli werepresented during the scan.
3.3. Functional Neuroimaging
During the hedonic evaluation of caffeine, caffeine non-consumers had significantly greaterneuronal activation in the right cuneus, right precuneus, left anterior cingulate, medial frontal gyrus,and left superior frontal gyrus (See Table 4 and Figure 2).
Table 4. Regions of significantly greater activity in caffeine non-consumers compared to caffeineconsumers while judging the pleasantness of caffeine.
Talaraich Coordinates
Region Hem. X Y Z Regr. Coef. Voxels in Cluster
Cuneus R 8 −85 26 1.76 38Precuneus R 16 −74 26 0.33
Medial Frontal Gyrus L −1 47 41 0.757 28Medial Frontal Gyrus R 0 45 39 0.608
Superior FrontalGyrus L −1 54 34 0.65
Anterior Cingulate L −7 38 22 0.52
Hem.: Hemisphere; R: right; L: left; Regr. Coef.: Regression coefficient; Minimum cluster = 21 voxels, p = 0.015.
Figure 2. Brain activation during the hedonic evaluation of caffeine. Orange indicates areas wherecaffeine non-consumers had significantly greater activation in comparison to caffeine consumers.
During the hedonic evaluation of saccharin, caffeine non-consumers had significantly lowerneuronal activation than caffeine consumers in the middle temporal gyrus, inferior temporal gyrus,
251

Nutrients 2019, 11, 34
middle occipital gyrus, right fusiform gyrus, right lingual gyrus, and right cuneus (See Table 5 andFigure 3).
Table 5. Regions of significantly greater activity in caffeine consumers compared to caffeinenon-consumers while judging the pleasantness of saccharin.
Talairach Coordinates
Region Hem. X Y Z Regr. Coef. Voxels in Cluster
Middle Temporal Gyrus L −55 −64 5 −0.87 50Inferior Temporal Gyrus L −44 −69 −1 −0.617Middle Occipital Gyrus L −44 −62 −3 −0.396Middle Temporal Gyrus R 59 −46 −7 −0.647 28Inferior Temporal Gyrus R 63 −48 −7 −0.39
Fusiform Gyrus R 46 −38 −7 −0.289Middle Occipital Gyrus R 29 −88 5 −1.12 27
Lingual Gyrus R 27 −89 −2 −0.849Cuneus R 23 −91 −1 −0.712
Hem.: Hemisphere; R: right; L: left; Regr. Coef.: Regression coefficient; Minimum cluster = 21 voxels, p = 0.015.
Figure 3. Brain activation during the hedonic evaluation of saccharin. Blue indicates areas wherecaffeine consumers had significantly greater activation in comparison to caffeine non-consumers.
During the hedonic evaluation of sucrose, caffeine non-consumers had significantly greaterneuronal activation in the anterior cingulate, medial frontal gyrus, right superior frontal gyrus,OFC BA 10, posterior cingulate, cingulate gyrus, and precuneus (See Table 6 and Figure 4).
252

Nutrients 2019, 11, 34
Table 6. Regions of significantly greater activity in caffeine non-consumers compared to caffeineconsumers while judging the pleasantness of sucrose.
Talairach Coordinates
Region Hem. X Y Z Regr. Coef. Voxels in Cluster
Anterior Cingulate R 2 41 −1 1.26 153Medial Frontal Gyrus R 2 62 20 1.03
Anterior Cingulate L −2 42 −1 0.937OFC BA10 R 5 62 14 0.63
Superior Frontal Gyrus R 10 59 21 0.535Medial Frontal Gyrus L −10 40 14 0.446
OFC BA10 L −10 43 12 0.421Posterior Cingulate L −1 −46 14 1.27 90Posterior Cingulate R 2 47 13 1.24
Cingulate Gyrus R 2 −49 27 0.862Cingulate Gyrus L 0 −50 29 0.64
Precuneus R 2 −49 32 0.583Precuneus L −7 −58 29 0.537
Hem.: Hemisphere; R: right; L: left; Regr. Coef.: Regression coefficient; Minimum cluster = 21 voxels, p = 0.015.
Figure 4. Brain activation during the hedonic evaluation of sucrose. Orange indicates areas wherecaffeine non-consumers had significantly greater activation in comparison to caffeine consumers.
4. Discussion
How one perceives taste stimuli has been shown to influence food choice and repeatedconsumption of a tastant may lead to altered taste preferences [32–35]. There are neuroimagingdata to suggest that the human brain responds differently as a result of habitual consumption [17,18].However, to our knowledge, there is no human research investigating brain response during hedonicevaluation of taste in caffeine consumers and non-consumers. In this study, we examined brainresponse in self-reported caffeine consumers and caffeine non-consumers during an fMRI scan to
253

Nutrients 2019, 11, 34
investigate whether regular consumption of caffeine is associated with differential activation of areasrelated to memory, reward, and information processing. Imaging data from the present study indicatethat caffeine consumers and caffeine non-consumers have significantly different neuronal activationsin areas related to memory, reward, and information processing when processing individual tastestimuli. Each participant was exposed to 0.3 mL/sec of each tastant for 16 repetitions resulting in atotal consumption of <5 mL, suggesting that these differences in activation occurred as a result fromprocessing the taste alone, rather than the possible physiological effects of ingestion. When ratingcaffeine and sucrose, caffeine non-consumers had significantly greater activation in areas relatedto memory, reward, and information processing. During hedonic evaluation of saccharin, caffeineconsumers had significantly greater activation in areas related to information processing. Overall,our results indicate differential neuronal activations between both groups during the processing ofall three tastes. These results suggest differences in overall cognitive expenditure between the twogroups, differing based on which taste was presented.
4.1. Psychophysical Data
Caffeine consumers and caffeine non-consumers demonstrated differences in taste perception.Post-scan intensity ratings of sucrose and saccharin were significantly higher in caffeine non-consumerscompared to caffeine consumers. Further, caffeine non-consumer ratings of caffeine and sucroseintensity significantly increased from before to after stimulus presentation within an fMRI scan.The latter phenomena were not present in caffeine consumers.
Psychophysical results suggest that caffeine non-consumers perceived sucrose and saccharinas being more intense than caffeine consumers after the scan. Also, caffeine and saccharin intensityratings significantly increased after stimuli were presented during the scan for caffeine non-consumers.A plausible explanation is that the sweet taste of sucrose and saccharin may have been potentiatedby caffeine [20]. The increase of perceived intensity of caffeine and saccharin after the scans innon-consumers suggests a stronger reaction to bitter taste, which is present in caffeine and in saccharinas an aftertaste. There is evidence that the perceived intensity of caffeine’s bitterness may be associatedwith whether caffeine is regularly consumed and the expression of bitter receptors, PAV-TAS2R38 [5,36].It is plausible that both a genetic predisposition and caffeine consumption habits contributed to caffeinenon-consumers perceiving all three tastes more intensely in comparison to caffeine consumers.
4.2. Reward Processing Areas
During the hedonic evaluation of caffeine and sucrose, caffeine non-consumers demonstratedgreater activation in areas associated with reward processing.
During the hedonic evaluation of sucrose, caffeine non-consumers demonstrated significantlygreater activation in both hemispheres of OFC BA 10, an area associated with encoding theincentive value of a stimulus during a decision-making task [37–39]. The OFC has been activated inresponse to abstract internal goals, such as rewards and punishments, while other tasks are beingperformed [37–39]. The OFC has been reported to be responsive to the reward value of tastes, as itassociates other stimuli with tastes to produce representations of expected reward value [37,40].A reward stimulus has been found to induce increased activation in OFC BA 10 when alreadyactivated by working memory processing [41]. Further, the OFC is activated by monetary rewards andpunishment, with more activation reported following a punishment outcome [38].
During the hedonic evaluation of caffeine and sucrose, activation in the anterior cingulate cortex(ACC) was significantly greater in caffeine non-consumers. During the hedonic evaluation of caffeine,only activation in the left anterior cingulate cortex was found to be significantly greater in caffeinenon-consumers in comparison to caffeine consumers. Lateralization in the ACC has been found duringerror processing and conflict monitoring, where correct inhibitions only occurred in the right ACC [42].Further, observational fear learning has been found to only be activated in the right, but not the leftACC [43]. The distinction that right ACC activation only occurred during the hedonic evaluation of
254

Nutrients 2019, 11, 34
sucrose and not during the hedonic evaluation of caffeine suggests that sucrose may have been a moreintense experience for caffeine non-consumers. Psychophysical data supports this assertion, as caffeinenon-consumers provided significantly higher intensity ratings for sucrose post-scan when comparedto caffeine consumers (Table 3).
Overall, the ACC has been associated with an overall neural circuit that uses past action-rewardhistory to learn action value in order to guide voluntary choice behavior [44]. This process requiresreferencing a history of outcomes regarding a given choice [44]. Further, previous studies suggestthat reward processing in the ACC may also guide choice behavior, as it relates actions to theirconsequences [45]. This suggests that ACC has an essential role in learning and using extendedaction-outcome histories to make voluntary choices.
It is important to emphasize that activity in the OFC is representative not merely of a rewardper se, but of a detailed and information rich representation of reward [46]. Similarly, the ACCreferences past-action reward history and is not a direct reflection of the reward value [44,45]. Therefore,the results are not necessarily indicative of caffeine non-consumers finding tastes to be more or lessrewarding than caffeine consumers. A more plausible explanation may be that greater activation inthe OFC and ACC found in caffeine non-consumers suggests a greater cognitive expenditure to usepast reward history and process the representation of a reward, in order to make a voluntary choice,which in this case, was the hedonic rating.
4.3. Memory Processing Areas
During the hedonic evaluation of caffeine, caffeine non-consumers demonstrated significantlygreater activation in right precuneus. During the hedonic evaluation of sucrose, caffeine non-consumersdemonstrated significantly greater activation in both the left and right side of the precuneus. The rightprecuneus has been previously linked to autobiographical memory retrieval [47]. It is of particularinterest that this area was activated during the hedonic evaluation of caffeine, an experience thatwould not be common in caffeine non-consumers. The precuneus is an area previously associated withepisodic memory retrieval, the ability to recall a previously experienced stimulus [48]. Continuoustheta burst stimulation (cTBS) over the precuneus in a picture memory task was associated with adecrease in source memory errors and improvement in context retrieval, suggesting that the precuneusis integral to a memory encoding and retrieval network [48]. During a source and item-recognitionmemory task, the left precuneus was activated during memory retrieval [49].
During the evaluation of sucrose, caffeine non-consumers also demonstrated greater activation inboth the left and right of the posterior cingulate and cingulate gyrus. The posterior cingulate cortex hasbeen associated with memory retrieval, namely autobiographical memory retrieval [50]. The posteriorcingulate cortex also subserves evaluative functions such as monitoring sensory events and behavioralactions in the service of spatial orientation and memory [51].
These results support the hypothesis that caffeine non-consumers demonstrate greater cognitiveexpenditure in memory processing areas. We speculate that greater activations in the caffeinenon-consumers while evaluating caffeine and sucrose could indicate a greater source memory retrievalexpenditure. It is possible that caffeine non-consumers may have had less exposure to these tastes dueto their dietary choices, and therefore, require greater cognitive effort to process them. Further, whilesucrose is ubiquitous in all types of food, it is possible that experiencing caffeine’s bitter taste is a newexperience for caffeine non-consumers, not only in experiencing caffeine’s flavor profile, but also itssubsequent impact on other tastes.
4.4. Information Processing
Activation in information processing pathways was observed during hedonic evaluation of allthree tastants. Activation in the right superior frontal gyrus (SFG) was significantly higher duringthe hedonic evaluation of sucrose. The right SFG has been linked to functioning in cognitive control,such that greater activation was linked to more efficient response inhibition, less motor urgency, as well
255

Nutrients 2019, 11, 34
as greater self-regulation [52,53]. The left SFG was significantly higher during the hedonic evaluationof caffeine in caffeine non-consumers. The superior frontal gyrus, particularly the left SFG, has beenassociated with performing higher cognitive functions associated with working memory retrieval,especially in relation to task-related behavioral goals [54].
Both sides of the medial frontal gyrus were significantly activated in caffeine non-consumersduring the hedonic evaluation of caffeine and sucrose, but not in the saccharin condition. Previousstudies have linked activation in the left dorsolateral prefrontal cortex to processing and ratingmultimodal flavor stimuli [55]. Further, this is an area where the consequences of actions directly affectcognition in the preparation for and selection of response [55]. Results suggest a greater cognitive effortduring the hedonic evaluation of caffeine and sucrose for caffeine non-consumers and during saccharinfor caffeine consumers in information processing pathways coinciding with results previously stated.Due to the variability in between group activation within information processing areas, it is difficultto make a conclusive decision whether or not caffeine non-consumers activate a larger network thanconsumers in order to perform the hedonic evaluation task. While there was primarily more activationwithin the overall study in caffeine non-consumers, caffeine consumers demonstrated greater activationduring the saccharin condition. We speculate that greater activation for caffeine consumers duringsaccharin evaluation may have occurred because saccharin evokes both sweet and bitter taste [56].In addition to the stimulation of both sweet and bitter receptors, additional expenditure of cognitiveeffort may be required to hedonically evaluate this taste experience.
4.5. Further Considerations
There are limitations to this study. We did not investigate the potential differences in responsebetween caffeine consumers who regularly consume caffeinated beverages with a higher sugar contentand caffeine consumers who more regularly consume more bitter tasting beverages. Future studiesmay differentiate between the impact of taste processing for habitual consumers that drink primarilybitter tasting beverages (i.e., black coffee and tea) or items greater in sugar content (i.e., energy drinks).Further, in the caffeine consumers group, there were varying levels of caffeine consumption. Futurestudies may choose to expand on this paradigm, considering the effect of varying types and levels ofcaffeine consumption on taste perception.
We did not specify whether the taste stimuli were administered to the left or right side of thetongue. While we could not locate literature detailing a lateralization in processing of sweet and bittertaste alone, previous studies have reported laterization when discriminating tastes and rating tastequality [57,58]. Stevenson, Miller, and McGrillen [58] reported that when administering sour, sweet,salty, bitter, and umami solutions, discrimination among tastes was better when stimuli were appliedto the right tongue tip and participants were better at taste quality judgements when tastants wereapplied to the left tongue tip [58]. All stimuli in the present study were administered to the tip ofthe tongue and whether the stimuli were more exposed to the left or the right side on trials was notspecified. However, future studies could elaborate on this paradigm by taking this lateralization ofgustatory processing into account.
The effects of caffeine consumption on taste perception are of considerable interest. Followinga report that adenosine can enhance sweet taste in mice through its actions on A2B receptors in thetaste bud, a recent report of a human psychophysical study suggested that caffeine, which is anadenosine-receptor antagonist, may decrease the perceived intensity of sweet taste through its actionon adenosine receptors in sweet-sensitive taste cells [19,59]. Early studies of the effects of caffeineon taste had reported that in aqueous solutions of two component mixtures, caffeine decreased thesweetness of sucrose; and that when applied directly to the tongue with filter paper, caffeine enhancedthe intensity of quinine HCl, NaCl, and a number of nonnutritive sweeteners, particularly thosewith bitter components (e.g., saccharin), but not the nutritive sweeteners sucrose and fructose [20,60].The acute ingestion of caffeine has been reported to reduce the intensity of saccharin but not other tastestimuli, and that raising caffeine levels in the saliva for a period of three weeks had no measurable
256

Nutrients 2019, 11, 34
effects on reported intensity of caffeine, denatonium benzoate or NaCl [61,62]. Differences in theeffects of caffeine on sweetness intensity may be related to the stimuli, their concentrations, the routeof administration or other methodological differences in these studies [19,20,60–62]. The currentstudy focused on the effects of habitual caffeine consumption on fMRI of central brain responseand found differential activation between caffeine consumers and non-consumers during hedonicevaluation of sucrose, caffeine, and saccharin stimuli. Further research on both intensity and hedonicsof bitter and sweet stimuli, including natural as well as artificial sweeteners, in caffeine consumersand non-consumers will be of great interest to better understand the nature of caffeine’s influence ontaste perception.
5. Conclusions
In summary, we administered three tastants, caffeine, sucrose, and saccharin, to investigatedifferences in neuronal activation between those who were self-reported caffeine consumers andcaffeine non-consumers. We found differences in intensity ratings between groups. We also founddifferences in activation patterns during a hedonic evaluation task. Our results suggest that thereis greater activation for caffeine non-consumers while processing caffeine and sucrose and greateractivation for caffeine consumers while rating saccharin. The results support differential memory,reward, and information processing of taste between those who habitually consume caffeine and thosewho do not. These results suggest that further research into the link between caffeine consumptionand taste perception is warranted.
Author Contributions: Conceptualization, L.G., E.K., and C.M.; Formal analysis, E.K., Funding acquisition,C.M.; Investigation, L.G. and C.M.; Methodology, L.G. and C.M.; Project administration; C.M., Resources, C.M.;Supervision, C.M.; Visualization, E.K. and C.M.; Writing—original draft, L.G., E.K., and C.M.; Writing—review &editing, E.K. and C.M.
Funding: This research was supported by NIH Grant No AG004085-26, from the National Institute on Aging(Claire Murphy).
Acknowledgments: We would like to thank Aaron Jacobson, and Erin Green and Lori Haase for fMRI acquisitionand expertise, as well as the Lifespan Human Senses Laboratory assistants for research assistance. We also thankThomas Liu and the UCSD Center for fMRI.
Conflicts of Interest: The authors declare no conflict of interest.
References
1. Cappelletti, S.; Daria, P.; Sani, G.; Aromatario, M. Caffeine: Cognitive and Physical Performance Enhancer orPsychoactive Drug? Curr. Neuropharmacol. 2015, 13, 71–88. [CrossRef] [PubMed]
2. Mitchell, D.C.; Knight, C.A.; Hockenberry, J.; Teplansky, R.; Hartman, T.J. Beverage caffeine intakes in theU.S. Food Chem. Toxicol. 2014, 63, 136–142. [CrossRef] [PubMed]
3. Smith, J.E.; Lawrence, A.D.; Diukova, A.; Wise, R.G.; Rogers, P.J. Storm in a coffee cup: Caffeine modifiesbrain activation to social signals of threat. Soc. Cogn. Affect. Neurosci. 2012, 7, 831–840. [CrossRef] [PubMed]
4. Clauson, K.A.; Shields, K.M.; McQueen, C.E.; Persad, N. Safety issues associated with commercially availableenergy drinks. J. Am. Pharm. Assoc. 2008, 48, e55–e67. [CrossRef] [PubMed]
5. Poole, R.L.; Tordoff, M.G. The Taste of Caffeine. J. Caffeine Res. 2017, 7, 39–52. [CrossRef] [PubMed]6. Glade, M.J. Caffeine—Not just a stimulant. Nutrition 2010, 26, 932–938. [CrossRef] [PubMed]7. Rao, A.; Henglong, H.; Nobre, A.C. The effects of combined caffeine and glucose drinks on attention in the
human brain. Nutr. Neurosci. 2005, 8, 141–153. [CrossRef]8. Quinlan, P.T.; Lane, J.; Moore, K.L.; Aspen, J.; Rycroft, J.A.; O’Brien, D.C. The Acute Physiological and Mood
Effects of Tea and Coffee: The Role of Caffeine Level. Pharmacol. Biochem. Behav. 2000, 66, 19–28. [CrossRef]9. Park, C.A.; Kang, C.K.; Son, Y.D.; Choi, E.J.; Kim, S.H.; Oh, S.T.; Kim, Y.B.; Park, C.W.; Cho, Z.H. The effects
of caffeine ingestion on cortical areas: Functional imaging study. Magnet. Reson. Imaging 2014, 32, 366–371.[CrossRef]
10. Van Schouwenburg, M.R.; den Ouden, H.E.M.; Cools, R. The Human Basal Ganglia ModulateFrontal-Posterior Connectivity during Attention Shifting. J. Neurosci. 2010, 30, 9910–9918. [CrossRef]
257

Nutrients 2019, 11, 34
11. Nehlig, A.; Boyet, S. Dose–response study of caffeine effects on cerebral functional activity with a specificfocus on dependence. Brain Res. 2000, 858, 71–77. [CrossRef]
12. Rogers, P.J.; Hohoff, C.; Heatherley, S.V.; Mullings, E.L.; Maxfield, P.J.; Evershed, R.P.; Deckert, J.;Nutt, D.J. Association of the Anxiogenic and Alerting Effects of Caffeine with ADORA2A and ADORA1Polymorphisms and Habitual Level of Caffeine Consumption. Neuropsychopharmacology 2010, 35, 1973–1983.[CrossRef] [PubMed]
13. Ratliff-Crain, J.; O’Keeffe, M.K.; Baum, A. Cardiovascular reactivity, mood, and task performance in deprivedand nondeprived coffee drinkers. Health Psychol. 1989, 8, 427–447. [CrossRef] [PubMed]
14. Schuh, K.J.; Griffiths, R.R. Caffeine reinforcement: The role of withdrawal. Psychopharmacology 1997, 130, 320.[CrossRef] [PubMed]
15. Berridge, K.C. Food reward: Brain substrates of wanting and liking. Neurosci. Biobehav. Rev. 1996, 20, 1–25.[CrossRef]
16. Rogers, P.J.; Hardman, C.A. Food reward. What it is and how to measure it. Appetite 2015, 90, 1–15. [CrossRef][PubMed]
17. Green, E.; Murphy, C. Altered processing of sweet taste in the brain of diet soda drinkers. Physiol. Behav.2012, 107, 560–567. [CrossRef]
18. Green, E.; Jacobson, A.; Haase, L.; Murphy, C. Reduced nucleus accumbens and caudate nucleus activationto a pleasant taste is associated with obesity in older adults. Brain Res. 2011, 1386, 109–117. [CrossRef]
19. Choo, E.; Picket, B.; Dando, R. Caffeine May Reduce Perceived Sweet Taste in Humans, Supporting EvidenceThat Adenosine Receptors Modulate Taste. J. Food Sci. 2017, 82, 2177–2182. [CrossRef]
20. Schiffman, S.S.; Diaz, C.; Beeker, T.G. Caffeine intensifies taste of certain sweeteners: Role of adenosinereceptor. Pharmacol. Biochem. Behav. 1986, 24, 429–432. [CrossRef]
21. Field, A.S.; Laurienti, P.J.; Yen, Y.-F.; Burdette, J.H.; Moody, D.M. Dietary Caffeine Consumption andWithdrawal: Confounding Variables in Quantitative Cerebral Perfusion Studies? Radiology 2003, 227,129–135. [CrossRef] [PubMed]
22. Laurienti, P.J.; Field, A.S.; Burdette, J.H.; Maldjian, J.A.; Yen, Y.-F.; Moody, D.M. Dietary CaffeineConsumption Modulates fMRI Measures. NeuroImage 2002, 17, 751–757. [CrossRef] [PubMed]
23. Haase, L.; Cerf-Ducastel, B.; Buracas, G.; Murphy, C. On-line psychophysical data acquisition andevent-related fMRI protocol optimized for the investigation of brain activation in response to gustatorystimuli. J. Neurosci. Methods 2007, 159, 98–107. [CrossRef] [PubMed]
24. Murphy, C.; Gilmore, M.M.; Seery, C.S.; Salmon, D.P.; Lasker, B.R. Olfactory thresholds are associated withdegree of dementia in Alzheimer’s disease. Neurobiol. Aging 1990, 11, 465–469. [CrossRef]
25. Royet, J.P.; Plailly, J.; Delon-Martin, C.; Kareken, D.A.; Segebarth, C. fMRI of emotional responses toodors: Influence of hedonic valence and judgment, handedness, and gender. NeuroImage 2003, 20, 713–728.[CrossRef]
26. Ekman, G.; Berglund, B.; Berglund, U.; Lindvall, T. Perceived intensity of odor as a function of time ofadaptation. Scand. J. Psychol. 1967, 8, 177–186. [CrossRef] [PubMed]
27. Bartoshuk, L.M.; Duffy, V.B.; Green, B.G.; Hoffman, H.J.; Ko, C.W.; Lucchina, L.A.; Marks, L.E.; Snyder, D.J.;Weiffenbach, J.M. Valid across-group comparisons with labeled scales: The gLMS versus magnitude matching.Physiol. Behav. 2004, 82, 109–114. [CrossRef]
28. Haase, L.; Cerf-Ducastel, B.; Murphy, C. The effect of stimulus delivery technique on perceived intensityfunctions for taste stimuli: Implications for fMRI studies. Atten. Percept. Psychophys. 2009, 71, 1167–1173.[CrossRef]
29. Smith, S.M.; Jenkinson, M.; Woolrich, M.W.; Beckman, C.F.; Behrens, T.E.J.; Johansen-Berg, H.; Bannister, P.R.;De Luca, M.; Drobnjak, I.; Flitney, D.E.; et al. Advances in functional and structural MR image analysis andimplementation as FSL. NeuroImage 2004, 23 (Suppl. 1), S208–S219. [CrossRef]
30. Cox, R.W. AFNI: Software for Analysis and Visualization of Functional Magnetic Resonance Neuroimages.Comput. Biomed. Res. 1996, 29, 162–173. [CrossRef]
31. Zald, D.H.; Pardo, J.V. Functional neuroimaging of the olfactory system in humans. Int. J. Psychophysiol.2000, 36, 165–181. [CrossRef]
32. Nolden, A.A.; Hayes, J.E. Perceptual Qualities of Ethanol Depend on Concentration, and Variation in ThesePercepts Associates with Drinking Frequency. Chemosens. Percept. 2015, 8, 149–157. [CrossRef] [PubMed]
258

Nutrients 2019, 11, 34
33. Zandstra, E.H.; De Graaf, C.; Mela, D.J.; Van Staveren, W.A. Short- and long-term effects of changes inpleasantness on food intake. Appetite 2000, 34, 253–260. [CrossRef] [PubMed]
34. Bolhuis, D.P.; Gijsbers, L.; de Jager, I.; Geleijnse, J.M.; de Graaf, K. Encapsulated sodium supplementationof 4 weeks does not alter salt taste preferences in a controlled low sodium and low potassium diet.Food Qual. Prefer. 2015, 46, 58–65. [CrossRef]
35. Bertino, M.; Beauchamp, G.K.; Engelman, K. Long-term reduction in dietary sodium alters the taste of salt.Am. J. Clin. Nutr. 1982, 36, 1134–1144. [CrossRef] [PubMed]
36. Lipchock, S.V.; Spielman, A.I.; Mennella, J.A.; Mansfield, C.J.; Hwang, L.-D.; Douglas, J.E.; Reed, D.R.Caffeine Bitterness is Related to Daily Caffeine Intake and Bitter Receptor mRNA Abundance in HumanTaste Tissue. Perception 2017, 46, 245–256. [CrossRef] [PubMed]
37. Simmons, W.K.; Martin, A.; Barsalou, L.W. Pictures of Appetizing Foods Activate Gustatory Cortices forTaste and Reward. Cerebr. Cortex 2005, 15, 1602–1608. [CrossRef] [PubMed]
38. O’Doherty, J.; Kringelbach, M.L.; Rolls, E.T.; Hornak, J.; Andrews, C. Abstract reward and punishmentrepresentations in the human orbitofrontal cortex. Nat. Neurosci. 2001, 4, 95–102. [CrossRef]
39. Green, E.; Jacobson, A.; Haase, L.; Murphy, C. Neural correlates of taste and pleasantness evaluation in themetabolic syndrome. Brain Res. 2015, 1620, 57–71. [CrossRef]
40. Rolls, E.T. The orbitofrontal cortex and emotion in health and disease, including depression. Neuropsychologia2017. [CrossRef]
41. Pochon, J.B.; Levy, R.; Fossati, P.; Lehericy, S.; Poline, J.B.; Pillon, B.; Le Bihan, D.; Dubois, B. The neuralsystem that bridges reward and cognition in humans: An fMRI study. Proc. Natl. Acad. Sci. USA 2002, 99,5669–5674. [CrossRef] [PubMed]
42. Lütcke, H.; Frahm, J. Lateralized Anterior Cingulate Function during Error Processing and ConflictMonitoring as Revealed by High-Resolution fMRI. Cereb. Cortex 2008, 18, 508–515. [CrossRef] [PubMed]
43. Kim, S.; Mátyás, F.; Lee, S.; Acsády, L.; Shin, H.-S. Lateralization of observational fear learning at the corticalbut not thalamic level in mice. Proc. Natl. Acad. Sci. USA 2012, 109, 15497–15501. [CrossRef] [PubMed]
44. Kennerley, S.W.; Walton, M.E.; Behrens, T.E.J.; Buckley, M.J.; Rushworth, M.F.S. Optimal decision makingand the anterior cingulate cortex. Nat. Neurosci. 2006, 9, 940–947. [CrossRef] [PubMed]
45. Rushworth, M.; Walton, M.; Kennerley, S.; Bannerman, D. Action sets and decisions in the medial frontalcortex. Trends Cogn. Sci. 2004, 8, 410–417. [CrossRef] [PubMed]
46. Rolls, E.T. The Orbitofrontal Cortex and Reward. Cereb. Cortex 2000, 10, 284–294. [CrossRef] [PubMed]47. Freton, M.; Lemogne, C.; Bergouignan, L.; Delaveau, P.; Lehéricy, S.; Fossati, P. The eye of the self: Precuneus
volume and visual perspective during autobiographical memory retrieval. Brain Struct. Funct. 2014, 219,959–968. [CrossRef] [PubMed]
48. Bonnì, S.; Veniero, D.; Mastropasqua, C.; Ponzo, V.; Caltagirone, C.; Bozzali, M.; Koch, G. TMS evidence for aselective role of the precuneus in source memory retrieval. Behav. Brain Res. 2015, 282, 70–75. [CrossRef]
49. Lundstrom, B.; Petersson, K.M.; Andersson, J.; Johansson, M.; Fransson, P.; Ingvar, M. Isolating the retrievalof imagined pictures during episodic memory: Activation of the left precuneus and left prefrontal cortex.NeuroImage 2003, 20, 1934–1943. [CrossRef]
50. Maddock, R.J.; Garrett, A.S.; Buonocore, M.H. Remembering familiar people: The posterior cingulate cortexand autobiographical memory retrieval. Neuroscience 2001, 104, 667–676. [CrossRef]
51. Vogt, B.A.; Finch, D.M.; Olson, C.R. Functional Heterogeneity in Cingulate Cortex: The Anterior Executiveand Posterior Evaluative Regions. Cereb. Cortex 1992, 2, 435–443. [CrossRef] [PubMed]
52. Hu, S.; Ide, J.S.; Zhang, S.; Li, C.R. The Right Superior Frontal Gyrus and Individual Variation in ProactiveControl of Impulsive Response. J. Neurosci. 2016, 36, 12688–12696. [CrossRef] [PubMed]
53. Beauregard, M.; Lévesque, J.; Bourgouin, P. Neural Correlates of Conscious Self-Regulation of Emotion.J. Neurosci. 2001, 21, 6993–7000. [CrossRef]
54. Boisgueheneuc, F.D.; Levy, R.; Volle, E.; Seassau, M.; Duffau, H.; Kinkingnehun, S.; Samson, Y.; Zhang, S.;Dubois, B. Functions of the left superior frontal gyrus in humans: A lesion study. Brain 2006, 129, 3315–3328.[CrossRef] [PubMed]
55. Kringelbach, M.L.; de Araujo, I.E.; Rolls, E.T. Taste-related activity in the human dorsolateral prefrontalcortex. NeuroImage 2004, 21, 781–788. [CrossRef] [PubMed]
56. Lawless, H. Adapting efficiency of salt-sucrose mixtures. Percept. Psychophys. 1982, 32, 419–422. [CrossRef][PubMed]
259

Nutrients 2019, 11, 34
57. Prinster, A.; Cantone, E.; Verlezza, V.; Magliulo, M.; Sarnelli, G.; Iengo, M.; Cuomo, R.; Di Salle, F.; Esposito, F.Cortical representation of different taste modalities on the gustatory cortex: A pilot study. PLoS ONE 2017,12, e0190164. [CrossRef]
58. Stevenson, R.J.; Miller, L.A.; McGrillen, K. The lateralization of gustatory function and the flow of informationfrom tongue to cortex. Neuropsychologia 2013, 51, 1408–1416. [CrossRef]
59. Dando, R.; Dvoryanchikov, G.; Pereira, E.; Chaudhari, N.; Roper, S.D. Adenosine enhances sweet tastethrough A2B receptors in the taste bud. J. Neurosci. 2012, 32, 322–330. [CrossRef]
60. Pangborn, R. Taste interrelationships. J. Food Sci. 1960, 25, 245–256. [CrossRef]61. Mela, D.J. Caffeine ingested under natural conditions does not alter taste intensity. Pharmacol. Biochem. Behav.
1989, 34, 483–485. [CrossRef]62. Mela, D.J.; Mattes, R.D.; Tanimura, S.; Garcia-Medina, M.R. Relationships between ingestion and gustatory
perception of caffeine. Pharmacol. Biochem. Behav. 1992, 43, 513–521. [CrossRef]
© 2018 by the authors. Licensee MDPI, Basel, Switzerland. This article is an open accessarticle distributed under the terms and conditions of the Creative Commons Attribution(CC BY) license (http://creativecommons.org/licenses/by/4.0/).
260

nutrients
Article
Sweet and Umami Taste Perception Differs withHabitual Exercise in Males
Emma L. Feeney 1, Laura Leacy 2, Mark O’Kelly 2, Niamh Leacy 2, Abbie Phelan 2,
Leah Crowley 2, Emily Stynes 1, Aude de Casanove 1 and Katy Horner 2,*
1 School of Agriculture and Food Science, Institute of Food and Health, University College Dublin, Belfield,Dublin 4, Ireland; [email protected] (E.L.F.); [email protected] (E.S.);[email protected] (A.d.C.)
2 School of Public Health, Physiotherapy and Sport Science, University College Dublin, Belfield, Dublin 4,Ireland; [email protected] (L.L.); [email protected] (M.O.);[email protected] (N.L.); [email protected] (A.P.); [email protected] (L.C.)
* Correspondence: [email protected]; Tel.: +353-1-716-3439
Received: 29 November 2018; Accepted: 29 December 2018; Published: 12 January 2019
Abstract: Taste is influenced by several factors. However, whether habitual exercise level is associatedwith differences in taste perception has received little investigation. The aim of this study was todetermine if habitual exercise is associated with differences in taste perception in men. Active(n = 16) and inactive (n = 14) males, between ages 18–55, underwent two days of sensory testing,using prototypical taste stimuli of high and low concentrations for sweet, salt, bitter, sour, umami,and carbohydrate (maltodextrin). Mean perceived intensity and hedonic ratings were recorded.Eating behaviour was assessed by the three factor eating questionnaire and food intake by EPIC foodfrequency questionnaire (FFQ). There were moderate to large differences between the two groups inperceived intensity for sweet taste at the high concentration and umami taste at both high and lowconcentrations, with active males recording a higher perceived intensity (p < 0.05 for all). The activegroup also recorded a greater dislike for umami low and carbohydrate low concentration (p < 0.01).Salt, bitter and sour perception did not significantly differ between the two groups. FFQ analysisshowed no difference in % energy from macronutrients between the groups. Eating behaviour traitscorrelated with sweet taste intensity and umami taste liking, independent of activity status. Resultsindicated that sweet and umami taste perception differ in active compared to inactive males. Habitualexercise level should be considered in taste perception research and in product development. Whetherdifferences in taste perception could be one factor influencing food intake and thus energy balancewith habitual exercise warrants further investigation.
Keywords: taste perception; umami; carbohydrate; sweet; salt; bitter; physical activity; intensity;liking
1. Introduction
The sense of taste allows us to identify and distinguish between sweet, sour, salty, bitter,and umami qualities [1], perceived on the tongue in the absence of odour. In addition, carbohydratehas recently been described as a taste [2] exemplified by maltodextrin. Taste sensitivity differs betweenindividuals for different taste qualities [3,4]. There is considerable variation in the degree of tasteperception, and a wide range of factors, including genetics [3,5], age [6], sleep [7] body mass index [8],anxiety level and neurotransmitters [9], hormonal factors [10], and habitual diet [11], among others,have been associated with differences in taste perception between individuals. Physical activity couldpotentially influence several of the modifiable factors associated with differences in taste perception.Although the outcomes are variable, some studies have reported alterations in taste perception during
Nutrients 2019, 11, 155; doi:10.3390/nu12010155 www.mdpi.com/journal/nutrients261

Nutrients 2019, 11, 155
and after a single bout of exercise (see References [12,13] for reviews). There is also some limitedevidence that habitual exercise may be associated with differences in taste perception [14]. In astudy of female swimmers and inactive females, swimmers were found to perceive high-sucrosestimuli as sweeter [14]. However, little other research to date has investigated taste perception andhabitual exercise.
Characterising factors influencing food intake in active and inactive individuals is important togain a greater understanding of the role of physical activity in energy balance [13,15,16]. Sedentaryindividuals have been proposed to be at a greater risk of overeating due to a lack of physiologicalregulation of appetite [17] and several aspects of appetite and food intake regulation have been shownto vary depending on habitual physical activity level [18–20]. Evidence from both cross-sectionaland longitudinal studies suggests physical activity is associated with improved short-term appetitecontrol [19]. Moreover, hedonic responses for high- or low-fat and sweet or savoury foods have beenshown to differ between habitual exercisers and inactive individuals [20]. The underlying factors andmechanisms associated with differences in appetite control and food intake with physical activity,however, remain to be fully elucidated.
Understanding whether taste perception differs depending on physical activity level is important,as differences in taste perception could influence food choice or eating behaviour [3,4,21] and may berelated to weight status [22,23]. Alterations in taste perception have been linked to weight gain, with arecent longitudinal study demonstrating attenuated sweet and salty taste perception was associatedwith weight gain in college-aged males [24]. Moreover, taste perception has been proposed as a factorthat may influence athletes’ food choices [25]. Determining whether taste perception differs in activeand inactive individuals could, therefore, provide greater insight into factors influencing food choiceand energy balance. For example, a reduced sensation of sweet or salty taste could potentially renderinactive individuals more susceptible to weight gain.
The present study aimed to compare taste perception (taste intensity and liking) between activeand inactive males for the five ‘basic’ taste qualities of sweet, sour, salty, bitter, and umami tastes,as well as the more recently proposed carbohydrate taste.
2. Materials and Methods
2.1. Study Design
Participants in this between-groups cross-sectional design study undertook two separate testmornings one week apart. Ethical approval for the study was provided by the University CollegeDublin School of Public Health, Physiotherapy and Sports Science undergraduate research ethicscommittee. The primary outcome measure was taste perception (intensity) and secondary outcomeswere liking and identification of taste, anthropometry and body composition, eating behaviour,and habitual dietary intake.
2.2. Participants
Thirty men were studied (n = 14 inactive and n = 16 active) between the ages of 19 and51 years. Inclusion criteria were: Male, aged 18–55 years, nondiabetic, no medical conditionsand not taking medication known to influence taste perception, willing to consume study tastesolutions, and nonsmokers. Participants were classified through a screening questionnaire based ontheir self-reported physical activity patterns over the last 6 months as either inactive (undertaking≤1 structured exercise session per week and not engaged in strenuous work) or active (undertaking≥4 structured exercise sessions per week). Individuals who did not fit either category were excluded.One exercise session was defined as at least 40 min of moderate to high intensity activity. Participantswere also asked to record the typical intensity, frequency, and duration of each activity per week.These criteria were used as identical to previous studies showing differences in appetite control inactive versus inactive individuals [18,26]. We have previously shown these categories to differ in
262

Nutrients 2019, 11, 155
objectively measured physical activity [27]. Sample size calculations were conducted in G*Power [28]using data from a recent study assessing sweet intensity in adults [29], as taste intensity was theprimary outcome measure, differences with physical activity in females were previously shown inrelation to sweet taste [14], and the most similar literature that provided quantitative data to allowsample size calculation related to sweet taste. To detect a 10-point difference in sweet taste intensityratings between the two groups in the present study with a power of 80% and a significance level of5%, 14 individuals were required per group.
2.3. Recruitment and Setting
Recruitment was conducted through the distribution of recruitment flyers and emails throughoutthe university campus. Participants who were eligible to participate based on information provided inthe screening questionnaire were invited to participate in the testing sessions. The testing sessionstook place in the sensory evaluation suite at UCD’s Institute of Food and Health. Participants wererecruited from the 1 January 2018 until the 15 March 2018.
2.4. Body Composition Measurement and Taste Perception Assessment Day Protocol
On arrival, all participants provided written informed consent. On both test days, participantsattended the laboratory in the morning, having avoided strong-flavoured foods/drinks, such as spicyfoods and coffee, for 12 h and strenuous exercise for 24 h, and were instructed to wear light clothingfor body composition measurements. Participants’ height measurements were first taken using astadiometer, followed by weight and body composition using a Tanita body composition analyser(BC-420MA, Tanita Ltd., Yiewsley, UK), which uses bioelectrical impedance (BIA) to assess bodycomposition. Participants were then familiarised with the generalised labelled magnitude scale toassess perceived intensity (gLMS) [30]. The gLMS is a validated scale for assessing taste intensity,according to the standard protocol outlined previously by Green, Schaffer, and Gilmore [31] andGreen et al. [32]. A generalised degree of liking scale (gDOL) with labels of ‘neutral’ and ‘strongestliking/disliking of any kind’ was used to assess liking of the stimuli.
2.4.1. Taste Stimuli
Food-grade, prototypical taste stimuli in water were prepared as follows: Sucrose (sweet)(27 mmol/L and 243 mmol/L), citric acid (sour) (1 mmol/L and 9 mmol/L), sodium chloride (salt)(33 mmol/L and 300 mmol/L), quinine (bitter) (0.056 mmol/L and 0.498 mmol/L), monosodiumglutamate; MSG (umami) (0.51 g/L and 4.566 g/L) [24], and maltodextrin (carbohydrate) (dextroseequivalent 4.0–7.0, Sigma Aldrich, Arklow, Ireland) (35.5 g/L and 112.4 g/L) [2]. These concentrationswere selected to provide ‘low’ and ‘high’ concentrations to allow comparison to recent research [2,24].
2.4.2. Taste Perception Rating
Participants undertook two identical taste sessions spaced one week apart. Previous workhas indicated that at least two taste intensity ratings are necessary to achieve reliable estimates ofindividual taste responsiveness when using the gLMS [33]. Both sessions took place in the mornings,and participants followed identical instructions prior to each visit. The taste stimuli were the samein each session and mean results from the two ratings for each concentration of each taste were theprimary outcome used in analyses. Results from the individual test days were also explored to examinethe reliability of results at the individual test session. At each session, participants tasted 12 samples(high and low concentrations of the six tastes), served at room temperature in 20 mL medicine cups in asip-and-spit manner in a randomised block design, presented blinded, using 3-digit randomised codes.The tests were administered on computers located in each sensory booth, using RedJade software(RedJade Software Solutions, LLC, Boulder, CO, USA). Participants were requested to identify the tastefrom a specified list (‘sweet’, ‘salt’, ‘sour’, ‘bitter’, ‘umami’, ‘carbohydrate’ or ‘unsure’) and then to ratethe perceived intensity and then liking of the stimuli on a gLMS and gDOL respectively presented on
263

Nutrients 2019, 11, 155
screen. A 30 s break was enforced with the software between each solution, with a 2-min break afterevery 4 samples, with water for rinsing provided between each sample.
2.4.3. Eating Behaviour and Habitual Diet
At the end of the taste protocol on the second test day, participants completed a paper-basedversion of the three factor eating questionnaire (TFEQ) [34] and European Prospective Investigationinto Cancer and Nutrition (EPIC) food frequency questionnaire (FFQ) [35].
2.5. Statistical Analysis
Statistical analysis was performed using PASW Statistics 24.0 (SPSS Inc., Chicago, IL, USA) andGraphPad Prism version 7.0 for Mac (GraphPad Software, San Diego, CA, USA). To determine ifthe data of the two groups was normally distributed, the Shapiro–Wilk test was used. For normallydistributed data, a parametric independent t-test was used; otherwise, the Mann–Whitney U testwas used. Pearson’s correlation or Spearman’s rank correlation coefficient were used to determinerelationships between variables where appropriate. Effect size (ES: Cohen’s d or r where appropriate)was also assessed. Multiple regression analysis was undertaken to identify the effects of confoundingvariables such as age and body composition on taste perception. There were no missing data for anyoutcomes, except for the TFEQ and FFQ for two participants in the active group. Only complete datafor the TFEQ was used in analyses (n = 14 in both groups). Statistical significance was considered atp < 0.05 and data are reported as mean (SD) unless otherwise stated.
3. Results
3.1. Subject Characteristics
Descriptive data for the active compared to inactive groups are shown in Table 1. Age, height,weight and body mass index (BMI) did not significantly differ between the two groups; however,the active group had a lower body fat percentage.
Table 1. Subject characteristics of active (n = 16) and inactive (n = 14) groups.
Active Inactive p-Value Effect Size (d)
Age (years)Median (IQR) 21 (21.0–22.5) 21 (20.5–25.5) 0.79 r = 0.05 1
Height (cm)Mean (SD) 179.83 (4.91) 181.09 (5.12) 0.50 0.25
Weight (kg)Mean (SD) 79.03 (8.02) 81.49 (10.96) 0.49 0.26
BMI (kg/m2)Mean (SD) 24.41 (1.93) 24.80 (3.14) 0.68 0.15
Body Fat (%)Mean (SD) 12.33 (4.30) 18.87 (6.45) <0.01 1.19
1 As data were not normally distributed, r is used for effect size.
264
Nutrients 2019, 11, 155
3.2. Taste Identification
Although the study was not designed to assess identification of tastes, we explored whether itdiffered between the two visits and two groups, as it could potentially influence the results. Overall,taste identification did not differ significantly for any taste and concentration between the first andsecond session, suggesting no learning effect for taste identification occurred. Mean percentage oftastes correctly identified was greater at the high concentrations than at the lower concentrations forboth groups (p < 0.05) but did not differ between the two groups (p > 0.05). When the individualtastes were compared at the two visits, a greater percentage of the active group correctly identified theumami taste compared to the inactive group (p = 0.03). However, there were no significant differencesin the identification of all tastes between the two groups for all other tastes and concentrations at thetwo visits.
3.3. Taste Intensity
Perceived intensity in the active compared to inactive groups for the six tastes studied areshown in Figure 1. There was a large difference (ES: d = 1.63, p < 0.05) in perceived intensity for thehigh-concentration sweet (sucrose) taste between the two groups, with the active group recording asignificantly higher intensity rating compared to the inactive group (Figure 1A). Significantly higherintensity ratings were also observed in the active group for the umami (MSG) taste (Figure 1C),with a large difference between the two groups for the low concentration (ES: d = 1.18, p < 0.01) andmoderate difference at the high concentration (ES: r = 0.38, p < 0.05). Perceived intensity did notsignificantly differ between the two groups for the low concentration of sucrose, nor for either high orlow concentrations of citric acid, quinine, sodium chloride, and maltodextrin (p > 0.05 for all; Figure 1).For the latter comparisons, effect sizes were small for all (d < 0.30), except for the low concentration ofquinine (d = 0.60) and low concentration of maltodextrin (d = 0.66).
265

Nutrients 2019, 11, 155
Figure 1. Differences (mean (SE)) in perceived intensity responses on a generalised labelled magnitudescale (gLMS) for high and low concentrations of: (A) Sweet, (B) sour, (C) umami, (D) bitter,(E) salt, and (F) carbohydrate (maltodextrin) taste intensity ratings with physical activity. Soliddark line indicates active group, dashed line indicates inactive group. * p < 0.05, ** p < 0.01. MSG,monosodium glutamate.
3.4. Hedonic Response
Hedonic ratings in the active compared to inactive group for the six tastes studied are shown inTable 2. Apart from the sweet taste, the majority of tastes had negative ratings, indicating varyinglevels of dislike on the gDOL. There was a large difference between the two groups in liking of theumami low concentration with the active group recording a dislike of the taste, compared to a meanresponse of a weak liking in the inactive group. Similarly, the active group recorded a dislike for thelow-concentration carbohydrate taste, compared to a mean response of a weak liking in the inactivegroup (Table 2). Although there were no statistically significant differences in hedonic ratings betweenthe two groups for the other solutions, moderate effect sizes were observed for the bitter taste, with atrend towards a greater dislike of the bitter taste in active individuals.
266

Nutrients 2019, 11, 155
Table 2. Hedonic ratings of tastes assessed using a generalised degree of liking scale (gDOL) 1 in active(n = 16) compared to inactive (n = 14) males.
ActiveMean (SD)
InactiveMean (SD)
p-Value Effect Size (d)
SucroseHigh 38.91 (27.68) 34.75 (28.66) 0.69 0.15Low 1.44 (10.98) 5.18 (21.85) 0.42 0.22
MSG 2
High −17.06 (31.66) −16.79 (29.36) 0.98 <0.01Low −13.09 (20.31) 2.82 (11.50) <0.01 0.96
Citric acidHigh −3.72 (34.10) 0.36 (33.31) 0.74 0.12Low −5.34 (18.19) 2.07 (22.59) 0.33 0.36
QuinineHigh −57.50 (20.97) −38.79 (28.06) 0.05 0.76Low −34.00 (22.86) −17.89 (29.02) 0.08 0.62
Sodium chlorideHigh −33.16 (43.22) −29.57 (35.17) 0.50 0.09Low −18.72 (16.21) −11.96 (23.87) 0.73 0.33
MaltodextrinHigh −7.16 (25.5) −3.32 (22.31) 0.67 0.16Low −12.28 (12.76) 0.21 (14.29) <0.01 0.93
1 The labels of the scale were ‘neutral’ and ‘strongest liking/disliking of any kind’. 2 MSG, monosodium glutamate.
3.5. Reproducibility of Taste Intensity Comparisons between Groups at Individual Test Days
Interestingly, carbohydrate perceived intensity was higher at the first visit in the active group(p < 0.05) but did not differ at the second visit and therefore was not significantly different whenmean ratings were compared. By contrast, umami high concentration intensity ratings did notsignificantly differ statistically between groups at the individual test days but differed when meanratings were compared. However, most differences that were observed in mean ratings were alsoevident at both individual test days, with significant differences or similar trends observed (p < 0.1) forhigh-concentration sweet and low-concentration umami. Moreover, similar to mean ratings, perceivedintensity for low-concentration sweet, and both concentrations of sour, bitter, and salty were notdifferent between the two groups at the separate test visits.
3.6. Habitual Dietary Intake
There was no difference observed in the percentage of energy from macronutrients,or carbohydrate between the active and inactive group (Table 3), except for fructose, which washigher in the inactive group (p = 0.04), and fibre, which trended towards being higher in the inactivegroup (p = 0.05).
267

Nutrients 2019, 11, 155
Table 3. Mean energy intake and percentage of energy from macronutrients for active and inactivemen (FFQ data).
Active (n = 13) 1
Mean (SD)Inactive (n = 13) 1
Mean (SD)p-Value
(2-Tailed)
Energy Intakekcal/day 2290.7 (841.6) 2018.7 (826.7) 0.41
Macronutrient Intake, % of energy
Fat 36.4 (3.7) 37.7 (6.6) 0.53Protein 21.5 (3.6) 19.9 (2.8) 0.22
Carbohydrate 43.8 (4.6) 42.0 (8.8) 0.50Sugar 18.1 (3.5) 18.7 (4.6) 0.73
Sucrose 6.5 (2.3) 6.7 (1.9) 0.78Fructose 2.5 (1.0) 3.4 (1.2) 0.04
Galactose 0.1 (0.1) 0.1 (0.1) 0.59Maltose 0.5 (0.1) 0.5 (0.3) 0.77Lactose 5.6 (2.0) 4.1 (2.7) 0.11Starch 25.0 (3.8) 22.5 (6.9) 0.25Fibre 2.9 (0.8) 3.6 (1.0) 0.05
1 FFQ (food frequency questionnaire) data were available for n = 26 individuals (n = 13 per group). Data weremissing for two participants and data for two individuals were removed due to energy misreporting (energy intake>2 SD above or below the mean energy intake were removed as per Low et al. [2].
3.7. Regression Analysis Including Age, BMI, and Body Composition
3.7.1. Taste Intensity
For the sweet taste, physical activity status was the only variable associated with perceivedintensity at the high concentration (model adjusted R2: 0.13; ß = −0.39, p = 0.03). Age, BMI orpercentage of body fat were not independently associated with sweet taste intensity or when includedin models for either concentration (p > 0.1 for all).
For the umami taste at both concentrations, physical activity status showed the strongestassociation with perceived intensity. BMI, body fat or age were not associated with differencesin umami perceived intensity (p > 0.1).
For the sour taste, at the low concentration, both age and body composition were significantlyassociated with perceived intensity (p < 0.01) but not independently in the same model. Moreover,there were no associations between sour taste at the high concentration and age, BMI, percentage ofbody fat or physical activity status. Bitter and salty tastes also showed no significant associations withthese variables at either the high or low concentrations (p > 0.1 for all). For the carbohydrate taste,BMI and activity status together in the same model significantly predicted perceived intensity at thelow concentration (model adjusted R2: 0.14; p < 0.05; activity status ß = −0.30, p = 0.099; BMI ß = −0.31,p = 0.08).
3.7.2. Liking
Sweet and sour taste liking were not associated with physical activity status, age or bodycomposition (p > 0.1). However, activity status was associated with liking of the low-concentrationumami (ß = 0.44, p = 0.02), high-concentration bitter (ß = 0.37, p < 0.05), and low-concentrationcarbohydrate (ß = 0.43, p = 0.02) tastes. Liking of the low-concentration salty taste (ß = 0.45, p = 0.01)and of the high-concentration umami taste (ß = 0.45, p = 0.01) were both associated with age. Liking ofthe low-concentration carbohydrate solution was the only variable associated with percentage of bodyfat (ß = 0.45, p = 0.01) and, together with activity status in the same model, was associated with 20%of the variance in liking for carbohydrate at the low concentration (model adjusted R2: 0.20; p < 0.05;activity status ß = 0.27, p = 0.18; body fat ß = 0.31, p = 0.13).
268
Nutrients 2019, 11, 155
3.8. Regression Analysis with Eating Behaviour
3.8.1. Hunger
Sweet taste perceived intensity for the high concentration was positively associated with the traithunger (ß = 0.39, p = 0.04), (i.e., a higher hunger score was associated with greater perceived intensity).This remained significant when included in the same model as activity status. Together, activity statusand hunger were associated with 27% of the variance in perceived intensity for sweet taste at the highconcentration (model adjusted R2: 0.27; p < 0.01). In addition, hunger was associated with perceivedintensity for the high-concentration bitter taste (ß = 0.44, p = 0.02) and liking for the high-concentrationsalt taste (ß = 0.43, p = 0.02).
3.8.2. Disinhibition
Disinhibition was also associated with liking of the high-concentration salt taste (ß = 0.49, p < 0.01),but not with any other variables.
3.8.3. Restraint
Perceived intensity for the high-concentration bitter taste (ß = −0.41, p = 0.03), and liking of thelow- (ß = −0.46, p = 0.02) and high- (ß = −0.43, p = 0.02) concentration umami taste were associatedwith dietary restraint. As activity status (active or inactive) was also significantly associated with likingfor umami low concentration (model adjusted R2 = 0.19, ß = 0.439, p < 0.015), they were included in thesame model. Together, activity status and restraint accounted for 38% of the variance in umami lowconcentration liking (model adjusted R2 0·38, p < 0·001; activity: ß = 0·46, p < 0·01; restraint: ß = −0.47,p < 0·001). Dietary restraint was also inversely associated with liking of the high-concentrationcarbohydrate taste (ß = −0.41, p = 0.03).
4. Discussion
The present findings demonstrate that taste perception intensity differed between active andinactive males. In this cohort, active males reported a greater perceived intensity for both sweetand umami tastes. Given previous evidence of associations between taste perception and foodchoice [3,4,21], and weight gain [24], these findings may have implications for understanding factorsinfluencing the control of food intake and energy balance with habitual exercise.
Although limited research has investigated associations of habitual exercise with taste perception,our finding of a greater perceived intensity of sweet taste in active males is comparable to aprevious study in females. Crystal, Frye, and Kanarek [14] found female swimmers perceived ahigh-concentration sucrose solution as sweeter compared to inactive females’ using visual analoguescales (VAS). In response to acute exercise, increases, no change, and decreases in acuity of tasteand rated preference for tastes have been previously reported, with results appearing to depend ondifferences in length and intensity of the exercise session and the taste [13]. Regarding sweet tastespecifically, Westerterp-Plantenga et al. [36] observed an increase in perceived intensity of taste usingVAS for a low-concentration sucrose solution (but not high-concentration) following 2 h of moderateintensity cycling. By contrast, others have reported no change in sweet taste intensity for a sucrosesolution, but an increase in intensity of sour taste following 10 minutes of cycling to generate a ‘lightsweat’ [37]. However, assessing differences with longer-term interventions and with habitual exerciseis also essential, as the repeated effects of regular exercise on physiological and psychological processesof appetite control do not always mimic the acute effects of exercise. Participants in the present studywere instructed to avoid strenuous exercise for 24 h before the test sessions to avoid influence of acuteexercise on results.
Perceived intensity of umami taste also differed between the active and inactive groups. Perceivedintensity of both low and high concentrations of MSG was rated as significantly higher in active males.In a previous study, along with the other ‘basic’ tastes, Horio and Kawamura [38] assessed umami
269

Nutrients 2019, 11, 155
threshold and liking using six different concentration solutions of MSG after moderate-intensity cyclingand found no difference compared to pre-exercise in healthy university students. Generally, the effectsof both acute and chronic exercise on umami taste perception, however, have not been extensivelystudied previously.
Several factors could contribute to the differences in sweet and umami taste perception weobserved with habitual exercise. Some previous studies have shown habitual diet to be associatedwith taste perception. For example, sweet taste intensity has been shown to negatively correlatewith total energy and carbohydrate and sweet food intake [11], although this was not demonstratedelsewhere [39]. By contrast, higher carbohydrate taste intensity has been positively associated withgreater energy and starch intakes, assessed by either FFQ or food diary [2]. In the present study,however, we did not observe differences in the percentage of energy consumed from starch, sugar orother carbohydrate forms, apart from fructose, which was higher in the inactive group, although thelimitations of FFQ are recognised.
Eating behaviour traits could also contribute to differences in taste perception between individuals.Dietary restraint and disinhibition have been identified as factors that may influence relationshipsbetween adiposity and taste sensitivities to 6-n-propylthiouracil [40]. Therefore, we investigatedwhether eating behaviours could influence associations between habitual exercise and taste perception.The trait hunger and physical activity were both independently associated with sweet taste intensityperception at the high concentration in the same model. Hunger and restraint were both also associatedwith perceived intensity of the high-concentration bitter taste (quinine); however, eating behaviourswere not related to other perceived intensity ratings. These findings suggest eating behaviour traitsmay be linked to taste perception of some tastes; however, the traits hunger, restraint or disinhibitiondo not explain the differences in taste perception observed with habitual exercise.
Although we did not assess hormonal status, hormonal differences could be another mechanismcontributing to the differences in taste perception we observed in active compared to inactive males.It is interesting that perception of sweet and umami were the two tastes that differed between theactive and inactive groups, indicating the differences in perception were specific mainly to thesetastes and not an overall effect on taste function. Both sweet and umami share the same class of tastereceptor in the mouth, which initiate a G protein-coupled signalling cascade [10,41,42]. There is nowstrong evidence that in addition to intestinal signalling, glucagon-like peptide-1 (GLP-1) signallingalso occurs within the taste bud [43], and evidence from animal studies indicates GLP-1 signallinghas an important role in the modulation of both sweet and umami taste [42]. In the present study,a sip-and-spit technique was used for the tasting of solutions, suggesting any differences in the tasteresponses observed are influenced by orososensory mechanisms and not a post-oral response tonutrients. Other hormones modified by regular exercise or body composition could also potentiallycontribute to the differences we observed (see Reference [10] for a review). For example, leptin caninhibit the response to sweet taste [10,44]. An increased circulating leptin (due to a greater body fatpercentage) in less active individuals could be one potential mechanism contributing to a reducedintensity of sweet taste. However, BMI or percentage body fat did not moderate the relationshipbetween activity status and sweet taste perception in the present study. Endocannabinoids [45] andglucose levels [46] also influence sweet taste responses and are altered with physical activity [47].Characterising multiple hormonal factors is warranted in future studies, as it may provide mechanisticinsight into differences in taste perception with habitual exercise.
Regarding liking, sweet was the only taste to be positively rated by both groups, adding supportthat sweet tastes are liked by most individuals [48]. We also observed that in addition to a greaterperceived intensity in the active group, active males also had a lower (negative) hedonic rating forthe low-concentration umami taste, suggesting the greater perceived intensity could have contributedto a dislike for the taste. In contrast, liking of the sweet and umami high concentration tastesdid not differ between the active and inactive groups, despite differences in perceived intensity.Others have also observed no difference in hedonic rating, despite changes in taste perception of
270

Nutrients 2019, 11, 155
simple solutions, including sucrose and quinine sulphate, with acute exercise [36]. One explanationcould be the form in which the taste stimuli are provided. For standardisation, all samples here wereprovided to participants in solutions made up with water. However, when compared to more complexfood and beverage matrices, possible differences are likely [49]. The implications of differences inperceived taste intensity with habitual exercise for liking of different foods and food choice warrantfurther investigation.
Various methodological aspects of the present study should be considered. Participants includedmales only to eliminate the possible interference of the menstrual cycle on taste perception, and to addto previous research in females [14]. Further research in females is warranted. As body compositionhas a role in some hedonic aspects of appetite control [15,20], body composition (fat and fat freemass) should also be further considered. Links between taste and body weight or BMI have beenpreviously studied [8,22,23]; however, fewer studies [50] have examined fat or fat free mass. In thepresent study, BMI did not differ between active and inactive groups, while percent body fat differedsignificantly. These and other potential modifying variables were included in regression models but didnot modify the relationship between physical activity status and taste perception. For logistical reasons,body composition was assessed using BIA. Relationships between taste and body composition havepreviously been reported using BIA [51]. However, studies have shown variable findings regarding theaccuracy of BIA [52,53]. Future studies should explore relationships between taste perception and bodycomposition (fat and free mass) on an individual level using more accurate measures. Measurement ofwaist circumference would also be relevant. In addition, objective measurement of physical activityshould be considered in future studies, to further elucidate relationships with aspects such as energyexpenditure and sedentary behaviour. Finally, a significant strength of the study is the use of six tastes,low and high concentrations and two taste sessions, allowing a comprehensive assessment of potentialdifferences in taste perception with habitual exercise. Therefore, the findings can be considered toprovide reliable estimates of individual taste responsiveness in active versus inactive males.
In conclusion, these data show sweet and umami taste perception differ in habitual exerciserscompared to inactive individuals. There is evidence elsewhere that habitually active individualshave improved energy compensation for energy density of foods [19]. Alterations in taste perceptioncould be one potential mechanism contributing to the regulation of energy balance with exercise.While causal inferences cannot be drawn due to the cross-sectional nature of this study, the findingshave implications for researchers and for product development—indicating habitual exercise levelshould be considered in studies examining taste perception and for consumer selection for productdevelopment. Further studies are needed to examine longitudinal responses to exercise interventionand to further explore the underlying mechanisms and implications for food intake.
Author Contributions: Conceptualisation, K.H., E.L.F., L.L., M.O., N.L., A.P., L.C.; formal analysis, K.H., E.L.F.;investigation, L.L., M.O., N.L., A.P., L.C., A.d.C., E.S.; writing—original draft preparation, L.L., M.O., N.L.,A.P., L.C., K.H., E.L.F.; writing—review and editing, K.H., E.L.F., supervision, K.H., E.L.F., A.d.C., projectadministration: L.L., M.O., N.L., A.P., L.C., E.S., A.d.C.
Funding: This research received no external funding.
Acknowledgments: We are grateful to all of the participants in this study.
Conflicts of Interest: The authors declare no conflict of interest.
References
1. Zhao, G.Q.; Zhang, Y.; Hoon, M.A.; Chandrashekar, J.; Erlenbach, I. The receptors for mammalian sweet andumami taste. Cell 2003, 115, 255–266. [CrossRef]
2. Low, J.Y.; Lacy, K.E.; McBride, R.L.; Keast, R.S. Carbohydrate Taste Sensitivity Is Associated with StarchIntake and Waist Circumference in Adults. J. Nutr. 2017, 147, 2235–2242. [CrossRef] [PubMed]
3. Feeney, E.; O’Brien, S.; Markey, A.; Scannell, A.; Gibney, E. Genetic variation in taste perception—Does ithave a role in healthy eating? Proc. Nutr. Soc. 2011, 70, 135–143. [CrossRef]
271

Nutrients 2019, 11, 155
4. Hayes, J.E.; Feeney, E.L.; Allen, A.L. Do polymorphisms in chemosensory genes matter for human ingestivebehavior? Food Qual. Prefer. 2013, 30, 202–216. [CrossRef]
5. Chamoun, E.; Mutch, D.M.; Allen-Vercoe, E.; Buchholz, A.C.; Duncan, A.M.; Spriet, L.L.; Haines, J.;Ma, D.W.L.; Guelph Family Health Study. A review of the associations between single nucleotidepolymorphisms in taste receptors, eating behaviors, and health. Crit. Rev. Food Sci. Nutr. 2018, 58,194–207. [CrossRef]
6. Fukunaga, A.; Uematsu, H.; Sugimoto, K. Influences of aging on taste perception and oral somatic sensation.J. Gerontol. A Biol. Sci. Med. Sci. 2005, 60, 109–113. [CrossRef] [PubMed]
7. Lv, W.; Finlayson, G.; Dando, R. Sleep, food cravings and taste. Appetite 2018, 125, 210–216. [CrossRef]8. Bartoshuk, L.M.; Duffy, V.B.; Hayes, J.E.; Moskowitz, H.R.; Snyder, D.J. Psychophysics of sweet and fat
perception in obesity: Problems, solutions and new perspectives. Phil. Trans. R. Soc. B Biol. Sci. 2006, 361,1137–1148. [CrossRef]
9. Heath, T.P.; Melichar, J.K.; Nutt, D.J.; Donaldson, L.F. Human taste thresholds are modulated by serotoninand noradrenaline. J. Neurosci. 2006, 26, 12664–12671. [CrossRef]
10. Loper, H.B.; La Sala, M.; Dotson, C.; Steinle, N. Taste perception, associated hormonal modulation,and nutrient intake. Nutr. Rev. 2015, 73, 83–91. [CrossRef]
11. Jayasinghe, S.N.; Kruger, R.; Walsh, D.C.I.; Cao, G.; Rivers, S.; Richter, M.; Breier, B.H. Is Sweet TastePerception Associated with Sweet Food Liking and Intake? Nutrients 2017, 9, 750. [CrossRef] [PubMed]
12. Elder, S.J.; Roberts, S.B. The effects of exercise on food intake and body fatness: A summary of publishedstudies. Nutr. Rev. 2007, 65, 1–19. [CrossRef] [PubMed]
13. King, N.A.; Horner, K.; Hills, A.P.; Byrne, N.M.; Wood, R.E.; Bryant, E.; Caudwell, P.; Finlayson, G.;Gibbons, C.; Hopkins, M.; et al. Exercise, appetite and weight management: Understanding thecompensatory responses in eating behaviour and how they contribute to variability in exercise-inducedweight loss. Br. J. Sports Med. 2012, 46, 315–322. [CrossRef] [PubMed]
14. Crystal, S.; Frye, C.A.; Kanarek, R.B. Taste preferences and sensory perceptions in female varsity swimmers.Appetite 1995, 24, 25–36. [CrossRef]
15. Hopkins, M.; Blundell, J.E. Energy balance, body composition, sedentariness and appetite regulation:Pathways to obesity. Clin. Sci. (Lond.) 2016, 130, 1615–1628. [CrossRef] [PubMed]
16. Beaulieu, K.; Hopkins, M.; Blundell, J.; Finlayson, G. Homeostatic and non-homeostatic appetite controlalong the spectrum of physical activity levels: An updated perspective. Physiol. Behav. 2018, 192, 23–29.[CrossRef] [PubMed]
17. Blundell, J.E. Physical activity and appetite control: Can we close the energy gap? Nutr. Bull. 2011, 36,356–366. [CrossRef]
18. Long, S.J.; Hart, K.; Morgan, L.M. The ability of habitual exercise to influence appetite and food intake inresponse to high- and low-energy preloads in man. Br. J. Nutr. 2002, 87, 517–523. [CrossRef]
19. Beaulieu, K.; Hopkins, M.; Blundell, J.; Finlayson, G. Does Habitual Physical Activity Increase the Sensitivityof the Appetite Control System? A Systematic Review. Sports Med. 2016, 46, 1897–1919. [CrossRef]
20. Horner, K.M.; Finlayson, G.; Byrne, N.M.; King, N.A. Food reward in active compared to inactive men: Rolesfor gastric emptying and body fat. Physiol. Behav. 2016, 160, 43–49. [CrossRef]
21. Drewnowski, A. Taste preferences and food intake. Annu. Rev. Nutr. 1997, 17, 237–253. [CrossRef] [PubMed]22. Feeney, E.L.; O’Brien, S.A.; Scannell, A.G.; Markey, A.; Gibney, E.R. Suprathreshold measures of taste
perception in children—Association with dietary quality and body weight. Appetite 2017, 113, 116–123.[CrossRef] [PubMed]
23. Overberg, J.; Hummel, T.; Krude, H.; Wiegand, S. Differences in taste sensitivity between obese and non-obesechildren and adolescents. Arch. Dis. Child. 2012, 97, 1048–1052. [CrossRef] [PubMed]
24. Noel, C.A.; Cassano, P.A.; Dando, R. College-Aged Males Experience Attenuated Sweet and Salty Taste withModest Weight Gain. J. Nutr. 2017, 147, 1885–1891. [CrossRef] [PubMed]
25. Birkenhead, K.L.; Slater, G. A Review of Factors Influencing Athletes’ Food Choices. Sports Med. 2015, 45,1511–1522. [CrossRef]
26. Beaulieu, K.; Hopkins, M.; Blundell, J.; Finlayson, G. Impact of physical activity level and dietary fat contenton passive overconsumption of energy in non-obese adults. Int. J. Behav. Nutr. Phys. Act. 2017, 14, 14.[CrossRef]
272

Nutrients 2019, 11, 155
27. Horner, K.M.; Byrne, N.M.; Cleghorn, G.J.; King, N.A. Influence of habitual physical activity on gastricemptying in healthy males and relationships with body composition and energy expenditure. Br. J. Nutr.2015, 114, 489–496. [CrossRef]
28. Faul, F.; Erdfelder, E.; Lang, A.G.; Buchner, A. G*Power 3: A flexible statistical power analysis program forthe social, behavioral, and biomedical sciences. Behav. Res. Methods 2007, 39, 175–191. [CrossRef]
29. Low, J.Y.; Lacy, K.E.; McBride, R.; Keast, R.S. The Association between Sweet Taste Function, Anthropometry,and Dietary Intake in Adults. Nutrients 2016, 8, 241. [CrossRef]
30. Hayes, J.E.; Allen, A.L.; Bennett, S.M. Direct comparison of the generalized visual analog scale (gVAS) andgeneral labeled magnitude scale (gLMS). Food Qual. Prefer. 2013, 28, 36–44. [CrossRef]
31. Green, B.G.; Shaffer, G.S.; Gilmore, M.M. Derivation and Evaluation of a Semantic Scale of Oral SensationMagnitude with Apparent Ratio Properties. Chem. Senses 1993, 18, 683–702. [CrossRef]
32. Green, B.G.; Dalton, P.; Cowart, B.; Shaffer, G.; Rankin, K. Evaluating the Labeled Magnitude Scale formeasuring sensations of taste and smell. Chem. Senses 1996, 21, 323–334. [CrossRef] [PubMed]
33. Lim, J.; Urban, L.; Green, B.G. Measures of Individual Differences in Taste and Creaminess Perception.Chem. Senses 2008, 33, 493–501. [CrossRef] [PubMed]
34. Stunkard, A.J.; Messick, S. The three-factor eating questionnaire to measure dietary restraint, disinhibitionand hunger. J. Psychosom. Res. 1985, 29, 71–83. [CrossRef]
35. Kroke, A.; Klipstein-Grobusch, K.; Voss, S.; Moseneder, J.; Thielecke, F.; Noack, R.; Boeing, H. Validation of aself-administered food-frequency questionnaire administered in the European Prospective Investigation intoCancer and Nutrition (EPIC) Study: Comparison of energy, protein, and macronutrient intakes estimatedwith the doubly labeled water, urinary nitrogen, and repeated 24-h dietary recall methods. Am. J. Clin. Nutr.1999, 70, 439–447. [CrossRef] [PubMed]
36. Westerterp-Plantenga, M.S.; Verwegen, C.R.; Ijedema, M.J.; Wijckmans, N.E.; Saris, W.H. Acute effects ofexercise or sauna on appetite in obese and nonobese men. Physiol. Behav. 1997, 62, 1345–1354. [CrossRef]
37. Nakagawa, M.; Mizuma, K.; Inui, T. Changes in taste perception following mental or physical stress.Chem. Senses 1996, 21, 195–200. [CrossRef]
38. Horio, T.; Kawamura, Y. Influence of physical exercise on human preferences for various taste solutions.Chem. Senses 1998, 23, 417–421. [CrossRef]
39. Cicerale, S.; Riddell, L.J.; Keast, R.S. The association between perceived sweetness intensity and dietaryintake in young adults. J. Food Sci. 2012, 77, H31–H35. [CrossRef]
40. Tepper, B.J.; Ullrich, N.V. Influence of genetic taste sensitivity to 6-n-propylthiouracil (PROP), dietaryrestraint and disinhibition on body mass index in middle-aged women. Physiol. Behav. 2002, 75, 305–312.[CrossRef]
41. Li, X.; Staszewski, L.; Xu, H.; Durick, K.; Zoller, M.; Adler, E. Human receptors for sweet and umami taste.Proc. Natl. Acad. Sci. USA 2002, 99, 4692–4696. [CrossRef]
42. Martin, B.; Dotson, C.D.; Shin, Y.K.; Ji, S.; Drucker, D.J.; Maudsley, S.; Munger, S.D. Modulation of tastesensitivity by GLP-1 signaling in taste buds. Ann. N. Y. Acad. Sci. 2009, 1170, 98–101. [CrossRef] [PubMed]
43. Shin, Y.K.; Martin, B.; Golden, E.; Dotson, C.D.; Maudsley, S.; Kim, W.; Jang, H.J.; Mattson, M.P.; Drucker, D.J.;Egan, J.M.; et al. Modulation of taste sensitivity by GLP-1 signaling. J. Neurochem. 2008, 106, 455–463.[CrossRef] [PubMed]
44. Nakamura, Y.; Sanematsu, K.; Ohta, R.; Shirosaki, S.; Koyano, K.; Nonaka, K.; Shigemura, N.; Ninomiya, Y.Diurnal variation of human sweet taste recognition thresholds is correlated with plasma leptin levels.Diabetes 2008, 57, 2661–2665. [CrossRef] [PubMed]
45. Yoshida, R.; Ohkuri, T.; Jyotaki, M.; Yasuo, T.; Horio, N.; Yasumatsu, K.; Sanematsu, K.; Shigemura, N.;Yamamoto, T.; Margolskee, R.F. Endocannabinoids selectively enhance sweet taste. Proc. Natl. Acad. Sci. USA2010, 107, 935–939. [CrossRef] [PubMed]
46. Rodrigues, L.; Costa, G.; Cordeiro, C.; Pinheiro, C.; Amado, F.; Lamy, E. Salivary proteome and glucose levelsare related with sweet taste sensitivity in young adults. Food Nutr. Res. 2017, 61. [CrossRef]
47. Tantimonaco, M.; Ceci, R.; Sabatini, S.; Catani, M.V.; Rossi, A.; Gasperi, V.; Maccarrone, M. Physical activityand the endocannabinoid system: An overview. Cell. Mol. Life Sci. 2014, 71, 2681–2698. [CrossRef]
48. Yeomans, M.R. Taste, palatability and the control of appetite. Proc. Nutr. Soc. 1998, 57, 609–615. [CrossRef]49. Perry, D.M.; Hayes, J.E. Effects of Matrix Composition on Detection Threshold Estimates for Methyl
Anthranilate and 2-Aminoacetophenone. Foods 2016, 5, 35. [CrossRef]
273

Nutrients 2019, 11, 155
50. Sartor, F.; Donaldson, L.F.; Markland, D.A.; Loveday, H.; Jackson, M.J.; Kubis, H.P. Taste perception andimplicit attitude toward sweet related to body mass index and soft drink supplementation. Appetite 2011, 57,237–246. [CrossRef]
51. Fernandez-Garcia, J.C.; Alcaide, J.; Santiago-Fernandez, C.; Roca-Rodriguez, M.M.; Aguera, Z.; Banos, R.;Botella, C.; de la Torre, R.; Fernandez-Real, J.M.; Fruhbeck, G.; et al. An increase in visceral fat is associatedwith a decrease in the taste and olfactory capacity. PLoS ONE 2017, 12, e0171204. [CrossRef]
52. Pietrobelli, A.; Rubiano, F.; St-Onge, M.P.; Heymsfield, S.B. New bioimpedance analysis system: Improvedphenotyping with whole-body analysis. Eur. J. Clin. Nutr. 2004, 58, 1479–1484. [CrossRef] [PubMed]
53. Volgyi, E.; Tylavsky, F.A.; Lyytikainen, A.; Suominen, H.; Alen, M.; Cheng, S. Assessing body compositionwith DXA and bioimpedance: Effects of obesity, physical activity, and age. Obesity (Silver Spring) 2008, 16,700–705. [CrossRef] [PubMed]
© 2019 by the authors. Licensee MDPI, Basel, Switzerland. This article is an open accessarticle distributed under the terms and conditions of the Creative Commons Attribution(CC BY) license (http://creativecommons.org/licenses/by/4.0/).
274

nutrients
Article
Modeling Associations between Chemosensation,Liking for Fats and Sweets, Dietary Behaviors andBody Mass Index in Chronic Smokers
Brittany A. Larsen 1, Mark D. Litt 2, Tania B. Huedo-Medina 1 and Valerie B. Duffy 1,*
1 Department of Allied Health Sciences, University of Connecticut, Storrs, CT 06269, USA;[email protected] (B.A.L.); [email protected] (T.B.H.-M.)
2 Division of Behavioral Sciences & Community Health, University of Connecticut Health Center, Farmington,CT 06030, USA; [email protected]
* Correspondence: [email protected]; Tel.: +1-860-486-1997
Received: 19 December 2018; Accepted: 22 January 2019; Published: 26 January 2019
Abstract: Chronic smokers have a greater risk for altered chemosensation, unhealthy dietary patterns,and excessive adiposity. In an observational study of chronic smokers, we modeled relationshipsbetween chemosensation, fat/carbohydrate liking, smoking-associated dietary behaviors, and bodymass index (BMI). Also tested in the model was liking for sweet electronic cigarette juice(e-juice). Smokers (n = 135, 37 ± 11 years) were measured for: Taste genetics (intensity of6-n-propylthiouracil—PROP); taste (NaCl and quinine intensities) and olfactory (odor identification)function; liking for cherry e-juice; and weight/height to calculate BMI. Smokers survey-reported theirfood liking and use of smoking for appetite/weight control. Structural equation models tested directand indirect relationships between chemosensation, fat/carbohydrate liking, dietary behaviors, andBMI. In good-fitting models, taste intensity was linked to BMI variation through fat/carbohydrateliking (greater PROP intensity→greater NaCl intensity→greater food liking→higher BMI). Olfactoryfunction tended to predict sweet e-juice liking, which, in turn, partially mediated the food liking andBMI association. The path between smoking-associated dietary behaviors and BMI was direct andindependent of chemosensation or liking. These findings indicate that taste associates with BMI inchronic smokers through liking of fats/carbohydrates. Future research should determine if vapingsweet e-juice could improve diet quality and adiposity for smokers.
Keywords: sweet liking; fat liking; e-cigarettes; body mass index; dietary behaviors; smell; taste;tobacco; cigarettes; chronic smoking
1. Introduction
Cigarette smoking and obesity increase disease susceptibility and all-cause mortality risk.Although U.S. cigarette smoking rates have declined, 37.8 million adults (15.5%) were currentsmokers in 2016 [1]. Conversely, U.S. rates of obesity have increased, with 39.8% of adults affected in2015–2016 [2]. Chronic smoking with obesity is a complex interplay between unhealthy behaviors andbiological factors that fuel both conditions and require unique attention for health promotion efforts [3].The smoking-adiposity relationship, however, is not linear. Nicotine, a parasympa-thomimetic alkaloidin tobacco, produces an anorectic effect [4] and elevates metabolic rate [5], elucidating findings oflower body weight among smokers [6,7]. Yet two population-based studies showed that long-termsmokers had a greater risk of overweight [8] and obesity [9], which may result from unhealthydietary patterns [10–12]. A population-based survey showed that heavy smokers consumed a morepro-inflammatory diet (energy-dense, rich in saturated fats, added sugars, and refined carbohydrates)than did nonsmokers [10], fueling greater adiposity [13]. There also are parallels in brain reward
Nutrients 2019, 11, 271; doi:10.3390/nu11020271 www.mdpi.com/journal/nutrients275

Nutrients 2019, 11, 271
circuitry in response to nicotine addiction and highly palatable fats and sweets, which support weightgain [14]. Of interest in the present study are associations between dietary behaviors and adiposity inchronic smokers, and whether these associations are influenced by chemosensory function, which maybe altered by routine exposure to cigarette smoking.
There have been inconsistent associations between smoking and taste function in the literature,with most studies reporting effects on taste thresholds. Suprathreshold function, however, may havemore applicability in efforts to understand links between taste and dietary behaviors. For example,a small trial showed that obese smokers reported less sweetness and creaminess from sugar/fatmixtures than did non-smokers and normal weight smokers [15]. Relative to non-smokers, chronicsmokers from our laboratory-based study reported higher taste intensity from concentrated NaCl [16].Variation in ability to taste the bitterness of phenylthiocarbamide (PTC) and propylthiouracil (PROP),phenotypes of genetic variation in taste, also has been studied in smokers. Cigarette smokers havebeen hypothesized as more likely to be PTC/PROP nontasters [17]. Smokers who are phenotypicallynontasters show less aversion to the bitter taste of nicotine [18,19], may have greater nicotinedependence [20], and may be more likely to smoke based on sensory cues than smokers who arePTC/PROP tasters [21]. However, our laboratory-based study [16] and a crowdsourced cohortstudy [22] did not find greater frequencies of PROP nontasters among chronic smokers. Importantly,there is racial/ethnic variability in PTC/PROP tasting [23] and in cigarette smoking [1], convolutingthe ability to study their intersection and effects on dietary behaviors. The olfactory function also maybe influenced by cigarette smoking. A meta-analysis revealed significantly higher odds of olfactorydysfunction among current smokers [24]. Similarly, our laboratory-based study showed higher ratesof hyposmia among chronic smokers from the nationally-representative 2012–2014 NHANES [16].
Of interest is how alterations in taste and smell function in chronic smokers might influence dietarybehaviors and risk of excessive adiposity. Both senses play unique roles in dietary behaviors [25].Taste function has been most commonly studied through the effects of PTC/PROP on taste andoral sensations [26], food preference [27], dietary patterns, and body weight [28]. Variation in tastefunction beyond PROP also has been linked to food preferences and ingestive behaviors, includingsalty taste [29]. Smell function plays a priming role in dietary behavior [25], cueing appetite andcephalic phase responses [30]. As reviewed, an individual’s dietary and weight response to smellimpairment varies partially by self-awareness and response to the impairment [31]. Some studies havereported that smell impairment has been linked to differences in food preferences [32], while otherstudies have reported no substantial differences in food preferences [33] or dietary choices [34].
Obese smokers [3], especially women [35], have reported using cigarette smoking for weightcontrol. Electronic cigarettes (e-cigarettes) are also marketed [36] and perceived as safer forweight/appetite control than tobacco cigarettes [37,38]. E-cigarettes allow the inhalation of vaporizedvegetable glycerol- or propylene glycol-containing fluids (e-liquids/e-juices) that vary in nicotineconcentrations and flavorings. Sweet e-juice flavors are the most popular [39], increasing the liking [40],reward and reinforcement values of e-cigarettes [41], and ability to enjoy vaping flavors that mimicsweets without ingesting calories [38]. These factors may have contributed to the substantial increasein e-cigarette usage, with global sales totaling $3.5 billion USD in 2015 [42] and may surpass $20 billionUSD by 2025 [43].
Because of growing interest in overlaps between cigarette smoking, sensory cues, and dietarybehaviors [14], as well as interest in e-cigarettes for appetite/weight control, we aimed to describeassociations between taste and olfactory functions, food liking, smoking-associated dietary behaviors,e-juice flavor liking, and body mass index (BMI) in chronic smokers exposed to e-cigarettes.We hypothesized that chemosensory function would influence food liking, which, in turn, wouldinfluence food/beverage liking and smoking-associated dietary behaviors, which, in turn, would beassociated with BMI. We used structural equation modeling to describe simultaneous associationsbetween taste and smell function, food and sweet e-juice liking, smoking-associated dietary behaviors,and BMI among chronic smokers.
276

Nutrients 2019, 11, 271
2. Materials and Methods
2.1. Participants
Purposive convenience sampling was used to recruit chronic smokers, ages 18 to 55 years,who resided in Hartford County, Connecticut. Potential participants answered newspaper and radioadvertisements from May 2014 to December 2016. A telephone screening ensured that all initialexclusion and inclusion criteria were satisfied. The criteria for exclusion were: (1) Unstable medicalor psychiatric disorders, including uncontrolled hypertension (blood pressure ≥160/100 mm Hg);(2) pregnancy; (3) awareness of hypersensitivity to nicotine or propylene glycol; (4) medical history ofmyocardial infarction(s) or cerebrovascular accident(s). The criterion for inclusion was the current useof a minimum of ten cigarettes daily. The study was approved by the Institutional Review Board (IRB)at the University of Connecticut Health Center. Participants provided informed and written consentand were compensated $20 upon completion of baseline assessments in the initial visit. Data describedin the present paper were obtained from 135 participants (65 males) who completed the baseline visit.
2.2. Study Procedures and Measures
Eligible participants were invited for baseline laboratory testing, conducted between 10:00AMand 2:00PM. All subjects were requested to refrain from cigarette smoking for at least three hours priorto testing. After completion of the consenting process, all subjects underwent a physical examination.Current smoking status was confirmed by a breath carbon monoxide (CO) test using a Bedfont Micro+TM Smokerlyzer handheld CO monitor (Bedfont Scientific Ltd, Harrietsham, Kent, UK). Potentialparticipants were instructed to first inhale, hold their breath for 15 s, and then exhale slowly intothe mouthpiece, aiming to empty lungs completely. CO levels are heightened in current smokers;cut-off values of ≤12 ppm can identify smokers who have refrained from smoking for at least 8 h [44].In addition, because alcohol consumption has been linked to cigarette smoking behaviors, smokerswere briefly assessed for patterns of heavy and binge alcohol consumption via a timeline follow-backmethod (TLFB) [45]. Heavy drinking was defined as the consumption of ≥8 drinks per week overthe preceding three months while binge drinking was considered to be the consumption of ≥4 drinksduring a single occasion for females or ≥6 drinks for males.
After providing consent and completion of a physical examination, participants completed thefollowing procedures in a single visit to a hospital-based clinical research center:
2.2.1. Taste and Smell Function
For the taste testing, participants were oriented, with a specific script, to the general LabeledMagnitude Scale (gLMS) and verbalized intensity ratings. The gLMS generalizes the LMS [46] to allsensations [47]. Shown in the vertical orientation on a 100-point scale, it ranges from “no sensation”(0) to “strongest sensation of any kind” (100) and includes intermediate labels at “barely detectable”(1.4), “weak” (6), “moderate” (17), “strong” (35), and “very strong” (53) [47]. Participants practicedrating the intensity of brightness of three remembered stimuli (well-lit room, dimly lit restaurant,brightest light ever seen) and then reported the intensity of 1000 Hz tone series presented in 12 dBsteps from 50–98 dB. Then, participants rinsed their mouth with bottled water and then sampledtastants, served at room temperature and in plastic medicine cups. Participants reported the intensityof each tastant (1 mM quinine hydrochloride (QHCl; Sigma-Aldrich, St. Louis, MO, USA) and 1 Msodium chloride (NaCl; Morton Salt, Chicago, IL, USA), which were first drawn across the tongueapex with a medical cotton swab and then, in addition to 0.32 M NaCl, were sampled with the wholemouth per protocol via the National Health and Nutrition Examination Survey (NHANES) 2012–2014guidelines [48]. Following this, 1 mM and 3.2 mM propylthiouracil (PROP; Tokyo Chemical IndustryCo., Ltd., Portland, OR, USA) were sampled with the whole mouth. The 1 mM and 3.2 mM PROPintensities were averaged for use in the analyses. Because chronic smokers reported higher intensitiesfrom 1 M NaCl than did nonsmokers [16], only 0.32 M NaCl and averaged PROP intensities were tested
277

Nutrients 2019, 11, 271
in the analyses that follow. Using an algorithm previously reported [16], categorized PROP tasterstatuses (supertasters, medium tasters, non-tasters) were explored via chi-square to assess differencesby demographics.
Smell function was measured using a 16-item odor identification task, with odors generated by anolfactometer (Osmic Enterprises, Inc., Cincinnati, OH, USA). These odor items included food (cherry,strawberry, lemon, onion, coffee, cinnamon, chocolate, grape, vanilla), warning (gasoline, smoke,menthol); and household (soap, leather, baby powder, rose) odors. Participants were instructed to leantoward the olfactometer nozzle, sniff the generated odor, and, in a forced-choice procedure, refer tofour choices (one correct option and three distractors shown as pictures and word-labels), and pick thebest choice. Possible scores on the odor identification task ranged from 0 to 16 correct responses forclassification of: Anosmia/severe hyposmia (0–7 correct), hyposmia (8–12 correct), and normosmia(≥13 correct).
2.2.2. Liking for Saturated Fats/Carbohydrates
The intensities of liking/disliking of 40 foods and beverages and 11 non-foods (physicalactivities, smoking products, pleasurable/unpleasurable items) were measured on a validated likingsurvey [49,50]. The liking survey included a bidirectional, 100-point horizontal scale labeled withfive faces and verbal descriptors, which ranged from “neither like nor dislike” (0) to “strongestdisliking/liking of any kind” (±100), with survey items shown as a picture and verbal descriptor.Before starting the survey, the participants were oriented to the scale (verbally and in print) withexamples that represented the intensity of disliking (running out of money, paper cut), liking(winning the lottery, succeeding) and neutral (doing a routine chore). The scores on 19 of the 40individual foods/beverage items that contribute to excessive adiposity [51] were averaged together tocomprise a reliable saturated fat/carbohydrate liking index (Cronbach’s α = 0.8): Sweets and sugarybeverages (doughnuts, cookies/cake/pie, chocolate, soda/sweet drinks, coffee drinks/Frappuccino®/Coolatta®, sports drinks); high fat foods (breakfast sausage/bacon, butter/margarine, beef steak, friedchicken, whole milk, ham/pork, mayonnaise); and carbohydrates (french fries, whole wheat bread,high-fiber bar, bagel/rolls, spaghetti/pasta, high-fiber cereal). This conceptual food group was used inthe analysis.
2.2.3. Liking for E-juice Flavors
The e-cigarettes (Joyetech eGo-C, Shenzhen Joyetech Co., Ltd., Shajing Town, Baoan District,ShenZhen, China) were filled with e-juices (Americanliquidscore.com) comprised of a base (50%vegetable glycerin-50% propylene glycol) and 18mg/mL of nicotine alone (flavorless) or with aflavoring (tobacco, chocolate, cherry, or menthol). Participants rinsed the mouth with bottled waterthen blindly vaped each e-juice for one minute, presented in random order. Subjects rated theflavor-nicotine combinations for sweetness, bitterness/sourness, irritation, and level of liking/dislikingon the hedonic gLMS [47]. Of the flavors tested cherry e-juice was rated highest in sweetness [52].In the models explored here, all e-liquid flavors were tested, but only the cherry flavor showed asignificant association with the variables of interest.
2.2.4. Smoking-Associated Dietary Behaviors
Five items from the 68-item Wisconsin Inventory of Smoking Dependence Motives (WISDM) [53]asked participants to report tendencies to use smoking for appetite and weight control on a seven-pointLikert scale (1 = “not true of me at all” to 7 = “extremely true of me”). The index of the five summeditems (range 5 to 35) had a Cronbach’s α = 0.85.
2.2.5. Body Mass Index
A registered nurse obtained the weight and height from each participant at baseline visit.Body mass index (BMI) was calculated as: (weight (kg) /height (meters)2). BMI was classified as:
278

Nutrients 2019, 11, 271
Underweight (>18.5), normal weight (18.5–24.99), overweight (25.0–29.99), and obese (>30). In order tocreate more even distributions in BMI categories, underweight participants (n = 3) were included inthe normal weight category.
2.3. Statistical Analysis
Statistical analyses were conducted using Statistical Package for the Social Sciences (SPSS) version25.0 (IBM, Armonk, New York, NY, USA), R version 3.5.0 (R Foundation for Statistical Programming,Vienna, Austria), and AMOS version 25.0 (IBM, Armonk, New York, NY, USA) with statisticalsignificance criterion set at p ≤ 0.05. Demographic descriptors that have been previously linked withfood liking or sweet preference [54], smoking-associated dietary behaviors [55], and BMI [56], weretested for differences in variables of interest (taste and smell function, food liking, sweet e-juice liking,smoking-associated dietary behaviors, and BMI). In these analyses, race/ethnicity was treated as twogroups (non-Hispanic/Latino Caucasians vs. African Americans/Hispanics/Latinos/ multi-racial),which is consistent with previous research practices [57].
Independent sample t-tests were used to assess differences in BMI by age (younger/older than38 years, by median split), heavy/binge drinking (yes/no), race/ethnicity (non-Hispanic/LatinoCaucasian vs. African American/Hispanic/Latino/multiracial), income (≤$40,000 vs. >$40,000 annualhousehold income), educational attainment (≤high school education/equivalent vs. some college),and marital status (single/divorced/widowed vs. married/cohabitating). One-way analysis ofcovariance (ANCOVA) was used to test differences in BMI by PROP taster status (non-taster, mediumtaster, supertaster), controlling for demographic and dietary behaviors.
The frequency distributions of BMI, the smoking-associated dietary behaviors index, and thesweet e-juice liking variable were evaluated and square root transformed. Pearson correlation analysiswas used to test relationships between chemosensory function, fat/carbohydrate liking, sweet e-juiceliking, smoking-associated dietary behaviors, and BMI.
Structural equation modeling (SEM) was used to test the idea that chemosensory function wouldinfluence food liking (controlling for race/ethnicity and age), which, in turn, would influence sweete-juice liking and smoking-associated dietary behaviors (controlling for sex), which, in turn, wouldbe associated with BMI [29,58]. A multiple imputation procedure was performed using the MICEpackage in R, based on restricted maximum likelihood estimation [59], to fill in missing data (<5%).
Univariate and multivariate outliers among the model variables were identified by thestandardized residual (≥2.5) and by the Mahalanobis distance criteria [60]. Sensitivity analyseswere conducted on original and transformed variables to assess differences in model statistics andsignificance [61]. Potential confounders were also included in the theoretical model, including age,breath CO readings (ppm), income, sex, race/ethnicity, and binge/heavy alcohol consumption.Confounders that were found to be non-significant were excluded from the final models. Testedassociations were not found to differ significantly between the conceptual and final models, with orwithout the non-significant confounding variables. Measures of global fit, including χ2, Tucker-LewisIndex (TLI), Comparative Fit Index (CFI), and the Root Mean Square Error of Approximation (RMSEA),were chosen a priori. The criteria for adequate model fit included a non-significant χ2 (p > 0.05),TLI > 0.87, CFI > 0.92. and RMSEA < 0.05 [60]. Non-significant paths (p > 0.1) were trimmed fromthe model and the re-specified model tested, with fit parameters evaluated before being provisionallyaccepted [62].
3. Results
The sample has been described previously [16]. In brief, most were non-Hispanic/LatinoCaucasians (68.1%) and 51.9% were female; this sex distribution was similar to the general distributionof the nationwide population of females (51.3%) in 2017 [63]. By race/ethnicity, our sample had fewernon-Hispanic/Latino Caucasians (68.1% vs. 74%) and Hispanics/Latinos (7.4% vs. 8.2%) and morenon-Hispanic/Latino African Americans (23% vs. 7.1%) and multi-racial participants (1.5% vs. 1.3%)
279

Nutrients 2019, 11, 271
than the U.S. racial/ethnic distributions [63]. By BMI, our sample had significantly heavier AfricanAmerican/Hispanic/Latino/multiracial participants compared to non-Hispanic/Latino Caucasians(30.9 ± 6.8 vs. 27.8 ± 6.5, respectively, p = 0.01). Females and males did not vary by age or BMI.Compared to the general U.S. population in 2017 the smokers in our sample were less educated (42%vs. 40% with a high school diploma/GED or less), more were unemployed or retired (39% vs. 30.5%unemployed/retired), and fewer were married/cohabitating (36% vs. 56.1%) [63].
3.1. Body Mass Index (BMI)
Mean BMI was 28.8 ± 6.74. More of our smokers were obese when compared with the 2017U.S. Behavioral Risk Factor Surveillance System nationally-representative sample [63] (36% vs. 31.3%,respectively) while fewer were normal weight/underweight (31% vs. 33.8%, respectively). Table 1shows bivariate correlations between age, chemosensory function, fat/carbohydrate liking, sweete-juice liking, smoking-associated dietary behaviors, and BMI.
Table 1. Bivariate correlations among variables used in structural equation models in chronic smokers(n = 135) 1.
Variable Number Variable 1 2 3 4 5 6 7 8
1 Age 12 PROP intensity 0.05 13 0.32 NaCl intensity 0.09 0.32 c 14 Fat/carb liking 0.29 c 0.18 a 0.22 a 15 SDBI 0.11 0.08 0.01 −0.11 16 Olfaction −0.12 0.06 −0.06 −0.18 a 0.03 17 Sweet E-J liking 0.12 −0.01 0.03 0.26 c −0.02 −0.19 a 18 BMI 0.17 0.07 −0.07 0.24 b 0.22 a −0.02 0.27 c 1
1 The bolded correlation coefficients were statistically significant, where PROP intensity = perceived taste intensityof 6-n-propylthiouracil, a probe for genetic variation in taste, SDBI = Smoking Dietary Behavior Index [53], SweetE-J Liking = Sweet E-juice Liking, and BMI = Body Mass Index. a correlations were significant at p ≤ 0.05; b p ≤ 0.01;and c p ≤ 0.005.
3.2. Taste Function
The intensities of whole mouth PROP, NaCl, and quinine have been reported previously [16].The mean intensity for the averaged 1 mM and 3.2 mM PROP solutions was 40.6±26.5 (between“strong” and “very strong” intensity), which tended to be higher in females (t = 1.75, p = 0.08). Thosewith heightened taste intensity of PROP were significantly more likely to be non-Caucasian (51.4 ± 28.6vs. 35.5 ± 23.9, t = 3.38, p = 0.001) and report lower annual household income (44.5 ± 27.1 vs. 34.6 ± 25,t = 2.13, p = 0.04), but no significant differences were observed by binge/heavy alcohol consumption,age, or BMI category. The mean 0.32 M NaCl intensity was 38.3 ± 23 (“strong” intensity), which didnot differ significantly by sex, age, race, income category, binge/heavy drinking, nor BMI category.
PROP taster statuses were observed to be 21% nontasters, 58% medium tasters, and 21%supertasters. Hispanic/Latino/African American/multiracial participants were significantly morelikely to be supertasters (32.6%) compared to non-Hispanic/Latino Caucasians (15.6%), whilesignificantly fewer, respectively, were PROP nontasters (11.6% vs. 25.6%; χ2(2)=6.72, p = 0.04).
3.3. Olfactory Function
The mean number of correctly identified odors was 12.8 ± 1.9. As reported previously, 40.7%were classified with hyposmia or anosmia/severe hyposmia [16]. Smell function was significantlypoorer in those who reported a history of binge or heavy alcohol consumption (12.5 ± 1.9 vs. 13.4 ± 2,respectively, t = 2.69, p = 0.008), consistent with previous literature [64]. Smell function did not varysignificantly by age, race/ethnicity, across males and females, or by BMI category.
280

Nutrients 2019, 11, 271
3.4. Liking for Saturated Fats/Carbohydrates
Liking for saturated fat/carbohydrate foods and beverages was variable, ranging from −39.6to +90.9, and averaging 31.4 ± 22. Older smokers reported greater liking of these foods than didyounger counterparts when assessed by categorized median age of the sample (37.3 ± 21.6 vs.24.9 ± 20.7, t = 3.38, p = 0.001). Food liking also varied by race, with greater liking ratings reportedby Hispanic/Latino/African American/multiracial participants compared to non-Hispanic/Latinowhites (40.7 ± 22.6 vs. 27 ± 20.4, respectively, t = 3.52, p = 0.001). Food liking also varied by BMIcategory (F(2, 129) = 4.95, p = 0.008), with obese smokers reporting the greatest overall liking ratings(38.80 ± 3.23 SEM) than normal weight/underweight (29.0 ± 3.37) or overweight (25.21 ± 3.0) smokers.There were non-significant differences in food liking between men and women or between binge/heavyalcohol consumption versus not (p’s > 0.05).
3.5. Liking for E-juice Flavors
Cherry e-liquid liking averaged 16.8 ± 32.6 and was highest in obese smokers (27.9 ± 32.7 vs.16.5 ± 27.9 vs. 4.6 ± 33.2 reported in obese, overweight, and normal weight/underweight participants,respectively, (F(2, 127) = 6.58, p = 0.002). Non-whites reported a significantly higher liking for cherrye-juice than did non-Hispanic/Latino white counterparts (24.8 ± 35.74.5 vs. 13.1 ± 30.6, respectively,t = 2.31, p = 0.02). There were no significant differences in cherry e-juice liking by income, sex, age,or binge/heavy alcohol consumption.
3.6. Smoking-Associated Dietary Behaviors
The mean score of the smoking-associated dietary behaviors was 15.2 ± 8.4. Consistentwith existing literature, female chronic smokers reported a greater tendency to use cigarettes forappetite/weight management than did males (18.1 ± 8.9 vs. 12 ± 6.5, t = 4.59, p < 0.001). Self-reportedtendencies to use smoking for appetite/weight control did not differ by race/ethnicity, age, income, orbinge/heavy alcohol consumption (p’s > 0.05). Because associations between PROP bitter phenotypeand BMI may be influenced by dietary behaviors [65], we tested this association in a one-way analysisof covariance with smoking associated dietary behaviors and sex as covariates. BMI did not varysignificantly by PROP taster groups (F(2, 131) = 0.093, p = 0.91).
3.7. Structural Equation Modeling of Chemosensation, Liking, Behaviors, and BMI
The SEM simultaneously tested the direct and indirect associations between chemosensation,liking for saturated fats/carbohydrates, liking for sweet e-juice, smoking-associated dietary behaviors,and BMI of the hypothesized conceptual model (Figure 1). The model had excellent global fitparameters (χ2 = 25.6, df = 27, p = 0.54; CFI = 1.00; TLI = 1.03; RMSEA = 0.000, 90% C.I. 0.000–0.063),but was over-fit (TLI >1). In the model, PROP intensity and olfactory function were not directlyassociated with fat/carbohydrate liking (p’s > 0.1). Instead, NaCl taste intensity was associatedwith food liking (β = 0.16, p = 0.053), which, in turn, tended to associate with BMI (β = 0.16,p = 0.069). Additionally, fat/carbohydrate liking did not significantly predict smoking-associateddietary behaviors (p’s > 0.1). Olfactory function demonstrated tended to inversely associate with sweete-juice liking (β = −0.14, p = 0.093). Finally, sex, race/ethnicity, and age did not associate significantlywith BMI (p’s > 0.1) and were removed as covariates from the conceptual model.
281

Nutrients 2019, 11, 271
Figure 1. Conceptual hypothesis-based model of associations between chemosensation, liking,smoking-associated dietary behaviors, and BMI in chronic adult smokers. The numerical valueslabeled on the arrow lines represent standardized beta coefficients. Errors (represented by the encircledletter “e“) are required computationally, but are not of theoretical interest. The coefficient in parenthesisrepresents the associations before cherry e-juice liking was added to the model. indicating that cherrye-juice mediated the dietary preference-BMI relationship (indirect effect coefficient = 0.05, p < 0.05).Dashed lines with “X” coefficients indicate non-significant associations. The model was adequatelyfit (CFI = 1.00, TLI = 1.03, Chi-square = 25.6, df = 27, p = 0.54, RMSEA = 0.00, 90% C.I. 0.000–0.063).*** indicates that p ≤ 0.005; ** p ≤ 0.01; *p ≤ 0.05; † p ≤ 0.1. (PROP= 6-n-propylthiouracil).
Based on findings from the tested conceptual model and supporting bivariate analyses,a re-specified model with all non-significant pathways (p > 0.1) trimmed was tested in SEM (Figure 2).The global fit remained excellent and showed an improvement in the TLI, which showed a goodfitting model (χ2 = 34, df = 34, p = 0.47; CFI = 1.00; TLI = 1.00; RMSEA = 0.000, 90% C.I. 0.000–0.063).In the final model, PROP intensity was related to 0.32 NaCl taste intensity, which was linked to food
282
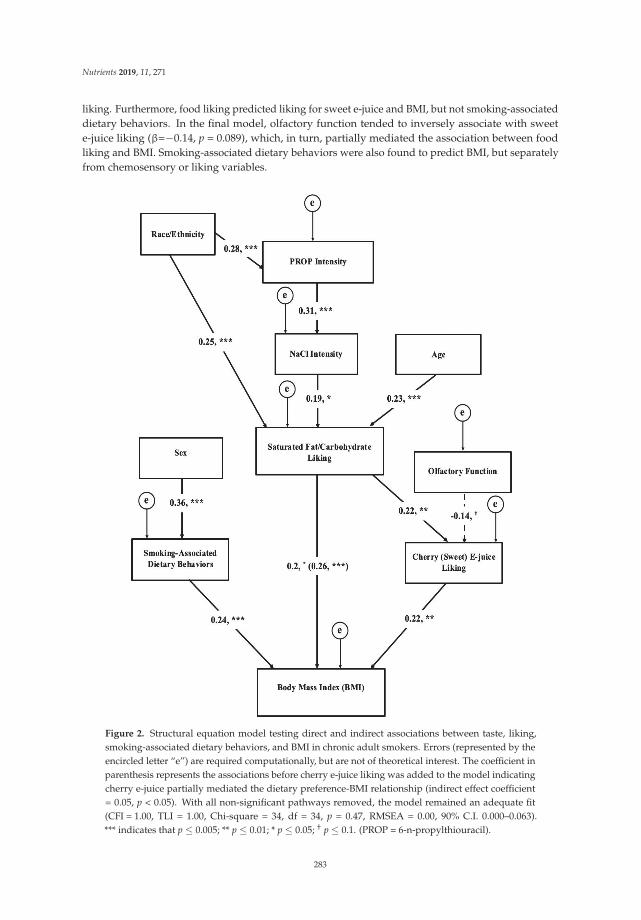
Nutrients 2019, 11, 271
liking. Furthermore, food liking predicted liking for sweet e-juice and BMI, but not smoking-associateddietary behaviors. In the final model, olfactory function tended to inversely associate with sweete-juice liking (β=−0.14, p = 0.089), which, in turn, partially mediated the association between foodliking and BMI. Smoking-associated dietary behaviors were also found to predict BMI, but separatelyfrom chemosensory or liking variables.
Figure 2. Structural equation model testing direct and indirect associations between taste, liking,smoking-associated dietary behaviors, and BMI in chronic adult smokers. Errors (represented by theencircled letter “e”) are required computationally, but are not of theoretical interest. The coefficient inparenthesis represents the associations before cherry e-juice liking was added to the model indicatingcherry e-juice partially mediated the dietary preference-BMI relationship (indirect effect coefficient= 0.05, p < 0.05). With all non-significant pathways removed, the model remained an adequate fit(CFI = 1.00, TLI = 1.00, Chi-square = 34, df = 34, p = 0.47, RMSEA = 0.00, 90% C.I. 0.000–0.063).*** indicates that p ≤ 0.005; ** p ≤ 0.01; * p ≤ 0.05; † p ≤ 0.1. (PROP = 6-n-propylthiouracil).
283

Nutrients 2019, 11, 271
4. Discussion
In this observational study we sought to model associations between chemosensory function,food and beverage liking, smoking-associated dietary behaviors, and body mass index (BMI) amonga sample of chronic smokers. Furthermore, we modeled the interplay between liking for a vapedsweet e-cigarette juice flavor, liking for foods and beverages, and BMI. The best fitting model hadmeasures of taste intensity that were associated with variability in fat and carbohydrate liking, which,in turn, was associated with variability in BMI. Ability to taste PROP bitterness did not show a directassociation with fat and carbohydrate liking, and instead was associated through the intensity of NaCl.Greater fat/carbohydrate liking was associated with greater BMI, an association partially mediated bygreater liking of the vaped sweet e-juice, suggesting that liking for sweetness, even in an e-juice, was aprimary determinant of BMI in this sample. Olfactory function, measured by an odor identificationtask, failed to associate significantly with the liking variables. Finally, reported use of smoking tocontrol appetite and weight showed a separate pathway of association from either chemosensory orliking variables.
The sample of chronic smokers showed sufficient variability to test these models of association,including demographic, chemosensory, food liking, dietary behavior, and BMI characteristics.The study sample was gender-balanced and diverse in race/ethnicity, education, household income,and employment consistent with characteristics of smokers in the U.S. [1]; these demographic variableshave associated with chemosensory function [66] and dietary behaviors [67,68]. In addition, our sampleof chronic smokers captured a range of BMI from underweight to obese, with a higher frequency ofobesity than that reported for adults in the U.S. [63], but consistent with greater odds of obesity inchronic smokers [9].
The observed variation in perceived PROP bitterness across the sample was similar to whatwe have seen previously (e.g. [69]) and that reported by other laboratory-based studies (e.g. [70]).The frequency of PROP nontasters, medium, and supertasters in our sample [16] was comparable totheoretical rates (i.e., 25% nontasters, 50% medium tasters, 25% supertasters). Greater PROP bitternessis linked with heightened ability to perceive oral sensations and tastes from fat, which may be explainedin part by a higher density of fungiform papillae found on the tongue of PROP tasters compared tonontasters [71]. Among nonsmokers, this has furthermore been associated with a lower liking forfats/sweets among PROP tasters compared to nontasters [72–74]. Although we observed a positivebivariate association between PROP bitterness and fat/carbohydrate liking, as previously observed inyoung adults with poor dietary behaviors [75], perceived PROP bitterness did not contribute directlyto fat/carbohydrate liking in the full structural equation model.
Instead, we observed that PROP taste intensity was indirectly associated with the liking offats/carbohydrates through the intensity of NaCl. The PROP-NaCl association is consistent withthe previous reports [29], but the ability of 0.32 M NaCl to associate with food liking among chronicsmokers is a new finding. Chronic smoking likely diminishes the ability of PROP to serve as amarker for differences in oral sensation to associate with dietary behaviors and health outcomes [26].Most studies of taste phenotype, diet, and health are conducted with non-smokers and study groupswho are homogenous in race/ethnicity. As expected among chronic smokers, our study samplewas diverse in race/ethnicity, which also could have contributed to a lack of direct associationbetween PROP bitterness perception and food liking. We found more PROP supertasters among theHispanic/Latino/African American/multiracial smokers and more nontasters among non-Hispanic/Latino Caucasians. This is consistent with the global distribution of TAS2R38 receptors gene mediatingthe ability to taste PROP and PTC bitterness [76]. Thus, there likely was a race/ethnic interactionbetween PROP tasting and food liking as reported previously [77].
We also tested the ability of smell function to influence liking variables and BMI. In the bivariateassociation, greater functioning associated with a lower liking of fat/carbohydrate foods and beverages,as well as a lower liking of sweet e-juice. However, in the final model, we could not detect variabilityin reported food liking based on performance on an odor identification task. However, our sample
284

Nutrients 2019, 11, 271
showed an overrepresentation of hyposmia and lower frequency of less severe dysfunction (severehyposmia, anosmia) compared to the distributions reported in the nationally-representative U.S.NHANES sample [66]. This may have resulted in insufficient variability in olfactory function toassociate with differences in food liking and dietary behaviors. In addition, although chronic smokingincreases the risk of olfactory dysfunction [24], our study sample was younger than the age associatedwith declines in olfactory function [66].
The smokers in the current study varied in liking for less healthy foods (fat/carbohydrates) andgreater liking was associated with greater BMI, which remained significant after controlling for age andrace/ethnicity. These findings suggest that not all chronic smokers have unhealthy eating behaviors.A positive association between a liking for fat/carbohydrate foods and BMI is consistent with findingsfrom our laboratory [78–80] and others [81,82]. This relationship may be pronounced in heavy smokers;nicotine, as the predominant addictive constituent and reinforcing property in tobacco products, isthe primary driver of repeated cigarette smoking secondary to the neurological rewarding effects [83],especially with chronic nicotine exposure [84].
In our model, we found that some of the association between food liking and BMI was partiallymediated by liking for the sweetest (cherry) nicotine-containing e-juice flavor. As expected, foodliking was found to influence the liking for the sweet e-juice flavor, which, in turn, associated withBMI. The physiological effects of nicotine on appetite and weight [4,5], delivered through e-cigarettes(which are considered safer than tobacco cigarettes [85]), could provide a tool for chronic smokerswith greater BMI to achieve and maintain a healthy weight. Although e-juice flavors are perceivedretronasally [86], one with a greater preference for sweets may be more drawn to e-juice flavors thatsimulate sweet flavors [87], which may explain why the other vaped nicotine-containing e-juice flavors(chocolate, unflavored, menthol, tobacco) was unable to mediate the relationship between food likingand BMI. Such an association was only found in cherry, which was reported as the sweetest e-juiceflavor choice amongst participants. Sweet flavors appear to elicit a stronger response in the nucleusaccumbens (the predominant reward center) than non-sweet flavors [88]. With nicotine-containinge-cigarette sweet flavors, a supra-addictive response in the reward center of the brain was observed viafMRI. Thus, sweet e-juice flavors may be the predominant driver of the reinforcing effects of nicotinein e-cigarettes as a result of heightened neurological responses in the reward center [88]. There alsomay be a genetic susceptibility to the reward of sweets among smokers [89]. Furthermore, artificialsweeteners are commonly included in the ingredients of e-juice flavors [87]. Consumption of thesesweeteners is high in the U.S., especially among individuals with obesity [90]. A greater level ofscientific evidence is needed [91] to address the active debate on whether or not these sweetenerssupport weight management [92] or fuel the risk of obesity and associated chronic disease [93]. Finally,our model also demonstrated an inverse tendency between olfactory function and sweet e-juicepreference. With the insufficient representation of olfactory impairment among our smokers, we wereunable to fully test the olfactory function, sweet liking, and sweet e-juice relationships.
Smoking-associated dietary behaviors were associated with BMI in our statistical model withoutinteracting with any of the liking variables. These findings are consistent with prior reports that suggesta separation of pathways between liking and wanting in the brain and that these circumstances for astimulus, consequently, do not co-depend [94]. Of note, variability of self-reported smoking-associateddietary behaviors in our sample showed variability similarly to what has been previously reported [95].The greater obesity and overweight amongst our sample may explain the elevated levels of usingsmoking to control appetite and weight in our sample, as overweight and obese individuals are morelikely to use smoking for appetite/weight control [3]. Our findings were consistent with differencesobserved in smoking-associated dietary behaviors between males and females, with females reportinghigher mean tendencies to smoke for appetite and weight control [95].
This current study is not without limitations. The observational cross-sectional nature of this studycannot be used to draw cause-and-effect relationships. In addition, the range of e-cigarette flavorstested was rather narrow. Furthermore, because our study sought to assess associations between
285

Nutrients 2019, 11, 271
chemosensation, diet behavior and BMI in smokers, we did not compare our findings to non-smokers,which limits the generalization of our findings. An additional limitation is that we did not attempt tomeasure dietary intake directly (e.g., food frequency questionnaire, biomarker). However, measuringusual dietary behaviors by asking what is liked/disliked is a novel and feasible alternative to intakereporting which is often biased [96]. Reported food liking correlates with reported intake [69,97]and biomarkers of dietary intake and/or adiposity young adults [69,78], and adults [50,79]. Likingsurvey responses can be formed into an index of diet quality (similar to the Healthy Eating Index)that explains the variability in adiposity or cardiovascular disease risk factors [49,69,78]. Additionally,body composition was not analyzed beyond the calculation of BMI, which may have resulted in anoverestimation of obese and overweight classifications among the sample [98]. However, chronicsmokers have been reported to have a less healthy lifestyle than nonsmokers and lighter smokers [12].Because BMI has been found to correlate highly among more sedentary individuals [98], however,the risk for overestimating overweight and obesity in our sample is not likely to be significant. Finally,a laboratory procedure may not faithfully reflect true preferences and behaviors with respect to vaping,eating, and BMI.
5. Conclusions
This observational study supports the idea that variation in taste perception associates withvariation in fat/carbohydrate liking. Food liking, in turn, was associated with some of the variationsin BMI amongst chronic smokers. Moreover, liking for sweet e-juice flavors partially mediated theassociation between food liking and BMI. The associations between taste, food liking, and BMI wereseparate from the associations between reported use of smoking to control appetite/weight and BMI.Dual chronic smoking with obesity presents a greater risk of further chronic conditions and diseasesthan either health risk alone. Chronic smokers can lose weight comparable to nonsmokers in a weightloss intervention [99]. The present study provides observational findings that sweet e-cigarettes mayattenuate some of the association between greater liking of sweets and high-fat foods/beverages andgreater BMI. Prospective studies are needed to test whether chronic smokers with obesity wouldbenefit from the availability of sweet e-cigarette e-juice flavors in order to satisfy their liking for lesshealthy foods and assist in weight control.
Author Contributions: M.D.L. and V.B.D. conceived and designed the study; B.A.L. conducted the experimentalmethods; B.A.L., T.B.H.-M. and V.B.D. conducted the statistical analyses; B.A.L., M.D.L., T.B.H.-M. and V.B.D.interpreted the data; B.A.L. and V.B.D. wrote the manuscript; all authors reviewed the manuscript.
Funding: This research was funded by Grant 1 R01 DA036492 from the National Institute on Drug Abuse, and inpart by General Clinical Research Center Grant M01-RR06192 from the National Institutes of Health.
Acknowledgments: The authors would like to recognize the research team on the Electronic Cigarette Study atthe UCONN Health Center, Diane Wilson and Eileen Leonard, for their work in this study. Additionally, we wishto thank Shane Sacco for their statistical support.
Conflicts of Interest: The authors declare no conflict of interest. The funders had no role in the design of thestudy; in the collection, analyses, or interpretation of data; in the writing of the manuscript, or in the decision topublish the results.
References
1. Jamal, A.; Phillips, E.; Gentzke, A.S.; Homa, D.M.; Babb, S.D.; King, B.A.; Neff, L.J. Current CigaretteSmoking Among Adults—United States, 2016. MMWR Morb. Mortal. Wkly. Rep. 2018, 67, 53–59. [CrossRef][PubMed]
2. Hales, C.M.; Carroll, M.D.; Fryar, C.D.; Ogden, C.L. Prevalence of Obesity Among Adults and Youth: UnitedStates, 2015-2016. NCHS Data Briefs. Available online: https://www.cdc.gov/nchs/data/databriefs/db219.pdf (accessed on 18 January 2019).
3. Rupprecht, L.E.; Donny, E.C.; Sved, A.F. Obese Smokers as a Potential Subpopulation of Risk in TobaccoReduction Policy. Yale J. Biol. Med. 2015, 88, 289–294. [PubMed]
286
Nutrients 2019, 11, 271
4. Mineur, Y.S.; Abizaid, A.; Rao, Y.; Salas, R.; DiLeone, R.J.; Gundisch, D.; Diano, S.; De Biasi, M.; Horvath, T.L.;Gao, X.B.; et al. Nicotine decreases food intake through activation of POMC neurons. Science 2011, 332,1330–1332. [CrossRef] [PubMed]
5. Audrain-McGovern, J.; Benowitz, N.L. Cigarette smoking, nicotine, and body weight. Clin. Pharmacol. Ther.2011, 90, 164–168. [CrossRef] [PubMed]
6. Ginawi, I.; Bashir, A.; Alreshidi, Y.; Dirweesh, A.; Al-Hazimi, A.; Ahmed, H.; Kamal, E.; Ahmed, M.Association Between Obesity and Cigarette Smoking: A Community-Based Study. J. Endocrinol. Metab. 2016,6, 149–153. [CrossRef]
7. Jitnarin, N.; Kosulwat, V.; Rojroongwasinkul, N.; Boonpraderm, A.; Haddock, C.K.; Poston, W.S. Therelationship between smoking, body weight, body mass index, and dietary intake among Thai adults: Resultsof the national Thai Food Consumption Survey. Asia Pac. J. Public Health 2014, 26, 481–493. [CrossRef][PubMed]
8. Mackay, D.F.; Gray, L.; Pell, J.P. Impact of smoking and smoking cessation on overweight and obesity:Scotland-wide, cross-sectional study on 40,036 participants. BMC Public Health 2013, 13, 348. [CrossRef][PubMed]
9. Dare, S.; Mackay, D.F.; Pell, J.P. Relationship between smoking and obesity: A cross-sectional study of 499,504middle-aged adults in the UK general population. PLoS ONE 2015, 10, e0123579. [CrossRef]
10. Alkerwi, A.; Baydarlioglu, B.; Sauvageot, N.; Stranges, S.; Lemmens, P.; Shivappa, N.; Hebert, J.R. Smokingstatus is inversely associated with overall diet quality: Findings from the ORISCAV-LUX study. Clin. Nutr.2017, 36, 1275–1282. [CrossRef]
11. Chiolero, A.; Wietlisbach, V.; Ruffieux, C.; Paccaud, F.; Cornuz, J. Clustering of risk behaviors with cigaretteconsumption: A population-based survey. Prev. Med. 2006, 42, 348–353. [CrossRef]
12. Lohse, T.; Rohrmann, S.; Bopp, M.; Faeh, D. Heavy Smoking Is More Strongly Associated with GeneralUnhealthy Lifestyle than Obesity and Underweight. PLoS ONE 2016, 11, e0148563. [CrossRef] [PubMed]
13. Ramallal, R.; Toledo, E.; Martinez, J.A.; Shivappa, N.; Hebert, J.R.; Martinez-Gonzalez, M.A.; Ruiz-Canela, M.Inflammatory potential of diet, weight gain, and incidence of overweight/obesity: The SUN cohort. Obesity(Silver Spring) 2017, 25, 997–1005. [CrossRef] [PubMed]
14. Criscitelli, K.; Avena, N.M. The neurobiological and behavioral overlaps of nicotine and food addiction. Prev.Med. 2016, 92, 82–89. [CrossRef] [PubMed]
15. Pepino, M.Y.; Mennella, J.A. Cigarette smoking and obesity are associated with decreased fat perception inwomen. Obesity (Silver Spring) 2014, 22, 1050–1055. [CrossRef] [PubMed]
16. Duffy, V.B.; Glennon, S.G.; Larsen, B.A.; Rawal, S.; Oncken, C.; Litt, M.D. Heightened olfactory dysfunctionand oral irritation among chronic smokers and heightened propylthiouracil (PROP) bitterness amongmenthol smokers. Physiol. Behav. 2018, 201, 111–122. [CrossRef] [PubMed]
17. Enoch, M.A.; Harris, C.R.; Goldman, D. Does a reduced sensitivity to bitter taste increase the risk of becomingnicotine addicted? Addict. Behav. 2001, 26, 399–404. [CrossRef]
18. Ahijevych, K.; Tepper, B.J.; Graham, M.C.; Holloman, C.; Matcham, W.A. Relationships of PROP TastePhenotype, Taste Receptor Genotype, and Oral Nicotine Replacement Use. Nicotine Tob. Res. 2015, 17,1149–1155. [CrossRef]
19. Dehkordi, O.; Rose, J.E.; Balan, K.V.; Millis, R.M.; Bhatti, B.; Jayam-Trouth, A. Co-expression of nAChRs andmolecules of the bitter taste transduction pathway by epithelial cells of intrapulmonary airways. Life Sci.2010, 86, 281–288. [CrossRef]
20. Snedecor, S.M.; Pomerleau, C.S.; Mehringer, A.M.; Ninowski, R.; Pomerleau, O.F. Differences insmoking-related variables based on phenylthiocarbamide “taster” status. Addict. Behav. 2006, 31, 2309–2312.[CrossRef]
21. Cannon, D.S.; Baker, T.B.; Piper, M.E.; Scholand, M.B.; Lawrence, D.L.; Drayna, D.T.; McMahon, W.M.;Villegas, G.M.; Caton, T.C.; Coon, H.; et al. Associations between phenylthiocarbamide gene polymorphismsand cigarette smoking. Nicotine Tob. Res. 2005, 7, 853–858. [CrossRef]
22. Baker, A.N.; Miranda, A.M.; Garneau, N.L.; Hayes, J.E. Self-reported smoking status, TAS2R38 variants, andpropylthiouracil phenotype: An exploratory crowdsourced cohort study. Chem. Senses 2018, 43, 617–625.[CrossRef] [PubMed]
23. Wooding, S.; Kim, U.K.; Bamshad, M.J.; Larsen, J.; Jorde, L.B.; Drayna, D. Natural selection and molecularevolution in PTC, a bitter-taste receptor gene. Am. J. Hum. Genet. 2004, 74, 637–646. [CrossRef] [PubMed]
287

Nutrients 2019, 11, 271
24. Ajmani, G.S.; Suh, H.H.; Wroblewski, K.E.; Pinto, J.M. Smoking and olfactory dysfunction: A systematicliterature review and meta-analysis. Laryngoscope 2017, 127, 1753–1761. [CrossRef] [PubMed]
25. Boesveldt, S.; de Graaf, K. The Differential Role of Smell and Taste for Eating Behavior. Perception 2017, 46,307–319. [CrossRef] [PubMed]
26. Tepper, B.J.; Melis, M.; Koelliker, Y.; Gasparini, P.; Ahijevych, K.L.; Tomassini Barbarossa, I. FactorsInfluencing the Phenotypic Characterization of the Oral Marker, PROP. Nutrients 2017, 9, 1275. [CrossRef][PubMed]
27. Tepper, B.J. Nutritional implications of genetic taste variation: The role of PROP sensitivity and other tastephenotypes. Annu. Rev. Nutr. 2008, 28, 367–388. [CrossRef] [PubMed]
28. Tepper, B.J.; Banni, S.; Melis, M.; Crnjar, R.; Tomassini Barbarossa, I. Genetic sensitivity to the bitter taste of6-n-propylthiouracil (PROP) and its association with physiological mechanisms controlling body mass index(BMI). Nutrients 2014, 6, 3363–3381. [CrossRef]
29. Hayes, J.E.; Sullivan, B.S.; Duffy, V.B. Explaining variability in sodium intake through oral sensory phenotype,salt sensation and liking. Physiol. Behav. 2010, 100, 369–380. [CrossRef]
30. Proserpio, C.; de Graaf, C.; Laureati, M.; Pagliarini, E.; Boesveldt, S. Impact of ambient odors on food intake,saliva production and appetite ratings. Physiol. Behav. 2017, 174, 35–41. [CrossRef]
31. Boesveldt, S.; Postma, E.M.; Boak, D.; Welge-Luessen, A.; Schopf, V.; Mainland, J.D.; Martens, J.; Ngai, J.;Duffy, V.B. Anosmia-A Clinical Review. Chem. Senses 2017, 42, 513–523. [CrossRef]
32. Aschenbrenner, K.; Hummel, C.; Teszmer, K.; Krone, F.; Ishimaru, T.; Seo, H.S.; Hummel, T. The influence ofolfactory loss on dietary behaviors. Laryngoscope 2008, 118, 135–144. [CrossRef] [PubMed]
33. Manesse, C.; Ferdenzi, C.; Sabri, M.; Bessy, M.; Rouby, C.; Faure, F.; Bellil, D.; Jomain, S.N.; Landis, B.;Hugentobler, M.; et al. Dysosmia-Associated Changes in Eating Behavior. Chem. Percept. 2017, 10, 104–113.[CrossRef]
34. Schubert, C.R.; Cruickshanks, K.J.; Fischer, M.E.; Huang, G.H.; Klein, B.E.; Klein, R.; Pankow, J.S.;Nondahl, D.M. Olfactory impairment in an adult population: The Beaver Dam Offspring Study. Chem. Senses2012, 37, 325–334. [CrossRef] [PubMed]
35. Kovacs, M.A.; Palmer, A.M.; Correa, J.B.; Brandon, T.H. Smoking by young women with restrained eatingfollowing a food prime in the context of an alternative distractor. Exp. Clin. Psychopharmacol. 2018, 26,186–194. [CrossRef] [PubMed]
36. Singh, H.; Kennedy, R.D.; Lagasse, L.P.; Czaplicki, L.M.; Cohen, J.E. E-cigarettes and Weight Loss-ProductDesign Innovation Insights from Industry Patents. Nicotine Tob. Res. 2018, 20, 1010–1014. [CrossRef][PubMed]
37. Morean, M.E.; Wedel, A.V. Vaping to lose weight: Predictors of adult e-cigarette use for weight loss or control.Addict. Behav. 2017, 66, 55–59. [CrossRef] [PubMed]
38. Soule, E.K.; Lopez, A.A.; Guy, M.C.; Cobb, C.O. Reasons for using flavored liquids among electronic cigaretteusers: A concept mapping study. Drug Alcohol Depend. 2016, 166, 168–176. [CrossRef]
39. Feirman, S.P.; Lock, D.; Cohen, J.E.; Holtgrave, D.R.; Li, T. Flavored Tobacco Products in the United States:A Systematic Review Assessing Use and Attitudes. Nicotine Tob. Res. 2016, 18, 739–749. [CrossRef]
40. Kim, H.; Lim, J.; Buehler, S.S.; Brinkman, M.C.; Johnson, N.M.; Wilson, L.; Cross, K.S.; Clark, P.I. Role of sweetand other flavours in liking and disliking of electronic cigarettes. Tob. Control 2016, 25, ii55–ii61. [CrossRef]
41. Audrain-McGovern, J.; Strasser, A.A.; Wileyto, E.P. The impact of flavoring on the rewarding and reinforcingvalue of e-cigarettes with nicotine among young adult smokers. Drug Alcohol Depend. 2016, 166, 263–267.[CrossRef]
42. Kennedy, R.D.; Awopegba, A.; De Leon, E.; Cohen, J.E. Global approaches to regulating electronic cigarettes.Tob. Control 2017, 26, 440–445. [CrossRef] [PubMed]
43. Wood, L. Research and Markets: E-Cigarette & Vaporizer Market to Reach USD 50 Billion by 2025—Global Analysis& Forecast Report 2015–2025; Business Wire, Inc.: San Francisco, CA, USA, 2015.
44. Sandberg, A.; Skold, C.M.; Grunewald, J.; Eklund, A.; Wheelock, A.M. Assessing recent smoking status bymeasuring exhaled carbon monoxide levels. PLoS ONE 2011, 6, e28864. [CrossRef] [PubMed]
45. Sobell, L.C.; Sobell, M.B. Alcohol Timeline Followback Users’ Manual; Addiction Research Foundation: Toronto,ON, Canada, 1995.
46. Green, B.G.; Dalton, P.; Cowart, B.; Shaffer, G.; Rankin, K.; Higgins, J. Evaluating the ‘Labeled MagnitudeScale’ for measuring sensations of taste and smell. Chem. Senses 1996, 21, 323–334. [CrossRef] [PubMed]
288

Nutrients 2019, 11, 271
47. Bartoshuk, L.M.; Duffy, V.B.; Green, B.G.; Hoffman, H.J.; Ko, C.W.; Lucchina, L.A.; Marks, L.E.; Snyder, D.J.;Weiffenbach, J.M. Valid across-group comparisons with labeled scales: The gLMS versus magnitude matching.Physiol. Behav. 2004, 82, 109–114. [CrossRef] [PubMed]
48. Centers for Disease Control and Prevention. Taste and Smell Examination Component Manual: NationalHealth and Examination Survey (NHANES). Available online: https://wwwn.cdc.gov/nchs/data/nhanes/2013-2014/manuals/Taste_Smell.pdf (accessed on 18 January 2019).
49. Zoghbi, M.; Stone, A.; Papsavas, P.; Swede, H.; Hubert, P.; Tisher, D.; Duffy, V.B. Evaluating Taste Preferencesand Dietary Quality with a Simple Liking Survey: Application in Bariatric Treatment Settings. Bariatr. Surg.Pract. Patient Care 2017. [CrossRef]
50. Pallister, T.; Sharafi, M.; Lachance, G.; Pirastu, N.; Mohney, R.P.; MacGregor, A.; Feskens, E.J.; Duffy, V.;Spector, T.D.; Menni, C. Food Preference Patterns in a UK Twin Cohort. Twin Res. Hum. Genet. 2015, 18,793–805. [CrossRef] [PubMed]
51. U.S. Department of Health and Human Services, U.S. Department of Agriculture. 2015–2020 DietaryGuidelines for Americans. 2015. Available online: https://health.gov/dietaryguidelines/2015/ (accessedon 18 January 2019).
52. Mead, E.L.; Duffy, V.; Oncken, C.; Litt, M.D. E-cigarette palatability in smokers as a function of flavorings,nicotine content and propylthiouracil (PROP) taster phenotype. Addict. Behav. 2018. [CrossRef]
53. Smith, S.S.; Piper, M.E.; Bolt, D.M.; Fiore, M.C.; Wetter, D.W.; Cinciripini, P.M.; Baker, T.B. Developmentof the Brief Wisconsin Inventory of Smoking Dependence Motives. Nicotine Tob. Res. 2010, 12, 489–499.[CrossRef]
54. Drewnowski, A.; Hann, C. Food preferences and reported frequencies of food consumption as predictors ofcurrent diet in young women. Am. J. Clin. Nutr. 1999, 70, 28–36. [CrossRef]
55. Kendzor, D.E.; Businelle, M.S.; Cofta-Woerpel, L.M.; Reitzel, L.R.; Castro, Y.; Vidrine, J.I.; Mazas, C.A.;Cinciripini, P.M.; Wetter, D.W. Mechanisms linking socioeconomic disadvantage and BMI in smokers. Am. J.Health Behav. 2013, 37, 587–598. [CrossRef]
56. Fan, M.; Su, M.; Tan, Y.; Liu, Q.; Ren, Y.; Li, L.; Lv, J. Gender, Age, and Education Level Modify the Associationbetween Body Mass Index and Physical Activity: A Cross-Sectional Study in Hangzhou, China. PLoS ONE2015, 10, e0125534. [CrossRef] [PubMed]
57. Williams, J.A.; Bartoshuk, L.M.; Fillingim, R.B.; Dotson, C.D. Exploring Ethnic Differences in Taste Perception.Chem. Senses 2016, 41, 449–456. [CrossRef] [PubMed]
58. Dinehart, M.E.; Hayes, J.E.; Bartoshuk, L.M.; Lanier, S.L.; Duffy, V.B. Bitter taste markers explain variabilityin vegetable sweetness, bitterness, and intake. Physiol. Behav. 2006, 87, 304–313. [CrossRef] [PubMed]
59. Buuren, S.V.; Groothuis-Oudshoorn, K. mice: Multivariate Imputation by Chained Equations in R.J. Stat. Softw. 2011, 45, 1–67. [CrossRef]
60. Tabachnick, B.G.; Fidell, L.S. Using Multivariate Statistics; Allyn and Bacon: Boston, MA, USA, 2001;Volume xxvi.
61. Lee, S.Y.; Wang, S.J. Sensitivity analysis of structural equation models. Psychometrika 1996, 61, 93–108.[CrossRef]
62. Kline, R.B. Principles and Practice of Structural Equation Modeling; Guilford Press: New York, NY, USA, 1998;Volume xiv.
63. Centers for Disease Control and Prevention; National Center for Chronic Disease Prevention and HealthPromotion. Behavioral Risk Factor Surveillance System Prevalence & Trends Data. Available online:https://www.cdc.gov/brfss/brfssprevalence/ (accessed on 18 January 2019).
64. Tanaka, A.; Cui, R.; Kitamura, A.; Liu, K.; Imano, H.; Yamagishi, K.; Kiyama, M.; Okada, T.;Iso, H.; Investigators, C. Heavy Alcohol Consumption is Associated with Impaired Endothelial Function.J. Atheroscler. Thromb. 2016, 23, 1047–1054. [CrossRef] [PubMed]
65. Tepper, B.J.; Ullrich, N.V. Influence of genetic taste sensitivity to 6-n-propylthiouracil (PROP), dietaryrestraint and disinhibition on body mass index in middle-aged women. Physiol. Behav. 2002, 75, 305–312.[CrossRef]
66. Hoffman, H.J.; Rawal, S.; Li, C.M.; Duffy, V.B. New chemosensory component in the U.S. National Health andNutrition Examination Survey (NHANES): First-year results for measured olfactory dysfunction. Rev. Endocr.Metab. Disord. 2016, 17, 221–240. [CrossRef]
289

Nutrients 2019, 11, 271
67. Wang, Y.; Chen, X. How much of racial/ethnic disparities in dietary intakes, exercise, and weight statuscan be explained by nutrition- and health-related psychosocial factors and socioeconomic status among USadults? J. Am. Diet Assoc. 2011, 111, 1904–1911. [CrossRef]
68. Wang, Y.; Chen, X. Between-group differences in nutrition- and health-related psychosocial factors amongUS adults and their associations with diet, exercise, and weight status. J. Acad. Nutr. Diet. 2012, 112, 486–498.[CrossRef]
69. Sharafi, M.; Rawal, S.; Fernandez, M.L.; Huedo-Medina, T.B.; Duffy, V.B. Taste phenotype associates withcardiovascular disease risk factors via diet quality in multivariate modeling. Physiol. Behav. 2018, 194,103–112. [CrossRef] [PubMed]
70. Fischer, M.E.; Cruickshanks, K.J.; Pankow, J.S.; Pankratz, N.; Schubert, C.R.; Huang, G.H.; Klein, B.E.;Klein, R.; Pinto, A. The associations between 6-n-propylthiouracil (PROP) intensity and taste intensitiesdiffer by TAS2R38 haplotype. J. Nutrigenet. Nutrigenom. 2014, 7, 143–152. [CrossRef] [PubMed]
71. Bartoshuk, L.M.; Duffy, V.B.; Hayes, J.E.; Moskowitz, H.R.; Snyder, D.J. Psychophysics of sweet and fatperception in obesity: Problems, solutions and new perspectives. Philos. Trans. R. Soc. Lond. B Biol. Sci. 2006,361, 1137–1148. [CrossRef] [PubMed]
72. Duffy, V.B. Associations between oral sensation, dietary behaviors and risk of cardiovascular disease (CVD).Appetite 2004, 43, 5–9. [CrossRef] [PubMed]
73. Hayes, J.E.; Duffy, V.B. Oral sensory phenotype identifies level of sugar and fat required for maximal liking.Physiol. Behav. 2008, 95, 77–87. [CrossRef] [PubMed]
74. Tepper, B.J.; Nurse, R.J. PROP taster status is related to fat perception and preference. Ann. N. Y. Acad. Sci.1998, 855, 802–804. [CrossRef]
75. Stevenson, R.J.; Boakes, R.A.; Oaten, M.J.; Yeomans, M.R.; Mahmut, M.; Francis, H.M. ChemosensoryAbilities in Consumers of a Western-Style Diet. Chem. Senses 2016, 41, 505–513. [CrossRef] [PubMed]
76. Risso, D.S.; Mezzavilla, M.; Pagani, L.; Robino, A.; Morini, G.; Tofanelli, S.; Carrai, M.; Campa, D.; Barale, R.;Caradonna, F.; et al. Global diversity in the TAS2R38 bitter taste receptor: Revisiting a classic evolutionaryPROPosal. Sci. Rep. 2016, 6, 25506. [CrossRef]
77. Choi, S.E. Racial differences between African Americans and Asian Americans in the effect of6-n-propylthiouracil taste intensity and food liking on body mass index. J. Acad. Nutr. Diet. 2014, 114,938–944. [CrossRef]
78. Sharafi, M.; Duffy, V.B.; Miller, R.J.; Winchester, S.B.; Huedo-Medina, T.B.; Sullivan, M.C. Dietary behaviorsof adults born prematurely may explain future risk for cardiovascular disease. Appetite 2016, 99, 157–167.[CrossRef]
79. Duffy, V.B.; Lanier, S.A.; Hutchins, H.L.; Pescatello, L.S.; Johnson, M.K.; Bartoshuk, L.M. Food preferencequestionnaire as a screening tool for assessing dietary risk of cardiovascular disease within health riskappraisals. J. Am. Diet. Assoc. 2007, 107, 237–245. [CrossRef] [PubMed]
80. Duffy, V.B.; Hayes, J.E.; Sullivan, B.S.; Faghri, P. Surveying food and beverage liking: A tool forepidemiological studies to connect chemosensation with health outcomes. Ann. N. Y. Acad. Sci. 2009,1170, 558–568. [CrossRef] [PubMed]
81. Deglaire, A.; Mejean, C.; Castetbon, K.; Kesse-Guyot, E.; Hercberg, S.; Schlich, P. Associations betweenweight status and liking scores for sweet, salt and fat according to the gender in adults (The Nutrinet-Santestudy). Eur. J. Clin. Nutr. 2015, 69, 40–46. [CrossRef] [PubMed]
82. Lampure, A.; Castetbon, K.; Deglaire, A.; Schlich, P.; Peneau, S.; Hercberg, S.; Mejean, C. Associationsbetween liking for fat, sweet or salt and obesity risk in French adults: A prospective cohort study. Int. J.Behav. Nutr. Phys. Act. 2016, 13, 74. [CrossRef] [PubMed]
83. De Biasi, M.; Dani, J.A. Reward, addiction, withdrawal to nicotine. Annu. Rev. Neurosci. 2011, 34, 105–130.[CrossRef]
84. Perkins, K.A.; Epstein, L.H.; Stiller, R.L.; Fernstrom, M.H.; Sexton, J.E.; Jacob, R.G. Perception and hedonicsof sweet and fat taste in smokers and nonsmokers following nicotine intake. Pharmacol. Biochem. Behav. 1990,35, 671–676. [CrossRef]
85. Farsalinos, K.E.; Polosa, R. Safety evaluation and risk assessment of electronic cigarettes as tobacco cigarettesubstitutes: A systematic review. Ther. Adv. Drug Saf. 2014, 5, 67–86. [CrossRef]
86. Litt, M.D.; Duffy, V.; Oncken, C. Cigarette smoking and electronic cigarette vaping patterns as a function ofe-cigarette flavourings. Tob. Control 2016, 25, ii67–ii72. [CrossRef]
290

Nutrients 2019, 11, 271
87. Rosbrook, K.; Erythropel, H.C.; DeWinter, T.M.; Falinski, M.; O’Malley, S.; Krishnan-Sarin, S.; Anastas, P.T.;Zimmerman, J.B.; Green, B.G. The effect of sucralose on flavor sweetness in electronic cigarettes variesbetween delivery devices. PLoS ONE 2017, 12, e0185334. [CrossRef]
88. Kroemer, N.B.; Veldhuizen, M.G.; Delvy, R.; Patel, B.P.; O’Malley, S.S.; Small, D.M. Sweet taste potentiatesthe reinforcing effects of e-cigarettes. Eur. Neuropsychopharmacol. 2018, 28, 1089–1102. [CrossRef]
89. Soberg, S.; Sandholt, C.H.; Jespersen, N.Z.; Toft, U.; Madsen, A.L.; von Holstein-Rathlou, S.; Grevengoed, T.J.;Christensen, K.B.; Bredie, W.L.P.; Potthoff, M.J.; et al. FGF21 Is a Sugar-Induced Hormone Associated withSweet Intake and Preference in Humans. Cell Metab. 2017, 25, 1045–1053. [CrossRef] [PubMed]
90. Sylvetsky, A.C.; Welsh, J.A.; Brown, R.J.; Vos, M.B. Low-calorie sweetener consumption is increasing in theUnited States. Am. J. Clin. Nutr. 2012, 96, 640–646. [CrossRef] [PubMed]
91. Mosdol, A.; Vist, G.E.; Svendsen, C.; Dirven, H.; Lillegaard, I.T.L.; Mathisen, G.H.; Husoy, T. Hypotheses andevidence related to intense sweeteners and effects on appetite and body weight changes: A scoping reviewof reviews. PLoS ONE 2018, 13, e0199558. [CrossRef] [PubMed]
92. Miller, P.E.; Perez, V. Low-calorie sweeteners and body weight and composition: A meta-analysis ofrandomized controlled trials and prospective cohort studies. Am. J. Clin. Nutr. 2014, 100, 765–777. [CrossRef][PubMed]
93. Azad, M.B.; Abou-Setta, A.M.; Chauhan, B.F.; Rabbani, R.; Lys, J.; Copstein, L.; Mann, A.; Jeyaraman, M.M.;Reid, A.E.; Fiander, M.; et al. Nonnutritive sweeteners and cardiometabolic health: A systematic review andmeta-analysis of randomized controlled trials and prospective cohort studies. CMAJ 2017, 189, E929–E939.[CrossRef] [PubMed]
94. Berridge, K.C. Wanting and Liking: Observations from the Neuroscience and Psychology Laboratory.Inquiry (Oslo) 2009, 52, 378. [CrossRef] [PubMed]
95. Piasecki, T.M.; Piper, M.E.; Baker, T.B.; Hunt-Carter, E.E. WISDM primary and secondary dependencemotives: Associations with self-monitored motives for smoking in two college samples. Drug Alcohol Depend.2011, 114, 207–216. [CrossRef]
96. Bel-Serrat, S.; Julian-Almarcegui, C.; Gonzalez-Gross, M.; Mouratidou, T.; Bornhorst, C.; Grammatikaki, E.;Kersting, M.; Cuenca-Garcia, M.; Gottrand, F.; Molnar, D.; et al. Correlates of dietary energy misreportingamong European adolescents: The Healthy Lifestyle in Europe by Nutrition in Adolescence (HELENA)study. Br. J. Nutr. 2016, 115, 1439–1452. [CrossRef]
97. Tuorila, H.; Huotilainen, A.; Lähteenmäki, L.; Ollila, S.; Tuomi-Nurmi, S.; Urala, N. Comparison of affectiverating scales and their relationship to variables reflecting food consumption. Food Qual. Pref. 2008, 19, 51–61.[CrossRef]
98. Nuttall, F.Q. Body Mass Index: Obesity, BMI, and Health: A Critical Review. Nutr. Today 2015, 50, 117–128.[CrossRef]
99. Murphy, C.M.; Rohsenow, D.J.; Johnson, K.C.; Wing, R.R. Smoking and weight loss among smokers withoverweight and obesity in Look AHEAD. Health Psychol. 2018, 37, 399–406. [CrossRef] [PubMed]
© 2019 by the authors. Licensee MDPI, Basel, Switzerland. This article is an open accessarticle distributed under the terms and conditions of the Creative Commons Attribution(CC BY) license (http://creativecommons.org/licenses/by/4.0/).
291


nutrients
Article
Effects of Varying the Color, Aroma, Bitter, and SweetLevels of a Grapefruit-Like Model Beverage on theSensory Properties and Liking of the Consumer
Andries G. S. Gous 1, Valérie L. Almli 2, Vinet Coetzee 3 and Henrietta L. de Kock 1,*
1 Department of Consumer and Food Sciences, University of Pretoria, P O Box X20, Hatfield,Pretoria 0028, South Africa; [email protected]
2 Nofima AS, P O Box 210, 1431 Ås, Norway; [email protected] Department of Genetics, University of Pretoria, P O Box X20, Hatfield, Pretoria 0028, South Africa;
[email protected]* Correspondence: [email protected]; Tel.: +27-(0)12-420-3238
Received: 14 December 2018; Accepted: 11 February 2019; Published: 22 February 2019
Abstract: Color, aroma, sweet, and bitter tastes contribute to the sensory perception ofgrapefruit juice. Consumers differ about liking grapefruit. A reason is the bitter taste thatcharacterize the fruit. The objective was to determine the effect of varying the color (red or yellow),aroma (two levels), bitterness (three levels), and sweetness (three levels) of a grapefruit-like modelbeverage, on consumers’ liking and perception of its sensory properties. The sensory profiles ofthirty-six grapefruit-like beverages, created on the basis of a factorial design, has been described.Consumers rated their liking of color, aroma, and flavor of the twelve most diverse beverages.Bitter and sweet levels of the beverages had a significant effect on the flavor and aftertaste attributes.Aroma concentration had a significant effect on the majority of the sensory attributes. Color hada significant effect on perception of some of the aroma attributes, as well as the grapefruit’sflavor intensity. Consumers liked the red beverages more than the yellow ones, and those withlow aroma over the high aroma intensity. Consumers preferred the low bitter/high sweet beverages.Pungent and grapefruit aroma were found to be negative drivers for liking of the aroma. Sweet andcitrus flavors were found to be positive drivers and sour and bitter flavors were found to be negativedrivers of flavor-preferences (or liking) of the tested beverages.
Keywords: grapefruit; sensory; consumer; bitter; naringin; sweet; aroma; color; hedonic
1. Introduction
The sensory properties of grapefruit (Citrus X paradisi) are distinctive characterizing componentsand play a key role in reasons why consumers choose or not choose to consume the fruit and itsproducts, e.g., juice. Grapefruit is a rich source of vitamin C, and health-promoting citrus flavonoidsand limonoids and has beneficial antioxidant and anti-inflammatory properties [1,2]. Its appearance,aroma, flavor, and mouthfeel properties contribute to the sensory perception of the fruit.
Consumers differ widely in opinions on liking or disliking grapefruit and part of thisindividual preference is attributed to liking or disliking of the bitter taste that characterizes the fruit.Excessive bitterness of the juice was considered to be an important problem in commercial grapefruitjuice production [3]. Naringin and limonin are mainly responsible for the bitter taste commonlyassociated with grapefruit [4]. The consumption of fresh grapefruit, and grapefruit products has beendeclining [5] and plant breeders are working on ways to select for desirable sensory traits. A betterunderstanding of the impact of the different sensory modalities contributing to the sensory perceptionof grapefruit products (e.g., juice) might assist product developers to optimize formulations and
Nutrients 2019, 11, 464; doi:10.3390/nu11020464 www.mdpi.com/journal/nutrients293

Nutrients 2019, 11, 464
improve uptake of the products among consumers, thereby, maintaining or enhancing profitability forthe role-players, along the grapefruit value chain.
Flavor perception is complex, due to the simultaneous stimulation of a number of senses. It is theresult of processes that respond to sensory signals, from the activation of multiple sensory modalities,including smell (retronasal olfaction), mouthfeel (somatosensation), as well as taste (gustation),and to some extent also sight. When different senses are stimulated, concurrently, and perceptuallyinteract with each other, the perceived flavor is the result of the cross-modal sensory interaction [6].Cross-modal interactions can change the intensity and perceived character of individual tastes andaromas, and even the overall flavor [7].
The present study aimed broadly, to determine the relations between the stimulus componentsof a model beverage (formulated to be similar to grapefruit juice) and their effects on the perceivedsensory properties and hedonic responses. We factorially combined, in the same acidified neutral base,each of three possible levels of bitter naringin (low, medium, and high) with each of three levels ofsweet sucrose (low, medium, and high), two levels of grapefruit aroma (low and high) and two colorvariants (red and yellow). We hypothesized that perceived bitterness of the model grapefruit-likebeverage will drive consumers dislike for the beverage but that bitterness perception will be a functionof cross-modal color–taste, aroma–taste, and sweet–bitter taste interactions.
The color of the natural juice extracted from the grapefruit depends on the variety used andranges from greenish-yellow to pale yellow, pink, and light red [8]. We hypothesized that a rose redgrapefruit-like beverage would be perceived as sweeter than a pale yellow option. Previously, it wasreported [9] that a red color decreased the perception of bitter taste intensity of a caffeine + watersolution, with the yellow and green color having had no effect. The color of food and drinks impactssubsequent perception of taste, flavor, and overall sensory perception. It has been reported in severalstudies that the color of a solution greatly impacts the ability to identify its flavor and also affects theliking responses [7].
We hypothesized that a beverage with high, compared to a low grapefruit aroma, would suppressthe bitter taste perception and enhance the taste of sweetness [10]. A new study [10] reported thatlemon extract, sucrose, and citric acid, when presented separately and also together, affected theperception of sweet, sour, and citrus flavors. The aroma of the products can influence the perception ofbasic tastes and vice versa [11–15].
It is well-known that sucrose and other sweet tasting compounds can suppress bitterness. This ispractically applied when bitter tasting coffee or tea is sweetened with sugar. Here the expectationwas that sweetness would suppress bitterness but an enhancement effect on volatile aroma and flavorcompounds was also expected. When sucrose was added to the fruit juices, not only were the perceivedlevel of bitterness and sourness reduced and the sweet taste intensity increased, but the sweet aromaintensity rating also changed [16].
2. Materials and Methods
2.1. Preparation of the Grapefruit-Like Beverages
Thirty-six grapefruit-like beverages (Table 1) were manufactured, following a factorial designwith deflavored, clarified, deionized, and acidified apple juice, as base, with an addition of naringin(three bitter levels), sucrose (three sweet levels), a grapefruit aroma compound mixture (two intensity levels)consisting of caryophyllene, citral, nootkatone, aldehyde C8 (octanal), aldehyde C9 (nonanal, aldehyde C10(decanal), and two colorants (red or yellow). The addition of naringin was intended to reflect a low-level,in-between, and a high-level, based on the typical content in the grapefruit juice (218–340 mg/kg) [17].The low level of sweetness was based on the industry minimum requirement for export purposes, withincrementally higher levels added to reflect medium and high sweetness. These aroma compound mixtureand levels used were selected in consultation with a flavorant supplier. The typical grapefruit juice colorwas copied using artificial colorants. The red color was a 0.001% solution blend of 30% sunset yellow
294

Nutrients 2019, 11, 464
and 70% ponceau red. The yellow color consisted of 0.0125% quinoline yellow. Standard preparation andmixing procedures were used for all added stimuli to ensure uniformity. The grapefruit-like beverageswere filled in 250 mL plastic bottles, with lids, for easy handling and uniformity, and were kept frozen at−18 ◦C, until use. The beverages were defrosted overnight at an ambient temperature and kept at 14 ◦C,until served. A summary of the physico-chemical characterization of the 36 grapefruit-like beverages ispresented in the Supplementary Material (Table S1).
Table 1. Factorial design for the 36 grapefruit-like beverages.
Number Code 1 Bitter Level Naringin mg/kg Sweet Level Sucrose Brix Aroma2 Level mg/kg Color3
1 LMHR 158 low 10 medium 10 high. Red2 MMHR 315 medium 10 medium 10 high Red3 HMHR 473 high 10 medium 10 high. Red4 LHHR 158 low 12 high 10 high Red5 MHHR 315 medium 12 high 10 high. Red6 HHHR 473 high 12 high 10 high. Red7 LLHR 158 low 8 low 10 high. Red8 MLHR 315 medium 8 low 10 high. Red9 HLHR 473 high 8 low 10 high Red
10 LMLR 158 low 10 medium 2.5 low Red11 MMLR 315 medium 10 medium 2.5 low Red12 HMLR 473 high 10 medium 2.5 low Red13 LHLR 158 low 12 high 2.5 low Red14 MHLR 315 medium 12 high 2.5 low Red15 HHLR 473 high 12 high 2.5 low Red16 LLLR 158 low 8 low 2.5 low Red17 MLLR 315 medium 8 low 2.5 low Red18 HLLR 473 high 8 low 2.5 low Red19 LMHY 158 low 10 medium 10 high. Yellow20 MMHY 315 medium 10 medium 10 high. Yellow21 HMHY 473 high 10 medium 10 high. Yellow22 LHHY 158 low 12 high 10 high. Yellow23 MHHY 315 medium 12 high 10 high. Yellow24 HHHY 473 high 12 high 10 high. Yellow25 LLHY 158 low 8 low 10 high. Yellow26 MLHY 315 medium 8 low 10 high. Yellow27 HLHY 473 high 8 low 10 high. Yellow28 LMLY 158 low 10 medium 2.5 low Yellow29 MMLY 315 medium 10 medium 2.5 low Yellow30 HMLY 473 high 10 medium 2.5 low Yellow31 LHLY 158 low 12 high 2.5 low Yellow32 MHLY 315 medium 12 high 2.5 low Yellow33 HHLY 473 high 12 high 2.5 low Yellow34 LLLY 158 low 8 low 2.5 low Yellow35 MLLY 315 medium 8 low 2.5 low Yellow36 HLLY 473 high 8 low 2.5 low Yellow
1 Code: 1st letter = bitter level (High, Medium, or Low); 2nd letter = sweet level (High, Medium, or Low);3rd letter = aroma level (High or Low); 4th letter = color (Red or Yellow). Samples in bold italics were used forconsumer evaluation. 2 Aroma blend = Caryophyllene, citral, nootkatone, aldehyde C8 (octanal), aldehyde C9(nonanal), aldehyde C10 (decanal). 3 Red color = 0.001% solution (30% Sunset yellow and 70% Ponceau red);Yellow color = 0.0125% Quinoline yellow.
2.2. Descriptive Sensory Analysis
The sensory profiles of the beverages were described by a sixteen-member trained sensorypanel with one to two years of descriptive sensory analysis experience. The specific training forattribute and methodology development for the evaluation of the beverages consisted of two sessionsof 2 h each, using the generic descriptive analysis method [18]. A total of 21 attributes weregenerated to characterize the aroma, flavor, and aftertaste of the grapefruit-like beverages (Table 2).Beverage samples (±30 mL) were served at ±14 ◦C, in 125 ml polystyrene cups with plastic lids,and marked with randomly selected three-digit numbers. Samples were evaluated in duplicates,12 beverages per 2 h session per day and a total of six sessions. The presentation order of samplesper day for the different panelists followed a Williams Latin square design. Reference standards wereavailable during training and evaluation sessions.
295

Nutrients 2019, 11, 464
Table 2. Definitions of attributes used for describing the aroma, flavor, and aftertaste of thegrapefruit-like beverages.
Attribute Definition (References Indicated Where Applicable)
AromaOverall aroma intensity The aroma of the beverage upon taking the first few sniffs
Citrus aroma The aroma associated with the general impression of citrus fruitsGrapefruit aroma The aroma of fresh grapefruitChemical aroma A very general term associated with many different types of compounds, such as solvents and cleaning compounds
Deteriorated/rotten aroma Aroma associated with rotten, deteriorated, and decayed fruit/materialMuddy/moldy aroma Aromatic characteristic of damp soil, wet foliage, or slightly undercooked boiled potato
Fruity aroma Aroma associated with a mixture of non-specific fruits (apples, pears, melons, and guava)Green/grassy aroma Aromatic characteristic of freshly cut leaves, grass, or green vegetables (green beans)Peely/peel oil aroma Aroma associated with grapefruit peel or skin; Ref: Grapefruit oil extracted from grapefruit
Soapy aroma Aroma associated with unscented soapPungent aroma Aroma causing a sharp sensation of the nasal mucous membranes; Ref: vinegar
Woody/spicy aroma Aroma associated with dry, fresh-cut wood; balsamic or bark-like; Ref: 10 ppm alpha-humulone in waterSweet aroma Aroma associated with high sugar content vegetables;Ref: Freshly boiled sweet corn
FlavorOverall flavor The intensity of the flavor that is released from the beverage upon taking the first sip
Sour taste Basic taste on tongue stimulated by acids; Ref: citric acid in waterSweet taste Taste on the tongue stimulated by sugars;Ref: 5% sugar (sucrose) in waterBitter taste Taste on tongue stimulated by bitter solutions;Ref: 473 mg/kg naringin in water
Astringent flavor The chemical feeling factor on the tongue or surface of the oral cavity described as puckering/dry and associated withtannins;Ref: Strong black tea
Citrus flavor Flavor associated with the general impression of citrus fruits;Ref: Cut lemon fruit and lime cordialGrapefruit flavor The flavor of fresh grapefruit; Ref: Cut red and white grapefruit fleshBitter aftertaste Bitter taste remaining in the mouth after swallowing the beverage
Panel performance was monitored to test reproducibility and consistency of the panel ratingsusing PanelCheck 1.3.2 (www.panelcheck.com; Nofima, Ås, Norway).
The attributes were evaluated on a structured horizontal line scale (10 cm) with descriptors at thescale ends ranging from ‘not intense’ (at the left end of the scale, 0 cm) to ‘very intense’ (at the right endof the scale, 10 cm). Data was captured using Compusense® five release 4.6 software (Compusense Inc.,Guelph, ON, Canada).
2.3. Consumer Evaluation
Ninety six young South African female consumers aged 18–24 years were recruited by trainedfieldworkers. Each consumer completed an online screening survey and were invited to participate ifin a self-reported good state of health, and if not limited by any food intolerance(s) and/or allergies.Participants were briefed and gave written consent before evaluating the beverages. Participants wererequested not to eat, drink (except for water) or smoke for at least 1 h prior to the session.
The consumers (n = 90) evaluated liking of the color, aroma and flavor of the 12 most diversebeverages (selected on the basis of composition) (Table 1) using the Simplified Labeled AffectiveMagnitude (SLAM) scale [19], a 10 cm line scale labelled with descriptors ‘greatest imaginable dislike’(at 0 cm), and ‘greatest imaginable like’ (at 10 cm). Sample preparation and presentation was the sameas for the trained panel. The 12 samples were evaluated in one session and the order of presentation todifferent consumers followed a Williams design.
Data was captured using Compusense® five release 4.6 software (Compusense Inc.,Guelph, ON, Canada).
Ethical approval for this study was obtained from the Faculty of Natural and Agricultural SciencesEthics Committee at the University of Pretoria (EC 130827-088).
2.4. Statistical Analysis
An analysis of variance (ANOVA) model fitted using PROC GLM in SAS v9.4 (SAS Institute Inc.,Cary, NC, USA) was used to determine the main effects of the panelists, the bitter level, the sweetlevel, the aroma level, and the color type, together with the respective two-way interactions on thesensory attributes of the beverages. Tukey’s HSD test (p = 0.05) was used to compare beveragesthat differed in an attribute. Principal component analysis (PCA) using XLSTAT 2014 (Addinsoft,Paris, France) was applied to the correlation matrix of the sensory panel mean ratings, for all attributesof all grapefruit-like beverages.
296

Nutrients 2019, 11, 464
Consumer liking of the color, aroma, and flavor of the 12 most diverse beverages was analyzedby a three-way ANOVA model, including the effects of color, aroma level, and tastants (bitter andsweet levels in three combination). Means were compared using Fisher’s least significant differencetest at p < 0.05. Data were analyzed using GenStat® (VSN International Ltd., Hertfordshire, UK).Consumer liking ratings (y) for color, aroma, and flavor of beverages were modeled as a function of thedescriptive sensory attributes (x), using three separate partial least squares (PLS) regression models.Preliminary models were run with all sensory attributes and their squared terms. Variable importance(VIP), which measures how important a variable is in terms of modeling the liking attributes, wasused to select a smaller number of linear and squared terms for the final model. The VIP valuessummarize the overall contribution of each X-variable to the PLS model, summed over all components,and weighted according to the Y variation, accounted for by each component. Only those linear termswith a VIP greater than 0.8, as well as the five squared terms with the highest contribution, wereretained. The PLS models were used to determine the positive and negative drivers of color, aroma,and flavor liking, and also to predict consumer liking of the 24 samples that were profiled by thedescriptive sensory panel, but not evaluated by the consumers. The SIMCA-P package (Umetrics,Umea, Sweden) was used for the PLS modeling.
3. Results
3.1. Descriptive Sensory Profiles of the Grapefruit-Like Beverages
Table 3 presents a summary of the main effects (color, aroma, bitter, and sweet) and two-wayinteraction ANOVA effects (provided in Supplementary Tables S2, S3 and S4) on sensory attributes ofgrapefruit-like beverages, as evaluated by the trained sensory panel. Means for each of the samplesrepresent the average of duplicate ratings by 16 panelists. Color of the grapefruit-like beverages had asignificant effect on perception of some aroma and flavor properties. The overall aroma and grapefruit,deteriorated/rotten, muddy/mouldy, fruity and sweet aroma, and grapefruit flavor of the red coloredbeverages were perceived as significantly (p < 0.05) more intense than the yellow colored beverages.
The level of aroma added had a significant effect on the majority of the sensory attributes,namely, overall aroma intensity and citrus, grapefruit, chemical, muddy/moldy, fruity, green/grassy,peely/peel oil, soapy, pungent, woody/spicy, and sweet aroma, with the lowest intensities perceivedin the beverages with the low aroma level added. Aroma level had a significant effect on the bitter,astringent, and citrus flavor, and the bitter aftertaste perception, with the highest bitter and astringentflavor and bitter aftertaste being perceived in the beverages with a low aroma level and the highestcitrus flavor being perceived in the beverages with a high aroma level.
Varying the naringin content (bitter level) of the beverages did not have any significant effecton any of the aroma attributes. It did, however, have a significant effect on the intensities of overallflavor and the astringent flavor, with the highest values observed for beverages with mediumand high naringin concentrations. The naringin level had a significant effect on the intensities ofsweet, sour, bitter, and grapefruit flavor, and the bitter aftertaste perception. The highest sweetness,but lowest sourness and grapefruit flavors were perceived in the beverages with low and mediumnaringin concentrations. Intensity of bitter flavor and bitter aftertaste followed the level of bittercompound addition.
Sweetness level contributed by sucrose had a significant effect on the perception of the manysensory properties of the grapefruit-like beverages. Significantly higher soapy aroma was perceivedin the beverages with low and medium levels of sucrose, compared to a high sucrose addition.Sucrose level in the beverages had a significant effect on sour, sweet, bitter, astringent, and grapefruitflavor, and the bitter aftertaste intensities. Sour, bitter, astringent, and bitter aftertaste intensitiesdecreased as the sweet level increased, while sweetness increased. A less intense grapefruit flavor wasperceived in the high sweet level beverages, compared to the low and medium sweet levels.
297

Nutrients 2019, 11, 464
Ta
ble
3.
Sum
mar
yof
the
sign
ifica
nce
ofva
ryin
gth
em
ain
effe
cts
ofco
lor
hue,
arom
a,bi
tter
,and
swee
tlev
els
ofa
mod
elgr
apef
ruit-
like
beve
rage
,on
the
mea
nva
lues
1(±
SEM
)for
sens
ory
attr
ibut
esas
eval
uate
dby
atr
aine
dse
nsor
ypa
nel(
n=
16).
Att
rib
ute
sC
olo
r2
Aro
ma
3m
g/k
gB
itte
r(N
ari
ng
inm
g/k
g)
Sw
ee
t(S
ucr
ose
mg
/kg
)
Red
Yell
ow
2.5
10
15
8L
ow
31
5M
ed
ium
47
3H
igh
8B
rix
10
Bri
x1
2B
rix
Ove
rall
arom
ain
tens
ity
6.06
a(0
.05)
5.83
b(0
.05)
**5.
52b
(0.0
5)6.
37a
(0.0
5)**
*5.
87a
2
(0.0
6)6.
04a
(0.0
6)5.
93a
(0.0
6)N
S5.
96a
(0.0
6)5.
91a
(0.0
6)5.
96a
(0.0
6)N
S
Cit
rus
arom
a4.
54a
(0.0
5)4.
55a
(0.0
5)N
S4.
23b
(0.0
5)4.
86a
(0.0
5)**
*4.
51a
(0.0
6)4.
58a
(0.0
6)4.
55a
(0.0
6)N
S4.
51a
(0.0
6)4.
58a
(0.0
6)4.
55a
(0.0
6)N
S
Gra
pefr
uita
rom
a4.
40a
(0.0
5)4.
15b
(0.0
5)**
4.06
b(0
.05)
4.49
a(0
.05)
***
4.28
a(0
.06)
4.23
a(0
.06)
4.32
a(0
.06)
NS
4.23
a(0
.06)
4.35
a(0
.06)
4.25
a(0
.06)
NS
Che
mic
alar
oma
4.09
a(0
.06)
4.03
a(0
.06)
NS
3.86
b(0
.06)
4.25
a(0
.06)
***
3.99
a(0
.07)
4.13
a(0
.07)
4.06
a(0
.07)
NS
4.06
a(0
.07)
4.03
a(0
.07)
4.09
a(0
.07)
NS
Det
erio
rate
d/ro
tten
arom
a2.
14a
(0.0
4)2.
00b
(0.0
4)**
2.09
a(0
.04)
2.05
a(0
.04)
NS
2.08
a(0
.05)
2.04
a(0
.05)
2.09
a(0
.05)
NS
2.05
a(0
.05)
2.04
a(0
.05)
2.12
a(0
.05)
NS
Mud
dy/m
oldy
arom
a2.
20a
(0.0
3)2.
09b
(0.0
3)**
2.09
b(0
.03)
2.20
a(0
.03)
**2.
12a
(0.0
4)2.
13a
(0.0
4)2.
18a
(0.0
4)N
S2.
18a
(0.0
4)2.
13a
(0.0
4)2.
13a
(0.0
4)N
S
Frui
tyar
oma
3.93
a(0
.05)
3.78
b(0
.05)
*3.
71b
(0.0
5)4.
00a
(0.0
5)**
*3.
89a
(0.0
6)3.
83a
(0.0
6)3.
85a
(0.0
6)N
S3.
83a
(0.0
6)3.
90a
(0.0
6)3.
83a
(0.0
6)N
S
Gre
en/g
rass
yar
oma
3.13
a(0
.04)
3.14
a(0
.04)
NS
2.91
b(0
.04)
3.36
a(0
.04)
***
3.12
a(0
.05)
3.09
a(0
.05)
3.19
a(0
.05)
NS
3.12
a(0
.05)
3.18
a(0
.05)
3.10
a(0
.05)
NS
Peel
y/pe
eloi
laro
ma
3.53
a(0
.05)
3.47
a(0
.05)
NS
3.20
b(0
.05)
3.79
a(0
.05)
***
3.53
a(0
.06)
3.47
a(0
.06)
3.49
a(0
.06)
NS
3.49
a(0
.06)
3.55
a(0
.06)
3.46
a(0
.06)
NS
Soap
yar
oma
3.29
a(0
.05)
3.23
a(0
.05)
NS
3.16
b(0
.05)
3.36
a(0
.05)
**3.
27a
(0.0
6)3.
20a
(0.0
6)3.
31a
(0.0
6)N
S3.
41a
(0.0
6)4.
33a
(0.0
6)3.
04b
(0.0
6)**
Pung
enta
rom
a3.
16a
(0.0
5)3.
11a
(0.0
5)N
S2.
84b
(0.0
5)3.
43a
(0.0
5)**
*3.
10a
(0.0
6)3.
14a
(0.0
6)3.
18a
(0.0
6)N
S3.
17a
(0.0
6)3.
13a
(0.0
6)3.
11a
(0.0
6)N
S
Woo
dy/s
picy
arom
a2.
49a
(0.0
4)2.
40a
(0.0
4)N
S2.
33b
(0.0
4)2.
57a
(0.0
4)**
*2.
43a
(0.0
4)2.
44a
(0.0
4)2.
47a
(0.0
4)N
S2.
48a
(0.0
4)2.
48a
(0.0
4)2.
37a
(0.0
4)N
S
Swee
taro
ma
3.79
a(0
.05)
3.62
b(0
.05)
*3.
56b
(0.0
5)3.
86a
(0.0
5)**
*3.
73a
(0.0
6)3.
69a
(0.0
6)3.
70a
(0.0
6)N
S3.
69a
(0.0
6)3.
72a
(0.0
6)3.
72a
(0.0
6)N
S
Ove
rall
flavo
rin
tens
ity
6.39
a(0
.05)
6.34
a(0
.05)
NS
6.37
a(0
.05)
6.36
a(0
.05)
NS
6.14
b(0
.06)
6.51
a(0
.06)
6.46
a(0
.06)
***
6.41
a(0
.06)
6.29
a(0
.06)
6.40
a(0
.06)
NS
Sour
flavo
r5.
09a
(0.0
6)5.
17a
(0.0
6)N
S5.
14a
(0.0
6)5.
11a
(0.0
6)N
S4.
90b
(0.0
8)5.
08b
(0.0
8)5.
40a
(0.0
8)**
*5.
93a
(0.0
8)5.
07b
(0.0
8)4.
38c
(0.0
8)**
*
Swee
tflav
or4.
48a
(0.0
5)4.
43a
(0.0
5)N
S4.
38a
(0.0
5)4.
53a
(0.0
5)N
S4.
64a
(0.0
6)4.
51a
(0.0
6)4.
21b
(0.0
6)**
*3.
04c
(0.0
6)4.
50b
(0.0
6)5.
82a
(0.0
6)**
*
Bitt
erfla
vor
4.56
a(0
.07)
4.48
a(0
.07)
NS
4.77
a(0
.07)
4.27
b(0
.07)
***
3.94
c(0
.08)
4.46
b(0
.08)
5.17
a(0
.08)
***
5.24
a(0
.08)
4.43
b(0
.08)
3.89
c(0
.08)
***
Ast
ring
entfl
avor
4.95
a(0
.06)
4.81
a(0
.06)
NS
4.97
a(0
.06)
4.79
b(0
.06)
*4.
62b
(0.0
7)4.
91a
(0.0
7)5.
12a
(0.0
7)**
*5.
35a
(0.0
7)4.
88b
(0.0
7)4.
41c
(0.0
7)**
*
Cit
rus
flavo
r4.
47a
(0.0
5)4.
43a
(0.0
5)N
S4.
30b
(0.0
5)4.
60a
(0.0
5)**
*4.
52a
(0.0
6)4.
44a
(0.0
6)4.
39a
(0.0
6)N
S4.
43a
(0.0
6)4.
45a
(0.0
6)4.
48a
(0.0
6)N
S
Gra
pefr
uitfl
avor
4.53
a(0
.05)
4.36
b(0
.05)
*4.
49a
(0.0
5)4.
40a
(0.0
5)N
S4.
19b
(0.0
7)4.
41b
(0.0
7)4.
73a
(0.0
7)**
*4.
53a
(0.0
7)4.
54a
(0.0
7)4.
26b
(0.0
7)**
Bitt
eraf
tert
aste
4.32
a(0
.07)
4.26
a(0
.07)
NS
4.49
a(0
.07)
4.08
b(0
.07)
***
3.69
c(0
.08)
4.26
b(0
.08)
4.91
a(0
.08)
***
4.90
a(0
.08)
4.25
b(0
.08)
3.71
c(0
.08)
***
1A
ttri
bute
inte
nsit
ysc
ale
from
‘not
inte
nse’
(0)
to‘v
ery
inte
nse’
(10)
;2
Red
=0.
001%
solu
tion
(30%
Suns
etye
llow
and
70%
Pon
ceau
red
);Ye
llow
=0.
0125
%Q
uin
olin
eye
llow
.3
Aro
ma
blen
d{c
aryo
phyl
lene
,citr
al,n
ootk
aton
e,al
dehy
deC
8(o
ctan
al),
alde
hyde
C9
(non
anal
),an
dal
dehy
deC
10(d
ecan
al)}
.abc
—di
ffer
entl
ette
rsin
dica
tesi
gnifi
cant
lydi
ffer
entm
ean
valu
esac
ross
desi
gnva
riab
lele
vels
.Mea
nsre
pres
entt
heav
erag
eof
dupl
icat
era
ting
sby
16pa
nelis
ts;*
p≤
0.05
,**
p≤
0.01
,***
p≤
0.00
01;N
S=
nots
igni
fican
tly
diff
eren
t.
298

Nutrients 2019, 11, 464
Very few two-way interactions were significant. The detailed tables for the significant interactioneffects are presented in the Supplementary Material (Tables S2–S4). The bitter level x aroma levelinteraction effect (Table S2) was significant for the perception of the intensity of chemical aromaand overall flavor intensity, the bitter flavor, and the bitter aftertaste. A trend was observed in thatthe chemical aroma was more intensely perceived in the beverages with high aroma, although onlysignificantly so in the low and high bitter samples and not in the medium bitter samples. The overallflavor intensity was significantly but slightly lower in the high aroma/medium bitter, compared tothe low aroma/medium bitter sample. Aroma level did not affect the overall flavor perception at thelow or high bitter levels. Bitter flavor and bitter aftertaste were notably less intense in the high aromasamples, compared to the low aroma samples, but only significantly so for the medium and high bitterlevel beverages.
The bitter level x color type interaction effect (Table S2) was significant for the bitter aftertasteintensity. However, bitter aftertaste was essentially driven more by the bitter level than the color type.The bitter level x sweet level interaction effect (Table S3) was significant only for the pungent aroma.A significantly lower pungent aroma was noted between the medium sweet and low sweet beverages,at the medium bitter level.
The aroma level x color interaction effect (Table S3) was significant only for bitter flavor intensity.At a low aroma level, no difference in bitter flavor intensity was found between the two colors.However, at the high aroma level, the yellow beverage was perceived as being significantly bitterer.
The sweet level x aroma level interaction effect (Table S4) was not significant for any of the sensoryaroma attributes. A sweet level x color interaction effect (Table S4) was significant for the astringentand citrus flavor perception. While no significant differences were found between the red and yellowbeverages at the medium sweet level, the red beverage was perceived as significantly more astringentat low sweet and high sweet levels. A similar effect was found for the citrus flavor, although the redbeverages were found to have a more intense citrus flavor, only at the low sweet level.
The multivariate differentiation of the beverages is presented in Figure 1 as a PCA map over atwo-dimensional space. The first and second principal components (F1 and F2) explained 37% and35%, respectively, of the variance across the samples. F1 clearly separated beverages based on intensityof overall aroma, peely/peel oil aroma, citrus aroma, sweet aroma, and pungent aroma. Beverages thatwere more intense in terms of the mentioned attributes are located on the right of the plot. Note that allof these beverages have an H as third letter, therefore, they have a high aroma level. The beverages withlower intensities are located on the left of the plot and notably has L as the third letter, therefore, witha low level aroma. F2 separated the beverages based on ‘taste’ perception, i.e., naringin (bitter)-sucrose(sweet) levels. Beverages with high and medium bitter levels and low sweet are positioned at the top,and beverages with low bitter level and medium and high sweet levels, are at the bottom. Beverages atthe top, namely HLLY and HLLR with a high level of naringin and MLHY with a medium level, werecharacterized by more intense astringency, sour, and bitter tastes, and with grapefruit and overallflavor intensities. Beverages (e.g., LHHR) with a low naringin level (at the bottom), were characterizedby a more intense sweet taste. The attributes citrus flavor, chemical aroma, and muddy/moldy aromain the middle of the plot, did not discriminate beverages on the first two PCs.
299

Nutrients 2019, 11, 464
Figure 1. Principal Component Analysis (PCA) of the sensory profiles of the 36 grapefruit-likebeverages. The vectors indicate the loadings for sensory attributes while the position of the samplecodes indicate the score values. The four-letter codes indicate levels of naringin (1st letter: L = Low,M = Medium, or H = High), sucrose (2nd letter: L = Low, M = Medium, or H = High), aroma (3rd letter:L = Low, or H = High) and color (4th letter: R = red or Y = yellow). Sensory attributes 1AT = Aftertaste,2Fl = Flavor, 3Ar = Aroma. Beverages in green font were selected for the consumer tests.
3.2. Consumer Evaluation of the Grapefruit-Like Beverages
The effects of color, aroma level, and bitter/sweet levels of the grapefruit-like beverages on meanliking ratings for the color, aroma, and flavor, as evaluated by the consumers, are presented in Table 4.Two-way interaction effects were not significant.
300

Nutrients 2019, 11, 464
Ta
ble
4.
The
effe
ctof
vary
ing
the
colo
r,ar
oma,
and
bitt
er/s
wee
tgus
tato
ryfla
vora
nts
onm
ean
likin
gra
tings
1(±
stan
dard
devi
atio
n)fo
rco
lor,
arom
a,an
dfla
vor
ofgr
apef
ruit
-lik
ebe
vera
ges
by(n
=90
)con
sum
ers.
Co
lor
2A
rom
a3
mg
/kg
3B
itte
r-S
we
et
Na
rin
gin
mg
/kg
/Su
cro
seB
rix
Re
dY
ell
ow
2.5
10
mg
/kg
15
8/1
2L
ow
/Hig
h3
15
/10
Me
diu
m/M
ed
ium
47
3/8
Hig
h/L
ow
Liki
ngof
colo
r64
b(3
0)60
a(3
0)**
63a
(30)
61a
(31)
NS
62a
1(3
0)62
a(3
1)61
a(3
0)N
SLi
king
ofar
oma
51a
(30)
51a
(30)
NS
53a
(29)
49b
(31)
***
50ab
(30)
53a
(30)
49b
(29)
*Li
king
offla
vor
45a
(33)
45a
(34)
NS
45a
(34)
45a
(34)
NS
55a
(33)
46b
(33)
34c
(32)
***
1Si
mpl
ified
Lab
elle
dA
ffec
tive
Mag
nitu
de
Scal
e(S
LA
M);
0=
grea
test
imag
inab
led
islik
e,10
0=
grea
test
imag
inab
lelik
ing.
abc—
diff
eren
tlet
ters
ind
icat
esi
gnifi
cant
lyd
iffer
entm
ean
valu
esac
ross
the
desi
gnva
riab
lele
vels
.NS
=no
tsig
nific
ant,
*p≤
0.05
,**
p≤
0.01
,***
p≤
0.00
1.2
Red
=0.
001%
solu
tion
(30%
Suns
etye
llow
and
70%
Ponc
eau
red)
;Yel
low
=0.
0125
%Q
uino
line
yello
w..3
Aro
ma
blen
d{c
aryo
phyl
lene
,cit
ral,
noot
kato
ne,a
ldeh
yde
C8
(oct
anal
),al
dehy
deC
9(n
onan
al),
and
alde
hyde
C10
(dec
anal
)}.
301

Nutrients 2019, 11, 464
The standardized PLS regression coefficients for attributes as part of the prediction models arepresented in Table 5. PLS regression (PLSR) models were used to predict liking of the color, aroma,and flavor of the 36 beverages, including the beverages that were not evaluated by consumers (Table 6).Expected errors of prediction for the models were low, lying between ±1.288 for the aroma model to±2.458 for the color model, and ±2.678 for the flavor model, with a 95% confidence interval, indicatingreliable prediction estimations of the liking variables.
Table 5. Standardized partial least squares (PLS) regression coefficients for factors to summarize therelationship between predictors (X, consumer liking variables) and Y, sensory response variables. Onlyselected important variables (main effects and squared effects, noted as ‘2’) from the refined modelsare shown.
Liking of the Color R2 = 0.871 Liking of the Aroma R2 = 0.970 Liking of the Flavor R2 = 0.982
Overall aroma intensity 2 0.23 Fruity aroma 2 0.08 Sweet aroma 0.16Citrus aroma 2 0.16 Citrus flavor 0.03 Chemical aroma 2 0.15Sweet aroma 0.16 Sweet flavor 0.03 Citrus flavor 0.12
Astringent flavor 2 0.15 Astringent flavor 0.02 Deteriorated/rottenaroma 0.03
Green/grassy aroma 2 0.10 Grapefruit flavor 0.02 Green/grassy aroma 2 −0.01Fruity aroma 0.00 Bitter aftertaste −0.01 Greed/grassy aroma −0.01
Overall aroma intensity 0.00 Bitter flavor −0.01 Chemical aroma −0.01Grapefruit aroma 0.00 Sour flavor −0.02 Woody/spicy aroma 2 −0.04
Green/grassy aroma −0.01 Overall flavor intensity −0.04 Overall flavor intensity −0.04
Astringent flavor −0.04 Deteriorated/rottenaroma −0.05 Bitter flavor −0.07
Peely/peel oil aroma −0.04 Soapy aroma −0.05 Grapefruit flavor −0.07Pungent aroma −0.05 Chemical aroma −0.06 Woody/spicy aroma −0.08Citrus aroma −0.06 Woody/spicy aroma −0.06 Fruity aroma −0.08Citrus flavor −0.07 Sweet aroma −0.07 Muddy/moldy aroma −0.10
Muddy/moldy aroma −0.08 Fruity aroma −0.07 Bitter flavor −0.11Woody/spicy aroma −0.09 Peely/peel oil aroma −0.08 Astringent flavor −0.11
Soapy aroma −0.13 Pungent aroma 2 −0.08 Sour flavor −0.12Chemical aroma 2 −0.18 Citrus aroma −0.09 Bitter aftertaste −0.12Chemical aroma −0.19 Grapefruit aroma −0.09 Soapy aroma −0.19
Overall aroma intensity −0.10Green/grassy aroma −0.11
Muddy/moldy aroma −0.12Bitter flavor −0.14
Pungent aroma −0.14Sweet flavor 2 −0.16Sweet aroma 2 −0.17
Table 6. Partial least square regression (PLSR) model predicted liking ratings for color, aroma, and flavorof the grapefruit-like beverages.
Color Liking Aroma Liking Flavor Liking
Number 1 Code 2 Observed 3 Predicted Observed Predicted Observed Predicted
2 MMHR 61ab (31) 61 51ab (30) 51 44abc (31) 454 LHHR 64ab (29) 64 45b (30) 45 54a (32) 529 HLHR 63ab (33) 64 47ab (30) 47 35bc (33) 3611 MMLR 66a (29) 64 57a (29) 56 48a (33) 4813 LHLR 67a (30) 68 55ab (29) 55 55a (34) 5518 HLLR 62ab (30) 61 51ab (29) 50 32c (29) 3220 MMHY 62ab (32) 61 52ab (29) 52 48a (35) 4822 LHHY 55b (32) 56 48ab (33) 48 54a (34) 5427 HLHY 59ab (30) 60 49ab (31) 49 35bc (34) 3429 MMLY 60ab (32) 60 54ab (31) 54 46ab (34) 4731 LHLY 61ab (29) 62 52ab (29) 53 55a (33) 5636 HLLY 61ab (28) 62 50ab (28) 51 35bc (32) 341 LMHR 59 44 413 HMHR 62 49 415 MHHR 63 47 476 HHHR 60 46 457 LLHR 62 46 418 MLHR 60 47 3810 LMLR 61 53 4712 HMLR 64 54 45
302

Nutrients 2019, 11, 464
Table 6. Cont.
Color Liking Aroma Liking Flavor Liking
14 MHLR 61 52 5015 HHLR 63 52 4816 LLLR 62 53 4317 MLLR 59 48 3219 LMHY 59 49 4421 HMHY 62 41 3823 MHHY 62 52 5724 HHHY 62 52 5125 LLHY 60 48 3626 MLHY 61 45 4028 LMLY 63 55 5630 HMLY 62 54 4032 MHLY 66 55 5633 HHLY 63 52 4634 LLLY 68 57 5335 MLLY 60 52 39
1 Refer to Table 1 for number. 2 Code: 1st letter = bitter level (High, Medium, or Low); 2nd letter = sweet level(High, Medium, or Low); 3rd letter = aroma level (High or Low); 4th letter = color (Red or Yellow). Samples in bolditalic were used for consumer evaluation. 3 Values are means (± standard deviation); Observed means in a columnwith different letters are significantly different (p < 0.05).
Liking of the color of the red grapefruit-like beverages were rated, on average, slightly higher thanthe yellow ones (p < 0.05) (Table 4). Whether the beverage was colored yellow or red, it did not affectthe liking of the aroma or the flavor. Predicted mean liking of the color for the highest and lowest likedof the 36 beverages differed, however, only by a maximum of 12.2 scale units (Table 6). Notably theresearch found no significant sensory attribute drivers for liking of the color of the grapefruit-likebeverages (Table 5).
Liking of the aroma of beverages with a low added-aroma level, was higher (p < 0.05) than forthose with a high added-aroma level (Table 4). Aroma level did not have an effect on the liking ofthe color of the beverage. Aroma level also did not affect the liking of the flavor of the beverage.The predicted mean liking of the aroma for the highest and the lowest liked beverages, differed by16.5 scale units (Table 6). Main effects and squared effects are indicated as ‘2’. Positive attributedrivers for liking of the aroma of the grapefruit-like beverages were the square term of fruity aroma(noted fruity aroma2), citrus flavor, and sweet flavor, while negative drivers were sweet aroma 2, sweetflavor2, and pungent aroma (Table 5).
As expected, the level of the gustatory flavorants, the naringin, and the sucrose, did not affectthe liking of the color of the beverages (Table 4). Surprisingly the non-volatile taste level did havea significant effect (p < 0.05) on the liking of the aroma of the beverages. The aroma of the mostbitter/least sweet beverages was liked significantly less than the other two taste combination levels.Not surprisingly, liking of the flavor of the beverages decreased significantly (p < 001) as the bitter levelincreased and the sweet level decreased. Predicted mean ratings for liking of the flavor, the highestliked and the lowest liked of the 36 beverages, differed by 27.5 scale units. Positive drivers for liking ofthe flavor of the grapefruit-like beverages were sweet taste, squared term for chemical aroma (noted as‘chemical aroma2), and citrus flavor intensities, while the negative drivers were intensity of soapyaroma, bitter aftertaste, and sour taste (Table 6).
4. Discussion
The research studied the effect of varying the bitterness, sweetness, color, and aroma intensityof grapefruit-like beverages on the cross-modal perception of sensory properties and its effects onconsumer liking. A model grapefruit-like beverage standard formulation was created and a sensorylexicon with a total of 21 attributes and definitions were generated to characterize the aroma, the flavor,
303

Nutrients 2019, 11, 464
and the aftertaste of the grapefruit-like model beverage with variations in color, aroma, and gustatoryflavorant levels.
Color hue of the grapefruit-like beverage affected the perception and description of the aromaand flavor sensory properties, as evaluated by the trained human panelists. Color of the beverages,and, in particular, the sample with the rose-red hue had a significant enhancing effect on perception ofoverall aroma intensity and grapefruit, deteriorated/rotten, muddy/moldy, fruity, and sweet aromaintensities. It also corresponded to the consumer liking—the red beverages were liked more thanthe yellow ones. The cross modal effect of the beverage color on aroma and flavor of the beverages,however, did not lead to significant differences in the liking of aroma or a liking of the flavor of thered and yellow beverages. The difference in methodology followed and the cognitive tasks employedby the two groups of panels might be the reason. When the group of consumers evaluated the likingof the color of the beverages, solely based on appearance, a slight but significant preference for thered-colored beverages was noted. This preference was solely driven by visual cues, since the consumersdid not yet smell or taste the beverages. After smelling and tasting the beverages, it is likely that theopinion and preference might have changed, based on the cross-modal, color-aroma/flavor sensoryinteraction, as demonstrated by the results for the trained panel in this study. Considering that theconsumers first evaluated the liking of the color, then the aroma (retronasally), and lastly the flavor(after consumption) of each sample, sequentially, it cannot be excluded that some form of learning,anticipation, and association might have occurred over the evaluation of the sequence of twelvesamples, of which 50% were red and 50% were yellow.
A study [20] reported that the red color decreased the perception of the bitter taste sensitivityof a water solution. Coloring a clear bitter solution red, decreased the perception of the bitter taste,while the addition of yellow and green coloring had no such effect [9]. Other researchers [21] suggestedthat color-induced olfactory enhancement observed when odorous solutions are smelled orthonasally,might be the result of a conditioned olfactory percept caused by the color. Conditioned expectationspredict that certain colors would be strongly associated with particular flavors, e.g., red with cherry,orange with orange, and green with lime [22]; yellow with lemon, blue with spearmint, and red withstrawberry, raspberry, and cherry [23]. In South Africa, the location for the study, both yellow andred/pink grapefruit are marketed. The Star Ruby variety with a red color is the most planted (84%)grapefruit variety in South Africa, followed by the white variety Marsh (16%) (the juice of this type ofgrapes is pale yellow) [24]. In another study [25] it was found that the relationship of green and yellowcolors in the lemon and lime-flavored sucrose solutions was altered; such color changes were found tohave an impact on the perceived sweetness ratings. In another study, results showed that color–odorsolution pairings were rated as having more intense odors with color cues than without, regardlessof the color–odor pairing appropriateness [21]. This cross-modal effect presumably results from thecolor-cue setting up an expectation concerning the likely identity and intensity of a food or drink’staste or flavor [20]. No significant sensory attribute drivers for liking of the color of the grapefruit-likebeverages was identified, since the trained sensory panel did not evaluate the appearance attributes.
Aroma level added to the model beverage had a significant enhancing effect, on the majority ofthe aroma and flavor sensory attributes. The enhancement of overall aroma and characteristic aromaqualities, including citrus flavor, as a function of the level of aroma added, was expected and confirmed.When consumers evaluated liking of the aroma of the beverages, solely based on orthonasal inspection,surprisingly the beverages with low aroma were slightly preferred over those with high aroma. It ispossible that the higher aroma level was more distinctive and clearly reminiscent of grapefruit andpossibly evoked a stronger cue for those disliking grapefruit. An interesting and unexpected findingwas the apparent suppression of bitter and astringent gustatory sensations, due to a higher load ofolfactory stimuli (high aroma level). Previous studies have found that aroma–taste interactions canresult in complicated changes in the perceived flavor. The addition of an aroma can, e.g., elevatethe bitter-detection threshold [26,27]. The perceived intensity of tastes in solutions was increased byvolatile compounds, especially when there was a logical association between them, such as between
304

Nutrients 2019, 11, 464
sweetness and fruitiness [28]. Apple and strawberry aromas evoked both sweetness and sourness.A study found that tasteless aromas, namely green tea and coffee, predominantly evoked bitterness,while the vanilla aroma predominantly evoked sweetness [29]. The grapefruit aroma consisted ofa blend of caryophyllene, citral, nootkatone, and various aldehydes; octanal, nonanal, and decanal.No study could be found that specifically indicated that any of these compounds evoked bitterness.Nootkatone at the above threshold concentrations was reported as tasting bitter [30]. Consumption ofa beverage results in the simultaneous perception of aroma and taste, coupled with tactile sensations,all of which contribute to an overall impression of flavor. Compounds that stimulate taste perception(e.g., naringin contributing a bitter taste) can increase the apparent intensity of aromas. In this study,the grapefruit flavor was enhanced by the naringin addition. The aroma compound (containing acitral component) of the grapefruit-like beverages had an enhancing effect on the citrus aroma intensity.An additive effect of the sweet components with citral or limonene volatiles having a ‘citrus’-likearoma was reported by [31] but was not observed in this study. The suppression of bitterness in thehigh aroma beverages, however, did not affect the liking of the flavor, since there was no differencefound in the liking of the flavor of beverages with low or high aroma levels. Positive drivers for likingof the aroma of the grapefruit-like beverages were fruity aroma2, citrus flavor, and sweet flavor, whilenegative drivers were sweet aroma2, sweet flavor2, and pungent aroma.
The low bitter/high sweet beverages were preferred over the high bitter/low sweet samples.A study [32] reported that with an increase in the ratio of ◦Brix/acidity of reconstituted grapefruitjuice, the consumer perception of sweetness increased and bitterness and aroma intensity decreased.Some bitterness in processed grapefruit products is acceptable for consumers, but excessive bitternessis one of the major consumer objections to such products [28,31]; this was confirmed in this study.The variation in sensitivity of the individual consumers to bitter compounds in grapefruit beveragescould be explored further to identify whether subgroups might have different preferences. As expected,the contribution of varying concentrations of naringin affecting the bitterness of the grapefruit-likebeverages did not have a significant effect on any of the aroma attributes. Similarly, [32] reportedthat consumers did not find any difference in aroma with increased levels of naringin in processedgrapefruit juice. However, the concentration of bitterness of the grapefruit-like beverages had asignificant effect on the flavor attributes (astringent, sweet, sour, bitter and grapefruit flavor, and thebitter aftertaste). A study [32] has also reported that an increase of limonin (also a bitter compound)in processed grapefruit juice, increased the perceived bitterness and tartness, while decreasingthe sweetness.
In a previous study, an increase in the ◦Brix with sucrose, enhanced the taste of sweetness, and hada decreasing effect on the sour, bitter, astringent, and grapefruit flavors, and the bitter aftertaste.When sucrose was added to fruit juices, not only were the perceived levels of bitterness and sournessreduced (as was also found in this research) but the sweet aroma intensity rating also changed [16](although this was not found here). Sucrose was also reported to mask the bitter taste of sinigrin,goitrin, and quinine [33]. In the complex beverage model, increasing sucrose did not have the oftenreported enhanced effect on the perceived fruity aroma. Increasing the sugar concentration of blueberryand cranberry fruit juices, increased their fruitiness (evaluated by sipping), even though no differencein aroma was perceived by sniffing alone [16]. Sucrose in the mouth significantly enhanced the “citrus”ratings, compared to when citral was inhaled alone [12]. Similarly, increases in the intensity of different‘fruity’ aromas were perceived in a multichannel flavor delivery system [34], model dairy desserts [35],and custard desserts [36], when increasing the sweetness with sucrose. Sweet level also affected thesoapy aroma of the grapefruit-like beverages. The reason for the effect on soapy aroma is unclear. It ispossible that the aroma blend contributed a slight soapy aroma.
The effect of aroma level and color on the perceived sensory attributes, as observed in this study,are evidence of cross-modal sensory interactions. It was anticipated that the intensity and character ofthe aroma level of a grapefruit juice would increase the perception of the citrus flavor, a positive driverof grapefruit flavor liking and reduce the negative attributes, the bitter and astringent flavor, as well as
305

Nutrients 2019, 11, 464
the bitter aftertaste. Positive drivers for liking of the flavor of grapefruit-like beverages were the sweettaste, the chemical aroma, and the citrus flavor intensities, while negative drivers were intensity ofsoapy aroma, bitter aftertaste, and sour taste.
5. Conclusions
This study indicated that aroma, bitterness, and sweetness levels, and also product color (hue)influences the perception of grapefruit-like beverages, as well as their hedonic value. A grapefruit-likebeverage model was created and a lexicon to describe the sensory properties of the cross-modalinteraction of stimulus components of the model beverage was developed. From the descriptivesensory profiles, prediction models for liking of the color, aroma, and flavor of grapefruit-like beverageswere developed. In the next phase, the models should be applied to a wide range of grapefruit juicesamples to determine validity and reliability in real juices. The models can then be optimized forapplication in grapefruit quality control and product development programs.
Supplementary Materials: The following are available online at www.mdpi.com/xxx/s1. Table S1:Physico-chemical characterization (means ± standard deviation) of the 36 grapefruit-like beverages. TableS2: Summary of sensory attribute mean values1 [± standard error of means (SEM)] and significance of bitterx aroma and bitter x color two-way ANOVA interactions of the model grapefruit-like beverages as evaluatedby a trained sensory panel (n = 16). Table S3: Summary of sensory attribute mean values1 [± standard error ofmeans (SEM)] and significance of bitter x sweet and aroma x color two-way ANOVA interactions of the modelgrapefruit-like beverages as evaluated by a trained sensory panel (n = 16). Table S4: Summary of sensory attributemean values1 [± standard error of means (SEM)] and significance of sweet x aroma and sweet x color two-wayANOVA interactions of the model grapefruit-like beverages as evaluated by a trained sensory panel (n = 16).
Author Contributions: Conceptualization, A.G.S.G.; Formal analysis, A.G.S.G. and V.L.A.; Funding acquisition,A.G.S.G. and H.L.d.K.; Investigation, A.G.S.G.; Methodology, A.G.S.G.; Resources, A.G.S.G.; Supervision, V.C.and H.L.d.K.; Writing—original draft, A.G.S.G., V.L.A., V.C., and H.L.d.K.; Writing—review & editing, H.L.d.K.
Funding: This work is based on research supported, in part, by the National Research Foundation of South Africa,Grant Number: 76905. V.L.A. is thankful for funding from the Norwegian Agriculture and Food Industry ResearchFunds, FoodSMaCK strategic program.
Acknowledgments: The technical and research support of Karien Kotze, Melanie Richards-Dennil, Marise Kinnear,Leandri de Kock is acknowledged.
Conflicts of Interest: The authors declare no conflict of interest. The funders had no role in the design of thestudy; in the collection, analyses, or interpretation of data; in the writing of the manuscript, or in the decision topublish the results. Any opinion, finding, and conclusion or recommendation expressed in this material is that ofthe author(s) and the NRF does not accept any liability in this regard.
References
1. Zargar, S.; Al-Majed, A.-R.A.; Wani, T.A. Potentiating and synergistic effect of grapefruit juice on theantioxidant and anti-inflammatory activity of aripiprazole against hydrogen peroxide induced oxidativestress in mice. BMC Complement. Altern. Med. 2018, 18, 106. [CrossRef] [PubMed]
2. Cristóbal-Luna, J.M.; Álvarez-González, I.; Madrigal-Bujaidar, E.; Chamorro-Cevallos, G. Grapefruit andits biomedical, antigenotoxic and chemopreventive properties. Food Chem. Toxicol. 2018, 112, 224–234.[CrossRef] [PubMed]
3. Manlan, M.; Matthews, R.F.; Rouseff, R.L.; Littell, R.C.; Marshall, M.R.; Moye, H.A.; Teixeira, A.A. Evaluationof the properties of Polystyrene Divinylbenzene adsorbents for debittering grapefruit juice. J. Food Sci. 1990,55, 440–445. [CrossRef]
4. Ribeiro, I.A.; Ribeiro, M.H.L. Naringin and naringenin determination and control in grapefruit juice by avalidated HPLC method. Food Control 2008, 19, 432–438. [CrossRef]
5. Obenland, D.; Campisi-Pinto, S.; Arpaia, M.L. Determinants of sensory acceptability in grapefruit. Sci. Hortic.2018, 231, 151–157. [CrossRef]
6. Delahunty, C.M.; Drake, M.A. Sensory character of cheese and its evaluation. In Cheese: Chemistry, Physicsand Microbiology; Fox, P.F., McSweeney, P.L.H., Cogan, T.M., Guinee, T.P., Eds.; Elsevier Academic Press:London, UK, 2004; pp. 517–545.
306

Nutrients 2019, 11, 464
7. Delwiche, J. The impact of perceptual interactions on perceived flavor. Food Qual. Prefer. 2004, 15, 137–146.[CrossRef]
8. Rosales, C.K.; Suwonsichon, S. Sensory lexicon of pomelo fruit over various cultivars and fresh-cut storage.J. Sens. Stud. 2015, 30, 21–32. [CrossRef]
9. Maga, J.A. Influence of color on taste thresholds. Chem. Senses 1974, 1, 115–119. [CrossRef]10. Veldhuizen, M.G.; Siddique, A.; Rosenthal, S.; Marks, L.E. Interactions of lemon, sucrose and citric acid in
enhancing citrus, sweet and sour flavors. Chem. Senses 2018, 43, 17–26. [CrossRef]11. Forde, C.G.; Delahunty, C.M. Understanding the role cross-modal sensory interactions play in food
acceptability in younger and older consumers. Food Qual. Prefer. 2004, 15, 715–727. [CrossRef]12. Fujimaru, T.; Lim, J. Effects of stimulus intensity on odor enhancement by taste. Chemosens. Percept. 2013, 6,
1–7. [CrossRef]13. Green, B.G.; Nachtigal, D.; Hammond, S.; Lim, J. Enhancement of retronasal odors by taste. Chem. Senses
2012, 37, 77–86. [CrossRef] [PubMed]14. Lim, J.; Fujimaru, T.; Linscott, T.D. The role of congruency in taste-odor interactions. Food Qual. Prefer. 2014,
34, 5–13. [CrossRef]15. Niimi, J.; Eddy, A.I.; Overington, A.R.; Heenan, S.P.; Silcock, P.; Bremer, P.J.; Delahunty, C.M. Aroma-taste
interactions between a model cheese aroma and five basic tastes in solution. Food Qual. Prefer. 2014, 31, 1–9.[CrossRef]
16. Von Sydow, E.; Moskowitz, H.; Jacbs, H.; Meiselman, H. Odor taste interaction in fruit juices.Leb. Wissenchaft Technol. 1974, 7, 9–16.
17. Pichaiyongvongdee, R.; Haruenkit, S. Comparative studies of limonin and naringin distribution in differentparts of pummelo [Citrus grandis (L) Osbeck] cultivars grown in Thailand. Kasetsat J. Nat. Sci. 2009, 43,28–36.
18. Einstein, M.A. Descriptive techniques and their hybridiztion. In Sensory Science: Theory and Applicationin Food; Lawless, H.T., Klein, B.P., Eds.; Marcel Dekker: New York, NY, USA, 1991; pp. 317–338.
19. Lawless, H.T.; Cardello, A.V.; Chapman, K.W.; Lesher, L.L.; Given, Z.; Schutz, H.G. A comparison of theeffectiveness of hedonic scales and end-anchor compression effects. J. Sens. Stud. 2010, 25, 18–34. [CrossRef]
20. Spence, C.; Levitan, C.A.; Shankar, M.U.; Zampini, M. Does food color influence taste and flavor perceptionin humans? Chemosens. Percept. 2010, 3, 68–84. [CrossRef]
21. Zellner, D.A.; Kautz, M.A. Color affects perceived odor intensity. J. Exp. Psychol. Hum. Percept. Perform. 1990,16, 391–397. [CrossRef]
22. DuBose, C.N.; Cardello, A.V.; Maller, O. Effects of colorants and flavorants on identification, perceivedflavor intensity, and hedonic quality of fruit-flavored beverages and cake. J. Food Sci. 1980, 45, 1393–1399.[CrossRef]
23. Zampini, M.; Spence, C. Modifying the multisensory perception of a carbonated beverage using auditory cues.Food Qual. Prefer. 2005, 16, 632–641. [CrossRef]
24. Department of Agriculture, Forestry and Fisheries. A Profile of the South African Citrus Market Value Chain 2015;Department of Agriculture, Forestry and Fisheries: Pretoria, South Africa, 2015.
25. Roth, H.A.; Radle, L.J.; Gifford, S.R.; Clydesdale, F.M. Psychophysical relationships between perceivedsweetness and color in lemon- and lime-flavored drinks. J. Food Sci. 1988, 53, 1116–1119. [CrossRef]
26. Gaudette, N.J.; Pickering, G.J. Modifying bitterness in functional food systems. Crit. Rev. Food Sci. Nutr.2013, 53, 464–481. [CrossRef] [PubMed]
27. Haraguchi, T.; Yoshida, M.; Hazekawa, M.; Uchida, T. Synergistic effects of sour taste and low temperaturein suppressing the bitterness of Aminoleban® EN. Chem. Pharm. Bull. (Tokyo) 2011, 59, 536–540. [CrossRef][PubMed]
28. Noble, A.C. Taste-aroma interactions. Trends Food Sci. Technol. 1996, 7, 439–444. [CrossRef]29. Mukai, J.; Tokuyama, E.; Ishizaka, T.; Okada, S.; Uchida, T. Inhibitory effect of aroma on the bitterness of
branched-chain amino acid solutions. Chem. Pharm. Bull. (Tokyo) 2007, 55, 1581–1584. [CrossRef] [PubMed]30. Berry, R.E.; Wagner, C.J., Jr.; Moshonas, M.G. Flavor Studies of Nootkatone in Grapefruit Juice. J. Food Sci.
1967, 32, 75–76. [CrossRef]31. Hewson, L.; Hollowood, T.; Chandra, S.; Hort, J. Taste–aroma interactions in a citrus flavoured model
beverage system: Similarities and differences between acid and sugar type. Food Qual. Prefer. 2008, 19,323–334. [CrossRef]
307

Nutrients 2019, 11, 464
32. Fellers, P.J.; Carter, R.D.; de Jager, G. Influence of Limonin on consumer preference of processedgrapefruit juice. J. Food Sci. 1987, 52, 741–743. [CrossRef]
33. Beck, T.K.; Jensen, S.; Bjoern, G.K.; Kidmose, U. The masking effect of sucrose on perception of bittercompounds in Brassica vegetables. J. Sens. Stud. 2014, 29, 190–200. [CrossRef]
34. Hort, J.; Hollowood, T.A. Controlled continuous flow delivery system for investigatingtaste-aroma interactions. J. Agric. Food Chem. 2004, 52, 4834–4843. [CrossRef] [PubMed]
35. Lethuaut, L.; Weel, K.G.C.; Boelrijk, A.E.M.; Brossard, C.D. Flavor Perception and Aroma Release fromModel Dairy Desserts. J. Agric. Food Chem. 2004, 52, 3478–3485. [CrossRef] [PubMed]
36. Tournier, C.; Sulmont-Rossé, C.; Sémon, E.; Vignon, A.; Issanchou, S.; Guichard, E. A study ontexture-taste-aroma interactions: Physico-chemical and cognitive mechanisms. Int. Dairy J. 2009, 19, 450–458.[CrossRef]
© 2019 by the authors. Licensee MDPI, Basel, Switzerland. This article is an open accessarticle distributed under the terms and conditions of the Creative Commons Attribution(CC BY) license (http://creativecommons.org/licenses/by/4.0/).
308
nutrients
Article
The Influence of Water Composition on Flavor andNutrient Extraction in Green and Black Tea
Melanie Franks, Peter Lawrence, Alireza Abbaspourrad and Robin Dando *
Department of Food Science, Cornell University, Ithaca, NY 14850, USA; [email protected] (M.F.);[email protected] (P.L.); [email protected] (A.A.)* Correspondence: [email protected]
Received: 19 November 2018; Accepted: 18 December 2018; Published: 3 January 2019
Abstract: Tea is made from the processed leaves of the Camellia sinensis plant, which is a tropical andsubtropical evergreen plant native to Asia. Behind water, tea is the most consumed beverage in theworld. Factors that affect tea brewing include brewing temperature, vessel, and time, water-to-leafratio, and, in some reports, the composition of the water used. In this project, we tested if the waterused to brew tea was sufficient to influence perceived flavor to the everyday tea drinker. Black andgreen tea were brewed with bottled, tap, and deionized water, with brewing temperature, vessel, time,and the water-to-leaf ratio matched. The samples were analyzed with a human consumer sensorypanel, as well as instrumentally for color, turbidity, and Epigallocatechin Gallate (EGCG) content.Results showed that the type of water used to brew tea drastically affected sensory properties of greentea (and mildly also for black tea), which was likely driven by a much greater degree of extraction ofbitter catechins in teas brewed with more purified bottled or deionized water. For the everyday teadrinker who drinks green tea for health, the capability to double the EGCG content in tea by simplybrewing with bottled or deionized water represents a clear advantage. Conversely, those drinking teafor flavor may benefit from instead brewing tea with tap water.
Keywords: taste; sensory evaluation; tea; EGCG; hedonics
1. Introduction
1.1. Tea and Tea Processing
Tea is a beverage steeped in culture and history. Valued for its taste and caffeine content as wellas its numerous health properties [1], tea has been consumed for centuries [2]. Behind water, tea is themost consumed beverage in the world [3]. The botanical name for the plant producing tea is Camelliasinensis (L.) Kuntze. There are many other plants used for extraction such as rooibos and chamomile,however these are not strictly teas. Instead, they are classified under the category of tisanes or herbalinfusions. The main difference between various styles of tea is the level of oxidation of the leaf duringprocessing. Green and white teas are unoxidized, oolongs vary in the levels of oxidation, and black tealeaves are fully oxidized. A cup of tea is made from processed fresh tea leaves. Biochemical changesthat occur during processing help reduce the bitter taste of fresh tea leaves. Processing the tea leaveslowers water content to aid in shelf stability, deactivates enzymes, and adds sweetness and a myriadof colors to the cup. Physically the leaf transforms from a sturdy crisp leaf to limp and pliable duringwithering. Chemically, caffeine content increases, hydrolysis of hydrophobic carbohydrates begins,non-gallated catechins and aroma compounds form, and the levels of chlorophyll and various enzymesincrease [4]. For black teas, after withering, the leaves are purposefully crushed to speed oxidation.This step is what gives black tea its defining quality, whereby enzymatic oxidation converts catechinsinto theaflavins and thearubigins. Polyphenols give black tea its reddish-brown coloration [5].
Nutrients 2019, 11, 80; doi:10.3390/nu11010080 www.mdpi.com/journal/nutrients309
Nutrients 2019, 11, 80
1.2. Tea Flavanols
The main polyphenols found in tea are flavonoids. Flavonoids are a group of bioactive compoundssynthesized during plant metabolism. Flavonoids are found in fruits and vegetables, prominently inspinach, apples, and blueberries, as well as in beverages like tea and wine. Previous health-relatedresearch on tea has largely focused on the flavonoid group. Flavonoids contain two six-carbon ringslinked by a three-carbon unit, which is also known as a chalcone structure [6]. Catechins (also referredto as flavanols) are bioactive compounds that are a subclass of flavonoids, and, in tea, are the mainsecondary metabolites. The main catechins in tea are: catechin, epicatechin, epicatechin gallate,epigallocatechin, epigallocatechin-3-gallate, and gallocatechin. Catechin content in tea differs by teatype or style. Catechins in green tea are relatively stable since they do not go through oxidation duringprocessing, and are what gives green tea its characteristic bitterness and astringency. In black tea,the catechins are largely oxidized to theaflavins and thearubigins [6], which reduces catechin contentby around 85% compared to green tea [7], leaving the tea darker and less bitter.
1.3. Tea and Water
After tea leaves are harvested and processed, the final product is ready to consume. However,unlike many other beverages, the final processing step is left to the consumer. A high-quality teathat has gone through many labor-intensive steps can be ruined in an instant by improper brewing.Factors that alter the taste of the brewed cup are brewing temperature, time, vessel, the water-to-leafratio, and the water composition [8,9]. This study focuses on the water used to brew tea, specificallyhow water quality influences the sensory and chemical qualities of black and green tea. Taste is a keyfactor in consumer acceptance of water [10], however water is often not a top priory when making tea,despite its critical role as the vehicle for the infusion. References to the importance of water content inbrewing tea can be found as early as 758AD, in The Classic of Tea by Lu Yu [11]. Lu Yu was an orphanduring the Tang Dynasty, raised by an abbot in the Dragon Cloud Monastery. He authored an efficient7000-character book detailing how to harvest, process, and brew tea, including what types of waterare suitable for tea, as well as the proper tools and utensils. Lu Yu felt that tea made from mountainsstreams was ideal, river water was sufficient, and well water was inferior [3]. In a more recent bookfrom Kuroda & Hara [12], tap water is recommended as the most suitable water for making tea,although specific recommendations are that water should be clear of odors and deficient in magnesiumand calcium.
Previous work suggests that tap water can influence the amount of tea flavanols extracted in greentea compared to brewing green tea with purified water [13]. Tap water has a differing (inconsistentbetween regions, and over time) mineral balance. “Hard” water is high in minerals such as calciumand magnesium. Tea infusions are particularly affected by calcium, with previous studies showing thatlevels of theaflavins and caffeine extracted decrease with high levels of calcium [14]. Magnesium andcalcium can also promote two undesirable outcomes of tea brewing: tea cream and scum formation.Tea cream is the precipitate matter that forms as the tea cools and is caused by the reaction betweencaffeine and tea flavanols, while tea scum is a surface film that forms on the tea infusion surface,which is composed of calcium, hydrogen carbonates, and other organic material. This film occurs dueto calcium carbonate triggering oxidation of organic compounds [9]. It has also been demonstratedthat catechin extraction can be increased in white tea by brewing with purified water [15].
1.4. Tea Flavor
Between 25% to 35% of the fresh tea leaf is composed of phenolic compounds with 80% of thesebeing flavanols [16]. Both phenolic compounds and alkaloids such as caffeine contribute to the bittertaste in tea, though the catechins are thought to be the main contributors to bitterness [17]. Glucose,fructose, sucrose, and arabinose in tea account for its sweet taste. Free amino acids make up about 1%to 3% of the dry leaf, and, in green tea, may yield an umami characteristic [16]. Astringency, albeit
310

Nutrients 2019, 11, 80
not a taste, is a common oral sensation in tea, thought to arise from its catechin content [18]. Despitetea being consumed for several thousand years, there are few consumer sensory studies of tea flavor,with researchers more often favoring evaluation by trained or expert panels. The goal of this projectwas to test if the water source used to brew tea (tap, bottled, or deionized) influenced flavor or likingfrom the everyday tea drinker, using both black and green tea. Tea samples were analyzed witha human consumer sensory panel as well as with a number of instrumental methods.
2. Materials and Methods
2.1. Mineral Analysis of Water Samples
Ithaca city tap water, Poland SpringTM bottled water (Nestle Waters, Paris, France), and deionizedwater used for the study were tested by the Community Science Institute, Inc (Ithaca, NY, USA),assaying calcium, iron, magnesium, sodium, and copper content. Methods followed thoserecommended by the Environmental Protection Agency (EPA). Briefly, Iron, Magnesium, and Sodiumwere measured spectrochemically (EPA protocol 200.2, Rv. 2.8) and with inductively coupledplasma-atomic emission spectrometry (EPA 200.7, Rv 4.4), while copper was measured usingInductively Coupled Plasma Mass Spectrometry (EPA 200.8/EPA200.8, Rv 5.4). Calcium and residualchlorine were measured colorimetrically, using an EDTA titration for calcium (SM 3500-Ca B),and a Lamotte test kit for chlorine (LaMotte DPD-1R, LaMotte Co., Maryland, USA).
2.2. Preparation of Tea Infusions
Two high-quality loose leaf teas known as Zhejiang green and Mao Feng black teas were purchasedfrom In Pursuit of Tea (New York, NY, USA). Both teas are from the Zhejiang Province in China, whichis a highly regarded tea region, with both produced on the same farm. Green teas were brewed intap (GT) water, bottled (GB) water, and deionized (GD) water, with black similarly denoted as blacktea in tap (BT), bottled (BB), and deionized (BD) water. For the green tea samples, 2.5 g of tea wasweighed out into pre-warmed Gaiwan tea brewing vessels (Figure S1), with 125 mL of water at 80 ◦Cadded to the vessel. The green tea infusion was brewed for three minutes and then strained througha fine mesh strainer. Black tea samples were brewed at 100 ◦C for 5 min (more typical for black teapreparation), and strained. Samples were then either cooled to room temperature for instrumentalanalysis or served fresh in pre-heated cups for sensory analysis (see 2.6 below).
2.3. Colorimetry
Analysis of tea color was performed with a Hunter Lab UltraScan VIS colorimeter(Reston, VA, USA). L (light vs dark), a (red vs green), and b (yellow vs blue) values were recorded foreach sample with each of the samples measured in triplicate.
2.4. Turbidity
The turbidity of each sample was measured in triplicate with use of a HACH 2100P portableTurbidity meter (Loveland, CO, USA), with measurements recorded in Nephelometric Turbidity Units(NTU). The samples were held at a 90◦ angle to the incident beam using single detection. Turbiditystandards used were 0.1 NTU, 20 NTU, and 100 NTU.
2.5. Analysis of EGCG
Epigallocatechin Gallate (EGCG) in the tea infusions was measured using high performance liquidchromatography (HPLC), following the methods of Wang and Helliwell [13]. Samples were run usingan Agilent 1100 HPLC system (Santa Clara, CA, USA) with a DAD detector. Separations were carriedout using a Waters Cortecs (Milford, MA, USA) C18 (4.6 mm × 100 mm) column using an isocraticsolvent system consisting of 90% 0.01% phosphoric acid in Millipore water (v/v) and 10% methanolwith a flow rate of 0.6 mL/min. The column was held at a constant temperature of 30 ◦C. The DAD
311

Nutrients 2019, 11, 80
detector was set to 210 nm. Sample injection volume was 10 μL. The total run time was 20 min.All samples were filtered just before being loaded onto the HPLC using a 0.22 μm PolyvinylideneFluoride (PVDF) filter from Celltreat (Pepperell, MA, USA). Quantification was performed by theuse of an external standard curve using purified EGCG purchased from Sigma Aldrich (St Louis,MO, USA). Identification of EGCG in tea samples was performed using retention time of the purestandards (10.26 min).
2.6. Sensory Evaluation
All human study procedures were approved by the Cornell University Institutional Review Boardfor Human Participants, with all methods performed in accordance with relevant guidelines andregulations. A total of 103 panelists were recruited from the local community, pre-screened for theirtea drinking behavior, and all gave informed consent. All the participants in the study drank teathree to five times a week or more, and were both green and black tea drinkers. The panelist eitherhabitually consumed tea with no milk or sugar added to it or stated no dislike of tea in this manner.Participants knew that the study involved tea but were unaware of the true objective of the research.The session took approximately 45 min, with panelists compensated for their time. The panelistsanswered questions about samples in individual booths, using Red Jade sensory evaluation software(Curion, Deerfield, IL, USA). The samples were delivered monadically, in a counterbalanced full-blockdesign, but panelists either received 3 green tea samples or 3 black tea samples first. Each tea samplewas evaluated for overall liking, appearance liking, and flavor liking with 9-point scales, and then usedthe generalized Labeled Magnitude Scale (gLMS) to test sweetness, bitterness, sourness, astringency,vegetal quality (for green tea only), and earthiness (for black tea only). All panelists were brieflytrained on how to use the gLMS before beginning the tasting [19]. The color of the tea was alsoevaluated by panelists with a color matching sheet (Figure S2) from which they chose the closest matchfor each tea sample. Teas were freshly brewed every 30 min. A total of 10 g of tea was brewed with500 mL of water, at 80 ◦C for green tea, and 100 ◦C for black tea. All infusions were kept warm inpre-heated, insulated carafes until the panelist was ready for the sample. Samples were served inpre-heated (80 ◦C) white ceramic Gung Fu cha teacups (see Figure 1 below) labeled with random3-digit codes. After each sample, panelists were instructed to cleanse their palette with water andnon-salted crackers to avoid fatigue as well as deter any lingering bitterness or astringency. At the endof the questionnaire, panelists were asked a series of demographic questions and for information ontheir tea drinking habits.
2.7. Statistical Analysis
Data were analyzed with repeated measure analyses of variance (ANOVA) and post-hoc Tukey’stests using Graphpad Prism 5.0 (Graphpad Software, La Jolla, CA, USA). Separate ANOVAs were usedfor green and black tea samples since such large differences in taste and chemical properties have beenshown previously. Statistical significance was inferred at p < 0.05. Multivariate analysis was performedusing XLSTAT (Addinsoft, Paris, France) whereby two separate Principal Components Analyseswere run on sensory and instrumental data as well as these two datasets combined in a MultipleFactor Analysis.
312

Nutrients 2019, 11, 80
Figure 1. (A) Image of black and green tea samples brewed in tap, bottled, or deionized water. For bothgreen and black tea, infusions appear darker and cloudier from tap wate compared to the teas brewedin DI or bottled water. (B)Turbidity measurements (NTU) for each tea infusion showing average ofthree replicates with SEM. (C–E) Colorimeter readings from tea infusions, L, a and b values displayedwith individual readings as dots, lines denoting average, and SEM. Samples denoted as green teabrewed in tap (GT), bottled (GB), and deionized (GD) water, black tea brewed in tap (BT), bottled (BB),and deionized (BD) water. Green tea samples represented in green, black tea in dark red.
3. Results and Discussion
3.1. Water Analysis
Deionized, tap, and bottled water samples were tested for calcium, magnesium, copper, iron,residual chlorine, and sodium (Table 1). The amount of calcium, magnesium, and sodium in tap waterwas far greater than that in bottled or deionized water.
Table 1. Mineral analysis of the different water types in mg/L.
Bottled Tap Deionized
Calcium 8.000 53.600 3.000Iron 0.050 0.050 0.050
Magnesium 1.370 9.460 0.100Sodium 10.600 20.900 0.100Copper 0.002 0.176 0.002
Residual Chlorine 0.200 0.200 0.200
3.2. Turbidity and Color
Figure 1A shows the appearance of tea samples when brewed with three different water types.Teas brewed in tap water appear more cloudy and darker in color than teas brewed in bottled wateror deionized (DI) water for both green and black teas. Turbidity measurements (Figure 1B) in green(p < 0.001) showed GT was more turbid than both GB (95% CI = 133.3 to 156.7) and GD (95% CI = 135.7
313

Nutrients 2019, 11, 80
to 159.1), with no difference between GB and GD. In black tea, the turbidity of BT was also higher(p < 0.001) than both BB (95% CI = 57.66 to 103.9) and BD (95% CI = 58.81 to 105.1), with no differencebetween BB and BD. Adding high concentrations of calcium or magnesium in water can causecloudiness and tea scum in tea infusion as well as possibly influencing tea’s sensory properties [9,18]since both calcium and magnesium were higher in tap water used in this project. This was likely thecause of the observed turbidity increase.
Both green (p = 0.016) and black (p = 0.023) tea infusions significantly differ in lightness. Greentea brewed in tap water exhibited lower L values compared to the same tea brewed in bottled(95% CI = −9.992 to −1.288) or DI (95% CI = −8.952 to −0.2476) water, with BT similarly lower thanBB (95% CI = −15.14 to −0.7051) or BD (95% CI = −15.13 to −0.6918). The a values for green (p < 0.001)but not black (p = 0.425) tea significantly differed between samples, with all pairs differing betweengreen teas (95% CI for GT vs GB = 2.042 to 2.458; GT vs GD = 1.269 to 1.685; GB vs GD = −0.9814to −0.5652). The b values for both green (p < 0.001) and black (p = 0.001) teas significantly variedbetween treatments, with tap water against the different sample. GT was higher compared to GB(95% CI = 5.661 to 12.80) and GD (95% CI = 8.401 to 15.540), with BT higher than BB (95% CI = −14.94to −4.711) or BD (95% CI = −15.33 to −5.105).
3.3. EGCG Content
The amount of EGCG in black tea is customarily lower than that found in green tea, since themajority of the catechins in black tea are converted to theaflavins and thearubigins [5]. The smallamount of EGCG in the black tea infusions did not vary with water type (p = 0.250, Figure 2C,D).Conversely, with green tea (natively much higher in EGCG), there was a significant difference betweengreen tea infusions (p < 0.001) and with green tea brewed in bottled water (95% CI = −6350 to −3984)and in deionized water (95% CI = −5890 to −3524) having around double the amount of EGCGcompared to green tea brewed in tap water (Figure 2A,B), despite being brewed from the same leaves,at the same strength, time and temperature, in identical vessels. Green teas brewed from bottledor deionized water achieved around the same level of EGCG extraction (95% CI = −723.0 to 1643).Such dramatically inferior EGCG extraction in tap water is important to green tea consumers, many ofwhom are consuming green tea due to a perceived consequence of health promotion [20]. EGCG is themost abundant catechin in green tea [21] as well as one of the most bitter tasting [22]. That green teaacceptance has been linked to bitter taste genes [23], and that bitterness in tea is largely a product ofEGCG content [24], implies that extraction of bitter catechins in bottled or deionized water may lead tomore healthy and yet less palatable tea infusions.
3.4. Sensory Testing of Tea Samples
There was no significant difference between panelists’ overall (p = 0.646), or flavor (p = 0.553)liking of black tea samples (Figure 3A,C). Panelists did find significant differences in appearance likingbetween the samples (Figure 3B, p = 0.0345), which is likely a reflection of the color differences betweenthe black tea infusions evident in Figure 1A. However, this trend was not strong enough to reflectdifferences between sample pairs in post-hoc Tukey’s tests. Panelists also evaluated various flavorattributes of the black tea infusions. No differences were evident with water type between black teainfusion for astringency, bitterness, sourness, or sweetness (Figure 3D–F,H, all p > 0.05). However,panelists did find a difference in earthy flavor (Figure 3G, p = 0.025), specifically between that brewedin bottled water compared to black tap water (95% CI = −7.339 to −0.5252). While the panel perceivedblack tea brewed in tap water to be earthier, it had little effect on liking, which suggests that watermay not be a critical factor in determining liking in black tea.
314

Nutrients 2019, 11, 80
Figure 2. (A) Chromatogram illustrative of HPLC spectrum from green tea. EGCG peak at arrow.Y axis in milli-Absorbance Units. (B) Total EGCG content for green tea in ppm, brewed in tap(GT), bottled (GB), and deionized (GD water. Display shows mean of three readings plus SEM.(C) Chromatogram illustrative of HPLC spectrum from black tea. EGCG peak at arrow. (D) TotalEGCG content for black tea in ppm. Samples denoted as black tea brewed in tap (BT), bottled (BB),and deionized (BD) water.
Figure 3. Consumer perception of black tea brewed in tap (BT), bottled (BB), and deionized (BD) water.(A) Overall liking of samples, from dislike extremely (1) to like extremely (9). (B) Appearance likingof samples, from dislike extremely (1) to like extremely (9). (C) Flavor liking of samples, from dislikeextremely (1) to like extremely (9). (D) Perceived sweetness of samples, rated on gLMS, scale descriptorsno sensation (0.0), barely detectable (1.4), weak (6.0), moderate (17.0), strong (34.7), very strong (52.5),and strongest imaginable sensation of any kind (100.0). (E) Bitterness, scale as in D. (F) Sourness,scale as in D. (G) Earthy flavor, scale as in D. (H) Astringency, scale as in D. Bars display mean ratingof panel (n = 103) plus SEM. * indicates p < 0.05.
315
Nutrients 2019, 11, 80
For green tea samples, the effects of water were clearer. Panelists rated their overall liking(Figure 4A, p < 0.001) of green tea samples as differing across water treatments, with the tap clearlyhigher than bottled water (95% CI = −1.138 to −0.2993), with tap vs. deionized water approachingsignificance (95% CI = −0.04054 to 0.7978). Interestingly, this reduction in liking seemed to be drivenby the panel’s liking of the sample’s flavor (Figure 4C, p = 0.001), and not its appearance (Figure 4B,p = 0.099). In investigating changes to the green tea’s flavor properties, panelist found no significantdifference in astringency, sourness, or vegetal flavor (Figure 4F–H, all p > 0.05). However, the paneljudged the green tea samples brewed with tap water to be far less bitter (Figure 4E, p < 0.001) than boththe sample brewed with bottled (95% CI = 0.6244 to 6.502) or with deionized water (95% CI = −9.162to −3.285). Since only around half the amount of EGCG was extracted in green tea brewed from tapwater compared to the other samples, and EGCG is experienced as highly bitter, this would result inless bitter tea infusion when brewing with tap water. Since bitterness is closely linked to liking tearegardless of ethnicity or tea drinking habits [25,26], this likely drove the increase in liking of greentea brewed in tap water. The GT sample was also experienced as sweeter by the panel (Figure 4D,p = 0.012), which was likely due to mixture suppression [27,28] of sweetness in samples with morebitter catechins. EGCG has been noted to extract more efficiently from green tea with purer water [29]and with higher conductivity (thus higher impurity) water producing poorer catechin extraction [30].Rossetti and colleagues [31] measured the detection threshold of EGCG (perceived to be bitter andastringent) to be 183 mg/L (at 37 ◦C). Despite the fact that bitterness may be somewhat depressed bytemperature [32], the bitterness of green tea in our study would be clear in the samples’ flavor profile.Thus, doubling the EGCG content of tea in bottled or deionized water (compared to tap) was likely thedriving factor behind reduced liking of these samples in consumer testing. Since black tea has fewercatechins than green tea due to the oxidation process in manufacturing, the type of water used seemsless important to the everyday tea drinker.
As well as instrumental measurement of color changes in tea samples, and assessment ofappearance liking of samples, we were also interested in whether variation in color between sampleswas visible to the human eye. Panelists used a color matching chart for both black and green teasamples (see Figure S2), divided into eight color segments for green teas, and eight more for black teas.The panelists could clearly discern differences between samples of both black (p < 0.001, chi-square39.91), and green tea samples (p < 0.001, chi-square 43.87), although this did not influence their likingof the samples overall, nor their liking of the appearance of the samples, which suggests flavor is morecritical in determining liking of tea infusions than their appearance. It is clear, however, that consumerperception of beverages can be altered by their color and appearance [33], and, thus, some of the effectsobserved may have been due to the cross modal influence of the different colored tea samples.
Some work exists concerning the influence of various brewing conditions on the sensory propertiesof tea. Liu et al. [34] found optimal conditions for acceptance, at least in a small expert panel,were brewing for 5.7 min at 82 ◦C, with tea of around 1100 μm in particle size, in a 70 mL/g ratioof water to tea. From instant green tea preparations, increasing the calcium concentration in thebrewing solution was found to weaken bitter taste in the mixture purportedly provided by EGCG [18],which is in good agreement with our observations. However, influences on the sweetness of infusions(attributed in part to theanine) were not seen in our work, possibly due to the around 4 mg/100 mgsucrose found in the group’s instant tea preparations. A study of hot and cold-brewed tea infusions ofvarying strength by Lin et al. [2] proposed a linkage between higher EGCG and EGC (epigallocatechin)levels and lower sensory appeal, which was attributed to lower bitterness and astringency in thesesamples. In a small group of trained panelists, sensory differences were reported in green tea brewedwith various water types [30], with mineral water found to produce tea with lower EGCG levels thantap water, purified water, or mountain spring water, as well as perceived bitterness mapping ontoEGCG levels. However, samples from this report were liked more with higher bitterness (and EGCG)unlike our own results. A similar result was reported by Zhang et al. [15], whereby EGCG levels fromgreen tea extractions varied with water quality. Sensory reports of taste quality were higher for the
316

Nutrients 2019, 11, 80
high EGCG samples, though no report was made of panel size or makeup. Such differences are likelyattributed to the difference in palate of a small group of experts from China versus a large panel oftea consumers in the US. Alternatively, those regularly consuming diets high in salty [35], sweet [36],or umami [37] stimuli have shown some reduced ability to perceive these stimuli possibly due toreceptor regulation in taste [38]. Thus, it is possible that regular consumers of very bitter tea experiencehow they taste in a fundamentally different manner.
Figure 4. Consumer perception of green tea brewed in tap (GT), bottled (GB), and deionized (GD) water.(A) Overall liking of samples, from dislike extremely (1) to like extremely (9). (B) Appearance likingof samples, from dislike extremely (1) to like extremely (9). (C) Flavor liking of samples, from dislikeextremely (1) to like extremely (9). (D) Perceived sweetness of samples, rated on gLMS, scale descriptorsno sensation (0.0), barely detectable (1.4), weak (6.0), moderate (17.0), strong (34.7), very strong (52.5),and strongest imaginable sensation of any kind (100.0). (E) Bitterness, scale as in D. (F) Sourness,scale as in D. (G) Earthy flavor, scale as in D. (H) Astringency, scale as in D. Bars display mean ratingof panel (n = 103) plus SEM. * indicates p < 0.05. ** indicates p < 0.01. *** indicates p < 0.001.
Following sensory testing, panelists participated in a survey of their attitudes toward tea.When asked their primary motivation for drinking black tea, only 7% of panelists responded due tohealthful properties and, instead, favoring taste or flavor (84%), with a small number of respondentsciting other reasons. However, when asked their primary motivation for drinking green tea, 26% citedits health benefits, with 67% for taste or flavor, and again a small number citing other reasons.This suggests the ability to almost double the EGCG content of green tea would be of great interest tomany green tea consumers.
3.5. Multivariate Analysis
Further analysis of the data with Principal Components Analysis (PCA) and Multiple FactorAnalysis (MFA) was performed. Scree plots revealed that data could be plotted well on two axes bothin the case of sensory and instrumental data, with 88.5% and 98% of the variance accounted for by
317

Nutrients 2019, 11, 80
the first two factors in the analysis, respectively. The sample of green tea brewed with tap water waslocated close to both dimensions of overall and flavor liking, which, in turn, were negatively correlatedwith bitterness (Figure 5A). In plots of instrumental results, samples pairs GD and GB as well as BDand BB plotted almost exactly on top of one another (Figure 5B). In the case of both black and green tea,the tap-brewed sample was the clear outlier. Samples GD and GB plotted closely to the axes representphenolics, EGCG, and colorimetric L-value. MFA plots combining both sensory and instrumentaldata showed similar patterns (Figure 5C), with sample GT lying in the directions of overall and flavorliking, and anti-parallel to that of bitterness.
(A)
(B)
(C)
Figure 5. Multivariate analysis of tea samples. (A) Principal components analysis of sensory data.Samples shown in black, original axes in red, variance from new factors in parentheses. (B) Principalcomponents analysis of instrumental data. Samples shown in black, original axes in blue, variance fromnew factors in parentheses. (C) Multiple factor analysis of sensory and instrumental data. Samplesshown in black, sensory axes in red, instrumental axes in blue, variance from new factors in parentheses.Samples denoted as green tea brewed in tap (GT), bottled (GB), and deionized (GD) water, black teabrewed in tap (BT), bottled (BB), and deionized (BD) water.
318

Nutrients 2019, 11, 80
4. Conclusions
Tea is the most consumed beverage besides water in the world. This project sought to get a betterunderstanding of whether the type of water used to brew tea is of importance to the everyday teadrinker. Through the instrumental analysis of green and black tea brewed in tap, bottled, and deionizedwater, we demonstrated a difference in color, turbidity, and the amount of EGCG extracted from tealeaves depending on the water type. The high mineral content of the tap water used in this study led toinferior extraction of catechins in green tea, and thus, produced an infusion that was less bitter, and alsoperceived as sweeter than the same tea brewed in bottled or deionized water, with an accompanyinghigher degree of liking for green tea when brewed in this manner. For tea drinkers consuming greentea for either flavor or its health benefits, our results highlight that the type of water used to brew teais clearly important, and suggests that those seeking greater health benefits should use a more purifiedwater source to brew green tea, while those more concerned with flavor may prefer to use water fromthe tap.
Supplementary Materials: The following are available online at http://www.mdpi.com/2072-6643/11/1/80/s1, Figure S1: Traditional Gaiwan brewing vessel, Figure S2: 8-option color matching diagram provided toconsumer panel.
Author Contributions: Conceptualization, M.F. and R.D.; formal analysis, M.F., P.L., A.A., and R.D.; investigation,M.F. and P.L.; writing—original draft preparation, M.F. and R.D.; writing—review and editing, M.F., P.L., A.A.,and R.D.; project administration, R.D.
Funding: This research received no external funding
Acknowledgments: Thanks to Alina Stelick and members of the Dando lab for support in consumer testing,and In Pursuit of Tea for initial consultation.
Conflicts of Interest: The authors declare no competing interests.
References
1. Dufresne, C.J.; Farnworth, E.R. A review of latest research findings on the health promotion properties of tea.J. Nutr. Biochem. 2001, 12, 404–421. [CrossRef]
2. Lin, S.-D.; Yang, J.-H.; Hsieh, Y.-J.; Liu, E.-H.; Mau, J.-L. Effect of different brewing methods on quality ofgreen tea. J. Food Process. Preserv. 2013, 38, 1234–1243. [CrossRef]
3. Mair, V.H.; Hoh, E. The True History of Tea; Thames & Hudson: New York, NY, USA, 2009.4. Ahmed, S.; Stepp, J.R. Pu-erh Tea: Botany, Production, and Chemistry. In Tea in Health and Disease Prevention;
Elsevier Science and Technology: Amsterdam, The Netherlands, 2013; pp. 59–71.5. Menet, M.C.; Sang, S.; Yang, C.S.; Ho, C.T.; Rosen, R.T. Analysis of theaflavins and thearubigins from black
tea extract by MALDI-TOF mass spectrometry. J. Agric. Food Chem. 2004, 52, 2455–2461. [CrossRef] [PubMed]6. Hodgson, J.M.; Croft, K.D. Tea flavonoids and cardiovascular health. Mol. Aspects Med. 2010, 31, 495–502.
[CrossRef] [PubMed]7. Preedy, V. Tea in Health and Disease Prevention; Elsevier: London, UK, 2013; pp. 73–77.8. Khokhar, S.; Magnusdottir, S.G.M. Total phenol, catechin, and caffeine contents of teas commonly consumed
in the United Kingdom. J. Agric. Food Chem. 2002, 50, 565–570. [CrossRef] [PubMed]9. Mossion, A.; Potin-Gautier, M.; Delerue, S.; Le Hécho, I.; Behra, P. Effect of water composition on aluminium,
calcium and organic carbon extraction in tea infusions. Food Chem. 2008, 106, 1467–1475. [CrossRef]10. Whelton, A.; Dietrich, A.; Burlingame, G.; Schechs, M.; Duncan, S. Minerals in drinking water: Impacts on
taste and importance to consumer health. Water Sci. Technol. 2007, 55, 283–291. [CrossRef] [PubMed]11. Lu, Y.; Carpenter, F. The Classic of Tea; Ecco Press: Hopewell, NJ, USA, 1974.12. Kuroda, Y.; Hara, Y. Health Effects of Tea and Its Catechins; Springer Science and Business Media: Berlin,
Germany, 2004.13. Wang, H.; Helliwell, K. Epimerisation of catechins in green tea infusions. Food Chem. 2000, 70, 337–344.
[CrossRef]
319

Nutrients 2019, 11, 80
14. Spiro, M.; Price, W.E. Kinetics and equilibria of tea infusion—Part 6: The effects of salts and of pH on theconcentrations and partition constants of theaflavins and caffeine in Kapchorua Pekoe fannings. Food Chem.1987, 24, 51–61. [CrossRef]
15. Zhang, H.; Jiang, Y.; Lv, Y.; Pan, J.; Duan, Y.; Huang, Y.; Zhu, Y.; Zhang, S.; Geng, K. Effect of water qualityon the main components in Fuding white tea infusions. J. Food Sci. Technol. 2017, 54, 1206–1211. [CrossRef][PubMed]
16. Belitz, H.-D.; Grosch, W.; Schieberle, P. Food Chemistry, 4th ed.; Springer: Berlin, Germany, 2016.17. Chen, Z.M.; Wang, H.F.; You, X.Q.; Xu, N.I.N.G. The Chemistry of Tea Non-Volatiles. In Tea: Bioactivity and
Therapeutic Potential. Medicinal and Aromatic Plants—Industrial Profiles; Taylor and Francis: London, UK, 2002.18. Yin, J.; Zhang, Y.; Du, Q.; Chen, J.; Yuan, H.; Xu, Y. Effect of Ca2+ concentration on the tastes from the main
chemicals in green tea infusions. Food Res. Int. 2014, 62, 941–946. [CrossRef]19. Noel, C.A.; Cassano, P.A.; Dando, R. College-aged males experience attenuated sweet and salty taste with
modest weight gain. J. Nutr. 2017, 147, 1885–1891. [CrossRef] [PubMed]20. Wang, E.S.T.; Yu, J.R. Means-end chain approach for exploring the motivation of ready-to-drink tea
consumers. Asia Pac. J. Mark. Logist. 2016, 28, 384–395. [CrossRef]21. Goto, T.; Nagashima, H.; Yoshida, Y.; Kiso, M. Contents of individual tea catechins and caffeine in Japanese
green tea. Tea Res. J. 1996, 1996, 21–28. [CrossRef]22. Narukawa, M.; Kimata, H.; Noga, C.; Watanabe, T. Taste characterisation of green tea catechins. Int. J. Food
Sci. Technol. 2010, 45, 1579–1585. [CrossRef]23. Gayathri Devi, A.; Henderson, S.A.; Drewnowski, A. Sensory acceptance of Japanese green tea and soy
products is linked to genetic sensitivity to 6-n-propylthiouracil. Nutr. Cancer. 1997, 29, 146–151. [PubMed]24. Yu, P.; Yeo, A.S.L.; Low, M.Y.; Zhou, W. Identifying key non-volatile compounds in ready-to-drink green tea
and their impact on taste profile. Food Chem. 2014, 155, 9–16. [CrossRef] [PubMed]25. Lee, J.; Chambers, D.H. Descriptive analysis and US consumer acceptability of 6 green tea samples from
China, Japan, and Korea. J. Food Sci. 2010, 75, S141–S147. [CrossRef]26. Lee, J.; Chambers, E., IV; Chambers, D.H.; Chun, S.S.; Oupadissakoon, C.; Johnson, D.E. Consumer acceptance
for green tea by consumers in the United States, Korea and Thailand. J. Sens. Stud. 2010, 25, 109–132.[CrossRef]
27. Kiesow, F. Beiträge zur Physiologischen Psychologie des Geschmackssinnes; Wilhelm Engelmann: Leipzig,Germany, 1894; Volume 3.
28. Kroeze, J.H.; Bartoshuk, L.M. Bitterness suppression as revealed by split-tongue taste stimulation in humans.Physiol. Behav. 1985, 35, 779–783. [CrossRef]
29. Lee, K.; Lee, S. Extraction behavior of caffeine and EGCG from green and black tea. Biotechnol. BioprocessEng. 2008, 13, 646–649. [CrossRef]
30. Xu, Y.; Zou, C.; Gao, Y.; Chen, J.; Wang, F.; Chen, G.; Yin, J. Effect of the type of brewing water on thechemical composition, sensory quality and antioxidant capacity of Chinese teas. Food Chem. 2017, 236,142–151. [CrossRef] [PubMed]
31. Rossetti, D.; Bongaerts, J.H.H.; Wantling, E.; Stokes, J.R.; Williamson, A.M. Astringency of tea catechins:More than an oral lubrication tactile percept. Food Hydrocoll. 2009, 23, 1984–1992. [CrossRef]
32. Kapaun, C.L.; Dando, R. Deconvoluting physical and chemical heat: Temperature and spiciness influenceflavor differently. Physiol. Behav. 2017, 170, 54–61. [CrossRef] [PubMed]
33. Sugrue, M.; Dando, R. Cross-modal influence of colour from product and packaging alters perceived flavourof cider. J. Inst. Brew. 2018, 124, 254–260. [CrossRef]
34. Liu, Y.; Luo, L.; Liao, C.; Chen, L.; Wang, J.; Zeng, L. Effects of brewing conditions on the phytochemicalcomposition, sensory qualities and antioxidant activity of green tea infusion: A study using response surfacemethodology. Food Chem. 2018, 269, 24–34. [CrossRef] [PubMed]
35. Bertino, M.; Beauchamp, G.K.; Engelman, K. Increasing dietary salt alters salt taste preference. Physiol. Behav.1986, 38, 203–213. [CrossRef]
36. Wise, P.M.; Nattress, L.; Flammer, L.J.; Beauchamp, G.K. Reduced dietary intake of simple sugars altersperceived sweet taste intensity but not perceived pleasantness. Am. J. Clin. Nutr. 2016, 103, 50–60. [CrossRef][PubMed]
320

Nutrients 2019, 11, 80
37. Noel, C.A.; Finlayson, G.; Dando, R. Prolonged exposure to monosodium glutamate in healthy young adultsdecreases perceived umami taste and diminishes appetite for savory foods. J. Nutr. 2018, 148, 980–988.[CrossRef] [PubMed]
38. Shahbandi, A.; Choo, E.; Dando, R. Receptor regulation in taste: Can diet influence how we perceive foods?Multidiscip. Sci. J. 2018, 1, 106–115. [CrossRef]
© 2019 by the authors. Licensee MDPI, Basel, Switzerland. This article is an open accessarticle distributed under the terms and conditions of the Creative Commons Attribution(CC BY) license (http://creativecommons.org/licenses/by/4.0/).
321


nutrients
Article
Estimation of Olfactory Sensitivity Using a BayesianAdaptive Method
Richard Höchenberger 1,2 and Kathrin Ohla 1,2,*
1 Institute of Neuroscience and Medicine INM-3, Research Center Jülich, 52428 Jülich, Germany2 Psychophysiology of Food Perception, German Institute of Human Nutrition Potsdam-Rehbrücke, 14558
Nuthetal, Germany* Correspondence: [email protected]
Received: 24 April 2019; Accepted: 28 May 2019; Published: 5 June 2019
Abstract: The ability to smell is crucial for most species as it enables the detection of environmentalthreats like smoke, fosters social interactions, and contributes to the sensory evaluation of foodand eating behavior. The high prevalence of smell disturbances throughout the life span callsfor a continuous effort to improve tools for quick and reliable assessment of olfactory function.Odor-dispensing pens, called Sniffin’ Sticks, are an established method to deliver olfactory stimuliduring diagnostic evaluation. We tested the suitability of a Bayesian adaptive algorithm (QUEST) toestimate olfactory sensitivity using Sniffin’ Sticks by comparing QUEST sensitivity thresholds withthose obtained using a procedure based on an established standard staircase protocol. Thresholdswere measured twice with both procedures in two sessions (Test and Retest). Overall, both proceduresexhibited considerable overlap, with QUEST displaying slightly higher test-retest correlations, lessvariability between measurements, and reduced testing duration. Notably, participants were morefrequently presented with the highest concentration during QUEST, which may foster adaptation andhabituation effects. We conclude that further research is required to better understand and optimizethe procedure for assessment of olfactory performance.
Keywords: smell sensitivity; olfaction; threshold; staircase; QUEST
1. Introduction
The appreciation of food involves all senses: sight, smell, taste, touch, and also hearing. Whilethe sight of a cup of coffee may indicate its availability, it is typically its smell that makes it appealingand that triggers an appetite for most people. During consumption, the smell or aroma is perceivedagain retronasally and supported by its pleasant temperature and a bitter taste. These largely parallelsensations occur automatically and only raise awareness when one or more senses are disturbed.That said, the sense of smell has been shown to influence food choice and eating behavior [1], and itsimpairment has even been associated with a higher risk for diet-related diseases like diabetes [2]. Evenmore, olfactory stimuli can invoke emotional states, are linked to memory storage and retrieval, and assuch also serve as important cues to rapid detection of potentially dangerous situations and threats(see e.g., [3,4]. Given that the estimated prevalence of smell impairment is 3.5% in the United States [5],continuous efforts are made toward an efficient and precise assessment of olfactory function.
The Sniffin’ Sticks test suite (Burghart, Wedel, Germany; [6]), is an established tool in theassessment of olfactory function. It consists of three tests involving sets of impregnated felt-tip pens:odor detection threshold (T), odor discrimination (D), and odor identification (I). Each test producesnumbers in the range from 1 to 16 (T) or from 0 to 16 (D and I) as a performance measure. Overallolfactory function is assessed by summing all three test results, resulting in the TDI score. Comparisonof individual TDI scores to the comprehensive set of available normative data (e.g., [7,8]) facilitates theinterpretation of test scores and allows to reliably diagnose olfactory impairment. Notably, threshold,
Nutrients 2019, 11, 1278; doi:10.3390/nu11061278 www.mdpi.com/journal/nutrients323
Nutrients 2019, 11, 1278
discrimination, and identification measure different facets of olfactory function [9]. The threshold,however, has been found to explain a larger portion of variability in TDI scores than the two othermeasures [10]. Moreover, the discrimination and identification tests follow relatively simple testprotocols in which all stimuli are presented only once and in a predefined order. The threshold, incomparison, is of a more complex nature, and the method, therefore provides the largest potentialfor possible improvements. It follows a so-called adaptive method, specifically, a “transformed”one-up/two-down staircase procedure [11]. The procedure first assesses a starting concentration andthen moves on to the “actual” threshold estimation, during which fixed step widths are used: for eachincorrect answer, the stimulus concentration is increased by one step; and for two consecutive correctanswers, the stimulus concentration is decreased by one step [6].
Since the one-up/two-down staircase was first conceived, several new approaches to thresholdestimation, including Bayesian methods, have been published. Bayesian methods estimate parametersof the psychometric function (e.g., threshold or slope) using Bayesian inference: based on priorassumptions about the true parameter value, the stimulus concentration to be presented next isselected such that the expected information gain (about the parameter) is maximized. The firstpublished Bayesian adaptive psychometric method is the QUEST procedure [12], which is still populartoday. QUEST has two distinct properties that set it apart from the staircase described above. Firstly,it always considers the entire response history and is not solely based on the past one or two trials toselect the optimal stimulus concentration to be presented next. Secondly, QUEST is not tied to a fixedstep width, allowing it to traverse through a large range of concentrations more quickly.
In a clinical setting, at the otorhinolaryngologist’s (ear-nose-throat, ENT) practice or at the bedsidein the hospital, shorter testing times are always beneficial, as they reduce strain on patients and free uptime for other parts of diagnostics and treatment. But also when working with healthy participants,e.g., in a psychophysical lab or in large cohort studies, reduced testing time spares resources andallows for a larger number of measurements in a given time.
QUEST has been shown to converge reliably and quickly in gustatory threshold estimations [13,14].Inspired by these results we set out to design and test a QUEST-based procedure for olfactory thresholdestimation and to compare its performance with that of the established staircase method.
2. Materials and Methods
2.1. Participants
36 participants (32 women; median age: 29.5 years, age range: 19–61 years) completed thestudy. The influence of gender on olfactory performance has been investigated in previous studies.The results typically showed no (e.g., [15], several hundred participants; [7], >3000 participants, nomain effect) or only rather small gender differences with negligible diagnostic and real-world relevance(e.g., [8], >9000 participants). We therefore did not enforce a gender balance in our sample. Due toa technical error, the identification test data was not recorded for one participant (female, 26 yearsold). All participants were non-smokers and reported being healthy and not having suffered from aninfectious rhinitis for at least two weeks before testing. The study conformed to the revised Declarationof Helsinki and was approved by the ethical board of the German Society of Psychology (DGPs).
2.2. Stimuli
Stimuli were so-called Sniffin’ Sticks (Burghart, Wedel, Germany; [6]), felt-tip pens filled withan odorant. The Sniffin’ Sticks test battery consists of three subtests: an odor threshold test, an odordetection test, and an odor identification test. The threshold test comprises 48 pens. There were16 pens filled with different concentrations of 2-phenylethanol (rose-like smell) ranging from 4% toapprox. 1.22 × 10⁻⁴% (a geometric sequence with the common ratio of 2, so the first pen contained a4% dilution, the second 2%, the third 1%, and so on), dissolved in 4% propylene glycol, an odorlesssolvent. Note that in this test, the 1st pen contained the highest, the 16th pen the lowest odorant
324

Nutrients 2019, 11, 1278
concentration. The remaining 32 pens contained 4% propylene glycol and served as blanks. Thepens were arranged in triplets such that each triplet contained one pen with odorant and two blanks.The detection test comprised 48 pens that were filled with 16 different odorants at supra-thresholdconcentrations. The pens were arranged in triplets such that two pens contained the same and onepen a different odorant. The identification test comprised 16 pens filled with different odorants atsupra-threshold concentrations.
2.3. Procedure
2.3.1. Experimental Sessions
Participants were invited for two experimental sessions – the Test and Retest session for the odorthreshold. To ensure similar testing conditions across sessions, participants were instructed to refrainfrom eating and drinking anything but water 30 min before visiting the laboratory. Further, bothsessions were scheduled at approximately the same time of day, and took place with a medianinter-session interval of 3.0 days (SD = 2.6, range: 0.9–8.9 days); only four participants had aninter-session interval of more than 7.0 days. In each session, olfactory detection thresholds weredetermined using two distinct algorithms, staircase and QUEST, described below. The order ofalgorithms was balanced across participants and kept constant for Test and Retest within eachparticipant. Additionally, odor discrimination and odor identification ability were measured atthe end of one session following the standard Sniffin’ Sticks protocol (Burghart, Wedel, Germany).
2.3.2. Stimulus Presentation
Testing took place in a well-ventilated testing room and was performed by the same experimenter,who refrained from using any fragrant products (e.g., soap, lotion, perfume, etc.) and wore odorlesscotton gloves when presenting the stimuli. At the beginning of each test session, participants wereblindfolded. To present a stimulus, the experimenter removed the cap from the pen, held the tip ofthe pen in front of the participant’s nose, approx. 2 cm from the nostrils, and asked the participant totake a sniff. For the threshold test, participants were blindfolded and informed that the odorant maybe presented in very low concentrations, and that only one of the three pens presented in each trialcontained the odorant, while the others contained the solvent exclusively. The task was to “indicatewhich of the three pens smells different from the others”, and participants had to provide a responseeven when unsure. Participants were familiarized with the odorant by presenting pen no. 1 (highestconcentration) before testing commenced.
A similar procedure was used for the discrimination test: participants were blindfolded andpresented with a triplet of pens containing clearly perceivable odorants. Each triplet consisted of twopens with the same and one pen with a different odorant. Again, participants were to indicate the penthat smelled different from the others. During threshold and discrimination testing, stimulus tripletswere presented during each trial, which lasted approx. 30 s and included the presentation of threepens (approx. 3 s each) and a pause of 20 s. These tests yield a probability of 1⁄3 of guessing correctly.
For the identification task, the blindfold was removed and participants smelled one pen at a time.They were to identify the odor by pointing to the matching word on a response sheet with four writtenresponse options. The interval between pens was approx. 30 s. The probability of guessing correctly inthis task was 1⁄4.
2.3.3. Staircase
Following the standard protocol as detailed in the test manual; see also [16]), the order ofpresentation within the triplets varied from trial to trial. In the first trial, the odor pen was presentedfirst, in the second trial, it was presented between two blanks, and in the third, after two blanks. Afterthe third trial, this sequence was repeated.
325

Nutrients 2019, 11, 1278
We first determined the starting concentration. Beginning with the presentation of triplet no. 16or 15 (balanced across participants), participants had to indicate which of the pens smelled different.Concentration was increased in steps of two (e.g., from pen 16 to 14) for each incorrect response. Onceparticipants provided a correct response, the same triplet was presented again. If the response wasincorrect, the concentration was increased again by two steps as before. However, if the triplet wascorrectly identified a second time, that dilution step served as the starting concentration.
Contrary to the standard protocol, where testing would then continue without interruption,our participants were granted a short break of approx. 1 min before the actual threshold estimationstarted with the presentation of the triplet containing the starting concentration. The threshold wasdetermined in a one-up/two-down staircase procedure: odor concentration was increased by onestep after each incorrect response (one-up), and decreased by one step after two consecutive correctresponses at the same concentration (two-down). This kind of staircase targets a threshold of 70.71%correct responses ([11]; but cf. [17], who found small deviations from this value). That is, if presentedrepeatedly with a stimulus at threshold intensity, participants would be able to correctly identify itin about 71 out of 100 cases. The probability of providing two consecutive correct responses purely byguessing is 1⁄3 × 1⁄3 = 1⁄9. The procedure finished after seven reversal points were reached. The finalthreshold estimate was the mean of the last four reversal concentrations. This procedure is referred tosimply as staircase throughout the this manuscript.
2.3.4. QUEST
QUEST requires to set parameters that describe the assumed psychometric function linkingstimulus intensity and expected response behavior. We assumed a sigmoid psychometric function ofthe Weibull family, as proposed by [12] (albeit in a slightly different parametrization) and used forgustatory testing [13], with a slope β = 3.5, a lower asymptote γ = 1/3 (chance of a correct responsejust by guessing), and a parameter λ = 0.01 to account for lapses (response errors due to momentaryfluctuation of attention):
Ψ(x) = λγ + (1 − λ)[1 − (1 − γ) exp(−10β(x+T))]
Here, the presented concentration is denoted as x, and the assumed threshold as T. This yielded afunction extending from 0.33 to 0.99 in units of “proportion of correct responses”. The granularity ofthe concentration grid was set to 0.01. All parameters of this function were constant, except for thethreshold, which was the parameter of interest that was going to be estimated in the course of theprocedure. The prior estimate of the threshold was a normal distribution with a standard deviation of20, which was centered on the concentration of pen no. 7, which was used as the starting concentration.The algorithm was set to target the threshold at 80% correct responses, which is slightly higher thanthe threshold target in the staircase procedure, but had proven to produce good results both in pilottesting as well as in gustatory threshold estimation [13,14]. Unlike in the staircase procedure, wherethe order of pen presentation varied systematically from triplet to triplet, triplets were presented inrandom order during the QUEST procedure.
Notably, QUEST updates its knowledge on the expected threshold after each response andproposes the concentration to present in the next trial such that it maximizes the expected informationgain about the “true” threshold. As the set of concentrations was discrete and limited to 16, QUESTmight propose concentrations other than those contained in the test set. In this case, the softwareselects the triplet with the concentration closest to the one proposed. In contrast to the staircase, wherethe concentration was always decreased or increased by a single step after the starting concentrationhad been determined, the step width was not fixed in QUEST. For example, QUEST might step upthree concentrations in one trial, step down two in the next, and present the exact same concentrationagain in the following trial. Whenever the same concentration had been presented on two consecutivetrials, the concentration for the next trial was decreased if both responses were correct, and increased if
326

Nutrients 2019, 11, 1278
both responses were incorrect. QUEST might suggest to present concentrations outside of the range ofavailable dilution steps. Therefore we set up the algorithm such that, whenever the presentation ofa pen below 1 or above 16 was suggested, we would instead present pen no. 1 and 16, respectively.QUEST would be informed about the actually presented pen, and incorporate this information intothe threshold estimate. Note, however, that final threshold estimates outside the concentration rangecould still occur occasionally, and needed to be dealt with accordingly; see the data cleaning paragraphin the next section for details.
The procedure ended after 20 trials. The final threshold estimate is the mean of the posteriorprobability density function of the threshold parameter. We will refer to this procedure as “QUEST”.
2.3.5. Analysis
Odor Discrimination and Identification
The discrimination and identification tests comprised 16 trials each. For each test, the number ofcorrect responses was summed up, resulting in a test score which can range from 0 to 16. Togetherwith the staircase threshold, which yielded values from 1 to 16, the sum of all three test results formeda cumulative score: the TDI score.
Data Cleaning
When a participant reached one of the most extreme concentrations (i.e., pens no. 1 or 16) andprovided a response that would, theoretically, require us to present a concentration outside the stimulusof set, the staircase procedure cannot be safely assumed to yield a reliable threshold estimate anymore.For example, if a participant fails to identify the highest concentration (pen no. 1), the staircaseprocedure would accordingly demand to present a hypothetical pen no. 0, which obviously does notexist. Since our sole termination criterion was “seven reversals”, we would repeatedly present penno. 1 until a correct identification allowed the procedure to move up to pen no. 2 again. The resultingthreshold estimate, then, would systematically overestimate this participant’s sensitivity. Thereforewe set the threshold values of staircase runs where participants could not identify pen no. 1 at leastonce to T = 1 after the run was completed, following [7] (but cf. [16], who suggest to set the value toT = 0 instead). This was the case in five out of the 72 staircase threshold measurements (two duringtest, three during retest; five participants affected). Conversely, when a participant were to correctlyidentify the lowest concentration (pen no. 16), the staircase procedure would require the presentationof a hypothetical pen no. 17, in which case we would have assigned a threshold value of T = 16;however, this situation did not occur in the present study after the starting concentration had beendetermined.
For QUEST, pen no. 1 was not correctly identified at least once in 12 of the 72 measurements,concerning 11 participants; no participant reached and correctly identified pen no. 16. QUEST yieldedfinal threshold estimates T < 1 in 11 measurements (8 during Test, 3 during Retest; 10 participantsaffected). Similarly to the data cleaning procedure for the staircase, we assigned threshold T = 1 inthese cases. Notably, this again concerned 3 of the 5 participants for whom we had assigned T = 1 in astaircase experiment.
Test–Restest Reliability
To establish test–retest reliability, we first compared the means of Test and Retest thresholdsfor each procedure. Q–Q plots and Shapiro–Wilk tests revealed that thresholds were not normallydistributed for the QUEST test session (W = 0.90, p < 0.01); we, therefore, compared the means usingnon-parametric Wilcoxon signed-rank tests. We then correlated Test and Retest threshold estimatesvia Spearman’s rank correlation (Spearman’s rho, denoted as ρ) to estimate the degree of monotonicrelationship between measurements. Ordinary least squares (OLS) models were used to fit regressionlines to provide a better understanding of the nature of the relationship between the threshold estimates
327

Nutrients 2019, 11, 1278
(i.e., whether test thresholds could predict retest thresholds). Q–Q plots and Shapiro–Wilk tests showedthat the regression residuals were normally distributed (all p > 0.05) and thus satisfied an importantrequirement for OLS regression.
Although correlation and regression analyses are widely used to assess test–retest reliability and tocompare methods, it has been argued that these measures may in fact be inappropriate (see e.g., [18–20]).Instead, analyses that focus on the differences between, not agreement of, measurements should bepreferred. A possible approach is to calculate the mean difference d and standard deviation of thedifferences between two measurements to derive limits of agreement, d ± 1.96 × SD [18]. These limitscorrespond to the 95% confidence interval. This means that in 95 out of 100 comparisons, the differencebetween two measurements can be expected to fall into this range. Narrower limits of agreementindicate a better agreement between two measurements. The related repeatability coefficient (RC)was simply 1.96 × SD, and its interpretation was very similar to the limits of agreement: only 5% ofabsolute measurement differences will exceed this value, and a smaller RC indicates better agreement.(It should be noted that an alternative method for calculating the repeatability coefficient has beensuggested, based on the within-participant standard deviation, sw [20]. The results we obtained fromthese calculations were similar to those based on the standard deviation of the measurement differences.Because the latter are directly visualized in the Bland–Altman plot by the limits of agreement, i.e.,mean difference ± 1.96 × SD, we opted to only report these values.)
If the differences between two measurements are plotted over the mean of the measurements, andd and the limits of agreement are added as horizontal lines, the resulting plot is called a Bland–Altmanplot (sometimes also referred to as Tukey mean difference plot). It can be used to quickly visuallyinspect how well measurements can be reproduced, specifically which systematic bias (d = 0) andwhich variability or “spread” of measurement differences to expect. Accordingly, we assessed the RC,limits of agreement, and produced Bland–Altman plots for both methods, staircase and QUEST, to gainmore insight into the repeatability (or lack thereof) of measurements for each method. The use ofthese analyses requires the measurement differences to be normally distributed, which we confirmedusing Q–Q plots, and Shapiro–Wilk tests failed to reject the null hypothesis of normal distributions (allp > 0.05). Confidence intervals for the limits of agreement were calculated using the “exact paired”method [21].
Lastly, to test whether the duration of the inter-session interval might be a confounding factor inthe threshold estimates, we also calculated the Spearman correlation between inter-session intervalsand differences between Test and Retest thresholds.
Comparison between Procedures
To compare the threshold estimates across procedures, we averaged Test and Retest thresholdsfor each participant within a procedure, and, similarly to the analysis of reliability, compared themeans with a Wilcoxon signed-rank test, followed by the calculation of Spearman’s ρ and the fit of aregression line using an OLS model. The regression residuals were normally distributed, according toa Q–Q plot and a Shapiro-Wilk test (W = 0.96, p = 0.26), satisfying the normality assumption of errorson which OLS regression crtitically relies.
Additionally, we estimated the 95% limits of agreement from the differences between thewithin-participant session means for the two procedures, and generated Bland-Altman plots. Themeasurement differences were normally distributed, according to a Q-Q plot and a Shapiro-Wilk test(W = 0.96, p = 0.30). Like in the investigation of test-retest reliability, we assessed confidence intervalsof the limits of agreement via the “exact paired” method [21].
Because the limits of agreement derived from session means might actually be too narrow,as within-participant variability is removed by averaging measurements across sessions [20],we calculated adjusted limits of agreement from the variance of the between-subject differences, σ2
d ,which in turn can be calculated as σ2
d = s2d + 0.5 s2
xw + 0.5 s2yw. Here, s2
d is the variance of the differencesbetween the session means; and s2
xw and s2yw are the within-participant variances of methods x and
328

Nutrients 2019, 11, 1278
y, respectively (staircase and QUEST in our case). The limits of agreement can then be calculatedas d ± 1.96 × σd, with d being the mean difference between the session means of both procedures.Again, the interpretation of these limits is straightforward: 95% of the differences between staircaseand QUEST measurements can be expected to fall into this interval, and narrower limits indicate abetter agreement across the measurement results produced by both procedures. Finally, we derived95% confidence intervals for these limits ([20], Section 5.1, Equation (5.10)).
Software
The experiments were run via PsychoPy 1.85.4 [22,23] running on Python 2.7.14 (https://www.python.org) installed via the Miniconda distribution (https://conda.io/miniconda.html) on Windows 7(Microsoft Corp., Redmond, WA, USA). All analyses were carried out with Python 3.7.1, running onmacOS 10.14.2 (Apple Inc., Cupertino, CA, USA). We used the following Python packages: correlationcoefficients, Bland-Altman and Q-Q plots were derived via pingouin 0.2.2 [24]; confidence intervalsfor the Bland–Altman plots were calculated with pyCompare 1.2.3 (https://github.com/jaketmp/pyCompare); Shapiro–Wilk statistics were calculated with SciPy 1.2.1 [25,26]; linear regression modelswere estimated using statsmodels 0.9.0 [27]; and box plots and correlation plots were created withseaborn 0.9.0 (https://seaborn.pydata.org) and matplotlib 3.0.2 [28].
3. Results
3.1. Odor Discrimination and Identification
The average test score was 13.3 (SD = 1.5, range: 11–16; N = 35) for odor discrimination, and 13.0(SD = 1.6, range: 11–16; N = 36) for odor identification. When summed with the staircase thresholdestimates from the Test and Retest sessions, we observed TDI scores of 33.34 (SD = 3.8; range: 26.5–43)and 33.64 (SD = 3.8; range: 26.75–41.75), respectively. Individual as well as cumulative scores indicatea below-average ability to smell (roughly around the 25th percentile) in our sample compared to recentnormative data from over 9000 subjects [8].
3.2. Starting Concentrations
The average starting concentration was pen no. 9.9 (SD = 4.2, range: 1–16) for the Test and9.6 (SD = 4.1, range: 1–16) for the Retest session of the staircase. The average difference in startingconcentrations between sessions was 4.9 (SD = 4.0, range: 0–15). In comparison, we used a slightlyhigher, fixed starting concentration of pen no. 7 for QUEST.
3.3. Test Duration
The average number of trials needed to complete the staircase measurements was 23.6 (SD = 4.8,range: 13–41), which translates to approx. 11.5 min and is 2 minutes longer than for QUEST, which perour parameters always lasted 9.5 minutes (20 trials). Test duration varied slightly between staircasesessions and was 24.4 trials (SD = 4.2, range: 16–34) for the test and 22.9 trials (SD = 5.4, range: 13–41)for the retest session. Please note that the number of trials and the testing duration for the staircase arebased on the time required to reach seven reversal points after the starting concentration had beendetermined, thereby deviating from the “standard” procedure, which treats the starting concentrationas the first reversal.
3.4. Test-Retest Reliability
The mean Test thresholds did not differ from the mean Retest thresholds for the staircase(MTest = 6.9, SDTest = 3.1; MRetest = 7.2, SDRetest = 3.2; W = 268.0, p = 0.19). For QUEST, onthe other hand, mean test and retest thresholds differed significantly, with slightly higher sensitivity(higher T unit) in the Retest (MTest = 5.2, SDTest = 3.8; MRetest = 6.2, SDRetest = 3.4; W = 201.5,p < 0.01; see Figure 1).
329

Nutrients 2019, 11, 1278
Figure 1. Threshold estimates for the staircase and QUEST procedures during Test and Retest sessions.Each dot represents one participant. Horizontal lines show the median values, and whisker lengthsrepresent 1.5× inter-quartile range.
The test and retest thresholds correlated significantly for both procedures, with QUESTdemonstrating a stronger relationship between measurements than the staircase (staircase: ρ34 = 0.49,p < 0.01; QUEST: ρ34 = 0.66, p < 0.001; Figure 2A).
As already pointed out, correlation gives an indication of the strength of the monotonicrelationship between values, but only provides limited information on their agreement. We thereforecalculated the repeatability coefficient RC and created Bland–Altman plots to generate a betterunderstanding of the measurement differences. The prediction of the RC is that two measurements (testand retest) will differ by the value of RC or less for 95% of participants. We found that RC was about16% smaller for QUEST than for the staircase (RCStaircase = 6.44, RCQUEST = 5.43), suggesting a slightlybetter agreement between Test and Retest measurements for the QUEST procedure. Accordingly, theBland–Altman plot (Figure 2B) showed narrower limits of agreement for QUEST (staircase: −6.79[−8.89,−5.63] and 6.09 [4.93, 8.18]; QUEST: −6.42 [−8.18,−5.44] and 4.44 [3.46, 6.29]; 95% CIs inbrackets). The mean of the differences between measurements was relatively small and deviated lessthan 1 T unit from zero—the “ideal” difference—for both methods (MΔT,Staircase = −0.35 [−1.43, 0.72];MΔT,QUEST = −0.99 [−1.89,−0.08]). This systematic negative shift indicates that participants, onaverage, reached higher T units in the second session than in the first. The differences between Testand Retest measurements for three (staircase) and two participants (QUEST), respectively, fell outsidetheir respective limits of agreement, which corresponds to the expected proportion of 5% of outliers(3/36 = 8.3%; 2/36 = 5.6%), demonstrating the appropriateness of the estimated limits. Considering theconfidence intervals of the limits of agreement, an equal number of measurement differences (four) felloutside the predicted range for both procedures.
To test whether the time between Test and Retest sessions might be linked to the observeddifferences between Test and Retest threshold estimates, we computed correlations between thosemeasures. We found no relationship for either method (staircase: ρ34 = −0.12, p = 0.50; QUEST:ρ34 = 0.03, p = 0.85).
330

Nutrients 2019, 11, 1278
Figure 2. (A) Correlation between Test and Retest threshold estimates for the staircase and QUESTprocedures. (B) Bland–Altman plots showing mean differences between Test and Retest, and limits ofagreement corresponding to 95% confidence intervals (CIs) as mean ± 1.96 × SD. The shaded areasrepresent the 95% CIs of the mean and the limits of agreement. Each dot represents one participant.
3.5. Comparison between Procedures
Although the threshold estimates, averaged across sessions, for the staircase were significantlyhigher than those for QUEST (Mstaircase = 7.0, SDstaircase = 2.7; MQUEST = 5.7, SDQUEST = 3.3;W = 101.0, p < 0.001; Figure 3A), we found a strong correlation between the procedures (ρ34 = 0.80,p < 0.001; Figure 3B). The regression slope was close to 1, providing an indication of agreement acrossprocedures. The Bland-Altman plot based on the session means (Figure 3C) shows a systematicdifference between both procedures; specifically, QUEST thresholds were, on average, 1.38 [0.78, 1.97]T units smaller than the staircase estimates (95% CIs in brackets). The limits of agreement reachedfrom −2.20 [−3.37,−1.56] to 4.95 [4.31, 6.12], meaning the difference between the two procedures willfall into this range for 95% of measurements. Only for 1 participant the observed differences betweenstaircase and QUEST fell outside the limits of agreement (1/36 = 2.8%; when considering the CIs of thelimits, 3 participants fell outside the expected range (3/36 = 8.3%)
The corrected limits of agreement, taking into account individual measurements (as opposed tosession means only), were −4.20 [−23.6, 15.3] and 6.96 [−12.5, 26.4], which is substantially larger than
331
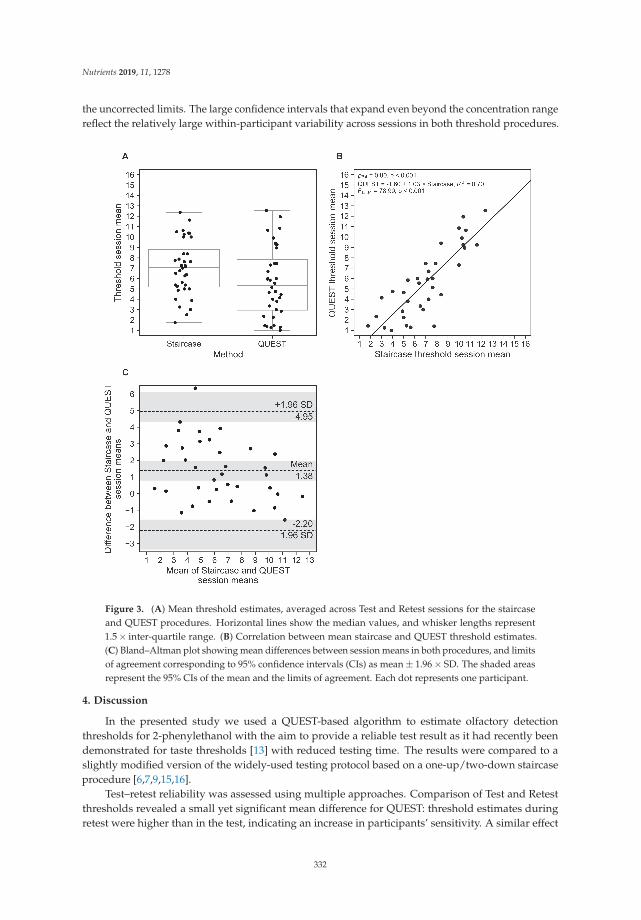
Nutrients 2019, 11, 1278
the uncorrected limits. The large confidence intervals that expand even beyond the concentration rangereflect the relatively large within-participant variability across sessions in both threshold procedures.
Figure 3. (A) Mean threshold estimates, averaged across Test and Retest sessions for the staircaseand QUEST procedures. Horizontal lines show the median values, and whisker lengths represent1.5× inter-quartile range. (B) Correlation between mean staircase and QUEST threshold estimates.(C) Bland–Altman plot showing mean differences between session means in both procedures, and limitsof agreement corresponding to 95% confidence intervals (CIs) as mean ± 1.96 × SD. The shaded areasrepresent the 95% CIs of the mean and the limits of agreement. Each dot represents one participant.
4. Discussion
In the presented study we used a QUEST-based algorithm to estimate olfactory detectionthresholds for 2-phenylethanol with the aim to provide a reliable test result as it had recently beendemonstrated for taste thresholds [13] with reduced testing time. The results were compared to aslightly modified version of the widely-used testing protocol based on a one-up/two-down staircaseprocedure [6,7,9,15,16].
Test–retest reliability was assessed using multiple approaches. Comparison of Test and Retestthresholds revealed a small yet significant mean difference for QUEST: threshold estimates duringretest were higher than in the test, indicating an increase in participants’ sensitivity. A similar effect
332

Nutrients 2019, 11, 1278
was reported in a previous study [6]. However, with a mean difference of approx. 1 T unit or pennumber, the practical relevance of this effect is debatable, even more so when considering the largevariability of measurement results within individual participants.
Following common practice of establishing test-retest reliability of olfactory thresholds (seee.g., [6,9,29]), we calculated correlations between Test and retest sessions. The correlation coefficientfor QUEST (ρ = 0.66) indicated solid, but not exceptionally great test–retest reliability. Reliability ofthe staircase procedure was only moderate (ρ = 0.49) and lower than reported in previous studies forn-butanol (r = 0.61; [6]) and 2-phenylethanol (r = 0.92; [9]) thresholds.
To acknowledge previous criticism of correlation analysis – which focuses on the agreement, butnot on the differences between measurements [18–20] – we calculated repeatability coefficients andgenerated Bland–Altman plots for the analysis of session differences. Repeatability was higher forQUEST than for the staircase; however, measurement results of both procedures varied considerablyacross sessions for many participants. This inter-session variability is further substantiated by thedifferences in starting concentrations assessed for the staircase, which varied up 15 pen numbers in themost extreme case. The effect was not universal: some participants performed better in the Test thanin the Retest session, whereas for others performance dropped across sessions, and remained almostunchanged in others. Since both sessions had been scheduled within a relatively short time period andall measurements have been performed by the same experimenter, measurement variability can bemostly attributed to variability within participants themselves.
The comparison of the staircase and QUEST procedures via the session means of each participantshowed that the staircase yielded slightly higher pen numbers (i.e., lower thresholds) than QUEST. Thiswas expected as the procedures were assumed to converge at approx. 71% and 80% correct responses,respectively. We found a strong correlation between the session means of the procedures (ρ = 0.80),and regression analysis showed an almost perfect linear relationship, which some would interpret asa good agreement between QUEST and staircase results. The 95% limits of agreement, taking intoaccount the within-participant variability, showed a large expected deviation between both procedures(range: QUEST thresholds almost 7 T units smaller or more than 4 T units greater than staircaseresults), with the corresponding CIs of those boundaries even exceeding the concentration range. Thisresult is indicative of the large variability we found within participants in both procedure. The limitsof agreement based on the within-participant session means were much narrower, as variability isgreatly reduced through averaging.
A potential source of variability might be guessing. In fact, the probability of responding correctlymerely by guessing is 1⁄3.
In a series of simulations, it could be shown that with an increasing number of trials the frequencyof correct guesses might get unacceptably high, potentially leading increased variability in the thresholdestimates [30]. The author determined that, for a staircase procedure like the one in our study, theexpected proportion of such false-positive responses exceeds 5% with the 23rd trial. For our staircaseexperiments, the average number of trials was 23.6; and the procedure finished after 23 or more trialsfor 24 of the 36 participants in the Test, and for 20 participants in the Retest session. Therefore, thelarge variability between Test and Retest threshold estimates in the staircase could, at least partially, beascribed to correct guesses “contaminating” the procedure. However, QUEST—which always finishedafter 20 trials—only had slightly better test-retest reliability according the the repeatability coefficient,suggesting that the largest portion of test-retest variability in our investigations was probably notcaused by (too) long trial sequences and related false-positive responses alone.
Surprisingly, a number of participants were unable to correctly identify pen no. 1 at least on oneoccasion, and this effect was more pronounced during QUEST compared to the staircase. It seemsplausible that the variable step size used by QUEST made it possible to approach even the extremeconcentration ranges quickly, whereas the staircase requires a longer sequence of incorrect responsesto reach pen no. 1.
333

Nutrients 2019, 11, 1278
Despite careful selection of healthy participants who reported no smell impairment, olfactoryperformance was lower than recently reported in a sample comprising over 9000 participants [8].This coincidental finding highlights the need for a comprehensive smell screening before enrollment.To what extend olfactory function contributed to the present results and limits their generalizabilityremains to be explored.
All QUEST runs completed after 20 trials for all participants. The procedure could be furtheroptimized by introducing a dynamic stopping rule. For example, [13] set the algorithm to terminateonce the threshold estimate had reached a certain degree of confidence. Such a rule can reducetesting time, as the run may finish in fewer than 20 trials, and should be considered in future studies.Although the reduction or omission of a minimum trial number bears potential to reduce the testingtime further, it needs to be shown first that the algorithm performs well under these conditionsand, most importantly, large-scale studies need to show whether such a reduced or faster protocol isappropriate to assess odor sensitivity in participants with odor abilities at the extremes (particularlyinsensitive/sensitive).
Inspection of the data showed that some staircase runs had not fully converged although sevenreversal points were reached. In these cases, participants exhibited a somewhat “fluctuating” responsebehavior (or threshold) that caused the procedure to move in the direction of higher concentrationsthroughout the experiment (see Figure A1 in the appendix and supplementary data for an example).QUEST proved to behave more consistently, at least in some cases, by either converging to a thresholdor by reaching pen no. 1, which would then sometimes not be identified correctly. These interestingdifferences between procedures require further investigation to fully understand their cause andinfluence on threshold estimates and, ultimately, diagnostics.
5. Conclusions
The present study compared the reliability of olfactory threshold estimates using two differentalgorithms: a one-up/two-down staircase and a QUEST-based procedure. The measurement results ofboth procedures showed considerable overlap. QUEST thresholds were more stable across sessionsthan the staircase, as indicated by a smaller variability of test-retest differences and a higher correlationbetween session estimates. QUEST offered a slightly reduced testing time, which may be furtherminimized through a variable stopping criterion. Yet, QUEST also tended to present the highestconcentration, pen no. 1, more quickly than the staircase, which may induce more rapid adaptationand habituation during the procedure and, eventually, produce biased results. Further research isneeded to better understand possible advantages and drawbacks of the QUEST procedure comparedto the staircase testing protocol.
6. Data and Software Availability
The data analyzed in this paper along with graphical representations of each individual thresholdrun are available from https://doi.org/10.5281/zenodo.2548620. The authors provide a hosted servicefor running the presented experiments online at https://sensory-testing.org; the sources of this onlineimplementation can be retrieved from https://github.com/hoechenberger/webtaste.
Author Contributions: conceptualization, R.H. and K.O.; programming, analysis, and visualization, R.H.;interpretation and writing, R.H. and K.O.; supervision and project administration, K.O.
Funding: The implementation of the online interface was supported by Wikimedia Deutschland, Stifterverband,and Volkswagen Foundation through an Open Science Fellowship granted to R.H.
Acknowledgments: The authors would like to thank Andrea Katschak for data collection.
Conflicts of Interest: The authors declare no conflict of interest. The funding agents had no role in the design ofthe study; in the collection, analyses, or interpretation of data; in the writing of the manuscript, or in the decisionto publish the results.
334

Nutrients 2019, 11, 1278
Appendix A
Example threshold runs of the same participant: while the QUEST runs did converge, the staircaseruns obviously did not fully converge although seven reversal points were reached. Intriguingly,the staircase provided more consistent results (more similar thresholds across runs) than QUEST.We speculate that this participant exhibited a fluctuating response behavior during the staircaseprocedure.
Figure A1. Comparison of threshold estimation runs of the same participant during test and retestsessions for QUEST (A) and the staircase (B).
References
1. Boesveldt, S.; Bobowski, N.; McCrickerd, K.; Maître, I.; Sulmont-Rossé, C.; Forde, C.G. The changing role ofthe senses in food choice and food intake across the lifespan. Food Qual. Prefer. 2018, 68, 80–89. [CrossRef]
2. Rasmussen, V.F.; Vestergaard, E.T.; Hejlesen, O.; Andersson, C.U.N.; Cichosz, S.L. Prevalence of taste andsmell impairment in adults with diabetes: A cross-sectional analysis of data from the National Health andNutrition Examination Survey (NHANES). Primary Care Diabetes 2018, 12, 453–459. [CrossRef] [PubMed]
3. Sullivan, R.M.; Wilson, D.A.; Ravel, N.; Mouly, A.M. Olfactory memory networks: From emotional learningto social behaviors. Front. Behav. Neurosci. 2015, 9.. [CrossRef] [PubMed]
4. Li, W. Learning to smell danger: Acquired associative representation of threat in the olfactory cortex. Front.Behav. Neurosci. 2014, 8. [CrossRef] [PubMed]
335

Nutrients 2019, 11, 1278
5. Liu, G.; Zong, G.; Doty, R.L.; Sun, Q. Prevalence and risk factors of taste and smell impairment in anationwide representative sample of the US population: A cross-sectional study. BMJ Open 2016, 6, e013246.[CrossRef] [PubMed]
6. Hummel, T.; Sekinger, B.; Wolf, S.; Pauli, E.; Kobal, G. ‘Sniffin’ Sticks’: Olfactory Performance Assessed bythe Combined Testing of Odour Identification, Odor Discrimination and Olfactory Threshold. Chem. Senses1997, 22, 39–52. [CrossRef] [PubMed]
7. Hummel, T.; Kobal, G.; Gudziol, H.; Mackay-Sim, A. Normative data for the “Sniffin’ Sticks” including testsof odor identification, odor discrimination, and olfactory thresholds: An upgrade based on a group of morethan 3,000 subjects. Eur. Arch. Oto-Rhino-Laryngol. 2007, 264, 237–243. [CrossRef] [PubMed]
8. Oleszkiewicz, A.; Schriever, V.A.; Croy, I.; Hähner, A.; Hummel, T. Updated Sniffin’ Sticks normative databased on an extended sample of 9139 subjects. Eur. Arch. Oto-Rhino-Laryngol. 2019, 276, 719–728. [CrossRef][PubMed]
9. Haehner, A.; Mayer, A.M.; Landis, B.N.; Pournaras, I.; Lill, K.; Gudziol, V.; Hummel, T. High Test-RetestReliability of the Extended Version of the “Sniffin’ Sticks” Test. Chem. Senses 2009, 34, 705–711. [CrossRef]
10. Lötsch, J.; Reichmann, H.; Hummel, T. Different Odor Tests Contribute Differently to the Evaluation ofOlfactory Loss. Chem. Senses 2008, 33, 17–21. [CrossRef]
11. Wetherill, G.B.; Levitt, H. Sequential Estimation of Points on a Psychometric Function. Br. J. Math. Stat.Psychol. 1965, 18, 1–10. [CrossRef] [PubMed]
12. Watson, A.B.; Pelli, D.G. Quest: A Bayesian adaptive psychometric method. Percept. Psychophys. 1983,33, 113–120. [CrossRef] [PubMed]
13. Höchenberger, R.; Ohla, K. Rapid Estimation of Gustatory Sensitivity Thresholds with SIAM and QUEST.Front. Psychol. 2017, 8. [CrossRef] [PubMed]
14. Hardikar, S.; Höchenberger, R.; Villringer, A.; Ohla, K. Higher sensitivity to sweet and salty taste in obesecompared to lean individuals. Appetite 2017, 111, 158–165. [CrossRef] [PubMed]
15. Kobal, G.; Klimek, L.; Wolfensberger, M.; Gudziol, H.; Temmel, A.; Owen, C.M.; Seeber, H.; Pauli, E.;Hummel, T. Multicenter investigation of 1,036 subjects using a standardized method for the assessment ofolfactory function combining tests of odor identification, odor discrimination, and olfactory thresholds. Eur.Arch. Oto-Rhino-Laryngol. 2000, 257, 205–211. [CrossRef]
16. Rumeau, C.; Nguyen, D.T.; Jankowski, R. How to assess olfactory performance with the Sniffin’ Sticks test ®.Eur. Ann. Otorhinolaryngol. Head Neck Dis. 2016, 133, 203–206. [CrossRef] [PubMed]
17. García-Pérez, M.A. Forced-choice staircases with fixed step sizes: Asymptotic and small-sample properties.Vis. Res. 1998, 38, 1861–1881. [CrossRef]
18. Altman, D.G.; Bland, J.M. Measurement in Medicine: The Analysis of Method Comparison Studies.Statistician 1983, 32, 307. [CrossRef]
19. Bland, J.M.; Altman, D. Statistical methods for assessing agreement between two methods of clinicalmeasurement. Lancet 1986, 327, 307–310. [CrossRef]
20. Bland, J.M.; Altman, D.G. Measuring agreement in method comparison studies. Stat. Methods Med. Res.1999, 8, 135–160. [CrossRef]
21. Carkeet, A. Exact Parametric Confidence Intervals for Bland-Altman Limits of Agreement. Optometry Vis.Sci. 2015, 92, e71–e80. [CrossRef] [PubMed]
22. Peirce, J.W. PsychoPy—Psychophysics software in Python. J. Neurosci. Methods 2007, 162, 8–13. [CrossRef][PubMed]
23. Peirce, J.W. Generating stimuli for neuroscience using PsychoPy. Front. Neuroinf. 2008, 2. [CrossRef][PubMed]
24. Vallat, R. Pingouin: Statistics in Python. J. Open Source Softw. 2018, 3, 1026. [CrossRef]25. Oliphant, T.E. Python for Scientific Computing. Comput. Sci. Eng. 2007, 9, 10–20. [CrossRef]26. Millman, K.J.; Aivazis, M. Python for Scientists and Engineers. Comput. Sci. Eng. 2011, 13, 9–12. [CrossRef]27. Seabold, S.; Perktold, J. Statsmodels: Econometric and statistical modeling with Python. In Proceedings of
the 9th Python in Science Conference, Austin, TX, USA, 9–15 July 2010; Volume 57, p. 61.28. Hunter, J.D. Matplotlib: A 2D Graphics Environment. Comput. Sci. Eng. 2007, 9, 90–95. [CrossRef]
336

Nutrients 2019, 11, 1278
29. Croy, I.; Lange, K.; Krone, F.; Negoias, S.; Seo, H.S.; Hummel, T. Comparison between Odor Thresholds forPhenyl Ethyl Alcohol and Butanol. Chem. Senses 2009, 34, 523–527. [CrossRef] [PubMed]
30. Running, C.A. High false positive rates in common sensory threshold tests. Atten. Percept. Psychophys. 2014,77, 692–700. [CrossRef]
© 2019 by the authors. Licensee MDPI, Basel, Switzerland. This article is an open accessarticle distributed under the terms and conditions of the Creative Commons Attribution(CC BY) license (http://creativecommons.org/licenses/by/4.0/).
337


MDPISt. Alban-Anlage 66
4052 BaselSwitzerland
Tel. +41 61 683 77 34Fax +41 61 302 89 18
www.mdpi.com
Nutrients Editorial OfficeE-mail: [email protected]
www.mdpi.com/journal/nutrients


MDPI St. Alban-Anlage 66 4052 Basel Switzerland
Tel: +41 61 683 77 34 Fax: +41 61 302 89 18
www.mdpi.com ISBN 978-3-03928-445-0