Nutrition, Exercise, and End-of-Life Discussion in the ... - MDPI
196
Edited by Nutrition, Exercise, and End-of-Life Discussion in the Cardiovascular Field Yoshihiro Fukumoto Printed Edition of the Special Issue Published in Nutrients www.mdpi.com/journal/nutrients
-
Upload
khangminh22 -
Category
Documents
-
view
7 -
download
0
Transcript of Nutrition, Exercise, and End-of-Life Discussion in the ... - MDPI
Edited by
Nutrition, Exercise,
and End-of-Life
Discussion in the
Cardiovascular
Field
Yoshihiro Fukumoto
Printed Edition of the Special Issue Published in Nutrients
www.mdpi.com/journal/nutrients

Nutrition, Exercise, and End-of-LifeDiscussion in the Cardiovascular Field


Nutrition, Exercise, and End-of-LifeDiscussion in the Cardiovascular Field
Editor
Yoshihiro Fukumoto
MDPI • Basel • Beijing • Wuhan • Barcelona • Belgrade • Manchester • Tokyo • Cluj • Tianjin
Editor
Yoshihiro Fukumoto
Kurume University School of
Medicine
Japan
Editorial Office
MDPI
St. Alban-Anlage 66
4052 Basel, Switzerland
This is a reprint of articles from the Special Issue published online in the open access journal
Nutrients (ISSN 2072-6643) (available at: https://www.mdpi.com/journal/nutrients/special issues/
Nutrition Exercise and End of Life Discussion in the Cardiovascular Field).
For citation purposes, cite each article independently as indicated on the article page online and as
indicated below:
LastName, A.A.; LastName, B.B.; LastName, C.C. Article Title. Journal Name Year, Volume Number,
Page Range.
ISBN 978-3-0365-3891-4 (Hbk)
ISBN 978-3-0365-3892-1 (PDF)
© 2022 by the authors. Articles in this book are Open Access and distributed under the Creative
Commons Attribution (CC BY) license, which allows users to download, copy and build upon
published articles, as long as the author and publisher are properly credited, which ensures maximum
dissemination and a wider impact of our publications.
The book as a whole is distributed by MDPI under the terms and conditions of the Creative Commons
license CC BY-NC-ND.

Contents
About the Editor . . . . . . . . . . . . . . . . . . . . . . . . . . . . . . . . . . . . . . . . . . . . . . ix
Yoshihiro Fukumoto
Nutrition and Cardiovascular DiseasesReprinted from: Nutrients 2022, 14, 94, doi:10.3390/nu14010094 . . . . . . . . . . . . . . . . . . . 1
Yuki Ishida, Daigo Yoshida, Takanori Honda, Yoichiro Hirakawa, Mao Shibata,
Satoko Sakata, Yoshihiko Furuta, Emi Oishi, Jun Hata, Takanari Kitazono and
Toshiharu Ninomiya
Influence of the Accumulation of Unhealthy Eating Habits on Obesity in a General JapanesePopulation: The Hisayama StudyReprinted from: Nutrients 2020, 12, 3160, doi:10.3390/nu13113916 . . . . . . . . . . . . . . . . . . 5
Ruixin Zhu, Mikael Fogelholm, Sally D. Poppitt, Marta P. Silvestre, Grith Møller,
Maija Huttunen-Lenz, Gareth Stratton, Jouko Sundvall, Laura Raman, Elli Jalo,
Moira A. Taylor, Ian A. Macdonald, Svetoslav Handjiev, Teodora Handjieva-Darlenska,
J. Alfredo Martinez, Roslyn Muirhead, Jennie Brand-Miller and Anne Raben
Adherence to a Plant-Based Diet and Consumption of Specific Plant Foods—Associations with3-Year Weight-Loss Maintenance and Cardiometabolic Risk Factors: A Secondary Analysis ofthe PREVIEW Intervention StudyReprinted from: Nutrients 2021, 13, 3916, doi:10.3390/nu13113916 . . . . . . . . . . . . . . . . . . 15
Chaochen Wang, Hiroshi Yatsuya, Yingsong Lin, TaeSasakabe, Sayo Kawai, Shogo Kikuchi,
Hiroyasu Iso and Akiko Tamakoshi
Milk Intake and Stroke Mortality in the Japan Collaborative Cohort Study—A BayesianSurvival AnalysisReprinted from: Nutrients 2020, 12, 2743, doi:10.3390/nu12092743 . . . . . . . . . . . . . . . . . . 31
Urban Alehagen, Jan Aaseth, Tomas L. Lindahl, Anders Larsson and Jan Alexander
Dietary Supplementation with Selenium and Coenzyme Q10 Prevents Increase in PlasmaD-Dimer While Lowering Cardiovascular Mortality in an Elderly Swedish PopulationReprinted from: Nutrients 2021, 13, 1344, doi:10.3390/nu13041344 . . . . . . . . . . . . . . . . . . 43
Futoshi Eto, Kazuo Washida, Masaki Matsubara, Hisashi Makino, Akio Takahashi,
Kotaro Noda, Yorito Hattori, Yuriko Nakaoku, Kunihiro Nishimura, Kiminori Hosoda and
Masafumi Ihara
Glucose Fluctuation and Severe Internal Carotid Artery Siphon Stenosis in Type 2 DiabetesPatientsReprinted from: Nutrients 2021, 13, 2379, doi:10.3390/nu13072379 . . . . . . . . . . . . . . . . . . 57
Miki Sugiyama, Takuma Hazama, Kaoru Nakano, Kengo Urae, Tomofumi Moriyama,
Takuya Ariyoshi, Yuka Kurokawa, Goh Kodama, Yoshifumi Wada, Junko Yano,
Yoshihiko Otsubo, Ryuji Iwatani, Yukie Kinoshita, Yusuke Kaida, Makoto Nasu,
Ryo Shibata, Kyoko Tashiro and Kei Fukami
Effects of Reducing L-Carnitine Supplementation on Carnitine Kinetics and Cardiac Function inHemodialysis Patients: A Multicenter, Single-Blind, Placebo-Controlled, Randomized ClinicalTrialReprinted from: Nutrients 2021, 13, 1900, doi:10.3390/nu13061900 . . . . . . . . . . . . . . . . . . 69
vi
Keiko Matsuzaki, Nobuko Fukushima, Yutaka Saito, Naoya Matsumoto, Mayu Nagaoka,
Yousuke Katsuda and Shin-ichiro Miura
The Effects of Long-Term Nutrition Counseling According to the Behavioral ModificationStages in Patients with Cardiovascular DiseaseReprinted from: Nutrients 2021, 13, 414, doi:10.3390/nu13020414 . . . . . . . . . . . . . . . . . . . 81
Tomoaki Okada, Toru Miyoshi, Masayuki Doi, Kosuke Seiyama, Wataru Takagi,
Masahiro Sogo, Kazumasa Nosaka, Masahiko Takahashi, Keisuke Okawa and Hiroshi Ito
Secular Decreasing Trend in Plasma Eicosapentaenoic and Docosahexaenoic Acids amongPatients with Acute Coronary Syndrome from 2011 to 2019: A Single Center Descriptive StudyReprinted from: Nutrients 2021, 13, 253, doi:10.3390/nu13010253 . . . . . . . . . . . . . . . . . . . 95
Andrea Greco, Agostino Brugnera, Roberta Adorni, Marco D’Addario, Francesco Fattirolli,
Cristina Franzelli, Cristina Giannattasio, Alessandro Maloberti, Francesco Zanatta and
Patrizia Steca
Protein Intake and Physical Activity in Newly Diagnosed Patients with Acute CoronarySyndrome: A 5-Year Longitudinal StudyReprinted from: Nutrients 2021, 13, 634, doi:10.3390/nu13020634 . . . . . . . . . . . . . . . . . . . 107
Naoki Itaya, Ako Fukami, Tatsuyuki Kakuma and Yoshihiro Fukumoto
Nutrition Status and Renal Function as Predictors in Acute Myocardial Infarction with andwithout Cancer: A Single Center Retrospective StudyReprinted from: Nutrients 2021, 13, 2663, doi:10.3390/nu13082663 . . . . . . . . . . . . . . . . . . 123
Naoaki Matsuo, Toru Miyoshi, Atsushi Takaishi, Takao Kishinoue, Kentaro Yasuhara,
Masafumi Tanimoto, Yukari Nakano, Nobuhiko Onishi, Masayuki Ueeda and Hiroshi Ito
High Plasma Docosahexaenoic Acid Associated to Better Prognoses of Patients with AcuteDecompensated Heart Failure with Preserved Ejection FractionReprinted from: Nutrients 2021, 13, 371, doi:10.3390/nu13020371 . . . . . . . . . . . . . . . . . . . 137
Yoshikuni Obata, Naoya Kakutani, Shintaro Kinugawa, Arata Fukushima, Takashi Yokota,
Shingo Takada, Taisuke Ono, Takeshi Sota, Yoshiharu Kinugasa, Masashige Takahashi,
Hisashi Matsuo, Ryuichi Matsukawa, Ichiro Yoshida, Isao Yokota, Kazuhiro Yamamoto and
Miyuki Tsuchihashi-Makaya
Impact of Inadequate Calorie Intake on Mortality and Hospitalization in Stable Patients withChronic Heart FailureReprinted from: Nutrients 2021, 13, 874, doi:10.3390/nu13030874 . . . . . . . . . . . . . . . . . . . 151
Kenya Kusunose, Yuichiro Okushi, Yoshihiro Okayama, Robert Zheng, Miho Abe,
Michikazu Nakai, Yoko Sumita, Takayuki Ise, Takeshi Tobiume, Koji Yamaguchi,
Shusuke Yagi, Daiju Fukuda, Hirotsugu Yamada, Takeshi Soeki, Tetsuzo Wakatsuki
and Masataka Sata
Association between Vitamin D and Heart Failure Mortality in 10,974 Hospitalized IndividualsReprinted from: Nutrients 2021, 13, 335, doi:10.3390/nu13020335 . . . . . . . . . . . . . . . . . . . 161
Tatsuhiro Shibata, Kazutoshi Mawatari, Naoko Nakashima, Koutatsu Shimozono,
Kouko Ushijima, Yumiko Yamaji, Kumi Tetsuka, Miki Murakami, Kouta Okabe,
Toshiyuki Yanai, Shoichiro Nohara, Jinya Takahashi, Hiroki Aoki, Hideo Yasukawa
and Yoshihiro Fukumoto
Multidisciplinary Team-Based Palliative Care for Heart Failure and Food Intake at the Endof LifeReprinted from: Nutrients 2021, 13, 2387, doi:10.3390/nu13072387 . . . . . . . . . . . . . . . . . . 173
vii


About the Editor
Yoshihiro Fukumoto: MD, PhD, FJCC, FESC, FAHA, FJCS. Professor and Chairman, Division of
Cardiovascular Medicine, Department of Internal Medicine, Kurume University School of Medicine.
Deputy Director of Kurume University Hospital. He works in the cardiology field, especially on
atherosclerosis, heart failure, pulmonary hypertension, and onco-cardiology.
ix


Citation: Fukumoto, Y. Nutrition and
Cardiovascular Diseases. Nutrients
2022, 14, 94. https://doi.org/
10.3390/nu14010094
Received: 30 November 2021
Accepted: 16 December 2021
Published: 27 December 2021
Publisher’s Note: MDPI stays neutral
with regard to jurisdictional claims in
published maps and institutional affil-
iations.
Copyright: © 2021 by the author.
Licensee MDPI, Basel, Switzerland.
This article is an open access article
distributed under the terms and
conditions of the Creative Commons
Attribution (CC BY) license (https://
creativecommons.org/licenses/by/
4.0/).
nutrients
Editorial
Nutrition and Cardiovascular Diseases
Yoshihiro Fukumoto
Division of Cardiovascular Medicine, Department of Internal Medicine, Kurume University School of Medicine,Kurume 830-0011, Japan; [email protected]; Tel.: +81-942-31-7562; Fax: +81-942-33-6509
Unhealthy food intake and insufficient physical activities are related with obesity orlife-style diseases, which can cause cardiovascular diseases, finally leading to death [1,2].First, to prevent the progression of obesity or life-style diseases, nutrition and exerciseare the most important issues. However, many people are not aware of their importance.Second, after the development of obesity or life-style diseases, nutrition and exercise controlwith appropriate medical therapies are required. Still, many patients do not recognize this.Third, after the cardiovascular diseases, nutrition and exercise with optimal medical and/orinterventional therapies are required. However, some patients are not able to control theirfood intake and physical activities. Finally, patients with end-stage cardiovascular diseasesneed their end-of-life discussion. In the current Special Issue of Nutrients, the importanceof nutrition was reported before and after cardiovascular diseases development.
Regarding BEFORE cardiovascular diseases development, Wang et al. [3] have shownthe strong evidence that daily milk intake among Japanese men was associated with delayedand lower risk of mortality from stroke (especially cerebral infarction, using data from theJACC study) as a good eating habit. The time before an event of stroke mortality occurredwas slowed down among men who drank milk regularly. [3] Also in the aspect of healthyfood, Zhu et al. [4] have demonstrated that their secondary analysis showed that long-term consumption of specific healthy plant foods including nuts, fruits, and vegetablesimproved weight management and cardiometabolic health, whereas adherence to anoverall plant-based diets benefited weight management only, supporting the hypothesisthat specific components in plant-based diets are important as well. As a good habit in ahigh-risk group, Alehagen et al. [5] have reported the relationship between D-dimer and adietary supplement consisting of selenium and coenzyme Q10 in an elderly community-living population. They observed a significantly reduced cardiovascular mortality inthe population with a high D-dimer level when given selenium and coenzyme Q10, ascompared to those on placebo [5].
Conversely, unhealthy food issues were also reported. Ishida et al. [6] have revealeddose-response-positive associations between the number of accumulated unhealthy eatinghabits and the likelihood of obesity and central obesity in a general Japanese population,suggesting that modifying individual unhealthy eating habits and avoiding their accu-mulation might reduce the burden of obesity and central obesity [6]. As indicated in thisarticle, healthcare professionals need to encourage those who have unhealthy eating habitsto modify each of their habits individually, including avoidance of accumulating multipleunhealthy habits, in order to prevent cardiovascular diseases [6]. Further longitudinalstudies should be performed to examine whether a causal relationship exists between theaccumulation of unhealthy eating habits and the incidence of obesity or central obesity [6].
Regarding AFTER cardiovascular diseases development, the importance of nutri-tion in various types of cardiovascular diseases was reported. Matsuzaki et al. [7] havedemonstrated that acquisition of effective behaviour modifications by long-term nutritioncounselling, according to behavioural modification stages, was important for patients withcardiovascular diseases.
In acute coronary syndrome (ACS), Okada et al. [8] have found a decreasing trend ineicosapentaenoic acid (EPA) and docosahexaenoic acid (DHA) levels, and EPA to arachi-donic acid ratio in men from 2011 to 2019 without significant changes in low-density
Nutrients 2022, 14, 94. https://doi.org/10.3390/nu14010094 https://www.mdpi.com/journal/nutrients1

Nutrients 2022, 14, 94
lipoprotein and high-density lipoprotein cholesterol levels, in which decreasing trend inEPA and DHA levels did not depend on age and was significant only in men in patientswith ACS. Administration of a sufficient dose of n-3 polyunsaturated fatty acids may beeffective in the secondary prevention of ACS, but further studies are needed to obtainrobust evidence. Next, Creco A, et al. [9] have indicated that patients with ACS experiencedifficulties in achieving and mostly maintaining adequate levels of a healthy diet and phys-ical activity over time, of which difficulties were modulated by environmental conditions,and most importantly, by psychological characteristics, suggesting how to perform tailordiet and physical activity interventions. They considered that tailoring should be aimedat promoting cognitive awareness of the risks associated with cardiovascular diseasesrecurrence. In fact, they showed that patients, who were more anxious, and thereforemore concerned and somehow aware of their health, were more able to maintain healthybehaviour over time [9]. Cognitive awareness of the risks associated with cardiovasculardiseases recurrence may be a useful tool to sustain patients’ capabilities to self-regulatetheir behaviours and to ameliorate lifestyle behaviour [9]. In atherosclerosis, blood glucosefluctuations are also important. Eto et al. [10] have indicated that patients with severe inter-nal carotid artery siphon stenosis had higher blood glucose fluctuations as assessed withstandard deviation, coefficient of variation, and mean amplitude of glycaemic excursions.Meanwhile, there were no significant differences in other vascular risk factors, such ashypertension, dyslipidaemia, mean blood glucose levels, haemoglobin A1c, and durationin years of type 2 diabetes mellitus, suggesting that glucose fluctuation can be a target ofpreventive therapies for intracranial artery stenosis and ischemic stroke [10].
In advanced cardiovascular diseases, low nutrition status is another problem. In thisspecial issue, the correlation between nutrition status and acute myocardial infarction (AMI)with cancer was also reported. Itaya et al. [11] have indicated that the prevalence of cancerin AMI was 13%, and that worse nutrition status and renal dysfunction were associatedwith AMI with cancer, in which nutrition status was a major different characteristic fromnon-cancer. Further, they have developed formulas to predict the presence of cancer inAMI [11].
Next, in heart failure (HF), Kurunose et al. [12] have shown that patients withvitamin D supplementation had a lower in-hospital mortality for HF than patients withoutvitamin D supplementation in the propensity matched cohort. The causality should betested in the future RCTs in specific population based on their study [12]. As also reportedin ACS, Matsuo et al. [13] have found that low plasma DHA levels were significantlyassociated with an increase in all-cause death in patients with acute decompensated heartfailure with preserved ejection fraction (HFpEF), independent of nutritional status, inwhich measurement of plasma DHA levels may be useful in identifying high-risk patientswith HFpEF, and supplementation with DHA may be a potential therapeutic target inthese patients.
After HF development, adequate nutrition intake is important. Obata et al. [14]indicated that inadequate dietary calorie intake was independently associated with anincreased risk of adverse clinical events including all-cause death and hospitalization dueto worsening HF in stable patients with chronic HF. To meet the humanly end of HFlife, nutritional care is quite important. Shibata et al. [15] have demonstrated that HFpalliative care team activities were able to provide an opportunity to discuss end-of-lifecare with patients, reduce the burden of physical and mental symptoms, and shift the goalsof end-of-life nutritional care to ensuring comfort and quality of life.
In patients with end-stage kidney disease, HF is a serious condition characterizedby decreased myocardial contractility and abnormal hemodynamic state [16]. It has beendemonstrated that L-carnitine supplementation could improve clinical symptoms andcardiac function and decrease serum levels of B-type natriuretic peptide (BNP) and NT-proBNP in patients with chronic HF, [17] which might also improve cardiac function inhemodialysis patients [18], suggesting that L-carnitine treatment may have protectiveeffects on HF in hemodialysis patients with carnitine deficiency. In the current issue,
2

Nutrients 2022, 14, 94
Sugiyama et al. [16] have reported that reducing L-carnitine administration for six monthssignificantly decreased both plasma and red blood cell carnitine levels. Moreover, stoppingL-carnitine increased plasma BNP levels. However, this stoppage did not influence cardiacfunction in hemodialysis patients [16].
Nutrition should be considered before and after cardiovascular development. Accord-ing to these findings, we should pay more attention to preventive and therapeutic strategiesfor cardiovascular diseases.
Conflicts of Interest: The authors declare no conflict of interest.
References
1. Adachi, H.; Enomoto, M.; Fukami, A.; Nakamura, S.; Nohara, Y.; Kono, S.; Sakaue, A.; Hamamura, H.; Toyomasu, K.;Yamamoto, M.; et al. Trends in nutritional intake and coronary risk factors over 60 years among Japanese men in Tanushi-maru. Heart Vessel. 2020, 35, 901–908. [CrossRef] [PubMed]
2. Sakaue, A.; Adachi, H.; Enomoto, M.; Fukami, A.; Kumagai, E.; Nakamura, S.; Nohara, Y.; Kono, S.; Nakao, E.; Morikawa, N.; et al.Association between physical activity, occupational sitting time and mortality in a general population: An 18-year prospectivesurvey in Tanushimaru, Japan. Eur. J. Prev. Cardiol. 2020, 27, 758–766. [CrossRef] [PubMed]
3. Wang, C.; Yatsuya, H.; Lin, Y.; Sasakabe, T.; Kawai, S.; Kikuchi, S.; Iso, H.; Tamakoshi, A. Milk Intake and Stroke Mortality in theJapan Collaborative Cohort Study—A Bayesian Survival Analysis. Nutrients 2020, 12, 2743. [CrossRef] [PubMed]
4. Zhu, R.; Robertson, K.; Protudjer, J.L.; Macikunas, A.; Kim, R.; Jeimy, S.; Kim, H. Impact of age on adherence and efficacy ofpeanut oral-immunotherapy using a standardized protocol. Pediatr. Allergy Immunol. 2021, 32, 783–786. [CrossRef] [PubMed]
5. Alehagen, U.; Aaseth, J.; Lindahl, T.; Larsson, A.; Alexander, J. Dietary Supplementation with Selenium and Coenzyme Q10Prevents Increase in Plasma D-Dimer While Lowering Cardiovascular Mortality in an Elderly Swedish Population. Nutrients2021, 13, 1344. [CrossRef] [PubMed]
6. Ishida, Y.; Yoshida, D.; Honda, T.; Hirakawa, Y.; Shibata, M.; Sakata, S.; Furuta, Y.; Oishi, E.; Hata, J.; Kitazono, T.; et al. Influenceof the Accumulation of Unhealthy Eating Habits on Obesity in a General Japanese Population: The Hisayama Study. Nutrients2020, 12, 3160. [CrossRef] [PubMed]
7. Matsuzaki, K.; Fukushima, N.; Saito, Y.; Matsumoto, N.; Nagaoka, M.; Katsuda, Y.; Miura, S.-I. The Effects of Long-Term NutritionCounseling According to the Behavioral Modification Stages in Patients with Cardiovascular Disease. Nutrients 2021, 13, 414.[CrossRef] [PubMed]
8. Okada, T.; Miyoshi, T.; Doi, M.; Seiyama, K.; Takagi, W.; Sogo, M.; Nosaka, K.; Takahashi, M.; Okawa, K.; Ito, H. SecularDecreasing Trend in Plasma Eicosapentaenoic and Docosahexaenoic Acids among Patients with Acute Coronary Syndrome from2011 to 2019: A Single Center Descriptive Study. Nutrients 2021, 13, 253. [CrossRef] [PubMed]
9. Greco, A.; Brugnera, A.; Adorni, R.; D’Addario, M.; Fattirolli, F.; Franzelli, C.; Giannattasio, C.; Maloberti, A.; Zanatta, F.; Steca, P.Protein Intake and Physical Activity in Newly Diagnosed Patients with Acute Coronary Syndrome: A 5-Year Longitudinal Study.Nutrients 2021, 13, 634. [CrossRef]
10. Eto, F.; Washida, K.; Matsubara, M.; Makino, H.; Takahashi, A.; Noda, K.; Hattori, Y.; Nakaoku, Y.; Nishimura, K.; Hosoda, K.;et al. Glucose Fluctuation and Severe Internal Carotid Artery Siphon Stenosis in Type 2 Diabetes Patients. Nutrients 2021, 13, 2379.[CrossRef]
11. Itaya, N.; Fukami, A.; Kakuma, T.; Fukumoto, Y. Nutrition Status and Renal Function as Predictors in Acute Myocardial Infarctionwith and without Cancer: A Single Center Retrospective Study. Nutrients 2021, 13, 2663. [CrossRef]
12. Kusunose, K.; Okushi, Y.; Okayama, Y.; Zheng, R.; Abe, M.; Nakai, M.; Sumita, Y.; Ise, T.; Tobiume, T.; Yamaguchi, K.; et al.Association between Vitamin D and Heart Failure Mortality in 10,974 Hospitalized Individuals. Nutrients 2021, 13, 335. [CrossRef]
13. Matsuo, N.; Miyoshi, T.; Takaishi, A.; Kishinoue, T.; Yasuhara, K.; Tanimoto, M.; Nakano, Y.; Onishi, N.; Ueeda, M.; Ito, H.High Plasma Docosahexaenoic Acid Associated to Better Prognoses of Patients with Acute Decompensated Heart Failure withPreserved Ejection Fraction. Nutrients 2021, 13, 371. [CrossRef]
14. Obata, Y.; Kakutani, N.; Kinugawa, S.; Fukushima, A.; Yokota, T.; Takada, S.; Ono, T.; Sota, T.; Kinugasa, Y.; Takahashi, M.; et al.Impact of Inadequate Calorie Intake on Mortality and Hospitalization in Stable Patients with Chronic Heart Failure. Nutrients2021, 13, 874. [CrossRef] [PubMed]
15. Shibata, T.; Mawatari, K.; Nakashima, N.; Shimozono, K.; Ushijima, K.; Yamaji, Y.; Tetsuka, K.; Murakami, M.; Okabe, K.;Yanai, T.; et al. Multidisciplinary Team-Based Palliative Care for Heart Failure and Food Intake at the End of Life. Nutrients 2021,13, 2387. [CrossRef]
16. Sugiyama, M.; Hazama, T.; Nakano, K.; Urae, K.; Moriyama, T.; Ariyoshi, T.; Kurokawa, Y.; Kodama, G.; Wada, Y.; Yano, J.;et al. Effects of Reducing L-Carnitine Supplementation on Carnitine Kinetics and Cardiac Function in Hemodialysis Patients: AMulticenter, Single-Blind, Placebo-Controlled, Randomized Clinical Trial. Nutrients 2021, 13, 1900. [CrossRef]
3

Nutrients 2022, 14, 94
17. Song, X.; Qu, H.; Yang, Z.; Rong, J.; Cai, W.; Zhou, H. Efficacy and Safety of L-Carnitine Treatment for Chronic Heart Failure: AMeta-Analysis of Randomized Controlled Trials. BioMed Res. Int. 2017, 2017, 6274854. [CrossRef]
18. Higuchi, T.; Abe, M.; Yamazaki, T.; Okawa, E.; Ando, H.; Hotta, S.; Oikawa, O.; Kikuchi, F.; Okada, K.; Soma, M. LevocarnitineImproves Cardiac Function in Hemodialysis Patients With Left Ventricular Hypertrophy: A Randomized Controlled Trial. Am. J.Kidney Dis. 2016, 67, 260–270. [CrossRef] [PubMed]
4

nutrients
Article
Influence of the Accumulation of Unhealthy EatingHabits on Obesity in a General Japanese Population:The Hisayama Study
Yuki Ishida 1, Daigo Yoshida 1,*, Takanori Honda 1, Yoichiro Hirakawa 1,2, Mao Shibata 1,3,
Satoko Sakata 1,2,3, Yoshihiko Furuta 1,2, Emi Oishi 1,2, Jun Hata 1,2,3, Takanari Kitazono 2,3
and Toshiharu Ninomiya 1,3
1 Department of Epidemiology and Public Health, Graduate School of Medical Sciences, Kyushu University,Fukuoka 812-8582, Japan; [email protected] (Y.I.); [email protected] (T.H.);[email protected] (Y.H.); [email protected] (M.S.);[email protected] (S.S.); [email protected] (Y.F.);[email protected] (E.O.); [email protected] (J.H.);[email protected] (T.N.)
2 Department of Medicine and Clinical Science, Graduate School of Medical Sciences, Kyushu University,Fukuoka 812-8582, Japan; [email protected]
3 Center for Cohort Studies, Graduate School of Medical Sciences, Kyushu University,Fukuoka 812-8582, Japan
* Correspondence: [email protected]
Received: 24 September 2020; Accepted: 14 October 2020; Published: 16 October 2020
Abstract: Few studies have examined the association between the accumulation of unhealthy eatinghabits and the likelihood of obesity or central obesity in a general Japanese population. We examinedthis association in a sample of 1906 community-dwelling Japanese subjects (age: 40–74 years) whoparticipated in a health check-up in 2014. A face-to-face questionnaire interview was conducted tocollect information about three unhealthy eating habits, i.e., snacking, eating quickly, and eatinglate-evening meals. Obesity was defined as body mass index ≥25 kg/m2 and central obesity wasdefined as waist circumference ≥90 cm in men and ≥80 cm in women. The odds ratios (OR) wereestimated by using a logistic regression analysis. Subjects with any one of the three eating habits had asignificantly higher likelihood of obesity than those without that habit after adjusting for confoundingfactors. The multivariable-adjusted OR for obesity increased linearly with an increase in the numberof accumulated unhealthy eating habits (p for trend <0.001). Similar associations were observedfor central obesity. Our findings suggest that modifying each unhealthy eating habit and avoidingan accumulation of multiple unhealthy eating habits might be important to reduce the likelihoodof obesity.
Keywords: unhealthy eating habits; accumulation; obesity; central obesity; general Japanese population
1. Introduction
The number of people with obesity is increasing globally [1]. Obesity is a major risk factor forchronic diseases, such as hypertension, diabetes, hyperlipidemia, cardiovascular disease, and cancer [2].Central obesity, defined by an increased waist circumference, has also been reported to increase therisk of cardiovascular disease and death [3,4]. In order to reduce the burden of obesity-related diseases,the prevention of obesity must be a public health priority.
Among the various strategies for health promotion, one commonality is the importance of healthyeating habits to prevent obesity [2]. Several epidemiologic studies have indicated that unhealthyeating habits, such as snacking [5–8], eating quickly [7,9,10], and eating late-evening meals [11,12],
Nutrients 2020, 12, 3160; doi:10.3390/nu13113916 www.mdpi.com/journal/nutrients
5

Nutrients 2020, 12, 3160
are significantly associated with an increased risk of obesity or central obesity. These previous studiesinvestigated the influence of each eating habit separately, but it is also important to consider theinfluence of the accumulation of unhealthy eating habits on obesity and central obesity, since unhealthyeating habits tend to overlap. However, there have been few population-based studies evaluatingthe influence of the accumulation of multiple unhealthy eating habits on having obesity and centralobesity in Japanese.
Therefore, the aim of the present study was to examine the associations of both individual andaccumulated unhealthy eating habits with the likelihood of having obesity and central obesity in ageneral Japanese population.
2. Materials and Methods
2.1. Study Population
The Hisayama Study is a population-based prospective cohort study of cardiovascular diseaseand its risk factors, which was begun in 1961 in the town of Hisayama, a suburb of the Fukuokametropolitan area on Kyushu Island, Japan. According to the national census, the age and occupationaldistributions in Hisayama have been almost identical to those of all of Japan since the 1960s [13,14].The present cross-sectional study was based on a screening survey conducted in 2014. A total of 1930residents aged 40–74 years (51.7% of the total population of this age group) underwent a health check-upand completed an interviewer-administered questionnaire about eating habits. After excluding 4individuals who did not provide consent to participate in the study and 20 without available data ofeating habits, the remaining 1906 subjects (835 men and 1071 women) were enrolled in this study.
2.2. Definition of Obesity and Central Obesity
Body height and weight were measured using an automated digital scale (DC-250, Tanita, Tokyo,Japan) in light clothing without shoes, and body mass index (BMI) was calculated as weight (kg) dividedby height squared (m2). Obesity was defined as a BMI ≥25 kg/m2. Waist circumference at the umbilicallevel was measured by trained nurses using a non-stretchable tape measure with the participant in thestanding position, and central obesity was defined as a waist circumference ≥90 cm in men and ≥80 cm inwomen according to International Obesity Task Force central obesity criteria for Asia [15].
2.3. Definition of Unhealthy Eating Habits
A face-to-face interview by registered dietitians was conducted to collect the information on eatinghabits using a questionnaire, which was modified from the questionnaire for the Standard HealthCheck-up and Counseling Guidance to prevent metabolic syndrome proposed by the Japanese Ministryof Health, Labour and Welfare [16]. The original questionnaire is widely used in the nationwide healthcheck-ups for residents aged 40 to 74 years in Japan.
Eating habits were determined by the following questions: “Do you eat snacks?” (snacking);“Does your eating speed more quickly than other people?” (eating quickly); “Do you have late-eveningmeals within two hours before bedtime?” (eating late-evening meals). The answer options were “yes”or “no”. Those who answered yes to a question were defined as having that particular unhealthyeating habit. The number of accumulated unhealthy eating habits was determined by summing up thepositive responses, ranging from 0 to 3.
2.4. Measurement of Other Risk Factors
Each participant completed a self-administered questionnaire including smoking habits,drinking habits, regular exercise, marital status, living status, and employment status. Smoking habitsand drinking habits were classified into currently habitual or not. The subjects who reported engaging insports or other forms of exertion ≥3 times a week during their leisure time made up the regular exercisegroup. Marital status was classified as currently “married” or “unmarried, divorced, or widowed”.
6
Nutrients 2020, 12, 3160
Living status was categorized as “living alone” or “living with others”. Employment status wascategorized as currently “employed” or “unemployed”; housewives were classified as “unemployed”in the present study. The questionnaire was checked by trained interviewers at the screening.
2.5. Statistical Analysis
Descriptive statistics according to the response to each unhealthy eating habit and the number ofaccumulated eating habits were presented as age- and sex-adjusted means or frequencies. The groupdifferences were tested by analysis of covariance and a logistic regression model. The age- andsex-adjusted mean values of BMI and waist circumference according to the status of each unhealthyeating habit and the numbers of accumulated eating habits were estimated by using the analysis ofcovariance. The means of BMI and waist circumference across the numbers of accumulated unhealthyeating habits were tested by a linear regression model. The odds ratios (OR) and their 95% confidenceintervals (CIs) for the presence of obesity and central obesity according to each unhealthy eating habitand the number of accumulated eating habits were computed with the use of the logistic regressionmodel. The trends in the estimates across the number of accumulated unhealthy eating habits weretested by including the ordinal number (0, 1, 2, or 3) representing the number of the accumulated eatinghabits in the relevant model. The heterogeneities in the association between subgroup covariates weretested by adding the multiplicative interaction term to the relevant model. All statistical analyses wereperformed using the SAS program package version 9.4 (SAS Institute Inc., Cary, NC, USA). Two-tailedp-values of < 0.05 were considered significant.
2.6. Ethical Considerations
The study protocol was approved by the Kyushu University Institutional Review Board for ClinicalResearch, and the procedures followed were in accordance with national guidelines. All participantsprovided written informed consent.
3. Results
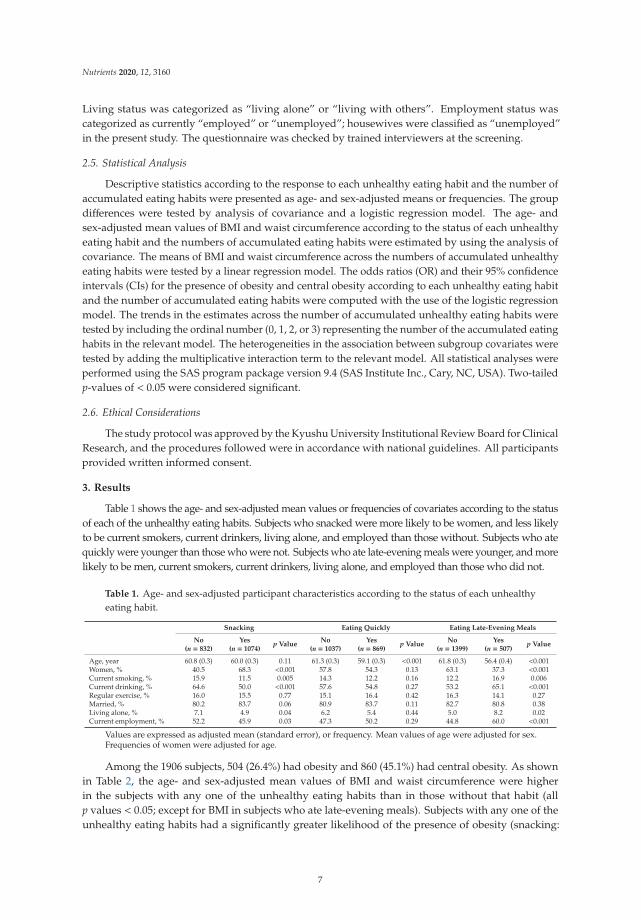
Table 1 shows the age- and sex-adjusted mean values or frequencies of covariates according to the statusof each of the unhealthy eating habits. Subjects who snacked were more likely to be women, and less likelyto be current smokers, current drinkers, living alone, and employed than those without. Subjects who atequickly were younger than those who were not. Subjects who ate late-evening meals were younger, and morelikely to be men, current smokers, current drinkers, living alone, and employed than those who did not.
Table 1. Age- and sex-adjusted participant characteristics according to the status of each unhealthyeating habit.
Snacking Eating Quickly Eating Late-Evening Meals
No Yes p ValueNo Yes p Value
No Yes p Value(n = 832) (n = 1074) (n = 1037) (n = 869) (n = 1399) (n = 507)
Age, year 60.8 (0.3) 60.0 (0.3) 0.11 61.3 (0.3) 59.1 (0.3) <0.001 61.8 (0.3) 56.4 (0.4) <0.001Women, % 40.5 68.3 <0.001 57.8 54.3 0.13 63.1 37.3 <0.001Current smoking, % 15.9 11.5 0.005 14.3 12.2 0.16 12.2 16.9 0.006Current drinking, % 64.6 50.0 <0.001 57.6 54.8 0.27 53.2 65.1 <0.001Regular exercise, % 16.0 15.5 0.77 15.1 16.4 0.42 16.3 14.1 0.27Married, % 80.2 83.7 0.06 80.9 83.7 0.11 82.7 80.8 0.38Living alone, % 7.1 4.9 0.04 6.2 5.4 0.44 5.0 8.2 0.02Current employment, % 52.2 45.9 0.03 47.3 50.2 0.29 44.8 60.0 <0.001
Values are expressed as adjusted mean (standard error), or frequency. Mean values of age were adjusted for sex.Frequencies of women were adjusted for age.
Among the 1906 subjects, 504 (26.4%) had obesity and 860 (45.1%) had central obesity. As shownin Table 2, the age- and sex-adjusted mean values of BMI and waist circumference were higherin the subjects with any one of the unhealthy eating habits than in those without that habit (allp values < 0.05; except for BMI in subjects who ate late-evening meals). Subjects with any one of theunhealthy eating habits had a significantly greater likelihood of the presence of obesity (snacking:
7

Nutrients 2020, 12, 3160
OR 1.49 [95% CI 1.19–1.86]; eating quickly: 2.11 [1.71–2.61]; eating late-evening meals: 1.39 [1.09–1.77])and central obesity (snacking: 1.29 [1.05–1.58]; eating quickly: 1.89 [1.55–2.30]; eating late-eveningmeals: 1.36 [1.08–1.72]) after adjusting for age, sex, current smoking, current drinking, regular exercise,marital status, living status, and employment status.
Table 2. Multivariable-adjusted likelihood of the presence of obesity and central obesity according tothe status of each unhealthy eating habit.
OutcomesUnhealthy Eating Habits
Age- and Sex-Adjusted Mean(95% CI) of BMI or WC
No. of Obese or CentralObese Subjects/Total Subjects
Model 1 a) Model 2 b)
OR (95% CI) p Value OR (95% CI) p Value
Obesity BMI (kg/m2)Snacking
No 22.8 (22.5–23.0) c) 200/832 1.00 (reference) 1.00 (reference)Yes 23.5 (23.2–23.7) c),** 304/1074 1.50 (1.20–1.86) <0.001 1.49 (1.19–1.86) <0.001
Eating quickly
No 22.6 (22.3–22.8) c) 207/1037 1.00 (reference) 1.00 (reference)Yes 23.9 (23.7–24.1) c),** 297/869 2.12 (1.72–2.61) <0.001 2.11 (1.71–2.61) <0.001
Eating late-evening meals
No 23.1 (22.9–23.3) c) 342/1399 1.00 (reference) 1.00 (reference)Yes 23.4 (23.1–23.7) c) 162/507 1.38 (1.09–1.74) 0.008 1.39 (1.09–1.77) 0.007
Central obesity WC (cm)Snacking
No 82.9 (82.2–83.5) d) 315/832 1.00 (reference) 1.00 (reference)Yes 84.7 (84.1–85.3) d),** 545/1074 1.30 (1.06–1.58) 0.01 1.29 (1.05–1.58) 0.01
Eating quickly
No 82.4 (81.9–83.0) d) 413/1037 1.00 (reference) 1.00 (reference)Yes 85.7 (85.1–86.3) d),** 447/869 1.88 (1.55–2.29) <0.001 1.89 (1.55–2.30) <0.001
Eating late-evening meals
No 83.6 (83.1–84.1) d) 645/1399 1.00 (reference) 1.00 (reference)Yes 84.7 (83.9–85.6) d),* 215/507 1.35 (1.07–1.70) 0.01 1.36 (1.08–1.72) 0.009
Abbreviations: BMI, body mass index; OR, odds ratio; CI, confidence interval; WC, waist circumference.a) Adjusted for age and sex. b) Adjusted for age, sex, current smoking, current drinking, regular exercise,marital status, living status, and employment status. c) The values are shown as the age- and sex-adjusted meanvalues (95% CI) of BMI (unit: kg/m2). d) The values are shown as the age- and sex-adjusted mean values (95% CI) ofWC (unit: cm). * p < 0.05, ** p < 0.01 vs. “No”.
Next, we investigated the association between the number of accumulated unhealthy eatinghabits and the likelihood of obesity and central obesity. Descriptive statistics according to the numberof accumulated unhealthy eating habits are shown in Table 3. Subjects with a higher number ofaccumulated unhealthy eating habits were more likely to be younger. A higher number of accumulatedunhealthy eating habits were significantly associated with the age- and sex-adjusted mean values ofBMI and waist circumference (both p for trend <0.001; Figure 1). The multivariable-adjusted OR forhaving obesity or central obesity increased linearly with a higher number of accumulated unhealthyeating habits (obesity: OR 1.53 [95% CI 1.11–2.12], 2.62 [1.89–3.63], and 3.65 [2.36–5.63] for one, two,and three unhealthy eating habits, respectively, p for trend <0.001; central obesity: 1.53 [1.16–2.01], 2.28[1.71–3.05], and 2.87 [1.89–4.36], p for trend <0.001; Figure 2).
Table 3. Age- and sex-adjusted characteristics of the study participants according to the number ofaccumulated unhealthy eating habits.
Number of Unhealthy Eating Habits
0 1 2 3 p for Trend(n = 367) (n = 779) (n = 609) (n = 151)
Age, year 63.3 (0.5) 61.0 (0.3) 58.7 (0.4) 56.2 (0.8) <0.001Women, % 45.6 61.7 57.2 49.5 0.20Current smoking, % 14.1 14.3 11.5 13.9 0.36Current drinking, % 60.6 57.2 52.6 56.0 0.06Regular exercise, % 15.5 16.4 14.8 16.2 0.81Married, % 76.9 83.0 85.6 76.9 0.12Living alone, % 6.2 6.3 4.8 7.2 0.64Current employment, % 46.4 46.7 51.1 54.4 0.08
Values are expressed as adjusted mean (standard error), or frequency. Mean values of age were adjusted for sex.Frequencies of women were adjusted for age.
8

Nutrients 2020, 12, 3160
(a) (b)
Figure 1. Age- and sex-adjusted mean values of body mass index and waist circumference accordingto the number of accumulated unhealthy eating habits: (a) Body mass index; (b) Waist circumference.Solid circles and vertical bars represent the mean values and 95% confidence intervals of each parameter,respectively. * p < 0.05, ** p < 0.01 vs. “0”, † p for trend <0.001.
(a) (b)
Figure 2. Multivariable-adjusted odds ratio of obesity and central obesity according to the numberof accumulated unhealthy eating habits: (a) Obesity; (b) Central obesity. The values on the barsshow the odds ratios (95% confidence intervals), which were adjusted for age, sex, current smoking,current drinking, regular exercise, marital status, living status, and employment status. * p < 0.05,** p < 0.01 vs. “0”, † p for trend <0.001.
Finally, we compared the age- and sex-adjusted ORs of the presence of obesity and centralobesity per every one increment in the number of accumulated unhealthy eating habits betweenthe subgroups of covariates (Table 4). The magnitudes of the association between the number ofaccumulated unhealthy eating habits and the likelihood of obesity and central obesity were strongerin the subgroups of subjects aged 40–59 years, male subjects, and employed subjects than in subjectsaged 60–74 years, female subjects, and unemployed subjects (all p for heterogeneity <0.05). In addition,the likelihood of obesity per the number of accumulated unhealthy eating habits was greater in subjectswith regular exercise than in those without it. Meanwhile, the association with central obesity tendedto be heterogeneous between the drinking habit subgroups (p for heterogeneity =0.09). No clearheterogeneity was detected between the subgroups of smoking habits, marital status, and living status(all p for heterogeneity >0.3).
9

Nutrients 2020, 12, 3160
Table 4. Age- and sex-adjusted odds ratios and 95% confidence intervals of the presence of obesity andcentral obesity per every one increment in the number of accumulated unhealthy eating habits in thesubgroups of covariates.
Subgroups
Obesity Central Obesity
No. ofEvents
No. ofSubjects
OR (95% CI) per 1Increment in the
Number of UnhealthyEating Habits
p forHetero.
No. ofEvents
No. ofSubjects
OR (95% CI) per 1Increment in the
Number of UnhealthyEating Habits
p forHetero.
Age40–59 years 186 757 1.98 (1.60–2.45) 298 757 1.71 (1.42–2.05)60–74 years 318 1149 1.40 (1.20–1.63) 0.01 562 1149 1.27 (1.10–1.47) 0.01
SexMen 267 835 1.75 (1.48–2.08) 243 835 1.63 (1.37–1.93)Women 237 1071 1.41 (1.17–1.69) 0.02 617 1071 1.32 (1.13–1.54) 0.007
Current smokingNo 413 1576 1.55 (1.35–1.78) 760 1576 1.44 (1.27–1.64)Yes 91 330 1.77 (1.33–2.35) 0.38 100 330 1.53 (1.16–2.01) 0.47
Current drinkingNo 214 855 1.55 (1.27–1.88) 439 855 1.31 (1.11–1.56)Yes 290 1051 1.62 (1.38–1.91) 0.66 421 1051 1.58 (1.36–1.85) 0.09
Regular exerciseNo 422 1595 1.69 (1.47–1.93) 741 1595 1.51 (1.33–1.72)Yes 82 309 1.20 (0.90–1.62) 0.046 119 309 1.21 (0.90–1.61) 0.22
Marital statusUnmarried, divorced,
and widowed 77 346 1.45 (1.94–1.92) 150 346 1.35 (1.05–1.74)
Married 427 1560 1.63 (1.42–1.87) 0.49 710 1560 1.48 (1.30–1.69) 0.47Living status
Living with others 477 1790 1.62 (1.43–1.84) 807 1790 1.47 (1.30–1.65)Living alone 27 116 1.23 (0.75–2.03) 0.34 53 116 1.35 (0.85–2.14) 0.66
Employment statusUnemployed 239 983 1.39 (1.16–1.66) 513 983 1.25 (1.07–1.47)Employed 265 923 1.82 (1.53–2.17) 0.048 347 923 1.71 (1.45–2.02) 0.006
Abbreviations: OR, odds ratio; CI, confidence intervals; hetero., heterogeneity.
4. Discussion
In the present study, we clearly demonstrated that subjects with unhealthy eating habits—namely,snacking, eating quickly, and eating late-evening meals—had a significantly greater likelihood of thepresence of obesity and central obesity. Notably, the accumulation of these unhealthy eating habitswas linearly associated with a higher likelihood of obesity and central obesity after adjusting fordemographic, socioeconomic, and lifestyle factors in a general Japanese adult population. These findingshighlight that unhealthy eating habits, and especially their accumulation, have a major influence onobesity and central obesity, and may suggest that an improvement in these unhealthy eating habitswould help to prevent obesity or central obesity.
Epidemiological evidence from cross-sectional and longitudinal studies has shown that individualunhealthy eating habits play a significant role in the development of obesity [5–12]. However, there havebeen few studies addressing the influence of the accumulation of unhealthy eating habits on obesity orcentral obesity. Three cross-sectional studies have shown that an accumulation of unhealthy eatinghabits was positively associated with the prevalence of obesity or metabolic syndrome in adult Japanesepopulations [12,17,18]. A community-based study conducted in northeast Japan showed that themultivariate-adjusted OR for obesity increased with an increase in the number of unhealthy eatinghabits, which in this case were skipping breakfast, eating quickly, and eating late-evening meals [18].These findings were similar to our findings. In addition, one longitudinal study of working adultsrevealed that individuals who had both of two unhealthy eating habits—namely, snacking after dinnerand eating late-evening meals—had an approximately twofold greater likelihood of having obesitythan those with only one or neither of these habits [11]. Therefore, it seems reasonable to speculatethat the accumulation of multiple unhealthy eating habits might increase the likelihood of obesity andcentral obesity in Japanese adults.
There are several possible mechanisms underlying the significant association between individualunhealthy eating habits and the greater likelihood of having obesity or central obesity. Subjects witha snacking habit were shown to have a higher total energy intake than those without a snackinghabit [19,20]. In general, snacks tend to be high in calories, carbohydrates, and fats [21]. In the US
10

Nutrients 2020, 12, 3160
population, the number of individuals with a snacking habit has increased over the last 30 years,and the energy intake from snacking has been estimated to be approximately 280 kcal/day, which isequivalent to 15.4% of the average energy intake of US adults [22,23]. In addition, eating speed islikely to influence the blood concentrations of appetite suppressant hormones. Subjects who eatquickly have been reported to have lower blood concentrations of pancreatic or gut hormones thatare expected to suppress appetite (e.g., insulin, glucagon-like peptide 1, and peptide YY) than thosewho do not [24]. A systematic review revealed that subjects who ate quickly had a higher energyintake than those who ate slowly [25]. These results suggest that subjects with the unhealthy eatinghabit of eating quickly are more likely to have a higher energy intake due to an increased appetitethan those without this habit. Meanwhile, eating late-evening meals has been considered to lead toan energy surplus, because diet-induced thermogenesis is lower at night than in the daytime [26,27].Moreover, the sympathetic nerve activation and subsequent sleep disturbance caused by increasedleptin secretion after a meal may be involved in the excess risk of obesity from eating late-eveningmeals [28,29]. Insufficient sleep leads to elevated ghrelin, which is an orexigenic peptide that mayincrease appetite [30]. As we noted above, several independent mechanisms, including behavioral,endocrine, and energy metabolic mechanisms, may be at play in the relation between unhealthy eatinghabits and obesity, and therefore the accumulation of unhealthy eating habits might additively increasethe likelihood of having obesity or central obesity.
In the present study, the subgroup analysis showed that the magnitude of the influence of theaccumulation of unhealthy eating habits on the excess likelihood of having obesity or central obesitywere stronger in the groups of middle-aged subjects, male subjects, current drinkers, subjects who didnot perform regular exercise, and subjects who currently engaged in work than in their counterpartgroups (non-middle-aged subjects, female subject, etc.). In general, middle-aged male subjects tend tohave a greater energy intake than older subjects and/or women [31,32]. The significant heterogeneityin obesity and central obesity observed between subjects in the current drinking and non-currentdrinking subgroups and subjects in the employed and unemployed subgroups may also reflect thehigh energy consumption: Middle-aged men are more likely to have a drinking habit and to beemployed. In addition, the absence of a regular exercise habit could contribute to decreased energyexpenditure, resulting in a further energy surplus. Our findings suggest that middle-aged male subjectsand subjects who do not perform exercise regularly are more likely to be affected by the adverse effectsof accumulated unhealthy eating habits on obesity.
The present study has several limitations. First, because of the cross-sectional nature of this study,we were not able to determine whether there was a causal association between unhealthy eating habitsand either obesity or central obesity. Second, the information about the unhealthy eating habits wasderived from questioning the participants rather than observing their actual behaviors. However,a moderate-to-high level of concordance between the self-reported and friend-reported rate of eatingwas shown in a previous study [33]. Finally, we did not have information on the energy intake andnutrients. Further studies will be needed to assess these parameters carefully in order to clarify whetherunhealthy eating habits increase the likelihood of obesity and central obesity through excessive intakeof energy, fat, and carbohydrates.
5. Conclusions
The present study revealed dose–response-positive associations between the number ofaccumulated unhealthy eating habits and the likelihood of obesity and central obesity in ageneral Japanese population. Our findings suggest that modifying individual unhealthy eatinghabits and avoiding their accumulation might reduce the burden of obesity and central obesity.Healthcare professionals need to encourage those who have unhealthy eating habits to modifyeach of their habits individually as well as to avoid accumulating multiple unhealthy habits.Further longitudinal studies will be needed to elucidate whether a causal relationship exists betweenthe accumulation of unhealthy eating habits and the incidence of obesity or central obesity.
11

Nutrients 2020, 12, 3160
Author Contributions: Study concept and design, Y.I. and D.Y.; data collection, D.Y., T.H., Y.H., M.S., S.S., Y.F.,E.O., J.H., and T.N.; interpretation of data, Y.I., D.Y., T.H., Y.H., M.S., S.S., Y.F., E.O., J.H., T.K., and T.N.; statisticalanalysis, Y.I. and D.Y.; study coordinator, T.N.; funding acquisition, T.N.; writing—original manuscript, Y.I. andD.Y.; writing—review and editing, Y.I., D.Y., T.H., Y.H., M.S., S.S., Y.F., E.O., J.H., T.K., and T.N. All authors haveread and agreed to the published version of the manuscript.
Funding: This study was supported in part by Grants-in-Aid for Scientific Research A (JP16H02692), B (JP17H04126,JP18H02737, and JP19H03863), C (JP18K07565, JP18K09412, JP19K07890, JP20K10503, and JP20K11020),Grants-in-Aid for Early-Career Scientists (JP18K17925), and Grants-in-Aid for Research Activity Start-up(JP19K23971) from the Ministry of Education, Culture, Sports, Science and Technology of Japan; by Healthand Labour Sciences Research Grants of the Ministry of Health, Labour and Welfare of Japan (20FA1002); and bythe Japan Agency for Medical Research and Development (JP20dk0207025, JP20km0405202, and JP20fk0108075).
Acknowledgments: The authors thank the residents of the town of Hisayama for their participation in the surveyand the staff of the Division of Health and Welfare of Hisayama for their cooperation with this study. The statisticalanalyses were carried out using the computer resources offered under the category of General Projects by ResearchInstitute for Information Technology, Kyushu University.
Conflicts of Interest: The authors have no conflict of interest to declare.
References
1. NCD Risk Factor Collaboration. Trends in adult body-mass index in 200 countries from 1975 to 2014:A pooled analysis of 1698 population-based measurement studies with 19.2 million participants. Lancet 2016,387, 1377–1396. [CrossRef]
2. WHO; FEC. Diet, Nutrition and the Prevention of Chronic Diseases, WHO Technical Report Series 916; WHO:Geneva, Switzerland, 2003.
3. Saito, I.; Kokubo, Y.; Kiyohara, Y.; Doi, Y.; Saitoh, S.; Ohnishi, H.; Miyamoto, Y. Prospective study on waistcircumference and risk of all-cause and cardiovascular mortality. Circ. J. 2012, 76, 2867–2874. [CrossRef]
4. Schneider, H.J.; Friedrich, N.; Klotsche, J.; Pieper, L.; Nauck, M.; John, U.; Dörr, M.; Felix, S.; Lehnert, H.;Pittrow, D.; et al. The predictive value of different measures of obesity for incident cardiovascular events andmortality. J. Clin. Endocrinol. Metab. 2010, 95, 1777–1785. [CrossRef]
5. Liu, X.; Zheng, C.; Xu, C.; Liu, Q.; Wang, J.; Hong, Y.; Zhao, P. Nighttime snacking is associated with risk ofobesity and hyperglycemia in adults: A cross-sectional survey from Chinese adult teachers. J. Biomed. Res.2017, 31, 541–547.
6. Murakami, K.; Livingstone, M.B.E. Eating Frequency is positively associated with overweight and centralobesity in US adults. J. Nutr. 2015, 145, 2715–2724. [CrossRef]
7. Mesas, A.E.; Muñoz-Pareja, M.; López-García, E.; Rodríguez-Artalejo, F. Selected eating behaviours andexcess body weight: A systematic review. Obes. Rev. 2012, 13, 106–135. [CrossRef]
8. Bes-Rastrollo, M.; Sanchez-Villegas, A.; Basterra-Gortari, F.J.; Nunez-Cordoba, J.M.; Toledo, E.;Serrano-Martinez, M. Prospective study of self-reported usual snacking and weight gain in a Mediterraneancohort: The SUN project. Clin. Nutr. 2010, 29, 323–330. [CrossRef]
9. Ohkuma, T.; Hirakawa, Y.; Nakamura, U.; Kiyohara, Y.; Kitazono, T.; Ninomiya, T. Association betweeneating rate and obesity: A systematic review and meta-analysis. Int. J. Obes. 2015, 39, 1589–1596. [CrossRef]
10. Ohkuma, T.; Fujii, H.; Iwase, M.; Kikuchi, Y.; Ogata, S.; Idewaki, Y.; Ide, H.; Doi, Y.; Hirakawa, Y.; Mukai, N.;et al. Impact of eating rate on obesity and cardiovascular risk factors according to glucose tolerance status:The Fukuoka Diabetes Registry and the Hisayama Study. Diabetologia 2013, 56, 70–77. [CrossRef]
11. Yoshida, J.; Eguchi, E.; Nagaoka, K.; Ito, T.; Ogino, K. Association of night eating habits with metabolicsyndrome and its components: A longitudinal study. BMC Public Health 2018, 18, 1366. [CrossRef]
12. Kutsuma, A.; Nakajima, K.; Suwa, K. Potential association between breakfast skipping and concomitantlate-night-dinner eating with metabolic syndrome and proteinuria in the Japanese population. Scientifica 2014,2014, 253581. [CrossRef] [PubMed]
12

Nutrients 2020, 12, 3160
13. Hata, J.; Ninomiya, T.; Hirakawa, Y.; Nagata, M.; Mukai, N.; Gotoh, S.; Fukuhara, M.; Ikeda, F.; Shikata, K.;Yoshida, D.; et al. Secular trends in cardiovascular disease and its risk factors in Japanese: Half-century datafrom the Hisayama Study (1961–2009). Circulation 2013, 128, 1198–1205. [CrossRef] [PubMed]
14. Ninomiya, T. Japanese legacy cohort studies: The Hisayama Study. J. Epidemiol. 2018, 28, 444–451. [CrossRef][PubMed]
15. Alberti, K.G.M.M.; Eckel, R.H.; Grundy, S.M.; Zimmet, P.Z.; Cleeman, J.I.; Donato, K.A.; Fruchart, J.;James, W.P.T.; Loria, C.M.; Smith, S.C., Jr. Harmonizing the metabolic syndrome: A joint interim statementof the International Diabetes Federation Task Force on Epidemiology and Prevention; National Heart, Lung,and Blood Institute; American Heart Association; World Heart Federation; International AtherosclerosisSociety; and International Association for the Study of Obesity. Circulation 2009, 120, 1640–1645. [PubMed]
16. Ministry of Health, Labour and Welfare, Japan. Standardized Health Check-Up and InterventionProgram. 2007. Available online: http://tokutei-kensyu.tsushitahan.jp/manage/wp-content/uploads/2014/05/36ec0bcdf91b61a94a1223627abffe8d.pdf (accessed on 3 September 2020).
17. Kimura, Y.; Nanri, A.; Matsushita, Y.; Sasaki, S.; Mizoue, T. Eating behavior in relation to prevalence ofoverweight among Japanese men. Asia Pac. J. Clin. Nutr. 2011, 20, 29–34.
18. Lee, J.S.; Mishra, G.; Hayashi, K.; Watanabe, E.; Mori, K.; Kawakubo, K. Combined eating behaviors andoverweight: Eating quickly, late evening meals, and skipping breakfast. Eat. Behav. 2016, 21, 84–88.[CrossRef] [PubMed]
19. Larson, N.I.; Miller, J.M.; Watts, A.W.; Story, M.T.; Neumark-Sztainer, D.R. Adolescent snacking behaviorsare associated with dietary intake and weight status. J. Nutr. 2016, 146, 1348–1355. [CrossRef] [PubMed]
20. de Graaf, C. Effects of snacks on energy intake: An evolutionary perspective. Appetite 2006, 47, 18–23.[CrossRef] [PubMed]
21. Ministry of Education, Culture, Sports, Science and Technology-JAPAN. Standard Tables of Food Compositionin Japan. 2015. Available online: https://www.mext.go.jp/en/policy/science_technology/policy/title01/detail01/1374030.htm (accessed on 3 September 2020).
22. Duffey, K.J.; Popkin, B.M. Energy density, portion size, and eating occasions: Contributions to increasedenergy intake in the United States, 1977–2006. PLoS Med. 2011, 8, e1001050. [CrossRef]
23. Nielsen, S.J.; Siega-Riz, A.M.; Popkin, B.M. Trends in energy intake in U.S. between 1977 and 1996:Similar shifts seen across age groups. Obes. Res. 2002, 10, 370–378. [CrossRef]
24. Karl, J.P.; Young, A.J.; Rood, J.C.; Montain, S.J. Independent and combined effects of eating rate and energydensity on energy intake, appetite, and gut hormones. Obesity 2013, 21, E244–E252. [CrossRef]
25. Robinson, E.; Almiron-Roig, E.; Rutters, F.; de Graaf, C.; Forde, C.G.; Smith, C.T.; Nolan, S.J.; Jebb, S.A.A systematic review and meta-analysis examining the effect of eating rate on energy intake and hunger.Am. J. Clin. Nutr. 2014, 100, 123–151. [CrossRef]
26. Bo, S.; Fadda, M.; Castiglione, A.; Ciccone, G.; de Francesco, A.; Fedele, D.; Guggino, A.; Caprino, M.P.;Ferrara, S.; Boggio, M.V.; et al. Is the timing of caloric intake associated with variation in diet-inducedthermogenesis and in the metabolic pattern? a randomized cross-over study. Int. J. Obes. 2015, 39, 1689–1695.[CrossRef] [PubMed]
27. Romon, M.; Edme, J.L.; Boulenguez, C.; Lescroart, J.L.; Frimat, P. Circadian variation of diet-inducedthermogenesis. Am. J. Clin. Nutr. 1993, 57, 476–480. [CrossRef] [PubMed]
28. Imayama, I.; Prasad, B. Role of leptin in obstructive sleep apnea. Ann. Am. Thorac. Soc. 2017,14, 1607–1621. [CrossRef]
29. Yasumoto, Y.; Hashimoto, C.; Nakao, R.; Yamazaki, H.; Hiroyama, H.; Nemoto, T.; Yamamoto, S.; Sakurai, M.;Oike, H.; Wada, N.; et al. Short-term feeding at the wrong time is sufficient to desynchronize peripheral clocksand induce obesity with hyperphagia, physical inactivity and metabolic disorders in mice. Metabolism 2016,65, 714–727. [CrossRef]
30. Taheri, S.; Lin, L.; Austin, D.; Young, T.; Mignot, E. Short sleep duration is associated with reduced leptin,elevated ghrelin, and increased body mass index. PLoS Med. 2004, 1, e62. [CrossRef]
31. Lee, K.W.; Song, W.O.; Cho, M.S. Dietary quality differs by consumption of meals prepared at home vs.outside in Korean adults. Nutr. Res. Pract. 2016, 10, 294–304. [CrossRef]
13

Nutrients 2020, 12, 3160
32. Research Group on Health and Nutrition Information. The National Health and Nutrition Survey inJapan. 2014. Available online: https://www.mhlw.go.jp/file/04-Houdouhappyou-10904750-Kenkoukyoku-Gantaisakukenkouzoushinka/0000117311.pdf (accessed on 3 September 2020). (In Japanese)
33. Sasaki, S.; Katagiri, A.; Tsuji, T.; Shimoda, T.; Amano, K. Self-reported rate of eating correlates with bodymass index in 18-y-old Japanese women. Int. J. Obes. Relat. Metab. Disord. 2003, 27, 1405–1410. [CrossRef]
Publisher’s Note: MDPI stays neutral with regard to jurisdictional claims in published maps and institutionalaffiliations.
© 2020 by the authors. Licensee MDPI, Basel, Switzerland. This article is an open accessarticle distributed under the terms and conditions of the Creative Commons Attribution(CC BY) license (http://creativecommons.org/licenses/by/4.0/).
14
nutrients
Article
Adherence to a Plant-Based Diet and Consumption of SpecificPlant Foods—Associations with 3-Year Weight-LossMaintenance and Cardiometabolic Risk Factors: A SecondaryAnalysis of the PREVIEW Intervention Study
Ruixin Zhu 1, Mikael Fogelholm 2, Sally D. Poppitt 3, Marta P. Silvestre 3,4, Grith Møller 1, Maija Huttunen-Lenz 5,
Gareth Stratton 6, Jouko Sundvall 7, Laura Råman 7, Elli Jalo 2, Moira A. Taylor 8,
Ian A. Macdonald 9, Svetoslav Handjiev 10, Teodora Handjieva-Darlenska 10, J. Alfredo Martinez 11,12,13,14,
Roslyn Muirhead 15, Jennie Brand-Miller 15 and Anne Raben 1,16,*
Citation: Zhu, R.; Fogelholm, M.;
Poppitt, S.D.; Silvestre, M.P.; Møller,
G.; Huttunen-Lenz, M.; Stratton, G.;
Sundvall, J.; Råman, L.; Jalo, E.; et al.
Adherence to a Plant-Based Diet and
Consumption of Specific Plant
Foods—Associations with 3-Year
Weight-Loss Maintenance and
Cardiometabolic Risk Factors:
A Secondary Analysis of the
PREVIEW Intervention Study.
Nutrients 2021, 13, 3916.
https://doi.org/10.3390/
nu13113916
Academic Editor:
Yoshihiro Fukumoto
Received: 27 September 2021
Accepted: 31 October 2021
Published: 1 November 2021
Publisher’s Note: MDPI stays neutral
with regard to jurisdictional claims in
published maps and institutional affil-
iations.
Copyright: © 2021 by the authors.
Licensee MDPI, Basel, Switzerland.
This article is an open access article
distributed under the terms and
conditions of the Creative Commons
Attribution (CC BY) license (https://
creativecommons.org/licenses/by/
4.0/).
1 Department of Nutrition, Exercise and Sports, Faculty of Science, University of Copenhagen, Rolighedsvej 30,Frederiksberg C, 1958 Copenhagen, Denmark; [email protected] (R.Z.); [email protected] (G.M.)
2 Department of Food and Nutrition, University of Helsinki, P.O. Box 66, 00014 Helsinki, Finland;[email protected] (M.F.); [email protected] (E.J.)
3 Human Nutrition Unit, Department of Medicine, School of Biological Sciences, University of Auckland,Auckland 1042, New Zealand; [email protected] (S.D.P.); [email protected] (M.P.S.)
4 CINTESIS, NOVA Medical School, NMS, Universidade Nova de Lisboa, 1169-056 Lisboa, Portugal5 Institute for Nursing Science, University of Education Schwäbisch Gmünd, Oberbettringerstrasse 200,
73525 Schwäbisch Gmünd, Germany; [email protected] Applied Sports, Technology, Exercise and Medicine (A-STEM) Research Centre, Swansea University,
Swansea SA1 8EN, UK; [email protected] Finnish Institute for Health and Welfare, P.O. Box 30, 00271 Helsinki, Finland;
[email protected] (J.S.); [email protected] (L.R.)8 Division of Physiology, Pharmacology and Neuroscience, School of Life Sciences, Queen’s Medical Centre,
Nottingham NG7 2UH, UK; [email protected] Division of Physiology, Pharmacology and Neuroscience, School of Life Sciences, Queen’s Medical Centre,
MRC/ARUK Centre for Musculoskeletal Ageing Research, ARUK Centre for Sport, Exercise andOsteoarthritis, National Institute for Health Research (NIHR) Nottingham Biomedical Research Centre,Nottingham NG7 2RD, UK; [email protected]
10 Department of Pharmacology and Toxicology, Medical University of Sofia, 1000 Sofia, Bulgaria;[email protected] (S.H.); [email protected] (T.H.-D.)
11 Department of Nutrition and Physiology, University of Navarra, 31008 Pamplona, Spain; [email protected] Precision Nutrition and Cardiometabolic Health Program, IMDEA-Food Institute (Madrid Institute for
Advanced Studies), CEI UAM + CSIC, 28049 Madrid, Spain13 Centro de Investigacion Biomedica en Red Area de Fisiologia de la Obesidad y la Nutricion (CIBEROBN),
28029 Madrid, Spain14 IdisNA Instituto for Health Research, 31008 Pamplona, Spain15 Charles Perkins Centre, School of Life and Environmental Sciences, University of Sydney, Camperdown,
Sydney 2006, Australia; [email protected] (R.M.); [email protected] (J.B.-M.)16 Steno Diabetes Center Copenhagen, 2820 Gentofte, Denmark* Correspondence: [email protected]; Tel.: +45-21-30-69-12
Abstract: Plant-based diets are recommended by dietary guidelines. This secondary analysis aimedto assess longitudinal associations of an overall plant-based diet and specific plant foods with weight-loss maintenance and cardiometabolic risk factors. Longitudinal data on 710 participants (aged26–70 years) with overweight or obesity and pre-diabetes from the 3-year weight-loss maintenancephase of the PREVIEW intervention were analyzed. Adherence to an overall plant-based diet wasevaluated using a novel plant-based diet index, where all plant-based foods received positive scoresand all animal-based foods received negative scores. After adjustment for potential confounders,linear mixed models with repeated measures showed that the plant-based diet index was inverselyassociated with weight regain, but not with cardiometabolic risk factors. Nut intake was inverselyassociated with regain of weight and fat mass and increments in total cholesterol and LDL cholesterol.Fruit intake was inversely associated with increments in diastolic blood pressure, total cholesterol,and LDL cholesterol. Vegetable intake was inversely associated with an increment in diastolic blood
Nutrients 2021, 13, 3916. https://doi.org/10.3390/nu13113916 https://www.mdpi.com/journal/nutrients15

Nutrients 2021, 13, 3916
pressure and triglycerides and was positively associated with an increase in HDL cholesterol. Allreported associations with cardiometabolic risk factors were independent of weight change. Long-term consumption of nuts, fruits, and vegetables may be beneficial for weight management andcardiometabolic health, whereas an overall plant-based diet may improve weight management only.
Keywords: plant-based dietary patterns; grains; legumes; nuts; fruits; vegetables; obesity; cardiovas-cular disease
1. Introduction
Cardiovascular diseases (CVDs) have placed a substantial healthcare and economicburden on governments and individuals [1]. Obesity is a major risk factor for CVDs [1].Plant-based diets (PBDs) recommended by European food-based dietary guidelines [2] andthe EAT-Lancet Commission [3] may be beneficial in terms of environmental sustainability,particularly if plant-based proteins replace animal-based foods such as red meat [2]. PBDsmay also assist in weight management and prevention of CVDs [4–9] and improve multiplecardiometabolic risk factors [5].
Many previous randomized controlled trials (RCTs) and observational studies haveexplored the association of a vegetarian or a PBD with weight loss (WL) [8] or weightgain [6] or BMI [5]. Some prospective cohort studies have explored the association ofPBDs with risk of CVDs [10], whereas previous evidence on PBDs and cardiometabolicrisk factors was mainly based on cross-sectional studies and small-scale, short- or medium-term RCTs [11–17]. Long-term data on adherence to a PBD and weight regain and car-diometabolic risk factors during weight-loss maintenance (WLM), particularly after diet-induced rapid WL, are largely lacking.
Specific components of a PBD may also have an important role to play in weightmanagement and cardiometabolic health. Certain plant foods such as whole grains, veg-etables, fruits, legumes, and nuts are rich in vitamins, minerals, antioxidants, unsaturatedfatty acids, and dietary fiber [7]. These plant foods are considered healthy, with improvedhealth outcomes [7]. Other plant foods such as sugar-sweetened beverages, cakes, andcookies have lower nutrient density and higher energy density [7]. These plant foods areregarded as unhealthy and may have negative effects on health [7]. To our knowledge, fewlong-term studies have to date explored consumption of plant foods and weight regainand cardiometabolic risk factors during WLM.
Therefore, the objective of the current study was to assess the longitudinal associationsof adherence to an overall PBD and specific plant foods with WLM and cardiometabolicrisk factors in adults with high risk of type 2 diabetes (T2D). Data from the PREVIEW study,a 3-year randomized trial aimed at examining the effects of diet and physical activity (PA)interventions on T2D prevention, were used. We hypothesized that consumption of anoverall PBD and healthy plant foods would be inversely associated with weight regain andcardiometabolic risk factors.
2. Materials and Methods
2.1. Study Design
The PREVIEW study was a 3-year, large-scale, 2 × 2 factorial randomized trial. It wasconducted at 8 study centers including Denmark, Finland, The Netherlands, the UK,Spain, Bulgaria, New Zealand, and Australia. The detailed information has been describedelsewhere [18], and the main results have been published [19,20]. Briefly, the PREVIEWstudy was designed to examine the effect of a high protein-low glycemic index (GI) dietvs a moderate protein–moderate GI diet (25 E% protein and GI < 50 vs. 15 E% proteinand GI > 56) combined with 2 PA programs (high intensity or moderate intensity) on T2Dincidence in adults with overweight or obesity and pre-diabetes. The primary endpointwas T2D incidence. The participants underwent an 8-week weight loss (WL) period, and
16

Nutrients 2021, 13, 3916
during this period, they were instructed to consume a low energy total meal replacementdiet containing 3.4 MJ·day−1. After this period, participants started a 148-week WLMperiod and received 1 of the 4 diet–PA interventions. The intervention diets were consumedad libitum during WLM, and the participants were given examples of eating plans, cookingbooks, and food-exchange lists. Both diet interventions included the recommendation ofwhole grain cereals. A behavioral modification program (PREMIT) and 17 group visits wereconducted throughout the intervention to improve dietary and PA compliance [21]. Dietarycompliance was evaluated using 4-day food records. In addition, urinary nitrogen or ureaanalyses were done on 24 h urine samples to assess compliance to the diets, i.e., proteinintake. PA compliance was evaluated using 7-day accelerometry.
The PREVIEW study was designed and conducted in line with the Declaration ofHelsinki and its latest amendments. The protocol of the PREVIEW study was reviewedand approved by the following Human Ethics Committees at each intervention center.Denmark: The Research Ethics Committees of the Capital Region, ethical approval code:H-1-2013-052; Finland: Coordinating Ethical Committee of HUS (Helsinki and UusimaaHospital District), ethical approval code: HUS/1733/2017; the UK: UK National ResearchEthics Service (NRES) and East Midlands (Leicester) Ethics Committee, ethical approvalcode: 13/EM/0259; the Netherlands: Medical Ethics Committee of the Maastricht Uni-versity Medical Centre, ethical approval code: NL43054.068.13/METC 13-3-008; Spain:Research Ethics Committee of the University of Navarra, ethical approval code: 71/2013;Bulgaria: Commission on Ethics in Scientific Research with the Medical University-Sofia(KENIMUS), ethical approval code: 4303/13.06.2014; Australia: The University of Sydney,Human Research Ethics Committee (HREC), ethical approval code: 2013/535; and NewZealand: Health and Disability Ethics Committees (HDEC), ethical approval code: X14-0408.
The current analysis was an exploratory analysis based on the secondary outcomesof the PREVIEW study. Given that only 5 study centers (Finland, the UK, Bulgaria, NewZealand, and Australia) provided food intake data in g·day−1 or serving size·day−1 andfull plant food categories, only data from the WLM phase (8–156 weeks) from participantsat these 5 study centers were included.
2.2. Study Population
Participants aged 25–70 years with overweight (BMI 25–29.9 kg·m−2) or obesity(BMI ≥ 30 kg·m−2) and pre-diabetes were recruited between June 2013 and April 2015.Pre-diabetes was defined as impaired FPG (FPG of 5.6–6.9 mmol·L−1) or impaired glu-cose tolerance (2-h plasma glucose of 7.8–11.0 mmol·L−1 and FPG < 7.0 mmol·L−1) afteran oral glucose tolerance test (oral ingestion of 75 g of glucose) [22]. Participants whowere diagnosed with diabetes (T2D or type 1 diabetes) prior to the study or who werenon-compliant with the intervention were excluded. Eligible participants were enrolled,underwent randomization by gender and age, and started WL. Participants who lost ≥8%of initial BW after the WL phase were eligible to continue, entering the 148-week WLMperiod. In the current analysis, we included those with available plant food data (andfull plant food categories) at 26 weeks and plausible energy intake (2520–14700 kJ·day−1
for women and 3360–17640 kJ·day−1 for men) [23]. All participants provided writteninformed consent.
2.3. Assessment of Dietary Intake and Adherence to an Overall Plant-Based Diet
Dietary intake was estimated using self-administered 4-day food records on 4 con-secutive days, including 3 weekdays and 1 weekend day. The 4-day food records werecollected at 26, 52, 104, and 156 weeks. Participants were encouraged to record their dietby weighing foods and drinks using a weigh scale or household measures in the absenceof a scale. Standard household measures such as cup, spoon, glass, and portions wereexplained. Additionally, participants were asked to describe the food in detail (e.g., typeof foods, cooking methods, and ingredients). Food records were entered into the nationalnutrient analysis software, i.e., AivoDiet (Finland), Nutritics (the UK), Nutrition Calcula-
17
Nutrients 2021, 13, 3916
tion (Bulgaria), and Foodworks (Australia and New Zealand). Food intake at each timepoint was calculated as the average of 4 days and expressed in g·day−1 or serving·day−1.Serving sizes were converted to grams of food [23].
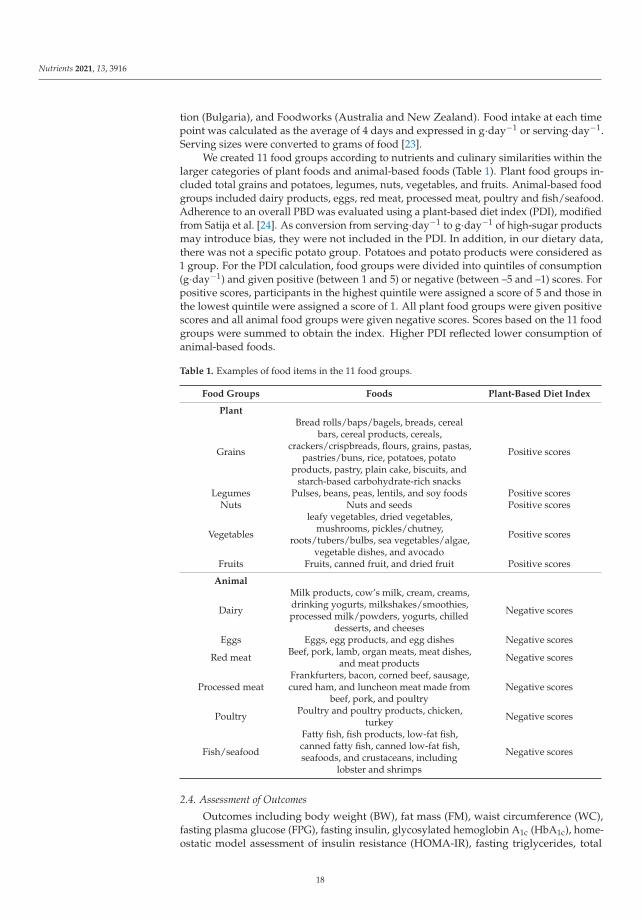
We created 11 food groups according to nutrients and culinary similarities within thelarger categories of plant foods and animal-based foods (Table 1). Plant food groups in-cluded total grains and potatoes, legumes, nuts, vegetables, and fruits. Animal-based foodgroups included dairy products, eggs, red meat, processed meat, poultry and fish/seafood.Adherence to an overall PBD was evaluated using a plant-based diet index (PDI), modifiedfrom Satija et al. [24]. As conversion from serving·day−1 to g·day−1 of high-sugar productsmay introduce bias, they were not included in the PDI. In addition, in our dietary data,there was not a specific potato group. Potatoes and potato products were considered as1 group. For the PDI calculation, food groups were divided into quintiles of consumption(g·day−1) and given positive (between 1 and 5) or negative (between –5 and –1) scores. Forpositive scores, participants in the highest quintile were assigned a score of 5 and those inthe lowest quintile were assigned a score of 1. All plant food groups were given positivescores and all animal food groups were given negative scores. Scores based on the 11 foodgroups were summed to obtain the index. Higher PDI reflected lower consumption ofanimal-based foods.
Table 1. Examples of food items in the 11 food groups.
Food Groups Foods Plant-Based Diet Index
Plant
Grains
Bread rolls/baps/bagels, breads, cerealbars, cereal products, cereals,
crackers/crispbreads, flours, grains, pastas,pastries/buns, rice, potatoes, potato
products, pastry, plain cake, biscuits, andstarch-based carbohydrate-rich snacks
Positive scores
Legumes Pulses, beans, peas, lentils, and soy foods Positive scoresNuts Nuts and seeds Positive scores
Vegetables
leafy vegetables, dried vegetables,mushrooms, pickles/chutney,
roots/tubers/bulbs, sea vegetables/algae,vegetable dishes, and avocado
Positive scores
Fruits Fruits, canned fruit, and dried fruit Positive scores
Animal
Dairy
Milk products, cow’s milk, cream, creams,drinking yogurts, milkshakes/smoothies,processed milk/powders, yogurts, chilled
desserts, and cheeses
Negative scores
Eggs Eggs, egg products, and egg dishes Negative scores
Red meat Beef, pork, lamb, organ meats, meat dishes,and meat products Negative scores
Processed meatFrankfurters, bacon, corned beef, sausage,cured ham, and luncheon meat made from
beef, pork, and poultryNegative scores
Poultry Poultry and poultry products, chicken,turkey Negative scores
Fish/seafood
Fatty fish, fish products, low-fat fish,canned fatty fish, canned low-fat fish,seafoods, and crustaceans, including
lobster and shrimps
Negative scores
2.4. Assessment of Outcomes
Outcomes including body weight (BW), fat mass (FM), waist circumference (WC),fasting plasma glucose (FPG), fasting insulin, glycosylated hemoglobin A1c (HbA1c), home-ostatic model assessment of insulin resistance (HOMA-IR), fasting triglycerides, total
18

Nutrients 2021, 13, 3916
cholesterol, high-density lipoprotein cholesterol (HDL cholesterol), low-density lipoproteincholesterol (LDL cholesterol), systolic blood pressure (SBP), and diastolic blood pressure(DBP) were measured at 8, 26, 52, 104, and 156 weeks. BW was measured in the fasting state(>10 h), with participants wearing light clothing or underwear. FM was determined by dualenergy X-ray absorptiometry in the UK, Australia, and New Zealand and by bioelectricalimpedance in Finland and Bulgaria. Blood samples were drawn from fasting participants’antecubital veins. FPG, HbA1c, fasting insulin, fasting triglycerides, total cholesterol, HDLcholesterol, and LDL cholesterol were determined at the central laboratory of the FinnishInstitute for Health and Welfare, Helsinki, Finland. HOMA-IR was calculated with theformula: fasting insulin (mU·L−1) × FPG (mmol·L−1)/22.5 [25]. SBP and DBP were deter-mined using a validated automatic device on participants’ right arm after 5–10 min in aresting position.
2.5. Assessment of Covariates
Self-reported questionnaires were used to collect sociodemographic information in-cluding age, sex, ethnicity, and smoking status at baseline (0 weeks). PA was determinedusing 7-day accelerometry (ActiSleep+, ActiGraph LLC, Pensacola, FL, USA) and wasexpressed as counts·min−1, i.e., mean activity counts during valid wear time.
2.6. Statistical Analysis
For descriptive statistics, the normality of continuous variables was assessed by p–pplots and histograms. Approximately normally distributed variables are presented asmeans ± standard deviation (SD) and non-normal variables as medians (25th, 75th per-centiles). Categorical variables are presented as absolute values and frequencies.
We conducted an available-case analysis and merged all participants into 1 group toassess longitudinal associations of adherence to an overall PBD (evaluated by PDI) andplant food intake with yearly changes in outcomes including BW and cardiometabolic riskfactors, using adjusted linear mixed models with repeated measures. Model 1 was adjustedfor fixed factors including age (continuous), sex (categorical; women and men), ethnicity(categorical; Caucasian, Asian, Black, Arabic, or other), intervention group (categorical),BMI at 8 weeks, weight or cardiometabolic risk factors at 8 weeks (continuous), and time(categorical) and random factors including study center (categorical) and participant-ID.For adherence to a PBD, model 2 was adjusted for covariates in model 1 plus fixed factorsincluding time-varying PA (continuous), energy intake (kJ·day−1; continuous), and alcoholintake (g·day−1; continuous). For specific plant food intake, model 2 was additionallyadjusted for consumption of animal-based foods (g·day−1; continuous) and other plantfoods (g·day−1; continuous) as fixed factors. As dietary sodium intake may be associatedwith blood pressure [26], model 2 was additionally adjusted for sodium intake (g·day−1;continuous) when DBP or SBP was added as a dependent variable. Model 3 was adjustedfor covariates in model 2 plus time-varying yearly weight change (continuous) as a fixedfactor. Yearly changes were obtained by dividing changes in outcomes from 8 to 26, 52, 104,and 156 weeks by changes in years. To best represent the long-term dietary and PA patternsof participants during WLM, a cumulative average method [24,27] based on all availablemeasurements of self-reported diet and device-measured PA was used. In this calculation,the 26-week diet was related to yearly changes in weight and cardiometabolic risk factorsfrom 8 to 26 weeks; the average of the 26- and 52-week diets was related to yearly changesin weight and cardiometabolic risk factors from 8 to 52 weeks; the average of the 26-,52-, and 104-week diets was related to yearly changes in weight and cardiometabolicrisk factors from 8 to 104 weeks; the average of the 26-, 52-,104-, and 156-week diets wasrelated to yearly changes in weight and cardiometabolic risk factors from 8 to 156 weeks.Cumulative average PA was calculated using the same method. Detailed information isincluded in Supplementary Materials Table S1. A sensitivity analysis was conducted byadding smoking status (categorical; daily, less than weekly, or no smoking) at 0 weeks inthe abovementioned models. As the results were similar, they are not shown.
19

Nutrients 2021, 13, 3916
The associations of adherence to PBD with outcomes of interest are expressed aschanges in outcomes per year induced by each 1 SD increment in PDI. To clarify theassociations of PDI with BW, we also divided the participants into 2 groups, i.e., higher(n = 344 at 8 weeks) or lower (n = 344 at 8 weeks) adherence to PBD, at each time pointseparately according to PDI. We examined the difference in change in BW between the2 groups using linear mixed models adjusted for the covariates in model 2. As the 2 groupswere defined afresh at each time point, we compared the 2 groups at each time pointregardless of the significance of time and group interaction. The associations of plantfoods with outcomes of interest are expressed as changes in outcomes per year associatedwith each 1-serving size increment in plant food intake. The serving sizes were definedas follows: 75 g·day−1 for total grains and potatoes, 10 g·day−1 for legumes, 5 g·day−1
for nuts, 100 g·day−1 for vegetables, 50 g·day−1 for fruits, and 150 g·day−1 for combinedconsumption of vegetables and fruit—all based on medians and 25th and 75th percentilesof plant food intakes from dietary records over 3 years.
Missing data were not handled with multiple imputation because this method did notincrease precision [28,29]. Data were analyzed using IBM SPSS v26.0 (Chicago, IL, USA).All P values were based on 2-sided tests and P < 0.05 was considered significant.
3. Results
In the present available-case analysis, we included 710 participants and 2144–2336 observations of outcomes from available plant food data and full plant food categories at 26 weeksand plausible energy intakes (Figure 1). Of these, 493 participants completed the study.Participants who withdrew during WLM did so for personal reasons, including timeconstraints, moving away, and illness. The median age of participants (69% women) atthe beginning of WLM was 57 years (range: 26–70 years) (Table 2). As there were nopoultry and processed meat data from participants in Bulgaria, PDI analysis was based on688 participants with both complete plant food and animal food data.
Adherence to an overall PBD was inversely associated with weight regain and in-crement in LDL cholesterol in model 2, whereas after adjustment for weight change, theassociation of PBD with LDL cholesterol was lost (Figure 2). No associations were observedbetween PBD and other cardiometabolic risk factors in models 2 and 3 (Table S2). In allparticipants (n = 688), compared with those with lower adherence to PBD, participantswith higher adherence to PBD had less weight regain at 52 and 104 weeks (Figure S1A).In completers (n = 493), compared with those with lower adherence to PBD, participantswith higher adherence to PBD had less weight regain at 26, 52, and 104 weeks (Figure S1B).
Total grains and potatoes were not associated with any health outcomes in models2 and 3 (Table S3). Legumes were positively associated with an increase in HDL cholesterol,whereas after adjustment for weight change, the association was lost (Figure 3). No associ-ations were observed between legumes and weight regain or other cardiometabolic riskfactors in models 2 and 3 (Table S4). Nuts were inversely associated with increments inBW, FM, HbA1c, total cholesterol, and LDL cholesterol in model 2. After adjustment forweight change, the association of nuts with HbA1c was lost (Figure 3). No associations wereobserved between nuts and other cardiometabolic risk factors in models 2 and 3 (Table S5).
In the available analysis, fruits were inversely associated with increments in DBP, totalcholesterol, and LDL cholesterol after adjustment for weight change in model 3 (Figure 4).No associations were observed between fruits and weight regain or other cardiometabolicrisk factors in models 2 and 3 (Table S6). Vegetables were inversely associated with DBP andtriglycerides and were positively associated with HDL cholesterol, independent of weightchange in model 3 (Figure 4). No associations were observed between vegetables andweight regain or other cardiometabolic risk factors in models 2 and 3 (Table S7). Combinedvegetable and fruit intake was inversely associated with an increment in SBP, and DBPand was positively associated with an increase in HDL cholesterol in model 2, whereasafter adjustment for weight change, only the associations of DBP and HDL cholesterol
20

Nutrients 2021, 13, 3916
with combined vegetable and fruit intake remained significant in model 3 (Figure 4 andTable S8).
Figure 1. Participant flow diagram. 1 Individuals with missing plant food data at 26 weeks and/orimplausible energy intake data (<2520 or >14,700 kJ·day−1 for women and <3360 or >17,640 kJ·day−1
for men) were excluded.
21

Nutrients 2021, 13, 3916
Table 2. Characteristics of participants at baseline (0 weeks), the start of weight-loss maintenance(8 weeks), or 26 weeks.
Characteristics
n 710
Socio-demographics 1
Female, n (%) 491 (69.2)Age (years) 57 (46, 63)Height (m) 1.66 (1.61, 1.73)
Ethnicity, n (%)Caucasian 617 (86.9)
Asian 24 (3.4)Black 19 (2.7)
Arabic 4 (0.6)Other 46 (6.5)
Smoking, n (%)No 659 (92.8)
Yes, but less than weekly 17 (2.4)Yes, at least daily 30 (4.2)
Missing 4 (0.6)
Anthropometric outcomes and body composition 2
Body weight (kg) 86.1 ± 16.6BMI (kg·m−2) 29.5 (26.7, 33.5)Fat mass (kg) 33.5 ± 12.3
Waist circumference (cm) 100.2 ± 12.6
Cardiometabolic risk factors 2
Fasting plasma glucose (mmol·L−1) 5.7 ± 0.6HbA1c (mmol·mol−1) 35.0 ± 3.1
HbA1c (%) 5.4 ± 0.3Fasting insulin (mU·L−1) 7.3 (5.3, 9.9)
HOMA-IR 1.8 (1.3, 2.5)Systolic blood pressure (mmHg) 121.6 ± 15.8Diastolic blood pressure (mmHg) 72.1 ± 9.5
Triglycerides (mmol·L−1) 1.0 (0.8, 1.2)Total cholesterol (mmol·L−1) 4.1 ± 0.9HDL cholesterol (mmol·L−1) 1.1 ± 0.2LDL cholesterol (mmol·L−1) 2.4 (1.9, 3.0)
Energy and food intake 3
Energy (kJ·day−1) 29,491 ± 7731Grains (g·day−1) 206.1 (144.7, 276.6)
Legumes (g·day−1) 0.2 (0, 27.5)Nuts (g·day−1) 3.2 (0, 10.8)Fruits (g·day−1) 169.5 (83.8, 260.5)
Vegetables (g·day−1) 185.9 (97.1, 310.7)Dairy (g·day−1) 361.0 (226.4, 501.0)Eggs (g·day−1) 20.8 (5.1, 41.3)
Red meat (g·day−1) 35.9 (0, 71.9)Processed meat (g·day−1) 12.0 (0, 29.7)
Poultry (g·day−1) 37.2 (9.6, 70.4)Fish/seafood (g·day−1) 30.0 (3.6, 62.7)
Values represent mean ± standard deviation, median (25th, 75th percentiles), and the number of participants (%)1 Data were collected at 0 weeks. 2 Data were collected at 8 weeks. 3 Data were collected at 26 weeks. BMI, bodymass index; HbA1c, glycosylated hemoglobin A1c; HDL cholesterol, high-density lipoprotein cholesterol; HOMA-IR, homeostatic model assessment of insulin resistance; LDL cholesterol, low-density lipoprotein cholesterol.
22
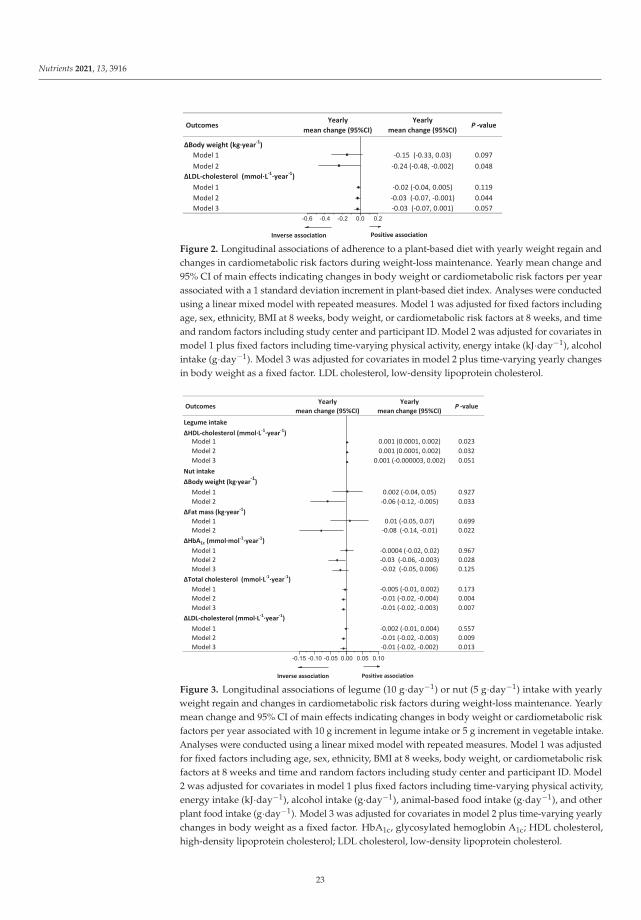
Nutrients 2021, 13, 3916
Figure 2. Longitudinal associations of adherence to a plant-based diet with yearly weight regain andchanges in cardiometabolic risk factors during weight-loss maintenance. Yearly mean change and95% CI of main effects indicating changes in body weight or cardiometabolic risk factors per yearassociated with a 1 standard deviation increment in plant-based diet index. Analyses were conductedusing a linear mixed model with repeated measures. Model 1 was adjusted for fixed factors includingage, sex, ethnicity, BMI at 8 weeks, body weight, or cardiometabolic risk factors at 8 weeks, and timeand random factors including study center and participant ID. Model 2 was adjusted for covariates inmodel 1 plus fixed factors including time-varying physical activity, energy intake (kJ·day−1), alcoholintake (g·day−1). Model 3 was adjusted for covariates in model 2 plus time-varying yearly changesin body weight as a fixed factor. LDL cholesterol, low-density lipoprotein cholesterol.
Figure 3. Longitudinal associations of legume (10 g·day−1) or nut (5 g·day−1) intake with yearlyweight regain and changes in cardiometabolic risk factors during weight-loss maintenance. Yearlymean change and 95% CI of main effects indicating changes in body weight or cardiometabolic riskfactors per year associated with 10 g increment in legume intake or 5 g increment in vegetable intake.Analyses were conducted using a linear mixed model with repeated measures. Model 1 was adjustedfor fixed factors including age, sex, ethnicity, BMI at 8 weeks, body weight, or cardiometabolic riskfactors at 8 weeks and time and random factors including study center and participant ID. Model2 was adjusted for covariates in model 1 plus fixed factors including time-varying physical activity,energy intake (kJ·day−1), alcohol intake (g·day−1), animal-based food intake (g·day−1), and otherplant food intake (g·day−1). Model 3 was adjusted for covariates in model 2 plus time-varying yearlychanges in body weight as a fixed factor. HbA1c, glycosylated hemoglobin A1c; HDL cholesterol,high-density lipoprotein cholesterol; LDL cholesterol, low-density lipoprotein cholesterol.
23

Nutrients 2021, 13, 3916
Figure 4. Longitudinal associations of fruit (50 g·day−1) or vegetable (100 g·day−1) or fruit andvegetable intake (150 g·day−1) with yearly changes in cardiometabolic risk factors during weight-lossmaintenance. Yearly mean change and 95% CI of main effects indicating changes in cardiometabolicrisk factors per year associated with 50 g increment in fruit intake or 100 g increment in vegetableintake or 150 g increment in fruit and vegetable intake. Analyses were conducted using a linear mixedmodel with repeated measures. Model 1 was adjusted for fixed factors including age, sex, ethnicity,BMI at 8 weeks, cardiometabolic risk factors at 8 weeks, and time and random factors including studycenter and participant ID. Model 2 was adjusted for covariates in model 1 plus fixed factors includingtime-varying physical activity, energy intake (kJ·day−1), alcohol intake (g·day−1), animal-based foodintake (g·day−1), and other plant food intake (g·day−1); for systolic blood pressure and diastolicblood pressure, model 2 was additionally adjusted for dietary sodium intake (g·day−1). Model3 was adjusted for covariates in model 2 plus time-varying yearly changes in body weight as afixed factor. HDL cholesterol, high-density lipoprotein cholesterol; LDL cholesterol, low-densitylipoprotein cholesterol.
4. Discussion
In this 3-year, multi-center study, we examined the longitudinal associations of anoverall PBD and specific plant foods with WLM and cardiometabolic risk factors in indi-viduals with a high risk of developing T2D. We found that adherence to an overall PBD
24

Nutrients 2021, 13, 3916
diet improved weight management. Consumption of nuts, fruits, and vegetables and fruitsand vegetables was inversely associated with weight regain or cardiometabolic risk factors.Importantly, the reported associations with cardiometabolic risk factors were independentof weight change.
In the present analysis, we found that an overall PBD was inversely associated withweight regain, which is in agreement with findings from meta-analyses of RCTs [5,8,30] andprospective studies. Satija et al. [31] and Choi et al. [6] found inverse associations betweenadherence to a PBD and long-term weight gain. We did not find any associations betweenan overall PBD and cardiometabolic risk factors including glycemic markers, lipids, andblood pressure, after adjustment for weight change. On the contrary, Satija et al. [24,27,31]and Chen et al. [32] showed that an overall PDI was associated with smaller weight changeor lower risk of T2D and coronary heart disease in three US prospective cohort studies.In addition, Glenn et al. [33] found that a plant-based Portfolio Diet was associated with areduced CVD risk in the Women’s Health Initiative Prospective Cohort.
The mixed findings may be partly explained by differences in assessment of adherenceto a PBD. In observational studies, compliance to a PBD was commonly assessed by dietaryindices such as PDI (including 18 food groups) [24,27] and A Priori Diet Quality Score(including 46 food groups) [6]. Specifically, the PDI created by Satija et al. [27] includedvegetable oils, tea, and coffee (as healthy plant foods) and sugar-sweetened beverages andsweets and desserts (as unhealthy plant foods). However, in our PDI version, we did notinclude these food groups. In addition, some prospective studies showed that comparedwith overall PDI, healthy PDI emphasizing whole grains, fruits, vegetables, nuts, legumes,and vegetable oils showed stronger associations with smaller weight change and lower riskof T2D and coronary heart disease [24,27,31]. Furthermore, we did not calculate healthyPDI by giving positive scores to whole grains, vegetable oils, and tea and coffee and givingnegative scores to refined grains, sugar sweetened beverages, and sweets and desserts.Compared with healthy PBDs or vegetarian diets in the abovementioned studies, our PDIcaptured a “less healthy” diet. PBDs rich in healthy components have higher dietary fiberand micronutrients as well as lower energy, GI, and glycemic load [27]. In a previoussecondary analysis of the PREVIEW study, we found positive associations between GI,glycemic load, and weight regain during WLM [34].
In terms of specific components of PBDs, we found that nuts were linked with im-proved weight management and cardiometabolic risk factors during WLM. Similar to ourfindings, meta-analyses of prospective studies and RCTs also showed that nuts improvedweight management [35–37] and cardiometabolic risk factors including HOMA-IR andfasting insulin [38]. In a study based on a cross-sectional nutrition survey, compared withnon-nut consumers, nut consumers had lower BW, BMI, and WC, whereas there wereno differences in cardiometabolic risk factors including blood pressure, total cholesterol,HDL cholesterol, and HbA1c [13]. The results, however, were limited by cross-sectionaldesign, and causal inferences could not be drawn. Our study stands out because it usedlong-term, repeatedly measured, and updated dietary records and health outcomes, whichnot only provided a large number of observations, but also deeper insights into the causallyrelevant associations compared with cross-sectional studies and prospective studies withdiet measured at baseline only.
We also observed that fruits, vegetables, and combined consumption of vegetablesand fruits were associated with improved cardiometabolic risk factors. Similarly, in apopulation-based cross-sectional study, Mirmiran et al. [39] showed that consumption offruits and vegetables was associated with lower concentrations of total cholesterol and LDLcholesterol. However, in a 12-week RCT, McEvoy et al. [40] did not find dose–responseeffects of fruit and vegetable intake on cardiometabolic risk factors including ambulatoryblood pressure and plasma lipids. For grains, several RCTs and observational studiessuggested that whole grains showed inverse effects on cardiometabolic risk factors [41–43],whereas refined grains showed positive effects [44,45]. However, there are conflictingreports of the associations of whole grains with obesity measures [46,47]. In the current
25

Nutrients 2021, 13, 3916
study, total grains were not associated with any favorable change in health outcome.This may be because the grain group in the PREVIEW dietary dataset was not strictlybased on whole grains, although whole grains were recommended to participants in eachintervention arms during WLM.
The strengths of the current study are that this is the first multi-center, internationalstudy to explore associations of consumption of a PBD and specific plant foods withweight gain and cardiometabolic risk factors during 3-year WLM after diet-induced WL.Additionally, our study included individuals who met the pre-diabetes criteria (not justoverweight/obesity) at the start. Furthermore, long-term, repeated dietary records werecollected, which provided a large number of observations and a sufficient statistical powerto adjust for important and multiple confounding factors including animal-based foodintake and PA measured by accelerometry.
The current study also has some limitations. First, the attrition rate, especially at theend of the study, was higher than expected, which may affect the generalization of ourfindings. Second, the dietary data were obtained via 4-day food records, and misreporting,overreporting, or underreporting were inevitable [48]. Third, specific food groups suchas refined grains, whole grains, and sugar sweetened beverages were not included inPDI calculation, which made this index less accurate when describing adherence to anoverall PBD. It was not possible for us to investigate unhealthy PDI or specific unhealthyplant foods because these foods were specifically excluded in the dietary instructions.Furthermore, in order to make the results easy to understand, we divided the participantsinto higher or lower plant-based diet adherence groups according to PDI at each timepoint. Unlike RCTs, however, in the present analysis the participants were not randomlyallocated to one of the two groups, which means that their baseline characteristics may beunbalanced. The statistical phenomenon “regression toward the mean” may have affectedthe two groups differently, making the natural variation in BW appear as true change [49].Finally, residual and unmeasured confounders are possible in any observational analysis,which may create bias. Hyperuricemia, an independent risk factor for major CVD [50] andan important confounding factor, was not included in the current analysis. As we collectedsmoking status at baseline only (not at each time point), it was not possible to adjust forsmoking status as a time-varying variable in the models. Adjustment for baseline valuesonly may introduce bias because smokers may quit smoking during a long-term healthylifestyle intervention.
5. Conclusions
This secondary analysis showed that long-term consumption of specific healthyplant foods including nuts, fruits, and vegetables improved weight management and car-diometabolic health, whereas adherence to an overall PBD benefited weight managementonly. Our findings support the hypothesis that specific components in a PBD are importantas well. Although healthy and high-quality plant foods are currently recommended toindividuals for reducing weight regain and the risk of developing CVDs, the observationalnature of our analysis cannot establish a cause-and-effect relationship. The findings shouldbe treated with caution because misreporting of food intake and unmeasured confoundersare common.
Supplementary Materials: The following are available online at https://www.mdpi.com/article/10.3390/nu13113916/s1, Table S1: Calculations for cumulative average dietary intake, physicalactivity, and yearly changes in body weight and cardiometabolic risk factors, Table S2. Longitudinalassociations of adherence to healthy plant-based diet with yearly changes in weight outcomesand cardiometabolic risk factors during weight-loss maintenance (n = 688), Table S3. Longitudinalassociations of total grain and potato intake with yearly weight regain and changes in cardiometabolicrisk factors during weight-loss maintenance (n = 710), Table S4. Longitudinal associations of legumeintake with yearly weight regain and changes in cardiometabolic risk factors during weight-lossmaintenance (n = 710), Table S5. Longitudinal associations of nut intake with yearly changes in waistcircumference and cardiometabolic risk factors during weight-loss maintenance (n = 710), Table S6.
26

Nutrients 2021, 13, 3916
Longitudinal associations of fruit intake with yearly weight regain and changes in cardiometabolicrisk factors during weight-loss maintenance (n = 710), Table S7. Longitudinal associations of vegetableintake with yearly weight regain and changes in cardiometabolic risk factors during weight-lossmaintenance (n = 710), Table S8. Longitudinal associations of vegetable and fruit intake with yearlyweight regain and changes in cardiometabolic risk factors during weight-loss maintenance (n = 710),Figure S1. Changes in body weight during weight-loss maintenance in all participants (n = 688)(A) or completers (n = 493) (B) with lower or higher adherence to the plant-based diet.
Author Contributions: Conceptualization for the secondary analysis, R.Z. and A.R.; methodology,A.R., J.B.-M., M.F., S.D.P., I.A.M., J.A.M., G.S. and S.H.; sample analysis, J.S. and L.R.; writing—original draft preparation, R.Z.; writing—review and editing, R.Z., A.R., J.B.-M., M.F., S.D.P., J.A.M.,G.M., M.H.-L., E.J., R.M., M.A.T., M.P.S., T.H.-D., I.A.M., G.S., S.H., J.S. and L.R. A.R. attests that alllisted authors meet authorship criteria and that no others meeting the criteria have been omitted.The funders had no role in the design of the study; in the collection, analyses, or interpretation ofdata; in the writing of the manuscript; or in the decision to publish the results. All authors have readand agreed to the published version of the manuscript.
Funding: EU framework programme 7 (FP7/2007-2013) grant agreement # 312057. National Healthand Medical Research Council—EU Collaborative Grant, AUS 8, ID 1067711). The Glycemic IndexFoundation Australia through royalties to the University of Sydney. The New Zealand HealthResearch Council (grant #14/191) and University of Auckland Faculty Research Development Fund.The Cambridge Weight Plan© donated all products for the 8-week LED period. The Danish Agri-culture & Food Council. The Danish Meat and Research Institute. National Institute for HealthResearch Biomedical Research Centre (NIHR BRC) (UK). Engineering and Physical Sciences ResearchCouncil (EPSRC) (UK). Nutritics (Dublin) donated all dietary analyses software used by UNOTT.Juho Vainio Foundation (FIN), Academy of Finland (grant numbers: 272376, 314383, 266286, 314135),Finnish Medical Foundation, Gyllenberg Foundation, Novo Nordisk Foundation, Finnish DiabetesResearch Foundation, University of Helsinki, Government Research Funds for Helsinki UniversityHospital (FIN), Jenny and Antti Wihuri Foundation (FIN), Emil Aaltonen Foundation (FIN). ChinaScholarship Council.
Institutional Review Board Statement: The PREVIEW study was conducted according to the guide-lines of the Declaration of Helsinki, and the study was approved by the Human Ethics Committeesat each intervention center (Denmark: The Research Ethics Committees of the Capital Region, ethicalapproval code: H-1-2013-052; Finland: Coordinating Ethical Committee of HUS (Helsinki and Uusi-maa Hospital District), ethical approval code: HUS/1733/2017; the UK: UK National Research EthicsService (NRES) and East Midlands (Leicester) Ethics Committee, ethical approval code: 13/EM/0259;the Netherlands: Medical Ethics Committee of the Maastricht University Medical Centre, ethical ap-proval code: NL43054.068.13/METC 13–3-008; Spain: Research Ethics Committee of the University ofNavarra, ethical approval code: 71/2013; Bulgaria: Commission on Ethics in Scientific Research withthe Medical University-Sofia (KENIMUS), ethical approval code: 4303/13.06.2014; Australia: The Uni-versity of Sydney, Human Research Ethics Committee (HREC), ethical approval code: 2013/535; andNew Zealand: Health and Disability Ethics Committees (HDEC), ethical approval code: X14-0408).
Informed Consent Statement: Written informed consent was obtained from all participants.
Data Availability Statement: The dataset for this study is available from the corresponding authoron reasonable request.
Acknowledgments: The PREVIEW consortium would like to thank all study participants at everyintervention center for their time and commitment and all scientists, advisors, and students for theirdedication and contributions to the study. Specially, we would like to thank Thomas Meinert Larsen(University of Copenhagen), Margriet Westerterp-Plantenga (Maastricht University), Edith Feskens(Wageningen University), and Wolfgang Schlicht (University of Stuttgart).
Conflicts of Interest: A.R. has received honorariums from Unilever and the International SweetenersAssociation. J.B.-M. is President and Director of the Glycemic Index Foundation, oversees a glycemicindex testing service at the University of Sydney, and is a co-author of books about diet and diabetes.She is a member of the Scientific Advisory Board of the Novo Foundation and of ZOE Global. I.A.M.was a member of the UK Government Scientific Advisory Committee on Nutrition, Treasurer ofthe Federation of European Nutrition Societies, Treasurer of the World Obesity Federation, memberof the Mars Scientific Advisory Council, member of the Mars Europe Nutrition Advisory Board,
27

Nutrients 2021, 13, 3916
and Scientific Adviser to the Waltham Centre for Pet Nutrition. He was also a member of theNestle Research Scientific Advisory Board and of the Novozymes Scientific Advisory Board. Hewithdrew from all of these roles in 2020 and on 1 August 2020 became Professor Emeritus at theUniversity of Nottingham and took up the post of Scientific Director of the Nestle Institute of HealthSciences in Lausanne, Switzerland. S.D.P. was the Fonterra Chair in Human Nutrition during thePREVIEW intervention.
References
1. Timmis, A.; Townsend, N.; Gale, C.P.; Torbica, A.; Lettino, M.; Petersen, S.E.; Mossialos, E.A.; Maggioni, A.P.; Kazakiewicz, D.;May, H.T.; et al. European Society of Cardiology: Cardiovascular Disease Statistics 2019. Eur. Heart J. 2020, 41, 12–85. [CrossRef][PubMed]
2. Bechthold, A.; Boeing, H.; Tetens, I.; Schwingshackl, L.; Nothlings, U. Perspective: Food-Based Dietary Guidelines in Europe-Scientific Concepts, Current Status, and Perspectives. Adv. Nutr. 2018, 9, 544–560. [CrossRef]
3. Willett, W.; Rockstrom, J.; Loken, B.; Springmann, M.; Lang, T.; Vermeulen, S.; Garnett, T.; Tilman, D.; DeClerck, F.; Wood, A.; et al.Food in the Anthropocene: The EAT-Lancet Commission on healthy diets from sustainable food systems. Lancet 2019, 393,447–492. [CrossRef]
4. Aune, D. Plant Foods, Antioxidant Biomarkers, and the Risk of Cardiovascular Disease, Cancer, and Mortality: A Review of theEvidence. Adv. Nutr. 2019, 10, S404–S421. [CrossRef]
5. Dinu, M.; Abbate, R.; Gensini, G.F.; Casini, A.; Sofi, F. Vegetarian, vegan diets and multiple health outcomes: A systematic reviewwith meta-analysis of observational studies. Crit. Rev. Food Sci. Nutr. 2017, 57, 3640–3649. [CrossRef]
6. Choi, Y.; Larson, N.; Gallaher, D.D.; Odegaard, A.O.; Rana, J.S.; Shikany, J.M.; Steffen, L.M.; Jacobs, D.R., Jr. A Shift toward aPlant-Centered Diet from Young to Middle Adulthood and Subsequent Risk of Type 2 Diabetes and Weight Gain: The CoronaryArtery Risk Development in Young Adults (CARDIA) Study. Diabetes Care 2020, 43, 2796–2803. [CrossRef] [PubMed]
7. Hemler, E.C.; Hu, F.B. Plant-Based Diets for Personal, Population, and Planetary Health. Adv. Nutr. 2019, 10, S275–S283.[CrossRef] [PubMed]
8. Huang, R.Y.; Huang, C.C.; Hu, F.B.; Chavarro, J.E. Vegetarian Diets and Weight Reduction: A Meta-Analysis of RandomizedControlled Trials. J. Gen. Intern. Med. 2016, 31, 109–116. [CrossRef] [PubMed]
9. Kim, H.; Caulfield, L.E.; Garcia-Larsen, V.; Steffen, L.M.; Coresh, J.; Rebholz, C.M. Plant-Based Diets Are Associated With a LowerRisk of Incident Cardiovascular Disease, Cardiovascular Disease Mortality, and All-Cause Mortality in a General Population ofMiddle-Aged Adults. J. Am. Heart Assoc. 2019, 8, e012865. [CrossRef] [PubMed]
10. Satija, A.; Hu, F.B. Plant-based diets and cardiovascular health. Trends Cardiovasc. Med. 2018, 28, 437–441. [CrossRef]11. Bielefeld, D.; Grafenauer, S.; Rangan, A. The Effects of Legume Consumption on Markers of Glycaemic Control in Individuals
with and without Diabetes Mellitus: A Systematic Literature Review of Randomised Controlled Trials. Nutrients 2020, 12, 2123.[CrossRef]
12. Abbaspour, N.; Roberts, T.; Hooshmand, S.; Kern, M.; Hong, M.Y. Mixed nut consumption may improve cardiovascular diseaserisk factors in overweight and obese adults. Nutrients 2019, 11, 1488. [CrossRef]
13. Brown, R.C.; Tey, S.L.; Gray, A.R.; Chisholm, A.; Smith, C.; Fleming, E.; Parnell, W. Association of Nut Consumption withCardiometabolic Risk Factors in the 2008/2009 New Zealand Adult Nutrition Survey. Nutrients 2015, 7, 7523–7542. [CrossRef]
14. Carter, P.; Gray, L.J.; Talbot, D.; Morris, D.H.; Khunti, K.; Davies, M.J. Fruit and vegetable intake and the association with glucoseparameters: A cross-sectional analysis of the Let’s Prevent Diabetes Study. Eur. J. Clin. Nutr. 2013, 67, 12–17. [CrossRef] [PubMed]
15. Fisk, P.S., II; Middaugh, A.L.; Rhee, Y.S.; Brunt, A.R. Few favorable associations between fruit and vegetable intake and biomarkersfor chronic disease risk in American adults. Nutr. Res. 2011, 31, 616–624. [CrossRef] [PubMed]
16. Toumpanakis, A.; Turnbull, T.; Alba-Barba, I. Effectiveness of plant-based diets in promoting well-being in the management oftype 2 diabetes: A systematic review. BMJ Open Diabetes Res. Care 2018, 6, e000534. [CrossRef] [PubMed]
17. Yokoyama, Y.; Barnard, N.D.; Levin, S.M.; Watanabe, M. Vegetarian diets and glycemic control in diabetes: A systematic reviewand meta-analysis. Cardiovasc. Diagn. Ther. 2014, 4, 373–382. [CrossRef]
18. Fogelholm, M.; Larsen, T.M.; Westerterp-Plantenga, M.; Macdonald, I.; Martinez, J.A.; Boyadjieva, N.; Poppitt, S.; Schlicht, W.;Stratton, G.; Sundvall, J.; et al. PREVIEW: Prevention of diabetes through lifestyle intervention and population studies in Europeand around the world. design, methods, and baseline participant description of an adult cohort enrolled into a three-yearrandomised clinical trial. Nutrients 2017, 9, 632. [CrossRef]
19. Christensen, P.; Meinert Larsen, T.; Westerterp-Plantenga, M.; Macdonald, I.; Martinez, J.A.; Handjiev, S.; Poppitt, S.; Hansen, S.;Ritz, C.; Astrup, A.; et al. Men and women respond differently to rapid weight loss: Metabolic outcomes of a multi-centreintervention study after a low-energy diet in 2500 overweight, individuals with pre-diabetes (PREVIEW). Diabetes Obes. Metab.2018, 20, 2840–2851. [CrossRef]
20. Raben, A.; Vestentoft, P.S.; Brand-Miller, J.; Jalo, E.; Drummen, M.; Simpson, L.; Martinez, J.; Handjieva-Darlenska, T.; Stratton, G.;Huttunen-Lenz, M.; et al. PREVIEW-Results from a 3-year randomised 2 x 2 factorial multinational trial investigating the role ofprotein, glycemic index and physical activity for prevention of type-2 diabetes. Diabetes Obes. Metab. 2020, 23, 324–337. [CrossRef]
28

Nutrients 2021, 13, 3916
21. Kahlert, D.; Unyi-Reicherz, A.; Stratton, G.; Meinert Larsen, T.; Fogelholm, M.; Raben, A.; Schlicht, W. PREVIEW behaviormodification intervention toolbox (PREMIT): A study protocol for a psychological element of a multicenter project. Front. Psychol.2016, 7, 1136. [CrossRef]
22. American Diabetes Association. 2. Classification and Diagnosis of Diabetes. Diabetes Care 2017, 40, S11–S24. [CrossRef] [PubMed]23. National Health and Medical Research Council. Australian Dietary Guidelines; National Health and Medical Research Council:
Canberra, Australia, 2013.24. Satija, A.; Bhupathiraju, S.N.; Rimm, E.B.; Spiegelman, D.; Chiuve, S.E.; Borgi, L.; Willett, W.C.; Manson, J.E.; Sun, Q.; Hu, F.B.
Plant-Based Dietary Patterns and Incidence of Type 2 Diabetes in US Men and Women: Results from Three Prospective CohortStudies. PLoS Med. 2016, 13, e1002039. [CrossRef] [PubMed]
25. Wallace, T.M.; Levy, J.C.; Matthews, D.R. Use and abuse of HOMA modeling. Diabetes Care 2004, 27, 1487–1495. [CrossRef][PubMed]
26. He, F.J.; Tan, M.; Ma, Y.; MacGregor, G.A. Salt Reduction to Prevent Hypertension and Cardiovascular Disease: JACC State-of-the-Art Review. J. Am. Coll. Cardiol 2020, 75, 632–647. [CrossRef]
27. Satija, A.; Bhupathiraju, S.N.; Spiegelman, D.; Chiuve, S.E.; Manson, J.E.; Willett, W.; Rexrode, K.M.; Rimm, E.B.; Hu, F.B.Healthful and Unhealthful Plant-Based Diets and the Risk of Coronary Heart Disease in U.S. Adults. J. Am. Coll. Cardiol. 2017, 70,411–422. [CrossRef]
28. Peters, S.A.; Bots, M.L.; den Ruijter, H.M.; Palmer, M.K.; Grobbee, D.E.; Crouse III, J.R.; O’Leary, D.H.; Evans, G.W.; Raichlen, J.S.;Moons, K.G. Multiple imputation of missing repeated outcome measurements did not add to linear mixed-effects models. J. Clin.Epidemiol. 2012, 65, 686–695. [CrossRef]
29. Twisk, J.; de Boer, M.; de Vente, W.; Heymans, M. Multiple imputation of missing values was not necessary before performing alongitudinal mixed-model analysis. J. Clin. Epidemiol. 2013, 66, 1022–1028. [CrossRef]
30. Wang, F.; Zheng, J.; Yang, B.; Jiang, J.; Fu, Y.; Li, D. Effects of Vegetarian Diets on Blood Lipids: A Systematic Review andMeta-Analysis of Randomized Controlled Trials. J. Am. Heart Assoc. 2015, 4, e002408. [CrossRef]
31. Satija, A.; Malik, V.; Rimm, E.B.; Sacks, F.; Willett, W.; Hu, F.B. Changes in intake of plant-based diets and weight change: Resultsfrom 3 prospective cohort studies. Am. J. Clin. Nutr. 2019, 110, 574–582. [CrossRef]
32. Chen, Z.; Drouin-Chartier, J.P.; Li, Y.; Baden, M.Y.; Manson, J.E.; Willett, W.C.; Voortman, T.; Hu, F.B.; Bhupathiraju, S.N. Changesin Plant-Based Diet Indices and Subsequent Risk of Type 2 Diabetes in Women and Men: Three U.S. Prospective Cohorts. DiabetesCare 2021, 44, 663–671. [CrossRef]
33. Glenn, A.J.; Lo, K.; Jenkins, D.J.A.; Boucher, B.A.; Hanley, A.J.; Kendall, C.W.C.; Manson, J.E.; Vitolins, M.Z.; Snetselaar, L.G.;Liu, S.; et al. Relationship Between a Plant-Based Dietary Portfolio and Risk of Cardiovascular Disease: Findings From theWomen’s Health Initiative Prospective Cohort Study. J. Am. Heart Assoc. 2021, 10, e021515. [CrossRef]
34. Zhu, R.; Larsen, T.M.; Fogelholm, M.; Poppitt, S.; Vestentoft, P.S.; Silvestre, M.P.; Jalo, E. Dose-dependent associations of dietaryglycemic index, glycemic load and fiber with 3-year weight-loss maintenance and glycemic status in a high-risk population:A secondary analysis of the PREVIEW diabetes prevention study. Diabetes Care 2021, 44, 1672–1681. [CrossRef]
35. Schlesinger, S.; Neuenschwander, M.; Schwedhelm, C.; Hoffmann, G.; Bechthold, A.; Boeing, H.; Schwingshackl, L. Food Groupsand Risk of Overweight, Obesity, and Weight Gain: A Systematic Review and Dose-Response Meta-Analysis of ProspectiveStudies. Adv. Nutr. 2019, 10, 205–218. [CrossRef]
36. Li, H.; Li, X.; Yuan, S.; Jin, Y.; Lu, J. Nut consumption and risk of metabolic syndrome and overweight/obesity: A meta-analysisof prospective cohort studies and randomized trials. Nutr. Metab. 2018, 15, 46. [CrossRef]
37. Eslami, O.; Shidfar, F.; Dehnad, A. Inverse association of long-term nut consumption with weight gain and risk of over-weight/obesity: A systematic review. Nutr. Res. 2019, 68, 1–8. [CrossRef]
38. Tindall, A.M.; Johnston, E.A.; Kris-Etherton, P.M.; Petersen, K.S. The effect of nuts on markers of glycemic control: A systematicreview and meta-analysis of randomized controlled trials. Am. J. Clin. Nutr. 2019, 109, 297–314. [CrossRef]
39. Ibarrola-Jurado, N.; Bulló, M.; Guasch-Ferré, M.; Ros, E.; Martínez-González, M.A.; Corella, D.; Fiol, M.; Wärnberg, J.; Estruch,R.; Román, P. Cross-sectional assessment of nut consumption and obesity, metabolic syndrome and other cardiometabolic riskfactors: The PREDIMED study. PLoS ONE 2013, 8, e57367. [CrossRef] [PubMed]
40. McEvoy, C.T.; Wallace, I.R.; Hamill, L.L.; Hunter, S.J.; Neville, C.E.; Patterson, C.C.; Woodside, J.V.; Young, I.S.; McKinley, M.C.Increasing fruit and vegetable intake has no dose-response effect on conventional cardiovascular risk factors in overweight adultsat high risk of developing cardiovascular disease. J. Nutr. 2015, 145, 1464–1471. [CrossRef] [PubMed]
41. Marshall, S.; Petocz, P.; Duve, E.; Abbott, K.; Cassettari, T.; Blumfield, M.; Fayet-Moore, F. The Effect of Replacing Refined Grainswith Whole Grains on Cardiovascular Risk Factors: A Systematic Review and Meta-Analysis of Randomized Controlled Trialswith GRADE Clinical Recommendation. J. Acad. Nutr. Diet. 2020, 120, 1859–1883.E31. [CrossRef] [PubMed]
42. Tieri, M.; Ghelfi, F.; Vitale, M.; Vetrani, C.; Marventano, S.; Lafranconi, A.; Godos, J.; Titta, L.; Gambera, A.; Alonzo, E.; et al.Whole grain consumption and human health: An umbArella review of observational studies. Int. J. Food Sci. Nutr. 2020, 71,668–677. [CrossRef]
43. Reynolds, A.; Mann, J.; Cummings, J.; Winter, N.; Mete, E.; Te Morenga, L. Carbohydrate quality and human health: A series ofsystematic reviews and meta-analyses. Lancet 2019, 393, 434–445. [CrossRef]
29
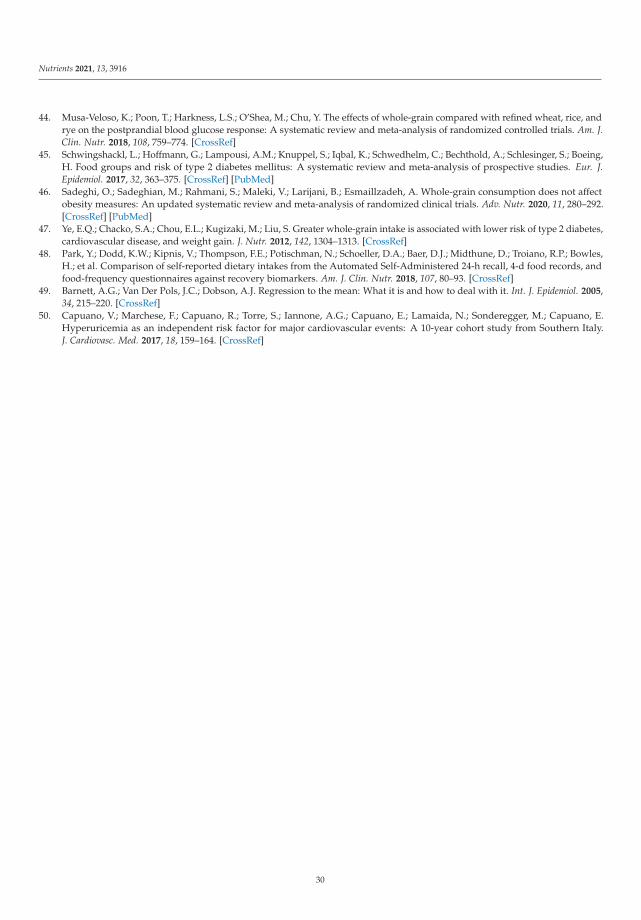
Nutrients 2021, 13, 3916
44. Musa-Veloso, K.; Poon, T.; Harkness, L.S.; O’Shea, M.; Chu, Y. The effects of whole-grain compared with refined wheat, rice, andrye on the postprandial blood glucose response: A systematic review and meta-analysis of randomized controlled trials. Am. J.Clin. Nutr. 2018, 108, 759–774. [CrossRef]
45. Schwingshackl, L.; Hoffmann, G.; Lampousi, A.M.; Knuppel, S.; Iqbal, K.; Schwedhelm, C.; Bechthold, A.; Schlesinger, S.; Boeing,H. Food groups and risk of type 2 diabetes mellitus: A systematic review and meta-analysis of prospective studies. Eur. J.Epidemiol. 2017, 32, 363–375. [CrossRef] [PubMed]
46. Sadeghi, O.; Sadeghian, M.; Rahmani, S.; Maleki, V.; Larijani, B.; Esmaillzadeh, A. Whole-grain consumption does not affectobesity measures: An updated systematic review and meta-analysis of randomized clinical trials. Adv. Nutr. 2020, 11, 280–292.[CrossRef] [PubMed]
47. Ye, E.Q.; Chacko, S.A.; Chou, E.L.; Kugizaki, M.; Liu, S. Greater whole-grain intake is associated with lower risk of type 2 diabetes,cardiovascular disease, and weight gain. J. Nutr. 2012, 142, 1304–1313. [CrossRef]
48. Park, Y.; Dodd, K.W.; Kipnis, V.; Thompson, F.E.; Potischman, N.; Schoeller, D.A.; Baer, D.J.; Midthune, D.; Troiano, R.P.; Bowles,H.; et al. Comparison of self-reported dietary intakes from the Automated Self-Administered 24-h recall, 4-d food records, andfood-frequency questionnaires against recovery biomarkers. Am. J. Clin. Nutr. 2018, 107, 80–93. [CrossRef]
49. Barnett, A.G.; Van Der Pols, J.C.; Dobson, A.J. Regression to the mean: What it is and how to deal with it. Int. J. Epidemiol. 2005,34, 215–220. [CrossRef]
50. Capuano, V.; Marchese, F.; Capuano, R.; Torre, S.; Iannone, A.G.; Capuano, E.; Lamaida, N.; Sonderegger, M.; Capuano, E.Hyperuricemia as an independent risk factor for major cardiovascular events: A 10-year cohort study from Southern Italy.J. Cardiovasc. Med. 2017, 18, 159–164. [CrossRef]
30
nutrients
Article
Milk Intake and Stroke Mortality in the JapanCollaborative Cohort Study—A BayesianSurvival Analysis
Chaochen Wang 1,*, Hiroshi Yatsuya 2, Yingsong Lin 1, Tae Sasakabe 1, Sayo Kawai 1, Shogo
Kikuchi 1, Hiroyasu Iso 3 and Akiko Tamakoshi 4
1 Department of Public Health, Aichi Medical University School of Medicine, 480-1195 Aichi, Japan;[email protected] (Y.L.); [email protected] (T.S.); [email protected] (S.K.);[email protected] (S.K.)
2 Department of Public Health, Fujita Health University School of Medicine, Toyoake 470-1192, Japan;[email protected]
3 Public Health, Department of Social Medicine, Osaka University Graduate School of Medicine,Osaka 565-0871, Japan; [email protected]
4 Department of Public Health, Hokkaido University, Faculty of Medicine, Sapporo 002-8501, Japan;[email protected]
* Correspondence: [email protected]; Tel.: +81-561-62-3311
Received: 1 August 2020; Accepted: 3 September 2020; Published: 9 September 2020
Abstract: The aim of this study was to further examine the relationship between milk intake andstroke mortality among the Japanese population. We used data from the Japan Collaborative Cohort(JACC) Study (total number of participants = 110,585, age range: 40–79) to estimate the posterioracceleration factors (AF) as well as the hazard ratios (HR) comparing individuals with different milkintake frequencies against those who never consumed milk at the study baseline. These estimationswere computed through a series of Bayesian survival models that employed a Markov Chain MonteCarlo simulation process. In total, 100,000 posterior samples were generated separately through fourindependent chains after model convergency was confirmed. Posterior probabilites that daily milkconsumers had lower hazard or delayed mortality from strokes compared to non-consumers was99.0% and 78.0% for men and women, respectively. Accordingly, the estimated posterior means of AFand HR for daily milk consumers were 0.88 (95% Credible Interval, CrI: 0.81, 0.96) and 0.80 (95% CrI:0.69, 0.93) for men and 0.97 (95% CrI: 0.88, 1.10) and 0.95 (95% CrI: 0.80, 1.17) for women. In conclusion,data from the JACC study provided strong evidence that daily milk intake among Japanese men wasassociated with delayed and lower risk of mortality from stroke especially cerebral infarction.
Keywords: milk intake; mortality; stroke; Bayesian survival anlysis; time-to-event data; JACC study
1. Introduction
Eastern Asian populations were reported to have a higher burden from both mortality andmorbidity from stroke than populations in European or American regions [1]. Dairy foods, especiallymilk, have been suggested to relate with decreased stroke risk by nearly 7% for each 200 g incrementof daily consumption [2]. Although two daily servings of milk or dairy products is recommended inJapan [3], the actual per capita intake (≈63 g/day) of these food groups is much lower and less frequentthan that in Western countries [4]. Given that previous reports have also indicated no significant [5–7]or even positive associations [8], it would be of interest to provide information on the associationwithin a context where most individuals have much lower range of milk intake compared to mostof the previous studies. Whether people with such a low level intake of milk can still benefit againststroke would requires elucidation.
Nutrients 2020, 12, 2743; doi:10.3390/nu12092743 www.mdpi.com/journal/nutrients
31

Nutrients 2020, 12, 2743
Moreover, a more intuitive or straightforward interpretation would be available if we wereable to show the probabilities and the certainty that the existing data can provide evidence aboutwhether drinking milk can delay or lower the hazard of dying from stroke. This would require thetransformation of the research question into “Do individuals with milk intake habit have lower hazardof dying from a stroke event?” Another way of asking the same research question would be “Can anevent of dying from stroke be postponed by forming a milk intake habit?” The later question directlycompares the length of times before events or the speed from the same departure point (entry of thestudy) to a fatal stroke event. Accelerated failure time (AFT) models under the Bayesian frameworkare convenient tools that would help to avoid worrying about the assumptions of repeatability of alarge scale prospective study, and can calculate the exact proportion of posterior estimates (hazardratios, HR) that are lower than 1. AFT model is helpful in estimating acceleration factors (AF) whichcan be interpreted as the velocity for developing an event of interest. This velocity parameter showshow faster/slower individuals in one exposure group might have an event compared to others indifferent exposure groups [9,10].
Our aim was to provide a more straightforward answer to the primary research question that,whether someone answering that he/she drank milk at the baseline of study, had lower hazard of dyingfrom stroke compared with his/her counterparts who said they never consumed milk. If the answerto the primary objective was yes, then the probabilities that individuals with different frequenciesof milk intake may have lower risk compared with those who never drank milk were calculatedthrough a Markov Chain Monte Carlo (MCMC) simulation process. A Bayesian survival analysismethod was applied on an existing database and through which we provided estimates about whetherdrinking milk could delay a stroke mortality event from happening after controlling for the otherpotential confounders.
2. Materials and Methods
2.1. The Database
We used data from the Japan Collaborative Cohort (JACC) study, which was sponsored by theMinistry of Education, Sports, Science, and Technology of Japan. Sampling methods and details aboutthe JACC study have been described extensively in the literature [11–13]. Participants in the JACCstudy completed self-administered questionnaires about their lifestyles, food intake (food frequencyquestionnaire, FFQ), and medical histories of cardiovascular disease or cancer. In the final follow-upof the JACC study, data from a total of 110,585 individuals (46,395 men and 64,190 women) who,aged between 40–79 at the baseline, were successfully retained for the current analysis. We furtherexcluded samples if they met one of the following criteria: (1) with any disease history of stroke, cancer,myocardial infarction, ischemic heart disease, or other types heart disease (n = 6655, 2931 men and3724 women); (2) did not answer the question regarding their milk consumption in the baseline FFQsurvey (n = 9545, 3593 men and 5952 women). Finally, 94,385 (39,386 men and 54,999 women) wereleft in the database. The study design and informed consent procedure were approved by the EthicsReview Committee of Hokkaido University School of Medicine.
2.2. Exposure and the Outcome of Interest
Frequency of milk intake during the preceding year of the baseline was assessed by FFQ as“never”, “1–2 times/month”, “1–2 times/week”, “3–4 times/week”, and “Almost daily”. The exactamount of milk consumption was difficult to assess here. However, good reproducibility and validitywere confirmed previously (Spearman rank correlation coefficient between milk intake frequency andweighed dietary record for 12 days was 0.65) [14]. From the same validation study [14] on the FFQ,daily consumers of milk were found to have a median intake of 146 g. At the baseline of the JACCstudy (between 1988 and 1990), most “milk and dairy product” consumption (92.1%) was in the formof whole milk [15].
32

Nutrients 2020, 12, 2743
In the study area, investigators conducted a systematic review of death certificates till the endof 2009. Date and cause of death were confirmed with the permission of the Director-General of thePrime Minister’s Office. The follow-up period was defined as from the time the baseline survey wascompleted, which was between 1988–1990, until the end of 2009 (administrative censor), the date whenthey moved out of the study area, or the date of death from stroke was recorded—whichever occurredfirst. Other causes of death were treated as censored and assumed not informative. The causes ofdeath were coded by the 10th Revision of the International Statistical Classification of Diseases andRelated Health Problems (ICD-10); therefore, stroke was defined as I60–I69. We further classified thesedeaths into hemorrhagic stroke (I60, I61 and I62) or cerebral infarction (I63) when subtypes of stroke intheir death certificates were available.
2.3. Statistical Approach
Analyses were stratified by sex as difference in milk consumption levels and mortality rate weresuggested previously [16,17]. We calculated sex-specific means (standard deviation, SD) and proportionof selected baseline characteristics according to the frequency of milk intake. Age-adjusted strokemortality rate were expressed as per 1000 person-year, predicted through poisson regression models.
Full parametric proportional hazard models under Bayesian framework with Weibull distributionwere fitted using Just Another Gibbs Sampler (JAGS) program [18], version 4.3.0 in R, version 4.0.1 [19].JAGS program is similar to the OpenBUGS [20] project that uses a Gibbs sampling engine for MCMCsimulation. In the current analysis, we specified non-informative prior distributions for each of theparameters in our models (βn ∼ N(0, 1000), and κshape ∼ Γ(0.001, 0.001)). The Brooks–Gelman–Rubindiagnostic [21] was used to refine the approximate point of convergence, the point when the ratioof the chains is stable around 1 and the within and between chain variability start to reach stability,was visually checked. The auto-correlation tool further identified if convergence has been achievedor if a high degree of auto-correlation exists in the sample. Then, the number of iterations discardedas “burn-in” was chosen. All models had a posterior sample size of 100,000 from four separatedchains with a “burn-in” of 2500 iterations. Posterior means (SD) and 95% Credible Intervals (CrI)of the estimated hazard ratios (HRs), as well as acceleration factors (AFs), were presented for eachcategory of milk intake frequency taking the “never” category as the reference. Posterior probabilitiesthat the estimated hazard of dying from stroke for the milk intake for frequency that higher or equalto “1–2 times/month” were smaller compared with those who chose “never” for their milk intakefrequency, and were calculated as Pr(HR < 1).
The parametric forms of the models fitted in the Bayesian survival analyses included threemodels: (1) the crude model, (2) the age-centered adjusted model, (3) and a model further adjustedfor potential confounders which includes: age (centered, continuous), smoking habit (never, current,former), alcohol intake (never or past, <4 times/week, Daily), body mass index (<18.5, ≥18.5 and <25,≥25 and <30, ≥30 kg/m2), history of hypertension, diabetes, kidney/liver diseases (yes/no), exercise(more than 1 h/week, yes/no), sleep duration (<7, ≥7 and <8, ≥8 and <9, ≥9, hours), quartilesof total energy intake, coffee intake (never, <3–4 times/week, almost daily), and education level(attended school till age 18, yes/no).
3. Results
The total follow-up was 1,555,073 person-year (median = 19.3 years), during which 2675 deathsfrom stroke were confirmed (1352 men and 1323 women). Among these stroke mortalities, 952 werehemorrhagic stroke (432 men and 520 women), and 957 were cerebral infarction (520 men and437 women). The number of deaths from causes other than stroke was 18,868 (10,731 men and8137 women); 5493 (2022 men and 3471 women) dropped out from the follow-up (5.8%); 67,349(25,281 men and 42,068 women) were censored at the end of follow-up (71.4%). The medians(interquartile range, IQR) of follow-up years for hemorrhagic stroke mortality were 9.9 (5.4, 12.3)in men and 10.9 (5.9, 15.1) in women; the medians (IQR) of follow-up years for cerebral infarction
33

Nutrients 2020, 12, 2743
mortality were 11.2 (7.1, 15.3) and 11.8 (7.9, 16.4) in men and women, respectively. Age-adjusted strokemortality rates for each category of milk intake frequency was estimated to be 1.8, 2.0, 1.7, 1.6, an 1.5per 1000 person-year for men and 1.3, 1.4, 1.2, 1.1, and 1.2 per 1000 person-year for women.
As listed in Table 1, compared with those who chose “never” as their milk intake frequency atbaseline, milk drinkers were less likely to be a current smoker or a daily alcohol consumer in both menand women. Furthermore, people who consumed milk more than 1–2 times/month were more likelyto be a daily consumers of vegetables and fruit, as well as coffee, and were more likely to performexercise more than 1 h/week among both sexes.
Table 1. Sex-specific baseline characteristics according to the frequency of milk intake (JACC study,1988–2009).
Milk Drinkers
Never Drinkers 1–2 Times/ 1–2 Times/ 3–4 Times/ AlmostMonth Week Week Daily
Men (n = 39,386)Number of subjects 8508 30,878 3522 5928 5563 15,865Age, year (mean (SD)) 56.8 (9.9) 56.8 (10.2) 55.2 (10.1) 55.4 (10.1) 55.4 (9.9) 58.1 (10.1)Current smoker, % 58.7 49.8 57.4 55.9 51.1 45.4Daily alcohol drinker, % 51.9 47.8 50.9 48.4 48.6 46.5BMI, kg/m2 (mean (SD)) 22.6 (3.4) 22.7 (3.4) 22.8 (2.8) 22.8 (2.8) 22.9 (5.4) 22.6 (2.8)Exercise (>1 h/week), % 19.0 27.6 26.5 25.0 25.5 29.5Sleep duration, 8–9 h, % 35.6 35.9 34.6 36.2 35.1 36.3Energy intake, kcal/day (mean (SD)) 1611 (505) 1764 (504) 1606 (496) 1679 (495) 1772 (509) 1830 (495)Vegetable intake, daily, % 21.3 25.4 20.1 20.4 20.8 30.1Fruit intake, daily, % 14.8 22.4 15.4 16.3 17.3 28.1Green tea intake, daily, % 76.5 79.2 79.9 78.3 77.9 79.8Coffee intake, daily, % 43.8 50.7 50.5 48.0 47.5 52.9Educated over 18 years old, % 9.9 14.1 12.4 12.8 11.1 15.9History of diabetes, % 5.0 6.3 4.5 4.2 5.5 7.7History of hypertension, % 18.4 17.9 17.5 17.1 16.8 18.7History of kidney diseases, % 3.0 3.4 3.8 3.0 3.0 3.5History of liver diseases, % 5.8 6.5 6.3 6.0 5.4 7.2
Women (n = 54,999)number of subjects 10,407 44,592 3640 7590 8108 25,254Age, year (mean (SD)) 58.0 (10.2) 56.9 (9.9) 56.5 (10.2) 55.6 (10.1) 55.6 (9.9) 57.9 (9.9)Current smoker, % 6.9 4.2 6.1 5.5 4.3 3.5Daily alcohol drinker, % 4.3 4.5 5.5 4.3 4.2 4.6BMI, kg/m2 (mean (SD)) 23.0 (3.4) 22.9 (3.7) 23.0 (3.8) 23.1 (4.4) 23.1 (3.1) 22.8 (3.6)Exercise (>1 h/week), % 13.6 20.8 17.1 18.5 18.8 22.6Sleep duration, 8–9 h, % 27.7 25.6 25.1 25.9 25.4 25.7Energy intake, kcal/day (mean (SD)) 1519 (451) 1690 (449) 1522 (447) 1596 (443) 1661 (432) 1752 (443)Vegetable intake, daily, % 24.7 30.4 25.0 24.6 24.2 34.8Fruit intake, daily, % 25.0 35.7 26.6 29.2 29.2 41.1Green tea intake, daily, % 73.8 76.8 77.0 76.4 75.8 77.3Coffee intake, daily, % 39.6 48.2 46.2 46.4 44.4 50.2Educated over 18 years old, % 4.8 8.3 6.7 7.2 6.5 9.4History of diabetes, % 2.6 3.7 3.2 2.7 2.7 4.4History of hypertension, % 21.5 19.7 20.5 19.1 18.9 20.0History of kidney diseases, % 3.6 4.1 3.9 3.7 3.7 4.4History of liver diseases, % 3.5 4.6 4.9 3.9 3.9 5.0
Note: Abbreviations: JACC: Japan Collaborative Cohort; SD: standard deviation; BMI: body mass index.
Detailed results from the Bayesian survival models (crude, age-adjusted and multivariable-adjusted) according to the frequency of milk intake separated by sex are listed in Table 2 (men) andTable 3 (women). Compared to those who never had milk, both men and women had slower speedand lower hazard of dying from total stroke in crude models. Velocities that milk consumers dyingfrom stroke were slowed down by a crude acceleration factor (AF) between 0.79 (SD = 0.05; 95% CrI:0.74, 0.90) and 0.93 (SD = 0.04; 95% CrI: 0.85, 1.02) compared with non-consumers. Chances that theposterior crude HRs were estimated to be lower than 1 for those who had at least 1–2 times/monthwas higher than 86.5% in men and greater than 94.6% in women. However, lower hazard and delayedtime-to-event was observed to remain after age or multivariable adjustment only among daily male
34
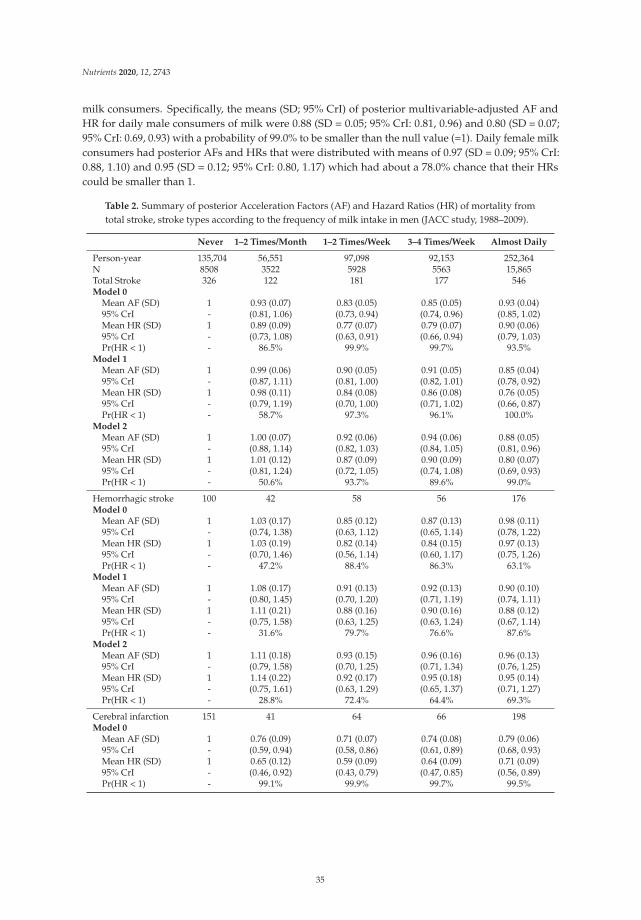
Nutrients 2020, 12, 2743
milk consumers. Specifically, the means (SD; 95% CrI) of posterior multivariable-adjusted AF andHR for daily male consumers of milk were 0.88 (SD = 0.05; 95% CrI: 0.81, 0.96) and 0.80 (SD = 0.07;95% CrI: 0.69, 0.93) with a probability of 99.0% to be smaller than the null value (=1). Daily female milkconsumers had posterior AFs and HRs that were distributed with means of 0.97 (SD = 0.09; 95% CrI:0.88, 1.10) and 0.95 (SD = 0.12; 95% CrI: 0.80, 1.17) which had about a 78.0% chance that their HRscould be smaller than 1.
Table 2. Summary of posterior Acceleration Factors (AF) and Hazard Ratios (HR) of mortality fromtotal stroke, stroke types according to the frequency of milk intake in men (JACC study, 1988–2009).
Never 1–2 Times/Month 1–2 Times/Week 3–4 Times/Week Almost Daily
Person-year 135,704 56,551 97,098 92,153 252,364N 8508 3522 5928 5563 15,865Total Stroke 326 122 181 177 546Model 0
Mean AF (SD) 1 0.93 (0.07) 0.83 (0.05) 0.85 (0.05) 0.93 (0.04)95% CrI - (0.81, 1.06) (0.73, 0.94) (0.74, 0.96) (0.85, 1.02)Mean HR (SD) 1 0.89 (0.09) 0.77 (0.07) 0.79 (0.07) 0.90 (0.06)95% CrI - (0.73, 1.08) (0.63, 0.91) (0.66, 0.94) (0.79, 1.03)Pr(HR < 1) - 86.5% 99.9% 99.7% 93.5%
Model 1Mean AF (SD) 1 0.99 (0.06) 0.90 (0.05) 0.91 (0.05) 0.85 (0.04)95% CrI - (0.87, 1.11) (0.81, 1.00) (0.82, 1.01) (0.78, 0.92)Mean HR (SD) 1 0.98 (0.11) 0.84 (0.08) 0.86 (0.08) 0.76 (0.05)95% CrI - (0.79, 1.19) (0.70, 1.00) (0.71, 1.02) (0.66, 0.87)Pr(HR < 1) - 58.7% 97.3% 96.1% 100.0%
Model 2Mean AF (SD) 1 1.00 (0.07) 0.92 (0.06) 0.94 (0.06) 0.88 (0.05)95% CrI - (0.88, 1.14) (0.82, 1.03) (0.84, 1.05) (0.81, 0.96)Mean HR (SD) 1 1.01 (0.12) 0.87 (0.09) 0.90 (0.09) 0.80 (0.07)95% CrI - (0.81, 1.24) (0.72, 1.05) (0.74, 1.08) (0.69, 0.93)Pr(HR < 1) - 50.6% 93.7% 89.6% 99.0%
Hemorrhagic stroke 100 42 58 56 176Model 0
Mean AF (SD) 1 1.03 (0.17) 0.85 (0.12) 0.87 (0.13) 0.98 (0.11)95% CrI - (0.74, 1.38) (0.63, 1.12) (0.65, 1.14) (0.78, 1.22)Mean HR (SD) 1 1.03 (0.19) 0.82 (0.14) 0.84 (0.15) 0.97 (0.13)95% CrI - (0.70, 1.46) (0.56, 1.14) (0.60, 1.17) (0.75, 1.26)Pr(HR < 1) - 47.2% 88.4% 86.3% 63.1%
Model 1Mean AF (SD) 1 1.08 (0.17) 0.91 (0.13) 0.92 (0.13) 0.90 (0.10)95% CrI - (0.80, 1.45) (0.70, 1.20) (0.71, 1.19) (0.74, 1.11)Mean HR (SD) 1 1.11 (0.21) 0.88 (0.16) 0.90 (0.16) 0.88 (0.12)95% CrI - (0.75, 1.58) (0.63, 1.25) (0.63, 1.24) (0.67, 1.14)Pr(HR < 1) - 31.6% 79.7% 76.6% 87.6%
Model 2Mean AF (SD) 1 1.11 (0.18) 0.93 (0.15) 0.96 (0.16) 0.96 (0.13)95% CrI - (0.79, 1.58) (0.70, 1.25) (0.71, 1.34) (0.76, 1.25)Mean HR (SD) 1 1.14 (0.22) 0.92 (0.17) 0.95 (0.18) 0.95 (0.14)95% CrI - (0.75, 1.61) (0.63, 1.29) (0.65, 1.37) (0.71, 1.27)Pr(HR < 1) - 28.8% 72.4% 64.4% 69.3%
Cerebral infarction 151 41 64 66 198Model 0
Mean AF (SD) 1 0.76 (0.09) 0.71 (0.07) 0.74 (0.08) 0.79 (0.06)95% CrI - (0.59, 0.94) (0.58, 0.86) (0.61, 0.89) (0.68, 0.93)Mean HR (SD) 1 0.65 (0.12) 0.59 (0.09) 0.64 (0.09) 0.71 (0.09)95% CrI - (0.46, 0.92) (0.43, 0.79) (0.47, 0.85) (0.56, 0.89)Pr(HR < 1) - 99.1% 99.9% 99.7% 99.5%
35

Nutrients 2020, 12, 2743
Table 2. Cont.
Never 1–2 Times/Month 1–2 Times/Week 3–4 Times/Week Almost Daily
Model 1Mean AF (SD) 1 0.83 (0.08) 0.79 (0.07) 0.82 (0.07) 0.74 (0.05)95% CrI - (0.68, 1.01) (0.67, 0.93) (0.69, 0.96) (0.66, 0.84)Mean HR (SD) 1 0.73 (0.13) 0.65 (0.10) 0.70 (0.11) 0.58 (0.07)95% CrI - (0.49, 1.02) (0.48, 0.88) (0.51, 0.94) (0.46, 0.72)Pr(HR < 1) - 96.9% 99.8% 98.9% 100.0%
Model 2Mean AF (SD) 1 0.84 (0.09) 0.80 (0.08) 0.83 (0.08) 0.75 (0.06)95% CrI - (0.67, 1.02) (0.67, 0.95) (0.69, 0.99) (0.66, 0.85)Mean HR (SD) 1 0.73 (0.14) 0.67 (0.11) 0.72 (0.12) 0.61 (0.08)95% CrI - (0.50, 1.04) (0.48, 0.91) (0.52, 0.99) (0.48, 0.79)Pr(HR < 1) - 96.1% 99.1% 97.5% 99.8%
Note: Abbreviations: N, number of subjects,; SD, standard deviation; CrI, credible interval. Pr(HR < 1)indicates the probability for posterior HR to be smaller than 1. Model 0 = Crude model; Model 1 = age-adjustedmodel; Model 2 = multivariable adjusted model. Covariates included in Model 2: age, smoking habit, alcoholintake, body mass index, history of hypertension, diabetes, kidney/liver diseases, exercise, sleep duration,quartiles of total energy intake, coffee intake, and education level.
Table 3. Summary of posterior Acceleration Factors (AF) and Hazard Ratios (HR) of mortality from totalstroke and stroke types according to the frequency of milk intake in women (JACC study, 1988–2009).
Never 1–2 Times/Month 1–2 Times/Week 3–4 Times/Week Almost Daily
Person-year 173,222 59,904 129,233 139,919 418,925N 10,407 3640 7590 8108 25,254Total Stroke 300 84 182 172 585Model 0
Mean AF (SD) 1 0.88 (0.07) 0.87 (0.05) 0.79 (0.05) 0.88 (0.04)95% CrI - (0.75, 1.03) (0.78, 0.98) (0.71, 0.90) (0.80, 0.96)Mean HR (SD) 1 0.83 (0.10) 0.81 (0.08) 0.70 (0.07) 0.81 (0.07)95% CrI - (0.64, 1.05) (0.68, 0.97) (0.58, 0.85) (0.71, 0.93)Pr(HR < 1) - 94.6% 98.7% 99.9% 99.6%
Model 1Mean AF (SD) 1 0.99 (0.09) 1.11 (0.08) 1.02 (0.08) 0.95 (0.06)95% CrI - (0.85, 1.17) (0.97, 1.26) (0.89, 1.16) (0.86, 1.06)Mean HR (SD) 1 1.00 (0.14) 1.18 (0.14) 1.03 (0.12) 0.92 (0.09)95% CrI - (0.76, 1.31) (0.95, 1.47) (0.82, 1.28) (0.78, 1.09)Pr(HR < 1) - 52.3% 6.3% 42.0% 86.8%
Model 2Mean AF (SD) 1 1.01 (0.12) 1.11 (0.14) 1.02 (0.12) 0.97 (0.09)95% CrI - (0.85, 1.20) (0.97, 1.30) (0.89, 1.19) (0.88, 1.10)Mean HR (SD) 1 1.01 (0.17) 1.19 (0.15) 1.03 (0.15) 0.95 (0.12)95% CrI - (0.75, 1.36) (0.96, 1.52) (0.81, 1.31) (0.80, 1.17)Pr(HR < 1) - 52.8% 6.4% 44.4% 78.0%
Hemorrhagic stroke 108 27 78 76 231Model 0
Mean AF (SD) 1 0.78 (0.13) 0.98 (0.12) 0.90 (0.11) 0.92 (0.09)95% CrI - (0.55, 1.06) (0.76, 1.25) (0.70, 1.13) (0.76, 1.12)Mean HR (SD) 1 0.73 (0.16) 0.98 (0.15) 0.87 (0.14) 0.89 (0.11)95% CrI - (0.47, 1.08) (0.71, 1.31) (0.64, 1.16) (0.71, 1.15)Pr(HR < 1) - 94.7% 58.1% 83.1% 83.0%
Model 1Mean AF (SD) 1 0.88 (0.13) 1.12 (0.13) 1.04 (0.13) 0.95 (0.09)95% CrI - (0.63, 1.17) (0.90, 1.41) (0.82, 1.32) (0.80, 1.14)Mean HR (SD) 1 0.84 (0.18) 1.17 (0.18) 1.06 (0.17) 0.93 (0.12)95% CrI - (0.54, 1.24) (0.86, 1.58) (0.76, 1.45) (0.73, 1.19)Pr(HR < 1) - 81.6% 16.9% 38.9% 74.6%
36

Nutrients 2020, 12, 2743
Table 3. Cont.
Never 1–2 Times/Month 1–2 Times/Week 3–4 Times/Week Almost Daily
Model 2Mean AF (SD) 1 0.93 (0.24) 1.23 (0.38) 1.14 (0.33) 1.04 (0.25)95% CrI - (0.64, 1.33) (0.93, 1.98) (0.87, 1.83) (0.83, 1.55)Mean HR (SD) 1 0.89 (0.22) 1.26 (0.26) 1.15 (0.23) 1.02 (0.19)95% CrI - (0.55, 1.39) (0.90, 1.90) (0.83, 1.74) (0.78, 1.51)Pr(HR < 1) - 73.2% 9.5% 24.8% 53.3%
Cerebral infarction 102 35 63 50 187Model 0
Mean AF (SD) 1 1.01 (0.13) 0.90 (0.09) 0.75 (0.08) 0.86 (0.06)95% CrI - (0.79, 1.27) (0.75, 1.10) (0.60, 0.91) (0.75, 0.99)Mean HR (SD) 1 1.03 (0.20) 0.85 (0.14) 0.61 (0.11) 0.78 (0.10)95% CrI - (0.69, 1.48) (0.60, 1.13) (0.43, 0.84) (0.59, 0.99)Pr(HR < 1) - 51.9% 75.6% 97.6% 96.1%
Model 1Mean AF (SD) 1 1.21 (0.32) 1.16 (0.30) 0.98 (0.19) 0.97 (0.14)95% CrI - (0.95, 2.08) (0.93, 1.95) (0.79, 1.48) (0.84, 1.43)Mean HR (SD) 1 1.37 (0.33) 1.25 (0.28) 0.94 (0.22) 0.92 (0.17)95% CrI - (0.89, 2.18) (0.87, 1.95) (0.63, 1.52) (0.69, 1.40)Pr(HR < 1) - 8.5% 14.2% 70.1% 79.4%
Model 2Mean AF (SD) 1 1.19 (0.19) 1.12 (0.15) 0.96 (0.12) 0.97 (0.09)95% CrI - (0.94, 1.62) (0.92, 1.49) (0.78, 1.21) (0.83, 1.18)Mean HR (SD) 1 1.38 (0.29) 1.21 (0.22) 0.91 (0.18) 0.94 (0.14)95% CrI - (0.89, 2.02) (0.85, 1.70) (0.62, 1.34) (0.69, 1.25)Pr(HR < 1) - 7.3% 15.6% 72.8% 70.0%
Note: Abbreviations: N, number of subjects; SD, standard deviation; CrI, credible interval. Pr(HR < 1) indicatesthe probability for posterior HR to be smaller than 1. Model 0 = Crude model; Model 1 = age-adjusted model;Model 2 = multivariable adjusted model. Covariates included in Model 2: age, smoking habit, alcohol intake,body mass index, history of hypertension, diabetes, kidney/liver diseases, exercise, sleep duration, quartilesof total energy intake, coffee intake, and education level.
Posterior distributions of AFs and HRs for mortality from hemorrhagic stroke were found tocontain the null value for either men or women among all fitted models. In contrast, men who a hadmilk intake frequency higher than 1–2 times/week were found to be associated with an average of17–20% slower velocity or 28–39% lower risk of dying from cerebral infarction compared to men whonever drank milk (Model 2 in Table 2). Probability that the posterior HRs distributed below the nullvalue was greater or equal to 97.5%. No evidence was found about the associations between milkintake and risk of cerebral infarction mortality among women.
4. Discussion
In the JACC study cohort, our analyses showed that men in Japan who consumed milk almostdaily had lower hazard of dying from stroke especially from cerebral infarction. Our evidence alsosuggested that stroke mortality events were delayed among Japanese male daily milk consumerscompared with non-consumers.
These findings showed similar negative effect estimates that were reported previously [16] usingdata from the same cohort, in which the outcomes of interest were focused on cardiovascular diseasesand all-cause mortality. Moreover, we have further updated the results with more comprehensive andstraightforward evidence about whether and how certain the data shown about the daily consumptionof milk were contributing to a postponed stroke (mostly cerebral infarction) mortality event amongJapanese men. A recent dose-response meta-analysis of 18 prospective cohort studies showed a similarnegative association [2] between milk consumption and risk of stroke. The same meta-analysis alsoreported a greater reduction in risk of stroke (18%) for East Asian populations in contrast with the 7%less risk in the pooled overall finding for all populations combined. Benefits of increased milk intakemight be particularly noticeable in East Asian countries where strokes are relatively more common,
37

Nutrients 2020, 12, 2743
and milk consumption is much lower than those studies conducted among European or Americanpopulations [22]. However, the Life Span Study [6], which was conducted about 10 years earlier thanthe JACC Study, reported a null association between milk intake and fatal stroke among men andwomen combined who survived the Hiroshima and Nagasaki atomic bomb. The difference couldbe largely explained by the different targeting populations between the two studies. Kondo et al. [23]also reported a null association in both men or women from the NIPPON DATA80 study. In fact,the exact number of stroke mortality events was about 85% less and the number of participants inthe NIPPON DATA80 study was about 90% less than those in the JACC study database—their nullassociation might likely due to its limited statistical power. Umesawa et al. [24] reported that dairycalcium intake was inversely associated with ischemic stroke mortality risk, which could be consideredas one of the potential pieces of evidence that supported our findings. Furthermore, a stronger inverseassociation between milk consumption and stroke mortality in men rather than in women was foundin the Singapore Chinese Health Study [17] as well. The reasons for this gender difference is currentlyunknown. This might be due to generally better/healthier lifestyles (such as much less smokers andalcohol drinkers) in women regardless of milk intake frequency, or maybe due to other factors thatwere not available in/considered by our models, such as intake of calcium or other supplements.The probably existing beneficial effect of milk intake might be less evident in women than in men.Further investigation is needed.
Possible reasons for a protective effect of milk consumption against stroke could be interpreted,as such an association might be mediated by its content in calcium, magnesium, potassium, and otherbioactive compounds, as recommended by Iacoviello et al. [25]. Apart from the inorganic mineralsin milk that would be helpful with health effects, recent studies on animal models also indicatedkey evidence that stroke-associated morbidity was delayed in stroke-prone rats who were fed withmilk-protein enriched diets [26,27]. More precisely, Singh et al. [28] found that whey protein and itscomponents—lactalbumin and lactoferrin—improved energy balance and glycemic control againstthe onset of neurological deficits associated with stroke. Bioactive peptides from milk proteins werealso responsible for the limitation of thrombosis [29] through their angiotensin convertase enzymeinhibitory potential, which might partly explain why the effect was found mainly for mortality fromcerebral infarction in the current study.
Strength and Limitations
Some limitations are worth mentioning here. First, the milk intake frequency, as well as otherlifestyle information, was collected only once at the baseline and was self-reported. Apparently,life habits are possible to alter over time and these would result in misclassification and residualconfounding. Second, despite the fact that the reasonable validity of FFQ in the JACC study cohortwas assessed and confirmed, measurement errors are inevitable. Therefore, we did not try to computethe amount of consumption by multiplying an average volume per occasion with the frequencyof intake, since the random error might be exaggerated and the observed associations may haveattenuated. Third, the Bayesian way of conducting the survival analysis using a large sample sizeis computationally expensive. However, the classic maximum likelihood estimations are based onunrealistic assumptions, such as repeatability of the study, and fixed but unknown values of parameters,which are unfulfilled in a large cohort study in the current setting. The strengths of our analysesincluded that we transformed the research questions to more transparent ones that are easier forinterpretation. Direct probabilities that daily milk intake is associated with lower hazard or delayedstroke mortality event were provided here after thorough computer simulations.
38
Nutrients 2020, 12, 2743
5. Conclusions
In conclusion, the JACC study database provided evidence that Japanese men who consumedmilk daily had a lower risk of dying from stroke, particularly cerebral infarction, compared with theircounterparts who never consumed milk. The time before an event of stroke mortality occurred wasslowed down among men who drank milk regularly.
Author Contributions: Conceived and designed the JACC study (maintaining the database, organization of thecohort project): H.I., A.T. and S.K. (Shogo Kikuchi); conceived and designed the current analysis: C.W. and H.Y.;data analysis: C.W.; manuscript (including tables) preparation: C.W.; revised the manuscript critically: H.Y., Y.L.,T.S., S.K. (Sayo Kawai), S.K. (Shogo Kikuchi), H.I., A.T. All authors have read and agreed to the published versionof the manuscript.
Funding: The funding sponsors had no role in the design of the study; in the collection, analyses, or interpretationof data; in the writing of the manuscript, or in the decision to publish the results. This study has beensupported by Grants-in-Aid for Scientific Research from the Ministry of Education, Culture, Sports, Scienceand Technology of Japan (MEXT) (MonbuKagaku-sho); Grants-in-Aid for Scientific Research on Priority Areas ofCancer; Grants-in-Aid for Scientific Research on Priority Areas of Cancer Epidemiology from MEXT (nos. 61010076,62010074, 63010074, 1010068, 2151065, 3151064, 4151063, 5151069, 6279102, 11181101, 17015022, 18014011, 20014026,20390156, 26293138); and a JSPS KAKENHI (16H06277). This research was also supported by Grants-in-Aid fromthe Ministry of Health, Labour and Welfare, Health and Labor sciences research grants, Japan (ComprehensiveResearch on Cardiovas- cular Disease and Life-Style Related Diseases: H20– Junkankitou [Seishuu]–Ippan–013;H23–Junkankitou [Seishuu]–Ippan–005); an Intramural Research Fund (22-4-5) for Cardiovascular Diseases ofthe National Cerebral and Cardiovascular Center; Comprehensive Research on Cardiovascular Diseases andLife-Style- Related Diseases (H26-Junkankitou [Seisaku]-Ippan-001) and H29–Junkankitou [Seishuu]–Ippan–003).
Acknowledgments: The authors would like to express their sincere appreciation to Kunio Aoki andYoshiyuki Ohno, Professors Emeritus at Nagoya University School of Medicine and former chairpersons ofthe JACC Study. All members of JACC Study Group can be found at https://publichealth.med.hokudai.ac.jp/jacc/index.html.
Conflicts of Interest: The authors declare no conflict of interest.
Abbreviations
The following abbreviations are used in this manuscript:
JACC Japan Collaborative CohortFFQ Food Frequency QuestionnaireMCMC Markov Chain Monte CarloJAGS Just Another Gibbs SamplersAFT accelerated failure timeHR hazard ratioAF acceleration factorSD standard deviationCrI credible interval
References
1. Kim, J.S. Stroke in Asia: A global disaster. Int. J. Stroke 2014, 9, 856–857. [CrossRef]2. De Goede, J.; Soedamah-Muthu, S.S.; Pan, A.; Gijsbers, L.; Geleijnse, J.M. Dairy consumption and risk
of stroke: A systematic review and updated dose–response meta-analysis of prospective cohort studies.J. Am. Heart Assoc. 2016, 5, e002787. [CrossRef] [PubMed]
3. Yoshiike, N.; Hayashi, F.; Takemi, Y.; Mizoguchi, K.; Seino, F. A new food guide in Japan: The Japanese foodguide Spinning Top. Nutr. Rev. 2007, 65, 149–154. [CrossRef] [PubMed]
4. Saito, A.; Okada, E.; Tarui, I.; Matsumoto, M.; Takimoto, H. The Association between Milk and Dairy ProductsConsumption and Nutrient Intake Adequacy among Japanese Adults: Analysis of the 2016 National Healthand Nutrition Survey. Nutrients 2019, 11, 2361. [CrossRef]
5. Iso, H.; Stampfer, M.J.; Manson, J.E.; Rexrode, K.; Hennekens, C.H.; Colditz, G.A.; Speizer, F.E.; Willett, W.C.Prospective study of calcium, potassium, and magnesium intake and risk of stroke in women. Stroke 1999,30, 1772–1779. [CrossRef] [PubMed]
39

Nutrients 2020, 12, 2743
6. Sauvaget, C.; Nagano, J.; Allen, N.; Grant, E.J.; Beral, V. Intake of animal products and stroke mortality inthe Hiroshima/Nagasaki Life Span Study. Int. J. Epidemiol. 2003, 32, 536–543. [CrossRef] [PubMed]
7. Elwood, P.C.; Pickering, J.E.; Fehily, A.; Hughes, J.; Ness, A. Milk drinking, ischaemic heart disease andischaemic stroke I. Evidence from the Caerphilly cohort. Eur. J. Clin. Nutr. 2004, 58, 711–717. [CrossRef][PubMed]
8. Larsson, S.C.; Männistö, S.; Virtanen, M.J.; Kontto, J.; Albanes, D.; Virtamo, J. Dairy foods and risk of stroke.Epidemiology 2009, 20, 355. [CrossRef]
9. Wei, L.J. The accelerated failure time model: A useful alternative to the Cox regression model in survivalanalysis. Stat. Med. 1992, 11, 1871–1879. [CrossRef]
10. Ibrahim, J.G.; Chen, M.H.; Sinha, D. Bayesian Survival Analysis. In Wiley StatsRef: Statistics Reference Online;John Wiley & Sons: Hoboken, NJ, USA, 2014.
11. Ohno, Y.; Tamakoshi, A.; JACC Study Group. Japan collaborative cohort study for evaluation of cancer risksponsored by monbusho (JACC study). J. Epidemiol. 2001, 11, 144–150. [CrossRef]
12. Tamakoshi, A.; Yoshimura, T.; Inaba, Y.; Ito, Y.; Watanabe, Y.; Fukuda, K.; Iso, H. Profile of the JACC study.J. Epidemiol. 2005, 15, S4–S8. [CrossRef] [PubMed]
13. Tamakoshi, A.; Ozasa, K.; Fujino, Y.; Suzuki, K.; Sakata, K.; Mori, M.; Kikuchi, S.; Iso, H. Cohort profile ofthe Japan Collaborative Cohort Study at final follow-up. J. Epidemiol. 2013. [CrossRef] [PubMed]
14. Date, C.; Fukui, M.; Yamamoto, A.; Wakai, K.; Ozeki, A.; Motohashi, Y.; Adachi, C.; Okamoto, N.;Kurosawa, M.; Tokudome, Y.; et al. Reproducibility and validity of a self-administered food frequencyquestionnaire used in the JACC study. J. Epidemiol. 2005, 15, S9–S23. [CrossRef] [PubMed]
15. Ministry of Health and Welfare. Kokumin Eiyo No Genjyo (The National Nutrition Survey in Japan, 1990); DaiichiShuppan: Tokyo, Japan, 1992.
16. Wang, C.; Yatsuya, H.; Tamakoshi, K.; Iso, H.; Tamakoshi, A. Milk drinking and mortality: Findings from theJapan collaborative cohort study. J. Epidemiol. 2015, 25, 66–73. [CrossRef]
17. Talaei, M.; Koh, W.P.; Yuan, J.M.; Pan, A. The association between dairy product intake and cardiovasculardisease mortality in Chinese adults. Eur. J. Nutr. 2016, 56, 2343–2352. [CrossRef]
18. Plummer, M. JAGS: A program for analysis of Bayesian graphical models using Gibbs sampling.In Proceedings of the 3rd international workshop on distributed statistical computing, Vienna, Austria,20–22 March 2003.
19. R Core Team. R: A Language and Environment for Statistical Computing; R Foundation for Statistical Computing:Vienna, Austria, 2020.
20. Lunn, D.; Spiegelhalter, D.; Thomas, A.; Best, N. The BUGS project: Evolution, critique and future directions.Stat. Med. 2009, 28, 3049–3067. [CrossRef]
21. Brooks, S.P.; Gelman, A. General methods for monitoring convergence of iterative simulations. J. Comput.Graph. Stat. 1998, 7, 434–455.
22. Dehghan, M.; Mente, A.; Rangarajan, S.; Sheridan, P.; Mohan, V.; Iqbal, R.; Gupta, R.; Lear, S.;Wentzel-Viljoen, E.; Avezum, A.; et al. Association of dairy intake with cardiovascular disease and mortalityin 21 countries from five continents (PURE): A prospective cohort study. Lancet 2018, 392, 2288–2297.[CrossRef]
23. Kondo, I.; Ojima, T.; Nakamura, M.; Hayasaka, S.; Hozawa, A.; Saitoh, S.; Ohnishi, H.; Akasaka, H.;Hayakawa, T.; Murakami, Y.; et al. Consumption of dairy products and death from cardiovascular diseasein the Japanese general population: The NIPPON DATA80. J. Epidemiol. 2013, 23, 47–54. [CrossRef]
24. Umesawa, M.; Iso, H.; Ishihara, J.; Saito, I.; Kokubo, Y.; Inoue, M.; Tsugane, S. Dietary calcium intake andrisks of stroke, its subtypes, and coronary heart disease in Japanese: The JPHC Study Cohort I. Stroke 2008,39, 2449–2456. [CrossRef]
25. Iacoviello, L.; Bonaccio, M.; Cairella, G.; Catani, M.V.; Costanzo, S.; D’Elia, L.; Giacco, R.; Rendina, D.;Sabino, P.; Savini, I.; et al. Diet and primary prevention of stroke: Systematic review and dietaryrecommendations by the ad hoc Working Group of the Italian Society of Human Nutrition. Nutr. Metab.Cardiovasc. Dis. 2018, 28, 309–334. [CrossRef] [PubMed]
26. Chiba, T.; Itoh, T.; Tabuchi, M.; Ooshima, K.; Satou, T.; Ezaki, O. Delay of stroke onset by milk proteins instroke-prone spontaneously hypertensive rats. Stroke 2012, 43, 470–477. [CrossRef] [PubMed]
40

Nutrients 2020, 12, 2743
27. Singh, A.; Pezeshki, A.; Zapata, R.C.; Yee, N.J.; Knight, C.G.; Tuor, U.I.; Chelikani, P.K. Diets enrichedin whey or casein improve energy balance and prevent morbidity and renal damage in salt-loaded andhigh-fat-fed spontaneously hypertensive stroke-prone rats. J. Nutr. Biochem. 2016, 37, 47–59. [CrossRef][PubMed]
28. Singh, A.; Zapata, R.C.; Pezeshki, A.; Knight, C.G.; Tuor, U.I.; Chelikani, P.K. Whey Protein and ItsComponents Lactalbumin and Lactoferrin Affect Energy Balance and Protect against Stroke Onset and RenalDamage in Salt-Loaded, High-Fat Fed Male Spontaneously Hypertensive Stroke-Prone Rats. J. Nutr. 2020,150, 763–774. [CrossRef] [PubMed]
29. Tokajuk, A.; Zakrzeska, A.; Chabielska, E.; Car, H. Whey protein concentrate limits venous thrombosis inrats. Appl. Physiol. Nutr. Metab. 2019, 44, 907–910. [CrossRef]
© 2020 by the authors. Licensee MDPI, Basel, Switzerland. This article is an open accessarticle distributed under the terms and conditions of the Creative Commons Attribution(CC BY) license (http://creativecommons.org/licenses/by/4.0/).
41


nutrients
Article
Dietary Supplementation with Selenium and Coenzyme Q10Prevents Increase in Plasma D-Dimer While LoweringCardiovascular Mortality in an Elderly Swedish Population
Urban Alehagen 1,*, Jan Aaseth 2, Tomas L. Lindahl 3, Anders Larsson 4 and Jan Alexander 5
Citation: Alehagen, U.; Aaseth, J.;
Lindahl, T.L.; Larsson, A.; Alexander,
J. Dietary Supplementation with
Selenium and Coenzyme Q10
Prevents Increase in Plasma D-Dimer
While Lowering Cardiovascular
Mortality in an Elderly Swedish
Population. Nutrients 2021, 13, 1344.
https://doi.org/10.3390/nu13041344
Academic Editor: Yoshihiro
Fukumoto
Received: 26 February 2021
Accepted: 13 April 2021
Published: 17 April 2021
Publisher’s Note: MDPI stays neutral
with regard to jurisdictional claims in
published maps and institutional affil-
iations.
Copyright: © 2021 by the authors.
Licensee MDPI, Basel, Switzerland.
This article is an open access article
distributed under the terms and
conditions of the Creative Commons
Attribution (CC BY) license (https://
creativecommons.org/licenses/by/
4.0/).
1 Division of Cardiovascular Medicine, Department of Health, Medicine and Caring Sciences,Linköping University, SE-581 85 Linköping, Sweden
2 Research Department, Innlandet Hospital Trust, N-2381 Brumunddal, Norway; [email protected] Division of Clinical Chemistry and Pharmacology, Department of Biomedical and Clinical Sciences,
Linköping University, SE-581 85 Linköping, Sweden; [email protected] Department of Medical Sciences, Uppsala University, SE-751 85 Uppsala, Sweden;
[email protected] Norwegian Institute of Public Health, N-0403 Oslo, Norway; [email protected]* Correspondence: [email protected]; Tel.: +46-10-103-0000
Abstract: A low intake of selenium is associated with increased cardiovascular mortality. This couldbe reduced by supplementation with selenium and coenzyme Q10. D-dimer, a fragment of fibrinmirroring fibrinolysis, is a biomarker of thromboembolism, increased inflammation, endothelialdysfunction and is associated with cardiovascular mortality in ischemic heart disease. The objec-tive was to examine the impact of selenium and coenzyme Q10 on the level of D-dimer, and itsrelationship to cardiovascular mortality. D-dimer was measured in 213 individuals at the startand after 48 months of a randomised double-blind placebo-controlled trial with selenium yeast(200 μg/day) and coenzyme Q10 (200 mg/day) (n = 106) or placebo (n = 107). The follow-up time was4.9 years. All included individuals were low in selenium (mean 67 μg/L, SD 16.8). The differencesin D-dimer concentration were evaluated by the use of T-tests, repeated measures of variance andANCOVA analyses. At the end, a significantly lower D-dimer concentration was observed in theactive treatment group in comparison with those on placebo (p = 0.006). Although D-dimer valuesat baseline were weakly associated with high-sensitive CRP, while being more strongly associatedwith soluble tumour necrosis factor receptor 1 and sP-selectin, controlling for these in the analysisthere was an independent effect on D-dimer. In participants with a D-dimer level above medianat baseline, the supplementation resulted in significantly lower cardiovascular mortality comparedto those on placebo (p = 0.014). All results were validated with a persisting significant differencebetween the two groups. Therefore, supplementation with selenium and coenzyme Q10 in a group ofelderly low in selenium and coenzyme Q10 prevented an increase in D-dimer and reduced the risk ofcardiovascular mortality in comparison with the placebo group. The obtained results also illustrateimportant associations between inflammation, endothelial function and cardiovascular risk.
Keywords: D-dimer; intervention; elderly; cardiovascular mortality; selenium; coenzyme Q10
1. Introduction
D-dimer is a fragment of degraded fibrin and reflects the activation of fibrinolysis andthrombosis, but also the activity of peripheral artery disease [1]. It is thus an indicator of thefibrin turnover [2]. The most common indications for use of D-dimer are in the diagnosisof venous thromboembolism [3–7], for the exclusion of pulmonary embolism [8] and in theevaluation of recanalisation of pulmonary emboli after anticoagulation [9]. D-dimer is oneof the most commonly used biomarkers in clinical medicine [10]. The assay is mainly basedon antibodies against D-dimer [11], and as different antibodies are used in commercial kits,there is some variability in the obtained measurements [12].
Nutrients 2021, 13, 1344. https://doi.org/10.3390/nu13041344 https://www.mdpi.com/journal/nutrients43

Nutrients 2021, 13, 1344
After successful electro-conversion, the level of D-dimer is reduced in patients withatrial fibrillation; hence, it is believed that the velocity and turbulence of the blood flowis important for the level of D-dimer as well [13–15]. However, the occurrence of emboliin atrial fibrillation as a reason for the increased level of D-dimer cannot be ignored. Anincreased level of D-dimer has also been associated with increased mortality in patientswith heart failure [16] and ischaemic heart disease [17,18]. In patients with myocardialinfarction, an association between an increased level of D-dimer and increased risk ofmortality after a percutaneous coronary intervention has been reported [19,20]. Thisrelation between D-dimer and mortality risk could be explained by the thrombus areain patients with concomitant pulmonary emboli, but there is also a reported associationbetween the myocardial infarct area and level of D-dimer and mortality risk [21]. Hence,D-dimer also could contribute to prognostic cardiovascular risk information, as has alsobeen reported by Bai et al. [22].
Clinical interpretation of D-dimer-values is complicated by the fact that D-dimerincreases with age for patients over 50 years [23]. Furthermore, elevated levels of D-dimercould also be the result of inflammatory activity in the absence of thromboembolism [24].It has been reported that D-dimer and C-reactive protein (CRP) both provide prognos-tic information in patients with acute coronary syndromes [25], probably based on theclose relation between inflammation and ischaemic heart disease. Recently, a matter ofdiscussion has been the intimate relation between D-dimer and endothelial function, wherea dysfunction is an important step in the development of inflammation and structuraldamage [26]. Therefore, it is of interest to more broadly investigate the inflammatoryresponse by examining the D-dimer response following supplementation with seleniumand coenzyme Q10. In this context, it is interesting to note that several reports have demon-strated the prognostic properties of D-dimer in patients with COVID-19 disease [22–24]emphasising the important association between D-dimer and inflammation and diseaseprognosis [27–29].
Our group has previously reported that in an elderly population with symptoms thatcould be interpreted as heart failure, D-dimer had prognostic information regarding riskof cardiovascular mortality during a follow-up time of more than five years [30]. Evenif exclusion of those with atrial fibrillation or dilated atria as seen on echocardiography,or development of malignant disease during the follow-up time [31,32], the prognosticinformation remained. Therefore, we assume that an association between D-dimer concen-tration and cardiovascular disease exists, due for example to increases in atherosclerosisagain resulting in a hypercoagulable state [33,34]
Selenium is an essential trace element needed for any human cell in order to fulfil nor-mal cellular functions [35,36]. However, because of soil low in selenium, the dietary intakeof selenium is low in European regions, with an estimated intake in European countriesof <50 μg/day [37]. In order to obtain an optimal cellular function, the required intake ofselenium is at least 75 μg/day of selenium for adult Caucasians [38]. However, to obtainan optimal expression of one of the important selenoproteins; for selenoprotein P, whichdistributes selenium from the liver to peripheral tissues, a daily intake of 100–150 μg/dayof selenium is required [39]. Moreover, in conditions with increased oxidative stress andduring inflammation, the need for selenium is increased [40]. These requirements can bemet for persons living in regions with an adequate selenium content of the soil, as in theUSA. However, in healthy, elderly community-living persons in Sweden, our group haspreviously reported increased cardiovascular mortality associated with a low intake ofselenium [41].
Coenzyme Q10 is present in all human cells, where it is active in the mitochondrialrespiratory chain, but it is also an important lipid soluble antioxidant. The endogenousproduction of coenzyme Q10 declines with age, and at the age of 80, the endogenousmyocardial production of coenzyme Q10 is about half that at 20 years of age [42,43].
Cytosolic selenoenzyme thioreductase1 plays a major role in reducing ubiquinone (theoxidised form of coenzyme Q10) to ubiquinol, the active, reduced form of coenzyme Q10.
44
Nutrients 2021, 13, 1344
For an optimal functioning, the cell is both dependent on an adequate supply of coenzymeQ10 and synthesis of selenoproteins. An insufficiency in selenium and reduced thioredoxinreductase activity could therefore result in decreased concentrations of active coenzymeQ10 (ubiquinol) in the cell. This important relationship between selenium and coenzymeQ10 has been known about for a long time [44,45].
Our group has previously observed effects by combined intervention with seleniumand coenzyme Q10 on several biomarkers for inflammation in a randomised clinical trialon an elderly Swedish population. Thus, the levels of sP-selectin, CRP, osteopontin,osteoprotegerin, soluble tumour necrosis factor receptor 1 (TNFr1) and soluble tumournecrosis factor receptor 2 (TNFr2) were significantly lowered in those receiving activetreatment, as compared with those in the placebo group [46,47]. We also observed effectson the biomarker levels of the von Willebrand factor and plasminogen activator inhibitor-1indicating improved endothelial function in the verum group [48]. With this in mind,we wanted to evaluate if an association between D-dimer levels and supplementation ofselenium and coenzyme Q10 exists, as D-dimer has also been reported to be associatedwith endothelial function [26].
Apart from a small study from the former Eastern Germany on 61 patients withmyocardial infarction [49], we did not find any other report in the literature using thecombined supplementation with selenium and coenzyme Q10, which is why the presentedresults are novel and interesting.
The aim of the present sub-study was to investigate a possible influence of supple-mentation for four years with selenium and coenzyme Q10 on the level of D-dimer, withemphasis on its role in cardiovascular mortality during 4.9 years of follow-up, in an elderlySwedish population.
2. Methods
2.1. Subjects
From a rural municipality, all individuals living in the age between 69 and 88 yearswere invited to participate in a study on epidemiology in 1998 (n = 1320). Out of those876 decided to participate in the main project. In 2003, those still alive (n = 675) wereinvited to participate in an intervention project with selenium and coenzyme Q10 as adietary supplement. Due to the fact that some individuals regarded the transportationdistance to the Health Center for inclusion as being too long, the number who agreed toparticipate were 589 individuals. Out of those, 443 individuals in the age 70–88 years agreedto participate in the intervention project. The supplementation consisted of selenium andcoenzyme Q10, or placebo given over four years, and where blood samples were drawnevery 6 months [50]. All participants in the intervention study had a suboptimal pre-intervention serum selenium level, mean 67 μg/L (SD 16.8) (equivalent to an estimateddaily intake of 35 μg/day), and this is below what is regarded as an adequate seleniumconcentration of ≥100 μg/L [51].
In the present sub-analysis on impact on D-dimer, from the group of 443 participantsin the intervention, we excluded individuals with conditions known to influence theconcentration of D-dimer: atrial fibrillation and/or on treatment with anticoagulants(n = 50), participants with malignancies (n = 17) or the dimension of the left atrium > 40mm (n = 163). The final population consisted of 213 individuals. Of those, 106 individualswere on active treatment, and 107 individuals were on placebos.
In the main project, the participants received supplementation of 200 mg/day ofcoenzyme Q10 capsules (Bio-Quinon 100 mg B.I.D, Pharma Nord, Vejle, Denmark) and200 μg/day of organic selenium yeast tablets (SelenoPrecise 100 μg B.I.D, Pharma Nord,Vejle, Denmark) (n = 221), or a similar placebo (n = 222) over 48 months. After this time,the intervention was finished. The study tablets were taken in addition to any regularmedication. All study medications (active drug and placebo) not consumed were returnedand counted. One of three experienced cardiologists examined all study participants at theinclusion. Besides a new clinical history, a clinical examination was performed at inclusion
45

Nutrients 2021, 13, 1344
and after the study period, including blood pressure, there was an assessment using theNew York Heart Association functional class (NYHA class) as well as an electrocardiogram(ECG) and Doppler-echocardiography. Echocardiographic examinations were performedwith the participant in the left lateral position. The ejection fraction (EF) readings werecategorised into four classes: 30%, 40% and 50% [52,53]. Normal systolic function wasdefined as EF ≥ 50%, while severely impaired systolic function was defined as EF < 30%.Only the systolic function was evaluated. The inclusion started in January 2003 and finishedin February 2010.
The exclusion criteria for the main project were: recent myocardial infarction (withinfour weeks); planned cardiovascular operative procedure within four weeks; hesitationconcerning whether the candidate could decide for him/herself to participate in the studyor not, or doubt about whether he/she understood the consequences of participation;serious disease that substantially reduced survival or when it was not expected that theparticipant could cooperate for the full four-year period; other factors making participationunreasonable, or drug/alcohol abuse [50]. Cardiovascular mortality (CV mortality) wasregistered for all study participants for a follow-up period of 4.9 years. Informationregarding mortality was obtained from the National Board of Health and Welfare inSweden. It registers all deaths of Swedish citizens based on death certificates or autopsyreports. All patients obtained written informed consent.
Cardiovascular mortality was defined as mortality due to myocardial infarctions,cerebrovascular lesions, fatal cardiac arrythmias, heart failure and aortic aneurysms.
The result of the main study was that the actively treated group showed a significantlyincreased cardiac systolic function, a reduced concentration of the cardiac peptide N-terminal fragment of B-type natriuretic peptide (NT-proBNP), and significantly reducedcardiovascular mortality [50]. As the result of the main study was surprising, several substudies were performed. This sub study is one of the different steps in order to obtainbetter understanding of the mechanisms between supplementation as clinical results.
2.2. Biochemical Analyses
All blood samples were collected at start of the study, and after 48 months, and weredrawn with the participants resting and in a supine position. Pre-chilled, EDTA vials forplasma were used. The vials were centrifuged at 3000× g, +4 ◦C, and were then frozen at−70 ◦C. No sample was thawed more than once.
2.3. Determination of D-Dimer
Blood was collected in Vacutainer tubes containing 1/10 volume sodium citrate0.11 mol/L and stored at −70 ◦C until analysis. The samples were analysed utilising anautomated micro-latex D-dimer reagent, MRX-143, from Medirox (Nyköping, Sweden)using ACL Top analyser (Instrumentation Laboratories, Milan, Italy). The precision wasgood; for a low control at mean concentrations of 0.39 mg/L (n = 917) and a high control at0.96 mg/L (n = 526), the total imprecision was 7.3% and 2.9%, respectively.
2.4. Statistical Methods
Descriptive data are presented as percentages or mean ± standard deviation (SD). AStudent’s unpaired two-sided T-test was used for continuous variables and the chi-squaretest was used for analysis of one discrete variable. Kaplan–Meier evaluations of all-causeand cardiovascular mortality were made for both the active treatment and placebo groups.The term ‘censored participants’ refers to those still living at the end of the study, or whohad died for reasons other than cardiovascular disease. ‘Completed participants’ refers tothose who had died due to cardiovascular disease. Repeated measures of variance wereused in order to obtain better information on the individual changes in the concentrationof the biomarker analysed, compared to group mean values.
In the analysis of covariance (ANCOVA) evaluation, both transformed and non-transformed data were applied, with no significant difference in the results.
46
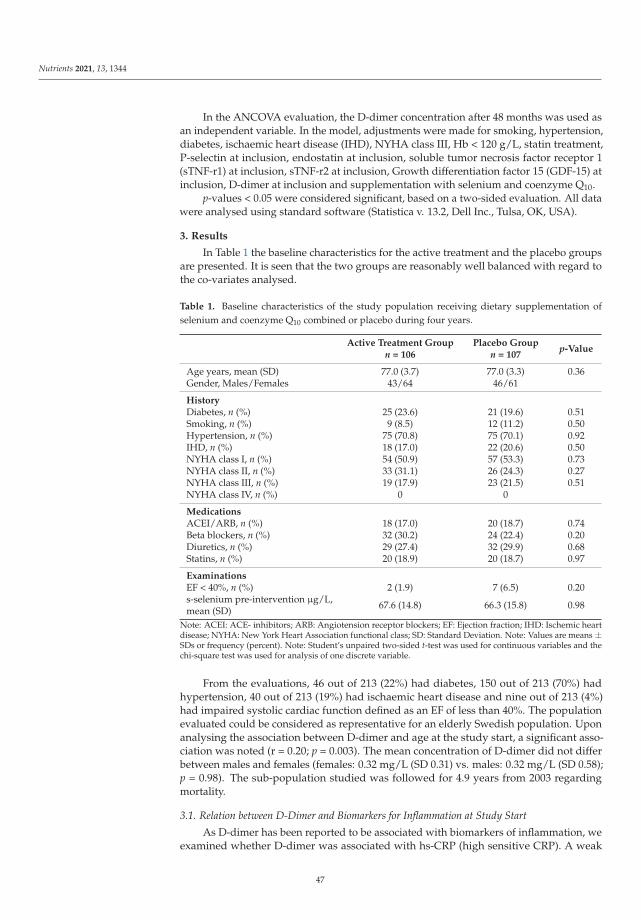
Nutrients 2021, 13, 1344
In the ANCOVA evaluation, the D-dimer concentration after 48 months was used asan independent variable. In the model, adjustments were made for smoking, hypertension,diabetes, ischaemic heart disease (IHD), NYHA class III, Hb < 120 g/L, statin treatment,P-selectin at inclusion, endostatin at inclusion, soluble tumor necrosis factor receptor 1(sTNF-r1) at inclusion, sTNF-r2 at inclusion, Growth differentiation factor 15 (GDF-15) atinclusion, D-dimer at inclusion and supplementation with selenium and coenzyme Q10.
p-values < 0.05 were considered significant, based on a two-sided evaluation. All datawere analysed using standard software (Statistica v. 13.2, Dell Inc., Tulsa, OK, USA).
3. Results
In Table 1 the baseline characteristics for the active treatment and the placebo groupsare presented. It is seen that the two groups are reasonably well balanced with regard tothe co-variates analysed.
Table 1. Baseline characteristics of the study population receiving dietary supplementation ofselenium and coenzyme Q10 combined or placebo during four years.
Active Treatment Groupn = 106
Placebo Groupn = 107
p-Value
Age years, mean (SD) 77.0 (3.7) 77.0 (3.3) 0.36Gender, Males/Females 43/64 46/61
HistoryDiabetes, n (%) 25 (23.6) 21 (19.6) 0.51Smoking, n (%) 9 (8.5) 12 (11.2) 0.50Hypertension, n (%) 75 (70.8) 75 (70.1) 0.92IHD, n (%) 18 (17.0) 22 (20.6) 0.50NYHA class I, n (%) 54 (50.9) 57 (53.3) 0.73NYHA class II, n (%) 33 (31.1) 26 (24.3) 0.27NYHA class III, n (%) 19 (17.9) 23 (21.5) 0.51NYHA class IV, n (%) 0 0
MedicationsACEI/ARB, n (%) 18 (17.0) 20 (18.7) 0.74Beta blockers, n (%) 32 (30.2) 24 (22.4) 0.20Diuretics, n (%) 29 (27.4) 32 (29.9) 0.68Statins, n (%) 20 (18.9) 20 (18.7) 0.97
ExaminationsEF < 40%, n (%) 2 (1.9) 7 (6.5) 0.20s-selenium pre-intervention μg/L,mean (SD) 67.6 (14.8) 66.3 (15.8) 0.98
Note: ACEI: ACE- inhibitors; ARB: Angiotension receptor blockers; EF: Ejection fraction; IHD: Ischemic heartdisease; NYHA: New York Heart Association functional class; SD: Standard Deviation. Note: Values are means ±SDs or frequency (percent). Note: Student’s unpaired two-sided t-test was used for continuous variables and thechi-square test was used for analysis of one discrete variable.
From the evaluations, 46 out of 213 (22%) had diabetes, 150 out of 213 (70%) hadhypertension, 40 out of 213 (19%) had ischaemic heart disease and nine out of 213 (4%)had impaired systolic cardiac function defined as an EF of less than 40%. The populationevaluated could be considered as representative for an elderly Swedish population. Uponanalysing the association between D-dimer and age at the study start, a significant asso-ciation was noted (r = 0.20; p = 0.003). The mean concentration of D-dimer did not differbetween males and females (females: 0.32 mg/L (SD 0.31) vs. males: 0.32 mg/L (SD 0.58);p = 0.98). The sub-population studied was followed for 4.9 years from 2003 regardingmortality.
3.1. Relation between D-Dimer and Biomarkers for Inflammation at Study Start
As D-dimer has been reported to be associated with biomarkers of inflammation, weexamined whether D-dimer was associated with hs-CRP (high sensitive CRP). A weak
47

Nutrients 2021, 13, 1344
non-significant association was seen (r = 0.10; p = 0.17). However, the size of the associationfound is as reported by Folsom et al. (r = 0.13) [18]. Stronger associations were seenbetween D-dimer and soluble tumour necrosis factor (TNF) receptor 1, (r = 0.35; p > 0.0001),and soluble TNF receptor 2 (r = 0.24; p = 0.01). We also found a significant association withsP-selectin (r = 0.17; p = 0.01), another biomarker for inflammation, which is also a markerfor platelet activation.
3.2. Effect of Supplementation on the Concentration of D-Dimer
At inclusion, there was no significant difference in the mean concentration of D-dimerbetween the two groups (active: 0.29 mg/L vs. placebo: 0.36 mg/L; p = 0.27). However,after 48 months, a significant difference in the concentration of D-dimer between the twogroups could be seen (active: 0.22 mg/L vs. 0.34 mg/L; T-value: 2.80; p = 0.006).
As a validation of the results obtained, we performed a repeated measures of varianceanalysis (Figure 1). From this evaluation, the difference between the two groups, active vs.placebo, was still significant (F (1, 111) = 5.11; p = 0.026).
As a second step in the validation of the obtained results, an ANCOVA analysis wasperformed (Table 2).
Table 2. Analysis of covariance using D-dimer after 48 months as dependent variable.
Effects Mean Squares Degrees of Freedom F p
Intercept 0.24 1 6.35 0.01
Smoker 0.01 1 0.39 0.53
Hypertension 0.11 1 2.92 0.09
Diabetes 0.02 1 0.66 0.42
IHD 0.001 1 0.03 0.86
NYHA III 0.005 1 0.13 0.72
Hb < 120g/L 0.02 1 0.47 0.49
Statin treatment 0.08 1 2.16 0.15
p-selectin incl 0.002 1 0.04 0.84
hsCRP incl 0.0002 1 0.004 0.95
Endostatin incl 0.30 1 8.08 0.006
sTNF-r1 incl 0.009 1 0.23 0.63
sTNF-r2 incl 0.25 1 6.73 0.01
GDF-15 incl 0.12 1 3.14 0.08
D-dimer incl 0.95 1 25.6 0.000002
Active treatment 0.37 1 9.89 0.002
Error 0.04 1Note: GDF-15: Growth/differentiation factor 15; HsCRP: High sensitivity assay of CRP; IHD: Ischemic heartdisease; NYHA: New York Heart Association functional class III; sTNF-r1: Tumor necrosis factor receptor 1;sTNF-r2: Tumor necrosis factor receptor 2.
We found a significantly lower concentration of D-dimer (p = 0.002) in those supple-mented with selenium and coenzyme Q10, also after adjusting for co-variates that mightinfluence the concentration of D-dimer, like the CRP, sP-selectin, TNF-r1, TNf-r2, endostatinand GDF-15, all of which being biomarkers of inflammation.
3.3. Effect of Supplementation with Selenium and Coenzyme Q10 on Mortality
This sub-study population was followed during a median follow-up period of 4.9 yearsfrom 2003. As the study population was relatively small, we chose to evaluate the groupswhere the risk of mortality was highest. As it has been shown that an increased level of
48
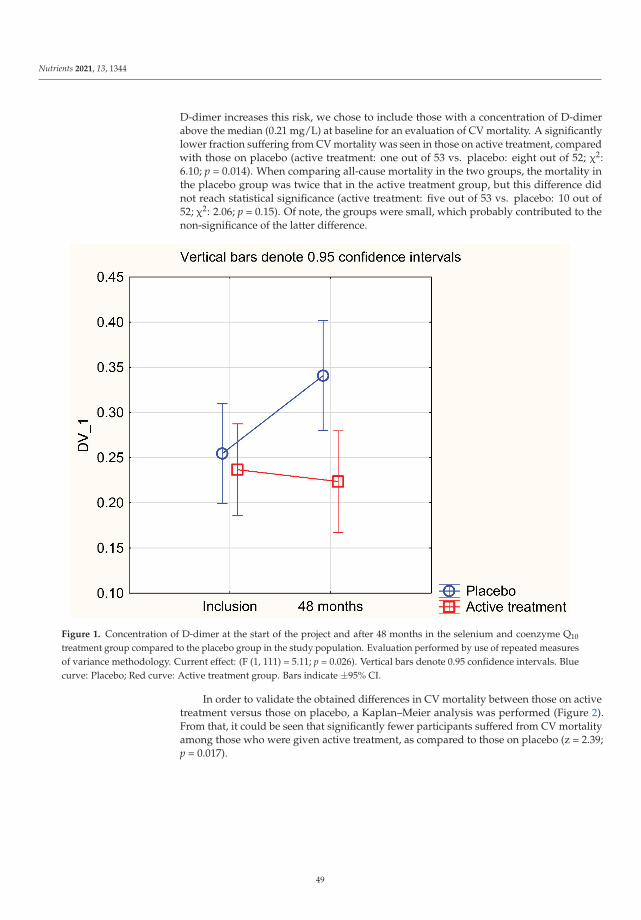
Nutrients 2021, 13, 1344
D-dimer increases this risk, we chose to include those with a concentration of D-dimerabove the median (0.21 mg/L) at baseline for an evaluation of CV mortality. A significantlylower fraction suffering from CV mortality was seen in those on active treatment, comparedwith those on placebo (active treatment: one out of 53 vs. placebo: eight out of 52; χ2:6.10; p = 0.014). When comparing all-cause mortality in the two groups, the mortality inthe placebo group was twice that in the active treatment group, but this difference didnot reach statistical significance (active treatment: five out of 53 vs. placebo: 10 out of52; χ2: 2.06; p = 0.15). Of note, the groups were small, which probably contributed to thenon-significance of the latter difference.
Figure 1. Concentration of D-dimer at the start of the project and after 48 months in the selenium and coenzyme Q10
treatment group compared to the placebo group in the study population. Evaluation performed by use of repeated measuresof variance methodology. Current effect: (F (1, 111) = 5.11; p = 0.026). Vertical bars denote 0.95 confidence intervals. Bluecurve: Placebo; Red curve: Active treatment group. Bars indicate ±95% CI.
In order to validate the obtained differences in CV mortality between those on activetreatment versus those on placebo, a Kaplan–Meier analysis was performed (Figure 2).From that, it could be seen that significantly fewer participants suffered from CV mortalityamong those who were given active treatment, as compared to those on placebo (z = 2.39;p = 0.017).
49

Nutrients 2021, 13, 1344
Figure 2. Kaplan–Meier graph illustrating cardiovascular mortality in participants with a D-dimer level above median(0.21 mg/L) and given selenium and coenzyme Q10 treatment versus those on placebo during a follow-up period of 4.9 years.Note: Censored participants were those still living at the end of the study period, or who had died for reasons other thancardiovascular disease. Completed participants were those who had died due to cardiovascular disease.
3.4. Impact of Supplementation on D-Dimer Levels in Participants with Hypertension or IschaemicHeart Disease
We conducted a sub-group analysis on participants with hypertension, and/or withischaemic heart disease, diseases where inflammation is an inseparable part of the picture.In this sub-population, we evaluated the group with a D-dimer concentration above themedian (>0.21 mg/L) at baseline. Also in this group, we found a significant difference inimpact of the treatment on D-dimer concentration between those on active treatment andthose on placebo, when applying the repeated measures of variance methodology (F (1, 75)= 6.23; p = 0.015) (Figure 3).
Upon analysing mortality, we found that those on active treatment had a significantlylower CV mortality, compared with those on placebo (active: one out of 46 vs. placebo:six out of 41; χ2: 4.55; p = 0.033). There was no significant difference in all-cause mortality(active: four out of 46 vs. placebo: eight out of 41: χ2: 2.13; p = 0.14). However, these groupswere small, and consequently the results should be interpreted with caution.
50

Nutrients 2021, 13, 1344
Figure 3. Concentration of D-dimer at the start of the project and after 48 months in the selenium and coenzyme Q10
treatment group compared to the placebo group in a sub-group of the study population consisting of participants withhypertension or ischaemic heart disease. Evaluation performed by use of repeated measures of variance methodology.Current effect: (F (1, 75) = 6.23; p = 0.015). Vertical bars denote 0.95 confidence intervals. Blue curve: Placebo; Red curve:Active treatment group. Bars indicate ±95% CI.
4. Discussion
The present evaluations of the effect of supplementation with selenium and coenzymeQ10 on the level of D-dimer in an elderly community-living population in Sweden hasshown that this treatment prevented an increase in D-dimer levels, as compared with theplacebo group in which the levels appeared to increase. Also, in a sub-group analysis ofpatients with hypertension or ischemic heart disease, a significantly lower concentrationof D-dimer as a result of the supplementation was observed. In those with a D-dimerlevel above the median at baseline, the supplementation resulted in significantly lowercardiovascular mortality compared with those on placebo. Although the studied subjectshad a low serum selenium at inclusion (mean 67 μg/L, SD 16.8), which is lower thanrecommended [51], we consider the studied group to be representative for an elderlySwedish population.
From the main study (referred to as the KiSel-10 project), we have previously disclosedthat intervention with selenium and coenzyme Q10 caused reduced levels of biomarkers ofinflammation [34,35]. As regards this elderly population with a suboptimal selenium status,our group has also observed a significant reducing effect on von Willebrand factor, andplasminogen activator inhibitor-1, by the supplementation with selenium and coenzymeQ10 [48]. These latter biomarkers, which are indicators of endothelial function, suggestdevelopment of dysfunction in non-supplemented elderly controls. In the present study,we aimed at focusing on D-dimer as an additional biomarker for endothelial dysfunction.
51

Nutrients 2021, 13, 1344
The sub-population included here was selected with the aim of eliminating clinicalconditions (atrial fibrillation, increased left atrium size, treatment with anticoagulants andmalignancies) known to increase the level of D-dimer. As a result, the sample size wasreduced by about 50%. To compensate for the increased uncertainty of the results basedon the small study samples, we performed a two-step validation process; first throughrepeated measures of variance, and then through ANCOVA evaluation, and for mortalitythrough Kaplan–Meier survival analyses. From these analyses, it remained clear that in theelderly Swedish population under investigation with supplementation of selenium andcoenzyme Q10 had a significantly lower D-dimer concentration than those on placebo bypreventing the increase in D-dimer concentration that seemed to take place among thoseon placebo.
An important issue is whether the elevated level of D-dimer in the studied cohort isa result of thromboembolism—which secondarily results in an increased level of inflam-mation, or whether inflammation per se resulted in an increased level of D-dimer in theabsence of thrombus formation. Previous studies have indicated that an increased level ofD-dimer could result from an increased non-specific inflammation without any on-goingthromboembolism [54,55]. Our present results could thus be explained by the previouslyreported increase in inflammatory activity in elderly populations [34,35]. However, it isto be noted that even if adjusted for biomarkers of inflammation as co-variates, an inde-pendent reduction in the level of D-dimer persisted as a result of the supplementationwith selenium and coenzyme Q10. This indicates an association between D-dimer and thesupplementation beyond the role of D-dimer as a biomarker solely of inflammation.
In accordance with previous observations [56,57], we found a significant positiveassociation between age and D-dimer in our population. Thus, the participants on placeboshowed a substantial increase in the D-dimer level. This association could be a resultof an increased level of inflammation as part of the normal ageing process in “healthy”subjects or could be an indicator on pathological inflammatory activity in the apparentlyselenium-deficient population evaluated [35]. It appears that an increase in D-dimerbesides a reported positive association with inflammation, also is positively associated withendothelial dysfunction. Therefore, in those with a low baseline selenium concentrationsupplementation with selenium and coenzyme Q10 could prevent the increase in D-dimerobserved in the placebo group and thereby inflammation and endothelial dysfunction, andalso decrease the cardiovascular risk.
5. Limitations
The population analysed in this study was of a relatively small size. This increasestherefore the uncertainty of the obtained results. However, as we used a two-step validationprocess, we argue that the results are likely to be correct. Even if the size of the studypopulation is small, we regard the results as being interesting from a scientific point ofview, and for hypothesis-generating.
The included participants represented a relatively narrow age stratum, so it is notpossible to extrapolate the results to other age groups without uncertainty.
Finally, as the evaluated population consisted of Caucasians who were low in seleniumand coenzyme Q10, it is not necessarily true that the obtained results could be extrapolatedto another population.
6. Conclusions
D-dimer, a fragment of cleaved fibrin, reflects the fibrinolytic process, which is whyit is used in clinical routines to rule out a possible thromboembolic process. However, D-dimer is also intimately related to inflammatory activity and also to endothelial dysfunction.In this report, an elderly community-living population with a relative selenium deficiencywas given a dietary supplement consisting of selenium and coenzyme Q10. While the levelof D-dimer in the placebo group increased during the intervention period, it remainedunchanged or was slightly reduced in those on active treatment. After 48 months, D-
52
Nutrients 2021, 13, 1344
dimer was significantly lower in the active treatment group in comparison with those onplacebo. The results were validated through repeated measures of variance methodologyand ANCOVA analyses.
We observed a significantly reduced CV mortality among those with a high D-dimerlevel when given selenium and coenzyme Q10, as compared to those on placebo. In a sub-group analysis of patients with hypertension or ischemic heart disease, the significantlylower concentration of D-dimer as a result of the supplementation could be demonstrated.High D-dimer levels in the present elderly population may reflect age-related inflammatoryactivity, although D-dimer may impact cardiovascular pathology beyond its role as abiomarker of inflammation.
The demonstrated results might be of interest for follow-up studies, although thepresent sample size was small. The results should be regarded as hypothesis-generatingand it is hoped they will stimulate more research within the same area.
Author Contributions: Conceived and designed the research project, U.A. and A.L.; conducted theresearch, U.A. and A.L.; provided the essential reagents, T.L.L. and the analyses were performedin his lab; analysed data and performed the statistical analyses, U.A. and A.L.; wrote the paper,U.A., J.A. (Jan Aaseth), J.A. (Jan Alexander), T.L.L. and A.L.; had the final responsibility for the finalcontent, U.A. All authors have read and approved the final manuscript.
Funding: Part of the analysis cost was supported by grants from Pharma Nord Aps, Denmark, theCounty Council of Östergötland, Linköping University. The funding organisations had no role inthe design, management, analysis or interpretation of the data, nor in the preparation, review orapproval of the manuscript. No economic compensation was distributed.
Institutional Review Board Statement: Not applicable.
Ethical Approval: The study was approved by the Regional Ethical Committee (Forskningsetikkom-mitten, Hälsouniversitetet, SE-581 85 Linköping, Sweden; No. D03-176), and conforms to the ethicalguidelines of the 1975 Declaration of Helsinki. (As the Medical Product Agency considered the trialas a trial of one food supplement and not a medication, it declined to review the study protocol). Thisstudy has been registered retrospectively at Clinicaltrials.gov, and has the identifier NCT01443780, asit was not mandatory to register at the time the study began.
Informed Consent Statement: Informed consent was obtained from each patient.
Data Availability Statement: Under Swedish Law, the authors cannot share the data used in thisstudy and cannot conduct any further research other than what is specified in the ethical permissionsapplication. For inquiries about the data, researchers should first contact the owner of the database,the University of Linköping. Please contact the corresponding author with requests for and assistancewith data. If the university approves the request, researchers can submit an application to the RegionalEthical Review Board for the specific research question that the researcher wants to examine.
Conflicts of Interest: The authors declare no conflict of interest.
Abbreviations
ACEI: ACE inhibitors; ANCOVA: Analysis of covariance, ARB; Angiotension receptor blockers,CRP: C-reactive protein; CV: Cardiovascular; EF: Ejection fraction, ECG: Electrocardiogram, Hs-CRP:High sensitivity analysis of C-reactive protein, IHD: Ischaemic heart disease, NT-proBNP: N-terminalfragment of B-type natriuretic peptide; NYHA class: New York Heart Association functional class,SD: Standard deviation.
References
1. Adam, S.S.; Key, N.S.; Greenberg, C.S. D-dimer antigen: Current concepts and future prospects. Blood 2009, 113, 2878–2887.[CrossRef]
2. Marder, V.J. Identification and purification of fibrinogen degradation products produced by plasmin: Considerations on thestructure of fibrinogen. Scand. J. Haematol. 2009, 8, 21–36. [CrossRef] [PubMed]
3. Rosendaal, F. Venous thrombosis: A multicausal disease. Lancet 1999, 353, 1167–1173. [CrossRef]
53

Nutrients 2021, 13, 1344
4. Van der Graaf, F.; van den Borne, H.; van der Kolk, M.; de Wild, P.J.; Janssen, G.W.; van Uum, S.H. Exclusion of deep venousthrombosis with D-dimer testing—Comparison of 13 D-dimer methods in 99 outpatients suspected of deep venous thrombosisusing venography as reference standard. Thromb. Haemost. 2000, 83, 191–198.
5. Wells, P.S.; Brill-Edwards, P.; Stevens, P.; Panju, A.; Patel, A.; Douketis, J.; Massicotte, M.P.; Hirsh, J.; Weitz, J.I.; Kearon, C.; et al. ANovel and Rapid Whole-Blood Assay for D-Dimer in Patients with Clinically Suspected Deep Vein Thrombosis. Circulation 1995,91, 2184–2187. [CrossRef]
6. Kearon, C.; Ginsberg, J.S.; Douketis, J.; Crowther, M.; Brill-Edwards, P.; Weitz, J.I.; Hirsh, J. Management of suspected deep venousthrombosis in outpatients by using clinical assessment and D-dimer testing. Ann. Intern. Med. 2001, 135, 108–111. [CrossRef]
7. Wells, P.S. Integrated strategies for the diagnosis of venous thromboembolism. J. Thromb. Haemost. 2007, 5, 41–50. [CrossRef]8. Kearon, C.; De Wit, K.; Parpia, S.; Schulman, S.; Afilalo, M.; Hirsch, A.; Spencer, F.A.; Sharma, S.; D’Aragon, F.; Deshaies, J.-F.;
et al. Diagnosis of Pulmonary Embolism with d-Dimer Adjusted to Clinical Probability. N. Engl. J. Med. 2019, 381, 2125–2134.[CrossRef]
9. Kaczynska, A.; Kostrubiec, M.; Pacho, R.; Kunikowska, J.; Pruszczyk, P. Elevated D-dimer concentration identifies patients withincomplete recanalization of pulmonary artery thromboemboli despite 6 months anticoagulation after the first episode of acutepulmonary embolism. Thromb. Res. 2008, 122, 21–25. [CrossRef]
10. Lowe, G.D.O. Fibrin D-Dimer and Cardiovascular Risk. Semin. Vasc. Med. 2005, 5, 387–398. [CrossRef] [PubMed]11. Dempfle, C.-E. Validation, Calibration, and Specificity of Quantitative D-Dimer Assays. Semin. Vasc. Med. 2005, 5, 315–320.
[CrossRef]12. Dempfle, C.; Zips, S.; Ergül, H.; Heene, D.L. The Fibrin Assay Comparison Trial (FACT): Evaluation of 23 quantitative D-dimer
assays as basis for the development of D-dimer calibrators. FACT study group. Thromb. Haemost. 2001, 85, 671–678.13. Lip, G.Y.; Rumley, A.; Dunn, F.G.; Lowe, G.D. Plasma fibrinogen and fibrin D-dimer in patients with atrial fibrillation: Effects of
cardioversion to sinus rhythm. Int. J. Cardiol. 1995, 51, 245–251. [CrossRef]14. Kamath, S.; Chin, B.S.P.; Blann, A.D.; Lip, G.Y.H. A study of platelet activation in paroxysmal, persistent and permanent atrial
fibrillation. Blood Coagul. Fibrinolysis 2002, 13, 627–636. [CrossRef]15. Giansante, C.; Fiotti, N.; Miccio, M.; Altamura, N.; Salvi, R.; Guarnieri, G. Coagulation indicators in patients with paroxysmal
atrial fibrillation: Effects of electric and pharmacologic cardioversion. Am. Heart J. 2000, 140, 423–429. [CrossRef] [PubMed]16. Zorlu, A.; Yilmaz, M.B.; Yücel, H.; Bektasoglu, G.; Ege, M.R.; Tandogan, I.; Tandogan, I. Increased d-dimer levels predict
cardiovascular mortality in patients with systolic heart failure. J. Thromb. Thrombolysis 2011, 33, 322–328. [CrossRef]17. Morange, P.E.; Bickel, C.; Nicaud, V.; Schnabel, R.; Rupprecht, H.J.; Peetz, D.; Lackner, K.J.; Cambien, F.; Blankenberg, S.; Tiret, L.;
et al. Haemostatic factors and the risk of cardiovascular death in patients with coronary artery disease: The AtheroGene study.Arterioscler. Thromb. Vasc. Biol. 2006, 26, 2793–2799. [CrossRef]
18. Folsom, A.R.; Delaney, J.A.C.; Lutsey, P.L.; Zakai, N.A.; Jenny, N.S.; Polak, J.F.; Cushman, M. For the Multiethnic Study ofAtherosclerosis Investigators Associations of factor VIIIc, D-dimer, and plasmin-antiplasmin with incident cardiovascular diseaseand all-cause mortality. Am. J. Hematol. 2009, 84, 349–353. [CrossRef]
19. Tataru, M.-C.; Heinrich, J.; Junker, R.; Schulte, H.; Von Eckardstein, A.; Assmann, G.; Koehler, E. D-dimers in relation to theseverity of arteriosclerosis in patients with stable angina pectoris after myocardial infarction. Eur. Heart J. 1999, 20, 1493–1502.[CrossRef]
20. Huang, D.; Gao, W.; Wu, R.; Zhong, X.; Qian, J.; Ge, J. D-dimer level predicts in-hospital adverse outcomes after primary PCI forST-segment elevation myocardial infarction. Int. J. Cardiol. 2020, 305, 1–4. [CrossRef] [PubMed]
21. Choi, S.; Jang, W.J.; Bin Song, Y.; Lima, J.A.C.; Guallar, E.; Choe, Y.H.; Hwang, J.K.; Kim, E.K.; Yang, J.H.; Hahn, J.-Y.; et al.D-Dimer Levels Predict Myocardial Injury in ST-Segment Elevation Myocardial Infarction: A Cardiac Magnetic ResonanceImaging Study. PLoS ONE 2016, 11, e0160955. [CrossRef] [PubMed]
22. Bai, Y.; Zheng, Y.-Y.; Tang, J.-N.; Yang, X.-M.; Guo, Q.-Q.; Zhang, J.-C.; Cheng, M.-D.; Song, F.-H.; Wang, K.; Zhang, Z.-L.; et al.D-Dimer to Fibrinogen Ratio as a Novel Prognostic Marker in Patients After Undergoing Percutaneous Coronary Intervention:A Retrospective Cohort Study. Clin. Appl. Thromb. 2020, 26. [CrossRef] [PubMed]
23. Urban, K.; Kirley, K.; Stevermer, J.J. PURLs: It’s time to use an age-based approach to D-dimer. J. Fam. Pract. 2014, 63, 155–158.24. Bruinstroop, E.; Van De Ree, M.; Huisman, M. The use of D-dimer in specific clinical conditions: A narrative review. Eur. J. Intern.
Med. 2009, 20, 441–446. [CrossRef]25. Mjelva, Ø.R.; Pönitz, V.; Brügger-Andersen, T.; Grundt, H.; Staines, H.; Nilsen, D.W. Long-term prognostic utility of pentraxin
3 and D-dimer as compared to high-sensitivity C-reactive protein and B-type natriuretic peptide in suspected acute coronarysyndrome. Eur. J. Prev. Cardiol. 2016, 23, 1130–1140. [CrossRef] [PubMed]
26. Zhang, J.; Tecson, K.M.; McCullough, P.A. Endothelial dysfunction contributes to COVID-19-associated vascular inflammationand coagulopathy. Rev. Cardiovasc. Med. 2020, 21, 315–319. [CrossRef]
27. Long, H.; Nie, L.; Xiang, X.; Li, H.; Zhang, X.; Fu, X.; Ren, H.; Liu, W.; Wang, Q.; Wu, Q. D-Dimer and Prothrombin Time Are theSignificant Indicators of Severe COVID-19 and Poor Prognosis. BioMed Res. Int. 2020, 2020, 6159720. [CrossRef] [PubMed]
28. Hodges, G.; Pallisgaard, J.; Olsen, A.-M.S.; Mcgettigan, P.; Andersen, M.; Krogager, M.; Kragholm, K.; Køber, L.; Gislason, G.H.;Torp-Pedersen, C.; et al. Association between biomarkers and COVID-19 severity and mortality: A nationwide Danish cohortstudy. BMJ Open 2020, 10, e041295. [CrossRef]
54

Nutrients 2021, 13, 1344
29. Yang, L.; Jin, J.; Luo, W.; Gan, Y.; Chen, B.; Li, W. Risk factors for predicting mortality of COVID-19 patients: A systematic reviewand meta-analysis. PLoS ONE 2020, 15, e0243124. [CrossRef]
30. Dahlström, U.; Lindahl, T.L.; Alehagen, U. Elevated D-dimer level is an independent risk factor for cardiovascular death inout-patients with symptoms compatible with heart failure. Thromb. Haemost. 2004, 92, 1250–1258. [CrossRef]
31. Buccheri, G.; Torchio, P.; Ferrigno, D. Plasma levels of D-dimer in lung carcinoma: Clinical and prognostic significance. Cancer2003, 97, 3044–3052. [CrossRef]
32. Xu, G.; Zhang, Y.-L.; Huang, W. Relationship between plasma D-dimer levels and clinicopathologic parameters in resectablecolorectal cancer patients. World J. Gastroenterol. 2004, 10, 922–923. [CrossRef] [PubMed]
33. Sato, T.; Yoshimura, M.; Sanda, T.; Hyodo, K.; Yamamoto, J.; Ishii, H.; Yamashita, T. Changes in spontaneous thrombolyticactivity during progression of atherosclerosis in Apo(-/-) and LDLR(-/-) double knockout mice. Int. J. Clin. Exp. Pathol. 2018, 11,4521–4528.
34. Kremers, B.M.M.; Cate, H.T.; Spronk, H.M.H. Pleiotropic effects of the hemostatic system. J. Thromb. Haemost. 2018, 16, 1464–1473.[CrossRef] [PubMed]
35. Fairweather-Tait, S.J.; Bao, Y.; Broadley, M.R.; Collings, R.; Ford, D.; Hesketh, J.E.; Hurst, R. Selenium in Human Health andDisease. Antioxid. Redox Signal. 2011, 14, 1337–1383. [CrossRef] [PubMed]
36. Selenius, M.; Rundlöf, A.-K.; Olm, E.; Fernandes, A.P.; Björnstedt, M. Selenium and the Selenoprotein Thioredoxin Reductase inthe Prevention, Treatment and Diagnostics of Cancer. Antioxid. Redox Signal. 2010, 12, 867–880. [CrossRef] [PubMed]
37. Rayman, M.P. Selenium and human health. Lancet 2012, 379, 1256–1268. [CrossRef]38. Xia, Y.; Hill, K.; Li, P.; Xu, J.; Zhou, D.; Motley, A.K.; Wang, L.; Byrne, D.W.; Burk, R.F. Optimization of selenoprotein P and other
plasma selenium biomarkers for the assessment of the selenium nutritional requirement: A placebo-controlled, double-blind studyof selenomethionine supplementation in selenium-deficient Chinese subjects. Am. J. Clin. Nutr. 2010, 92, 525–531. [CrossRef]
39. Brodin, O.; Hackler, J.; Misra, S.; Wendt, S.; Sun, Q.; Laaf, E.; Stoppe, C.; Björnstedt, M.; Schomburg, L. Selenoprotein P asBiomarker of Selenium Status in Clinical Trials with Therapeutic Dosages of Selenite. Nutrients 2020, 12, 1067. [CrossRef]
40. Manzanares, W.; Biestro, A.; Galusso, F.; Torre, M.H.; Manay, N.; Pittini, G.; Facchin, G.; Hardy, G. Serum selenium and glutathioneperoxidase-3 activity: Biomarkers of systemic inflammation in the critically ill? Intensive Care Med. 2009, 35, 882–889. [CrossRef]
41. Alehagen, U.; Johansson, P.; Björnstedt, M.; Rosén, A.; Post, C.; Aaseth, J. Relatively high mortality risk in elderly Swedishsubjects with low selenium status. Eur. J. Clin. Nutr. 2015, 70, 91–96. [CrossRef] [PubMed]
42. Kalén, A.; Appelkvist, E.-L.; Dallner, G. Age-related changes in the lipid compositions of rat and human tissues. Lipids 1989, 24,579–584. [CrossRef]
43. Gutierrez-Mariscal, F.M.; Yubero-Serrano, E.M.; Villalba, J.M.; Lopez-Miranda, J. Coenzyme Q10: From bench to clinic in agingdiseases, a translational review. Crit. Rev. Food Sci. Nutr. 2019, 59, 2240–2257. [CrossRef] [PubMed]
44. Xia, L.; Nordman, T.; Olsson, J.M.; Damdimopoulos, A.; Björkhem-Bergman, L.; Nalvarte, I.; Eriksson, L.C.; Arnér, E.S.J.; Spyrou,G.; Björnstedt, M. The Mammalian Cytosolic Selenoenzyme Thioredoxin Reductase Reduces Ubiquinone. J. Biol. Chem. 2003, 278,2141–2146. [CrossRef] [PubMed]
45. Norman, J.A.; Little, D.; Bolgar, M.; Di Donato, G. Degradation of brain natriuretic peptide by neutral endopeptidase: Speciesspecific sites of proteolysis determined by mass spectrometry. Biochem. Biophys. Res. Commun. 1991, 175, 22–30. [CrossRef]
46. Alehagen, U.; Alexander, J.; Aaseth, J.; Larsson, A. Decrease in inflammatory biomarker concentration by intervention withselenium and coenzyme Q10: A subanalysis of osteopontin, osteoprotergerin, TNFr1, TNFr2 and TWEAK. J. Inflamm. 2019, 16, 5.[CrossRef]
47. Alehagen, U.; Lindahl, T.L.; Aaseth, J.; Svensson, E.; Johansson, P. Levels of sP-selectin and hs-CRP Decrease with DietaryIntervention with Selenium and Coenzyme Q10 Combined: A Secondary Analysis of a Randomized Clinical Trial. PLoS ONE2015, 10, e0137680. [CrossRef] [PubMed]
48. Alehagen, U.; Alexander, J.; Aaseth, J.; Larsson, A.; Lindahl, T.L. Significant decrease of von Willebrand factor and plasminogenactivator inhibitor-1 by providing supplementation with selenium and coenzyme Q10 to an elderly population with a lowselenium status. Eur. J. Nutr. 2020, 59, 3581–3590. [CrossRef]
49. Kuklinski, B.; Weissenbacher, E.; Fähnrich, A. Coenzyme Q10 and antioxidants in acute myocardial infarction. Mol. Asp. Med.1994, 15, s143–s147. [CrossRef]
50. Alehagen, U.; Johansson, P.; Bjornstedt, M.; Rosen, A.; Dahlstrom, U. Cardiovascular mortality and N-terminal-proBNP reducedafter combined selenium and coenzyme Q10 supplementation: A 5-year prospective randomized double-blind placebo-controlledtrial among elderly Swedish citizens. Int. J. Cardiol. 2013, 167, 1860–1866. [CrossRef]
51. Alexander, J.; Alehagen, U.; Larsson, A.; Aaseth, J. Selenium in clinical medicine and medical biochemistry. Klin. Biokem. I Nord.2019, 31, 12–19.
52. Jensen-Urstad, K.; Bouvier, F.; Höjer, J.; Ruiz, H.; Hulting, J.; Samad, B.; Thorstrand, C.; Jensen-Urstad, M. Comparison ofDifferent Echocardiographic Methods With Radionuclide Imaging for Measuring Left Ventricular Ejection Fraction During AcuteMyocardial Infarction Treated by Thrombolytic Therapy. Am. J. Cardiol. 1998, 81, 538–544. [CrossRef]
53. Van Royen, N.; Jaffe, C.C.; Krumholz, H.M.; Johnson, K.M.; Lynch, P.J.; Natale, D.; Atkinson, P.; Deman, P.; Wackers, F.J.Comparison and reproducibility of visual echocardiographic and quantitative radionuclide left ventricular ejection fractions.Am. J. Cardiol. 1996, 77, 843–850. [CrossRef]
55

Nutrients 2021, 13, 1344
54. Zhang, M.; Zhang, J.; Zhang, Q.; Yang, X.; Shan, H.; Ming, Z.; Chen, H.; Liu, Y.; Yin, J.; Li, Y. D-dimer as a potential biomarker forthe progression of COPD. Clin. Chim. Acta 2016, 455, 55–59. [CrossRef] [PubMed]
55. Ge, Y.L.; Liu, C.H.; Wang, N.; Xu, J.; Zhu, X.Y.; Su, C.S.; Li, H.L.; Zhang, H.F.; Li, Z.Z.; Li, H.L.; et al. Elevated Plasma D-Dimer inAdult Community-Acquired Pneumonia Patients is Associated with an Increased Inflammatory Reaction and Lower Survival.Clin. Lab. 2019, 65. [CrossRef]
56. Franchini, M.; Lippi, G.; Favaloro, E.J. Aging Hemostasis: Changes to Laboratory Markers of Hemostasis As We Age—A NarrativeReview. Semin. Thromb. Hemost. 2014, 40, 621–633. [CrossRef]
57. Haase, C.; Joergensen, M.; Ellervik, C.; Joergensen, M.K.; Bathum, L. Age- and sex-dependent reference intervals for D-dimer:Evidence for a marked increase by age. Thromb. Res. 2013, 132, 676–680. [CrossRef] [PubMed]
56

nutrients
Article
Glucose Fluctuation and Severe Internal Carotid Artery SiphonStenosis in Type 2 Diabetes Patients
Futoshi Eto 1, Kazuo Washida 1,*, Masaki Matsubara 2, Hisashi Makino 2, Akio Takahashi 1, Kotaro Noda 1,
Yorito Hattori 1, Yuriko Nakaoku 3, Kunihiro Nishimura 3, Kiminori Hosoda 2 and Masafumi Ihara 1
Citation: Eto, F.; Washida, K.;
Matsubara, M.; Makino, H.;
Takahashi, A.; Noda, K.; Hattori, Y.;
Nakaoku, Y.; Nishimura, K.; Hosoda,
K.; et al. Glucose Fluctuation and
Severe Internal Carotid Artery Siphon
Stenosis in Type 2 Diabetes Patients.
Nutrients 2021, 13, 2379. https://
doi.org/10.3390/nu13072379
Academic Editor:
Yoshihiro Fukumoto
Received: 18 June 2021
Accepted: 10 July 2021
Published: 12 July 2021
Publisher’s Note: MDPI stays neutral
with regard to jurisdictional claims in
published maps and institutional affil-
iations.
Copyright: © 2021 by the authors.
Licensee MDPI, Basel, Switzerland.
This article is an open access article
distributed under the terms and
conditions of the Creative Commons
Attribution (CC BY) license (https://
creativecommons.org/licenses/by/
4.0/).
1 Department of Neurology, National Cerebral and Cardiovascular Center, Suita 564-8565, Japan;[email protected] (F.E.); [email protected] (A.T.); [email protected] (K.N.);[email protected] (Y.H.); [email protected] (M.I.)
2 Division of Diabetes and Lipid Metabolism, National Cerebral and Cardiovascular Center,Suita 564-8565, Japan; [email protected] (M.M.); [email protected] (H.M.);[email protected] (K.H.)
3 Department of Preventive Medicine and Epidemiology, National Cerebral and Cardiovascular Center,Suita 564-8565, Japan; [email protected] (Y.N.); [email protected] (K.N.)
* Correspondence: [email protected]; Tel.: +81-6-6170-1070
Abstract: The impact of glucose fluctuation on intracranial artery stenosis remains to be elucidated.This study aimed to investigate the association between glucose fluctuation and intracranial arterystenosis. This was a cross-sectional study of type 2 diabetes mellitus (T2DM) patients equippedwith the FreeStyle Libre Pro continuous glucose monitoring system (Abbott Laboratories) betweenFebruary 2019 and June 2020. Glucose fluctuation was evaluated according to the standard deviation(SD) of blood glucose, coefficient of variation (%CV), and mean amplitude of glycemic excursions(MAGE). Magnetic resonance angiography was used to evaluate the degree of intracranial arterystenosis. Of the 103 patients, 8 patients developed severe internal carotid artery (ICA) siphon stenosis(≥70%). SD, %CV, and MAGE were significantly higher in the severe stenosis group than in thenon-severe stenosis group (<70%), whereas there was no significant intergroup difference in themean blood glucose and HbA1c. Multivariable logistic regression analysis adjusted for sex showedthat SD, %CV, and MAGE were independent factors associated with severe ICA siphon stenosis. Inconclusion, glucose fluctuation is significantly associated with severe ICA siphon stenosis in T2DMpatients. Thus, glucose fluctuation can be a target of preventive therapies for intracranial arterystenosis and ischemic stroke.
Keywords: continuous glucose monitoring; glucose fluctuation; intracranial artery stenosis; meanamplitude of glycemic excursions; standard deviation
1. Introduction
It was estimated that 451 million individuals globally have diabetes mellitus (DM) in2017 [1]. DM is a major cause of blindness, kidney failure, heart attacks, stroke, and lowerlimb amputation. Long-term management of DM can prevent atherosclerotic cardiovascu-lar disease (ASCVD) such as ischemic stroke or acute coronary syndrome. Patients withsevere intracranial artery stenosis have the highest rate of recurrent stroke [2,3]. There havebeen various reports on the relationship between DM and intracranial artery stenosis [4,5],but the findings have been conflicting. Although some studies reported that elevatedhemoglobin A1c (HbA1c) and fasting blood glucose levels are associated with intracranialartery stenosis [6], others showed no correlations [7]. Thus, the usefulness of HbA1c andfasting blood glucose levels as predictors of intracranial artery stenosis remains unclear.
There are various indicators for blood glucose control in patients with DM; theseinclude hemoglobin A1c (HbA1c) and glycoalbumin. However, these indicators only reflectthe mean blood glucose level for a certain period and cannot reflect glucose fluctuation.
Nutrients 2021, 13, 2379. https://doi.org/10.3390/nu13072379 https://www.mdpi.com/journal/nutrients57

Nutrients 2021, 13, 2379
Atherosclerotic stenosis such as intracranial artery stenosis and coronary artery stenosisare major complications of DM. Glucose fluctuation can cause atherosclerosis because itinduces chronic inflammation and oxidative stress in the vasculature [8]. Thus, preventionof atherosclerosis in patients with DM requires targeting glucose fluctuation. Continuousglucose monitoring (CGM) systems, such as the FreeStyle Libre Pro, have been recentlyapproved for use in clinical practice. In contrast to self-monitoring of blood glucose (SMBG)where up to 80% of hypoglycemia and hyperglycemia can be missed [9], CGM enables acontinuous monitoring of blood glucose levels and fluctuations.
Recent clinical studies have shown that blood glucose fluctuation is related to AS-CVD [7,10–12]. Furthermore, glucose fluctuation could predict prognosis after acute coro-nary syndrome [13]. However, although blood glucose fluctuation is associated with therisk of many cardiovascular diseases, the relationship between blood glucose fluctuationand intracranial artery stenosis remains unclear. Therefore, this study aimed to investigatethe relationship between glucose fluctuation and intracranial artery stenosis in type 2 DM(T2DM) patients who are using the FreeStyle Libre Pro continuous glucose monitoringsystem.
2. Materials and Methods
2.1. Study Design and Patients
This retrospective, observational, cross-sectional study was performed at the NationalCerebral and Cardiovascular Center (NCVC), Suita, Osaka, Japan. This study is part of anongoing prospective longitudinal study on the relationship between glucose fluctuationand cognitive function in T2DM (PROPOSAL Study: Trial Registration, University HospitalMedical Information Network Clinical Trial Registry (UMIN000038546)) [14].
T2DM patients with mild cognitive impairment (MCI) were enrolled in the registrybetween February 2019 and June 2020. The PROPOSAL Study is aimed at evaluatingthe relationships between glucose fluctuation indices assessed by CGM and cognitivefunction among elderly patients with T2DM. Therefore, patients are limited to those aged65–85 years. T2DM was diagnosed according to the Japan Diabetes Society criteria. MCIwas diagnosed based on the clinical course and a score of 17–25 on the Japanese versionof Montreal Cognitive Assessment scale [14–16]. Carotid artery stenosis was evaluatedaccording to the North American Symptomatic Carotid Endarterectomy Trial method [17].Patients with ≥80% carotid artery stenosis [18] or those undergoing renal replacementtherapy [19] were excluded because these conditions could affect cognitive function. Ad-ditionally, those taking antidementia drugs or having underlying comorbidities affectingcognitive function (depression, thyroid dysfunction, and vitamin B1, vitamin B12, andfolate deficiency) were excluded. Sex, age, baseline patient characteristics including currentsmoking status, medical history such as hypertension or active use of antihypertensivemedications, dyslipidemia or active use of lipid-lowering agents, T2DM or antidiabetictreatment, atrial fibrillation or antidiabetic treatment, medical history of percutaneous coro-nary intervention or coronary artery bypass grafting (PCI/CABG), and former ischemicstroke episode, were collected from the registry.
All subjects gave their informed consent for inclusion before they participated in thestudy. The study was conducted in accordance with the Declaration of Helsinki, and theprotocol was approved by the Ethics Committee of NCVC (Project identification codeM30-110-3).
2.2. Imaging Protocol
Magnetic resonance imaging (MRI) was performed with a 3-Tesla system. The vesselsconstituting the intracranial artery were defined as shown in Figure 1: (i) the A1 or A2segment of the anterior cerebral arteries (ACA), (ii) the C1 to C5 segment of the intracranialinternal carotid arteries (ICA) categorized according to Fischer’s classification [20], (iii) theP1 or P2 segment of the posterior cerebral arteries (PCA), and (iv) the M1 or M2 segmentof the middle cerebral arteries (MCA).
58
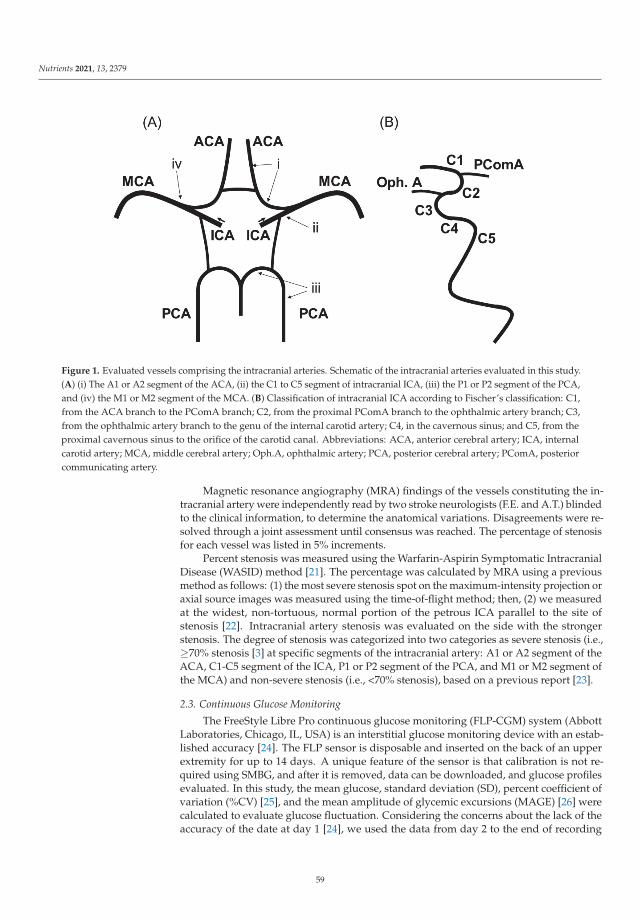
Nutrients 2021, 13, 2379
Figure 1. Evaluated vessels comprising the intracranial arteries. Schematic of the intracranial arteries evaluated in this study.(A) (i) The A1 or A2 segment of the ACA, (ii) the C1 to C5 segment of intracranial ICA, (iii) the P1 or P2 segment of the PCA,and (iv) the M1 or M2 segment of the MCA. (B) Classification of intracranial ICA according to Fischer’s classification: C1,from the ACA branch to the PComA branch; C2, from the proximal PComA branch to the ophthalmic artery branch; C3,from the ophthalmic artery branch to the genu of the internal carotid artery; C4, in the cavernous sinus; and C5, from theproximal cavernous sinus to the orifice of the carotid canal. Abbreviations: ACA, anterior cerebral artery; ICA, internalcarotid artery; MCA, middle cerebral artery; Oph.A, ophthalmic artery; PCA, posterior cerebral artery; PComA, posteriorcommunicating artery.
Magnetic resonance angiography (MRA) findings of the vessels constituting the in-tracranial artery were independently read by two stroke neurologists (F.E. and A.T.) blindedto the clinical information, to determine the anatomical variations. Disagreements were re-solved through a joint assessment until consensus was reached. The percentage of stenosisfor each vessel was listed in 5% increments.
Percent stenosis was measured using the Warfarin-Aspirin Symptomatic IntracranialDisease (WASID) method [21]. The percentage was calculated by MRA using a previousmethod as follows: (1) the most severe stenosis spot on the maximum-intensity projection oraxial source images was measured using the time-of-flight method; then, (2) we measuredat the widest, non-tortuous, normal portion of the petrous ICA parallel to the site ofstenosis [22]. Intracranial artery stenosis was evaluated on the side with the strongerstenosis. The degree of stenosis was categorized into two categories as severe stenosis (i.e.,≥70% stenosis [3] at specific segments of the intracranial artery: A1 or A2 segment of theACA, C1-C5 segment of the ICA, P1 or P2 segment of the PCA, and M1 or M2 segment ofthe MCA) and non-severe stenosis (i.e., <70% stenosis), based on a previous report [23].
2.3. Continuous Glucose Monitoring
The FreeStyle Libre Pro continuous glucose monitoring (FLP-CGM) system (AbbottLaboratories, Chicago, IL, USA) is an interstitial glucose monitoring device with an estab-lished accuracy [24]. The FLP sensor is disposable and inserted on the back of an upperextremity for up to 14 days. A unique feature of the sensor is that calibration is not re-quired using SMBG, and after it is removed, data can be downloaded, and glucose profilesevaluated. In this study, the mean glucose, standard deviation (SD), percent coefficient ofvariation (%CV) [25], and the mean amplitude of glycemic excursions (MAGE) [26] werecalculated to evaluate glucose fluctuation. Considering the concerns about the lack of theaccuracy of the date at day 1 [24], we used the data from day 2 to the end of recording
59
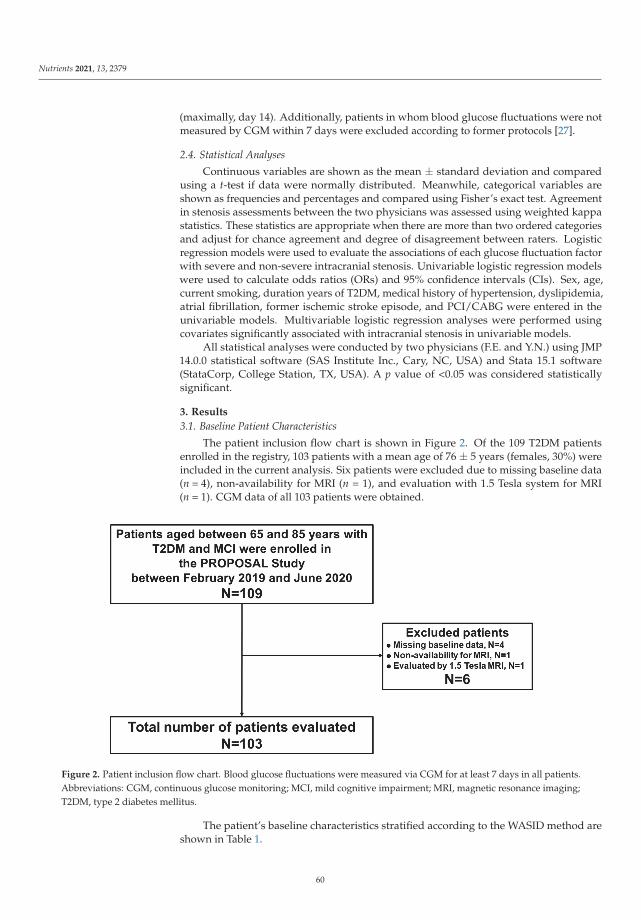
Nutrients 2021, 13, 2379
(maximally, day 14). Additionally, patients in whom blood glucose fluctuations were notmeasured by CGM within 7 days were excluded according to former protocols [27].
2.4. Statistical Analyses
Continuous variables are shown as the mean ± standard deviation and comparedusing a t-test if data were normally distributed. Meanwhile, categorical variables areshown as frequencies and percentages and compared using Fisher’s exact test. Agreementin stenosis assessments between the two physicians was assessed using weighted kappastatistics. These statistics are appropriate when there are more than two ordered categoriesand adjust for chance agreement and degree of disagreement between raters. Logisticregression models were used to evaluate the associations of each glucose fluctuation factorwith severe and non-severe intracranial stenosis. Univariable logistic regression modelswere used to calculate odds ratios (ORs) and 95% confidence intervals (CIs). Sex, age,current smoking, duration years of T2DM, medical history of hypertension, dyslipidemia,atrial fibrillation, former ischemic stroke episode, and PCI/CABG were entered in theunivariable models. Multivariable logistic regression analyses were performed usingcovariates significantly associated with intracranial stenosis in univariable models.
All statistical analyses were conducted by two physicians (F.E. and Y.N.) using JMP14.0.0 statistical software (SAS Institute Inc., Cary, NC, USA) and Stata 15.1 software(StataCorp, College Station, TX, USA). A p value of <0.05 was considered statisticallysignificant.
3. Results
3.1. Baseline Patient Characteristics
The patient inclusion flow chart is shown in Figure 2. Of the 109 T2DM patientsenrolled in the registry, 103 patients with a mean age of 76 ± 5 years (females, 30%) wereincluded in the current analysis. Six patients were excluded due to missing baseline data(n = 4), non-availability for MRI (n = 1), and evaluation with 1.5 Tesla system for MRI(n = 1). CGM data of all 103 patients were obtained.
Figure 2. Patient inclusion flow chart. Blood glucose fluctuations were measured via CGM for at least 7 days in all patients.Abbreviations: CGM, continuous glucose monitoring; MCI, mild cognitive impairment; MRI, magnetic resonance imaging;T2DM, type 2 diabetes mellitus.
The patient’s baseline characteristics stratified according to the WASID method areshown in Table 1.
60

Nutrients 2021, 13, 2379
Table 1. Baseline patient characteristics by degree of internal carotid artery siphon stenosis.
Intracranial Internal Carotid Artery Siphon Stenosis
Variables Severe (n = 8) Non-Severe (n = 95) p Value
Baseline demographicsFemale (%) 6 (75) 26 (27) 0.01Age, years 76 ± 5 76 ± 5 0.63Cerebrovascular risk factorsHypertension (%) 6 (75) 88 (93) 0.14Dyslipidemia (%) 8 (100) 83 (87) 0.59Current or past smoking (%) 3 (38) 54 (57) 0.46Atrial fibrillation (%) 1 (13) 16 (17) 1.00Medical history ofpercutaneous coronaryintervention or coronaryartery bypass grafting (%)
4 (50) 41 (44) 0.73
Ischemic stroke episode (%) 3 (38) 42 (45) 1.00Diabetes mellitusDuration, years 26 ± 10 23 ± 11 0.32HbA1c at registration, % 7.8 ± 0.9 7.5 ± 0.9 0.47Blood glucose at registration,mg/dL 136 ± 42 150 ± 42 0.54
Blood glucose (CGM average),mg/dL 148 ± 25 136 ± 28 0.19
SD, mg/dL 53 ± 12 39 ± 10 <0.01%CV 36 ± 7 29 ± 6 <0.01MAGE, mg/dL 114 ± 18 90 ± 23 <0.01
Continuous variables are shown as the mean (± SD), while categorical variables are shown as frequencies and percentages. Abbreviations:HbA1c, hemoglobin A1c; CGM, continuous glucose monitoring; SD, standard deviation; %CV, coefficient of variation; MAGE, meanamplitude of glycemic excursions.
3.2. Head Magnetic Resonance Angiography Findings
Of the 103 patients examined, 8 patients presented with severe (≥70%) ICA siphonstenosis (severe stenosis group: 8%), while 95 patients presented non-severe (<70%) ICAsiphon stenosis (non-severe stenosis group: 92%). Among these 95 patients, 48 and 47patients had moderate (50–70%) and mild (0–50%) ICA siphon stenosis, respectively. Arepresentative case of severe stenosis of the left ICA siphon on MRA is shown in Figure 3.
Except ICA siphon, severe stenoses (≥70%) were not observed in any other intracranialarteries. In addition, moderate stenoses (50–70%) were only observed at the M1 portion ofthe MCA in 3 of the 103 patients. Regarding the consistency of intracranial artery stenosisevaluation, the inter-rater agreement of the quadratic weighted kappa statistic for theevaluation of the vessels constituting the intracranial artery was 0.952, indicating highconsistency.
61
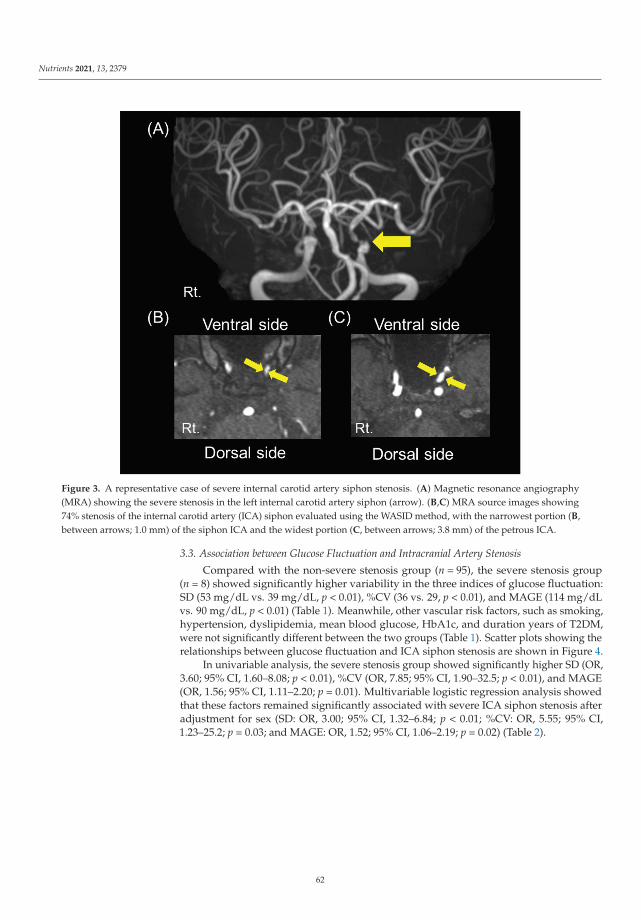
Nutrients 2021, 13, 2379
Figure 3. A representative case of severe internal carotid artery siphon stenosis. (A) Magnetic resonance angiography(MRA) showing the severe stenosis in the left internal carotid artery siphon (arrow). (B,C) MRA source images showing74% stenosis of the internal carotid artery (ICA) siphon evaluated using the WASID method, with the narrowest portion (B,between arrows; 1.0 mm) of the siphon ICA and the widest portion (C, between arrows; 3.8 mm) of the petrous ICA.
3.3. Association between Glucose Fluctuation and Intracranial Artery Stenosis
Compared with the non-severe stenosis group (n = 95), the severe stenosis group(n = 8) showed significantly higher variability in the three indices of glucose fluctuation:SD (53 mg/dL vs. 39 mg/dL, p < 0.01), %CV (36 vs. 29, p < 0.01), and MAGE (114 mg/dLvs. 90 mg/dL, p < 0.01) (Table 1). Meanwhile, other vascular risk factors, such as smoking,hypertension, dyslipidemia, mean blood glucose, HbA1c, and duration years of T2DM,were not significantly different between the two groups (Table 1). Scatter plots showing therelationships between glucose fluctuation and ICA siphon stenosis are shown in Figure 4.
In univariable analysis, the severe stenosis group showed significantly higher SD (OR,3.60; 95% CI, 1.60–8.08; p < 0.01), %CV (OR, 7.85; 95% CI, 1.90–32.5; p < 0.01), and MAGE(OR, 1.56; 95% CI, 1.11–2.20; p = 0.01). Multivariable logistic regression analysis showedthat these factors remained significantly associated with severe ICA siphon stenosis afteradjustment for sex (SD: OR, 3.00; 95% CI, 1.32–6.84; p < 0.01; %CV: OR, 5.55; 95% CI,1.23–25.2; p = 0.03; and MAGE: OR, 1.52; 95% CI, 1.06–2.19; p = 0.02) (Table 2).
62

Nutrients 2021, 13, 2379
Figure 4. Scatter plots showing relationships between glucose fluctuation and internal carotid artery siphon stenosis.Glucose fluctuations assessed by standard deviation (SD) (A), coefficient of validation (%CV) (B), and mean amplitude ofglycemic excursions (MAGE) (C) are significantly higher in the severe stenosis group than in the non-severe stenosis group(* p < 0.01).
Table 2. Multivariable analysis of influencing factors of stenosis adjusted for sex.
SD (10 mg/dL) %CV (/10) MAGE (10 mg/dL)
p Value p Value p Value
Crude OR(95% CI)
3.60(1.60–8.08) <0.01 7.85
(1.90–32.5) <0.01 1.56(1.11–2.20) 0.01
AdjustedOR
(95% CI)
3.00(1.32–6.84) <0.01 5.55
(1.23–25.2) 0.03 1.52(1.06–2.19) 0.02
Abbreviations: SD, standard deviation; CV, coefficient of variation; MAGE, mean amplitude of glycemic excur-sions; OR, odds ratio; CI, confidence interval.
As for the cases with moderate (50–70%) and mild (0–50%) ICA siphon stenosis, therewas no significant intergroup difference in all variables including SD, %CV, and MAGE(Table S1). There was also no significant intergroup difference in all variables includingSD, %CV, and MAGE for the cases with moderate (50–70%) and mild (0–50%) MCA M1stenosis (Table S2).
4. Discussion
The relationship between blood glucose fluctuation and intracranial artery stenosis inT2DM patients remains unclear. In this study, patients with severe ICA siphon stenosishad higher blood glucose fluctuations as assessed with SD, %CV, and MAGE. Meanwhile,there were no significant differences for other vascular risk factors, such as hypertension,dyslipidemia, mean blood glucose levels, HbA1c, and duration in years of T2DM. To ourbest knowledge, this is the first study to reveal the association between intracranial arterystenosis and glucose fluctuation.
63
Nutrients 2021, 13, 2379
There are several possible mechanisms by which blood glucose fluctuation causesthe atherosclerotic stenosis of the major intracranial arteries. Atherosclerosis is a complexmultifactorial disease and often causes diabetic macrovascular complications. Glucosefluctuation plays a key role in the development of atherosclerosis. One of the most commoncausative factors for atherosclerosis by glucose fluctuation is an increase in oxidativestress due to a rapid blood glucose change that causes vascular endothelial damage.Compared with chronic sustained hyperglycemia, glucose fluctuations induce a morespecific effect on oxidative stress [8]. Severe blood glucose fluctuation is known to lowerthe number of vascular endothelial progenitor cells [28]. Blood glucose fluctuation isalso correlated with carotid intima media thickness (IMT) [29], which is an indicator ofsubclinical atherosclerosis. Coronary plaque has been reported to be correlated withglucose fluctuation [30].
Additionally, glucose fluctuation usually includes hyperglycemia and hypoglycemia,and these are also associated with the presence and severity of cardiovascular disease in DMpatients [31]. Hyperglycemia increases the advanced glycation endproducts (AGEs), andthe binding of the AGEs to the receptor of AGEs induces oxidative stress and inflammationvia the NF-kappa B pathway, leading to atherosclerosis [32]. Furthermore, a meta-analysisby Liang et al. showed that minimizing glucose fluctuation improved insulin resistance andcarotid IMT thickness, thus lowering the risk of cardiovascular disease [33]. Reductions inglucose fluctuation by DPP-IV inhibitors can prevent atherosclerosis progression in T2DMpatients by lowering inflammation and oxidative stress [34].
However, there is still limited evidence on the association between glucose fluctuations andcerebrovascular lesions. Glucose is the primary energy source for the brain, and severe glucosefluctuations have been associated with numerous types of central nervous system damage [35].Several studies demonstrated that oxidative stress and inflammation due to blood glucosefluctuations impair the blood–brain barrier [36] or induce hypercoagulability and suppressionof the fibrinolytic system [37]. Blood glucose fluctuations also worsen the progression ofcerebral white matter lesions [38] and the prognosis of cerebral infarction [39,40]. Increasingevidence shows that glucose fluctuation significantly increases oxidative stress, leading toneuroinflammation and cognitive dysfunction [35]. However, the detailed mechanisms bywhich glucose fluctuation causes cerebrovascular lesions remain to be elucidated, highlightingthe need for further studies.
With respect to the site of the intracranial artery stenosis, our study showed thatintracranial artery stenosis particularly occurred at the siphon portion of the ICA. Fewstudies have examined the sites of intracranial artery stenosis. Atherosclerotic stenosisoften occurs at sites with complex hemodynamics, such as arteries with high curvature orbifurcations. A study on fluid dynamics in morphology identified three preferred sites ofstenoses along the carotid siphon with low and highly oscillatory wall shear stress [41].Another review showed that low and oscillatory shear stress is closely associated withatherogenesis [42]. In our study, stenosis was also found along the carotid siphon area.As for the degree of the intracranial artery stenosis, Mo et al. [7] assessed the relationshipbetween glucose fluctuation and degree of intracranial artery stenosis and found no sig-nificant relationship. However, stenosis was defined as more than 50% thickening of thearterial wall, and this could have affected the finding. A previous analysis of the predictorsof ischemic stroke in symptomatic intracranial arterial stenosis showed that patients with≥70% intracranial stenosis have a ≥2 times higher risk of stroke than patients with <70%stenosis [3]. In this context, we compared patients with severe intracranial stenosis (≥70%stenosis) and non-severe intracranial stenosis (<70%), and found a significant difference inglucose fluctuation between them.
In this study, the proportion of female patients was higher in the severe ICA siphonstenosis group than in the non-severe group in the univariable analysis. A prospectivemulticenter study of 2864 consecutive acute ischemic stroke patients in China reportedthat women aged >63 years were more likely to have intracranial artery stenosis thanmen [43]. This sex difference in the risk of intracranial artery stenosis is complex and
64

Nutrients 2021, 13, 2379
not easily explained. However, elderly women have more vascular risk factors, such asDM, hypertension and dyslipidemia, than elderly men [43]. Additionally, elderly femalesare more likely to have hormone imbalance. Low sex hormone–binding globulin levelsand high free androgen index are strongly associated with cardiovascular risk factors(DM, dyslipidemia and inflammation) in multiethnic premenopausal and perimenopausalwomen [44]. This could explain the sex difference for intracranial artery stenosis. However,in this study, multivariable logistic regression analysis adjusted for sex showed that SD,%CV, and MAGE were independent factors associated with severe ICA siphon stenosis,although there was a possibility that sex difference could have affected the tolerance ofvessel structural change.
Our findings support the idea that glucose fluctuation may help predict intracranialartery stenosis and accordingly direct preventive measures against ischemic stroke inT2DM patients. The rate of ischemic stroke episode was not significantly different betweensevere and non-severe ICA siphon stenosis. This may be due to the relatively small samplesize of patients with severe stenosis or because patients with ≥80% carotid artery stenosiswere excluded from the current study. However, identifying factors associated withsevere intracranial artery stenosis is important because patients with severe intracranialstenosis have the highest rate of recurrent stroke [2,3]. Furthermore, glucose fluctuationis also associated with early neurological deterioration and poor functional outcome inpatients with acute ischemic stroke [45]. Interventions for glucose fluctuation can preventintracranial artery stenosis and ischemic stroke in T2DM patients.
This study has some limitations that need to be considered when interpreting theresults. First, this was a cross-sectional study, and thus the causal association betweenglucose fluctuation and intracranial artery stenosis still needs to be clarified in studies withlonger follow-up. Second, this study was conducted at a single center that was specializedfor stroke and cardiovascular disease, and there was a relatively small number of patientswith severe intracranial stenosis. Multicenter studies with a larger sample size are neededto further confirm the association between glucose fluctuation and ICA siphon stenosis.Third, patients with ≥80% carotid artery stenosis were excluded in this study becausesevere carotid artery stenosis is known to affect cognitive function [18]. This may lead todifficulty in interpretation of the results due to poor diabetes control of dementia patients.Glycemic variability is correlated with carotid IMT, which is an indicator of subclinicalatherosclerosis [29]. Additionally, patients with intracranial artery stenosis tend to havecarotid artery stenosis [46]. It is assumed that patients with ≥80% carotid artery stenosishave greater glycemic variability. It is therefore necessary to conduct future studies that in-clude patients with carotid artery stenosis ≥80% along with a detailed neuropsychologicalassessment. Fourth, MRI may have lower accuracy than digital subtraction angiography(DSA) or computed tomography angiography (CTA) for evaluating stenosis. ICA siphon,where the stenosis was observed in this study, runs parallel to the axial images. Therefore,saturation of the blood signal may result in poor vessel delineation. However, some dia-betes patients have chronic renal failure, which sometimes makes it difficult to performDSA or CTA. Advances in vascular imaging technology are eagerly awaited.
5. Conclusions
Glucose fluctuation, as indicated by elevations in SD, %CV, and MAGE, is significantlyassociated with severe ICA siphon stenosis. Thus, glucose fluctuation can be a target ofpreventive therapies for intracranial artery stenosis and ischemic stroke.
Supplementary Materials: The following are available online at https://www.mdpi.com/article/10.3390/nu13072379/s1, Table S1. Baseline patient characteristics by degree of internal carotid arterysiphon stenosis. Table S2. Baseline patient characteristics by degree of middle cerebral artery stenosis.
Author Contributions: Conceptualization, K.W.; methodology, F.E. and K.W.; software, F.E. andY.N.; validation, F.E. and K.W.; formal analysis, F.E., K.N. (Kotaro Noda), Y.N. and K.N. (KunihiroNishimura); investigation, F.E. and A.T.; resources, F.E.; data curation, F.E., M.M. and A.T.; writing—
65

Nutrients 2021, 13, 2379
original draft preparation, F.E.; writing—review and editing, K.W., M.M., H.M., A.T., Y.H., Y.N.,K.N. (Kunihiro Nishimura), K.H. and M.I.; visualization, F.E. and K.W.; supervision, M.I.; projectadministration, K.W.; funding acquisition, K.H. All authors have read and agreed to the publishedversion of the manuscript.
Funding: This research was funded by Japan Agency for Medical Research and Development(AMED), grant number 18ek0210104h0001.
Institutional Review Board Statement: The study was conducted according to the guidelines of theDeclaration of Helsinki, and registered part of the PROPOSAL study, University Hospital MedicalInformation Network clinical trials database (UMIN000038546). The study was approved by theInstitutional Review Board of National Cerebral and Cardiovascular Center (approved numberM30-110-3).
Informed Consent Statement: Informed consent was obtained from all subjects involved in thestudy. Written informed consent has been obtained from the patients to publish this paper.
Data Availability Statement: The data presented in this study are available on request from thecorresponding author.
Acknowledgments: We are indebted to Yoko Ohashi and Sayaka Wada for their excellent secretarialassistance.
Conflicts of Interest: The authors declare no conflict of interest.
References
1. Cho, N.H.; Shaw, J.E.; Karuranga, S.; Huang, Y.; Fernandes, J.D.R.; Ohlrogge, A.W.; Malanda, B. IDF Diabetes Atlas: Globalestimates of diabetes prevalence for 2017 and projections for 2045. Diabetes Res. Clin. Pract. 2018, 138, 271–281. [CrossRef][PubMed]
2. Arenillas, J.F. Intracranial atherosclerosis: Current concepts. Stroke 2011, 42, S20–S23. [CrossRef]3. Kasner, S.E.; Chimowitz, M.I.; Lynn, M.J.; Howlett-Smith, H.; Stern, B.J.; Hertzberg, V.S.; Frankel, M.R.; Levine, S.R.; Chaturvedi,
S.; Benesch, C.G.; et al. Predictors of ischemic stroke in the territory of a symptomatic intracranial arterial stenosis. Circulation2006, 113, 555–563. [CrossRef]
4. Shitara, S.; Fujiyoshi, A.; Hisamatsu, T.; Torii, S.; Suzuki, S.; Ito, T.; Arima, H.; Shiino, A.; Nozaki, K.; Miura, K.; et al. Intracranialartery stenosis and its association with conventional risk factors in a general popilation of Japanese men. Stroke 2019, 50,2967–2969. [CrossRef] [PubMed]
5. Sun, Q.; Wang, Q.; Wang, X.; Ji, X.; Sang, S.; Shao, S.; Zhao, Y.; Xiang, Y.; Xue, Y.; Li, J.; et al. Prevalence and cardiovascular riskfactors of asymptomatic intracranial arterial stenosis: The Kongcun town study in Shandong, China. Eur. J. Neurol. 2020, 27,729–735. [CrossRef]
6. Wang, Y.-L.; Leng, X.-Y.; Dong, Y.; Hou, X.-H.; Tong, L.; Ma, Y.-H.; Xu, W.; Cui, M.; Dong, Q.; Tan, L.; et al. Fasting glucose andHbA1c levels as risk factors for the presence of intracranial atherosclerotic stenosis. Ann. Transl. Med. 2019, 7, 804. [CrossRef][PubMed]
7. Mo, Y.; Zhou, J.; Li, M.; Wang, Y.; Bao, Y.; Ma, X.; Li, D.; Lu, W.; Hu, C.; Li, M.; et al. Glycemic variability is associated withsubclinical atherosclerosis in Chinese type 2 diabetic patients. Cardiovasc. Diabetol. 2013, 12, 15. [CrossRef] [PubMed]
8. Monnier, L.; Mas, E.; Ginet, C.; Michel, F.; Villon, L.; Cristol, J.P.; Colette, C. Activation of oxidative stress by acute glucosefluctuations compared with sustained chronic hyperglycemia in patients with type 2 diabetes. JAMA 2006, 295, 1681–1687.[CrossRef]
9. Kaufman, F.R.; Gibson, L.C.; Halvorson, M.; Carpenter, S.; Fisher, L.K.; Pitukcheewanont, P. A pilot study of the continuousglucose monitoring system: Clinical decisions and glycemic control after its use in pediatric type 1 diabetic subjects. Diabetes Care2001, 24, 2030–2034. [CrossRef] [PubMed]
10. Chen, X.M.; Zhang, Y.; Shen, X.P.; Huang, Q.; Ma, H.; Huang, Y.L.; Zhang, W.Q.; Wu, H.J. Correlation between glucose fluctuationsand carotid intima-media thickness in type 2 diabetes. Diabetes Res. Clin. Pract. 2010, 90, 95–99. [CrossRef] [PubMed]
11. Gohbara, M.; Hibi, K.; Mitsuhashi, T.; Maejima, N.; Iwahashi, N.; Kataoka, S.; Akiyama, E.; Tsukahara, K.; Kosuge, M.; Ebina,T.; et al. Glycemic variability on continuous glucose monitoring system correlates with non-culprit vessel coronary plaquevulnerability in patients with first-episode acute coronary syndrome. Circ. J. 2016, 80, 202–210. [CrossRef]
12. Su, G.; Mi, S.; Tao, H.; Li, Z.; Yang, H.; Zheng, H.; Zhou, Y.; Ma, C. Association of glycemic variability and the presence andseverity of coronary artery disease in patients with type 2 diabetes. Cardiovasc. Diabetol. 2011, 10, 19. [CrossRef]
13. Takahashi, H.; Iwahashi, N.; Kirigaya, J.; Kataoka, S.; Minamimoto, Y.; Gohbara, M.; Abe, T.; Okada, K.; Matsuzawa, Y.; Konishi,M.; et al. Glycemic variability determined with a continuous glucose monitoring system can predict prognosis after acutecoronary syndrome. Cardiovasc. Diabetol. 2018, 17, 116. [CrossRef] [PubMed]
66

Nutrients 2021, 13, 2379
14. Matsubara, M.; Makino, H.; Washida, K.; Matsuo, M.; Koezuka, R.; Ohata, Y.; Tamanaha, T.; Honda-Kohmo, K.; Noguchi, M.;Tomita, T.; et al. A prospective longitudinal study on the relationship between glucose fluctuation and cognitive function in type2 diabetes: PROPOSAL Study Protocol. Diabetes Ther. 2020, 11, 2729–2737. [CrossRef]
15. Fujiwara, Y.; Suzuki, H.; Yasunaga, M.; Sugiyama, M.; Ijuin, M.; Sakuma, N.; Inagaki, H.; Iwasa, H.; Ura, C.; Yatomi, N.; et al.Brief screening tool for mild cognitive impairment in older Japanese: Validation of the Japanese version of the Montreal CognitiveAssessment. Geriatr. Gerontol. Int. 2010, 10, 225–232. [CrossRef] [PubMed]
16. Trzepacz, P.T.; Hochstetler, H.; Wang, S.; Walker, B.; Saykin, A.J.; The Alzheimer’s Disease Neuroimaging Initiative. Relationshipbetween the Montreal Cognitive Assessment and Mini-mental State Examination for assessment of mild cognitive impairment inolder adults. BMC Geriatr. 2015, 15, 107. [CrossRef] [PubMed]
17. North American Symptomatic Carotid Endarterectomy Trial Collaborators. Beneficial effect of carotid endarterectomy insymptomatic patients with high-grade carotid stenosis. N. Engl. J. Med. 1991, 325, 445–453. [CrossRef]
18. Marshall, R.S.; Pavol, M.A.; Cheung, Y.K.; Asllani, I.; Lazar, R.M. Cognitive impairment correlates linearly with mean flowvelocity by transcranial doppler below a definable threshold. Cerebrovasc. Dis. Extra 2020, 10, 21–27. [CrossRef]
19. Zwieten, A.; Wong, G.; Ruospo, M.; Palmer, S.C.; Barulli, M.R.; Iurillo, A.; Saglimbene, V.; Natale, P.; Gargano, L.; Murgo, M.;et al. Prevalence and patterns of cognitive impairment in adult hemodialysis patients: The COGNITIVE-HD study. Nephrol. Dial.Transplant. 2018, 33, 1197–1206. [CrossRef] [PubMed]
20. Fischer, E. Die Lageabweichungen de vorderen hirnarterie im gefaessbild. Zentralbl. Neurochir. 1938, 3, 300–313.21. Samuels, O.B.; Joseph, G.J.; Lynn, M.J.; Smith, H.A.; Chimowitz, M.I. A standardized method for measuring intracranial arterial
stenosis. AJNR 2000, 21, 643–646.22. Baradaran, H.; Patel, P.; Gialdini, G.; Al-Dasuqi, K.; Giambrone, A.; Kamel, H.; Gupta, A. Quantifying intracranial internal carotid
artery stenosis on MR angiography. AJNR 2017, 38, 986–990. [CrossRef]23. Turan, T.N.; Makki, A.A.; Tsappidi, S.; Cotsonis, G.; Lynn, M.J.; Cloft, H.J.; Chimowitz, M.I.; WASID investigators. Risk factors
associated with severity and location of intracranial arterial stenosis. Stroke 2010, 41, 1636–1640. [CrossRef] [PubMed]24. Bailey, T.; Bode, B.W.; Christiansen, M.P.; Klaff, L.J.; Alva, S. The performance and usability of a factory-calibrated flash glucose
monitoring system. Diabetes Technol. Ther. 2015, 17, 787–794. [CrossRef] [PubMed]25. Battelino, T.; Danne, T.; Bergenstal, R.M.; Amiel, S.A.; Beck, R.; Biester, T.; Bosi, E.; Buckingham, B.A.; Cefalu, W.T.; Close, K.L.;
et al. Clinical targets for continuous glucose monitoring data interpretation: Recommendations from the international consensuson time in range. Diabetes Care 2019, 42, 1593–1603. [CrossRef] [PubMed]
26. Marics, G.; Lendvai, Z.; Lódi, C.; Koncz, L.; Zakariás, D.; Schuster, G.; Mikos, B.; Hermann, C.; Szabó, A.J.; Tóth-Heyn, P.Evaluation of an open access software for calculating glucose variability parameters of a continuous glucose monitoring systemapplied at pediatric intensive care unit. Biomed. Eng. Online 2015, 14, 37. [CrossRef] [PubMed]
27. Matsuoka, A.; Hirota, Y.; Takeda, A.; Kishi, M.; Hashimoto, N.; Ohara, T.; Higo, S.; Yamada, H.; Nakamura, T.; Hamaguchi, T.;et al. Relationship between glycated hemoglobin level and duration of hypoglycemia in type 2 diabetes patients treated withsulfonylureas: A multicenter cross-sectional study. J. Diabetes Investig. 2020, 11, 417–425. [CrossRef]
28. Inaba, Y.; Tsutsumi, C.; Haseda, F.; Fujisawa, R.; Mitsui, S.; Sano, H.; Terasaki, J.; Hanafusa, T.; Imagawa, A. Impact of glycemicvariability on the levels of endothelial progenitor cells in patients with type 1 diabetes. Diabetol. Int. 2017, 9, 113–120. [CrossRef]
29. Di Flaviani, A.; Picconi, F.; Di Stefano, P.; Giordani, I.; Malandrucco, I.; Maggio, P.; Palazzo, P.; Sgreccia, F.; Peraldo, C.; Farina, F.;et al. Impact of glycemic and blood pressure variability on surrogate measures of cardiovascular outcomes in type 2 diabeticpatients. Diabetes Care 2011, 34, 1605–1609. [CrossRef]
30. Otowa-Suematsu, N.; Sakaguchi, K.; Komada, H.; Nakamura, T.; Sou, A.; Hirota, Y.; Kuroda, M.; Shinke, T.; Hirata, K.-I.; Ogawa,W. Comparison of the relationship between multiple parameters of glycemic variability and coronary plaque vulnerabilityassessed by virtual histology-intravascular ultrasound. J. Diabetes Investig. 2017, 9, 610–615. [CrossRef]
31. Papachristoforou, E.; Lambadiari, V.; Maratou, E.; Makrilakis, K. Association of glycemic indices (Hyperglycemia, Glucosevariability, and Hypoglycemia) with oxidative stress and diabetic complications. J. Diabetes Res. 2020, 7489795. [CrossRef]
32. Katakami, N. Mechanism of development of atherosclerosis and cardiovascular disease in diabetes mellitus. J. Atheroscler. Thromb.2018, 25, 27–39. [CrossRef]
33. Liang, S.; Yin, H.; Wei, C.; Xie, L.; He, H.; Liu, X. Glucose variability for cardiovascular risk factors in type 2 diabetes: Ameta-analysis. J. Diabetes Metab. Disord. 2017, 16, 45. [CrossRef]
34. Barbieri, M.; Rizzo, M.R.; Marfella, R.; Boccardi, V.; Esposito, A.; Pansini, A.; Paolisso, G. Decreased carotid atherosclerotic processby control of daily acute glucose fluctuations in diabetic patients treated by DPP-IV inhibitors. Atherosclerosis 2013, 227, 349–354.[CrossRef] [PubMed]
35. Watt, C.; Sanchez-Rangel, E.; Hwang, J.J. Glycemic variability and CNS inflammation: Reviewing the connection. Nutrients 2020,12, 3906. [CrossRef]
36. Sajja, R.K.; Cucullo, L. Altered glycaemia differentially modulates efflux transporter expression and activity in hCMEC/D3 cellline. Neurosci. Lett. 2015, 598, 59–65. [CrossRef] [PubMed]
37. Wada, S.; Yoshimura, S.; Inoue, M.; Matsuki, T.; Arihiro, S.; Koga, M.; Kitazono, T.; Makino, H.; Hosoda, K.; Ihara, M.; et al.Outcome prediction in acute stroke patients by continuous glucose monitoring. J. Am. Heart Assoc. 2018, 7, e008744. [CrossRef][PubMed]
67

Nutrients 2021, 13, 2379
38. Livny, A.; Ravona-Springer, R.; Heymann, A.; Priess, R.; Kushnir, T.; Tsarfaty, G.; Rabinov, L.; Moran, R.; Hoffman, H.; Cooper, I.;et al. Long-term variability in glycemic control is associated with white matter hyperintensities in APOE4 genotype carriers withtype 2 diabetes. Diabetes Care 2016, 39, 1056–1059. [CrossRef]
39. Hui, J.; Zhang, J.; Mao, X.; Li, Z.; Li, X.; Wang, F.; Wang, T.; Yuan, Q.; Wang, S.; Pu, M.; et al. The initial glycemic variability isassociated with early neurological deterioration in diabetic patients with acute ischemic stroke. Neurol. Sci. 2018, 39, 1571–1577.[CrossRef]
40. Naess, H.; Thomassen, L.; Waje-Andreassen, U.; Glad, S.; Kvistad, C.E. High risk of neurological worsening of lacunar infarction.Acta Neurol. Scand. 2019, 139, 143–149. [CrossRef]
41. Zhang, C.; Xie, S.; Li, S.; Pu, F.; Deng, X.; Fan, Y.; Li, D. Flow patterns and wall shear stress distribution in human internal carotidarteries: The geometric effect on the risk for stenoses. J. Biomech. 2012, 45, 83–89. [CrossRef]
42. Cecchi, E.; Giglioli, C.; Valente, S.; Lazzeri, C.; Gensini, G.F.; Abbate, R.; Mannini, L. Role of hemodynamic shear stress incardiovascular disease. Atherosclerosis 2011, 214, 249–256. [CrossRef]
43. Pu, Y.; Liu, L.; Wang, Y.; Zou, X.; Pan, Y.; Soo, Y.; Leung, T.; Zhao, X.; Wong, K.S.; Wang, Y.; et al. Geographic and sex difference inthe distribution of intracranial atherosclerosis in China. Stroke 2013, 44, 2109–2114. [CrossRef] [PubMed]
44. Sutton-Tyrrell, K.; Wildman, R.P.; Matthews, K.A.; Chae, C.; Lasley, B.L.; Brockwell, S.; Pasternak, R.C.; Lloyd-Jones, D.; Sowers,M.F.; Torréns, J.I.; et al. Sex-hormone-binding globulin and the free androgen index are related to cardiovascular risk factors inmultiethnic premenopausal and perimenopausal women enrolled in the Study of Woman across the Nation (SWAN). Circulation2005, 111, 1242–1249. [CrossRef] [PubMed]
45. Lee, S.H.; Kim, Y.; Park, S.Y.; Kim, C.; Kim, Y.J.; Sohn, J.H. Pre-stroke glycemic variability estimated by glycated albumin isassociated with early neurological deterioration and poor functional outcome in prediabetic patients with acute ischemic stroke.Cerebrovasc. Dis. 2021, 50, 26–33. [CrossRef] [PubMed]
46. Hoshino, T.; Sissani, L.; Labreuche, J.; Ducrocq, G.; Lavallée, P.C.; Meseguer, E.; Guidoux, C.; Cabrejo, L.; Hobeanu, C.; Gongora-Rivera, F.; et al. Prevalence of Systemic Atherosclerosis Burdens and Overlapping Stroke Etiologies and Their Associations withLong-term Vascular Prognosis in Stroke with Intracranial Atherosclerotic Disease. JAMA Neurol. 2018, 75, 203–211. [CrossRef]
68
nutrients
Article
Effects of Reducing L-Carnitine Supplementation on CarnitineKinetics and Cardiac Function in Hemodialysis Patients: AMulticenter, Single-Blind, Placebo-Controlled, RandomizedClinical Trial
Miki Sugiyama 1,2, Takuma Hazama 1, Kaoru Nakano 1, Kengo Urae 1, Tomofumi Moriyama 1, Takuya Ariyoshi 1,
Yuka Kurokawa 1, Goh Kodama 1, Yoshifumi Wada 3, Junko Yano 1,4, Yoshihiko Otsubo 5, Ryuji Iwatani 6,
Yukie Kinoshita 7, Yusuke Kaida 1, Makoto Nasu 1, Ryo Shibata 1, Kyoko Tashiro 7 and Kei Fukami 1,*
Citation: Sugiyama, M.; Hazama, T.;
Nakano, K.; Urae, K.; Moriyama, T.;
Ariyoshi, T.; Kurokawa, Y.; Kodama,
G.; Wada, Y.; Yano, J.; et al. Effects of
Reducing L-Carnitine
Supplementation on Carnitine
Kinetics and Cardiac Function in
Hemodialysis Patients: A Multicenter,
Single-Blind, Placebo-Controlled,
Randomized Clinical Trial. Nutrients
2021, 13, 1900. https://doi.org/
10.3390/nu13061900
Academic Editor:
Yoshihiro Fukumoto
Received: 8 May 2021
Accepted: 28 May 2021
Published: 31 May 2021
Publisher’s Note: MDPI stays neutral
with regard to jurisdictional claims in
published maps and institutional affil-
iations.
Copyright: © 2021 by the authors.
Licensee MDPI, Basel, Switzerland.
This article is an open access article
distributed under the terms and
conditions of the Creative Commons
Attribution (CC BY) license (https://
creativecommons.org/licenses/by/
4.0/).
1 Division of Nephrology, Department of Medicine, Kurume University School of Medicine, Kurume,Fukuoka 830-0011, Japan; [email protected] (M.S.);[email protected] (T.H.); [email protected] (K.N.);[email protected] (K.U.); [email protected] (T.M.);[email protected] (T.A.); [email protected] (Y.K.);[email protected] (G.K.); [email protected] (J.Y.);[email protected] (Y.K.); [email protected] (M.N.);[email protected] (R.S.)
2 Sugi Hospital, Omuta, Fukuoka 837-0916, Japan3 Wada Cardiovascular Clinic, Tosu, Saga 841-0071, Japan; [email protected] Kurume Ekimae Clinic, Kurume, Fukuoka 830-0023, Japan5 Shin Koga Clinic, Kurume, Fukuoka 830-0033, Japan; [email protected] Koga 21 Hospital, Kurume, Fukuoka 839-0801, Japan; [email protected] Research Institute of Medical Mass Spectrometry, Kurume University School of Medicine, Kurume,
Fukuoka 830-0011, Japan; [email protected] (Y.K.);[email protected] (K.T.)
* Correspondence: [email protected]; Tel.: +81-942317002
Abstract: L-carnitine (LC) supplementation improves cardiac function in hemodialysis (HD) patients.However, whether reducing LC supplementation affects carnitine kinetics and cardiac functionin HD patients treated with LC remains unclear. Fifty-nine HD patients previously treated withintravenous LC 1000 mg per HD session (three times weekly) were allocated to three groups: LCinjection three times weekly, once weekly, and placebo, and prospectively followed up for six months.Carnitine fractions were assessed by enzyme cycling methods. Plasma and red blood cell (RBC)acylcarnitines were profiled using tandem mass spectrometry. Cardiac function was evaluated usingechocardiography and plasma B-type natriuretic peptide (BNP) levels. Reducing LC administrationto once weekly significantly decreased plasma carnitine fractions and RBC-free carnitine levelsduring the study period, which were further decreased in the placebo group (p < 0.001). PlasmaBNP levels were significantly elevated in the placebo group (p = 0.03). Furthermore, changes in RBC(C16 + C18:1)/C2 acylcarnitine ratio were positively correlated with changes in plasma BNP levels(β = 0.389, p = 0.005). Reducing LC administration for six months significantly decreased both plasmaand RBC carnitine levels, while the full termination of LC increased plasma BNP levels; however, itdid not influence cardiac function in HD patients.
Keywords: acylcarnitine; brain natriuretic peptide; cardiac function; cardiomyopathy; carnitinedeficiency; CPT2; end-stage kidney disease; free fatty acid; heart failure; hemodialysis
1. Introduction
Heart failure (HF), as well as some of its complications, such as pulmonary edema,is a serious condition characterized by decreased myocardial contractility and abnormalhemodynamic state in patients with end-stage kidney disease (ESKD). The United States
Nutrients 2021, 13, 1900. https://doi.org/10.3390/nu13061900 https://www.mdpi.com/journal/nutrients69

Nutrients 2021, 13, 1900
Renal Data System revealed that an estimated 44% of patients on hemodialysis (HD) havechronic HF (CHF), and 5.4% of HD patients die of chronic HF [1] (https://render.usrds.org/2016/view/v2_09.aspx. Accessed date: 8 May 2021). The Japanese Society of DialysisTransplantation has reported that HF is the most common cause of death in patientsundergoing dialysis [2]. Furthermore, CHF is associated with impairments in activities ofdaily living and quality of life in HD patients [3]. Taken together, the prevention of HFdevelopment is a crucial therapeutic strategy for HD patients worldwide.
Carnitine is a natural substance that plays an important role in fatty acid β-oxidationand energy production in mitochondria [4]. Organic cation/carnitine transporter 2 (OCTN2)is capable of transporting free carnitine into the cytoplasm. In addition, carnitine palmitoyl-transferase 1 (CPT1) and CPT2 are the mitochondrial outer and inner membrane enzymes,respectively. These enzymes are responsible for delivering long-chain fatty acids into mito-chondria, leading to β-oxidation and ATP synthesis. A lack of carnitine and dysfunction ofOCTN2 and/or CPT2 results in the inability to produce energy from long-chain fatty acids,leading to the development of cardiomyopathy [5,6]. We, along with others, reported thatserum carnitine levels are significantly decreased in HD patients due to the elimination ofserum carnitine from the blood via HD [7,8]. Accordingly, HD-related carnitine deficiencymay be one of the causative factors for the progression of HF in patients with ESKD. Ameta-analysis demonstrated that L-carnitine (LC) supplementation may improve clinicalsymptoms and cardiac function and decrease serum levels of B-type natriuretic peptide(BNP) and NT-proBNP in patients with CHF [9]. Furthermore, LC supplementation fora year might improve cardiac function in HD patients [10], suggesting that LC treatmentmay have protective effects on HF in HD patients with carnitine deficiency.
In a recent study, we observed that plasma carnitine concentration is approximatelyten-fold higher in HD patients treated with intravenous LC administration at a dose of1000 mg three times weekly than in those receiving no LC treatment. This finding couldbe related to the fact that circulating carnitine cannot be excreted in urine and can onlybe eliminated by dialysis [11]. Furthermore, six months of intravenous LC treatment at adose of 2000 mg per HD session increased muscle carnitine concentration by three-foldin HD patients [12]. However, the kinetics of serum carnitine fractions and changes incardiac function after reducing or stopping LC treatment in HD patients remain unknown.Therefore, we prospectively examined the effects of reducing or stopping LC therapy oncarnitine concentrations in plasma and red blood cells (RBCs) and cardiac function in HDpatients treated with LC.
2. Materials and Methods
2.1. Patients and Study Protocol
This multicenter, single-blind, placebo-controlled, randomized clinical trial was con-ducted at Kurume University Hospital, Sugi Hospital, Wada Cardiovascular Clinic, Ku-rume Ekimae Clinic, Shin Koga Clinic, and Koga 21 Hospital. We recruited a total of 64HD patients from December 2018 to June 2020. Patients over 20 years of age with ESKDundergoing HD who could provide written informed consent for study participation wereenrolled in this study. All patients had already been diagnosed with dialysis-associatedsecondary carnitine deficiency and had been administered intravenous LC at a dose of1000 mg per HD session three times weekly for at least three months. The exclusioncriteria were as follows: under 20 years of age, unstable lower limb cramps and generalfatigue, hemoglobin (Hb) levels below 10 g/dL, and patients deemed to have inadequateinformation by a physician.
Six months after the registration period, seven patients were excluded before random-ization. Among these seven patients, one had Hb levels below 10 g/dL, one did not receiveLC, one was referred to another clinic, and four had been administered LC once weekly(Figure 1). The remaining 57 patients were finally included and randomly assigned usingsimple randomization procedures (computer-generated list of random numbers) by theclinical research coordinator (CRC). They were allocated to LC 1000 mg (5 mL) three times
70

Nutrients 2021, 13, 1900
weekly (LC-3) (n = 19), LC 1000 mg once and placebo (saline 5 mL) twice weekly (LC-1)(n = 18), or placebo three times weekly (LC-0) (n = 20) groups (Figure 1).
Figure 1. CONSORT flow diagram of this trial. Sixty-four hemodialysis patients were assessed for eligibility, and 57 wererandomized and allocated to LC 3/week, LC 1/week + placebo 2/week, and placebo 3/week groups and followed up forsix months. Hb: hemoglobin; LC: L-carnitine.
The participants were blinded to the intervention after the assignment. At baseline,30 days, 90 days, and 176 days of the study period, patients provided a complete history andunderwent physical examination, including blood pressure (BP) and blood chemistry test,just before HD sessions at two-day intervals. The study protocol is shown in Figure 2. Alldata and samples were collected by the CRC at Kurume University Hospital. The patientswere dialyzed for 4–5 h with high-flux dialyzers three times weekly. All patients received1000 mg of LC intravenously immediately after HD sessions. The primary endpoint wasthe effects of dose reduction or discontinuation of LC on the kinetics of plasma and RBCcarnitine concentration and cardiac function. Additional analyses were performed toevaluate changes in plasma BNP levels before and after the study period.
2.2. Clinical, Demographic, and Anthropometric Measurements
The patients’ medical histories were ascertained using a questionnaire. Vigorousphysical activity and smoking were avoided for at least 30 min before HD sessions. Bloodwas drawn from an arteriovenous shunt just before starting the HD sessions to determineHb, total protein, serum albumin, total cholesterol, low-density lipoprotein cholesterol,blood urea nitrogen, calcium, and phosphate levels. These parameters were analyzed bycommercially available laboratories (Daiichi Pure Chemicals, Tokyo, Japan, and Wako PureChemical Industries, Osaka, Japan). Plasma BNP was measured using a chemilumines-cent immunoassay (CRC Corporation, Fukuoka, Japan). Plasma carnitine fraction (totalcarnitine, free carnitine, and acylcarnitine) levels were determined by an enzymatic cyclingmethod, as previously described [13]. Free carnitine and acylcarnitines in plasma and RBCwere profiled using tandem mass spectrometry at baseline, 30 days, 90 days, and 176 daysafter beginning the study, according to a previously described method [14,15]. Changes inplasma BNP and acylcarnitine ratio were defined as the differences between the baselinevalues (pre-data) and those at 176 days (post-data). Changes in these data were calculatedusing the following formula: (post-data–pre-data)/pre-data × 100 (%).
71
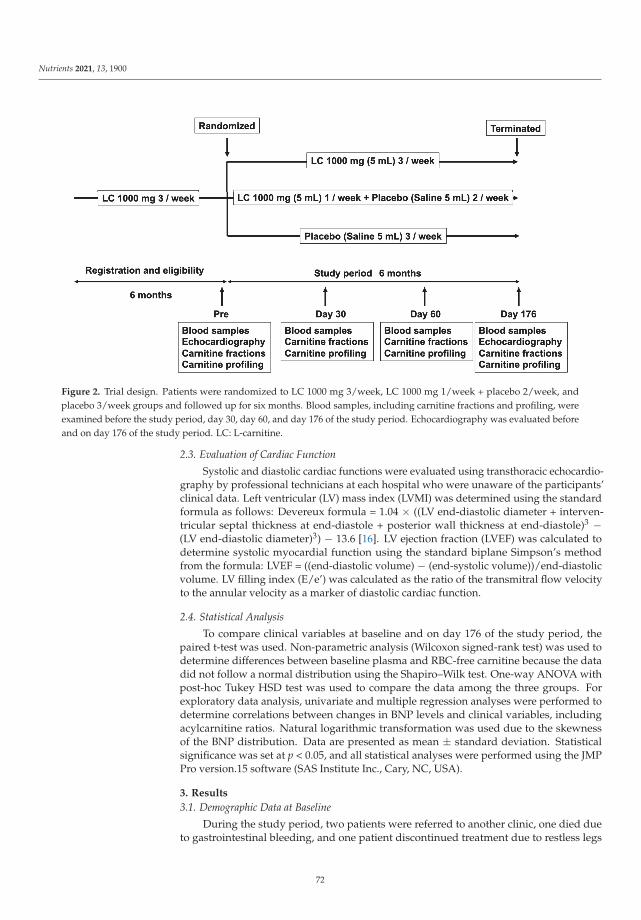
Nutrients 2021, 13, 1900
Figure 2. Trial design. Patients were randomized to LC 1000 mg 3/week, LC 1000 mg 1/week + placebo 2/week, andplacebo 3/week groups and followed up for six months. Blood samples, including carnitine fractions and profiling, wereexamined before the study period, day 30, day 60, and day 176 of the study period. Echocardiography was evaluated beforeand on day 176 of the study period. LC: L-carnitine.
2.3. Evaluation of Cardiac Function
Systolic and diastolic cardiac functions were evaluated using transthoracic echocardio-graphy by professional technicians at each hospital who were unaware of the participants’clinical data. Left ventricular (LV) mass index (LVMI) was determined using the standardformula as follows: Devereux formula = 1.04 × ((LV end-diastolic diameter + interven-tricular septal thickness at end-diastole + posterior wall thickness at end-diastole)3 −(LV end-diastolic diameter)3) − 13.6 [16]. LV ejection fraction (LVEF) was calculated todetermine systolic myocardial function using the standard biplane Simpson’s methodfrom the formula: LVEF = ((end-diastolic volume) − (end-systolic volume))/end-diastolicvolume. LV filling index (E/e’) was calculated as the ratio of the transmitral flow velocityto the annular velocity as a marker of diastolic cardiac function.
2.4. Statistical Analysis
To compare clinical variables at baseline and on day 176 of the study period, thepaired t-test was used. Non-parametric analysis (Wilcoxon signed-rank test) was used todetermine differences between baseline plasma and RBC-free carnitine because the datadid not follow a normal distribution using the Shapiro–Wilk test. One-way ANOVA withpost-hoc Tukey HSD test was used to compare the data among the three groups. Forexploratory data analysis, univariate and multiple regression analyses were performed todetermine correlations between changes in BNP levels and clinical variables, includingacylcarnitine ratios. Natural logarithmic transformation was used due to the skewnessof the BNP distribution. Data are presented as mean ± standard deviation. Statisticalsignificance was set at p < 0.05, and all statistical analyses were performed using the JMPPro version.15 software (SAS Institute Inc., Cary, NC, USA).
3. Results
3.1. Demographic Data at Baseline
During the study period, two patients were referred to another clinic, one died dueto gastrointestinal bleeding, and one patient discontinued treatment due to restless legs
72

Nutrients 2021, 13, 1900
syndrome. Two patients were excluded from the study because RBC acylcarnitine levelswere not measured. Finally, a total of 51 patients completed the treatment in the groups:LC-3 group (n = 18), LC-1 group (n = 16), and LC-0 group (n = 17) (Figure 1). No significantadverse events related to LC treatment stoppage were observed during the study period.No significant differences in age, HD duration, duration of previous LC treatment, or otherclinical parameters, except for phosphate, were observed among the groups. The baselinephosphate level was higher in the LC-0 group than in the LC-1 group (p = 0.038) (Table 1).The baseline plasma total and free carnitines, acylcarnitine, and RBC-free carnitine levelswere extremely high in all groups and were not different among the groups. The baselinefree carnitine levels in RBCs were significantly higher than those in plasma in patientsassessed by tandem mass spectrometry (462 ± 215, 293 ± 66 μmol/L, p < 0.0001). Thebaseline cardiac function and BNP levels were not different among the study groups.
Table 1. Clinical characteristics at baseline.
LC 3 Times/w(LC-3)
LC 1 Time/w +Placebo 2 Times/w
(LC-1)
Placebo 3Times/w
(LC-0)
p(LC-3 vs.
LC-1)
p(LC-3 vs.
LC-0)
p(LC-1 vs.
LC-0)
Number 18 16 17 N/AAge
(years) 64.5 ± 13.3 69.4 ± 12.7 69.5 ± 9.8 0.471 0.438 0.999
Sex (no.)(male/female) 12/6 10/6 10/7 N/A
HD duration (months) 178 ± 91 150 ± 95 164 ± 120 0.721 0.916 0.926Duration of LC
treatment(months)
40 ± 21 35 ± 21 44 ± 27 0.788 0.860 0.484
Body weight(kg) 61.0 ± 13.2 57.4 ± 11.0 54.6 ± 10.7 0.656 0.249 0.765
Systolic BP(mmHg) 151 ± 27 141 ± 31 145 ± 24 0.516 0.792 0.892
Hemoglobin(g/dL) 11.2 ± 0.9 11.4 ± 0.7 11.7 ± 0.9 0.853 0.263 0.577
Total protein(g/dL) 6.26 ± 0.46 6.30 ± 0.51 6.45 ± 0.39 0.967 0.427 0.598
Serum albumin(g/dL) 3.57 ± 0.36 3.49 ± 0.27 3.54 ± 0.27 0.701 0.952 0.870
Total cholesterol(mg/dL) 164 ± 31 155 ± 28 159 ± 29 0.699 0.901 0.925
LDL-cholesterol(mg/dL) 89 ± 21 81 ± 20 88 ± 22 0.445 0.967 0.602
BUN(mg/dL) 56.6 ± 11.8 52.2 ± 14.0 61.5 ± 16.1 0.633 0.554 0.145
Corrected Ca(mg/dL) 8.73 ± 0.65 8.63 ± 0.39 8.49 ± 0.45 0.849 0.362 0.707
Phosphate(mg/dL) 4.64 ± 0.86 4.05 ± 0.90 4.97 ± 1.30 0.236 0.616 0.038
Plasma total carnitine(μmol/L) 454 ± 128 424 ± 119 466 ± 117 0.761 0.948 0.580
Plasma free carnitine(μmol/L) 270 ± 44 264 ± 40 284 ± 43 0.901 0.601 0.365
Plasma acylcarnitine(μmol/L) 183 ± 91 160 ± 83 182 ± 81 0.712 0.999 0.742
Acyl/free ratio 0.66 ± 0.24 0.59 ± 0.21 0.62 ± 0.21 0.633 0.909 0.872RBC-free carnitine
(μmol/L) 407 ± 203 456 ± 215 525 ± 224 0.781 0.242 0.629LVEF(%) 65.3 ± 13.9 65.5 ± 10.1 65.8 ± 7.3 0.999 0.990 0.996E/e’ 13.9 ± 6.0 14.2 ± 7.1 13.2 ± 5.7 0.990 0.942 0.894
LVMI(g/m2) 122 ± 26 108 ± 23 115 ± 44 0.420 0.786 0.817
BNP †
(pg/mL) 317 (34–1150) 424 (15–1380) 460 (44–1440) 0.866 0.541 0.858
Acyl/free: acylcarnitine/free carnitine; BNP: B-type natriuretic peptide; BUN: blood urea nitrogen; Ca: calcium; E/e’: ratio of earlytransmitral velocity E to mitral annular early diastolic velocity e′; HD: hemodialysis; LC: L-carnitine; LVMI: left ventricular mass index;LDL: low-density lipoprotein; RBC: red blood cell. † Because of the skewness of the BNP distribution, a natural logarithmic transformationwas used for analysis.
73

Nutrients 2021, 13, 1900
3.2. Effects of Reducing or Stopping LC Administration on Clinical Variables andCarnitine Fractions
In Table 2, the comparison of clinical variables and carnitine fractions between baselineand day 176 of the study period is represented by the p-value. After the study period,body weight significantly decreased and the total protein, albumin, and total and LDL-cholesterol levels in the serum increased in the LC-3 group rather than the LC-1 and LC-0groups (Table 2).
Table 2. Clinical characteristics at baseline and day 176 of the study period.
LC 3 Times/w LC 1 Time/w + Placebo 2 Times/w Placebo 3 Times/w
Pre Day 176 p Pre Day 176 p Pre Day 176 p
Body weight(kg) 61.0 ± 13.2 60.0 ± 13.0 0.036 57.4 ± 11.0 56.8 ± 10.4 0.063 54.6 ± 10.7 54.4 ± 11.2 0.555
Systolic BP(mmHg) 151 ± 27 154 ± 25 0.613 141 ± 31 149 ± 30 0.149 145 ± 24 140 ± 24 0.416
Hemoglobin(g/dL) 11.2 ± 0.9 11.0 ± 0.8 0.472 11.4 ± 0.7 11.2 ± 0.8 0.455 11.7 ± 0.9 11.4 ± 1.2 0.274
Total protein(g/dL) 6.26 ± 0.46 6.38 ± 0.43 0.043 6.30 ± 0.51 6.40 ± 0.40 0.377 6.45 ± 0.39 6.31 ± 0.40 0.079
Serum albumin(g/dL) 3.57 ± 0.36 3.67 ± 0.37 0.012 3.49 ± 0.27 3.50 ± 0.26 0.849 3.54 ± 0.27 3.50 ± 0.30 0.311
Total cholesterol(mg/dL) 164 ± 31 169 ± 30 0.044 155 ± 28 157 ± 24 0.765 159 ± 29 157 ± 30 0.573
LDL-cholesterol(mg/dL) 89 ± 21 96 ± 20 0.002 81 ± 20 83 ± 18 0.522 88 ± 22 87 ± 22 0.908
BUN(mg/dL) 56.6 ± 11.8 60.1 ± 12.6 0.052 52.2 ± 14.0 57.8 ± 16.5 0.065 61.5 ± 16.1 65.4 ± 19.0 0.211
Corrected Ca(mg/dL) 8.73 ± 0.65 8.78 ± 0.56 0.655 8.63 ± 0.39 8.73 ± 0.40 0.426 8.49 ± 0.45 8.48 ± 0.51 0.961
Phosphate(mg/dL) 4.64 ± 0.86 4.99 ± 0.76 0.180 4.05 ± 0.90 4.32 ± 1.21 0.373 4.97 ± 1.30 4.93 ± 1.36 0.910
Plasma totalcarnitine(μmol/L)
454 ± 128 431 ± 117 0.318 424 ± 119 143 ± 37 <0.0001 466 ± 117 66 ± 20 <0.0001
Plasma freecarnitine(μmol/L)
270 ± 44 260 ± 44 0.383 264 ± 40 93 ± 28 <0.0001 284 ± 43 41 ± 14 <0.0001
Plasmaacylcarnitine
(μmol/L)183 ± 91 171 ± 87 0.348 160 ± 83 50 ± 12 <0.0001 182 ± 81 25 ± 8 <0.0001
Acyl/free ratio 0.66 ± 0.24 0.65 ± 0.26 0.955 0.59 ± 0.21 0.56 ± 0.15 0.631 0.62 ± 0.21 0.62 ± 0.14 0.963RBC-freecarnitine(μmol/L)
407 ± 203 418 ± 157 0.717 456 ± 215 179 ± 80 <0.0001 525 ± 224 50 ± 21 <0.0001
Acyl/free: acylcarnitine/free carnitine; BP: blood pressure; BUN: blood urea nitrogen; Ca: calcium; LC: L-carnitine; LDL: low-densitylipoprotein; RBC: red blood cell.
Significant decreases in the plasma total carnitine, free carnitine, and acylcarnitinelevels assessed by enzyme cycling methods were observed at 30 days after reducing orstopping LC administration. In addition, all carnitine fraction levels were further reducedat 90 and 176 days in the LC-1 and LC-0 groups (p < 0.0001) (Figure 3A–C). Significantdifferences in plasma carnitine fraction levels between the LC-1 and LC-0 groups weresimilarly observed in this study (Figure 3A–C). The acyl/free carnitine ratio was notaffected by the reduction or cessation of LC therapy during the study (Figure 3D).
In addition, we examined free carnitine levels in RBCs, reflecting tissue carnitinelevels. Free carnitine levels in RBCs were decreased in the LC-1 and LC-0 groups comparedwith those in the LC-3 group during the study (p < 0.0001) (Figure 4). Similarly, there was asignificant difference in free carnitine levels in RBCs between the LC-1 and LC-0 groupsduring the study (Figure 4).
74

Nutrients 2021, 13, 1900
Figure 3. Kinetics of plasma total carnitine, free carnitine, acylcarnitine levels, and acyl/free carnitine ratio during the study.(A) plasma total carnitine levels; (B) plasma free carnitine levels; (C) plasma acylcarnitine levels; (D) acyl/free carnitineratio. LC-3: LC 1000 mg three times weekly; LC-1: LC 1000 mg once and placebo (saline 5 mL) twice weekly; LC-0: placebothree times weekly (LC-0). **** p < 0.0001 vs. LC-3; ## p < 0.01; ### p < 0.001; #### p < 0.0001 vs. LC-0.
Figure 4. Kinetics of RBC-free carnitine level during the study. LC-3: LC 1000 mg three times weekly; LC-1: LC 1000 mgonce and placebo (saline 5 mL) twice weekly; LC-0: placebo three times weekly (LC-0). **** p < 0.0001 vs. LC-3; # p < 0.05;### p < 0.001; #### p < 0.0001 vs. LC-0.
3.3. Effects of Reducing or Stopping LC Administration on Cardiac Function and PlasmaBNP Levels
Reducing or stopping LC administration did not change systolic and diastolic cardiacfunctions assessed by LVEF and E/e’, respectively. There was no difference in LVMI beforeand after the study period in any of the groups. However, only stopping LC treatment forsix months significantly increased BNP levels (p = 0.03) (Table 3).
75

Nutrients 2021, 13, 1900
Table 3. Effects of reducing or stopping LC treatment on LV function, LVMI, and BNP levels.
LC 3 Times/w LC 1 Time/w + Placebo 2 Times/w Placebo 3 Times/w
Pre Day 176 p Pre Day 176 p Pre Day 176 p
LVEF(%) 65.3 ± 13.9 63.7 ± 10.8 0.446 65.5 ± 10.1 65.4 ± 7.6 0.967 65.8 ± 7.3 65.3 ± 7.4 0.774
E/e’ 13.9 ± 6.0 14.1 ± 7.0 0.737 14.2 ± 7.1 14.0 ± 6.2 0.893 13.2 ± 5.7 15.1 ± 8.9 0.224LVMI
(g/m2) 122 ± 26 129 ± 33 0.330 108 ± 23 107 ± 39 0.873 115 ± 44 120 ± 44 0.207
BNP †
(pg/mL)317
(34–1150)396
(51–1270) 0.255 424(15–1380)
433(57–1580) 0.422 460
(44–1440)631
(44–1450) 0.030
BNP: B-type natriuretic peptide; E/e’: ratio of early transmitral velocity E to mitral annular early diastolic velocity e′; LC: L-carnitine; LV:left ventricular; LVMI: left ventricular mass index. † Because of the skewness of the BNP distribution, a natural logarithmic transformationwas used for analysis.
3.4. Correlations between Changes in BNP Levels and Clinical Variables and Acylcarnitine Ratios
To further explore which variables could be independently associated with BNP levels,we assessed correlations between changes in BNP and clinical variables and acylcarnitineratios, such as (C16 + C18:1)/C2, a marker of CPT2 deficiency; C0/(C16 + C18), a marker ofCPT1 deficiency; C8/C10, a marker of medium-chain acyl-CoA dehydrogenase deficiency;and C14/C3, another marker of CPT2 deficiency, by univariate and multiple regressionanalyses in all HD patients. We speculated that independent determinants of the changes inBNP might be involved in the pathogenesis of carnitine deficiency-associated HF. Changesin systolic BP were positively associated with changes in BNP levels (β = 0.373, SE = 0.152,p = 0.007) (Table 4). Changes in plasma (C16 + C18:1)/C2, C0/(C16 + C18), C8/C10, andC14/C3 were not associated with changes in BNP levels (Table 4) (Figure 5A). Althoughchanges in RBC C0/(C16 + C18), C8/C10, and C14/C3 were not associated with BNP,changes in RBC (C16 + C18:1)/C2 were positively correlated with changes in BNP levels(β = 0.398, SE = 0.283, p = 0.005) (Table 4) (Figure 5B). Both changes in systolic BP and RBC(C16 + C18:1)/C2 were the sole independent determinants of changes in BNP levels inthese patients (R2 = 0.259) (Table 4).
Table 4. Univariate and multiple regression analyses for the covariates of changes in BNP.
Univariate Regression Multiple Regression
β SE p β SE p
ΔBody weight 0.069 0.024 0.630ΔSystolic blood pressure 0.373 0.152 0.007 0.331 0.109 0.011
ΔHemoglobin −0.077 0.097 0.590ΔTotal protein −0.038 0.051 0.789
ΔAlbumin −0.032 0.052 0.826ΔTotal cholesterol 0.000 0.095 0.999ΔLDL-cholesterol −0.106 0.145 0.461
ΔBlood urea nitrogen −0.220 0.180 0.121ΔCorrected Ca 0.011 0.051 0.441
ΔPhosphate −0.144 0.285 0.312ΔPlasma total carnitine −0.114 0.349 0.427ΔPlasma free carnitine −0.135 0.344 0.345ΔPlasma acylcarnitine −0.063 0.352 0.661
ΔAcyl/Free ratio 0.229 0.233 0.110ΔPlasma
(C16 + C18:1)/C2 0.219 1.191 0.123
ΔPlasmaC0/(C16 + C18) −0.156 1458.7 0.273
ΔPlasma C8/C10 −0.206 0.160 0.147ΔPlasma C14/C3 0.016 2.451 0.912
ΔRBC(C16 + C18:1)/C2 0.389 0.283 0.005 0.350 0.058 0.007
ΔRBCC0/(C16 + C18) −0.131 0.282 0.359ΔRBC C8/C10 −0.154 0.218 0.281ΔRBC C14/C3 0.160 0.923 0.160
R2 = 0.259. Acyl/free: acylcarnitine/free carnitine; BNP: B-type natriuretic peptide; Ca: calcium; Δ: delta; LDL:low-density lipoprotein; RBC: red blood cell.
76
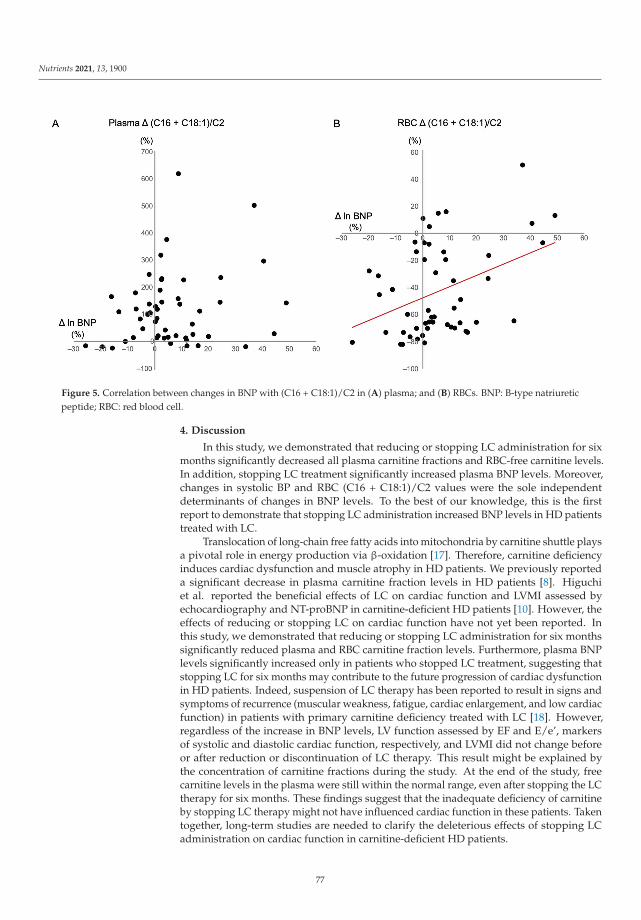
Nutrients 2021, 13, 1900
Figure 5. Correlation between changes in BNP with (C16 + C18:1)/C2 in (A) plasma; and (B) RBCs. BNP: B-type natriureticpeptide; RBC: red blood cell.
4. Discussion
In this study, we demonstrated that reducing or stopping LC administration for sixmonths significantly decreased all plasma carnitine fractions and RBC-free carnitine levels.In addition, stopping LC treatment significantly increased plasma BNP levels. Moreover,changes in systolic BP and RBC (C16 + C18:1)/C2 values were the sole independentdeterminants of changes in BNP levels. To the best of our knowledge, this is the firstreport to demonstrate that stopping LC administration increased BNP levels in HD patientstreated with LC.
Translocation of long-chain free fatty acids into mitochondria by carnitine shuttle playsa pivotal role in energy production via β-oxidation [17]. Therefore, carnitine deficiencyinduces cardiac dysfunction and muscle atrophy in HD patients. We previously reporteda significant decrease in plasma carnitine fraction levels in HD patients [8]. Higuchiet al. reported the beneficial effects of LC on cardiac function and LVMI assessed byechocardiography and NT-proBNP in carnitine-deficient HD patients [10]. However, theeffects of reducing or stopping LC on cardiac function have not yet been reported. Inthis study, we demonstrated that reducing or stopping LC administration for six monthssignificantly reduced plasma and RBC carnitine fraction levels. Furthermore, plasma BNPlevels significantly increased only in patients who stopped LC treatment, suggesting thatstopping LC for six months may contribute to the future progression of cardiac dysfunctionin HD patients. Indeed, suspension of LC therapy has been reported to result in signs andsymptoms of recurrence (muscular weakness, fatigue, cardiac enlargement, and low cardiacfunction) in patients with primary carnitine deficiency treated with LC [18]. However,regardless of the increase in BNP levels, LV function assessed by EF and E/e’, markersof systolic and diastolic cardiac function, respectively, and LVMI did not change beforeor after reduction or discontinuation of LC therapy. This result might be explained bythe concentration of carnitine fractions during the study. At the end of the study, freecarnitine levels in the plasma were still within the normal range, even after stopping the LCtherapy for six months. These findings suggest that the inadequate deficiency of carnitineby stopping LC therapy might not have influenced cardiac function in these patients. Takentogether, long-term studies are needed to clarify the deleterious effects of stopping LCadministration on cardiac function in carnitine-deficient HD patients.
77
Nutrients 2021, 13, 1900
In our study, changes in systolic BP and RBC (C16 + C18:1)/C2 ratio, a marker ofCPT2 deficiency, were only positively correlated with changes in plasma BNP levels. CPT2deficiency in humans is diagnosed by abnormal acylcarnitine profile obtained from bloodspotted on filter paper with an increased (C16 + C18:1)/C2 ratio [19]. CPT2 plays a cen-tral role in ATP synthesis in cardiomyocytes mitochondria. Genetic deletion of mouseCPT2 induces cardiac hypertrophic remodeling, which activates the mammalian targetof the rapamycin complex, thereby reducing protein acetylation and accumulating lipiddroplets [20]. Furthermore, LC supplementation is effective in severe CPT2 deficiency [21],indicating that stopping LC supplementation may influence the activity of CPT2 in car-diomyocytes, leading to an increase in BNP levels in HD patients. Furthermore, we foundthat changes in the (C16 + C18:1)/C2 ratio in RBC, not in plasma, were associated withchanges in plasma BNP levels. Acylcarnitine levels in RBCs are higher than those inplasma [22]. In addition, elevated RBC carnitine levels by LC administration decreasedvery slowly even after irrigation suggesting a low carnitine turnover in RBCs [22]. Thesefindings indicate that the acylcarnitine ratio in RBC, rather than that in plasma, appears tobe an accurate tissue acylcarnitine profile in HD patients.
This study has several limitations. First, the sample size of the patients was small;thus, the statistical power was weak. Second, the short study duration might have affectedthe efficacy of reducing or stopping LC in cardiac function. Therefore, further large andlong-term clinical studies are warranted to verify the effect of reduction in LC treatment onthe cardiac function of HD patients.
Carnitine deficiency induces mitochondrial damages through the impairment of β-oxidation and ATP production. However, the exact mechanism underlying the exacerbationof cardiomyocyte injury by hemodialysis-induced carnitine deficiency through the ma-nipulation of carnitine-related mitochondrial enzymes, such as CPT1 and CPT2, is notfully understood. Hence, future research using a carnitine-deficient experimental modelmight be required to examine the mediating mechanism underlying carnitine deficiency-associated myocardial injury.
5. Conclusions
In conclusion, reducing LC administration for six months significantly decreased bothplasma and RBC carnitine levels. Moreover, stopping LC increased plasma BNP levels;however, this stoppage did not influence cardiac function in HD patients.
Author Contributions: J.Y. and K.F.; Methodology, K.F.; Software, K.F.; Validation, Y.K. (YusukeKaida) and K.F.; Formal Analysis, K.F.; Investigation, Y.K. (Yusuke Kaida), R.S., and K.F.; Re-sources, Y.K. (Yukie Kinoshita) and K.T.; Data Curation, M.S., T.H., K.N., K.U., T.M., T.A., Y.K.(Yuka Kurokawa), G.K., Y.W., Y.O., R.I., and M.N.; Writing—Original Draft Preparation, K.F.; Visual-ization, K.F.; Supervision, K.F.; Project Administration, K.F.; Funding Acquisition, K.F. All authorshave read and agreed to the published version of the manuscript.
Funding: This research was funded in part by a Grant-in-Aid for Welfare and Scientific Research(C) (no. 19K08693) from the Ministry of Education, Culture, Sports, Science, and Technology ofJapan (K.F.).
Institutional Review Board Statement: The study was conducted according to the guidelines of theDeclaration of Helsinki and registered with the University Hospital Medical Information Networkclinical trials database (UMIN000037330). The study protocol was approved by the InstitutionalEthics Committees of Kurume University School of Medicine (Approval Number: 18179).
Informed Consent Statement: Informed consent was obtained from all patients as specified in therecommendations set by the International Committee of Medical Journal Editors.
Data Availability Statement: The data presented in this study are available on request from thecorresponding author.
Acknowledgments: We would like to thank all of investigators.
78

Nutrients 2021, 13, 1900
Conflicts of Interest: K.F. has received honoraria, including lecture fees, from Otsuka PharmaceuticalCo., Ltd. All other authors declare no conflict of interest.
References
1. House, A.A.; Wanner, C.; Sarnak, M.J.; Piña, I.L.; McIntyre, C.W.; Komenda, P.; Kasiske, B.L.; Deswal, A.; de Filippi, C.R.;Cleland, J.G.F.; et al. Heart Failure in Chronic Kidney Disease: Conclusions From a Kidney Disease: Improving Global Outcomes(KDIGO) Controversies Conference. Kidney Int. 2019, 95, 1304–1317. [CrossRef] [PubMed]
2. Nitta, K.; Abe, M.; Masakane, I.; Hanafusa, N.; Taniguchi, M.; Hasegawa, T.; Nakai, S.; Wada, A.; Hamano, T.; Hoshino, J.; et al.Annual dialysis data report 2018, JSDT Renal Data Registry: Dialysis fluid quality, hemodialysis and hemodiafiltration, peritonealdialysis, and diabetes. Ren. Replace Ther. 2020, 6, 51. [CrossRef]
3. Liang, K.V.; Pike, F.; Argyropoulos, C.; Weissfeld, L.; Teuteberg, J.; Dew, M.A.; Unruh, M.L. Heart Failure Severity Scoring Systemand Medical- and Health-Related Quality-of-Life Outcomes: The HEMO Study. Am. J. Kidney Dis. 2011, 58, 84–92. [CrossRef][PubMed]
4. Evans, A.M.; Fornasini, G. Pharmacokinetics of L-Carnitine. Clin. Pharmacokinet. 2003, 42, 941–967. [CrossRef]5. Chapoy, P.R.; Angelini, C.; Brown, W.J.; Stiff, J.E.; Shug, A.L.; Cederbaum, S.D. Systemic Carnitine Deficiency–A Treatable
Inherited Lipid-Storage Disease Presenting as Reye’s Syndrome. N. Engl. J. Med. 1980, 303, 1389–1394. [CrossRef]6. Semba, S.; Yasujima, H.; Takano, T.; Yokozaki, H. Autopsy Case of the Neonatal Form of Carnitine Palmitoyltransferase-II
Deficiency Triggered by a Novel Disease-Causing Mutation del1737C. Pathol. Int. 2008, 58, 436–441. [CrossRef]7. Evans, A. Dialysis-Related Carnitine Disorder and Levocarnitine Pharmacology. Am. J. Kidney Dis. 2003, 41 (Suppl. 4), S13–S26.
[CrossRef]8. Adachi, T.; Fukami, K.; Yamagishi, S.; Kaida, Y.; Ando, R.; Sakai, K.; Adachi, H.; Otsuka, A.; Ueda, S.; Sugi, K.; et al. Decreased
Serum Carnitine Is Independently Correlated With Increased Tissue Accumulation Levels of Advanced Glycation End Productsin Haemodialysis Patients. Nephrology (Carlton) 2012, 17, 689–694. [CrossRef]
9. Song, X.; Qu, H.; Yang, Z.; Rong, J.; Cai, W.; Zhou, H. Efficacy and Safety of L-Carnitine Treatment for Chronic Heart Failure: AMeta-Analysis of Randomized Controlled Trials. BioMed Res. Int. 2017, 2017, 6274854. [CrossRef]
10. Higuchi, T.; Abe, M.; Yamazaki, T.; Okawa, E.; Ando, H.; Hotta, S.; Oikawa, O.; Kikuchi, F.; Okada, K.; Soma, M. LevocarnitineImproves Cardiac Function in Hemodialysis Patients With Left Ventricular Hypertrophy: A Randomized Controlled Trial. Am. J.Kidney Dis. 2016, 67, 260–270. [CrossRef]
11. Yano, J.; Kaida, Y.; Maeda, T.; Hashida, R.; Tonan, T.; Nagata, S.; Hazama, T.; Nakayama, Y.; Ito, S.; Kurokawa, Y.; et al. l-CarnitineSupplementation vs. Cycle Ergometer Exercise for Physical Activity and Muscle Status in Hemodialysis Patients: A RandomizedClinical Trial. Ther. Apher. Dial. 2020. [CrossRef]
12. Siami, G.; Clinton, M.E.; Mrak, R.; Griffis, J.; Stone, W. Evaluation of the Effect of Intravenous L-Carnitine Therapy on Function,Structure and Fatty Acid Metabolism of Skeletal Muscle in Patients Receiving Chronic Hemodialysis. Nephron 1991, 57, 306–313.[CrossRef]
13. Takahashi, M.; Ueda, S.; Misaki, H.; Sugiyama, N.; Matsumoto, K.; Matsuo, N.; Murao, S. Carnitine Determination by anEnzymatic Cycling Method With Carnitine Dehydrogenase. Clin. Chem. 1994, 40, 817–821. [CrossRef]
14. Shigematsu, Y.; Hirano, S.; Hata, I.; Tanaka, Y.; Sudo, M.; Sakura, N.; Tajima, T.; Yamaguchi, S. Newborn Mass Screening andSelective Screening Using Electrospray Tandem Mass Spectrometry in Japan. J. Chromatogr. B Analyt. Technol. Biomed. Life Sci.2002, 776, 39–48. [CrossRef]
15. Chace, D.H.; Kalas, T.A.; Naylor, E.W. Use of Tandem Mass Spectrometry for Multianalyte Screening of Dried Blood SpecimensFrom Newborns. Clin. Chem. 2003, 49, 1797–1817. [CrossRef]
16. Devereux, R.B.; Reichek, N. Echocardiographic Determination of Left Ventricular Mass in Man. Anatomic Validation of theMethod. Circulation 1977, 55, 613–618. [CrossRef]
17. Longo, N.; Frigeni, M.; Pasquali, M. Carnitine Transport and Fatty Acid Oxidation. Biochim. Biophys. Acta 2016, 1863, 2422–2435.[CrossRef]
18. Agnetti, A.; Bitton, L.; Tchana, B.; Raymond, A.; Carano, N. Primary Carnitine Deficiency Dilated Cardiomyopathy: 28 YearsFollow-Up. Int. J. Cardiol. 2013, 162, e34–e35. [CrossRef]
19. Gempel, K.; Kiechl, S.; Hofmann, S.; Lochmüller, H.; Kiechl-Kohlendorfer, U.; Willeit, J.; Sperl, W.; Rettinger, A.; Bieger, I.;Pongratz, D.; et al. Screening for Carnitine Palmitoyltransferase II Deficiency by Tandem Mass Spectrometry. J. Inherit. Metab. Dis.2002, 25, 17–27. [CrossRef]
20. Pereyra, A.S.; Hasek, L.Y.; Harris, K.L.; Berman, A.G.; Damen, F.W.; Goergen, C.J.; Ellis, J.M. Loss of Cardiac Carnitine Palmi-toyltransferase 2 Results in Rapamycin-Resistant, Acetylation-Independent Hypertrophy. J. Biol. Chem. 2017, 292, 18443–18456.[CrossRef]
21. Bonnefont, J.P.; Djouadi, F.; Prip-Buus, C.; Gobin, S.; Munnich, A.; Bastin, J. Carnitine Palmitoyltransferases 1 and 2: Biochemical,Molecular and Medical Aspects. Mol. Aspects Med. 2004, 25, 495–520. [CrossRef]
22. Wanner, C.; Wäckerle, B.; Boeckle, H.; Schollmeyer, P.; Hörl, W.H. Plasma and Red Blood Cell Carnitine and Carnitine EstersDuring L-Carnitine Therapy in Hemodialysis Patients. Am. J. Clin. Nutr. 1990, 51, 407–410. [CrossRef]
79

nutrients
Article
The Effects of Long-Term Nutrition Counseling According tothe Behavioral Modification Stages in Patients withCardiovascular Disease
Keiko Matsuzaki 1,*, Nobuko Fukushima 2, Yutaka Saito 3, Naoya Matsumoto 4, Mayu Nagaoka 5,
Yousuke Katsuda 6 and Shin-ichiro Miura 6
Citation: Matsuzaki, K.; Fukushima,
N.; Saito, Y.; Matsumoto, N.;
Nagaoka, M.; Katsuda, Y.; Miura, S.-i.
The Effects of Long-Term Nutrition
Counseling According to the
Behavioral Modification Stages in
Patients with Cardiovascular Disease.
Nutrients 2021, 13, 414. https://
doi.org/10.3390/nu13020414
Academic Editor:
Yoshihiro Fukumoto
Received: 7 December 2020
Accepted: 25 January 2021
Published: 28 January 2021
Publisher’s Note: MDPI stays neutral
with regard to jurisdictional claims in
published maps and institutional affil-
iations.
Copyright: © 2021 by the authors.
Licensee MDPI, Basel, Switzerland.
This article is an open access article
distributed under the terms and
conditions of the Creative Commons
Attribution (CC BY) license (https://
creativecommons.org/licenses/by/
4.0/).
1 Department of Nutrition, Fukuoka University Nishijin Hospital, Fukuoka 814-8522, Japan2 Fukuoka Women’s Junior College Health and Nutrition, Fukuoka 818-0193, Japan;
[email protected] Department of Cardiovascular Medicine, Public Yame General Hospital, Fukuoka 834-0034, Japan;
[email protected] Department of Rehabilitation, Fukuoka University Nishijin Hospital, Fukuoka 814-8522, Japan;
[email protected] Department of Pharmacy, Fukuoka University Nishijin Hospital, Fukuoka 814-8522, Japan;
[email protected] Department of Cardiovascular Medicine, Fukuoka University Nishijin Hospital, Fukuoka 814-8522, Japan;
[email protected] (Y.K.); [email protected] (S.-i.M.)* Correspondence: [email protected]; Tel.: +81-92-831-1211
Abstract: Background: the behavioral modification stages (BMS) are widely used; however, there areno reports on long-term nutrition counseling for cardiovascular disease (CVD) according to BMS.Aim: to study the effects of long-term nutrition counseling based on the BMS in patients with CVD.Methods: fifteen patients with CVD who participated in nutrition counseling were enrolled betweenJune 2012 and December 2016. We provided BMS and dietary questionnaires to estimate the stagescore (SS), salt intake, and drinking habits (non-drinking group (n = 7)/drinking group (n = 8)),and measured the blood pressure (BP), body mass index (BMI), and biochemical markers beforeand after hospitalization at 6 months, 1 year, and 1.5 years after leaving the outpatient department(OPD). Results: a significant decreased salt intake and increase in SS were found at 1.5 years. Itsignificantly decreased the BP and salt intake in the non-drinking group at 1.5 years. Conclusions:long-term nutrition counseling according to BMS improved salt intake and BP in the non-drinkinggroup. However, in the drinking group, increased salt intake might weaken the BP improvement.Temperance and low-sodium intake are essential factors that control BP, especially in drinkers.
Keywords: behavioral modification stages; nutrition counseling; patient education
1. Introduction
Currently, cardiovascular disease (CVD) is the second leading cause of death alongwith malignant neoplasm in Japan [1]. In Japan, in particular, where the population aged>65 years exceeds 27.3% of the total population [2], increased mortality from cardiovasculardisease has become a social problem. However, the implementation of guideline-basedmedical therapy in elderly patients with CVD was insufficient to prevent the recurrence ofCVD [3].
Lifestyle-related diseases, such as hypertension, are strongly involved in the develop-ment of CVD or congestive heart disease (CHF). Therefore, to prevent CVD, daily habitsshould be improved from early in the day, such as implementing nutritional and exercisetherapies and quitting smoking [4,5]. Furthermore, it is reported that recurrence of CHF inelderly patients is caused by their refusal to incorporate behavioral changes—and they con-tinue to consume excessive amounts of salt [6]. Behavioral changes, such as decreased salt
Nutrients 2021, 13, 414. https://doi.org/10.3390/nu13020414 https://www.mdpi.com/journal/nutrients81

Nutrients 2021, 13, 414
intake, are important factors in patients with CVD or CHF. Recently, the trans-theoreticalmodel (TTM) has been used to improve the lifestyle and provide specific guidance topatients with type 2 diabetes [7–11]. TTM theorizes behavioral modification of dietaryhabits; it suggests behavioral modification by estimating personal readiness to changesand performs specific, individual intervention programs. Behavioral modification stages(BMS) have been indicated in one of the concepts, as well as the preparatory state of psy-chology, and its practice situations, of five stages: 1) precontemplation (participants haveno intention of changing their behavior within the next 6 months); 2) contemplation (theyare aware a problem exists and intend to change their behavior within the next 6 months,but not within 1 month); 3) preparation (they are ready for the change within the next1 month); 4) action (they actively modified their behavior within the last 6 months); and 5)maintenance (they sustained their behavioral changes for >6 months) [12,13].
However, no reports on nutrition counseling using the TTM and long-term follow-upin patients with CVD have been described. We evaluated the effects of long-term nutritioncounseling based on the BMS in patients with CVD. Therefore, we hypothesized thatlong-term nutrition counseling, according to the BMS, should induce lifestyle modification,in particular improvement of high blood pressure and decreased salt intake.
2. Materials and Methods
2.1. Investigation Period
This study was conducted from June 2012 to December 2016.
2.2. Inclusion Criteria
The participants were patients who had no coronary restenosis after percutaneouscoronary intervention at Fukuoka University Nishijin Hospital. The study protocol isindicated in Figure 1. Finally, 15 patients with CVD participated in nutrition counseling.We provided BMS and dietary questionnaires to estimate the stage score (SS), salt intake,and drinking habits, and measured the BP, body mass index (BMI), and biochemicalmarkers at hospitalization to 6 months, 1 year, and 1.5 years after leaving the outpatientdepartment (OPD). Nine, four, and two patients had angina, heart failure (with ischemicheart disease history), and acute myocardial infarction, respectively.
Figure 1. Study protocol.
82

Nutrients 2021, 13, 414
2.3. Methods2.3.1. Research Ethics and Patient Consent
Informed consent was obtained from all patients via consent confirm. The investi-gation conforms to the principles outlined in the Declaration of Helsinki. The presentstudy was approved by the ethics committee of Fukuoka Medical Association Hospital(Fukuoka University Nishijin Hospital at present) (approval number: N19-03-001) and wasprospectively performed form June 2012 to December 2016.
2.3.2. BMS Questionnaire
Prior to individual nutrition counseling, patients were provided with self-administeredBMS questionnaires about dietary intake [8]. Dietary intake in BMS was assessed usingfive stages of the first described BMS. Furthermore, we performed the scores as follows:precontemplation, 0; contemplation, 1; preparation, 2; action, 3; and maintenance, 4.
2.3.3. Dietary Survey Questionnaire
Patients were provided with three-day food record questionnaires [14], with self-reports regarding their standard dietary intakes (in OPD, 3 days before nutrition counseling)for 3 days before hospitalization. An interview survey on dietary intake was conducted bya managerial dietician during nutrition counseling. To investigate the amount of drinkingper day, and the drinking frequency for 1 week, we conducted interview surveys. Thecalculation of alcohol intake was based on the Standard Tables of Food Composition inJapan, 2015 (Seventh Revised Version) [15]. Furthermore, we calculated the alcohol intakeon an average day.
2.3.4. Nutrition Counseling
Nutrition counseling involved making appropriate improvement suggestions in di-etary habits and behavior. Cardiologists provided counseling and nutritional intake di-rections (energy, protein, fat, and salt intake). Counseling to promote a diet focused onincreased consumption of, vegetables, mushrooms, seaweed, and fish and decreased con-sumption of foods that are high in salt (sodium), deep-fried food, and food with addedsugar. Recommendations applied to risk factors for CVD, such as high blood pressure andhigh cholesterol [4,5]. Long-term nutrition counseling included counseling done duringhospitalization, and 6 months, 1 year, and then 1.5 years after leaving the OPD. We deter-mined BMS on dietary intake and dietary survey contents, and then nutrition counseling(30-min individual interview) was performed according to the preparatory state (BMS)at each time. The same managerial dietician set a target along BMS with patients at eachtime point.
Counseling was guided by referring to the Ministry of Health, Labor, and Welfare,Japan Safety, and Health Council (2018): the standard medical checkup and health guidanceprogram (definitive) [10]. There are five stages, as follows.
The precontemplation stage: the managerial dietician confirmed the many benefits ofchanging dietary habits. We explained that, without changing dietary habits, it is mucheasier for the recrudescence of CVD.
The contemplation stage: the managerial dietician proposed a behavior change on thedietary habits. High blood pressure and high cholesterol can be improved by increasingconsumption of vegetables, mushrooms, seaweed, and fish, while reducing the consump-tion of food high in salt (sodium), deep-fried food, and added sugars. We explained thatsuch behavior changes could assist in reducing the risk of CVD.
The preparation stage: when patients seemed to have a problem regarding dietaryintake, the managerial dietician could assist to establish some behavioral objectives on howto improve. We proposed increasing the consumption of vegetables, mushrooms, seaweed,and fish while reducing consumption of high salt (sodium), deep-fried food, and food withadded sugar.
83

Nutrients 2021, 13, 414
The action stage: the managerial dietician identified the behavior problem then pro-vided appropriate correction actions. We suggested continuing consumption of vegetables,mushrooms, seaweed, and fish, while decreasing consumption of food high in salt (sodium),deep-fried food, and food with added sugar.
The maintenance stage: the managerial dietician identified the plan that preventedinterruptions in behavioral modifications, concerning dietary habits with patients. Weinsisted on the continued increase of consumption of vegetables, mushrooms, seaweed,and fish, and reduced consumption of food high in salt (sodium), deep-fried foods, andfood with added sugar. We asked patients with concerns about dietary habits.
We assumed a deviation from and retractability in BMS beforehand and establisheda target [10,11]. Moreover, we investigated factors such as dining out, usage of preparedfood, snacking, and exercise habits.
2.3.5. Dietary Intake
Dietary intake investigated energy, carbohydrate, protein, fat, dietary fiber, potassium,and sodium from a three-day food record questionnaire. The calculation of the salt intakewas based on the Microsoft Excel software—Excel Eiyoukun version 8.0 (kenpakusha,Tokyo, Japan) [16] from “Sodium (mg)/1000 × 2.54” [15].
2.4. Investigation Item
The data from the medical records were collected—that is, age, weight, BMI (weight(kg)/height (m) × height (m)), total cholesterol (T-Cho), high-density lipoprotein choles-terol (HDL-Cho), low-density lipoprotein cholesterol (LDL-Cho), hemoglobin A1c (HbA1c),uric acid (UA), estimated glomerular filtration rate (eGFR), BP. Regarding alcohol con-sumption, the patients were divided into the drinking (n = 8) and non-drinking groups(n = 7). The data on SS, salt intake, and alcohol intake at hospitalization, 6 months, 1 year,and 1.5 years after leaving the OPD, were compared.
The relation between salt intake and each factor (sex, age, snacking, drinking habit)after 1.5 years of leaving was also determined. Regarding alcohol consumption (1.5 yearsafter leaving, the non-drinking group (n = 7), the drinking group < thrice a week (n = 3),the drinking group > four times a week (n = 5)) and salt intake, the drinking habit and therespective compared with salt intake and BP were considered.
2.5. Measuring Method of Blood Pressure
We normally inform our patients to come to the hospital at 11:00 a.m., and a clinicalnurse measures the patient’s BP. BP was collected using a double cuff electronic sphygmo-manometer (Terumo ES-H55).
2.6. Calculating Dietary Intake
The calculation of the dietary intake was based on the Microsoft Excel software—ExcelEiyoukun version 8.0 (kenpakusha, Tokyo, Japan) [16], from the standard table of foodcomposition in Japan 2015 (Seventh Revised Version) [15].
2.7. Statistical Analysis
All analyses were performed using SPSS Statistics Version 22 (IBM, Tokyo, Japan).The weight, BMI, T-Cho, HDL-Cho, LDL-Cho, neutral lipid, HbA1c, UA, eGFR, energy,carbohydrate, protein, fat, dietary fiber, and potassium, with their means expressed asmean (standard deviation), were compared with salt intake, alcohol intake, BP, SS aboutdietary intake, drinking habits (the non-drinking group (n = 7)/the drinking group (n = 8)),and the respective SS and salt intake, BP were performed by statistical analysis of one-wayanalysis of variance, subjected to the general linear model with replicate.
Using the multiple regression analysis, the relation between salt intake (dependentvariable) and each factor (sex, age, snacking, the drinking habit; independent variable)1.5 years after leaving was identified. Then, a stepwise method was used. Furthermore,
84
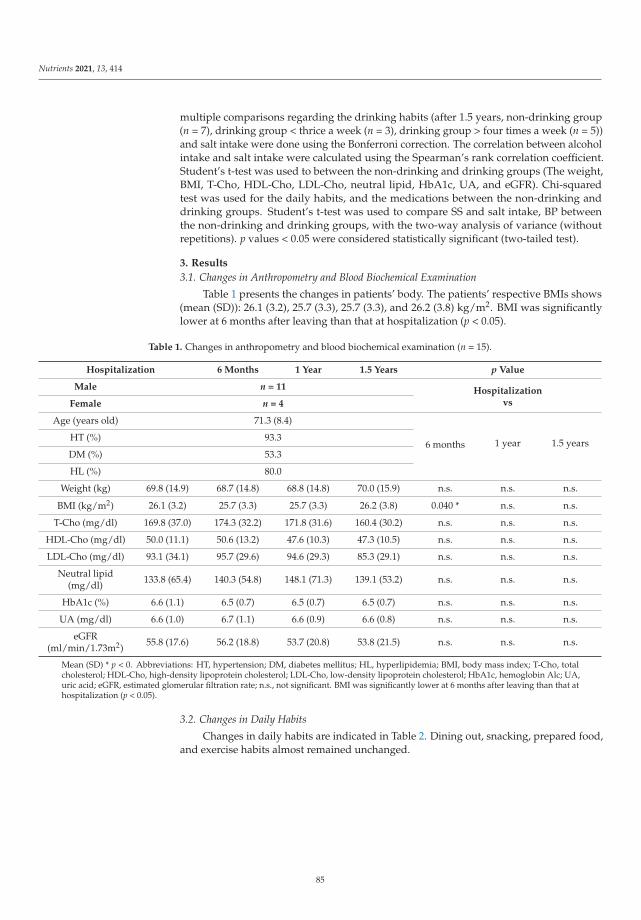
Nutrients 2021, 13, 414
multiple comparisons regarding the drinking habits (after 1.5 years, non-drinking group(n = 7), drinking group < thrice a week (n = 3), drinking group > four times a week (n = 5))and salt intake were done using the Bonferroni correction. The correlation between alcoholintake and salt intake were calculated using the Spearman’s rank correlation coefficient.Student’s t-test was used to between the non-drinking and drinking groups (The weight,BMI, T-Cho, HDL-Cho, LDL-Cho, neutral lipid, HbA1c, UA, and eGFR). Chi-squaredtest was used for the daily habits, and the medications between the non-drinking anddrinking groups. Student’s t-test was used to compare SS and salt intake, BP betweenthe non-drinking and drinking groups, with the two-way analysis of variance (withoutrepetitions). p values < 0.05 were considered statistically significant (two-tailed test).
3. Results
3.1. Changes in Anthropometry and Blood Biochemical Examination
Table 1 presents the changes in patients’ body. The patients’ respective BMIs shows(mean (SD)): 26.1 (3.2), 25.7 (3.3), 25.7 (3.3), and 26.2 (3.8) kg/m2. BMI was significantlylower at 6 months after leaving than that at hospitalization (p < 0.05).
Table 1. Changes in anthropometry and blood biochemical examination (n = 15).
Hospitalization 6 Months 1 Year 1.5 Years p Value
Male n = 11 HospitalizationvsFemale n = 4
Age (years old) 71.3 (8.4)
6 months 1 year 1.5 yearsHT (%) 93.3
DM (%) 53.3
HL (%) 80.0
Weight (kg) 69.8 (14.9) 68.7 (14.8) 68.8 (14.8) 70.0 (15.9) n.s. n.s. n.s.
BMI (kg/m2) 26.1 (3.2) 25.7 (3.3) 25.7 (3.3) 26.2 (3.8) 0.040 * n.s. n.s.
T-Cho (mg/dl) 169.8 (37.0) 174.3 (32.2) 171.8 (31.6) 160.4 (30.2) n.s. n.s. n.s.
HDL-Cho (mg/dl) 50.0 (11.1) 50.6 (13.2) 47.6 (10.3) 47.3 (10.5) n.s. n.s. n.s.
LDL-Cho (mg/dl) 93.1 (34.1) 95.7 (29.6) 94.6 (29.3) 85.3 (29.1) n.s. n.s. n.s.
Neutral lipid(mg/dl) 133.8 (65.4) 140.3 (54.8) 148.1 (71.3) 139.1 (53.2) n.s. n.s. n.s.
HbA1c (%) 6.6 (1.1) 6.5 (0.7) 6.5 (0.7) 6.5 (0.7) n.s. n.s. n.s.
UA (mg/dl) 6.6 (1.0) 6.7 (1.1) 6.6 (0.9) 6.6 (0.8) n.s. n.s. n.s.
eGFR(ml/min/1.73m2) 55.8 (17.6) 56.2 (18.8) 53.7 (20.8) 53.8 (21.5) n.s. n.s. n.s.
Mean (SD) * p < 0. Abbreviations: HT, hypertension; DM, diabetes mellitus; HL, hyperlipidemia; BMI, body mass index; T-Cho, totalcholesterol; HDL-Cho, high-density lipoprotein cholesterol; LDL-Cho, low-density lipoprotein cholesterol; HbA1c, hemoglobin Alc; UA,uric acid; eGFR, estimated glomerular filtration rate; n.s., not significant. BMI was significantly lower at 6 months after leaving than that athospitalization (p < 0.05).
3.2. Changes in Daily Habits
Changes in daily habits are indicated in Table 2. Dining out, snacking, prepared food,and exercise habits almost remained unchanged.
85

Nutrients 2021, 13, 414
Table 2. Changes in the daily (n = 15).
Admission Time 1 12 Years after Leaving p Value
Dining out habits Yes 11 120.307
No 4 3
Usage of prepared food Yes 12 100.494
No 3 5
Snacking Yes 14 131.000
No 1 2
Exercise habitsYes 10 13
1.000No 5 2
3.3. Cardiovascular Disease and Medications
Table 3 presents cardiovascular disease and medication information. Medications forthe treatment of diabetes accounted for 11.4%. Alpha-blocker was addition one patient1 year later about antihypertensive drug. Calcium channel blocker was addition one patient1.5 years later, and Angiotensin II receptor blocker dose reduction one patient. Antiplateletaggregation drug come off three patients 1.5 years later. HMG-CoA reductase inhibitorand anticlotting drug were addition respectively one patient 1.5 years later.
Table 3. Cardiovascular disease and medications (at the time of hospitalization) (n = 15).
Drug Number (%)
Antiplatelet aggregation drug 23 21.9HMG-CoA reductase inhibitor 10 9.5
Beta-blocking drug 9 8.6Vasodilating drug 9 8.6
Calcium channel blocker 9 8.6Angiotensin IIreceptor blocker 7 6.7
Diuretic drug 6 5.7DPP-4 inhibitor 6 5.7
Diuretic antihypertensive drug 5 4.8Environmental Protection Agency drug 4 3.8
Angiotensin-converting enzyme inhibitor 3 2.9Non-pudding type selective xanthine
oxidase inhibitor 3 2.9
Anticlotting drug 3 2.9Anti-arrhythmic drug 2 1.9Sulphonyl urea drug 2 1.9
α—glucosidase inhibitor 1 1.0Biguanide 1 1.0
Long acting insulin 1 1.0Fast acting insulin 1 1.0
3.4. Changes in SS Regarding Dietary Intake
Score results of the BMS questionnaire were indicated. Changes in SS regarding dietaryintake are indicated in Figure 2a. SS after nutrition counseling were significantly higherthan those at hospitalization and 1.5 years after leaving (p < 0.01); SS at hospitalization,6 months, 1 year, and 1.5 years after leaving were 2.7 (0.9), 3.3 (0.7), 3.8 (0.4), and 3.9 (0.3)points, respectively.
86

Nutrients 2021, 13, 414
Figure 2. Change in SS regarding dietary intake, salt intake, and BP. Mean (SD). * p < 0.05, ** p < 0.01, n = 15. Abbreviations:SS, stage scores; SBP, systolic blood pressure; n.s., not significant. (a) A significant increase in SS was found 1.5 years afterleaving compared with that at hospitalization (p < 0.01). (b) ESI decreased in 1.5 years after leaving compared with that athospitalization (p < 0.05). (c) SBPs significantly decreased at 6 months and 1 year compared with hospitalization (p < 0.05),however an upward trend in 1.5 years from 1 year after leaving.
3.5. Changes in the Salt Intake
The salt intake in patients at the time of hospitalization and 6 months, 1 year, and1.5 years after leaving were 10.7 (3.2), 8.7 (1.4), 8.2 (1.4), and 8.3 (1.5) g/day, respectively. Itdecreased in 1 year as well as 1.5 years after leaving, compared with that at hospitalization(at 1 year p = 0.0043, at 1.5 years p = 0.032) (Figure 2b).
3.6. Changes in the Nutrient Intake
Changes in the nutrient intake are indicated in Table 4. Energy, carbohydrate, protein,fat, dietary fiber, and potassium were almost unchanged. Dietary fiber was of low valueover this time period.
87
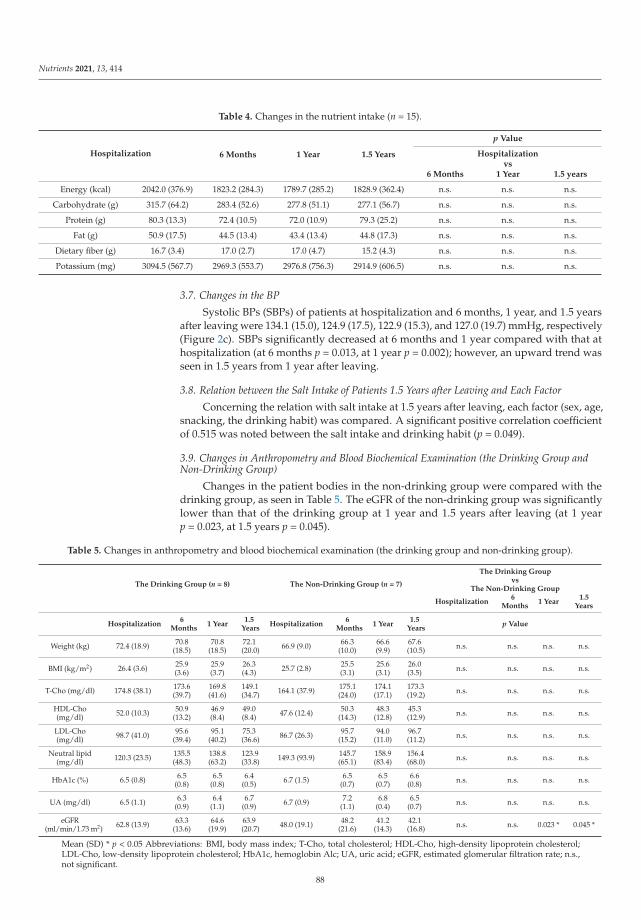
Nutrients 2021, 13, 414
Table 4. Changes in the nutrient intake (n = 15).
Hospitalization 6 Months 1 Year 1.5 Years
p Value
Hospitalizationvs
6 Months 1 Year 1.5 years
Energy (kcal) 2042.0 (376.9) 1823.2 (284.3) 1789.7 (285.2) 1828.9 (362.4) n.s. n.s. n.s.
Carbohydrate (g) 315.7 (64.2) 283.4 (52.6) 277.8 (51.1) 277.1 (56.7) n.s. n.s. n.s.
Protein (g) 80.3 (13.3) 72.4 (10.5) 72.0 (10.9) 79.3 (25.2) n.s. n.s. n.s.
Fat (g) 50.9 (17.5) 44.5 (13.4) 43.4 (13.4) 44.8 (17.3) n.s. n.s. n.s.
Dietary fiber (g) 16.7 (3.4) 17.0 (2.7) 17.0 (4.7) 15.2 (4.3) n.s. n.s. n.s.
Potassium (mg) 3094.5 (567.7) 2969.3 (553.7) 2976.8 (756.3) 2914.9 (606.5) n.s. n.s. n.s.
3.7. Changes in the BP
Systolic BPs (SBPs) of patients at hospitalization and 6 months, 1 year, and 1.5 yearsafter leaving were 134.1 (15.0), 124.9 (17.5), 122.9 (15.3), and 127.0 (19.7) mmHg, respectively(Figure 2c). SBPs significantly decreased at 6 months and 1 year compared with that athospitalization (at 6 months p = 0.013, at 1 year p = 0.002); however, an upward trend wasseen in 1.5 years from 1 year after leaving.
3.8. Relation between the Salt Intake of Patients 1.5 Years after Leaving and Each Factor
Concerning the relation with salt intake at 1.5 years after leaving, each factor (sex, age,snacking, the drinking habit) was compared. A significant positive correlation coefficientof 0.515 was noted between the salt intake and drinking habit (p = 0.049).
3.9. Changes in Anthropometry and Blood Biochemical Examination (the Drinking Group andNon-Drinking Group)
Changes in the patient bodies in the non-drinking group were compared with thedrinking group, as seen in Table 5. The eGFR of the non-drinking group was significantlylower than that of the drinking group at 1 year and 1.5 years after leaving (at 1 yearp = 0.023, at 1.5 years p = 0.045).
Table 5. Changes in anthropometry and blood biochemical examination (the drinking group and non-drinking group).
The Drinking Group (n = 8) The Non-Drinking Group (n = 7)
The Drinking Groupvs
The Non-Drinking Group
Hospitalization6
Months1 Year
1.5Years
Hospitalization6
Months1 Year
1.5Years
Hospitalization6
Months1 Year
1.5Years
p Value
Weight (kg) 72.4 (18.9) 70.8(18.5)
70.8(18.5)
72.1(20.0) 66.9 (9.0) 66.3
(10.0)66.6(9.9)
67.6(10.5) n.s. n.s. n.s. n.s.
BMI (kg/m2) 26.4 (3.6) 25.9(3.6)
25.9(3.7)
26.3(4.3) 25.7 (2.8) 25.5
(3.1)25.6(3.1)
26.0(3.5) n.s. n.s. n.s. n.s.
T-Cho (mg/dl) 174.8 (38.1) 173.6(39.7)
169.8(41.6)
149.1(34.7) 164.1 (37.9) 175.1
(24.0)174.1(17.1)
173.3(19.2) n.s. n.s. n.s. n.s.
HDL-Cho(mg/dl) 52.0 (10.3) 50.9
(13.2)46.9(8.4)
49.0(8.4) 47.6 (12.4) 50.3
(14.3)48.3
(12.8)45.3(12.9) n.s. n.s. n.s. n.s.
LDL-Cho(mg/dl) 98.7 (41.0) 95.6
(39.4)95.1
(40.2)75.3(36.6) 86.7 (26.3) 95.7
(15.2)94.0
(11.0)96.7(11.2) n.s. n.s. n.s. n.s.
Neutral lipid(mg/dl) 120.3 (23.5) 135.5
(48.3)138.8(63.2)
123.9(33.8) 149.3 (93.9) 145.7
(65.1)158.9(83.4)
156.4(68.0) n.s. n.s. n.s. n.s.
HbA1c (%) 6.5 (0.8) 6.5(0.8)
6.5(0.8)
6.4(0.5) 6.7 (1.5) 6.5
(0.7)6.5
(0.7)6.6
(0.8) n.s. n.s. n.s. n.s.
UA (mg/dl) 6.5 (1.1) 6.3(0.9)
6.4(1.1)
6.7(0.9) 6.7 (0.9) 7.2
(1.1)6.8
(0.4)6.5
(0.7) n.s. n.s. n.s. n.s.
eGFR(ml/min/1.73 m2) 62.8 (13.9) 63.3
(13.6)64.6
(19.9)63.9(20.7) 48.0 (19.1) 48.2
(21.6)41.2
(14.3)42.1(16.8) n.s. n.s. 0.023 * 0.045 *
Mean (SD) * p < 0.05 Abbreviations: BMI, body mass index; T-Cho, total cholesterol; HDL-Cho, high-density lipoprotein cholesterol;LDL-Cho, low-density lipoprotein cholesterol; HbA1c, hemoglobin Alc; UA, uric acid; eGFR, estimated glomerular filtration rate; n.s.,not significant.
88

Nutrients 2021, 13, 414
3.10. Cardiovascular Disease and Medications (the Drinking Group and Non-Drinking Group)
There was no significant difference between the drinking and non-drinking groups atthe time of hospitalization.
3.11. Drinking Habit and SS
SS in the non-drinking (n = 7) and drinking (n = 8) groups were compared (Figure 3a).In both groups, SS at hospitalization and 6 months, 1 year, and 1.5 years after leaving hadsignificantly increased (the non-drinking group: 2.9 (0.9), 3.4 (0.5), 3.9 (0.4), and 4.0 (0.0)points, respectively; all, p < 0.05, the drinking group: 2.6 (0.9), 3.1 (0.8), 3.8 (0.5), and 3.8(0.5) points, respectively; all, p < 0.05). SS of the drinking group tended to be lower thanthat of the non-drinking group.
(a)
(b)
(c)
Figure 3. Cont.89
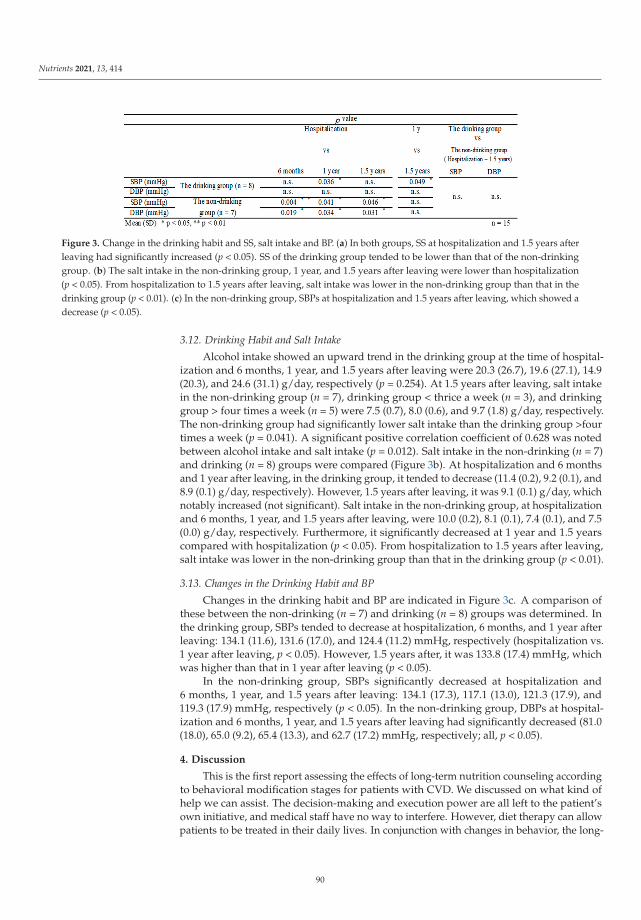
Nutrients 2021, 13, 414
Figure 3. Change in the drinking habit and SS, salt intake and BP. (a) In both groups, SS at hospitalization and 1.5 years afterleaving had significantly increased (p < 0.05). SS of the drinking group tended to be lower than that of the non-drinkinggroup. (b) The salt intake in the non-drinking group, 1 year, and 1.5 years after leaving were lower than hospitalization(p < 0.05). From hospitalization to 1.5 years after leaving, salt intake was lower in the non-drinking group than that in thedrinking group (p < 0.01). (c) In the non-drinking group, SBPs at hospitalization and 1.5 years after leaving, which showed adecrease (p < 0.05).
3.12. Drinking Habit and Salt Intake
Alcohol intake showed an upward trend in the drinking group at the time of hospital-ization and 6 months, 1 year, and 1.5 years after leaving were 20.3 (26.7), 19.6 (27.1), 14.9(20.3), and 24.6 (31.1) g/day, respectively (p = 0.254). At 1.5 years after leaving, salt intakein the non-drinking group (n = 7), drinking group < thrice a week (n = 3), and drinkinggroup > four times a week (n = 5) were 7.5 (0.7), 8.0 (0.6), and 9.7 (1.8) g/day, respectively.The non-drinking group had significantly lower salt intake than the drinking group >fourtimes a week (p = 0.041). A significant positive correlation coefficient of 0.628 was notedbetween alcohol intake and salt intake (p = 0.012). Salt intake in the non-drinking (n = 7)and drinking (n = 8) groups were compared (Figure 3b). At hospitalization and 6 monthsand 1 year after leaving, in the drinking group, it tended to decrease (11.4 (0.2), 9.2 (0.1), and8.9 (0.1) g/day, respectively). However, 1.5 years after leaving, it was 9.1 (0.1) g/day, whichnotably increased (not significant). Salt intake in the non-drinking group, at hospitalizationand 6 months, 1 year, and 1.5 years after leaving, were 10.0 (0.2), 8.1 (0.1), 7.4 (0.1), and 7.5(0.0) g/day, respectively. Furthermore, it significantly decreased at 1 year and 1.5 yearscompared with hospitalization (p < 0.05). From hospitalization to 1.5 years after leaving,salt intake was lower in the non-drinking group than that in the drinking group (p < 0.01).
3.13. Changes in the Drinking Habit and BP
Changes in the drinking habit and BP are indicated in Figure 3c. A comparison ofthese between the non-drinking (n = 7) and drinking (n = 8) groups was determined. Inthe drinking group, SBPs tended to decrease at hospitalization, 6 months, and 1 year afterleaving: 134.1 (11.6), 131.6 (17.0), and 124.4 (11.2) mmHg, respectively (hospitalization vs.1 year after leaving, p < 0.05). However, 1.5 years after, it was 133.8 (17.4) mmHg, whichwas higher than that in 1 year after leaving (p < 0.05).
In the non-drinking group, SBPs significantly decreased at hospitalization and6 months, 1 year, and 1.5 years after leaving: 134.1 (17.3), 117.1 (13.0), 121.3 (17.9), and119.3 (17.9) mmHg, respectively (p < 0.05). In the non-drinking group, DBPs at hospital-ization and 6 months, 1 year, and 1.5 years after leaving had significantly decreased (81.0(18.0), 65.0 (9.2), 65.4 (13.3), and 62.7 (17.2) mmHg, respectively; all, p < 0.05).
4. Discussion
This is the first report assessing the effects of long-term nutrition counseling accordingto behavioral modification stages for patients with CVD. We discussed on what kind ofhelp we can assist. The decision-making and execution power are all left to the patient’sown initiative, and medical staff have no way to interfere. However, diet therapy can allowpatients to be treated in their daily lives. In conjunction with changes in behavior, the long-
90

Nutrients 2021, 13, 414
term nutrition counseling is reflected in the reduction of salt intake and the improvementof blood pressure.
This strategy improved long-term behavioral modification, salt intake, and hyperten-sion, and its effectiveness was significant in non-drinking patients with CVD. It is wellknown that excessive salt intake increases BP [17–20]. In this study, a significant long-termdecrease in salt intake and SBP was observed in the non-drinking group, but not in thedrinking-group. Thus, long-term decreased salt intake might have resulted in decreasedBP in the non-drinking group. Studies have shown that single or repetitive nutritioncounseling alone could lead to decreased salt intake and BP, but the long-term effects wereunknown [21,22]. In this study, effective behavioral changed and long-term BP reductioncould be obtained by repeating nutrition counseling based on TTM. Thus, it was suggestedthat behavioral change was an important factor to keep long-term BP reduction.
In the drinking group, SBPs had significantly decreased in the short term, but theeffects of BP disappeared after 1.5 years. Long-term nutrition counseling with behavioralmodification stages went wrong in the drinking group. It is necessary to grope the planningof temperance and abstinence as a target of behavioral modification in social concerns.Yoshimura et al. reported that alcohol consumption is associated with salt intake andBP, and salt sensitivity improved by reducing alcohol intake [23]. Salt intake was alsoexcessive for the drinking group at hospitalization in this study. Salt intake and SBPs hadsignificantly decreased after 1 year in the drinking group. However, the salt intake andBP tended to increase 1.5 years after hospitalization in the drinking group. Moreover, inthis study, 1.5 years after hospitalization, due to intake, beef jerky, salted nuts, and pickle(salt intake >2 g) consumption increased in the drinking group (data not shown) [15].These were regarded as factors of the salt intake and BP tended to increase. Thus, in thelong-term drinkers, increased salt intake during alcohol intake might weaken the effectfor BP. Therefore, temperance and stricter sodium reduction [24,25] in drinkers [20,26,27]are essential.
Most of the patients in this study were elderly with an average age of 71 years old.Akita et al. reported that guideline-based drug therapy alone for elderly cardiovascularpatients was insufficient to prevent recurrence of CHF [3], and Tsuchihashi et al. alsoreported that one-third of the triggers for relapse of CHF in elderly patients are because ofexcess salt intake [6]. Therefore, repetitive nutrition counseling based on TTM was effectivein preventing recurrence in elderly patients with CVD. Furthermore, there is no significantimprovement about lipid profile and dietary fiber intake. It will be problematic in targetsetting of nutrition counseling in the future. In this study, target setting to the drinkersof temperance, and stricter sodium reduction, with behavioral modification stages areimportant. To prevent the development or recurrence of CVD, we should also support theacquisition of self-management skills [28], as well as long-term improvement of dietaryintake and daily lifestyle habits. This is crucial because absence of effective behaviorchanges may exacerbate the symptoms, resulting in long-term consequences.
The findings of this study have to be seen in light of some limitations. The smallsample of patients with CVD. Since this study is small, a large-scale, prospective study isnecessary to obtain a final conclusion. Moreover, we were not considering the change ofmedication in this study, but that was a number of minor changes.
In conclusion, this study suggests that acquisition of effective behavior modificationsby long-term nutrition counseling, according to behavioral modification stages, is importantfor patients with CVD.
Author Contributions: K.M. designed the study, and wrote the initial draft of the manuscript. Y.K.and S.-i.M. contributed to data analysis and interpretation, and assisted in manuscript preparation.All other authors have contributed to data collection and interpretation, and critically reviewedthe manuscript. All authors agreed to be accountable for all aspects of the work in ensuring thatquestions related to the accuracy or integrity of any part of the work are appropriately investigatedand resolved. All authors have read and agreed to the published version of the manuscript.
91

Nutrients 2021, 13, 414
Funding: This study has not received funding.
Institutional Review Board Statement: The study was conducted according to the guidelines ofthe Declaration of Helsinki, and approved by the ethics committee of Fukuoka Medical AssociationHospital (Fukuoka University Nishijin Hospital at present) (approval number: N19-03-001, 1 March2019 of approval).
Informed Consent Statement: Informed consent was obtained from all subjects involved in the study.
Data Availability Statement: The data that support the findings of this study are available from thecorresponding author upon reasonable request.
Conflicts of Interest: The Authors declare that there is no conflict of interest.
References
1. Ministry of Health Japan, Labour and Welfare. Source: A Population Movement Investigation in 2018. Available online:http://www.mhlw.go.jp/toukei/saikin/hw/jinkou/kakutei18 (accessed on 28 November 2019).
2. Ministry of Internal Affairs and Communications Department of Statistics Japan. Source: Demographic Forecast. 2019. Availableonline: http://www.stat.go.jp/data/jinsui/new.html (accessed on 20 June 2019).
3. Akita, K.; Kohno, T.; Kohsaka, S.; Shiraishi, Y.; Nagatomo, Y.; Izumi, Y.; Goda, A.; Mizuno, A.; Sawano, M.; Inohara, T.; et al.Current use of guideline-based medical therapy in elderly patients admitted with acute heart failure with reduced ejectionfraction and its impact on event-free survival. Int. J. Cardiol. 2017, 235, 162–168. [CrossRef] [PubMed]
4. Iestra, J.A.; Kromhout, D.; van der Schouw, Y.T.; Grobbee, D.E.; Boshuizen, H.C.; van Staveren, W.A. Effect size estimates oflifestyle and dietary change on all-cause mortality in coronary artery disease patients. Circulation 2005, 112, 924–934. [CrossRef][PubMed]
5. The American College of Cardiology Foundation; The American Heart Association. ACC/AHA Guideline on the PrimaryPrevention of Cardiovascular Disease. J. Am. Coll. Cardiol. 2019, 74, 177–232. [CrossRef]
6. Tsuchihashi, M.; Tsutsui, H.; Kodama, K.; Kasagi, F.; Takeshita, A. Clinical characteristics and prognosis of hospitalized patientswith congestive heart failure—A study in Fukuoka, Japan. Jpn. Circ. J. 2000, 64, 953–959. [CrossRef]
7. Jones, H.; Edwards, L.; Vallis, T.M.; Ruggiero, L.; Rossi, S.R.; Rossi, J.S.; Greene, G.; Prochaska, J.O. Changes in diabetes self−carebehaviors make a difference in glycemic control: The diabetes stages of change (DiSC) study. Diabetes Care 2003, 26, 732–737.[CrossRef]
8. Ministry of Health Japan, Labour and Welfare Safety and Health Council. Source: Standard Medical Checkup and HealthGuidance Program (Definitive). Available online: https://www.mhlw.go.jp/file/06-seisakujouhou-10900000-kenkoukyoku/00_3.pdf (accessed on 16 February 2018).
9. Prochaska, J.O.; Redding, C.A.; Evers, K.E. The Transtheoretical Model and Stages of Change, Health Behavior and Health Education, 3rded.; Glanz, K., Rimer, B.K., Lewis, F.M., Eds.; Jossey-Bass: San Francisco, CA, USA, 2002; pp. 97–121.
10. Prochaska, J.O.; Velicer, W.F. The transtheoretical model of health behavior change. Am. J. Health Promot. 1997, 12, 38–48.[CrossRef] [PubMed]
11. Johnson, S.S.; Paiva, A.L.; Cummins, C.O.; Johnson, J.L.; Dyment, S.J.; Wright, J.A.; Prochaska, J.O.; Prochaska, J.M.; Sherman, K.Transtheoretical model based multiple behavior intervention for weight management: Effectiveness on a population basis. Prev.Med. 2008, 46, 238–246. [CrossRef]
12. Prochaska, J.O.; DiClemente, C.C.; Norcross, J.C. In search of how people change. Applications to addictive behavior. Am. Psychol.1992, 47, 1102–1114. [CrossRef]
13. Rosen, C.S. Is the sequencing of change processes by stage consistent across health problems? A meta-analysis. Health Psychol.2000, 19, 593–604. [CrossRef]
14. Thompson, F.E.; Byers, T. Dietary Assessment Resource Manual. J. Nutr. 1994, 124, 2245–2317.15. Ministry of Education Japan, Culture, Sports, Science and Technology; Office for Resources; Policy Division Science; Technology
Policy Bureau. Source: Standard Table of Food Composition in Japan 2015 (Seventh Revised Version). Available online:http://www.mext.go.jp/a_menu/syokuhinseibun/1365295.htm (accessed on 25 December 2015).
16. Excel Eiyoukun Ver. 8.0. Available online: https://www.kenpakusha.co.jp/np/code/600821-01/ (accessed on 1 May 2016).17. Intersalt Cooperative Research Group. Intersalt: An international study of electrolyte excretion and blood pressure. Results for
24-hour urinary sodium and potassium excretion. Br. Med. J. 1988, 297, 319–328. [CrossRef] [PubMed]18. Salonen, J.T.; Tuomilehto, J.; Tanskanen, A. Relation of blood pressure to reported intake of salt, saturated fats, and alcohol in
healthy middle-aged population. J. Epidemiol. Community Health 1983, 37, 32–37. [CrossRef] [PubMed]19. Morgan, T.; Adam, W.; Gillies, A.; Wilson, M.; Morgan, G.; Carney, S. Hypertension treated by salt restriction. Lancet 1978, 1,
227–230. [CrossRef]20. Meneely, G.R.; Dahl, L.K. Electrolytes in hypertension: The effects of sodium chloride. The evidence from animal and human
studies. Med. Clin. N. Am. 1961, 45, 271–283. [CrossRef]
92

Nutrients 2021, 13, 414
21. Asai, K.; Kobayashi, T.; Miyata, H.; Tanaka, Y.; Okada, Y.; Sakai, K.; Negoro, H.; Kamba, T.; Tsuji, H.; Shide, K.; et al. Theshort-term impact of dietary counseling on sodium intake and blood pressure in renal allograft recipients. Prog. Transpl. 2006, 26,365–371. [CrossRef] [PubMed]
22. Kim, E.J.; Cho, S.W.; Kang, J.Y.; Choi, T.I.; Park, Y. Effects of a 12-week lifestyle intervention on health outcome and serumadipokines in middle-aged Korean men with borderline high blood pressure. J. Am. Coll. Nutr. 2012, 31, 352–360. [CrossRef]
23. Yoshimura, R.; Yamamoto, R.; Shinzawa, M.; Tomi, R.; Ozaki, S.; Fujii, Y.; Ito, T.; Tanabe, K.; Moriguchi, Y.; Isaka, Y.; et al. Drinkingfrequency modifies an association between salt intake and blood pressure: A cohort study. J. Clin. Hypertens. 2020, 22, 649–655.[CrossRef]
24. Pimenta, E.; Gaddam, K.K.; Oparil, S.; Aban, I.; Husain, S.; Dell’Italia, L.J.; Calhoun, D.A. Effects of dietary sodium reduction onblood pressure in subjects with resistant hypertension: Results from a randomized trial. Hypertension 2009, 54, 475–481. [CrossRef]
25. Sacks, F.M.; Svetkey, L.P.; Vollmer, W.M.; Appel, L.J.; Bray, G.A.; Harsha, D.; Obarzanek, E.; Conlin, P.R.; Miller, E.R.; Simons-Morton, D.G.; et al. Effects on blood pressure of reduced dietary sodium and the Dietary Approaches to Stop Hypertension(DASH) diet. DASH-Sodium Collaborative Research Group. N. Engl. J. Med. 2001, 344, 3–10. [CrossRef]
26. Nakamura, K.; Okamura, T.; Hayakawa, T.; Hozawa, A.; Kadowaki, T.; Murakami, Y.; Kita, Y.; Okayama, A.; Ueshima, H.The proportion of individuals with alcohol-induced hypertension among total hypertensives in a general Japanese population:NIPPON DATA90. Hypertens. Res. 2007, 30, 663–668. [CrossRef]
27. Xue, X.; Jiang, H.; Maria, G.; Motsamai, O.I.; Whelton, P.K. Effects of alcohol reduction on blood pressure: A meta-analysis ofrandomized controlled trials. Hypertension 2001, 38, 1112–1117.
28. Anderson, R.M.; Funnell, M.M.; Butler, P.M.; Arnold, M.S.; Fitzgerald, J.T.; Feste, C.C. Patient empowerment. Results of arandomized controlled trial. Diabetes Care 1995, 18, 943–949. [CrossRef] [PubMed]
93


nutrients
Article
Secular Decreasing Trend in Plasma Eicosapentaenoic andDocosahexaenoic Acids among Patients with Acute CoronarySyndrome from 2011 to 2019: A Single Center Descriptive Study
Tomoaki Okada 1, Toru Miyoshi 2,*, Masayuki Doi 1, Kosuke Seiyama 1, Wataru Takagi 1, Masahiro Sogo 1,
Kazumasa Nosaka 1, Masahiko Takahashi 1, Keisuke Okawa 1 and Hiroshi Ito 2
Citation: Okada, T.; Miyoshi, T.; Doi,
M.; Seiyama, K.; Takagi, W.; Sogo, M.;
Nosaka, K.; Takahashi, M.; Okawa, K.;
Ito, H. Secular Decreasing Trend in
Plasma Eicosapentaenoic and
Docosahexaenoic Acids among
Patients with Acute Coronary
Syndrome from 2011 to 2019: A
Single Center Descriptive Study.
Nutrients 2021, 13, 253.
https://doi.org/10.3390/nu13010253
Received: 25 December 2020
Accepted: 15 January 2021
Published: 17 January 2021
Publisher’s Note: MDPI stays neu-
tral with regard to jurisdictional clai-
ms in published maps and institutio-
nal affiliations.
Copyright: © 2021 by the authors. Li-
censee MDPI, Basel, Switzerland.
This article is an open access article
distributed under the terms and con-
ditions of the Creative Commons At-
tribution (CC BY) license (https://
creativecommons.org/licenses/by/
4.0/).
1 Department of Cardiology, Kagawa Prefectural Central Hospital, 1-2-1 Asahi-machi,Takamatsu City 760-8557, Japan; [email protected] (T.O.); [email protected] (M.D.);[email protected] (K.S.); [email protected] (W.T.); [email protected] (M.S.);[email protected] (K.N.); [email protected] (M.T.); [email protected] (K.O.)
2 Department of Cardiovascular Medicine, Okayama University Graduate School of Medicine,Dentistry and Pharmaceutical Sciences, 2-5-1 Shikata-cho, Okayama City 700-8558, Japan;[email protected]
* Correspondence: [email protected]; Tel.: +81-86-235-7351
Abstract: Despite intensive lipid-lowering interventions, patients treated with statins developatherosclerotic cardiovascular disease (ASCVD), and these patients have an increased risk of de-veloping recurrent cardiovascular events during follow-up. Therefore, there is a need to focus onthe residual risks in patients in statin therapy to further reduce ASCVD. The aim of this study wasto retrospectively investigate the 10-year trend (2011–2019) regarding changes in polyunsaturatedfatty acids (PUFAs) in patients with acute coronary syndrome (ACS) in a single center. We included686 men and 203 women with ACS admitted to Kagawa Prefectural Central Hospital. Plasma PU-FAs, including eicosapentaenoic acid (EPA), docosahexaenoic acid (DHA), arachidonic acid (AA),and dihomo-γ-linolenic acid (DGLA), were measured at admission for suspected ACS. A seculardecreasing trend in the levels of EPA and DHA and the EPA/AA ratio, but not of AA and DGLA,was observed. The analyses based on age (>70 or <70 years) and sex showed that the decreasingtrend in the levels of EPA and DHA did not depend on age and remained significant only in men.Further studies are needed to obtain robust evidence to justify that the administration of n-3 PUFAcontributes to the secondary prevention of ACS.
Keywords: atherosclerotic cardiovascular disease; polyunsaturated fatty acids; eicosapentaenoicacid; docosahexaenoic acid; arachidonic acid; descriptive study
1. Introduction
Atherosclerotic cardiovascular disease (ASCVD) is the leading cause of mortality,accounting for 30% of all global deaths [1]. There are several methods to prevent ASCVD,including smoking cessation, increased physical activity, and weight loss [2]. The recentguidelines for the prevention of ASCVD recommend lipid-lowering agents, particularlystatins, as the essence of primary and secondary prevention of ASCVD [3–5]. However,despite intensive lipid-lowering interventions, patients treated with statins develop ASCVD,and these patients have an increased recurrent risk of cardiovascular events [6–8]. Therefore,the residual risks in patients on statin therapy need to be the focus to further reduceASCVD. An observational study showed that lower n-3 polyunsaturated fatty acids (PUFAs),especially eicosapentaenoic acid (EPA) and docosahexaenoic acid (DHA), were associatedwith the incidence of ASCVD [9]. Other studies have demonstrated that a low ratio of EPAto arachidonic acid (AA) is associated with a greater risk of cardiovascular disease [10–12].Therefore, active screening of PUFAs is beneficial in identifying patients at high risk forASCVD. A survey of a community-dwelling middle-aged and elderly Japanese population
Nutrients 2021, 13, 253. https://doi.org/10.3390/nu13010253 https://www.mdpi.com/journal/nutrients95
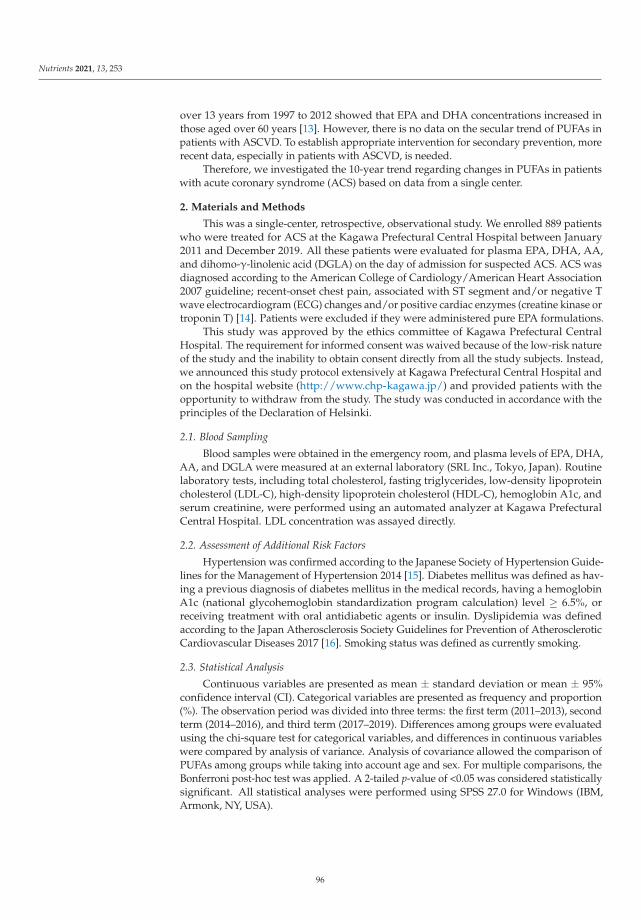
Nutrients 2021, 13, 253
over 13 years from 1997 to 2012 showed that EPA and DHA concentrations increased inthose aged over 60 years [13]. However, there is no data on the secular trend of PUFAs inpatients with ASCVD. To establish appropriate intervention for secondary prevention, morerecent data, especially in patients with ASCVD, is needed.
Therefore, we investigated the 10-year trend regarding changes in PUFAs in patientswith acute coronary syndrome (ACS) based on data from a single center.
2. Materials and Methods
This was a single-center, retrospective, observational study. We enrolled 889 patientswho were treated for ACS at the Kagawa Prefectural Central Hospital between January2011 and December 2019. All these patients were evaluated for plasma EPA, DHA, AA,and dihomo-γ-linolenic acid (DGLA) on the day of admission for suspected ACS. ACS wasdiagnosed according to the American College of Cardiology/American Heart Association2007 guideline; recent-onset chest pain, associated with ST segment and/or negative Twave electrocardiogram (ECG) changes and/or positive cardiac enzymes (creatine kinase ortroponin T) [14]. Patients were excluded if they were administered pure EPA formulations.
This study was approved by the ethics committee of Kagawa Prefectural CentralHospital. The requirement for informed consent was waived because of the low-risk natureof the study and the inability to obtain consent directly from all the study subjects. Instead,we announced this study protocol extensively at Kagawa Prefectural Central Hospital andon the hospital website (http://www.chp-kagawa.jp/) and provided patients with theopportunity to withdraw from the study. The study was conducted in accordance with theprinciples of the Declaration of Helsinki.
2.1. Blood Sampling
Blood samples were obtained in the emergency room, and plasma levels of EPA, DHA,AA, and DGLA were measured at an external laboratory (SRL Inc., Tokyo, Japan). Routinelaboratory tests, including total cholesterol, fasting triglycerides, low-density lipoproteincholesterol (LDL-C), high-density lipoprotein cholesterol (HDL-C), hemoglobin A1c, andserum creatinine, were performed using an automated analyzer at Kagawa PrefecturalCentral Hospital. LDL concentration was assayed directly.
2.2. Assessment of Additional Risk Factors
Hypertension was confirmed according to the Japanese Society of Hypertension Guide-lines for the Management of Hypertension 2014 [15]. Diabetes mellitus was defined as hav-ing a previous diagnosis of diabetes mellitus in the medical records, having a hemoglobinA1c (national glycohemoglobin standardization program calculation) level ≥ 6.5%, orreceiving treatment with oral antidiabetic agents or insulin. Dyslipidemia was definedaccording to the Japan Atherosclerosis Society Guidelines for Prevention of AtheroscleroticCardiovascular Diseases 2017 [16]. Smoking status was defined as currently smoking.
2.3. Statistical Analysis
Continuous variables are presented as mean ± standard deviation or mean ± 95%confidence interval (CI). Categorical variables are presented as frequency and proportion(%). The observation period was divided into three terms: the first term (2011–2013), secondterm (2014–2016), and third term (2017–2019). Differences among groups were evaluatedusing the chi-square test for categorical variables, and differences in continuous variableswere compared by analysis of variance. Analysis of covariance allowed the comparison ofPUFAs among groups while taking into account age and sex. For multiple comparisons, theBonferroni post-hoc test was applied. A 2-tailed p-value of <0.05 was considered statisticallysignificant. All statistical analyses were performed using SPSS 27.0 for Windows (IBM,Armonk, NY, USA).
96

Nutrients 2021, 13, 253
3. Results
Analysis of the patient characteristics and lipid profile of the study population accord-ing to the terms as shown in Table 1, patients in the third term were significantly older thanthose in the second term. The prevalence of dyslipidemia in the third term was significantlylower than that in the second term. There was a higher prevalence of patients with currentsmoking habit and statin use in the second term than in the first and third terms, respectively.The level of hemoglobin A1c in the second term was significantly lower than that in the firstterm. The level of triglyceride in the third term was significantly lower than that in the firstterm, whereas the levels of LDL-C and HDL-C did not differ among the three terms.
Table 1. Patient characteristics in the first, second and third terms.
First Term(2011–2013),
n = 238
Second Term(2014–2016),
n = 285
Third Term(2017–2019),
n = 366p Value
Age, years 70.3 ± 11.4 68.5 ± 12.1 71.7 ± 12.7 # 0.003Male/female 181 (76)/57 (24) 227 (80)/58 (20) 278 (76)/88 (24) 0.480
Body mass index, kg/m2 23.7 ± 3.8 23.9 ± 3.4 23.8 ± 3.8 0.765Hypertension 165 (69) 211 (74) 264 (72) 0.489
Diabetes mellitus 92 (39) 95 (33) 140 (38) 0.340Dyslipidemia 159 (67) 199 (70) 219 (60) # 0.023
Current smoker 69 (29) 124 (43.8) * 107 (29) # <0.001AMI/UAP 160 (67)/78 (33) 194 (68)/91 (32) 245 (67)/121 (33) 0.097
History of CAD 37 (16) 32 (11) 47 (13) 0.34Statin 39 (16) 74 (26) * 67 (18) # 0.012
Ezetimibe N/A 5 (2) 7 (2) 0.710ACEI/ARB 65 (28) 108 (37) 106 (28) 0.770β-blocker 22 (9) 28 (10) 31 (8) 0.995
Serum creatinine, mg/dL 1.00 ± 0.91 0.98 ± 0.88 1.18 ± 1.49 0.057Hemoglobin A1c, % 6.4 ± 1.3 6.0 ± 0.9 * 6.2 ± 1.1 0.005
Total cholesterol, mg/dL 181 ± 39 185 ± 44 180 ± 40 0.223LDL-C, mg/dL 114 ± 33 116 ± 36 113 ± 34 0.692
Triglyceride, mg/dL 110 ± 131 114 ± 99 94 ± 77 # 0.037HDL-C, mg/dL 42 ± 10 44 ± 12 44 ± 12 0.257
EPA, μg/mL 63.0 ± 42.2 60.2 ± 38.3 51.6 ± 33.2 *# <0.001DHA, μg/mL 138.1 ± 51.7 130.2 ± 51.0 116.0 ± 43.8 *# <0.001AA, μg/mL 169.6 ± 45.6 178.3 ± 53.2 180.8 ± 55.7 * 0.032
DGLA, μg/mL 36.0 ± 14.7 39.3 ± 15.2 * 36.0 ± 14.8 # 0.010EPA/AA 0.37 ± 0.22 0.35 ± 0.22 0.29 ± 0.18 *# <0.001
Categorical variables are presented as number of patients (%). Continuous variables are presented as mean ± standard deviation. AMI,acute myocardial infarction; UAP, unstable angina pectoris; CAD, coronary artery disease; N/A, not available; ACEI/ARB, angiotensin-converting-enzyme inhibitor/angiotensin II Receptor Blocker; HDL-C, high-density lipoprotein cholesterol; LDL-C, low-density lipoproteincholesterol; EPA, eicosapentaenoic acid; DHA, docosahexaenoic acid; DGLA, dihomo-γ-linolenic acid; AA, arachidonic acid. * p < 0.05versus first term and # p < 0.05 versus second term. For multiple comparisons, the Bonferroni post-hoc test was applied.
On analyzing the secular trend of EPA, AA, DGLA, AA, and EPA/AA levels in allpatients, and according to age (>70 or < 70years) and sex (Table 2), the levels of EPA andDHA in the third term were significantly lower than those in the first and second terms,respectively. The AA level in the third term was significantly higher than that in the firstterm. The DGLA level in the second term was significantly higher than that in the first andthird terms. Regarding the influence of age on the trend, the levels of EPA and DHA in thethird term remained significantly lower than those in the first term in both patients aged<70 years and >70 years. Regarding the influence of sex on the trend, the levels of EPA andDHA in the third term remained significantly lower than those in the first term in men, butnot in women. The levels of AA and DGLA did not differ among the three terms regardlessof age and sex. The EPA/AA ratio in the third term was significantly lower than that inthe first term regardless of age, and this difference remained significant in men, but notin women.
97

Nutrients 2021, 13, 253
Table 2. Secular trend in polyunsaturated fatty acids in all patients.
First Term(2011–2013)
Second Term(2014–2016)
Third Term(2017–2019)
p Value
EPA, μg/mLAll patients 63.0 ± 42.2 60.2 ± 38.3 51.6 ± 33.2 *# <0.001
Age ≤ 70 years 62.8 ± 40.1 57.9 ± 37.4 49.5 ± 31.2 * 0.010Age > 70 years 65.9 ± 50.4 62.6 ± 36.6 53.4 ± 34.9 * 0.018
Men 64.5 ± 43.9 58.8 ± 36.7 51.7 ± 31.7 * 0.002Women 63.8 ± 50.3 64.8 ± 38.3 51.3 ± 37.8 0.080
DHA, μg/mLAll patients 138.1 ± 51.7 130.2 ± 51.0 116.0 ± 43.8 *# <0.001
Age ≤ 70 years 142.9 ± 62.5 128.6 ± 49.0 110.9 ± 41.9 * <0.001Age > 70 years 139.0 ± 48.1 131.6 ± 48.4 120.2 ± 45.1 * 0.004
Men 140.5 ± 59.1 126.3 ± 46.0 * 111.7 ± 38.9 *,# <0.001Women 142.2 ± 44.4 143.9 ± 56.0 129.4 ± 54.7 0.183
AA, μg/mLAll patients 169.6 ± 45.6 178.3 ± 53.2 180.8 ± 55.7 * 0.032
Age ≤ 70 years 179.4 ± 53.1 185.7 ± 53.2 192.0 ± 61.7 0.225Age > 70 years 161.9 ± 39.4 164.7 ± 46.4 171.5 ± 48.4 0.186
Men 169.7 ± 48.1 171.3 ± 50.5 179.4 ± 53.3 0.093Women 174.1 ± 45.8 194.8 ± 50.3 185.5 ± 63.1 0.150
DGLA, μg/mLAll patients 36.0 ± 14.7 39.3 ± 15.2 * 36.0 ± 14.8 # 0.010
Age ≤ 70 years 40.1 ± 17.2 42.8 ± 16.0 39.6 ± 14.3 0.124Age > 70 years 32.4 ±12.7 33.5 ± 11.1 33.1 ± 14.6 0.813
Men 36.6 ± 15.6 38.2 ± 15.0 36.2 ± 15.6 0.298Women 35.2 ± 15.5 40.1 ± 13.4 35.6 ± 12.2 0.066
EPA/AAAll patients 0.37 ± 0.22 0.35 ± 0.22 0.29 ± 0.18 *,# <0.001
Age ≤ 70 years 0.35 ± 0.19 0.32 ± 0.20 0.27 ± 0.17 * 0.002Age > 70 years 0.40 ± 0.28 0.439 ± 0.23 0.31 ± 0.19 * 0.001
Men 0.38 ± 0.24 0.36 ± 0.21 0.30 ± 0.21 * <0.001Women 0.35 ± 0.22 0.35 ± 0.23 0.27 ± 0.17 0.035
Continuous variables are presented as mean ± standard deviation. EPA, eicosapentaenoic acid; DHA, docosa-hexaenoic acid; DGLA, dihomo-γ-linolenic acid; AA, arachidonic acid. * p < 0.05 versus first term and # p < 0.05versus second term. For multiple comparisons, the Bonferroni post-hoc test was applied.
Next, the secular trends of EPA, AA, DGLA, and EPA/AA levels in patients with andwithout diabetes were analyzed separately (Tables 3 and 4). The trend in patients withdiabetes was similar to that in all patients. However, in patients without diabetes, thelevels of EPA in the third term were significantly lower than those in the second term inwomen >70 years; the levels of DHA in the third term were significantly lower than thosein the second term regardless age and sex; and the EPA/AA ratio in the third term wassignificantly lower than that in the first and the second terms in women >70 years.
Based on Figure 1, which shows the secular trend in the age- and sex-adjusted EPA,AA, DGLA, and EPA/AA levels, the adjusted levels of PUFAs [mean (95% CI)] in thefirst, second, and third terms were 62.4 (55.5–69.2), 57.6 (52.4–62.8), and 47.7 (42.6–52.8) ofEPA (μg/mL, p = 0.001); 142.4 (133.9–150.6), 128.7 (122.3–13.5.1), and 116.6 (110.3–122.9)of DHA (μg/mL, p < 0.001); 174.9 (165.7–14.0), 182.7 (175.8–189.6), 186.8 (180.1–193.6) ofAA (p = 0.102); 39.2 (36.8–41.7), 40.2 (38.4–42.0), and 37.0 (35.2–38.8) of DGLA (μg/mL,p = 0.045), 0.63 (0.32–0.40), 0.33 (0.30–0.36), and 0.26 (0.23–0.29) of EPA/AA (p < 0.001),respectively.
98

Nutrients 2021, 13, 253
Table 3. Secular trend in polyunsaturated fatty acids in patients with diabetes.
First Term(2011–2013),
n = 92
Second Term(2014–2016),
n = 95
Third Term(2017–2019),
n = 139p Value
EPA, μg/mLAge ≤ 70 years 71.2 ± 44.3 58.1 ± 32.2 46.3 ± 28.2 *,# 0.001Age > 70 years 71.4 ± 50.5 62.5 ± 40.8 54.3 ± 41.4 * 0.125
Men 71.6 ± 49.3 59.9 ± 37.8 48.2 ± 28.5 *,# <0.001Women 70.2 ± 37.1 61.4 ± 31.8 60.0 ± 56.1 0.732
DHA, μg/mLAge ≤ 70 years 145.4 ± 67.4 127.7 ± 46.8 106.2 ± 43.7 *,# 0.001Age > 70 years 146.3 ± 51.1 131.4 ± 58.3 120.6 ± 54.7 * 0.055
Men 144.6 ± 65.0 125.9 ± 47.8 * 106.6 ± 37.1 *,# <0.001Women 150.4 ± 38.8 142.9 ± 66.4 142.1 ± 77.6 0.903
AA, μg/mLAge ≤ 70 years 183.0 ± 58.8 239.4 ± 331.6 194.8 ± 70.9 0.297Age > 70 years 162.6 ± 36.6 173.0 ± 38.6 170.4 ± 42.5 0.455
Men 173.0 ± 52.6 210.2 ± 272.1 178.3 ± 50.9 0.266Women 177.1 ± 45.1 199.6 ± 64.4 191.2 ± 78.1 0.569
DGLA, μg/mLAge ≤ 70 years 42.6 ± 19.2 44.5 ± 16.4 39.9 ± 14.4 0.348Age > 70 years 32.5 ± 12.2 34.7 ± 12.8 31.2 ± 11.0 0.280
Men 38.2 ± 17.7 39.8 ± 15.1 34.7 ± 13.1 # 0.063Women 37.8 ± 15.3 40.1 ± 17.5 36.2 ± 13.9 0.694
EPA/AAAge ≤ 70 years 0.38 ± 0.20 0.31 ± 0.19 0.25 ± 0.14 *,# <0.001Age > 70 years 0.45 ± 0.33 0.36 ± 0.24 0.31 ± 0.19 * 0.016
Men 0.42 ± 0.27 0.34 ± 0.23 0.28 ± 0.16 *,# <0.001Women 0.40 ± 0.23 0.31 ± 0.14 0.30 ± 0.23 0.220
Continuous variables are presented as mean ± standard deviation. EPA, eicosapentaenoic acid; DHA, docosa-hexaenoic acid; DGLA, dihomo-γ-linolenic acid; AA, arachidonic acid. * p < 0.05 versus first term and # p < 0.05versus second term. For multiple comparisons, the Bonferroni post-hoc test was applied.
Table 4. Secular trend in polyunsaturated fatty acids in patients without diabetes.
First Term(2011–2013),
n = 146
Second Term(2014–2016),
n = 190
Third Term(2017–2019),
n = 227p Value
EPA, μg/mLAge ≤ 70 years 54.9 ± 29.5 57.7 ± 42.6 51.3 ± 32.8 0.434Age > 70 years 60.9 ± 45.4 63.2 ± 35.2 52.8 ± 30.0 # 0.096
Men 56.8 ± 32.1 58.6 ± 38.6 53.9 ± 33.6 0.491Women 60.7 ± 52.0 66.7 ± 42.2 46.8 ± 22.7 # 0.036
DHA, μg/mLAge ≤ 70 years 134.7 ± 47.5 129.0 ± 54.2 113.7 ± 40.8 *,# 0.009Age > 70 years 131.7 ± 42.3 132.3 ± 46.0 119.9 ± 37.8 *,# 0.057
Men 131.1 ± 45.1 127.1 ± 48.4 115.0 ± 39.9 *,# 0.006Women 139.1 ± 44.3 144.3 ± 56.8 122.9 ± 37.1 # 0.057
AA, μg/mLAge ≤ 70 years 175.0 ± 41.2 185.0 ± 53.1 190.3 ± 56.1 * 0.146Age > 70 years 158.5 ± 41.0 163.7 ± 51.3 172.2 ± 52.0 0.151
Men 164.0 ± 40.1 169.8 ± 54.1 180.1 ± 54.8 * 0.031Women 174.9 ± 45.9 197.1 ± 43.8 * 182.5 ± 54.3 0.137
DGLA, μg/mLAge ≤ 70 years 37.6 ± 13.1 43.4 ± 16.7 * 39.4 ± 14.3 0.027Age > 70 years 31.6 ± 11.9 33.7 ± 10.7 34.3 ± 16.5 0.420
Men 34.7 ± 12.4 38.4 ± 15.7 * 37.2 ± 16.9 0.177Women 34.4 ± 14.1 41.4 ± 11.8 * 35.3 ± 11.4 # 0.024
99
Nutrients 2021, 13, 253
Table 4. Cont.
First Term(2011–2013),
n = 146
Second Term(2014–2016),
n = 190
Third Term(2017–2019),
n = 227p Value
EPA/AAAge ≤ 70 years 0.31 ±0.16 0.32 ± 0.22 0.28 ± 0.18 0.312Age > 70 years 0.37 ± 0.22 0.40 ± 0.22 0.31± 0.18 *,# 0.006
Men 0.35 ± 0.18 0.35 ± 0.22 0.31 ± 0.20 0.101Women 0.33 ± 0.22 0.36 ± 0.26 0.26 ± 0.12 # 0.038
Continuous variables are presented as mean ± standard deviation. EPA, eicosapentaenoic acid; DHA, docosa-hexaenoic acid; DGLA, dihomo-γ-linolenic acid; AA, arachidonic acid. * p < 0.05 versus first term and # p < 0.05versus second term. For multiple comparisons, the Bonferroni post-hoc test was applied.
Figure 1. Secular trend in age- and sex- adjusted polyunsaturated fatty acids and EPA/AA. (A)EPA, (B) DHA, (C) AA, (D) DGLA, and (E) EPA/AA Data are presented as mean ± 95% confidenceinterval. EPA, eicosapentaenoic acid; DHA, docosahexaenoic acid; DGLA, dihomo-γ-linolenic acid;AA, arachidonic acid. * p < 0.05 versus first term and # p < 0.05 versus second term. Analysis ofcovariance allowed the comparison of PUFAs among groups while taking into account age and sex.For multiple comparisons, the Bonferroni post-hoc test was applied.
4. Discussion
This study demonstrated a decreasing trend in the levels of EPA, DHA, and EPA/AA,but not of AA and DGLA. Analyses based on age (<70 and >70 years) and sex showedthat this decreasing trend in the levels of EPA and DHA did not depend on age and wassignificant only in men. To our knowledge, this is the first study to describe changes inPUFAs over a decade in patients with ACS.
100

Nutrients 2021, 13, 253
A previous study from 1997 to 2012 in a contemporary healthy Japanese populationliving in an urban area showed a secular increasing trend in the serum levels of EPA andDHA in the population aged over 60 years [17]. The present study evaluated subsequentchanges in PUFAs from 2011 to 2019 in patients with ACS and demonstrated a decreasingtrend in plasma EPA and DHA. After 2010, a substantial reduction in the fish intake inthe Japanese elderly population was reported [18], which could be an explanation of thisdecreasing trend of n-3 PUFAs in the present study, as fish intake is closely correlatedwith circulating n-3 PUFAs level [19]. Another explanation is the difference in participantcharacteristics between the general population and patients with ACS. A previous studyin patients with ACS showed that the mean levels of EPA and DHA during 2004 and 2011were 73.4 μg/mL and 146.9 μg/mL, respectively, which were slightly higher than thosein the first term (2011–2013) in our study (63.0 μg/mL and 138.1 μg/mL, respectively).Furthermore, the level of AA during 2004 and 2011 in patients with ACS was reported to be159.9 μg/mL, which was moderately lower than that in the first term in the present studyof 169.6 μg/mL. Thus, in patients with ACS, a decreasing trend in the levels of EPA, DHA,and EPA/AA may have continued before 2011. However, further larger studies are neededto confirm this decreasing trend in patients with ACS.
The mechanisms underlying the favorable effects of n-3 PUFAs remain partly un-known [20], whereas previous experimental studies showed that n-3 PUFAs have multipleactions towards prevention of ASCVD, including anti-inflammatory effect [21], inhibitionof platelet aggregation [22], and improvement of endothelial function [23]. Several studiesusing intra-coronary imaging showed that circulating EPA levels were associated withlipid plaque volume, [24] and fibrous-cap thickness of the plaque [25]. A randomizedcontrol study evaluating coronary plaque change by multidetector computed tomographyshowed that treatment with n-3 PUFA formulation for 18 months significantly reduced theaccumulation of low-attenuation plaque, which is a component of vulnerable plaque, com-pared to placebo [26]. Furthermore, a recent study showed that the proportion of EPA inserum phosphatidylcholine at the time of ACS was associated with further clinical adverseevents [27]. Thus, clinical trials and basic experiments suggest an important associationbetween n-3 PUFAs and the development of ASCVD.
The Japanese Registry of All Cardiac and Vascular Disease showed that the number ofpatients with ACS is slightly increasing in Japan (http://www.j-circ.or.jp/jittai_chosa/).Furthermore, despite significant improvement in cardiovascular events by intensive statintreatment, up to 40% of statin-treated patients continue to experience recurrent cardiovas-cular events [8]. Thus, the control of risk factors beyond LDL-C and residual risk is anemerging problem for preventing ASCVD. In this context, n-3 PUFA has been evaluated asa residual cardiovascular risk factor. Our study demonstrated the secular decreasing trendin the levels of EPA, DHA, and EPA/AA without significant changes in LDL-C and HDL-C.Although our study did not evaluate the association between the secular decreasing trendand the incidence of ASCVD, it highlights the importance of n-3 PUFAs in the developmentof ACS.
Previous studies have shown that triglyceride-rich lipoproteins, the main carriers oftriglycerides, are associated with foam cell formation via macrophage uptake directly at thearterial wall, which results in the development of atherosclerosis [28]. In addition, recentgenetic studies have provided robust evidence of the role of triglycerides in the causalpathway for ASCVD [29]. Thus, supplemental n-3 PUFA lower triglyceride can be usedas a treatment in patients with hypertriglyceridemia. However, the clinical benefit of thetreatment of hypertriglyceridemia for the prevention of ASCVD has not been established.Future clinical trials are needed to determine whether triglyceride-lowering therapiesreduce the risk of ASCVD in patients with hypertriglyceridemia. In addition, lipoprotein(a),which is composed of an LDL-like particle and characteristic glycoprotein apolipoprotein(a)connected by a disulfide bond, has been recognized as a residual risk of ASCVD [30]. Thus,the control of residual risks is an emerging issue to prevent ASCVD after the achievementof substantial reduction of LDL-C.
101

Nutrients 2021, 13, 253
Although a few clinical studies have shown the effectiveness of n-3 PUFAs in high-riskpatients, the benefit of n-3 PUFAs in the prevention of ASCVD remains controversial [31–42].For primary prevention, a study of cardiovascular events in diabetes (ASCEND) [43] and along-term outcomes study to assess STatin Residual Risk Reduction With EpaNova in HiGhCardiovascular Risk PatienTs With Hypertriglyceridemia (STRENGTH) [44] failed to show asignificant reduction in ASCVD by n-3 PUFA formulation in high risk patients. The VitaminD and Omega-3 Trial (VITAL) showed that supplemental n-3 PUFAs did not significantlyreduce the primary cardiovascular end point of major cardiovascular events (compositeof myocardial infarction, stroke, and cardiovascular mortality), but were associated withsignificant reductions in total myocardial infarction, percutaneous coronary intervention, andfatal myocardial infarction [45]. On the other hand, for secondary prevention, Reduction ofCardiovascular Events With EPA—Intervention Trial (REDUCE-IT) [46] showed a significantreduction in ASCVD. There were several differences among the studies. One issue is theformulation of n-3 PUFAs. The ASCEND, the VITAL, and the STRENGTH tested mixedformulations of EPA and DHA, whereas the REDUCE-IT evaluated pure EPA formulation.Another issue is the dose of n-3 PUFA. Participants in the ASCEND and the VITAL received1 g/day of n-3 PUFA, whereas participants in the STRENGTH and the REDUCE-IT received4 g/day. A high dose of n-3 PUFA formulation may be preferable because circulating EPAlevels were shown to be tightly linked with ASCVD outcomes in the REDUCE-IT trial [46].Furthermore, it is possible that the specific formulation of n-3 PUFAs makes a differencebecause the biological roles of EPA and DHA in tissue are different [18]. Further large-scale,carefully planned, and controlled clinical studies are needed to provide solid evidence thatn-3 PUFAs can prevent ASCVD.
There are several limitations in this study. This study was retrospectively performedat a single center located in a costal provincial city. Therefore, the study results cannot beapplied directly to patients living in urban areas. Second, this study did not aim to analyzethe causal relationship between the decrease in the levels of EPA and DHA, EPA/AA, andthe incidence of ACS. Further investigation is needed to achieve robust evidence on therole of n-3 PUFAs in preventing ASCVD.
5. Conclusions
This study demonstrated a decreasing trend in the levels of EPA and DHA, andEPA/AA in men from 2011 to 2019 without significant changes in the levels of LDL-C andHDL-C. This decreasing trend in the levels of EPA and DHA did not depend on age and wassignificant only in men. Considering the results of recent large-scale trials, administrationof a sufficient dose of n-3 PUFAs may contribute to the secondary prevention of ACS, butfurther studies are needed to obtain robust evidence.
Author Contributions: Conceptualization, M.D.; formal analysis, M.D. and T.M.; investigation, T.O.,K.S., W.T., M.S., K.N., M.T. and K.O.; writing—original draft preparation, T.O. and T.M.; writing—review and editing, H.I. All authors have read and agreed to the published version of the manuscript.
Funding: This research received no external funding.
Institutional Review Board Statement: The study was conducted according to the guidelines ofthe Declaration of Helsinki and approved by the Ethics Committee of Kagawa Prefectural CentralHospital.
Informed Consent Statement: Patient consent was waived due to the low-risk nature of the studyand the inability to obtain consent directly from all the study subjects.
Data Availability Statement: The data presented in this study are available on request from thecorresponding author.
Conflicts of Interest: The authors declare no conflict of interest.
102

Nutrients 2021, 13, 253
References
1. Roth, G.A.; Abate, D.; Abate, K.H.; Abay, S.M.; Abbafati, C.; Abbasi, N.; Abbastabar, H.; Abd-Allah, F.; Abdela, J.; Abdelalim, A.;et al. Global, regional, and national age-sex-specific mortality for 282 causes of death in 195 countries and territories, 1980–2017:A systematic analysis for the global burden of disease study 2017. Lancet 2018, 392, 1736–1788. [CrossRef]
2. Piepoli, M.F.; Hoes, A.W.; Agewall, S.; Albus, C.; Brotons, C.; Catapano, A.L.; Cooney, M.T.; Corrà, U.; Cosyns, B.; Deaton, C.;et al. 2016 European Guidelines on cardiovascular disease prevention in clinical practice: The Sixth Joint Task Force of theEuropean Society of Cardiology and Other Societies on Cardiovascular Disease Prevention in Clinical Practice (constituted byrepresentatives of 10 societies and by invited experts) Developed with the special contribution of the European Association forCardiovascular Prevention & Rehabilitation (EACPR). Eur. Heart J. 2016, 37, 2315–2381. [PubMed]
3. Arnett, D.K.; Blumenthal, R.S.; Albert, M.A.; Buroker, A.B.; Goldberger, Z.D.; Hahn, E.J.; Himmelfarb, C.D.; Khera, A.; Lloyd-Jones, D.; McEvoy, J.W.; et al. 2019 ACC/AHA guideline on the primary prevention of cardiovascular disease: A report of theAmerican College of Cardiology/American Heart Association Task Force on Clinical Practice Guidelines. J. Am. Coll. Cardiol.2019, 74, e177–e232. [CrossRef] [PubMed]
4. Mach, F.; Baigent, C.; Catapano, A.L.; Koskinas, K.C.; Casula, M.; Badimon, L.; Chapman, M.J.; De Backer, G.G.; Delgado, V.;Ference, B.A.; et al. 2019 ESC/EAS Guidelines for the management of dyslipidaemias: Lipid modification to reduce cardiovascularrisk. Atherosclerosis 2019, 290, 140–205. [CrossRef] [PubMed]
5. Kimura, K.; Kimura, T.; Ishihara, M.; Nakagawa, Y.; Nakao, K.; Miyauchi, K.; Sakamoto, T.; Tsujita, K.; Hagiwara, N.; Miyazaki, S.;et al. JCS 2018 Guideline on diagnosis and treatment of acute coronary syndrome. Circ. J. 2019, 83, 1085–1196. [CrossRef] [PubMed]
6. Stone, S.G.; Serrao, G.W.; Mehran, R.; Tomey, M.I.; Witzenbichler, B.; Guagliumi, G.; Peruga, J.Z.; Brodie, B.R.; Dudek, D.;Möckel, M.; et al. Incidence, predictors, and implications of reinfarction after primary percutaneous coronary intervention inST-segment-elevation myocardial infarction: The harmonizing outcomes with revascularization and stents in acute myocardialinfarction trial. Circ. Cardiovasc. Interv. 2014, 7, 543–551. [CrossRef]
7. Motivala, A.A.; Tamhane, U.; Ramanath, V.S.; Saab, F.; Montgomery, D.G.; Fang, J.; Kline-Rogers, E.; May, N.; Ng, G.; Froehlich, J.;et al. A prior myocardial infarction: How does it affect management and outcomes in recurrent acute coronary syndromes?Clin. Cardiol. 2008, 31, 590–596. [CrossRef]
8. Sachdeva, A.; Cannon, C.P.; Deedwania, P.C.; Labresh, K.A.; Smith, S.C., Jr.; Dai, D.; Hernandez, A.; Fonarow, G.C. Lipid levels inpatients hospitalized with coronary artery disease: An analysis of 136,905 hospitalizations in Get with the Guidelines. Am. HeartJ. 2009, 157, 111–117. [CrossRef]
9. Iso, H.; Kobayashi, M.; Ishihara, J.; Sasaki, S.; Okada, K.; Kita, Y.; Kokubo, Y.; Tsugane, S.; JPHC Study Group. Intake of fish andn3 fatty acids and risk of coronary heart disease among Japanese: The Japan Public Health Center-Based (JPHC) Study Cohort I.Circulation 2006, 113, 195–202. [CrossRef]
10. Domei, T.; Yokoi, H.; Kuramitsu, S.; Soga, Y.; Arita, T.; Ando, K.; Shirai, S.; Kondo, K.; Sakai, K.; Goya, M.; et al. Ratio of serumn-3 to n-6 polyunsaturated fatty acids and the incidence of major adverse cardiac events in patients undergoing percutaneouscoronary intervention. Circ. J. 2012, 76, 423–429. [CrossRef]
11. Ueeda, M.; Doumei, T.; Takaya, Y.; Ohnishi, N.; Takaishi, A.; Hirohata, S.; Miyoshi, T.; Shinohata, R.; Usui, S.; Kusachi, S.Association of serum levels of arachidonic acid and eicosapentaenoic acid with prevalence of major adverse cardiac events afteracute myocardial infarction. Heart Vessel. 2011, 26, 145–152. [CrossRef] [PubMed]
12. Ninomiya, T.; Nagata, M.; Hata, J.; Hirakawa, Y.; Ozawa, M.; Yoshida, D.; Ohara, T.; Kishimoto, H.; Mukai, N.; Fukuhara, M.; et al.Association between ratio of serum eicosapentaenoic acid to arachidonic acid and risk of cardiovascular disease: The HisayamaStudy. Atherosclerosis 2013, 231, 261–267. [CrossRef] [PubMed]
13. Otsuka, R.; Kato, Y.; Imai, T.; Ando, F.; Shimokata, H. Secular trend of serum docosahexaenoic acid, eicosapentaenoic acid, andarachidonic acid concentrations among Japanese-a 4- and 13-year descriptive epidemiologic study. Prostaglandins Leukot. Essent.Fatty Acids 2015, 94, 35–42. [CrossRef] [PubMed]
14. King, S.B., 3rd; Smith, S.C., Jr.; Hirshfeld, J.W., Jr.; Jacobs, A.K.; Morrison, D.A.; Williams, D.O.; Feldman, T.E.; Kern, M.J.;O’Neill, W.W.; Schaff, H.V.; et al. 2007 focused update of the ACC/AHA/SCAI 2005 guideline update for percutaneous coronaryintervention: A report of the American College of Cardiology/American Heart Association Task Force on Practice guidelines.J. Am. Coll. Cardiol. 2008, 172–209. [CrossRef] [PubMed]
15. Shimamoto, K.; Ando, K.; Fujita, T.; Hasebe, N.; Higaki, J.; Horiuchi, M.; Imai, Y.; Imaizumi, T.; Ishimitsu, T.; Ito, M.; et al. TheJapanese Society of Hypertension Guidelines for the Management of Hypertension (JSH 2014). Hypertens. Res. 2014, 37, 253–390.[PubMed]
16. Kinoshita, M.; Yokote, K.; Arai, H.; Iida, M.; Ishigaki, Y.; Ishibashi, S.; Umemoto, S.; Egusa, G.; Ohmura, H.; Okamura, T.; et al.Japan Atherosclerosis Society (JAS) Guidelines for Prevention of Atherosclerotic Cardiovascular Diseases 2017. J. Atheroscler.Thromb. 2018, 25, 846–984. [CrossRef] [PubMed]
17. Yanagisawa, N.; Shimada, K.; Miyazaki, T.; Kume, A.; Kitamura, Y.; Ichikawa, R.; Ohmura, H.; Kiyanagi, T.; Hiki, M.; Fukao, K.;et al. Polyunsaturated fatty acid levels of serum and red blood cells in apparently healthy Japanese subjects living in an urbanarea. J. Atheroscler. Thromb. 2010, 17, 285–294. [CrossRef] [PubMed]
18. Yokoyama, S. Beneficial effect of retuning to “Japan Diet” for the Japanese. J. Atheroscler. Thromb. 2019, 26, 1–2. [CrossRef]
103
Nutrients 2021, 13, 253
19. Shijo, Y.; Maruyama, C.; Nakamura, E.; Nakano, R.; Shima, M.; Mae, A.; Okabe, Y.; Park, S.; Kameyama, N.; Hirai, S. Japan dietintake changes serum phospholipid fatty acid compositions in middle-aged men: A pilot study. J. Atheroscler. Thromb. 2019, 26, 3–13.[CrossRef]
20. Mason, R.P.; Libby, P.; Bhatt, D.L. Emerging mechanisms of cardiovascular protection for the omega-3 fatty acid eicosapentaenoicacid. Arterioscler. Thromb. Vasc. Biol. 2020, 40, 1135–1147. [CrossRef]
21. Bäck, M.; Hansson, G.K. Omega-3 fatty acids, cardiovascular risk, and the resolution of inflammation. FASEB J. 2019, 33, 1536–1539.[CrossRef] [PubMed]
22. Krämer, H.J.; Stevens, J.; Grimminger, F.; Seeger, W. Fish oil fatty acids and human platelets: Dose-dependent decrease in dienoicand increase in trienoic thromboxane generation. Biochem. Pharmacol. 1996, 52, 1211–1217. [CrossRef]
23. Mason, R.P.; Dawoud, H.; Jacob, R.F.; Sherratt, S.C.R.; Malinski, T. Eicosapentaenoic acid improves endothelial function andnitric oxide bioavailability in a manner that is enhanced in combination with a statin. Biomed. Pharmacother. 2018, 103, 1231–1237.[CrossRef] [PubMed]
24. Niki, T.; Wakatsuki, T.; Yamaguchi, K.; Taketani, Y.; Oeduka, H.; Kusunose, K.; Ise, T.; Iwase, T.; Yamada, H.; Soeki, T.; et al. Effectsof the addition of eicosapentaenoic acid to strong statin therapy on inflammatory cytokines and coronary plaque componentsassessed by integrated backscatter intravascular ultrasound. Circ. J. 2016, 80, 450–460. [CrossRef] [PubMed]
25. Nishio, R.; Shinke, T.; Otake, H.; Nakagawa, M.; Nagoshi, R.; Inoue, T.; Kozuki, A.; Hariki, H.; Osue, T.; Taniguchi, Y.; et al.Stabilizing effect of combined eicosapentaenoic acid and statin therapy on coronary thin-cap fibroatheroma. Atherosclerosis 2014,234, 114–119. [CrossRef]
26. Budoff, M.J.; Bhatt, D.L.; Kinninger, A.; Lakshmanan, S.; Muhlestein, J.B.; Le, V.T.; May, H.T.; Shaikh, K.; Shekar, C.; Roy, S.K.; et al.Effect of icosapent ethyl on progression of coronary atherosclerosis in patients with elevated triglycerides on statin therapy: Finalresults of the EVAPORATE trial. Eur. Heart J. 2020, 41, 3925–3932. [CrossRef]
27. Lázaro, I.; Rueda, F.; Cediel, G.; Ortega, E.; García-García, C.; Sala-Vila, A.; Bayés-Genís, A. Circulating omega-3 fatty acids andincident adverse events in patients with acute myocardial infarction. J. Am. Coll. Cardiol. 2020, 76, 2089–2097. [CrossRef]
28. Nordestgaard, B.G.; Varbo, A. Triglycerides and cardiovascular disease. Lancet 2014, 384, 626–635. [CrossRef]29. Nordestgaard, B.G. Triglyceride-rich lipoproteins and atherosclerotic cardiovascular disease: New insights from epidemiology,
genetics, and biology. Circ. Res. 2016, 118, 547–563. [CrossRef]30. Cesaro, A.; Schiavo, A.; Moscarella, E.; Coletta, S.; Conte, M.; Gragnano, F.; Fimiani, F.; Monda, E.; Caiazza, M.; Limongelli, G.; et al.
Lipoprotein(a): A genetic marker for cardiovascular disease and target for emerging therapies. J. Cardiovasc. Med. (Hagerstown) 2020.[CrossRef]
31. Abdelhamid, A.S.; Brown, T.J.; Brainard, J.S.; Biswas, P.; Thorpe, G.C.; Moore, H.J.; Deane, K.H.; Summerbell, C.D.; Worthington,H.V.; Song, F.; et al. Omega-3 fatty acids for the primary and secondary prevention of cardiovascular disease. Cochrane DatabaseSyst. Rev. 2020, CD003177. [CrossRef] [PubMed]
32. Alexander, D.D.; Miller, P.E.; Van Elswyk, M.E.; Kuratko, C.N.; Bylsma, L.C. A Meta-Analysis of Randomized Controlled Trialsand Prospective Cohort Studies of Eicosapentaenoic and Docosahexaenoic Long-Chain Omega-3 Fatty Acids and Coronary HeartDisease Risk. Mayo Clin. Proc. 2017, 92, 15–29. [CrossRef] [PubMed]
33. Aung, T.; Halsey, J.; Kromhout, D.; Gerstein, H.C.; Marchioli, R.; Tavazzi, L.; Geleijnse, J.M.; Rauch, B.; Ness, A.; Galan, P.; et al.Associations of Omega-3 Fatty Acid Supplement Use with Cardiovascular Disease Risks: Meta-analysis of 10 Trials Involving77917 Individuals. JAMA Cardiol. 2018, 3, 225–234. [CrossRef] [PubMed]
34. Bernasconi, A.A.; Wiest, M.M.; Lavie, C.J.; Milani, R.V.; Laukkanen, J.A. Effect of Omega-3 Dosage on Cardiovascular Outcomes:An Updated Meta-Analysis and Meta-Regression of Interventional Trials. Mayo Clin. Proc. 2020. [CrossRef]
35. Cabiddu, M.F.; Russi, A.; Appolloni, L.; Mengato, D.; Chiumente, M. Omega-3 for the prevention of cardiovascular diseases:Meta-analysis and trial-sequential analysis. Eur. J. Hosp. Pharm. 2020. [CrossRef]
36. Casula, M.; Olmastroni, E.; Gazzotti, M.; Galimberti, F.; Zambon, A.; Catapano, A.L. Omega-3 polyunsaturated fatty acidssupplementation and cardiovascular outcomes: Do formulation, dosage, and baseline cardiovascular risk matter? An updatedmeta-analysis of randomized controlled trials. Pharmacol. Res. 2020, 160, 105060. [CrossRef]
37. Doshi, R.; Kumar, A.; Thakkar, S.; Shariff, M.; Adalja, D.; Doshi, A.; Taha, M.; Gupta, R.; Desai, R.; Shah, J.; et al. Meta-analysisComparing Combined Use of Eicosapentaenoic Acid and Statin to Statin Alone. Am. J. Cardiol. 2020, 125, 198–204. [CrossRef]
38. Hoang, T.; Kim, J. Comparative Effect of Statins and Omega-3 Supplementation on Cardiovascular Events: Meta-Analysis andNetwork Meta-Analysis of 63 Randomized Controlled Trials Including 264,516 Participants. Nutrients 2020, 12, 2218. [CrossRef]
39. Hu, Y.; Hu, F.B.; Manson, J.E. Marine Omega-3 Supplementation and Cardiovascular Disease: An Updated Meta-Analysis of 13Randomized Controlled Trials Involving 127 477 Participants. J. Am. Heart Assoc. 2019, 8, e013543. [CrossRef]
40. Lombardi, M.; Chiabrando, J.G.; Vescovo, G.M.; Bressi, E.; Del Buono, M.G.; Carbone, S.; Koenig, R.A.; Van Tassell, B.W.; Abbate,A.; Biondi-Zoccai, G.; et al. Impact of Different Doses of Omega-3 Fatty Acids on Cardiovascular Outcomes: A Pairwise andNetwork Meta-analysis. Curr. Atheroscler. Rep. 2020, 22, 45. [CrossRef]
41. Maki, K.C.; Palacios, O.M.; Bell, M.; Toth, P.P. Use of supplemental long-chain omega-3 fatty acids and risk for cardiac death: Anupdated meta-analysis and review of research gaps. J. Clin. Lipidol. 2017, 11, 1152–1160. [CrossRef] [PubMed]
42. Popoff, F.; Balaciano, G.; Bardach, A.; Comande, D.; Irazola, V.; Catalano, H.N.; Izcovich, A. Omega 3 fatty acid supplementationafter myocardial infarction: A systematic review and meta-analysis. BMC Cardiovasc. Disord. 2019, 19, 136. [CrossRef] [PubMed]
104

Nutrients 2021, 13, 253
43. Bhatt, D.L.; Steg, P.G.; Miller, M.; Brinton, E.A.; Jacobson, T.A.; Ketchum, S.B.; Doyle, R.T.; Juliano, R.A.; Jiao, L.; Granowitz, C.; et al.Cardiovascular risk reduction with icosapent ethyl for hypertriglyceridemia. N. Engl. J. Med. 2019, 380, 11–22. [CrossRef] [PubMed]
44. ASCEND Study Collaborative Group; Bowman, L.; Mafham, M.; Wallendszus, K.; Stevens, W.; Buck, G.; Barton, J.; Murphy, K.;Aung, T.; Haynes, R.; et al. Effects of n-3 fatty acid supplements in diabetes mellitus. N. Engl. J. Med. 2018, 379, 1540–1550. [PubMed]
45. Manson, J.E.; Cook, N.R.; Lee, I.M.; Christen, W.; Bassuk, S.S.; Mora, S.; Gibson, H.; Albert, C.M.; Gordon, D.; Copeland, T.; et al.Marine n-3 fatty acids and prevention of cardiovascular disease and cancer. N. Engl. J. Med. 2019, 380, 23–32. [CrossRef] [PubMed]
46. Nicholls, S.J.; Lincoff, A.M.; Garcia, M.; Bash, D.; Ballantyne, C.M.; Barter, P.J.; Davidson, M.H.; Kastelein, J.J.P.; Koenig, W.;McGuire, D.K.; et al. Effect of high-dose omega-3 fatty acids vs corn oil on major adverse cardiovascular events in patients athigh cardiovascular risk: The STRENGTH randomized clinical trial. JAMA 2020, 324, 2268–2280. [CrossRef] [PubMed]
105


nutrients
Article
Protein Intake and Physical Activity in Newly DiagnosedPatients with Acute Coronary Syndrome: A 5-YearLongitudinal Study
Andrea Greco 1,*, Agostino Brugnera 1, Roberta Adorni 2, Marco D’Addario 2, Francesco Fattirolli 3,4,
Cristina Franzelli 5, Cristina Giannattasio 6,7, Alessandro Maloberti 6,7, Francesco Zanatta 2 and Patrizia Steca 2
Citation: Greco, A.; Brugnera, A.;
Adorni, R.; D’Addario, M.; Fattirolli,
F.; Franzelli, C.; Giannattasio, C.;
Maloberti, A.; Zanatta, F.; Steca, P.
Protein Intake and Physical Activity
in Newly Diagnosed Patients with
Acute Coronary Syndrome: A 5-Year
Longitudinal Study. Nutrients 2021,
13, 634. https://doi.org/10.3390/
nu13020634
Academic Editor: Yoshihiro Fukumoto
Received: 20 December 2020
Accepted: 13 February 2021
Published: 16 February 2021
Publisher’s Note: MDPI stays neutral
with regard to jurisdictional claims in
published maps and institutional affil-
iations.
Copyright: © 2021 by the authors.
Licensee MDPI, Basel, Switzerland.
This article is an open access article
distributed under the terms and
conditions of the Creative Commons
Attribution (CC BY) license (https://
creativecommons.org/licenses/by/
4.0/).
1 Department of Human and Social Sciences, University of Bergamo, 24129 Bergamo, Italy;[email protected]
2 Department of Psychology, University of Milano-Bicocca, 20126 Milan, Italy; [email protected] (R.A.);[email protected] (M.D.); [email protected] (F.Z.); [email protected] (P.S.)
3 Department of Medical and Surgical Critical Care, Cardiac Rehabilitation Unit, University of Florence,50139 Florence, Italy; [email protected]
4 Azienda Ospedaliero-Universitaria Careggi, 50134 Florence, Italy5 Cardiac Rehabilitation Centre-CTO Hospital, 20126 Milan, Italy; [email protected] School of Medicine, Surgery University of Milano-Bicocca, 20126 Milan, Italy;
[email protected] (C.G.); [email protected] (A.M.)7 Cardiology IV, “A. De Gasperis” Department, Ospedale Niguarda Ca’ Granda, 20162 Milan, Italy* Correspondence: [email protected]
Abstract: Cardiovascular disease is one of the most common causes of hospitalization and is associ-ated with high morbidity and mortality rates. Among the most important modifiable and well-knownrisk factors are an unhealthy diet and sedentary lifestyle. Nevertheless, adherence to healthy lifestyleregimes is poor. The present study examined longitudinal trajectories (pre-event, 6-, 12-, 24-, 36-, and60-month follow-ups) of protein intake (fish, legumes, red/processed meat) and physical activityin 275 newly-diagnosed patients with acute coronary syndrome. Hierarchical Generalized LinearModels were performed, controlling for demographic and clinical variables, the season in which eachassessment was made, and the presence of anxiety and depressive symptoms. Significant changesin protein intake and physical activity were found from pre-event to the six-month follow-up, sug-gesting the adoption of healthier behaviors. However, soon after the six-month follow-up, patientsexperienced significant declines in their healthy behaviors. Both physical activity and red/processedmeat intake were modulated by the season in which the assessments took place and by anxietysymptoms over time. The negative long-term trajectory of healthy behaviors suggests that tailoredinterventions are needed that sustain patients’ capabilities to self-regulate their behaviors over timeand consider patient preference in function of season.
Keywords: acute coronary syndrome; healthy behaviors; diet; legumes; fish; red/processed meat;physical activity; anxiety; depression; season
1. Introduction
Cardiovascular disease (CVD) is one of the most common causes of hospitalizationin Western countries and is associated with high morbidity and mortality rates. CVD’sburden is not only a health issue, but also a growing economic and societal challenge [1,2].INTERHEART [3], a case-control study conducted in 52 countries, has identified ninerisk factors and health behaviors (namely, hypertension, dyslipidemia, diabetes, obesity,smoking, alcohol, unhealthy diet, sedentary lifestyle, and psychosocial factors) that accountfor more than 90% of the population attributable risk of CVD. Based on scientific evidencethat the virtuous management of these risk factors may reduce the incidence of CVD atthe population level, eight of them (all except psychosocial factors) are the World Health
Nutrients 2021, 13, 634. https://doi.org/10.3390/nu13020634 https://www.mdpi.com/journal/nutrients107

Nutrients 2021, 13, 634
Organization targets for reduction by 2025 [4]. Nevertheless, according to a recent reportfrom the European Society of Cardiology [2], based on current trends, only the reductionin smoking from 28% to 21% over the last 20 years appears to be able to meet the WHOtarget. This goal may be achieved for smoking, but other behaviors like unhealthy diet andsedentary lifestyle still need strong attention.
Regarding physical activity, international guidelines recommend that adults engagein at least 150 minutes per week of accumulated moderate-intensity or 75 minutes perweek of vigorous-intensity aerobic physical activity to reduce CVD risk [1,2]. Encouragingleisure-time exercise has consistently been shown to promote cardiovascular health [5].International guidelines recommend a diet emphasizing the intake of fruits and vegetables,whole grains, fish, and legumes, and minimizing the intake of processed meats and fats todecrease CVD risk factors [1]. The widespread popularity of high-protein diets has drawncontroversy as well as scientific interest [6]. Many meta-analyses have shown a potentialCVD benefit for mainly secondary prevention with increased fish intake [7] and decreasedred/processed meat intake [8]. Data about the intake of legumes are less consistent but goin the same direction [9,10].
Despite the large amount of scientific evidence and recommendations described in theinternational guidelines, both in terms of primary and secondary prevention, there is poorcompliance with regimens of a healthy diet and physical activity [5]. Studies focused onthe longitudinal trajectories of healthy lifestyle highlighted that patients with establishedCVD after the initial adoption of healthier lifestyles tend to drop out within six months ofhospital discharge [11–13].
The role of psychological factors is largely underestimated. Indeed, these risk factorsare not currently recorded in the ESC Atlas [2], nor are they among the WHO’s targetsfor management for 2025 [4], although they are well established as contributors to CVDrisk [14–16]. In a previous study by the present research group, an association betweenlifestyle profiles and psychological factors of depression and anxiety was found [17], consis-tent with other empirical evidence showing a deleterious effect of depression and anxietyon changing unhealthy lifestyles [18]. In another study [19], we found that higher levelsof depression six months after an acute coronary event were associated with subsequentunhealthy lifestyle six months later. However, higher levels of depression at baselinewere not associated with subsequent unhealthy lifestyle six or twelve months later. Thesefindings underscore the importance of investigating the long-term role of psychologicalfactors in predicting healthy behavior trajectories that to date remain almost unknown.
Compliance with regimens of a healthy lifestyle may also be influenced, at least par-tially, by the seasons [20]. Indeed, bad weather can represent a barrier to carrying outphysical activity, especially outdoors. Again, eating habits change considerably accord-ing to the season [21,22]. All these changes, by modifying physiological responses andmetabolism, could affect cardiovascular function and disease [23]. These changes maybe particularly pronounced in countries subject to four distinct seasons and with verydifferent winter-to-summer weather conditions, like countries in the Mediterranean area.Nevertheless, seasonal variations have seldom been considered a factor that modulatescompliance with healthy regimens in patients with established CVD [24,25].
The present study explores the longitudinal trajectories and underlying predictorsassociated with protein consumption and physical activity in a cohort of 275 consecutivepatients with acute coronary syndrome (ACS) at their first coronary event. The aim wasto assess whether these factors could play a significant role in predicting adherence tophysicians’ prescriptions to achieve and maintain a sufficient level of physical activity anda balanced protein intake. In addition to the most well-known demographic and clinicalpredictors, for the first time, this study has investigated the role played by both psycho-logical factors, namely anxiety and depressive symptoms, and environmental factors, i.e.,seasonal variation. Patients were assessed at six time points, i.e., at baseline, at six months,and at one, two, three, and five years after the first cardiovascular event. An advancedstatistical technique, namely hierarchical linear models (HLMs) with a piecewise regression
108
Nutrients 2021, 13, 634
approach, was used to model the individual change rate from pre-event to five-year post-cardiovascular event. This technique allowed us to test the hypotheses that (1) patientsexperienced increases in healthy protein consumption and physical activity from pre- tosix-months post-cardiovascular event; (2) patients decreased their healthy behaviors fromsix-months to five-years post-cardiovascular event. We trust that investigating the predic-tors of lifestyle changes in patients affected by CVD can be a useful tool for developingtailored cardiovascular rehabilitation programs to increase and stabilize healthy behaviors.This may have a great impact on the effectiveness of healthcare practices.
2. Materials and Methods
2.1. Study Design and Participants
A total of 275 consecutive patients affected by ACS at their first coronary event wererecruited from February 2011 to October 2013, in three large public hospitals in Italy.Eligible patients were between 30 and 80 years of age, had sufficient Italian languageskills, and had neither cognitive deficits nor comorbidity with other major pathologiessuch as cancer. Physicians recruited patients who met the eligibility criteria during theircardiovascular rehabilitation (CR) at the hospital, which took place between two and eightweeks after their first acute coronary event. Information on lifestyle before the onset ofACS was retrospectively collected during the first assessment (baseline). After the first datacollection, patients were re-evaluated at five subsequent follow-ups (after six months, one,two, three, and five years). At each time-point, sociodemographic, clinical, psychological,and behavioral data were collected. The date of each of the six assessments was used todefine the variable “season” at each time-point.
This study is part of a larger longitudinal study aimed at profiling patients withACS and hypertension in terms of a series of behavioral, clinical, and psychologicalvariables [13,17,19,26]. For the first time, this study has focused on a five-year periodafter the first cardiovascular event and has considered the role of both psychological(anxiety and depressive symptoms) and environmental (seasonal variations) factors aspredictors of the longitudinal trajectories of healthy behaviors in terms of diet and physicalactivity.
The Bio-Ethics Committee of all the institutions involved in the research project ap-proved the study. Each participant provided written informed consent before their enrollment.
2.2. Measures2.2.1. Protein Consumption
Protein consumption was measured using three items (pertinent to fish, legumes,and red/processed meat intake) from the Italian version of the Mediterranean Diet Scale(MDS) [26,27]. The MDS is a nine-item self-report questionnaire that measures the weeklyconsumption of nine foods using a six-point Likert scale (from 1 = Never to 6 = Morethan three times per day). Each response was coded as a dichotomous variable followingTrichopoulou and collaborators [27]; 1 indicates healthy (two or more servings of fish perweek; two or more servings of legumes per week; two or fewer servings of red/processedmeat per week) and 0 indicates unhealthy consumption.
2.2.2. Physical Activity
Physical activity was measured using the Italian version of the Rapid Assessment ofPhysical Activity Questionnaire (RAPA-Q) [28], a seven-item measure of the frequencyand intensity of the participants’ physical activity. The questionnaire uses a yes/no scale.The total score ranges from 1 (i.e., sedentary) to 7 (i.e., regular and vigorous activity), withhigher scores indicating a healthier amount of physical activity. Scores of 6 or 7 (i.e., atleast 30 min of moderate to vigorous aerobic exercise five times a week) indicate the targetamount of physical activity for cardiovascular prevention.
109

Nutrients 2021, 13, 634
2.2.3. Anxious and Depressive Symptoms
Anxious and depressive symptoms were measured using the Italian version of theHospital Anxiety and Depression Scale (HADS) [29,30], a 14-item self-report question-naire developed to screen for generalized symptoms of psychological distress in medicalpatients. Participants reported their feelings and mood on a four-point Likert scale (for ex-ample, “I’ve lost interest in my appearance”, and the possible answers are 3 = “definitely”,2 = “I don’t take as much care as I should”, 1 = “I may not take quite as much care”,and 0 = “I take just as much care as ever”). Two sum scores were calculated for anxietyand depressive symptoms; the total score ranges from 0 to 21, in which higher scoresindicate a greater presence of symptoms. The scale showed adequate internal consistency(Cronbach’s alphas: anxiety = 0.81, depression = 0.73).
2.3. Data Analysis
Levels of physical activity from pre-event to the five-year follow-up were evaluatedusing two-level Hierarchical Linear Models (HLMs), whilst changes in fish, legume, andred/processed meat consumption (three dichotomous variables) were analyzed usinghierarchical generalized linear models (H(G)LMs). H(G)LMs are the best statistical methodsto examine longitudinal changes in nested data [31]. Their main advantage is their flexibilityin handling missing data [32], a common occurrence in longitudinal studies.
We tested the hypotheses on lifestyle behaviors using piecewise regression modelsin H(G)LM, in which two level-1 “time” parameters were included to model the slopediscontinuity from pre- to six-months post-cardiovascular event (Time.D1), and fromsix-months to five-year post-cardiovascular event (Time.D2) [33].
H(G)LM analyses were adjusted for several confounding demographic and clinicalvariables, namely age, sex, working status (not working vs. working), educational level(less than high school vs. high school or higher), marital status (single/widowed/divorcedvs. married), presence of hypertension, diabetes, dyslipidemia, obesity, and family historyof CVD (not present vs. present). Additionally, both anxious and depressive symptomsand the season during which data were collected for each participant were added as time-varying covariates at level 1 of the H(G)LM models. We further assessed and reportedpseudo-R2, a measure of HLMs’ effect sizes indicating the proportion of within-personvariance accounted for by adding the linear parameters [31]. All multilevel models andfurther information on piecewise regressions are reported in the Appendix A.
Analyses were performed using the Statistical Package for Social Sciences (SPSS)version 26.0 and Hierarchical Linear Models (HLM) Professional version 8.0. All statisticaltests were two-tailed, and a p ≤ 0.05 was considered statistically significant.
3. Results
3.1. Study Population
The study population included 275 consecutive ACS patients at their first coronaryevent, aged 57.1± 7.87 years; 84% were men and 16% women. The proportion of menin the sample was a direct consequence of the incidence of ACS, which is more commonamong men than women [34]. The patients’ mean BMI was 27.2± 4.1 kg/m2; their meanwaist circumference [WC] was 96.5± 11.1 cm. All of them were Caucasian. Almost allpatients were prescribed pharmacological treatment for ACS, consisting of antiplateletdrugs (99% of patients), beta-blockers (89%), statins (97%), sartans, or ace-inhibitors (99%).Further demographic and clinical variables are reported in Tables 1 and 2.
110

Nutrients 2021, 13, 634
Table 1. Sociodemographic characteristics of the sample (N = 275). Means and standard deviations(SD) are reported for age. Frequencies (n) and percentages are reported for gender, working status,educational level, and marital status.
Sociodemographic Variables ACS Patients
Age, mean (SD) 57.1 (7.87)Gender, n (%)
Male 231 (84%)Female 44 (16%)
Working status, n (%)working 111 (40.4%)
not working 163 (59.3%)Educational level, n (%)
less than high school 141 (51.3%)high school or higher 134 (48.7%)Marital status, n (%)
single\widowed\divorced 78 (28.4%)married 197 (71.6%)
Table 2. Clinical characteristics of the sample (N = 275). Frequencies (n) and percentages are reportedfor clinical presentation, percutaneous coronary intervention, patients with at least one stent, andrisk factors. Means and standard deviations (SD) are reported for body mass index, systolic bloodpressure, and diastolic blood pressure.
Clinical Variables ACS Patients
Clinical Presentation, n (%)Non-ST elevation myocardial infarction
(NSTEMI) 54 (19.8)
ST-elevation myocardial infarction (STEMI) 196 (71.8)Unstable Angina 23 (8.5)
Percutaneous coronary intervention, n (%) 258 (94.5)Patients with at least one stent, n (%) 263 (96)
Risk factors, n (%)Hypertension 127 (46.5)Dyslipidemia 143 (52.4)
Smoking History 180 (66.4)Diabetes 47 (17.2)Obesity 43 (15.8)
Family History of CVD 108 (39.3)Physical Inactivity 20 (7.3)
Body Mass Index, mean (SD) 27.2 (4.1)Systolic Blood Pressure (SBP), mean (SD) 115.9 (13.9)
Diastolic Blood Pressure (DBP), mean (SD) 72.9 (8.5)
Regarding the psychological assessment, the results showed that, on average, patientswere not affected by clinically significant anxiety (the mean score overtime was 5.78, with acut-off of 7), or clinically significant depression (the mean score overtime was 3.16, with acut-off of 7). Table 3 reports a detailed description of anxiety and depression scores acrossall time points.
111

Nutrients 2021, 13, 634
Table 3. Sample size (N) and percentages of patients with a mean score above the cut-off of 7 for anxiety and depressionduring all time points (baseline, six-month, one-, two-, three- and five-year follow-up). The cut-off of 7 defines the presenceof clinically significant symptoms of anxiety and depression. Means and standard deviations (SD) of the sample for eachtime point are also reported.
Baseline 6 Months 1 Year 2 Years 3 Years 5 Years
N (%) Mean(SD) N (%) Mean
(SD) N (%) Mean(SD) N (%) Mean
(SD) N (%) Mean(SD) N (%) Mean
(SD)
Anxiety 27439%
6.85(3.88)
24133%
6.23(3.35)
23326%
5.70(3.45)
21828%
5.99(3.37)
18326%
5.68(3.34)
17514%
4.21(3.19)
Depression 27421%
4.73(3.42)
24119%
4.45(3.18)
23311%
3.84(2.98)
21817%
4.45(3.14)
18315%
4.25(3.29)
17514%
2.90(2.94)
Regarding drop-outs, 12.7% of patients were absent at the six-month follow-up, 14.9%at the one-year, 20.7% at the two-year, 33.1% at the three-year, and 35.3% at the five-year.In comparison, percentages of drop-outs at the one-year follow-up were similar to thosereported in other European studies on ACS patients [35]. Causes of drop-out included: lossto follow-up, relocation, refusal, and, in a small minority of cases, inability to track downthe patient. It is worth noting that this study’s statistical techniques enabled us to use allthe data available and not only those provided by completers. Therefore, the final numberof participants remained 275.
3.2. Longitudinal Changes in Protein Intake
Preliminary analyses showed that both the time slopes (Time.D1 and Time.D2; seeAppendix A for the multilevel model) for the variables Fish and Legume intake were non-significant and were therefore fixed in subsequent analyses. Similarly, the pre-to-post eventtime slope for the variable red/processed meat intake was non-significant, and its effectwas treated as fixed. In both cases, this suggested that participants had similar changesover time in the aforementioned eating behaviors (i.e., the slopes were not significantlydifferent between participants).
As regards fish intake, results showed that before the onset of cardiovascular disease(i.e., at the intercept), 66.4% of patients consumed two or more servings of fish per week.From pre-event to six months later (i.e., the “Time.D1” slope β1), patients increased theirfish intake. Those who had a family history of CVD had a greater increase in fish intake(β = 1.31; p = 0.043) than those without a family history of CVD. A significant longitudinaldecrease in fish intake was found from the six-month to the five-year follow-up (i.e., the“Time.D2” slope β2). Anxiety, depression, and seasonal variations were not significantpredictors.
As regards legume intake, results showed that before the onset of CVD (i.e., at theintercept), a high percentage (79.1%) of patients consumed two or more servings of legumesper week. Older patients reported higher levels of legume intake (β = 0.07; p = 0.007).From pre-event to six months after (i.e., the “Time.D1” slope β1), patients maintainedstable levels of legume intake, except older patients, who decreased their consumption oflegumes (β = −0.13; p = 0.009). A significant longitudinal decrease in legume intake wasfound from the six-month to the five-year follow-up (i.e., the “Time.D2” slope β2). Thisdecrease was smaller among patients affected by hypertension (β = 0.15; p = 0.035), anddyslipidemia (β = 0.15; p = 0.041). Anxiety, depression, and seasonal variations were notsignificant predictors.
Regarding the consumption of red/processed meat, results showed that before theonset of cardiovascular disease (i.e., at the intercept), only 8.4% of patients consumedtwo or fewer servings of red/processed meat per week. From pre-event to six monthsafter (i.e., the “Time.D1” slope β1), red meat consumption significantly declined; indeed,33.5% of patients consumed two or fewer servings of red/processed meat per week.This decrease was greater among patients affected by hypertension (β = 1.87; p = 0.031).
112

Nutrients 2021, 13, 634
From the six-month to the five-year follow-up (i.e., the “Time.D2” slope β2), a significantlongitudinal decrease in red/processed meat consumption was found. Patients who weremarried decreased their consumption of red/processed meat more than patients whowere single, widowed, or divorced (β = 0.20; p = 0.041). Patients affected by hypertensiondecreased their consumption of red/processed meat less than patients not affected byhypertension (β = −0.24; p = 0.004). Patients with higher levels of anxiety decreased theirconsumption of red/processed meat more than patients with lower anxiety levels (β = 0.09;p = 0.025). There was no statistically significant effect of depression on red/processedmeat consumption. The decrease in red/processed meat consumption was significantlyhigher in spring (β = 0.47; p = 0.016) and in autumn (β = 0.43; p = 0.041) than in winter.Further, the consumption of red/processed meat was significantly lower in spring than insummer (β = 0.48; p = 0.027). The lowest consumption of red/processed meat was recordedin spring (frequency = 165, 39.3% of patients ate a healthy amount of meat); it increasedin summer (frequency = 75, 28.8%), decreased in autumn (frequency = 120, 39.2%), andincreased again in winter (frequency = 115, 34%).
3.3. Longitudinal Changes in Physical Activity
Regarding physical activity, results showed that before the onset of cardiovasculardisease (i.e., at the intercept), patients affected by hypertension performed less physicalactivity (β = −0.63; p = 0.011) compared to patients not affected by hypertension. Frompre-event to six months after (i.e., the “Time.D1” slope β1), patients increased their physicalactivity. Patients with higher educational levels had steeper increases (β = 0.99; p = 0.036)than those with less education. Patients affected by hypertension increased their levelsof physical activity (β = 1.08; p = 0.025). A significant longitudinal decrease in levelsof physical activity was found from the six-month to the five-year follow-up (i.e., the“Time.D2” slope β2). Patients who were married decreased their physical activity levelsmore than patients who were single, widowed, or divorced (β = −0.12; p = 0.048). Anxietyand depression were not significant predictors. Physical activity was significantly higher inautumn than in winter (β = 0.31; p = 0.015). The difference between the amount of physicalactivity in summer and winter approached significance (β = 0.28; p = 0.048). The highestamount of physical activity was recorded in autumn (mean = 5.11 ± 1.88); it decreasedsignificantly in winter (mean = 4.65 ± 2.09), then rose in a variable manner in spring(mean = 4.92 ± 1.93) and summer (mean = 4.83 ± 2.06).
Frequencies, percentages, means, and standard deviations for all outcome variablesacross all time points are reported in Table 4. All regression coefficients, standard errors, tand p values for β1 and β2 slope parameters are reported in Table 5. All fixed effects arereported in the Supplementary Materials. Figure 1 illustrates the longitudinal trajectory ofhealthy protein consumption and the amount of physical activity.
Table 4. Descriptive statistics of the outcome measures at all time points (pre-event, six-month, one-, two-, three- andfive-year follow-up). Frequencies (n) and percentages are reported for the protein consumption outcomes (fish, legumes,and healthy consumption of red/processed meat). Means and standard deviations (SD) are reported for physical activity.
Pre 6 Months 1 Year 2 Years 3 Years 5 Years
N n (%) N n (%) N n (%) N n (%) N n (%) N n (%)
Fish 274 182(66.4) 239 185
(77.4) 233 186(67.6) 216 124
(57.4) 183 105(57.4) 176 109
(61.9)
Legumes 273 216(79.1) 238 195
(81.9) 231 190(82.3) 218 151
(69.3) 183 124(67.8) 175 131
(74.9)Red/processedmeat 274 23 (8.4) 239 80
(33.5) 233 75(32.2) 218 105
(48.2) 184 85(46.2) 176 107
(60.8)
NMean(SD)
NMean(SD)
NMean(SD)
NMean(SD)
NMean(SD)
NMean(SD)
PhysicalActivity 275 4.20
(2.02) 240 5.48(1.79) 234 5.36
(1.80) 217 5.17(1.89) 183 5.12
(1.94) 176 3.86(1.96)
Data on lifestyle behaviors at pre-event were collected retrospectively once patients were hospitalized.
113

Nutrients 2021, 13, 634
Table 5. Fixed effects for the longitudinal changes in behavioral outcomes (fish intake, legume intake, red/processed meatintake, physical activity).
Variables Fixed Effects
β1 SE t Values DF p β2 SE t Values DF p R2
Fish intake 0.902 0.324 2.783 1006 0.005 −0.213 0.040 −5.341 1006 <0.001 \Legume intake −0.035 0.339 −0.103 1003 0.918 −0.085 0.038 −2.240 1003 0.025 \Red/processedmeat intake 4.011 0.508 7.895 749 <0.001 0.276 0.044 6.351 260 <0.001 \PhysicalActivity 2.334 0.229 10.217 260 <0.001 −0.240 0.025 −9.623 260 <0.001 34.4%
β1 = unstandardized regression coefficient for the average growth rate from pre-event to six months after. β2 = unstandardized regressioncoefficient for the average growth rate from the six-month follow-up to the five-year follow-up. SE = standard error of the regressioncoefficient; DF = degrees of freedom (df changes due to missing values or to the presence of fixed\random time slopes). R2 refers topseudo-R2, indicating the proportion of within-person variance accounted for by adding the “Time.1” and “Time.2” parameter to themodel; it cannot be analyzed for dichotomous variables.
Figure 1. (a) The graph shows the longitudinal trajectory of healthy protein consumption (i.e., two or more portions offish per week—grey line, two or more portions of legumes per week—dashed line, two or fewer portions of red meat perweek/processed—black line). The time is represented on the horizontal axis, the percentage of patients showing healthybehavior is represented on the vertical axis; (b) the graph shows the longitudinal trajectory of the amount of physical activity.The time is represented on the horizontal axis; the average physical activity score is represented on the vertical axis. Thetotal score ranges from 1 to 7, with higher scores indicating a healthier amount of physical activity. Scores higher than 6indicate the target amount of physical activity for cardiovascular prevention.
4. Discussion
The present study explored the longitudinal trajectories of physical activity andprotein consumption in a cohort of patients with ACS at their first event. The aim wasto assess whether and which factors could play a significant role in predicting healthierbehavior. For the first time, this study has investigated the role played by anxiety anddepressive symptoms, and the change of seasons.
Our results are in agreement with previous studies showing that most patients affectedby CVD fail to achieve healthy lifestyle targets [11,13,36,37]. They showed that, on average,patients experienced significant increases in the levels of healthy behaviors from pre- topost-cardiovascular event. However, from post-event to the five-year follow-up, patientsshowed a significant decline in their levels of healthy behaviors. This demonstrates thedifficulty of patients not so much in assuming but maintaining the recommended healthybehaviors in the long term. In particular, as regards fish intake, results showed that a goodpercentage of patients consumed two or more servings of fish per week before the onsetof the ACS, which has been related to positive health outcomes [27]. Immediately afterthe cardiovascular event, fish consumption increased, especially among patients with a
114

Nutrients 2021, 13, 634
family history of CVD. We could argue that patients with this risk factor received morehealth-related suggestions or were more sensitive to prescriptions received regarding fishintake, possibly due to a greater risk perception than patients with no family history ofCVD. In support of this hypothesis, a cross-sectional study showed that a family historyof CVD was associated with both higher risk perception and the adoption of a healthierlifestyle in people diagnosed with familial hypercholesterolemia [38]. Overall, the findingstherefore suggest that healthcare professionals should be aware that some people mayunderestimate the risk of CVD and emphasize how behavior change can reduce risk [38].This consideration is reinforced by the evidence that adherence declined over time in oursample, highlighting a great difficulty in maintaining positive behavior.
Similar results were obtained in the case of legume intake. Indeed, before the onsetof the ACS, many patients consumed the recommended two or more servings of legumesper week [27], especially older adults. Immediately after the cardiovascular event, patientsmaintained stable levels of legume intake. Considering the high percentage of patients whoconsumed a quantity of legumes in line with recommendations before the cardiac event,it is not surprising that the behavior was maintained and did not increase further. Thisobservation is reinforced by the fact that older patients decreased legume intake, regressingtowards the mean. Over the five-year follow-up, legume consumption decreased, exceptfor patients affected by hypertension and dyslipidemia. Again, the presence of multiple riskfactors could be associated with higher risk perception. Previous studies have shown thatreporting a high perceived CVD risk in the general population was strongly associated withtreatment for hypertension, diabetes, or dyslipidemia [39]. This could make patients morealert and receptive to physicians’ prescriptions during cardiovascular rehabilitation andhave an effect, albeit weak, in the long term. Again, this finding underlines that healthcareprofessionals should be aware that some patients underestimate the risks associated withCVD and are therefore less likely to change their health-related behavior stably.
As regards the consumption of red and processed meat, results showed that a smallpercentage of patients consumed the recommended two or fewer servings of red andprocessed meat per week before the cardiovascular event [27]. Immediately after thecardiovascular event, patients significantly decreased red and processed meat intake. Con-sumption continued to decrease over time, especially among patients who were married.This result goes in the same direction as studies that showed this demographic variable’sprotective role in fostering a healthier diet [13,40], and it emphasizes the importance thatthe partner can have in motivating and supporting the patient to adopt a healthy diet. Asecond relevant observation is that immediately after the cardiovascular event, patientswith hypertension adopted healthier behavior than patients without this risk factor. How-ever, after the first follow-up, they decreased their red and processed meat intake less thanpatients without this risk factor, regressing towards the mean. This result underlines onceagain how the presence of multiple risk factors can make patients more alert and willing tofollow medical indications to adopt a healthier lifestyle, although there is a difficulty inmaintaining healthy behavior stably.
Interestingly, patients with higher anxiety levels decreased red and processed meatintake more than patients with lower levels of anxiety over the five-year follow-up. Amongpsychological disorders, anxiety, together with depression, is the most widely and fre-quently studied condition. Anxiety has been linked to health status and several risk factorspredisposing CVD [41]. Previous studies have reported contrasting results of the impact ofanxiety on manifold health-related outcomes [42,43]. In line with our findings, Grace andcolleagues [14] found that patients with anxiety symptoms were more likely to participatein cardiovascular rehabilitation. Moreover, Parker and colleagues [44] found that patientswho had been hospitalized for an ACS and suffered from generalized anxiety disorderhad a superior five-year outcome than patients with different psychological symptoms.The group discussed the positive contribution of worry in medication adherence and aproactive approach to health practitioners. However, to the best of our knowledge, nostudies have explored if a relatively high level of anxiety could play a role in promoting a
115
Nutrients 2021, 13, 634
positive long-term lifestyle change, specifically in adopting a healthier diet. Feeling “tenseor wound up”, getting “a sort of frightened feeling as if something awful were about tohappen”, experiencing “worrying thoughts” about one’s health can somehow promoteawareness of the risks to one’s health and consequently motivate one to change one’sbehavior. Consistently, a study focused on sedentary young adults [45] found that theexposure to web-based images and information about cardiovascular risk could lead tohigher levels of worry and risk perception, contributing to increase motivation in adoptinga healthier behavior. Our findings suggest that cardiovascular rehabilitation programswould benefit from the introduction of psychological interventions aimed, on the one hand,at treating the emotional aspects related to anxiety, providing psychological support, andpromoting coping [14,41], and on the other hand, at exploiting the concern patients expressabout their health to promote cognitive awareness of the risks associated to CVD recurrence.This awareness could sustain patients’ abilities to self-regulate their behaviors and increasetheir beliefs about their self-efficacy [46–48]. Self-efficacy refers to the belief in one’s ca-pabilities to organize and execute the actions required to produce given attainments [49].Such beliefs are particularly relevant with regard to health-related behaviors [50]. In thecontext of CVD, it has been shown that self-efficacy plays a crucial role in adopting andmaintaining a healthy diet [26,51] and a physically active lifestyle [51,52]. Especially formaintenance, the confidence in one’s abilities to preserve the newly developed behaviorin spite of the possible barriers is pivotal. Indeed, as already suggested: “once an actionhas been taken, individuals with high maintenance self-efficacy invest more effort andpersist longer than those who are less self-efficacious” [53]. Regarding depression, ourresults go in the same direction as a previous study in which we found that higher levelsof depression at baseline were not associated with a subsequent unhealthy lifestyle six ortwelve months later [19]. It should be noted that only a very small percentage of patientsexperienced anxiety and depressive symptoms, so it was probably not possible to captureany effects of this psychological variable.
The last observation regarding the longitudinal trajectory in red and processed meatconsumption is that it was affected by seasonal variations. Red and processed meat intakewas significantly lower in spring and autumn than in winter and summer. This result is notsurprising if we consider the seasonal cultural habits of the Mediterranean area, where thepatients of this study come from. Indeed, winter, especially Christmastime, and summer arethe times when the longest holidays are taken in Italy. It is possible that it is more difficultto follow a healthy diet, particularly at these times. Similar trends have been described ina recent meta-analysis [21], suggesting a significant decrease of meat consumption fromsummer to autumn across different European countries. Interestingly, those food groupscharacterized by less healthy consumption (high consumption of unhealthy foods, or lowconsumption of healthy foods) were also characterized by consumption that varied with theseason [22]. Consistent with this observation, in the present study, the role of seasonalityemerged on the consumption of red and processed meat, whose intake was on averageless healthy than the fish and legume intake. Maintaining a low consumption of red andprocessed meat was the eating behavior that saw the greatest effort, and in which thegreatest change was observed. Perhaps for this reason, it is the behavior where a greatersensitivity to exceptions emerges. It is possible that patients were led to allow themselvesexceptions, being more sensitive to contextual factors linked to the change in seasons in thecase of red and processed meat consumption than in fish and legume consumption. Thistrend highlights, once again, the need for tailored cardiovascular rehabilitation programs.Patients’ preference for red/processed meat intake may differ between seasons, and thisvariation may impact adherence to a healthy lifestyle. Patients should be aware that theincidence of CVDs has seasonal peaks [23], and the incidence of cardiovascular eventscould be, at least in part, associated with the difficulties they may encounter at differentseasons of the year in adopting a healthy lifestyle. Patients should be supported in findingstrategies that can compensate for variations in healthy behavior linked to contextualfactors and seasonal variations (i.e., weather, holiday periods, or vice versa of greater
116

Nutrients 2021, 13, 634
workload). It is useful to underline once again that red/processed meat is the proteinsource for which the unhealthier behavior was recorded before the cardiovascular eventand for which the most significant changes in consumption were observed over time;perhaps for this reason, among the protein sources examined in the present study, it is alsothe one in which the role of several predictors emerged.
Finally, as regards physical activity, the results of the present study showed thatpatients reported sub-optimal amounts of physical activity at each time-point. Accordingly,previous studies showed that adherence to good physical activity levels is one of the mostdifficult goals to reach and maintain among patients with CVDs [11,12,46]. Before the onsetof cardiovascular disease, patients with hypertension were less physically active than thosewithout hypertension. This observation is consistent with previous studies [54], and it isrelevant considering that regular exercise is one of the most important activities for primaryprevention of hypertension and improving long-term survival [54]. Immediately after thecardiovascular event, patients significantly increased their physical activity. This increasewas higher among patients with hypertension, and those with higher educational levels.This last result goes in the same direction as studies that have shown that this demographicvariable plays a protective role [55,56]. Low levels of education have been associatedwith low levels of health literacy [55]. Health literacy is defined as the set of skills toaccess, understand, and evaluate information to make health related decisions in everydaylife. Poor health literacy has been linked to less healthy behaviors. Our results support,albeit indirectly, studies that emphasize the crucial role of health literacy in the successof cardiovascular rehabilitation programs [55]. After the first time-point, a significantlongitudinal decrease in physical activity levels was found, decreeing a failure to adopta healthier behavior stably. Patients who were married decreased their physical activitylevels more than patients who were single, widowed, or divorced. This result may seemsurprising when we generally consider being married as an indicator of social support.For red and processed meat consumption, we found the opposite pattern. This differencecould lie in the fact that in the sample of the present study, made up mostly of men intheir 60s, the wife represents the partner. In this generation and the Mediterranean areaculture, it is common for women to cook, so we may infer that somehow their presencepromotes a healthier diet [13,40]. In the case of physical activity, patients must activelyengage themselves in doing more physical activity. It is also possible that partners hinderrather than encourage this behavior, which leads patients to choose between exercise timeand family time. Indeed, our results may suggest that patient caregivers should also beincluded in the physical activity education programs. It is also important to underline thatit is not so much being married (an indicator of structural social support), but rather thequality of the relationship (the so-called functional social support) that plays a protectiverole in the behavior of adherence to the prescriptions for one’s health [57]. Therefore the“marital status” variable can only capture part of the phenomenon linked to social support.
The highest amount of physical activity was recorded in autumn; it decreased signifi-cantly in winter, and rose variably in spring and summer. These results show that patientstend to be more active after the summer; in winter, perhaps due to the cold, they havemore difficulty maintaining a sufficient physical activity level. In spring, probably beingable to resume physical activity outdoors, they become more active again, but with theheat of summer, the trend goes down once more. The seasonal variation of recreationalphysical activity has been reported in several studies [20]. In the CVD population, it hasbeen argued that the decrease in physical activity from summer to winter was mainly dueto an increase in symptom severity in winter, making exercise difficult to maintain over allthe seasons [25]. Nevertheless, seasonal variations have seldom been considered a factorthat modulates compliance with healthy regimens in this population [24,25]. Indeed, priorliterature has also suggested taking seasonal differences in physical activity levels intoconsideration in future research, in order to better understand their influence on long-termadherence [58]. As discussed above, our findings suggest the need to pay attention to therole of environmental variations in CVD patients’ adherence to healthy lifestyles, and they
117

Nutrients 2021, 13, 634
confirm the need for tailored cardiovascular rehabilitation programs that help patientsovercome the difficulties they may face in adopting a healthy lifestyle in different seasons ofthe year. For example, at specific times of the year, it would be useful to suggest alternativeactivities, if those preferred by patients are outdoors (walking).
The present study has a series of limitations. First, despite using the piecewise re-gression approach, which allows for modeling the slope discontinuity from pre-event tosix months after, information about diet and physical activity before the onset of the ACSwas measured retrospectively by asking patients to report their habits before the acuteevent. This approach may limit the results’ reliability, because patients may have over- orunderestimated their real past healthy lifestyle. Second, both diet and physical activitywere evaluated through self-report measures and not through an objective behavioral mea-sure. Nevertheless, this methodology is widely adopted in the medical and psychologicalliterature [26–28], and it has been proven to correlate with more objective measurementmethods [59].
Despite these limitations, the present study reports several original findings and hasimportant implications for behavioral intervention in cardiovascular disease patients. First,patients’ protein consumption and physical activity were evaluated over a long periodof time. Second, an advanced statistical technique (HLMs) with a piecewise regressionapproach was used to model the individual change rate from pre-event to five-year post-cardiovascular event. This technique allowed us to test the hypotheses that patientsexperienced both increases and decreases in healthy protein consumption and physicalactivity in subsequent periods of time. Overall, this approach allowed us to demonstratethat patients’ main difficulty was not in assuming but in maintaining the recommendedhealthy behaviors in the long term. Third, the study focused on a homogeneous sampleof patients at their first cardiovascular event. While the homogeneity of the sample maylimit the generalizability of the results, it ensures that the inferences drawn from the studyapply effectively to the population of ACS patients at their first cardiac event. Therefore,they assume an important significance for secondary cardiovascular prevention. Finally, bysimultaneously considering several predictors of healthy behavior, our results confirmedthe protective role of specific sociodemographic and clinical characteristics. For the firsttime, the roles of both environmental and psychological factors have been considered.
5. Conclusions
In summary, the present study shows that patients with ACS experience difficulties inachieving and mostly maintaining adequate levels of a healthy diet and physical activityover time. These difficulties are modulated by environmental conditions, and most im-portantly, by psychological characteristics. These findings suggest how to tailor diet andphysical activity interventions. Tailoring should consider that patients’ preference for dietand physical activity could differ between seasons, which could impact their adherenceto a healthy lifestyle. Tailoring should also be aimed at promoting cognitive awareness ofthe risks associated with CVD recurrence. In fact, our study results showed that patientswho were more anxious, therefore more concerned and somehow aware of their health,were more able to maintain healthy behavior over time. Cognitive awareness of the risksassociated with CVD recurrence may be a useful tool to sustain patients’ capabilities toself-regulate their behaviors and to ameliorate lifestyle behavior.
Supplementary Materials: The following are available online at https://www.mdpi.com/2072-6643/13/2/634/s1: Table S1: Fixed effects (with robust standard errors) for the dependent variable“Physical Activity” (MDS8); Table S2: Fixed effects (with robust standard errors) for the dependentvariable “Legume intake”; Table S3: Fixed effects (with robust standard errors) for the dependentvariable “Fish Intake”; Table S4: Fixed effects (with robust standard errors) for the dependent variable“Red/processed Meat Intake”.
Author Contributions: Conceptualization: A.G., M.D., F.F., C.G. and P.S.; data curation: A.G. andA.M.; formal analysis: A.G. and A.B.; funding acquisition: P.S.; investigation: A.G. and A.B.; method-
118
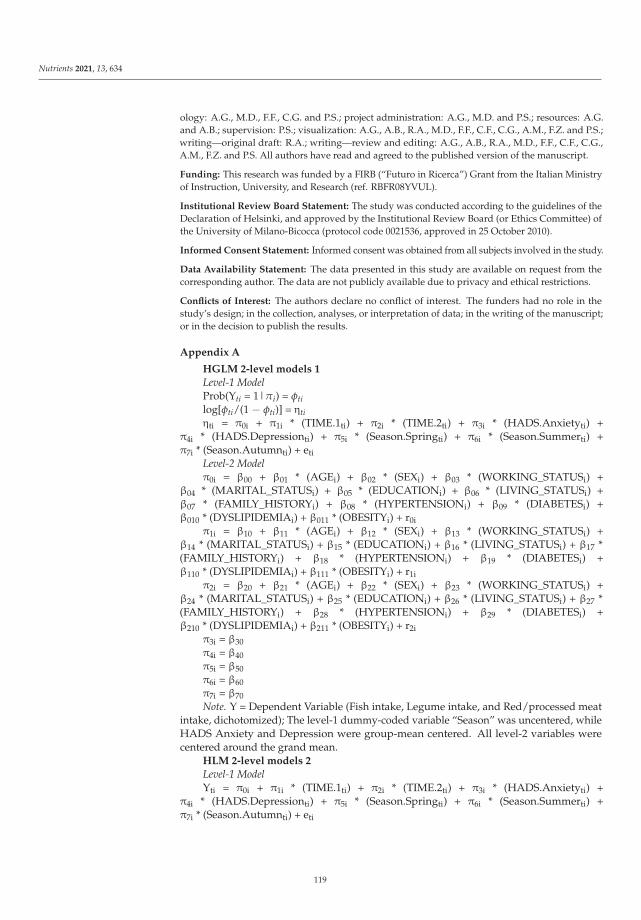
Nutrients 2021, 13, 634
ology: A.G., M.D., F.F., C.G. and P.S.; project administration: A.G., M.D. and P.S.; resources: A.G.and A.B.; supervision: P.S.; visualization: A.G., A.B., R.A., M.D., F.F., C.F., C.G., A.M., F.Z. and P.S.;writing—original draft: R.A.; writing—review and editing: A.G., A.B., R.A., M.D., F.F., C.F., C.G.,A.M., F.Z. and P.S. All authors have read and agreed to the published version of the manuscript.
Funding: This research was funded by a FIRB (“Futuro in Ricerca”) Grant from the Italian Ministryof Instruction, University, and Research (ref. RBFR08YVUL).
Institutional Review Board Statement: The study was conducted according to the guidelines of theDeclaration of Helsinki, and approved by the Institutional Review Board (or Ethics Committee) ofthe University of Milano-Bicocca (protocol code 0021536, approved in 25 October 2010).
Informed Consent Statement: Informed consent was obtained from all subjects involved in the study.
Data Availability Statement: The data presented in this study are available on request from thecorresponding author. The data are not publicly available due to privacy and ethical restrictions.
Conflicts of Interest: The authors declare no conflict of interest. The funders had no role in thestudy’s design; in the collection, analyses, or interpretation of data; in the writing of the manuscript;or in the decision to publish the results.
Appendix A
HGLM 2-level models 1
Level-1 ModelProb(Yti = 1|πi) = φtilog[φti/(1 − φti)] = ηtiηti = π0i + π1i * (TIME.1ti) + π2i * (TIME.2ti) + π3i * (HADS.Anxietyti) +
π4i * (HADS.Depressionti) + π5i * (Season.Springti) + π6i * (Season.Summerti) +π7i * (Season.Autumnti) + eti
Level-2 Modelπ0i = β00 + β01 * (AGEi) + β02 * (SEXi) + β03 * (WORKING_STATUSi) +
β04 * (MARITAL_STATUSi) + β05 * (EDUCATIONi) + β06 * (LIVING_STATUSi) +β07 * (FAMILY_HISTORYi) + β08 * (HYPERTENSIONi) + β09 * (DIABETESi) +β010 * (DYSLIPIDEMIAi) + β011 * (OBESITYi) + r0i
π1i = β10 + β11 * (AGEi) + β12 * (SEXi) + β13 * (WORKING_STATUSi) +β14 * (MARITAL_STATUSi) + β15 * (EDUCATIONi) + β16 * (LIVING_STATUSi) + β17 *(FAMILY_HISTORYi) + β18 * (HYPERTENSIONi) + β19 * (DIABETESi) +β110 * (DYSLIPIDEMIAi) + β111 * (OBESITYi) + r1i
π2i = β20 + β21 * (AGEi) + β22 * (SEXi) + β23 * (WORKING_STATUSi) +β24 * (MARITAL_STATUSi) + β25 * (EDUCATIONi) + β26 * (LIVING_STATUSi) + β27 *(FAMILY_HISTORYi) + β28 * (HYPERTENSIONi) + β29 * (DIABETESi) +β210 * (DYSLIPIDEMIAi) + β211 * (OBESITYi) + r2i
π3i = β30π4i = β40π5i = β50π6i = β60π7i = β70Note. Y = Dependent Variable (Fish intake, Legume intake, and Red/processed meat
intake, dichotomized); The level-1 dummy-coded variable “Season” was uncentered, whileHADS Anxiety and Depression were group-mean centered. All level-2 variables werecentered around the grand mean.
HLM 2-level models 2
Level-1 ModelYti = π0i + π1i * (TIME.1ti) + π2i * (TIME.2ti) + π3i * (HADS.Anxietyti) +
π4i * (HADS.Depressionti) + π5i * (Season.Springti) + π6i * (Season.Summerti) +π7i * (Season.Autumnti) + eti
119
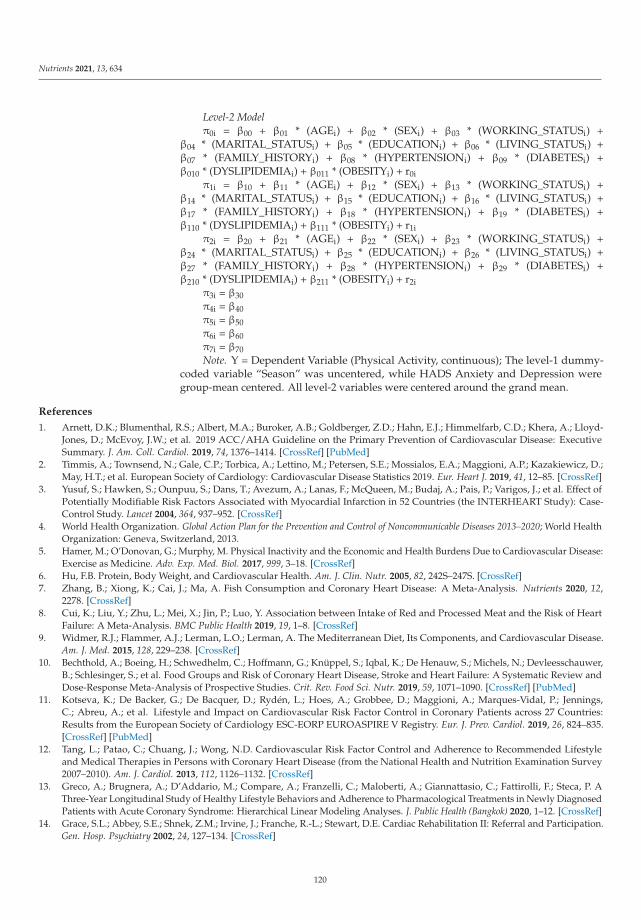
Nutrients 2021, 13, 634
Level-2 Modelπ0i = β00 + β01 * (AGEi) + β02 * (SEXi) + β03 * (WORKING_STATUSi) +
β04 * (MARITAL_STATUSi) + β05 * (EDUCATIONi) + β06 * (LIVING_STATUSi) +β07 * (FAMILY_HISTORYi) + β08 * (HYPERTENSIONi) + β09 * (DIABETESi) +β010 * (DYSLIPIDEMIAi) + β011 * (OBESITYi) + r0i
π1i = β10 + β11 * (AGEi) + β12 * (SEXi) + β13 * (WORKING_STATUSi) +β14 * (MARITAL_STATUSi) + β15 * (EDUCATIONi) + β16 * (LIVING_STATUSi) +β17 * (FAMILY_HISTORYi) + β18 * (HYPERTENSIONi) + β19 * (DIABETESi) +β110 * (DYSLIPIDEMIAi) + β111 * (OBESITYi) + r1i
π2i = β20 + β21 * (AGEi) + β22 * (SEXi) + β23 * (WORKING_STATUSi) +β24 * (MARITAL_STATUSi) + β25 * (EDUCATIONi) + β26 * (LIVING_STATUSi) +β27 * (FAMILY_HISTORYi) + β28 * (HYPERTENSIONi) + β29 * (DIABETESi) +β210 * (DYSLIPIDEMIAi) + β211 * (OBESITYi) + r2i
π3i = β30π4i = β40π5i = β50π6i = β60π7i = β70Note. Y = Dependent Variable (Physical Activity, continuous); The level-1 dummy-
coded variable “Season” was uncentered, while HADS Anxiety and Depression weregroup-mean centered. All level-2 variables were centered around the grand mean.
References
1. Arnett, D.K.; Blumenthal, R.S.; Albert, M.A.; Buroker, A.B.; Goldberger, Z.D.; Hahn, E.J.; Himmelfarb, C.D.; Khera, A.; Lloyd-Jones, D.; McEvoy, J.W.; et al. 2019 ACC/AHA Guideline on the Primary Prevention of Cardiovascular Disease: ExecutiveSummary. J. Am. Coll. Cardiol. 2019, 74, 1376–1414. [CrossRef] [PubMed]
2. Timmis, A.; Townsend, N.; Gale, C.P.; Torbica, A.; Lettino, M.; Petersen, S.E.; Mossialos, E.A.; Maggioni, A.P.; Kazakiewicz, D.;May, H.T.; et al. European Society of Cardiology: Cardiovascular Disease Statistics 2019. Eur. Heart J. 2019, 41, 12–85. [CrossRef]
3. Yusuf, S.; Hawken, S.; Ounpuu, S.; Dans, T.; Avezum, A.; Lanas, F.; McQueen, M.; Budaj, A.; Pais, P.; Varigos, J.; et al. Effect ofPotentially Modifiable Risk Factors Associated with Myocardial Infarction in 52 Countries (the INTERHEART Study): Case-Control Study. Lancet 2004, 364, 937–952. [CrossRef]
4. World Health Organization. Global Action Plan for the Prevention and Control of Noncommunicable Diseases 2013–2020; World HealthOrganization: Geneva, Switzerland, 2013.
5. Hamer, M.; O’Donovan, G.; Murphy, M. Physical Inactivity and the Economic and Health Burdens Due to Cardiovascular Disease:Exercise as Medicine. Adv. Exp. Med. Biol. 2017, 999, 3–18. [CrossRef]
6. Hu, F.B. Protein, Body Weight, and Cardiovascular Health. Am. J. Clin. Nutr. 2005, 82, 242S–247S. [CrossRef]7. Zhang, B.; Xiong, K.; Cai, J.; Ma, A. Fish Consumption and Coronary Heart Disease: A Meta-Analysis. Nutrients 2020, 12,
2278. [CrossRef]8. Cui, K.; Liu, Y.; Zhu, L.; Mei, X.; Jin, P.; Luo, Y. Association between Intake of Red and Processed Meat and the Risk of Heart
Failure: A Meta-Analysis. BMC Public Health 2019, 19, 1–8. [CrossRef]9. Widmer, R.J.; Flammer, A.J.; Lerman, L.O.; Lerman, A. The Mediterranean Diet, Its Components, and Cardiovascular Disease.
Am. J. Med. 2015, 128, 229–238. [CrossRef]10. Bechthold, A.; Boeing, H.; Schwedhelm, C.; Hoffmann, G.; Knüppel, S.; Iqbal, K.; De Henauw, S.; Michels, N.; Devleesschauwer,
B.; Schlesinger, S.; et al. Food Groups and Risk of Coronary Heart Disease, Stroke and Heart Failure: A Systematic Review andDose-Response Meta-Analysis of Prospective Studies. Crit. Rev. Food Sci. Nutr. 2019, 59, 1071–1090. [CrossRef] [PubMed]
11. Kotseva, K.; De Backer, G.; De Bacquer, D.; Rydén, L.; Hoes, A.; Grobbee, D.; Maggioni, A.; Marques-Vidal, P.; Jennings,C.; Abreu, A.; et al. Lifestyle and Impact on Cardiovascular Risk Factor Control in Coronary Patients across 27 Countries:Results from the European Society of Cardiology ESC-EORP EUROASPIRE V Registry. Eur. J. Prev. Cardiol. 2019, 26, 824–835.[CrossRef] [PubMed]
12. Tang, L.; Patao, C.; Chuang, J.; Wong, N.D. Cardiovascular Risk Factor Control and Adherence to Recommended Lifestyleand Medical Therapies in Persons with Coronary Heart Disease (from the National Health and Nutrition Examination Survey2007–2010). Am. J. Cardiol. 2013, 112, 1126–1132. [CrossRef]
13. Greco, A.; Brugnera, A.; D’Addario, M.; Compare, A.; Franzelli, C.; Maloberti, A.; Giannattasio, C.; Fattirolli, F.; Steca, P. AThree-Year Longitudinal Study of Healthy Lifestyle Behaviors and Adherence to Pharmacological Treatments in Newly DiagnosedPatients with Acute Coronary Syndrome: Hierarchical Linear Modeling Analyses. J. Public Health (Bangkok) 2020, 1–12. [CrossRef]
14. Grace, S.L.; Abbey, S.E.; Shnek, Z.M.; Irvine, J.; Franche, R.-L.; Stewart, D.E. Cardiac Rehabilitation II: Referral and Participation.Gen. Hosp. Psychiatry 2002, 24, 127–134. [CrossRef]
120

Nutrients 2021, 13, 634
15. Jensen, M.T.; Marott, J.L.; Holtermann, A.; Gyntelberg, F. Living Alone Is Associated with All-Cause and Cardiovascular Mortality:32 Years of Follow-up in the Copenhagen Male Study. Eur. Heart J. Qual. Care Clin. Outcomes 2019, 5, 208–217. [CrossRef]
16. May, H.T.; Horne, B.D.; Knight, S.; Knowlton, K.U.; Bair, T.L.; Lappé, D.L.; Le, V.T.; Muhlestein, J.B. The Association of Depressionat Any Time to the Risk of Death Following Coronary Artery Disease Diagnosis. Eur. Heart. J. Qual. Care Clin. Outcomes 2017, 3,296–302. [CrossRef]
17. Monzani, D.; D’Addario, M.; Fattirolli, F.; Giannattasio, C.; Greco, A.; Quarenghi, F.; Steca, P. Clustering of Lifestyle Risk Factorsin Acute Coronary Syndrome: Prevalence and Change after the First Event. Appl. Psychol. Health Well-Being 2018, 10, 434–456.[CrossRef] [PubMed]
18. Kuhl, E.A.; Fauerbach, J.A.; Bush, D.E.; Ziegelstein, R.C. Relation of Anxiety and Adherence to Risk-Reducing RecommendationsFollowing Myocardial Infarction. Am. J. Cardiol. 2009, 103, 1629–1634. [CrossRef]
19. Steca, P.; Monzani, D.; Greco, A.; Franzelli, C.; Magrin, M.E.; Miglioretti, M.; Sarini, M.; Scrignaro, M.; Vecchio, L.; Fattirolli, F.;et al. Stability and Change of Lifestyle Profiles in Cardiovascular Patients after Their First Acute Coronary Event. PLoS ONE 2017,12, e0183905. [CrossRef]
20. Ma, Y.; Olendzki, B.C.; Li, W.; Hafner, A.R.; Chiriboga, D.; Hebert, J.R.; Campbell, M.; Sarnie, M.; Ockene, I.S. Seasonal Variationin Food Intake, Physical Activity, and Body Weight in a Predominantly Overweight Population. Eur. J. Clin. Nutr. 2006, 60,519–528. [CrossRef]
21. Stelmach-Mardas, M.; Kleiser, C.; Uzhova, I.; Peñalvo, J.L.; La Torre, G.; Palys, W.; Lojko, D.; Nimptsch, K.; Suwalska, A.;Linseisen, J.; et al. Seasonality of Food Groups and Total Energy Intake: A Systematic Review and Meta-Analysis. Eur. J. Clin.Nutr. 2016, 70, 700–708. [CrossRef]
22. van der Toorn, J.E.; Cepeda, M. Seasonal Variation of Diet Quality in a Large Middle-Aged and Elderly Dutch Population-BasedCohort. Eur. J. Nutr. 2020, 59, 493–504. [CrossRef]
23. Bhatnagar, A. Environmental Determinants of Cardiovascular Disease. Circ. Res. 2017, 121, 162–180. [CrossRef] [PubMed]24. Izawa, K.P.; Watanabe, S.; Oka, K.; Brubaker, P.H.; Hirano, Y.; Omori, Y.; Kida, K.; Suzuki, K.; Osada, N.; Omiya, K.; et al.
Leisure-Time Physical Activity over Four Seasons in Chronic Heart Failure Patients. Int. J. Cardiol. 2014, 177, 651–653.[CrossRef] [PubMed]
25. Klompstra, L.; Jaarsma, T.; Strömberg, A.; van der Wal, M.H.L. Seasonal Variation in Physical Activity in Patients with HeartFailure. Heart Lung 2019, 48, 381–385. [CrossRef]
26. Steca, P.; Pancani, L.; Greco, A.; D’Addario, M.; Magrin, M.E.; Miglioretti, M.; Sarini, M.; Scrignaro, M.; Vecchio, L.; Cesana, F.;et al. Changes in Dietary Behavior among Coronary and Hypertensive Patients: A Longitudinal Investigation Using the HealthAction Process Approach. Appl. Psychol. Health Well Being 2015, 7, 316–339. [CrossRef] [PubMed]
27. Trichopoulou, A.; Costacou, T.; Bamia, C.; Trichopoulos, D. Adherence to a Mediterranean Diet and Survival in a Greek Population.N. Engl. J. Med. 2003, 348, 2599–2608. [CrossRef]
28. Topolski, T.D.; LoGerfo, J.; Patrick, D.L.; Williams, B.; Walwick, J.; Patrick, M.B. The Rapid Assessment of Physical Activity(RAPA) among Older Adults. Prev. Chronic Dis. 2006, 3, A118.
29. Zigmond, A.S.; Snaith, R.P. The Hospital Anxiety and Depression Scale. Acta Psychiatr. Scand. 1983, 67, 361–370.[CrossRef] [PubMed]
30. Costantini, M.; Musso, M.; Viterbori, P.; Bonci, F.; Del Mastro, L.; Garrone, O.; Venturini, M.; Morasso, G. Detecting PsychologicalDistress in Cancer Patients: Validity of the Italian Version of the Hospital Anxiety and Depression Scale. Support. Care Cancer1999, 7, 121–127. [CrossRef]
31. Raudenbush, S.W.; Bryk, A.S. Hierarchical Linear Models: Applications and Data Analysis Methods, 2nd ed.; Sage: Thousand Oaks,CA, USA, 2002; Volume 1.
32. Gallop, R.; Tasca, G.A. Multilevel Modeling of Longitudinal Data for Psychotherapy Researchers: II. The Complexities. Psychother.Res. 2009, 19, 438–452. [CrossRef]
33. Willet, J.; Singer, J. Applied Longitudinal Data Analysis: Modeling Change and Event Occurrence; Oxford University Press: New York,NY, USA, 2003.
34. Calabrò, P.; Gragnano, F.; Di Maio, M.; Patti, G.; Antonucci, E.; Cirillo, P.; Gresele, P.; Palareti, G.; Pengo, V.; Pignatelli, P.; et al.Epidemiology and Management of Patients With Acute Coronary Syndromes in Contemporary Real-World Practice: EvolvingTrends from the EYESHOT Study to the START-ANTIPLATELET Registry. Angiology 2018, 69, 795–802. [CrossRef]
35. Munyombwe, T.; Hall, M.; Dondo, T.B.; Alabas, O.A.; Gerard, O.; West, R.M.; Pujades-Rodriguez, M.; Hall, A.; Gale, C.P. Qualityof Life Trajectories in Survivors of Acute Myocardial Infarction: A National Longitudinal Study. Heart 2020, 106, 33–39. [CrossRef]
36. Peersen, K.; Munkhaugen, J.; Gullestad, L.; Liodden, T.; Moum, T.; Dammen, T.; Perk, J.; Otterstad, J.E. The Role of CardiacRehabilitation in Secondary Prevention after Coronary Events. Eur. J. Prev. Cardiol. 2017, 24, 1360–1368. [CrossRef]
37. Urbinati, S.; Olivari, Z.; Gonzini, L.; Savonitto, S.; Farina, R.; Del Pinto, M.; Valbusa, A.; Fantini, G.; Mazzoni, A.; Maggioni, A.P.Secondary Prevention after Acute Myocardial Infarction: Drug Adherence, Treatment Goals, and Predictors of Health LifestyleHabits. The BLITZ-4 Registry. Eur. J. Prev. Cardiol. 2015, 22, 1548–1556. [CrossRef]
38. Claassen, L.; Henneman, L.; Kindt, I.; Marteau, T.M.; Timmermans, D.R. Perceived Risk and Representations of CardiovascularDisease and Preventive Behaviour in People Diagnosed with Familial Hypercholesterolemia: A Cross-Sectional QuestionnaireStudy. J. Health Psychol. 2010, 15, 33–43. [CrossRef] [PubMed]
121

Nutrients 2021, 13, 634
39. Alwan, H.; William, J.; Viswanathan, B.; Paccaud, F.; Bovet, P. Perception of Cardiovascular Risk and Comparison with ActualCardiovascular Risk. Eur. J. Cardiovasc. Prev. Rehabil. 2009, 16, 556–561. [CrossRef]
40. Laursen, U.B.; Johansen, M.N.; Joensen, A.M.; Overvad, K.; Larsen, M.L. Is Cardiac Rehabilitation Equally Effective in ImprovingDietary Intake in All Patients with Ischemic Heart Disease? J. Am. Coll. Nutr. 2020, 1–8. [CrossRef] [PubMed]
41. Grace, S.L.; Abbey, S.E.; Shnek, Z.M.; Irvine, J.; Franche, R.-L.; Stewart, D.E. Cardiac Rehabilitation I: Review of PsychosocialFactors. Gen. Hosp. Psychiatry 2002, 24, 121–126. [CrossRef]
42. Tully, P.J.; Cosh, S.M.; Baune, B.T. A review of the affects of worry and generalized anxiety disorder upon cardiovascular healthand coronary heart disease. Psychol. Health Med. 2013, 18, 627–644. [CrossRef]
43. Beckie, T.M.; Beckstead, J.W. Predicting Cardiac Rehabilitation Attendance in a Gender-Tailored Randomized Clinical Trial. J.Cardiopulm. Rehabil. Prev. 2010, 30, 147–156. [CrossRef]
44. Parker, G.; Hyett, M.; Hadzi-Pavlovic, D.; Brotchie, H.; Walsh, W. GAD is good? Generalized anxiety disorder predicts a superiorfive-year outcome following an acute coronary syndrome. Psychiatry Res. 2011, 188, 383–389. [CrossRef] [PubMed]
45. Lee, T.J.; Cameron, L.D.; Wünsche, B.; Stevens, C. A randomized trial of computer-based communications using imagery and textinformation to alter representations of heart disease risk and motivate protective behaviour. Br. J. Health Psychol. 2011, 16, 72–91.[CrossRef] [PubMed]
46. Conraads, V.M.; Deaton, C.; Piotrowicz, E.; Santaularia, N.; Tierney, S.; Piepoli, M.F.; Pieske, B.; Schmid, J.P.; Dickstein, K.;Ponikowski, P.P.; et al. Adherence of Heart Failure Patients to Exercise: Barriers and Possible Solutions: A Position Statement ofthe Study Group on Exercise Training in Heart Failure of the Heart Failure Association of the European Society of Cardiology.Eur. J. Heart Fail. 2012, 14, 451–458. [CrossRef] [PubMed]
47. Greco, A.; Steca, P.; Pozzi, R.; Monzani, D.; D’Addario, M.; Villani, A.; Rella, V.; Giglio, A.; Malfatto, G.; Parati, G. PredictingDepression from Illness Severity in Cardiovascular Disease Patients: Self-Efficacy Beliefs, Illness Perception, and Perceived SocialSupport as Mediators. Int. J. Behav. Med. 2014, 21, 221–229. [CrossRef]
48. Vellone, E.; Pancani, L.; Greco, A.; Steca, P.; Riegel, B. Self-Care Confidence May Be More Important than Cognition to InfluenceSelf-Care Behaviors in Adults with Heart Failure: Testing a Mediation Model. Int. J. Nurs. Stud. 2016, 60, 191–199. [CrossRef]
49. Bandura, A. Self-Efficacy: Toward a Unifying Theory of Behavioral Change. Psychol. Rev. 1977, 84, 191. [CrossRef]50. Schwarzer, R. Social-Cognitive Factors in Changing Health-Related Behaviors. Curr. Dir. Psychol. Sci. 2001, 10, 47–51. [CrossRef]51. Sol, B.G.M.; van der Graaf, Y.; van Petersen, R.; Visseren, F.L.J. The Effect of Self-Efficacy on Cardiovascular Lifestyle. Eur. J.
Cardiovasc. Nurs. 2011, 10, 180–186. [CrossRef]52. Baretta, D.; Sartori, F.; Greco, A.; D’Addario, M.; Melen, R.; Steca, P. Improving Physical Activity MHealth Interventions:
Development of a Computational Model of Self-Efficacy Theory to Define Adaptive Goals for Exercise Promotion. Adv. Hum.Comput. Interact. 2019, 2019, 3068748. [CrossRef]
53. Schwarzer, R. Modeling health behavior change: How to predict and modify the adoption and maintenance of health behaviors.Appl. Psychol. 2008, 57, 1–29. [CrossRef]
54. Sharman, J.E.; La Gerche, A.; Coombes, J.S. Exercise and Cardiovascular Risk in Patients with Hypertension. Am. J. Hypertens.2015, 28, 147–158. [CrossRef] [PubMed]
55. Aaby, A.; Friis, K.; Christensen, B.; Rowlands, G.; Maindal, H.T. Health Literacy Is Associated with Health Behaviour andSelf-Reported Health: A Large Population-Based Study in Individuals with Cardiovascular Disease. Eur. J. Prev. Cardiol. 2017, 24,1880–1888. [CrossRef] [PubMed]
56. Veronesi, G.; Ferrario, M.M.; Kuulasmaa, K.; Bobak, M.; Chambless, L.E.; Salomaa, V.; Soderberg, S.; Pajak, A.; Jørgensen, T.;Amouyel, P.; et al. Educational Class Inequalities in the Incidence of Coronary Heart Disease in Europe. Heart 2016, 102, 958–965.[CrossRef] [PubMed]
57. Magrin, M.E.; D’addario, M.; Greco, A.; Miglioretti, M.; Sarini, M.; Scrignaro, M.; Steca, P.; Vecchio, L.; Crocetti, E. Social Supportand Adherence to Treatment in Hypertensive Patients: A Meta-Analysis. Ann. Behav. Med. 2015, 49, 307–318. [CrossRef]
58. Warehime, S.; Dinkel, D.; Alonso, W.; Pozehl, B. Long-term exercise adherence in patients with heart failure: A qualitative study.Heart Lung 2020, 49, 696–701. [CrossRef] [PubMed]
59. Prince, S.A.; Adamo, K.B.; Hamel, M.E.; Hardt, J.; Gorber, S.C.; Tremblay, M. A Comparison of Direct versus Self-Report Measuresfor Assessing Physical Activity in Adults: A Systematic Review. Int. J. Behav. Nutr. Phys. Act. 2008, 5, 1–24. [CrossRef] [PubMed]
122
nutrients
Article
Nutrition Status and Renal Function as Predictors in AcuteMyocardial Infarction with and without Cancer: A SingleCenter Retrospective Study
Naoki Itaya 1, Ako Fukami 1, Tatsuyuki Kakuma 2 and Yoshihiro Fukumoto 1,*
Citation: Itaya, N.; Fukami, A.;
Kakuma, T.; Fukumoto, Y. Nutrition
Status and Renal Function as
Predictors in Acute Myocardial
Infarction with and without Cancer:
A Single Center Retrospective Study.
Nutrients 2021, 13, 2663. https://
doi.org/10.3390/nu13082663
Academic Editor: Pramod Khosla
Received: 22 June 2021
Accepted: 28 July 2021
Published: 30 July 2021
Publisher’s Note: MDPI stays neutral
with regard to jurisdictional claims in
published maps and institutional affil-
iations.
Copyright: © 2021 by the authors.
Licensee MDPI, Basel, Switzerland.
This article is an open access article
distributed under the terms and
conditions of the Creative Commons
Attribution (CC BY) license (https://
creativecommons.org/licenses/by/
4.0/).
1 Division of Cardiovascular Medicine, Department of Internal Medicine, Kurume University School ofMedicine, Kurume 830-0011, Japan; [email protected] (N.I.); [email protected] (A.F.)
2 Biostatistics Center, Kurume University, Kurume 830-0011, Japan; [email protected]* Correspondence: [email protected]; Tel.: +81-94-231-7562
Abstract: Background: Clinical characteristics of nutrition status in acute myocardial infarction (AMI)patients with cancer remains unknown. Therefore, this study aimed to clarify the differences ofclinical parameters, including nutrition status, between AMI patients with and without history ofcancer. Methods and Results: This retrospective cohort study, using the database of AMI between2014 and 2019 in Kurume University Hospital, enrolled 411 patients; AMI patients without cancer(n = 358, 87.1%) and with cancer (n = 53, 12.9%). AMI patients with cancer were significantly olderwith lower body weight, worse renal function, and worse nutrition status. Next, we divided thepatients into 4 groups by cancer, age, and plaque area, detected by coronary image devices. Theprediction model indicated that nutrition, lipid, and renal functions were significant predictors ofAMI with cancer. The ordinal logistic regression model revealed that worse nutrition status, renaldysfunction, lower uric acid, and elevated blood pressure were significant predictors. Finally, wewere able to calculate the probability of the presence of cancer, by combining each factor and scoring.Conclusions: Worse nutrition status and renal dysfunction were associated with AMI with cancer, inwhich nutrition status was a major different characteristic from those without cancer.
Keywords: onco-cardiology; nutrition status; cancer; acute myocardial infarction
1. Introduction
Acute myocardial infarction (AMI) is mainly caused by coronary arteries thrombusdue to atherosclerotic plaque rupture or endothelial erosion, and sometimes coronaryartery spasm, microvascular thrombus, or others [1]. The formation of fibrofatty lesions inthe atherosclerotic vulnerable plaques occurs during the atherosclerosis progression [2],which have been treated by lipid-lowering therapy to stabilize during these 2 decades [3,4].Further, it has been reported that rapid plaque progression of moderately severe vulnerableplaques is the critical step prior to AMI in most patients [5–7]. Actually, accumulatingevidence demonstrates that atherosclerotic risk factors, including hypertension, dyslipi-demia, diabetes mellitus, and cigarette smoking, develop atherosclerotic lesions throughimmune system [2]. The atherosclerotic plaques often contain lipid core and fibrous cap,which consist of smooth muscle cells, macrophages, angiogenesis, and adventitial inflam-mation [8]. Taken together, when focused on vulnerable coronary atherosclerosis, notstable atheroma, it is considered that AMI most likely occurs due to rapidly progressedcoronary atherosclerosis, caused by traditional atherosclerotic risk factors, including age;however, even small atherosclerotic plaques can cause AMI in some patients, which mightbe associated with some other risk factors.
In cancer patients, the mechanisms of atherosclerosis progression might be different.Especially, clonal hematopoiesis with indeterminate potential (CHIP) has been reported toincrease the risk of AMI [9]. CHIP carriers had a 4.0-fold (95% confidence interval 2.4–6.7)
Nutrients 2021, 13, 2663. https://doi.org/10.3390/nu13082663 https://www.mdpi.com/journal/nutrients123

Nutrients 2021, 13, 2663
higher risk of myocardial infarction than non-carriers [9]. It has been also reported that eachof DNA methyltransferase 3A (DNMT3A), ten-eleven translocation-2 (TET2), additional sexcombs-like 1 (ASXL1), and Janus kinase 2 (JAK2) mutation was associated with coronaryartery disease, and that CHIP carriers with these mutations also had high levels of coronaryartery calcification [9]. Further, TET2-deficient bone marrow cells enlarge atheroscleroticplaques by infiltrating macrophages, and TET2-deficiency increases cytokines/chemokinessuch as C-X-C motif ligand (CXCL)-1, CXCL 2, CXCL 3, interleukin (IL)-6 and IL-1β [10].Also, Heyde et al., have reported that CHIP causes hematopoietic stem cell proliferation,promotes arteriosclerosis, and leads to a vicious cycle of proliferation of hematopoieticstem cells [11]. Above all, CHIP is an independent coronary risk factor in patients withpremature menopause, especially in patients with spontaneous premature menopause [12].Thus, coronary risk factors in the clinical settings might be different between cancer andnon-cancer patients.
During these 4 decades, cancer is the first cause of death in Japan, and cardiovasculardiseases (CVDs) are the second [13]. Because of recent improvement of cancer prognosisdue to the advancement of cancer early detection, surgery, and anticancer drug treatment,the number of cancer survivors has increased [6,7]. Cancer and CVDs have common risksof lifestyle factors, such as smoking, obesity, and unhealthy food intake, in which healthylifestyle is oppositely associated with a longer life expectancy free from major chronicdiseases, including cancer and CVDs [14]. However, the clinical characteristics, especiallyin the aspects of nutrition status, remains scant in AMI patients with cancer.
Therefore, the purpose of the present study was to clarify the differences of clinicalparameters in AMI with and without history of cancer, focusing on traditional coronaryrisk factors and nutrition status, and to develop a statistical model to evaluate the presenceof cancer in patients with AMI, using database of AMI in Kurume University Hospital.
2. Materials and Methods
2.1. Study Design
This study was retrospective cohort study using the database of AMI in CardiovascularMedicine, Kurume University Hospital. We enrolled 437 patients, who were treated byprimary percutaneous coronary intervention (PCI) due to AMI in Cardiovascular Medicine,Kurume University Hospital from January 2014 to December 2019. We excluded patients ifthe patients had following reasons; (1) AMI occurred due to PCI complication, (2) PCI dueto acute stent thrombosis, (3) unsuccessful PCI, and (4) coronary bypass surgery due tomulti-vessel coronary artery disease.
2.2. Data Collection
Baseline demographic data were collected based on the medical records, including age,sex, height, body weight, waist, medications, traditional risk factors (hypertension, glucoseintolerance/diabetes mellitus and dyslipidemia), blood pressure (BP), pulse rate, heart rate,and comorbidities (coronary artery disease, hypertensive heart disease, cardiomyopathy,valvular heart diseases, and congenital heart diseases). All cardiovascular diseases werediagnosed by expert cardiologists. AMI was diagnosed according to fourth universaldefinition of myocardial infarction [15].
All patients were treated by PCI combined with the use of image devices, such as in-travascular ultrasound (IVUS) or optical coherence tomography (OCT). We retrospectivelymeasured the coronary atherosclerotic plaque area by image devices at the culprit lesions.
2.3. Blood Sampling
Peripheral blood was drawn from the antecubital vein for measurements of blood cellcounts, lipid profiles including total cholesterol (T.chol), low-density lipoprotein choles-terol (LDL-c), high-density lipoprotein cholesterol (HDL-c), and triglyceride, liver andrenal function markers including creatinine (Cr) and estimated glomerular filtration rate(eGFR), glycemic parameters of fasting plasma glucose (FPG) and hemoglobin A1c (HbA1c),
124

Nutrients 2021, 13, 2663
uric acid, troponin, and N-terminal pro-brain natriuretic peptide (NT-pro-BNP). Thesechemistries were measured at a commercially available laboratory in Kurume Univer-sity Hospital.
2.4. Definition of Comorbidities
Hypertension was defined as the use of antihypertensive drugs and/or systolic bloodpressure ≥ 140 mmHg or diastolic blood pressure ≥ 90 mmHg. Dyslipidemia was definedas the use of lipid-lowering drugs and/or plasma LDL-c ≥ 140 mg/dL and/or triglyc-erides ≥ 150 mg/dL, and/or HDL-c < 40 mg/dL. Diabetes mellitus was diagnosed usingantidiabetic drugs and/or fasting plasma glucose ≥ 110 mg/dL or HbA1c ≥ 6.5%.
2.5. Evaluation of Nutrition Status
The nutrition status was evaluated using the Glasgow Prognostic Score (GPS) [16],modified GPS (mGPS) [17,18] and Controlling Nutritional Status (CONUT) [19].
2.6. Statistical Analysis
All continuous variables were given as the mean ± standard deviations (SDs) or me-dian with interquartile range. Categorical data were presented as number (n) or percentage(%). For intergroup univariate comparisons, an unpaired t test was applied in continuousvariables and chi-square test in categorical variables.
The mean ± SDs and frequencies were presented by the two groups with and withoutcancer (Tables 1 and 2).
Table 1. Clinical characteristics of acute myocardial infarction patients with and without cancer.
Non-Cancer(N = 358)
Cancer(N = 53)
p Value
Age, y 67.6 ± 12.3 74.0 ± 7.6 <0.0001Male sex (n,%) 273.0 (80.0) 38.0 (70.0) 0.47Height, cm 161.7 ± 9.4 157.9 ± 8.9 0.006Body mass index 23.8 ± 3.6 22.8 ± 2.8 0.03Weight, kg 62.8 ± 13.2 57.2 ± 9.4 0.0002Systolic BP, mmHg 131.2 ± 26.6 131.5 ± 25.2 0.95Diastolic BP, mmHg 78.2 ± 18.3 71.5 ± 15.5 0.01Heart rate, bpm 80.5 ± 21.9 83.6 ± 20.0 0.34Blood test
Red blood cell count, ×104/mm3 7.1 ± 35.8 3.9 ± 0.8 0.1Hemoglobin, g/dL 13.6 ± 2.0 12.2 ± 2.2 <0.0001Hematocrit, % 40.0 ± 5.5 36.0 ± 6.2 <0.0001Platelet count, ×104/mm3 218.7 ± 68.7 227.9 ± 110.3 0.56White blood cell count, /mm3 10.6 ± 4.3 9.2 ± 4.3 0.04Lymphocytes, /mm3 2126.7 ± 1470.1 1708.0 ± 1248.1 0.05Total bilirubin, mg/dL 0.7 ± 0.3 0.8 ± 0.5 0.22AST, U/L 133.0 (25–72.3) 62.8 (25.5–54) 0.21ALT, U/L 56.3 (17–42) 31.4 (15–29.5) 0.05LDH, U/L 355.9 (199.8–347.5) 297.7 (202–335.5) 0.17ALP, U/L 234.3 ±79.9 316.8 ± 250.7 0.03γ-GTP, U/L 41.7 (18.3–47.8) 45.8 (17–46) 0.66C-reactive protein, mg/dL 0.8 ±2.0 1.9 ± 4.9 0.1Creatinine kinase, U/L 492.6 (104.8–421.3) 319.6 (81.5–356) 0.03Creatinine kinase -MB, U/L 45.1 (6–44) 31.9 (7–33.5) 0.1NT-pro BNP, pg/mL 402.1 (75.3–2013.7) 5993.1 (212–3720) 0.54Blood urea nitrogen, mg/dL 18.5 ± 9.5 21.7 ± 15.8 0.16Creatinine, mg/dL 1.1 (0.64–1.01) 1.6 (0.69–1.11) 0.14eGFR, mL/min/1.73 m2 71.0 (54.3–88.5) 59.2 (46.8–74.7) 0.005Sodium, mEq/L 139.3 ± 3.2 137.8 ± 4.0 0.01Potassium, mEq/L 4.0 ± 0.6 4.2 ± 0.6 0.11Chloride, mEq/L 104.0 ± 3.5 102.9 ± 3.8 0.03
125
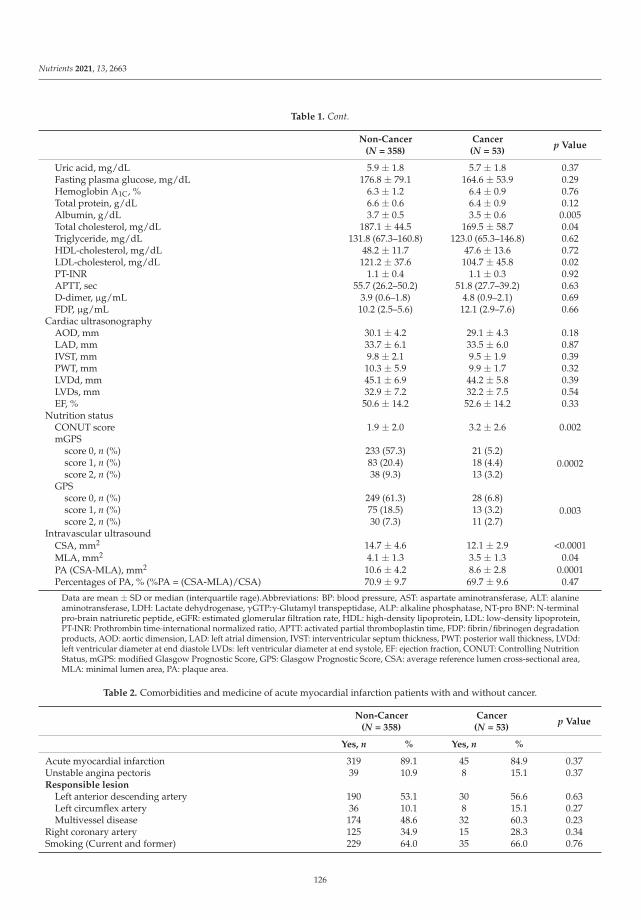
Nutrients 2021, 13, 2663
Table 1. Cont.
Non-Cancer(N = 358)
Cancer(N = 53)
p Value
Uric acid, mg/dL 5.9 ± 1.8 5.7 ± 1.8 0.37Fasting plasma glucose, mg/dL 176.8 ± 79.1 164.6 ± 53.9 0.29Hemoglobin A1C, % 6.3 ± 1.2 6.4 ± 0.9 0.76Total protein, g/dL 6.6 ± 0.6 6.4 ± 0.9 0.12Albumin, g/dL 3.7 ± 0.5 3.5 ± 0.6 0.005Total cholesterol, mg/dL 187.1 ± 44.5 169.5 ± 58.7 0.04Triglyceride, mg/dL 131.8 (67.3–160.8) 123.0 (65.3–146.8) 0.62HDL-cholesterol, mg/dL 48.2 ± 11.7 47.6 ± 13.6 0.72LDL-cholesterol, mg/dL 121.2 ± 37.6 104.7 ± 45.8 0.02PT-INR 1.1 ± 0.4 1.1 ± 0.3 0.92APTT, sec 55.7 (26.2–50.2) 51.8 (27.7–39.2) 0.63D-dimer, μg/mL 3.9 (0.6–1.8) 4.8 (0.9–2.1) 0.69FDP, μg/mL 10.2 (2.5–5.6) 12.1 (2.9–7.6) 0.66
Cardiac ultrasonographyAOD, mm 30.1 ± 4.2 29.1 ± 4.3 0.18LAD, mm 33.7 ± 6.1 33.5 ± 6.0 0.87IVST, mm 9.8 ± 2.1 9.5 ± 1.9 0.39PWT, mm 10.3 ± 5.9 9.9 ± 1.7 0.32LVDd, mm 45.1 ± 6.9 44.2 ± 5.8 0.39LVDs, mm 32.9 ± 7.2 32.2 ± 7.5 0.54EF, % 50.6 ± 14.2 52.6 ± 14.2 0.33
Nutrition statusCONUT score 1.9 ± 2.0 3.2 ± 2.6 0.002mGPS
score 0, n (%) 233 (57.3) 21 (5.2)0.0002score 1, n (%) 83 (20.4) 18 (4.4)
score 2, n (%) 38 (9.3) 13 (3.2)GPS
score 0, n (%) 249 (61.3) 28 (6.8)0.003score 1, n (%) 75 (18.5) 13 (3.2)
score 2, n (%) 30 (7.3) 11 (2.7)Intravascular ultrasound
CSA, mm2 14.7 ± 4.6 12.1 ± 2.9 <0.0001MLA, mm2 4.1 ± 1.3 3.5 ± 1.3 0.04PA (CSA-MLA), mm2 10.6 ± 4.2 8.6 ± 2.8 0.0001Percentages of PA, % (%PA = (CSA-MLA)/CSA) 70.9 ± 9.7 69.7 ± 9.6 0.47
Data are mean ± SD or median (interquartile rage).Abbreviations: BP: blood pressure, AST: aspartate aminotransferase, ALT: alanineaminotransferase, LDH: Lactate dehydrogenase, γGTP:γ-Glutamyl transpeptidase, ALP: alkaline phosphatase, NT-pro BNP: N-terminalpro-brain natriuretic peptide, eGFR: estimated glomerular filtration rate, HDL: high-density lipoprotein, LDL: low-density lipoprotein,PT-INR: Prothrombin time-international normalized ratio, APTT: activated partial thromboplastin time, FDP: fibrin/fibrinogen degradationproducts, AOD: aortic dimension, LAD: left atrial dimension, IVST: interventricular septum thickness, PWT: posterior wall thickness, LVDd:left ventricular diameter at end diastole LVDs: left ventricular diameter at end systole, EF: ejection fraction, CONUT: Controlling NutritionStatus, mGPS: modified Glasgow Prognostic Score, GPS: Glasgow Prognostic Score, CSA: average reference lumen cross-sectional area,MLA: minimal lumen area, PA: plaque area.
Table 2. Comorbidities and medicine of acute myocardial infarction patients with and without cancer.
Non-Cancer(N = 358)
Cancer(N = 53)
p Value
Yes, n % Yes, n %
Acute myocardial infarction 319 89.1 45 84.9 0.37Unstable angina pectoris 39 10.9 8 15.1 0.37Responsible lesion
Left anterior descending artery 190 53.1 30 56.6 0.63Left circumflex artery 36 10.1 8 15.1 0.27Multivessel disease 174 48.6 32 60.3 0.23
Right coronary artery 125 34.9 15 28.3 0.34Smoking (Current and former) 229 64.0 35 66.0 0.76
126
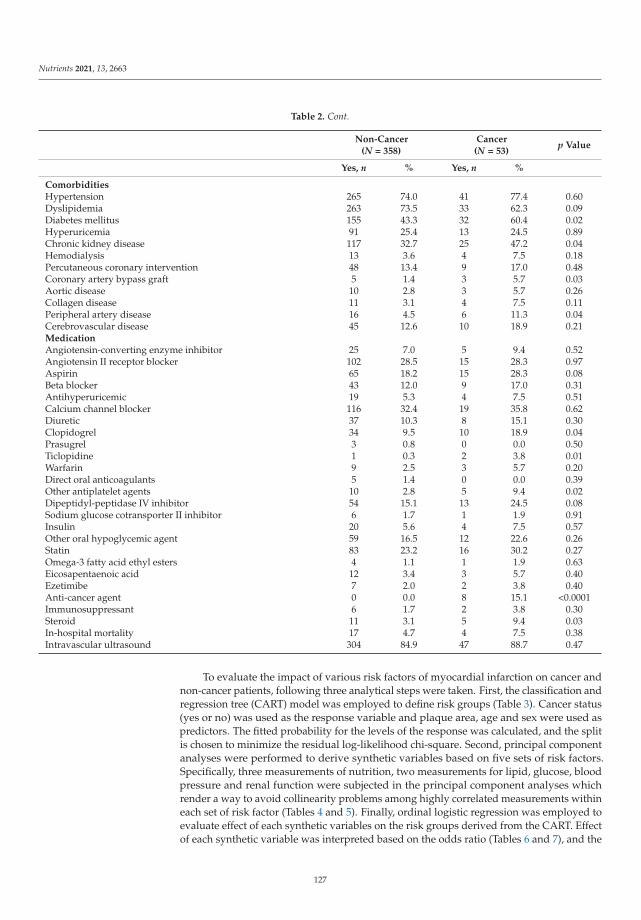
Nutrients 2021, 13, 2663
Table 2. Cont.
Non-Cancer(N = 358)
Cancer(N = 53)
p Value
Yes, n % Yes, n %
ComorbiditiesHypertension 265 74.0 41 77.4 0.60Dyslipidemia 263 73.5 33 62.3 0.09Diabetes mellitus 155 43.3 32 60.4 0.02Hyperuricemia 91 25.4 13 24.5 0.89Chronic kidney disease 117 32.7 25 47.2 0.04Hemodialysis 13 3.6 4 7.5 0.18Percutaneous coronary intervention 48 13.4 9 17.0 0.48Coronary artery bypass graft 5 1.4 3 5.7 0.03Aortic disease 10 2.8 3 5.7 0.26Collagen disease 11 3.1 4 7.5 0.11Peripheral artery disease 16 4.5 6 11.3 0.04Cerebrovascular disease 45 12.6 10 18.9 0.21MedicationAngiotensin-converting enzyme inhibitor 25 7.0 5 9.4 0.52Angiotensin II receptor blocker 102 28.5 15 28.3 0.97Aspirin 65 18.2 15 28.3 0.08Beta blocker 43 12.0 9 17.0 0.31Antihyperuricemic 19 5.3 4 7.5 0.51Calcium channel blocker 116 32.4 19 35.8 0.62Diuretic 37 10.3 8 15.1 0.30Clopidogrel 34 9.5 10 18.9 0.04Prasugrel 3 0.8 0 0.0 0.50Ticlopidine 1 0.3 2 3.8 0.01Warfarin 9 2.5 3 5.7 0.20Direct oral anticoagulants 5 1.4 0 0.0 0.39Other antiplatelet agents 10 2.8 5 9.4 0.02Dipeptidyl-peptidase IV inhibitor 54 15.1 13 24.5 0.08Sodium glucose cotransporter II inhibitor 6 1.7 1 1.9 0.91Insulin 20 5.6 4 7.5 0.57Other oral hypoglycemic agent 59 16.5 12 22.6 0.26Statin 83 23.2 16 30.2 0.27Omega-3 fatty acid ethyl esters 4 1.1 1 1.9 0.63Eicosapentaenoic acid 12 3.4 3 5.7 0.40Ezetimibe 7 2.0 2 3.8 0.40Anti-cancer agent 0 0.0 8 15.1 <0.0001Immunosuppressant 6 1.7 2 3.8 0.30Steroid 11 3.1 5 9.4 0.03In-hospital mortality 17 4.7 4 7.5 0.38Intravascular ultrasound 304 84.9 47 88.7 0.47
To evaluate the impact of various risk factors of myocardial infarction on cancer andnon-cancer patients, following three analytical steps were taken. First, the classification andregression tree (CART) model was employed to define risk groups (Table 3). Cancer status(yes or no) was used as the response variable and plaque area, age and sex were used aspredictors. The fitted probability for the levels of the response was calculated, and the splitis chosen to minimize the residual log-likelihood chi-square. Second, principal componentanalyses were performed to derive synthetic variables based on five sets of risk factors.Specifically, three measurements of nutrition, two measurements for lipid, glucose, bloodpressure and renal function were subjected in the principal component analyses whichrender a way to avoid collinearity problems among highly correlated measurements withineach set of risk factor (Tables 4 and 5). Finally, ordinal logistic regression was employed toevaluate effect of each synthetic variables on the risk groups derived from the CART. Effectof each synthetic variable was interpreted based on the odds ratio (Tables 6 and 7), and the
127

Nutrients 2021, 13, 2663
predicted probability of the risk groups were calculated (Figure 5). To compare the resultswith logistic regressing model with cancer/non-cancer as response variable, an additionaltable was added (Table 8).
Table 3. Divided groups by age and atherosclerotic plaque area.
Group N Cancer Age Plaque Area Group Definition
G1 90 No <60 years old N/A Non-cancer/Low riskG2 122 No ≥60 years old ≥9.39 mm2 Non-cancer/Middle riskG3 146 No ≥60 years old <9.39 mm2 Non-cancer/High riskG4 53 Yes ≥60 years old N/A Cancer
Table 4. Comportments of Synthetic variable with weights.
Synthetic Variable Original Variables with Its Weight
Nutrition CONUT (0.243) GPS (0.898) mGPS (0.846) cons * (−1.307)Lipid T.chol (0.015) LDL-c (0.018) - cons * (−4.947)Glucose FPG (0.009) HbA1c (0.594) - cons * (−4.45)Blood pressure sBP (0.027) Pulse pressure (0.038) - cons * (−5.559)Renal function Cr (0.469) eGFR (0.025) - cons * (1.151)
Abbreviations: CONUT; Controlling Nutrition Status, GPS; Glasgow Prognostic Score, mGPS; modified Glasgow Prognostic Score, T.chol;total cholesterol, LDL-c; low-density lipoprotein cholesterol, FPG; Fasting plasma glucose, HbA1c; hemoglobin A1c, sBP; systolic bloodpressure, Cr; Creatinine, eGFR; estimated glomerular filtration rate, cons *; constant term used to calculate principal component score alongwith weight of each variable.
Table 5. Mean and SD of six risk variables by Four Groups.
G1 G2 G3 G4 p Value *
Nutrition −0.65 (1.13) −0.15(1.43) 0.26(1.68) 0.76(1.85) <0.0001Lipid 0.44 (1.33) 0.001(1.19) −0.09(1.39) −0.50(1.69) 0.001Glucose −0.06 (1.15) −0.09(0.95) 0.15(1.30) −0.11(0.81) 0.27Uric acid 6.33 (1.55) 5.86(1.76) 5.75(1.91) 5.70(1.82) 0.13Bloodpressure −0.14 (1.23) −0.01(1.38) 0.01(1.24) 0.22(1.49) 0.47
Renalfunction −0.60 (0.83) 0.01(1.07) 0.19(1.36) 0.47(1.72) <0.0001
p value * based on One-Way Analysis of Variance (ANOVA). Data are means (SD). The equation of nutrition wasexpressed as “Nutrition = (−1.307) + 0.243 * CONUT + 0.898 * GPS + 0.846 * mGPS”. Similarly, other equationswere expressed as “Lipid = (−4.947) + 0.018 * LDL-c + 0.015 * T.chol”, “Glucose = (−5.448) + 0.594 * HbA1c +0.0092 * FPG”, “Blood pressure = (−5.559) + 0.038 * Pulse pressure + 0.027 * systolic BP”, “Renal function = (1.151)+ 0.469 * Cr + (−0.025) * eGFR”. Nutrition, lipid, and renal functions were significant predictors of risk grouping.
Table 6. Estimate of the ordinal logistic regression model.
Parameter Estimate SE Wald χ2 p Value
G4 (α1) −0.985 0.362 7.39 0.01G3 (α2) 1.157 0.359 10.39 0.00G2 (α3) 2.658 0.376 50.00 <0.0001Nutrition 0.232 0.071 10.64 0.00Lipid −0.134 0.080 2.80 0.09Glucose 0.032 0.087 0.14 0.71Blood pressure 0.157 0.074 4.53 0.03Renal 0.363 0.091 16.00 <0.0001Uric acid −0.209 0.059 12.59 0.00smoking (Yes) −0.081 0.100 0.65 0.42
128

Nutrients 2021, 13, 2663
Table 7. Estimates of odds ratio from ordinal logistic regression model.
Variable Odds Ratio * 95% CI p Value
Nutrition 1.26 1.10–1.45 0.001Lipid 0.88 0.75–1.02 0.09Glucose 1.03 0.87–1.23 0.71Uric acid 0.81 0.72–091 0.0004Blood pressure 1.17 1.01–1.35 0.03Renal function 1.44 1.20–1.72 <0.0001Smoking (Yes vs. No) 0.85 0.58–1.26 0.42
Odds ratio *: G1 is used as reference group.
Table 8. Estimates of odds ratio from ordinal logistic regression model.
Variable Odds Ratio * 95% CI p Value
Nutrition 0.927 0.709–1.211 0.578Lipid 0.700 0.477–1.026 0.068Glucose 0.860 0.573–1.291 0.467Blood pressure 1.002 0.753–1.334 0.987Renal function 1.316 0.976–1.775 0.072Uric acid 0.972 0.782–1.209 0.800Smoking (Yes vs. No) 1.419 0.626–3.217 0.403Age 1.036 0.996–1.079 0.079Plaque area 0.855 0.759–0.964 0.011
Statistical significance was defined as p value < 0.05. All statistical analyses wereperformed using JMP Pro 13.0 and SAS software (Release 9.3; SAS Institute, Cary, NC, USA).
2.7. Description of Ordinal Logistic Regression Model
Each subject denoted by i (i = 1, . . . , N) is classified into risk group denoted as “G1”,“G2”, “G3” or “G4”, and group membership is represented by random variable Y. Y takesvalue = 1 if G1, Y = 2 if G2, Y = 3 if G3 and Y = 3 if G4. Ordinal logistic regression is used tomodel Yi. Let X be a vector of covariate defined as X = (X1, · · · , X6, W)′ where X1, · · · , X6are 6 risk variables. W is a dummy variable, which takes value 0 or 1 for non-smoker andsmoker respectively. Given covariate vector X, cumulative probability of Y is written asP(Y ≤ k|X), and ordinal logistic regression model is defined as
logit(P(Y ≤ k|X)) = log{
P(Y ≤ k|X)
1 − P(Y ≤ k|X)
}= αk − X′β (1)
where αk is an intercept with α4 = 0, and β is 7 × 1 parameter vector. From definition ofthe model, the expected predicted probabilities for G1, G2, G3 and G4 are given by
P1 = P(Y = 1|X) =exp(α1−X′β)
1−exp(α1−X′β) ,
P2 = P(Y = 2|X) =exp(α2−X′β)
1−exp(α2−X′β) −exp(α1−X′β)
1−exp(α1−X′β) ,
P3 = P(Y = 3|X) =exp(α3−X′β)
1−exp(α3−X′β) −exp(α2−X′β)
1−exp(α2−X′β) ,
P4 = P(Y = 4|X) = 1 − exp(α3−X′β)1−exp(α3−X′β)
(2)
Finally, the predicted probabilities(
P1, P2, P3, P4)
were obtained by plugging in pa-rameter estimates
(αk, β
)into the expected predicted probabilities, and αk − X′ β is referred
to as the linear predicted score in the Figure 5.Since our model is defined as logit(P(Y ≤ k|X)) = αk − X′β, log odds ratio of belong-
ing lower risk group when Nutrition score increase one unit is given by
logit(P(Y ≤ k|X1 = a + 1))− logit(P(Y ≤ k|X1 = a)) = −β1 (3)
129

Nutrients 2021, 13, 2663
where β1 is the parameter estimate of “Nutrition”, thus, odds ratio is given by exp (−β1).However, interpretation of odds ratio for a risk variable is easier for a subject beingclassified into higher risk group. To this end, we reversed the order of group membership(i.e., Y * = 5 − Y) and model Y * instead of Y where G1 was set as a reference group. Table 6shown parameter estimates for modeling Y * where OR for nutrition is calculated as exp(0.232) = 1.26.
3. Results
3.1. Clinical Differences of Traditional Coronary Risk Factors and Nutrition Status with andwithout Cancer
Among 437 enrolled patients in the present study, 26 patients were excluded (Figure 1).
Figure 1. Enrollment of patients.
In the remaining 411 patients, there were 358 AMI patients without cancer (87.1%)and 53 with cancer (12.9%). To compare with AMI patients without cancer, those withcancer were significantly older with significantly lower body weight, lower diastolic bloodpressure, anemia, worse renal function, lower albumin and cholesterol levels, and worsenutrition status, evaluated by CONUT score, GPS, and mGPS (Table 1).
Next in comorbidities, those with cancer had significantly higher prevalence of dia-betes mellitus, chronic kidney disease, history of coronary artery bypass surgery treatment,and peripheral artery disease, who also had more frequent drug interventions by clopido-grel, ticlopidine, other antiplatelet agents, anti-cancer agents, and steroid (Table 2).
3.2. Risk Model of Cancer
To divide the patients into some groups to evaluate the presence of cancer, we firstexamined the association between age and coronary atherosclerotic plaque area (Figure 2).
Obviously, there was no cancer patient in Age < 60 years-old group. Then, the CARTdivided the patients by plaque area < 9.39 mm2 and those ≥9.39 mm2, which was thecut-off value of the presence and absence of cancer. According to this grouping process, wedivided the whole patients into 4 groups to develop a new response variable to evaluatethe presence of cancer (Figure 3 and Table 3). As we considered that if AMI occurred inpatients with smaller coronary atherosclerotic plaques, the patients had higher risks, wedefined the 4 groups as described in Figure 3 and Table 3.
130

Nutrients 2021, 13, 2663
Figure 2. Association between age and coronary atherosclerotic plaque area. There was no significant association betweenage and coronary plaque area.
Figure 3. Disposition of patients. As there was no cancer patient in age < 60 years old, we firstdivided the patients into 2 groups according to age of 60 years old. Next, the CART defined thatthe cut-off value of coronary atherosclerotic plaque area (PA) to divide the patients into with andwithout cancer was 9.39 mm2. Then, we divided the patients ≥ 60 years old into 2 groups accordingto plaque area of 9.39 mm2, with and without cancer. Due to the small number of cancer patients, wemade 4 groups as shown above. Group 1; non-cancer, age < 60 years old, Group 2; non-cancer, age ≥60 years old, plaque area ≥ 9.39 mm2, Group 3; non-cancer, age ≥ 60 years old, plaque area < 9.39mm2, Group 4; cancer, age ≥ 60 years old.
131
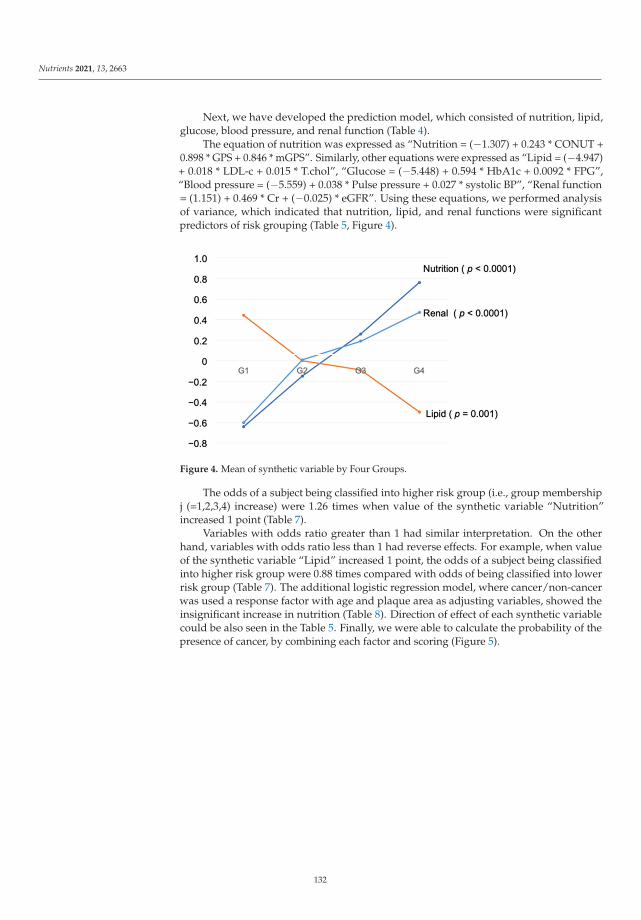
Nutrients 2021, 13, 2663
Next, we have developed the prediction model, which consisted of nutrition, lipid,glucose, blood pressure, and renal function (Table 4).
The equation of nutrition was expressed as “Nutrition = (−1.307) + 0.243 * CONUT +0.898 * GPS + 0.846 * mGPS”. Similarly, other equations were expressed as “Lipid = (−4.947)+ 0.018 * LDL-c + 0.015 * T.chol”, “Glucose = (−5.448) + 0.594 * HbA1c + 0.0092 * FPG”,“Blood pressure = (−5.559) + 0.038 * Pulse pressure + 0.027 * systolic BP”, “Renal function= (1.151) + 0.469 * Cr + (−0.025) * eGFR”. Using these equations, we performed analysisof variance, which indicated that nutrition, lipid, and renal functions were significantpredictors of risk grouping (Table 5, Figure 4).
Figure 4. Mean of synthetic variable by Four Groups.
The odds of a subject being classified into higher risk group (i.e., group membershipj (=1,2,3,4) increase) were 1.26 times when value of the synthetic variable “Nutrition”increased 1 point (Table 7).
Variables with odds ratio greater than 1 had similar interpretation. On the otherhand, variables with odds ratio less than 1 had reverse effects. For example, when valueof the synthetic variable “Lipid” increased 1 point, the odds of a subject being classifiedinto higher risk group were 0.88 times compared with odds of being classified into lowerrisk group (Table 7). The additional logistic regression model, where cancer/non-cancerwas used a response factor with age and plaque area as adjusting variables, showed theinsignificant increase in nutrition (Table 8). Direction of effect of each synthetic variablecould be also seen in the Table 5. Finally, we were able to calculate the probability of thepresence of cancer, by combining each factor and scoring (Figure 5).
132
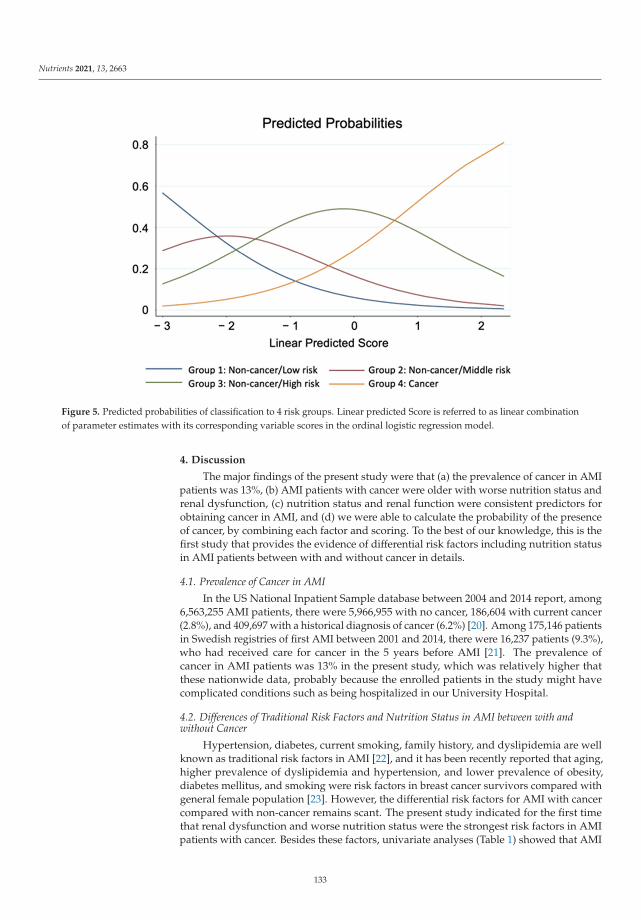
Nutrients 2021, 13, 2663
Figure 5. Predicted probabilities of classification to 4 risk groups. Linear predicted Score is referred to as linear combinationof parameter estimates with its corresponding variable scores in the ordinal logistic regression model.
4. Discussion
The major findings of the present study were that (a) the prevalence of cancer in AMIpatients was 13%, (b) AMI patients with cancer were older with worse nutrition status andrenal dysfunction, (c) nutrition status and renal function were consistent predictors forobtaining cancer in AMI, and (d) we were able to calculate the probability of the presenceof cancer, by combining each factor and scoring. To the best of our knowledge, this is thefirst study that provides the evidence of differential risk factors including nutrition statusin AMI patients between with and without cancer in details.
4.1. Prevalence of Cancer in AMI
In the US National Inpatient Sample database between 2004 and 2014 report, among6,563,255 AMI patients, there were 5,966,955 with no cancer, 186,604 with current cancer(2.8%), and 409,697 with a historical diagnosis of cancer (6.2%) [20]. Among 175,146 patientsin Swedish registries of first AMI between 2001 and 2014, there were 16,237 patients (9.3%),who had received care for cancer in the 5 years before AMI [21]. The prevalence ofcancer in AMI patients was 13% in the present study, which was relatively higher thatthese nationwide data, probably because the enrolled patients in the study might havecomplicated conditions such as being hospitalized in our University Hospital.
4.2. Differences of Traditional Risk Factors and Nutrition Status in AMI between with andwithout Cancer
Hypertension, diabetes, current smoking, family history, and dyslipidemia are wellknown as traditional risk factors in AMI [22], and it has been recently reported that aging,higher prevalence of dyslipidemia and hypertension, and lower prevalence of obesity,diabetes mellitus, and smoking were risk factors in breast cancer survivors compared withgeneral female population [23]. However, the differential risk factors for AMI with cancercompared with non-cancer remains scant. The present study indicated for the first timethat renal dysfunction and worse nutrition status were the strongest risk factors in AMIpatients with cancer. Besides these factors, univariate analyses (Table 1) showed that AMI
133
Nutrients 2021, 13, 2663
with cancer patients had significantly lower levels of albumin, T.chol, and LDL-c than thosewithout cancer, which seemed to be caused by deterioration of nutrition status, which weredifferent from traditional coronary risk factors.
4.3. Prediction and Scoring of Cancer in AMI
In the present study, we have developed formulas regarding nutrition status, lipid,glucose blood pressure, and renal function (Table 4). Using these formulas, we are able toavoid to evaluate several data separately, such as T.chol and LDL-c, or Cr and eGFR, and toconsider these factors as whole. Further, we have established the predicted scoring systemfor AMI with cancer (Figure 5), which means that we are able to predict if the patientswith AMI have cancer, by calculating this score. This might be useful in clinical settings torecognize the presence of cancer.
4.4. Limitations
Several limitations should be acknowledged in the present study. First, the presentstudy was an observational retrospective cohort study from a single center. Thus, theremight be some bias. Second, we were not able to divide cancer patients into active cancerand history of cancer, due to the limited number of patients with cancer. Also, we were notable to evaluate cancer stage in this study. Third, we were not able to distinguish coronaryplaque rupture from coronary artery erosion as causes of AMI. Fourth, the enrolled patientsin the present study were hospitalized in University Hospital, which may also cause somebias. Fifth, due to the limited number of enrolled patients, we were not able to examine sex-difference in the present study. Taken together, further investigations should be necessaryin larger multi-center cohort studies.
5. Conclusions
The present study demonstrates that the prevalence of cancer in AMI was 13%, andthat worse nutrition status and renal dysfunction were associated with AMI with cancer, inwhich nutrition status was a major different characteristic from non-cancer. Further, wehave developed formulas to predict the presence of cancer in AMI.
Author Contributions: Conceptualization, N.I. and Y.F.; methodology, A.F. and T.K.; software, A.F.and T.K.; validation, T.K.; formal analysis, A.F.; investigation, N.I.; resources, Y.F.; data curation,N.I.; writing—original draft preparation, N.I.; writing—review and editing, Y.F.; visualization, A.F.;supervision, Y.F.; project administration, Y.F.; funding acquisition, Y.F. All authors have read andagreed to the published version of the manuscript.
Funding: This research received no external funding.
Institutional Review Board Statement: The study was conducted according to the guidelines of theDeclaration of Helsinki, and approved by the institutional review board at Kurume University (No.20181, 18 November 2020 approved).
Informed Consent Statement: Informed consent was waved due to the retrospective nature andopt-out was used in the study.
Data Availability Statement: The data presented in this paper are available on request from thecorresponding author.
Conflicts of Interest: The authors declare no conflict of interest.
References
1. Crea, F.; Libby, P. Acute Coronary Syndromes: The Way Forward From Mechanisms to Precision Treatment. Circulation 2017, 136,1155–1166. [CrossRef] [PubMed]
2. Libby, P.; Buring, J.E.; Badimon, L.; Hansson, G.K.; Deanfield, J.; Bittencourt, M.S.; Tokgozoglu, L.; Lewis, E.F. Atherosclerosis.Nat. Rev. Dis. Primers 2019, 5, 56. [CrossRef]
3. Fukumoto, Y.; Libby, P.; Rabkin, E.; Hill, C.C.; Enomoto, M.; Hirouchi, Y.; Shiomi, M.; Aikawa, M. Statins alter smooth muscle cellaccumulation and collagen content in established atheroma of watanabe heritable hyperlipidemic rabbits. Circulation 2001, 103,993–999. [CrossRef] [PubMed]
134

Nutrients 2021, 13, 2663
4. Libby, P.; Aikawa, M. Mechanisms of plaque stabilization with statins. Am. J. Cardiol. 2003, 91, 4B–8B. [CrossRef]5. Ahmadi, A.; Leipsic, J.; Blankstein, R.; Taylor, C.; Hecht, H.; Stone, G.W.; Narula, J. Do plaques rapidly progress prior to
myocardial infarction? The interplay between plaque vulnerability and progression. Circ. Res. 2015, 117, 99–104. [CrossRef]6. Mayer, D.K.; Nasso, S.F.; Earp, J.A. Defining cancer survivors, their needs, and perspectives on survivorship health care in the
USA. Lancet Oncol. 2017, 18, e11–e18. [CrossRef]7. Takahashi, M. Cancer survivorship: Current status of research, care, and policy in Japan. Jpn. J. Clin. Oncol. 2016, 46,
599–604. [CrossRef]8. Falk, E. Pathogenesis of atherosclerosis. J. Am. Coll. Cardiol. 2006, 47, C7–C12. [CrossRef]9. Jaiswal, S.; Natarajan, P.; Silver, A.J.; Gibson, C.J.; Bick, A.G.; Shvartz, E.; McConkey, M.; Gupta, N.; Gabriel, S.; Ardissino,
D.; et al. Clonal Hematopoiesis and Risk of Atherosclerotic Cardiovascular Disease. N. Engl. J. Med. 2017, 377, 111–121.[CrossRef] [PubMed]
10. Pardali, E.; Dimmeler, S.; Zeiher, A.M.; Rieger, M.A. Clonal hematopoiesis, aging, and cardiovascular diseases. Exp. Hematol.2020, 83, 95–104. [CrossRef]
11. Heyde, A.; Rohde, D.; McAlpine, C.S.; Zhang, S.; Hoyer, F.F.; Gerold, J.M.; Cheek, D.; Iwamoto, Y.; Schloss, M.J.; Vandoorne,K.; et al. Increased stem cell proliferation in atherosclerosis accelerates clonal hematopoiesis. Cell 2021, 184, 1348–1361.e1322.[CrossRef] [PubMed]
12. Honigberg, M.C.; Zekavat, S.M.; Niroula, A.; Griffin, G.K.; Bick, A.G.; Pirruccello, J.P.; Nakao, T.; Whitsel, E.A.; Farland, L.V.;Laurie, C.; et al. Premature Menopause, Clonal Hematopoiesis, and Coronary Artery Disease in Postmenopausal Women.Circulation 2021, 143, 410–423. [CrossRef] [PubMed]
13. Ministry of Health, Labour and Welfare. Available online: https://www.mhlw.go.jp/toukei/saikin/hw/jinkou/geppo/nengai18/dl/gaikyou30.pdf (accessed on 22 June 2021).
14. Li, Y.; Schoufour, J.; Wang, D.D.; Dhana, K.; Pan, A.; Liu, X.; Song, M.; Liu, G.; Shin, H.J.; Sun, Q.; et al. Healthy lifestyleand life expectancy free of cancer, cardiovascular disease, and type 2 diabetes: Prospective cohort study. BMJ 2020, 368, l6669.[CrossRef] [PubMed]
15. Thygesen, K.; Alpert, J.S.; Jaffe, A.S.; Chaitman, B.R.; Bax, J.J.; Morrow, D.A.; White, H.D. Executive Group on behalf of the JointEuropean Society of Cardiology/American College of Cardiology/American Heart Association/World Heart Federation TaskForce for the Universal Definition of Myocardial, I. Fourth Universal Definition of Myocardial Infarction (2018). Circulation 2018,138, e618–e651. [CrossRef]
16. Forrest, L.M.; McMillan, D.C.; McArdle, C.S.; Angerson, W.J.; Dunlop, D.J. Evaluation of cumulative prognostic scoresbased on the systemic inflammatory response in patients with inoperable non-small-cell lung cancer. Br. J. Cancer 2003,89, 1028–1030. [CrossRef]
17. Toiyama, Y.; Miki, C.; Inoue, Y.; Tanaka, K.; Mohri, Y.; Kusunoki, M. Evaluation of an inflammation-based prognostic score for theidentification of patients requiring postoperative adjuvant chemotherapy for stage II colorectal cancer. Exp. Ther. Med. 2011, 2,95–101. [CrossRef]
18. Inoue, Y.; Iwata, T.; Okugawa, Y.; Kawamoto, A.; Hiro, J.; Toiyama, Y.; Tanaka, K.; Uchida, K.; Mohri, Y.; Miki, C.; et al. Prognosticsignificance of a systemic inflammatory response in patients undergoing multimodality therapy for advanced colorectal cancer.Oncology 2013, 84, 100–107. [CrossRef]
19. de Ulibarri, J.I.; Gonzalez-Madrono, A.; de Villar, N.G.; Gonzalez, P.; Gonzalez, B.; Mancha, A.; Rodriguez, F.; Fernandez, G.CONUT: A tool for controlling nutritional status. First validation in a hospital population. Nutr. Hosp. 2005, 20, 38–45.
20. Bharadwaj, A.; Potts, J.; Mohamed, M.O.; Parwani, P.; Swamy, P.; Lopez-Mattei, J.C.; Rashid, M.; Kwok, C.S.; Fischman, D.L.;Vassiliou, V.S.; et al. Acute myocardial infarction treatments and outcomes in 6.5 million patients with a current or historicaldiagnosis of cancer in the USA. Eur. Heart J. 2020, 41, 2183–2193. [CrossRef]
21. Velders, M.A.; Hagstrom, E.; James, S.K. Temporal Trends in the Prevalence of Cancer and Its Impact on Outcome in PatientsWith First Myocardial Infarction: A Nationwide Study. J. Am. Heart Assoc. 2020, 9, e014383. [CrossRef]
22. Kawano, H.; Soejima, H.; Kojima, S.; Kitagawa, A.; Ogawa, H.; Japanese Acute Coronary Syndrome Study (JACSS) Investigators.Sex differences of risk factors for acute myocardial infarction in Japanese patients. Circ. J. 2006, 70, 513–517. [CrossRef] [PubMed]
23. Yandrapalli, S.; Malik, A.H.; Pemmasani, G.; Gupta, K.; Harikrishnan, P.; Nabors, C.; Aronow, W.S.; Cooper, H.A.; Panza,J.A.; Frishman, W.H.; et al. Risk Factors and Outcomes During a First Acute Myocardial Infarction in Breast Cancer SurvivorsCompared with Females Without Breast Cancer. Am. J. Med. 2020, 133, 444–451. [CrossRef] [PubMed]
135


nutrients
Article
High Plasma Docosahexaenoic Acid Associated to BetterPrognoses of Patients with Acute Decompensated Heart Failurewith Preserved Ejection Fraction
Naoaki Matsuo 1, Toru Miyoshi 1,*, Atsushi Takaishi 2, Takao Kishinoue 2, Kentaro Yasuhara 2,
Masafumi Tanimoto 2, Yukari Nakano 3, Nobuhiko Onishi 2, Masayuki Ueeda 4 and Hiroshi Ito 1
Citation: Matsuo, N.; Miyoshi, T.;
Takaishi, A.; Kishinoue, T.;
Yasuhara, K.; Tanimoto, M.;
Nakano, Y.; Onishi, N.; Ueeda, M.;
Ito, H. High Plasma Docosahexaenoic
Acid Associated to Better Prognoses
of Patients with Acute
Decompensated Heart Failure with
Preserved Ejection Fraction. Nutrients
2021, 13, 371. https://doi.org/
10.3390/nu13020371
Academic Editor:
Yoshihiro Fukumoto
Received: 11 December 2020
Accepted: 22 January 2021
Published: 26 January 2021
Publisher’s Note: MDPI stays neutral
with regard to jurisdictional claims in
published maps and institutional affil-
iations.
Copyright: © 2021 by the authors.
Licensee MDPI, Basel, Switzerland.
This article is an open access article
distributed under the terms and
conditions of the Creative Commons
Attribution (CC BY) license (https://
creativecommons.org/licenses/by/
4.0/).
1 Department of Cardiovascular Medicine, Okayama University Graduate School of Medicine,Dentistry and Pharmaceutical Sciences, Okayama 700-8558, Japan; [email protected] (N.M.);[email protected] (H.I.)
2 Department of Cardiovascular Medicine, Mitoyo General Hospital, Kagawa 769-1601, Japan;[email protected] (A.T.); [email protected] (T.K.); [email protected] (K.Y.);[email protected] (M.T.); [email protected] (N.O.)
3 Nakano Cardiovascular Clinic, Kagawa 762-0012, Japan; [email protected] Ueeda Cardiovascular Clinic, Kagawa 769-1504, Japan; [email protected]* Correspondence: [email protected]; Tel.: +81-86-235-7351
Abstract: The clinical relevance of polyunsaturated fatty acids (PUFAs) in heart failure remainsunclear. The aim of this study was to investigate the association between PUFA levels and theprognosis of patients with heart failure with preserved ejection fraction (HFpEF). This retrospectivestudy included 140 hospitalized patients with acute decompensated HFpEF (median age 84.0 years,42.9% men). The patients’ nutritional status was assessed, using the geriatric nutritional risk index(GNRI), and their plasma levels of eicosapentaenoic acid (EPA), docosahexaenoic acid (DHA),arachidonic acid (AA), and dihomo-gamma-linolenic acid (DGLA) were measured before discharge.The primary outcome was all-cause mortality. During a median follow-up of 23.3 months, the primaryoutcome occurred in 37 patients (26.4%). A Kaplan–Meier analysis showed that lower DHA andDGLA levels, but not EPA or AA levels, were significantly associated with an increase in all-causedeath (log-rank; p < 0.001 and p = 0.040, respectively). A multivariate Cox regression analysis alsorevealed that DHA levels were significantly associated with the incidence of all-cause death (HR: 0.16,95% CI: 0.06–0.44, p = 0.001), independent of the GNRI. Our results suggest that low plasma DHAlevels may be a useful predictor of all-cause mortality and potential therapeutic target in patientswith acute decompensated HFpEF.
Keywords: heart failure with preserved ejection fraction; docosahexaenoic acid; geriatric nutritionalrisk index
1. Introduction
Heart failure (HF) is a common and growing public health problem with an estimatedprevalence of over 37.7 million cases worldwide [1]. Despite recent developments of HFtreatments, including pharmacological and device therapy, HF still results in high mortalityand re-hospitalization rates [2]. HF clinically manifests in two modes, which are definedby ventricular function: HF with reduced ejection fraction (HFrEF) and HF with preservedejection fraction (HFpEF) [3]. Unfortunately, standard pharmacological therapies for HFrEFsuch as angiotensin-converting enzyme inhibitors and β-blockers show a lack of efficacy inthe treatment of HFpEF [4]. Patients with HFpEF are more likely to be older, female, andhave hypertension, renal disease, atrial fibrillation, and malnutrition [5]. Malnutrition, inparticular, is a common problem in elderly patients with HFpEF and is a known risk factorfor a poor prognosis [6].
Nutrients 2021, 13, 371. https://doi.org/10.3390/nu13020371 https://www.mdpi.com/journal/nutrients137

Nutrients 2021, 13, 371
Polyunsaturated fatty acids (PUFAs) play structural and functional roles as membranecomponents and precursors of physiologically active substances involved in inflamma-tion [7]. Fish oils, sunflower, safflower, and corn oils are rich in omega-3 PUFAs, while meatfrom farm animals are rich in omega-6 PUFAs [8]. Omega-3 PUFAs, such as eicosapen-taenoic acid (EPA) and docosahexaenoic acid (DHA), and oemga-6 PUFAs, such as arachi-donic acid (AA) and dihomo-gamma-linolenic acid (DGLA), have been shown to haveopposite effect [9]. It has been reported that AA-derived metabolites are pro-inflammatory,while EPA- and DHA-derived metabolites are pro-resolution/anti-inflammatory [10–12].Some metabolites have been reported to play a critical role in the development of cardiachypertrophy and heart failure by regulating inflammatory reactions [12–14]. However,omega-7 and omega-9 monounsaturated fatty acids, such as palmitoleic acid and oleic acid,are components of complex lipids, such as sphingosines and phospholipids, and couldinterfere with cellular injury [15–17].
Several clinical trials and meta-analysis have demonstrated that omega-3 PUFAs arebeneficial for patients with cardiovascular events [18–20]. Regarding the association be-tween omega-3 PUFAs and heart failure, a meta-analysis of seven prospective studies with176,441 subjects and 5480 cases of HF found a lower risk of HF in patients that took highamounts of marine omega-3 PUFAs [21]. Another study including 6562 patients, in over13 years, found that plasma EPA levels were significantly lower in HF patients, comparedto HF-free patients [22]. Small-scale clinical trials have indicated that omega-3 PUFAs mayimprove the outcomes of patients with HF [23–26]. However, recent large-scale random-ized controlled studies investigating cardiovascular benefit of omega-3 supplementationshowed conflicting findings [27,28].
The aim of this study was to investigate the role of PUFAs in the prognosis of patientswith acute decompensated HFpEF. In addition, the impact of the patients’ nutritional statuson the association between PUFAs and their prognosis was evaluated.
2. Materials and Methods
2.1. Study Design and Participants
This study was a retrospective single-center cohort study. The study protocol wasapproved by the Institutional Review Board of Mitoyo General Hospital (19CR01-122)and conducted in accordance with the principles of the Declaration of Helsinki. Therequirement for informed consent was waived because of the low-risk nature of the studyand inability to obtain consent directly from all the study subjects. Instead, we announcedthis study protocol extensively at Mitoyo General Hospital and on the hospital website(http://mitoyo-hosp.jp) and provided patients with the opportunity to withdraw from thestudy. We initially enrolled 301 consecutive patients with acute decompensated HFpEFthat were not receiving hemodialysis and who were admitted to Mitoyo General Hospitalbetween August 2015 and January 2019. Acute decompensated HF was diagnosed basedon the Framingham’s criteria. [29]. A diagnosis of HF was made if a patient had atleast two major criteria or one major criterion and two minor criteria. The major criteriaare acute pulmonary edema, cardiomegaly, hepatojugular reflex, distended neck veins,paroxysmal nocturnal dyspnea, pulmonary rales, and third heart sound. The minorcriteria are ankle edema, dyspnea on exertion, hepatomegaly, nocturnal cough, pleuraleffusion, and tachycardia [29]. HFpEF was defined as HF with a left ventricular ejectionfraction ≥50%. Patients with HFrEF and those receiving omega-3 PUFA therapy wereexcluded. Figure 1 shows the flow diagram of this study. Follow-ups were performed byreferring to patient electronic medical records, direct contact with the patients’ physiciansin the outpatient clinic, and telephone interviews with patients or family members. A totalof 140 patients were ultimately included in the final analysis.
138
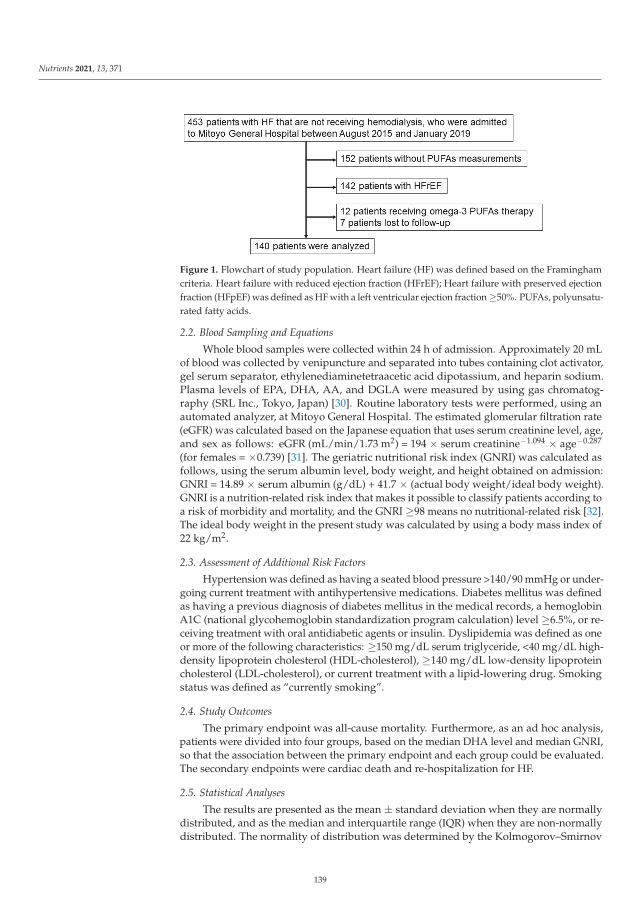
Nutrients 2021, 13, 371
Figure 1. Flowchart of study population. Heart failure (HF) was defined based on the Framinghamcriteria. Heart failure with reduced ejection fraction (HFrEF); Heart failure with preserved ejectionfraction (HFpEF) was defined as HF with a left ventricular ejection fraction ≥50%. PUFAs, polyunsatu-rated fatty acids.
2.2. Blood Sampling and Equations
Whole blood samples were collected within 24 h of admission. Approximately 20 mLof blood was collected by venipuncture and separated into tubes containing clot activator,gel serum separator, ethylenediaminetetraacetic acid dipotassium, and heparin sodium.Plasma levels of EPA, DHA, AA, and DGLA were measured by using gas chromatog-raphy (SRL Inc., Tokyo, Japan) [30]. Routine laboratory tests were performed, using anautomated analyzer, at Mitoyo General Hospital. The estimated glomerular filtration rate(eGFR) was calculated based on the Japanese equation that uses serum creatinine level, age,and sex as follows: eGFR (mL/min/1.73 m2) = 194 × serum creatinine−1.094 × age−0.287
(for females = ×0.739) [31]. The geriatric nutritional risk index (GNRI) was calculated asfollows, using the serum albumin level, body weight, and height obtained on admission:GNRI = 14.89 × serum albumin (g/dL) + 41.7 × (actual body weight/ideal body weight).GNRI is a nutrition-related risk index that makes it possible to classify patients according toa risk of morbidity and mortality, and the GNRI ≥98 means no nutritional-related risk [32].The ideal body weight in the present study was calculated by using a body mass index of22 kg/m2.
2.3. Assessment of Additional Risk Factors
Hypertension was defined as having a seated blood pressure >140/90 mmHg or under-going current treatment with antihypertensive medications. Diabetes mellitus was definedas having a previous diagnosis of diabetes mellitus in the medical records, a hemoglobinA1C (national glycohemoglobin standardization program calculation) level ≥6.5%, or re-ceiving treatment with oral antidiabetic agents or insulin. Dyslipidemia was defined as oneor more of the following characteristics: ≥150 mg/dL serum triglyceride, <40 mg/dL high-density lipoprotein cholesterol (HDL-cholesterol), ≥140 mg/dL low-density lipoproteincholesterol (LDL-cholesterol), or current treatment with a lipid-lowering drug. Smokingstatus was defined as “currently smoking”.
2.4. Study Outcomes
The primary endpoint was all-cause mortality. Furthermore, as an ad hoc analysis,patients were divided into four groups, based on the median DHA level and median GNRI,so that the association between the primary endpoint and each group could be evaluated.The secondary endpoints were cardiac death and re-hospitalization for HF.
2.5. Statistical Analyses
The results are presented as the mean ± standard deviation when they are normallydistributed, and as the median and interquartile range (IQR) when they are non-normallydistributed. The normality of distribution was determined by the Kolmogorov–Smirnov
139
Nutrients 2021, 13, 371
test. Differences between the groups were analyzed by using the unpaired Student’s t-testor Mann–Whitney U test for continuous variables, and the chi-squared test or Fisher’sexact test for dichotomous variables, as appropriate. For the survival analyses, Kaplan–Meier survival plots were constructed by dividing the patients’ PUFA levels on admissioninto two groups, according to the median values, and log-rank testing was performed tostudy the influence of PUFA levels on primary and secondary endpoints. To evaluate theinfluence of PUFA levels on the primary endpoint, Cox proportional-hazards regressionmodels were used to estimate the hazard ratio (HR) and 95% confidence interval (CI). Toavoid overfitting, variables that were included in the principal multivariate models wereadjusted for age, sex, hypertension, dyslipidemia, diabetes mellitus, and GNRI. All thetests were two-tailed, and a value of p < 0.05 was considered statistically significant. All theanalyses were performed by using IBM SPSS statistics version 24.0 (IBM Corp., Armonk,NY, USA).
3. Results
3.1. Baseline Characteristics
Table 1 shows the baseline characteristics of the patients in this study and a comparisonof those characteristics between the patients with and without primary endpoints. Themedian age of all the patients was 84.0 years, 42.9% were male, and 56.4% had atrialfibrillation. The prevalence of hypertension and diabetes mellitus within the group ofpatients was 90.0% and 22.9%, respectively.
During the median follow-up of 23.3 months, 37 (26.4%) of the patients exhibited theprimary endpoint. Patients experiencing the primary endpoint were older; had lower BMIand GNRI values; had a lower prevalence of hypertension and dyslipidemia; had lowerstatin use; and had lower hemoglobin, albumin, HDL-cholesterol, and LDL-cholesterollevels than those who did not experience the primary endpoint. No significant differencesin the prevalence of atrial fibrillation, prior hospitalization for HF, or medication use,except for statins, were observed between the two groups. The median levels of EPA, DHA,DGLA, and AA, as well as the ratio of EPA to AA (EPA/AA), DHA to AA (DHA/AA), andAA + DGLA to EPA + DHA (AA + DGLA/EPA + DHA), on admission were 46.6 μg/mL,116.1 μg/mL, 23.6 μg/mL, 159.8 μg/mL, 0.26, 0.74, and 1.15, respectively. The levels ofDHA, DGLA, and AA for the patients with adverse events were significantly lower thanfor those patients without adverse events. The levels of EPA, EPA/AA, DHA/AA, andAA+DGLA/EPA+DHA did not differ between the two groups.
3.2. Cumulative Event Rates Based on PUFA Levels
The Kaplan–Meier analyses showed that lower levels of DHA and DGLA on admissionwere significantly associated with the incidence of adverse events (log-rank; p < 0.001 andp = 0.040, respectively) (Figure 2B,D). However, the EPA and AA levels and the EPA/AA,DHA/AA, and AA + DGLA/ EPA + DHA were not associated (log-rank; p = 0.051,p = 0.154, p = 0.649, p = 0.887, p = 0.712, respectively) (Figure 2A,C,E–G).
3.3. Univariate and Multivariate Analyses of Parameters Contributing to the Primary andSecondary Endpoints
The univariate Cox regression analyses showed that age, body mass index, statin use,hemoglobin, albumin, LDL-cholesterol, GNRI, DGLA level, and DHA level were associatedwith the incidence of the primary endpoint (Table 2). The multivariate Cox regressionanalyses revealed that patients with high DHA levels was significantly associated witha low incidence of the primary endpoint after an adjustment for age, sex, hypertension,dyslipidemia, diabetes mellitus, and GNRI (HR: 0.16, 95% CI: 0.06–0.44, p = 0.001). How-ever, the DGLA level was not significantly associated with the primary endpoint after anadjustment for confounding variables.
140

Nutrients 2021, 13, 371
Table 1. Baseline characteristics according to the presence or absence of the primary endpoint.
Primary Endpoint
Variables All (n = 140) Absent (n = 103) Present (n = 37) p
Men 60 (42.9) 40 (38.8) 20 (54.1) 0.110Age, years 84.0 (77.0, 88.0) 82.0 (76.0, 88.0) 86.0 (83.0, 89.0) 0.018
Body mass index, kg/m2 23.3 (20.4, 26.6) 22.4 (20.8, 27.5) 22.1 (19.9, 24.1) 0.008Hypertension 126 (90.0) 96 (93.2) 30 (81.1) 0.035
Diabetes Mellitus 32 (22.9) 22 (21.4) 10 (27.0) 0.485Dyslipidemia 45 (32.1) 38 (36.9) 7 (18.9) 0.045
Current smoker 49 (35.0) 33 (32.0) 16 (43.2) 0.223Prior hospitalization for heart failure 19 (13.6) 13 (12.6) 6 (16.2) 0.587
Ischemic heart disease 18 (12.9) 15 (14.6) 3 (8.1) 0.318Atrial fibrillation 79 (56.4) 59 (57.3) 20 (54.1) 0.736
Prior PCI 14 (10.0) 12 (11.7) 2 (5.4) 0.281Prior CABG 5 (3.6) 5 (4.9) 0 (0) 0.175
Valve repair/placement 14 (10.0) 12 (11.7) 2 (5.4) 0.281Pacemaker implantation 14 (10.0) 7 (6.8) 7 (18.9) 0.035
MedicationsACEIs/ARBs 55 (39.3) 43 (41.7) 12 (32.4) 0.323β-blockers 48 (34.3) 39 (37.9) 9 (24.3) 0.139
CCBs 72 (51.4) 55 (53.4) 17 (45.9) 0.440Loop diuretics 79 (56.4) 54 (52.4) 25 (67.6) 0.113
MRAs 26 (18.6) 16 (15.5) 10 (27.0) 0.125Antiplatelets 31 (22.1) 27 (26.2) 4 (10.8) 0.053
Oral antidiabetic agents 22 (15.7) 17 (16.5) 5 (13.5) 0.671Statins 35 (25.0) 31 (30.1) 4 (10.8) 0.020
Anticoagulants 22 (15.7) 46 (44.7) 17 (45.9) 0.894Laboratory findingsHemoglobin (g/dL) 11.0 ± 2.09 11.2 ± 2.10 10.3 ± 1.94 0.017Creatinine (mg/dL) 1.08 (0.82, 1.62) 1.03 (0.83, 1.56) 1.27 (0.79, 1.75) 0.364
eGFR (ml/min/1.73 m2) 42.2 (29.0, 56.0) 43.0 (29.0, 55.0) 41.0 (26.2, 59.6) 0.530Albumin (g/dL) 3.6 (3.2, 3.9) 3.6 (3.4, 3.9) 3.4 (2.9, 3.7) 0.001hsCRP (mg/dL) 0.43 (0.17, 1.45) 0.36 (0.15, 1.08) 0.86 (0.24, 1.59) 0.581BNP (pg/mL) 453.0 (260.4, 699.0) 464.0 (246.8, 739.4) 411.0 (269.9, 659.5) 0.107
Troponin I (pg/mL) 32.7 (15.2, 84.7) 33.0 (14.3, 84.7) 28.9 (16.3, 70.8) 0.520Hemoglobin A1C (%) 5.9 (5.6, 6.5) 5.9 (5.6, 6.5) 5.9 (5.6, 6.6) 0.871Triglycerides (mg/dL) 76 (57, 98) 78 (62, 98) 67 (50, 94) 0.110
HDL-C (mg/dL) 46 ± 14.4 48 ± 13.8 41 ± 15.5 0.047LDL-C (mg/dL) 97 ± 36.7 102 ± 37.1 81 ± 30.8 0.014
EPA (μg/mL) 46.6 (30.7, 64.2) 48.0 (31.9, 67.8) 39.6 (28.0, 55.0) 0.076DHA (μg/mL) 116.1 (96.7, 144.9) 126.7 (99.1, 149.8) 102.8 (94.3, 119.5) 0.009AA (μg/mL) 159.8 (133.8, 194.5) 167.1 (144.2, 195.0) 139.1 (110.5, 180.7) 0.001
DGLA (μg/mL) 23.6 (19.6, 30.5) 24.2 (20.1, 32.5) 22.2 (18.4, 27.1) 0.019EPA/AA 0.26 (0.20, 0.40) 0.27 (0.20, 0.40) 0.26 (0.21, 0.39) 0.812DHA/AA 0.74 (0.62, 0.89) 0.74 (0.60, 0.90) 0.78 (0.63, 0.88) 0.287
AA + DGLA/EPA + DHA 1.15 (0.90, 1.38) 1.15 (0.90, 1.42) 1.14 (0.95, 1.32) 0.481GNRI 97.7 ± 12.03 99.9 ± 11.59 90.8 ± 10.84 < 0.001
Categorical variables are presented as number of patients (%). Continuous variables are presented as the mean ± standard deviationor median (interquartile range). PCI, percutaneous coronary intervention; CABG, coronary artery bypass grafting; ACEs, angiotensin-converting enzyme inhibitors; ARBs, angiotensin II receptor blockers; CCBs, calcium channel blockers; MRAs, mineralocorticoid receptorantagonists; eGFR, estimated glomerular filtration rate; hsCRP, high-sensitivity C-reactive protein; BNP, brain natriuretic peptide; HDL-C,high-density lipoprotein cholesterol; LDL-C, low-density lipoprotein cholesterol; EPA, eicosapentaenoic acid; DHA, docosahexaenoic acid;DGLA, dihomo-gamma-linolenic acid; AA, arachidonic acid; DHA/AA, ratio of DHA to AA; AA+DGLA/EPA+DHA, ratio of AA+DGLAto EPA+DHA; GNRI, geriatric nutritional risk index.
141
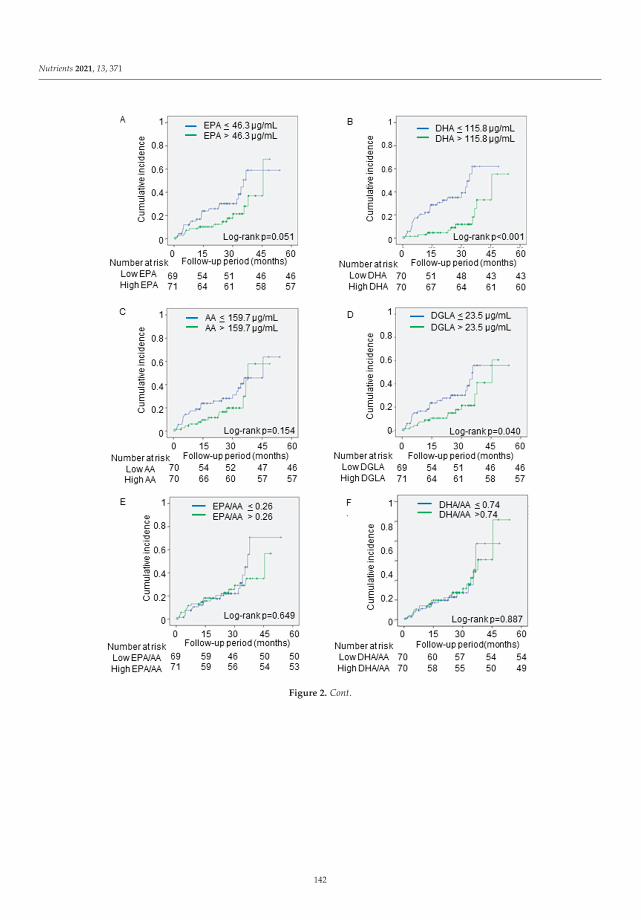
Nutrients 2021, 13, 371
Figure 2. Cont.
142

Nutrients 2021, 13, 371
Figure 2. The associations between the primary outcomes and PUFA levels. The cumulative incidences of the primaryendpoint (all-cause death) were estimated by using the Kaplan–Meier method. The patients were divided into twogroups, based on the median levels of (A) EPA, (B) DHA, (C) AA, (D) DGLA, (E) EPA/AA, (F) DHA/AA, and (G)AA + DGLA/ EPA + DHA. Log-rank testing was performed to study the influence of PUFA levels on primary endpoint.EPA, eicosapentaenoic acid; DHA, docosahexaenoic acid; DGLA, dihomo-gamma-linolenic acid; AA, arachidonic acid;EPA/AA, ratio of EPA to AA; DHA/AA, ratio of DHA to AA; AA + DGLA/EPA + DHA; ratio of AA + DGLA toEPA + DHA.
Table 2. The association between PUFAs and the primary endpoint analyzed with Cox proportional hazards models.
Univariate Multivariate-1 Multivariate-2
HR 95% CI p HR 95% CI p HR 95% CI p
Age,per 1 year 1.06 1.01–1.11 0.009 1.05 0.99–1.10 1.102 1.06 1.00–1.13 0.042
Male 1.76 0.92–3.37 0.087 1.76 0.81–3.83 0.155 1.98 0.91–4.29 0.083Body mass index,
per 1.0 kg/m2 0.90 0.82–0.98 0.017 - - - - - -
Hypertension 0.52 0.26–1.06 0.071 0.65 0.26–1.59 0.342 1.13 0.45–2.82 0.793Dyslipidemia 0.45 0.20–1.03 0.060 0.72 0.25–2.12 0.549 0.66 0.23–1.91 0.441
Diabetes mellitus 1.54 0.74–3.21 0.249 1.99 0.87–4.58 0.104 1.86 0.78–4.46 0.164Statin use 0.34 0.12–0.95 0.040 - - - - - -
Hemoglobin,per 1.0 mg/dL 0.82 0.70–0.96 0.013 - - - - - -
Albumin,per 1.0 g/dL 0.34 0.18–0.63 0.001 - - - - - -
HDL-C,per 1 mg/dL 0.96 0.93–1.00 0.054 - - - - - -
LDL-C,per 1 mg/dL 0.98 0.96–0.99 0.004 - - - - - -
GNRI,per 1 index 0.94 0.91–0.97 <0.001 0.95 0.91–0.99 0.010 0.95 0.91–0.98 0.002
High DGLA 0.50 0.26–0.98 0.044 1.02 0.47–2.19 0.969 - - -High AA 0.61 0.31–1.21 0.158 - - - - - -High EPA 0.52 0.27–1.01 0.055 - - - - - -High DHA 0.25 0.12–0.53 <0.001 - - - 0.16 0.06–0.44 <0.001
High EPA/AA 0.86 0.45–1.65 0.650 - - - -High DHA/AA 1.05 0.54–2.02 0.887 - - - -
High AA +DGLA/
EPA + DHA1.13 0.59–2.17 0.712 - - - -
The multivariate model-1 and model-2 were adjusted for age, sex, hypertension, dyslipidemia, diabetes mellitus, and GNRI. HR, hazard ra-tio; CI, confidence interval; GNRI, geriatric nutritional risk index; EPA, eicosapentaenoic acid; DHA, docosahexaenoic acid; DGLA, dihomo-gamma-linolenic acid; AA, arachidonic acid. EPA/AA, ratio of EPA to AA; DHA/AA, ratio of DHA to AA; AA + DGLA/EPA + DHA;ratio of AA + DGLA to EPA + DHA.
143
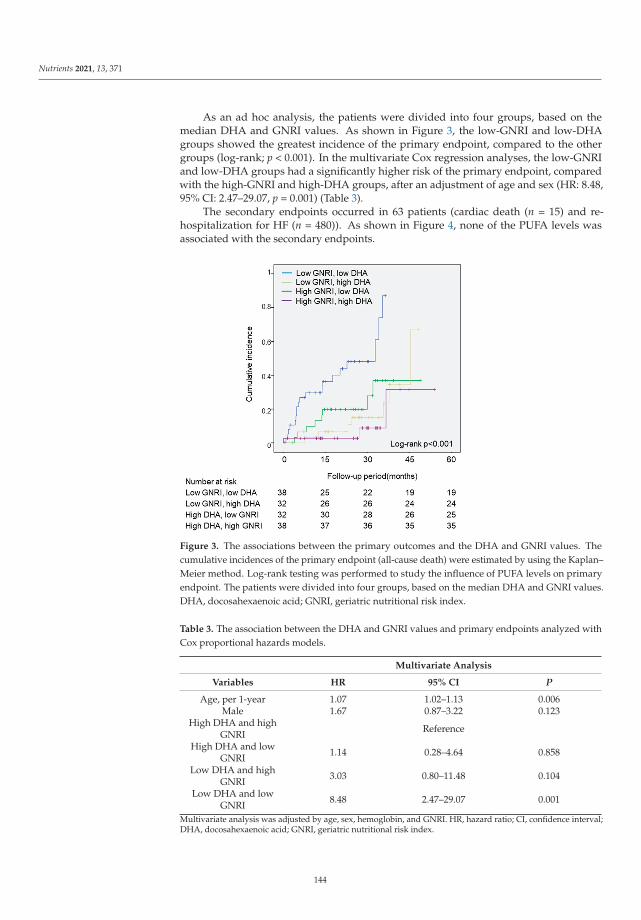
Nutrients 2021, 13, 371
As an ad hoc analysis, the patients were divided into four groups, based on themedian DHA and GNRI values. As shown in Figure 3, the low-GNRI and low-DHAgroups showed the greatest incidence of the primary endpoint, compared to the othergroups (log-rank; p < 0.001). In the multivariate Cox regression analyses, the low-GNRIand low-DHA groups had a significantly higher risk of the primary endpoint, comparedwith the high-GNRI and high-DHA groups, after an adjustment of age and sex (HR: 8.48,95% CI: 2.47–29.07, p = 0.001) (Table 3).
The secondary endpoints occurred in 63 patients (cardiac death (n = 15) and re-hospitalization for HF (n = 480)). As shown in Figure 4, none of the PUFA levels wasassociated with the secondary endpoints.
Figure 3. The associations between the primary outcomes and the DHA and GNRI values. Thecumulative incidences of the primary endpoint (all-cause death) were estimated by using the Kaplan–Meier method. Log-rank testing was performed to study the influence of PUFA levels on primaryendpoint. The patients were divided into four groups, based on the median DHA and GNRI values.DHA, docosahexaenoic acid; GNRI, geriatric nutritional risk index.
Table 3. The association between the DHA and GNRI values and primary endpoints analyzed withCox proportional hazards models.
Multivariate Analysis
Variables HR 95% CI P
Age, per 1-year 1.07 1.02–1.13 0.006Male 1.67 0.87–3.22 0.123
High DHA and highGNRI Reference
High DHA and lowGNRI 1.14 0.28–4.64 0.858
Low DHA and highGNRI 3.03 0.80–11.48 0.104
Low DHA and lowGNRI 8.48 2.47–29.07 0.001
Multivariate analysis was adjusted by age, sex, hemoglobin, and GNRI. HR, hazard ratio; CI, confidence interval;DHA, docosahexaenoic acid; GNRI, geriatric nutritional risk index.
144

Nutrients 2021, 13, 371
Figure 4. Cont.
145

Nutrients 2021, 13, 371
Figure 4. The associations between the secondary outcomes and PUFA levels. The cumulative incidences of the secondaryendpoints (cardiac death and re-hospitalization for heart failure) were estimated by using the Kaplan–Meier method.Log-rank testing was performed to study the influence of PUFA levels on primary endpoint. The patients were divided intotwo groups, based on the median levels of (A) EPA, (B) DHA, (C) AA, (D) DGLA, and (E) EPA/AA, (F) DHA/AA, and (G)AA + DGLA/EPA + DHA. PUFA, polyunsaturated fatty acid; EPA, eicosapentaenoic acid; DHA, docosahexaenoic acid; AA,arachidonic acid; DGLA, dihomo-gamma-linolenic acid; EPA/AA, ratio of EPA to AA; DHA/AA, ratio of DHA to AA;AA + DGLA/EPA + DHA; ratio of AA + DGLA to EPA + DHA.
4. Discussion
The data from the present study showed that the acute decompensated HFpEF patientswith lower plasma DHA levels had a significantly higher incidence of all-cause death,independent of GNRI. These findings suggest that plasma DHA levels are an importantfactor associated with prognosis, regardless of the nutritional status of patients with acutedecompensated HFpEF. This suggests that measuring plasma DHA levels may be usefulfor the detection of high-risk patients hospitalized with HFpEF.
Several studies have shown the association between circulating concentrations ofPUFAs and the incidence of HF. A previous cohort study, which included 2735 adults inthe Cardiovascular Health Study from 1992 to 2006, reported that the total concentrationsof omega-3 fatty acid were associated with the incidence of primary congestive HF [19]. Arecent report from the Multi-Ethnic Study of Atherosclerosis (MESA) trial indicated thathigher plasma EPA levels were significantly associated with a reduced risk of HF (for bothreduced and preserved EF) [22]. In addition, regarding the association between PUFAs andthe prognosis of patients with acute decompensated HF, a study showed that decreasedplasma levels of DHA, DGLA, and AA were independently associated with long-termmortality in patients with acute decompensated HF [33]. Other studies have shown thatlower omega-6 PUFAs levels were related to worse clinical outcomes in patients with acutedecompensated HF [34,35]. However, most of the patients included in these studies hadHFrEF. Thus, to the best of our knowledge, this is the first study to evaluate the correlationbetween PUFA levels and the prognosis of patients with HFpEF.
This study showed that lower DHA levels, but not EPA levels, were independentlyassociated with all-cause mortality in patients with acute decompensated HFpEF. PUFAsplay an important role in cellular membrane function [36]. While DHA is abundant in thecell membranes of cardiomyocytes [25], EPA is scarce. This difference may contribute tothe distinct effects that DHA and EPA have on cardiac health. It should be noted, however,that while DHA can be obtained from the diet, it can also be synthesized from EPA [37]. Infact, the data from MESA suggested that EPA was more important than DHA for HF [19].Therefore, any interpretation of the differences between the effects of DHA and EPA on theprognosis of HFpEF patients should be made with caution.
146
Nutrients 2021, 13, 371
Although the present study showed a relationship between lower plasma DHA levelsand a higher incidence of all-cause death, there was no significant association betweenDHA levels and composite events of cardiac death and re-hospitalization for HF. Accordingto a Japanese cohort study called the Chronic Heart Failure Analysis and Registry in theTohoku (CHART), the temporal trend in the mode of death in symptomatic HF has changed.As the prevalence of HFpEF in symptomatic HF increased from CHART-1 (2000–2005)to CHART-2 (2006–2010), the proportion of non-cardiac deaths increased from 23% inCHART-1 to 40% in CHART-2 [5]. In this study [5], those factors that were significantlyassociated with all-cause death were reported to be advanced age, low BMI, high systolicblood pressure, and absence of dyslipidemia. This is in line with our data shown in Table 1.Patients with HFpEF had more comorbidities than HFrEF patients, and noncardiac deathsoccurred more frequently in HFpEF patients than in HFrEF patients [38].
Thus, the characteristics inherent to HFpEF patients specifically may be involved inthe significant impact that DHA levels have on all-cause death, as opposed to cardiac deathor re-hospitalization for HF.
Malnutrition is frequently observed and an important risk factor for poor outcomes inpatients with HF. The GNRI is a simple and objective nutritional index, and a GNRI < 92 isgenerally used to evaluate the increased risk of morbidity and mortality in hospitalizedelderly patients [21]. In our study, patients with the primary endpoint had an averageGNRI of 90.8, suggesting a poor nutritional status. Although the patients with the primaryendpoint also showed lower omega-3 PUFA levels, which were affected by oral intake,the Cox regression analyses revealed that the impact of the DHA levels on the patients’prognoses was independent of the GNRI. Even in the patients with a poor nutritionalstatus, lower DHA levels were shown to be an independent predictor of all-cause mortalityin HFpEF patients.
Inflammation is a normal process that is part of the body’s defense and tissue-healingmechanism. However, excessive or unresolved inflammation can lead to uncontrolledtissue injury, and disease. Omega-6-derived metabolites, such as prostaglandins andleukotrienes, have pro-inflammatory effects, while omega-3-derived metabolites, such asresolvins and protectins, have anti-inflammatory and pro-resolving effects [10,11]. In thiscontext, several clinical studies showed that the ratio of omega-3 to omega-6 PUFAs is apowerful predictor of heart disease [39–41]. Therefore, active screening of PUFAs would bebeneficial in identifying patients at high risk of cardiovascular disease.
The GISSI-HF (Gruppo Italiano per lo Studio della Sopravvivenza nell’Infarto Mio-cardico Heart Failure) trial was a large-scale, placebo-controlled, randomized study thatshowed that 1 g daily of omega-3 fatty acid administration reduced the risk of all-causedeath by 9% and the risk of hospitalization due to cardiovascular reasons by 8% in patientswith chronic heart failure [42]. Other clinical trials have indicated that omega-3 fatty acidsmight improve outcomes in patients with HF [23–26]. In addition, animal studies haveshown that omega-3 fatty acids, including EPA and DHA, at supraphysiological levels,preserve left ventricular function and prevent interstitial fibrosis in a mouse model of pres-sure overload-induced HF [39,43,44]. Despite these potential benefits, the use of omega-3fatty acids in patients with HF remains controversial. Future large-scale randomized clin-ical trials to investigate the benefit of high dosages of omega-3 fatty acids, on top of theguideline-directed medical therapy for patients with documented overt HF, will be needed.
This study had several limitations. First, the study was conducted in a single center,the sample size was small, and the follow-up period was short. Therefore, it may be difficultto generalize these results. Second, the PUFAs were not measured in the cell membrane.PUFAs in the cell membrane have been reported to be direct precursors of pro- and anti-inflammatory eicosanoids. However, it has also been reported that cell-membrane PUFAsare significantly correlated with serum PUFAs in the Japanese population [30]. Third, foodintake is associated with blood levels of PUFAs; however, measurement of dietary intakeby using a frequency food questionnaire was not performed in this study. Moreover, themultivariate cox regression model included a limited number of variates to avoid statistical
147

Nutrients 2021, 13, 371
overfitting, because of the small number of the primary outcome. Therefore, large-scalestudies will be needed to confirm our findings. Finally, the study was an observationalstudy, so the causal relationship between DHA levels and prognosis is uncertain.
5. Conclusions
Lower levels of DHA are significantly associated with an increase in all-cause deathin patients with acute decompensated HFpEF, independent of nutritional status. Measure-ment of plasma DHA levels may be useful in identifying high-risk patients with HFpEF,and supplementation with DHA may be a potential therapeutic target in these patients.
Author Contributions: Conceptualization, A.T.; formal analysis, N.M. and T.M.; data curation, N.M.;T.K., K.Y., M.T., Y.N., N.O., and M.U.; investigation, N.M.; A.T.; T.K., K.Y., M.T., Y.N., N.O., and M.U.;writing—original draft preparation, N.M.; writing—Review and Editing, T.M.; A.T.; T.K., K.Y., M.T.,Y.N., N.O., and M.U.; project administration, H.I. All authors have read and agreed to the publishedversion of the manuscript.
Funding: This research received no external funding.
Institutional Review Board Statement: The study protocol was approved by the Institutional ReviewBoard of Mitoyo General Hospital (19CR01-122).
Informed Consent Statement: Patient consent was waived because of the low-risk nature of thestudy and inability to obtain consent directly from all the study subjects.
Data Availability Statement: The data presented in this study are available on request from thecorresponding author.
Conflicts of Interest: The authors declare no conflict of interest.
References
1. Ziaeian, B.; Fonarow, G.C. Epidemiology and aetiology of heart failure. Nat. Rev. Cardiol. 2016, 13, 368–378. [CrossRef] [PubMed]2. Virani, S.S.; Alonso, A.; Benjamin, E.J.; Bittencourt, M.S.; Callaway, C.W.; Carson, A.P.; Chamberlain, A.M.; Chang, A.R.; Cheng, S.;
Delling, F.N.; et al. Heart Disease and Stroke Statistics-2020 Update: A Report From the American Heart Association. Circulation2020, 141, e139–e596. [CrossRef] [PubMed]
3. Butler, J.; Fonarow, G.C.; Zile, M.R.; Lam, C.S.; Roessig, L.; Schelbert, E.B.; Shah, S.J.; Ahmed, A.; Bonow, R.O.; Cleland, J.G.; et al.Developing therapies for heart failure with preserved ejection fraction: Current state and future directions. JACC Heart Fail. 2014,2, 97–112. [CrossRef] [PubMed]
4. Yancy, C.W.; Jessup, M.; Bozkurt, B.; Butler, J.; Casey, D.E., Jr.; Colvin, M.M.; Drazner, M.H.; Filippatos, G.S.; Fonarow, G.C.;Givertz, M.M.; et al. 2017 ACC/AHA/HFSA Focused Update of the 2013 ACCF/AHA Guideline for the Management of HeartFailure: A Report of the American College of Cardiology/American Heart Association Task Force on Clinical Practice Guidelinesand the Heart Failure Society of America. Circulation 2017, 136, e137–e161. [CrossRef]
5. Ushigome, R.; Sakata, Y.; Nochioka, K.; Miyata, S.; Miura, M.; Tadaki, S.; Yamauchi, T.; Sato, S.; Onose, T.; Tsuji, K.; et al. Temporaltrends in clinical characteristics, management and prognosis of patients with symptomatic heart failure in Japan—Report fromthe CHART Studies. Circ. J. 2015, 79, 2396–2407. [CrossRef]
6. Narumi, T.; Arimoto, T.; Funayama, A.; Kadowaki, S.; Otaki, Y.; Nishiyama, S.; Takahashi, H.; Shishido, T.; Miyashita, T.;Miyamoto, T.; et al. Prognostic importance of objective nutritional indexes in patients with chronic heart failure. J. Cardiol. 2013,62, 307–313. [CrossRef]
7. Sokoła-Wysoczanska, E.; Wysoczanski, T.; Wagner, J.; Czyz, K.; Bodkowski, R.; Lochynski, S.; Patkowska-Sokoła, B. Polyun-saturated Fatty Acids and Their Potential Therapeutic Role in Cardiovascular System Disorders—A Review. Nutrients 2018,10, 1561. [CrossRef]
8. Russo, G.L. Dietary n-6 and n-3 polyunsaturated fatty acids: From biochemistry to clinical implications in cardiovascularprevention. Biochem. Pharmacol. 2009, 77, 937–946. [CrossRef]
9. Sakamoto, A.; Saotome, M.; Iguchi, K.; Maekawa, Y. Marine-Derived Omega-3 Polyunsaturated Fatty Acids and Heart Failure:Current Understanding for Basic to Clinical Relevance. Int. J. Mol. 2019, 20, 4025. [CrossRef]
10. Innes, J.K.; Calder, P.C. Omega-6 fatty acids and inflammation. Prostaglandins Leukot. Essent. Fatty Acids 2018, 132, 41–48. [CrossRef]11. Serhan, C.N. Pro-resolving lipid mediators are leads for resolution physiology. Nature 2014, 510, 92–101. [CrossRef] [PubMed]12. Frigolet, M.E.; Gutierrez-Aguilar, R. The Role of the Novel Lipokine Palmitoleic Acid in Health and Disease. Adv. Nut. 2017, 8,
173S–181S. [CrossRef] [PubMed]13. Carrillo, C.; Cavia, M.D.M.; Alonso-Torre, S. Role of oleic acid in immune system; mechanism of action; a review. Nutr. Hosp.
2012, 27, 978–990. [CrossRef] [PubMed]
148

Nutrients 2021, 13, 371
14. Sales-Campos, H.; Souza, P.R.; Peghini, B.C.; da Silva, J.S.; Cardoso, C.R. An overview of the modulatory effects of oleic acid inhealth and disease. Mini Rev. Med. Chem. 2013, 13, 201–210. [CrossRef]
15. Kayama, Y.; Minamino, T.; Toko, H.; Sakamoto, M.; Shimizu, I.; Takahashi, H.; Okada, S.; Tateno, K.; Moriya, J.; Yokoyama, M.; et al.Cardiac 12/15 lipoxygenase-induced inflammation is involved in heart failure. J. Exp. Med. 2009, 206, 1565–1574. [CrossRef]
16. Endo, J.; Sano, M.; Isobe, Y.; Fukuda, K.; Kang, J.X.; Arai, H.; Arita, M. 18-HEPE, an n-3 fatty acid metabolite released bymacrophages, prevents pressure overload-induced maladaptive cardiac remodeling. J. Exp. Med. 2014, 211, 1673–1687. [CrossRef]
17. Kunapuli, P.; Lawson, J.A.; Rokach, J.A.; Meinkoth, J.L.; FitzGerald, G.A. Prostaglandin F2alpha (PGF2alpha) and the isoprostane,8, 12-iso-isoprostane F2alpha-III, induce cardiomyocyte hypertrophy. Differential activation of downstream signaling pathways.J. Biol. Chem. 1998, 273, 22442–22452. [CrossRef]
18. GISSI-Prevenzione Investigators (Gruppo Italiano per lo Studio della Sopravvivenza nell’Infarto miocardico). Dietary supple-mentation with n-3 polyunsaturated fatty acids and vitamin E after myocardial infarction: Results of the GISSI-Prevenzione trial.Lancet 1999, 354, 447–455. [CrossRef]
19. Mozaffarian, D.; Lemaitre, R.N.; King, I.B.; Song, X.; Spiegelman, D.; Sacks, F.M.; Rimm, E.B.; Siscovick, D.S. Circulatinglong-chain ω-3 fatty acids and incidence of congestive heart failure in older adults: The cardiovascular health study: A cohortstudy. Ann. Intern. Med. 2011, 155, 160–170. [CrossRef]
20. Bernasconi, A.A.; Wiest, M.M.; Lavie, C.J.; Milani, R.V.; Laukkanen, J.A. Effect of Omega-3 Dosage on Cardiovascular Outcomes:An Updated Meta-Analysis and Meta-Regression of Interventional Trials. Mayo Clin. Proc. 2020. [CrossRef]
21. Djousse, L.; Akinkuolie, A.O.; Wu, J.H.; Ding, E.L.; Gaziano, J.M. Fish consumption, omega-3 fatty acids and risk of heart failure:A meta-analysis. Clin. Nutr. 2012, 31, 846–853. [CrossRef] [PubMed]
22. Block, R.C.; Liu, L.; Herrington, D.M.; Huang, S.; Tsai, M.Y.; O’Connell, T.D.; Shearer, G.C. Predicting Risk for Incident HeartFailure With Omega-3 Fatty Acids: From MESA. JACC Heart Fail. 2019, 7, 651–661. [CrossRef] [PubMed]
23. Nodari, S.; Triggiani, M.; Campia, U.; Manerba, A.; Milesi, G.; Cesana, B.M.; Gheorghiade, M.; Dei Cas, L. Effects of n-3polyunsaturated fatty acids on left ventricular function and functional capacity in patients with dilated cardiomyopathy. J. Am.Coll. Cardiol. 2011, 57, 870–879. [CrossRef]
24. Chrysohoou, C.; Metallinos, G.; Georgiopoulos, G.; Mendrinos, D.; Papanikolaou, A.; Magkas, N.; Pitsavos, C.; Vyssoulis, G.;Stefanadis, C.; Tousoulis, D. Short term omega-3 polyunsaturated fatty acid supplementation induces favorable changes in rightventricle function and diastolic filling pressure in patients with chronic heart failure; A randomized clinical trial. Vasc. Pharmacol.2016, 79, 43–50. [CrossRef] [PubMed]
25. Kohashi, K.; Nakagomi, A.; Saiki, Y.; Morisawa, T.; Kosugi, M.; Kusama, Y.; Atarashi, H.; Shimizu, W. Effects of eicosapentaenoicacid on the levels of inflammatory markers, cardiac function and long-term prognosis in chronic heart failure patients withdyslipidemia. J. Atheroscler. Thromb. 2014, 21, 712–729. [CrossRef]
26. Moertl, D.; Hammer, A.; Steiner, S.; Hutuleac, R.; Vonbank, K.; Berger, R. Dose-dependent effects of omega-3-polyunsaturatedfatty acids on systolic left ventricular function, endothelial function, and markers of inflammation in chronic heart failure ofnonischemic origin: A double-blind, placebo-controlled, 3-arm study. Am. Heart. J. 2011, 161, 915.e1–915.e9. [CrossRef]
27. O’Keefe, E.L.; Harris, W.S.; DiNicolantonio, J.J.; Elagizi, A.; Milani, R.V.; Lavie, C.J.; O’Keefe, J.H. Sea Change for MarineOmega-3s: Randomized Trials Show Fish Oil Reduces Cardiovascular Events. Mayo Clin. Proc. 2019, 94, 2524–2533. [CrossRef]
28. Elagizi, A.; Lavie, C.J.; O’Keefe, E.; Marshall, K.; O’Keefe, J.H.; Milani, R.V. An Update on Omega-3 Polyunsaturated Fatty Acidsand Cardiovascular Health. Nutrients 2021, 13, 204. [CrossRef]
29. McKee, P.A.; Castelli, W.P.; McNamara, P.M.; Kannel, W.B. The natural history of congestive heart failure: The Framingham study.N. Engl. J. Med. 1971, 285, 1441–1446. [CrossRef]
30. Yanagisawa, N.; Shimada, K.; Miyazaki, T.; Kume, A.; Kitamura, Y.; Ichikawa, R.; Ohmura, H.; Kiyanagi, T.; Hiki, M.;Fukao, K.; et al. Polyunsaturated fatty acid levels of serum and red blood cells in apparently healthy Japanese subjects liv-ing in an urban area. J. Atheroscler. Thromb. 2010, 17, 285–294. [CrossRef]
31. Matsuo, S.; Imai, E.; Horio, M.; Yasuda, Y.; Tomita, K.; Nitta, K.; Yamagata, K.; Tomino, Y.; Yokoyama, H.; Hishida, A.; et al.Revised equations for estimated GFR from serum creatinine in Japan. Am. J. Kidney Dis. 2009, 53, 982–992. [CrossRef] [PubMed]
32. Bouillanne, O.; Morineau, G.; Dupont, C.; Coulombel, I.; Vincent, J.P.; Nicolis, I.; Benazeth, S.; Cynober, L.; Aussel, C. GeriatricNutritional Risk Index: A new index for evaluating at-risk elderly medical patients. Am. J. Clin. Nutr. 2005, 82, 777–783.[CrossRef] [PubMed]
33. Ouchi, S.; Miyazaki, T.; Shimada, K.; Sugita, Y.; Shimizu, M.; Murata, A.; Kato, T.; Aikawa, T.; Suda, S.; Shiozawa, T.; et al. LowDocosahexaenoic Acid, Dihomo-Gamma-Linolenic Acid, and Arachidonic Acid Levels Associated with Long-Term Mortality inPatients with Acute Decompensated Heart Failure in Different Nutritional Statuses. Nutrients 2017, 9, 956. [CrossRef] [PubMed]
34. Nagai, T.; Honda, Y.; Sugano, Y.; Nishimura, K.; Nakai, M.; Honda, S.; Iwakami, N.; Okada, A.; Asaumi, Y.; Aiba, T.; et al.Circulating Omega-6, But Not Omega-3 Polyunsaturated Fatty Acids, Are Associated with Clinical Outcomes in Patients withAcute Decompensated Heart Failure. PLoS ONE 2016, 11, e0165841. [CrossRef]
35. Ouchi, S.; Miyazaki, T.; Shimada, K.; Sugita, Y.; Shimizu, M.; Murata, A.; Kato, T.; Aikawa, T.; Suda, S.; Shiozawa, T.; et al.Decreased circulating dihomo-gamma-linolenic acid levels are associated with total mortality in patients with acute cardiovasculardisease and acute decompensated heart failure. Lipids Health Dis. 2017, 16, 150. [CrossRef]
36. Nieman, D.C.; Mitmesser, S.H. Potential Impact of Nutrition on Immune System Recovery from Heavy Exertion: A MetabolomicsPerspective. Nutrients 2017, 9, 513. [CrossRef]
149

Nutrients 2021, 13, 371
37. Saito, M.; Ueno, M.; Kubo, K.; Yamaguchi, M. Dose-Response Effect of Dietary Docosahexaenoic Acid on Fatty Acid Profiles ofSerum and Tissue Lipids in Rats. J. Agric. Food Chem. 1998, 46, 184–193. [CrossRef]
38. Hamaguchi, S.; Kinugawa, S.; Sobirin, M.A.; Goto, D.; Tsuchihashi-Makaya, M.; Yamada, S.; Yokoshiki, H.; Tsutsui, H.; JCARE-CARD Investigators. Mode of death in patients with heart failure and reduced vs. preserved ejection fraction: Report from theregistry of hospitalized heart failure patients. Circ. J. 2012, 76, 1662–1669. [CrossRef]
39. Fukuhara, M.; Kitazono, T.; Kiyohara, Y. Association between ratio of serum eicosapentaenoic acid to arachidonic acid and risk ofcardiovascular disease: The Hisayama Study. Atherosclerosis 2013, 231, 261–267.
40. Domei, T.; Yokoi, H.; Kuramitsu, S.; Soga, Y.; Arita, T.; Ando, K.; Shirai, S.; Kondo, K.; Sakai, K.; Goya, M.; et al. Ratio of serumn-3 to n-6 polyunsaturated fatty acids and the incidence of major adverse cardiac events in patients undergoing percutaneouscoronary intervention. Circ. J. 2012, 76, 423–429. [CrossRef]
41. Ueeda, M.; Doumei, T.; Takaya, Y.; Ohnishi, N.; Takaishi, A.; Hirohata, S.; Miyoshi, T.; Shinohata, R.; Usui, S.; Kusachi, S.Association of serum levels of arachidonic acid and eicosapentaenoic acid with prevalence of major adverse cardiac events afteracute myocardial infarction. Heart Vessel. 2011, 26, 145–152. [CrossRef] [PubMed]
42. Tavazzi, L.; Maggioni, A.P.; Marchioli, R.; Barlera, S.; Franzosi, M.G.; Latini, R.; Lucci, D.; Nicolosi, G.L.; Porcu, M.;Tognoni, G.; et al. Effect of n-3 polyunsaturated fatty acids in patients with chronic heart failure (the GISSI-HF trial): Arandomised, double-blind, placebo-controlled trial. Lancet 2008, 372, 1223–1230. [PubMed]
43. Madingou, N.; Gilbert, K.; Tomaro, L.; Prud’homme Touchette, C.; Trudeau, F.; Fortin, S.; Rousseau, G. Comparison of the effectsof EPA and DHA alone or in combination in a murine model of myocardial infarction. Prostaglandins Leukot. Essent. Fat. Acids2016, 111, 11–16. [CrossRef] [PubMed]
44. Chen, J.; Shearer, G.C.; Chen, Q.; Healy, C.L.; Beyer, A.J.; Nareddy, V.B.; Gerdes, A.M.; Harris, W.S.; O’Connell, T.D.; Wang, D.Omega-3 fatty acids prevent pressure overload-induced cardiac fibrosis through activation of cyclic GMP/protein kinase Gsignaling in cardiac fibroblasts. Circulation 2011, 123, 584–593. [CrossRef] [PubMed]
150

nutrients
Article
Impact of Inadequate Calorie Intake on Mortality andHospitalization in Stable Patients with Chronic Heart Failure
Yoshikuni Obata 1, Naoya Kakutani 1, Shintaro Kinugawa 1,2,*, Arata Fukushima 1, Takashi Yokota 1,3,
Shingo Takada 1, Taisuke Ono 4, Takeshi Sota 5, Yoshiharu Kinugasa 6, Masashige Takahashi 7, Hisashi Matsuo 8,
Ryuichi Matsukawa 9, Ichiro Yoshida 10, Isao Yokota 11, Kazuhiro Yamamoto 6 and Miyuki Tsuchihashi-Makaya 12
Citation: Obata, Y.; Kakutani, N.;
Kinugawa, S.; Fukushima, A.; Yokota,
T.; Takada, S.; Ono, T.; Sota, T.;
Kinugasa, Y.; Takahashi, M.; et al.
Impact of Inadequate Calorie Intake
on Mortality and Hospitalization in
Stable Patients with Chronic Heart
Failure. Nutrients 2021, 13, 874.
https://doi.org/10.3390/nu13030874
Academic Editor:
Yoshihiro Fukumoto
Received: 26 January 2021
Accepted: 4 March 2021
Published: 8 March 2021
Publisher’s Note: MDPI stays neutral
with regard to jurisdictional claims in
published maps and institutional affil-
iations.
Copyright: © 2021 by the authors.
Licensee MDPI, Basel, Switzerland.
This article is an open access article
distributed under the terms and
conditions of the Creative Commons
Attribution (CC BY) license (https://
creativecommons.org/licenses/by/
4.0/).
1 Department of Cardiovascular Medicine, Faculty of Medicine, Graduate School of Medicine,Hokkaido University, Sapporo 060-8638, Japan; [email protected] (Y.O.);[email protected] (N.K.); [email protected] (A.F.); [email protected] (T.Y.);[email protected] (S.T.)
2 Department of Cardiovascular Medicine, Faculty of Medical Sciences, Kyusyu University,Fukuoka 812-8582, Japan
3 Clinical Research and Medical Innovation Center, Hokkaido University Hospital, Sapporo 060-8648, Japan4 Department of Cardiology, Kitami Red Cross Hospital, Kitami 090-8666, Japan; [email protected] Division of Rehabilitation, Tottori University Hospital, Tottori 683-8504, Japan; [email protected] Department of Cardiovascular Medicine and Endocrinology and Metabolism, Faculty of Medicine, Tottori
University, Tottori 683-8503, Japan; [email protected] (Y.K.); [email protected] (K.Y.)7 Department of Cardiology, Kushiro City General Hospital, Kushiro 085-0822, Japan;
[email protected] Department of Cardiology, Keiwakai Ebetsu Hospital, Ebetsu 069-0817, Japan; [email protected] Division of Cardiology, Cardiovascular and Aortic Center, Saiseikai Fukuoka General Hospital,
Fukuoka 810-0001, Japan; [email protected] Department of Cardiology, Obihiro Kyokai Hospital, Obihiro 080-0805, Japan;
[email protected] Department of Biostatistics, Faculty of Medicine, Graduate School of Medicine, Hokkaido University,
Sapporo 060-8638, Japan; [email protected] School of Nursing, Kitasato University, Sagamihara 252-0373, Japan; [email protected]* Correspondence: [email protected]; Tel.: +81-92-642-5360
Abstract: Malnutrition is highly prevalent in patients with heart failure (HF), but the precise impactof dietary energy deficiency on HF patients’ clinical outcomes is not known. We investigated theassociations between inadequate calorie intake and adverse clinical events in 145 stable outpatientswith chronic HF who had a history of hospitalization due to worsening HF. To assess the patients’dietary pattern, we used a brief self-administered diet-history questionnaire (BDHQ). Inadequatecalorie intake was defined as <60% of the estimated energy requirement. In the total chronic HFcohort, the median calorie intake was 1628 kcal/day. Forty-four patients (30%) were identifiedas having an inadequate calorie intake. A Kaplan–Meier analysis revealed that the patients withinadequate calorie intake had significantly worse clinical outcomes including all-cause death andHF-related hospitalization during the 1-year follow-up period versus those with adequate calorieintake (20% vs. 5%, p < 0.01). A multivariate logistic regression analysis showed that inadequatecalorie intake was an independent predictor of adverse clinical events after adjustment for variousfactors that may influence patients’ calorie intake. Among patients with chronic HF, inadequatecalorie intake was associated with an increased risk of all-cause mortality and rehospitalization dueto worsening HF. However, our results are preliminary and larger studies with direct measurementsof dietary calorie intake and total energy expenditure are needed to clarify the intrinsic nature ofthis relationship.
Keywords: calorie intake; heart failure; hospitalization; malnutrition; mortality
Nutrients 2021, 13, 874. https://doi.org/10.3390/nu13030874 https://www.mdpi.com/journal/nutrients151

Nutrients 2021, 13, 874
1. Introduction
Heart failure (HF) is common in adults and is associated with increased morbidityand mortality. Its prevalence is increasing due to the aging of the population in manycountries [1]. Despite recent advances in pharmacological and non-pharmacological treat-ments for HF, the prognosis of individuals with chronic HF remains poor, and diet andexercise interventions are thus recognized as essential treatments for the prevention ofHF progression.
Although obesity is a risk of incident HF, a low body mass index (BMI) is moreclosely associated with poor clinical outcomes in chronic HF patients, in a phenomenonknown as the obesity paradox [2,3]. As one of the possible mechanisms of this paradox,malnutrition is a recent focus of attention among healthcare providers who are engagedin HF management. Malnutrition is highly prevalent in patients with chronic HF, and itincreases their risk of death and hospitalization [4]. Patients with chronic HF have beendemonstrated to have an increased energy expenditure compared to healthy sedentarysubjects, but HF patients’ dietary energy intake is often insufficient to meet their energyrequirements for daily activities, even in a stable condition [5]. The negative energy balanceleads to a catabolic state and causes protein–energy malnutrition, which results in musclewasting and sarcopenia [6,7]. In addition, dietary guidance for HF patients has traditionallyfocused on reducing their salt and fluid intake; the patients’ intake of dietary nutrientshas tended to be less of a concern [8]. Restrictive diets for HF patients may cause areduced intake of macronutrients and micronutrients, leading to increased morbidity andmortality [8].
We conducted the present study to determine whether calorie intake that is inade-quate for the energy needed for daily activities is associated with adverse clinical eventsincluding all-cause death and HF-related hospitalization in stable patients with chronic HF.The patients’ daily calorie intake was calculated by a brief self-administered diet-historyquestionnaire (BDHQ), which is a well-validated questionnaire for determining a patient’sdietary pattern.
2. Materials and Methods
2.1. Study Design
This study was part of a multicenter, prospective observational investigation of theeffects of dietary patterns on clinical outcomes in patients with chronic HF, and thus someof the data used herein were obtained from the same patients whose data were publishedpreviously but in a different context [9]. The study was approved by the ethics committeesof Hokkaido University Hospital (approval no. 012-0224) and the other nine participatingresearch institutes—Hakodate National Hospital, Hikone Municipal Hospital, KitamiRed Cross Hospital, Keiwakai Ebetsu Hospital, Kushiro City General Hospital, ObihiroKyokai Hospital, Otaru Kyokai Hospital, Saiseikai Fukuoka General Hospital, and TottoriUniversity Hospital. The study was conducted in accordance with the ethical principlesdescribed in the Declaration of Helsinki. Written informed consent was obtained from eachpatient before his or her participation in the study.
2.2. Patients
A total of 145 stable patients with chronic HF who were regularly visiting an outpatientward for >1 month were enrolled between December 2012 and September 2014. Thesepatients had a history of hospitalization due to worsening HF at least once within the 5 yearsbefore enrollment. The exclusion criteria included nephrotic syndrome, liver cirrhosis,cancer, a history of gastrointestinal surgery within the prior 3 months, or poorly controlleddiabetes, i.e., glycosylated hemoglobin (HbA1c) >7.0%. We also excluded patients whowere taking steroids or antidepressants, which could influence their appetite.
152

Nutrients 2021, 13, 874
2.3. Study Protocol
At baseline, the patients underwent clinical and anthropometric measurements, bloodtesting, echocardiography, a 6-min walk test to assess exercise capacity, and the evaluationof their dietary pattern and calorie intake. The patients were then followed up for 1 yearto evaluate adverse clinical events including all-cause death and hospitalization due toworsening HF.
2.4. Anthropometric Measurements
To assess the patients’ muscle mass, we measured the circumferences of the upperarm and the thigh at the level of the muscle belly.
2.5. Laboratory Measurements
After blood collection, the patients’ hemoglobin, serum albumin, HbA1c, and plasmalevels of B-type natriuretic peptide (BNP) were determined by routine in-house analyses.The estimated glomerular filtration rate (eGFR) was calculated from the serum creatininevalues and the patient’s age with the use of the Japanese equation [10]:eGFR = 194 × (serum creatinine, mg/dL)−1.094 × (age, years)−0.287 × (0.739 if female).
2.6. Assessment of Dietary Calorie Intake
Each patient’s dietary pattern was evaluated using a BDHQ adjusted to typicalJapanese diets. The BDHQ is a four-page fixed-portion questionnaire that calculatesthe frequency of the consumption of selected foods to estimate the intake of 58 food andbeverage items during the preceding month, as described [11,12]. The BDHQ consists offive sections—(1) the intake frequency of food and nonalcoholic beverage items, (2) thedaily intake of rice and miso soup, (3) the frequency of alcoholic beverage consumptionand the amount per drink, (4) usual cooking methods, and (5) general dietary behavior.The dietary calorie intake was calculated as the sum of each energy conversion factorfrom the fats, proteins, and carbohydrates whose amount is estimated using the BDHQ,as described previously [13,14]. Dietary salt intake was estimated according to the diethistory method using the quantitative information. In this estimation, intakes of table saltand salt-containing seasoning at the table, calculated using the qualitative information ofgeneral dietary behavior, were also considered, as described [12].
2.7. Estimation of the Dietary Calorie Requirement
The dietary calorie requirement was estimated using the Japanese Dietary ReferenceIntakes published by the Ministry of Health, Labour and Welfare (Japan) in 2015, asdescribed previously [15,16]. Briefly, each patient’s estimated dietary calorie requirementwas determined in consideration of his or her age, gender, and physical activity level (low,moderate, or high). Since most of the patients were in a stable condition with New YorkHeart Association (NYHA) functional class I or II (normal or mild HF) and all the patientswere ambulant and regularly visited an outpatient ward, the daily calorie requirement wasestimated with the assumption that all of the patients were engaged in moderate physicalactivity (categorized as level II). This level requires the ability to do self-care activities (e.g.,washing and dressing) and walk outside without any support. We then calculated thedietary energy adequacy (%) as the ratio of the individual patient’s daily calorie intake tothe estimated daily calorie requirement.
2.8. Assessment of Nutritional Status
Each patient’s nutritional status was assessed by determining his or her control-ling nutritional status (CONUT) score [17] and score on a geriatric nutritional risk index(GNRI) [18]. Briefly, the CONUT score was calculated based on the serum albumin level, to-tal peripheral lymphocyte count, and total cholesterol level, and the scores are classified intonormal (0–1 points), mild risk (2–4), moderate risk (5–8), and severe risk (9–12) of malnutri-tion. The GNRI was calculated from the patient’s BMI and albumin concentration according
153

Nutrients 2021, 13, 874
to the modified version—GNRI = 14.89× serum albumin (g/dL) + 41.7 × BMI/22. TheGNRI values are classified into four grades of malnutrition-related risk—major risk(GNRI < 82), moderate risk (GNRI 82–91), low risk (GNRI 92–98), and no risk (GNRI > 98).
2.9. Statistical Analyses
Continuous variables are expressed as medians (interquartile range), and categori-cal variables are expressed as numbers (percentages). We divided the 145 patients intotwo groups based on their dietary calorie intake adequacy—the adequate calorie intakegroup (dietary calorie intake adequacy ≥60%; N = 101) and the inadequate calorie intakegroup (dietary calorie intake adequacy <60%; N = 44). The cut-off value of dietary calorieintake adequacy rate (60%) was predetermined by the results of the multivariate analysis.Continuous variables were compared between these groups with a Mann–Whitney U-test,and the χ2-test was used for group comparisons of categorical variables. We performed amultivariate analysis to identify the decrease in dietary calorie intake adequacy that inde-pendently predicts adverse clinical events in chronic HF patients with other confoundingfactors that may influence dietary calorie intake, including age, BMI, NYHA functionalclass III, diabetes, left ventricular ejection fraction (LVEF), serum albumin, eGFR, and logBNP. The odds ratios (ORs) and 95% confidence intervals (CIs) were calculated for eachvariable from the logistic regression model. A Kaplan–Meier analysis with log-rank testwas performed to assess the rates of all-cause death and rehospitalization due to worseningHF for 1 year. All analyses were performed using JMP Pro 13.1.0 software (SAS Institute,Cary, NC, USA). Probability (p)-values < 0.05 were considered significant.
3. Results
3.1. Characteristics of the Total Chronic HF Cohort
The characteristics of the total chronic HF cohort (N = 145) are summarized in Table 1.The median age of the patients with chronic HF was 67 years, and the median BMI was22.9 kg/m2. We recruited stable outpatients with chronic HF, and 90% of the patients hadan NYHA functional class I or II. The median LVEF was 45%, and both HF patients with areduced LVEF and those with a preserved LVEF were included in this cohort. The majorityof the chronic HF patients were being treated with an angiotensin-converting enzyme(ACE) inhibitor or an angiotensin II receptor blocker (ARB) and a β-blocker. For the totalchronic HF cohort, the median value of dietary calorie intake was 1628 kcal/day and thedietary calorie intake adequacy rate was 75%. The distribution of the dietary calorie intakeadequacy rates of the patients is shown in Figure 1.
Figure 1. Distribution of dietary calorie intake adequacy rate of the female and male patients withchronic HF.
154
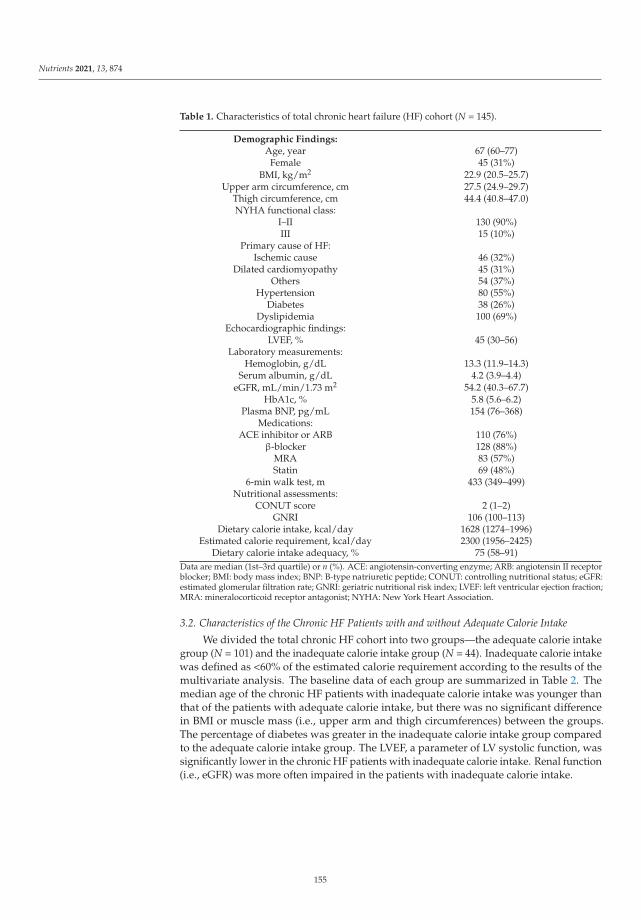
Nutrients 2021, 13, 874
Table 1. Characteristics of total chronic heart failure (HF) cohort (N = 145).
Demographic Findings:Age, year 67 (60–77)
Female 45 (31%)BMI, kg/m2 22.9 (20.5–25.7)
Upper arm circumference, cm 27.5 (24.9–29.7)Thigh circumference, cm 44.4 (40.8–47.0)NYHA functional class:
I–II 130 (90%)III 15 (10%)
Primary cause of HF:Ischemic cause 46 (32%)
Dilated cardiomyopathy 45 (31%)Others 54 (37%)
Hypertension 80 (55%)Diabetes 38 (26%)
Dyslipidemia 100 (69%)Echocardiographic findings:
LVEF, % 45 (30–56)Laboratory measurements:
Hemoglobin, g/dL 13.3 (11.9–14.3)Serum albumin, g/dL 4.2 (3.9–4.4)
eGFR, mL/min/1.73 m2 54.2 (40.3–67.7)HbA1c, % 5.8 (5.6–6.2)
Plasma BNP, pg/mL 154 (76–368)Medications:
ACE inhibitor or ARB 110 (76%)β-blocker 128 (88%)
MRA 83 (57%)Statin 69 (48%)
6-min walk test, m 433 (349–499)Nutritional assessments:
CONUT score 2 (1–2)GNRI 106 (100–113)
Dietary calorie intake, kcal/day 1628 (1274–1996)Estimated calorie requirement, kcal/day 2300 (1956–2425)
Dietary calorie intake adequacy, % 75 (58–91)Data are median (1st–3rd quartile) or n (%). ACE: angiotensin-converting enzyme; ARB: angiotensin II receptorblocker; BMI: body mass index; BNP: B-type natriuretic peptide; CONUT: controlling nutritional status; eGFR:estimated glomerular filtration rate; GNRI: geriatric nutritional risk index; LVEF: left ventricular ejection fraction;MRA: mineralocorticoid receptor antagonist; NYHA: New York Heart Association.
3.2. Characteristics of the Chronic HF Patients with and without Adequate Calorie Intake
We divided the total chronic HF cohort into two groups—the adequate calorie intakegroup (N = 101) and the inadequate calorie intake group (N = 44). Inadequate calorie intakewas defined as <60% of the estimated calorie requirement according to the results of themultivariate analysis. The baseline data of each group are summarized in Table 2. Themedian age of the chronic HF patients with inadequate calorie intake was younger thanthat of the patients with adequate calorie intake, but there was no significant differencein BMI or muscle mass (i.e., upper arm and thigh circumferences) between the groups.The percentage of diabetes was greater in the inadequate calorie intake group comparedto the adequate calorie intake group. The LVEF, a parameter of LV systolic function, wassignificantly lower in the chronic HF patients with inadequate calorie intake. Renal function(i.e., eGFR) was more often impaired in the patients with inadequate calorie intake.
155
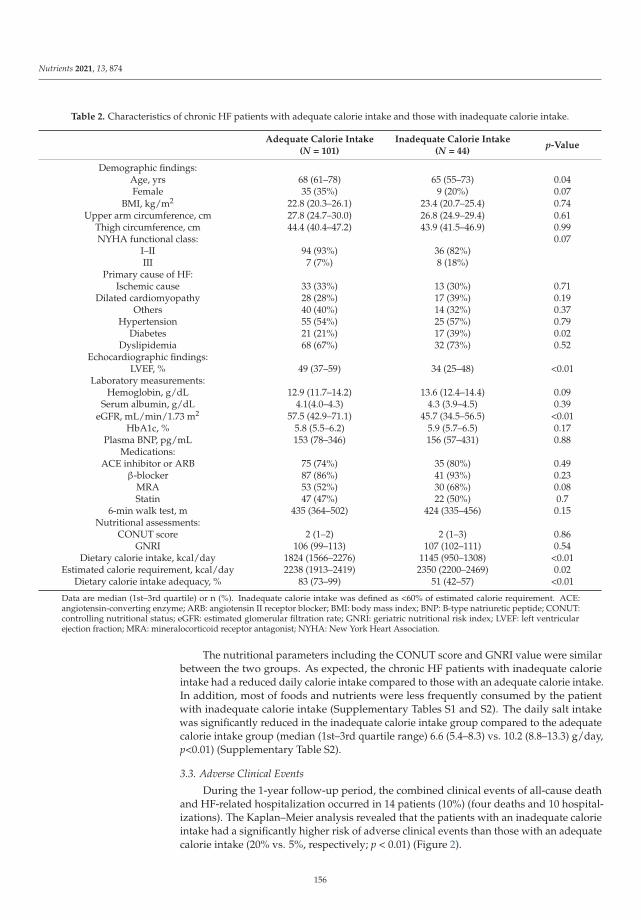
Nutrients 2021, 13, 874
Table 2. Characteristics of chronic HF patients with adequate calorie intake and those with inadequate calorie intake.
Adequate Calorie Intake(N = 101)
Inadequate Calorie Intake(N = 44)
p-Value
Demographic findings:Age, yrs 68 (61–78) 65 (55–73) 0.04Female 35 (35%) 9 (20%) 0.07
BMI, kg/m2 22.8 (20.3–26.1) 23.4 (20.7–25.4) 0.74Upper arm circumference, cm 27.8 (24.7–30.0) 26.8 (24.9–29.4) 0.61
Thigh circumference, cm 44.4 (40.4–47.2) 43.9 (41.5–46.9) 0.99NYHA functional class: 0.07
I–II 94 (93%) 36 (82%)III 7 (7%) 8 (18%)
Primary cause of HF:Ischemic cause 33 (33%) 13 (30%) 0.71
Dilated cardiomyopathy 28 (28%) 17 (39%) 0.19Others 40 (40%) 14 (32%) 0.37
Hypertension 55 (54%) 25 (57%) 0.79Diabetes 21 (21%) 17 (39%) 0.02
Dyslipidemia 68 (67%) 32 (73%) 0.52Echocardiographic findings:
LVEF, % 49 (37–59) 34 (25–48) <0.01Laboratory measurements:
Hemoglobin, g/dL 12.9 (11.7–14.2) 13.6 (12.4–14.4) 0.09Serum albumin, g/dL 4.1(4.0–4.3) 4.3 (3.9–4.5) 0.39
eGFR, mL/min/1.73 m2 57.5 (42.9–71.1) 45.7 (34.5–56.5) <0.01HbA1c, % 5.8 (5.5–6.2) 5.9 (5.7–6.5) 0.17
Plasma BNP, pg/mL 153 (78–346) 156 (57–431) 0.88Medications:
ACE inhibitor or ARB 75 (74%) 35 (80%) 0.49β-blocker 87 (86%) 41 (93%) 0.23
MRA 53 (52%) 30 (68%) 0.08Statin 47 (47%) 22 (50%) 0.7
6-min walk test, m 435 (364–502) 424 (335–456) 0.15Nutritional assessments:
CONUT score 2 (1–2) 2 (1–3) 0.86GNRI 106 (99–113) 107 (102–111) 0.54
Dietary calorie intake, kcal/day 1824 (1566–2276) 1145 (950–1308) <0.01Estimated calorie requirement, kcal/day 2238 (1913–2419) 2350 (2200–2469) 0.02
Dietary calorie intake adequacy, % 83 (73–99) 51 (42–57) <0.01
Data are median (1st–3rd quartile) or n (%). Inadequate calorie intake was defined as <60% of estimated calorie requirement. ACE:angiotensin-converting enzyme; ARB: angiotensin II receptor blocker; BMI: body mass index; BNP: B-type natriuretic peptide; CONUT:controlling nutritional status; eGFR: estimated glomerular filtration rate; GNRI: geriatric nutritional risk index; LVEF: left ventricularejection fraction; MRA: mineralocorticoid receptor antagonist; NYHA: New York Heart Association.
The nutritional parameters including the CONUT score and GNRI value were similarbetween the two groups. As expected, the chronic HF patients with inadequate calorieintake had a reduced daily calorie intake compared to those with an adequate calorie intake.In addition, most of foods and nutrients were less frequently consumed by the patientwith inadequate calorie intake (Supplementary Tables S1 and S2). The daily salt intakewas significantly reduced in the inadequate calorie intake group compared to the adequatecalorie intake group (median (1st–3rd quartile range) 6.6 (5.4–8.3) vs. 10.2 (8.8–13.3) g/day,p<0.01) (Supplementary Table S2).
3.3. Adverse Clinical Events
During the 1-year follow-up period, the combined clinical events of all-cause deathand HF-related hospitalization occurred in 14 patients (10%) (four deaths and 10 hospital-izations). The Kaplan–Meier analysis revealed that the patients with an inadequate calorieintake had a significantly higher risk of adverse clinical events than those with an adequatecalorie intake (20% vs. 5%, respectively; p < 0.01) (Figure 2).
156

Nutrients 2021, 13, 874
Figure 2. Kaplan–Meier curves for the cumulative event (all-cause death and HF-relatedhospitalization)-free ratio in the chronic HF patients with an adequate calorie intake (dietary calo-rie intake adequacy ≥60%) and those with an inadequate calorie intake (dietary calorie intakeadequacy <60%).
3.4. Predictors of Adverse Clinical Events in Patients with Chronic HF
The results of the multivariate analysis revealed that after the adjustment for age,BMI, NYHA functional class III, LVEF, serum albumin, eGFR, and log BNP, inadequatecalorie intake defined as <60% of the estimated calorie requirement was a significantlyindependent predictor of adverse clinical events including all-cause death and HF-relatedhospitalization over 1 year in the patients with chronic HF (Table 3).
Table 3. Multivariate analysis of predictors of adverse clinical events including all-cause death andHF-related hospitalization in patients with chronic HF.
Dietary Calorie IntakeAdequacy OR 95% CI p-Value
Inadequatecalorie intake
<80% 2.16 0.33–14.2 0.42<70% 4.89 0.68–35.1 0.11<60% 7.39 1.02–53.5 0.04
As confounding factors that may influence patient’s dietary calorie intake, age, BMI, NYHA functional classIII, diabetes, LVEF, serum albumin, eGFR, and log BNP were included in each analysis. OR: odds ratio; CI:confidence interval.
4. Discussion
In the present cohort of 145 patients with chronic HF, the inadequate calorie intakegroup had a significantly higher risk of adverse clinical events including all-cause deathand hospitalization due to worsening HF for the 1-year follow-up period compared tothe adequate calorie intake group, when we defined inadequate calorie intake as <60%of estimated calorie requirement. The multivariate logistic regression analysis showedthat dietary calorie intake adequacy <60% was an independent predictor of worse clinicaloutcomes after adjustment for age, BMI, NYHA functional class III, diabetes, LVEF, serumalbumin, eGFR, and log BNP in chronic HF patients. To the best of our knowledge, thisis the first study that revealed the impact of dietary energy deficiency on mortality andhospitalization in stable outpatients with chronic HF.
Although several nutritional assessment tools such as the CONUT score and theGNRI are used in clinical practice, we here focused on a questionnaire-based assessmentof the daily calorie intake in patients with chronic HF. All of the patients were in stablecondition at baseline, and most of them were categorized as having no risk or only a mildrisk of malnutrition when they were evaluated using the CONUT score or the GNRI. Themalnutrition risk scores calculated by these nutritional assessment tools did not differ
157
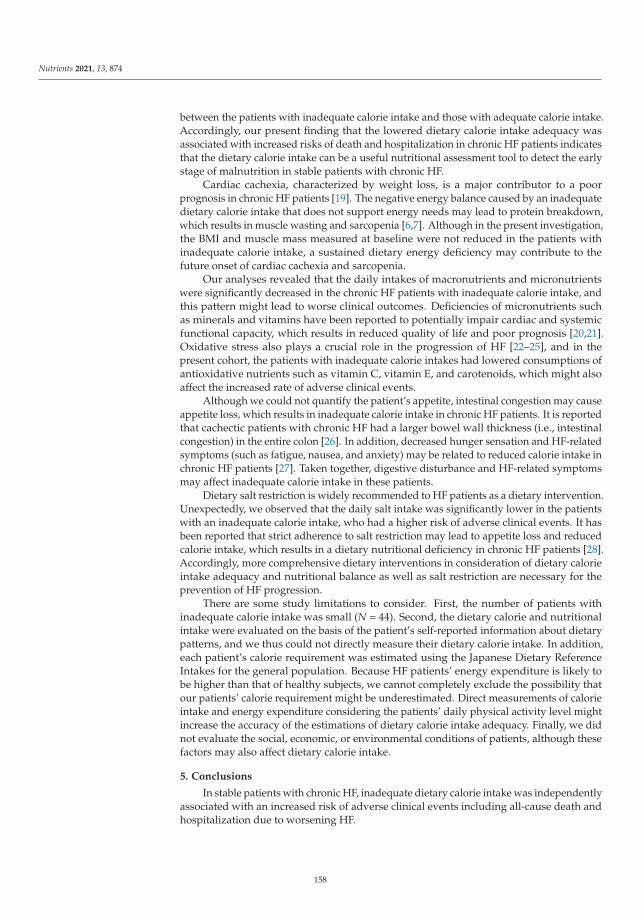
Nutrients 2021, 13, 874
between the patients with inadequate calorie intake and those with adequate calorie intake.Accordingly, our present finding that the lowered dietary calorie intake adequacy wasassociated with increased risks of death and hospitalization in chronic HF patients indicatesthat the dietary calorie intake can be a useful nutritional assessment tool to detect the earlystage of malnutrition in stable patients with chronic HF.
Cardiac cachexia, characterized by weight loss, is a major contributor to a poorprognosis in chronic HF patients [19]. The negative energy balance caused by an inadequatedietary calorie intake that does not support energy needs may lead to protein breakdown,which results in muscle wasting and sarcopenia [6,7]. Although in the present investigation,the BMI and muscle mass measured at baseline were not reduced in the patients withinadequate calorie intake, a sustained dietary energy deficiency may contribute to thefuture onset of cardiac cachexia and sarcopenia.
Our analyses revealed that the daily intakes of macronutrients and micronutrientswere significantly decreased in the chronic HF patients with inadequate calorie intake, andthis pattern might lead to worse clinical outcomes. Deficiencies of micronutrients suchas minerals and vitamins have been reported to potentially impair cardiac and systemicfunctional capacity, which results in reduced quality of life and poor prognosis [20,21].Oxidative stress also plays a crucial role in the progression of HF [22–25], and in thepresent cohort, the patients with inadequate calorie intakes had lowered consumptions ofantioxidative nutrients such as vitamin C, vitamin E, and carotenoids, which might alsoaffect the increased rate of adverse clinical events.
Although we could not quantify the patient’s appetite, intestinal congestion may causeappetite loss, which results in inadequate calorie intake in chronic HF patients. It is reportedthat cachectic patients with chronic HF had a larger bowel wall thickness (i.e., intestinalcongestion) in the entire colon [26]. In addition, decreased hunger sensation and HF-relatedsymptoms (such as fatigue, nausea, and anxiety) may be related to reduced calorie intake inchronic HF patients [27]. Taken together, digestive disturbance and HF-related symptomsmay affect inadequate calorie intake in these patients.
Dietary salt restriction is widely recommended to HF patients as a dietary intervention.Unexpectedly, we observed that the daily salt intake was significantly lower in the patientswith an inadequate calorie intake, who had a higher risk of adverse clinical events. It hasbeen reported that strict adherence to salt restriction may lead to appetite loss and reducedcalorie intake, which results in a dietary nutritional deficiency in chronic HF patients [28].Accordingly, more comprehensive dietary interventions in consideration of dietary calorieintake adequacy and nutritional balance as well as salt restriction are necessary for theprevention of HF progression.
There are some study limitations to consider. First, the number of patients withinadequate calorie intake was small (N = 44). Second, the dietary calorie and nutritionalintake were evaluated on the basis of the patient’s self-reported information about dietarypatterns, and we thus could not directly measure their dietary calorie intake. In addition,each patient’s calorie requirement was estimated using the Japanese Dietary ReferenceIntakes for the general population. Because HF patients’ energy expenditure is likely tobe higher than that of healthy subjects, we cannot completely exclude the possibility thatour patients’ calorie requirement might be underestimated. Direct measurements of calorieintake and energy expenditure considering the patients’ daily physical activity level mightincrease the accuracy of the estimations of dietary calorie intake adequacy. Finally, we didnot evaluate the social, economic, or environmental conditions of patients, although thesefactors may also affect dietary calorie intake.
5. Conclusions
In stable patients with chronic HF, inadequate dietary calorie intake was independentlyassociated with an increased risk of adverse clinical events including all-cause death andhospitalization due to worsening HF.
158
Nutrients 2021, 13, 874
Supplementary Materials: The following are available online at https://www.mdpi.com/2072-6643/13/3/874/s1. Table S1: Daily intakes of foods and beverages estimated using a BDHQ, Table S2:Daily intakes of nutrients estimated using a BDHQ.
Author Contributions: S.K. and M.T.-M. designed the study. S.K., A.F., T.Y., T.O., T.S., Y.K., M.T.,H.M., R.M., I.Y. (Ichiro Yoshida), and K.Y. collected the data and contributed to the discussion. Y.O.,N.K., S.K., A.F., T.Y., S.T., and I.Y. (Isao Yokota) contributed to the data analysis. Y.O., N.K., andT.Y. wrote the manuscript. S.K., A.F., S.T., I.Y. (Isao Yokota), and M.T.-M. reviewed and edited themanuscript. All authors have read and agreed to the published version of the manuscript.
Funding: This study was partly supported by a Grant-in-Aid for Scientific Research from KAKENHI(no. JP24614001 to M.T.-M. and no. 18K08022 to T.Y.) and the Center of Innovation Program from theJapan Science and Technology Agency (no. JPMJCE1301 to T.Y.).
Institutional Review Board Statement: The study was approved by the ethics committees ofHokkaido University Hospital (approval no. 012-0224) and the other nine participating researchinstitutes—Hakodate National Hospital, Hikone Municipal Hospital, Kitami Red Cross Hospital,Keiwakai Ebetsu Hospital, Kushiro City General Hospital, Obihiro Kyokai Hospital, Otaru KyokaiHospital, Saiseikai Fukuoka General Hospital, and Tottori University Hospital.
Informed Consent Statement: The study was conducted in accordance with the ethical principlesdescribed in the Declaration of Helsinki. Written informed consent was obtained from each patientbefore his or her participation in the study.
Data Availability Statement: Data supporting the findings of this work are available from thecorresponding author upon reasonable request. All the data are obtained from subjects and are notpublicly available due to ethical reasons.
Acknowledgments: We thank Yoshihiro Himura (Hikone Municipal Hospital), Shigeo Kakinoki(Otaru Kyokai Hospital), Kazuya Yonezawa (National Hospital Organization Hakodate NationalHospital), and Yoko Ikeda and Ayako Muramoto (Hokkaido University Hospital) for their kindsupport of this study. We also thank all of the participating patients, cardiologists, nurses, anddieticians who contributed to this study.
Conflicts of Interest: I.Y. received a speaking fee from Japan Tobacco, Inc. (Pharmaceutical Division).The other authors declare no conflict of interest relevant to this article.
References
1. Metra, M.; Teerlink, J.R. Heart failure. Lancet 2017, 390, 1981–1995. [CrossRef]2. Sharma, A.; Lavie, C.J.; Borer, J.S.; Vallakati, A.; Goel, S.; Lopez-Jimenez, F.; Arbab-Zadeh, A.; Mukherjee, D.; Lazar, J.M.
Meta-analysis of the relation of body mass index to all-cause and cardiovascular mortality and hospitalization in patients withchronic heart failure. Am. J. Cardiol. 2015, 115, 1428–1434. [CrossRef]
3. Hamaguchi, S.; Tsuchihashi-Makaya, M.; Kinugawa, S.; Goto, D.; Yokota, T.; Goto, K.; Yamada, S.; Yokoshiki, H.; Takeshita, A.;Tsutsui, H. Body mass index is an independent predictor of long-term outcomes in patients hospitalized with heart failure inJapan. Circ. J. 2010, 74, 2605–2611. [CrossRef] [PubMed]
4. Wawrzenczyk, A.; Anaszewicz, M.; Budzynski, J. Clinical significance of nutritional status in patients with chronic heart failure-asystematic review. Heart Fail. Rev. 2019, 24, 671–700. [CrossRef]
5. Pasini, E.; Opasich, C.; Pastoris, O.; Aquilani, R. Inadequate nutritional intake for daily life activity of clinically stable patientswith chronic heart failure. Am. J. Cardiol. 2004, 93, 41A–43A. [CrossRef]
6. Doehner, W.; Frenneaux, M.; Anker, S.D. Metabolic impairment in heart failure: The myocardial and systemic perspective. J. Am.Coll. Cardiol. 2014, 64, 1388–1400. [CrossRef]
7. Springer, J.; Springer, J.I.; Anker, S.D. Muscle wasting and sarcopenia in heart failure and beyond: Update 2017. ESC Heart Fail.2017, 4, 492–498. [CrossRef]
8. Vest, A.R.; Chan, M.; Deswal, A.; Givertz, M.M.; Lekavich, C.; Lennie, T.; Litwin, S.E.; Parsly, L.; Rodgers, J.E.; Rich, M.W.; et al.Nutrition, obesity, and cachexia in patients with heart failure: A consensus statement from the Heart Failure Society of AmericaScientific Statements Committee. J. Card. Fail. 2019, 25, 380–400. [CrossRef] [PubMed]
9. Nakano, I.; Tsuda, M.; Kinugawa, S.; Fukushima, A.; Kakutani, N.; Takada, S.; Yokota, T. Loop diuretic use is associated withskeletal muscle wasting in patients with heart failure. J. Cardiol. 2020, 76, 109–114. [CrossRef]
10. Matsuo, S.; Imai, E.; Horio, M.; Yasuda, Y.; Tomita, K.; Nitta, K.; Yamagata, K.; Tomino, Y.; Yokoyama, H.; Hishida, A.; et al.Revised equations for estimated GFR from serum creatinine in Japan. Am. J. Kidney Dis. 2009, 53, 982–992. [CrossRef]
159

Nutrients 2021, 13, 874
11. Kobayashi, S.; Honda, S.; Murakami, K.; Sasaki, S.; Okubo, H.; Hirota, N.; Notsu, A.; Fukui, M.; Date, C. Both comprehensive andbrief self-administered diet history questionnaires satisfactorily rank nutrient intakes in Japanese adults. J. Epidemiol. 2012, 22,151–159. [CrossRef]
12. Kobayashi, S.; Murakami, K.; Sasaki, S.; Okubo, H.; Hirota, N.; Notsu, A.; Fukui, M.; Date, C. Comparison of relative validity offood group intakes estimated by comprehensive and brief-type self-administered diet history questionnaires against 16 d dietaryrecords in Japanese adults. Public Health Nutr. 2011, 14, 1200–1211. [CrossRef] [PubMed]
13. Kagawa, M.; Hills, A.P. Preoccupation with body weight and under-reporting of energy intake in female Japanese nutritionstudents. Nutrients 2020, 12, 830. [CrossRef] [PubMed]
14. Komada, Y.; Narisawa, H.; Ueda, F.; Saito, H.; Sakaguchi, H.; Mitarai, M.; Suzuki, R.; Tamura, N.; Inoue, S.; Inoue, Y. Relationshipbetween self-reported dietary nutrient intake and self-reported sleep duration among Japanese adults. Nutrients 2017, 9, 134.[CrossRef]
15. Kobayashi, S.; Asakura, K.; Suga, H.; Sasaki, S. Living status and frequency of eating out-of-home foods in relation to nutritionaladequacy in 4,017 Japanese female dietetic students aged 18-20 years: A multicenter cross-sectional study. J. Epidemiol. 2017, 27,287–293. [CrossRef] [PubMed]
16. Matsumoto, M.; Hatamoto, Y.; Masumoto, A.; Sakamoto, A.; Ikemoto, S. Mothers’ nutrition knowledge is unlikely to be relatedto adolescents’ habitual nutrient intake inadequacy in Japan: A cross-sectional study of Japanese junior high school students.Nutrients 2020, 12, 2801. [CrossRef]
17. Ignacio de Ulibarri, J.; Gonzalez-Madrono, A.; de Villar, N.G.; Gonzalez, P.; Gonzalez, B.; Mancha, A.; Rodriguez, F.; Fernandez,G. CONUT: A tool for controlling nutritional status. First validation in a hospital population. Nutr. Hosp. 2005, 20, 38–45.
18. Kinugasa, Y.; Kato, M.; Sugihara, S.; Hirai, M.; Yamada, K.; Yanagihara, K.; Yamamoto, K. Geriatric nutritional risk index predictsfunctional dependency and mortality in patients with heart failure with preserved ejection fraction. Circ. J. 2013, 77, 705–711.[CrossRef]
19. Argiles, J.M.; Fontes-Oliveira, C.C.; Toledo, M.; Lopez-Soriano, F.J.; Busquets, S. Cachexia: A problem of energetic inefficiency. J.Cachexia Sarcopenia Muscle 2014, 5, 279–286. [CrossRef]
20. Witte, K.K.; Clark, A.L.; Cleland, J.G. Chronic heart failure and micronutrients. J. Am. Coll. Cardiol. 2001, 37, 1765–1774. [CrossRef]21. Sciatti, E.; Lombardi, C.; Ravera, A.; Vizzardi, E.; Bonadei, I.; Carubelli, V.; Gorga, E.; Metra, M. Nutritional deficiency in patients
with heart failure. Nutrients 2016, 8, 442. [CrossRef]22. Shirakawa, R.; Yokota, T.; Nakajima, T.; Takada, S.; Yamane, M.; Furihata, T.; Maekawa, S.; Nambu, H.; Katayama, T.;
Fukushima, A.; et al. Mitochondrial reactive oxygen species generation in blood cells is associated with disease severity andexercise intolerance in heart failure patients. Sci. Rep. 2019, 9, 14709. [CrossRef]
23. Tang, W.H.; Tong, W.; Troughton, R.W.; Martin, M.G.; Shrestha, K.; Borowski, A.; Jasper, S.; Hazen, S.L.; Klein, A.L. Prognosticvalue and echocardiographic determinants of plasma myeloperoxidase levels in chronic heart failure. J. Am. Coll. Cardiol. 2007,49, 2364–2370. [CrossRef]
24. Tang, W.H.; Wu, Y.; Mann, S.; Pepoy, M.; Shrestha, K.; Borowski, A.G.; Hazen, S.L. Diminished antioxidant activity of high-densitylipoprotein-associated proteins in systolic heart failure. Circ. Heart Fail. 2011, 4, 59–64. [CrossRef]
25. Yokota, T.; Kinugawa, S.; Hirabayashi, K.; Yamato, M.; Takada, S.; Suga, T.; Nakano, I.; Fukushima, A.; Matsushima, S.;Okita, K.; et al. Systemic oxidative stress is associated with lower aerobic capacity and impaired skeletal muscle energymetabolism in heart failure patients. Sci. Rep. 2021, 11, 2272. [CrossRef]
26. Valentova, M.; von Haehling, S.; Bauditz, J.; Doehner, W.; Ebner, N.; Bekfani, T.; Elsner, S.; Sliziuk, V.; Scherbakov, N.;Murin, J.; et al. Intestinal congestion and right ventricular dysfunction: A link with appetite loss, inflammation, and cachexia inchronic heart failure. Eur. Heart J. 2016, 37, 1684–1691. [CrossRef] [PubMed]
27. Lennie, T.A.; Moser, D.K.; Heo, S.; Chung, M.L.; Zambroski, C.H. Factors influencing food intake in patients with heart failure: Acomparison with healthy elders. J. Cardiovasc. Nurs. 2006, 21, 123–129. [CrossRef] [PubMed]
28. Colin-Ramirez, E.; McAlister, F.A.; Zheng, Y.; Sharma, S.; Ezekowitz, J.A. Changes in dietary intake and nutritional statusassociated with a significant reduction in sodium intake in patients with heart failure. A sub-analysis of the SODIUM-HF pilotstudy. Clin. Nutr. ESPEN 2016, 11, e26–e32. [CrossRef]
160

nutrients
Article
Association between Vitamin D and Heart Failure Mortality in10,974 Hospitalized Individuals
Kenya Kusunose 1,*, Yuichiro Okushi 1, Yoshihiro Okayama 2, Robert Zheng 1, Miho Abe 1, Michikazu Nakai 3,
Yoko Sumita 3, Takayuki Ise 1, Takeshi Tobiume 1, Koji Yamaguchi 1, Shusuke Yagi 1, Daiju Fukuda 1,
Hirotsugu Yamada 4, Takeshi Soeki 1, Tetsuzo Wakatsuki 1 and Masataka Sata 1
Citation: Kusunose, K.; Okushi, Y.;
Okayama, Y.; Zheng, R.; Abe, M.;
Nakai, M.; Sumita, Y.; Ise, T.; Tobiume,
T.; Yamaguchi, K.; et al. Association
between Vitamin D and Heart Failure
Mortality in 10,974 Hospitalized
Individuals. Nutrients 2021, 13, 335.
https://doi.org/10.3390/nu13020335
Academic Editor: Karl Michaëlsson
Received: 22 December 2020
Accepted: 20 January 2021
Published: 23 January 2021
Publisher’s Note: MDPI stays neutral
with regard to jurisdictional claims in
published maps and institutional affil-
iations.
Copyright: © 2021 by the authors.
Licensee MDPI, Basel, Switzerland.
This article is an open access article
distributed under the terms and
conditions of the Creative Commons
Attribution (CC BY) license (https://
creativecommons.org/licenses/by/
4.0/).
1 Department of Cardiovascular Medicine, Tokushima University Hospital, Tokushima 770-8503, Japan;[email protected] (Y.O.); [email protected] (R.Z.); [email protected] (M.A.);[email protected] (T.I.); [email protected] (T.T.);[email protected] (K.Y.); [email protected] (S.Y.); [email protected] (D.F.);[email protected] (T.S.); [email protected] (T.W.);[email protected] (M.S.)
2 Clinical Research Center for Developmental Therapeutics, Tokushima University Hospital,Tokushima 770-8503, Japan; [email protected]
3 Center for Cerebral and Cardiovascular Disease Information, National Cerebral and Cardiovascular Center,Osaka 564-8565, Japan; [email protected] (M.N.); [email protected] (Y.S.)
4 Department of Community Medicine for Cardiology, Tokushima University Graduate School of BiomedicalSciences, Tokushima 770-8503, Japan; [email protected]
* Correspondence: [email protected]; Tel.: +81-88-633-7851; Fax: +81-88-633-7894
Abstract: A broad range of chronic conditions, including heart failure (HF), have been associatedwith vitamin D deficiency. Existing clinical trials involving vitamin D supplementation in chronicHF patients have been inconclusive. We sought to evaluate the outcomes of patients with vitamin Dsupplementation, compared with a matched cohort using real-world big data of HF hospitalization.This study was based on the Diagnosis Procedure Combination database in the Japanese Registry ofAll Cardiac and Vascular Datasets (JROAD-DPC). After exclusion criteria, we identified 93,692 pa-tients who were first hospitalized with HF between April 2012 and March 2017 (mean age was79 ± 12 years, and 52.2% were male). Propensity score (PS) was estimated with logistic regressionmodel, with vitamin D supplementation as the dependent variable and clinically relevant covariates.On PS-matched analysis with 10,974 patients, patients with vitamin D supplementation had lowertotal in-hospital mortality (6.5 vs. 9.4%, odds ratio: 0.67, p < 0.001) and in-hospital mortality within7 days and 30 days (0.9 vs. 2.5%, OR, 0.34, and 3.8 vs. 6.5%, OR: 0.56, both p < 0.001). In the sub-groupanalysis, mortalities in patients with age < 75, diabetes, dyslipidemia, atrial arrhythmia, cancer,renin-angiotensin system blocker, and β-blocker were not affected by vitamin D supplementation.Patients with vitamin D supplementation had a lower in-hospital mortality for HF than patientswithout vitamin D supplementation in the propensity matched cohort. The identification of specificclinical characteristics in patients benefitting from vitamin D may be useful for determining targetsof future randomized control trials.
Keywords: heart failure; vitamin D; mortality; big data
1. Introduction
The main treatment medications for heart failure (HF) remains to be β-blockers,angiotensin converting enzyme inhibitors, angiotensin receptor blockers, and aldosteronereceptor antagonists in the guidelines [1]. Although it is well known that these medicationscan reduce the incidence of adverse cardiac events and improve cardiac function, HF is stilla main cause of death worldwide [2]. Thus, supplementary treatment methods continue tobe explored for improving the outcome of HF.
Nutrients 2021, 13, 335. https://doi.org/10.3390/nu13020335 https://www.mdpi.com/journal/nutrients161

Nutrients 2021, 13, 335
Vitamin D is a steroid hormone belonging to a group of lipid-soluble vitamins. Re-cently, many papers showed that a broad range of chronic conditions have been associatedwith vitamin D deficiency [3–5]. Around 90% of chronic HF patients have insufficientvitamin D levels, even in sunny climates [6,7]. Vitamin D has pleiotropic effects in thepathology of chronic HF [8]. Despite current evidence regarding the association of vitaminD with HF, there are many controversial results in previous clinical trials [9–11]. In thesetrials, lack of a large sample size and the small number of high-risk patients are majorlimitations. Our hypothesis was that vitamin D supplementation was associated witha decreased risk of in-hospital death in HF patients with specific clinical characteristics.Therefore, we sought to evaluate the outcomes of patients with vitamin D supplementationcompared with a matched cohort using real-world big data based on HF hospitalizations.
2. Materials and Methods
2.1. Study Population
The study population was composed of hospitalized patients between April 2012 andMarch 2017 in The Japanese Registry of All Cardiac and Vascular Diseases and the DiagnosisProcedure Combination (JROAD-DPC) database. JROAD-DPC is a nationwide registry, amedical database with information of admission and discharge for cardiovascular diseases,clinical examinations and treatment status, patient status and hospital overview. JROAD-DPC database integrates the information composed by JROAD-DPC data, with analysisdata sets covering 5.1 million cases in 1022 hospitals between April 2012 and March 2017.The identification of HF (I50.0, I50.1, I50.9) hospitalization was based on the InternationalClassification of Diseases (ICD)-10 diagnosis codes. Data regarding patient age and sex,main diagnosis, comorbidity at admission, length of hospitalization and treatment contentwere extracted from the database. We recruited 654,737 patients hospitalized with HF.Diagnosis of HF was defined as the main diagnosis, admission-precipitating diagnosis ormost resource-consuming diagnosis. We excluded patients of unknown age (n = 1073),readmission cases (n = 172,805), age < 20 years (n = 1477), death in 24 h after admission(n = 10,298), planned hospitalization (n = 54,713), and incomplete data (n = 320,679). Asa result, total 93,692 (88,205 patients without vitamin D and 5487 patients with vitaminD) were recruited to assess hospital mortality (Figure 1). For vitamin D supplementation,oral 25(OH)D 3 (Calcifediol, Dedrogyl®) was prescribed at a daily dose of 0.5–1.0 μg/daybased on the attending physician’s discretion.
Figure 1. Flowchart of this study. HF, heart failure; Vit D, vitamin D supplementation.
2.2. Clinical Outcomes
The main outcome was in-hospital mortality (total number of deaths during hospital-ization). Death ≤ 7 and 30 days after admission was assessed as secondary outcomes.
162
Nutrients 2021, 13, 335
2.3. Sample Matching
Propensity score (PS) matching was used to reduce confounding effects related todifferences in patient background. PS was estimated with a logistic regression model,with vitamin D supplementation as the dependent variable and the following clinicallyrelevant covariates; age, sex, body mass index (BMI), smoking, New York Heart Associ-ation functional classification (NYHA), comorbidities (hypertension: HT, diabetes: DM,dyslipidemia: DL, osteoporosis, atrial fibrillation/atrial flutter: Af/AFL, stroke, myocar-dial infarction: MI, peripheral vascular disease: PVD, renal disease, liver failure, chronicobstructive pulmonary disease: COPD, rheumatoid arthritis: RA, dementia, cancer), treat-ment (catecholamine, intra-aortic balloon pumping: IABP, percutaneous cardiopulmonarysupport: PCPS, ventilation, hemodialysis: HD, percutaneous coronary intervention: PCI).These covariates were chosen for their potential association with reference to risk factorof heart failure and in-hospital mortality [12–14]. Matching was performed with greedy-matching algorithm (ratio = 1:1 without replacement), with a caliper of width 0.2 standarddeviations of the logistic of the estimated propensity score. After matching, vitamin D andnon-vitamin D groups of 5487 patients each were included in the final analysis. The areaunder the curve was 0.785 and the consistency of PS densities was matched after matching(Supplemental Figure S1). The balance of each covariate before and after matching betweenthe 2 groups was evaluated by standardized differences. Absolute value of standardizeddifferences less than 10% was considered to be a relatively small imbalance. Becausethe propensity score included cases in which vitamin D was used under the insuranceof Japan (renal disease, osteoporosis, and dialysis), we believed the propensity score ac-counted for the factors that influence the prescription of vitamin D by general physiciansin this analysis.
2.4. Statistical Analysis
Continuous variables are expressed as mean ± SD for parameters with normal dis-tribution, as median (interquartile range; IQR) for parameters with skewed distribution,and categorical variables as proportion (%). We checked characteristics between groupswith and without vitamin D supplementation using standardized difference. After match-ing, we estimated the OR for in-hospital mortality (total, within 7 days, 30 days) usingmixed-effects logistic regression model with each institute as a random effect. We alsoanalyzed subgroups in the PS-matched cohort. In-hospital mortality was assessed usingKaplan–Meier curves and log-rank test to compare the two groups. To clarify the beneficialgroup of vitamin D supplementation, odds ratios (ORs) and their 95% confidence interval(CI) for in-hospital mortality were calculated using multivariate models of multinomiallogistic regression analysis in vitamin D (+) and vitamin D (−) groups. All statistical testswere 2-sided and p values less than 0.05 were considered statistically significant. Statisticalanalysis was performed using SAS version 9.4 and JMP version 14.0.
3. Results
3.1. Patient Characteristics
A total of 52.2% of patients in this study were male. Mean age was 79 ± 12 years, andhalf of all patients had hypertension (52.9%). Over 60% of the patients were NYHA class IIIor IV. Patients with vitamin D supplementation were more likely to have a history of chronickidney disease, osteoporosis, hypoparathyroidism, or hemodialysis. There are differencesfor age, gender, BMI, smoking, hypertrophic cardiomyopathy, atrial fibrillation/atrialflutter, and rheumatoid arthritis between two groups. Around 19.7% took angiotensinconverting enzyme inhibitors (ACE-I) or angiotensin-receptor blocker (ARB) and 9.1% tookbeta-blockers. About 19.4% of the patients took loop diuretic and 10.1% took K-sparingdiuretics.
After propensity score matching, 10,974 patients were included in the survival analysis.In the matched cohort, there were no significant differences between groups for age, gender,comorbidities, and treatments (Table 1).
163

Nutrients 2021, 13, 335
Table 1. Baseline characteristics before and after propensity score matching.
Non Matching Matching
All Vit.D (+) Vit.D (−) std.diff (%) Vit.D (+) Vit.D (−) std.diff (%)
Number (n = 93,692) (n = 5487) (n = 88,205) (n = 5487) (n = 5487)
Age average(years) 79 ± 12 80 ± 11 79 ± 13 10.6 80 ± 11 81 ± 11 8.4Age(%) 20–30 0.2 0.1 0.2 −1.7 0.1 0.1 2.7
30–40 0.8 0.4 0.8 −6.2 0.4 0.4 −0.240–50 2.4 1.4 2.4 −7.8 1.4 1.1 2.550–60 4.8 3.6 4.8 −6.3 3.6 3.1 2.660–70 12.1 10.8 12.2 −4.4 10.8 9.8 3.370–80 23.0 23.8 22.9 2.0 23.8 22.1 3.980–90 39.8 42.4 39.7 5.5 42.4 44.2 −3.8
>90 17.0 17.6 17.0 1.7 17.6 19.3 −4.2Male (%) 52.2 33.9 53.4 −40.1 33.9 31.4 5.3
BMI 22.7 ± 5.0 21.8 ± 4.1 22.7 ± 5.0 −20.8 21.8 ± 4.1 21.7 ± 4.1 1.9Smoking 30.2 21.1 30.8 −22.1 21.1 18.9 5.7
NYHA 1 12.2 12.8 12.2 1.9 12.8 13.2 −1.02 24.4 24.5 24.3 0.3 24.5 25.0 −1.23 32.2 32.1 32.2 −0.2 32.1 31.8 0.84 31.2 30.5 31.2 −1.5 30.5 30.0 1.1
Comorbidities (%)Hypertension 52.9 48.8 53.2 −8.8 48.8 47.8 2.0
Diabetes mellitus 26.8 26.1 26.8 −1.7 26.1 25.1 2.2Dyslipidemia 18.6 16.2 18.8 −6.7 16.2 14.9 3.7Osteoporosis 3.0 24.5 1.7 72.1 24.5 21.2 7.1
Hypoparathyroidism <0.1 0.2 <0.1 5.0 0.2 <0.1 4.5HCM 3.4 1.4 3.5 −14.1 1.4 1.6 −2.0DCM 1.2 1.0 1.3 −2.9 1.0 1.2 −2.8
Cardiac Amyloidosis 0.1 0.1 0.1 −0.8 0.1 0.1 <0.1Cardiac Sarcoidosis 0.3 0.5 0.3 3.0 0.5 0.2 4.5
Af/AFL 35.5 27.5 36.0 −18.3 27.5 27.2 0.8AT 0.9 0.6 0.9 −2.9 0.6 0.7 −0.9
Stroke 8.3 7.5 8.3 −3.3 7.5 7.2 1.1MI 10.3 7.9 10.5 −9.1 7.9 7.2 2.6
PVD 3.8 4.8 3.7 5.1 4.8 3.9 4.3CKD 14.1 38.6 12.6 62.5 38.6 35.3 6.9
Liver failure 0.1 0.1 0.1 −0.8 0.1 0.2 −2.7COPD 7.4 6.1 7.5 −5.6 6.1 5.3 3.6
RA 1.3 4.2 1.2 19.0 4.2 4.9 −3.2Dementia 6.2 6.9 6.2 3.1 6.9 7.0 −0.4
Cancer 11.0 11.0 11.0 0.1 11.0 10.6 1.3Treatment (%)Catecholamine 12.4 11.3 12.5 −3.8 11.3 10.6 2.1
IABP 1.0 0.9 1.0 −1.1 0.9 1.1 −1.7PCPS 0.1 0.0 0.2 −3.6 0.0 0.1 −0.5
Artificial Ventilation 21.3 21.1 21.3 −0.5 21.1 20.8 0.7Hemodialysis 4.6 29.5 3.1 76.8 29.5 28.3 2.6
PCI 4.9 5.2 4.9 1.6 5.2 5.1 0.7Drug (%)
ACE-i/ARB 19.7 19.4 19.8 −0.8 19.4 21.0 −3.9βblocker 9.1 8.0 9.2 −4.1 8.0 8.6 −1.9
Loop diuretic 19.4 18.4 19.4 −2.6 18.4 20.3 −4.8K-sparing diuretic 10.1 7.4 10.3 −10.3 7.4 8.4 −3.7
Statin 13.1 13.5 13.0 1.2 13.5 13.7 −0.7Hospital length (days) 18 (12–28) 19 (12–31) 17 (12–27) 13.1 19 (12–31) 18 (11–30) 14.9
Data are presented as percentage of patients or median (interquartile range). A standardized difference of < 10% suggests adequatebalance. Abbreviations: Vit.D, vitamin D supplementation; std.diff, standardization difference; BMI, body mass index; NYHA, New Yorkheart association functional class; HCM, hypertrophic cardiomyopathy; DCM, dilated cardiomyopathy; Af, atrial fibrillation; AFL, atrialflatter; AT, atrial tachycardia, MI, myocardial infarction; PVD, peripheral vascular disease; CKD, chronic kidney disease; COPD, chronicobstructive pulmonary disease; RA, rheumatoid arthritis, IABP, intra-aortic balloon pumping; PCPS, percutaneous cardiopulmonarysystem; PCI, percutaneous coronary intervention; ACE-I, angiotensin converting enzyme inhibitor; ARB, angiotensin II receptor blocker.
164

Nutrients 2021, 13, 335
3.2. Outcomes
In-hospital mortality, mortality within 7 days and within 30 days of hospitalizationare summarized in Table 2. Even after matching, patients with vitamin D supplementationhad significantly lower in-hospital mortality (6.5 vs. 9.4%, p < 0.001; OR, 0.67, 95% CI:0.58–0.77), mortality within 7 days of hospitalization (0.9 vs. 2.5%, p < 0.001; OR, 0.34, 95%CI: 0.25–0.48), and mortality within 30 days of hospitalization (3.8 vs. 6.5%, p < 0.001; OR,0.56, 95% CI: 0.47–0.67).
Table 2. In-hospital mortality before and after propensity score matching.
Non Matching Matching
In-HospitalMortality
Vit.D (+) Vit.D (−) OR (95%CI) p-Value Vit.D (+) Vit.D (−) OR (95%CI) p-Value
Total (%) 357 (6.5) 7256 (8.2) 0.79 (0.71–0.88) <0.0001 357 (6.5) 515 (9.4) 0.67 (0.58–0.77) <0.00017 days (%) 48 (0.9) 1761 (2.0) 0.44 (0.33–0.58) <0.0001 48 (0.9) 138 (2.5) 0.34 (0.25–0.48) <0.0001
30 days (%) 207 (3.8) 5171 (5.9) 0.64 (0.55–0.73) <0.0001 207 (3.8) 358 (6.5) 0.56 (0.47–0.67) <0.0001
Data given as proportion. Abbreviations: OR, odds ratio.
Kaplan–Meier curves of in-hospital mortality were shown in Figure 2. Vitamin Dsupplementation was strongly associated with survival rate (p < 0.001).
Figure 2. Kaplan Meier curves of in-hospital mortality and hospitalization days. Compar-ison between with and without vitamin D (Vit.D) supplementation.
Multivariate analysis was performed with covariates that were significant in theunivariate analysis to assess the association with in-hospital mortality for all patients. Majorcontributors were age, BMI, NYHA, hypertension, peripheral vascular disease, chronickidney disease, artificial ventilation, PCI, catecholamine, and atrial fibrillation/flutter inthis cohort. After adjustment of clinical backgrounds, vitamin D supplementation wasassociated with low in-hospital mortality (OR, 0.63, 95% CI: 0.49–0.81, p < 0.001) (Table 3A).
165

Nutrients 2021, 13, 335
Table 3. Multivariate analysis of covariates for in-hospital mortality.
A: In all patients. See abbreviations in Table 1.
AllOR Lower Higher p
Vit.D 0.63 0.49 0.81 0.0003Age 1.06 1.05 1.08 <0.0001BMI 0.93 0.90 0.96 <0.0001
NYHA 1.18 1.04 1.33 0.0070Male 1.00 0.74 1.35 0.9884
Smoking 0.93 0.67 1.31 0.6867HT 0.39 0.30 0.51 <0.0001DM 0.80 0.60 1.07 0.1398DL 0.83 0.57 1.22 0.3445MI 1.17 0.76 1.80 0.4721
PVD 1.88 1.19 2.96 0.0064Stroke 0.96 0.62 1.50 0.8659
Dementia 1.21 0.78 1.87 0.4000COPD 0.95 0.56 1.59 0.8370
RA 1.10 0.65 1.89 0.7187CKD 1.65 1.19 2.30 0.0030
Cancer 0.84 0.57 1.24 0.3764Hemodialysis 0.84 0.58 1.22 0.3669
Artificial Ventilation 2.55 1.95 3.33 <0.0001PCI 0.22 0.10 0.47 <0.0001
IABP 1.04 0.44 2.43 0.9355Catecholamines 4.59 3.50 6.02 <0.0001
Osteoporosis 0.76 0.48 1.19 0.2331HCM 0.61 0.18 2.09 0.4338
Sarcoidosis 2.60 0.55 12.18 0.2253Af/AFL 0.68 0.51 0.92 0.0107
B: In patients with vitamin D supplementation. See abbreviations in Table 1.
Vitamin D (+)OR Lower Higher p
Age 1.07 1.04 1.09 <0.0001BMI 0.97 0.92 1.02 0.2186
NYHA 1.22 1.01 1.48 0.0379Male 0.62 0.37 1.02 0.0589
Smoking 1.10 0.64 1.87 0.7396HT 0.33 0.22 0.52 <0.0001DM 0.70 0.44 1.11 0.1257DL 1.11 0.64 1.90 0.7187MI 1.36 0.71 2.59 0.3519
PVD 2.24 1.18 4.27 0.0138Stroke 1.25 0.66 2.37 0.4844
Dementia 1.17 0.59 2.31 0.6536COPD 0.86 0.38 1.94 0.7122
RA 0.80 0.30 2.12 0.6558CKD 1.68 0.95 2.99 0.0746
Cancer 1.09 0.60 1.98 0.7663Hemodialysis 0.98 0.52 1.85 0.9510
Artificial Ventilation 2.18 1.44 3.31 0.0003PCI 0.19 0.06 0.64 0.0075
IABP 1.34 0.40 4.49 0.6352Catecholamines 4.91 3.24 7.43 <0.0001
Osteoporosis 0.61 0.36 1.04 0.0707HCM 1.57 0.34 7.23 0.5659
Sarcoidosis 2.14 0.26 17.31 0.4763Af/AFL 0.66 0.41 1.06 0.0822
166
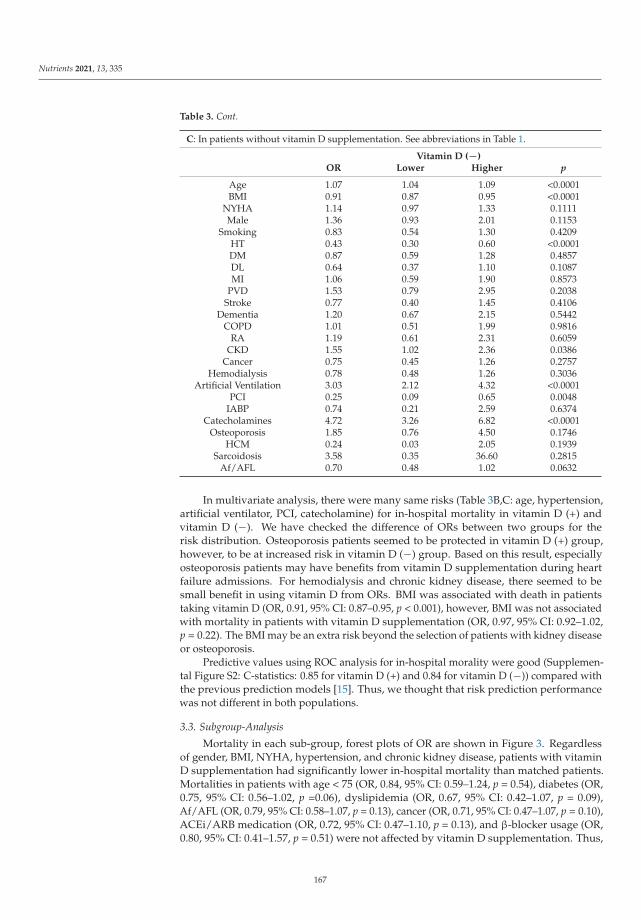
Nutrients 2021, 13, 335
Table 3. Cont.
C: In patients without vitamin D supplementation. See abbreviations in Table 1.
Vitamin D (−)OR Lower Higher p
Age 1.07 1.04 1.09 <0.0001BMI 0.91 0.87 0.95 <0.0001
NYHA 1.14 0.97 1.33 0.1111Male 1.36 0.93 2.01 0.1153
Smoking 0.83 0.54 1.30 0.4209HT 0.43 0.30 0.60 <0.0001DM 0.87 0.59 1.28 0.4857DL 0.64 0.37 1.10 0.1087MI 1.06 0.59 1.90 0.8573
PVD 1.53 0.79 2.95 0.2038Stroke 0.77 0.40 1.45 0.4106
Dementia 1.20 0.67 2.15 0.5442COPD 1.01 0.51 1.99 0.9816
RA 1.19 0.61 2.31 0.6059CKD 1.55 1.02 2.36 0.0386
Cancer 0.75 0.45 1.26 0.2757Hemodialysis 0.78 0.48 1.26 0.3036
Artificial Ventilation 3.03 2.12 4.32 <0.0001PCI 0.25 0.09 0.65 0.0048
IABP 0.74 0.21 2.59 0.6374Catecholamines 4.72 3.26 6.82 <0.0001
Osteoporosis 1.85 0.76 4.50 0.1746HCM 0.24 0.03 2.05 0.1939
Sarcoidosis 3.58 0.35 36.60 0.2815Af/AFL 0.70 0.48 1.02 0.0632
In multivariate analysis, there were many same risks (Table 3B,C: age, hypertension,artificial ventilator, PCI, catecholamine) for in-hospital mortality in vitamin D (+) andvitamin D (−). We have checked the difference of ORs between two groups for therisk distribution. Osteoporosis patients seemed to be protected in vitamin D (+) group,however, to be at increased risk in vitamin D (−) group. Based on this result, especiallyosteoporosis patients may have benefits from vitamin D supplementation during heartfailure admissions. For hemodialysis and chronic kidney disease, there seemed to besmall benefit in using vitamin D from ORs. BMI was associated with death in patientstaking vitamin D (OR, 0.91, 95% CI: 0.87–0.95, p < 0.001), however, BMI was not associatedwith mortality in patients with vitamin D supplementation (OR, 0.97, 95% CI: 0.92–1.02,p = 0.22). The BMI may be an extra risk beyond the selection of patients with kidney diseaseor osteoporosis.
Predictive values using ROC analysis for in-hospital morality were good (Supplemen-tal Figure S2: C-statistics: 0.85 for vitamin D (+) and 0.84 for vitamin D (−)) compared withthe previous prediction models [15]. Thus, we thought that risk prediction performancewas not different in both populations.
3.3. Subgroup-Analysis
Mortality in each sub-group, forest plots of OR are shown in Figure 3. Regardlessof gender, BMI, NYHA, hypertension, and chronic kidney disease, patients with vitaminD supplementation had significantly lower in-hospital mortality than matched patients.Mortalities in patients with age < 75 (OR, 0.84, 95% CI: 0.59–1.24, p = 0.54), diabetes (OR,0.75, 95% CI: 0.56–1.02, p =0.06), dyslipidemia (OR, 0.67, 95% CI: 0.42–1.07, p = 0.09),Af/AFL (OR, 0.79, 95% CI: 0.58–1.07, p = 0.13), cancer (OR, 0.71, 95% CI: 0.47–1.07, p = 0.10),ACEi/ARB medication (OR, 0.72, 95% CI: 0.47–1.10, p = 0.13), and β-blocker usage (OR,0.80, 95% CI: 0.41–1.57, p = 0.51) were not affected by vitamin D supplementation. Thus,
167

Nutrients 2021, 13, 335
this analysis suggested that there were specific clinical characteristics in patients benefittingfrom vitamin D supplementation.
Figure 3. Odds ratio of in-hospital mortality. Patients with vitamin D compared with matchedpatients without vitamin D. Dots and lines mean OR and 95% CI, respectively.
4. Discussion
The main findings of the present study were (1) HF patients with vitamin D sup-plementation had significantly lower in-hospital mortality and mortality within 7 and30 days of hospitalization in the propensity matched cohort; (2) mortalities in patientswith age < 75, diabetes, dyslipidemia, atrial arrhythmia, cancer, renin-angiotensin systemblocker medication, and β-blocker were not affected by vitamin D supplementation; (3) bymultivariate analysis we identified that it was mainly osteoporosis patients that benefitfrom being treated with vitamin D supplementation when they were admitted for HF. Mor-tality was consistently low in patients with vitamin D supplementation at 7 days, 30 days,and during hospitalization. On the other hand, there are specific clinical characteristics inHF patients who do not benefit much from vitamin D. The identification of specific clinicalcharacteristics in patients benefitting from vitamin D may be useful in determining targetsof future studies.
168
Nutrients 2021, 13, 335
4.1. Impact of Vitamin D on HF Mortality
Although there is much evidence showing that a lack of vitamin D could result inpoor prognosis among patients with HF, different studies have reported controversialresults about the benefit of vitamin D supplementation in patients with HF. In recent years,there were some randomized control trials for the effects of vitamin D on patients withHF. For example, the Vitamin D treating patients with chronic heart failure (VINDICATE)study showed that vitamin D supplementation has beneficial effect on left ventricular (LV)structure and function [11]. An individual participant data meta-analysis observed anassociation between low vitamin D level and increased risk of all-cause mortality [16]. Onthe other hand, another meta-analysis reported that vitamin D supplementation did notimprove LV ejection fraction and 6-min walk distance in the treatment of chronic HF [17].A recent updated meta-analysis also reported that vitamin D supplementation was notsignificantly associated with reduced major adverse cardiovascular events [18].
While randomized clinical trials (RCT) provide a foundation for clinical evidence, trialsare often performed in highly controlled environments with narrow inclusion and exclusioncriteria, which reduces their generalizability and external validity. Highly protocolledcare in an RCT may differ substantially from interventions in routine settings [19]. TheMendelian Randomization study is a new concept of analysis, however, the genetic variantsare unclear in the vitamin D3 levels [20]. A notably limitation of these trials is that nonewere focused on vitamin D supplementation in patients with high-risk cohort includingNYHA 3 and 4. From our subgroup analysis, patients, the effect of vitamin D on in-hospitalmortality was seemed to be greater in NYHA III-IV patients compared with NYHA I-II(NYHA III-IV: OR: 0.63, p < 0.001 and NYHA I-II: OR: 0.72, p = 0.014). We believe that thekey to proving the worth of vitamin D supplementation is to create clinical studies thatalso involve a significant number of decompensated HF patients.
4.2. Mechanisms of Vitamin D for HF
There are some theories for the association between vitamin D and HF prognosis. InHF, cardiac contraction and relaxation are affected due to overload of Ca2+ ions in myocar-dial cells. Lack of vitamin D may intervene with the functions of Ca2+ in myocardial cells,resulting in cardiomyocyte hypertrophy, intra-organisational inflammatory reaction andfibrosis [21,22]. Low vitamin D levels may activate the renin–angiotensin system [23], giverise to inflammatory reactions [24] and result in endothelial dysfunction [25]. Interestingly,our subgroup analysis suggested that patients without ACEi/ARB had received morebeneficial effects from vitamin D in regards to in-hospital mortality. The effect of vitamin Dwas more pronounced in patients without ACEi/ARB usage, hence suggesting an activatedrenin–angiotensin system in these patients.
The effects of vitamin D on the cardiovascular system are additionally mediatedthrough elevated parathyroid hormone levels [26]. An age-related increase in parathyroidhormone levels has been demonstrated in several studies [27]. In our cohort, elderly pa-tients (with suspected elevation of parathyroid hormone) with vitamin D supplementationwere associated with lower in-hospital mortality (age < 75: OR: 0.84, p = 0.40 and age ≥ 75:OR: 0.66, p < 0.001). This result may suggest a link between vitamin D and elevatedparathyroid hormone levels in the cardiovascular system. Based on the basic knowledge ofthese mechanisms, the link between vitamin D and prognosis in HF may be explained.
4.3. Clinical Implication
Even with the current wealth of guidelines and recommendations about HF anddevelopment of many new treatment methods, HF is associated with a high in-hospitalmortality [1]. For patients with HF, vitamin D supplementation is a low-cost low-riskchoice, and certain patients may benefit greatly from this therapy. According to our datafrom the large high-risk HF cohort, patients with vitamin D supplementation had lowermortality, and specific clinical characteristics were linked to better in-hospital mortality.The identified specific clinical characteristics that might be useful for future RCT studies.
169

Nutrients 2021, 13, 335
4.4. Limitations
The study based on ICD codes has several limitations. First, we analyzed only patientswith HF hospitalized in facilities contributing to the database, which may lead to selectionbias. Second, the database has no information on echocardiography or laboratory data toassess the prognosis of HF. Third, the database lacked information on the specific doses ofvitamin D supplementation in each patient. Dose dependency was unable to be examined.Forth, propensity score-matching reports the potential differences between groups, withonly a certain degree of accuracy. Despite the application of propensity matching to thecomparator group of patients, this non-randomized observational study could still besubject to hidden biases related to patient selection, because of unknown unadjusted differ-ences. To overcome this issue, we used treatment devices and catecholamine medicationas markers of HF severity. All-cause mortality was used as the primary end point in ourpatient population. The most likely cause of death in our patient population is HF, giventhe known high-risk nature of our patient population. The patients in this study are mostlyJapanese. Results may differ due to racial or cultural differences in other countries. TheJROAD-DPC dataset extracts only a record which contains all types of cardiovascular dis-eases in any categories of diagnosis based on the DPC dataset in Ministry of Health, Laborand Welfare in Japan. The DPC dataset has already been validated in past studies [28].However, we were unable to check the undefined diseases by the coding system in our finaldataset. This registry data does not include laboratory data. However, there would be nodifference in background between the two groups as we corrected for many confoundingfactors. Finally, the results cannot be applied to all heart failure admissions. The results canbe applied to the group of patients who should receive vitamin D supplementation but didnot get it. The reason is that there were many osteoporosis and hemodialysis patients inboth groups. Thus, the vitamin D group was suspected to have higher serum 25(OH)Dcompared with the non-vitamin D group. Considering these limitations, the present studyshould be considered as a hypothesis generating study for future RCT studies.
5. Conclusions
Patients with vitamin D supplementation had a lower in-hospital mortality for HFthan patients without vitamin D supplementation in this propensity matched cohort. Thecausality should be tested in the future RCTs in specific population based on our study.
Supplementary Materials: The following are available online at https://www.mdpi.com/2072-6643/13/2/335/s1, Figure S1a: Receiver operating characteristic curve and concordance index. FigureS1b: comparison of the consistency of propensity score densities before and after matching. FigureS2: Predictive values for in-hospital mortality.
Author Contributions: K.K. conceived the idea for this study. Y.O. (Yuichiro Okushi) and Y.O.(Yoshihiro Okayama) conducted the data analyses. The initial draft of the manuscript was producedby K.K. and Y.O. (Yuichiro Okushi). All authors (K.K., Y.O. (Yuichiro Okushi), Y.O. (YoshihiroOkayama), R.Z., M.A., M.N., Y.S., T.I., T.T., K.Y., S.Y., D.F., H.Y., T.S., T.W., and M.S.) were involvedin interpreting the results and writing the manuscript. All authors have read and agreed to thepublished version of the manuscript.
Funding: This work was partially supported by Japan Society for the Promotion of Science KakenhiGrants (Number 20K17084 to Y. Okushi, 19H03654 to M. Sata), the Takeda Science Foundation (toK. Kusunose), and Japan Agency for Medical Research and Development under Grant NumberJP19lk1010035 (to K. Kusunose).
Institutional Review Board Statement: The study was conducted according to the guidelines of theDeclaration of Helsinki, and approved by the Institutional Review Board of Tokushima University(protocol no. 3503).
Informed Consent Statement: Patient consent was waived because the analysis used anonymousclinical data.
170

Nutrients 2021, 13, 335
Data Availability Statement: The datasets are available from the corresponding author on reasonablerequest.
Conflicts of Interest: The authors have no conflicts of interest to declare.
References
1. Tsutsui, H.; Isobe, M.; Ito, H.; Okumura, K.; Ono, M.; Kitakaze, M.; Kinugawa, K.; Kihara, Y.; Goto, Y.; Komuro, I.; et al. JCS2017/JHFS 2017 Guideline on Diagnosis and Treatment of Acute and Chronic Heart Failure- Digest Version. Circ. J. 2019, 83,2084–2184. [CrossRef] [PubMed]
2. Heidenreich, P.A.; Albert, N.M.; Allen, L.A.; Bluemke, D.A.; Butler, J.; Fonarow, G.C.; Ikonomidis, J.S.; Khavjou, O.; Konstam,M.A.; Maddox, T.M.; et al. Forecasting the impact of heart failure in the United States: A policy statement from the AmericanHeart Association. Circ. Heart Fail. 2013, 6, 606–619. [CrossRef] [PubMed]
3. Wang, T.J. Vitamin D and Cardiovascular Disease. Annu. Rev. Med. 2016, 67, 261–272. [CrossRef] [PubMed]4. Krul-Poel, Y.H.; Ter Wee, M.M.; Lips, P.; Simsek, S. Management of Endocrine Disease: The effect of vitamin D supplementation
on glycaemic control in patients with type 2 diabetes mellitus: A systematic review and meta-analysis. Eur. J. Endocrinol. 2017,176, R1–R14. [CrossRef] [PubMed]
5. Hewison, M. An update on vitamin D and human immunity. Clin. Endocrinol. 2012, 76, 315–325. [CrossRef] [PubMed]6. Kim, D.H.; Sabour, S.; Sagar, U.N.; Adams, S.; Whellan, D.J. Prevalence of hypovitaminosis D in cardiovascular diseases (from the
National Health and Nutrition Examination Survey 2001 to 2004). Am. J. Cardiol. 2008, 102, 1540–1544. [CrossRef] [PubMed]7. Ameri, P.; Ronco, D.; Casu, M.; Denegri, A.; Bovio, M.; Menoni, S.; Ferone, D.; Murialdo, G. High prevalence of vitamin D
deficiency and its association with left ventricular dilation: An echocardiography study in elderly patients with chronic heartfailure. Nutr. Metab. Cardiovasc. Dis. 2010, 20, 633–640. [CrossRef]
8. Gardner, D.G.; Chen, S.; Glenn, D.J. Vitamin D and the heart. Am. J. Physiol. Regul. Integr. Comp. Physiol. 2013, 305, R969–R977.[CrossRef]
9. Schleithoff, S.S.; Zittermann, A.; Tenderich, G.; Berthold, H.K.; Stehle, P.; Koerfer, R. Vitamin D supplementation improvescytokine profiles in patients with congestive heart failure: A double-blind, randomized, placebo-controlled trial. Am. J. Clin. Nutr.2006, 83, 754–759. [CrossRef]
10. Witham, M.D.; Crighton, L.J.; Gillespie, N.D.; Struthers, A.D.; McMurdo, M.E. The effects of vitamin D supplementation onphysical function and quality of life in older patients with heart failure: A randomized controlled trial. Circ. Heart Fail. 2010, 3,195–201. [CrossRef]
11. Witte, K.K.; Byrom, R.; Gierula, J.; Paton, M.F.; Jamil, H.A.; Lowry, J.E.; Gillott, R.G.; Barnes, S.A.; Chumun, H.; Kearney, L.C.;et al. Effects of Vitamin D on Cardiac Function in Patients With Chronic HF: The VINDICATE Study. J. Am. Coll. Cardiol. 2016, 67,2593–2603. [CrossRef] [PubMed]
12. Win, S.; Hussain, I.; Hebl, V.B.; Dunlay, S.M.; Redfield, M.M. Inpatient Mortality Risk Scores and Postdischarge Events inHospitalized Heart Failure Patients: A Community-Based Study. Circ. Heart Fail. 2017, 10. [CrossRef] [PubMed]
13. Peterson, P.N.; Rumsfeld, J.S.; Liang, L.; Albert, N.M.; Hernandez, A.F.; Peterson, E.D.; Fonarow, G.C.; Masoudi, F.A.; AmericanHeart Association Get With the Guidelines-Heart Failure Program. A validated risk score for in-hospital mortality in patientswith heart failure from the American Heart Association get with the guidelines program. Circ. Cardiovasc. Qual. Outcomes 2010, 3,25–32. [CrossRef] [PubMed]
14. Hannan, E.L.; Wu, C.; Bennett, E.V.; Carlson, R.E.; Culliford, A.T.; Gold, J.P.; Higgins, R.S.; Smith, C.R.; Jones, R.H. Risk index forpredicting in-hospital mortality for cardiac valve surgery. Ann. Thorac. Surg. 2007, 83, 921–929. [CrossRef]
15. Fonarow, G.C. Clinical risk prediction tools in patients hospitalized with heart failure. Rev. Cardiovasc. Med. 2012, 13, e14–e23.16. Gaksch, M.; Jorde, R.; Grimnes, G.; Joakimsen, R.; Schirmer, H.; Wilsgaard, T.; Mathiesen, E.B.; Njolstad, I.; Lochen, M.L.; Marz,
W.; et al. Vitamin D and mortality: Individual participant data meta-analysis of standardized 25-hydroxyvitamin D in 26916individuals from a European consortium. PLoS ONE 2017, 12, e0170791. [CrossRef]
17. Jiang, W.L.; Gu, H.B.; Zhang, Y.F.; Xia, Q.Q.; Qi, J.; Chen, J.C. Vitamin D Supplementation in the Treatment of Chronic HeartFailure: A Meta-analysis of Randomized Controlled Trials. Clin. Cardiol. 2016, 39, 56–61. [CrossRef]
18. Barbarawi, M.; Kheiri, B.; Zayed, Y.; Barbarawi, O.; Dhillon, H.; Swaid, B.; Yelangi, A.; Sundus, S.; Bachuwa, G.; Alkotob, M.L.Vitamin D supplementation and cardiovascular disease risks in more than 83,000 individuals in 21 randomized clinical trials: Ameta-analysis. JAMA Cardiol. 2019, 4, 765–775. [CrossRef]
19. Stuart, E.A.; Bradshaw, C.P.; Leaf, P.J. Assessing the generalizability of randomized trial results to target populations. Prev. Sci.2015, 16, 475–485. [CrossRef]
20. Davies, N.M.; Holmes, M.V.; Davey Smith, G. Reading Mendelian randomisation studies: A guide, glossary, and checklist forclinicians. BMJ 2018, 362, k601. [CrossRef]
21. Weishaar, R.E.; Simpson, R.U. Involvement of vitamin D3 with cardiovascular function. II. Direct and indirect effects. Am. J.Physiol. 1987, 253, E675–E683. [CrossRef] [PubMed]
22. Chen, S.; Law, C.S.; Grigsby, C.L.; Olsen, K.; Hong, T.T.; Zhang, Y.; Yeghiazarians, Y.; Gardner, D.G. Cardiomyocyte-specificdeletion of the vitamin D receptor gene results in cardiac hypertrophy. Circulation 2011, 124, 1838–1847. [CrossRef] [PubMed]
23. Vaidya, A.; Williams, J.S. The relationship between vitamin D and the renin-angiotensin system in the pathophysiology ofhypertension, kidney disease, and diabetes. Metabolism 2012, 61, 450–458. [CrossRef]
171

Nutrients 2021, 13, 335
24. Zhang, Y.; Leung, D.Y.; Richers, B.N.; Liu, Y.; Remigio, L.K.; Riches, D.W.; Goleva, E. Vitamin D inhibits monocyte/macrophageproinflammatory cytokine production by targeting MAPK phosphatase-1. J. Immunol. 2012, 188, 2127–2135. [CrossRef] [PubMed]
25. Caprio, M.; Mammi, C.; Rosano, G.M. Vitamin D: A novel player in endothelial function and dysfunction. Arch. Med. Sci. 2012, 8,4–5. [CrossRef]
26. Schluter, K.D.; Piper, H.M. Left ventricular hypertrophy and parathyroid hormone: A causal connection? Cardiovasc. Res. 1998,39, 523–524. [CrossRef]
27. Haden, S.T.; Brown, E.M.; Hurwitz, S.; Scott, J.; El-Hajj Fuleihan, G. The effects of age and gender on parathyroid hormonedynamics. Clin. Endocrinol. 2000, 52, 329–338. [CrossRef]
28. Yamana, H.; Moriwaki, M.; Horiguchi, H.; Kodan, M.; Fushimi, K.; Yasunaga, H. Validity of diagnoses, procedures, and laboratorydata in Japanese administrative data. J. Epidemiol. 2017, 27, 476–482. [CrossRef]
172

nutrients
Article
Multidisciplinary Team-Based Palliative Care for Heart Failureand Food Intake at the End of Life
Tatsuhiro Shibata 1,2, Kazutoshi Mawatari 1, Naoko Nakashima 2,3, Koutatsu Shimozono 1, Kouko Ushijima 3,
Yumiko Yamaji 3, Kumi Tetsuka 3, Miki Murakami 2,3, Kouta Okabe 1, Toshiyuki Yanai 1, Shoichiro Nohara 1,
Jinya Takahashi 1, Hiroki Aoki 4, Hideo Yasukawa 1 and Yoshihiro Fukumoto 1,*
Citation: Shibata, T.; Mawatari, K.;
Nakashima, N.; Shimozono, K.;
Ushijima, K.; Yamaji, Y.; Tetsuka, K.;
Murakami, M.; Okabe, K.; Yanai, T.;
et al. Multidisciplinary Team-Based
Palliative Care for Heart Failure and
Food Intake at the End of Life.
Nutrients 2021, 13, 2387. https://
doi.org/10.3390/nu13072387
Academic Editor: Bradley S. Ferguson
Received: 10 June 2021
Accepted: 10 July 2021
Published: 13 July 2021
Publisher’s Note: MDPI stays neutral
with regard to jurisdictional claims in
published maps and institutional affil-
iations.
Copyright: © 2021 by the authors.
Licensee MDPI, Basel, Switzerland.
This article is an open access article
distributed under the terms and
conditions of the Creative Commons
Attribution (CC BY) license (https://
creativecommons.org/licenses/by/
4.0/).
1 Division of Cardiovascular Medicine, Department of Internal Medicine, Kurume University School ofMedicine, Kurume 830-0011, Japan; [email protected] (T.S.);[email protected] (K.M.); [email protected] (K.S.);[email protected] (K.O.); [email protected] (T.Y.);[email protected] (S.N.); [email protected] (J.T.);[email protected] (H.Y.)
2 Kurume University Hospital Palliative Care Team, Kurume University, Kurume 830-0011, Japan;[email protected] (N.N.); [email protected] (M.M.)
3 Department of Nursing, Kurume University Hospital, Kurume 830-0011, Japan;[email protected] (K.U.); [email protected] (Y.Y.);[email protected] (K.T.)
4 Cardiovascular Research Institute, Kurume University, Kurume 830-0111, Japan; [email protected]* Correspondence: [email protected]; Tel.: +81-942-31-7562
Abstract: Traditionally, patients with end-stage heart failure (HF) have rarely been involved inend-of-life care (EOLC) discussions in Japan. The purpose of this study was to examine the impact ofHF-specific palliative care team (HF-PCT) activities on EOLC discussions with patients, HF therapyand care, and food intake at the end of life. We retrospectively analyzed 52 consecutive patients withHF (mean age, 70 ± 15 years; 42% female) who died at our hospital between May 2013 and July 2020and divided them into two groups: before (Era 1, n = 19) and after (Era 2, n = 33) the initiation ofHF-PCT activities in June 2015. Compared to Era 1, Era 2 showed a decrease in invasive procedures,an increase in opioid and non-intubating sedative use for symptom relief, improved quality ofmeals at the end of life, and an increase in participation in EOLC discussions. The administration ofartificial nutrition in the final three days was associated with non-ischemic cardiomyopathy etiology,the number of previous hospitalizations for HF, and multidisciplinary EOLC discussion support.HF-PCT activities may provide an opportunity to discuss EOLC with patients, reduce the burden ofphysical and psychological symptoms, and shift the goals of end-of-life nutritional intake to ensurecomfort and quality of life.
Keywords: heart failure; palliative care; end-of-life care discussion; advance care planning; foodintake; artificial nutrition
1. Introduction
Recent developments in new drugs, monitoring systems, and device therapies haveevolved heart failure (HF) therapy; however, these developments may stabilize HF butrarely cure it. Furthermore, these advances are often only available for a limited number ofpatients. During HF progression, patients experience a high symptom burden and poorquality of life similar to that reported by patients with cancer [1,2]. HF often follows anunpredictable illness trajectory, with stable periods interrupted by exacerbations and some-times resulting in sudden cardiac death, leading to difficulties in estimating survival [3].When focusing on end-of-life decision making, such prognostic uncertainty complicatesthe patients’ plans concerning their end-of-life wishes and sometimes leads to an overesti-mation of survival [4]. Furthermore, traditionally in Japan, patients rarely participate in
Nutrients 2021, 13, 2387. https://doi.org/10.3390/nu13072387 https://www.mdpi.com/journal/nutrients173

Nutrients 2021, 13, 2387
discussions about their own goals and preferences for end-of-life care (EOLC), because theirfamilies may hesitate to bring bad news. As patients tend to lose their decision-makingability toward the end of life [5], they sometimes have no opportunity to express theirwishes and preferences regarding their EOLC. Until recently in Japan, these situations oftenled to providing life-prolonging treatment to critically ill patients, regardless of the medicalfutility [6]. In addition, at the end-stage of HF, associated symptoms such as anorexia,nausea, vomiting, and dyspnea are observed, and food intake decreases [7]. In patientswith end-stage HF, the goal of nutritional care is to optimize quality of life and comfort.Even though patients eventually lose their appetite spontaneously, artificial nutrition hasoften been attempted in the past.
Palliative care comprises a multidisciplinary team approach for patients and their fam-ilies facing serious illnesses that focuses on improving quality of life and death. Recently,palliative care has been recommended by the Japanese Circulation Society (JCS)/JapaneseHeart Failure Society (JHFS) and American College of Cardiology (ACC)/American HeartAssociation (AHA) HF guidelines [8,9]. The core elements of a multidisciplinary palliativecare team (PCT) include not only expert assessment of physical and psychosocial distressbut also the establishment of care goals and support for advance care planning (ACP) andcomplex decision-making, including EOLC discussion. In Japan, a multidisciplinary PCTis available in most of the regional cancer centers; however, it is only available in 9% ofJCS-authorized cardiology training hospitals [10]. One of the major reasons is that PCTintervention had not been reimbursed for patients with HF by April 2018. Given that theseservices are not yet widely available, there has been insufficient clinical data regardingPCTs in patients with HF in Japan. Moreover, even in Western countries, only limitedevidence is available regarding the patient-centered EOLC discussions of inpatient PCTswith patients with HF [11,12].
Therefore, the main purpose of this study was to compare changes in HF therapies interms of palliative care and EOLC discussions, with a focus on food intake at the end of lifein HF, before and after the initiation of HF-specific PCT (HF-PCT) activities at our institute.
2. Materials and Methods
2.1. Study Design and Population
The study was performed at Kurume University Hospital, a 1000-bed tertiary medicalcenter located in the southern part of Fukuoka Prefecture, Japan. We retrospectivelyanalyzed the medical records of 215 consecutive patients who died at the Division ofCardiology of our hospital between May 2013 and July 2020. Among these, we excluded163 cases of non-HF deaths, including acute myocardial infarction, and patients treated onlyin the intensive care unit. HF was diagnosed by at least two specialist cardiologists basedon the Framingham criteria [13]. Thus, we conducted a final analysis of 52 patients withHF who died in our department. These patients were divided into two groups accordingto their time of death before (Era 1; May 2013 to May 2015) and after (Era 2; June 2015to July 2020) the HF-PCT activity started in June 2015. In this study, a multidisciplinarypalliative approach for patients and their families was provided by an HF-PCT, whichconsisted of cardiologists, palliative care physicians, nurses (inpatient, outpatient, and acertified palliative care nurse), pharmacists, a psychologist, a medical social worker, anda managerial dietitian. The HF-PCT was available for all HF patients and assisted thetreatment of patients with HF through refractory symptom relief, the establishment ofcare goals, psychosocial support, support of ACP and EOLC discussions, and provision ofnutritional support for EOLC.
The demographic and clinical information of each patient was extracted from theelectronic medical records of Kurume University Hospital. We obtained data on thepatients’ background, etiology of HF, duration of HF, comorbidities, echocardiographicfindings, HF treatments, sedative medications, laboratory data, location of death, invasiveprocedures undergone before death (cardiopulmonary resuscitation, intubation, directcurrent shocks, and mechanical circulatory support) and length of hospital stay. We also
174
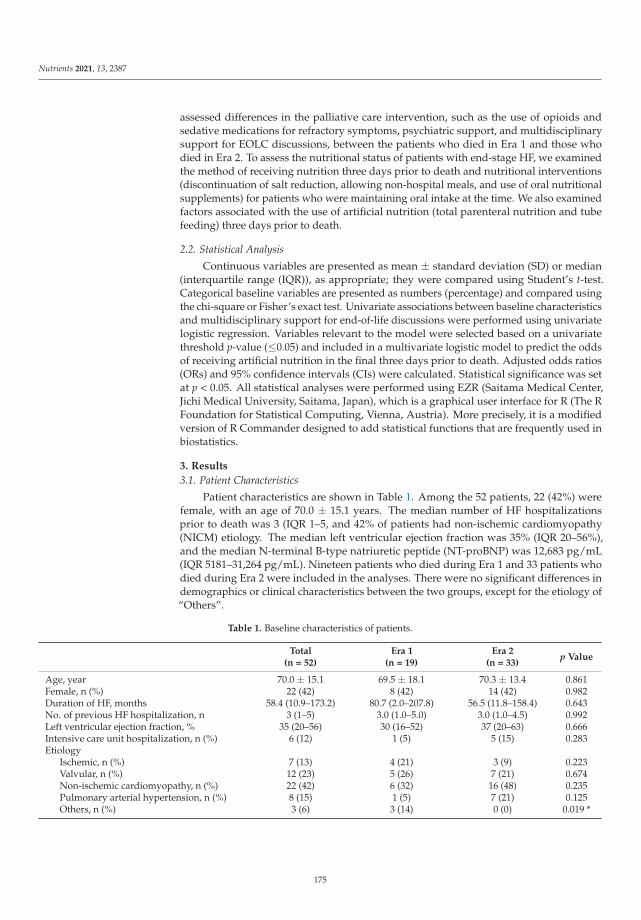
Nutrients 2021, 13, 2387
assessed differences in the palliative care intervention, such as the use of opioids andsedative medications for refractory symptoms, psychiatric support, and multidisciplinarysupport for EOLC discussions, between the patients who died in Era 1 and those whodied in Era 2. To assess the nutritional status of patients with end-stage HF, we examinedthe method of receiving nutrition three days prior to death and nutritional interventions(discontinuation of salt reduction, allowing non-hospital meals, and use of oral nutritionalsupplements) for patients who were maintaining oral intake at the time. We also examinedfactors associated with the use of artificial nutrition (total parenteral nutrition and tubefeeding) three days prior to death.
2.2. Statistical Analysis
Continuous variables are presented as mean ± standard deviation (SD) or median(interquartile range (IQR)), as appropriate; they were compared using Student’s t-test.Categorical baseline variables are presented as numbers (percentage) and compared usingthe chi-square or Fisher’s exact test. Univariate associations between baseline characteristicsand multidisciplinary support for end-of-life discussions were performed using univariatelogistic regression. Variables relevant to the model were selected based on a univariatethreshold p-value (≤0.05) and included in a multivariate logistic model to predict the oddsof receiving artificial nutrition in the final three days prior to death. Adjusted odds ratios(ORs) and 95% confidence intervals (CIs) were calculated. Statistical significance was setat p < 0.05. All statistical analyses were performed using EZR (Saitama Medical Center,Jichi Medical University, Saitama, Japan), which is a graphical user interface for R (The RFoundation for Statistical Computing, Vienna, Austria). More precisely, it is a modifiedversion of R Commander designed to add statistical functions that are frequently used inbiostatistics.
3. Results
3.1. Patient Characteristics
Patient characteristics are shown in Table 1. Among the 52 patients, 22 (42%) werefemale, with an age of 70.0 ± 15.1 years. The median number of HF hospitalizationsprior to death was 3 (IQR 1–5, and 42% of patients had non-ischemic cardiomyopathy(NICM) etiology. The median left ventricular ejection fraction was 35% (IQR 20–56%),and the median N-terminal B-type natriuretic peptide (NT-proBNP) was 12,683 pg/mL(IQR 5181–31,264 pg/mL). Nineteen patients who died during Era 1 and 33 patients whodied during Era 2 were included in the analyses. There were no significant differences indemographics or clinical characteristics between the two groups, except for the etiology of“Others”.
Table 1. Baseline characteristics of patients.
Total(n = 52)
Era 1(n = 19)
Era 2(n = 33)
p Value
Age, year 70.0 ± 15.1 69.5 ± 18.1 70.3 ± 13.4 0.861Female, n (%) 22 (42) 8 (42) 14 (42) 0.982Duration of HF, months 58.4 (10.9–173.2) 80.7 (2.0–207.8) 56.5 (11.8–158.4) 0.643No. of previous HF hospitalization, n 3 (1–5) 3.0 (1.0–5.0) 3.0 (1.0–4.5) 0.992Left ventricular ejection fraction, % 35 (20–56) 30 (16–52) 37 (20–63) 0.666Intensive care unit hospitalization, n (%) 6 (12) 1 (5) 5 (15) 0.283Etiology
Ischemic, n (%) 7 (13) 4 (21) 3 (9) 0.223Valvular, n (%) 12 (23) 5 (26) 7 (21) 0.674Non-ischemic cardiomyopathy, n (%) 22 (42) 6 (32) 16 (48) 0.235Pulmonary arterial hypertension, n (%) 8 (15) 1 (5) 7 (21) 0.125Others, n (%) 3 (6) 3 (14) 0 (0) 0.019 *
175

Nutrients 2021, 13, 2387
Table 1. Cont.
Total(n = 52)
Era 1(n = 19)
Era 2(n = 33)
p Value
ComorbiditiesCerebrovascular disease, n (%) 9 (17) 5 (26) 4 (12) 0.193Hypertension, n (%) 12 (23) 6 (32) 6 (18) 0.270Diabetes, n (%) 21 (40) 7 (37) 14 (42) 0.693Atrial fibrilation, n (%) 27 (52) 9 (47) 18 (55) 0.618Malignancies, n (%) 5 (10) 1 (5) 4 (12) 0.419
Cardiac resynchronization therapy, n (%) 19 (37) 8 (42) 11 (33) 0.527Implantable cardioverter defibrillator, n (%) 19 (37) 7 (37) 12 (36) 0.973Systolic blood pressure, mmHg 104.0 ± 26.5 113.2 ± 29.0 98.7 ± 23.7 0.056NYHA class III or IV, n (%) 43 (83) 15 (79) 28 (85) 0.592Medication on admission
ACE-I/ARB, n (%) 29 (56) 13 (68) 16 (48) 0.163β-blocker, n (%) 31 (60) 11 (58) 20 (61) 0.848Mineralocorticoid receptor antagonist, n (%) 25 (48) 7 (37) 18 (55) 0.219Loop diuretic, n (%) 44 (85) 15 (79) 29 (88) 0.390
Laboratory dataNT-proBNP, pg/mL 12,683 (5181–31,264) 12,684 (4512–38,571) 13,728 (5526–31,109) 0.770Blood urea nitrogen, mg/dL 46.0 ± 24.9 52.1 ± 25.6 42.5 ± 24.2 0.180Creatinine, mg/dL 1.8 ± 1.2 2.1 ± 1.4 1.6 ± 1.0 0.148Sodium, mEq/L 135.0 ± 7.4 133.6 ± 8.1 135.8 ± 7.0 0.310
Data are presented as mean ± SD, median (IQR) and n (%); HF = heart failure; HFrEF = HF with reduced ejection fraction; NYHA = NewYork Heart Association functional classification; ACE-I = angiotensin-converting-enzyme inhibitor; ARB = angiotensin II receptor blocker;NT-proBNP = n-terminal b-type natriuretic peptide. * p < 0.05.
3.2. Palliative and End-of-Life Care
Table 2 presents an overview of the palliative care and EOLC provided prior to death.In patients who died during Era 2, the rates of attempted cardiopulmonary resuscitation,intubation, and direct current shock at the end of life were significantly lower than in thosewho died in Era 1 (53% vs. 6%; p < 0.001, 47% vs. 0%; p < 0.001, 37% vs. 6%; p = 0.005,respectively). Compared to Era 1, a greater proportion of patients who died in Era 2 receivedopioids (11% vs. 70%). All the patients who received opioids were non-intubated and theadministration was indicated to relieve dyspnea resistant to hemodynamic interventions(afterload reduction, diuretics, and inotropes). Sedative medications were significantlymore commonly used in intubated patients who died in Era 1 and non-intubated patientswho died in Era 2 (p < 0.05). Sedative medications without intubation were used forrefractory symptoms, such as dyspnea, malaise, and delirium. Patients who died in Era 2received more psychiatric consultations, although the difference was not significant. InEra 2, 70% of patients received multidisciplinary EOLC discussion support, a significantincrease from 5% in Era 1 (p < 0.001).
Table 2. Palliative and end-of-life care.
Era 1(n = 19)
Era 2(n = 33)
p Value
Length of hospital stay until death, days 20 (9–59) 24 (14–91) 0.448Transfer to intensive care unit prior to death, n (%) 2 (11) 0 (0) 0.057Invasive treatment at the time of death
Cardiopulmonary resuscitation, n (%) 10 (53) 2 (6) <0.001 *Intubation, n (%) 9 (47) 0 (0) <0.001 *Direct current shocks, n (%) 7 (37) 2 (6) 0.005 *Mechanical circulatory support, n (%) 1 (5) 0 (0) 0.183
Palliative care interventionUse of opioid, n (%) 2 (11) 23 (70) <0.001 *Use of sedative medication, n (%) 6 (32) 13 (39) 0.573
176

Nutrients 2021, 13, 2387
Table 2. Cont.
Era 1(n = 19)
Era 2(n = 33)
p Value
For intubated patients, n (%) 5 (26) 1 (3) 0.020 *For non-intubated patients, n (%) 1 (5) 12 (36) 0.018 *
Specialized psychiatric care, n (%) 4 (21) 15 (45) 0.078Multidisciplinary support for EOLC discussions, n (%) 1 (5) 23 (70) <0.001 *
Data are presented as median (IQR) and n (%); EOLC = end-of-life care. * p < 0.05.
3.3. Nutrition in the Three Days Prior to Death
Among the patients who died in Era 1 and Era 2, total parenteral nutrition wasprovided to 7 (37%) and 11 (33%), tube feeding to 1 (5%) and 5 (15%), and 9 (47%) and12 (36%) patients fasted, respectively. There were no significant differences in nutritionadministration methods between the two groups. Food intake three days before deathwas maintained in 9 out of 19 patients (47%) in Era 1 and 16 out of 33 patients (48%) inEra 2. The characteristics of the patients who maintained food intake three days prior todeath are summarized in Table 3. Compared to the patients who died in Era 1 (n = 9),significantly more patients who died in Era 2 (n = 16) maintained food intake during opioidadministration (11% vs. 63%, respectively, p = 0.013). In addition, food intake duringsedation was not observed in Era 1 but was observed in 19% of patients who died in Era 2(p = 0.166). Nutritional counseling was more frequently provided to patients who died inEra 2 than to those who died in Era 1 (33% vs. 81%, respectively, p = 0.017), and the changefrom a low-sodium diet to a regular-sodium diet was also significantly more frequent (59%vs. 22%, respectively, p = 0.025). Permission for non-hospital foods, such as bringing apatient’s favorite meal cooked by their family, also tended to be more frequently granted topatients who died in Era 2 as compared to those who died in Era 1 (p = 0.053).
Table 3. Characteristics of patients who maintained oral intake in the three days prior to death.
Era 1(n = 9)
Era 2(n = 16)
p Value
Use of artificial nutrition, n (%) 0 (0) 3 (19) 0.166Food intake under opioid administration, n (%) 1 (11) 10 (63) 0.013 *Food intake under sedative medication administration, n (%) 0 (0) 3 (19) 0.166Nutritional Counselling, n (%) 3 (33) 13 (81) 0.017 *
Change from low-sodium to regular-sodium diets, n (%) 2 (22) 11 (59) 0.025 *Permission for non-hospital meals, n (%) 2 (22) 10 (63) 0.053Use of oral nutritional supplements, n (%) 3 (33) 10 (63) 0.161
Data are presented as n (%). * p < 0.05.
Logistic regression analysis of factors associated with the administration of artificialnutrition three days prior to death was performed (Table 4). In the univariate regres-sion analysis, the number of previous hospitalizations for HF (OR 0.69; 95% CI 0.51–0.93;p = 0.014) and HF due to NICM (OR 3.30; 95% CI 1.03–10.60; p = 0.045) were significantlyassociated with the administration of artificial nutrition in the final three days of life. Mul-tivariate analysis demonstrated that the number of previous HF hospitalizations (OR 0.63;95% CI 0.44–0.91; p = 0.014), NICM-caused HF (OR 15.8; 95% CI 2.42–103.00; p = 0.004), andmultidisciplinary support for EOLC discussions (OR 0.15; 95% CI 0.03–0.91; p = 0.039) wereindependent factors related to the administration of artificial nutrition three days prior todeath.
177

Nutrients 2021, 13, 2387
Table 4. Results of univariate and multivariate analysis associated with the administration of artificial nutrition three daysprior to death.
Univariate Analysis Multivariate Analysis
OR 95% CI p Value OR 95% CI p Value
Age 1.01 0.97–1.05 0.74 1.00 0.95–1.06 0.86Female 1.20 0.39–3.70 0.76 1.22 0.27–5.58 0.80
ICM 0.60 0.11–3.44 0.57NICM 3.30 1.03–10.60 0.045 * 15.80 2.42–103.00 0.004 *VHD 0.75 0.19–2.91 0.68
NYHA class III or IV on admission 0.43 0.10–1.84 0.25Number of previous hospitalizations for HF 0.69 0.51–0.93 0.014 * 0.63 0.44–0.91 0.014 *
Multidisciplinary support for EOLC discussions 0.29 0.09–1.00 0.05 0.15 0.03–0.91 0.039 *
OR = odds ratio; CI = confidence interval; ICM = ischemic cardiomyopathy; NICM = non-ischemic cardio myopathy; VHD = valvular heartdisease; HF = heart failure; EOLC = end-of-life care. * p < 0.05.
4. Discussion
In this study, we compared the changes in HF therapies in terms of palliative careand EOLC discussions before and after the initiation of HF-PCT activities at our institute,with a focus on food intake at the end of life. The major findings were that after HF-PCTactivities, (a) fewer invasive procedures were performed, (b) the use of opioids and non-intubated sedatives for symptom relief increased, (c) support from the multidisciplinaryteam in EOLC discussions increased, and (d) quality of meals was improved at the endof life in patients (from low-sodium diet to regular diet, adequate symptom relief withopioids, provision of non-hospital meals such as patients’ favorite meals mainly by familymembers). Furthermore, the administration of artificial nutrition in the final three daysprior to death was associated with NICM etiology, number of previous hospitalizationsfor HF, and multidisciplinary EOLC discussion support. To the best of our knowledge,this is the first report on changes in HF palliative care and end-of-life food intake after theinitiation of HF-PCT activities.
4.1. End-of-Life Discussion with Patients with HF
Considering the plateau in diagnostic capacity and treatment efficacy for HF, newproblems have arisen related to difficult EOLC decision-making under uncertain diseasetrajectories [14]. In addition, physicians often discuss EOLC with the families rather thanthe patients in Far East Asian countries such as China, South Korea, and Japan [15–17],where physicians and patients’ families traditionally tend to avoid giving unfavorableinformation to patients. However, Matsushima et al. showed that 85% of English-speakingJapanese Americans desired to make treatment decisions on their own, as compared toonly 36% of Japanese individuals living in Japan [18]. Another Japanese study had shownthat only 4.7% of patients with end-stage HF participated in EOLC discussions [19]. Inthe present study, EOLC discussions were more frequent in patients who died in Era 2.Moreover, the number of patients who underwent invasive procedures prior to death wassignificantly lower among patients who died in Era 2. Our findings suggest that HF-PCTactivities might facilitate EOLC discussions based on patient values and preferences andcould avoid unnecessary invasive treatment prior to death.
The current study did not confirm the existence of the ACP process. However, EOLCdiscussions with patients are an extension of the ACP process. The latest survey, conductedby the Japanese Ministry of Health, Labour and Welfare in 2017, indicated that 64.9% ofJapanese individuals approved ACP and that 66% of them agreed to make an advancedirective [20]. Furthermore, the newly revised Japanese Guidelines on the Diagnosis andTreatment of Acute and Chronic Heart Failure consider ACP as a class I recommendationfor the management of HF [9]. Reflecting such situations, ACP and patient-centereddecision-making processes have become an increased focus in Japan.
178
Nutrients 2021, 13, 2387
4.2. Symptom Management
In this study, many patients who died in Era 2 received opioids for refractory dyspnea.Kuragaichi et al. reported in a nationwide survey that dyspnea is the most common symp-tom requiring palliative care in patients with HF [10]. Some small studies have shownthat low-dose opioids, especially morphine, relieve breathlessness in these patients [21,22],although another study does not support this finding [23]. Further studies are required toinvestigate appropriate opioid use in patients with HF and refractory dyspnea. Further-more, there has been little evidence for palliative sedation in non-cancer patients, includingHF [24]; however, in this study, 36% of non-intubated patients with HF who died in Era2 received palliative sedation. Palliative sedation is only performed to relieve intractabledistress at the end of life, but not to hasten death [25]. Clinicians should discuss the indi-cation of palliative sedation with a multidisciplinary team such as an HF-PCT in termsof the patients’ benefits, goals, and risks, as well as the limited prognosis and presence oftreatable factors. Psychological issues are also important problems in patients with HF. Inparticular, depression has an independent impact on morbidity and mortality in HF [26,27].It is important to recognize psychological problems that may occur in the complex diseasetrajectory of HF. In this study, specialized psychiatric care was more often performed inpatients with HF who died in Era 2; therefore, the HF-PCT may promote psychologicalsupport.
4.3. Diet in Palliative Care of Patients with HF
Food intake is extremely important in human life. Clinical evidence on the adminis-tration of artificial nutrition at the end of life is limited, even in oncology, and even more inHF. However, the goal of nutritional care at the end of life may be the same in both cancerand HF, in which it needs to change from maintaining nutritional status and function toensure the patient’s well-being and quality of life [7]. In addition, the enjoyment of foodmay increase when restrictions are lifted. In Era 2 of this study, patients with HF, whohad maintained food intake until three days prior to death, were provided symptomaticrelief using opioids and dietary modification—providing a normal diet, not a low-sodiumdiet. Extensive communication and psychosocial support between the healthcare teamand patients and/or families are important to alleviate distress related to food intakeand weight loss, eliminate false expectations about nutrition, and set goals for nutritionalcare [28]. In this study, discussing EOLC with multidisciplinary support was associatedwith a decrease in the use of artificial nutrition in the last three days of life. If HF-PCTactivities provide more opportunities to discuss EOLC in the future, the administration ofunnecessary artificial nutrition may be avoided, and patients may be able to enjoy theirmeals at the end of life.
4.4. Limitations
The present study has several limitations. First, the retrospective and single-centernature of this study, including the small number of study patients, might have resulted in acertain extent of bias. Second, patients who die at a university hospital may be a selectedgroup, incorporating bias. Thus, future studies should include a larger population andmore hospitals. Third, although palliative care should be provided at the early stage of alife-threatening illness, only patients with HF who died at our hospital were included inthis study. Further research is required to confirm whether palliative care would benefitpatients from an earlier stage of HF. Fourth, since this study focuses on correlations betweeneras, reverse causality and hidden causal relationships may exist. Fifth, Era 1 and Era 2differ not only in the existence of HF-PCT but also in the time background of HF palliativecare awareness. The time background may be responsible for the differences found betweenthe two eras. Sixth, because of the retrospective nature of the study, we could not evaluateobjective health-related quality of life indicators in determining the effectiveness of HF-PCTconsultation. Seventh, we will examine a longer period before death in the next study in
179

Nutrients 2021, 13, 2387
near future. Finally, further research is required to examine how to provide HF palliativecare that is adapted to the healthcare system in Japan.
5. Conclusions
Despite increasing attention on palliative care in HF, providing optimal palliative careat the end of life presents many challenges and complexities. The present study indicatedthat HF-PCT activities provide an opportunity to discuss EOLC with patients, reduce theburden of physical and mental symptoms, and may shift the goals of end-of-life nutritionalcare to ensuring comfort and quality of life.
Author Contributions: Conceptualization, T.S., K.M., K.S. and N.N.; methodology, H.A. and Y.F.;formal analysis, T.S.; investigation, K.U., Y.Y., K.T., M.M., K.O. and T.Y.; data curation, T.S.; writing—original draft preparation, T.S.; supervision, S.N., J.T. and H.Y.; project administration, Y.F. All authorshave read and agreed to the published version of the manuscript.
Funding: This research received no external funding.
Institutional Review Board Statement: The study was conducted in accordance with the guidelinesof the Declaration of Helsinki and approved by the Institutional Review Board of Kurume University(No. 18066).
Informed Consent Statement: The release of research information in this study allowed us to collectand analyze data without obtaining written informed consent from each patient.
Data Availability Statement: Data supporting the results obtained in this study are available fromthe corresponding author upon reasonable request. All data were obtained from the subjects and arenot available to the public for ethical reasons.
Acknowledgments: The authors thank the great contribution of the Heart Failure Support Team ofKurume University Hospital (Tomomi Sano, Toyoharu Oba, Takanobu Nagata, Naoki Horikawa,Hiroshi Eguchi, Koji Akasu, Kyoko Nuruki, Michiko Mukae, Moe Tokunaga, Mika Sumiyoshi, MasaeAoki, Yuki Umeno, Ryoko Fukumori, Tomoko Ishikawa, Miki Sakaguchi, Natsumi Maruyama, YukiKamori, Hideki Kojima, and Keiko Nishie) and all medical staff involved in this study.
Conflicts of Interest: The authors declare no conflict of interest.
References
1. Moens, K.; Higginson, I.J.; Harding, R.; Brearley, S.; Caraceni, A.; Cohen, J.; Costantini, M.; Deliens, L.; Francke, A.L.; Kaasa, S.;et al. Are There Differences in the Prevalence of Palliative Care-Related Problems in People Living with Advanced Cancer andEight Non-Cancer Conditions? A Systematic Review. J. Pain Symptom Manag. 2014, 48, 660–677. [CrossRef]
2. Bekelman, D.B.; Havranek, E.P.; Becker, D.M.; Kutner, J.S.; Peterson, P.N.; Wittstein, I.S.; Gottlieb, S.H.; Yamashita, T.E.; Fairclough,D.L.; Dy, S.M. Symptoms, Depression, and Quality of Life in Patients with Heart Failure. J. Card. Fail. 2007, 13, 643–648. [CrossRef]
3. Allen, L.A.; Stevenson, L.W.; Grady, K.L.; Goldstein, N.E.; Matlock, D.D.; Arnold, R.M.; Cook, N.R.; Felker, G.M.; Francis, G.S.;Hauptman, P.J.; et al. Decision making in advanced heart failure: A scientific statement from the Amer-ican Heart Association.Circulation 2012, 125, 1928–1952. [CrossRef] [PubMed]
4. Allen, L.A.; Yager, J.E.; Funk, M.J.; Levy, W.C.; Tulsky, J.A.; Bowers, M.T.; Dodson, G.C.; O’Connor, C.M.; Felker, G.M. Discordancebetween patient-predicted and model-predicted life expectancy among am-bulatory patients with heart failure. JAMA 2008, 299,2533–2542. [CrossRef]
5. Silveira, M.J.; Kim, S.Y.; Langa, K. Advance Directives and Outcomes of Surrogate Decision Making before Death. N. Engl. J. Med.2010, 362, 1211–1218. [CrossRef]
6. Makino, J.; Fujitani, S.; Twohig, B.; Krasnica, S.; Oropello, J. End-of-life considerations in the ICU in Japan: Ethical and legalper-spectives. J. Intensive Care 2014, 2, 9. [CrossRef]
7. Yamamoto, K.; Tsuchihashi-Makaya, M.; Kinugasa, Y.; Iida, Y.; Kamiya, K.; Kihara, Y.; Kono, Y.; Sato, Y.; Suzuki, N.; Takeuchi, H.;et al. Japanese Heart Failure Society 2018 Scientific Statement on Nutri-tional Assessment and Management in Heart FailurePatients. Circ. J. 2020, 84, 1408–1444. [CrossRef]
8. Yancy, C.W.; Jessup, M.; Bozkurt, B.; Butler, J.; Casey, D.E., Jr.; Drazner, M.H.; Fonarow, G.C.; Geraci, S.A.; Horwich, T.; Januzzi,J.L.; et al. 2013 ACCF/AHA Guideline for the Management of Heart FailureA Report of the American College of CardiologyFoundation/American Heart Association Task Force on Practice Guidelines. J. Am. Coll. Cardiol. 2013, 62, e147–e239. [CrossRef]
9. Tsutsui, H.; Isobe, M.; Ito, H.; Okumura, K.; Ono, M.; Kitakaze, M.; Kinugawa, K.; Kihara, Y.; Goto, Y.; Komuro, I.; et al. JCS2017/JHFS 2017 Guideline on Diagnosis and Treatment of Acute and Chronic Heart Failure—Digest Version. Circ. J. 2019, 83,2084–2184. [CrossRef] [PubMed]
180

Nutrients 2021, 13, 2387
10. Kuragaichi, T.; Kurozumi, Y.; Ohishi, S.; Sugano, Y.; Sakashita, A.; Kotooka, N.; Suzuki, M.; Higo, T.; Yumino, D.; Takada, Y.; et al.Nationwide Survey of Palliative Care for Patients with Heart Failure in Japan. Circ. J. 2018, 82, 1336–1343. [CrossRef]
11. Hopp, F.P.; Zalenski, R.J.; Waselewsky, D.; Burn, J.; Camp, J.; Welch, R.D.; Levy, P. Results of a Hospital-Based Palliative CareIntervention for Patients with an Acute Exacerbation of Chronic Heart Failure. J. Card. Fail. 2016, 22, 1033–1036. [CrossRef]
12. Sidebottom, A.C.; Jorgenson, A.; Richards, H.; Kirven, J.; Sillah, A. Inpatient palliative care for patients with acute heart failure:Outcomes from a randomized trial. J. Palliat. Med. 2015, 18, 134–142. [CrossRef]
13. McKee, P.A.; Castelli, W.P.; McNamara, P.M.; Kannel, W.B. The Natural History of Congestive Heart Failure: The FraminghamStudy. N. Engl. J. Med. 1971, 285, 1441–1446. [CrossRef]
14. Mizuno, A.; Shibata, T.; Oishi, S. The Essence of Palliative Care Is Best Viewed as the “Problematization”. J. Palliat. Med. 2019,22, 6. [CrossRef] [PubMed]
15. Weng, L.; Joynt, G.M.; Lee, A.; Du, B.; Leung, P.; Peng, J.; Gomersall, C.D.; Hu, X.; Yap, H.Y.; Chinese Critical Care Ethics Group.Attitudes towards ethical problems in critical care medicine: The Chinese perspective. Intensiv. Care Med. 2011, 37, 655–664.[CrossRef] [PubMed]
16. Shin, D.W.; Lee, J.E.; Cho, B.; Yoo, S.H.; Kim, S.; Yoo, J.-H. End-of-life communication in Korean older adults: With focus onadvance care planning and advance directives. Geriatr. Gerontol. Int. 2015, 16, 407–415. [CrossRef] [PubMed]
17. Akabayashi, A.; Slingsby, B.T.; Kai, I. Perspectives on advance directives in Japanese society: A population-based questionnairesurvey. BMC Med. Ethic. 2003, 4, 5. [CrossRef] [PubMed]
18. Matsumura, S.; Bito, S.; Liu, H.; Kahn, K.; Fukuhara, S.; Kagawa-Singer, M.; Wenger, N. Acculturation of attitudes towardend-of-life care: A cross-cultural survey of Japanese Americans and Japanese. J. Gen. Intern. Med. 2002, 17, 531–539. [CrossRef][PubMed]
19. Nakamura, K.; Kinugasa, Y.; Sugihara, S.; Hirai, M.; Yanagihara, K.; Haruki, N.; Matsubara, K.; Kato, M.; Yamamoto, K. Sexdifferences in surrogate decision-maker preferences for life-sustaining treatments of Japanese patients with heart failure. ESCHeart Fail. 2018, 5, 1165–1172. [CrossRef]
20. Ministry of Health, Labour and Welfare. Survey on Attitudes toward Medical Care in the End Stages of Life. Available online:https://www.mhlw.go.jp/toukei/list/dl/saisyuiryo_a_h29.pdf (accessed on 20 June 2021).
21. Johnson, M.; McDonagh, T.; Harkness, A.; McKay, S.; Dargie, H. Morphine for the relief of breathlessness in patients with chronicheart failure-a pilot study. Eur. J. Heart Fail. 2002, 4, 753–756. [CrossRef]
22. Williams, S.G.; Wright, D.J.; Marshall, P.; Reese, A.; Tzeng, B.H.; Coats, A.J.; Tan, L.B. Safety and potential benefits of low dosediamorphine during exercise in patients with chronic heart failure. Heart 2003, 89, 1085–1086. [CrossRef]
23. Oxberry, S.G.; Torgerson, D.; Bland, J.M.; Clark, A.L.; Cleland, J.G.; Johnson, M. Short-term opioids for breathlessness in stablechronic heart failure: A randomized controlled trial. Eur. J. Heart Fail. 2011, 13, 1006–1012. [CrossRef] [PubMed]
24. Swart, S.J.; Rietjens, J.A.; van Zuylen, L.; Zuurmond, W.W.; Perez, R.S.; Van Der Maas, P.J.; Van Delden, J.J.; Van Der Heide,A. Continuous Palliative Sedation for Cancer and Noncancer Patients. J. Pain Symptom Manag. 2012, 43, 172–181. [CrossRef][PubMed]
25. Romano, M. The Role of Palliative Care in the Cardiac Intensive Care Unit. Healthcare 2019, 7, 30. [CrossRef] [PubMed]26. Gathright, E.C.; Goldstein, C.M.; Josephson, R.A.; Hughes, J.W. Depression increases the risk of mortality in patients with heart
failure: A meta-analysis. J. Psychosom. Res. 2017, 94, 82–89. [CrossRef]27. Rutledge, T.; Reis, V.A.; Linke, S.E.; Greenberg, B.H.; Mills, P.J. Depression in Heart Failure: A Meta-Analytic Review of Prevalence,
Intervention Effects, and Associations with Clinical Outcomes. J. Am. Coll. Cardiol. 2006, 48, 1527–1537. [CrossRef]28. Orrevall, Y. Nutritional support at the end of life. Nutrition 2015, 31, 615–616. [CrossRef]
181


MDPISt. Alban-Anlage 66
4052 BaselSwitzerland
Tel. +41 61 683 77 34Fax +41 61 302 89 18
www.mdpi.com
Nutrients Editorial OfficeE-mail: [email protected]
www.mdpi.com/journal/nutrients


MDPI
St. Alban-Anlage 66
4052 Basel
Switzerland
Tel: +41 61 683 77 34
Fax: +41 61 302 89 18
www.mdpi.com ISBN 978-3-0365-3892-1