Comments and Discussion
49
Electronic copy available at: http://ssrn.com/abstract=1809708 Annamaria Lusardi, Daniel Schneider and Peter Tufano Financially Fragile Households Evidence and Implications Discussion Paper 03/2011-013
Transcript of Comments and Discussion

Electronic copy available at: http://ssrn.com/abstract=1809708
Annamaria Lusardi, Daniel Schneider and Peter Tufano
Financially Fragile Households Evidence and Implications
Discussion Paper 03/2011-013

Electronic copy available at: http://ssrn.com/abstract=1809708
Financially Fragile Households: Evidence and Implications
March 7, 2011
Annamaria Lusardi The George Washington University School of Business, Financial Literacy Center, and NBER
Daniel Schneider Princeton University Peter Tufano Harvard Business School (through June 30, 2011), University of Oxford Saïd Business School (as of July 1, 2011), NBER, and Doorways to Dreams Fund
© 2011 Lusardi, Schneider and Tufano

Electronic copy available at: http://ssrn.com/abstract=1809708
Financially Fragile Households: Evidence and Implications*
This paper examines households’ financial fragility by looking at their capacity to come up with $2,000 in 30 days. Using data from the 2009 TNS Global Economic Crisis survey, we document widespread financial weakness in the United States: Almost half of Americans report that they are incapable of coming-up with the funds necessary to deal with an ordinary financial shock. While financial fragility is more severe among those with low educational attainment and no financial education, families with children, those who suffered large wealth losses, and those who are unemployed, a sizable fraction of seemingly “middle class” Americans judge themselves to be financially fragile. We examine the coping methods people use to deal with shocks. While savings is used most often, relying on family and friends, using formal and alternative credit, increasing work hours, and selling items are also used frequently to deal with emergencies, especially for some subgroups. Household finance researchers must look beyond precautionary saving to understand how families cope with risk. We also find evidence of a pecking order of coping methods in which savings appears to be first in the ordering. Finally, the paper compares the levels of financial fragility and methods of coping among eight industrialized countries. While there are differences in coping ability across countries, there is general evidence of a consistent ordering of coping methods.
*Contact information: Annamaria Lusardi, The George Washington School of Business, 2201 G Street, NW, Washington, DC, 20052 ([email protected]); Financial Literacy Center and NBER. Daniel Schneider, Princeton University, Department of Sociology and Office of Population Research, Princeton, NJ, 08544 ([email protected]); Peter Tufano, through June 30, 2011: Sylvan C. Coleman Professor of Financial Management, Harvard Business School, Soldiers Field, Boston, MA 02163 ([email protected]); as of July 1, 2011, Peter Moores Dean, University of Oxford, Saïd Business School, Park End Street, Oxford OX1 1HP, United Kingdom ([email protected]); NBER and Doorways to Dreams Fund (www.d2dfund.org). We would like to thank TNS Global and, in particular, Bertina Bus, Maria Eugenia Garcia Neder, Ellen Sills-Levy, and Bob Neuhaus. We are grateful for the comments from our colleagues, seminar participants at Columbia Business School, the American Economic Association meetings, the Association for Public Policy Analysis and Management conference, and especially from Sumit Agarwal, Arie Kaptein, Kartini Shastry, and the editors, David Romer, and Justin Wolfers. Lusardi gratefully acknowledges financial support from Netspar. Schneider thanks the National Science Foundation Graduate Research Fellowship and Princeton University for financial support. Tufano thanks the HBS Division of Research and Faculty Development for financial support for this work. We are grateful to Andrea Ryan and Dan Quan for research assistance. The views expressed herein do not reflect those of TNS Global.

2
Introduction
Economists and policymakers have focused on various elements of consumer financial
behavior to gauge the overall wellbeing of households and of the economy. For example, the
household savings rate, its converse—the rate of consumer spending, and household borrowing
levels are commonly used aggregate metrics. On the micro-level, researchers have studied the
distribution of wealth across the population, for example to assess households’ abilities to afford to
retire. Other research examines households’ abilities to withstand financial shocks, usually by
looking at their savings levels and access to credit. Yet other work examines bankruptcy filings as a
metric of financial problems. Our work builds upon this large literature, but characterizes financial
fragility by examining households’ abilities to access emergency funds from any source. In
particular, we study U.S. households’ abilities to come up with $2,000 in 30 days, and we compare
their coping ability with households in seven other industrialized countries.
Using this $2000/30 day metric of financial fragility, we find widespread financial weakness
in America, with almost half of all households reporting that they could probably or certainly not
come-up with funds to deal with an ordinary financial shock of this size. We characterize the cross-
sectional distribution of financial fragility and we show that it is not just a poor person’s problem: a
material fraction of the solidly middle class is pessimistic about their ability to come up with $2000
in a month. Our work allows us to begin to characterize a “pecking order” of coping mechanisms,
broadly rationalize them on the basis of direct and indirect costs, and suggest some implications of
these patterns. Finally, we compare the levels of financial fragility and methods of coping across
eight industrialized countries. While we find differences in coping ability, we find a largely
consistent ordering of coping methods.
This textured description of households’ financial fragility and coping mechanisms, while
raising many questions, is useful to advance economic research, public policy, and business practice.
We make two principal contributions to the research literature. First, the fragility measure we
propose may be a powerful metric that enlightens empiricists’ understanding of important
household decisions. In related work, we have found that our simple measure of financial fragility is
more predictive than traditional demographic data in understanding consumer behavior, in particular
decisions with respect to cutting back health care usage and with respect to individuals’ attitudes
about financial regulation (Lusardi, Schneider and Tufano, 2010; Tufano, 2011). Second, just as
pecking order theory led to advances in understanding corporate financial decisions, we hope that
our work will stimulate new economic research on why households’ have certain ordered methods

3
for coping—and what the implications are for the interactions between various financial markets
and decisions.
We believe that a full consideration of financial fragility will enlighten public policy. In
advocacy and policy circles, asset building for long horizon goals (retirement, education, small
business development) has understandably been the primary focus. While the U.S. government
provides extensive direct and indirect subsidies to long-horizon savings, there is much less, if any,
explicit policy related to short-term emergency savings. For example, home borrowing (and
indirectly long-term savings in equity build-up) is tax advantaged through home mortgage
deductions and as long-term investing is advantaged through long-term capital gains rates. At the
same time, income earned from emergency savings accounts receives no special treatment. To the
contrary, asset limits on many social programs actively discourage low-income families from
building-up savings. While borrowing from family and friends is a critical element of household
coping, it is virtually invisible in public policy. Finally, discussions of regulating and banning high
cost short-term borrowing schemes do not typically acknowledge their place in the pecking order of
coping mechanisms.
Finally, the level of financial fragility we identify suggests business opportunities for firms to
provide better products for households. For example, a debit card structure with an associated
credit line or overdraft facility represents two elements of the pecking order we observe, drawing
first from savings and then from credit. However, our work might suggest that there might be the
possibility to draw first from savings, then a constrained pool of friends and family funds, and then
finally credit.
In the remainder of the paper we briefly summarize some of the related literature on
financial fragility and coping, describe our data source, summarize the results on financial fragility
levels, analyze the cross-sectional determinants of coping, describe the apparent hierarchy of coping
mechanisms, and report on cross national comparisons. We conclude with a discussion of the
implications of our work.
Related Research
Most of the work in both macroeconomics and microeconomics on how individuals manage
short-term risks and their exposure to shocks focuses on precautionary savings and asset levels.
According to theory, risk-averse individuals who face uninsurable risks accumulate wealth to shield
themselves against shocks (Deaton 1992, Carroll, 1997). But, many empirical studies, including one
based on recent data from the Financial Capability Study (Lusardi, 2010), find that, in fact, many

4
households hold few or no assets and that they are very vulnerable to shocks (Caner and Wolff,
2004). Others have documented the paucity of assets among certain groups of the population
(Oliver and Shapiro, 1995; Conley, 1999; Havemann and Wolff, 2004; Bucks, Kennickell, and
Moore, 2004; Sherraden, 2005). It has, however, been very difficult to evaluate the strength of the
precautionary motive in the economy and estimates of the amount of precautionary wealth have
varied considerably in the literature, from zero or very small values (Skinner, 1988), to moderate
values of less than ten percent of wealth (Hurst, Lusardi, Kennickell and Torralba, 2010), to values
of fifty percent of household wealth (Carroll and Samwick, 1997, 1998), depending on the empirical
specifications and the datasets under consideration.
Looking at assets alone may be misleading. Household’s assets may be low not because they
did not accumulate wealth, but because they have already experienced shocks that depleted savings.
There are also numerous, often unobservable, characteristics about the individual and the
environment that determine how much wealth people wish to hold, including risk aversion, rate of
time preferences, and the subjective probability of facing shocks, for which we often do not have
good data (see Deaton, 1992 and Lusardi and Browning, 1996, for an overview of theoretical models
of precautionary saving).
Most importantly, assets are not the only way in which individuals can buffer themselves
against shocks. Individuals could access credit for example, via credit cards, home equity lines of
credit, or loans on retirement accounts, all of which expanded considerably over the past four
decades. Indeed, in many theoretical models, positive amounts of precautionary savings are
generated by imposing liquidity constraints that prevent the individual from borrowing or drawing
down the assets to zero (Deaton, 1991). Given the significant access to personal credit that has, until
recently, been available in the U.S., these assumptions are debatable. Second, as emphasized in the
sociological literature, individuals can and do rely on the networks of family and friends to cope with
unexpected financial shocks (Biggs, 1998; Sarkasian and Gerstel, 2004; Henley, Danziger, and Offer,
2005; Harknett and Knab, 2007). Some economic models have argued that the family can be a very
effective way to insure against longevity risk and can provide insurance in place of or perhaps better
than financial or insurance markets (Kotlikoff and Spivak, 1981). Moreover, there is evidence of
significant borrowing and lending within the family and with relatives and friends. For example,
24% of all Americans claim to have borrowed money from a family member of friend during the
Great Recession (Taylor, Morin, and Wang, 2010) and 9% of Americans reported having
outstanding loans to family or friends in 2004 (El Hage, Schneider, and Tufano, 2006). While
economic models of precautionary savings have not incorporated this channel into their schemes,

5
other models have considered the possibility that individuals might make adjustments on other
margins, for example by increasing the labor supply or sending one of the spouses to work.
These considerations do not exhaust the list of activities that people can engage in when
faced with a shock. For example, according to Aguiar and Hurst (2005), the unemployed increase
their home production of goods, reducing their expenditure on goods but not their consumption as
much. Also, many hold non-financial assets that may be sold (car(s), furniture, jewelry, and so on),
items that are not normally included in measures of wealth (or liquid wealth).
One feature we would like to better incorporate into existing models of savings is the wide
heterogeneity in household behavior that has been documented in all existing savings studies
(Browning and Lusardi, 1996), and is documented in this paper as well. Heterogeneity in behavior
may reflect differences in economic circumstances and opportunity (e.g., education and wealth),
differences in attitudes and preferences, or differences in financial capabilities (Lusardi, 2009). On
the latter point, there is mounting evidence that many individuals, in the United States and
elsewhere, are not familiar with basic financial concepts, such as interest compounding, inflation and
basic asset pricing (see Lusardi (2008) for an overview), and especially risk diversification (Lusardi
and Mitchell, 2011a). Variations in households’ abilities to cope could reflect these factors.
Moreover, the risk preferences used in many neo-classical models of saving seem at odds with the
prevalence and amount of gambling in large sectors of the population (Tufano et al., 2011). In
addition to naiveté or specific risk preferences, gambling may also proxy for different attitudes
toward the future, and may be related to households’ preparedness to cope with financial shocks
The financial crisis may heighten heterogeneity insofar as individuals were affected
differentially by shocks that accompanied the crisis, i.e., a surge in the unemployment rate and a
sharp decline in both the stock market and the housing market. Households’ abilities to cope would
likely be a function of the extent to which they experienced these shocks.
Data and Outline of Approach
In this paper, we use an indicator of financial fragility that overcomes some of the problems
of the measures described above. We rely on a self-assessed measure of capacity to deal with
financial shocks regardless of the source of funds. Thus, we ask the individual to assess whether, for
example, his assets, capacity to borrow, network of family and friends, or other strategies can shield
him against shocks. Specifically, we ask respondents: “How confident are you that you could come up with
$2,000 if an unexpected need arose within the next month?” Respondents could reply, “I am certain I could
come up with the full $2,000,” “I could probably come up with $2,000,” “I could probably not come up with

6
$2,000,” or “I am certain I could not come up with $2,000.” They could also state that they do not know
or they could refuse to answer. Because we are dealing with an unexpected event in the future, it is
important to ask about confidence rather than a yes or no question. The $2,000 figure reflects the
order of magnitude of the cost of an unanticipated major car repair, a large co-payment on a medical
expense, legal expenses, or a home repair.1 Our question asks about whether the individuals could
“come up with” the funds—not whether they have them in the form of savings. This is again
important as individuals may not rely on saving only. This type of question has been used in other
settings. The Australian Household Expenditure Survey asked a similar question in 2002
(Worthington, 2003). In fact, these sorts of questions are common in the financial planning
literature, where having emergency funds is one of the recommendations that financial planners
provide to households, but where emergency funds are sometimes considered synonymous with
savings (Chieffe and Rakes, 1999). In our discussion, we use the terms “capacity to cope” and
“come up with the needed funds” interchangeably, although the latter is more exact.
To gauge how respondents would cope with a financial shock, survey respondents (except
those who stated that they would certainly be unable to come up with $2,000 in response to the
prior question), were asked: “If you were to face a $2,000 unexpected expense in the next month, how would you
get the funds you need?”2 Respondents were presented with a list of 14 options (plus “other” and “don’t
know”) and were instructed that “if there is one source that you would use, select it. If you would use multiple
sources, please select up to three.” The list of 14 options was randomized onscreen to avoid response-
order bias, and the category labels given below were not part of the survey. The list was composed
of the following methods, grouped by type:
• Savings: (1) draw from savings, (2) liquidate or sell investments, (3) liquidate some retirement investments even if it required me to pay a penalty (4) borrow against my retirement savings at my employer3
• Family/friends: (5) borrow or ask for help from my family, (6) borrow or ask for help from my friends (not members of my family)
• Traditional credit: (7) use credit cards, (8) open or use a home equity line of credit or take out a second mortgage, (9) take out an unsecured loan
1 Brobeck (2008) reports that low-income families claim to need about $1500 in savings for emergencies. Edmunds.com, the auto web site, suggests that the replacement of an auto transmission can cost $2000. http://www.edmunds.com/ownership/techcenter/articles/43836/article.html. 2 Respondents in the UK were asked about £1,500 expense, respondents in Canada about a C$2,000 expense, and respondents in France, Germany, Italy, Portugal, and the Netherlands about at €1,500 expense. 3 Due to the institutional details of certain retirement plans, funds can be accessed prematurely through borrowing. According to the Financial Capability Survey, 9% of individuals who have self-directed retirement accounts have taken out a loan from their retirement accounts and 5% have taken a hardship withdrawal (Lusardi, 2010). We include these coping methods as drawing upon savings, rather than as borrowing from a third party. We also combine items 3 and 4 into a single response for the purposes of presentation.

7
• Alternative credit: (10) get a short term payday or payroll advance loan, (11) pawn an asset I own • Work more: (12) work overtime, get a second job, or another member of my household would work longer or
go to work) • Selling possessions: (13) sell things I own, except my home, (14) sell my home
These questions were added to a new survey fielded in 13 countries: the TNS Global
Economic Crisis survey. The survey was administered via an online panel by the survey research
firm TNS Global (www.tnsglobal.com and in collaboration with two of the authors, Lusardi and
Tufano. TNS, which has substantial experience in designing and administering cross-national
surveys, reviewed the questions before they were fielded both in the United States and in other
countries. The various country surveys were fielded between June and September 2009. The
country samples were designed to be nationally representative and were subsequently weighted to
reflect each nation’s population. To the extent that internet access is stratified by socio-economic
status, we expect that the data may under-represent individuals who are the most at risk. This paper
deals primarily with the 2,148 United States survey participants, all of whom were between the ages
of 18 and 65. We also perform an international comparison to assess financial fragility in other
countries. To limit the comparison to countries which are relatively similar to the United States and
to each other in term of economic structure and development of financial markets, we study
respondents in eight high-wealth Western countries: the United States, the United Kingdom,
Canada, France, Germany, Italy, the Netherlands, and Portugal. Our final sample is composed of
9,147 observations.
To examine financial fragility in the wake of a financial crisis, the survey includes not only
demographic and economic attributes, such as age, gender, race/ethnicity, marital status, presence of
children, income, but also information about wealth, wealth losses and unemployment. Specifically,
respondents were asked to report current levels of financial assets. Moreover, to capture recent
financial shocks, respondents were asked if they were unemployed and looking for work, and
whether over the past year their wealth had increased (> 10% or 1% - 10%), stayed the same, or
decreased (1% - 10%; 10% - 29%; 30% - 50%; or > 50%). To capture behavioral heterogeneity, we
have also included proxies for financial literacy in general and risk literacy in particular. Following
Bernheim, Garrett and Maki (2001), we have information on whether individuals were exposed to
financial education in school, a variable which was shown to be correlated with saving later in life.
Moreover, as reported in the Appendix, individuals were asked three questions aimed to measure
knowledge of risk, which we name risk literacy. Finally, respondents were asked if they had played
8
the lottery or had engaged in betting on sports or games of chance in the year leading up the
financial crisis.
Information for many of these items was collected from respondents in all eight countries,
however, not every question was asked in every country and in many cases the response options are
not easily harmonized across countries. For that reason, Appendix Table 1 displays univariate
statistics for these measures for the United States only and compares the distributions of responses
from the TNS survey with pooled 2006-2008 American Community Survey (ACS) data and with
data from the 2007 Survey of Consumer Finances (SCF) for the United States. In general, our
sample matches well in terms of basic demographics, including age, gender, and geography.
However, our sample is underrepresented with respect to minorities and families with children, and
is slightly better educated than the ACS sample. Our sample is also quite similar to the overall
population, as measured by the 2007 SCF, in terms of wealth.
In our empirical analysis, described in the next section, we examine American respondents’
perceived capacity to cope with an unexpected expense. Here, we are primarily concerned with
describing the level of coping capacity in the U.S. population and with describing the correlation
between coping capacity and socio-economic and demographic characteristics. We tabulate
descriptive statistics and estimate probit models of the relationship between a dichotomous indicator
of confidence in ability to cope and the respondent characteristics. In these and in all analyses, we
handle missing data by including indicators for non-response on covariates in our regression models,
but exclude respondents with missing data on the dependent variable.
Second, we examine the ways in which U.S. respondents foresee coping with such a financial
shock. Here, we examine the frequency with which different coping methods are named, including
savings but also taking account of a much more complete range of coping options. We next
describe a “pecking order” of coping responses. To establish this ordering, we examine three
indicators: (1) the ways in which coping methods are used in isolation or combined, (2) the
association between different coping methods and confidence in capacity to cope, and (3) the socio-
economic and demographic correlates of each type of coping method. For this final aspect of the
analysis, we estimate six separate probit regressions with the outcome variable being naming a
coping method involving (1) savings, (2) family/friends, (3) mainstream credit, (4) alternative
financial services, (5) additional work, and (6) selling possessions and the predictors, in each case,
being the demographic and economic covariates described above.

9
Third, we provide some comparative analysis, contrasting perceived capacity to cope, coping
methods, and number of coping methods in the United States and in the other seven Western
developed countries in our sample.
Empirical Results
Americans’ Financial Fragility
American’s capacity to cope with financial emergency is strikingly limited. The first row of
Table 1 presents the share of respondents according to whether they could certainly cope with a
financial emergency in the next month that required them to come up with $2,000, probably could
do so, probably could not do so, and certainly could not do so. These figures reveal that half of
Americans report that they would probably or certainly be unable to cope with such an emergency.4
More specifically, 24.9% of respondents reported being certainly able to cope, 25.1% probably able
to cope, 22.2% probably unable to cope, and 27.9% certainly unable to cope.
This finding is broadly consistent with other studies. For example, when asked whether
“they have set aside emergency or rainy day funds that cover your expenses for 3 months, in case of
sickness, job loss, economic downturn, or other emergencies,” only 49% of respondents in the 2009
Financial Capability Study responded affirmatively.5 Data from the most recent Survey of Consumer
Finances in 2007 shows that households hold little in liquid assets, such as checking, saving, and
money market mutual funds; as many as 42.4% of Americans have $2,000 or less in those liquid
assets. A related measure of financial fragility is the ability to make ends meet. The Pew Research
Center for the People and the Press has regularly asked a national sample of Americans, if they
“often don’t have enough money to make ends meet.” Forty-two percent of Americans completely
or mostly agreed with that statement in 2009. Similarly, nearly half of survey respondents in the
Financial Capability Study reported facing difficulties in covering monthly expenses and paying bills
(Lusardi, 2010).
4 These statistics exclude respondents who replied that they “did not know” if they could cope with an emergency of this kind. Including all respondents, about 46% certainly or probably could raise the funds, 47% certainly or probably could not raise the funds, and the remaining 7% claimed not to know. 5 In consultation with the U.S. Department of the Treasury and the President’s Advisory Council on Financial Literacy, the FINRA Investor Education Foundation supported a national study of the financial capability of American adults, named the Financial Capability Study. The overarching research objectives were to benchmark key indicators of financial capability and evaluate how these indicators vary with underlying demographic, behavioral, attitudinal, and financial literacy characteristics. For detail, see Lusardi (2010) and http://www.finrafoundation.org/resources/research/p120478

10
The capacity to cope with emergency is not only generally limited but also varies significantly
with the economic and demographic characteristics of individuals and their households. We observe
a pronounced gradient in capacity to cope by income and education. While those with higher
income and greater educational attainment report higher capacity to cope, a high proportion of
individuals at middle class levels of income report they are certainly or probably not able to cope.
Moreover, even among those with some higher education, for example some college, more than half
judge they would be certainly or probably not able to cope. While inability to cope is severe among
the less educated and low-income, this phenomenon is not limited to the poor or to a small group of
the population. It seems somewhat unbelievable that nearly a quarter of households making between
$100,000 and $150,000 claim not to be able to raise $2,000 in a month, but this fact may be less
shocking when one considers costs of living in urban areas, costs of housing and childcare,
substantial debt service, and other factors (for an earlier discussion, see Warren and Tyagi, 2003).
In the 2008 Presidential Election, this issue came to the fore when there was a vigorous debate
about what “rich” and “middle class” means in our economy.
Similarly, while financial fragility is more pronounced among the young, many of those in
older age groups, who are presumably close to retirement and at a point in life when their wealth
accumulation should at its peak, report having difficulty in coping with a financial a shock. Women
are also less likely to be able to cope with shocks than men. There also appear to be differences in
ability to copy by race/ethnicity with African Americans (and those of other race/ethnicity) more
likely to report being unable (certainly or probably) to deal with a shock, followed closely by
Hispanics. Respondents living in households that include minor children are less able to cope than
those that do not and respondents living in households with their parents are also less able to cope
than those that do not. These characteristics are again consistent with the findings from the
Financial Capability Study (Lusardi, 2010).
The financial crisis is a clear contributor to financial fragility. Those who suffered wealth
losses, particularly large losses in excess of 30%, report greater inability to cope. This may explain
why even some people with sizable absolute amounts of wealth judge that they are unlikely to be
able to cope—lowered wealth in conjunction with high fixed costs and inflexible commitments may
leave little room for flexibility. Not surprisingly, the unemployed are also much more financially
fragile, with just about one third reporting they will certainly or probably able to cope and 41.2%
reporting they will certainly be unable to cope.
Table 2 reports a multivariate analysis of the relationships between economic and
demographic characteristics and capacity to cope, presenting marginal effects from a probit

11
regression where the dependent variable equals one if respondents are probably or certainly able to
cope and zero if they are probably or certainly not able to cope. We find that many of the
relationships described in the univariate analysis hold true in the multivariate analysis. First, the
financial crisis has diminished the ability to cope with shocks: Those with severe wealth losses and
the unemployed are particularly vulnerable to shocks. Some groups, such as the women and those
with children are much less able to deal with shocks, even after accounting for their characteristics
and economic circumstances. Moreover, having higher educational attainment improves the ability
to deal with shocks, even after accounting for income, wealth, and wealth losses. In the multivariate
setting, we see that the ability to cope increases with income, but only those with income above
$60,000 are better able to cope with shocks. Financial assets can also help smooth shocks and we see
a monotonic increase in the ability to deal with shocks with increasing values of wealth above $2000.
Generally, these findings speak to the quality of the data as many of the relationships reported in the
multivariate regressions have the expected sign.
The picture that emerges from this analysis is that many Americans are vulnerable to shocks.
This vulnerability extends to large groups of the population, including those with higher than
average income and higher educational attainment. Women, those with children, and those living
with parents expressed a vulnerability to shocks, even after accounting for demographic and
economic characteristics.
Model 1 (in Table 2) includes just standard demographic variables, but Model 2 adds
additional factors to explain variation in the ability to cope: (1) a dichotomous variable equal to one
if the respondent engaged in gambling, (2) a dichotomous variable equal to one if the respondent
had financial or economic education while in school, and (3) a dichotomous variable equal to one if
the respondent correctly answered the three risk literacy questions (which we take as measure of
being knowledgeable about risk.) After controlling for all of the standard demographics, gamblers
are 7.9% points less likely to be able to come up with $2000 in a month. This could reflect the
depletion of their resources through gambling, a lack of self-control, a willingness to bear more risk
(by having fewer spare resources) or their use of gambling as an (ineffective) means to take care of
their future. On the latter point, a 2006 survey by the Consumer Federation of America and the
Financial Planning Association of a representative sample of more than 1,000 U.S. adults found that
“21% of Americans, and 38% of those with incomes below $25,000, think that winning the lottery
represents the most practical way for them to accumulate several hundred thousand dollars”
(Consumer Federation of America, 2006).

12
People who acknowledge having finance or economics training in school are 10.2% points
more likely to be able to cope, even after controlling for all of the various demographic factors.
This is consistent with previous finding on the effect of knowledge on financial behavior (Lusardi
and Mitchell, 2011a; Bernheim, Garrett and Maki, 2001). This relationship might be causal, or could
reflect some degree of self-selection of educational experiences by certain individuals. We do not
find a relationship between the particular risk literacy measures we tested and the ability to come up
with $2000 in 30 days.
These factors begin to suggest that financial fragility may be part of a broader set of
behaviors. We do not normally study savings and gambling together, but the results here suggest a
link between the two, at least for people’s ability to cope with emergencies.6 Moreover, financial
knowledge may also affect the ability to cope with shocks.
Americans’ Methods of Coping with Financial Emergency
These univariate and multivariate analysis point to some determinants of financial fragility,
but do not address how Americans cope with emergencies. We now examine how people who have
some capacity to cope do so. This analysis excludes those who reported that they are certain they
could not cope with a shock that requires coming-up with $2,000.
The first row of Table 3 shows that more than half of these respondents (55%) indicate
that they would use multiple coping methods. The first column of Table 3 indicates the share of
respondents listing each coping method. For convenience, we have aggregated these methods into
six groups: savings, family or friends, mainstream credit, alternative credit, sale of possessions, and
increased work, but at a more disaggregated list is provided at the end of that table. A large
proportion of those reporting an ability to cope list drawing from savings as a coping method (62%),
even though, for some, this method may require liquidating a retirement investment and paying a
penalty (see bottom of Table 3). Drawing from savings is one method individuals rely on, but
clearly not the only one. Approximately one in three (34%) of those able to cope report relying on
family and friends. A similar proportion (31%) would resort to “main-stream credit,” mostly using a
credit card. Others would rely on alternative credit, such as payday loans or pawn shops. Moreover,
close to one in five (19%) would sell their possessions. Taken together with those who would pawn
their possessions, 17% of these respondents would come up with the funds for an emergency at
6 This link is made clearer in lottery-linked savings schemes. See Kearney et al. (2011), Tufano et al. (2011), Tufano (2008), and Cole et al, (2008).
13
least in part by pawning or selling possessions. Along with the 29.7% respondents who report that
they could certainly not cope with an emergency, this suggests that nearly 47% of American
households are living very close to the financial edge. Another method, which is chosen by 23% of
those able to cope is working more, which includes working overtime, getting a second job or
increased work by another household member. These findings highlight that individuals can and
plan to adjust on several margins when facing a shock, relying not only on formal methods such as
drawing from saving or borrowing, but also relying on assistance from networks of family and
friends. Moreover, many plan to rely on the labor margin, changing either hours of work or supply
of labor.
Table 3 also presents the coping methods mentioned by respondents listing one, two, or
three coping methods. The second column of the table (labeled “One”) shows that savings,
mentioned by 65%, is the predominant coping strategy among those naming just one coping
strategy. Savings is followed by just using family/friends (13%) and then by just using mainstream
credit (11%). Even smaller shares of respondents would turn to just using alternative credit
providers, just the sale of possessions, or just increased work.
The third column of Table 3 presents the coping strategies listed by respondents who list at
least two coping strategies.7 Among these respondents, savings is still the most commonly
mentioned (64%), followed by family/friends and mainstream credit (at 36% and 39% respectively).
While alternative credit, work, and selling possessions were very rarely used in isolation, they are
somewhat more commonly used in combination with one other method, with 8% of respondents
naming an alternative credit provider and a fifth of respondents each mentioning selling possessions
and increasing work. Finally, the last column of Table 3 presents the coping strategies listed by the
37% of eligible respondents who listed three coping methods. Here, among respondents using
several strategies in combination, we see that savings, family/friends, and mainstream credit are all
listed by at least half of these respondents. Alternative credit (23%), the sale of possessions (37%),
and increased work effort (45%) are all much more common when used in combination. In other
words, focusing on saving or liquid assets to assess how able people are to weather a shock severely
limits the set of what individuals do or plan to do when facing a shock. But, it is also the case that
few respondents would use any other coping method but savings in isolation.
7 The sum of the percent listing each category of savings strategies is 189%, short of 200% because 11% of respondents listed two strategies within the same broad category.

14
While these figures show that respondents use these six general coping strategies in
combination, they do not reveal the specific bundles of coping methods that respondents would
assemble. In order to identify these bundles of emergency support, we can create a two-dimensional
matrix of coping methods for respondents listing two coping methods and a three-dimensional
matrix of methods for respondents listing three methods (not presented in tables). These matrices
reveal that, among respondents listing two coping strategies, the most commonly assembled bundle
is savings and mainstream credit, a combination employed by 24.8% of these respondents. The next
most common bundle is the combination of savings and family/friends (12.3%) followed by
combining two different savings strategies (9.8%). Smaller shares, none greater than 10%, list the
other possible combinations. Among respondents listing three savings strategies, the most
commonly assembled bundles involve savings and are: (1) savings, family/friends, and mainstream
credit (8.6%), (2) savings, family/friends, and increased work (7.6%), and (3) savings, mainstream
credit, and increased work (6.8%). The only common bundle that did not involve savings was social
support, sale of possessions, and increased work (7.9%). Other combinations in this 6x6x6 matrix
are mentioned by smaller shares of the respondents who list three strategies, most by no more than
2% of this group.
Table 4 shows that respondents who were highly confident in their ability to cope with
emergency were much more likely to name just one coping strategy. Seventy-two percent of those
who were certain they could cope with the hypothetical emergency listed one coping strategy as
compared with just 26.7% of those who thought it probable that they could not cope with the
emergency. Conversely, 54.5% of those who thought they could probably not cope with an
emergency listed three coping methods, as compared with just 13% of those who were certain they
could cope. Together, these pieces of evidence suggest that method of coping, number of ways of
coping, and confidence in ability to cope are tightly bound together. Savings emerges as an
important, but not exclusive coping strategy: it is the method most commonly used in isolation and
using just one strategy in isolation is associated with higher levels of confidence in ability to cope.
Table 5 presents additional evidence on the factors that explain the use of each coping
strategy. The first model shows marginal effects from a probit regression predicting the use of
savings as a coping strategy, using the same rich set of variables employed in Table 2. Here, the
sample is not limited to respondents selecting a certain number of strategies and instead includes all
respondents who were asked about methods of coping. Models 2 – 6 present comparable results for
models in which the outcome is listing family/friends, mainstream credit, alternative credit, sale of
possessions, and increased work.

15
Looking across these six models reveals that measures of economic advantage are linked to
the use of savings and mainstream credit and disadvantage to the use of family/friends and
alternative credit. While income is not significantly associated with listing any of the six coping
strategies (when the income variables are tested jointly), wealth is strongly positively associated with
listing savings and with selecting mainstream credit, while it is negatively linked with listing
family/friends, the sale of possessions, and increased work effort. Unemployment too is negatively
associated with the use of savings and mainstream credit and positively related to relying on
family/friends. There are also strong positive associations between educational attainment and
listing savings as a coping strategy with those with a college education being 16.5 percentage points
more likely to list savings than respondents with a high school diploma or less (against an average of
60.6% of respondents using savings). There is also a negative relationship between education and
the use of alternative credit, with those with a college degree 2.9 percentage points and those with
graduate education 2.7 percentage points less likely to list alternative credit (against an average of
10.8% of respondents listing alternative credit).
While risk literacy doesn’t relate to the overall ability to cope, it is correlated with the means by
which people intend to cope with shocks. Those who are risk literate are 11 percentage points more
likely to list savings as copying strategy and are 7 percentage points less likely to cope with a shock
by selling things. Consistent with other findings, higher financial knowledge is related to different
types of financial decisions and differential use of financial and credit markets (Lusardi and Tufano,
2009; Lusardi and Mitchell, 2011b).
Some demographic markers of stability are also positively associated with listing savings and
mainstream credit and negatively associated with using other coping methods. For instance, older
respondents are less likely to list family/friends or increased work effort as coping resources and
more likely to use mainstream credit or savings. But, there are relatively few notable links between
race/ethnicity and coping strategies, one exception being the greater reliance of Hispanics on
family/friends. There are also few significant relationships between marital status and coping
strategies, though there is some weak evidence that respondents who are divorced are less likely to
use savings. Finally, there are some regional differences in use of alternative credit, with it being
relatively less common in the North East and Mid-West compared with the South.
Gambling is also correlated with how people plan to cope with financial shocks: gamblers
are more likely to rely on credit, whether in traditional and alternative sources. This may reflect both
the attitudes toward risk and the depletion of financial resources via gambling.

16
These findings show that, while economic theories have emphasized the importance of
precautionary assets to shield against shocks and sociologists have emphasized the importance of
family of friends, in fact, both play a role in how individuals plan to cope with a financial shock.
Furthermore, adjustments in labor supply (both at the intensive and extensive margins) are also
observed in the data, as are sales of assets.
Differences in coping methods may result from simple heterogeneity, or may suggest a more
generalized pecking order that households follow when dealing with a shock. In corporate finance,
Myers (1984) Myers and Majluf (1984), drawing on a long empirical tradition starting with
Donaldson (1961), posit that companies prioritize their sources of financing. The empirical
observation was based on both case study evidence and aggregate data. In brief, the empirical
regularity is that firms tend to draw from internal finances first before seeking external finances,
then draw upon “the safest securities” (i.e., debt) before issuing new equity. Myers (1984) and Myers
and Majluf (1984) posited that this empirical regularity could be explained by considering the
information asymmetries and associated deadweight costs of the different alternatives. Empirical
evidence, a consistent theoretical grounding, and new testable predictions have made the pecking
order theory useful in corporate finance.
Our work does not yet provide these three elements, but it does suggest a direction to
establish whether a household pecking order theory is supportable—and whether there is a single
pecking order for all households, or different types of orderings for different types of households,
given their characteristics, financial knowledge, and preferences. Like corporations, which first turn
to internal funds, our evidence suggests that households first (or primarily) turn to internal
resources: their own savings. Four pieces of evidence point to this conclusion: savings is the most
commonly used coping method overall, it is the coping method most commonly used in isolation, it
is associated with greater certainty in being able to cope, and it is associated with greater economic
and demographic advantage and stability. That households might turn to savings first stands to
reason in part because these funds are “lower cost” on four dimensions: direct financial costs,
transaction costs, social costs, and private effort. Because borrowing rates tend to exceed rates paid
to savers, the foregone income on reducing savings is lower than the explicit interest on borrowing.
While the vast majority of family and friends loans charge zero interest (El Hage, Schneider, and
Tufano, 2006), the social costs of asking for funds, the potential for default, and certain ethnic
norms make such borrowing costlier than the interest rate might suggest. The large discounts on
resale of items makes selling one’s possessions unattractive (perhaps less so in the wake of
innovations like eBay). Generating funds by working more may be simple in some jobs, but in

17
others (e.g., professional jobs without overtime), would require finding a second job and working
more hours. Savings dominates the other mechanisms on each of these dimensions, and explaining
why savings comes first—at least for households with savings--is fairly easy.
The corporate finance pecking order posits internal funds, then debt, then equity; however
for specific firms, the ordering may vary—e.g., some technology firms raise equity before issuing
debt. A robust household pecking order would help explain why the next choice for some is credit
and for others is family and friends. We posit that the second choice—after savings—will be
determined by the relevant costs of the alternatives. These costs could include sheer availability,
direct costs (e.g., interest charges on loans or foregone interest on savings consumed), fees and other
transaction costs, effort involved (e.g., proxied by time), and social costs (e.g., drawing upon favors
or social capital.) Beyond explaining which is the “second” source for coping, a robust theory might
give us insight into the incentives to save. Where credit is easily available or kin networks are strong,
incentives to save may be smaller—a testable proposition, but not with our data. When the
transaction costs of selling goods go down (as with Ebay), the use of this coping mechanism should
increase and perhaps the desire to save might be reduced.
To simply state that some set of ordered methods exist is a first step to describing a pecking
order; there is substantial additional research that needed to definitively demonstrate it, justify it, and
discuss the implications of an ordering of preferred methods.
International Comparisons
The above analysis captures what appears to be a relatively high level of financial fragility in
the United States, with 50% of respondents probably or certainly unable to come-up with the funds
needed to cope with an emergency expense of $2,000 in the next thirty days. However, the literature
offers few comparisons, across time or space, to gauge the severity of that level of fragility. Here,
we provide some comparative perspective, undertaking a cross-national comparison of respondents’
abilities to come-up with funds in the event of an unexpected expense. We set the precise levels of
funds asked about in each country ($2,000 in the US and Canada, £1,500 in the UK, and €1,500
elsewhere) in consultation with our local research partners. They were intended to be roughly
comparable, round-number, levels corresponding to the level of a major auto repair and other
similar shocks. Generally, all of the currency levels are within 15% of average at USD exchange
rates. On a purchasing power parity basis, the differentials are broader, +/- 20% of the sample
average PPP measure, although a crude PPP measure is unlikely to capture price differences of
emergency services.

18
Table 6 shows that perceived capacity to cope with an emergency is lowest in the U.S., U.K.,
and Germany, all countries in which 50% of households or more would probably or certainly be
unable to come-up with the emergency funds. France and Portugal occupy an intermediate position;
46% of respondents in Portugal would certainly or probably be unable to come-up with the funds as
would 37% of those in France. The highest levels of coping capacity are found in Canada (28%
certainly or probably unable), Netherlands (27.9%), and Italy (20%). In sum, we see substantial
cross-national heterogeneity in perceived capacity to cope, with the United States at the upper end in
terms of financial fragility.
We first test to see if these differences are explained by variation in individuals’
characteristics across countries. We pool the individual-level data on respondents in the U.S., U.K.,
Canada, France, Germany, and Italy and estimate a similar model to that presented in Table 2 (The
Netherlands is omitted because information on respondents’ demographic and economic
characteristics could not be harmonized with the information on respondents in the other seven
countries). The outcome for this probit model is equal to one if the respondent reported that she
could certainly or probably come up with the required funds and zero if she reported that she
certainly or probably could not do so. We include country fixed-effects in the model and
harmonized measures of changes in wealth, education, age, gender, household composition, risk
literacy, gambling, and financial education. We examine if the ordering of countries by ability to
cope changes after adjusting for these demographic and economic characteristics.
In the simple descriptive statistics shown in Table 6, the share of respondents probably or
certainly able to come-up with funds was, compared with the U.S., 2.2 percentage points lower in
the UK, 0.6 points lower in Germany, 4.1 points higher in Portugal, 12.7 points higher in France,
21.8 points higher in Canada, and 30 points higher in Italy. As we would expect, this ordering is
reproduced in the model that only includes the country fixed-effects (Model 1 of Appendix Table 2).
But, we also find that even after accounting for individual-level characteristics, the ranking of
countries is basically unchanged and the magnitudes of differences from the US are quite similar to
those in the unadjusted model (Model 2 of Appendix Table 2).
If individual-level covariates do not explain this cross-national variation, national-level
characteristics might. However, given that our data is cross-sectional and limited to just eight
countries, we lack the ability to use a regression framework to test if national-level covariates might
explain these cross-national differences in capacity to come-up with emergency funds. Instead,
below, we introduce and qualitatively discuss several factors that may help to explain these
differences. In this way we hope to set the stage for future work that might draw on additional

19
observations (either across time or across countries) to more formally test the relationships between
these factors and coping ability.
We first consider the possibility that differences in coping capacity could be explained by
differences in poverty across countries.8 Measured as the share of households with less than 50% of
median income, poverty is highest in the US (17.1%), followed by Portugal (12.9%), Canada
(11.7%), and Italy (11.4%). At 8.3%, poverty is somewhat lower in the UK and lower still in the
Netherlands (7.7%) and France (7.1%) (OECD, 2010). The ordering of countries by poverty rate
demonstrates relatively little alignment with the ordering by capacity to come-up with emergency
funds. While poverty is high and capacity to cope low in the US, and the converse is true in the
Netherlands, other countries do not follow the pattern. For instance, poverty is relatively high in
Italy where capacity to come-up with emergency funds is also high.
The existence of national social safety net programs might provide a base level of support
for the most vulnerable households, allowing them and their family networks to be able to build up
greater resources (saving, credit capacity, etc) to deal with emergencies. The OECD measures
government social safety net spending (old age, survivors, disability, etc.) as a percentage of GDP
(see Tesliuc, 2006). Using 2001 figures, the U.S. and Canada had far lower social safety net spending
(averaging 8.2%) than the other countries in the sample, yet had among the higher and lowest level
of confidence in ability to come up with $2000 in 30 days. Comparing these two countries with the
others (whose social safety net spending as a fraction of GDP averaged 15.8%), the North American
countries had a slightly higher average level of ability to cope, primarily due to the high coping ability
by Canadians. Social safety nets alone cannot explain the patterns we observe.
The large law and finance literature examines financial development of countries and it
might be sensible to predict that citizens of better financially developed countries might show
greater abilities to cope with financial shocks. The World Bank has assembled an extensive dataset
of many of the financial development indicators.9 There are far more of these indicators than our
handful of observations, but it is possible to calculate correlations between various metrics of
financial market development and the ability to cope (using the coefficients on the country fixed
effects from Model 1 from Appendix Table 2). If anything, the simple correlations with ability to
cope are overwhelmingly negative, suggesting a lower ability to cope in more well developed
8 While this type of variable could be included as an individual-level measure, our survey, which collected income as a categorical measure in local currency, does not allow for easy harmonization and comparison across these 7 countries. 9http://econ.worldbank.org/WBSITE/EXTERNAL/EXTDEC/EXTRESEARCH/0,,contentMDK:20696167~pagePK:64214825~piPK:64214943~theSitePK:469382,00.html (visited March 5, 2011)

20
financial markets, as measured by the negative correlations of coping ability with private credit by
deposit money banks and other financial institutions/GDP, bank deposits/GDP, stock market
capitalization/GDP, stock market total value traded/GDP, life insurance premiums/GDP, non-life
insurance premiums/GDP.
An alternative explanation is that perceptions of economic wellbeing, rather than just actual
material resources, might affect confidence in capacity to come-up with emergency funds. In the
period we study (2009), the severity of the economic crisis in each country might reasonably proxy
for such perceptions. While our individual-level analysis included a measure of recent shocks to
wealth from the crisis, that measure does not capture how the more general state of the national
economy might affect perceptions. We examined changes in unemployment rates between 2008 and
2009 in each of the eight countries (OECD, 2010). The UK and US had the largest increases in
unemployment, ticking up 45% and 60% to 7.7% and 9.3%, respectively. However, while German
respondents reported fairly low levels of coping capacity, German unemployment was fairly steady
at 7.8% in 2009, an increase of only 3%. France and Portugal each saw 25% increases in
unemployment between 2008 and 2009 to 9.2% and 9.5% respectively, smaller increases than in the
UK and US and in-line with their middle position in terms of coping capacity. Among the countries
with the highest coping capacity, the Netherlands had very low unemployment (3.4%) in 2009, an
increase of about 21% over the prior year and Italy’s unemployment rate rose about 16% from 2008
to 7.9% in 2009. But, Canada had an 8.3% unemployment rate, about 36% higher than in 2008.
We next consider the methods by which respondents report they would cope with such an
emergency. This analysis serves a two-fold purpose. First, this analysis serves to highlight and begin
to explain variation across countries in how those who could cope with emergency would do so.
Second, examining cross-national variation in how respondents would cope with emergency may
also reveal something about the between-country differences in the share of respondents that could
come-up with funds in the event of an emergency. While we asked respondents separately about
their confidence in ability to cope and the methods they would use to cope, perhaps respondents
considered their responses to the latter with the former in mind.
For the most part, the tabulations presented in Table 6 of coping methods seem to present a
story of international similarity. Savings is the most commonly named coping method in every
country, generally followed by family/friends, with mainstream credit usually the third most
frequently named strategy, trailed by increased work effort and then the sale of possessions with
alternative credit a distant fifth. However, there are several notable exceptions to this pattern.

21
First, the use of savings is fairly low in Portugal (49.2%), quite high in Italy (71.3%), and
especially high in the Netherlands (88.8%). Second, the Netherlands is also distinct for having
comparatively low levels of family/friends support (just 10.3%) versus 24% - 36% elsewhere. Third,
the use of mainstream credit is also quite rare in the Netherlands (7.8%) and Portugal (12.4%) and
quite common in Canada (40.3%) against a more general range of 16% - 30%. Fourth, Americans
are the most likely to sell possessions, work more, or use alternative sources of credit. They are also
less likely to report that they “don’t know” what coping methods they would use.
These findings track some of the aggregate characteristics of the countries. For example,
Italy and the Netherlands are relatively high saving rate countries with household savings rates of
8.6% and 6.8% respectively. These rates are much above the savings rates of the U.K. (-4.5%),
Portugal (-0.9%), the U.S. (2.7%), and Canada (3.8%), but are lower than the savings rates of
Germany (11.2%) and France (11.6%) (OECD, 2010) in which savings was relatively less frequently
mentioned.
Individuals in the U.S., the U.K. and Germany are much more likely to resort to family and
friends for emergencies than, for example individuals in the Netherlands, and these figures are
consistent with some of the findings about trust in familiars as captured by the World Value Survey.
For example, consistent with the differences we observe in reliance on family and friends for
financial support, only 63.5% of Dutch respondents state that they trust their family completely
versus 86% in Great Britain, 82% in Germany and 83% in Canada. Those in Italy and the
Netherlands also report little trust in people they know personally. In the Netherlands, the
percentage who completely trust the people they know personally is 30% and in Italy is 7%, as
compared with 53% in Great Britain and 47% in Canada.10
Similarly, the very high reliance on sources of mainstream credit in Canada, is interpretable
in light of the very high levels of short term consumer credit in Canada, with the population of
approximately 33 million holding nearly 413 billion in short term consumer debt, a ratio higher than
that of the US and orders of magnitude above France, Italy, The Netherlands, and Portugal.
(OECD, 2010).11
Finally, Table 6 also presents descriptive evidence of cross-national variation in the number
of ways respondents report that they would cope with an emergency. The United States, followed
by Canada and Germany, stands out for having the largest share of respondents, about a third, who
10 Authors’ calculations from the World Values Survey. 11 Calculated by dividing total household liabilities in consumer credit (revolving and non-revolving) by total population.

22
report three methods of coping with emergency. This share is much lower in Italy (13.8%), Portugal
(15.6%), and the Netherlands (6.8%), countries that tend to have higher saving rates than the United
States. That same ordering applies to the share that would need only one method of coping, with
that share highest in Italy, Portugal and the Netherlands followed by the U.K. and France and trailed
by the U.S., Canada, and Germany.
These data on methods of coping are also somewhat helpful in understanding the cross-
national differences in confidence in capacity to cope. However, their usefulness in that regard is
constrained by the fact that the question about coping methods was not asked of respondents who
reported that they could certainly not come-up with the emergency funds. That said, it is striking
that respondents in Italy and the Netherlands, the two countries with the highest levels of
confidence in ability to come-up with emergency funds, are also characterized by very high levels of
reliance on savings as a coping method. In contrast, respondents in the U.S., U.K., Germany, and
France, where confidence in ability to come-up with emergency funds was relatively lower, were
more likely to name coping methods such as the use of alterative credit, the sale of possessions, and
increases in work.
Overall, with eight data points we are reluctant to make any broad characterizations of the
differences in coping ability, but see some evidence that the propensity to save, financial market
development (specifically credit markets), and the extent of trust—which in turn affect the
availability of savings, credit and family support—are likely candidates to explain variation in the
ability to come up with $2000 in 30 days.
Conclusions and Implications
The descriptive empirical results in this paper are fairly clear and are of some cause for
concern. The first finding is that a disturbingly high fraction of Americans report not being able to
come up with $2,000 in 30 days. Households with socio-economic markers of vulnerability (income,
wealth, wealth losses, education, women, families with children) are more likely to be financially
fragile, and substantially more so. The more surprising finding is that a material fraction of
seemingly “middle class” Americans also judge themselves to be financially fragile, reflecting either a
substantially weaker financial position than one would expect, or a very high level of anxiety or
pessimism. Both are important in terms of behavior and for public policy.
There are fairly straightforward implications of high levels of financial fragility for scholars,
policymakers, and businesses people. Scholars need to better understand, through theory and
deeper empirical work, the implications of financial fragility for explaining other consumer decisions.

23
For example, in a related paper, Lusardi, Schneider, and Tufano, 2010), document how Americans
cut back on their use of non-emergency medical services in the wake of the financial crisis, much
more so than in other developed countries with national health care plans. Even in empirical
specifications including wealth, income, and other economic measures, our measure of financial
fragility was one of the strongest predictors of the likelihood of cuts in non-emergency care. Tufano
(2011) examines Americans’ attitudes toward financial regulation and finds, in particular, that the
fragile—as defined here—were less likely to report that laws and regulations adequately protect their
financial interests. This financial fragility measure, more so than traditional economic and
demographic factors, was one of the strongest predictors of attitudes toward regulation. These two
papers begin to examine how financial fragility is either a reduced form correlate of important
behaviors, or may perhaps be a causal factor in affecting household decisions. Much more research
needs to be done to trace out the link between financial fragility and various outcomes, but these
first few studies are quite suggestive. For example, it would be useful to know if financially fragile
families, as we define them, are more likely to become homeless, bankrupt, experience marital
problems, etc.
In addition to understanding the consequences of financial fragility, we need to better
understand the mechanisms that give rise to it. The lowest income households’ fragility—in the
form of lack of saving—could be attributable to tax disincentives to save, but this would not likely
explain the pervasive lack of savings among higher income Americans. Lack of savings and heavy
reliance on credit could also be due to overspending or attitudes toward risk and the future, partially
captured by gambling. Failure to cope could reflect weakening social ties that make it harder to
access family and friends borrowing networks. The lack of financial knowledge could also play a
role in explaining lack of saving and crude methods of dealing with risk (such as selling possessions).
There needs to be substantially more work done on the factors that not just describe the financially
fragile, but explain how they come to be fragile.
While this work needs to precede policy action, there are some steps policymakers might
consider to strengthen households’ abilities to weather financial storms. For example, there is
considerable direct and indirect federal support for long-term asset building, most of which is
delivered through tax policies. The Corporation for Enterprise Development estimates that federal
asset building expenditures in 2009 were $384 billion with the major programs benefiting the
wealthiest Americans. Looking at the mortgage interest deduction, property tax deductions, and
preferential capital gains and dividend rates, the top 20% of Americans by income received 84% of
these benefits and the bottom 20% of Americans received just 0.04% of these benefits (Woo,

24
Rademacher and Meier, 2010). At the same time, some federal policies actively discourage
precautionary saving through asset limits (Hubbard, Skinner, and Zeldes, 1995). To the extent that
financial fragility is shown to have substantial negative consequences, federal policy could help
households to build emergency buffers. For example, interest and dividends on the first few
thousand dollars of savings could be tax free or could earn a refundable credit, asset limits on federal
assistance programs could be significantly increased, policy could support family and friends lending,
incentives could be created for banks and other financial institutions to open emergency accounts,
etc. If self-control problems are substantial, the terms of these programs might include a
substantial commitment component, which has been documented by Ashraf et al. (2006) to be
effective. Improving financial literacy and promoting financial education may be another way to
address lack of precautionary savings.
These high levels of financial fragility also suggest the presence of opportunities for financial
institutions that can tap into the market for products that facilitate emergency support. While bank
savings products, credit cards, payday lenders, pawn shops, overdraft programs and other products
are used as coping mechanisms,12 one suspects that there might be different products to address
these needs.13 For example, while savings accounts are almost always associated with interest
payments, Christmas Clubs historically did not pay much interest, yet were quite popular. If one
were to design an emergency product, what service might be attached in lieu of interest to enhance
the popularity of the product? Might a household opening this account as an emergency account
prefer vouchers for a flu shot, AAA club membership, or other services as much as, or more than,
interest?
These implications for academics, policy makers, and businesses flow from a consideration
of the high level of financial fragility. The second finding of our paper is that households use a
variety of mechanisms to cope with financial shocks, and that while savings is the most commonly
12 Looking at one single year may not show how often these sources are used. According to the Financial Capability Study, 23% of households in America have used high cost methods of borrowing (payday loans, pawns shops, advances on tax refunds, auto title loans, rent-to-own stores) in the past five years (Lusardi, 2010). 13 Credit unions have developed and piloted projects that address some of these needs. For example, the “2 Grand Plan” program combines saving with borrowing to make sure emergency cash is available when needed most. In this program, an individual deposits regularly to a saving account, but if an emergency occurs, an affordable rate loan is made available so the saving plan is not disrupted. The “Big Payoff Loan” is another example of an innovative program offered by credit unions. The borrower transfers a percentage of his/her unsecured debt to a 12-18 month personal loan at a low fixed interest rate. When the borrower successfully pays down this portion of the debt, the credit union may advance additional funds to pay down another portion of the debt. The cycle repeats itself until the debt is repaid. For more detail, see Gabel (2011).
25
listed coping method, it is hardly the only coping method. Households rely on a broad set of
supports (credit, family and friends, increased labor, etc.) to deal with shocks. We empirically posit
that these coping mechanisms may be sequenced in a form of pecking order or orders. Just as
corporations tend to fund themselves first by drawing upon internal funds, households address
financial shocks first by drawing down savings. Just as the cost of funds, both direct transaction
costs and information asymmetries, may help explain corporate choices, the relative direct financial
costs, transaction costs, social costs, information costs and effort might explain the ordering of
coping mechanisms for different households.
This contention leads to opportunities for considerable additional research. For example,
among households with ready access to credit, does the size of the spread between borrowing and
savings rates affect the choice between dipping into savings and borrowing? Do the associated
transaction costs, in terms of time and ease of borrowing, explain this over time and across
countries? We find that friends and family are the second most popular coping mechanism. Does
the strength of friend and family ties affect the relative attractiveness of this choice? In particular, in
more tight-knight communities do we see greater use of friend and family financial support? Is
there a relationship between physical proximity and friend and family support—and would that
manifest itself in different patterns depending on migration patterns? Some recent research
calculates the basis point premium that some borrowers will pay if offered certain types of marketing
(Bertrand, et. al., 2010). We know that most friends and family loans charge zero percent interest.
Nevertheless, people may prefer to lose interest on savings to avoid the social cost of asking for
money. How large is this discount, how much does it vary, and how do social factors influence its
size? We find that 19% of people claim they would sell something they own as a coping mechanism.
Has eBay, which made selling personal items easier—and arguably reduced the discount on resale
items—increased the use of this coping mechanism? We also find that financial education and risk
literacy affect the ability and the methods of coping, suggesting ways to enrich models of saving or
public policies toward saving. Moreover, just as empirical work on corporate financial choices both
motivated, but then challenged, pecking order theory, work on household coping mechanisms could
enhance our understanding of the trade-offs involved.
Policy makers might reflect on the pecking order by considering that just as it is important to
support savings, other policies might be sensible as well. If many of the financially fragile are low
income, then perhaps refundable tax credits could be used as a financial stimulant for savings. The
size of the average tax refund is approximately equal to the amount of financial buffer that we study
here (Tufano and Schneider, 2009). Would it be possible to allow households to get their refunds in

26
a form that could serve as an emergency savings account? Would it be possible to borrow against
next year’s refund through a reduction in withholdings? Could policy be used to support family and
friends borrowing? Credit, in both the form of mainstream credit and alternative credit, are
important ways that households plan to deal with shocks. Government policy on small dollar credit
has recently focused on issues of affordability and pricing, as seen in the Talent Amendment, which
imposed a 36% interest rate ceiling on loans to members of the Armed Forces. But, we can also ask
what government policy can do to make small dollar credit more widely available. The FDIC’s
Small Dollar Loan Pilot program may provide some answers in this regard.
Recognizing the pecking order of coping mechanisms might also point the way for
businesses to innovate new products. There are already products that combine savings and
borrowing, for instance in the form of a savings account with an attached line of credit. Given the
importance of family and friends lending, one wonders whether it might be possible to create a
group account where people open individual savings accounts where a portion might be “drawn
down” by others in the group, to be repaid by the borrower with interest. There might be a
mechanism by which the would-be lenders would need to assent to the draw down. This financial-
institution administered product might be a modern version of friends and family lending, better
protect lenders from friend and family default, and increase the stickiness and size of these accounts
to the financial institution.
Our research doesn’t yet indicate that any one policy or business practice is the “solution” to
high levels of financial fragility. Rather, our goal is to document not only high levels of fragility but
a rich approach to how households deal with it, as a first step to encouraging greater research in this
field. We hope our work—and subsequent work on financial fragility that takes a broad approach to
understanding how households cope with financial shocks—can enlighten scholars, policy makers,
and businesses trying to understand and serve household financial needs.

27
References Aguiar, Mark and Erik Hurst. 2005. “Consumption Versus Expenditure.” Journal of Political Economy
113(5): 919-948. Ashraf, Nava, Dean Karlan and Wesley Yin. 2006. “Tying Odysseus to the Mast: Evidence from a
Commitment Savings Product in the Philippines.” Quarterly Journal of Economics 121(2): 635- 672.
Bernheim, D., D. Garrett, and D. Maki. 2001. “Education and saving: The long-term effects of high
school financial curriculum mandates.” Journal of Public Economics 85: 435-565. Bertrand, Marianne, Dean Karlan, Sendhil Mullainathan, Eldar Shafir and Jonathan Zinman. 2010.
“What’s the Advertising Content Worth? Evidence from a Consumer Credit Marketing Field Experiment.” Quarterly Journal of Economics 125: 263-305
Biggs, Xavier de Souza. 1998. “Brown Kids in White Suburbs: Housing Mobility and the Many
Faces of Social Capital.” Housing Policy Debate 9(1): 177 – 221. Brobeck, Stephen. 2008. “Understanding the Emergency Savings Needs of Low- and Moderate-
Income Households.” Consumer Federation of America Manuscript available at http://www.consumerfed.org/elements/www.consumerfed.org/file/Emergency_Savings_Survey_Analysis_Nov_2008.pdf
Browning, Martin and Annamaria Lusardi. 1996. “Household Saving: Micro Theories and Micro
Facts.” Journal of Economic Literature 34(4): 1797 – 1855. Bucks, Brian K., Arthur B. Kennickell, and Kevin B. Moore. 2006. “Recent Changes in U.S. Family
Finances: Evidence from the 2001 and 2004 Survey of Consumer Finances.” Federal Reserve Bulletin A1 – A38.
Caner, Asena and Edward Wolff. 2004. “Asset Poverty in the United States, 1984-99: Evidence from the Panel Study of Income Dynamics.” Review of Income and Wealth 50(4): 493 – 518.
Carroll, Christopher. 1997. “Buffer Stock Saving and the Life Cycle/Permanent Income
Hypothesis.” Quarterly Journal of Economics 112(1): 1–56. Carroll, Christopher and Andrew Samwick. 1997. “The Nature of Precautionary Wealth.” Journal of
Monetary Economics 40: 41-71. Carroll, Christopher and Andrew Samwick. 1998. “How Important is Precautionary Savings?” The
Review of Economics and Statistics 8(3): 410-419. Chieffe, Natalie and Ganas Kaye Rakes. 1999. “An Integrated Model for Financial Planning.”
Financial Services Review 8(4): 261-268. Cole, Shawn, Daryl Collins, Daniel Schneider, and Peter Tufano. 2008. "First National Bank's
Golden Opportunity." Harvard Business School Case Study (208-072)

28
Conley, Dalton. 1999. Being Black, Living in the Red. Berkeley: University of California Press. Consumer Federation of America. 2006. How Americans View Personal Wealth Versus How Planner's
View This Wealth. Washington, DC Deaton, Angus. 1991. “Saving and Liquidity Constraints.” Econometrica 59: 1221-1248. Deaton, Angus. 1992. Understanding Consumption. Oxford: Oxford University Press. Donaldson, Gordon. 1961. Corporate Debt Capacity: A Study of Corporate Debt Policy and the Determination
of Corporate Debt Capacity. Beard Books. El Hage, Nabil, Daniel Schneider and Peter Tufano. 2006. Circle Lending. Harvard Business
School Case Study. Gabel, Denise. 2011. Blueprints for Innovation. Filene Research Institute. Harknett, Kristen and Jean Knab. 2007. “More Kin, Less Support: Multipartnered Fertility and
Perceived Support Among Mothers.” Journal of Marriage and Family 69: 237-253. Havemann, Robert and Edward Wolff. 2004. “The Concept and Measurement of Asset Poverty:
Levels, Trends, and Composition for the US 1983 – 2001.” Journal of Economic Inequality 2: 145 – 169.
Henley, Julia, Sandra Danziger, and Shira Offer. 2005. “The Contribution of Social Support to the
Material Well-Being of Low-Income Families.” Journal of Marriage and Family 67: 122 – 140. Hubbard, Glenn, Jonathan Skinner, and Steven Zeldes. 1995. “Precautionary Saving and Social
Insurance.” Journal of Political Economy 103: 360-399. Hurst, Erik, Annamaria Lusardi, Arthur Kennickell, and Francisco Torralba. 2010. “The
Importance of Business Owners in Assessing the Size of Precautionary Savings.” Review of Economics and Statistics 92: 61-69.
Kearney, Melissa, Jonathan Guryan, Erik Hurst, and Peter Tufano. 2011. “Making Savers Winners:
An Overview of Prize-Linked Savings Product.” Forthcoming in Financial Literacy: Implications for Retirement Security and the Financial Marketplace. Eds. A Lusardi and O.S. Mitchell. Oxford University Press
Kotlikoff, Laurence and Avia Spivak. 1981. “The Family as an Incomplete Annuities Market.”
Journal of Political Economy 89(2): 372-391. Lusardi, Annamaria. 2008. “Financial Literacy: An Essential Tool for Informed Consumer Choice?”
Working Paper, Joint Center for Housing Studies Working Paper, Harvard University. Lusardi, Annamaria. 2009. “U.S. Household Savings Behavior: The Role of Financial Literacy,
Information and Financial Education Programs.” (pp. 109-149) In Policymaking Insights from Behavioral Economics. Eds. C. Foote, L Goette, and S. Meier. Federal Reserve Bank of Boston.

29
Lusardi, Annamaria. 2010. “Americans’ Financial Capability,” Report Prepared for the Financial
Crisis Inquiry Commission, Washington, DC, February 2010. Lusardi, Annamaria and Olivia Mitchell. 2011a. “Financial Literacy and Planning: Implications for
Retirement WellBeing.” Forthcoming in Financial Literacy: Implications for Retirement Security and the Financial Marketplace. Eds. A Lusardi and O.S. Mitchell, Oxford University Press.
Lusardi, Annamaria and Olivia Mitchell. 2011b. “Financial Literacy Across the World: An
Overview.” In preparation for the Journal of Pension Economics and Finance special issue on financial literacy.
Lusardi, Annamaria, Daniel Schneider and Peter Tufano, 2010, “The Economic Crisis and Medical
Care Usage,” NBER Working Paper 15843. Lusardi, Annamaria and Peter Tufano. 2009. “Debt Literacy, Financial Experiences and
Overindebtedness, NBER Working Paper 14808. Available at SSRN: http://ssrn.com/abstract=1366208
Myers, Stewart. 1984. “The Capital Structure Puzzle.” Journal of Finance 39(2): 575-592. Myers, Stewart and Nicholal Majluf. 1984. “Corporate Financing and Investment Decisions when
Firms have Information that Investors Do Not Have.” Journal of Financial Economics 13(2): 187-221.
Oliver, Melvin and Thomas Shapiro. 1995. Black Wealth/White Wealth: A New Perspective on Racial
Inequality. New York: Routledge. OECD. 2010. OECD Factbook 2010: Economic, Environmental and Social Statistics. OECD Publishing. Sarkasian, Natalia and Naomi Gerstel. 2004. “Kin Support among Blacks and Whites: Race and
Family Organization.” American Sociological Review 69(6): 812 – 837. Skinner, Jonathan. 1988. “Risky Income, Life Cycle Consumption and Precautionary Saving.”
Journal of Monetary Economics 22: 237–255. Sherraden, Michael. 2005. Inclusion in the American Dream: Assets, Poverty and Public Policy. New York:
Oxford University Press. Taylor, Paul, Rich Morin, and Wendy Wang. 2010. “One Recession, Two Americas: Most Lost
Ground but Nearly Half Held their Own.” Pew Research Center, Social and Demographic Trends Project.
Tesliuc, Emil. 2006. “Social Safety Nets in OECD Countries.” Social Safety Nets Primer Notes
No. 25, World Bank. Tufano, Peter, 2008, "Savings Whilst Gambling: An Empirical Analysis of U.K. Premium Bonds."
American Economic Review Papers and Proceedings 98(2): 321-326.

30
Tufano, Peter. 2011. “Setting Financial Regulatory Priorities: Listening to Consumers.” Mimeo, HBS.
Tufano, Peter, Nick Maynard and Jan-Emmanuel De Neve. 2011. "Consumer Demand for Prize-
linked Savings: A Preliminary Analysis." Economics Letters. Tufano, Peter and Daniel Schneider. 2009. “Using Financial Innovation to Support Savers: From
Coercion to Excitement.” In Rebecca Blank and Michael Barr (eds), Insufficient Funds: Savings, Assets, Credit and Banking Among Low-Income Households. New York: Russell Sage.
Warren Elizabeth and Amelia W. Tyagi. 2003. The Two Income Trap: Why Middle-Class Mothers and
Fathers Are Going Broke, New York: Basic Books. Woo, Beadsie, Ida Rademacher, and Jillien Meier. 2010. Upside Down. The $400 Billion Federal Asset-
Building Budget. CFED Report. Worthington, Andrew. 2003. “Emergency Finance in Australian Households: An Empirical Analysis
of Capacity and Sources.” Discussion Paper 163. Queensland University of Technology, Brisbane, Australia.

31
Table 1. Relationship between Economic and Demographic Characteristics and Confidence in Ability to Cope with Unexpected Expense
Certainly
Able to CopeProbably Able
to Cope Probably Not Able to Cope
Certainly Not Able to Cope
All Respondents 24.9 25.1 22.1 27.9
Change in Wealth Since Crisis Same 23.8 28.6 22.4 19.9 Increase Wealth > 10% 40.4 15.6 26.4 17.6 Increase Wealth < 10% 34.9 27.4 22.1 15.6 Decrease Wealth < 10% 24.0 33.8 22.4 19.9 Decrease Wealth 10% to 29% 30.9 27.0 19.5 22.6 Decrease Wealth 30% to 50% 20.7 26.4 24.7 28.2 Decrease Wealth > 50% 10.0 8.3 24.1 57.7
Income Less than $20,000 9.3 14.6 19.2 56.8 $20,000 - $29,999 11.4 21.2 27.7 39.7 $30,000 - $39,999 17.5 27.5 23.6 31.4 $40,000 - $49,999 17.0 26.1 29.9 27.0 $50,000 - $59,999 21.9 24.7 26.1 27.3 $60,000 - $74,999 33.1 27.9 21.8 17.3 $75,000 - $99,999 40.7 33.7 15.4 10.2 $100,000 - $149,999 49.0 27.3 12.9 10.8 $150,000 or more 58.1 27.5 4.7 9.8
Wealth Zero 5.8 11.9 21.8 60.5 Less than $1000 2.4 14.9 36.5 46.2 $1,000 - $2,999 6.3 27.6 37.7 28.4 $3,000 - $4,999 10.3 35.7 30.3 23.7 $4,000 - $9,999 19.0 35.6 243 21.1 $10,000 - $19,999 25.9 35.1 15.5 23.5 $20,000 - $49,999 36.4 27.8 19.6 16.1 $50,000 - $99,999 34.3 28.9 17.9 18.9 $100,000 - $249,999 48.7 25.3 10.9 15.1 $250,000 or more 55.1 26.3 8.3 10.3
Education High School or Less 12.3 21.0 27.1 39.6 Trade School 17.1 25.8 22.3 34.9 Some College 23.0 24.7 22.9 29.5 College (Bachelor’s Degree) 34.5 27.1 19.7 18.8 Graduate Education 45.4 31.8 11.6 11.3
Employment Status Unemployed 15.3 15.7 27.8 41.2 Not Unemployed 26.5 26.7 21.1 25.8
Age 18 – 34 17.8 24.6 29.0 28.7 35 – 54 25.4 26.8 19.3 28.6 55 - 65 43.0 21.1 12.3 23.6 (cont…)
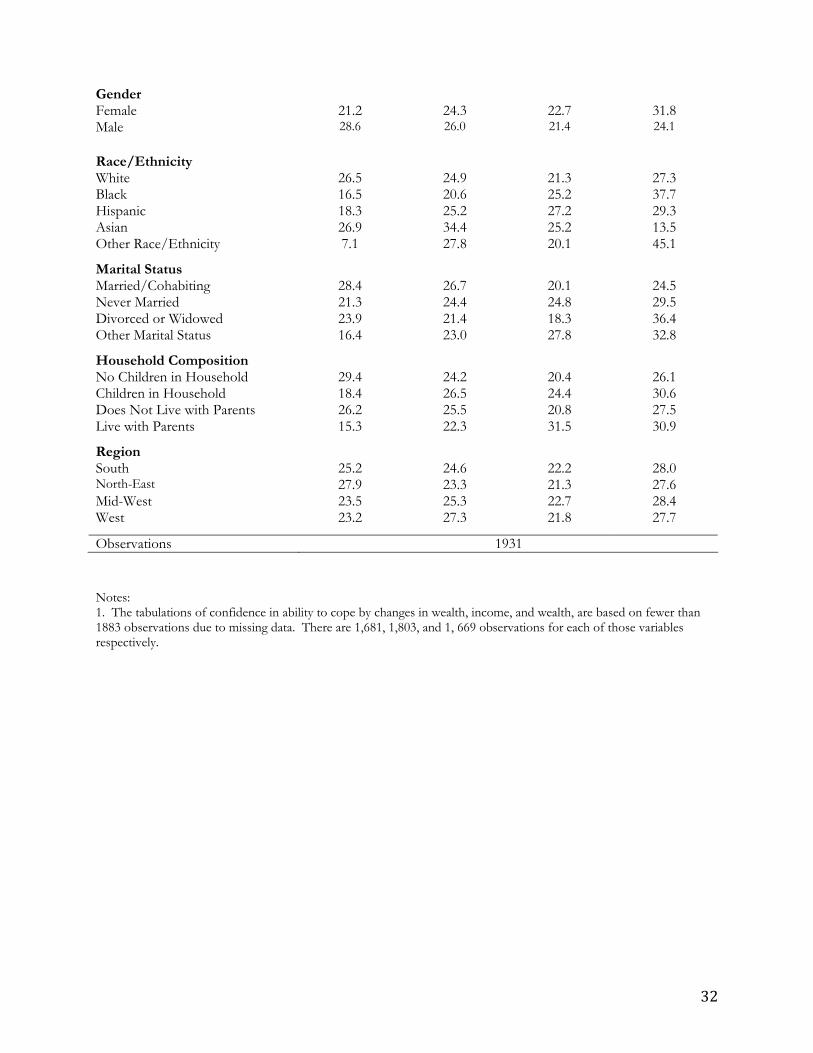
32
Gender Female 21.2 24.3 22.7 31.8 Male 28.6 26.0 21.4 24.1 Race/Ethnicity White 26.5 24.9 21.3 27.3 Black 16.5 20.6 25.2 37.7 Hispanic 18.3 25.2 27.2 29.3 Asian 26.9 34.4 25.2 13.5 Other Race/Ethnicity 7.1 27.8 20.1 45.1
Marital Status Married/Cohabiting 28.4 26.7 20.1 24.5 Never Married 21.3 24.4 24.8 29.5 Divorced or Widowed 23.9 21.4 18.3 36.4 Other Marital Status 16.4 23.0 27.8 32.8
Household Composition No Children in Household 29.4 24.2 20.4 26.1 Children in Household 18.4 26.5 24.4 30.6 Does Not Live with Parents 26.2 25.5 20.8 27.5 Live with Parents 15.3 22.3 31.5 30.9
Region South 25.2 24.6 22.2 28.0 North-East 27.9 23.3 21.3 27.6 Mid-West 23.5 25.3 22.7 28.4 West 23.2 27.3 21.8 27.7
Observations 1931 Notes: 1. The tabulations of confidence in ability to cope by changes in wealth, income, and wealth, are based on fewer than 1883 observations due to missing data. There are 1,681, 1,803, and 1, 669 observations for each of those variables respectively.

33
Table 2. Relationship between Economic and Demographic Characteristics and Being Confident in Ability to Cope with an Unexpected Expense, Marginal Effects from Probit Regression (SE) Model 1 Model 2
Change in Wealth Since Crisis Same (reference) -- --
Increase Wealth > 10% -0.017 -0.010 (0.060) (0.059)
Increase Wealth < 10% 0.018 0.025 (0.050) (0.051)
Decrease Wealth < 10% -0.018 -0.017 (0.046) (0.047)
Decrease Wealth 10% to 29% -0.040 -0.046 (0.040) (0.040)
Decrease Wealth 30% to 50% -0.115 * -0.111 * (0.047) (0.047)
Decrease Wealth > 50% -0.277 *** -0.272 *** (0.050) (0.050)
Income Less than $20,000 (reference) -- --
$20,000 - $29,999 0.056 0.048 (0.057) (0.057)
$30,000 - $39,999 0.121 * 0.126 * (0.053) (0.054)
$40,000 - $49,999 0.041 0.033 (0.057) (0.058)
$50,000 - $59,999 0.046 0.041 (0.059) (0.060)
$60,000 - $74,999 0.168 ** 0.169 ** (0.054) (0.054)
$75,000 - $99,999 0.260 *** 0.260 *** (0.052) (0.053)
$100,000 - $149,999 0.246 *** 0.244 *** (0.059) (0.059)
$150,000 or more 0.286 *** 0.287 *** (0.077) (0.077)
Wealth Zero (reference) -- --
Less than $1000 -0.045 -0.042 (0.063) (0.064)
$1,000 - $2,999 0.137 * 0.133 * (0.066) (0.067)
$3,000 - $4,999 0.251 *** 0.237 *** (0.062) (0.064)

34
$4,000 - $9,999 0.294 *** 0.300 *** (0.054) (0.054)
$10,000 - $19,999 0.342 *** 0.334 *** (0.049) (0.050)
$20,000 - $49,999 0.363 *** 0.357 *** (0.045) (0.047)
$50,000 - $99,999 0.327 *** 0.315 *** (0.050) (0.051)
$100,000 - $249,999 0.359 *** 0.359 *** (0.047) (0.048)
$250,000 or more 0.409 *** 0.401 *** (0.044) (0.046)
Education High School or Less (reference) -- --
Trade School 0.029 0.030 (0.056) (0.056)
Some College 0.080 * 0.068 (0.037) (0.037)
College 0.124 ** 0.098 * (0.038) (0.039)
Graduate Education 0.245 *** 0.222 *** (0.052) (0.055) Unemployed -0.105 ** -0.109 ** (0.041) (0.041)
Age
18-34 (reference) -- --
35 - 55 0.064 * 0.076 * (0.032) (0.032)
55 - 65 0.129 ** 0.144 ** (0.048) (0.048) Female -0.081 ** -0.077 ** (0.027) (0.028)
Race/Ethnicity White (reference) -- --
Black -0.006 -0.008 (0.051) (0.051)
Hispanic 0.007 0.023 (0.068) (0.068)
Asian 0.102 0.103 (0.064) (0.065)
Other Race/Ethnicity -0.002 -0.014 (0.094) (0.092)
Marital Status Married (reference) -- --

35
Never Married -0.041 -0.049 (0.041) (0.040)
Divorced or Widowed -0.031 -0.029 (0.044) (0.044)
Other Marital Status -0.079 -0.077 (0.049) (0.050)
Household Composition
Children in Household -0.071 * -0.075 * (0.030) (0.030)
Live with Parents -0.142 ** -0.146 ** (0.046) (0.046)
Region South (reference) -- --
North-East -0.002 0.011 (0.038) (0.038)
Mid-West -0.014 -0.012 (0.034) (0.034)
West 0.010 0.003 (0.036) (0.037) Gambled -- -0.079 ** (0.028)
Financial Education -- 0.102 *** (0.031)
Risk Literacy -- 0.060 (0.037) Observations 1931 1931 Pseudo R2 0.218 0.226 + p<0.10, * p<0.05, ** p<0.01, *** p<0.001 Notes: 1. Dependent variable = 1 if respondent is certainly or probably able to cope and = 0 if certainly or probably unable to
cope 2. Models also include dichotomous indicators of having missing data on income, wealth, or change in wealth.

36
Table 3. Coping Mechanisms for All Respondents, by Number of Coping Strategies (Percent of Respondents) (TNS, 2009)
Number of Coping Methods
All
One Two Three
Share of Respondents 100 46.5 18.6 34.9
Coping Methods by Type Savings 60.6 65.4 63.0 52.8 Family/Friends 34.2 13.4 36.7 60.6 Mainstream Credit 29.5 10.9 38.5 49.5 Alternative Credit 10.8 1.7 7.8 24.5 Sell Possessions 19.1 3.2 20.7 39.5 Work More 22.9 5.3 21.3 47.2
Coping Methods Listed Individually Draw from Savings 52.4 61.3 47.6 43.2 Liquidate or Sell Investments 2.3 0 6.2 3.4 Liquidate Some Retirement Investments, Even If Required to Pay a Penalty 11.1 4.1 19.0 16.1 Borrow or Ask for Help from My Family 29.6 10.8 30.8 54.1 Borrow or Ask for Help from My Friends 7.4 2.7 6.8 14.0 Use Credit Cards 20.9 7.3 29.0 34.5 Open or Use a Home Equity Line of Credit or Take Out a Second Mortgage 4.3 1.4 4.3 8.3 Take Out an Unsecured Loan 7.1 2.1 6.5 14.0 Get a Short Term Payday or Payroll Advance Loan 3.6 0.7 1.5 8.7 Pawn an Asset I Owned 7.7 1.1 6.4 17.1 Sell Things I Owned, Except My Home 18.8 2.9 20.0 39.3 Sell My Home 0.4 0.4 0.7 0.2 Work Overtime, Get a Second Job, or Other Household Member Increase Work 22.9 5.3 21.3 47.2
Other 0 0 0 0 Don't Know 1.9 1.6 6.1 0
Observations 1255 582 236 437 Note: Respondents listing multiple coping methods of the same general type (i.e. multiple coping strategies within the savings category) are not double-counted in the statistics listed in the final two columns.

37
Table 4. Percent listing Zero, One, Two, or Three Coping Strategies by Confidence in Ability to Cope. Certainly
Able to CopeProbably
Able to CopeProbably Not Able to Cope
Number of Coping Strategies One 72.1 37.8 26.7 Two 15.0 22.1 18.9 Three 13.0 40.1 54.5 Observations 1255
Notes: 1. Respondents who were “certain” that would not be able to cope with an unexpected expense are excluded because they were not asked any questions about coping mechanisms.

38
Table 5. Relationship between Economic and Demographic Characteristics and Types of Coping Responses, Marginal Effects from Probit Regression (SE) Savings Family/Friends Mainstream
Credit AFS Credit Sell Things Work More
Change in Wealth Since Crisis Same (reference) -- -- -- -- -- --
Increase Wealth > 10% 0.043 -0.044 -0.056 -0.025 0.003 -0.001 (0.063) (0.057) (0.052) (0.023) (0.048) (0.047)
Increase Wealth < 10% 0.088 + -0.128 ** -0.079 + 0.037 -0.003 -0.016 (0.051) (0.044) (0.043) (0.029) (0.042) (0.043)
Decrease Wealth < 10% 0.087 + -0.082 + 0.007 -0.002 0.033 0.009 (0.050) (0.045) (0.046) (0.026) (0.041) (0.042)
Decrease Wealth 10% to 29% -0.025 0.015 -0.094 * 0.060 * 0.068 + -0.005 (0.048) (0.044) (0.037) (0.028) (0.039) (0.036)
Decrease Wealth 30% to 50% 0.033 -0.055 -0.053 0.037 0.037 -0.005 (0.055) (0.052) (0.046) (0.034) (0.045) (0.045)
Decrease Wealth > 50% -0.071 -0.011 -0.032 0.047 0.044 -0.021 (0.087) (0.076) (0.068) (0.047) (0.064) (0.058)
Income Less than $20,000 (reference) -- -- -- -- -- --
$20,000 - $29,999 -0.092 -0.014 0.097 0.022 0.018 -0.040 (0.077) (0.073) (0.075) (0.034) (0.054) (0.051)
$30,000 - $39,999 -0.097 0.013 0.084 -0.001 0.041 0.035 (0.076) (0.072) (0.073) (0.029) (0.055) (0.059)
$40,000 - $49,999 -0.036 0.091 0.046 0.002 -0.018 0.014 (0.074) (0.077) (0.070) (0.029) (0.047) (0.058)
$50,000 - $59,999 0.029 -0.048 -0.008 -0.035 0.016 0.058 (0.076) (0.071) (0.072) (0.021) (0.056) (0.066)
$60,000 - $74,999 -0.007 -0.048 0.073 -0.053 ** -0.015 0.049 (0.074) (0.069) (0.073) (0.018) (0.050) (0.062)

39
$75,000 - $99,999 0.076 -0.105 0.085 -0.038 + -0.048 0.059 (0.071) (0.066) (0.075) (0.022) (0.047) (0.065)
$100,000 - $149,999 0.144 * -0.076 0.110 -0.047 * -0.072 -0.049 (0.070) (0.072) (0.082) (0.020) (0.045) (0.056)
$150,000 or more 0.042 0.087 0.060 0.059 -0.067 -0.039 (0.107) (0.114) (0.104) (0.072) (0.063) (0.084)
Wealth Zero (reference) -- -- -- -- -- --
Less than $1000 -0.140 0.151 + 0.052 -0.001 0.031 -0.041 (0.087) (0.083) (0.078) (0.031) (0.057) (0.052)
$1,000 - $2,999 0.022 0.025 0.139 -0.018 0.052 0.004 (0.085) (0.079) (0.087) (0.028) (0.064) (0.064)
$3,000 - $4,999 0.139 + -0.114 + 0.237 * -0.050 ** -0.037 -0.020 (0.075) (0.067) (0.094) (0.018) (0.052) (0.062)
$4,000 - $9,999 0.271 *** -0.112 + 0.114 -0.045 * -0.050 -0.114 ** (0.050) (0.065) (0.088) (0.019) (0.048) (0.042)
$10,000 - $19,999 0.246 *** -0.160 ** 0.225 * -0.017 -0.141 *** -0.074 (0.056) (0.057) (0.088) (0.029) (0.027) (0.049)
$20,000 - $49,999 0.281 *** -0.186 *** 0.102 -0.046 * -0.040 -0.100 * (0.051) (0.052) (0.079) (0.020) (0.047) (0.043)
$50,000 - $99,999 0.226 *** -0.149 ** 0.153 + -0.044 * -0.033 -0.170 *** (0.059) (0.057) (0.081) (0.020) (0.049) (0.031)
$100,000 - $249,999 0.291 *** -0.187 *** 0.034 -0.047 * -0.103 ** -0.148 *** (0.049) (0.054) (0.079) (0.020) (0.037) (0.036)
$250,000 or more 0.273 *** -0.247 *** 0.051 -0.075 *** -0.090 * -0.109 * (0.054) (0.045) (0.083) (0.012) (0.041) (0.046)
Education High School or Less (reference) -- -- -- -- -- --
Trade School 0.085 -0.011 -0.003 -0.009 -0.027 -0.059 (0.063) (0.062) (0.061) (0.025) (0.042) (0.044)

40
Some College 0.042 0.006 0.034 -0.022 -0.020 0.011 (0.045) (0.042) (0.040) (0.017) (0.031) (0.035)
College 0.172 *** -0.045 0.029 -0.053 ** -0.046 -0.027 (0.045) (0.045) (0.045) (0.017) (0.032) (0.037)
Graduate Education 0.124 * -0.047 0.088 -0.055 *** -0.020 -0.087 * (0.056) (0.057) (0.062) (0.014) (0.044) (0.041)
Unemployed -0.140 ** 0.187 *** -0.030 0.047 + 0.071 + -0.049 (0.053) (0.053) (0.043) (0.027) (0.040) (0.035)
Age 18-34 (reference) -- -- -- -- -- --
35 - 55 0.112 ** -0.100 ** 0.003 -0.021 -0.052 + -0.117 *** (0.038) (0.034) (0.034) (0.017) (0.027) (0.027)
55 - 65 0.128 * -0.249 *** -0.015 -0.058 *** -0.072 * -0.185 *** (0.052) (0.035) (0.050) (0.015) (0.033) (0.025)
Female 0.065 * 0.059 + 0.007 -0.019 -0.051 * 0.046 + (0.032) (0.030) (0.028) (0.014) (0.023) (0.025)
Race/Ethnicity White (reference) -- -- -- -- -- --
Black 0.007 0.090 0.005 0.008 -0.068 + 0.064 (0.063) (0.066) (0.057) (0.027) (0.035) (0.056)
Hispanic 0.022 0.073 -0.076 -0.051 *** -0.063 0.035 (0.080) (0.077) (0.061) (0.015) (0.044) (0.060)
Asian -0.102 0.024 0.098 -0.030 -0.061 0.004 (0.069) (0.065) (0.067) (0.022) (0.042) (0.053)
Other Race/Ethnicity 0.014 0.158 0.011 0.017 -0.090 + 0.070 (0.112) (0.112) (0.098) (0.057) (0.051) (0.098)
Marital Status Married (reference) -- -- -- -- -- --
Never Married 0.015 0.029 -0.044 0.014 0.024 0.004 (0.046) (0.045) (0.042) (0.023) (0.036) (0.036)

41
Divorced or Widowed -0.087 0.086 0.009 0.031 0.064 0.012 (0.057) (0.054) (0.049) (0.031) (0.046) (0.045)
Other Marital Status -0.034 0.080 -0.026 0.008 0.033 0.086 + (0.059) (0.058) (0.050) (0.028) (0.044) (0.051)
Household Composition
Children in Household -0.147 *** 0.074 * 0.021 0.050 ** 0.026 -0.000 (0.035) (0.033) (0.030) (0.018) (0.025) (0.027)
Live with Parents 0.060 0.116 * 0.000 -0.018 0.026 -0.026 (0.055) (0.057) (0.052) (0.022) (0.044) (0.039)
Region South (reference) -- -- -- -- -- --
North-East 0.025 -0.059 0.014 -0.044 ** 0.007 -0.002 (0.044) (0.040) (0.039) (0.014) (0.032) (0.035)
Mid-West -0.014 0.037 -0.003 -0.039 ** 0.029 -0.031 (0.043) (0.041) (0.037) (0.014) (0.031) (0.030)
West -0.016 0.044 0.046 -0.016 -0.002 -0.023 (0.042) (0.040) (0.038) (0.017) (0.031) (0.031)
Gambled -0.019 0.048 0.062 * 0.060 *** 0.040 -0.008 (0.033) (0.032) (0.029) (0.017) (0.024) (0.025)
Financial Education 0.047 -0.023 -0.011 0.030 * 0.016 0.040 (0.037) (0.036) (0.033) (0.014) (0.026) (0.028)
Risk Literacy 0.111 ** -0.018 0.009 -0.009 -0.073 ** -0.046 (0.038) (0.039) (0.036) (0.017) (0.026) (0.029) Observations 1255 1255 1255 1255 1255 1255 Pseudo R2 0.184 0.170 0.037 0.178 0.089 0.103
+ p<0.10, * p<0.05, ** p<0.01, *** p<0.001
Notes: 1. Models also include dichotomous indicators of having missing data on income, wealth, or change in wealth. 2. Savings = (1) draw from savings, (2) liquidate or sell investments, (3) borrow against retirement savings, and/or (4) liquidate some retirement investments 3. Family/Friends = (1) borrow or ask for help from family and/or (2) borrow or ask for help from my friends (not family) 4. Mainstream Credit = (1) use credit cards, (2) open or use home equity line of credit/second mortgage, and/or (3) unsecured loan 5. AFS Credit = (1) payday or payroll advance loan and/or (2) pawn an asset

42
6. Sell Things = (1) sell things I owned, except my home and/or (2) sell my home 7. Work More = (1) Work overtime, get a second job, or another member of my household would work longer or go to work

43
Table 6. Cross-national Comparisons of Confidence in Capacity to Cope and Methods of Coping, Percent of Respondents by Country
US UK France Germany Canada Italy Portugal Netherlands
Confidence in Ability to Cope Certainly Able to Cope 24.9 24.1 36.2 30.7 44.3 48.2 31.0 57.7 Probably Able to Cope 25.1 23.7 26.6 18.7 27.4 31.9 23.1 15.5 Probably Not Able to Cope 22.1 16.7 18.5 21.7 12.3 11.0 13.8 8.0 Certainly Not Able to Cope 27.9 35.5 18.8 28.9 15.9 9.0 32.1 18.9
Coping Method by Type Savings 60.6 53.6 57.5 54.8 58.9 71.3 49.2 88.8 Family or Friends 34.2 33.7 33.0 35.9 25.6 23.9 28.0 10.3 Mainstream Credit 29.5 26.2 15.9 21.5 40.3 16.6 12.4 7.8 Alternative Credit 10.8 4.1 5.2 7.3 7.0 6.4 6.3 0.5 Sell Possessions 19.1 14.8 12.9 11.0 9.5 3.7 4.3 1.5 Work More 22.9 15.4 16.8 14.2 12.9 10.6 14.7 1.5 Other 0 0 0 0 0 0 0 1.8 Don't Know 1.9 3.8 5.5 6.0 7.5 3.4 11.6 5.9
Number of Coping Methods One 46.5 59.8 59.9 54.7 48.3 67.0 71.2 84.3 Two 18.6 16.0 17.8 16.6 21.3 19.3 13.2 8.9 Three 34.9 24.2 22.2 28.8 30.4 13.8 15.6 6.8
Observations 1,931 1,001 1,097 1,107 1,132 935 1,011 1,001

44
Appendix Table 1. Descriptive Statistics: Economic and Demographic Characteristics (TNS Survey, ACS Pooled 2006 – 2008 Sample, 2007 SCF)
TNS External Data
Change in Wealth Since Crisis Same 27.09 --Increase Wealth > 10% 7.76 --Increase Wealth < 10% 10.56 --Decrease Wealth < 10% 12.54 --Decrease Wealth 10% to 29% 21.66 --Decrease Wealth 30% to 50% 11.70 --Decrease Wealth > 50% 8.69 --
Income Less than $20,000 13.29 14.8$20,000 - $29,999 11.96 9.17$30,000 - $39,999 12.88 9.72$40,000 - $49,999 13.27 9.25$50,000 - $59,999 11.29 8.67$60,000 - $74,999 13.13 11.15$75,000 - $99,999 11.18 13.79$100,000 - $149,999 9.53 13.85$150,000 or more 3.47 9.59
Wealth Zero 12.93 9.02Less than $1000 14.70 17.19$1,000 - $2,999 7.22 12.46$3,000 - $4,999 5.31 5.76$4,000 - $9,999 7.54 8.91$10,000 - $19,999 8.24 9.19$20,000 - $49,999 12.02 11.54$50,000 - $99,999 12.34 8.05$100,000 - $249,999 10.27 9.13$250,000 or more 9.45 8.75
Education High School or Less 22.34 42.71Trade School 8.23 --Some College 34.81 31.15College (Bachelor’s Degree) 26.71 17.21Graduate Education 7.89 8.93
Unemployed 13.92 --
Age 18 – 34 39.11 36.8235 – 54 47.06 45.9355 - 65 13.83 17.25
Female 49.61 50.05
(cont…)

45
Notes: 1. ACS data is used for all comparison measures but for wealth which is calculated from the 2008 SCF. 2. The census categorizes Hispanic as an ethnic category separate from racial categories. Calculations were done on ACS data to ensure that the race data presented here were for ages 18-64 and that Hispanics were not also included in other racial categories (e.g., white, black). 3. The ACS does not categorize separately those who “cohabitate”. The ACS category “married” includes all married persons who are either living together, separated or designated as “other married”. 4. The most comparable ACS data are provided here: all persons who have their own children in the household.
Race/Ethnicity White 80.48 66.55Black 7.78 12.06Hispanic 4.34 14.44Asian 5.03 4.69Other Race/Ethnicity 2.37 2.26
Marital Status Married/Cohabiting 54.16 56.24Never Married 23.65 31.81Divorced or Widowed 11.55 11.95Other Marital Status 10.65 --
Household Composition Children in Household 41.36 53.41Live with Parents 11.62 --
Region South 36.21 36.54North-East 18.83 18.25Mid-West 22.46 21.83West 22.50 23.37
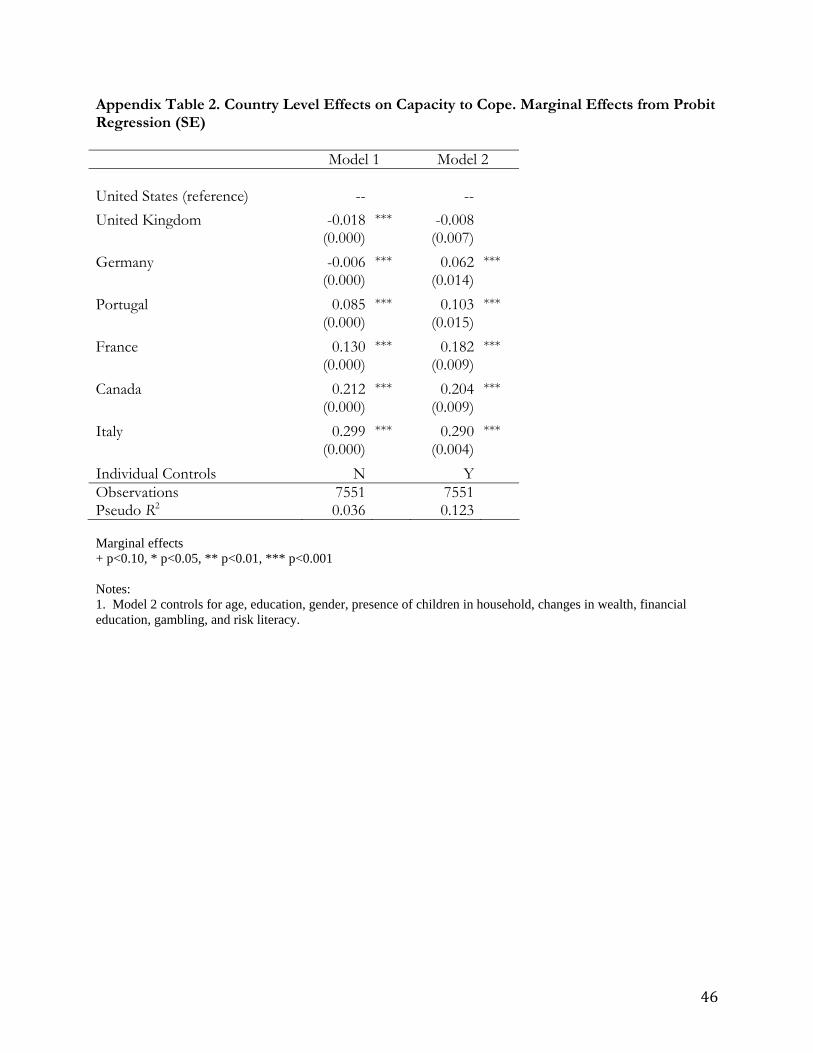
46
Appendix Table 2. Country Level Effects on Capacity to Cope. Marginal Effects from Probit Regression (SE)
Marginal effects + p<0.10, * p<0.05, ** p<0.01, *** p<0.001 Notes: 1. Model 2 controls for age, education, gender, presence of children in household, changes in wealth, financial education, gambling, and risk literacy.
Model 1 Model 2 United States (reference) -- --
United Kingdom -0.018 *** -0.008 (0.000) (0.007)
Germany -0.006 *** 0.062 *** (0.000) (0.014)
Portugal 0.085 *** 0.103 *** (0.000) (0.015)
France 0.130 *** 0.182 *** (0.000) (0.009)
Canada 0.212 *** 0.204 *** (0.000) (0.009)
Italy 0.299 *** 0.290 *** (0.000) (0.004)
Individual Controls N Y Observations 7551 7551 Pseudo R2 0.036 0.123

47
Appendix: Questions to Measure Risk Literacy Q1. For the same amount of money, a person can enter either one of these two lotteries. Lottery A pays a prize of [US $200, GB £140, GER & FRA 150 Euros] and the chance of winning is 5%. Lottery B pays a prize of [US $90,000, GB £60,000, GER & FRA 65,000 Euros] and the chance of winning is 0.01%. In either case, if one does not win, one does not get any money. Which lottery pays the higher average amount? (Please pick one option only) i) Lottery A ii) Lottery B iii) These two lotteries pay the same average amount iv) I do not know v) I refuse to answer Q2. You can invest in two projects. Project A will either deliver a return of 10% or 6%, with either outcome equally likely. Project B will either deliver a return of 12% or 4%, with either outcome equally likely. Which of the following is true? Compared to Project B, Project A has…. (Please pick one option only) i) Higher return and lower risk ii) Same average return and lower risk iii) Lower return and higher risk iv) I do not know v) I refuse to answer Q3 As a general rule, if you were investing in stocks [GB change to: investing in stocks and shares], which of the two types of investments listed below is likely to be riskier? (Please pick one option only) i) Investing in a single stock ii) Investing in a fund that holds 100 different stocks iii) I don’t know iv) I refuse to answer