CHAPTER 5 RESULTS AND DISCUSSION
22
74 CHAPTER 5 RESULTS AND DISCUSSION After the fabrication and the packaging of the designed sensors, measurements are carried out to characterize the sensors. In this chapter, the setup and the measurements of the fabricated PSOI and 6H-SiC piezoresistive tactile and pressure sensors will be described. 5.1 Piezoresistive Tactile Sensors The static performance of the fabricated tactile sensor is characterized by the system, illustrated in Fig. 5.1. The sensor is attached to a PCB (Printing Circuit Board) by a silver adhesive and the signals from the sensor are connected to the other side of PCB by the conducting paths on the PCB and aluminum pins. A known weight is used to apply a force and is conducted to the sensor by a needle which is supported by a Teflon block. A programmable voltage source (Keithley 230) and a multi meter (Keithley 196) are connected to the sensor properly to measure the change in the voltage for the piezoresistor bridge at room temperature. The result is shown in Fig. 5.2. The offset of the sensor is about –8.54 mV. The sensitivity of the sensor is about -4.95 µV/g.w. when 0.5 V is applied across the Wheatstone bridge. The nonlinearity and the hysteresis of the sensor are 1.5% and 4.3%, respectively. A curve according to the previously developed analytic solution is also drawn in
-
Upload
khangminh22 -
Category
Documents
-
view
0 -
download
0
Transcript of CHAPTER 5 RESULTS AND DISCUSSION

74
CHAPTER 5
RESULTS AND DISCUSSION
After the fabrication and the packaging of the designed sensors, measurements are
carried out to characterize the sensors. In this chapter, the setup and the measurements
of the fabricated PSOI and 6H-SiC piezoresistive tactile and pressure sensors will be
described.
5.1 Piezoresistive Tactile Sensors
The static performance of the fabricated tactile sensor is characterized by the
system, illustrated in Fig. 5.1. The sensor is attached to a PCB (Printing Circuit Board)
by a silver adhesive and the signals from the sensor are connected to the other side of
PCB by the conducting paths on the PCB and aluminum pins. A known weight is used
to apply a force and is conducted to the sensor by a needle which is supported by a
Teflon block. A programmable voltage source (Keithley 230) and a multi meter
(Keithley 196) are connected to the sensor properly to measure the change in the
voltage for the piezoresistor bridge at room temperature. The result is shown in Fig.
5.2. The offset of the sensor is about –8.54 mV. The sensitivity of the sensor is about
-4.95 µV/g.w. when 0.5 V is applied across the Wheatstone bridge. The nonlinearity
and the hysteresis of the sensor are 1.5% and 4.3%, respectively.
A curve according to the previously developed analytic solution is also drawn in

75
the same diagram, using the geometry of the fabricated sensor. A gauge factor of –6.3
[70] is used because of the highly doped n-type polysilicon piezoresistors. When
adding the offset voltage to the theoretical values, the measurement results agree very
well with the analytical solutions.
The 6H-SiC piezoresistive tactile sensor was measured with the same setup. The
result is illustrated in Fig. 5.3. The offset at room temperature is about 1.83 mV when
1 V is applied to the bridge. The sensitivity at room temperature is about -31 µV/g.w.
The nonlinearity and hysteresis are 9.8% and 24% respectively.
50g
voltage source
multi meter
PCB
+ -
+ -
known weight
Teflonblock
needle
pin
tactilesensor
pin
Figure 5.1. Setup of the characterization environment for the tactile sensor.

76
0 100 200 300 400 500 600 700 800 900 10003.0
4.0
5.0
6.0
7.0
8.0
9.0
a=1.695mmb=0.47mmh=150µmE=130GPav=0.28
outp
ut v
olta
ge (
mV
)
weight (g.w.)
forward backward analytic solution
Figure 5.2. Measurement result of a PSOI piezoresistive tactile sensor at room
temperature and supplying voltage 500mV.
0 50 100 150 200 250
1.826
1.827
1.828
1.829
1.830
1.831
1.832
1.833
1.834
1.835
outp
ut v
olta
ge (m
V)
weight (g.w.)
forward backward linear fit
Figure 5.3. Measurement results of a 6H-SiC tactile sensor at room temperature
and 1 V supplying voltage.

77
5.2 PSOI Piezoresistive Pressure Sensors
To characterize the fabricated PSOI and 6H-SiC piezoresistive pressure sensors,
not only the pressure but also the temperature must be controlled. The setup of the
measurement system is illustrated in Fig. 5.4. The packaged pressure sensor is
mounted on a ceramic based carrier and transferred into a hermetic chamber. The
chamber is then placed inside a furnace. The temperature of the furnace is controlled
by a temperature controller, which is made by the company Eurotherme. Inside the
furnace, there is a K-type thermocouple. The controller uses this sensor to acquire the
temperature of the furnace and adjust the temperature according to PID (Proportional,
Integral, and Derivative) control algorithm. Cooling water circulates outside the
furnace to prevent heat conduction to the ambient. The pressure in the chamber is
controlled by a pressure calibrator by Druck Messtechnik GmbH. Nitrogen gas is
pumped into the chamber to avoid the oxidation of the metal during the high
temperature measurement. According to this arrangement, the temperature and the
pressure can be controlled from room temperature to 450°C and from 1 bar to 10 bar
respectively. Fig. 5.5 shows a photography of the high temperature pressure sensor
testing environment.
The voltage supply for the Wheatstone bridge on the pressure sensor is applied
by a voltage source (Keithley 230). The output voltage of the bridge is measured by a

78
multi meter (Keithley 196). Because there is a temperature difference between the
furnace and the pressure sensor, a Pt-100 thermal sensor is mounted on the backside
of the sensor and its resistance is measured by another multi meter (Keithley 196).
Therefore, the temperature of the pressure sensor during the measurement can be
recorded.
Figure 5.4. Setup of the high temperature pressure sensor measurement
environment.

79
oven
packagedpressuresensor
Figure 5.5. Photography of the setup of the high temperature pressure sensor
measure environment.
First, the change in the resistance of one PSOI piezoresistor against the
temperature is measured and illustrated in Fig. 5.6. The resistance increases from 265
Ω at room temperature to 340 Ω at 450°C. The resistor is measured 5 times and the
repeatability of the resistors is good. The change of the resistance with respect to the
temperature is mainly dominated by the doping concentration of the polysilicon

80
piezoresistor.
0 50 100 150 200 250 300 350 400 450 500
260
270
280
290
300
310
320
330
340
resi
stan
ce (
Ω)
temperature (oC)
1. measurement 2. measurement 3. measurement 4. measurement 5. measurement
Figure 5.6. Variation of the resistance of a resistor in the PSOI pressure sensor’s
bridge with respect to temperature.
As mentioned in Chapter 4, different kinds of high temperature adhesives are
examined in order to make a hermetic package of the pressure sensor. However, after
the thermal cycling test, some of them show either non-hermetic behavior or have a
large influence on the performance of the sensor. One of the epoxies, Epotek
353ND-10, shows a good result as illustrated in Fig. 5.7. The measurement is first
carried out at room temperature which is around 25°C. The pressure is applied
forward from 0 bar (the ambient pressure) to 10 bar with the interval of 2 bar and then,

81
backward from 10 bar to 0 bar to see if hysteresis exists. After the measurement at
room temperature is complete, the temperature is raised to 100°C. As the temperature
is stable, the pressure is applied in the same way as described above. After a third
measurement at 300°C, the furnace is cooled down to room temperature. In order to
determine the repeatability, a second run of the measurements is carried out. Before
the measurement, the bridge has an offset 0.016 mV. At room temperature, the
sensitivity of the sensor is 377 µV/V/bar and the non-linearity and hysteresis are
0.66% and 0.84% respectively. After the first set of measurements, the bridge’s offset
changes to 0.107 mV when no pressure is applied at room temperature. The sensitivity
remains 378 µV/V/bar. The nonlinearity and hysteresis are 0.07% and 0.47%,
respectively at room temperature.
As the temperature changes, both the offset and the sensitivity of the pressure
sensor change as illustrated in Fig. 5.7 (b) and (c). The Temperature Coefficient of the
Offset (TCO) is defined as
0
0
( ) ( )1 o o
DD
V T V TTCO
V T T
−=−
(5.1)
where T is the temperature, 0T is the room temperature, oV is the offset
voltage and DDV is the supply voltage. The Temperature Coefficient of Sensitivity
(TCS) is defined as

82
0
0 0
( ) ( )1
( )
S T S TTCS
S T T T
−=−
(5.2)
where S is the sensitivity of the pressure sensor.
In the first measurement, TCO and TCS of the PSOI pressure sensor at 100°C
temperature are 7.29 µV/V/°C and 0.0064 %/°C and change to 6.88 µV/V/°C and
-0.0002 %/°C in the second measurement, respectively. The offset of the pressure
sensor is due to the imbalanced bridge output when no pressure is applied. It is caused
by the differences of thermal expansion coefficients between the different materials
(silicon chip, alumina spacer and carrier, adhesive), the asymmetry or non-uniformity
of the membrane, the difference in the thermal coefficient of the four piezoresistors
and the different resistance values of the four piezoresistors. TCS is mainly caused by
the doping concentration of the polysilicon piezoresistors.
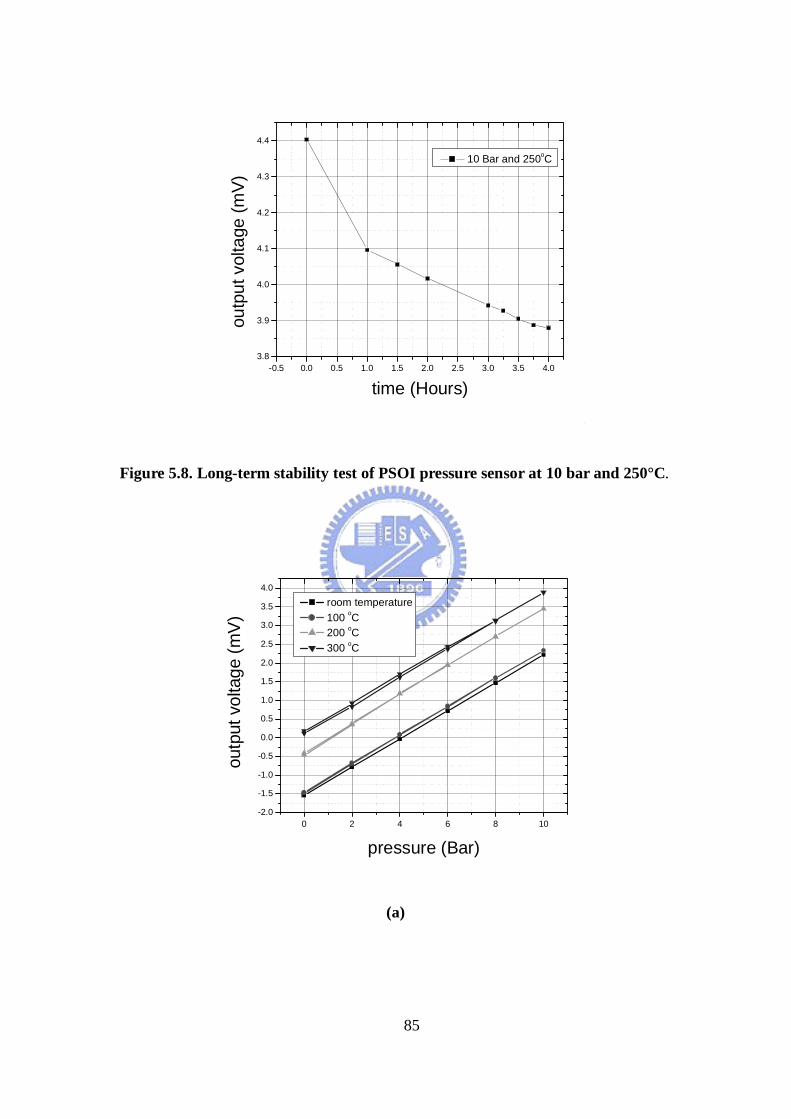
The long-term stability of the sensor has also been tested and the result is
illustrated in Fig. 5.8. The test was performed with a pressure of 10 bar at 250 °C. The
output signal drops sharply in the first hour and then stabilizes at 3.9 mV. This drift
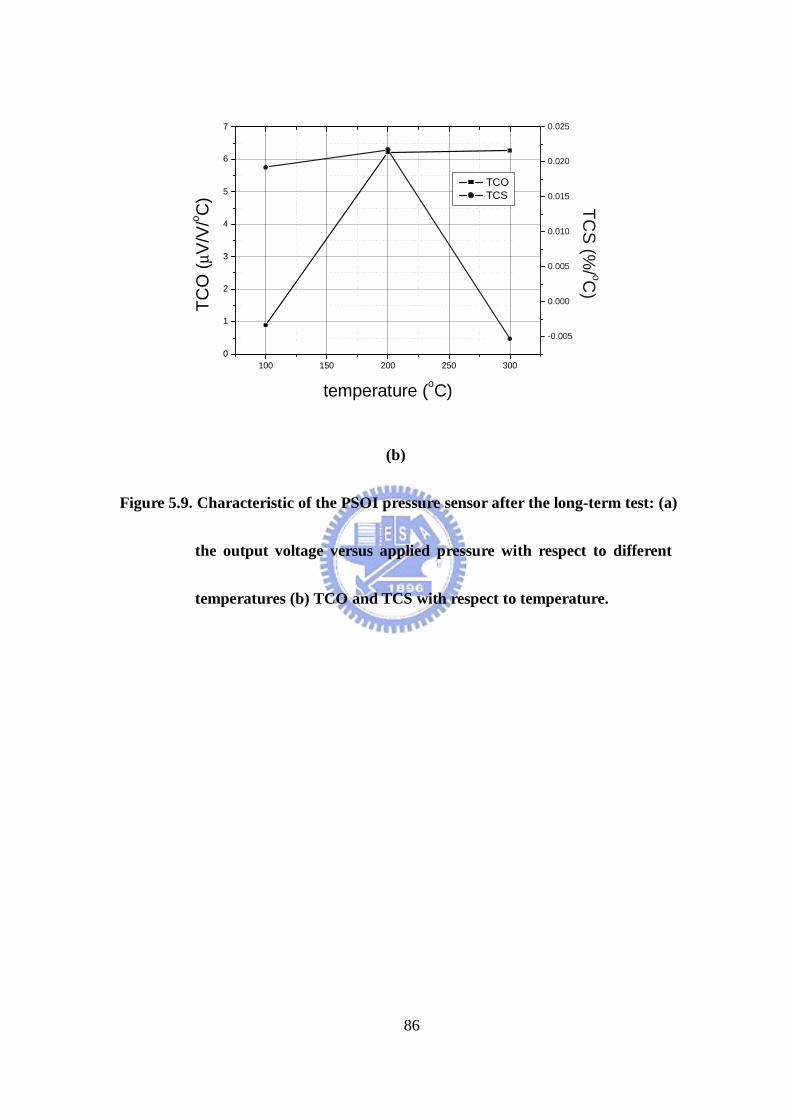
may be due to the further curing of the adhesive. After the 4 hours long-term stability
test, another measurement of the output voltage against pressure and temperature is
performed and illustrated in Fig. 5.9. The sensitivity is 375 µV/V/°C, the nonlinearity
is 0.14% and the hysteresis is 0.25%. Table 5.1 gives a summary of the PSOI pressure
sensor properties.

83
0 2 4 6 8 10-0.5
0.0
0.5
1.0
1.5
2.0
2.5
3.0
3.5
4.0
4.5
5.0
5.5
6.0
outp
ut v
olta
ge (
mV
)
pressure (Bar)
R.T. 100oC 200oC 300oC R.T. 100oC 200oC 300oC
(a)
100 150 200 250 3006
7
8
TC
O (
µV/V
/o C)
temperature (oC)
1st measurement 2nd measurement
(b)

84
100 150 200 250 300-0.006
-0.004
-0.002
0.000
0.002
0.004
0.006
0.008
0.010
TC
S (
%/o C
)
temperature (oC)
1st measurement 2nd measurement
(c)
Figure 5.7. Characteristic of one PSOI pressure sensor with the adhesive Epotek
526N (a) output voltage versus applied pressure with respect to
different temperatures (b) TCO and (c) TCS with respect to
temperature.
85
-0.5 0.0 0.5 1.0 1.5 2.0 2.5 3.0 3.5 4.03.8
3.9
4.0
4.1
4.2
4.3
4.4
outp
ut v
olta
ge (
mV
)
time (Hours)
10 Bar and 250oC
Figure 5.8. Long-term stability test of PSOI pressure sensor at 10 bar and 250°C.
0 2 4 6 8 10-2.0
-1.5
-1.0
-0.5
0.0
0.5
1.0
1.5
2.0
2.5
3.0
3.5
4.0
outp
ut v
olta
ge (
mV
)
pressure (Bar)
room temperature 100 oC 200 oC 300 oC
(a)
86
100 150 200 250 3000
1
2
3
4
5
6
7
TCO TCS
temperature (oC)
TC
O (
µV/V
/o C)
-0.005
0.000
0.005
0.010
0.015
0.020
0.025
TC
S (%
/ oC)
(b)
Figure 5.9. Characteristic of the PSOI pressure sensor after the long-term test: (a)
the output voltage versus applied pressure with respect to different
temperatures (b) TCO and TCS with respect to temperature.

87
Table 5.1. Characteristics of the PSOI piezoresistive pressure sensor.
Parameter PSOI pressure sensor After long-term stability test
Offset (mV) 0.107 -1.54
Full-Scale-Output (mV/V) 3.778 3.897
Sensitivity (µV/V/bar) 378 389
TCO (µV/V/°C) 6.88 0.167
TCS (%/°C) -0.0002 -0.0049
Nonlinearity (% F.S.O.) 0.07 0.144
Hysteresis (% F.S.O.) 0.47 0.25
5.3 6H-SiC Piezoresistive Pressure Sensor
Due to difficulties in obtaining an ohmic contact to the n-type 6H-SiC
piezoresistors, not all of the piezoresistors on the sensors have ideal resistor properties.
First, the I-V curve is measured to make sure if the piezoresistors are really formed.
Four piezoresistors and a temperature resistor are measured at room temperature and
illustrated in Fig. 5.10. The linearity of the I-V curve shows that the fabricated
6H-SiC piezoresistors have a resistor characteristic and the resistance is about 65 KΩ.
A typical resistance measurement with different temperature is illustrated in Fig. 5.11.
The non-stability of the resistance maybe due to the non-perfect contact between

88
WSi2 and n-type 6H-SiC piezoresistor.
Fig. 5.12 illustrates the measurement of one of the 6H-SiC pressure sensors. The
offset voltage depends largely on the temperature, which means the sensor suffers a
significant thermal deformation. However, the sensitivity remains relatively constant.
As the temperature exceeds 200°C, no signal can be detected. An examination of this
chip at room temperature shows that the chip is broken. The thermal expansion
between the sensor and the package could be the main reason. The offset and the
sensitivity of the sensor at room temperature are 160.5 mV and 1.0 mV/V/bar
respectively. The nonlinearity is 3% and the hysteresis is 7%. The correspondent TCO
and TCS are illustrated in Fig. 5.13. At 100°C, they are 1.7 µV/V/°C and –0.36 %/°C
respectively.
-1.0 -0.5 0.0 0.5 1.0
-45.0-40.0-35.0-30.0-25.0-20.0-15.0-10.0-5.00.05.0
10.015.020.025.030.035.040.045.0
R1 62.8k R2 63.2k R3 64.9k R4 71.2k RT 25.6k
curr
ent (
µA)
voltage (V)
Figure 5.10. I-V curve of n-type 6H-SiC piezoresistors.

89
0 100 200 300 400 500
80
100
120
140
160
180
resi
stan
ce (
kOhm
)
temperature (? )
25oC to 450oC 450oC to 25oC
Figure 5.11. Temperature dependence of the resistance of an n-type 6H-SiC
piezoresistor.
0 2 4 6 8 10
160
162
164166
168170
172
174176
178180
182
184186
188190
192
194196
Out
put V
olta
ge (
mV
)
Pressure (Bar)
R.T. 100oC 150oC 200oC
Figure 5.12. Output voltage of a 6H-SiC piezoresistive pressure sensor with
respect to pressure and temperature.

90
100 120 140 160 180 2000.16
0.18
0.20
0.22
0.24
0.26
TCO TCS
temperature (oC)
TC
O (
%/V
/o C)
-0.9
-0.8
-0.7
-0.6
-0.5
-0.4
-0.3
TC
S (%
/ oC)
Figure 5.13. TCO and TCS of a 6H-SiC piezoresistive pressure sensor.

91
CHAPTER 6
CONCLUSIONS AND FUTURE WORKS
This work is focused on the design and fabrication of piezoresistive sensors
working in high temperature environment. Two high temperature materials, namely
Polysilicon-On-Insulator (PSOI) and 6H-SiC, are used in this study. Due to the
isolation of the piezoresistor, the PSOI piezoresistive sensor can work up to 350°C.
The piezoresistive sensor made from the wide band gap material 6H-SiC can function
up to 650°C if a reliable package of the sensor is available. Because both polysilicon
and 6H-SiC have isotropic piezoresistivity, the circular membrane structure with
center boss is used. This maximizes the sensitivity of the sensor by using only the
longitudinal piezoresistance coefficient since it is larger than the transverse one.
The pressure and tactile sensor based on the same design are analyzed,
respectively. According to the plate theory, the analytic solutions for the design of the
pressure and tactile sensor are derived. Three cases of operating modes are discussed
for the pressure sensor: before the center boss touches the bottom, after the center
boss touches the bottom, and when the center boss has a distance from the bottom.
Some conclusions for the center boss pressure sensor are obtained after the derivation.
Firstly, longitudinal stresses with the same magnitude and opposite numerical sign can
be found at the inner and outer edge of the annular membrane. Therefore, a full

92
Wheatstone bridge with maximum sensitivity can be formed. Nevertheless, the
distribution of the longitudinal stress with respect to the radius of the circular
membrane is a fourth order function and the position where the longitudinal stress is
zero is not in the middle of the annular structure. Therefore, it will result in a pair of
non-balance longitudinal stresses if the piezoresistors are not exactly at the edge of
the inner and outer membrane.
Secondly, the optimum ratio of the radius of center boss to that of the circular
membrane, n , is chosen by the criterion 0 0.5n≤ ≤ in order to obtain a high
sensitive center boss pressure sensor. Thirdly, with a choice of the center boss –
bottom plate distance d, the over-range protection can be realized. Moreover, the
second sensitivity after the center boss touches down may result in other applications,
e.g. brake-by-wire[73].
The tactile sensor based on the circular membrane with center boss structure
contains three parts: a center boss which serves as a force-conducting structure, a
circular membrane which serves as a force-sensing structure and a frame which is
used to support the center boss and the circular membrane. The analytic solutions of
the tactile sensor are different from the ones of the pressure sensor. According to the
analysis, the longitudinal stresses on the inner and outer edge of the annular structure
have different magnitudes which will result in a non-balanced Wheatstone bridge. To
93
keep the high sensitivity, piezoresistors placed on the inner and outer edge of the
annular structure are recommended.
The pressure and tactile sensor are fabricated by PSOI and 6H-SiC, respectively.
For PSOI, RIE is used to create the poly-Si piezoresistors and the center boss
structure. For 6H-SiC, RIE and electrochemical etching are used to create the 6H-SiC
piezoresistors and the center boss structure, respectively. With the proposed high
temperature hermetic package based on high temperature adhesives, the sensor can
work up to 350°C and 200°C for the PSOI and 6H-SiC pressure sensor, respectively.
This study has illustrated a feasible way to produce the high temperature
piezoresistive sensors based on PSOI and 6H-SiC. However, there is still a plenty of
room to improve this work. The further development of the work includes:
1. Thermally stable ohmic contacts
Good ohmic contacts are needed for a piezoresistive sensor because their
electric properties will affect the measurement result of the sensor. Especially in
high temperature environment, the metal components on the semiconductor will
begin to diffuse into the bulk material or oxidize, which can increase the
resistivity of the ohmic contact. In this work, Ni/Cr is used as the polysilicon
piezoresistor’s ohmic contact metal and Al and WSi2 are used as the p-type and
n-type 6H-SiC piezoresistor’s ohmic contact metal respectively. The stability of

94
these ohmic contacts at high temperature should be further investigated and
characterized.
2. High temperature metallization scheme
WSi2 and thick Al cover layers with thick Al bonding wire are used as
metallization scheme for 6H-SiC. This metal scheme has been tested at 400°C
for more than 1000 hours and no intermixing or degradation was observed[63].
However, the melting point of aluminum is about 660°C. This property
constrains the further process for the high temperature package. For example, a
glass-frit bonding needs a higher temperature to make a hermetic sealing. As the
curing temperature is below 600°C, the working temperature after the glass-frit
bonding will be below 500°C, which limits the further working temperature of
the piezoresistive sensor. Another metallization scheme based on Ti/TiN/Pt and
Pt[74] bonding wire is recommended for the further development of the high
temperature piezoresistive sensor.
3. High temperature packages
A high temperature package is needed to let the sensor working in high
temperature environment. This is still a challenging task today because it needs
to protect the electronic devices of the sensor from degradation and also to
conduct the signals without distortion at high temperatures. The tactile sensor in

95
this research is only tested at room temperature. Although the pressure sensor
can work at 350°C with the developed high temperature package, another
reliable high temperature package for tactile and pressure sensor is still needed.
A possible package is proposed by Masheeb, et al.[75]. In this work, the leadless
packaging without bonding wires allowed the fabricated sensor to work at
500°C. The conductive metal-glass frits mixture is used to make electrical
contacts between the metallized pads of the sensor chip and the pins of the
sensor header on the package. The sensor chip, cover and header are bonded
using electrically nonconductive glass frits. Such a packaging scheme is
particularly suitable for the piezoresistive center boss tactile and pressure sensor
and should be further developed.
4. Fine tuning of fabrication processes
To further improve the properties of the sensors, the fabrication process needs to
be adjusted continuously.
Successful solutions of these topics will give a reliable and long-term stable high
temperature piezoresistive sensor in the future.