Management Discussion & Analysis - Tata Power
21
1. Industry Developments Global Power Sector The global power sector is witnessing a rapid change with the influx of renewable energy in the power portfolio mix as all nations rise to the challenge of climate change. In addition, Electric vehicles, Digitalisation, Grid scale energy storage, Cyber Security, Big Data Analytics, Energy Access to all and Demand Side Management are going to create a visible impact on the sector and the way it operates in the coming years. With energy sources moving to the edge of the grid, the role of players in the sector is also undergoing a change, necessitating a move from conventional methods to service delivery to becoming energy solution providers for the end consumers. Amidst a changing energy landscape, global power utilities are capitalising on the growth opportunities presented by clean energy. Power market developments are likely to undergo further transformation with changes in policy actions and technological advancements. Focus on environmental sustainability on the back of climate change, customer demand for clean energy sources and commitment to help customers optimise energy consumption and enable savings, are driving power utility companies in the U.S. and Europe to increasingly adopt green energy solutions and raise the bar on climate change. A U.S. utility was the first to commit to a ‘100% carbon- free’ initiative by 2050, and 80% by 2030. Several Europeans nations have formulated renewable energy targets which include increasing share of renewables portfolio in the power generation mix by 2030, while also planning to phase out coal by that time. Similar announcements have gathered pace worldwide. Renewables have become the preferred mode for energy generation and sourcing. The gradual reduction in costs supported by favourable Government policies are bringing about a positive change in the electricity generation mix. As per the International Energy Agency (IEA), the share of renewables is expected to be 44% by 2040, from the current level of 26%. The resulting impact of this would be the decline in coal-based power generation from 38% to 25% during the same period. Natural gas enabled generation is set to increase by 50% by 2040, driven by low-cost availability of shale gas. However, as rural and semi-urban electrification continues in most developing economies, affordability and ease-of-access are at the core of consumer demand, and these continue to be met by coal-based generation, especially in the developing markets of Africa and Asia. Global coal prices are stabilising as a result of increasing demand of certain developing economies, off-set by declining requirements of advanced economies. The global coal prices fell from a high of USD 120/MT (Newcastle FOB) in July 2018 to USD 66/MT in March 2020. With the changing scenario in the global energy market in terms of oil prices and renewable power generation costs, the oil-exporting Middle-East countries have devised economic diversification plans. As a means of diversifying its power mix, the MENA (Middle East and North Africa) region is increasingly shifting its focus towards renewables and setting long-term targets for clean energy development. While Morocco’s target is to generate 52% energy through renewable energy sources by 2030, the same for Dubai stands at attaining 75% level by 2050. Saudi Arabia is host to the largest programme of planned projects. The country set an ambitious target of developing 60 GW (60,000 MW) of Renewable Energy (RE) capacity by 2030, scaling up manifold from the current capacity of 100 MW. The region has witnessed large investments in renewables, driving some of the economically viable solar PV and onshore wind projects globally. With coal-based generation unlikely to wane away, a balanced approach aligned to the environmental responsibility is being explored. Technologies including blended power, carbon capture utilisation and storage (CCUS), or biomass co-firing equipment, are being explored depending upon the markets and economic viability and implications, given the high cost associated with such an approach. Electricity access in Africa is the biggest concern, with half of the population in sub-Saharan Africa having no access to power. The region is making progress and with that the rising demand needs have to be met with corresponding increase in supply, requiring significant expansion of the power system. Electricity output in the region is expected to increase from 225 TWh to 900 TWh by 2040, mainly supplied by on-grid power, though decentralised solutions are also being adopted, as declining costs of solar PV and battery storage technologies make these solutions more competitive and economically viable. Electricity access is also one of the core focus areas of ASEAN countries, and Southeast Asia is making steady progress towards achieving universal electricity access by 2030. The region’s electricity demand is growing at a rapid rate of 6% per annum and this demand is primarily met by thermal power, given its lower generation costs and abundant supply of fuel source. Although dominance of coal in power generation mix is expected to continue, the declining costs of renewables, concerns over emissions and pollution accompanied by financing difficulties of coal projects, have started tilting the scales in favour of RE projects. Recent revisions to policy planning documents have been made to boost the long- term share of renewables, backed by private finance and policy incentives. Management Discussion & Analysis Overview Our Emphasis on Value Our Value‑creation Paradigm Statutory Reports Financial Statements Future ready for smart choices 179
-
Upload
khangminh22 -
Category
Documents
-
view
5 -
download
0
Transcript of Management Discussion & Analysis - Tata Power

1. Industry Developments Global Power Sector The global power sector is witnessing a rapid change with
the influx of renewable energy in the power portfolio mix as all nations rise to the challenge of climate change. In addition, Electric vehicles, Digitalisation, Grid scale energy storage, Cyber Security, Big Data Analytics, Energy Access to all and Demand Side Management are going to create a visible impact on the sector and the way it operates in the coming years. With energy sources moving to the edge of the grid, the role of players in the sector is also undergoing a change, necessitating a move from conventional methods to service delivery to becoming energy solution providers for the end consumers.
Amidst a changing energy landscape, global power utilities are capitalising on the growth opportunities presented by clean energy. Power market developments are likely to undergo further transformation with changes in policy actions and technological advancements. Focus on environmental sustainability on the back of climate change, customer demand for clean energy sources and commitment to help customers optimise energy consumption and enable savings, are driving power utility companies in the U.S. and Europe to increasingly adopt green energy solutions and raise the bar on climate change. A U.S. utility was the first to commit to a ‘100% carbon-free’ initiative by 2050, and 80% by 2030. Several Europeans nations have formulated renewable energy targets which include increasing share of renewables portfolio in the power generation mix by 2030, while also planning to phase out coal by that time. Similar announcements have gathered pace worldwide.
Renewables have become the preferred mode for energy generation and sourcing. The gradual reduction in costs supported by favourable Government policies are bringing about a positive change in the electricity generation mix. As per the International Energy Agency (IEA), the share of renewables is expected to be 44% by 2040, from the current level of 26%. The resulting impact of this would be the decline in coal-based power generation from 38% to 25% during the same period. Natural gas enabled generation is set to increase by 50% by 2040, driven by low-cost availability of shale gas. However, as rural and semi-urban electrification continues in most developing economies, affordability and ease-of-access are at the core of consumer demand, and these continue to be met by coal-based generation, especially in the developing markets of Africa and Asia. Global coal prices are stabilising as a result of increasing demand of certain developing economies, off-set by declining requirements of advanced economies. The global coal prices fell from a high of USD 120/MT (Newcastle FOB) in July 2018 to USD 66/MT in March 2020.
With the changing scenario in the global energy market in terms of oil prices and renewable power generation costs, the oil-exporting Middle-East countries have devised economic diversification plans. As a means of diversifying its power mix, the MENA (Middle East and North Africa) region is increasingly shifting its focus towards renewables and setting long-term targets for clean energy development. While Morocco’s target is to generate 52% energy through renewable energy sources by 2030, the same for Dubai stands at attaining 75% level by 2050. Saudi Arabia is host to the largest programme of planned projects. The country set an ambitious target of developing 60 GW (60,000 MW) of Renewable Energy (RE) capacity by 2030, scaling up manifold from the current capacity of 100 MW. The region has witnessed large investments in renewables, driving some of the economically viable solar PV and onshore wind projects globally.
With coal-based generation unlikely to wane away, a balanced approach aligned to the environmental responsibility is being explored. Technologies including blended power, carbon capture utilisation and storage (CCUS), or biomass co-firing equipment, are being explored depending upon the markets and economic viability and implications, given the high cost associated with such an approach.
Electricity access in Africa is the biggest concern, with half of the population in sub-Saharan Africa having no access to power. The region is making progress and with that the rising demand needs have to be met with corresponding increase in supply, requiring significant expansion of the power system. Electricity output in the region is expected to increase from 225 TWh to 900 TWh by 2040, mainly supplied by on-grid power, though decentralised solutions are also being adopted, as declining costs of solar PV and battery storage technologies make these solutions more competitive and economically viable.
Electricity access is also one of the core focus areas of ASEAN countries, and Southeast Asia is making steady progress towards achieving universal electricity access by 2030. The region’s electricity demand is growing at a rapid rate of 6% per annum and this demand is primarily met by thermal power, given its lower generation costs and abundant supply of fuel source. Although dominance of coal in power generation mix is expected to continue, the declining costs of renewables, concerns over emissions and pollution accompanied by financing difficulties of coal projects, have started tilting the scales in favour of RE projects. Recent revisions to policy planning documents have been made to boost the long-term share of renewables, backed by private finance and policy incentives.
Management Discussion & AnalysisO
verviewO
ur Emphasis on Value
Our Value‑creation Paradigm
Statutory ReportsFinancial Statem
ents
Future ready for smart choices 179

Given the focus on electricity access to all, microgrids is another area that is garnering attention. The demand for microgrids too is gaining momentum with the backing of the need for resiliency, energy security and electrification of rural and under-penetrated areas in a cost-effective manner without the requirement to extend the conventional grids.
Another major global focus has been the adoption of Electric Vehicles (EV). EV deployment targets are witnessing upticks globally, thereby encouraging industry participants to invest in the EV supply chain. Large power utilities in Europe have been investing in EV charging infrastructure. Oil majors are also participating through acquisitions.
With power generation through decentralised renewable energy sources gaining prominence, the same has also created requirement for deployment of storage solutions to accommodate the heightened demand. Many countries including the U.S., China, Germany and India are investing in energy storage projects to support power sector transformation and the cost of energy storage has been witnessing a downward trend with increasing advancements in technology.
The power industry is transforming into a technology business as the utilities adapt to the evolving diverse needs of the customers and invest resources in development and adoption of new technologies. With more and more systems getting intelligent and connected, Cyber Security has emerged as an area of interest and concern in the power sector and most of the utilities are investing heavily in making their system robust and secure. Data Analytics is another area that is gaining prominence in the current scenario, with the increasing requirements of customised service delivery and improvement in operational excellence. Further, with the increasing infusion of decentralised generation, EVs, the demand supply scenario has become dynamic and requires accurate load and supply forecasting (including weather forecasting) to ensure stability and robustness of the grid.
All the aforementioned factors, coupled with the need for affordable, sustainable and modern energy systems, is shaping the global power sector and opening business service opportunities for power utilities. This wave of change is not just limited to the power companies, but is also opening-up business opportunities for other industry groups like automobile and oil majors, which have been actively participating in this transition through business diversification, acquisition and collaboration with power utilities.
Indian Power Sector India’s demand for power is expected to grow at an
average rate of 6% (as per the Ministry of Power’s Five Year Vision Document), led by industrial and residential consumers. This is, however, expected to take a hit in FY21, on account of the COVID-19 pandemic that has put the entire nation under lockdown, affecting power demand from high paying industrial and commercial segments. Power demand already witnessed a decline of more than 20% during the lockdown period. Moving ahead, the revival of economic activity coupled with the Government’s push towards 24x7 power for all, should provide the impetus to electricity demand growth in the country. While coal is expected to remain a significant fuel source in the country’s quest to provide power to every citizen, its growth would diminish in the coming years. The Government will focus on limited thermal capacity additions to be undertaken only by the Central and State utilities, primarily against retirals. It is focussing on RE growth in alignment to the sustainability and carbon emission reduction targets with an intent to increase the RE capacity 3-fold from the targeted level of 175 GW in 2022 to 500 GW by 2030. Measures to curb emissions by thermal power plants are also in place. These include installation of Flue Gas Desulphurisation (FGD) to reduce SO2 from exhaust flue-gas. The deadline for the same has been extended to December 2022. Actions are being taken to shut down coal-fired plants that fail to meet emission standards.
The Government’s focus in the transmission and distribution space has been on private sector participation. Fund inflows by private players in Transmission is through the TBCB (tariff based competitive bidding) route. The distribution segment is also witnessing entry of private players through Public Private Partnerships (PPP) or franchisee models, in a bid to reduce high AT&C losses across India. The financial stress of Distribution companies (Discoms) is limiting their ability to make payments to the generation companies, thus adding on to the stress in the sector. The sector has Non-Performing Assets (NPAs) to the tune of ` 2 trillion, resulting in cautious lending to the sector by banks and financial institutions. However, a lot of efforts have been made to resolve this issue through various Government interventions. Out of the total 40 GW of stressed capacity, around 10 GW have been resolved – the recent acquisition of Prayagraj Power Generation Company Limited (PPGCL) by Resurgent Power Ventures Pte. Limited (Resurgent) being one such example. Emphasis now lies on the remaining assets.
Management Discussion & Analysis
The Tata Power Company Limited Integrated Annual Report 2019-20180

Generation India’s installed generation capacity stands at 370 GW
as on 31st March 2020, which excludes 55 GW of captive generation capacity. Grid connected capacity addition during FY20 was 14 GW vis-à-vis 12 GW in FY19.
Thermal Generation Coal-based capacities have accounted for more than half
of India’s total installed capacity over the last 10 years (FY20 vs FY10), while that of renewables has risen from 9% to 23%. The PLF of thermal plants have witnessed a declining trend in the last decade, falling to 56.08% in FY20 from 77.5% in FY10.
Renewable Generation The Government’s commitment towards carbon
reduction accompanied by declining costs of renewables, have provided the impetus for rapid increase in renewable based capacities. The overall renewables addition during FY20 was 9 GW as against 8.6 GW during the previous year. Issues like safeguard duty, renegotiation of contracts, land availability, financing constraints and delayed payments by Discoms, have impacted RE projects. The tariffs have also risen from the lows of ` 2.44/unit to the range of ` 2.8-2.9/unit, with the rise in ceiling tariffs.
FY10 FY20
Coal Gas Nuclear Hydro Renewables Others
9% 4% 4% 2% 19% 19%
199
84
25
17
75
46
37
87
16 71
(Source: MoP, GoI, CEA)
CAGR (%) Installed capacity (GW)
INDIA GENERATION MIX (IN GW)
Fuel Coal produced by Coal India Limited (CIL) and its
subsidiaries declined by 0.8% during FY20 to 602 MT from 607 MT in the previous fiscal. Extended monsoons posed challenges for supporting growth in domestic coal production, which might have necessitated coal imports
by power utilities. Thermal coal imports grew by 3% y-o-y in FY20, supported by declining international coal prices in 2019.
GLOBAL COAL PRICE AND INDIA’S COAL IMPORTS
7.00140
Apr
-18
May
-18
Jun-
18Ju
l-18
Aug
-18
Sep
-18
Oct
-18
Nov
-18
Dec
-18
Jan-
19Fe
b-1
9M
ar-1
9A
pr-1
9M
ay-1
9Ju
n-19
Jul-1
9A
ug-1
9Se
p-1
9O
ct-1
9N
ov-1
9D
ec-1
9Ja
n-20
Feb
-20
Mar
-20
6.001205.001004.00803.00602.0040
Coal
Impo
rts
(MT)
Coal
Pric
e (U
SD/t
n)
Coal Import by Power Plant (MT)
Global Coal Price Movement (USD/tn)
1.00200.000
(Source: World Bank, CEA)
Transmission The backbone transmission system in India is mainly
through 765 kV, 400 kV and 220 kV AC networks, with the highest transmission voltage level being 800 kV (HVDC). Total transmission lines and substation capacity reached nearly 4.23 lakh Ckms and 9.62 MVA respectively, reflecting an increase of about 10,226 Ckms and 62,760 MVA over the previous year.
With the changing power generation mix on account of increase in renewables, the Government is emphasising on augmenting the transmission infrastructure to support demand growth. In order to expedite the development of transmission lines for solar parks under Green Corridor-II (Under Green Corridor-I, Power Grid Corporation of India Limited (PGCIL) is responsible for strengthening transmission networks and constructing inter-state transmission network for connecting RE-rich states) and open-up private participation, which is still limited to 7%, the Government has decided to award these projects to private players through tariff based competitive bidding (TBCB).
The National Electricity Plan (Volume II-Transmission) i.e. NEP-Trans, has been notified to review the development of the transmission system during the 12th Plan Period, the current planning period 2017-22 and the subsequent period 2022-27.
Distribution The distribution segment has been plagued by a host of
issues resulting in its deteriorating financial health. The sector has been at the forefront of major power sector reforms and policy developments in the country. The current outstanding debt of ` 4.3 lakh crore is largely due to delayed payments, issues around tariff rationalisation and subsidy disbursement constraints. UDAY scheme is yet to yield the desired results
Overview
Our Em
phasis on ValueO
ur Value‑creation ParadigmStatutory Reports
Financial Statements
Future ready for smart choices 181
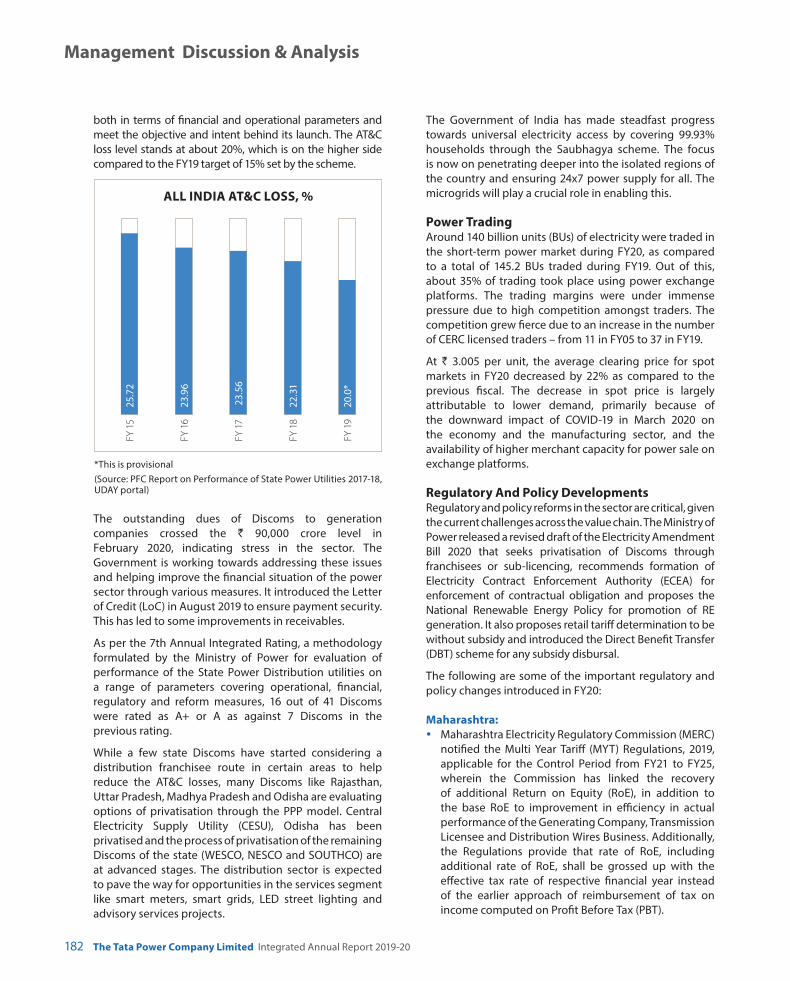
both in terms of financial and operational parameters and meet the objective and intent behind its launch. The AT&C loss level stands at about 20%, which is on the higher side compared to the FY19 target of 15% set by the scheme.
ALL INDIA AT&C LOSS, %
FY 1
525
.72
FY 1
623
.96
FY 1
7 2
3.56
FY 1
822
.31
FY 1
920
.0*
*This is provisional(Source: PFC Report on Performance of State Power Utilities 2017-18, UDAY portal)
The outstanding dues of Discoms to generation companies crossed the ` 90,000 crore level in February 2020, indicating stress in the sector. The Government is working towards addressing these issues and helping improve the financial situation of the power sector through various measures. It introduced the Letter of Credit (LoC) in August 2019 to ensure payment security. This has led to some improvements in receivables.
As per the 7th Annual Integrated Rating, a methodology formulated by the Ministry of Power for evaluation of performance of the State Power Distribution utilities on a range of parameters covering operational, financial, regulatory and reform measures, 16 out of 41 Discoms were rated as A+ or A as against 7 Discoms in the previous rating.
While a few state Discoms have started considering a distribution franchisee route in certain areas to help reduce the AT&C losses, many Discoms like Rajasthan, Uttar Pradesh, Madhya Pradesh and Odisha are evaluating options of privatisation through the PPP model. Central Electricity Supply Utility (CESU), Odisha has been privatised and the process of privatisation of the remaining Discoms of the state (WESCO, NESCO and SOUTHCO) are at advanced stages. The distribution sector is expected to pave the way for opportunities in the services segment like smart meters, smart grids, LED street lighting and advisory services projects.
The Government of India has made steadfast progress towards universal electricity access by covering 99.93% households through the Saubhagya scheme. The focus is now on penetrating deeper into the isolated regions of the country and ensuring 24x7 power supply for all. The microgrids will play a crucial role in enabling this.
Power Trading Around 140 billion units (BUs) of electricity were traded in
the short-term power market during FY20, as compared to a total of 145.2 BUs traded during FY19. Out of this, about 35% of trading took place using power exchange platforms. The trading margins were under immense pressure due to high competition amongst traders. The competition grew fierce due to an increase in the number of CERC licensed traders – from 11 in FY05 to 37 in FY19.
At ` 3.005 per unit, the average clearing price for spot markets in FY20 decreased by 22% as compared to the previous fiscal. The decrease in spot price is largely attributable to lower demand, primarily because of the downward impact of COVID-19 in March 2020 on the economy and the manufacturing sector, and the availability of higher merchant capacity for power sale on exchange platforms.
Regulatory And Policy Developments Regulatory and policy reforms in the sector are critical, given
the current challenges across the value chain. The Ministry of Power released a revised draft of the Electricity Amendment Bill 2020 that seeks privatisation of Discoms through franchisees or sub-licencing, recommends formation of Electricity Contract Enforcement Authority (ECEA) for enforcement of contractual obligation and proposes the National Renewable Energy Policy for promotion of RE generation. It also proposes retail tariff determination to be without subsidy and introduced the Direct Benefit Transfer (DBT) scheme for any subsidy disbursal.
The following are some of the important regulatory and policy changes introduced in FY20:
Maharashtra: y Maharashtra Electricity Regulatory Commission (MERC)
notified the Multi Year Tariff (MYT) Regulations, 2019, applicable for the Control Period from FY21 to FY25, wherein the Commission has linked the recovery of additional Return on Equity (RoE), in addition to the base RoE to improvement in efficiency in actual performance of the Generating Company, Transmission Licensee and Distribution Wires Business. Additionally, the Regulations provide that rate of RoE, including additional rate of RoE, shall be grossed up with the effective tax rate of respective financial year instead of the earlier approach of reimbursement of tax on income computed on Profit Before Tax (PBT).
Management Discussion & Analysis
The Tata Power Company Limited Integrated Annual Report 2019-20182

In addition, the most prominent impact of this Regulation includes no reduction of equity for older plants, incentives on making higher power generation during peak hours.
For Hydro generating stations, incentive on excess generation from saleable Design Energy has been increased from existing 90 paise/unit to 120 paise/unit and rate of depreciation on batteries has been increased from existing 5.28% to 18%.
y MERC notified the Deviation Settlement Mechanism (DSM) Regulations, 2019. As per the said Regulations, the energy accounting and deviation settlement will no longer be as per the Final Balancing and Settlement Mechanism (FBSM) and the provisions under the DSM Regulations will override the FBSM. The Commission vide the said Regulations has set the Deviation Volume Limit for each utility and the consequential penalty for under-drawing or over-drawing beyond the defined limit. Further, a pass through of such penalty as part of the Annual Revenue Requirement (ARR) of the utility will not be allowed.
y MERC notified the Guidelines for operation of Merit Order Despatch under Availability Based Tariff Order applicable from 1st April 2019 onwards wherein the Distribution Utility wise Merit Order Despatch (MOD) stack shall be prepared by Maharashtra State Load Despatch Centre (MSLDC) as compared to the state-wise MOD stack being prepared before the notification of the aforesaid guidelines. Hence, a Distribution Utility can now have access to the lowest variable cost generator tied up with another Distribution Utility only through an independent commercial arrangement. The guideline also put in place ‘zero schedule’ and ‘Reserve Shut Down (RSD)’ for generating stations in addition to specifying technical minimum for their operation.
y In June 2019, MERC amended the MERC Distribution Open Access Regulations, 2016. MERC has introduced conditions of Notional Contract Demand and levy of incremental Demand Charges in cases where consumers, who do not opt for reduction in Contract Demand up to Open Access Capacity. In addition, the duration of the term of open access has been redefined. Further, repeated Short Term Open Access applications will be levied with additional transmission charges. Deviation Charges have been brought in line with the DSM Regulations (from its effective date). The Commission has also permitted banking of energy on a monthly basis.
MERC has also made similar amendments in the MERC Transmission Open Access Regulations, 2016.
y All generating companies and utilities in Maharashtra submitted tariff petitions to MERC seeking approval of True-up of Aggregate Revenue Requirement (ARR) for FY18 and FY19, Provisional True-up of Aggregate Revenue Requirement for FY20, and approval of ARR and Tariff for the MYT 4th Control Period from FY21 to FY25 for its Generation, Distribution and Transmission Business in November 2019. Subsequently, public notices were issued followed by public hearings seeking suggestions and objections from the public at large. After prudence check of the respective tariff petitions, the MERC has issued the Orders for the Generation, Distribution and Transmission Business approving the tariff largely in line with the tariff applications submitted by the Company. The new tariffs are applicable from 1st April 2020 onwards.
Renewables y MERC issued Grid Interactive Rooftop Renewable
Energy Generating Systems Regulations, 2019. The Regulations apply to Net Metering Arrangements, Net Billing Arrangements and Grid Connected Renewable Energy Generating Systems connected behind the Consumer’s meter, for those who have not opted either for Net Metering Arrangement or Net Billing Arrangement. The purpose of the said Regulation is to introduce modifications in certain clauses vis-à-vis the clauses specified in the MERC Net Metering Regulations, 2015 based on the experiences in implementation of the Net Metering Regulations, and in order to simplify/clarify/amend certain provisions as considered reasonable.
y MERC issued Terms and Conditions for Determination of Renewable Energy Tariff Regulations, 2019 and Renewable Purchase Obligation, its Compliance and Implementation of Renewable Energy Certificate Framework Regulations, 2019.
CERC & JSERC y CERC (Sharing of Revenue Derived from Utilisation
of Transmission Assets for Other Business) Regulations, 2020
CERC issued the above Regulation, which is applicable to the inter-state transmission licensees who are proposing to undertake other business. This Regulation defines the manner of sharing of revenue from other business and the consequential reduction of transmission charges payable by the long-term customers of the transmission assets in proportion to the transmission charges payable by them to the transmission licensee. In case the transmission licensee engages in telecommunication business, an amount equal to 10% of the gross revenue from such business in a given financial year shall be shared with the long-term customers. In case the other business is not a telecommunication business, the
Overview
Our Em
phasis on ValueO
ur Value‑creation ParadigmStatutory Reports
Financial Statements
Future ready for smart choices 183

sharing of revenue shall be decided by the Commission on a case-to-case basis based on transmission assets utilised for such other business.
y Jharkhand State Electricity Regulatory Commission (JSERC) (Operation of Parallel Licensees) Regulations, 2019
The Commission, through this Regulation, aims to enable the consumer, in those areas, to avail electricity
from any of the Distribution Licensees as per the choice of the consumer. This will also foster competition and may improve the utilisation of the existing assets. In cases where the distribution system of one Distribution Licensee already exists, the other Distribution Licensee may provide electricity to consumers by using the wires of the other licensee on payment of wheeling charges to the Licensee, whose wire is being used.
2. Tata Power Business Portfolio, Opportunities and Outlook Your Company’s generation business operates under various business models across divisions in the domestic as well as
international markets, with the PPA/Fixed Tariff model contributing to the largest share of the generation segment. The following is a summary of the different business models under which various generation assets of your Company operate.
Model Returns Project Capacity (MW) % Overall Capacity
Regulated Tariff Regulated return on equity Mumbai operations (Trombay and Hydro), Maithon, Jojobera (Unit 2 and 3) TPDDL-Rithala
2,775 21.8
PPA/Fixed Tariff (Renewables)
Feed In Tariff + Bid Driven Wind and Solar Projects (Domestic) 2,637 20.7
PPA/Fixed Tariff (Bid/ Others)
Bilateral Agreement + Bid Driven
Jojobera (Unit 1 and 4), CGPL, Itezhi-Tezhi, Hydro projects, Georgia hydro, Kalinganagar-IEL-40 MW
4,676 36.7
Captive Bilateral Captive Agreement IEL (Unit 5, PH6, KPO), CKP (Indonesia) 429 3.4Merchant Market Driven Haldia, Dagachhu 246 1.9Under platform management
PPA Based Prayagraj 1,980 15.5
Total 12,742 100
The Indian market continues to remain the primary focus of business for your Company with domestic markets accounting for more than 90% of generation capacity. As highlighted earlier, your Company has put in place well-defined plans to grow in the areas of renewable generation, distribution as well as new and service-led businesses.
Renewables Generation Your Company is a leading player in the renewable
generation space, having a presence across the value chain. Significant growth opportunities in renewables (both organic and inorganic) are expected to arise in the future and your Company plans to increase its footprint by capitalising on those opportunities through value-accretive projects. Significant emphasis has been laid on rooftop solar, and your Company has already rolled it out in 94 cities till March 2020. In the microgrids space, your Company intends to install 10,000 microgrids to service and meet the electricity requirements of customers in remote areas with unstable grid networks.
Thermal and Hydro Generation Your Company plans to limit its exposure to thermal
projects and does not intend to expand its coal based power plant portfolio beyond the current size. Your
Company does not have any greenfield or brownfield expansion plans in the near term, but would continue to maintain the existing thermal and hydro operations in a sustainable manner. However, your Company has explored the inorganic route to acquire a few stressed thermal assets through Resurgent and has acquired PPGCL, a super critical Thermal plant (1,980 MW) in Uttar Pradesh.
Your Company has been granted a long-term coal mining license for the Krutogorovskya coal deposit located in Sobolevo District, Kamchatka of the Russian Federation under competitive bidding, to explore cheaper and sustainable coal supply for its subsidiary, Coastal Gujarat Power Limited (CGPL). The project feasibility is being studied.
Your Company is also evaluating growth opportunities in services for thermal and hydro plants by leveraging its technical and operation expertise.
Transmission Your Company is significantly focusing on augmenting
transmission infrastructure in Mumbai operations. In addition, your Company will also look for suitable opportunities for acquiring few assets through M&A.
Management Discussion & Analysis
The Tata Power Company Limited Integrated Annual Report 2019-20184

Distribution With growing focus on improving the state of the
distribution business, more states have been adopting the Distribution Franchisee (DF) model, while a few have invited bids through the PPP route. Your Company has already acquired CESU in Odisha and will evaluate similar opportunities in future to be a leading player in this space. Your Company will also explore services business opportunities in both, domestic and international markets.
New and Service-Led Businesses Your Company is looking to scale-up its service
businesses, i.e. businesses with little or no capital investment (EV Charging, Home Automation, Distribution services, Thermal O&M services and solar EPC) and is also evaluating opportunities in emerging business areas such as microgrids, rooftop solar, energy efficiency solutions and EV charging stations.
It has collaborated with Tata Motors Limited to roll-out EV charging infrastructure and aims to expand its presence further in high EV adoption cities in India. Your Company is also working on developing a robust software platform for customers of EV charging and has released a mobile based application towards the same effect. With the increase in EV adoption, your Company plans to cover the segments of home, workplace and captive charging through different models and approaches.
Your Company has collaborated with the Rockefeller Foundation to roll out 10,000 microgrids to provide innovative solutions for the under-served communities and expand the global microgrid footprint.
Your Company has also identified eight business wide Strategic Business Objectives (SBO). You may refer to page number 23 of the Integrated Report for a detailed explanation of these SBOs, along with goals and action plans to achieve these objectives.
3. Business Performance Consolidated operations of your Company are
categorised into four segments: Generation, Transmission & Distribution, Renewables and Others. Report on the performance and financial position of each of the subsidiaries, joint ventures and associate companies has been provided in Form AOC-1.
Your Company’s business performance in FY20 was mainly driven by lower losses in CGPL, capacity addition in renewables and strong operational performance across all businesses. The large section of the portfolio being under the regulated framework demonstrates the strong and reliable fundamentals of your Company’s finances. Also, the balance between regulated return businesses and market-linked businesses in it’s portfolio aids your
Company in capitalising on favourable market conditions, while ensuring stable returns.
Highlights of operational performance of key entities are listed below:
Renewables Tata Power Renewable Energy Limited - TPREL
(1,187 MW) Type of entity: Wholly owned subsidiary
Particulars FY20 FY19
Generation Sales (MUs) 2,162 1,450Net sales (` crore) 975 774PAT (` crore) (51) 89
TPREL’s higher sales were due to addition of solar capacity during the year. During FY20, the company has added 300 MW Solar PV assets in operating portfolio and 9 MW of Rooftop Solar assets. The company has commissioned two new solar projects during the year – 150 MW at Karnataka (3 blocks of 50 MW each in Pavagada Solar Park), 150 MW at Pokharan in Rajasthan.
The PAT for the year has reduced due to lower dividend income from Walwhan Renewable Energy Limited (WREL), increased O&M costs due to end of free O&M period at its wind sites located in Andhra Pradesh, Gujarat, Madhya Pradesh, curtailment of power offtake in Andhra Pradesh, one time impact of adoption of new tax regime and increased finance charges due to higher borrowings drawn to fund projects. During the year, the company evaluated the option given under the New Tax Ordinance and found that it would be beneficial to opt for the new tax regime. Based on this decision, the company reversed the MAT credit amount of ` 48 crore during the year resulting in lower profit for the year.
The company is executing 650 MW solar PV projects under long term PPAs in Gujarat, Uttar Pradesh and Rajasthan. 400 MW of this capacity will be based out of solar parks located in Gujarat with long term power tie up with Gujarat Urja Vikas Nigam Limited (GUVNL). The Company has also signed PPA with Tata Power-Distribution for supply of 150 MW long term Solar power for which it is proposing to develop the project in Rajasthan. It has also signed a 100 MW PPA with Uttar Pradesh Power Corporation Limited and Noida Power Corporation Limited, awarded through a bid process conducted by the Uttar Pradesh New and Renewable Energy Development Agency. The company has planned commissioning of 650 MW capacity by Q4 of FY21. The company is also developing a 50 MW solar project in Maharashtra through its subsidiary, Poolavadi Windfarms Limited which will sell power to Netmagic IT Services Limited for their captive consumption.
The commissioned capacity at the end of FY20 was 1,187 MW which included Vagarai Wind Farm Limited (21 MW)
Overview
Our Em
phasis on ValueO
ur Value‑creation ParadigmStatutory Reports
Financial Statements
Future ready for smart choices 185
and Indorama Renewable Jath Limited (30 MW). The carve out of 379 MW of RE assets from Tata Power to TPREL through National Company Law Tribunal approved process is under review.
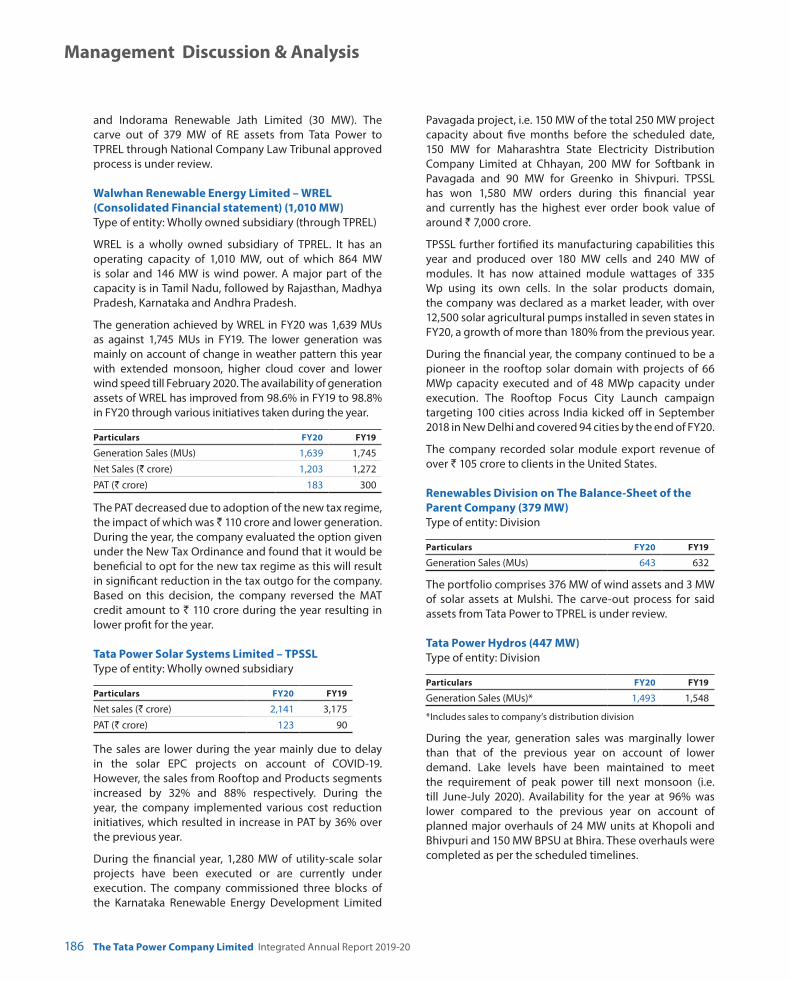
Walwhan Renewable Energy Limited – WREL (Consolidated Financial statement) (1,010 MW)
Type of entity: Wholly owned subsidiary (through TPREL)
WREL is a wholly owned subsidiary of TPREL. It has an operating capacity of 1,010 MW, out of which 864 MW is solar and 146 MW is wind power. A major part of the capacity is in Tamil Nadu, followed by Rajasthan, Madhya Pradesh, Karnataka and Andhra Pradesh.
The generation achieved by WREL in FY20 was 1,639 MUs as against 1,745 MUs in FY19. The lower generation was mainly on account of change in weather pattern this year with extended monsoon, higher cloud cover and lower wind speed till February 2020. The availability of generation assets of WREL has improved from 98.6% in FY19 to 98.8% in FY20 through various initiatives taken during the year.
Particulars FY20 FY19
Generation Sales (MUs) 1,639 1,745Net Sales (` crore) 1,203 1,272PAT (` crore) 183 300
The PAT decreased due to adoption of the new tax regime, the impact of which was ` 110 crore and lower generation. During the year, the company evaluated the option given under the New Tax Ordinance and found that it would be beneficial to opt for the new tax regime as this will result in significant reduction in the tax outgo for the company. Based on this decision, the company reversed the MAT credit amount to ` 110 crore during the year resulting in lower profit for the year.
Tata Power Solar Systems Limited – TPSSL Type of entity: Wholly owned subsidiary
Particulars FY20 FY19
Net sales (` crore) 2,141 3,175PAT (` crore) 123 90
The sales are lower during the year mainly due to delay in the solar EPC projects on account of COVID-19. However, the sales from Rooftop and Products segments increased by 32% and 88% respectively. During the year, the company implemented various cost reduction initiatives, which resulted in increase in PAT by 36% over the previous year.
During the financial year, 1,280 MW of utility-scale solar projects have been executed or are currently under execution. The company commissioned three blocks of the Karnataka Renewable Energy Development Limited
Pavagada project, i.e. 150 MW of the total 250 MW project capacity about five months before the scheduled date, 150 MW for Maharashtra State Electricity Distribution Company Limited at Chhayan, 200 MW for Softbank in Pavagada and 90 MW for Greenko in Shivpuri. TPSSL has won 1,580 MW orders during this financial year and currently has the highest ever order book value of around ` 7,000 crore.
TPSSL further fortified its manufacturing capabilities this year and produced over 180 MW cells and 240 MW of modules. It has now attained module wattages of 335 Wp using its own cells. In the solar products domain, the company was declared as a market leader, with over 12,500 solar agricultural pumps installed in seven states in FY20, a growth of more than 180% from the previous year.
During the financial year, the company continued to be a pioneer in the rooftop solar domain with projects of 66 MWp capacity executed and of 48 MWp capacity under execution. The Rooftop Focus City Launch campaign targeting 100 cities across India kicked off in September 2018 in New Delhi and covered 94 cities by the end of FY20.
The company recorded solar module export revenue of over ` 105 crore to clients in the United States.
Renewables Division on The Balance-Sheet of the Parent Company (379 MW)
Type of entity: Division
Particulars FY20 FY19
Generation Sales (MUs) 643 632
The portfolio comprises 376 MW of wind assets and 3 MW of solar assets at Mulshi. The carve-out process for said assets from Tata Power to TPREL is under review.
Tata Power Hydros (447 MW) Type of entity: Division
Particulars FY20 FY19
Generation Sales (MUs)* 1,493 1,548
*Includes sales to company’s distribution division
During the year, generation sales was marginally lower than that of the previous year on account of lower demand. Lake levels have been maintained to meet the requirement of peak power till next monsoon (i.e. till June-July 2020). Availability for the year at 96% was lower compared to the previous year on account of planned major overhauls of 24 MW units at Khopoli and Bhivpuri and 150 MW BPSU at Bhira. These overhauls were completed as per the scheduled timelines.
Management Discussion & Analysis
The Tata Power Company Limited Integrated Annual Report 2019-20186

CGPL, Coal and Related Infrastructure Companies Coastal Gujarat Power Limited - CGPL (4,150 MW) Type of entity: Wholly owned subsidiary
Particulars FY20 FY19
Generation Sales (MUs) 24,463 24,752Net sales (` crore) 7,017 7,064PAT (` crore) (891) (1,654)
Loss in FY20 was lower as compared to FY19 mainly due to lower under-recovery on account of lower coal benchmark prices, optimized blending, effective coal procurement strategy and lower finance cost mainly due to re-financing of ECB loan partly offset by impact of Ind-AS 116.
Under-recovery of fuel cost is listed below:
Particulars FY20 FY19
Total Revenue* (` crore) 7,037 7,137EBITDA (` crore) 810 (194)Fuel under-recovery**(in ` crore) (1,066)*** (2,080)(in ` per kWh) (0.44)*** (0.84)
* Total revenue consists of Revenue from Operations and other income
** Fuel under-recovery consists of total coal cost under recovery (Fuel revenue net of coal costs).
*** Fuel under-recovery includes ` 230 crore Ind-AS 116 non-cash positive impact for FY20.
It is pertinent to note that the increase in EBITDA in CGPL is due to lower fuel under-recovery on account of lower benchmark coal price and optimised blending and lower forex loss pertaining to coal and freight exposures in FY20. CGPL continues to engage with the procuring states to find a solution for long-term viability of the plant.
CGPL is also making efforts to improve profitability through initiatives like sourcing of low-cost coal from other geographies and increasing blending of low calorific value coal.
Mundra (CGPL) Tariff Relief matter A ‘High Power Committee’ (HPC) was constituted by the
Government of Gujarat (GoG) for suggesting relief to stressed thermal plants arising out of the issue of change in coal law in Indonesia. This HPC re-looked, reviewed, analysed and re-evaluated the overall situation afresh and made reasoned recommendations on 3rd October 2018 along with a draft Supplemental PPA to be executed between the parties to PPA.
The Supreme Court passed an order allowing the parties to approach CERC for amendments in the PPAs in response to application filed by GoG and State Bank of India. Subsequently, based on the recommendation and acceptance of GoG for HPC recommendation, GUVNL
has finalised Supplemental PPA and circulated to other Procurers (four states) seeking their approval. CGPL is pursuing the matter with other Procuring States for a consensus on Supplemental PPA circulated by GUVNL. As per the legal opinion received, even if UMPP Mundra supplies power as per the tariff discovered through the competitive bidding process to five states under single PPA, in order to implement HPC recommendations, CGPL can enter into separate Supplemental PPAs with each Procurer. CGPL is pursuing with Gujarat and Maharashtra to sign separate supplemental PPAs and once Supplemental PPAs are signed, parties will approach CERC for approval of the same. Once HPC recommendation is implemented in these two states, the matter will be taken up with other Procuring States.
Russian Coal Mine Development Project The Company has acquired a long-term coal mining
license for the Krutogorovskya coal deposit located in the Sobolevo District, Kamchatka of the Russian Federation under competitive bidding, to explore cheaper and sustainable coal supply for its subsidiary CGPL. The Far East Natural Resources LLC (FENR) is a registered local subsidiary entity of Tata Power International Pte Limited (TPIPL) and Bhira Investments Pte Limited (Bhira) incorporated in Russia to develop this coal mine. The Company also signed the TOR-I agreement with Far East Development Corporation (FEDC) Russia to become a resident of Advanced Special Economic Zone (ASEZ) and avail benefits/grants extended to the resident companies. Firm estimates of reserves and resource are being assessed through detailed drilling and exploration activities, which are presently under progress.
Regulatory matters Ministry of Environment, Forest and Climate Change
(MOEF&CC) vide its notification dated 7th December 2015 mandated all thermal power plants to comply with new environmental norms. Implementation of such revised environmental norms requires huge Capex and Opex. Therefore, CGPL filed a petition seeking in-principle Capex and Opex approval to secure finance from the lending institution. CERC passed an order in September 2018 holding that new/revised environmental norms qualify as change in law under the provision of PPA. Further, the company approached the CERC for determination of increase in cost or/and revenue expenditure on account of implementation of revised norms in accordance with the guidelines to be issued by CEA and the mode of recovery of the same through the monthly tariff. CGPL had a series of meetings and discussion with CEA and finalised the technology, based on which it filed a petition in June 2019 seeking approval of capital expenditure and annual operating expenditure. The matter has been heard on merit and reserved for order.
Overview
Our Em
phasis on ValueO
ur Value‑creation ParadigmStatutory Reports
Financial Statements
Future ready for smart choices 187
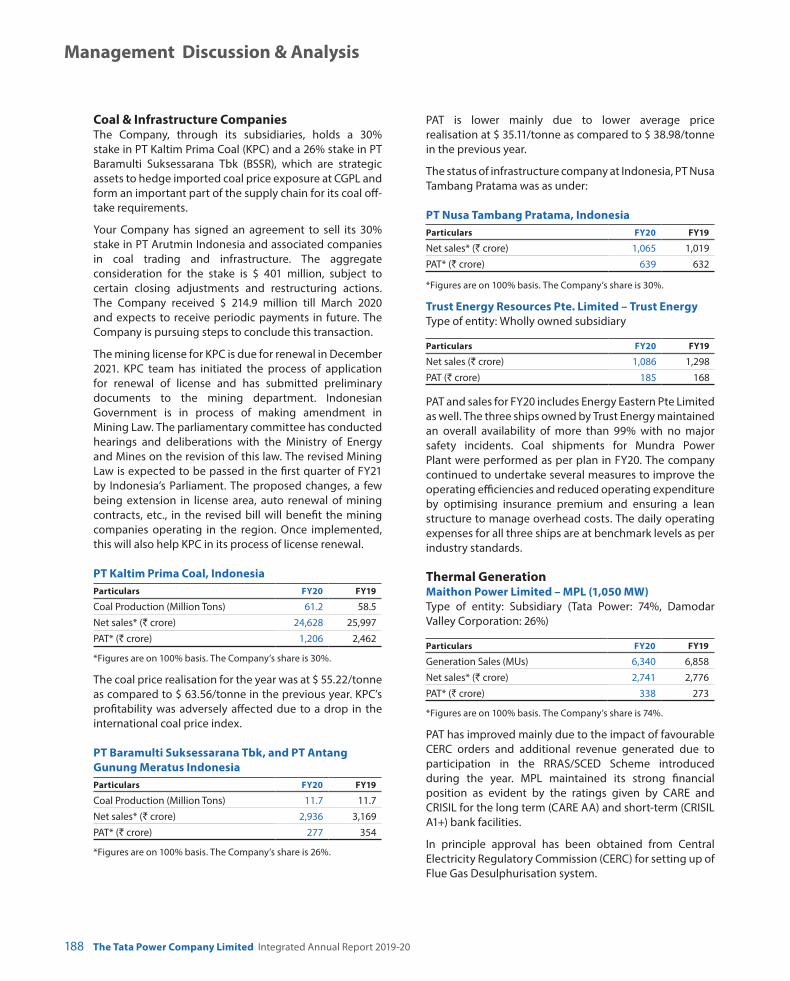
Coal & Infrastructure Companies The Company, through its subsidiaries, holds a 30%
stake in PT Kaltim Prima Coal (KPC) and a 26% stake in PT Baramulti Suksessarana Tbk (BSSR), which are strategic assets to hedge imported coal price exposure at CGPL and form an important part of the supply chain for its coal off-take requirements.
Your Company has signed an agreement to sell its 30% stake in PT Arutmin Indonesia and associated companies in coal trading and infrastructure. The aggregate consideration for the stake is $ 401 million, subject to certain closing adjustments and restructuring actions. The Company received $ 214.9 million till March 2020 and expects to receive periodic payments in future. The Company is pursuing steps to conclude this transaction.
The mining license for KPC is due for renewal in December 2021. KPC team has initiated the process of application for renewal of license and has submitted preliminary documents to the mining department. Indonesian Government is in process of making amendment in Mining Law. The parliamentary committee has conducted hearings and deliberations with the Ministry of Energy and Mines on the revision of this law. The revised Mining Law is expected to be passed in the first quarter of FY21 by Indonesia’s Parliament. The proposed changes, a few being extension in license area, auto renewal of mining contracts, etc., in the revised bill will benefit the mining companies operating in the region. Once implemented, this will also help KPC in its process of license renewal.
PT Kaltim Prima Coal, Indonesia Particulars FY20 FY19
Coal Production (Million Tons) 61.2 58.5Net sales* (` crore) 24,628 25,997PAT* (` crore) 1,206 2,462
*Figures are on 100% basis. The Company’s share is 30%.
The coal price realisation for the year was at $ 55.22/tonne as compared to $ 63.56/tonne in the previous year. KPC’s profitability was adversely affected due to a drop in the international coal price index.
PT Baramulti Suksessarana Tbk, and PT Antang Gunung Meratus Indonesia Particulars FY20 FY19
Coal Production (Million Tons) 11.7 11.7Net sales* (` crore) 2,936 3,169PAT* (` crore) 277 354
*Figures are on 100% basis. The Company’s share is 26%.
PAT is lower mainly due to lower average price realisation at $ 35.11/tonne as compared to $ 38.98/tonne in the previous year.
The status of infrastructure company at Indonesia, PT Nusa Tambang Pratama was as under:
PT Nusa Tambang Pratama, Indonesia Particulars FY20 FY19
Net sales* (` crore) 1,065 1,019PAT* (` crore) 639 632
*Figures are on 100% basis. The Company’s share is 30%.
Trust Energy Resources Pte. Limited – Trust Energy Type of entity: Wholly owned subsidiary
Particulars FY20 FY19
Net sales (` crore) 1,086 1,298PAT (` crore) 185 168
PAT and sales for FY20 includes Energy Eastern Pte Limited as well. The three ships owned by Trust Energy maintained an overall availability of more than 99% with no major safety incidents. Coal shipments for Mundra Power Plant were performed as per plan in FY20. The company continued to undertake several measures to improve the operating efficiencies and reduced operating expenditure by optimising insurance premium and ensuring a lean structure to manage overhead costs. The daily operating expenses for all three ships are at benchmark levels as per industry standards.
Thermal Generation Maithon Power Limited – MPL (1,050 MW) Type of entity: Subsidiary (Tata Power: 74%, Damodar
Valley Corporation: 26%)
Particulars FY20 FY19
Generation Sales (MUs) 6,340 6,858Net sales* (` crore) 2,741 2,776PAT* (` crore) 338 273
*Figures are on 100% basis. The Company’s share is 74%.
PAT has improved mainly due to the impact of favourable CERC orders and additional revenue generated due to participation in the RRAS/SCED Scheme introduced during the year. MPL maintained its strong financial position as evident by the ratings given by CARE and CRISIL for the long term (CARE AA) and short-term (CRISIL A1+) bank facilities.
In principle approval has been obtained from Central Electricity Regulatory Commission (CERC) for setting up of Flue Gas Desulphurisation system.
Management Discussion & Analysis
The Tata Power Company Limited Integrated Annual Report 2019-20188

Industrial Energy Limited – IEL (415 MW) Type of entity: Subsidiary (Tata Power: 74%, Tata Steel:
26%) (Joint Venture under Ind AS)
Particulars FY20 FY19
Generation Sales (MUs) 2,829 2,992Net sales* (` crore) 301 300PAT* (` crore) 149 111
*Figures are on 100% basis. The Company’s share is 74%.
IEL operates a 120 MW tolling coal-based plant in Jojobera. It also operates a 120 MW co-generation plant (Power House #6) in Jamshedpur, inside the Tata Steel plant, which is based on blast furnace and coke oven gas. 2 out of 3 units of 67.5 MW each of co-generation plant at Kalinganagar, Odisha, are also under operation by deploying production gases from Tata Steel’s plant.
The company has started executing the third turbine of 67.5 MW co-generation plant at Kalinganagar, Odisha, based on discussions with Tata Steel for Phase Two of the steel plant.
During the year, the company evaluated the option given under the New Tax Ordinance and found that it would be beneficial to opt for the new tax regime from FY32 since MAT credit will be fully utilised by FY31. This resulted in reversal of the deferred tax liability amounting to ` 48 crore, which improved the profitability for the year.
Jamshedpur Unit 5 achieved highest monthly generation since inception in the month of December 2019, surpassing its previous best in May 2018.
MoU have been signed with Tata Steel for multiple captive projects, including Captive Power Plant # 2, various CDQs, TRT projects, DG Projects and Thermal Projects.
Trombay (930 MW) Type of entity: Division
Particulars FY20 FY19
Generation Sales (MUs)* 5,576 6,092
*Includes sales to Company’s distribution division.
The plant achieved an availability of 94% in FY20 (compared to last year’s availability of 95%). Unit 5 and Unit 7 overhauling were successfully completed within the stipulated time frame. The plant had undertaken several operational improvement measures including reduction in auxiliary consumption, optimisation of operational expenses and reduction of store inventory etc.
Jojobera (428 MW) Type of entity: Division
Particulars FY20 FY19
Generation Sales (MUs) 2,681 2,604
Jojobera plant achieved availability of 97% in FY20 improving from the previous year level of 92%. The plant had also achieved maximum continuous running days of Unit 3 (327 days) and Unit 4 (352 days) in FY20 since inception.
The Jojobera Division secured 4.6 lakh MT coal from Shakti B (ii) coal linkage auction in May 2019.
Haldia (120 MW) Type of entity: Division
Particulars FY20 FY19
Generation Sales (MUs) 693 704
Generation sales in FY20 were marginally lower than the previous year. However, lower flue gas availability from Tata Steel continues to remain a challenge for enhancing generation sales. The plant availability in FY20 is 97%, which is significantly higher than the FY19 achievement of 90%.
Transmission Mumbai Transmission The transmission assets, which are a part of the Mumbai
license area, had a grid availability of 99.75% in FY20 as against the MERC norm of 98%. Availability was maintained at high levels by proactive actions taken based on preventive maintenance practices, effective condition monitoring and judicious planning and execution of planned outages.
Particulars FY20 FY19
Grid Availability (%) 99.75 99.50Transmission Capacity (MVA) 9,838 9,803
Powerlinks Transmission Limited – PTL Type of entity: Subsidiary (Tata Power: 51%, Power
Grid Corporation of India Limited: 49%) (Joint Venture under Ind AS)
Particulars FY20 FY19
Net sales* (` crore) 92 146PAT* (` crore) 121 113
*Figures are on 100% basis. The Company’s share is 51%.
The availability of the lines was maintained at 99.97% for Eastern Region in FY20 (previous year availability stood at 99.97%) and 99.95% for Northern Region (previous year availability was 99.89%), as against the minimum stipulated availability of 98.50%. PAT for FY20 is higher mainly because of one-time impact due to change in MAT rate from 18.5% to 15% as per the New Tax Ordinance.
Overview
Our Em
phasis on ValueO
ur Value‑creation ParadigmStatutory Reports
Financial Statements
Future ready for smart choices 189

Distribution Mumbai Distribution The highlights of the Mumbai Distribution business
are as follows:
Particulars FY20 FY19
Sales (MUs) 4,573 4,521Consumer Base (Nos.) 7,20,310 7,01,438
Mumbai Distribution has added about 20,000 customers in FY20. The overall MUs sales has remained constant over the last year. The Multi-Year Tariff (MYT) order for Tata Power Mumbai Distribution was rolled out for FY21 to FY25 by MERC in FY20.
Some key highlights of the Mumbai Distribution business including certain initiatives to improve customer experience are:
y Mumbai Distribution is now IMS certified (ISO 9001:2015 for Quality Management system, ISO 14001:2015 for Environmental Management system, ISO 45001:2018 for Occupational Health and Safety Management system).
y Won Platinum Award at ISGF Innovation Awards 2020 for ‘Most Reliable Supply of Electricity by Utility in India’.
y Introduced a real-time tracking solution, where customers can track the real-time location of the complaint management crew.
y Smart Meter Reading and Dispatch app (SMRD) was rolled out for meter reading activities, online spot billing and collection.
y Became the first power utility to launch ‘Kaizala’, in collaboration with Microsoft, a one-stop window for information/alert-sharing, billing and meter related information and complaint management for consumers.
y Added another all-women Customer Relations Centre at Ghatkopar, Mumbai, taking the total number to 4.
y Know Your Electricity Consumption (KYEC) launched as part of Value-Added Services, which helps consumers monitor and analyse energy usage, made available in intervals of 15 minutes, to help consumers take decisions.
Tata Power Delhi Distribution Limited – TPDDL Type of entity: Subsidiary (Tata Power: 51%, Government
of National Capital Territory (NCT) of Delhi: 49%)
Particulars FY20 FY19
Distribution Sales (MUs) 9,051 8,870Net sales (` crore) 7,888 7,600PAT (` crore) 414 336
The profit during the year increased due to one-time impact of impairment of ` 106 crore for Rithala Plant in the previous year.
In FY20, TPDDL had a registered customer base of 17.56 lakh spanning across an area of 510 sq. km. in North and North-West parts of Delhi. The AT&C losses for the year stood at 7.89% as against 7.93% last year.
TPDDL met a peak demand of 2,069 MW in FY20 as compared to 1,967 MW during the last year. TPDDL was able to reduce the System Average Interruption Duration Index (SAIDI) to a level of 26.97 hours against the 38.43 hours in the previous financial year.
TPDDL has given paramount importance to quality in all aspects of service delivery while at the same time focusing on optimising costs and meeting increasingly stringent regulatory guidelines. TPDDL has adopted TQM framework for taking operational excellence to the next higher level. TPDDL took several initiatives during the year:
y Furthered the implementation of Advanced Metering Infrastructure (AMI) and rolled-out Smart Meter for its customers. During the financial year, 1.94 lakh Smart Meters were installed within the licensed area. To increase transparency and customer satisfaction, the data generated from the Smart Meters has been integrated with the TPDDL Mobile app.
y Launched an interactive bill service through WhatsApp with the feature of audio description of bill, 6 months bill history details, nearby payment avenues along with existing offers and schemes.
y Launched various energy efficiency programmes like 5-star AC Replacement Scheme, Super-Efficient BLDC Fan and LED Lighting Products, which helped reduce the Peak Load by 65 MW, with 99 MUs energy saving, leading to 32,531 MT CO2 reduction since FY15.
y TPDDL is exploring innovative technology adoption to improve its overall performance and enhance customer experience.
Under the Horizon 2020 programme, funded by the European Union, TPDDL is carrying out a pilot exercise of deploying an Energy Islanding System at one of its distribution sub-stations with the aim of creating a model for individual community-based storage systems. The project has deployed a holistic approach including community engagement and technology deployment to create a successful model.
Management Discussion & Analysis
The Tata Power Company Limited Integrated Annual Report 2019-20190

TP Ajmer Distribution Limited – TPADL Type of entity: Wholly owned subsidiary
Particulars FY20 FY19
Distribution Sales (MUs) 483 465Net sales (` crore) 401 376PAT (` crore) 1.02 0.40
TPADL has been operating as a franchisee for the supply and distribution of power in Ajmer city over the past three years.
The total area under the franchisee is around 190 sq. km. The total consumer base in FY20 is 1.51 lakh and total peak demand is 128.64 MW, higher by 14.5% compared to that of last year.
In FY20, PAT increased due to strong operational performance and AT&C loss reduction from 11.2% in FY19 to 9.96% in FY20.
For enhancing consumer centricity and reliability, various initiatives were implemented resulting in improvement in business performance, which were manifested by 60% reduction in commercial complaints compared to previous year, zero meter faulty pendency within 30 days, reduction in provisional billing from 3.8% in FY19 to 1.8% in FY20, increase in digital payment from 19.0 % in FY19 to 33.4 % in FY20. The average restoration time of tripping also improved from 6.40 minutes in FY19 to 4.22 minutes in FY20 (34.1% reduction).
Other Businesses Services In FY20, the Services division provided O&M management
services for 3,180 MW capacity, complete O&M services for 99 MW, Project Management Services for 120 MW, Corporate Management Services for 1,425 MW and Asset Management Services for 692 MW of wind and solar assets. In addition, the division provided services such as training for Asset Management and Safety Management systems etc. to various clients.
Tata Power Trading Company Limited – TPTCL Type of entity: Wholly owned subsidiary
Particulars FY20 FY19
Generation Sales (MUs) 10,155 10,442Net sales (` crore) 248 262PAT (` crore) 41 37
TPTCL’s PAT improved over that of last year owing to higher realisation for sale of power from Dagachhu Hydro Power Corporation Limited (DHPC) in Bhutan, improvement in working capital cycle, efficient receivables management and lower tax expenses on account of shifting to the new tax regime in the current year.
New Businesses – EV Charging In line with its larger aim of being a change agent towards
green and sustainable development, your Company has made a significant impact in developing EV ecosystem and encouraging EV adoption in the country. Your Company is committed to play a key role along with other stakeholders in achieving the national goal of transition to electric mobility. In FY20, Tata Power partnered with Tata Motors and Jaguar Land Rover for developing EV Charging Infrastructure for their customers and dealers. In Q4 FY20, your Company rolled out Beta Version of its Software Platform and Mobile App that plays a crucial role in the customer journey of EV charging, by helping customers in locating EV charging stations, charging EVs and making bill payments online. Tata Power EV charging points are now present in 20 cities including Delhi, Mumbai, Bengaluru, Pune, Hyderabad, Kolkata, Chennai, Ahmedabad and Lucknow, under various business models and market segments. Your Company aims to increase its presence both in terms of a greater number of charging stations and larger geographical presence across the country. As on 31st March 2020, your Company has set up 170 EV charging points in 20 cities.
International Businesses Cennergi Pty Limited – Cennergi (230 MW) Type of entity: Joint Venture (Tata Power (through Khopoli
Investments Limited) 50%, Exxaro Resources Limited 50%)
Cennergi is an independent power producer jointly owned by Tata Power (50%) and Exxaro Resources Limited (Exxaro) (50%). The 134 MW Amakhala Emoyeni wind farm was commissioned on 28th July 2016 with the 95 MW Tsitsikamma Community Wind Farm reaching COD on 18th August 2016. The Company sold its entire stake in Cennergi to Exxaro on 31st March 2020 for ₹ 842 crore including hedging gain.
Dagachhu Hydro Power Corporation Limited – DHPC (126 MW)
Type of entity: Associate (Tata Power 26%, Druk Green Power Corporation Limited & Affiliates: 74%)
Particulars FY20 FY19
Generation Sales (MUs) 513 495Net sales* (` crore) 143 124PAT* (` crore) (43) (25)
*Figures are on 100% basis. The Company’s share is 26%.
While the generation sales increased from 495 MUs in FY19 to 513 MUs in FY20, foreign exchange variations resulted in increase of loss to ` (43) crore.
Overview
Our Em
phasis on ValueO
ur Value‑creation ParadigmStatutory Reports
Financial Statements
Future ready for smart choices 191

Adjaristsqali Georgia LLC - AGL Type of entity: Joint Venture (Tata Power (through TPIPL):
50%, Clean Energy Invest: 50%)
AGL is developing a 187 MW hydropower project (Shuakhevi and Skhalta projects) on the Adjaristsqali River and its tributaries in Georgia. This is one of the largest infrastructure investments in Georgia.
The plant operations were suspended in October 2017 on account of collapses experienced in certain sections of the tunnels. The company received insurance claims proceeds from its insurers, which were used towards restoration and repair of the tunnels. The Company also negotiated a restructuring package with the project lenders to sustain the viability of the project. AGL had engaged experts from Austria and Brazil in tandem with the Owner’s Engineer team (Mott MacDonald UK) to identify the root cause of the collapses and understand the inconsistent geological behaviour in these tunnels to undertake the remedial work design required in the affected sections.
Further, the company held discussions with the Government of Georgia for negotiating a Power Purchase Agreement (PPA) for the sale of power generated from the Shuakhevi Project. The same has been concluded and the amended BOO Agreement was executed in December 2019 for a 15-year PPA.
The repair work has been completed and the tunnels have been put back in service. Further, both 89 MW Units of Shuakhevi HPP have been tested and re-commissioned and have commenced commercial operations in March 2020. The 9 MW Skhalta HPP, which is also a component of the overall project is expected to be commissioned in Q1 FY21.
Digital Initiatives Your Company has implemented digital technologies
and solutions across various business segments in order to enhance customer experience, improve operational efficiencies , create competitive differentiation and support business growth. Tata Power has implemented Integrated Management System (IMS) for Digital and IT and secured ISO 27001:2013 and ISO 9001:2015 Certification, that puts Tata Power Digital & IT service aligned with the accepted global benchmark.
Some of the key initiatives across business/functions during the year are summarised as follows:
Initiatives to enhance customer experience − Redesigning of customer mobile application, keeping
focus on simplicity and user friendliness.
− Simplification of online New Connection Application form resulting in significant reduction of average time taken to fill up the form from 15 min to 2 min.
− Implementation of Voice of Customer module for automatic capture of customer’s feedback/suggestions and assignment through CRM to appropriate stakeholders for prompt resolution.
− Launch of ‘Kaizala’ App for Mumbai customers for variety of customer communications, including matters related to meter reading, billing, payment, discounts, complaints, etc.
− AI assisted system to analyse the feedback received from the customers through email, automatically classify, create tickets and forward it to appropriate group of people for further action.
Initiatives to enhance employee productivity, experience and learning
− Implementation of O365 product suite for enhancing collaboration and productivity, and 24x7 availability and secured access to organisational data.
− Setting up of the Data Analytics and Insights Academy, to build analytical capability across business clusters and functions, helping in enhancing business delivery outcomes by leveraging statistical, ML&AI methods.
Initiative for business growth − EV – Mobile App for EV charging, developed in
collaboration with other Tata group companies contributing to the development of the EV ecosystem.
Initiatives to enhance Operational Efficiency (Asset performance and digitisation of process)
− SAP footprint further extended to PPGCL to enhance business processes in terms of productivity, better inventory management, effective human resource management, etc.
− Implementation of Project Management tool, Wrench for Roof Top Solar, to help TPSSL manage the real time status of various Roof Top Solar Projects.
− Implementing Sales Force for Lead Management.
− CCRA Infrastructure and platform integration – to help in near real-time monitoring of distributed generation assets (Solar and Wind) from a central location with the aid of automated system alerts, predictive analysis and reports.
− Sankalp (RCM) – Implementation of APM tool in various generation plants including Trombay, Jojobera, MPL and CGPL to optimise the Preventive Maintenance (PM) cycle, improvement of reliability and utilisation of assets.
− EKPI dashboards have been implemented for all major business verticals for monitoring and review of cluster and department level critical KPIs. As of now, around 140+ KPIs are deployed in various dashboards of T&D,
Management Discussion & Analysis
The Tata Power Company Limited Integrated Annual Report 2019-20192

Generation, Renewables, Finance and HR clusters. These KPIs are available to the Senior Management/Cluster Heads for tracking and review of business performance at any point of time.
− Automation of the Related Party Transaction process, which led to significant reduction of cycle time required for month-end closing, freeing up resources from the repetitive job and ensured robust control and compliance of applicable norms.
Initiatives for communities − Implementation of Roshni portal to help in tracking
the beneficiaries of community initiatives, thereby improving the follow-up and transparency of such initiatives.
4. Financial Performance – Standalone Your Company recorded a Profit After Tax of ` 148.12 crore
during the financial year ended 31st March 2020 (the Profit After Tax was ` 1,768.70 crore in FY19). Both the basic and the diluted earnings per share were at ` (0.08) for FY20
The analysis of major items of the Standalone Financial Statements is shown below.
Revenue(` in crore)
Particulars FY20 FY19 Change%
Change
Revenue from Operations 7,726 8,255 (529) (6)Regulatory Deferral Balances including deferred tax recoverable/(payable)
(651) (146) (505) (343)
Total 7,075 8,109 (1,034) (13)
The decrease in revenue was mainly due to lower generation on account of lower demand from procurers, lower transmission charges as per the MERC tariff order and the impact of the truing up order passed by MERC.
Other Income(` in crore)
Particulars FY20 FY19 Change%
Change
Interest Income 120 85 35 41Dividend Income 369 384 (15) (4)Gain/(Loss) on Investments 22 7 15 214Other Non-operating Income 72 40 32 80
Total 583 516 67 13
Increase in Other Income was mainly due to higher interest receipt on delayed payment from BEST, interest income on take or pay order in Mumbai Licensed area, guarantee commission income recognised pursuant to Advance Pricing Agreement with Income Tax Department
and interest income from ICD given to subsidiaries, offset by the lower mutual fund and dividend income.
Cost of Power Purchased and Cost of Fuel(` in crore)
Particulars FY20 FY19 Change%
Change
Cost of Power Purchased 458 457 1 NilCost of Fuel 2,766 3,168 (402) (13)
The cost of fuel was lower mainly due to lower generation and lower fuel price.
Transmission Charges(` in crore)
Particulars FY20 FY19 Change%
Change
Transmission Charges 214 248 (34) (14)
Transmission charges are lower in the Mumbai regulated business on account of MYT order issued by MERC.
Employee Benefit Expenses(` in crore)
Particulars FY20 FY19 Change%
Change
Employee benefit expenses 611 638 (27) (4)
Employee Benefit Expenses are lower mainly due to reversal of performance pay provision and lower capitalisation of employee cost to the projects offset by higher provisions for retirals as per actuarial valuation.
Finance Costs (` in crore)
Particulars FY20 FY19 Change%
Change
Finance Costs 1,510 1,500 10 1
Finance Cost was higher mainly due to increased borrowings and impact of IND-AS 116 off-set by higher interest paid on entry tax order in Mumbai Licensed Area in the previous year.
Depreciation and Amortisation(` in crore)
Particulars FY20 FY19 Change%
Change
Depreciation and Amortisation
686 633 53 8
Depreciation has increased mainly on account of Ind AS 116 and capitalisation during the year.
Overview
Our Em
phasis on ValueO
ur Value‑creation ParadigmStatutory Reports
Financial Statements
Future ready for smart choices 193
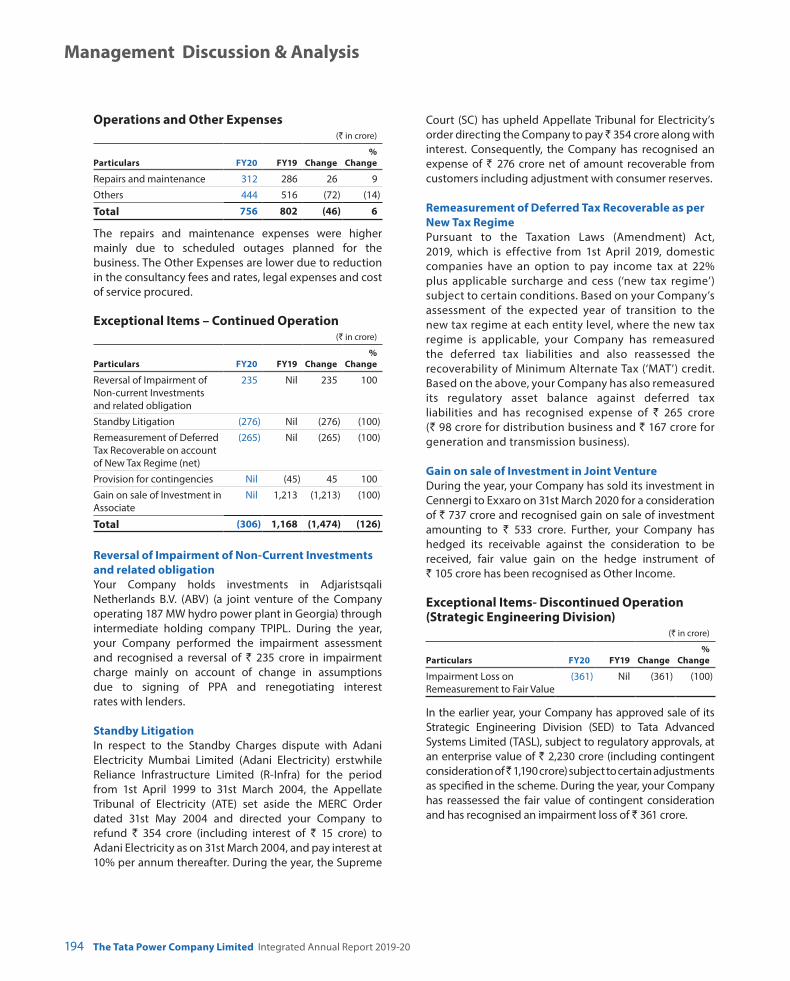
Operations and Other Expenses(` in crore)
Particulars FY20 FY19 Change%
Change
Repairs and maintenance 312 286 26 9Others 444 516 (72) (14)
Total 756 802 (46) 6
The repairs and maintenance expenses were higher mainly due to scheduled outages planned for the business. The Other Expenses are lower due to reduction in the consultancy fees and rates, legal expenses and cost of service procured.
Exceptional Items – Continued Operation(` in crore)
Particulars FY20 FY19 Change%
Change
Reversal of Impairment of Non-current Investments and related obligation
235 Nil 235 100
Standby Litigation (276) Nil (276) (100)Remeasurement of Deferred Tax Recoverable on account of New Tax Regime (net)
(265) Nil (265) (100)
Provision for contingencies Nil (45) 45 100Gain on sale of Investment in Associate
Nil 1,213 (1,213) (100)
Total (306) 1,168 (1,474) (126)
Reversal of Impairment of Non-Current Investments and related obligation
Your Company holds investments in Adjaristsqali Netherlands B.V. (ABV) (a joint venture of the Company operating 187 MW hydro power plant in Georgia) through intermediate holding company TPIPL. During the year, your Company performed the impairment assessment and recognised a reversal of ` 235 crore in impairment charge mainly on account of change in assumptions due to signing of PPA and renegotiating interest rates with lenders.
Standby Litigation In respect to the Standby Charges dispute with Adani
Electricity Mumbai Limited (Adani Electricity) erstwhile Reliance Infrastructure Limited (R-Infra) for the period from 1st April 1999 to 31st March 2004, the Appellate Tribunal of Electricity (ATE) set aside the MERC Order dated 31st May 2004 and directed your Company to refund ` 354 crore (including interest of ` 15 crore) to Adani Electricity as on 31st March 2004, and pay interest at 10% per annum thereafter. During the year, the Supreme
Court (SC) has upheld Appellate Tribunal for Electricity’s order directing the Company to pay ̀ 354 crore along with interest. Consequently, the Company has recognised an expense of ` 276 crore net of amount recoverable from customers including adjustment with consumer reserves.
Remeasurement of Deferred Tax Recoverable as per New Tax Regime
Pursuant to the Taxation Laws (Amendment) Act, 2019, which is effective from 1st April 2019, domestic companies have an option to pay income tax at 22% plus applicable surcharge and cess (‘new tax regime’) subject to certain conditions. Based on your Company’s assessment of the expected year of transition to the new tax regime at each entity level, where the new tax regime is applicable, your Company has remeasured the deferred tax liabilities and also reassessed the recoverability of Minimum Alternate Tax (‘MAT’) credit. Based on the above, your Company has also remeasured its regulatory asset balance against deferred tax liabilities and has recognised expense of ` 265 crore (` 98 crore for distribution business and ` 167 crore for generation and transmission business).
Gain on sale of Investment in Joint Venture During the year, your Company has sold its investment in
Cennergi to Exxaro on 31st March 2020 for a consideration of ` 737 crore and recognised gain on sale of investment amounting to ` 533 crore. Further, your Company has hedged its receivable against the consideration to be received, fair value gain on the hedge instrument of ` 105 crore has been recognised as Other Income.
Exceptional Items- Discontinued Operation (Strategic Engineering Division)
(` in crore)
Particulars FY20 FY19 Change%
Change
Impairment Loss on Remeasurement to Fair Value
(361) Nil (361) (100)
In the earlier year, your Company has approved sale of its Strategic Engineering Division (SED) to Tata Advanced Systems Limited (TASL), subject to regulatory approvals, at an enterprise value of ` 2,230 crore (including contingent consideration of ̀ 1,190 crore) subject to certain adjustments as specified in the scheme. During the year, your Company has reassessed the fair value of contingent consideration and has recognised an impairment loss of ` 361 crore.
Management Discussion & Analysis
The Tata Power Company Limited Integrated Annual Report 2019-20194

Tax Expenses(` in crore)
Particulars FY20 FY19 Change%
Change
Current Tax 19 111 (92) (83)Deferred Tax 73 332 (259) (78)Deferred Tax relating to earlier Year
(25) 10 (35) (350)
Remeasurement of deferred tax on account of new tax regime (net)
(275) Nil (275) (100)
Total (208) 453 (661) (146)
In FY20, lower current tax on account of lower operating profit, reduced MAT rate and increase in exceptional expenses relating to standby litigation. Previous year had exceptional reversal of DTA on sale of asset.
Pursuant to the Taxation Laws (Amendment) Act, 2019 which is effective from 1st April 2019, domestic companies have an option to pay income tax at 22% plus applicable surcharge and cess (‘new tax regime’) subject to certain conditions. Based on your Company’s assessment of the expected year of transition to the new tax regime at each entity level, where the new tax regime is applicable, it has remeasured the deferred tax liabilities and also reassessed the recoverability of Minimum Alternate Tax (‘MAT’) credit. Accordingly, your Company has recognised deferred tax income of ` 275 crore after adjusting the MAT credit write off.
Property, Plant and Equipment, Investment Property & Intangible Assets
(` in crore)
Particulars FY20 FY19 Change%
Change
Property, plant and equipment
7,974 7,546 428 6
Intangible Assets 62 84 (22) (26)Capital Work-in-Progress 403 368 35 10
Total 8,439 7,998 441 6
The above assets increased mainly due to higher capitalisation offset by the depreciation and amortisation for FY20.
Non-Current Investments(` in crore)
Particulars FY20 FY19 Change%
Change
Investment in Subsidiary, JV and Associate
20,743 20,477 266 1
Statutory Investments 168 374 (206) (55)Others 416 420 (4) (1)
Total 21,327 21,271 56 0.3
Non-Current Investments have increased mainly due to reclassification of Tata Project Investment from Assets held for sale, reversal of Georgia impairment provision offset by lower statutory investments in Government Securities.
Current Investments (` in crore)
Particulars FY20 FY19 Change%
Change
Deferred Tax Liability Fund Investment
Nil 42 (42) (100)
Mutual Funds (Unquoted) 20 Nil 20 100
Total 20 42 (22) (52)
Current Investments are lower mainly due to reclassification from current to non-current offset by the higher investment in mutual funds during the year.
Trade Receivables(` in crore)
Particulars FY20 FY19 Change%
Change
Non-current Nil 186 (186) (100)Current 1,109 1,256 (147) (12)
Total 1,109 1,442 (333) (23)
Decrease in Trade Receivables is mainly due to recovery of dues from BEST in the Mumbai operation area and final settlement of standby order.
Loans(` in crore)
Particulars FY20 FY19 Change%
Change
Non-current 42 51 (9) (18)Current 550 119 431 362
Total 592 170 422 248
Increase in loans was mainly due to higher Inter-Corporate loans given to related parties.
Finance Lease Receivable(` in crore)
Particulars FY20 FY19 Change%
Change
Non-current 553 554 (1) NILCurrent 32 38 (6) (16)
Total 585 592 (7) (1)
Finance Lease Receivable reduced due to recovery of lease rentals during the year.
Overview
Our Em
phasis on ValueO
ur Value‑creation ParadigmStatutory Reports
Financial Statements
Future ready for smart choices 195
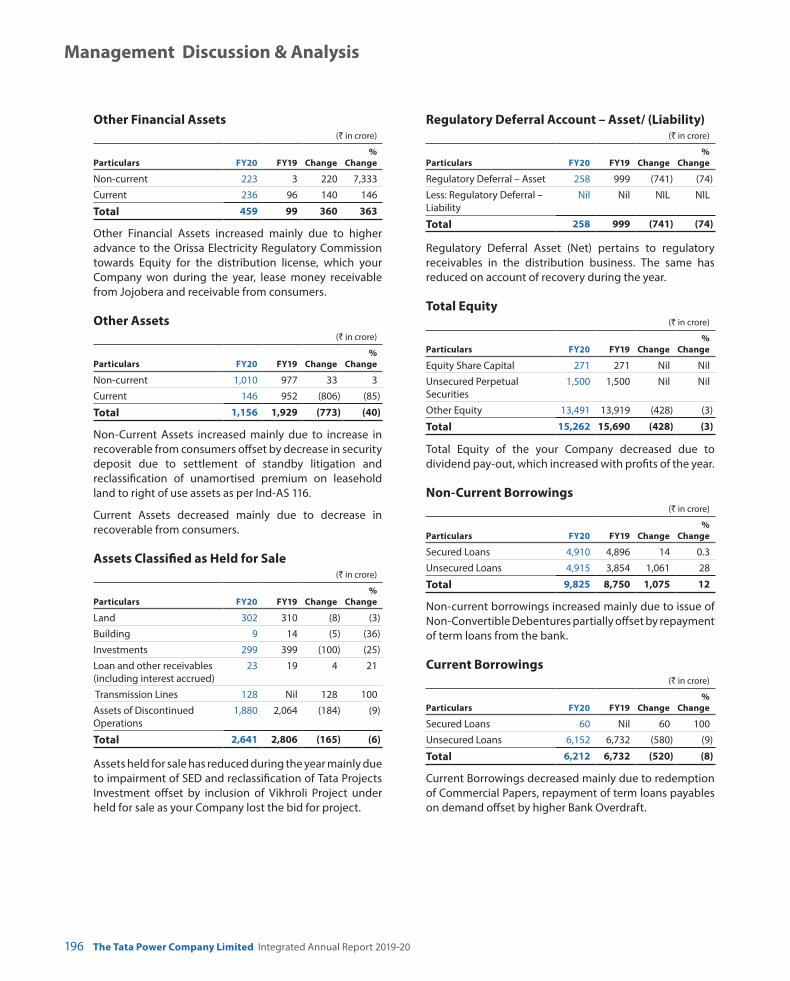
Other Financial Assets(` in crore)
Particulars FY20 FY19 Change%
Change
Non-current 223 3 220 7,333Current 236 96 140 146
Total 459 99 360 363
Other Financial Assets increased mainly due to higher advance to the Orissa Electricity Regulatory Commission towards Equity for the distribution license, which your Company won during the year, lease money receivable from Jojobera and receivable from consumers.
Other Assets(` in crore)
Particulars FY20 FY19 Change%
Change
Non-current 1,010 977 33 3Current 146 952 (806) (85)
Total 1,156 1,929 (773) (40)
Non-Current Assets increased mainly due to increase in recoverable from consumers offset by decrease in security deposit due to settlement of standby litigation and reclassification of unamortised premium on leasehold land to right of use assets as per Ind-AS 116.
Current Assets decreased mainly due to decrease in recoverable from consumers.
Assets Classified as Held for Sale(` in crore)
Particulars FY20 FY19 Change%
Change
Land 302 310 (8) (3)Building 9 14 (5) (36)Investments 299 399 (100) (25)Loan and other receivables (including interest accrued)
23 19 4 21
Transmission Lines 128 Nil 128 100Assets of Discontinued Operations
1,880 2,064 (184) (9)
Total 2,641 2,806 (165) (6)
Assets held for sale has reduced during the year mainly due to impairment of SED and reclassification of Tata Projects Investment offset by inclusion of Vikhroli Project under held for sale as your Company lost the bid for project.
Regulatory Deferral Account – Asset/ (Liability)(` in crore)
Particulars FY20 FY19 Change%
Change
Regulatory Deferral – Asset 258 999 (741) (74)Less: Regulatory Deferral – Liability
Nil Nil NIL NIL
Total 258 999 (741) (74)
Regulatory Deferral Asset (Net) pertains to regulatory receivables in the distribution business. The same has reduced on account of recovery during the year.
Total Equity(` in crore)
Particulars FY20 FY19 Change%
Change
Equity Share Capital 271 271 Nil NilUnsecured Perpetual Securities
1,500 1,500 Nil Nil
Other Equity 13,491 13,919 (428) (3)
Total 15,262 15,690 (428) (3)
Total Equity of the your Company decreased due to dividend pay-out, which increased with profits of the year.
Non-Current Borrowings(` in crore)
Particulars FY20 FY19 Change%
Change
Secured Loans 4,910 4,896 14 0.3Unsecured Loans 4,915 3,854 1,061 28
Total 9,825 8,750 1,075 12
Non-current borrowings increased mainly due to issue of Non-Convertible Debentures partially offset by repayment of term loans from the bank.
Current Borrowings(` in crore)
Particulars FY20 FY19 Change%
Change
Secured Loans 60 Nil 60 100Unsecured Loans 6,152 6,732 (580) (9)
Total 6,212 6,732 (520) (8)
Current Borrowings decreased mainly due to redemption of Commercial Papers, repayment of term loans payables on demand offset by higher Bank Overdraft.
Management Discussion & Analysis
The Tata Power Company Limited Integrated Annual Report 2019-20196

Lease Liability(` in crore)
Particulars FY20 FY19 Change%
Change
Non-current 237 Nil 237 100Current 42 Nil 42 100
Total 279 Nil 279 100
During the year, your Company has recognised Lease Liability based on the requirement of the Ind-AS 116.
Trade Payables (` in crore)
Particulars FY20 FY19 Change%
Change
Non-current Nil 23 (23) (100)Current 1,002 1,102 (100) (9)
Total 1,002 1,125 (123) (11)
Trade payables decreased due to payment to the vendor as per the payment terms.
Other Financial Liabilities(` in crore)
Particulars FY20 FY19 Change%
Change
Non-current 15 43 (28) (65)Current 2,622 2,895 (273) (9)
Total 2,637 2,938 (301) (10)
Other Financial Liabilities decreased mainly due to reduction in current maturity of non-current borrowings & lower financial guarantee obligation.
Other Liabilities(` in crore)
Particulars FY20 FY19 Change%
Change
Non-current 161 184 (23) (13)Current 503 849 (346) (41)
Total 664 1,033 (369) (36)
Other Liabilities decreased mainly due to reduction in statutory consumers reserves offset by higher liability towards consumers.
Provisions(` in crore)
Particulars FY20 FY19 Change%
Change
Non-current 222 196 26 13Current 62 15 47 313
Total 284 211 74 35
Provision for FY20 is higher due to compensated absences and other defined benefit plans.
Liabilities Directly Associated With Assets Classified as Held for Sale
(` in crore)
Particulars FY20 FY19 Change%
Change
Liabilities classified as held for sale
1,036 966 70 7
Total 1,036 966 70 7
The liabilities increased mainly due to liabilities of SED business classified as ‘Discontinued Operations’, and accordingly, assets and liabilities were classified as held for sale.
5. Financial Performance – Consolidated(` in crore)
Particulars FY20 FY19 Change%
Change
Total Income* 29,510 30,370 (860) (3)Depreciation & Amortisation Expenses
2,634 2,393 241 10
Finance Costs 4,494 4,170 324 7Exceptional Item 226 1,746 (1,520) (87)Profit Before Taxes 2,368 3,819 (1,451) (38)
Profit for the year 1,316 2,606 (1,290) (49)
*Includes Regulatory Income/(Expenses)
y Total Income decreased primarily on account of lower revenue in Tata Power, TPTCL, TPDDL and MPL.
y Depreciation increased marginally with increased capitalisation and assets recognised as right of use as per Ind-AS 116.
y Finance costs were higher mainly due to interest component on lease liability in CGPL and Trust Energy as per Ind-AS 116.
y Exceptional items in FY20 included gain on sale of investments in Cennergi and reversal of impairments, offset by Remeasurement of Deferred Tax Recoverable and regulatory deferral balance on account of New Tax Regime.
y Exceptional items in FY19 included gain on sale of investments in (Tata Communications Limited and Panatone Finvest Limited) offset by provision for contingencies related to entry tax provision and impairment of plant, property and equipment in the Rithala plant.
Overview
Our Em
phasis on ValueO
ur Value‑creation ParadigmStatutory Reports
Financial Statements
Future ready for smart choices 197

Property, Plant and Equipment, Investment Property & Intangible Assets
(` in crore)
Particulars FY20 FY19 Change%
Change
Property, plant and equipment
44,663 41,102 3,561 9
Intangible Assets 1,362 1,562 (200) (13)Capital Work-in-Progress 1,612 2,576 (964) (38)
Total 47,637 45,240 2,397 5
The above assets increased mainly on account of higher capitalisation in Tata Power, TPREL, TPDDL, MPL, reclassification of operating lease to right of use as per Ind-AS 116 offset by depreciation and amortisation for FY20 and assets reclassified as held for sale.
Goodwill(` in crore)
Particulars FY20 FY19 Change%
Change
Goodwill 1,642 1,642 Nil Nil
There is no change in goodwill during the year.
Non-Current Investments(` in crore)
Particulars FY20 FY19 Change%
Change
Investments in Joint Ventures & Associates
13,203 12,513 690 6
Statutory Investments 168 374 (206) (55)Others 465 487 (22) (5)
Total 13,836 13,374 462 5
Increase in Non-Current Investments was mainly due to increase in investments in Resurgent for acquisition of PPGCL, profit from joint ventures for the year net of dividend received and reclassification of Tata Projects Limited to investment from assets held for sale.
Current Investments(` in crore)
Particulars FY20 FY19 Change%
Change
Statutory Investments Nil 42 (42) (100)Investments in Mutual Funds 700 125 575 460
Total 700 167 533 319
Increase in current Investments was mainly on account of increase in mutual fund investments in Af-Taab Investment Company Limited, MPL, TPDDL, TPREL and Tata Power, offset by decrease in statutory investments in Tata Power.
Trade Receivables(` in crore)
Particulars FY20 FY19 Change%
Change
Non-current 30 193 (163) (84)Current 4,426 4,445 (19) (1)
Total 4,456 4,638 (182) (4)
Decrease in Trade Receivables was mainly due to decrease in receivables in Tata Power, CGPL and MPL offset by increase in receivables in TPSSL, TPTCL, WREL and TPREL.
Loans(` in crore)
Particulars FY20 FY19 Change%
Change
Non-current 81 91 (10) (11)Current 33 87 (54) (62)
Total 114 178 (64) (36)
Decrease in Loans is mainly due to repayment of loans in TPIPL.
Finance Lease Receivable(` in crore)
Particulars FY20 FY19 Change%
Change
Non-current 589 566 23 4Current 33 38 (5) (12)
Total 622 604 18 3
Finance Lease Receivable increased due to reduction in unearned finance income during the year.
Other Financial Assets(` in crore)
Particulars FY20 FY19 Change%
Change
Non-current 579 317 262 83Current 1,412 242 1,170 483
Total 1,991 559 1,432 256
Other Financial Assets increased mainly due to receivables on sale of investment in Cennergi, increase in fair valuation gain on derivative contracts and other advances.
Other Assets(` in crore)
Particulars FY20 FY19 Change%
Change
Non-current 1,185 1,358 (173) (13)Current 770 1,882 (1,112) (59)
Total 1,955 3,240 (1,285) (40)
Other Assets decreased mainly due to decrease in recoverable from consumers in Tata Power and MPL,
Management Discussion & Analysis
The Tata Power Company Limited Integrated Annual Report 2019-20198
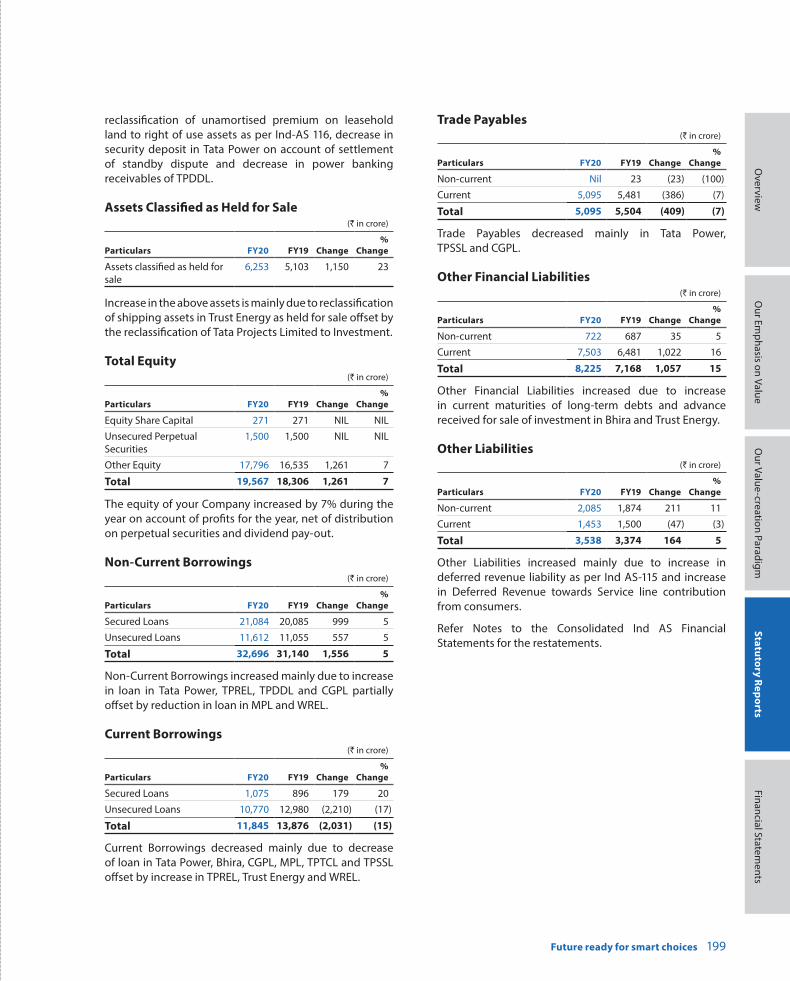
reclassification of unamortised premium on leasehold land to right of use assets as per Ind-AS 116, decrease in security deposit in Tata Power on account of settlement of standby dispute and decrease in power banking receivables of TPDDL.
Assets Classified as Held for Sale (` in crore)
Particulars FY20 FY19 Change%
Change
Assets classified as held for sale
6,253 5,103 1,150 23
Increase in the above assets is mainly due to reclassification of shipping assets in Trust Energy as held for sale offset by the reclassification of Tata Projects Limited to Investment.
Total Equity(` in crore)
Particulars FY20 FY19 Change%
Change
Equity Share Capital 271 271 NIL NILUnsecured Perpetual Securities
1,500 1,500 NIL NIL
Other Equity 17,796 16,535 1,261 7
Total 19,567 18,306 1,261 7
The equity of your Company increased by 7% during the year on account of profits for the year, net of distribution on perpetual securities and dividend pay-out.
Non-Current Borrowings(` in crore)
Particulars FY20 FY19 Change%
Change
Secured Loans 21,084 20,085 999 5Unsecured Loans 11,612 11,055 557 5
Total 32,696 31,140 1,556 5
Non-Current Borrowings increased mainly due to increase in loan in Tata Power, TPREL, TPDDL and CGPL partially offset by reduction in loan in MPL and WREL.
Current Borrowings(` in crore)
Particulars FY20 FY19 Change%
Change
Secured Loans 1,075 896 179 20Unsecured Loans 10,770 12,980 (2,210) (17)
Total 11,845 13,876 (2,031) (15)
Current Borrowings decreased mainly due to decrease of loan in Tata Power, Bhira, CGPL, MPL, TPTCL and TPSSL offset by increase in TPREL, Trust Energy and WREL.
Trade Payables(` in crore)
Particulars FY20 FY19 Change%
Change
Non-current Nil 23 (23) (100)Current 5,095 5,481 (386) (7)
Total 5,095 5,504 (409) (7)
Trade Payables decreased mainly in Tata Power, TPSSL and CGPL.
Other Financial Liabilities(` in crore)
Particulars FY20 FY19 Change%
Change
Non-current 722 687 35 5Current 7,503 6,481 1,022 16
Total 8,225 7,168 1,057 15
Other Financial Liabilities increased due to increase in current maturities of long-term debts and advance received for sale of investment in Bhira and Trust Energy.
Other Liabilities(` in crore)
Particulars FY20 FY19 Change%
Change
Non-current 2,085 1,874 211 11Current 1,453 1,500 (47) (3)
Total 3,538 3,374 164 5
Other Liabilities increased mainly due to increase in deferred revenue liability as per Ind AS-115 and increase in Deferred Revenue towards Service line contribution from consumers.
Refer Notes to the Consolidated Ind AS Financial Statements for the restatements.
Overview
Our Em
phasis on ValueO
ur Value‑creation ParadigmStatutory Reports
Financial Statements
Future ready for smart choices 199