ANNEXURE 1 - Tata Steel
48
ANNEXURE 1 Dividend Distribution Policy 1. Preamble 1.1 The Dividend Distribution Policy (hereinafter referred to as the ‘Policy’) has been developed in accordance with the extant provisions of the Companies Act, 2013 and SEBI regulations. 1.2 The Board of Directors (the ‘Board’) of Tata Steel Limited (the ‘Company’) has adopted the Policy of the Company as required in terms of Regulation 43A of the SEBI (Listing Obligations and Disclosure Requirements) Regulations, 2015 (the ‘Listing Regulations’) at its meeting held on April 20, 2017. 1.3 Under Section 2(35) of the Companies Act, 2013, “Dividend” includes any interim dividend. In common parlance, “dividend” means the profit of a company, which is not retained in the business and is distributed among the shareholders in proportion to the amount paid-up on the shares held by them. In case of listed companies, Section 24 of the Companies Act, 2013 confers on SEBI, the power of administration of the provisions pertaining to non-payment of dividend. 2. Effective Date The Policy shall become effective from the date of its adoption by the Board i.e. April 20, 2017. 3. Purpose, Objectives and Scope 3.1 T he Securities and Exchange Board of India (“SEBI”) vide its Gazette Notification dated July 8, 2016 has amended the Listing Regulations by inserting Regulation 43A in order to make it mandatory to have a Dividend Distribution Policy in place by the top five hundred listed companies based on their market capitalisation calculated as on the 31st day of March of every year. 3.2 As the Company is one of the top five hundred companies as on March 31, 2016, the Board has laid down a broad framework for distribution of dividend to its shareholders and / or retaining or plough back of its profits. The Policy also sets out the circumstances and different factors for consideration by the Board at the time of taking such decisions of distribution or of retention of profits, in the interest of providing transparency to the shareholders. 3.3 Declaration of dividend on the basis of parameters in addition to the elements of this Policy or resulting in amendment of any element or the Policy will be regarded as deviation. Any such deviation on elements of this Policy in extraordinary circumstances, when deemed necessary in the interests of the Company, along with the rationale will be disclosed in the Annual Report by the Board. 3.4 The Policy reflects the intent of the Company to reward its shareholders by sharing a portion of its profits after retaining sufficient funds for growth of the Company. The Company shall pursue this Policy, to pay, subject to the circumstances and factors enlisted hereon, progressive dividend, which shall be consistent with the performance of the Company over the years. 4. Parameters to be Considered While Declaring Dividends 4.1 Financial Parameters a) Magnitude of current year’s earnings of the Company: Since dividend is directly linked with the availability of earning over the long haul, the magnitude of earnings will significantly impact the dividend declaration decisions of the Company. b) Operating cash flow of the Company: If the Company cannot generate adequate operating cash flow, it may need to rely on outside funding to meet its financial obligations and sometimes to run the day- to-day operations. The Board will consider the same before its decision whether to declare dividend or retain its profits. c) Return on invested capital: The efficiency with which the Company uses its capital. d) Cost of borrowings: The Board will analyse the requirement of necessary funds considering the long-term or short-term projects proposed to be undertaken by the Company and the viability of the raising funds from alternative sources vis-à-vis plough back its own funds. e) Obligations to lenders: The Company should be able to repay its debt obligations without much difficulty over a reasonable period of time. Considering the volume of such obligations and time period of repayment, the decision of dividend declaration shall be taken. f) Inadequacy of profits: If during any financial year, the Board determines that the profits of the Company are inadequate, the Board may decide not to declare dividends for that financial year. g) Post dividend EPS: The post dividend EPS can have strong impact on the funds of the Company, thus, impacting the overall operations on day-to-day basis and therefore, affects the profits and can impact the decision for dividend declaration during a particular year. 4.2 Proposals for major capital expenditures The Board may also take into consideration the need for replacement of capital assets, expansion and modernisation or augmentation of capital asset including any major sustenance, improvement and growth proposals. 4.3 Agreements with lending institutions / Bondholders / Debenture Trustees The decision of dividend pay-out shall also be affected by the restrictions and covenants contained in the agreements as may be entered into with the lenders of the Company from time to time. 4.4 Statutory requirements The Company shall observe the relevant statutory requirements including those with respect to mandatory transfer of a certain portion of profits to any specific reserve such as Debenture Redemption Reserve, Capital Redemption Reserve etc. as provided in the Companies Act, 2013, which may be applicable to the Company at the time of taking decision with regard to dividend declaration or retention of profit. 5. Factors that May Affect Dividend Payout 5.1 External Factors • Macroeconomic conditions: Considering the current and future outlook of the economy of the Country, the policy decisions that may be formulated by the Government and other similar conditions prevailing in the global market which may have a bearing on or affect the business of the Company, the management may consider retaining a larger part of the profits to have sufficient reserves to meet the exigency during unforeseen circumstances. • Cost of raising funds from alternative sources: If the cost of raising funds to pursue its planned growth and expansion plans is significantly higher, the management may consider retaining a larger part of the profits to have sufficient funds to meet the capital expenditure plan. • Taxation and other regulatory provisions: Dividend distribution tax or any tax deduction at source as required by applicable tax regulations in India, as may be applicable at the time of declaration of dividend. Any restrictions on payment of dividends by virtue of any regulation as may be applicable to the Company at the time of declaration of dividend. 5.2 Internal Factors • The Company’s long-term growth strategy which requires to conserve cash in the Company to execute the growth plan. • The liquidity position of the Company including its working capital requirements and debt servicing obligations. • The trend of the performance / reputation of the Company that has been during the past years determine the expectation of the shareholders. 6. Target Dividend 6.1 T he Company has adopted a progressive dividend policy, intending to maintain or grow the dividend each year. 6.2 The Company targets to pay dividend up to 50% of profit after tax of the Company subject to the applicable rules and regulations. 7. Circumstances Under which the Shareholders Can or Cannot Expect Dividend 7.1 The Board shall consider the factors provided above under Clause 4 and 5 above, before determination of any dividend payout after analysing the prospective opportunities and threats, viability of the options of dividend payout or retention, etc. 7.2 The decision of dividend payout shall, majorly be based on the aforesaid factors considering the balanced interest of the shareholders and the Company. 8. Manner of Dividend Payout 8.1 Given below is a summary of the process of declaration and payment of dividends, and is subject to applicable regulations. 8.2 In case of final dividends: a) Recommendation, if any, shall be done by the Board, usually in the Board meeting that considers and approves the annual financial statements, subject to approval of the shareholders of the Company. b) The dividend as recommended by the Board shall be approved / declared at the annual general meeting of the Company. c) The payment of dividends shall be made within 30 days from the date of declaration to the shareholders entitled to receive the dividend on the record date / book closure period as per the applicable law. Annexure 1 (Contd.) Integrated Report & Annual Accounts 2020-21 | 114 th Year 138 139 Statutory Reports Stakeholders and Materiality Performance Snapshot About Tata Steel Leadership Capitals Governance Strategy Financial Statements
-
Upload
khangminh22 -
Category
Documents
-
view
0 -
download
0
Transcript of ANNEXURE 1 - Tata Steel
ANNEXURE 1Dividend Distribution Policy
1. Preamble1.1 The Dividend Distribution Policy (hereinafter referred to
as the ‘Policy’) has been developed in accordance with the extant provisions of the Companies Act, 2013 and SEBI regulations.
1.2 The Board of Directors (the ‘Board’) of Tata Steel Limited (the ‘Company’) has adopted the Policy of the Company as required in terms of Regulation 43A of the SEBI (Listing Obligations and Disclosure Requirements) Regulations, 2015 (the ‘Listing Regulations’) at its meeting held on April 20, 2017.
1.3 Under Section 2(35) of the Companies Act, 2013, “Dividend” includes any interim dividend. In common parlance, “dividend” means the profit of a company, which is not retained in the business and is distributed among the shareholders in proportion to the amount paid-up on the shares held by them. In case of listed companies, Section 24 of the Companies Act, 2013 confers on SEBI, the power of administration of the provisions pertaining to non-payment of dividend.
2. Effective Date The Policy shall become effective from the date of its
adoption by the Board i.e. April 20, 2017.
3. Purpose, Objectives and Scope3.1 T he Securities and Exchange Board of India (“SEBI”)
vide its Gazette Notification dated July 8, 2016 has amended the Listing Regulations by inserting Regulation 43A in order to make it mandatory to have a Dividend Distribution Policy in place by the top five hundred listed companies based on their market capitalisation calculated as on the 31st day of March of every year.
3.2 As the Company is one of the top five hundred companies as on March 31, 2016, the Board has laid down a broad framework for distribution of dividend to its shareholders and / or retaining or plough back of its profits. The Policy also sets out the circumstances and different factors for consideration by the Board at the time of taking such decisions of distribution or of retention of profits, in the interest of providing transparency to the shareholders.
3.3 Declaration of dividend on the basis of parameters in addition to the elements of this Policy or resulting in amendment of any element or the Policy will be regarded as deviation. Any such deviation on elements of this Policy
in extraordinary circumstances, when deemed necessary in the interests of the Company, along with the rationale will be disclosed in the Annual Report by the Board.
3.4 The Policy reflects the intent of the Company to reward its shareholders by sharing a portion of its profits after retaining sufficient funds for growth of the Company. The Company shall pursue this Policy, to pay, subject to the circumstances and factors enlisted hereon, progressive dividend, which shall be consistent with the performance of the Company over the years.
4. Parameters to be Considered While Declaring Dividends
4.1 Financial Parameters a) Magnitude of current year’s earnings of the
Company: Since dividend is directly linked with the availability of earning over the long haul, the magnitude of earnings will significantly impact the dividend declaration decisions of the Company.
b) Operating cash flow of the Company: If the Company cannot generate adequate operating cash flow, it may need to rely on outside funding to meet its financial obligations and sometimes to run the day-to-day operations. The Board will consider the same before its decision whether to declare dividend or retain its profits.
c) Return on invested capital: The efficiency with which the Company uses its capital.
d) Cost of borrowings: The Board will analyse the requirement of necessary funds considering the long-term or short-term projects proposed to be undertaken by the Company and the viability of the raising funds from alternative sources vis-à-vis plough back its own funds.
e) Obligations to lenders: The Company should be able to repay its debt obligations without much difficulty over a reasonable period of time. Considering the volume of such obligations and time period of repayment, the decision of dividend declaration shall be taken.
f) Inadequacy of profits: If during any financial year, the Board determines that the profits of the Company are inadequate, the Board may decide not to declare dividends for that financial year.
g) Post dividend EPS: The post dividend EPS can have strong impact on the funds of the Company, thus, impacting the overall operations on day-to-day basis and therefore, affects the profits and can impact the decision for dividend declaration during a particular year.
4.2 Proposals for major capital expenditures The Board may also take into consideration the need
for replacement of capital assets, expansion and modernisation or augmentation of capital asset including any major sustenance, improvement and growth proposals.
4.3 Agreements with lending institutions / Bondholders / Debenture Trustees
The decision of dividend pay-out shall also be affected by the restrictions and covenants contained in the agreements as may be entered into with the lenders of the Company from time to time.
4.4 Statutory requirements The Company shall observe the relevant statutory
requirements including those with respect to mandatory transfer of a certain portion of profits to any specific reserve such as Debenture Redemption Reserve, Capital Redemption Reserve etc. as provided in the Companies Act, 2013, which may be applicable to the Company at the time of taking decision with regard to dividend declaration or retention of profit.
5. Factors that May Affect Dividend Payout5.1 External Factors
• Macroeconomic conditions: Considering the current and future outlook of the economy of the Country, the policy decisions that may be formulated by the Government and other similar conditions prevailing in the global market which may have a bearing on or affect the business of the Company, the management may consider retaining a larger part of the profits to have sufficient reserves to meet the exigency during unforeseen circumstances.
• Cost of raising funds from alternative sources: If the cost of raising funds to pursue its planned growth and expansion plans is significantly higher, the management may consider retaining a larger part of the profits to have sufficient funds to meet the capital expenditure plan.
• Taxation and other regulatory provisions: Dividend distribution tax or any tax deduction at source as required by applicable tax regulations in India, as may be applicable at the time of declaration of dividend.
Any restrictions on payment of dividends by virtue of any regulation as may be applicable to the Company at the time of declaration of dividend.
5.2 Internal Factors• The Company’s long-term growth strategy which
requires to conserve cash in the Company to execute the growth plan.
• The liquidity position of the Company including its working capital requirements and debt servicing obligations.
• The trend of the performance / reputation of the Company that has been during the past years determine the expectation of the shareholders.
6. Target Dividend6.1 T he Company has adopted a progressive dividend policy,
intending to maintain or grow the dividend each year.
6.2 The Company targets to pay dividend up to 50% of profit after tax of the Company subject to the applicable rules and regulations.
7. Circumstances Under which the Shareholders Can or Cannot Expect Dividend
7.1 The Board shall consider the factors provided above under Clause 4 and 5 above, before determination of any dividend payout after analysing the prospective opportunities and threats, viability of the options of dividend payout or retention, etc.
7.2 The decision of dividend payout shall, majorly be based on the aforesaid factors considering the balanced interest of the shareholders and the Company.
8. Manner of Dividend Payout8.1 Given below is a summary of the process of declaration
and payment of dividends, and is subject to applicable regulations.
8.2 In case of final dividends:
a) Recommendation, if any, shall be done by the Board, usually in the Board meeting that considers and approves the annual financial statements, subject to approval of the shareholders of the Company.
b) The dividend as recommended by the Board shall be approved / declared at the annual general meeting of the Company.
c) The payment of dividends shall be made within 30 days from the date of declaration to the shareholders entitled to receive the dividend on the record date / book closure period as per the applicable law.
Annexure 1 (Contd.)Integrated Report & Annual Accounts 2020-21 | 114th Year138 139
StatutoryReports
Stakeholders and Materiality
Performance Snapshot
About Tata Steel
Leadership Capitals GovernanceStrategyFinancial
Statements
8.3 In case of interim dividend
a) Interim dividend, if any, shall be declared by the Board.
b) Before declaring interim dividend, the Board shall consider the financial position of the Company that allows the payment of such dividend.
c) The payment of dividends shall be made within 30 days from the date of declaration to the shareholders entitled to receive the dividend on the record date as per the applicable laws.
d) In case no final dividend is declared, interim dividend paid during the year, if any, will be regarded as final dividend in the annual general meeting.
9. Policy as to how the Retained Earnings will be Utilised
9.1 The Board may retain its earnings in order to make better use of the available funds and increase the value of the stakeholders in the long run.
9.2 The decision of utilisation of the retained earnings of the Company shall be based on the following factors:
• Long-term strategic plans• Augmentation / Increase in production capacity• Market expansion plan• Product expansion plan• Modernisation plan• Diversification of business• Replacement of capital assets• Balancing the Capital Structure by de-leveraging the
Company• Other such criteria as the Board may deem fit from
time to time.
10. Provisions in Regard to Various Classes of Shares
10.1 The Company has only one class of equity shareholders and does not have any issued preference share capital. However, in case the Company issues different class of equity shares at any point in time, the factors and parameters for declaration of dividend to different class of shares of the Company shall be same as covered above.
10.2 The payment of dividend shall be based on the respective rights attached to each class of shares as per their terms of issue.
10.3 The dividends shall be paid out of the Company’s distributable profits and / or general reserves, and shall be allocated among shareholders on a pro-rata basis according to the number of each type and class of shares held.
10.4 Dividend when declared shall be first paid to the preference shareholders of the Company, if any as per the terms and conditions of their issue.
11. Applicability of the Policy11.1 The Policy shall not apply to
• Determination and declaring dividend on preference shares as the same will be as per the terms of issue approved by the shareholders;
• Distribution of dividend in kind, i.e. by issue of fully or partly paid bonus shares or other securities, subject to applicable law;
• Distribution of cash as an alternative to payment of dividend by way of buyback of equity shares.
12. Reporting and Disclosure As prescribed by Regulation 43A of the Listing Regulation,
this Policy shall be disclosed on the Company’s website and the Annual report.
13. Review of the Policy13.1 This Policy shall be subject to review as may be deemed
necessary as per any regulatory amendments.
13.2 Such amended Policy shall be periodically placed before the Board for adoption immediately after such changes.
14. Compliance Responsibility Compliance of this Policy shall be the responsibility of the
Company Secretary of the Company who shall have the power to ask for any information or clarifications from the management in this regard.
ANNEXURE 2Management Discussion and Analysis
I. OverviewThe objective of this report is to convey the Management’s perspective on the external environment and steel industry, as well as strategy, operating and financial performance, material developments in human resources and industrial relations, risks and opportunities and internal control systems and their adequacy in the Company during the financial year 2020-21. This report should be read in conjunction with the Company’s financial statements, the schedules and notes thereto and other information included elsewhere in the Integrated Report. The Company’s financial statements have been prepared in accordance with Indian Accounting Standards (‘Ind AS’) complying with the requirements of the Companies Act, 2013, (‘Act’) and regulations issued by the Securities and Exchange Board of India (‘SEBI’), each as amended from time to time.
II. External Environment1. Macroeconomic conditionGlobal GDP contracted by 3.5% in 2020 as governments in both developed and emerging economies took measures to contain the spread of the COVID-19 virus. While the decline was sharper than the global financial crisis in 2009, but the scale of the fiscal response to the COVID-19 crisis was unprecedented and three times bigger than 2008-09 financial crisis. The response by policy makers prevented a collapse that would have been at least three times worse, and the medium-term losses for the global economy are expected to be smaller than the global financial crisis.
While China is forecasted to continue its rapid growth in 2021, Latin America and the Eurozone is expected to lag behind. US saw overall GDP decline of 3.5%. India’s economy rebounded quickly from one of the world’s longest and most stringent lockdowns, which also came with steepest fall in GDP in Q2. Real GDP grew by 0.4% in Q3FY2021 after a contraction in the previous two quarters. Real GDP is estimated to have contracted by ~8% in FY 2020-21.
2. Economic OutlookThe accelerating rollout of COVID-19 vaccines in many advanced economies has set the stage for rapid recovery in the second half of this year and into 2022. Advanced economies will remain less affected by the virus this year and beyond, with low-income countries and emerging markets suffering more which is a contrast to 2009. While, the global economy is expected to recover to its pre-pandemic level of output in 2022,
the emerging-market and developing economies are expected to take until 2023 to recover to the pre-pandemic level.
Policy rates in the United States, Eurozone, United Kingdom, and Japan will remain near zero, well beyond 2021. Emerging-market and developing economies may take until 2023 to recover to the pre-pandemic level. Divergent recovery paths are likely to create wider gaps in living standards across countries compared to pre-pandemic expectations.
3. Indian EconomyIndia witnessed a gradual resumption of economic activity from Q2FY2021. The initial recovery was driven by government spending on infrastructure, exports and rural economy. The recovery gained momentum since August 2020 with pickup in consumption demand driven by festive buying and return of urban consumption. However, the growth projections for FY 2021-22 have been revised to be below 11% due to the acute resurgence of the virus in the country, as many cities and states went into lockdown. While the growth will depend upon the trajectory of the pandemic, the overall impact on the economy is expected to be less severe than last year.
India is expected to witness a full economic recovery in H2FY2022 driven by (a) ongoing vaccination supporting the current recovery momentum; (b) restart of investment cycle with significant spending on infrastructure and (c) continued recovery in consumption supported by urban demand, accentuated by work-from-home and preferences for personal mobility along with rising rural income and affordability. However, normal growth levels would be seen in FY 2022-23 only, provided no further economic disruption occurs and success of the ongoing vaccination drive.
III. Steel Industry1. Global Steel IndustryDisruption on both demand and supply resulted in global steel demand in 2020 to fall by 0.2% against a growth of 3.7% in 2019. The total demand in 2020 was 1,772 MnT against 1,775 MnT in 2019. The impact of COVID-19 has been much more benign for the steel industry due to resurgent demand in China and better than expected post lockdown recovery globally in second half of 2020. China and Turkey were two key countries that saw an increase in finished steel demand of 9% and 13% respectively in 2020. North America and the European Union (‘EU’) have experienced strong decline in steel demand owing to the COVID-19 pandemic. Both regions experienced demand decline of around 11%-16%. India also contributed to global decline, as
Annexure 2 (Contd.) 141
StatutoryReports
Stakeholders and Materiality
Performance Snapshot
About Tata Steel
Leadership Capitals GovernanceStrategyFinancial
Statements
Integrated Report & Annual Accounts 2020-21 | 114th Year140
steel consumption in India declined by 13.7% to 88.5 MnT in 2020 against 102.6 MnT in 2019.
Up to 30% of global steelmaking capacity (excluding China) was idled or production at steel mills significantly reduced in response to a pandemic-induced drop in demand. However, the recovery in automotive production and white goods manufacturing was quicker than expected when the strictest lockdown measures were lifted. The construction sector was less affected, as it was supported by government stimulus schemes in many regions. As a result, steel prices rallied in all regions in late 2020.
2. Outlook for steel industry Steel demand is expected to be strong due to recovery in manufacturing businesses around the world and global fiscal stimulus supporting infrastructure projects. The outlook for 2021 is expected to be positive because of the unprecedented fiscal stimulus provided by the governments across Europe, the US, Japan, Korea, Russia and China. These stimulus packages are expected to spur growth in these nation’s respective infrastructure sectors, boosting steel demand. China is expected to grow by 5% in 2021 with continuation of healthy demand conditions especially in the first half of 2021. Steel demand in key emerging economies (like India, Turkey) and Europe is expected to witness double digit recovery while Asia and Middle-East are likely to grow by 5%.
While it is expected that steel prices will consolidate closer to historical levels, prices are likely to remain high supported by (i) strong iron ore prices, (ii) rebound in coking coal prices, (iii) positive impact from stimulus plans, and (iv) improved business confidence from the roll-out of vaccines. Strong rebound of demand in 2021, in addition to supply-side reforms in China could lead to higher steel prices globally.
Political and geopolitical developments, such as a reduction in government stimulus programmes, policies to cut emissions and trade wars, could increase pressure on the steel sector.
3. Indian Steel IndustryIndia’s steel industry has also suffered the production loss due to lockdown last year and recovered gradually since then, initially driven by export followed by gradual recovery in domestic demand. Strong rebound in manufacturing and infrastructure development activity has led to a sharp rise in both production and consumption of steel in India. In 2021, India’s steel demand is expected to grow by 20% over 2020, taking the demand higher than the pre-pandemic level of 103 MnT, driven by strong infrastructure spending and sustained demand of automotive and consumer durables.
The key opportunities boosting the steel demand are as follows:
• Government’s focus on strengthening the domestic manufacturing base under the flagship “Atmanirbhar
Bharat” programme. The Production Linked Incentive scheme has been introduced to boost the manufacturing sector in industries like automobile & auto components, consumer durables, solar equipment, telecom, etc. These are expected to boost steel consumption.
• Government has announced an investment of over ₹1 trillion in infrastructure over the next 5 years. This would be a key growth driver not only for steel industry but will also be a multiplier of growth across the sectors, boosting steel demand from sectors such as transportation, real estate and infrastructure.
• Emergence of new trends after COVID-19 such as work from home, preference to physical distancing would create additional demand for furniture, personal mobility, etc. In addition, the rise in e-commerce activity will support the growth of warehousing and light commercial vehicles.
However, the downside to these opportunities are as follows:
• Resurgence of infections leading to fresh lockdowns, both localised as well as regional / national level resulting in disruption in economic activity.
• Heavy dependence of agriculture sector on monsoon. In last 2 years, a normal monsoon has supported the growth in agriculture sector.
• Slower recovery in contact-based services, which is an integral part of Indian economy and affects lives & livelihood of service sector.
IV. Operational Performance1. Tata Steel GroupDuring the year under review, the consolidated steel production for Tata Steel Group (‘TSG’) was 28.54 MnT recording a 7% decrease over that of the previous year, primarily due to disruptions arising out of COVID-19. TSG recorded total deliveries of 28.50 MnT as against 28.88 MnT in the previous year which was marginally lower by 1%. The steel deliveries decreased at Tata Steel Europe by 5% and at NatSteel Holdings by 25% due to lower demand. This decrease was off-set by higher deliveries at Tata Steel BSL Limited (‘TSBSL’) by 4%. Further, deliveries at Tata Steel Long Products Limited (formerly Tata Sponge Iron Limited) increased by 25% and at Tata Steel Thailand by 9% due to higher availability of finished products and higher demand. The deliveries at Tata Steel (Standalone) were at par, despite disruptions arising out of COVID-19.
The turnover of TSG was at ₹1,56,294 crore during FY 2020-21, an increase of 5% over the previous financial year due to increase in realisations across geographies, partly offset by marginal decline in deliveries.
The EBITDA of TSG was ₹30,892 crore during the FY 2020-21 as compared to ₹18,103 crore in the previous year
due to improvement in realisations along with lower cost and favourable exchange rate movement at other foreign entities.
TSG reported a consolidated profit after tax of ₹8,190 crore during FY 2020-21 as against a profit of ₹1,172 crore in FY 2019-20. The increase was mainly due to higher operating profits attributable to increase in the steel prices across geographies during FY 2020-21 along with lower cost and lower exceptional charge as compared to that of the previous year, partly offset by higher tax expenses mainly at Tata Steel (Standalone) due to higher profits. Moreover, the previous year included re-measurement of deferred tax liabilities based on the new lower rate of Income tax prescribed under Section 115BAA of the Income Tax Act, 1961 along with creation of deferred tax assets at some of the foreign entities as against creation of deferred tax liabilities during the current fiscal primarily at Tata Steel Europe.
2. Tata Steel Limited (Standalone)The turnover and profit / (loss) figures of Tata Steel Limited (Standalone) are given below:
(` crore)
FY 21 FY 20
Turnover 64,869 60,436EBITDA 21,952 15,096Profit before tax (PBT), before exceptional 15,022 8,315Profit before tax (PBT) 17,795 6,611Profit after tax (PAT), before exceptional 10,834 8,447Profit after tax (PAT) 13,607 6,744
a) Operations(mn tonnes)
FY 21 FY 20 Change (%)
Hot Metal 13.24 14.09 (6)Crude Steel 12.19 13.16 (7)Saleable Steel 12.04 12.88 (6)Sales 12.36 12.32 0
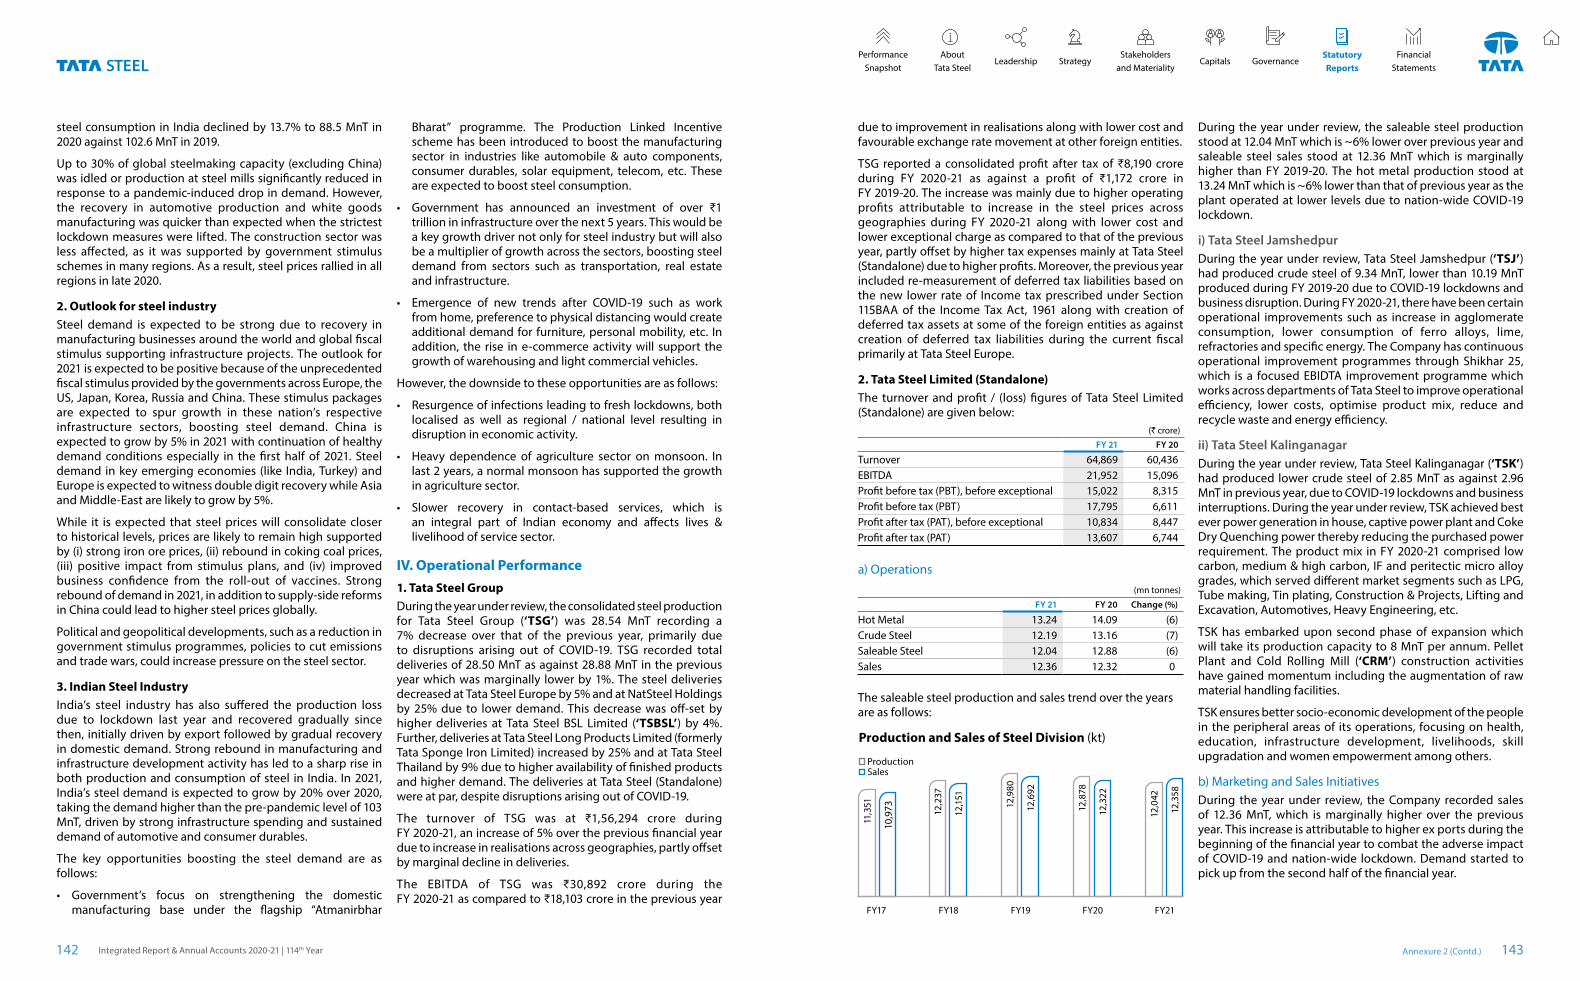
The saleable steel production and sales trend over the years are as follows:
Production and Sales of Steel Division (kt)
10,9
73
11,3
51
FY17
12,1
51
12,2
37
FY18
12,6
92
12,9
80
FY19
12,3
22
12,8
78
FY20
12,3
58
12,0
42
FY21
Production Sales
During the year under review, the saleable steel production stood at 12.04 MnT which is ~6% lower over previous year and saleable steel sales stood at 12.36 MnT which is marginally higher than FY 2019-20. The hot metal production stood at 13.24 MnT which is ~6% lower than that of previous year as the plant operated at lower levels due to nation-wide COVID-19 lockdown.
i) Tata Steel JamshedpurDuring the year under review, Tata Steel Jamshedpur (‘TSJ’) had produced crude steel of 9.34 MnT, lower than 10.19 MnT produced during FY 2019-20 due to COVID-19 lockdowns and business disruption. During FY 2020-21, there have been certain operational improvements such as increase in agglomerate consumption, lower consumption of ferro alloys, lime, refractories and specific energy. The Company has continuous operational improvement programmes through Shikhar 25, which is a focused EBIDTA improvement programme which works across departments of Tata Steel to improve operational efficiency, lower costs, optimise product mix, reduce and recycle waste and energy efficiency.
ii) Tata Steel KalinganagarDuring the year under review, Tata Steel Kalinganagar (‘TSK’) had produced lower crude steel of 2.85 MnT as against 2.96 MnT in previous year, due to COVID-19 lockdowns and business interruptions. During the year under review, TSK achieved best ever power generation in house, captive power plant and Coke Dry Quenching power thereby reducing the purchased power requirement. The product mix in FY 2020-21 comprised low carbon, medium & high carbon, IF and peritectic micro alloy grades, which served different market segments such as LPG, Tube making, Tin plating, Construction & Projects, Lifting and Excavation, Automotives, Heavy Engineering, etc.
TSK has embarked upon second phase of expansion which will take its production capacity to 8 MnT per annum. Pellet Plant and Cold Rolling Mill (‘CRM’) construction activities have gained momentum including the augmentation of raw material handling facilities.
TSK ensures better socio-economic development of the people in the peripheral areas of its operations, focusing on health, education, infrastructure development, livelihoods, skill upgradation and women empowerment among others.
b) Marketing and Sales InitiativesDuring the year under review, the Company recorded sales of 12.36 MnT, which is marginally higher over the previous year. This increase is attributable to higher ex ports during the beginning of the financial year to combat the adverse impact of COVID-19 and nation-wide lockdown. Demand started to pick up from the second half of the financial year.
Annexure 2 (Contd.)Integrated Report & Annual Accounts 2020-21 | 114th Year142 143
StatutoryReports
Stakeholders and Materiality
Performance Snapshot
About Tata Steel
Leadership Capitals GovernanceStrategyFinancial
Statements
The break-up of sales in our various segments and the break-up of domestic sales to exports are as follows:
(` crore)
FY 21 FY 20
Automotive & Special products 1.57 1.45Branded Products, Retail & Solutions 3.42 3.82Industrial Products & Projects 4.05 4.61Domestic 9.04 9.88Exports 2.41 1.50Domestic + Exports 11.45 11.38Transfers (Wires, Tubes, IBMD, Agrico) 0.91 0.94Total Deliveries 12.36 12.32
The key business initiatives and achievements in the FY 2020-21 are given below:
Automotive and Special Products: The year under review started on a daunting note with demand plunging by 44% and 57% in Personal Vehicle (‘PV’) and Commercial Vehicle (‘CV’) segment respectively on a Y-o-Y basis by H1FY2021. However, the onset of the festive season in September 2020 brought significant uptick in demand also supported by the need for personal mobility in pandemic times. The impressive revival in demand in H2FY2021 ensured that the sector ended the year with a de-growth of only 11% and 18% in PV and CV respectively (Y-o-Y). Tata Steel registered annual sales of 1.57 MnT with an increase in market share over FY 2019-20 across all products (including outer skin panel, high tensile steel segment). The year ended with an overall market share of 43% as against 35% in FY 2019-20 on standalone basis. Tata Steel continues to command market leadership with high SOB (Share of Business) in all new model launches including entry into import intensive OEMs.
Tata Steel continues to be a differentiator through its offerings to automotive customers amidst changing business realities including an enhanced focus on ancillary space by bringing in corporate level focus in large ancillaries, solution oriented offerings and broadening supply chain capabilities through new processing partners. It has helped us improve the sales experience of our customers when they do business with us. Also, the launch of a first of its kind digital VAVE (Value Analysis & Value Engineering) platform “e-DRIVE” helped take our customer engagement to a new level in these tough times.
Branded Products and Retail: During the year under review, Branded Products sales was 3.42 MnT (38% of total domestic sales of FY 2020-21).
The B2C segment achieved sales volume of 1.51 MnT in FY 2020-21. Tata Shaktee achieved a sales growth of ~4% over FY 2019-20 with a volume of 190kT from TSJ against 183 kT in FY 2019-20, with the scale up of new products such as WAMA (for walling application) and Long Length GC sheets contributing to the increase in sales. Tata KOSH has achieved
sales of 27 kT in FY 2020-21, despite COVID-19 led disruptions. In addition, TSBSL integration led to 27 kT (11% of Total Sales) of Tata Shaktee Sales and 43kT (61% of total Sales) of Tata Kosh sales through the Company’s channel in FY 2020-21.
In FY 2020-21, B2ECA (Business to Emerging Corporate Accounts) business clocked a volume of 1.91 MnT and in the process serviced 9,000+ customers. Value Added Products contributed 24% of overall ECA Volumes. This was achieved through market development and access to key micro segments (Railways, Wagons, Transmission Line Tower, PEB, Solar, Appliances) and introduction of segment specific 41 new products. ECA business launched 3 New Coated Brands from Tata Steel BSL “GalvaRoS, Galvanova and Colornova” for entry into new product and market segments like Appliances, Solar, Commercial Building. The New Coated Brands promote sustainability in line with the changing consumer requirements. DigEca, a digital solution for ECA business, has created real-time, segmental visibility of sales by channel partners to ECA customers.
Industrial Products, Projects and Exports: The vertical registered a strong performance on the back of exports in H1FY2021 and recovery in Construction, Engineering and Valued Added segments in H2FY2021 resulting in sales of 6.46 MnT for the year (~6% growth Y-o-Y).
Tata Steel continued its focus on Engineering segments and Value-Added Products (‘VAP’) through an enriched product portfolio. Precision Tubes segment grew by 12% Y-o-Y from 107 kT to 120 kT registering the highest ever sales in any fiscal year. Despite the impact of the pandemic, sales in MCHC (Medium Carbon / High Carbon) and LPG segment also grew marginally over FY 2019-20. Sales of high strength and corrosion resistant rebars together grew by 39% Y-o-Y. Engineering Segment also achieved best ever sales with a growth of 5% Y-o-Y driven by 3.5 times growth in Oil & Gas segment through approvals from major Oil Marketing Companies for API X65 & API X70. The Company increased its market share in Lifting & Excavation segments with a growth of 14% Y-o-Y and increased its presence in niche segments comprising of solar, transmission towers, crash barriers and special structural grades with a growth of 58% Y-o-Y. Engineering Segments also increased dispatches through costal route by 25% over last year bringing in cost savings.
In Construction space, the Company has maintained its focus on offering services and solutions through Cut & Bend with Tiscon Readybuild sales at 106 kT in FY 2020-21. The Company has also supplied ~109 kT rebars (~11% of total project sales) to 29 Marquee projects in India.
Steel exports in FY 2020-21 increased to ~2.41 MnT to combat the pandemic affected H1FY2021 and contributed to ~20% of Tata Steel sales. In order to maximise exports, the Company started using two more ports (Kolkata & Vishakhapatnam)
in addition to the regular ports for break-bulk shipments. Customers from 7 new countries were added to the Company’s portfolio which helped increase exports during Q1FY2021. In its pursuit to enrich sales mix, the Company doubled its VAP export sales in FY 2020-21 to 240 kT. In our drive to improve agility, the Company concluded an end-to-end paperless trade transaction enabled by Blockchain. It is a first of its kind transaction in the steel industry and has helped reduce the payment cycle time from 2 weeks to 4 working days.
Services & Solutions: During the year under review, the Company has consolidated its position in the Services & Solutions space through continuous innovation, to provide customer-centric offerings and better consumer experience in a pandemic affected uncertain market. In FY 2020-21, Tata Pravesh Doors and Windows registered a system turnover of ₹145 core. The installation figures have increased to 80K units in FY 2020-21, a Y-o-Y increase of 40%. Nest-In, the construction solutions brand from Services & Solutions, has received an order book of ₹104 crore and executed orders worth ₹55 crore in FY 2020-21. In response to a stagnating sanitation market, Nest-In successfully scaled up its shelter solutions, registering a growth of ~113% in this segment (₹38 crore in FY 2019-20 as against ₹81 crore in FY 2020-21).
Digital Initiatives: Tata Steel Aashiyana an initiative providing early inspiration, engagement & e-commerce for Individual Home Builder (‘IHB’) achieved turnover of ₹726 crore in FY 2020-21 with growth of 122% over FY 2019-20. Tata Basera has expanded its reach to 255+ districts. The Tata Basera programme offers special benefits from 5 Tata Group companies to IHB across 7 brands. These digital initiatives have helped serve 5,545 unique pin code thus allowing us to serve new markets and enabled meeting customer requirement specially during pandemic period.
Apart from Aashiyana, Tata Steel has also scaled up various digital initiatives in multiple customer segments viz (B2C, B2B & B2ECA). Compass, a digital supply chain visibility solution was rolled out to B2B customers & DigEca, an initiative that captures lead management for ECAs received traction from its distributors & customers. Digital projects such as Magibox have helped improve product value realisation.
c) Engineering & ProjectsEngineering & Projects (‘E&P’) continued to support Tata Steel’s growth and sustenance plan by ensuring project progress amidst the COVID-19 pandemic. In line with the Company’s long-term vision to attain leadership position in India, capacity expansion project of Tata Steel Kalinganagar phase 2 (3 MnTPA to 8 MnTPA), some Raw Material locations, sustenance projects at Tata Steel Jamshedpur and other locations were continued. Quick adaptation to the new normal was done and commissioning of various projects were successfully completed with limited local and remote support from technology supplier.
The Company continued to focus on attractive opportunities to deploy capital optimally to increase the future returns of the business. These projects will enhance our downstream capabilities, increase high added value capacities and reduce costs. Besides these, the compliance related projects on improving the environment related parameters were pursued.
During FY 2020-21, the team focused on building a future ready organisation with the driving theme being Agility, Value creation, Building Deep Capabilities, adapting Future ready construction practices and indigenisation while achieving manufacturing excellence. We strengthened our master plans across locations through effective and efficient conceptualisation, design and engineering capabilities and considering efficient technologies, environment and sustainability.
In digitalisation journey, capex programmes customised various digital initiative’s such as Integrated Project Management System, which aimed at integrating project information at a common platform; i3M, Connected Man, Machines and Materials for better traceability of critical enablers, 2D to 3D modeling conversion, for creating 3D based assembly sequence & constructability validation and Virtual Reality platform, virtual construction, virtual assembly and virtual commissioning. Smart construction practices such as digital work platform was adapted which enabled online monitoring of remote work place activities.
Various initiatives were undertaken to ensure adherence to COVID-19 protocols while continuing construction at project sites and manufacturing work. Adapting quickly to the new normal, all the capability building sessions and awareness programmes were conducted online. Detailed planning was done after assessment of shift-wise and location-wise minimum manpower requirements. Support facilities such as canteen, transportation and medical service arrangements were geared up with strict adherence to COVID-19 protocol including extensive sanitisation and social distancing norms. Central CCTV monitoring for all locations helped to ensure compliance to utilisation of personal protective equipment and kits (including masks) by the people at work sites.
Other daily management activities were seamlessly carried out through virtual platforms. Collaboration was done with supplier partners to workout win-win situation in terms of revising delivery schedules of material. Restricted movement from employee residence’s and labour camps, sanitisation of sites and transport vehicles helped in containment of the pandemic at our project construction sites to a large extent.
d) Sustainable Steel Business Initiatives
i) New Materials BusinessThe New Materials Business (‘NMB’) was set up with the vision of making the Company future ready by insulating revenues from the cyclicity of the steel business and to explore advanced
Annexure 2 (Contd.)Integrated Report & Annual Accounts 2020-21 | 114th Year144 145
StatutoryReports
Stakeholders and Materiality
Performance Snapshot
About Tata Steel
Leadership Capitals GovernanceStrategyFinancial
Statements
material solutions. NMB has currently three material verticals – Composites, Graphene and Medical Materials & Devices.
Fibre Reinforced Polymer (‘FRP’) Composites: The business is focused on an asset light model with successful tie ups with partners of choice for production and supply of composite products. NMB Composites has marked its presence already in the Industrial, Infrastructure and Railway segments.
The business focusses on building scale in the industrial sector through internal capability development and building long-term relationship with customers. Successful large project executions would enable the Composites to establish itself as one of the leading players in the industry. Leveraging on group synergies would further strengthen this position in the market.
The division also plays a significant role in providing the nation with clean drinking water with the offerings of FRP Pipes and Pressure Vessels. The other key areas of growth in the infrastructure is building smart cities with modern solutions which are functionally superior and aesthetically appealing.
The Railways segment focusses on providing the best-in-class railway interiors to the Indian passenger. With the successful roll-out of the interior furnishing of the AC I coach to Modern Coach Factory in FY 2020-21, the journey is set to provide comfort and luxury to Indian railway passengers.
In FY 2020-21, NMB Composites division registered a substantial growth in revenue over the previous year.
Graphene: The journey of commercialisation has commenced and the graphene business crossed the revenue mark of $2 million sales in FY 2020-21. The business has also commissioned its 100 TPA integrated graphene manufacturing plant in March 2021. The division has demonstrated significant value across ten different graphene enriched products.
Medical Material and Devices: NMB has ventured into affordable medical material and devices to take up the role of aggregator for the domestic manufacturers in creating holistic medical device solutions at global standard. The vision is to empower the medical device manufacturing ecosystem in India to fit the demography and in lieu of the inverted duty structure, create affordable and global standard health technology solutions for India and the World. This would make India self-reliant in the medical technology space.
The initial business scope covers medical consumables, in - vitro diagnostics, implantables, prosthetics & orthotics and medical device components. Among materials, advanced ceramics and biologics which are among the largely imported and priority list for Indian population and market form part of the business scope.
ii) Steel Recycling BusinessThe Steel Recycling Business is an initiative and a definitive step by Tata Steel towards sustainable steel production and a
quantum leap towards circular economy. The steel produced through the recycled route entails significantly lower carbon emissions (63%), resource consumption (68%) and energy utilisation (58%). The initiative aims to provide the much-needed raw material l fillip to Steel Industry by making available quality processed ferrous scrap, streamlining the currently unorganised scrap supply chain, enhancing the transparency and lowering the dependency on imports.
Steel Recycling Business commissioned its first Steel Scrap Recycling plant of 0.5 MnTPA capacity in September 2020 at Rohtak, Haryana. It is a state-of-the-art plant with mechanised equipment such as Shredder, Baler, Material Handler, etc. for processing, handling and producing top quality scrap. Steel scraps are procured from various market segments such as End-of-Life Vehicle scrap, Obsolete Household Scrap, Construction & Demolition scrap, Industrial Scrap, etc. Digital App based supply chains facilitate procurement of scrap in a fair and transparent manner. This scrap is processed through mechanised equipment and the high quality processed scrap is supplied to Electric Arc Furnaces, Induction Furnaces and Foundries for downstream Steel making, satiating their long-standing demand.
Various initiatives have been launched to raise the bar in the scrap industry. Tata FerroBaled and Tata FerroShred are first of-its-kind brands in the world for Ferrous Scrap launched by Tata Steel. FerroHaat™ App, again a first-of-its-kind in the world, to source steel scrap from the traders has been launched. These initiatives reinforce Tata Steel’s commitment to foster trust, transparency and ease of doing business in the scrap industry.
Steel recycling route is dovetailed with the long product growth strategy of the Company.
e) Performance of business units
i) Tubes DivisionThe Company’s Tubes Strategic Business Unit is a leading manufacturer of pipes and tubes in India having its manufacturing facility situated at Jamshedpur with an annual production capacity of ~500 kilo tonnes. The three main lines of businesses are conveyance tubes (Tata Pipes), structural tubes (Tata Structura) and precision tubes for auto and boiler segments.
FY 2020-21 was a unique year which started with a zero base, as almost all segments and markets were shut down due to the pandemic and impending lockdown in April 2020. Subsequently, the demand centres also shifted more towards rural and less-restrictive zones during Q1FY2021. Automotive sector recovered from Q3FY2021 onwards. However, the construction and infrastructure recovered after Q3FY2021.
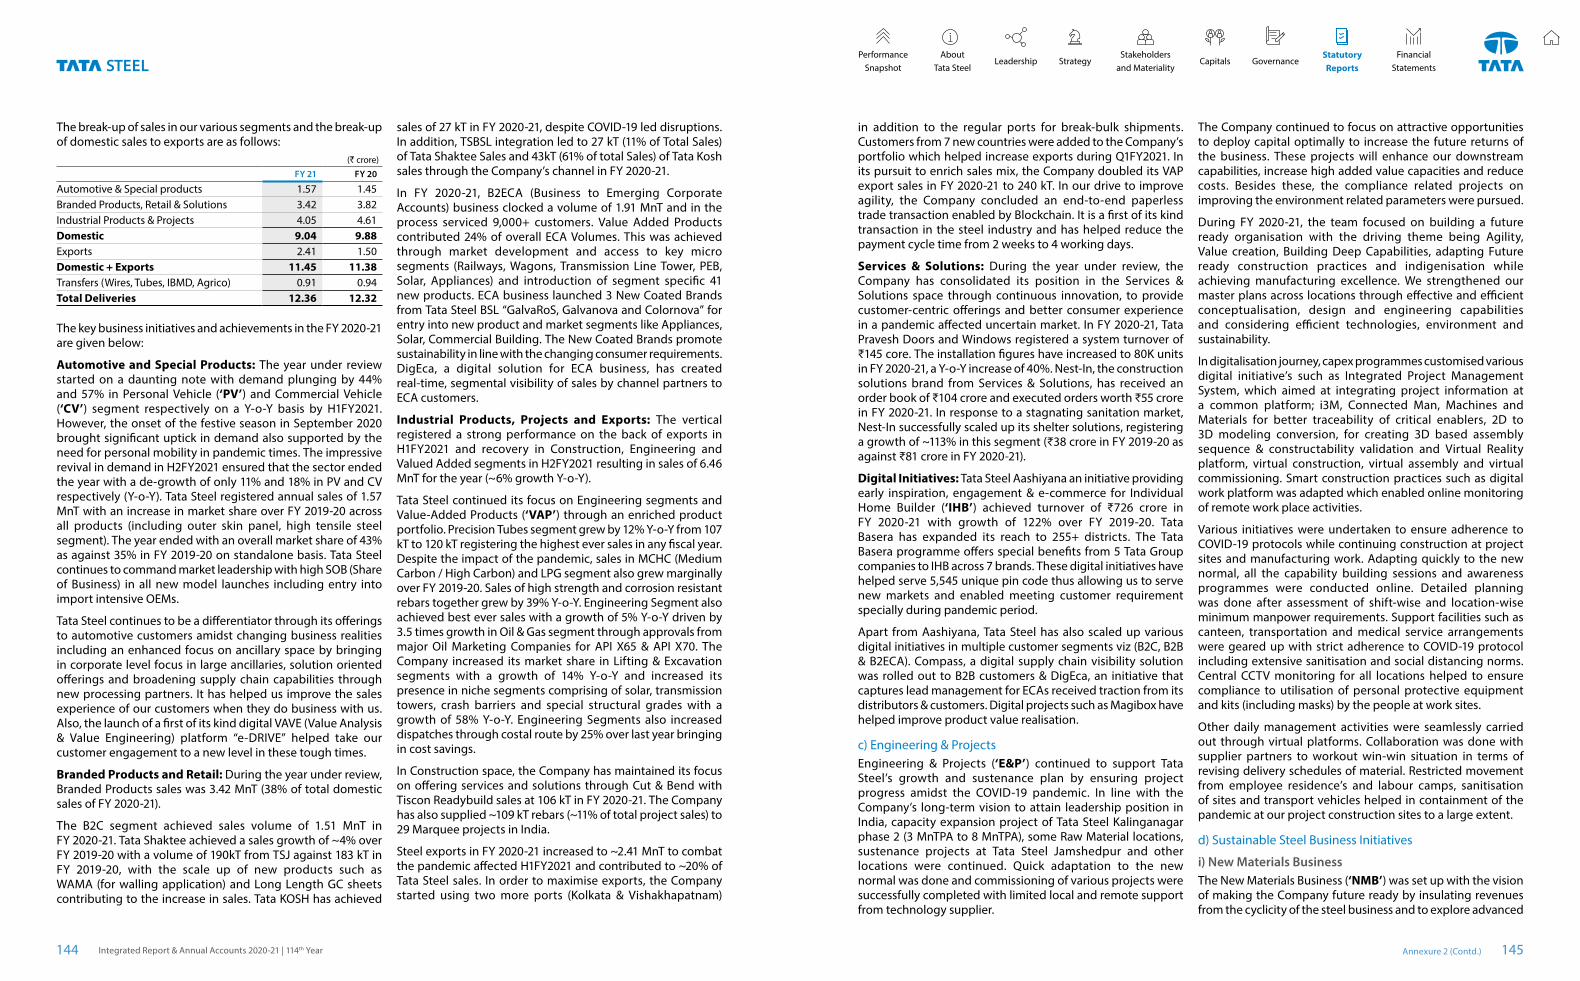
The production and sales performance is as below:
Production and Sales of Tube Division (kt)
483
487
FY17
511
509
FY18
524
523
FY19
509
518
FY20
468
458
FY21
Production Sales
During the FY 2020-21, the production was at 458 kt as against 518 kt in FY 2019-20, lower by 60 kt and the division achieved sales of 468 kt in FY 2020-21 as against 509 kt in FY 2019-20, lower by 41kt due to plant shutdown during Q1FY2021 due to pandemic.
Key Business Highlights: Through its digital platform, the division achieved sales of ~20,000 Mt in FY 2020-21 (6300 Mt in FY 2019-20) from the Aashiyana Portal, which is ~10% of our Brands & Retail Sales.
Recognition: ‘Tata Structura’ Tata Steel’s premium hollow section brand received the Times Business Award for Best Manufacturer of Structural Tubes.
ii) Wires DivisionThe Company’s Global Wires India (‘GWI’) Business Unit is the largest manufacturer of steel wires in India. The manufacturing plants are located at Tarapur, Pithampur and Jamshedpur, and contribute to nearly 65% of its sales volume, with remaining 35% being catered by Wires Processing Centres. GWI caters to the requirements of the Indian Automobile, Construction and the rural markets with various products.
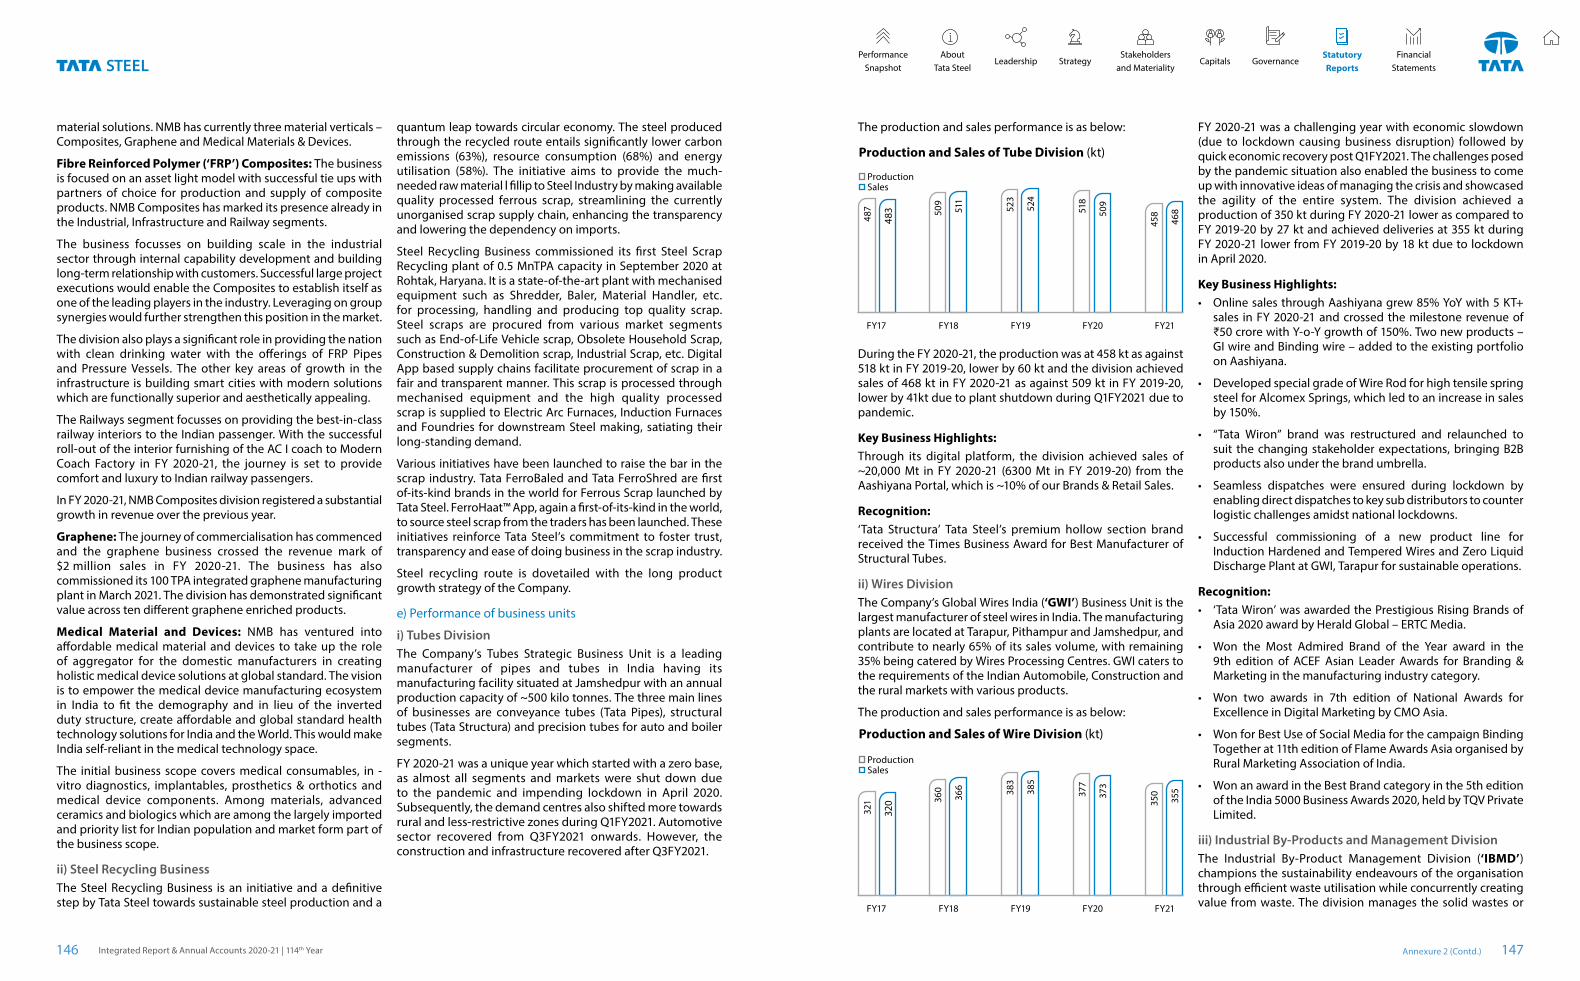
The production and sales performance is as below:
Production and Sales of Wire Division (kt)
320
321
FY17
366
360
FY18
385
383
FY19
373
377
FY20
355
350
FY21
Production Sales
FY 2020-21 was a challenging year with economic slowdown (due to lockdown causing business disruption) followed by quick economic recovery post Q1FY2021. The challenges posed by the pandemic situation also enabled the business to come up with innovative ideas of managing the crisis and showcased the agility of the entire system. The division achieved a production of 350 kt during FY 2020-21 lower as compared to FY 2019-20 by 27 kt and achieved deliveries at 355 kt during FY 2020-21 lower from FY 2019-20 by 18 kt due to lockdown in April 2020.
Key Business Highlights:• Online sales through Aashiyana grew 85% YoY with 5 KT+
sales in FY 2020-21 and crossed the milestone revenue of ₹50 crore with Y-o-Y growth of 150%. Two new products – GI wire and Binding wire – added to the existing portfolio on Aashiyana.
• Developed special grade of Wire Rod for high tensile spring steel for Alcomex Springs, which led to an increase in sales by 150%.
• “Tata Wiron” brand was restructured and relaunched to suit the changing stakeholder expectations, bringing B2B products also under the brand umbrella.
• Seamless dispatches were ensured during lockdown by enabling direct dispatches to key sub distributors to counter logistic challenges amidst national lockdowns.
• Successful commissioning of a new product line for Induction Hardened and Tempered Wires and Zero Liquid Discharge Plant at GWI, Tarapur for sustainable operations.
Recognition:• ‘Tata Wiron’ was awarded the Prestigious Rising Brands of
Asia 2020 award by Herald Global – ERTC Media.
• Won the Most Admired Brand of the Year award in the 9th edition of ACEF Asian Leader Awards for Branding & Marketing in the manufacturing industry category.
• Won two awards in 7th edition of National Awards for Excellence in Digital Marketing by CMO Asia.
• Won for Best Use of Social Media for the campaign Binding Together at 11th edition of Flame Awards Asia organised by Rural Marketing Association of India.
• Won an award in the Best Brand category in the 5th edition of the India 5000 Business Awards 2020, held by TQV Private Limited.
iii) Industrial By-Products and Management DivisionThe Industrial By-Product Management Division (‘IBMD’) champions the sustainability endeavours of the organisation through efficient waste utilisation while concurrently creating value from waste. The division manages the solid wastes or
Annexure 2 (Contd.)Integrated Report & Annual Accounts 2020-21 | 114th Year146 147
StatutoryReports
Stakeholders and Materiality
Performance Snapshot
About Tata Steel
Leadership Capitals GovernanceStrategyFinancial
Statements
by-products generated across the steel value chain. Operating on 3R (Reduce, Reuse, Recycle) principles of circular economy, it handled around ~12 MnT of by-products in previous year which saw pandemic led disruptions. Through its dedicated marketing and sales initiatives, the division witnessed a 16% Y-o-Y increase in the revenue and ensured sustainable value creation for the Company. Today, the product portfolio of IBMD spans across 25+ categories with more than 250 SKU’s. IBMD endeavours to remain an industry benchmark in managing by-products by adopting new technology to produce value-added downstream products and leveraging digital with a focus to increase efficiency & customer delight.
During the year under review, the One IBMD strategy has helped to augment value creation across plants through horizontal deployment of major operational KPIs and Customer & Contract Realignment. Automation in operations and supply chain through initiatives such as unmanned weighbridges, paperless supply chains has helped improving operational efficiency. These connected systems now form the backbone of IBMD’s digital future and synergy efforts.
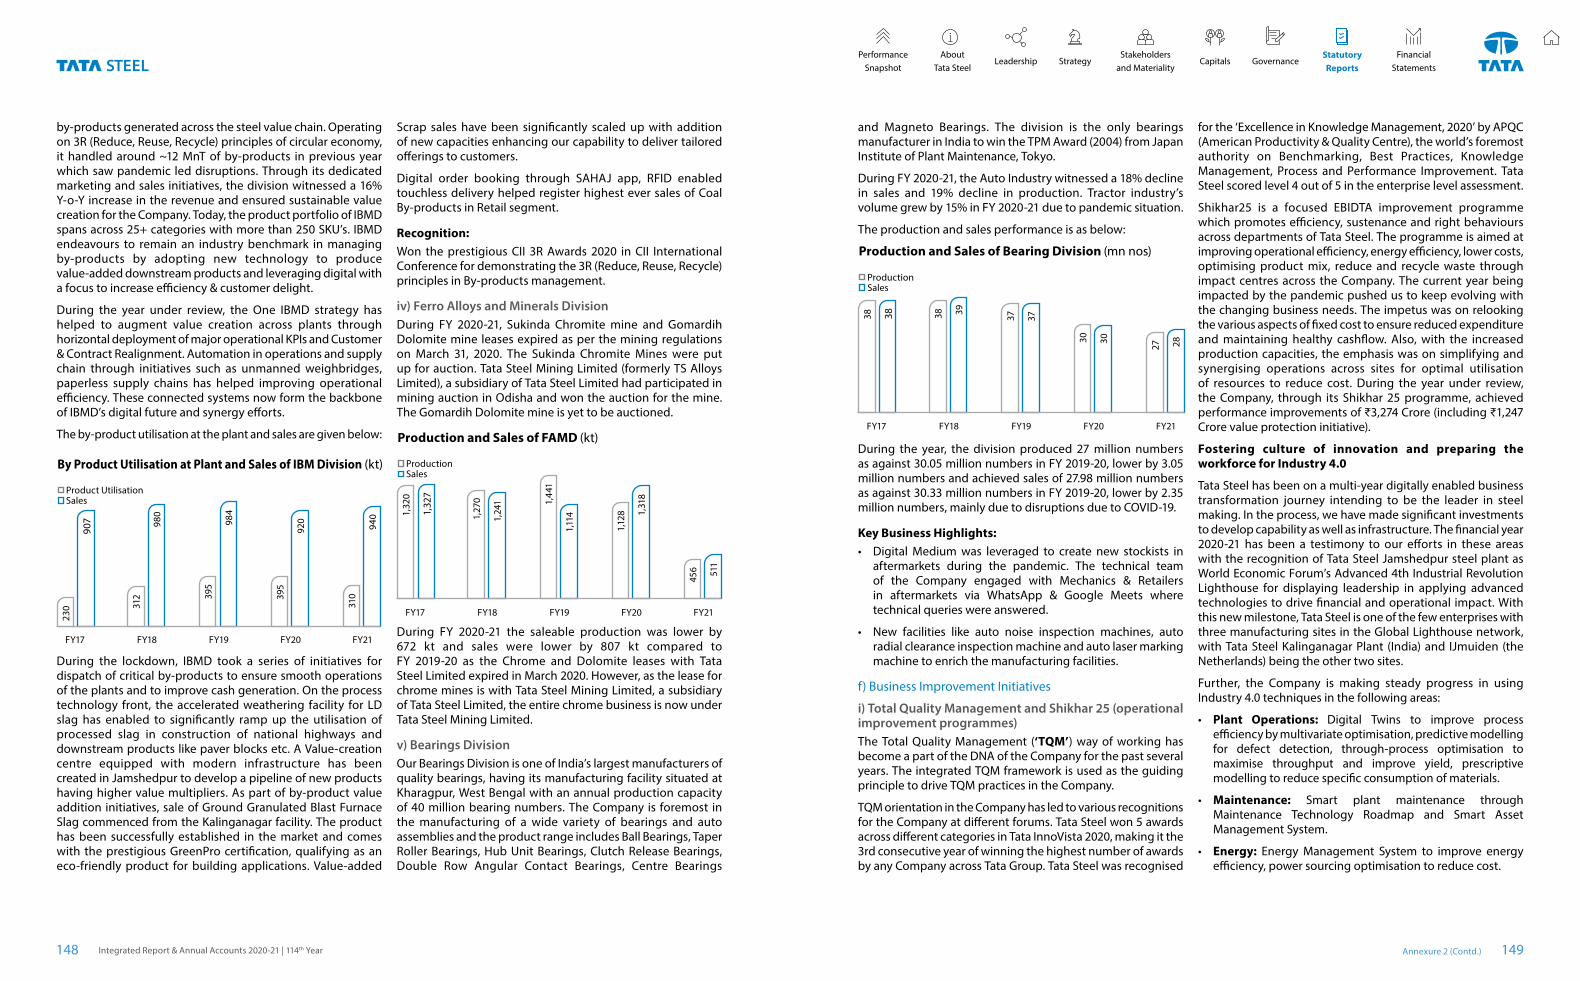
The by-product utilisation at the plant and sales are given below:
By Product Utilisation at Plant and Sales of IBM Division (kt)
907
230
FY17
980
312
FY18
984
395
FY19
920
395
FY20
940
310
FY21
Product Utilisation Sales
During the lockdown, IBMD took a series of initiatives for dispatch of critical by-products to ensure smooth operations of the plants and to improve cash generation. On the process technology front, the accelerated weathering facility for LD slag has enabled to significantly ramp up the utilisation of processed slag in construction of national highways and downstream products like paver blocks etc. A Value-creation centre equipped with modern infrastructure has been created in Jamshedpur to develop a pipeline of new products having higher value multipliers. As part of by-product value addition initiatives, sale of Ground Granulated Blast Furnace Slag commenced from the Kalinganagar facility. The product has been successfully established in the market and comes with the prestigious GreenPro certification, qualifying as an eco-friendly product for building applications. Value-added
Scrap sales have been significantly scaled up with addition of new capacities enhancing our capability to deliver tailored offerings to customers.
Digital order booking through SAHAJ app, RFID enabled touchless delivery helped register highest ever sales of Coal By-products in Retail segment.
Recognition:Won the prestigious CII 3R Awards 2020 in CII International Conference for demonstrating the 3R (Reduce, Reuse, Recycle) principles in By-products management.
iv) Ferro Alloys and Minerals DivisionDuring FY 2020-21, Sukinda Chromite mine and Gomardih Dolomite mine leases expired as per the mining regulations on March 31, 2020. The Sukinda Chromite Mines were put up for auction. Tata Steel Mining Limited (formerly TS Alloys Limited), a subsidiary of Tata Steel Limited had participated in mining auction in Odisha and won the auction for the mine. The Gomardih Dolomite mine is yet to be auctioned.
Production and Sales of FAMD (kt)1,
327
1,32
0
FY17
1,24
1
1,27
0
FY18
1,11
4
1,44
1
FY19
1,31
8
1,12
8FY20
511
456
FY21
Production Sales
During FY 2020-21 the saleable production was lower by 672 kt and sales were lower by 807 kt compared to FY 2019-20 as the Chrome and Dolomite leases with Tata Steel Limited expired in March 2020. However, as the lease for chrome mines is with Tata Steel Mining Limited, a subsidiary of Tata Steel Limited, the entire chrome business is now under Tata Steel Mining Limited.
v) Bearings DivisionOur Bearings Division is one of India’s largest manufacturers of quality bearings, having its manufacturing facility situated at Kharagpur, West Bengal with an annual production capacity of 40 million bearing numbers. The Company is foremost in the manufacturing of a wide variety of bearings and auto assemblies and the product range includes Ball Bearings, Taper Roller Bearings, Hub Unit Bearings, Clutch Release Bearings, Double Row Angular Contact Bearings, Centre Bearings
and Magneto Bearings. The division is the only bearings manufacturer in India to win the TPM Award (2004) from Japan Institute of Plant Maintenance, Tokyo.
During FY 2020-21, the Auto Industry witnessed a 18% decline in sales and 19% decline in production. Tractor industry’s volume grew by 15% in FY 2020-21 due to pandemic situation.
The production and sales performance is as below:
Production and Sales of Bearing Division (mn nos)
3838
FY17
3938
FY18
3737
FY19
3030
FY20
2827
FY21
Production Sales
During the year, the division produced 27 million numbers as against 30.05 million numbers in FY 2019-20, lower by 3.05 million numbers and achieved sales of 27.98 million numbers as against 30.33 million numbers in FY 2019-20, lower by 2.35 million numbers, mainly due to disruptions due to COVID-19.
Key Business Highlights:• Digital Medium was leveraged to create new stockists in
aftermarkets during the pandemic. The technical team of the Company engaged with Mechanics & Retailers in aftermarkets via WhatsApp & Google Meets where technical queries were answered.
• New facilities like auto noise inspection machines, auto radial clearance inspection machine and auto laser marking machine to enrich the manufacturing facilities.
f) Business Improvement Initiatives
i) Total Quality Management and Shikhar 25 (operational improvement programmes)The Total Quality Management (‘TQM’) way of working has become a part of the DNA of the Company for the past several years. The integrated TQM framework is used as the guiding principle to drive TQM practices in the Company.
TQM orientation in the Company has led to various recognitions for the Company at different forums. Tata Steel won 5 awards across different categories in Tata InnoVista 2020, making it the 3rd consecutive year of winning the highest number of awards by any Company across Tata Group. Tata Steel was recognised
for the ‘Excellence in Knowledge Management, 2020’ by APQC (American Productivity & Quality Centre), the world’s foremost authority on Benchmarking, Best Practices, Knowledge Management, Process and Performance Improvement. Tata Steel scored level 4 out of 5 in the enterprise level assessment.
Shikhar25 is a focused EBIDTA improvement programme which promotes efficiency, sustenance and right behaviours across departments of Tata Steel. The programme is aimed at improving operational efficiency, energy efficiency, lower costs, optimising product mix, reduce and recycle waste through impact centres across the Company. The current year being impacted by the pandemic pushed us to keep evolving with the changing business needs. The impetus was on relooking the various aspects of fixed cost to ensure reduced expenditure and maintaining healthy cashflow. Also, with the increased production capacities, the emphasis was on simplifying and synergising operations across sites for optimal utilisation of resources to reduce cost. During the year under review, the Company, through its Shikhar 25 programme, achieved performance improvements of ₹3,274 Crore (including ₹1,247 Crore value protection initiative).
Fostering culture of innovation and preparing the workforce for Industry 4.0
Tata Steel has been on a multi-year digitally enabled business transformation journey intending to be the leader in steel making. In the process, we have made significant investments to develop capability as well as infrastructure. The financial year 2020-21 has been a testimony to our efforts in these areas with the recognition of Tata Steel Jamshedpur steel plant as World Economic Forum’s Advanced 4th Industrial Revolution Lighthouse for displaying leadership in applying advanced technologies to drive financial and operational impact. With this new milestone, Tata Steel is one of the few enterprises with three manufacturing sites in the Global Lighthouse network, with Tata Steel Kalinganagar Plant (India) and IJmuiden (the Netherlands) being the other two sites.
Further, the Company is making steady progress in using Industry 4.0 techniques in the following areas:
• Plant Operations: Digital Twins to improve process efficiency by multivariate optimisation, predictive modelling for defect detection, through-process optimisation to maximise throughput and improve yield, prescriptive modelling to reduce specific consumption of materials.
• Maintenance: Smart plant maintenance through Maintenance Technology Roadmap and Smart Asset Management System.
• Energy: Energy Management System to improve energy efficiency, power sourcing optimisation to reduce cost.
Annexure 2 (Contd.)Integrated Report & Annual Accounts 2020-21 | 114th Year148 149
StatutoryReports
Stakeholders and Materiality
Performance Snapshot
About Tata Steel
Leadership Capitals GovernanceStrategyFinancial
Statements
• Procurement & Supply Chain: Agile & insights based buying through price prediction & e-auctioning, digital negotiation factory, prescriptive analytics to reduce total cost to serve, advanced analytics based network optimisation for iron ore (VISTAR), unified platform for Integrated Shipping and Port Operations (ISOP), text analytics to improve export documentation cycle time.
• Marketing & Sales: Digitally enabled product sales and customer engagement across B2C, B2SME and B2B segments through platforms like Aashiyana, DigEca and Compass, analytics powered retail sales acceleration (PARAS and ASCEND), improvement in value realisation from co-products through prescriptive and predictive analytics (AMRIT), online bidding platform for ETO inventory.
• Finance: Digital readiness for statutory changes, optimisation of cost and interests through online visibility and system-based controls.
ii) Strategic Procurement Initiatives• The Company took several new initiatives for its raw
material procurement which resulted in substantial savings in cost and working capital.
• Tata Steel’s strategic engagement and relationship management with raw material suppliers has led to efficient inventory control thereby managing / avoiding any adverse effect due to the disruption caused by the COVID-19 pandemic to steel production.
• Tata Steel invested in developing a predictive analytics tool for forecasting coking coal prices incorporating 13,000+ data inputs. This has been integrated with the Company’s customised e-auction tool to mainly execute metallurgical coal spot trades. This helped in creating a positive impact of ~₹103 crore. The Company was recognised by World Economic Forum as a leader in applying fourth industrial revolution technologies due to this initiative.
• The Company continued to reduce its working capital requirement on account of raw materials. This was through implementation of Vendor Managed Inventory at Indian ports for coal and supplier credit enhancement resulting in freeing-up of non-fund based working capital lines above `500 crore.
• Group synergies through centralised procurement, technical optimisation and knowledge sharing continued to result in substantial savings and efficiency improvement. With Tata Steel Long Products and Tata Metaliks integrated (in addition to Tata Steel BSL integrated earlier), blend improvements, new product development and coal commonality related initiatives brought about ~ `300 crore savings this year.
3. Performance of Major Subsidiaries
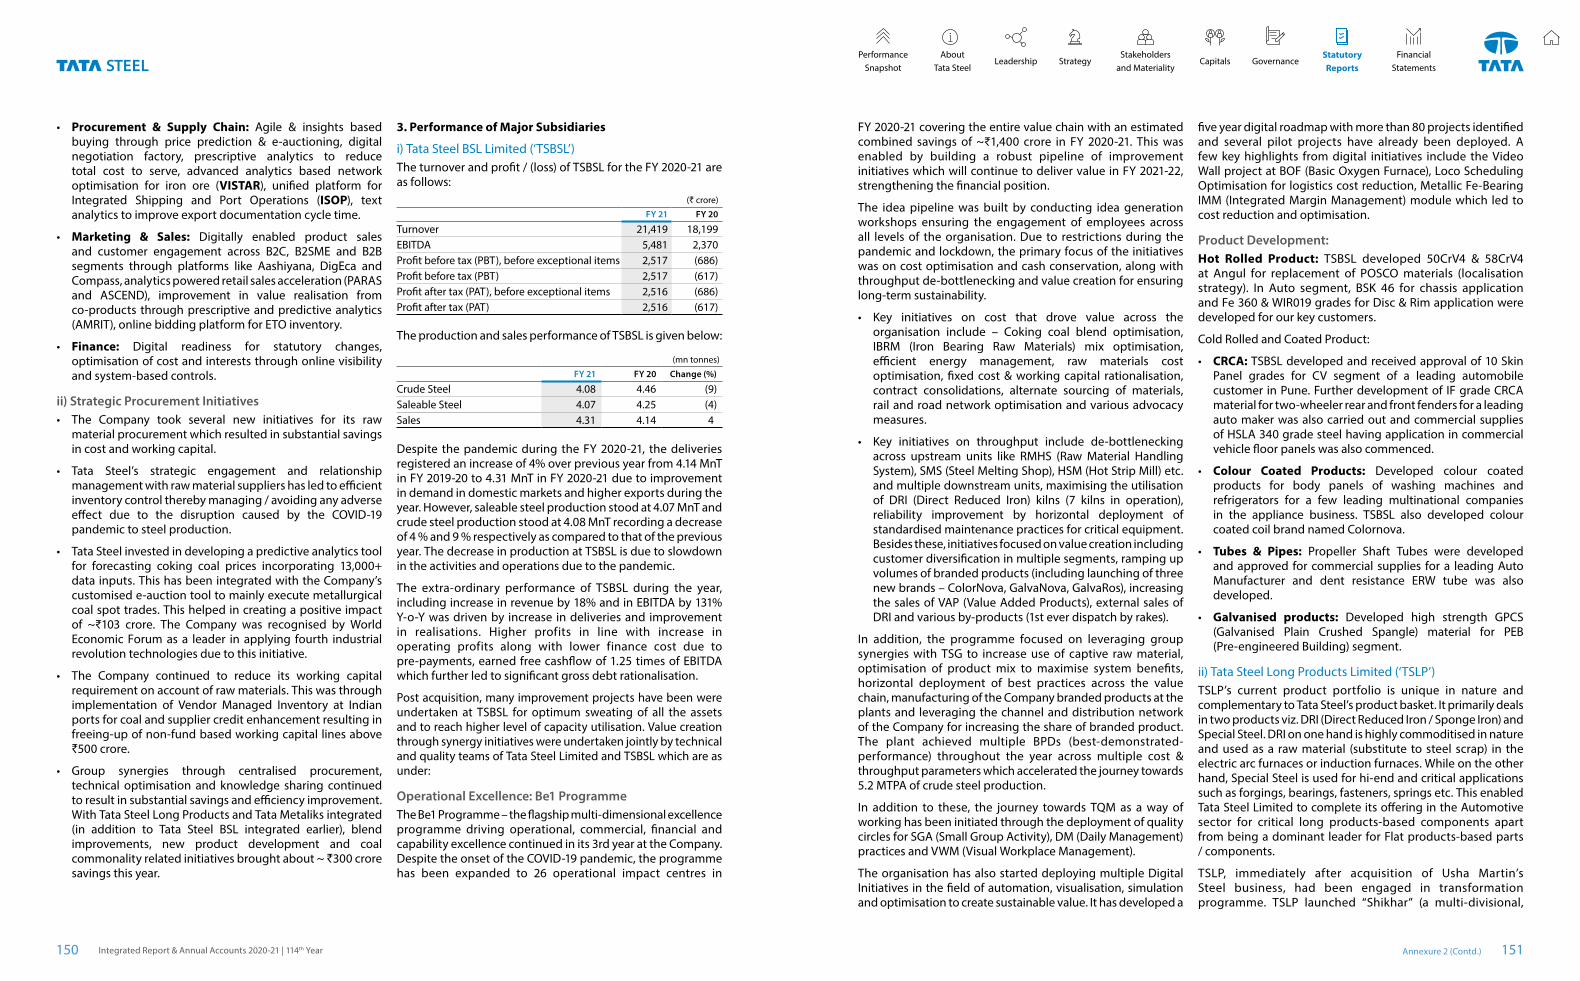
i) Tata Steel BSL Limited (‘TSBSL’)The turnover and profit / (loss) of TSBSL for the FY 2020-21 are as follows:
(` crore)
FY 21 FY 20
Turnover 21,419 18,199EBITDA 5,481 2,370Profit before tax (PBT), before exceptional items 2,517 (686)Profit before tax (PBT) 2,517 (617)Profit after tax (PAT), before exceptional items 2,516 (686)Profit after tax (PAT) 2,516 (617)
The production and sales performance of TSBSL is given below:
(mn tonnes)
FY 21 FY 20 Change (%)
Crude Steel 4.08 4.46 (9)Saleable Steel 4.07 4.25 (4)Sales 4.31 4.14 4
Despite the pandemic during the FY 2020-21, the deliveries registered an increase of 4% over previous year from 4.14 MnT in FY 2019-20 to 4.31 MnT in FY 2020-21 due to improvement in demand in domestic markets and higher exports during the year. However, saleable steel production stood at 4.07 MnT and crude steel production stood at 4.08 MnT recording a decrease of 4 % and 9 % respectively as compared to that of the previous year. The decrease in production at TSBSL is due to slowdown in the activities and operations due to the pandemic.
The extra-ordinary performance of TSBSL during the year, including increase in revenue by 18% and in EBITDA by 131% Y-o-Y was driven by increase in deliveries and improvement in realisations. Higher profits in line with increase in operating profits along with lower finance cost due to pre-payments, earned free cashflow of 1.25 times of EBITDA which further led to significant gross debt rationalisation.
Post acquisition, many improvement projects have been were undertaken at TSBSL for optimum sweating of all the assets and to reach higher level of capacity utilisation. Value creation through synergy initiatives were undertaken jointly by technical and quality teams of Tata Steel Limited and TSBSL which are as under:
Operational Excellence: Be1 ProgrammeThe Be1 Programme – the flagship multi-dimensional excellence programme driving operational, commercial, financial and capability excellence continued in its 3rd year at the Company. Despite the onset of the COVID-19 pandemic, the programme has been expanded to 26 operational impact centres in
FY 2020-21 covering the entire value chain with an estimated combined savings of ~₹1,400 crore in FY 2020-21. This was enabled by building a robust pipeline of improvement initiatives which will continue to deliver value in FY 2021-22, strengthening the financial position.
The idea pipeline was built by conducting idea generation workshops ensuring the engagement of employees across all levels of the organisation. Due to restrictions during the pandemic and lockdown, the primary focus of the initiatives was on cost optimisation and cash conservation, along with throughput de-bottlenecking and value creation for ensuring long-term sustainability.
• Key initiatives on cost that drove value across the organisation include – Coking coal blend optimisation, IBRM (Iron Bearing Raw Materials) mix optimisation, efficient energy management, raw materials cost optimisation, fixed cost & working capital rationalisation, contract consolidations, alternate sourcing of materials, rail and road network optimisation and various advocacy measures.
• Key initiatives on throughput include de-bottlenecking across upstream units like RMHS (Raw Material Handling System), SMS (Steel Melting Shop), HSM (Hot Strip Mill) etc. and multiple downstream units, maximising the utilisation of DRI (Direct Reduced Iron) kilns (7 kilns in operation), reliability improvement by horizontal deployment of standardised maintenance practices for critical equipment. Besides these, initiatives focused on value creation including customer diversification in multiple segments, ramping up volumes of branded products (including launching of three new brands – ColorNova, GalvaNova, GalvaRos), increasing the sales of VAP (Value Added Products), external sales of DRI and various by-products (1st ever dispatch by rakes).
In addition, the programme focused on leveraging group synergies with TSG to increase use of captive raw material, optimisation of product mix to maximise system benefits, horizontal deployment of best practices across the value chain, manufacturing of the Company branded products at the plants and leveraging the channel and distribution network of the Company for increasing the share of branded product. The plant achieved multiple BPDs (best-demonstrated-performance) throughout the year across multiple cost & throughput parameters which accelerated the journey towards 5.2 MTPA of crude steel production.
In addition to these, the journey towards TQM as a way of working has been initiated through the deployment of quality circles for SGA (Small Group Activity), DM (Daily Management) practices and VWM (Visual Workplace Management).
The organisation has also started deploying multiple Digital Initiatives in the field of automation, visualisation, simulation and optimisation to create sustainable value. It has developed a
five year digital roadmap with more than 80 projects identified and several pilot projects have already been deployed. A few key highlights from digital initiatives include the Video Wall project at BOF (Basic Oxygen Furnace), Loco Scheduling Optimisation for logistics cost reduction, Metallic Fe-Bearing IMM (Integrated Margin Management) module which led to cost reduction and optimisation.
Product Development: Hot Rolled Product: TSBSL developed 50CrV4 & 58CrV4 at Angul for replacement of POSCO materials (localisation strategy). In Auto segment, BSK 46 for chassis application and Fe 360 & WIR019 grades for Disc & Rim application were developed for our key customers.
Cold Rolled and Coated Product:
• CRCA: TSBSL developed and received approval of 10 Skin Panel grades for CV segment of a leading automobile customer in Pune. Further development of IF grade CRCA material for two-wheeler rear and front fenders for a leading auto maker was also carried out and commercial supplies of HSLA 340 grade steel having application in commercial vehicle floor panels was also commenced.
• Colour Coated Products: Developed colour coated products for body panels of washing machines and refrigerators for a few leading multinational companies in the appliance business. TSBSL also developed colour coated coil brand named Colornova.
• Tubes & Pipes: Propeller Shaft Tubes were developed and approved for commercial supplies for a leading Auto Manufacturer and dent resistance ERW tube was also developed.
• Galvanised products: Developed high strength GPCS (Galvanised Plain Crushed Spangle) material for PEB (Pre-engineered Building) segment.
ii) Tata Steel Long Products Limited (‘TSLP’)TSLP’s current product portfolio is unique in nature and complementary to Tata Steel’s product basket. It primarily deals in two products viz. DRI (Direct Reduced Iron / Sponge Iron) and Special Steel. DRI on one hand is highly commoditised in nature and used as a raw material (substitute to steel scrap) in the electric arc furnaces or induction furnaces. While on the other hand, Special Steel is used for hi-end and critical applications such as forgings, bearings, fasteners, springs etc. This enabled Tata Steel Limited to complete its offering in the Automotive sector for critical long products-based components apart from being a dominant leader for Flat products-based parts / components.
TSLP, immediately after acquisition of Usha Martin’s Steel business, had been engaged in transformation programme. TSLP launched “Shikhar” (a multi-divisional,
Annexure 2 (Contd.)Integrated Report & Annual Accounts 2020-21 | 114th Year150 151
StatutoryReports
Stakeholders and Materiality
Performance Snapshot
About Tata Steel
Leadership Capitals GovernanceStrategyFinancial
Statements
cross functional improvement initiative that aims to drive break-through improvement projects) to achieve operational excellence, and achieve the synergy benefits for long-term sustainability. The programme has generated more than 1,100 ideas and majority of the ideas have been successfully implemented resulting in total savings of ~ ₹300 crore.
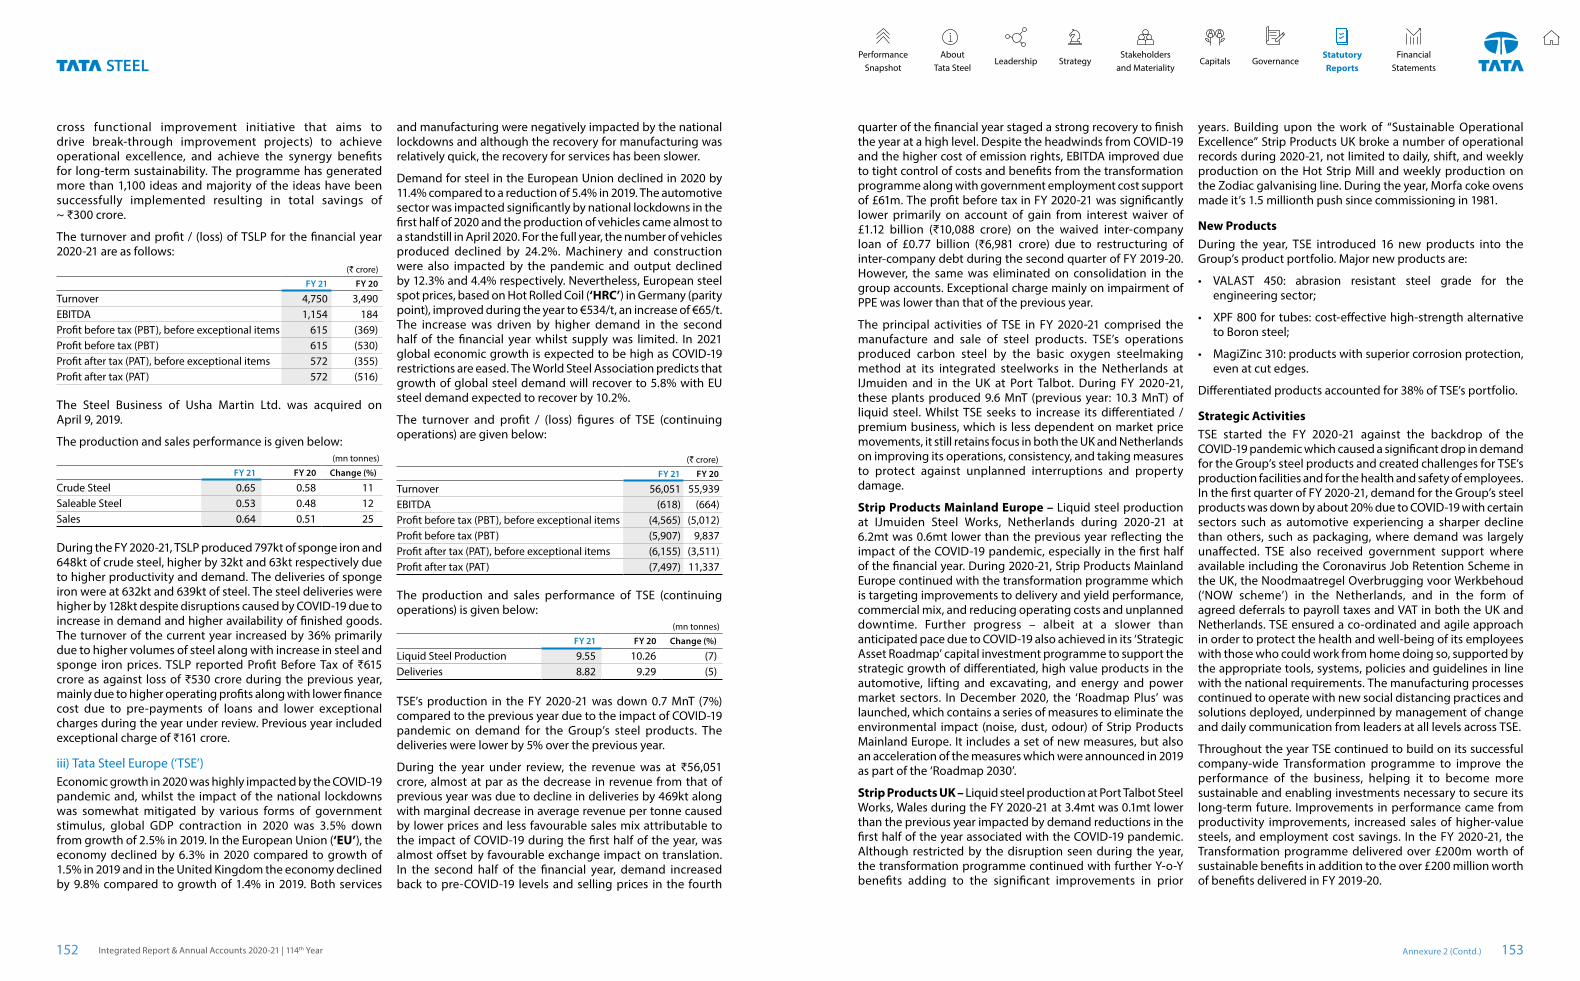
The turnover and profit / (loss) of TSLP for the financial year 2020-21 are as follows:
(` crore)
FY 21 FY 20
Turnover 4,750 3,490EBITDA 1,154 184Profit before tax (PBT), before exceptional items 615 (369)Profit before tax (PBT) 615 (530)Profit after tax (PAT), before exceptional items 572 (355)Profit after tax (PAT) 572 (516)
The Steel Business of Usha Martin Ltd. was acquired on April 9, 2019.
The production and sales performance is given below:(mn tonnes)
FY 21 FY 20 Change (%)
Crude Steel 0.65 0.58 11Saleable Steel 0.53 0.48 12Sales 0.64 0.51 25
During the FY 2020-21, TSLP produced 797kt of sponge iron and 648kt of crude steel, higher by 32kt and 63kt respectively due to higher productivity and demand. The deliveries of sponge iron were at 632kt and 639kt of steel. The steel deliveries were higher by 128kt despite disruptions caused by COVID-19 due to increase in demand and higher availability of finished goods. The turnover of the current year increased by 36% primarily due to higher volumes of steel along with increase in steel and sponge iron prices. TSLP reported Profit Before Tax of ₹615 crore as against loss of ₹530 crore during the previous year, mainly due to higher operating profits along with lower finance cost due to pre-payments of loans and lower exceptional charges during the year under review. Previous year included exceptional charge of ₹161 crore.
iii) Tata Steel Europe (‘TSE’)Economic growth in 2020 was highly impacted by the COVID-19 pandemic and, whilst the impact of the national lockdowns was somewhat mitigated by various forms of government stimulus, global GDP contraction in 2020 was 3.5% down from growth of 2.5% in 2019. In the European Union (‘EU’), the economy declined by 6.3% in 2020 compared to growth of 1.5% in 2019 and in the United Kingdom the economy declined by 9.8% compared to growth of 1.4% in 2019. Both services
and manufacturing were negatively impacted by the national lockdowns and although the recovery for manufacturing was relatively quick, the recovery for services has been slower.
Demand for steel in the European Union declined in 2020 by 11.4% compared to a reduction of 5.4% in 2019. The automotive sector was impacted significantly by national lockdowns in the first half of 2020 and the production of vehicles came almost to a standstill in April 2020. For the full year, the number of vehicles produced declined by 24.2%. Machinery and construction were also impacted by the pandemic and output declined by 12.3% and 4.4% respectively. Nevertheless, European steel spot prices, based on Hot Rolled Coil (‘HRC’) in Germany (parity point), improved during the year to €534/t, an increase of €65/t. The increase was driven by higher demand in the second half of the financial year whilst supply was limited. In 2021 global economic growth is expected to be high as COVID-19 restrictions are eased. The World Steel Association predicts that growth of global steel demand will recover to 5.8% with EU steel demand expected to recover by 10.2%.
The turnover and profit / (loss) figures of TSE (continuing operations) are given below:
(` crore)
FY 21 FY 20
Turnover 56,051 55,939EBITDA (618) (664)Profit before tax (PBT), before exceptional items (4,565) (5,012)Profit before tax (PBT) (5,907) 9,837Profit after tax (PAT), before exceptional items (6,155) (3,511)Profit after tax (PAT) (7,497) 11,337
The production and sales performance of TSE (continuing operations) is given below:
(mn tonnes)
FY 21 FY 20 Change (%)
Liquid Steel Production 9.55 10.26 (7)Deliveries 8.82 9.29 (5)
TSE’s production in the FY 2020-21 was down 0.7 MnT (7%) compared to the previous year due to the impact of COVID-19 pandemic on demand for the Group’s steel products. The deliveries were lower by 5% over the previous year.
During the year under review, the revenue was at ₹56,051 crore, almost at par as the decrease in revenue from that of previous year was due to decline in deliveries by 469kt along with marginal decrease in average revenue per tonne caused by lower prices and less favourable sales mix attributable to the impact of COVID-19 during the first half of the year, was almost offset by favourable exchange impact on translation. In the second half of the financial year, demand increased back to pre-COVID-19 levels and selling prices in the fourth
quarter of the financial year staged a strong recovery to finish the year at a high level. Despite the headwinds from COVID-19 and the higher cost of emission rights, EBITDA improved due to tight control of costs and benefits from the transformation programme along with government employment cost support of £61m. The profit before tax in FY 2020-21 was significantly lower primarily on account of gain from interest waiver of £1.12 billion (₹10,088 crore) on the waived inter-company loan of £0.77 billion (₹6,981 crore) due to restructuring of inter-company debt during the second quarter of FY 2019-20. However, the same was eliminated on consolidation in the group accounts. Exceptional charge mainly on impairment of PPE was lower than that of the previous year.
The principal activities of TSE in FY 2020-21 comprised the manufacture and sale of steel products. TSE’s operations produced carbon steel by the basic oxygen steelmaking method at its integrated steelworks in the Netherlands at IJmuiden and in the UK at Port Talbot. During FY 2020-21, these plants produced 9.6 MnT (previous year: 10.3 MnT) of liquid steel. Whilst TSE seeks to increase its differentiated / premium business, which is less dependent on market price movements, it still retains focus in both the UK and Netherlands on improving its operations, consistency, and taking measures to protect against unplanned interruptions and property damage.
Strip Products Mainland Europe – Liquid steel production at IJmuiden Steel Works, Netherlands during 2020-21 at 6.2mt was 0.6mt lower than the previous year reflecting the impact of the COVID-19 pandemic, especially in the first half of the financial year. During 2020-21, Strip Products Mainland Europe continued with the transformation programme which is targeting improvements to delivery and yield performance, commercial mix, and reducing operating costs and unplanned downtime. Further progress – albeit at a slower than anticipated pace due to COVID-19 also achieved in its ‘Strategic Asset Roadmap’ capital investment programme to support the strategic growth of differentiated, high value products in the automotive, lifting and excavating, and energy and power market sectors. In December 2020, the ‘Roadmap Plus’ was launched, which contains a series of measures to eliminate the environmental impact (noise, dust, odour) of Strip Products Mainland Europe. It includes a set of new measures, but also an acceleration of the measures which were announced in 2019 as part of the ‘Roadmap 2030’.
Strip Products UK – Liquid steel production at Port Talbot Steel Works, Wales during the FY 2020-21 at 3.4mt was 0.1mt lower than the previous year impacted by demand reductions in the first half of the year associated with the COVID-19 pandemic. Although restricted by the disruption seen during the year, the transformation programme continued with further Y-o-Y benefits adding to the significant improvements in prior
years. Building upon the work of “Sustainable Operational Excellence” Strip Products UK broke a number of operational records during 2020-21, not limited to daily, shift, and weekly production on the Hot Strip Mill and weekly production on the Zodiac galvanising line. During the year, Morfa coke ovens made it’s 1.5 millionth push since commissioning in 1981.
New Products During the year, TSE introduced 16 new products into the Group’s product portfolio. Major new products are:
• VALAST 450: abrasion resistant steel grade for the engineering sector;
• XPF 800 for tubes: cost-effective high-strength alternative to Boron steel;
• MagiZinc 310: products with superior corrosion protection, even at cut edges.
Differentiated products accounted for 38% of TSE’s portfolio.
Strategic Activities TSE started the FY 2020-21 against the backdrop of the COVID-19 pandemic which caused a significant drop in demand for the Group’s steel products and created challenges for TSE’s production facilities and for the health and safety of employees. In the first quarter of FY 2020-21, demand for the Group’s steel products was down by about 20% due to COVID-19 with certain sectors such as automotive experiencing a sharper decline than others, such as packaging, where demand was largely unaffected. TSE also received government support where available including the Coronavirus Job Retention Scheme in the UK, the Noodmaatregel Overbrugging voor Werkbehoud (‘NOW scheme’) in the Netherlands, and in the form of agreed deferrals to payroll taxes and VAT in both the UK and Netherlands. TSE ensured a co-ordinated and agile approach in order to protect the health and well-being of its employees with those who could work from home doing so, supported by the appropriate tools, systems, policies and guidelines in line with the national requirements. The manufacturing processes continued to operate with new social distancing practices and solutions deployed, underpinned by management of change and daily communication from leaders at all levels across TSE.
Throughout the year TSE continued to build on its successful company-wide Transformation programme to improve the performance of the business, helping it to become more sustainable and enabling investments necessary to secure its long-term future. Improvements in performance came from productivity improvements, increased sales of higher-value steels, and employment cost savings. In the FY 2020-21, the Transformation programme delivered over £200m worth of sustainable benefits in addition to the over £200 million worth of benefits delivered in FY 2019-20.
Annexure 2 (Contd.)Integrated Report & Annual Accounts 2020-21 | 114th Year152 153
StatutoryReports
Stakeholders and Materiality
Performance Snapshot
About Tata Steel
Leadership Capitals GovernanceStrategyFinancial
Statements
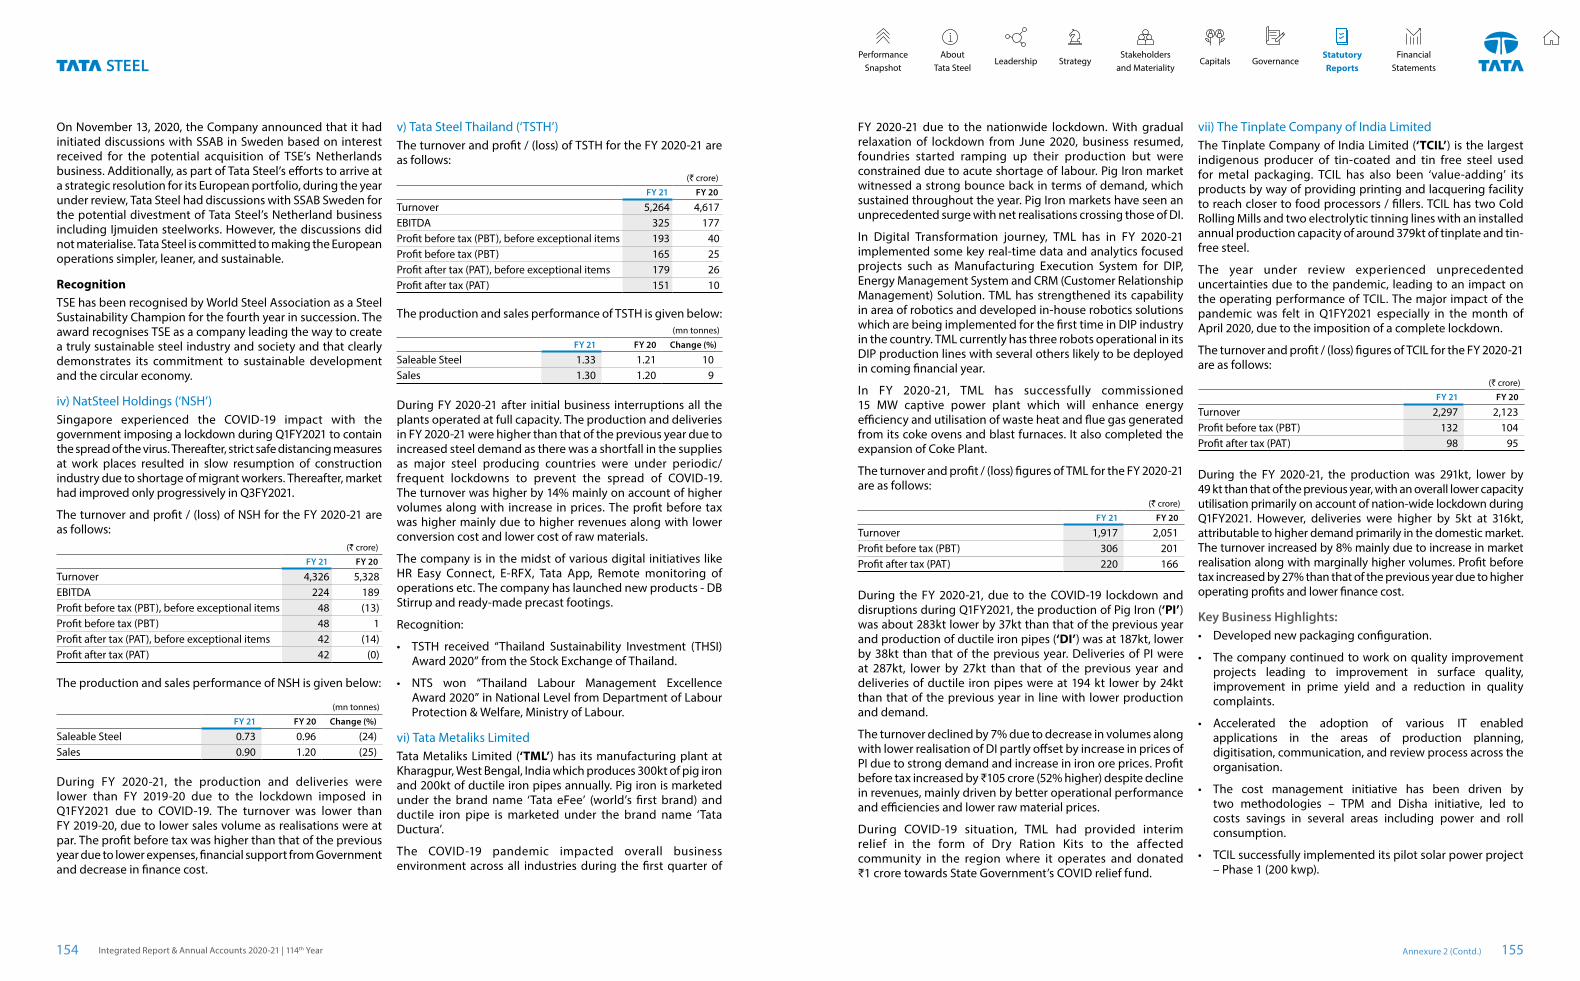
On November 13, 2020, the Company announced that it had initiated discussions with SSAB in Sweden based on interest received for the potential acquisition of TSE’s Netherlands business. Additionally, as part of Tata Steel’s efforts to arrive at a strategic resolution for its European portfolio, during the year under review, Tata Steel had discussions with SSAB Sweden for the potential divestment of Tata Steel’s Netherland business including Ijmuiden steelworks. However, the discussions did not materialise. Tata Steel is committed to making the European operations simpler, leaner, and sustainable.
RecognitionTSE has been recognised by World Steel Association as a Steel Sustainability Champion for the fourth year in succession. The award recognises TSE as a company leading the way to create a truly sustainable steel industry and society and that clearly demonstrates its commitment to sustainable development and the circular economy.
iv) NatSteel Holdings (‘NSH’)Singapore experienced the COVID-19 impact with the government imposing a lockdown during Q1FY2021 to contain the spread of the virus. Thereafter, strict safe distancing measures at work places resulted in slow resumption of construction industry due to shortage of migrant workers. Thereafter, market had improved only progressively in Q3FY2021.
The turnover and profit / (loss) of NSH for the FY 2020-21 are as follows:
(` crore)
FY 21 FY 20
Turnover 4,326 5,328EBITDA 224 189Profit before tax (PBT), before exceptional items 48 (13)Profit before tax (PBT) 48 1Profit after tax (PAT), before exceptional items 42 (14)Profit after tax (PAT) 42 (0)
The production and sales performance of NSH is given below:
(mn tonnes)
FY 21 FY 20 Change (%)
Saleable Steel 0.73 0.96 (24)Sales 0.90 1.20 (25)
During FY 2020-21, the production and deliveries were lower than FY 2019-20 due to the lockdown imposed in Q1FY2021 due to COVID-19. The turnover was lower than FY 2019-20, due to lower sales volume as realisations were at par. The profit before tax was higher than that of the previous year due to lower expenses, financial support from Government and decrease in finance cost.
v) Tata Steel Thailand (‘TSTH’)The turnover and profit / (loss) of TSTH for the FY 2020-21 are as follows:
(` crore)
FY 21 FY 20
Turnover 5,264 4,617EBITDA 325 177Profit before tax (PBT), before exceptional items 193 40Profit before tax (PBT) 165 25Profit after tax (PAT), before exceptional items 179 26Profit after tax (PAT) 151 10
The production and sales performance of TSTH is given below:(mn tonnes)
FY 21 FY 20 Change (%)
Saleable Steel 1.33 1.21 10Sales 1.30 1.20 9
During FY 2020-21 after initial business interruptions all the plants operated at full capacity. The production and deliveries in FY 2020-21 were higher than that of the previous year due to increased steel demand as there was a shortfall in the supplies as major steel producing countries were under periodic/frequent lockdowns to prevent the spread of COVID-19. The turnover was higher by 14% mainly on account of higher volumes along with increase in prices. The profit before tax was higher mainly due to higher revenues along with lower conversion cost and lower cost of raw materials.
The company is in the midst of various digital initiatives like HR Easy Connect, E-RFX, Tata App, Remote monitoring of operations etc. The company has launched new products - DB Stirrup and ready-made precast footings.
Recognition:
• TSTH received “Thailand Sustainability Investment (THSI) Award 2020” from the Stock Exchange of Thailand.
• NTS won “Thailand Labour Management Excellence Award 2020” in National Level from Department of Labour Protection & Welfare, Ministry of Labour.
vi) Tata Metaliks LimitedTata Metaliks Limited (‘TML’) has its manufacturing plant at Kharagpur, West Bengal, India which produces 300kt of pig iron and 200kt of ductile iron pipes annually. Pig iron is marketed under the brand name ‘Tata eFee’ (world’s first brand) and ductile iron pipe is marketed under the brand name ‘Tata Ductura’.
The COVID-19 pandemic impacted overall business environment across all industries during the first quarter of
FY 2020-21 due to the nationwide lockdown. With gradual relaxation of lockdown from June 2020, business resumed, foundries started ramping up their production but were constrained due to acute shortage of labour. Pig Iron market witnessed a strong bounce back in terms of demand, which sustained throughout the year. Pig Iron markets have seen an unprecedented surge with net realisations crossing those of DI.
In Digital Transformation journey, TML has in FY 2020-21 implemented some key real-time data and analytics focused projects such as Manufacturing Execution System for DIP, Energy Management System and CRM (Customer Relationship Management) Solution. TML has strengthened its capability in area of robotics and developed in-house robotics solutions which are being implemented for the first time in DIP industry in the country. TML currently has three robots operational in its DIP production lines with several others likely to be deployed in coming financial year.
In FY 2020-21, TML has successfully commissioned 15 MW captive power plant which will enhance energy efficiency and utilisation of waste heat and flue gas generated from its coke ovens and blast furnaces. It also completed the expansion of Coke Plant.
The turnover and profit / (loss) figures of TML for the FY 2020-21 are as follows:
(` crore)
FY 21 FY 20
Turnover 1,917 2,051Profit before tax (PBT) 306 201Profit after tax (PAT) 220 166
During the FY 2020-21, due to the COVID-19 lockdown and disruptions during Q1FY2021, the production of Pig Iron (‘PI’) was about 283kt lower by 37kt than that of the previous year and production of ductile iron pipes (‘DI’) was at 187kt, lower by 38kt than that of the previous year. Deliveries of PI were at 287kt, lower by 27kt than that of the previous year and deliveries of ductile iron pipes were at 194 kt lower by 24kt than that of the previous year in line with lower production and demand.
The turnover declined by 7% due to decrease in volumes along with lower realisation of DI partly offset by increase in prices of PI due to strong demand and increase in iron ore prices. Profit before tax increased by ₹105 crore (52% higher) despite decline in revenues, mainly driven by better operational performance and efficiencies and lower raw material prices.
During COVID-19 situation, TML had provided interim relief in the form of Dry Ration Kits to the affected community in the region where it operates and donated ₹1 crore towards State Government’s COVID relief fund.
vii) The Tinplate Company of India LimitedThe Tinplate Company of India Limited (‘TCIL’) is the largest indigenous producer of tin-coated and tin free steel used for metal packaging. TCIL has also been ‘value-adding’ its products by way of providing printing and lacquering facility to reach closer to food processors / fillers. TCIL has two Cold Rolling Mills and two electrolytic tinning lines with an installed annual production capacity of around 379kt of tinplate and tin-free steel.
The year under review experienced unprecedented uncertainties due to the pandemic, leading to an impact on the operating performance of TCIL. The major impact of the pandemic was felt in Q1FY2021 especially in the month of April 2020, due to the imposition of a complete lockdown.
The turnover and profit / (loss) figures of TCIL for the FY 2020-21 are as follows:
(` crore)
FY 21 FY 20
Turnover 2,297 2,123Profit before tax (PBT) 132 104Profit after tax (PAT) 98 95
During the FY 2020-21, the production was 291kt, lower by 49 kt than that of the previous year, with an overall lower capacity utilisation primarily on account of nation-wide lockdown during Q1FY2021. However, deliveries were higher by 5kt at 316kt, attributable to higher demand primarily in the domestic market. The turnover increased by 8% mainly due to increase in market realisation along with marginally higher volumes. Profit before tax increased by 27% than that of the previous year due to higher operating profits and lower finance cost.
Key Business Highlights: • Developed new packaging configuration.
• The company continued to work on quality improvement projects leading to improvement in surface quality, improvement in prime yield and a reduction in quality complaints.
• Accelerated the adoption of various IT enabled applications in the areas of production planning, digitisation, communication, and review process across the organisation.
• The cost management initiative has been driven by two methodologies – TPM and Disha initiative, led to costs savings in several areas including power and roll consumption.
• TCIL successfully implemented its pilot solar power project – Phase 1 (200 kwp).
Annexure 2 (Contd.)Integrated Report & Annual Accounts 2020-21 | 114th Year154 155
StatutoryReports
Stakeholders and Materiality
Performance Snapshot
About Tata Steel
Leadership Capitals GovernanceStrategyFinancial
Statements
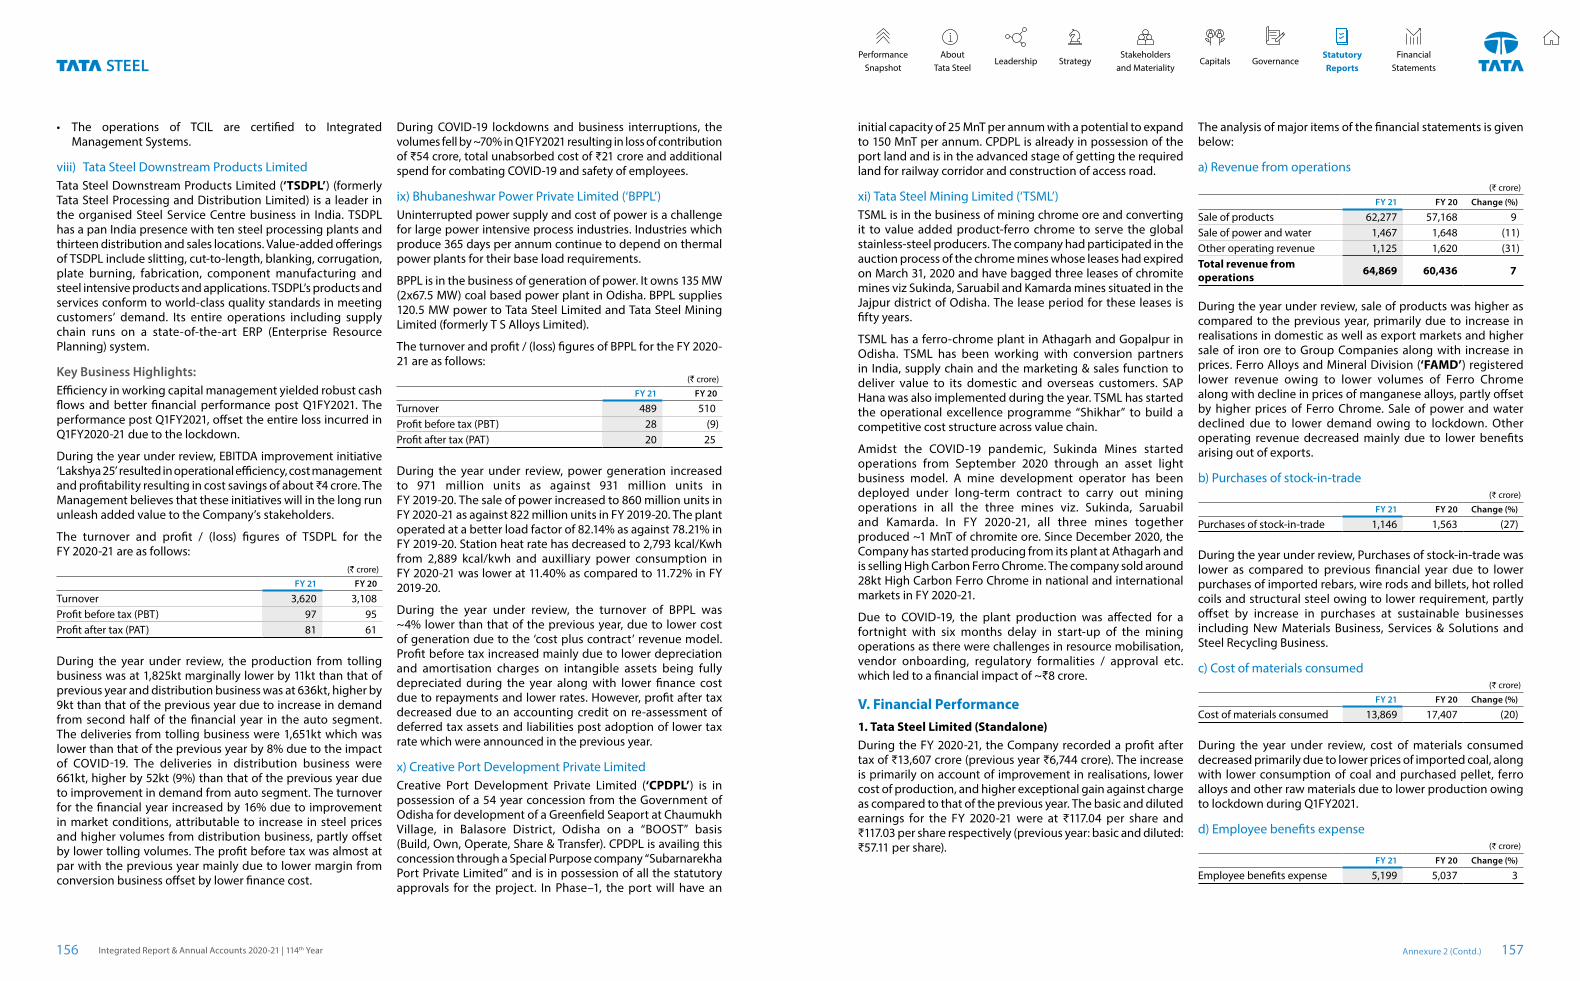
• The operations of TCIL are certified to Integrated Management Systems.
viii) Tata Steel Downstream Products LimitedTata Steel Downstream Products Limited (‘TSDPL’) (formerly Tata Steel Processing and Distribution Limited) is a leader in the organised Steel Service Centre business in India. TSDPL has a pan India presence with ten steel processing plants and thirteen distribution and sales locations. Value-added offerings of TSDPL include slitting, cut-to-length, blanking, corrugation, plate burning, fabrication, component manufacturing and steel intensive products and applications. TSDPL’s products and services conform to world-class quality standards in meeting customers’ demand. Its entire operations including supply chain runs on a state-of-the-art ERP (Enterprise Resource Planning) system.
Key Business Highlights:Efficiency in working capital management yielded robust cash flows and better financial performance post Q1FY2021. The performance post Q1FY2021, offset the entire loss incurred in Q1FY2020-21 due to the lockdown.
During the year under review, EBITDA improvement initiative ‘Lakshya 25’ resulted in operational efficiency, cost management and profitability resulting in cost savings of about ₹4 crore. The Management believes that these initiatives will in the long run unleash added value to the Company’s stakeholders.
The turnover and profit / (loss) figures of TSDPL for the FY 2020-21 are as follows:
(` crore)
FY 21 FY 20
Turnover 3,620 3,108Profit before tax (PBT) 97 95Profit after tax (PAT) 81 61
During the year under review, the production from tolling business was at 1,825kt marginally lower by 11kt than that of previous year and distribution business was at 636kt, higher by 9kt than that of the previous year due to increase in demand from second half of the financial year in the auto segment. The deliveries from tolling business were 1,651kt which was lower than that of the previous year by 8% due to the impact of COVID-19. The deliveries in distribution business were 661kt, higher by 52kt (9%) than that of the previous year due to improvement in demand from auto segment. The turnover for the financial year increased by 16% due to improvement in market conditions, attributable to increase in steel prices and higher volumes from distribution business, partly offset by lower tolling volumes. The profit before tax was almost at par with the previous year mainly due to lower margin from conversion business offset by lower finance cost.
During COVID-19 lockdowns and business interruptions, the volumes fell by ~70% in Q1FY2021 resulting in loss of contribution of ₹54 crore, total unabsorbed cost of ₹21 crore and additional spend for combating COVID-19 and safety of employees.
ix) Bhubaneshwar Power Private Limited (‘BPPL’)Uninterrupted power supply and cost of power is a challenge for large power intensive process industries. Industries which produce 365 days per annum continue to depend on thermal power plants for their base load requirements.
BPPL is in the business of generation of power. It owns 135 MW (2x67.5 MW) coal based power plant in Odisha. BPPL supplies 120.5 MW power to Tata Steel Limited and Tata Steel Mining Limited (formerly T S Alloys Limited).
The turnover and profit / (loss) figures of BPPL for the FY 2020-21 are as follows:
(` crore)
FY 21 FY 20
Turnover 489 510Profit before tax (PBT) 28 (9)Profit after tax (PAT) 20 25
During the year under review, power generation increased to 971 million units as against 931 million units in FY 2019-20. The sale of power increased to 860 million units in FY 2020-21 as against 822 million units in FY 2019-20. The plant operated at a better load factor of 82.14% as against 78.21% in FY 2019-20. Station heat rate has decreased to 2,793 kcal/Kwh from 2,889 kcal/kwh and auxilliary power consumption in FY 2020-21 was lower at 11.40% as compared to 11.72% in FY 2019-20.
During the year under review, the turnover of BPPL was ~4% lower than that of the previous year, due to lower cost of generation due to the ‘cost plus contract’ revenue model. Profit before tax increased mainly due to lower depreciation and amortisation charges on intangible assets being fully depreciated during the year along with lower finance cost due to repayments and lower rates. However, profit after tax decreased due to an accounting credit on re-assessment of deferred tax assets and liabilities post adoption of lower tax rate which were announced in the previous year.
x) Creative Port Development Private Limited Creative Port Development Private Limited (‘CPDPL’) is in possession of a 54 year concession from the Government of Odisha for development of a Greenfield Seaport at Chaumukh Village, in Balasore District, Odisha on a “BOOST” basis (Build, Own, Operate, Share & Transfer). CPDPL is availing this concession through a Special Purpose company “Subarnarekha Port Private Limited” and is in possession of all the statutory approvals for the project. In Phase–1, the port will have an
initial capacity of 25 MnT per annum with a potential to expand to 150 MnT per annum. CPDPL is already in possession of the port land and is in the advanced stage of getting the required land for railway corridor and construction of access road.
xi) Tata Steel Mining Limited (‘TSML’) TSML is in the business of mining chrome ore and converting it to value added product-ferro chrome to serve the global stainless-steel producers. The company had participated in the auction process of the chrome mines whose leases had expired on March 31, 2020 and have bagged three leases of chromite mines viz Sukinda, Saruabil and Kamarda mines situated in the Jajpur district of Odisha. The lease period for these leases is fifty years.
TSML has a ferro-chrome plant in Athagarh and Gopalpur in Odisha. TSML has been working with conversion partners in India, supply chain and the marketing & sales function to deliver value to its domestic and overseas customers. SAP Hana was also implemented during the year. TSML has started the operational excellence programme “Shikhar” to build a competitive cost structure across value chain.
Amidst the COVID-19 pandemic, Sukinda Mines started operations from September 2020 through an asset light business model. A mine development operator has been deployed under long-term contract to carry out mining operations in all the three mines viz. Sukinda, Saruabil and Kamarda. In FY 2020-21, all three mines together produced ~1 MnT of chromite ore. Since December 2020, the Company has started producing from its plant at Athagarh and is selling High Carbon Ferro Chrome. The company sold around 28kt High Carbon Ferro Chrome in national and international markets in FY 2020-21.
Due to COVID-19, the plant production was affected for a fortnight with six months delay in start-up of the mining operations as there were challenges in resource mobilisation, vendor onboarding, regulatory formalities / approval etc. which led to a financial impact of ~`8 crore.
V. Financial Performance1. Tata Steel Limited (Standalone)During the FY 2020-21, the Company recorded a profit after tax of ₹13,607 crore (previous year ₹6,744 crore). The increase is primarily on account of improvement in realisations, lower cost of production, and higher exceptional gain against charge as compared to that of the previous year. The basic and diluted earnings for the FY 2020-21 were at ₹117.04 per share and ₹117.03 per share respectively (previous year: basic and diluted: ₹57.11 per share).
The analysis of major items of the financial statements is given below:
a) Revenue from operations(₹ crore)
FY 21 FY 20 Change (%)
Sale of products 62,277 57,168 9Sale of power and water 1,467 1,648 (11)Other operating revenue 1,125 1,620 (31)Total revenue from operations 64,869 60,436 7
During the year under review, sale of products was higher as compared to the previous year, primarily due to increase in realisations in domestic as well as export markets and higher sale of iron ore to Group Companies along with increase in prices. Ferro Alloys and Mineral Division (‘FAMD’) registered lower revenue owing to lower volumes of Ferro Chrome along with decline in prices of manganese alloys, partly offset by higher prices of Ferro Chrome. Sale of power and water declined due to lower demand owing to lockdown. Other operating revenue decreased mainly due to lower benefits arising out of exports.
b) Purchases of stock-in-trade(₹ crore)
FY 21 FY 20 Change (%)
Purchases of stock-in-trade 1,146 1,563 (27)
During the year under review, Purchases of stock-in-trade was lower as compared to previous financial year due to lower purchases of imported rebars, wire rods and billets, hot rolled coils and structural steel owing to lower requirement, partly offset by increase in purchases at sustainable businesses including New Materials Business, Services & Solutions and Steel Recycling Business.
c) Cost of materials consumed(₹ crore)
FY 21 FY 20 Change (%)
Cost of materials consumed 13,869 17,407 (20)
During the year under review, cost of materials consumed decreased primarily due to lower prices of imported coal, along with lower consumption of coal and purchased pellet, ferro alloys and other raw materials due to lower production owing to lockdown during Q1FY2021.
d) Employee benefits expense(₹ crore)
FY 21 FY 20 Change (%)
Employee benefits expense 5,199 5,037 3
Annexure 2 (Contd.)Integrated Report & Annual Accounts 2020-21 | 114th Year156 157
StatutoryReports
Stakeholders and Materiality
Performance Snapshot
About Tata Steel
Leadership Capitals GovernanceStrategyFinancial
Statements
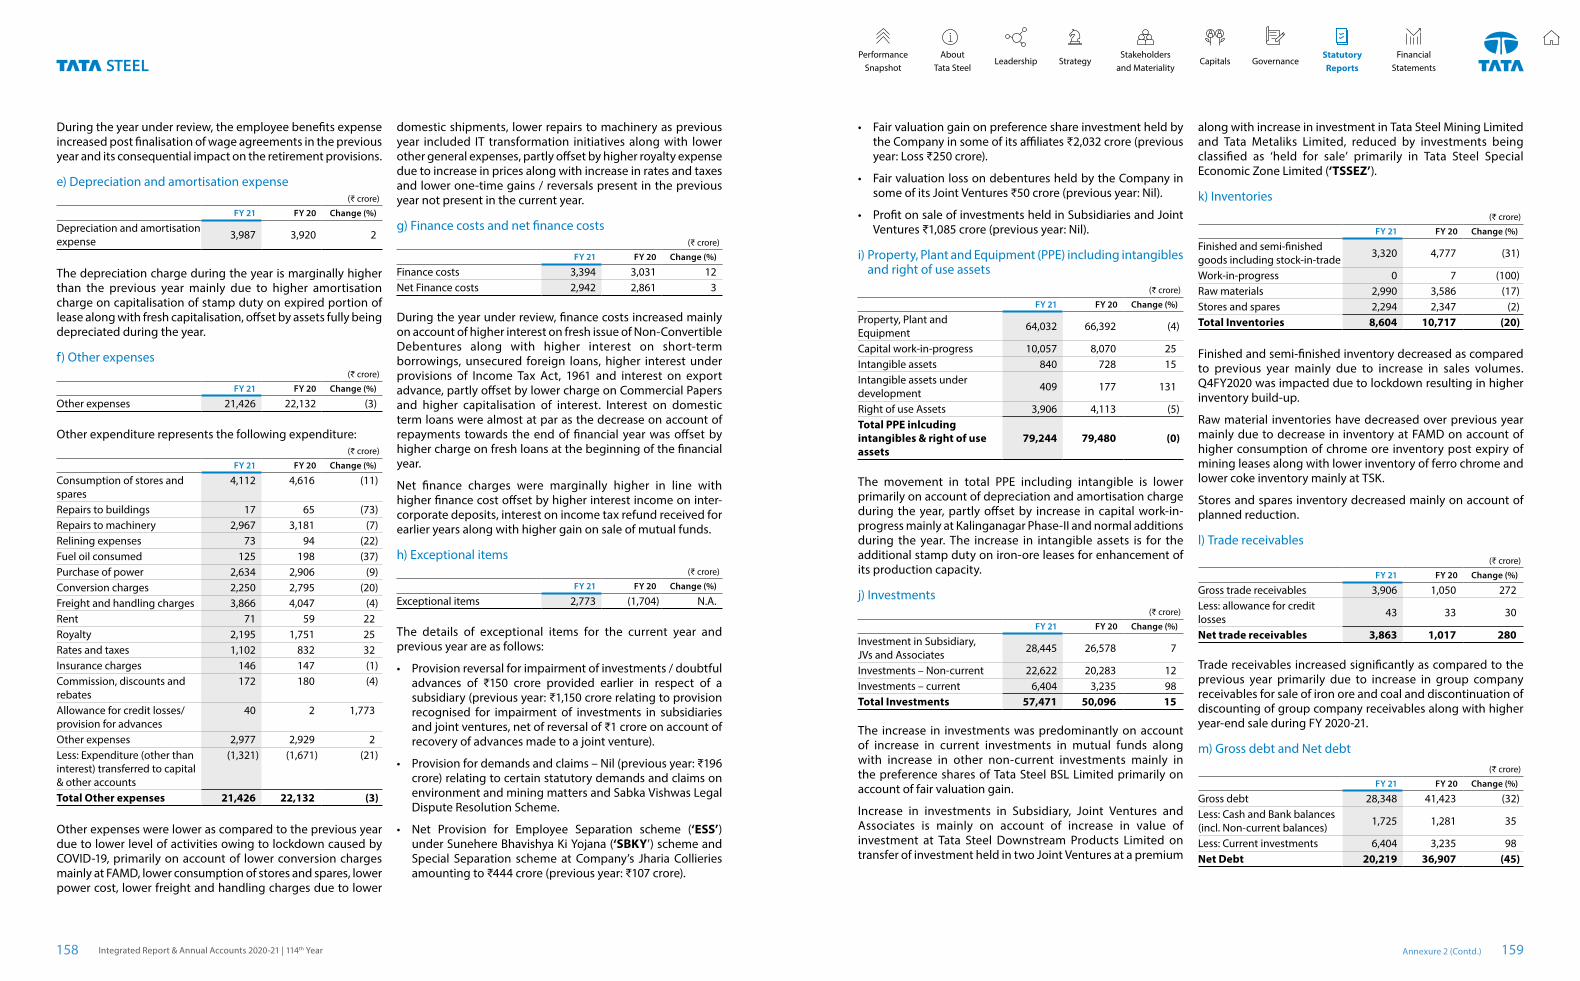
During the year under review, the employee benefits expense increased post finalisation of wage agreements in the previous year and its consequential impact on the retirement provisions.
e) Depreciation and amortisation expense(₹ crore)
FY 21 FY 20 Change (%)
Depreciation and amortisation expense 3,987 3,920 2
The depreciation charge during the year is marginally higher than the previous year mainly due to higher amortisation charge on capitalisation of stamp duty on expired portion of lease along with fresh capitalisation, offset by assets fully being depreciated during the year.
f) Other expenses(₹ crore)
FY 21 FY 20 Change (%)
Other expenses 21,426 22,132 (3)
Other expenditure represents the following expenditure:(₹ crore)
FY 21 FY 20 Change (%)
Consumption of stores and spares
4,112 4,616 (11)
Repairs to buildings 17 65 (73)Repairs to machinery 2,967 3,181 (7)Relining expenses 73 94 (22)Fuel oil consumed 125 198 (37)Purchase of power 2,634 2,906 (9)Conversion charges 2,250 2,795 (20)Freight and handling charges 3,866 4,047 (4)Rent 71 59 22Royalty 2,195 1,751 25Rates and taxes 1,102 832 32Insurance charges 146 147 (1)Commission, discounts and rebates
172 180 (4)
Allowance for credit losses/ provision for advances
40 2 1,773
Other expenses 2,977 2,929 2Less: Expenditure (other than interest) transferred to capital & other accounts
(1,321) (1,671) (21)
Total Other expenses 21,426 22,132 (3)
Other expenses were lower as compared to the previous year due to lower level of activities owing to lockdown caused by COVID-19, primarily on account of lower conversion charges mainly at FAMD, lower consumption of stores and spares, lower power cost, lower freight and handling charges due to lower
domestic shipments, lower repairs to machinery as previous year included IT transformation initiatives along with lower other general expenses, partly offset by higher royalty expense due to increase in prices along with increase in rates and taxes and lower one-time gains / reversals present in the previous year not present in the current year.
g) Finance costs and net finance costs(₹ crore)
FY 21 FY 20 Change (%)
Finance costs 3,394 3,031 12Net Finance costs 2,942 2,861 3
During the year under review, finance costs increased mainly on account of higher interest on fresh issue of Non-Convertible Debentures along with higher interest on short-term borrowings, unsecured foreign loans, higher interest under provisions of Income Tax Act, 1961 and interest on export advance, partly offset by lower charge on Commercial Papers and higher capitalisation of interest. Interest on domestic term loans were almost at par as the decrease on account of repayments towards the end of financial year was offset by higher charge on fresh loans at the beginning of the financial year.
Net finance charges were marginally higher in line with higher finance cost offset by higher interest income on inter- corporate deposits, interest on income tax refund received for earlier years along with higher gain on sale of mutual funds.
h) Exceptional items(₹ crore)
FY 21 FY 20 Change (%)
Exceptional items 2,773 (1,704) N.A.
The details of exceptional items for the current year and previous year are as follows:
• Provision reversal for impairment of investments / doubtful advances of ₹150 crore provided earlier in respect of a subsidiary (previous year: ₹1,150 crore relating to provision recognised for impairment of investments in subsidiaries and joint ventures, net of reversal of ₹1 crore on account of recovery of advances made to a joint venture).
• Provision for demands and claims – Nil (previous year: ₹196 crore) relating to certain statutory demands and claims on environment and mining matters and Sabka Vishwas Legal Dispute Resolution Scheme.
• Net Provision for Employee Separation scheme (‘ESS’) under Sunehere Bhavishya Ki Yojana (‘SBKY’) scheme and Special Separation scheme at Company’s Jharia Collieries amounting to ₹444 crore (previous year: ₹107 crore).
• Fair valuation gain on preference share investment held by the Company in some of its affiliates ₹2,032 crore (previous year: Loss ₹250 crore).
• Fair valuation loss on debentures held by the Company in some of its Joint Ventures ₹50 crore (previous year: Nil).
• Profit on sale of investments held in Subsidiaries and Joint Ventures ₹1,085 crore (previous year: Nil).
i) Property, Plant and Equipment (PPE) including intangibles and right of use assets
(₹ crore)
FY 21 FY 20 Change (%)
Property, Plant and Equipment 64,032 66,392 (4)
Capital work-in-progress 10,057 8,070 25Intangible assets 840 728 15Intangible assets under development 409 177 131
Right of use Assets 3,906 4,113 (5)Total PPE inlcuding intangibles & right of use assets
79,244 79,480 (0)
The movement in total PPE including intangible is lower primarily on account of depreciation and amortisation charge during the year, partly offset by increase in capital work-in-progress mainly at Kalinganagar Phase-II and normal additions during the year. The increase in intangible assets is for the additional stamp duty on iron-ore leases for enhancement of its production capacity.
j) Investments(₹ crore)
FY 21 FY 20 Change (%)
Investment in Subsidiary, JVs and Associates 28,445 26,578 7
Investments – Non-current 22,622 20,283 12Investments – current 6,404 3,235 98Total Investments 57,471 50,096 15
The increase in investments was predominantly on account of increase in current investments in mutual funds along with increase in other non-current investments mainly in the preference shares of Tata Steel BSL Limited primarily on account of fair valuation gain.
Increase in investments in Subsidiary, Joint Ventures and Associates is mainly on account of increase in value of investment at Tata Steel Downstream Products Limited on transfer of investment held in two Joint Ventures at a premium
along with increase in investment in Tata Steel Mining Limited and Tata Metaliks Limited, reduced by investments being classified as ‘held for sale’ primarily in Tata Steel Special Economic Zone Limited (‘TSSEZ’).
k) Inventories(₹ crore)
FY 21 FY 20 Change (%)
Finished and semi-finished goods including stock-in-trade 3,320 4,777 (31)
Work-in-progress 0 7 (100)Raw materials 2,990 3,586 (17)Stores and spares 2,294 2,347 (2)Total Inventories 8,604 10,717 (20)
Finished and semi-finished inventory decreased as compared to previous year mainly due to increase in sales volumes. Q4FY2020 was impacted due to lockdown resulting in higher inventory build-up.
Raw material inventories have decreased over previous year mainly due to decrease in inventory at FAMD on account of higher consumption of chrome ore inventory post expiry of mining leases along with lower inventory of ferro chrome and lower coke inventory mainly at TSK.
Stores and spares inventory decreased mainly on account of planned reduction.
l) Trade receivables(₹ crore)
FY 21 FY 20 Change (%)
Gross trade receivables 3,906 1,050 272Less: allowance for credit losses 43 33 30
Net trade receivables 3,863 1,017 280
Trade receivables increased significantly as compared to the previous year primarily due to increase in group company receivables for sale of iron ore and coal and discontinuation of discounting of group company receivables along with higher year-end sale during FY 2020-21.
m) Gross debt and Net debt(₹ crore)
FY 21 FY 20 Change (%)
Gross debt 28,348 41,423 (32)Less: Cash and Bank balances (incl. Non-current balances) 1,725 1,281 35
Less: Current investments 6,404 3,235 98Net Debt 20,219 36,907 (45)
Annexure 2 (Contd.)Integrated Report & Annual Accounts 2020-21 | 114th Year158 159
StatutoryReports
Stakeholders and Materiality
Performance Snapshot
About Tata Steel
Leadership Capitals GovernanceStrategyFinancial
Statements
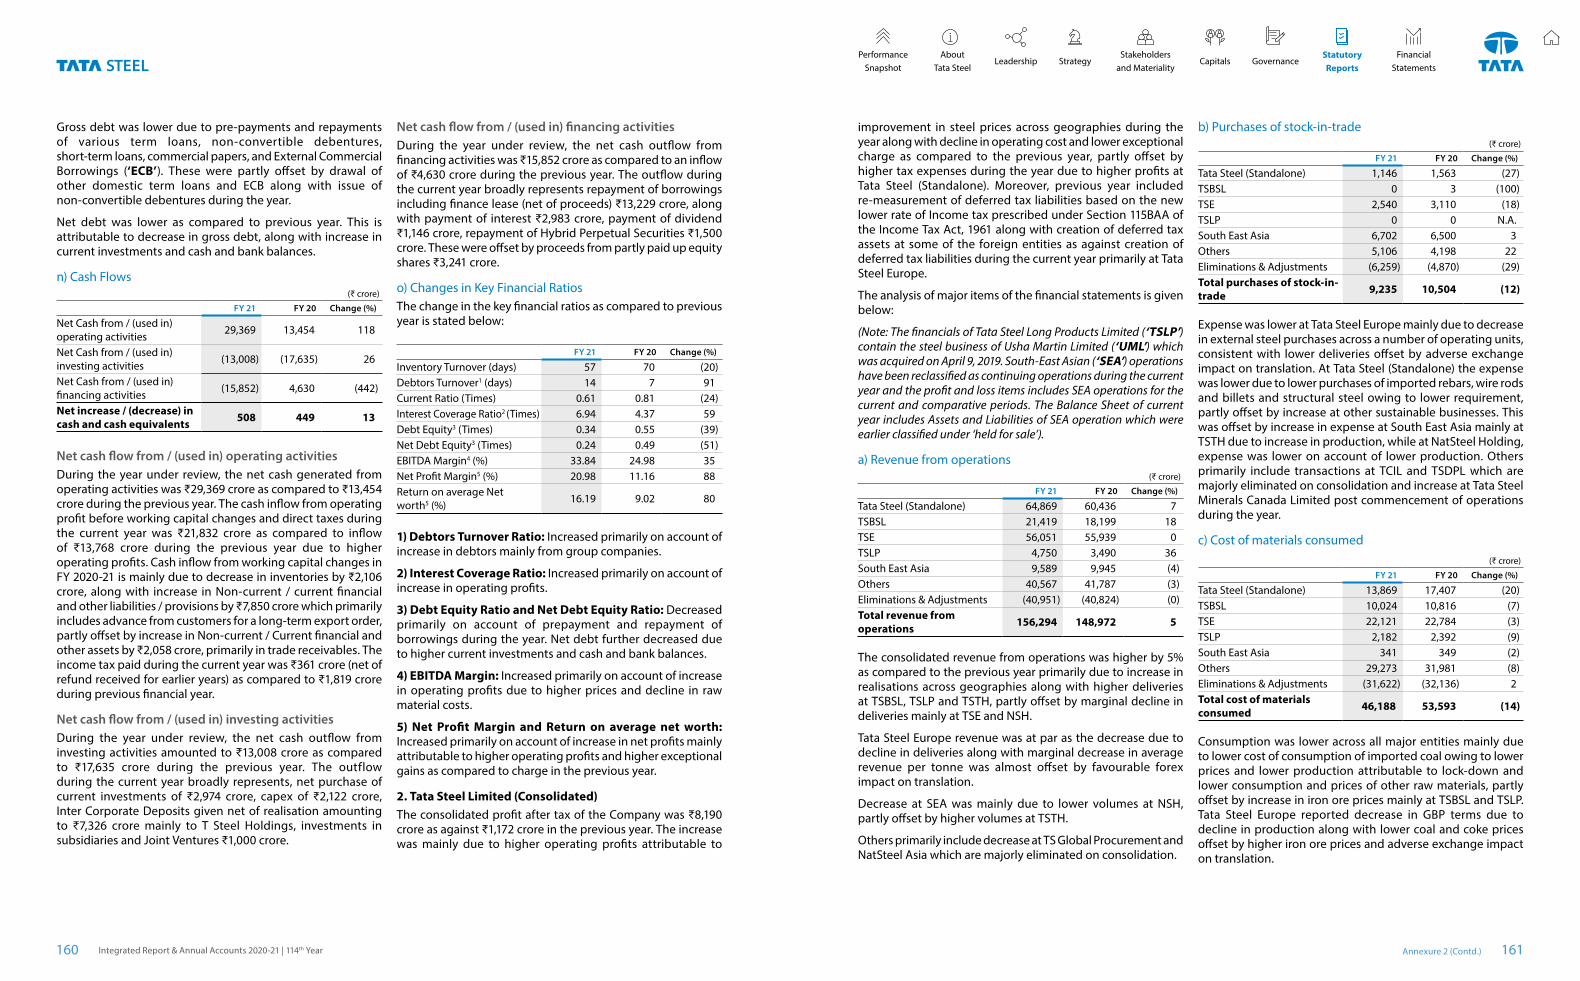
Gross debt was lower due to pre-payments and repayments of various term loans, non-convertible debentures, short-term loans, commercial papers, and External Commercial Borrowings (‘ECB’). These were partly offset by drawal of other domestic term loans and ECB along with issue of non-convertible debentures during the year.
Net debt was lower as compared to previous year. This is attributable to decrease in gross debt, along with increase in current investments and cash and bank balances.
n) Cash Flows(₹ crore)
FY 21 FY 20 Change (%)
Net Cash from / (used in) operating activities 29,369 13,454 118
Net Cash from / (used in) investing activities (13,008) (17,635) 26
Net Cash from / (used in) financing activities (15,852) 4,630 (442)
Net increase / (decrease) in cash and cash equivalents 508 449 13
Net cash flow from / (used in) operating activitiesDuring the year under review, the net cash generated from operating activities was ₹29,369 crore as compared to ₹13,454 crore during the previous year. The cash inflow from operating profit before working capital changes and direct taxes during the current year was ₹21,832 crore as compared to inflow of ₹13,768 crore during the previous year due to higher operating profits. Cash inflow from working capital changes in FY 2020-21 is mainly due to decrease in inventories by ₹2,106 crore, along with increase in Non-current / current financial and other liabilities / provisions by ₹7,850 crore which primarily includes advance from customers for a long-term export order, partly offset by increase in Non-current / Current financial and other assets by ₹2,058 crore, primarily in trade receivables. The income tax paid during the current year was ₹361 crore (net of refund received for earlier years) as compared to ₹1,819 crore during previous financial year.
Net cash flow from / (used in) investing activitiesDuring the year under review, the net cash outflow from investing activities amounted to ₹13,008 crore as compared to ₹17,635 crore during the previous year. The outflow during the current year broadly represents, net purchase of current investments of ₹2,974 crore, capex of ₹2,122 crore, Inter Corporate Deposits given net of realisation amounting to ₹7,326 crore mainly to T Steel Holdings, investments in subsidiaries and Joint Ventures ₹1,000 crore.
Net cash flow from / (used in) financing activitiesDuring the year under review, the net cash outflow from financing activities was ₹15,852 crore as compared to an inflow of ₹4,630 crore during the previous year. The outflow during the current year broadly represents repayment of borrowings including finance lease (net of proceeds) ₹13,229 crore, along with payment of interest ₹2,983 crore, payment of dividend ₹1,146 crore, repayment of Hybrid Perpetual Securities ₹1,500 crore. These were offset by proceeds from partly paid up equity shares ₹3,241 crore.
o) Changes in Key Financial RatiosThe change in the key financial ratios as compared to previous year is stated below:
FY 21 FY 20 Change (%)
Inventory Turnover (days) 57 70 (20)Debtors Turnover1 (days) 14 7 91Current Ratio (Times) 0.61 0.81 (24)Interest Coverage Ratio2 (Times) 6.94 4.37 59Debt Equity3 (Times) 0.34 0.55 (39)Net Debt Equity3 (Times) 0.24 0.49 (51)EBITDA Margin4 (%) 33.84 24.98 35Net Profit Margin5 (%) 20.98 11.16 88Return on average Net worth5 (%) 16.19 9.02 80
1) Debtors Turnover Ratio: Increased primarily on account of increase in debtors mainly from group companies.
2) Interest Coverage Ratio: Increased primarily on account of increase in operating profits.
3) Debt Equity Ratio and Net Debt Equity Ratio: Decreased primarily on account of prepayment and repayment of borrowings during the year. Net debt further decreased due to higher current investments and cash and bank balances.
4) EBITDA Margin: Increased primarily on account of increase in operating profits due to higher prices and decline in raw material costs.
5) Net Profit Margin and Return on average net worth: Increased primarily on account of increase in net profits mainly attributable to higher operating profits and higher exceptional gains as compared to charge in the previous year.
2. Tata Steel Limited (Consolidated)The consolidated profit after tax of the Company was ₹8,190 crore as against ₹1,172 crore in the previous year. The increase was mainly due to higher operating profits attributable to
improvement in steel prices across geographies during the year along with decline in operating cost and lower exceptional charge as compared to the previous year, partly offset by higher tax expenses during the year due to higher profits at Tata Steel (Standalone). Moreover, previous year included re-measurement of deferred tax liabilities based on the new lower rate of Income tax prescribed under Section 115BAA of the Income Tax Act, 1961 along with creation of deferred tax assets at some of the foreign entities as against creation of deferred tax liabilities during the current year primarily at Tata Steel Europe.
The analysis of major items of the financial statements is given below:
(Note: The financials of Tata Steel Long Products Limited (‘TSLP’) contain the steel business of Usha Martin Limited (‘UML’) which was acquired on April 9, 2019. South-East Asian (‘SEA’) operations have been reclassified as continuing operations during the current year and the profit and loss items includes SEA operations for the current and comparative periods. The Balance Sheet of current year includes Assets and Liabilities of SEA operation which were earlier classified under ‘held for sale’).
a) Revenue from operations(₹ crore)
FY 21 FY 20 Change (%)
Tata Steel (Standalone) 64,869 60,436 7TSBSL 21,419 18,199 18TSE 56,051 55,939 0TSLP 4,750 3,490 36South East Asia 9,589 9,945 (4)Others 40,567 41,787 (3)Eliminations & Adjustments (40,951) (40,824) (0)Total revenue from operations 156,294 148,972 5
The consolidated revenue from operations was higher by 5% as compared to the previous year primarily due to increase in realisations across geographies along with higher deliveries at TSBSL, TSLP and TSTH, partly offset by marginal decline in deliveries mainly at TSE and NSH.
Tata Steel Europe revenue was at par as the decrease due to decline in deliveries along with marginal decrease in average revenue per tonne was almost offset by favourable forex impact on translation.
Decrease at SEA was mainly due to lower volumes at NSH, partly offset by higher volumes at TSTH.
Others primarily include decrease at TS Global Procurement and NatSteel Asia which are majorly eliminated on consolidation.
b) Purchases of stock-in-trade(₹ crore)
FY 21 FY 20 Change (%)
Tata Steel (Standalone) 1,146 1,563 (27)TSBSL 0 3 (100)TSE 2,540 3,110 (18)TSLP 0 0 N.A.South East Asia 6,702 6,500 3Others 5,106 4,198 22Eliminations & Adjustments (6,259) (4,870) (29)Total purchases of stock-in-trade 9,235 10,504 (12)
Expense was lower at Tata Steel Europe mainly due to decrease in external steel purchases across a number of operating units, consistent with lower deliveries offset by adverse exchange impact on translation. At Tata Steel (Standalone) the expense was lower due to lower purchases of imported rebars, wire rods and billets and structural steel owing to lower requirement, partly offset by increase at other sustainable businesses. This was offset by increase in expense at South East Asia mainly at TSTH due to increase in production, while at NatSteel Holding, expense was lower on account of lower production. Others primarily include transactions at TCIL and TSDPL which are majorly eliminated on consolidation and increase at Tata Steel Minerals Canada Limited post commencement of operations during the year.
c) Cost of materials consumed(₹ crore)
FY 21 FY 20 Change (%)
Tata Steel (Standalone) 13,869 17,407 (20)TSBSL 10,024 10,816 (7)TSE 22,121 22,784 (3)TSLP 2,182 2,392 (9)South East Asia 341 349 (2)Others 29,273 31,981 (8)Eliminations & Adjustments (31,622) (32,136) 2Total cost of materials consumed 46,188 53,593 (14)
Consumption was lower across all major entities mainly due to lower cost of consumption of imported coal owing to lower prices and lower production attributable to lock-down and lower consumption and prices of other raw materials, partly offset by increase in iron ore prices mainly at TSBSL and TSLP. Tata Steel Europe reported decrease in GBP terms due to decline in production along with lower coal and coke prices offset by higher iron ore prices and adverse exchange impact on translation.
Annexure 2 (Contd.)Integrated Report & Annual Accounts 2020-21 | 114th Year160 161
StatutoryReports
Stakeholders and Materiality
Performance Snapshot
About Tata Steel
Leadership Capitals GovernanceStrategyFinancial
Statements
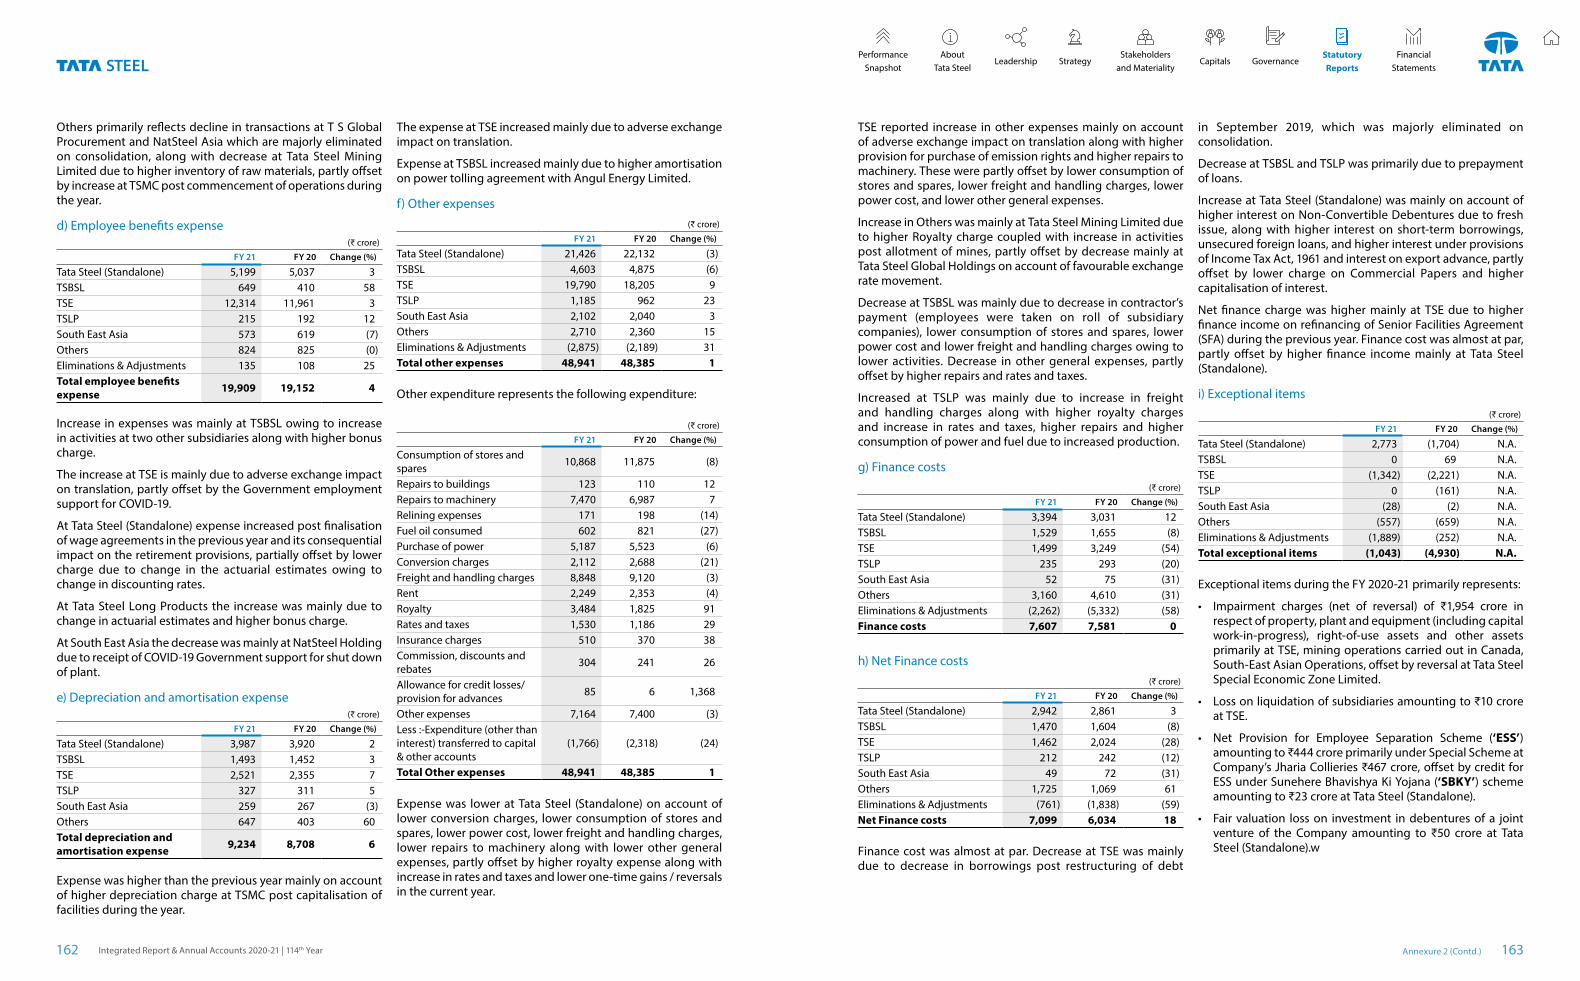
Others primarily reflects decline in transactions at T S Global Procurement and NatSteel Asia which are majorly eliminated on consolidation, along with decrease at Tata Steel Mining Limited due to higher inventory of raw materials, partly offset by increase at TSMC post commencement of operations during the year.
d) Employee benefits expense(₹ crore)
FY 21 FY 20 Change (%)
Tata Steel (Standalone) 5,199 5,037 3TSBSL 649 410 58TSE 12,314 11,961 3TSLP 215 192 12South East Asia 573 619 (7)Others 824 825 (0)Eliminations & Adjustments 135 108 25Total employee benefits expense 19,909 19,152 4
Increase in expenses was mainly at TSBSL owing to increase in activities at two other subsidiaries along with higher bonus charge.
The increase at TSE is mainly due to adverse exchange impact on translation, partly offset by the Government employment support for COVID-19.
At Tata Steel (Standalone) expense increased post finalisation of wage agreements in the previous year and its consequential impact on the retirement provisions, partially offset by lower charge due to change in the actuarial estimates owing to change in discounting rates.
At Tata Steel Long Products the increase was mainly due to change in actuarial estimates and higher bonus charge.
At South East Asia the decrease was mainly at NatSteel Holding due to receipt of COVID-19 Government support for shut down of plant.
e) Depreciation and amortisation expense(₹ crore)
FY 21 FY 20 Change (%)
Tata Steel (Standalone) 3,987 3,920 2TSBSL 1,493 1,452 3TSE 2,521 2,355 7TSLP 327 311 5South East Asia 259 267 (3)Others 647 403 60Total depreciation and amortisation expense 9,234 8,708 6
Expense was higher than the previous year mainly on account of higher depreciation charge at TSMC post capitalisation of facilities during the year.
The expense at TSE increased mainly due to adverse exchange impact on translation.
Expense at TSBSL increased mainly due to higher amortisation on power tolling agreement with Angul Energy Limited.
f) Other expenses(₹ crore)
FY 21 FY 20 Change (%)
Tata Steel (Standalone) 21,426 22,132 (3)TSBSL 4,603 4,875 (6)TSE 19,790 18,205 9TSLP 1,185 962 23South East Asia 2,102 2,040 3Others 2,710 2,360 15Eliminations & Adjustments (2,875) (2,189) 31Total other expenses 48,941 48,385 1
Other expenditure represents the following expenditure:
(₹ crore)
FY 21 FY 20 Change (%)
Consumption of stores and spares 10,868 11,875 (8)
Repairs to buildings 123 110 12Repairs to machinery 7,470 6,987 7Relining expenses 171 198 (14)Fuel oil consumed 602 821 (27)Purchase of power 5,187 5,523 (6)Conversion charges 2,112 2,688 (21)Freight and handling charges 8,848 9,120 (3)Rent 2,249 2,353 (4)Royalty 3,484 1,825 91Rates and taxes 1,530 1,186 29Insurance charges 510 370 38Commission, discounts and rebates 304 241 26
Allowance for credit losses/ provision for advances 85 6 1,368
Other expenses 7,164 7,400 (3)Less :-Expenditure (other than interest) transferred to capital & other accounts
(1,766) (2,318) (24)
Total Other expenses 48,941 48,385 1
Expense was lower at Tata Steel (Standalone) on account of lower conversion charges, lower consumption of stores and spares, lower power cost, lower freight and handling charges, lower repairs to machinery along with lower other general expenses, partly offset by higher royalty expense along with increase in rates and taxes and lower one-time gains / reversals in the current year.
TSE reported increase in other expenses mainly on account of adverse exchange impact on translation along with higher provision for purchase of emission rights and higher repairs to machinery. These were partly offset by lower consumption of stores and spares, lower freight and handling charges, lower power cost, and lower other general expenses.
Increase in Others was mainly at Tata Steel Mining Limited due to higher Royalty charge coupled with increase in activities post allotment of mines, partly offset by decrease mainly at Tata Steel Global Holdings on account of favourable exchange rate movement.
Decrease at TSBSL was mainly due to decrease in contractor’s payment (employees were taken on roll of subsidiary companies), lower consumption of stores and spares, lower power cost and lower freight and handling charges owing to lower activities. Decrease in other general expenses, partly offset by higher repairs and rates and taxes.
Increased at TSLP was mainly due to increase in freight and handling charges along with higher royalty charges and increase in rates and taxes, higher repairs and higher consumption of power and fuel due to increased production.
g) Finance costs(₹ crore)
FY 21 FY 20 Change (%)
Tata Steel (Standalone) 3,394 3,031 12TSBSL 1,529 1,655 (8)TSE 1,499 3,249 (54)TSLP 235 293 (20)South East Asia 52 75 (31)Others 3,160 4,610 (31)Eliminations & Adjustments (2,262) (5,332) (58)Finance costs 7,607 7,581 0
h) Net Finance costs(₹ crore)
FY 21 FY 20 Change (%)
Tata Steel (Standalone) 2,942 2,861 3TSBSL 1,470 1,604 (8)TSE 1,462 2,024 (28)TSLP 212 242 (12)South East Asia 49 72 (31)Others 1,725 1,069 61Eliminations & Adjustments (761) (1,838) (59)Net Finance costs 7,099 6,034 18
Finance cost was almost at par. Decrease at TSE was mainly due to decrease in borrowings post restructuring of debt
in September 2019, which was majorly eliminated on consolidation.
Decrease at TSBSL and TSLP was primarily due to prepayment of loans.
Increase at Tata Steel (Standalone) was mainly on account of higher interest on Non-Convertible Debentures due to fresh issue, along with higher interest on short-term borrowings, unsecured foreign loans, and higher interest under provisions of Income Tax Act, 1961 and interest on export advance, partly offset by lower charge on Commercial Papers and higher capitalisation of interest.
Net finance charge was higher mainly at TSE due to higher finance income on refinancing of Senior Facilities Agreement (SFA) during the previous year. Finance cost was almost at par, partly offset by higher finance income mainly at Tata Steel (Standalone).
i) Exceptional items(₹ crore)
FY 21 FY 20 Change (%)
Tata Steel (Standalone) 2,773 (1,704) N.A.TSBSL 0 69 N.A.TSE (1,342) (2,221) N.A.TSLP 0 (161) N.A.South East Asia (28) (2) N.A.Others (557) (659) N.A.Eliminations & Adjustments (1,889) (252) N.A.Total exceptional items (1,043) (4,930) N.A.
Exceptional items during the FY 2020-21 primarily represents:
• Impairment charges (net of reversal) of ₹1,954 crore in respect of property, plant and equipment (including capital work-in-progress), right-of-use assets and other assets primarily at TSE, mining operations carried out in Canada, South-East Asian Operations, offset by reversal at Tata Steel Special Economic Zone Limited.
• Loss on liquidation of subsidiaries amounting to ₹10 crore at TSE.
• Net Provision for Employee Separation Scheme (‘ESS’) amounting to ₹444 crore primarily under Special Scheme at Company’s Jharia Collieries ₹467 crore, offset by credit for ESS under Sunehere Bhavishya Ki Yojana (‘SBKY’) scheme amounting to ₹23 crore at Tata Steel (Standalone).
• Fair valuation loss on investment in debentures of a joint venture of the Company amounting to ₹50 crore at Tata Steel (Standalone).w
Annexure 2 (Contd.)Integrated Report & Annual Accounts 2020-21 | 114th Year162 163
StatutoryReports
Stakeholders and Materiality
Performance Snapshot
About Tata Steel
Leadership Capitals GovernanceStrategyFinancial
Statements
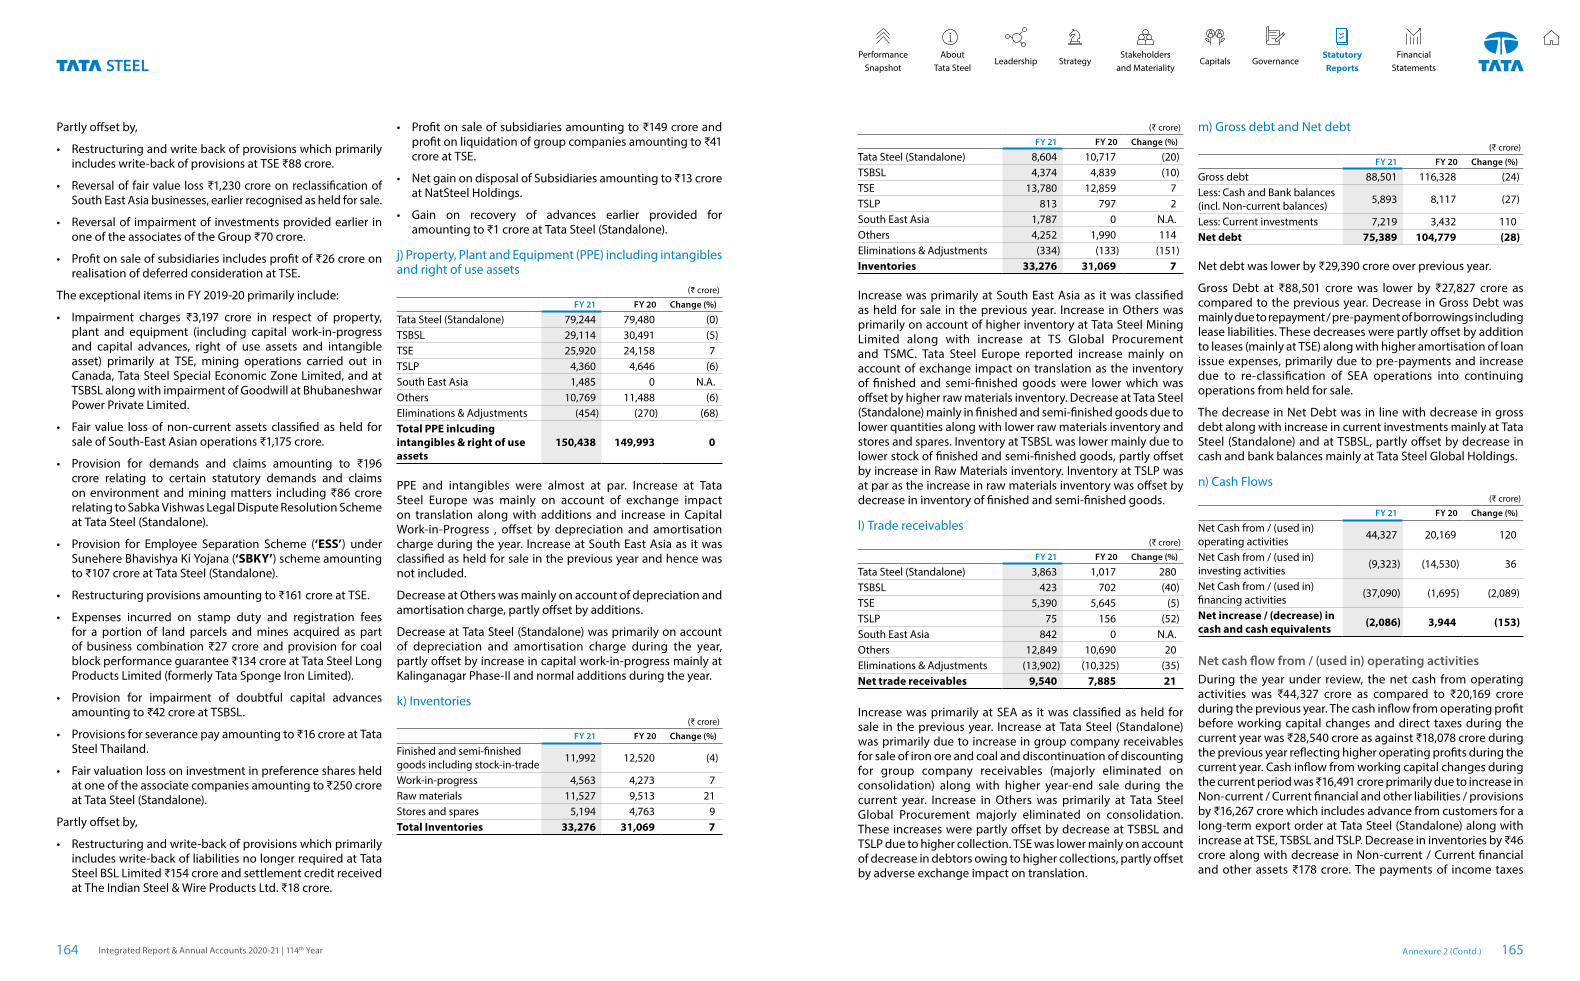
Partly offset by,
• Restructuring and write back of provisions which primarily includes write-back of provisions at TSE ₹88 crore.
• Reversal of fair value loss ₹1,230 crore on reclassification of South East Asia businesses, earlier recognised as held for sale.
• Reversal of impairment of investments provided earlier in one of the associates of the Group ₹70 crore.
• Profit on sale of subsidiaries includes profit of ₹26 crore on realisation of deferred consideration at TSE.
The exceptional items in FY 2019-20 primarily include:
• Impairment charges ₹3,197 crore in respect of property, plant and equipment (including capital work-in-progress and capital advances, right of use assets and intangible asset) primarily at TSE, mining operations carried out in Canada, Tata Steel Special Economic Zone Limited, and at TSBSL along with impairment of Goodwill at Bhubaneshwar Power Private Limited.
• Fair value loss of non-current assets classified as held for sale of South-East Asian operations ₹1,175 crore.
• Provision for demands and claims amounting to ₹196 crore relating to certain statutory demands and claims on environment and mining matters including ₹86 crore relating to Sabka Vishwas Legal Dispute Resolution Scheme at Tata Steel (Standalone).
• Provision for Employee Separation Scheme (‘ESS’) under Sunehere Bhavishya Ki Yojana (‘SBKY’) scheme amounting to ₹107 crore at Tata Steel (Standalone).
• Restructuring provisions amounting to ₹161 crore at TSE.
• Expenses incurred on stamp duty and registration fees for a portion of land parcels and mines acquired as part of business combination ₹27 crore and provision for coal block performance guarantee ₹134 crore at Tata Steel Long Products Limited (formerly Tata Sponge Iron Limited).
• Provision for impairment of doubtful capital advances amounting to ₹42 crore at TSBSL.
• Provisions for severance pay amounting to ₹16 crore at Tata Steel Thailand.
• Fair valuation loss on investment in preference shares held at one of the associate companies amounting to ₹250 crore at Tata Steel (Standalone).
Partly offset by,
• Restructuring and write-back of provisions which primarily includes write-back of liabilities no longer required at Tata Steel BSL Limited ₹154 crore and settlement credit received at The Indian Steel & Wire Products Ltd. ₹18 crore.
• Profit on sale of subsidiaries amounting to ₹149 crore and profit on liquidation of group companies amounting to ₹41 crore at TSE.
• Net gain on disposal of Subsidiaries amounting to ₹13 crore at NatSteel Holdings.
• Gain on recovery of advances earlier provided for amounting to ₹1 crore at Tata Steel (Standalone).
j) Property, Plant and Equipment (PPE) including intangibles and right of use assets
(₹ crore)
FY 21 FY 20 Change (%)
Tata Steel (Standalone) 79,244 79,480 (0)TSBSL 29,114 30,491 (5)TSE 25,920 24,158 7TSLP 4,360 4,646 (6)South East Asia 1,485 0 N.A.Others 10,769 11,488 (6)Eliminations & Adjustments (454) (270) (68)Total PPE inlcuding intangibles & right of use assets
150,438 149,993 0
PPE and intangibles were almost at par. Increase at Tata Steel Europe was mainly on account of exchange impact on translation along with additions and increase in Capital Work-in-Progress , offset by depreciation and amortisation charge during the year. Increase at South East Asia as it was classified as held for sale in the previous year and hence was not included.
Decrease at Others was mainly on account of depreciation and amortisation charge, partly offset by additions.
Decrease at Tata Steel (Standalone) was primarily on account of depreciation and amortisation charge during the year, partly offset by increase in capital work-in-progress mainly at Kalinganagar Phase-II and normal additions during the year.
k) Inventories(₹ crore)
FY 21 FY 20 Change (%)
Finished and semi-finished goods including stock-in-trade 11,992 12,520 (4)
Work-in-progress 4,563 4,273 7Raw materials 11,527 9,513 21Stores and spares 5,194 4,763 9Total Inventories 33,276 31,069 7
(₹ crore)
FY 21 FY 20 Change (%)
Tata Steel (Standalone) 8,604 10,717 (20)TSBSL 4,374 4,839 (10)TSE 13,780 12,859 7TSLP 813 797 2South East Asia 1,787 0 N.A.Others 4,252 1,990 114Eliminations & Adjustments (334) (133) (151)Inventories 33,276 31,069 7
Increase was primarily at South East Asia as it was classified as held for sale in the previous year. Increase in Others was primarily on account of higher inventory at Tata Steel Mining Limited along with increase at TS Global Procurement and TSMC. Tata Steel Europe reported increase mainly on account of exchange impact on translation as the inventory of finished and semi-finished goods were lower which was offset by higher raw materials inventory. Decrease at Tata Steel (Standalone) mainly in finished and semi-finished goods due to lower quantities along with lower raw materials inventory and stores and spares. Inventory at TSBSL was lower mainly due to lower stock of finished and semi-finished goods, partly offset by increase in Raw Materials inventory. Inventory at TSLP was at par as the increase in raw materials inventory was offset by decrease in inventory of finished and semi-finished goods.
l) Trade receivables(₹ crore)
FY 21 FY 20 Change (%)
Tata Steel (Standalone) 3,863 1,017 280TSBSL 423 702 (40)TSE 5,390 5,645 (5)TSLP 75 156 (52)South East Asia 842 0 N.A.Others 12,849 10,690 20Eliminations & Adjustments (13,902) (10,325) (35)Net trade receivables 9,540 7,885 21
Increase was primarily at SEA as it was classified as held for sale in the previous year. Increase at Tata Steel (Standalone) was primarily due to increase in group company receivables for sale of iron ore and coal and discontinuation of discounting for group company receivables (majorly eliminated on consolidation) along with higher year-end sale during the current year. Increase in Others was primarily at Tata Steel Global Procurement majorly eliminated on consolidation. These increases were partly offset by decrease at TSBSL and TSLP due to higher collection. TSE was lower mainly on account of decrease in debtors owing to higher collections, partly offset by adverse exchange impact on translation.
m) Gross debt and Net debt(₹ crore)
FY 21 FY 20 Change (%)
Gross debt 88,501 116,328 (24)Less: Cash and Bank balances (incl. Non-current balances) 5,893 8,117 (27)
Less: Current investments 7,219 3,432 110Net debt 75,389 104,779 (28)
Net debt was lower by ₹29,390 crore over previous year.
Gross Debt at ₹88,501 crore was lower by ₹27,827 crore as compared to the previous year. Decrease in Gross Debt was mainly due to repayment / pre-payment of borrowings including lease liabilities. These decreases were partly offset by addition to leases (mainly at TSE) along with higher amortisation of loan issue expenses, primarily due to pre-payments and increase due to re-classification of SEA operations into continuing operations from held for sale.
The decrease in Net Debt was in line with decrease in gross debt along with increase in current investments mainly at Tata Steel (Standalone) and at TSBSL, partly offset by decrease in cash and bank balances mainly at Tata Steel Global Holdings.
n) Cash Flows(₹ crore)
FY 21 FY 20 Change (%)
Net Cash from / (used in) operating activities 44,327 20,169 120
Net Cash from / (used in) investing activities (9,323) (14,530) 36
Net Cash from / (used in) financing activities (37,090) (1,695) (2,089)
Net increase / (decrease) in cash and cash equivalents (2,086) 3,944 (153)
Net cash flow from / (used in) operating activitiesDuring the year under review, the net cash from operating activities was ₹44,327 crore as compared to ₹20,169 crore during the previous year. The cash inflow from operating profit before working capital changes and direct taxes during the current year was ₹28,540 crore as against ₹18,078 crore during the previous year reflecting higher operating profits during the current year. Cash inflow from working capital changes during the current period was ₹16,491 crore primarily due to increase in Non-current / Current financial and other liabilities / provisions by ₹16,267 crore which includes advance from customers for a long-term export order at Tata Steel (Standalone) along with increase at TSE, TSBSL and TSLP. Decrease in inventories by ₹46 crore along with decrease in Non-current / Current financial and other assets ₹178 crore. The payments of income taxes
Annexure 2 (Contd.)Integrated Report & Annual Accounts 2020-21 | 114th Year164 165
StatutoryReports
Stakeholders and Materiality
Performance Snapshot
About Tata Steel
Leadership Capitals GovernanceStrategyFinancial
Statements
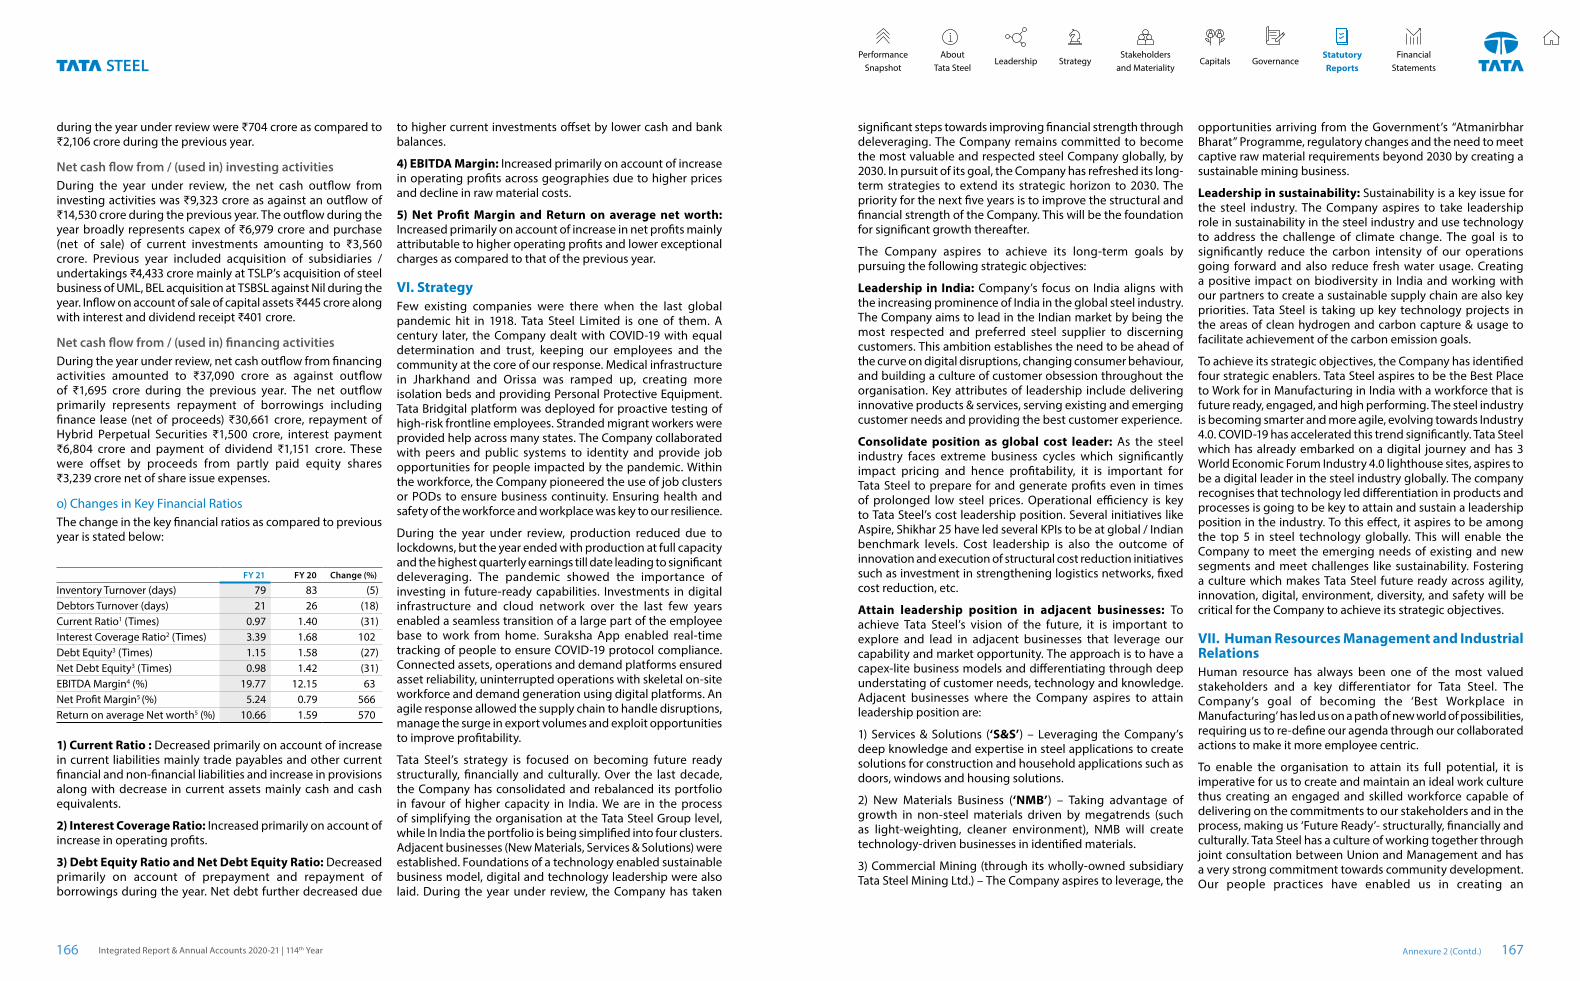
during the year under review were ₹704 crore as compared to ₹2,106 crore during the previous year.
Net cash flow from / (used in) investing activitiesDuring the year under review, the net cash outflow from investing activities was ₹9,323 crore as against an outflow of ₹14,530 crore during the previous year. The outflow during the year broadly represents capex of ₹6,979 crore and purchase (net of sale) of current investments amounting to ₹3,560 crore. Previous year included acquisition of subsidiaries / undertakings ₹4,433 crore mainly at TSLP’s acquisition of steel business of UML, BEL acquisition at TSBSL against Nil during the year. Inflow on account of sale of capital assets ₹445 crore along with interest and dividend receipt ₹401 crore.
Net cash flow from / (used in) financing activitiesDuring the year under review, net cash outflow from financing activities amounted to ₹37,090 crore as against outflow of ₹1,695 crore during the previous year. The net outflow primarily represents repayment of borrowings including finance lease (net of proceeds) ₹30,661 crore, repayment of Hybrid Perpetual Securities ₹1,500 crore, interest payment ₹6,804 crore and payment of dividend ₹1,151 crore. These were offset by proceeds from partly paid equity shares ₹3,239 crore net of share issue expenses.
o) Changes in Key Financial RatiosThe change in the key financial ratios as compared to previous year is stated below:
FY 21 FY 20 Change (%)
Inventory Turnover (days) 79 83 (5)Debtors Turnover (days) 21 26 (18)Current Ratio1 (Times) 0.97 1.40 (31)Interest Coverage Ratio2 (Times) 3.39 1.68 102Debt Equity3 (Times) 1.15 1.58 (27)Net Debt Equity3 (Times) 0.98 1.42 (31)EBITDA Margin4 (%) 19.77 12.15 63Net Profit Margin5 (%) 5.24 0.79 566Return on average Net worth5 (%) 10.66 1.59 570
1) Current Ratio : Decreased primarily on account of increase in current liabilities mainly trade payables and other current financial and non-financial liabilities and increase in provisions along with decrease in current assets mainly cash and cash equivalents.
2) Interest Coverage Ratio: Increased primarily on account of increase in operating profits.
3) Debt Equity Ratio and Net Debt Equity Ratio: Decreased primarily on account of prepayment and repayment of borrowings during the year. Net debt further decreased due
to higher current investments offset by lower cash and bank balances.
4) EBITDA Margin: Increased primarily on account of increase in operating profits across geographies due to higher prices and decline in raw material costs.
5) Net Profit Margin and Return on average net worth: Increased primarily on account of increase in net profits mainly attributable to higher operating profits and lower exceptional charges as compared to that of the previous year.
VI. Strategy Few existing companies were there when the last global pandemic hit in 1918. Tata Steel Limited is one of them. A century later, the Company dealt with COVID-19 with equal determination and trust, keeping our employees and the community at the core of our response. Medical infrastructure in Jharkhand and Orissa was ramped up, creating more isolation beds and providing Personal Protective Equipment. Tata Bridgital platform was deployed for proactive testing of high-risk frontline employees. Stranded migrant workers were provided help across many states. The Company collaborated with peers and public systems to identity and provide job opportunities for people impacted by the pandemic. Within the workforce, the Company pioneered the use of job clusters or PODs to ensure business continuity. Ensuring health and safety of the workforce and workplace was key to our resilience.
During the year under review, production reduced due to lockdowns, but the year ended with production at full capacity and the highest quarterly earnings till date leading to significant deleveraging. The pandemic showed the importance of investing in future-ready capabilities. Investments in digital infrastructure and cloud network over the last few years enabled a seamless transition of a large part of the employee base to work from home. Suraksha App enabled real-time tracking of people to ensure COVID-19 protocol compliance. Connected assets, operations and demand platforms ensured asset reliability, uninterrupted operations with skeletal on-site workforce and demand generation using digital platforms. An agile response allowed the supply chain to handle disruptions, manage the surge in export volumes and exploit opportunities to improve profitability.
Tata Steel’s strategy is focused on becoming future ready structurally, financially and culturally. Over the last decade, the Company has consolidated and rebalanced its portfolio in favour of higher capacity in India. We are in the process of simplifying the organisation at the Tata Steel Group level, while In India the portfolio is being simplified into four clusters. Adjacent businesses (New Materials, Services & Solutions) were established. Foundations of a technology enabled sustainable business model, digital and technology leadership were also laid. During the year under review, the Company has taken
significant steps towards improving financial strength through deleveraging. The Company remains committed to become the most valuable and respected steel Company globally, by 2030. In pursuit of its goal, the Company has refreshed its long-term strategies to extend its strategic horizon to 2030. The priority for the next five years is to improve the structural and financial strength of the Company. This will be the foundation for significant growth thereafter.
The Company aspires to achieve its long-term goals by pursuing the following strategic objectives:
Leadership in India: Company’s focus on India aligns with the increasing prominence of India in the global steel industry. The Company aims to lead in the Indian market by being the most respected and preferred steel supplier to discerning customers. This ambition establishes the need to be ahead of the curve on digital disruptions, changing consumer behaviour, and building a culture of customer obsession throughout the organisation. Key attributes of leadership include delivering innovative products & services, serving existing and emerging customer needs and providing the best customer experience.
Consolidate position as global cost leader: As the steel industry faces extreme business cycles which significantly impact pricing and hence profitability, it is important for Tata Steel to prepare for and generate profits even in times of prolonged low steel prices. Operational efficiency is key to Tata Steel’s cost leadership position. Several initiatives like Aspire, Shikhar 25 have led several KPIs to be at global / Indian benchmark levels. Cost leadership is also the outcome of innovation and execution of structural cost reduction initiatives such as investment in strengthening logistics networks, fixed cost reduction, etc.
Attain leadership position in adjacent businesses: To achieve Tata Steel’s vision of the future, it is important to explore and lead in adjacent businesses that leverage our capability and market opportunity. The approach is to have a capex-lite business models and differentiating through deep understating of customer needs, technology and knowledge. Adjacent businesses where the Company aspires to attain leadership position are:
1) Services & Solutions (‘S&S’) – Leveraging the Company’s deep knowledge and expertise in steel applications to create solutions for construction and household applications such as doors, windows and housing solutions.
2) New Materials Business (‘NMB’) – Taking advantage of growth in non-steel materials driven by megatrends (such as light-weighting, cleaner environment), NMB will create technology-driven businesses in identified materials.
3) Commercial Mining (through its wholly-owned subsidiary Tata Steel Mining Ltd.) – The Company aspires to leverage, the
opportunities arriving from the Government’s “Atmanirbhar Bharat” Programme, regulatory changes and the need to meet captive raw material requirements beyond 2030 by creating a sustainable mining business.
Leadership in sustainability: Sustainability is a key issue for the steel industry. The Company aspires to take leadership role in sustainability in the steel industry and use technology to address the challenge of climate change. The goal is to significantly reduce the carbon intensity of our operations going forward and also reduce fresh water usage. Creating a positive impact on biodiversity in India and working with our partners to create a sustainable supply chain are also key priorities. Tata Steel is taking up key technology projects in the areas of clean hydrogen and carbon capture & usage to facilitate achievement of the carbon emission goals.
To achieve its strategic objectives, the Company has identified four strategic enablers. Tata Steel aspires to be the Best Place to Work for in Manufacturing in India with a workforce that is future ready, engaged, and high performing. The steel industry is becoming smarter and more agile, evolving towards Industry 4.0. COVID-19 has accelerated this trend significantly. Tata Steel which has already embarked on a digital journey and has 3 World Economic Forum Industry 4.0 lighthouse sites, aspires to be a digital leader in the steel industry globally. The company recognises that technology led differentiation in products and processes is going to be key to attain and sustain a leadership position in the industry. To this effect, it aspires to be among the top 5 in steel technology globally. This will enable the Company to meet the emerging needs of existing and new segments and meet challenges like sustainability. Fostering a culture which makes Tata Steel future ready across agility, innovation, digital, environment, diversity, and safety will be critical for the Company to achieve its strategic objectives.
VII. Human Resources Management and Industrial RelationsHuman resource has always been one of the most valued stakeholders and a key differentiator for Tata Steel. The Company’s goal of becoming the ‘Best Workplace in Manufacturing’ has led us on a path of new world of possibilities, requiring us to re-define our agenda through our collaborated actions to make it more employee centric.
To enable the organisation to attain its full potential, it is imperative for us to create and maintain an ideal work culture thus creating an engaged and skilled workforce capable of delivering on the commitments to our stakeholders and in the process, making us ‘Future Ready’- structurally, financially and culturally. Tata Steel has a culture of working together through joint consultation between Union and Management and has a very strong commitment towards community development. Our people practices have enabled us in creating an
Annexure 2 (Contd.)Integrated Report & Annual Accounts 2020-21 | 114th Year166 167
StatutoryReports
Stakeholders and Materiality
Performance Snapshot
About Tata Steel
Leadership Capitals GovernanceStrategyFinancial
Statements
environment of collaboration and connect which has aided us to achieve industrial harmony of over 92 years.
The COVID-19 pandemic accelerated our journey of being Digital leader in Steel industry globally. For us, COVID-19 brought digitalisation into sharp focus with many projects being implemented to ensure employee safety through data driven decision-making. One such project ‘Connected Workforce system’ was implemented with focus on improving safety of contract workforce engaged in our plants. POD working system, remote working for employees to the extent possible and Suraksha app were introduced in the Company to ensure employee safety and well-being. People Care - a 24*7 helpline was also introduced to provide accurate and quick information on COVID-19 and address grievances / queries of employees. The Company was also recognised by UN GCNI for its efforts on ‘Being Focused on People during and post COVID-19’.
To remain competitive, improving employee productivity is of utmost importance to the organisation and we strive to achieve benchmark performance in this area through continuous efforts with initiatives like customised “Sunehre Bhavishya Ki Yojana” for redundancy management and Team Performance Reward which was introduced during the year. The overall Employees on Roll (‘EOR’) for the Company reduced from 32,364 to 31,189 in FY 2020-21.
During the year under review we implemented some major initiatives to promote inclusion and diversity. We deployed the first batch of 22 women as heavy machinery operators at Noamundi iron mine and extended ‘Women@Mines’ coverage in Raw Materials Division. We have rolled out various initiatives for LGBTQ+ community like developing a site for the LGBTQ+ community and the allies to connect, interact and share their experiences and make a difference. Efforts have also been taken on creating digital infrastructure for diverse workforce as well as retaining and developing women leaders to create a pool of diverse talent in the organisation. Our continuous efforts in this direction have led to the increase in gender diversity from 6.5% to 7.4% and reduction in attrition of female employees from 8% to 6%.
We ensured that we stay ahead of the curve, with our focused employee experience initiatives such as Agile working policy, to enable employees to work remotely, Rewards Hub, a one stop solution for all officers related policies and benefits, etc. To measure our performance, eNPS (Net Promoter Score) for HR processes was launched companywide. We also launched Alumni Portal to engage with superannuated and separated officers. Real-time dashboards using analytics were implemented to provide insights on employee cost, diversity & workforce productivity. Also, various cost optimisation and deferment initiatives were undertaken in FY 2020-21.
Multiple interventions for skill building of our own and contract employees were undertaken during the year. Action learning projects through School of Excellence, were rolled out in prioritised areas of Steel Plant Operations and Maintenance with the objective of developing world-class technical competencies and maximise business performance. Tata Steel Digi-e-shala, an intrapreneurial venture by offering learning and development services to external world was launched. The initiative won the World Steelie Award’2020 constituted by World Steel Association for Excellence in Education and Training.
Tata Steel was once again certified as Great Place to Work in the Great Place to Work study and was declared as one of the top 30 ‘India’s Best Workplaces in the Manufacturing sector’ by Great Place to Work for the 4th time. Tata Steel was also recognised as India Workplace Equality Index (‘IWEI’) Top Employers 2020 for the commitment demonstrated towards advancing equality for LGBTQ+ people.
VIII. Digital TransformationTata Steel as an organisation has always been an early adopter of the latest technologies. Over the last few years, the Company has been driving Business Transformation through adoption of Digital Technologies. The Company aspires to be the Global Digital Leader in Steel Manufacturing by 2030 through digital interventions across its value chain, remodel work practices by enhancing digital maturity and in the process, be more insightful, intelligent and agile as an organisation.
Tata Steel banked upon Cloud, Data and Artificial Intelligence (‘AI’) as the building blocks of its digital transformation journey and made substantial investments to augment its network, computing, and cyber security capabilities. The Company moved ~85% of its servers to cloud over the last 3 years in one of the biggest cloud migration programmes in Asia. The Company’s cyber security cell was equipped with the necessary expertise & tools to pre-empt cyber threats & intrusions. The investments made on building up the sturdy infrastructure proved to be a lifesaver over the last year, when all were forced to operate remotely due to the pandemic. Without any special efforts, the Company has been able to seamlessly connect to the Company’s network while working from home and continued production even with a skeletal workforce physically present at the mines and plants. The employees logging into enterprise applications and virtual meetings taking place each day, the Company has been running business as usual with no adverse impact on employee productivity.
Along with Digital Transformation, the division has parallelly focused on transforming the Company from being process driven to data driven. The idea is to use data to generate better business insights and drive decision-making coupled with
streamlined and robust business processes. The 4th Industrial Revolution Advanced Global Lighthouse recognition by World Economic Forum conferred on Tata Steel Jamshedpur only strengthens our belief on the transformational journey we are undertaking. On the Digital Maturity front, Gartner’s Digital Execution Scorecard Report compared the Company’s Digital Execution journey with globally comparable industry sectors over a 12 months horizon and rated our digital maturity to be better than the market average.
In Tata Steel, well defined & lean processes have always been one of the strongest pillars driving operational excellence. Over the last year, we have focused towards building multiple business platforms to consolidate bespoke IT solutions, analyse the data generated to aid intelligent decision-making and enable process efficiencies, thereby ensuring global optima.
The company uses Connected Workforce platform designed to cover employees and contract workers in the areas of safety, security and productivity. The platform gives us end-to-end visibility of the work patterns of the contract workforce across plants and helps pre-empt unsafe incidents while improving the workforce productivity through analytics.
Our e-commerce platforms such as Aashiyana, DigECA, Compass etc. have already proved their mettle and drove sales and customer connect over the last year. Aashiyana clocked record business during COVID-19 delivering a 7 times growth over FY 2018-19. Through digital interventions we have been able to achieve a reduction of 30% in customer complain resolution time.
The Company has developed multiple asset-specific algorithms to predict failures as well as residual life of equipment. This has minimised failure scenarios for mission critical equipment and eliminated unplanned downtime. The Smart Asset Maintenance Platform is helping to achieve higher asset availability at lower maintenance cost, across equipment from mines to rolling mills through enhanced sensorisation & building predictive analytics solutions.
The Company has revamped its procurement process by introducing digital catalogue-based buying, commodity price prediction aided buying, analytics powered negotiation tools for the Category Managers, and end-to-end contract lifecycle management & analytics. The Procurement 4.0 platform has enabled ~50% reduction in vendor registration cycle time and ~20% reduction in Purchase requisition to purchase order cycle time.
The COVID-19 pandemic came as a challenge for one and all. At Tata Steel, we undertook multiple Digital Safety Initiatives with utmost urgency to cope up with the threats of the virus. Through the Suraksha Platform, we ensured health and safety of our employees, from them entering company’s premises through their work hours. Camera feeds were used to identify people without face coverings through an AI based Face Mask
Detection solution and pre-empt & detect violation of Social distancing at shop floors, canteens & on roads. The Crowd Sensing solution sent out alerts if any section of the workplace had a large group of people. The same was also getting tracked through a real-time digital heatmap. Suraksha Scanners empowered Security personnel at entry gates scan RFID cards through smart phones and extract relevant information on Travel Declaration and Suraksha Compliance of our Contract workmen thereby preventing high risk people from entering our premises. All these initiatives were bundled up and accessed through one single dashboard thereby helping in immediate response. The Tata Steel’s digital response to COVID-19 was ranked amongst the top 6% globally by one of the surveys conducted by Gartner.
IX. Effect of COVID-19 Pandemic on the Company The outbreak of COVID-19 has impacted the economy and businesses not only in India, but all over the World. The rapid spread of the infection amongst the Indian population, forced Government of India to announce the imposition of nation-wide lockdown from March 25, 2020. This brought all logistics, businesses establishments and industries to a grinding halt except where the government had notified that essential services and process industries where the continuous operations of the plant facilities are important (including Integrated steel plants), are exempt from the lockdown measures and can continue to operate subject to the hygiene standards and social distancing norms being followed.
However, the crisis of the pandemic continued throughout the year under review. In current phase the crisis has become severe with the onset of second wave of the pandemic.
a) Impact on the operations The Company adopted safety and hygiene standards at shop floor and offices and implemented social distancing norms, work from home, workforce deployment plan, staggered shift timing for safety of the employees. The Company has instantly moved all essential activities to digital platform. The blast furnace and steel making operations at Jamshedpur and Kalinganagar operated at production levels lower than normal due to suspension of the downstream facilities as despatches of finished goods could not be done to customer operations in automotive, construction and other segments as they were closed due to lockdown. Even the Strategic Business Units (‘SBUs’) of Steel like Bearings, Tubes, Wires were also closed. The supply chain activities were affected as all despatches were stopped.
b) Impact on the profitability, cash flow, liquidity and financialsThe closure of business led to decline in steel deliveries which resulted in lower earnings and piling up of the finished goods inventory. Post lockdown, the plant production was gradually
Annexure 2 (Contd.)Integrated Report & Annual Accounts 2020-21 | 114th Year168 169
StatutoryReports
Stakeholders and Materiality
Performance Snapshot
About Tata Steel
Leadership Capitals GovernanceStrategyFinancial
Statements
ramping up and the inventory was getting liquidated based on market demand and off-take. In view of ramping up of the production, there is no threat of redundancies of the existing assets. The Company’s robust digital initiatives have enabled compliance of the internal financial controls and reporting of the Company. The Company has been fulfilling its legal obligations as required for execution of the existing contracts / agreements, so there is no effect of the lockdown on the business.
The Company has continued to have a strong liquidity position. In response to the COVID-19, the Company has sharpened its focus on cash. A cash war room exercise has been undertaken with an aim of running cash neutral operations. Outflows are monitored to have it minimised by cutting down on non-essential expenditure, renegotiating payment terms with vendors, improving working capital management and reducing capex. However, given the uncertainty, the Company has also sought to create a liquidity buffer. The Company raised funds in April and May 2020 through issue of Non-Convertible Debentures. The Company has secured short-term borrowings to handle any situation of shortage of liquidity.
The Company has always strived to have a balanced maturity profile and a judicious mix of funding instruments which help in minimising costs while providing flexibility in managing cashflows. Taking its cashflows and liquidity position into account, the Company is confident that it will be able to service its debt and other financing arrangements. The company has chosen not to avail the moratorium offered by RBI on interest and principal payments, demonstrating its ability to service its debt obligations.
c) Corporate Social Responsibility – helping the community in the wake of COVID-19 pandemicThe Company through Tata Steel Foundation (‘TSF’) and District Administration have reached out to the citizens of the Company’s operational areas Jharkhand and Odisha through various initiatives such as food, sustainable livelihood to the communities & migrant labourers of the region, provided ration and safety support to the vulnerable communities, augmented the medical facilities at the designated hospitals for medical treatment and so on. In the recent crisis of supply of oxygen to various hospitals, the Company is supplying oxygen from its own oxygen plant at Jamshedpur and Kalinganagar. The Company had incurred expenses towards hospital infrastructure, sanitisation activities in town and contribution towards COVID-19 relief.
X. Risks and OpportunitiesThe Company’s Enterprise Risk Management (‘ERM’) process is based on international standards like Committee of Sponsoring Organization of the Treadway Commission (‘COSO’) and ISO
31000. The Company follows coordinated risk assurance and the ERM process is integrated with Corporate Audit, Strategy & Business Planning, Corporate Legal & Compliance functions. This brings further rigour in driving the process across the organisation and Tata Steel Group (‘TSG’) companies. An in-house built IT system is in place across the organisation to enable recording and review of risks through live dashboards and real-time monitoring of data.
Risk Management Committee (‘RMC’) of the Board provides oversight and sets the tone for implementing the ERM framework across the organisation. It reviews the status of key risks, progress of ERM implementation across locations and any specific exceptions as flagged to it, on quarterly basis.
The risk appetite of the organisation is aligned to the TSL Vision. Risk Appetite is driven by the following:
• Health and safety of our employees and the communities in which we operate are our prime concern and our operating strategy is focused on the above objective
• All business decisions are aligned to the Tata Code of Conduct
• Management actions are focused on continuous improvement
• Environment and Climate Change impacts are assessed on a continuous basis and business decisions support systems including capital allocation consider impact of climate impact through the internal carbon pricing framework
• The long-term strategy of the Company is focused on generating profitable growth and sustainable cashflows that creates long-term stakeholder value
Risk Owners may accept risk exposure to their Annual and Long-term business plans, which after implementation of mitigation strategies, is aligned to our risk appetite.
For better focus on Risk Governance and ERM implementation, the Company has set up a Management Committee called Group Risk Review Committee (‘GRRC’). GRRC has the primary responsibility of implementing the Risk Management Policy of TSL and developing a risk intelligent culture.
A dedicated business vertical has been set up to ensure deployment of the ERM process across the organisation. The team is led by Group Head – Corporate Finance & Risk Management who acts as the Chief Risk Officer (‘CRO’) of the Company. The ERM team continuously scans the external environment for developments which may throw up risks for the organisation and risk flags are sent out to the Business Units (‘BU’). BUs engage in identification and management of bottom-up risks, which are periodically reviewed as per defined ERM process. The risks are escalated and aggregated
for reporting to GRRC and RMC. This is complemented by a top-down process, which helps in identification of strategic, enterprise level risks.
To assess the maturity of our ERM process, Risk Maturity Assessment was undertaken through an external partner in FY 2020-21. We are pleased to report that with a score of 4.63 on a scale of 5, TSL has been recognised to be much ahead in the maturity curve compared to its peers in mining & metal sector and marginally behind the organisations with leading score (across sectors).
TSL has also been adjudged ‘Masters of Risk in Metals & Mining’ and ‘Risk Technology’ categories, at the 7th edition of The India Risk Management Awards.
Risk intelligent culture of TSL enabled it to manage the uncertainties in an unprecedented business environment in FY 2020-21. As the Covid situation evolved, “scenario-based risk assessment” was facilitated across the Company.
Business decisions were pivoted to achieve cash neutrality in operations by reducing spend, managing working capital and reducing capital expenditures. Operating regime was recalibrated in response to the decline in domestic demand. Supply chain disruptions were managed through obtaining necessary licenses to ensure movement of raw materials and finished goods. In view of sluggish domestic steel demand, risk to sales was mitigated through enhanced exports and new international markets were targeted.
To reduce dependence on global commodity supply chains, captive coal, iron ore and pellet inventory were ramped up to reduce the buy post normalisation of operations and improve profitability. Investments made by the Company over the years on digital transformation, ensured seamless migration of our work processes to remote working models across the Company locations. The Company also engaged in assessing the risk of single geography sourcing and mitigations have been put in place to diversify sourcing and / or find alternate materials.
Implementation of focused risk mitigation strategies coupled with improvement in the global and domestic macro environment has significantly improved TSL risk profile in H2 FY 2020-21. Despite the challenges posed by COVID-19, the Company has been able to deleverage beyond the target set for the year.
The Company continues to be vigilant of the evolving pandemic situation to proactively manage risks, as they emerge in FY 2021-22. Health and safety of employees and the communities in the vicinity of our operations, continues to be the top-most priority for the Company, whilst simultaneously ensuring continuity of our business operations.
A detailed overview on the risk landscape and mitigation strategies as well as the strategies for capitalising on opportunities in business is provided in the “Risk and Opportunities” Section forming part of the Integrated Report.
XI. Internal Financial Control Systems and Internal AuditThe Company has an Internal Financial Controls (‘IFC’) framework, commensurate with the size, scale, and complexity of the Company’s operations. The Board of Directors of the Company is responsible for ensuring that IFC have been laid down by the Company and that such controls are adequate and operating effectively. The internal control framework has been designed to provide reasonable assurance with respect to recording and providing reliable financial and operational information, complying with applicable laws, safeguarding assets from unauthorised use, executing transactions with proper authorisation and ensuring compliance with corporate policies.
The Company’s internal financial control framework is commensurate with the size and operations of the business and is in line with requirements of the Companies Act, 2013. The Company has laid down Standard Operating Procedures and policies to guide the operations of each of its functions. Business heads are responsible to ensure compliance with these policies and procedures. Robust and continuous internal monitoring mechanisms ensure timely identification of risks and issues. To make the controls more robust and comprehensive, IFC standardisation & rationalisation project was undertaken in FY 2020-21 which has ensured comprehensive coverage cutting across all functions of the Company. The management, statutory auditors and internal auditors have also carried out adequate due diligence of the control environment of the Company through rigorous testing.
The Company has deployed SAP Governance, Risk and Compliance (‘GRC’) Module and other IT platforms to keep the IFC framework robust and our Information Management Policy governs these IT platforms. IFC have been documented and embedded in the business processes and such controls have been assessed during the year under review and no material weaknesses were observed.
The scope and authority of the Internal Audit function is defined in the Internal Audit Charter. To maintain its objectivity and independence, the Internal Audit function reports to the Chairman of the Audit Committee. The Internal Audit team develops an annual audit plan based on the risk profile of the business activities. The Internal Audit plan is approved by the Audit Committee, which also reviews compliance to the plan. The Internal Audit team monitors and evaluates the efficacy
Annexure 2 (Contd.)Integrated Report & Annual Accounts 2020-21 | 114th Year170 171
StatutoryReports
Stakeholders and Materiality
Performance Snapshot
About Tata Steel
Leadership Capitals GovernanceStrategyFinancial
Statements
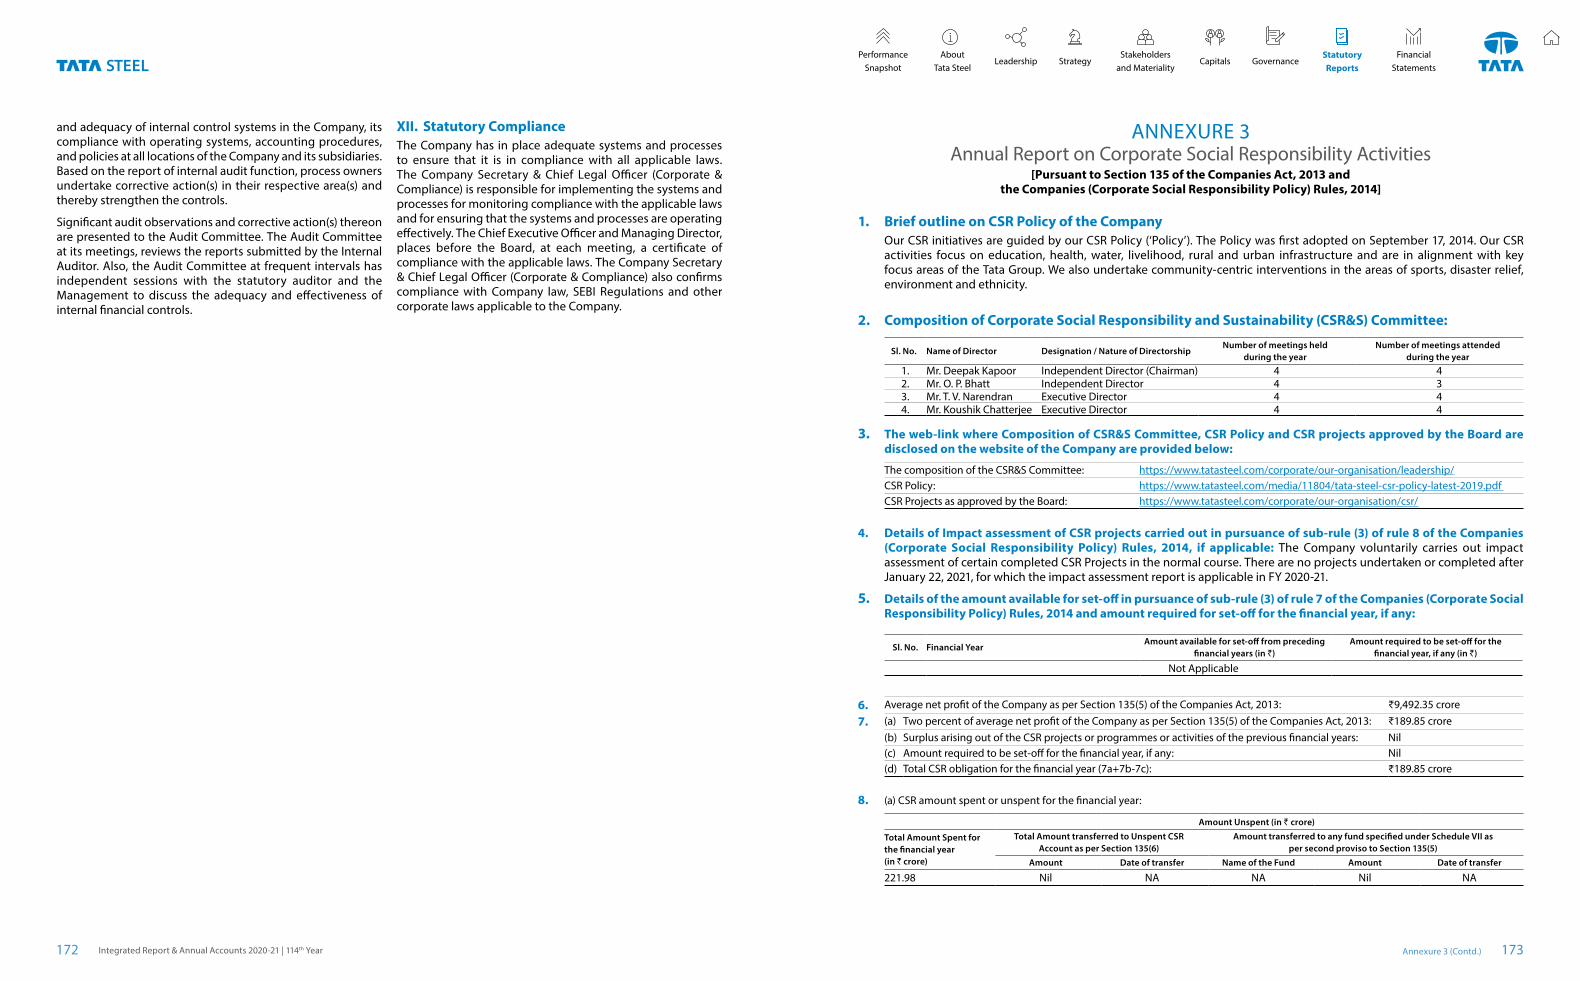
1. Brief outline on CSR Policy of the Company Our CSR initiatives are guided by our CSR Policy (‘Policy’). The Policy was first adopted on September 17, 2014. Our CSR
activities focus on education, health, water, livelihood, rural and urban infrastructure and are in alignment with key focus areas of the Tata Group. We also undertake community-centric interventions in the areas of sports, disaster relief, environment and ethnicity.
ANNEXURE 3Annual Report on Corporate Social Responsibility Activities
[Pursuant to Section 135 of the Companies Act, 2013 and the Companies (Corporate Social Responsibility Policy) Rules, 2014]
2. Composition of Corporate Social Responsibility and Sustainability (CSR&S) Committee:
Sl. No. Name of Director Designation / Nature of DirectorshipNumber of meetings held
during the yearNumber of meetings attended
during the year
1. Mr. Deepak Kapoor Independent Director (Chairman) 4 42. Mr. O. P. Bhatt Independent Director 4 33. Mr. T. V. Narendran Executive Director 4 44. Mr. Koushik Chatterjee Executive Director 4 4
3. The web-link where Composition of CSR&S Committee, CSR Policy and CSR projects approved by the Board are disclosed on the website of the Company are provided below:
The composition of the CSR&S Committee: https://www.tatasteel.com/corporate/our-organisation/leadership/ CSR Policy: https://www.tatasteel.com/media/11804/tata-steel-csr-policy-latest-2019.pdf CSR Projects as approved by the Board: https://www.tatasteel.com/corporate/our-organisation/csr/
4. Details of Impact assessment of CSR projects carried out in pursuance of sub-rule (3) of rule 8 of the Companies (Corporate Social Responsibility Policy) Rules, 2014, if applicable: The Company voluntarily carries out impact assessment of certain completed CSR Projects in the normal course. There are no projects undertaken or completed after January 22, 2021, for which the impact assessment report is applicable in FY 2020-21.
5. Details of the amount available for set-off in pursuance of sub-rule (3) of rule 7 of the Companies (Corporate Social Responsibility Policy) Rules, 2014 and amount required for set-off for the financial year, if any:
Sl. No. Financial YearAmount available for set-off from preceding
financial years (in `)Amount required to be set-off for the
financial year, if any (in `)
Not Applicable
6. Average net profit of the Company as per Section 135(5) of the Companies Act, 2013: ₹9,492.35 crore
7. (a) Two percent of average net profit of the Company as per Section 135(5) of the Companies Act, 2013: ₹189.85 crore(b) Surplus arising out of the CSR projects or programmes or activities of the previous financial years: Nil(c) Amount required to be set-off for the financial year, if any: Nil(d) Total CSR obligation for the financial year (7a+7b-7c): ₹189.85 crore
8. (a) CSR amount spent or unspent for the financial year:
Amount Unspent (in ` crore)
Total Amount Spent for the financial year (in ` crore)
Total Amount transferred to Unspent CSR Account as per Section 135(6)
Amount transferred to any fund specified under Schedule VII as per second proviso to Section 135(5)
Amount Date of transfer Name of the Fund Amount Date of transfer
221.98 Nil NA NA Nil NA
and adequacy of internal control systems in the Company, its compliance with operating systems, accounting procedures, and policies at all locations of the Company and its subsidiaries. Based on the report of internal audit function, process owners undertake corrective action(s) in their respective area(s) and thereby strengthen the controls.
Significant audit observations and corrective action(s) thereon are presented to the Audit Committee. The Audit Committee at its meetings, reviews the reports submitted by the Internal Auditor. Also, the Audit Committee at frequent intervals has independent sessions with the statutory auditor and the Management to discuss the adequacy and effectiveness of internal financial controls.
XII. Statutory Compliance The Company has in place adequate systems and processes to ensure that it is in compliance with all applicable laws. The Company Secretary & Chief Legal Officer (Corporate & Compliance) is responsible for implementing the systems and processes for monitoring compliance with the applicable laws and for ensuring that the systems and processes are operating effectively. The Chief Executive Officer and Managing Director, places before the Board, at each meeting, a certificate of compliance with the applicable laws. The Company Secretary & Chief Legal Officer (Corporate & Compliance) also confirms compliance with Company law, SEBI Regulations and other corporate laws applicable to the Company.
Annexure 3 (Contd.) 173
StatutoryReports
Stakeholders and Materiality
Performance Snapshot
About Tata Steel
Leadership Capitals GovernanceStrategyFinancial
Statements
Integrated Report & Annual Accounts 2020-21 | 114th Year172
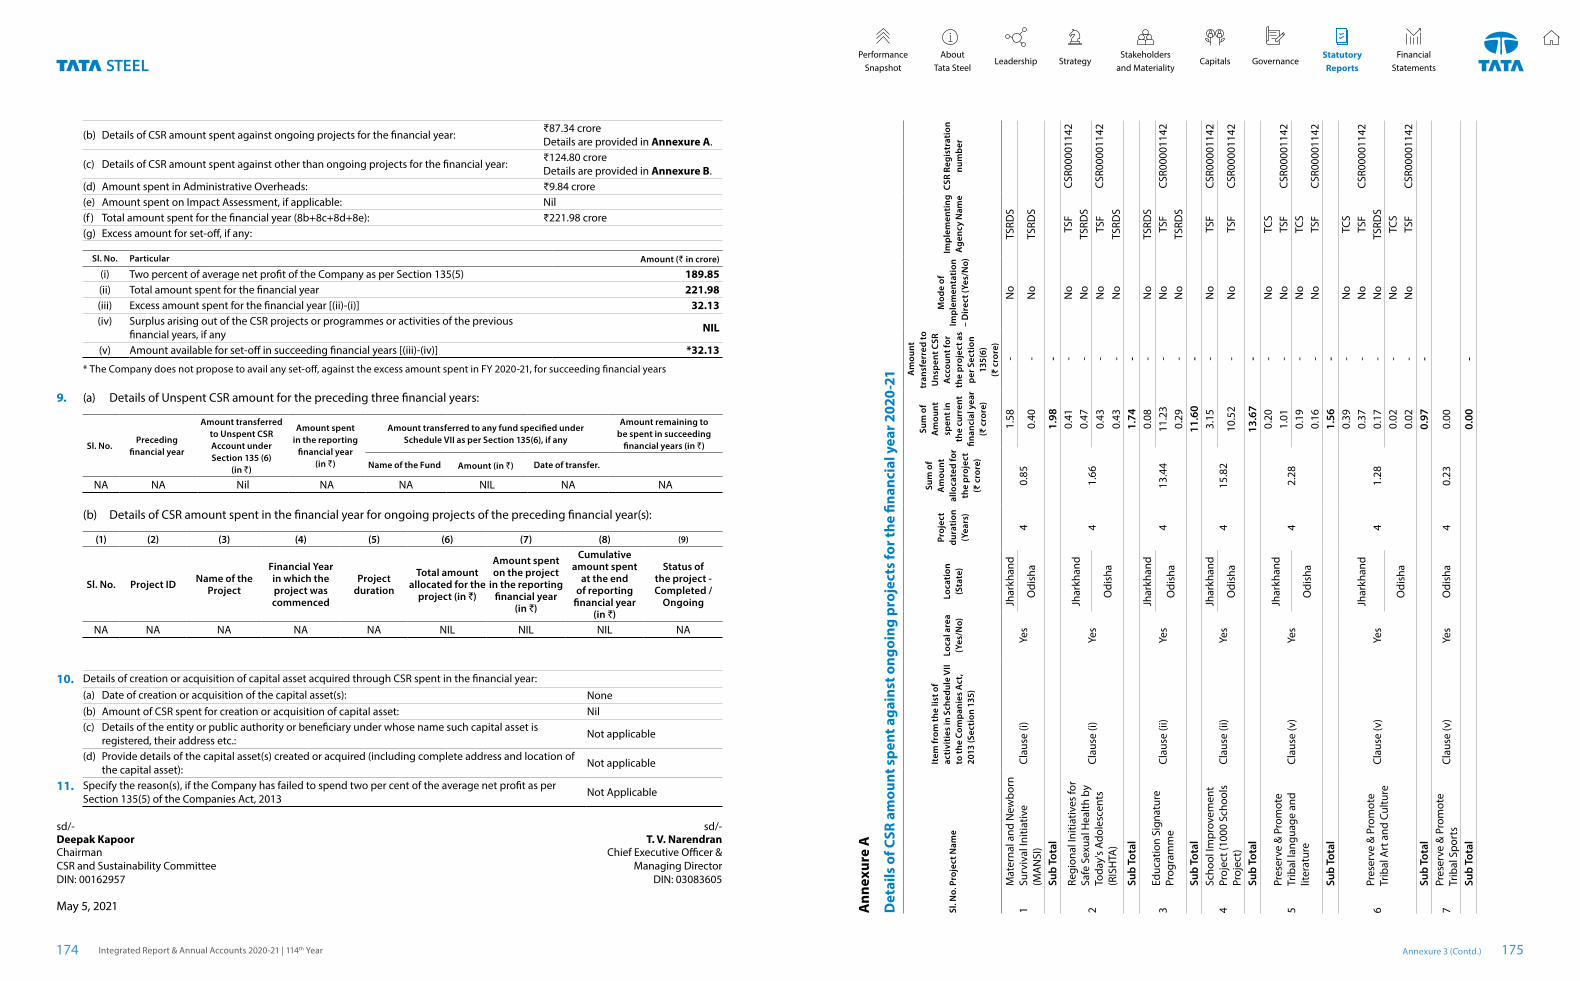
(b) Details of CSR amount spent against ongoing projects for the financial year: ₹87.34 croreDetails are provided in Annexure A.
(c) Details of CSR amount spent against other than ongoing projects for the financial year: ₹124.80 croreDetails are provided in Annexure B.
(d) Amount spent in Administrative Overheads: ₹9.84 crore(e) Amount spent on Impact Assessment, if applicable: Nil(f ) Total amount spent for the financial year (8b+8c+8d+8e): ₹221.98 crore(g) Excess amount for set-off, if any:
Sl. No. Particular Amount (` in crore)
(i) Two percent of average net profit of the Company as per Section 135(5) 189.85(ii) Total amount spent for the financial year 221.98(iii) Excess amount spent for the financial year [(ii)-(i)] 32.13(iv) Surplus arising out of the CSR projects or programmes or activities of the previous
financial years, if any NIL
(v) Amount available for set-off in succeeding financial years [(iii)-(iv)] *32.13
* The Company does not propose to avail any set-off, against the excess amount spent in FY 2020-21, for succeeding financial years
9. (a) Details of Unspent CSR amount for the preceding three financial years:
Sl. No.Preceding
financial year
Amount transferred to Unspent CSR Account under Section 135 (6)
(in `)
Amount spent in the reporting
financial year (in `)
Amount transferred to any fund specified under Schedule VII as per Section 135(6), if any
Amount remaining to be spent in succeeding
financial years (in `)
Name of the Fund Amount (in `) Date of transfer.
NA NA Nil NA NA NIL NA NA
(b) Details of CSR amount spent in the financial year for ongoing projects of the preceding financial year(s):
(1) (2) (3) (4) (5) (6) (7) (8) (9)
Sl. No. Project ID Name of the Project
Financial Year in which the project was commenced
Project duration
Total amount allocated for the
project (in `)
Amount spent on the project
in the reporting financial year
(in `)
Cumulative amount spent
at the end of reporting
financial year (in `)
Status of the project - Completed /
Ongoing
NA NA NA NA NA NIL NIL NIL NA
10. Details of creation or acquisition of capital asset acquired through CSR spent in the financial year:(a) Date of creation or acquisition of the capital asset(s): None(b) Amount of CSR spent for creation or acquisition of capital asset: Nil(c) Details of the entity or public authority or beneficiary under whose name such capital asset is
registered, their address etc.: Not applicable
(d) Provide details of the capital asset(s) created or acquired (including complete address and location of the capital asset): Not applicable
11. Specify the reason(s), if the Company has failed to spend two per cent of the average net profit as per Section 135(5) of the Companies Act, 2013 Not Applicable
sd/- sd/-Deepak Kapoor T. V. Narendran ChairmanCSR and Sustainability CommitteeDIN: 00162957
Chief Executive Officer & Managing Director
DIN: 03083605
May 5, 2021 Ann
exur
e A
Det
ails
of C
SR a
mou
nt s
pent
aga
inst
ong
oing
pro
ject
s fo
r the
fina
ncia
l yea
r 202
0-21
Sl. N
o.Pr
ojec
t Nam
e
Item
from
the
list o
f ac
tivi
ties
in S
ched
ule
VII
to th
e Co
mpa
nies
Act
, 20
13 (S
ecti
on 1
35)
Loca
l are
a (Y
es/N
o)Lo
cati
on
(Sta
te)
Proj
ect
dura
tion
(Y
ears
)
Sum
of
Am
ount
al
loca
ted
for
the
proj
ect
(₹ c
rore
)
Sum
of
Am
ount
sp
ent i
n th
e cu
rren
t fin
anci
al y
ear
(₹ c
rore
)
Am
ount
tr
ansf
erre
d to
U
nspe
nt C
SR
Acc
ount
for
the
proj
ect a
s pe
r Sec
tion
13
5(6)
(₹
cro
re)
Mod
e of
Im
plem
enta
tion
–
Dir
ect (
Yes/
No)
Impl
emen
ting
A
genc
y N
ame
CSR
Regi
stra
tion
nu
mbe
r
1M
ater
nal a
nd N
ewbo
rn
Surv
ival
Initi
ativ
e (M
AN
SI)
Clau
se (i
) Ye
sJh
arkh
and
40.
851.
58 -
No
TSRD
S
Odi
sha
0.40
- N
oTS
RDS
Sub
Tota
l1.
98 -
2
Regi
onal
Initi
ativ
es fo
r Sa
fe S
exua
l Hea
lth b
y To
day'
s Ad
oles
cent
s (R
ISH
TA)
Clau
se (i
) Ye
sJh
arkh
and
41.
66
0.41
- N
oTS
FCS
R000
0114
20.
47 -
No
TSRD
S
Odi
sha
0.43
- N
oTS
FCS
R000
0114
20.
43 -
No
TSRD
SSu
b To
tal
1.74
-
3Ed
ucat
ion
Sign
atur
e Pr
ogra
mm
eCl
ause
(ii)
Yes
Jhar
khan
d4
13.4
40.
08 -
No
TSRD
S
Odi
sha
11.2
3 -
No
TSF
CSR0
0001
142
0.29
- N
oTS
RDS
Sub
Tota
l11
.60
-
4Sc
hool
Impr
ovem
ent
Proj
ect (
1000
Sch
ools
Pr
ojec
t)Cl
ause
(ii)
Yes
Jhar
khan
d4
15.8
23.
15 -
No
TSF
CSR0
0001
142
Odi
sha
10.5
2 -
No
TSF
CSR0
0001
142
Sub
Tota
l13
.67
-
5Pr
eser
ve &
Pro
mot
e Tr
ibal
lang
uage
and
lit
erat
ure
Clau
se (v
) Ye
sJh
arkh
and
42.
28
0.20
- N
oTC
S1.
01 -
No
TSF
CSR0
0001
142
Odi
sha
0.19
- N
oTC
S0.
16 -
No
TSF
CSR0
0001
142
Sub
Tota
l1.
56 -
6Pr
eser
ve &
Pro
mot
e Tr
ibal
Art
and
Cul
ture
Cl
ause
(v)
Yes
Jhar
khan
d4
1.28
0.39
- N
oTC
S0.
37 -
No
TSF
CSR0
0001
142
0.17
- N
oTS
RDS
Odi
sha
0.02
- N
oTC
S0.
02 -
No
TSF
CSR0
0001
142
Sub
Tota
l0.
97 -
7Pr
eser
ve &
Pro
mot
e Tr
ibal
Spo
rts
Clau
se (v
) Ye
sO
dish
a4
0.23
0.00
Sub
Tota
l0.
00 -
Annexure 3 (Contd.)Integrated Report & Annual Accounts 2020-21 | 114th Year174 175
StatutoryReports
Stakeholders and Materiality
Performance Snapshot
About Tata Steel
Leadership Capitals GovernanceStrategyFinancial
Statements
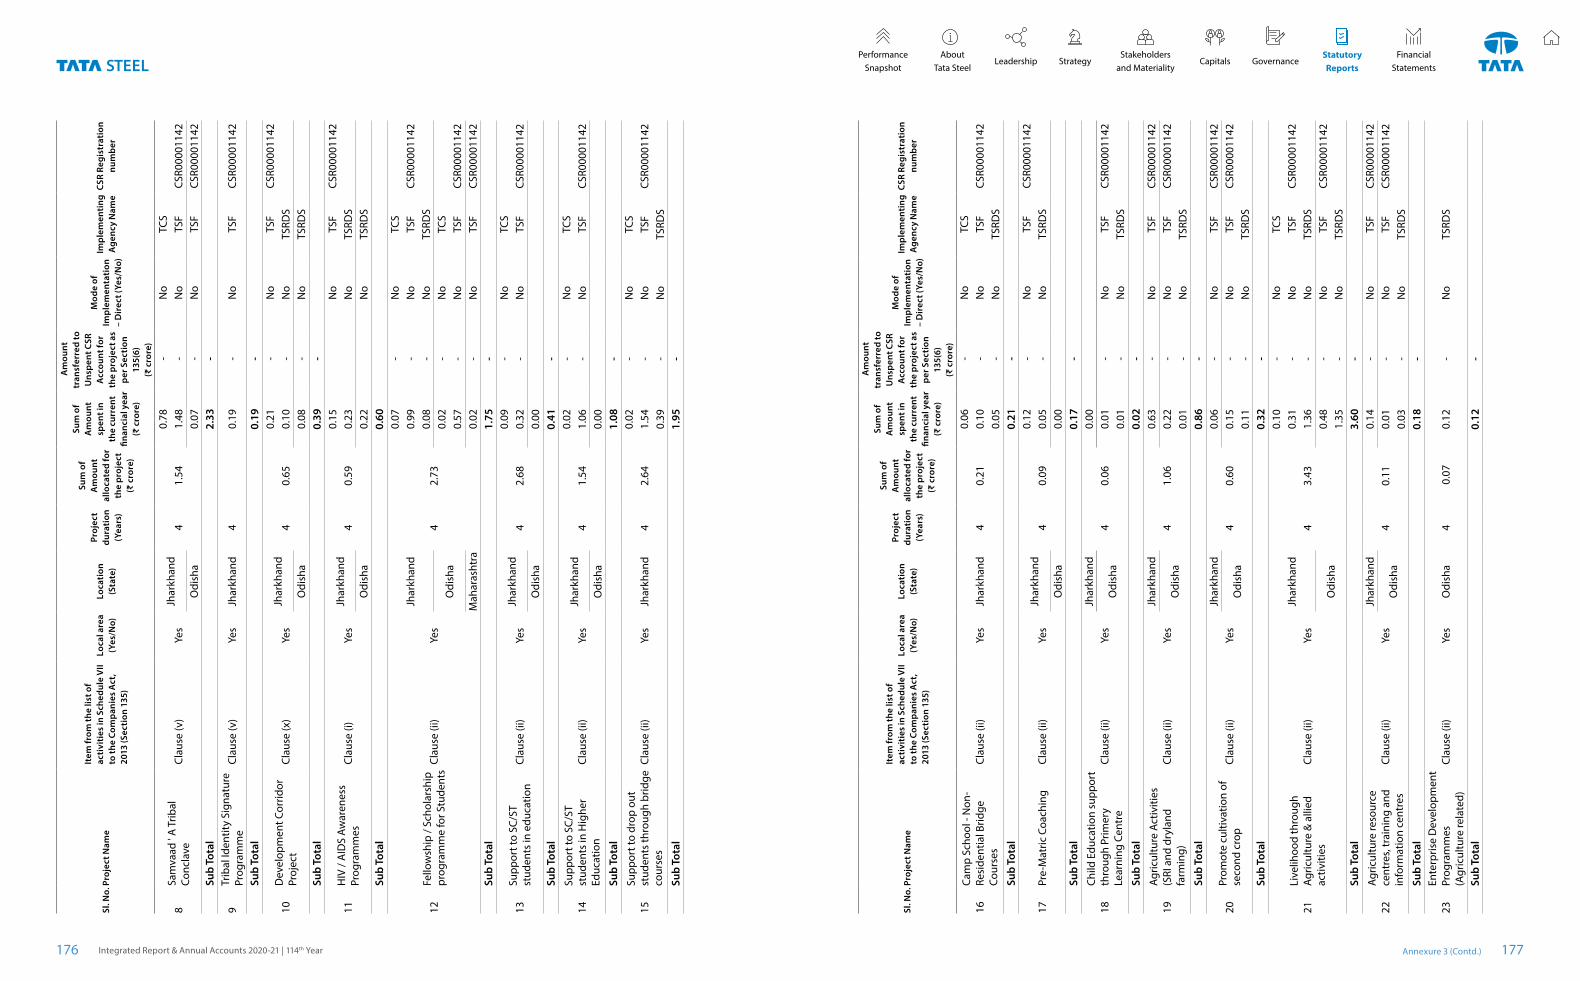
Sl. N
o.Pr
ojec
t Nam
e
Item
from
the
list o
f ac
tivi
ties
in S
ched
ule
VII
to th
e Co
mpa
nies
Act
, 20
13 (S
ecti
on 1
35)
Loca
l are
a (Y
es/N
o)Lo
cati
on
(Sta
te)
Proj
ect
dura
tion
(Y
ears
)
Sum
of
Am
ount
al
loca
ted
for
the
proj
ect
(₹ c
rore
)
Sum
of
Am
ount
sp
ent i
n th
e cu
rren
t fin
anci
al y
ear
(₹ c
rore
)
Am
ount
tr
ansf
erre
d to
U
nspe
nt C
SR
Acc
ount
for
the
proj
ect a
s pe
r Sec
tion
13
5(6)
(₹
cro
re)
Mod
e of
Im
plem
enta
tion
–
Dir
ect (
Yes/
No)
Impl
emen
ting
A
genc
y N
ame
CSR
Regi
stra
tion
nu
mbe
r
8Sa
mva
ad '
A T
ribal
Co
ncla
ve
Clau
se (v
) Ye
sJh
arkh
and
41.
540.
78 -
No
TCS
1.48
- N
oTS
FCS
R000
0114
2O
dish
a0.
07 -
No
TSF
CSR0
0001
142
Sub
Tota
l2.
33 -
9Tr
ibal
Iden
tity
Sign
atur
e Pr
ogra
mm
eCl
ause
(v)
Yes
Jhar
khan
d4
0.19
- N
oTS
FCS
R000
0114
2
Sub
Tota
l0.
19 -
10D
evel
opm
ent C
orrid
or
Proj
ect
Clau
se (x
) Ye
sJh
arkh
and
40.
650.
21 -
No
TSF
CSR0
0001
142
0.10
- N
oTS
RDS
Odi
sha
0.08
- N
oTS
RDS
Sub
Tota
l0.
39 -
11H
IV /
AID
S Aw
aren
ess
Prog
ram
mes
Cl
ause
(i)
Yes
Jhar
khan
d4
0.59
0.15
No
TSF
CSR0
0001
142
0.23
No
TSRD
SO
dish
a0.
22N
oTS
RDS
Sub
Tota
l0.
60
12Fe
llow
ship
/ Sc
hola
rshi
p pr
ogra
mm
e fo
r Stu
dent
s Cl
ause
(ii)
Yes
Jhar
khan
d
42.
73
0.07
- N
oTC
S0.
99 -
No
TSF
CSR0
0001
142
0.08
- N
oTS
RDS
Odi
sha
0.02
- N
oTC
S0.
57 -
No
TSF
CSR0
0001
142
Mah
aras
htra
0.02
- N
oTS
FCS
R000
0114
2Su
b To
tal
1.75
-
13Su
ppor
t to
SC/S
T st
uden
ts in
edu
catio
n Cl
ause
(ii)
Yes
Jhar
khan
d4
2.68
0.09
- N
oTC
S0.
32 -
No
TSF
CSR0
0001
142
Odi
sha
0.00
Sub
Tota
l0.
41 -
14Su
ppor
t to
SC/S
T st
uden
ts in
Hig
her
Educ
atio
n Cl
ause
(ii)
Yes
Jhar
khan
d4
1.54
0.02
- N
oTC
S1.
06 -
No
TSF
CSR0
0001
142
Odi
sha
0.00
Sub
Tota
l1.
08 -
15Su
ppor
t to
drop
out
st
uden
ts th
roug
h br
idge
co
urse
s Cl
ause
(ii)
Yes
Jhar
khan
d4
2.64
0.02
- N
oTC
S1.
54 -
No
TSF
CSR0
0001
142
0.39
- N
oTS
RDS
Sub
Tota
l1.
95 -
Sl. N
o.Pr
ojec
t Nam
e
Item
from
the
list o
f ac
tivi
ties
in S
ched
ule
VII
to th
e Co
mpa
nies
Act
, 20
13 (S
ecti
on 1
35)
Loca
l are
a (Y
es/N
o)Lo
cati
on
(Sta
te)
Proj
ect
dura
tion
(Y
ears
)
Sum
of
Am
ount
al
loca
ted
for
the
proj
ect
(₹ c
rore
)
Sum
of
Am
ount
sp
ent i
n th
e cu
rren
t fin
anci
al y
ear
(₹ c
rore
)
Am
ount
tr
ansf
erre
d to
U
nspe
nt C
SR
Acc
ount
for
the
proj
ect a
s pe
r Sec
tion
13
5(6)
(₹
cro
re)
Mod
e of
Im
plem
enta
tion
–
Dir
ect (
Yes/
No)
Impl
emen
ting
A
genc
y N
ame
CSR
Regi
stra
tion
nu
mbe
r
16Ca
mp
Scho
ol -
Non
-Re
side
ntia
l Brid
ge
Cour
ses
Clau
se (i
i) Ye
sJh
arkh
and
40.
210.
06 -
No
TCS
0.10
- N
oTS
FCS
R000
0114
20.
05 -
No
TSRD
SSu
b To
tal
0.21
-
17Pr
e-M
atric
Coa
chin
g Cl
ause
(ii)
Yes
Jhar
khan
d4
0.09
0.12
- N
oTS
FCS
R000
0114
20.
05 -
No
TSRD
SO
dish
a0.
00Su
b To
tal
0.17
-
18Ch
ild E
duca
tion
supp
ort
thro
ugh
Prim
ery
Lear
ning
Cen
tre
Clau
se (i
i) Ye
sJh
arkh
and
40.
060.
00
Odi
sha
0.01
- N
oTS
FCS
R000
0114
20.
01 -
No
TSRD
SSu
b To
tal
0.02
-
19Ag
ricul
ture
Act
iviti
es
(SRI
and
dry
land
fa
rmin
g)
Clau
se (i
i) Ye
sJh
arkh
and
41.
060.
63 -
No
TSF
CSR0
0001
142
Odi
sha
0.22
- N
oTS
FCS
R000
0114
20.
01 -
No
TSRD
SSu
b To
tal
0.86
-
20Pr
omot
e cu
ltiva
tion
of
seco
nd c
rop
Clau
se (i
i) Ye
sJh
arkh
and
40.
600.
06 -
No
TSF
CSR0
0001
142
Odi
sha
0.15
- N
oTS
FCS
R000
0114
20.
11 -
No
TSRD
SSu
b To
tal
0.32
-
21Li
velih
ood
thro
ugh
Agric
ultu
re &
alli
ed
activ
ities
Clau
se (i
i) Ye
sJh
arkh
and
43.
43
0.10
- N
oTC
S0.
31 -
No
TSF
CSR0
0001
142
1.36
- N
oTS
RDS
Odi
sha
0.48
- N
oTS
FCS
R000
0114
21.
35 -
No
TSRD
SSu
b To
tal
3.60
-
22Ag
ricul
ture
reso
urce
ce
ntre
s, tr
aini
ng a
nd
info
rmat
ion
cent
res
Clau
se (i
i) Ye
sJh
arkh
and
40.
110.
14 -
No
TSF
CSR0
0001
142
Odi
sha
0.01
- N
oTS
FCS
R000
0114
20.
03 -
No
TSRD
SSu
b To
tal
0.18
-
23En
terp
rise
Dev
elop
men
t Pr
ogra
mm
es
(Agr
icul
ture
rela
ted)
Cl
ause
(ii)
Yes
Odi
sha
4 0
.07
0.12
- N
oTS
RDS
Sub
Tota
l0.
12 -
Annexure 3 (Contd.)Integrated Report & Annual Accounts 2020-21 | 114th Year176 177
StatutoryReports
Stakeholders and Materiality
Performance Snapshot
About Tata Steel
Leadership Capitals GovernanceStrategyFinancial
Statements
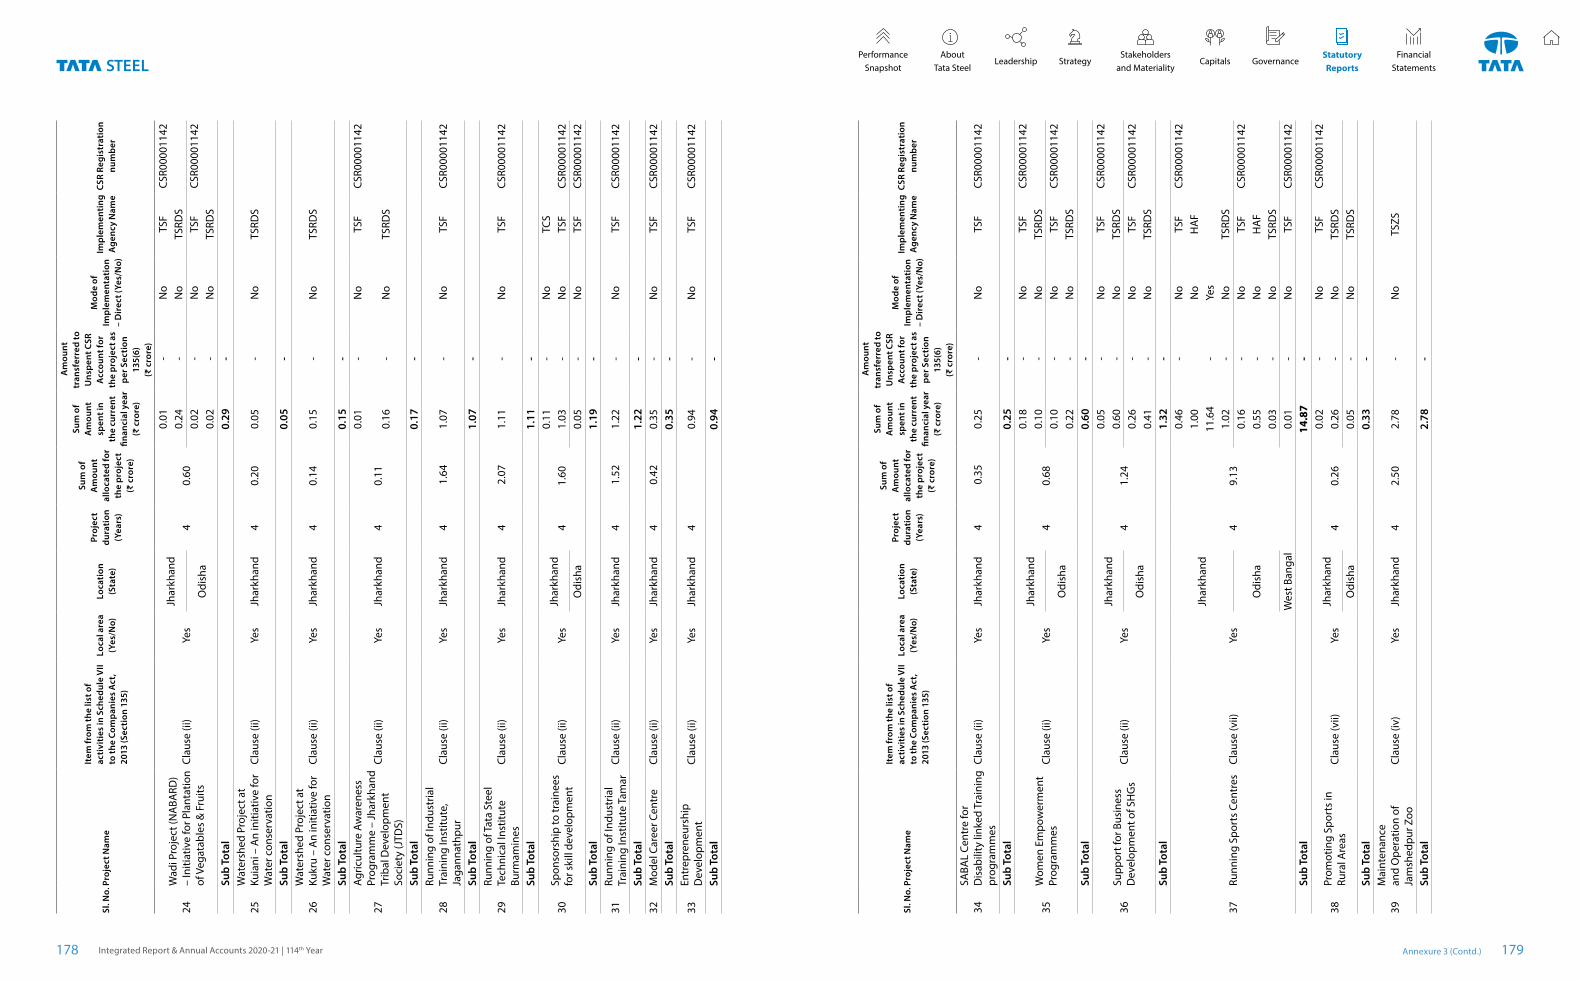
Sl. N
o.Pr
ojec
t Nam
e
Item
from
the
list o
f ac
tivi
ties
in S
ched
ule
VII
to th
e Co
mpa
nies
Act
, 20
13 (S
ecti
on 1
35)
Loca
l are
a (Y
es/N
o)Lo
cati
on
(Sta
te)
Proj
ect
dura
tion
(Y
ears
)
Sum
of
Am
ount
al
loca
ted
for
the
proj
ect
(₹ c
rore
)
Sum
of
Am
ount
sp
ent i
n th
e cu
rren
t fin
anci
al y
ear
(₹ c
rore
)
Am
ount
tr
ansf
erre
d to
U
nspe
nt C
SR
Acc
ount
for
the
proj
ect a
s pe
r Sec
tion
13
5(6)
(₹
cro
re)
Mod
e of
Im
plem
enta
tion
–
Dir
ect (
Yes/
No)
Impl
emen
ting
A
genc
y N
ame
CSR
Regi
stra
tion
nu
mbe
r
24W
adi P
roje
ct (N
ABA
RD)
– In
itiat
ive
for P
lant
atio
n of
Veg
atab
les
& F
ruits
Cl
ause
(ii)
Yes
Jhar
khan
d4
0.60
0.01
- N
oTS
FCS
R000
0114
20.
24 -
No
TSRD
S
Odi
sha
0.02
- N
oTS
FCS
R000
0114
20.
02 -
No
TSRD
SSu
b To
tal
0.29
-
25W
ater
shed
Pro
ject
at
Kuia
ni –
An
initi
ativ
e fo
r W
ater
con
serv
atio
nCl
ause
(ii)
Yes
Jhar
khan
d4
0.20
0.05
- N
oTS
RDS
Sub
Tota
l0.
05 -
26W
ater
shed
Pro
ject
at
Kukr
u –
An
initi
ativ
e fo
r W
ater
con
serv
atio
nCl
ause
(ii)
Yes
Jhar
khan
d4
0.14
0.15
- N
oTS
RDS
Sub
Tota
l0.
15 -
27
Agric
ultu
re A
war
enes
s Pr
ogra
mm
e –
Jhar
khan
d Tr
ibal
Dev
elop
men
t So
ciet
y (J
TDS)
Clau
se (i
i) Ye
sJh
arkh
and
40.
11
0.01
- N
oTS
FCS
R000
0114
2
0.16
- N
oTS
RDS
Sub
Tota
l0.
17 -
28Ru
nnin
g of
Indu
stria
l Tr
aini
ng In
stitu
te,
Jaga
nnat
hpur
Cl
ause
(ii)
Yes
Jhar
khan
d4
1.6
4 1.
07 -
No
TSF
CSR0
0001
142
Sub
Tota
l1.
07 -
29Ru
nnin
g of
Tat
a St
eel
Tech
nica
l Ins
titut
e Bu
rmam
ines
Clau
se (i
i) Ye
sJh
arkh
and
4 2
.07
1.11
- N
oTS
FCS
R000
0114
2
Sub
Tota
l1.
11 -
30Sp
onso
rshi
p to
trai
nees
fo
r ski
ll de
velo
pmen
tCl
ause
(ii)
Yes
Jhar
khan
d4
1.60
0.11
- N
oTC
S1.
03 -
No
TSF
CSR0
0001
142
Odi
sha
0.05
- N
oTS
FCS
R000
0114
2Su
b To
tal
1.19
-
31Ru
nnin
g of
Indu
stria
l Tr
aini
ng In
stitu
te T
amar
Clau
se (i
i) Ye
sJh
arkh
and
4 1
.52
1.22
- N
oTS
FCS
R000
0114
2
Sub
Tota
l1.
22 -
32M
odel
Car
eer C
entr
e Cl
ause
(ii)
Yes
Jhar
khan
d4
0.4
2 0.
35 -
No
TSF
CSR0
0001
142
Sub
Tota
l0.
35 -
33En
trep
rene
ursh
ip
Dev
elop
men
tCl
ause
(ii)
Yes
Jhar
khan
d4
0.94
- N
oTS
FCS
R000
0114
2
Sub
Tota
l0.
94 -
Sl. N
o.Pr
ojec
t Nam
e
Item
from
the
list o
f ac
tivi
ties
in S
ched
ule
VII
to th
e Co
mpa
nies
Act
, 20
13 (S
ecti
on 1
35)
Loca
l are
a (Y
es/N
o)Lo
cati
on
(Sta
te)
Proj
ect
dura
tion
(Y
ears
)
Sum
of
Am
ount
al
loca
ted
for
the
proj
ect
(₹ c
rore
)
Sum
of
Am
ount
sp
ent i
n th
e cu
rren
t fin
anci
al y
ear
(₹ c
rore
)
Am
ount
tr
ansf
erre
d to
U
nspe
nt C
SR
Acc
ount
for
the
proj
ect a
s pe
r Sec
tion
13
5(6)
(₹
cro
re)
Mod
e of
Im
plem
enta
tion
–
Dir
ect (
Yes/
No)
Impl
emen
ting
A
genc
y N
ame
CSR
Regi
stra
tion
nu
mbe
r
34SA
BAL
Cent
re fo
r D
isab
ility
link
ed T
rain
ing
prog
ram
mes
Clau
se (i
i) Ye
sJh
arkh
and
4 0
.35
0.25
- N
oTS
FCS
R000
0114
2
Sub
Tota
l0.
25 -
35W
omen
Em
pow
erm
ent
Prog
ram
mes
Cl
ause
(ii)
Yes
Jhar
khan
d4
0.68
0.18
- N
oTS
FCS
R000
0114
20.
10 -
No
TSRD
S
Odi
sha
0.10
- N
oTS
FCS
R000
0114
20.
22 -
No
TSRD
SSu
b To
tal
0.60
-
36Su
ppor
t for
Bus
ines
s D
evel
opm
ent o
f SH
Gs
Clau
se (i
i) Ye
sJh
arkh
and
41.
24
0.05
- N
oTS
FCS
R000
0114
20.
60 -
No
TSRD
S
Odi
sha
0.26
- N
oTS
FCS
R000
0114
20.
41 -
No
TSRD
SSu
b To
tal
1.32
-
37Ru
nnin
g Sp
orts
Cen
tres
Cl
ause
(vii)
Ye
s
Jhar
khan
d
49.
13
0.46
- N
oTS
FCS
R000
0114
21.
00N
oH
AF
11.6
4 -
Yes
1.02
- N
oTS
RDS
Odi
sha
0.16
- N
oTS
FCS
R000
0114
20.
55 -
No
HA
F0.
03 -
No
TSRD
SW
est B
anga
l0.
01 -
No
TSF
CSR0
0001
142
Sub
Tota
l14
.87
-
38Pr
omot
ing
Spor
ts in
Ru
ral A
reas
Cl
ause
(vii)
Yes
Jhar
khan
d4
0.26
0.02
- N
oTS
FCS
R000
0114
20.
26 -
No
TSRD
SO
dish
a0.
05 -
No
TSRD
SSu
b To
tal
0.33
-
39M
aint
enan
ce
and
Ope
ratio
n of
Ja
msh
edpu
r Zoo
Clau
se (i
v)
Yes
Jhar
khan
d4
2.50
2.78
- N
oTS
ZS
Sub
Tota
l2.
78 -
Annexure 3 (Contd.)Integrated Report & Annual Accounts 2020-21 | 114th Year178 179
StatutoryReports
Stakeholders and Materiality
Performance Snapshot
About Tata Steel
Leadership Capitals GovernanceStrategyFinancial
Statements
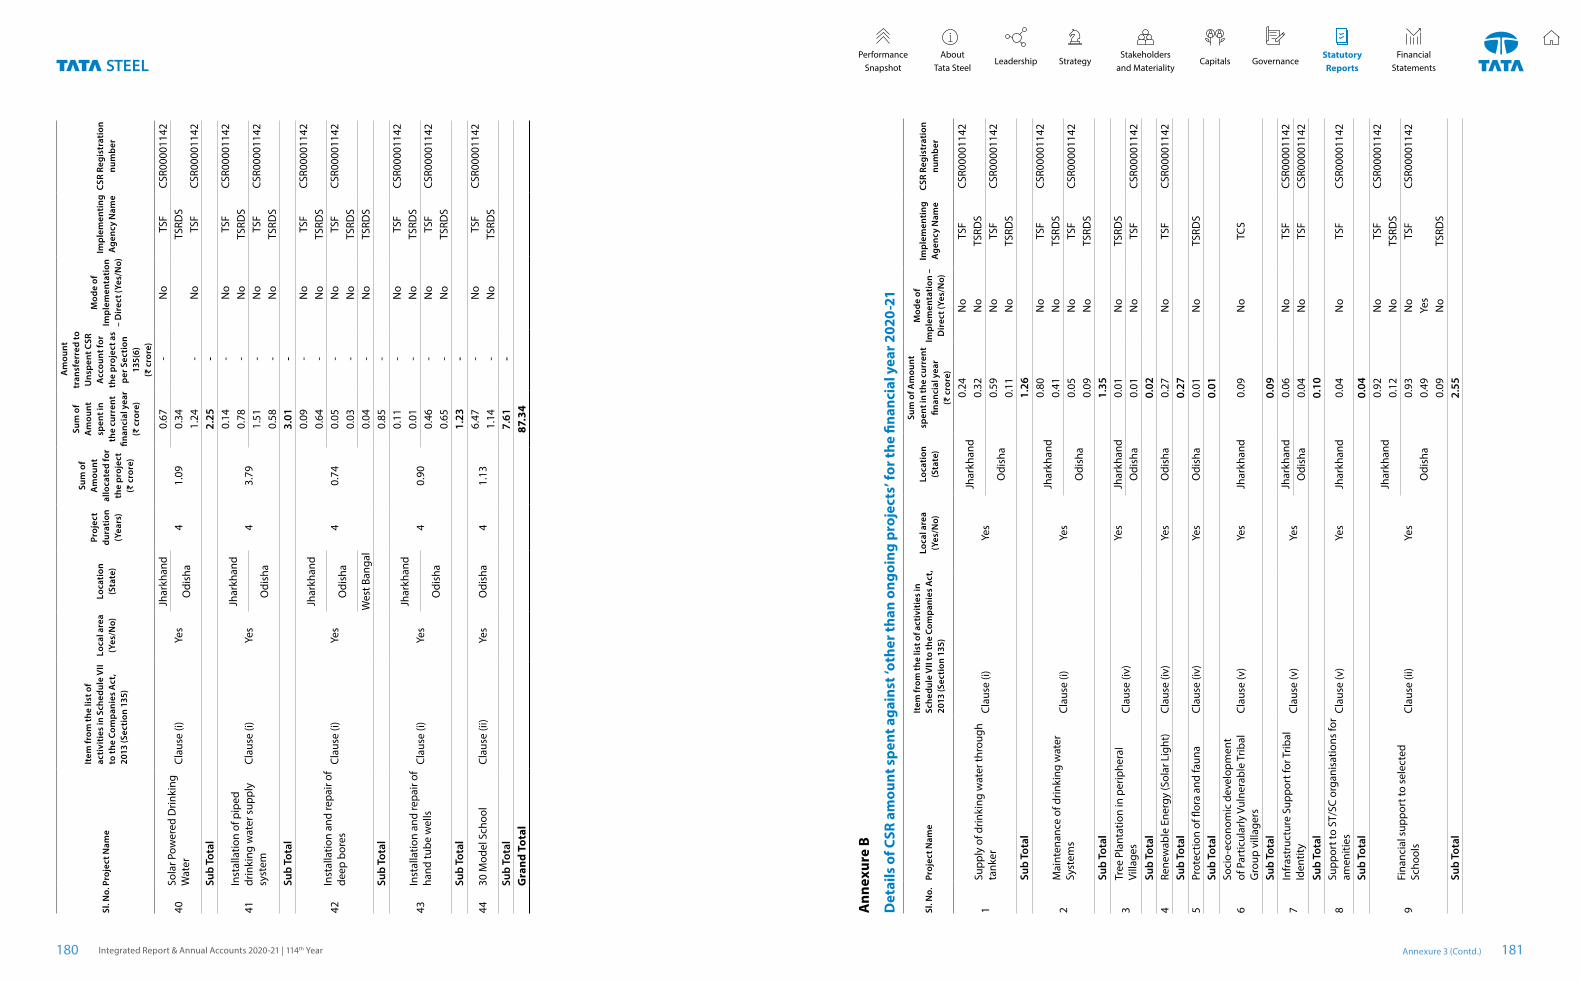
Sl. N
o.Pr
ojec
t Nam
e
Item
from
the
list o
f ac
tivi
ties
in S
ched
ule
VII
to th
e Co
mpa
nies
Act
, 20
13 (S
ecti
on 1
35)
Loca
l are
a (Y
es/N
o)Lo
cati
on
(Sta
te)
Proj
ect
dura
tion
(Y
ears
)
Sum
of
Am
ount
al
loca
ted
for
the
proj
ect
(₹ c
rore
)
Sum
of
Am
ount
sp
ent i
n th
e cu
rren
t fin
anci
al y
ear
(₹ c
rore
)
Am
ount
tr
ansf
erre
d to
U
nspe
nt C
SR
Acc
ount
for
the
proj
ect a
s pe
r Sec
tion
13
5(6)
(₹
cro
re)
Mod
e of
Im
plem
enta
tion
–
Dir
ect (
Yes/
No)
Impl
emen
ting
A
genc
y N
ame
CSR
Regi
stra
tion
nu
mbe
r
40So
lar P
ower
ed D
rinki
ng
Wat
erCl
ause
(i)
Yes
Jhar
khan
d4
1.09
0.67
- N
oTS
FCS
R000
0114
2
Odi
sha
0.34
TSRD
S1.
24 -
No
TSF
CSR0
0001
142
Sub
Tota
l2.
25 -
41In
stal
latio
n of
pip
ed
drin
king
wat
er s
uppl
y sy
stem
Clau
se (i
) Ye
sJh
arkh
and
43.
79
0.14
- N
oTS
FCS
R000
0114
20.
78 -
No
TSRD
S
Odi
sha
1.51
- N
oTS
FCS
R000
0114
20.
58 -
No
TSRD
SSu
b To
tal
3.01
-
42In
stal
latio
n an
d re
pair
of
deep
bor
es
Clau
se (i
) Ye
s
Jhar
khan
d
40.
74
0.09
- N
oTS
FCS
R000
0114
20.
64 -
No
TSRD
S
Odi
sha
0.05
- N
oTS
FCS
R000
0114
20.
03 -
No
TSRD
SW
est B
anga
l0.
04 -
No
TSRD
SSu
b To
tal
0.85
-
43In
stal
latio
n an
d re
pair
of
hand
tube
wel
lsCl
ause
(i)
Yes
Jhar
khan
d4
0.90
0.11
- N
oTS
FCS
R000
0114
20.
01 -
No
TSRD
S
Odi
sha
0.46
- N
oTS
FCS
R000
0114
20.
65 -
No
TSRD
SSu
b To
tal
1.23
-
4430
Mod
el S
choo
l Cl
ause
(ii)
Yes
Odi
sha
41.
136.
47 -
No
TSF
CSR0
0001
142
1.14
- N
oTS
RDS
Sub
Tota
l7.
61 -
Gra
nd T
otal
87.3
4
Ann
exur
e B
Det
ails
of C
SR a
mou
nt s
pent
aga
inst
‘oth
er th
an o
ngoi
ng p
roje
cts’
for t
he fi
nanc
ial y
ear 2
020-
21
Sl. N
o.Pr
ojec
t Nam
eIt
em fr
om th
e lis
t of a
ctiv
itie
s in
Sc
hedu
le V
II to
the
Com
pani
es A
ct,
2013
(Sec
tion
135
)
Loca
l are
a
(Yes
/No)
Loca
tion
(S
tate
)
Sum
of A
mou
nt
spen
t in
the
curr
ent
finan
cial
yea
r (₹
cro
re)
Mod
e of
Im
plem
enta
tion
–
Dir
ect (
Yes/
No)
Impl
emen
ting
A
genc
y N
ame
CSR
Regi
stra
tion
nu
mbe
r
1Su
pply
of d
rinki
ng w
ater
thro
ugh
tank
erCl
ause
(i)
Yes
Jhar
khan
d0.
24N
oTS
FCS
R000
0114
20.
32N
oTS
RDS
Odi
sha
0.59
No
TSF
CSR0
0001
142
0.11
No
TSRD
SSu
b To
tal
1.26
2M
aint
enan
ce o
f drin
king
wat
er
Syst
ems
Clau
se (i
) Ye
sJh
arkh
and
0.80
No
TSF
CSR0
0001
142
0.41
No
TSRD
S
Odi
sha
0.05
No
TSF
CSR0
0001
142
0.09
No
TSRD
SSu
b To
tal
1.35
3Tr
ee P
lant
atio
n in
per
iphe
ral
Villa
ges
Clau
se (i
v)
Yes
Jhar
khan
d0.
01N
oTS
RDS
Odi
sha
0.01
No
TSF
CSR0
0001
142
Sub
Tota
l0.
024
Rene
wab
le E
nerg
y (S
olar
Lig
ht)
Clau
se (i
v)
Yes
Odi
sha
0.27
No
TSF
CSR0
0001
142
Sub
Tota
l0.
275
Prot
ectio
n of
flor
a an
d fa
una
Clau
se (i
v)
Yes
Odi
sha
0.01
No
TSRD
SSu
b To
tal
0.01
6So
cio-
econ
omic
dev
elop
men
t of
Par
ticul
arly
Vul
nera
ble
Trib
al
Gro
up v
illag
ers
Clau
se (v
) Ye
sJh
arkh
and
0.09
No
TCS
Sub
Tota
l0.
09
7In
fras
truc
ture
Sup
port
for T
ribal
Id
entit
y Cl
ause
(v)
Yes
Jhar
khan
d0.
06N
oTS
FCS
R000
0114
2O
dish
a0.
04N
oTS
FCS
R000
0114
2Su
b To
tal
0.10
8Su
ppor
t to
ST/S
C or
gani
satio
ns fo
r am
eniti
esCl
ause
(v)
Yes
Jhar
khan
d0.
04N
oTS
FCS
R000
0114
2
Sub
Tota
l0.
04
9Fi
nanc
ial s
uppo
rt to
sel
ecte
d Sc
hool
sCl
ause
(ii)
Yes
Jhar
khan
d0.
92N
oTS
FCS
R000
0114
20.
12N
oTS
RDS
Odi
sha
0.93
No
TSF
CSR0
0001
142
0.49
Yes
0.09
No
TSRD
SSu
b To
tal
2.55
Annexure 3 (Contd.)Integrated Report & Annual Accounts 2020-21 | 114th Year180 181
StatutoryReports
Stakeholders and Materiality
Performance Snapshot
About Tata Steel
Leadership Capitals GovernanceStrategyFinancial
Statements
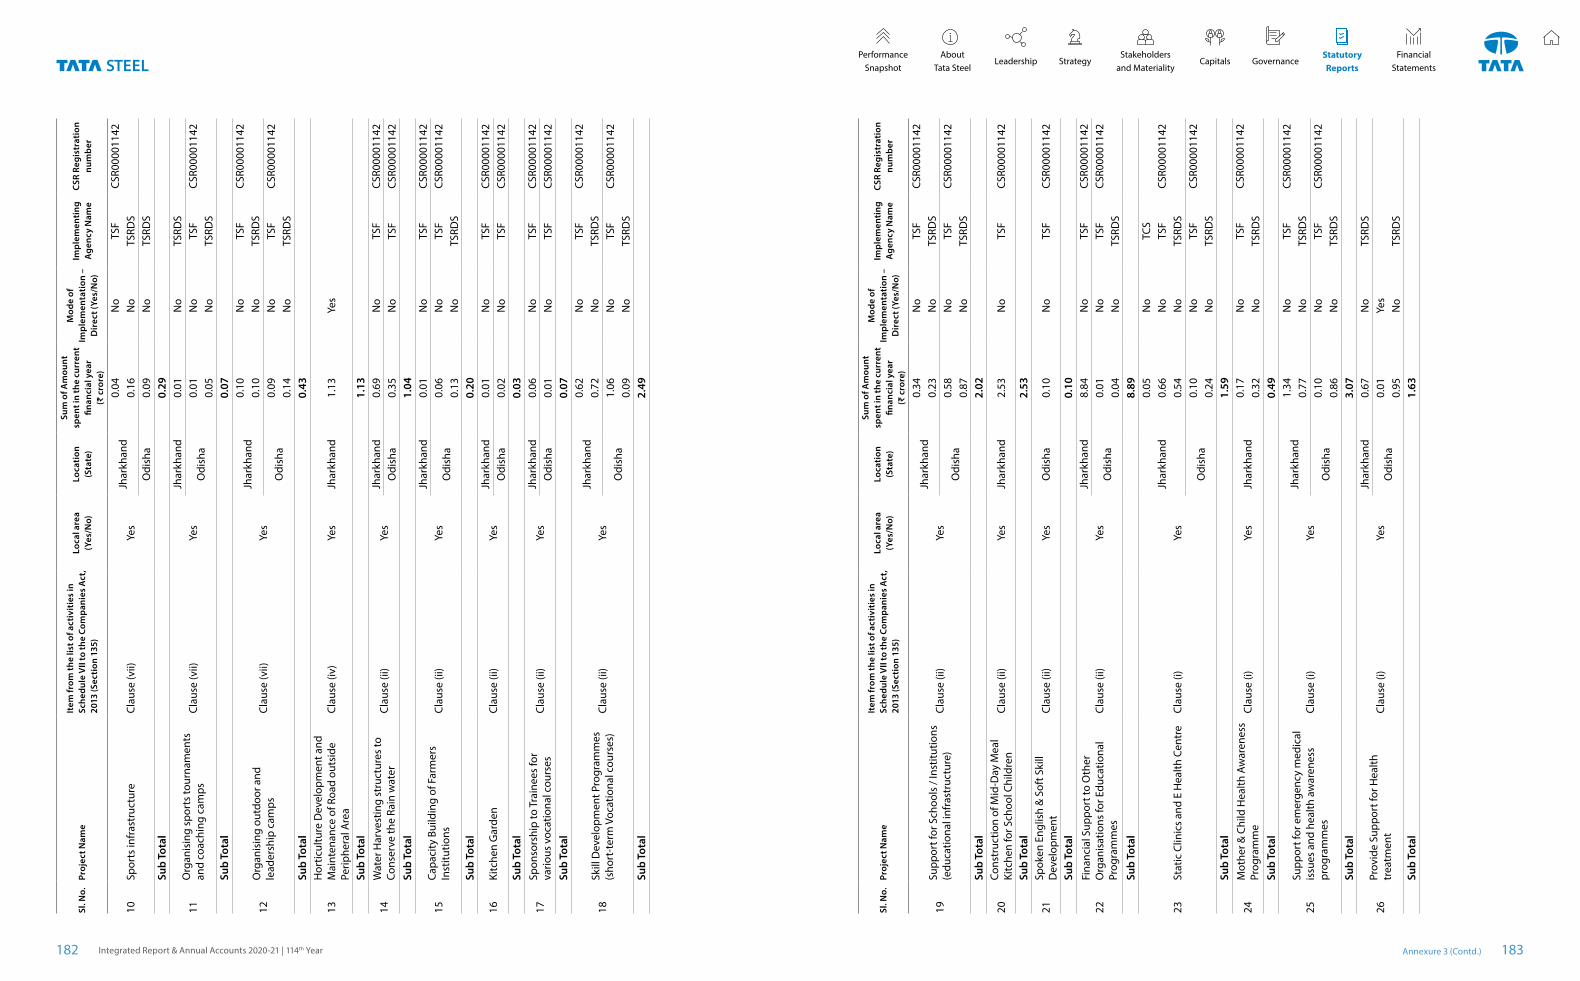
Sl. N
o.Pr
ojec
t Nam
eIt
em fr
om th
e lis
t of a
ctiv
itie
s in
Sc
hedu
le V
II to
the
Com
pani
es A
ct,
2013
(Sec
tion
135
)
Loca
l are
a
(Yes
/No)
Loca
tion
(S
tate
)
Sum
of A
mou
nt
spen
t in
the
curr
ent
finan
cial
yea
r (₹
cro
re)
Mod
e of
Im
plem
enta
tion
–
Dir
ect (
Yes/
No)
Impl
emen
ting
A
genc
y N
ame
CSR
Regi
stra
tion
nu
mbe
r
10Sp
orts
infr
astr
uctu
re
Clau
se (v
ii)
Yes
Jhar
khan
d0.
04N
oTS
FCS
R000
0114
20.
16N
oTS
RDS
Odi
sha
0.09
No
TSRD
SSu
b To
tal
0.29
11O
rgan
isin
g sp
orts
tour
nam
ents
an
d co
achi
ng c
amps
Cl
ause
(vii)
Ye
sJh
arkh
and
0.01
No
TSRD
S
Odi
sha
0.01
No
TSF
CSR0
0001
142
0.05
No
TSRD
SSu
b To
tal
0.07
12O
rgan
isin
g ou
tdoo
r and
le
ader
ship
cam
psCl
ause
(vii)
Ye
sJh
arkh
and
0.10
No
TSF
CSR0
0001
142
0.10
No
TSRD
S
Odi
sha
0.09
No
TSF
CSR0
0001
142
0.14
No
TSRD
SSu
b To
tal
0.43
13H
ortic
ultu
re D
evel
opm
ent a
nd
Mai
nten
ance
of R
oad
outs
ide
Perip
hera
l Are
a Cl
ause
(iv)
Ye
sJh
arkh
and
1.13
Yes
Sub
Tota
l1.
13
14W
ater
Har
vest
ing
stru
ctur
es to
Co
nser
ve th
e Ra
in w
ater
Clau
se (i
i) Ye
sJh
arkh
and
0.69
No
TSF
CSR0
0001
142
Odi
sha
0.35
No
TSF
CSR0
0001
142
Sub
Tota
l1.
04
15Ca
paci
ty B
uild
ing
of F
arm
ers
Inst
itutio
ns
Clau
se (i
i) Ye
sJh
arkh
and
0.01
No
TSF
CSR0
0001
142
Odi
sha
0.06
No
TSF
CSR0
0001
142
0.13
No
TSRD
SSu
b To
tal
0.20
16Ki
tche
n G
arde
nCl
ause
(ii)
Yes
Jhar
khan
d0.
01N
oTS
FCS
R000
0114
2O
dish
a0.
02N
oTS
FCS
R000
0114
2Su
b To
tal
0.03
17Sp
onso
rshi
p to
Tra
inee
s fo
r va
rious
voc
atio
nal c
ours
es
Clau
se (i
i) Ye
sJh
arkh
and
0.06
No
TSF
CSR0
0001
142
Odi
sha
0.01
No
TSF
CSR0
0001
142
Sub
Tota
l0.
07
18Sk
ill D
evel
opm
ent P
rogr
amm
es
(sho
rt-t
erm
Voc
atio
nal c
ours
es)
Clau
se (i
i) Ye
sJh
arkh
and
0.62
No
TSF
CSR0
0001
142
0.72
No
TSRD
S
Odi
sha
1.06
No
TSF
CSR0
0001
142
0.09
No
TSRD
SSu
b To
tal
2.49
Sl. N
o.Pr
ojec
t Nam
eIt
em fr
om th
e lis
t of a
ctiv
itie
s in
Sc
hedu
le V
II to
the
Com
pani
es A
ct,
2013
(Sec
tion
135
)
Loca
l are
a
(Yes
/No)
Loca
tion
(S
tate
)
Sum
of A
mou
nt
spen
t in
the
curr
ent
finan
cial
yea
r (₹
cro
re)
Mod
e of
Im
plem
enta
tion
–
Dir
ect (
Yes/
No)
Impl
emen
ting
A
genc
y N
ame
CSR
Regi
stra
tion
nu
mbe
r
19Su
ppor
t for
Sch
ools
/ In
stitu
tions
(e
duca
tiona
l inf
rast
ruct
ure)
Clau
se (i
i) Ye
sJh
arkh
and
0.34
No
TSF
CSR0
0001
142
0.23
No
TSRD
S
Odi
sha
0.58
No
TSF
CSR0
0001
142
0.87
No
TSRD
SSu
b To
tal
2.02
20Co
nstr
uctio
n of
Mid
-Day
Mea
l Ki
tche
n fo
r Sch
ool C
hild
ren
Clau
se (i
i) Ye
sJh
arkh
and
2.53
No
TSF
CSR0
0001
142
Sub
Tota
l2.
53
21Sp
oken
Eng
lish
& S
oft S
kill
Dev
elop
men
tCl
ause
(ii)
Yes
Odi
sha
0.10
No
TSF
CSR0
0001
142
Sub
Tota
l0.
10
22Fi
nanc
ial S
uppo
rt to
Oth
er
Org
anis
atio
ns fo
r Edu
catio
nal
Prog
ram
mes
Clau
se (i
i) Ye
sJh
arkh
and
8.84
No
TSF
CSR0
0001
142
Odi
sha
0.01
No
TSF
CSR0
0001
142
0.04
No
TSRD
SSu
b To
tal
8.89
23St
atic
Clin
ics
and
E H
ealth
Cen
tre
Clau
se (i
) Ye
sJh
arkh
and
0.05
No
TCS
0.66
No
TSF
CSR0
0001
142
0.54
No
TSRD
S
Odi
sha
0.10
No
TSF
CSR0
0001
142
0.24
No
TSRD
SSu
b To
tal
1.59
24M
othe
r & C
hild
Hea
lth A
war
enes
s Pr
ogra
mm
eCl
ause
(i)
Yes
Jhar
khan
d0.
17N
oTS
FCS
R000
0114
20.
32N
oTS
RDS
Sub
Tota
l0.
49
25Su
ppor
t for
em
erge
ncy
med
ical
is
sues
and
hea
lth a
war
enes
s pr
ogra
mm
esCl
ause
(i)
Yes
Jhar
khan
d1.
34N
oTS
FCS
R000
0114
20.
77N
oTS
RDS
Odi
sha
0.10
No
TSF
CSR0
0001
142
0.86
No
TSRD
SSu
b To
tal
3.07
26Pr
ovid
e Su
ppor
t for
Hea
lth
trea
tmen
tCl
ause
(i)
Yes
Jhar
khan
d0.
67N
oTS
RDS
Odi
sha
0.01
Yes
0.95
No
TSRD
SSu
b To
tal
1.63
Annexure 3 (Contd.)Integrated Report & Annual Accounts 2020-21 | 114th Year182 183
StatutoryReports
Stakeholders and Materiality
Performance Snapshot
About Tata Steel
Leadership Capitals GovernanceStrategyFinancial
Statements
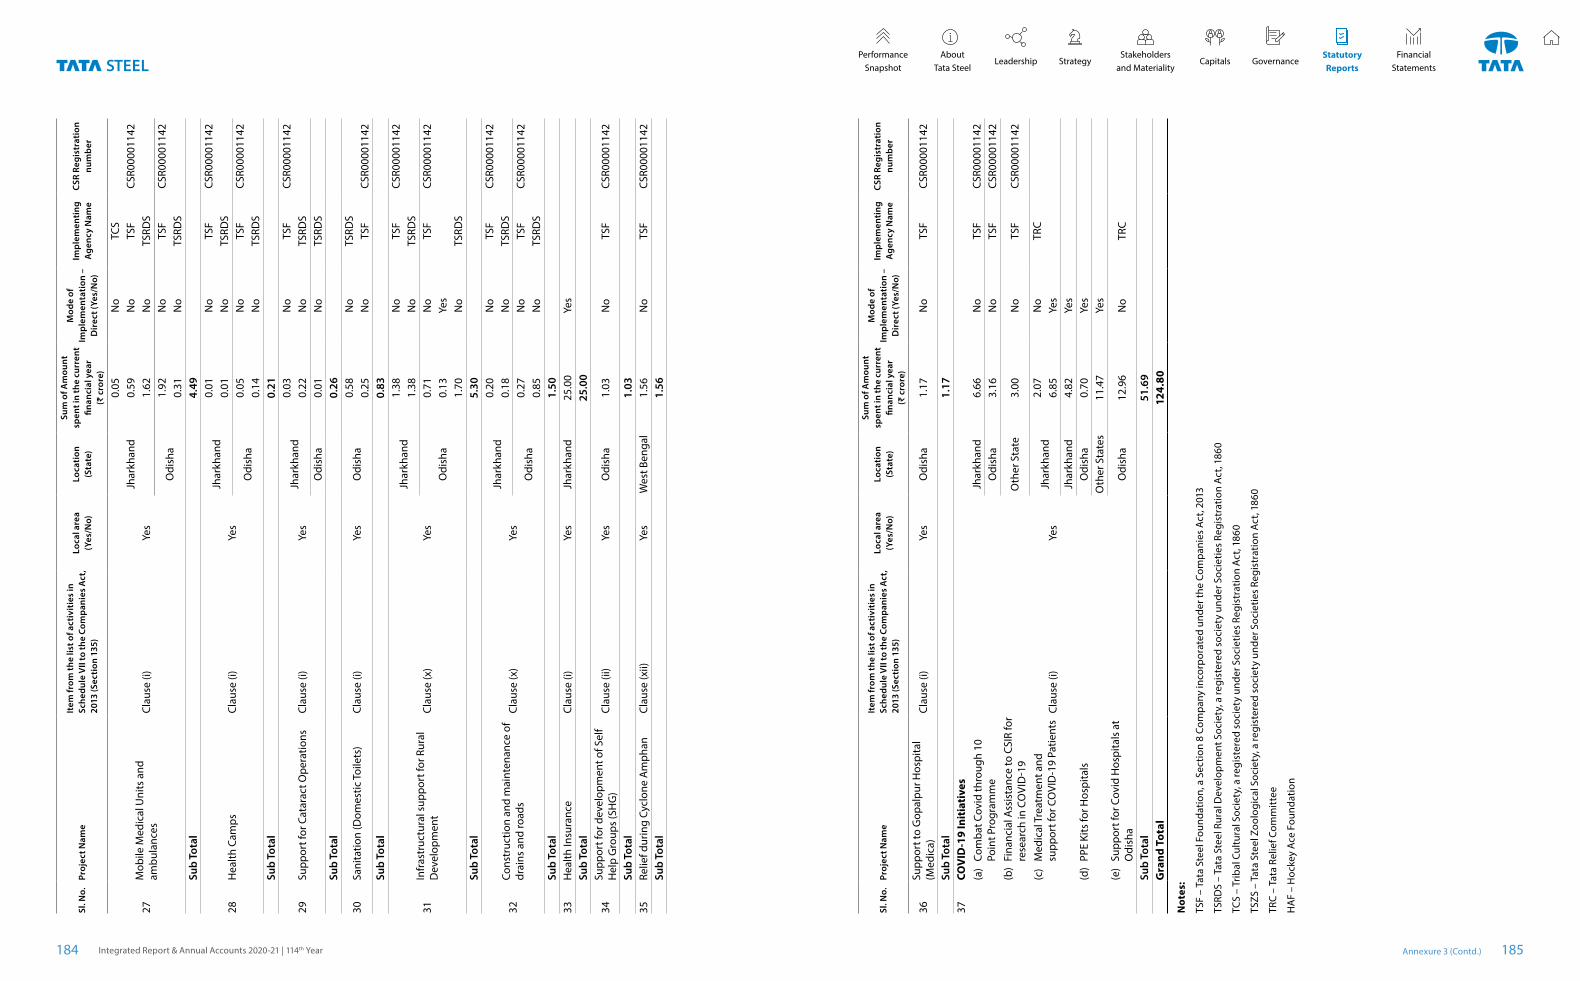
Sl. N
o.Pr
ojec
t Nam
eIt
em fr
om th
e lis
t of a
ctiv
itie
s in
Sc
hedu
le V
II to
the
Com
pani
es A
ct,
2013
(Sec
tion
135
)
Loca
l are
a
(Yes
/No)
Loca
tion
(S
tate
)
Sum
of A
mou
nt
spen
t in
the
curr
ent
finan
cial
yea
r (₹
cro
re)
Mod
e of
Im
plem
enta
tion
–
Dir
ect (
Yes/
No)
Impl
emen
ting
A
genc
y N
ame
CSR
Regi
stra
tion
nu
mbe
r
27M
obile
Med
ical
Uni
ts a
nd
ambu
lanc
esCl
ause
(i)
Yes
Jhar
khan
d0.
05N
oTC
S0.
59N
oTS
FCS
R000
0114
21.
62N
oTS
RDS
Odi
sha
1.92
No
TSF
CSR0
0001
142
0.31
No
TSRD
SSu
b To
tal
4.49
28H
ealth
Cam
psCl
ause
(i)
Yes
Jhar
khan
d0.
01N
oTS
FCS
R000
0114
20.
01N
oTS
RDS
Odi
sha
0.05
No
TSF
CSR0
0001
142
0.14
No
TSRD
SSu
b To
tal
0.21
29Su
ppor
t for
Cat
arac
t Ope
ratio
ns
Clau
se (i
) Ye
sJh
arkh
and
0.03
No
TSF
CSR0
0001
142
0.22
No
TSRD
SO
dish
a0.
01N
oTS
RDS
Sub
Tota
l0.
26
30Sa
nita
tion
(Dom
estic
Toile
ts)
Clau
se (i
) Ye
sO
dish
a0.
58N
oTS
RDS
0.25
No
TSF
CSR0
0001
142
Sub
Tota
l0.
83
31In
fras
truc
tura
l sup
port
for R
ural
D
evel
opm
ent
Clau
se (x
) Ye
s
Jhar
khan
d1.
38N
oTS
FCS
R000
0114
21.
38N
oTS
RDS
Odi
sha
0.71
No
TSF
CSR0
0001
142
0.13
Yes
1.70
No
TSRD
SSu
b To
tal
5.30
32Co
nstr
uctio
n an
d m
aint
enan
ce o
f dr
ains
and
road
s Cl
ause
(x)
Yes
Jhar
khan
d0.
20N
oTS
FCS
R000
0114
20.
18N
oTS
RDS
Odi
sha
0.27
No
TSF
CSR0
0001
142
0.85
No
TSRD
SSu
b To
tal
1.50
33H
ealth
Insu
ranc
eCl
ause
(i)
Yes
Jhar
khan
d25
.00
Yes
Sub
Tota
l25
.00
34Su
ppor
t for
dev
elop
men
t of S
elf
Hel
p G
roup
s (S
HG
)Cl
ause
(ii)
Yes
Odi
sha
1.03
No
TSF
CSR0
0001
142
Sub
Tota
l1.
0335
Relie
f dur
ing
Cycl
one
Am
phan
Clau
se (x
ii)
Yes
Wes
t Ben
gal
1.56
No
TSF
CSR0
0001
142
Sub
Tota
l1.
56
Sl. N
o.Pr
ojec
t Nam
eIt
em fr
om th
e lis
t of a
ctiv
itie
s in
Sc
hedu
le V
II to
the
Com
pani
es A
ct,
2013
(Sec
tion
135
)
Loca
l are
a
(Yes
/No)
Loca
tion
(S
tate
)
Sum
of A
mou
nt
spen
t in
the
curr
ent
finan
cial
yea
r (₹
cro
re)
Mod
e of
Im
plem
enta
tion
–
Dir
ect (
Yes/
No)
Impl
emen
ting
A
genc
y N
ame
CSR
Regi
stra
tion
nu
mbe
r
36Su
ppor
t to
Gop
alpu
r Hos
pita
l (M
edic
a)Cl
ause
(i)
Yes
Odi
sha
1.17
No
TSF
CSR0
0001
142
Sub
Tota
l1.
1737
COV
ID-1
9 In
itia
tive
s(a
) Co
mba
t Cov
id th
roug
h 10
Po
int P
rogr
amm
e
Clau
se (i
)Ye
s
Jhar
khan
d6.
66N
oTS
FCS
R000
0114
2O
dish
a3.
16N
oTS
FCS
R000
0114
2(b
) Fi
nanc
ial A
ssis
tanc
e to
CSI
R fo
r re
sear
ch in
CO
VID
-19
Oth
er S
tate
3.00
No
TSF
CSR0
0001
142
(c)
Med
ical
Tre
atm
ent a
nd
supp
ort f
or C
OVI
D-1
9 Pa
tient
sJh
arkh
and
2.07
No
TRC
6.85
Yes
(d)
PPE
Kits
for H
ospi
tals
Jhar
khan
d4.
82Ye
sO
dish
a0.
70Ye
sO
ther
Sta
tes
11.4
7Ye
s(e
) Su
ppor
t for
Cov
id H
ospi
tals
at
Odi
sha
Odi
sha
12.9
6N
oTR
C
Sub
Tota
l51
.69
Gra
nd T
otal
124.
80
Not
es:
TSF
– Ta
ta S
teel
Fou
ndat
ion,
a S
ectio
n 8
Com
pany
inco
rpor
ated
und
er th
e Co
mpa
nies
Act
, 201
3
TSRD
S –
Tata
Ste
el R
ural
Dev
elop
men
t Soc
iety
, a re
gist
ered
soc
iety
und
er S
ocie
ties
Regi
stra
tion
Act
, 186
0
TCS
– Tr
ibal
Cul
tura
l Soc
iety
, a re
gist
ered
soc
iety
und
er S
ocie
ties
Regi
stra
tion
Act
, 186
0
TSZS
– T
ata
Stee
l Zoo
logi
cal S
ocie
ty, a
regi
ster
ed s
ocie
ty u
nder
Soc
ietie
s Re
gist
ratio
n A
ct, 1
860
TRC
– Ta
ta R
elie
f Com
mit
tee
HA
F –
Hoc
key
Ace
Fou
ndat
ion
Annexure 3 (Contd.)Integrated Report & Annual Accounts 2020-21 | 114th Year184 185
StatutoryReports
Stakeholders and Materiality
Performance Snapshot
About Tata Steel
Leadership Capitals GovernanceStrategyFinancial
Statements
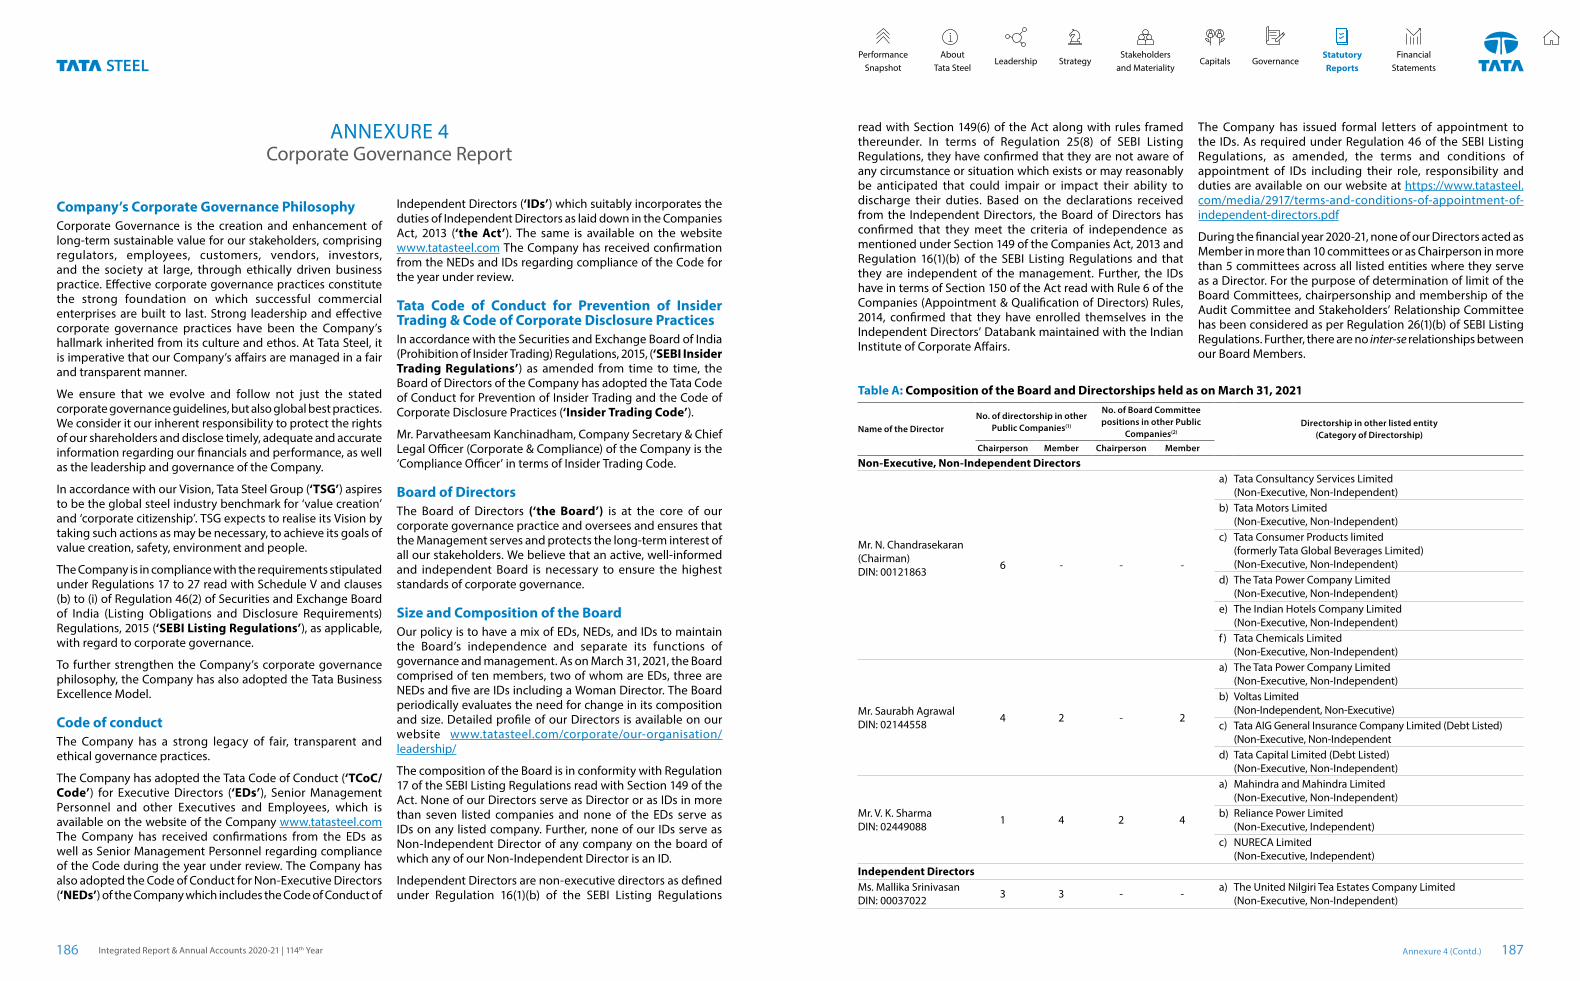
Company’s Corporate Governance PhilosophyCorporate Governance is the creation and enhancement of long-term sustainable value for our stakeholders, comprising regulators, employees, customers, vendors, investors, and the society at large, through ethically driven business practice. Effective corporate governance practices constitute the strong foundation on which successful commercial enterprises are built to last. Strong leadership and effective corporate governance practices have been the Company’s hallmark inherited from its culture and ethos. At Tata Steel, it is imperative that our Company’s affairs are managed in a fair and transparent manner.
We ensure that we evolve and follow not just the stated corporate governance guidelines, but also global best practices. We consider it our inherent responsibility to protect the rights of our shareholders and disclose timely, adequate and accurate information regarding our financials and performance, as well as the leadership and governance of the Company.
In accordance with our Vision, Tata Steel Group (‘TSG’) aspires to be the global steel industry benchmark for ‘value creation’ and ‘corporate citizenship’. TSG expects to realise its Vision by taking such actions as may be necessary, to achieve its goals of value creation, safety, environment and people.
The Company is in compliance with the requirements stipulated under Regulations 17 to 27 read with Schedule V and clauses (b) to (i) of Regulation 46(2) of Securities and Exchange Board of India (Listing Obligations and Disclosure Requirements) Regulations, 2015 (‘SEBI Listing Regulations’), as applicable, with regard to corporate governance.
To further strengthen the Company’s corporate governance philosophy, the Company has also adopted the Tata Business Excellence Model.
Code of conductThe Company has a strong legacy of fair, transparent and ethical governance practices.
The Company has adopted the Tata Code of Conduct (‘TCoC/ Code’) for Executive Directors (‘EDs’), Senior Management Personnel and other Executives and Employees, which is available on the website of the Company www.tatasteel.com The Company has received confirmations from the EDs as well as Senior Management Personnel regarding compliance of the Code during the year under review. The Company has also adopted the Code of Conduct for Non-Executive Directors (‘NEDs’) of the Company which includes the Code of Conduct of
ANNEXURE 4Corporate Governance Report
Independent Directors (‘IDs’) which suitably incorporates the duties of Independent Directors as laid down in the Companies Act, 2013 (‘the Act’). The same is available on the website www.tatasteel.com The Company has received confirmation from the NEDs and IDs regarding compliance of the Code for the year under review.
Tata Code of Conduct for Prevention of Insider Trading & Code of Corporate Disclosure PracticesIn accordance with the Securities and Exchange Board of India (Prohibition of Insider Trading) Regulations, 2015, (‘SEBI Insider Trading Regulations’) as amended from time to time, the Board of Directors of the Company has adopted the Tata Code of Conduct for Prevention of Insider Trading and the Code of Corporate Disclosure Practices (‘Insider Trading Code’).
Mr. Parvatheesam Kanchinadham, Company Secretary & Chief Legal Officer (Corporate & Compliance) of the Company is the ‘Compliance Officer’ in terms of Insider Trading Code.
Board of DirectorsThe Board of Directors (‘the Board’) is at the core of our corporate governance practice and oversees and ensures that the Management serves and protects the long-term interest of all our stakeholders. We believe that an active, well-informed and independent Board is necessary to ensure the highest standards of corporate governance.
Size and Composition of the BoardOur policy is to have a mix of EDs, NEDs, and IDs to maintain the Board’s independence and separate its functions of governance and management. As on March 31, 2021, the Board comprised of ten members, two of whom are EDs, three are NEDs and five are IDs including a Woman Director. The Board periodically evaluates the need for change in its composition and size. Detailed profile of our Directors is available on our website www.tatasteel.com/corporate/our-organisation/leadership/
The composition of the Board is in conformity with Regulation 17 of the SEBI Listing Regulations read with Section 149 of the Act. None of our Directors serve as Director or as IDs in more than seven listed companies and none of the EDs serve as IDs on any listed company. Further, none of our IDs serve as Non-Independent Director of any company on the board of which any of our Non-Independent Director is an ID.
Independent Directors are non-executive directors as defined under Regulation 16(1)(b) of the SEBI Listing Regulations
read with Section 149(6) of the Act along with rules framed thereunder. In terms of Regulation 25(8) of SEBI Listing Regulations, they have confirmed that they are not aware of any circumstance or situation which exists or may reasonably be anticipated that could impair or impact their ability to discharge their duties. Based on the declarations received from the Independent Directors, the Board of Directors has confirmed that they meet the criteria of independence as mentioned under Section 149 of the Companies Act, 2013 and Regulation 16(1)(b) of the SEBI Listing Regulations and that they are independent of the management. Further, the IDs have in terms of Section 150 of the Act read with Rule 6 of the Companies (Appointment & Qualification of Directors) Rules, 2014, confirmed that they have enrolled themselves in the Independent Directors’ Databank maintained with the Indian Institute of Corporate Affairs.
Table A: Composition of the Board and Directorships held as on March 31, 2021
Name of the DirectorNo. of directorship in other
Public Companies(1)
No. of Board Committee positions in other Public
Companies(2)Directorship in other listed entity
(Category of Directorship)Chairperson Member Chairperson Member
Non-Executive, Non-Independent Directors
Mr. N. Chandrasekaran(Chairman)DIN: 00121863 6 - - -
a) Tata Consultancy Services Limited (Non-Executive, Non-Independent)
b) Tata Motors Limited(Non-Executive, Non-Independent)
c) Tata Consumer Products limited (formerly Tata Global Beverages Limited)(Non-Executive, Non-Independent)
d) The Tata Power Company Limited(Non-Executive, Non-Independent)
e) The Indian Hotels Company Limited(Non-Executive, Non-Independent)
f ) Tata Chemicals Limited(Non-Executive, Non-Independent)
Mr. Saurabh AgrawalDIN: 02144558 4 2 - 2
a) The Tata Power Company Limited(Non-Executive, Non-Independent)
b) Voltas Limited(Non-Independent, Non-Executive)
c) Tata AIG General Insurance Company Limited (Debt Listed) (Non-Executive, Non-Independent
d) Tata Capital Limited (Debt Listed)(Non-Executive, Non-Independent)
Mr. V. K. SharmaDIN: 02449088 1 4 2 4
a) Mahindra and Mahindra Limited(Non-Executive, Non-Independent)
b) Reliance Power Limited(Non-Executive, Independent)
c) NURECA Limited(Non-Executive, Independent)
Independent DirectorsMs. Mallika SrinivasanDIN: 00037022 3 3 - - a) The United Nilgiri Tea Estates Company Limited
(Non-Executive, Non-Independent)
The Company has issued formal letters of appointment to the IDs. As required under Regulation 46 of the SEBI Listing Regulations, as amended, the terms and conditions of appointment of IDs including their role, responsibility and duties are available on our website at https://www.tatasteel.com/media/2917/terms-and-conditions-of-appointment-of-independent-directors.pdf
During the financial year 2020-21, none of our Directors acted as Member in more than 10 committees or as Chairperson in more than 5 committees across all listed entities where they serve as a Director. For the purpose of determination of limit of the Board Committees, chairpersonship and membership of the Audit Committee and Stakeholders’ Relationship Committee has been considered as per Regulation 26(1)(b) of SEBI Listing Regulations. Further, there are no inter-se relationships between our Board Members.
Annexure 4 (Contd.)Integrated Report & Annual Accounts 2020-21 | 114th Year186 187
StatutoryReports
Stakeholders and Materiality
Performance Snapshot
About Tata Steel
Leadership Capitals GovernanceStrategyFinancial
Statements
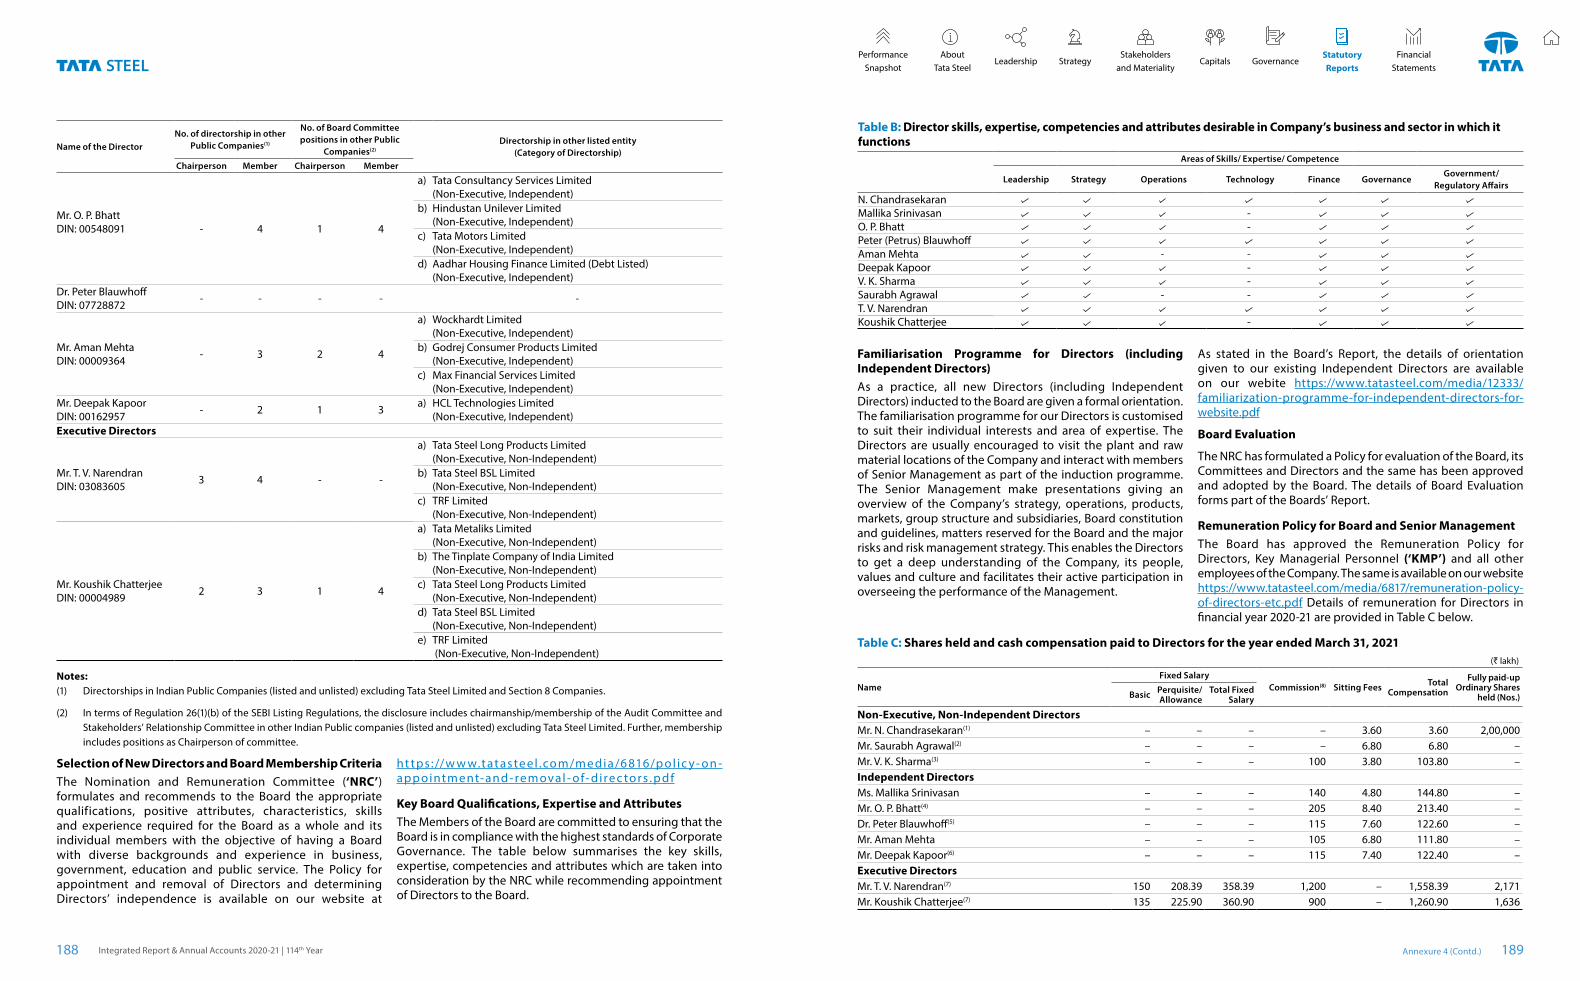
Name of the DirectorNo. of directorship in other
Public Companies(1)
No. of Board Committee positions in other Public
Companies(2)Directorship in other listed entity
(Category of Directorship)Chairperson Member Chairperson Member
Mr. O. P. BhattDIN: 00548091 - 4 1 4
a) Tata Consultancy Services Limited(Non-Executive, Independent)
b) Hindustan Unilever Limited (Non-Executive, Independent)
c) Tata Motors Limited (Non-Executive, Independent)
d) Aadhar Housing Finance Limited (Debt Listed)(Non-Executive, Independent)
Dr. Peter BlauwhoffDIN: 07728872 - - - - -
Mr. Aman Mehta DIN: 00009364 - 3 2 4
a) Wockhardt Limited (Non-Executive, Independent)
b) Godrej Consumer Products Limited (Non-Executive, Independent)
c) Max Financial Services Limited(Non-Executive, Independent)
Mr. Deepak KapoorDIN: 00162957 - 2 1 3 a) HCL Technologies Limited
(Non-Executive, Independent)Executive Directors
Mr. T. V. NarendranDIN: 03083605 3 4 - -
a) Tata Steel Long Products Limited (Non-Executive, Non-Independent)
b) Tata Steel BSL Limited(Non-Executive, Non-Independent)
c) TRF Limited(Non-Executive, Non-Independent)
Mr. Koushik ChatterjeeDIN: 00004989 2 3 1 4
a) Tata Metaliks Limited(Non-Executive, Non-Independent)
b) The Tinplate Company of India Limited (Non-Executive, Non-Independent)
c) Tata Steel Long Products Limited(Non-Executive, Non-Independent)
d) Tata Steel BSL Limited(Non-Executive, Non-Independent)
e) TRF Limited (Non-Executive, Non-Independent)
Notes:(1) Directorships in Indian Public Companies (listed and unlisted) excluding Tata Steel Limited and Section 8 Companies.
(2) In terms of Regulation 26(1)(b) of the SEBI Listing Regulations, the disclosure includes chairmanship/membership of the Audit Committee and Stakeholders’ Relationship Committee in other Indian Public companies (listed and unlisted) excluding Tata Steel Limited. Further, membership includes positions as Chairperson of committee.
Selection of New Directors and Board Membership CriteriaThe Nomination and Remuneration Committee (‘NRC’) formulates and recommends to the Board the appropriate qualifications, positive attributes, characteristics, skills and experience required for the Board as a whole and its individual members with the objective of having a Board with diverse backgrounds and experience in business, government, education and public service. The Policy for appointment and removal of Directors and determining Directors’ independence is available on our website at
ht tps : //w w w.t at as te e l .co m /m e dia /6 816/p o l ic y - o n -app ointm ent-and - removal - of- dire c tor s . p df
Key Board Qualifications, Expertise and AttributesThe Members of the Board are committed to ensuring that the Board is in compliance with the highest standards of Corporate Governance. The table below summarises the key skills, expertise, competencies and attributes which are taken into consideration by the NRC while recommending appointment of Directors to the Board.
Familiarisation Programme for Directors (including Independent Directors)As a practice, all new Directors (including Independent Directors) inducted to the Board are given a formal orientation. The familiarisation programme for our Directors is customised to suit their individual interests and area of expertise. The Directors are usually encouraged to visit the plant and raw material locations of the Company and interact with members of Senior Management as part of the induction programme. The Senior Management make presentations giving an overview of the Company’s strategy, operations, products, markets, group structure and subsidiaries, Board constitution and guidelines, matters reserved for the Board and the major risks and risk management strategy. This enables the Directors to get a deep understanding of the Company, its people, values and culture and facilitates their active participation in overseeing the performance of the Management.
As stated in the Board’s Report, the details of orientation given to our existing Independent Directors are available on our webite https://www.tatasteel.com/media/12333/familiarization-programme-for-independent-directors-for-website.pdf
Board Evaluation
The NRC has formulated a Policy for evaluation of the Board, its Committees and Directors and the same has been approved and adopted by the Board. The details of Board Evaluation forms part of the Boards’ Report.
Remuneration Policy for Board and Senior ManagementThe Board has approved the Remuneration Policy for Directors, Key Managerial Personnel (‘KMP’) and all other employees of the Company. The same is available on our website https://www.tatasteel.com/media/6817/remuneration-policy-of-directors-etc.pdf Details of remuneration for Directors in financial year 2020-21 are provided in Table C below.
Table C: Shares held and cash compensation paid to Directors for the year ended March 31, 2021 (` lakh)
NameFixed Salary
Commission(8) Sitting Fees Total Compensation
Fully paid-up Ordinary Shares
held (Nos.)Basic Perquisite/Allowance
Total Fixed Salary
Non-Executive, Non-Independent DirectorsMr. N. Chandrasekaran(1) – – – – 3.60 3.60 2,00,000Mr. Saurabh Agrawal(2) – – – – 6.80 6.80 –Mr. V. K. Sharma(3) – – – 100 3.80 103.80 –Independent DirectorsMs. Mallika Srinivasan – – – 140 4.80 144.80 –Mr. O. P. Bhatt(4) – – – 205 8.40 213.40 –Dr. Peter Blauwhoff(5) – – – 115 7.60 122.60 –Mr. Aman Mehta – – – 105 6.80 111.80 –Mr. Deepak Kapoor(6) – – – 115 7.40 122.40 –Executive DirectorsMr. T. V. Narendran(7) 150 208.39 358.39 1,200 – 1,558.39 2,171Mr. Koushik Chatterjee(7) 135 225.90 360.90 900 – 1,260.90 1,636
Table B: Director skills, expertise, competencies and attributes desirable in Company’s business and sector in which it functions
Areas of Skills/ Expertise/ Competence
Leadership Strategy Operations Technology Finance GovernanceGovernment/
Regulatory Affairs
N. ChandrasekaranMallika Srinivasan -O. P. Bhatt -Peter (Petrus) BlauwhoffAman Mehta - -Deepak Kapoor -V. K. Sharma -Saurabh Agrawal - -T. V. NarendranKoushik Chatterjee -
Annexure 4 (Contd.)Integrated Report & Annual Accounts 2020-21 | 114th Year188 189
StatutoryReports
Stakeholders and Materiality
Performance Snapshot
About Tata Steel
Leadership Capitals GovernanceStrategyFinancial
Statements
Notes:
(1) As a Policy, Mr. N. Chandrasekaran, Chairman has abstained from receiving commission from the Company.
(2) In line with the internal guidelines of the Company, no payment is made towards commission to the Non-Executive Directors of the Company, who are in full time employment with any other Tata Company. Accordingly, no commission is paid to Mr. Saurabh Agrawal.
(3) The sitting fees is paid to Mr. V. K. Sharma and the commission is paid to Life Insurance Corporation of India.
(4) Mr. O. P. Bhatt serves as an Independent Director of TSE. Towards this, he additionally receives an annual fee of £70,000 from TSE. The fee paid is consistent with the market practices and is aligned to the benchmark figures published by global consulting firms.
(5) Dr. Peter Blauwhoff serves as an Independent Director of TSE and as an Independent Chairman and Member of Supervisory Board of Tata Steel Nederland BV (‘TSN BV’). Towards this, he additionally receives an annual fee of £70,000 from TSE and annual Board fee of €80,000 plus expenses allowance of €1,500 from TSN BV. The fee paid is consistent with the market practices and is aligned to the benchmark figures published by global consulting firms.
(6) Mr. Deepak Kapoor serves as an Independent Director and as the Chairman of the Board of Tata Steel Minerals Canada (‘TSMC’). Towards this, he additionally receives an annual Board fee of CAD 13,000 and CAD 600/Board Meeting from TSMC.
(7) None of the Executive Directors are eligible for payment of any severance fees and the contracts with Executive Directors may be terminated by either party giving the other party six months’ notice or the Company paying six months’ remuneration in lieu thereof.
(8) Commission relates to the financial year ended March 31, 2021, which was approved by the Board on May 5, 2021 and will be paid during the financial year 2021-22.
(9) The Company does not have any stock options plan. Accordingly, none our Directors hold stock options as on March 31, 2021.
Board MeetingsScheduling and selection of agenda items for Board MeetingsTentative dates for Board Meetings in the ensuing financial year are decided in advance and communicated to the members of the Board. The information, as required under Regulation 17(7) read with Schedule II Part A of the SEBI Listing Regulations, is made available to the Board.
The Board meets at least once a quarter to review the quarterly financial results and other agenda items. Additional meetings are held when necessary. Committees of the Board usually meet the day before or on the day of the formal Board meeting, or whenever the need arises for transacting business. The
recommendations of the Committees are placed before the Board for necessary approval.
6 Board meetings were held during the financial year ended March 31, 2021. These were held on April 24, 2020, June 29, 2020, August 13, 2020, November 13, 2020, February 9, 2021 and March 24, 2021. The gap between any two Board meetings during the year under review did not exceed one hundred and twenty days. The requisite quorum was present for all the meetings.
Table D: Attendance details of Directors for the year ended March 31, 2021 are given below:
Name of the Director CategoryNo. of Meetings
held during tenure
No. of Meetings Attended
Mr. N. Chandrasekaran (Chairman) NED 6 6
Mr. Saurabh Agrawal NED 6 6Mr. V. K. Sharma NED 6 6Ms. Mallika Srinivasan ID 6 6Mr. O. P. Bhatt ID 6 6Dr. Peter Blauwhoff ID 6 6Mr. Aman Mehta ID 6 6Mr. Deepak Kapoor ID 6 6Mr. T. V. Narendran ED 6 6Mr. Koushik Chatterjee ED 6 6
All the Directors were present at the Annual General Meeting of the Company held on Thursday, August 20, 2020.
Due to the exceptional circumstances caused by the COVID-19 pandemic and consequent relaxations granted by MCA and SEBI, all meetings in FY 2020-21 were held through Video Conferencing (‘VC’).
Meeting of the Independent Directors Pursuant to Schedule IV of the Act, the Independent Directors met on June 27, 2020 and March 24, 2021 without the presence of Non-Independent Directors and Members of the Management. The meetings of Independent Directors were chaired by Ms. Mallika Srinivasan, Independent Director and Chairperson of the Nomination and Remuneration Committee.
The Independent Directors, inter alia, evaluated the performance of the Non-Independent Directors and the Board of Directors as a whole, evaluated the performance of the Chairman of the Board after taking into account the views of Executive and Non-Executive Directors and discussed aspects relating to the quality, quantity and timeliness of the flow of information between the Company, the Management and the Board.
Board Committees Audit CommitteeThe primary objective of the Audit Committee is to monitor and provide an effective supervision of the Management’s financial
reporting process, to ensure accurate and timely disclosures, with the highest levels of transparency, integrity and quality of financial reporting. The Committee oversees the work carried out in the financial reporting process by the Management, the internal auditor, the statutory auditor and the cost auditor and notes the processes and safeguards deployed by each of them. The Committee further reviews the processes and controls including compliance with laws, Tata Code of Conduct and Insider Trading Code, Whistle-Blower Policies and related cases thereto. The Committee also reviews matters under the Prevention of Sexual Harassment at Workplace Policy.
The Board of Directors of the Company adopted the Audit Committee Charter (which includes terms of reference as provided under the Act and SEBI Listing Regulations) on March 31, 2015 which was revised on March 2, 2017 and February 8, 2019.
The Company Secretary and Chief Legal Officer (Corporate & Compliance) acts as the Secretary to the Committee. The internal auditor reports functionally to the Audit Committee. The Executive Directors and Senior Management of the Company also attend the meetings as invitee.
8 meetings of the Committee were held during the year ended March 31, 2021. These meetings were held on April 7, 2020, May 22, 2020, June 20, 2020, June 28, 2020, August 13, 2020, October 1, 2020, November 13, 2020, and February 9, 2021. The requisite quorum was present for all the meetings. All the decisions at the Audit Committee meetings were taken unanimously.
Table E: The composition of the Committee and the attendance details of the Members for the year ended March 31, 2021 are given below:
Name of the Members CategoryNo. of Meetings
held during tenure
No. of Meetings Attended
Mr. O.P. Bhatt (Chairperson) ID 8 8
Mr. Aman Mehta ID 8 8Dr. Peter Blauwhoff ID 8 7Mr. Deepak Kapoor ID 8 8Mr. Saurabh Agrawal NED 8 8
Mr. O. P. Bhatt, Chairperson of the Audit Committee was present at the AGM of the Company held on Thursday, August 20, 2020.
Nomination and Remuneration CommitteeThe purpose of the Nomination and Remuneration Committee (‘NRC’) is to oversee the Company’s nomination process including succession planning for the senior management & the Board and specifically to assist the Board in identifying, screening and reviewing individuals qualified to serve as Executive Directors, Non-Executive Directors and Independent Directors consistent with the criteria as stated by the Board in
its Policy on Appointment and Removal of Directors. The NRC and the Board periodically reviews the succession planning process of the Company and is satisfied that the Company has adequate process for orderly succession of Board Members and Members of the Senior Management.
The Board has adopted the NRC Charter (which includes terms of reference as provided under the Act and SEBI Listing Regulations for the functioning of the Committee on May 20, 2015 which was revised on March 29, 2019, basis the amendments in SEBI Listing Regulations.
The NRC also assists the Board in discharging its responsibilities relating to compensation of the Company’s Executive Directors and Senior Management. The Committee has formulated Remuneration Policy for Directors, KMPs and all other employees of the Company and the same is available on Company’s website at https://www.tatasteel.com/media/6817/remuneration-policy-of-directors-etc.pdf The criteria for making payments to Non-Executive Directors is available on our website at https://www.tatasteel.com/investors/corporate-governance/compliance/ The Committee has the overall responsibility of approving and evaluating the compensation plans, policies and programmes for Executive Directors and the Senior Management. The Committee reviews and recommends to the Board for its approval, the base salary, incentives / commission, other benefits, compensation or arrangements and executive employment agreements for the Executive Directors.
4 meetings of the Committee were held during the year ended March 31, 2021. These meetings were held on June 19, 2020, June 28, 2020, March 24, 2021, and March 30, 2021. The requisite quorum was present for all the meetings.
Table F: The composition of the Committee and the attendance details of the Members for the year ended March 31, 2021 are given below:
Name of the Members CategoryNo. of Meetings
held during tenure
No. of Meetings Attended
Ms. Mallika Srinivasan (Chairperson) ID 4 4
Mr. O. P. Bhatt ID 4 4Mr. N. Chandrasekaran NED 4 3
Ms. Mallika Srinivasan, Chairperson of the NRC was present at the AGM of the Company held on Thursday, August 20, 2020.
Corporate Social Responsibility and Sustainability CommitteeThe purpose of our Corporate Social Responsibility and Sustainability (‘CSR&S’) Committee is to formulate and recommend to the Board, a Corporate Social Responsibility Policy, which shall indicate the initiatives to be undertaken by the Company, recommend the amount of expenditure the Company should incur on Corporate Social Responsibility
Annexure 4 (Contd.)Integrated Report & Annual Accounts 2020-21 | 114th Year190 191
StatutoryReports
Stakeholders and Materiality
Performance Snapshot
About Tata Steel
Leadership Capitals GovernanceStrategyFinancial
Statements
(‘CSR’) activities and to monitor from time to time the CSR activities and Policy of the Company. The Committee provides guidance in formulation of CSR strategy and its implementation and also reviews practices and principles to foster sustainable growth of the Company by creating values consistent with long-term preservation and enhancement of financial, manufacturing, natural, social, intellectual and human capital.
The Board has approved a Charter for the functioning of the Committee, on March 31, 2015, which was last reviewed on March 2, 2017.
The CSR policy is available on our website at https://www.tatasteel.com/media/11804/tata-steel-csr-policy-latest-2019.pdf
4 meetings of the Committee were held during the year ended March 31, 2021. These meetings were held on June 20, 2020, October 20, 2020, December 18, 2020, and February 8, 2021. The requisite quorum was present for all the meetings.
Table G: The composition of the Committee and the attendance details of the Members for the year ended March 31, 2021 are given below:
Name of the Members CategoryNo. of Meetings
held during tenure
No. of Meetings Attended
Mr. Deepak Kapoor (Chairperson) ID 4 4
Mr. O. P. Bhatt ID 4 3Mr. T. V. Narendran ED 4 4Mr. Koushik Chatterjee ED 4 4
Mr. Deepak Kapoor, Chairperson of CSR&S Committee was present at the AGM of the Company held on Thursday, August 20, 2020.
Risk Management CommitteeThe Company has constituted a Risk Management Committee (‘RMC’) for framing, implementing and monitoring the risk management policy of the Company. The Committee assists the Board in fulfilling its oversight responsibility with respect to Enterprise Risk Management.
The terms of reference of the RMC are:
a) Overseeing key risks, including strategic, financial, operational, IT (including cyber security) and compliance risks.
b) Assisting the Board in framing, implementing and monitoring the risk management plan for the Company and reviewing and guiding the Risk Policy.
c) Developing risk management policy and risk management system / framework for the Company.
The Board has adopted a Charter for RMC on May 20, 2015, which was revised on November 13, 2020.
3 meetings of the Committee were held during the year ended March 31, 2021. These meetings were held on June 19, 2020, October 21, 2020, and February 8, 2021. The requisite quorum was present for all the meetings.
Table H: The composition of the Committee and the attendance details of the Members for the year ended March 31, 2021 are given below:
Name of the Members CategoryNo. of Meetings
held during tenure
No. of Meetings Attended
Mr. Aman Mehta (Chairperson) ID 3 3
Dr. Peter Blauwhoff ID 3 3Mr. Saurabh Agrawal NED 3 3Mr. T. V. Narendran ED 3 3Mr. Koushik Chatterjee ED 3 3Dr. Henrik Adam MoM 3 3Mr. Sandip Biswas MoM 3 3Ms. Samita Shah(1) MoM 1 1
MoM – Member of Management
1. Ms. Samita Shah was appointed as the Member of RMC effective November 13, 2020.
Stakeholders’ Relationship CommitteeThe Stakeholders’ Relationship Committee (‘SRC’) considers and resolves the grievances of our shareholders, debenture holders and other security holders, including complaints relating to non-receipt of annual report, transfer and transmission of securities, non-receipt of dividends / interests, issue of new / duplicate certificates, general meetings and such other grievances as may be raised by the security holders from time to time.
The Committee also reviews:
a) Measures taken for effective exercise of voting rights by Shareholders;
b) Service standards adopted by the Company in respect of services redered by our Registrars & Transfer Agent;
c) Measures rendered and initiatives taken for reducing quantum of unclaimed dividends and ensuring timely receipt of dividend / annual report / notices and other information by Shareholders.
The Board has adopted a Charter (which includes terms of reference as provided under the Act and SEBI Listing Regulations) for the functioning of the SRC on April 11, 2014 which was revised on February 8, 2019.
2 meetings of the Committee were held during the year ended March 31, 2021. These meetings were held on March 9, 2021 and March 24, 2021. The requisite quorum was present for the meetings.
Table I: The composition of the Committee and the attendance details of the Members for the year ended March 31, 2021 are given below:
Name of the Members CategoryNo. of Meetings
held during tenure
No. of Meetings Attended
Mr. V. K. Sharma (Chairperson) NED 2 2
Mr. Deepak Kapoor ID 2 2Mr. T. V. Narendran ED 2 2Mr. Koushik Chatterjee ED 2 2
Mr. V. K. Sharma, Chairperson of Committee was present at the AGM of the Company held on Thursday, August 20, 2020.
In terms of Regulation 6 and Schedule V of the SEBI Listing Regulations, the Board has appointed Mr. Parvatheesam Kanchinadham, Company Secretary & Chief Legal Officer (Corporate & Compliance) as the Compliance Officer of the Company.
The details of investor complaints received and resolved during the financial year ended March 31, 2021 are given in Table J below. The complaints relate to non-receipt of annual report, dividend, share transfers and other investor grievances.
Table J: Details of investor complaints received and resolved during the year ended March 31, 2021:Opening as on April 1, 2020 0Received during the year 142Resolved during the year 141Closing as on March 31, 2021 1
Safety, Health and Environment CommitteeThe Safety, Health and Environment Committee of the Board oversees the policies relating to Safety, Health and Environment and their implementation across Tata Steel Group.
The Board has approved a Charter for the functioning of the Committee on October 27, 2009.
3 meetings of the Committee were held during the year ended March 31, 2021. These meetings were held on June 18, 2020, October 20, 2020, and February 8, 2021. The requisite quorum was present for all the meetings.
Table K: The composition of the Committee and the attendance details of the Members for the year ended March 31, 2021 are given below:
Name of the Members CategoryNo. of Meetings
held during tenure
No. of Meetings Attended
Dr. Peter Blauwhoff (Chairperson) ID 3 3
Ms. Mallika Srinivasan ID 3 2Mr. V. K. Sharma NED 3 3Mr. T. V. Narendran ED 3 3Dr. Henrik Adam MoM 3 3
MoM – Member of Management
General Information for ShareholdersGeneral Body Meetings
Table L: Location and time, where last three AGMs were held:
financial year Ended
Date Time Venue Special Resolution(s) Passed
March 31, 2020 August 20, 2020
3:00 p.m. (IST)
The Meeting was held through two-way video-conferencing
-
March 31, 2019 July 19, 2019Birla Matushri Sabhagar,19, Sir VithaldasThackersey Marg,Mumbai – 400 020.
(i) Re–appointment of Ms. Mallika Srinivasan (DIN: 00037022) as an Independent Director of the Company.
(ii) Re–appointment of Mr. O.P. Bhatt (DIN: 00548091) as an Independent Director of the Company.
March 31, 2018 July 20, 2018 Issue of Non-Convertible Debentures on private placement basis not exceeding ₹12,000 crore
None of the businesses proposed to be transacted at the ensuing AGM requires passing of a Special Resolution by way of Postal Ballot. No Extraordinary General Meeting was held during the past 3 years. No other special Resolution(s) requiring a Postal Ballot was passed last year except as mentioned below:
Annexure 4 (Contd.)Integrated Report & Annual Accounts 2020-21 | 114th Year192 193
StatutoryReports
Stakeholders and Materiality
Performance Snapshot
About Tata Steel
Leadership Capitals GovernanceStrategyFinancial
Statements
Special Resolution passed at the Meeting of the equity shareholders of the Company, convened under the directions of the Hon’ble National Company Law Tribunal, Mumbai Bench:As per the directions of the Hon’ble National Company Law Tribunal, Mumbai Bench (‘Hon’ble Tribunal’) vide its order dated February 20, 2020 in the Company Scheme Application No. CA(CAA)3083/MB/2019 and the orders dated January 11, 2021, January 19, 2021 and February 5, 2021 in the Company Application No. 1056/2020, a Meeting of the equity shareholders of the Company was convened. The details of the Meeting are given below:Type of meeting Date Time Venue Resolution
Meeting convened pursuant to the directions of the Hon’ble National Company Law Tribunal, Mumbai Bench
March 26, 2021 11.00 a.m. (IST)The Meeting was held through two-way video-conferencing
Approval of the Composite Scheme of Amalgamation of Bamnipal Steel Limited and Tata Steel BSL Limited (formerly known as Bhushan Steel Limited) into and with Tata Steel Limited (‘Scheme of Amalgamation’)
Postal Ballot and Remote e-voting:During the year, pursuant to Sections 230(4) read with Sections 108 and 110 of the Act read with Rules 20 and 22 of the Companies (Management and Administration) Rules, 2014 as amended, Rule 6(3)(xi) of the Companies (Compromises, Arrangements and Amalgamations) Rules, 2016, Regulation 44 and other applicable provisions of the SEBI Listing Regulations, and Circular No. CFD/DIL3/CIR/2017/21 dated March 10, 2017, issued by the SEBI, each as amended from time to time, (to the extent applicable) the Company had provided the facility of postal ballot and remote e-voting (prior to as well as during the Meeting) for obtaining the approval of the Members of the Company on the Scheme of Amalgamation.
The Hon’ble Tribunal had appointed Mr. P. N. Parikh, (Membership No. FCS 327 and CP No. 1228), or failing him, Ms. Jigyasa Ved (Membership No. FCS 6488 and CP No. 6018), or failing her, Mr. Mitesh Dhabliwala (Membership No. FCS 8331 and CP No. 9511) of M/s. Parikh & Associates, Practicing Company Secretaries as Scrutinizer for the Meeting, including any adjournments thereof as well as Scrutinizer for the process of postal ballot and remote e-voting (prior to as well as during the Meeting).
The Company had sent the Notice dated February 19, 2021 together with the Explanatory Statement, to the Members only through electronic mode i.e. to those Members whose e-mail addresses were registered with the Company / RTA / Depositories. Voting rights were reckoned on the paid-up value of the equity share capital of the Company as on the close of business hours on the Cut-Off Date i.e. Friday, February 12, 2021 as per the Register of Members / Register of Beneficial Owners as furnished by the Registrar and Transfer Agents / Depositories. The voting period for remote e-voting as well as postal ballot commenced on Wednesday, February 24, 2021 at 9.00 a.m. (IST) and ended on Thursday, March 25, 2021 at 5.00 p.m. (IST) and the e-voting platform was disabled thereafter. The consolidated report on the result of the remote e-voting / postal ballot and remote e-voting at the Meeting in respect of the resolution for approving the Scheme of Amalgamation was provided by the Scrutinizer on March 26, 2021.
The details of Voting on the above resolution passed by votes cast by way of postal ballot and remote e-voting (prior to as well as during the Meeting) are as under:Resolution Type Number and percentage of Votes
Assent % Dissent %
Resolution passed by majority of persons representing three-fourth in value as per the Act 82,36,86,663 99.99 45,407 0.01
Resolution passed by Public Shareholders as per SEBI Circular dated March 10, 2017 43,96,87,826 99.99 45,407 0.01
The special resolution was passed with requisite majority.
Details of special resolution proposed to be conducted through postal ballot:
None of the businesses proposed to be transacted at the ensuing AGM requires passing of a special resolution through postal ballot.
Table M: Annual General Meeting 2021:
Day & Date Wednesday, June 30, 2021Time 3:00 p.m. (IST)Venue In view of the continuing COVID-19 pandemic, the Ministry of Corporate Affairs (‘MCA’) has vide its circular dated
May 5, 2020 read with circulars dated April 8, 2020, April 13, 2020, and January 13, 2021 (collectively referred to as ‘MCA Circulars’) and SEBI Circular dated May 12, 2020 and January 15, 2021 (collectively referred to as ‘SEBI Circulars’) permitted the holding of the Annual General Meeting through video-conferencing / other audio-visual means (‘VC / OAVM’), without the physical presence of the Members at a common venue. In compliance with the provisions of the Act, MCA Circulars and SEBI Circulars, the AGM of the Company is being held through VC / OAVM. The deemed venue of the AGM shall be Bombay Hosue, 24, Homi Mody Street, Fort, Mumbai - 400 001
financial year April 1 to March 31Book Closure Dates Saturday, June 19, 2021 to Wednesday, June 30, 2021 (both days inclusive)Dividend Payment Date On and from, July 2, 2021, (subject to approval of the Shareholders at the AGM)
Communication to the ShareholdersThe Company sends quarterly, half-yearly, and yearly financial results to our Shareholders electronically. Key financial data is published in The Indian Express, Financial Express, Nav Shakti, Free Press Journal and Loksatta. The financial results along with the earnings releases are also posted on the Company’s website www.tatasteel.com
Earnings calls on financials / quarterly results are held with analysts and investors and their transcripts are published on the website. Such presentations made to analysts and others are also made available on the Company’s website www.tatasteel.com
All disclosures as required under the SEBI Listing Regulations are made through the respective Stock Exchanges where the securities of the Company are listed. The same are also available on the Company’s website www.tatasteel.com
The Company’s website is a comprehensive reference on it’s leadership, management, vision, mission, policies, corporate governance, sustainability, investor relations, products and processes and updates and news. The section on ‘Investors’ serves to inform the Shareholders, by giving complete financial details, stock exchange compliances including shareholding patterns and updated credit ratings amongst others, corporate benefits, information relating to Stock Exchanges, details of Registrars & Transfer Agent and frequently asked questions. Investors can also submit their queries by submitting ‘Shareholder Query Form’ and get feedback online. The section on ‘Media’ includes all major press reports and releases, awards and campaigns by the Company, amongst others.
Investor grievance and share transfer systemThe Company has a Board-level Stakeholders’ Relationship Committee to examine and redress investors’ complaints. The status on complaints and share transfers are reported to the entire Board.
As per Regulation 40 of SEBI Listing Regulations, as amended, securities of listed companies can be transferred only in
dematerialised form with effect from, April 1, 2019, except in case of request received for transmission or transposition and relodged transfers of securities. Further, SEBI vide its circular no. SEBI/HO/MIRSD/RTAMB/CIR/P/2020/236 dated December 2, 2020 had fixed March 31, 2021 as the cut-off date for re-lodgement of transfer deeds and the shares that are re-lodged for transfer shall be issued only in demat mode. In view of this and to eliminate all risks associated with physical shares and for ease of portfolio management, members holding shares in physical form are requested to consider converting their holdings to dematerialised form.
Share transactions in electronic form can be effected in a much simpler and faster manner. After a confirmation of a sale / purchase transaction from the broker, shareholders should approach the Depository Participant (‘DP’) with a request to debit or credit the account for the transaction. The DP will immediately arrange to complete the transaction by updating the account.
Shareholders should communicate with TSR Darashaw Consultants Private Limited (formerly TSR Darashaw Limited), the Company’s Registrars and Transfer Agent (‘RTA’) quoting their folio number or Depository Participant ID (‘DP ID’) and Client ID number, for any queries relating to their securities.
Details of non-complianceThe Company has complied with the requirements of the Stock Exchanges, SEBI and other statutory authorities on all matters relating to capital markets during the last three years and no penalties and / or strictures have been imposed on the Company in this regard. There has been no instance of non-compliance with any legal requirements particularly with any requirement of the Corporate Governance Report, during the year under review.
During the year under review, the Company did not raise any funds through preferential allotment or qualified institutions placement as specified under Regulation 32(7A) of the SEBI Listing Regulations. However, during the year under review,
Annexure 4 (Contd.)Integrated Report & Annual Accounts 2020-21 | 114th Year194 195
StatutoryReports
Stakeholders and Materiality
Performance Snapshot
About Tata Steel
Leadership Capitals GovernanceStrategyFinancial
Statements
the Company has issued several Non-Convertible Debentures (‘NCDs’) on private placement basis, listed on debt market segment of BSE Limited. The Company affirms that there has been no deviation or variation in utilisation of proceeds of the listed NCDs of the Company.
Further, during the year under review, the Company made the first and final call on the partly paid-up ordinary shares. The Company affirms that there has been no deviation or variation in utilisation of proceeds of the call money.
On account of the first and final call made on the partly paid-up ordinary shares of the Company, the said securities listed on the National Stock Exchange of India Limited and BSE Limited under symbol TATASTLPP and Scrip Code 891044, respectively, stand suspended from trading with effect from February 17, 2021.
Certificates from Practising Company SecretariesAs required under Regulation 34(3) and Schedule V, Part E of the SEBI Listing Regulations, the certificate given by Parikh & Associates (Firm Registration No. P1988MH009800), Practicing Company Secretaries regarding compliance of conditions of corporate governance, is annexed to this report.
As required under Clause 10 (i) of Part C under Schedule V of the SEBI Listing Regulations, the Company has received a certificate from Parikh & Associates (Firm Registration No. P1988MH009800), Practicing Company Secretaries certifying that none of our Directors have been debarred or disqualified from being appointed or continuing as Directors of the Company by SEBI or MCA or such other statutory authority.
CEO and CFO certificationAs required by Regulation 17(8) read with Schedule II Part B of the SEBI Listing Regulations, the Chief Executive Officer & Managing Director and Executive Director & Chief Financial Officer have given appropriate certifications to the Board of Directors.
Half-yearly Certificate on Security TransferIn terms of Regulation 40(9) and 61(4) of the SEBI Listing Regulations, certificates, on half-yearly basis, have been issued by a Company Secretary in Practice with respect to due compliance of share and security transfer formalities by the Company.
Reconciliation of Share Capital AuditThe Company Secretary in Practice carried out a Reconciliation of Share Capital Audit to reconcile the total admitted capital with National Securities Depository Limited (‘NSDL’) and Central Depository Services (India) Limited (‘CDSL’) (collectively ‘Depositories’) and the total issued and listed capital. The Audit confirms that the total paid-up capital is in agreement with the aggregate of the total number of shares in physical form and in dematerialised form (held with Depositories).
The Audit Report is disseminated to the Stock Exchanges on quarterly basis and is also available on our website https://www.tatasteel.com/investors/stock-exchange-compliances/reconciliation-of-share-capital-audit-reports/
Related Party TransactionsAll transactions entered into with related parties as defined under the Act and Regulation 23 of the SEBI Listing Regulations, each as amended, during the year under review were on an arm’s length price basis and in the ordinary course of business. These have been approved by the Audit Committee. Certain transactions which were repetitive in nature were approved through omnibus route by the Audit Committee. The Company has not entered into any materially significant related party transaction. The policy on Related Party Transactions as approved by the Board of Directors from time to time is uploaded on the Company’s website at https://www.tatasteel.com/media/5891/policy-on-related-party-transactions.pdf
During the financial year 2020-21, the Company did not have any material pecuniary relationship or transactions with Non-Executive Directors apart from paying Director’s remuneration. Further, the Directors have not entered into any contracts with the Company or its subsidiaries, which will be in material conflict with the interest of the Company.
The Board has received disclosures from KMPs and Members of Senior Management confirming that there have been no material, financial and commercial transactions with the Company where they and / or their relatives have personal interest.
Policy for Determining Material SubsidiariesThe Company has formulated a Policy for Determining Material Subsidiaries and the same is available on the Company’s website https://www.tatasteel.com/media/5890/policy-on-determining-material-subsidiaries.pdf During the year, the Company did not have any Indian unlisted material subsidiary. The Company is in compliance with the provisions governing material subsidiaries.
Vigil MechanismThe Vigil Mechanism approved by the Board provides a formal mechanism for all Directors, employees and vendors of the Company to approach the Chairman of the Audit Committee of the Company and make protective disclosures regarding the unethical behaviour, actual or suspected fraud or violation of the Company’s Code of Conduct. Under the Policy, in addition, Directors, employees, and vendors, may approach the Chief Ethics Counsellor to make any such protected disclosure. During the year under review, no person has been denied access to the Chairman of the Audit Committee. Details of the Vigil Mechanism are given in the Board’s Report.
The Whistle-Blower Policy for Directors and Employees is available on the Company’s website at https://www.tatasteel.com/corporate/our-organisation/policies/
Disclosures as per the Sexual Harassment of Women at Workplace (Prevention, Prohibition and Redressal) Act, 2013The disclosure regarding the complaints of sexual harassment are given in the Board’s Report.
Consolidated Fees paid to Statutory AuditorsDuring the financial year 2020-21, the total fees for all services paid by the Company and its subsidiaries, on a consolidated basis, to Price Waterhouse & Co Chartered Accountants LLP, Statutory Auditors of the Company is as under:
Table N: Consolidated fees paid to statutory auditors:(₹ crore)
Particulars Amount
As auditors (Statutory Audit) 43.51For taxation matters 1.07For other services 7.97Out-of-pocket expenses 0.76Total 53.31
Dematerialisation of shares and liquidityThe Company’s Ordinary Shares are tradable compulsorily in electronic form. We have established connectivity with both the depositories, i.e. NSDL and CDSL. The International Securities Identification Number (‘ISIN’) allotted to the Fully paid-up and Partly paid-up Ordinary Shares under the Depository System are INE081A01012 and IN9081A01010 respectively.
The Board of Directors of the Company at its meeting held on February 9, 2021 approved making of the First and Final Call of ₹461/- (comprising ₹7.496 towards face value and ₹453.504 towards securities premium) per partly paid-up equity share (‘First and Final Call’), in respect of 7,76,36,788 outstanding partly paid-up equity shares of face value ₹10 each, issued by the Company, on a rights basis, pursuant to the Letter of Offer dated January 22, 2018. The Record Date for the purpose of determining the holders of partly paid-up equity shares was set as February 19, 2021. The Partly paid-up shares were suspended from trading with effect from February 17, 2021. On March 24, 2021, 7,02,49,241 partly paid-up equity shares, on which the first and final call money was received pursuant to the First and Final Call, were converted to fully paid-up equity shares of the Company. The outstanding partly paid-up shares (PPS) of the Company post conversion were 73,87,547.
The Company has 1,18,92,48,935 Ordinary Shares (including fully paid-up and partly paid-up Ordinary Shares) representing 98.76% of the Company’s share capital which is dematerialised as on March 31, 2021.
Further, outstanding GDR Shares 1,00,14,395 (March 31, 2020: 1,25,61,401) of face value ₹10 per share represent the shares underlying GDRs which were issued during 1994 and 2010. Each GDR represents one underlying fully paid-up Ordinary Share.
Designated e-mail address for investor servicesTo serve the investors better and as required under Regulation 46(2)(j) of the SEBI Listing Regulations, the designated e-mail address for investor complaints is [email protected] The e-mail address for grievance redressal is monitored by the Company’s Compliance Officer.
Investor AwarenessAs part of good governance, we have provided subscription facilities to our investors, for alerts regarding press release, results, webcasts, analyst meets and presentations amongst others. We also provide our investors the facility to write queries regarding their rights and shareholdings and have provided details of persons to be contacted for this purpose. We encourage investors to visit our website for reading the documents and for availing the above facilities at www.tatasteel.com
Legal proceedings in respect of title of sharesThere are certain pending cases related to disputes over title to shares in which the Company has been made a party. However, these cases are not material in nature.
Commodity price riskCommodities are essential inputs to the manufacturing of steel. The dynamic geo-political landscape and climate change issues cause unpredictability in commodity outputs leading to volatility in commodity prices. This is an inherent market risk for the Company as it impacts the profitability and cash flows. However, steel prices, follow the trend of commodity prices, over a period which is a natural hedge to the business.
The Company meets 100% of its iron ore requirements in India, through its captive iron ore mines and about a quarter of its coking coal requirements from its coal mines. These captive mines provide a structural hedge to the price risk of these commodities.
The Company has a dedicated commodity sourcing team which engages with key raw material producers across the globe and the commodity market at large to optimise sourcing. The team has identified the risk of single geography sourcing and undertakes periodic risk assessment of the supply chain. The team proactively works on diversification of vendors, geographies, development of substitutes & new products, Vendor Managed Inventory and Value-In-Use (‘VIU’) optimisation framework to mitigate the impact of single geography sourcing and other disruptions in the
Annexure 4 (Contd.)Integrated Report & Annual Accounts 2020-21 | 114th Year196 197
StatutoryReports
Stakeholders and Materiality
Performance Snapshot
About Tata Steel
Leadership Capitals GovernanceStrategyFinancial
Statements
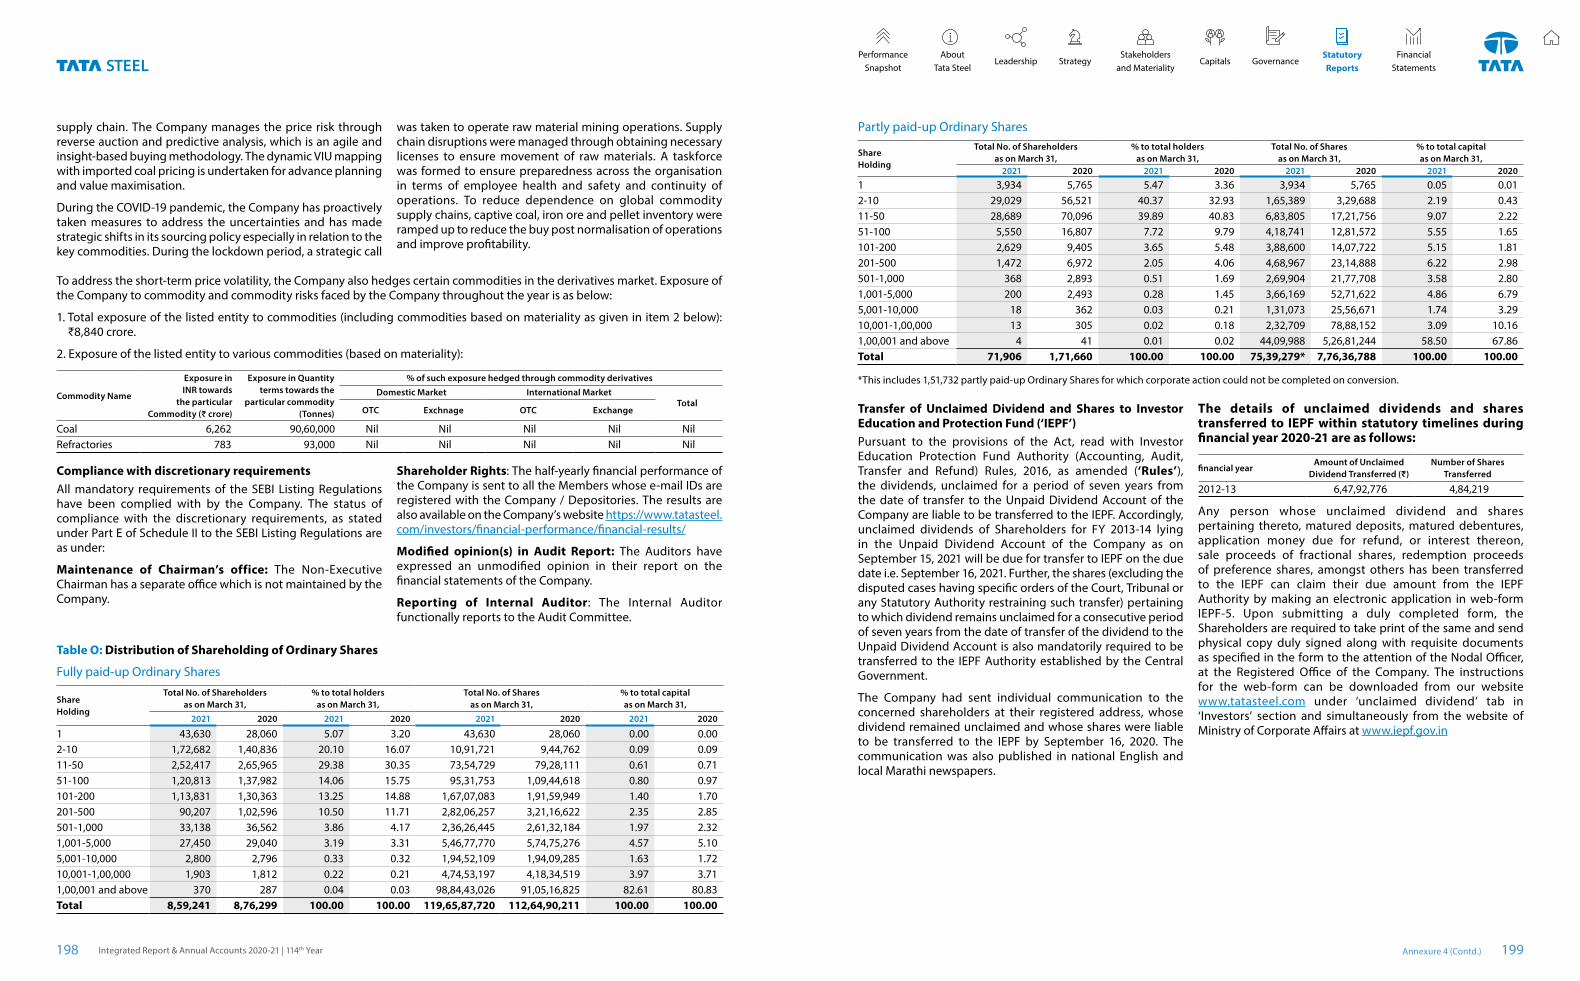
supply chain. The Company manages the price risk through reverse auction and predictive analysis, which is an agile and insight-based buying methodology. The dynamic VIU mapping with imported coal pricing is undertaken for advance planning and value maximisation.
During the COVID-19 pandemic, the Company has proactively taken measures to address the uncertainties and has made strategic shifts in its sourcing policy especially in relation to the key commodities. During the lockdown period, a strategic call
To address the short-term price volatility, the Company also hedges certain commodities in the derivatives market. Exposure of the Company to commodity and commodity risks faced by the Company throughout the year is as below:
1. Total exposure of the listed entity to commodities (including commodities based on materiality as given in item 2 below): ₹8,840 crore.
2. Exposure of the listed entity to various commodities (based on materiality):
Commodity Name
Exposure in INR towards
the particular Commodity (₹ crore)
Exposure in Quantity terms towards the
particular commodity (Tonnes)
% of such exposure hedged through commodity derivatives
Domestic Market International MarketTotal
OTC Exchnage OTC Exchange
Coal 6,262 90,60,000 Nil Nil Nil Nil NilRefractories 783 93,000 Nil Nil Nil Nil Nil
was taken to operate raw material mining operations. Supply chain disruptions were managed through obtaining necessary licenses to ensure movement of raw materials. A taskforce was formed to ensure preparedness across the organisation in terms of employee health and safety and continuity of operations. To reduce dependence on global commodity supply chains, captive coal, iron ore and pellet inventory were ramped up to reduce the buy post normalisation of operations and improve profitability.
Compliance with discretionary requirementsAll mandatory requirements of the SEBI Listing Regulations have been complied with by the Company. The status of compliance with the discretionary requirements, as stated under Part E of Schedule II to the SEBI Listing Regulations are as under:
Maintenance of Chairman’s office: The Non-Executive Chairman has a separate office which is not maintained by the Company.
Shareholder Rights: The half-yearly financial performance of the Company is sent to all the Members whose e-mail IDs are registered with the Company / Depositories. The results are also available on the Company’s website https://www.tatasteel.com/investors/financial-performance/financial-results/
Modified opinion(s) in Audit Report: The Auditors have expressed an unmodified opinion in their report on the financial statements of the Company.
Reporting of Internal Auditor: The Internal Auditor functionally reports to the Audit Committee.
Table O: Distribution of Shareholding of Ordinary Shares
Fully paid-up Ordinary Shares
ShareHolding
Total No. of Shareholders as on March 31,
% to total holders as on March 31,
Total No. of Shares as on March 31,
% to total capital as on March 31,
2021 2020 2021 2020 2021 2020 2021 2020
1 43,630 28,060 5.07 3.20 43,630 28,060 0.00 0.002-10 1,72,682 1,40,836 20.10 16.07 10,91,721 9,44,762 0.09 0.0911-50 2,52,417 2,65,965 29.38 30.35 73,54,729 79,28,111 0.61 0.7151-100 1,20,813 1,37,982 14.06 15.75 95,31,753 1,09,44,618 0.80 0.97101-200 1,13,831 1,30,363 13.25 14.88 1,67,07,083 1,91,59,949 1.40 1.70201-500 90,207 1,02,596 10.50 11.71 2,82,06,257 3,21,16,622 2.35 2.85501-1,000 33,138 36,562 3.86 4.17 2,36,26,445 2,61,32,184 1.97 2.321,001-5,000 27,450 29,040 3.19 3.31 5,46,77,770 5,74,75,276 4.57 5.105,001-10,000 2,800 2,796 0.33 0.32 1,94,52,109 1,94,09,285 1.63 1.7210,001-1,00,000 1,903 1,812 0.22 0.21 4,74,53,197 4,18,34,519 3.97 3.711,00,001 and above 370 287 0.04 0.03 98,84,43,026 91,05,16,825 82.61 80.83Total 8,59,241 8,76,299 100.00 100.00 119,65,87,720 112,64,90,211 100.00 100.00
Partly paid-up Ordinary Shares
ShareHolding
Total No. of Shareholders as on March 31,
% to total holders as on March 31,
Total No. of Shares as on March 31,
% to total capital as on March 31,
2021 2020 2021 2020 2021 2020 2021 2020
1 3,934 5,765 5.47 3.36 3,934 5,765 0.05 0.012-10 29,029 56,521 40.37 32.93 1,65,389 3,29,688 2.19 0.4311-50 28,689 70,096 39.89 40.83 6,83,805 17,21,756 9.07 2.2251-100 5,550 16,807 7.72 9.79 4,18,741 12,81,572 5.55 1.65101-200 2,629 9,405 3.65 5.48 3,88,600 14,07,722 5.15 1.81201-500 1,472 6,972 2.05 4.06 4,68,967 23,14,888 6.22 2.98501-1,000 368 2,893 0.51 1.69 2,69,904 21,77,708 3.58 2.801,001-5,000 200 2,493 0.28 1.45 3,66,169 52,71,622 4.86 6.795,001-10,000 18 362 0.03 0.21 1,31,073 25,56,671 1.74 3.2910,001-1,00,000 13 305 0.02 0.18 2,32,709 78,88,152 3.09 10.161,00,001 and above 4 41 0.01 0.02 44,09,988 5,26,81,244 58.50 67.86Total 71,906 1,71,660 100.00 100.00 75,39,279* 7,76,36,788 100.00 100.00
*This includes 1,51,732 partly paid-up Ordinary Shares for which corporate action could not be completed on conversion.
Transfer of Unclaimed Dividend and Shares to Investor Education and Protection Fund (‘IEPF’)Pursuant to the provisions of the Act, read with Investor Education Protection Fund Authority (Accounting, Audit, Transfer and Refund) Rules, 2016, as amended (‘Rules’), the dividends, unclaimed for a period of seven years from the date of transfer to the Unpaid Dividend Account of the Company are liable to be transferred to the IEPF. Accordingly, unclaimed dividends of Shareholders for FY 2013-14 lying in the Unpaid Dividend Account of the Company as on September 15, 2021 will be due for transfer to IEPF on the due date i.e. September 16, 2021. Further, the shares (excluding the disputed cases having specific orders of the Court, Tribunal or any Statutory Authority restraining such transfer) pertaining to which dividend remains unclaimed for a consecutive period of seven years from the date of transfer of the dividend to the Unpaid Dividend Account is also mandatorily required to be transferred to the IEPF Authority established by the Central Government.
The Company had sent individual communication to the concerned shareholders at their registered address, whose dividend remained unclaimed and whose shares were liable to be transferred to the IEPF by September 16, 2020. The communication was also published in national English and local Marathi newspapers.
The details of unclaimed dividends and shares transferred to IEPF within statutory timelines during financial year 2020-21 are as follows:
financial yearAmount of Unclaimed
Dividend Transferred (₹)Number of Shares
Transferred
2012-13 6,47,92,776 4,84,219
Any person whose unclaimed dividend and shares pertaining thereto, matured deposits, matured debentures, application money due for refund, or interest thereon, sale proceeds of fractional shares, redemption proceeds of preference shares, amongst others has been transferred to the IEPF can claim their due amount from the IEPF Authority by making an electronic application in web-form IEPF-5. Upon submitting a duly completed form, the Shareholders are required to take print of the same and send physical copy duly signed along with requisite documents as specified in the form to the attention of the Nodal Officer, at the Registered Office of the Company. The instructions for the web-form can be downloaded from our website www.tatasteel.com under ‘unclaimed dividend’ tab in ‘Investors’ section and simultaneously from the website of Ministry of Corporate Affairs at www.iepf.gov.in
Annexure 4 (Contd.)Integrated Report & Annual Accounts 2020-21 | 114th Year198 199
StatutoryReports
Stakeholders and Materiality
Performance Snapshot
About Tata Steel
Leadership Capitals GovernanceStrategyFinancial
Statements
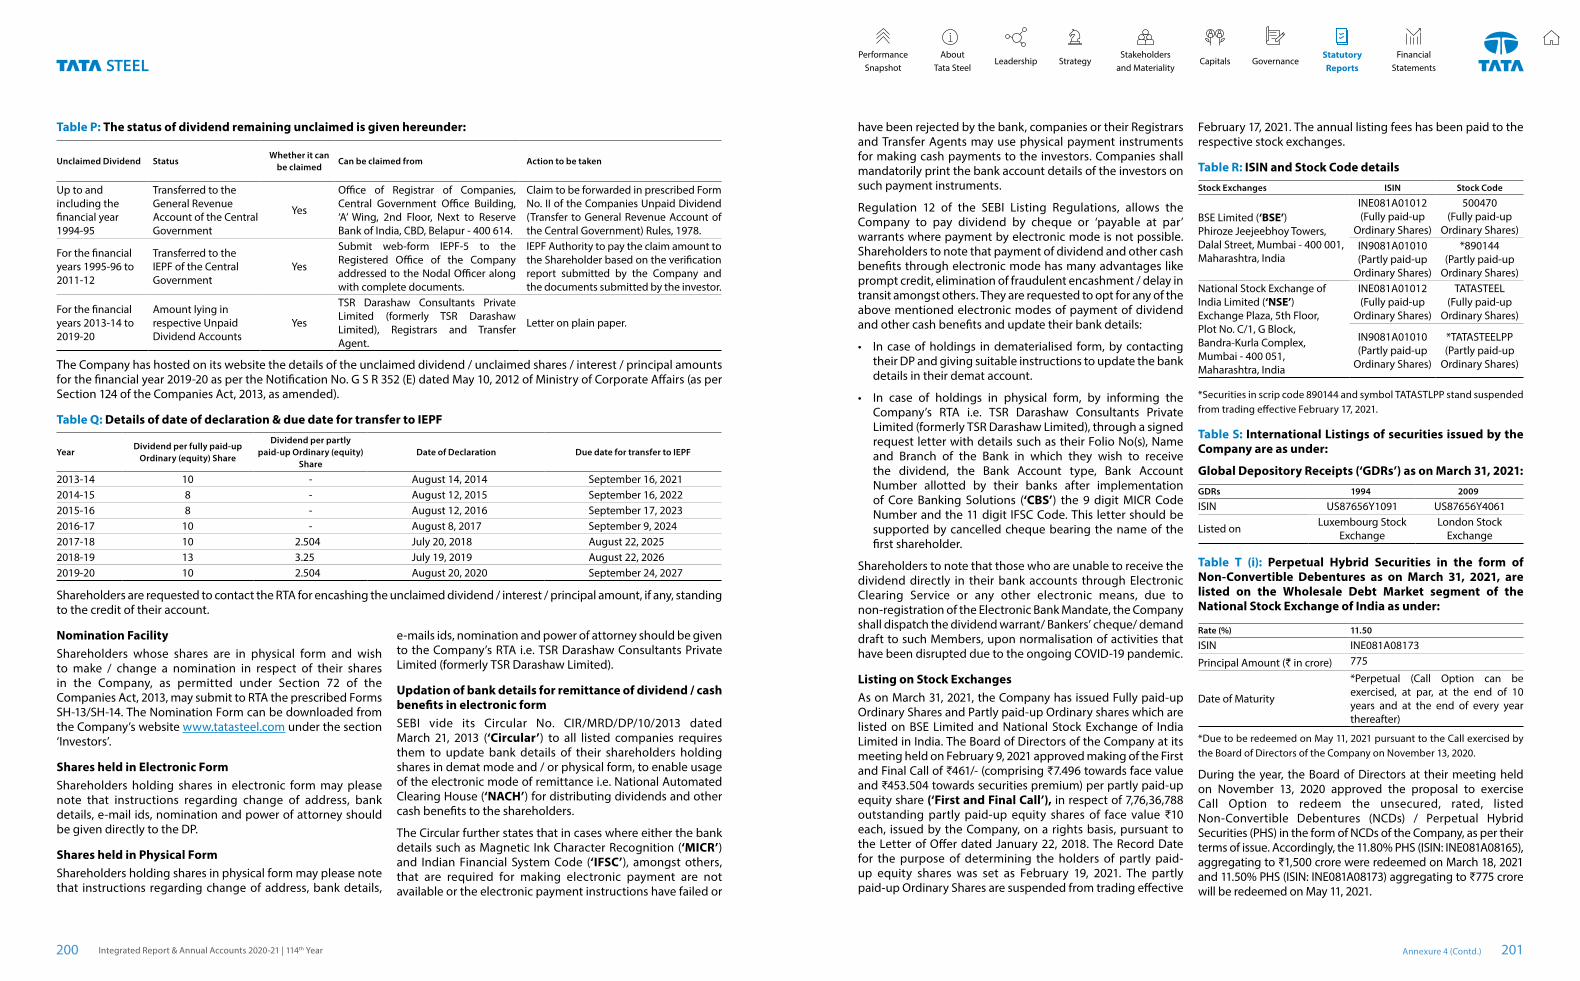
Table P: The status of dividend remaining unclaimed is given hereunder:
Unclaimed Dividend StatusWhether it can
be claimedCan be claimed from Action to be taken
Up to and including the financial year 1994-95
Transferred to the General Revenue Account of the Central Government
Yes
Office of Registrar of Companies, Central Government Office Building, ‘A’ Wing, 2nd Floor, Next to Reserve Bank of India, CBD, Belapur - 400 614.
Claim to be forwarded in prescribed Form No. II of the Companies Unpaid Dividend (Transfer to General Revenue Account of the Central Government) Rules, 1978.
For the financial years 1995-96 to 2011-12
Transferred to the IEPF of the Central Government
Yes
Submit web-form IEPF-5 to the Registered Office of the Company addressed to the Nodal Officer along with complete documents.
IEPF Authority to pay the claim amount to the Shareholder based on the verification report submitted by the Company and the documents submitted by the investor.
For the financial years 2013-14 to 2019-20
Amount lying in respective Unpaid Dividend Accounts
Yes
TSR Darashaw Consultants Private Limited (formerly TSR Darashaw Limited), Registrars and Transfer Agent.
Letter on plain paper.
The Company has hosted on its website the details of the unclaimed dividend / unclaimed shares / interest / principal amounts for the financial year 2019-20 as per the Notification No. G S R 352 (E) dated May 10, 2012 of Ministry of Corporate Affairs (as per Section 124 of the Companies Act, 2013, as amended).
Table Q: Details of date of declaration & due date for transfer to IEPF
YearDividend per fully paid-up
Ordinary (equity) Share
Dividend per partly paid-up Ordinary (equity)
ShareDate of Declaration Due date for transfer to IEPF
2013-14 10 - August 14, 2014 September 16, 20212014-15 8 - August 12, 2015 September 16, 20222015-16 8 - August 12, 2016 September 17, 20232016-17 10 - August 8, 2017 September 9, 20242017-18 10 2.504 July 20, 2018 August 22, 20252018-19 13 3.25 July 19, 2019 August 22, 20262019-20 10 2.504 August 20, 2020 September 24, 2027
Shareholders are requested to contact the RTA for encashing the unclaimed dividend / interest / principal amount, if any, standing to the credit of their account.
Nomination FacilityShareholders whose shares are in physical form and wish to make / change a nomination in respect of their shares in the Company, as permitted under Section 72 of the Companies Act, 2013, may submit to RTA the prescribed Forms SH-13/SH-14. The Nomination Form can be downloaded from the Company’s website www.tatasteel.com under the section ‘Investors’.
Shares held in Electronic FormShareholders holding shares in electronic form may please note that instructions regarding change of address, bank details, e-mail ids, nomination and power of attorney should be given directly to the DP.
Shares held in Physical FormShareholders holding shares in physical form may please note that instructions regarding change of address, bank details,
e-mails ids, nomination and power of attorney should be given to the Company’s RTA i.e. TSR Darashaw Consultants Private Limited (formerly TSR Darashaw Limited).
Updation of bank details for remittance of dividend / cash benefits in electronic formSEBI vide its Circular No. CIR/MRD/DP/10/2013 dated March 21, 2013 (‘Circular’) to all listed companies requires them to update bank details of their shareholders holding shares in demat mode and / or physical form, to enable usage of the electronic mode of remittance i.e. National Automated Clearing House (‘NACH’) for distributing dividends and other cash benefits to the shareholders.
The Circular further states that in cases where either the bank details such as Magnetic Ink Character Recognition (‘MICR’) and Indian Financial System Code (‘IFSC’), amongst others, that are required for making electronic payment are not available or the electronic payment instructions have failed or
have been rejected by the bank, companies or their Registrars and Transfer Agents may use physical payment instruments for making cash payments to the investors. Companies shall mandatorily print the bank account details of the investors on such payment instruments.
Regulation 12 of the SEBI Listing Regulations, allows the Company to pay dividend by cheque or ‘payable at par’ warrants where payment by electronic mode is not possible. Shareholders to note that payment of dividend and other cash benefits through electronic mode has many advantages like prompt credit, elimination of fraudulent encashment / delay in transit amongst others. They are requested to opt for any of the above mentioned electronic modes of payment of dividend and other cash benefits and update their bank details:
• In case of holdings in dematerialised form, by contacting their DP and giving suitable instructions to update the bank details in their demat account.
• In case of holdings in physical form, by informing the Company’s RTA i.e. TSR Darashaw Consultants Private Limited (formerly TSR Darashaw Limited), through a signed request letter with details such as their Folio No(s), Name and Branch of the Bank in which they wish to receive the dividend, the Bank Account type, Bank Account Number allotted by their banks after implementation of Core Banking Solutions (‘CBS’) the 9 digit MICR Code Number and the 11 digit IFSC Code. This letter should be supported by cancelled cheque bearing the name of the first shareholder.
Shareholders to note that those who are unable to receive the dividend directly in their bank accounts through Electronic Clearing Service or any other electronic means, due to non-registration of the Electronic Bank Mandate, the Company shall dispatch the dividend warrant/ Bankers’ cheque/ demand draft to such Members, upon normalisation of activities that have been disrupted due to the ongoing COVID-19 pandemic.
Listing on Stock ExchangesAs on March 31, 2021, the Company has issued Fully paid-up Ordinary Shares and Partly paid-up Ordinary shares which are listed on BSE Limited and National Stock Exchange of India Limited in India. The Board of Directors of the Company at its meeting held on February 9, 2021 approved making of the First and Final Call of ₹461/- (comprising ₹7.496 towards face value and ₹453.504 towards securities premium) per partly paid-up equity share (‘First and Final Call’), in respect of 7,76,36,788 outstanding partly paid-up equity shares of face value ₹10 each, issued by the Company, on a rights basis, pursuant to the Letter of Offer dated January 22, 2018. The Record Date for the purpose of determining the holders of partly paid-up equity shares was set as February 19, 2021. The partly paid-up Ordinary Shares are suspended from trading effective
February 17, 2021. The annual listing fees has been paid to the respective stock exchanges.
Table R: ISIN and Stock Code detailsStock Exchanges ISIN Stock Code
BSE Limited (‘BSE’)Phiroze Jeejeebhoy Towers,Dalal Street, Mumbai - 400 001,Maharashtra, India
INE081A01012(Fully paid-up
Ordinary Shares)
500470(Fully paid-up
Ordinary Shares)IN9081A01010(Partly paid-up
Ordinary Shares)
*890144(Partly paid-up
Ordinary Shares)National Stock Exchange of India Limited (‘NSE’)Exchange Plaza, 5th Floor, Plot No. C/1, G Block, Bandra-Kurla Complex,Mumbai - 400 051, Maharashtra, India
INE081A01012(Fully paid-up
Ordinary Shares)
TATASTEEL(Fully paid-up
Ordinary Shares)
IN9081A01010(Partly paid-up
Ordinary Shares)
*TATASTEELPP(Partly paid-up
Ordinary Shares)
*Securities in scrip code 890144 and symbol TATASTLPP stand suspended from trading effective February 17, 2021.
Table S: International Listings of securities issued by the Company are as under:
Global Depository Receipts (‘GDRs’) as on March 31, 2021:
GDRs 1994 2009
ISIN US87656Y1091 US87656Y4061
Listed on Luxembourg Stock Exchange
London Stock Exchange
Table T (i): Perpetual Hybrid Securities in the form of Non-Convertible Debentures as on March 31, 2021, are listed on the Wholesale Debt Market segment of the National Stock Exchange of India as under:
Rate (%) 11.50
ISIN INE081A08173
Principal Amount (` in crore) 775
Date of Maturity
*Perpetual (Call Option can be exercised, at par, at the end of 10 years and at the end of every year thereafter)
*Due to be redeemed on May 11, 2021 pursuant to the Call exercised by the Board of Directors of the Company on November 13, 2020.
During the year, the Board of Directors at their meeting held on November 13, 2020 approved the proposal to exercise Call Option to redeem the unsecured, rated, listed Non-Convertible Debentures (NCDs) / Perpetual Hybrid Securities (PHS) in the form of NCDs of the Company, as per their terms of issue. Accordingly, the 11.80% PHS (ISIN: INE081A08165), aggregating to ₹1,500 crore were redeemed on March 18, 2021 and 11.50% PHS (ISIN: INE081A08173) aggregating to ₹775 crore will be redeemed on May 11, 2021.
Annexure 4 (Contd.)Integrated Report & Annual Accounts 2020-21 | 114th Year200 201
StatutoryReports
Stakeholders and Materiality
Performance Snapshot
About Tata Steel
Leadership Capitals GovernanceStrategyFinancial
Statements
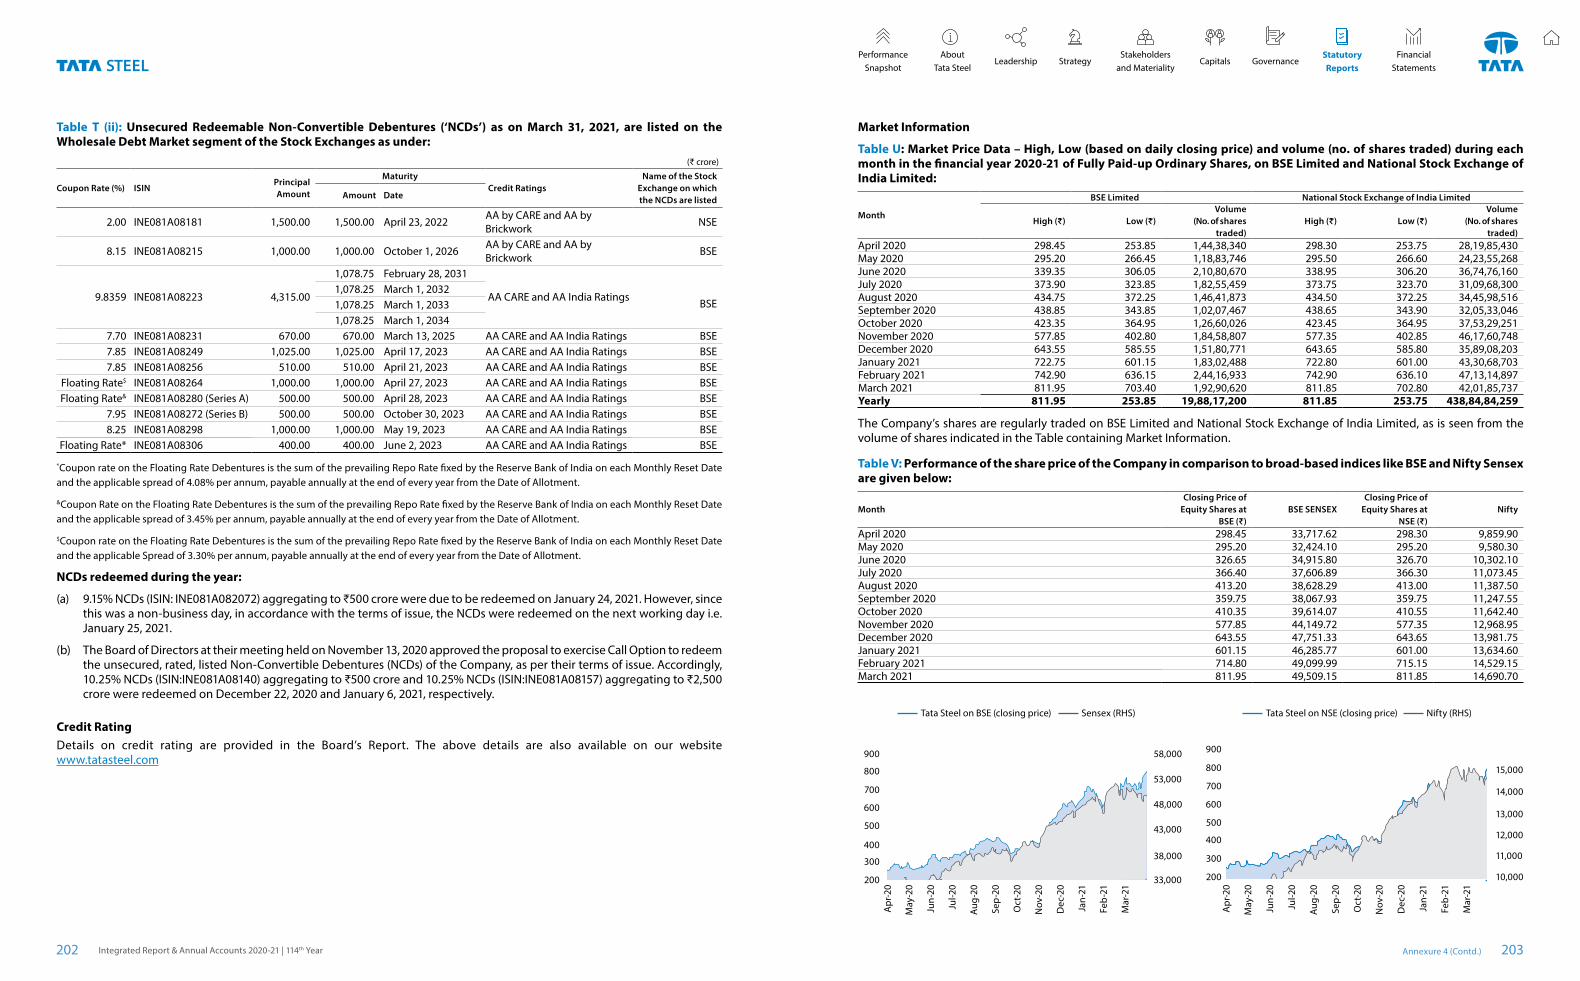
Table T (ii): Unsecured Redeemable Non-Convertible Debentures (‘NCDs’) as on March 31, 2021, are listed on the Wholesale Debt Market segment of the Stock Exchanges as under:
(₹ crore)
Coupon Rate (%) ISINPrincipal Amount
MaturityCredit Ratings
Name of the Stock Exchange on which the NCDs are listedAmount Date
2.00 INE081A08181 1,500.00 1,500.00 April 23, 2022 AA by CARE and AA by Brickwork NSE
8.15 INE081A08215 1,000.00 1,000.00 October 1, 2026 AA by CARE and AA by Brickwork BSE
9.8359 INE081A08223 4,315.00
1,078.75 February 28, 2031
AA CARE and AA India Ratings BSE1,078.25 March 1, 20321,078.25 March 1, 20331,078.25 March 1, 2034
7.70 INE081A08231 670.00 670.00 March 13, 2025 AA CARE and AA India Ratings BSE7.85 INE081A08249 1,025.00 1,025.00 April 17, 2023 AA CARE and AA India Ratings BSE7.85 INE081A08256 510.00 510.00 April 21, 2023 AA CARE and AA India Ratings BSE
Floating Rate$ INE081A08264 1,000.00 1,000.00 April 27, 2023 AA CARE and AA India Ratings BSEFloating Rate& INE081A08280 (Series A) 500.00 500.00 April 28, 2023 AA CARE and AA India Ratings BSE
7.95 INE081A08272 (Series B) 500.00 500.00 October 30, 2023 AA CARE and AA India Ratings BSE8.25 INE081A08298 1,000.00 1,000.00 May 19, 2023 AA CARE and AA India Ratings BSE
Floating Rate* INE081A08306 400.00 400.00 June 2, 2023 AA CARE and AA India Ratings BSE
*Coupon rate on the Floating Rate Debentures is the sum of the prevailing Repo Rate fixed by the Reserve Bank of India on each Monthly Reset Date and the applicable spread of 4.08% per annum, payable annually at the end of every year from the Date of Allotment.
&Coupon Rate on the Floating Rate Debentures is the sum of the prevailing Repo Rate fixed by the Reserve Bank of India on each Monthly Reset Date and the applicable spread of 3.45% per annum, payable annually at the end of every year from the Date of Allotment.
$Coupon rate on the Floating Rate Debentures is the sum of the prevailing Repo Rate fixed by the Reserve Bank of India on each Monthly Reset Date and the applicable Spread of 3.30% per annum, payable annually at the end of every year from the Date of Allotment.
NCDs redeemed during the year:
(a) 9.15% NCDs (ISIN: INE081A082072) aggregating to ₹500 crore were due to be redeemed on January 24, 2021. However, since this was a non-business day, in accordance with the terms of issue, the NCDs were redeemed on the next working day i.e. January 25, 2021.
(b) The Board of Directors at their meeting held on November 13, 2020 approved the proposal to exercise Call Option to redeem the unsecured, rated, listed Non-Convertible Debentures (NCDs) of the Company, as per their terms of issue. Accordingly, 10.25% NCDs (ISIN:INE081A08140) aggregating to ₹500 crore and 10.25% NCDs (ISIN:INE081A08157) aggregating to ₹2,500 crore were redeemed on December 22, 2020 and January 6, 2021, respectively.
Credit RatingDetails on credit rating are provided in the Board’s Report. The above details are also available on our website www.tatasteel.com
Market Information
Table U: Market Price Data – High, Low (based on daily closing price) and volume (no. of shares traded) during each month in the financial year 2020-21 of Fully Paid-up Ordinary Shares, on BSE Limited and National Stock Exchange of India Limited:
Month
BSE Limited National Stock Exchange of India Limited
High (₹) Low (₹)Volume
(No. of shares traded)
High (₹) Low (₹)Volume
(No. of shares traded)
April 2020 298.45 253.85 1,44,38,340 298.30 253.75 28,19,85,430May 2020 295.20 266.45 1,18,83,746 295.50 266.60 24,23,55,268June 2020 339.35 306.05 2,10,80,670 338.95 306.20 36,74,76,160July 2020 373.90 323.85 1,82,55,459 373.75 323.70 31,09,68,300August 2020 434.75 372.25 1,46,41,873 434.50 372.25 34,45,98,516September 2020 438.85 343.85 1,02,07,467 438.65 343.90 32,05,33,046October 2020 423.35 364.95 1,26,60,026 423.45 364.95 37,53,29,251November 2020 577.85 402.80 1,84,58,807 577.35 402.85 46,17,60,748December 2020 643.55 585.55 1,51,80,771 643.65 585.80 35,89,08,203January 2021 722.75 601.15 1,83,02,488 722.80 601.00 43,30,68,703February 2021 742.90 636.15 2,44,16,933 742.90 636.10 47,13,14,897March 2021 811.95 703.40 1,92,90,620 811.85 702.80 42,01,85,737Yearly 811.95 253.85 19,88,17,200 811.85 253.75 438,84,84,259
The Company’s shares are regularly traded on BSE Limited and National Stock Exchange of India Limited, as is seen from the volume of shares indicated in the Table containing Market Information.
Table V: Performance of the share price of the Company in comparison to broad-based indices like BSE and Nifty Sensex are given below:
MonthClosing Price of
Equity Shares at BSE (₹)
BSE SENSEXClosing Price of
Equity Shares at NSE (₹)
Nifty
April 2020 298.45 33,717.62 298.30 9,859.90May 2020 295.20 32,424.10 295.20 9,580.30June 2020 326.65 34,915.80 326.70 10,302.10July 2020 366.40 37,606.89 366.30 11,073.45August 2020 413.20 38,628.29 413.00 11,387.50September 2020 359.75 38,067.93 359.75 11,247.55October 2020 410.35 39,614.07 410.55 11,642.40November 2020 577.85 44,149.72 577.35 12,968.95December 2020 643.55 47,751.33 643.65 13,981.75January 2021 601.15 46,285.77 601.00 13,634.60February 2021 714.80 49,099.99 715.15 14,529.15March 2021 811.95 49,509.15 811.85 14,690.70
Tata Steel on BSE (closing price) Sensex (RHS)
Apr
-20
May
-20
Jun-
20
Jul-2
0
Aug
-20
Sep
-20
Oct
-20
Nov
-20
Dec
-20
Jan-
21
Feb-
21
Mar
-21
58,000900
800
700
600
500
400
300
200
53,000
48,000
43,000
38,000
33,000
Apr
-20
May
-20
Jun-
20
Jul-2
0
Aug
-20
Sep
-20
Oct
-20
Nov
-20
Dec
-20
Jan-
21
Feb-
21
Mar
-21
15,000
14,000
13,000
12,000
11,000
10,000200
300
400
500
600
700
800
900
Tata Steel on NSE (closing price) Nifty (RHS)
Annexure 4 (Contd.)Integrated Report & Annual Accounts 2020-21 | 114th Year202 203
StatutoryReports
Stakeholders and Materiality
Performance Snapshot
About Tata Steel
Leadership Capitals GovernanceStrategyFinancial
Statements
Secretarial Audit The Board of Directors has appointed Parikh and Associates (Firm Registration No. P1988MH009800), Practising Company Secretaries, to conduct secretarial audit of its records and documents for the financial year 2020-21. The secretarial audit report confirms that the Company has complied with all applicable provisions of the Companies Act, 2013, Secretarial Standards, Depositories Act, 2018, SEBI (Listing Obligations and Disclosure Requirements) Regulations, 2015, SEBI (Prohibition of Insider Trading) Regulations, 2015, each as amended and all other regulations and guidelines of SEBI as applicable to the Company. The Secretarial Audit Report forms part of the Board’s Report.
Green InitiativeAs a responsible corporate citizen, the Company welcomes and supports the ‘Green Initiative’ undertaken by the Ministry of Corporate Affairs, Government of India, enabling electronic delivery of documents including the Annual Report, quarterly and half-yearly results, amongst others, to Shareholders at their e-mail address previously registered with the DPs and RTAs.
Shareholders who have not registered their e-mail addresses so far are requested to do the same. Those holding shares in demat form can register their e-mail address with their concerned DPs. Shareholders who hold shares in physical form are requested to register their e-mail addresses with the RTA, by sending a letter, duly signed by the first / sole holder quoting details of Folio No.
Plant Locations:
Tata Steel Kalinganagar PlantTata Steel LimitedKalinganagar Industrial ComplexDuburi, Dist. JajpurOdisha – 755 026
Tata Steel Jamshedpur PlantTata Steel LimitedP.O. BistupurJamshedpur – 831 001
Cold Rolling Mill Complex, BaraTata Steel LimitedP.O. Agrico, P.S. SidhgoraBlock: Jamshedpur, Dist. Purbi SinghbhumPin – 831 009
Tata Steel Growth ShopGrowth ShopTata Steel LimitedAdityapur Industrial Estate,P.O. Gamharia, Dist. Seraikela-Kharsawan Pin – 832 108
Tata Steel Tubes DivisionTubes DivisionTata Steel LimitedP.O. Burma MinesJamshedpur – 831 007
Joda East Iron MineJoda Central OrganisationTata Steel Limited, JodaDist. Keonjhar, Odisha – 758 034
Cold Rolling Complex (West)Tata Steel LimitedPlot No. S 76, Tarapur Industrial AreaP Box 22, Tarapur Industrial Estate Post Office District Palghar, Maharashtra – 401 506
Wire Division, TarapurTata Steel Limited - Wire DivisionPlot F8 & A6, Tarapur MIDCP.O. Boisar, Dist. Palghar – 401 506
Wire Division, IndoreIndore – Tata Steel Limited, Wire DivisionPlot 14/15/16 & 32 Industrial EstateLaxmibai Nagar, Fort IndoreMadhya Pradesh – 452 006
Wire Division, PithampurPithampur Wire DivisionPlot 158 & 158A, Sector IIIIndustrial Estate, PithampurMadhya Pradesh – 454 774
Bearings DivisionTata Steel LimitedP.O. Rakha Jungle, Nimpura Industrial EstateKharagpur, West Bengal – 721 301
Noamundi Iron MineTata Steel LimitedWest Singhbhum, NoamundiJharkhand – 833 217
Ferro Alloys Plant, BamnipalTata Steel LimitedP.O. Bamnipal, Dist. KeonjharOdisha – 758 082
Katamati Iron MineTata Steel Limited Village: Deojhar , Subdivision: Champua, PO: Deojhar, Dist: Keonjhar, Odisha – 758 038
Khondbond Iron MineTata Steel Limited Village: Khondbond, Guruda, Subdivision: Champua, PO: Joda, Dist: Keonjhar, Odisha – 758 034
Joda West Iron & Manganese MineTata Steel LimitedP.O. Bichakundi, Joda, Dist. KeonjharOdisha – 758 034
Ferro Manganese Plant, JodaTata Steel LimitedDist. Keonjhar, Odisha – 758 034
Bamebari Iron & Manganese MineTata Steel LimitedP.O. Bamebari, Joda, Dist. KeonjharOdisha – 758 086
Tiringpahar Iron & Manganese MineTata Steel LimitedP.O. Bamebari, Joda, Dist. KeonjharOdisha – 758 086
Jharia DivisionTata Steel LimitedJamadoba, DhanbadJharkhand – 828 112
West Bokaro DivisionTata Steel LimitedGhatotand, Dist. RamgarhJharkhand – 825 314
Hooghly Met Coke DivisionTata Steel LimitedPatikhali, Haldia, PurbaMedinipur, West Bengal – 721 606
Ferro Chrome Plant, GopalpurTata Steel LimitedP.O. Chamakhandi, Chatrapur Tahsil Dist. Ganjam, Odisha – 761 020
Annexure 4 (Contd.)Integrated Report & Annual Accounts 2020-21 | 114th Year204 205
StatutoryReports
Stakeholders and Materiality
Performance Snapshot
About Tata Steel
Leadership Capitals GovernanceStrategyFinancial
Statements
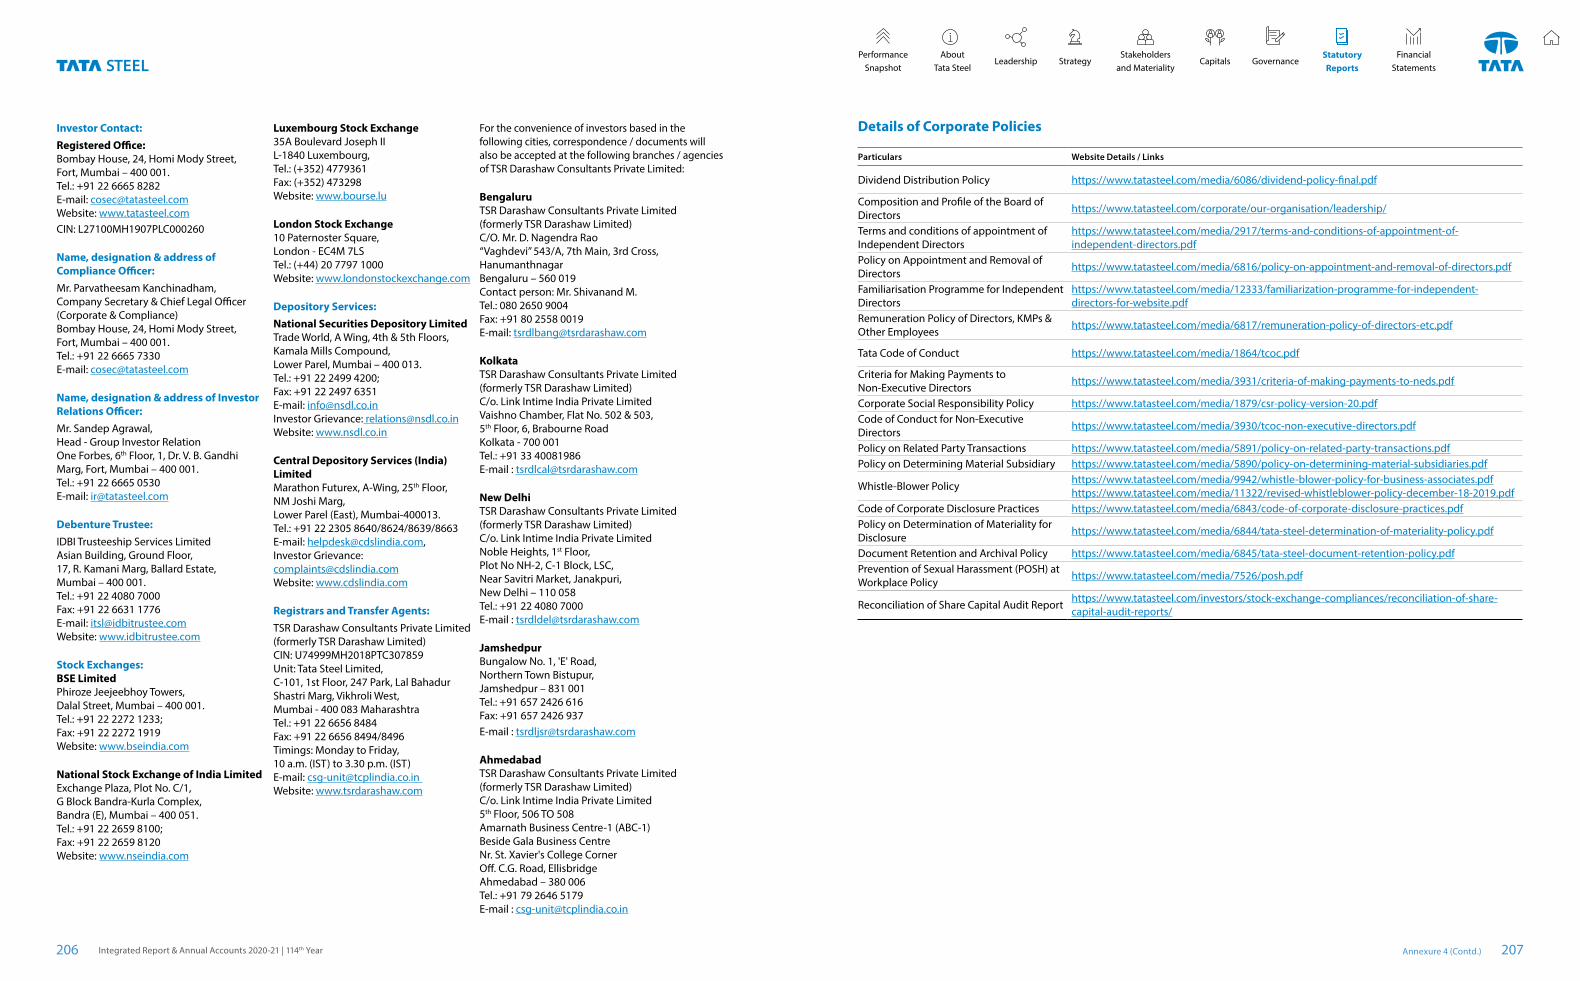
Investor Contact:Registered Office:Bombay House, 24, Homi Mody Street,Fort, Mumbai – 400 001.Tel.: +91 22 6665 8282E-mail: [email protected]: www.tatasteel.comCIN: L27100MH1907PLC000260
Name, designation & address of Compliance Officer:Mr. Parvatheesam Kanchinadham,Company Secretary & Chief Legal Officer (Corporate & Compliance)Bombay House, 24, Homi Mody Street, Fort, Mumbai – 400 001.Tel.: +91 22 6665 7330E-mail: [email protected]
Name, designation & address of Investor Relations Officer:Mr. Sandep Agrawal,Head - Group Investor RelationOne Forbes, 6th Floor, 1, Dr. V. B. Gandhi Marg, Fort, Mumbai – 400 001.Tel.: +91 22 6665 0530E-mail: [email protected]
Debenture Trustee:IDBI Trusteeship Services LimitedAsian Building, Ground Floor, 17, R. Kamani Marg, Ballard Estate,Mumbai – 400 001.Tel.: +91 22 4080 7000 Fax: +91 22 6631 1776E-mail: [email protected]: www.idbitrustee.com
Stock Exchanges:BSE LimitedPhiroze Jeejeebhoy Towers,Dalal Street, Mumbai – 400 001.Tel.: +91 22 2272 1233; Fax: +91 22 2272 1919Website: www.bseindia.com
National Stock Exchange of India LimitedExchange Plaza, Plot No. C/1, G Block Bandra-Kurla Complex, Bandra (E), Mumbai – 400 051.Tel.: +91 22 2659 8100; Fax: +91 22 2659 8120Website: www.nseindia.com
Luxembourg Stock Exchange35A Boulevard Joseph IIL-1840 Luxembourg,Tel.: (+352) 4779361Fax: (+352) 473298Website: www.bourse.lu
London Stock Exchange10 Paternoster Square,London - EC4M 7LSTel.: (+44) 20 7797 1000Website: www.londonstockexchange.com
Depository Services:National Securities Depository LimitedTrade World, A Wing, 4th & 5th Floors,Kamala Mills Compound,Lower Parel, Mumbai – 400 013.Tel.: +91 22 2499 4200; Fax: +91 22 2497 6351E-mail: [email protected] Grievance: [email protected]: www.nsdl.co.in
Central Depository Services (India) LimitedMarathon Futurex, A-Wing, 25th Floor,NM Joshi Marg,Lower Parel (East), Mumbai-400013.Tel.: +91 22 2305 8640/8624/8639/8663E-mail: [email protected],Investor Grievance: [email protected]: www.cdslindia.com
Registrars and Transfer Agents:TSR Darashaw Consultants Private Limited (formerly TSR Darashaw Limited)CIN: U74999MH2018PTC307859Unit: Tata Steel Limited,C-101, 1st Floor, 247 Park, Lal Bahadur Shastri Marg, Vikhroli West, Mumbai - 400 083 MaharashtraTel.: +91 22 6656 8484Fax: +91 22 6656 8494/8496Timings: Monday to Friday,10 a.m. (IST) to 3.30 p.m. (IST)E-mail: [email protected] Website: www.tsrdarashaw.com
For the convenience of investors based in the following cities, correspondence / documents will also be accepted at the following branches / agencies of TSR Darashaw Consultants Private Limited:
BengaluruTSR Darashaw Consultants Private Limited (formerly TSR Darashaw Limited)C/O. Mr. D. Nagendra Rao“Vaghdevi” 543/A, 7th Main, 3rd Cross, HanumanthnagarBengaluru – 560 019Contact person: Mr. Shivanand M.Tel.: 080 2650 9004 Fax: +91 80 2558 0019 E-mail: [email protected]
KolkataTSR Darashaw Consultants Private Limited (formerly TSR Darashaw Limited)C/o. Link Intime India Private LimitedVaishno Chamber, Flat No. 502 & 503, 5th Floor, 6, Brabourne RoadKolkata - 700 001Tel.: +91 33 40081986 E-mail : [email protected]
New DelhiTSR Darashaw Consultants Private Limited(formerly TSR Darashaw Limited) C/o. Link Intime India Private LimitedNoble Heights, 1st Floor,Plot No NH-2, C-1 Block, LSC,Near Savitri Market, Janakpuri,New Delhi – 110 058Tel.: +91 22 4080 7000 E-mail : [email protected]
JamshedpurBungalow No. 1, 'E' Road, Northern Town Bistupur, Jamshedpur – 831 001Tel.: +91 657 2426 616 Fax: +91 657 2426 937 E-mail : [email protected]
AhmedabadTSR Darashaw Consultants Private Limited (formerly TSR Darashaw Limited)C/o. Link Intime India Private Limited5th Floor, 506 TO 508Amarnath Business Centre-1 (ABC-1)Beside Gala Business CentreNr. St. Xavier's College CornerOff. C.G. Road, EllisbridgeAhmedabad – 380 006Tel.: +91 79 2646 5179E-mail : [email protected]
Details of Corporate Policies
Particulars Website Details / Links
Dividend Distribution Policy https://www.tatasteel.com/media/6086/dividend-policy-final.pdf
Composition and Profile of the Board of Directors https://www.tatasteel.com/corporate/our-organisation/leadership/
Terms and conditions of appointment of Independent Directors
https://www.tatasteel.com/media/2917/terms-and-conditions-of-appointment-of-independent-directors.pdf
Policy on Appointment and Removal of Directors https://www.tatasteel.com/media/6816/policy-on-appointment-and-removal-of-directors.pdf
Familiarisation Programme for Independent Directors
https://www.tatasteel.com/media/12333/familiarization-programme-for-independent-directors-for-website.pdf
Remuneration Policy of Directors, KMPs & Other Employees https://www.tatasteel.com/media/6817/remuneration-policy-of-directors-etc.pdf
Tata Code of Conduct https://www.tatasteel.com/media/1864/tcoc.pdf
Criteria for Making Payments to Non-Executive Directors https://www.tatasteel.com/media/3931/criteria-of-making-payments-to-neds.pdf
Corporate Social Responsibility Policy https://www.tatasteel.com/media/1879/csr-policy-version-20.pdfCode of Conduct for Non-Executive Directors https://www.tatasteel.com/media/3930/tcoc-non-executive-directors.pdf
Policy on Related Party Transactions https://www.tatasteel.com/media/5891/policy-on-related-party-transactions.pdfPolicy on Determining Material Subsidiary https://www.tatasteel.com/media/5890/policy-on-determining-material-subsidiaries.pdf
Whistle-Blower Policy https://www.tatasteel.com/media/9942/whistle-blower-policy-for-business-associates.pdf https://www.tatasteel.com/media/11322/revised-whistleblower-policy-december-18-2019.pdf
Code of Corporate Disclosure Practices https://www.tatasteel.com/media/6843/code-of-corporate-disclosure-practices.pdfPolicy on Determination of Materiality for Disclosure https://www.tatasteel.com/media/6844/tata-steel-determination-of-materiality-policy.pdf
Document Retention and Archival Policy https://www.tatasteel.com/media/6845/tata-steel-document-retention-policy.pdfPrevention of Sexual Harassment (POSH) at Workplace Policy https://www.tatasteel.com/media/7526/posh.pdf
Reconciliation of Share Capital Audit Report https://www.tatasteel.com/investors/stock-exchange-compliances/reconciliation-of-share-capital-audit-reports/
Annexure 4 (Contd.)Integrated Report & Annual Accounts 2020-21 | 114th Year206 207
StatutoryReports
Stakeholders and Materiality
Performance Snapshot
About Tata Steel
Leadership Capitals GovernanceStrategyFinancial
Statements
Declaration Regarding Compliance by Board Members and Senior Management Personnel with the Code of Conduct
Practising Company Secretaries’ Certificate on Corporate Governance
This is to confirm that the Company has adopted the Tata Code of Conduct for its employees including the Managing Director and the Whole-time Directors. In addition, the Company has adopted the Tata Code of Conduct for the Non-Executive Directors. Both these Codes are available on the Company’s website at www.tatasteel.com
I confirm that the Company has in respect of the financial year ended March 31, 2021, received from the Senior Management Team of the Company and the Members of the Board, a declaration of compliance with the Code of Conduct as applicable to them.
For the purpose of this declaration, Senior Management Team means the Members of the Management one level below the Chief Executive Officer & Managing Director as on March 31, 2021.
sd/- T. V. NARENDRAN
Chief Executive Officer & Managing Director
May 5, 2021 DIN: 03083605
To,The Members ofTata Steel Limited
We have examined the compliance of the conditions of Corporate Governance by Tata Steel Limited (‘the Company’) for the year ended on March 31, 2021, as stipulated under Regulations 17 to 27, clauses (b) to (i) of sub-regulation (2) of Regulation 46 and para C, D & E of Schedule V of the Securities and Exchange Board of India (Listing Obligations and Disclosure Requirements) Regulations, 2015 (‘SEBI Listing Regulations’).
The compliance of the conditions of Corporate Governance is the responsibility of the management. Our examination was limited to the review of procedures and implementation thereof, as adopted by the Company for ensuring compliance with conditions of Corporate Governance. It is neither an audit nor an expression of opinion on the financial statements of the Company.
In our opinion and to the best of our information and according to the explanations given to us, and the representations made by the Directors and the management and considering the relaxations granted by the Ministry of Corporate Affairs and Securities and Exchange Board of India warranted due to the spread of the COVID-19 pandemic, we certify that the Company has complied with the conditions of Corporate Governance as stipulated in the SEBI Listing Regulations for the year ended on March 31, 2021.
We further state that such compliance is neither an assurance as to the future viability of the Company nor of the efficiency or effectiveness with which the management has conducted the affairs of the Company.
For Parikh & AssociatesPractising Company Secretaries
sd/- P. N. PARIKH
Mumbai FCS No.: 327 CP No.: 1228May 5, 2021 UDIN: F000327C000241887
Practising Company Secretaries’ Certificate on Directors(Pursuant to Regulation 34(3) and Schedule V Para C clause (10)(i) of the SEBI (Listing Obligations and Disclosure Requirements) Regulations, 2015)
To,The MembersTata Steel LimitedBombay House, 24 Homi Mody Street,Fort, Mumbai – 400 001
We have examined the relevant registers, records, forms, returns and disclosures received from the Directors of Tata Steel Limited having CIN: L27100MH1907PLC000260 and having registered office at Bombay House, 24 Homi Mody Street, Fort, Mumbai – 400 001 (hereinafter referred to as ‘the Company’), produced before me / us by the Company for the purpose of issuing this Certificate, in accordance with Regulation 34(3) read with Schedule V Para-C Sub-clause 10(i) of the Securities and Exchange Board of India (Listing Obligations and Disclosure Requirements) Regulations, 2015.
In our opinion and to the best of our information and according to the verifications (including Directors Identification Number (‘DIN’) status at the portal www.mca.gov.in) as considered necessary and explanations furnished to us by the Company & its officers and considering the relaxations granted by the Ministry of Corporate Affairs and Securities and Exchange Board of India warranted due to the spread of the COVID-19 pandemic, we hereby certify that none of the Directors on the Board of the Company as stated below for the financial year ended March 31, 2021 have been debarred or disqualified from being appointed or continuing as Directors of companies by the Securities and Exchange Board of India, Ministry of Corporate Affairs (‘MCA’), or any such other Statutory Authority.
Sl No. Name of the Director DIN Date of Appointment in Company*
1. N. Chandrasekaran 00121863 January 13, 20172. Saurabh Agrawal 02144558 August 10, 20173. V. K. Sharma 02449088 August 24, 20184. Mallika Srinivasan 00037022 May 21, 20125. O. P. Bhatt 00548091 June 10, 20136. Dr. Peter Blauwhoff 07728872 February 7, 20177. Aman Mehta 00009364 March 29, 20178. Deepak Kapoor 00162957 April 1, 20179. T. V. Narendran 03083605 September 19, 2013**10. Koushik Chatterjee 00004989 November 9, 2012
*The date of appointment is as per the MCA Portal.
**Mr. T. V. Narendran was appointed as the Managing Director of the Company effective September 19, 2013 and the said appointment was approved by the Shareholders at the Annual General Meeting held on August 14, 2014.
Ensuring the eligibility for the appointment / continuity of every Director on the Board is the responsibility of the management of the Company. Our responsibility is to express an opinion on these based on our verification. This certificate is neither an assurance as to the future viability of the Company nor of the efficiency or effectiveness with which the management has conducted the affairs of the Company.
For Parikh & AssociatesPractising Company Secretaries
sd/-P. N. PARIKH
Mumbai FCS No.: 327 CP No.: 1228May 5, 2021 UDIN: F000327C000241876
Annexure 4 (Contd.)Integrated Report & Annual Accounts 2020-21 | 114th Year208 209
StatutoryReports
Stakeholders and Materiality
Performance Snapshot
About Tata Steel
Leadership Capitals GovernanceStrategyFinancial
Statements
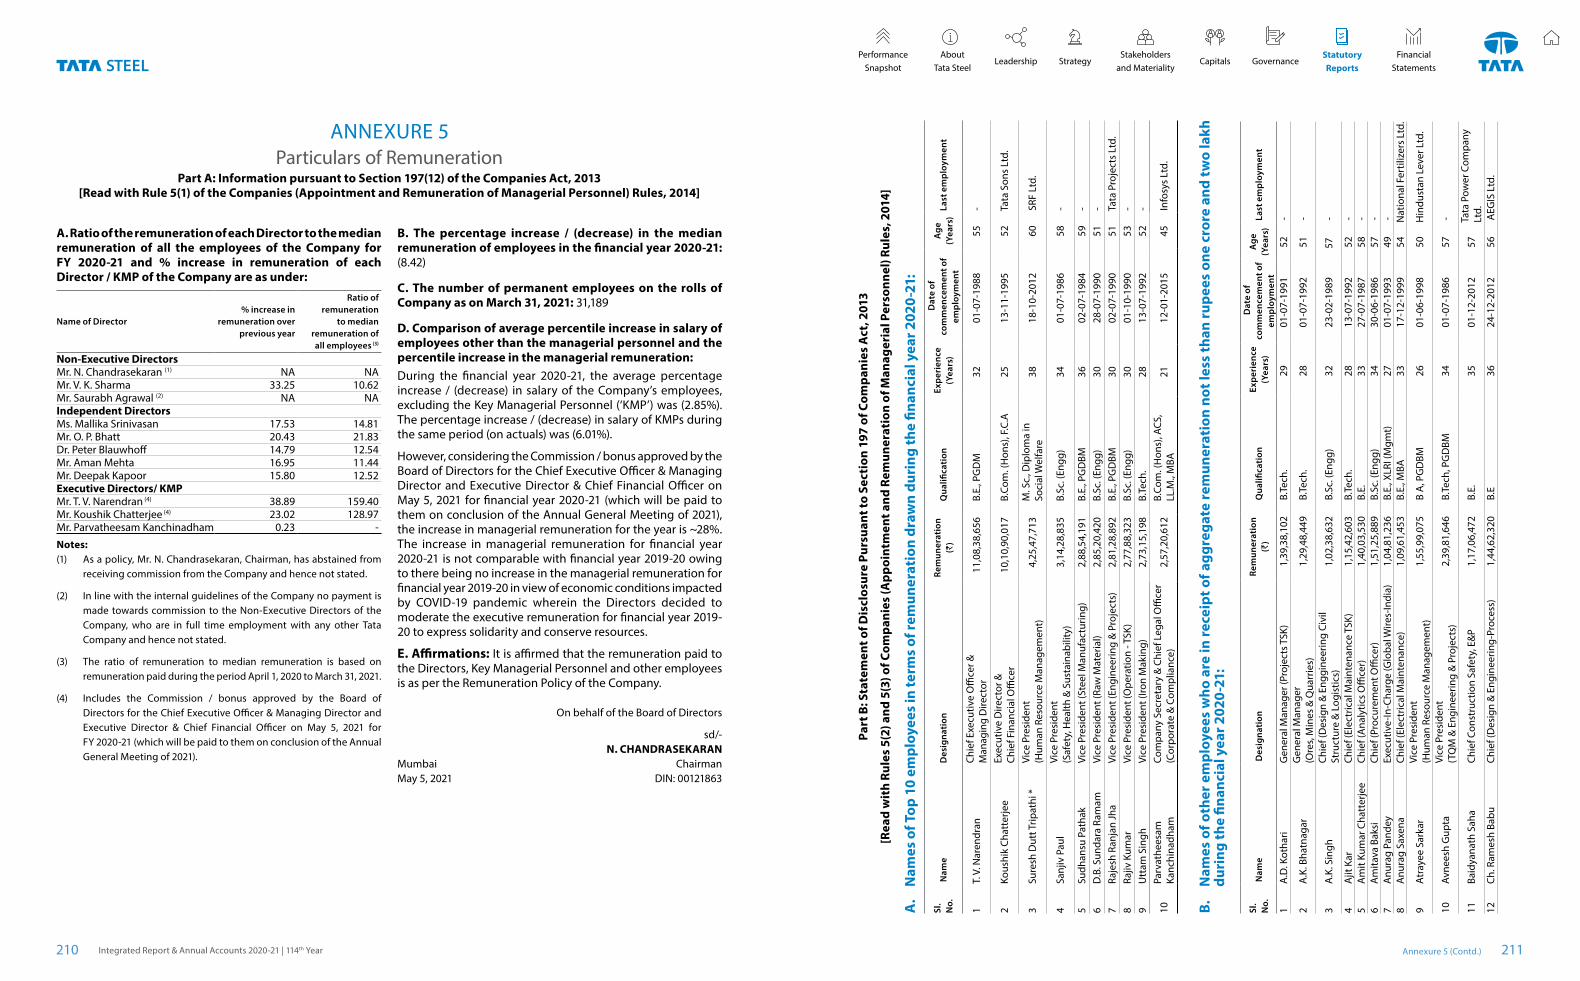
Particulars of RemunerationPart A: Information pursuant to Section 197(12) of the Companies Act, 2013
[Read with Rule 5(1) of the Companies (Appointment and Remuneration of Managerial Personnel) Rules, 2014]
ANNEXURE 5
A. Ratio of the remuneration of each Director to the median remuneration of all the employees of the Company for FY 2020-21 and % increase in remuneration of each Director / KMP of the Company are as under:
Name of Director% increase in
remuneration over previous year
Ratio of remuneration
to median remuneration of all employees (3)
Non-Executive DirectorsMr. N. Chandrasekaran (1) NA NAMr. V. K. Sharma 33.25 10.62Mr. Saurabh Agrawal (2) NA NAIndependent DirectorsMs. Mallika Srinivasan 17.53 14.81Mr. O. P. Bhatt 20.43 21.83Dr. Peter Blauwhoff 14.79 12.54Mr. Aman Mehta 16.95 11.44Mr. Deepak Kapoor 15.80 12.52Executive Directors/ KMPMr. T. V. Narendran (4) 38.89 159.40Mr. Koushik Chatterjee (4) 23.02 128.97Mr. Parvatheesam Kanchinadham 0.23 -
Notes: (1) As a policy, Mr. N. Chandrasekaran, Chairman, has abstained from
receiving commission from the Company and hence not stated.
(2) In line with the internal guidelines of the Company no payment is made towards commission to the Non-Executive Directors of the Company, who are in full time employment with any other Tata Company and hence not stated.
(3) The ratio of remuneration to median remuneration is based on remuneration paid during the period April 1, 2020 to March 31, 2021.
(4) Includes the Commission / bonus approved by the Board of Directors for the Chief Executive Officer & Managing Director and Executive Director & Chief Financial Officer on May 5, 2021 for FY 2020-21 (which will be paid to them on conclusion of the Annual General Meeting of 2021).
B. The percentage increase / (decrease) in the median remuneration of employees in the financial year 2020-21: (8.42)
C. The number of permanent employees on the rolls of Company as on March 31, 2021: 31,189
D. Comparison of average percentile increase in salary of employees other than the managerial personnel and the percentile increase in the managerial remuneration: During the financial year 2020-21, the average percentage increase / (decrease) in salary of the Company’s employees, excluding the Key Managerial Personnel (‘KMP’) was (2.85%). The percentage increase / (decrease) in salary of KMPs during the same period (on actuals) was (6.01%).
However, considering the Commission / bonus approved by the Board of Directors for the Chief Executive Officer & Managing Director and Executive Director & Chief Financial Officer on May 5, 2021 for financial year 2020-21 (which will be paid to them on conclusion of the Annual General Meeting of 2021), the increase in managerial remuneration for the year is ~28%. The increase in managerial remuneration for financial year 2020-21 is not comparable with financial year 2019-20 owing to there being no increase in the managerial remuneration for financial year 2019-20 in view of economic conditions impacted by COVID-19 pandemic wherein the Directors decided to moderate the executive remuneration for financial year 2019-20 to express solidarity and conserve resources.
E. Affirmations: It is affirmed that the remuneration paid to the Directors, Key Managerial Personnel and other employees is as per the Remuneration Policy of the Company.
On behalf of the Board of Directors
sd/-N. CHANDRASEKARAN
Mumbai ChairmanMay 5, 2021 DIN: 00121863
Part
B: S
tate
men
t of D
iscl
osur
e Pu
rsua
nt to
Sec
tion
197
of C
ompa
nies
Act
, 201
3
[Rea
d w
ith
Rule
s 5(
2) a
nd 5
(3) o
f Com
pani
es (A
ppoi
ntm
ent a
nd R
emun
erat
ion
of M
anag
eria
l Per
sonn
el) R
ules
, 201
4]
A.
Nam
es o
f Top
10
empl
oyee
s in
term
s of
rem
uner
atio
n dr
awn
duri
ng th
e fin
anci
al y
ear 2
020-
21:
Sl.
No.
N
ame
Des
igna
tion
Re
mun
erat
ion
(`)
Qua
lifica
tion
Ex
peri
ence
(Y
ears
)
Dat
e of
co
mm
ence
men
t of
empl
oym
ent
Age
(Y
ears
) L
ast e
mpl
oym
ent
1T.
V. N
aren
dran
Chie
f Exe
cutiv
e O
ffice
r &
Man
agin
g D
irect
or 1
1,08
,38,
656
B.E.
, PG
DM
3201
-07-
1988
55
-
2Ko
ushi
k Ch
atte
rjee
Exec
utiv
e D
irect
or &
Ch
ief F
inan
cial
Offi
cer
10,
10,9
0,01
7 B.
Com
. (H
ons)
, F.C
.A25
13-1
1-19
95 5
2 T
ata
Sons
Ltd
.
3Su
resh
Dut
t Trip
athi
*Vi
ce P
resi
dent
(H
uman
Res
ourc
e M
anag
emen
t) 4
,25,
47,7
13
M. S
c., D
iplo
ma
in
Soci
al W
elfa
re38
18-1
0-20
12 6
0 S
RF L
td.
4Sa
njiv
Pau
lVi
ce P
resi
dent
(S
afet
y, H
ealth
& S
usta
inab
ility
) 3
,14,
28,8
35
B.Sc
. (En
gg)
3401
-07-
1986
58
-
5Su
dhan
su P
atha
kVi
ce P
resi
dent
(Ste
el M
anuf
actu
ring)
2,8
8,54
,191
B.
E., P
GD
BM36
02-0
7-19
84 5
9 -
6D
.B. S
unda
ra R
amam
Vice
Pre
side
nt (R
aw M
ater
ial)
2,8
5,20
,420
B.
Sc. (
Engg
)30
28-0
7-19
90 5
1 -
7Ra
jesh
Ran
jan
Jha
Vice
Pre
side
nt (E
ngin
eerin
g &
Pro
ject
s) 2
,81,
28,8
92
B.E.
, PG
DBM
3002
-07-
1990
51
Tat
a Pr
ojec
ts L
td.
8Ra
jiv K
umar
Vice
Pre
side
nt (O
pera
tion
- TSK
) 2
,77,
88,3
23
B.Sc
. (En
gg)
3001
-10-
1990
53
- 9
Utt
am S
ingh
Vice
Pre
side
nt (I
ron
Mak
ing)
2,7
3,15
,198
B.
Tech
.28
13-0
7-19
92 5
2 -
10Pa
rvat
hees
am
Kanc
hina
dham
Co
mpa
ny S
ecre
tary
& C
hief
Leg
al O
ffice
r (C
orpo
rate
& C
ompl
ianc
e) 2
,57,
20,6
12
B.Co
m. (
Hon
s), A
CS,
LL.M
., M
BA21
12-0
1-20
15 4
5 In
fosy
s Lt
d.
B.
Nam
es o
f oth
er e
mpl
oyee
s w
ho a
re in
rece
ipt o
f agg
rega
te re
mun
erat
ion
not l
ess
than
rupe
es o
ne c
rore
and
two
lakh
du
ring
the
finan
cial
yea
r 202
0-21
:
Sl.
No.
N
ame
Des
igna
tion
Re
mun
erat
ion
(`)
Qua
lifica
tion
Ex
peri
ence
(Y
ears
)
Dat
e of
co
mm
ence
men
t of
empl
oym
ent
Age
(Y
ears
) L
ast e
mpl
oym
ent
1A
.D. K
otha
riG
ener
al M
anag
er (P
roje
cts T
SK)
1,3
9,38
,102
B.
Tech
. 29
01-0
7-19
91 5
2 -
2A
.K. B
hatn
agar
Gen
eral
Man
ager
(O
res,
Min
es &
Qua
rrie
s) 1
,29,
48,4
49
B.Te
ch.
2801
-07-
1992
51
-
3A
.K. S
ingh
Chie
f (D
esig
n &
Eng
gine
erin
g Ci
vil
Stru
ctur
e &
Log
istic
s) 1
,02,
38,6
32
B.Sc
. (En
gg)
3223
-02-
1989
57 -
4A
jit K
arCh
ief (
Elec
tric
al M
aint
enan
ce T
SK)
1,1
5,42
,603
B.
Tech
.28
13-0
7-19
92 5
2 -
5A
mit
Kum
ar C
hatt
erje
eCh
ief (
Ana
lytic
s O
ffice
r) 1
,40,
03,5
30
B.E.
33
27-0
7-19
87 5
8 -
6A
mita
va B
aksi
Chie
f (Pr
ocur
emen
t Offi
cer)
1,5
1,25
,889
B.
Sc. (
Engg
)34
30-0
6-19
86 5
7 -
7A
nura
g Pa
ndey
Exec
utiv
e-In
-Cha
rge
(Glo
bal W
ires-
Indi
a) 1
,04,
81,2
36
B.E.
, XLR
I (M
gmt)
27
01-0
7-19
93 4
9 -
8A
nura
g Sa
xena
Chie
f (El
ectr
ical
Mai
nten
ance
) 1
,09,
61,4
53
B.E.
, MBA
33
17-1
2-19
99 5
4 N
atio
nal F
ertil
izer
s Lt
d.
9A
tray
ee S
arka
rVi
ce P
resi
dent
(H
uman
Res
ourc
e M
anag
emen
t) 1
,55,
99,0
75
B A
, PG
DBM
2601
-06-
1998
50
Hin
dust
an L
ever
Ltd
.
10Av
nees
h G
upta
Vice
Pre
side
nt
(TQ
M &
Eng
inee
ring
& P
roje
cts)
2,3
9,81
,646
B.
Tech
, PG
DBM
3401
-07-
1986
57
-
11Ba
idya
nath
Sah
aCh
ief C
onst
ruct
ion
Safe
ty, E
&P
1,1
7,06
,472
B.
E.
3501
-12-
2012
57
Tata
Pow
er C
ompa
ny
Ltd.
12
Ch. R
ames
h Ba
buCh
ief (
Des
ign
& E
ngin
eerin
g-Pr
oces
s) 1
,44,
62,3
20
B.E
3624
-12-
2012
56
AEG
IS L
td.
Annexure 5 (Contd.)Integrated Report & Annual Accounts 2020-21 | 114th Year210 211
StatutoryReports
Stakeholders and Materiality
Performance Snapshot
About Tata Steel
Leadership Capitals GovernanceStrategyFinancial
Statements
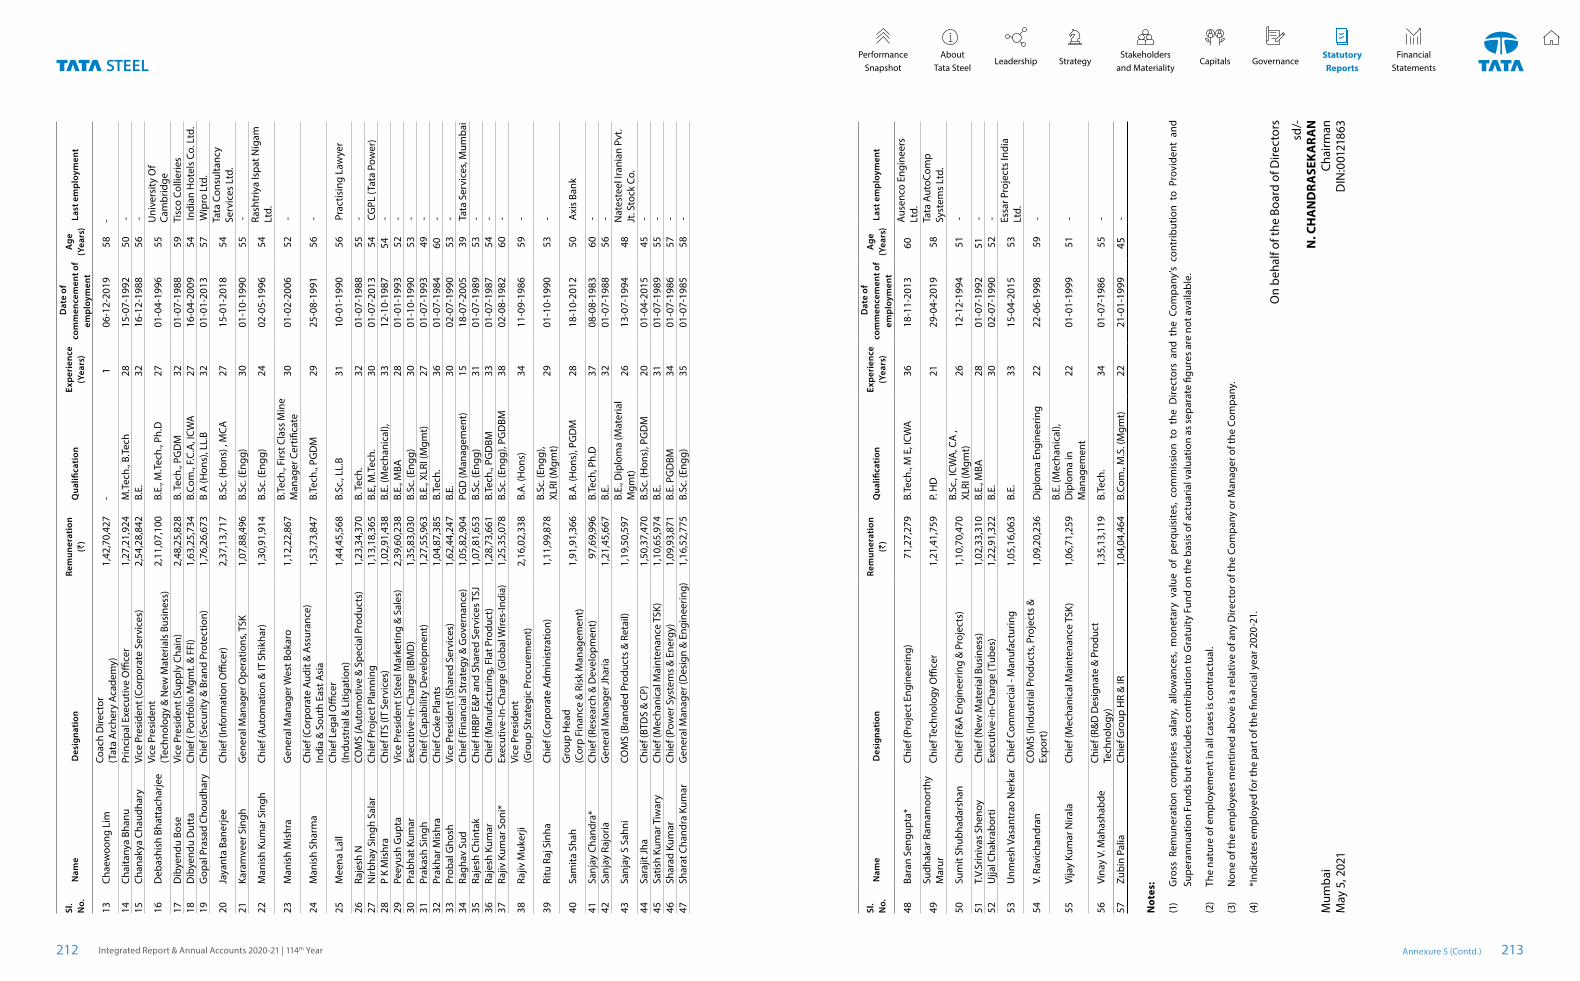
Sl.
No.
N
ame
Des
igna
tion
Re
mun
erat
ion
(`)
Qua
lifica
tion
Ex
peri
ence
(Y
ears
)
Dat
e of
co
mm
ence
men
t of
empl
oym
ent
Age
(Y
ears
) L
ast e
mpl
oym
ent
13Ch
aew
oong
Lim
Coac
h D
irect
or
(Tat
a A
rche
ry A
cade
my)
1,4
2,70
,427
-
106
-12-
2019
58
-
14Ch
aita
nya
Bhan
uPr
inci
pal E
xecu
tive
Offi
cer
1,2
7,21
,924
M
.Tec
h., B
.Tec
h28
15-0
7-19
92 5
0 -
15Ch
anak
ya C
haud
hary
Vice
Pre
side
nt (C
orpo
rate
Ser
vice
s) 2
,54,
28,8
42
B.E.
3216
-12-
1988
56
-
16D
ebas
hish
Bha
ttac
harje
eVi
ce P
resi
dent
(T
echn
olog
y &
New
Mat
eria
ls B
usin
ess)
2,1
1,07
,100
B.
E., M
.Tec
h., P
h.D
2701
-04-
1996
55
Uni
vers
ity O
f Ca
mbr
idge
17
Dib
yend
u Bo
seVi
ce P
resi
dent
(Sup
ply
Chai
n) 2
,48,
25,8
28
B. Te
ch.,
PGD
M
3201
-07-
1988
59
Tisc
o Co
llier
ies
18D
ibye
ndu
Dut
taCh
ief (
Por
tfolio
Mgm
t. &
FFI)
1,6
3,25
,734
B.
Com
., F.C
.A, I
CWA
2716
-04-
2009
54
Indi
an H
otel
s Co
. Ltd
. 19
Gop
al P
rasa
d Ch
oudh
ary
Chie
f (Se
curit
y &
Bra
nd P
rote
ctio
n) 1
,76,
26,6
73
B A
(Hon
s), L
L.B
3201
-01-
2013
57
Wip
ro L
td.
20Ja
yant
a Ba
nerje
eCh
ief (
Info
rmat
ion
Offi
cer)
2,3
7,13
,717
B.
Sc. (
Hon
s) ,
MCA
2715
-01-
2018
54
Tata
Con
sulta
ncy
Serv
ices
Ltd
. 21
Kara
mve
er S
ingh
Gen
eral
Man
ager
Ope
ratio
ns, T
SK 1
,07,
88,4
96
B.Sc
. (En
gg)
3001
-10-
1990
55
-
22M
anis
h Ku
mar
Sin
ghCh
ief (
Auto
mat
ion
& IT
Shi
khar
) 1
,30,
91,9
14
B.Sc
. (En
gg)
2402
-05-
1996
54
Rash
triy
a Is
pat N
igam
Lt
d.
23M
anis
h M
ishr
aG
ener
al M
anag
er W
est B
okar
o 1
,12,
22,8
67
B.Te
ch.,
Firs
t Cla
ss M
ine
Man
ager
Cer
tifica
te30
01-0
2-20
06 5
2 -
24M
anis
h Sh
arm
aCh
ief (
Corp
orat
e Au
dit &
Ass
uran
ce)
Indi
a &
Sou
th E
ast A
sia
1,5
3,73
,847
B.
Tech
., PG
DM
2925
-08-
1991
56
-
25M
eena
Lal
lCh
ief L
egal
Offi
cer
(Indu
stria
l & L
itiga
tion)
1,4
4,45
,568
B.
Sc.,
LL.B
3110
-01-
1990
56
Pra
ctis
ing
Law
yer
26Ra
jesh
NCO
MS
(Aut
omot
ive
& S
peci
al P
rodu
cts)
1,2
3,34
,370
B.
Tech
.32
01-0
7-19
88 5
5 -
27N
irbha
y Si
ngh
Sala
rCh
ief P
roje
ct P
lann
ing
1,1
3,18
,365
B.
E, M
.Tec
h.30
01-0
7-20
13 5
4 C
GPL
(Tat
a Po
wer
) 28
P K
Mis
hra
Chie
f ITS
(IT
Serv
ices
) 1
,02,
91,4
38
B.E.
(Mec
hani
cal),
3312
-10-
1987
54 -
29Pe
eyus
h G
upta
Vice
Pre
side
nt (S
teel
Mar
ketin
g &
Sal
es)
2,3
9,60
,238
B.
E., M
BA28
01-0
1-19
93 5
2 -
30Pr
abha
t Kum
arEx
ecut
ive-
In-C
harg
e (IB
MD
) 1
,35,
83,0
30
B.Sc
. (En
gg)
3001
-10-
1990
53
- 31
Prak
ash
Sing
hCh
ief (
Capa
bilit
y D
evel
opm
ent)
1,2
7,55
,963
B.
E., X
LRI (
Mgm
t)27
01-0
7-19
93 4
9 -
32Pr
akha
r Mis
hra
Chie
f Cok
e Pl
ants
1,0
4,87
,385
B.
Tech
.36
01-0
7-19
8460
- 33
Prob
al G
hosh
Vice
Pre
side
nt (S
hare
d Se
rvic
es)
1,6
2,44
,247
B.
E.30
02-0
7-19
90 5
3 -
34Ra
ghav
Sud
Chie
f (Fi
nanc
ial S
trat
egy
& G
over
nanc
e) 1
,05,
82,9
04
PGD
(Man
agem
ent)
1518
-07-
2005
39
Tat
a Se
rvic
es, M
umba
i 35
Raje
sh C
hint
akCh
ief H
RBP
E&P
and
Shar
ed S
ervi
ces T
SJ 1
,07,
81,6
53
B.Sc
. (En
gg)
3101
-07-
1989
53
- 36
Raje
sh K
umar
Chie
f (M
anuf
actu
ring,
Fla
t Pro
duct
) 1
,28,
73,6
61
B.Te
ch.,
PGD
BM33
01-0
7-19
87 5
4 -
37Ra
jiv K
umar
Son
i*Ex
ecut
ive-
In-C
harg
e (G
loba
l Wire
s-In
dia)
1,2
5,35
,078
B.
Sc. (
Engg
), PG
DBM
3802
-08-
1982
60
-
38Ra
jiv M
uker
jiVi
ce P
resi
dent
(G
roup
Str
ateg
ic P
rocu
rem
ent)
2,1
6,02
,338
B.
A. (
Hon
s)34
11-0
9-19
86 5
9 -
39Ri
tu R
aj S
inha
Chie
f (Co
rpor
ate
Adm
inis
trat
ion)
1,1
1,99
,878
B.
Sc. (
Engg
), XL
RI (M
gmt)
2901
-10-
1990
53
-
40Sa
mita
Sha
hG
roup
Hea
d (C
orp
Fina
nce
& R
isk
Man
agem
ent)
1,9
1,91
,366
B.
A. (
Hon
s), P
GD
M28
18-1
0-20
12 5
0 A
xis
Bank
41Sa
njay
Cha
ndra
*Ch
ief (
Rese
arch
& D
evel
opm
ent)
97,
69,9
96
B.Te
ch, P
h.D
3708
-08-
1983
60
- 42
Sanj
ay R
ajor
iaG
ener
al M
anag
er Jh
aria
1,2
1,45
,667
B.
E.
3201
-07-
1988
56
-
43Sa
njay
S S
ahni
COM
S (B
rand
ed P
rodu
cts
& R
etai
l) 1
,19,
50,5
97
B.E.
, Dip
lom
a (M
ater
ial
Mgm
t)26
13-0
7-19
94 4
8 N
ates
teel
Iran
ian
Pvt.
Jt. S
tock
Co.
44
Sara
jit Jh
aCh
ief (
BTD
S &
CP)
1,5
0,37
,470
B.
Sc. (
Hon
s), P
GD
M20
01-0
4-20
15 4
5 -
45Sa
tish
Kum
ar T
iwar
yCh
ief (
Mec
hani
cal M
aint
enan
ce T
SK)
1,1
0,65
,974
B.
E.31
01-0
7-19
89 5
5 -
46Sh
arad
Kum
arCh
ief (
Pow
er S
yste
ms
& E
nerg
y) 1
,09,
93,8
71
B.E.
PG
DBM
34
01-0
7-19
86 5
7 -
47Sh
arat
Cha
ndra
Kum
arG
ener
al M
anag
er (D
esig
n &
Eng
inee
ring)
1,1
6,52
,775
B.
Sc. (
Engg
)35
01-0
7-19
85 5
8 -
Sl.
No.
N
ame
Des
igna
tion
Re
mun
erat
ion
(`)
Qua
lifica
tion
Ex
peri
ence
(Y
ears
)
Dat
e of
co
mm
ence
men
t of
empl
oym
ent
Age
(Y
ears
) L
ast e
mpl
oym
ent
48Ba
ran
Seng
upta
*Ch
ief (
Proj
ect E
ngin
eerin
g)
71,
27,2
79
B.Te
ch.,
M E
, ICW
A
3618
-11-
2013
60Au
senc
o En
gine
ers
Ltd.
49Su
dhak
ar R
amam
oort
hy
Mar
urCh
ief T
echn
olog
y O
ffice
r 1
,21,
41,7
59
P. H
D21
29-0
4-20
19 5
8 Ta
ta A
utoC
omp
Syst
ems
Ltd.
50Su
mit
Shub
hada
rsha
nCh
ief (
F&A
Eng
inee
ring
& P
roje
cts)
1,1
0,70
,470
B.
Sc.,
ICW
A, C
A ,
XLRI
(Mgm
t)26
12-1
2-19
94 5
1 -
51T.
V.Sr
iniv
as S
heno
yCh
ief (
New
Mat
eria
l Bus
ines
s) 1
,02,
33,3
10
B.E.
, MBA
2801
-07-
1992
51 -
52U
jjal C
hakr
abor
tiEx
ecut
ive-
in-C
harg
e (T
ubes
) 1
,22,
91,3
22
B.E.
3002
-07-
1990
52
-
53U
nmes
h Va
sant
rao
Ner
kar
Chie
f Com
mer
cial
- M
anuf
actu
ring
1,0
5,16
,063
B.
E.33
15-0
4-20
15 5
3 Es
sar P
roje
cts
Indi
a Lt
d.
54V.
Rav
icha
ndra
nCO
MS
(Indu
stria
l Pro
duct
s, Pr
ojec
ts &
Ex
port
) 1
,09,
20,2
36
Dip
lom
a En
gine
erin
g 22
22-0
6-19
98 5
9 -
55Vi
jay
Kum
ar N
irala
Chie
f (M
echa
nica
l Mai
nten
ance
TSK
) 1
,06,
71,2
59
B.E.
(Mec
hani
cal),
D
iplo
ma
in
Man
agem
ent
2201
-01-
1999
51
-
56Vi
nay
V. M
ahas
habd
eCh
ief (
R&D
Des
igna
te &
Pro
duct
Te
chno
logy
) 1
,35,
13,1
19
B.Te
ch.
3401
-07-
1986
55
-
57Zu
bin
Palia
Chie
f Gro
up H
R &
IR 1
,04,
04,4
64
B.Co
m.,
M.S
. (M
gmt)
2221
-01-
1999
45 -
Not
es:
(1)
Gro
ss R
emun
erat
ion
com
pris
es s
alar
y, a
llow
ance
s, m
onet
ary
valu
e of
per
quis
ites,
com
mis
sion
to
the
Dire
ctor
s an
d th
e Co
mpa
ny’s
cont
ribut
ion
to P
rovi
dent
and
Su
pera
nnua
tion
Fund
s bu
t exc
lude
s co
ntrib
utio
n to
Gra
tuit
y Fu
nd o
n th
e ba
sis
of a
ctua
rial v
alua
tion
as s
epar
ate
figur
es a
re n
ot a
vaila
ble.
(2)
The
natu
re o
f em
ploy
emen
t in
all c
ases
is c
ontr
actu
al.
(3)
Non
e of
the
empl
oyee
s m
entin
ed a
bove
is a
rela
tive
of a
ny D
irect
or o
f the
Com
pany
or M
anag
er o
f the
Com
pany
.
(4)
*Ind
icat
es e
mpl
oyed
for t
he p
art o
f the
fina
ncia
l yea
r 202
0-21
.
On
beha
lf of
the
Boar
d of
Dire
ctor
s
sd/-
N. C
HA
ND
RASE
KA
RAN
M
umba
i Ch
airm
an
May
5, 2
021
D
IN:0
0121
863
Annexure 5 (Contd.)Integrated Report & Annual Accounts 2020-21 | 114th Year212 213
StatutoryReports
Stakeholders and Materiality
Performance Snapshot
About Tata Steel
Leadership Capitals GovernanceStrategyFinancial
Statements
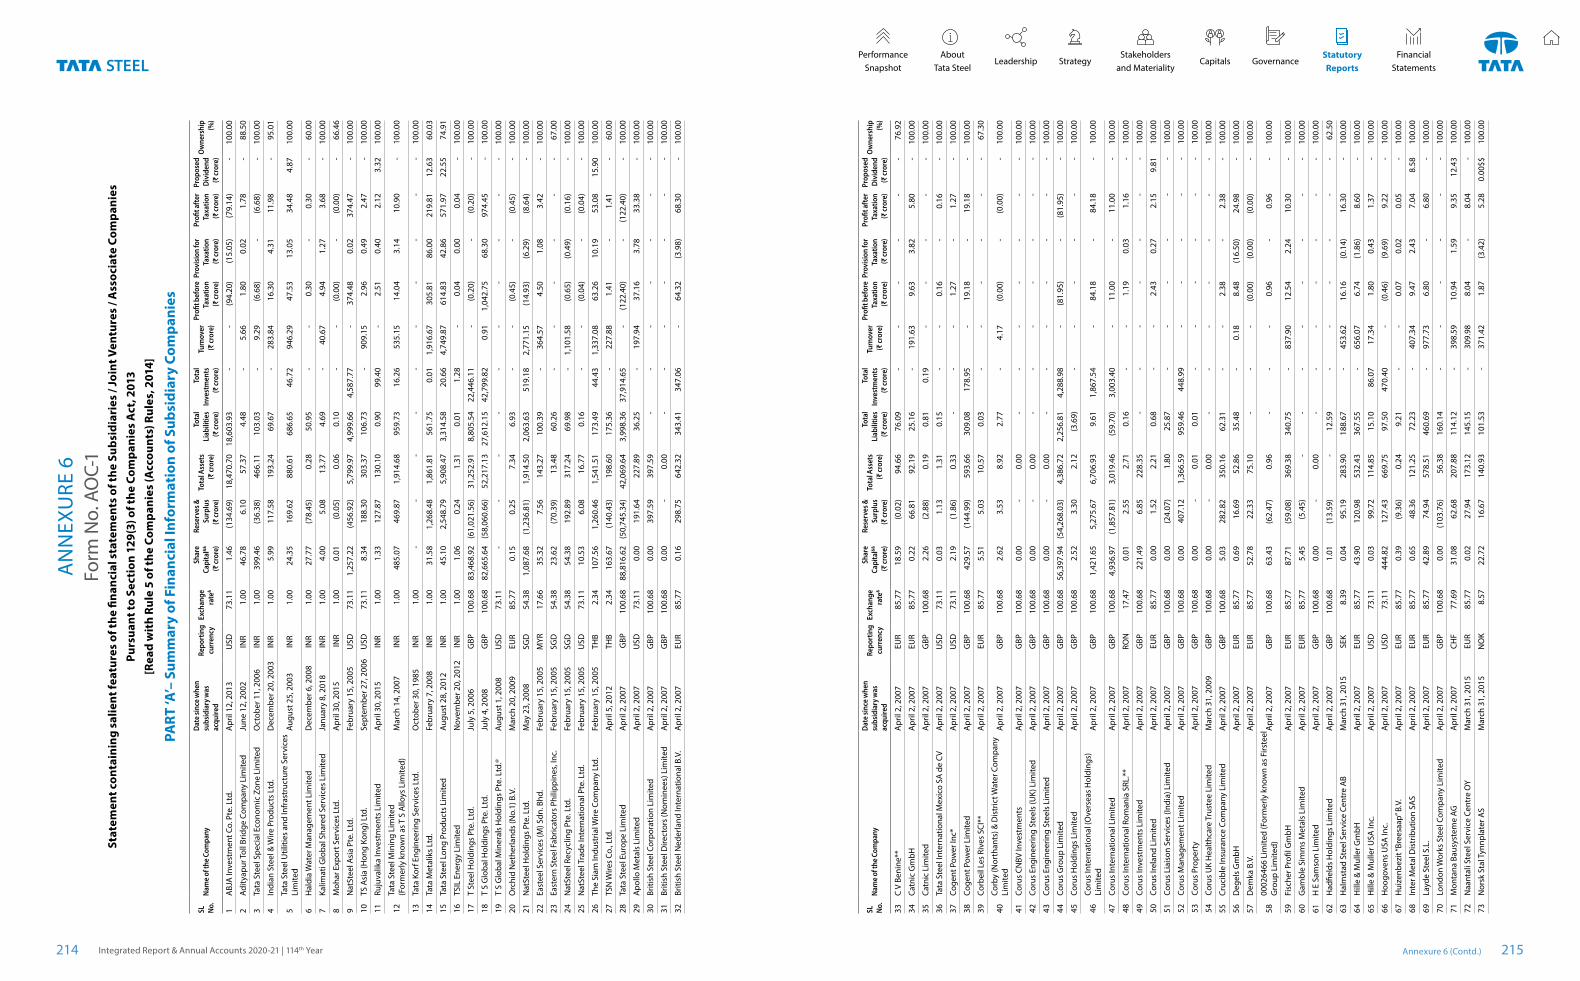
Form
No.
AO
C-1
Stat
emen
t con
tain
ing
salie
nt fe
atur
es o
f the
fina
ncia
l sta
tem
ents
of t
he S
ubsi
diar
ies
/ Joi
nt V
entu
res
/ Ass
ocia
te C
ompa
nies
Purs
uant
to S
ecti
on 1
29(3
) of t
he C
ompa
nies
Act
, 201
3[R
ead
wit
h Ru
le 5
of t
he C
ompa
nies
(Acc
ount
s) R
ules
, 201
4]
PART
‘A’–
Sum
mar
y of
Fin
anci
al In
form
atio
n of
Sub
sidi
ary
Com
pani
es
AN
NEX
URE
6
SL
No.
Nam
e of
the
Com
pany
Dat
e sin
ce w
hen
subs
idia
ry w
as
acqu
ired
Repo
rtin
g cu
rren
cy E
xcha
nge
rate
&
Shar
e Ca
pita
l&&
(₹ cr
ore)
Rese
rves
&
Surp
lus
(₹ cr
ore)
Tota
l Ass
ets
(₹ cr
ore)
Tota
l Li
abili
ties
(₹ cr
ore)
Tota
l In
vest
men
ts
(₹ cr
ore)
Turn
over
(₹
cror
e)
Profi
t bef
ore
Taxa
tion
(₹ cr
ore)
Prov
ision
for
Taxa
tion
(₹ cr
ore)
Profi
t aft
er
Taxa
tion
(₹ cr
ore)
Prop
osed
D
ivid
end
(₹ cr
ore)
Ow
ners
hip
(%)
1A
BJA
Inve
stm
ent C
o. P
te. L
td.
Apr
il 12
, 201
3U
SD 7
3.11
1
.46
(134
.69)
1
8,47
0.70
1
8,60
3.93
-
- (9
4.20
) (1
5.05
) (7
9.14
) -
100.
00
2Ad
ityap
ur To
ll Br
idge
Com
pany
Lim
ited
June
12,
200
2IN
R 1
.00
46.
78
6.1
0 5
7.37
4
.48
- 5
.66
1.8
0 0
.02
1.7
8 -
88.5
0
3Ta
ta S
teel
Spe
cial
Eco
nom
ic Z
one
Lim
ited
Oct
ober
11,
200
6IN
R 1
.00
399
.46
(36.
38)
466
.11
103
.03
- 9
.29
(6.6
8)
- (6
.68)
-
100.
00
4In
dian
Ste
el &
Wire
Pro
duct
s Lt
d.D
ecem
ber 2
0, 2
003
INR
1.0
0 5
.99
117
.58
193
.24
69.
67
- 2
83.8
4 1
6.30
4
.31
11.
98
- 95
.01
5Ta
ta S
teel
Util
ities
and
Infr
astr
uctu
re S
ervi
ces
Lim
ited
Augu
st 2
5, 2
003
INR
1.0
0 2
4.35
1
69.6
2 8
80.6
1 6
86.6
5 4
6.72
9
46.2
9 4
7.53
1
3.05
3
4.48
4
.87
100.
00
6H
aldi
a W
ater
Man
agem
ent L
imite
dD
ecem
ber 6
, 200
8IN
R 1
.00
27.
77
(78.
45)
0.2
8 5
0.95
-
- 0
.30
- 0
.30
- 60
.00
7Ka
limat
i Glo
bal S
hare
d Se
rvic
es L
imite
dJa
nuar
y 8,
201
8IN
R 1
.00
4.0
0 5
.08
13.
77
4.6
9 -
40.
67
4.9
4 1
.27
3.6
8 -
100.
00
8M
ohar
Exp
ort S
ervi
ces
Ltd.
Apr
il 30
, 201
5 IN
R 1
.00
0.0
1 (0
.05)
0
.06
0.1
0 -
- (0
.00)
-
(0.0
0)
- 66
.46
9N
atSt
eel A
sia
Pte.
Ltd
.Fe
brua
ry 1
5, 2
005
USD
73.
11
1,2
57.2
2 (4
56.9
2)
5,7
99.9
7 4
,999
.66
4,5
87.7
7 -
374
.48
0.0
2 3
74.4
7 -
100.
00
10TS
Asi
a (H
ong
Kong
) Ltd
.Se
ptem
ber 2
7, 2
006
USD
73.
11
8.3
4 1
88.3
0 3
03.3
7 1
06.7
3 -
909
.15
2.9
6 0
.49
2.4
7 -
100.
00
11Ru
juva
lika
Inve
stm
ents
Lim
ited
Apr
il 30
, 201
5IN
R 1
.00
1.3
3 1
27.8
7 1
30.1
0 0
.90
99.
40
- 2
.51
0.4
0 2
.12
3.3
2 10
0.00
12Ta
ta S
teel
Min
ing
Lim
ited
(F
orm
erly
kno
wn
as T
S A
lloys
Lim
ited)
Mar
ch 1
4, 2
007
INR
1.0
0 4
85.0
7 4
69.8
7 1
,914
.68
959
.73
16.
26
535
.15
14.
04
3.1
4 1
0.90
-
100.
00
13Ta
ta K
orf E
ngin
eerin
g Se
rvic
es L
td.
Oct
ober
30,
198
5IN
R 1
.00
- -
- -
- -
- -
- -
100.
00
14Ta
ta M
etal
iks
Ltd.
Febr
uary
7, 2
008
INR
1.0
0 3
1.58
1
,268
.48
1,8
61.8
1 5
61.7
5 0
.01
1,9
16.6
7 3
05.8
1 8
6.00
2
19.8
1 1
2.63
60
.03
15Ta
ta S
teel
Lon
g Pr
oduc
ts L
imite
dAu
gust
28,
201
2IN
R 1
.00
45.
10
2,5
48.7
9 5
,908
.47
3,3
14.5
8 2
0.66
4
,749
.87
614
.83
42.
86
571
.97
22.
55
74.9
1
16TS
IL E
nerg
y Li
mite
dN
ovem
ber 2
0, 2
012
INR
1.0
0 1
.06
0.2
4 1
.31
0.0
1 1
.28
- 0
.04
0.0
0 0
.04
- 10
0.00
17T
Stee
l Hol
ding
s Pt
e. L
td.
July
5, 2
006
GBP
100
.68
83,
468.
92
(61,
021.
56)
31,
252.
91
8,8
05.5
4 2
2,44
6.11
-
(0.2
0)
- (0
.20)
-
100.
00
18T
S G
loba
l Hol
ding
s Pt
e. L
td.
July
4, 2
008
GBP
100
.68
82,
665.
64
(58,
060.
66)
52,
217.
13
27,
612.
15
42,
799.
82
0.9
1 1
,042
.75
68.
30
974
.45
- 10
0.00
19T
S G
loba
l Min
eral
s H
oldi
ngs
Pte.
Ltd
.@Au
gust
1, 2
008
USD
73.
11
- -
- -
- -
- -
- -
100.
00
20O
rchi
d N
ethe
rland
s (N
o.1)
B.V
.M
arch
20,
200
9EU
R 8
5.77
0
.15
0.2
5 7
.34
6.9
3 -
- (0
.45)
-
(0.4
5)
- 10
0.00
21N
atSt
eel H
oldi
ngs
Pte.
Ltd
.M
ay 2
3, 2
008
SGD
54.
38
1,0
87.6
8 (1
,236
.81)
1
,914
.50
2,0
63.6
3 5
19.1
8 2
,771
.15
(14.
93)
(6.2
9)
(8.6
4)
- 10
0.00
22Ea
stee
l Ser
vice
s (M
) Sdn
. Bhd
.Fe
brua
ry 1
5, 2
005
MYR
17.
66
35.
32
7.5
6 1
43.2
7 1
00.3
9 -
364
.57
4.5
0 1
.08
3.4
2 -
100.
00
23Ea
ster
n St
eel F
abric
ator
s Ph
ilipp
ines
, Inc
.Fe
brua
ry 1
5, 2
005
SGD
54.
38
23.
62
(70.
39)
13.
48
60.
26
- -
- -
- -
67.0
0
24N
atSt
eel R
ecyc
ling
Pte.
Ltd
.Fe
brua
ry 1
5, 2
005
SGD
54.
38
54.
38
192
.89
317
.24
69.
98
- 1
,101
.58
(0.6
5)
(0.4
9)
(0.1
6)
- 10
0.00
25N
atSt
eel T
rade
Inte
rnat
iona
l Pte
. Ltd
.Fe
brua
ry 1
5, 2
005
USD
73.
11
10.
53
6.0
8 1
6.77
0
.16
- -
(0.0
4)
- (0
.04)
-
100.
00
26Th
e Si
am In
dust
rial W
ire C
ompa
ny L
td.
Febr
uary
15,
200
5TH
B 2
.34
107
.56
1,2
60.4
6 1
,541
.51
173
.49
44.
43
1,3
37.0
8 6
3.26
1
0.19
5
3.08
1
5.90
10
0.00
27TS
N W
ires
Co.,
Ltd.
Apr
il 5,
201
2TH
B 2
.34
163
.67
(140
.43)
1
98.6
0 1
75.3
6 -
227
.88
1.4
1 -
1.4
1 -
60.0
0
28Ta
ta S
teel
Eur
ope
Lim
ited
Apr
il 2,
200
7 G
BP
100
.68
88,
816.
62
(50,
745.
34)
42,
069.
64
3,9
98.3
6 3
7,91
4.65
-
(122
.40)
-
(122
.40)
-
100.
00
29A
pollo
Met
als
Lim
ited
Apr
il 2,
200
7U
SD 7
3.11
0
.00
191
.64
227
.89
36.
25
- 1
97.9
4 3
7.16
3
.78
33.
38
- 10
0.00
30Br
itish
Ste
el C
orpo
ratio
n Li
mite
dA
pril
2, 2
007
GBP
100
.68
0.0
0 3
97.5
9 3
97.5
9 -
- -
- -
- -
100.
00
31Br
itish
Ste
el D
irect
ors
(Nom
inee
s) L
imite
dA
pril
2, 2
007
GBP
100
.68
0.0
0 -
0.0
0 -
- -
- -
- -
100.
00
32Br
itish
Ste
el N
eder
land
Inte
rnat
iona
l B.V
.A
pril
2, 2
007
EUR
85.
77
0.1
6 2
98.7
5 6
42.3
2 3
43.4
1 3
47.0
6 -
64.
32
(3.9
8)
68.
30
- 10
0.00
SL
No.
Nam
e of
the
Com
pany
Dat
e sin
ce w
hen
subs
idia
ry w
as
acqu
ired
Repo
rtin
g cu
rren
cy E
xcha
nge
rate
&
Shar
e Ca
pita
l&&
(₹ cr
ore)
Rese
rves
&
Surp
lus
(₹ cr
ore)
Tota
l Ass
ets
(₹ cr
ore)
Tota
l Li
abili
ties
(₹ cr
ore)
Tota
l In
vest
men
ts
(₹ cr
ore)
Turn
over
(₹
cror
e)
Profi
t bef
ore
Taxa
tion
(₹ cr
ore)
Prov
ision
for
Taxa
tion
(₹ cr
ore)
Profi
t aft
er
Taxa
tion
(₹ cr
ore)
Prop
osed
D
ivid
end
(₹ cr
ore)
Ow
ners
hip
(%)
33C
V Be
nine
**A
pril
2, 2
007
EUR
85.
77
18.
59
(0.0
2)
94.
66
76.
09
- -
- -
- -
76.9
2
34Ca
tnic
Gm
bHA
pril
2, 2
007
EUR
85.
77
0.2
2 6
6.81
9
2.19
2
5.16
-
191
.63
9.6
3 3
.82
5.8
0 -
100.
00
35Ca
tnic
Lim
ited
Apr
il 2,
200
7G
BP 1
00.6
8 2
.26
(2.8
8)
0.1
9 0
.81
0.1
9 -
- -
- -
100.
00
36Ta
ta S
teel
Inte
rnat
iona
l Mex
ico
SA d
e CV
Apr
il 2,
200
7U
SD 7
3.11
0
.03
1.1
3 1
.31
0.1
5 -
- 0
.16
- 0
.16
- 10
0.00
37Co
gent
Pow
er In
c*A
pril
2, 2
007
USD
73.
11
2.1
9 (1
.86)
0
.33
- -
- 1
.27
- 1
.27
- 10
0.00
38Co
gent
Pow
er L
imite
dA
pril
2, 2
007
GBP
100
.68
429
.57
(144
.99)
5
93.6
6 3
09.0
8 1
78.9
5 -
19.
18
- 1
9.18
-
100.
00
39Co
rbei
l Les
Riv
es S
CI**
Apr
il 2,
200
7EU
R 8
5.77
5
.51
5.0
3 1
0.57
0
.03
- -
- -
- -
67.3
0
40Co
rby
(Nor
than
ts) &
Dis
tric
t Wat
er C
ompa
ny
Lim
ited
Apr
il 2,
200
7G
BP 1
00.6
8 2
.62
3.5
3 8
.92
2.7
7 -
4.1
7 (0
.00)
-
(0.0
0)
- 10
0.00
41Co
rus
CNBV
Inve
stm
ents
Apr
il 2,
200
7G
BP 1
00.6
8 0
.00
- 0
.00
- -
- -
- -
- 10
0.00
42Co
rus
Engi
neer
ing
Stee
ls (U
K) L
imite
dA
pril
2, 2
007
GBP
100
.68
0.0
0 -
0.0
0 -
- -
- -
- -
100.
00
43Co
rus
Engi
neer
ing
Stee
ls L
imite
dA
pril
2, 2
007
GBP
100
.68
0.0
0 -
0.0
0 -
- -
- -
- -
100.
00
44Co
rus
Gro
up L
imite
dA
pril
2, 2
007
GBP
100
.68
56,
397.
94
(54,
268.
03)
4,3
86.7
2 2
,256
.81
4,2
88.9
8 -
(81.
95)
- (8
1.95
) -
100.
00
45Co
rus
Hol
ding
s Li
mite
dA
pril
2, 2
007
GBP
100
.68
2.5
2 3
.30
2.1
2 (3
.69)
-
- -
- -
- 10
0.00
46Co
rus
Inte
rnat
iona
l (O
vers
eas
Hol
ding
s)
Lim
ited
Apr
il 2,
200
7G
BP 1
00.6
8 1
,421
.65
5,2
75.6
7 6
,706
.93
9.6
1 1
,867
.54
- 8
4.18
-
84.
18
- 10
0.00
47Co
rus
Inte
rnat
iona
l Lim
ited
Apr
il 2,
200
7G
BP 1
00.6
8 4
,936
.97
(1,8
57.8
1)
3,0
19.4
6 (5
9.70
) 3
,003
.40
- 1
1.00
-
11.
00
- 10
0.00
48Co
rus
Inte
rnat
iona
l Rom
ania
SRL
.**
Apr
il 2,
200
7RO
N 1
7.47
0
.01
2.5
5 2
.71
0.1
6 -
- 1
.19
0.0
3 1
.16
- 10
0.00
49Co
rus
Inve
stm
ents
Lim
ited
Apr
il 2,
200
7G
BP 1
00.6
8 2
21.4
9 6
.85
228
.35
- -
- -
- -
- 10
0.00
50Co
rus
Irela
nd L
imite
dA
pril
2, 2
007
EUR
85.
77
0.0
0 1
.52
2.2
1 0
.68
- -
2.4
3 0
.27
2.1
5 9
.81
100.
00
51Co
rus
Liai
son
Serv
ices
(Ind
ia) L
imite
dA
pril
2, 2
007
GBP
100
.68
0.0
0 (2
4.07
) 1
.80
25.
87
- -
- -
- -
100.
00
52Co
rus
Man
agem
ent L
imite
dA
pril
2, 2
007
GBP
100
.68
0.0
0 4
07.1
2 1
,366
.59
959
.46
448
.99
- -
- -
- 10
0.00
53Co
rus
Prop
erty
Apr
il 2,
200
7G
BP 1
00.6
8 0
.00
- 0
.01
0.0
1 -
- -
- -
- 10
0.00
54Co
rus
UK
Hea
lthca
re T
rust
ee L
imite
dM
arch
31,
200
9G
BP 1
00.6
8 0
.00
- 0
.00
- -
- -
- -
- 10
0.00
55Cr
ucib
le In
sura
nce
Com
pany
Lim
ited
Apr
il 2,
200
7G
BP 1
00.6
8 5
.03
282
.82
350
.16
62.
31
- -
2.3
8 -
2.3
8 -
100.
00
56D
egel
s G
mbH
Apr
il 2,
200
7EU
R 8
5.77
0
.69
16.
69
52.
86
35.
48
- 0
.18
8.4
8 (1
6.50
) 2
4.98
-
100.
00
57D
emka
B.V
.A
pril
2, 2
007
EUR
85.
77
52.
78
22.
33
75.
10
- -
- (0
.00)
(0
.00)
(0
.00)
-
100.
00
5800
0264
66 L
imite
d (F
orm
erly
kno
wn
as F
irste
el
Gro
up L
imite
d)A
pril
2, 2
007
GBP
100
.68
63.
43
(62.
47)
0.9
6 -
- -
0.9
6 -
0.9
6 -
100.
00
59Fi
sche
r Pro
fil G
mbH
Apr
il 2,
200
7EU
R 8
5.77
8
7.71
(5
9.08
) 3
69.3
8 3
40.7
5 -
837
.90
12.
54
2.2
4 1
0.30
-
100.
00
60G
ambl
e Si
mm
s M
etal
s Li
mite
dA
pril
2, 2
007
EUR
85.
77
5.4
5 (5
.45)
-
- -
- -
- -
- 10
0.00
61H
E S
amso
n Li
mite
dA
pril
2, 2
007
GBP
100
.68
0.0
0 -
0.0
0 -
- -
- -
- -
100.
00
62H
adfie
lds
Hol
ding
s Li
mite
dA
pril
2, 2
007
GBP
100
.68
1.0
1 (1
3.59
) -
12.
59
- -
- -
- -
62.5
0
63H
alm
stad
Ste
el S
ervi
ce C
entr
e A
BM
arch
31,
201
5SE
K 8
.39
0.0
4 9
5.19
2
83.9
0 1
88.6
7 -
453
.62
16.
16
(0.1
4)
16.
30
- 10
0.00
64H
ille
& M
ulle
r Gm
bHA
pril
2, 2
007
EUR
85.
77
43.
90
120
.98
532
.43
367
.55
- 6
56.0
7 6
.74
(1.8
6)
8.6
0 -
100.
00
65H
ille
& M
ulle
r USA
Inc.
Apr
il 2,
200
7U
SD 7
3.11
0
.03
99.
72
114
.85
15.
10
86.
07
17.
34
1.8
0 0
.43
1.3
7 -
100.
00
66H
oogo
vens
USA
Inc.
Apr
il 2,
200
7U
SD 7
3.11
4
44.8
2 1
27.4
3 6
69.7
5 9
7.50
4
70.4
0 -
(0.4
6)
(9.6
9)
9.2
2 -
100.
00
67H
uize
nbez
it “B
rees
aap”
B.V
.A
pril
2, 2
007
EUR
85.
77
0.3
9 (9
.36)
0
.24
9.2
1 -
- 0
.07
0.0
2 0
.05
- 10
0.00
68In
ter M
etal
Dis
trib
utio
n SA
SA
pril
2, 2
007
EUR
85.
77
0.6
5 4
8.36
1
21.2
5 7
2.23
-
407
.34
9.4
7 2
.43
7.0
4 8
.58
100.
00
69La
yde
Stee
l S.L
.A
pril
2, 2
007
EUR
85.
77
42.
89
74.
94
578
.51
460
.69
- 9
77.7
3 6
.80
- 6
.80
- 10
0.00
70Lo
ndon
Wor
ks S
teel
Com
pany
Lim
ited
Apr
il 2,
200
7G
BP 1
00.6
8 0
.00
(103
.76)
5
6.38
1
60.1
4 -
- -
- -
- 10
0.00
71M
onta
na B
ausy
stem
e AG
Apr
il 2,
200
7CH
F 7
7.69
3
1.08
6
2.68
2
07.8
8 1
14.1
2 -
398
.59
10.
94
1.5
9 9
.35
12.
43
100.
00
72N
aant
ali S
teel
Ser
vice
Cen
tre
OY
Mar
ch 3
1, 2
015
EUR
85.
77
0.0
2 2
7.94
1
73.1
2 1
45.1
5 -
309
.98
8.0
4 -
8.0
4 -
100.
00
73N
orsk
Sta
l Tyn
npla
ter A
SM
arch
31,
201
5N
OK
8.5
7 2
2.72
1
6.67
1
40.9
3 1
01.5
3 -
371
.42
1.8
7 (3
.42)
5
.28
0.0
0$$
100.
00
Annexure 6 (Contd.)Integrated Report & Annual Accounts 2020-21 | 114th Year214 215
StatutoryReports
Stakeholders and Materiality
Performance Snapshot
About Tata Steel
Leadership Capitals GovernanceStrategyFinancial
Statements
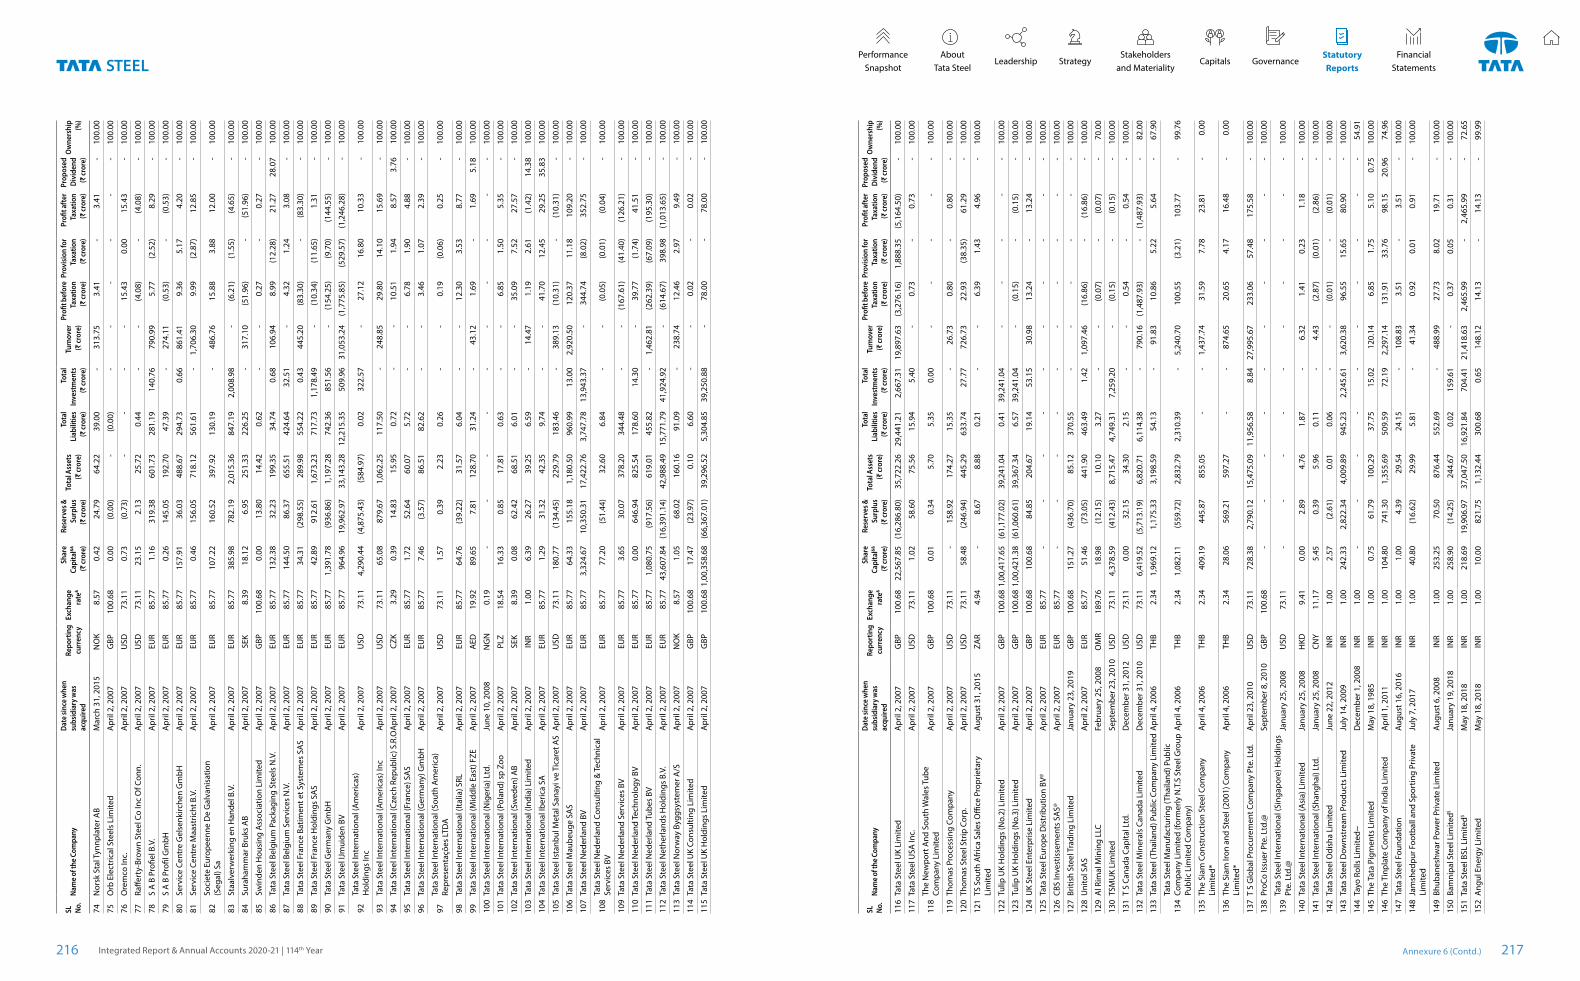
SL
No.
Nam
e of
the
Com
pany
Dat
e sin
ce w
hen
subs
idia
ry w
as
acqu
ired
Repo
rtin
g cu
rren
cy E
xcha
nge
rate
&
Shar
e Ca
pita
l&&
(₹ cr
ore)
Rese
rves
&
Surp
lus
(₹ cr
ore)
Tota
l Ass
ets
(₹ cr
ore)
Tota
l Li
abili
ties
(₹ cr
ore)
Tota
l In
vest
men
ts
(₹ cr
ore)
Turn
over
(₹
cror
e)
Profi
t bef
ore
Taxa
tion
(₹ cr
ore)
Prov
ision
for
Taxa
tion
(₹ cr
ore)
Profi
t aft
er
Taxa
tion
(₹ cr
ore)
Prop
osed
D
ivid
end
(₹ cr
ore)
Ow
ners
hip
(%)
74N
orsk
Sta
l Tyn
npla
ter A
BM
arch
31,
201
5N
OK
8.5
7 0
.42
24.
79
64.
22
39.
00
- 3
13.7
5 3
.41
- 3
.41
- 10
0.00
75O
rb E
lect
rical
Ste
els
Lim
ited
Apr
il 2,
200
7G
BP 1
00.6
8 0
.00
(0.0
0)
- (0
.00)
-
- -
- -
- 10
0.00
76O
rem
co In
c.A
pril
2, 2
007
USD
73.
11
0.7
3 (0
.73)
-
- -
- 1
5.43
0
.00
15.
43
- 10
0.00
77Ra
ffert
y-Br
own
Stee
l Co
Inc
Of C
onn.
Apr
il 2,
200
7U
SD 7
3.11
2
3.15
2
.13
25.
72
0.4
4 -
- (4
.08)
-
(4.0
8)
- 10
0.00
78S
A B
Pro
fiel B
.V.
Apr
il 2,
200
7EU
R 8
5.77
1
.16
319
.38
601
.73
281
.19
140
.76
790
.99
5.7
7 (2
.52)
8
.29
- 10
0.00
79S
A B
Pro
fil G
mbH
Apr
il 2,
200
7EU
R 8
5.77
0
.26
145
.05
192
.70
47.
39
- 2
74.1
1 (0
.53)
-
(0.5
3)
- 10
0.00
80Se
rvic
e Ce
ntre
Gel
senk
irche
n G
mbH
Apr
il 2,
200
7EU
R 8
5.77
1
57.9
1 3
6.03
4
88.6
7 2
94.7
3 0
.66
861
.41
9.3
6 5
.17
4.2
0 -
100.
00
81Se
rvic
e Ce
ntre
Maa
stric
ht B
.V.
Apr
il 2,
200
7EU
R 8
5.77
0
.46
156
.05
718
.12
561
.61
- 1
,706
.30
9.9
9 (2
.87)
1
2.85
-
100.
00
82So
ciet
e Eu
rope
enne
De
Gal
vani
satio
n
(Seg
al) S
aA
pril
2, 2
007
EUR
85.
77
107
.22
160
.52
397
.92
130
.19
- 4
86.7
6 1
5.88
3
.88
12.
00
- 10
0.00
83St
aalv
erw
erki
ng e
n H
ande
l B.V
.A
pril
2, 2
007
EUR
85.
77
385
.98
782
.19
2,0
15.3
6 8
47.1
9 2
,008
.98
- (6
.21)
(1
.55)
(4
.65)
-
100.
00
84Su
raha
mm
ar B
ruks
AB
Apr
il 2,
200
7SE
K 8
.39
18.
12
6.9
5 2
51.3
3 2
26.2
5 -
317
.10
(51.
96)
- (5
1.96
) -
100.
00
85Sw
inde
n H
ousi
ng A
ssoc
iatio
n Li
mite
dA
pril
2, 2
007
GBP
100
.68
0.0
0 1
3.80
1
4.42
0
.62
- -
0.2
7 -
0.2
7 -
100.
00
86Ta
ta S
teel
Bel
gium
Pac
kagi
ng S
teel
s N
.V.
Apr
il 2,
200
7EU
R 8
5.77
1
32.3
8 3
2.23
1
99.3
5 3
4.74
0
.68
106
.94
8.9
9 (1
2.28
) 2
1.27
2
8.07
10
0.00
87Ta
ta S
teel
Bel
gium
Ser
vice
s N
.V.
Apr
il 2,
200
7EU
R 8
5.77
1
44.5
0 8
6.37
6
55.5
1 4
24.6
4 3
2.51
-
4.3
2 1
.24
3.0
8 -
100.
00
88Ta
ta S
teel
Fra
nce
Batim
ent e
t Sys
tem
es S
AS
Apr
il 2,
200
7EU
R 8
5.77
3
4.31
(2
98.5
5)
289
.98
554
.22
0.4
3 4
45.2
0 (8
3.30
) -
(83.
30)
- 10
0.00
89Ta
ta S
teel
Fra
nce
Hol
ding
s SA
SA
pril
2, 2
007
EUR
85.
77
42.
89
912
.61
1,6
73.2
3 7
17.7
3 1
,178
.49
- (1
0.34
) (1
1.65
) 1
.31
- 10
0.00
90Ta
ta S
teel
Ger
man
y G
mbH
Apr
il 2,
200
7EU
R 8
5.77
1
,391
.78
(936
.86)
1
,197
.28
742
.36
851
.56
- (1
54.2
5)
(9.7
0)
(144
.55)
-
100.
00
91Ta
ta S
teel
IJm
uide
n BV
Apr
il 2,
200
7EU
R 8
5.77
9
64.9
6 1
9,96
2.97
3
3,14
3.28
1
2,21
5.35
5
09.9
6 3
1,05
3.24
(1
,775
.85)
(5
29.5
7)
(1,2
46.2
8)
- 10
0.00
92Ta
ta S
teel
Inte
rnat
iona
l (A
mer
icas
) H
oldi
ngs
Inc
Apr
il 2,
200
7U
SD 7
3.11
4
,290
.44
(4,8
75.4
3)
(584
.97)
0
.02
322
.57
- 2
7.12
1
6.80
1
0.33
-
100.
00
93Ta
ta S
teel
Inte
rnat
iona
l (A
mer
icas
) Inc
Apr
il 2,
200
7U
SD 7
3.11
6
5.08
8
79.6
7 1
,062
.25
117
.50
- 2
48.8
5 2
9.80
1
4.10
1
5.69
-
100.
00
94Ta
ta S
teel
Inte
rnat
iona
l (Cz
ech
Repu
blic
) S.R
.O A
pril
2, 2
007
CZK
3.2
9 0
.39
14.
83
15.
95
0.7
2 -
- 1
0.51
1
.94
8.5
7 3
.76
100.
00
95Ta
ta S
teel
Inte
rnat
iona
l (Fr
ance
) SA
SA
pril
2, 2
007
EUR
85.
77
1.7
2 5
2.64
6
0.07
5
.72
- -
6.7
8 1
.90
4.8
8 -
100.
00
96Ta
ta S
teel
Inte
rnat
iona
l (G
erm
any)
Gm
bHA
pril
2, 2
007
EUR
85.
77
7.4
6 (3
.57)
8
6.51
8
2.62
-
- 3
.46
1.0
7 2
.39
- 10
0.00
97Ta
ta S
teel
Inte
rnat
iona
l (So
uth
Am
eric
a)
Repr
esen
taçõ
es LT
DA
Apr
il 2,
200
7U
SD 7
3.11
1
.57
0.3
9 2
.23
0.2
6 -
- 0
.19
(0.0
6)
0.2
5 -
100.
00
98Ta
ta S
teel
Inte
rnat
iona
l (Ita
lia) S
RLA
pril
2, 2
007
EUR
85.
77
64.
76
(39.
22)
31.
57
6.0
4 -
- 1
2.30
3
.53
8.7
7 -
100.
00
99Ta
ta S
teel
Inte
rnat
iona
l (M
iddl
e Ea
st) F
ZEA
pril
2, 2
007
AED
19.
92
89.
65
7.8
1 1
28.7
0 3
1.24
-
43.
12
1.6
9 -
1.6
9 5
.18
100.
00
100
Tata
Ste
el In
tern
atio
nal (
Nig
eria
) Ltd
.Ju
ne 1
0, 2
008
NG
N 0
.19
- -
- -
- -
- -
- -
100.
00
101
Tata
Ste
el In
tern
atio
nal (
Pola
nd) s
p Zo
oA
pril
2, 2
007
PLZ
18.
54
16.
33
0.8
5 1
7.81
0
.63
- -
6.8
5 1
.50
5.3
5 -
100.
00
102
Tata
Ste
el In
tern
atio
nal (
Swed
en) A
BA
pril
2, 2
007
SEK
8.3
9 0
.08
62.
42
68.
51
6.0
1 -
- 3
5.09
7
.52
27.
57
- 10
0.00
103
Tata
Ste
el In
tern
atio
nal (
Indi
a) L
imite
dA
pril
2, 2
007
INR
1.0
0 6
.39
26.
27
39.
25
6.5
9 -
14.
47
1.1
9 2
.61
(1.4
2)
14.
38
100.
00
104
Tata
Ste
el In
tern
atio
nal I
beric
a SA
Apr
il 2,
200
7EU
R 8
5.77
1
.29
31.
32
42.
35
9.7
4 -
- 4
1.70
1
2.45
2
9.25
3
5.83
10
0.00
105
Tata
Ste
el Is
tanb
ul M
etal
San
ayi v
e Ti
care
t AS
Apr
il 2,
200
7U
SD 7
3.11
1
80.7
7 (1
34.4
5)
229
.79
183
.46
- 3
89.1
3 (1
0.31
) -
(10.
31)
- 10
0.00
106
Tata
Ste
el M
aube
uge
SAS
Apr
il 2,
200
7EU
R 8
5.77
6
4.33
1
55.1
8 1
,180
.50
960
.99
13.
00
2,9
20.5
0 1
20.3
7 1
1.18
1
09.2
0 -
100.
00
107
Tata
Ste
el N
eder
land
BV
Apr
il 2,
200
7EU
R 8
5.77
3
,324
.67
10,
350.
31
17,
422.
76
3,7
47.7
8 1
3,94
3.37
-
344
.74
(8.0
2)
352
.75
- 10
0.00
108
Tata
Ste
el N
eder
land
Con
sulti
ng &
Tech
nica
l Se
rvic
es B
VA
pril
2, 2
007
EUR
85.
77
77.
20
(51.
44)
32.
60
6.8
4 -
- (0
.05)
(0
.01)
(0
.04)
-
100.
00
109
Tata
Ste
el N
eder
land
Ser
vice
s BV
Apr
il 2,
200
7EU
R 8
5.77
3
.65
30.
07
378
.20
344
.48
- -
(167
.61)
(4
1.40
) (1
26.2
1)
- 10
0.00
110
Tata
Ste
el N
eder
land
Tech
nolo
gy B
VA
pril
2, 2
007
EUR
85.
77
0.00
646.
94 8
25.5
4 1
78.6
0 1
4.30
-
39.
77
(1.7
4)
41.
51
- 10
0.00
111
Tata
Ste
el N
eder
land
Tub
es B
VA
pril
2, 2
007
EUR
85.
77
1,0
80.7
5 (9
17.5
6)
619
.01
455
.82
- 1
,462
.81
(262
.39)
(6
7.09
) (1
95.3
0)
- 10
0.00
112
Tata
Ste
el N
ethe
rland
s H
oldi
ngs
B.V.
Apr
il 2,
200
7EU
R 8
5.77
4
3,60
7.84
(1
6,39
1.14
) 4
2,98
8.49
1
5,77
1.79
4
1,92
4.92
-
(614
.67)
3
98.9
8 (1
,013
.65)
-
100.
00
113
Tata
Ste
el N
orw
ay B
yggs
yste
mer
A/S
Apr
il 2,
200
7N
OK
8.5
7 1
.05
68.
02
160
.16
91.
09
- 2
38.7
4 1
2.46
2
.97
9.4
9 -
100.
00
114
Tata
Ste
el U
K Co
nsul
ting
Lim
ited
Apr
il 2,
200
7G
BP 1
00.6
8 1
7.47
(2
3.97
) 0
.10
6.6
0 -
- 0
.02
- 0
.02
- 10
0.00
115
Tata
Ste
el U
K H
oldi
ngs
Lim
ited
Apr
il 2,
200
7G
BP 1
00.6
8 1
,00,
358.
68
(66,
367.
01)
39,
296.
52
5,3
04.8
5 3
9,25
0.88
-
78.
00
- 7
8.00
-
100.
00
SL
No.
Nam
e of
the
Com
pany
Dat
e sin
ce w
hen
subs
idia
ry w
as
acqu
ired
Repo
rtin
g cu
rren
cy E
xcha
nge
rate
&
Shar
e Ca
pita
l&&
(₹ cr
ore)
Rese
rves
&
Surp
lus
(₹ cr
ore)
Tota
l Ass
ets
(₹ cr
ore)
Tota
l Li
abili
ties
(₹ cr
ore)
Tota
l In
vest
men
ts
(₹ cr
ore)
Turn
over
(₹
cror
e)
Profi
t bef
ore
Taxa
tion
(₹ cr
ore)
Prov
ision
for
Taxa
tion
(₹ cr
ore)
Profi
t aft
er
Taxa
tion
(₹ cr
ore)
Prop
osed
D
ivid
end
(₹ cr
ore)
Ow
ners
hip
(%)
116
Tata
Ste
el U
K Li
mite
dA
pril
2, 2
007
GBP
100
.68
22,
567.
85
(16,
286.
80)
35,
722.
26
29,
441.
21
2,6
67.3
1 1
9,89
7.63
(3
,276
.16)
1
,888
.35
(5,1
64.5
0)
- 10
0.00
117
Tata
Ste
el U
SA In
c.A
pril
2, 2
007
USD
73.
11
1.0
2 5
8.60
7
5.56
1
5.94
5
.40
- 0
.73
- 0
.73
- 10
0.00
118
The
New
port
And
Sou
th W
ales
Tub
e Co
mpa
ny L
imite
dA
pril
2, 2
007
GBP
100
.68
0.0
1 0
.34
5.7
0 5
.35
0.0
0 -
- -
- -
100.
00
119
Thom
as P
roce
ssin
g Co
mpa
nyA
pril
2, 2
007
USD
73.
11
- 1
58.9
2 1
74.2
7 1
5.35
-
26.
73
0.8
0 -
0.8
0 -
100.
00
120
Thom
as S
teel
Str
ip C
orp.
Apr
il 2,
200
7U
SD 7
3.11
5
8.48
(2
46.9
4)
445
.29
633
.74
27.
77
726
.73
22.
93
(38.
35)
61.
29
- 10
0.00
121
TS S
outh
Afr
ica
Sale
s O
ffice
Pro
prie
tary
Li
mite
dAu
gust
31,
201
5ZA
R 4
.94
- 8
.67
8.8
8 0
.21
- -
6.3
9 1
.43
4.9
6 -
100.
00
122
Tulip
UK
Hol
ding
s (N
o.2)
Lim
ited
Apr
il 2,
200
7G
BP 1
00.6
8 1
,00,
417.
65
(61,
177.
02)
39,
241.
04
0.4
1 3
9,24
1.04
-
- -
- -
100.
00
123
Tulip
UK
Hol
ding
s (N
o.3)
Lim
ited
Apr
il 2,
200
7G
BP 1
00.6
8 1
,00,
421.
38
(61,
060.
61)
39,
367.
34
6.5
7 3
9,24
1.04
-
(0.1
5)
- (0
.15)
-
100.
00
124
UK
Stee
l Ent
erpr
ise
Lim
ited
Apr
il 2,
200
7G
BP 1
00.6
8 1
00.6
8 8
4.85
2
04.6
7 1
9.14
5
3.15
3
0.98
1
3.24
-
13.
24
- 10
0.00
125
Tata
Ste
el E
urop
e D
istr
ibut
ion
BV@
Apr
il 2,
200
7EU
R 8
5.77
-
- -
- -
- -
- -
- 10
0.00
126
CBS
Inve
stis
sem
ents
SA
S@A
pril
2, 2
007
EUR
85.
77
- -
- -
- -
- -
- -
100.
00
127
Briti
sh S
teel
Tra
ding
Lim
ited
Janu
ary
23, 2
019
GBP
100
.68
151
.27
(436
.70)
8
5.12
3
70.5
5 -
- -
- -
- 10
0.00
128
Uni
tol S
AS
Apr
il 2,
200
7EU
R 8
5.77
5
1.46
(7
3.05
) 4
41.9
0 4
63.4
9 1
.42
1,0
97.4
6 (1
6.86
) -
(16.
86)
- 10
0.00
129
Al R
imal
Min
ing
LLC
Febr
uary
25,
200
8O
MR
189
.76
18.
98
(12.
15)
10.
10
3.2
7 -
- (0
.07)
-
(0.0
7)
- 70
.00
130
TSM
UK
Lim
ited
Sept
embe
r 23,
201
0U
SD 7
3.11
4
,378
.59
(412
.43)
8
,715
.47
4,7
49.3
1 7
,259
.20
- (0
.15)
-
(0.1
5)
- 10
0.00
131
T S
Cana
da C
apita
l Ltd
.D
ecem
ber 3
1, 2
012
USD
73.
11
0.0
0 3
2.15
3
4.30
2
.15
- -
0.5
4 -
0.5
4 -
100.
00
132
Tata
Ste
el M
iner
als
Cana
da L
imite
d D
ecem
ber 3
1, 2
010
USD
73.
11
6,4
19.5
2 (5
,713
.19)
6
,820
.71
6,1
14.3
8 -
790
.16
(1,4
87.9
3)
- (1
,487
.93)
-
82.0
0
133
Tata
Ste
el (T
haila
nd) P
ublic
Com
pany
Lim
ited
Apr
il 4,
200
6TH
B 2
.34
1,9
69.1
2 1
,175
.33
3,1
98.5
9 5
4.13
-
91.
83
10.
86
5.2
2 5
.64
- 67
.90
134
Tata
Ste
el M
anuf
actu
ring
(Tha
iland
) Pub
lic
Com
pany
Lim
ited
(form
erly
N.T
.S S
teel
Gro
up
Publ
ic L
imite
d Co
mpa
ny)
Apr
il 4,
200
6TH
B 2
.34
1,0
82.1
1 (5
59.7
2)
2,8
32.7
9 2
,310
.39
- 5
,240
.70
100
.55
(3.2
1)
103
.77
- 99
.76
135
The
Siam
Con
stru
ctio
n St
eel C
ompa
ny
Lim
ited*
Apr
il 4,
200
6TH
B 2
.34
409
.19
445
.87
855
.05
- -
1,4
37.7
4 3
1.59
7
.78
23.
81
- 0.
00
136
The
Siam
Iron
and
Ste
el (2
001)
Com
pany
Li
mite
d*A
pril
4, 2
006
THB
2.3
4 2
8.06
5
69.2
1 5
97.2
7 -
- 8
74.6
5 2
0.65
4
.17
16.
48
- 0.
00
137
T S
Glo
bal P
rocu
rem
ent C
ompa
ny P
te. L
td.
Apr
il 23
, 201
0U
SD 7
3.11
7
28.3
8 2
,790
.12
15,
475.
09
11,
956.
58
8.8
4 2
7,99
5.67
2
33.0
6 5
7.48
1
75.5
8 -
100.
00
138
ProC
o Is
suer
Pte
. Ltd
.@Se
ptem
ber 8
, 201
0G
BP 1
00.6
8 -
- -
- -
- -
- -
- 10
0.00
139
Tata
Ste
el In
tern
atio
nal (
Sing
apor
e) H
oldi
ngs
Pte.
Ltd
.@Ja
nuar
y 25
, 200
8U
SD 7
3.11
-
- -
- -
- -
- -
- 10
0.00
140
Tata
Ste
el In
tern
atio
nal (
Asi
a) L
imite
dJa
nuar
y 25
, 200
8H
KD 9
.41
0.0
0 2
.89
4.7
6 1
.87
- 6
.32
1.4
1 0
.23
1.1
8 -
100.
00
141
Tata
Ste
el In
tern
atio
nal (
Shan
ghai
) Ltd
.Ja
nuar
y 25
, 200
8CN
Y 1
1.17
5
.45
0.3
9 5
.96
0.1
1 -
4.4
3 (2
.87)
(0
.01)
(2
.86)
-
100.
00
142
Tata
Ste
el O
dish
a Li
mite
dJu
ne 2
2, 2
012
INR
1.0
0 2
.57
(2.6
1)
0.0
1 0
.06
- -
(0.0
1)
- (0
.01)
-
100.
00
143
Tata
Ste
el D
owns
trea
m P
rodu
cts
Lim
ited
July
14,
200
9IN
R 1
.00
242
.33
2,8
22.3
4 4
,009
.89
945
.23
2,2
45.6
1 3
,620
.38
96.
55
15.
65
80.
90
- 10
0.00
144
Tayo
Rol
ls L
imite
d~D
ecem
ber 1
, 200
8IN
R 1
.00
- -
- -
- -
- -
- -
54.9
1
145
The
Tata
Pig
men
ts L
imite
dM
ay 1
8, 1
985
INR
1.0
0 0
.75
61.
79
100
.29
37.
75
15.
02
120
.14
6.8
5 1
.75
5.1
0 0
.75
100.
00
146
The
Tinp
late
Com
pany
of I
ndia
Lim
ited
Apr
il 1,
201
1IN
R 1
.00
104
.80
741
.30
1,3
55.6
9 5
09.5
9 7
2.19
2
,297
.14
131
.91
33.
76
98.
15
20.
96
74.9
6
147
Tata
Ste
el F
ound
atio
nAu
gust
16,
201
6IN
R 1
.00
1.0
0 4
.39
29.
54
24.
15
- 1
08.8
3 3
.51
- 3
.51
- 10
0.00
148
Jam
shed
pur F
ootb
all a
nd S
port
ing
Priv
ate
Lim
ited
July
7, 2
017
INR
1.0
0 4
0.80
(1
6.62
) 2
9.99
5
.81
- 4
1.34
0
.92
0.0
1 0
.91
- 10
0.00
149
Bhub
anes
hwar
Pow
er P
rivat
e Li
mite
dAu
gust
6, 2
008
INR
1.0
0 2
53.2
5 7
0.50
8
76.4
4 5
52.6
9 -
488
.99
27.
73
8.0
2 1
9.71
-
100.
00
150
Bam
nipa
l Ste
el L
imite
d$Ja
nuar
y 19
, 201
8IN
R 1
.00
258
.90
(14.
25)
244
.67
0.0
2 1
59.6
1 -
0.3
7 0
.05
0.3
1 -
100.
00
151
Tata
Ste
el B
SL L
imite
d$M
ay 1
8, 2
018
INR
1.0
0 2
18.6
9 1
9,90
6.97
3
7,04
7.50
1
6,92
1.84
7
04.4
1 2
1,41
8.63
2
,465
.99
- 2
,465
.99
- 72
.65
152
Ang
ul E
nerg
y Li
mite
d M
ay 1
8, 2
018
INR
1.0
0 1
0.00
8
21.7
5 1
,132
.44
300
.68
0.6
5 1
48.1
2 1
4.13
-
14.
13
- 99
.99
Annexure 6 (Contd.)Integrated Report & Annual Accounts 2020-21 | 114th Year216 217
StatutoryReports
Stakeholders and Materiality
Performance Snapshot
About Tata Steel
Leadership Capitals GovernanceStrategyFinancial
Statements
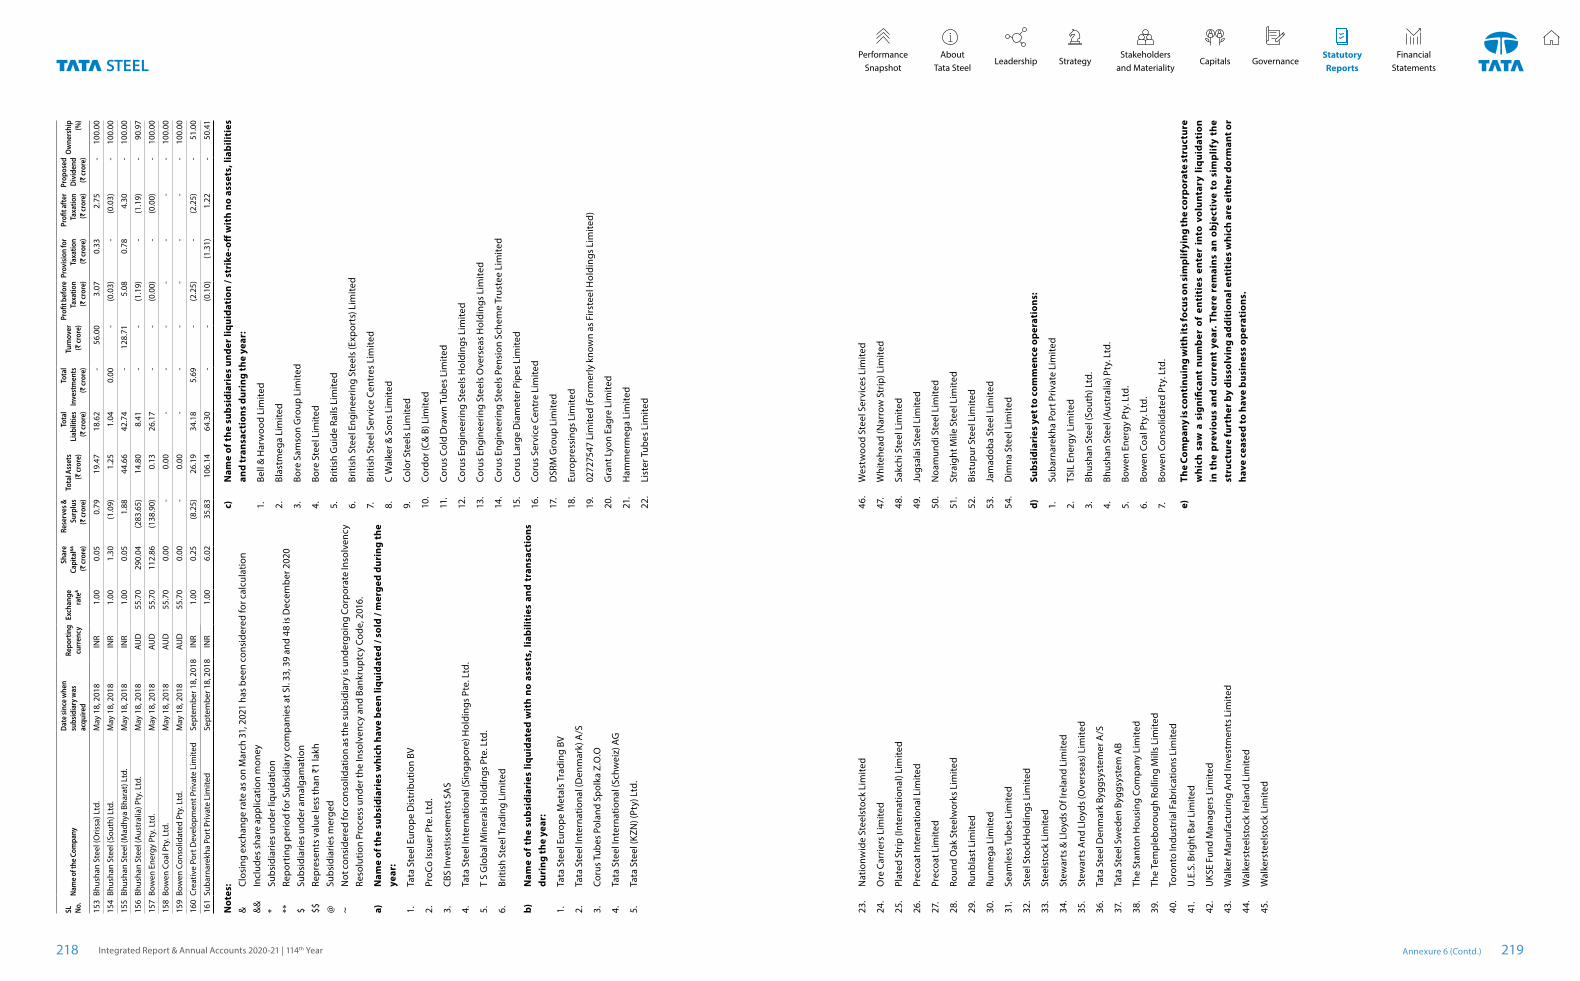
SL
No.
Nam
e of
the
Com
pany
Dat
e sin
ce w
hen
subs
idia
ry w
as
acqu
ired
Repo
rtin
g cu
rren
cy E
xcha
nge
rate
&
Shar
e Ca
pita
l&&
(₹ cr
ore)
Rese
rves
&
Surp
lus
(₹ cr
ore)
Tota
l Ass
ets
(₹ cr
ore)
Tota
l Li
abili
ties
(₹ cr
ore)
Tota
l In
vest
men
ts
(₹ cr
ore)
Turn
over
(₹
cror
e)
Profi
t bef
ore
Taxa
tion
(₹ cr
ore)
Prov
ision
for
Taxa
tion
(₹ cr
ore)
Profi
t aft
er
Taxa
tion
(₹ cr
ore)
Prop
osed
D
ivid
end
(₹ cr
ore)
Ow
ners
hip
(%)
153
Bhus
han
Stee
l (O
rissa
) Ltd
.M
ay 1
8, 2
018
INR
1.0
0 0
.05
0.7
9 1
9.47
1
8.62
-
56.
00
3.0
7 0
.33
2.7
5 -
100.
00
154
Bhus
han
Stee
l (So
uth)
Ltd
.M
ay 1
8, 2
018
INR
1.0
0 1
.30
(1.0
9)
1.2
5 1
.04
0.0
0 -
(0.0
3)
- (0
.03)
-
100.
00
155
Bhus
han
Stee
l (M
adhy
a Bh
arat
) Ltd
.M
ay 1
8, 2
018
INR
1.0
0 0
.05
1.8
8 4
4.66
4
2.74
-
128
.71
5.0
8 0
.78
4.3
0 -
100.
00
156
Bhus
han
Stee
l (Au
stra
lia) P
ty. L
td.
May
18,
201
8AU
D 5
5.70
2
90.0
4 (2
83.6
5)
14.
80
8.4
1 -
- (1
.19)
-
(1.1
9)
- 90
.97
157
Bow
en E
nerg
y Pt
y. L
td.
May
18,
201
8AU
D 5
5.70
1
12.8
6 (1
38.9
0)
0.1
3 2
6.17
-
- (0
.00)
-
(0.0
0)
- 10
0.00
158
Bow
en C
oal P
ty. L
td.
May
18,
201
8AU
D 5
5.70
0
.00
- 0
.00
- -
- -
- -
- 10
0.00
159
Bow
en C
onso
lidat
ed P
ty. L
td.
May
18,
201
8AU
D 5
5.70
0
.00
- 0
.00
- -
- -
- -
- 10
0.00
160
Crea
tive
Port
Dev
elop
men
t Priv
ate
Lim
ited
Sept
embe
r 18,
201
8IN
R 1
.00
0.2
5 (8
.25)
2
6.19
3
4.18
5
.69
- (2
.25)
-
(2.2
5)
- 51
.00
161
Suba
rnar
ekha
Por
t Priv
ate
Lim
ited
Sept
embe
r 18,
201
8IN
R 1
.00
6.0
2 3
5.83
1
06.1
4 6
4.30
-
- (0
.10)
(1
.31)
1
.22
- 50
.41
Not
es:
&
Clos
ing
exch
ange
rate
as
on M
arch
31,
202
1 ha
s be
en c
onsi
dere
d fo
r cal
cula
tion
&&
In
clud
es s
hare
app
licat
ion
mon
ey*
Subs
idia
ries
unde
r liq
uida
tion
**
Repo
rtin
g pe
riod
for S
ubsi
diar
y co
mpa
nies
at S
l. 33
, 39
and
48 is
Dec
embe
r 202
0$
Subs
idia
ries
unde
r am
alga
mat
ion
$$
Repr
esen
ts v
alue
less
than
₹1
lakh
@
Subs
idia
ries
mer
ged
~ N
ot c
onsi
dere
d fo
r con
solid
atio
n as
the
subs
idia
ry is
und
ergo
ing
Corp
orat
e In
solv
ency
Re
solu
tion
Proc
ess
unde
r the
Inso
lven
cy a
nd B
ankr
uptc
y Co
de, 2
016.
a)
Nam
e of
the
subs
idia
ries
whi
ch h
ave
been
liqu
idat
ed /
sold
/ m
erge
d du
ring
the
year
:
1.
Tata
Ste
el E
urop
e D
istr
ibut
ion
BV
2.
ProC
o Is
suer
Pte
. Ltd
.
3.
CBS
Inve
stis
sem
ents
SA
S
4.
Tata
Ste
el In
tern
atio
nal (
Sing
apor
e) H
oldi
ngs
Pte.
Ltd
.
5.
T S
Glo
bal M
iner
als
Hol
ding
s Pt
e. L
td.
6.
Briti
sh S
teel
Tra
ding
Lim
ited
b)
Nam
e of
the
sub
sidi
arie
s liq
uida
ted
wit
h no
ass
ets,
liab
iliti
es a
nd t
rans
acti
ons
duri
ng th
e ye
ar:
1.
Tata
Ste
el E
urop
e M
etal
s Tr
adin
g BV
2.
Tata
Ste
el In
tern
atio
nal (
Den
mar
k) A
/S
3.
Coru
s Tu
bes
Pola
nd S
polk
a Z.
O.O
4.
Tata
Ste
el In
tern
atio
nal (
Schw
eiz)
AG
5.
Tata
Ste
el (K
ZN) (
Pty)
Ltd
.
c)
Nam
e of
the
sub
sidi
arie
s un
der
liqui
dati
on /
stri
ke-o
ff w
ith
no a
sset
s, li
abili
ties
an
d tr
ansa
ctio
ns d
urin
g th
e ye
ar:
1.
Bell
& H
arw
ood
Lim
ited
2.
Blas
tmeg
a Li
mite
d
3.
Bore
Sam
son
Gro
up L
imite
d
4.
Bore
Ste
el L
imite
d
5.
Briti
sh G
uide
Rai
ls L
imite
d
6.
Briti
sh S
teel
Eng
inee
ring
Stee
ls (E
xpor
ts) L
imite
d
7.
Briti
sh S
teel
Ser
vice
Cen
tres
Lim
ited
8.
C W
alke
r & S
ons
Lim
ited
9.
Colo
r Ste
els
Lim
ited
10.
Cord
or (C
& B
) Lim
ited
11.
Coru
s Co
ld D
raw
n Tu
bes
Lim
ited
12.
Coru
s En
gine
erin
g St
eels
Hol
ding
s Li
mite
d
13.
Coru
s En
gine
erin
g St
eels
Ove
rsea
s H
oldi
ngs
Lim
ited
14.
Coru
s En
gine
erin
g St
eels
Pen
sion
Sch
eme
Trus
tee
Lim
ited
15.
Coru
s La
rge
Dia
met
er P
ipes
Lim
ited
16.
Coru
s Se
rvic
e Ce
ntre
Lim
ited
17.
DSR
M G
roup
Lim
ited
18.
Euro
pres
sing
s Li
mite
d
19.
0272
7547
Lim
ited
(For
mer
ly k
now
n as
Firs
teel
Hol
ding
s Li
mite
d)
20.
Gra
nt L
yon
Eagr
e Li
mite
d
21.
Ham
mer
meg
a Li
mite
d
22.
List
er T
ubes
Lim
ited
23.
Nat
ionw
ide
Stee
lsto
ck L
imite
d
24.
Ore
Car
riers
Lim
ited
25.
Plat
ed S
trip
(Int
erna
tiona
l) Li
mite
d
26.
Prec
oat I
nter
natio
nal L
imite
d
27.
Prec
oat L
imite
d
28.
Roun
d O
ak S
teel
wor
ks L
imite
d
29.
Runb
last
Lim
ited
30.
Runm
ega
Lim
ited
31.
Seam
less
Tub
es L
imite
d
32.
Stee
l Sto
ckH
oldi
ngs
Lim
ited
33.
Stee
lsto
ck L
imite
d
34.
Stew
arts
& L
loyd
s O
f Ire
land
Lim
ited
35.
Stew
arts
And
Llo
yds
(Ove
rsea
s) L
imite
d
36.
Tata
Ste
el D
enm
ark
Bygg
syst
emer
A/S
37.
Tata
Ste
el S
wed
en B
yggs
yste
m A
B
38.
The
Stan
ton
Hou
sing
Com
pany
Lim
ited
39.
The
Tem
pleb
orou
gh R
ollin
g M
ills
Lim
ited
40.
Toro
nto
Indu
stria
l Fab
ricat
ions
Lim
ited
41.
U.E
.S. B
right
Bar
Lim
ited
42.
UKS
E Fu
nd M
anag
ers
Lim
ited
43.
Wal
ker M
anuf
actu
ring
And
Inve
stm
ents
Lim
ited
44.
Wal
kers
teel
stoc
k Ire
land
Lim
ited
45.
Wal
kers
teel
stoc
k Li
mite
d
46.
Wes
twoo
d St
eel S
ervi
ces
Lim
ited
47.
Whi
tehe
ad (N
arro
w S
trip
) Lim
ited
48.
Sakc
hi S
teel
Lim
ited
49.
Jugs
alai
Ste
el L
imite
d
50.
Noa
mun
di S
teel
Lim
ited
51.
Stra
ight
Mile
Ste
el L
imite
d
52.
Bist
upur
Ste
el L
imite
d
53.
Jam
adob
a St
eel L
imite
d
54.
Dim
na S
teel
Lim
ited
d)
Subs
idia
ries
yet
to c
omm
ence
ope
rati
ons:
1.
Suba
rnar
ekha
Por
t Priv
ate
Lim
ited
2.
TSIL
Ene
rgy
Lim
ited
3.
Bhus
han
Stee
l (So
uth)
Ltd
.
4.
Bhus
han
Stee
l (A
ustr
alia
) Pty
. Ltd
.
5.
Bow
en E
nerg
y Pt
y. L
td.
6.
Bow
en C
oal P
ty. L
td.
7.
Bow
en C
onso
lidat
ed P
ty. L
td.
e)
The
Com
pan
y is
con
tinu
ing
wit
h it
s foc
us o
n si
mp
lifyi
ng th
e co
rpor
ate
stru
ctur
e w
hic
h sa
w a
sig
nifi
cant
nu
mb
er o
f en
titi
es e
nter
int
o vo
lunt
ary
liqui
dat
ion
in t
he p
revi
ous
and
curr
ent
year
. The
re r
emai
ns a
n ob
ject
ive
to s
imp
lify
the
stru
ctur
e fu
rthe
r by
dis
solv
ing
add
itio
nal e
ntit
ies
whi
ch a
re e
ithe
r dor
man
t or
have
cea
sed
to h
ave
bus
ines
s op
erat
ions
.
Annexure 6 (Contd.)Integrated Report & Annual Accounts 2020-21 | 114th Year218 219
StatutoryReports
Stakeholders and Materiality
Performance Snapshot
About Tata Steel
Leadership Capitals GovernanceStrategyFinancial
Statements
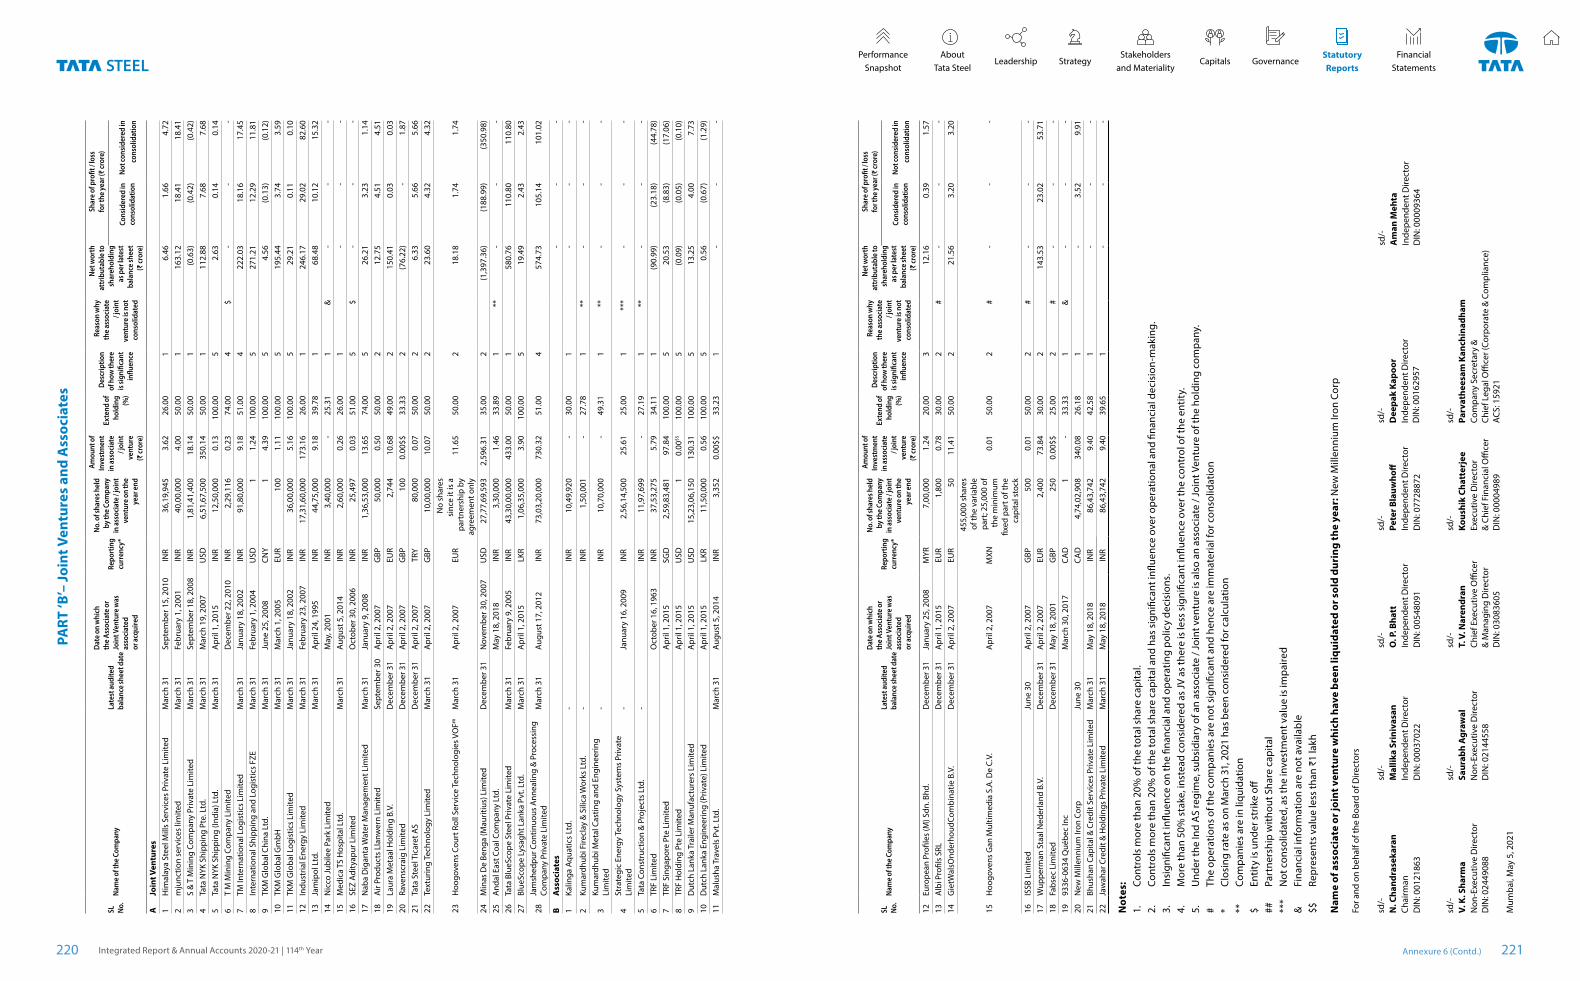
PART
‘B’–
Join
t Ven
ture
s an
d A
ssoc
iate
s
SL
No.
Nam
e of
the
Com
pany
Late
st a
udite
d ba
lanc
e sh
eet d
ate
Dat
e on
whi
ch
the
Asso
ciat
e or
Jo
int V
entu
re w
as
asso
ciat
ed
or a
cqui
red
Repo
rtin
g cu
rren
cy*
No.
of s
hare
s hel
d by
the
Com
pany
in
ass
ocia
te /
join
t ve
ntur
e on
the
year
end
Amou
nt o
f In
vest
men
t in
ass
ocia
te
/ joi
nt
vent
ure
(₹ cr
ore)
Exte
nd o
f ho
ldin
g (%
)
Des
crip
tion
of h
ow th
ere
is sig
nific
ant
influ
ence
Rea
son
why
th
e as
soci
ate
/ joi
nt
vent
ure
is no
t co
nsol
idat
ed
Net
wor
th
attr
ibut
able
to
shar
ehol
ding
as
per
late
st
bala
nce
shee
t (₹
cror
e)
Shar
e of
pro
fit /
loss
fo
r the
year
(₹ cr
ore)
Con
sider
ed in
co
nsol
idat
ion
Not
cons
ider
ed in
co
nsol
idat
ion
AJo
int V
entu
res
1H
imal
aya
Stee
l Mill
s Se
rvic
es P
rivat
e Li
mite
dM
arch
31
Sept
embe
r 15,
201
0IN
R 3
6,19
,945
3
.62
26.0
01
6.4
6 1
.66
4.7
2 2
mju
nctio
n se
rvic
es li
mite
dM
arch
31
Febr
uary
1, 2
001
INR
40,
00,0
00
4.0
0 50
.00
1 1
63.1
2 1
8.41
1
8.41
3
S &
T M
inin
g Co
mpa
ny P
rivat
e Li
mite
dM
arch
31
Sept
embe
r 18,
200
8IN
R 1
,81,
41,4
00
18.
14
50.0
01
(0.6
3)
(0.4
2) (0
.42)
4
Tata
NYK
Shi
ppin
g Pt
e. L
td.
Mar
ch 3
1M
arch
19,
200
7U
SD 6
,51,
67,5
00
350
.14
50.0
01
112
.88
7.6
8 7
.68
5Ta
ta N
YK S
hipp
ing
(Indi
a) L
td.
Mar
ch 3
1A
pril
1, 2
015
INR
12,
50,0
00
0.1
3 10
0.00
5 2
.63
0.1
4 0
.14
6T
M M
inin
g Co
mpa
ny L
imite
dD
ecem
ber 2
2, 2
010
INR
2,2
9,11
6 0
.23
74.0
04
$
- -
- 7
TM In
tern
atio
nal L
ogis
tics
Lim
ited
Mar
ch 3
1Ja
nuar
y 18
, 200
2IN
R 9
1,80
,000
9
.18
51.0
04
222
.03
18.
16
17.
45
8In
tern
atio
nal S
hipp
ing
and
Logi
stic
s FZ
EM
arch
31
Febr
uary
1, 2
004
USD
1
1.2
4 10
0.00
5 2
71.2
1 1
2.29
1
1.81
9
TKM
Glo
bal C
hina
Ltd
.M
arch
31
June
25,
200
8CN
Y 1
4
.39
100.
005
4.5
6 (0
.13)
(0
.12)
10
TKM
Glo
bal G
mbH
Mar
ch 3
1M
arch
1, 2
005
EUR
100
1
.11
100.
005
195
.44
3.7
4 3
.59
11TK
M G
loba
l Log
istic
s Li
mite
dM
arch
31
Janu
ary
18, 2
002
INR
36,
00,0
00
5.1
6 10
0.00
5 2
9.21
0
.11
0.1
0 12
Indu
stria
l Ene
rgy
Lim
ited
Mar
ch 3
1Fe
brua
ry 2
3, 2
007
INR
17,
31,6
0,00
0 1
73.1
6 26
.00
1 2
46.1
7 2
9.02
8
2.60
13
Jam
ipol
Ltd
.M
arch
31
Apr
il 24
, 199
5IN
R 4
4,75
,000
9
.18
39.7
81
68.
48
10.
12
15.
32
14N
icco
Jubi
lee
Park
Lim
ited
May
, 200
1IN
R 3
,40,
000
- 25
.31
1&
- -
- 15
Med
ica
TS H
ospi
tal L
td.
Mar
ch 3
1Au
gust
5, 2
014
INR
2,6
0,00
0 0
.26
26.0
01
- -
- 16
SEZ
Adity
apur
Lim
ited
Oct
ober
30,
200
6IN
R 2
5,49
7 0
.03
51.0
05
$ -
- -
17N
aba
Dig
anta
Wat
er M
anag
emen
t Lim
ited
Mar
ch 3
1Ja
nuar
y 9,
200
8IN
R 1
,36,
53,0
00
13.
65
74.0
05
26.
21
3.2
3 1
.14
18A
ir Pr
oduc
ts L
lanw
ern
Lim
ited
Sept
embe
r 30
Apr
il 2,
200
7G
BP 5
0,00
0 0
.50
50.0
02
12.
75
4.5
1 4
.51
19La
ura
Met
aal H
oldi
ng B
.V.
Dec
embe
r 31
Apr
il 2,
200
7EU
R 2
,744
1
0.68
49
.00
2 1
50.4
1 0
.03
0.0
3 20
Rave
nscr
aig
Lim
ited
Dec
embe
r 31
Apr
il 2,
200
7G
BP 1
00
0.0
0$$
33.3
32
(76.
22)
- 1
.87
21Ta
ta S
teel
Tic
aret
AS
Dec
embe
r 31
Apr
il 2,
200
7TR
Y 8
0,00
0 0
.07
50.0
02
6.3
3 5
.66
5.6
6 22
Text
urin
g Te
chno
logy
Lim
ited
Mar
ch 3
1A
pril
2, 2
007
GBP
10,
00,0
00
10.
07
50.0
02
23.
60
4.3
2 4
.32
23H
oogo
vens
Cou
rt R
oll S
ervi
ce Te
chno
logi
es V
OF##
Mar
ch 3
1A
pril
2, 2
007
EUR
No
shar
es
sinc
e it
is a
pa
rtne
rshi
p by
ag
reem
ent o
nly
11.
65
50.0
02
18.
18
1.7
4 1
.74
24M
inas
De
Beng
a (M
aurit
ius)
Lim
ited
Dec
embe
r 31
Nov
embe
r 30,
200
7U
SD 2
7,77
,69,
593
2,5
96.3
1 35
.00
2 (1
,397
.36)
(1
88.9
9)(3
50.9
8)25
And
al E
ast C
oal C
ompa
ny L
td.
May
18,
201
8IN
R 3
,30,
000
1.4
6 33
.89
1**
- -
- 26
Tata
Blu
eSco
pe S
teel
Priv
ate
Lim
ited
Mar
ch 3
1Fe
brua
ry 9
, 200
5IN
R 4
3,30
,00,
000
433
.00
50.0
01
580
.76
110
.80
110
.80
27Bl
ueSc
ope
Lysa
ght L
anka
Pvt
. Ltd
.M
arch
31
Apr
il 1,
201
5LK
R 1
,06,
35,0
00
3.9
0 10
0.00
5 1
9.49
2
.43
2.4
3
28Ja
msh
edpu
r Con
tinuo
us A
nnea
ling
& P
roce
ssin
g Co
mpa
ny P
rivat
e Li
mite
dM
arch
31
Augu
st 1
7, 2
012
INR
73,
03,2
0,00
0 7
30.3
2 51
.00
4 5
74.7
3 1
05.1
4 1
01.0
2
BA
ssoc
iate
s -
- -
1Ka
linga
Aqu
atic
s Lt
d.-
INR
10,
49,9
20
- 30
.00
1 -
- -
2Ku
mar
dhub
i Fire
clay
& S
ilica
Wor
ks L
td.
-IN
R 1
,50,
001
- 27
.78
1**
- -
-
3Ku
mar
dhub
i Met
al C
astin
g an
d En
gine
erin
g
Lim
ited
-IN
R 1
0,70
,000
-
49.3
11
** -
- -
4St
rate
gic
Ener
gy Te
chno
logy
Sys
tem
s Pr
ivat
e Li
mite
d-
Janu
ary
16, 2
009
INR
2,5
6,14
,500
2
5.61
25
.00
1**
* -
- -
5Ta
ta C
onst
ruct
ion
& P
roje
cts
Ltd.
-IN
R 1
1,97
,699
-
27.1
91
** -
- -
6TR
F Li
mite
dO
ctob
er 1
6, 1
963
INR
37,
53,2
75
5.7
9 34
.11
1(9
0.99
)(2
3.18
)(4
4.78
)7
TRF
Sing
apor
e Pt
e Li
mite
dA
pril
1, 2
015
SGD
2,5
9,83
,481
97
.84
100.
005
20.
53
(8.8
3)
(17.
06)
8TR
F H
oldi
ng P
te L
imite
dA
pril
1, 2
015
USD
1
0.0
0$$
100.
005
(0.0
9)
(0.0
5)
(0.1
0)
9D
utch
Lan
ka T
raile
r Man
ufac
ture
rs L
imite
dA
pril
1, 2
015
USD
15,
23,0
6,15
0 13
0.31
100.
005
13.
25
4.0
0 7
.73
10D
utch
Lan
ka E
ngin
eerin
g (P
rivat
e) L
imite
dA
pril
1, 2
015
LKR
11,
50,0
00
0.56
100.
005
0.56
(0.6
7)(1
.29)
11M
alus
ha T
rave
ls P
vt. L
td.
Mar
ch 3
1Au
gust
5, 2
014
INR
3,3
52
0.0
0$$
33.2
31
- -
-
SL
No.
Nam
e of
the
Com
pany
Late
st a
udite
d ba
lanc
e sh
eet d
ate
Dat
e on
whi
ch
the
Asso
ciat
e or
Jo
int V
entu
re w
as
asso
ciat
ed
or a
cqui
red
Repo
rtin
g cu
rren
cy*
No.
of s
hare
s hel
d by
the
Com
pany
in
ass
ocia
te /
join
t ve
ntur
e on
the
year
end
Amou
nt o
f In
vest
men
t in
ass
ocia
te
/ joi
nt
vent
ure
(₹ cr
ore)
Exte
nd o
f ho
ldin
g (%
)
Des
crip
tion
of h
ow th
ere
is sig
nific
ant
influ
ence
Rea
son
why
th
e as
soci
ate
/ joi
nt
vent
ure
is no
t co
nsol
idat
ed
Net
wor
th
attr
ibut
able
to
shar
ehol
ding
as
per
late
st
bala
nce
shee
t (₹
cror
e)
Shar
e of
pro
fit /
loss
fo
r the
year
(₹ cr
ore)
Con
sider
ed in
co
nsol
idat
ion
Not
cons
ider
ed in
co
nsol
idat
ion
12Eu
rope
an P
rofil
es (M
) Sdn
. Bhd
.D
ecem
ber 3
1Ja
nuar
y 25
, 200
8M
YR 7
,00,
000
1.2
4 20
.00
3 1
2.16
0
.39
1.5
7 13
Alb
i Pro
fils
SRL
Dec
embe
r 31
Apr
il 1,
201
5EU
R 1
,800
0
.78
30.0
02
#
- -
- 14
Gie
tWal
sOnd
erho
udCo
mbi
natie
B.V
.D
ecem
ber 3
1A
pril
2, 2
007
EUR
50
11.
41
50.0
02
21.
56
3.2
0 3
.20
15H
oogo
vens
Gan
Mul
timed
ia S
.A. D
e C.
V.
Apr
il 2,
200
7M
XN
455
,000
sha
res
of th
e va
riabl
e pa
rt; 2
5,00
0 of
th
e m
inim
um
fixed
par
t of t
he
capi
tal s
tock
0.0
1 50
.00
2 #
-
- -
16IS
SB L
imite
d Ju
ne 3
0A
pril
2, 2
007
GBP
500
0
.01
50.0
02
#
- -
- 17
Wup
perm
an S
taal
Ned
erla
nd B
.V.
Dec
embe
r 31
Apr
il 2,
200
7EU
R 2
,400
7
3.84
30
.00
2 1
43.5
3 2
3.02
5
3.71
18
Fabs
ec L
imite
dD
ecem
ber 3
1M
ay 1
8, 2
001
GBP
250
0
.00$
$ 25
.00
2 #
-
- -
1993
36-0
634
Qué
bec
Inc
Mar
ch 3
0, 2
017
CAD
1
- 33
.33
1&
- -
- 20
New
Mill
enni
um Ir
on C
orp
June
30
CAD
4,7
4,02
,908
3
40.0
8 26
.18
1 -
3.5
2 9
.91
21Bh
usha
n Ca
pita
l & C
redi
t Ser
vice
s Pr
ivat
e Li
mite
d M
arch
31
May
18,
201
8IN
R 8
6,43
,742
9
.40
42.5
81
- -
- 22
Jaw
ahar
Cre
dit &
Hol
ding
s Pr
ivat
e Li
mite
dM
arch
31
May
18,
201
8IN
R 8
6,43
,742
9
.40
39.6
51
- -
-
Not
es:
1.
Cont
rols
mor
e th
an 2
0% o
f the
tota
l sha
re c
apita
l.2.
Co
ntro
ls m
ore
than
20%
of t
he to
tal s
hare
cap
ital a
nd h
as s
igni
fican
t infl
uenc
e ov
er o
pera
tiona
l and
fina
ncia
l dec
isio
n-m
akin
g.3.
In
sign
ifica
nt in
fluen
ce o
n th
e fin
anci
al a
nd o
pera
ting
polic
y de
cisi
ons.
4.
Mor
e th
an 5
0% s
take
, ins
tead
con
side
red
as JV
as
ther
e is
less
sig
nific
ant i
nflue
nce
over
the
cont
rol o
f the
ent
ity.
5.
Und
er th
e In
d A
S re
gim
e, s
ubsi
diar
y of
an
asso
ciat
e / J
oint
ven
ture
is a
lso
an a
ssoc
iate
/ Jo
int V
entu
re o
f the
hol
ding
com
pany
.#
The
oper
atio
ns o
f the
com
pani
es a
re n
ot s
igni
fican
t and
hen
ce a
re im
mat
eria
l for
con
solid
atio
n*
Clos
ing
rate
as
on M
arch
31,
202
1 ha
s be
en c
onsi
dere
d fo
r cal
cula
tion
**
Com
pani
es a
re in
liqu
idat
ion
$ En
tity
is u
nder
str
ike
off##
Pa
rtne
rshi
p w
ithou
t Sha
re c
apita
l**
* N
ot c
onso
lidat
ed, a
s th
e in
vest
men
t val
ue is
impa
ired
&
Fina
ncia
l inf
orm
atio
n ar
e no
t ava
ilabl
e$$
Re
pres
ents
val
ue le
ss th
an ₹
1 la
kh
Nam
e of
ass
ocia
te o
r joi
nt v
entu
re w
hich
hav
e be
en li
quid
ated
or s
old
duri
ng th
e ye
ar: N
ew M
illen
nium
Iron
Cor
p
For a
nd o
n be
half
of th
e Bo
ard
of D
irect
ors
sd/-
sd/-
sd/-
sd/-
sd/-
sd
/-
N. C
hand
rase
kara
nM
allik
a Sr
iniv
asan
O. P
. Bha
ttPe
ter B
lauw
hoff
Dee
pak
Kapo
orA
man
Meh
taCh
airm
anIn
depe
nden
t Dire
ctor
Inde
pend
ent D
irect
orIn
depe
nden
t Dire
ctor
Inde
pend
ent D
irect
or
DIN
: 001
6295
7In
depe
nden
t Dire
ctor
D
IN: 0
0009
364
DIN
: 001
2186
3D
IN: 0
0037
022
DIN
: 005
4809
1D
IN: 0
7728
872
sd/-
sd/-
sd/-
sd/-
sd/-
V.
K. S
harm
aSa
urab
h A
graw
alT.
V. N
aren
dran
Kous
hik
Chat
terj
eePa
rvat
hees
am K
anch
inad
ham
Non
-Exe
cutiv
e D
irect
or
DIN
: 024
4908
8N
on-E
xecu
tive
Dire
ctor
D
IN: 0
2144
558
Chie
f Exe
cutiv
e O
ffice
r &
Man
agin
g D
irect
or
DIN
: 030
8360
5
Exec
utiv
e D
irect
or
& C
hief
Fin
anci
al O
ffice
r D
IN: 0
0004
989
Com
pany
Sec
reta
ry &
Ch
ief L
egal
Offi
cer (
Corp
orat
e &
Com
plia
nce)
AC
S: 1
5921
Mum
bai,
May
5, 2
021
Annexure 6 (Contd.)Integrated Report & Annual Accounts 2020-21 | 114th Year220 221
StatutoryReports
Stakeholders and Materiality
Performance Snapshot
About Tata Steel
Leadership Capitals GovernanceStrategyFinancial
Statements
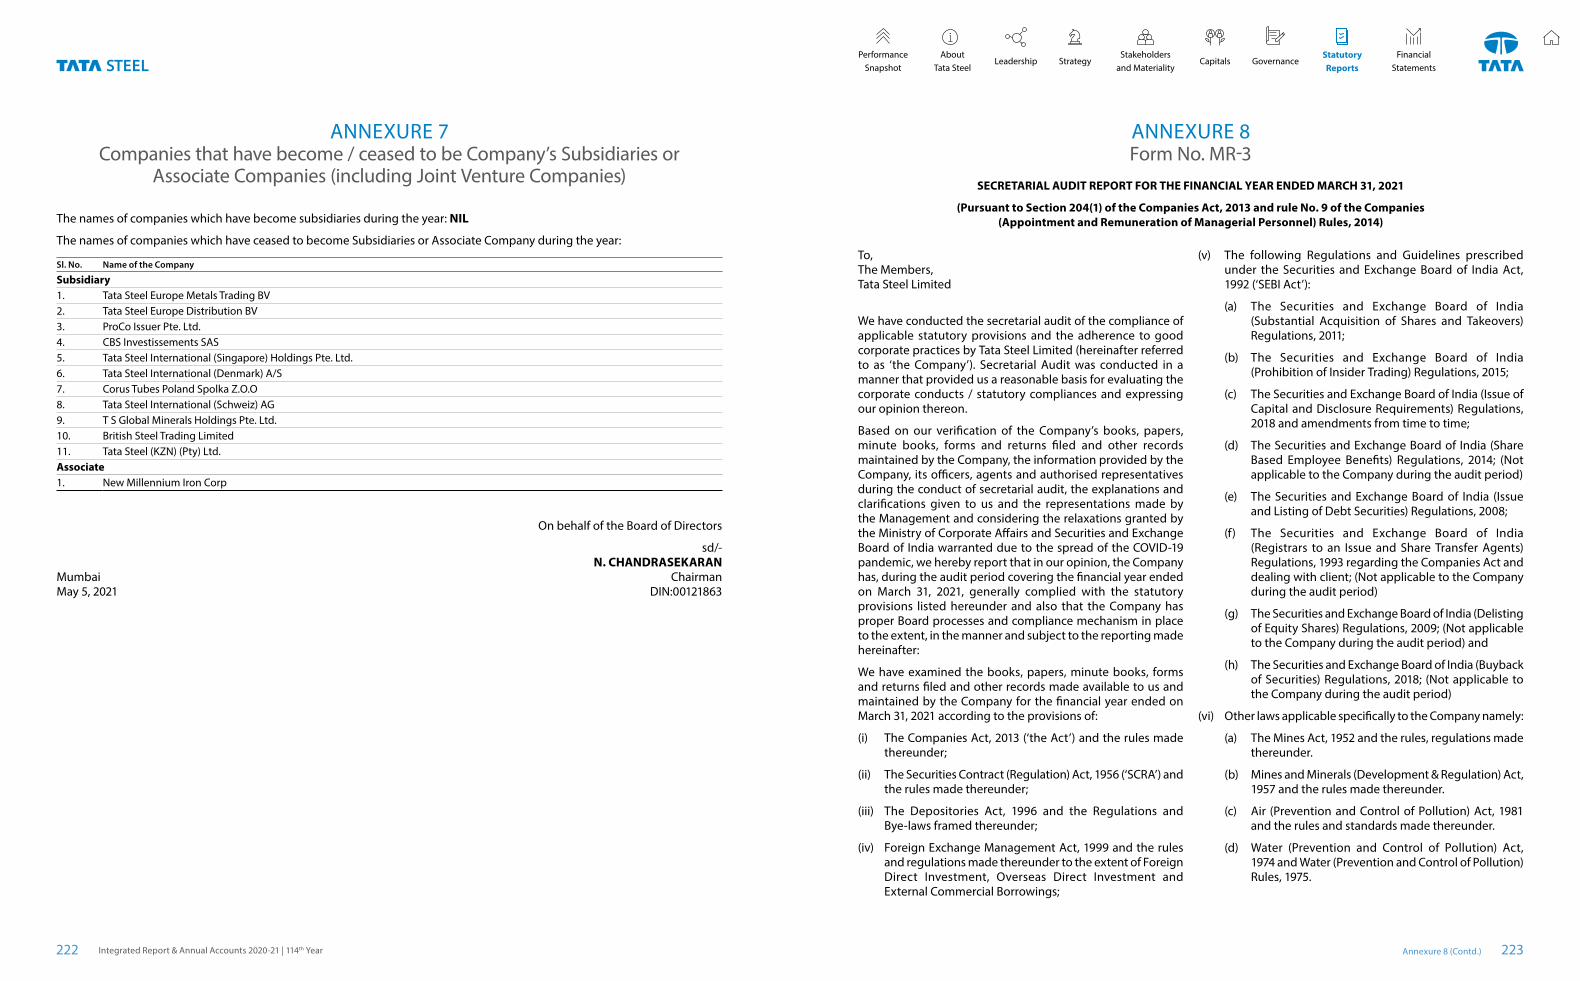
ANNEXURE 7Companies that have become / ceased to be Company’s Subsidiaries or
Associate Companies (including Joint Venture Companies)
The names of companies which have become subsidiaries during the year: NIL
The names of companies which have ceased to become Subsidiaries or Associate Company during the year:
Sl. No. Name of the Company
Subsidiary1. Tata Steel Europe Metals Trading BV2. Tata Steel Europe Distribution BV3. ProCo Issuer Pte. Ltd.4. CBS Investissements SAS5. Tata Steel International (Singapore) Holdings Pte. Ltd.6. Tata Steel International (Denmark) A/S7. Corus Tubes Poland Spolka Z.O.O8. Tata Steel International (Schweiz) AG9. T S Global Minerals Holdings Pte. Ltd.10. British Steel Trading Limited11. Tata Steel (KZN) (Pty) Ltd.Associate1. New Millennium Iron Corp
On behalf of the Board of Directors
sd/-N. CHANDRASEKARAN
Mumbai ChairmanMay 5, 2021 DIN:00121863
ANNEXURE 8Form No. MR-3
SECRETARIAL AUDIT REPORT FOR THE FINANCIAL YEAR ENDED MARCH 31, 2021
(Pursuant to Section 204(1) of the Companies Act, 2013 and rule No. 9 of the Companies (Appointment and Remuneration of Managerial Personnel) Rules, 2014)
To,The Members,Tata Steel Limited
We have conducted the secretarial audit of the compliance of applicable statutory provisions and the adherence to good corporate practices by Tata Steel Limited (hereinafter referred to as ‘the Company’). Secretarial Audit was conducted in a manner that provided us a reasonable basis for evaluating the corporate conducts / statutory compliances and expressing our opinion thereon.
Based on our verification of the Company’s books, papers, minute books, forms and returns filed and other records maintained by the Company, the information provided by the Company, its officers, agents and authorised representatives during the conduct of secretarial audit, the explanations and clarifications given to us and the representations made by the Management and considering the relaxations granted by the Ministry of Corporate Affairs and Securities and Exchange Board of India warranted due to the spread of the COVID-19 pandemic, we hereby report that in our opinion, the Company has, during the audit period covering the financial year ended on March 31, 2021, generally complied with the statutory provisions listed hereunder and also that the Company has proper Board processes and compliance mechanism in place to the extent, in the manner and subject to the reporting made hereinafter:
We have examined the books, papers, minute books, forms and returns filed and other records made available to us and maintained by the Company for the financial year ended on March 31, 2021 according to the provisions of:
(i) The Companies Act, 2013 (‘the Act’) and the rules made thereunder;
(ii) The Securities Contract (Regulation) Act, 1956 (‘SCRA’) and the rules made thereunder;
(iii) The Depositories Act, 1996 and the Regulations and Bye-laws framed thereunder;
(iv) Foreign Exchange Management Act, 1999 and the rules and regulations made thereunder to the extent of Foreign Direct Investment, Overseas Direct Investment and External Commercial Borrowings;
(v) The following Regulations and Guidelines prescribed under the Securities and Exchange Board of India Act, 1992 (‘SEBI Act’):
(a) The Securities and Exchange Board of India (Substantial Acquisition of Shares and Takeovers) Regulations, 2011;
(b) The Securities and Exchange Board of India (Prohibition of Insider Trading) Regulations, 2015;
(c) The Securities and Exchange Board of India (Issue of Capital and Disclosure Requirements) Regulations, 2018 and amendments from time to time;
(d) The Securities and Exchange Board of India (Share Based Employee Benefits) Regulations, 2014; (Not applicable to the Company during the audit period)
(e) The Securities and Exchange Board of India (Issue and Listing of Debt Securities) Regulations, 2008;
(f) The Securities and Exchange Board of India (Registrars to an Issue and Share Transfer Agents) Regulations, 1993 regarding the Companies Act and dealing with client; (Not applicable to the Company during the audit period)
(g) The Securities and Exchange Board of India (Delisting of Equity Shares) Regulations, 2009; (Not applicable to the Company during the audit period) and
(h) The Securities and Exchange Board of India (Buyback of Securities) Regulations, 2018; (Not applicable to the Company during the audit period)
(vi) Other laws applicable specifically to the Company namely:
(a) The Mines Act, 1952 and the rules, regulations made thereunder.
(b) Mines and Minerals (Development & Regulation) Act, 1957 and the rules made thereunder.
(c) Air (Prevention and Control of Pollution) Act, 1981 and the rules and standards made thereunder.
(d) Water (Prevention and Control of Pollution) Act, 1974 and Water (Prevention and Control of Pollution) Rules, 1975.
Annexure 8 (Contd.) 223
StatutoryReports
Stakeholders and Materiality
Performance Snapshot
About Tata Steel
Leadership Capitals GovernanceStrategyFinancial
Statements
Integrated Report & Annual Accounts 2020-21 | 114th Year222
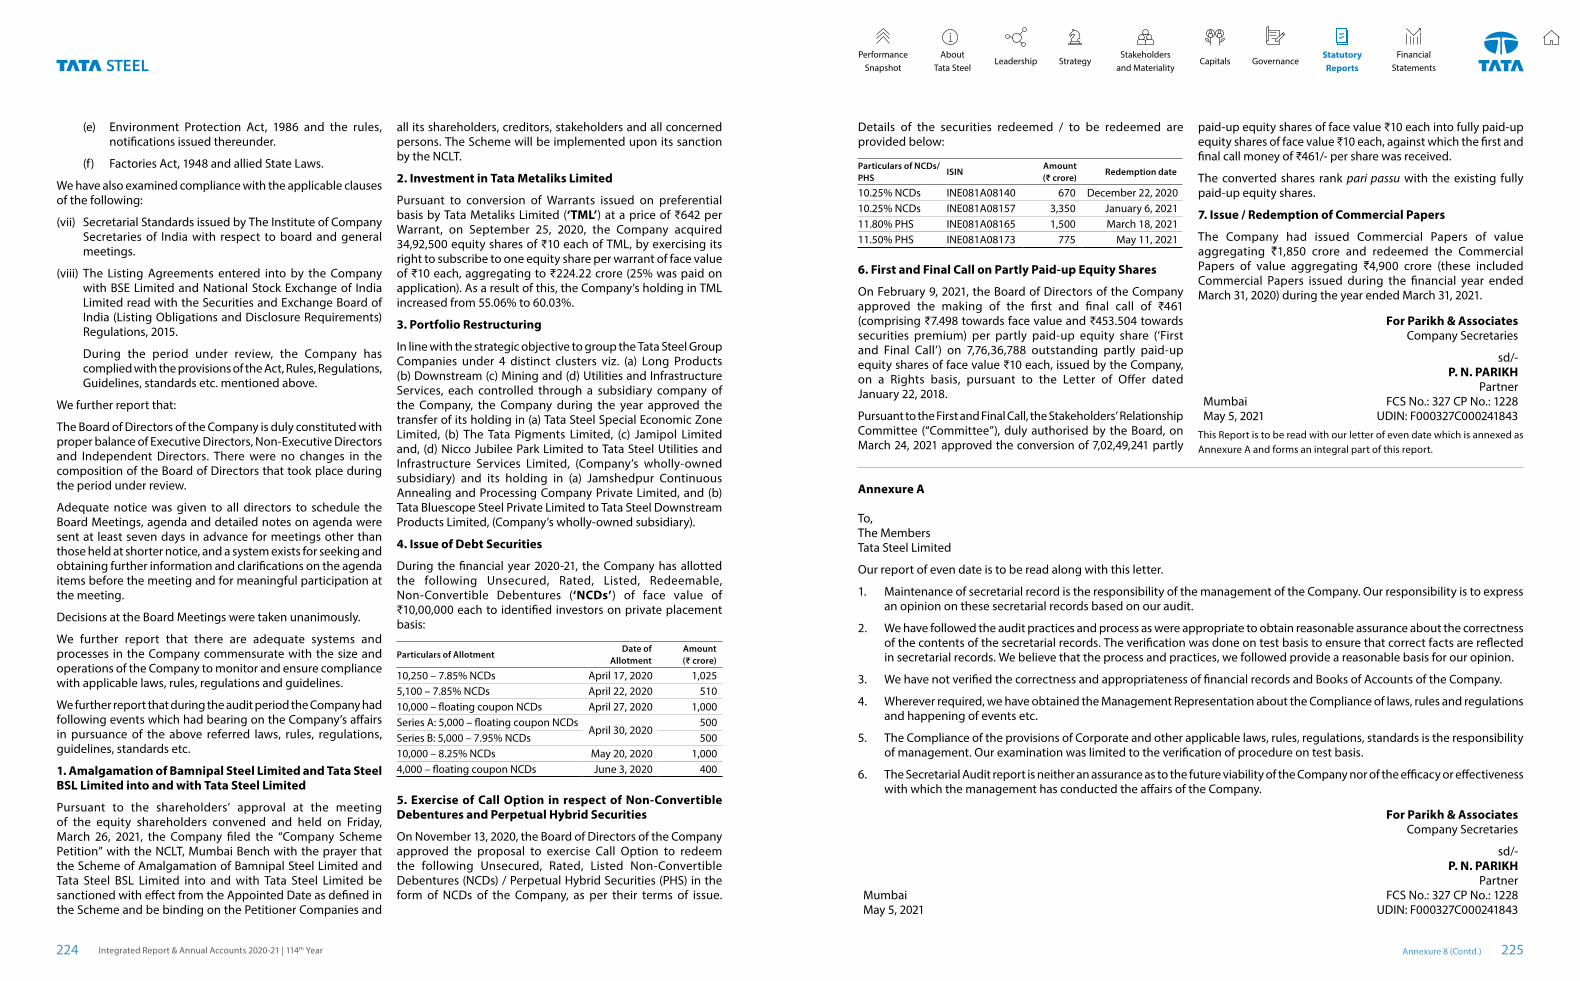
(e) Environment Protection Act, 1986 and the rules, notifications issued thereunder.
(f) Factories Act, 1948 and allied State Laws.
We have also examined compliance with the applicable clauses of the following:
(vii) Secretarial Standards issued by The Institute of Company Secretaries of India with respect to board and general meetings.
(viii) The Listing Agreements entered into by the Company with BSE Limited and National Stock Exchange of India Limited read with the Securities and Exchange Board of India (Listing Obligations and Disclosure Requirements) Regulations, 2015.
During the period under review, the Company has complied with the provisions of the Act, Rules, Regulations, Guidelines, standards etc. mentioned above.
We further report that:
The Board of Directors of the Company is duly constituted with proper balance of Executive Directors, Non-Executive Directors and Independent Directors. There were no changes in the composition of the Board of Directors that took place during the period under review.
Adequate notice was given to all directors to schedule the Board Meetings, agenda and detailed notes on agenda were sent at least seven days in advance for meetings other than those held at shorter notice, and a system exists for seeking and obtaining further information and clarifications on the agenda items before the meeting and for meaningful participation at the meeting.
Decisions at the Board Meetings were taken unanimously.
We further report that there are adequate systems and processes in the Company commensurate with the size and operations of the Company to monitor and ensure compliance with applicable laws, rules, regulations and guidelines.
We further report that during the audit period the Company had following events which had bearing on the Company’s affairs in pursuance of the above referred laws, rules, regulations, guidelines, standards etc.
1. Amalgamation of Bamnipal Steel Limited and Tata Steel BSL Limited into and with Tata Steel Limited
Pursuant to the shareholders’ approval at the meeting of the equity shareholders convened and held on Friday, March 26, 2021, the Company filed the “Company Scheme Petition” with the NCLT, Mumbai Bench with the prayer that the Scheme of Amalgamation of Bamnipal Steel Limited and Tata Steel BSL Limited into and with Tata Steel Limited be sanctioned with effect from the Appointed Date as defined in the Scheme and be binding on the Petitioner Companies and
all its shareholders, creditors, stakeholders and all concerned persons. The Scheme will be implemented upon its sanction by the NCLT.
2. Investment in Tata Metaliks Limited
Pursuant to conversion of Warrants issued on preferential basis by Tata Metaliks Limited (‘TML’) at a price of ₹642 per Warrant, on September 25, 2020, the Company acquired 34,92,500 equity shares of ₹10 each of TML, by exercising its right to subscribe to one equity share per warrant of face value of ₹10 each, aggregating to ₹224.22 crore (25% was paid on application). As a result of this, the Company’s holding in TML increased from 55.06% to 60.03%.
3. Portfolio Restructuring
In line with the strategic objective to group the Tata Steel Group Companies under 4 distinct clusters viz. (a) Long Products (b) Downstream (c) Mining and (d) Utilities and Infrastructure Services, each controlled through a subsidiary company of the Company, the Company during the year approved the transfer of its holding in (a) Tata Steel Special Economic Zone Limited, (b) The Tata Pigments Limited, (c) Jamipol Limited and, (d) Nicco Jubilee Park Limited to Tata Steel Utilities and Infrastructure Services Limited, (Company’s wholly-owned subsidiary) and its holding in (a) Jamshedpur Continuous Annealing and Processing Company Private Limited, and (b) Tata Bluescope Steel Private Limited to Tata Steel Downstream Products Limited, (Company’s wholly-owned subsidiary).
4. Issue of Debt Securities
During the financial year 2020-21, the Company has allotted the following Unsecured, Rated, Listed, Redeemable, Non-Convertible Debentures (‘NCDs’) of face value of ₹10,00,000 each to identified investors on private placement basis:
Particulars of AllotmentDate of
AllotmentAmount (₹ crore)
10,250 – 7.85% NCDs April 17, 2020 1,0255,100 – 7.85% NCDs April 22, 2020 51010,000 – floating coupon NCDs April 27, 2020 1,000Series A: 5,000 – floating coupon NCDs
April 30, 2020500
Series B: 5,000 – 7.95% NCDs 50010,000 – 8.25% NCDs May 20, 2020 1,0004,000 – floating coupon NCDs June 3, 2020 400
5. Exercise of Call Option in respect of Non-Convertible Debentures and Perpetual Hybrid Securities
On November 13, 2020, the Board of Directors of the Company approved the proposal to exercise Call Option to redeem the following Unsecured, Rated, Listed Non-Convertible Debentures (NCDs) / Perpetual Hybrid Securities (PHS) in the form of NCDs of the Company, as per their terms of issue.
Details of the securities redeemed / to be redeemed are provided below:
Particulars of NCDs/PHS
ISINAmount (₹ crore)
Redemption date
10.25% NCDs INE081A08140 670 December 22, 202010.25% NCDs INE081A08157 3,350 January 6, 202111.80% PHS INE081A08165 1,500 March 18, 202111.50% PHS INE081A08173 775 May 11, 2021
6. First and Final Call on Partly Paid-up Equity Shares
On February 9, 2021, the Board of Directors of the Company approved the making of the first and final call of ₹461 (comprising ₹7.498 towards face value and ₹453.504 towards securities premium) per partly paid-up equity share (‘First and Final Call’) on 7,76,36,788 outstanding partly paid-up equity shares of face value ₹10 each, issued by the Company, on a Rights basis, pursuant to the Letter of Offer dated January 22, 2018.
Pursuant to the First and Final Call, the Stakeholders’ Relationship Committee (“Committee”), duly authorised by the Board, on March 24, 2021 approved the conversion of 7,02,49,241 partly
paid-up equity shares of face value ₹10 each into fully paid-up equity shares of face value ₹10 each, against which the first and final call money of ₹461/- per share was received.
The converted shares rank pari passu with the existing fully paid-up equity shares.
7. Issue / Redemption of Commercial Papers
The Company had issued Commercial Papers of value aggregating `1,850 crore and redeemed the Commercial Papers of value aggregating `4,900 crore (these included Commercial Papers issued during the financial year ended March 31, 2020) during the year ended March 31, 2021.
For Parikh & AssociatesCompany Secretaries
sd/-P. N. PARIKH
PartnerMumbai FCS No.: 327 CP No.: 1228May 5, 2021 UDIN: F000327C000241843
This Report is to be read with our letter of even date which is annexed as Annexure A and forms an integral part of this report.
Annexure A
To, The Members Tata Steel Limited
Our report of even date is to be read along with this letter.
1. Maintenance of secretarial record is the responsibility of the management of the Company. Our responsibility is to express an opinion on these secretarial records based on our audit.
2. We have followed the audit practices and process as were appropriate to obtain reasonable assurance about the correctness of the contents of the secretarial records. The verification was done on test basis to ensure that correct facts are reflected in secretarial records. We believe that the process and practices, we followed provide a reasonable basis for our opinion.
3. We have not verified the correctness and appropriateness of financial records and Books of Accounts of the Company.
4. Wherever required, we have obtained the Management Representation about the Compliance of laws, rules and regulations and happening of events etc.
5. The Compliance of the provisions of Corporate and other applicable laws, rules, regulations, standards is the responsibility of management. Our examination was limited to the verification of procedure on test basis.
6. The Secretarial Audit report is neither an assurance as to the future viability of the Company nor of the efficacy or effectiveness with which the management has conducted the affairs of the Company.
For Parikh & AssociatesCompany Secretaries
sd/-P. N. PARIKH
PartnerMumbai FCS No.: 327 CP No.: 1228May 5, 2021 UDIN: F000327C000241843
Annexure 8 (Contd.)Integrated Report & Annual Accounts 2020-21 | 114th Year224 225
StatutoryReports
Stakeholders and Materiality
Performance Snapshot
About Tata Steel
Leadership Capitals GovernanceStrategyFinancial
Statements
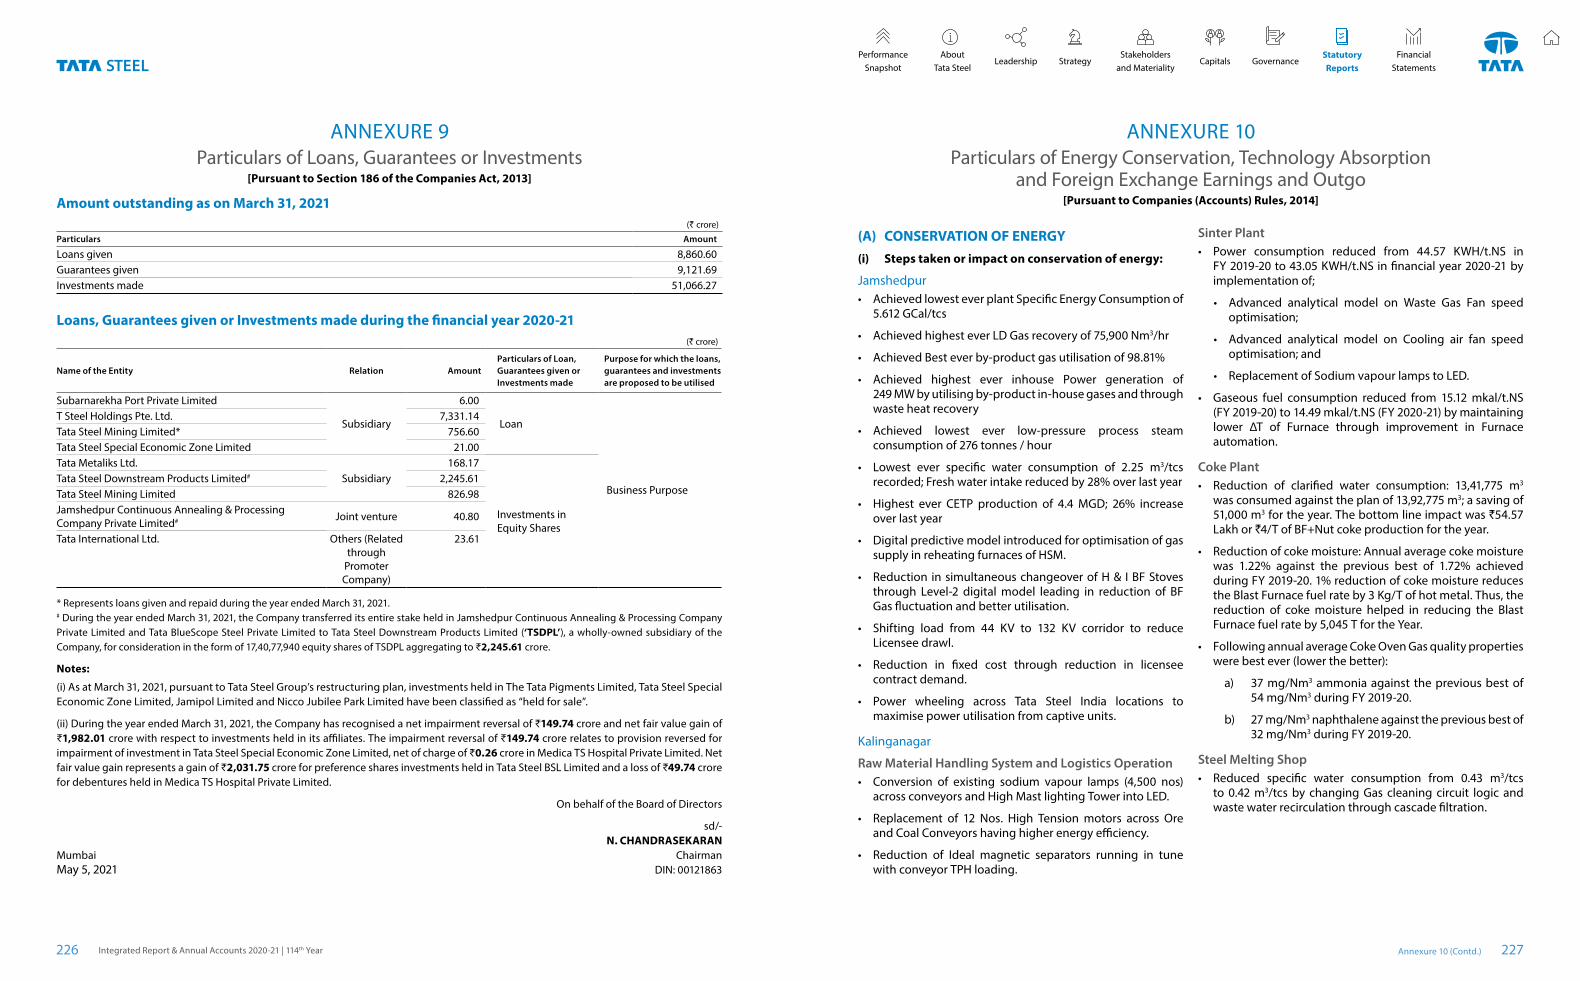
Particulars of Loans, Guarantees or Investments[Pursuant to Section 186 of the Companies Act, 2013]
ANNEXURE 9
Amount outstanding as on March 31, 2021(` crore)
Particulars Amount
Loans given 8,860.60 Guarantees given 9,121.69 Investments made 51,066.27
Loans, Guarantees given or Investments made during the financial year 2020-21 (` crore)
Name of the Entity Relation AmountParticulars of Loan, Guarantees given or Investments made
Purpose for which the loans, guarantees and investments are proposed to be utilised
Subarnarekha Port Private Limited
Subsidiary
6.00
Loan
Business Purpose
T Steel Holdings Pte. Ltd. 7,331.14 Tata Steel Mining Limited* 756.60 Tata Steel Special Economic Zone Limited 21.00 Tata Metaliks Ltd.
Subsidiary 168.17
Investments in Equity Shares
Tata Steel Downstream Products Limited# 2,245.61Tata Steel Mining Limited 826.98 Jamshedpur Continuous Annealing & Processing Company Private Limited# Joint venture 40.80
Tata International Ltd. Others (Related through
Promoter Company)
23.61
* Represents loans given and repaid during the year ended March 31, 2021.# During the year ended March 31, 2021, the Company transferred its entire stake held in Jamshedpur Continuous Annealing & Processing Company Private Limited and Tata BlueScope Steel Private Limited to Tata Steel Downstream Products Limited (‘TSDPL’), a wholly-owned subsidiary of the Company, for consideration in the form of 17,40,77,940 equity shares of TSDPL aggregating to ₹2,245.61 crore.
Notes:
(i) As at March 31, 2021, pursuant to Tata Steel Group’s restructuring plan, investments held in The Tata Pigments Limited, Tata Steel Special Economic Zone Limited, Jamipol Limited and Nicco Jubilee Park Limited have been classified as “held for sale”.
(ii) During the year ended March 31, 2021, the Company has recognised a net impairment reversal of ₹149.74 crore and net fair value gain of ₹1,982.01 crore with respect to investments held in its affiliates. The impairment reversal of ₹149.74 crore relates to provision reversed for impairment of investment in Tata Steel Special Economic Zone Limited, net of charge of ₹0.26 crore in Medica TS Hospital Private Limited. Net fair value gain represents a gain of ₹2,031.75 crore for preference shares investments held in Tata Steel BSL Limited and a loss of ₹49.74 crore for debentures held in Medica TS Hospital Private Limited.
On behalf of the Board of Directors
sd/-N. CHANDRASEKARAN
Mumbai ChairmanMay 5, 2021 DIN: 00121863
Particulars of Energy Conservation, Technology Absorption and Foreign Exchange Earnings and Outgo
[Pursuant to Companies (Accounts) Rules, 2014]
ANNEXURE 10
(A) CONSERVATION OF ENERGY(i) Steps taken or impact on conservation of energy:
Jamshedpur• Achieved lowest ever plant Specific Energy Consumption of
5.612 GCal/tcs
• Achieved highest ever LD Gas recovery of 75,900 Nm3/hr
• Achieved Best ever by-product gas utilisation of 98.81%
• Achieved highest ever inhouse Power generation of 249 MW by utilising by-product in-house gases and through waste heat recovery
• Achieved lowest ever low-pressure process steam consumption of 276 tonnes / hour
• Lowest ever specific water consumption of 2.25 m3/tcs recorded; Fresh water intake reduced by 28% over last year
• Highest ever CETP production of 4.4 MGD; 26% increase over last year
• Digital predictive model introduced for optimisation of gas supply in reheating furnaces of HSM.
• Reduction in simultaneous changeover of H & I BF Stoves through Level-2 digital model leading in reduction of BF Gas fluctuation and better utilisation.
• Shifting load from 44 KV to 132 KV corridor to reduce Licensee drawl.
• Reduction in fixed cost through reduction in licensee contract demand.
• Power wheeling across Tata Steel India locations to maximise power utilisation from captive units.
Kalinganagar
Raw Material Handling System and Logistics Operation• Conversion of existing sodium vapour lamps (4,500 nos)
across conveyors and High Mast lighting Tower into LED.
• Replacement of 12 Nos. High Tension motors across Ore and Coal Conveyors having higher energy efficiency.
• Reduction of Ideal magnetic separators running in tune with conveyor TPH loading.
Sinter Plant• Power consumption reduced from 44.57 KWH/t.NS in
FY 2019-20 to 43.05 KWH/t.NS in financial year 2020-21 by implementation of;
• Advanced analytical model on Waste Gas Fan speed optimisation;
• Advanced analytical model on Cooling air fan speed optimisation; and
• Replacement of Sodium vapour lamps to LED.
• Gaseous fuel consumption reduced from 15.12 mkal/t.NS (FY 2019-20) to 14.49 mkal/t.NS (FY 2020-21) by maintaining lower ∆T of Furnace through improvement in Furnace automation.
Coke Plant• Reduction of clarified water consumption: 13,41,775 m3
was consumed against the plan of 13,92,775 m3; a saving of 51,000 m3 for the year. The bottom line impact was `54.57 Lakh or `4/T of BF+Nut coke production for the year.
• Reduction of coke moisture: Annual average coke moisture was 1.22% against the previous best of 1.72% achieved during FY 2019-20. 1% reduction of coke moisture reduces the Blast Furnace fuel rate by 3 Kg/T of hot metal. Thus, the reduction of coke moisture helped in reducing the Blast Furnace fuel rate by 5,045 T for the Year.
• Following annual average Coke Oven Gas quality properties were best ever (lower the better):
a) 37 mg/Nm3 ammonia against the previous best of 54 mg/Nm3 during FY 2019-20.
b) 27 mg/Nm3 naphthalene against the previous best of 32 mg/Nm3 during FY 2019-20.
Steel Melting Shop• Reduced specific water consumption from 0.43 m3/tcs
to 0.42 m3/tcs by changing Gas cleaning circuit logic and waste water recirculation through cascade filtration.
Annexure 10 (Contd.) 227
StatutoryReports
Stakeholders and Materiality
Performance Snapshot
About Tata Steel
Leadership Capitals GovernanceStrategyFinancial
Statements
Integrated Report & Annual Accounts 2020-21 | 114th Year226
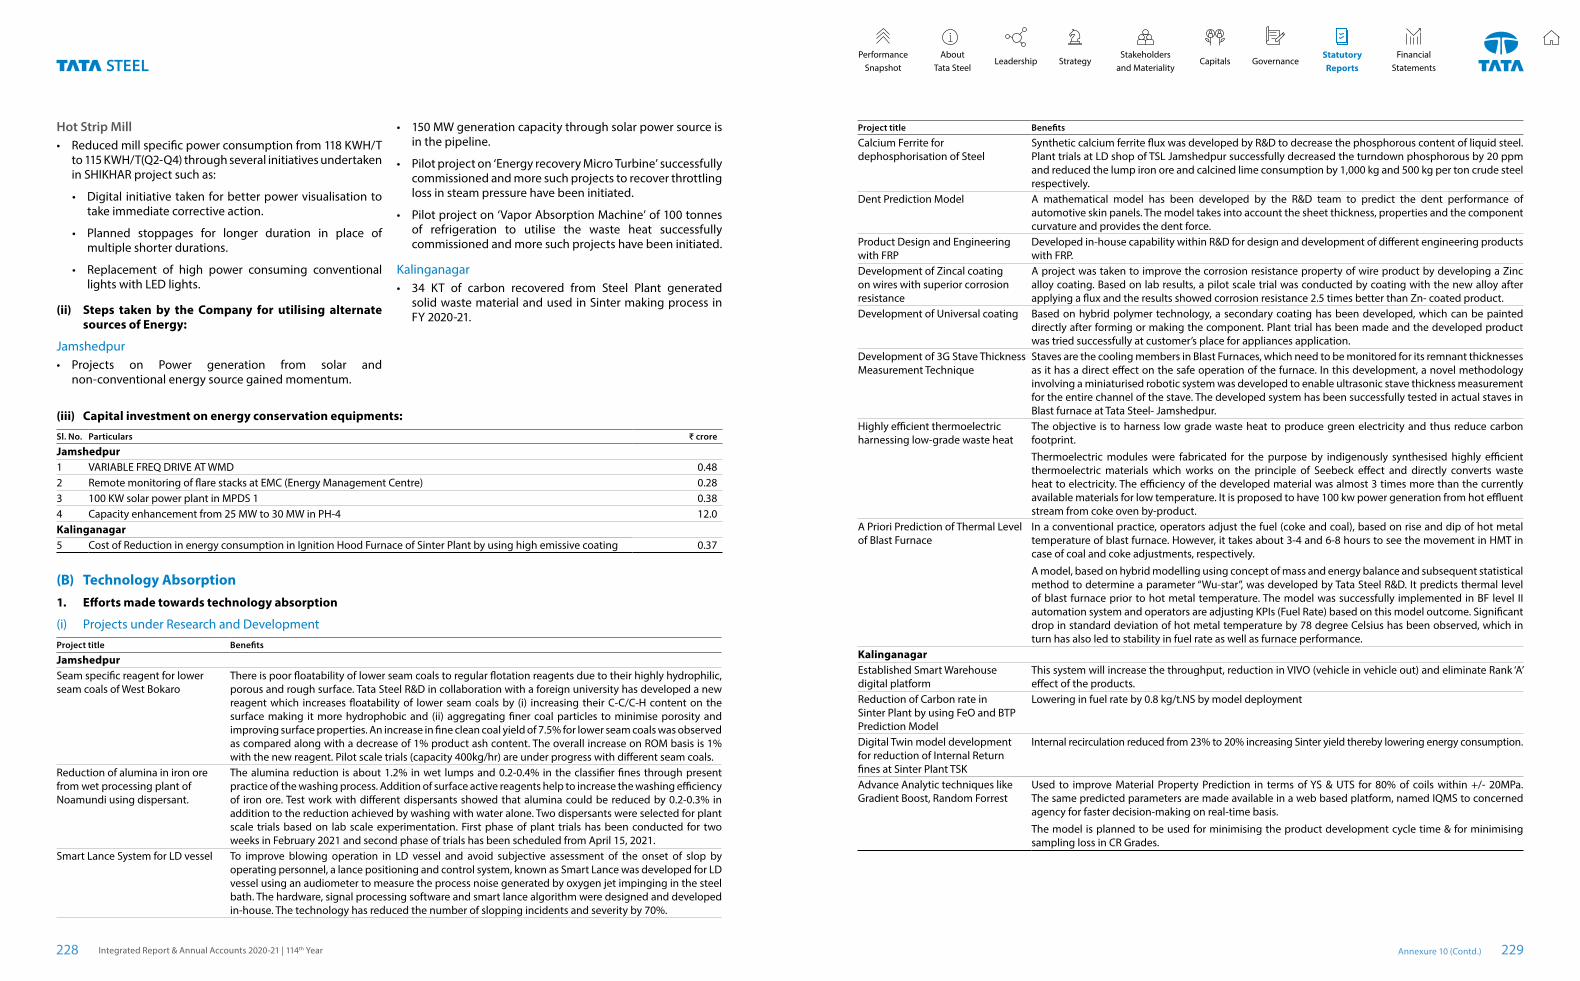
Hot Strip Mill• Reduced mill specific power consumption from 118 KWH/T
to 115 KWH/T(Q2-Q4) through several initiatives undertaken in SHIKHAR project such as:
• Digital initiative taken for better power visualisation to take immediate corrective action.
• Planned stoppages for longer duration in place of multiple shorter durations.
• Replacement of high power consuming conventional lights with LED lights.
(ii) Steps taken by the Company for utilising alternate sources of Energy:
Jamshedpur• Projects on Power generation from solar and
non-conventional energy source gained momentum.
(iii) Capital investment on energy conservation equipments:
Sl. No. Particulars ₹ crore
Jamshedpur1 VARIABLE FREQ DRIVE AT WMD 0.482 Remote monitoring of flare stacks at EMC (Energy Management Centre) 0.283 100 KW solar power plant in MPDS 1 0.384 Capacity enhancement from 25 MW to 30 MW in PH-4 12.0Kalinganagar5 Cost of Reduction in energy consumption in Ignition Hood Furnace of Sinter Plant by using high emissive coating 0.37
(B) Technology Absorption1. Efforts made towards technology absorption
(i) Projects under Research and DevelopmentProject title Benefits
JamshedpurSeam specific reagent for lower seam coals of West Bokaro
There is poor floatability of lower seam coals to regular flotation reagents due to their highly hydrophilic, porous and rough surface. Tata Steel R&D in collaboration with a foreign university has developed a new reagent which increases floatability of lower seam coals by (i) increasing their C-C/C-H content on the surface making it more hydrophobic and (ii) aggregating finer coal particles to minimise porosity and improving surface properties. An increase in fine clean coal yield of 7.5% for lower seam coals was observed as compared along with a decrease of 1% product ash content. The overall increase on ROM basis is 1% with the new reagent. Pilot scale trials (capacity 400kg/hr) are under progress with different seam coals.
Reduction of alumina in iron ore from wet processing plant of Noamundi using dispersant.
The alumina reduction is about 1.2% in wet lumps and 0.2-0.4% in the classifier fines through present practice of the washing process. Addition of surface active reagents help to increase the washing efficiency of iron ore. Test work with different dispersants showed that alumina could be reduced by 0.2-0.3% in addition to the reduction achieved by washing with water alone. Two dispersants were selected for plant scale trials based on lab scale experimentation. First phase of plant trials has been conducted for two weeks in February 2021 and second phase of trials has been scheduled from April 15, 2021.
Smart Lance System for LD vessel To improve blowing operation in LD vessel and avoid subjective assessment of the onset of slop by operating personnel, a lance positioning and control system, known as Smart Lance was developed for LD vessel using an audiometer to measure the process noise generated by oxygen jet impinging in the steel bath. The hardware, signal processing software and smart lance algorithm were designed and developed in-house. The technology has reduced the number of slopping incidents and severity by 70%.
• 150 MW generation capacity through solar power source is in the pipeline.
• Pilot project on ‘Energy recovery Micro Turbine’ successfully commissioned and more such projects to recover throttling loss in steam pressure have been initiated.
• Pilot project on ‘Vapor Absorption Machine’ of 100 tonnes of refrigeration to utilise the waste heat successfully commissioned and more such projects have been initiated.
Kalinganagar• 34 KT of carbon recovered from Steel Plant generated
solid waste material and used in Sinter making process in FY 2020-21.
Project title Benefits
Calcium Ferrite for dephosphorisation of Steel
Synthetic calcium ferrite flux was developed by R&D to decrease the phosphorous content of liquid steel. Plant trials at LD shop of TSL Jamshedpur successfully decreased the turndown phosphorous by 20 ppm and reduced the lump iron ore and calcined lime consumption by 1,000 kg and 500 kg per ton crude steel respectively.
Dent Prediction Model A mathematical model has been developed by the R&D team to predict the dent performance of automotive skin panels. The model takes into account the sheet thickness, properties and the component curvature and provides the dent force.
Product Design and Engineering with FRP
Developed in-house capability within R&D for design and development of different engineering products with FRP.
Development of Zincal coating on wires with superior corrosion resistance
A project was taken to improve the corrosion resistance property of wire product by developing a Zinc alloy coating. Based on lab results, a pilot scale trial was conducted by coating with the new alloy after applying a flux and the results showed corrosion resistance 2.5 times better than Zn- coated product.
Development of Universal coating Based on hybrid polymer technology, a secondary coating has been developed, which can be painted directly after forming or making the component. Plant trial has been made and the developed product was tried successfully at customer’s place for appliances application.
Development of 3G Stave Thickness Measurement Technique
Staves are the cooling members in Blast Furnaces, which need to be monitored for its remnant thicknesses as it has a direct effect on the safe operation of the furnace. In this development, a novel methodology involving a miniaturised robotic system was developed to enable ultrasonic stave thickness measurement for the entire channel of the stave. The developed system has been successfully tested in actual staves in Blast furnace at Tata Steel- Jamshedpur.
Highly efficient thermoelectric harnessing low-grade waste heat
The objective is to harness low grade waste heat to produce green electricity and thus reduce carbon footprint.Thermoelectric modules were fabricated for the purpose by indigenously synthesised highly efficient thermoelectric materials which works on the principle of Seebeck effect and directly converts waste heat to electricity. The efficiency of the developed material was almost 3 times more than the currently available materials for low temperature. It is proposed to have 100 kw power generation from hot effluent stream from coke oven by-product.
A Priori Prediction of Thermal Level of Blast Furnace
In a conventional practice, operators adjust the fuel (coke and coal), based on rise and dip of hot metal temperature of blast furnace. However, it takes about 3-4 and 6-8 hours to see the movement in HMT in case of coal and coke adjustments, respectively.
A model, based on hybrid modelling using concept of mass and energy balance and subsequent statistical method to determine a parameter “Wu-star”, was developed by Tata Steel R&D. It predicts thermal level of blast furnace prior to hot metal temperature. The model was successfully implemented in BF level II automation system and operators are adjusting KPIs (Fuel Rate) based on this model outcome. Significant drop in standard deviation of hot metal temperature by 78 degree Celsius has been observed, which in turn has also led to stability in fuel rate as well as furnace performance.
KalinganagarEstablished Smart Warehouse digital platform
This system will increase the throughput, reduction in VIVO (vehicle in vehicle out) and eliminate Rank ‘A’ effect of the products.
Reduction of Carbon rate in Sinter Plant by using FeO and BTP Prediction Model
Lowering in fuel rate by 0.8 kg/t.NS by model deployment
Digital Twin model development for reduction of Internal Return fines at Sinter Plant TSK
Internal recirculation reduced from 23% to 20% increasing Sinter yield thereby lowering energy consumption.
Advance Analytic techniques like Gradient Boost, Random Forrest
Used to improve Material Property Prediction in terms of YS & UTS for 80% of coils within +/- 20MPa. The same predicted parameters are made available in a web based platform, named IQMS to concerned agency for faster decision-making on real-time basis.
The model is planned to be used for minimising the product development cycle time & for minimising sampling loss in CR Grades.
Annexure 10 (Contd.)Integrated Report & Annual Accounts 2020-21 | 114th Year228 229
StatutoryReports
Stakeholders and Materiality
Performance Snapshot
About Tata Steel
Leadership Capitals GovernanceStrategyFinancial
Statements
(ii) Process Improvement
Raw Materials Division
Mining:• Concept developed for paste backfilling in Highwall mining
face at West Bokaro (first in the world) in collaboration with XCUMT backfill, China to increase the coal extraction ratio to more than 65% as compared to existing 30%. Lab test work at XCUMT & CIMFR is in progress to finalise material proportioning for paste backfilling and prerequisites for subsequent approval from regulatory authority (DGMS) for field trial respectively.
• Novel mining approach proposed for extraction of friable chrome ore (~30 million Ton) below ultimate pit limit at Sukinda. Technical feasibility study is under progress.
Ore Beneficiation Technology:
• Stickiness index to predict iron ore fines flowability: A project was formulated to minimise the rake unloading
issue by developing a Statistical Index to provide prior information about the flowability characteristics of fines. The collective effect of factors such as granulometry, mineralogy and ratio of wet & dry fines create the stickiness issue. Methods like principle component analysis and multiple regression were used to develop the stickiness index.
• Identification of enablers to reduce alumina in Dispatch fines at Noamundi:
Several initiatives (short-term and medium-term) were identified to reduce alumina in fines. Short term initiatives are as follows (a) Jig utilisation 100% and (b) hydrocyclones bypass) and medium-term initiative are (a) 100% classifier fine processed through jig (b) slime beneficiation and (c) jigging in upcoming low grade plant. These initiatives have a potential to reduce alumina by 0.37% (from 2.95% to 2.58%).
• Identification of enablers to reduce the K2O and SiO2 from Gomardih dolomite: Beneficiation studies to reduce K2O and SiO2 from dolomite were carried out and it was observed that by floatation it was possible to reduce the SiO2 from 12.2% to 1.31% and K2O from 0.8% to 0.14% which is very promising from an end usage view point.
Coal Beneficiation Technology:• West Bokaro Washery#3 Flotation Circuit Performance
Improvement by:
(a) ~0.5% clean coal yield improvement (on raw coal basis) by replacement of conventional rotor-stator with FloatForce (a new generation mixing mechanism developed by Outotec). 3 units of FloatForce were introduced in FY 2017-18 and based on the encouraging results, 3 more units integrated in FY 2020-21.
(b) ~10% reduction in flotation cell level fluctuation achieved by replacement of conventional actuators with advanced FESTO actuators.
• Intermediate size (0.5mm-0.25mm) beneficiation circuit -Reflux Classier stabilisation at new Jamadoba Coal Preparation Plant
Kalinganagar
Raw Material Handling System and Logistics • Elimination of man-machine interface through adoption
of Robotic application in in-haul and out-haul operation of Wagon Tippler 2.
• Installation of smart fencing system in Wagon Tippler 4 to prevent unauthorised entry during unloading operation of wagons.
• Integrated Power Supply installation of Cabin A and B for increase of reliability of signaling operation.
• Integration of Road weigh-bridge weighment Screen with VTS.
• Installation of Change over Visual Indicator at BF Critical Points.
• Started the dosing of chemical powder in PCI that enhanced the flowability and increased the PCI rate to 200Kg/thm even during monsoon period.
• Successfully commissioned the S&T system in upline between Jakhapura & Cabin-B that will increase the flowability of inward and outward rakes in parallel mode.
• Electronic interlocking system ensures safe and optimum rake movement with all interlocks in place.
• In-house mechanical modification done in the reach stacker which enabled it to handle slabs along with HR Coil.
• Signal and Hooter installation at Outside LC’s during Rake movement.
Sinter Plant• Maintaining Sinter bin level >60% to improve Sinter yield
and lower specific energy consumption.
• Number of interruptions reduced from 1.31 per day to 0.54 per day.
Coke Plant • PHCC in the coal blend was reduced from the previous
lowest of 18.68% during FY 2019-20 to 14.75%.
• OHCC in the coal blend was reduced from the previous lowest of 28.21% during FY 2019-20 to 19.63%.
Steel Melting Shop (‘SMS’) • Improvement in usage of clean scrap from 4.1% in
FY 2019-20 to 4.7% from Q3FY2021 (post Covid- manpower restrictions) resulted into CO2 reduction of more than 0.084 t/tcs.
• Optimisation of MRP Scrap Consumption in SMS, increased usage up to 59.2 % in FY 2020-21 against the annual plan of 50 %.
• Stabilising LRF Operations, (first complete financial year of LRF Operations) to achieve Specific Power consumption of 18 kwh/tcs and Electrode Consumption of 0.10 kgs/tcs.
• Reduction of DS reagent consumption in SMS from 3.11 Kg/Tcs in FY 2019-20 to 2.10 Kg/Tcs in FY 2020-21 due to improvement in DS process and routing 75 % heats through LRF.
• Commercialised high-end API (for Line pipe application) using RH for Vacuum treatment. Efforts made towards import substitution. Total API production in SMS increased from 46,722 tonnes in FY 2019-20 to 1,60,090 tonnes in FY 2020-21.
Hot Strip Mill (‘HSM’) • Improved Mill stability through increasing accuracy of
Model’s Power Prediction and Roughing Mill delivery thickness accuracy.
• Digital initiative taken under Shikhar for improving Safety and Process time related to coil reprocessing by decreasing number of mutations in coil yard. Coil movement through conveyor and stacking of the coils in Yards is made based on re-processing requirement and final dispatch destination in auto mode, through scheduling and process control with the help of MILL L2 and CYMS Model along with L1 interface.
• Improved Scale loss from 0.87% to 0.84% by optimising heating curve using advance analytics technique like lasso regression in furnace.
(iii) Product Development
Jamshedpur• First foray into advanced high strength coated steels
through DP600 GA and DP600 GI approvals.
• First foray into functional secondary coatings space – approval for lubrication-coated GA (T-COAT) in exposed panel application.
• Multiple Auto OEM approvals to DP780CR – highest strength achieved yet from continuous annealing.
• Tata Steel’s first ever passenger vehicle skin panel approval made from bake-hardenable grade BH180 GA.
• Completion of the entire range of grades within the high strength IF-based steel family.
• Gr 3[CW], 5.5mm wire rods rolled from slab route for core conducting wire used in DTH coaxial cables an import substitute.
• SAE 1008[M], 5.5mm wire rods for GI Gabion wires for export to Nepal.
• HC80B[PC] wire rods for PC wires for increased productivity at customer end.
• HC80BCrV[SS] wire rods for high strength roller shutter spring wire, an import substitute.
• High ductility Fe 500SD, 8mm rebars from New Bar Mill.
• High strength high ductility Fe 550SD 8mm to 25mm.
• Seven grades of billets (first time TSL) for export during nationwide pandemic (e.g. SD40NT and SD40GB for producing air cooled rebars).
• Commercial supply of Fe500 CRS, 40mm for construction.
Kalinganagar
Following new Grades were developed in TSK:• X70 (non-sour): API X-70 for non-sour applications
developed from TSK. Mecon demo route approval completed successfully.
• FB590/FB540: Development of Ferrite + Bainite for the first time from TSL. These will be used for wheels disc applications.
• S460MC & S420MC: These grades are developed and will be used in Auto structural application for Light Weight Vehicles.
• DP590: This grade is developed and will be used in auto internals (Brackets).
• JSH590R & JSH440: This will be used for auto structural applications internal.
• Development of UT guaranteed grades: Grades such as E350 Gr.C/S355J2 for thickness of >16mm for L&E and wind tower applications.
Annexure 10 (Contd.)Integrated Report & Annual Accounts 2020-21 | 114th Year230 231
StatutoryReports
Stakeholders and Materiality
Performance Snapshot
About Tata Steel
Leadership Capitals GovernanceStrategyFinancial
Statements
2. Benefits derived from key projects:
Project title Benefits
JamshedpurReduction of LPG consumption at GI wire line of ISWP LPG consumption reduced by ~ 3.4 Kg/ton. This resulted in yearly cost benefit of ̀ 1crore10 new grades of billets made for export market during country wide lockdown
This enabled in utilisation of LD1 capacity during COVID-19 and resulted in overall savings of `40 crore.
Elimination of black edge defect at TBSL Elimination of input RM defect from CRM Bara resulted in yield improvement at CGL1 and TBSL – a combined benefit of `3 crore p.a.
API Clone TDC from TSK 96 clone TDCs created through Agile-IT based system to maximise order execution resulted in record sales in API in FY 2020-21.
Low cost API X65 and X70(non-sour) from TSK A cost saving of ~ `1,400/T for X65 and X70(non-sour) achieved. Total 14kT of X65 and > 30kT of X70(non-sour) supplied with lean chemistry (till February, 2021)
Computer vision based toolbox for detection of segregation (CLS) and internal cracks (ICC) for slabs from Sulphur print images
This toolbox has automated the whole CLS classification to save the time of QA operators as well as to avoid the error due to operator to operator judgement
Online dashboard for Zinc consumption in continuous galvanising lines (CGL) of CRM
Saving more than `0.75 crore
Predictive maintenance of critical equipment of continuous galvanising line number 2 of CRM
Saving more than `0.67 crore
Auto pattern and trend analysis visualisation toolbox for defects with respect to processing lines from Hot Strip Mill (HSM) to Recoiling lines (RCL) of CRM
This has enabled faster decision-making and defect finding for quality assurance people
KalinganagarTest wagon modification with Test Weights embedded in it
Ensuring healthiness of In-motion Weigh bridge for eliminating the error during loaded rake weighment
Modification of Re Railing Van for Road and Rail Movement
Minimum time Re railing equipment reaching site without any travel delay effecting production and also safe shifting of re-railing equipment at site
De-railer fabricated (6 no's) savings of approximately `24 Lakhs (`4 Lakhs/ Derailer)
Positive isolation ensuring safety of workmen on rail yard
Installation of Anti toppling tilt switch in Hywa This can avoid toppling hazards in moveable hywasReduction of Carbon rate in Sinter Plant by using FeO and BTP Prediction Model
Lowering in fuel rate by 0.8 kg/t.NS by model deployment
Digital Twin model development for reduction of Internal Return fines at Sinter Plant TSK
Internal recirculation reduced from 23% to 20% increasing Sinter yield thereby lowering energy consumption.
3. Information regarding imported technology (last three years)
Sl. No
Technology ImportedFinancial Year
of ImportStatus
Jamshedpur1 Hot Strip Mill Furnace Skid Revamping
2018 - 19 Commissioned2 Electro Magnetic Brake (Phase-1)3 E – Blast Furnace Relining4 New LD Gas Holder5 Electro Magnetic Brake (Phase-2)
2020 - 21Commissioned
6 Vessel 2 Trunion and Guide System Yet to be commissionedKalinganagar7 2nd Barrel Reclaimer (Make: TAKRAF Tenova) in RMBB Sinter Plant 2020-21 In operation
4. Expenditure on Research & Development (R&D)
(₹ crore)
(a) Capital 2.75(b) Recurring 228.29(c) Total 231.04(d) Total R&D expenditure as a % of Total Turnover 0.36%
(C) Foreign Exchange Earnings and Outgo
(₹ crore)
FY 2020-21 FY 2019-20
Foreign Exchange Earnings 9,241.88 6,314.97Value of direct imports (C.I.F. Value) 8,902.53 12,381.28Expenditure in foreign currency 365.71 509.47
On behalf of the Board of Directors
sd/-N. CHANDRASEKARAN
Mumbai ChairmanMay 5, 2021 DIN: 00121863
Annexure 10 (Contd.)Integrated Report & Annual Accounts 2020-21 | 114th Year232 233
StatutoryReports
Stakeholders and Materiality
Performance Snapshot
About Tata Steel
Leadership Capitals GovernanceStrategyFinancial
Statements