Annexure A - Ekurhuleni
214
Annexure A EKURHULENI METROPOLITAN MUNICIPALITY Integrated Development Plan (IDP) 2016/17
-
Upload
khangminh22 -
Category
Documents
-
view
2 -
download
0
Transcript of Annexure A - Ekurhuleni
Annexure A
EKURHULENI METROPOLITAN
MUNICIPALITY
Integrated Development Plan (IDP) 2016/17
Contents
1. INTRODUCTION ............................................................................................................. 3
1.1 CONTEXT AND OVERVIEW ............................................................................................... 3
2. STATUS QUO ....................................................................................................................... 9
2.1 SITUATIONAL ANALYSIS .................................................................................................. 9
2.2 VISION, MISSION AND VALUES ..................................................................................29
3.1 STRATEGIC PLANNING FRAMEWORK ...........................................................................31
4.1 GOVERNANCE AND INSTITUTIONAL ARRANGEMENTS ...............................................40
5. INTERGOVERNMENTAL ALIGNMENT ...............................................................................50
6. COMMUNITY PARTICIPATION ...........................................................................................65
6.1 IDP PLANNING PROCESS FOR 2016/17: WARD CONSULTATIONS .............................65
7. REVIEW OF THE INTEGRATED DEVELOPMENT PLAN ................................................. 100
7.1 GUIDING PRINCIPLES .................................................................................................... 100
7.2 IDP/SDBIP ........................................................................................................................ 101
8. DRAFT MULTI-YEAR FINANCIAL PLAN .......................................................................... 169
9.1 EMM METROPOLITAN SPATIAL DEVELOPMENT FRAMEWORK 2035 (MSDF) ......... 170
INTRODUCTION .................................................................................................................... 178
10. DISASTER MANAGEMENT PLAN................................................................................... 205
11. PERFORMANCE MANAGEMENT SYSTEM .................................................................... 207
CHAPTER 1
1. INTRODUCTION
1.1 CONTEXT AND OVERVIEW
Integrated development planning is a process through which municipalities prepare a strategic
development plan which extends over a five-year period. The Integrated Development Plan (IDP)
is a product of this planning process. The Ekurhuleni Metropolitan Municipality’s (EMM) IDP is
the principal strategic planning instrument which guides and informs all planning, budgeting,
management and decision-making processes in the municipality.
Through Integrated Development Planning, which necessitates the involvement of all relevant
stakeholders, a municipality will:
Identify its key development priorities;
Formulate a clear vision, mission and values;
Formulate appropriate strategies;
Develop the appropriate organisational structure and systems to realize the vision and mission; and
Align resources with developmental priorities.
In terms of the Municipal Systems Act, all municipalities have to undertake an integrated
development planning process to produce IDPs. As the IDP is a legislative requirement, it has a
legal status and supersedes all other plans that guide development at local government level.
Through the IDP, municipalities are required to align with the provincial and national spheres of
government in the delivery of national and provincial developmental programmes at local level.
Furthermore, municipalities have to incorporate a wide range of sectoral programmes (e.g. water,
health and small business development) into their own municipal development programmes, and
also comply with the requirements of a variety of national legislation aimed at facilitating
development.
This draft IDP is a transitional IDP. The IDP being produced for 16/17 financial year normally
would have been an IDP for the new term of office, but because of the scheduling of the election
and the simultaneous need to comply with the law, an IDP has to be produced overlapping into
the new term. This IDP therefore primarily about continuation of the work the municipality has
been doing in the last 4/5 years.
Since the establishment of the municipality, EMM has made excellent progress in enabling the
people of this region to enjoy the fruits of liberation and democracy. We have seen substantial
improvements made in the provision of healthcare, houses, water, electricity and sanitation.
Widespread use of the bucket system has been significantly reduced, if not eliminated. We have
laid a solid foundation and are on course to improve the lives of our communities. As we celebrate
the positive change in our communities, we are also aware of the many challenges we still face.
Our fight against poverty and underdevelopment will be further intensified to work towards halving
unemployment. Our responsibility as a sphere of government is to ensure that the quality of life
of all who live and work in Ekurhuleni is improved. We will continue to engage in both progressive
and meaningful discussions with our communities to shape a clear path from which governance
and development will draw guidance and direction.
Since 2011, when the IDP for the term was approved, the municipality has implemented
numerous projects and programmes to improve the lives of Ekurhuleni’s citizens. The section
below highlights some of the achievements in service delivery. This summary of achievements is
presented in line with the strategic objectives of the City as derived from the Growth and
Development Strategy 2055.
All work and interventions implemented by EMM is informed by the GDS and its five themes of
re-governing, re-urbanizing, re-industrializing, re-mobilizing and re-generating the city.
Effective Cooperative Governance
In efforts to better re-govern the city, EMM has achieved:
Four (4) successive unqualified audit opinions and a clean audit opinion in the financial years
2013/14 and 14/15. The clean audit opinion in the 2013/14 and 14/15 financial year was also
awarded to five of the municipalities’ entities. This is the first time in the history of this metro
that we have received back-to-back clean audits. A clean audit means that financial
statements of the municipality are free from material misstatements (in other words, a
financially unqualified audit opinion) and there are no material findings on reporting on
performance objectives or non-compliance with legislation.
Implemented the separation of powers model which it adopted in 2012 where commendable
progress has been made. The model promotes a system of checks and balances and through
its implementation the Legislature conducts oversight on the work of the Executive. By
implementing this model in its governance framework, EMM has positively entrenched
accountability in the metro.
Revenue collection in the municipality has consistently been above a 90% over the last four
years and a target of 95% is close to being achieved. Revenue Collection for the 11/12 was
93.2%, for 12/13 FY was 92.02, for 13/14 was 89.6% and for the 14/15 FY was 92.19%.
A culture of community participation in municipal decision-making has been entrenched to
IDP Consultations, Izimbizos, Functioning Ward Committee System etc.
The City developed a range of customer response and governance mechanisms to address
needs. This includes 20 Customer care Centres and a 258-seater Call-Centre. A whole range
of new customer interface mechanisms are continuing to be rolled-out.
Sustainable Urban Integration
To re-urbanize Ekurhuleni, its infrastructure is been improved on a continuous basis and among
others, the following have been achieved since June 2011:
6167 street lights were installed;
24 267 subsidized household were electrified;
27 119 additional households provided with minimum water supply;
2300 houses were built
To deal with informality:
275 high mast lights were fitted in informal settlements;
26778 PV Solar Units were distributed in informal settlements
Public transport infrastructure and roads as an important aspect of sustainable urbanization is
also receiving attention:
Over 150 bus shelters having been constructed since 2011 and
An Integrated Rapid Public Transport Network Plans is now at an advanced stage of
implementation.
280km of roads was tarred
In addition to this other social facilities such as sport and recreational facilities including fire
stations, sports and recreation facilities and clinics were constructed.
Job-creating Economic Growth
In pursuit of efforts to re-industrialize EMM, among others the metro has:
Facilitated 14 large projects with a pipeline value of over R30 billion since 2011/12. These
projects include:
o The PRASA-Gibela rolling stock manufacturing project in Dunnotar wherein 3 600
locomotives will be manufactured. EMM has already approved the leasing of 288
hectares to PRASA-GIBELA;
o Facilitation of the process to establish the Tambo-Springs Inland Port which is
progressing well following approval of the Township Establishment application in 2014.
EMM has also pioneered the revitalisation of township economies. Among milestones achieved
in relation to this is:
Development of 13 township business hubs and the building of 2 fabrication laboratories
(FabLabs) in Tembisa and Thokoza to train youth on conceptualization and with the
development of product prototypes;
Identification of 10 Council-owned shops in townships for refurbishment.
Social Empowerment
Among achievements to re-mobilize and empower communities of EMM:
1 010 peace corps (10 per ward) were recruited, trained and placed in identified crime hot
spots.
Over 5 000 early childhood development (ECD) practitioners were trained;
The Electric Health Records System, which electronically keeps patient’s record, was rolled
out to 36 primary health care facilities and about 27 791 patients were registered on the
system.
To address youth unemployment and empower young people, EMM entered into strategic
partnerships with the private sector for the placement of youth in learnerships, internships and in
some tailored industry skills development programmes:
EMM facilitated and invested in the empowerment of 20 emerging youth-owned construction
companies and 20 learner supervisors with contracts worth R150 million.
Environmental Well-being
To attain environmental well-being and regenerate all-ready used material and waste generated
within its borders, EMM undertook to:
Roll out 240 litre bins to all households. A total of more than 300 000 household have already
been reached.
Weekly refuse collection reaches approximately 1 million households.
To keep the metro clean:
More than 10 000 swivel bins have been installed at strategic positions across the city.
End of Term Programme of Visible Service Delivery
To further advance what has so far been achieved under the different themes of the GDS, 2
Mayoral Lekgotlas were held in 2015. Some of the key resolutions included:
Institutionalization of a Healthy Lifestyles programme in Ekurhuleni to combat the triple burden
of disease and life style diseases which are increasingly becoming the dominant sources of
morbidity and mortality world- wide. In line with this Outdoor Gyms are to be installed in 60
community parks/recreation facilities;
Additional recruitment of Metro Police Officers (300 by 2016) to intensify crime prevention
interventions including dealing with the scourge of illegal mining in Ekurhuleni;
Establishment of Ekurhuleni Planning Commission in order to build long term growth and
development partnership in line with the GDS 2055;
Increase the roll-out of metering to unmetered as part of the revenue protection and
enhancement;
20 000 electricity connections to targeted areas (Eden park, Esselen park and Palm Ridge);
Intensification cleanliness programme with a special focus on the CBDs and Townships;
Roll out of 140 000 240l bins to areas in Ekurhuleni as part of the cleanliness programme;
33 mini recycling facilities to be operationalised;
Implementation of Nightshift CDBs (10);
106 new vehicles to be deployed to strengthen community safety and security;
100 Land Invasion Officers to be recruited;
150 Trainee Constables to be appointed;
26 new municipal buses (green buses) to be operationalised;
50 new bus shelters to be erected;
10km of NMT to be constructed;
6051 Serviced Stands to be released;
15 complexes to be refurbished;
6 liveable Informal Settlements pilots to be completed (Emandleni, Makause, Ekuthuleni,
Ekanini, Winnie Mandela, Thusong;
10,000 subsidized houses to be electrified;
88 km of new tar roads to be constructed and rehabilitated;
15 Townships to be proclaimed; and
160 Wi-Fi hotspots to be deployed.
CHAPTER OVERVIEW
Chapter 1: Introduces the IDP and also provides a high level summary of service delivery achievements of the last four years. Chapter 2: assesses levels of development in terms of demographics, the economy, poverty and inequality and access to basic services. Using data mined from a variety sources (e.g. StatSA) and various Ekurhuleni strategic and operational plans, it extracts growth and development challenges facing the City and gives an indication of the City’s interventions to address these challenges. Chapter 3: discusses the Ekurhuleni Strategic Planning Framework. It outlines key inputs into the planning process from province to national and at the City Level. Key at the city level is the Growth
and Development Strategy 2055 that outlines long term plans that the City will use to change the Growth and Development trajectory of Ekurhuleni region. The chapter also provides a broad framework for the initial work done on the Strategy Implementation Plan (SIP) and the process for its finalization. Chapter 4: outlines the governance systems, and processes that the city use to plan and manage and coordinate its activities in order to fulfil its mandate. A new governance framework for EMM in terms of which legislative and executive authority are separated is also discussed. Chapter 5: discusses the city’s approach to intergovernmental relations. A large section of the chapter is focussed on the MEC’s comments on the IDP 15/16 and Ekurhuleni’s response to those comments. Chapter 6: reviews the public participation processes that underpinned the review of IDP for the 2015/16 financial year. The legislation governing public participation and EMM’s public participation policy framework is discussed. A high level summary of the public participation process and outcomes is delineated. The outcomes of the public participation process embarked upon in preparation is analysed and finally the needs per ward are also outlined. Chapter 7: is the main Chapter of this document. It provides details of the key deliverables planned for the 2015/16 financial year. The deliverables are presented in line with the key strategic objectives of EMM extracted from the GDS. The strategic objectives are sustainable urban integration, job creating economic growth, social empowerment, and environmental well-being effective and cooperative governance. All work by the city is therefore aligned with the GDS. Work on the EMM’s Flagships is also detailed as support to other work being done by the Metro. To give full expression to the meaning of the IDP, work (with a potential to restructure the City) currently being done by private sector in conjunction with the City is also discussed. Chapter 8: Is supposed to reflect the multi-year budget but since it is voluminous, an indication is provided that it is contained in a separate document. Chapter 9: outlines the Municipal Spatial Development Framework (MSDF) outlining the desired spatial development of the metropolitan area as contemplated in the Spatial Planning and Land Use Planning Act (SPLUMA). Chapter 10: outlines EMM Corporate Disaster Plan which articulates the city’s approach to preventing and managing disasters. The Disaster Management Plan seeks to achieve the integration of disaster management functions into the strategic and operational planning and project implementation of all line functions and role players within the municipality against assessed disaster risks and through this coordinative effort; promotes the integration of fast, efficient and effective responses to disasters (actual or impending) by all role-players. Chapter 11: in line with the Municipal Systems Act that requires municipalities to develop a performance management system suitable for their own circumstances, this chapter discusses the Metro’s approach to managing organizational performance.
CHAPTER 2
2. STATUS QUO
2.1 SITUATIONAL ANALYSIS
INTRODUCTION
Section 26 of the Municipal Systems Act 2000 requires that as part of developing an IDP, existing
levels of development within a municipality be assessed. This chapter does exactly that by casting
its eyes back at where Ekurhuleni has been and how far it has come. Among others, it discusses
distinct and unique features Ekurhuleni inherited including the service delivery implications they
hold. In addition, the chapter also discusses interventions made by EMM in an effort to address
these challenges, including planned future interventions. Key information pertaining to trends in
population, the economy and the provision of basic services are discussed with the aim of
extracting their implications for growth and development.
HISTORICAL BACKGROUND AND FEATURES
Ekurhuleni Metropolitan Municipality was established in the year 2000 from the amalgamation of
the then two existing regional entities, namely Kyalami Metropolitan and the Eastern Gauteng
Services (EGS). It is the fourth largest municipality out of all metropolitan areas that currently exist
in South Africa. With the impending amalgamation of Lesedi, this position will change as its size
will increase even further. Ekurhuleni was established with a distinct set of fragmentations
compared to other metros making it unique in its own right. It has a legacy of 9 towns and 17
townships with no single large administration as in the case of the former cities of Johannesburg,
Cape Town, Pretoria and Durban – which had to coalesce around relatively mature big city
administrations. As a result of this fragmented and dispersed urban structure, the City had no
identifiable city centre and suffers from a diffuse and problematic civic identity gravely challenged
by the relics of the former East Rand identity.
The inherited fragmentation also manifests itself through extreme social isolation and as the worst
excesses of apartheid planning placed ever larger townships on the periphery of a weakened
urban spine. Four major concentrations of previously disadvantaged communities exist in the
area. These include Tembisa, the Katorus complex, the Kwatsaduza complex, and the Daveyton
Etwatwa area. These low income residential clusters are located on the urban periphery and are
far removed from the majority of social and economic opportunities in the metropolitan area, and
are linked to the main economy via rail and/or road networks. Collectively these areas represent
approximately 61% of the total population of Ekurhuleni. The cumulative effect of all this includes
high levels of poverty and homelessness for the majority of citizens. Further to this is ageing
infrastructure together with vast service areas. Already, these attest to the magnitude of service
delivery challenges that Ekurhuleni is confronted with. With the re-demarcation of Ekurhuleni to
include Lesedi municipality, these service delivery challenges will be compounded even further.
DEMOGRAPHICS
Ekurhuleni houses 6% of the country’s population and 26% of Gauteng’s population. It has a
resident population of approximately 3 178 470 million people and 1 015 645 million households1.
The municipality has an average annual population growth rate of 2.47%. Between 2001 and
2011, the number of households in Ekurhuleni increased by 36.1%, a figure which was above the
average national growth of 35.7%. This growth in population holds serious service delivery
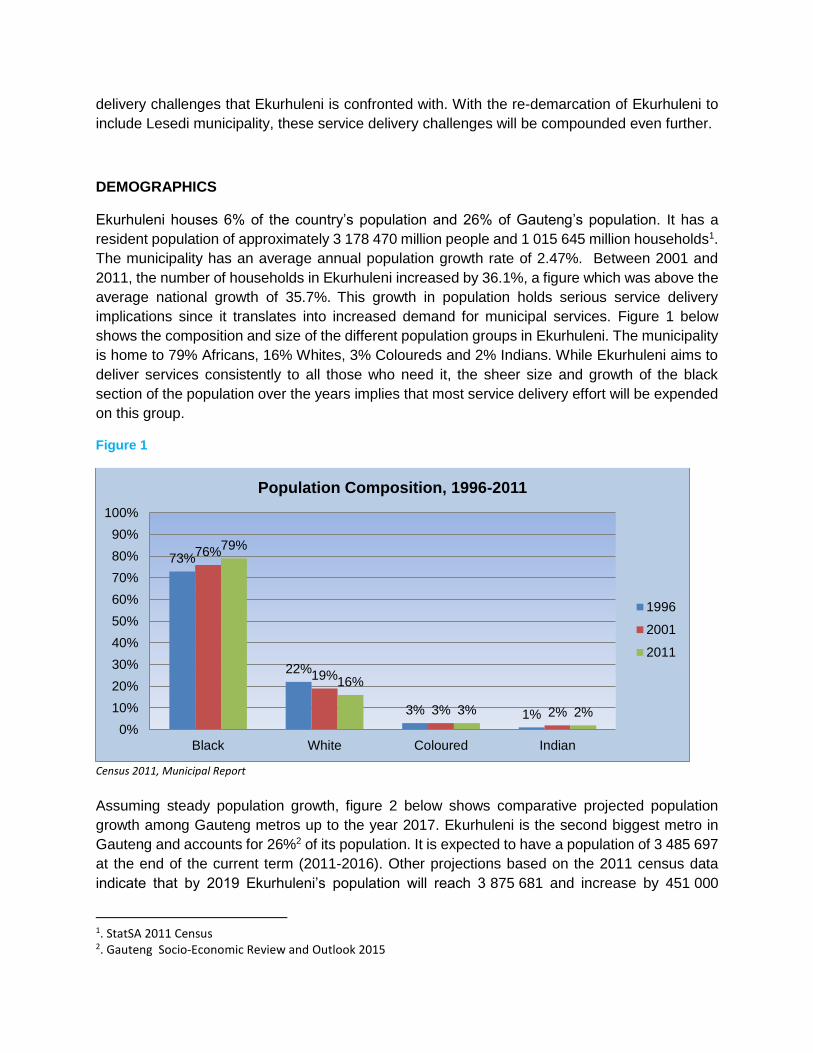
implications since it translates into increased demand for municipal services. Figure 1 below
shows the composition and size of the different population groups in Ekurhuleni. The municipality
is home to 79% Africans, 16% Whites, 3% Coloureds and 2% Indians. While Ekurhuleni aims to
deliver services consistently to all those who need it, the sheer size and growth of the black
section of the population over the years implies that most service delivery effort will be expended
on this group.
Figure 1
Census 2011, Municipal Report
Assuming steady population growth, figure 2 below shows comparative projected population
growth among Gauteng metros up to the year 2017. Ekurhuleni is the second biggest metro in
Gauteng and accounts for 26%2 of its population. It is expected to have a population of 3 485 697
at the end of the current term (2011-2016). Other projections based on the 2011 census data
indicate that by 2019 Ekurhuleni’s population will reach 3 875 681 and increase by 451 000
1. StatSA 2011 Census 2. Gauteng Socio-Economic Review and Outlook 2015
73%
22%
3% 1%
76%
19%
3% 2%
79%
16%
3% 2%
0%
10%
20%
30%
40%
50%
60%
70%
80%
90%
100%
Black White Coloured Indian
Population Composition, 1996-2011
1996
2001
2011
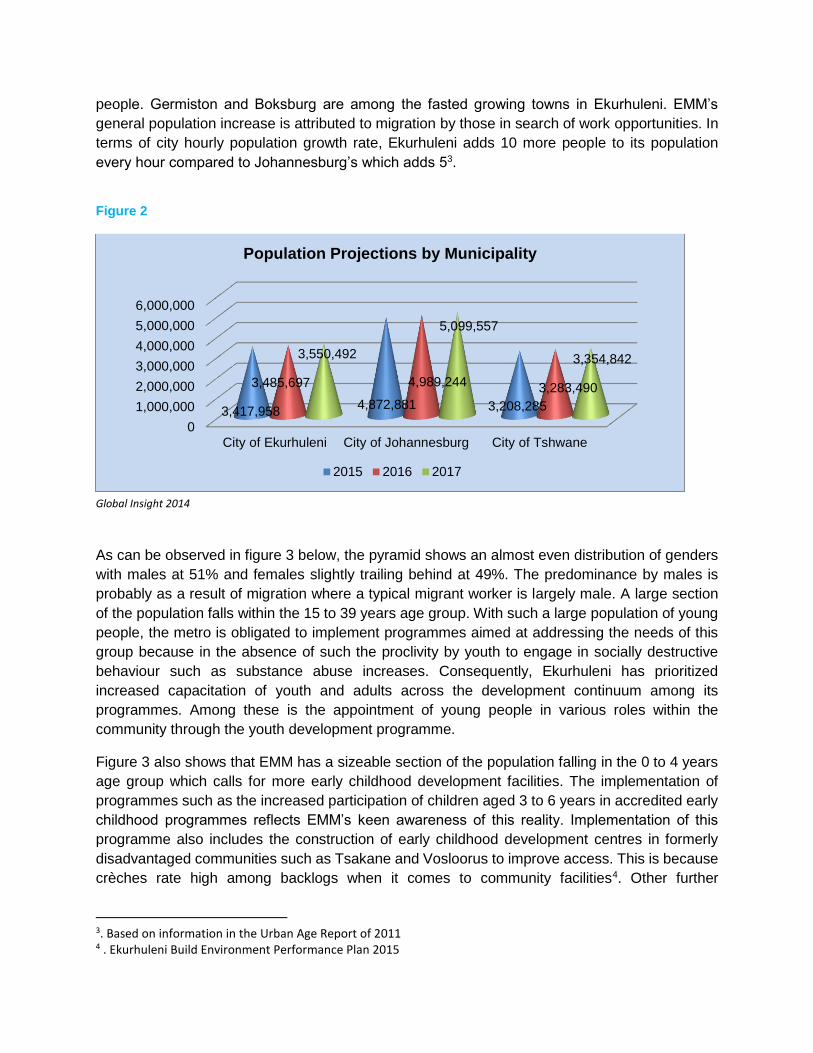
people. Germiston and Boksburg are among the fasted growing towns in Ekurhuleni. EMM’s
general population increase is attributed to migration by those in search of work opportunities. In
terms of city hourly population growth rate, Ekurhuleni adds 10 more people to its population
every hour compared to Johannesburg’s which adds 53.
Figure 2
Global Insight 2014
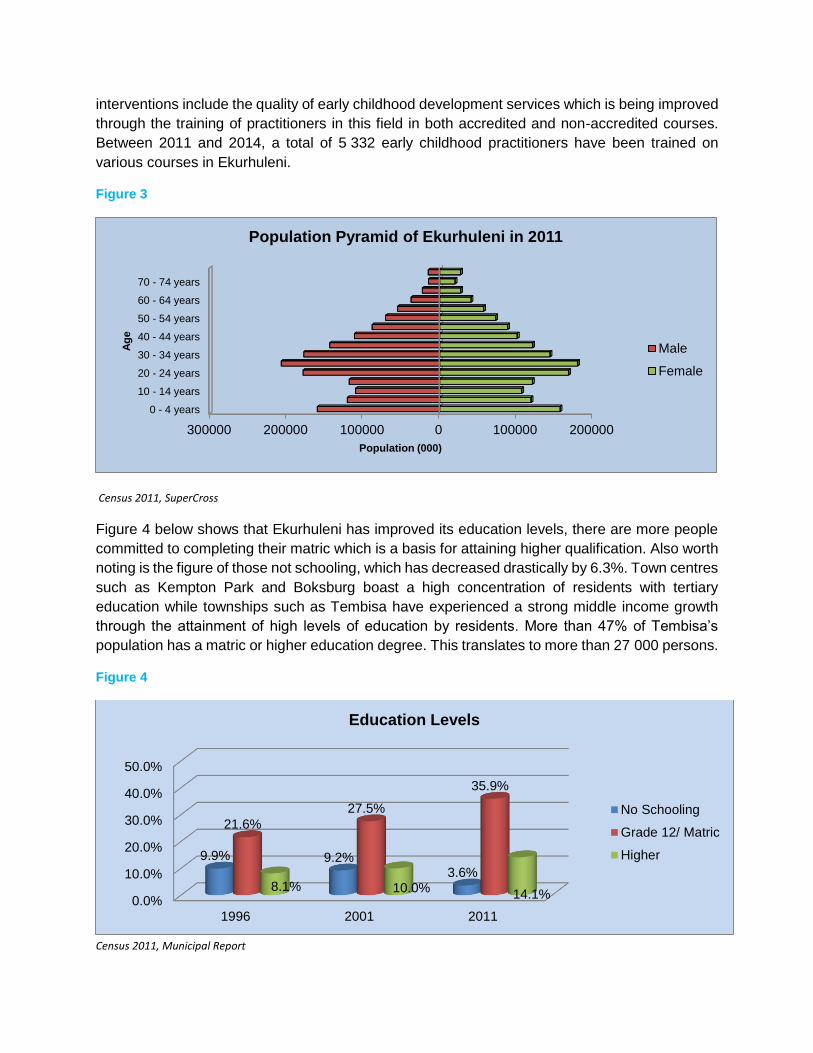
As can be observed in figure 3 below, the pyramid shows an almost even distribution of genders
with males at 51% and females slightly trailing behind at 49%. The predominance by males is
probably as a result of migration where a typical migrant worker is largely male. A large section
of the population falls within the 15 to 39 years age group. With such a large population of young
people, the metro is obligated to implement programmes aimed at addressing the needs of this
group because in the absence of such the proclivity by youth to engage in socially destructive
behaviour such as substance abuse increases. Consequently, Ekurhuleni has prioritized
increased capacitation of youth and adults across the development continuum among its
programmes. Among these is the appointment of young people in various roles within the
community through the youth development programme.
Figure 3 also shows that EMM has a sizeable section of the population falling in the 0 to 4 years
age group which calls for more early childhood development facilities. The implementation of
programmes such as the increased participation of children aged 3 to 6 years in accredited early
childhood programmes reflects EMM’s keen awareness of this reality. Implementation of this
programme also includes the construction of early childhood development centres in formerly
disadvantaged communities such as Tsakane and Vosloorus to improve access. This is because
crèches rate high among backlogs when it comes to community facilities4. Other further
3. Based on information in the Urban Age Report of 2011 4 . Ekurhuleni Build Environment Performance Plan 2015
0
1,000,000
2,000,000
3,000,000
4,000,000
5,000,000
6,000,000
City of Ekurhuleni City of Johannesburg City of Tshwane
3,417,9584,872,881 3,208,285
3,485,697 4,989,244 3,283,490
3,550,492
5,099,557
3,354,842
Population Projections by Municipality
2015 2016 2017
interventions include the quality of early childhood development services which is being improved
through the training of practitioners in this field in both accredited and non-accredited courses.
Between 2011 and 2014, a total of 5 332 early childhood practitioners have been trained on
various courses in Ekurhuleni.
Figure 3
Census 2011, SuperCross
Figure 4 below shows that Ekurhuleni has improved its education levels, there are more people
committed to completing their matric which is a basis for attaining higher qualification. Also worth
noting is the figure of those not schooling, which has decreased drastically by 6.3%. Town centres
such as Kempton Park and Boksburg boast a high concentration of residents with tertiary
education while townships such as Tembisa have experienced a strong middle income growth
through the attainment of high levels of education by residents. More than 47% of Tembisa’s
population has a matric or higher education degree. This translates to more than 27 000 persons.
Figure 4
Census 2011, Municipal Report
300000 200000 100000 0 100000 200000
0 - 4 years
10 - 14 years
20 - 24 years
30 - 34 years
40 - 44 years
50 - 54 years
60 - 64 years
70 - 74 years
Population (000)
Ag
e
Population Pyramid of Ekurhuleni in 2011
Male
Female
0.0%
10.0%
20.0%
30.0%
40.0%
50.0%
1996 2001 2011
9.9% 9.2%3.6%
21.6%
27.5%
35.9%
8.1% 10.0%14.1%
Education Levels
No Schooling
Grade 12/ Matric
Higher
An improved education profile is a positive development as it implies that the metro has a literate
workforce that is readily available to drive its economy. Be that as it may, the municipality still
faces a major challenge when it comes to the full utilization of its available human capital
especially the deployment of individuals with much-needed skills to drive its economy.
Consequently, EMM has prioritised the acquisition of relevant skills by individuals through
partnerships with institutions of higher learning such as the Vaal University of Technology (VUT).
The municipality also has a Bursary Scheme for qualifying individuals in different priority fields to
ensure there is constant supply of the needed critical skills in Ekurhuleni. However, compared to
other metros such as Tshwane and Johannesburg, Ekurhuleni has no university. As part of its
Aerotropolis vision and to support manufacturing as the backbone of the economy, an academy
or technical institution5 for skills in the science and engineering fields is most needed In
Ekurhuleni.
ECONOMIC DEVELOPMENT
Figure 5
Global Insight 2014
EMM’s economy has evolved since its heydays as an economy founded on mining. However, the
municipality today faces the problem of illegal mining bequeathed by this history. Since this is a
national scourge, the City may therefore need to draw from its own resources and in collaboration
with the South African Police Services fight to stem this problem. In addition, the City’s public
5 Municipal Spatial Development Framework, Draft Review 2015
-3.0%
-2.0%
-1.0%
0.0%
1.0%
2.0%
3.0%
4.0%
5.0%
6.0%
7.0%
2005 2006 2007 2008 2009 2010 2011 2012 2013
%
GVA-R Average Annual Growth
National Total
Gauteng
Ekurhuleni
safety and emergency personnel finds itself having to acquire new training as illegal mining comes
with new challenges and rescue situations such as being trapped underground.
“Ekurhuleni has the largest concentration of industrial activity in South Africa and Sub-Saharan
Africa”. It is now a commercial and manufacturing hub of South Africa. It economic size is reflected
in the table below.
Table 1: Ekurhuleni’s Economic Contribution
Contribution to SA’s GDP 6%
Contribution to Gauteng’s economic output 18%
Estimated average growth (1997-2012) 3.1%
Contribution to national unemployment 9%
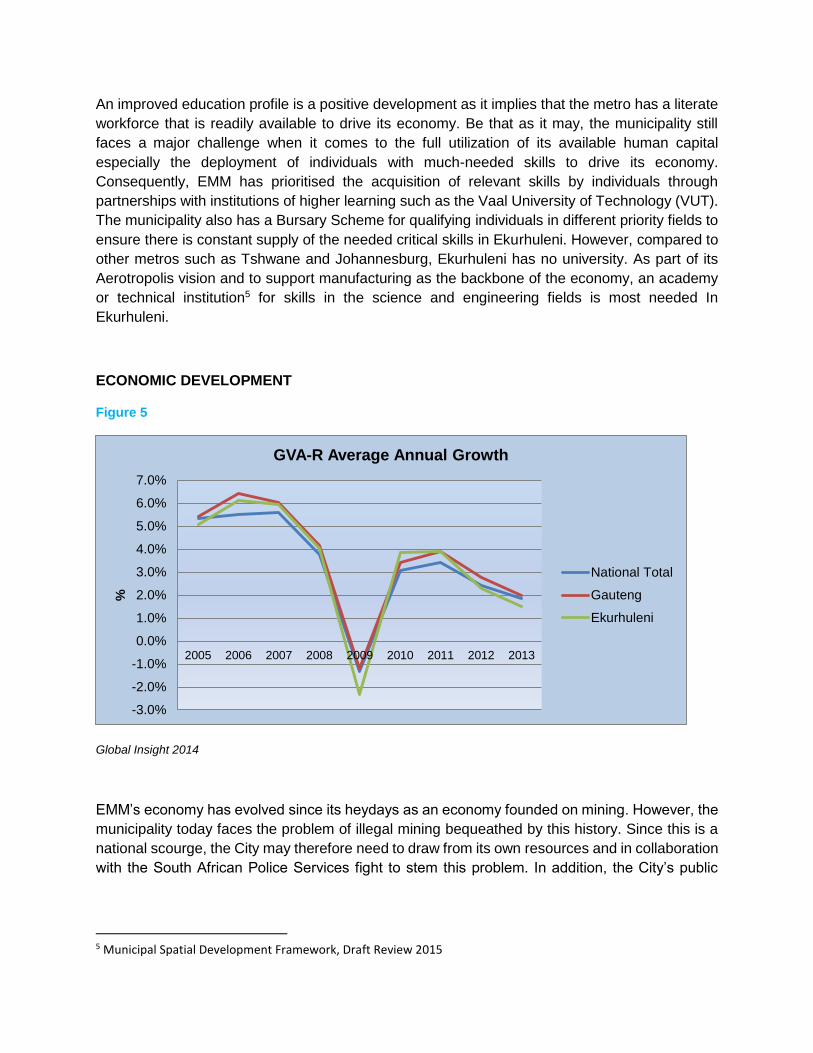
Over the period 2005 to 2013 the economy of Ekurhuleni registered steady growth following a
slump from 2009. From figure 5 above it is evident that the growth trend over this period was quite
volatile, reaching both lows of –2.3% and highs of 6.1% over the 8 year period. GDP in Ekurhuleni
is forecast to reach 2.7% by 2016.
In South Africa, high unemployment (25.4% in quarter three of 2014) coincides with low economic
growth (1.4% in quarter three of 2014). Ekurhuleni suffers the same fate. It has the highest
unemployment rate in Gauteng compared to other metros. According to StatSA, unemployment
in Ekurhuleni stands at 28.8%. This is higher than the national rate and can be attributed, among
others, to internal migration with individuals being attracted to Ekurhuleni in search of
employment. 36.9% of the unemployed is youth – something requiring the municipality to
constantly refine its job creation strategies on a continuous basis in order to address the needs
of this grouping. 72% of Ekurhuleni’s population is economically active (i.e. those who are
employed or unemployed but looking for work).
In addition to internal migration, another reason for Ekurhuleni’s high levels of unemployment
emanates from the declining contribution of the manufacturing sector to its economy. Ekurhuleni’s
manufacturing sector declined by 9.3% between 2004 and 2014. A closer look into manufacturing
actually shows that it is the sub-sectors of the fuel, petroleum, chemical and rubber products that
suffered major declines during this period. So did the metal products, machinery and household
appliances sub-sectors6. Be that as it may, manufacturing remains an important sector to
Ekurhuleni’s economy especially its metal products, machinery and household appliances sub-
sector which has been the main driver behind its output.
6. Gauteng Socio-Economic Review 2015
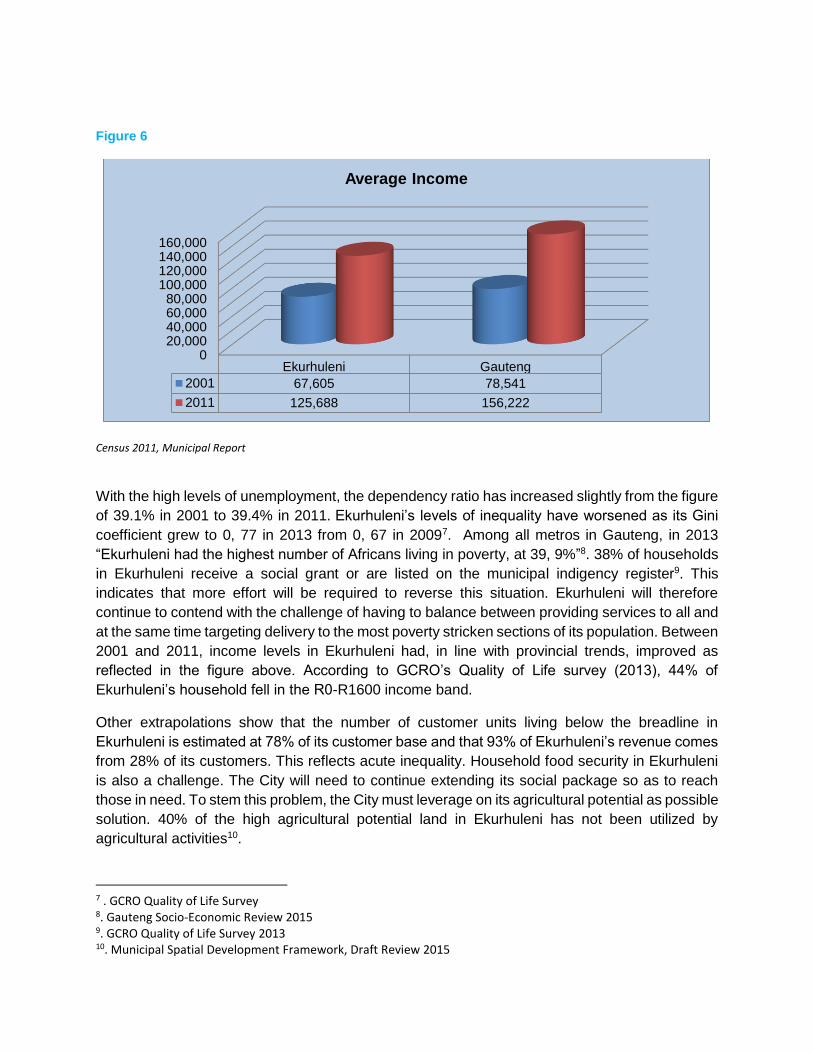
Figure 6
Census 2011, Municipal Report
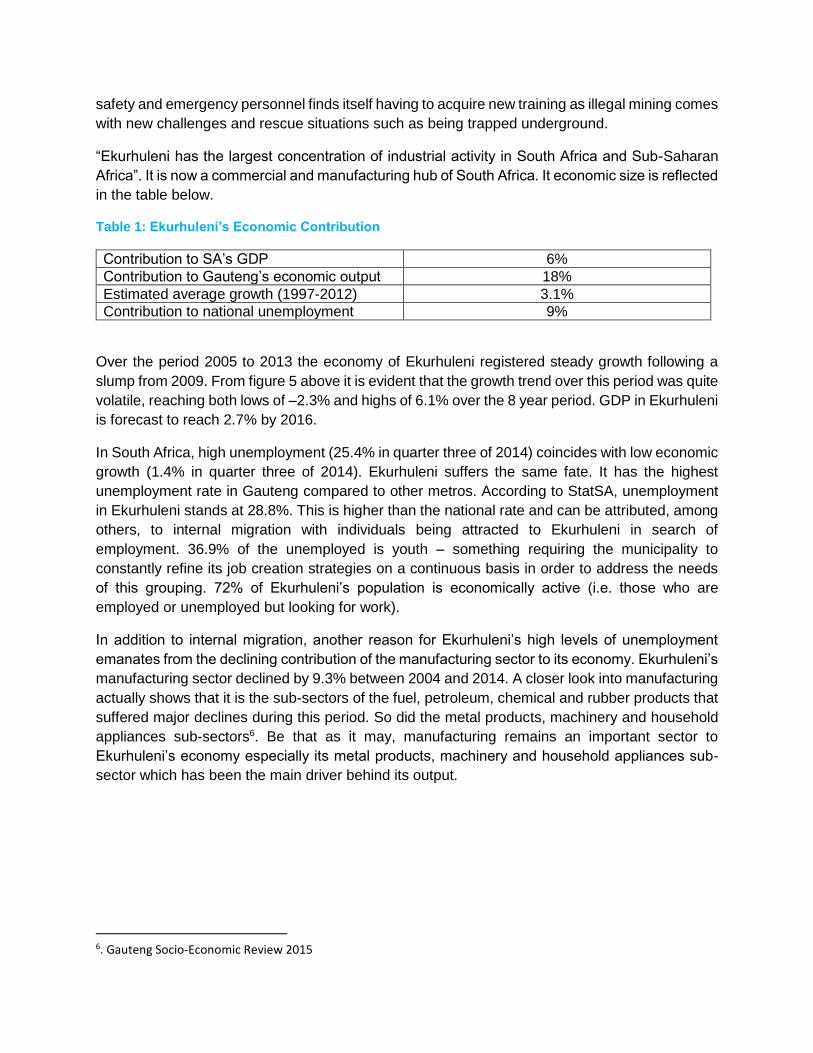
With the high levels of unemployment, the dependency ratio has increased slightly from the figure
of 39.1% in 2001 to 39.4% in 2011. Ekurhuleni’s levels of inequality have worsened as its Gini
coefficient grew to 0, 77 in 2013 from 0, 67 in 20097. Among all metros in Gauteng, in 2013
“Ekurhuleni had the highest number of Africans living in poverty, at 39, 9%”8. 38% of households
in Ekurhuleni receive a social grant or are listed on the municipal indigency register9. This
indicates that more effort will be required to reverse this situation. Ekurhuleni will therefore
continue to contend with the challenge of having to balance between providing services to all and
at the same time targeting delivery to the most poverty stricken sections of its population. Between
2001 and 2011, income levels in Ekurhuleni had, in line with provincial trends, improved as
reflected in the figure above. According to GCRO’s Quality of Life survey (2013), 44% of
Ekurhuleni’s household fell in the R0-R1600 income band.
Other extrapolations show that the number of customer units living below the breadline in
Ekurhuleni is estimated at 78% of its customer base and that 93% of Ekurhuleni’s revenue comes
from 28% of its customers. This reflects acute inequality. Household food security in Ekurhuleni
is also a challenge. The City will need to continue extending its social package so as to reach
those in need. To stem this problem, the City must leverage on its agricultural potential as possible
solution. 40% of the high agricultural potential land in Ekurhuleni has not been utilized by
agricultural activities10.
7 . GCRO Quality of Life Survey 8. Gauteng Socio-Economic Review 2015 9. GCRO Quality of Life Survey 2013 10. Municipal Spatial Development Framework, Draft Review 2015
020,00040,00060,00080,000
100,000120,000140,000160,000
Ekurhuleni Gauteng
2001 67,605 78,541
2011 125,688 156,222
Average Income
Figure 7
Global Insight 2014
Figure 5 shows that the economy of Ekurhuleni is driven primarily by five economic sectors and
these are: finance and business services, community services, manufacturing, trade and
transport. These five economic sectors collectively account for 89% of economic activity within
the city. These sectors also account for the highest levels of formal and informal employment.
Within the finance and business services sector, it is the finance and insurance and other business
activities sub-sectors that contribute most to the sector. In the trade sector, the wholesale and
commission trade sub-sector has been the driving force.
Further analysis11 reveals that in terms of recent employment opportunities within EMM’s
economy, the mining and quarrying sub-sector held some good prospects. So does the retail
trade and repairs sub-sector. The sales, repairs of motor vehicles and sale of fuel sub-sector has
also experienced growth in terms of employment levels created therein. Ekurhuleni has also
recently experienced increased employment in skilled employment rather than in non-skilled
employment. This spells good prospects for individuals since skilled employment hold the promise
of a stable source of income. In relation to trade, Ekurhuleni was the highest exporter of machinery
and electrical equipment in Gauteng in 2013. It however also imported more vehicles, aircrafts
and transport equipment. Nonetheless its ability to export machinery and electrical equipment
should be exploited given its strategically located nature closer to the Maputo Corridor.
As a manufacturing hub and with the opportunities presented by the location of OR Tambo
International Airport within its borders, supporting the export industry therefore represents a viable
11. Gauteng Socio-Economic Review 2015
0.4% 1.7%
21.2%
3.6%
5.1%
15.4%
10.9%
21.9%
19.7%
Sectoral Contribution
Agriculture
Mining
Manufacturing
Electricity
Construction
Trade
Transport
Finance
Community services
strategy for Ekurhuleni. In pursuit of this, the metro has prioritised both the revitalisation of the
manufacturing sector and the creation of an Aerotropolis (a city that maximises economic benefits
arising from the location of an airport within its jurisdiction) in the effort to realize this. Among
projects being carried out as part of revitalizing manufacturing are the facilitation of the Tambo
Springs Inland Port and the Prasa-Gibela manufacturing of new rolling stock.
EMM also has a programme to revitalize township economies. The economic transformation of
townships since 2000 has been rated and an institutional framework proposed to advance the
township economic agenda with local businesses. Supplier SMMEs in townships are also given
support through the Township Enterprise Development Programme. In addition EMM is adapting
old council-owned structures into street trading facilities and is also providing previously
disadvantaged communities with access to state of the art manufacturing facilities through
Fabrication Laboratories. Thus the economic viability of townships is high on the metros’ agenda.
Table 2: Town GVA and Township Economies
Town Centres’ GVA Contributions Size of Township Economies
Town 2013 GVA Contribution Township Economy size
Alberton 9% Daveyton 2.6%
Benoni 7% Duduza 1.2%
Boksburg 11% Dukathole 0.7%
Brakpan 3% Etwatwa 2.2%
Edenvale 3% KwaThema 2.0%
Germiston 9% Katlehong 7.4%
Kempton Park 12% Tembisa 8.5%
Nigel 1% Thokoza 1.8%
Springs 5% Vosloorus 3.9% Quantec 2014
SERVICE DELIVERY
According to Ekurhuleni’s Built Environment Performance Plan (BEPP), service access to public
amenities rates high in the backlogs of museums, galleries and theatres. Research reveals that,
most residents of Ekurhuleni “reported that they never access public facilities such as parks,
libraries, world heritage sites, sport facilities, museums and galleries”12. This is because inherited
land use practises from the past distributed Ekurhuleni’s population in a manner the limits access
to open spaces. These are not important for consumption by the residents of Ekurhuleni alone
but for boosting the economic potential of the City through tourism and a multiplicity of places of
attraction. This is a view that the 2015 BEPP advocates. In particular, the City will need to promote
itself as a place to live and play through the promotion of the many social and recreation facilities
it manages. There City boasts a total of 266 heritages, cultural and tourism sites within the 5
regions of Ekurhuleni13.
12 . GCRO Quality of Life Survey 2013:12 13 . Municipal Spatial Development Framework, Draft Review 2015
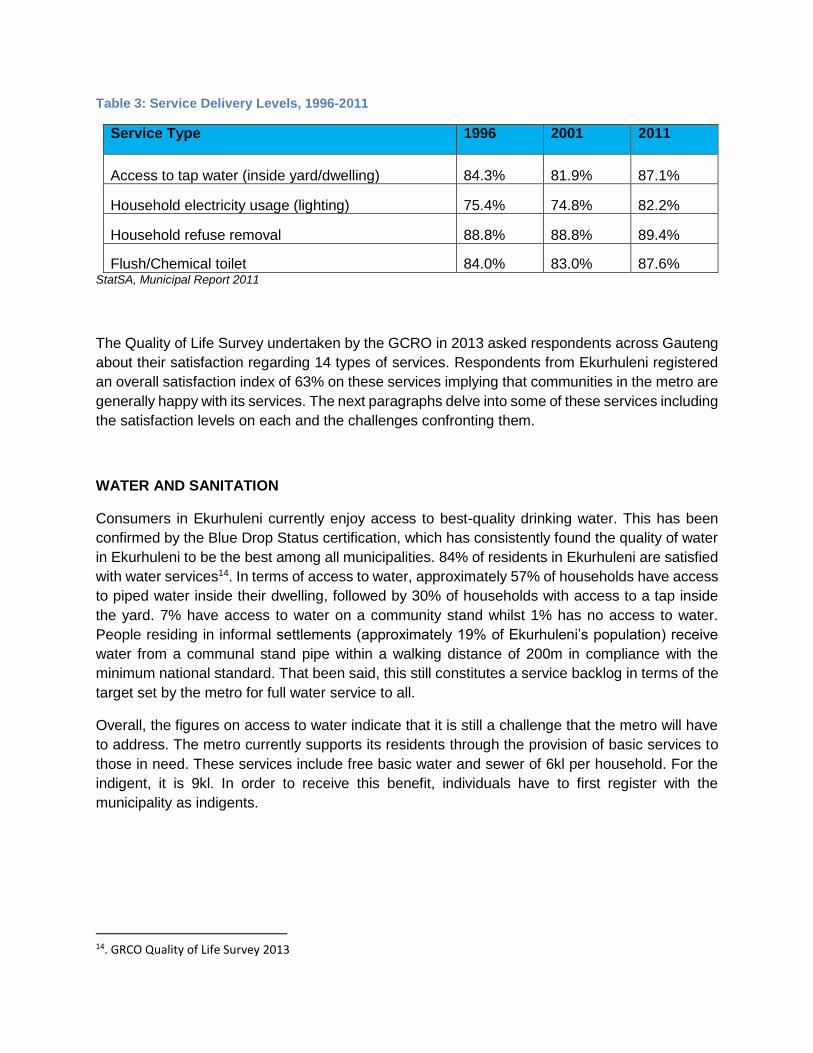
Table 3: Service Delivery Levels, 1996-2011
Service Type 1996 2001 2011
Access to tap water (inside yard/dwelling) 84.3% 81.9% 87.1%
Household electricity usage (lighting) 75.4% 74.8% 82.2%
Household refuse removal 88.8% 88.8% 89.4%
Flush/Chemical toilet 84.0% 83.0% 87.6% StatSA, Municipal Report 2011
The Quality of Life Survey undertaken by the GCRO in 2013 asked respondents across Gauteng
about their satisfaction regarding 14 types of services. Respondents from Ekurhuleni registered
an overall satisfaction index of 63% on these services implying that communities in the metro are
generally happy with its services. The next paragraphs delve into some of these services including
the satisfaction levels on each and the challenges confronting them.
WATER AND SANITATION
Consumers in Ekurhuleni currently enjoy access to best-quality drinking water. This has been
confirmed by the Blue Drop Status certification, which has consistently found the quality of water
in Ekurhuleni to be the best among all municipalities. 84% of residents in Ekurhuleni are satisfied
with water services14. In terms of access to water, approximately 57% of households have access
to piped water inside their dwelling, followed by 30% of households with access to a tap inside
the yard. 7% have access to water on a community stand whilst 1% has no access to water.
People residing in informal settlements (approximately 19% of Ekurhuleni’s population) receive
water from a communal stand pipe within a walking distance of 200m in compliance with the
minimum national standard. That been said, this still constitutes a service backlog in terms of the
target set by the metro for full water service to all.
Overall, the figures on access to water indicate that it is still a challenge that the metro will have
to address. The metro currently supports its residents through the provision of basic services to
those in need. These services include free basic water and sewer of 6kl per household. For the
indigent, it is 9kl. In order to receive this benefit, individuals have to first register with the
municipality as indigents.
14. GRCO Quality of Life Survey 2013
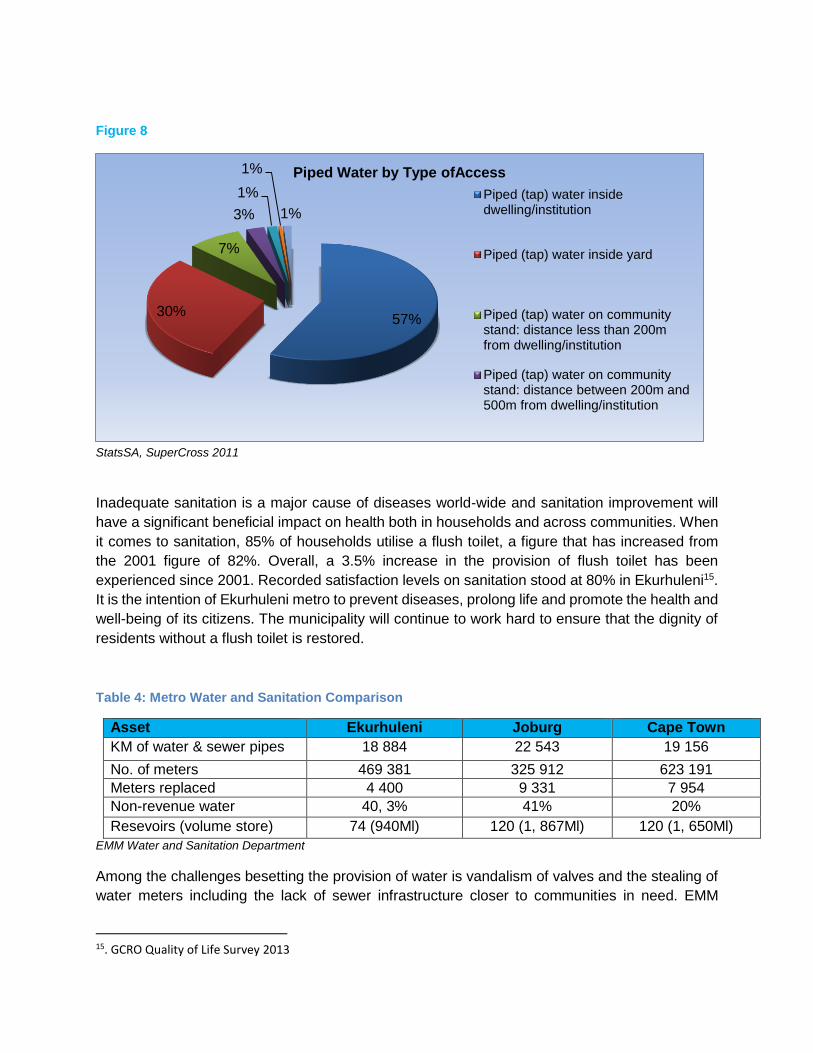
Figure 8
StatsSA, SuperCross 2011
Inadequate sanitation is a major cause of diseases world-wide and sanitation improvement will
have a significant beneficial impact on health both in households and across communities. When
it comes to sanitation, 85% of households utilise a flush toilet, a figure that has increased from
the 2001 figure of 82%. Overall, a 3.5% increase in the provision of flush toilet has been
experienced since 2001. Recorded satisfaction levels on sanitation stood at 80% in Ekurhuleni15.
It is the intention of Ekurhuleni metro to prevent diseases, prolong life and promote the health and
well-being of its citizens. The municipality will continue to work hard to ensure that the dignity of
residents without a flush toilet is restored.
Table 4: Metro Water and Sanitation Comparison
Asset Ekurhuleni Joburg Cape Town
KM of water & sewer pipes 18 884 22 543 19 156
No. of meters 469 381 325 912 623 191
Meters replaced 4 400 9 331 7 954
Non-revenue water 40, 3% 41% 20%
Resevoirs (volume store) 74 (940Ml) 120 (1, 867Ml) 120 (1, 650Ml)
EMM Water and Sanitation Department
Among the challenges besetting the provision of water is vandalism of valves and the stealing of
water meters including the lack of sewer infrastructure closer to communities in need. EMM
15. GCRO Quality of Life Survey 2013
57%30%
7%
3%
1%
1%
1%
Piped Water by Type ofAccess
Piped (tap) water insidedwelling/institution
Piped (tap) water inside yard
Piped (tap) water on communitystand: distance less than 200mfrom dwelling/institution
Piped (tap) water on communitystand: distance between 200m and500m from dwelling/institution
continues to experience a greater number of sewer blockages, more than 600 per 100km/year
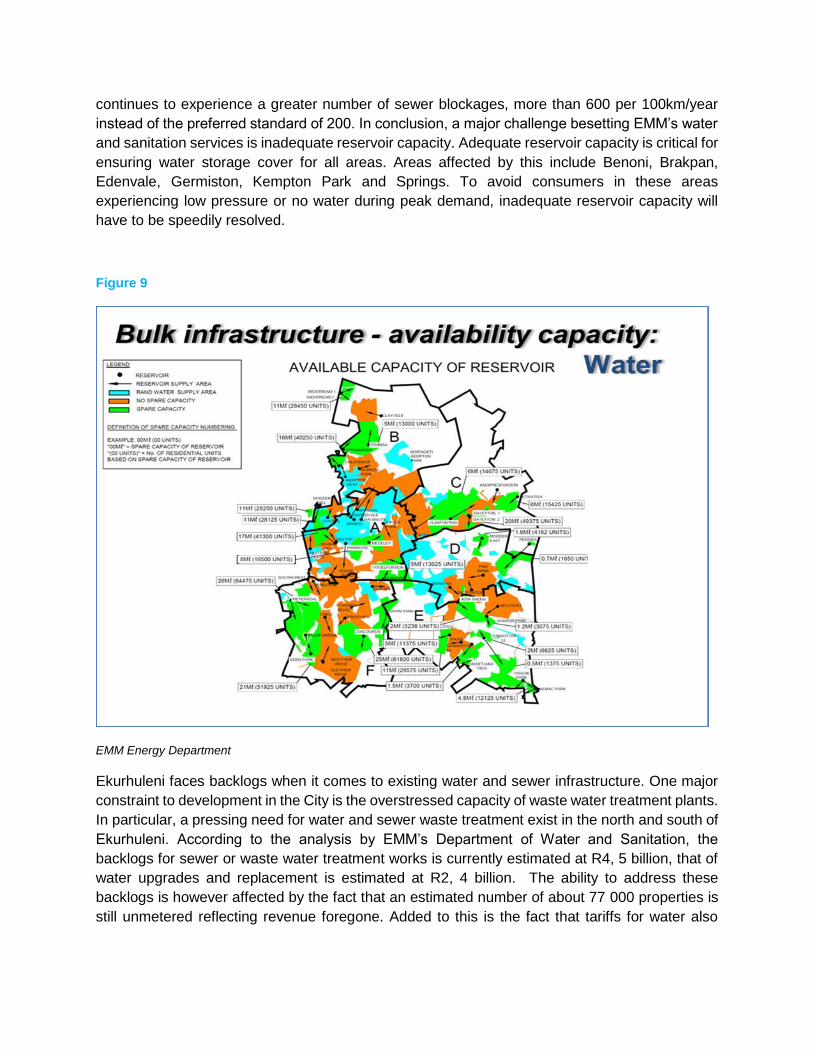
instead of the preferred standard of 200. In conclusion, a major challenge besetting EMM’s water
and sanitation services is inadequate reservoir capacity. Adequate reservoir capacity is critical for
ensuring water storage cover for all areas. Areas affected by this include Benoni, Brakpan,
Edenvale, Germiston, Kempton Park and Springs. To avoid consumers in these areas
experiencing low pressure or no water during peak demand, inadequate reservoir capacity will
have to be speedily resolved.
Figure 9
EMM Energy Department
Ekurhuleni faces backlogs when it comes to existing water and sewer infrastructure. One major
constraint to development in the City is the overstressed capacity of waste water treatment plants.
In particular, a pressing need for water and sewer waste treatment exist in the north and south of
Ekurhuleni. According to the analysis by EMM’s Department of Water and Sanitation, the
backlogs for sewer or waste water treatment works is currently estimated at R4, 5 billion, that of
water upgrades and replacement is estimated at R2, 4 billion. The ability to address these
backlogs is however affected by the fact that an estimated number of about 77 000 properties is
still unmetered reflecting revenue foregone. Added to this is the fact that tariffs for water also
remain below its cost making it difficult to recover all investment made when installing, fixing and
replacing damaged or old water and sanitation infrastructure.
ENERGY
To ensure access to electricity by household and businesses, EMM distributes 2 600 MVA to
consumers. This is equivalent to the total electricity load demand of Botswana, Lesotho,
Zimbabwe, Mozambique and Namibia combined. The quality of electricity bought and sold by
EMM is monitored by means of data recorded at more than 400 points. This is in line with the
National Electricity Regulator of South Africa’s (NERSA) requirements for the annual submission
on grid performance. EMM’s Department of Energy has approximately 79 000 infrastructure
assets on its asset register. The metro has an estimated 200 000 street lights. The cost of illegal
connections is conservatively estimated at R200 million per annum. Already these figures indicate
the scale of responsibility that EMM has to deal with when it comes to the provision of electricity.
According to Census 2011, the proportion of households in Ekurhuleni using electricity as the
main source of energy for heating is 66%, for cooking is 79.4% and for lighting is 82.2% (see
Figure 7 below). There has been a significant increase of about 7.4% in electricity used for lighting
from 2001 to 2011. According to the GCRO Quality of Life Survey (2013), 77% of Ekurhuleni’s
residents are satisfied with energy services. The figure below reflects an upward trend in the use
of electricity in Ekurhuleni. However even with an increase in electricity provision, other analysis
concludes that Ekurhuleni is among metros in Gauteng that have experienced “a marginal
increase in electricity provision backlogs”16. Because of Ekurhuleni’s attractiveness to job
seekers, pressure is being made to bear on its infrastructure with backlogs becoming a moving
target.
The estimated electrification backlog in Ekurhuleni totals 281 721 customer units. The backlogs
figure for formal houses is estimated at 118 985 and for informal houses is 162 713. However,
there is concern that the backlogs are not being addressed fast enough as this depends on the
provision of houses by the Human Settlements Department. As a result of this dependency,
electricity backlogs are not being addressed quickly enough. According to EMM’s Energy
Department, the demand on the network is increasing with 58 375 low income electricity
connections having been made since 2007.
Even though access has increased, there are still challenges experienced in relation to the
delivery of electricity. Equipment failure which includes problems with underground cables and
overhead lines is the highest cause of forced network interruptions. Underground cable failure
contributed almost 40% to recorded forced power interruptions. Through the maintenance of
electrical assets however significant decrease in electricity downtime was achieved. Forced
outages were reduced to an average of 164 in 2014/15 compared to 178 in 2013/14.
16. Gauteng Socio-Economic Review 2015
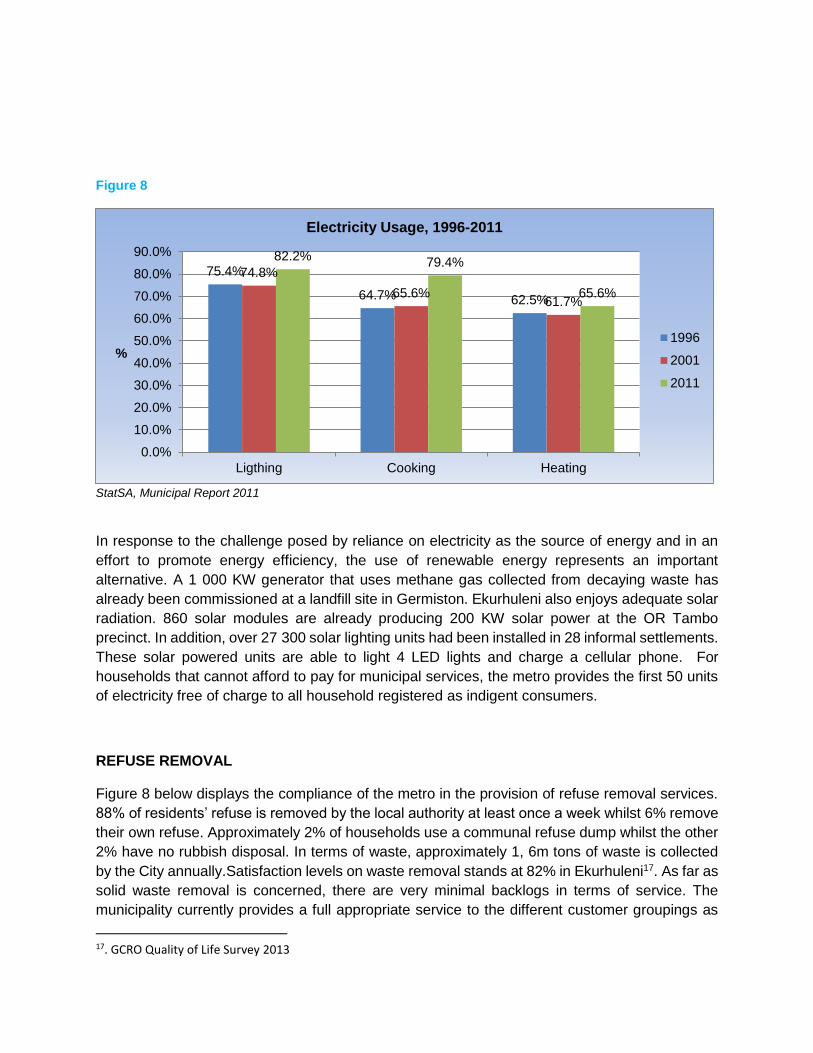
Figure 8
StatSA, Municipal Report 2011
In response to the challenge posed by reliance on electricity as the source of energy and in an
effort to promote energy efficiency, the use of renewable energy represents an important
alternative. A 1 000 KW generator that uses methane gas collected from decaying waste has
already been commissioned at a landfill site in Germiston. Ekurhuleni also enjoys adequate solar
radiation. 860 solar modules are already producing 200 KW solar power at the OR Tambo
precinct. In addition, over 27 300 solar lighting units had been installed in 28 informal settlements.
These solar powered units are able to light 4 LED lights and charge a cellular phone. For
households that cannot afford to pay for municipal services, the metro provides the first 50 units
of electricity free of charge to all household registered as indigent consumers.
REFUSE REMOVAL
Figure 8 below displays the compliance of the metro in the provision of refuse removal services.
88% of residents’ refuse is removed by the local authority at least once a week whilst 6% remove
their own refuse. Approximately 2% of households use a communal refuse dump whilst the other
2% have no rubbish disposal. In terms of waste, approximately 1, 6m tons of waste is collected
by the City annually.Satisfaction levels on waste removal stands at 82% in Ekurhuleni17. As far as
solid waste removal is concerned, there are very minimal backlogs in terms of service. The
municipality currently provides a full appropriate service to the different customer groupings as
17. GCRO Quality of Life Survey 2013
75.4%
64.7% 62.5%
74.8%
65.6%61.7%
82.2%79.4%
65.6%
0.0%
10.0%
20.0%
30.0%
40.0%
50.0%
60.0%
70.0%
80.0%
90.0%
Ligthing Cooking Heating
%
Electricity Usage, 1996-2011
1996
2001
2011
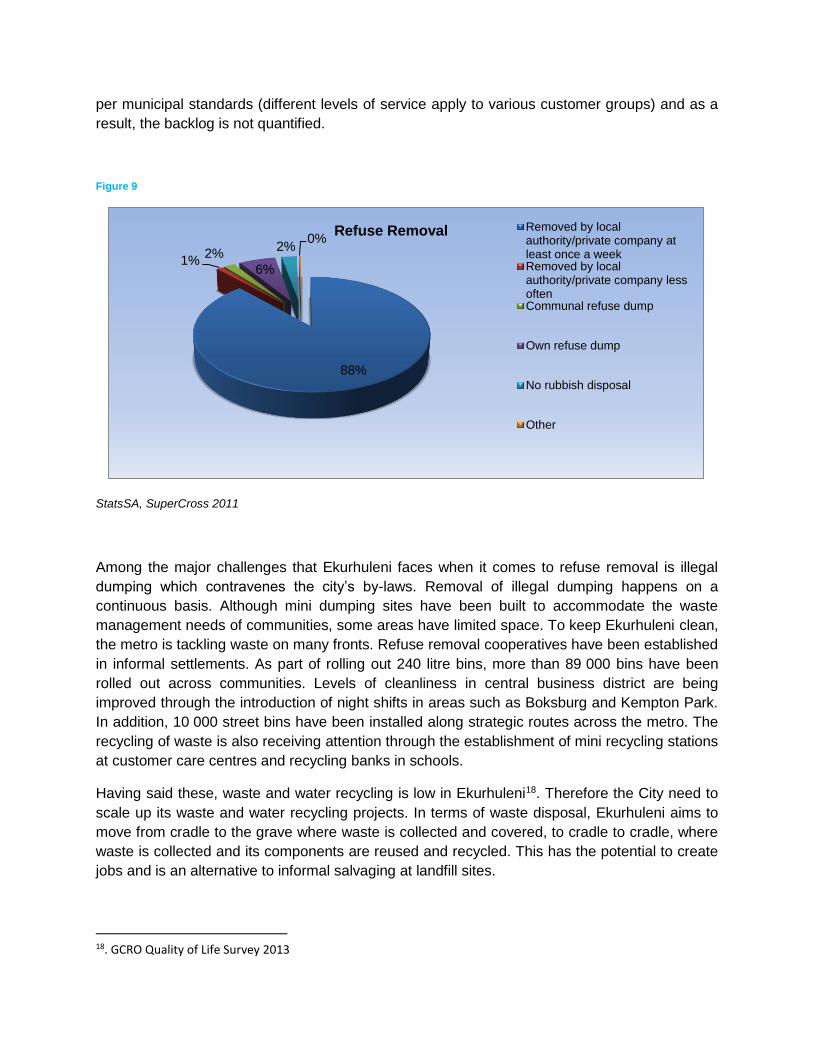
per municipal standards (different levels of service apply to various customer groups) and as a
result, the backlog is not quantified.
Figure 9
StatsSA, SuperCross 2011
Among the major challenges that Ekurhuleni faces when it comes to refuse removal is illegal
dumping which contravenes the city’s by-laws. Removal of illegal dumping happens on a
continuous basis. Although mini dumping sites have been built to accommodate the waste
management needs of communities, some areas have limited space. To keep Ekurhuleni clean,
the metro is tackling waste on many fronts. Refuse removal cooperatives have been established
in informal settlements. As part of rolling out 240 litre bins, more than 89 000 bins have been
rolled out across communities. Levels of cleanliness in central business district are being
improved through the introduction of night shifts in areas such as Boksburg and Kempton Park.
In addition, 10 000 street bins have been installed along strategic routes across the metro. The
recycling of waste is also receiving attention through the establishment of mini recycling stations
at customer care centres and recycling banks in schools.
Having said these, waste and water recycling is low in Ekurhuleni18. Therefore the City need to
scale up its waste and water recycling projects. In terms of waste disposal, Ekurhuleni aims to
move from cradle to the grave where waste is collected and covered, to cradle to cradle, where
waste is collected and its components are reused and recycled. This has the potential to create
jobs and is an alternative to informal salvaging at landfill sites.
18. GCRO Quality of Life Survey 2013
88%
1%2%
6%
2%0%
Refuse Removal Removed by localauthority/private company atleast once a weekRemoved by localauthority/private company lessoftenCommunal refuse dump
Own refuse dump
No rubbish disposal
Other
TRANSPORT
An efficient and well-functioning public transport system is fundamental to economic and social
development. According to the Quality of Life Survey of 2013 by the GCRO, 37% of the trips made
in Ekurhuleni are for purposes of work, 30% for shopping and 10% for education. Comparatively
speaking, Ekurhuleni residents spend slightly more time travelling to work when viewed alongside
cities like Johannesburg and Tshwane. Commuters in Ekurhuleni take on average just under an
hour, 55 minutes to be precise, before reaching their place of work compared to commuters in
Johannesburg at 54 minutes and Tshwane at 52 minutes. This makes the provision of an efficient
and reliable public transport system by the metro imperative. Overall, 76% of commuters in
Ekurhuleni reported that they were satisfied with the main mode of public transport that they used.
Most trips in Ekurhuleni are by taxi or car. The city though “demonstrates a greater proportion of
people using trains, while fewer respondents use buses”19. 34% of Ekurhuleni’s population reside
within walking distance of rail transport. A total of 75 train stations exist in Ekurhuleni with
Germiston, Kempton Park, Isando, Daveyton and Tembisa being among the busiest20. All the
major national rail corridors in South Africa converge at the Germiston railway station in
Ekurhuleni, which is also the largest railway station in South Africa. The Metro is also served by
a very good rail system consisting of the PRASA rail network, as well as Gautrain, linking
Johannesburg and Tshwane to Kempton Park and ORTIA. Therefore rail forms the backbone of
public transport albeit it is not yet fully optimized. Using other modes of transport is also a
challenge as “not knowing how to cycle is a more significant problem in EMM”21. In line with its
low density and widely dispersed nature, residents of Ekurhuleni also walk longer distances
compared to other metros in the province. Ekurhuleni is also fraught with many other transport
challenges that include non-availability of public transport, expensive transport costs and
preference for the use of private cars.
To address these challenges Ekurhuleni’s Municipal Spatial Development Framework (MSDF)
advocates densification and the construction of human settlements along public transport
corridors. It also calls for social infrastructure such as schools to be built to maximise walkability.
To promote other modes of transport such as buses, the City, in launching and implementing the
Integrated Rapid Public Transport Network (IRPTN), has built a strong business case on the
convenience of using buses to its residents. According to the City’s transport plan, the lack of
adequate facilities for pedestrians is being considered in planning including provision of more and
better facilities in future.22
19. GCRO Quality of Life Survey 2013, p.12 20. Municipal Spatial Development Framework, Draft Review 2015 21. GCRO Quality of Life Survey 2013, p.12 22. EMM Comprehensive Integrated Transport Plan 2013-2017
In terms of interventions by Ekurhuleni metro to better the situation of its residents, public transport
facilities are being constructed across the City. These include taxi ranks, taxi lay-by and bus lay-
bys for the off-loading of commuters, including bus shelters. The IRPTN will transform the public
transport sector through the provision of a high quality and affordable transport system whilst
reducing the overall commuting times. The construction of the trunk route for the IRPTN including
the associated feeder routes has started in earnest. Its full implementation will have a major spin-
off socially, economically and in terms of infrastructure. Jobs will be created, travelling times will
be seamless and critically the cost of travelling will be affordable in the future.
HUMAN SETTLEMENTS
As a metro, Ekurhuleni is not immune to cross-cutting challenges such as housing backlogs, land
invasion and in-migration. Among Gauteng metros, Ekurhuleni is a municipality with the highest
proportion of informal settlements. It is host to the 119 informal settlements out of the estimated
total of 322 informal settlements that exist in Gauteng or rather constitutes 37% thereof23. As a
result, the provision of housing is a top priority. The Housing Migration Matrix (July 2011) placed
the housing backlog at around 209 420. This is comprised of 165 000 units in informal settlements
as well as 44 721 units on the Municipal Housing Waiting List (Infrastructure and Community
Services Backlogs Report 2011-2036, page 70). The Department of Human Settlement’s recent
analysis estimates the demand for low cost housing units in informal settlements to be 157 720.
These figures confirm the general struggle to cater for an affordable housing market.24 This is
also corroborated by the fact that in Ekurhuleni “[t]here is a smaller proportion of flats as a housing
type”25. In cognizance of this, the City has initiated processes to increase its rental stock in order
to cater for this section of the property market. However, to effectively meet the overall existing
housing backlogs, EMM would have to deliver six times at its current level of delivery.
Population growth and in-migration has led to densification and growth in settlements. Urban
sprawl has resulted in inequality where, due to the high cost of service provision, migrants have
opted to stay in land that is not suitable for housing development, such as dolomitic area and
wetlands. There is continuous influx of people moving into the municipal area, particularly the
unemployed in search of job opportunities. The perceived available economic opportunities that
individuals see in Ekurhuleni has resulted in the continuous demand for affordable
accommodation, which often becomes a backyard shack, informal settlement or hostel as these
still remain the most affordable entry-level housing options.
In Ekurhuleni’s Backlog Study of 2011, the Ekurhuleni Metropolitan Housing Development Plan
highlights backyard shacks as an important dwelling type. However, they are not included as part
of the housing backlog when counting is done. This means that the backlogs in Ekurhuleni are
higher as a result of this exclusion. Moreover, a direct correlation exists between reduction in
informal settlements and the increase in backyard shacks. This means the provision of subsidized
23. SAIRR 2015, “South Africa’s Housing Conundrum” , Policy Bulletin No.4 24. EMM CCA Imbizo Consolidation Report 25. GCRO Quality of Life Survey 2013, p.11
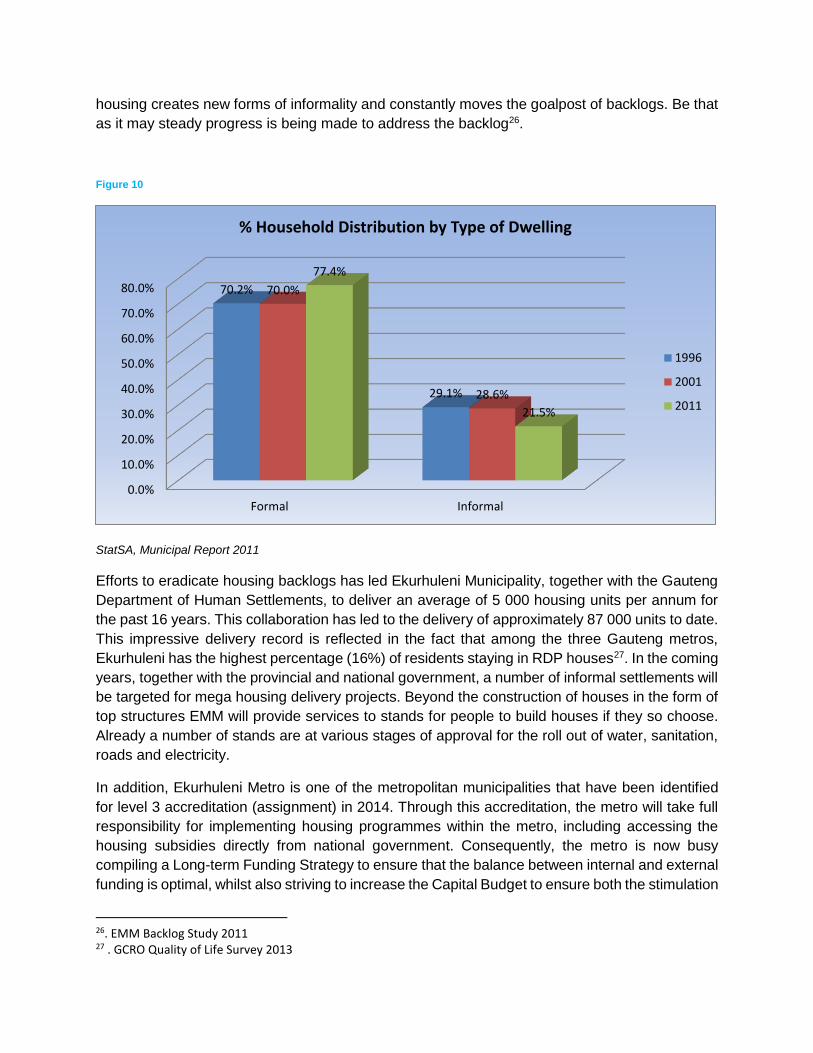
housing creates new forms of informality and constantly moves the goalpost of backlogs. Be that
as it may steady progress is being made to address the backlog26.
Figure 10
StatSA, Municipal Report 2011
Efforts to eradicate housing backlogs has led Ekurhuleni Municipality, together with the Gauteng
Department of Human Settlements, to deliver an average of 5 000 housing units per annum for
the past 16 years. This collaboration has led to the delivery of approximately 87 000 units to date.
This impressive delivery record is reflected in the fact that among the three Gauteng metros,
Ekurhuleni has the highest percentage (16%) of residents staying in RDP houses27. In the coming
years, together with the provincial and national government, a number of informal settlements will
be targeted for mega housing delivery projects. Beyond the construction of houses in the form of
top structures EMM will provide services to stands for people to build houses if they so choose.
Already a number of stands are at various stages of approval for the roll out of water, sanitation,
roads and electricity.
In addition, Ekurhuleni Metro is one of the metropolitan municipalities that have been identified
for level 3 accreditation (assignment) in 2014. Through this accreditation, the metro will take full
responsibility for implementing housing programmes within the metro, including accessing the
housing subsidies directly from national government. Consequently, the metro is now busy
compiling a Long-term Funding Strategy to ensure that the balance between internal and external
funding is optimal, whilst also striving to increase the Capital Budget to ensure both the stimulation
26. EMM Backlog Study 2011 27 . GCRO Quality of Life Survey 2013
0.0%
10.0%
20.0%
30.0%
40.0%
50.0%
60.0%
70.0%
80.0%
Formal Informal
70.2%
29.1%
70.0%
28.6%
77.4%
21.5%
% Household Distribution by Type of Dwelling
1996
2001
2011
of the local economy and the eradication of backlogs. Success on this front will however depend
on firm commitment by national government regarding the decision to fully accredit qualifying
municipalities as prevarication on this has witnessed municipalities becoming reluctant to fully
invest their own resources in housing projects28.
The Human Settlements Strategy will promote a proactive approach that seeks to ensure that the
citizens of Ekurhuleni are adequately housed in a sustainable and integrated manner. The
strategy will also take into consideration social and economic needs as well environmental
impacts to ensure that Ekurhuleni meets the constitutional obligation of ensuring that residents
have proper access to sustainable human settlements solutions.
HEALTH
Figure 11
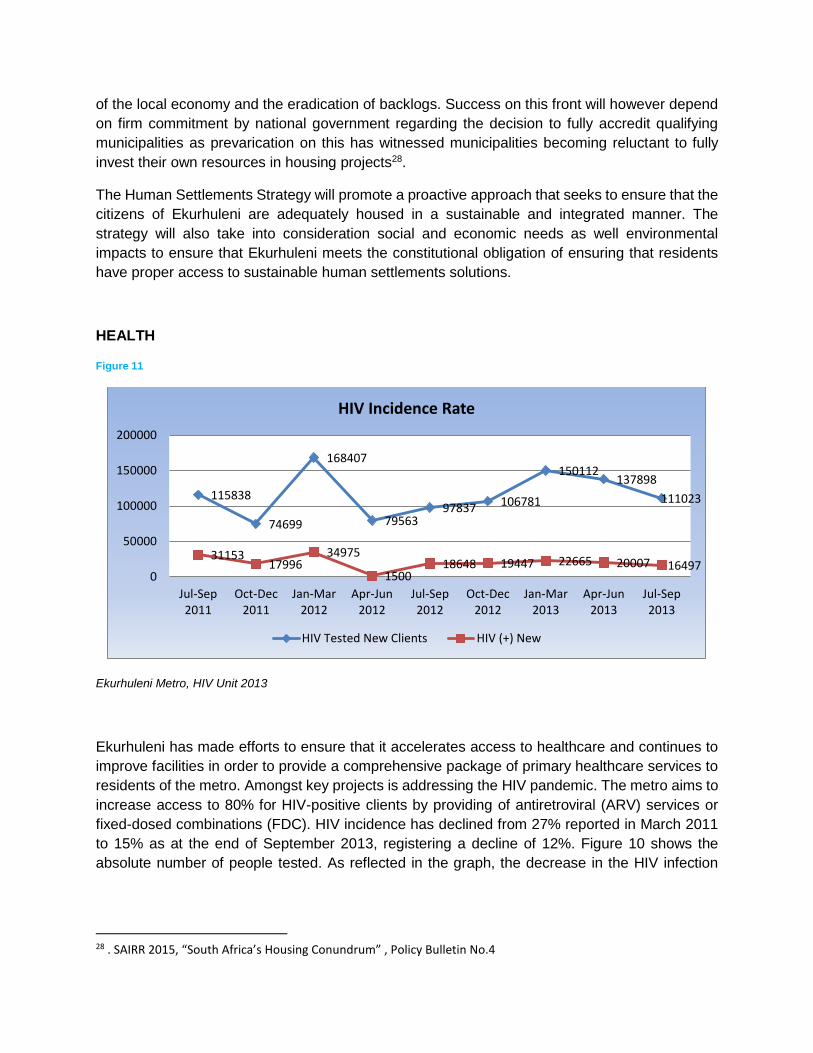
Ekurhuleni Metro, HIV Unit 2013
Ekurhuleni has made efforts to ensure that it accelerates access to healthcare and continues to
improve facilities in order to provide a comprehensive package of primary healthcare services to
residents of the metro. Amongst key projects is addressing the HIV pandemic. The metro aims to
increase access to 80% for HIV-positive clients by providing of antiretroviral (ARV) services or
fixed-dosed combinations (FDC). HIV incidence has declined from 27% reported in March 2011
to 15% as at the end of September 2013, registering a decline of 12%. Figure 10 shows the
absolute number of people tested. As reflected in the graph, the decrease in the HIV infection
28 . SAIRR 2015, “South Africa’s Housing Conundrum” , Policy Bulletin No.4
115838
74699
168407
7956397837 106781
150112137898
111023
3115317996
34975
150018648 19447 22665 20007 16497
0
50000
100000
150000
200000
Jul-Sep2011
Oct-Dec2011
Jan-Mar2012
Apr-Jun2012
Jul-Sep2012
Oct-Dec2012
Jan-Mar2013
Apr-Jun2013
Jul-Sep2013
HIV Incidence Rate
HIV Tested New Clients HIV (+) New
rate can be noted. This can be attributed to the focus on this high-priority programme as well as
the dedication of the personnel in the Primary Health Care Division.
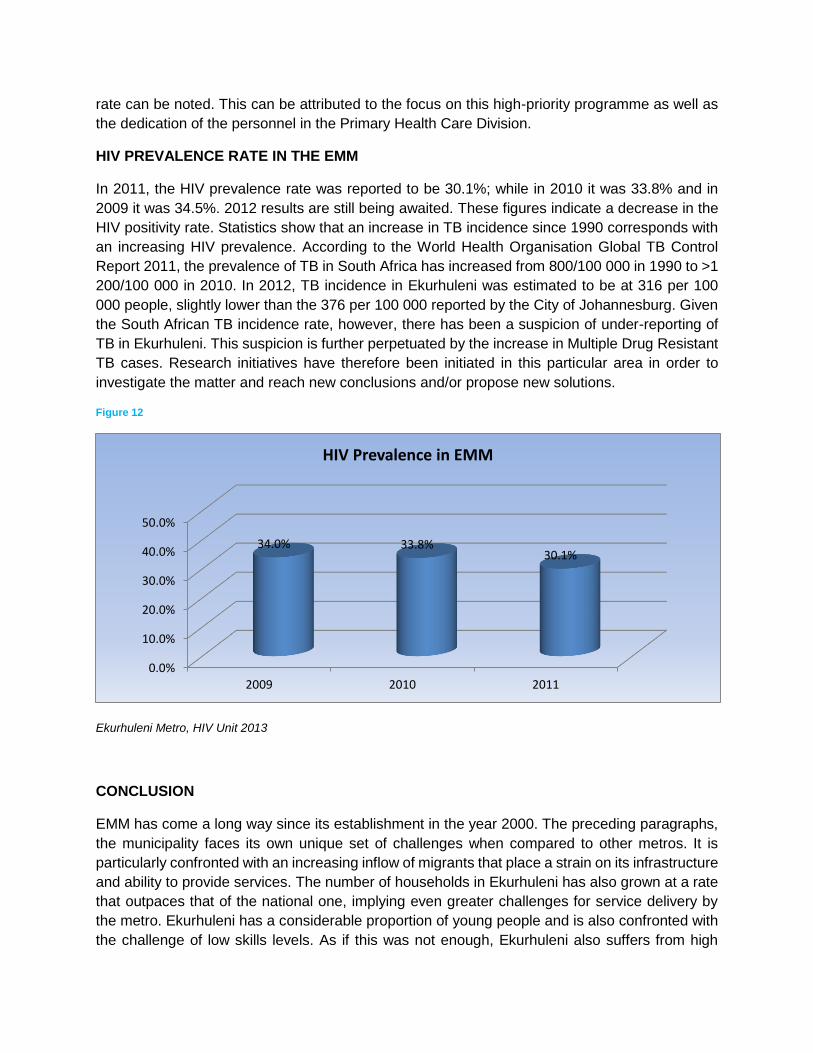
HIV PREVALENCE RATE IN THE EMM
In 2011, the HIV prevalence rate was reported to be 30.1%; while in 2010 it was 33.8% and in
2009 it was 34.5%. 2012 results are still being awaited. These figures indicate a decrease in the
HIV positivity rate. Statistics show that an increase in TB incidence since 1990 corresponds with
an increasing HIV prevalence. According to the World Health Organisation Global TB Control
Report 2011, the prevalence of TB in South Africa has increased from 800/100 000 in 1990 to >1
200/100 000 in 2010. In 2012, TB incidence in Ekurhuleni was estimated to be at 316 per 100
000 people, slightly lower than the 376 per 100 000 reported by the City of Johannesburg. Given
the South African TB incidence rate, however, there has been a suspicion of under-reporting of
TB in Ekurhuleni. This suspicion is further perpetuated by the increase in Multiple Drug Resistant
TB cases. Research initiatives have therefore been initiated in this particular area in order to
investigate the matter and reach new conclusions and/or propose new solutions.
Figure 12
Ekurhuleni Metro, HIV Unit 2013
CONCLUSION
EMM has come a long way since its establishment in the year 2000. The preceding paragraphs,
the municipality faces its own unique set of challenges when compared to other metros. It is
particularly confronted with an increasing inflow of migrants that place a strain on its infrastructure
and ability to provide services. The number of households in Ekurhuleni has also grown at a rate
that outpaces that of the national one, implying even greater challenges for service delivery by
the metro. Ekurhuleni has a considerable proportion of young people and is also confronted with
the challenge of low skills levels. As if this was not enough, Ekurhuleni also suffers from high
0.0%
10.0%
20.0%
30.0%
40.0%
50.0%
2009 2010 2011
34.0% 33.8%30.1%
HIV Prevalence in EMM
levels of unemployment with more than a third of the unemployed being youth – a situation that
calls for targeted solutions.
Ekurhuleni has made serious strides in its efforts to provide services. The provision of water and
sanitation are the highest they have ever been. Even so, challenges still remain such as the
declining quality of infrastructure. Even though electricity usage has increased in Ekurhuleni, the
municipality is making efforts to mix the energy use of its communities by promoting solar power.
Cable theft and the vandalising of electricity meter boxes will continue to be combated as they
come with unnecessary resource implications. The levels of refuse removal are also high in
Ekurhuleni but illegal dumping still poses a challenge. On the transport front, the provision of an
efficient public transport system remains a goal that the municipality intends to achieve, including
the provision of facilities for non-motorised transport. The housing backlog will also continue to
receive the metro’s attention and full accreditation will hopefully see Ekurhuleni have a better
handle on this through direct involvement in the housing delivery process. Ekurhuleni remains
committed to fighting the spread of HIV and ensuring that those who are infected continue to live
a wholesome life through the provision of ARVs. Despite its many challenges, Ekurhuleni has its
hands on deck and aims to ensure that service delivery continues unabated and in fact is
broadened to reach more residents.
2.2 VISION, MISSION AND VALUES
VISION
Smart, Creative and Developmental City
MISSION
Ekurhuleni’s mission is:
To provide sustainable and people-centred development services that are affordable, appropriate
and of high quality by focusing on the social, environmental and economic regeneration of our
city and communities, as guided by the principles of Batho Pele and through the commitment of
a motivated and dedicated team
VALUES
In pursuing the above-mentioned vision and mission, Ekurhuleni is committed to upholding the
following core values:
Performance excellence;
Integrity;
Community centeredness;
Transparency; and

Co-operative governance.
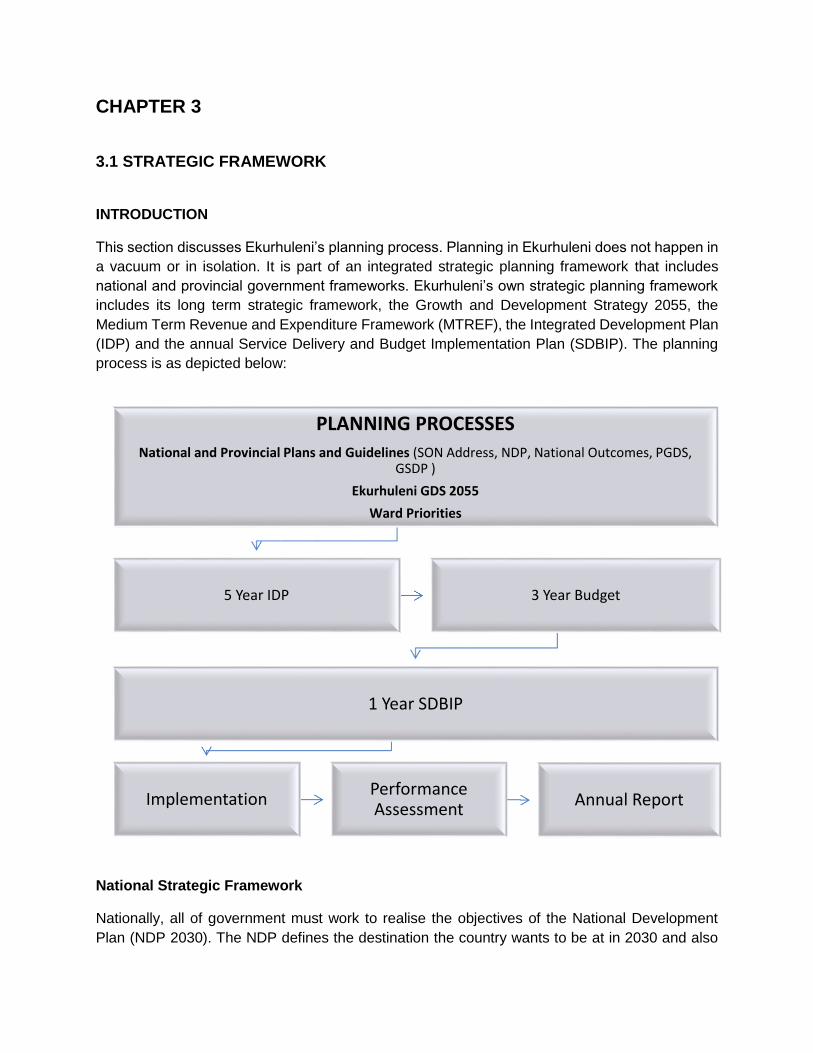
PLANNING PROCESSES
National and Provincial Plans and Guidelines (SON Address, NDP, National Outcomes, PGDS, GSDP )
Ekurhuleni GDS 2055
Ward Priorities
5 Year IDP 3 Year Budget
1 Year SDBIP
ImplementationPerformance Assessment
Annual Report
CHAPTER 3
3.1 STRATEGIC FRAMEWORK
INTRODUCTION
This section discusses Ekurhuleni’s planning process. Planning in Ekurhuleni does not happen in
a vacuum or in isolation. It is part of an integrated strategic planning framework that includes
national and provincial government frameworks. Ekurhuleni’s own strategic planning framework
includes its long term strategic framework, the Growth and Development Strategy 2055, the
Medium Term Revenue and Expenditure Framework (MTREF), the Integrated Development Plan
(IDP) and the annual Service Delivery and Budget Implementation Plan (SDBIP). The planning
process is as depicted below:
National Strategic Framework
Nationally, all of government must work to realise the objectives of the National Development
Plan (NDP 2030). The NDP defines the destination the country wants to be at in 2030 and also
identifies the roles different sectors of society need to play in reaching that goal. The Plan aims
to ensure that all South Africans attain a decent standard of living through the elimination of
poverty and reduction of inequality. The core elements of a decent standard of living identified in
the Plan are:
Housing, water, electricity and sanitation
Safe and reliable public transport
Quality education and skills development
Safety and security
Quality health care
Social protection
Employment
Recreation and leisure
Clean environment
Adequate nutrition
Because of its location at local government level, Ekurhuleni is at the coal face of service delivery
and assumes responsibility for the majority of these deliverables. Consequently, its strategies,
goals and objectives are aligned with those of the NDP. They form part and are incorporated into
existing activities of Ekurhuleni’s service delivery departments. To ensure implementation and
follow through of the NDP, national government elaborated the governing party’s electoral
mandate of 2014-2019 into 14 outcomes. The electoral mandate, inter alia, seeks to achieve
radical economic transformation, rural development and access to adequate human settlements
and basic services. In addition it prioritised access to quality education, health care and social
security including fighting corruption and crime, and contributing to building a better Africa and a
cohesive South Africa. From the electoral mandated the following 14 priority outcomes were
identified:
1. Quality basic education
2. A long and healthy life for all South Africans
3. All people in South Africa are and feel safe
4. Decent employment through inclusive growth
5. A skilled and capable workforce to support an inclusive growth path
6. An efficient, competitive and responsive economic infrastructure network
7. Vibrant, equitable and sustainable rural communities contributing towards food security
for all
8. Sustainable human settlements and improved quality of household life
9. Responsive, accountable, effective and efficient local government
10. Protect and enhance our environmental assets and natural resources
11. Create a better South Africa and contribute to a better Africa and a better world
12. An efficient, effective and development-oriented public service
13. A comprehensive, responsive and sustainable social protection system
14. A diverse, socially cohesive society with a common national identity
Provincial Strategic Framework
In its effort to align with national government, the Gauteng provincial government has since
adopted 2030 as part of its long term planning horizon. While its Growth and Development
Strategy stretched up to 2055 in line with the signing of the Freedom Charter, 2030 is now an
important landmark on the province’s calendar. Gauteng government’s policy priorities and its
medium to long term programme of radical socio-economic transformation emphasize the three
themes of transformation, modernisation and re-industrialization (TMR). The TMR is Gauteng
government’s long term vision of building the Gauteng City Region (GCR). The vision of the GCR
is:
“An integrated city-region, characterised by social cohesion and economic inclusion; the
leading economy on the continent, underpinned by smart, sustainable and socio-
economic development”
The three TMR themes have ten pillars among them. Mainstreamed across the pillars are issues
of gender, youth, the elderly, military veterans and people with disabilities. The ten pillars include:
1. RADICAL ECONOMIC TRANSFORMATION
2. DECISIVE SPATIAL TRANSFORMATION
3. ACCELERATING SOCIAL TRANSFORMATION
4. TRANSFORMATION OF THE STATE AND GOVERNANCE
5. MODERNISATION OF THE PUBLIC SERVICE
6. MODERNISATION OF THE ECONOMY
7. MODERNIZATION OF HUMAN SETTLEMENTS
8. MODERNISATION OF PUBLIC TRANSPORT
9. RE-INDUSTRIALISE GAUTENG AND SOUTH AFRIC
10. TAKE A LEAD IN AFRICA’S NEW INDUSTRIAL REVOLUTION
There are notable synergies between Ekurhuleni’s own programmes with the ten TMR pillars. In
terms of radical economic transformation, Ekurhuleni has a flagship project on township
economies and is promoting industrialization through the building on an Aerotropolis. With
regards to decisive spatial transformation, Ekurhuleni is implementing the Integrated Rapid Public
Transport Network (IRPTN) including developing and building human settlements along its routes.
On social transformation the City has increased access to primary health care services through
the provision and upgrading of clinics. Access to quality early childhood development programme
has also been promoted through increased participation. In relation to the pillar of state and
governance, Ekurhuleni has increased the effectiveness of regulatory compliance and has
attained consecutive clean audits. These are but a few of the programmes the City has
undertaken that demonstrates its alignment with provincial strategic priorities.
Ekurhuleni’s Strategic Framework
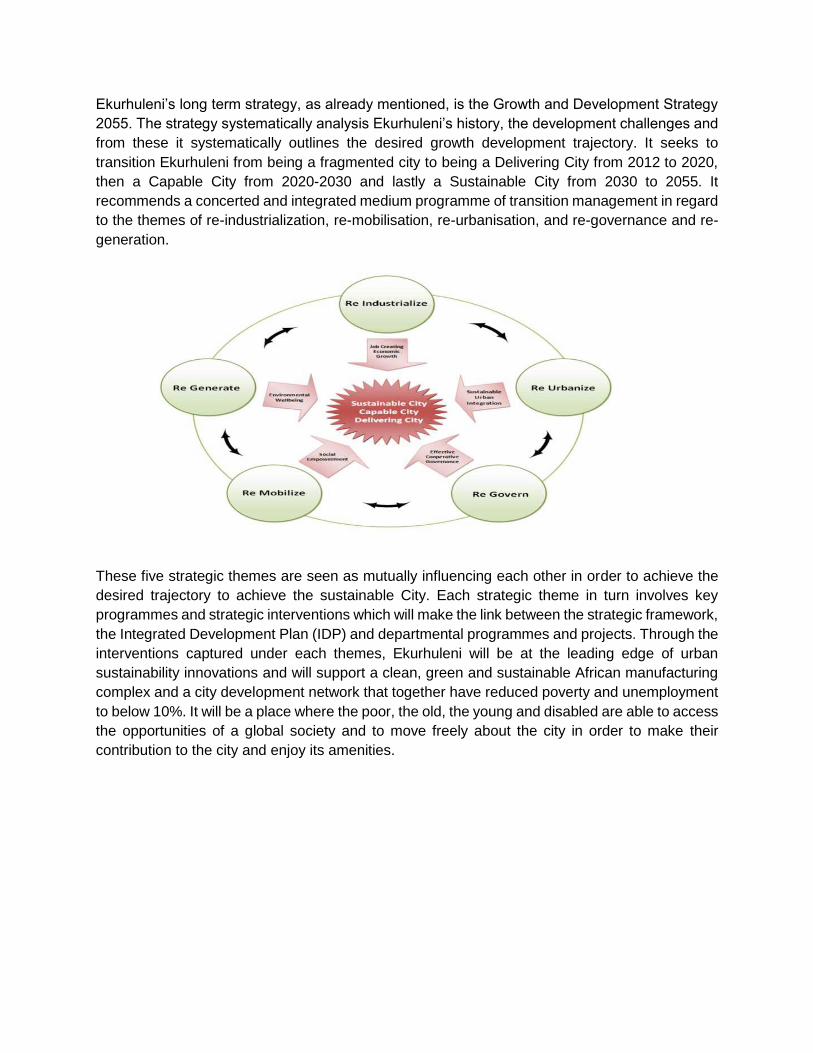
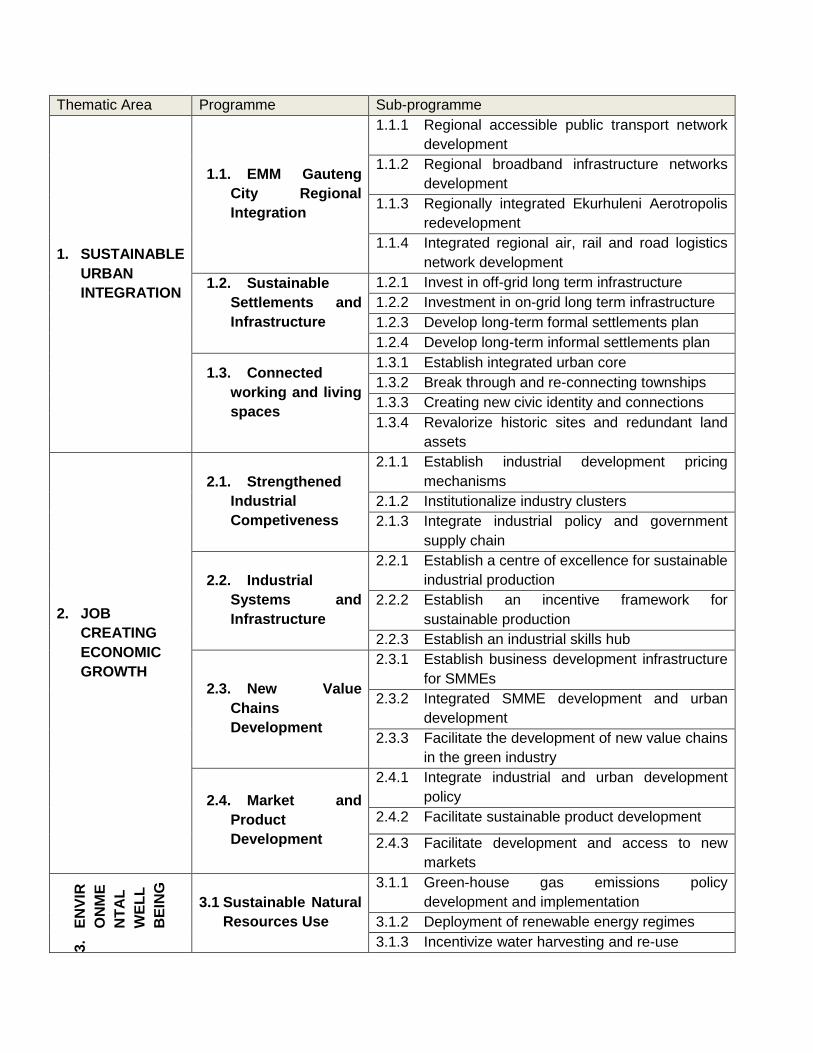
Ekurhuleni’s long term strategy, as already mentioned, is the Growth and Development Strategy
2055. The strategy systematically analysis Ekurhuleni’s history, the development challenges and
from these it systematically outlines the desired growth development trajectory. It seeks to
transition Ekurhuleni from being a fragmented city to being a Delivering City from 2012 to 2020,
then a Capable City from 2020-2030 and lastly a Sustainable City from 2030 to 2055. It
recommends a concerted and integrated medium programme of transition management in regard
to the themes of re-industrialization, re-mobilisation, re-urbanisation, and re-governance and re-
generation.
These five strategic themes are seen as mutually influencing each other in order to achieve the
desired trajectory to achieve the sustainable City. Each strategic theme in turn involves key
programmes and strategic interventions which will make the link between the strategic framework,
the Integrated Development Plan (IDP) and departmental programmes and projects. Through the
interventions captured under each themes, Ekurhuleni will be at the leading edge of urban
sustainability innovations and will support a clean, green and sustainable African manufacturing
complex and a city development network that together have reduced poverty and unemployment
to below 10%. It will be a place where the poor, the old, the young and disabled are able to access
the opportunities of a global society and to move freely about the city in order to make their
contribution to the city and enjoy its amenities.
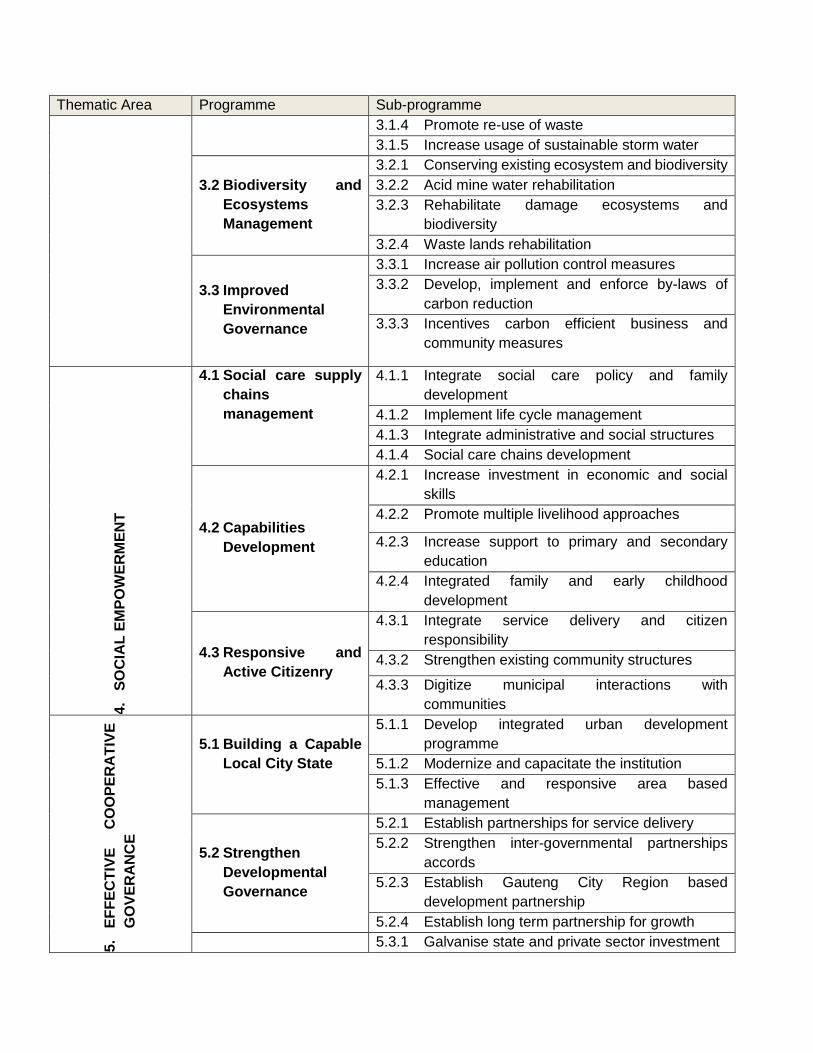
Thematic Area Programme Sub-programme
1. SUSTAINABLE
URBAN
INTEGRATION
1.1. EMM Gauteng
City Regional
Integration
1.1.1 Regional accessible public transport network
development
1.1.2 Regional broadband infrastructure networks
development
1.1.3 Regionally integrated Ekurhuleni Aerotropolis
redevelopment
1.1.4 Integrated regional air, rail and road logistics
network development
1.2. Sustainable
Settlements and
Infrastructure
1.2.1 Invest in off-grid long term infrastructure
1.2.2 Investment in on-grid long term infrastructure
1.2.3 Develop long-term formal settlements plan
1.2.4 Develop long-term informal settlements plan
1.3. Connected
working and living
spaces
1.3.1 Establish integrated urban core
1.3.2 Break through and re-connecting townships
1.3.3 Creating new civic identity and connections
1.3.4 Revalorize historic sites and redundant land
assets
2. JOB
CREATING
ECONOMIC
GROWTH
2.1. Strengthened
Industrial
Competiveness
2.1.1 Establish industrial development pricing
mechanisms
2.1.2 Institutionalize industry clusters
2.1.3 Integrate industrial policy and government
supply chain
2.2. Industrial
Systems and
Infrastructure
2.2.1 Establish a centre of excellence for sustainable
industrial production
2.2.2 Establish an incentive framework for
sustainable production
2.2.3 Establish an industrial skills hub
2.3. New Value
Chains
Development
2.3.1 Establish business development infrastructure
for SMMEs
2.3.2 Integrated SMME development and urban
development
2.3.3 Facilitate the development of new value chains
in the green industry
2.4. Market and
Product
Development
2.4.1 Integrate industrial and urban development
policy
2.4.2 Facilitate sustainable product development
2.4.3 Facilitate development and access to new
markets
3.
EN
VIR
ON
ME
NT
AL
WE
LL
BE
ING
3.1 Sustainable Natural
Resources Use
3.1.1 Green-house gas emissions policy
development and implementation
3.1.2 Deployment of renewable energy regimes
3.1.3 Incentivize water harvesting and re-use
Thematic Area Programme Sub-programme
3.1.4 Promote re-use of waste
3.1.5 Increase usage of sustainable storm water
3.2 Biodiversity and
Ecosystems
Management
3.2.1 Conserving existing ecosystem and biodiversity
3.2.2 Acid mine water rehabilitation
3.2.3 Rehabilitate damage ecosystems and
biodiversity
3.2.4 Waste lands rehabilitation
3.3 Improved
Environmental
Governance
3.3.1 Increase air pollution control measures
3.3.2 Develop, implement and enforce by-laws of
carbon reduction
3.3.3 Incentives carbon efficient business and
community measures
4.
SO
CIA
L E
MP
OW
ER
ME
NT
4.1 Social care supply
chains
management
4.1.1 Integrate social care policy and family
development
4.1.2 Implement life cycle management
4.1.3 Integrate administrative and social structures
4.1.4 Social care chains development
4.2 Capabilities
Development
4.2.1 Increase investment in economic and social
skills
4.2.2 Promote multiple livelihood approaches
4.2.3 Increase support to primary and secondary
education
4.2.4 Integrated family and early childhood
development
4.3 Responsive and
Active Citizenry
4.3.1 Integrate service delivery and citizen
responsibility
4.3.2 Strengthen existing community structures
4.3.3 Digitize municipal interactions with
communities
5.
EF
FE
CT
IVE
C
OO
PE
RA
TIV
E
GO
VE
RA
NC
E
5.1 Building a Capable
Local City State
5.1.1 Develop integrated urban development
programme
5.1.2 Modernize and capacitate the institution
5.1.3 Effective and responsive area based
management
5.2 Strengthen
Developmental
Governance
5.2.1 Establish partnerships for service delivery
5.2.2 Strengthen inter-governmental partnerships
accords
5.2.3 Establish Gauteng City Region based
development partnership
5.2.4 Establish long term partnership for growth
5.3.1 Galvanise state and private sector investment
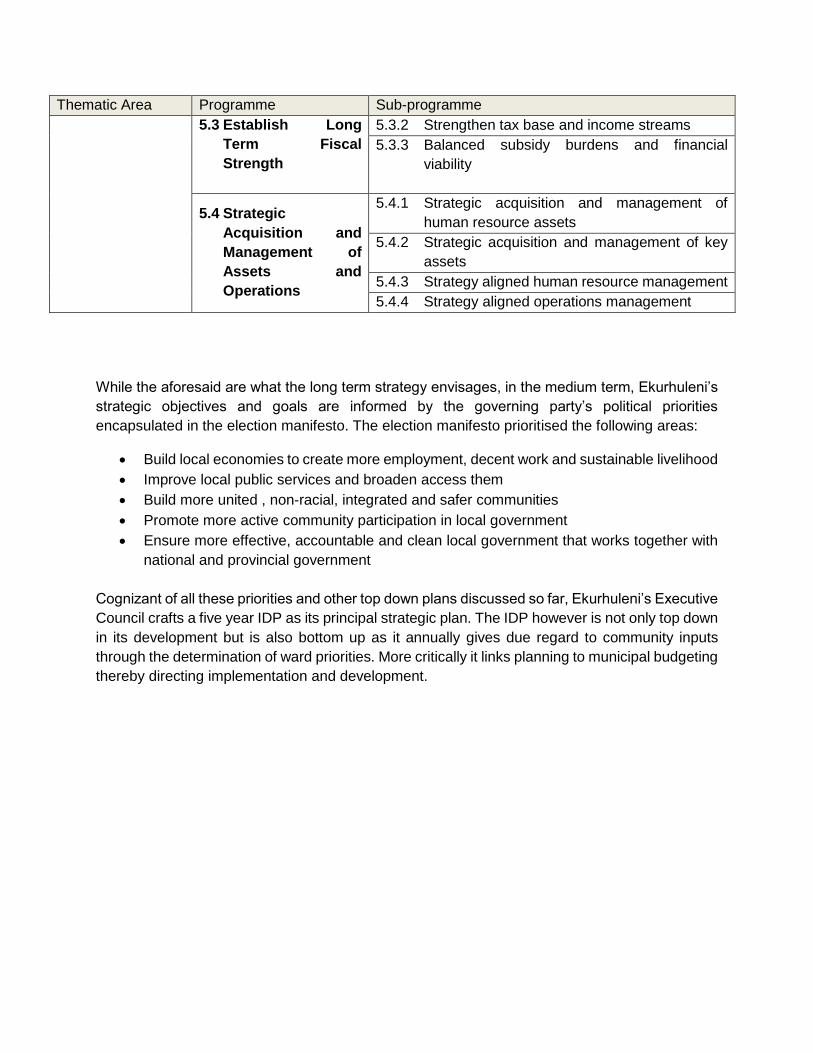
Thematic Area Programme Sub-programme
5.3 Establish Long
Term Fiscal
Strength
5.3.2 Strengthen tax base and income streams
5.3.3 Balanced subsidy burdens and financial
viability
5.4 Strategic
Acquisition and
Management of
Assets and
Operations
5.4.1 Strategic acquisition and management of
human resource assets
5.4.2 Strategic acquisition and management of key
assets
5.4.3 Strategy aligned human resource management
5.4.4 Strategy aligned operations management
While the aforesaid are what the long term strategy envisages, in the medium term, Ekurhuleni’s
strategic objectives and goals are informed by the governing party’s political priorities
encapsulated in the election manifesto. The election manifesto prioritised the following areas:
Build local economies to create more employment, decent work and sustainable livelihood
Improve local public services and broaden access them
Build more united , non-racial, integrated and safer communities
Promote more active community participation in local government
Ensure more effective, accountable and clean local government that works together with
national and provincial government
Cognizant of all these priorities and other top down plans discussed so far, Ekurhuleni’s Executive
Council crafts a five year IDP as its principal strategic plan. The IDP however is not only top down
in its development but is also bottom up as it annually gives due regard to community inputs
through the determination of ward priorities. More critically it links planning to municipal budgeting
thereby directing implementation and development.
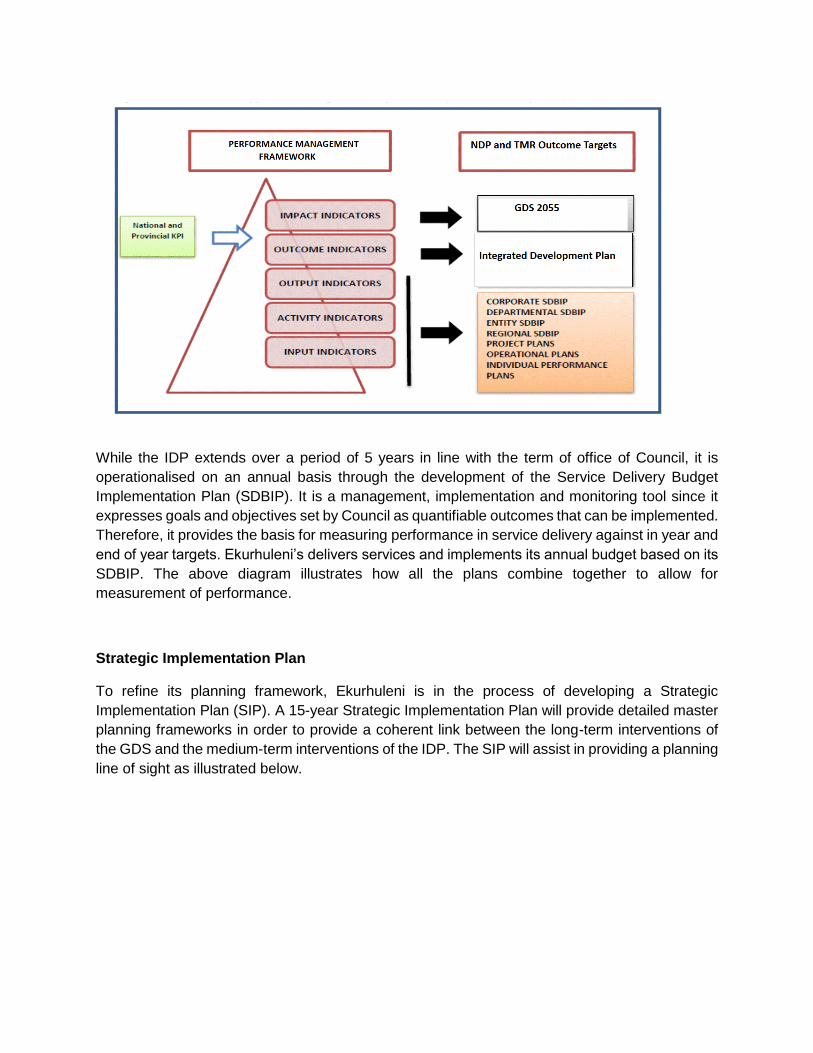
While the IDP extends over a period of 5 years in line with the term of office of Council, it is
operationalised on an annual basis through the development of the Service Delivery Budget
Implementation Plan (SDBIP). It is a management, implementation and monitoring tool since it
expresses goals and objectives set by Council as quantifiable outcomes that can be implemented.
Therefore, it provides the basis for measuring performance in service delivery against in year and
end of year targets. Ekurhuleni’s delivers services and implements its annual budget based on its
SDBIP. The above diagram illustrates how all the plans combine together to allow for
measurement of performance.
Strategic Implementation Plan
To refine its planning framework, Ekurhuleni is in the process of developing a Strategic
Implementation Plan (SIP). A 15-year Strategic Implementation Plan will provide detailed master
planning frameworks in order to provide a coherent link between the long-term interventions of
the GDS and the medium-term interventions of the IDP. The SIP will assist in providing a planning
line of sight as illustrated below.
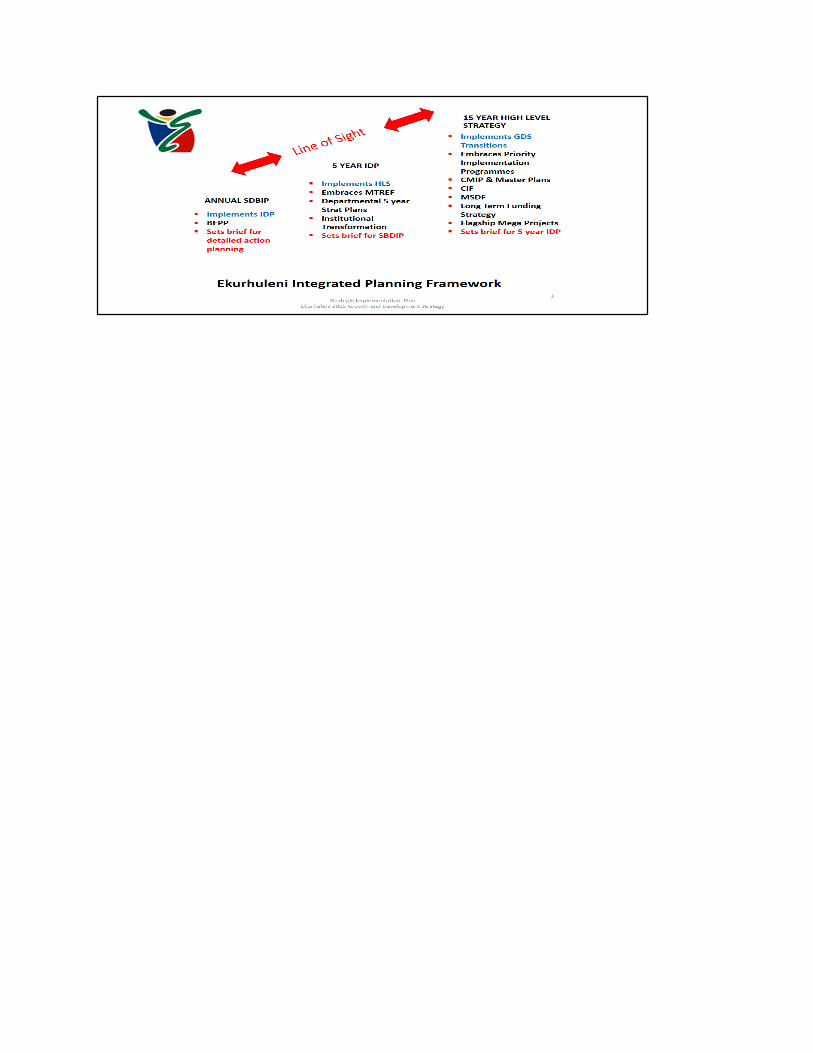
CHAPTER 4
4.1 GOVERNANCE AND INSTITUTIONAL ARRANGEMENTS
INTRODUCTION
The State of Local Government Overview Report (COGTA, 2009) identified inadequacies in
accountability and poor governance as being one of the challenges facing local government. The
Ekurhuleni Metropolitan Municipality (EMM) adopted the separation of powers model in August
2011 and continues to implement same in order to address these inadequacies. The purpose of
this new governance framework for EMM was, in the main, to create independent oversight and
accountability mechanism for the effective achievement of the municipal mandate which
according to Section 152 of the Constitution is to:
Promote democratic and accountable government for local communities;
Ensure the provision of sustainable services to communities;
Promote a safe and healthy environment;
Encourage community participation in local government.
This chapter reflects on EMM’s governance model with details on the roles and responsibilities of
various role players in the model. The administrative structure or arrangements of the city in terms
of the departments and entities is also briefly discussed.
EKURHULENI METROPOLITAN MUNICIPALITY GOVERNANCE MODEL
In 2011 Ekurhuleni Council resolved to implement separation of powers between its executive
and legislative arms of government. The separation of powers between the legislative and
executive arms of government is congruent with internationally accepted principles of good
governance. It creates checks and balances to ensure that state power is not abused, and that
there is independent oversight of the effective achievement of the constitutional mandate. It
further establishes an appropriate level of accountability, representation and participation through:
Clear delineation of powers and functions among the spheres of government;
Executive accountability for service delivery and development;
Independent and representative oversight by the Legislative arm.
Institutionalising a separation of powers model is expected to benefit the municipality through:
Increased achievement of the statutory objective of Section 38 of the Municipal Structures Act which provides that a municipality must:
o “promote a culture of performance management among its political structures, political
office bearers and councillors in its administration; and
o “administer its affairs in an economical, effective, efficient and accountable manner.”
Strengthened the role of Council as a legislature and policy maker whilst enhancing its role
in oversight and effectively promoting community participation in local government affairs;
Ensure improved and meaningful debate on matters that affect the municipality and are
reserved for consideration by the Council; and
The creation of independent oversight of the effective achievement of the municipal mandate.
Separation of powers can only have significance if it is implemented by means of a comprehensive
governance framework that defines appropriate roles, responsibilities and accountabilities, not
only for political structures and political office bearers but also for the City Manager and Municipal
Administration.
The following is a reflection of the Governance structure for EMM:
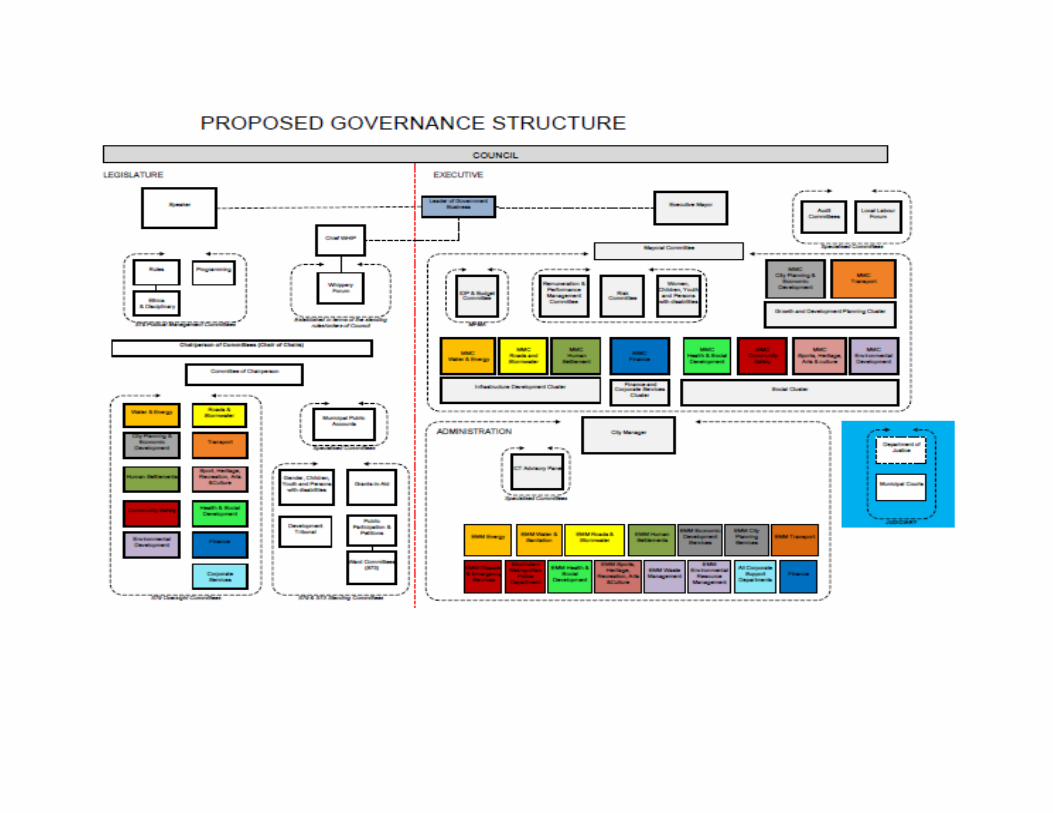
In terms of governance model, the Executive authority of Council is delegated to the Executive
Mayor and the members of the Mayoral Committee, collectively referred to as the Executive, who
are responsible for day-to-day decision-making and are departmental executive authorities. The
key role of Council in the current structure is to focus on its Legislative authority of by-law making,
community participation and oversight. The other key role is to facilitate political debate and
discussion.
LEGISLATIVE POLITICAL LEADERSHIP
The legislature is made up of Council, the Speaker of Council, The Chief Whip of Council, and
two sets of Council Committees, namely Section 79 Portfolio Committees and Standing
Committees.
COUNCIL
The municipality comprises 202 councillors, consisting of the 101 directly elected ward councillors
and 101 proportional representatives elected through political party lists. Each of the 101 ward
councillors chairs a ward committee as part of the Ward Participatory System that brings
participation to community levels. Ward Committees for all the 101 wards were established and
ward committee members elected.
Ward councillors play a central role in the communication process between the communities they
represent and the Municipality, reporting back regularly through ward meetings and assisting the
community in identifying needs and priority areas of development which feed into the
municipality's planning processes
SPEAKER OF COUNCIL
The Municipal Structures Act provides that each municipal council must have a chairperson who
is called the Speaker of Council. The Speaker is elected by the Council from among the
councillors at the first sitting of the council after the local government elections.
The Speaker acts as chairperson at council meetings and ensures compliance with the
councillor’s code of conduct and the council’s rules and orders. Councillor Patricia Kumalo is the
Chairperson of Council, known as the Speaker at Ekurhuleni Metropolitan Municipality. Other
responsibilities of the Council Speaker include, amongst others, ensure functionality and
resourcing of Ward Committees, functionality of Section 79 Committees, leadership and
governance of the institution and effective participatory democracy in the work of Council and its
structures.
CHIEF WHIP OF COUNCIL
Councillor Robert Mashego is the Chief Whip of Council and responsible for, amongst others,
maintaining cohesiveness amongst all political parties represented in Council and assists Speaker
in ensuring that councillors conduct themselves in an orderly manner.
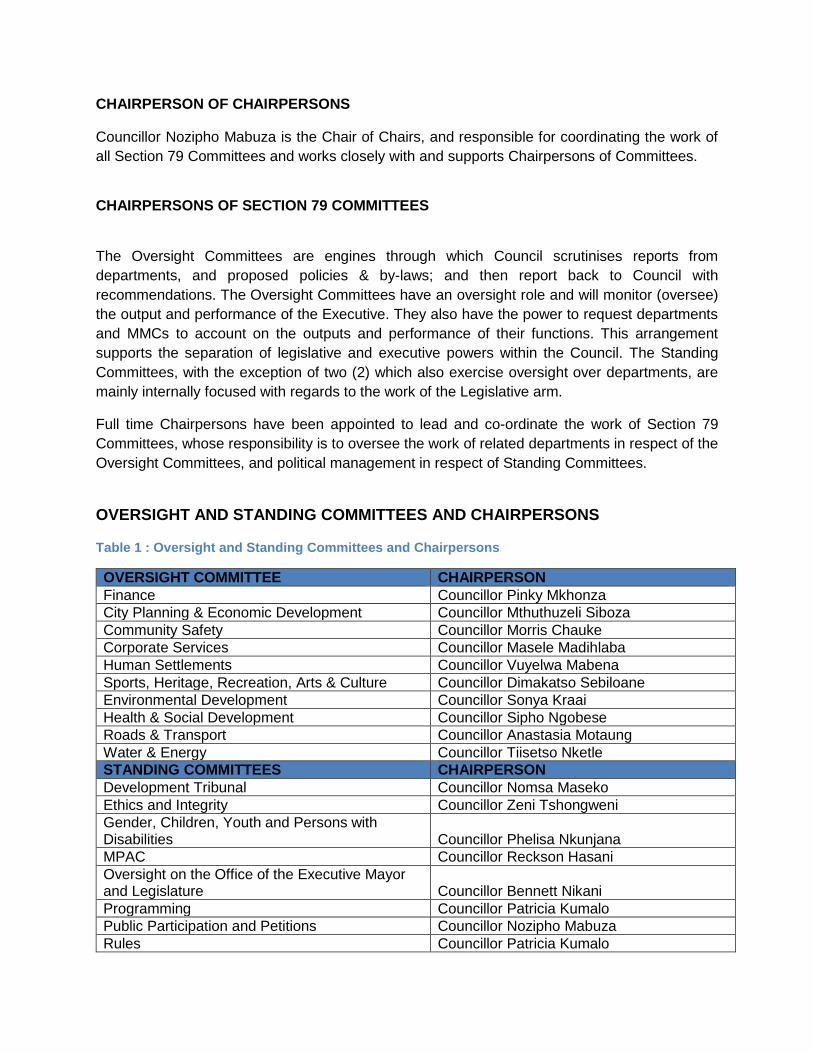
CHAIRPERSON OF CHAIRPERSONS
Councillor Nozipho Mabuza is the Chair of Chairs, and responsible for coordinating the work of
all Section 79 Committees and works closely with and supports Chairpersons of Committees.
CHAIRPERSONS OF SECTION 79 COMMITTEES
The Oversight Committees are engines through which Council scrutinises reports from
departments, and proposed policies & by-laws; and then report back to Council with
recommendations. The Oversight Committees have an oversight role and will monitor (oversee)
the output and performance of the Executive. They also have the power to request departments
and MMCs to account on the outputs and performance of their functions. This arrangement
supports the separation of legislative and executive powers within the Council. The Standing
Committees, with the exception of two (2) which also exercise oversight over departments, are
mainly internally focused with regards to the work of the Legislative arm.
Full time Chairpersons have been appointed to lead and co-ordinate the work of Section 79
Committees, whose responsibility is to oversee the work of related departments in respect of the
Oversight Committees, and political management in respect of Standing Committees.
OVERSIGHT AND STANDING COMMITTEES AND CHAIRPERSONS
Table 1 : Oversight and Standing Committees and Chairpersons
OVERSIGHT COMMITTEE CHAIRPERSON
Finance Councillor Pinky Mkhonza
City Planning & Economic Development Councillor Mthuthuzeli Siboza
Community Safety Councillor Morris Chauke
Corporate Services Councillor Masele Madihlaba
Human Settlements Councillor Vuyelwa Mabena
Sports, Heritage, Recreation, Arts & Culture Councillor Dimakatso Sebiloane
Environmental Development Councillor Sonya Kraai
Health & Social Development Councillor Sipho Ngobese
Roads & Transport Councillor Anastasia Motaung
Water & Energy Councillor Tiisetso Nketle
STANDING COMMITTEES CHAIRPERSON
Development Tribunal Councillor Nomsa Maseko
Ethics and Integrity Councillor Zeni Tshongweni
Gender, Children, Youth and Persons with Disabilities Councillor Phelisa Nkunjana
MPAC Councillor Reckson Hasani
Oversight on the Office of the Executive Mayor and Legislature Councillor Bennett Nikani
Programming Councillor Patricia Kumalo
Public Participation and Petitions Councillor Nozipho Mabuza
Rules Councillor Patricia Kumalo
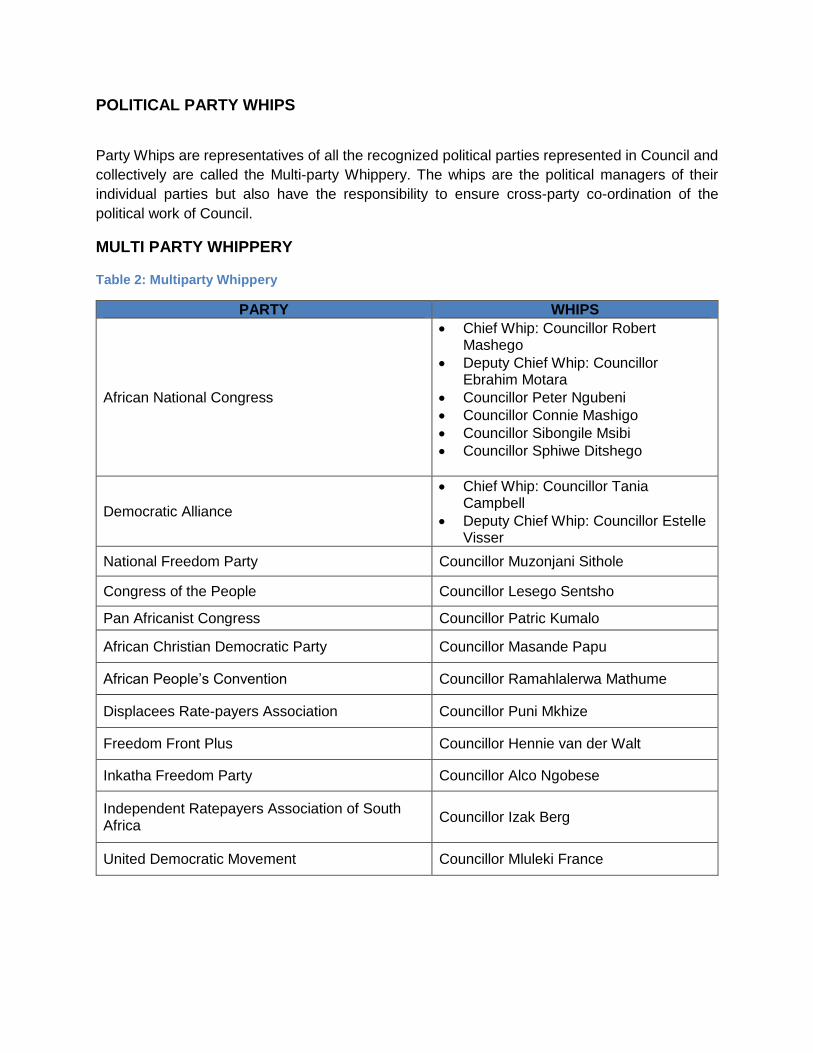
POLITICAL PARTY WHIPS
Party Whips are representatives of all the recognized political parties represented in Council and
collectively are called the Multi-party Whippery. The whips are the political managers of their
individual parties but also have the responsibility to ensure cross-party co-ordination of the
political work of Council.
MULTI PARTY WHIPPERY
Table 2: Multiparty Whippery
PARTY WHIPS
African National Congress
Chief Whip: Councillor Robert Mashego
Deputy Chief Whip: Councillor Ebrahim Motara
Councillor Peter Ngubeni
Councillor Connie Mashigo
Councillor Sibongile Msibi
Councillor Sphiwe Ditshego
Democratic Alliance
Chief Whip: Councillor Tania Campbell
Deputy Chief Whip: Councillor Estelle Visser
National Freedom Party Councillor Muzonjani Sithole
Congress of the People Councillor Lesego Sentsho
Pan Africanist Congress Councillor Patric Kumalo
African Christian Democratic Party Councillor Masande Papu
African People’s Convention Councillor Ramahlalerwa Mathume
Displacees Rate-payers Association Councillor Puni Mkhize
Freedom Front Plus Councillor Hennie van der Walt
Inkatha Freedom Party Councillor Alco Ngobese
Independent Ratepayers Association of South Africa
Councillor Izak Berg
United Democratic Movement Councillor Mluleki France
LEADER OF GOVERNMENT BUSINESS
The Leader of Government provides a link between the executive and the legislature (council).
Councillor Moses Makwakwa, Member of the Mayoral Committee responsible for finance is the
current term’s leader of government business.
The responsibilities of the leader of government business are:
Being a communication link between the Executive and the Legislative arm which also
includes interaction with the Speaker and Chief Whip
Acting as a central point of coordination between the Executive and the Legislature
Responsible to ensure that Executive business is included in the agenda of Council through
the Programming Committee
Liaises with the Speaker when the Speaker intends to call a special meeting of Council
outside the normal program for Council
Liaises with the Speaker for purposes of allocating time for discussion of matters of public
importance in the Council agenda, either directly or in the Programming Committee
Ensures that matters which have to be submitted to the Section 79 Committees and to
Council are duly processed.
ADMINISTRATIVE STRUCTURE
Ekurhuleni’s executive leadership manages the metropolitan municipality along best practice
principles, implementing the strategies and plans needed to meet the organisation’s long-term
goals which are set out in the GDS 2055. Day-to-day management and administration of the
municipality is carried out by the City Manager and his staff of more than 17 000 employees led
by Heads of Department, Divisional Heads, Customer Care Area Managers and operational levels
of management.
The City Manager for Ekurhuleni Metropolitan Municipality is Mr Khaya Ngema, who is the
Accounting Officer, as defined by the Municipal Structures Act. The responsibilities of the City
Manager include managing the financial affairs and service delivery in the municipality. The City
Manager, in discharging his duties and in line with the principles of good governance and
legislative requirements, has established administrative committees which are as follows:
• The Strategic Management Committee (SMT/EXCO) is constituted as executive
management committees of the EMM. The duties and responsibilities of the members are in
addition to those as HODs. The deliberations of the SMT committee do not reduce the
individual and collective responsibilities of the City Manager and HODs with regard to their
fiduciary or administrative duties and responsibilities, and they must continue to exercise due
diligence and good judgment in accordance with their statutory and contractual obligations. In
addition to the monthly meetings of the SMT/EXCO, a Joint Operations Committee (JOC)

meetings are currently being held on a weekly basis to deal with pressing service delivery
issues.
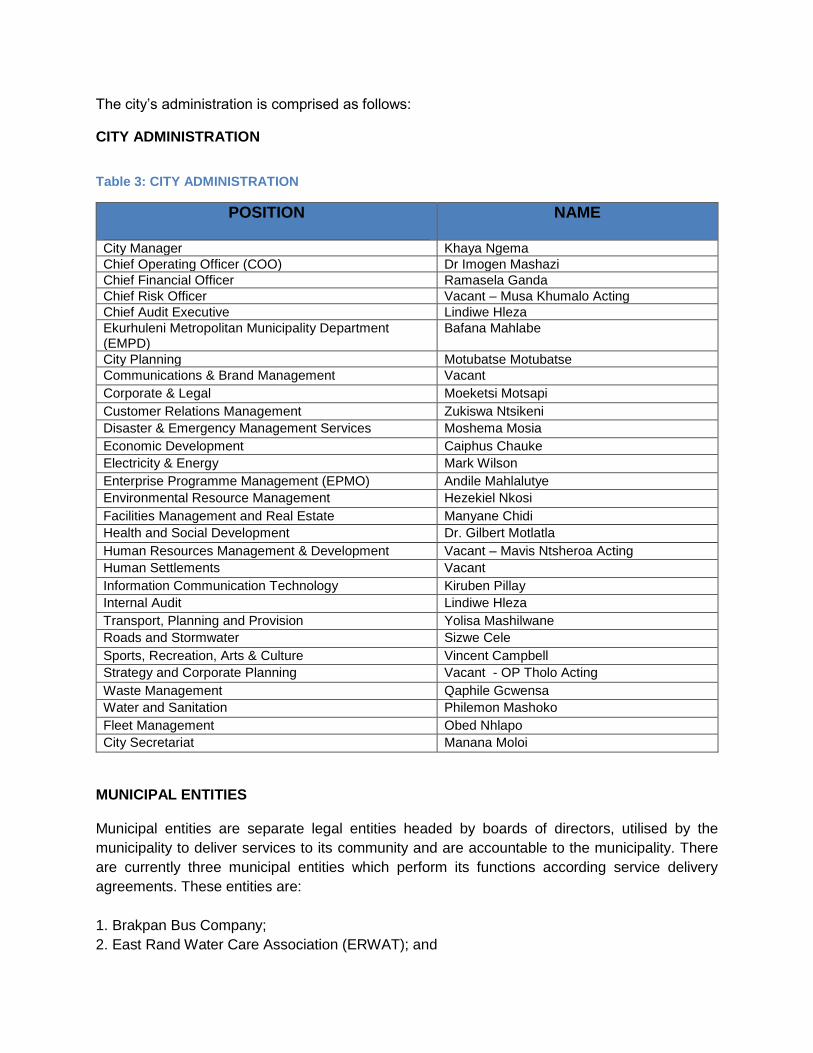
The city’s administration is comprised as follows:
CITY ADMINISTRATION
Table 3: CITY ADMINISTRATION
POSITION
NAME
City Manager Khaya Ngema
Chief Operating Officer (COO) Dr Imogen Mashazi
Chief Financial Officer Ramasela Ganda
Chief Risk Officer Vacant – Musa Khumalo Acting
Chief Audit Executive Lindiwe Hleza
Ekurhuleni Metropolitan Municipality Department (EMPD)
Bafana Mahlabe
City Planning Motubatse Motubatse
Communications & Brand Management Vacant
Corporate & Legal Moeketsi Motsapi
Customer Relations Management Zukiswa Ntsikeni
Disaster & Emergency Management Services Moshema Mosia
Economic Development Caiphus Chauke
Electricity & Energy Mark Wilson
Enterprise Programme Management (EPMO) Andile Mahlalutye
Environmental Resource Management Hezekiel Nkosi
Facilities Management and Real Estate Manyane Chidi
Health and Social Development Dr. Gilbert Motlatla
Human Resources Management & Development Vacant – Mavis Ntsheroa Acting
Human Settlements Vacant
Information Communication Technology Kiruben Pillay
Internal Audit Lindiwe Hleza
Transport, Planning and Provision Yolisa Mashilwane
Roads and Stormwater Sizwe Cele
Sports, Recreation, Arts & Culture Vincent Campbell
Strategy and Corporate Planning Vacant - OP Tholo Acting
Waste Management Qaphile Gcwensa
Water and Sanitation Philemon Mashoko
Fleet Management Obed Nhlapo
City Secretariat Manana Moloi
MUNICIPAL ENTITIES Municipal entities are separate legal entities headed by boards of directors, utilised by the
municipality to deliver services to its community and are accountable to the municipality. There
are currently three municipal entities which perform its functions according service delivery
agreements. These entities are:
1. Brakpan Bus Company;
2. East Rand Water Care Association (ERWAT); and

3. Ekurhuleni Development Company (EDC).
The Department of Transport Planning and Provisioning, Water and Sanitation and Human
Settlements respectively have an oversight responsibility over these entities on behalf of the
shareholder.
CHAPTER 5
5. INTERGOVERNMENTAL ALIGNMENT
INTRODUCTION
This chapter focusses on the EMM’s participation and enhancement of relations with other
spheres of government in pursuit of integrated planning and sound intergovernmental relations.
It reflects on the state of the nation and of the province addresses and articulates EMM’s
alignment with these as reflected on the work of the metro and also enunciated in the State of the
City Address (Please note that none of these addresses had been delivered at the time of
preparing the Draft IDP, but will be included in the Final IDP). The comments provided by the
MEC of Local Government on the IDP 14/15 and EMM’s response to these is also reflected herein.
The EMM’s response is not an attempt to respond to every issue raised by the MEC but rather a
high level response to certain specific issues. The thrust of the MEC’s comments is taken into
account in the overall IDP review process. This chapter also outlines the projects and
programmes which will be implemented by Gauteng Provincial Government in Ekurhuleni. These
projects are also not included in this draft as they only become available after the provincial budget
speech/ or the tabling of the budget at the Legislature. These will be included in the Final IDP as
well.
INTERGOVERNMENTAL RELATIONS
Intergovernmental Relations (IGR) refers to complex and interdependent relations amongst the
national, provincial and local spheres of government as well the coordination of public policies
amongst the three spheres. This essentially means that governance, administrative and fiscal
arrangements operating at interface between national, provincial and local governments must be
managed to promote the effective delivery of services. These relations between the various
spheres of government are guided by the principle of co-operative government as set out in the
Constitution and the relevant Act. This is further emphasised in the Municipal Systems Act that
states that planning of local government must at all times be integrated and aligned to the planning
and strategies of the national and provincial spheres of government.
NATIONAL GOVERNMENT OUTCOMES
The national outcomes were discussed in the first chapter and therefore the emphasis here is
demonstrating alignment of EMM’s programmes to the outcomes. The national outcomes were
originally approved in 2010 and address the strategic priorities. Thus the outcomes and the
related outputs were meant to be the strategic focus of government until 2014. However
indications are that these will continue beyond 2014 as they are sufficiently aligned with the
National Development Plan. The IDP revision of 2015/16 is therefore based on the outcomes as
they stand. The alignment of EMM’s programmes and sub programmes to the outcomes is
extensively elaborated in chapter 5, but a diagrammatic depiction is provided here to demonstrate
high level alignment with the IGR imperatives.
In terms of the national outcomes, municipalities directly contributes to outcomes 9, which speaks
to a responsive, accountable, effective and efficient local government system. The National
Development Plan (NDP) envisages that by 2030 South Africa will be a state that is capable of
playing a developmental and transformative role. In broad terms such a state intervenes to
support and guide development in such a way that benefits accrue across society, with particular
emphasis on the poor. Drawing from the NDP chapter on a Capable and Developmental State,
by 2030 we will have a developmental state that is accountable, focused on citizen’s priorities,
and capable of delivering high-quality services consistently and sustainably through cooperative
governance and participatory democracy.
As depicted in the White Paper on Local Government, developmental local government is “local
government committed to working with citizens and groups within the community to find
sustainable ways to meet their social, economic and material needs and improve the quality of
their lives”. In this scenario, local government is at the forefront of participatory democracy,
involving citizens in meaningful deliberations regarding governance and development; is
responsive to citizens’ priorities, and enjoys high levels of trust and credibility amongst the public;
whose employees are skilled, competent and committed to delivering quality services; is able to
cost-effectively increase the quantity and quality of services and operates within a supportive and
empowering intergovernmental system.
STATE OF THE NATION ADDRESS, 2016
Not yet delivered at the time of consolidation. Will be included in the final IDP.
STATE OF THE PROVINCE ADDRESS, 2016
Not yet delivered at the time of consolidation. Will be included in the final IDP.
STATE OF THE CITY
Not yet delivered at the time of consolidation. Will be included in the final IDP.
COMMENTS RECEIVED FROM GAUTENG PROVINCIAL GOVERNMENT ON THE
REVIEWED IDP 2015/2016:
MEC COMMENTS ON THE 2015/16 INTEGRATED DEVELOPMENT PLAN
I wish to congratulate the Ekurhuleni Metropolitan Municipality on its timeous adoption of the
Integrated Development Plan (IDP) and submission to my office in compliance with provisions of
the Municipal Systems Act (MSA). I am proud of the significant strides made by Gauteng
Municipalities in ensuring that their IDPs are credible and compliant with the law, as evidenced in
the timeous development, review and adoption of both draft and final IDPs.
At the same time, these successes have further emphasised some challenges with regards to
intergovernmental coordination and alignment. In particular, the link between IDPs and
government priorities remains blurry in a number of areas. Again, whereas gaps still remain,
municipalities are commended for taking various initiatives aimed at promoting the linkages
between IDPs and strategic pathways of the other two Spheres.
In line with Section 32 (2) of the Municipal Systems Act, kindly receive my comments on your
municipality’s 2015/16 IDP. The comments are structured in a manner that seeks to highlight
areas requiring correction as part of the IDP review process whilst also tabling issues for
consideration so as to improve both the credibility of IDPs as well as intergovernmental
coordination.
PART A: CROSS-CUTTING ISSUES
TOWARDS GAUTENG TOWNSHIP ECONOMIC REVITALISATION: Since the dawn of the new
administration, Gauteng Provincial Government has recognised the need to revitalise township
economies as a key strategy for socio-economic transformation. The Ten Pillars express a
programmatic intent of the current administration through radical Transformation, Modernisation
and Re-industrialisation of the provincial economy.
This represents a policy reaffirmation by government but most importantly elevates township
revitalisation as one of the key strategies for ascertaining that the Ten Pillar objectives are
realised. The approval of the Gauteng Township Economic Revitalisation (TER) Strategy
represents a clarion call for collective and integrated planning, harmonisation of budgets as well
as multi-sectoral implementation across all spheres of government.
The Gauteng Township Economy Revitalisation Strategy aims to contribute to the overall vision
for South Africa by 2030 to be a country with an economy that can sustainably meet the material
needs of all its citizens as well as broadening economic participation of previously marginalised
groups. The TER Strategy is cast in intergovernmental posture, suggesting that all relevant
stakeholders in Gauteng will have to put their collective support to ensure successful
implementation. The Strategy requires a strong multi-sectoral and sphere interaction wherein
provincial sector departments, municipalities, business and organised township chambers throw
in their lot for maximum impact.
Gauteng EXCO has further commissioned the establishment of a TER Intergovernmental Working
Committee as an institutional mechanism through which the Strategy is coordinated and
monitored. The purpose of the committee is to guide the coordination, facilitation, monitoring and
evaluation of the strategy implementation across all spheres of government. The TER committee
will interface with the IDP Technical Steering Committee mainly due to the fact that IDPs will
henceforth be used as platforms for tracking planning, budgeting as well as implementation intent
of municipalities regarding TER but most importantly striving for integration across the board.
ENERGY: At the present moment, energy and its use are a national concern. South Africa as
whole is affected by challenges regarding energy, its demand as well as how it is supplied. The
recent episodes of load shedding across the country, with a considerable amount of the impact
felt in Gauteng as the economic backbone of South Africa have demonstrated the necessity for
deeper dialogue and action around exploring sustainable ways of providing energy. One of the
immediate actions to be taken in the province, amidst others that have been proposed, is for
municipal IDPs to begin to design projects in the IDP that seek to mitigate against load shedding.
Energy efficiency projects together with energy saving campaigns, for instance, will go a long way
towards curbing the current energy demand facing the province.
REGULATORY ENVIRONMENT: Gauteng Municipalities are in general characterised by a
challenge pertaining to the inadequacy or poor enforcement of municipal by-laws; poor
implementation of anti-fraud and corruption policies as well as poor performance and risk
management systems. This was confirmed earlier this year by the Back to Basics report produced
by Gauteng COGTA. To address these challenges, the provincial government has embarked on:
Review, update and alignment of municipal by-laws across Gauteng; and
Review and update of anti-fraud and corruption policies, including efforts to build a culture
of ethical behaviour and accountability. To effect this, a partnership has been established
with SALGA, DCoG and Ethics Institute of South Africa (EthicsSA). Gauteng Provincial
Government will be piloting the conducting of the ethics survey in the province over the
next three (3) months.
EVIDENCE-BASED PLANNING: From a statistics perspective, IDP's have improved a great deal
in terms of compliance. That is having statistics visible and included in the IDP document(s). The
challenge, however has been the inconsistency of data sources, inconsistent or irrelevant
indicators as well as the absence of bench-marks. While it is not incorrect for municipalities to use
statistical data reports from other sources, it is a legislative requirement that such data must meet
specified minimum requirements to be considered official, as illustrated for instance, in the
gazetted Statistics Framework. Municipalities are therefore cautioned against using data that has
not been verified as this may lead to ill-planning and subsequent mismanagement of our already
limited resources.
From the IDP assessments this year, there is also a growing concern on the absence of a
demographic illustration of trends or patterns of the population within a given municipal area. The
entry of a quantity of sexes, ages, race and so forth are essential to understand the development
needs and quantities required, in planning for development.
This type of a data set also informs probable indexes, such as life expectancy, demographic
dividend, labour force, population growth, birth and death rates, migration patterns, and so on.
Moreover, municipalities should be able to appreciate the importance of their area’s population
pyramid. This is important as the shape of a population pyramid for a specific municipal area
informs the probable trends in the current and likelihoods in the future. Municipalities are
encouraged to study these statistical dynamics as strategic intentions must be grounded in
empirical data.
With limited resources and the rapid economic trends that impact on the social well-being of
communities, good use of statistics is a prerequisite.
MUNICIPAL SPECIFIC ISSUES
SERVICE DELIVERY AND INFRASTRUCTURE DEVELOPMENT
The City of Ekurhuleni is commended for rolling out its public transport infrastructure (i.e. Bus
Rapid Transit infrastructure) in its area of jurisdiction. These efforts by the Metro bode well with
the goals of the Gauteng Integrated Master Plan (GITMP25). As a way it is important that the
Metro begins to put in place plans to interlink the Bus Rapid Transit with that of the adjacent
Metropolitan areas as anchors of the Global City Region (GCR), to ensure a seamless movement
of people between the three Metropolitan areas.
It is observed that that informal housing remains a persistent challenge in the City of Ekurhuleni.
This is mainly exacerbated by rapid urbanisation into the area, a trend reflective of the province
as a whole. As a way of mitigating this challenge, the City is urged to work closely with the National
Upgrading Support Programme (NUSP), Gauteng Province as well as the Housing Development
Agency to create an urbanisation plan and informal settlements strategy. Such an approach will
assist to deal with issues around land identification, and backyard and informal settlements.
The City of Ekurhuleni’s IDP extensively covers issues of green energy (i.e. promotes renewable
energy sources) and this is welcome. The Metro is particularly applauded given the fact that
energy is a national concern at the moment. The implementation of the Ekurhuleni’s ideas around
energy will contribute, amongst others, to the creation of a sustainable green economy for the
future. In addition to these efforts, within the context of the current electricity outages and
shortages, Ekurhuleni is urged to develop and implement awareness campaigns on energy
efficiency to mitigate against load shedding, undertake proactive infrastructure maintenance as
well as civic education against theft and malicious damage.
FINANCIAL VIABILITY
Ekurhuleni Metropolitan Municipality has demonstrated a stable trend in the management of its
finances over the past number of financial years. The attainment of good results and performance
are supported by the Auditor General’s audit outcomes. Moreover, a positive outcome has been
observed on budgeted Cash Flow, for instance, where the City has an adequate cash coverage
of 2.4 months, 2.5 months and 2.6 months respectively over the MTREF period. The efforts by
the municipality are noteworthy as they bode well with, amongst others, the principle of financial
sustainability in local government. Ekurhuleni is applauded for these achievements.
Correspondingly, the 2015/16 budget was credible and funded in line with the requirements of
section 18 and 19 of the MFMA. The City revenue planning and associated assumptions were
also observed to be realistic and indicative of multi-year budgeting.
With regards to collection, it is noted that the City is not sufficiently collecting and this may have
negative ramifications on the sustainability of the financial environment of the institution. In light
of this, the City is advised to strengthen its cost recovery and collection mechanisms.
GOOD GOVERNANCE
It has been observed that the City’s petition system is not effective. The ineffectiveness of the
current system bears negative implications on participatory governance. It is important that the
municipality strengthens its petition management system, procedures and processes,
governance structures, reporting as well as monitoring and evaluation. This is particularly
important in strengthening trust between the Metro and its citizenry. We must be able to
demonstrate our ability to listen and effectively address concerns raised especially in the form of
petitions.
The City is further commented for having in place Fraud and Anti-Corruption strategies. However,
the effectiveness of these strategies is not reported on. In line with principles of accountability and
transparency as required by the Municipal Systems Act (2000), Sections 57 (a) subsection 7 to
8, it is important that the City inform and submit on a quarterly basis to the MEC for Local
Government whenever there is an investigation on corruption cases.
As advocated by the Gauteng Premier, and in line with ideal of active citizenry, it is important that
the City of Tshwane capacitates civil society structures within its respective areas of jurisdiction.
Furthermore, there is a need to review and strengthen the current public participation processes
or model in order to incorporate the views and needs of special groups of people in the IDP as
required by the Municipal Systems Act of 2000. In light of the pending merger between Ekurhuleni
and Lesedi Municipalities, it is important that both municipalities streamline their IGR structures
and processes.
SPATIAL PLANNING
The Spatial Development Framework (SDF) 2035 summary is wholly inward focused with no
spatial referencing beyond the borders of the municipal space. It essential that purposeful analysis
of adjoining functional areas beyond the boundaries of the City be included in the SDF 2040. This
is particularly important in making the Gauteng City-Region an integrated and functional globally
competitive city-region. It is thus essential that purposeful analysis of adjoining functional areas
beyond the boundaries of EMM should be included in the SDF 2035.
There is insufficient focus on issues of environmental and urban sustainability in the SDF 2035
summary. It has however been noted that some of these issues are addressed in the GDS 2055.
The City is encouraged to explore the applicability of mechanisms for environmental management
outlined in the (Gauteng Environmental Management Framework (GEMF) as prepared by
Gauteng Department of Agriculture and Rural Development. In addition, on-going efforts to
advance responses to climate change, resource scarcity, waste output reduction and sustainable
transformation of infrastructure to be integrated within the built environment and spatial planning.
In the context of the current merger of the EMM and Lesedi Local Municipality, processes and
plans should be put in place in preparation for the review of the Spatial Development Framework
for the newly merged City of Ekurhuleni.
CONCLUSION
The Integrated Development Plan continues to form a crucial aspect of our evolving system of
inter-governmental development planning. Over the years, with the new generation of IDPs only
months away now, the IDP has come to play a dual role – as a strategic planning tool of the
municipality whilst also serving as an instrument of inter-governmental alignment among the
various spheres of government. As envisaged in the White paper for Local Government,
municipalities have a critical contribution to make in integrating and coordinating the programmes
of various spheres of government being implemented within their spaces. As a Department, we
re-affirm our commitment to partner with your municipality in an on-going effort to strengthen
vertical alignment among the various spheres towards making the IDP a plan of all government.
EMM RESPONSE TO MEC COMMENTS ON THE IDP 15/16
MEC COMMENT EMM RESPONSE
Formation of IGR Working Group for
Township Economies Revitalization
The leadership of Ekurhuleni Metropolitan
Municipality has, at its strategic sessions, taken time
to reflect on how the Ten Pillars of the Province that
were launched by the Premier are integrated and
expressed in its own programmes and activities.
From this process it became clear that Ekurhuleni’s
work regarding township revitalization dovetails
neatly with the pillar on radical economic
transformation. Thus the formation of the Working
Group on township revitalization is a welcome move
as it is a point of convergence with work that
Ekurhuleni is already doing. Ekurhuleni is therefore
gladly to be part of this. As testament to this,
together with the MEC for Economic Development,
Ekurhuleni has already hosted a stakeholder
engagement on bed and breakfast (B&Bs)
businesses in townships. Collective effort of this
kind must be embraced as it will increase any
chance at success of this programme
Current energy challenges and the need
Civic Education
Ekurhuleni Municipality has also been hard hit by
the current energy challenges affecting the Country
and is heeding the national call to reduce the
demand for electricity. To this end, the municipality
is embarking in projects to alleviate energy poverty,
reduce constraints on the national grid as well as
reducing carbon footprint. Some of these projects
include:
Landfill gas to electricity generation
This process involves the extraction of methane gas
from refuse and converts it into power. Currently,
the plant at the Simmer and Jack landfill site is in
operation. There are plans in place to duplicate this
process in other landfill sites in EMM.
Rooftop Solar Photovoltaics systems
This plan calls for a rollout of Rooftop Solar PV plant
in modular stages, i.e. 0.5MW-2MW per year. Solar
plants will be place on the roofs of EMM buildings
across the city. The electricity generated in this
manner can be fed into the grid for general
MEC COMMENT EMM RESPONSE
consumption or used at its source, i.e. off grid
options available.
Solar lighting in informal settlements
There are about 119 informal settlements in
Ekurhuleni and this plan is aimed at the continued
rollout of solar lighting to households located
therein. The initiative seeks to alleviate energy
poverty through portable solar units that provide
energy for four (4) globes and a cell phone charger.
To date 25 253 units have been installed.
Long-term Energy plans.
EMM plans to add 300MW of renewable energy
sources in order to diversify the municipality’s
energy mix by 2020. This reflects 10% of our current
energy demand. To achieve this, the following long
term programmes have been planned for:
1. A municipal-owned solar farm generating
200-500MW: In relation to energy security, it
has become clear that EMM will have to
initiate mitigation efforts to alleviate the
effects of a shortage of generation capacity
on the side of the national generator. In this
regard, the viability of a solar farm is being
investigated, with a view of generating
between 200 and 500 Mega Watts in the
medium term;
2. The city plans to solicit proposals from
private power producers with the aim of
procuring renewable energy; and
3. Converting all EMM streetlights to light
emitting diode (LED) technology - This will
save the city in excess of 10MW.
Request for Proposals – Independent Power
producers
In addition, a request for proposals to independent
power producers was issued in October 2015. In
terms of RFP, EMM is seeking competitive
MEC COMMENT EMM RESPONSE
proposals from Independent Power Producers (IPP)
to enter into several Power Purchase Agreements
(PPA) for a period of at least 15 years at rates
competitive to those of Eskom. EMM has set targets
to diversify energy supply to include renewable and
cleaner energy sources with a target of 10% by
2020. In terms of the RFP, EMM is interested in
cleaner/green energy from a minimum of 5MW and
upwards per project. The successful bidder will
finance, design, procure, construct, commission,
operate and maintain a cleaner/green power plant
with a minimum capacity of 5MW. Further details will
be provided once this process has been completed.
Community awareness – Energy
EMM conducts at least 40 civic awareness
campaigns per financial year. This is implemented
mainly at a depot level and are aimed at both
businesses and residential customers. The
campaigns directed towards residential customers
deal with topics ranging from the dangers of illegal
connections (also their economic destruction of the
City grid), safe use of electricity in the house, energy
efficiency, tariffs and choices that are open to the
home-user, to the disadvantages of choosing to
have your meter tampered, and more.
In an effort to intensify these community awareness
campaigns, an additional 120 young people were
signed up to execute targeted communication within
EMM. Their efforts are complimentary to the above
discussion, and focused on the same topics, but in
a more personal door-to-door methodology.
Finally, topics of high importance (such as the
threats posed by illegal connections) are discussed
in the engagements of political leaders with
communities.
Evidenced based planning
Ekurhuleni Metropolitan Municipality has always
endeavoured to use relevant and officially
recognized data and statistics in all its planning.
Other data sources are only used for benchmarking
MEC COMMENT EMM RESPONSE
purposes but where projections are made in order
to come to grips with future service delivery
demands, official data and statistics are always
used as a basis. The municipality is also well aware
of population trends within its municipal area as
witnessed by the inclusion, in its IDP document, of
demographics on the size of different sexes and age
groups.
GCR Interconnectivity of the BRT
Ekurhuleni agrees with MEC on the need for EMM
to put in place plans to interlink the Bus Rapid
Transit with that of adjacent municipalities so that
this anchors the Global City Region. Ekurhuleni has
already commenced discussions with the City of
Johannesburg and we have agreed to run a joint
process of developing an operational plan for
integration of IPTN’s on the North East – North West
corridors in the two Cities. The CoJ/EMM BRT
integration has almost been organic as EMM’s
phase 1 lines cross their phase 1c. The 2013
Household Surveys also confirmed that there is big
travel demand on that corridor. It is envisaged that
the process will be concluded in 2016 and this will
guide the process going forward.
With regard to the City of Tshwane, although
informal discussions have been held with EMM, no
formal planning has been done in this regard. Due
to the greater distance between the current systems
of the two cities, it is envisaged that this integration
will follow after the CoJ integration processes.
Financial Viability The recent economic downturn has adversely
impacted profitability levels of businesses and has
reduced the disposable income of households. In
addition, tariff hikes for electricity and other utilities
are putting a strain on consumer affordability levels.
Eskom supplied areas have also had a negative
impact on EMM’s collection drive given the limited
credit control tools available in these areas.
Despite all these, EMM realised an improvement in
its collection rate from 90.14% in the 2013/2014
financial year to 92.63% in the 2014/2015 financial
year. Over and above the strengthening credit
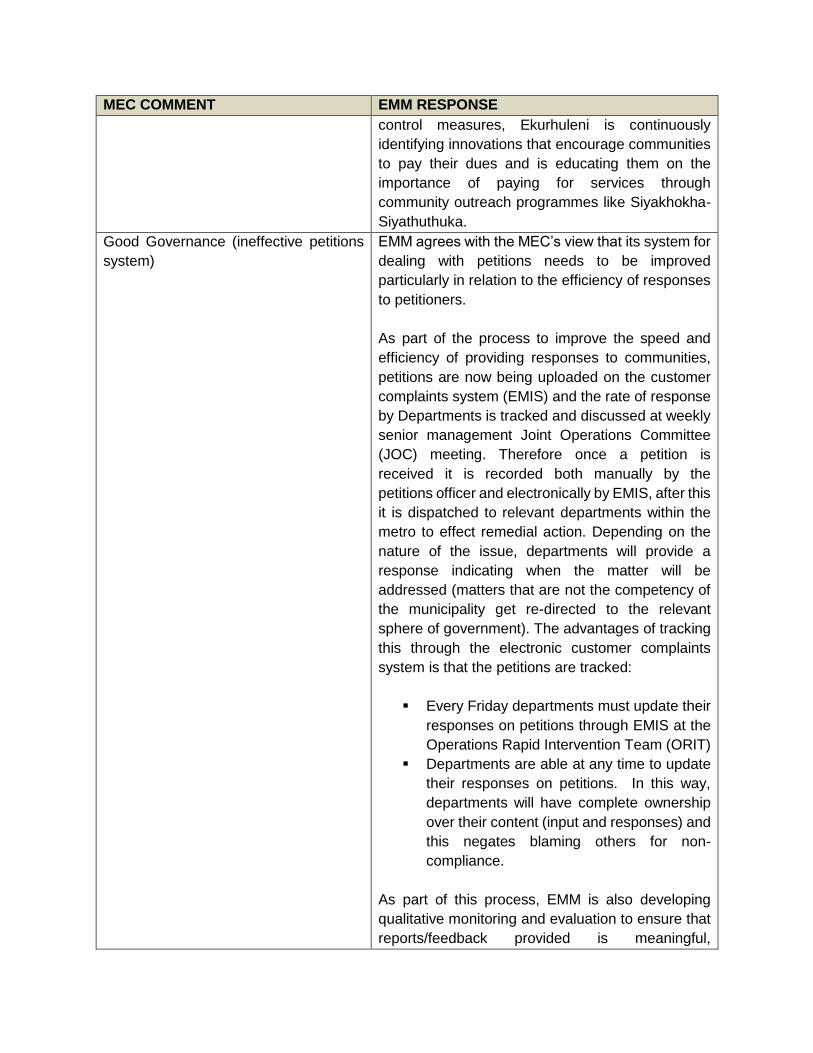
MEC COMMENT EMM RESPONSE
control measures, Ekurhuleni is continuously
identifying innovations that encourage communities
to pay their dues and is educating them on the
importance of paying for services through
community outreach programmes like Siyakhokha-
Siyathuthuka.
Good Governance (ineffective petitions
system)
EMM agrees with the MEC’s view that its system for
dealing with petitions needs to be improved
particularly in relation to the efficiency of responses
to petitioners.
As part of the process to improve the speed and
efficiency of providing responses to communities,
petitions are now being uploaded on the customer
complaints system (EMIS) and the rate of response
by Departments is tracked and discussed at weekly
senior management Joint Operations Committee
(JOC) meeting. Therefore once a petition is
received it is recorded both manually by the
petitions officer and electronically by EMIS, after this
it is dispatched to relevant departments within the
metro to effect remedial action. Depending on the
nature of the issue, departments will provide a
response indicating when the matter will be
addressed (matters that are not the competency of
the municipality get re-directed to the relevant
sphere of government). The advantages of tracking
this through the electronic customer complaints
system is that the petitions are tracked:
Every Friday departments must update their
responses on petitions through EMIS at the
Operations Rapid Intervention Team (ORIT)
Departments are able at any time to update
their responses on petitions. In this way,
departments will have complete ownership
over their content (input and responses) and
this negates blaming others for non-
compliance.
As part of this process, EMM is also developing
qualitative monitoring and evaluation to ensure that
reports/feedback provided is meaningful,
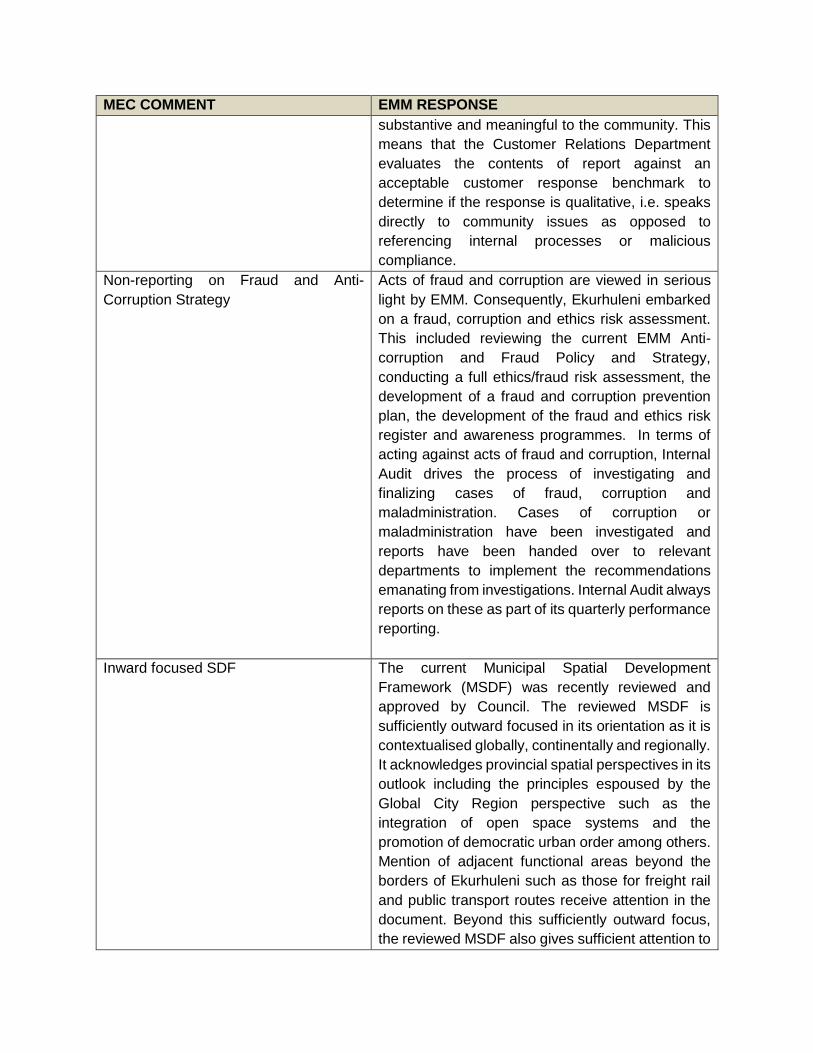
MEC COMMENT EMM RESPONSE
substantive and meaningful to the community. This
means that the Customer Relations Department
evaluates the contents of report against an
acceptable customer response benchmark to
determine if the response is qualitative, i.e. speaks
directly to community issues as opposed to
referencing internal processes or malicious
compliance.
Non-reporting on Fraud and Anti-
Corruption Strategy
Acts of fraud and corruption are viewed in serious
light by EMM. Consequently, Ekurhuleni embarked
on a fraud, corruption and ethics risk assessment.
This included reviewing the current EMM Anti-
corruption and Fraud Policy and Strategy,
conducting a full ethics/fraud risk assessment, the
development of a fraud and corruption prevention
plan, the development of the fraud and ethics risk
register and awareness programmes. In terms of
acting against acts of fraud and corruption, Internal
Audit drives the process of investigating and
finalizing cases of fraud, corruption and
maladministration. Cases of corruption or
maladministration have been investigated and
reports have been handed over to relevant
departments to implement the recommendations
emanating from investigations. Internal Audit always
reports on these as part of its quarterly performance
reporting.
Inward focused SDF
The current Municipal Spatial Development
Framework (MSDF) was recently reviewed and
approved by Council. The reviewed MSDF is
sufficiently outward focused in its orientation as it is
contextualised globally, continentally and regionally.
It acknowledges provincial spatial perspectives in its
outlook including the principles espoused by the
Global City Region perspective such as the
integration of open space systems and the
promotion of democratic urban order among others.
Mention of adjacent functional areas beyond the
borders of Ekurhuleni such as those for freight rail
and public transport routes receive attention in the
document. Beyond this sufficiently outward focus,
the reviewed MSDF also gives sufficient attention to
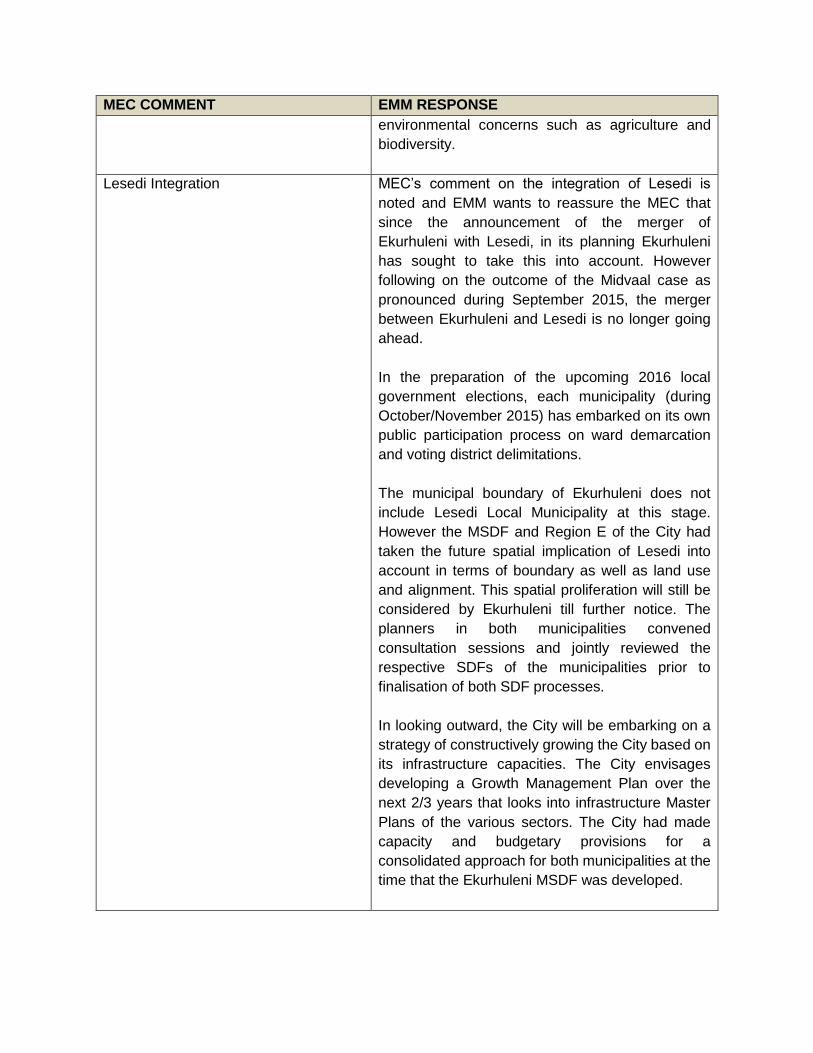
MEC COMMENT EMM RESPONSE
environmental concerns such as agriculture and
biodiversity.
Lesedi Integration MEC’s comment on the integration of Lesedi is
noted and EMM wants to reassure the MEC that
since the announcement of the merger of
Ekurhuleni with Lesedi, in its planning Ekurhuleni
has sought to take this into account. However
following on the outcome of the Midvaal case as
pronounced during September 2015, the merger
between Ekurhuleni and Lesedi is no longer going
ahead.
In the preparation of the upcoming 2016 local
government elections, each municipality (during
October/November 2015) has embarked on its own
public participation process on ward demarcation
and voting district delimitations.
The municipal boundary of Ekurhuleni does not
include Lesedi Local Municipality at this stage.
However the MSDF and Region E of the City had
taken the future spatial implication of Lesedi into
account in terms of boundary as well as land use
and alignment. This spatial proliferation will still be
considered by Ekurhuleni till further notice. The
planners in both municipalities convened
consultation sessions and jointly reviewed the
respective SDFs of the municipalities prior to
finalisation of both SDF processes.
In looking outward, the City will be embarking on a
strategy of constructively growing the City based on
its infrastructure capacities. The City envisages
developing a Growth Management Plan over the
next 2/3 years that looks into infrastructure Master
Plans of the various sectors. The City had made
capacity and budgetary provisions for a
consolidated approach for both municipalities at the
time that the Ekurhuleni MSDF was developed.

CHAPTER 6
6. COMMUNITY PARTICIPATION
6.1 IDP PLANNING PROCESS FOR 2016/17: WARD CONSULTATIONS
INTRODUCTION
This chapter provides an outline of the legislative framework guiding community and stakeholder
involvement in the IDP planning process. It also discusses processes followed especially the
outreach activities that were part of reviewing the draft 2016/17 IDP. Lastly it provides, in listed
fashion, the ward needs as gathered from the different consultation meetings.
LEGISLATIVE FRAMEWORK
Legislatively, it is the South African Constitution of 1996, the Municipal Structures Act of 1998 and
the Municipal Systems Act of 2000 that provide guidance on processes to be followed by
municipalities in the development of the IDP. In particular the Municipal Systems Act takes its cue
from the principles contained in the Constitution on participatory democracy. The Constitution
enjoins municipalities to encourage participation by communities and community organizations in
local government. Among the basic values and principles the Constitution espouses for public
administration governance is responsiveness to community needs and public participation in
policy making.
Section 34 of the Municipal System Act prescribes annual review and amendment of the IDP in
accordance with certain processes. Section 29 (1) (b) of Chapter 5 of the Municipal Systems Act
of 2000 states that municipalities, through appropriate mechanisms, processes and procedures
established in terms of public participation; allow for communities to be consulted on their
development needs and priorities; and the local community should participate in the drafting of
the IDP.
EMM’S PUBLIC PARTICIPATION FRAMEWORK AND APPROACH
To give effect to the Constitution and legislation, Ekurhuleni formulated its own Public
Participation Policy and Engagement Framework. In the policy the municipality commits itself to
co-implementing formal representative government with a system of participatory governance. It
recognizes the municipalities’ obligation to establish mechanisms, processes and procedures for
participation of the local community in its affairs. Further to this it outlines the mechanisms by
which the public may participate in the municipalities’ affairs.
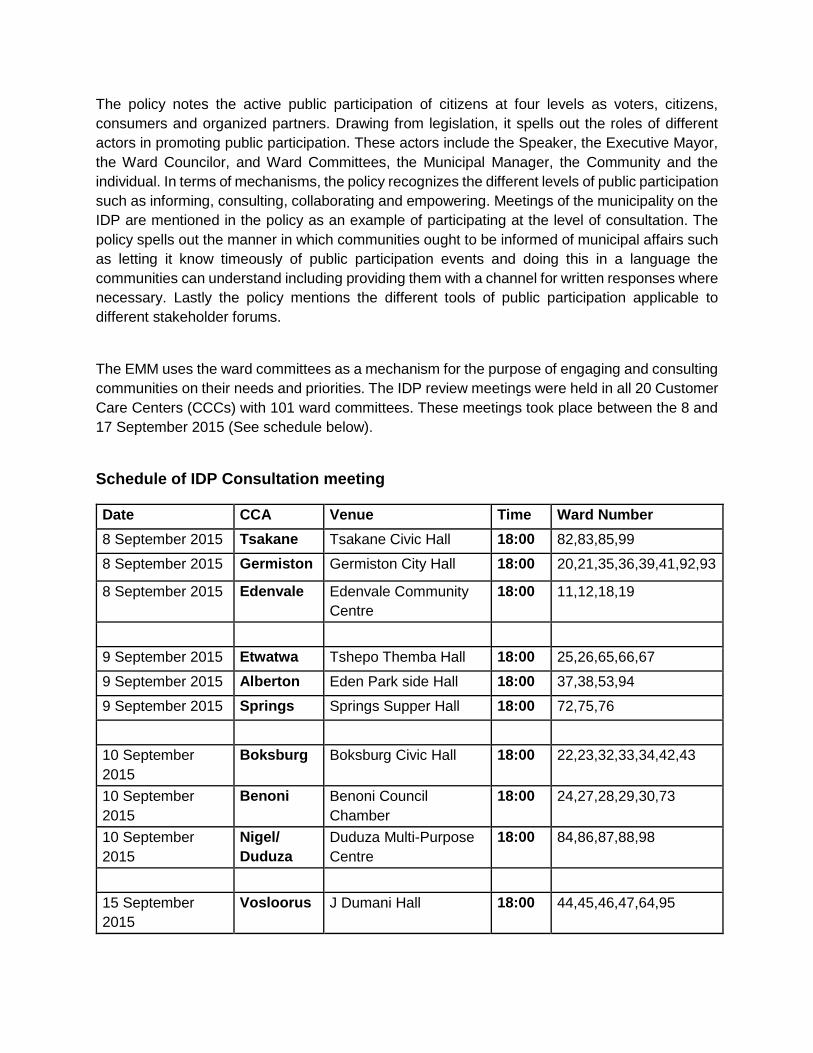
The policy notes the active public participation of citizens at four levels as voters, citizens,
consumers and organized partners. Drawing from legislation, it spells out the roles of different
actors in promoting public participation. These actors include the Speaker, the Executive Mayor,
the Ward Councilor, and Ward Committees, the Municipal Manager, the Community and the
individual. In terms of mechanisms, the policy recognizes the different levels of public participation
such as informing, consulting, collaborating and empowering. Meetings of the municipality on the
IDP are mentioned in the policy as an example of participating at the level of consultation. The
policy spells out the manner in which communities ought to be informed of municipal affairs such
as letting it know timeously of public participation events and doing this in a language the
communities can understand including providing them with a channel for written responses where
necessary. Lastly the policy mentions the different tools of public participation applicable to
different stakeholder forums.
The EMM uses the ward committees as a mechanism for the purpose of engaging and consulting
communities on their needs and priorities. The IDP review meetings were held in all 20 Customer
Care Centers (CCCs) with 101 ward committees. These meetings took place between the 8 and
17 September 2015 (See schedule below).
Schedule of IDP Consultation meeting
Date CCA Venue Time Ward Number
8 September 2015 Tsakane Tsakane Civic Hall 18:00 82,83,85,99
8 September 2015 Germiston Germiston City Hall 18:00 20,21,35,36,39,41,92,93
8 September 2015 Edenvale Edenvale Community
Centre
18:00 11,12,18,19
9 September 2015 Etwatwa Tshepo Themba Hall 18:00 25,26,65,66,67
9 September 2015 Alberton Eden Park side Hall 18:00 37,38,53,94
9 September 2015 Springs Springs Supper Hall 18:00 72,75,76
10 September
2015
Boksburg Boksburg Civic Hall 18:00 22,23,32,33,34,42,43
10 September
2015
Benoni Benoni Council
Chamber
18:00 24,27,28,29,30,73
10 September
2015
Nigel/
Duduza
Duduza Multi-Purpose
Centre
18:00 84,86,87,88,98
15 September
2015
Vosloorus J Dumani Hall 18:00 44,45,46,47,64,95
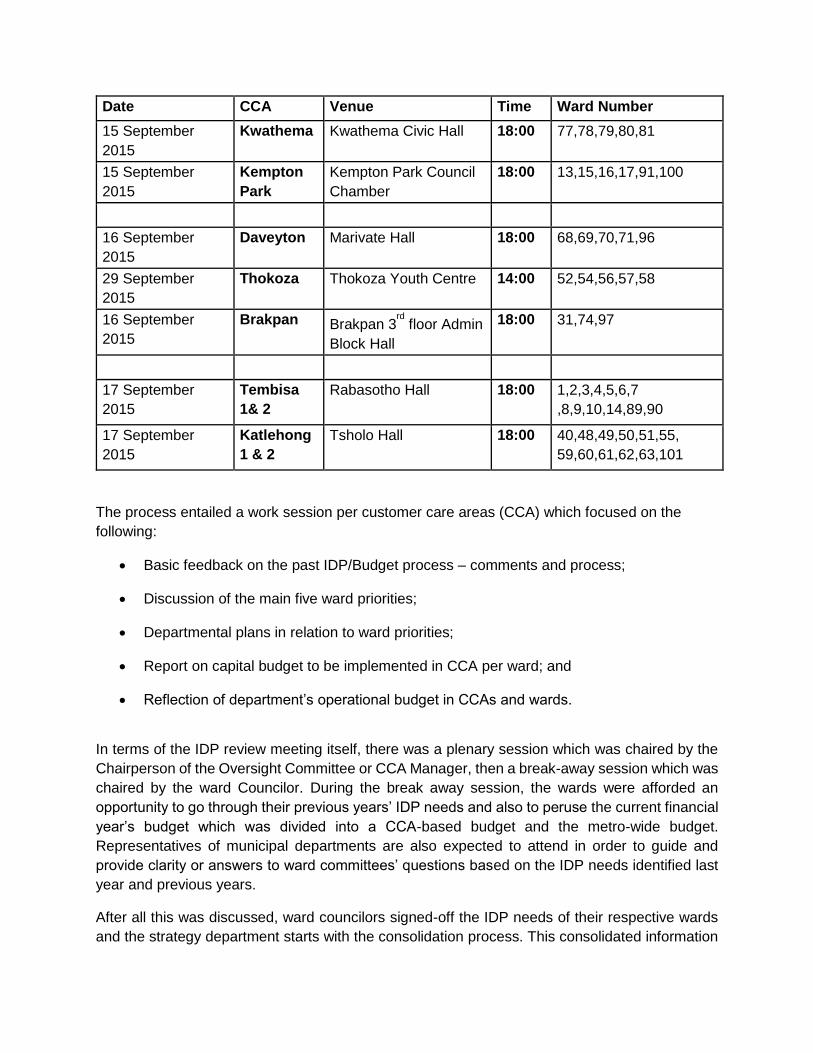
Date CCA Venue Time Ward Number
15 September
2015
Kwathema Kwathema Civic Hall 18:00 77,78,79,80,81
15 September
2015
Kempton
Park
Kempton Park Council
Chamber
18:00 13,15,16,17,91,100
16 September
2015
Daveyton Marivate Hall 18:00 68,69,70,71,96
29 September
2015
Thokoza Thokoza Youth Centre 14:00 52,54,56,57,58
16 September
2015
Brakpan Brakpan 3rd floor Admin
Block Hall
18:00 31,74,97
17 September
2015
Tembisa
1& 2
Rabasotho Hall 18:00 1,2,3,4,5,6,7
,8,9,10,14,89,90
17 September
2015
Katlehong
1 & 2
Tsholo Hall 18:00 40,48,49,50,51,55,
59,60,61,62,63,101
The process entailed a work session per customer care areas (CCA) which focused on the
following:
Basic feedback on the past IDP/Budget process – comments and process;
Discussion of the main five ward priorities;
Departmental plans in relation to ward priorities;
Report on capital budget to be implemented in CCA per ward; and
Reflection of department’s operational budget in CCAs and wards.
In terms of the IDP review meeting itself, there was a plenary session which was chaired by the
Chairperson of the Oversight Committee or CCA Manager, then a break-away session which was
chaired by the ward Councilor. During the break away session, the wards were afforded an
opportunity to go through their previous years’ IDP needs and also to peruse the current financial
year’s budget which was divided into a CCA-based budget and the metro-wide budget.
Representatives of municipal departments are also expected to attend in order to guide and
provide clarity or answers to ward committees’ questions based on the IDP needs identified last
year and previous years.
After all this was discussed, ward councilors signed-off the IDP needs of their respective wards
and the strategy department starts with the consolidation process. This consolidated information
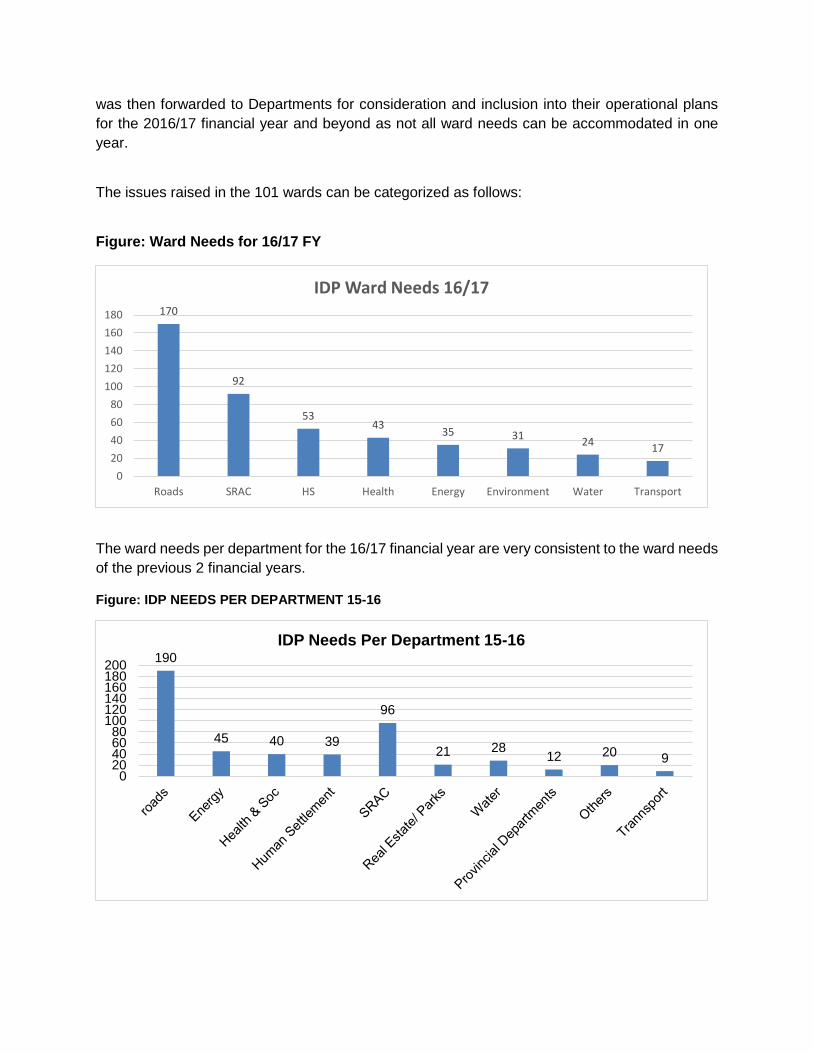
was then forwarded to Departments for consideration and inclusion into their operational plans
for the 2016/17 financial year and beyond as not all ward needs can be accommodated in one
year.
The issues raised in the 101 wards can be categorized as follows:
Figure: Ward Needs for 16/17 FY
The ward needs per department for the 16/17 financial year are very consistent to the ward needs
of the previous 2 financial years.
Figure: IDP NEEDS PER DEPARTMENT 15-16
170
92
5343
35 3124
17
0
20
40
60
80
100
120
140
160
180
Roads SRAC HS Health Energy Environment Water Transport
IDP Ward Needs 16/17
190
45 40 39
96
21 2812 20 9
020406080
100120140160180200
IDP Needs Per Department 15-16
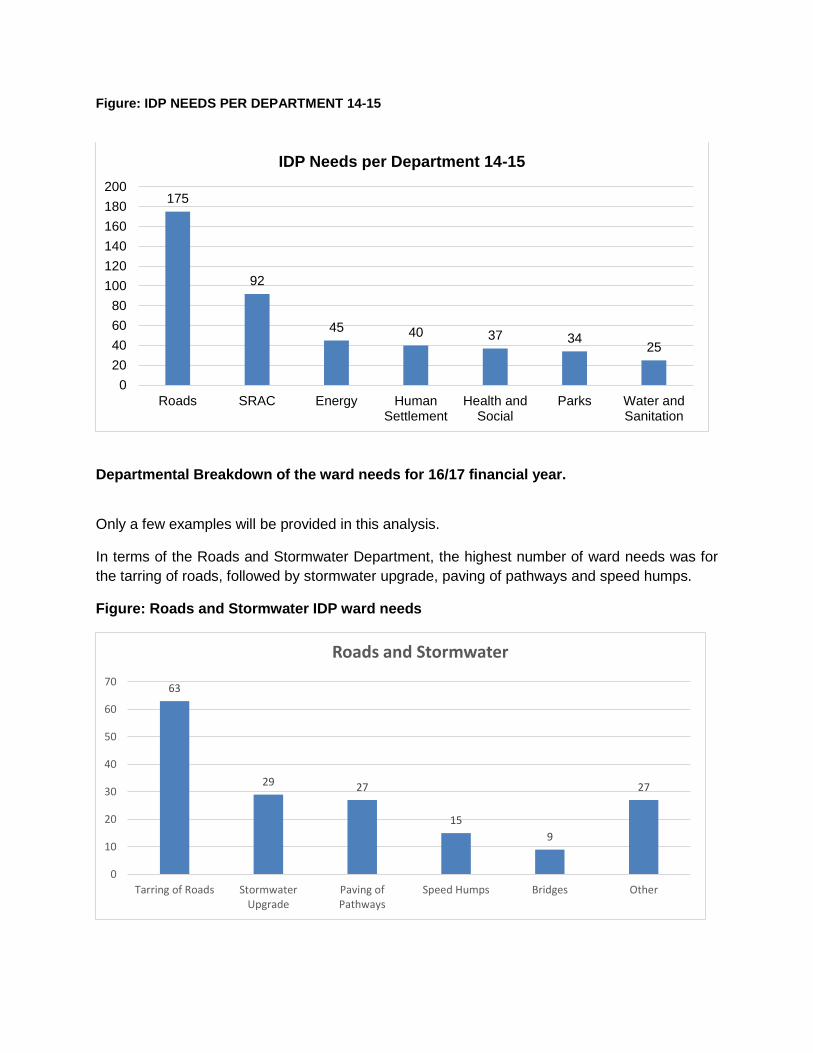
Figure: IDP NEEDS PER DEPARTMENT 14-15
Departmental Breakdown of the ward needs for 16/17 financial year.
Only a few examples will be provided in this analysis.
In terms of the Roads and Stormwater Department, the highest number of ward needs was for
the tarring of roads, followed by stormwater upgrade, paving of pathways and speed humps.
Figure: Roads and Stormwater IDP ward needs
175
92
45 40 37 3425
0
20
40
60
80
100
120
140
160
180
200
Roads SRAC Energy HumanSettlement
Health andSocial
Parks Water andSanitation
IDP Needs per Department 14-15
63
29 27
15
9
27
0
10
20
30
40
50
60
70
Tarring of Roads StormwaterUpgrade
Paving ofPathways
Speed Humps Bridges Other
Roads and Stormwater
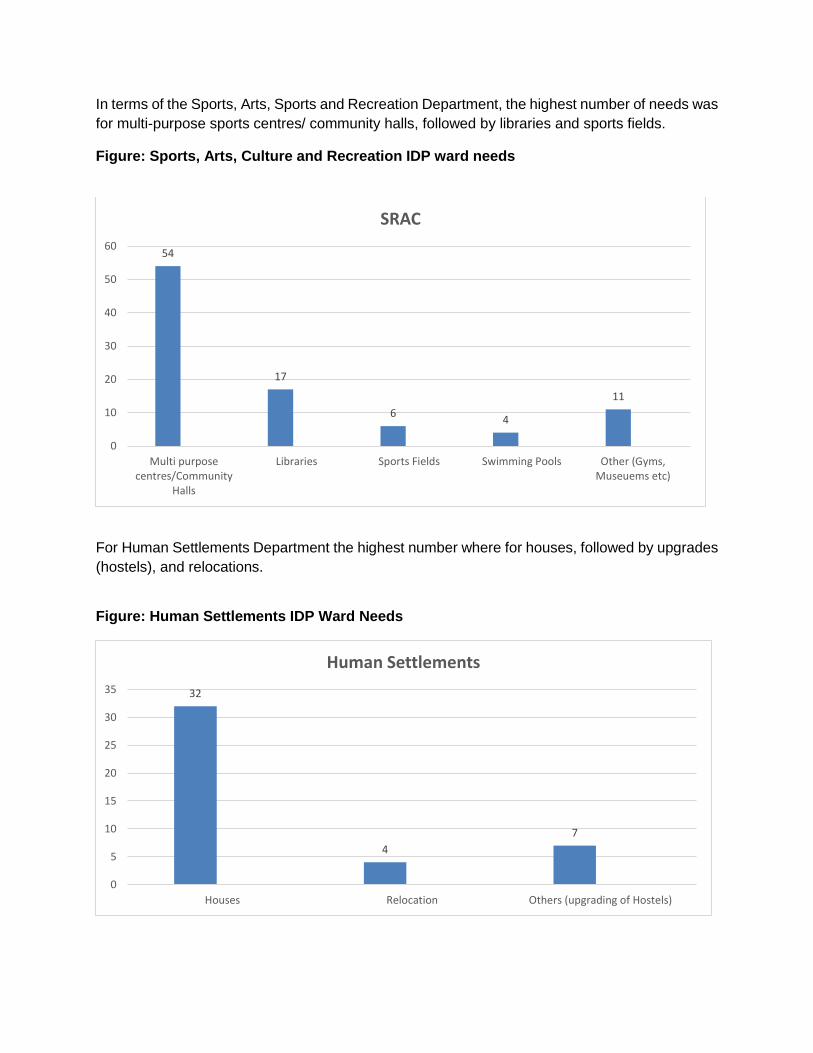
In terms of the Sports, Arts, Sports and Recreation Department, the highest number of needs was
for multi-purpose sports centres/ community halls, followed by libraries and sports fields.
Figure: Sports, Arts, Culture and Recreation IDP ward needs
For Human Settlements Department the highest number where for houses, followed by upgrades
(hostels), and relocations.
Figure: Human Settlements IDP Ward Needs
54
17
64
11
0
10
20
30
40
50
60
Multi purposecentres/Community
Halls
Libraries Sports Fields Swimming Pools Other (Gyms,Museuems etc)
SRAC
32
4
7
0
5
10
15
20
25
30
35
Houses Relocation Others (upgrading of Hostels)
Human Settlements
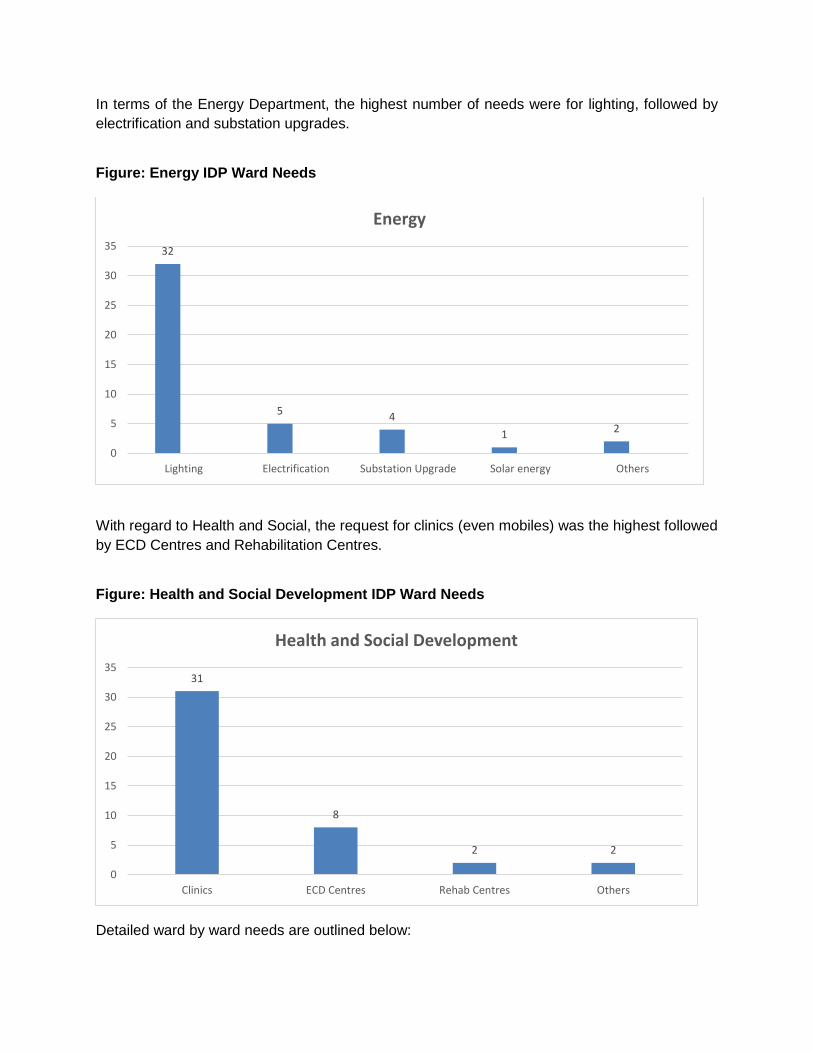
In terms of the Energy Department, the highest number of needs were for lighting, followed by
electrification and substation upgrades.
Figure: Energy IDP Ward Needs
With regard to Health and Social, the request for clinics (even mobiles) was the highest followed
by ECD Centres and Rehabilitation Centres.
Figure: Health and Social Development IDP Ward Needs
Detailed ward by ward needs are outlined below:
32
5 4
1 2
0
5
10
15
20
25
30
35
Lighting Electrification Substation Upgrade Solar energy Others
Energy
31
8
2 2
0
5
10
15
20
25
30
35
Clinics ECD Centres Rehab Centres Others
Health and Social Development
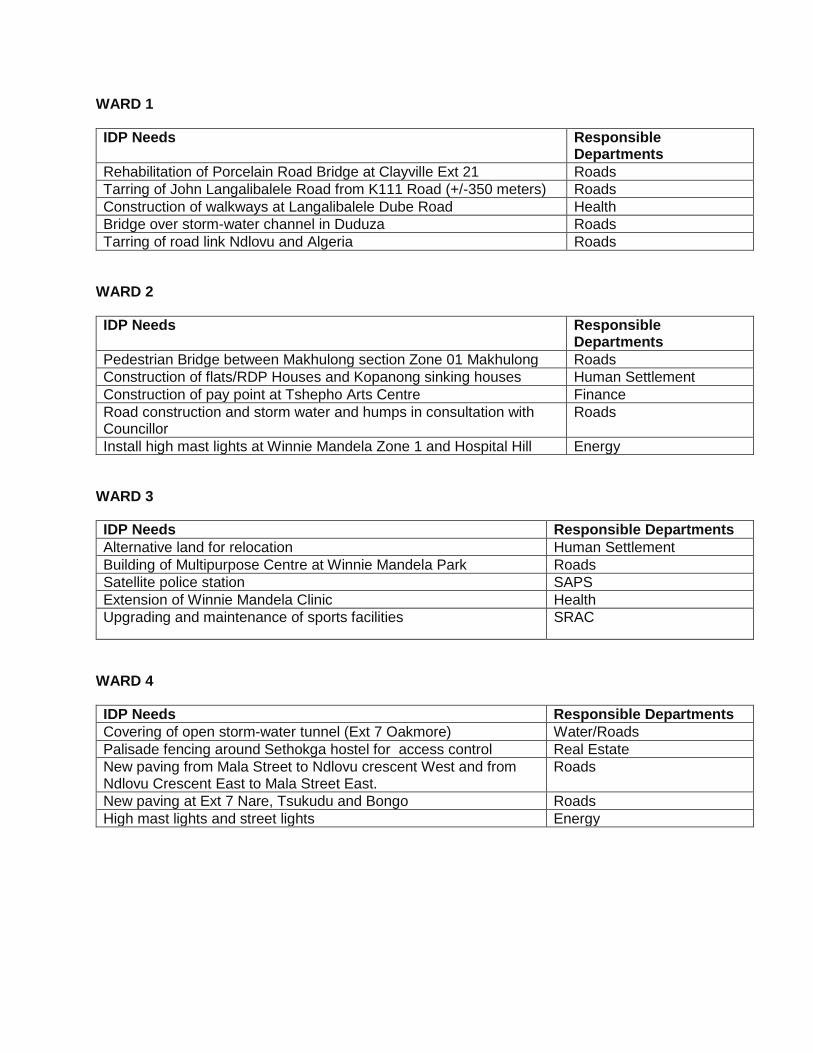
WARD 1
IDP Needs Responsible Departments
Rehabilitation of Porcelain Road Bridge at Clayville Ext 21 Roads
Tarring of John Langalibalele Road from K111 Road (+/-350 meters) Roads
Construction of walkways at Langalibalele Dube Road Health
Bridge over storm-water channel in Duduza Roads
Tarring of road link Ndlovu and Algeria Roads
WARD 2
IDP Needs Responsible Departments
Pedestrian Bridge between Makhulong section Zone 01 Makhulong Roads
Construction of flats/RDP Houses and Kopanong sinking houses Human Settlement
Construction of pay point at Tshepho Arts Centre Finance
Road construction and storm water and humps in consultation with Councillor
Roads
Install high mast lights at Winnie Mandela Zone 1 and Hospital Hill Energy
WARD 3
IDP Needs Responsible Departments
Alternative land for relocation Human Settlement
Building of Multipurpose Centre at Winnie Mandela Park Roads
Satellite police station SAPS
Extension of Winnie Mandela Clinic Health
Upgrading and maintenance of sports facilities SRAC
WARD 4
IDP Needs Responsible Departments
Covering of open storm-water tunnel (Ext 7 Oakmore) Water/Roads
Palisade fencing around Sethokga hostel for access control Real Estate
New paving from Mala Street to Ndlovu crescent West and from Ndlovu Crescent East to Mala Street East.
Roads
New paving at Ext 7 Nare, Tsukudu and Bongo Roads
High mast lights and street lights Energy
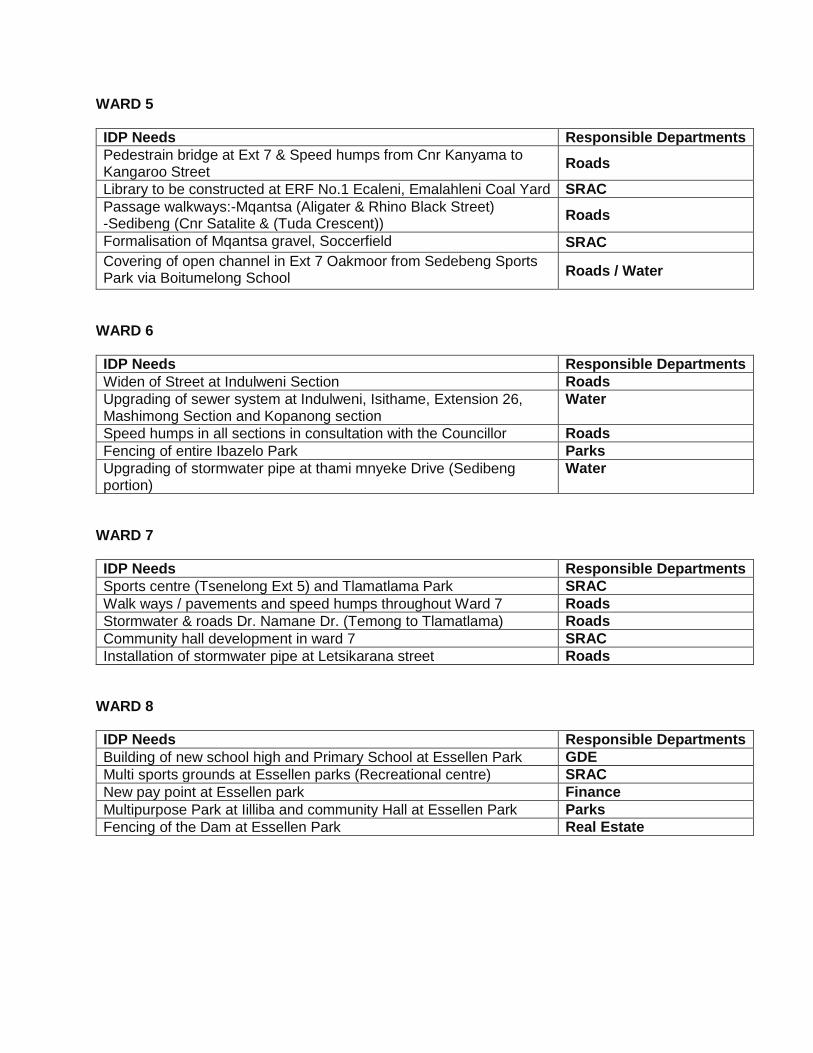
WARD 5
IDP Needs Responsible Departments
Pedestrain bridge at Ext 7 & Speed humps from Cnr Kanyama to Kangaroo Street
Roads
Library to be constructed at ERF No.1 Ecaleni, Emalahleni Coal Yard SRAC
Passage walkways:-Mqantsa (Aligater & Rhino Black Street) -Sedibeng (Cnr Satalite & (Tuda Crescent))
Roads
Formalisation of Mqantsa gravel, Soccerfield SRAC
Covering of open channel in Ext 7 Oakmoor from Sedebeng Sports Park via Boitumelong School
Roads / Water
WARD 6
IDP Needs Responsible Departments
Widen of Street at Indulweni Section Roads
Upgrading of sewer system at Indulweni, Isithame, Extension 26, Mashimong Section and Kopanong section
Water
Speed humps in all sections in consultation with the Councillor Roads
Fencing of entire Ibazelo Park Parks
Upgrading of stormwater pipe at thami mnyeke Drive (Sedibeng portion)
Water
WARD 7
IDP Needs Responsible Departments
Sports centre (Tsenelong Ext 5) and Tlamatlama Park SRAC
Walk ways / pavements and speed humps throughout Ward 7 Roads
Stormwater & roads Dr. Namane Dr. (Temong to Tlamatlama) Roads
Community hall development in ward 7 SRAC
Installation of stormwater pipe at Letsikarana street Roads
WARD 8
IDP Needs Responsible Departments
Building of new school high and Primary School at Essellen Park GDE
Multi sports grounds at Essellen parks (Recreational centre) SRAC
New pay point at Essellen park Finance
Multipurpose Park at Iilliba and community Hall at Essellen Park Parks
Fencing of the Dam at Essellen Park Real Estate
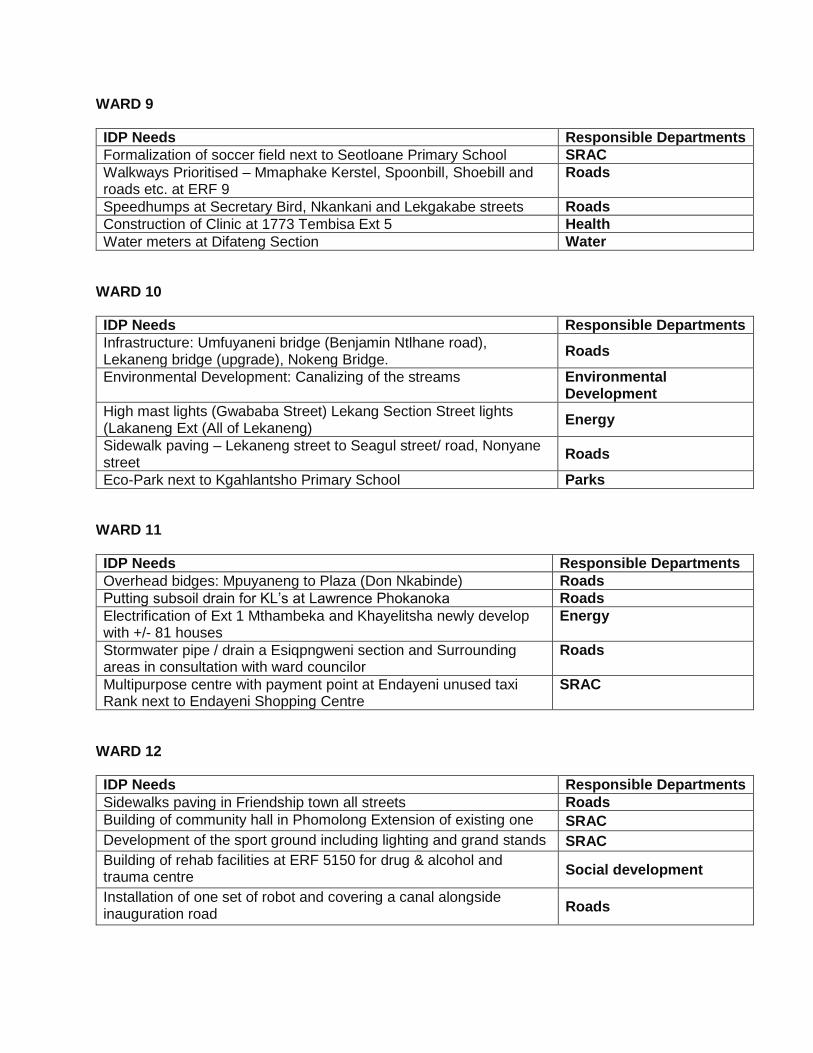
WARD 9
IDP Needs Responsible Departments
Formalization of soccer field next to Seotloane Primary School SRAC
Walkways Prioritised – Mmaphake Kerstel, Spoonbill, Shoebill and roads etc. at ERF 9
Roads
Speedhumps at Secretary Bird, Nkankani and Lekgakabe streets Roads
Construction of Clinic at 1773 Tembisa Ext 5 Health
Water meters at Difateng Section Water
WARD 10
IDP Needs Responsible Departments
Infrastructure: Umfuyaneni bridge (Benjamin Ntlhane road), Lekaneng bridge (upgrade), Nokeng Bridge.
Roads
Environmental Development: Canalizing of the streams Environmental Development
High mast lights (Gwababa Street) Lekang Section Street lights (Lakaneng Ext (All of Lekaneng)
Energy
Sidewalk paving – Lekaneng street to Seagul street/ road, Nonyane street
Roads
Eco-Park next to Kgahlantsho Primary School Parks
WARD 11
IDP Needs Responsible Departments
Overhead bidges: Mpuyaneng to Plaza (Don Nkabinde) Roads
Putting subsoil drain for KL’s at Lawrence Phokanoka Roads
Electrification of Ext 1 Mthambeka and Khayelitsha newly develop with +/- 81 houses
Energy
Stormwater pipe / drain a Esiqpngweni section and Surrounding areas in consultation with ward councilor
Roads
Multipurpose centre with payment point at Endayeni unused taxi Rank next to Endayeni Shopping Centre
SRAC
WARD 12
IDP Needs Responsible Departments
Sidewalks paving in Friendship town all streets Roads
Building of community hall in Phomolong Extension of existing one SRAC
Development of the sport ground including lighting and grand stands SRAC
Building of rehab facilities at ERF 5150 for drug & alcohol and trauma centre
Social development
Installation of one set of robot and covering a canal alongside inauguration road
Roads
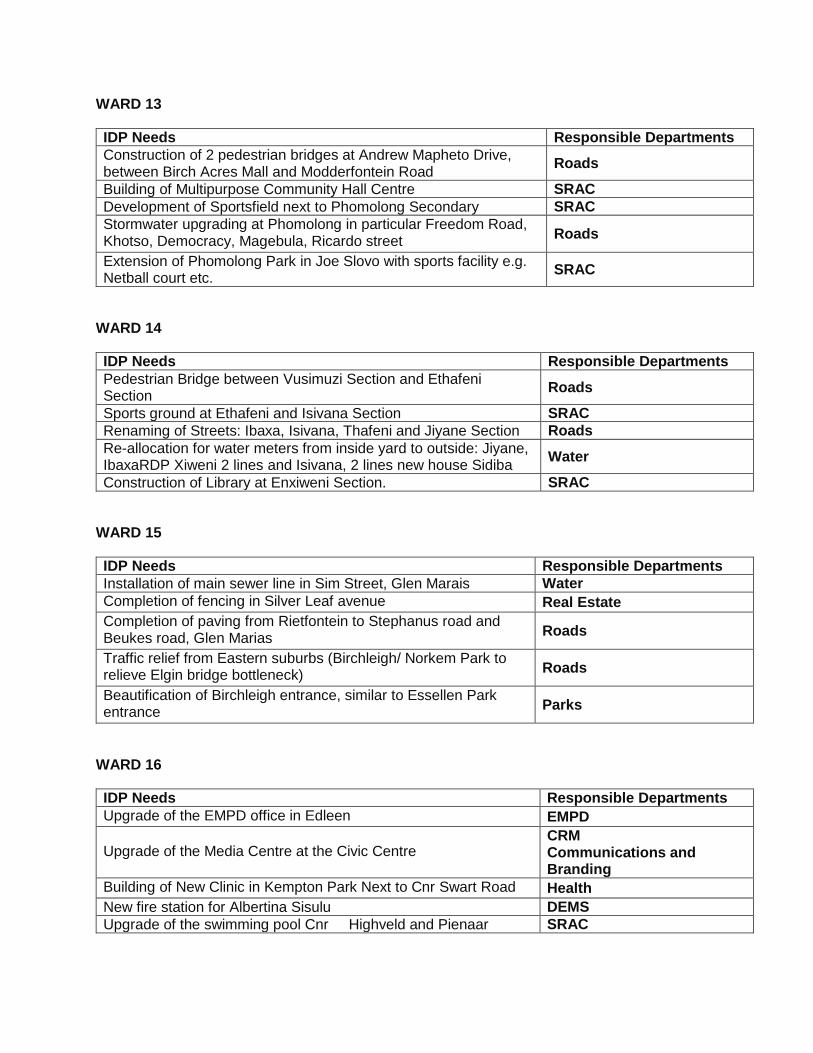
WARD 13
IDP Needs Responsible Departments
Construction of 2 pedestrian bridges at Andrew Mapheto Drive, between Birch Acres Mall and Modderfontein Road
Roads
Building of Multipurpose Community Hall Centre SRAC
Development of Sportsfield next to Phomolong Secondary SRAC
Stormwater upgrading at Phomolong in particular Freedom Road, Khotso, Democracy, Magebula, Ricardo street
Roads
Extension of Phomolong Park in Joe Slovo with sports facility e.g. Netball court etc.
SRAC
WARD 14
IDP Needs Responsible Departments
Pedestrian Bridge between Vusimuzi Section and Ethafeni Section
Roads
Sports ground at Ethafeni and Isivana Section SRAC
Renaming of Streets: Ibaxa, Isivana, Thafeni and Jiyane Section Roads
Re-allocation for water meters from inside yard to outside: Jiyane, IbaxaRDP Xiweni 2 lines and Isivana, 2 lines new house Sidiba
Water
Construction of Library at Enxiweni Section. SRAC
WARD 15
IDP Needs Responsible Departments
Installation of main sewer line in Sim Street, Glen Marais Water
Completion of fencing in Silver Leaf avenue Real Estate
Completion of paving from Rietfontein to Stephanus road and Beukes road, Glen Marias
Roads
Traffic relief from Eastern suburbs (Birchleigh/ Norkem Park to relieve Elgin bridge bottleneck)
Roads
Beautification of Birchleigh entrance, similar to Essellen Park entrance
Parks
WARD 16
IDP Needs Responsible Departments
Upgrade of the EMPD office in Edleen EMPD
Upgrade of the Media Centre at the Civic Centre CRM Communications and Branding
Building of New Clinic in Kempton Park Next to Cnr Swart Road Health
New fire station for Albertina Sisulu DEMS
Upgrade of the swimming pool Cnr Highveld and Pienaar SRAC
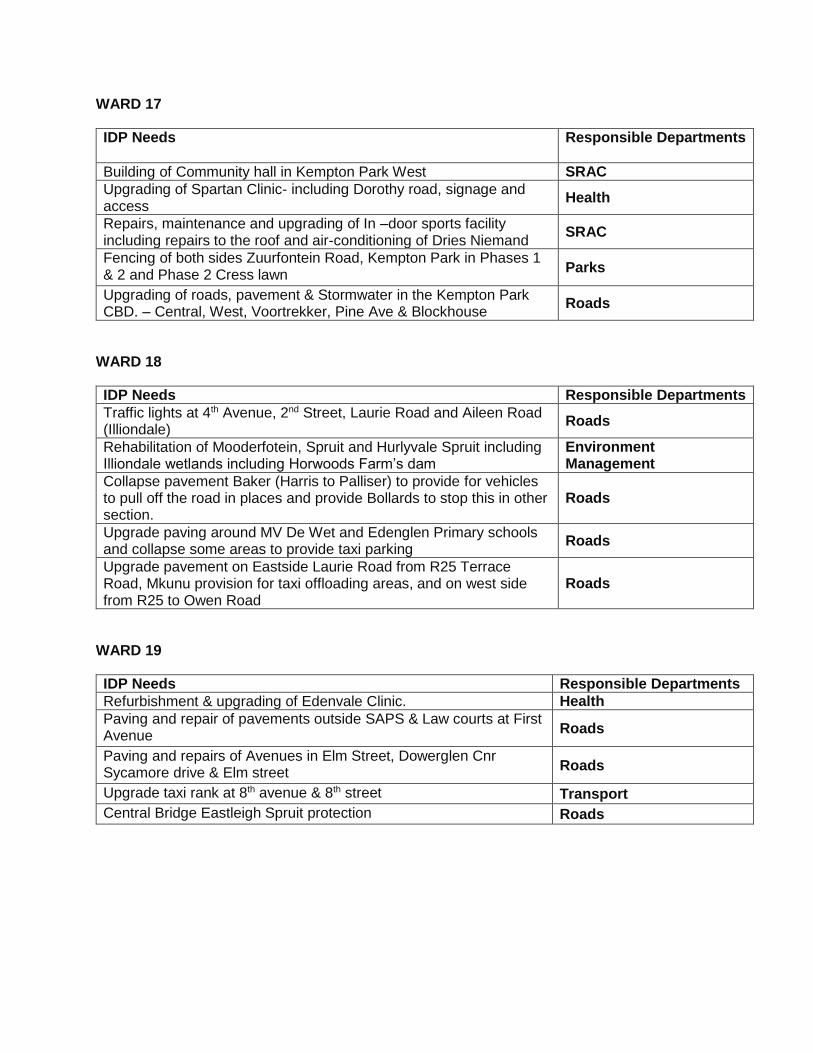
WARD 17
IDP Needs
Responsible Departments
Building of Community hall in Kempton Park West SRAC
Upgrading of Spartan Clinic- including Dorothy road, signage and access
Health
Repairs, maintenance and upgrading of In –door sports facility including repairs to the roof and air-conditioning of Dries Niemand
SRAC
Fencing of both sides Zuurfontein Road, Kempton Park in Phases 1 & 2 and Phase 2 Cress lawn
Parks
Upgrading of roads, pavement & Stormwater in the Kempton Park CBD. – Central, West, Voortrekker, Pine Ave & Blockhouse
Roads
WARD 18
IDP Needs Responsible Departments
Traffic lights at 4th Avenue, 2nd Street, Laurie Road and Aileen Road (Illiondale)
Roads
Rehabilitation of Mooderfotein, Spruit and Hurlyvale Spruit including Illiondale wetlands including Horwoods Farm’s dam
Environment Management
Collapse pavement Baker (Harris to Palliser) to provide for vehicles to pull off the road in places and provide Bollards to stop this in other section.
Roads
Upgrade paving around MV De Wet and Edenglen Primary schools and collapse some areas to provide taxi parking
Roads
Upgrade pavement on Eastside Laurie Road from R25 Terrace Road, Mkunu provision for taxi offloading areas, and on west side from R25 to Owen Road
Roads
WARD 19
IDP Needs Responsible Departments
Refurbishment & upgrading of Edenvale Clinic. Health
Paving and repair of pavements outside SAPS & Law courts at First Avenue
Roads
Paving and repairs of Avenues in Elm Street, Dowerglen Cnr Sycamore drive & Elm street
Roads
Upgrade taxi rank at 8th avenue & 8th street Transport
Central Bridge Eastleigh Spruit protection Roads
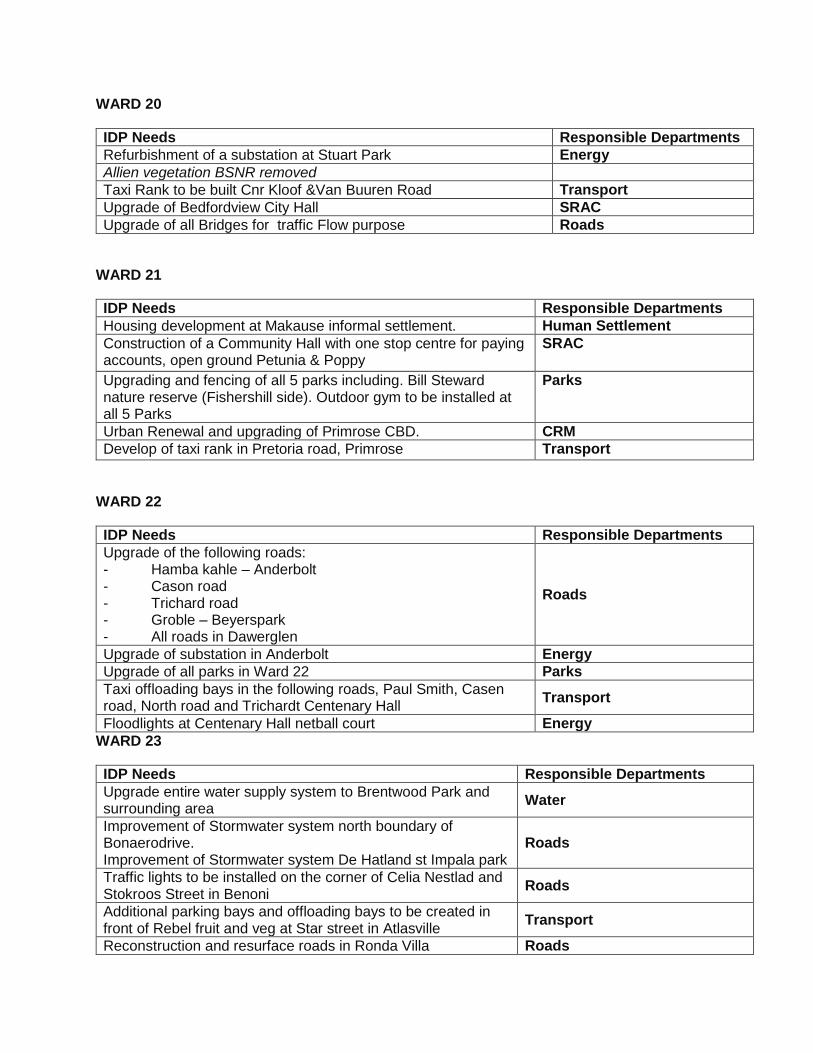
WARD 20
IDP Needs Responsible Departments
Refurbishment of a substation at Stuart Park Energy
Allien vegetation BSNR removed
Taxi Rank to be built Cnr Kloof &Van Buuren Road Transport
Upgrade of Bedfordview City Hall SRAC
Upgrade of all Bridges for traffic Flow purpose Roads
WARD 21
IDP Needs Responsible Departments
Housing development at Makause informal settlement. Human Settlement
Construction of a Community Hall with one stop centre for paying accounts, open ground Petunia & Poppy
SRAC
Upgrading and fencing of all 5 parks including. Bill Steward nature reserve (Fishershill side). Outdoor gym to be installed at all 5 Parks
Parks
Urban Renewal and upgrading of Primrose CBD. CRM
Develop of taxi rank in Pretoria road, Primrose Transport
WARD 22
IDP Needs Responsible Departments
Upgrade of the following roads: - Hamba kahle – Anderbolt - Cason road - Trichard road - Groble – Beyerspark - All roads in Dawerglen
Roads
Upgrade of substation in Anderbolt Energy
Upgrade of all parks in Ward 22 Parks
Taxi offloading bays in the following roads, Paul Smith, Casen road, North road and Trichardt Centenary Hall
Transport
Floodlights at Centenary Hall netball court Energy
WARD 23
IDP Needs Responsible Departments
Upgrade entire water supply system to Brentwood Park and surrounding area
Water
Improvement of Stormwater system north boundary of Bonaerodrive. Improvement of Stormwater system De Hatland st Impala park
Roads
Traffic lights to be installed on the corner of Celia Nestlad and Stokroos Street in Benoni
Roads
Additional parking bays and offloading bays to be created in front of Rebel fruit and veg at Star street in Atlasville
Transport
Reconstruction and resurface roads in Ronda Villa Roads
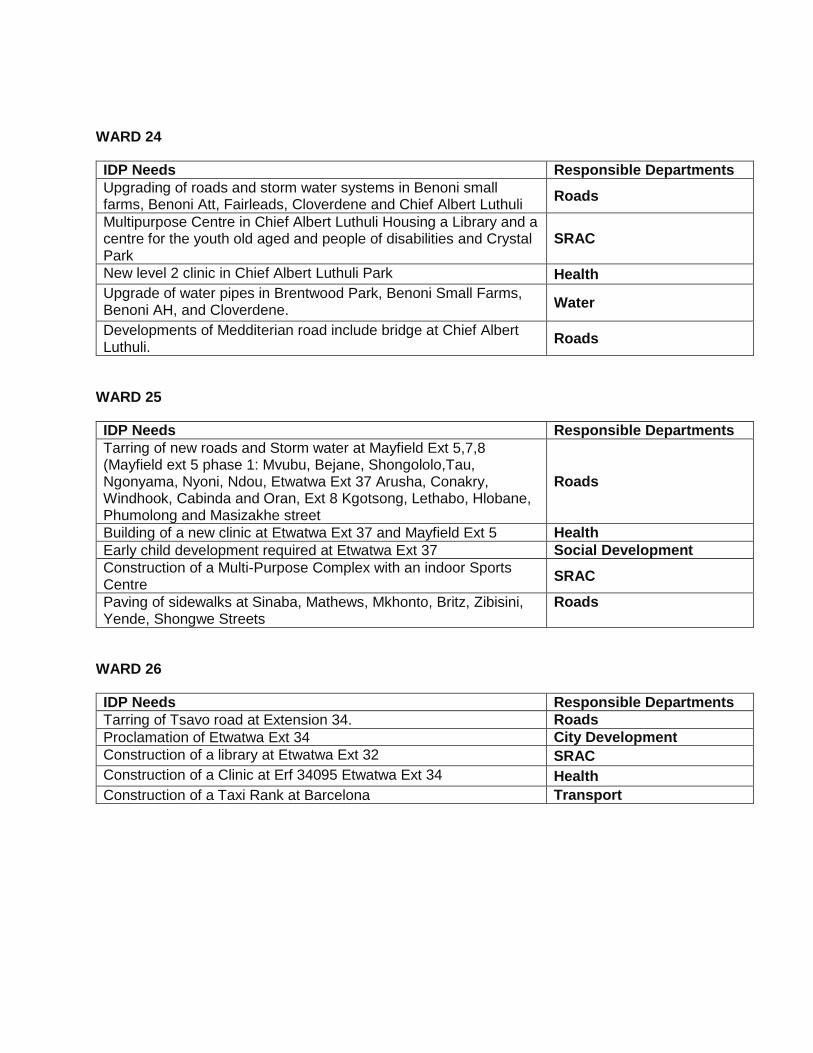
WARD 24
IDP Needs Responsible Departments
Upgrading of roads and storm water systems in Benoni small farms, Benoni Att, Fairleads, Cloverdene and Chief Albert Luthuli
Roads
Multipurpose Centre in Chief Albert Luthuli Housing a Library and a centre for the youth old aged and people of disabilities and Crystal Park
SRAC
New level 2 clinic in Chief Albert Luthuli Park Health
Upgrade of water pipes in Brentwood Park, Benoni Small Farms, Benoni AH, and Cloverdene.
Water
Developments of Medditerian road include bridge at Chief Albert Luthuli.
Roads
WARD 25
IDP Needs Responsible Departments
Tarring of new roads and Storm water at Mayfield Ext 5,7,8 (Mayfield ext 5 phase 1: Mvubu, Bejane, Shongololo,Tau, Ngonyama, Nyoni, Ndou, Etwatwa Ext 37 Arusha, Conakry, Windhook, Cabinda and Oran, Ext 8 Kgotsong, Lethabo, Hlobane, Phumolong and Masizakhe street
Roads
Building of a new clinic at Etwatwa Ext 37 and Mayfield Ext 5 Health
Early child development required at Etwatwa Ext 37 Social Development
Construction of a Multi-Purpose Complex with an indoor Sports Centre
SRAC
Paving of sidewalks at Sinaba, Mathews, Mkhonto, Britz, Zibisini, Yende, Shongwe Streets
Roads
WARD 26
IDP Needs Responsible Departments
Tarring of Tsavo road at Extension 34. Roads
Proclamation of Etwatwa Ext 34 City Development
Construction of a library at Etwatwa Ext 32 SRAC
Construction of a Clinic at Erf 34095 Etwatwa Ext 34 Health
Construction of a Taxi Rank at Barcelona Transport
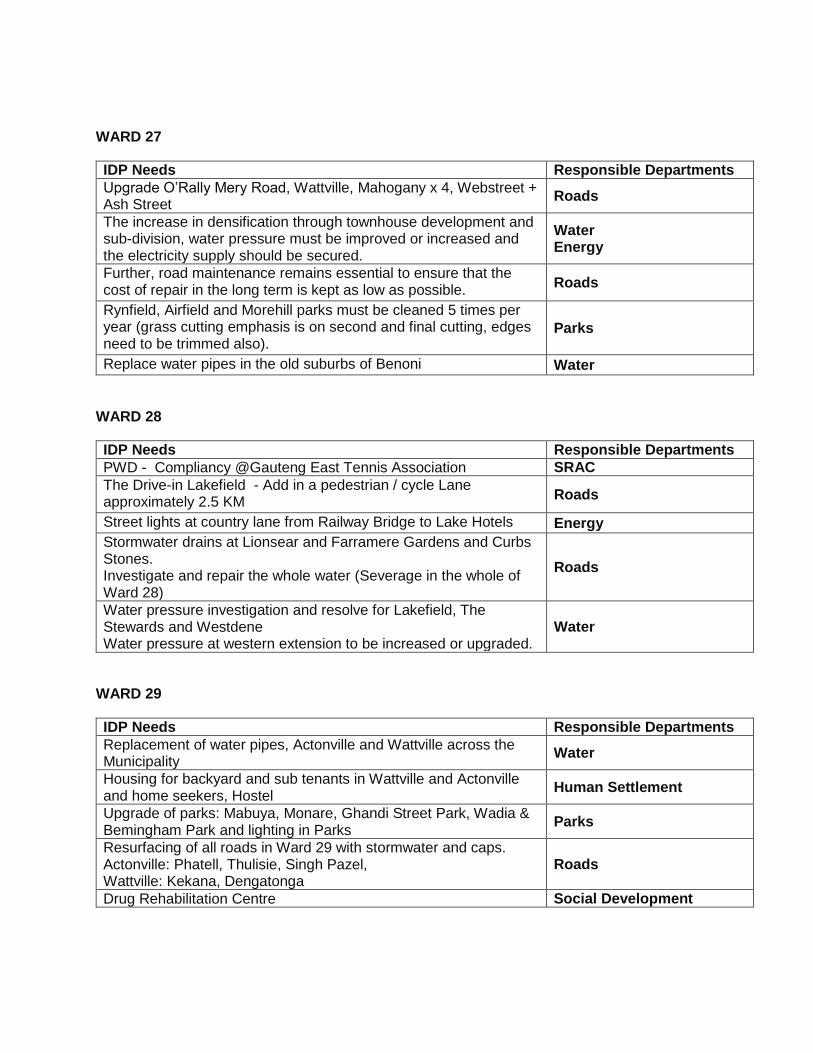
WARD 27
IDP Needs Responsible Departments
Upgrade O’Rally Mery Road, Wattville, Mahogany x 4, Webstreet + Ash Street
Roads
The increase in densification through townhouse development and sub-division, water pressure must be improved or increased and the electricity supply should be secured.
Water Energy
Further, road maintenance remains essential to ensure that the cost of repair in the long term is kept as low as possible.
Roads
Rynfield, Airfield and Morehill parks must be cleaned 5 times per year (grass cutting emphasis is on second and final cutting, edges need to be trimmed also).
Parks
Replace water pipes in the old suburbs of Benoni Water
WARD 28
IDP Needs Responsible Departments
PWD - Compliancy @Gauteng East Tennis Association SRAC
The Drive-in Lakefield - Add in a pedestrian / cycle Lane approximately 2.5 KM
Roads
Street lights at country lane from Railway Bridge to Lake Hotels Energy
Stormwater drains at Lionsear and Farramere Gardens and Curbs Stones. Investigate and repair the whole water (Severage in the whole of Ward 28)
Roads
Water pressure investigation and resolve for Lakefield, The Stewards and Westdene Water pressure at western extension to be increased or upgraded.
Water
WARD 29
IDP Needs Responsible Departments
Replacement of water pipes, Actonville and Wattville across the Municipality
Water
Housing for backyard and sub tenants in Wattville and Actonville and home seekers, Hostel
Human Settlement
Upgrade of parks: Mabuya, Monare, Ghandi Street Park, Wadia & Bemingham Park and lighting in Parks
Parks
Resurfacing of all roads in Ward 29 with stormwater and caps. Actonville: Phatell, Thulisie, Singh Pazel, Wattville: Kekana, Dengatonga
Roads
Drug Rehabilitation Centre Social Development
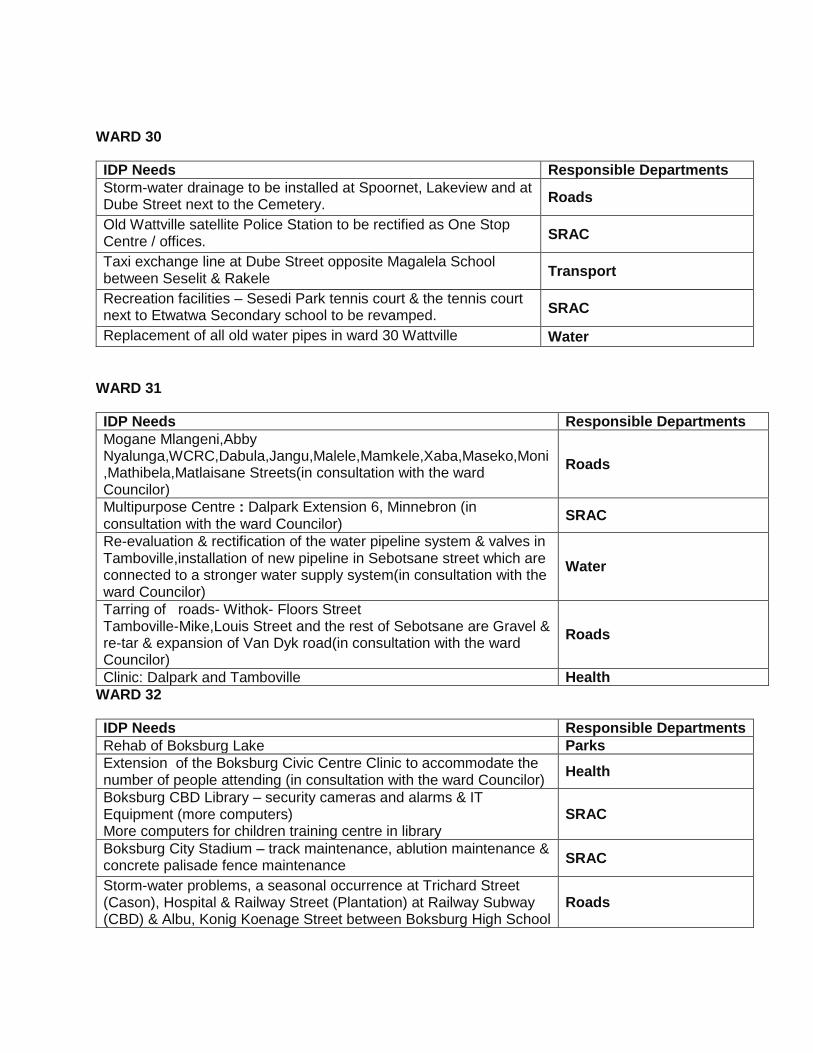
WARD 30
IDP Needs Responsible Departments
Storm-water drainage to be installed at Spoornet, Lakeview and at Dube Street next to the Cemetery.
Roads
Old Wattville satellite Police Station to be rectified as One Stop Centre / offices.
SRAC
Taxi exchange line at Dube Street opposite Magalela School between Seselit & Rakele
Transport
Recreation facilities – Sesedi Park tennis court & the tennis court next to Etwatwa Secondary school to be revamped.
SRAC
Replacement of all old water pipes in ward 30 Wattville Water
WARD 31
IDP Needs Responsible Departments
Mogane Mlangeni,Abby Nyalunga,WCRC,Dabula,Jangu,Malele,Mamkele,Xaba,Maseko,Moni,Mathibela,Matlaisane Streets(in consultation with the ward Councilor)
Roads
Multipurpose Centre : Dalpark Extension 6, Minnebron (in consultation with the ward Councilor)
SRAC
Re-evaluation & rectification of the water pipeline system & valves in Tamboville,installation of new pipeline in Sebotsane street which are connected to a stronger water supply system(in consultation with the ward Councilor)
Water
Tarring of roads- Withok- Floors Street Tamboville-Mike,Louis Street and the rest of Sebotsane are Gravel & re-tar & expansion of Van Dyk road(in consultation with the ward Councilor)
Roads
Clinic: Dalpark and Tamboville Health
WARD 32
IDP Needs Responsible Departments
Rehab of Boksburg Lake Parks
Extension of the Boksburg Civic Centre Clinic to accommodate the number of people attending (in consultation with the ward Councilor)
Health
Boksburg CBD Library – security cameras and alarms & IT Equipment (more computers) More computers for children training centre in library
SRAC
Boksburg City Stadium – track maintenance, ablution maintenance & concrete palisade fence maintenance
SRAC
Storm-water problems, a seasonal occurrence at Trichard Street (Cason), Hospital & Railway Street (Plantation) at Railway Subway (CBD) & Albu, Konig Koenage Street between Boksburg High School
Roads
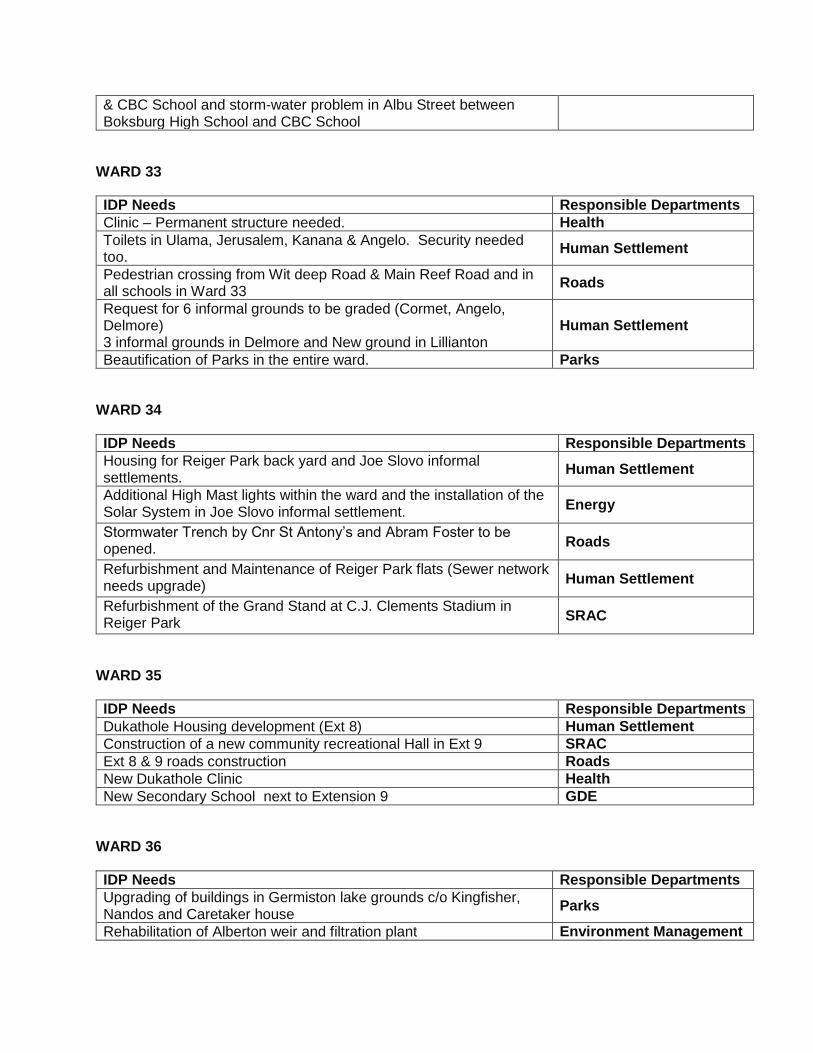
& CBC School and storm-water problem in Albu Street between Boksburg High School and CBC School
WARD 33
IDP Needs Responsible Departments
Clinic – Permanent structure needed. Health
Toilets in Ulama, Jerusalem, Kanana & Angelo. Security needed too.
Human Settlement
Pedestrian crossing from Wit deep Road & Main Reef Road and in all schools in Ward 33
Roads
Request for 6 informal grounds to be graded (Cormet, Angelo, Delmore) 3 informal grounds in Delmore and New ground in Lillianton
Human Settlement
Beautification of Parks in the entire ward. Parks
WARD 34
IDP Needs Responsible Departments
Housing for Reiger Park back yard and Joe Slovo informal settlements.
Human Settlement
Additional High Mast lights within the ward and the installation of the Solar System in Joe Slovo informal settlement.
Energy
Stormwater Trench by Cnr St Antony’s and Abram Foster to be opened.
Roads
Refurbishment and Maintenance of Reiger Park flats (Sewer network needs upgrade)
Human Settlement
Refurbishment of the Grand Stand at C.J. Clements Stadium in Reiger Park
SRAC
WARD 35
IDP Needs Responsible Departments
Dukathole Housing development (Ext 8) Human Settlement
Construction of a new community recreational Hall in Ext 9 SRAC
Ext 8 & 9 roads construction Roads
New Dukathole Clinic Health
New Secondary School next to Extension 9 GDE
WARD 36
IDP Needs Responsible Departments
Upgrading of buildings in Germiston lake grounds c/o Kingfisher, Nandos and Caretaker house
Parks
Rehabilitation of Alberton weir and filtration plant Environment Management
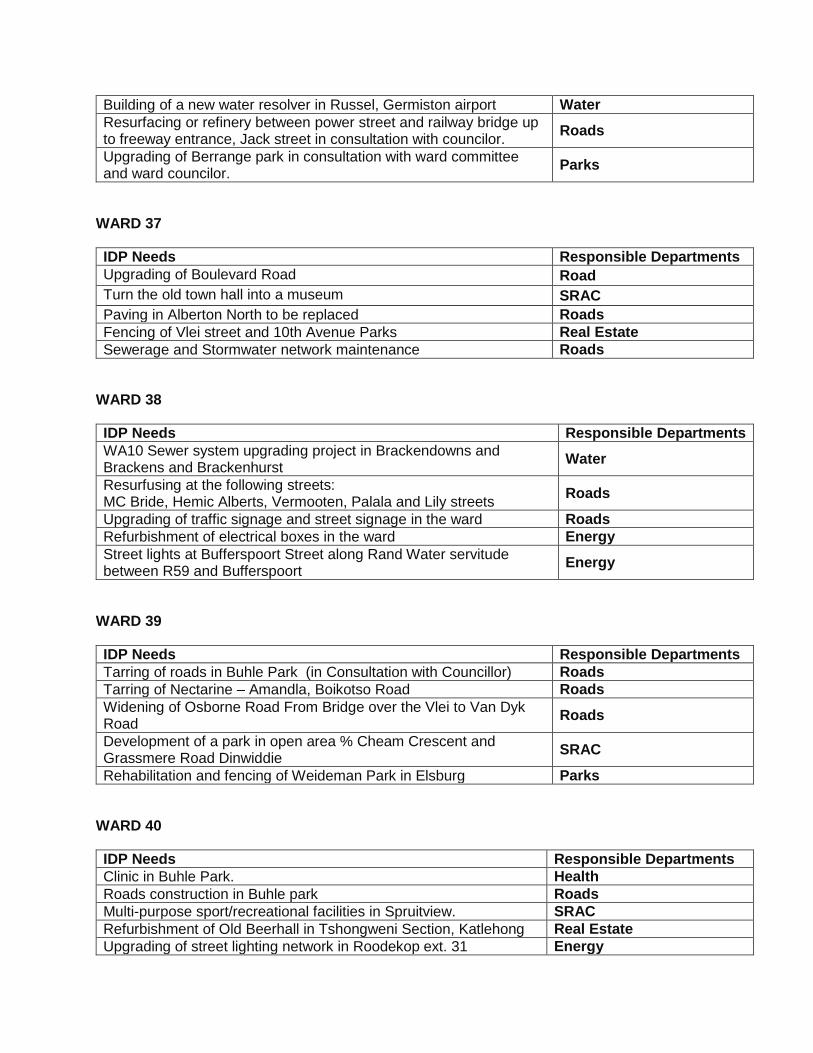
Building of a new water resolver in Russel, Germiston airport Water
Resurfacing or refinery between power street and railway bridge up to freeway entrance, Jack street in consultation with councilor.
Roads
Upgrading of Berrange park in consultation with ward committee and ward councilor.
Parks
WARD 37
IDP Needs Responsible Departments
Upgrading of Boulevard Road Road
Turn the old town hall into a museum SRAC
Paving in Alberton North to be replaced Roads
Fencing of Vlei street and 10th Avenue Parks Real Estate
Sewerage and Stormwater network maintenance Roads
WARD 38
IDP Needs Responsible Departments
WA10 Sewer system upgrading project in Brackendowns and Brackens and Brackenhurst
Water
Resurfusing at the following streets: MC Bride, Hemic Alberts, Vermooten, Palala and Lily streets
Roads
Upgrading of traffic signage and street signage in the ward Roads
Refurbishment of electrical boxes in the ward Energy
Street lights at Bufferspoort Street along Rand Water servitude between R59 and Bufferspoort
Energy
WARD 39
IDP Needs Responsible Departments
Tarring of roads in Buhle Park (in Consultation with Councillor) Roads
Tarring of Nectarine – Amandla, Boikotso Road Roads
Widening of Osborne Road From Bridge over the Vlei to Van Dyk Road
Roads
Development of a park in open area % Cheam Crescent and Grassmere Road Dinwiddie
SRAC
Rehabilitation and fencing of Weideman Park in Elsburg Parks
WARD 40
IDP Needs Responsible Departments
Clinic in Buhle Park. Health
Roads construction in Buhle park Roads
Multi-purpose sport/recreational facilities in Spruitview. SRAC
Refurbishment of Old Beerhall in Tshongweni Section, Katlehong Real Estate
Upgrading of street lighting network in Roodekop ext. 31 Energy
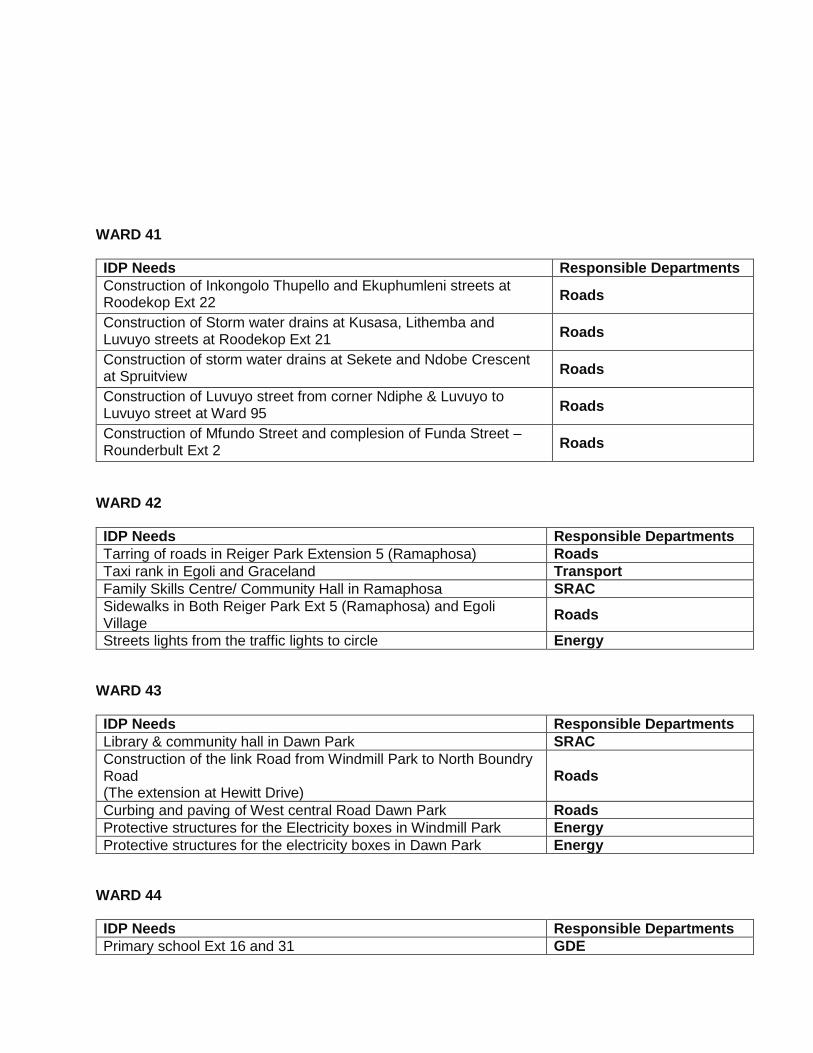
WARD 41
IDP Needs Responsible Departments
Construction of Inkongolo Thupello and Ekuphumleni streets at Roodekop Ext 22
Roads
Construction of Storm water drains at Kusasa, Lithemba and Luvuyo streets at Roodekop Ext 21
Roads
Construction of storm water drains at Sekete and Ndobe Crescent at Spruitview
Roads
Construction of Luvuyo street from corner Ndiphe & Luvuyo to Luvuyo street at Ward 95
Roads
Construction of Mfundo Street and complesion of Funda Street – Rounderbult Ext 2
Roads
WARD 42
IDP Needs Responsible Departments
Tarring of roads in Reiger Park Extension 5 (Ramaphosa) Roads
Taxi rank in Egoli and Graceland Transport
Family Skills Centre/ Community Hall in Ramaphosa SRAC
Sidewalks in Both Reiger Park Ext 5 (Ramaphosa) and Egoli Village
Roads
Streets lights from the traffic lights to circle Energy
WARD 43
IDP Needs Responsible Departments
Library & community hall in Dawn Park SRAC
Construction of the link Road from Windmill Park to North Boundry Road (The extension at Hewitt Drive)
Roads
Curbing and paving of West central Road Dawn Park Roads
Protective structures for the Electricity boxes in Windmill Park Energy
Protective structures for the electricity boxes in Dawn Park Energy
WARD 44
IDP Needs Responsible Departments
Primary school Ext 16 and 31 GDE
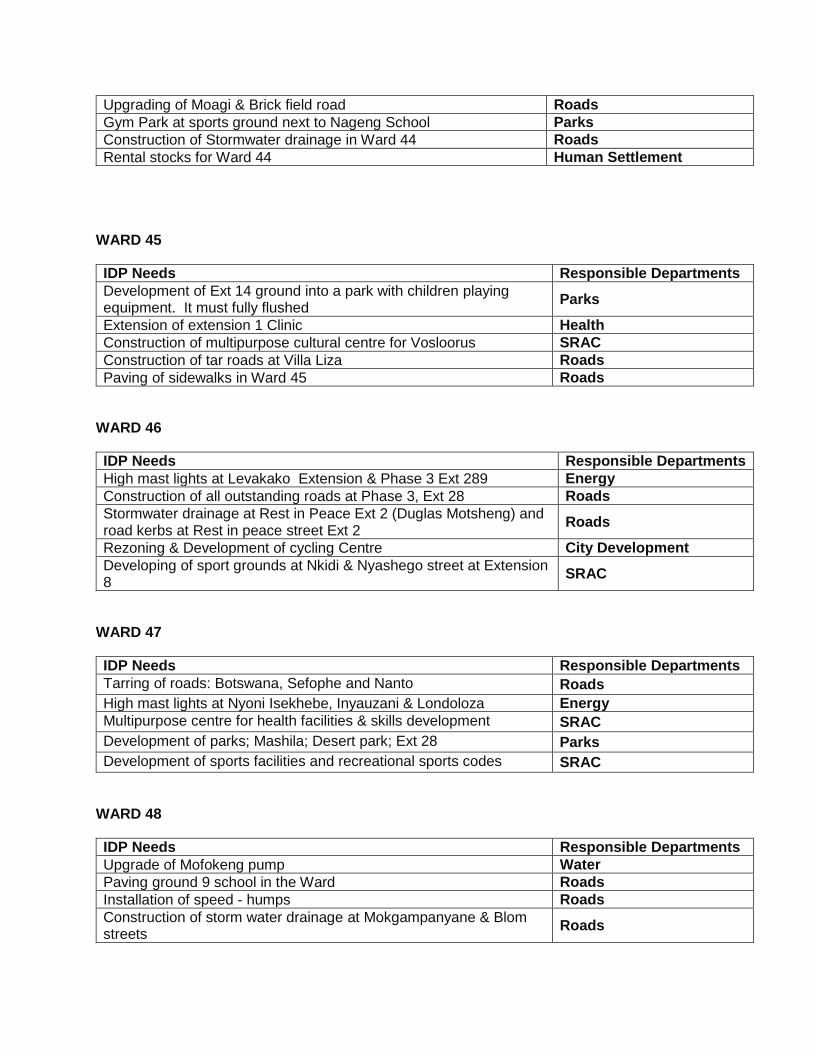
Upgrading of Moagi & Brick field road Roads
Gym Park at sports ground next to Nageng School Parks
Construction of Stormwater drainage in Ward 44 Roads
Rental stocks for Ward 44 Human Settlement
WARD 45
IDP Needs Responsible Departments
Development of Ext 14 ground into a park with children playing equipment. It must fully flushed
Parks
Extension of extension 1 Clinic Health
Construction of multipurpose cultural centre for Vosloorus SRAC
Construction of tar roads at Villa Liza Roads
Paving of sidewalks in Ward 45 Roads
WARD 46
IDP Needs Responsible Departments
High mast lights at Levakako Extension & Phase 3 Ext 289 Energy
Construction of all outstanding roads at Phase 3, Ext 28 Roads
Stormwater drainage at Rest in Peace Ext 2 (Duglas Motsheng) and road kerbs at Rest in peace street Ext 2
Roads
Rezoning & Development of cycling Centre City Development
Developing of sport grounds at Nkidi & Nyashego street at Extension 8
SRAC
WARD 47
IDP Needs Responsible Departments
Tarring of roads: Botswana, Sefophe and Nanto Roads
High mast lights at Nyoni Isekhebe, Inyauzani & Londoloza Energy
Multipurpose centre for health facilities & skills development SRAC
Development of parks; Mashila; Desert park; Ext 28 Parks
Development of sports facilities and recreational sports codes SRAC
WARD 48
IDP Needs Responsible Departments
Upgrade of Mofokeng pump Water
Paving ground 9 school in the Ward Roads
Installation of speed - humps Roads
Construction of storm water drainage at Mokgampanyane & Blom streets
Roads
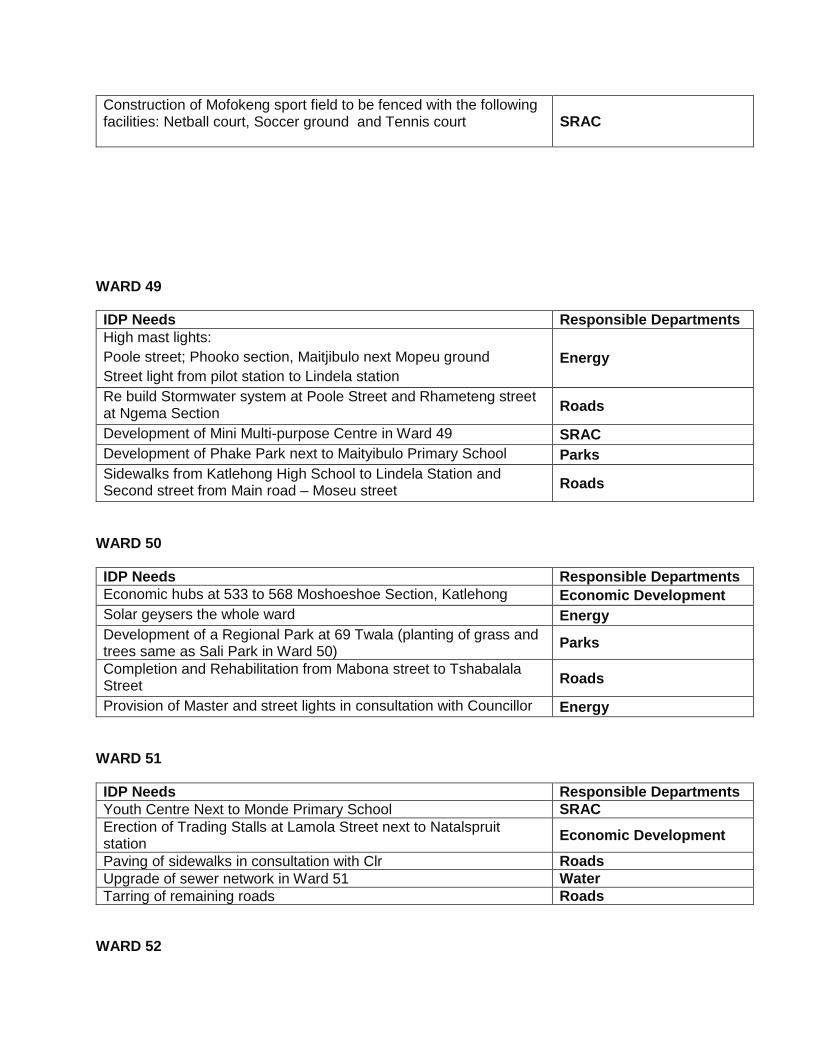
Construction of Mofokeng sport field to be fenced with the following facilities: Netball court, Soccer ground and Tennis court
SRAC
WARD 49
IDP Needs Responsible Departments
High mast lights:
Poole street; Phooko section, Maitjibulo next Mopeu ground
Street light from pilot station to Lindela station
Energy
Re build Stormwater system at Poole Street and Rhameteng street at Ngema Section
Roads
Development of Mini Multi-purpose Centre in Ward 49 SRAC
Development of Phake Park next to Maityibulo Primary School Parks
Sidewalks from Katlehong High School to Lindela Station and Second street from Main road – Moseu street
Roads
WARD 50
IDP Needs Responsible Departments
Economic hubs at 533 to 568 Moshoeshoe Section, Katlehong Economic Development
Solar geysers the whole ward Energy
Development of a Regional Park at 69 Twala (planting of grass and trees same as Sali Park in Ward 50)
Parks
Completion and Rehabilitation from Mabona street to Tshabalala Street
Roads
Provision of Master and street lights in consultation with Councillor Energy
WARD 51
IDP Needs Responsible Departments
Youth Centre Next to Monde Primary School SRAC
Erection of Trading Stalls at Lamola Street next to Natalspruit station
Economic Development
Paving of sidewalks in consultation with Clr Roads
Upgrade of sewer network in Ward 51 Water
Tarring of remaining roads Roads
WARD 52
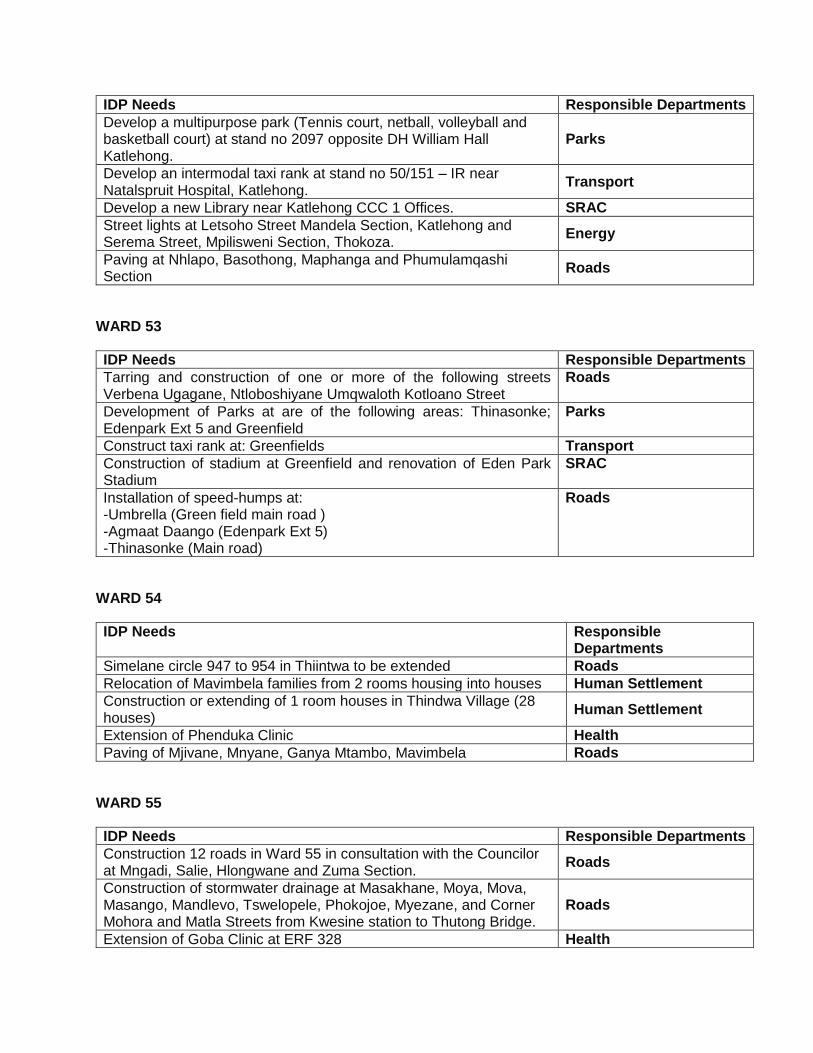
IDP Needs Responsible Departments
Develop a multipurpose park (Tennis court, netball, volleyball and basketball court) at stand no 2097 opposite DH William Hall Katlehong.
Parks
Develop an intermodal taxi rank at stand no 50/151 – IR near Natalspruit Hospital, Katlehong.
Transport
Develop a new Library near Katlehong CCC 1 Offices. SRAC
Street lights at Letsoho Street Mandela Section, Katlehong and Serema Street, Mpilisweni Section, Thokoza.
Energy
Paving at Nhlapo, Basothong, Maphanga and Phumulamqashi Section
Roads
WARD 53
IDP Needs Responsible Departments
Tarring and construction of one or more of the following streets Verbena Ugagane, Ntloboshiyane Umqwaloth Kotloano Street
Roads
Development of Parks at are of the following areas: Thinasonke; Edenpark Ext 5 and Greenfield
Parks
Construct taxi rank at: Greenfields Transport
Construction of stadium at Greenfield and renovation of Eden Park Stadium
SRAC
Installation of speed-humps at: -Umbrella (Green field main road ) -Agmaat Daango (Edenpark Ext 5) -Thinasonke (Main road)
Roads
WARD 54
IDP Needs Responsible Departments
Simelane circle 947 to 954 in Thiintwa to be extended Roads
Relocation of Mavimbela families from 2 rooms housing into houses Human Settlement
Construction or extending of 1 room houses in Thindwa Village (28 houses)
Human Settlement
Extension of Phenduka Clinic Health
Paving of Mjivane, Mnyane, Ganya Mtambo, Mavimbela Roads
WARD 55
IDP Needs Responsible Departments
Construction 12 roads in Ward 55 in consultation with the Councilor at Mngadi, Salie, Hlongwane and Zuma Section.
Roads
Construction of stormwater drainage at Masakhane, Moya, Mova, Masango, Mandlevo, Tswelopele, Phokojoe, Myezane, and Corner Mohora and Matla Streets from Kwesine station to Thutong Bridge.
Roads
Extension of Goba Clinic at ERF 328 Health
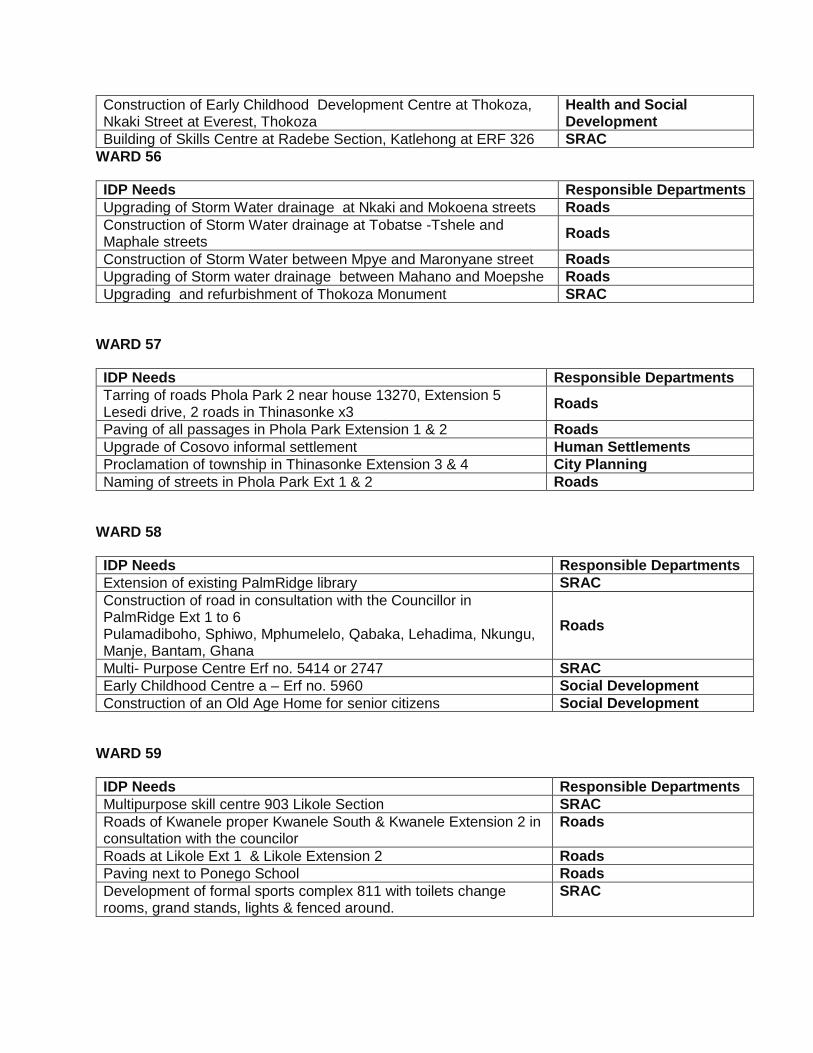
Construction of Early Childhood Development Centre at Thokoza, Nkaki Street at Everest, Thokoza
Health and Social Development
Building of Skills Centre at Radebe Section, Katlehong at ERF 326 SRAC
WARD 56
IDP Needs Responsible Departments
Upgrading of Storm Water drainage at Nkaki and Mokoena streets Roads
Construction of Storm Water drainage at Tobatse -Tshele and Maphale streets
Roads
Construction of Storm Water between Mpye and Maronyane street Roads
Upgrading of Storm water drainage between Mahano and Moepshe Roads
Upgrading and refurbishment of Thokoza Monument SRAC
WARD 57
IDP Needs Responsible Departments
Tarring of roads Phola Park 2 near house 13270, Extension 5 Lesedi drive, 2 roads in Thinasonke x3
Roads
Paving of all passages in Phola Park Extension 1 & 2 Roads
Upgrade of Cosovo informal settlement Human Settlements
Proclamation of township in Thinasonke Extension 3 & 4 City Planning
Naming of streets in Phola Park Ext 1 & 2 Roads
WARD 58
IDP Needs Responsible Departments
Extension of existing PalmRidge library SRAC
Construction of road in consultation with the Councillor in PalmRidge Ext 1 to 6 Pulamadiboho, Sphiwo, Mphumelelo, Qabaka, Lehadima, Nkungu, Manje, Bantam, Ghana
Roads
Multi- Purpose Centre Erf no. 5414 or 2747 SRAC
Early Childhood Centre a – Erf no. 5960 Social Development
Construction of an Old Age Home for senior citizens Social Development
WARD 59
IDP Needs Responsible Departments
Multipurpose skill centre 903 Likole Section SRAC
Roads of Kwanele proper Kwanele South & Kwanele Extension 2 in consultation with the councilor
Roads
Roads at Likole Ext 1 & Likole Extension 2 Roads
Paving next to Ponego School Roads
Development of formal sports complex 811 with toilets change rooms, grand stands, lights & fenced around.
SRAC
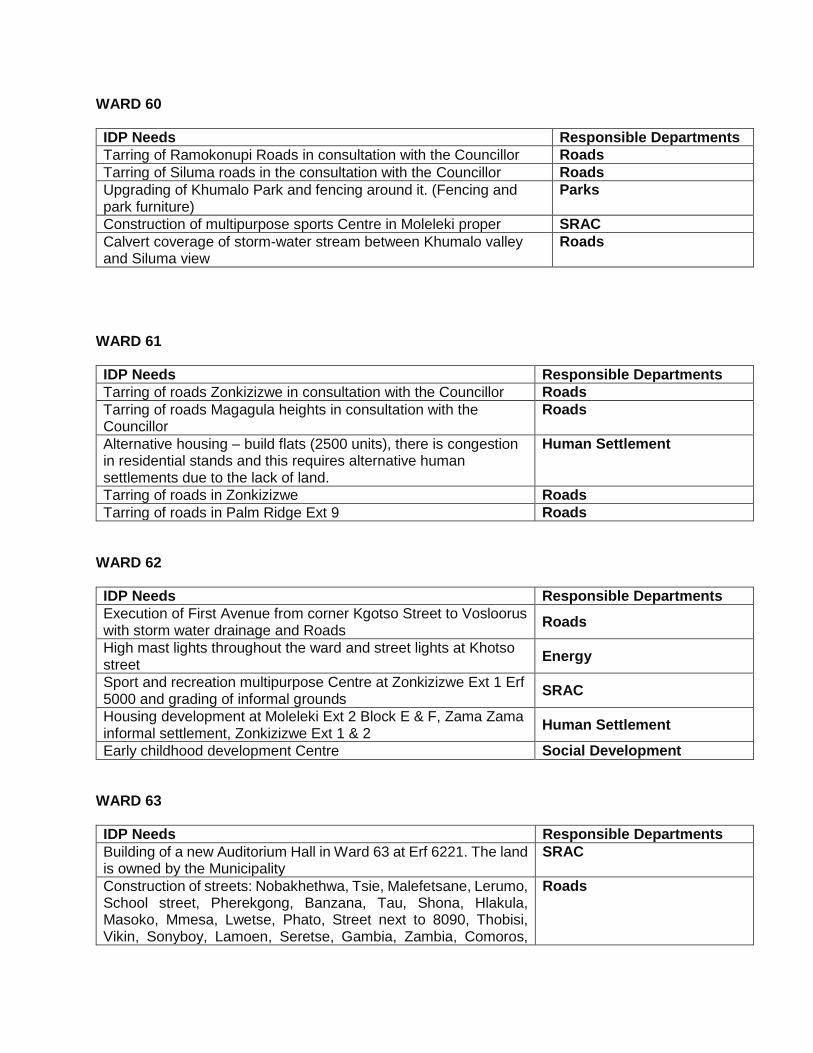
WARD 60
IDP Needs Responsible Departments
Tarring of Ramokonupi Roads in consultation with the Councillor Roads
Tarring of Siluma roads in the consultation with the Councillor Roads
Upgrading of Khumalo Park and fencing around it. (Fencing and park furniture)
Parks
Construction of multipurpose sports Centre in Moleleki proper SRAC
Calvert coverage of storm-water stream between Khumalo valley and Siluma view
Roads
WARD 61
IDP Needs Responsible Departments
Tarring of roads Zonkizizwe in consultation with the Councillor Roads
Tarring of roads Magagula heights in consultation with the Councillor
Roads
Alternative housing – build flats (2500 units), there is congestion in residential stands and this requires alternative human settlements due to the lack of land.
Human Settlement
Tarring of roads in Zonkizizwe Roads
Tarring of roads in Palm Ridge Ext 9 Roads
WARD 62
IDP Needs Responsible Departments
Execution of First Avenue from corner Kgotso Street to Vosloorus with storm water drainage and Roads
Roads
High mast lights throughout the ward and street lights at Khotso street
Energy
Sport and recreation multipurpose Centre at Zonkizizwe Ext 1 Erf 5000 and grading of informal grounds
SRAC
Housing development at Moleleki Ext 2 Block E & F, Zama Zama informal settlement, Zonkizizwe Ext 1 & 2
Human Settlement
Early childhood development Centre Social Development
WARD 63
IDP Needs Responsible Departments
Building of a new Auditorium Hall in Ward 63 at Erf 6221. The land is owned by the Municipality
SRAC
Construction of streets: Nobakhethwa, Tsie, Malefetsane, Lerumo, School street, Pherekgong, Banzana, Tau, Shona, Hlakula, Masoko, Mmesa, Lwetse, Phato, Street next to 8090, Thobisi, Vikin, Sonyboy, Lamoen, Seretse, Gambia, Zambia, Comoros,
Roads
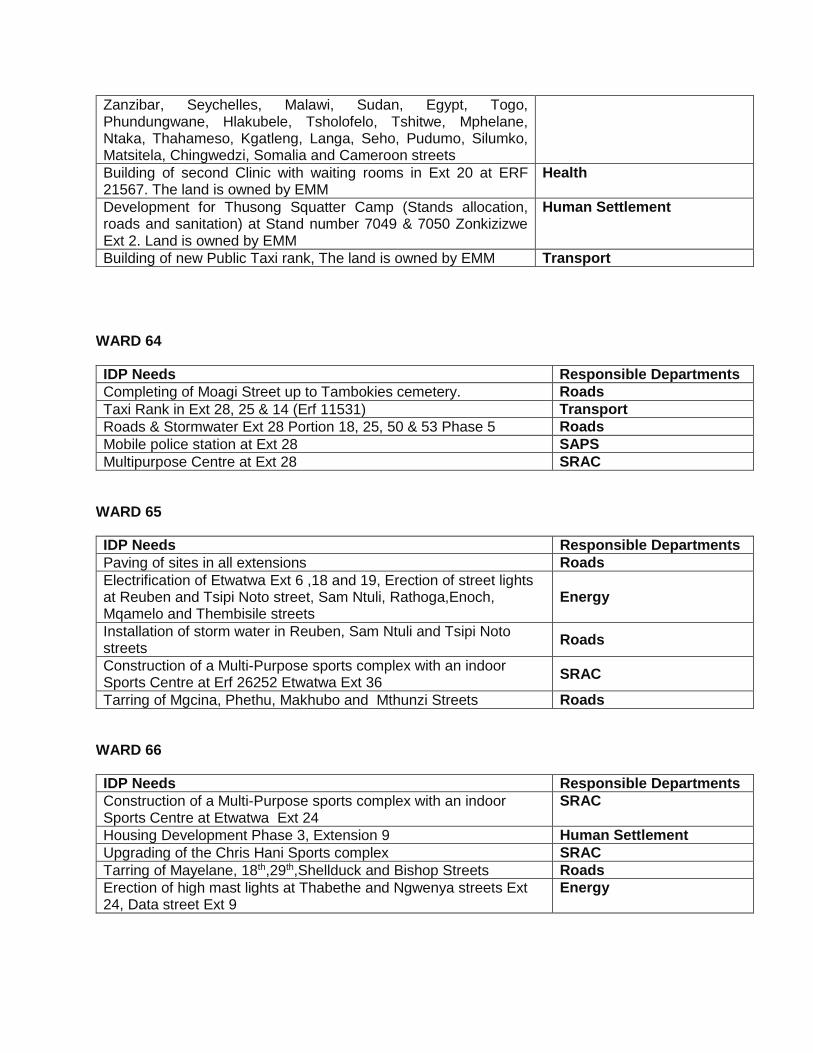
Zanzibar, Seychelles, Malawi, Sudan, Egypt, Togo, Phundungwane, Hlakubele, Tsholofelo, Tshitwe, Mphelane, Ntaka, Thahameso, Kgatleng, Langa, Seho, Pudumo, Silumko, Matsitela, Chingwedzi, Somalia and Cameroon streets
Building of second Clinic with waiting rooms in Ext 20 at ERF 21567. The land is owned by EMM
Health
Development for Thusong Squatter Camp (Stands allocation, roads and sanitation) at Stand number 7049 & 7050 Zonkizizwe Ext 2. Land is owned by EMM
Human Settlement
Building of new Public Taxi rank, The land is owned by EMM Transport
WARD 64
IDP Needs Responsible Departments
Completing of Moagi Street up to Tambokies cemetery. Roads
Taxi Rank in Ext 28, 25 & 14 (Erf 11531) Transport
Roads & Stormwater Ext 28 Portion 18, 25, 50 & 53 Phase 5 Roads
Mobile police station at Ext 28 SAPS
Multipurpose Centre at Ext 28 SRAC
WARD 65
IDP Needs Responsible Departments
Paving of sites in all extensions Roads
Electrification of Etwatwa Ext 6 ,18 and 19, Erection of street lights at Reuben and Tsipi Noto street, Sam Ntuli, Rathoga,Enoch, Mqamelo and Thembisile streets
Energy
Installation of storm water in Reuben, Sam Ntuli and Tsipi Noto streets
Roads
Construction of a Multi-Purpose sports complex with an indoor Sports Centre at Erf 26252 Etwatwa Ext 36
SRAC
Tarring of Mgcina, Phethu, Makhubo and Mthunzi Streets Roads
WARD 66
IDP Needs Responsible Departments
Construction of a Multi-Purpose sports complex with an indoor Sports Centre at Etwatwa Ext 24
SRAC
Housing Development Phase 3, Extension 9 Human Settlement
Upgrading of the Chris Hani Sports complex SRAC
Tarring of Mayelane, 18th,29th,Shellduck and Bishop Streets Roads
Erection of high mast lights at Thabethe and Ngwenya streets Ext 24, Data street Ext 9
Energy
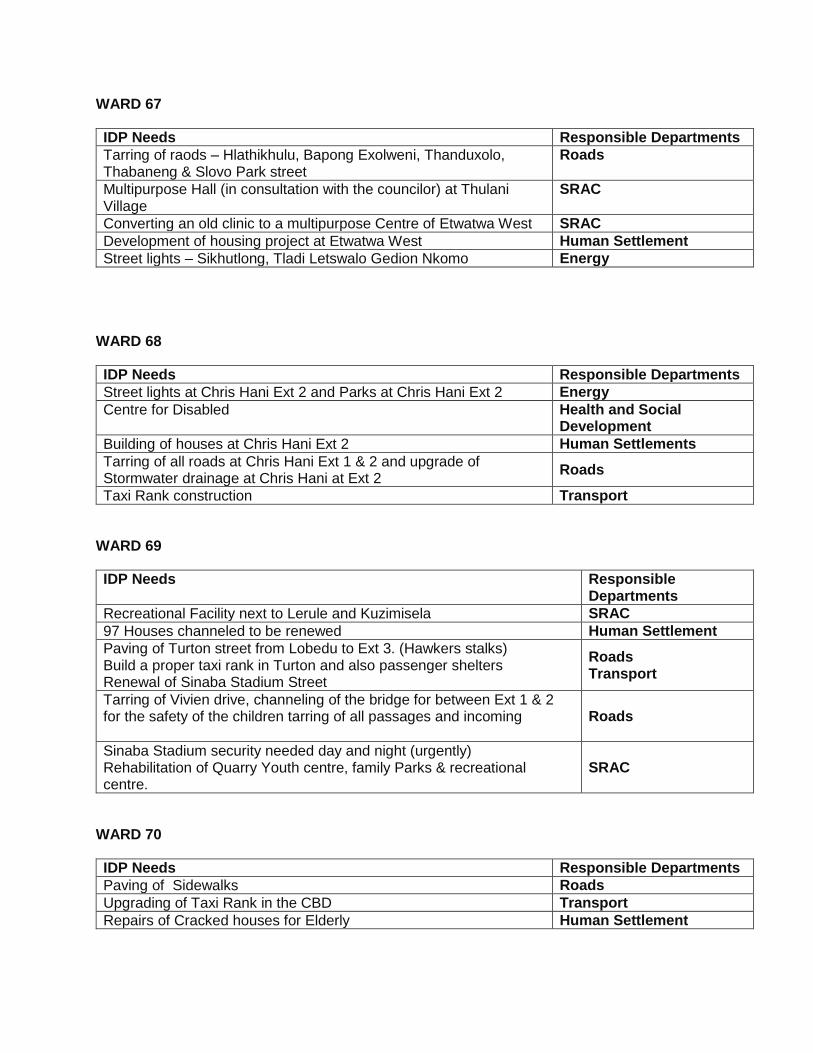
WARD 67
IDP Needs Responsible Departments
Tarring of raods – Hlathikhulu, Bapong Exolweni, Thanduxolo, Thabaneng & Slovo Park street
Roads
Multipurpose Hall (in consultation with the councilor) at Thulani Village
SRAC
Converting an old clinic to a multipurpose Centre of Etwatwa West SRAC
Development of housing project at Etwatwa West Human Settlement
Street lights – Sikhutlong, Tladi Letswalo Gedion Nkomo Energy
WARD 68
IDP Needs Responsible Departments
Street lights at Chris Hani Ext 2 and Parks at Chris Hani Ext 2 Energy
Centre for Disabled Health and Social Development
Building of houses at Chris Hani Ext 2 Human Settlements
Tarring of all roads at Chris Hani Ext 1 & 2 and upgrade of Stormwater drainage at Chris Hani at Ext 2
Roads
Taxi Rank construction Transport
WARD 69
IDP Needs Responsible Departments
Recreational Facility next to Lerule and Kuzimisela SRAC
97 Houses channeled to be renewed Human Settlement
Paving of Turton street from Lobedu to Ext 3. (Hawkers stalks) Build a proper taxi rank in Turton and also passenger shelters Renewal of Sinaba Stadium Street
Roads Transport
Tarring of Vivien drive, channeling of the bridge for between Ext 1 & 2 for the safety of the children tarring of all passages and incoming
Roads
Sinaba Stadium security needed day and night (urgently) Rehabilitation of Quarry Youth centre, family Parks & recreational centre.
SRAC
WARD 70
IDP Needs Responsible Departments
Paving of Sidewalks Roads
Upgrading of Taxi Rank in the CBD Transport
Repairs of Cracked houses for Elderly Human Settlement
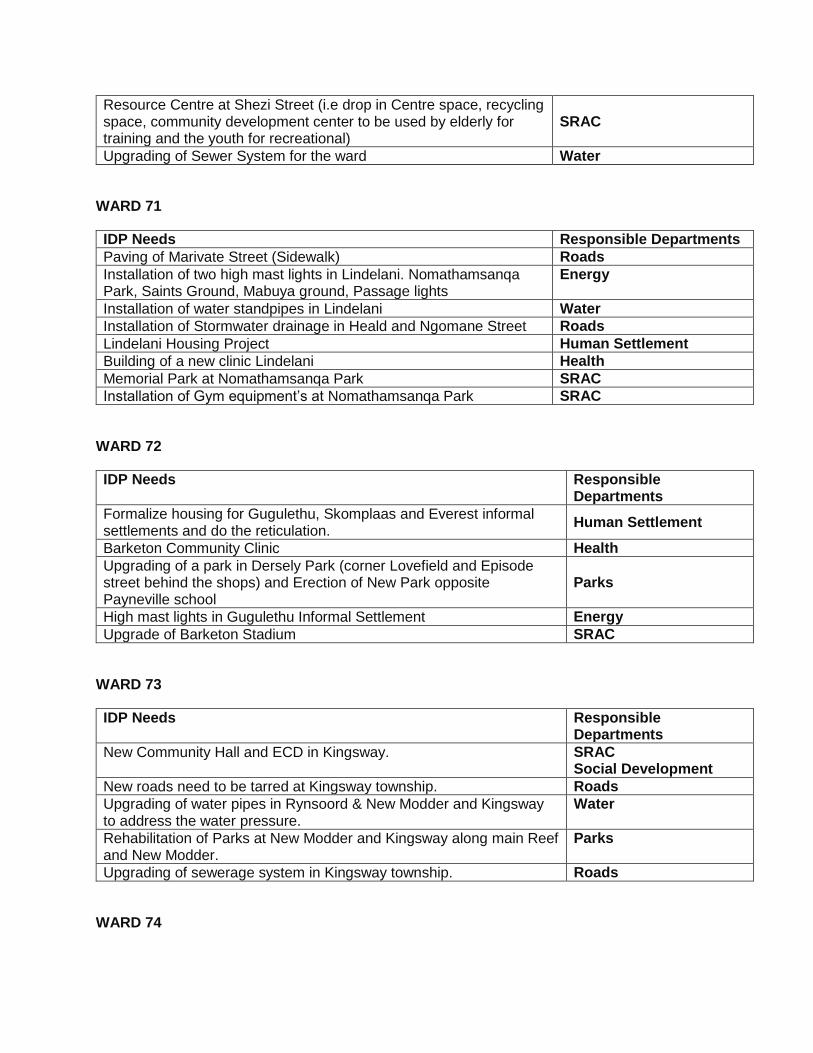
Resource Centre at Shezi Street (i.e drop in Centre space, recycling space, community development center to be used by elderly for training and the youth for recreational)
SRAC
Upgrading of Sewer System for the ward Water
WARD 71
IDP Needs Responsible Departments
Paving of Marivate Street (Sidewalk) Roads
Installation of two high mast lights in Lindelani. Nomathamsanqa Park, Saints Ground, Mabuya ground, Passage lights
Energy
Installation of water standpipes in Lindelani Water
Installation of Stormwater drainage in Heald and Ngomane Street Roads
Lindelani Housing Project Human Settlement
Building of a new clinic Lindelani Health
Memorial Park at Nomathamsanqa Park SRAC
Installation of Gym equipment’s at Nomathamsanqa Park SRAC
WARD 72
IDP Needs Responsible Departments
Formalize housing for Gugulethu, Skomplaas and Everest informal settlements and do the reticulation.
Human Settlement
Barketon Community Clinic Health
Upgrading of a park in Dersely Park (corner Lovefield and Episode street behind the shops) and Erection of New Park opposite Payneville school
Parks
High mast lights in Gugulethu Informal Settlement Energy
Upgrade of Barketon Stadium SRAC
WARD 73
IDP Needs Responsible Departments
New Community Hall and ECD in Kingsway. SRAC Social Development
New roads need to be tarred at Kingsway township. Roads
Upgrading of water pipes in Rynsoord & New Modder and Kingsway to address the water pressure.
Water
Rehabilitation of Parks at New Modder and Kingsway along main Reef and New Modder.
Parks
Upgrading of sewerage system in Kingsway township. Roads
WARD 74
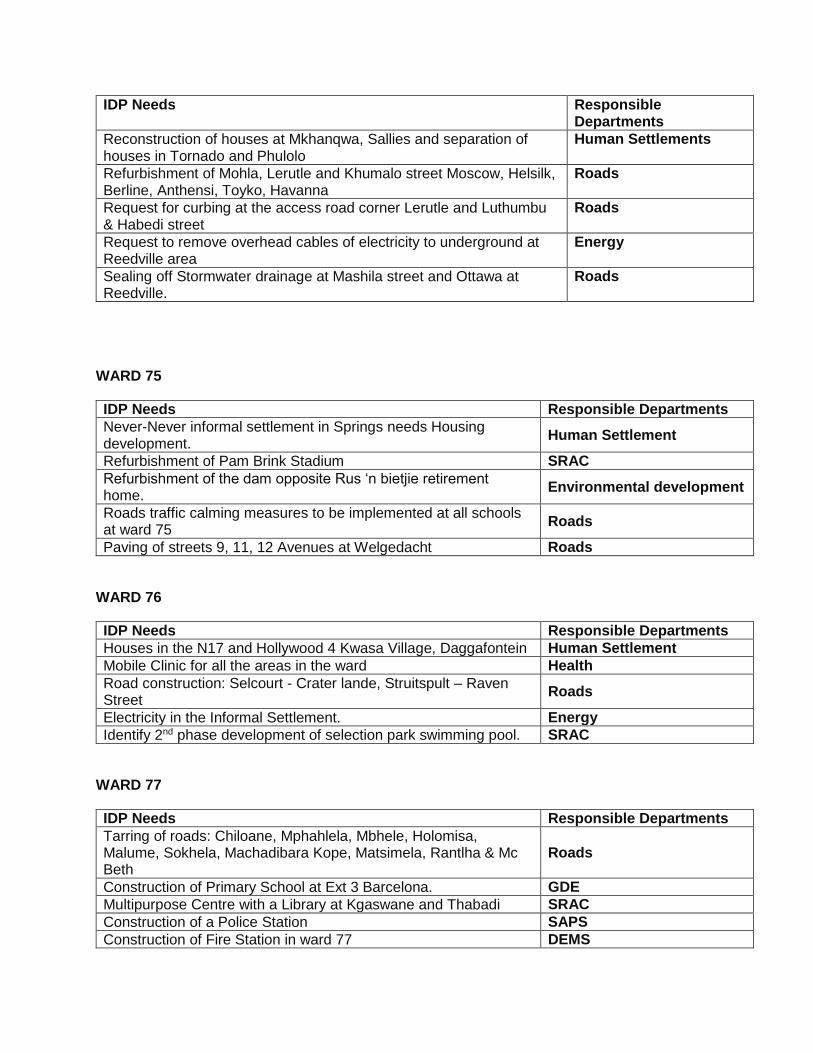
IDP Needs Responsible Departments
Reconstruction of houses at Mkhanqwa, Sallies and separation of houses in Tornado and Phulolo
Human Settlements
Refurbishment of Mohla, Lerutle and Khumalo street Moscow, Helsilk, Berline, Anthensi, Toyko, Havanna
Roads
Request for curbing at the access road corner Lerutle and Luthumbu & Habedi street
Roads
Request to remove overhead cables of electricity to underground at Reedville area
Energy
Sealing off Stormwater drainage at Mashila street and Ottawa at Reedville.
Roads
WARD 75
IDP Needs Responsible Departments
Never-Never informal settlement in Springs needs Housing development.
Human Settlement
Refurbishment of Pam Brink Stadium SRAC
Refurbishment of the dam opposite Rus ‘n bietjie retirement home.
Environmental development
Roads traffic calming measures to be implemented at all schools at ward 75
Roads
Paving of streets 9, 11, 12 Avenues at Welgedacht Roads
WARD 76
IDP Needs Responsible Departments
Houses in the N17 and Hollywood 4 Kwasa Village, Daggafontein Human Settlement
Mobile Clinic for all the areas in the ward Health
Road construction: Selcourt - Crater lande, Struitspult – Raven Street
Roads
Electricity in the Informal Settlement. Energy
Identify 2nd phase development of selection park swimming pool. SRAC
WARD 77
IDP Needs Responsible Departments
Tarring of roads: Chiloane, Mphahlela, Mbhele, Holomisa, Malume, Sokhela, Machadibara Kope, Matsimela, Rantlha & Mc Beth
Roads
Construction of Primary School at Ext 3 Barcelona. GDE
Multipurpose Centre with a Library at Kgaswane and Thabadi SRAC
Construction of a Police Station SAPS
Construction of Fire Station in ward 77 DEMS
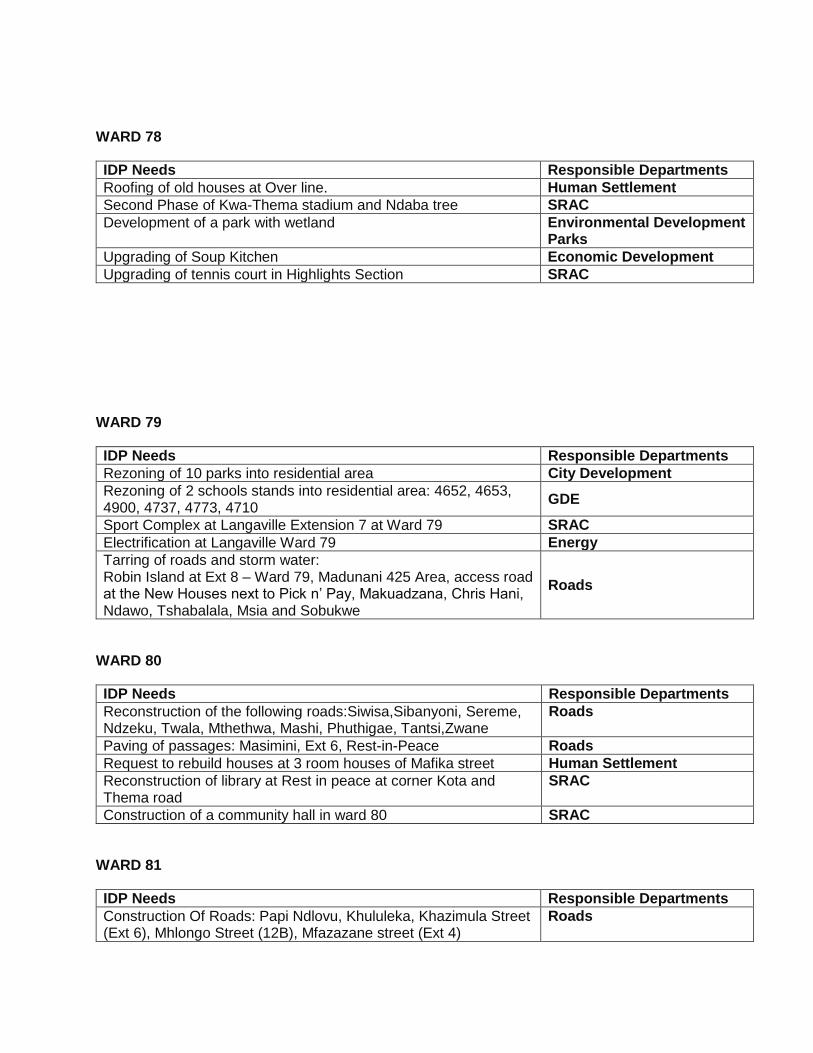
WARD 78
IDP Needs Responsible Departments
Roofing of old houses at Over line. Human Settlement
Second Phase of Kwa-Thema stadium and Ndaba tree SRAC
Development of a park with wetland Environmental Development Parks
Upgrading of Soup Kitchen Economic Development
Upgrading of tennis court in Highlights Section SRAC
WARD 79
IDP Needs Responsible Departments
Rezoning of 10 parks into residential area City Development
Rezoning of 2 schools stands into residential area: 4652, 4653, 4900, 4737, 4773, 4710
GDE
Sport Complex at Langaville Extension 7 at Ward 79 SRAC
Electrification at Langaville Ward 79 Energy
Tarring of roads and storm water: Robin Island at Ext 8 – Ward 79, Madunani 425 Area, access road at the New Houses next to Pick n’ Pay, Makuadzana, Chris Hani, Ndawo, Tshabalala, Msia and Sobukwe
Roads
WARD 80
IDP Needs Responsible Departments
Reconstruction of the following roads:Siwisa,Sibanyoni, Sereme, Ndzeku, Twala, Mthethwa, Mashi, Phuthigae, Tantsi,Zwane
Roads
Paving of passages: Masimini, Ext 6, Rest-in-Peace Roads
Request to rebuild houses at 3 room houses of Mafika street Human Settlement
Reconstruction of library at Rest in peace at corner Kota and Thema road
SRAC
Construction of a community hall in ward 80 SRAC
WARD 81
IDP Needs Responsible Departments
Construction Of Roads: Papi Ndlovu, Khululeka, Khazimula Street (Ext 6), Mhlongo Street (12B), Mfazazane street (Ext 4)
Roads
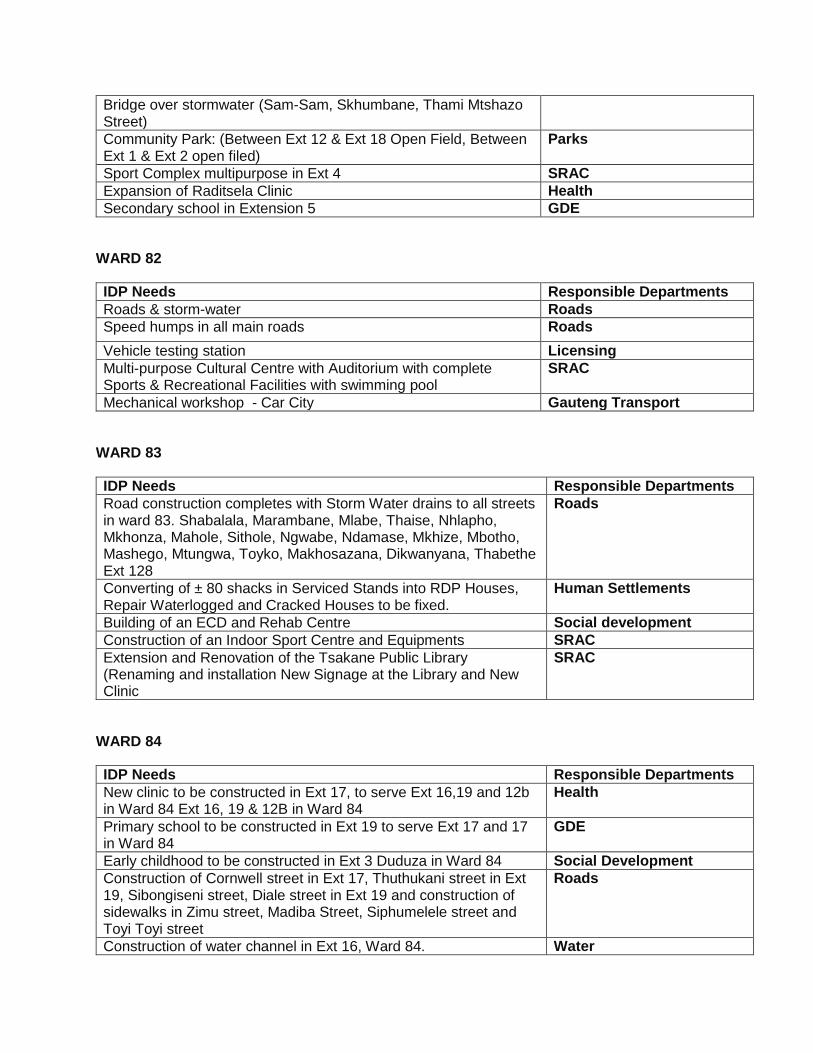
Bridge over stormwater (Sam-Sam, Skhumbane, Thami Mtshazo Street)
Community Park: (Between Ext 12 & Ext 18 Open Field, Between Ext 1 & Ext 2 open filed)
Parks
Sport Complex multipurpose in Ext 4 SRAC
Expansion of Raditsela Clinic Health
Secondary school in Extension 5 GDE
WARD 82
IDP Needs Responsible Departments
Roads & storm-water Roads
Speed humps in all main roads Roads
Vehicle testing station Licensing
Multi-purpose Cultural Centre with Auditorium with complete Sports & Recreational Facilities with swimming pool
SRAC
Mechanical workshop - Car City Gauteng Transport
WARD 83
IDP Needs Responsible Departments
Road construction completes with Storm Water drains to all streets in ward 83. Shabalala, Marambane, Mlabe, Thaise, Nhlapho, Mkhonza, Mahole, Sithole, Ngwabe, Ndamase, Mkhize, Mbotho, Mashego, Mtungwa, Toyko, Makhosazana, Dikwanyana, Thabethe Ext 128
Roads
Converting of ± 80 shacks in Serviced Stands into RDP Houses, Repair Waterlogged and Cracked Houses to be fixed.
Human Settlements
Building of an ECD and Rehab Centre Social development
Construction of an Indoor Sport Centre and Equipments SRAC
Extension and Renovation of the Tsakane Public Library (Renaming and installation New Signage at the Library and New Clinic
SRAC
WARD 84
IDP Needs Responsible Departments
New clinic to be constructed in Ext 17, to serve Ext 16,19 and 12b in Ward 84 Ext 16, 19 & 12B in Ward 84
Health
Primary school to be constructed in Ext 19 to serve Ext 17 and 17 in Ward 84
GDE
Early childhood to be constructed in Ext 3 Duduza in Ward 84 Social Development
Construction of Cornwell street in Ext 17, Thuthukani street in Ext 19, Sibongiseni street, Diale street in Ext 19 and construction of sidewalks in Zimu street, Madiba Street, Siphumelele street and Toyi Toyi street
Roads
Construction of water channel in Ext 16, Ward 84. Water
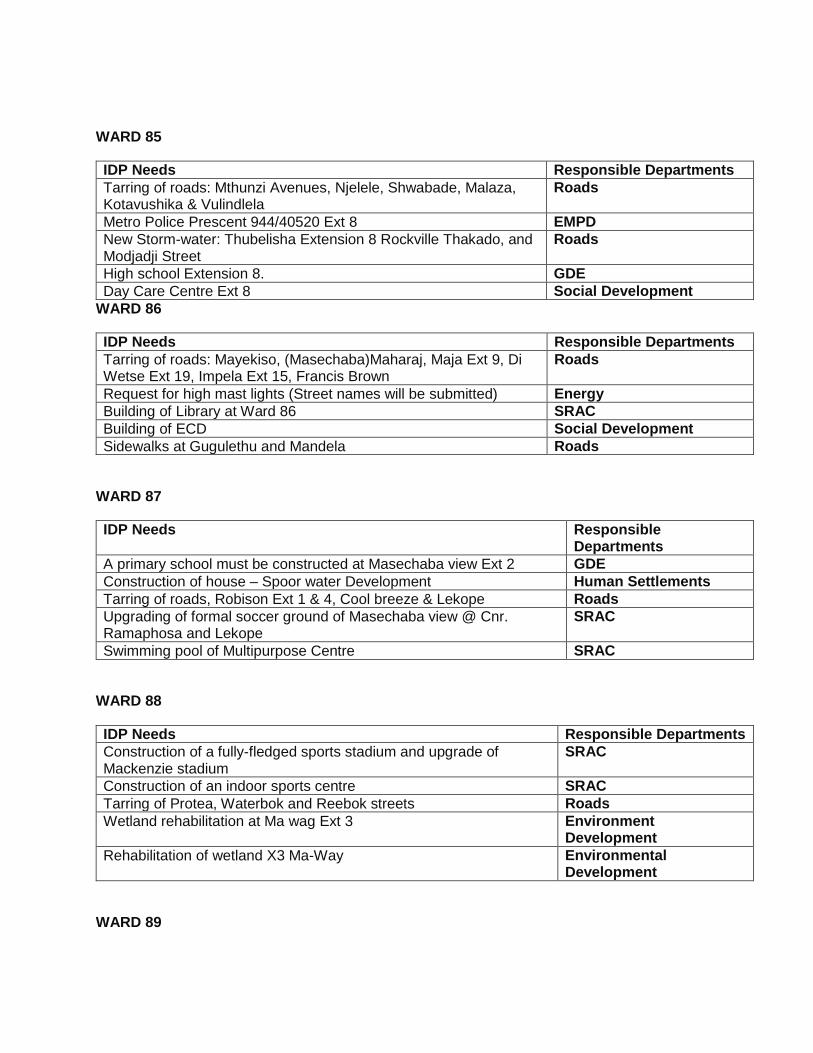
WARD 85
IDP Needs Responsible Departments
Tarring of roads: Mthunzi Avenues, Njelele, Shwabade, Malaza, Kotavushika & Vulindlela
Roads
Metro Police Prescent 944/40520 Ext 8 EMPD
New Storm-water: Thubelisha Extension 8 Rockville Thakado, and Modjadji Street
Roads
High school Extension 8. GDE
Day Care Centre Ext 8 Social Development
WARD 86
IDP Needs Responsible Departments
Tarring of roads: Mayekiso, (Masechaba)Maharaj, Maja Ext 9, Di Wetse Ext 19, Impela Ext 15, Francis Brown
Roads
Request for high mast lights (Street names will be submitted) Energy
Building of Library at Ward 86 SRAC
Building of ECD Social Development
Sidewalks at Gugulethu and Mandela Roads
WARD 87
IDP Needs Responsible Departments
A primary school must be constructed at Masechaba view Ext 2 GDE
Construction of house – Spoor water Development Human Settlements
Tarring of roads, Robison Ext 1 & 4, Cool breeze & Lekope Roads
Upgrading of formal soccer ground of Masechaba view @ Cnr. Ramaphosa and Lekope
SRAC
Swimming pool of Multipurpose Centre SRAC
WARD 88
IDP Needs Responsible Departments
Construction of a fully-fledged sports stadium and upgrade of Mackenzie stadium
SRAC
Construction of an indoor sports centre SRAC
Tarring of Protea, Waterbok and Reebok streets Roads
Wetland rehabilitation at Ma wag Ext 3 Environment Development
Rehabilitation of wetland X3 Ma-Way Environmental Development
WARD 89

IDP Needs Responsible Departments
Alternative land for Winnie Mandela and L&J informal settlement, to settle the communities
Human Settlement
Issuing of title deeds to beneficiaries of Tswelopele Ext 05 and Tembisa Ext 23
Human Settlement
Widening of Madiba Drive in Winnie Mandela Park Roads
EMPD Precinct: Erf 2739 EMPD
Community Hall: Erf 5877 SRAC
WARD 90
IDP Needs Responsible Departments
Upgrade informal settlement (proper stands with sustainable sanitation) Emhlangeni stands No. 316, 317, 318, 319, 320. Vusimuzi, Two line and Mangosuthu 1 and 2
Human Settlement
Relocation of congested and under electric pylons informal settlement for construction of roads and storm
Energy Roads
Building of early childhood development (ECD) centre at ERF 124/stand and a Hall at No. 210/124
Social Development
Proclamation of the following stands: 124/618, 619, 620, 621, 622, 623, 624, 159, 463, 462, 795 and 208
City Development
Transform Castel Hostel: Amour Foundation – stand no 303. Private school into a public primary school
GDE
WARD 91
IDP Needs Responsible Departments
Community Hall with Clinic and Library in Birch Acres Ext 23-44. SRAC Health
Community Hall with Clinic and Library in Esselen Park Ext 3. SRAC Health
Upgrade, extending and refurbishment of the Birchleigh North Clinic. Health
Proper sanitation (Flushing toilets) for every shack in the Sophia Town Informal Settlement.
Water
Pedestrian Bridge and paved walkways across stream/ spruit from Malvina Road/ Pongola Drive linking with Frikkie Street, Birchleigh North
Roads
WARD 92
IDP Needs Responsible Departments
Rehabilitation and upgrading of electricity network in Northern Germiston with Elandsfontein / Elandsfontein Rail being a priority
Energy
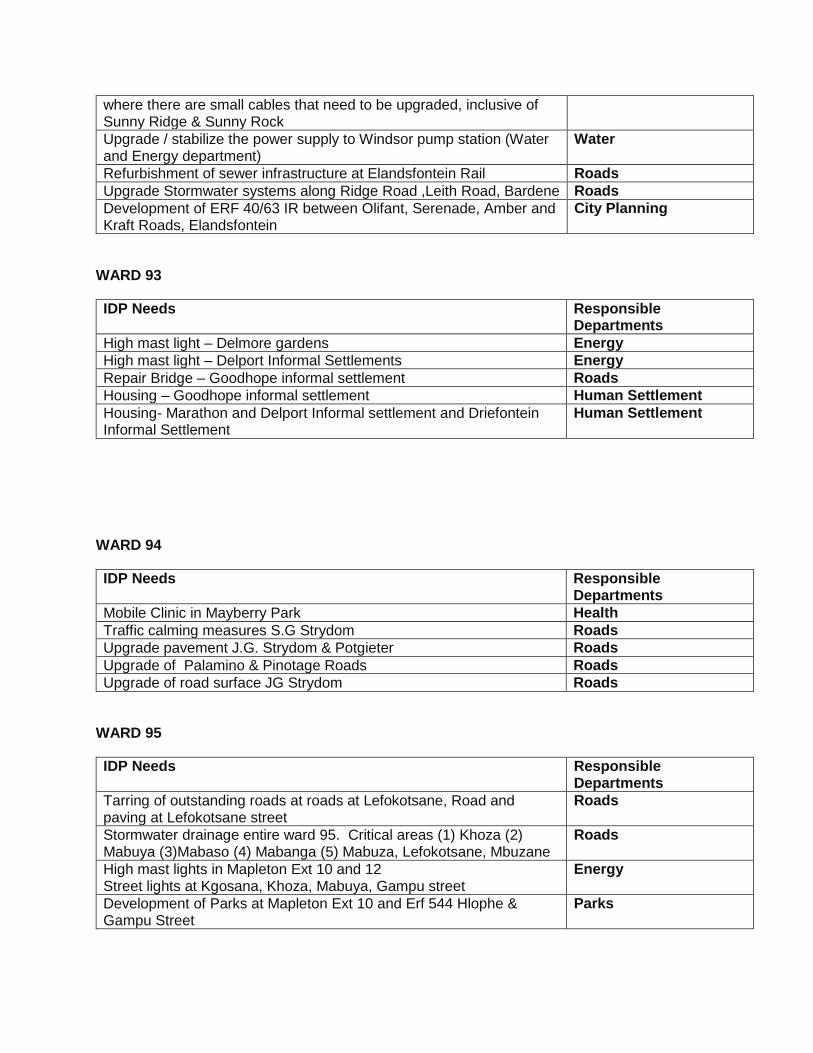
where there are small cables that need to be upgraded, inclusive of Sunny Ridge & Sunny Rock
Upgrade / stabilize the power supply to Windsor pump station (Water and Energy department)
Water
Refurbishment of sewer infrastructure at Elandsfontein Rail Roads
Upgrade Stormwater systems along Ridge Road ,Leith Road, Bardene Roads
Development of ERF 40/63 IR between Olifant, Serenade, Amber and Kraft Roads, Elandsfontein
City Planning
WARD 93
IDP Needs Responsible Departments
High mast light – Delmore gardens Energy
High mast light – Delport Informal Settlements Energy
Repair Bridge – Goodhope informal settlement Roads
Housing – Goodhope informal settlement Human Settlement
Housing- Marathon and Delport Informal settlement and Driefontein Informal Settlement
Human Settlement
WARD 94
IDP Needs Responsible Departments
Mobile Clinic in Mayberry Park Health
Traffic calming measures S.G Strydom Roads
Upgrade pavement J.G. Strydom & Potgieter Roads
Upgrade of Palamino & Pinotage Roads Roads
Upgrade of road surface JG Strydom Roads
WARD 95
IDP Needs Responsible Departments
Tarring of outstanding roads at roads at Lefokotsane, Road and paving at Lefokotsane street
Roads
Stormwater drainage entire ward 95. Critical areas (1) Khoza (2) Mabuya (3)Mabaso (4) Mabanga (5) Mabuza, Lefokotsane, Mbuzane
Roads
High mast lights in Mapleton Ext 10 and 12 Street lights at Kgosana, Khoza, Mabuya, Gampu street
Energy
Development of Parks at Mapleton Ext 10 and Erf 544 Hlophe & Gampu Street
Parks
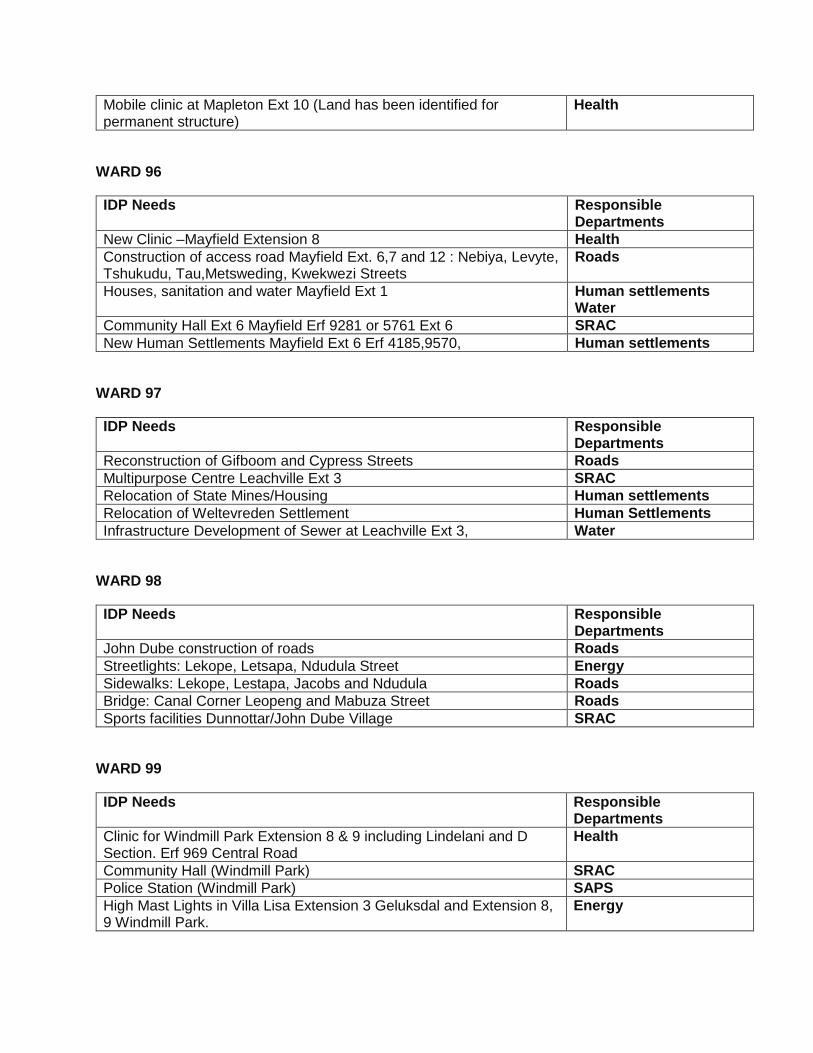
Mobile clinic at Mapleton Ext 10 (Land has been identified for permanent structure)
Health
WARD 96
IDP Needs Responsible Departments
New Clinic –Mayfield Extension 8 Health
Construction of access road Mayfield Ext. 6,7 and 12 : Nebiya, Levyte, Tshukudu, Tau,Metsweding, Kwekwezi Streets
Roads
Houses, sanitation and water Mayfield Ext 1 Human settlements Water
Community Hall Ext 6 Mayfield Erf 9281 or 5761 Ext 6 SRAC
New Human Settlements Mayfield Ext 6 Erf 4185,9570, Human settlements
WARD 97
IDP Needs Responsible Departments
Reconstruction of Gifboom and Cypress Streets Roads
Multipurpose Centre Leachville Ext 3 SRAC
Relocation of State Mines/Housing Human settlements
Relocation of Weltevreden Settlement Human Settlements
Infrastructure Development of Sewer at Leachville Ext 3, Water
WARD 98
IDP Needs Responsible Departments
John Dube construction of roads Roads
Streetlights: Lekope, Letsapa, Ndudula Street Energy
Sidewalks: Lekope, Lestapa, Jacobs and Ndudula Roads
Bridge: Canal Corner Leopeng and Mabuza Street Roads
Sports facilities Dunnottar/John Dube Village SRAC
WARD 99
IDP Needs Responsible Departments
Clinic for Windmill Park Extension 8 & 9 including Lindelani and D Section. Erf 969 Central Road
Health
Community Hall (Windmill Park) SRAC
Police Station (Windmill Park) SAPS
High Mast Lights in Villa Lisa Extension 3 Geluksdal and Extension 8, 9 Windmill Park.
Energy
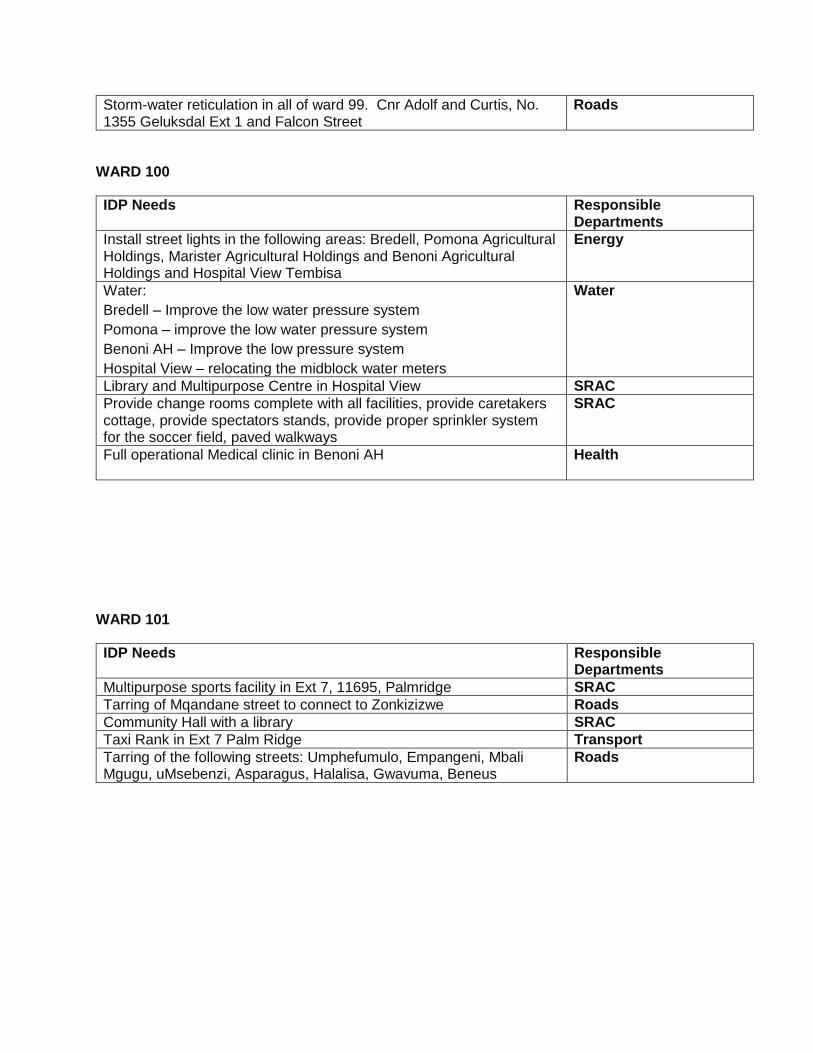
Storm-water reticulation in all of ward 99. Cnr Adolf and Curtis, No. 1355 Geluksdal Ext 1 and Falcon Street
Roads
WARD 100
IDP Needs Responsible Departments
Install street lights in the following areas: Bredell, Pomona Agricultural Holdings, Marister Agricultural Holdings and Benoni Agricultural Holdings and Hospital View Tembisa
Energy
Water:
Bredell – Improve the low water pressure system
Pomona – improve the low water pressure system
Benoni AH – Improve the low pressure system
Hospital View – relocating the midblock water meters
Water
Library and Multipurpose Centre in Hospital View SRAC
Provide change rooms complete with all facilities, provide caretakers cottage, provide spectators stands, provide proper sprinkler system for the soccer field, paved walkways
SRAC
Full operational Medical clinic in Benoni AH
Health
WARD 101
IDP Needs Responsible Departments
Multipurpose sports facility in Ext 7, 11695, Palmridge SRAC
Tarring of Mqandane street to connect to Zonkizizwe Roads
Community Hall with a library SRAC
Taxi Rank in Ext 7 Palm Ridge Transport
Tarring of the following streets: Umphefumulo, Empangeni, Mbali Mgugu, uMsebenzi, Asparagus, Halalisa, Gwavuma, Beneus
Roads
CHAPTER 7
7. REVIEW OF THE INTEGRATED DEVELOPMENT PLAN
7.1 GUIDING PRINCIPLES
The EMM IDP is its principal strategic planning instrument, which directly guides and informs its
planning, budget, management and development actions. This framework is rolled out into planning
statements covering the five-year objectives, key performance indicators and targets for
implementation which directly inform the SDBIP. The whole process was structured around supporting
and working towards contributing to the achievement of the programmes set out in the GDS 2055.
In terms of Section 34 of the Municipal Systems Act, 32 of 2000, the Council must annually review its
IDP in terms of a predetermined process. This process was adopted by Council on 30 August 2012.
The review of the IDP in terms of the Municipal Systems Act is guided and informed by the following:
It must support and work towards achieving the vision and mission of the EMM;
It must work towards the achievement of the EMM GDS 2055 programmes;
Address the national outcomes set by Cabinet;
Focus on basic service delivery in terms of the eradication of backlogs and the maintenance of
existing infrastructure and community needs; and
Applicable provincial plans and programmes. Budget allocations by the respective provincial
sector departments to these projects should also be reflected as far as possible.
All departments were part of the IDP and SDBIP reviewing process. The IDP/SDBIP for 2016/2017 is
organised and aligned to the GDS programmes and sub-programmes. This approach allows for
continuity from the previous financial year and clearly demonstrates the linkage with National
Development Plan. There is a seamless progression from the 2015/2016 financial year to the
2016/2017 financial year by retaining the critical indicators and extending existing indicators. The latter
enables EMM to measure progress from one year to the next. The overall planning methodology of the
EMM is results-based; therefore the focus is on the key results and not activities and outputs in the
IDP. The strategic activities and associated outputs are detailed in the departmental SDBIP, to assess
the overall implementation both the metro-wide SDBIP and the departmental SDBIP must be read
together.
The outcomes of the engagements with various municipal departments are contained below in the
metro-wide IDP and SDBIP.
7.2 IDP/SDBIP
INTRODUCTION
Through the IDP/SDBIP of the last few years, Ekurhuleni Metropolitan Municipality has laid a solid
service delivery foundation that the current IDP/SDBIP is seeking to build on. Enormous strides have
been made to change the lives and circumstances of our people. However much still has to be done in
discharging the 2016/2017 IDP/SDBIP. This IDP/SDBIP provides a chance to continue the change
process. It provides an opportunity – to improve efficiencies and effectiveness, thereby providing
services to all community and fulfilling the mandate held by the Municipality.
The IDP/SDBIP for the 2016/2017 financial year is a continuation from the previous years, building on
and extending the key results and outcomes. Once again the focus is on the most strategic results
representing the core mandate of the metro. The 2016/2017 IDP/SDBIP is structured around the GDS
programmes and sub-programmes and is aligned to the National Outcomes relevant and appropriate
to the metros core business. This approach is completed by the departmental SDBIPs, and when
looked at together provides insight into the overall implementation programme of the municipality.
NATIONAL OUTCOME: SUSTAINABLE HUMAN SETTLEMENTS
The inefficiencies and inequities in South Africa’s settlement patterns are deeply entrenched as
apartheid left a terrible spatial legacy (NDP: 2012), as described in the NDP, where people live and
work matters. Apartheid planning consigned the majority of South Africans to places far away from
work, where services could not be sustained and where it was difficult to access the benefits of society
and participate fully in the economy. Towns and cities are highly fragmented imposing high costs on
households and the economy.
Informal settlements and backyard shacks present a particular challenge related to the pursuit of
economic livelihood opportunities linked to a fundamental shift in the structure of households and
survivalist strategies. Most migrants utilise informal settlements, which constitute the most affordable
housing as landing points in towns and cities. With a declining delivery rate of supply of public and
private housing and the inability of migrants and other unskilled people to break into the labour market
and improve incomes, they find it difficult to move out of shacks into more formal accommodation. The
failure of housing developments, highlighted above; limited public financial resources, and other logistic
challenges, have resulted in local government being unable to provide housing for all its citizens. This
creates a need to provide rental housing for designated groups, based on income, which must usually
not be above a specified maximum level. The metro has as part of its housing policy a number of social
and rental housing Programme interventions to address the rental housing shortage.
At the core is the need to transform the functioning of human settlements and the workings of the space
economy so as to observe meaningful and measurable progress in creating more functionally
integrated, balanced and vibrant urban settlements by 2030. This requires institutional capabilities for
effective coordination and spatial.
EMM GAUTENG CITY REGIONAL INTEGRATION
In support of the national outcome on sustainable human settlements, Ekurhuleni Metro has embarked
on a number of programmes and sub-programmes that facilitates regional integration. The strategic
intent is to enable a process of re-urbanisation of well-connected and networked spaces to ensure a
compact and sustainable city, rejuvenate blighted and neglected areas, manage and channel growth,
facilitate upward mobility in the formal and informal housing markets, cater for the needs of households
requiring affordable accommodation in well located areas and provide efficient and affordable
accessibility to places of work, shopping nodes and facilities within the City and the City Region. At the
heart of Ekurhuleni’s urbanisation challenge is an inability to meet needs and demands with current
policies and supply modalities.
To address these challenges these challenges and deal with the elements of transformation towards
sustainability with regard to matters such as public transport, linear metabolism and air-road-rail
logistics, concerted action and integration at an inter metropolitan level will be required, as will the need
to position the urban industrial complex from an economic development perspective, the following
programmes will be implemented during the 2016/2017 financial year:
REGIONAL ACCESSIBLE PUBLIC TRANSPORT NETWORK DEVELOPMENT
The vision of the White Paper on National Transport Policy, 1996 is to provide safe, reliable, effective,
efficient, and fully integrated transport operations and infrastructure which will best meet the needs of
freight and passenger customers at improving levels of service and cost in a fashion which supports
government strategies for economic and social development whilst being economically and
environmentally sustainable.
There are a number of good reasons for improving the accessibility of public transport services.
Improving accessibility is good for business. It improves the perceived quality of services and leads to
satisfied customers. It also enables transport services for a wider group of customers at all times of the
day and week. Improving accessibility means increasing access for people meeting physical and
informational barriers. Accessible cities will enhance their reputation among their citizens, tourists and
visitors by being known as inclusive cities or locations. Improving accessibility will attract passengers
who would not previously have considered using public transport. This will improve both the
sustainability and the effectiveness of the urban transport system. The most imperative reason is that
all citizens have the right to participate in society on equal terms, and transport, in many ways, is the
gateway to participation; that is, daily life, social and leisure activities, employment etc. The services
are then available for more citizens and fewer other arrangements are needed. Legislative and
regulatory frameworks also require accessible public transport systems.
The regional accessible public transport network development will be implemented through providing
access to public transport by extending existing routes and building new routes thereby facilitating
easier transit from one point to another. In addition, to ease traffic congestion the city has will continue

with the installation of LED lights in order to increase operational capacity and reduce any outages. For
the 2016/2017- 2020/ 2021 financial years the following results are envisaged:
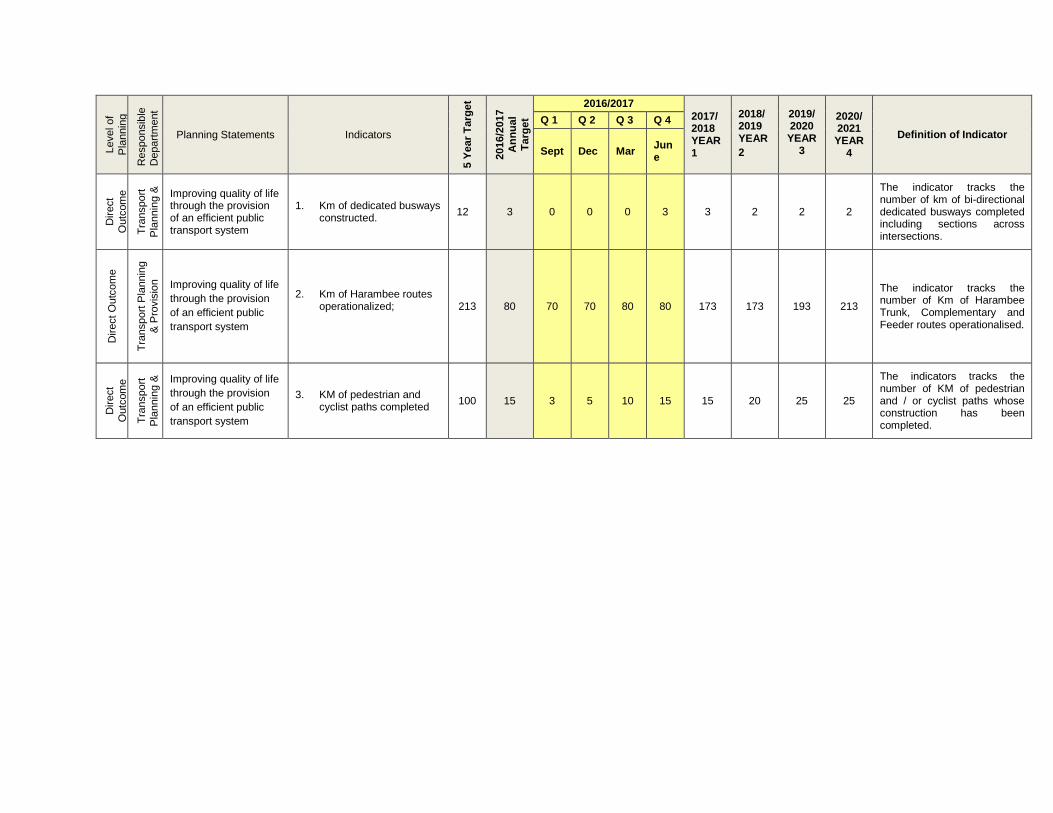
Level of
Pla
nnin
g
Responsib
le
Depart
me
nt
Planning Statements Indicators
5 Y
ear
Ta
rge
t
2016/2
017
An
nu
al
Ta
rge
t
2016/2017
2017/ 2018 YEAR 1
2018/ 2019 YEAR
2
2019/ 2020 YEAR
3
2020/ 2021 YEAR
4
Definition of Indicator
Q 1 Q 2 Q 3 Q 4
Sept Dec Mar June
Direct
Outc
om
e
Tra
nsport
Pla
nnin
g &
P
rovis
ion
Improving quality of life through the provision of an efficient public transport system
1. Km of dedicated busways constructed.
12 3 0 0 0 3 3 2 2 2
The indicator tracks the number of km of bi-directional dedicated busways completed including sections across intersections.
Direct O
utc
om
e
Tra
nsport
Pla
nnin
g
& P
rovis
ion
Improving quality of life
through the provision
of an efficient public
transport system
2. Km of Harambee routes operationalized;
213 80 70 70 80 80 173 173 193 213
The indicator tracks the number of Km of Harambee Trunk, Complementary and Feeder routes operationalised.
Direct
Outc
om
e
Tra
nsport
Pla
nnin
g &
P
rovis
ion Improving quality of life
through the provision
of an efficient public
transport system
3. KM of pedestrian and cyclist paths completed
100 15 3 5 10 15 15 20 25 25
The indicators tracks the number of KM of pedestrian and / or cyclist paths whose construction has been completed.
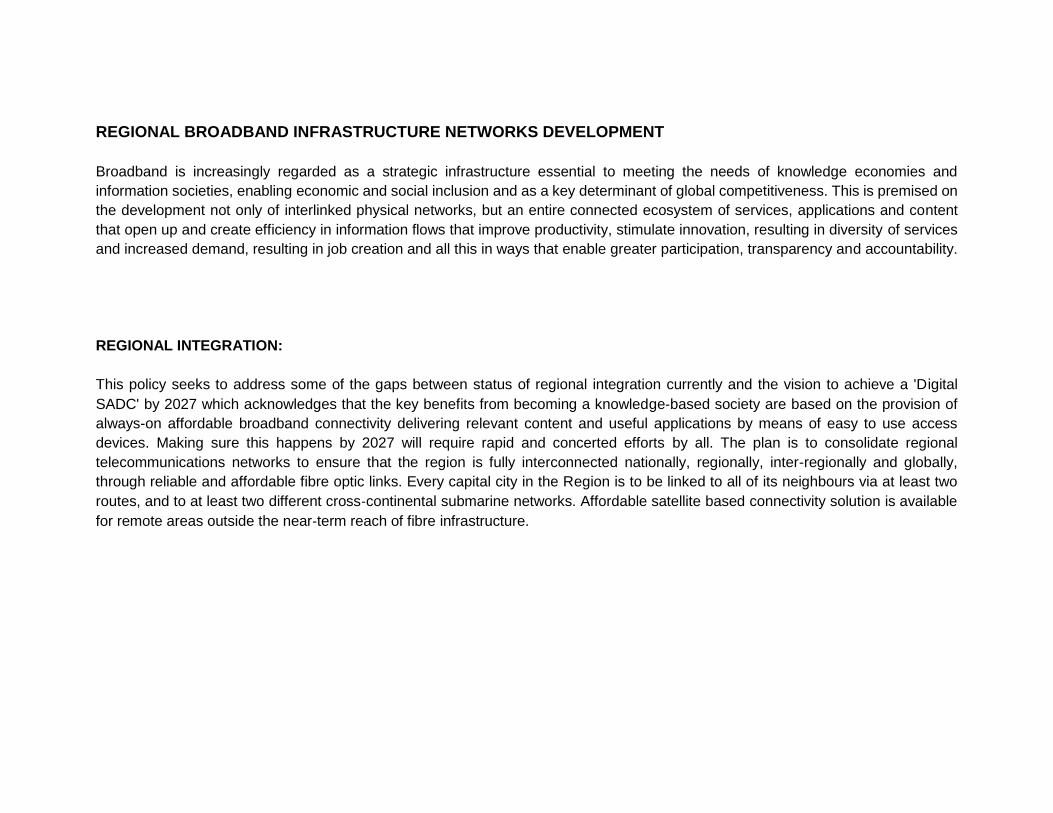
REGIONAL BROADBAND INFRASTRUCTURE NETWORKS DEVELOPMENT
Broadband is increasingly regarded as a strategic infrastructure essential to meeting the needs of knowledge economies and
information societies, enabling economic and social inclusion and as a key determinant of global competitiveness. This is premised on
the development not only of interlinked physical networks, but an entire connected ecosystem of services, applications and content
that open up and create efficiency in information flows that improve productivity, stimulate innovation, resulting in diversity of services
and increased demand, resulting in job creation and all this in ways that enable greater participation, transparency and accountability.
REGIONAL INTEGRATION:
This policy seeks to address some of the gaps between status of regional integration currently and the vision to achieve a 'Digital
SADC' by 2027 which acknowledges that the key benefits from becoming a knowledge‐based society are based on the provision of
always-on affordable broadband connectivity delivering relevant content and useful applications by means of easy to use access
devices. Making sure this happens by 2027 will require rapid and concerted efforts by all. The plan is to consolidate regional
telecommunications networks to ensure that the region is fully interconnected nationally, regionally, inter-regionally and globally,
through reliable and affordable fibre optic links. Every capital city in the Region is to be linked to all of its neighbours via at least two
routes, and to at least two different cross‐continental submarine networks. Affordable satellite based connectivity solution is available
for remote areas outside the near‐term reach of fibre infrastructure.
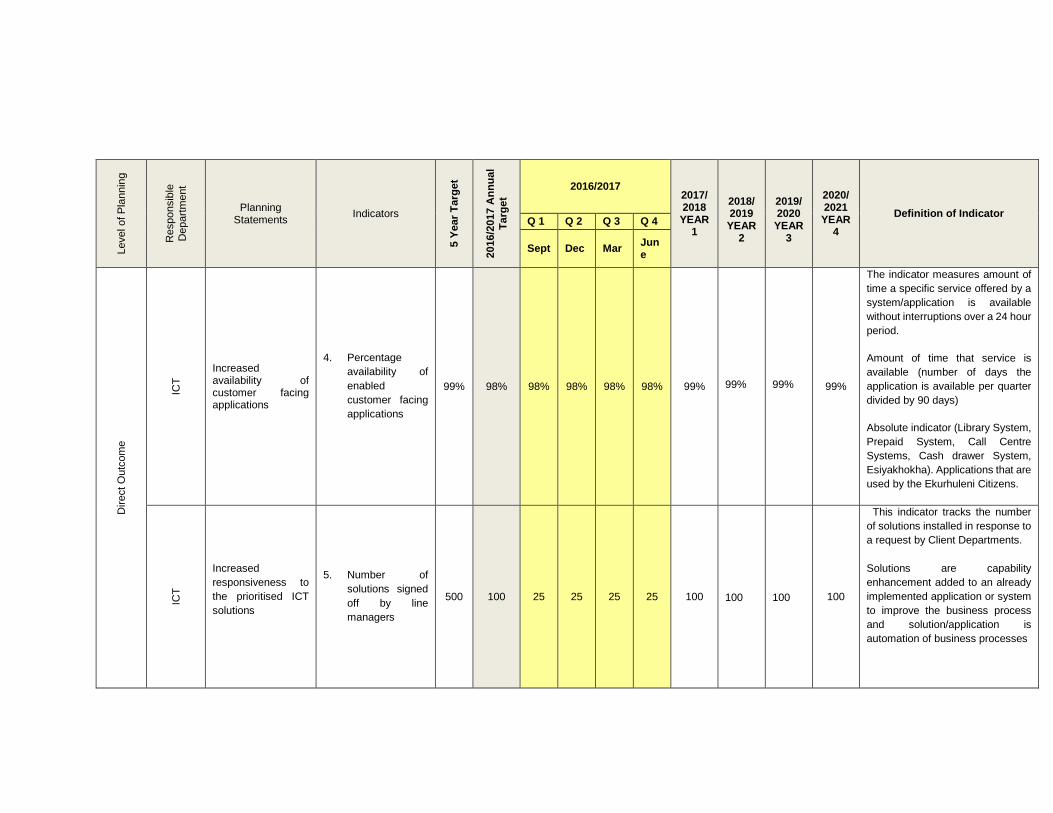
Level of P
lannin
g
Responsib
le
Depart
me
nt
Planning Statements
Indicators
5 Y
ear
Ta
rge
t
2016/2
017 A
nn
ua
l
Ta
rge
t
2016/2017 2017/ 2018 YEAR
1
2018/ 2019 YEAR
2
2019/ 2020 YEAR
3
2020/ 2021 YEAR
4
Definition of Indicator Q 1 Q 2 Q 3 Q 4
Sept Dec Mar June
Direct O
utc
om
e
ICT
Increased availability of customer facing applications
4. Percentage
availability of
enabled
customer facing
applications
99% 98% 98% 98% 98% 98% 99%
99%
99% 99%
The indicator measures amount of
time a specific service offered by a
system/application is available
without interruptions over a 24 hour
period.
Amount of time that service is
available (number of days the
application is available per quarter
divided by 90 days)
Absolute indicator (Library System,
Prepaid System, Call Centre
Systems, Cash drawer System,
Esiyakhokha). Applications that are
used by the Ekurhuleni Citizens.
ICT
Increased
responsiveness to
the prioritised ICT
solutions
5. Number of
solutions signed
off by line
managers
500 100 25 25 25 25 100
100
100 100
This indicator tracks the number
of solutions installed in response to
a request by Client Departments.
Solutions are capability
enhancement added to an already
implemented application or system
to improve the business process
and solution/application is
automation of business processes
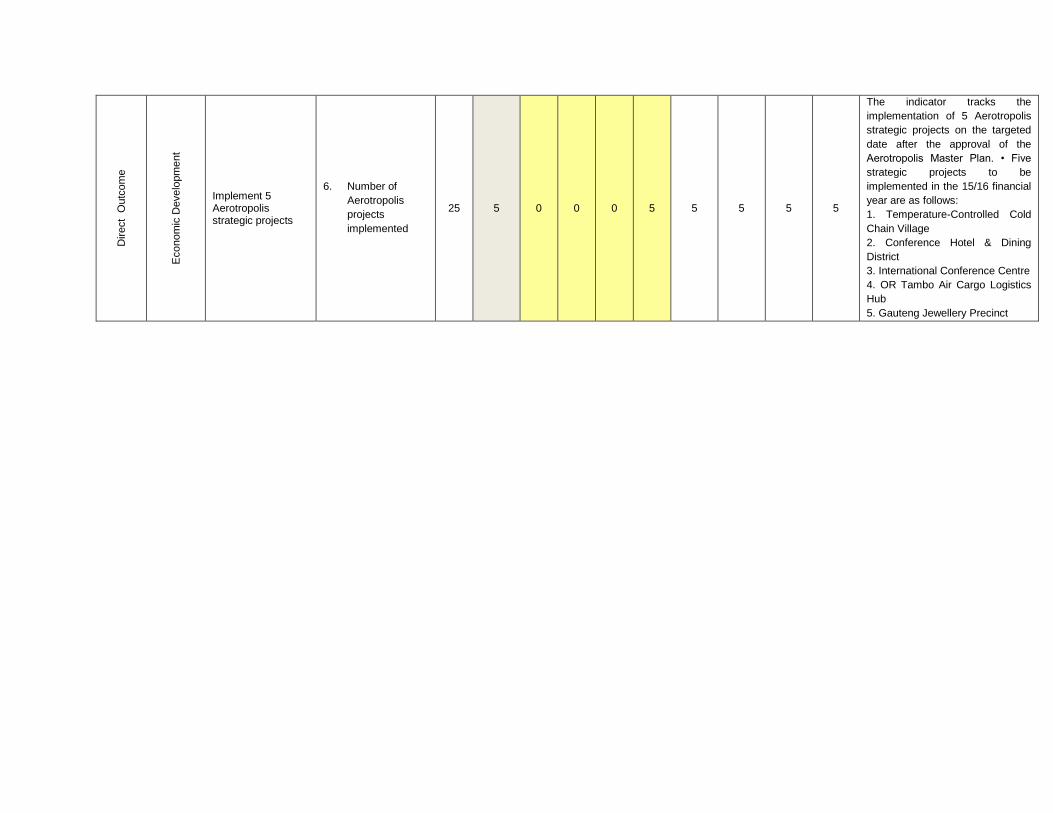
Direct O
utc
om
e
Econom
ic D
evelo
pm
ent
Implement 5 Aerotropolis strategic projects
6. Number of
Aerotropolis
projects
implemented
25 5 0 0 0 5 5 5 5 5
The indicator tracks the
implementation of 5 Aerotropolis
strategic projects on the targeted
date after the approval of the
Aerotropolis Master Plan. • Five
strategic projects to be
implemented in the 15/16 financial
year are as follows:
1. Temperature-Controlled Cold
Chain Village
2. Conference Hotel & Dining
District
3. International Conference Centre
4. OR Tambo Air Cargo Logistics
Hub
5. Gauteng Jewellery Precinct
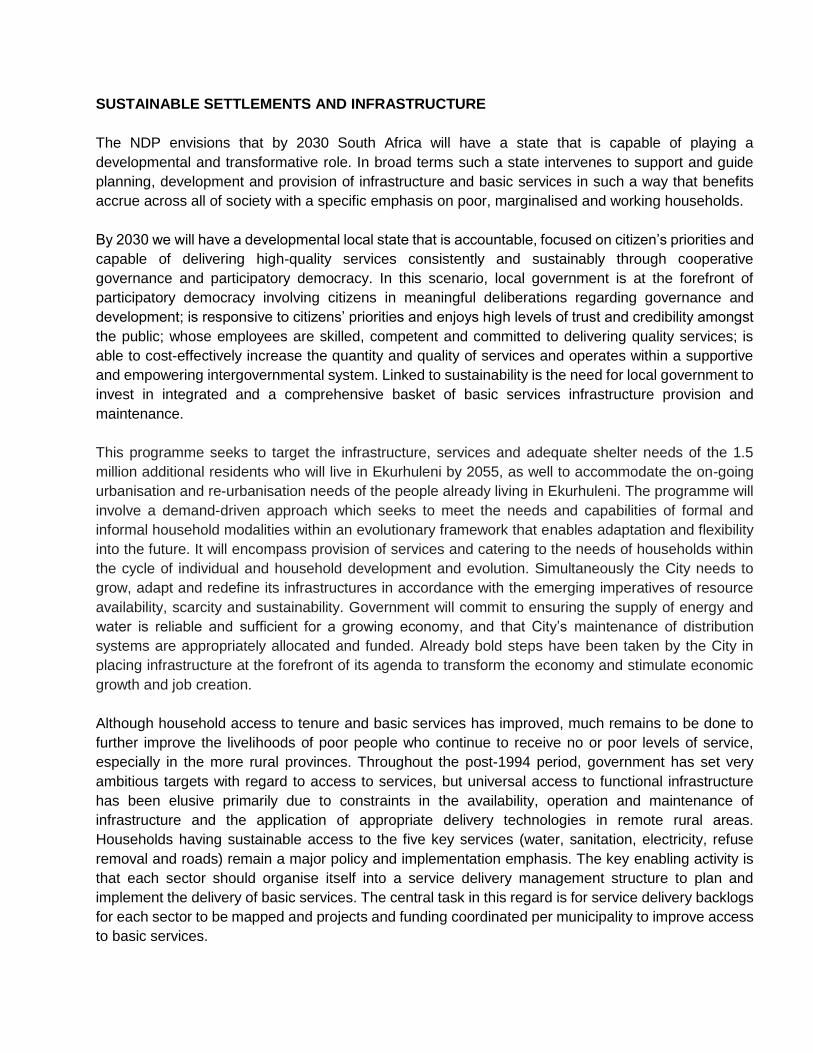
SUSTAINABLE SETTLEMENTS AND INFRASTRUCTURE
The NDP envisions that by 2030 South Africa will have a state that is capable of playing a
developmental and transformative role. In broad terms such a state intervenes to support and guide
planning, development and provision of infrastructure and basic services in such a way that benefits
accrue across all of society with a specific emphasis on poor, marginalised and working households.
By 2030 we will have a developmental local state that is accountable, focused on citizen’s priorities and
capable of delivering high-quality services consistently and sustainably through cooperative
governance and participatory democracy. In this scenario, local government is at the forefront of
participatory democracy involving citizens in meaningful deliberations regarding governance and
development; is responsive to citizens’ priorities and enjoys high levels of trust and credibility amongst
the public; whose employees are skilled, competent and committed to delivering quality services; is
able to cost-effectively increase the quantity and quality of services and operates within a supportive
and empowering intergovernmental system. Linked to sustainability is the need for local government to
invest in integrated and a comprehensive basket of basic services infrastructure provision and
maintenance.
This programme seeks to target the infrastructure, services and adequate shelter needs of the 1.5
million additional residents who will live in Ekurhuleni by 2055, as well to accommodate the on-going
urbanisation and re-urbanisation needs of the people already living in Ekurhuleni. The programme will
involve a demand-driven approach which seeks to meet the needs and capabilities of formal and
informal household modalities within an evolutionary framework that enables adaptation and flexibility
into the future. It will encompass provision of services and catering to the needs of households within
the cycle of individual and household development and evolution. Simultaneously the City needs to
grow, adapt and redefine its infrastructures in accordance with the emerging imperatives of resource
availability, scarcity and sustainability. Government will commit to ensuring the supply of energy and
water is reliable and sufficient for a growing economy, and that City’s maintenance of distribution
systems are appropriately allocated and funded. Already bold steps have been taken by the City in
placing infrastructure at the forefront of its agenda to transform the economy and stimulate economic
growth and job creation.
Although household access to tenure and basic services has improved, much remains to be done to
further improve the livelihoods of poor people who continue to receive no or poor levels of service,
especially in the more rural provinces. Throughout the post-1994 period, government has set very
ambitious targets with regard to access to services, but universal access to functional infrastructure
has been elusive primarily due to constraints in the availability, operation and maintenance of
infrastructure and the application of appropriate delivery technologies in remote rural areas.
Households having sustainable access to the five key services (water, sanitation, electricity, refuse
removal and roads) remain a major policy and implementation emphasis. The key enabling activity is
that each sector should organise itself into a service delivery management structure to plan and
implement the delivery of basic services. The central task in this regard is for service delivery backlogs
for each sector to be mapped and projects and funding coordinated per municipality to improve access
to basic services.
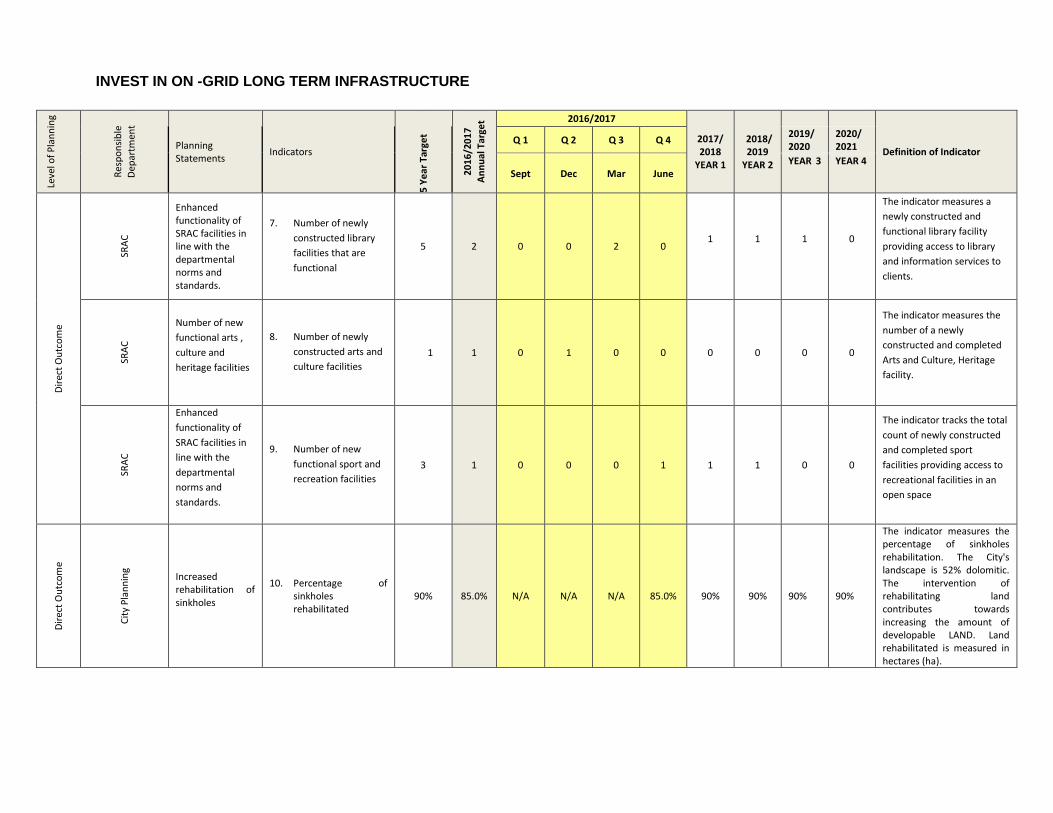
INVEST IN ON -GRID LONG TERM INFRASTRUCTURE
Leve
l of
Pla
nn
ing
Res
po
nsi
ble
Dep
artm
ent
Planning Statements
Indicators
5 Y
ear
Tar
get
20
16
/20
17
An
nu
al T
arge
t 2016/2017
2017/ 2018
YEAR 1
2018/ 2019
YEAR 2
Definition of Indicator Q 1 Q 2 Q 3 Q 4
2019/ 2020
2020/ 2021
Sept Dec Mar June YEAR 3 YEAR 4
Dir
ect
Ou
tco
me
SRA
C
Enhanced functionality of SRAC facilities in line with the departmental norms and standards.
7. Number of newly
constructed library
facilities that are
functional
5 2 0 0 2 0 1 1
1
0
The indicator measures a
newly constructed and
functional library facility
providing access to library
and information services to
clients.
SRA
C
Number of new
functional arts ,
culture and
heritage facilities
8. Number of newly
constructed arts and
culture facilities
1 1 0 1 0 0 0 0 0 0
The indicator measures the
number of a newly
constructed and completed
Arts and Culture, Heritage
facility.
SRA
C
Enhanced
functionality of
SRAC facilities in
line with the
departmental
norms and
standards.
9. Number of new
functional sport and
recreation facilities
3 1 0 0 0 1 1 1 0 0
The indicator tracks the total
count of newly constructed
and completed sport
facilities providing access to
recreational facilities in an
open space
Dir
ect
Ou
tco
me
Cit
y P
lan
nin
g
Increased rehabilitation of sinkholes
10. Percentage of sinkholes rehabilitated
90% 85.0% N/A N/A N/A 85.0% 90% 90%
90%
90%
The indicator measures the percentage of sinkholes rehabilitation. The City's landscape is 52% dolomitic. The intervention of rehabilitating land contributes towards increasing the amount of developable LAND. Land rehabilitated is measured in hectares (ha).
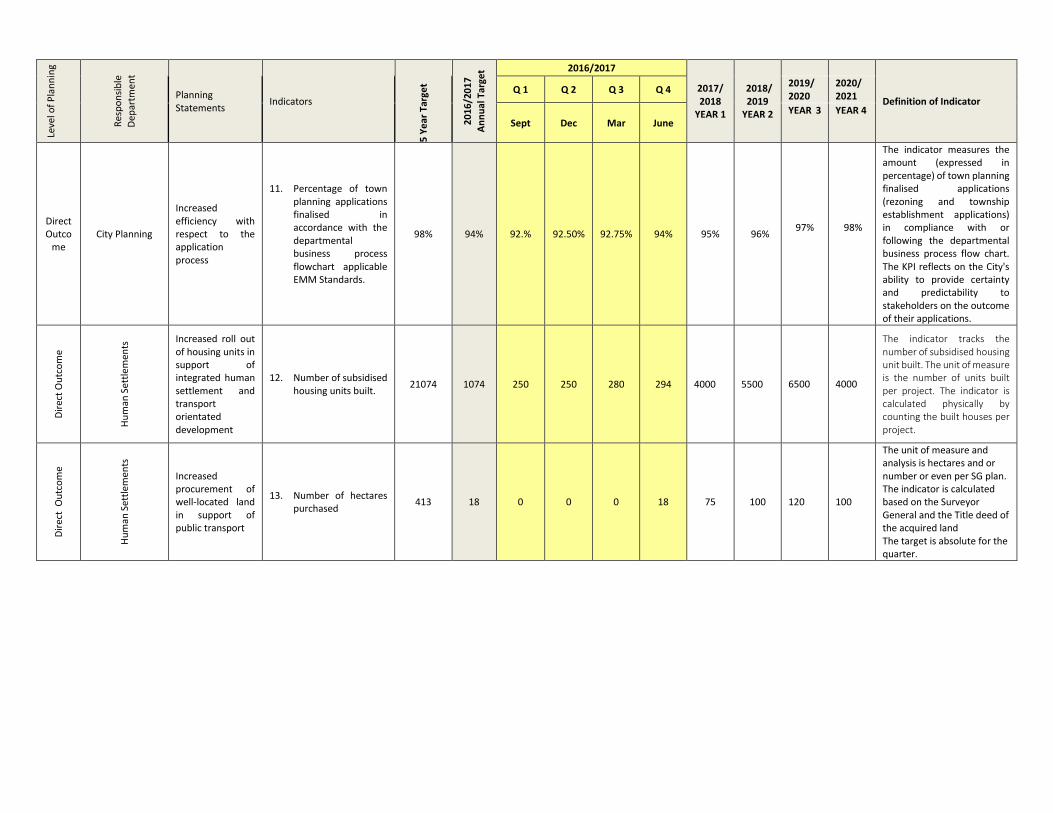
Leve
l of
Pla
nn
ing
Res
po
nsi
ble
Dep
artm
ent
Planning Statements
Indicators
5 Y
ear
Tar
get
20
16
/20
17
An
nu
al T
arge
t 2016/2017
2017/ 2018
YEAR 1
2018/ 2019
YEAR 2
Definition of Indicator Q 1 Q 2 Q 3 Q 4
2019/ 2020
2020/ 2021
Sept Dec Mar June YEAR 3 YEAR 4
Direct Outco
me City Planning
Increased efficiency with respect to the application process
11. Percentage of town planning applications finalised in accordance with the departmental business process flowchart applicable EMM Standards.
98% 94% 92.% 92.50% 92.75% 94% 95% 96%
97%
98%
The indicator measures the amount (expressed in percentage) of town planning finalised applications (rezoning and township establishment applications) in compliance with or following the departmental business process flow chart. The KPI reflects on the City's ability to provide certainty and predictability to stakeholders on the outcome of their applications.
Dir
ect
Ou
tco
me
Hu
man
Set
tlem
ents
Increased roll out of housing units in support of integrated human settlement and transport orientated development
12. Number of subsidised housing units built.
21074 1074 250 250 280 294 4000 5500
6500
4000
The indicator tracks the number of subsidised housing unit built. The unit of measure is the number of units built per project. The indicator is calculated physically by counting the built houses per project.
Dir
ect
Ou
tco
me
Hu
man
Set
tlem
ents
Increased procurement of well-located land in support of public transport
13. Number of hectares purchased
413 18 0 0 0 18 75 100
120
100
The unit of measure and analysis is hectares and or number or even per SG plan. The indicator is calculated based on the Surveyor General and the Title deed of the acquired land The target is absolute for the quarter.
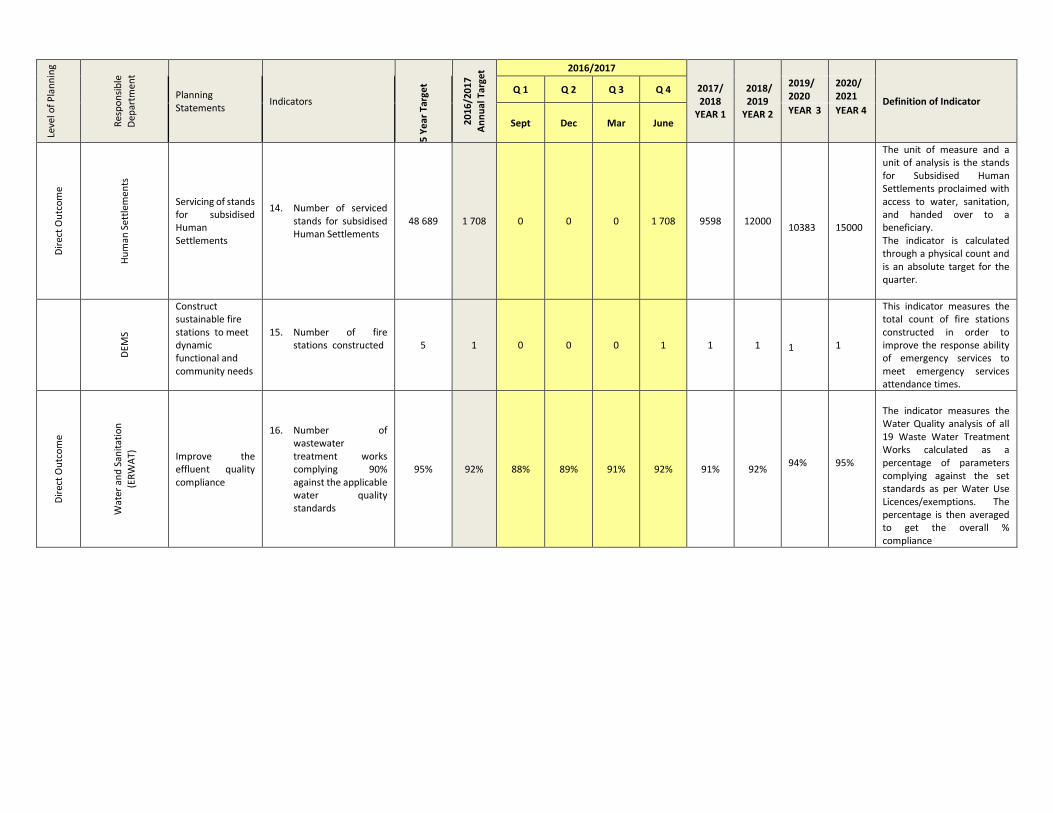
Leve
l of
Pla
nn
ing
Res
po
nsi
ble
Dep
artm
ent
Planning Statements
Indicators
5 Y
ear
Tar
get
20
16
/20
17
An
nu
al T
arge
t 2016/2017
2017/ 2018
YEAR 1
2018/ 2019
YEAR 2
Definition of Indicator Q 1 Q 2 Q 3 Q 4
2019/ 2020
2020/ 2021
Sept Dec Mar June YEAR 3 YEAR 4
Dir
ect
Ou
tco
me
Hu
man
Set
tlem
ents
Servicing of stands for subsidised Human Settlements
14. Number of serviced stands for subsidised Human Settlements
48 689 1 708 0 0 0 1 708 9598 12000
10383
15000
The unit of measure and a unit of analysis is the stands for Subsidised Human Settlements proclaimed with access to water, sanitation, and handed over to a beneficiary. The indicator is calculated through a physical count and is an absolute target for the quarter.
DEM
S
Construct sustainable fire stations to meet dynamic functional and community needs
15. Number of fire stations constructed
5 1 0 0 0 1 1 1
1
1
This indicator measures the total count of fire stations constructed in order to improve the response ability of emergency services to meet emergency services attendance times.
Dir
ect
Ou
tco
me
Wat
er a
nd
San
itat
ion
(ER
WA
T)
Improve the effluent quality compliance
16. Number of wastewater treatment works complying 90% against the applicable water quality standards
95% 92% 88% 89% 91% 92% 91% 92%
94%
95%
The indicator measures the Water Quality analysis of all 19 Waste Water Treatment Works calculated as a percentage of parameters complying against the set standards as per Water Use Licences/exemptions. The percentage is then averaged to get the overall % compliance
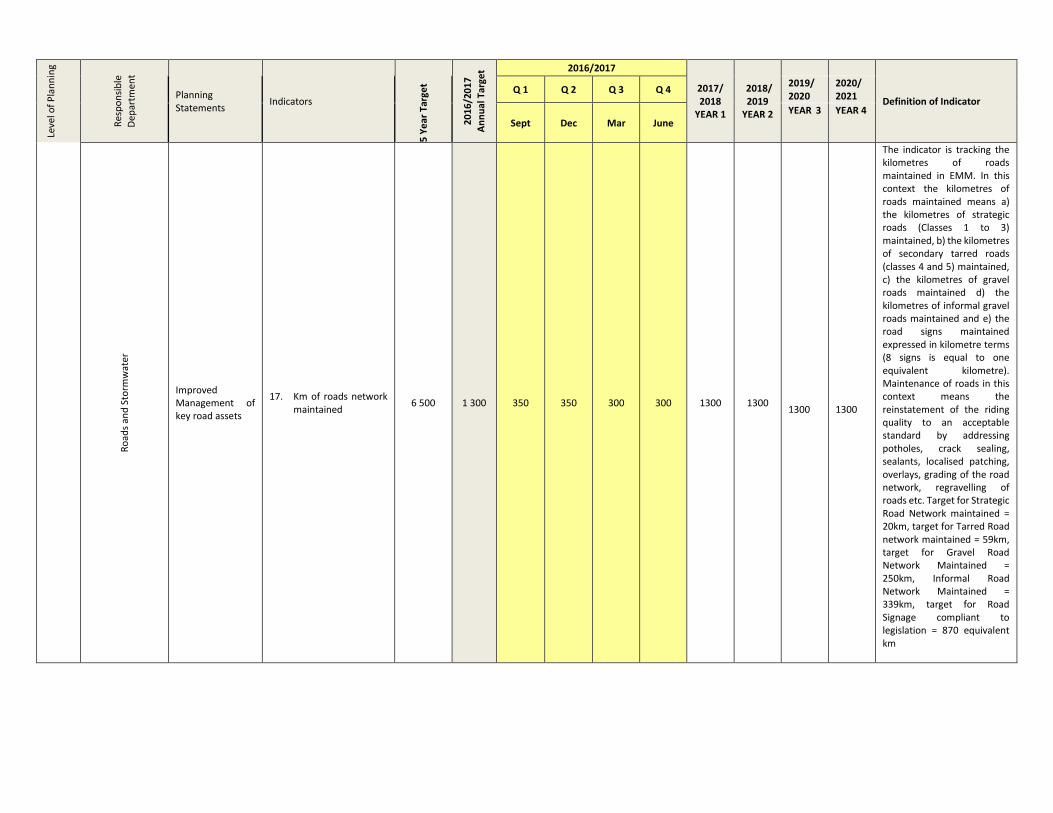
Leve
l of
Pla
nn
ing
Res
po
nsi
ble
Dep
artm
ent
Planning Statements
Indicators
5 Y
ear
Tar
get
20
16
/20
17
An
nu
al T
arge
t 2016/2017
2017/ 2018
YEAR 1
2018/ 2019
YEAR 2
Definition of Indicator Q 1 Q 2 Q 3 Q 4
2019/ 2020
2020/ 2021
Sept Dec Mar June YEAR 3 YEAR 4
Ro
ads
and
Sto
rmw
ater
Improved Management of key road assets
17. Km of roads network maintained
6 500 1 300 350 350 300 300 1300 1300
1300
1300
The indicator is tracking the kilometres of roads maintained in EMM. In this context the kilometres of roads maintained means a) the kilometres of strategic roads (Classes 1 to 3) maintained, b) the kilometres of secondary tarred roads (classes 4 and 5) maintained, c) the kilometres of gravel roads maintained d) the kilometres of informal gravel roads maintained and e) the road signs maintained expressed in kilometre terms (8 signs is equal to one equivalent kilometre). Maintenance of roads in this context means the reinstatement of the riding quality to an acceptable standard by addressing potholes, crack sealing, sealants, localised patching, overlays, grading of the road network, regravelling of roads etc. Target for Strategic Road Network maintained = 20km, target for Tarred Road network maintained = 59km, target for Gravel Road Network Maintained = 250km, Informal Road Network Maintained = 339km, target for Road Signage compliant to legislation = 870 equivalent km
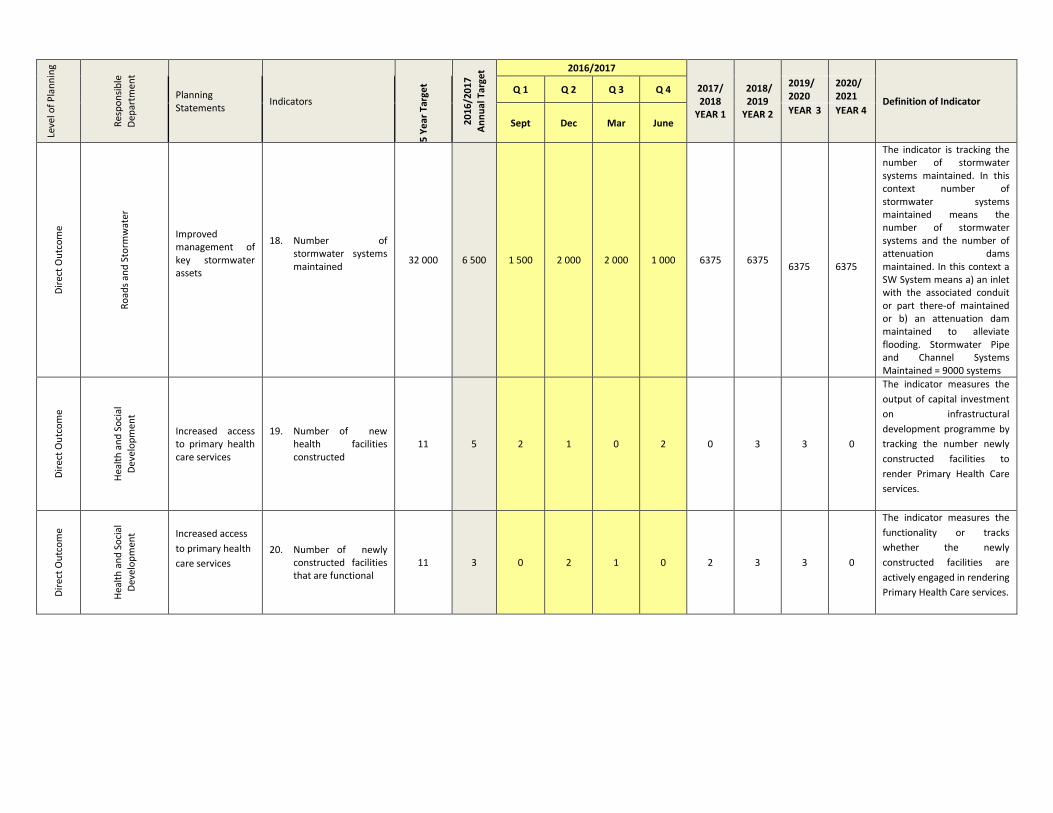
Leve
l of
Pla
nn
ing
Res
po
nsi
ble
Dep
artm
ent
Planning Statements
Indicators
5 Y
ear
Tar
get
20
16
/20
17
An
nu
al T
arge
t 2016/2017
2017/ 2018
YEAR 1
2018/ 2019
YEAR 2
Definition of Indicator Q 1 Q 2 Q 3 Q 4
2019/ 2020
2020/ 2021
Sept Dec Mar June YEAR 3 YEAR 4
Dir
ect
Ou
tco
me
Ro
ads
and
Sto
rmw
ater
Improved management of key stormwater assets
18. Number of stormwater systems maintained
32 000 6 500 1 500 2 000 2 000 1 000 6375 6375
6375
6375
The indicator is tracking the number of stormwater systems maintained. In this context number of stormwater systems maintained means the number of stormwater systems and the number of attenuation dams maintained. In this context a SW System means a) an inlet with the associated conduit or part there-of maintained or b) an attenuation dam maintained to alleviate flooding. Stormwater Pipe and Channel Systems Maintained = 9000 systems
Dir
ect
Ou
tco
me
Hea
lth
an
d S
oci
al
Dev
elo
pm
ent
Increased access to primary health care services
19. Number of new health facilities constructed
11 5 2 1 0 2 0 3 3 0
The indicator measures the
output of capital investment
on infrastructural
development programme by
tracking the number newly
constructed facilities to
render Primary Health Care
services.
Dir
ect
Ou
tco
me
Hea
lth
an
d S
oci
al
Dev
elo
pm
ent Increased access
to primary health
care services
20. Number of newly constructed facilities that are functional
11 3 0 2 1 0 2 3 3 0
The indicator measures the
functionality or tracks
whether the newly
constructed facilities are
actively engaged in rendering
Primary Health Care services.
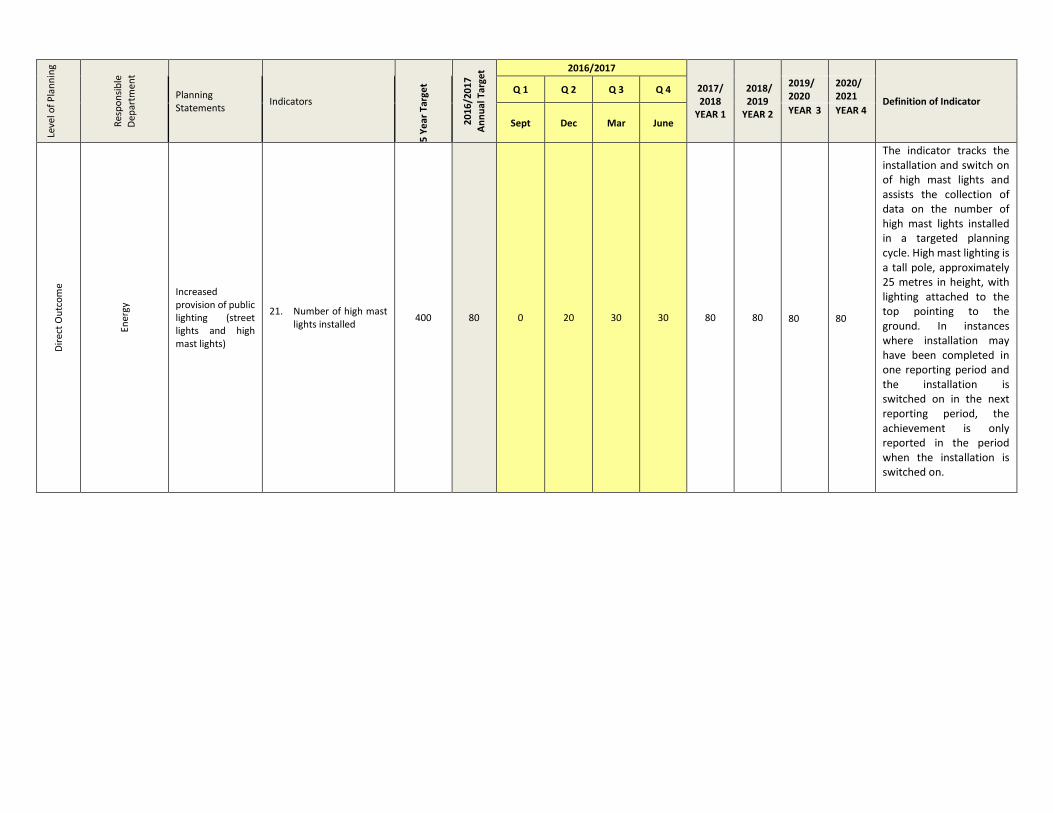
Leve
l of
Pla
nn
ing
Res
po
nsi
ble
Dep
artm
ent
Planning Statements
Indicators
5 Y
ear
Tar
get
20
16
/20
17
An
nu
al T
arge
t 2016/2017
2017/ 2018
YEAR 1
2018/ 2019
YEAR 2
Definition of Indicator Q 1 Q 2 Q 3 Q 4
2019/ 2020
2020/ 2021
Sept Dec Mar June YEAR 3 YEAR 4
Dir
ect
Ou
tco
me
Ener
gy
Increased provision of public lighting (street lights and high mast lights)
21. Number of high mast lights installed
400 80 0 20 30 30 80 80
80
80
The indicator tracks the installation and switch on of high mast lights and assists the collection of data on the number of high mast lights installed in a targeted planning cycle. High mast lighting is a tall pole, approximately 25 metres in height, with lighting attached to the top pointing to the ground. In instances where installation may have been completed in one reporting period and the installation is switched on in the next reporting period, the achievement is only reported in the period when the installation is switched on.
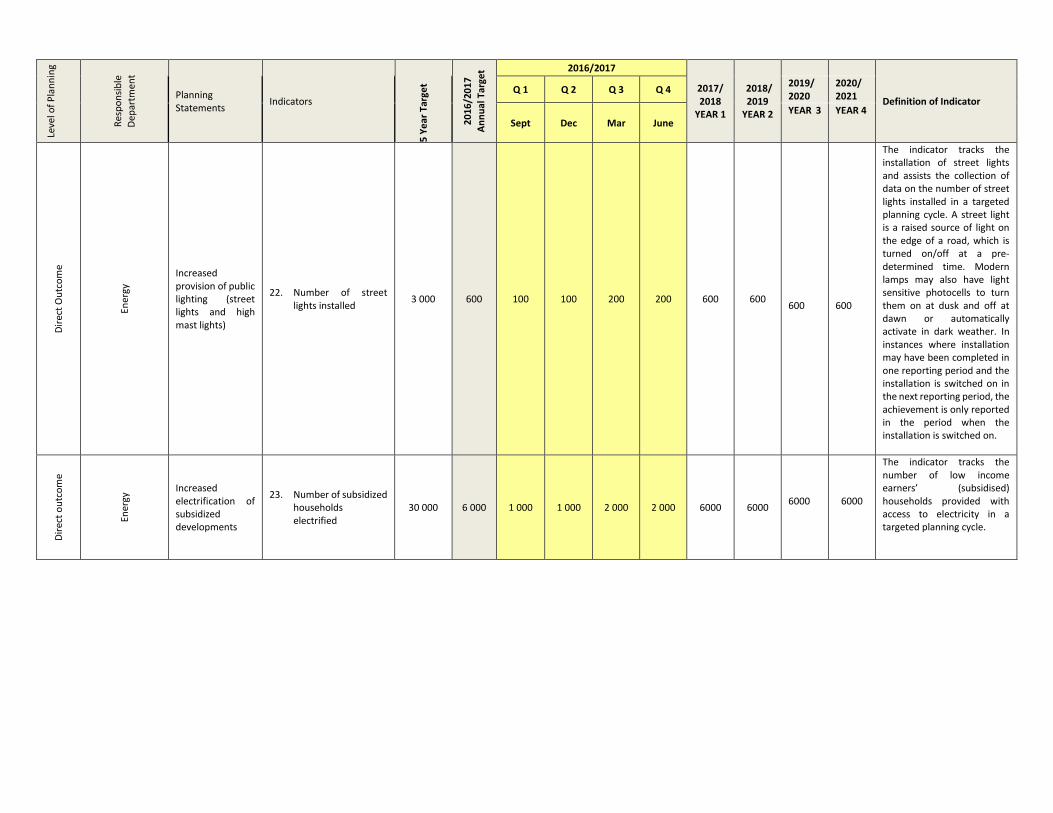
Leve
l of
Pla
nn
ing
Res
po
nsi
ble
Dep
artm
ent
Planning Statements
Indicators
5 Y
ear
Tar
get
20
16
/20
17
An
nu
al T
arge
t 2016/2017
2017/ 2018
YEAR 1
2018/ 2019
YEAR 2
Definition of Indicator Q 1 Q 2 Q 3 Q 4
2019/ 2020
2020/ 2021
Sept Dec Mar June YEAR 3 YEAR 4
Dir
ect
Ou
tco
me
Ener
gy
Increased provision of public lighting (street lights and high mast lights)
22. Number of street lights installed
3 000 600 100 100 200 200 600 600
600
600
The indicator tracks the installation of street lights and assists the collection of data on the number of street lights installed in a targeted planning cycle. A street light is a raised source of light on the edge of a road, which is turned on/off at a pre-determined time. Modern lamps may also have light sensitive photocells to turn them on at dusk and off at dawn or automatically activate in dark weather. In instances where installation may have been completed in one reporting period and the installation is switched on in the next reporting period, the achievement is only reported in the period when the installation is switched on.
Dir
ect
ou
tco
me
Ener
gy Increased
electrification of subsidized developments
23. Number of subsidized households electrified
30 000 6 000 1 000 1 000 2 000 2 000 6000 6000
6000
6000
The indicator tracks the number of low income earners’ (subsidised) households provided with access to electricity in a targeted planning cycle.
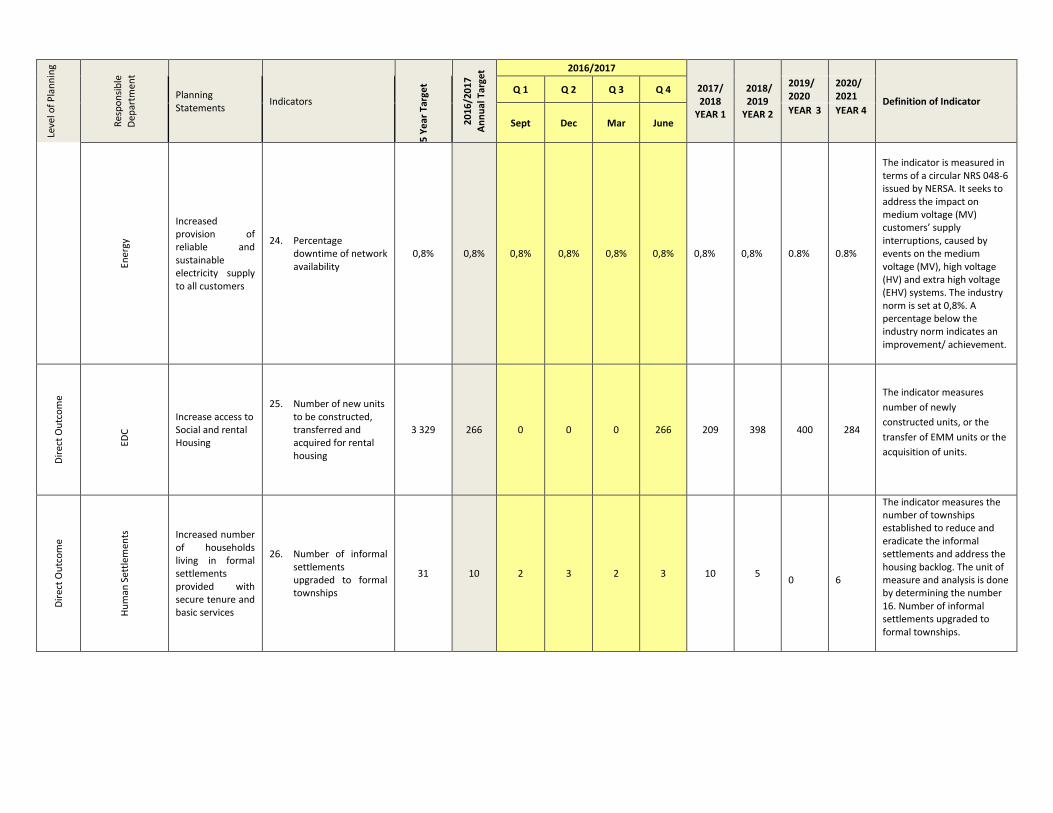
Leve
l of
Pla
nn
ing
Res
po
nsi
ble
Dep
artm
ent
Planning Statements
Indicators
5 Y
ear
Tar
get
20
16
/20
17
An
nu
al T
arge
t 2016/2017
2017/ 2018
YEAR 1
2018/ 2019
YEAR 2
Definition of Indicator Q 1 Q 2 Q 3 Q 4
2019/ 2020
2020/ 2021
Sept Dec Mar June YEAR 3 YEAR 4
Ener
gy
Increased provision of reliable and sustainable electricity supply to all customers
24. Percentage downtime of network availability
0,8% 0,8% 0,8% 0,8% 0,8% 0,8% 0,8% 0,8%
0.8%
0.8%
The indicator is measured in terms of a circular NRS 048-6 issued by NERSA. It seeks to address the impact on medium voltage (MV) customers’ supply interruptions, caused by events on the medium voltage (MV), high voltage (HV) and extra high voltage (EHV) systems. The industry norm is set at 0,8%. A percentage below the industry norm indicates an improvement/ achievement.
Dir
ect
Ou
tco
me
E
DC
Increase access to Social and rental Housing
25. Number of new units to be constructed, transferred and acquired for rental housing
3 329 266 0 0 0 266 209 398 400 284
The indicator measures
number of newly
constructed units, or the
transfer of EMM units or the
acquisition of units.
Dir
ect
Ou
tco
me
Hu
man
Set
tlem
ents
Increased number of households living in formal settlements provided with secure tenure and basic services
26. Number of informal settlements upgraded to formal townships
31 10 2 3 2 3 10 5
0
6
The indicator measures the number of townships established to reduce and eradicate the informal settlements and address the housing backlog. The unit of measure and analysis is done by determining the number 16. Number of informal settlements upgraded to formal townships.
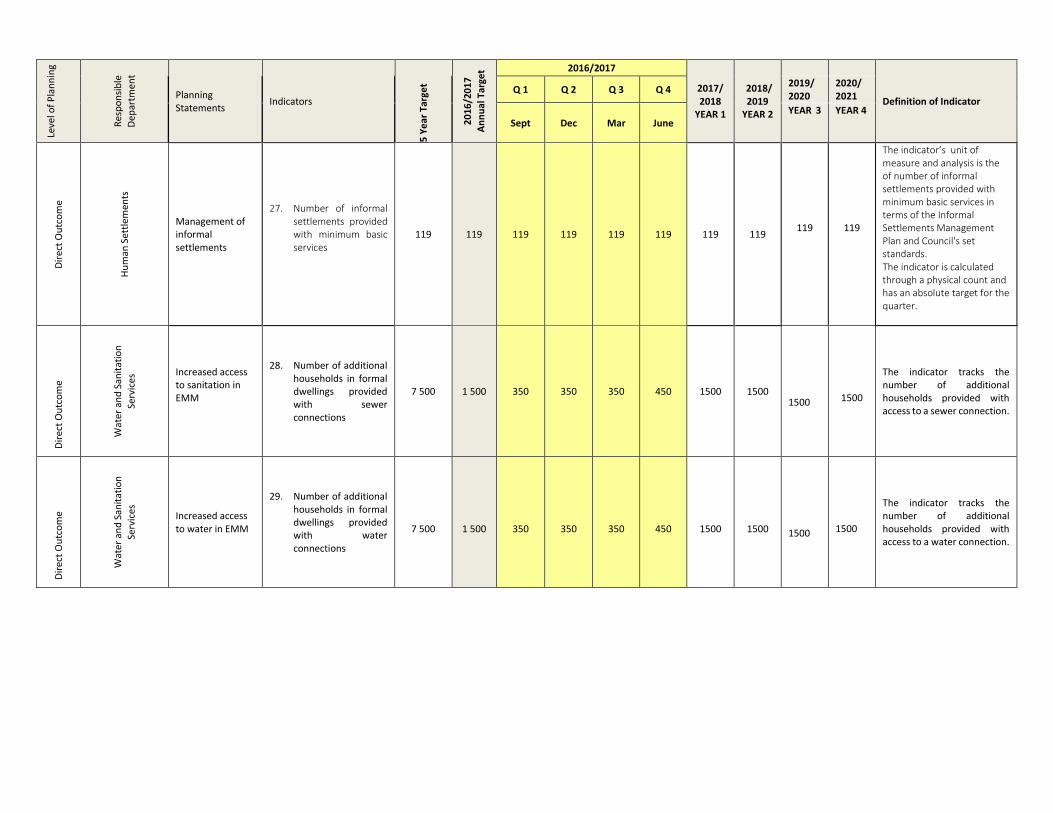
Leve
l of
Pla
nn
ing
Res
po
nsi
ble
Dep
artm
ent
Planning Statements
Indicators
5 Y
ear
Tar
get
20
16
/20
17
An
nu
al T
arge
t 2016/2017
2017/ 2018
YEAR 1
2018/ 2019
YEAR 2
Definition of Indicator Q 1 Q 2 Q 3 Q 4
2019/ 2020
2020/ 2021
Sept Dec Mar June YEAR 3 YEAR 4
Dir
ect
Ou
tco
me
Hu
man
Set
tlem
ents
Management of informal settlements
27. Number of informal settlements provided with minimum basic services
119 119 119 119 119 119 119 119
119
119
The indicator’s unit of measure and analysis is the of number of informal settlements provided with minimum basic services in terms of the Informal Settlements Management Plan and Council's set standards. The indicator is calculated through a physical count and has an absolute target for the quarter.
Dir
ect
Ou
tco
me
Wat
er a
nd
San
itat
ion
Serv
ices
Increased access to sanitation in EMM
28. Number of additional households in formal dwellings provided with sewer connections
7 500 1 500 350 350 350 450 1500 1500
1500
1500
The indicator tracks the number of additional households provided with access to a sewer connection.
Dir
ect
Ou
tco
me
Wat
er a
nd
San
itat
ion
Serv
ices
Increased access to water in EMM
29. Number of additional households in formal dwellings provided with water connections
7 500
1 500
350
350
350
450
1500
1500
1500
1500
The indicator tracks the number of additional households provided with access to a water connection.
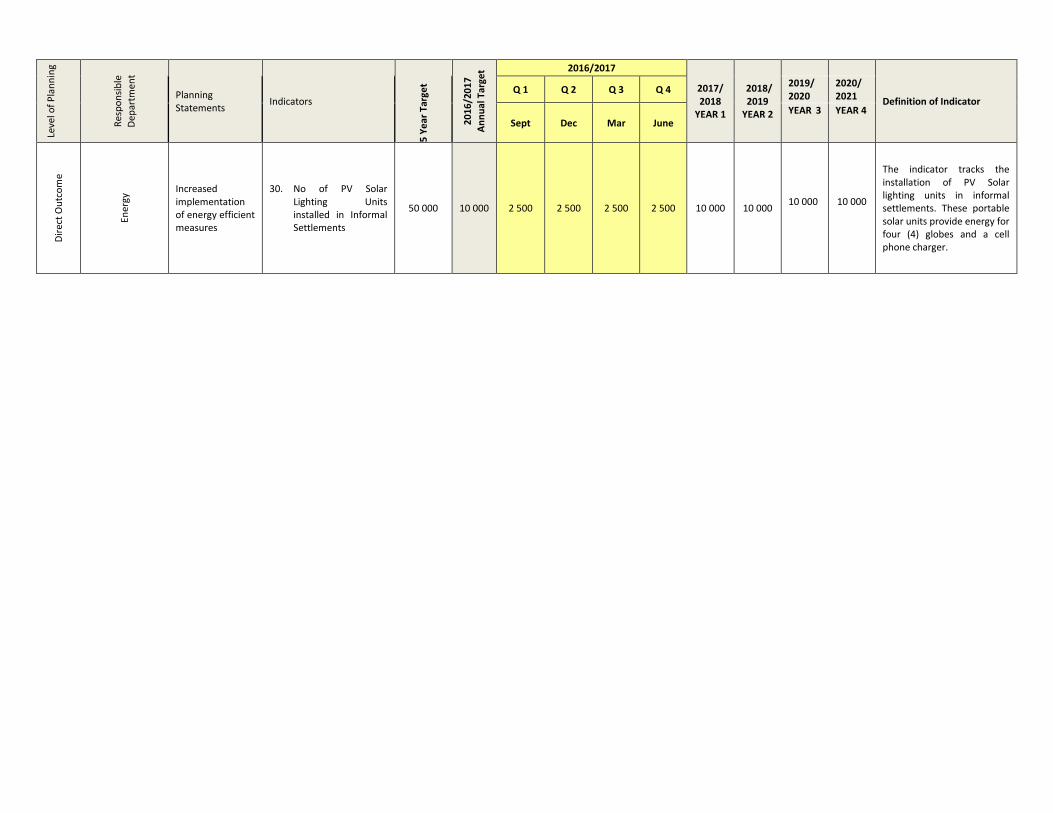
Leve
l of
Pla
nn
ing
Res
po
nsi
ble
Dep
artm
ent
Planning Statements
Indicators
5 Y
ear
Tar
get
20
16
/20
17
An
nu
al T
arge
t 2016/2017
2017/ 2018
YEAR 1
2018/ 2019
YEAR 2
Definition of Indicator Q 1 Q 2 Q 3 Q 4
2019/ 2020
2020/ 2021
Sept Dec Mar June YEAR 3 YEAR 4
Dir
ect
Ou
tco
me
Ener
gy Increased
implementation of energy efficient measures
30. No of PV Solar Lighting Units installed in Informal Settlements
50 000 10 000 2 500 2 500 2 500 2 500 10 000 10 000
10 000
10 000
The indicator tracks the installation of PV Solar lighting units in informal settlements. These portable solar units provide energy for four (4) globes and a cell phone charger.
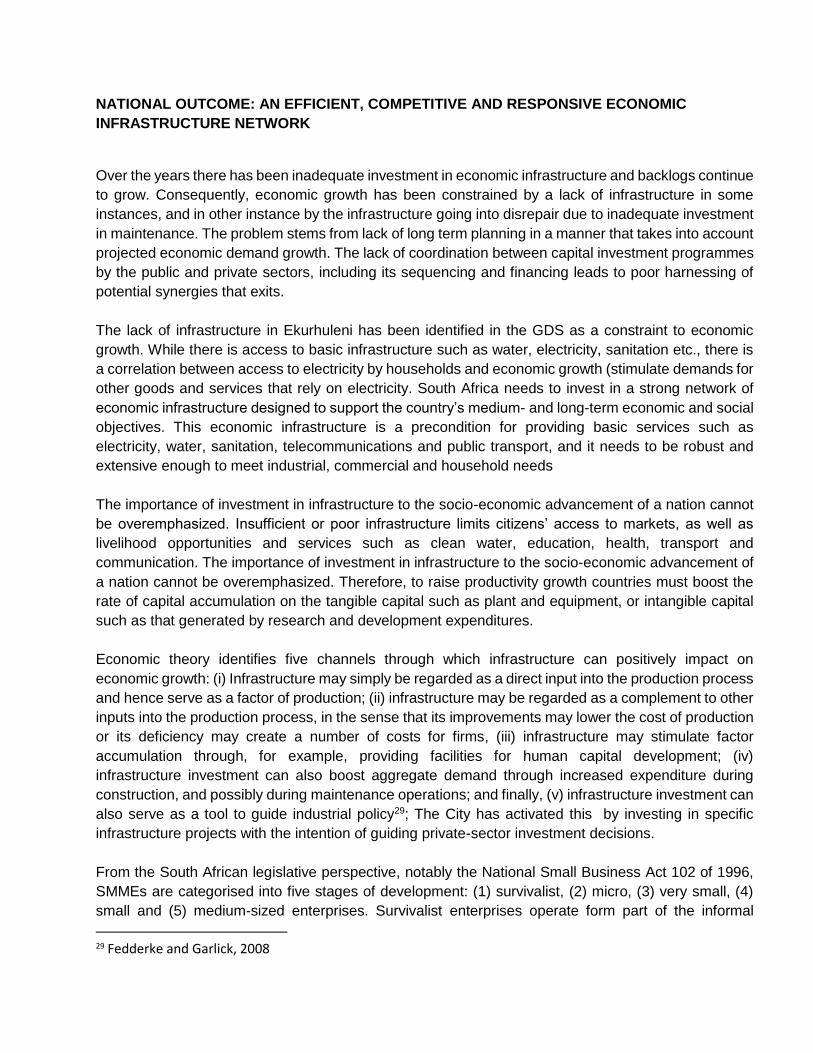
NATIONAL OUTCOME: AN EFFICIENT, COMPETITIVE AND RESPONSIVE ECONOMIC
INFRASTRUCTURE NETWORK
Over the years there has been inadequate investment in economic infrastructure and backlogs continue
to grow. Consequently, economic growth has been constrained by a lack of infrastructure in some
instances, and in other instance by the infrastructure going into disrepair due to inadequate investment
in maintenance. The problem stems from lack of long term planning in a manner that takes into account
projected economic demand growth. The lack of coordination between capital investment programmes
by the public and private sectors, including its sequencing and financing leads to poor harnessing of
potential synergies that exits.
The lack of infrastructure in Ekurhuleni has been identified in the GDS as a constraint to economic
growth. While there is access to basic infrastructure such as water, electricity, sanitation etc., there is
a correlation between access to electricity by households and economic growth (stimulate demands for
other goods and services that rely on electricity. South Africa needs to invest in a strong network of
economic infrastructure designed to support the country’s medium- and long-term economic and social
objectives. This economic infrastructure is a precondition for providing basic services such as
electricity, water, sanitation, telecommunications and public transport, and it needs to be robust and
extensive enough to meet industrial, commercial and household needs
The importance of investment in infrastructure to the socio-economic advancement of a nation cannot
be overemphasized. Insufficient or poor infrastructure limits citizens’ access to markets, as well as
livelihood opportunities and services such as clean water, education, health, transport and
communication. The importance of investment in infrastructure to the socio-economic advancement of
a nation cannot be overemphasized. Therefore, to raise productivity growth countries must boost the
rate of capital accumulation on the tangible capital such as plant and equipment, or intangible capital
such as that generated by research and development expenditures.
Economic theory identifies five channels through which infrastructure can positively impact on
economic growth: (i) Infrastructure may simply be regarded as a direct input into the production process
and hence serve as a factor of production; (ii) infrastructure may be regarded as a complement to other
inputs into the production process, in the sense that its improvements may lower the cost of production
or its deficiency may create a number of costs for firms, (iii) infrastructure may stimulate factor
accumulation through, for example, providing facilities for human capital development; (iv)
infrastructure investment can also boost aggregate demand through increased expenditure during
construction, and possibly during maintenance operations; and finally, (v) infrastructure investment can
also serve as a tool to guide industrial policy29; The City has activated this by investing in specific
infrastructure projects with the intention of guiding private-sector investment decisions.
From the South African legislative perspective, notably the National Small Business Act 102 of 1996,
SMMEs are categorised into five stages of development: (1) survivalist, (2) micro, (3) very small, (4)
small and (5) medium-sized enterprises. Survivalist enterprises operate form part of the informal
29 Fedderke and Garlick, 2008

economy, are undertaken by unemployed persons whose primary objective is to survive economically
(Turner, Varghese & Walker 2008:8). Little capital is invested in survivalist enterprises and therefore
they do not generate as much as necessary income and assets, the owners possess inappropriate
business skills and training to run the business, and the opportunities for growing the business are
limited.
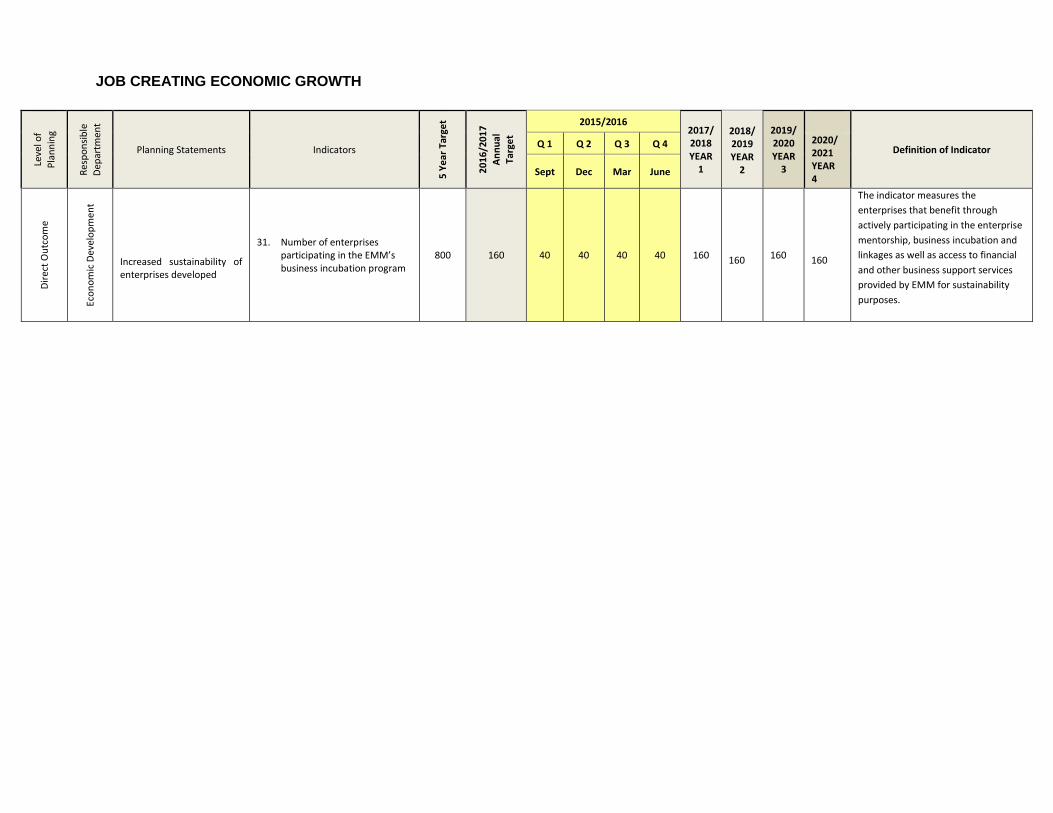
JOB CREATING ECONOMIC GROWTH
Leve
l of
Pla
nn
ing
Res
po
nsi
ble
Dep
artm
ent
Planning Statements Indicators
5 Y
ear
Tar
get
20
16
/20
17
An
nu
al
Targ
et
2015/2016 2017/ 2018 YEAR
1
2018/ 2019 YEAR
2
2019/ 2020 YEAR
3
Definition of Indicator Q 1 Q 2 Q 3 Q 4 2020/
2021 YEAR 4
Sept Dec Mar June
Dir
ect
Ou
tco
me
Eco
no
mic
Dev
elo
pm
ent
Increased sustainability of enterprises developed
31. Number of enterprises participating in the EMM’s business incubation program
800 160 40 40 40 40 160
160 160
160
The indicator measures the
enterprises that benefit through
actively participating in the enterprise
mentorship, business incubation and
linkages as well as access to financial
and other business support services
provided by EMM for sustainability
purposes.
NATIONAL OUTCOME: PROTECT AND ENHANCE OUR ENVIRONMENTAL ASSETS AND
NATURAL RESOURCES
The NDP 2030 vision is that by 2030, South Africa’s transition to an environmentally sustainable,
climate-change resilient, low-carbon economy and just society will be well under way. The NDP 2030
envisages a phased trajectory over the three successive MTSF periods. In order to realise the NDP
2030 Vision for Environmental Sustainability and Resilience there are a number of immediate
constraints that must be addressed. South Africa faces the challenge of deteriorating environmental
quality due to pollution and natural resource degradation, destruction and/or depletion. If the current
challenges are not effectively addressed they will exacerbate the rate of environmental degradation
and have the potential to undo or undermine many of the positive advances made in meeting South
Africa’s own development goals and the Millennium Development Goals (MDGs) as well as the 2030
vision. In supporting the national outcome the following interventions will be implemented during the
2016/2017 financial year:
Air Quality - EMM is an industrial hub with multiple manufacturing and processing industries. Because
of its heavy industries, EMM falls within the Highveld priority area which makes it highly susceptible to
air pollution. “Ekurhuleni region has numerous sources of air pollution such as domestic coal burning,
industries and mining, hence as the city aims to channel all resources to the improvement of air quality.
Climate Change - South Africa is a significant contributor to greenhouse gas emissions and
the country is also vulnerable to the impacts of climate change with adverse effects on inter alia
socio-economic conditions, water, food security, health, natural resources and ecosystem
services. In order to address increasing emissions of greenhouse gases, market-based
instruments such as a carbon tax, carbon budgets and policy support for low-carbon
technologies will be employed to ensure that greenhouse gas emissions peak, plateau and
decline. There is also a need to enhance the resilience of people and the economy to adapt to
the effects of climate change.
If climate variability is to increase, it is necessary to understand how climate impacts on the different
sectors and their resultant vulnerabilities. This will focus attention on where priority intervention might
reduce the impacts of climate change, and help cities to adapt rather than react when the damage has
already been done. It is, therefore, necessary to develop a framework for adaptation to climate change
at the municipal level in order to prioritize the most urgent local adaptation activities and identify the
required local human and financial resources. In the 2016/2017 financial year the City will invest in the
development of climate change response plans across the metro
Deployment of Renewable Energy Regimes - At present, the commercial exploitation of
South Africa’s renewable energy sources is limited, but it is clear that the cost of renewable
energy will continue to decline as the technologies mature. Increased use of renewables will
require the introduction of new policies. The White Paper on Renewable Energy (2003) set a
target of 4% of projected electricity demand for 2013 (DME 2003b). A strategy for implementing
this target needs to be formulated, focussing on specific projects and their financing. The
government has often stated its intention to improve the local content of renewable energy
technologies used in South Africa. Hence a policy should be set up for progressively increasing
local content in the local manufacture of renewable technologies. Such a policy should be
accompanied by government-sponsored enabling conditions for local technology. EMM in its
bid to deploy renewable energy regimes will increase the accessing energy from renewable
sources.
Promoting the Re-Use of Waste - The GDS indicates the need to reduce the negative impact
on the environment that is caused by waste throughout its life-span, from production to disposal,
via recycling. This approach means that every item of waste is seen not only as a source of
pollution to be reduced, but also as a potential resource to be exploited. The programmes that
will be implemented during 2016/2017 will move towards limiting waste production. Certain
techniques will be used to reduce the volume of waste are actually more polluting than others,
even if using them means greater reductions in volume. The main focus of the strategy for
preventing waste production is on reducing the environmental impact of waste and products
that will become waste. In order to be effective, this impact must be reduced at every stage of
a resource's life-span.
The strategy aims to promote the recycling sector in order to reintroduce waste into the economic
cycle in the form of quality products, while at the same time minimising the negative environmental
impact of doing so. Recycling targets could in the long run be set at appropriate levels, taking
account of the characteristics of each material and the range of options for recycling it.
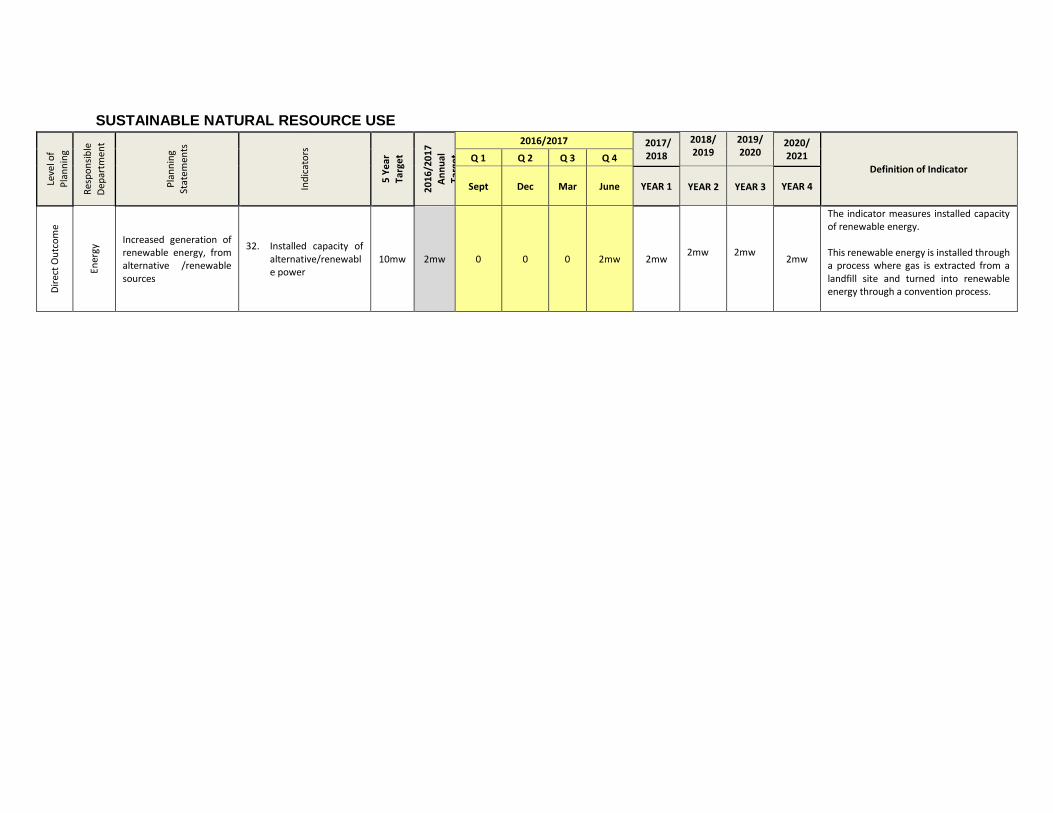
SUSTAINABLE NATURAL RESOURCE USE
Leve
l of
Pla
nn
ing
Res
po
nsi
ble
Dep
artm
ent
Pla
nn
ing
Stat
emen
ts
Ind
icat
ors
5 Y
ear
Targ
et
20
16
/20
17
An
nu
al
Targ
et
2016/2017 2017/ 2018
2018/ 2019
2019/ 2020
2020/ 2021
Definition of Indicator Q 1 Q 2 Q 3 Q 4
Sept Dec Mar June YEAR 1
YEAR 2
YEAR 3 YEAR 4
Dir
ect
Ou
tco
me
Ener
gy Increased generation of
renewable energy, from alternative /renewable sources
32. Installed capacity of alternative/renewable power
10mw 2mw 0 0 0 2mw 2mw
2mw
2mw 2mw
The indicator measures installed capacity of renewable energy. This renewable energy is installed through a process where gas is extracted from a landfill site and turned into renewable energy through a convention process.
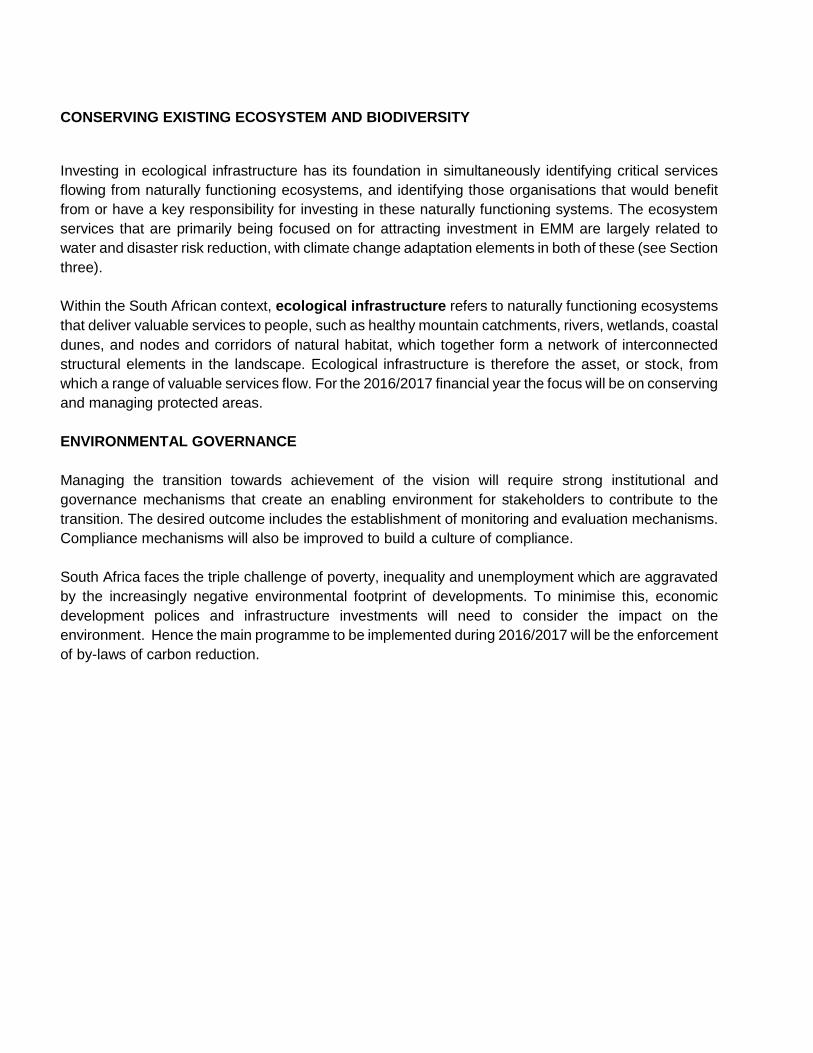
CONSERVING EXISTING ECOSYSTEM AND BIODIVERSITY
Investing in ecological infrastructure has its foundation in simultaneously identifying critical services
flowing from naturally functioning ecosystems, and identifying those organisations that would benefit
from or have a key responsibility for investing in these naturally functioning systems. The ecosystem
services that are primarily being focused on for attracting investment in EMM are largely related to
water and disaster risk reduction, with climate change adaptation elements in both of these (see Section
three).
Within the South African context, ecological infrastructure refers to naturally functioning ecosystems
that deliver valuable services to people, such as healthy mountain catchments, rivers, wetlands, coastal
dunes, and nodes and corridors of natural habitat, which together form a network of interconnected
structural elements in the landscape. Ecological infrastructure is therefore the asset, or stock, from
which a range of valuable services flow. For the 2016/2017 financial year the focus will be on conserving
and managing protected areas.
ENVIRONMENTAL GOVERNANCE
Managing the transition towards achievement of the vision will require strong institutional and
governance mechanisms that create an enabling environment for stakeholders to contribute to the
transition. The desired outcome includes the establishment of monitoring and evaluation mechanisms.
Compliance mechanisms will also be improved to build a culture of compliance.
South Africa faces the triple challenge of poverty, inequality and unemployment which are aggravated
by the increasingly negative environmental footprint of developments. To minimise this, economic
development polices and infrastructure investments will need to consider the impact on the
environment. Hence the main programme to be implemented during 2016/2017 will be the enforcement
of by-laws of carbon reduction.
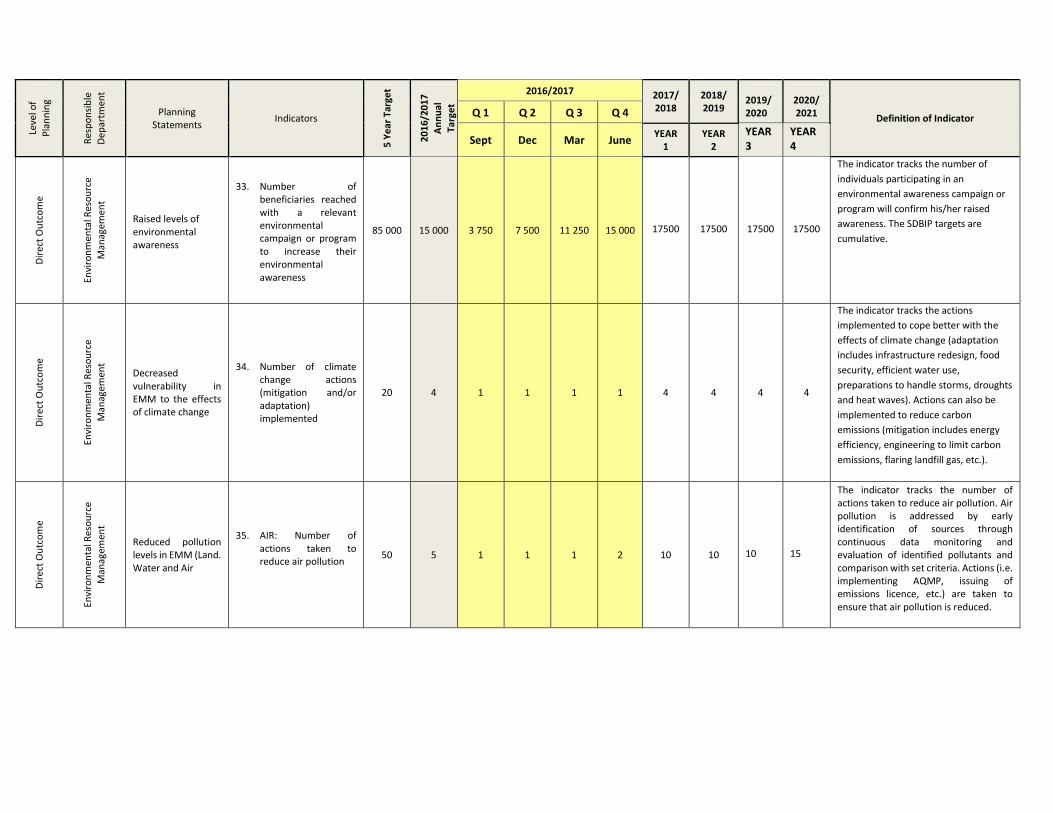
Leve
l of
Pla
nn
ing
Res
po
nsi
ble
Dep
artm
ent
Planning Statements
Indicators
5 Y
ear
Tar
get
20
16
/20
17
An
nu
al
Targ
et
2016/2017 2017/ 2018
2018/ 2019
2019/ 2020
2020/ 2021 Definition of Indicator Q 1 Q 2 Q 3 Q 4
Sept Dec Mar June YEAR
1 YEAR
2
YEAR 3
YEAR 4
Dir
ect
Ou
tco
me
Envi
ron
men
tal R
eso
urc
e
Man
agem
ent
Raised levels of environmental awareness
33. Number of
beneficiaries reached with a relevant environmental campaign or program to increase their environmental awareness
85 000 15 000 3 750 7 500 11 250 15 000
17500
17500
17500
17500
The indicator tracks the number of
individuals participating in an
environmental awareness campaign or
program will confirm his/her raised
awareness. The SDBIP targets are
cumulative.
Dir
ect
Ou
tco
me
Envi
ron
men
tal R
eso
urc
e
Man
agem
ent
Decreased vulnerability in EMM to the effects of climate change
34. Number of climate change actions (mitigation and/or adaptation) implemented
20 4 1 1 1 1 4 4 4 4
The indicator tracks the actions
implemented to cope better with the
effects of climate change (adaptation
includes infrastructure redesign, food
security, efficient water use,
preparations to handle storms, droughts
and heat waves). Actions can also be
implemented to reduce carbon
emissions (mitigation includes energy
efficiency, engineering to limit carbon
emissions, flaring landfill gas, etc.).
Dir
ect
Ou
tco
me
Envi
ron
men
tal R
eso
urc
e
Man
agem
ent
Reduced pollution levels in EMM (Land. Water and Air
35. AIR: Number of actions taken to reduce air pollution
50 5 1 1 1 2 10 10
10
15
The indicator tracks the number of actions taken to reduce air pollution. Air pollution is addressed by early identification of sources through continuous data monitoring and evaluation of identified pollutants and comparison with set criteria. Actions (i.e. implementing AQMP, issuing of emissions licence, etc.) are taken to ensure that air pollution is reduced.
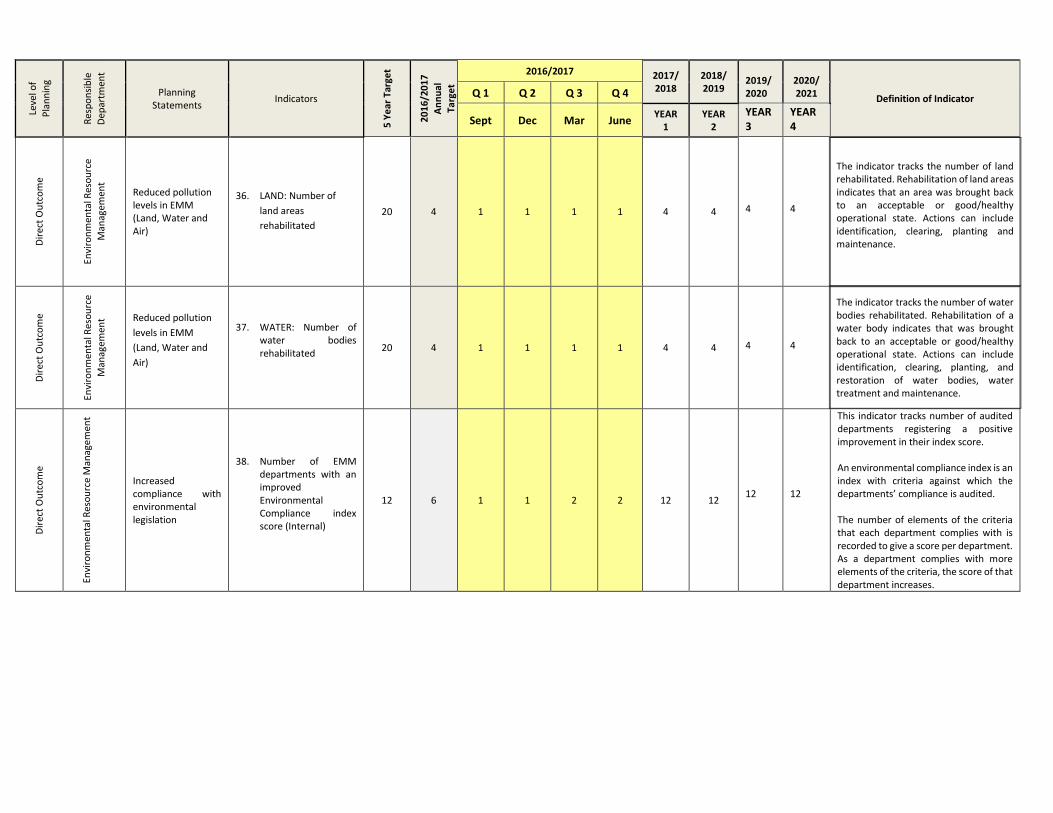
Leve
l of
Pla
nn
ing
Res
po
nsi
ble
Dep
artm
ent
Planning Statements
Indicators
5 Y
ear
Tar
get
20
16
/20
17
An
nu
al
Targ
et
2016/2017 2017/ 2018
2018/ 2019
2019/ 2020
2020/ 2021 Definition of Indicator Q 1 Q 2 Q 3 Q 4
Sept Dec Mar June YEAR
1 YEAR
2
YEAR 3
YEAR 4
Dir
ect
Ou
tco
me
Envi
ron
men
tal R
eso
urc
e
Man
agem
ent
Reduced pollution levels in EMM (Land, Water and Air)
36. LAND: Number of
land areas
rehabilitated
20 4 1 1 1 1 4 4
4
4
The indicator tracks the number of land rehabilitated. Rehabilitation of land areas indicates that an area was brought back to an acceptable or good/healthy operational state. Actions can include identification, clearing, planting and maintenance.
Dir
ect
Ou
tco
me
Envi
ron
men
tal R
eso
urc
e
Man
agem
ent Reduced pollution
levels in EMM
(Land, Water and
Air)
37. WATER: Number of water bodies rehabilitated
20 4 1 1 1 1 4 4
4
4
The indicator tracks the number of water bodies rehabilitated. Rehabilitation of a water body indicates that was brought back to an acceptable or good/healthy operational state. Actions can include identification, clearing, planting, and restoration of water bodies, water treatment and maintenance.
Dir
ect
Ou
tco
me
Envi
ron
men
tal R
eso
urc
e M
anag
emen
t
Increased compliance with environmental legislation
38. Number of EMM departments with an improved Environmental Compliance index score (Internal)
12 6 1 1 2 2 12 12
12
12
This indicator tracks number of audited departments registering a positive improvement in their index score. An environmental compliance index is an index with criteria against which the departments’ compliance is audited. The number of elements of the criteria that each department complies with is recorded to give a score per department. As a department complies with more elements of the criteria, the score of that department increases.
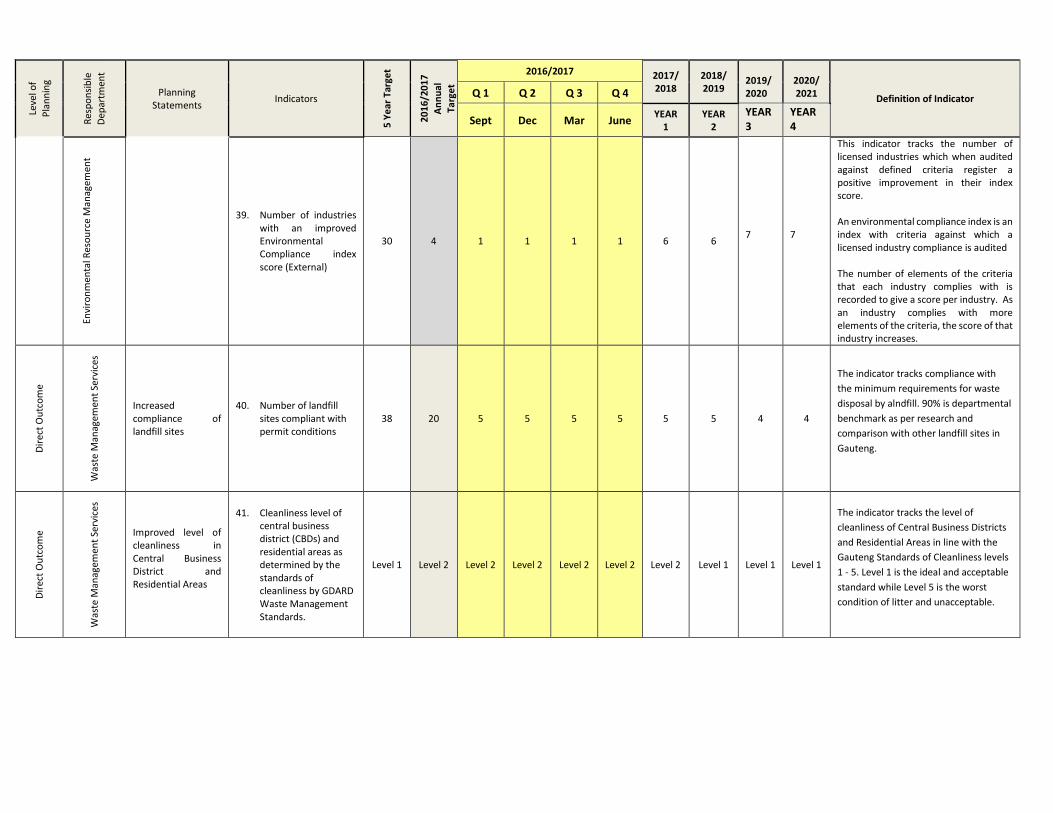
Leve
l of
Pla
nn
ing
Res
po
nsi
ble
Dep
artm
ent
Planning Statements
Indicators
5 Y
ear
Tar
get
20
16
/20
17
An
nu
al
Targ
et
2016/2017 2017/ 2018
2018/ 2019
2019/ 2020
2020/ 2021 Definition of Indicator Q 1 Q 2 Q 3 Q 4
Sept Dec Mar June YEAR
1 YEAR
2
YEAR 3
YEAR 4
Envi
ron
men
tal R
eso
urc
e M
anag
emen
t
39. Number of industries with an improved Environmental Compliance index score (External)
30 4 1 1 1 1 6 6
7
7
This indicator tracks the number of licensed industries which when audited against defined criteria register a positive improvement in their index score. An environmental compliance index is an index with criteria against which a licensed industry compliance is audited The number of elements of the criteria that each industry complies with is recorded to give a score per industry. As an industry complies with more elements of the criteria, the score of that industry increases.
Dir
ect
Ou
tco
me
Was
te M
anag
emen
t Se
rvic
es
Increased compliance of landfill sites
40. Number of landfill sites compliant with permit conditions
38 20 5 5 5 5 5 5 4 4
The indicator tracks compliance with
the minimum requirements for waste
disposal by alndfill. 90% is departmental
benchmark as per research and
comparison with other landfill sites in
Gauteng.
Dir
ect
Ou
tco
me
Was
te M
anag
emen
t Se
rvic
es
Improved level of cleanliness in Central Business District and Residential Areas
41. Cleanliness level of central business district (CBDs) and residential areas as determined by the standards of cleanliness by GDARD Waste Management Standards.
Level 1 Level 2 Level 2 Level 2 Level 2 Level 2 Level 2 Level 1 Level 1 Level 1
The indicator tracks the level of
cleanliness of Central Business Districts
and Residential Areas in line with the
Gauteng Standards of Cleanliness levels
1 - 5. Level 1 is the ideal and acceptable
standard while Level 5 is the worst
condition of litter and unacceptable.
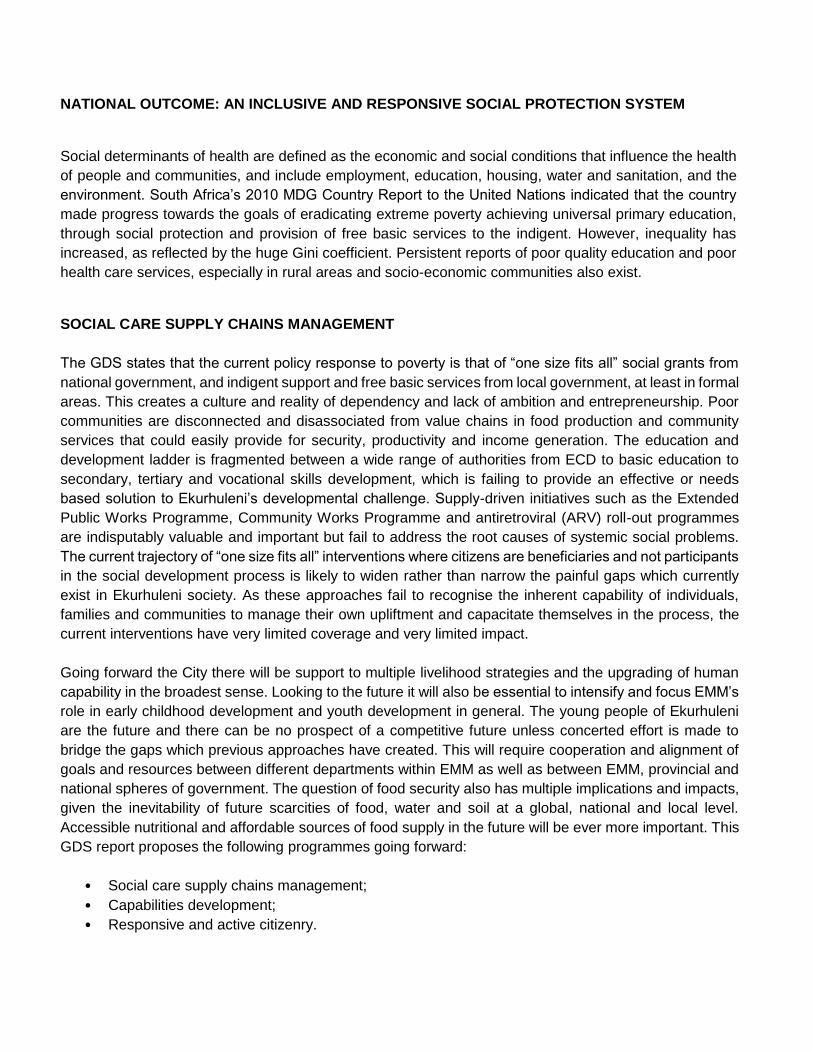
NATIONAL OUTCOME: AN INCLUSIVE AND RESPONSIVE SOCIAL PROTECTION SYSTEM
Social determinants of health are defined as the economic and social conditions that influence the health
of people and communities, and include employment, education, housing, water and sanitation, and the
environment. South Africa’s 2010 MDG Country Report to the United Nations indicated that the country
made progress towards the goals of eradicating extreme poverty achieving universal primary education,
through social protection and provision of free basic services to the indigent. However, inequality has
increased, as reflected by the huge Gini coefficient. Persistent reports of poor quality education and poor
health care services, especially in rural areas and socio-economic communities also exist.
SOCIAL CARE SUPPLY CHAINS MANAGEMENT
The GDS states that the current policy response to poverty is that of “one size fits all” social grants from
national government, and indigent support and free basic services from local government, at least in formal
areas. This creates a culture and reality of dependency and lack of ambition and entrepreneurship. Poor
communities are disconnected and disassociated from value chains in food production and community
services that could easily provide for security, productivity and income generation. The education and
development ladder is fragmented between a wide range of authorities from ECD to basic education to
secondary, tertiary and vocational skills development, which is failing to provide an effective or needs
based solution to Ekurhuleni’s developmental challenge. Supply-driven initiatives such as the Extended
Public Works Programme, Community Works Programme and antiretroviral (ARV) roll-out programmes
are indisputably valuable and important but fail to address the root causes of systemic social problems.
The current trajectory of “one size fits all” interventions where citizens are beneficiaries and not participants
in the social development process is likely to widen rather than narrow the painful gaps which currently
exist in Ekurhuleni society. As these approaches fail to recognise the inherent capability of individuals,
families and communities to manage their own upliftment and capacitate themselves in the process, the
current interventions have very limited coverage and very limited impact.
Going forward the City there will be support to multiple livelihood strategies and the upgrading of human
capability in the broadest sense. Looking to the future it will also be essential to intensify and focus EMM’s
role in early childhood development and youth development in general. The young people of Ekurhuleni
are the future and there can be no prospect of a competitive future unless concerted effort is made to
bridge the gaps which previous approaches have created. This will require cooperation and alignment of
goals and resources between different departments within EMM as well as between EMM, provincial and
national spheres of government. The question of food security also has multiple implications and impacts,
given the inevitability of future scarcities of food, water and soil at a global, national and local level.
Accessible nutritional and affordable sources of food supply in the future will be ever more important. This
GDS report proposes the following programmes going forward:
• Social care supply chains management;
• Capabilities development;
• Responsive and active citizenry.
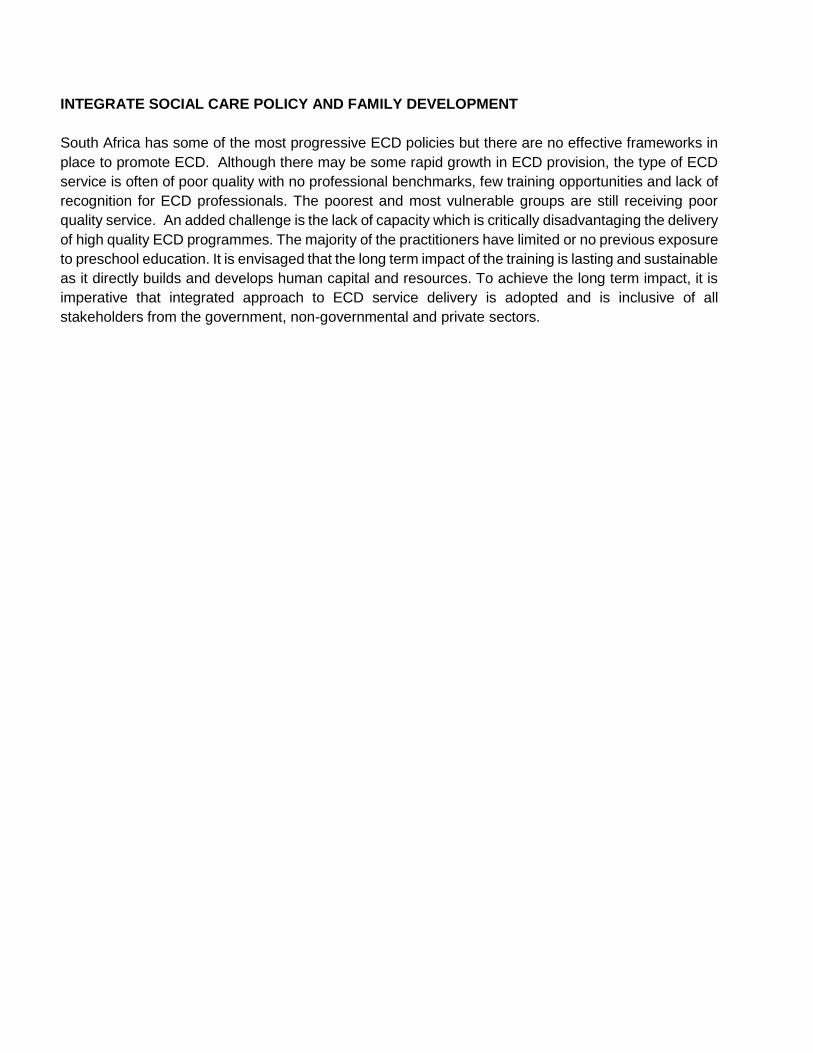
INTEGRATE SOCIAL CARE POLICY AND FAMILY DEVELOPMENT
South Africa has some of the most progressive ECD policies but there are no effective frameworks in
place to promote ECD. Although there may be some rapid growth in ECD provision, the type of ECD
service is often of poor quality with no professional benchmarks, few training opportunities and lack of
recognition for ECD professionals. The poorest and most vulnerable groups are still receiving poor
quality service. An added challenge is the lack of capacity which is critically disadvantaging the delivery
of high quality ECD programmes. The majority of the practitioners have limited or no previous exposure
to preschool education. It is envisaged that the long term impact of the training is lasting and sustainable
as it directly builds and develops human capital and resources. To achieve the long term impact, it is
imperative that integrated approach to ECD service delivery is adopted and is inclusive of all
stakeholders from the government, non-governmental and private sectors.
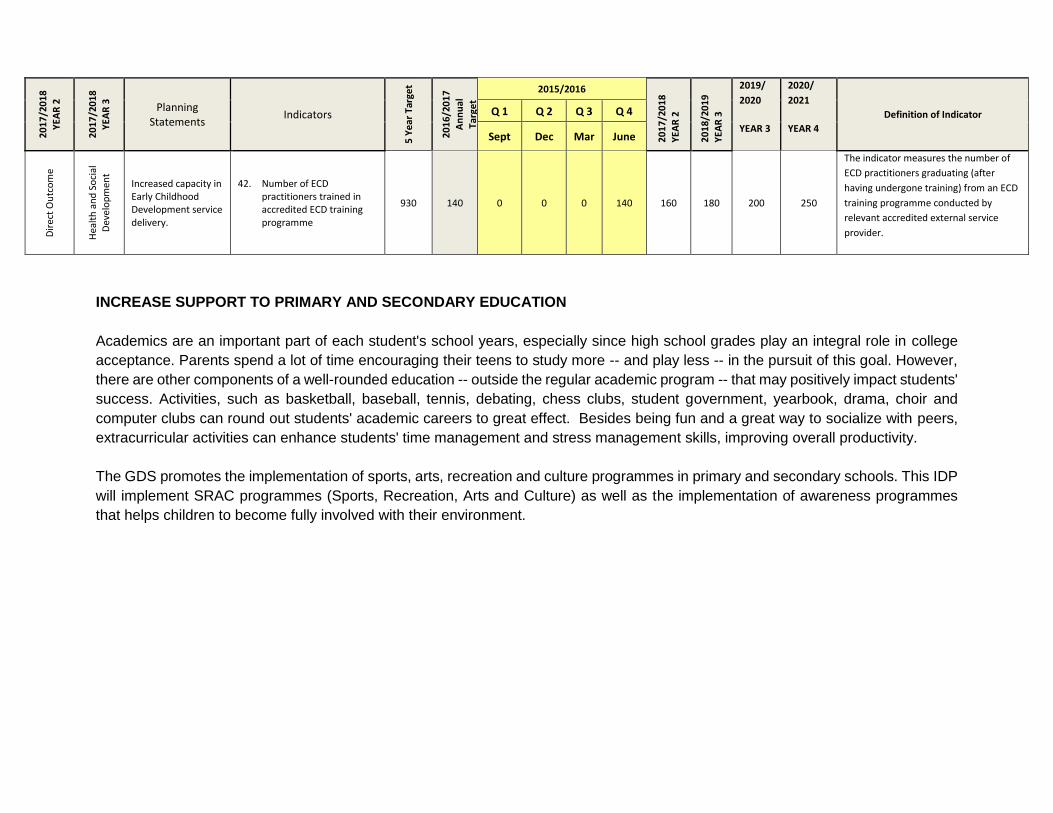
20
17
/20
18
YEA
R 2
20
17
/20
18
YEA
R 3
Planning
Statements Indicators
5 Y
ear
Tar
get
20
16
/20
17
An
nu
al
Targ
et
2015/2016
20
17
/20
18
YEA
R 2
20
18
/20
19
YEA
R 3
2019/
2020
YEAR 3
2020/
2021
YEAR 4
Definition of Indicator Q 1 Q 2 Q 3 Q 4
Sept Dec Mar June
Dir
ect
Ou
tco
me
Hea
lth
an
d S
oci
al
Dev
elo
pm
ent
Increased capacity in Early Childhood Development service delivery.
42. Number of ECD practitioners trained in accredited ECD training programme
930
140 0 0 0 140 160 180 200 250
The indicator measures the number of
ECD practitioners graduating (after
having undergone training) from an ECD
training programme conducted by
relevant accredited external service
provider.
INCREASE SUPPORT TO PRIMARY AND SECONDARY EDUCATION
Academics are an important part of each student's school years, especially since high school grades play an integral role in college
acceptance. Parents spend a lot of time encouraging their teens to study more -- and play less -- in the pursuit of this goal. However,
there are other components of a well-rounded education -- outside the regular academic program -- that may positively impact students'
success. Activities, such as basketball, baseball, tennis, debating, chess clubs, student government, yearbook, drama, choir and
computer clubs can round out students' academic careers to great effect. Besides being fun and a great way to socialize with peers,
extracurricular activities can enhance students' time management and stress management skills, improving overall productivity.
The GDS promotes the implementation of sports, arts, recreation and culture programmes in primary and secondary schools. This IDP
will implement SRAC programmes (Sports, Recreation, Arts and Culture) as well as the implementation of awareness programmes
that helps children to become fully involved with their environment.
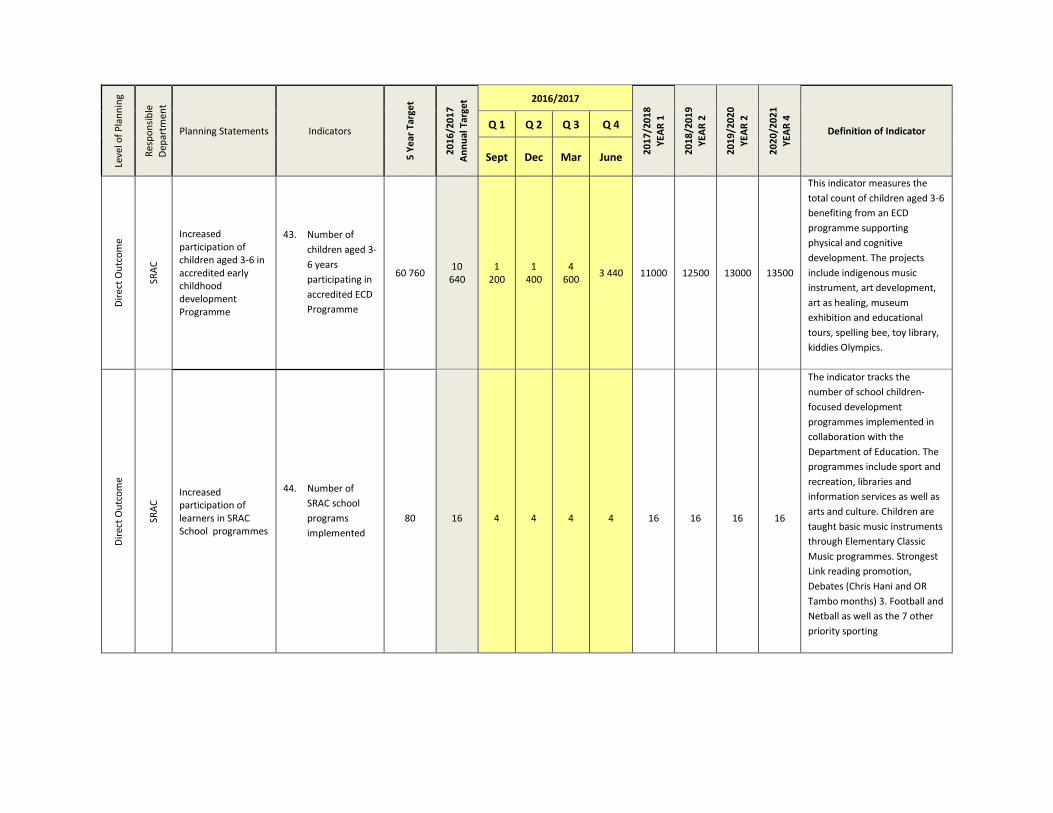
Leve
l of
Pla
nn
ing
Res
po
nsi
ble
Dep
artm
ent
Planning Statements Indicators
5 Y
ear
Tar
get
20
16
/20
17
An
nu
al T
arge
t 2016/2017
20
17
/20
18
YEA
R 1
20
18
/20
19
YEA
R 2
20
19
/20
20
YEA
R 2
20
20
/20
21
YEA
R 4
Definition of Indicator Q 1 Q 2 Q 3 Q 4
Sept Dec Mar June
Dir
ect
Ou
tco
me
SRA
C
Increased participation of children aged 3-6 in accredited early childhood development Programme
43. Number of
children aged 3-
6 years
participating in
accredited ECD
Programme
60 760
10 640
1 200
1 400
4 600
3 440 11000 12500 13000 13500
This indicator measures the
total count of children aged 3-6
benefiting from an ECD
programme supporting
physical and cognitive
development. The projects
include indigenous music
instrument, art development,
art as healing, museum
exhibition and educational
tours, spelling bee, toy library,
kiddies Olympics.
Dir
ect
Ou
tco
me
SRA
C Increased
participation of learners in SRAC School programmes
44. Number of
SRAC school
programs
implemented
80
16
4
4
4
4
16
16
16
16
The indicator tracks the
number of school children-
focused development
programmes implemented in
collaboration with the
Department of Education. The
programmes include sport and
recreation, libraries and
information services as well as
arts and culture. Children are
taught basic music instruments
through Elementary Classic
Music programmes. Strongest
Link reading promotion,
Debates (Chris Hani and OR
Tambo months) 3. Football and
Netball as well as the 7 other
priority sporting
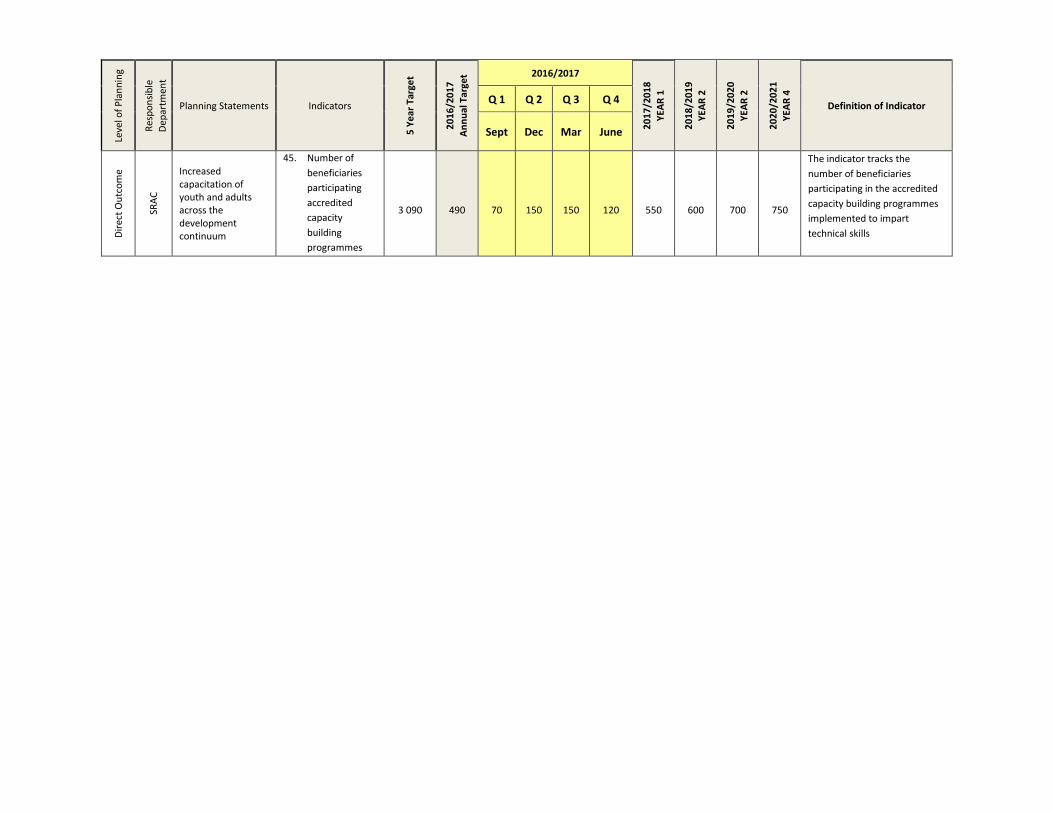
Leve
l of
Pla
nn
ing
Res
po
nsi
ble
Dep
artm
ent
Planning Statements Indicators
5 Y
ear
Tar
get
20
16
/20
17
An
nu
al T
arge
t 2016/2017
20
17
/20
18
YEA
R 1
20
18
/20
19
YEA
R 2
20
19
/20
20
YEA
R 2
20
20
/20
21
YEA
R 4
Definition of Indicator Q 1 Q 2 Q 3 Q 4
Sept Dec Mar June D
irec
t O
utc
om
e
SRA
C
Increased capacitation of youth and adults across the development continuum
45. Number of
beneficiaries
participating
accredited
capacity
building
programmes
3 090
490
70
150
150
120
550
600
700
750
The indicator tracks the
number of beneficiaries
participating in the accredited
capacity building programmes
implemented to impart
technical skills
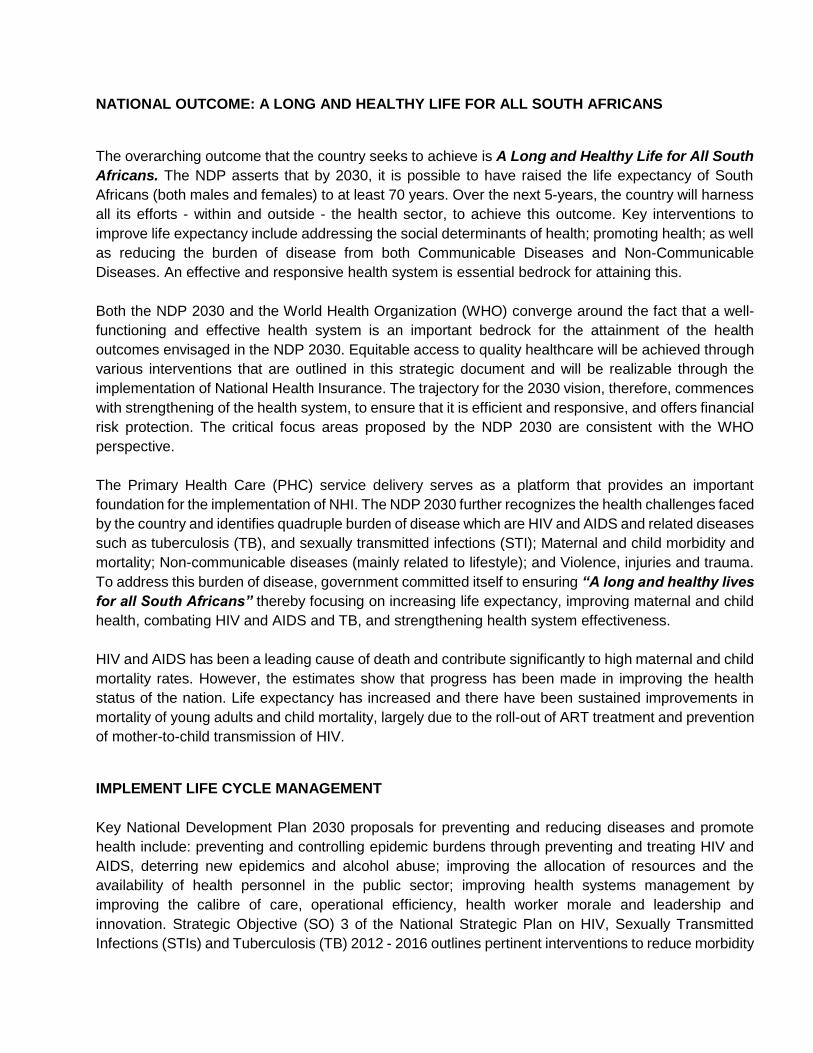
NATIONAL OUTCOME: A LONG AND HEALTHY LIFE FOR ALL SOUTH AFRICANS
The overarching outcome that the country seeks to achieve is A Long and Healthy Life for All South
Africans. The NDP asserts that by 2030, it is possible to have raised the life expectancy of South
Africans (both males and females) to at least 70 years. Over the next 5-years, the country will harness
all its efforts - within and outside - the health sector, to achieve this outcome. Key interventions to
improve life expectancy include addressing the social determinants of health; promoting health; as well
as reducing the burden of disease from both Communicable Diseases and Non-Communicable
Diseases. An effective and responsive health system is essential bedrock for attaining this.
Both the NDP 2030 and the World Health Organization (WHO) converge around the fact that a well-
functioning and effective health system is an important bedrock for the attainment of the health
outcomes envisaged in the NDP 2030. Equitable access to quality healthcare will be achieved through
various interventions that are outlined in this strategic document and will be realizable through the
implementation of National Health Insurance. The trajectory for the 2030 vision, therefore, commences
with strengthening of the health system, to ensure that it is efficient and responsive, and offers financial
risk protection. The critical focus areas proposed by the NDP 2030 are consistent with the WHO
perspective.
The Primary Health Care (PHC) service delivery serves as a platform that provides an important
foundation for the implementation of NHI. The NDP 2030 further recognizes the health challenges faced
by the country and identifies quadruple burden of disease which are HIV and AIDS and related diseases
such as tuberculosis (TB), and sexually transmitted infections (STI); Maternal and child morbidity and
mortality; Non-communicable diseases (mainly related to lifestyle); and Violence, injuries and trauma.
To address this burden of disease, government committed itself to ensuring “A long and healthy lives
for all South Africans” thereby focusing on increasing life expectancy, improving maternal and child
health, combating HIV and AIDS and TB, and strengthening health system effectiveness.
HIV and AIDS has been a leading cause of death and contribute significantly to high maternal and child
mortality rates. However, the estimates show that progress has been made in improving the health
status of the nation. Life expectancy has increased and there have been sustained improvements in
mortality of young adults and child mortality, largely due to the roll-out of ART treatment and prevention
of mother-to-child transmission of HIV.
IMPLEMENT LIFE CYCLE MANAGEMENT
Key National Development Plan 2030 proposals for preventing and reducing diseases and promote
health include: preventing and controlling epidemic burdens through preventing and treating HIV and
AIDS, deterring new epidemics and alcohol abuse; improving the allocation of resources and the
availability of health personnel in the public sector; improving health systems management by
improving the calibre of care, operational efficiency, health worker morale and leadership and
innovation. Strategic Objective (SO) 3 of the National Strategic Plan on HIV, Sexually Transmitted
Infections (STIs) and Tuberculosis (TB) 2012 - 2016 outlines pertinent interventions to reduce morbidity

and mortality from AIDS related causes and Tuberculosis. SO 3 focuses on sustaining health and
wellness, and achieving a significant reduction in deaths and disability as a result of HIV and TB
infection through universal access to accessible, affordable and good quality diagnosis, treatment and
care. The programmes implemented in the 2016/2017 financial year include strategic focus on
combating HIV and AIDS and TB.
Leve
l of
Pla
nn
ing
Res
po
nsi
ble
D
epar
tmen
t
Planning Statements Indicators
5 Y
ear
Tar
get
20
16
/20
17
An
nu
al
Targ
et
2016/2017
2017/ 2018
YEAR 1
2018/ 2019
YEAR 2
Definition of Indicator Q 1 Q 2 Q 3 Q 4 2019/
2020 YEAR 3
2020/ 2021 YEAR 4 Sept Dec Mar June
Dir
ect
Ou
tco
me
Hea
lth
an
d S
oci
al
Dev
elo
pm
ent
Reduced vertical transmission of HIV from Mother to Child
46. Percentage of babies tested HIV-positive (PCR) at six (6) weeks
<2%
<2.11% <2.11% <2.11% <2.11% <2.11% <2.10% <2.00% <2.00% <1.5%
The indicator measures the babies
tested PCR HIV-positive six (6)
weeks after birth as the proportion
of babies born to HIV-positive
mothers PCR tested for HIV at 6
weeks after birth.
Dir
ect
Ou
tco
me
Hea
lth
an
d
Soci
al
Dev
elo
pm
ent
Increased access to Antiretroviral Therapy initiations
47. Number of eligible patients initiated on Antiretroviral Therapy
159000
37000 9700 9700 8000 9600 35000 33000 28000 26000
The indicator tracks the number of
eligible HIV-positive patients
initiated on Antiretroviral Therapy
during the reporting period.
NATIONAL OUTCOME 3: ALL PEOPLE IN SOUTH AFRICA ARE AND FEEL SAFE
Crime in South Africa has occupied centre stage on the public agenda. Unacceptably high levels of
crime, especially serious and violent crime, result in people in South Africa, especially vulnerable
groups such as women, children, older persons and people with disabilities, living in fear and feeling
unsafe. It also impacts negatively on the country’s economic development and undermines the
wellbeing of people in the country and hinders their ability to achieve their potential.
Some progress has been made over the past five years in reducing the levels of serious crime such as
murders, aggravated robberies, crimes against women, children and other vulnerable groups, but they
remain unacceptably high. Communities and all people feel unsafe due to unacceptably high levels of
serious and violent crime such as murder, rape and aggravated robberies. To make certain that all
people are and feel safe the following actions will be undertaken:
Political and/or domestic instability is a serious challenge that if left unabated will undermine our
democracy, rule of law and development trajectory. Issues that contribute to this instability are violent
industrial and service delivery-related protest actions, as well as disrespect for authority and for one
another. It is therefore imperative to prevent and combat the violent crime that accompanies what is
otherwise legitimate industrial and protest action.
To combat and eliminate crime and contraventions of the laws the GDS has called upon the citizens of
Ekurhuleni to be responsive and active citizen is upholding the laws and legislation of the country so
all people in South Africa are and feel safe. Through the GDS the following will be considered in
2016/2017:
• Reduce fatal accidents;
• Drive down high levels of violent and serious crime; and
• Enforcement of by-laws.
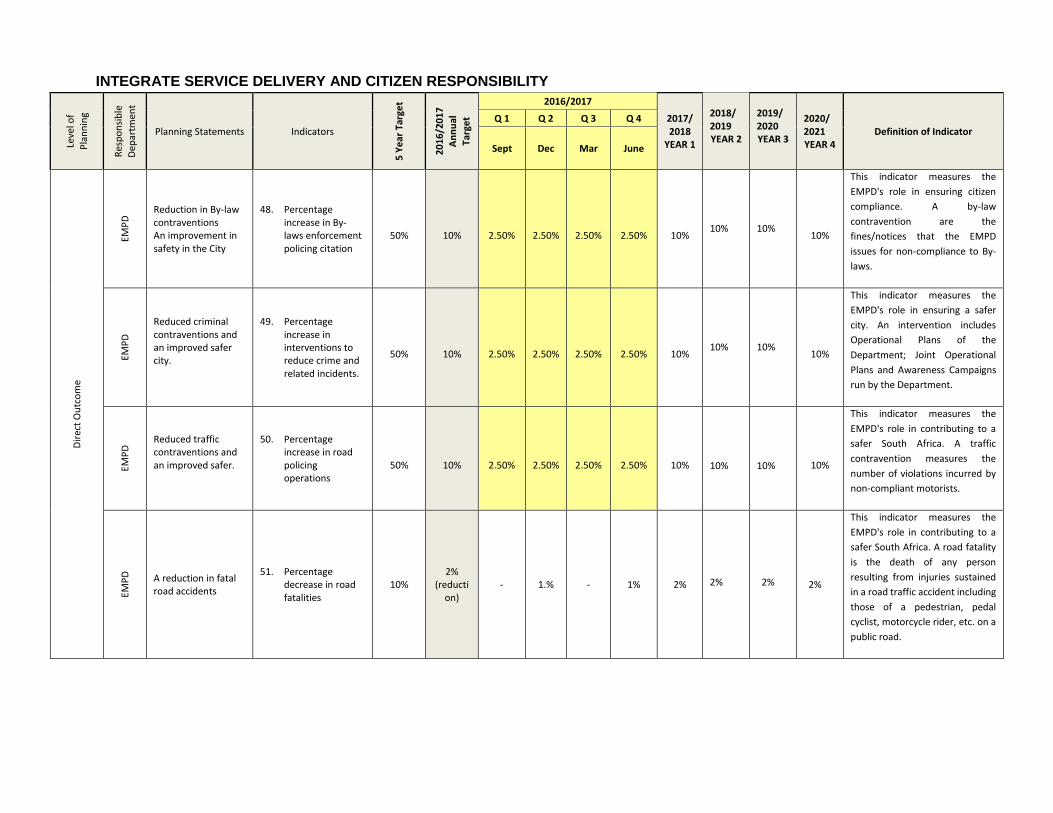
INTEGRATE SERVICE DELIVERY AND CITIZEN RESPONSIBILITY Le
vel o
f
Pla
nn
ing
Res
po
nsi
ble
Dep
artm
ent
Planning Statements Indicators
5 Y
ear
Tar
get
20
16
/20
17
An
nu
al
Targ
et
2016/2017
2017/ 2018
YEAR 1
2018/ 2019 YEAR 2
2019/ 2020 YEAR 3
2020/ 2021 YEAR 4
Definition of Indicator Q 1 Q 2 Q 3 Q 4
Sept Dec Mar June
Dir
ect
Ou
tco
me
EMP
D Reduction in By-law
contraventions An improvement in safety in the City
48. Percentage increase in By-laws enforcement policing citation
50%
10%
2.50%
2.50%
2.50%
2.50%
10%
10%
10%
10%
This indicator measures the
EMPD's role in ensuring citizen
compliance. A by-law
contravention are the
fines/notices that the EMPD
issues for non-compliance to By-
laws.
EMP
D
Reduced criminal contraventions and an improved safer city.
49. Percentage increase in interventions to reduce crime and related incidents.
50%
10%
2.50%
2.50%
2.50%
2.50%
10%
10%
10%
10%
This indicator measures the
EMPD's role in ensuring a safer
city. An intervention includes
Operational Plans of the
Department; Joint Operational
Plans and Awareness Campaigns
run by the Department.
EMP
D Reduced traffic
contraventions and an improved safer.
50. Percentage increase in road policing operations
50%
10%
2.50%
2.50%
2.50%
2.50%
10%
10%
10%
10%
This indicator measures the
EMPD's role in contributing to a
safer South Africa. A traffic
contravention measures the
number of violations incurred by
non-compliant motorists.
EMP
D
A reduction in fatal road accidents
51. Percentage decrease in road fatalities
10% 2%
(reduction)
- 1.% - 1% 2%
2%
2% 2%
This indicator measures the
EMPD's role in contributing to a
safer South Africa. A road fatality
is the death of any person
resulting from injuries sustained
in a road traffic accident including
those of a pedestrian, pedal
cyclist, motorcycle rider, etc. on a
public road.
NATIONAL OUTCOME: RESPONSIVE, ACCOUNTABLE, EFFECTIVE AND EFFICIENT
DEVELOPMENTAL LOCAL GOVERNMENT SYSTEM
The consolidated legal framework for local government consists of chapter 7 of the Constitution, the
Municipal Finance Management Act, together with the Municipal Structures Act, Municipal Systems
Act, Municipal Property Rates Act, various sector and other legislation applicable to local government.
The South African intergovernmental fiscal relations system is based on section 41(1) of the
Constitution, the Intergovernmental Fiscal Relations Act and Division of Revenue Act. Underlying policy
development in the arena of municipal finances is the issue of providing acceptable levels of municipal
services to poor households at affordable rates which in turn, requires some redistribution. That source
of redistribution can be local, through cross-subsidisation within the municipality or from grants financed
from national taxes, or a combination of the two. The conventional view internationally is that
redistribution is best effected from the national level. In this regard, an increasing reliance of
municipalities on transfers (equitable share and others) from national government to fund their activities
is evident. This partially reflects the national priority accorded to combating poverty through providing
universal access to basic services.
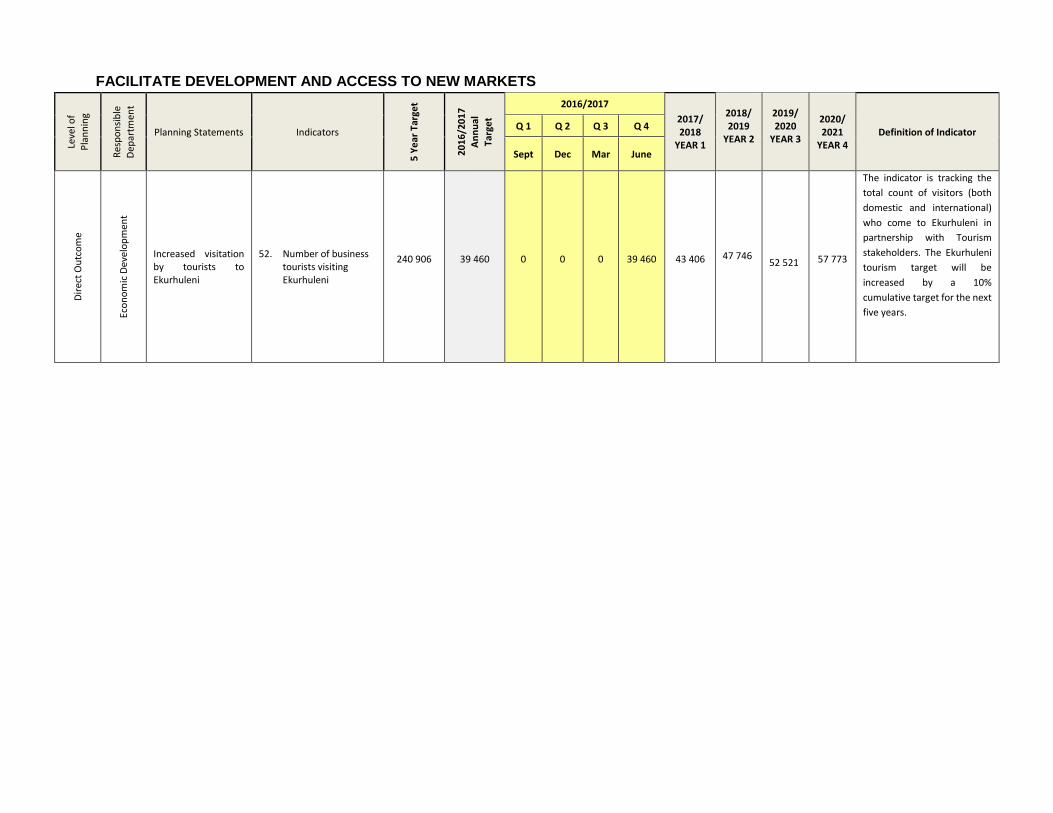
FACILITATE DEVELOPMENT AND ACCESS TO NEW MARKETS Le
vel o
f P
lan
nin
g
Res
po
nsi
ble
Dep
artm
ent
Planning Statements Indicators
5 Y
ear
Tar
get
20
16
/20
17
An
nu
al
Targ
et
2016/2017
2017/ 2018
YEAR 1
2018/ 2019
YEAR 2
2019/ 2020
YEAR 3
2020/ 2021
YEAR 4 Definition of Indicator
Q 1 Q 2 Q 3 Q 4
Sept Dec Mar June
Dir
ect
Ou
tco
me
Eco
no
mic
Dev
elo
pm
ent
Increased visitation by tourists to Ekurhuleni
52. Number of business tourists visiting Ekurhuleni
240 906 39 460 0 0 0 39 460 43 406
47 746
52 521 57 773
The indicator is tracking the
total count of visitors (both
domestic and international)
who come to Ekurhuleni in
partnership with Tourism
stakeholders. The Ekurhuleni
tourism target will be
increased by a 10%
cumulative target for the next
five years.
CAPABILITIES DEVELOPMENT - INVESTMENT IN SKILLS AND JOB CREATION
The NDP 2030 asserts that employment is the best form of social protection. However, given the
structural and historical factors in South Africa, and the effects of economic downturn that limit the
immediate growth of formal employment based on an industrial model of development, it is proposed
that the country’s approach to social protection should be a two-pronged strategy that protects the
vulnerable and those at risk, while simultaneously ensuring economic inclusion through a range of
active strategies. Government should ensure that social protection is affordable and sustainable to
avoid withdrawal of what is currently provided, and to promote solidarity and social cohesion.
South Africa is working towards improving the quality and skills levels of their labour forces. The
increasing recognition of higher technical and vocational skills are crucial in enhancing competitiveness
and contributing to social inclusion, decent employment, and poverty reduction has been a strong
incentive for reform. Competencies can be acquired either through structured training in public or
private TVET schools and centres, or through practical experience on the job in enterprises (work-place
training in the formal sector and informal apprenticeship), or both (the so-called “dual” training, involving
a combination of work-place and institution based training).
It is generally recognised that the development of relevant skills is an important instrument for improving
productivity and working conditions, and the promotion of decent work in the economy, which
represents the major employer in South Africa. Education and skills can open doors to economically
and socially rewarding jobs and can help the development of small informal-sector businesses, allow
the re-insertion of displaced workers and migrants, and support the transition from school to work for
school drop-outs and graduates. Ultimately, developing job-related competencies among the poor, the
youth and the vulnerable is recognised as crucial to progress in reducing poverty. The development of
job-related skills is, therefore, not only part of the countries’ human resource strategies but also of their
economic-growth and poverty-reduction strategies.
The inclusion of a skills-development component and job creation opportunities is critically important
towards breaking the cycle of poverty and reducing unemployment in Ekurhuleni. The programmes that
embarked upon in the 2016/2017 financial year include:
• Building the capacity of youth through accredited programmes;
• Facilitation of EPWP programmes and community worker programmes; and
• Creating jobs through marketing Ekurhuleni as a visitations destination of choice.
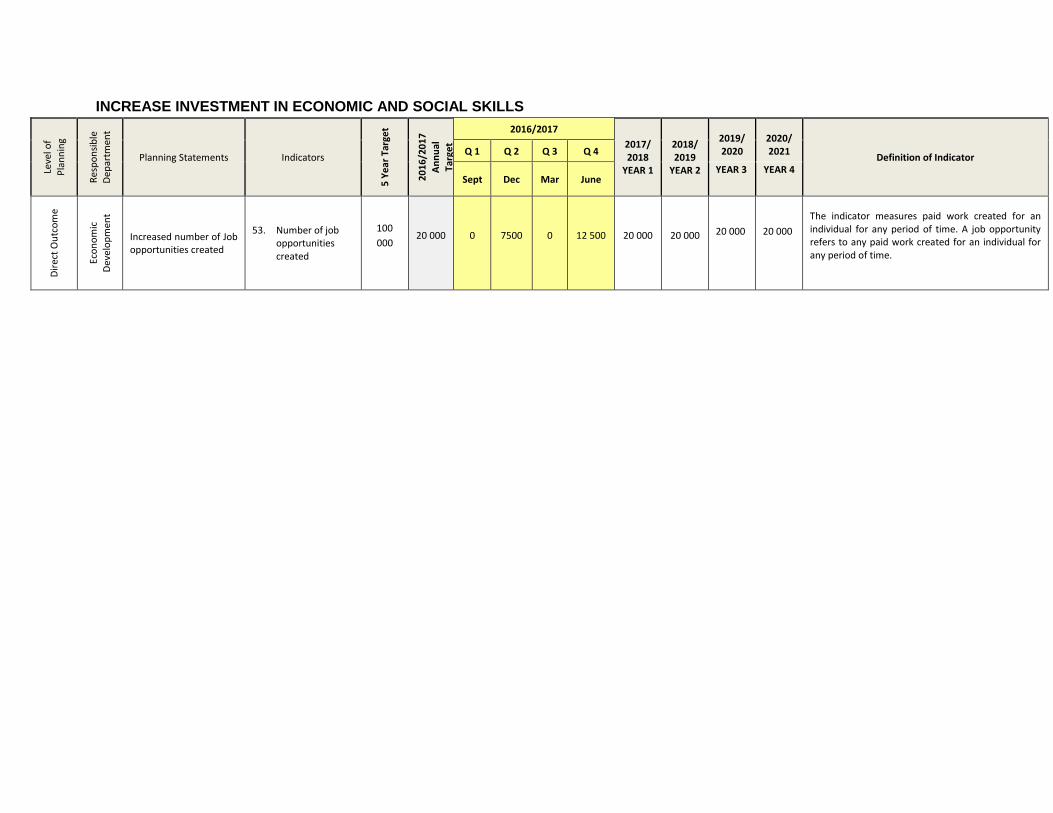
INCREASE INVESTMENT IN ECONOMIC AND SOCIAL SKILLS
Leve
l of
Pla
nn
ing
Res
po
nsi
ble
D
epar
tmen
t
Planning Statements Indicators
5 Y
ear
Tar
get
20
16
/20
17
An
nu
al
Targ
et
2016/2017
2017/ 2018
YEAR 1
2018/ 2019
YEAR 2
2019/ 2020
2020/ 2021
Definition of Indicator Q 1 Q 2 Q 3 Q 4
Sept Dec Mar June YEAR 3 YEAR 4
Dir
ect
Ou
tco
me
Eco
no
mic
D
evel
op
men
t
Increased number of Job opportunities created
53. Number of job opportunities created
100
000 20 000 0 7500 0 12 500 20 000 20 000
20 000
20 000
The indicator measures paid work created for an individual for any period of time. A job opportunity refers to any paid work created for an individual for any period of time.
RESPONSIVE AND ACTIVE CITIZENRY
The National Development Plan (NDP) views active citizenship as one of three ‘cogs’ that need to work
effectively to keep the wheels of development going in a desirable direction. The concept of “active
citizenship”, in particular as applied to the sphere of community development, has gained much
currency in community discourse and practice … The National Development Plan (2012) highlights the
need to improve state-citizen relations at the point of service delivery and positions this in terms of
routine accountability, arguing for the delegation of authority to frontline managers to enable this.
“Delegation presents an opportunity to strengthen mechanisms of routine accountability, enabling the
state to be more responsive to public concerns. Service delivery protests stem from citizens’ frustration
that the state is not responsive to their grievances. This is unfortunate, as citizens are often best placed
to advise on the standard of public services in their communities and to suggest possible interventions.”
(2012:427)
This is perhaps not surprising. Enveloped in wholesomely positive values such as cooperation,
cohesion, caring and neighbourliness, and evoking heart-warming ideals of belonging and solidarity,
the idea appears all at once virtuous, worthy and highly seductive. However, what actions constitute
active citizenship? Is it about community members taking initiative, raising popular support and
challenging government? Does it matter how active citizenship takes place, and if so, how? Is it always
helpful in addressing the needs of the majority of residents in an area? The South African government
has attempted, through for example the Municipal Systems Act (No. 32 of 2000), to legislate
opportunities for active citizenship to play a role in defining development at a local level. The Municipal
Systems Act (2000) (Section 16(1) obliges municipalities to “develop a culture of municipal governance
that complements formal representative governance with a system of participatory governance and
must for this purpose a) encourage, and create conditions for, the local community to participate in the
affairs of the municipality, including in (ii) the performance management system”. Thus, there seems to
be greater potential for local residents to have control over development processes that affect them.
(Gaynor 2011: 28).
The experiences of citizens – the intended beneficiaries of government services – are a critical
component in measuring the performance of government and for the delivery of appropriate and quality
services. Currently the emphasis of government’s monitoring is on internal government processes and
the voice of the citizen is largely absent. This presents a risk, as the picture is not complete. It is
therefore necessary to support the uptake of systematic ways to bring the experiences of citizens into
the monitoring of services. This will provide a measure of the gap between the perceived and the actual
experiences of service delivery, for both user and provider. Citizens cannot be passive recipients if
government is to deliver services that address real needs. The process of citizens working jointly with
government to produce information on service delivery fosters active citizenry and contributes to
building a capable and developmental state.
The programme described in the GDS seeks to embrace ordinary people within the rubric of civic life
and governance. Communities are taking responsibility for their destiny and delivering services which
no government could effectively provide. The GDS has looked at the response to active citizenry
through a number of programmes
INTEGRATE SERVICE DELIVERY AND CITIZEN RESPONSIBILITY
The supply of basic social services, or lack thereof, directly impacts on the quality of life for all. To this
end the Constitution of the Republic of South Africa, various policy instruments and strategy documents
emphasise the provision of such services to all citizens of the country. The responsibility and
accountability for the provisioning of social services is divided among the national, provincial and local
authorities. Public engagement in the planning and prioritising of these services is crucial and a
prerequisite for efficient and effective functioning of government. According to Shah (2006) government
should be citizen-centred in its planning and in the implementation of policies and programmes. The
Municipal Systems Act, the Batho Pele (People First) principle, and the Turn-around Strategy of 2009
compel municipalities to engage communities in their planning. This is reflected in, for example, the
Integrated Development Plans (IDPs), Service Delivery and Budget Implementation Plans (SDBIPs)
and other matters that impact on the service recipients or users. Do all municipalities adhere to and
apply these in their planning and budgeting for services?
This IDP focuses on integrating service delivers and citizen responsibility through action in terms of:
• EMM providing access to disaster and emergency services;
• Through providing basic services e.g. removal of waste and
• Ensuring that communities are rodent free.
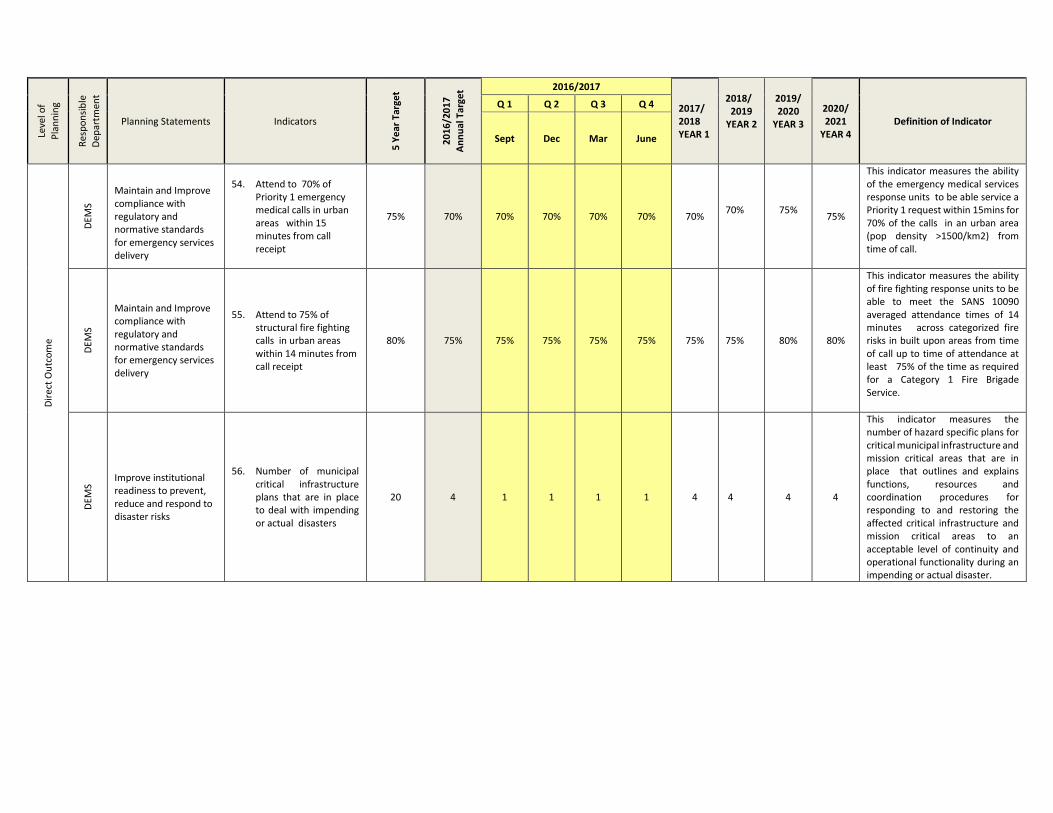
Leve
l of
Pla
nn
ing
Res
po
nsi
ble
Dep
artm
ent
Planning Statements Indicators
5 Y
ear
Tar
get
20
16
/20
17
An
nu
al T
arge
t 2016/2017
2017/ 2018 YEAR 1
2018/
2019 YEAR 2
2019/ 2020
YEAR 3
2020/ 2021
YEAR 4 Definition of Indicator
Q 1 Q 2 Q 3 Q 4
Sept Dec Mar June
Dir
ect
Ou
tco
me
DEM
S
Maintain and Improve compliance with regulatory and normative standards for emergency services delivery
54. Attend to 70% of Priority 1 emergency medical calls in urban areas within 15 minutes from call receipt
75% 70% 70% 70% 70% 70% 70%
70%
75% 75%
This indicator measures the ability of the emergency medical services response units to be able service a Priority 1 request within 15mins for 70% of the calls in an urban area (pop density >1500/km2) from time of call.
DEM
S
Maintain and Improve compliance with regulatory and normative standards for emergency services delivery
55. Attend to 75% of structural fire fighting calls in urban areas within 14 minutes from call receipt
80% 75% 75% 75% 75% 75% 75%
75%
80% 80%
This indicator measures the ability of fire fighting response units to be able to meet the SANS 10090 averaged attendance times of 14 minutes across categorized fire risks in built upon areas from time of call up to time of attendance at least 75% of the time as required for a Category 1 Fire Brigade Service.
DEM
S
Improve institutional readiness to prevent, reduce and respond to disaster risks
56. Number of municipal critical infrastructure plans that are in place to deal with impending or actual disasters
20 4 1 1 1 1 4
4
4 4
This indicator measures the number of hazard specific plans for critical municipal infrastructure and mission critical areas that are in place that outlines and explains functions, resources and coordination procedures for responding to and restoring the affected critical infrastructure and mission critical areas to an acceptable level of continuity and operational functionality during an impending or actual disaster.
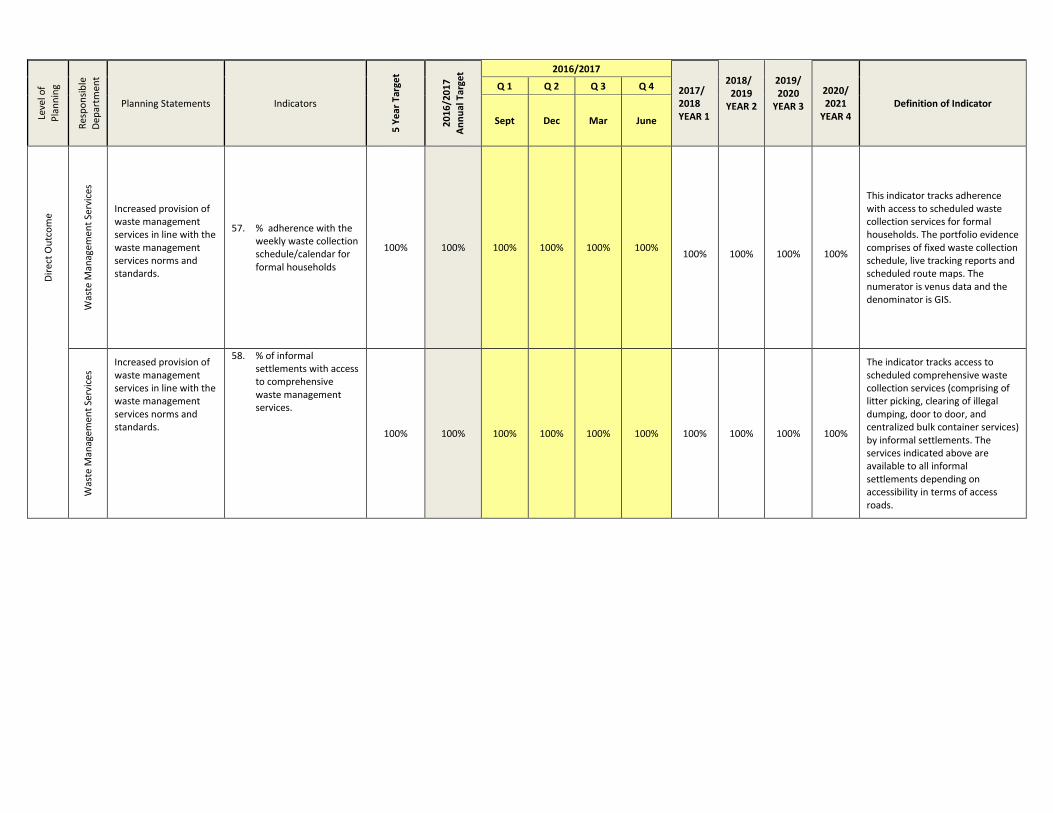
Leve
l of
Pla
nn
ing
Res
po
nsi
ble
Dep
artm
ent
Planning Statements Indicators
5 Y
ear
Tar
get
20
16
/20
17
An
nu
al T
arge
t 2016/2017
2017/ 2018 YEAR 1
2018/
2019 YEAR 2
2019/ 2020
YEAR 3
2020/ 2021
YEAR 4 Definition of Indicator
Q 1 Q 2 Q 3 Q 4
Sept Dec Mar June
Dir
ect
Ou
tco
me
Was
te M
anag
emen
t Se
rvic
es
Increased provision of waste management services in line with the waste management services norms and standards.
57. % adherence with the weekly waste collection schedule/calendar for formal households
100% 100% 100% 100% 100% 100%
100%
100%
100%
100%
This indicator tracks adherence with access to scheduled waste collection services for formal households. The portfolio evidence comprises of fixed waste collection schedule, live tracking reports and scheduled route maps. The numerator is venus data and the denominator is GIS.
Was
te M
anag
emen
t Se
rvic
es Increased provision of
waste management services in line with the waste management services norms and standards.
58. % of informal settlements with access to comprehensive waste management services.
100% 100% 100% 100% 100% 100% 100% 100% 100% 100%
The indicator tracks access to scheduled comprehensive waste collection services (comprising of litter picking, clearing of illegal dumping, door to door, and centralized bulk container services) by informal settlements. The services indicated above are available to all informal settlements depending on accessibility in terms of access roads.
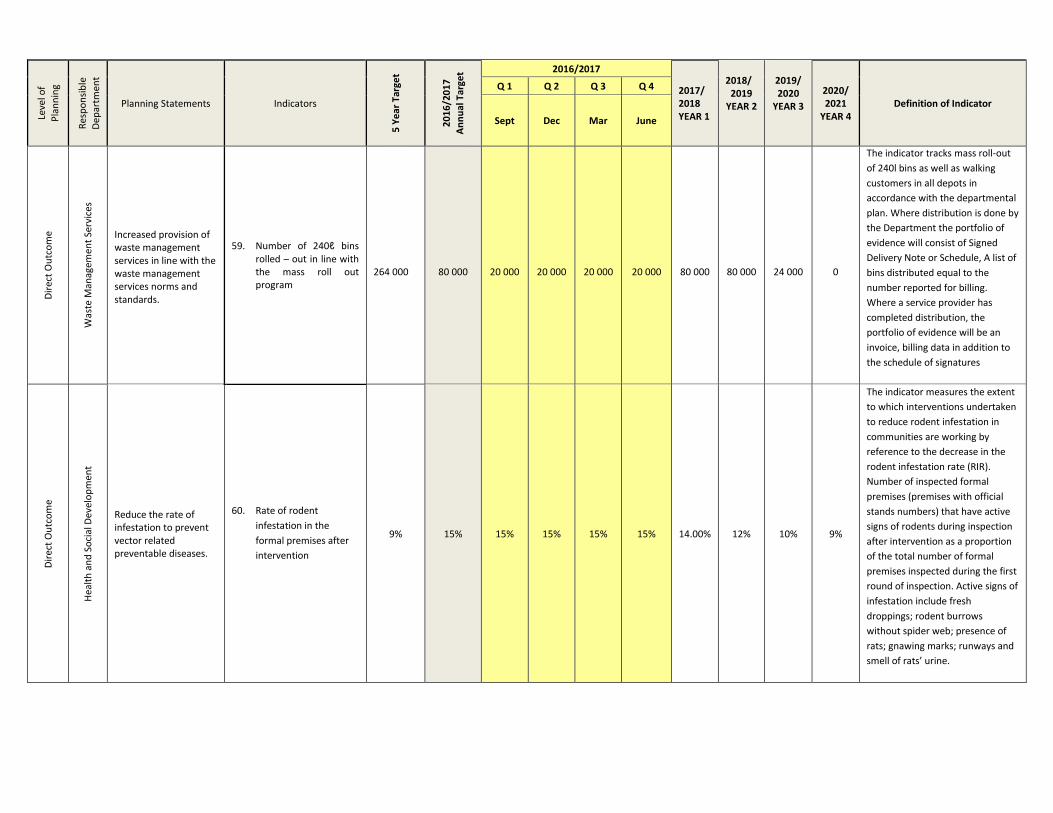
Leve
l of
Pla
nn
ing
Res
po
nsi
ble
Dep
artm
ent
Planning Statements Indicators
5 Y
ear
Tar
get
20
16
/20
17
An
nu
al T
arge
t 2016/2017
2017/ 2018 YEAR 1
2018/
2019 YEAR 2
2019/ 2020
YEAR 3
2020/ 2021
YEAR 4 Definition of Indicator
Q 1 Q 2 Q 3 Q 4
Sept Dec Mar June
Dir
ect
Ou
tco
me
Was
te M
anag
emen
t Se
rvic
es
Increased provision of waste management services in line with the waste management services norms and standards.
59. Number of 240ℓ bins
rolled – out in line with the mass roll out program
264 000
80 000
20 000
20 000
20 000
20 000
80 000
80 000
24 000
0
The indicator tracks mass roll-out
of 240l bins as well as walking
customers in all depots in
accordance with the departmental
plan. Where distribution is done by
the Department the portfolio of
evidence will consist of Signed
Delivery Note or Schedule, A list of
bins distributed equal to the
number reported for billing.
Where a service provider has
completed distribution, the
portfolio of evidence will be an
invoice, billing data in addition to
the schedule of signatures
Dir
ect
Ou
tco
me
Hea
lth
an
d S
oci
al D
evel
op
men
t
Reduce the rate of infestation to prevent vector related preventable diseases.
60. Rate of rodent
infestation in the
formal premises after
intervention
9%
15% 15% 15% 15% 15% 14.00% 12% 10% 9%
The indicator measures the extent
to which interventions undertaken
to reduce rodent infestation in
communities are working by
reference to the decrease in the
rodent infestation rate (RIR).
Number of inspected formal
premises (premises with official
stands numbers) that have active
signs of rodents during inspection
after intervention as a proportion
of the total number of formal
premises inspected during the first
round of inspection. Active signs of
infestation include fresh
droppings; rodent burrows
without spider web; presence of
rats; gnawing marks; runways and
smell of rats’ urine.
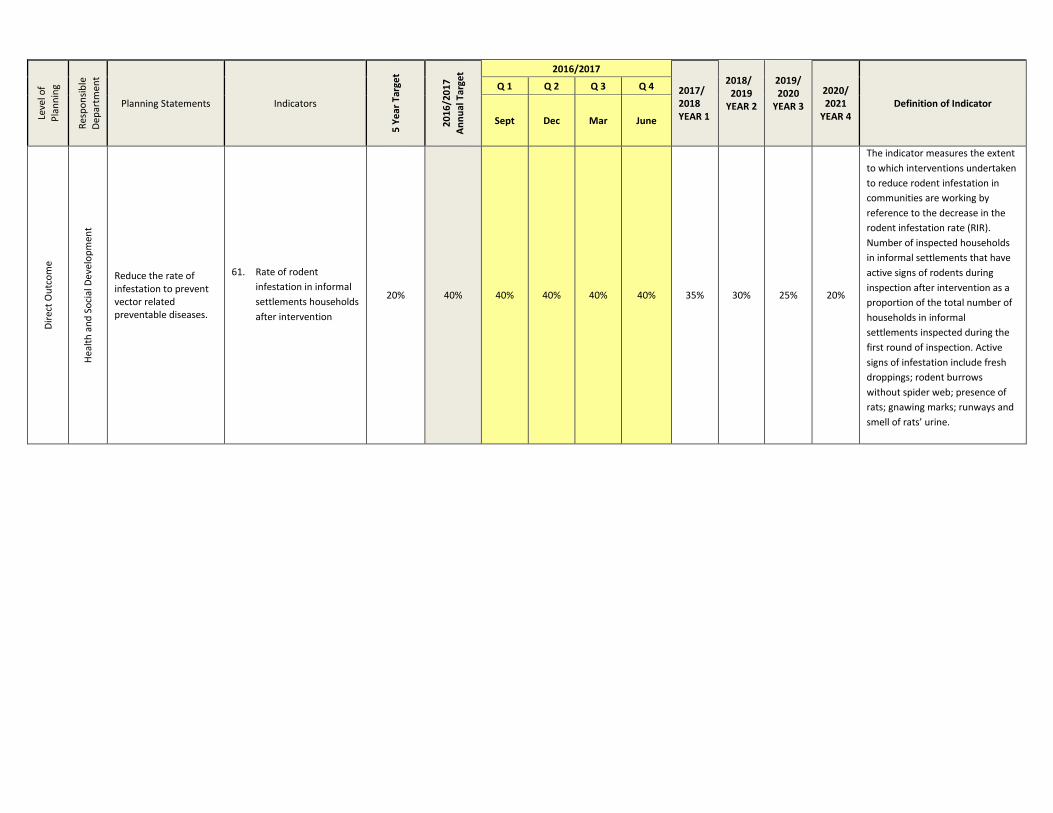
Leve
l of
Pla
nn
ing
Res
po
nsi
ble
Dep
artm
ent
Planning Statements Indicators
5 Y
ear
Tar
get
20
16
/20
17
An
nu
al T
arge
t 2016/2017
2017/ 2018 YEAR 1
2018/
2019 YEAR 2
2019/ 2020
YEAR 3
2020/ 2021
YEAR 4 Definition of Indicator
Q 1 Q 2 Q 3 Q 4
Sept Dec Mar June
Dir
ect
Ou
tco
me
Hea
lth
an
d S
oci
al D
evel
op
men
t
Reduce the rate of infestation to prevent vector related preventable diseases.
61. Rate of rodent
infestation in informal
settlements households
after intervention
20%
40% 40% 40% 40% 40% 35% 30% 25% 20%
The indicator measures the extent
to which interventions undertaken
to reduce rodent infestation in
communities are working by
reference to the decrease in the
rodent infestation rate (RIR).
Number of inspected households
in informal settlements that have
active signs of rodents during
inspection after intervention as a
proportion of the total number of
households in informal
settlements inspected during the
first round of inspection. Active
signs of infestation include fresh
droppings; rodent burrows
without spider web; presence of
rats; gnawing marks; runways and
smell of rats’ urine.
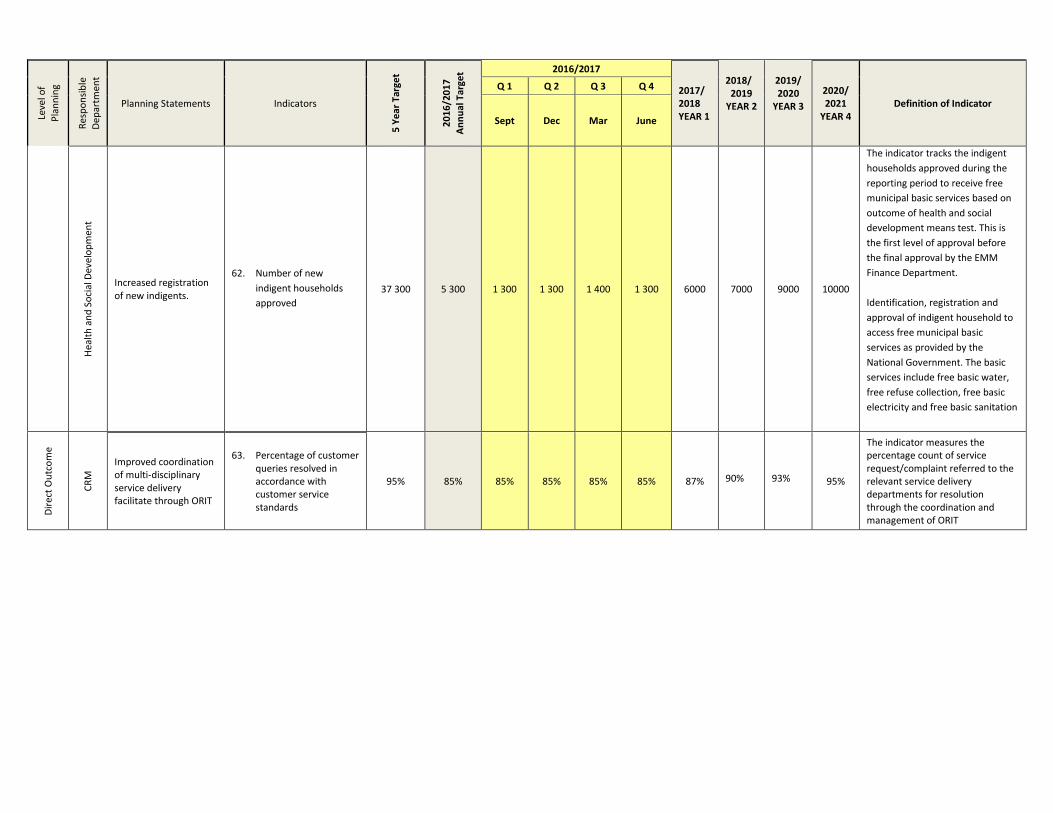
Leve
l of
Pla
nn
ing
Res
po
nsi
ble
Dep
artm
ent
Planning Statements Indicators
5 Y
ear
Tar
get
20
16
/20
17
An
nu
al T
arge
t 2016/2017
2017/ 2018 YEAR 1
2018/
2019 YEAR 2
2019/ 2020
YEAR 3
2020/ 2021
YEAR 4 Definition of Indicator
Q 1 Q 2 Q 3 Q 4
Sept Dec Mar June
Hea
lth
an
d S
oci
al D
evel
op
men
t
Increased registration of new indigents.
62. Number of new
indigent households
approved
37 300
5 300 1 300 1 300 1 400 1 300 6000 7000 9000 10000
The indicator tracks the indigent
households approved during the
reporting period to receive free
municipal basic services based on
outcome of health and social
development means test. This is
the first level of approval before
the final approval by the EMM
Finance Department.
Identification, registration and
approval of indigent household to
access free municipal basic
services as provided by the
National Government. The basic
services include free basic water,
free refuse collection, free basic
electricity and free basic sanitation
Dir
ect
Ou
tco
me
CR
M
Improved coordination of multi-disciplinary service delivery facilitate through ORIT
63. Percentage of customer queries resolved in accordance with customer service standards
95% 85% 85% 85% 85% 85% 87%
90%
93% 95%
The indicator measures the percentage count of service request/complaint referred to the relevant service delivery departments for resolution through the coordination and management of ORIT
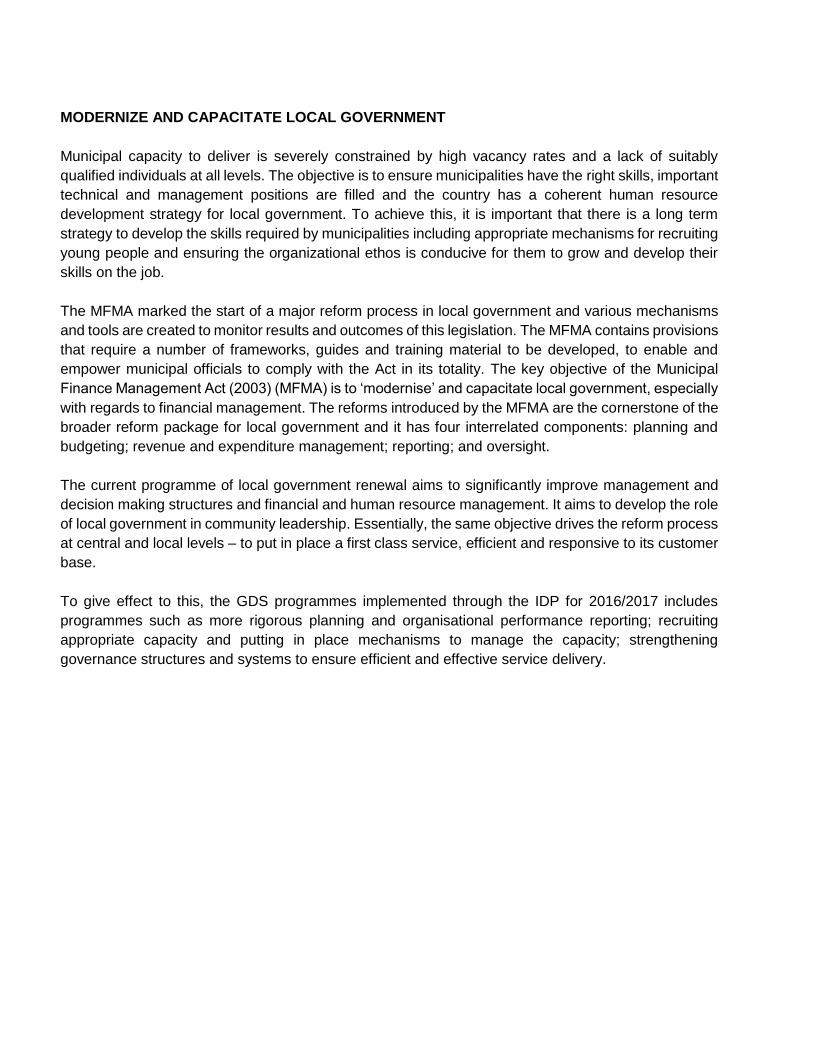
MODERNIZE AND CAPACITATE LOCAL GOVERNMENT
Municipal capacity to deliver is severely constrained by high vacancy rates and a lack of suitably
qualified individuals at all levels. The objective is to ensure municipalities have the right skills, important
technical and management positions are filled and the country has a coherent human resource
development strategy for local government. To achieve this, it is important that there is a long term
strategy to develop the skills required by municipalities including appropriate mechanisms for recruiting
young people and ensuring the organizational ethos is conducive for them to grow and develop their
skills on the job.
The MFMA marked the start of a major reform process in local government and various mechanisms
and tools are created to monitor results and outcomes of this legislation. The MFMA contains provisions
that require a number of frameworks, guides and training material to be developed, to enable and
empower municipal officials to comply with the Act in its totality. The key objective of the Municipal
Finance Management Act (2003) (MFMA) is to ‘modernise’ and capacitate local government, especially
with regards to financial management. The reforms introduced by the MFMA are the cornerstone of the
broader reform package for local government and it has four interrelated components: planning and
budgeting; revenue and expenditure management; reporting; and oversight.
The current programme of local government renewal aims to significantly improve management and
decision making structures and financial and human resource management. It aims to develop the role
of local government in community leadership. Essentially, the same objective drives the reform process
at central and local levels – to put in place a first class service, efficient and responsive to its customer
base.
To give effect to this, the GDS programmes implemented through the IDP for 2016/2017 includes
programmes such as more rigorous planning and organisational performance reporting; recruiting
appropriate capacity and putting in place mechanisms to manage the capacity; strengthening
governance structures and systems to ensure efficient and effective service delivery.
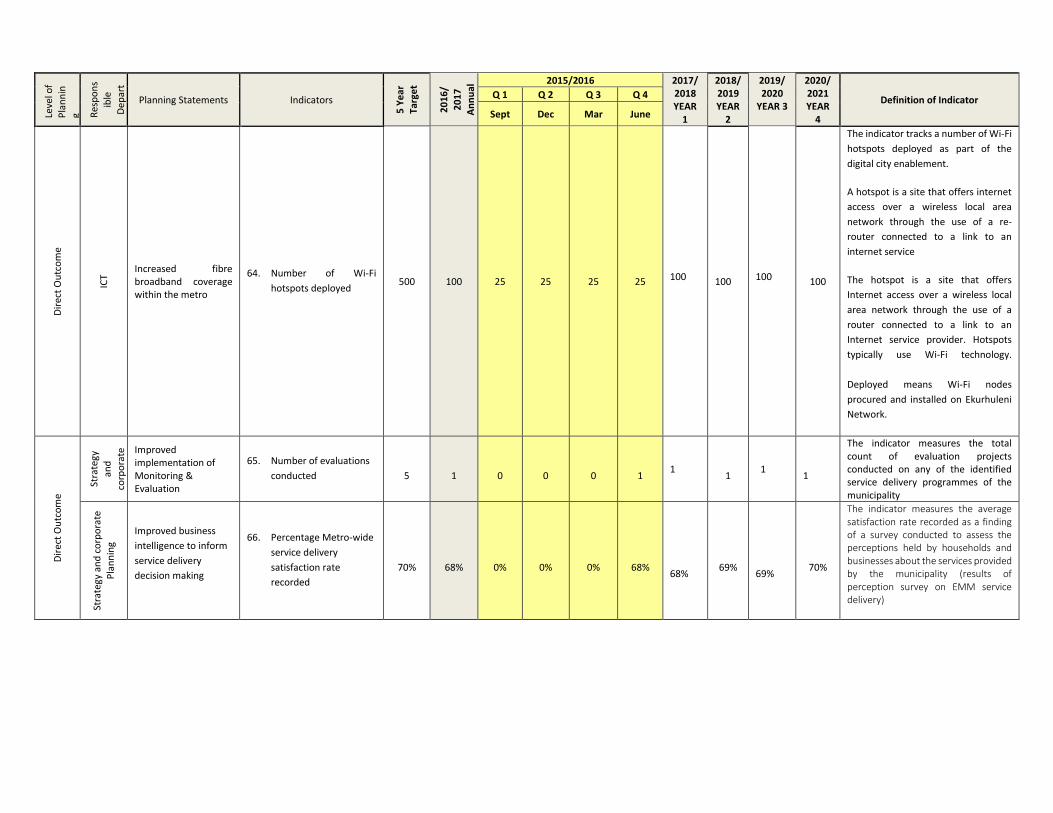
Leve
l of
Pla
nn
in
g Res
po
ns
ible
Dep
art
men
t
Planning Statements Indicators
5 Y
ear
Targ
et
20
16
/
20
17
An
nu
al
Targ
et 2015/2016 2017/
2018 YEAR
1
2018/ 2019 YEAR
2
2019/ 2020
YEAR 3
2020/ 2021 YEAR
4
Definition of Indicator Q 1 Q 2 Q 3 Q 4
Sept Dec Mar June
Dir
ect
Ou
tco
me
ICT
Increased fibre broadband coverage within the metro
64. Number of Wi-Fi
hotspots deployed 500 100 25 25 25 25
100 100
100 100
The indicator tracks a number of Wi-Fi
hotspots deployed as part of the
digital city enablement.
A hotspot is a site that offers internet
access over a wireless local area
network through the use of a re-
router connected to a link to an
internet service
The hotspot is a site that offers
Internet access over a wireless local
area network through the use of a
router connected to a link to an
Internet service provider. Hotspots
typically use Wi-Fi technology.
Deployed means Wi-Fi nodes
procured and installed on Ekurhuleni
Network.
Dir
ect
Ou
tco
me
Stra
tegy
an
d
corp
ora
te
Pla
nn
ing Improved
implementation of Monitoring & Evaluation
65. Number of evaluations
conducted
5
1
0
0
0
1
1
1
1 1
The indicator measures the total count of evaluation projects conducted on any of the identified service delivery programmes of the municipality
Stra
tegy
an
d c
orp
ora
te
Pla
nn
ing
Improved business
intelligence to inform
service delivery
decision making
66. Percentage Metro-wide
service delivery
satisfaction rate
recorded
70%
68%
0%
0%
0%
68%
68%
69%
69%
70%
The indicator measures the average satisfaction rate recorded as a finding of a survey conducted to assess the perceptions held by households and businesses about the services provided by the municipality (results of perception survey on EMM service delivery)
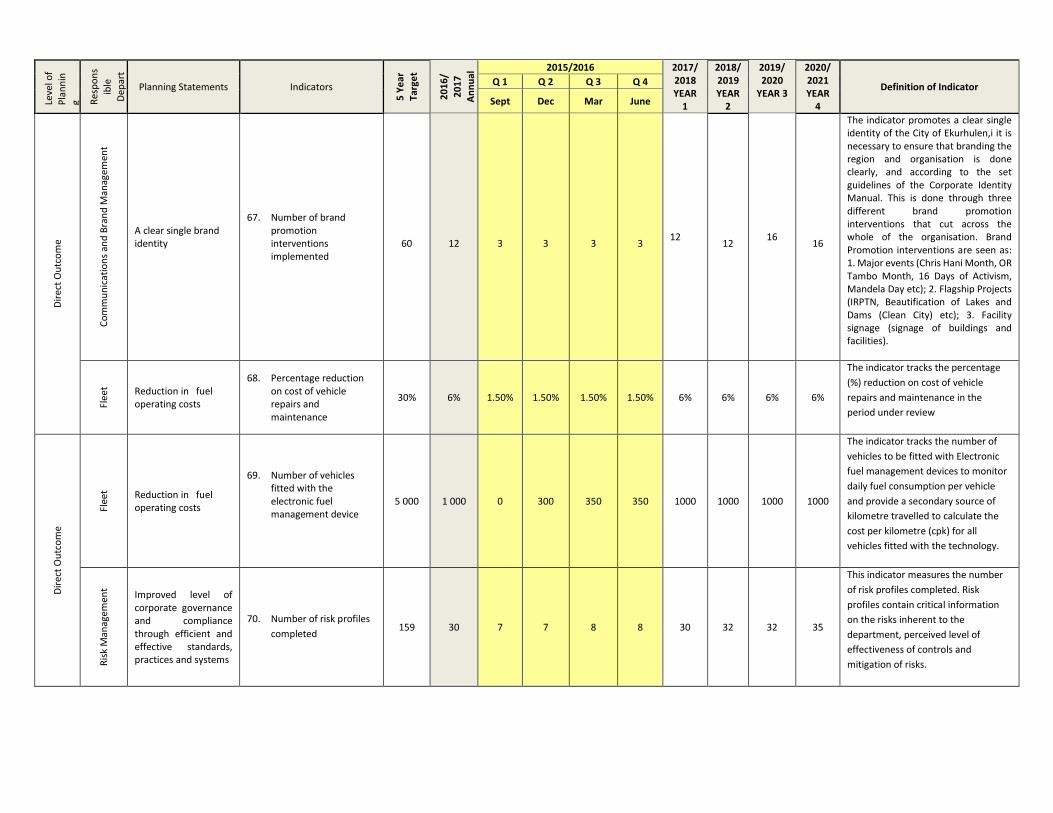
Leve
l of
Pla
nn
in
g Res
po
ns
ible
Dep
art
men
t
Planning Statements Indicators
5 Y
ear
Targ
et
20
16
/
20
17
An
nu
al
Targ
et 2015/2016 2017/
2018 YEAR
1
2018/ 2019 YEAR
2
2019/ 2020
YEAR 3
2020/ 2021 YEAR
4
Definition of Indicator Q 1 Q 2 Q 3 Q 4
Sept Dec Mar June
Dir
ect
Ou
tco
me
Co
mm
un
icat
ion
s an
d B
ran
d M
anag
em
ent
A clear single brand identity
67. Number of brand promotion interventions implemented
60
12
3
3
3
3
12
12
16
16
The indicator promotes a clear single identity of the City of Ekurhulen,i it is necessary to ensure that branding the region and organisation is done clearly, and according to the set guidelines of the Corporate Identity Manual. This is done through three different brand promotion interventions that cut across the whole of the organisation. Brand Promotion interventions are seen as: 1. Major events (Chris Hani Month, OR Tambo Month, 16 Days of Activism, Mandela Day etc); 2. Flagship Projects (IRPTN, Beautification of Lakes and Dams (Clean City) etc); 3. Facility signage (signage of buildings and facilities).
Flee
t Reduction in fuel operating costs
68. Percentage reduction on cost of vehicle repairs and maintenance
30% 6% 1.50% 1.50% 1.50% 1.50% 6% 6% 6% 6%
The indicator tracks the percentage
(%) reduction on cost of vehicle
repairs and maintenance in the
period under review
Dir
ect
Ou
tco
me
Flee
t Reduction in fuel operating costs
69. Number of vehicles fitted with the electronic fuel management device
5 000 1 000 0 300 350 350 1000 1000 1000 1000
The indicator tracks the number of
vehicles to be fitted with Electronic
fuel management devices to monitor
daily fuel consumption per vehicle
and provide a secondary source of
kilometre travelled to calculate the
cost per kilometre (cpk) for all
vehicles fitted with the technology.
Ris
k M
anag
emen
t
Improved level of corporate governance and compliance through efficient and effective standards, practices and systems
70. Number of risk profiles
completed 159 30 7 7 8 8 30 32 32 35
This indicator measures the number
of risk profiles completed. Risk
profiles contain critical information
on the risks inherent to the
department, perceived level of
effectiveness of controls and
mitigation of risks.
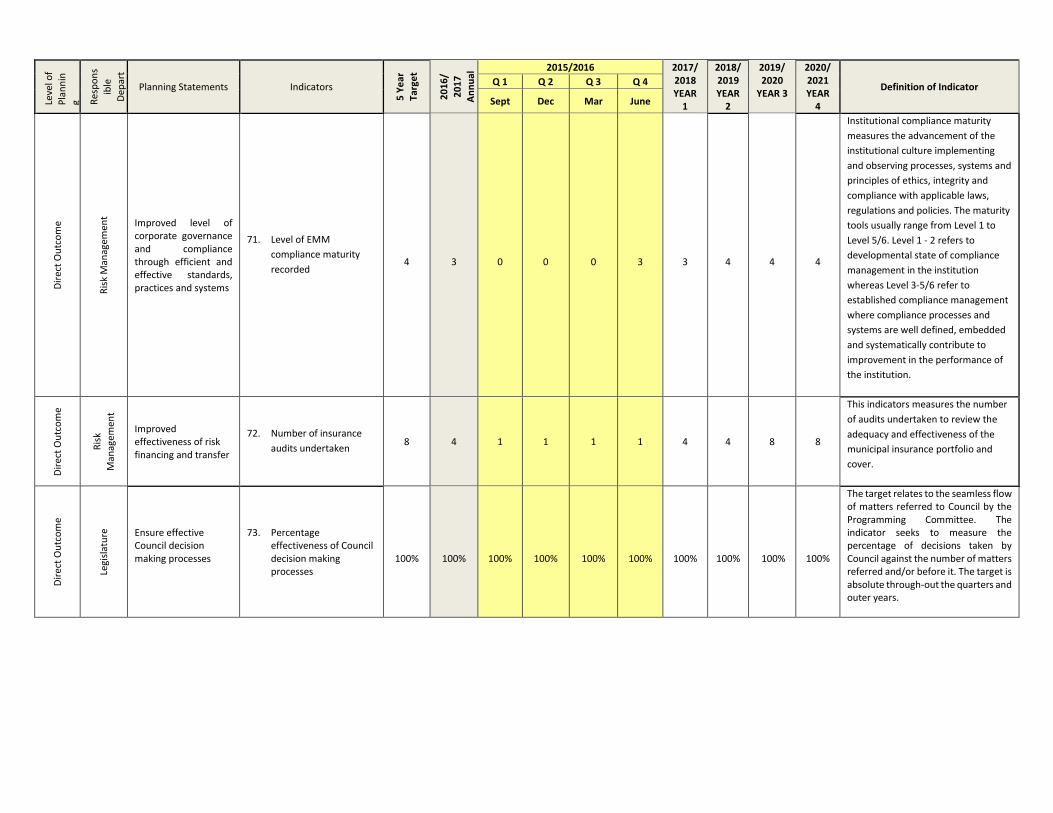
Leve
l of
Pla
nn
in
g Res
po
ns
ible
Dep
art
men
t
Planning Statements Indicators
5 Y
ear
Targ
et
20
16
/
20
17
An
nu
al
Targ
et 2015/2016 2017/
2018 YEAR
1
2018/ 2019 YEAR
2
2019/ 2020
YEAR 3
2020/ 2021 YEAR
4
Definition of Indicator Q 1 Q 2 Q 3 Q 4
Sept Dec Mar June
Dir
ect
Ou
tco
me
Ris
k M
anag
emen
t
Improved level of corporate governance and compliance through efficient and effective standards, practices and systems
71. Level of EMM
compliance maturity
recorded
4
3
0
0
0
3
3
4
4
4
Institutional compliance maturity
measures the advancement of the
institutional culture implementing
and observing processes, systems and
principles of ethics, integrity and
compliance with applicable laws,
regulations and policies. The maturity
tools usually range from Level 1 to
Level 5/6. Level 1 - 2 refers to
developmental state of compliance
management in the institution
whereas Level 3-5/6 refer to
established compliance management
where compliance processes and
systems are well defined, embedded
and systematically contribute to
improvement in the performance of
the institution.
Dir
ect
Ou
tco
me
Ris
k
Man
agem
ent
Improved effectiveness of risk financing and transfer
72. Number of insurance
audits undertaken 8 4 1 1 1 1 4 4 8 8
This indicators measures the number
of audits undertaken to review the
adequacy and effectiveness of the
municipal insurance portfolio and
cover.
Dir
ect
Ou
tco
me
Legi
slat
ure
Ensure effective Council decision making processes
73. Percentage effectiveness of Council decision making processes
100%
100%
100%
100%
100%
100%
100%
100%
100%
100%
The target relates to the seamless flow of matters referred to Council by the Programming Committee. The indicator seeks to measure the percentage of decisions taken by Council against the number of matters referred and/or before it. The target is absolute through-out the quarters and outer years.
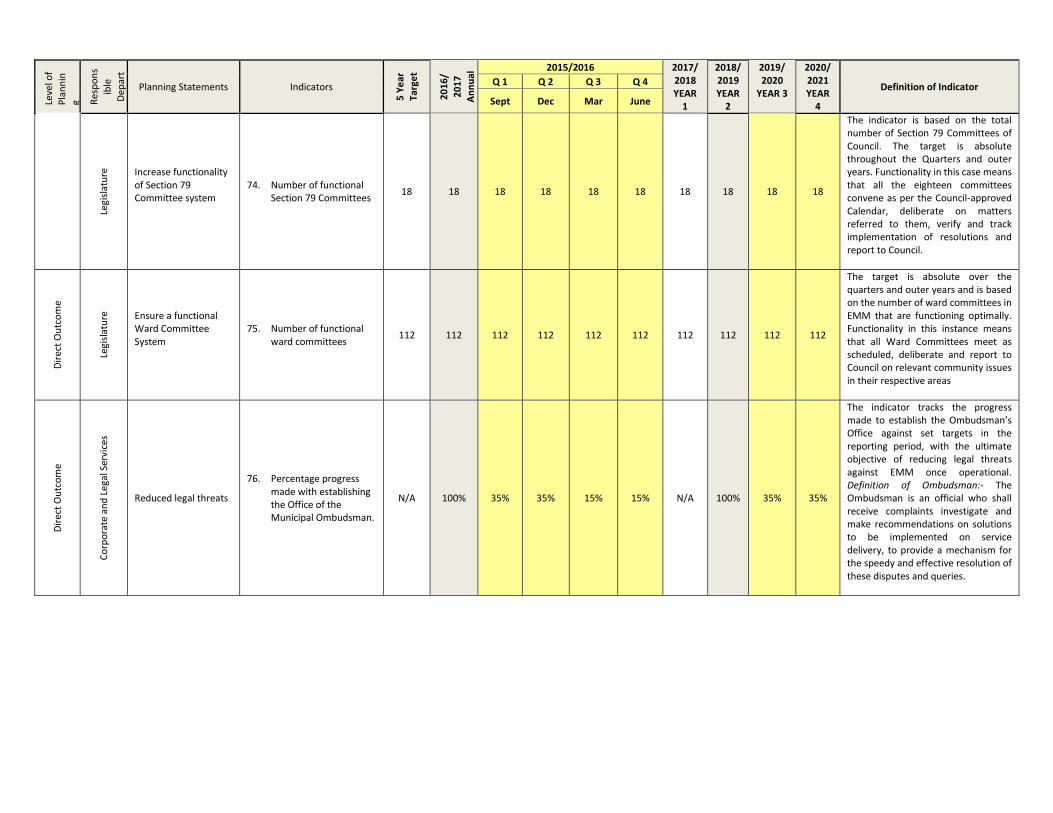
Leve
l of
Pla
nn
in
g Res
po
ns
ible
Dep
art
men
t
Planning Statements Indicators
5 Y
ear
Targ
et
20
16
/
20
17
An
nu
al
Targ
et 2015/2016 2017/
2018 YEAR
1
2018/ 2019 YEAR
2
2019/ 2020
YEAR 3
2020/ 2021 YEAR
4
Definition of Indicator Q 1 Q 2 Q 3 Q 4
Sept Dec Mar June Le
gisl
atu
re
Increase functionality of Section 79 Committee system
74. Number of functional Section 79 Committees
18 18 18 18 18 18 18 18 18 18
The indicator is based on the total number of Section 79 Committees of Council. The target is absolute throughout the Quarters and outer years. Functionality in this case means that all the eighteen committees convene as per the Council-approved Calendar, deliberate on matters referred to them, verify and track implementation of resolutions and report to Council.
Dir
ect
Ou
tco
me
Legi
slat
ure
Ensure a functional Ward Committee System
75. Number of functional ward committees
112 112 112 112 112 112 112 112 112 112
The target is absolute over the quarters and outer years and is based on the number of ward committees in EMM that are functioning optimally. Functionality in this instance means that all Ward Committees meet as scheduled, deliberate and report to Council on relevant community issues in their respective areas
Dir
ect
Ou
tco
me
Co
rpo
rate
an
d L
egal
Ser
vice
s
Reduced legal threats
76. Percentage progress made with establishing the Office of the Municipal Ombudsman.
N/A 100% 35% 35% 15% 15% N/A 100% 35% 35%
The indicator tracks the progress made to establish the Ombudsman’s Office against set targets in the reporting period, with the ultimate objective of reducing legal threats against EMM once operational. Definition of Ombudsman:- The Ombudsman is an official who shall receive complaints investigate and make recommendations on solutions to be implemented on service delivery, to provide a mechanism for the speedy and effective resolution of these disputes and queries.
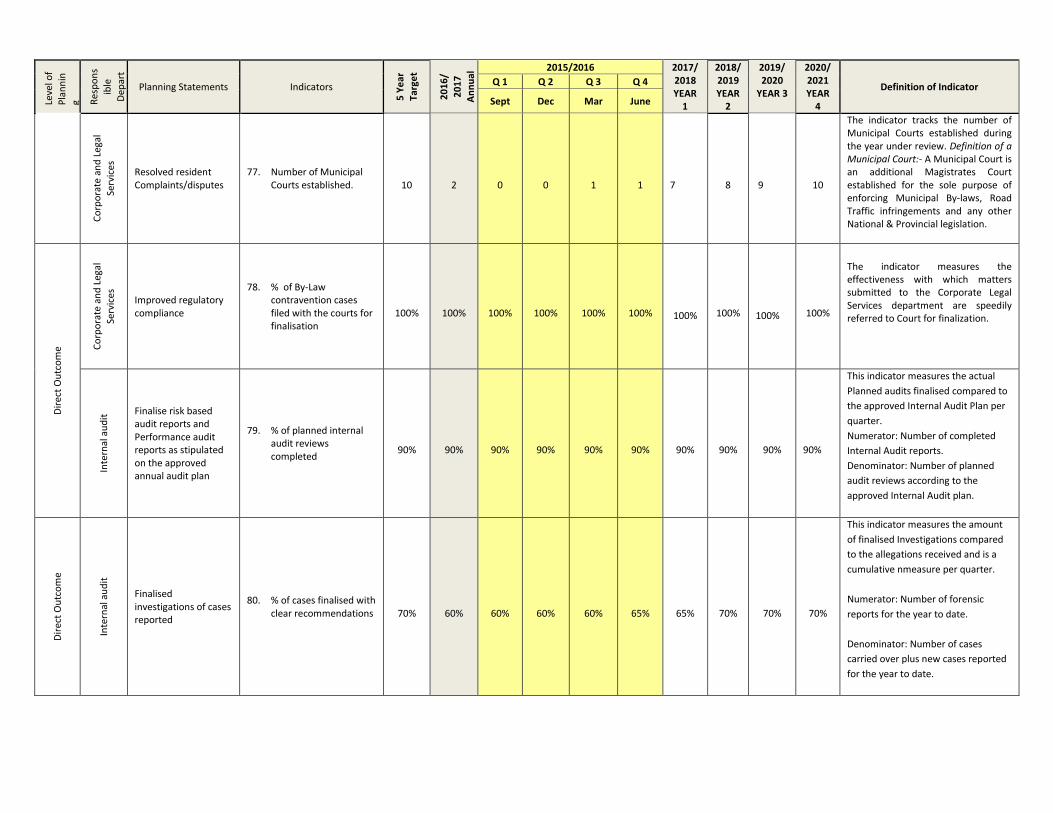
Leve
l of
Pla
nn
in
g Res
po
ns
ible
Dep
art
men
t
Planning Statements Indicators
5 Y
ear
Targ
et
20
16
/
20
17
An
nu
al
Targ
et 2015/2016 2017/
2018 YEAR
1
2018/ 2019 YEAR
2
2019/ 2020
YEAR 3
2020/ 2021 YEAR
4
Definition of Indicator Q 1 Q 2 Q 3 Q 4
Sept Dec Mar June C
orp
ora
te a
nd
Leg
al
Serv
ices
Resolved resident Complaints/disputes
77. Number of Municipal Courts established.
10
2
0
0
1
1
7
8
9
10
The indicator tracks the number of Municipal Courts established during the year under review. Definition of a Municipal Court:- A Municipal Court is an additional Magistrates Court established for the sole purpose of enforcing Municipal By-laws, Road Traffic infringements and any other National & Provincial legislation.
Dir
ect
Ou
tco
me
Co
rpo
rate
an
d L
egal
Serv
ices
Improved regulatory compliance
78. % of By-Law contravention cases filed with the courts for finalisation
100%
100%
100%
100%
100%
100%
100%
100%
100%
100%
The indicator measures the effectiveness with which matters submitted to the Corporate Legal Services department are speedily referred to Court for finalization.
Inte
rnal
au
dit
Finalise risk based audit reports and Performance audit reports as stipulated on the approved annual audit plan
79. % of planned internal audit reviews completed
90%
90%
90%
90%
90%
90%
90%
90%
90%
90%
This indicator measures the actual
Planned audits finalised compared to
the approved Internal Audit Plan per
quarter.
Numerator: Number of completed
Internal Audit reports.
Denominator: Number of planned
audit reviews according to the
approved Internal Audit plan.
Dir
ect
Ou
tco
me
Inte
rnal
au
dit
Finalised investigations of cases reported
80. % of cases finalised with clear recommendations
70%
60%
60%
60%
60%
65%
65%
70%
70%
70%
This indicator measures the amount
of finalised Investigations compared
to the allegations received and is a
cumulative nmeasure per quarter.
Numerator: Number of forensic
reports for the year to date.
Denominator: Number of cases
carried over plus new cases reported
for the year to date.
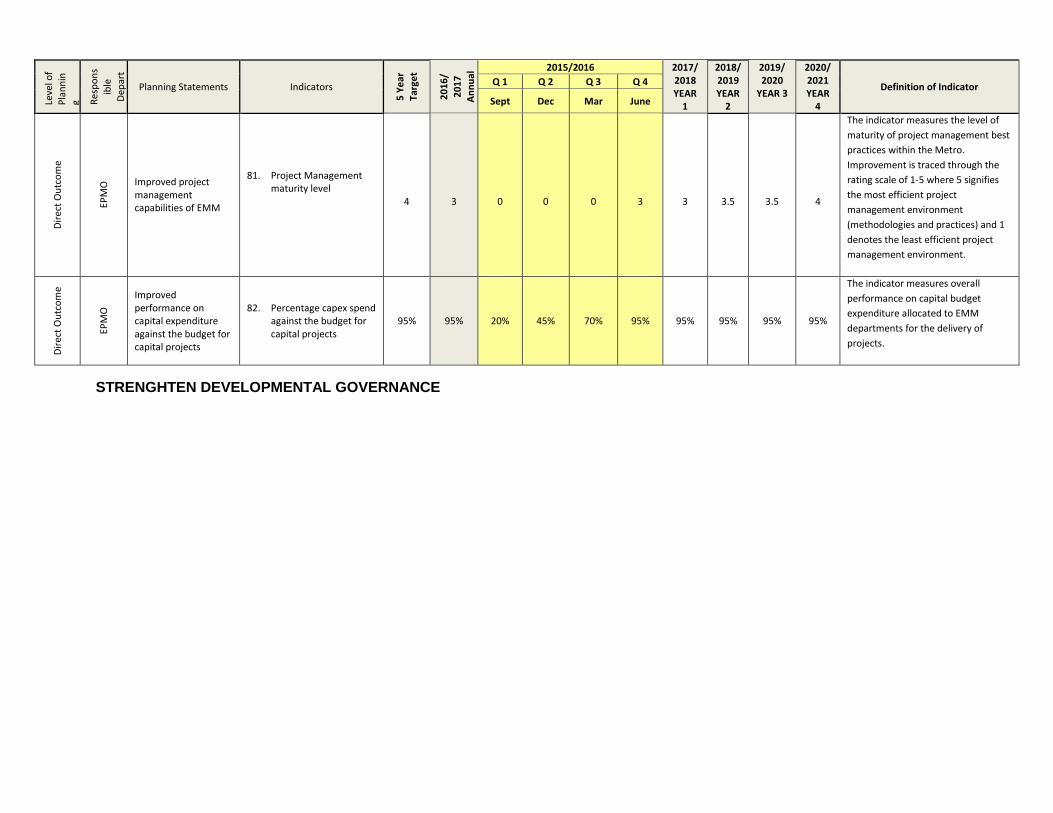
Leve
l of
Pla
nn
in
g Res
po
ns
ible
Dep
art
men
t
Planning Statements Indicators
5 Y
ear
Targ
et
20
16
/
20
17
An
nu
al
Targ
et 2015/2016 2017/
2018 YEAR
1
2018/ 2019 YEAR
2
2019/ 2020
YEAR 3
2020/ 2021 YEAR
4
Definition of Indicator Q 1 Q 2 Q 3 Q 4
Sept Dec Mar June
Dir
ect
Ou
tco
me
EPM
O Improved project
management capabilities of EMM
81. Project Management maturity level
4
3
0
0
0
3
3
3.5
3.5
4
The indicator measures the level of
maturity of project management best
practices within the Metro.
Improvement is traced through the
rating scale of 1-5 where 5 signifies
the most efficient project
management environment
(methodologies and practices) and 1
denotes the least efficient project
management environment.
Dir
ect
Ou
tco
me
EPM
O
Improved performance on capital expenditure against the budget for capital projects
82. Percentage capex spend
against the budget for capital projects
95%
95% 20% 45% 70% 95% 95% 95% 95% 95%
The indicator measures overall
performance on capital budget
expenditure allocated to EMM
departments for the delivery of
projects.
STRENGHTEN DEVELOPMENTAL GOVERNANCE
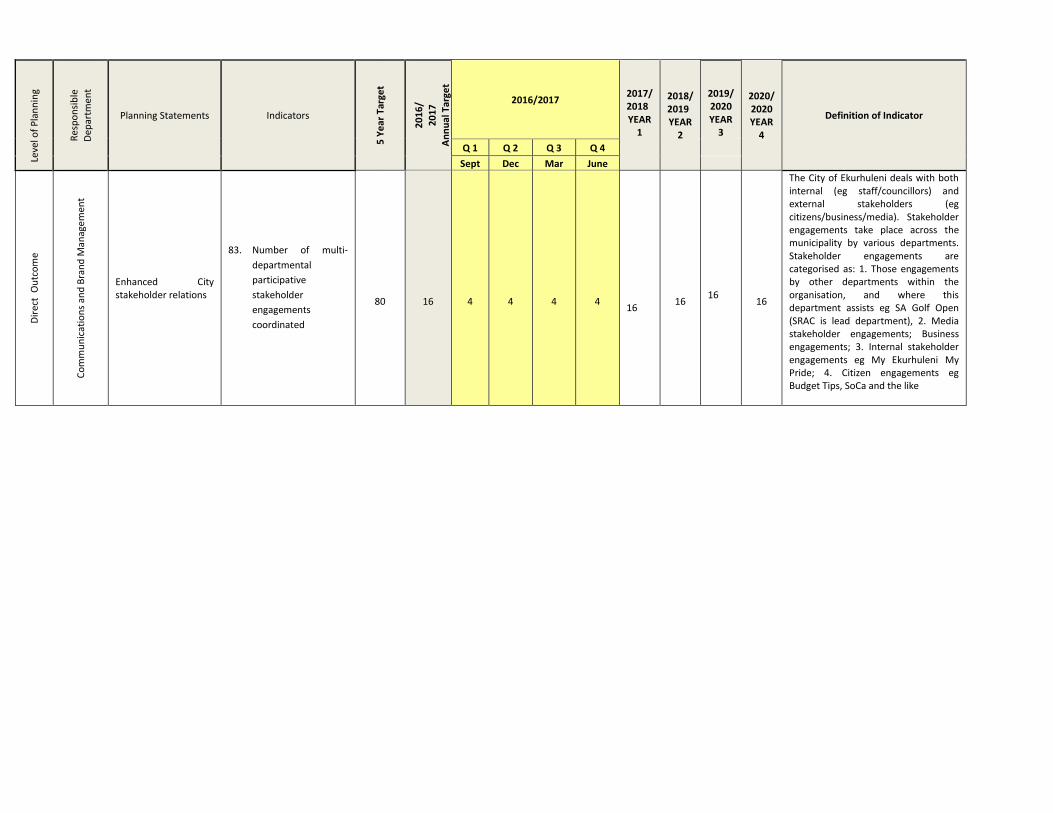
Leve
l of
Pla
nn
ing
Res
po
nsi
ble
Dep
artm
ent
Planning Statements Indicators
5 Y
ear
Tar
get
20
16
/
20
17
An
nu
al T
arge
t
2016/2017
2017/ 2018 YEAR
1
2018/ 2019 YEAR
2
2019/2020 YEAR
3
2020/ 2020 YEAR
4
Definition of Indicator
Q 1 Q 2 Q 3 Q 4
Sept Dec Mar June
Dir
ect
Ou
tco
me
Co
mm
un
icat
ion
s an
d B
ran
d M
anag
em
ent
Enhanced City stakeholder relations
83. Number of multi-
departmental
participative
stakeholder
engagements
coordinated
80
16
4
4
4
4
16
16
16
16
The City of Ekurhuleni deals with both internal (eg staff/councillors) and external stakeholders (eg citizens/business/media). Stakeholder engagements take place across the municipality by various departments. Stakeholder engagements are categorised as: 1. Those engagements by other departments within the organisation, and where this department assists eg SA Golf Open (SRAC is lead department), 2. Media stakeholder engagements; Business engagements; 3. Internal stakeholder engagements eg My Ekurhuleni My Pride; 4. Citizen engagements eg Budget Tips, SoCa and the like
ESTABLISH LONG TERM FISCAL STRENGTH
The fiscal performance of South African municipalities is under increasingly intense scrutiny, as more
municipalities are failing to create and deliver public value to their communities, despite sustained
national government efforts to build the capacity in local sphere and to support improvements in the
quality of municipal services and the eradication of service backlogs. Many municipalities are in fiscal
distress, which is a key public issue that affects the economic, social and political wellbeing of both
individuals and communities (Carmeli, 2008). As noted in Chapter 6, fiscal distress may mean different
things to different people. In this chapter, fiscal distress1 is defined as the sustained inability of a
municipality to fund the delivery of basic public goods and other requirements as per its constitutional
mandate and also meet its financial obligations. Municipalities in fiscal distress not only fail to satisfy
their service obligations to citizens but also drain the fiscal by requiring ameliorative measures, which
implies forgone economic growth and development. Therefore, fiscal distress modelling is needed to
provide early warnings of fiscal distress incidents in municipalities to promote proactive responses for
their resolution.
A key programme proposed by the GDS to establish long term fiscal strength is the need to develop a
long-term financial framework which clearly articulates how the EMM will meet its constitutional
obligations in regard to service delivery and finance new growth within an overall growth management
framework. The framework would cover the following aspects such as galvanise private and state
investment and strengthen the tax-base and income streams. Both these programmes will be
addressed in the 2016/2017 IDP.
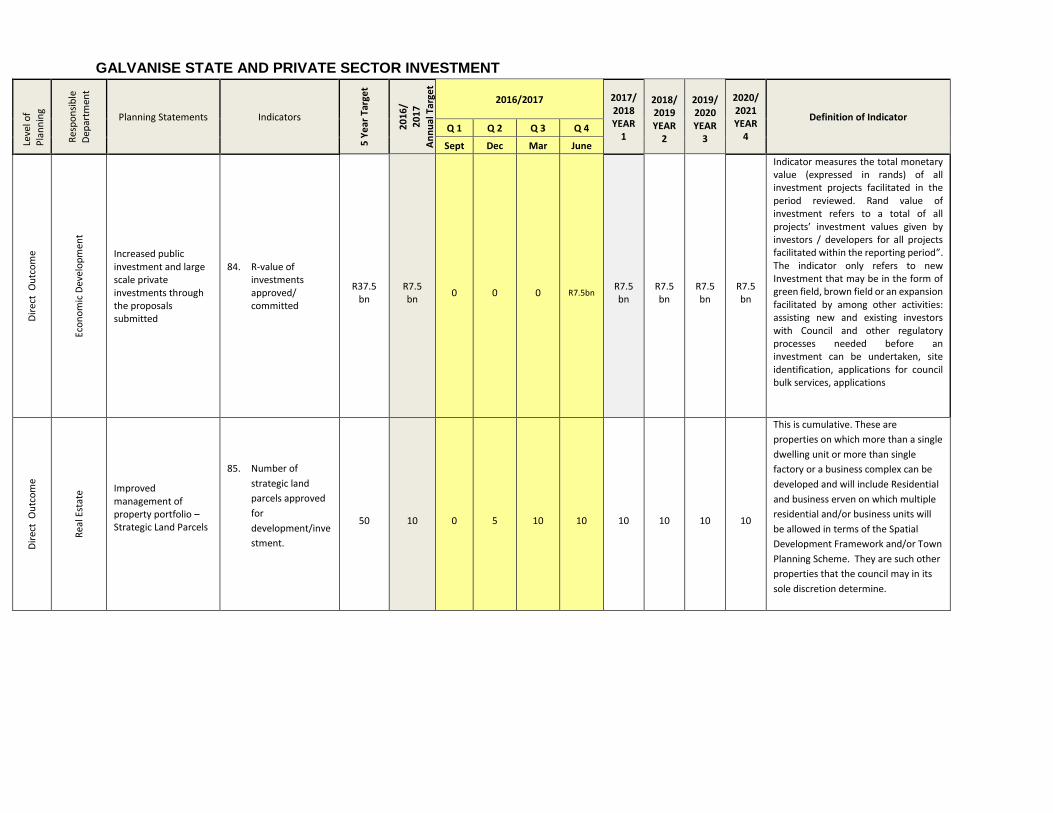
GALVANISE STATE AND PRIVATE SECTOR INVESTMENT
Leve
l of
Pla
nn
ing
Res
po
nsi
ble
Dep
artm
ent
Planning Statements Indicators
5 Y
ear
Tar
get
20
16
/ 2
01
7
An
nu
al T
arge
t
2016/2017 2017/ 2018 YEAR
1
2018/ 2019 YEAR
2
2019/ 2020 YEAR
3
2020/2021 YEAR
4
Definition of Indicator Q 1 Q 2 Q 3 Q 4
Sept Dec Mar June
Dir
ect
Ou
tco
me
Eco
no
mic
Dev
elo
pm
ent
Increased public investment and large scale private investments through the proposals submitted
84. R-value of investments approved/ committed
R37.5 bn
R7.5 bn
0
0
0
R7.5bn
R7.5 bn
R7.5 bn
R7.5 bn
R7.5 bn
Indicator measures the total monetary value (expressed in rands) of all investment projects facilitated in the period reviewed. Rand value of investment refers to a total of all projects’ investment values given by investors / developers for all projects facilitated within the reporting period”. The indicator only refers to new Investment that may be in the form of green field, brown field or an expansion facilitated by among other activities: assisting new and existing investors with Council and other regulatory processes needed before an investment can be undertaken, site identification, applications for council bulk services, applications
Dir
ect
Ou
tco
me
Rea
l Est
ate
Improved management of property portfolio – Strategic Land Parcels
85. Number of
strategic land
parcels approved
for
development/inve
stment.
50
10
0
5
10
10
10
10
10
10
This is cumulative. These are
properties on which more than a single
dwelling unit or more than single
factory or a business complex can be
developed and will include Residential
and business erven on which multiple
residential and/or business units will
be allowed in terms of the Spatial
Development Framework and/or Town
Planning Scheme. They are such other
properties that the council may in its
sole discretion determine.
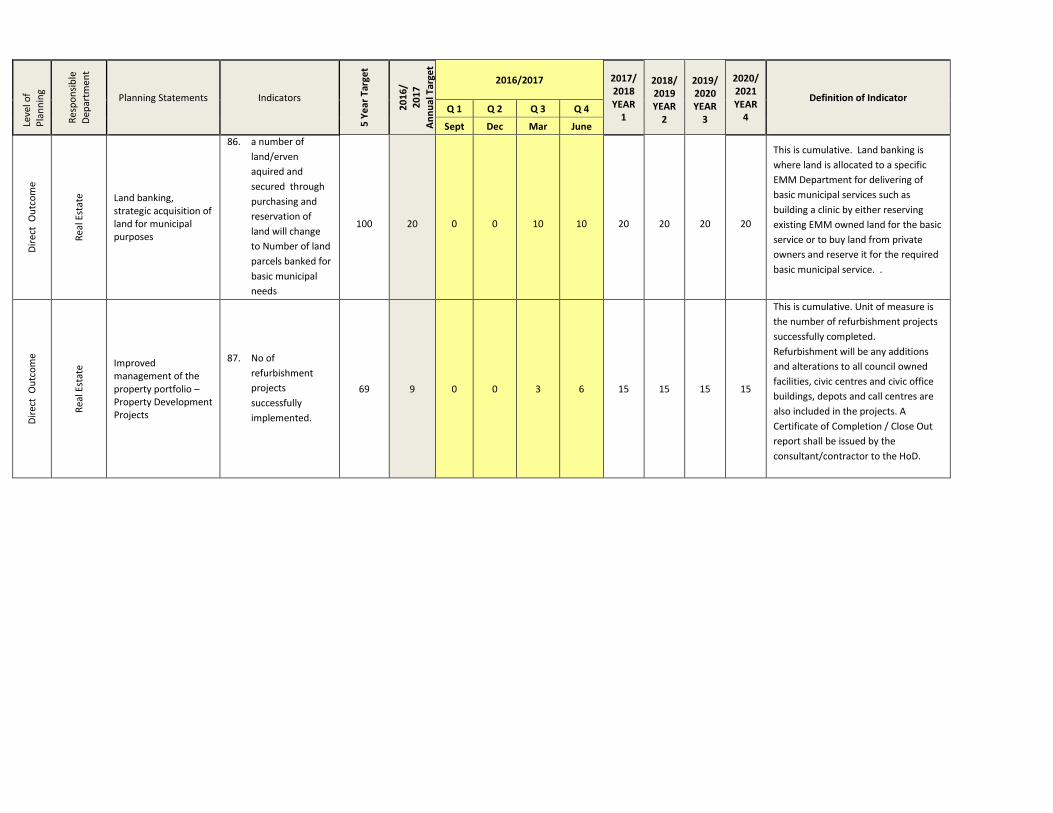
Leve
l of
Pla
nn
ing
Res
po
nsi
ble
Dep
artm
ent
Planning Statements Indicators
5 Y
ear
Tar
get
20
16
/ 2
01
7
An
nu
al T
arge
t
2016/2017 2017/ 2018 YEAR
1
2018/ 2019 YEAR
2
2019/ 2020 YEAR
3
2020/2021 YEAR
4
Definition of Indicator Q 1 Q 2 Q 3 Q 4
Sept Dec Mar June
Dir
ect
Ou
tco
me
Rea
l Est
ate
Land banking, strategic acquisition of land for municipal purposes
86. a number of
land/erven
aquired and
secured through
purchasing and
reservation of
land will change
to Number of land
parcels banked for
basic municipal
needs
100
20
0
0
10
10
20
20
20
20
This is cumulative. Land banking is
where land is allocated to a specific
EMM Department for delivering of
basic municipal services such as
building a clinic by either reserving
existing EMM owned land for the basic
service or to buy land from private
owners and reserve it for the required
basic municipal service. .
Dir
ect
Ou
tco
me
Rea
l Est
ate
Improved management of the property portfolio – Property Development Projects
87. No of
refurbishment
projects
successfully
implemented.
69 9 0 0 3 6 15 15 15 15
This is cumulative. Unit of measure is
the number of refurbishment projects
successfully completed.
Refurbishment will be any additions
and alterations to all council owned
facilities, civic centres and civic office
buildings, depots and call centres are
also included in the projects. A
Certificate of Completion / Close Out
report shall be issued by the
consultant/contractor to the HoD.
STRENGTHEN TAX BASE AND INCOME STREAMS
The mandate for local government is succinctly contained in the preamble to the Local Government:
Municipal Structures Act, 1998 (Act 117 of 1998) as: A vision of democratic and developmental local
government in which municipalities fulfil their constitutional obligations to ensure sustainable, effective
and efficient municipal services, promote social and economic development, encourage a safe and
healthy environment by working with communities in creating environments and human settlements in
which all our people can lead uplifted and dignified lives. The White Paper on Local Government asserts
that “basic services enhance the quality of life of citizens and increase their social and economic
opportunities by promoting health and safety, facilitating access to work, to education, to recreation and
stimulating new productive activities” (RSA, 1998:92).
Sound financial management is one of the key pre-requisites for an efficient and effective local
government. Although a lot has been achieved by local government in delivery of services, there is still
a lot of evidence which shows that local government does not have adequate capacity to manage its
affairs, as well as perform its functions – particularly with respect to delivery of good quality services
and achieve compliance with the MFMA. Through the implementation of the GDS programme
“strengthening its tax base and revenue streams” the 2016/2017 IDP proposes the following:
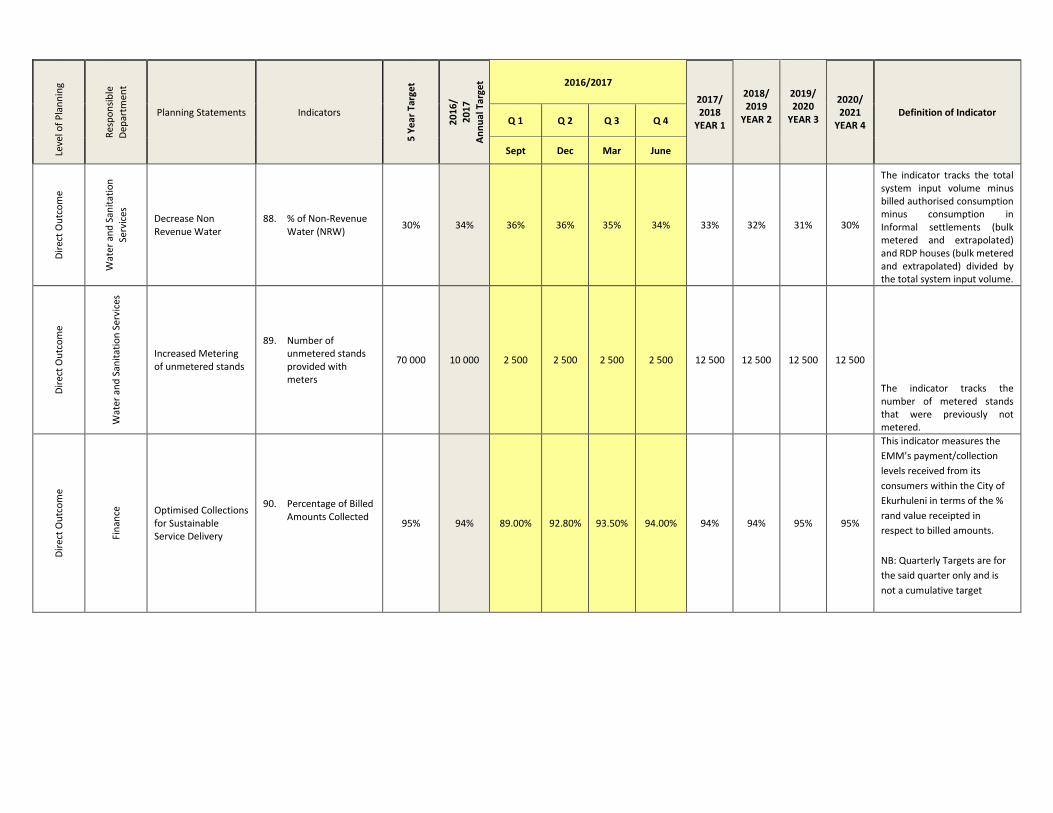
Leve
l of
Pla
nn
ing
Res
po
nsi
ble
Dep
artm
ent
Planning Statements Indicators
5 Y
ear
Tar
get
20
16
/ 2
01
7
An
nu
al T
arge
t 2016/2017
2017/ 2018
YEAR 1
2018/ 2019
YEAR 2
2019/ 2020
YEAR 3
2020/ 2021
YEAR 4 Definition of Indicator
Q 1 Q 2 Q 3 Q 4
Sept Dec Mar June
Dir
ect
Ou
tco
me
Wat
er a
nd
San
itat
ion
Serv
ices
Decrease Non Revenue Water
88. % of Non-Revenue Water (NRW)
30% 34% 36% 36% 35% 34% 33% 32% 31% 30%
The indicator tracks the total system input volume minus billed authorised consumption minus consumption in Informal settlements (bulk metered and extrapolated) and RDP houses (bulk metered and extrapolated) divided by the total system input volume.
Dir
ect
Ou
tco
me
Wat
er a
nd
San
itat
ion
Ser
vice
s
Increased Metering of unmetered stands
89. Number of unmetered stands provided with meters
70 000 10 000 2 500 2 500 2 500 2 500 12 500 12 500 12 500 12 500
The indicator tracks the number of metered stands that were previously not metered.
Dir
ect
Ou
tco
me
Fin
ance
Optimised Collections for Sustainable Service Delivery
90. Percentage of Billed Amounts Collected
95% 94% 89.00% 92.80% 93.50% 94.00% 94% 94% 95% 95%
This indicator measures the
EMM’s payment/collection
levels received from its
consumers within the City of
Ekurhuleni in terms of the %
rand value receipted in
respect to billed amounts.
NB: Quarterly Targets are for
the said quarter only and is
not a cumulative target
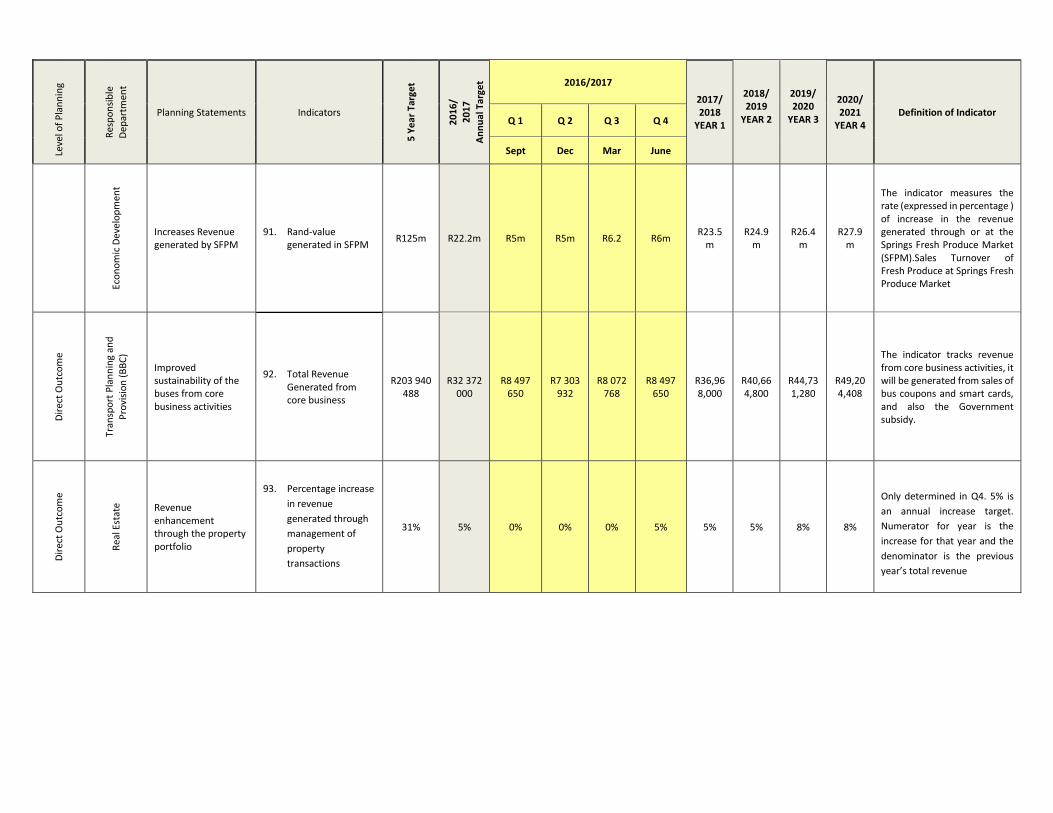
Leve
l of
Pla
nn
ing
Res
po
nsi
ble
Dep
artm
ent
Planning Statements Indicators
5 Y
ear
Tar
get
20
16
/ 2
01
7
An
nu
al T
arge
t 2016/2017
2017/ 2018
YEAR 1
2018/ 2019
YEAR 2
2019/ 2020
YEAR 3
2020/ 2021
YEAR 4 Definition of Indicator
Q 1 Q 2 Q 3 Q 4
Sept Dec Mar June
Eco
no
mic
Dev
elo
pm
ent
Increases Revenue generated by SFPM
91. Rand-value generated in SFPM
R125m R22.2m R5m R5m R6.2 R6m R23.5
m R24.9
m R26.4
m R27.9
m
The indicator measures the rate (expressed in percentage ) of increase in the revenue generated through or at the Springs Fresh Produce Market (SFPM).Sales Turnover of Fresh Produce at Springs Fresh Produce Market
Dir
ect
Ou
tco
me
Tran
spo
rt P
lan
nin
g an
d
Pro
visi
on
(B
BC
)
Improved sustainability of the buses from core business activities
92. Total Revenue Generated from core business
R203 940
488
R32 372 000
R8 497 650
R7 303 932
R8 072 768
R8 497 650
R36,968,000
R40,664,800
R44,731,280
R49,204,408
The indicator tracks revenue from core business activities, it will be generated from sales of bus coupons and smart cards, and also the Government subsidy.
Dir
ect
Ou
tco
me
Rea
l Est
ate
Revenue enhancement through the property portfolio
93. Percentage increase
in revenue
generated through
management of
property
transactions
31% 5% 0% 0% 0% 5% 5% 5% 8% 8%
Only determined in Q4. 5% is
an annual increase target.
Numerator for year is the
increase for that year and the
denominator is the previous
year’s total revenue
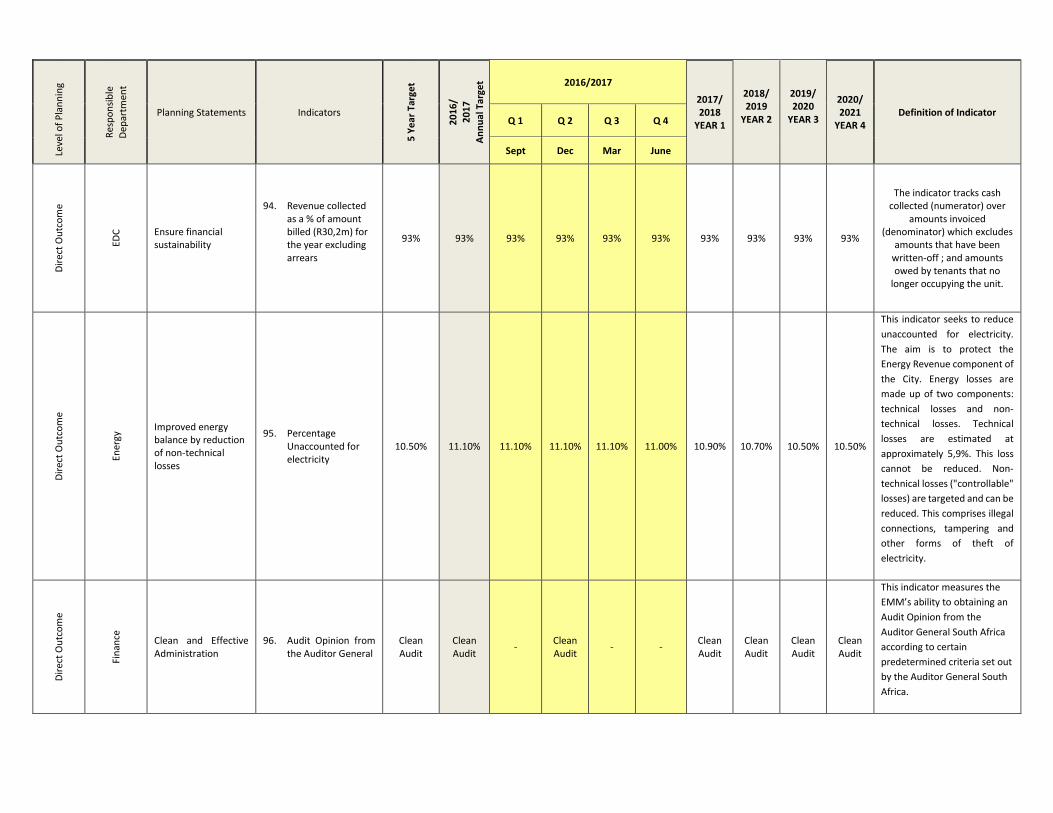
Leve
l of
Pla
nn
ing
Res
po
nsi
ble
Dep
artm
ent
Planning Statements Indicators
5 Y
ear
Tar
get
20
16
/ 2
01
7
An
nu
al T
arge
t 2016/2017
2017/ 2018
YEAR 1
2018/ 2019
YEAR 2
2019/ 2020
YEAR 3
2020/ 2021
YEAR 4 Definition of Indicator
Q 1 Q 2 Q 3 Q 4
Sept Dec Mar June
Dir
ect
Ou
tco
me
EDC
Ensure financial sustainability
94. Revenue collected as a % of amount billed (R30,2m) for the year excluding arrears
93% 93% 93% 93% 93% 93% 93% 93% 93% 93%
The indicator tracks cash collected (numerator) over
amounts invoiced (denominator) which excludes
amounts that have been written-off ; and amounts owed by tenants that no
longer occupying the unit.
Dir
ect
Ou
tco
me
Ener
gy Improved energy
balance by reduction of non-technical losses
95. Percentage Unaccounted for electricity
10.50%
11.10% 11.10% 11.10% 11.10% 11.00% 10.90% 10.70% 10.50% 10.50%
This indicator seeks to reduce
unaccounted for electricity.
The aim is to protect the
Energy Revenue component of
the City. Energy losses are
made up of two components:
technical losses and non-
technical losses. Technical
losses are estimated at
approximately 5,9%. This loss
cannot be reduced. Non-
technical losses ("controllable"
losses) are targeted and can be
reduced. This comprises illegal
connections, tampering and
other forms of theft of
electricity.
Dir
ect
Ou
tco
me
Fin
ance
Clean and Effective Administration
96. Audit Opinion from the Auditor General
Clean Audit
Clean Audit
- Clean Audit
- - Clean Audit
Clean Audit
Clean Audit
Clean Audit
This indicator measures the
EMM’s ability to obtaining an
Audit Opinion from the
Auditor General South Africa
according to certain
predetermined criteria set out
by the Auditor General South
Africa.
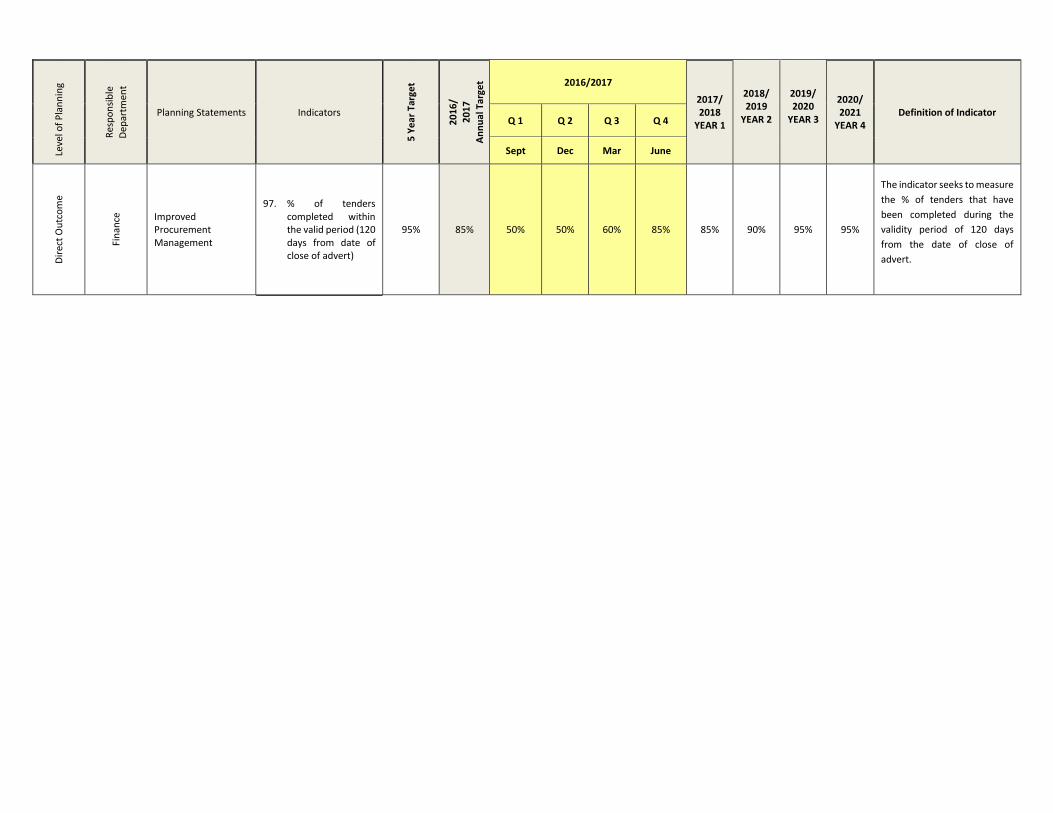
Leve
l of
Pla
nn
ing
Res
po
nsi
ble
Dep
artm
ent
Planning Statements Indicators
5 Y
ear
Tar
get
20
16
/ 2
01
7
An
nu
al T
arge
t 2016/2017
2017/ 2018
YEAR 1
2018/ 2019
YEAR 2
2019/ 2020
YEAR 3
2020/ 2021
YEAR 4 Definition of Indicator
Q 1 Q 2 Q 3 Q 4
Sept Dec Mar June
Dir
ect
Ou
tco
me
Fin
ance
Improved Procurement Management
97. % of tenders completed within the valid period (120 days from date of close of advert)
95% 85% 50% 50% 60% 85% 85% 90% 95% 95%
The indicator seeks to measure
the % of tenders that have
been completed during the
validity period of 120 days
from the date of close of
advert.
STRATEGIC ACQUISITION AND MANAGEMENT OF ASSETS AND OPERATIONS
A strategic asset management framework brings together the inter-relationships between key corporate
planning activities and asset management, allowing the entity’s strategic goals to be integrated with the
asset portfolio to meet the organisation’s program delivery requirements. The primary objective of
strategic asset management is to create and maintain an asset portfolio that contains an optimal mix
of assets to efficiently meet program delivery requirements. The program delivery requirements of an
entity are outlined in its strategic and business plans, which will reflect the organisation’s strategic
goals. Strategic asset management involves consideration of the City’s plan in light of the programme
delivery requirements, to identify an optimal asset mix and compare it to the existing asset portfolio.
This identification and review then culminates in an asset divergence analysis. The results are then
incorporated into an asset management strategy, which sets out how the asset portfolio will assist the
entity to meet its strategic outcomes. A key function of the municipality is to maintain their assets in
terms of the regulatory requirements.
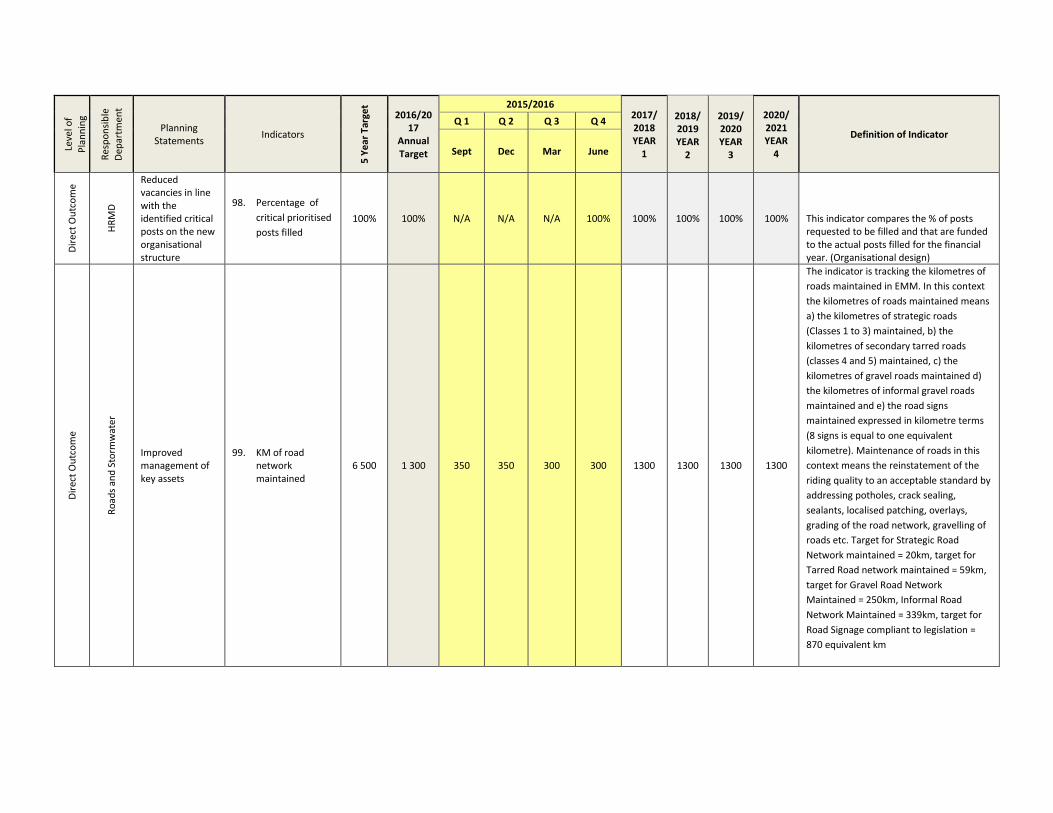
Leve
l of
Pla
nn
ing
Res
po
nsi
ble
D
epar
tmen
t Planning
Statements Indicators
5 Y
ear
Tar
get
2016/2017
Annual Target
2015/2016 2017/ 2018 YEAR
1
2018/ 2019 YEAR
2
2019/ 2020 YEAR
3
2020/ 2021 YEAR
4
Definition of Indicator Q 1 Q 2 Q 3 Q 4
Sept Dec Mar June
Dir
ect
Ou
tco
me
HR
MD
Reduced vacancies in line with the identified critical posts on the new organisational structure
98. Percentage of
critical prioritised
posts filled
100% 100% N/A N/A N/A 100% 100% 100% 100% 100% This indicator compares the % of posts requested to be filled and that are funded to the actual posts filled for the financial year. (Organisational design)
Dir
ect
Ou
tco
me
Ro
ads
and
Sto
rmw
ater
Improved management of key assets
99. KM of road network maintained
6 500
1 300 350 350 300 300 1300 1300 1300 1300
The indicator is tracking the kilometres of
roads maintained in EMM. In this context
the kilometres of roads maintained means
a) the kilometres of strategic roads
(Classes 1 to 3) maintained, b) the
kilometres of secondary tarred roads
(classes 4 and 5) maintained, c) the
kilometres of gravel roads maintained d)
the kilometres of informal gravel roads
maintained and e) the road signs
maintained expressed in kilometre terms
(8 signs is equal to one equivalent
kilometre). Maintenance of roads in this
context means the reinstatement of the
riding quality to an acceptable standard by
addressing potholes, crack sealing,
sealants, localised patching, overlays,
grading of the road network, gravelling of
roads etc. Target for Strategic Road
Network maintained = 20km, target for
Tarred Road network maintained = 59km,
target for Gravel Road Network
Maintained = 250km, Informal Road
Network Maintained = 339km, target for
Road Signage compliant to legislation =
870 equivalent km
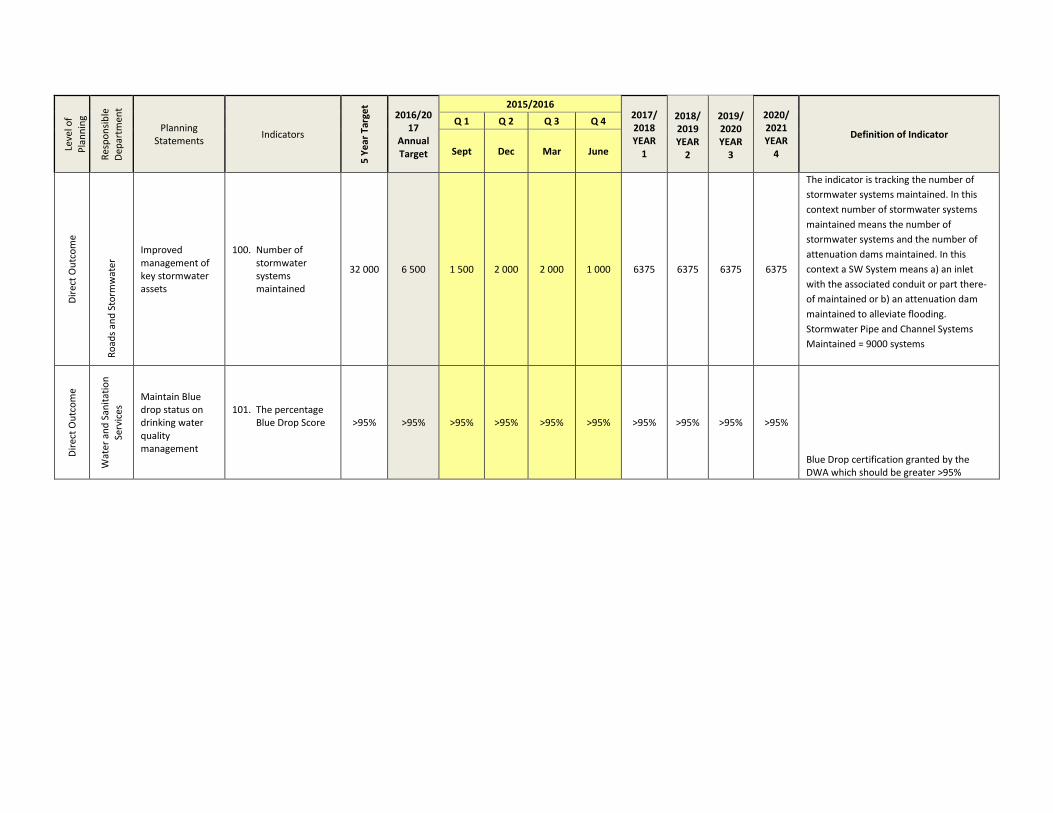
Leve
l of
Pla
nn
ing
Res
po
nsi
ble
D
epar
tmen
t Planning
Statements Indicators
5 Y
ear
Tar
get
2016/2017
Annual Target
2015/2016 2017/ 2018 YEAR
1
2018/ 2019 YEAR
2
2019/ 2020 YEAR
3
2020/ 2021 YEAR
4
Definition of Indicator Q 1 Q 2 Q 3 Q 4
Sept Dec Mar June
Dir
ect
Ou
tco
me
Ro
ads
and
Sto
rmw
ater
Improved management of key stormwater assets
100. Number of stormwater systems maintained
32 000 6 500 1 500 2 000 2 000 1 000 6375 6375 6375 6375
The indicator is tracking the number of
stormwater systems maintained. In this
context number of stormwater systems
maintained means the number of
stormwater systems and the number of
attenuation dams maintained. In this
context a SW System means a) an inlet
with the associated conduit or part there-
of maintained or b) an attenuation dam
maintained to alleviate flooding.
Stormwater Pipe and Channel Systems
Maintained = 9000 systems
Dir
ect
Ou
tco
me
Wat
er a
nd
San
itat
ion
Se
rvic
es Maintain Blue
drop status on drinking water quality management
101. The percentage Blue Drop Score
>95% >95% >95% >95% >95% >95% >95% >95% >95% >95%
Blue Drop certification granted by the DWA which should be greater >95%

CHAPTER 8
8. DRAFT MULTI-YEAR FINANCIAL PLAN
The Draft 2016-2019 Multi-year Financial Plan is contained under a separate cover.
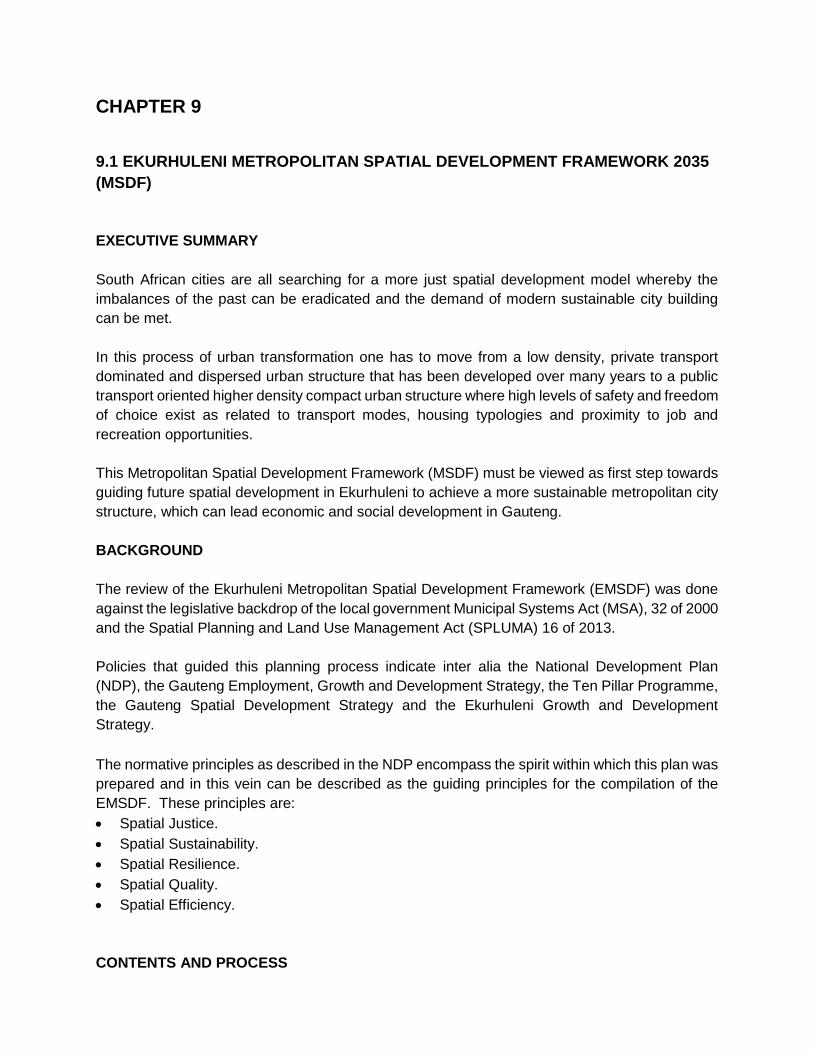
CHAPTER 9
9.1 EKURHULENI METROPOLITAN SPATIAL DEVELOPMENT FRAMEWORK 2035
(MSDF)
EXECUTIVE SUMMARY
South African cities are all searching for a more just spatial development model whereby the
imbalances of the past can be eradicated and the demand of modern sustainable city building
can be met.
In this process of urban transformation one has to move from a low density, private transport
dominated and dispersed urban structure that has been developed over many years to a public
transport oriented higher density compact urban structure where high levels of safety and freedom
of choice exist as related to transport modes, housing typologies and proximity to job and
recreation opportunities.
This Metropolitan Spatial Development Framework (MSDF) must be viewed as first step towards
guiding future spatial development in Ekurhuleni to achieve a more sustainable metropolitan city
structure, which can lead economic and social development in Gauteng.
BACKGROUND
The review of the Ekurhuleni Metropolitan Spatial Development Framework (EMSDF) was done
against the legislative backdrop of the local government Municipal Systems Act (MSA), 32 of 2000
and the Spatial Planning and Land Use Management Act (SPLUMA) 16 of 2013.
Policies that guided this planning process indicate inter alia the National Development Plan
(NDP), the Gauteng Employment, Growth and Development Strategy, the Ten Pillar Programme,
the Gauteng Spatial Development Strategy and the Ekurhuleni Growth and Development
Strategy.
The normative principles as described in the NDP encompass the spirit within which this plan was
prepared and in this vein can be described as the guiding principles for the compilation of the
EMSDF. These principles are:
Spatial Justice.
Spatial Sustainability.
Spatial Resilience.
Spatial Quality.
Spatial Efficiency.
CONTENTS AND PROCESS
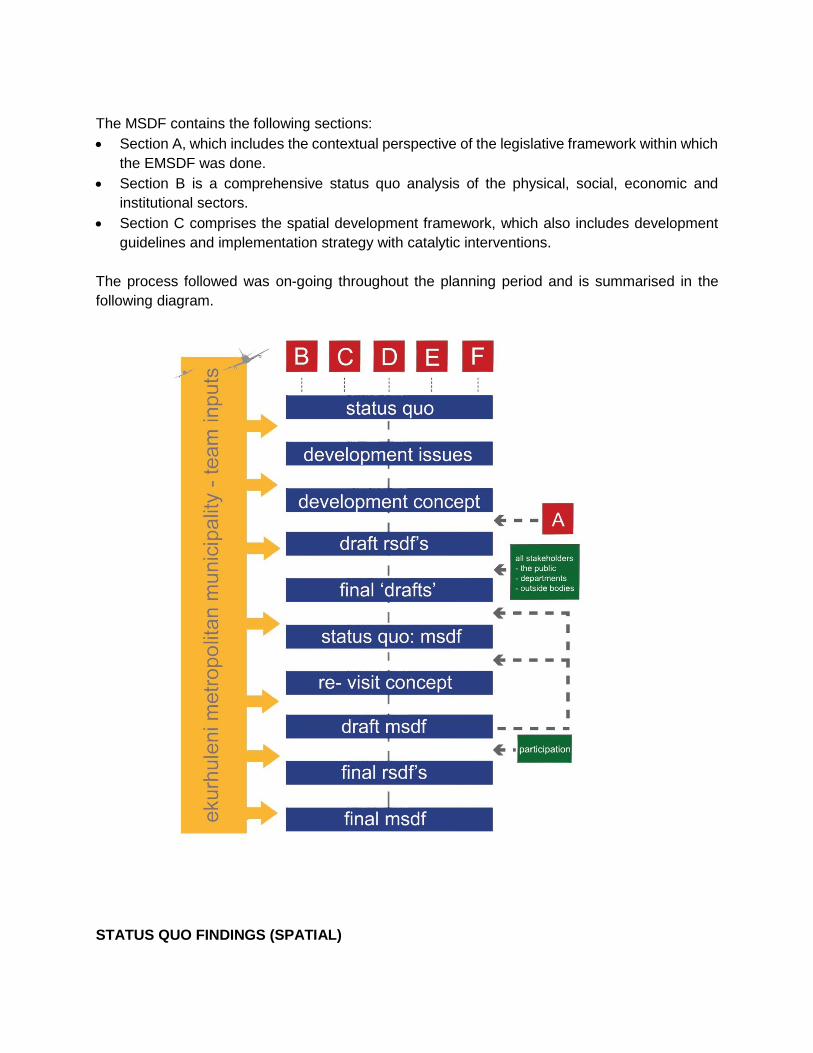
The MSDF contains the following sections:
Section A, which includes the contextual perspective of the legislative framework within which
the EMSDF was done.
Section B is a comprehensive status quo analysis of the physical, social, economic and
institutional sectors.
Section C comprises the spatial development framework, which also includes development
guidelines and implementation strategy with catalytic interventions.
The process followed was on-going throughout the planning period and is summarised in the
following diagram.
STATUS QUO FINDINGS (SPATIAL)
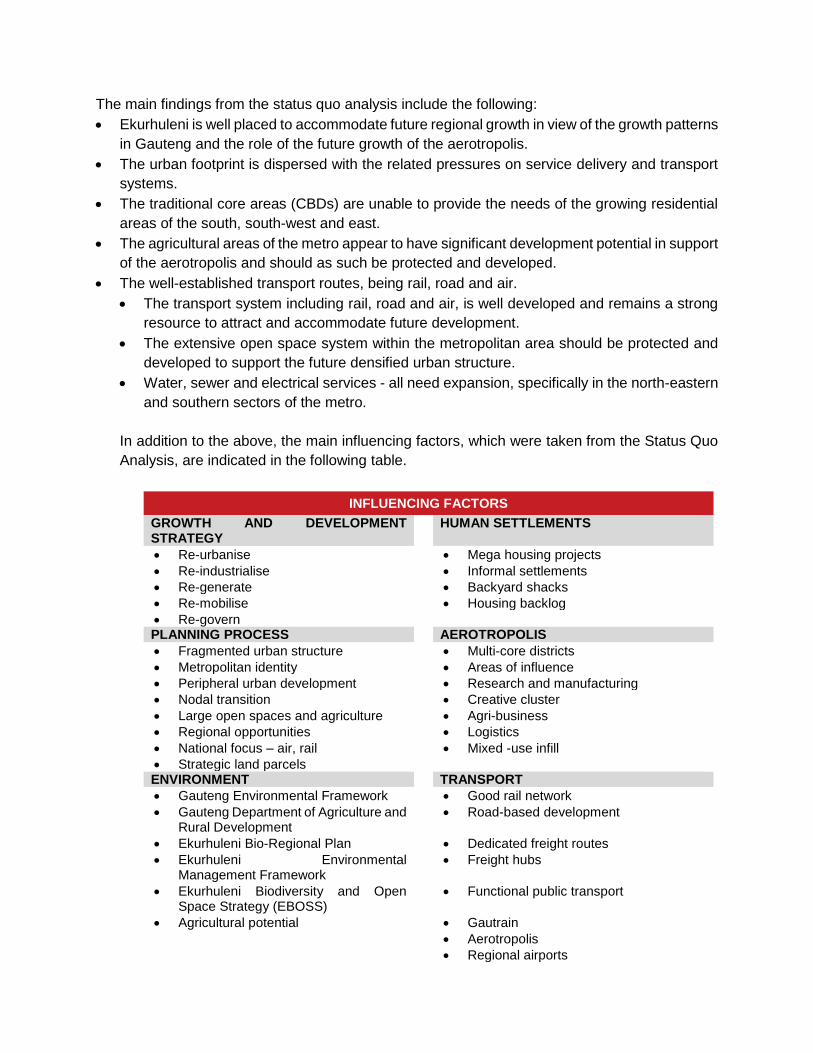
The main findings from the status quo analysis include the following:
Ekurhuleni is well placed to accommodate future regional growth in view of the growth patterns
in Gauteng and the role of the future growth of the aerotropolis.
The urban footprint is dispersed with the related pressures on service delivery and transport
systems.
The traditional core areas (CBDs) are unable to provide the needs of the growing residential
areas of the south, south-west and east.
The agricultural areas of the metro appear to have significant development potential in support
of the aerotropolis and should as such be protected and developed.
The well-established transport routes, being rail, road and air.
The transport system including rail, road and air, is well developed and remains a strong
resource to attract and accommodate future development.
The extensive open space system within the metropolitan area should be protected and
developed to support the future densified urban structure.
Water, sewer and electrical services - all need expansion, specifically in the north-eastern
and southern sectors of the metro.
In addition to the above, the main influencing factors, which were taken from the Status Quo
Analysis, are indicated in the following table.
INFLUENCING FACTORS
GROWTH AND DEVELOPMENT STRATEGY
HUMAN SETTLEMENTS
Re-urbanise Mega housing projects
Re-industrialise Informal settlements
Re-generate Backyard shacks
Re-mobilise Housing backlog
Re-govern
PLANNING PROCESS AEROTROPOLIS
Fragmented urban structure Multi-core districts
Metropolitan identity Areas of influence
Peripheral urban development Research and manufacturing
Nodal transition Creative cluster
Large open spaces and agriculture Agri-business
Regional opportunities Logistics
National focus – air, rail Mixed -use infill
Strategic land parcels
ENVIRONMENT TRANSPORT
Gauteng Environmental Framework Good rail network
Gauteng Department of Agriculture and Rural Development
Road-based development
Ekurhuleni Bio-Regional Plan Dedicated freight routes
Ekurhuleni Environmental Management Framework
Freight hubs
Ekurhuleni Biodiversity and Open Space Strategy (EBOSS)
Functional public transport
Agricultural potential Gautrain Aerotropolis Regional airports
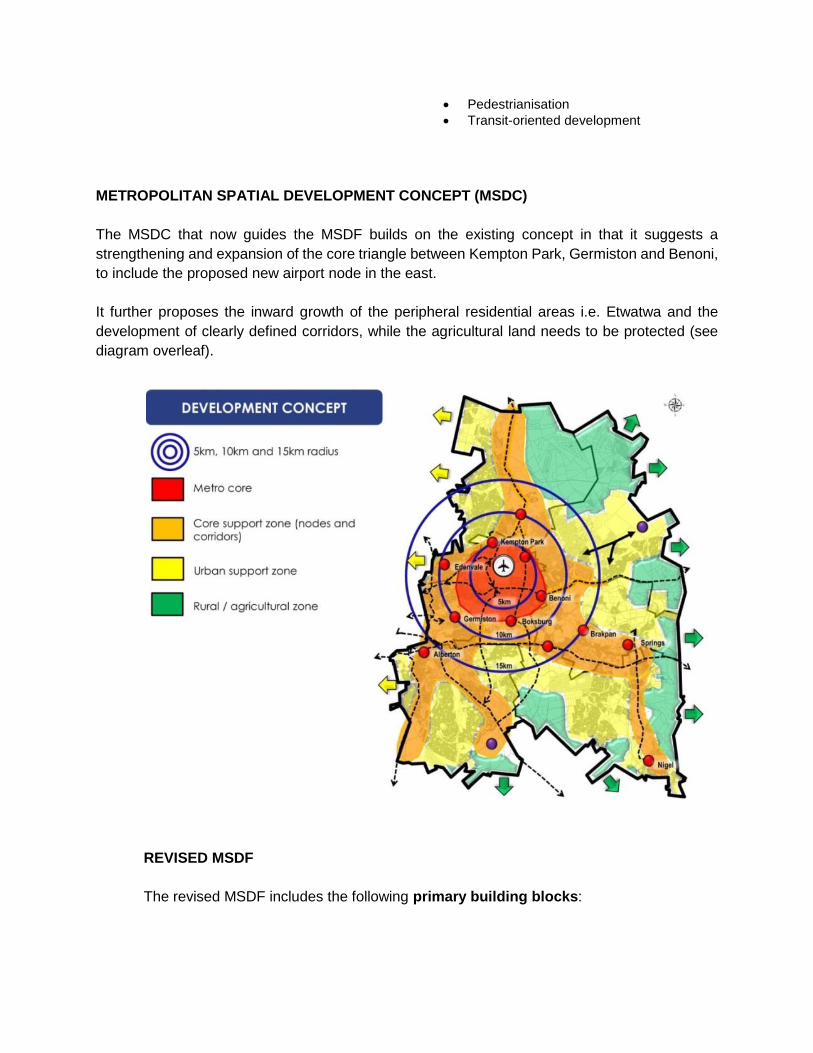
Pedestrianisation Transit-oriented development
METROPOLITAN SPATIAL DEVELOPMENT CONCEPT (MSDC)
The MSDC that now guides the MSDF builds on the existing concept in that it suggests a
strengthening and expansion of the core triangle between Kempton Park, Germiston and Benoni,
to include the proposed new airport node in the east.
It further proposes the inward growth of the peripheral residential areas i.e. Etwatwa and the
development of clearly defined corridors, while the agricultural land needs to be protected (see
diagram overleaf).
REVISED MSDF
The revised MSDF includes the following primary building blocks:
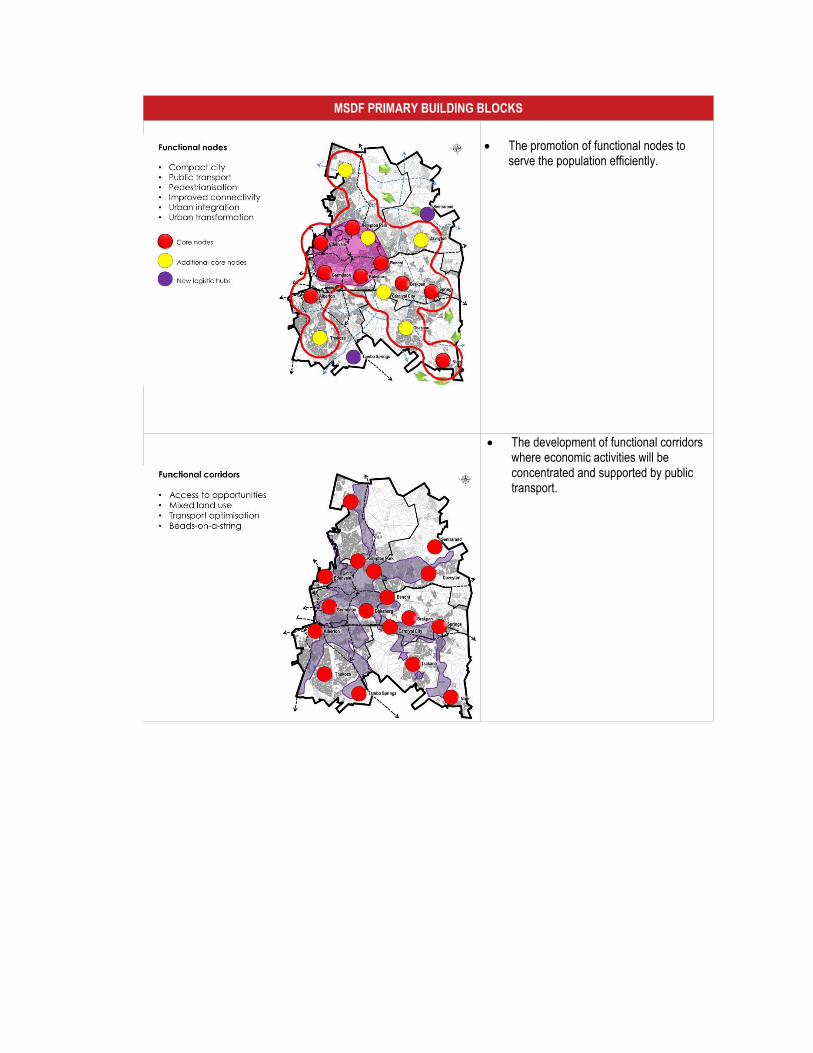
MSDF PRIMARY BUILDING BLOCKS
The promotion of functional nodes to serve the population efficiently.
The development of functional corridors where economic activities will be concentrated and supported by public transport.
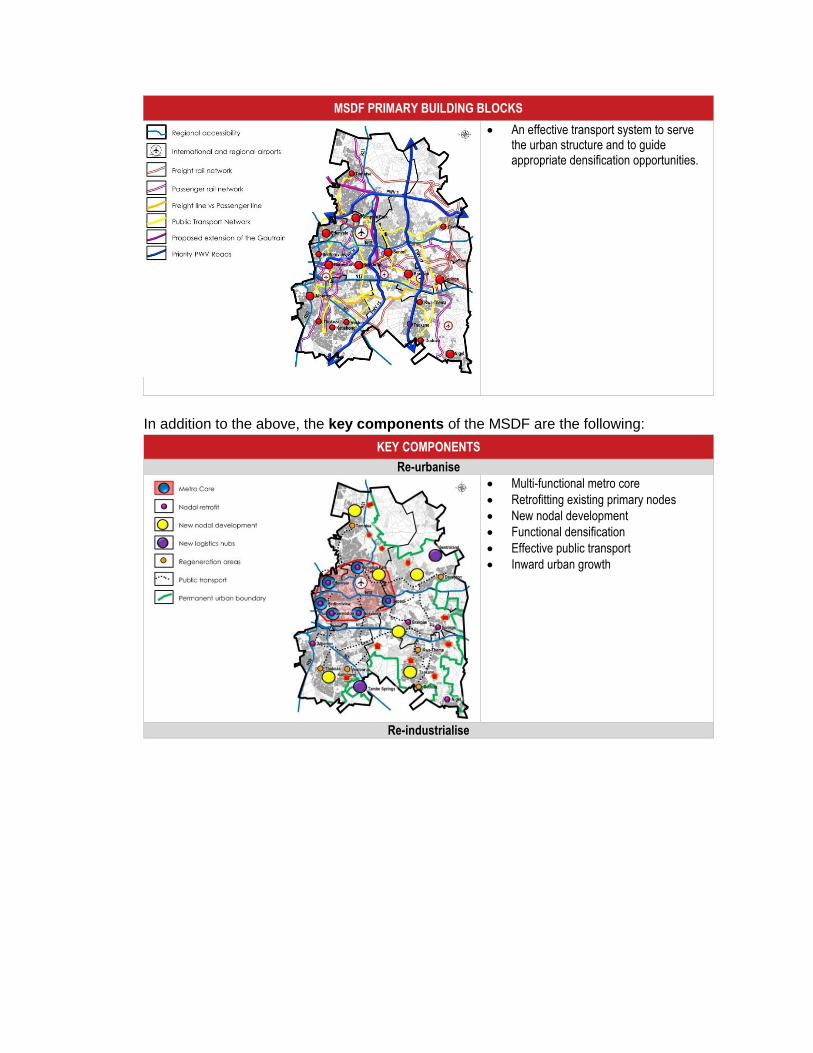
MSDF PRIMARY BUILDING BLOCKS
An effective transport system to serve the urban structure and to guide appropriate densification opportunities.
In addition to the above, the key components of the MSDF are the following:
KEY COMPONENTS
Re-urbanise
Multi-functional metro core
Retrofitting existing primary nodes
New nodal development
Functional densification
Effective public transport
Inward urban growth
Re-industrialise
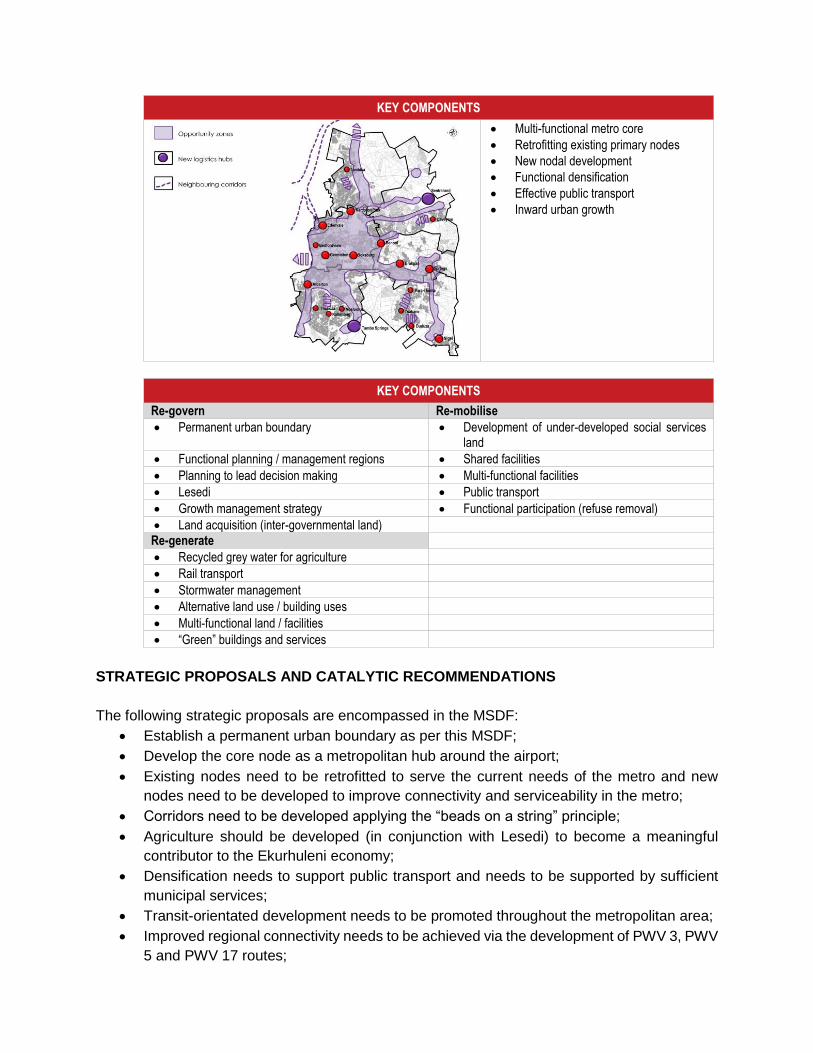
KEY COMPONENTS
Multi-functional metro core
Retrofitting existing primary nodes
New nodal development
Functional densification
Effective public transport
Inward urban growth
KEY COMPONENTS
Re-govern Re-mobilise
Permanent urban boundary Development of under-developed social services land
Functional planning / management regions Shared facilities
Planning to lead decision making Multi-functional facilities
Lesedi Public transport
Growth management strategy Functional participation (refuse removal)
Land acquisition (inter-governmental land)
Re-generate
Recycled grey water for agriculture
Rail transport
Stormwater management
Alternative land use / building uses
Multi-functional land / facilities
“Green” buildings and services
STRATEGIC PROPOSALS AND CATALYTIC RECOMMENDATIONS
The following strategic proposals are encompassed in the MSDF:
Establish a permanent urban boundary as per this MSDF;
Develop the core node as a metropolitan hub around the airport;
Existing nodes need to be retrofitted to serve the current needs of the metro and new
nodes need to be developed to improve connectivity and serviceability in the metro;
Corridors need to be developed applying the “beads on a string” principle;
Agriculture should be developed (in conjunction with Lesedi) to become a meaningful
contributor to the Ekurhuleni economy;
Densification needs to support public transport and needs to be supported by sufficient
municipal services;
Transit-orientated development needs to be promoted throughout the metropolitan area;
Improved regional connectivity needs to be achieved via the development of PWV 3, PWV
5 and PWV 17 routes;
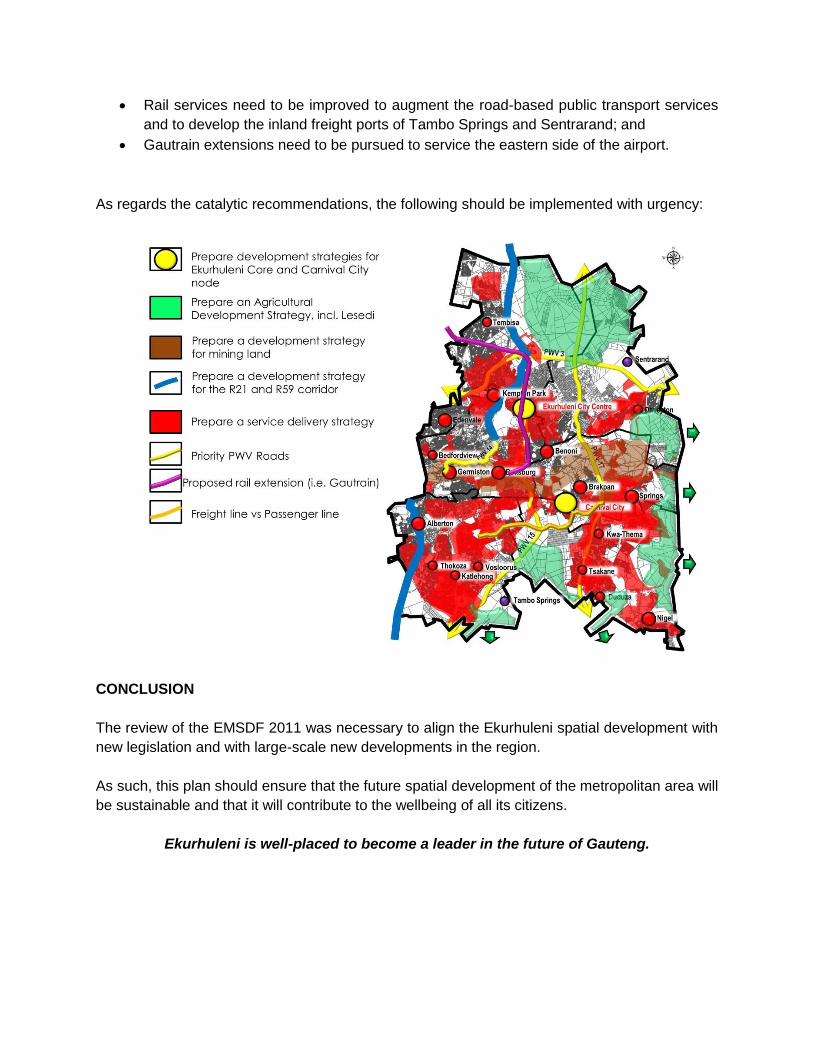
Rail services need to be improved to augment the road-based public transport services
and to develop the inland freight ports of Tambo Springs and Sentrarand; and
Gautrain extensions need to be pursued to service the eastern side of the airport.
As regards the catalytic recommendations, the following should be implemented with urgency:
CONCLUSION
The review of the EMSDF 2011 was necessary to align the Ekurhuleni spatial development with
new legislation and with large-scale new developments in the region.
As such, this plan should ensure that the future spatial development of the metropolitan area will
be sustainable and that it will contribute to the wellbeing of all its citizens.
Ekurhuleni is well-placed to become a leader in the future of Gauteng.
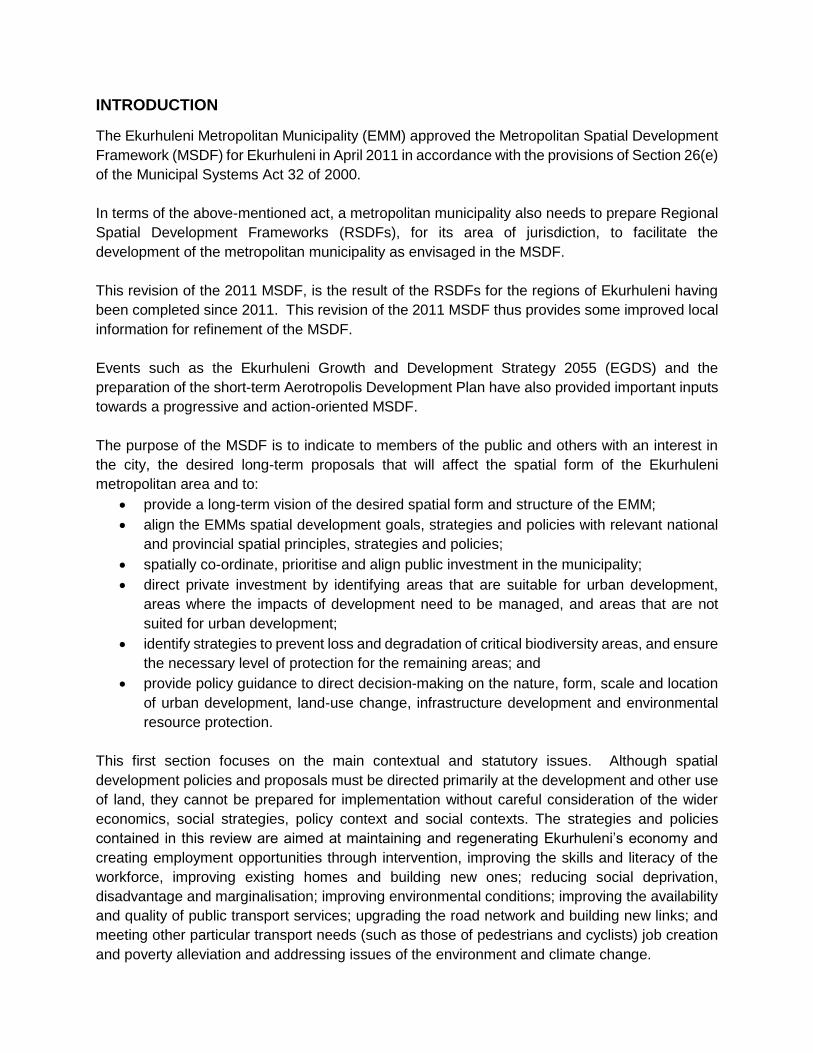
INTRODUCTION
The Ekurhuleni Metropolitan Municipality (EMM) approved the Metropolitan Spatial Development
Framework (MSDF) for Ekurhuleni in April 2011 in accordance with the provisions of Section 26(e)
of the Municipal Systems Act 32 of 2000.
In terms of the above-mentioned act, a metropolitan municipality also needs to prepare Regional
Spatial Development Frameworks (RSDFs), for its area of jurisdiction, to facilitate the
development of the metropolitan municipality as envisaged in the MSDF.
This revision of the 2011 MSDF, is the result of the RSDFs for the regions of Ekurhuleni having
been completed since 2011. This revision of the 2011 MSDF thus provides some improved local
information for refinement of the MSDF.
Events such as the Ekurhuleni Growth and Development Strategy 2055 (EGDS) and the
preparation of the short-term Aerotropolis Development Plan have also provided important inputs
towards a progressive and action-oriented MSDF.
The purpose of the MSDF is to indicate to members of the public and others with an interest in
the city, the desired long-term proposals that will affect the spatial form of the Ekurhuleni
metropolitan area and to:
provide a long-term vision of the desired spatial form and structure of the EMM;
align the EMMs spatial development goals, strategies and policies with relevant national
and provincial spatial principles, strategies and policies;
spatially co-ordinate, prioritise and align public investment in the municipality;
direct private investment by identifying areas that are suitable for urban development,
areas where the impacts of development need to be managed, and areas that are not
suited for urban development;
identify strategies to prevent loss and degradation of critical biodiversity areas, and ensure
the necessary level of protection for the remaining areas; and
provide policy guidance to direct decision-making on the nature, form, scale and location
of urban development, land-use change, infrastructure development and environmental
resource protection.
This first section focuses on the main contextual and statutory issues. Although spatial
development policies and proposals must be directed primarily at the development and other use
of land, they cannot be prepared for implementation without careful consideration of the wider
economics, social strategies, policy context and social contexts. The strategies and policies
contained in this review are aimed at maintaining and regenerating Ekurhuleni’s economy and
creating employment opportunities through intervention, improving the skills and literacy of the
workforce, improving existing homes and building new ones; reducing social deprivation,
disadvantage and marginalisation; improving environmental conditions; improving the availability
and quality of public transport services; upgrading the road network and building new links; and
meeting other particular transport needs (such as those of pedestrians and cyclists) job creation
and poverty alleviation and addressing issues of the environment and climate change.
DEVELOPMENT CONTEXT
Development is not a one-dimensional process. It is multi-facetted with various
components/sectors influencing one another. The four development sectors that inform the
development of a Spatial Development Framework (SDF) are the economic, social, physical
(natural and man-made) and institutional sectors.
Table 4 -
Table 6 provide concise overviews of the economic, social and physical development trends that
impact on the spatial development of Ekurhuleni.

Table 4: Trends in the economic sector
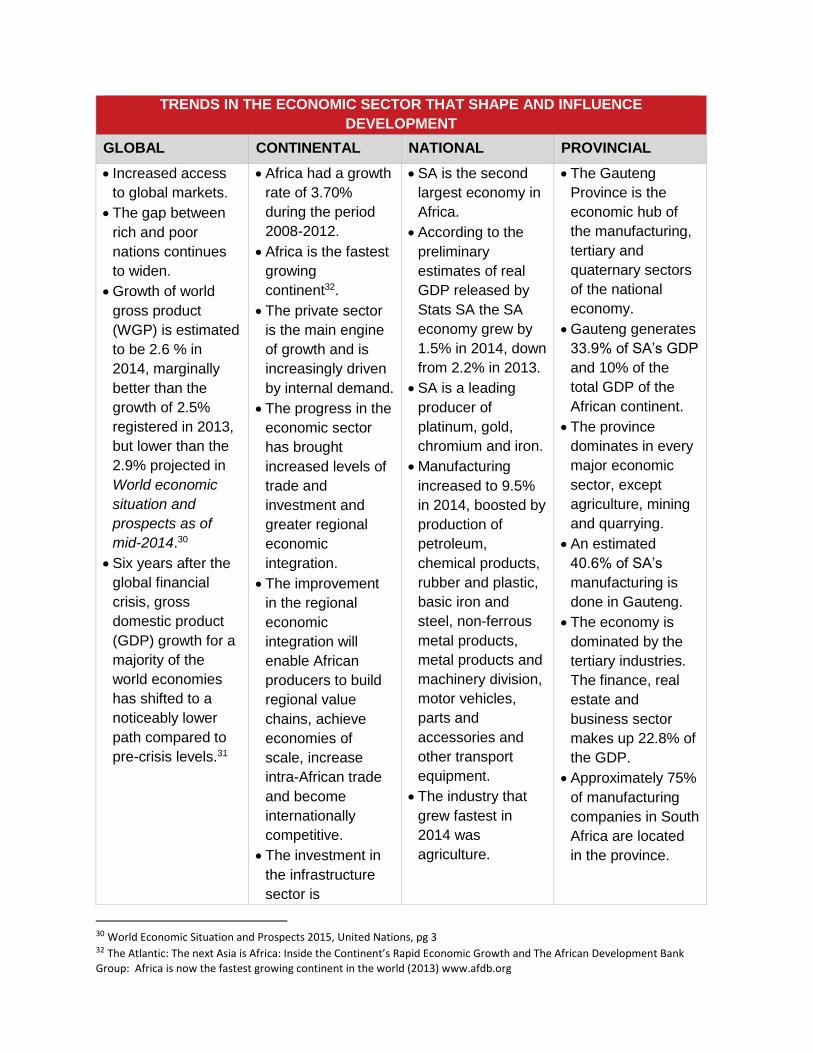
TRENDS IN THE ECONOMIC SECTOR THAT SHAPE AND INFLUENCE
DEVELOPMENT
GLOBAL CONTINENTAL NATIONAL PROVINCIAL
Increased access
to global markets.
The gap between
rich and poor
nations continues
to widen.
Growth of world
gross product
(WGP) is estimated
to be 2.6 % in
2014, marginally
better than the
growth of 2.5%
registered in 2013,
but lower than the
2.9% projected in
World economic
situation and
prospects as of
mid-2014.30
Six years after the
global financial
crisis, gross
domestic product
(GDP) growth for a
majority of the
world economies
has shifted to a
noticeably lower
path compared to
pre-crisis levels.31
Africa had a growth
rate of 3.70%
during the period
2008-2012.
Africa is the fastest
growing
continent32.
The private sector
is the main engine
of growth and is
increasingly driven
by internal demand.
The progress in the
economic sector
has brought
increased levels of
trade and
investment and
greater regional
economic
integration.
The improvement
in the regional
economic
integration will
enable African
producers to build
regional value
chains, achieve
economies of
scale, increase
intra-African trade
and become
internationally
competitive.
The investment in
the infrastructure
sector is
SA is the second
largest economy in
Africa.
According to the
preliminary
estimates of real
GDP released by
Stats SA the SA
economy grew by
1.5% in 2014, down
from 2.2% in 2013.
SA is a leading
producer of
platinum, gold,
chromium and iron.
Manufacturing
increased to 9.5%
in 2014, boosted by
production of
petroleum,
chemical products,
rubber and plastic,
basic iron and
steel, non-ferrous
metal products,
metal products and
machinery division,
motor vehicles,
parts and
accessories and
other transport
equipment.
The industry that
grew fastest in
2014 was
agriculture.
The Gauteng
Province is the
economic hub of
the manufacturing,
tertiary and
quaternary sectors
of the national
economy.
Gauteng generates
33.9% of SA’s GDP
and 10% of the
total GDP of the
African continent.
The province
dominates in every
major economic
sector, except
agriculture, mining
and quarrying.
An estimated
40.6% of SA’s
manufacturing is
done in Gauteng.
The economy is
dominated by the
tertiary industries.
The finance, real
estate and
business sector
makes up 22.8% of
the GDP.
Approximately 75%
of manufacturing
companies in South
Africa are located
in the province.
30 World Economic Situation and Prospects 2015, United Nations, pg 3 32 The Atlantic: The next Asia is Africa: Inside the Continent’s Rapid Economic Growth and The African Development Bank
Group: Africa is now the fastest growing continent in the world (2013) www.afdb.org
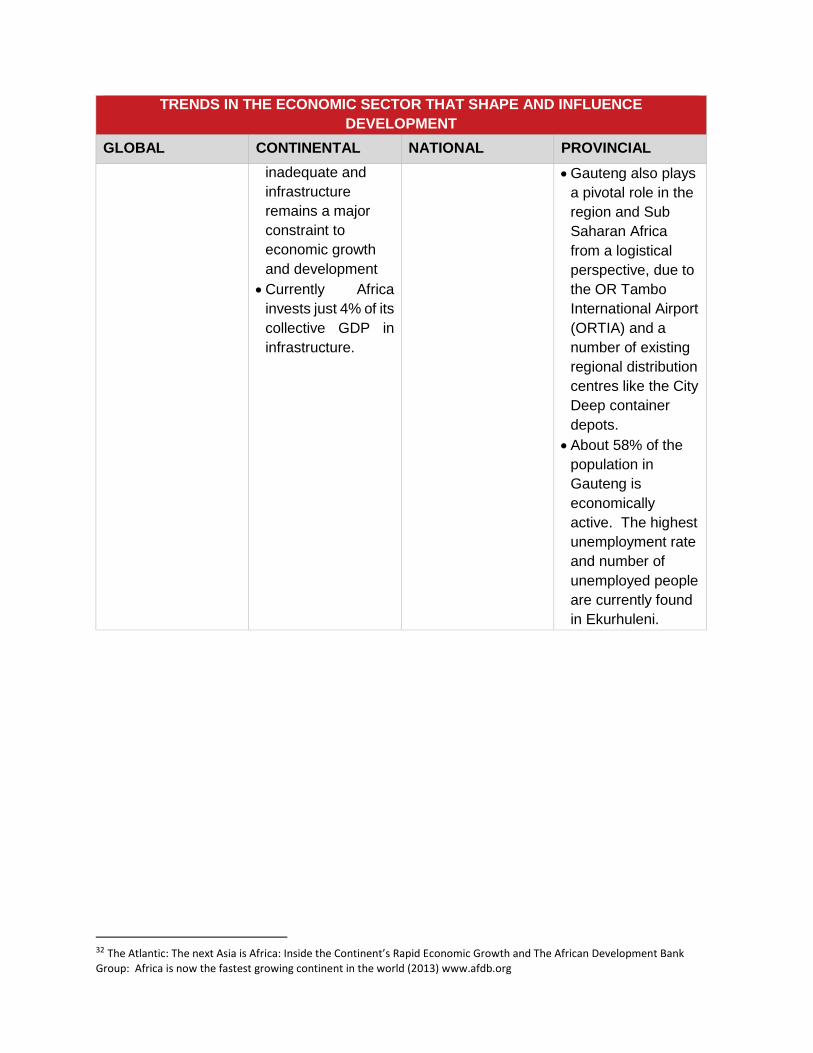
TRENDS IN THE ECONOMIC SECTOR THAT SHAPE AND INFLUENCE
DEVELOPMENT
GLOBAL CONTINENTAL NATIONAL PROVINCIAL
inadequate and
infrastructure
remains a major
constraint to
economic growth
and development
Currently Africa
invests just 4% of its
collective GDP in
infrastructure.
Gauteng also plays
a pivotal role in the
region and Sub
Saharan Africa
from a logistical
perspective, due to
the OR Tambo
International Airport
(ORTIA) and a
number of existing
regional distribution
centres like the City
Deep container
depots.
About 58% of the
population in
Gauteng is
economically
active. The highest
unemployment rate
and number of
unemployed people
are currently found
in Ekurhuleni.
32 The Atlantic: The next Asia is Africa: Inside the Continent’s Rapid Economic Growth and The African Development Bank
Group: Africa is now the fastest growing continent in the world (2013) www.afdb.org
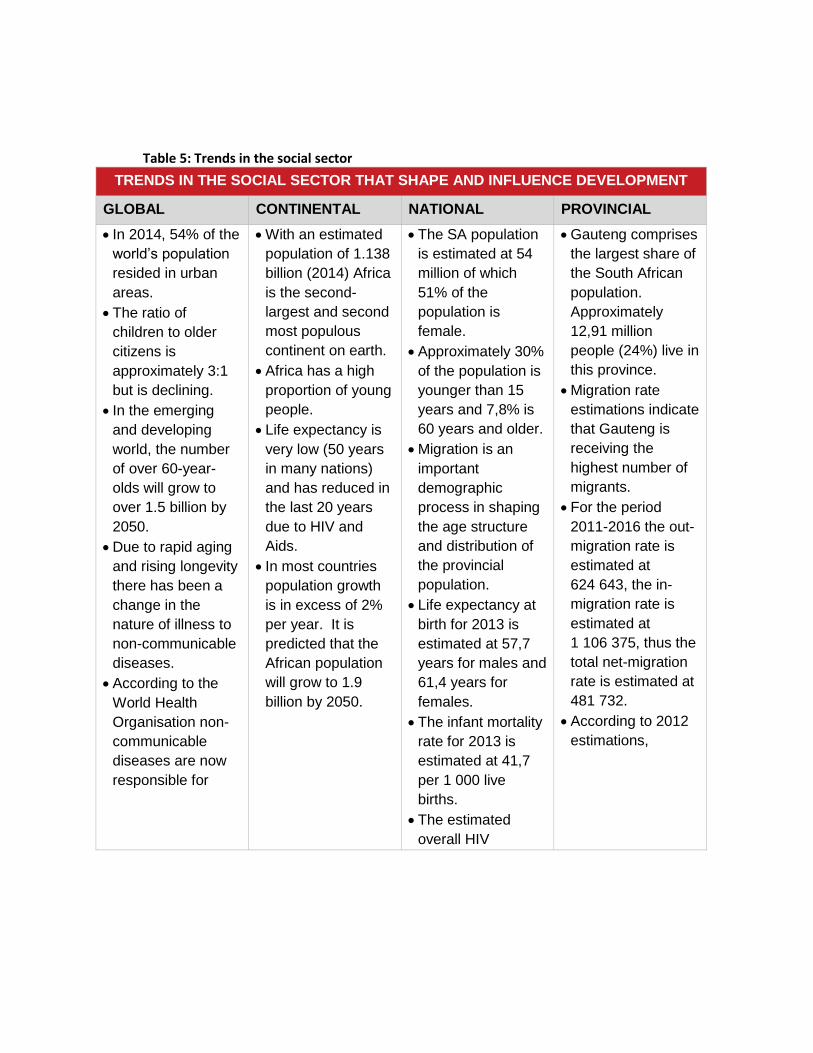
Table 5: Trends in the social sector
TRENDS IN THE SOCIAL SECTOR THAT SHAPE AND INFLUENCE DEVELOPMENT
GLOBAL CONTINENTAL NATIONAL PROVINCIAL
In 2014, 54% of the
world’s population
resided in urban
areas.
The ratio of
children to older
citizens is
approximately 3:1
but is declining.
In the emerging
and developing
world, the number
of over 60-year-
olds will grow to
over 1.5 billion by
2050.
Due to rapid aging
and rising longevity
there has been a
change in the
nature of illness to
non-communicable
diseases.
According to the
World Health
Organisation non-
communicable
diseases are now
responsible for
With an estimated
population of 1.138
billion (2014) Africa
is the second-
largest and second
most populous
continent on earth.
Africa has a high
proportion of young
people.
Life expectancy is
very low (50 years
in many nations)
and has reduced in
the last 20 years
due to HIV and
Aids.
In most countries
population growth
is in excess of 2%
per year. It is
predicted that the
African population
will grow to 1.9
billion by 2050.
The SA population
is estimated at 54
million of which
51% of the
population is
female.
Approximately 30%
of the population is
younger than 15
years and 7,8% is
60 years and older.
Migration is an
important
demographic
process in shaping
the age structure
and distribution of
the provincial
population.
Life expectancy at
birth for 2013 is
estimated at 57,7
years for males and
61,4 years for
females.
The infant mortality
rate for 2013 is
estimated at 41,7
per 1 000 live
births.
The estimated
overall HIV
Gauteng comprises
the largest share of
the South African
population.
Approximately
12,91 million
people (24%) live in
this province.
Migration rate
estimations indicate
that Gauteng is
receiving the
highest number of
migrants.
For the period
2011-2016 the out-
migration rate is
estimated at
624 643, the in-
migration rate is
estimated at
1 106 375, thus the
total net-migration
rate is estimated at
481 732.
According to 2012
estimations,
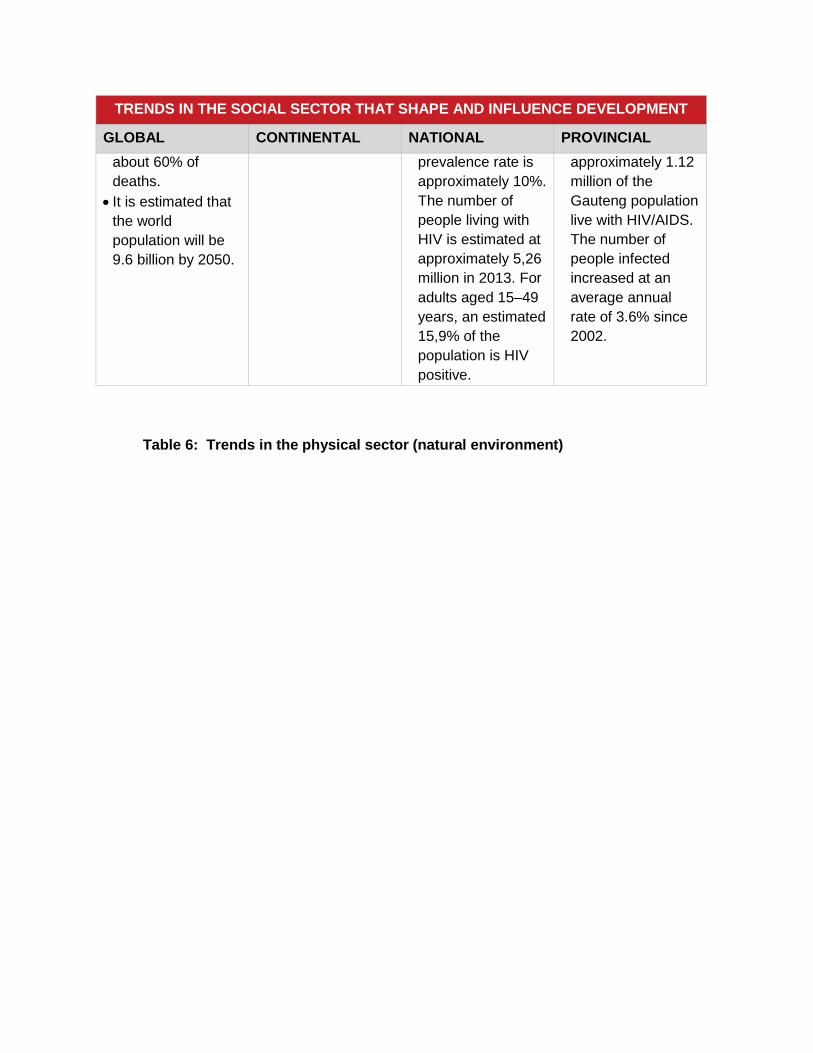
TRENDS IN THE SOCIAL SECTOR THAT SHAPE AND INFLUENCE DEVELOPMENT
GLOBAL CONTINENTAL NATIONAL PROVINCIAL
about 60% of
deaths.
It is estimated that
the world
population will be
9.6 billion by 2050.
prevalence rate is
approximately 10%.
The number of
people living with
HIV is estimated at
approximately 5,26
million in 2013. For
adults aged 15–49
years, an estimated
15,9% of the
population is HIV
positive.
approximately 1.12
million of the
Gauteng population
live with HIV/AIDS.
The number of
people infected
increased at an
average annual
rate of 3.6% since
2002.
Table 6: Trends in the physical sector (natural environment)

TRENDS IN THE PHYSICAL SECTOR THAT SHAPE AND INFLUENCE DEVELOPMENT
GLOBAL CONTINENTAL NATIONAL PROVINCIAL
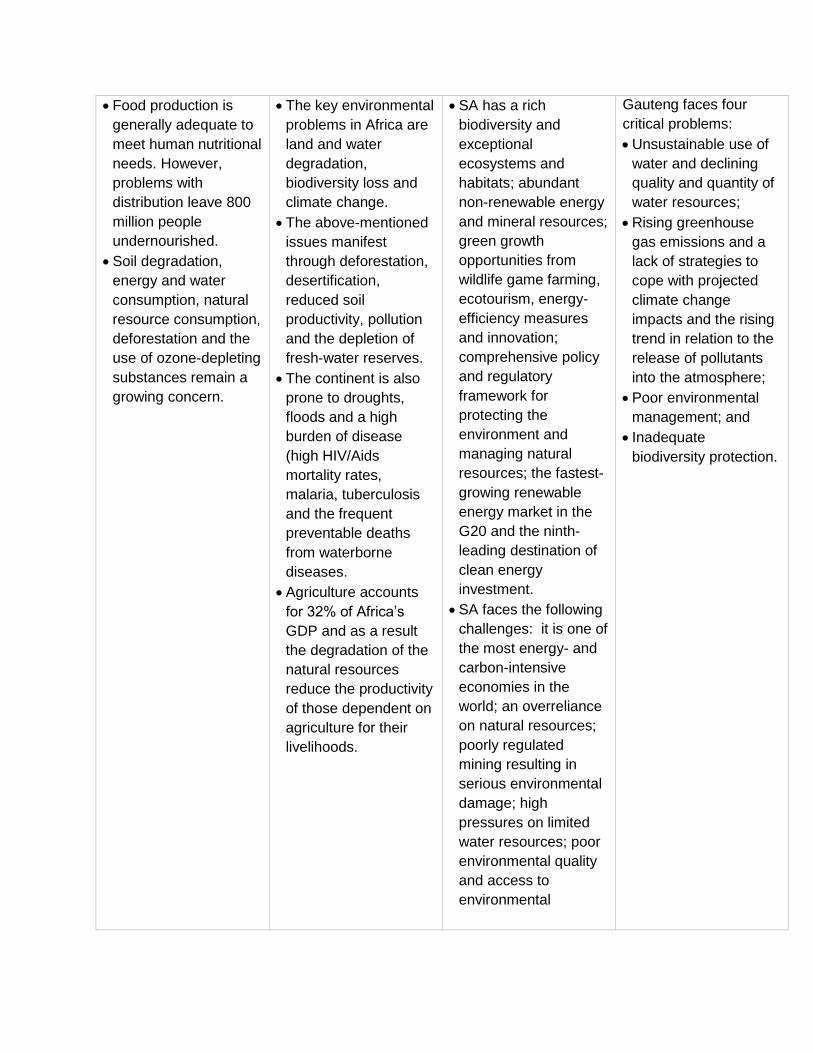
Food production is
generally adequate to
meet human nutritional
needs. However,
problems with
distribution leave 800
million people
undernourished.
Soil degradation,
energy and water
consumption, natural
resource consumption,
deforestation and the
use of ozone-depleting
substances remain a
growing concern.
The key environmental
problems in Africa are
land and water
degradation,
biodiversity loss and
climate change.
The above-mentioned
issues manifest
through deforestation,
desertification,
reduced soil
productivity, pollution
and the depletion of
fresh-water reserves.
The continent is also
prone to droughts,
floods and a high
burden of disease
(high HIV/Aids
mortality rates,
malaria, tuberculosis
and the frequent
preventable deaths
from waterborne
diseases.
Agriculture accounts
for 32% of Africa’s
GDP and as a result
the degradation of the
natural resources
reduce the productivity
of those dependent on
agriculture for their
livelihoods.
SA has a rich
biodiversity and
exceptional
ecosystems and
habitats; abundant
non-renewable energy
and mineral resources;
green growth
opportunities from
wildlife game farming,
ecotourism, energy-
efficiency measures
and innovation;
comprehensive policy
and regulatory
framework for
protecting the
environment and
managing natural
resources; the fastest-
growing renewable
energy market in the
G20 and the ninth-
leading destination of
clean energy
investment.
SA faces the following
challenges: it is one of
the most energy- and
carbon-intensive
economies in the
world; an overreliance
on natural resources;
poorly regulated
mining resulting in
serious environmental
damage; high
pressures on limited
water resources; poor
environmental quality
and access to
environmental
Gauteng faces four
critical problems:
Unsustainable use of
water and declining
quality and quantity of
water resources;
Rising greenhouse
gas emissions and a
lack of strategies to
cope with projected
climate change
impacts and the rising
trend in relation to the
release of pollutants
into the atmosphere;
Poor environmental
management; and
Inadequate
biodiversity protection.
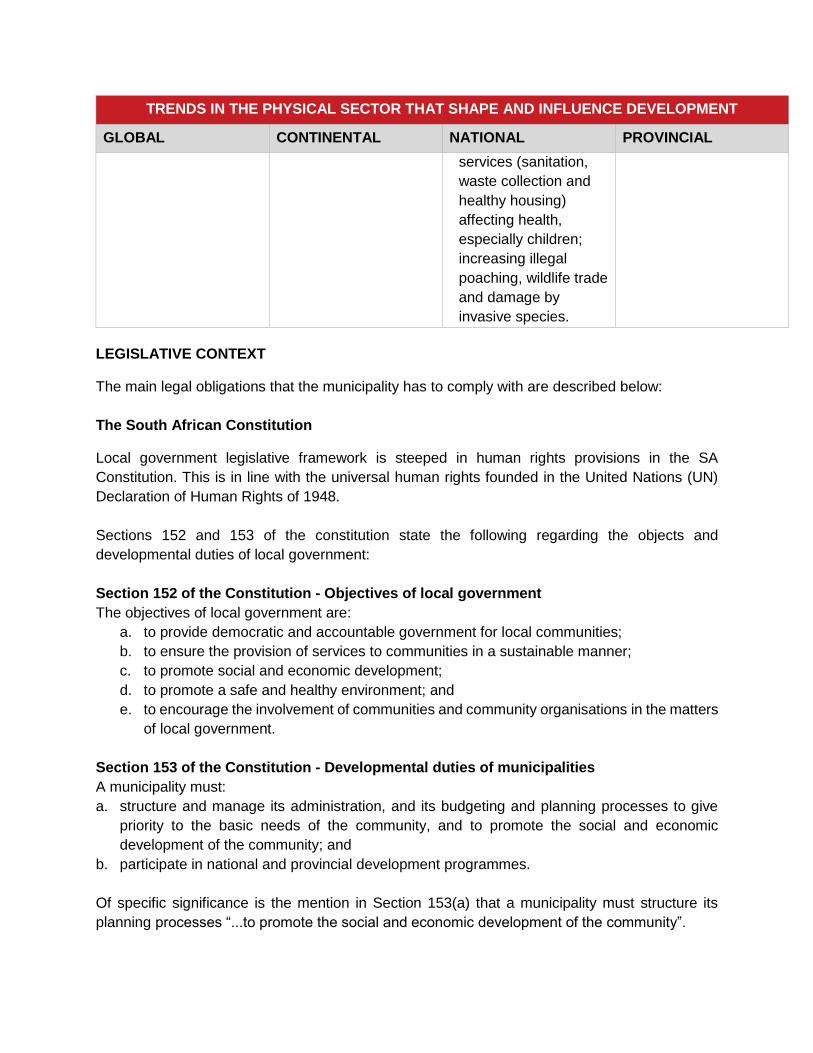
TRENDS IN THE PHYSICAL SECTOR THAT SHAPE AND INFLUENCE DEVELOPMENT
GLOBAL CONTINENTAL NATIONAL PROVINCIAL
services (sanitation,
waste collection and
healthy housing)
affecting health,
especially children;
increasing illegal
poaching, wildlife trade
and damage by
invasive species.
LEGISLATIVE CONTEXT
The main legal obligations that the municipality has to comply with are described below:
The South African Constitution
Local government legislative framework is steeped in human rights provisions in the SA
Constitution. This is in line with the universal human rights founded in the United Nations (UN)
Declaration of Human Rights of 1948.
Sections 152 and 153 of the constitution state the following regarding the objects and
developmental duties of local government:
Section 152 of the Constitution - Objectives of local government
The objectives of local government are:
a. to provide democratic and accountable government for local communities;
b. to ensure the provision of services to communities in a sustainable manner;
c. to promote social and economic development;
d. to promote a safe and healthy environment; and
e. to encourage the involvement of communities and community organisations in the matters
of local government.
Section 153 of the Constitution - Developmental duties of municipalities
A municipality must:
a. structure and manage its administration, and its budgeting and planning processes to give
priority to the basic needs of the community, and to promote the social and economic
development of the community; and
b. participate in national and provincial development programmes.
Of specific significance is the mention in Section 153(a) that a municipality must structure its
planning processes “...to promote the social and economic development of the community”.
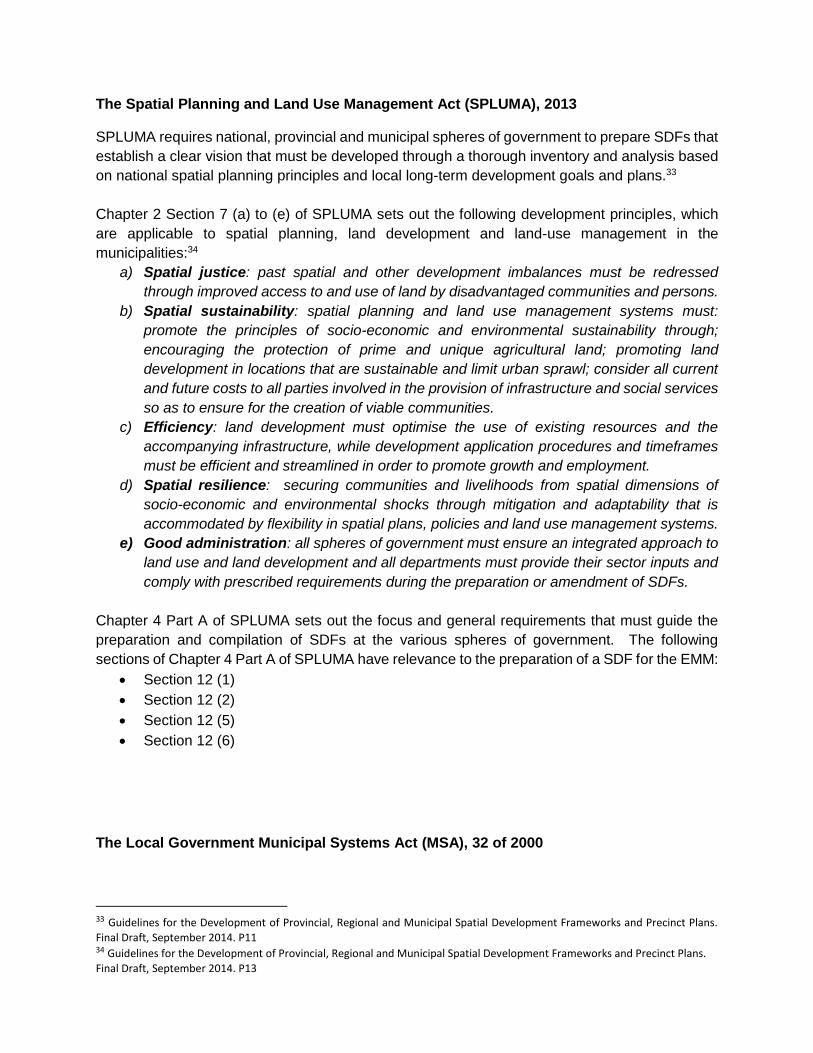
The Spatial Planning and Land Use Management Act (SPLUMA), 2013
SPLUMA requires national, provincial and municipal spheres of government to prepare SDFs that
establish a clear vision that must be developed through a thorough inventory and analysis based
on national spatial planning principles and local long-term development goals and plans.33
Chapter 2 Section 7 (a) to (e) of SPLUMA sets out the following development principles, which
are applicable to spatial planning, land development and land-use management in the
municipalities:34
a) Spatial justice: past spatial and other development imbalances must be redressed
through improved access to and use of land by disadvantaged communities and persons.
b) Spatial sustainability: spatial planning and land use management systems must:
promote the principles of socio-economic and environmental sustainability through;
encouraging the protection of prime and unique agricultural land; promoting land
development in locations that are sustainable and limit urban sprawl; consider all current
and future costs to all parties involved in the provision of infrastructure and social services
so as to ensure for the creation of viable communities.
c) Efficiency: land development must optimise the use of existing resources and the
accompanying infrastructure, while development application procedures and timeframes
must be efficient and streamlined in order to promote growth and employment.
d) Spatial resilience: securing communities and livelihoods from spatial dimensions of
socio-economic and environmental shocks through mitigation and adaptability that is
accommodated by flexibility in spatial plans, policies and land use management systems.
e) Good administration: all spheres of government must ensure an integrated approach to
land use and land development and all departments must provide their sector inputs and
comply with prescribed requirements during the preparation or amendment of SDFs.
Chapter 4 Part A of SPLUMA sets out the focus and general requirements that must guide the
preparation and compilation of SDFs at the various spheres of government. The following
sections of Chapter 4 Part A of SPLUMA have relevance to the preparation of a SDF for the EMM:
Section 12 (1)
Section 12 (2)
Section 12 (5)
Section 12 (6)
The Local Government Municipal Systems Act (MSA), 32 of 2000
33 Guidelines for the Development of Provincial, Regional and Municipal Spatial Development Frameworks and Precinct Plans.
Final Draft, September 2014. P11 34 Guidelines for the Development of Provincial, Regional and Municipal Spatial Development Frameworks and Precinct Plans.
Final Draft, September 2014. P13
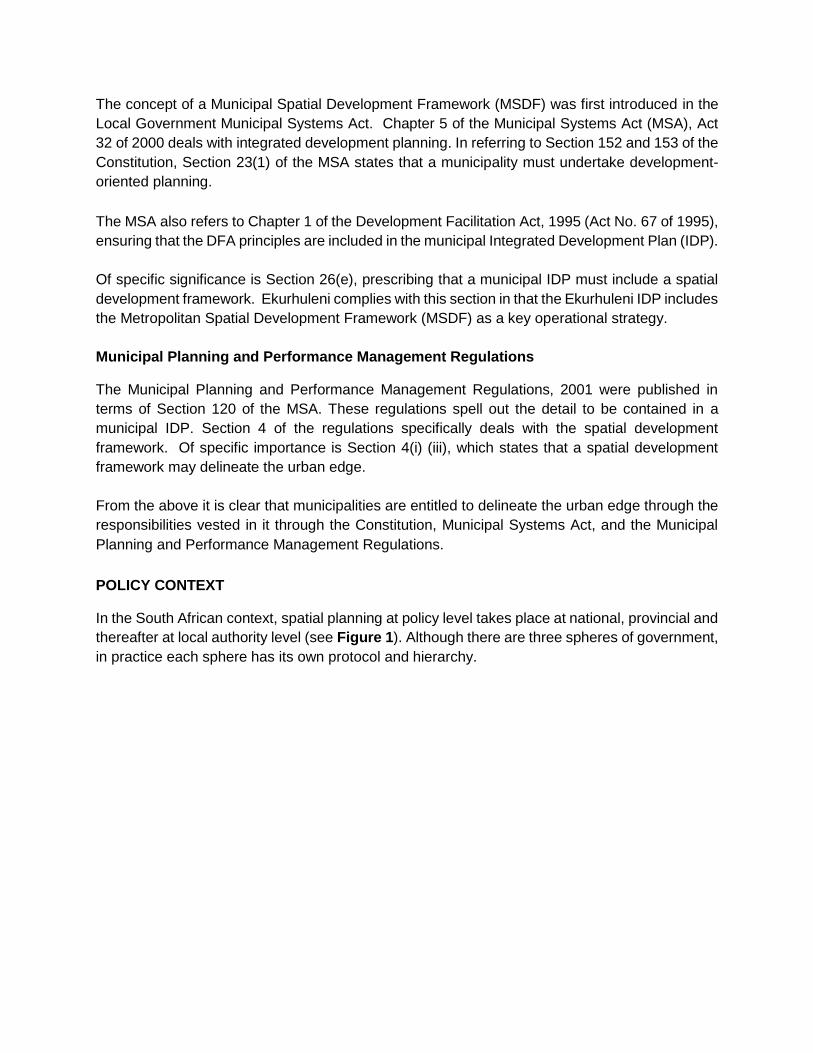
The concept of a Municipal Spatial Development Framework (MSDF) was first introduced in the
Local Government Municipal Systems Act. Chapter 5 of the Municipal Systems Act (MSA), Act
32 of 2000 deals with integrated development planning. In referring to Section 152 and 153 of the
Constitution, Section 23(1) of the MSA states that a municipality must undertake development-
oriented planning.
The MSA also refers to Chapter 1 of the Development Facilitation Act, 1995 (Act No. 67 of 1995),
ensuring that the DFA principles are included in the municipal Integrated Development Plan (IDP).
Of specific significance is Section 26(e), prescribing that a municipal IDP must include a spatial
development framework. Ekurhuleni complies with this section in that the Ekurhuleni IDP includes
the Metropolitan Spatial Development Framework (MSDF) as a key operational strategy.
Municipal Planning and Performance Management Regulations
The Municipal Planning and Performance Management Regulations, 2001 were published in
terms of Section 120 of the MSA. These regulations spell out the detail to be contained in a
municipal IDP. Section 4 of the regulations specifically deals with the spatial development
framework. Of specific importance is Section 4(i) (iii), which states that a spatial development
framework may delineate the urban edge.
From the above it is clear that municipalities are entitled to delineate the urban edge through the
responsibilities vested in it through the Constitution, Municipal Systems Act, and the Municipal
Planning and Performance Management Regulations.
POLICY CONTEXT
In the South African context, spatial planning at policy level takes place at national, provincial and
thereafter at local authority level (see Figure 1). Although there are three spheres of government,
in practice each sphere has its own protocol and hierarchy.
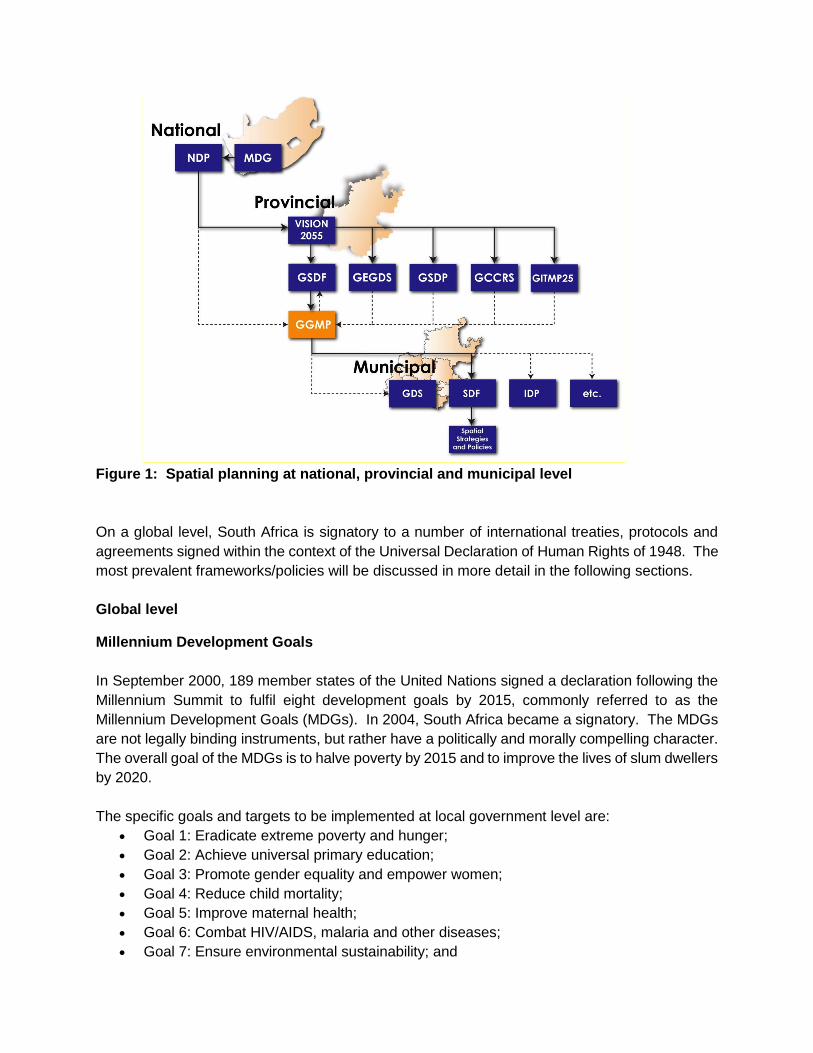
Figure 1: Spatial planning at national, provincial and municipal level
On a global level, South Africa is signatory to a number of international treaties, protocols and
agreements signed within the context of the Universal Declaration of Human Rights of 1948. The
most prevalent frameworks/policies will be discussed in more detail in the following sections.
Global level
Millennium Development Goals
In September 2000, 189 member states of the United Nations signed a declaration following the
Millennium Summit to fulfil eight development goals by 2015, commonly referred to as the
Millennium Development Goals (MDGs). In 2004, South Africa became a signatory. The MDGs
are not legally binding instruments, but rather have a politically and morally compelling character.
The overall goal of the MDGs is to halve poverty by 2015 and to improve the lives of slum dwellers
by 2020.
The specific goals and targets to be implemented at local government level are:
Goal 1: Eradicate extreme poverty and hunger;
Goal 2: Achieve universal primary education;
Goal 3: Promote gender equality and empower women;
Goal 4: Reduce child mortality;
Goal 5: Improve maternal health;
Goal 6: Combat HIV/AIDS, malaria and other diseases;
Goal 7: Ensure environmental sustainability; and
Goal 8: Develop a global partnership for development.
BRICS
The emerging economies of Brazil, Russia and China were forecast to realise fast economic
growth and be larger than some of the developed economies. In 2006, this group became a
diplomatic-political entity called BRIC. In 2011, South Africa officially joined and it is now referred
to as BRICS. Currently, the BRICS countries together account for more than a quarter of the
world’s land area, more than 40% of the world population and around 35% of global foreign
exchange reserves.
These countries’ collaboration is aimed at meeting economic needs of this century, which include
infrastructure development, consumption and increased trade. The strength of the BRICS
economies is of ever-increasing importance to the global economy. BRICS’ collective contribution
to world GDP has increased from 11% in 1990 to 26% in 2012.
Continental level
Despite various types of economic policies and programmes, the African economy remains
underdeveloped. The New Partnership for African Development (NEPAD) is an African
development initiative and a step towards anchoring development in the collective vision and
commitment of African leaders. The long-term objective is to place African countries on a path to
sustainable development.
In 2010, African leaders launched a new Programme for Infrastructure Development in Africa
(PIDA). The African Union, NEPAD and the African Development Bank lead this initiative. The
overall goal of PIDA is to promote socio-economic development and poverty reduction in Africa
through improved access to integrated regional and continental infrastructure networks and
services.
At a sub-continental level, South Africa (and therefore Ekurhuleni) has strong links with the
Southern African Development Community (SADC), and the SADC economic region has been
strengthened to negotiate with the developed world in particular the European Union for economic
and financial support and aid.
SADC is in the process of strengthening regional ties in sub-Saharan Africa. The intention is to
have free and unhindered movement and mobility of citizens of SADC, its resources and services
with a common currency, trade and citizenship. These include skills, transport and goods and
other services and infrastructure development.
National level
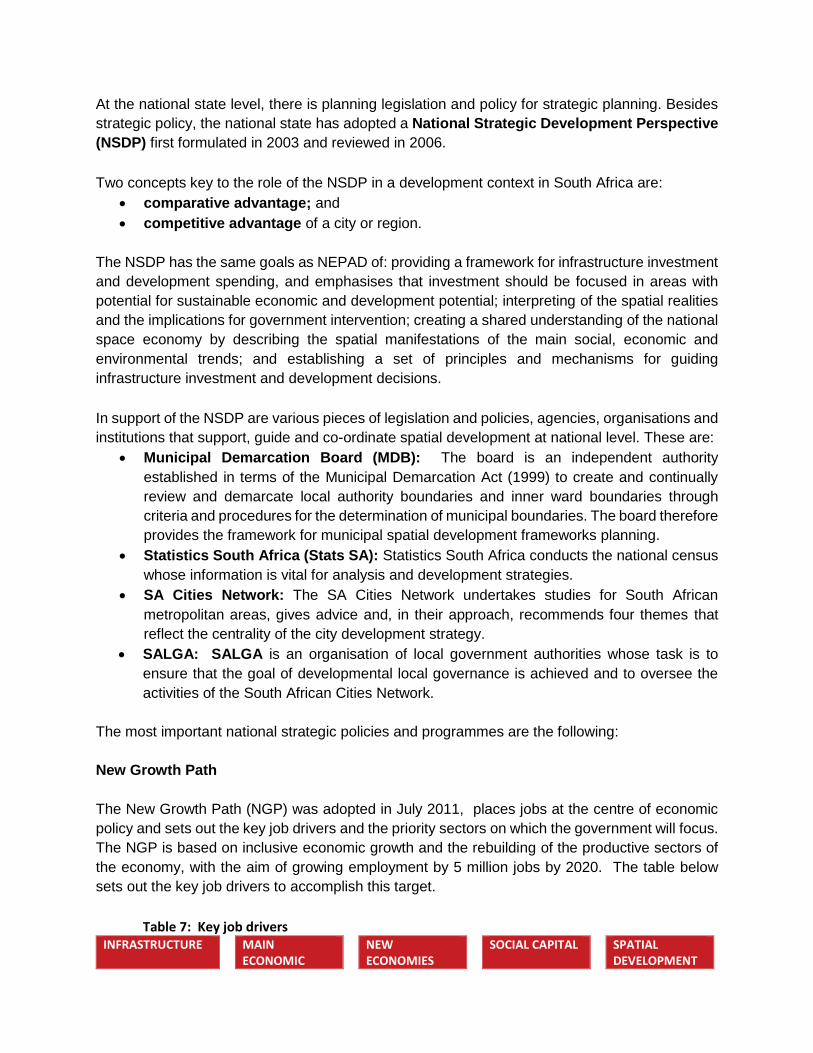
At the national state level, there is planning legislation and policy for strategic planning. Besides
strategic policy, the national state has adopted a National Strategic Development Perspective
(NSDP) first formulated in 2003 and reviewed in 2006.
Two concepts key to the role of the NSDP in a development context in South Africa are:
comparative advantage; and
competitive advantage of a city or region.
The NSDP has the same goals as NEPAD of: providing a framework for infrastructure investment
and development spending, and emphasises that investment should be focused in areas with
potential for sustainable economic and development potential; interpreting of the spatial realities
and the implications for government intervention; creating a shared understanding of the national
space economy by describing the spatial manifestations of the main social, economic and
environmental trends; and establishing a set of principles and mechanisms for guiding
infrastructure investment and development decisions.
In support of the NSDP are various pieces of legislation and policies, agencies, organisations and
institutions that support, guide and co-ordinate spatial development at national level. These are:
Municipal Demarcation Board (MDB): The board is an independent authority
established in terms of the Municipal Demarcation Act (1999) to create and continually
review and demarcate local authority boundaries and inner ward boundaries through
criteria and procedures for the determination of municipal boundaries. The board therefore
provides the framework for municipal spatial development frameworks planning.
Statistics South Africa (Stats SA): Statistics South Africa conducts the national census
whose information is vital for analysis and development strategies.
SA Cities Network: The SA Cities Network undertakes studies for South African
metropolitan areas, gives advice and, in their approach, recommends four themes that
reflect the centrality of the city development strategy.
SALGA: SALGA is an organisation of local government authorities whose task is to
ensure that the goal of developmental local governance is achieved and to oversee the
activities of the South African Cities Network.
The most important national strategic policies and programmes are the following:
New Growth Path
The New Growth Path (NGP) was adopted in July 2011, places jobs at the centre of economic
policy and sets out the key job drivers and the priority sectors on which the government will focus.
The NGP is based on inclusive economic growth and the rebuilding of the productive sectors of
the economy, with the aim of growing employment by 5 million jobs by 2020. The table below
sets out the key job drivers to accomplish this target.
Table 7: Key job drivers INFRASTRUCTURE MAIN
ECONOMIC NEW
ECONOMIES SOCIAL CAPITAL SPATIAL
DEVELOPMENT
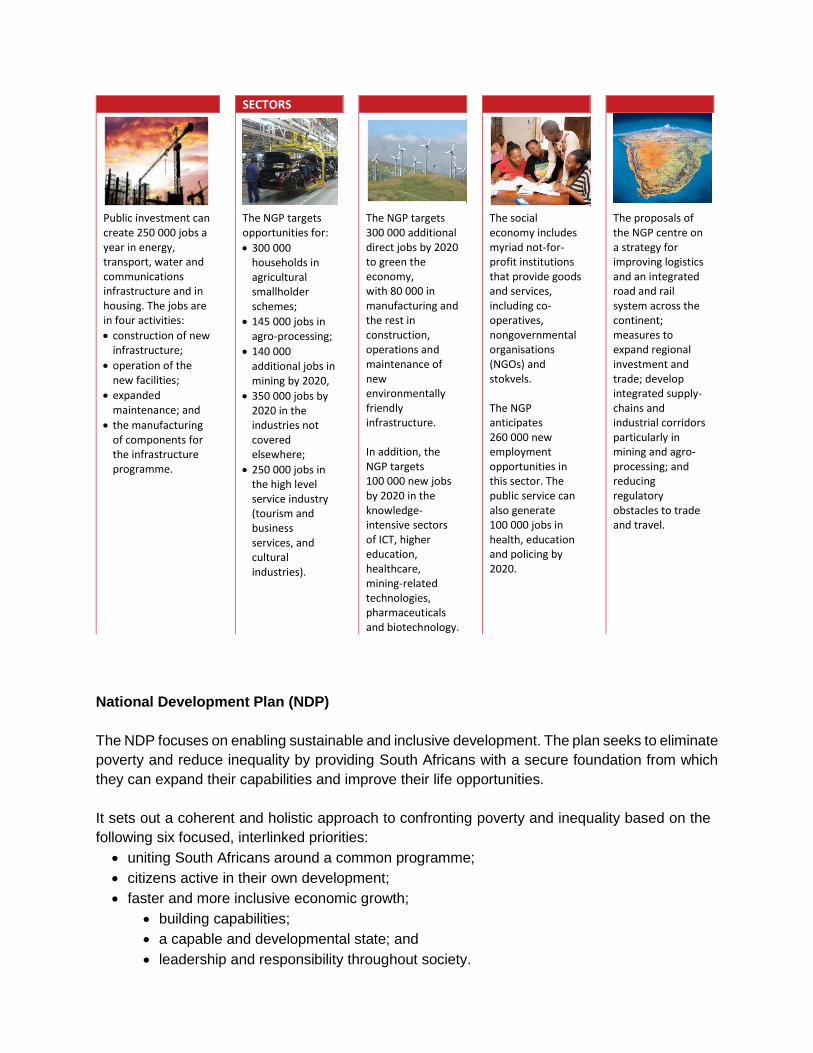
SECTORS
Public investment can create 250 000 jobs a year in energy, transport, water and communications infrastructure and in housing. The jobs are in four activities:
construction of new infrastructure;
operation of the new facilities;
expanded maintenance; and
the manufacturing of components for the infrastructure programme.
The NGP targets opportunities for:
300 000 households in agricultural smallholder schemes;
145 000 jobs in agro-processing;
140 000 additional jobs in mining by 2020,
350 000 jobs by 2020 in the industries not covered elsewhere;
250 000 jobs in the high level service industry (tourism and business services, and cultural industries).
The NGP targets 300 000 additional direct jobs by 2020 to green the economy, with 80 000 in manufacturing and the rest in construction, operations and maintenance of new environmentally friendly infrastructure. In addition, the NGP targets 100 000 new jobs by 2020 in the knowledge-intensive sectors of ICT, higher education, healthcare, mining-related technologies, pharmaceuticals and biotechnology.
The social economy includes myriad not-for-profit institutions that provide goods and services, including co-operatives, nongovernmental organisations (NGOs) and stokvels. The NGP anticipates 260 000 new employment opportunities in this sector. The public service can also generate 100 000 jobs in health, education and policing by 2020.
The proposals of the NGP centre on a strategy for improving logistics and an integrated road and rail system across the continent; measures to expand regional investment and trade; develop integrated supply-chains and industrial corridors particularly in mining and agro-processing; and reducing regulatory obstacles to trade and travel.
National Development Plan (NDP)
The NDP focuses on enabling sustainable and inclusive development. The plan seeks to eliminate
poverty and reduce inequality by providing South Africans with a secure foundation from which
they can expand their capabilities and improve their life opportunities.
It sets out a coherent and holistic approach to confronting poverty and inequality based on the
following six focused, interlinked priorities:
uniting South Africans around a common programme;
citizens active in their own development;
faster and more inclusive economic growth;
building capabilities;
a capable and developmental state; and
leadership and responsibility throughout society.
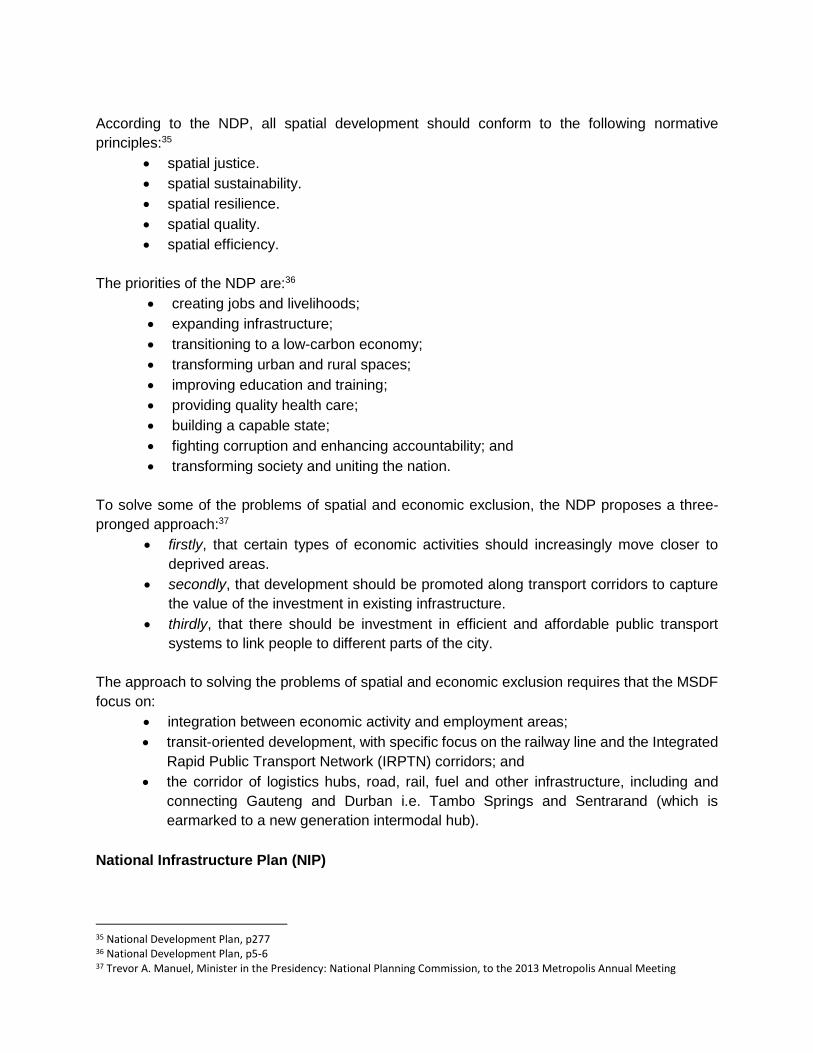
According to the NDP, all spatial development should conform to the following normative
principles:35
spatial justice.
spatial sustainability.
spatial resilience.
spatial quality.
spatial efficiency.
The priorities of the NDP are:36
creating jobs and livelihoods;
expanding infrastructure;
transitioning to a low-carbon economy;
transforming urban and rural spaces;
improving education and training;
providing quality health care;
building a capable state;
fighting corruption and enhancing accountability; and
transforming society and uniting the nation.
To solve some of the problems of spatial and economic exclusion, the NDP proposes a three-
pronged approach:37
firstly, that certain types of economic activities should increasingly move closer to
deprived areas.
secondly, that development should be promoted along transport corridors to capture
the value of the investment in existing infrastructure.
thirdly, that there should be investment in efficient and affordable public transport
systems to link people to different parts of the city.
The approach to solving the problems of spatial and economic exclusion requires that the MSDF
focus on:
integration between economic activity and employment areas;
transit-oriented development, with specific focus on the railway line and the Integrated
Rapid Public Transport Network (IRPTN) corridors; and
the corridor of logistics hubs, road, rail, fuel and other infrastructure, including and
connecting Gauteng and Durban i.e. Tambo Springs and Sentrarand (which is
earmarked to a new generation intermodal hub).
National Infrastructure Plan (NIP)
35 National Development Plan, p277 36 National Development Plan, p5-6 37 Trevor A. Manuel, Minister in the Presidency: National Planning Commission, to the 2013 Metropolis Annual Meeting
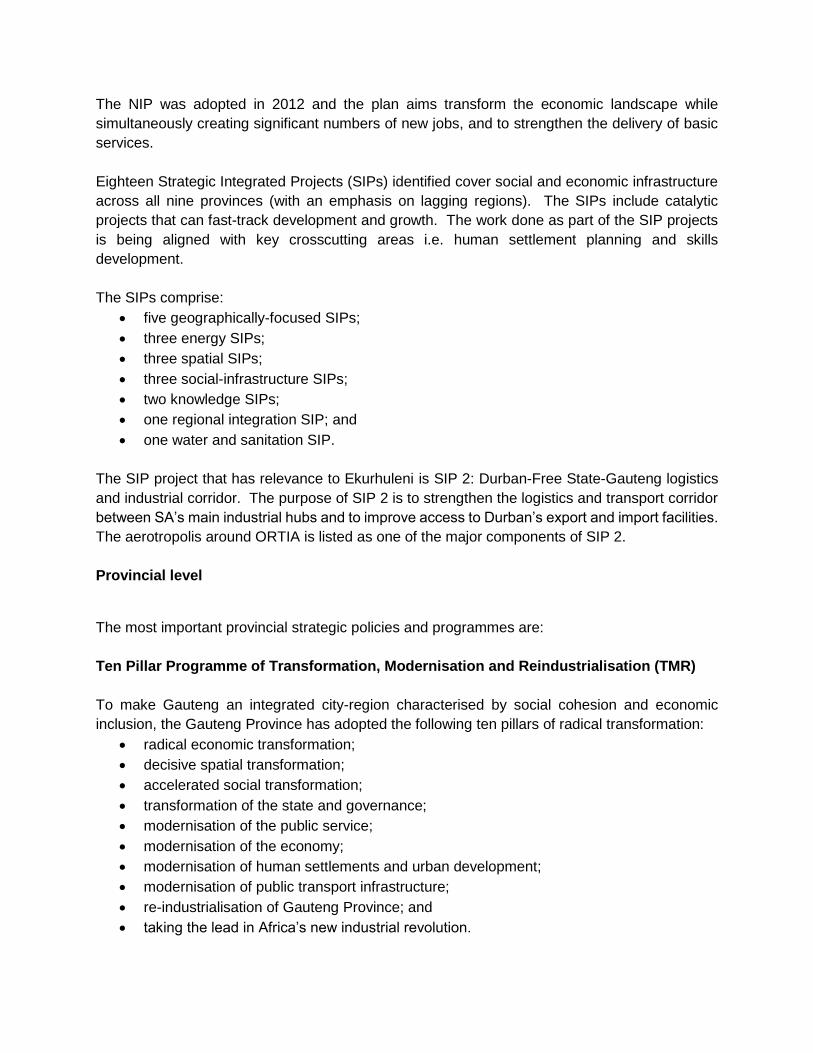
The NIP was adopted in 2012 and the plan aims transform the economic landscape while
simultaneously creating significant numbers of new jobs, and to strengthen the delivery of basic
services.
Eighteen Strategic Integrated Projects (SIPs) identified cover social and economic infrastructure
across all nine provinces (with an emphasis on lagging regions). The SIPs include catalytic
projects that can fast-track development and growth. The work done as part of the SIP projects
is being aligned with key crosscutting areas i.e. human settlement planning and skills
development.
The SIPs comprise:
five geographically-focused SIPs;
three energy SIPs;
three spatial SIPs;
three social-infrastructure SIPs;
two knowledge SIPs;
one regional integration SIP; and
one water and sanitation SIP.
The SIP project that has relevance to Ekurhuleni is SIP 2: Durban-Free State-Gauteng logistics
and industrial corridor. The purpose of SIP 2 is to strengthen the logistics and transport corridor
between SA’s main industrial hubs and to improve access to Durban’s export and import facilities.
The aerotropolis around ORTIA is listed as one of the major components of SIP 2.
Provincial level
The most important provincial strategic policies and programmes are:
Ten Pillar Programme of Transformation, Modernisation and Reindustrialisation (TMR)
To make Gauteng an integrated city-region characterised by social cohesion and economic
inclusion, the Gauteng Province has adopted the following ten pillars of radical transformation:
radical economic transformation;
decisive spatial transformation;
accelerated social transformation;
transformation of the state and governance;
modernisation of the public service;
modernisation of the economy;
modernisation of human settlements and urban development;
modernisation of public transport infrastructure;
re-industrialisation of Gauteng Province; and
taking the lead in Africa’s new industrial revolution.
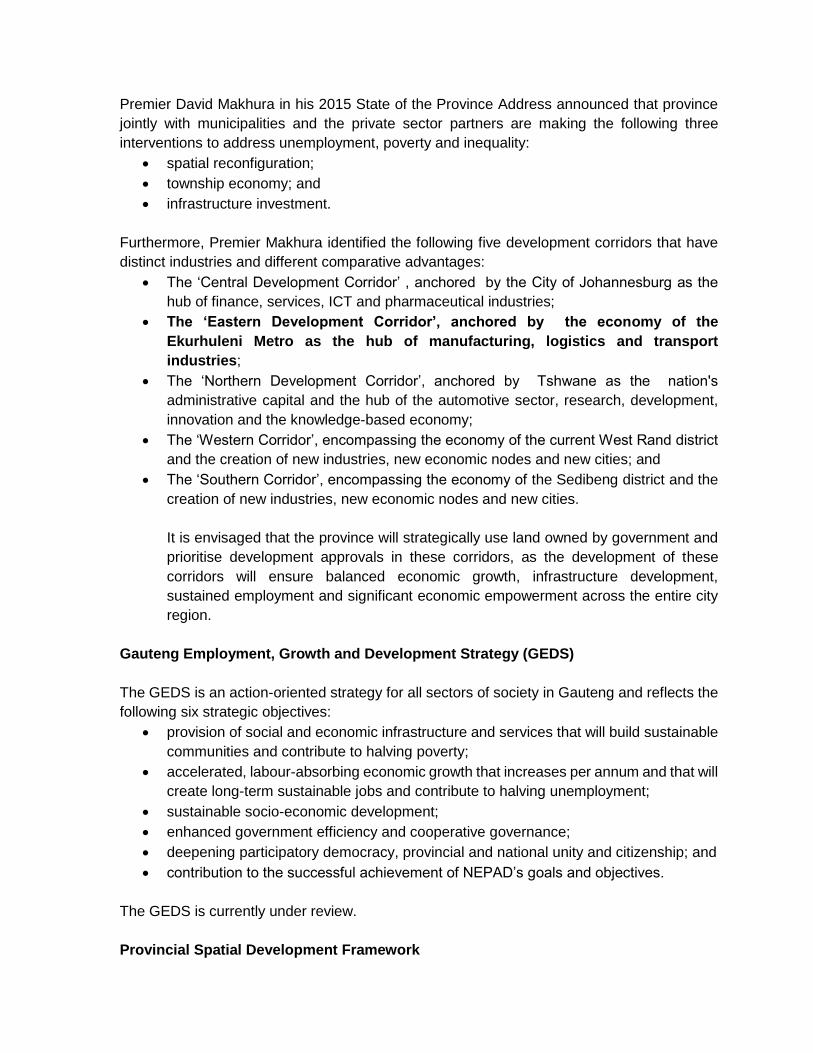
Premier David Makhura in his 2015 State of the Province Address announced that province
jointly with municipalities and the private sector partners are making the following three
interventions to address unemployment, poverty and inequality:
spatial reconfiguration;
township economy; and
infrastructure investment.
Furthermore, Premier Makhura identified the following five development corridors that have
distinct industries and different comparative advantages:
The ‘Central Development Corridor’ , anchored by the City of Johannesburg as the
hub of finance, services, ICT and pharmaceutical industries;
The ‘Eastern Development Corridor’, anchored by the economy of the
Ekurhuleni Metro as the hub of manufacturing, logistics and transport
industries;
The ‘Northern Development Corridor’, anchored by Tshwane as the nation's
administrative capital and the hub of the automotive sector, research, development,
innovation and the knowledge-based economy;
The ‘Western Corridor’, encompassing the economy of the current West Rand district
and the creation of new industries, new economic nodes and new cities; and
The ‘Southern Corridor’, encompassing the economy of the Sedibeng district and the
creation of new industries, new economic nodes and new cities.
It is envisaged that the province will strategically use land owned by government and
prioritise development approvals in these corridors, as the development of these
corridors will ensure balanced economic growth, infrastructure development,
sustained employment and significant economic empowerment across the entire city
region.
Gauteng Employment, Growth and Development Strategy (GEDS)
The GEDS is an action-oriented strategy for all sectors of society in Gauteng and reflects the
following six strategic objectives:
provision of social and economic infrastructure and services that will build sustainable
communities and contribute to halving poverty;
accelerated, labour-absorbing economic growth that increases per annum and that will
create long-term sustainable jobs and contribute to halving unemployment;
sustainable socio-economic development;
enhanced government efficiency and cooperative governance;
deepening participatory democracy, provincial and national unity and citizenship; and
contribution to the successful achievement of NEPAD’s goals and objectives.
The GEDS is currently under review.
Provincial Spatial Development Framework
The Gauteng Provincial Spatial Development Framework (2011) reflects Ekurhuleni, ORTIA
as one of the three legs of the provincial economic triangle and is used as such for the
purposes of developing Ekurhuleni Metropolitan Spatial Development Framework. The other
two legs are the City of Johannesburg and the City of Tshwane.
The Gauteng Spatial Development Framework is currently under review.
Gauteng Strategic Development Perspective (GSDP)
The primary function of the GSDP is to serve as a common platform for planning and
investment, in that it is a tool to help all stakeholders in the province agree on a common
understanding of the nature and functioning of the provincial space economy.
25-Year Gauteng Integrated Transport Master Plan:
The aim of the 25-Year Gauteng Transport Implementation Plan (GITMP25) is to “fast-track”
the implementation of certain urgent initiatives and projects. These include major projects
that are already set out in the range of transport plans prepared at the respective spheres of
government recently.
The 25-Year Gauteng Integrated Transport Master Plan (GITMP25) proposes eight key
interventions:
subsidised housing provision within urban core areas;
land use densification in support of public transport;
reinforcing the passenger rail network as the backbone of the system;
extending the integrated rapid and road-based public transport networks;
strengthening freight hubs;
ensuring effective travel demand management;
mainstreaming non-motorised transport; and
ensuring continued provincial wide mobility.
The GITMP25 states that “Land-use and transportation should be better integrated through
processes of land use densification and TODs along the priority public transport network within
the urban core of Gauteng.
Gauteng Environmental Management Framework
The objectives of the Gauteng Environmental Framework are:
to make it efficient for urban development (including associated service infrastructure)
to occur in defined selected areas with lower environmental concerns and high
development demand to help facilitate the implementation Gauteng Growth and
Management Perspective, 2014;
to facilitate the optimal use of current industrial, mining land and other suitable derelict
land for the development of non-polluting industrial and large commercial
developments;
to protect Critical Biodiversity Areas (CBAs as defined in C-Plan 3.3) within urban and
rural environments;
to ensure the proper integration Ecological Support Areas (ESAs as defined in C-Plan
3.3) into rural land use change and development;
to use ESAs as defined in municipal bioregional plans in spatial planning of urban
open space corridors and links within urban areas; and
to focus on the sustainability of development through the implementation of initiatives
such as:
o energy efficiency programmes, plans and designs;
o waste minimisation, re-use and recycling;
o green infrastructure in urban areas; and
o Sustainable Drainage Systems (SuDS).
The Gauteng Provincial Environmental Management Framework as gazetted on 22 May 2015
has now replaced all Environmental Management Frameworks in the Province, including
those at a local level.
Global City Region Concept (GCRC)
The purpose of the GCRC is to build Gauteng into an integrated and globally competitive
region where the economic activities of different parts of the province complement each other
in consolidating Gauteng as an economic hub of Africa and an internationally recognised
global city region.
The GCR concept aims to develop the Province based on the following principles:
reducing reliance on private mobility in favour of safe, convenient and affordable public
transport and non-motorised transport;
reducing present rates of non-renewable energy usage;
Reducing rates of energy expended on the manufacture of goods, the delivery of these
goods to market and the import of goods;
integrating open space systems into the city region and providing sustainable
ecosystems, urban agriculture, and quality of life as a fundamental of the province’s
development patterns.; and
promoting a democratic urban order to offer opportunities for all.
Gauteng 2055
This is a process by the Gauteng Provincial Government to produce a development strategy
for the Gauteng City Region in 2055 that:
Is credible;
enjoys broad ownership;
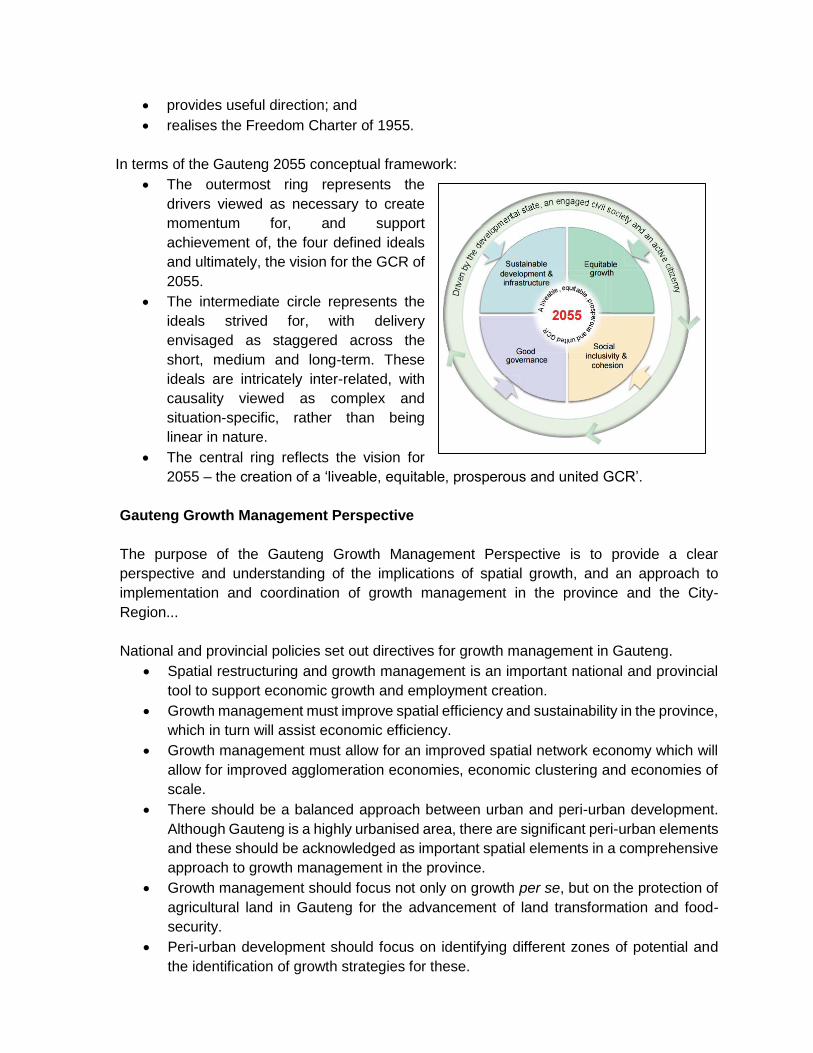
provides useful direction; and
realises the Freedom Charter of 1955.
In terms of the Gauteng 2055 conceptual framework:
The outermost ring represents the
drivers viewed as necessary to create
momentum for, and support
achievement of, the four defined ideals
and ultimately, the vision for the GCR of
2055.
The intermediate circle represents the
ideals strived for, with delivery
envisaged as staggered across the
short, medium and long-term. These
ideals are intricately inter-related, with
causality viewed as complex and
situation-specific, rather than being
linear in nature.
The central ring reflects the vision for
2055 – the creation of a ‘liveable, equitable, prosperous and united GCR’.
Gauteng Growth Management Perspective
The purpose of the Gauteng Growth Management Perspective is to provide a clear
perspective and understanding of the implications of spatial growth, and an approach to
implementation and coordination of growth management in the province and the City-
Region...
National and provincial policies set out directives for growth management in Gauteng.
Spatial restructuring and growth management is an important national and provincial
tool to support economic growth and employment creation.
Growth management must improve spatial efficiency and sustainability in the province,
which in turn will assist economic efficiency.
Growth management must allow for an improved spatial network economy which will
allow for improved agglomeration economies, economic clustering and economies of
scale.
There should be a balanced approach between urban and peri-urban development.
Although Gauteng is a highly urbanised area, there are significant peri-urban elements
and these should be acknowledged as important spatial elements in a comprehensive
approach to growth management in the province.
Growth management should focus not only on growth per se, but on the protection of
agricultural land in Gauteng for the advancement of land transformation and food-
security.
Peri-urban development should focus on identifying different zones of potential and
the identification of growth strategies for these.
Urban sprawl should be contained and possibly reversed, as denser forms of
development are more efficient in terms of land usage, infrastructure cost and
environmental protection.
Growth management should assist with improved movement systems through
improved urban linkages and land-use, and transportation integration around transport
corridors and Transit Oriented Developments (TODs).
Areas with existing demonstrated economic potential should form focus areas for
intensification and investment. However, economic growth and its spatial
manifestation should find ways of being more equitably distributed across the urban
environment, including marginalised areas.
A much greater degree of spatial integration and overlap between disadvantaged
areas and areas of economic activity must be ensured. Spatial growth should
therefore focus on creating linkages between these areas, but at the same time ensure
that such linkages are realistic and sustainable.
The proposals and outcomes of growth management must be measurable against the
five national principles for spatial development, spatial justice, spatial sustainability,
spatial resilience, spatial equality and spatial efficiency;
Growth management must support the Gauteng Vision 2055 ideals of (i) equitable
growth, (ii) social inclusivity and cohesion, (iii) sustainable development and
infrastructure and (iv) good governance.
Municipal level
Within the context of EMM, the mandate of the City Planning Department is key in developing
and promoting an integrated city that addresses spatial injustices and guides spatial
development to a sustainable, vibrant and developmental city.
In ensuring that the city’s spatial footprint meets the needs of communities as expressed in
the IDP, the city planning department ensures that levers such as policies and budget,
adequately respond to the spatial trajectory of the city expressed in the planning discourse,
GDS 2055, MSDF, guidelines for land-use management, development of a capital investment
framework and by-laws.
At the centre of the city planning department is a package of plans that direct investment and
development strategic areas of the city. Spatial planning is guided by the vision of the city
(GDS 2055). Long terms spatial development framework gives effect to the vision of the city,
through the IDP. Furthermore, special projects and geographic information systems give
strategic impact on the desired outcomes on the development and transformation of the city.
The City planning discourse subscribes to inter alia the following planning principles:
movements networks and systems;
densification of human settlements;
transport oriented development;
polycentric spatial structure;
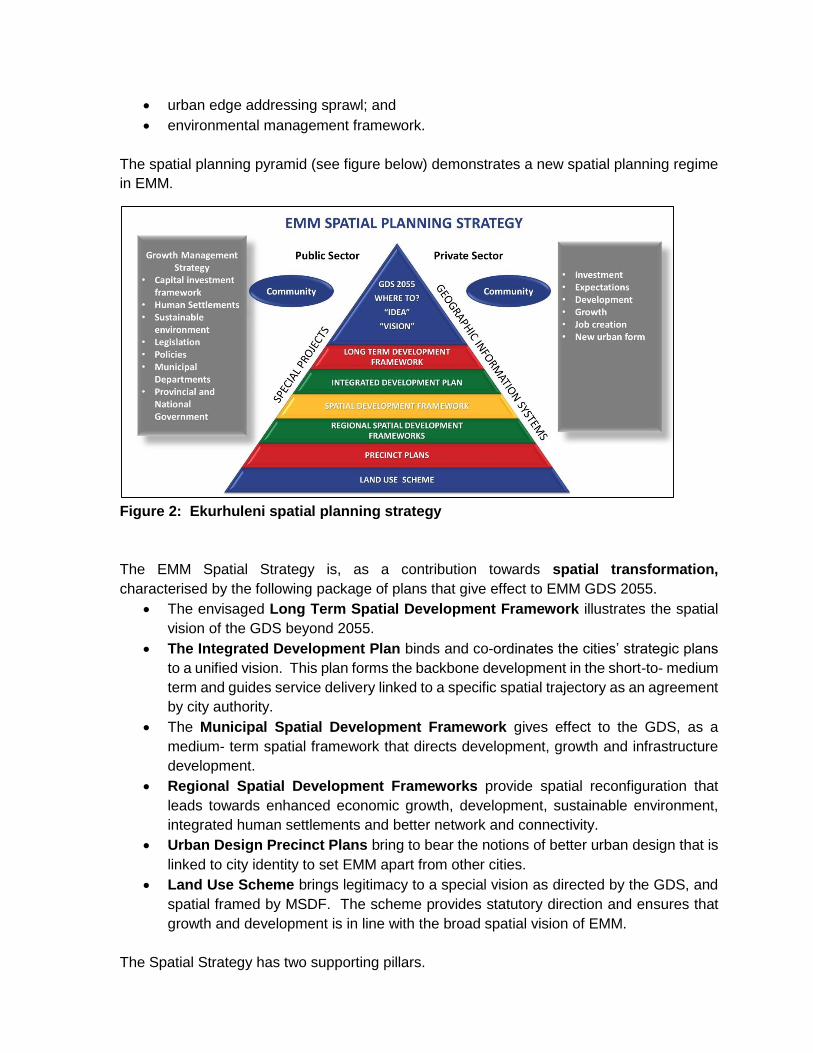
urban edge addressing sprawl; and
environmental management framework.
The spatial planning pyramid (see figure below) demonstrates a new spatial planning regime
in EMM.
Figure 2: Ekurhuleni spatial planning strategy
The EMM Spatial Strategy is, as a contribution towards spatial transformation,
characterised by the following package of plans that give effect to EMM GDS 2055.
The envisaged Long Term Spatial Development Framework illustrates the spatial
vision of the GDS beyond 2055.
The Integrated Development Plan binds and co-ordinates the cities’ strategic plans
to a unified vision. This plan forms the backbone development in the short-to- medium
term and guides service delivery linked to a specific spatial trajectory as an agreement
by city authority.
The Municipal Spatial Development Framework gives effect to the GDS, as a
medium- term spatial framework that directs development, growth and infrastructure
development.
Regional Spatial Development Frameworks provide spatial reconfiguration that
leads towards enhanced economic growth, development, sustainable environment,
integrated human settlements and better network and connectivity.
Urban Design Precinct Plans bring to bear the notions of better urban design that is
linked to city identity to set EMM apart from other cities.
Land Use Scheme brings legitimacy to a special vision as directed by the GDS, and
spatial framed by MSDF. The scheme provides statutory direction and ensures that
growth and development is in line with the broad spatial vision of EMM.
The Spatial Strategy has two supporting pillars.
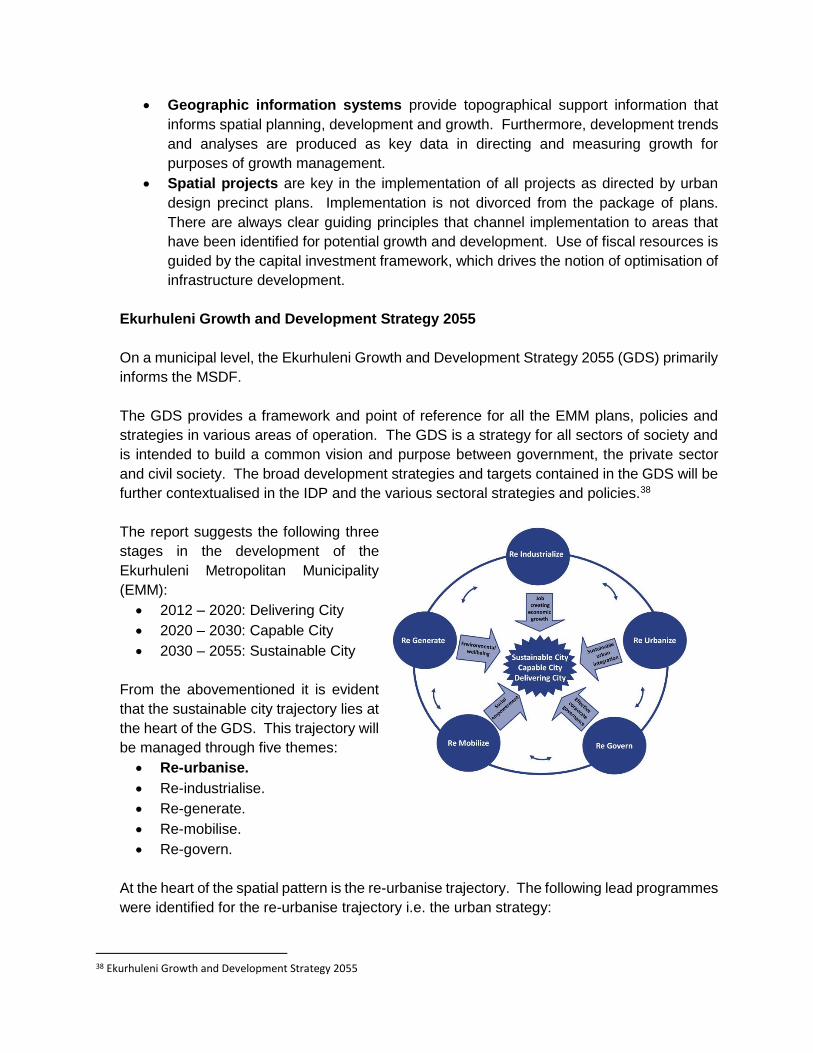
Geographic information systems provide topographical support information that
informs spatial planning, development and growth. Furthermore, development trends
and analyses are produced as key data in directing and measuring growth for
purposes of growth management.
Spatial projects are key in the implementation of all projects as directed by urban
design precinct plans. Implementation is not divorced from the package of plans.
There are always clear guiding principles that channel implementation to areas that
have been identified for potential growth and development. Use of fiscal resources is
guided by the capital investment framework, which drives the notion of optimisation of
infrastructure development.
Ekurhuleni Growth and Development Strategy 2055
On a municipal level, the Ekurhuleni Growth and Development Strategy 2055 (GDS) primarily
informs the MSDF.
The GDS provides a framework and point of reference for all the EMM plans, policies and
strategies in various areas of operation. The GDS is a strategy for all sectors of society and
is intended to build a common vision and purpose between government, the private sector
and civil society. The broad development strategies and targets contained in the GDS will be
further contextualised in the IDP and the various sectoral strategies and policies.38
The report suggests the following three
stages in the development of the
Ekurhuleni Metropolitan Municipality
(EMM):
2012 – 2020: Delivering City
2020 – 2030: Capable City
2030 – 2055: Sustainable City
From the abovementioned it is evident
that the sustainable city trajectory lies at
the heart of the GDS. This trajectory will
be managed through five themes:
Re-urbanise.
Re-industrialise.
Re-generate.
Re-mobilise.
Re-govern.
At the heart of the spatial pattern is the re-urbanise trajectory. The following lead programmes
were identified for the re-urbanise trajectory i.e. the urban strategy:
38 Ekurhuleni Growth and Development Strategy 2055
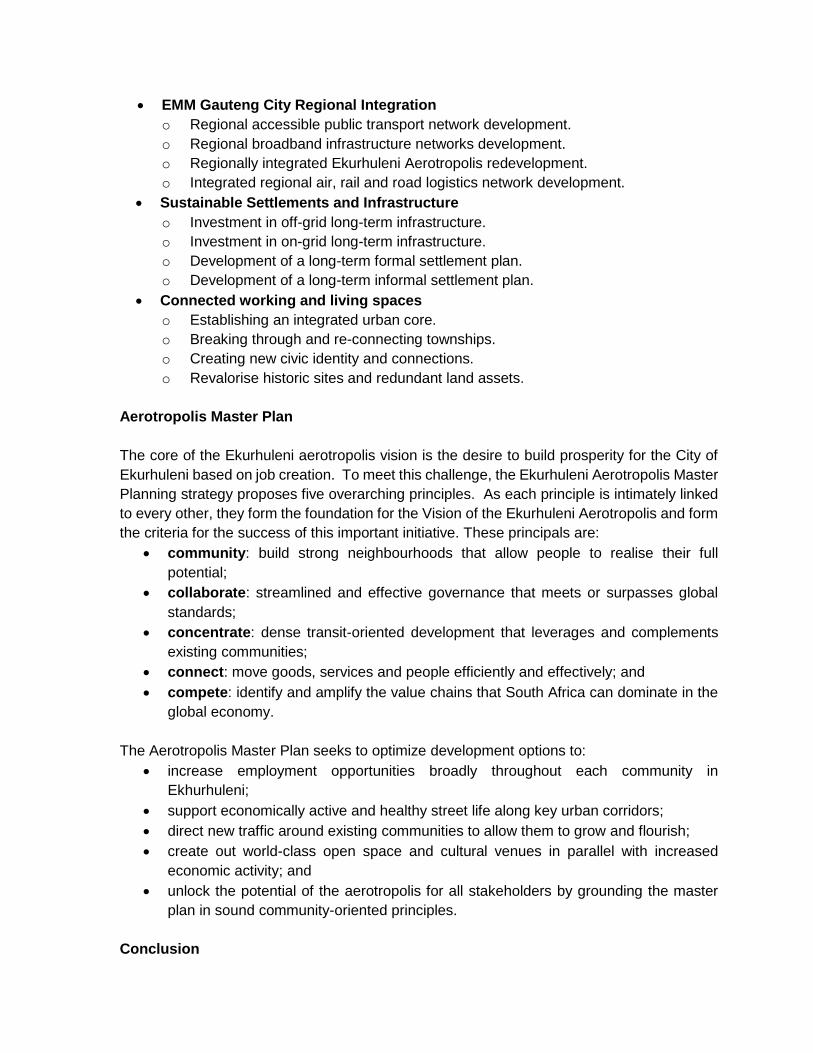
EMM Gauteng City Regional Integration
o Regional accessible public transport network development.
o Regional broadband infrastructure networks development.
o Regionally integrated Ekurhuleni Aerotropolis redevelopment.
o Integrated regional air, rail and road logistics network development.
Sustainable Settlements and Infrastructure
o Investment in off-grid long-term infrastructure.
o Investment in on-grid long-term infrastructure.
o Development of a long-term formal settlement plan.
o Development of a long-term informal settlement plan.
Connected working and living spaces
o Establishing an integrated urban core.
o Breaking through and re-connecting townships.
o Creating new civic identity and connections.
o Revalorise historic sites and redundant land assets.
Aerotropolis Master Plan
The core of the Ekurhuleni aerotropolis vision is the desire to build prosperity for the City of
Ekurhuleni based on job creation. To meet this challenge, the Ekurhuleni Aerotropolis Master
Planning strategy proposes five overarching principles. As each principle is intimately linked
to every other, they form the foundation for the Vision of the Ekurhuleni Aerotropolis and form
the criteria for the success of this important initiative. These principals are:
community: build strong neighbourhoods that allow people to realise their full
potential;
collaborate: streamlined and effective governance that meets or surpasses global
standards;
concentrate: dense transit-oriented development that leverages and complements
existing communities;
connect: move goods, services and people efficiently and effectively; and
compete: identify and amplify the value chains that South Africa can dominate in the
global economy.
The Aerotropolis Master Plan seeks to optimize development options to:
increase employment opportunities broadly throughout each community in
Ekhurhuleni;
support economically active and healthy street life along key urban corridors;
direct new traffic around existing communities to allow them to grow and flourish;
create out world-class open space and cultural venues in parallel with increased
economic activity; and
unlock the potential of the aerotropolis for all stakeholders by grounding the master
plan in sound community-oriented principles.
Conclusion
This conceptual and legislative framework forms the basis for the development of the
Ekurhuleni MSDF. Based on the National Spatial Development Perspective of 2006, the
MSDF will be informed by its comparative advantages as well as its competitive advantages.
The comparative advantage would be the provision of efficient production and service
delivery. In this instance it will entail an inward focus within Ekurhuleni that is its self-
assessment.
It will also look at the competitive advantage wherein Ekurhuleni as a developmental
metropolitan municipality will compare itself with other metropolitan municipalities and
regions.
The comparative advantage of Ekurhuleni is its industrial and manufacturing base (called the
industrial heartland of Africa). In Africa, and in South Africa in particular, the ORTIA gives the
metro tremendous corporative advantage. The transport network, the Maputo-Joburg corridor
that passes through Ekurhuleni and retail and commercial services give Ekurhuleni a
competitive advantage that the MSDF will work to improve.
CHAPTER 10
10. DISASTER MANAGEMENT PLAN
EXECUTIVE SUMMARY
Section 53(1) (a) of the Disaster Management Act, 2002 (Act 57 of 2002 – hereafter referred to
as “the Act”) requires the Municipality to prepare a disaster management plan for its area
according to the circumstances prevailing in the area and within the ambit of its municipal disaster
management framework.
Section 53(2) (a) of the Act specifies that the disaster management plan for a municipality must
form an integral part of the municipality’s integrated development plan (IDP). Section 26(g) of the
Local Government: Municipal Systems Act, 2000 lists “applicable disaster management plans” as
a core component of an IDP.
The Ekurhuleni Metropolitan Municipal Council resolution Item B-PS (10-2005) MC 07/04/2005
gives effect to the City Of Ekurhuleni Integrated Disaster Management Framework and Corporate
Disaster Management Plan for the period 2012 to 2017.
The Integrated Municipal Disaster Management Framework provides the institutional scope of
how the municipality will organize itself to deal with disaster preparedness planning, risk reduction
and response and relief responsibilities with clearly defined elements and is considered as the
‘parent’ document.
The Disaster Management Plan seeks to achieve the integration of disaster management
functions into the strategic and operational planning and project implementation of all line
functions and role players within the municipality against assessed disaster risks and through this
coordinative effort; promotes the integration of fast, efficient and effective responses to disasters
(actual or impending) by all role-players.
The Disaster Management Plan is aimed at enabling the City of Ekurhuleni to identify and then
reduce risks through proper and timely disaster risk reduction actions as well as the execution of
disaster responses; and provides all role-players with pre-determined guidelines on the processes
to be followed to save lives and protect property and the environment. Each department of council
has identified its disaster responsibilities to ensure that any response to a disaster means that
responders do not work against each other but rather complement each other to ensure a speedy
recovery from the disaster.
The plan further aims to ensure that development remains sustainable, through the embedding
of principles related to disaster risk reduction, disaster mitigation and disaster prevention into
developmental projects. This embedment is accomplished by the participation of the function in
the Development Facilitation Committee as well as other committees whose primary functions are
related to the identified disaster risks, i.e. Environmental Management Department, Health
Department and Disaster and Emergency Management Services Department.
The longer term disaster effects would continue to be coordinated from the Disaster Management
Centre using relevant departments to supply the necessary skills and direction. These actions
would ensure that recovery, rehabilitation and reconstruction (if necessary), occurs within the
context of a managed and well-coordinated environment that normalises a disaster-stricken
community as quickly as possible.
Funding of the post-disaster response occurs through utilisation of municipal funds set aside for
such contingencies; and then secondly by approaching the provincial and national government
for additional disaster response and/or disaster grant funding and by the application of municipal
finance legislation related to emergency situations.
The life cycle of the Disaster Management Plan (DMP) mirrors that of the IDP which ‘hosts’ the
DMP as part of the developmental agenda of the IDP.
The DMP is reviewed annually to ascertain progress made against actionable risk reduction, risk
mitigation and risk preparedness items and to determine whether any material and substantial
changes need to be made to the original or reviewed plan as a result of environmental, physical
and or developmental challenges in respect of disaster management planning.
Through this 2015/2016 review; it is confirmed, that steady progress is being made by the City of
Ekurhuleni in managing and monitoring its disaster management responsibilities and
implementable actions as per the plan. The Disaster Management Risk and Vulnerability
Assessment, which is currently underway, will inform us of any new and emerging disaster risks
which we need to mitigate and be prepared for.
The declared disaster of 16 November 2015 provides opportunity to test real and live disaster
response initiatives and the opportunity to learn, how to better provide for all facets of disaster
risk reduction and disaster response. The good progress being made in improving the city’s
readiness for disaster mitigation, preparedness, response and recovery, through the formalisation
of service levels agreements (SLAs) that is being pursuit between departments; Memoranda of
Understandings (MoU’s) between the City and non-governmental organisations; and the
compilation of critical infrastructure contingency plans for identified mission critical municipal
infrastructure and related life-line services will finally make our City a disaster resilient city.
CHAPTER 11
11. PERFORMANCE MANAGEMENT SYSTEM
a) INTRODUCTION
The organisational performance management system implemented aims to achieve the
following roles:
Intra-Organisational Performance Management
To ensure that there are appropriate internal controls to monitor the extent to which the
municipality and its entities are achieving the development objectives set out in the Growth
and Development Strategy, Intergraded Development Plans, Service Delivery and Budget
Implementation Plans and other strategies of national and provincial government. This
requires an ongoing monitoring of progress or lack thereof on the implementation of
programmes and projects in order to create early warnings and activate the implementation
of corrective improvement plans. It also requires a periodic evaluation and review of the
programmes or interventions implemented using the best available evidence collected
through a rigours monitoring and evaluation system.
External-Organisational Performance Accountability
To ensure that the municipality adheres to the statutory requirements that seek to promote
corporate governance. In this regard, the municipality has an obligation to communicate
performance for the purposes of governance and accountability to its stakeholders which
amongst others include provincial and national government, external oversight bodies (Office
of the Auditor General, National Treasury etc.) and the general public.
Therefore, simple and manageable processes, clear guidelines and standards, customised
controls, the right discipline and culture are the key success factors for any performance
management system.
b) LEGISLATIVE INSTRUMENTS GOVERNING PERFORMANCE MANAGEMENT
Performance management in local government is governed by a series of legislation and policy
guidelines. The most important of these include:
Municipal Structures Act, 117 of 1998
Municipal Systems Act, 32 of 2000
Municipal Finance Management Act, 56 of 2003
Municipal Planning and Performance Regulations, 2001
MUNICIPAL STRUCTURE ACT
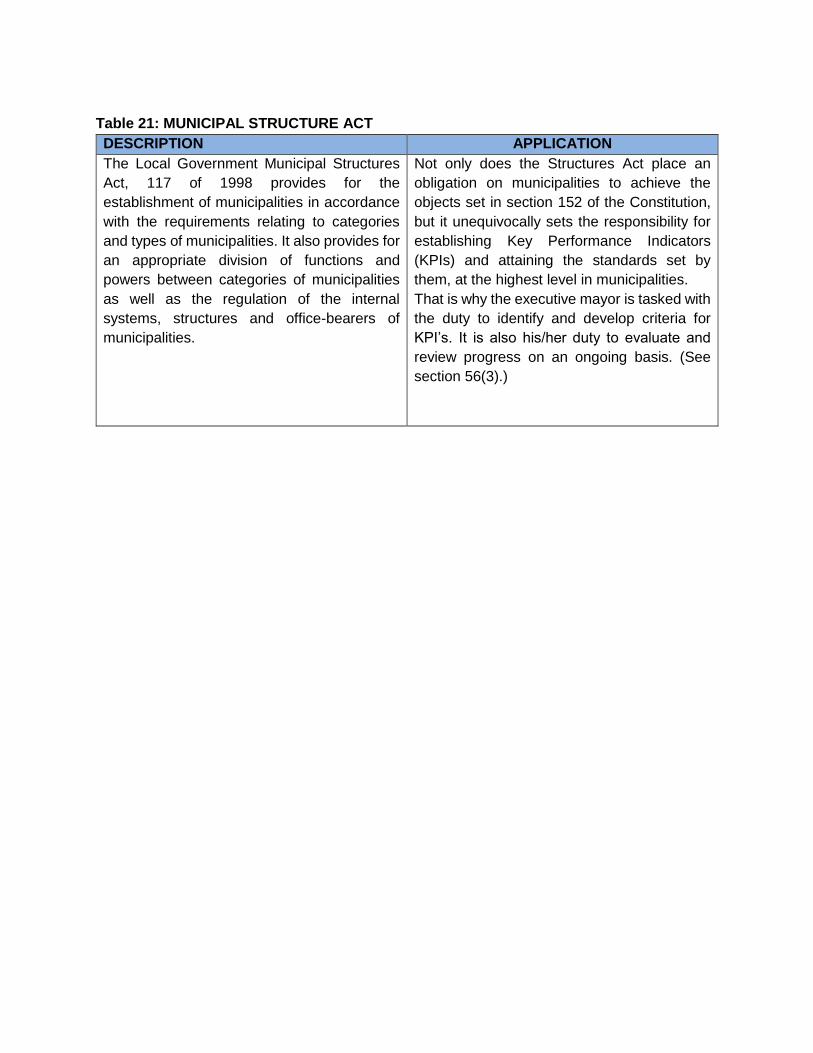
Table 21: MUNICIPAL STRUCTURE ACT
DESCRIPTION APPLICATION
The Local Government Municipal Structures
Act, 117 of 1998 provides for the
establishment of municipalities in accordance
with the requirements relating to categories
and types of municipalities. It also provides for
an appropriate division of functions and
powers between categories of municipalities
as well as the regulation of the internal
systems, structures and office-bearers of
municipalities.
Not only does the Structures Act place an
obligation on municipalities to achieve the
objects set in section 152 of the Constitution,
but it unequivocally sets the responsibility for
establishing Key Performance Indicators
(KPIs) and attaining the standards set by
them, at the highest level in municipalities.
That is why the executive mayor is tasked with
the duty to identify and develop criteria for
KPI’s. It is also his/her duty to evaluate and
review progress on an ongoing basis. (See
section 56(3).)
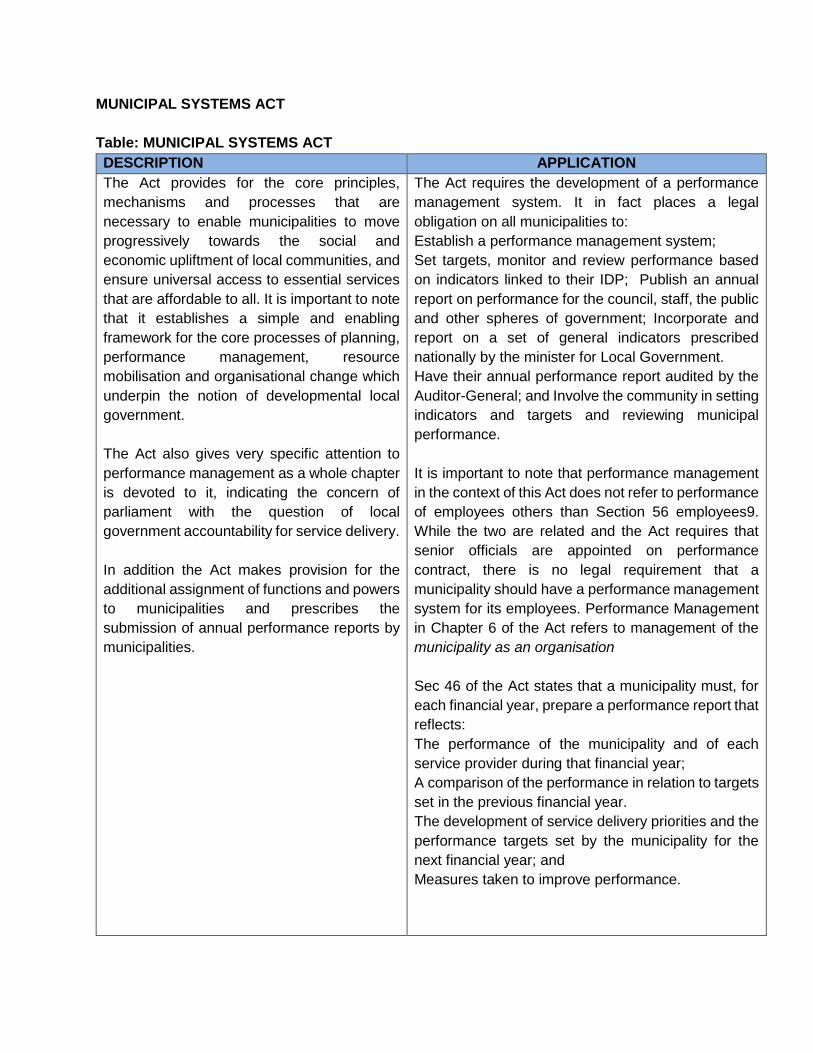
MUNICIPAL SYSTEMS ACT
Table: MUNICIPAL SYSTEMS ACT
DESCRIPTION APPLICATION
The Act provides for the core principles,
mechanisms and processes that are
necessary to enable municipalities to move
progressively towards the social and
economic upliftment of local communities, and
ensure universal access to essential services
that are affordable to all. It is important to note
that it establishes a simple and enabling
framework for the core processes of planning,
performance management, resource
mobilisation and organisational change which
underpin the notion of developmental local
government.
The Act also gives very specific attention to
performance management as a whole chapter
is devoted to it, indicating the concern of
parliament with the question of local
government accountability for service delivery.
In addition the Act makes provision for the
additional assignment of functions and powers
to municipalities and prescribes the
submission of annual performance reports by
municipalities.
The Act requires the development of a performance
management system. It in fact places a legal
obligation on all municipalities to:
Establish a performance management system;
Set targets, monitor and review performance based
on indicators linked to their IDP; Publish an annual
report on performance for the council, staff, the public
and other spheres of government; Incorporate and
report on a set of general indicators prescribed
nationally by the minister for Local Government.
Have their annual performance report audited by the
Auditor-General; and Involve the community in setting
indicators and targets and reviewing municipal
performance.
It is important to note that performance management
in the context of this Act does not refer to performance
of employees others than Section 56 employees9.
While the two are related and the Act requires that
senior officials are appointed on performance
contract, there is no legal requirement that a
municipality should have a performance management
system for its employees. Performance Management
in Chapter 6 of the Act refers to management of the
municipality as an organisation
Sec 46 of the Act states that a municipality must, for
each financial year, prepare a performance report that
reflects:
The performance of the municipality and of each
service provider during that financial year;
A comparison of the performance in relation to targets
set in the previous financial year.
The development of service delivery priorities and the
performance targets set by the municipality for the
next financial year; and
Measures taken to improve performance.
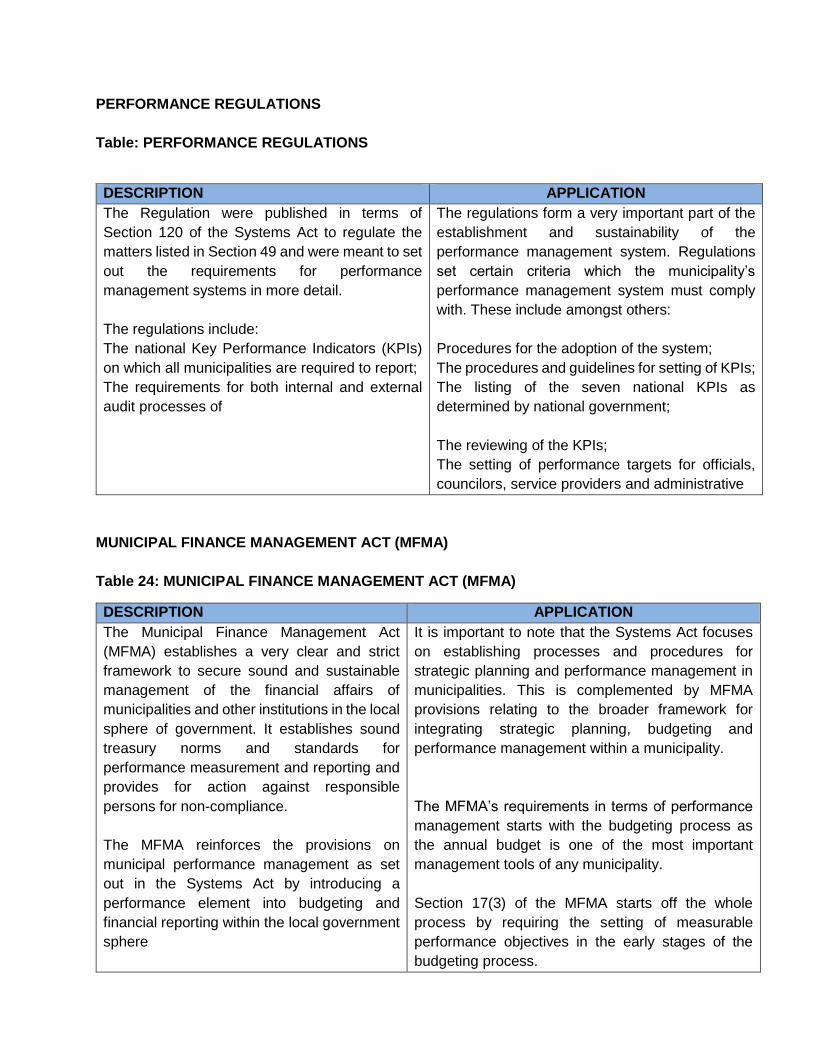
PERFORMANCE REGULATIONS
Table: PERFORMANCE REGULATIONS
DESCRIPTION APPLICATION
The Regulation were published in terms of
Section 120 of the Systems Act to regulate the
matters listed in Section 49 and were meant to set
out the requirements for performance
management systems in more detail.
The regulations include:
The national Key Performance Indicators (KPIs)
on which all municipalities are required to report;
The requirements for both internal and external
audit processes of
The regulations form a very important part of the
establishment and sustainability of the
performance management system. Regulations
set certain criteria which the municipality’s
performance management system must comply
with. These include amongst others:
Procedures for the adoption of the system;
The procedures and guidelines for setting of KPIs;
The listing of the seven national KPIs as
determined by national government;
The reviewing of the KPIs;
The setting of performance targets for officials,
councilors, service providers and administrative
MUNICIPAL FINANCE MANAGEMENT ACT (MFMA)
Table 24: MUNICIPAL FINANCE MANAGEMENT ACT (MFMA)
DESCRIPTION APPLICATION
The Municipal Finance Management Act
(MFMA) establishes a very clear and strict
framework to secure sound and sustainable
management of the financial affairs of
municipalities and other institutions in the local
sphere of government. It establishes sound
treasury norms and standards for
performance measurement and reporting and
provides for action against responsible
persons for non-compliance.
The MFMA reinforces the provisions on
municipal performance management as set
out in the Systems Act by introducing a
performance element into budgeting and
financial reporting within the local government
sphere
It is important to note that the Systems Act focuses
on establishing processes and procedures for
strategic planning and performance management in
municipalities. This is complemented by MFMA
provisions relating to the broader framework for
integrating strategic planning, budgeting and
performance management within a municipality.
The MFMA’s requirements in terms of performance
management starts with the budgeting process as
the annual budget is one of the most important
management tools of any municipality.
Section 17(3) of the MFMA starts off the whole
process by requiring the setting of measurable
performance objectives in the early stages of the
budgeting process.
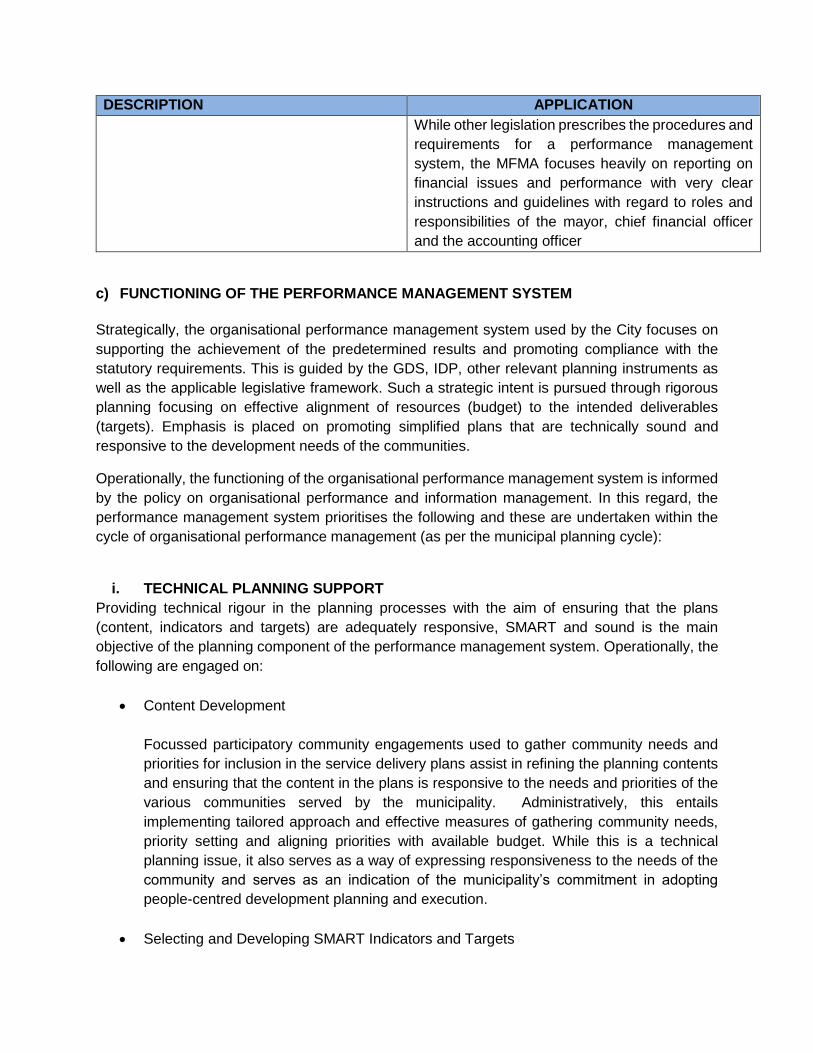
DESCRIPTION APPLICATION
While other legislation prescribes the procedures and
requirements for a performance management
system, the MFMA focuses heavily on reporting on
financial issues and performance with very clear
instructions and guidelines with regard to roles and
responsibilities of the mayor, chief financial officer
and the accounting officer
c) FUNCTIONING OF THE PERFORMANCE MANAGEMENT SYSTEM
Strategically, the organisational performance management system used by the City focuses on
supporting the achievement of the predetermined results and promoting compliance with the
statutory requirements. This is guided by the GDS, IDP, other relevant planning instruments as
well as the applicable legislative framework. Such a strategic intent is pursued through rigorous
planning focusing on effective alignment of resources (budget) to the intended deliverables
(targets). Emphasis is placed on promoting simplified plans that are technically sound and
responsive to the development needs of the communities.
Operationally, the functioning of the organisational performance management system is informed
by the policy on organisational performance and information management. In this regard, the
performance management system prioritises the following and these are undertaken within the
cycle of organisational performance management (as per the municipal planning cycle):
i. TECHNICAL PLANNING SUPPORT
Providing technical rigour in the planning processes with the aim of ensuring that the plans
(content, indicators and targets) are adequately responsive, SMART and sound is the main
objective of the planning component of the performance management system. Operationally, the
following are engaged on:
Content Development
Focussed participatory community engagements used to gather community needs and
priorities for inclusion in the service delivery plans assist in refining the planning contents
and ensuring that the content in the plans is responsive to the needs and priorities of the
various communities served by the municipality. Administratively, this entails
implementing tailored approach and effective measures of gathering community needs,
priority setting and aligning priorities with available budget. While this is a technical
planning issue, it also serves as a way of expressing responsiveness to the needs of the
community and serves as an indication of the municipality’s commitment in adopting
people-centred development planning and execution.
Selecting and Developing SMART Indicators and Targets
This entails using conceptual, logical and practical techniques to influence the quality of
indicators developed and targets set against specific development objectives and service
delivery commitments. This process also considers the programme content to select what
must be measured in line with the priorities and needs gathered in relation to the desired
results (outputs and outcomes). A process of rigorous consultation with programme
managers or line function departments and entities is followed as part of the technical
refinement of both content (service focus and baseline), performance indicators and
targets.
ii. ONGOING MONITORING The monitoring component of the performance management system focuses on tracking the
implementation of commitments, progress made and observations on what is not going according
to plan for early warning signals. In the main this functional area focuses on:
Strengthening of the frontline service delivery monitoring and institutionalisation of onsite
monitoring visits to identify service delivery bottle necks for early warnings and
implementation of tailored interventions as corrective measures where necessary;
Institutionalisation of and building of effective project management functions and
capabilities to support the completion of capital projects and achievement of the intended
project results;
Strengthening of oversight reporting as a monitoring mechanisms to improve
accountability and transparency; and
Tracking whether the commitments emanating from participatory community
engagements and community priority setting are carried through as intended in order to
express responsiveness
iii. IMPROVEMENT OF PERFORMANCE REPORTING
The performance reporting component of the performance management system provides for
learnings and facilitates early warning and improvements. It also serves as a mechanism to
express accountability and transparency. In pursuit of achieving these objectives, the
performance reporting component of the system focuses on:
Developing customised organisational performance reporting protocols supported by
detailed clarification of reporting requirements and standards;
Supporting business units to account adequately for performance in their respective
functional areas in order to improve the usefulness and reliability of performance reported
to Council, communities and other external oversight bodies;
Formalization of the process for collecting, collating, verification, transcription, analysis
and auditing of performance data. This includes defining the processes, developing
monitoring standards for data quality, defining the reporting protocols, clarification of roles
and responsibilities throughout the performance management value chain;
Ensuring that the reporting timelines and quality reporting requirements for compliance
reports are met consistently;
Ensuring that the information reported is useful and reliable at all times
Providing evidence-based information in order to support the decision making processes
of the municipality
The strengthening of reporting mechanisms contributes significantly in promoting participatory
development. This is expressed through transparent reporting to communities and other interests
groups including other external oversight bodies thus promoting accountability.
iv. INSTITUTIONALISATION OF EVALUATIONS
As a service delivery organisation, the municipality commits to making evidence not just useful
but usable and also commits to increasing the uptake of evidence in both practice and strategic
decision making processes. Therefore, the institutionalisation of programme evaluations as part
of the performance management system has become a preoccupation of the municipality.
Evaluations promote critical reflection and review of policy and programmes through a rigours
process of determining the worth and significance of programmes or interventions. As the City
improves its integrated development planning, budgeting, implementation and reporting,
evaluations are also made an integral part of its efforts that support its performance management
system. A phased approach in the institutionalisation of evaluations has been adopted.
The approach to the incremental implementation of an evaluation programme is to currently
prioritise small scale process evaluations through insourcing although there are capacity
challenges. As this matures, large scale evaluations i.e. infrastructure impact evaluations will be
considered.
v. CONCLUSION
The performance management system adopted by the municipality supports the statutory
requirements set out by various legislation and as set out by the National Treasury. The system
is also adapted to the national government and the local government planning cycle in order to
promote compliance with relevant legislation. Furthermore, a process to entrench a system of
controls throughout the system is currently being instituted to advance the desired management
practices.
The details presented above provide a brief summary of the City’s organisational performance
management system. It is worth noting that the formalisation of the system is currently underway
and the effectiveness of the system hinges on the following key success factors:

Management support;
Adequate adherence to the imperatives and guidance provided by the policy on
organisational performance and information management; and
Adopting a culture of continues learning and improvement.