pelatihan tata boga /tata rias - Pemerintah Kota Tasikmalaya
Upload
khangminh22Category
view
7download
0
1
Results PresentationFinancial quarter ended September 30, 2018November 13, 2018
2
Safe harbor statement
Statements in this presentation describing the Company’s performance may be
“forward looking statements” within the meaning of applicable securities laws and
regulations. Actual results may differ materially from those directly or indirectly
expressed, inferred or implied. Important factors that could make a difference to the
Company’s operations include, among others, economic conditions affecting
demand/supply and price conditions in the domestic and overseas markets in which
the Company operates, changes in or due to the environment, Government
regulations, laws, statutes, judicial pronouncements and/or other incidental factors.
3
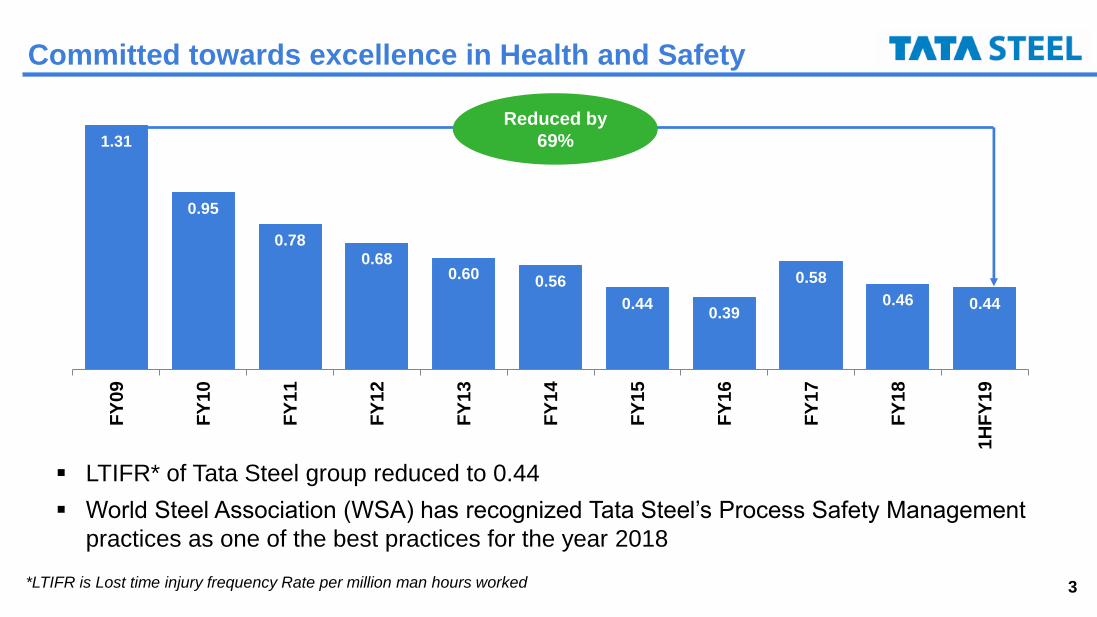
1.31
0.95
0.780.68
0.60 0.56
0.440.39
0.58
0.46 0.44
FY
09
FY
10
FY
11
FY
12
FY
13
FY
14
FY
15
FY
16
FY
17
FY
18
1H
FY
19
*LTIFR is Lost time injury frequency Rate per million man hours worked
Committed towards excellence in Health and Safety
▪ LTIFR* of Tata Steel group reduced to 0.44
▪ World Steel Association (WSA) has recognized Tata Steel’s Process Safety Management
practices as one of the best practices for the year 2018
Reduced by
69%
4
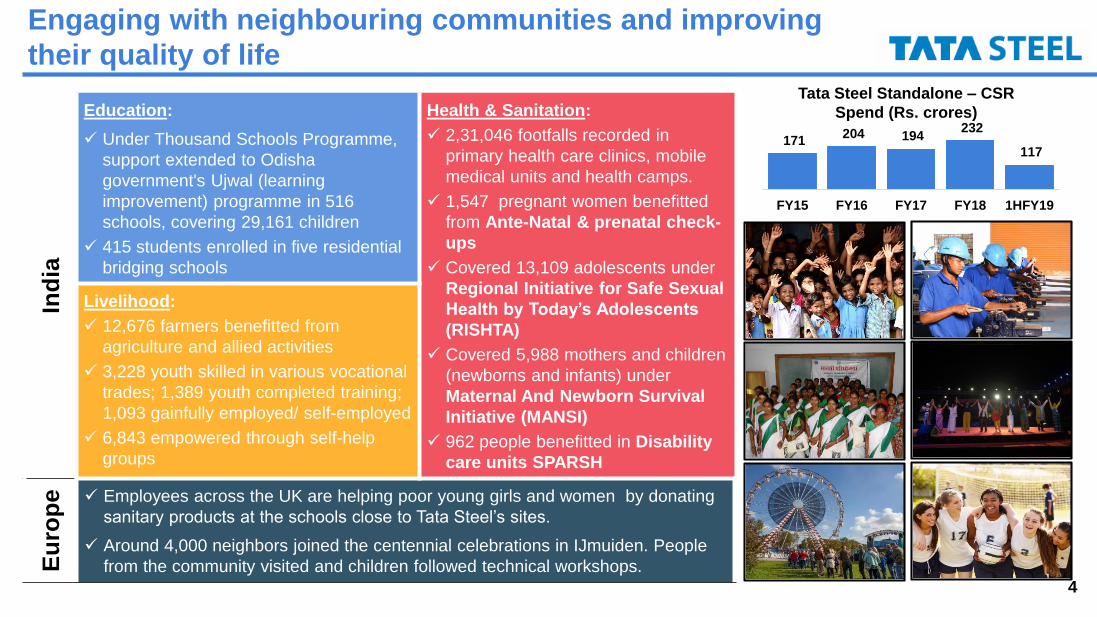
171 204 194
232
117
FY15 FY16 FY17 FY18 1HFY19
Engaging with neighbouring communities and improving
their quality of lifeTata Steel Standalone – CSR
Spend (Rs. crores)
Ind
ia
Education:
✓ Under Thousand Schools Programme,
support extended to Odisha
government's Ujwal (learning
improvement) programme in 516
schools, covering 29,161 children
✓ 415 students enrolled in five residential
bridging schools
Health & Sanitation:
✓ 2,31,046 footfalls recorded in
primary health care clinics, mobile
medical units and health camps.
✓ 1,547 pregnant women benefitted
from Ante-Natal & prenatal check-
ups
✓ Covered 13,109 adolescents under
Regional Initiative for Safe Sexual
Health by Today’s Adolescents
(RISHTA)
✓ Covered 5,988 mothers and children
(newborns and infants) under
Maternal And Newborn Survival
Initiative (MANSI)
✓ 962 people benefitted in Disability
care units SPARSH
Livelihood:
✓ 12,676 farmers benefitted from
agriculture and allied activities
✓ 3,228 youth skilled in various vocational
trades; 1,389 youth completed training;
1,093 gainfully employed/ self-employed
✓ 6,843 empowered through self-help
groups
Eu
rop
e ✓ Employees across the UK are helping poor young girls and women by donating
sanitary products at the schools close to Tata Steel’s sites.
✓ Around 4,000 neighbors joined the centennial celebrations in IJmuiden. People
from the community visited and children followed technical workshops.

5Tata Steel India includes Tata Steel standalone and Bhushan Steel
UML: Usha Martin Limited
Key highlights
European
Commission
begins review of
tkTSE JV
Definitive
agreement for
acquisition of
UML’s Steel
business
Tata Steel India
sales growth
stronger than
market
Tata Steel India
volumes at 4.32 mt,
58% of group
deliveries
Consolidated
EBITDA of
Rs.9,000 crores
Tata Steel
standalone
EBITDA/t at
Rs.19,241/t
TSK Phase II
expansion on
track
Bhushan Steel
normalised
financials
included
6
Agenda
Operational Performance
Financial Performance
Business Environment
Appendix

7
1,2
86
65
9
62
7
1,3
47
69
9
64
8
World China World ExChina
Production 9M CY17
Production 9M CY18
Crude steel production (in mn tons)
-1
0
1
2
3
4
5
6
1999 2004 2009 2014 2019
World GDP growth (% YoY)
Source: IMF, World Steel Association, Bloomberg
Global steel demand was resilient with steady economic
growth
1,5
95
73
7 85
9
1,6
58
78
1
87
7
World China World ExChina
Demand 2017
Demand 2018(f)
Demand growth forecast (In mn tons)
▪ Economic growth remained steady on improved investment activities in developed economies and
stabilization in emerging economies;
▪ Steel demand remained resilient with an estimate to grow at 3.9%YoY during CY2018
▪ Steel production grew by 4.7%YoY in 9MCY18; driven by higher production by China in the recent months
▪ Rising trade tensions, oil prices, interest rates in US coupled with sharp weakness of currencies are a cause
of concern
8
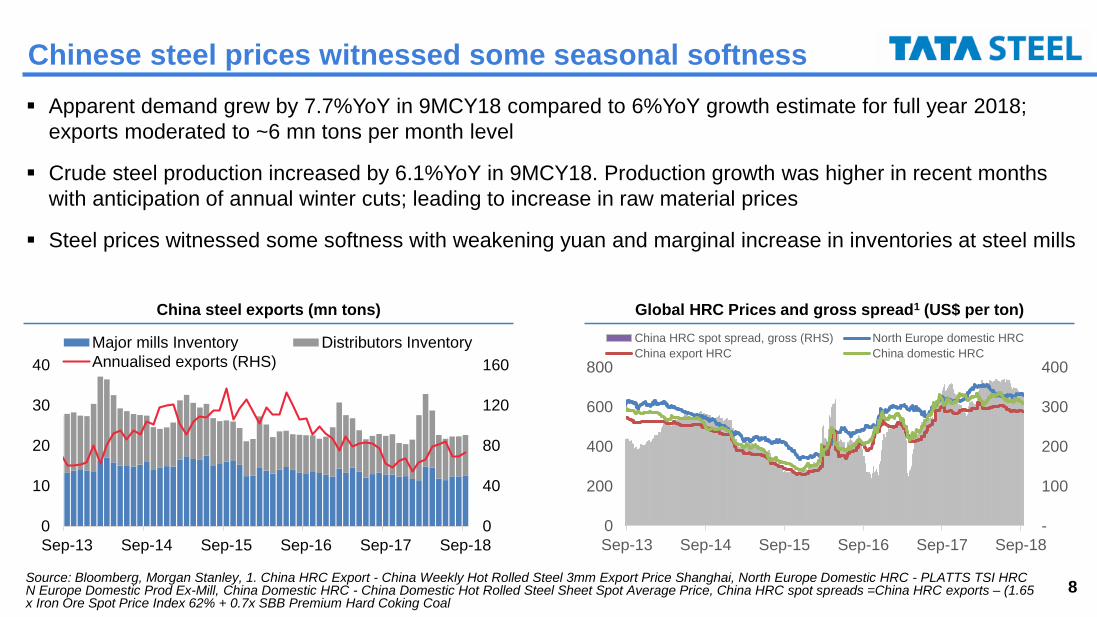
▪ Apparent demand grew by 7.7%YoY in 9MCY18 compared to 6%YoY growth estimate for full year 2018;
exports moderated to ~6 mn tons per month level
▪ Crude steel production increased by 6.1%YoY in 9MCY18. Production growth was higher in recent months
with anticipation of annual winter cuts; leading to increase in raw material prices
▪ Steel prices witnessed some softness with weakening yuan and marginal increase in inventories at steel mills
Global HRC Prices and gross spread1 (US$ per ton)China steel exports (mn tons)
Source: Bloomberg, Morgan Stanley, 1. China HRC Export - China Weekly Hot Rolled Steel 3mm Export Price Shanghai, North Europe Domestic HRC - PLATTS TSI HRC N Europe Domestic Prod Ex-Mill, China Domestic HRC - China Domestic Hot Rolled Steel Sheet Spot Average Price, China HRC spot spreads =China HRC exports – (1.65 x Iron Ore Spot Price Index 62% + 0.7x SBB Premium Hard Coking Coal
Chinese steel prices witnessed some seasonal softness
-
100
200
300
400
0
200
400
600
800
Sep-13 Sep-14 Sep-15 Sep-16 Sep-17 Sep-18
China HRC spot spread, gross (RHS) North Europe domestic HRC
China export HRC China domestic HRC
0
40
80
120
160
0
10
20
30
40
Sep-13 Sep-14 Sep-15 Sep-16 Sep-17 Sep-18
Major mills Inventory Distributors Inventory
Annualised exports (RHS)
9
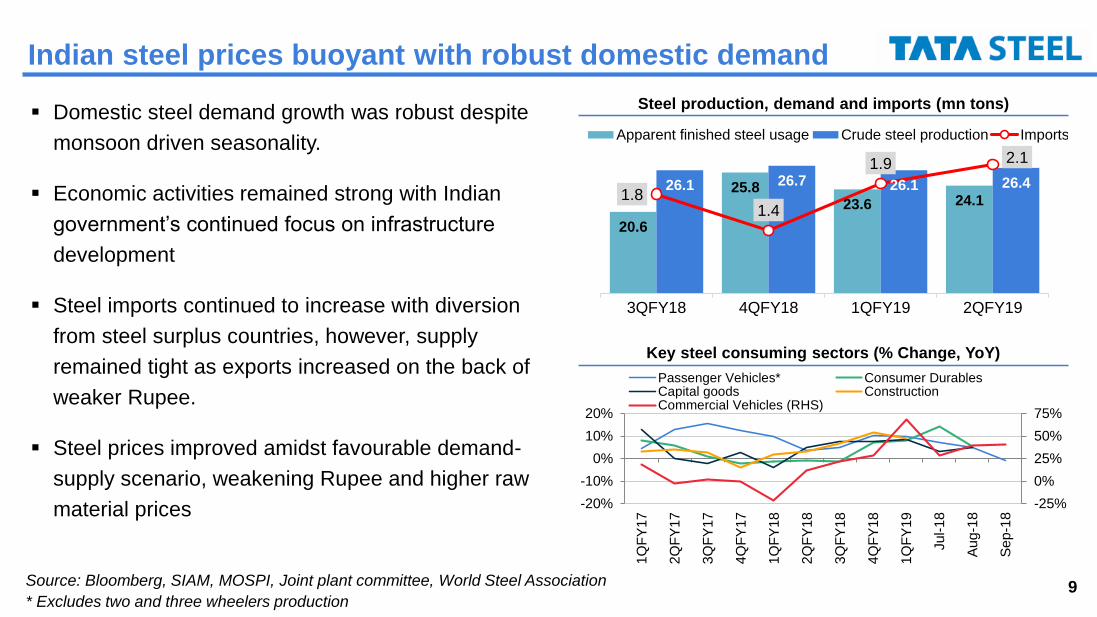
Steel production, demand and imports (mn tons)
Key steel consuming sectors (% Change, YoY)
Source: Bloomberg, SIAM, MOSPI, Joint plant committee, World Steel Association
* Excludes two and three wheelers production
Indian steel prices buoyant with robust domestic demand
▪ Domestic steel demand growth was robust despite
monsoon driven seasonality.
▪ Economic activities remained strong with Indian
government’s continued focus on infrastructure
development
▪ Steel imports continued to increase with diversion
from steel surplus countries, however, supply
remained tight as exports increased on the back of
weaker Rupee.
▪ Steel prices improved amidst favourable demand-
supply scenario, weakening Rupee and higher raw
material prices
20.6
25.823.6 24.1
26.1 26.7 26.1 26.41.8
1.4
1.9 2.1
0.7
1.2
1.7
2.2
10
12
14
16
18
20
22
24
26
28
3QFY18 4QFY18 1QFY19 2QFY19
Apparent finished steel usage Crude steel production Imports
-25%
0%
25%
50%
75%
-20%
-10%
0%
10%
20%
1Q
FY
17
2Q
FY
17
3Q
FY
17
4Q
FY
17
1Q
FY
18
2Q
FY
18
3Q
FY
18
4Q
FY
18
1Q
FY
19
Jul-
18
Au
g-1
8
Se
p-1
8
Passenger Vehicles* Consumer DurablesCapital goods ConstructionCommercial Vehicles (RHS)
10
0%
6%
12%
18%
24%
0
45
90
135
180
Ja
n-1
2
Ju
l-1
2
Ja
n-1
3
Ju
l-1
3
Ja
n-1
4
Ju
l-1
4
Ja
n-1
5
Ju
l-1
5
Jan-1
6
Ju
l-1
6
Ja
n-1
7
Ju
l-1
7
Ja
n-1
8
Ju
l-1
8
Deliveries Imports Import share (%)
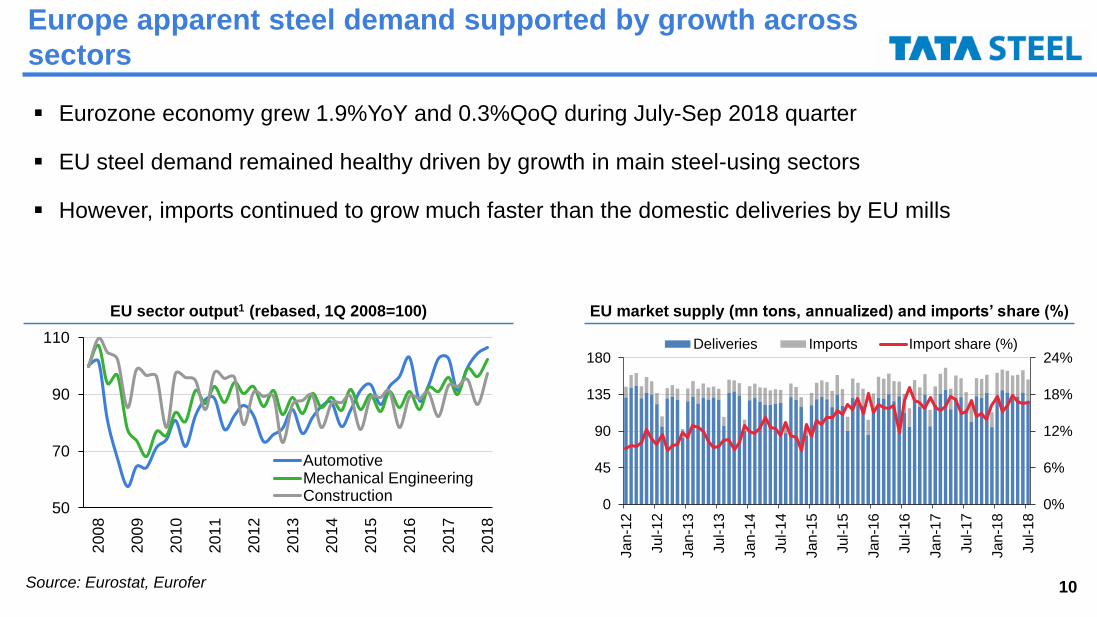
EU market supply (mn tons, annualized) and imports’ share (%)
50
70
90
110
200
8
200
9
201
0
201
1
201
2
201
3
201
4
201
5
201
6
201
7
201
8
AutomotiveMechanical EngineeringConstruction
EU sector output1 (rebased, 1Q 2008=100)
Source: Eurostat, Eurofer
Europe apparent steel demand supported by growth across
sectors
▪ Eurozone economy grew 1.9%YoY and 0.3%QoQ during July-Sep 2018 quarter
▪ EU steel demand remained healthy driven by growth in main steel-using sectors
▪ However, imports continued to grow much faster than the domestic deliveries by EU mills

11
South East Asia rebar-scrap spread (US$/tonne)Construction Growth (% Change, YoY)
Source: Bloomberg and ISSB, NESDB
SE Asia Rebar spreads improved marginally
▪ Long steel demand remained weak in Singapore and Thailand as construction sector remained sluggish
▪ South East Asia rebar spreads have softened in recent months with correction in rebar prices
-15
-5
5
15
25
Sep
-12
Ma
r-13
Sep
-13
Ma
r-14
Sep
-14
Ma
r-15
Sep
-15
Ma
r-16
Sep
-16
Ma
r-17
Sep
-17
Ma
r-18
Sep
-18
Singapore
Thailand
114 143 162 168 185
219 173 192 199 201 193 182
230 255
282 269
333 338 377 359 356 349 346 345 344
398 445 436
518 557 550 551 555 550 539 527
2Q
FY
17
3Q
FY
17
4Q
FY
17
1Q
FY
18
2Q
FY
18
3Q
FY
18
4Q
FY
18
1Q
FY
19
Ju
ly'1
8
Au
g'1
8
Se
p'1
8
Oc
t'1
8
Scrap Rebar Gap
Scrap Price
Rebar Price
12
Agenda
Operational Performance
Financial Performance
Business Environment
Appendix
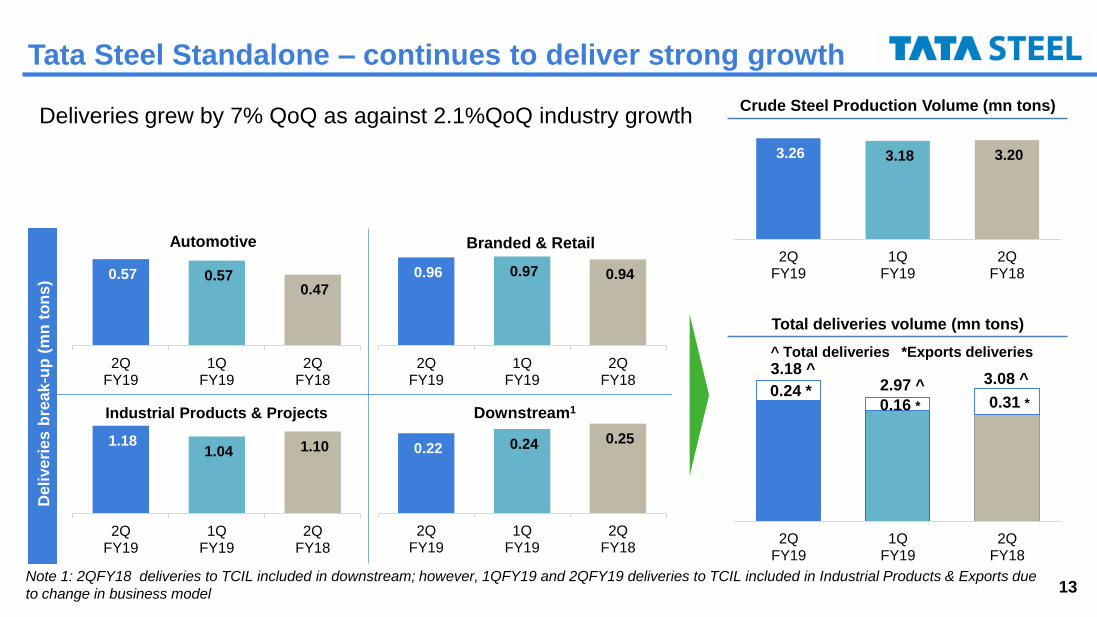
13Note 1: 2QFY18 deliveries to TCIL included in downstream; however, 1QFY19 and 2QFY19 deliveries to TCIL included in Industrial Products & Exports due
to change in business model
Deli
ve
rie
s b
rea
k-u
p (
mn
ton
s)
Tata Steel Standalone – continues to deliver strong growth
Crude Steel Production Volume (mn tons)
Total deliveries volume (mn tons)
Deliveries grew by 7% QoQ as against 2.1%QoQ industry growth
1.18 1.04 1.10
2QFY19
1QFY19
2QFY18
Industrial Products & Projects
0.22 0.24 0.25
2QFY19
1QFY19
2QFY18
Downstream1
0.96 0.97 0.94
2QFY19
1QFY19
2QFY18
Branded & Retail
0.57 0.57 0.47
2QFY19
1QFY19
2QFY18
Automotive
0.24 *0.16 * 0.31 *
3.18 ^2.97 ^ 3.08 ^
2QFY19
1QFY19
2QFY18
^ Total deliveries *Exports deliveries
3.26 3.18 3.20
2QFY19
1QFY19
2QFY18
14
Auto IPPE
Branded & Retail Downstream
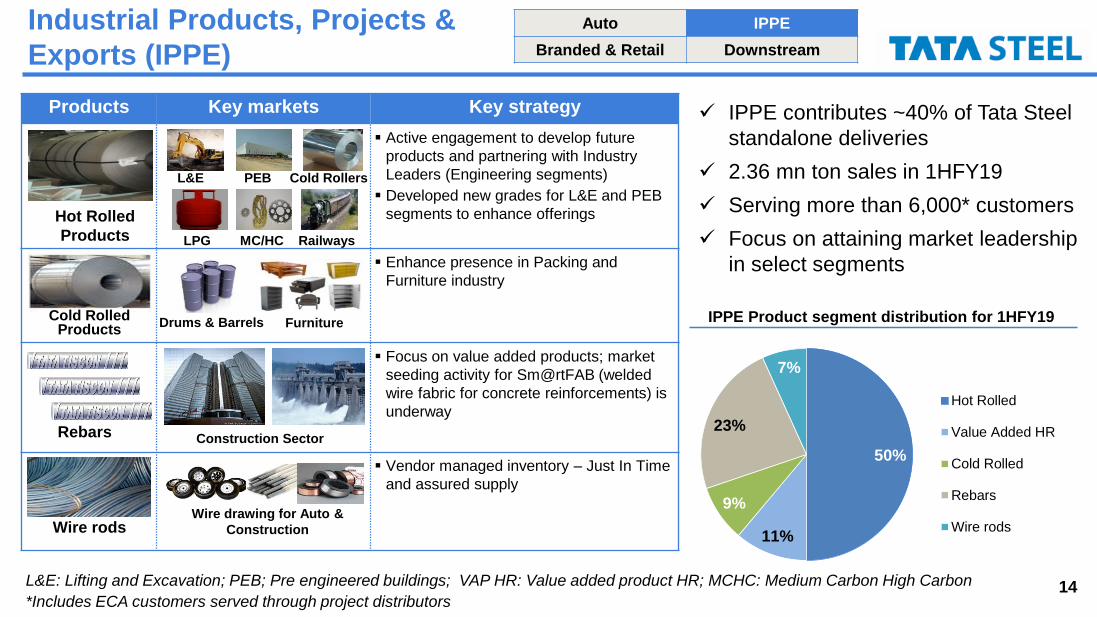
IPPE Product segment distribution for 1HFY19
L&E: Lifting and Excavation; PEB; Pre engineered buildings; VAP HR: Value added product HR; MCHC: Medium Carbon High Carbon
*Includes ECA customers served through project distributors
Industrial Products, Projects &
Exports (IPPE)
Products Key markets Key strategy
▪ Active engagement to develop future
products and partnering with Industry
Leaders (Engineering segments)
▪ Developed new grades for L&E and PEB
segments to enhance offerings
▪ Enhance presence in Packing and
Furniture industry
▪ Focus on value added products; market
seeding activity for Sm@rtFAB (welded
wire fabric for concrete reinforcements) is
underway
▪ Vendor managed inventory – Just In Time
and assured supply
Wire drawing for Auto &
Construction
FurnitureDrums & Barrels
L&E PEB Cold Rollers
LPG MC/HC Railways
Construction Sector
Hot Rolled
Products
Rebars
Cold Rolled Products
Wire rods
✓ IPPE contributes ~40% of Tata Steel
standalone deliveries
✓ 2.36 mn ton sales in 1HFY19
✓ Serving more than 6,000* customers
✓ Focus on attaining market leadership
in select segments
50%
11%
9%
23%
7%
Hot Rolled
Value Added HR
Cold Rolled
Rebars
Wire rods

15*Network of ~12000 dealers and 24 stockyards (6 hubs + 18 spokes)
Tata Steel Standalone – setting standards at multiple levels
Socially responsible corporate
CSR activities touch one million lives
every year
Market leading branded portfolio
Branded products sales contributes
41% of total sales
Market leader in Auto Steel
Auto steel sales grew 21%YoY exceeds
steel usage growth in Auto sector
Lowest cost producer
Both cash cost and conversion cost are
one of the lowest among the global peers
Sustainable business model
Domestic benchmark on various
parameters
Unparalleled Pan India reach*
Touches 2.5 million customers every
year across India
Most enriched product mix
Enriched/Value added products
contribute to 69% of total deliveries
Focus on innovation and R&D
New products in 2QFY19: 12 developed
and 6 commercialized
16
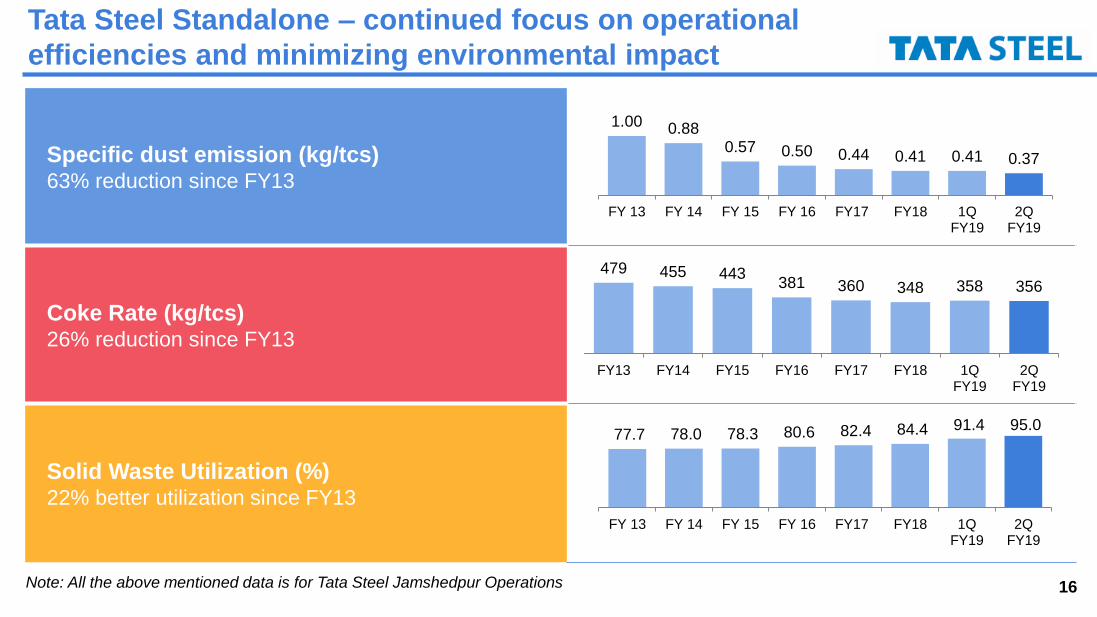
Specific dust emission (kg/tcs)63% reduction since FY13
Coke Rate (kg/tcs)26% reduction since FY13
Solid Waste Utilization (%)22% better utilization since FY13
Note: All the above mentioned data is for Tata Steel Jamshedpur Operations
Tata Steel Standalone – continued focus on operational
efficiencies and minimizing environmental impact
77.7 78.0 78.3 80.6 82.4 84.4 91.4 95.0
FY 13 FY 14 FY 15 FY 16 FY17 FY18 1QFY19
2QFY19
1.00 0.880.57 0.50 0.44 0.41 0.41 0.37
FY 13 FY 14 FY 15 FY 16 FY17 FY18 1QFY19
2QFY19
479 455 443381 360 348 358 356
FY13 FY14 FY15 FY16 FY17 FY18 1QFY19
2QFY19
17
Saleable Steel Sales Volume (mn tons)Liquid Steel Production Volume (mn tons)
Saleable Steel Sales Volume (mn tons)
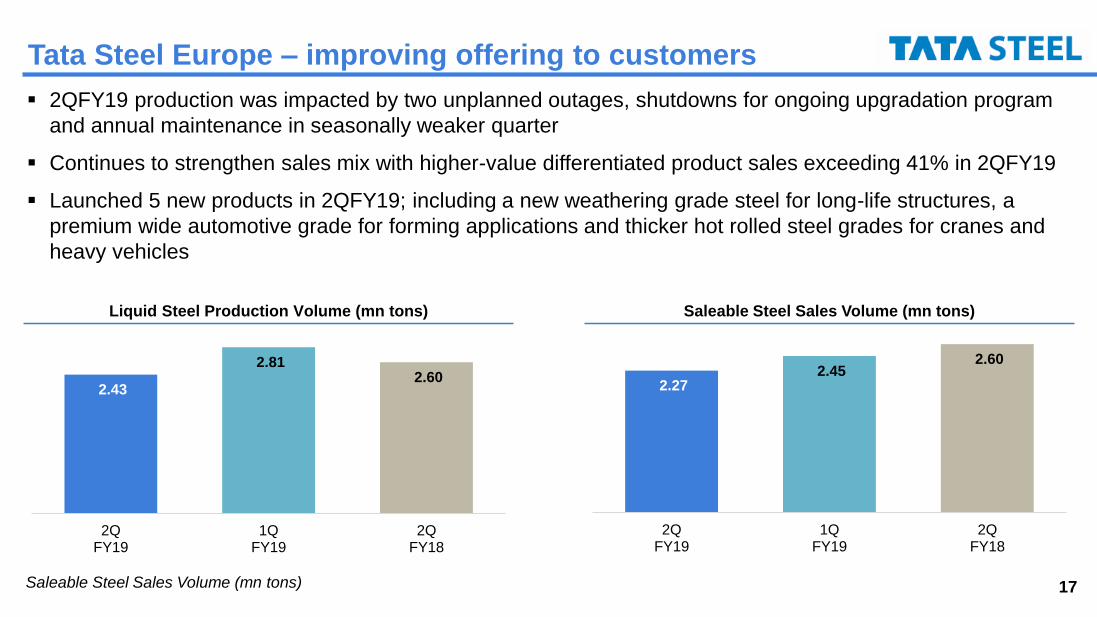
Tata Steel Europe – improving offering to customers
▪ 2QFY19 production was impacted by two unplanned outages, shutdowns for ongoing upgradation program
and annual maintenance in seasonally weaker quarter
▪ Continues to strengthen sales mix with higher-value differentiated product sales exceeding 41% in 2QFY19
▪ Launched 5 new products in 2QFY19; including a new weathering grade steel for long-life structures, a
premium wide automotive grade for forming applications and thicker hot rolled steel grades for cranes and
heavy vehicles
2.43
2.81 2.60
2QFY19
1QFY19
2QFY18
2.27 2.45
2.60
2QFY19
1QFY19
2QFY18

18
CO2 emission intensity (tCO2/tcs)5.8% reduction since FY13
Specific energy intensity* (Gcal/tcs)6.3% reduction since FY13
Specific Fuel Rate (kg/thm)4.8% reduction since FY13
All the above mentioned data is for Tata Steel Europe
Tata Steel Europe – continued focus on operational
efficiencies and minimizing environmental impact
2.07
1.97 1.951.92 1.94 1.96 1.95
FY 13 FY 14 FY 15 FY 16 FY 17 FY 18 1H FY19
5.40
5.03 4.994.89 4.93 4.96
5.06
FY 13 FY 14 FY 15 FY 16 FY17 FY18 1H FY19
525518 516
497 496500 500
FY 13 FY 14 FY 15 FY 16 FY 17 FY 18 1H FY19
19
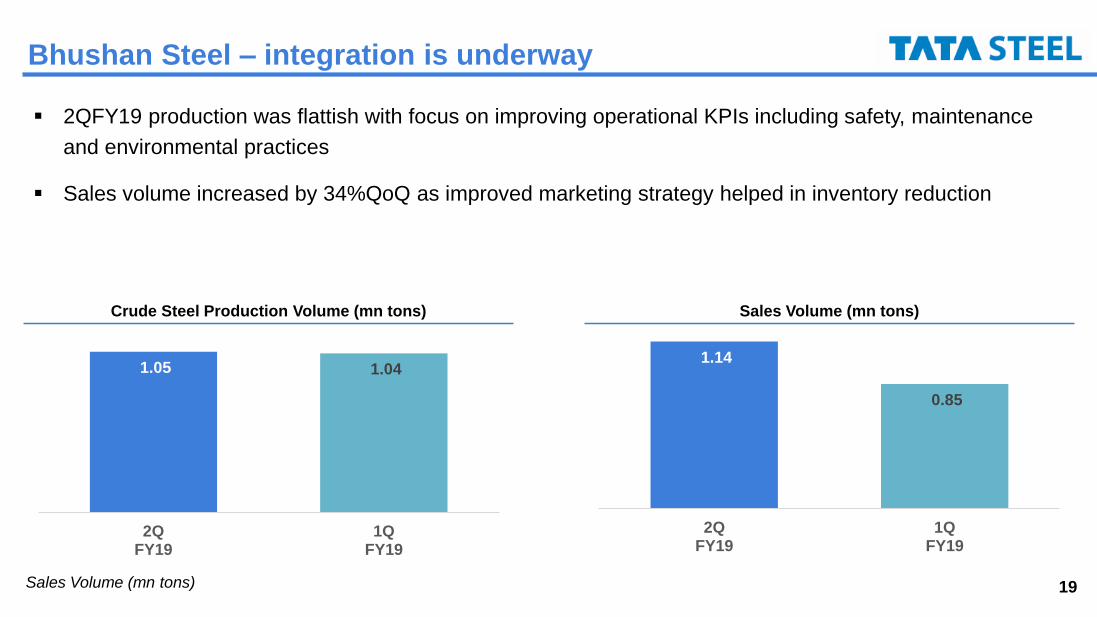
1.14
0.85
2QFY19
1QFY19
Sales Volume (mn tons)
1.05 1.04
2QFY19
1QFY19
Crude Steel Production Volume (mn tons)
Sales Volume (mn tons)
Bhushan Steel – integration is underway
▪ 2QFY19 production was flattish with focus on improving operational KPIs including safety, maintenance
and environmental practices
▪ Sales volume increased by 34%QoQ as improved marketing strategy helped in inventory reduction
20
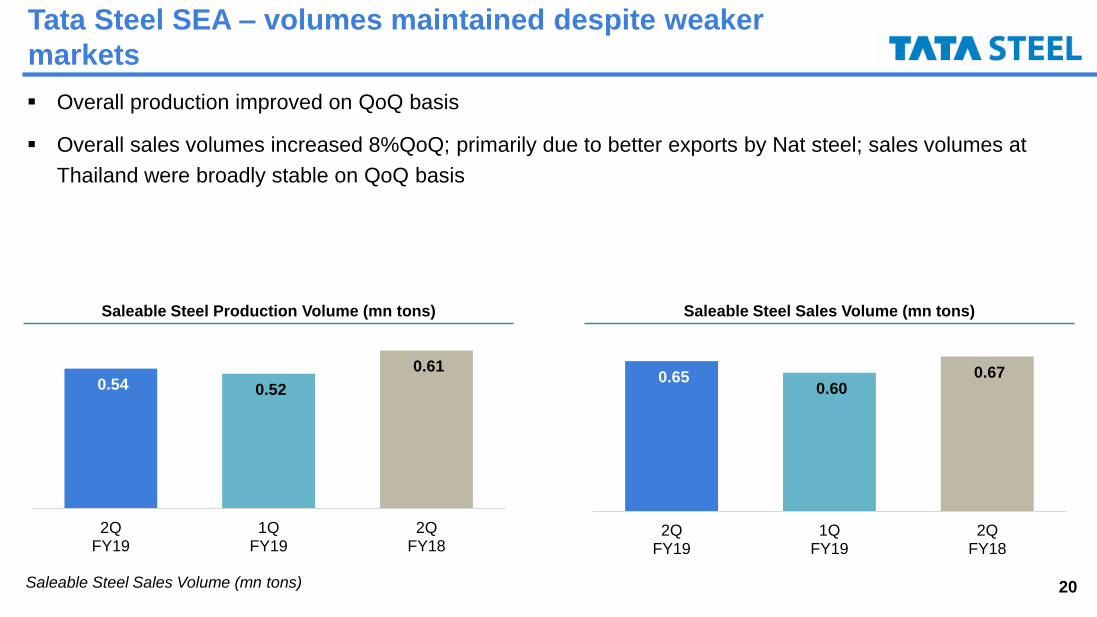
Saleable Steel Sales Volume (mn tons)Saleable Steel Production Volume (mn tons)
Saleable Steel Sales Volume (mn tons)
Tata Steel SEA – volumes maintained despite weaker
markets
▪ Overall production improved on QoQ basis
▪ Overall sales volumes increased 8%QoQ; primarily due to better exports by Nat steel; sales volumes at
Thailand were broadly stable on QoQ basis
0.65 0.60
0.67
2QFY19
1QFY19
2QFY18
0.54 0.52
0.61
2QFY19
1QFY19
2QFY18
21
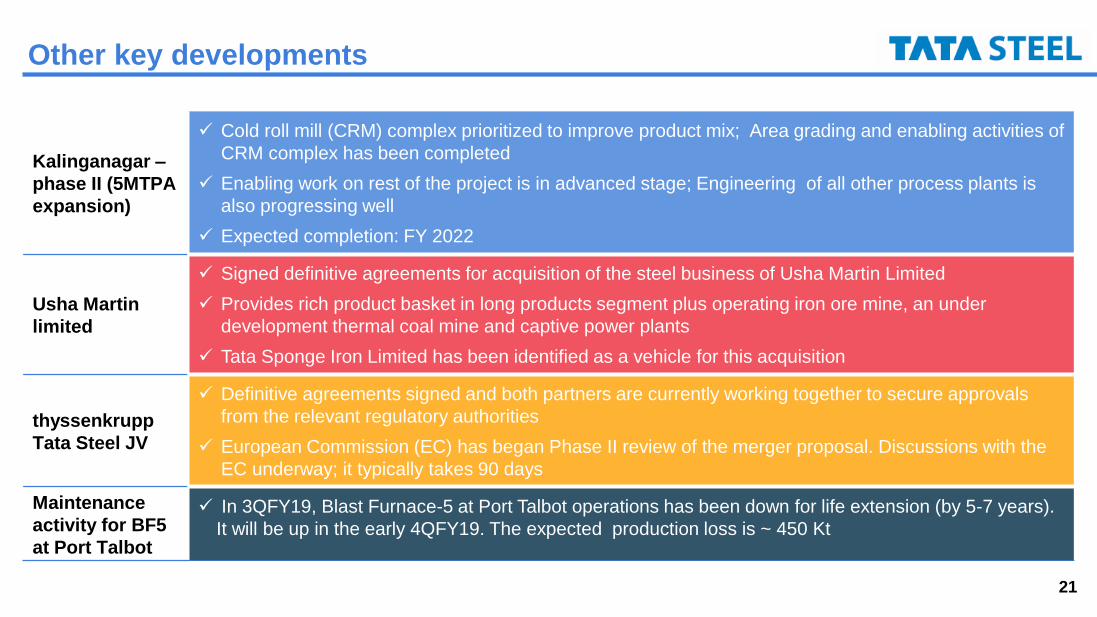
Other key developments
Kalinganagar –
phase II (5MTPA
expansion)
✓ Cold roll mill (CRM) complex prioritized to improve product mix; Area grading and enabling activities of
CRM complex has been completed
✓ Enabling work on rest of the project is in advanced stage; Engineering of all other process plants is
also progressing well
✓ Expected completion: FY 2022
Usha Martin
limited
✓ Signed definitive agreements for acquisition of the steel business of Usha Martin Limited
✓ Provides rich product basket in long products segment plus operating iron ore mine, an under
development thermal coal mine and captive power plants
✓ Tata Sponge Iron Limited has been identified as a vehicle for this acquisition
thyssenkrupp
Tata Steel JV
✓ Definitive agreements signed and both partners are currently working together to secure approvals
from the relevant regulatory authorities
✓ European Commission (EC) has began Phase II review of the merger proposal. Discussions with the
EC underway; it typically takes 90 days
Maintenance
activity for BF5
at Port Talbot
✓ In 3QFY19, Blast Furnace-5 at Port Talbot operations has been down for life extension (by 5-7 years).
It will be up in the early 4QFY19. The expected production loss is ~ 450 Kt
22
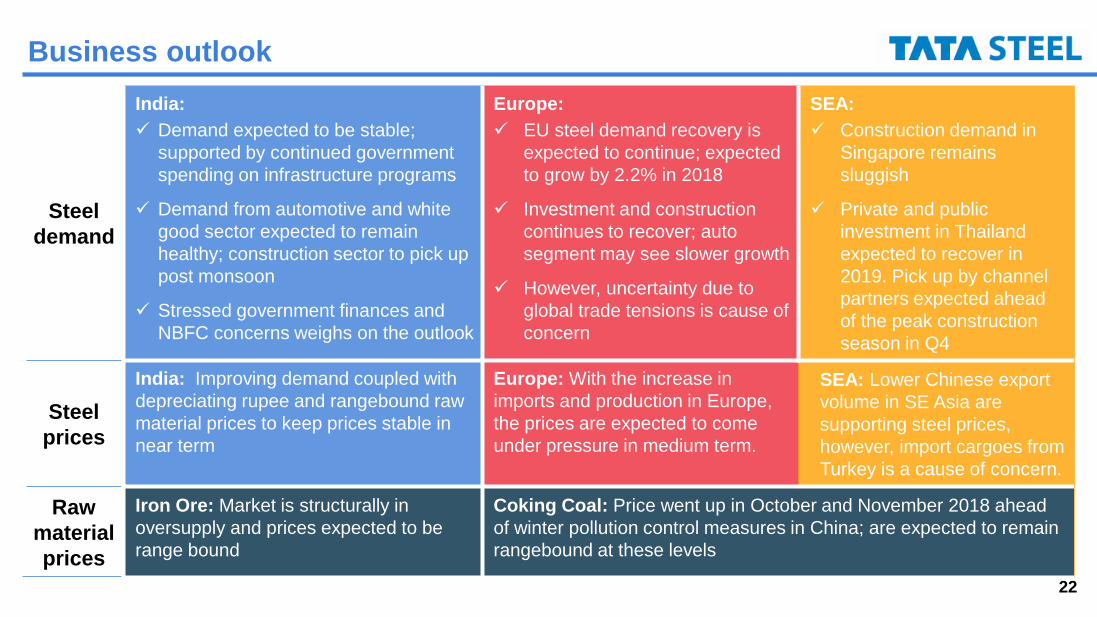
Business outlook
Steel
demand
India:
✓ Demand expected to be stable;
supported by continued government
spending on infrastructure programs
✓ Demand from automotive and white
good sector expected to remain
healthy; construction sector to pick up
post monsoon
✓ Stressed government finances and
NBFC concerns weighs on the outlook
Europe:
✓ EU steel demand recovery is
expected to continue; expected
to grow by 2.2% in 2018
✓ Investment and construction
continues to recover; auto
segment may see slower growth
✓ However, uncertainty due to
global trade tensions is cause of
concern
SEA:
✓ Construction demand in
Singapore remains
sluggish
✓ Private and public
investment in Thailand
expected to recover in
2019. Pick up by channel
partners expected ahead
of the peak construction
season in Q4
Steel
prices
India: Improving demand coupled with
depreciating rupee and rangebound raw
material prices to keep prices stable in
near term
Europe: With the increase in
imports and production in Europe,
the prices are expected to come
under pressure in medium term.
SEA: Lower Chinese export
volume in SE Asia are
supporting steel prices,
however, import cargoes from
Turkey is a cause of concern.
Raw
material
prices
Iron Ore: Market is structurally in
oversupply and prices expected to be
range bound
Coking Coal: Price went up in October and November 2018 ahead
of winter pollution control measures in China; are expected to remain
rangebound at these levels
23
Agenda
Operational Performance
Financial Performance
Business Environment
Appendix
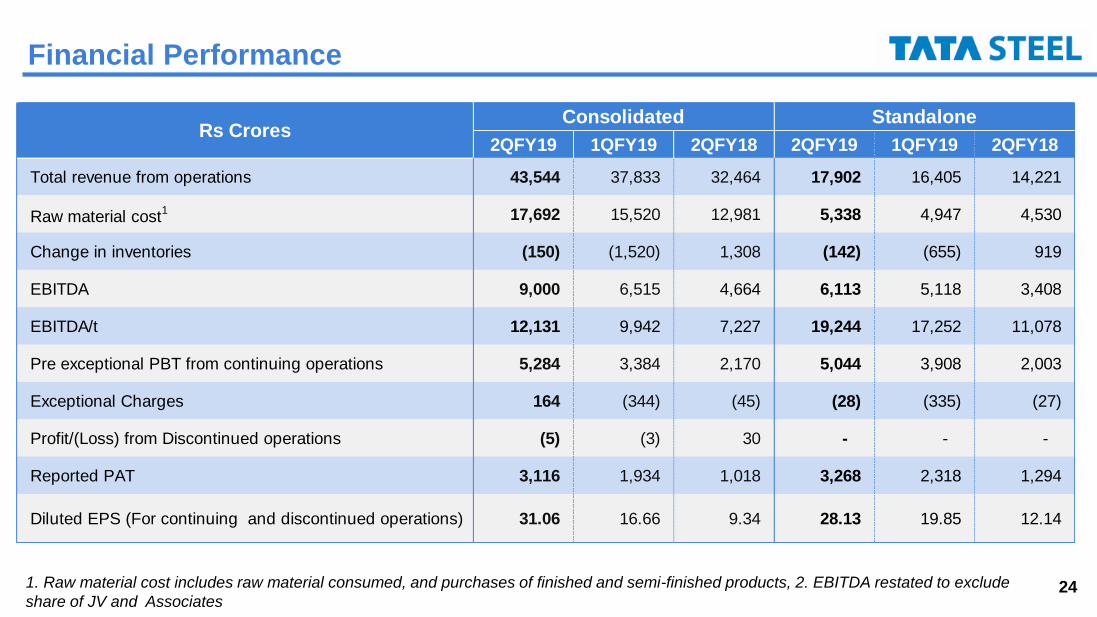
241. Raw material cost includes raw material consumed, and purchases of finished and semi-finished products, 2. EBITDA restated to exclude
share of JV and Associates
Financial Performance
2QFY19 1QFY19 2QFY18 2QFY19 1QFY19 2QFY18
Total revenue from operations 43,544 37,833 32,464 17,902 16,405 14,221
Raw material cost1 17,692 15,520 12,981 5,338 4,947 4,530
Change in inventories (150) (1,520) 1,308 (142) (655) 919
EBITDA 9,000 6,515 4,664 6,113 5,118 3,408
EBITDA/t 12,131 9,942 7,227 19,244 17,252 11,078
Pre exceptional PBT from continuing operations 5,284 3,384 2,170 5,044 3,908 2,003
Exceptional Charges 164 (344) (45) (28) (335) (27)
Profit/(Loss) from Discontinued operations (5) (3) 30 - - -
Reported PAT 3,116 1,934 1,018 3,268 2,318 1,294
Diluted EPS (For continuing and discontinued operations) 31.06 16.66 9.34 28.13 19.85 12.14
Rs CroresConsolidated Standalone
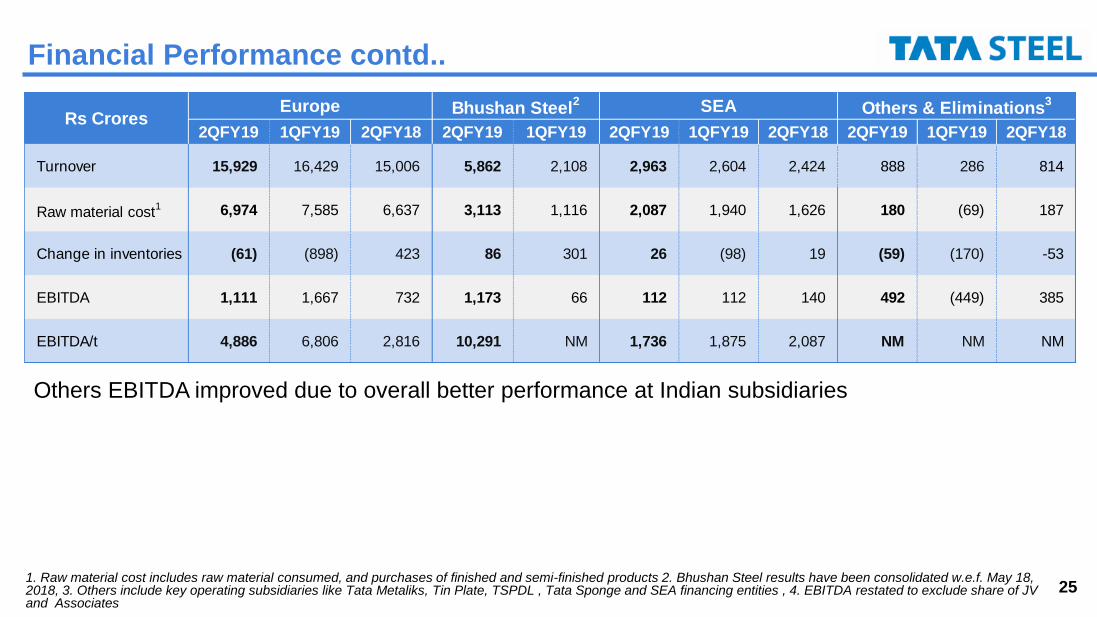
251. Raw material cost includes raw material consumed, and purchases of finished and semi-finished products 2. Bhushan Steel results have been consolidated w.e.f. May 18, 2018, 3. Others include key operating subsidiaries like Tata Metaliks, Tin Plate, TSPDL , Tata Sponge and SEA financing entities , 4. EBITDA restated to exclude share of JV and Associates
Financial Performance contd..
Others EBITDA improved due to overall better performance at Indian subsidiaries
2QFY19 1QFY19 2QFY18 2QFY19 1QFY19 2QFY19 1QFY19 2QFY18 2QFY19 1QFY19 2QFY18
Turnover 15,929 16,429 15,006 5,862 2,108 2,963 2,604 2,424 888 286 814
Raw material cost1 6,974 7,585 6,637 3,113 1,116 2,087 1,940 1,626 180 (69) 187
Change in inventories (61) (898) 423 86 301 26 (98) 19 (59) (170) -53
EBITDA 1,111 1,667 732 1,173 66 112 112 140 492 (449) 385
EBITDA/t 4,886 6,806 2,816 10,291 NM 1,736 1,875 2,087 NM NM NM
Rs CroresSEAEurope Others & Eliminations
3Bhushan Steel
2
26
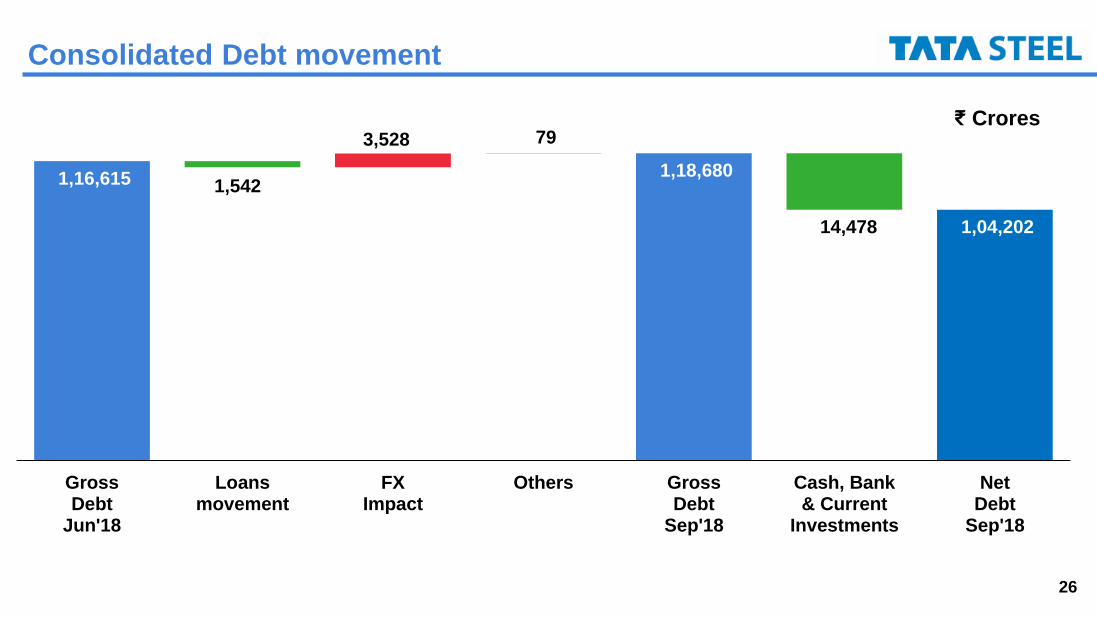
Consolidated Debt movement
1,16,615 1,18,680
1,04,202
1,542
3,528 79
14,478
GrossDebt
Jun'18
Loansmovement
FXImpact
Others GrossDebt
Sep'18
Cash, Bank& Current
Investments
NetDebt
Sep'18
₹ Crores
27All figures on a continuing operations basis, BSL – Bhushan Steel
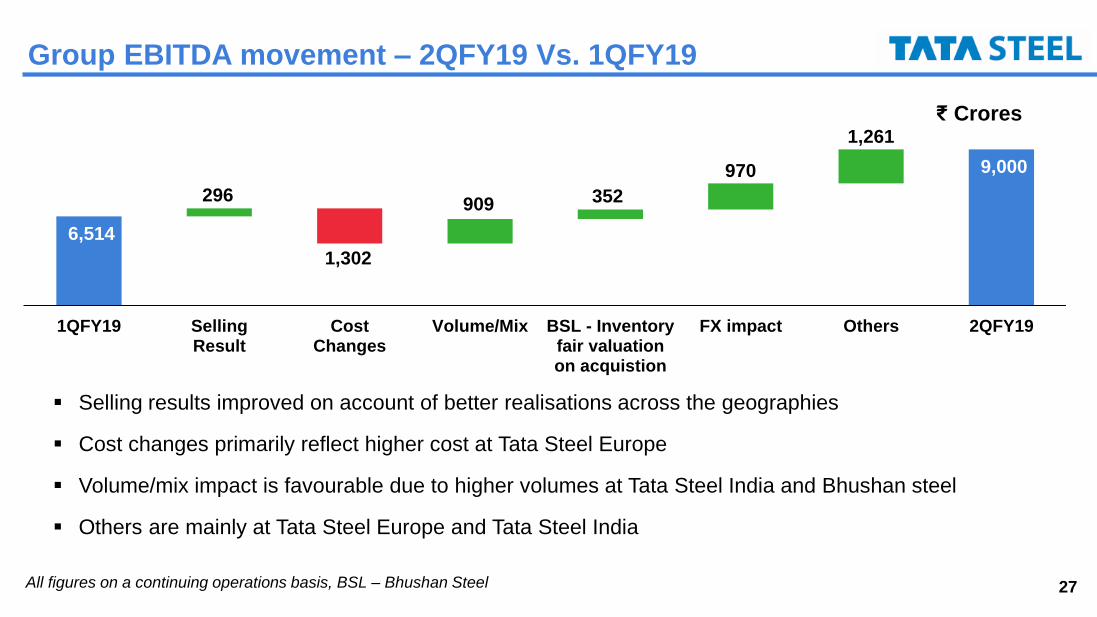
Group EBITDA movement – 2QFY19 Vs. 1QFY19
6,514
9,000
296
1,302
909 352
970
1,261
1QFY19 SellingResult
CostChanges
Volume/Mix BSL - Inventoryfair valuationon acquistion
FX impact Others 2QFY19
▪ Selling results improved on account of better realisations across the geographies
▪ Cost changes primarily reflect higher cost at Tata Steel Europe
▪ Volume/mix impact is favourable due to higher volumes at Tata Steel India and Bhushan steel
▪ Others are mainly at Tata Steel Europe and Tata Steel India
₹ Crores
28
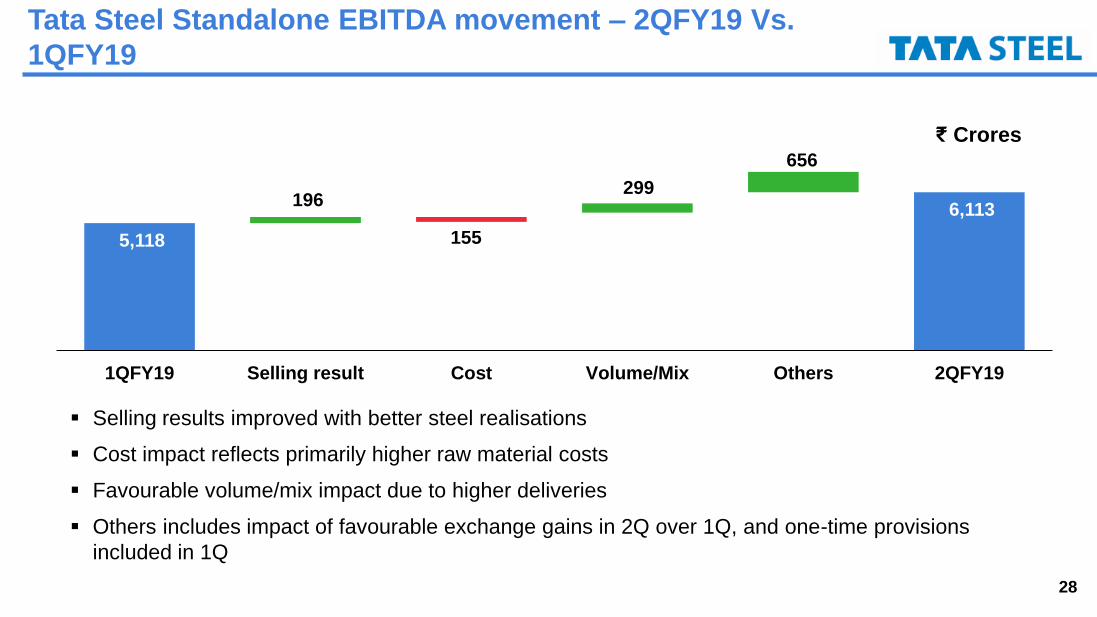
5,118
6,113 196
155
299
656
1QFY19 Selling result Cost Volume/Mix Others 2QFY19
Tata Steel Standalone EBITDA movement – 2QFY19 Vs.
1QFY19
▪ Selling results improved with better steel realisations
▪ Cost impact reflects primarily higher raw material costs
▪ Favourable volume/mix impact due to higher deliveries
▪ Others includes impact of favourable exchange gains in 2Q over 1Q, and one-time provisions
included in 1Q
₹ Crores

29
Tata Steel Europe EBITDA movement – 2QFY19 Vs. 1QFY19
▪ Selling result improved on account of better realisations
▪ Cost changes impacted by: a) higher raw material & energy costs, and b) lower production volume and
higher maintenance cost due to planned and unplanned production outages
▪ Volume/mix reflect lower sales volume impact
£183mn
£120mn
£10mn
£124mn£11mn
£62mn
1QFY19 SellingResult
CostChanges
Volume/mix Central& Other
2QFY19

30
Agenda
Operational Performance
Financial Performance
Business Environment
Appendix
31
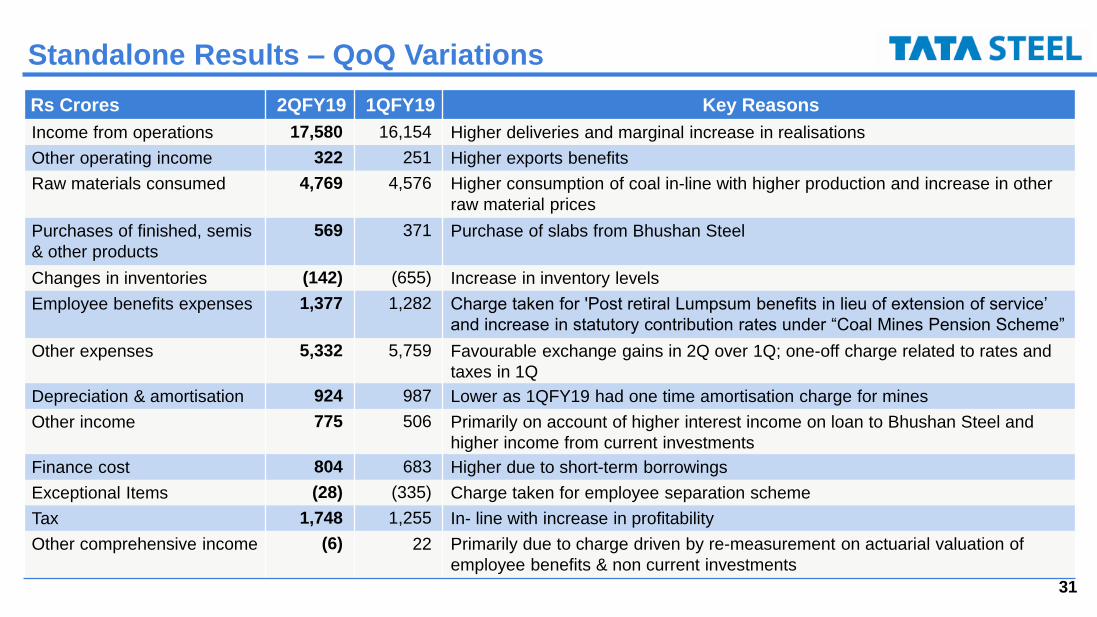
Standalone Results – QoQ Variations
Rs Crores 2QFY19 1QFY19 Key Reasons
Income from operations 17,580 16,154 Higher deliveries and marginal increase in realisations
Other operating income 322 251 Higher exports benefits
Raw materials consumed 4,769 4,576 Higher consumption of coal in-line with higher production and increase in other
raw material prices
Purchases of finished, semis
& other products
569 371 Purchase of slabs from Bhushan Steel
Changes in inventories (142) (655) Increase in inventory levels
Employee benefits expenses 1,377 1,282 Charge taken for 'Post retiral Lumpsum benefits in lieu of extension of service’
and increase in statutory contribution rates under “Coal Mines Pension Scheme”
Other expenses 5,332 5,759 Favourable exchange gains in 2Q over 1Q; one-off charge related to rates and
taxes in 1Q
Depreciation & amortisation 924 987 Lower as 1QFY19 had one time amortisation charge for mines
Other income 775 506 Primarily on account of higher interest income on loan to Bhushan Steel and
higher income from current investments
Finance cost 804 683 Higher due to short-term borrowings
Exceptional Items (28) (335) Charge taken for employee separation scheme
Tax 1,748 1,255 In- line with increase in profitability
Other comprehensive income (6) 22 Primarily due to charge driven by re-measurement on actuarial valuation of
employee benefits & non current investments
32
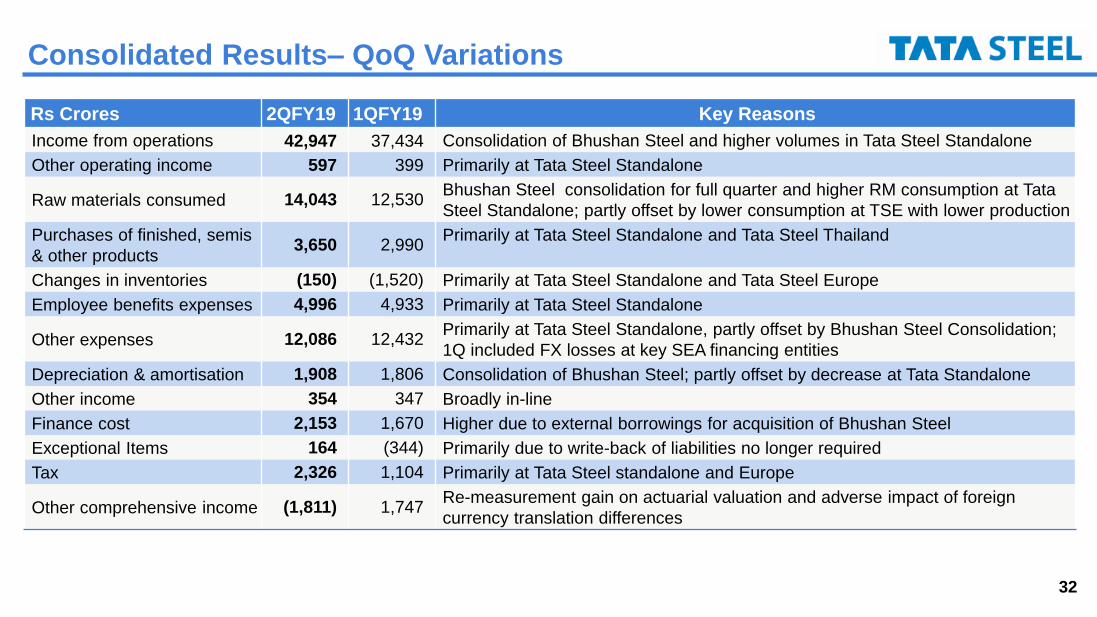
Consolidated Results– QoQ Variations
Rs Crores 2QFY19 1QFY19 Key Reasons
Income from operations 42,947 37,434 Consolidation of Bhushan Steel and higher volumes in Tata Steel Standalone
Other operating income 597 399 Primarily at Tata Steel Standalone
Raw materials consumed 14,043 12,530 Bhushan Steel consolidation for full quarter and higher RM consumption at Tata
Steel Standalone; partly offset by lower consumption at TSE with lower production
Purchases of finished, semis
& other products3,650 2,990
Primarily at Tata Steel Standalone and Tata Steel Thailand
Changes in inventories (150) (1,520) Primarily at Tata Steel Standalone and Tata Steel Europe
Employee benefits expenses 4,996 4,933 Primarily at Tata Steel Standalone
Other expenses 12,086 12,432 Primarily at Tata Steel Standalone, partly offset by Bhushan Steel Consolidation;
1Q included FX losses at key SEA financing entities
Depreciation & amortisation 1,908 1,806 Consolidation of Bhushan Steel; partly offset by decrease at Tata Standalone
Other income 354 347 Broadly in-line
Finance cost 2,153 1,670 Higher due to external borrowings for acquisition of Bhushan Steel
Exceptional Items 164 (344) Primarily due to write-back of liabilities no longer required
Tax 2,326 1,104 Primarily at Tata Steel standalone and Europe
Other comprehensive income (1,811) 1,747 Re-measurement gain on actuarial valuation and adverse impact of foreign
currency translation differences
Copyright © 2022 FDOKUMEN