102nd Annual Report 2008-2009 - Tata Steel
276
102 nd Annual Report 2008-2009 Endurance • Continuous Improvement • Growth
-
Upload
khangminh22 -
Category
Documents
-
view
0 -
download
0
Transcript of 102nd Annual Report 2008-2009 - Tata Steel

102nd Annual Report2008-2009
Endurance • Continuous Improvement • Growth
Bombay House 24 Homi Mody Street Mumbai 400 001
Final_Cover.indd 1Final_Cover.indd 1 7/8/09 1:22:02 PM7/8/09 1:22:02 PM

The Deming Application Prize, established in December 1950 in honour of W. Edwards Deming,
was originally designed to reward Japanese companies for major advances in quality improvement.
Tata Steel India’s Award of the Deming Application Prize-2008 for excellence in
Total Quality Management was a fi rst to an integrated steel company outside Japan.
Mr. B. Muthuraman, Managing Director, Tata Steel, received the coveted medal from
Mr. Fujio Mitarai, Chairman of The Deming Prize Committee in Japan.
The Deming Application Prize
Final_Cover.indd 2Final_Cover.indd 2 7/25/09 5:13:36 PM7/25/09 5:13:36 PM

Endurance • Continuous Improvement • Growth
The growth of a company is invariably determined not just by its strategy,
but on how it responds to the challenges it encounters. Over the decades,
Tata Steel has successfully countered several challenges that have come its
way with innovative responses and continuous improvement which have
enabled it to remain stable and even convert some of these challenges
into opportunities.
It is this culture of endurance, that has accorded Tata Steel the insight
and focus to deal with the current economic environment. Drawing from
its inner strength and beliefs, Tata Steel responded by launching several
initiatives across all its operations in various geographies that are helping
the Group achieve sustainable growth even in the current times. It is also
this very culture that will propel Tata Steel to continue on its growth
trajectory in the years to come.
000-027_TS_AR_part1.indd 1000-027_TS_AR_part1.indd 1 7/25/09 12:09:08 AM7/25/09 12:09:08 AM
Theme Note .....................................................................................04
Message from the Managing Director ...................................08
Board of Directors .........................................................................10
Tata Steel Group Senior Management...................................12
Consolidated Financial Highlights 2008-09 .........................14
Current Global Scenario and the Steel Industry .................16
Enduring the Turbulence and
getting Fit for the Future ............................................................20
A history of positive response ..................................................28
Responding to the Crisis .............................................................38
Review of Operations ...................................................................50
A 100 year heritage of Mining ..................................................60
Human Resources .........................................................................74
Continuous Improvement .........................................................78
Corporate Citizenship ..................................................................84
Awards, Recognitions & Certifi cations ...................................92
Management of Business Ethics ..............................................96
Directors’ Report ............................................................................98
Management Discussion & Analysis .....................................122
Highlights .......................................................................................141
Sources and Utilisation of Funds ...........................................142
Auditors’ Report ...........................................................................143
Annexure to the Auditors’ Report ..........................................144
Balance Sheet ..............................................................................148
Profi t & Loss Account ................................................................149
Cash Flow Statement ................................................................150
Schedules forming part of the
Profi t & Loss Account ................................................................152
Notes to Schedule 4 ..................................................................154
Schedules forming part of the Balance Sheet .................155
Contents
2
000-027_TS_AR_part1.indd 2000-027_TS_AR_part1.indd 2 7/25/09 12:09:14 AM7/25/09 12:09:14 AM
Research & Development ........................................................... 66
Chairman’s Statement ..................................................................06

The Annual General Meeting will be held on Thursday, 27th August, 2009 at Birla Matushri Sabhagar at 3.30 p.m.As a measure of economy, copies of the Annual Report will not be distributed at the Annual General Meeting. Shareholders are requested to kindly bring their copies to the meeting.
Visit us at : www.tatasteel.comE-mail : [email protected].: +91 22 66658282
Notes on Balance Sheet
& Profi t and Loss Account ........................................................169
Balance Sheet Abstract and Company’s
General Business Profi le ...........................................................193
Production Statistics .................................................................194
Financial Statistics ......................................................................195
Dividend Statistics .....................................................................196
Financial Ratios ...........................................................................197
Corporate Governance Report ...............................................198
Summary of Financial Information of
Subsidiary Companies ..............................................................218
Consolidated Financial Statements
Auditors’ Report ..........................................................................228
Consolidated Balance Sheet ...................................................230
Consolidated Profi t and Loss Account ................................231
Consolidated Cash Flow Statement .....................................232
Schedules forming part of the
Consolidated Profi t and Loss Account ................................234
Schedules forming part of the
Consolidated Balance Sheet ...................................................236
Notes to the Consolidated
Financial Statements .................................................................242
Consolidated Financial Ratios .................................................272
3
000-027_TS_AR_part1.indd 3000-027_TS_AR_part1.indd 3 7/25/09 12:09:15 AM7/25/09 12:09:15 AM

enduranceOneness with society, adaptability
to the changing environment,
empowerment of people, fi nancial
prudence and ethical governance have
been the cornerstone of Tata Steel’s
enduring philosophy. These attributes
have helped Tata Steel meet several
challenges over the last 100 years.
continuous improvementTata Steel encourages its employees
to work towards innovation in process
and product development to drive
effi ciencies and create value. This
approach has led to a work ethic that
focusses on continuous improvement
as a way of life.
Endurance • Continuous Improvement • Growth
4
000-027_TS_AR_part1.indd 4000-027_TS_AR_part1.indd 4 7/25/09 5:15:23 PM7/25/09 5:15:23 PM

A strong vision backed by focussed
actions have enabled Tata Steel to grow
over the last century. Tata Steel remains
alert to every opportunity and has
taken on several challenges to drive
value and become one of the top 10
global steel companies.
growth
5
000-027_TS_AR_part1.indd 5000-027_TS_AR_part1.indd 5 7/25/09 5:15:25 PM7/25/09 5:15:25 PM

Dear Shareholder,
Global MeltdownAfter decades of global growth, the world watched
in horror as fi nancial institutions collapsed, fi rst in the
United States followed by Western Europe and the
United Kingdom. The crisis then spread to nations in
Eastern Europe, Asia and other geographies. This global
meltdown had a widespread and devastating eff ect on
the world-wide banking system, stock markets, pension
funds, individuals’ net worth and ownership of assets. It
was a fi nancial crisis of proportions approaching that at
the time of the Great Depression of 1929.
In their eff orts to restore fi scal stability and credibility of
the banks, various governments stepped in with fi nancial
packages to assist banks and other fi nancial institutions,
with a view to normalising the fi nancial sector. However,
Chairman’s Statement
in most cases, these funds were used by the receiving
institutions to shore up their own balance sheets, and
very little reached the “real economy”.
The resultant lack of liquidity in the market, resulted in
the drying up of consumer credit and working capital,
leading to an unprecedented reduction in demand
and the consequent inability of companies to fi nance
their operations. This led to a domino-eff ect downward
spiral in various industrial sectors like construction,
automobiles, consumer products and capital goods.
The eff ects of this downturn were initially felt in the
industrialised nations but spread quickly to most other
countries around the world.
The global downturn also had a major eff ect on various
industries dependant on steel. Major contraction in the
construction projects, automobiles, white goods demand
from the third quarter of 2008-09 resulted in the global
demand for steel dropping by 21% compared to the level
consumed in the same quarter of the previous year.
While the economic scenario in India may look similar
to that in the West, the situation was entirely diff erent.
Unlike the international banks and fi nancial institutions,
Indian banks did not hold toxic paper nor had they
invested in sub-prime assets. Their loan portfolios were,
by and large, healthy. What did happen was that in June
2008, the Reserve Bank of India raised the Repo Rates
and the Cash Reserve Ratio of the banks, consciously
curtailing liquidity in the system to combat infl ation
which had reached a level of around 11%. Predictably,
the economy began to slow down in several sectors.
The corporate sector and particularly small businesses
increasingly faced diffi culties in running their businesses,
due to the lack of available fi nance and credit facilities.
GDP growth declined from a level of 9% to 6.7%
as new investments were deferred and output fell.
Ratan N. Tata Chairman
6
000-027_TS_AR_part1.indd 6000-027_TS_AR_part1.indd 6 7/25/09 12:09:22 AM7/25/09 12:09:22 AM

The situation was compounded when, as a result of
the fi nancial crisis in Western Europe and the United
States, foreign fi nancial institutions and foreign investors
hurriedly liquidated their investments in India, leading
to the collapse of Indian stock prices. Therefore from the
second half of 2008-09 Indian industry was constrained
to operate with very limited access to working capital,
an inability to raise funds from market sources and a
drastic drop in consumer demand.
The good news is that the economic revival in India is
beginning to take place faster than most people expected
and with the new government’s plans for increased
spending in infrastructure as well as rural development,
the recovery in India is expected to be robust. Many
believe the US economy has bottomed out, but that UK,
Europe and Russia may fall still further. The general view
is that an economic recovery in the Western world would
probably only be in late 2010.
Tata SteelThe eff ects of the world economic downturn seriously
impacted our Company’s global operations in the second
half of the year under review. The demand for steel
declined by 26% in the UK and Europe in the third quarter
compared to a year earlier and after a further contraction
in the fourth quarter, demand had fallen by 57% in the
UK and 44% in Europe compared with a year ago. This
refl ected in a sharp downturn in private construction
projects, as well as large falls in automotive and
mechanical engineering, amplifi ed by severe destocking
by both end users and service centers. Indian operations
witnessed a less pronounced drop in demand of 11%
in the third quarter, refl ecting the reduced activity in
infrastructure and commercial vehicles. There are however
signs that the infrastructure and road building activities in
India are gaining momentum, as a result of some of the
government’s actions to revive the economy.
Tata Steel has taken aggressive steps to meet the
challenges of these diffi cult times through major
initiatives in cost reduction, process improvement
and production rationalisation. The highest priority
is being given to expanding steel producing capacity
in Jamshedpur, and ensuring raw material security for
the European operations which do not have captive
iron ore and coal resources. Production rationalisation
is also being undertaken in Europe and the UK to
right-size manufacturing facilities to be in sync with the
lower off -take by the market. The same approach is also
being taken in the Company’s Asian subsidiaries.
The past year and probably the next 12-18 months
are likely to be diffi cult and challenging times for Tata
Steel. However, the spirit of the Company’s employees,
coupled with their commitment to meet the challenges,
I am sure, will see Tata Steel come out of this diffi cult
period, as a more cost-eff ective steel manufacturer with
a stronger global market presence and an enhanced
capability in producing new grades of steel products to
better serve its customers.
In ending I would like to thank all my colleagues
and our unions at Tata Steel for their support and
understanding through the year. They have collectively
made the Company what it is today, and will help lead
the Company into tomorrow. I would also like to thank
our shareholders for the trust they have reposed in the
Company over the years.
Chairman
Mumbai, 31st May, 2009
7
000-027_TS_AR_part1.indd 7000-027_TS_AR_part1.indd 7 7/25/09 12:09:24 AM7/25/09 12:09:24 AM

The year 2008-09 was an eventful one. Tata Steel’s Indian operations posted a record performance yet again. Compared to the previous fi nancial year, deliveries were higher by 9%, turnover increased by 23%, EBITDA was higher by 14% and net profi t higher by 11%. This, despite the fact that the world faced an unprecedented meltdown in the second half of the fi nancial year, when the prices dropped to nearly half of what these were in the fi rst half. Another high point for Tata Steel was to win the Deming Application Prize, which is the highest award for quality in the world. Tata Steel thus became the fi rst steel company in the world outside Japan to have ever won the Deming Prize. The Deming Prize is a refl ection of Tata Steel’s commitment to its customers, employees, other business partners and the exceptional contribution the Company has made to the society as a whole. Tata Steel’s longevity bears testimony to its long-term approach and its ability to embrace change with ease.
Message from the Managing Director, Tata Steel
B. Muthuraman Managing Director, Tata Steel
In contrast to Indian operations, our operations in Europe faced severe hardships, in line with the fate suff ered by all other steel producers in Europe and the US. Our operations in South East Asia also felt the eff ect of the meltdown but to a lesser degree.
Financial year 2008 – 09 was an exceptional year in which we witnessed the best of times and the worst of times. After setting records of every kind in the fi rst half, the year witnessed a dramatic reversal in the second half. The steel industry is used to cyclicality but what caught us and everyone by surprise was the speed and intensity of the downturn. Nations across the world responded to the crisis by introducing bail out and stimulus packages.
In its 102 years of history, Tata Steel has faced numerous challenges and has responded to each one appropriately. This crisis was no exception. The Tata Steel Group responded swiftly to the situation and took measures to ‘weather the storm’. In our European operations, immediate steps were taken as tactical measures to align production and cost to the reduced market demand and there were medium and long-term strategic measures taken to ensure long-term competitiveness and sustainability. We took quick and decisive measures by curtailing production and introduced measures that reduced the cost by over one billion US$ in 2008-09. Our integration programme delivered signifi cant gains accruing from improvement in operations in India and Europe. Our key cost savings and performance improvement initiatives are well advanced and are already giving signifi cant results.
We shifted our priority to consolidation of ongoing initiatives and putting the current operations on even keel. Financial prudence remains the hallmark of any strategy that Tata Steel adopts and our eff orts to de-leverage our balance sheet gained greater momentum. We gave a closer look to our capital expenditure programme and reduced the capex plan by over 40% in the fi rst two years by re-phasing the outlay
8
000-027_TS_AR_part1.indd 8000-027_TS_AR_part1.indd 8 7/25/09 12:09:24 AM7/25/09 12:09:24 AM

to later years and deferring some of the initiatives, yet retaining thrust on high yielding growth projects.
We remain committed to our long-term strategy and will continue to allocate capital towards our existing operations and new projects that are of strategic importance. Our inherent belief about the attractiveness of the steel industry has not been dented. We continue to dream and envision our future. The Tata Steel Group has developed a pipeline of high quality projects, which will be executed, though we will re-phase the sequence. Projects like the 3 million tonne expansion in Jamshedpur, the proposed steel plant in Orissa and raw material projects in Mozambique, South Africa and Canada are key drivers of our future value creation. We remain focussed on enhancing raw material security for our European operations and are looking at ways to speed up overseas raw material projects.
Tata Steel’s philosophy of forging long-term partnerships with its stakeholders was vindicated once again during this downturn. Our employees have been a source of strength for us. The entire workforce worked as a team to fulfi l the stretch targets that they set for themselves. Suppliers of equipment, materials and services responded positively to our requests by off ering better payment terms and reducing prices to the extent they could. We are thankful to them for their understanding. The lenders too showed a great deal of understanding in resetting the covenants for our European borrowings. This speaks volumes about their confi dence in Tata Steel and endorses the belief that the Tata Steel Group is as strong as it ever was.
The crisis in the second half of the year overshadowed some of the other achievements of the Tata Steel Group during the year. We set up the ‘H’ Blast Furnace at Jamshedpur during the year, which in addition to being the largest Blast Furnace in India, also achieved its rated capacity in a record time. The year also saw Tata Steel win the Economic Times’ ‘Company of the
Year Award’ and the Golden Peacock Global Award for Corporate Social Responsibility.
In times of crisis, Tata Steel did not lose sight of the long-term sustainability, which has been the cornerstone of Tata Steel’s value systems. We continued to concentrate on safety and corporate social responsibility and sharpened our focus on climate change initiatives. Tata Steel along with Tata Power is setting up a captive power plant in IJmuiden, Netherlands using waste gases. This will reduce the carbon footprint of the Group signifi cantly. Similarly ‘H’ Blast furnace will reduce CO2 emissions in India in a signifi cant way. These are just two of the many initiatives that were kick-started during the year. In order to institutionalise innovation, we have set up a Group-wide technology function headed by a senior executive to harvest innovative ideas in a structured manner.
On the outlook for the steel industry and of the economy as a whole, I believe the worst is behind us. The fact that we have reached the bottom of the cycle is itself a cause for satisfaction, as things can only improve from here. The buoyancy in the global economic activity was driven by trends of urbanisation and industrialisation in the Asian economies mainly of China and India. While the Indian economy remained largely on course even during this crisis, the revival of Chinese economy will be the turning point that will bring us back to the economic activity of the years 2007 and 2008.
I want to end by quoting Patanjali, who is credited with inventing yoga. This is what Patanjali said in 300 BC:
“When you are inspired by some great purpose, some extraordinary project,
all your thoughts break their bonds –your mind transcends limitations,
your consciousness expands in every direction,and you fi nd yourself in a new, great, and wonderful world.
Dormant forces, faculties and talents become alive and you discover yourself to be a greater person
by far than you ever dreamed”.
9
000-027_TS_AR_part1.indd 9000-027_TS_AR_part1.indd 9 7/25/09 12:09:28 AM7/25/09 12:09:28 AM

Board of Directors as on 25th June, 2009
COMPANY SECRETARY Mr. J.C. Bham
REGISTERED OFFICE Bombay House, 24 Homi Mody Street, Fort, Mumbai 400 001. Tel : (022) 6665 8282 Fax : (022) 6665 7724 / 6665 7725 E-mail : [email protected] Website : www.tatasteel.com
SHARE REGISTRARS TSR Darashaw Limited 6-10, Haji Moosa Patrawala Industrial Estate, 20, Dr. E. Moses Road, Mahalaxmi, Mumbai 400 011. Tel : (022) 6656 8484 Fax : (022) 6656 8494 / 6656 8496 E-mail : [email protected] Website : http://www.tsrdarashaw.com
Mr. Jacobus Schraven
Mr. James Leng
Dr. Anthony Hayward
Mr. Nusli N. WadiaMr. Ratan N. TataChairman
Mr. S. M. Palia
Mr. Andrew Robb
10
000-027_TS_AR_part1.indd 10000-027_TS_AR_part1.indd 10 7/25/09 12:09:28 AM7/25/09 12:09:28 AM

Dr. Jamshed J. Irani
Mr. B. MuthuramanManaging DirectorTata Steel Limited
Mr. Suresh Krishna
Mr. H.M. NerurkarExecutive Director
(India & South East Asia)
Mr. Subodh Bhargava
Mr. Kirby AdamsChief Executive Offi cer
Tata Steel Europe
Mr. Ishaat Hussain
LEGAL ADVISORS AZB & Partners Amarchand & Mangaldas & Suresh. A. Shroff & Co. Cleary Gottlieb Steen & Hamilton LLP Freehills Herbert Smith LLP Linklaters LLP Mulla & Mulla and Craigie Blunt & Caroe
AUDITORS Messrs Deloitte Haskins & Sells
11
000-027_TS_AR_part1.indd 11000-027_TS_AR_part1.indd 11 7/25/09 12:09:44 AM7/25/09 12:09:44 AM

Avneesh GuptaGroup Director
(Total Quality Management)
Manzer HussainGroup Director
(Communications)
B. Muthuraman Managing Director,
Tata Steel Limited
Koushik ChatterjeeGroup Chief Financial Offi cer
Kirby AdamsChief Executive Offi cer,
Tata Steel Europe
Jean-Sébastien JacquesGroup Director
(Strategy)
H. M. NerurkarExecutive Director
(India & South East Asia)
Arun BaijalGroup Director
(Global Minerals)
Group Corporate Centre
Group Corporate Functions
Tata Steel Group Senior Management
12
000-027_TS_AR_part1.indd 12000-027_TS_AR_part1.indd 12 7/25/09 12:10:15 AM7/25/09 12:10:15 AM

Senior Management
T. V. NarendranPresident & CEO
NatSteel Holdings
Santi CharnkolraweePresident
Tata Steel Thailand
Helen MathesonDirector
(Legal, Compliance & Secretariat) TSE
V. S. N. MurtyChief Financial Controller
(Corporate) TSL
Sandip BiswasGroup Head (Corporate
Finance, Treasury & Investor Relations)
Bimlendra JhaPrincipal Executive Offi cer
to Managing DirectorTSL
Lim Say YanGroup Head
(Corporate Assurance & Risk Management)
Dr. Debashish BhattacharjeeDirector
(Research, Development & Technology)
TSL - Tata Steel Limited TSE - Tata Steel Europe
Partha SenguptaVice President
(Corporate Services) TSL
Binay Kumar SinghVice President
(Orissa Project) TSL
N. K. MisraGroup Head
(Mergers & Acquisitions)
Hridayeshwar JhaVice President
(Safety & Long Products)TSL
Radhakrishnan NairChief Human Resource
Offi cer, TSL
Frank RoyleDirector
(Finance) TSE
Phil DrydenDivisional Director
(Long Products)TSE
Tor FarquharDirector
(Human Resources) TSE
Abanindra M. MisraVice President
(Raw Materials and Coke Sinter & Iron) TSL
Om NarayanVice President
(Shared Services) TSL
Marjan OudemanDivisional Director
(Strip Products)TSE
Anand SenVice President
(TQM & Flat Products)TSL
R. P. SinghVice President
(Engineering & Projects) TSL
Varun JhaVice President
(Chhattisgarh Project)TSL
Scott MacDonaldDivisional Director
(Distribution & Building Systems), TSE
13
000-027_TS_AR_part1.indd 13000-027_TS_AR_part1.indd 13 7/25/09 9:33:40 PM7/25/09 9:33:40 PM

Geographical Distribution of Revenue
Asia excluding India11.80%
UK34.25%
EU excluding UK 30.14%
Rest of World6.94%
India16.87%
0
3000
6000
9000
12000
15000
13,86213,645
07-08 08-090
30000
60000
90000
120000
150000 147,329
131,534
07-08 08-090
3000
6000
9000
12000
15000
4,951
12,350
07-08 08-09
Consolidated Financial Highlights 2008-09
Turnover(Rs. in crores)
Operating Profi t(Rs. in crores)
Profi t After Tax(Rs. in crores)
Turnover = Sales and Other operating income (-) Excise Duty
Operating Profi t = Profi t before exceptional items (+) Net Finance
Charges (-) Other Income
Profi t after taxes, minority interest and share of profi t of associates
14
000-027_TS_AR_part1.indd 14000-027_TS_AR_part1.indd 14 7/25/09 12:11:41 AM7/25/09 12:11:41 AM

Capital Employed by Geographies
Asia excluding India11.60%
UK31.83%
EU excluding UK25.95%
Rest of World2.64%
India27.98%
0
50
100
150
200
59
163
07-08 08-090
5
10
15
20
25
21%20%
07-08 08-09
13%
14%
07-08 08-090
3
6
9
12
15
Diluted Earnings Per Share(Rs. per share)
Return on Invested Capital(Pre-tax)
EBIDTA Margin
Net Operating Profi t before tax and exceptional items / (Net Fixed Assets (excluding WIP) + Adjusted Net
Current Assets)
15
000-027_TS_AR_part1.indd 15000-027_TS_AR_part1.indd 15 7/25/09 5:16:17 PM7/25/09 5:16:17 PM

Current Global Scenario and the Steel Industry
Current Global Scenario and the Steel IndustryThe steel industry has traditionally been very sensitive to the changing economic conditions.
The recent economic meltdown has created several challenges – which when addressed
appropriately, can be countered to positive eff ect. However, unlike the previous global
recessions, this time around, all the countries have come together and taken action.
Additionally, there has been a tremendous amount of governmental response to the global
depression which is helping to bring about a possible easing of the situation.
16
000-027_TS_AR_part1.indd 16000-027_TS_AR_part1.indd 16 7/25/09 12:11:55 AM7/25/09 12:11:55 AM

Economic RecoveryThe world economic recession had put an abrupt end to the
steel market upturn that began in 2002. The market had been
turbulent over the last three decades but today, the steel
industry is better prepared thanks to global restructuring and
consolidation. The Group of Eight (G8) industrialised nations
have begun preparing for an economic recovery, acknowledging
signs of stabilisation in the economy and exploring options to
establish procedures to unwind hefty stimulus packages. Despite
short-term uncertainties, the long-term prospect of the global
steel market is strong and growth in steel demand will resume
eventually supported by domestic-led growth in many emerging
economies. Such recovery might well be accompanied by
signifi cant structural changes in the industry worldwide.
The economic crisis has led to the cancellation or review of many
planned investments in capacity expansions in the steel industry.
However, since many expansion projects continue to advance
in some emerging economies, world steel making capacity is
expected to maintain an upward trend into 2010 which will well
exceed future demand levels. This imbalance between capacity
and demand is likely to hasten retirement of ineffi cient, more
environmentally polluting or high cost capacities in certain
countries, further aff ecting industry employment. Steel makers
in developed countries will maintain their pursuit of a shift from
volume to value. All this will further make the steel industry more
competitive and effi cient as the world economy recovers.
17
000-027_TS_AR_part1.indd 17000-027_TS_AR_part1.indd 17 7/25/09 12:11:58 AM7/25/09 12:11:58 AM

Climate ChangeClimate change is one of the most important issues that faces the steel industry in
the 21st century. Steel fulfi ls a unique place in our lives and is essential for sustainable
development. It is also key to infrastructure, energy delivery, transportation,
housing, construction and consumer goods. All major steel producing countries are
engaged in the process of substantive reduction in global emissions and learning
to cope with climate change, a phenomenon caused by greenhouse gas emissions
that are warming the atmosphere. The Tata Steel plant at Jamshedpur has reduced
the CO2 emissions by 36% over the past 12 years. This was possible through the
adoption of several measures which included, among others, the installation of
energy effi cient equipment and processes, improving by-product fuel recovery
and usage, and waste heat recovery. Tata Steel India is currently working on several
projects that could yield a reduction of 2 million tonnes of CO2 a year. In addition to
this, Tata Steel Europe is also working with other steel makers in Europe on a major
research and development project, ULCOS (Ultra Low CO2 Steelmaking) with the
ambitious objective of reducing carbon emissions per tonne of steel produced, by
50% by 2050.
Looking towards the future, the steel industry’s main contribution to the reduction
of CO2 emissions should be to further develop the use of by-products and to work
with its customers to help design better, long lasting, more energy and material
effi cient products. Additionally, improvements in areas other than primary steel
production may off er further opportunities for CO2 reduction.
Current Global Scenario and the Steel Industry
18
000-027_TS_AR_part1.indd 18000-027_TS_AR_part1.indd 18 7/25/09 12:12:01 AM7/25/09 12:12:01 AM

Health and SafetyThe steel industry prioritises on health and safety.
In most countries, the steel industry has been
synonymous with economic growth and prosperity.
Steel is used in everything from railroad tracks to
automobiles to orthodontic instruments. However,
the production of steel happens to be one of the
most hazardous jobs. A workplace fatality is tragic no
matter what the circumstances are. As an industry,
we have the opportunity and responsibility to
provide the best health and wellness solutions for
our employees. Health and Safety remains the Tata
Steel Group’s priority with clear objectives for health,
process safety and occupational safety. The Group has
taken an integrated and systematic approach towards
managing health and safety through structured
programmes across all entities.
Company StrategyDespite the current slowdown in consolidation within
the global steel industry, mergers and acquisitions
remain a critically important business strategy for most
corporates. Steel analysts are expecting a new wave
of consolidation to take place in the next three years.
Global giants are refocussing on positive markets by
applying their resources to the core business where
they are most needed. This creates opportunities to
gain market share from competitors who diversify and
split their focus. Acquisitions and strategic alliances
are also critical to strengthen, refocus and position
companies for increased growth and profi tability.
The Tata Steel Group is strongly pursuing its long-
term strategy of acquiring and developing mining
projects for its raw material security for iron ore and
coking coal. The Group has been concentrating on
the geographies that are logistically favourable with
respect to its plants in Europe and Asia.
19
000-027_TS_AR_part1.indd 19000-027_TS_AR_part1.indd 19 7/25/09 12:12:04 AM7/25/09 12:12:04 AM

Enduring the Turbulenceand getting Fit for the Future
Following the steep downturn in the global
economy, in the second half of 2008, the
senior management of the Tata Steel Group,
Mr. B. Muthuraman (Managing Director, Tata
Steel Ltd.), Mr. Kirby Adams (Chief Executive
Officer, Tata Steel Europe), Mr. H. M. Nerurkar
(Executive Director, India & South East
Asia), Mr. Koushik Chatterjee (Group Chief
Financial Officer) and Mr. Jean-Sébastien
Jacques (Group Director, Strategy) have
been interacting with various stakeholders
including the media, several government
bodies, equity analysts and global equity
investors, banks and rating agencies to
talk about the current environment, the
industry, Tata Steel’s response to the crisis
and strategy. The following are the key
themes of their discussions.
20
000-027_TS_AR_part1.indd 20000-027_TS_AR_part1.indd 20 7/25/09 5:16:21 PM7/25/09 5:16:21 PM

Q: How has the global economic crisis aff ected the steel industry?A: The three key pillars of the international financial
markets are confidence, capital and liquidity
and these three are somewhat interrelated. Until
September 2008, all these three pillars were on a
high and therefore, businesses across the various
sectors were performing in a robust manner.
However, the confidence in the financial system
was shaken with successive crises across various
banks in the US and Europe. This then resulted in a
significant erosion of capital in the banking industry
in the developed world which eventually spiralled
into an unprecedented global financial crisis. This
phenomenon brought about a sharp decline in
consumption of steel as it did in other products,
affecting the steel demand across the globe.
Consequently, global liquidity was choked and the
manufacturing sectors including the consumers
of the steel industry were severely affected. It is
estimated that during the second half of the year,
the steel demand declined by around 20% globally
over the same period last year.
21
000-027_TS_AR_part1.indd 21000-027_TS_AR_part1.indd 21 7/25/09 12:12:09 AM7/25/09 12:12:09 AM

Q: How has Tata Steel responded to the situation?
A: The Group has responded in time and with great
speed executing several initiatives to counter the
slowdown. Our actions have been geography specifi c
and well planned.
In India, we have responded by increasing production
post commissioning of the 1.8 mtpa programme and
focussing on performance improvement to neutralise
the eff ect of reduced realisations, whereas in South
East Asia, the focus is on working capital management
and cost reduction. In Europe we have cut production
by idling blast furnaces at three sites in order to align
production with demand as a part of the “Weathering
the Storm” initiative which resulted in cash savings
of £712 million (US$1.02 billion) in the second half
of the fi nancial year 2008-09. Further, these eff orts
have been supplemented by a strategic restructuring
initiative launched as “Fit for Future” programme which
when completed, will result in improvement of the
operating profi t of around £200 million annually. In all
our sites across the Group, the journey of ‘Continuous
Improvement’ stays on course, covering the entire
range of manufacturing and mining processes.
Q: What would be the Tata Steel Group’s strategic levers in the near future?
A: The strategic levers of the Group have remained the
same over the last few years. The current global economic
scenario has only rephased some of these strategies in
terms of timing and speed. The four levers are
(a) Making our European operations competitive
by hastening the speed of the “Weathering the
Storm” and “Fit for the Future” programme.
(b) Quick completion of our expansion plans in India.
The 3 mtpa project will be commissioned by 2011
and will add signifi cant value to the Group. Further
expansion in India through the Greenfi eld project
in Orissa and Chhattisgarh are ongoing and their
commencing will depend on ground realities and
iron ore allocation.
(c) Investment in raw material assets to provide
better raw material security especially to our
European operations.
(d) Vigourous pursuit of continuous improvement
across all our operations.
Enduring the Turbulenceand getting Fit for the Future
22
000-027_TS_AR_part1.indd 22000-027_TS_AR_part1.indd 22 7/25/09 5:16:24 PM7/25/09 5:16:24 PM
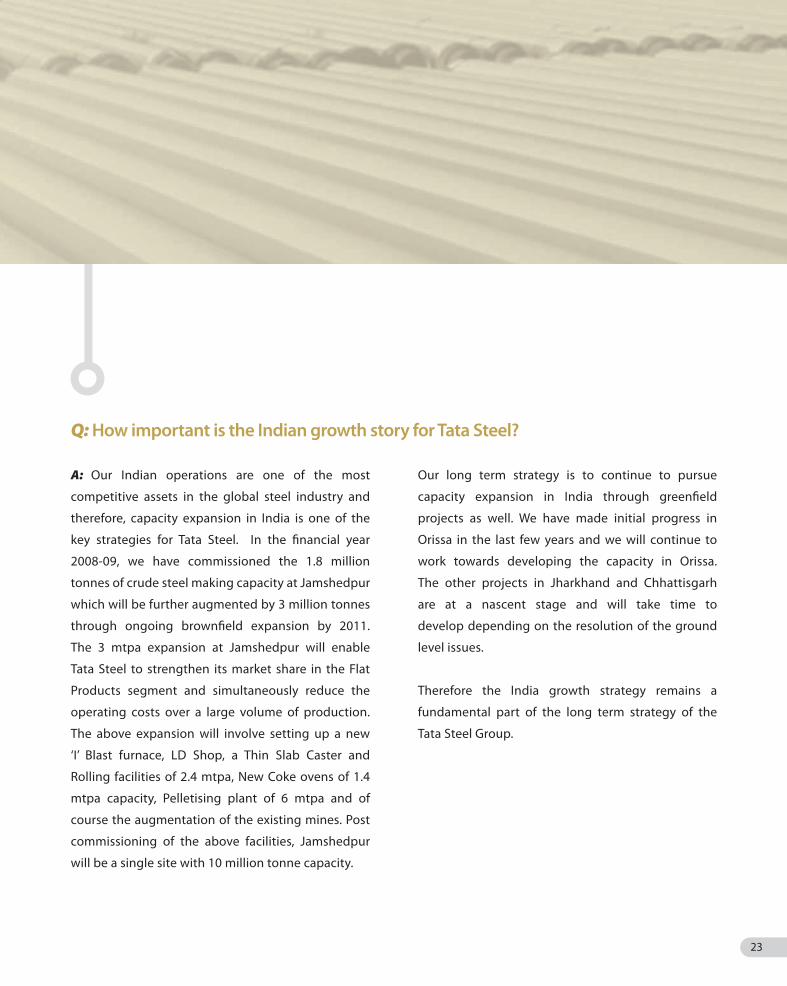
A: Our Indian operations are one of the most
competitive assets in the global steel industry and
therefore, capacity expansion in India is one of the
key strategies for Tata Steel. In the fi nancial year
2008-09, we have commissioned the 1.8 million
tonnes of crude steel making capacity at Jamshedpur
which will be further augmented by 3 million tonnes
through ongoing brownfi eld expansion by 2011.
The 3 mtpa expansion at Jamshedpur will enable
Tata Steel to strengthen its market share in the Flat
Products segment and simultaneously reduce the
operating costs over a large volume of production.
The above expansion will involve setting up a new
‘I’ Blast furnace, LD Shop, a Thin Slab Caster and
Rolling facilities of 2.4 mtpa, New Coke ovens of 1.4
mtpa capacity, Pelletising plant of 6 mtpa and of
course the augmentation of the existing mines. Post
commissioning of the above facilities, Jamshedpur
will be a single site with 10 million tonne capacity.
Our long term strategy is to continue to pursue
capacity expansion in India through greenfi eld
projects as well. We have made initial progress in
Orissa in the last few years and we will continue to
work towards developing the capacity in Orissa.
The other projects in Jharkhand and Chhattisgarh
are at a nascent stage and will take time to
develop depending on the resolution of the ground
level issues.
Therefore the India growth strategy remains a
fundamental part of the long term strategy of the
Tata Steel Group.
Q: How important is the Indian growth story for Tata Steel?
23
000-027_TS_AR_part1.indd 23000-027_TS_AR_part1.indd 23 7/25/09 5:16:26 PM7/25/09 5:16:26 PM
Q: How would the raw material strategy of Tata Steel unfold over the next few years?A: Tata Steel in India is an integrated player, for the majority
of its raw material requirements. However, raw material
self-suffi ciency for the consolidated entity is at 25% post
the Corus acquisition. It has been the stated objective of the
company to increase self-suffi ciency of raw materials to 50%
in the medium to long term. We are actively pursuing raw
material interests in coking coal and iron ore either in terms
of virgin sites with signifi cant resource potential or in terms
of smaller existing ventures which can be quickly aligned to
the requirements in Europe. Riversdale Energy Mining Limited,
where we hold 35% stake, has announced an inferred reserve
of around 4 billion tonnes in one tenement, in Mozambique,
where its subsidiary has been awarded the Mining Concession.
The feasibility study for the same is currently underway.
Tata Steel also has a Joint Venture with New Millennium
Capital Corp (“NML”) in Canada, with an option to acquire 80%
in the Direct Shipping Ore (“DSO”) project. This has estimated
reserves of around 100 million tonnes of iron ore. We also have
an option in a South African iron ore mine, to enter into a Joint
Venture with the promoters. This project is currently under
evaluation. It is expected that iron ore from both the DSO project
and the South African mines will service part requirement of the
European operations starting from mid 2011.
Q: Tata Steel Europe has a large pension scheme. Can you give us an update?A: The British Steel Pension Scheme
(BSPS) had assets at March 31, 2009
of approximately £9 billion. As part
of the strategy of de-risking the BSPS,
the investment management team has
been progressively altering the asset
mix, out of equities into fi xed income
assets (bonds). This was largely carried
out at a time when equity markets were
at relatively high levels, with a resulting
benefi t to the scheme. As at March 31,
2009, the asset mix comprised 68% of
fi xed income assets, with the balance
of 32% being principally equities. The
comparable fi gures at December 2006
prior to the acquisition by Tata Steel
were 50% and 50% respectively. The
BSPS on an IAS19 accounting basis
had a surplus of over £600 million
as at March 31, 2009. The Company
Enduring the Turbulenceand getting Fit for the Future
24
000-027_TS_AR_part1.indd 24000-027_TS_AR_part1.indd 24 7/25/09 12:12:13 AM7/25/09 12:12:13 AM

Q: How has the debt position moved for the Tata Steel Group in the previous year? A: The gross debt in the Tata Steel Group was US$10.54 billion
in March 2008 which increased to US$11.78 billion as at the
end of March 2009. The increase was primarily on account of
raising of new loans to the tune of US$2.07 billion, during the
year in Tata Steel India, to fund growth projects and to ensure
an adequate liquidity buff er in the wake of global liquidity
crisis. During the year, we repaid debts to the extent of US$
1.66 billion including a prepayment of debt in Tata Steel
Europe of around £150 m (US$215 million). The entire foreign
currency term debt in Tata Steel India is hedged into rupees
at acceptable levels. Therefore the company was unaff ected
by the volatile movement of the rupee on account of the
above loans. The only instrument which is unhedged are the
Convertible Bonds (CARS) which have a convertible option.The
gross debt as on March 2009, showed an increase of US$830
million, which was primarily on account of revaluation, due to
currency movements. The corresponding value of the hedges
taken to cover foreign currency loans in Tata Steel Limited,
amounted to approximately US$611 million, which was
refl ected on the asset side of the Balance Sheet. Taking into
account the liquid cash and cash equivalents on the books as
at March 31, 2009 of US$1.9 billion, the net consolidated debt
as at March 31, 2009 was US$9.9 billion.
has also completed discussions with
the Pension Trustee on the triennial
valuation of the scheme as at March 31,
2008 and the Company contributions
to meet the cost of future service
benefi ts will continue from April 1,
2009 at the rate of 12% of pensionable
earnings subject to review at future
actuarial valuations.
25
000-027_TS_AR_part1.indd 25000-027_TS_AR_part1.indd 25 7/25/09 12:12:15 AM7/25/09 12:12:15 AM
Q: The covenants for the debt in Europe have been restructured. Can you elaborate?
A: The Senior Facility Debt in Europe is a non-recourse
debt to Tata Steel Limited. This debt carries certain
covenants, which are tested on a quarterly basis. Tata
Steel Europe has performed strongly in 2008-09 and
has met all its covenant obligations till March 2009
with a strong liquidity position at the year end.
We have informed our lenders that we are taking
signifi cant steps to restructure our operations and
reduce costs to weather the downturn. This would
enable us to emerge stronger with improved
profi tability in the future. In the near term, however, like
most other companies in the industry, there could be an
adverse impact on our EBITDA, which could put a stress
on the covenant package in the forthcoming quarters.
As part of the pro-active discussions with our lenders
on the covenant package, we had not sought any
additional funding, as we had sufficient liquidity
for our operations and had also not requested any
re-scheduling of our debt servicing obligations
as there are no material repayment/refinancing
requirements in the near future. Furthermore, as
part of the covenant reset package being sought,
we volunteered to prepay £200 million of the
non-recourse debt to continue with our objective to
de-leverage our European operations. The Lenders
voted unanimously in favour of the resolution,
the redeeming feature being, that there will be no
increase in the current level of interest costs for the
remaining life of the loan.
The covenant reset package, as agreed, requires Tata
Steel, the parent company, to inject £425 million
into Tata Steel Europe in a phased manner, of which
around £ 200 million will be used to prepay debt and
de-leverage the European Balance Sheet.
The covenant resetting agreement demonstrates
the strong relationship of the Tata Steel Group with
its lenders and underlines the commitment of the
parent company to its European operations.
Enduring the Turbulenceand getting Fit for the Future
26
000-027_TS_AR_part1.indd 26000-027_TS_AR_part1.indd 26 7/25/09 12:12:16 AM7/25/09 12:12:16 AM

Q: Can you elaborate on the Financing & Liquidity Strategy of the Tata Steel Group in response to the crisis?
A: Given the unprecedented scale of the global fi nancial crisis, the
company responded very quickly on many fronts and fi nancing
was certainly one of them. Recognising the uncertain fi nancing
environment and the fragile state of the global banking industry,
we focussed on both internal and external levers. Internally as
an organisation, we placed primary importance on conserving
liquidity through reduced spend management and sharp reduction
in working capital levels. We also focussed on improvement in
the productivity levels and reduction in overheads. On capital
expenditure, we have re-prioritised on the most value creating
and critical projects and reworked the capital planning strategy.
On the external front, we raised long term capital which acted
as a liquidity buffer in the current circumstance and would be
deployed in value creating long term assets. The above actions
ensured that the Tata Steel Group had adequate liquidity and also
financial flexibility for growth and exigencies.
The liquidity position of the Group at the year end was
approximately US$1.9 billion of cash and cash equivalents and
undrawn lines.
Q: Finally what are the key priorities of the Company for the next twelve months?A: Our near term focus is on the
implementation of the “Fit for Future”
restructuring in Europe, to continue
with the 3 mtpa expansion project in
Jamshedpur and overseas raw material
projects, to increase production
volume in India and optimise working
capital management across the Group
to preserve liquidity.
27
000-027_TS_AR_part1.indd 27000-027_TS_AR_part1.indd 27 7/25/09 5:16:26 PM7/25/09 5:16:26 PM

A history of positive responseOver the past 100 years Tata Steel has witnessed many global crises. Every time the company has responded positively and proactively, enabling it not merely to overcome each crisis but to grow through the experience.
India’s Swadeshi Movement began in the early
1900s. It encouraged the boycotting of imported
goods in order to stimulate the demand for
products made in India. As a part of the Indian
Independence Movement, it was a successful
economic strategy to improve economic
conditions in India through the principles of
self-sufficiency as well as to prove that Indians
had what it takes to produce for themselves,
administer themselves and be self-reliant. The
market also needed a boost that would encourage
Indian trade and enterprise.
The Movement gave tremendous impetus to the
Indian industry , opening the way for the manufacture
of swadeshi salt, sugar and other products.
The Swadeshi Movement (1905–1908)
BIRTH OF TATA STEEL The Swadeshi Movement encouraged Jamsetji Tata
to set up Asia’s fi rst ever privately-owned integrated
iron and steel plant. His interest in iron making was
triggered in 1882 when he came across an offi cial
report on the Chanda district which identifi ed large
deposits of high-quality iron ore but also noted
a lack of suitable coal in the region. His idea of
endowing his country with its own iron and steel
industry gained support within the government
and in 1907, when the Swadeshi Movement was
at its height, the Tata Iron and Steel Company Ltd.
was incorporated.
The Tatas raised the fi nance to build the steel plant
within India – a signifi cant milestone in Indian
economic history. They proved a point to the then
British government that an Indian company had
the vision and the wherewithal to build an industry
from the ground up and had the know-how to
apply international standards to meet local needs.
The setting up of the Tata Iron and Steel Company
Ltd. gave Indian industry a voice paving the way for
many a future enterprise.
28
028-049_TS_AR_part2.indd 28028-049_TS_AR_part2.indd 28 7/25/09 12:14:45 AM7/25/09 12:14:45 AM

World War I began as a local European war on
28th July, 1914 and eventually became a global
confl ict spanning four years and involving 32
nations, before fi nally ending on 11th November,
1918. It caused unprecedented carnage and
devastation across the world. During the war no
fewer than 26 vessels carrying Tata Steel material
were sunk. The war eff ort took almost 80% of Tata
Steel’s production.
Tata Steel responds During World War I there was a requirement
for substantial amounts of steel to oppose
the German aggression. Through innovative
eff orts like stopping the manufacture of highly
profi table ferro-manganese in favour of using its
blast furnaces to convert pig iron into the steel
that the war eff ort required, Tata Steel supplied
World War I (1914 –1918)
1,500 miles of rail and 300,000 tonnes of steel
material at concessional rates for the military
campaigns. The plant was geared to meet the
priority needs of the government. It worked on
a 24-hour schedule, and sold its products to the
government at a fraction of the price prevailing
in the open market. Two more open hearth
furnaces, each of 60 tonnes capacity, were added
to make more steel. The British acknowledged at
the end of the war that the allied victory would
not have been possible without the 1,500 miles
of railway track supplied by Tata Steel.
In 1919, in recognition of the Company’s contribution
to the war eff ort, Lord Chelmsford renamed Sakchi
as Jamshedpur and Kalimati Railway Station as
Tatanagar. It was also during this time that the
Company decided to expand its capacity.
29
028-049_TS_AR_part2.indd 29028-049_TS_AR_part2.indd 29 7/25/09 12:14:46 AM7/25/09 12:14:46 AM

The Great Depression (Late 1920s – early 1940s)
The Great Depression, which originated in the
US with the Wall Street Crash of October 1929,
was a worldwide economic downturn that had
a disastrous effect on virtually every country.
It was the most severe economic depression
of the 20th century, wiping out the value of
equities, wrecking the international currency
system and causing world commodity prices to
collapse. International trade plunged by half to
two-thirds, as did personal income, tax revenues,
prices and profits. Construction came to a virtual
halt in many countries. Facing plummeting
demand and rocketing unemployment, areas
dependent on basic industries such as farming,
mining and logging suffered the most. In the
UK the Great Depression brought to a head the
mounting discontent of the British steel industry’s
financial backers, some of which had already
effectively taken control of many family-owned
companies.
Tata Steel responds Early in World War I Tata Steel had embarked on an
expansion of the Works and this was followed by
a larger expansion programme in 1917 to raise its
steel production to 500,000 tonnes.
The value of this expansion programme was not
fully appreciated until the world was reeling
under the pressure of the Great Depression.
The Tatas survived the Depression and
supplied nearly three quarters of the country’s
steel requirements at that time.
A history of positive response
30
028-049_TS_AR_part2.indd 30028-049_TS_AR_part2.indd 30 7/25/09 12:14:46 AM7/25/09 12:14:46 AM

Formation of the British Iron & Steel FederationCo-ordinated by the Bank of England and boosted by a
devaluation of the Sterling, which helped exports and
hindered imports, a series of measures were adopted in
the early 1930s to cure the industry’s chronic ailments.
In 1934 the British Iron & Steel Federation (BISF) was
formed. Under its leader, Sir Andrew Duncan, the
BISF espoused a policy of rationalised regional steel
making. It left investment decisions to individual fi rms
but retained a strong infl uence over policy matters, as
well as control over the industry’s relations with the
government. This industry structure remained largely
intact until the second nationalisation of the UK’s
steel industry in 1967 (the fi rst was in 1949). The result
was a swift improvement in business performance as
living standards fi nally began to rise.
BIRTH OF KONINKLIJKE NEDERLANDSCHE HOOGOVENSIn September 1918 Koninklijke Nederlandsche
Hoogovens en Staalfabrieken was founded as a
private-sector initiative. Inspite of the uncertain
future, at the end of the War, a group of 23 men
comprising bankers, industrialists, merchants
and politicians founded the company under the
leadership of the visionary Henry Wenckebach. In
1924 iron making started up in IJmuiden, using
cutting-edge coke making and blast furnace
technology. Skilled labour was attracted from all
around Europe.
By 1929, as the Depression took hold, the company
was operating its two blast furnaces at full capacity,
selling all the pig iron output, as well as all the
furnaces’ by-products. However, a couple of loss-
making years in the pre-Depression period made
it fi nancially impossible to realise the dream of
expanding downstream into the melting and
rolling of steel.
In 1931 Hoogovens made a profi t and, with exports
of 225,000 tonnes of pig iron, was the most important
merchant iron supplier in the world. By carefully
building up a dedicated worldwide customer base,
establishing low-cost/high-quality integrated
iron making operations and fully exploiting the
opportunities to sell by-products, the new company
had acquired the ingredients which would ensure its
survival through the years of the Great Depression.
31
028-049_TS_AR_part2.indd 31028-049_TS_AR_part2.indd 31 7/25/09 12:14:47 AM7/25/09 12:14:47 AM
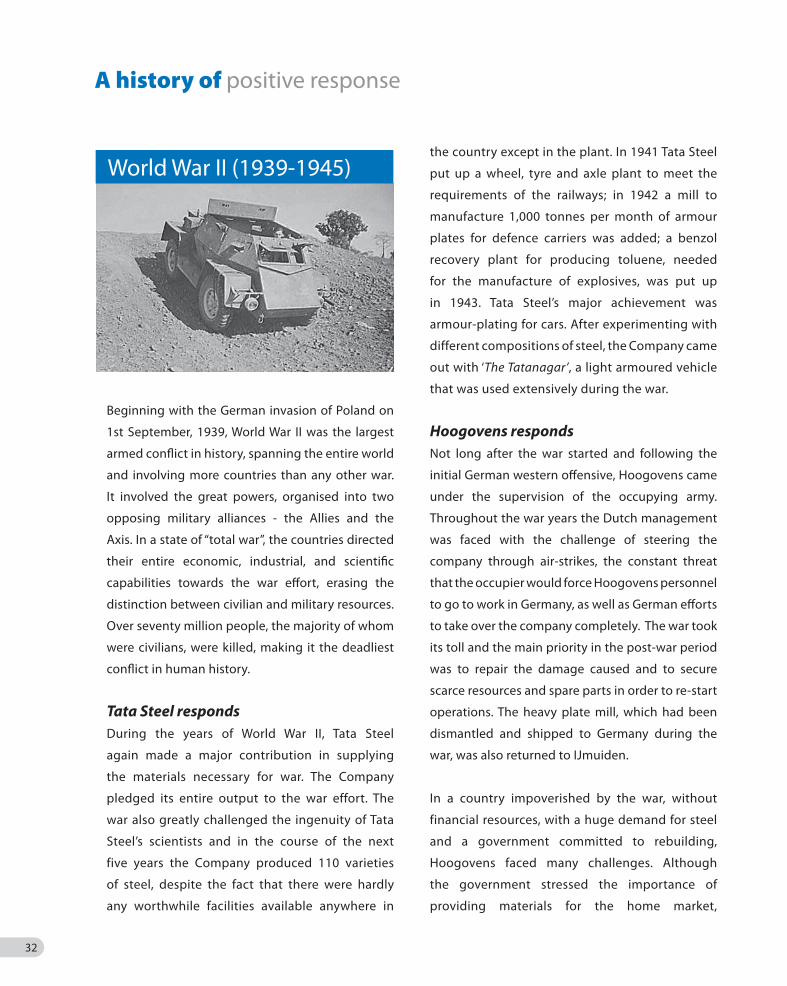
Beginning with the German invasion of Poland on
1st September, 1939, World War II was the largest
armed confl ict in history, spanning the entire world
and involving more countries than any other war.
It involved the great powers, organised into two
opposing military alliances - the Allies and the
Axis. In a state of “total war”, the countries directed
their entire economic, industrial, and scientifi c
capabilities towards the war eff ort, erasing the
distinction between civilian and military resources.
Over seventy million people, the majority of whom
were civilians, were killed, making it the deadliest
confl ict in human history.
Tata Steel responds During the years of World War II, Tata Steel
again made a major contribution in supplying
the materials necessary for war. The Company
pledged its entire output to the war effort. The
war also greatly challenged the ingenuity of Tata
Steel’s scientists and in the course of the next
five years the Company produced 110 varieties
of steel, despite the fact that there were hardly
any worthwhile facilities available anywhere in
World War II (1939-1945)the country except in the plant. In 1941 Tata Steel
put up a wheel, tyre and axle plant to meet the
requirements of the railways; in 1942 a mill to
manufacture 1,000 tonnes per month of armour
plates for defence carriers was added; a benzol
recovery plant for producing toluene, needed
for the manufacture of explosives, was put up
in 1943. Tata Steel’s major achievement was
armour-plating for cars. After experimenting with
different compositions of steel, the Company came
out with ‘The Tatanagar’, a light armoured vehicle
that was used extensively during the war.
Hoogovens respondsNot long after the war started and following the
initial German western off ensive, Hoogovens came
under the supervision of the occupying army.
Throughout the war years the Dutch management
was faced with the challenge of steering the
company through air-strikes, the constant threat
that the occupier would force Hoogovens personnel
to go to work in Germany, as well as German eff orts
to take over the company completely. The war took
its toll and the main priority in the post-war period
was to repair the damage caused and to secure
scarce resources and spare parts in order to re-start
operations. The heavy plate mill, which had been
dismantled and shipped to Germany during the
war, was also returned to IJmuiden.
In a country impoverished by the war, without
financial resources, with a huge demand for steel
and a government committed to rebuilding,
Hoogovens faced many challenges. Although
the government stressed the importance of
providing materials for the home market,
A history of positive response
32
028-049_TS_AR_part2.indd 32028-049_TS_AR_part2.indd 32 7/25/09 12:14:47 AM7/25/09 12:14:47 AM

Hoogovens was convinced it should maintain its
international outlook and was inspired by its new
semi-continuous wide hot strip mill technology,
which originated in the US and was obtained under
the American Marshall Aid recovery programme
after lengthy negotiations.
Soon after India won her hard fought battle for
independence in 1947, the country was hit by
the Partition and its after-eff ects. In the next
couple of years the government had the task
of nation building to make India self-suffi cient.
Serious eff orts began to boost industry and
commerce and build a stable economy.
Tata Steel responds The Tatas were ready to take part in the Herculean
task of nation building. The badly needed steel
for the new Five-year Plans came from the Tata
factory – steel for the Howrah Bridge in Kolkata,
Post Indian Independence Nation Building (Late 1940s)
Having a long-term international vision,
opting for completely new technologies, quick
decision-making and fostering social cohesion
among its workforce, all these things allowed
Hoogovens to emerge successfully from the
post-war period.
the Bhakra Nangal project, the Damodar Valley
Corporation and many more important projects.
Tata Steel played a key role in the recreation of
post-independence India.
Initiatives such as Leave with Pay, the Workers’
Provident Fund Scheme, the Workmens’ Accident
Compensation Scheme, Maternity Benefi ts,
Eight-Hour Working Days, Free Medical Aid,
Retirement Gratuity and Profi t Sharing Bonus
were introduced by Tata Steel long before they
were enforced by law.
33
028-049_TS_AR_part2.indd Sec1:33028-049_TS_AR_part2.indd Sec1:33 7/17/09 9:52:10 PM7/17/09 9:52:10 PM

The 1960s was a time of economic uncertainty in
Singapore. Infrastructure was poor and the existing
industrial facilities were mainly for domestic
consumption. There were few exports and very little
foreign investment. In addition, Singapore was also
battling unemployment and labour unrest after
the withdrawal of British troops. The need of the
hour was to give the country’s economy a boost,
accelerate industrial development and create jobs.
BIRTH OF NATSTEELNational Iron and Steel Mills Ltd. (NISM) was
incorporated on 12th August, 1961 to manufacture,
export and trade in iron and steel products for the
construction industry in Singapore, Malaysia and
the adjoining region. Tasked to support Singapore’s
nation-building eff orts, NISM’s products were
used in most construction projects, such as HDB
fl ats, MRT lines and Changi Airport. In 1990 NISM
changed its name to NatSteel. By the beginning of
the 21st century NatSteel had established a strategic
footprint in the growing economies of the Asia
Pacifi c and had built a premium brand name that
was widely respected for its quality and production
know-how. Since its inception NatSteel has nurtured
an ethic of positive response to challenge, a tradition
it continues as part of the Tata Steel Group.
Economic Development of Singapore (1960s)
A history of positive response
At the end of World War II it seemed unlikely
that the UK steel industry was about to enter a
long period of growth, given the fact that the
post-World War I boom had been short.
Despite being criticised for profi teering, UK
steel makers had worked tirelessly, contributing
97% of their output to the War and related
purposes. However, since the War had provided
no opportunity to focus on capital expenditure
or on consolidation, there were fears that the
industry might sink or stagnate.
BIRTH OF BRITISH STEEL Initially, under the auspices of the Iron & Steel
Control (set up during the war under the Ministry
of Supply) and based on the recommendations
of the 1945 Franks Report, a development plan
for the steel industry was drawn up. Over the
next two decades four more fi ve-year plans were
published, at the end of which the condition of
the British steel industry had immensely improved.
A succession of ambitious investment programmes
were undertaken to build new blast furnaces and
modern rolling mills (in particular hot strip mills).
Production grew to keep pace with demand and
reached a peak of 27 million tonnes of crude steel
in 1965. However, problems caused by fragmented
ownership continued until a solution was provided
in 1967 by way of nationalisation under the Iron
and Steel Act 1967. As a consequence, the British
Steel Corporation was formed, which incorporated
90% of UK steel making.
Post-War Rebuilding of the UK Steel Industry (1946-1967)
34
028-049_TS_AR_part2.indd Sec1:34028-049_TS_AR_part2.indd Sec1:34 7/17/09 9:52:11 PM7/17/09 9:52:11 PM

During the late 1960s and the early 1970s UK steel demand dropped for the fi rst time since the war. The oil shocks of 1974 and especially 1979 exacerbated the downturn in UK steel consumption, with output dropping in 1980 to less than 12 million tonnes. Britain was not alone in suff ering the eff ects of the economic turbulence. Regulation of the steel industry had transferred to Brussels in 1973, when Britain joined the tariff -free Common Market. In 1980 the European Commission declared the steel industry to be in “manifest crisis”, introducing production quotas, delivery ceilings, and state aid in return for capacity cuts.
Steel Denationalises and Consolidates (1988 onwards)The 1990s were, in general, good years for British Steel plc, despite the continuing cyclicality of the industry that could still produce loss making years. By and large shareholders had opportunities to prosper and the privately-owned company continued to modernise and rationalise, so much so that at times the company was held up as a model for the rest of the world’s steel makers. Meanwhile, the national players in a still-fragmented European and global industry were unable to cope with economic troughs and maintain the heavy capital expenditure the steel industry required. There arose an increasingly obvious need for the industry as a whole to free itself of state aid and to consolidate, which was recognised by the European Commission’s shift in policy towards accepting “one-time last-time” state aid in exchange for removal of state ownership together with rationalisation and support for cross-border mergers.
Formation of CorusIn 1999 British Steel plc and Koninklijke Hoogovens N.V. merged to form Corus in the largest European steel industry merger to date. Together they formed Europe’s second largest steel maker and the world’s fourth largest. In the fi rst few years of the new millennium the global steel demand balance oscillated wildly and by 2003 Corus was in severe diffi culty. The company adopted a programme of strategic reforms called “Restoring Success”, which aimed at going beyond a mere adaptation to new market conditions. This 3-year programme restructured the Group’s UK operations to give a focus on three core sites: Scunthorpe, Port Talbot and Rotherham. One of the key decisions was the closure of the hot end at Llanwern. By 2005 Corus had returned to profi t and restored value to shareholders.
British Steel respondsBritish Steel entered the 1980s suff ering from surplus capacity and chronic overmanning that had caused employment to rise to 38% of total costs. In 1980 the industry suff ered a lengthy steel workers’ strike. However, British Steel’s workforce had shrunk to 53,000 by 1988 from 250,000 in 1967. Furthermore, it had reversed ten years of heavy losses from the mid-1970s. By the late 1980s it was making a healthy profi t and was hailed as one of the world’s most effi cient steel makers. In 1987 the government decided that it had made an impressive turnaround in performance and had a suffi ciently healthy outlook for privatisation to take place. The sale of British Steel was a pioneering transaction that sparked off a mass migration from state to private ownership.
Economic Malaise and the Oil Crises (1967-1988)
35
028-049_TS_AR_part2.indd Sec1:35028-049_TS_AR_part2.indd Sec1:35 7/17/09 9:52:12 PM7/17/09 9:52:12 PM

Collapse of the Soviet Union (1992)The disarray in the post-Soviet era created a fl ood of steel imports from East European countries. In 1992 the situation worsened due to a softening business cycle and the devaluation of the US Dollar. All these elements led to plummeting prices.
Hoogovens respondsInspired by Nippon Steel’s Nagoya plant, a master plan was launched in 1990 which aimed at repositioning Hoogovens into the group of ‘Best in Europe’ by 1995. This plan covered a wide range of aspects such as organisation, education, complete customer focus and operational excellence. The
these new liberalisation measures, Tata Steel, under the guidance and leadership of its senior offi cers, embarked on a series of modernisation and restructuring initiatives which helped it grow from strength to strength. The full impact of economic liberalisation, which meant that steel could be easily imported, was felt in 1993-94. The Company set targets to reduce costs of production and raise the level of net realisation. This was a turning point for the Company, which was judged Number 1 in the league table of world-class steel companies by World Steel Dynamics in the year 2001.
The Company also began work in earnest on Phase III of its multi-thousand crore modernisation programme and, after the fi fth phase of modernisation, was awarded ISO-9000 certifi cation. The Six Sigma programme was introduced thereafter. In addition, as a measure to upgrade quality, a model of the US’s Malcolm Baldrige Awards was adopted under the banner of the JRD QV Awards. Tata Steel Limited (India) is today one of the lowest cost producers of steel in the world.
basis for this improved competitiveness was a drastic reduction in cost-base by gradually reducing the number of personnel and by increasing output.
Alarming fi nancial results in early 1992 forced the company to accelerate the master plan. Through the joint eff orts of its personnel, trade unions, shareholders and a large group of very loyal customers in Europe and the US , the company was able to counter the threat within two years. The eff orts paid off in the late 1990s, when Hoogovens in IJmuiden was declared the best plant in Europe for fi nancial performance.
Economic Liberalisation In India (1991 onwards)The economic liberalisation reforms did away
with the Licence Raj. In 1991, after being bailed
out of bankruptcy by the International Monetary
Fund, the government of P. V. Narasimha Rao
initiated several breakthrough reforms, including
opening up international trade and investment,
deregulation, initiation of privatisation etc. This
period was hailed as a breath of fresh air after the
tight and rigid control of the licensing policy that
was earlier prevalent in the country. India has been
on a fast track of economic growth ever since.
Tata Steel responds The 1991-1992 government policy was a
momentous change from the earlier trade controls
and restrictions and brought with it a new era of
growth for the country. The iron and steel industry
became one of the foremost sectors to be opened
under the New Economic Policy. Substantial private
investment fl owed in, with the consequent changes
heralding a new beginning for the interplay of free
market enterprise in this vital sector. Embracing
A history of positive response
36
028-049_TS_AR_part2.indd Sec1:36028-049_TS_AR_part2.indd Sec1:36 7/17/09 9:52:12 PM7/17/09 9:52:12 PM

2001 was a dramatic year. The 9/11 disaster and
the burst of the dot.com bubble sent strong
negative messages rippling through the
economy. Many American companies sought
refuge under ‘Chapter 11’, which aff orded them
protection against possible bankruptcy. There
was a concurrent impact on exports to the US,
which aff ected steel makers elsewhere.
Corus IJmuiden respondsAs a response to this business environment, on
5th March 2002 the US administration announced
that under Section 201 of the US Trade Act it
would impose a three-year safeguard duty on
steel imports, which in practice meant tariff s of up
to 30% on steel supplied from IJmuiden into the
US. With over half a million tonnes of high-quality
steel products supplied from the Netherlands to
a stable group of US customers, this presented
a major threat to IJmuiden’s market position.
The fi rst response was to assure US customers
that Corus IJmuiden would do everything
to keep them supplied. Already well-versed
The 2001 Financial Challenge in legal battles with the US administration,
IJmuiden stepped up its eff orts. The basis of
this confrontation revolved around the fact that
much of the material that IJmuiden supplied
simply could not be produced by US mills
because of its specifi c physical properties and
qualities. Politicians, ambassadors, US governors
and the American customers played vital roles in
keeping the trade channel open.
In order to continue dedicated services to its US
customers, which in most cases had a history
as far back as the 1960s, the plant in IJmuiden
was able to secure a minimum lifeline to meet
its customers’ delivery needs. This included
securing emergency supplies from other plants,
in some cases. In May 2003 the US president
withdrew the Section 201 tariff s.
A history of providing unique products along with
the united defence against the trade restrictions
served to reinforce the very valuable bond
between US customers and Corus in IJmuiden.
Corus IJmuiden, Netherlands
37
028-049_TS_AR_part2.indd Sec1:37028-049_TS_AR_part2.indd Sec1:37 7/17/09 9:52:12 PM7/17/09 9:52:12 PM

Responding to the Crisis - The Tata Steel Way
‘G’ Blast Furnace, Jamshedpur38
028-049_TS_AR_part2.indd Sec1:38028-049_TS_AR_part2.indd Sec1:38 7/17/09 9:52:16 PM7/17/09 9:52:16 PM

The steel industry is no stranger to market turbulence. Since it was founded in 1907, Tata Steel has
risen to each and every challenge, as have its subsidiaries. The latest challenge has come from the
economic downturn, which has destroyed vast amounts of wealth across the globe. In response, the
Tata Steel Group has reassessed its operating performance in order to strengthen its foundations.
The Company swung into action recognising that this economic downturn was deeper than what
had been previously experienced and was also more global in scale. The operating plan was realigned
to refl ect the current realities of the marketplace while working capital generation and utilisation
was optimised.
The Company looked at the slowdown as an opportunity to act quickly and eff ectively to create
value and has undertaken several initiatives over the last year. Cross-functional strategic teams
were assigned to drive transformational change across key process areas. Managers were asked to
make resource allocation decisions while serving two competing yet equally critical goals: keeping
the organisation viable during the economic downturn and readying it to surge forward when the
winds are favourable again. This was a time to identify best working practices and act on them.
Tata Steel has been working to enhance customer satisfaction and expand relationships with existing
clients. It has looked strategically at cost-cutting, which was an inevitable consequence of the economic
downturn. To fi ght against rising costs, the Company reorganised its business plans, tightened budgets
and eliminated unnecessary costs, and thus achieved its primary goal of emerging as a leaner,
cost-eff ective and more effi cient operation.
The Company’s second goal was to grow despite the economic downturn. Tata Steel focussed on
areas within its sphere of infl uence, communicated honestly and consistently, and negotiated better
deals and contracts. Throughout this process, it continued to maintain direct and unambiguous
communication with its employees and ensured that its teams stayed motivated.
To counter any eff ects of the downturn, Tata Steel has undertaken both tactical, or short-term, and
strategic measures in order to benefi t the organisation in the long run.
39
028-049_TS_AR_part2.indd Sec1:39028-049_TS_AR_part2.indd Sec1:39 7/17/09 9:52:20 PM7/17/09 9:52:20 PM
Tactical InitiativesTata Steel has successfuly preserved cash by reducing
net working capital and rephasing capex. In view of
the liquidity constraints, capital expenditure outgoings
during the year were contained at around Rs. 3,000
crore. Cash generated from operating activities this
year came to Rs. 7,397 crore, almost 18% higher than
last year.
Inventories were liquidated to release cash. Steel
stock was brought down to 28 days by the end of
March 2009 as against 71 days at the end of December
2008. Coal contracts were renegotiated and capacities
maximised by using cheaper domestic scrap. Output
from the large blast furnaces (BFs) was increased and
smaller, uneconomical BFs were discontinued.
Effi ciencies that led to yield improvement and reduced
power consumption were stepped up. The Company
bettered the Specifi c Energy Consumption record set
last year by achieving a new record of 6.594 GCal per
tonne of crude steel in 2008-2009.
The Hot Strip Mill (HSM) achieved its best ever
production of 310,600 tonnes in March 2009 compared
to the previous best record of 310,300 tonnes in August
Responding to the Crisis - Some Initiatives by Tata Steel (Indian & South East Asian Operations)
2008. Key enablers have been the Mill Pacing Model and
the Shutdown Management practices introduced from
IJmuiden, which have improved NOH (net operating
hours) and SOW (speed of work). In the January to March
quarter, the HSM achieved a yield of 98.18% consistently
over all three months, its best ever performance.
Renegotiations with suppliers and lenders led to better
deals. An across-the-board cost-cutting initiative
targeted and achieved a 15% reduction in general
administrative expenses. Training and reskilling
programmes to make use of any down periods were
set up. Sales in the January-March quarter rose to 1.5
million tonnes.
Strategic InitiativesTata Steel’s 2.9 million tonne per annum (mtpa)
expansion plans are on schedule. They will increase the
Jamshedpur plant’s crude steel making capacity from
6.8 mtpa to 9.7 mtpa, at an estimated cost of Rs. 13,900
crore. The scheduled date for completion of the project
is April 2011.
Supporting robust processes and IT development to
reshape its business relationships and become a true
strategic partner, has been a key initiative.
40
028-049_TS_AR_part2.indd Sec1:40028-049_TS_AR_part2.indd Sec1:40 7/17/09 9:52:20 PM7/17/09 9:52:20 PM
NatSteel Holdings InitiativesNatSteel’s Singapore operations have been
working and continue to work on improvements
in productivity and yield through various internal
initiatives like reducing operating and overhead
costs. Product mix has also been optimised
by selling larger tonnages of downstream
products with an estimated bottom line benefi t
of S$14 million.
As part of its effi ciency drive NatSteel implemented
its SAP IT project on schedule, thereby achieving
better workfl ows. The company is working on
programmes to restructure its businesses in order
to be better prepared to deal with industry peaks
and troughs.
Tata Steel Thailand (TSTH) InitiativesCost control and cost reduction initiatives were carried
out, including the reduction of overall maintenance
costs by Bh 53 mn during the last quarter and reducing
ferroalloy consumption to 12.9kg/tonne in the third
quarter from 13.8kg/tonne in the second quarter.
Cash conservation and liquidity enhancements were
achieved through vigorous monitoring. The entire
stockpile of inventory built up before the economic
downturn was liquidated, resulting in gains worth
Bh 4.7 billion by December 2008 compared with the
previous quarter. In the absence of a stable domestic
market demand, TSTH maximised its exports to India,
delivering approximately 23,000 tonnes in the third
quarter, and is expediting ACRS certifi cation in order
to facilitate exports to Australia.
Raw material sourcing for TSTH’s new mini-blast furnace
will be carried out under the Group’s Global Procurement
Policy. Iron ore & coke will be sourced using the Group’s
synergies, while limestone, other fl uxes and injection
coals will be sourced from the market.
Initiatives were undertaken to manufacture improved
and higher grade medium carbon and high carbon
wire rods.
41
028-049_TS_AR_part2.indd Sec1:41028-049_TS_AR_part2.indd Sec1:41 7/17/09 9:52:24 PM7/17/09 9:52:24 PM

Responding to the Crisis - Some Initiatives by Tata Steel Europe(Corus Group)
Corus employee at its Living Solutions Business42
028-049_TS_AR_part2.indd Sec1:42028-049_TS_AR_part2.indd Sec1:42 7/17/09 9:52:25 PM7/17/09 9:52:25 PM

Initiatives over the years...In the past Corus has had to address situations where the market has
changed in such a way that simple adaptation has not been suffi cient.
After evaluating a longer-term view of the market, Corus has restructured
or consolidated its manufacturing capacity, invested in the remaining
sites to enrich the order book and to enhance capacity in order to
meet future demand. Finally and most importantly, the company has
continually invested in developing the skills of its workforce.
Between 2000 and 2005 Corus was required to manage fl uctuation in
European demand and adapt its sites to the changes in the market.
In 2003 Corus began its UK Restructuring Programme. The aim of this
was to improve the effi ciency of the UK steel making businesses in
order to reduce costs and generate cash throughout the economic
cycle. Crude steel production in the UK was to be focussed on just
three sites – Rotherham, Port Talbot and Scunthorpe – with capacities
more closely aligned to likely future demand. The programme required
signifi cant investment in the company’s engineering steels business as it
concentrated its steel making, casting and rolling at Rotherham. Its aim
was to enable Corus Engineering Steels to achieve a competitive position
in the European market.
43
028-049_TS_AR_part2.indd Sec1:43028-049_TS_AR_part2.indd Sec1:43 7/17/09 9:52:29 PM7/17/09 9:52:29 PM

Responding to the Crisis - Initiatives over the years...
Other investment-led initiatives enhanced and increased the steel making
capacity for strip products at Port Talbot and long products at Scunthorpe.
These also included an improved process route for wire rod production and
adaptation of the medium sections mill to make very long rail, as the existing
facilities could no longer meet the needs of the market. Steel making at
Llanwern was closed and Teesside Works was no longer seen as core to the
company’s needs. However, Teesside would need to be retained until the
other investment programmes were completed. This led to the decision to
enter into a long-term sales agreement for slabs produced at Teesside.
To complement these changes in its manufacturing capability,
Corus embarked on ‘Restoring Success’ – a change programme
expected to last three years. A large part of this programme was
focussed on skills improvement, examples of which are ‘The Journey’ and
‘World-Class IJmuiden’.
By 2005 Corus had returned to profi t. The ‘Corus Way’ programme was
launched, which was designed to embed continuous improvement into the
culture of the company based on four principles:
• Best Supplier to Best Customers
• World-class Processes
• Selective Growth
• Passionate People
44
028-049_TS_AR_part2.indd Sec1:44028-049_TS_AR_part2.indd Sec1:44 7/17/09 9:52:30 PM7/17/09 9:52:30 PM
Corus Strip Products UK (CSPUK)The Journey‘The Journey’ was a programme that set about
creating a consistent positive working culture to
confront fundamental business issues, such as
health and safety, environmental performance and
profi tability. In late 2005 CSPUK’s management, senior
union representatives and principal contractors
and service providers began work on defi ning the
programme. In a series of workshops involving more
than 5,000 people, employees were invited to sign
a commitment to a raft of values and beliefs. This
was followed by the development of a system of
“goals translation”, which was applied consistently
throughout the organisation. A programme of
health and safety initiatives successfully transformed
performance in the area – and CSPUK became a
leading performer in its class. The business also set
about some technical projects. The Port Talbot heavy
end achieved a consistent annualised production
rate of 5 million tonnes and the plant’s Hot Rolling
Mill met its target to roll more than 3.5 million tonnes
of hot rolled coil. By early 2008 CSPUK was able to
announce a string of performance records and had
achieved much improved profi tability.
Corus IjmuidenWorld-Class IjmuidenThe ‘World-Class IJmuiden’ project started in 2001
with the aim of returning the IJmuiden site to the ranks
of Europe’s top steel makers. A three-year programme
was developed to improve the site’s overall
performance by €50 per tonne. Targets were set for
market share and product and process development
in such a way as not to compromise the company’s
commitment to its employees and surrounding
communities. The site’s safety record was to improve
30% year on year; there was a renewed commitment to
value creation for customers and to on-time delivery;
50% of the product range was to be new, and return
on net operating assets was to be 15% through the
cycle. By the end of 2004 the programme was
successfully completed.
Best Supplier to Best CustomersBy 2005 Corus Strip Products IJmuiden was ready for
the next step: an improvement programme based on
Lean Thinking. This would help it to remain ahead of
its increasingly competitive international rivals, not
only in Europe but around the world.
45
028-049_TS_AR_part2.indd Sec1:45028-049_TS_AR_part2.indd Sec1:45 7/17/09 9:52:37 PM7/17/09 9:52:37 PM

The current economic downturn was fi rst felt in
the European manufacturing industry during the
July-September quarter of 2008. Tata Steel Europe
(TSE) reacted quickly to realign its output with the
anticipated lower steel demand levels. It continued
to monitor and adjust its output levels throughout
the second half of the fi nancial year as European
steel demand deteriorated. The depth of the crisis
required Tata Steel Europe to adopt a dual strategy
and two series of measures were drawn up. The
fi rst, ‘Weathering the Storm’, comprised several
short-term actions designed to cut costs and
keep supply and demand in balance. The second,
‘Fit for Future’, addressed certain longer-term and
structural issues that the downturn had brought
into focus.
Weathering the StormThe severity of the crisis made it imperative for TSE to
quickly align production with market demand.
TSE’s crude steel output was cut by at least 40% in the
six months to the end of March 2009.
The reduction was achieved largely through the
temporary idling of three blast furnaces – one each at
the IJmuiden, Port Talbot and Scunthorpe works.
Responding to the Crisis - Some Initiatives by Tata Steel Europe
At the same time, the company moved to reduce
costs in line with expected reduced revenues.
A series of cost-cutting, working-capital and inventory
management, and other short-term initiatives
achieved more than £700 million in cash benefi ts
for the business during the period October 2008-
March 2009.
Much of the payroll-related cost cutting was achieved
through measures such as the elimination of
overtime, altering shift patterns (thus reducing shift
bonus payments) and the implementation of work
agreements that allowed the company to reduce the
hours of employees who were experiencing shortages
of work. There was also a reduction in the use of
third-party services.
In addition the company took advantage of
the drop in activity to institute retraining and
upskilling programmes for the workforce. A
Government payroll support scheme was effective
in the Netherlands.
46
028-049_TS_AR_part2.indd Sec1:46028-049_TS_AR_part2.indd Sec1:46 7/17/09 9:52:37 PM7/17/09 9:52:37 PM

Fit for FutureThe main items in the ‘Fit for Future’ initiative included divestment, asset restructuring
and an effi ciency and overhead review. Taken together these items will provide additional
annual cost savings of more than £200 million. The initiative also put about 3,500 jobs out
of the company’s 42,000-strong workforce at risk, mainly in the UK and the Netherlands – a
situation that has been sensitively and honestly handled.
• Divestments: During the last fi scal quarter, in February 2009, Tata Steel Europe completed
the sale of its two aluminium smelters in the Netherlands and Germany to Klesch & Co.
In January it signed a non-binding Memorandum of Understanding with Marcegaglia
SpA and Dongkuk Steel Mill Co. Ltd. on the sale of a majority stake in its Teesside
Cast Products (TCP) business unit in northeast England. However, in April 2009 the
consortium of Offtakers responsible for 80% of TCP’s output issued Corus with a Notice
of Termination of the binding 10-year Offtake Framework Agreement. As a direct
consequence, in May 2009 the company announced that it has been forced to open
negotiations that might result in a decision to mothball the TCP operation. Discussions
with employees and their representatives are continuing but any decision to mothball
is likely to lead to a significant number of redundancies.
47
028-049_TS_AR_part2.indd Sec1:47028-049_TS_AR_part2.indd Sec1:47 7/17/09 9:52:39 PM7/17/09 9:52:39 PM

Port Talbot
HSM3.2mt 4mt
Llanwern
HSM and PL1Mothballed
Port Talbot
CRMCAPL
Llanwern
PL2Cold RollingZODIAC
LlanwernCentral Engineering Workshop
PontarddulaisAluminised Products
Key Actions• Mothball Llanwern HSM and Pickle Line1• Extend life of BF4 to 2012
Close
Mothballed
• Increase Port Talbot HSM capacity to 4mt+• Effi ciency improvement programmes at Port Talbot
ROLLING RE-ROLLING + COATING
Port Talbot
BF5- running
BF4- currently idled
Repair BF#4 to extend life to 2012
STEEL MAKING
• Asset Restructuring: The company mothballed some of the rolling equipment at
its Llanwern plant in South Wales and drew up plans to expand the hot strip mill
capacity at Port Talbot to over 4mt. A decision was also taken to restructure Corus
Engineering Steels into two production routes: a specialised electric arc furnace
based business, which will focus on higher-margin products, and a bar business
that is integrated with the Scunthorpe works. Facilities in the downstream
Corus Distribution and Building Systems division, in the downstream units of
Corus’ engineering steels business, and in the Corus Tubes businesses are being
restructured and some site closures have been announced.
STRIP UK
Responding to the Crisis - Some Initiatives by Tata Steel Europe
48
028-049_TS_AR_part2.indd Sec1:48028-049_TS_AR_part2.indd Sec1:48 7/17/09 9:52:39 PM7/17/09 9:52:39 PM

CES (CORUS ENGINEERING STEELS)
The above initiatives were drawn up with the intention of maintaining and developing the
business’s market share.
• Effi ciency and Overhead Review : Partly in order to realign support functions with the new,
smaller group scale, Tata Steel Europe initiated an effi ciency and overhead review designed to
cut manpower costs by 20% in areas such as IT, Human Resources and Finance among others.
Overheads are targeted to be reduced by 20% through the leveraging of Tata Steel Group’s
capabilities worldwide and effi ciency improvements in the areas of IT, Research & Development
and the corporate centre.
Tata Steel Europe has opened consultations about the jobs identifi ed at the end of January 2009
as being at risk with trade unions and other employee representatives. The company committed
itself to seeking to reduce the workforce, wherever practical, through voluntary redundancies
and off ering those aff ected, comprehensive redundancy packages and outplacement support
services. Finally, the company announced a proposal to close the defi ned-benefi t British Steel
Pension Scheme to new recruits and to take steps to ensure the company contribution to future
service for existing members remains at 12%.
Key Actions
Resize CES to 1mt & Create 2 businesses• Speciality business
focussed on higher margin products (c 300kt)
• Bar Business (c 700 kt) to be integrated with Scunthorpe and supplied mainly through BOS route(c 550 kt) for cost competitiveness
Effi ciency Improvements• Reduce overhead
structure and operate Rotherham with mini-mill philosophy
• Consolidate secondary activities
RotherhamEAF-TEAF-N
StocksbridgeMills & Finishing
Aero Service Centres :
BoltonSuzhou, China
AldwarkePrimary Mill & Large Bloom Caster and Finishing
Slough, Bolton,Hetton,Wednesbury & Wolverhampton
~ 3
00 K
t ~
700
Kt
ScunthorpeBOSBBM
RotherhamThrybergh Bar mill
Consolidate downstream processing businesses at Rotherham
Spec
iali
ty B
usi
nes
s B
ar
Bu
sin
ess
Close
STEEL MAKING CASTING & ROLLING DOWNSTREAM
49
000-049_TS_AR_part1 (History & Current Global).indd 49000-049_TS_AR_part1 (History & Current Global).indd 49 7/17/09 9:14:07 PM7/17/09 9:14:07 PM

50
Review of Operations India & South East Asia
The major highlights of the year included record
breaking performances by many of the production
units. Hot metal production in FY 09 was up by 74000
tonnes as compared to FY 08, achieved mainly due to
the superior performance of the newly commissioned
‘H’ blast furnace. Prudent selective operation of the
blast furnaces helped the Company to lower its cost
of production of hot metal without aff ecting the
crude steel output.
The ‘H’ blast furnace, despite the delayed startup, has
surpassed its FY 09 target by 0.3 million tonnes in its
very fi rst year of operation. Various production units
including the sinter plant, LD#1, slab caster and new
bar mill achieved record production during the year.
Indian OperationsThe year 2008-09 was a historical one epitomised by
the acute global fi nancial imbalance which initially
appeared to have spared India only to impact the
markets adversely as the year rolled on. The global
economic slowdown has impacted the steel sector
as well. Amidst the turmoil in the global marketplace,
Jamshedpur Works performed remarkably creating
many records on the way.
In its continuing quest for performance excellence,
the Company reached a major milestone by winning
the coveted Deming Application Prize. This makes the
Company the only integrated steel company outside
Japan to win this prestigious award.
Aerial view of Tata Steel Works, Jamshedpur
050-059_TS_AR_part2.indd 50050-059_TS_AR_part2.indd 50 7/17/09 9:12:39 PM7/17/09 9:12:39 PM

51
The Raw Materials Division kept pace with the
production units with the OMQ (Ores, Mines &
Quarries) Division producing highest ever iron ore
at 10.72 million tonnes (previous best 10.29 million
tonnes in FY 08). Jharia collieries also recorded highest
ever production of raw coal (1.58 million tonnes
over 1.48 million tonnes in FY 08).
The Company bettered its Specific Energy
Consumption record set last year by achieving
6.594 GCal per tonne of crude steel as against
6.655 GCal per tonne of crude steel in FY 08. CO2
emissions reduced to 2.09 t/tonne of crude steel as
against 2.146 t/tonne of crude steel in FY 08, an
improvement of 2.61%.
The Company’s continuing focus on safety resulted
in a 10% reduction in Lost Time Injury Frequency
(LTIF) rate in the Works and an 80% reduction in the
Raw Material division as compared to the previous
year. The Fatality Risk Control Programme was rolled
out successfully across all the divisions during the
year. More than 1168 fatality potential conditions
were identified and corrected with irreversible
engineering solutions.
The Long Products Division was awarded the
prestigious certifi cate by CARES, UK for superior
quality rebars. These rebars guarantee a minimum of
5 million cycles of fatigue strength. Tata Steel Limited
is the only rebar manufacturer in India to be awarded
this accredition.
Marketplace Initiatives The performance of the Steel division in the
marketplace has been exemplary and many new
initiatives were undertaken to “weather the storm”,
especially in H2 FY 09.
In the automotive segment, market leadership was
maintained and accolades were won from Hyundai,
Tata Motors and Toyota. Approvals have been received
from new auto companies like Nissan and Volkswagen.
In the construction segment, TATA TISCON increased
its share of business with the enterprise account and
key customers from 19% in H1 to 30% in H2 through
innovative contracting and better availability of
material. Tata Steel also increased its focus on
government projects and Tata Group companies to
spread the customer base. Its sales to the government
and the Group companies increased from 14 kt in H1
050-059_TS_AR_part2.indd 51050-059_TS_AR_part2.indd 51 7/17/09 9:12:41 PM7/17/09 9:12:41 PM
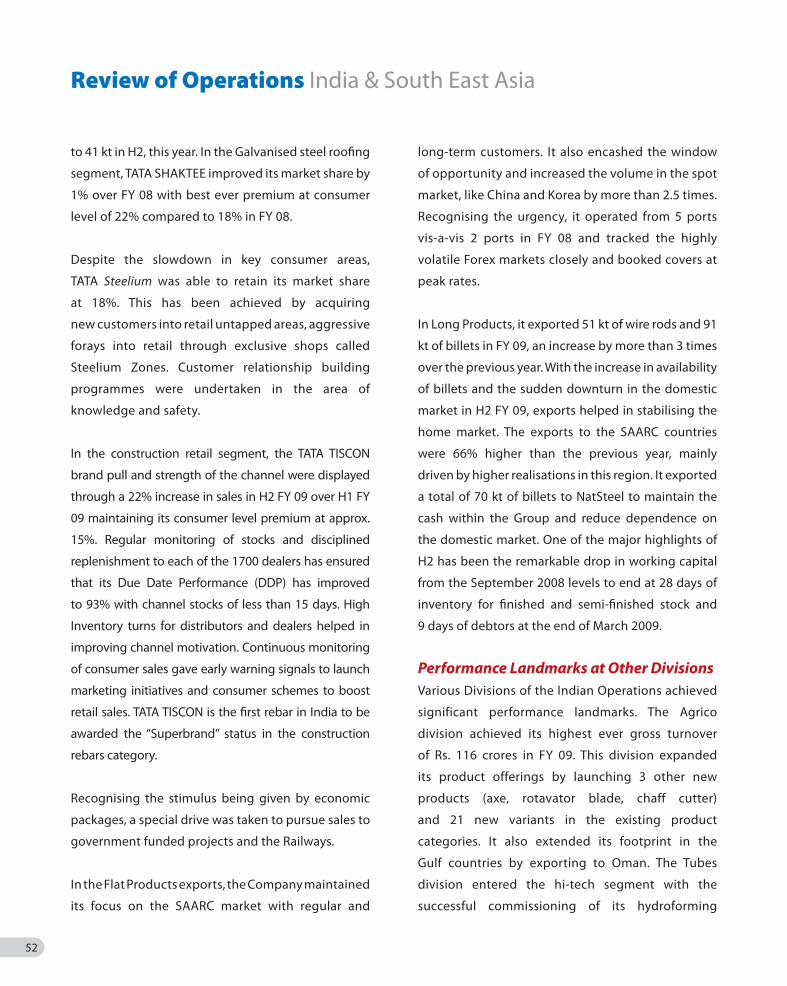
52
Review of Operations India & South East Asia
to 41 kt in H2, this year. In the Galvanised steel roofi ng
segment, TATA SHAKTEE improved its market share by
1% over FY 08 with best ever premium at consumer
level of 22% compared to 18% in FY 08.
Despite the slowdown in key consumer areas,
TATA Steelium was able to retain its market share
at 18%. This has been achieved by acquiring
new customers into retail untapped areas, aggressive
forays into retail through exclusive shops called
Steelium Zones. Customer relationship building
programmes were undertaken in the area of
knowledge and safety.
In the construction retail segment, the TATA TISCON
brand pull and strength of the channel were displayed
through a 22% increase in sales in H2 FY 09 over H1 FY
09 maintaining its consumer level premium at approx.
15%. Regular monitoring of stocks and disciplined
replenishment to each of the 1700 dealers has ensured
that its Due Date Performance (DDP) has improved
to 93% with channel stocks of less than 15 days. High
Inventory turns for distributors and dealers helped in
improving channel motivation. Continuous monitoring
of consumer sales gave early warning signals to launch
marketing initiatives and consumer schemes to boost
retail sales. TATA TISCON is the fi rst rebar in India to be
awarded the “Superbrand” status in the construction
rebars category.
Recognising the stimulus being given by economic
packages, a special drive was taken to pursue sales to
government funded projects and the Railways.
In the Flat Products exports, the Company maintained
its focus on the SAARC market with regular and
long-term customers. It also encashed the window
of opportunity and increased the volume in the spot
market, like China and Korea by more than 2.5 times.
Recognising the urgency, it operated from 5 ports
vis-a-vis 2 ports in FY 08 and tracked the highly
volatile Forex markets closely and booked covers at
peak rates.
In Long Products, it exported 51 kt of wire rods and 91
kt of billets in FY 09, an increase by more than 3 times
over the previous year. With the increase in availability
of billets and the sudden downturn in the domestic
market in H2 FY 09, exports helped in stabilising the
home market. The exports to the SAARC countries
were 66% higher than the previous year, mainly
driven by higher realisations in this region. It exported
a total of 70 kt of billets to NatSteel to maintain the
cash within the Group and reduce dependence on
the domestic market. One of the major highlights of
H2 has been the remarkable drop in working capital
from the September 2008 levels to end at 28 days of
inventory for fi nished and semi-fi nished stock and
9 days of debtors at the end of March 2009.
Performance Landmarks at Other Divisions Various Divisions of the Indian Operations achieved
significant performance landmarks. The Agrico
division achieved its highest ever gross turnover
of Rs. 116 crores in FY 09. This division expanded
its product offerings by launching 3 other new
products (axe, rotavator blade, chaff cutter)
and 21 new variants in the existing product
categories. It also extended its footprint in the
Gulf countries by exporting to Oman. The Tubes
division entered the hi-tech segment with the
successful commissioning of its hydroforming
050-059_TS_AR_part2.indd 52050-059_TS_AR_part2.indd 52 7/17/09 9:12:41 PM7/17/09 9:12:41 PM

53
line and commencement of supply of tubular
hydroformed engine cradle for the Tata Nano cars.
The division has also developed telescopic front
fork for motorcycles. The Ferro Alloys & Mineral
Division achieved its highest ever load factor of
90 as compared to 88 in previous year. LOW PHOS
(0.018-0.020%) and LOW Titanium (0.20% MAX) ferro
chrome were produced and dispatched to customers
like SMI and Hitachi.
Performance Improvement InitiativesIn addition to winning the coveted Deming prize,
Tata Steel also won the Most Admired Knowledge
Enterprise (MAKE) 2008 award and was recognised as
the overall Asian MAKE winner.
Solution for Sales (SFS) off ers based on the Theory
of Constraints (TOC) concept saw stabilisation in
the steel division. The replenishment module was
extended to cover 100% of the retail channel of TATA
TISCON, achieved 90% coverage in TATA SHAKTEE
and 60% in TATA Steelium. This resulted in a reduction
of stock outs in retail shops and more signifi cantly,
a reduction in channel stocks. Reliability solutions
were extended to direct customers in the Steelium
distribution. For the Construction Projects segment,
an S-DBR (Simplifi ed Drum Buff er Rope) mechanism
was implemented under the Theory of Constraints
supply chain improvement initiative which improved
the availability of rebars at the warehouses, thereby
reducing instances of delays and loss of orders.
Tubes Division, Jamshedpur
050-059_TS_AR_part2.indd 53050-059_TS_AR_part2.indd 53 7/17/09 9:12:43 PM7/17/09 9:12:43 PM

54
Wire DivisionTo bring about a greater focus to the Steel Wires
Business, Tata Steel has brought all its wire
manufacturing under one umbrella viz Global Wires
Business. Tata Steel’s Global Wires Business would be
amongst the top three wire manufacturing companies
across the world with 9 manufacturing operations in
India, Sri Lanka, Thailand and China.
Tata Steel’s Wire Division in India has completed
50 years and has brought in a plethora of new products
from umbrella rib wires in the 1960s to tyre bead to
PC strands and promoted their applications. In India,
the division is setting up a world-class manufacturing
facility at Tarapur and also modernising the facilities
at The Indian Steel & Wire Products in Jamshedpur.
Its Thailand plant Siam Industrial Wire Co. Ltd.,
completed the commissioning of its new PC strands
manufacturing facility in a record 10 months in
January 2009. The Wuxi Jinyang Metal Products Co.
China plant, which is one of the largest exporters of
PC strands for the construction industry, has been
approved by Dubai, CARES -UK and Finland.
The Wire Division, was the sole supplier of prestressed
concrete strands used in the construction of
precast segments for the 8-lane cable-stayed
bridge covering 4.7 kms – Bandra-Worli Sea Link at
Mumbai, India.
South East Asian Operations The global economic crisis has had a signifi cant
impact on most of the East Asian economies. Export
dependent economies like Japan, South Korea,
Taiwan, Singapore, Malaysia and Thailand have fared
far worse than the others in the region. However,
many of the governments led by China, Australia
and Singapore, have been quick to announce huge
stimulus packages. These economies have been
followed by the other economies in the region. The
Review of Operations India & South East Asia
Bandra-Worli Sea Link at Mumbai, India.
050-059_TS_AR_part2.indd 54050-059_TS_AR_part2.indd 54 7/17/09 9:12:44 PM7/17/09 9:12:44 PM

55
learnings from the 1997 crisis has also ensured that
the South East Asian economies are now fi nancially
better positioned to weather the storm.
Over the last decade, the dependence of these
economies on the Chinese economy has increased
and hence a Chinese recovery will have a big impact
on the region.
As most of the stimulus packages announced so far
have a signifi cant focus on infrastructure spending
and construction which accounts for 65% of the
steel consumption in the region, the steel industry is
expected to benefi t from the same.
The Company continues to invest to improve the
competitiveness of its existing facilities, and to
seek more opportunities to grow in the fast growth
markets of the region. With a population of 550
million and a steel consumption of around 45 million
tonnes, the South East Asian region continues to
offer a lot of potential.
NatSteel HoldingsIn the year under review, the sales volume from the
Singapore operations went up by 6% as against last
year with a market share of about 58%. The down
stream facility sold 20% more as compared to last
year. It is one of the largest single cut and bend
facilities in the world. The Xiamen operations in
China, a 100% subsidiary of NatSteel, reported a
higher sales volume of about 17% over that of last
year’s volume.
The Vietnam operations are making structural
modifi cations required to reduce their vulnerability
to volatile prices. A distribution network is also being
built in northern and central Vietnam.
In Australia, NatSteel runs a network of service
centres across all the states through two entities
namely NatSteel Australia and Best Bar. In the year
under review, the two entities reported a 12% higher
sales volume (1,88,000 t) as against last year in the
form of straight length rebars, mesh, cut & bend and
other accessories.
Continuous Improvement NatSteel continued its focussed approach towards
reducing cost, improving productivity and enhancing
quality. In order to strengthen the business
fundamentals by matching price and cost cycles and
reducing the exposure of the business to frequent
fl uctuations in raw materials or fi nished product
prices, the Singapore operations reduced the long-
term sales contract from 12-18 months to 3 months.
During the year, the Singapore operations focussed
on yield improvement, reduction in power
consumption and improvement in downstream
tonnages with an estimated bottom line benefi t of
S$14 million. The electric arc furnace shop achieved
power consumption of 282 KWhr/tonne (last year
292 KWhr/tonne) and the rolling mill achieved power
consumption of 79 KWHr/tonne. The implementation
of the SAP project is on schedule and is expected to
go live in the second quarter of 2009.
The Xiamen operations have also engaged in eff orts
to align the price-cost cycle to make themselves
less vulnerable to price fl uctuations. To this extent,
the short-term supply of billets from the Tata
050-059_TS_AR_part2.indd 55050-059_TS_AR_part2.indd 55 7/17/09 9:12:44 PM7/17/09 9:12:44 PM

56
Steel operations has also helped. In Vietnam, the
establishment of a distribution network in the
northern and central regions has been undertaken.
SafetyNatSteel Singapore embarked on the two-year DuPont
Safety journey in FY 09. During the year, the Singapore
operations made signifi cant progress on safety with
help from the DuPont consultants and have brought
down the LTIF from over 10 to less than 6. The various
initiatives include continuous communication and
emphasis from senior management, safety training,
formation of Apex council for review, formation of
risk containment groups to identify and contain
high risk activities and STOP teams to observe safety
behaviour and interact with employees on safety.
The other subsidiaries will gradually be aligned to the
DuPont safety management system.
Tata Steel Thailand (TSTH)The Group’s equity in Tata Steel Thailand (TSTH),
headquartered in Bangkok, is 67.1%. It has three main
subsidiaries SISCO, NTS and SCSC.
The impact of the global economic downturn has
been felt more severely in the TSTH performance.
The total production reduced by 22% (1.07 million
tonnes) while sales at 1.1 million tonnes were
lower by about 20% as compared to last year.
TSTH launched various initiatives in the market
place to understand the buying behaviour of the
end-users better in order to produce a stronger value
proposition. Examples include increasing sales from
the cut and bend centre, conducting a retail value
management programme, strengthening the brand
equity of the ‘Bor-Lor-Sor’ brand and developing
a network in the neighbouring countries of Laos,
Cambodia, Myanmar and Vietnam.
Mini Blast FurnaceIn an attempt to bridge the gap between steel making
and rolling mill capacities, to reduce the dependence
on scrap and to meet the special steel requirements
of the customers, TSTH is in the process of setting up
a 0.5 mtpa mini blast furnace. This project is likely
to begin its operations by the end of the second
quarter of FY 10.
Continuous Improvement InitiativesOver the past year, the operations in Thailand focussed
on cost reduction in the rolling process scheme by
optimising the roll consumption cost and in the Alloy
consumption scheme at the steel shop. The operations
achieved a Fe-alloys consumption of 12.6 Kgs/tonne
(13.6 Kgs/tonne last year) and roll consumption of
26.2 Kgs/tonne ( 28.7 Kgs/tonne last year).
SafetyTSTH achieved a LTIF of 3.01 in the year and initiated
initiatives like the line risk assessment for all
work activity according to TIS 18000 and the
Implementation of the ‘Why-Why’ analysis.
Vietnam ProjectsVietnam is one of the fast growing economies in South
East Asia with a GDP growth of 7-8% and an industrial
growth rate of around 11%. The manufacturing sector
share has grown from 28% in 1995 to 41% in 2008.
Favourable demography, balanced economic policies
coupled with investor-friendly incentives and the
government’s initiatives to create infrastructure for
projects, makes Vietnam a good investment destination.
Review of Operations India & South East Asia
050-059_TS_AR_part2.indd 56050-059_TS_AR_part2.indd 56 7/17/09 9:12:44 PM7/17/09 9:12:44 PM

57
The total steel consumption in Vietnam is around 10
mtpa while the crude steel production is 2.5 mtpa,
the balance met through imports of semi products
or fi nished goods. There is thus, a good opportunity
for an integrated steel project.
Tata Steel signed an MOU with Vietnam Steel
Corporation in 2007 to set up a steel mill. Subsequently,
it signed a Joint Venture (JV) agreement with Vietnam
Steel Corporation (VNSTEEL) and Vietnam Cement
Industries (VICEM) for the proposed steel complex
in Vietnam. Tata Steel will have a 65% stake in the JV.
An application for the investment license has been
submitted to the Vung Ang Economic Zone.
The JV is also in the process of fi nalising the
port-based land for the 3 phases of the steel complex
and township.
Tata Steel will also take a 30% share in the nearby
Thach Khe iron ore mine that is about 60 Kms from
the steel project.
The Company has completed the feasibility study
for the steel complex which will be developed in 3
phases. Tata Steel in co-operation with VNSTEEL and
VICEM, has also completed the detailed project report
for Phase 1 i.e. the cold rolling mill.
050-059_TS_AR_part2.indd 57050-059_TS_AR_part2.indd 57 7/17/09 9:12:45 PM7/17/09 9:12:45 PM

58
Review of Operations UK & Europe
The operating strategy of Tata Steel is based on the
aspiration to be a world steel industry benchmark in
value creation and corporate citizenship.
In keeping with these objectives, Tata Steel Europe
continues to focus on health and safety and a
three-year plan has been developed that spans
occupational safety, health and process safety. During
2008-09, particular emphasis was placed on contractor
management. Building on the success of previous years,
the lost time injury frequency rate for employees and
contractors combined fell by a further 25% compared
to the previous fi nancial year. However, tragically there
was one fatal accident during the fi nancial year, in
April 2008, with a third-party fatality to a customer’s
employee in April 2009. These events underline the
fact that there is a need for constant vigilance to ensure
a safe working environment for all.
Tata Steel Europe has three main operating divisions –
Strip Products, Long Products and Distribution & Building
Systems. The activities of each division are organised
into individual business units, with their own managing
directors who, with their respective management teams,
hold responsibility for the performance of that business.
Europe is the principal market for the Group, accounting
for 80% of total turnover in 2008-09.
After a strong fi rst half of the year, during which
operations were generally loaded to capacity across all
divisions, the economic downturn aff ected operations
severely in the second half of the year. In response, a
company-wide programme, ‘Weathering the Storm’
was launched that aimed at off setting the impact
of reduced steel demand. Production was aligned
with market demand and a cost-saving programme
was initiated that generated estimated net savings
of over £700 mn in the second half of the year. This
involved a reduction in the use of third-party services,
rationalisation of employment costs through reduced
overtime and bonuses, and an alignment of the
hedging position to new activity levels. In January 2009
the restructuring of European assets was accelerated
through the launch of the ‘Fit for Future’ programme,
050-059_TS_AR_part2.indd 58050-059_TS_AR_part2.indd 58 7/17/09 9:12:46 PM7/17/09 9:12:46 PM

59
which will result in around 3,500 redundancies and
produce steady-state benefi ts of more than £250mn
per annum. The programme focusses on three areas:
divestments, asset restructuring and a company-wide
effi ciency and overhead review.
Capital expenditure was lower by 13% this year over
the last year, refl ecting the slowing of investment
as the impact of the downturn began to be felt.
Nevertheless, two major schemes were completed
during the year: a slab caster enhancement at Teesside
and the replacement of the control system for the
hot rolling mill at IJmuiden. Other major schemes in
progress included:
1. Installation of a new continuous galvanising
line and a 3-stand cold rolling mill at IJmuiden.
Commercial production from both facilities has
started. They will increase the company’s ability to
serve the automotive market, as they can process
speciality high-strength steel grades.
2. A BOS gas recovery plant and an energy
management system are being set up at Port
Talbot to reduce emissions and energy costs.
3. The conversion of the 7-stand fi nishing mill at
IJmuiden with heavy bending and hydraulic
gauge control has been implemented in order to
improve profi le, shape and thickness control.
4. A ladle furnace scheme at IJmuiden is underway as
part of the development of steel making capacity
at the works.
TechnologyIn keeping with the Vision announced in February
2008, whereby Innovation is one of the key elements
in achieving targets, there was a continued emphasis
on research and development and on continuous
improvement of processes and products.
Process DevelopmentThe Tata Steel Group is a major partner in the
multi-partner ULCOS (Ultra Low CO2 Steel making)
project aimed at developing technology to achieve a 50%
reduction of CO2 emissions per tonne of steel produced
by 2050. Tata Steel is playing a key role in the further
development of two of the technologies that have been
selected for pilot-scale demonstration, i.e. a blast furnace
that uses pure oxygen and top gas recycling and the
smelting reduction based process called ISARNA.
Product DevelopmentThe main focus areas for strip products continued
to be the further development of steel grades with
high strength and good formability and coated
steels with sophisticated coating properties. These
developments are partly carried out in partnership
with other companies, such as the development
of High Strength and Ductility (HSD) steels in
collaboration with Salzgitter and of a physical
vapour deposition (PVD) based coating process in
collaboration with POSCO.
Application DevelopmentA focus area is the continuous enhancement of customer
support in the automotive market. For the construction
sector, the group led the Framework 6 project ManuBuild
aimed at developing advanced industrial construction
techniques and supporting IT solutions for residential,
education and healthcare buildings. This project ended
in March 2009 and results were demonstrated at the
Ecobuild and Futurebuild events that took place in
London in the same month.
050-059_TS_AR_part2.indd 59050-059_TS_AR_part2.indd 59 7/17/09 9:12:47 PM7/17/09 9:12:47 PM

60
A 100 yearheritage of MiningIn the true spirit of enterprise, Tata Steel Limited, nearly 100 years ago, pioneered the discovery of the rich mineral wealth in Jharkhand and Orissa. Since then, it has continued to play a leading role by introducing modern mining techniques which today have become benchmarks in the steel industry.
Jharia - 100 Years of Sustainable MiningIn 1903, eminent geologist,
P. N. Bose discovered iron ore deposits
in Gorumahisani hills in Mayurbhanj
state. Following this, he wrote a letter
to J.N. Tata on February 24, 1904
urging him to explore further. Since
no geological data was available
either with the Government or any
other agency, J.N. Tata took steps to
undertake prospecting in these areas
to assess the quantity and quality of
ore. It was this foresight that led to
the setting up of Tata Iron and Steel
Company at Sakchi, now Jamshedpur.
Today, the Jharia Division celebrates
a century of sustainable mining.
It began its operations at its Bhelatand
‘A’ collieries in 1910. Operations in Jharia
began as late as 1890 when surveys by
the Geological Survey of India drew the
attention of entrepreneurs to this ore
deposit for use in the blast furnaces.
060-101_TS_AR_part3.indd 60060-101_TS_AR_part3.indd 60 7/17/09 9:14:46 PM7/17/09 9:14:46 PM

61
Acquisition of the Coal FieldsAbout eight to ten tonnes of coal were sent to Germany
and America for testing, together with a quantity of iron
ore from Dhalli and Rajhara hills. With the smelting of
coal with iron ore it was discovered that the result was
highly satisfactory.
The economic advantage off ered by the proximity of India’s
most important storehouse of prime coking coal to its
richest iron ore deposits gave birth to the iron and steel
industry in India.
On its creation, the fi rst priority for the then Tata Iron & Steel
Company Limited (now Tata Steel Limited) was to acquire
mineral deposits and secure raw material supplies of iron
ore, metallurgical coal and limestone – initially for the
next 15 years. From 1910 to 1918, Tata Steel leased six of
the metallurgical coal bearing properties in the Jharia coal
fi elds, situated in the Damodar River Valley, with estimated
reserves of 287 million tonnes. Spread across 5500 acres,
these six collieries are grouped in two locations, Sijua
and Jamadoba. The Bhelatand colliery of the Sijua Group
was acquired by the Company from Barakar Coal Co. Ltd.
Subsequently in 1918, Tata Steel acquired Malkera and
Sijua as well as Jamadoba, Digwadih and 6&7 Pits Collieries
of the Jamadoba Group.
The Indian operations of Tata Steel draws its greatest
strength and its competitive position as one of the lowest
cost producers of steel in the world from the quality and
yield of its raw material units. The mines have successfully
given it raw material security and have partially insulated
it from the volatility of the global markets. The Company
has, therefore, continuously modernised and expanded its
raw material facilities right from the 1950s, when Tata Steel
launched its two million tonne expansion programme.
P. N. Bose
060-101_TS_AR_part3.indd 61060-101_TS_AR_part3.indd 61 7/17/09 9:14:49 PM7/17/09 9:14:49 PM

62
Technological Progress in JhariaIn the early years, good quality metallurgical coal for
steel making was available in suffi cient quantities in the
market. The Company purchased coal from the market
and extracted small quantities from its own mines.
Coal was then mined with hand picks and loaded by
baskets into tubs. It was hauled to the surface with the
help of steam winders. Over the years, technological
innovations led to the following improvements:
• The 1930s and 1940s saw the advent of
mechanisation and coal cutting machines, electric
drills and endless haulage were used to transport
coal to the surface. In 1942, a three mile long
ropeway was also built which made underground
mining safer and more productive.
• Coal benefi ciation began between 1950s and
1960s and a 300 tonne per hour Central Washery
at Jamadoba was installed for all six collieries in
1952. Later in 1967, a Dense Media Cyclone was
also installed.
• The installation of Koepe Winders in the 1970s
helped increase production and transportation
of miners.
• Ash reduction since 1980s has helped increase
productivity. In 1988, a fl uidised Bed Combustion
Power Plant was set up.
• In the 1990s, Information Technology (IT) was
used in planning and surveying. It was also
used in the integration of the Division with the
Jamshedpur Steel Works through an ERP System,
which brought about superior connectivity.
• Winders with Programmable Logic Controllers
(PLC) at Digwadih and the deepening of the 9 Pit
shaft, prepared the division for the pace of things
to come in the new millennium. A Tailing and
Dewatering Plant and Rotary Breakers were added
at Bhelatand.
• During the decade, modernisation of the Jamadoba
Colliery was initiated. This was achieved by the
commencement of opencast mining commencing
at the Kalimela Colliery.
A Focus on Environment SustainabilityEven before Tata Steel mined its fi rst tonne of coal,
it gave itself the aim of conserving the resources
in its mines, taking the fi rst step in environment
sustainability. It is fully committed to preserving the
ecological balance and safety and to learning from its
mistakes. All its mines are ISO-14001-Environmental
Management System Certifi ed. In addition to
conducting massive tree plantation campaigns,
location specifi c, environmental management
initiatives have been taken.
Today, the Jharia division fulfils the philosophy of
putting back into the earth what has been extracted
from it, by also using coarse ash from its captive power
plants for stowing. Careful planning has resulted in
mine water being conveyed from all the collieries to
four water treatment plants which is then recycled for
use in the residential colonies of employees. Energy
conservation is continuously improved due to the
involvement of the employees of the Jharia division.
The division is also continuously cutting back on the
use of conventional timber to provide roof support
in underground mines by introduction of roof bolts,
A 100 year heritage of Mining
060-101_TS_AR_part3.indd 62060-101_TS_AR_part3.indd 62 7/17/09 9:14:52 PM7/17/09 9:14:52 PM

63
using compressed air drill machines and adopting
more efficient methods for coal extraction.
Commitment to Employee Welfare Underground operations pose both safety and health
risks. At the same time, mine locations, by their very
nature, are remote and lack connectivity.
In Jharia, Tata Steel has made available to its employees,
amenities such as schools, hospitals, housing, water,
power, sanitation, recreational facilities, telephone,
internet connectivity and a clean living environment.
Safety and occupational health The Jharia division has adopted undoubtedly the
best mines rescue procedures, as is evident from their
track records at various competitions.
The division also follows the Tata Steel Safety
Excellence Management and Review processes,
which allows it to proactively assess risks and hazards
and to control them through multi-level safety
action plans.
Training and skill enhancements The advent of mechanisation in underground coal
mining is as much a treatise on technology as it is
on manpower training. In 1967, the fi rst professional
training institute in India for coal mines was set up
in Digwadih. This was followed by institutes at Sijua
and Malkera. A Mechanisation Training Centre was
also set up at Jamadoba in 1971. These institutes have
kept employees abreast of the latest technologies.
The division has designed need-based training
programmes for employees.
Social Sustainability Tata Steel was conceived by its founder, Jamsetji Tata, to
serve the interests of his country. In the early years, as
the Company invested in employee welfare amenities,
it simultaneously allowed the local community access to
them. In 1979, it set up the Tata Steel Rural Development
Society (TSRDS), with the fi rst rural welfare unit in
Jamshedpur. Today over 20,000 patients are provided
basic health care. TSRDS provides safe drinking water,
higher farm yield and productivity and empowerment of
individuals eff ected through sports and education.
060-101_TS_AR_part3.indd 63060-101_TS_AR_part3.indd 63 7/17/09 9:14:52 PM7/17/09 9:14:52 PM

64
A Continuing Raw Material Resource Strength Today, the raw materials division of Tata Steel raises
over 14 million tonnes of ore from the states of
Jharkhand and Orissa. Coal, iron ore, manganese ore,
chrome ore and dolomite are produced at various
mines and quarries for Jamshedpur’s steel plant.
Tata Steel has two collieries in West Bokaro and Jharia.
The West Bokaro unit is an open cast mine, while the
Jharia unit is an underground one. The coal mines
are located about 150 kms from the steel plant at
Jamshedpur and produce superior grades of clean coal.
Tata Steel’s collieries use Surpac, a state-of-the-art mine
planning software, that estimates the volume of coal in
every seam. This is coupled with qualitative detailing
that focusses on output consistency. To maximise
productivity and utilisation, a voice and data equipped
Global Positioning System is used, which helps to
supervise mining activity for machine movement and
engine status.
Iron ore mining is an integral part of steel making
at Tata Steel and began with the discovery of iron
ore deposits in 1903. The iron ore units are located
in Noamundi, Joda and Katamandi in the states
of Jharkhand and Orissa. The Company also has
manganese mines and dolomite quarries in Orissa.
The Company’s iron ore units produce 9 million tonnes
per annum (mtpa) of various grades of high quality
iron ore including rich blue dust ore. The mineral ore
is crushed, right-sized and washed in-house at the site
and transported to the steel works in Jamshedpur and
to other customers. The mines division also provides
technical services to the Bhutan Dolomite Mine in the
Royal Kingdom of Bhutan.
Beyond Jharia - a Global Strategy for Securing Raw MaterialThe Tata Steel Group is actively pursuing the
long-term strategy of acquiring and developing
mining projects for the security of iron ore and coking
A 100 year heritage of Mining
Jharia collieries, India
060-101_TS_AR_part3.indd 64060-101_TS_AR_part3.indd 64 7/17/09 9:14:53 PM7/17/09 9:14:53 PM

65
coal. It has also explored mining opportunities
overseas for ferro chrome and limestone.
To enrich its raw material supply, Tata Steel has also
set up joint ventures outside India in Queensland,
Australia and Thailand. With iron ore from its overseas
mines at, New Millennium Corporation, Canada and
Ivory Coast, iron ore security would gradually increase
over the next few years. The overseas coal mines of
the Group are located in Australia and Mozambique
and the coal mines at CDJV, Australia are already
producing coal. The Riversdale mines in Mozambique
are likely to begin production in the near future.
Riversdale, Mozambique Coal ProjectTata Steel has formed a JV with Riversdale Mining
Limited, Australia for a 35% stake in two coal
tenements in Mozambique - Benga and Tete including
off take rights to 40 per cent of coking coal produced
from these mines. The production from Benga mine is
expected to begin in 2011.
Carborough Downs Coal ProjectTata Steel has 5% in the equity capital of the
Carborough Downs JV, Australia in partnership with
Vale, Nippon Steel, JFE, and POSCO. It was formed
to develop a coal project in the Bowen Basin. The
first raw coal production began in August 2006 and
the mine is currently producing around 1 mtpa. The
second phase of expansion is in progress.
New Millennium Capital Corp Iron ore ProjectIn September 2008, Tata Steel entered into a Heads of
Agreement with New Millennium Capital Corp, Canada
to develop iron ore projects in northern Quebec. The
Company has acquired a 19.9% stake in it.
Uyun Limestone Project In January 2008, Tata Steel signed a JV agreement with
the Al Bahja Group, Oman for the mining of limestone
in the Uyun region.
West Bokaro collieries, India Mozambique-Benga and Tete
060-101_TS_AR_part3.indd 65060-101_TS_AR_part3.indd 65 7/16/09 10:47:54 PM7/16/09 10:47:54 PM

66
Research & Development
A Focus on Research & DevelopmentAn innovative approach is one of the key elements
in driving and delivering the Tata Steel Group (TSG)
vision that was formulated early in 2008. Innovation
at Tata Steel means continuously developing
cutting-edge solutions in technology, processes and
products. Achieving this calls for substantial eff orts
in research and development, for which, to stay
ahead of competitors, the Group maintains its own
research centres.
Currently, the TSG operates four research centres: Tata
Steel Limited’s (TSL) laboratories in Jamshedpur and
the Tata Steel Europe’s (TSE) technology centres in
IJmuiden, Netherlands and Rotherham and Teesside,
United Kingdom. A total of over 1000 people are
involved in R&D within the TSG. The Group’s research
programme is split between programmes funded
by the separate business units, which make up the
major part of the work done in the European research
centres and work on a number of identifi ed thrust
areas that receive corporate funding. The thrust areas
also incorporate the projects that were previously a
part of Corus’ strategic programme.
Economic Mineral Benefi ciationThe research in this area is aimed at identifying ways
to maximise use of raw materials from captive sources
and is focussed on three subjects:
8% Ash coal maintaining yield Here the objective is to develop a cost-eff ective
benefi ciation route for producing clean coal with
8% ash, maintaining current yield from the captive
collieries. A dense medium cyclone that can use coarse
coal (2 mm and over) to produce 12% ash clean coal
has been designed and tested on a laboratory scale in
preparation of a plant test. A similar cyclone designed
for benefi ciating fi nes from 0.25 to 2 mm to produce
10% ash clean coal will be tested directly on the plant.
060-101_TS_AR_part3.indd 66060-101_TS_AR_part3.indd 66 7/16/09 10:47:59 PM7/16/09 10:47:59 PM

67
Complete benefi ciation of iron oreTechnologies are being developed and up-scaled to
benefi ciate high-alumina fractions and slimes with the
aim to reduce alumina content to less than 1.5%. Eff orts
are also being made to commercially utilise the rejects.
Technology for cost-eff ective use of newly acquired raw material sourcesA direct reduction method was developed for zinc
bearing iron ore that ensures that zinc is retained in the
DRI to avoid problems associated with vaporisation
of zinc. The DRI thus produced can be processed in
electric arc furnaces, a well established route for
steel production from scrap with high zinc content.
A feasibility study was successfully carried out.
To Stretch the Raw Materials EnvelopeThis programme was taken up to improve the process
of lowering the phosphorus content in the converter
during oxygen steel making. Themes addressed are
design of a new supersonic lance, improvement in
bottom stirring and assessment of the BOF slag system.
• Trials have been carried out at the LD2 steel plant
in Jamshedpur with a new 6+1 hole top lance
designed by R&D.
• Implementation of a new way of blowing argon
from the vessel bottom called ‘Diff erential Flow’
at the LD2 plant in Jamshedpur has improved
the phosphorus partition and reduced the
argon consumption.
Heavy End of the Future The work in this area refers to the three main
trends that have infl uenced the steel industry in
recent years: the drive to increase output to follow
demand, the massive increase of the cost of raw
materials and energy and the growing concern over
climate change.
060-101_TS_AR_part3.indd 67060-101_TS_AR_part3.indd 67 7/16/09 10:48:02 PM7/16/09 10:48:02 PM

68
Research & Development
For the medium-term, the objective is to develop
technology and operational practices to achieve
cost-effective productivity rises with existing
installations, maximise recycling, and reduce the
environmental and CO2 footprint. The focus in this
area is on the use of cheaper raw materials without
compromising blast furnace performance and on
optimising the burden distribution and pulverised
coal injection rate.
For the long-term, the focus is on the large scale
multi-partner project ULCOS (Ultra Low CO2 Steel
making). This is aimed at reducing CO2 emissions per
tonne of steel produced by at least 50% by 2050. Out
of four possible approaches that have been identifi ed
for further development, two are of interest to the
Group, i.e. the blast furnace that uses pure oxygen
and top gas recycling, and the process now known
as ISARNA.
Pilot trials with the former process carried out in 2008
at the experimental blast furnace of LKAB in Lulea,
Sweden, have shown that with top gas recycling, the
carbon input per tonne of steel can be reduced by
24% and that with the storage of CO2 gas removed
from the top, the CO2 emission to the atmosphere
can be halved. For the ISARNA process, the core of
which is the melting and pre-reduction of ore fi nes
in a cyclone, the engineering of a pilot plant was
completed. A decision is expected at the end of the
year regarding the location of the pilot plant.
New Generation High Strength Steels This area comprises of projects to develop new
metallurgical options to enable the Group to meet
future demands for high strength steels.
Among the multiple approaches, one related work
aimed at meeting already known needs, is the
development of high strength and ductility (HSD)
steels. Since 2005, Corus and Salzgitter have been
working together on identifying opportunities
for the application of HSD steels in selected
market sectors.
Advanced Coatings Developments Work on coatings is aimed at responding to the
market drive to reduce coatings costs and maintain
the Group’s position in the market for coated
products. Within this, four work streams have been
defi ned i.e. physical vapour deposition, development
of zinc free coated products for current and future
applications, high speed galvanising and high speed
organic coating lines.
The physical vapour deposition (PVD) project is a
joint development with POSCO in Korea. It is based
060-101_TS_AR_part3.indd 68060-101_TS_AR_part3.indd 68 7/16/09 10:48:03 PM7/16/09 10:48:03 PM

69
on a PVD process developed by Tata Steel Europe
that uses electromagnetic levitation of the metal(s) to
be deposited.
Producing Ferro Chrome with Less EnergyThe Group’s R&D centre at Jamshedpur has developed a
novel process technology than can be applied either for
the direct production of stainless steel or for producing
ferro chrome in submerged arc furnaces (SAF) with
reduced specifi c power and coke consumption. In 2008,
scale-up trials were carried out to establish the technical
and economical feasibility of the process. The research
team also worked closely with the Institute of Minerals
and Materials Technology (IMMT), Bhubaneswar on a
fl uidised bed reactor process.
Two variants of this process are being developed
for the production of pre-reduced chrome for use
in production of ferro chrome in the existing SAF
process and chrome nuggets that are used as alloying
addition in stainless and alloy steel making. The novel
process uses non-coking coal as a reducing agent and
energy source. Thus there is reduced need for low
ash, low phosphorus (imported) coke.
Hydrogen HarvestingThe slag granulation or quenching processes
commonly used for slag cooling are not
environmentally friendly and the heat contained in
the molten slag is wasted.
Tata Steel has developed a novel process to generate
hydrogen-rich gas by utilising the heat of molten slag.
This process was demonstrated on a pilot project basis
using a set up with 10 tonnes slag capacity, designed
and developed in-house with the help of Tata Growth
Shop, producing gas that contains over 70% hydrogen.
International and Indian patent applications have been
fi led and work is now in progress to optimise the process
for commercialisation at the Ferro Alloys plant.
060-101_TS_AR_part3.indd 69060-101_TS_AR_part3.indd 69 7/16/09 10:48:04 PM7/16/09 10:48:04 PM

70
Research & Development
This novel process has the potential to generate
low cost hydrogen which can save energy and
reduce the consumption of fossil fuels in the
steel plant.
Viable Photovoltaic Coating SystemsThe work in this area is aimed at developing
state-of-the-art thin fi lm photovoltaic systems that
are suitable for integration into the Tata Steel Group
products. Part of the work focusses on the further
development of technology developed by DyeSol, a
company specialising in photovoltaics, and is done
in collaboration with that company. A second work
stream concentrates on the further development of
steel as a substrate for PV systems. In the course of the
fi nancial year, a dedicated facility for the development
of PV systems based on steel substrates, including a
pilot line, was set up on the site of Corus Colors in
Shotton. The fi rst coating trials on the pilot line were
highly promising.
Energy Effi cient FluidsThe research in this area focusses on the development
of effi cient coolants and lubricants for rolling.
After laboratory tests had confi rmed that suspending
nanoparticles in an aqueous medium result in a
higher heat transfer rate, subsequent tests have
shown that the overall heat transfer was between
1.8 (at high temperatures) and 2.5 times (at low
temperatures) that of water. For industrial scale use
however, methods for large scale production and safe
handling of these fl uids were needed.
As a fi rst step to solve these problems, an eff ervescent
tablet was developed that would dissolve in water in
fi ve seconds. A patent application for this has been fi led.
As a second step, a novel concept of a high speed shear
mixer for bulk nanofl uid generation was demonstrated
in October 2008 for 20,000 litres for use in wire box
cooling in the wire rod mill of Indian Steel and Wire
060-101_TS_AR_part3.indd 70060-101_TS_AR_part3.indd 70 7/16/09 10:48:04 PM7/16/09 10:48:04 PM
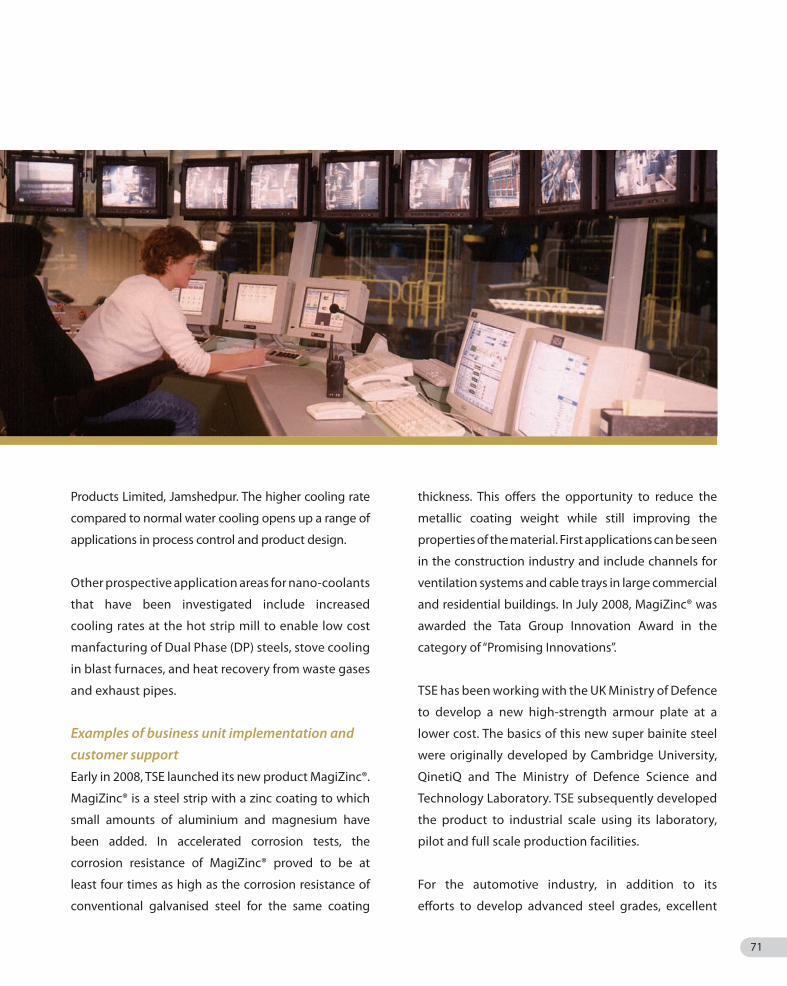
71
Products Limited, Jamshedpur. The higher cooling rate
compared to normal water cooling opens up a range of
applications in process control and product design.
Other prospective application areas for nano-coolants
that have been investigated include increased
cooling rates at the hot strip mill to enable low cost
manfacturing of Dual Phase (DP) steels, stove cooling
in blast furnaces, and heat recovery from waste gases
and exhaust pipes.
Examples of business unit implementation and customer supportEarly in 2008, TSE launched its new product MagiZinc®.
MagiZinc® is a steel strip with a zinc coating to which
small amounts of aluminium and magnesium have
been added. In accelerated corrosion tests, the
corrosion resistance of MagiZinc® proved to be at
least four times as high as the corrosion resistance of
conventional galvanised steel for the same coating
thickness. This off ers the opportunity to reduce the
metallic coating weight while still improving the
properties of the material. First applications can be seen
in the construction industry and include channels for
ventilation systems and cable trays in large commercial
and residential buildings. In July 2008, MagiZinc® was
awarded the Tata Group Innovation Award in the
category of “Promising Innovations”.
TSE has been working with the UK Ministry of Defence
to develop a new high-strength armour plate at a
lower cost. The basics of this new super bainite steel
were originally developed by Cambridge University,
QinetiQ and The Ministry of Defence Science and
Technology Laboratory. TSE subsequently developed
the product to industrial scale using its laboratory,
pilot and full scale production facilities.
For the automotive industry, in addition to its
eff orts to develop advanced steel grades, excellent
060-101_TS_AR_part3.indd 71060-101_TS_AR_part3.indd 71 7/16/09 10:48:06 PM7/16/09 10:48:06 PM

72
customer support is a key target. TSE’s portable
strain analysis system (PHAST) combines expertise
in three-dimensional measurement technology with
in-depth materials knowledge and has been used for
some years with much success to support press shop
operators in using new steel grades or help solve
problems in pressing complex car parts.
In 2008, an upgraded version of this system was
launched, which provides analysis results within a few
hours, so allowing minor changes to tool geometry or
press settings to be made and their eff ect analysed
during one shift.
The current focus for the packaging market is on
developments that lead to growth with existing
products, particularly in the European market. For
example, working closely with TSE, Italy’s leading
maker of cans for the paint and edible oil markets
Gruppo ASA has developed PlatinunÒ, a new family of
containers for paint based on TSE’s ProtactÒ polymer-
coated packaging steel. PlatinunÒ has attracted a
great deal of interest among paint manufacturers.
Process ImprovementsBuilding on the experience gained with Process
Improvement Groups in Corus, the Tata Steel Group
Process Improvement Teams have been set up with
the aim to ensure that best practice in process
technology is applied throughout the Group. This
involves among other things, transferring technology
that has been proven in one plant to similar other
installations. An example of this is an investment
at Port Talbot steelworks in energy management
technology similar to systems that already exist at
other plants, including TSL’s Jamshedpur plant.
The Group is continuously working on ways to reduce
emissions. It is also working on the development of
measuring techniques so that its operations comply
with pollution reduction regulations. For example,
the TSE RD&T has led a major European project
to investigate the sources of fi ne and ultra fi ne
particulate matter in the steel industry. The study has
identifi ed the major sources of such particulates as
being emitted by a typical integrated steel plant, and
also as eff ects of long range transport.
These results will help TSE to anticipate future
legislation and to take appropriate measures to reduce
any emissions from steel making to lower levels.
In India, experts from TSE RD&T’s environment
department have assisted in assessing ways to
maintain emissions from the Jamshedpur works at
current levels when production capacity is increased
to 9.7 mtpa from the current 6.8 mtpa.
Research & Development
060-101_TS_AR_part3.indd 72060-101_TS_AR_part3.indd 72 7/16/09 10:48:08 PM7/16/09 10:48:08 PM
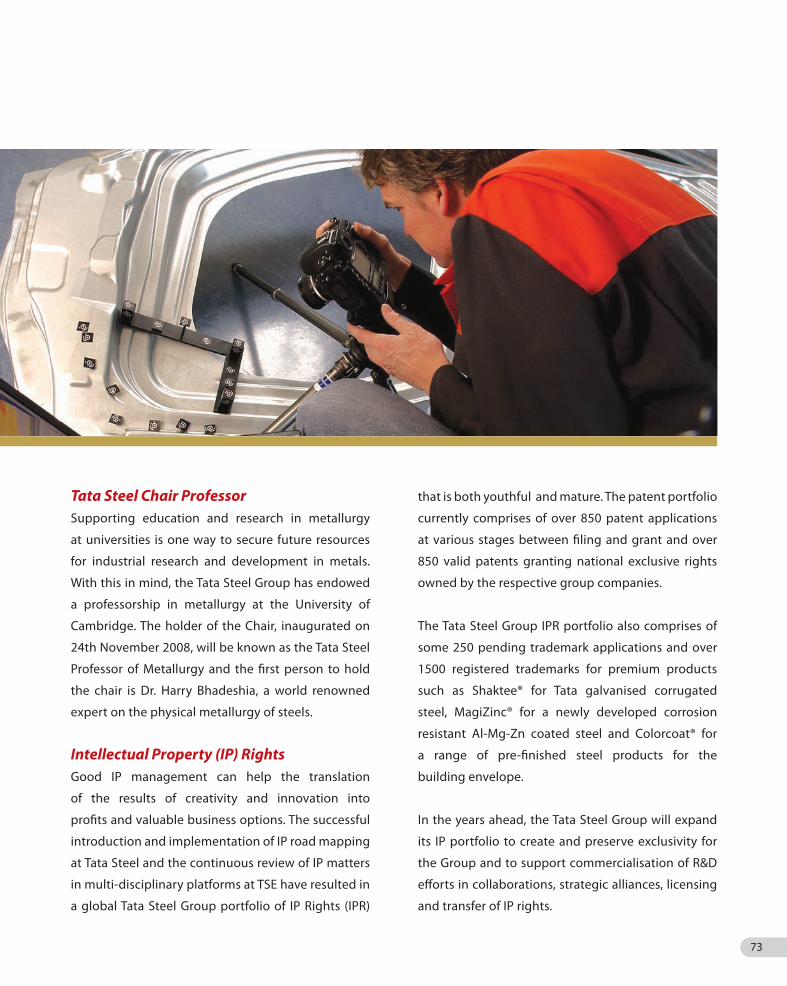
73
Tata Steel Chair ProfessorSupporting education and research in metallurgy
at universities is one way to secure future resources
for industrial research and development in metals.
With this in mind, the Tata Steel Group has endowed
a professorship in metallurgy at the University of
Cambridge. The holder of the Chair, inaugurated on
24th November 2008, will be known as the Tata Steel
Professor of Metallurgy and the fi rst person to hold
the chair is Dr. Harry Bhadeshia, a world renowned
expert on the physical metallurgy of steels.
Intellectual Property (IP) RightsGood IP management can help the translation
of the results of creativity and innovation into
profi ts and valuable business options. The successful
introduction and implementation of IP road mapping
at Tata Steel and the continuous review of IP matters
in multi-disciplinary platforms at TSE have resulted in
a global Tata Steel Group portfolio of IP Rights (IPR)
that is both youthful and mature. The patent portfolio
currently comprises of over 850 patent applications
at various stages between fi ling and grant and over
850 valid patents granting national exclusive rights
owned by the respective group companies.
The Tata Steel Group IPR portfolio also comprises of
some 250 pending trademark applications and over
1500 registered trademarks for premium products
such as Shaktee® for Tata galvanised corrugated
steel, MagiZinc® for a newly developed corrosion
resistant Al-Mg-Zn coated steel and Colorcoat® for
a range of pre-fi nished steel products for the
building envelope.
In the years ahead, the Tata Steel Group will expand
its IP portfolio to create and preserve exclusivity for
the Group and to support commercialisation of R&D
eff orts in collaborations, strategic alliances, licensing
and transfer of IP rights.
060-101_TS_AR_part3.indd 73060-101_TS_AR_part3.indd 73 7/16/09 10:48:09 PM7/16/09 10:48:09 PM

74
While the impact of the global economic crisis has
been felt in varied degrees across all the geographies
in which the Tata Steel Group (TSG) operates, keeping
the employees cheerful and motivated in these trying
times has remained the focus of the Human Resources
department. The Group realises that its employees are
the most valuable human capital and that they play a
major role in building the competitive advantage of the
Company’s business across the globe.
As the economic crisis hit the world, Tata Steel Europe
(TSE) employees contributed to the ‘Weathering the
Storm’ initiatives to reduce costs and increase value,
in the second half of the financial year. The company,
the employees and the trade unions demonstrated
the strength of their relationships by working
together in the difficult times. Despite the present
economic crisis, TSE has been able to maintain
its position as an employer of choice through the
following initiatives:
• By demonstrating its commitment to health
and safety.
• By maintaining a level of apprentice and
graduate recruitment.
• By demonstrating the value of its culture of
innovation and improvement by delivering value
creation and cost reductions.
• By building and maintaining positive employee
relations by agreeing to innovative partnership
deals with employee representatives and
trade unions to reduce employment costs and
minimise redundancies.
• By taking the highest moral approach in
its management of redundancies and
their impact on the communities in which
they occur.
Human Resources
060-101_TS_AR_part3.indd 74060-101_TS_AR_part3.indd 74 7/16/09 10:48:09 PM7/16/09 10:48:09 PM
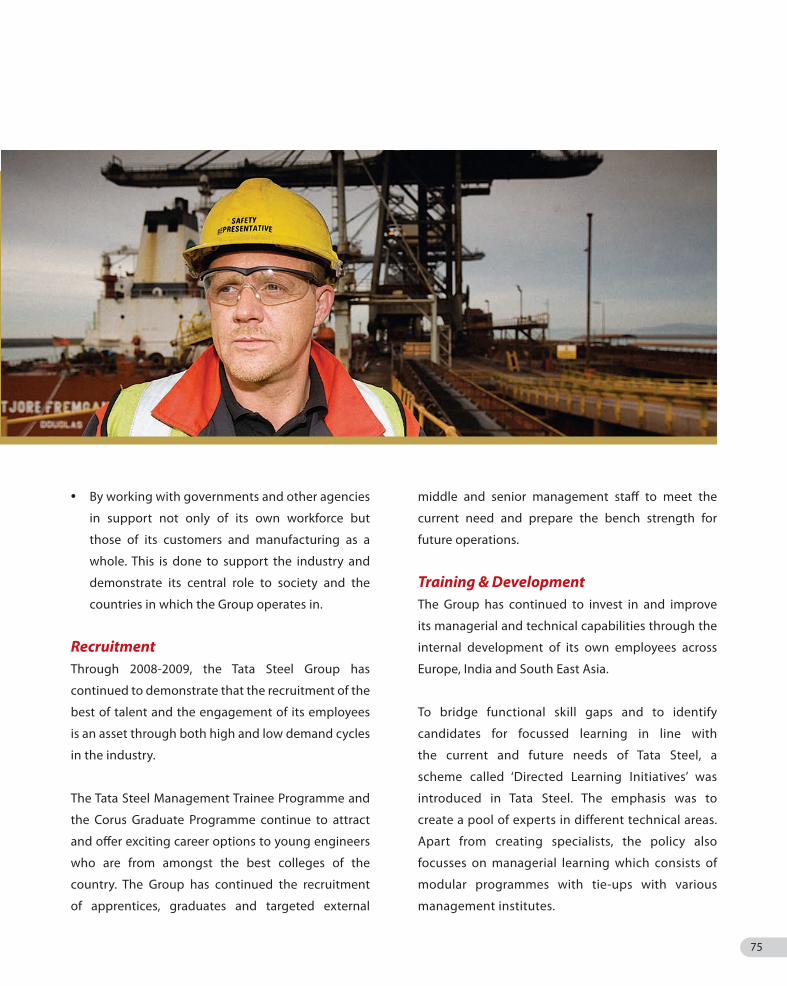
75
• By working with governments and other agencies
in support not only of its own workforce but
those of its customers and manufacturing as a
whole. This is done to support the industry and
demonstrate its central role to society and the
countries in which the Group operates in.
Recruitment Through 2008-2009, the Tata Steel Group has
continued to demonstrate that the recruitment of the
best of talent and the engagement of its employees
is an asset through both high and low demand cycles
in the industry.
The Tata Steel Management Trainee Programme and
the Corus Graduate Programme continue to attract
and off er exciting career options to young engineers
who are from amongst the best colleges of the
country. The Group has continued the recruitment
of apprentices, graduates and targeted external
middle and senior management staff to meet the
current need and prepare the bench strength for
future operations.
Training & Development The Group has continued to invest in and improve
its managerial and technical capabilities through the
internal development of its own employees across
Europe, India and South East Asia.
To bridge functional skill gaps and to identify
candidates for focussed learning in line with
the current and future needs of Tata Steel, a
scheme called ‘Directed Learning Initiatives’ was
introduced in Tata Steel. The emphasis was to
create a pool of experts in different technical areas.
Apart from creating specialists, the policy also
focusses on managerial learning which consists of
modular programmes with tie-ups with various
management institutes.
060-101_TS_AR_part3.indd 75060-101_TS_AR_part3.indd 75 7/16/09 10:48:12 PM7/16/09 10:48:12 PM

76
With a view to augment the technical capabilities
of the employees, a pilot programme in line with
the Technical Competency Assessment System was
introduced in Tata Steel. Based on the results, the
learnings from the programme will be introduced to
the rest of the organisation.
The Performance Improvement Committee has
continued to focus on improving both knowledge
management and the adoption of best practices
across the Tata Steel Group. This has benefi tted TSE
alongside the other operations of Tata Steel, NatSteel
and Tata Steel Thailand.
During the year, a greater focus was assigned to the ‘On-
the-Job Learning’ for executives. This is being off ered
through cross functional assignment/taskforce, role
enhancement/enrichment and improvement Initiatives.
The executives were also encouraged to undertake
special projects arising from their work assignments
which had focussed measures and deliverables.
Talent Management & Career Planning As part of the global talent management initiatives,
the year saw a greater movement of executives
between Tata Steel India, Tata Steel Europe, NatSteel
and Tata Steel Thailand to enable the cross pollination
of ideas and practices and also provide executives
with a global experience. The Management Trainee
Programme has been re-designed to include special
modules of six months each in the areas of TQM,
engineering and projects, and safety. This will help
the fresh graduate engineers prepare in a better way,
for future assignments.
Leadership Development Leadership Development across all levels continues to
be the focus across the Tata Steel Group. The Executive
Human Resources
060-101_TS_AR_part3.indd 76060-101_TS_AR_part3.indd 76 7/16/09 10:48:12 PM7/16/09 10:48:12 PM

77
Committee owns the development and succession
plans for the top positions. With regards to the next
level of offi cers, this is done by the respective talent
review committees. During the year, the Company
continued to support and send senior executives to
world-class leadership development programmes
at some of the world’s leading management
development institutes.
A Global Leadership Development Programme was
also initiated with the objective of shaping future
Tata Steel Group leaders across the globe. This was
done to convey to the would be leaders, what it
means to be part of the Tata Group, to build a shared
understanding of what needs to be done to be
recognised as outstanding in the steel industry and to
create an understanding of what inspiring leadership
within the Group needs to be like.
Compensation Management & Better SynergyIt is a fundamental principal of the Tata Steel
Group that all the employees across the
globe are compensated fairly. Last year, like the
previous years, compensation was based on
market benchmarking to ensure that Tata Steel
remains an attractive and competitive employer
in the market place. Throughout the year, greater
synergy was established between TSE, Tata
Steel India and the South East Asian operations.
This included secondment of employees across
geographies. The Performance Improvement
Committee has improved both the Knowledge
Management and the Adoption of Best Practices
Initiatives across the Tata Steel Group and this
has benefitted TSE alongside the other operations of
Tata Steel.
060-101_TS_AR_part3.indd 77060-101_TS_AR_part3.indd 77 7/16/09 10:48:15 PM7/16/09 10:48:15 PM

78
Continuous Improvement
From the year 2002, the global steel industry grew
with the steel demand shooting from 2% to 8% year
on year. The Indian steel industry with its 43 million
tonnes of steel production in a booming economy,
was also showing rapid growth. At such a time when
the situation could not have been any better, in 2008
the global economic slowdown cast its shadow on
almost all industries including steel. The steel industry
was suddenly faced with a high locked up capital
and is now having to resort to serious fi refi ghting
measures to overcome the current scenario.
Tata Steel India was also impacted by the economic
slowdown. However, it still had the confi dence that
it would be able to continue to perform much better
than many others in the industry. This confi dence is
an outcome of its understanding the cause and eff ect
and its ability to use Total Quality Management (TQM)
to achieve its desired goals. While there is no quick
fi x approach on this journey, Tata Steel believes that
long years of perseverance and belief are needed to
continue the journey of excellence.
Tata Steel has been pursuing TQM for business
excellence formally since the late 1980s. With the
vision of becoming a world-class steel company, it
adopted various popular improvement initiatives
practiced around the world. All this has resulted in
recognition by various agencies from accreditation
on ISO standards for quality systems, business
excellence awards based on Malcolm Baldridge
model- JRDQV award, EFQM (European Foundation
for Quality Management) model- CII Exim Bank award
and JIPM (Japanese Institute of Plant Maintenance)–
TPM Excellence award to name a few.
With these laurels, Tata Steel believed that it was
on the right track to be deemed a TQM company.
Pan view of Tata Steel Works, Jamshedpur
060-101_TS_AR_part3.indd 78060-101_TS_AR_part3.indd 78 7/16/09 10:48:16 PM7/16/09 10:48:16 PM

79
The process of working for and winning the coveted
Deming Application Prize in 2008 has also been a
humbling and enlightening experience for Tata Steel.
Humbling, because it helped Tata Steel pinpoint
inconsistencies in its approach of managing its
business based on logical principles that are often
camoufl aged during the good times and surface
only during a crisis. Enlightening, because the same
process has helped Tata Steel focus on its strengths in
areas that are most critical to its business.
The road to the Deming Application Prize forced Tata Steel
to research some of the basic systems which exist (but
may not be apparent) in an integrated steel industry.
Understanding Customer Needs Integrated steel plants are capital intensive with a long
payback period. It is natural therefore, for steel plants
to maximise capital productivity through volumes.
Like any other steel plant in the past, Tata Steel’s focus
had been internal, primarily on cost and volumes.
With its growing understanding of TQM and Theory of
Constraints (TOC) on the journey towards the Deming
Application Prize, its customer focus and approach
to the market has undergone a signifi cant change. It
started changing the levers of improvement from an
internally focussed effi ciency driven culture to a culture
of value creation with customers and suppliers.
Some specifi c approaches in the market that Tata Steel
started were Customer Value Management (CVM),
Retail Value Management (RVM) and Solution for
Sales (SFS). These approaches focussed on the “needs”
rather than “wants” of the customer. It is important
to note that these approaches were continued or
initiated in a supplier’s market condition when the
steel cycle was on a high. Even as the overall market
experienced seasonality of demand, the retail sales
(through which a signifi cant volume of construction
bars is sold) of Tata Steel India was rather insulated.
In a downturn, it is often tempting to chase sales. This
inevitably results in a price war which is detrimental
to the organisation and the industry. The objective
therefore should be to create value for the customer
or in other words, should help the customer make
money. The assumption that the customer makes
money when prices are low can often be unfounded.
The journey towards the Deming Application Prize
using TQM, provided a deep insight of the needs
of the customer and how to capitalise on the need
without jeopardising mutual interests.
Mirroring the CVM process, Tata Steel initiated the
Supplier Value Management (SVM) programme
with its key suppliers, which also works on the ‘one
fi rm concept’ with the objective of mutual value
creation. Similarly, focussed approaches to improve
and eff ectively manage raw materials have been
undertaken with the objective to maximise the use of
captive resources.
Infrastructure StrengtheningIn its zeal to constantly conquer new frontiers
especially during a boom period, maintenance,
sustenance or standardisation of the current practices
are often ignored by an organisation. In good times,
the weaknesses in the daily work management
system are not focussed upon which later are
exposed even during mild storms in the market or
economy. Robust daily work management practices,
a clean and safe work environment and consistency
060-101_TS_AR_part3.indd 79060-101_TS_AR_part3.indd 79 7/16/09 10:48:16 PM7/16/09 10:48:16 PM

80
Continuous Improvement
and stability of processes are essential building
blocks to weather the economic storm. A robust
base is essential to improve and sustain gains. The
road to the Deming Application Prize emphasised
the importance of a robust base and the process of
ensuring deployment of the same.
The Improvement PhilosophyJust sustaining the current performance is inadequate
under any environment. Today, most organisations
continuously strive to improve. However, the following
three aspects often remain as weaknesses:
1. Improvement is often inward looking and relatively
less eff ort is made in distinctly diff erentiating the
off erings to the customers
2. The objectives may not be challenging (aspirational)
3. The means to bring about improvements are
often not tested for causality i.e. the means
are not checked for necessary and suffi ciency
conditions to meet the desired objective. Failure
to test interventions against appropriate causality
leads to making the ‘One size fi ts all’ approach
to target setting as well as the choice of tools
and techniques.
The company’s ASPIRE technique helps to set goals
and choose the appropriate tools. Under this, certain
parts of the planned improvements are checked for
causality, explored for means (causes) and then the
implementations are carried out using diff erentiated
tools and techniques. For the remaining parts of the
aspirational goals the means are innovated as we
proceed in the implementation journey.
The future belongs to organisations that can increase
the pace of standardisation (to have a robust base),
improve quickly on their current operations and
continuously innovate to diff erentiate themselves
from the rest.
060-101_TS_AR_part3.indd 80060-101_TS_AR_part3.indd 80 7/16/09 10:48:17 PM7/16/09 10:48:17 PM

81
This can only be achieved by leadership, passion,
process and knowledge.
Tata Steel’s TQM journey has made it acknowledge the
fact that the only sure way to prosperity in the long
run, is to ensure value creation for the system as a
whole, starting from the customers to the suppliers.
Performance Improvement in theTata Steel GroupFollowing its principle of driving all processes towards
quality under TQM, Tata Steel in January 2008 set
up the Performance Improvement Committee (PIC)
to drive performance improvement on a continual
and accelerated basis. In the next few months, the
framework and structure of the PIC was fi nalised,
with Performance Improvement (PI) Groups for
iron making, steel making, fl at rolling, long rolling,
maintenance, distribution service centres and
building systems. RD&T also represented in most of
the PI teams under each of the groups.
Initially, projects were identifi ed with bottom-line impact
of $180 mn, of which 30% were cost projects and the
balance were throughput (volume) related. With the
change in market situation in H2, the sites reworked their
projects and now cost related projects comprise 40%,
though the total benefi ts have reduced to $ 150 mn.
Early Success AreasSome areas where Tata Steel’s eff ort at continuous
improvement bore fruit include:
Higher usage of processed reverts at Scunthorpe
and Port Talbot
Reduction in hot metal manganese at Port Talbot
Bottom stirring at IJmuiden leading to improved
converter life and yield
Higher usage of Low Cost Carbon Source (LCCS) in
the blend at Ijmuiden, Port Talbot and Scunthorpe
INNOVATE
Customer Focussed CultureDriven by Employees
STANDARDISELEADERSHIP
PASSION
PROCESS
KNOWLEDGE
IMPROVE
Standardise, Improve and Innovate
060-101_TS_AR_part3.indd 81060-101_TS_AR_part3.indd 81 7/16/09 10:49:34 PM7/16/09 10:49:34 PM

82
Vessel life improvement at Jamshedpur
and Scunthorpe
Blast Furnace and Coke Ovens operating process
for lower production levels developed and
successfully implemented in Tata Steel European
operations without compromising equipment
health and safety
Coke Self Suffi ciencyCoke oven availability improvements
Improvement in caster speed at LD2, Jamshedpur
by implementing shop tracking system
Improvement in HSM productivity, Jamshedpur
by mill pacing model and eff ective shutdown
management
Improvement in PLTCM productivity at CRM,
Jamshedpur by looper optimisation
Change In Performance CultureThe Performance Improvement journey has
resulted in some positive changes in the
performance culture:
KPI ComparisonsEach PI team has identifi ed its top three to seven KPIs
which are being tracked and compared across sites
each month – commencing from July 2008. Such
KPI comparisons have led to discussions on areas
where there have been signifi cant performance gaps
within the Group and often, these have resulted in
improvement project opportunities.
Bottom line OrientationMost projects are being identifi ed with a view towards
impacting bottom line improvement and most of the
projects are conceptualised along with an expected
fi nancial benefi t.
Continuous Improvement
Site Total Quantifi ed Savings Cost Volume Cost Projects Projects Projects Potential Projects Projects not linked to Volume
Number Number $m $m $m $m %
IJmuiden 21 18 29 27 2 23 79
Jamshedpur 38 18 14 5 10 4 28
Port Talbot 31 24 74 53 21 43 58
Scunthorpe 30 24 33 15 18 7 20
Teesside 32 0 0
Packaging Plus 23 18 5 4 1 2 49
Total 175 102 155 104 51 79 51
a) 1 £ = 1.5 $ ; 1 $ = Rs. 48
Summary: Latest view of Performance Improvement Projects
060-101_TS_AR_part3.indd 82060-101_TS_AR_part3.indd 82 7/16/09 10:49:35 PM7/16/09 10:49:35 PM

83
Knowledge Exchange with a PurposeWithin the PI teams, knowledge exchange is
principally to address common operational issues,
address common weaknesses and pain areas and
significant KPI gaps. For example, Blast Furnace
PIT and Coke PIT have discussed how to manage
operations at lower production levels in a safe
manner and without damaging the equipment.
As part of the agenda, the PIC meetings drive specifi c
knowledge exchange opportunities.
People InvolvementThe PI Team (PIT) meetings and the resulting
project opportunities have had a positive infl uence
on involving more people at each site in taking
on improvement projects and participating in PIC /
PIT reviews.
With a legacy of over 100 years, Tata Steel already
had practices in place to manage its operations and
situations. In the last twenty years, it has explored
and practiced a number of improvement initiatives
with TQM forming the holistic approach to manage
its processes by quality.
Tata Steel believes that this approach will ensure
sustainability while continuously improving its
current practices to keep pace with changing
market requirements.
It constantly strives to break away from the common
place and to set new industry benchmarks for others
to emulate.
060-101_TS_AR_part3.indd 83060-101_TS_AR_part3.indd 83 7/16/09 10:49:36 PM7/16/09 10:49:36 PM

84
Corporate Citizenship
“There is one kind of charity common enough
among us, and which is certainly a good thing,
though I do not think it is the best thing we have.
It is patchwork philanthropy… What advances
a nation or community is not so much to prop up
its weakest and most helpless members as to lift
up the best and most gifted so as to make them
of greatest service to the country. I prefer this
constructive philosophy”.
– Jamsetji Tata
As the Tata Steel Group’s operations have expanded
manifold to new geographies, it has retained a
collective focus on the various areas of corporate
sustainability that impact the environment, people
and their health and society at large. As a policy, all
its businesses promote and encourage economic,
social and educational development within their
communities while also giving active support to
local initiatives. With economic growth, stakeholder
expectations have also grown and hence, as compared
to last year, the Group’s focus on the area of Corporate
Social Responsibility (CSR) stresses more on social
and environmental sustainability, social welfare, sport
and inclusive growth, in an attempt to ensure that its
successes are shared by all its constituents.
From the policies on corporate accountability, drug
abuse and alcohol, HIV prevention to a Code of Conduct
which the company extends to its stakeholders, issues
like ethics too are interwoven in the daily course of
Tata Steel’s business. CSR is an integral component
of its business strategy and constitutes one of the
Company’s key enterprise processes.
Towards a Sustainable FutureWithin Tata Steel and other industries, as the demand
for unskilled and semi-skilled labourers is reducing, the
company is continually working to help local people
harness resources and skills available towards sustainable
livelihood opportunities, in rural and urban areas.
In India, the Tata Steel Rural Development Society
(TSRDS) has focussed on improving agricultural
productivity. This year, two major pilot projects
were initiated. In the fi rst collaborative project with
the Agriculture Consultancy and Management
Foundation, Chennai, interventions in approximately
20 acres, resulted in increased productivity of 2.25
tonnes per acre in the fi rst year of the initiative against
the target of two tonnes per acre.
The second pilot project on dry land farming with the
International Crop Research Institute for Semi Arid
060-101_TS_AR_part3.indd 84060-101_TS_AR_part3.indd 84 7/16/09 10:49:36 PM7/16/09 10:49:36 PM

85
Tropic, Hyderabad, developed nearly 22 acres of land
resulting in increased yields. In addition, 2800 acres
of wasteland have been developed. The second and
third croppings in about 3300 acres of land, have been
facilitated through 65 water harvesting structures.
The Land and Water Management programme was
initiated in the Ganjam district of Orissa. TSRDS took
up the job of reviving non-functional lift irrigation
systems, covering over 720 acres of land which
benefi tted 1400 families.
The Company is also training 3000 youths in diff erent
kinds of vocations to help them develop several
skills. 780 youths from Kalinganagar in Orissa and
Chhattisgarh have successfully found jobs.
As a platform to link rural craftsmen and women with
potential markets and customers, Tata Steel hosted
the 17th Gramshree Mela in March 2009. In this
extremely successful initiative, a total of 209 stalls
were put up with artisans displaying artefacts from
20 states of India.
Over the past 30 years, the TSE subsidiary UK, Steel
Enterprise has provided fi nance and premises,
together with help and advice, to more than
4200 growth businesses to support the economic
regeneration of communities aff ected by changes
in the steel industry. The total fi nancial support is
over £72 mn with over £50 mn in direct investment,
which has enabled these businesses to create over
68,000 new jobs. Projects supported since April 2008
include fi nancial support for community centres
and sports projects such as the Stephen Harrison
Academy, which uses sport to improve the lives of
disadvantaged young people, sponsorship of youth
activities such as a new Creative Training Academy
060-101_TS_AR_part3.indd 85060-101_TS_AR_part3.indd 85 7/16/09 10:49:42 PM7/16/09 10:49:42 PM

86
project and the Lanarkshire fi nal of the 2008 Prince’s
Scottish Youth Business Trust ‘Young Entrepreneur
of the Year’ Awards, a grant to improve facilities for
Middlesbrough’s South Bank community and help
residents fi nd employment.
Over the last fi scal, NatSteel Australia Pty Ltd. donated
$5000 to the Victorian Fire Appeal for the victims of
the Victorian bush fi res in February 2009.
The Sports & Recreation Club of NatSteel Holdings
raised an amount of $53,500 which went into
the purchase of a handicapped modifi ed van.
The company also launched its pilot CSR Leave
project which entitles the staff to pro-rate one
day leave per year to carry out activities with their
adopted charities.
NatSteel Xiamen Ltd. (China), in May 2008, as part
of their social sustainability programme, gave the
Xiamen Red Cross Society an RMB $160,000 cheque in
aid of the Sichuan Earthquake victims. Its employees
also donated an RMB $80,000 check to the same.
The Siam Industrial Wire Co. Ltd. (Thailand) undertook
the Watdonchan School Project and renovated the
canteen, computer room along with the playground.
The company also initiated the Bankhai Technical
College & SIW Dual Vocational Training project where
they trained students for specifi c careers in SIW.
The Wuxi Jinyang Metal Products Company
donated RMB 120K for the disaster of earthquake
in Sichuan province and NatSteelVina Co. Ltd.
(Vietnam) donated to fl ood eff orts in Bac Giang and
Vinh Phuc Provinces.
Giving Back to the CommunitySince its inception, Tata Steel has been working
towards improving the quality of life in its areas
of operations.
In India, Project RISHTA (Regional Initiative for
Sexual Health by Today’s Adolescents) safeguards the
youth from adverse effects of teenage pregnancy,
sexual abuse and disease. This year, it reached out
to 24,000 youth. 7750 children were immunised
and 8400 women were covered through antenatal
check-ups. Over 1640 cataract operations were
also conducted. During the year, over 7000 couples
were protected through permanent methods of
family planning.
As part of the HIV/AIDS interventions, counselling
at Sneh Kendra, Jamshedpur, has helped over 1440
‘at risk’ people. Under Project Kavach, various media
Corporate Citizenship
060-101_TS_AR_part3.indd 86060-101_TS_AR_part3.indd 86 7/16/09 10:49:43 PM7/16/09 10:49:43 PM

87
events, counselling sessions and Khushi clinics were
organised throughout the year to minimise the risk of
HIV/AIDS among truckers.
The Port Talbot steel plant of Tata Steel Europe
welcomed Alexander Rose, the founder of the STOP
(Solve This Ongoing Problem) Knife Crime campaign,
to witness the destruction of 729 knives, blades,
swords and axes handed in a knife amnesty in 2008
and their recycling into new steel slab.
During the year, Tata Steel Thailand organised
an environmental conservation camp for 50
students and provided for rebars for the
Yuwawitsawakornbopit 36 Bridge Construction
Project operations. It also provided life bags for flood
victims in Tambon Khao Sam Yord Lopburi Province
and to the victims in Amphur Bangban, Ayudhya
Province as well.
A Focus on Literacy and Education Tata Steel has endowed a Professorship of Metallurgy
in the Department of Materials, Science and
Metallurgy at the University of Cambridge. The fi rst
holder of the chair, inaugurated in November 2008,
is Dr Harry Bhadeshia, a world-renowned expert on
the physical metallurgy of steels. The endowment
recognises the commitment of Tata Steel and the
University to world-leading research in the fi eld.
In India, the Company continued its efforts
to improve literacy rate and has taken several
initiatives to attain ‘education for all’ with a specific
focus on rural and urban slum children, girls and
youths from scheduled castes and tribes. In the
urban areas, out of about 570 students who were
enrolled in 12 centres, over 380 students (67%)
have been integrated into formal schools. In the
rural areas, 22 centres catered to 550 children in
060-101_TS_AR_part3.indd 87060-101_TS_AR_part3.indd 87 7/16/09 10:49:44 PM7/16/09 10:49:44 PM
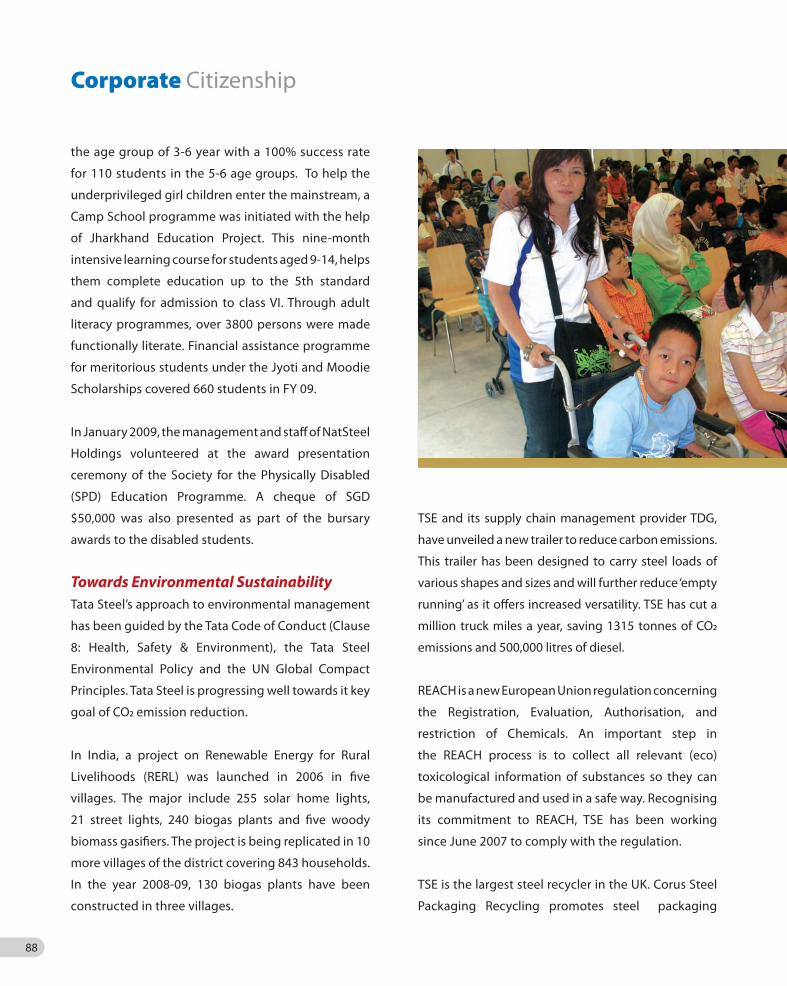
88
the age group of 3-6 year with a 100% success rate
for 110 students in the 5-6 age groups. To help the
underprivileged girl children enter the mainstream, a
Camp School programme was initiated with the help
of Jharkhand Education Project. This nine-month
intensive learning course for students aged 9-14, helps
them complete education up to the 5th standard
and qualify for admission to class VI. Through adult
literacy programmes, over 3800 persons were made
functionally literate. Financial assistance programme
for meritorious students under the Jyoti and Moodie
Scholarships covered 660 students in FY 09.
In January 2009, the management and staff of NatSteel
Holdings volunteered at the award presentation
ceremony of the Society for the Physically Disabled
(SPD) Education Programme. A cheque of SGD
$50,000 was also presented as part of the bursary
awards to the disabled students.
Towards Environmental Sustainability Tata Steel’s approach to environmental management
has been guided by the Tata Code of Conduct (Clause
8: Health, Safety & Environment), the Tata Steel
Environmental Policy and the UN Global Compact
Principles. Tata Steel is progressing well towards it key
goal of CO2 emission reduction.
In India, a project on Renewable Energy for Rural
Livelihoods (RERL) was launched in 2006 in fi ve
villages. The major include 255 solar home lights,
21 street lights, 240 biogas plants and fi ve woody
biomass gasifi ers. The project is being replicated in 10
more villages of the district covering 843 households.
In the year 2008-09, 130 biogas plants have been
constructed in three villages.
TSE and its supply chain management provider TDG,
have unveiled a new trailer to reduce carbon emissions.
This trailer has been designed to carry steel loads of
various shapes and sizes and will further reduce ‘empty
running’ as it off ers increased versatility. TSE has cut a
million truck miles a year, saving 1315 tonnes of CO2
emissions and 500,000 litres of diesel.
REACH is a new European Union regulation concerning
the Registration, Evaluation, Authorisation, and
restriction of Chemicals. An important step in
the REACH process is to collect all relevant (eco)
toxicological information of substances so they can
be manufactured and used in a safe way. Recognising
its commitment to REACH, TSE has been working
since June 2007 to comply with the regulation.
TSE is the largest steel recycler in the UK. Corus Steel
Packaging Recycling promotes steel packaging
Corporate Citizenship
060-101_TS_AR_part3.indd 88060-101_TS_AR_part3.indd 88 7/16/09 10:49:45 PM7/16/09 10:49:45 PM

89
recycling to consumers, local authorities and the
commercial sector, and off ers an established end
market for recovered used steel packaging.
Climate change is one of the most important issues
facing the world today. In 2008, the Group launched
its Climate Change Strategy, which recognises that
the steel industry is a signifi cant contributor to man-
made greenhouse gas emissions as the manufacture
of steel unavoidably produces carbon dioxide (CO2). It
continues to improve its current processes to increase
its energy effi ciency and to reduce its carbon footprint,
with a goal of reducing CO2 emissions per tonne of
liquid steel by at least 20% (to less than 1.5t/tls) by
2020 compared to 1990 levels. In February 2008,
TSE announced an investment of £60 mn in energy
management technology at its Port Talbot site, an
investment that will reduce CO2 emissions from 2009
onwards. In addition to these improvements, TSE is also
working with other steel makers in Europe on a major
research and development project, ULCOS (Ultra-Low
CO2 Steel making) to investigate new technologies
that could bring about a step change reduction of 50%
CO2 emissions per tonne of liquid steel by 2050.
NatSteel Holdings increased the use of NEWater
(recycled water) in operations, to be ‘greener’ in its
use of water. It is also in the process of building a
baghouse to collect all fugitive dust generated from
the scrap melting process.
NatSteel Australia Pty Ltd. implemented an energy
audit/tracking programme this year and reduced
the use of multi-machine servers. It also installed
rainwater tanks to harvest rainwater.
The Siam Industrial Wire Co. Ltd. began its Stop
Global Warming project, in which employees, 350
060-101_TS_AR_part3.indd 89060-101_TS_AR_part3.indd 89 7/16/09 10:49:49 PM7/16/09 10:49:49 PM
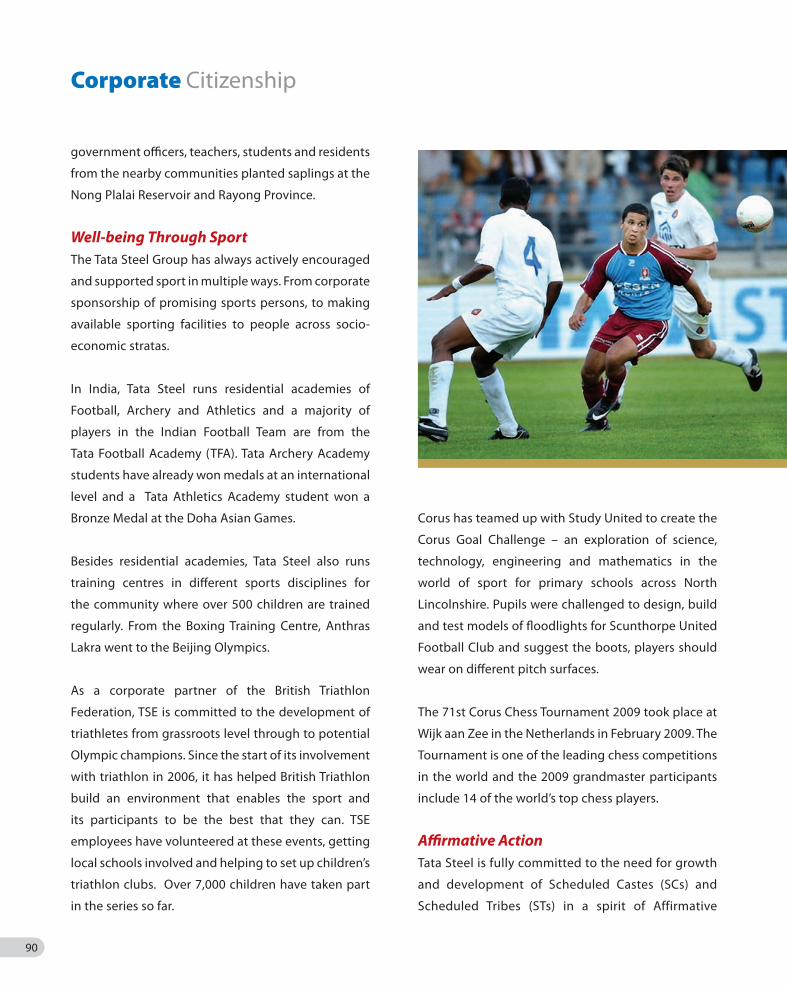
90
government offi cers, teachers, students and residents
from the nearby communities planted saplings at the
Nong Plalai Reservoir and Rayong Province.
Well-being Through SportThe Tata Steel Group has always actively encouraged
and supported sport in multiple ways. From corporate
sponsorship of promising sports persons, to making
available sporting facilities to people across socio-
economic stratas.
In India, Tata Steel runs residential academies of
Football, Archery and Athletics and a majority of
players in the Indian Football Team are from the
Tata Football Academy (TFA). Tata Archery Academy
students have already won medals at an international
level and a Tata Athletics Academy student won a
Bronze Medal at the Doha Asian Games.
Besides residential academies, Tata Steel also runs
training centres in diff erent sports disciplines for
the community where over 500 children are trained
regularly. From the Boxing Training Centre, Anthras
Lakra went to the Beijing Olympics.
As a corporate partner of the British Triathlon
Federation, TSE is committed to the development of
triathletes from grassroots level through to potential
Olympic champions. Since the start of its involvement
with triathlon in 2006, it has helped British Triathlon
build an environment that enables the sport and
its participants to be the best that they can. TSE
employees have volunteered at these events, getting
local schools involved and helping to set up children’s
triathlon clubs. Over 7,000 children have taken part
in the series so far.
Corus has teamed up with Study United to create the
Corus Goal Challenge – an exploration of science,
technology, engineering and mathematics in the
world of sport for primary schools across North
Lincolnshire. Pupils were challenged to design, build
and test models of fl oodlights for Scunthorpe United
Football Club and suggest the boots, players should
wear on diff erent pitch surfaces.
The 71st Corus Chess Tournament 2009 took place at
Wijk aan Zee in the Netherlands in February 2009. The
Tournament is one of the leading chess competitions
in the world and the 2009 grandmaster participants
include 14 of the world’s top chess players.
Affi rmative Action Tata Steel is fully committed to the need for growth
and development of Scheduled Castes (SCs) and
Scheduled Tribes (STs) in a spirit of Affirmative
Corporate Citizenship
060-101_TS_AR_part3.indd 90060-101_TS_AR_part3.indd 90 7/16/09 10:49:50 PM7/16/09 10:49:50 PM

91
Action. Though Affirmative Action was declared
as a Policy in 2006 by the Government of India,
Tata Steel has been practising it for over three
decades now. Its focus population includes the
SC/ST communities in Singhbhum (East & West) and
Sareikela-Kharsawan in Jharkhand. An important
initiative is the socio-economic development project
at primitive tribe villages for which four hamlets,
two each of Birhor and Savar have been identified,
a detailed socio-economic survey conducted,
and project implementation has been initiated in
areas of sustainable livelihood, education, health
and sanitation.
Tata Steel contributed towards the development
of a self-learning kit for the Santhali language
in collaboration with Santhal Engineers’ Welfare
Association, a group of Santhal professionals. The
package is geared at the revival of Santhali language
and comprises of basics of alphabet, elementary
grammar, vocabulary and math to enable learners
to read and write.
“Humata, Hukhta, Hvarshta” – These words in the
ancient Avestan language, are inscribed on the crest
of the founder of Tata Steel, Jamsetji Nusserwanji
Tata. They mean: Good Thoughts, Good Words and
Good Deeds. These words form the essence and the
driving force of the Corporate Citizenship philosophy
of Tata Steel, which amply communicates to all its
stakeholders that “… what comes from the people goes
back to the people …”
060-101_TS_AR_part3.indd 91060-101_TS_AR_part3.indd 91 7/16/09 10:49:52 PM7/16/09 10:49:52 PM

92
Awards, Recognitions and Certifications
The Deming Application Prize, established
in December 1950 in honour of W. Edwards
Deming, was originally designed to reward
Japanese companies for major advances in
quality improvement. It has grown under the
guidance of the Japanese Union of Scientists
and Engineers (JUSE) and is now also
awarded to non-Japanese companies. The
Prize is awarded to an individual or company
and other operating organisations and
factories located outside Japan. Worldwide,
160 companies have won the Deming
Application Prize since it was instituted. Of
these 160, 15 companies are Indian, primarily
from the automotive sector.
Tata Steel India Wins the Deming Application Prize-2008
Tata Steel India’s Award of the Deming Application
Prize-2008 for excellence in Total Quality
Management was a first to an integrated steel
company outside Japan. Mr. B. Muthuraman,
Managing Director, Tata Steel, received the coveted
medal from Mr. Fujio Mitarai, Chairman of the
Deming Prize Committee, at a formal function in
Tokyo, Japan.
While accepting the award at the function,
Mr. Muthuraman dedicated the award to the
employees and workers of Tata Steel. He said in his
speech, “ It is because we have taken the first
steps, first firm and sure steps towards quality
movement and because a large number of
people in the entire organization are involved
in that movement that we are being given this
prestigious award.”
And he added, “Our efforts to challenge the
Deming Prize and the questions the Deming
Examiners asked us made us humble and made
us realize that we now have a tool and a system
with which we can improve everything we do
in a continuous and predictable basis, that our
The Deming Application Prize

93
results would be based on our efforts and that
we would be able to overcome any obstacles
put on us by the external environment.”
During the assessment process, the Japanese
examiners were not only impressed by the quality
parameters followed at Tata Steel, but also by the
social commitment of Tata Steel and its work done
in the rural areas over the last 100 years.

94
Awards, Recognitions and Certifi cations
Tata Steel’s leadership in sectors of economic, social and environmental signifi cance brings a unique set of capabilities. The heritage of returning to society what the company earns evokes trust among all its stakeholders, including consumers, employees, shareholders, communities and government regulatory bodies. Because of its strong commitment to the cause of sustainable development, certifi cation to environment management systems, quality standards, and the belief that better environmental management leads to superior business performance, the Company won a number of national and international awards and accolades during the year.
Tata Steel Group – Some Key Awards
• The crowning glory this year was the Deming Application Prize 2008, which is the highest award for quality in the world. Tata Steel India earned the unique distinction of being the fi rst integrated steel company outside Japan to win the Deming Prize.
• The Golden Peacock Global Corporate Social
Responsibility Award for its continual commitment
to ethical behaviour and its contribution to
economic development while improving the
quality of life of its workforce, their families as well
as of the local community and society at large.
• The Economic Times Company of the Year Award
for making a fundamental diff erence to the way
business is done.
• The Best Establishment Award by the President of
India, Mrs. Patibha Devi Singh Patil.
• The Most Admired Knowledge Enterprise (MAKE)
Asia Award for the fi fth time.
• The TERI Corporate Award for its HIV/AIDS initiatives.
• The Think Odisha Leadership Award for 100 years
of service to the nation.
• National safety awards to the West Bokaro and
Jharia divisions.
• HMS Faglig Forum, the organisation of professional
and industrial bodies for health, environment and
safety professionals in Norway awarded its 2008
prize to Corus Packaging Plus in March 2009.
• Corus’ Scunthorpe site was recognised by the
North Lincolnshire Health and Safety Group as
one of the most improved companies for accident
prevention within the group in March 2009.
Work-Life Excellence Award
Most Admired Knowledge Enterprise Award
060-101_TS_AR_part3.indd 94060-101_TS_AR_part3.indd 94 7/16/09 10:50:06 PM7/16/09 10:50:06 PM

95
• Corus Tubes Maastricht received a national ‘Good
Practice Award’ from the European Agency for
Safety and Health at Work in November 2008.
• Corus Distribution UK and Ireland’s help in setting
up a new approach to work experience was
recognised with a CSR award from Walsall Town
Council in March 2009.
• Confi dex Sustain®, the world’s fi rst cradle-to-cradle
CarbonNeutral building envelope from Corus Colors,
was recognised by four major awards, including:
1) A 2008 Welsh Marketing Award from The
Chartered Institute of Marketing in Wales.
2) The Chartered Institute for Waste
Management’s award for Sustainable Product
Development of the Year, which rewards
environmental excellence and products
that have been designed or produced to
improve sustainability.
• NatSteel Holdings bagged the Platinum Singapore
HEALTH (Helping Employees Attain Life Time
Health) Award in November 2008.
• For the third time running, NatSteel Holdings won the
Work-Life Excellence (WLE) Award in August 2008.
• SCSC, a subsidiary of Tata Steel Thailand, received
the Excellence in Manufacture Award for Quality,
Environment and Safety Management and
the award for Logistics Management from the
Department of Primary Industries and Mines of
Thailand’s Ministry of Industry.
• NatSteel Xiamen Ltd. received accreditation
from the Australian Certifi cation Authority for
Reinforcing Steel (ACRS).
• Wuxi Jinyang Metal Products Co. was awarded the ISO
14001 accreditation for environment protection.
• TSTH subsidiary, SISCO received the ISO 9001:2000,
TIS 18001:1999 and OHSAS 18001:1999 quality
management certifi cations.
TERI Corporate Award
BE Award
Platinum Singapore HEALTH
060-101_TS_AR_part3.indd 95060-101_TS_AR_part3.indd 95 7/16/09 10:50:11 PM7/16/09 10:50:11 PM
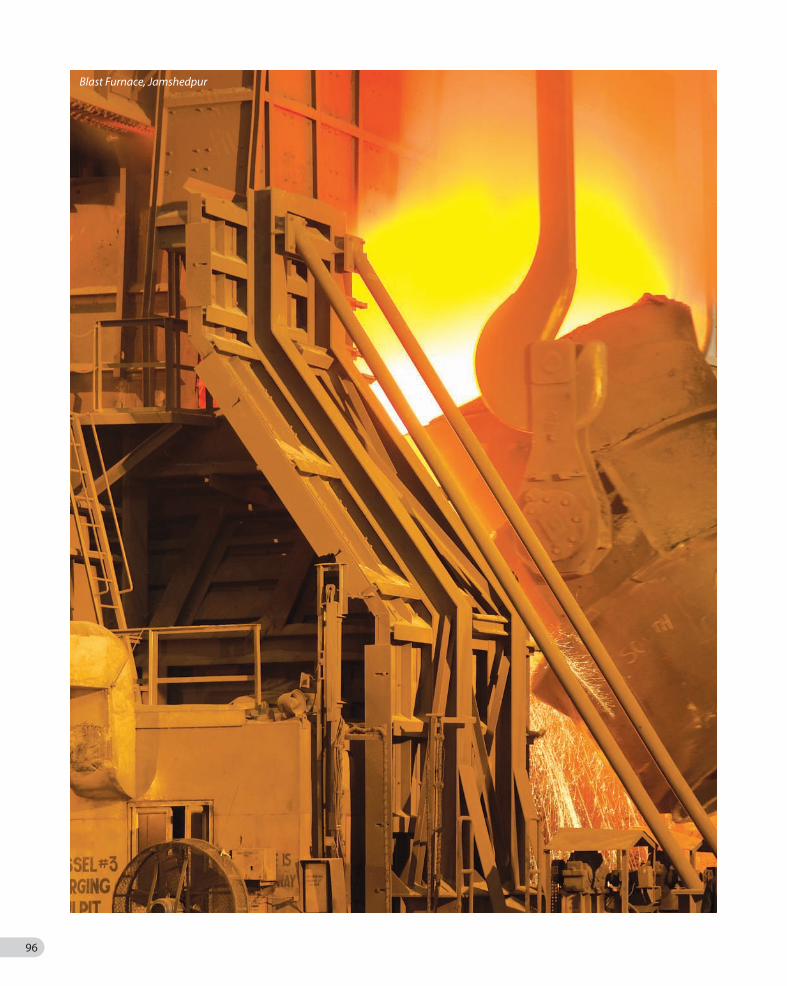
96
Blast Furnace, Jamshedpur
060-101_TS_AR_part3.indd 96060-101_TS_AR_part3.indd 96 7/16/09 10:50:16 PM7/16/09 10:50:16 PM

97
Management of Business Ethics
The values and principles which have governed Tata Steel’s
business for a century, have been deployed through the
implementation of the Tata Code of Conduct (TCOC). This
process of implementation of TCOC among stakeholders is
known as the Management of Business Ethics (MBE), which
is deployed eff ectively in the Company through its ‘Four
Pillars’ concept, which are:
• Leadership
• Systems and Processes
• Training and Awareness
• Measurement
The year 2008-09 was marked by the launch of the Tata Code
of Conduct 2008. The Code has the fl avour of globalisation
and gender sensitivity, which refl ected the presence of
the Tata Group’s footprints in many foreign countries. The
revision of the Code included the following points keeping
globalisation in mind:
• International nuances were added (originally perceived
as India-centric was modifi ed and the Code was
made global).
• Gender bias was removed.
• An additional global focus area was incorporated, e.g.
culture sensitivity, colluding to bribe, right to privacy,
improving environment-greenhouse gases, preserving
human rights, honouring commitments.
• Employee responsibility has been inserted under
relevant clauses.
• Third party accountability has been added by obtaining
Non Disclosure Agreements by the Tata Company with
third parties and their employees.
Tata Steel took various steps to roll out the Code within
the Company. The leadership team and all executives
reconfirmed their dedication to the Code by an online
acceptance of compliance through the SAPHR Portal.
The changes in the new Code were made known to all by
circulating two codes per week through Lotus Notes, which
is the internal mailing system of the Company. This system
has helped people within the organisation understand the
Code better.
In addition to this, other initiatives were also taken to
deploy the Code throughout the Company. These include
printing of books, posters of the Code in English, Hindi and
other regional languages which also carried the Managing
Director’s message. Posters were put up at strategic
locations to help all employees to familiarise themselves
with the Code. There were also several classroom training
sessions and shop floor discussions. The Code has also
been uploaded on the Company’s website.
All partners including vendors, contractors and other
agencies, were informed about the new Code through the e-
Procurement and online business sites. Their non disclosure
agreements were also taken online.
In order to make the Company’s ‘Whistle Blower Policy’
effective and to encourage more whistle blowers, the
‘Whistle Blower Reward Policy’ was incorporated. In
addition to this, a film on a whistle blower’s role was also
made and screened across all levels of the Company.
The Ethics Group of the Company was also subject to the
Deming examinations this year and this has helped the
function improve the monitoring of its processes.
For further details, please e-mail the Ethics Group at: ethics.
2090661-1 Tata Steel AR 2K8-9_2c97 972090661-1 Tata Steel AR 2K8-9_2c97 97 7/18/09 1:28:56 AM7/18/09 1:28:56 AM

Hundred and second annual report 2008-09
98
Directors’ ReportTo the Members,The Directors hereby present their 102nd annual report on the business and operations of the Company along with the standalone and consolidated fi nancial accounts for the year ended 31st March, 2009.
Figures in Rupees crore
Tata Steel Standalone Tata Steel Group
2008-09 2007-08 2008-09 2007-08
Net Sales/Income 24,315.77 19,691.03 147,329.26 131,533.63
Total expenditure before depreciation (net of expenditure transferred to capital)
15,182.34 11,677.25 129,201.59 113,751.20
Operating Profi t 9,133.43 8,013.78 18,127.67 17,782.43
Add: Dividend and Other Income 308.27 242.80 265.67 475.86
Profi t before Interest, Depreciation, Exceptional Items and Taxes 9,441.70 8,256.58 18,393.34 18,258.29
Less: Net Finance Charges 1,152.69 786.50 3,290.18 4,085.41
Profi t before Depreciation, Exceptional Items and Taxes 8,289.01 7,470.08 15,103.16 14,172.88
Less: Depreciation 973.40 834.61 4,265.39 4,136.95
Profi t before Exception Items and Taxes 7,315.61 6,635.47 10,837.77 10,035.93
Add/(Less): Exceptional Items — 430.89 (4,094.53) 6,335.13
Profi t before taxes 7,315.61 7,066.36 6,743.24 16,371.06
Less: Provision for current taxation 2,173.00 2,252.00 1,997.12 3,353.73
Less: Provision for deferred taxation (75.13) 108.33 (121.93) 674.58
Less: Provision for Fringe Benefi t tax 16.00 19.00 18.81 20.99
Profi t after taxes 5,201.74 4,687.03 4,849.24 12,321.76
Less: Minority interest — — (40.94) 139.94
Add: Share of profi t of Associates — — 60.72 168.16
Profi t after minority interest and share of profi t of Associates — — 4,950.90 12,349.98
Add: Balance brought forward from the previous year 6,387.46 4,593.98 8,234.03 4,840.39
Balance 11,589.20 9,281.01 13,184.93 17,190.37
Which the Directors have appropriated as under to: –
(i) Proposed dividend 1,168.95 1,168.93 1,167.88 1,167.86
(ii) Dividend on Compulsory Cumulative Preference Shares 109.45 22.19 109.45 22.19
(iii) Tax on Dividend 214.10 202.43 217.64 207.75
(iv) Special Reserve — — 4.24 6.32
(v) Actuarial gain/(Loss) — — — 5,906.84
(vi) Statutory Reserve — — 51.53 96.30
(vii) General Reserve 600.00 1,500.00 672.23 1,549.08
Total 2,092.50 2,893.55 2,222.97 8,956.34
Balance to be carried forward 9,496.70 6,387.46 10,961.96 8,234.03
2090661-1 Tata Steel AR 2K8-9_2c98 982090661-1 Tata Steel AR 2K8-9_2c98 98 7/18/09 1:28:57 AM7/18/09 1:28:57 AM

99
GLOBAL ECONOMY
After a period of robust global economic expansion for
the last four years, the global economy slipped into a
recession in the second half of 2008, lowering world
GDP growth to 2.1% in 2008 (The IMF considers growth
less than 3% as a recession). The financial meltdown
resulting from the US housing crisis precipitated the
recession leading to lower trade finance, lower purchasing
power and falling demand in advanced economies with
world trade growth dipping to 3.3% (6% in 2007). The IMF
expects world trade to fall by 11% in 2009, recovering to
positive growth of 0.6% in 2010.
Governments the world over have committed to provide
significant liquidity and stimulus packages to support their
fragile economies. Major nations through the G-20 forum
have also committed to greater transparency in accounting
practices by the banks and hedge funds and also closer
monitoring of tax havens.
The Gross Domestic Product (GDP) in the Organisation
of Economic and Co-operation and Development (OECD)
area fell by 4.8% in the first quarter of calendar 2009 on
a year-on-year basis following a fall of 1.7% in the fourth
quarter of 2008. US GDP increased by 1.1% in 2008 but is
expected to fall in 2009. A fiscal recovery package of around
$800 billion was announced by the US government which
included a combination of spending incentives and tax
rebates to boost consumer spending. The Federal Reserve
was very aggressive in cutting interest rates during the end
of 2008 and early 2009, bringing down the Federal Funds
rate to a current low of 0.18%.
The Euro currency grew by 0.85% in 2008 and is still likely
to post negative growth in 2009, before a mild recovery in
2010. The UK GDP slowed to 0.7% in 2008 and is expected
to fall further in 2009 with a slight improvement in 2010.
Investment spending declined in the UK in the fourth
quarter of 2008 as businesses facing weaker demand and
tighter financing conditions cut back on production and
employment. Automotive manufacturers and the steel
producers were particularly badly hit resulting in layoffs
and factory closures.
World GDP growth was sustained by the emerging and
the developing economies, which grew at 6.1% in 2008,
though this is projected to fall sharply in 2009. Growth in
the Asian powerhouse, China, slowed down to 9% in 2008
and is expected to fall further to around 6.5-7% in 2009. The
Chinese government is hoping that the stimulus package
of $600 billion it announced in February 2009, would raise
the growth rate to 8%, with the domestic economy picking
up the slack in exports. The Indian economy which grew
at an average rate of 8.8% between 2003-04 and 2007-08,
saw the growth dip to 6.7% in 2008-09, mainly on account
of a sharp dip in exports. The newly elected government
has emphasised an expenditure and investment focussed
agenda to enable the country return to an 8% growth in
the near future.
STEEL INDUSTRY
While most steel companies across geographies enjoyed
strong demand and record earnings in the first half of 2008,
the demand for steel weakened significantly after August
2008 with the global financial crisis adversely impacting the
construction sector and capital spending. Steel companies
across all major geographies announced substantial
production cuts to align inventory levels with underlying
demand. This affected the capacity utilisation level of the
global steel industry. Further, tight credit conditions in the
second half of the year and the need to generate cash flows
resulted in a severe level of industry-wide destocking.
Steel prices also declined significantly across the world with
more than a 50% reduction in the second half, compared to
the first half of 2008-09. Similarly, the spot prices for iron
ore and metallurgical coal also came down significantly
in the latter part of 2008. It is very likely that the annual
benchmark rates in 2009 for iron ore and metallurgical coal
will be settled at a significantly lower level. For most of the
world, the overall downward trend continued into the first
quarter of 2009 in tandem with the global downturn. World
steel production in the first quarter of calendar 2009 was
269 million tonnes, a decrease of 22.8% over the first quarter
of calender 2008. The largest decline in steel demand was
felt in the US, Europe and Japan.
2090661-1 Tata Steel AR 2K8-9_2c99 992090661-1 Tata Steel AR 2K8-9_2c99 99 7/18/09 1:28:58 AM7/18/09 1:28:58 AM

Hundred and second annual report 2008-09
100
Reduced demand and falling prices put extreme pressure
on the profits, margins and liquidity of the steel companies.
Capacity has been idled and capital expenditure has been
curtailed for 2009 and onwards. Many manufacturers have
utilised this downtime for overhaul and maintenance.
Long-term contracts are being renegotiated with
producers using the economic downturn to negotiate
price concessions from raw material suppliers and vendors.
Some steel companies are acquiring iron ore and coal
mines to insulate themselves from the price volatility and
to ensure a dependable supply of raw materials.
The slowdown in the real economy the world over is likely to
delay recovery in the steel industry in 2009. Steel demand
is likely to stabilise in the latter part of 2009 leading to a
mild recovery in 2010.
Emerging economies were also affected by the
economic crisis, but to a lesser degree. Steel consumption
in the BRIC countries (Brazil, Russia, India and China)
is expected to fall by 5.9% in 2009, with China, which
has been the source of much of the global increase
in steel demand, too seeing negative growth of about
5% in 2009.
The Indian economy, which is recovering faster than its
global peers from the current slowdown, appears better
positioned with the World Steel Association forecasting
a 2% growth in the country’s steel consumption in 2009.
With India’s GDP growth forecast to grow around 6.5% in
2009-10 on the back of robust infrastructure spending, it is
likely that the World Steel Association’s forecast may turn
out to be too modest.
BUSINESS RESULTS
Tata Steel Group The steel deliveries of the Tata Steel Group for the financial
year 2008-09 at 28.54 million tonnes were 10% lower
compared to 31.68 million tonnes during the financial
year 2007-08. The Group recorded a turnover of Rs.147,329
crore (US$ 28,962 mn) for the financial year 2008-09,
12% higher than the turnover of Rs. 131,534 crore
(US$ 25,857 mn) for the financial year 2007-08.
• The EBITDA for the Group at Rs. 18,495 crore (US$ 3,636
mn) for the fi nancial year 2008-09 was 1% higher than
the EBITDA of Rs.18,287 crore (US$ 3,595 mn) recorded
during the fi nancial year 2007-08.
• Profi t before taxes and exceptional items was Rs.10,838
crore (US$ 2,130 mn) during the fi nancial year 2008-09
against Rs.10,036 crore (US$ 1,973 mn) for the fi nancial
year 2007-08.
• Exceptional items during the fi nancial year 2008-09
was a loss of Rs. 4,095 crore (US$ 805 mn) representing
‘restructuring, impairment and disposals’ relating
to the disposal/impairment of assets and restructuring
arising out of the ‘Fit for Future’ programme at
Tata Steel Europe.
Tata Steel - Indian OperationsThe Steel Division of the Indian operations posted an
increase of around 10% in its finished steel production
and sales during 2008-09 riding high on the performances
of the newly commissioned ‘H’ Blast Furnace, the
Sinter Plant, the steel melting shops LD Shop 1 and
LD Shop 2 and the Finishing Mills at both Flat and Long
product divisions.
Total sales at 5.231 million tonnes were 9% higher than
the previous year. Long products sales at 2.00 million
tonnes increased by 25%. Flat products recorded a sales of
3.23 million tonnes, slightly higher than the previous year.
The Indian operations achieved a significant reduction in
the consumption of coke, following increased production
from the larger Blast Furnaces with higher productivity.
The Tubes Division commissioned a state-of-the-art
2” Mill during FY 09. This improved its operational efficiency,
productivity and energy consumption and enabled it to
offer improved products. With the installation of the new
mill, the Tubes division capacity increased to 300,000
tonnes per annum. The division has started manufacturing
high end precision tubes with the commissioning of the
hydroforming facilities and has recently initiated the
supplies of Engine Cradles for Tata Nano cars, tubes for
Telescopic Front Fork (TFF) & Propeller Shaft applications.
2090661-1 Tata Steel AR 2K8-9_2c100 1002090661-1 Tata Steel AR 2K8-9_2c100 100 7/18/09 1:28:58 AM7/18/09 1:28:58 AM

101
The Bearings Division of the Company sold 26.34 million
bearings during FY 09, 5% lower than the previous year.
The Bearings division’s major customer segment is the
automobile sector and its performance is linked to the
performance of the automobile industry. The automotive
segment saw a robust growth of 12.7% during the first
half of the financial year, but witnessed a steep decline
of 13% in the third quarter before recovering marginally
in the fourth quarter. The division put in place several
cost reduction measures to meet the challenges of the
highly competitive bearing market. It also introduced
new products and branded grease in the market during
the year.
Tata Steel Europe (TSE) – (Corus Group)Tata Steel Europe’s liquid steel production in 2008-09 at
16 million tonnes was 20% lower than that of 2007-08.
The production for the first six months was 10 million
tonnes, which however fell to 6 million tonnes during the
second half of the year, reflecting the planned reduction of
production to match the sharp contraction in the demand
environment during the second half of the year. The selling
price of the steel products also dropped substantially with
margins adversely affected because of the fixed annual
contracts for raw material supplies.
The TSE Group turnover for the period was Rs. 1,09,570
crore (US$ 21,539 mn) [2007-08: Rs. 1,00,218 crore (US$
19,701 mn)]. Average revenue per tonne increased for each
of the Group’s steel divisions by over 30%. Conversely,
deliveries reduced sharply by approximately 18%. However,
these overall movements indicated significant quarterly
variations, as at first the buoyant steel market saw prices
and volumes grow, followed by a market collapse in the
second half of the year.
The TSE Group’s operating profit for 2008-09 was Rs. 5,953
crore (US$ 1,170 mn) [2007-08: Rs. 6,041 crore (US$ 1,188
mn)]. The significant deterioration over the previous year
was due to a combination of the fall in deliveries and a
high level of net realisable value provisions against
inventories, as prices fell sharply. Within the year, a similar
pattern to the turnover of a buoyant first half followed by a
substantial deterioration in the second half was evident in
the result. The loss before tax of TSE amounted to Rs. 184
crore (US$ 36 mn) as against a profit of Rs. 9,187 crore (US$
1,806 mn) in the previous year.
TSE’s estimated UK market share in 2008-09 for main carbon
steel products was 50% (2007-08: 49%). It is estimated that
the other UK steel companies had a 4% market share, with
imports amounting to 46%.
NatSteel HoldingsThe Tata Steel Group’s Singapore operations consist of
an Electric Arc Furnace-based steel making and rolling
operations with a production capacity of about 750,000
tonnes per annum. During the financial year 2008-
09 Singapore sold about 956,000 tonnes of steel, 6%
more than the previous financial year, and achieved a
market share of about 58%. The downstream facilities in
Singapore sold over 4,75,000 tonnes in FY 09, 20% more
compared to the previous year. Among other operations
of the NatSteel Holdings, the Xiamen operations in China,
a 100% subsidiary of NatSteel, sold 426,000 tonnes of
rolled products during FY 09, 17% higher than the previous
year and the Australian operations of NatSteel sold
around 188,000 tonnes (12% higher than the previous
year) of steel in straight length rebars, mesh, cut & bend
and other accessories.
During the year, the Singapore operations focussed on
working capital management to ensure adequate liquidity
and also improved the operating parameters including
an improvement in yield and downstream tonnages with
an estimated benefit of S$14 million (US$ 9 million).
Tata Steel ThailandProduction during FY 09 at 1.07 million tonnes was lower
by 22%, while sales at 1.1 million tonnes were about 20%
lower than the previous year. The political instability
in Thailand and the economic downturn significantly
impacted the construction industry in Thailand. Tata Steel
Thailand took significant steps to readjust to the emerging
economic environment including writing down of higher
value inventory focussing on cost reduction in the Rolling
Process Scheme by optimising the roll consumption
cost and in Alloy Consumption at the steel shop and
re-engineering working capital management.
2090661-1 Tata Steel AR 2K8-9_2c101 1012090661-1 Tata Steel AR 2K8-9_2c101 101 7/18/09 1:28:58 AM7/18/09 1:28:58 AM

Hundred and second annual report 2008-09
102
ENDURING THE DOWNTURN
Every steel maker worldwide faced an unprecedented
decline in demand after October 2008 following the
global economic downturn. The Tata Steel Group made
a quick risk assessment of the consequential financial
impact and initiated programmes labelled ‘Weathering
the Storm’ and becoming ‘Fit for Future’, so as to remain
competitive in the future.
Indian & South East Asian operationsWhile India was not structurally impacted by the global
financial crisis, the Indian economy slowed down
considerably in the second half of the year. In order to
retain its competitive position, the Indian operations
initiated several cost reduction measures with targeted
savings of about Rs. 440 crore which was achieved during
the year. In line with the above, the output from the large
Blast Furnaces were increased and the production from
the smaller furnaces were scaled down to lower overall
costs. The Company also focussed on gaining market
share through increased volumes at competitive costs, a
better product mix with increased flat product volumes
and a reduction in maintenance costs. It also reduced
the cost of hot metal production by improving the
production of coke by 5% through better coke oven
utilisation, reduced cost at the sinter plant, reduced use
of refractories and reducing the power consumption at
the Blast Furnaces.
The Capital Expenditure plan was also reviewed to focus
only on those capital projects which had a higher Internal
Rate of Return (IRR). Based on the above review, the 2.9
million tonnes per annum (mtpa) Jamshedpur project
and the global raw material projects have been accorded
priority and would be completed as per plan.
Tata Steel’s South East Asian operations undertook various
steps for cash conservation and liquidity enhancement
such as the securitisation of receivables and reduction
in net working capital. It also undertook several initiatives
towards cost control and cost reduction by reducing the
maintenance cost of the plant, and reducing administrative,
employee and travel costs.
European Operations: Launch of the ‘Weathering the Storm’ ProgrammeWith a view to counter the adverse impact of the economic
downturn, the European operations undertook a very
significant initiative during the second half of the financial
year under the ‘Weathering the Storm’ programme.
Consequent to a lower volume of production, the focus
under this programme was to review and reduce costs in
manufacturing, material usage and employee related areas
including a one-off monetisation of hedges. During the six
month period of October 2008 to March 2009, the extent
of value from the “Weathering the Storm” initiative was
around £700 mn ($1 bn).
In January 2009, the restructuring of European assets
was accelerated through the launch of the ‘Fit for Future’
programme that focusses primarily on three areas:
divestments, asset restructuring and a company-wide
efficiency and overhead review.
TATA STEEL – CORUS INTEGRATION
During the year, considerable progress was made in
institutionalising an integrated approach in various
functional areas. In procurement, Lead Buyers have been
appointed for high value items. Joint sourcing has resulted
in renewed contracts with a savings of over $40 mn.
In manufacturing, knowledge exchange and synergy
identifi cation has been driven through Performance
Improvement Teams (PITs) in 15 diff erent areas. Recognising
that the economic downturn would aff ect realisation of volume
related synergies at Tata Steel Europe (TSE) sites, the PITs
redirected their eff orts to new cost related projects, the most
important being the use of low cost coal for coke production
and increased recycling of steel plant wastes. These initiatives
contributed signifi cantly to the realisation of $103 mn in
manufacturing synergy against a target of $113 mn.
The total synergy realised in FY 09 was $256 mn comprising
of manufacturing, procurement, corporate centre, and tax
savings. The Group target is to achieve a synergy of $450 mn
by March 2010.
With the outbound supply chain being strengthened at
TSE with information technology (IT) support provided
2090661-1 Tata Steel AR 2K8-9_2c102 1022090661-1 Tata Steel AR 2K8-9_2c102 102 7/18/09 1:28:58 AM7/18/09 1:28:58 AM

103
by Tata Steel India, IT teams of both entities are also
working together to create online visibility of operating
performance on a common platform.
During the course of the year, the Research, Development
& Technology (RD&T) function was integrated into one
function across the Tata Steel Group with a focus on ‘Thrust
Area Projects’ of long-term value to the Group.
CENTENARY YEAR OF JHARIA COALFIELDS
The Jharia Division of Tata Steel India celebrates a century
of sustainable mining in 2010. The division started its
operations in its Bhelatand ‘A’ collieries in 1910. The Jharia
coalfields, spread across 5,500 acres, have been fulfilling
the coal requirements of Tata Steel India. The Jharia division
has pioneered several technological innovations which
have revolutionised underground coal mining in India.
Coal mining and beneficiation at Jharia are a benchmark
in mining in India.
DIVIDEND
The Board, for the year ended 31st March, 2009, has
recommended Dividends as under:
(i) Rs. 2 per Convertible Cumulative Preference Shares
(CCPS) on 547,266,011 CCPS of Rs. 100 each. (2007-08
Re. 0.41 pro rata from the date of allotment i.e. 18th
January, 2008) on 547,251,605 CCPS of Rs. 100 each.
(ii) Rs. 16 per Ordinary Share on 730,592,471 Ordinary
Shares (2007-08 on 730,584,320 Ordinary Shares
@ Rs.16 per share).
The Dividends on CCPS and Ordinary Shares are subject
to the approvals of the shareholders at the Annual
General Meeting.
The total dividend payout works out to 29% (2007-08: 30%)
for the standalone company and on a consolidated basis is
30% (2007-08: 11%).
COMPULSORILY CONVERTIBLE CUMULATIVE PREFERENCE SHARES (CCPS)
Six CCPS of face value of Rs.100 each will be compulsorily
and automatically converted into one Ordinary Share of
Rs.10 each, at a premium of Rs. 590 on September 1, 2009
without any application or further action on the part of the
CCPS holders.
The Company will not issue any fractional certificates to
CCPS holders on its conversion to Ordinary Shares. All such
fractional entitlements to which the CCPS holders will be
entitled to on allotment of the Ordinary Shares, will be
consolidated and the Company will issue and allot Ordinary
Shares in lieu thereof to a authorised person, which would
be sold in the market within 15 days from the date of
allotment. The sale proceeds thereof will be distributed
proportionately to those persons who are entitled to
fractional entitlements.
The CCPS holders will be eligible, as on record date, to the
pro rata dividend from 1st April, 2009 to 31st August, 2009.
FINANCE
During FY 09, the Company restructured its overseas
investments into Tata Steel Global Holdings Pte Limited
(TSGH), domiciled in Singapore. The major subsidiaries of
TSGH include Tata Steel Europe (Corus), NatSteel Holdings,
Tata Steel Thailand and Tata Steel Global Minerals, which
includes all of Tata Steel’s major overseas raw material
ventures in Mozambique, Ivory Coast, Canada, Oman and
Australia. In early 2008, the unprecedented increase in the
prices of input costs, particularly raw materials, substantially
increased the working capital requirements in the overseas
businesses. In a complete reversal, a sharp decline in
steel demand and prices globally adversely impacted the
operating margins and cash flows in late 2008. Reduced
capacity utilisation in Europe put further pressures on
the operating margins. As a result, the Company focussed
on maintaining adequate liquidity to cope with these
challenges as well as for necessary capital expenditure
and on significant cost reduction programmes and asset
disposals. This allowed Tata Steel UK (TSUK) to comply with
conditions stipulated under the senior (acquisition) debt
up to March 2009. However, the reduction in profitability
would have made it increasingly difficult for the company
to comply with its financial covenants in the coming three
quarters. As a result, TSUK approached its lenders with
2090661-1 Tata Steel AR 2K8-9_2c103 1032090661-1 Tata Steel AR 2K8-9_2c103 103 7/18/09 1:28:58 AM7/18/09 1:28:58 AM

Hundred and second annual report 2008-09
104
an amendment and waiver proposal. This proposal did
not seek any new capital from the banks or any extended
repayment profile. TSUK would also continue to meet
interest and amortisation payments as they fall due.
As per the agreement reached with the banks, testing of
the facility’s earnings related covenants would largely
be suspended till March 2010 and would then resume
with significantly higher flexibility than in the case of
the original covenants. Furthermore, there would be
no increase in the current level of interest costs for the
remaining life of the loan. The revised covenant package
does not involve any additional finance from the lenders
or rescheduling of its debt-servicing commitments. As part
of these amendments, Tata Steel further infused GBP 200
mn in June 2009 and has committed to an additional GBP
225 mn by close of September 2009.
Tata Steel placed Non-Convertible Debentures totalling
upto Rs. 2,000 crore in May 2008 comprising of 3 series
having phased maturities. The Company further raised
a 2-year term loan of Rs. 2,000 crore in May 2008. In
November 2008, the Company raised Rs. 1,250 crore
through Non-Convertible Debentures privately placed
with the Life Insurance Corporation of India, repayable
in equal instalments at the end of the 6th, 7th and 8th
years. In April 2009, the Company further raised Rs. 2,000
crore from a term loan and in May 2009, it privately placed
Rs. 2,150 crore of Non-Convertible Debentures repayable
after 10 years. Thus the Company raised Rs. 9,400 crore
in a year marked by tight liquidity.
The Company hedged the foreign currency risk on
repayment of the major part of the USD 1.65 billion of
external commercial borrowings drawn in FY 07. The
foreign currency repayment risk on the Convertible
Alternative Reference Securities (CARS) remains
un-hedged, since they may be converted to underlying
securities in FY 12 and FY 13. The Company has also
selectively hedged a portion of the interest rate risk
on its US dollar loans.
The Company’s Credit Ratings have recently been revised
downwards by its Rating Agencies. In the fourth quarter of
FY 09, Moody’s and S&P have downgraded Tata Steel
to below investment grade (Ba2 and BB- respectively
with a negative outlook). Fitch lowered the Company’s
credit rating to BB+ (with a negative outlook). The
debt in the Company’s consolidated balance sheet has
increased considerably after the Corus acquisition. At
the same time, the downturn in global steel markets
has severely impacted the near term earnings of the
overseas operations of the Company. As on 31st March,
2009, the cash and cash equivalents in Tata Steel Limited
were Rs. 1,591 crore. The April 2009 Rs. 2,000 crore term
loan and the May 2009 private placement of Rs. 2,150
crore of Non-Convertible Debentures may be used by
the company for various purposes.
SUBSIDIARIES
Pursuant to the Accounting Standards AS-21 issued by
the Institute of Chartered Accountants of India, the
consolidated financial statements presented by the
Company includes financial information of its subsidiaries.
The Company has made an application to the Government
of India seeking exemption under Section 212(8) of the
Companies Act, 1956, from attaching the balance sheet,
profit and loss account and other documents of the
subsidiary companies to the balance sheet of the Company.
The Company will make available these documents/details
upon request by any member of the Company.
A list of the Company’s subsidiaries is given on page
numbers 218-227 of this Report.
EXPANSION PROJECTS
BROWNFIELD PROJECT
Brownfi eld Project of Tata Steel, Indian OperationsThe Company is in the process of increasing its crude
steel capacity to 10 mtpa at its Jamshedpur Works by the
year 2011. As part of this programme, the first phase
which entails reaching a crude steel capacity of 6.8 mtpa
has essentially been completed. Major facilities that
were commissioned during this phase included the
Sinter Plant No. 4, the ‘H’ Blast Furnace and the Continuous
Caster No. 3 at LD Shop-1.
2090661-1 Tata Steel AR 2K8-9_2c104 1042090661-1 Tata Steel AR 2K8-9_2c104 104 7/18/09 1:28:58 AM7/18/09 1:28:58 AM

105
Project work pertaining to taking the capacity from
6.8 million tonnes to 9.7 million tonnes is moving at a rapid
pace. This includes setting up a new ‘I’ Blast Furnace, a
Pellet Plant with a capacity of 6 mtpa, Thin Slab Casters and
Rolling Mill, two new Lime Kilns as well as augmentation
of the iron ore mines at Noamundi and Joda. Orders for
the supply of equipment have been placed. Site work
is in progress for most of the facilities. The Company
has committed an amount of Rs. 9,100 crore against the
approved project cost of Rs. 13,900 crore towards various
supplies and services pertaining to the project.
Simultaneously, the Company also has a few major capital
projects underway like the capacity augmentation of the
Hot Strip Mill, Coke Dry Quenching at Coke Ovens Batteries
5, 6 & 7 and setting up a new mill at Bara for producing Full
Hard Cold Rolled (FHCR) coils.
GREENFIELD PROJECTS
Kalinganagar Project Preliminary work on the 6 mtpa capacity greenfield steel
plant at Kalinganagar, Orissa focussing on land acquisition,
rehabilitation and resettlement work is in progress. In order
to enhance the employment opportunities of the people
in the area including the displaced families, the Company
is conducting skill development training programmes at
Kalinganagar to enable them to seek gainful employment.
As the Company has fulfilled its obligation of placing
the order for equipment and services stipulated in the
MOU signed with the Orissa state government, it is
seeking the grant of the mining lease for iron ore from
the Government.
Chhattisgarh & Jharkhand ProjectsThe Company has also signed MOUs for setting up
greenfield integrated steel plants with the State
Governments of Chhattisgarh and Jharkhand for
which the Company is pursuing with the respective
State Governments for the acquisition of land and
allotment of mining leases for iron ore and coal. The
Company has also applied for environment clearances
and other licenses.
OTHER PROJECTS
Hooghly Met Coke and Power Company Ltd. (HMPCL)Incorporated in 2005, Hooghly Met Coke and Power
Company Ltd. (HMCPCL) is a 100% subsidiary of Tata Steel.
The company was set up to produce low ash metallurgical
coke by adopting the heat recovery route, for Tata Steel’s
requirements at its Jamshedpur plant and also to supply hot
gases to Tata Power for electricity generation by adopting
heat recovery route. The plant is located in Haldia, West
Bengal, on the banks of river Hooghly. Close proximity to the
Haldia Dock Complex off ers several advantages, including
the import of coking coal in a more cost eff ective manner.
The company currently has a production capacity of
1.2 mtpa of coke and its capacity is likely to be increased to
1.6 mtpa in 2009.
Tata BlueScope Steel LimitedTata BlueScope Steel Limited (TBSL) is an equal stake joint
venture between Tata Steel and BlueScope Steel Australia
in the field of coated steel, steel building solutions
and related building products. The company operates
in the South Asian Association for Regional Cooperation
(SAARC) region.
TBSL has two business divisions, the Buildings Division
which is further divided into Building Solutions and
Building Products and Distribution and the Coated Steel
Division. This division has set up three manufacturing
facilities one each at Pune, Chennai and Bhiwadi. TBSL
executes building solutions projects under the Brand name
of BUTLER™, Durashine™, PEBLite™, SMARTBUILD®, and
SMARTRUSS®. Building Solutions division was awarded the
Best Pre-Engineered Building project trophy on a national
level at the Infrastructure Excellence Awards.
All the three manufacturing facilities of downstream
business at Hinjewadi, Bhiwadi and Chennai are now
certified for QMS (ISO 9001), EMS (ISI14001) & OHSAS
(ISO 18001). The manufacturing facility for Coated Steel
is under construction at Jamshedpur and is expected to
be completed by March 2010. The Metal Coating line will
manufacture ZINCALUME® brand and the Color Coated line
will manufacture COLORBOND® brand.”
2090661-1 Tata Steel AR 2K8-9_2c105 1052090661-1 Tata Steel AR 2K8-9_2c105 105 7/18/09 1:28:59 AM7/18/09 1:28:59 AM

Hundred and second annual report 2008-09
106
The project to set up a Coated Steel manufacturing facility at
Jamshedpur is well in progress and will be operational in the
fi rst quarter of 2010. This Joint Venture (JV) is a step in the
direction of value addition to Tata Steel’s hot rolled coil and
off ering the Indian consumer a world class product.
Dhamra Port Company LimitedTata Steel and Larsen & Toubro Limited have formed a
50:50 joint venture for the development of a deep water
port in Dhamra, Orissa. The project is being developed
on a “Build, Own, Operate, Share and Transfer” (BOOST)
basis, under a concession awarded by the Government of
Orissa. The project will provide Tata Steel a competitive
advantage in the logistics chain given the ongoing
expansion and greenfield projects which will lead to an
increased volume of imported raw material. The project
is located on the eastern coast of India approximately
225 km southwest of Kolkata by sea route and is 205 km
from Bhubaneswar by road.
Acquisition proceedings for a private land for the railway
corridor have been largely completed in respect of a total
of 2,033 acres and the construction of the port is more
than 50% complete. The port is expected to be operational
by April 2010.
Having received necessary environmental clearances,
the port is taking a number of safeguards and
measures under the direct advice and supervision of the
International Union for Conservation of Nature (IUCN),
the world’s premier scientific body in environment and
wildlife, to ensure that the construction and operation
of the port does not pose any threat to the ecology
of the area.
Tata NYK Shipping Pte LimitedTata NYK Shipping Pte Limited is a Singapore based
50:50 joint venture between Tata Steel and Nippon
Yusen Kabushiki Kaisha (NYK Line), a Japanese shipping
major. The joint venture was set up to cater to the ship
bulk cargo such as coal, iron ore and steel arriving in and
departing from Indian shores. The shipping firm would
cater to the needs of the Tata Steel Group for moving
raw materials and finished steel. In future, Tata Steel
would require to transport large quantities of raw
materials and finished steel, which would necessitate
strategic control over logistics and this joint venture is
a step in that direction. Progressing towards the goal
of achieving logistics control, Tata NYK has entered into
a long-term charter for 8 Supramax/Panamax vessels
and orders have been placed for building two new
Supramax vessels. As part of its long term strategy, the
Company plans to enter into a long term charter for
capesize vessels in 2009.
The Company has handled a total of 4.48 million tonnes
of cargo during the year ended 31st March, 2009, which
included 1.98 million tonnes of cargo for the Tata Group.
The global financial crisis has severely affected the
shipping industry with the Baltic Dry Index (BDI) hitting
a 20 year low after reaching a peak of more than 12000
in May 2008. Increase in demand for steel related raw
materials is critical for improving the BDI.
Tata Steel (KZN) (Pty) Ltd.Tata Steel KZN (TSKZN) is a South Africa-based subsidiary
of Tata Steel that is in the business of producing high
carbon ferrochrome and charge chrome. The plant, located
at Richards Bay on the KwaZulu-Natal coast of South Africa
was commissioned in 2008 with an annual production
capacity of 1,51,000 tonnes. The briquette technology
being used by the company is new to South Africa and is
environmental friendly compared to the other competing
technologies of agglomeration.
The ferro-chrome used in the manufacture of stainless
steel will be exported to Tata Steel’s customers in Asia,
Europe, the US and elsewhere. TSKZN commenced
commercial production on 1st July, 2008 and is one of
the most environment compliant plants globally. It has
a fully covered storage area for all fine raw materials,
a wet gas scrubbing system (with 100% redundancy)
linked with a closed furnace. This plant set new
standards in environment management. In its first year
of operations, TSKZN achieved a production of 63,479
mt of saleable grade charge chrome during the financial
year 31st March, 2009.
2090661-1 Tata Steel AR 2K8-9_2c106 1062090661-1 Tata Steel AR 2K8-9_2c106 106 7/18/09 1:28:59 AM7/18/09 1:28:59 AM

107
RAW MATERIAL SECURITY
Over the years, the Tata Steel Group’s growth and
globalisation strategy has been built upon a balanced
focus on every node of the value chain – from raw
material security to steel making to value added products
to control over logistics. During 2008-09 the focus was
not only on tapping new raw material opportunities
but was also on consolidation of existing ventures. As a
further step towards increasing its iron ore security for
the European operations, two new iron ore projects were
identified - one in Canada and the another in South Africa.
Tata Steel also increased its equity stake in the Riversdale
Mining Limited, Australia, which is currently progressing
with its coking coal project in Mozambique. Another
milestone was achieved when the Company’s ferro-chrome
venture in South Africa became operational during
the financial year. With the signing of a definitive
agreement for a steel project in Vietnam, Tata Steel
took a significant step towards increasing its footprint
in South East Asia. The Company continues to look for
suitable downstream projects in geographies of interest,
in order to add value to its steel.
The Tata Steel Group is currently self-sufficient to the
extent of 25% for its iron ore requirements. With iron
ore becoming available from its overseas mines at New
Millennium Corporation in Canada and potentially from
the Ivory Coast over a longer term, the iron ore security
would gradually increase to around 62% by 2015. Iron ore
from these mines will be primarily supplied to Tata Steel’s
European Operations.
Overall raw material security would reach approximately
50% by 2015 increasing to around 60% by 2018 from its
current level of 25%. For this purpose, the Company would
be required to make substantial investment in a phased
manner to secure the raw material from its overseas mines.
The Company is also evaluating several other mineral
projects in Brazil and Australia.
The status of various ongoing raw material projects is
as follows:
Coal ProjectsCoking Coal Project in Mozambique (Riversdale)
Tata Steel has formed a Joint Venture (JV) with Riversdale
Mining Limited, Australia for a 35% stake in two coal
tenements in Mozambique - Benga and Tete including
offtake rights to 40% of the coking coal produced from
these mines. The JV owns 24,960 hectares of coal tenements
out of which the Benga license near Tete covers an area
of 4,560 hectares. As per the press release of Riversdale,
inferred resource in the Benga licence area is currently
estimated at 4 billion tonnes compared to 1.2 billion tonnes
estimated at the time of signing of definitive agreements.
There is a potential for the resource base going up further.
The government of Mozambique has approved the mining
contract for the tenements which represents a significant
step towards commencement of the Benga coal project.
The feasibility study for the project is in progress. The
production from the Benga mine is expected to commence
in 2017. Tata Steel plans to supply hard coking coal from this
project to its facilities in Europe and also for the Company’s
enhanced requirements in India in the future.
Tata Steel also holds a 14.99% equity stake in the parent
company, Riversdale Mining Limited.
Coal Mining Project in Australia (CDJV)
Tata Steel has a strategic interest of 5% in the coal mining
project in Australia in partnership with Vale, Nippon
Steel, JFE and POSCO with 20% off-take rights. The Joint
Venture was formed for the development of a greenfield
underground coal project in Bowen Basin, Queensland.
The first raw coal production started in August 2006 and
the mine is currently producing around 1 mtpa. During the
year, the JV company had undertaken the second phase
of expansion. On completion of the second phase, it is
expected to produce 3.7 mtpa of coking coal and PCI coal.
Joint Venture with SAIL for coking coal properties
SAIL and Tata Steel formed a 50:50 Joint Venture company,
S&T Mining Co. in September, 2008 with its registered
office in Kolkata. The company has been working towards
acquiring the coal blocks as per the recommendations of
the joint working group of SAIL and Tata Steel and has
identified some coal blocks for acquisition.
2090661-1 Tata Steel AR 2K8-9_2c107 1072090661-1 Tata Steel AR 2K8-9_2c107 107 7/18/09 1:28:59 AM7/18/09 1:28:59 AM

Hundred and second annual report 2008-09
108
S&T Mining is also participating in tenders that are floated
by PSUs who have been allotted coal blocks by the
Government and who are looking for JV partners for mining
and selling the coal. The JV company intends to leverage
the mining strengths of both SAIL and Tata Steel in order
to acquire coal mines to fulfill the increased requirements
of its promoters.
Iron Ore ProjectsIron Ore Project in Canada (New Millennium Capital Corp.)
In September 2008, Tata Steel through its subsidiaries had
signed a Heads of Agreement memorandum with New
Millennium Capital Corporation (NML), a Canadian listed
mining company aiming to develop iron ore projects in
Northern Quebec, Labrador and Newfoundland provinces.
Tata Steel holds a 19.9% stake in NML with an option to
acquire an 80% equity interest in NML’s Direct Shipping
Ore project (DSO Project) located in the Province of
Newfoundland and Labrador (NL) and the Province of
Quebec (QC). The agreement provides exclusivity to
Tata Steel with respect to both the DSO Project and
the LabMag taconite iron ore property located in NL,
with an 80:20 ownership by NML and Naskapi Nation of
Kawawachikamach respectively.
The DSO resource is estimated to be approximately a
100 million tonnes. The feasibility study for the DSO Project is
progressing and the production is expected to commence in
2011. Tata Steel will have 100% off take rights to the produce
of the mine. The iron ore from this project will be supplied to
Tata Steel Group’s facilities located in Europe.
The LabMag deposit consists of 3.5 billion tonnes of
proven and probable mineral reserves. These reserves are
contained in the 4.6 billion tonnes of measured and indicated
resources and 1.2 billion tonnes of inferred resources. Tata
Steel is jointly working with NML to fi nd an economically
viable solution to advance the LabMag Project.
Limestone ProjectsLimestone Project in Oman
Limestone is a key raw material for producing quality
steel. Tata Steel has so far been sourcing limestone from
central India, Thailand and the Middle Eastern countries
for its Indian operations. In order to reduce dependence
on purchased limestone, Tata Steel signed a Joint Venture
(JV) agreement with Al Bahja Group, Oman for a 70% stake
in the JV. The project envisages mining in limestone in the
Uyun region, believed to be rich in limestone deposits and
is located in the Salalah province of Oman. Exploration and
feasibility studies are in progress.
HEALTH AND SAFETY
The Tata Steel Group is committed to ensuring the health
and safety of its employees, its plants and its surrounding
communities at all its operation sites. The Group constantly
endeavours to provide safe and hygienic working conditions
for its employees as well as its contract workers. It takes an
integrated and systematic approach to managing health
and safety, which is encompassed in the Tata Steel Safety
Programme and the Corus Health and Safety Management
System with a successful delivery reliant on employee
engagement and felt leadership. Both the programmes
have been developed with the support and expertise of
DuPont consultants.
Since 2005, with the help of the DuPont Safety Resources
organisation, a quantum jump has been achieved in
the safety culture of the organisation through the
implementation of the ‘behavioural safety model’. Potentially
fatal situations have been rectified with a focussed ‘Fatality
Risk Control Programme’ (FRCP). Pursuing this initiative will
help the Company realise its goal of becoming a fatality
free organisation in the near future.
For the sustainability of its operations, the “Process
Safety & Risk Management” (PSRM) programme has been
started for the high hazard operations and processes, in
order to ensure freedom from a high consequence, low
frequency process incidents. PSRM will be implemented in
all facilities by FY 12.
Tata Steel is also extending support to the community
for improving their safety standards with the help of
the Safety Awareness For Everyone (SAFE) organisation.
School children are being given special training on road &
2090661-1 Tata Steel AR 2K8-9_2c108 1082090661-1 Tata Steel AR 2K8-9_2c108 108 7/18/09 1:28:59 AM7/18/09 1:28:59 AM

109
behaviour safety. A safety curriculum has been introduced
in the schools in Jamshedpur to generate an awakening
within the community.
With these initiatives, the Company has been able to reduce
the Lost Time Injury Frequency Rate (LTIFR), an accepted
measure of safety performance worldwide, to 0.80 for FY’09
from 1.70 in FY’08 and is confident of achieving its target of
0.40 LTIFR by 2012.
ENVIRONMENT
Climate change is one of the most important issues facing
the world today. The steel industry is a signifi cant contributor
to man-made greenhouse gas emissions as the manufacture
of steel unavoidably produces carbon dioxide (CO2). Tata
Steel along with its subsidiaries and associate companies
believe that respect for the environment is critical to the
success of its business. It is committed to minimising
the environmental impact of its operations and its
products through the adoption of sustainable practices and
continuous improvements in environmental performance.
The Tata Steel Group has set itself a target for reduction in
CO2 emission level to 1.5 tonnes of CO2 per ton of liquid
steel for its Indian operations by 2015 against the present
level of 2.1 tonnes/tls. Several energy efficiency measures
have been taken to reduce CO2 emission during the year
including a detailed carbon footprint exercise. A notable
achievement was the registration of the ‘G’ Blast Furnace
Top Pressure Recovery Turbine project of Jamshedpur unit
at UNFCCC as a CDM project.
Tata Steel’s European operations have taken several steps
to reduce its total energy consumption. It has signed a
voluntary agreement with the Dutch government for
achieving an energy efficiency improvement of 2% per
annum. In the UK, an agreement has been reached with
the Government to reduce energy consumption by 15.8%
by 2010 as compared to the 1997 levels. The Group is
making an investment of approximately £ 60 million in
energy management technology at its Port Talbot site
to enable the plant reduce its CO2 emission from the
current year’s level.
DIRECTORS
Mr. Kirby Adams and Mr. H. M. Nerurkar were appointed
additional Directors on the Board of the Company with
effect from 9th April, 2009.
Mr. Kirby Adams has been appointed as the CEO of Tata Steel
Europe Limited, a wholly owned indirect subsidiary of the
Company. He would oversee the operations of Tata Steel in
Europe. In addition, he would also be responsible for the
Global Raw Material pursuits of Tata Steel. Mr. Adams was
formerly the Chief Executive of BlueScope Steel, Australia.
Mr. H. M. Nerurkar was the Chief Operating Officer of the
Company prior to his appointment as Executive Director,
India and South East Asia. He would be responsible for the
Indian and South East Asian operations of the Company.
He joined the Company in 1972 and has held various posts
since then. He is also on the Board of some of the Tata Steel
Group companies.
The Directors believe that the appointments of the above
mentioned directors on the Board of the Company would
bring in a rich and varied experience that would enable it
to manage a business of this size and complexity.
Dr. T. Mukherjee stepped down from the Board of the
Company effective 31st March, 2009. The Board records its
appreciation of the contribution made by Dr. Mukherjee
during his tenure as a director of the Company.
Mr. Philippe Varin, on taking charge as Chairman
of the Management Board of PSA Peugeot Citroen,
France, stepped down from the Board of the Company
effective 27th May, 2009. The Board records its appreciation
of the contribution made by Mr. Varin during his tenure
with the Company.
Dr. J. J. Irani received the coveted Life Time Achievement
Award from the Government of India in acknowledgement
of his services and the outstanding contributions made by
him in the area of metallurgy.
In accordance with the provisions of the Companies
Act, 1956, and the Company’s Articles of Association,
Mr. R. N. Tata, Mr. Nusli N. Wadia, Mr. Subodh Bhargava and
2090661-1 Tata Steel AR 2K8-9_2c109 1092090661-1 Tata Steel AR 2K8-9_2c109 109 7/18/09 1:28:59 AM7/18/09 1:28:59 AM

Hundred and second annual report 2008-09
110
Mr. Jacobus Schraven retire by rotation and are eligible for
re-appointment.
ENERGY, TECHNOLOGY AND FOREIGN EXCHANGE
Details of energy conservation and research and
development activities undertaken by the Company along
with the information in accordance with the provisions of
Section 217(1)(e) of the Companies Act, 1956, read with the
Companies (Disclosure of Particulars in the Report of Board
of Directors) Rules, 1988, are given in Annexure ‘A’ to the
Directors’ Report.
PARTICULARS OF EMPLOYEES
Information in accordance with the provisions of Section
217(2A) of the Companies Act, 1956, read with the
Companies (Particulars of Employees) Rules, 1975, as
amended, regarding employees is given in Annexure ‘B’ to
the Directors’ Report.
CORPORATE GOVERNANCE
Pursuant to Clause 49 of the Listing Agreements with the
Stock Exchanges, a Management Discussion and Analysis,
Corporate Governance Report, Managing Director’s and
Auditors’ Certificate regarding compliance of conditions
of Corporate Governance are made a part of the Annual
Report. A note on the Company’s corporate sustainability
initiatives is also included.
DIRECTORS’ RESPONSIBILITY STATEMENT
Pursuant to Section 217(2AA) of the Companies Act, 1956,
the Directors, based on the representations received from
the Operating Management, confirm that –
1. in the preparation of the annual accounts, the applicable
accounting standards have been followed and that
there are no material departures;
2. they have, in the selection of the Accounting Policies,
consulted the Statutory Auditors and have applied them
consistently and made judgements and estimates that
are reasonable and prudent so as to give a true and fair
view of the state of affairs of the Company at the end of
the financial year and of the profit of the Company for
that period;
3. they have taken proper and sufficient care to the best
of their knowledge and ability for the maintenance of
adequate accounting records in accordance with the
provisions of the Companies Act, 1956, for safeguarding
the assets of the Company and for preventing and
detecting fraud and other irregularities;
4. they have prepared the annual accounts on a going
concern basis.
On behalf of the Board of Directors
RATAN N. TATAMumbai, 25th June, 2009 Chairman
2090661-1 Tata Steel AR 2K8-9_2c110 1102090661-1 Tata Steel AR 2K8-9_2c110 110 7/18/09 1:28:59 AM7/18/09 1:28:59 AM

111
Declaration Regarding Compliance By Board Members And Senior Management Personnel With The Code Of ConductThis is to confi rm that the Company has adopted the Tata Code of Conduct for its employees including the Managing Director and
hole-time Directors. In addition, the Company has adopted the Tata Code of Conduct for Non Executive Directors. Both these
Codes are posted on the Company’s website.
I confi rm that the Company has in respect of the fi nancial year ended March 31, 2009, received from the senior management team
of the Company and the Members of the Board a declaration of compliance with the Code of Conduct as applicable to them.
For the purpose of this declaration, the Senior Management Team means Members of the Management one level below Executive
Directors as on March 31, 2009.
B. MUTHURAMAN
Mumbai, 25th June 2009 Managing Director
2090661-1 Tata Steel AR 2K8-9_2c111 1112090661-1 Tata Steel AR 2K8-9_2c111 111 7/18/09 1:29:00 AM7/18/09 1:29:00 AM
w

Hundred and second annual report 2008-09
112
Annexure 'A' to Directors’ Report
Particulars Required Under the Companies (Disclosure of Particulars in the Report of the Board of Directors) Rules, 1988
A. Conservation of Energy
a. Energy Conservation measures taken :
i. Installation and commissioning of Top Recovery Turbine in 'H' Blast Furnace to generate electrical energy.
ii. Application of fuel catalyst in Loco’s to reduce HSD consumption.
iii. Injection of Propane in C.O. Gas for better CV control of Mixed Gas, thereby increasing the productivity of furnace &
energy saving.
b. Additional investments and proposal for reduction of consumption of energy :
i. Installation and commissioning of Power House #6 on By-Product gases as a fuel, for 100% utilisation of By-Product
gases.
ii. Installation and commissioning of Top Recovery Turbine at ‘G’ Blast Furnace.
iii. Upgradation of L.D. Gas export system to enhance L.D. Gas recovery.
iv. Recovery of sensible heat of coke by installation of Coke Dry Quenching system in Batteries 5, 6, 7, 8 & 9 at Coke
Plant.
v. B.F. Gas fi red re-heating furnace at Hot Strip Mill.
vi. Shut down of old & ineffi cient Blast Furnaces.
c. Impact of the above measures :
Energy Conservation measures during 2008-2009 has resulted in achieving :
i. Lowest ever Plant Specifi c Energy Consumption i.e. 6.587 Gcal/tcs.
ii. Lowest ever boiler coal consumption i.e. 24.84 kg/tss.
iii. Higher LD Gas Recovery i.e. 38,595 Nm3/hr.
iv. Higher combine boiler effi ciency i.e. 84.76%.
2090661-1 Tata Steel AR 2K8-9_2c112 1122090661-1 Tata Steel AR 2K8-9_2c112 112 7/18/09 5:17:57 PM7/18/09 5:17:57 PM

113
Form - AForm for disclosure of particulars with respect to Conservation of Energy : 2007-2008 Particulars 2008-2009 2007-2008A. POWER AND FUEL CONSUMPTION 1. ELECTRICITY (a) Purchased Units (M. KWH) 2,194.54 2,031.07 Total Amount (Rs. Lakhs) # 63,605.96 55,934.67 Average Rate/Unit (Rs. /KWH) 2.90 2.75 (b) Own Generation (i) Through Diesel Generator Units (M. KWH) 12.48 14.05 Units per litre of Diesel Oil (KWH) 3.91 3.91 Average Cost/Unit (Rs. /KWH) 15.91 12.27 (ii) Through Steam Turbine/Generator Units (M. KWH) 1,069.45 996.85 Units per tonne of Coal (KWH) 6,638 4,294 Average Cost/Unit (Rs. /KWH) 2.05 1.88 (* This includes generation of PH4 in M. KWH * 359.59 325.52 which is operated on by-product gases upto 95%) 2. COAL (i) Coking Coal & Cookeries Quantity (Million Tonnes) 4.75 3.37 Total cost (Rs. Lakhs) 2,87,419.20 98,770.88 Average Rate (Rs. /Tonne) 6,055.07 2,929.54 (ii) Blast Furnace Injection Coal Quantity (Million Tonnes) 0.52 0.39 Total cost (Rs. Lakhs) 35,974.50 15,946.06 Average Rate (Rs. /Tonne) 6,884.06 4,122.84 (iii) Middling Coal and ROM Quantity (Million Tonnes) 0.14 0.20 Total cost (Rs. Lakhs) 1,509.39 1,892.64 Average Rate (Rs. /Tonne) 1,107.85 942.33 3. FURNACE OIL Quantity (Kilo litres) 12,520.19 12,701.73 Total Amount (Rs. Lakhs) 3,020.91 2,300.14 Average Rate (Rs. /KL) 24,128.28 18,108.91 4. OTHERS L.D.O. Quantity (Kilo litres) 6,221.55 7,920.11 Total cost (Rs. Lakhs) 2,394.17 2,294.54 Average Rate (Rs. /KL) 38,481.86 28,971.05 5. OTHERS L.P.G. Quantity (Tonnes) 3,837.75 4,292.69 Total cost (Rs. Lakhs) 1,611.53 1,512.48 Average Rate (Rs. /Tonnes) 41,991.53 35,233.88 6. OTHERS NG Quantity (Tonnes) 2,204.84 2,217.40 Total cost (Rs. Lakhs) 240.77 242.14 Average Rate (Rs. /Tonnes) 10,920.07 10,920.00
# Excludes electricity duty paid on purchases.Form for disclosure of particulars with respect to Conservation of Energy : 2007-2008B. CONSUMPTION PER UNIT OF PRODUCTION Particulars Steel Tubes Bearings F.A.M.D. Growth Shop CRC West Wire Div. (per tonne) (per tonne) (per no.) (per tonne) (per tonne) (per tonne) (per tonne)
Electricity (KWH) 431.91 114.00 0.66 3704.34 463.87 137.51 214.94 412.06 108.00 0.76 3556.70 528.98 133.11 229.06 Furnace Oil (Litres) — 16.94 7.41 24.76 — 21.99 7.03 21.99 Coking Coal (Tonnes) 0.66 0.66 Others : Light Diesel Oil (Litres) 0.83 1.30 — 6.90 1.21 1.21 — 7.82 High Speed Diesel Oil (Litres)
L.P.G. (kg) 12.92 10.39 13.25 10.08 NG (kg) 26.77 23.21
2090661-1 Tata Steel AR 2K8-9_2c113 1132090661-1 Tata Steel AR 2K8-9_2c113 113 7/18/09 9:57:28 PM7/18/09 9:57:28 PM
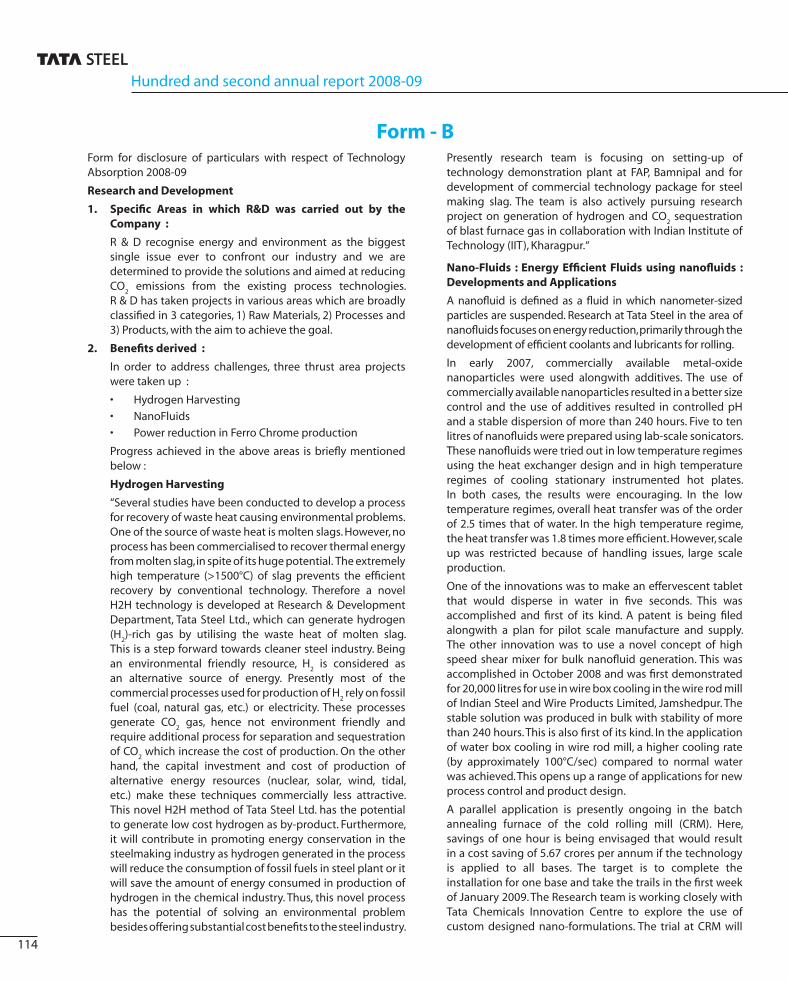
Hundred and second annual report 2008-09
114
Form - BForm for disclosure of particulars with respect of Technology Absorption 2008-09
Research and Development
1. Specifi c Areas in which R&D was carried out by the Company :
R & D recognise energy and environment as the biggest single issue ever to confront our industry and we are determined to provide the solutions and aimed at reducing CO
2 emissions from the existing process technologies.
R & D has taken projects in various areas which are broadly classifi ed in 3 categories, 1) Raw Materials, 2) Processes and 3) Products, with the aim to achieve the goal.
2. Benefi ts derived :
In order to address challenges, three thrust area projects were taken up :
• Hydrogen Harvesting
• NanoFluids
• Power reduction in Ferro Chrome production
Progress achieved in the above areas is briefl y mentioned below :
Hydrogen Harvesting
“Several studies have been conducted to develop a process for recovery of waste heat causing environmental problems.One of the source of waste heat is molten slags. However, no process has been commercialised to recover thermal energy from molten slag, in spite of its huge potential. The extremely high temperature (>1500°C) of slag prevents the effi cient recovery by conventional technology. Therefore a novel H2H technology is developed at Research & Development Department, Tata Steel Ltd., which can generate hydrogen (H
2)-rich gas by utilising the waste heat of molten slag.
This is a step forward towards cleaner steel industry. Being an environmental friendly resource, H
2 is considered as
an alternative source of energy. Presently most of the commercial processes used for production of H
2 rely on fossil
fuel (coal, natural gas, etc.) or electricity. These processes generate CO
2 gas, hence not environment friendly and
require additional process for separation and sequestration of CO
2 which increase the cost of production. On the other
hand, the capital investment and cost of production of alternative energy resources (nuclear, solar, wind, tidal, etc.) make these techniques commercially less attractive.This novel H2H method of Tata Steel Ltd. has the potential to generate low cost hydrogen as by-product. Furthermore, it will contribute in promoting energy conservation in the steelmaking industry as hydrogen generated in the process will reduce the consumption of fossil fuels in steel plant or it will save the amount of energy consumed in production of hydrogen in the chemical industry. Thus, this novel process has the potential of solving an environmental problem besides offering substantial cost benefi ts to the steel industry.
Presently research team is focusing on setting-up of technology demonstration plant at FAP, Bamnipal and for development of commercial technology package for steel making slag. The team is also actively pursuing research project on generation of hydrogen and CO
2 sequestration
of blast furnace gas in collaboration with Indian Institute of Technology (IIT), Kharagpur.“
Nano-Fluids : Energy Effi cient Fluids using nanofl uids : Developments and Applications
A nanofl uid is defi ned as a fl uid in which nanometer-sized particles are suspended. Research at Tata Steel in the area of nanofl uids focuses on energy reduction, primarily through the development of effi cient coolants and lubricants for rolling.
In early 2007, commercially available metal-oxide nanoparticles were used alongwith additives. The use of commercially available nanoparticles resulted in a better size control and the use of additives resulted in controlled pH and a stable dispersion of more than 240 hours. Five to ten litres of nanofl uids were prepared using lab-scale sonicators. These nanofl uids were tried out in low temperature regimes using the heat exchanger design and in high temperature regimes of cooling stationary instrumented hot plates. In both cases, the results were encouraging. In the low temperature regimes, overall heat transfer was of the order of 2.5 times that of water. In the high temperature regime, the heat transfer was 1.8 times more effi cient. However, scale up was restricted because of handling issues, large scale production.
One of the innovations was to make an effervescent tablet that would disperse in water in fi ve seconds. This was accomplished and fi rst of its kind. A patent is being fi led alongwith a plan for pilot scale manufacture and supply. The other innovation was to use a novel concept of high speed shear mixer for bulk nanofl uid generation. This was accomplished in October 2008 and was fi rst demonstrated for 20,000 litres for use in wire box cooling in the wire rod mill of Indian Steel and Wire Products Limited, Jamshedpur. The stable solution was produced in bulk with stability of more than 240 hours. This is also fi rst of its kind. In the application of water box cooling in wire rod mill, a higher cooling rate (by approximately 100°C/sec) compared to normal water was achieved. This opens up a range of applications for new process control and product design.
A parallel application is presently ongoing in the batch annealing furnace of the cold rolling mill (CRM). Here, savings of one hour is being envisaged that would result in a cost saving of 5.67 crores per annum if the technology is applied to all bases. The target is to complete the installation for one base and take the trails in the fi rst week of January 2009. The Research team is working closely with Tata Chemicals Innovation Centre to explore the use of custom designed nano-formulations. The trial at CRM will
2090661-1 Tata Steel AR 2K8-9_2c114 1142090661-1 Tata Steel AR 2K8-9_2c114 114 7/18/09 9:57:29 PM7/18/09 9:57:29 PM
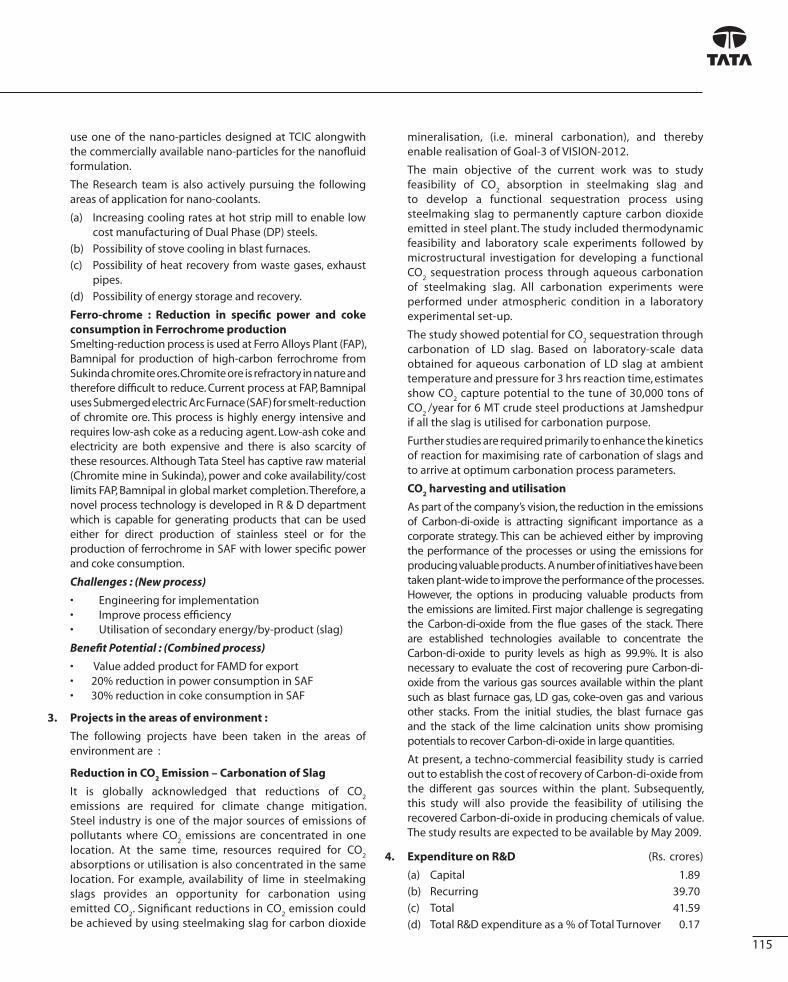
115
use one of the nano-particles designed at TCIC alongwith the commercially available nano-particles for the nanofl uid formulation.
The Research team is also actively pursuing the following areas of application for nano-coolants.
(a) Increasing cooling rates at hot strip mill to enable low cost manufacturing of Dual Phase (DP) steels.
(b) Possibility of stove cooling in blast furnaces.
(c) Possibility of heat recovery from waste gases, exhaust pipes.
(d) Possibility of energy storage and recovery.
Ferro-chrome : Reduction in specifi c power and coke consumption in Ferrochrome production
Smelting-reduction process is used at Ferro Alloys Plant (FAP), Bamnipal for production of high-carbon ferrochrome from Sukinda chromite ores. Chromite ore is refractory in nature and therefore diffi cult to reduce. Current process at FAP, Bamnipal uses Submerged electric Arc Furnace (SAF) for smelt-reduction of chromite ore. This process is highly energy intensive and requires low-ash coke as a reducing agent. Low-ash coke and electricity are both expensive and there is also scarcity of these resources. Although Tata Steel has captive raw material (Chromite mine in Sukinda), power and coke availability/cost limits FAP, Bamnipal in global market completion. Therefore, a novel process technology is developed in R & D department which is capable for generating products that can be used either for direct production of stainless steel or for the production of ferrochrome in SAF with lower specifi c power and coke consumption.
Challenges : (New process)
• Engineering for implementation • Improve process effi ciency • Utilisation of secondary energy/by-product (slag)
Benefi t Potential : (Combined process)
• Value added product for FAMD for export • 20% reduction in power consumption in SAF • 30% reduction in coke consumption in SAF
3. Projects in the areas of environment :
The following projects have been taken in the areas of environment are :
Reduction in CO2 Emission – Carbonation of Slag
It is globally acknowledged that reductions of CO2
emissions are required for climate change mitigation. Steel industry is one of the major sources of emissions of pollutants where CO
2 emissions are concentrated in one
location. At the same time, resources required for CO2
absorptions or utilisation is also concentrated in the same location. For example, availability of lime in steelmaking slags provides an opportunity for carbonation using emitted CO
2. Signifi cant reductions in CO
2 emission could
be achieved by using steelmaking slag for carbon dioxide
mineralisation, (i.e. mineral carbonation), and thereby enable realisation of Goal-3 of VISION-2012.
The main objective of the current work was to study feasibility of CO
2 absorption in steelmaking slag and
to develop a functional sequestration process using steelmaking slag to permanently capture carbon dioxide emitted in steel plant. The study included thermodynamic feasibility and laboratory scale experiments followed by microstructural investigation for developing a functional CO
2 sequestration process through aqueous carbonation
of steelmaking slag. All carbonation experiments were performed under atmospheric condition in a laboratory experimental set-up.
The study showed potential for CO2 sequestration through
carbonation of LD slag. Based on laboratory-scale data obtained for aqueous carbonation of LD slag at ambient temperature and pressure for 3 hrs reaction time, estimates show CO
2 capture potential to the tune of 30,000 tons of
CO2
/year for 6 MT crude steel productions at Jamshedpur if all the slag is utilised for carbonation purpose.
Further studies are required primarily to enhance the kinetics of reaction for maximising rate of carbonation of slags and to arrive at optimum carbonation process parameters.
CO2 harvesting and utilisation
As part of the company’s vision, the reduction in the emissions of Carbon-di-oxide is attracting signifi cant importance as a corporate strategy. This can be achieved either by improving the performance of the processes or using the emissions for producing valuable products. A number of initiatives have been taken plant-wide to improve the performance of the processes. However, the options in producing valuable products from the emissions are limited. First major challenge is segregating the Carbon-di-oxide from the fl ue gases of the stack. There are established technologies available to concentrate the Carbon-di-oxide to purity levels as high as 99.9%. It is also necessary to evaluate the cost of recovering pure Carbon-di-oxide from the various gas sources available within the plant such as blast furnace gas, LD gas, coke-oven gas and various other stacks. From the initial studies, the blast furnace gas and the stack of the lime calcination units show promising potentials to recover Carbon-di-oxide in large quantities.
At present, a techno-commercial feasibility study is carried out to establish the cost of recovery of Carbon-di-oxide from the different gas sources within the plant. Subsequently, this study will also provide the feasibility of utilising the recovered Carbon-di-oxide in producing chemicals of value. The study results are expected to be available by May 2009.
4. Expenditure on R&D (Rs. crores)
(a) Capital 1.89
(b) Recurring 39.70
(c) Total 41.59
(d) Total R&D expenditure as a % of Total Turnover 0.17
2090661-1 Tata Steel AR 2K8-9_2c115 1152090661-1 Tata Steel AR 2K8-9_2c115 115 7/18/09 9:57:29 PM7/18/09 9:57:29 PM

Hundred and second annual report 2008-09
116
Technology Absorption, Adaptation and Innovation
Efforts made On the Process Front …
Hydrogen Harvesting
At Bamnipal “Hydrogen Harvesting” trials were conducted by utilising the waste heat.
The purpose of the trials was to produce Hydrogen from the waste heat and utilise the gas to pre heat the ladles initially and extend further to dry the chrome ore.
We were successful in producing Hydrogen gas and also storing it tanker for a couple of hours. The second phase of the trial is to utilise the gas for Ladle heating which is likely to take place during May 2009.
JODA The following technological changes/new product
developments were carried out :
1) Process for production of +75 grade FeMn was established. This will allow us to increase the market share. This product will help us to enter into international FeMn market. Increased NR is also expected.
2) Improvement in water quality by modifying the water treatment system. New equipments were also installed for the same.
3) Improvement in the pneumatic arrangement to reduce the down time (due to obsolete equipments)
Raw Materials Column fl otation studies were carried out on different seams
of coal of West Bokaro. On the implementation of the study results, the prime coal yield in the fi ne circuit will improve. This provides an opportunity to replace the ineffi cient mechanical cells.
Process was developed for the washing of Jhama coal to obtain consistency in yield and ash level and this facilitated its regular use in sinter plant as a replacement of imported anthracite.
Laboratory study was made for the direct utilisation of the briquetting of iron ore slime. The trials were successful and we are in the process of developing a party for the commercial production of briquettes. Cold bonded briquettes, produced out of iron ore slime will be used in steel making as coolant to replace prime iron ore, which is being used currently.
“Jhama” – a naturally partially ‘burnt’ coal found at Jharia, having low volatile matter content, was mined and washed separately; and successfully applied as substitute for imported anthracite in sintermaking.
Iron Making Application of local raw materials - viz. higher alumina
bearing iron ore and higher ash coals – to ironmaking at large scale. The operation of 3800 m3 ‘H’ BF was stabilised at competitive levels of performance. This was the fi rst
example, worldwide, of such a large BF being operated with these levels of alumina and ash loading – and is a landmark development for ironmaking in India.
HBF, the largest BF in India, with latest technological features such as stave cooling in stack, 4 tap hole operation, INBA slag granulation system, 1200 degC blast temperature, 2.5 bar high top pressure, use of electrical blowers for cold blast etc. has given record production and productivity in its very fi rst year of operation.
A number of innovative techniques were developed to ‘slow down’ processes while continuing to maintain stability of operations in cokemaking and ironmaking. While these were prompted by developments arising from economic slowdown in European plants, the new knowledge developed on use of cheaper coal blends and pre-emptive steps required for slowing or shutting down BFs were leveraged in Indian operations as well.
Presence of carbonaceous materials present in ESP dust of sinter plants was identifi ed as the possible cause of fi re in the ESP. These were caused by presence of volatiles in the recycled wastes and solid fuels used in sintering. The study resulted in control over the type and quantity of fuels used in sintering.
SteelMaking
A new ladle furnace has been commissioned at Steelmaking Shop #1.
A new 6-strand billet caster has been commissioned at Steelmaking Shop #1 with Deburring, Billet Marking, Mould & Final EMS Facilities.
Steelmaking Shop #1 started and stabilised 2/2 vessel operations to increase shop production which is not very common in the world.
Casting sequence length increased by 12.6% and 6% for Billet Caster-1 and Billet Caster-2 respectively.
Casting of 150mm square billet has been stabilised at Steelmaking Shop #1.
Installation of hot metal tracking system for display of torpedo position and hot metal buffer available at Steelmaking Shop #2.
Adoption of 100% usage of coated mould in caster B and C in Steelmaking Shop #2 resulting improved surface quality of cast slabs.
Additional tilter installed in the ladle bay to improve ladle management. Better control on superheat has been achieved.
A portable mini-scan technology has been installed to assess online the left over refractory thickness of the vessel and facilitate repair of hot spots.
2090661-1 Tata Steel AR 2K8-9_2c116 1162090661-1 Tata Steel AR 2K8-9_2c116 116 7/18/09 9:57:29 PM7/18/09 9:57:29 PM

117
Highest ever refractory life of 5014 heats for the vessel achieved at Steelmaking Shop #2.
Highest ever slab production of 3.52 MT achieved at Steelmaking Shop #2.
Long Product
High carbon wire rods with reduced variation in UTS (<40 Mpa) within a lap.
WRM
Increase in yield of TMT rebars at WRM by nearly 1% by improved performance of water boxes.
TMT facilities introduced at WRM (W) and production of rebars started.
Product Development
Obtained CARES certifi cation for reinforcement bars from the Long Product Rolling Mills.
Non-microalloyed, non-TMT, air-cooled reinforcement bars produced for stirrup application for the fi rst time.
Development of Low calcium wire rods for superior welding electrode performance.
Development of Plasma coated rebars for improved corrosion performance in concrete environment.
Flat Products
LD-2
Development of CR grade 440 by batch annealing for the automobile application.
High Strength formable grade such as SPRC-35 for skin panel applications in passenger car segment.
High Strength Steel with UTS 600 MPa with good hole expansion properties for wheel application.
Development of Chrome free passivation for export market
Development of coated Dual Phase Steel with 600 MPa strength.
Technology Upgradation and Absorption in Tubes Division – 2007-08
In Tubes division, the following efforts are made to improve operational effi ciency.
ST Mills :
Installation of state-of-the-art HF3 Mill size range ½” NB to 2” NB as a replacement of old FM mill.
Modernisation of Galvanising Bath no. 2.
Installation of screwing socketing and Mair packing machine.
ITW Signode auto strapping unit at HF 1.
PT Mills :
Installation of state-of-the-art Schuler German make Hydroforming unit with automatic & robotic control.
Installation of YLM Taiwan make tube bending machine for feeding to main hydroforming unit.
SOCO machine for precision unit length cutting of high end application tubes.
Replacement of 3 “ mill cut off machine by OTO make cold saw cutting machine.
Hexagonal automatic tube packing line for auto and cold draw tubes.
Installation of express Lab at PT4 for in-process metallographic of weld quality.
Some Major New products Developed through new technology absorption :
• Number of new products developed PT 47 and ST 17.
• Development and commercialisation of TFF tubes in single pass 30.25 OD x 24 ID, 31.25 OD x 24 ID.
• Engine Cradle by hydro forming for NANO Car.
• Development of 152.40 mm Idler tubes at ST by in house modifi cation in roll pass design.
• Usage of boron bearing steel for replacement of FM Tubes.
• Development and commercialisation of the 57 x 5 Graziano tube.
• Development of 50 x 6 & 40 x 6 for Rane Madras and TML as replacement of seamless tubes.
• Development of galvanised structural tube from pre-coated strip for Marco polo bus body.
• Development of 100 x 100 x 6.000 mm thick structura tube of Yst 310 grade.
Efforts for Energy Conservation at Jharia
Power generation from Fluidised Bed Power Plant was 55.42 million units in 2008-2009 by using coal washery rejects having more than 60% ash and low calorifi c value.
The following energy saving measure have been taken in jharia Division.
a. Rearrangement of pumping station at Digwadih and Jamadoba colliery.
b. Reduction in idle running of washing plant.
c. Introduction of power saver CFL Lamp in place of ordinary lamp in lighting load circuit.
The above measures have resulted to maintain the specifi c power consumption up to 17.79 KWH/ton of Clean coal .
Annual cost of power generation from Fluidised Bed Power Plant was only Rs. 1.95 paisa per unit as against Rs. 3.34 paisa per unit of purchased power.
2090661-1 Tata Steel AR 2K8-9_2c117 1172090661-1 Tata Steel AR 2K8-9_2c117 117 7/18/09 9:57:30 PM7/18/09 9:57:30 PM

Hundred and second annual report 2008-09
118
Particulars of technology imported during last fi ve years :
Steel Division Status of Absorption Implementation
a) Upgradation of ‘G’ blast furnace (SMS Demag, Germany) 2004 Commissioned
b) Upgradation of HSM 2004 Commissioned
c) Upgradation of billet caster-1 at LD1 (Concast, Zurich) 2004 Commissioned
d) Ladle furnace-2 at LD1 (SMS Demag, Germany) 2004 Commissioned
e) New Rabar Mill (Morgan, USA) 2004 Commissioned
f ) Upgradation of caster at LD2 (Voest Alpine, Astria) 2004 Commissioned
g) Imported design and engineering for hot metal desulphurisation unit at LD1 (Kuettner GmbH) 2005 Commissioned
h) Supply of imported engineering for new induced draught fans, electrics & accessories for the LD
Converter GCP at LD1 (Ebara Corporation) 2005 Commissioned
I) Adequacy checking BOF converters for augmentation of heat size at LD2 (SMS Demag, Germany) 2005 Commissioned
j) Imported design and engineering for upgradation of Caster 2 & 3 at LD2 (VAI, Astria) 2005 Commissioned
k) Imported design and engineering for hot metal desulphurisation unit 2 & 3 at LD2 (Kuettner GmbH) 2005 Commissioned
l) Imported design and engineering for capacity increase of slab reheating furnace nos. 1 & 2 of HSM (Techint) 2005 Commissioned
m) Supply of design and engineering and training for 150 tph walking beam furnace to Rebar Mill (Bricmont) 2005 Commissioned
n) Imported design and engineering (Mother well Bridge - Clayton walker) 2005 Commissioned
o) Supply of imported design and engineering for LD gas b;oosters (Howden Power Ltd. U.K.) 2005 Commissioned
p) Supply of imported design and drawing for Technology control system at HSM (SMS Demag, Germany) 2005 Commissioned
q) Supply of imported design and drawing for Basic level automation at HSM (Alstom, USA) 2005 Commissioned
r) Supply of imported design and drawing for dual zinc pot at CRM (CMI, Belgium) 2005 Commissioned
s) Supply of imported design and drawing for BAF, CRM (LOI, Germany) 2005 Commissioned
t) Supply of imported design and drawing for 4th Stove of ‘G’ Blast Furnace (Paul Wurth Italia, Italy) 2006 Commissioned
u) Supply of imported design and drawing for ‘H’ Blast Furnace (Paul Wurth Italia, Italy) 2006 Commissioned
v) Supply of imported design and drawing for Sinter Plant No. 4 (Outokumpu Technology , Germany) 2006 Commissioned
w) Supply of imported design and drawing for LD2 expansion project. (SMS Demag, Germany) 2006 Commissioned
x) Supply of imported design and drawings for convertor gas cleaning plants in
LD shop 1 & 2 (SMS Demag, Germany) 2006 Commissioned
y) Facility for quantitative estimation of minerals through Scanning Electron
Microscope (Intellection Pty. Ltd., Australia) 2006 Commissioned
z) Polarising Microscope with Photometer and Imaging at R&D
(Leica Mikrosysteme Vertrieb GmbH, Germany and PRESI S.A., France) 2006 Commissioned
aa) Variable Frequency Drive for Descaling Pump Motor at Hot Strip Mill (ABB, India) 2007 Commissioned
ab) Sinter Plant No. 4, having a bed area of 204 sq. mtr. with ESP having lesser emission of 50 mg/ Nm3 2007 Commissioned
ac) Double Jaw Eye Vertical Tong For Batch Annealing Furnace at CRM 2007 Commissioned
ad) SCADA System for Water Utilities 2007 Commissioned
ae) Quantitative Estimation of Minerals by SEM (Scanning Electron Microscope) 2007 Commissioned
af ) XRD (X-Ray Defraction) for quantitative phase and texture analysis 2007 Commissioned
ag) Electric Blowers for 'H' Blast Furnace 2009 Commissioned
ah) Top Gas Recovery Turbine for 'H' Blast Furnaces 2009 Commissioned
ai) Flat Cast House Design for 'H' Blast Furnace 2009 Commissioned
aj) Internal Stoves for 'H' Blast Furnace 2009 Commissioned
ak) Use of mixed gas in place for CO gas, for fi ring in 7th Lime Kiln 2009 Commissioned
al) New Billet Caster having all the latest facilities and having 9 m casting radius installed in an existing
building suitable for 6 m casting radius, by going underground and taking the pass line to (-)3.3 m level. 2009 Commissioned
am) Use of hydraulic mould occilator and hydraulically operated turn over cooling bed at CC 3 at LD Shop 1 2009 Commissioned
an) Robotised Sample Testing Laboratory at LD Shop No 1. 2009 Commissioned
2090661-1 Tata Steel AR 2K8-9_2c118 1182090661-1 Tata Steel AR 2K8-9_2c118 118 7/18/09 9:57:30 PM7/18/09 9:57:30 PM

119
Annexure 'B' to Directors’ ReportStatement pursuant to Section 217(2A) of the Companies Act, 1956 and the Companies (Particulars of Employees) Rules, 1975
Sr .No.
Name Age(Years)
Designation/Nature of Duties
GrossRemune-
rationRs.
NetRemune-
rationRs.
Qualifi cations TotalExperi-
ence(Years)
Date ofCommence-
ment ofEmployment
Last employment heldDesignation – Period for
which post held
1 Ansari N. A. * 57 General Manager (Project) 21,89,759 13,17,470 B.Sc. (Engg.) 34 28.12.1974 –2 Anupam Ashish 40 Chief (Marketing & Sales) 26,76,603 15,09,690 B.E. 17 01.07.1991 –3 Asokan S. 61 EIC (Titania Project) &
GM (Geolo. Srv.)33,66,008 18,41,845 B.Sc., M.Sc., Ph.D., Cer.
(Computer)34 09.12.1998 HCL Group company, executive
Director - 3 years4 Baijal A. D. 61 Group Director,
Global Minerals1,14,36,482 60,82,710 B.Sc. ( Engg.), ( Met.),
P.G.D.B.M39 13.12.1969 –
5 Bham J. C. 59 Company Secretary 25,66,523 14,71,230 B.Com, C.S., C.A. 36 17.10.2001 OTIS Elevator Company (India) Limited, Company Secretary - 24 years
6 Bhaskar S. 51 Chief Mills & Utilities(Mech. Maint.)
32,69,133 19,37,279 B.E., Diploma in Management
27 01.07.1981 –
7 Bhaskaran Sunil 44 Executive-in-Charge (Global Wires)
28,74,490 15,75,409 B.Tech., PGD (Mgmt.) 21 01.07.1987 Tata International - 3 years
8 Bhattacharjee Debashish 44 Director Research, Develop. & Technology
28,79,618 16,83,590 B.E., M.Tech., Ph.D. 12 01.04.1996 –
9 Biswas Sandip 40 Group Head Corporate Finance, Treasury & Investor Relations
39,06,638 22,90,782 B.Com. (Hons), ACA, ACS
16 01.04.2005 First India Asset Management Co. (P) Ltd., Head Eastern India - 3 years
10 Chakrabarti Indranil 56 Chief (Scientifi c Services) 24,09,444 14,54,703 AMIE, B.E., M.E. 24 03.05.1984 –11 Chakrabarty Asoke
Kumar58 Chief Cost Research &
Standard Costing G28,47,863 17,26,106 B.Sc., B.Com., I.C.W.A 30 08.01.1981 SAIL, Bokaro Steel Plant, Finance
Executive - 2 years12 Chakraborty Jayant 43 Chief (Corporate Acc. &
Fin. Reporting)28,54,687 16,53,365 B.Com. (Hons), C.A. 18 30.04.1990 –
13 Chandra Sanjay 48 Chief (L P Tech. Group) 27,08,194 16,48,796 B.Tech., Ph.D. (Engg.) 25 08.08.1983 –14 Chatterjee Amit Kumar 46 Chief Electrical Maintenance 30,76,875 19,84,316 B.E. 21 27.07.1987 –15 Chatterjee Koushik 40 Group Chief Financial Offi cer 1,06,98,186 60,50,380 B.Com. (Hons), F.C.A. 13 13.11.1995 Tata Sons Ltd. – General Manager -
Corporate Finance - 4 years 7 months16 Chaudhary Chanakya 43 Chief Resident Executive,
New Delhi36,80,220 24,80,956 B.E. 20 16.12.1988 –
17 Chaudhury S. B. 53 Head (System Integration) 26,33,106 15,90,217 B.E., M.Tech. 16 22.04.1992 RDCIS SAIL, Manager - 9 years 7 months18 Chintak Rajesh 41 Chief Resident Executive,
Bhubaneshwar26,06,157 17,70,901 B.Sc. (Engg.) 19 01.07.1989 –
19 Choudhry Sanjay 52 Chief Corporate Aff airs & Communications
31,74,087 18,39,373 M.A., P.G.D.B.M. 28 16.09.2002 Coca Cola Industries - Corporate aff airs Manager - 6 years
20 Choudhury Dr. Shyamal Kumar
57 Sr. Specialist 26,13,418 14,90,333 MBBS, MD 28 01.08.1980 –
21 Chowdhary D. M. 57 Chief (Electrical Maint.) 34,58,941 19,96,409 B.Sc. (Engg.), P.G.D.B.M. 33 20.03.1976 –22 Das Binod Kumar 51 Chief (Sinter Plant) 35,99,321 21,13,066 B.Tech., M.Tech. 29 01.08.1980 –23 Das Debashis 49 Chief (LD1) 32,10,072 19,02,609 B.Tech. 26 02.08.1982 –24 Das Dr. N. K. 58 Chief Medical Services 30,32,925 17,74,495 MBBS, MD 26 29.01.1983 –25 Deshpande D. P. 52 Chief (Coke, Sinter & Iron) 41,89,713 22,26,307 B.Tech., P.G.D.B.M 30 01.01.1979 –26 Dhar G. S. 56 Chief (Raw Material Project) 28,58,511 16,90,453 B.Tech. 32 07.02.1977 –27 Divaker Chavala 56 General Manager (Jharia) 33,43,987 19,58,834 B.E. 33 27.01.1977 Singereni Collieries Company Limited28 Garg C. P. * 66 Sr. Consultant Pilot 28,16,121 18,13,492 B.Com. 46 13.08.2007 Jagsons Airlines Pilot - 11 months29 Ghatak S. N. 59 Chief Engineering Civil &
Structurl27,05,116 14,25,163 B.E. 38 01.09.1970 –
30 Ghose P. K. 39 Chief RM Project 33,33,745 19,51,353 B.Tech. 17 01.07.1991 –31 Ghosh Santanu 52 Chief (Project Engg.) 33,68,026 21,95,324 B.E. 28 01.08.1980 –32 Gupta Avneesh 45 Chief (TQM) 25,61,882 15,40,503 B.Tech., P.G.D.B.M. 22 01.07.1986 –33 Gupta Dr. G. 56 Chief Medical Offi cer 25,48,050 13,65,695 MBBS, MS 26 01.10.1982 –34 Gupta Peeyush 40 Chief (Marketing &
Sales - Flat Products)32,21,090 17,95,981 B.E., M.B.A. 16 01.01.1993 –
35 Hariharan S. 56 Chief (3MT Expansion Project) 33,37,391 19,73,587 B.Sc. (Engg.) 35 29.12.1973 –36 Iyer Ramesh B. 43 Chief (LD#3 & TSCR) 36,44,365 21,36,801 B.E. 20 01.07.1988 –37 Jha Bimlendra 41 Principal Executive Offi cer 34,36,039 22,39,353 B.Tech, P.G.D.B.M. 18 02.07.1990 –38 Jha Dwarika Nand 49 Chief (Blast Furnace),
Kalinganagar Proj.48,45,461 26,21,749 B.Sc,. (Engg.), PGD
(Mgmt.)28 01.08.1980 –
39 Jha Hridayeshwar 53 Vice-President (Safety & Long Product)
60,53,679 33,78,079 B.Tech., M.Sc. (Engg.), P.G.D.B.M.
30 01.01.1979 –
40 Jha Varun K. 57 Vice-President (Chattisgarh Project)
99,76,684 52,69,268 B. Tech. (Hons), P.G.D.B.M.
36 03.10.1972 –
41 Kalha Sarbraj Singh 63 Sr. Consultant Pilot 43,69,558 27,03,376 — 1 01.10.2007 –42 Kamra Vivek M. 41 Executive-in-Charge (Tubes) 36,72,510 20,48,505 B.Tech., Management
Prog.19 01.07.1989 –
2090661-1 Tata Steel AR 2K8-9_2c119 1192090661-1 Tata Steel AR 2K8-9_2c119 119 7/18/09 9:57:30 PM7/18/09 9:57:30 PM

Hundred and second annual report 2008-09
120
43 Kant Neeraj 45 Chief Sales Manager (North) 26,18,596 16,84,178 B. Tech., M.B.A. 23 16.07.2001 SAIL, Asst. Divisional Manager - 15 years 9 months
44 Kharkar Hement C. * 52 Vice-President 37,05,083 18,51,331 B.E. (Met), P.G.D.B.M. 31 22.01.1978 –45 Kumar Ashok 47 Chief (I M T G) 34,76,986 19,81,573 B.Tech. 24 01.07.1984 –46 Kumar Rajiv 41 Chief (HSM) 27,68,880 18,53,010 B.Sc. (Engg.) 18 01.10.1990 –47 Kumar Sanjay 46 Chief (G Blast Furnace) 32,87,053 19,54,631 B.Tech., P.G.D.B.M. 24 02.07.1984 –48 Kumar Sudhanshu 50 Chief (Customer Service
Division)27,06,325 16,68,808 B.Sc. (Engg.), P.G.D.B.M. 25 08.08.1983 –
49 Kumar Suresh 51 Chief (Mechanical Maintenance)
32,12,005 16,38,141 B.Tech., P.G.D.B.M. 29 01.08.1980 –
50 Lal Mohan 56 Chief (Manufacturing), Long Product
37,00,512 21,69,121 B.Sc. (Engg.), P.G.D.B.M. 30 09.01.1978 –
51 Mahashabde Vinay V. 43 Chief (SMCT) and AGM (Steel), KPO
28,38,213 17,16,263 B.Tech. 22 01.07.1986 –
52 Makashir Wg. Cd. S. D. 62 Sr. Consultant Pilot 44,54,694 28,60,178 M.Sc. (Defence Studies) 41 02.09.1997 Indian Air Force, Wg. Commander - 12 years
53 Mangal Rajiv 41 Chief (Wire Division) 35,02,124 19,92,140 B.E., P.G.D.B.M. 19 01.07.1989 –54 Mani R. 51 Chief (Corporate and
International Taxation)28,87,045 19,14,567 B.Com., C.A., I.C.W.A.I 26 18.10.1982 –
55 Misra Abanindra M. 57 VP (Raw Materials & Coke Sinter & Iron)
80,42,438 43,98,628 B.E., M.B.A. 35 29.12.1973 –
56 Misra Arun 43 General Manager (O M & Q) 30,52,384 18,80,098 B.Tech. 20 01.07.1988 –57 Misra N. K. 53 Group Head - Mergers &
Acquisition63,00,916 30,09,162 B.Sc. , A.C.A. 28 21.02.1981 –
58 Mitra Nil Ratan * 51 Pilot 34,33,614 21,41,198 B.Sc., Commercial Helicopter Pilot’s Licence
30 02.06.2008 Indian Air Force, Commissioned offi cer - 26 years
59 Mitra Samindra Narayan 45 Executive-in-Charge(Iran Chrome Project)
24,72,712 14,21,736 B.Tech., PGD (Mgmt.) 18 02.07.1990 Tata International limited, Chief (International Op.) - 3 years 8 months
60 Mokashi S. 51 Chief Information Technology 39,39,269 22,62,944 B.Tech., P.G.D.B.M 27 01.02.1982 –61 Murthy R. N. 44 Chief Marketing OE 28,14,540 16,95,436 B.Tech. 22 01.07.1986 Tata International Limited, Product
Manager - 3 years 8 months62 Murty V. S. N. 57 Chief Financial Controller
(Corporate)51,77,919 28,04,670 B.Com., C.A. 32 01.06.1976 –
63 Muthuraman B. 64 Managing Director 4,03,13,211 2,27,05,260 B.Tech. (Met), P.G.D.B.M. 42 14.11.1966 –64 Nair K. P. G. 59 Chief (Design & Technical
Services)27,68,918 16,45,738 Dip. in Mech. Engg.,
AMIE (India), P.G.D.B.M.37 04.10.1971 –
65 Nair Radhakrishnan 49 Chief Human Resource Offi cer 72,72,110 41,14,234 B.Com., PGD (PM & IR) 24 01.04.2007 Tata Sons, Vice President - 5 years66 Nandan Krishna 53 Head Corporate Relations 24,37,587 15,04,831 L.L.B. 31 07.12.1977 –67 Narayan Om 58 Vice-President
(Shared Services)78,28,807 41,44,762 B.Sc. (Engg), P.G.D.B.M. 36 03.10.1972 –
68 Nerurkar H. M. 60 Chief Operating Offi cer (Steel) 1,51,87,370 79,08,877 B.Tech. (Met) 37 01.02.1982 U.M.I. Ltd., Manager (QC) - 5 years69 Ojha Awadhesh Kumar 57 General Manager (W B) 33,97,649 17,68,389 B.Sc. (Engg.) 33 01.08.1975 –70 Panda Amitabh 40 Chief (Procurement) 26,06,165 15,63,189 B.E., P.G.D.B.M. 19 01.10.2004 Free Markets Services Pvt. Ltd. 71 Pandey Subodh 39 Chief (Marketing - LP) 24,39,863 13,76,166 B.Tech. 16 13.07.1992 –72 Pathak Sudhansu 47 Chief (LD2 & SC) 35,39,411 21,17,892 B.E., P.G.D.B.M. 24 02.07.1984 –73 Pati Srikant Kumar 50 Chief (Power Systems) 27,21,635 16,42,598 B.Sc. (Engg.), P.G.D.B.M. 27 01.07.1981 –74 Pattanaik S. K. 49 Chief Raw Material Strategy
Group28,11,867 18,00,384 B.E. 25 01.07.1983 –
75 Pattanayak Pradip K. R. 55 Chief (IR and R&R) 24,62,044 14,14,118 B.Sc. (Hons), M.A. 30 01.03.1979 –76 Pillai Satish 57 Chief (Corporate
Sustainability Services)26,58,622 15,62,219 B.A. 37 16.06.1971 –
77 Pradhan Ganesh Chandra
61 Sr. Consultant Pilot 25,57,418 16,82,712 B.Sc., Commercial Pilot’s Licence
14 01.09.2008 Poonawala Aviation Services - 2 years 8 months
78 Prakash Sunil 55 Chief (Manufacturing), Flat Product
31,50,771 18,82,130 B.Tech. 16 14.05.1992 –
79 Prasad Avinash 61 Chief Resident Executive, Ranchi
58,47,830 34,43,664 B.E. (Met.) 37 14.06.1971 –
80 Prasad Priya Ranjan 48 Chief (Sinter Plant) 26,78,286 16,39,659 B.Tech. 25 08.08.1983 –81 Purohit Sushil Kumar 46 Pilot 39,52,844 24,36,337 L.L.B. 16 03.04.2006 Ran Air Limited, Pilot - 1 month82 Rajesh N. 42 Chief (CRM) 26,65,071 16,31,034 B.Tech. 20 01.07.1988 –83 Rammurty N. 58 Chief Strategic Project
Procurement31,14,647 19,11,352 B.Sc. (Engg.), P.G.D.B.M. 35 03.01.1974 –
84 Ranjan Amrendra 49 Chief Mills & Utilities (Elect. Maint.)
26,97,086 15,96,875 B.Tech., P.G.D.B.M. 28 01.07.1980 –
85 Ranjan Rajiv 50 Chief (1.8 MT Project) 26,11,139 14,38,419 B.Sc. (Engg.) 28 01.08.1980 –86 Raste Pramod R. 56 Chief (IR-West) 24,95,670 16,57,895 B.A. (Hons), M.A. 23 01.06.1985 –
Sr .No.
Name Age(Years)
Designation/Nature of Duties
GrossRemune-
rationRs.
NetRemune-
rationRs.
Qualifi cations TotalExperi-
ence(Years)
Date ofCommence-
ment ofEmployment
Last employment heldDesignation – Period for
which post held
2090661-1 Tata Steel AR 2K8-9_2c120 1202090661-1 Tata Steel AR 2K8-9_2c120 120 7/18/09 9:57:30 PM7/18/09 9:57:30 PM

121
87 Rattan G. S.* 61 Executive-in-Charge (Bearings)
28,19,087 15,22,725 B.Sc. (Engg.) 30 10.11.1978 –
88 Ray Dr. Banambar 61 General Manager (Medical Services)
47,02,487 24,77,252 MBBS, MD 29 01.03.1980 –
89 Reddy P. S. 45 Chief MRO 28,15,816 17,26,023 B.Tech., M.Tech. 21 30.01.1988 Telgu Ganga Project - Asst.Excecutive Engineer - 4 months
90 Roy S. K. 56 Chief ('H' Blast Furnace) 46,18,412 26,62,501 B.Sc. (Engg.) 32 19.03.1977 –91 Sachdev Harsh V. 48 Executive-in-Charge
(Bearings)24,15,047 13,60,498 B.Tech. 25 01.07.1983 –
92 Samaddar Dr. D. P. 55 Sr. Specialist & HOD (Anaesthesia)
26,41,546 15,61,185 MBBS, M.D 23 03.06.1985 –
93 Samaradivakera Lalith 54 General Manager (Operations) 27,80,697 18,62,215 B.Tech. 31 01.09.1977 –94 Sarangi B. N. 58 Chief (Employee Training &
Development) 30,22,051 17,54,184 B.A., PGD (Mgmt.) 39 20.12.1969 –
95 Sastry C. V. 45 Chief Corporate Quality Assurance & FPTG
33,03,867 19,29,788 B.E, P.G.D.B.M 23 15.07.1985 –
96 Satyanarayana Sistla 53 Chief (Automation) 27,79,805 16,38,696 M.Tech. 30 07.04.1993 Instrumentation Limited, Kota (Public Enterprice), Deputy Manager -14 years
97 Sen Anand 49 Vice-President (TQM & Flat Products)
96,15,675 51,16,877 B.Tech. (Hons), Met. Engg., P.G.D.B.M.
27 27.07.1981 –
98 Sengupta Dipankar 63 Adviser to M. D. 53,04,919 29,77,993 B.E. 41 30.12.1967 –99 Sengupta Indronil 38 Executive-in-Charge
(Vietnam Project)25,14,121 15,43,855 B.E., P.G.D.B.M. 16 13.07.1992 –
100 Sengupta Partha 51 Vice-President (Corporate Services)
59,18,283 29,85,896 B.Tech. (Metallurgical) 28 01.08.1980 –
101 Sengupta Sibaji 52 Chief (Financial Reporting Center)
26,25,316 16,03,849 B.Com., C.A. 27 12.12.1983 Bank of Baroda, Dy. Manager - 1 year 3 months
102 Shukla Shobhit 51 Chief (Financial Transaction Center)
25,37,667 15,60,300 B.Com., C.A. 23 19.03.1986 –
103 Singh A. K. 58 Chief (IR - RM) 25,88,375 15,43,846 PGD (PM&IR) 34 03.06.1974 –104 Singh Binay Kumar 61 Vice-President (Orissa Project) 56,00,135 33,62,730 B.E. (Met), M.Tech.
(Process Metallurgy),38 19.12.1970 Hoogly Met Coke & Power Co. Ltd.,
Managing Director - 3 years105 Singh Jai Prakash 52 Chief, Blast Furnaces
up-gradation Pelle25,25,102 15,02,827 B.Sc. (Engg.) 28 30.03.1981 –
106 Singh P. K. 59 Chief (Spares & Services) 24,71,535 15,08,115 B.Sc. (Engg.) 36 03.10.1972 –107 Singh Ram Prit 64 Vice-President (Engineering
& Projects)1,17,32,754 58,81,116 B.Sc. (Engg.) (Mech.) 43 01.03.1996 SAIL & R I N L, General Manager
(Project) - 30 years 108 Singh R. P. 56 General Manager (IR) 35,55,778 20,22,343 B.Com, PGD (PM&IR) 31 14.04.1977 –109 Singhal Rajeev 45 Chief (M & S - LP) 30,44,061 17,18,839 B.Tech., P.G.D.B.M. 23 01.07.1985 –110 Singh S. K. 40 Chief (S E Block) 25,21,970 14,96,166 B.Tech. 17 01.07.1991 –111 Singh Uttam 40 Chief ('I' Blast Furnance) 27,85,154 16,66,881 B.Tech. 16 13.07.1992 –112 Sinha Arvind Kumar 52 Chief (Electrical T & D) 27,03,018 16,34,063 B.Tech., P.G.D.B.M. 30 01.01.1979 Hooglty Met Coke & Power Co. Ltd.,
Chief Construction - 1 year 5 months113 Sinha Vinod Prasad 60 Advisor 25,61,849 16,44,678 B.Sc. (Hons), Ph. D. 39 01.01.1970 –114 Srikanth R. 46 General Manager
(Raw Material Projects)39,48,173 22,58,013 B.Tech, M.S (Engg.),
Ph.D.24 10.02.1997 Penn State University USA, Research
Assistant - 6 years115 Srivastava Ved Prakash 49 Chief IT - Architecture 28,69,241 17,25,994 B.Tech., PGD (Mgmt.) 28 01.08.1980 –116 Sundara Ramam D. B. 39 Chief (Noamundi) 30,53,172 18,45,751 B.Sc. (Engg.) 18 28.07.1990 –117 Sunder Shyam 47 Chief Operations, Wire
Division27,21,578 15,00,953 B.E. 25 08.08.1983 –
118 Tiwari Kalika 58 Pilot 33,17,715 22,36,416 B.Sc. 26 01.06.2006 I.S.W.P, Chief Pilot - 15 years119 Venugopalan T. 56 Chief Technology Offi cer 43,17,226 25,04,000 B.Tech. (Met. Engg.),
M.Tech. (Ind. Metallurgy 31 04.05.2001 Ispat Ind., V.P.
(Technical Services) - 4 years120 Verma Gyan Prakash 51 Chief (Budgeting &
Construction Plannin)25,44,782 15,27,661 B.Sc. (Engg.), P.G.D.B.M. 27 13.07.1981 –
121 Verughese K. K. 57 Chief (Corporate Audit) 35,49,754 20,91,840 B.Sc., C.A. 32 23.12.1976 –
Sr .No.
Name Age(Years)
Designation/Nature of Duties
GrossRemune-
rationRs.
NetRemune-
rationRs.
Qualifi cations TotalExperi-
ence(Years)
Date ofCommence-
ment ofEmployment
Last employment heldDesignation – Period for
which post held
Notes : (1) Gross remuneration comprises salary, allowances, monetary value of perquisites, commission to the Directors and the Company’s contribution to Provident and Superannuation Funds but excludes contribution to Gratuity Fund on the basis of actuarial valuation as separate fi gures are not available.
(2) Net remuneration is after tax and is exclusive of Company’s contribution to Provident and Superannuation Funds and monetary value of non-cash perquisites. (3) The nature of employment in all cases is contractual. (4) None of the employees mentioned above is a relative of any Director of the Company.
* Indicates earnings for part of the year.On behalf of the Board of Directors
RATAN N. TATAMumbai, 25th June, 2009. Chairman
2090661-1 Tata Steel AR 2K8-9_2c121 1212090661-1 Tata Steel AR 2K8-9_2c121 121 7/18/09 9:57:30 PM7/18/09 9:57:30 PM

Hundred and second annual report 2008-09
122
Business Review
Tata Steel Limited, Asia’s first integrated private sector
Steel Company, is the world’s second most geographically
diversified steel producer with major operations in India,
Europe and South East Asia. Listed as a Fortune 500
company and with an annual crude steel capacity of around
31 million tonnes, the Company has manufacturing units
in 26 countries and a strong presence in 50 European and
Asian markets. Tata Steel India is the first integrated steel
company in the world, outside of Japan, to be awarded the
coveted Deming Application Prize 2008 for excellence in
Total Quality Management.
Over the past decades, the Company has carried out several
modernisation and expansion programmes – including the
acquisition of businesses in Europe and South East Asia,
which have helped it to grow and diversify.
The strategic focus of the Company has been to increase the
steel making capacity in excess of 50 million tonnes by 2015
through organic and inorganic growth. The key enablers
identified to achieve the strategic goal and to build a
sustainable value centric culture are:
• Being the employer of choice
• Oneness with the society
• Leadership & talent management
• Adaptability to changes in the external environment
• Security of raw materials
• Research & development and technological upgradation
• Branding
• Financial prudence through capital stewardship &
performance management
Management Discussion and Analysis 2008-09
Tata Steel Group Performance
A. Business Overview
a. Tata Steel India:
1. Steel Division:
The production and sales figures of the Steel division of the
Company are shown in the following table:
Figures in million tonnes
FY 09 FY 08 Change %
Hot Metal 6.25 5.51 14%
Crude Steel 5.65 5.01 13%
Saleable Steel 5.37 4.86 11%
Sales 5.23 4.78 9%
The division posted an increase of around 11% in its
Finished Steel production and 9% in sales during the
financial year 2008-09 owing to the newly commissioned
‘H’ Blast Furnace, Sinter Plant #4, Billet Caster #3 etc. The
major production and sales highlights for the financial
year 2008-09 are shown below:
Production
• Best ever Hot metal (6.25 million tonnes), Crude steel
(5.65 million tonnes) and saleable steel (5.37 million
tonnes) production.
• Newly commissioned Blast Furnace (‘H’ furnace) in its
very first year of operation surpassed its yearly target
and is running above the rated capacity.
• One of the Steel Melting Shops (LD#2 & Slab Caster)
achieved the best ever slab production of 3.52 million
tonnes (previous best 3.35 million tonnes in FY 08).
2090661-1 Tata Steel AR 2K8-9_2cSec1:122 Sec1:1222090661-1 Tata Steel AR 2K8-9_2cSec1:122 Sec1:122 7/18/09 10:00:15 PM7/18/09 10:00:15 PM

123
• LD#1, another Steel Melting Shop also achieved the best
ever annual billet production of 2.12 million tonnes
(previous best 1.76 million tonnes in FY 07).
• Sinter Plant produced 6.5 million tonnes sinter which
is the best ever (previous best 5.88 million tonnes in
FY 08). Highest ever solid waste utilisation at 90%
(previous best 85.4% in FY 08).
• One of the finishing mills i.e. New Bar Mill achieved
highest ever production of 0.611 million tonnes
(previous best 0.549 million tonnes in FY 08).
Sales
• Overall sales at 5.231 million tonnes, grew by 9% over
last year (4.782 million tonnes in FY 08).
• 25% increase in Long products sales at 2.00 million
tonnes (1.60 million tonnes in FY 08).
• Highest ever sales of Flat products at 3.23 million tonnes
(3.18 million tonnes in FY 08).
Other major highlights of the division were:
• Maximisation of production from bigger Blast Furnaces
with higher productivity resulting in a significant
reduction in the coke rate.
• Increased vessel life in both the steel making shops.
• The revenue generation through sale of by-products
was enhanced as compared to the previous year.
• Reduction in dust emission per tonne of crude steel
compared to FY 08.
2. Ferro Alloys and Minerals Division (FAMD):
The production and sales volume of Ferro Alloys and
Minerals Division for the financial year 2008-09 against the
last financial year are shown in the following tables:
Saleable Production
Figures in million tonnes
Products FY 09 FY 08 Change %
Chrome Concentrate 0.270 0.379 (29)%
Ferro-chrome 0.170 0.202 (16)%
Ferro Manganese 0.055 0.055 (1)%
Pyroxenite 0.229 0.235 (3)%
Dolomite 0.362 0.467 (23)%
Silico Manganese 0.071 0.070 1%
Total 1.157 1.409 (18)%
Sales PerformanceFigures in million tonnes
Products FY 09 FY 08 Change %
Chrome Concentrate 0.254 0.392 (35)%
Ferro-chrome 0.177 0.186 (5)%
Ferro Manganese 0.034 0.041 (16)%
Dolomite 0.342 0.468 (27)%
Silico Manganese 0.042 0.040 (5)%
Total 0.867 1.143 (24)%
Robust demand for ferroalloys and consequent higher
prices during the first half of FY 09 were affected by the
market slowdown during the second half. In spite of the
slowdown, the division ranked sixth among ferro-chrome
producers in the world at the end of the financial year. Cost
competitiveness and market and product developments
were the key enablers in increasing the customer base and
expanding the market reach.
Global ferro-chrome producers struggled to meet the
soaring demand from consumers and for the first time in
the history of its business, High Carbon Ferro-Chrome spot
market prices crossed the level of US $2 / lb CIF in the first
half of FY 09. The Company’s ferro-chrome exports touched
2090661-1 Tata Steel AR 2K8-9_2cSec1:123 Sec1:1232090661-1 Tata Steel AR 2K8-9_2cSec1:123 Sec1:123 7/18/09 10:00:16 PM7/18/09 10:00:16 PM

Hundred and second annual report 2008-09
124
an all time high and the division recorded its highest ever
global market share of 4% in FY 09. In India, FAMD is the
market leader in the ferro-chrome business with a market
share of around 36%.
Shortage of the High Grade Manganese Ore and rising costs
led to a substantial appreciation in both Silico Manganese
and Ferro Manganese prices in FY 09.
Manganese alloys sales recorded an all time high in FY 09.
FAMD with its unique advantage of being the lowest cost
Manganese alloy producer in India, has attained the status
of being the largest producer of Manganese alloys in India
with a market share of approximately 14%.
While the prices of Chrome Concentrate almost doubled
over FY 08, ferro-chrome prices moved north by 35% and
Ferro Manganese & Silico Manganese prices increased by
75% and 72% respectively over the last financial year.
3. Tubes Division:
The production and sales performance of the division are
shown below:
Figures in million tonnes
Production FY 09 FY 08 Change %
Commercial Tubes 0.163 0.169 (4)%
Precision Tubes 0.085 0.087 (2)%
Structural Tubes 0.068 0.066 3%
Total 0.316 0.322 (2)%
Figures in million tonnes
Sales FY 09 FY 08 Change %
Commercial Tubes 0.163 0.172 (5)%
Precision Tubes 0.068 0.063 8%
Structural Tubes 0.087 0.088 (1)%
Total 0.318 0.323 (2)%
Trend of Sales volume over the last few years is
shown below:
The division commissioned a second state-of-the-art Mill
during FY 09 in order to improve manpower productivity,
lower energy consumption, increase operational efficiency
and offer improved products. The division’s thrust in
High end Precision Tubes started to bear fruit, with the
commissioning of the Hydroforming facilities and has
recently initiated the supplies of Engine Cradles for the
Tata Nano car, production of tubes for Telescopic Front Fork
(TFF) & Propeller Shaft applications.
There was a substantial progress in Customer Relationship
Building and IT based solutions. Some highlights include
the implementation of web based VMI, replenishment
system for all distributors and EVI with large construction
companies. Inspite of the market slowdown especially
in construction activities during the second half of FY
09, the sales volume remained at the same level as
that of FY 08 mainly due to the development of new
products and sizes for Structural applications under the
“TATA STRUCTURA” brand.
While the tubes industry witnessed a negative growth of
3-4%, the Tubes division maintained its volume at FY 08
levels. In line with recent investments, the Precision tubes
business of the division grew by 7% even though growth in
2090661-1 Tata Steel AR 2K8-9_2cSec1:124 Sec1:1242090661-1 Tata Steel AR 2K8-9_2cSec1:124 Sec1:124 7/20/09 6:02:38 PM7/20/09 6:02:38 PM

125
the industry was largely stagnant. In the Commercial tubes
segment, in spite of a drop in volumes, the market share
grew by 2% over FY 08 in the retail trade.
4. Bearings Division:
The production and sales performance of the division are
shown below:
Figures in million numbers
FY 09 FY 08 Change Change %
Production 27.40 26.36 1.04 4%
Sales 26.34 27.61 (1.27) (5%)
A major customer segment for the Bearings Division of the
Company is the automobile sector. In the first half of FY 09,
the automotive segment saw a robust growth of 12.7% but
witnessed a steep 13% negative growth in the third quarter
before recovering to a 1% growth in the fourth quarter.
b. Tata Steel Europe (TSE):
Tata Steel Europe is Europe’s second largest steel producer
operating three main divisions — Strip Products, Long
Products and Distribution & Building Systems. The fourth
division — Primary Aluminium was hived off to Klesch &
Company during February 2009.
The production and sales performance of TSE is
shown below:
Figures in million tonnes
FY 09 FY 08 Change Change %
Liquid SteelProduction
16 20 (4) (20)%
Sales 20 23 (3) (14)%
TSE’s liquid steel production in FY 09 was around 16 million
tonnes, 20% lower than FY 08. While during the first half of
FY 09 the production was around 10 million tonnes, almost
at the same level of FY 08, the production for the second half
of FY 09 was 6 million tonnes against the level of around 10
million tonnes recorded during FY 08.
The sales for FY 09 at around 20 million tonnes were lower
by 14% as compared to sales of 23 million tonnes registered
during FY 08.
The demand for TSE’s carbon steel products was around
8.9 million tonnes, lower by 15% than FY 08. The drop in
demand was mainly due to the sharp downturn in steel
consumption during the second half of the financial year
along with the effects of the stock correction, particularly
for strip products.
c. NatSteel Holdings:
The Singapore operations are an Electric Arc Furnace (EAF)
based steel making and rolling operations with a production
capacity of about 0.750 million tonnes per annum.
The first half of the financial year saw a rise in the prices and
volume due to buoyant market conditions. However, in the
second half of FY 09, South East Asia experienced the effects
of the global slowdown bringing down the volume as well
as prices significantly, offsetting the increases achieved
during the first half.
During the year, the Singapore operations mainly focussed
on yield improvement, reduction in power consumption
and improvement in downstream tonnages.
The Singapore operations sold about 0.956 million tonnes
of steel during FY 09, 6% more than the last financial year.
Out of total sales, the sales of the downstream facility
in Singapore, the world’s largest single cut-and-bend
operations facility, were around 0.475 million tonnes, 20%
higher as compared to the previous year.
The Chinese subsidiary of NatSteel sold 0.426 million
tonnes of rolled products during FY 09, 17% higher than the
previous year.
2090661-1 Tata Steel AR 2K8-9_2cSec1:125 Sec1:1252090661-1 Tata Steel AR 2K8-9_2cSec1:125 Sec1:125 7/18/09 10:00:16 PM7/18/09 10:00:16 PM

Hundred and second annual report 2008-09
126
In Australia, NatSteel Australia and Best Bar sold around
0.188 million tonnes (12% higher than FY 08) of steel in
the form of straight length rebars, mesh, cut-and-bend and
other accessories.
d. Tata Steel Thailand:
Production during FY 09 at 1.07 million tonnes was lower by
22% than FY 08 while sales at 1.1 million tonnes were about
20% lower compared to the previous year. While the first
half of FY 09 witnessed a rise in demand, the latter half saw
a drastic drop in the prices of domestic and international
scrap, which in turn led to a decrease in prices for finished
products. The high stocks in the supply chain also added to
the adverse performance. During the year, the operations in
Thailand focussed on cost reduction in the Rolling Process
by optimising the roll consumption cost and in the Alloy
Consumption at the steel shop.
e. Tata Refractories Ltd.:
Tata Refractories Ltd. (TRL), is India’s No 1 Refractories
Producer with service backup for Total Refractory Solutions
(Design & Application) & Total Refractories Management.
The company also has a manufacturing facility in China.
The company has a wide range of refractory products
like Basic refractories, Dolomite refractories, Flow Control
refractories, High Alumina refractories, Monolithic
refractories and Silica Refractories. With operations in China,
Gujarat, Jamshedpur, Salem and Belpahar, TRL has been
meeting the growing needs of a wide variety of customers
in different markets viz., Steel, Cement, Glass, Copper, Zinc,
Aluminium, and the Petrochemical industry.
During FY 09, the production was lower by 1% from 234 k
tonnes during FY 08 to 231 k tonnes in FY 09 while the sales
were higher by 1% from 264 k tonnes during FY 08 to 267 k
tonnes in FY 09.
f. TM International Logistics Limited:
TM International Logistics Limited is involved in the activity
of running port operations at the Ports of Haldia and Paradip
on the east coast of India backed by a fully dedicated
customs clearance and shipping agency services at both
ports. The company runs a clean dry cargo terminal at
berth # 12 at Haldia which is equipped with modern handling
facilities including heavy equipments, shore cranes and
vast large open storage area as well as covered
warehousing facilities.
The main performance highlights of the company during
the financial year 2008-09 are the following:
FY 09 FY 08 Growth
Port Operations
Million tonnes
7.01 6.04 16%
ShippingMillion tonnes
2.28 1.87 22%
Clearing & InlandLogistics
Rs. crore 4,047 3,667 10%
Freight forwarding
Volume inTEUs
25,495 26,106 (2%)
g. Tata Metaliks Limited:
Tata Metaliks Limited became a subsidiary of Tata Steel
Ltd. w.e.f 1st Februrary, 2008 and is the largest producer of
foundry grade Pig Iron in the country. The company, which
has an annual total capacity of 650,000 tonnes, is the largest
producer of foundry grade Pig Iron in the country and has
two plants: one at Kharagpur, West Bengal and the other
at Redi, Maharashtra. The company also has a joint venture
Tata Metaliks Kubota Pipes Limited with M/s. Kubota
Corporation, Japan for producing ductile iron pipes with an
annual capacity of 110,000 tonnes.
During the last two financial years, the company
has graduated from low-end ballast weight castings to
2090661-1 Tata Steel AR 2K8-9_2cSec1:126 Sec1:1262090661-1 Tata Steel AR 2K8-9_2cSec1:126 Sec1:126 7/18/09 10:00:16 PM7/18/09 10:00:16 PM

127
high-end crank case castings. The operational highlights
of the company during the financial year 2008-09 are
shown below:
Figures in ‘000 tonnes
Hot Metal Production 387
Pig Iron (capacity) 650
Pig Iron Production 378
Sales 379
During FY 09, while the Kharagpur unit of the company
operated at 78% of the total capacity (92% in the first half
and 62% in the second half ), the Redi unit operated at 20% of
its capacity primarily due to the complete shutdown of one
furnace throughout the year and slowdown of automotive
sector during the second half of the financial year.
Raw Materials:
India:
Tata Steel India is self-sufficient in iron ore due to its
captive mines. With regard to coking coal, the company is
self-sufficient to an extent of 52%, the balance amount being
procured mostly through imports largely covered by annual
contracts. At the Jharia collieries, the raw coal production
was slightly higher than FY 08 (1.582 million tonnes) at
1.587 million tonnes with flexibility in ash% between 16.5%
to 17.0% in Jamadoba and 15.5% to 17.0% in Bhelatand. The
West Bokaro division achieved the highest ever raw coal
production at 5.68 million tonnes (1.96 million tonnes of
clean coal at 13.96% ash). The iron ore sized production was
4.14 million tonnes and the fines production was higher by
8% to reach a level of 5.91 million tonnes.
Europe:
During FY 09, approximately 22 million tonnes of iron ore
and 11 million tonnes of coal were imported by TSE. While
iron ore was imported mainly from Australia, Canada, South
Africa and South America, coal was principally imported
from Australia, Canada and the US.
Supply contracts lasting typically anywhere between three
and ten years are entered into for certain raw materials for
steel production wherein the prices are generally agreed
upon on an annual basis. The TSE policy for these raw
materials is to ensure that at least 60% of the requirement
is accounted for by long-term contracts. The remaining raw
materials are purchased through one year contracts, options
and spot purchases at market rates providing flexibility and
commercial leverage.
The market reference price of iron ore fines for the calendar
year 2008 saw increases of around 65% as compared to
2007. This significant increase in price was driven by growth
in demand, predominantly from China. The price of hard
coking coal increased even more significantly, by more
than 200% in 2008 compared to 2007. Severe flooding
in Australia, which resulted in a massive under supply of
coal further exacerbated the unprecedented increase in
price. During the second half of 2008, the global demand
for steel and therefore, steel making raw materials
deteriorated sharply and spot prices fell. As a result,
significant contract price reductions are anticipated for
both iron ore and coal in 2009.
B. STRATEGY:
In February 2008, the Tata Steel Group launched a new
Vision with the aim of setting a world benchmark in Value
Creation and Corporate Citizenship.
With regard to Value Creation, the Tata Steel Group set
itself a target of increasing the return on invested capital of
its existing assets to 30% by 2012-13 and to generate
selective growth. In order to meet this target, the Group has
developed a two-fold strategy:
• In order to increase the quality of earnings of its existing
assets, the Group will pursue the optimisation of its
European assets, restructure low profitability assets
2090661-1 Tata Steel AR 2K8-9_2cSec1:127 Sec1:1272090661-1 Tata Steel AR 2K8-9_2cSec1:127 Sec1:127 7/18/09 10:00:16 PM7/18/09 10:00:16 PM

Hundred and second annual report 2008-09
128
and continue to derive benefits through continuous
improvement and synergies across the Group.
• In order to generate selective growth, the Group will
pursue capacity expansions and securing access to
raw materials. The Group is increasing its capacity
in India, through expansion of its current operations
in Jamshedpur and through the construction of a
greenfield site in Orissa, and assessment of raw material
investment opportunities as and when they arise.
Corporate citizenship involves providing a safe working
place, respecting the environment, caring for its
communities and demonstrating high ethical standards.
The Group wants to be a part of the climate change solution
and has set a target to reduce its CO2 emission from the
current 2.07 tonnes of CO2 per tonne of liquid steel to 1.5
tonnes of CO2 per tonne of liquid steel by 2012 through
process improvements, breakthrough technologies and
development of new products and services. More specifically,
the emission target is planned to be achieved through:
• Large investments including BOS gas recovery and
back pressure valves at Port Talbot and a new ladle
furnace at IJmuiden.
• Burden optimisation, e.g. through switching to pellet
feed, increased scrap ratio, reduced slag volume and
increased coal injection.
• Smaller investments and housekeeping actions e.g.
yield improvements, lighting efficiency and variable
speed drives across all entities.
During the year, the Group has continued to execute
its long-term strategy and the tactical planning for
development of new markets is well underway. South East
Asia is one of the key growth regions and the Group is
focussed on developing a greenfield expansion in Vietnam
and optimising operations in both NatSteel and Tata Steel
Thailand. In the construction sector, the Group is exploring
options to develop strong positions in India and in South
East Asia through leveraging its European expertise. The
Group also continued to explore raw material opportunities
to improve the cost competitiveness of its European and
South East Asian operations.
C. FINANCIAL ANALYSIS OF TATA STEEL INDIAN OPERATIONS (Standalone entity in India):
1. Net Sales / Income from Operations:
Figures in Rs. crore
FY 09 FY 08 Change Change %
Sale of products 25,945 21,392 4,553 21%
Sale of power and water 566 546 20 4%
Income from town, medical and other services
41 41 (0) 0%
Other operating income 291 210 81 39%
Total Sale of productsand services 26,844 22,190 4,654 21%
Less: Excise Duty 2,528 2,499 29 1%
Net sales/Income from Operations 24,316 19,691 4,625 23%
The net sales increased by 23% during FY 09 over FY 08
mainly due to higher prices realised on Steel as well as
other products during the first half of the financial year.
While realisation declined following the global economic
slowdown, Steel volumes improved significantly in the
second half as can be seen from the following table:
Figures in million tonnes
Steel volume H1 H2 Change %
FY 09 2.38 2.85 20%
FY 08 2.26 2.52 12%
2090661-1 Tata Steel AR 2K8-9_2cSec1:128 Sec1:1282090661-1 Tata Steel AR 2K8-9_2cSec1:128 Sec1:128 7/18/09 10:00:17 PM7/18/09 10:00:17 PM

129
The divisional net sales of the Company are shown below:
Figures in Rs. crore
Net Sales FY 09 FY 08 Change Change %
Steel 20,456 16,539 3,917 24%
Tubes 1,410 1,217 193 16%
Ferroalloys and Minerals 2,324 1,808 516 29%
Bearings 127 127 (0) 0%
Total 24,316 19,691 4,625 23%
As explained above net sales in the Steel division increased
by 23% due to increase in prices in the first half of FY 09
and increase in volume in the second half of FY 09. Similarly
sales of Tubes and Ferroalloys improved mainly due
to higher realisations experienced during the year on
account of increase in prices with lower volumes as
compared to the last year.
2. Raw Materials Consumed:
Figures in Rs. crore
FY 09 FY 08 Change Change %
Raw Materials consumed 5,710 3,355 2,355 70%
Raw Materials consumption showed significant increase
over the previous year mainly due to higher prices of Coal
and Coke and also due to higher production resulting from
the commissioning of ‘H’ Blast Furnace as well as other
facilities and operational improvements. Increase in the
prices of Ferroalloys also contributed to the increase in raw
materials consumed.
3. Payments to and Provisions for Employees:
Figures in Rs. crore
FY 09 FY 08 Change Change %
Payments to and provisions for employees
2,306 1,816 490 27%
The increase of staff cost over last financial year represents
the revised wages, arrears and impact of change in
discounting rate for valuation of employee benefits as per
Accounting Standards (AS15).
4. Conversion Charges:
Figures in Rs. crore
FY 09 FY 08 Change Change %
Conversion charges 1,042 857 185 22%
Conversion charges increased by 22% over FY 08 mainly
due to an increase in the conversion activities at the Long
Products division as well as an increase in the conversion of
tin coated products.
5. Stores and Spares Consumed:
Figures in Rs. crore
FY 09 FY 08 Change Change %
Stores consumed 1,249 936 313 33%
Stores consumption has gone up by 33% as compared to FY
08 primarily on account of higher production which was due
to the commissioning of ‘H’ Blast Furnace as well as other
facilities and operational improvements and an increase in
the price of operational refractories in Steel melting shops.
6. Purchase of Power:
Figures in Rs. crore
FY 09 FY 08 Change Change %
Purchase of Power
1,091 933 159 17%
There was an increase in expenses related to the purchase
of power at the Jamshedpur Works during the year as fourth
unit of Tata Power was shutdown for maintenance activities
and the Company (Tata Steel) had to purchase power at
higher rate from alternate sources. Increase in production,
increase in sale of power to other consumers also led to
higher purchase of power.
2090661-1 Tata Steel AR 2K8-9_2cSec1:129 Sec1:1292090661-1 Tata Steel AR 2K8-9_2cSec1:129 Sec1:129 7/18/09 10:00:17 PM7/18/09 10:00:17 PM

Hundred and second annual report 2008-09
130
7. Other Expenses:
Figures in Rs. crore
FY 09 FY 08 Change Change %
Other expenses 1,266 1,069 196 18%
Other expenses have gone up mainly due to consultancy
charges, exchange fluctuation on raw material supplies,
port charges due to increased exports, increase in brand
equity payment, software development charges, packing
charges due to increase in prices of steel packing materials
and higher payments for contractual jobs.
8. Net Finance Charges:
Figures in Rs. crore
FY 09 FY 08 Change Change %
Net Finance charges 1,153 787 366 47%
The net finance charges were higher by 47% over
the previous financial year mainly due to interest on
new non-convertible debentures issued during the year,
interest on fresh term loans taken during the year, interest
on working capital loans partly offset by the increase
in interest income from current investments, advances,
and deposits.
9. Fixed Assets:
Figures in Rs. crore
FY 09 FY 08 Change Change %
Gross Block 23,545 20,847 2,698 13%
Less: Impairment 100 100 — 0%
Less: Depreciation
8,962 8,123 839 10%
Net Block 14,482 12,624 1,859 15%
The Gross Block increased during the year primarily on
account of the 1.8 million tonne steel expansion programme
and the 3 million tonne steel expansion programme
(commenced in the last quarter of FY 09) at Jamshedpur.
10. Investments:
Figures in Rs. crore
FY 09 FY 08 Change Change %
Trade investments 1,744 1,152 592 51%
Investment in subsidiary companies
37,359 1,914 35,444 1852%
Investment in mutual funds
3,269 1,028 2,241 218%
Other current investments — 9 (9) (100%)
Total investments 42,372 4,103 38,269 933%
Increase in Investments in subsidiary companies was due to
conversion of advance against equity to Tata Steel Holdings
(included in loans and advances as on 31.3.08) and also
on account of further contributions to the capital of Tata
Steel Holdings apart from contributions to equity of some
subsidiary companies in India.
11. Stock-in-trade and Stores & Spares:
Figures in Rs. crore
FY 09 FY 08 Change Change %
Stock-in-trade 2,868 2,047 821 40%
Stores & Spares 612 558 55 10%
Total inventories 3,480 2,605 875 34%
The Stock-in-trade as on 31st March, 2009 was higher than
the level of 31st March, 2008 by Rs. 821 crore primarily
due to increase in the stock of finished and semi-finished
materials (Rs. 289 crore) as well as increase in stock of raw
materials (Rs. 532 crore).
The finished, semi-finished and scrap inventory went up
at the Works and Conversion agents. The raw materials
inventory was higher than last year for the steel works and
at the Ferro Alloys and Minerals Division due to a significant
increase in the prices of imported coal and coke as on
2090661-1 Tata Steel AR 2K8-9_2cSec1:130 Sec1:1302090661-1 Tata Steel AR 2K8-9_2cSec1:130 Sec1:130 7/18/09 10:00:17 PM7/18/09 10:00:17 PM

131
31st March, 2009 as compared to prices as on 31st March,
2008. The increase was also partly due to increase in the
stock level to support higher volume of operations.
The stores stock has gone up by Rs. 55 crore as on
31st March, 2009 over 31st March, 2008 mainly due to
an increase in stores and spares required to support the
upgraded Steel Melting Shops and Hot Strip Mill, new
facilities like the ‘H’ Blast Furnace and Sinter Plant #4 etc.
12. Sundry Debtors:
Figures in Rs. crore
FY 09 FY 08 Change Change %
Gross Debtors 662 577 85 15%
Less: Provision for doubtful debts
26 34 (8) (23%)
Net Debtors 636 543 93 17%
The debtors as on 31st March, 2009 was higher by Rs. 93
crore than the level of 31st March, 2008. The increase is in
line with the increase in turnover.
13. Loans and Advances:
Figures in Rs. Crore
FY 09 FY 08 Change Change %
Loans and advances
4,578 33,349 (28,771) (86%)
The loans and advances reduced substantially as the
advance against equity was converted into investments
during the financial year and accordingly there was an
increase in the investments.
14. Cash Flow and Net Debt:
Net cash flow from operating activities: The net cash from
operating activities was Rs. 7,397 crore during FY 09
as compared to Rs. 6,254 crore during FY 08. The cash
operating profit before working capital changes and direct
taxes during FY 09 was Rs. 9,457 crore, as compared to
Rs. 8,138 crore during the previous year (Depreciation was Rs.
973 crore in FY 09, FY 08: Rs. 835 crore). The change in working
capital, during the financial year, was mainly due to increase
in inventories on account of volumes and prices partly offset
by an increase in creditors. The payment of income taxes
during FY 09 was higher than in FY 08 by Rs. 737 crore.
Net cash from investing activities: The net cash outflow from
investing activities amounted to Rs. 9,428 crore in FY 09.
The outflow broadly represents a capex of Rs. 2,786 crore,
increase in investments in mutual funds of Rs. 2,241 crore
and an incremental investment in Tata Steel Holdings of
Rs. 4,286 crore.
Net cash from financing activities: The net cash from financing
activities was Rs. 3,156 crore during FY 09 as compared to
Rs. 15,848 crore during FY 08. The incremental borrowing of
Rs. 6,494 crore in the current year is mainly from the issue
of non-convertible debentures and term loans from Banks
partly offset by interest payment of Rs. 1,214 crore and a
dividend payment of Rs. 1,187 crore .
Net Debt:
Figures in Rs. crore
FY 09 FY 08 Change
Secured loans 3,913 3,521 392
Unsecured loans 23,033 14,501 8,532
Total Debt 26,946 18,022 8,924
Less : Cash and Bank balances
1,591 465 1,126
Less: Current investments 3,269 1,037 2,233
Net Debt 22,086 16,520 5,566
Net debt as on 31st March, 2009 stood at Rs. 22,086 crore as
compared to Rs. 16,520 crore as on 31st March, 2008. During
the current fiscal year, the secured and unsecured loans
increased by Rs. 8,924 crore as compared to the balances as
2090661-1 Tata Steel AR 2K8-9_2cSec1:131 Sec1:1312090661-1 Tata Steel AR 2K8-9_2cSec1:131 Sec1:131 7/18/09 10:00:17 PM7/18/09 10:00:17 PM

Hundred and second annual report 2008-09
132
on 31st March, 2008 mainly due to issue of privately placed
non-convertible debentures, term loans taken from Banks
and other short term borrowings.
D. FINANCIAL ANALYSIS OF THE TATA STEEL GROUP:
1. Net Sales/Income from Operations:
Figures in Rs. crore
FY 09 FY 08 Change
Tata Steel 24,316 19,691 4,625
Tata Steel Europe 109,570 100,218 9,351
NatSteel 13,468 7,658 5,811
Tata Steel Thailand 3,965 4,077 (112)
Others 4,606 3,327 1,279
Eliminations & Adjustments
(8,596) (3,438) (5,159)
Total 147,329 131,534 15,796
Sales (net of duties) increased by 12% during FY 09 primarily
due to higher sales during the first six months partly offset
by lower sales in the second half on account of the impact
of the global slowdown. Other than Tata Steel India, all
other steel units had a lower volume of sales during FY 09
as compared to FY 08. NatSteel had higher sales from the
minerals business. Tata Metaliks Limited, which became a
subsidiary of Tata Steel in Q4FY 08 contributed Rs. 805 crore
to the increase in net sales.
2. Purchase of Finished, Semi-finished and Other Products:
Figures in Rs. crore
FY 09 FY 08 Change
Tata Steel 359 388 (29)
Tata Steel Europe 23,513 19,151 4,362
NatSteel 6,817 4,876 1,941
Tata Steel Thailand 2,652 2,500 152
Others 795 1,063 (268)
Eliminations & Adjustments
(2,731) (1,009) (1,722)
Total 31,406 26,969 4,437
The purchase of finished and semi-finished products
increased by 16% during FY 09 over FY 08 mainly on
account of increases in prices experienced in Tata Steel Europe,
NatSteel and Tata Steel Thailand (TSTH), especially during the
first half year of the current fiscal partly offset during Q3 and Q4
of FY 09 by lower volume of operations on account of
pullback of demand.
3. Raw Materials consumed:
Figures in Rs. crore
FY 09 FY 08 Change
Tata Steel 5,710 3,355 2,355
Tata Steel Europe 34,063 29,317 4,746
NatSteel 4,907 1,694 3,213
Tata Steel Thailand 225 165 60
Others 1,498 428 1,071
Eliminations & Adjustments
(4,872) (1,700) (3,172)
Total 41,532 33,259 8,272
Raw Materials consumed increased by 25% primarily due
to an increase in the prices of raw materials (especially iron
ore, coal, and coke) partly offset by the reduction in the
production volume of TSE and South East Asia.
4. Payments to and Provisions for Employees:
Figures in Rs. crore
FY 09 FY 08 Change
Tata Steel 2,306 1,816 490
Tata Steel Europe 14,931 14,513 418
NatSteel 364 303 61
Tata Steel Thailand 79 75 4
Others 295 193 102
Eliminations & Adjustments
— 0 (0)
Total 17,975 16,900 1,075
2090661-1 Tata Steel AR 2K8-9_2cSec1:132 Sec1:1322090661-1 Tata Steel AR 2K8-9_2cSec1:132 Sec1:132 7/18/09 10:00:17 PM7/18/09 10:00:17 PM

133
The staff cost increased by 6% mainly due to the
increase of Rs. 418 crore in Tata Steel Europe and Rs. 490
crore in Tata Steel India. The increases in Tata Steel Europe
were on account of increase in the average number of
employees in the first half of the year, offset by the fall
in employment costs experienced in Q4FY 09 as a
result of the production cutbacks. The increases
in Tata Steel Indian operations were for revised wages,
arrears and impact of change in discounting rate for
valuation of employee benefits as per Accounting
Standards (AS15).
5. Purchase of Power:
Figures in Rs. crore
FY 09 FY 08 Change
Tata Steel 1,091 933 159
Tata Steel Europe 4,288 3,448 840
NatSteel 212 211 0
Tata Steel Thailand 237 271 (34)
Others 150 83 67
Eliminations & Adjustments
(20) (16) (4)
Total 5,957 4,929 1,028
Power charges increased by 21% mainly due to increase
in electricity prices over the last 12 months in Tata Steel
Europe and in the Indian Operations due to higher
purchase of power expenses at the Jamshedpur Works
as a fourth unit of Tata Power was shutdown for
maintenance activities and the company (Tata Steel) had
to purchase power at higher rates from alternate sources.
Increase in production, increase in sale of power to other
consumers also led to higher consumption of power at the
Indian operations.
6. Freight and Handling Charges:
Figures in Rs. crore
FY 09 FY 08 Change
Tata Steel 1,251 1,141 111
Tata Steel Europe 4,134 4,269 (135)
NatSteel 257 218 39
Tata Steel Thailand 29 50 (21)
Others 613 545 68
Eliminations & Adjustments
(260) (184) (76)
Total 6,025 6,039 (14)
Increase in freight and handling charges on account of
increase in sales volume for Indian operations was offset by
reduction in volume at Tata Steel Europe.
7. Other Expenditure:
Figures in Rs. crore
FY 09 FY 08 Change
Tata Steel 4,754 4,083 671
Tata Steel Europe 17,882 21,978 (4,097)
NatSteel 577 531 46
Tata Steel Thailand 411 525 (114)
Others 1,378 712 666
Eliminations & Adjustments
(672) (526) (146)
Total 24,331 27,304 (2,974)
Other Expenditure represents the following expenses:
Figures in Rs. crore
FY 09 FY 08 Change
Stores and Spares consumed
9,520 8,413 1,107
Fuel Oil Consumed 1,028 719 309
Repairs to Buildings 576 432 144
Repairs to Machinery 5,817 6,345 (528)
Relining Expenses 101 63 38
Conversion Charges 1,086 880 206
Rent 3,689 3,757 (68)
Royalty 235 178 57
Rates and Taxes 627 571 56
Others(*) 1,652 5,947 (4,294)
Total 24,331 27,304 (2,974)
2090661-1 Tata Steel AR 2K8-9_2cSec1:133 Sec1:1332090661-1 Tata Steel AR 2K8-9_2cSec1:133 Sec1:133 7/18/09 10:00:18 PM7/18/09 10:00:18 PM

Hundred and second annual report 2008-09
134
(*) includes Insurance charges, commissions, discounts
and rebates, provision for wealth tax, adjustments relating
to previous years, other expenses, provision for doubtful
debts and advances, excise duty and expenditure transferred
to capital.
The other expenditure during FY 09 was lower by 11% as
compared to FY 08. Decrease in other expenditure of Tata
Steel Europe was due to Gains on financial derivatives
and foreign exchange fluctuation more than offsetting
increases in stores consumption (on account of increase in
energy costs), repairs, rent and rates, legal and professional
fees and other administrative expenses, resulting in overall
decrease in other expenses. Increases in Other Expenditure
for Tata Steel India were mainly on account of increase in
stores consumption on account of increase in volume of
operations, higher maintenance expenses, conversion
charges for Ferroalloys and tin coated products, export
duty on steel exports, higher royalty charges, exchange
fluctuation on supplies etc.
8. Net Finance Charges:
Figures in Rs. crore
FY 09 FY 08 Change
Tata Steel 1,153 786 366
Tata Steel Europe 2,043 2,760 (718)
NatSteel 74 56 17
Tata Steel Thailand 23 32 (9)
Others (2) 450 (453)
Total 3,290 4,085 (795)
The reduction in net finance charges is primarily on account
of benefit of interest rate reduction achieved in Tata Steel
Europe as a part of redenomination of the senior loan
facilities during end 2007 partly offset by the term loans
taken and NCDs issued during the year by Tata Steel India.
9. Stock-in-trade:
Figures in Rs. crore
Stock-in-trade FY 09 FY 08 Inc./(Dec.)
Tata Steel 2,868 2,047 821
Tata Steel Europe 14,931 17,447 (2,516)
NatSteel 1,115 1,005 110
Tata Steel Thailand 428 450 (22)
Others 474 460 14
Total 19,816 21,409 (1,593)
Stock-in-trade (Raw materials, WIP and Finished and
semi finished) for the Group was lower on 31st March,
2009 as compared to 31st March, 2008, primarily
on account of a net realisable value provision at
TSE. The stock value was higher in Tata Steel India
primarily due to higher valued raw material stock
(imported coal and coke) and increase in finished,
semi-finished and scrap inventory at Works and with
conversion agents.
10. Stores and Spares Stock:
Figures in Rs. crore
Stores and Spaces FY 09 FY 08 Inc./(Dec.)
Tata Steel 612 558 55
Tata Steel Europe 780 845 (65)
NatSteel 77 55 23
Tata Steel Thailand 298 158 140
Others 85 39 46
Total 1,853 1,655 198
The Stores stock was higher in Indian operations
due to an increase in stores and spares for new and
upgraded facilities (CC3 in LD1, Hot Strip Mill (rolls),
‘H’ Blast Furnace etc.). Tata Steel Thailand experienced
stock increases due to a decrease in stores consumption
on account of lower volume.
2090661-1 Tata Steel AR 2K8-9_2cSec1:134 Sec1:1342090661-1 Tata Steel AR 2K8-9_2cSec1:134 Sec1:134 7/18/09 10:00:18 PM7/18/09 10:00:18 PM

135
11. Debtors:
Figures in Rs. crore
Debtors FY 09 FY 08 Inc./(Dec.)
Tata Steel 636 543 93
Tata Steel Europe 11,480 16,951 (5,471)
NatSteel 924 648 276
Tata Steel Thailand 73 305 (232)
Others (81) 251 (331)
Total 13,032 18,698 (5,666)
The debtors balances for the Group decreased by Rs. 5,666
crore at the end of March, 2009 over the level at the end of
March 2008 mainly due to a decrease in debtors balances
in Tata Steel Europe on account of lower sales during the
fourth quarter.
12. Cash Flow and Net Debt:
Net cash flow from operating activities: The net cash from
operating activities was Rs. 15,630 crore during FY 09
as compared to Rs. 13,394 crore during FY 08. The cash
operating profit before working capital changes and
direct taxes during FY 09 was Rs. 18,792 crore as compared
to Rs. 18,302 crore during FY 08. The working capital
during FY 09 reduced by Rs. 225 crore, mainly due to a
reduction in Inventory (with reduction in finished and
semi-finished inventory and increase in raw materials
inventory) and Debtors.
Net cash from investing activities: The net cash outflow from
investing activities amounted to Rs. 10,757 crore in FY 09 as
against an outflow of Rs. 46,198 crore in FY 08. The outflow
during the current year represents capital expenditure of
Rs. 8,433 crore and investments in mutual funds of
Rs. 2,825 crore (net of sale). The outflow in the previous year
was on account of capital expenditure of Rs. 8,420 crore and
Rs. 40,740 crore towards acquisition of Corus Group plc.
Net cash from financing activities: The net cash outflow
from financing activities was Rs. 2,754 crore during
FY 09 as compared to inflow of Rs. 20,543 crore during
FY 08. There is a net borrowing (net of payments) of
Rs. 2,052 crore during the current year mainly from
the issue of debentures, term loan from Banks and
other borrowings partly offset by repayment of external
debts and other repayments. The last year’s borrowings
represent the loans taken for funding the acquisition of
Corus Group Plc.
Net Debt:
Figures in Rs. crore
FY 09 FY 08 Change
Secured loans 34,329 35,415 (1,086)
Unsecured loans 25,571 18,210 7,361
Total Debt 59,901 53,625 6,276
Less: Cash and Bank Balances
6,148 4,232 1,917
Less: Current investments
3,398 1,134 2,264
Net Debt 50,354 48,259 2,095
The increase in net debt by Rs. 2,095 crore represents
an increase in the gross debt by Rs. 6,276 crore due
to the issue of non-convertible debentures and term
loans taken from Banks, by Tata Steel India, partly
compensated by repayment of external debts at Tata
Steel Europe. The increase in gross debts was offset by
an increase in current investments (in growth funds) by
Rs. 2,264 crore and an increase in the cash and bank
balance by Rs. 1,917 crore.
2090661-1 Tata Steel AR 2K8-9_2cSec1:135 Sec1:1352090661-1 Tata Steel AR 2K8-9_2cSec1:135 Sec1:135 7/20/09 6:03:07 PM7/20/09 6:03:07 PM

Hundred and second annual report 2008-09
136
E. INTERNAL CONTROLS & SYSTEMS:
Indian Operations:
The Company has adequate internal control systems and
procedures in place commensurate with the size and
nature of its business. The effectiveness of the internal
controls is continuously monitored by the Corporate
Audit Division of the Company. Corporate Audit’s
main objective is to provide to the Audit Committee
and the Board of Directors, an independent, objective
and reasonable assurance of the adequacy and
effectiveness of the organisation’s risk management,
control and governance processes. Corporate Audit
also assesses opportunities for improvement in
business processes, systems & controls and may
provide recommendations, designed to add value to
the organisation. The division also follows up on the
implementation of corrective actions and improvements
in business processes after review by the Audit
Committee and Senior Management.
The scope and authority of the Corporate Audit division
is derived from the Audit Charter approved by the Audit
Committee. The Charter is designed in a manner that the
Audit Plan is focussed on the following objectives:
• Review of the identification and management of Risks.
• All operational and related activities are performed
efficiently and effectively.
• Significant financial, managerial and operating
information is relevant, accurate, reliable and is
provided timely.
• Resources are acquired economically, used efficiently
and safeguarded adequately.
• Employees’ actions are in accordance with the Company’s
policies and procedures, the Tata Code of Conduct and
applicable laws and regulations.
• Significant legislative and regulatory provisions
impacting the organisation are recognised and
addressed appropriately.
• Opportunities identified during audits, for improving
management control, business targets and profitability,
process efficiency and the organisation’s image,
are communicated to the appropriate level of
management.
• Shareholders’ and other Stakeholders’ wealth and
welfare are preserved, protected and enhanced.
The audit activities are undertaken as per the Annual Audit
Plan developed by Corporate Audit based on the risk profile
of business processes/sub-processes of various functions.
The Audit Plan is approved by the Audit Committee which
regularly reviews compliance to the Plan.
During the year, the Audit Committee met regularly to
review the reports submitted by the Corporate Audit
Division. All significant audit observations and follow-up
actions thereon were reported to the Audit Committee.
The Audit Committee also met the Company’s Statutory
Auditors to ascertain their views on the adequacy of internal
control systems in the Company and their observations on
financial reports. The Audit Committee’s observations and
suggestions were acted upon by the Management.
2090661-1 Tata Steel AR 2K8-9_2cSec1:136 Sec1:1362090661-1 Tata Steel AR 2K8-9_2cSec1:136 Sec1:136 7/18/09 10:00:18 PM7/18/09 10:00:18 PM
137
UK & European Operations:
TSE has a well-established internal audit function that
reports to the Director Finance on a day-to-day basis
and has direct access to the chairman of the Audit
Committee, who meets with the Director Audit several
times each year. The Audit Committee receives reports
from the internal audit function four times a year and also
considers the terms of reference, plans and effectiveness
of the function. The internal audit function works closely
with the external auditors. It provides independent and
objective assurance to the Board, the Audit Committee
and the Executive Committee on the systems of
internal control employed in the Group, and provides
a systematic, disciplined approach to evaluating and
improving the effectiveness of risk management, control
and governance procedures.
The Board of Directors is responsible for TSE’s system of
internal control and reviewing its effectiveness.
There were no changes in internal control over financial
reporting that occurred during the period under review
that have materially affected, or are reasonably likely to
materially affect, internal control over financial reporting.
However, the asset protection function has been reorganised
and strengthened during the year.
TSE’s system of internal control has been designed in
order to provide the directors with reasonable assurance
that its assets are safeguarded, that transactions are
authorised and properly recorded and that material errors
and irregularities are either prevented or detected within
a timely period.
F. RISK MANAGEMENT:
Industry Cyclicality:
The steel industry is subject to cyclical swings arising
from factors such as excessive capacity expansion, volatile
demand swings etc.
The current global economic crisis which accelerated
during the second half of the financial year resulted in a
sharp contraction in global steel demand, especially in
the construction and automotive sectors of the developed
economies of UK, Europe and United States. To align with
significantly lower demand, TSE quickly implemented
reductions in output and put in place programmes aimed at
short term cost reduction as well as streamlining operations
and assets with a view to positioning the operational
readiness for the eventual market recovery. Such measures
are now substantially in place and are already accruing
savings and have allowed the Group to avert the worst
effects of this sharp and sudden downturn.
The Group has profitable operations in India that are
expected to experience positive growth in steel demand
and in South East Asia which are expected to recover more
quickly from the current downturn and this diversity will
help the Group to cushion the shortfall in the UK and
European sphere.
Raw Materials Security and Price Volatility:
During the first half of FY 09 strong economic growth
experienced by the global economies, led by China
and India led to strong demand for steel worldwide.
Even as the mining and shipping industry struggled to
2090661-1 Tata Steel AR 2K8-9_2cSec1:137 Sec1:1372090661-1 Tata Steel AR 2K8-9_2cSec1:137 Sec1:137 7/18/09 10:00:18 PM7/18/09 10:00:18 PM

Hundred and second annual report 2008-09
138
respond to the massive growth in demand, prices for iron
making materials like iron ore, coal, Ferroalloys,
scrap and freight climbed relentlessly. Although the
economic downturn has dampened short-term
sentiments, the underlying demand for scarce resources
is expected to resume once the world economies
progressively recover.
The Group has therefore identified it as a priority to
increase its overall raw material security threshold from its
current level of 25% to 60% within the next few years. To
this end, the group’s 35% stake in the Benga Coal Project
with Riversdale Mining in Mozambique is a major step.
The Government of Mozambique has approved the Mining
Contract for the tenements which represents a significant
step towards commencement of the project. Under the
offtake agreement with Riversdale, the Group has rights
to 40% of the mine’s output. Tata Steel also holds 14.99%
equity stake in the parent company Riversdale Mining
Limited. The Group is also well positioned to benefit
from the Direct Shipping Ore (“DSO”) project with New
Millennium Capital Corp (“NML”) in Canada.
Operationally, the Group enters into long-term contracts and
annual benchmark pricing contracts for its key raw material
requirements. This approach provides price certainty and
an objective basis for the recovery of cost increases from
its customers.
Growth Strategy:
The Company’s growth strategy comprises of various
capital expenditure programmes and/or acquisitions in
different locations. Integration and project execution risks
therefore exist.
In light of the current economic situation, except for
critical raw material related investments and those
approved capital expenditure programmes at the
Jamshedpur site which are expected to deliver immediate
incremental earnings on completion, all other major group
investments and capital projects have been put on hold.
This prudent approach will allow the accumulation of cash
resources and its subsequent deployment will be based on
new priorities of profit contributions and quick time to
market principles.
The integration of TSE post 2007 is critical to achieving
the promised synergies for the Tata Steel Group. It is now
two years in the making and the integration process is
proceeding well at all levels of interaction.
Health, Safety & Environmental Risks:
The manufacture of steel involves steps that are potentially
hazardous and which are likely to cause disruptions to normal
operations if not executed with due care. The Company’s
businesses are subject to numerous laws, regulations and
contractual commitments relating to health, safety and the
environment in the countries in which it operates. These
rules are becoming more stringent.
The Group has set specific goals to be achieved by 2012 in
the areas of CO2 emissions (1.5 tonnes per tonne of liquid
steel) and LTIF (below 0.4).
Technology Risks:
One of the biggest risks before the Group is to ensure that
the its plants are equipped with upto date technologies that
can give it cost competitiveness and R & D leadership.
2090661-1 Tata Steel AR 2K8-9_2cSec1:138 Sec1:1382090661-1 Tata Steel AR 2K8-9_2cSec1:138 Sec1:138 7/18/09 10:00:19 PM7/18/09 10:00:19 PM

139
For this purpose, the Group has not cut back the necessary
capital investments in relation to the same and continues to
enhance and deploy R & D capabilities.
Regulatory & Compliance Risks:
Global operations require compliance with multiple and
complex laws and regulations. In countries where the
political systems are still evolving, frequent changes in
economic policy are common, investment guarantees and
property rights are secured, any unforeseen changes can
expose the Group’s businesses to uncertainties.
The Group operations are primarily in countries where
investment flows are freer and where there are established
political, business and legal frameworks in place. There is an
established due process to independently evaluate country
risk exposures for investments in emerging economies.
Financing:
The Company funded the acquisition of Corus with a
significant level of debt that was assumed at the acquired
company level. Sharp decline in steel demand and prices
particularly during the second half of the financial year
has adversely affected the cash flow generation of TSE and
potentially put a strain on its ability to meet the current
scheduled debt repayment obligations under the existing
Senior Facility Agreement.
The Group has successfully renegotiated specific terms
relating to debt repayments and financial covenant
measurements. Unless the current economic crisis does not
get protracted, these reset criteria are expected to provide
TSE with the necessary space and time to work towards
returning to sustainable profit levels.
Pensions:
The Tata Steel business in Europe provides retirement
benefits for substantially all of its employees, including
defined benefit plans. The market value of pension assets
and liabilities is significantly greater than the net assets of
TSE and therefore, any change can have a material impact
on the financial statements as well as impacting the level of
company pension contributions.
Despite the steep decline encountered in the financial
markets, none of the Group’s funded schemes are in
under-funded positions. In its continuing search to
ensure that pension obligations remain sustainable and
affordable, it was decided to close the UK defined benefit
scheme to new members and replace it with a defined
contribution arrangement.
Forex, Credit, Liquidity and Counterparty Risks:
Through its global operations, the Group operates in several
currency areas. The major currencies used in its sales and
procurement activities are the US Dollar, Euro and Sterling
pound. Any major fluctuations or change in currency trends
can greatly affect not only the Group’s short-term trading
positions but the long-term economic competitive position
vis-à-vis imports. The current economic crisis has also raised
credit and counterparty risks, especially with the withdrawal
of credit insurance.
The Group has a hedging policy in place to protect its trading
and manufacturing margins against rapid and significant
movements in its major trading currencies. Under current
market conditions, all cash is swept into regional centres for
more effective concentration and deployment. The Group
does not enter into leveraged derivative instruments.
2090661-1 Tata Steel AR 2K8-9_2cSec1:139 Sec1:1392090661-1 Tata Steel AR 2K8-9_2cSec1:139 Sec1:139 7/18/09 10:00:19 PM7/18/09 10:00:19 PM

Hundred and second annual report 2008-09
140
G. STATUTORY COMPLIANCE:
The Managing Director makes a declaration at each
Board Meeting regarding the compliance with provisions
of various statutes after obtaining confirmation from
all the units of the company. The Company Secretary
ensures compliance with the SEBI regulations and
provisions of the Listing Agreement. The Group Chief
Financial Officer as the Compliance Officer ensures
compliance with the guidelines on the insider trading for
prevention of insider trading.
H. CAUTIONARY STATEMENT:
Statements in the Management Discussion and Analysis
describing the Company’s objectives, projections, estimates,
expectations may be “forward-looking statements” within
the meaning of applicable securities laws and regulations.
Actual results could differ materially from those expressed
or implied. Important factors that could make a difference
to the Company’s operations include economic conditions
affecting demand/supply and price conditions in the
domestic and overseas markets in which the Company
operates, changes in the Government regulations, tax laws
and other statutes and incidental factors.
2090661-1 Tata Steel AR 2K8-9_2cSec1:140 Sec1:1402090661-1 Tata Steel AR 2K8-9_2cSec1:140 Sec1:140 7/18/09 10:00:19 PM7/18/09 10:00:19 PM

141
HighlightsFigures in Rupees crores
Tata Steel Standalone Tata Steel Group
2008-09 2007-08 2008-09 2007-08
Gross revenue 27,152.00 22,432.35 1,50,250.61 1,34,562.63
Profi t before taxes 7,315.61 7,066.36 6,743.24 16,371.06
Profi t after taxes 5,201.74 4,687.03 4,849.24 12,321.76
Profi t after minority interest and share ofprofi t of associates 4,950.90 12,349.98
Dividends (including Tax on Dividends) 1,492.50 1,393.55 1,494.97 1,397.80
Retained earnings 4,682.64 4,128.09 7,721.32 15,089.13
Capital employed 58,165.04 46,920.41 90,777.94 92,037.98
Net worth 29,599.53 27,145.62 27,137.14 34,018.35
Borrowings 26,946.18 18,021.69 59,900.50 53,624.74
Ratio Ratio Ratio Ratio
Net Debt : Equity 0.78 0.81 1.65 1.99
Rupees Rupees Rupees Rupees
Net worth per Share as at year end 360.18 376.28 330.70 472.27
Earnings per Share :
Basic 69.45 66.80 66.07 176.81
Diluted 61.78 61.29 58.99 162.62
Dividend per Share 160% 160% 160% 160%
Employees (Numbers) 34,918 35,870 86,548 87,598
Shareholders (Numbers) 8,57,041 6,87,564

Hundred and second annual report 2008-09
142
Sources and Utilisation of Funds
(Rupees crores)
Total for 2004-05 to 2008-09 2007-08 2006-07 2005-06 2004-05 2008-09
SOURCES OF FUNDS :
1. FUND GENERATED FROM
OPERATIONS
(a) PROFIT AFTER TAXES ............... 5,201.74 4,687.03 4,222.15 3,506.38 3,474.16 21,091.46
(b) DEPRECIATION ............................ 973.40 834.61 819.29 775.10 618.78 4,021.18
(c) OTHER INCOME AND
ADJUSTMENTS ........................... (636.20) 208.67 853.79 136.68 (14.08) 548.86
(d) TOTAL .......................................... 5,538.94 5,730.31 5,895.23 4,418.16 4,078.86 25,661.50
2. SHARE CAPITAL
(INCLUDING SHARE PREMIUM) ......... (278.85) 9,666.03 174.06 — — 9,561.24
3. NET INCREASE / (DECREASE)
IN BORROWINGS ................................. 8,924.49 8,376.36 7,129.18 (223.55) (642.51) 23,563.97
14,184.58 23,772.70 13,198.47 4,194.61 3,436.35 58,786.71
UTILISATION OF FUNDS :
4. CAPITAL EXPENDITURE ..................... 2,846.79 2,448.35 2,007.68 1,527.58 1,978.36 10,808.76
5. INVESTMENTS (NET) ........................... 38,268.59 (2,002.99) 2,036.22 1,637.31 238.53 40,177.66
6. DIVIDENDS# ......................................... 1,492.50 1,393.55 1,104.33 820.43 821.37 5,632.18
7. NET INCREASE / (DECREASE) IN
WORKING CAPITAL* ............................. (28,882.62) 21,945.43 7,819.35 45.29 290.44 1,217.89
8. MISC. EXPENDITURE** ........................ 459.32 (11.64) 230.89 164.00 107.65 950.22
14,184.58 23,772.70 13,198.47 4,194.61 3,436.35 58,786.71
# Including tax on dividend Rs. 214.10 crores (2007-08 : Rs. 202.43 crores, 2006-07 : Rs. 160.42 crores, 2005-06 : Rs. 100.92 crores,
2004-05 : Rs. 101.86 crores).
* Stocks and stores, book debts, advances and cash balances less trade creditors, provisions etc.
** Expenses of Employee Separation Compensation not amortised (Net of Provision).

143
Auditors’ Report
TO THE MEMBERS OF TATA STEEL LIMITED
1. We have audited the attached Balance Sheet of TATA STEEL LIMITED, as at 31st March, 2009, the Profi t and Loss Account for the year ended on that date and the Cash Flow Statement for the year ended on that date both annexed thereto in which are incorporated the Returns from the Singapore Branch audited by another auditor. These fi nancial statements are the responsibility of the Company’s management. Our responsibility is to express an opinion on these fi nancial statements based on our audit.
2. We conducted our audit in accordance with auditing standards generally accepted in India. Those Standards require that we plan and perform the audit to obtain reasonable assurance about whether the fi nancial statements are free of material misstatement. An audit includes examining, on a test basis, evidence supporting the amounts and disclosures in the fi nancial statements. An audit also includes assessing the accounting principles used and signifi cant estimates made by management, as well as evaluating the overall fi nancial statement presentation. We believe that our audit provides a reasonable basis for our opinion.
3. As required by the Companies (Auditor’s Report) Order, 2003 issued by the Central Government of India in terms of sub-section (4A) of Section 227 of the Companies Act, 1956, we enclose in the Annexure a statement on the matters specifi ed in paragraphs 4 and 5 of the said Order to the extent applicable.
4. Further to our comments in the Annexure referred to in paragraph (3) above, we report that :
(a) we have obtained all the information and explanations, which to the best of our knowledge and belief were necessary for the purposes of our audit;
(b) in our opinion, proper books of account as required by law have been kept by the Company so far as appears from our examination of the books and proper returns adequate for the purposes of our audit have been received from the Singapore Branch not visited by us. The Branch Auditor’s Report has been forwarded to us and appropriately dealt with;
(c) the Balance Sheet, the Profi t and Loss Account and Cash Flow Statement dealt with by this report are in agreement with the books of account and with the audited returns from the branch;
(d) in our opinion, the Balance Sheet, the Profi t and Loss Account and Cash Flow Statement dealt with by this report comply with the Accounting Standards referred to in sub-section (3C) of Section 211 of the Companies Act, 1956;
(e) in our opinion, and to the best of our information and according to the explanations given to us, the said accounts give the information required by the Companies Act, 1956, in the manner so required and give a true and fair view in conformity with the accounting principles generally accepted in India :
(i) in the case of the Balance Sheet, of the state of affairs of the Company as at 31st March, 2009;
(ii) in the case of the Profi t and Loss Account, of the profi t of the Company for the year ended on that date; and
(iii) in the case of the Cash Flow Statement, of the cash fl ows for the year ended on that date.
5. On the basis of written representations received from the directors, as on 31st March, 2009 and taken on record by the Board of Directors, we report that none of the directors is disqualifi ed as on 31st March, 2009 from being appointed as a director in terms of clause (g) of sub-section (1) of Section 274 of the Companies Act, 1956.
For DELOITTE HASKINS & SELLSChartered Accountants,
P. R. RAMESHPartner.Membership No. : 70928
Mumbai, 25th June, 2009
Hundred and second annual report 2008-09
144
Annexure to the Auditors’ Report
[Referred to in paragraph (3) of our report of even date]
The nature of the Company’s business/activities during the year is such that clauses (xii), (xiii) and (xiv) of paragraph 4 of the
Companies (Auditor’s Report) Order, 2003 are not applicable to the Company
(i) In respect of its fi xed assets :
(a) The Company has maintained proper records showing full particulars including quantitative details and situation
of fi xed assets.
(b) Some of the fi xed assets have been physically verifi ed during the year by the Management in accordance with a
programme of verifi cation, which in our opinion provides for physical verifi cation of all the fi xed assets at reasonable
intervals. According to the information and explanations given to us no material discrepancies were noticed on
such verifi cation.
(c) The fi xed assets disposed off during the year, in our opinion, do not constitute substantial part of the fi xed assets
of the Company and such disposal has, in our opinion, not affected the going concern status of the Company.
(ii) In respect of its inventories :
(a) As explained to us, the inventories of fi nished and semi-fi nished goods and raw materials at Works, Mines and
Collieries were physically verifi ed during the year by the Management. In respect of stores and spare parts and
stocks at stockyards and with Consignment/Conversion Agents, the Company has a programme of verifi cation of
stocks over a three-year period. In our opinion, having regard to the nature and location of stocks, the frequency
of verifi cation is reasonable. In case of materials lying with third parties, certifi cates confi rming stocks have been
received in respect of a substantial portion of the stocks held.
(b) In our opinion and according to the information and explanations given to us, the procedures of physical verifi cation
of inventories followed by the management were reasonable and adequate in relation to the size of the Company
and the nature of its business.
(c) In our opinion and according to the information and explanations given to us, the Company has maintained proper
records of its inventories and no material discrepancies were noticed on physical verifi cation.
(iii) According to the information and explanations given to us, the Company has not granted or taken any secured or
unsecured loan to or from companies, fi rms or other parties covered in the Register maintained under Section 301 of
the Companies Act, 1956. Consequently, clauses (iii)(a) to (iii)(g) of paragraph 4 of the order are not applicable.
(iv) In our opinion and according to the information and explanations given to us, having regard to the explanation that some
of the items purchased are of special nature and suitable alternative sources do not exist for obtaining comparable
quotations, there is adequate internal control system commensurate with the size of the Company and the nature of
its business for the purchase of inventories and fi xed assets and for the sale of goods and services and we have not
observed any continuing failure to correct major weaknesses in such internal control system.

145
(v) According to the information and explanations given to us, the Company has not entered into any contract or arrangement
with other parties, which needs to be entered in the register maintained under Section 301 of the Companies Act, 1956.
Consequently, clause (v)(a) and (v)(b) of paragraph 4 of the order are not applicable.
(vi) In our opinion and according to the information and explanations given to us, the Company has complied with the
provisions of Sections 58A, 58AA or any other relevant provisions of the Companies Act, 1956 and the Companies
(Acceptance of Deposits) Rules, 1975 with regard to the deposits accepted from the public.
(vii) In our opinion, the Company has an adequate internal audit system commensurate with the size and nature of its
business.
(viii) We have broadly reviewed the books of account and records maintained by the Company relating to the manufacture of
bearings, steel tubes and pipes, steel, chrome ore and alloys and electricity, pursuant to the Rules made by the Central
Government for the maintenance of cost records under Section 209(1)(d) of the Companies Act, 1956 and are of the
opinion that prima facie, the prescribed accounts and records have been made and maintained. We have, however,
not made a detailed examination of the records with a view to determining whether they are accurate or complete. To
the best of our knowledge and according to the information given to us, the Central Government has not prescribed the
maintenance of cost records for any other product of the Company.
(ix) In respect of Statutory Dues :
(a) According to the information and explanations given to us, the Company has been generally regular in depositing
undisputed statutory dues including Provident Fund, Investor Education and Protection Fund, Income Tax,
Sales Tax, Wealth Tax, Service Tax, Custom Duty, Excise Duty, Cess and other material statutory dues with the
appropriate authorities during the year. We are informed that the Company intends to obtain exemption from the
operation of the Employees’ State Insurance Act at all locations and necessary steps have been taken by the
Company. We are also informed that action taken by the authorities at some locations to bring the employees of
the Company under the Employees’ State Insurance Scheme has been contested by the Company and accordingly
full payment has not been made of the contributions demanded.
(b) According to the information and explanations given to us, no undisputed amounts payable in respect of Income
Tax, Wealth Tax, Sales Tax, Custom Duty, Excise Duty, Cess and other material statutory dues, were in arrears,
as at 31st March, 2009 for a period of more than six months from the date they became payable, except for
collection of sales tax which we are informed are refundable to customers because they have been collected in
excess or which have been collected pending receipt of the relevant certifi cates from the customers.

Hundred and second annual report 2008-09
146
(c) According to the information and explanations given to us, details of dues of sales tax, wealth tax, service tax,
customs duty, excise duty and cess which have not been deposited as on 31st March, 2009 on account of any
dispute are given below :
Name of the Statute(Nature of the Dues)
Period to which the amount relates
Forum where matter is pending
AmountRs. crores
Customs duty 1990-91, 1993-94 Supreme Court 9.66
2002-03 High Court 0.03
1993-94 Commissioner 3.92
Excise duty 2005-06 Supreme Court 235.48
1988-89 to 1995-99, 2000-01, 2003-04 to 2005-08
High Court 152.77
1985-1987, 1990-91, 1992-93 to 1994-95, 1996-97 to 2008-09
Tribunal 158.93
1987-88 to 1989-90, 1994-95 to 2008-09
Commissioner 60.15
1998-99 Deputy Commissioner 0.06
1983-84 to 2005-06 Assistant Commissioner
2.09
Sales tax 1969-1973, 2006-2009 Supreme Court 23.50
1970-71 to 1971-72,1973-74 to 1974-75,1980-81 to 1981-82,1991-92 to 1992-93,1994-95 to 1995-96,1998-99,
2000-01 to 2005-06
High Court 17.49
1977-78 to 1980-81,1982-83 to 1986-87,1988-89 to 1989-90,
1991-92 to 2003-04
Tribunal 6.56
1985-86 to 1986-87, 1988-89, 1993-94 to 2007-08
Commissioner 55.63
1975-76,1977-78 to 1979-80,1981-82,1983-84 to 1985-86, 1987-88 to 1994-95,
1996-97 to 2008-09
Deputy Commissioner 331.37
1973-74,1980-81,1983-84 to 1998-99, 2000-01 to 2008-09
Assistant Commissioner
25.53
Cess on royalty, education, welfare etc.
1956 to 1994, 1996-97 to 2007-08 High Court 29.84
1979-80, 1989-91, 1992-2003 Commissioner 1.10
2002-03 Deputy Commissioner 3.80

147
(x) The Company does not have any accumulated losses and has not incurred cash loss during the fi nancial year covered
by our audit and the immediately preceding fi nancial year.
(xi) In our opinion and according to the information and explanations given to us, the Company has not defaulted in
repayment of dues to fi nancial institutions, banks or debenture holders.
(xii) In our opinion and according to information and explanations given to us, the terms and conditions of the guarantees
given by the Company for loans taken by others from banks or fi nancial institutions, are not prima facie prejudicial to the
interest of the Company.
(xiii) To the best of our knowledge and belief and according to the information and explanations given to us, in our opinion,
term loans availed by the Company were, prima facie, applied by the Company during the year for the purposes for
which the loans were obtained, other than temporary deployment pending application.
(xiv) According to the information and explanations given to us and on an overall examination of the Balance Sheet of the
Company, funds raised on short-term basis have, prima facie, not been used during the year for long term investment.
(xv) The Company has not made any preferential allotment of shares to parties and companies covered in the register
maintained under Section 301 of the Companies Act, 1956.
(xvi) According to the information and explanations given to us and the records examined by us, securities/charges have
been created in respect of debentures issued.
(xvii) During the period covered by our audit report, the Company has not raised any money by public issues.
(xviii) To the best of our knowledge and belief and according to the information and explanations given to us, no signifi cant
fraud on or by the Company was noticed or reported during the year.
For DELOITTE HASKINS & SELLS
Chartered Accountants,
P. R. RAMESH
Partner.
Membership No.: 70928
Mumbai, 25th June, 2009

Hundred and second annual report 2008-09
148
As atSchedule Page 31-03-2008 Rupees Rupees Rupees FUNDS EMPLOYED : crores crores crores
A 155 1. SHARE CAPITAL ........................................................................ 6,203.45 6,203.30 B 156 2. RESERVES AND SURPLUS ....................................................... 23,972.81 21,097.43
3. TOTAL SHAREHOLDERS' FUNDS ............................................ 30,176.26 27,300.73 4. LOANS C 157 a. Secured ................................................................................. 3,913.05 3,520.58 D 158 b. Unsecured ............................................................................. 23,033.13 14,501.11
c. Total Loans ............................................................................ 26,946.18 18,021.69
5. DEFERRED TAX LIABILITY (NET) (See Note 16, Page 186) ....... 585.73 681.80
6. PROVISION FOR EMPLOYEE SEPARATION COMPENSATION (See Note 9(a), Page 172) ............................. 1,033.60 1,071.30
7. TOTAL FUNDS EMPLOYED ........................................................ 58,741.77 47,075.52
APPLICATION OF FUNDS : E 159 8. FIXED ASSETS a. Gross Block............................................................................ 23,544.69 20,847.04 b. Less — Impairment ............................................................... 100.47 100.47 c. Less — Depreciation ............................................................. 8,962.00 8,123.01
d. Net Block ............................................................................... 14,482.22 12,623.56 F 160 9. INVESTMENTS ........................................................................... 42,371.78 4,103.19
10. FOREIGN CURRENCY MONETARY ITEM TRANSLATION DIFFERENCE ACCOUNT (See Note 9(c), Page 172) ................. 471.66 –
11. A. CURRENT ASSETS a. Stores and spare parts .......................................................... 612.19 557.67 G 166 b. Stock-in-trade ........................................................................ 2,868.28 2,047.31 H 166 c. Sundry debtors ...................................................................... 635.98 543.48 d. Interest accrued on investments ............................................ – 0.20 I 167 e. Cash and Bank balances ...................................................... 1,590.60 465.04
5,707.05 3,613.70 J 167 B. LOANS AND ADVANCES ...................................................... 4,578.04 33,348.74
10,285.09 36,962.44 12. Less : CURRENT LIABILITIES AND PROVISIONS K 168 A. Current Liabilities ................................................................... 6,039.86 3,855.26 L 168 B. Provisions .............................................................................. 2,934.19 2,913.52
8,974.05 6,768.78
13. NET CURRENT ASSETS ............................................................. 1,311.04 30,193.66 14. MISCELLANEOUS EXPENDITURE (to the extent not written off or adjusted) Employee Separation Compensation (See Note 9(a), Page 172) 105.07 155.11 15. TOTAL ASSETS (Net) .................................................................. 58,741.77 47,075.52 Contingent Liabilities (See Note 2, Page 170) M 169 NOTES ON BALANCE SHEET AND PROFIT AND LOSS ACCOUNT
Balance Sheet as at 31st March, 2009Tata Steel Limited
J C BHAMCompany Secretary
As per our report attached
For DELOITTE HASKINS & SELLSChartered Accountants,
P R RAMESHPartner.
Mumbai, 25th June, 2009
For and on behalf of the BoardRATAN N TATA ChairmanJAMES LENGNUSLI N WADIAS M PALIA ISHAAT HUSSAINJAMSHED J IRANI DirectorsSUBODH BHARGAVA JACOBUS SCHRAVENANDREW ROBBB MUTHURAMAN Managing DirectorKIRBY ADAMS DirectorH M NERURKAR Executive Director
}

149
PreviousSchedule Page Year Rupees Rupees Rupees INCOME : crores crores crores
1 152 1. SALES AND OTHER OPERATING INCOME ..................................... 26,843.73 22,189.55 Less — Excise Duty ........................................................................... 2,527.96 2,498.52 24,315.77 19,691.03
2 152 2. OTHER INCOME ................................................................................ 308.27 242.80
24,624.04 19,933.83
EXPENDITURE : 4 153 3. MANUFACTURING AND OTHER EXPENSES .................................. 15,525.99 11,852.75 4. DEPRECIATION ................................................................................ 973.40 834.61
16,499.39 12,687.36 5. Less — EXPENDITURE (OTHER THAN INTEREST) TRANSFERRED TO CAPITAL AND OTHER ACCOUNTS ....................................................................... 343.65 175.50 16,155.74 12,511.86
3 152 6. NET FINANCE CHARGES ................................................................. 1,152.69 786.50 7. TOTAL EXPENDITURE ...................................................................... 17,308.43 13,298.36
PROFIT BEFORE TAXES AND EXCEPTIONAL ITEMS .......................... 7,315.61 6,635.47 8. a. CONTRIBUTION FOR SPORTS INFRASTRUCTURE ............... – (150.00) b. EXCHANGE GAIN/(LOSS) ......................................................... – 580.89
430.89
PROFIT BEFORE TAXES ......................................................................... 7,315.61 7,066.36
9. TAXES a. CURRENT TAX ........................................................................... 2,173.00 2,252.00 b. DEFERRED TAX (See Note 16, Page 186) ................................. (75.13) 108.33 c. FRINGE BENEFIT TAX................................................................ 16.00 19.00 2,113.87 2,379.33 PROFIT AFTER TAXES ........................................................................... 5,201.74 4,687.03
10. BALANCE BROUGHT FORWARD FROM LAST YEAR .................... 6,387.46 4,593.98
AMOUNT AVAILABLE FOR APPROPRIATIONS ................................... 11,589.20 9,281.01
11. APPROPRIATIONS : a. PROPOSED DIVIDENDS ............................................................ 1,168.95 1,168.93 (Details as per Directors’ Report, Page 103) b. DIVIDEND ON CUMULATIVE CONVERTIBLE PREFERENCE SHARES............................................................. 109.45 22.19 c. TAX ON DIVIDENDS ................................................................... 214.10 202.43
1,492.50 1,393.55
d. GENERAL RESERVE .................................................................. 600.00 1,500.00
2,092.50 2,893.55
BALANCE CARRIED TO BALANCE SHEET ......................................... 9,496.70 6,387.46
Basic Earnings per Share Rs. .................................................................. 69.45 66.80 Diluted Earnings per Share Rs. (See Note 15, Page 186) ...................... 61.78 61.29
M 169 NOTES ON BALANCE SHEET AND PROFIT AND LOSS ACCOUNT
Profi t and Loss Account for the year ended 31st March, 2009
J C BHAMCompany Secretary
As per our report attached
For DELOITTE HASKINS & SELLSChartered Accountants,
P R RAMESHPartner.
Mumbai, 25th June, 2009
For and on behalf of the BoardRATAN N TATA ChairmanJAMES LENGNUSLI N WADIAS M PALIA ISHAAT HUSSAINJAMSHED J IRANI DirectorsSUBODH BHARGAVA JACOBUS SCHRAVENANDREW ROBBB MUTHURAMAN Managing DirectorKIRBY ADAMS DirectorH M NERURKAR Executive Director
}

Hundred and second annual report 2008-09
150
Cash Flow Statement for the year ended 31st March, 2009
Year Ended Year Ended 31-03-2009 31-03-2008 Rupees crores Rupees croresA. Cash Flow from Operating Activities : Net Profi t before tax 7,315.61 7,066.36
Adjustments for : Depreciation 973.40 834.61
(Profi t)/Loss on sale of Assets/Discarded Assets written off 6.43 (28.26)
(Profi t)/Loss on sale of other investments (186.46) (0.03)
Impairment of Assets – 0.06
(Gain)/Loss on cancellation of forward covers/options (26.62) (124.30)
Provision for diminution in value of investments 0.10 –
Interest and income from current investment (336.81) (142.53)
Income from other investments (101.62) (88.42)
Interest charged to Profi t and Loss Account 1,489.50 929.03
Amortisation of employee separation compensation 222.34 226.18
Provision for Wealth Tax 1.00 0.95
Contribution for sports infrastructure written off – 150.00
Exchange (Gain)/Loss on revaluation of foreign
currency loans 67.91 (743.60)
Amortisation of long term loan expenses 32.71 57.99
2,141.88 1,071.68
Operating Profi t before Working Capital Changes 9,457.49 8,138.04
Adjustments for : Trade and Other Receivables (159.25) (143.44) Inventories (875.49) (272.00) Trade Payables and Other Liabilities 1,772.03 591.80
737.29 176.36
Cash Generated from Operations 10,194.78 8,314.40
Direct Taxes paid (2,797.56) (2,060.20)
Net Cash from Operating Activities 7,397.22 6,254.20
B. Cash Flow from Investing Activities :
Purchase of fi xed assets (2,786.29) (2,458.97) Sale of fi xed assets 15.18 63.88 Purchase of investments (59,903.25) (31,605.12) Purchase of investments in Subsidiaries (4,439.80) (29,587.40) Sale of investments 57,181.61 34,110.46 Inter-corporate deposits 90.73 (85.80) Interest and income from current investments received 312.12 155.95 Dividend received 101.62 88.42
Net Cash used in Investing Activities (9,428.08) (29,318.58)

151
C. Cash Flow from Financing Activities : Issue of Equity Capital 0.25 4,881.45 Issue of Cumulative Convertible Preference Shares 0.14 5,472.52 Proceeds from borrowings 6,494.43 17,632.70 Repayment of borrowings (894.39) (10,386.61) Amount received on cancellation of forward covers/options (10.17) 134.41 Long term loan expenses (32.51) (202.38) Interest paid (1,213.96) (746.07) Dividends paid (1,187.37) (937.95)
Net Cash from Financing Activities 3,156.42 15,848.07
Net increase/(decrease) in Cash or Cash equivalents (A+B+C) 1,125.56 (7,216.31)
Opening Cash and Cash equivalents 465.04 (iv) 7,681.35 [See Schedule I, Page 167]
Closing Cash and Cash equivalents (v) 1,590.60 (v) 465.04 [See Schedule I, Page 167]
Notes : (i) Figures in brackets represent outfl ows.
(ii) Interest paid is exclusive of and purchase of fi xed assets is inclusive of interest capitalised Rs. 29.11 crores
(31.03.2008 : Rs. 12.24 crores).
(iii) Investment in subsidiaries represents the portion of purchase consideration discharged in cash during the period and includes application money on investments Rs. 4,439.80 crores (31.03.2008 : Rs. 29,587.40 crores).
(iv) Includes Rs. 7,225.94 crores ringfenced for a specifi c purpose.
(v) Includes Rs. 0.24 crores (31.03.2008 : Rs. 5.65 crores) refund orders issued on account of over subscription of Rights Issue of Equity Shares not encashed as on 31st March, 2009.
(vi) Previous year fi gures have been recast/restated wherever necessary.
Year Ended Year Ended 31-03-2009 31-03-2008 Rupees crores Rupees crores
Cash Flow Statement for the year ended 31st March, 2009
J C BHAMCompany Secretary
As per our report attached
For DELOITTE HASKINS & SELLSChartered Accountants,
P R RAMESHPartner.
Mumbai, 25th June, 2009
For and on behalf of the BoardRATAN N TATA ChairmanJAMES LENGNUSLI N WADIAS M PALIA ISHAAT HUSSAINJAMSHED J IRANI DirectorsSUBODH BHARGAVA JACOBUS SCHRAVENANDREW ROBBB MUTHURAMAN Managing DirectorKIRBY ADAMS DirectorH M NERURKAR Executive Director
}

Hundred and second annual report 2008-09
152
SCHEDULE 1 : SALES AND OTHER OPERATING INCOME :—(Item No. 1, Page 149)
Previous Year Rupees Rupees Rupees crores crores crores
(a) Sale of products ...................................................................................................... 25,945.45 21,392.39
(b) Sale of power and water ......................................................................................... 566.31 546.33
(c) Income from town, medical and other services ....................................................... 40.65 40.66
(d) Other operating income ........................................................................................... 291.32 210.17 [Including lease rentals of Rs. 0.20 crore (2007-08 : Rs. 0.19 crore) on Wagons
leased to Railways under Own Your Wagon Scheme]
26,843.73 22,189.55
Previous Year Rupees Rupees Rupees crores crores crores
SCHEDULE 2 : OTHER INCOME :—(Item No. 2, Page 149)
(a) Income from Investments
(i) Trade investments ...................................................................................... 64.39 71.72
(ii) Investments in subsidiary companies ......................................................... 37.23 16.70
101.62 88.42
(b) Profi t on sale/redemption of other investments ....................................................... 186.46 0.03
(c) Profi t on sale of capital assets (net of loss on assets sold/scrapped/written off) ............. (6.43) 28.26
(d) Gain from swaps and cancellation of forward covers/options ................................ 26.62 124.30
(e) Miscellaneous income ............................................................................................ – 1.79
308.27 242.80
Previous Year Rupees Rupees Rupees crores crores crores
SCHEDULE 3 : NET FINANCE CHARGES:—(Item No. 6, Page 149)1. Interest on
(i) Debentures and Fixed Loans ..................................................................... 1,440.06 880.81
(ii) Others ........................................................................................................ 78.55 60.46
1,518.61 941.27
Less - Interest capitalised ..................................................................................... 29.11 12.24
1,489.50 929.032. Less - (i) Interest received on sundry advances, deposits, customers’ balances etc. [Gross, inclusive of tax deducted at source Rs. 16.27 crores (2007-08 : Rs. 8.54 crores)] .................................... 103.07 50.33 (ii) Income from current investments ........................................................ 100.47 82.25 (iii) Profi t/(loss) on sale of current investments ......................................... 133.27 9.95
1,152.69 786.50
Schedules forming part of the profi t and loss account

153
SCHEDULE 4 : MANUFACTURING AND OTHER EXPENSES :—(Item No. 3, Page 149)
Previous Year Rupees Rupees Rupees crores crores crores
1. PURCHASE OF FINISHED, SEMI-FINISHED STEEL AND OTHER PRODUCTS ........................................................................................................ 358.87 387.94
2. RAW MATERIALS CONSUMED ......................................................................... 5,709.91 3,355.20
3. PAYMENTS TO AND PROVISIONS FOR EMPLOYEES : (a) Wages and salaries, including bonus ......................................................... 2,015.06 1,616.87 (b) Company’s contributions to provident and other funds .............................. 290.75 199.08
2,305.81 1,815.95
4. OPERATION AND OTHER EXPENSES : (a) Stores and spares consumed .................................................................. 1,248.70 936.11 (b) Fuel oil consumed ..................................................................................... 131.11 115.33 (c) Repairs to buildings .................................................................................. 47.37 48.88 (d) Repairs to machinery ................................................................................ 809.62 739.21 (e) Relining expenses .................................................................................... 48.69 30.14 (f) Conversion charges ................................................................................. 1,041.50 856.86 (g) Purchase of power .................................................................................... 1,091.37 932.78 (h) Rent .......................................................................................................... 11.95 10.57 (i) Royalty ...................................................................................................... 227.67 171.91 (j) Rates and taxes ....................................................................................... 202.02 151.18 (k) Insurance charges .................................................................................... 25.54 25.37 (l) Commission, discounts and rebates ......................................................... 61.49 52.53 (m) Provision for wealth tax ............................................................................ 1.00 0.95 (n) Other expenses ........................................................................................ 1,265.55 1,069.28
6,213.58 5,141.10
5. FREIGHT AND HANDLING CHARGES ............................................................ 1,251.23 1,140.63
6. PROVISION FOR DOUBTFUL DEBTS AND ADVANCES ................................ 8.61 12.16
7. EXCISE DUTY .................................................................................................. (32.75) 38.50
15,815.26 11,891.488. ACCRETION/(REDUCTION) IN STOCKS OF FINISHED AND SEMI-FINISHED PRODUCTS AND WORK-IN-PROGRESS (DEDUCTED)/ADDED:
(a) Opening Stock........................................................................................... 1,145.75 1,107.02
(b) Less – Closing Stock................................................................................. 1,435.02 1,145.75
(289.27) (38.73)
15,525.99 11,852.75
Schedules forming part of the profi t and loss account

Hundred and second annual report 2008-09
154
Previous Year Rupees Rupees crores crores
Item 2 Raw materials consumed excludes amounts charged to wages & salaries and other revenue accounts .......................................................................................................................... 487.14 412.35Item 4 (a) Stores and spares consumed (including write-off of obsolete spares, if any) exclude cost of stores manufactured departmentally and charged to wages and salaries and other revenue accounts ..... 95.88 54.62Item 4 (c) Repairs to buildings exclude amounts charged to wages & salaries and other revenue accounts ..... 4.50 3.92Item 4 (d) Repairs to machinery exclude amounts charged to wages & salaries and other revenue accounts ..... 244.46 209.29Item 4 (l) Commission, discounts and rebates include — (1) Commission paid to selling agents ........................................................................................ 13.97 16.37 (2) Consignment agency handling charges ................................................................................ 45.35 34.92 (3) Discounts .............................................................................................................................. 2.17 3.18Item 4 (n) Other expenses include — (1) Provision for diminution in value of investments .................................................................. 0.10 – (2) Exchange (Gain)/Loss .......................................................................................................... 42.11 (8.86) (3) Fees and out-of-pocket expenses paid/payable to Auditors : Rupees Rupees (i) For services as Auditors .............................................................................................. 2,41,00,000 1,95,00,000 (ii) For other services (excluding payment of Rs. 52,000 made to a fi rm in which some of the partners of the audit fi rm are partners) ............................................................. 85,68,011 85,99,063 (iii) Reimbursement of travelling and out-of-pocket expenses........................................... 22,23,663 18,90,428 (iv) For Branch Audit .......................................................................................................... 2,94,096 2,90,800 (4) Cost Audit Fees [including expenses Rs. 64,954 (2007-08 : Rs. 25,191)] ........................... 1,21,244 1,09,517
Managerial RemunerationManagerial Remuneration for Managing Director, other Whole-time Directors and Non Whole-time Directors Rupees Rupees crores crores(a) Salaries (including Company's contribution to Provident and Superannuation fund) ................................ 1.06 1.65(b) Commission ............................................................................................................................................. 8.50 9.55(c) Perquisites ............................................................................................................................................. 0.51 0.64(d) Sitting Fees ............................................................................................................................................. 0.33 0.24
10.40 12.08Note :
In addition, the Managing Director is entitled to free supply of water and use of medical facilities at the Company’s hospital at Jamshedpur. The above fi gures do not include contribution to Gratuity Fund, as separate fi gure is not available for the Managing Director and retirement benefi ts of Rs. 0.88 crore (2007-08 : Rs. 2.72 crores) relating to eight former directors and retirement benefi ts of Rs. 0.36 crore (2007-08 : Rs. 0.35 crore) paid to a former Managing Director. Previous year includes the remuneration paid to two Whole-time Directors other than the Managing Director.
COMPUTATION OF NET PROFIT IN ACCORDANCE WITH SECTION 309(5) OF THE COMPANIES ACT, 1956. Rupees Rupees crores croresProfi t before taxes ................................................................................................................................................ 7,315.61 7,066.36Add — (a) Managerial remuneration .......................................................................................................... 10.40 12.08 (b) Provision for bad & doubtful debts and advances .................................................................... 8.61 12.16 (c) Provision for diminution in value of investments ...................................................................... 0.10 – (d) Provision for wealth tax ............................................................................................................. 1.00 0.95 7,335.72 7,091.55
Deduct — (a) Bad debts written off (net of recoveries) ................................................................................... 27.07 6.20 (b) Profi t on sale/redemption of Investments ................................................................................. 319.73 9.98 (c) Capital profi t on sale of fi xed assets ......................................................................................... – 0.51 346.80 16.69Net profi t as per Section 309(5) ........................................................................................................................... 6,988.92 7,074.86
Commission : Rupees Rupees
(a) Whole-time Directors ...................................................................................................................... 3,50,00,000 4,55,00,000 (b) Non Whole-time Directors — 1% of the net profi ts : Rs. 69.89 crores (2007-08 : Rs. 70.75 crores) restricted to ...................................................................................... 5,00,00,000 5,00,00,000
8,50,00,000 9,55,00,000
Notes to Schedule 4 (Page 153)

155
Schedules forming part of the balance sheet
SCHEDULE A : SHARE CAPITAL :—(Item No. 1, Page 148)
As at 31-03-2008 Rupees RupeesAuthorised : crores crores 1,75,00,00,000 Ordinary Shares of Rs. 10 each (31.03.2008 :1,75,00,00,000 Ordinary Shares of Rs. 10 each) ............................. 1,750.00 1,750.00 2,50,00,000 Cumulative Redeemable Preference Shares of Rs. 100 each
(31.03.2008 : 2,50,00,000 Shares of Rs. 100 each) .............................................. 250.00 250.00
60,00,00,000 2% Cumulative Convertible Preference Shares of Rs. 100 each (31.03.2008: 60,00,00,000 Shares of Rs. 100 each) ............................................. 6,000.00 6,000.00
8,000.00 8,000.00Issued : 73,13,69,503 Ordinary Shares of Rs. 10 each
(31.03.2008 : 73,13,69,503 Ordinary Shares of Rs. 10 each) ............................... 731.37 731.37
54,80,75,571 2% Cumulative Convertible Preference Shares of Rs. 100 each (31.03.2008: 54,80,75,571 Shares of Rs. 100 each) ............................................. 5,480.76 5,480.76
Subscribed : 73,05,92,471 Ordinary Shares of Rs. 10 each fully paid up (31.03.2008 : 73,05,84,320 Ordinary Shares of Rs. 10 each) .............................. 730.59 730.58 Add — Amount paid up on 3,89,516 Ordinary Shares forfeited (31.03.2008 : 3,89,516 Shares of Rs. 10 each) ....................................................... 0.20 0.20
730.79 730.78
54,72,66,011 2% Cumulative Convertible Preference Shares of Rs. 100 each (31.03.2008 : 54,72,51,605 Shares of Rs. 100 each) ............................................ 5,472.66 5,472.52
6,203.45 6,203.301. Of the 73,05,92,471 Ordinary Shares : (a) 95,63,300 shares represent after sub-division 9,56,330 shares (including 9,35,000 shares issued pursuant to the Scheme of
Arrangement for the conversion of Deferred Shares into Ordinary Shares and the issue of additional fully paid shares) of the face value of Rs. 75 per share which were issued as fully paid up pursuant to contracts for consideration other than cash. The nominal value of these 9,56,330 shares was increased from Rs. 75 to Rs. 100 each with effect from 1.01.1977.
(b) 1,98,12,460 shares represent after sub-division 19,81,246 shares of the face value of Rs. 75 per share which were issued as fully paid bonus shares by utilisation of Rs. 3,81,44,470 from Share Premium Account and Rs. 11,04,48,980 from General Reserve. The nominal value of these 19,81,246 shares was increased from Rs. 75 to Rs. 100 each with effect from 1.01.1977.
(c) 5,14,40,270 shares represent after sub-division 51,44,027 Ordinary Shares whose face value was increased during the year 1976-77 from Rs. 75 to Rs. 100 per share by utilisation of Rs. 49,760 from Share Premium Account and Rs. 12,85,50,915 from General Reserve.
(d) 2,05,76,110 shares represent after sub-division 20,57,611 shares of the face value of Rs. 100 per share which were issued as fully paid bonus shares by utilisation of Rs. 20,57,61,100 from General Reserve.
(e) 7,21,530 shares represent after sub-division 72,153 shares of the face value of Rs. 100 per share which were issued as fully paid up to the shareholders of the erstwhile Indian Tube Company Limited on its amalgamation with the Company, for consideration other than cash.
(f) 3,30,51,470 shares represent after sub-division 33,05,147 shares of the face value of Rs. 100 per share which were issued as fully paid bonus shares by utilisation of Rs. 33,05,14,700 from General Reserve.
(g) 12,10,003 shares of the face value of Rs. 10 per share were issued as fully paid up to the shareholders of the erstwhile Tata SSL Ltd. on its amalgamation with the Company, for consideration other than cash.
(h) 18,44,90,952 shares of face value of Rs. 10 per share were issued as fully paid bonus shares by utilisation of Rs. 1,84,49,09,520 from Securities Premium Account during the year 2004-05.
(i) 2,70,00,000 shares of face value of Rs. 10 per share issued to Tata Sons Limited on a preferential basis during the year 2006-07.
(j) 2,85,00,000 shares of face value of Rs. 10 per share allotted to Tata Sons Limited on a preferential basis during the year 2007-08.
(k) 12,16,11,464 shares of face value of Rs. 10 per share allotted at a premium of Rs. 290 per share to the shareholders on Rights basis during the year 2007-08.
(l) 8,151 shares of face value of Rs. 10 per share allotted on Rights basis at a premium of Rs. 290 per share during 2008-09 to the shareholders whose shares were kept in abeyance in the Rights issue made in 2007, leaving a balance of 1,74,956 shares being kept in abeyance.
2. 2% Cumulative Convertible Preference Shares 54,72,51,605 CCPS of face value Rs. 100 per share were allotted at a price of Rs. 100 per share to the shareholders on Rights basis
during the year 2007-08. Further, 14,406 CCPS have been allotted during 2008-09 at a price of Rs. 100 per share to the shareholders whose shares were kept in abeyance in the Right issue made in 2007, leaving 8,09,560 CCPS which are now kept in abeyance.
As per the terms of the issue, 6 CCPS of Rs. 100 each are compulsorily and automatically convertible on 1st September, 2009 into 1 Ordinary Share of Rs. 10 each at a premium of Rs. 590 per share.

Hundred and second annual report 2008-09
156
Schedules forming part of the balance sheetSCHEDULE B : RESERVES AND SURPLUS :—(Item No. 2, Page 148)
As at 31-03-2008 Rupees Rupees Rupees crores crores crores(a) SECURITIES PREMIUM ACCOUNT : Balance as per last account ............................................................................ 6,391.92 2,201.46 Add — Amount received on conversion of warrants ........................................... – 1,351.67
Add — Amount received on Rights Issue ........................................................ 0.24 3,526.73
Less — Expenses related to Rights/CARS/NCD Issues (See Note 27, Page 192) (238.56) (147.04)
Less — Premium on CARS (See Note 27, Page 192) ....................................... (40.68) (540.90)
6,112.92 6,391.92
(b) AMALGAMATION RESERVE :
Balance as per last account ............................................................................. 1.12 1.12
(c) DEBENTURE REDEMPTION RESERVE :
Balance as per last account ............................................................................. 646.00 646.00
(d) CAPITAL REDEMPTION RESERVE :
Balance as per last account ............................................................................. 0.83 0.83
(e) CAPITAL RESERVE :
Balance as per last account ............................................................................. 1.49 1.49
(f) GENERAL RESERVE :
Balance as per last account ............................................................................. 7,484.96 5,784.82
Add — Adjustment as per transitional provisions of AS 15 ................................. – 200.14 Less — Adjustment as per AS 11 Notifi cation (See Note 9(c), Page 172) .............. (529.15) –
6,955.81 5,984.96 Add — Amount transferred from Profi t and Loss Account ............................... 600.00 1,500.00
7,555.81 7,484.96
(g) EXPORT PROFITS RESERVE :
Balance as per last account ............................................................................. 1.25 1.25(h) FOREIGN EXCHANGE FLUCTUATION RESERVE : Balance as per last account ............................................................................. 39.71 (5.22) Add/(Less) — Exchange Fluctuation on long term loans and advances to non-integral foreign operations ................................................ (25.71) 44.93
14.00 39.71
(i) CONTRIBUTIONS FOR CAPITAL EXPENDITURE :
Balance as per last account ............................................................................. 42.65 42.65(j) CONTINGENCY RESERVE :
Balance as per last account ............................................................................. 100.00 100.00
(k) DEBENTURE FORFEITURE RESERVE :
Balance as per last account ............................................................................. 0.04 0.04(l) PROFIT AND LOSS ACCOUNT : Balance carried forward ................................................................................... 9,496.70 6,387.46
23,972.81 21,097.43

157
Schedules forming part of the balance sheet
SCHEDULE C : SECURED LOANS :—(Item No. 4(a), Page 148)
As at 31-03-2008 Rupees Rupees crores crores
(a) Joint Plant Committee-Steel Development Fund [including funded interest Rs. 233.91 crores (31.03.2008 : Rs. 227.82 crores)] .................................................................................................. 1,752.40 1,700.63
(b) 14.25% Non-Convertible Debentures (privately placed with LIC Mutual Fund) ................................... 8.50 16.75
(c) 10.50% Non-Convertible Debentures (privately placed with Life Insurance Corporation of India) .. 33.33 66.67(d) International Finance Corporation, Washington - A Loan US $ 100 million equivalent* ................ 507.20 401.20(e) International Finance Corporation, Washington - B Loan US $ 300 million equivalent* ............... 1,521.60 1,203.60(f) Cash Credit/Packing Credit from Banks (i) State Bank of India ................................................................................................................. – – (ii) Others .................................................................................................................................... 90.00 131.71
Borrowing from State Bank of India and Other Banks under items f(i) & f(ii) above are secured by hypothecation of stocks, stores and book debts, ranking in priority to the fl oating charge under items (a) to (e) hereof.
(g) Government of India (i) for constructing a hostel for trainees at Jamshedpur ............................................................. 0.01 0.01 (ii) for setting up a dispensary and a clinic at Collieries .............................................................. 0.01 0.01
Secured respectively by a first mortage on the lands together with the buildings for hostel and dispensary and clinic constructed thereon. 3,913.05 3,520.58
* Repayable in foreign currency
Loan from the Joint Plant Committee-Steel Development Fund, the 14.25% Non-Convertible Debentures and the 10.50% Non-Convertible Debentures [items (a), (b) & (c) above] from the above institutions/banks are secured by mortgages, ranking pari passu inter se, on all present and future fi xed assets, excluding land and buildings mortgaged in favour of Government of India under item (g) hereof, land and buildings, plant and machinery and movables of the Tubes Division and the Bearings Division mortgaged in favour of the fi nancial institutions and banks, assets of the Ferro Alloys Plant at Bamnipal mortgaged in favour of State Bank of India and assets of Cold Rolling Complex (West) at Tarapur and a fl oating charge on other properties and assets (excluding investments) of the Company, subject to the prior fl oating charge in favour of State Bank of India and other banks under items f(i) and f(ii) hereof.
Loan from the Joint Plant Committee-Steel Development Fund included in item (a) above is not secured by charge on movable assets of the Company and includes Rs. 1,053.45 crores (31.03.2008: Rs. 879.63 crores) representing repayments and interest on earlier loans for which applications of funding are awaiting sanction.
The 14.25% Non-Convertible Debentures under item (b) (allotted on 28.10.1998) are redeemable at par in 3 annual installments in the ratio of 33:33:34 commencing at the end of the 9th year from the date of allotment. The second installment of Rs. 8.25 crores has been repaid during the year.
The 10.50% Non-Convertible Debentures under item (c) (allotted on 29.10.1998) are redeemable at par in 3 equal installments at the end of 9th, 10th and 11th year from the date of allotment. The second installment of Rs. 33.33 crores has been repaid during the year.
Loans A & B from IFCW included in items (d) and (e) above are secured by charge on the immovable properties of the Company at Jamshedpur and additionally secured on all the movable properties of the Company (excluding current assets) located at Jamshedpur ranking pari passu with the security for the debentures (items (b) and (c) above).

Hundred and second annual report 2008-09
158
As at 31-03-2008 Rupees Rupees crores crores
(a) Fixed Deposits ............................................................................................................................... 4.24 12.74
(b) Housing Development Finance Corporation Ltd. .......................................................................... 3.03 5.50
(c) Privately Placed Non-convertible Debentures ............................................................................... 3,250.00 –
(d) Japan Bank for International Cooperation and various Financial Institutions* ............................... 87.48 95.54
(e) JPY Syndicated ECB Loan – US $ 495 million equivalent* ........................................................... 3,028.55 2,362.74
(f) JPY Syndicated Standard Chartered Bank Loan – US $ 750 million equivalent* .......................... 4,619.68 3,604.06
(g) Canara Bank, London ECB Loan US $ 5 million equivalent* ........................................................ 25.36 20.06
(h) Euro Hermes Loan from Deutsche Bank, Frankfurt* ..................................................................... 39.32 41.05
(i) Euro Sace Loan from Deutsche Bank, Frankfurt* .......................................................................... 261.12 179.04
(j) 1% Convertible Alternative Reference Securities – US $ 875 million equivalent*
(See Note 27, Page 192) ............................................................................................................. 5,473.92 4,329.92
(k) Term loan from IDBI Bank Ltd. ...................................................................................................... 1,100.00 1,350.00
(l) Term loan from SBI ....................................................................................................................... 2,500.00 2,500.00
(m) Term loan from Axis Bank .............................................................................................................. 2,000.00 –
(n) Buyers' credit * ............................................................................................................................... 639.98 –
(o) Interest free loans under Sales Tax Deferral Scheme .................................................................. 0.45 0.46
23,033.13 14,501.11
Note : Amounts repayable within one year Rs. 1,811.25 crores (31.03.2008 : Rs. 43.63 crores).
* Repayable in foreign currency.
SCHEDULE D : UNSECURED LOANS :—(Item No. 4(b), Page 148)
Schedules forming part of the balance sheet
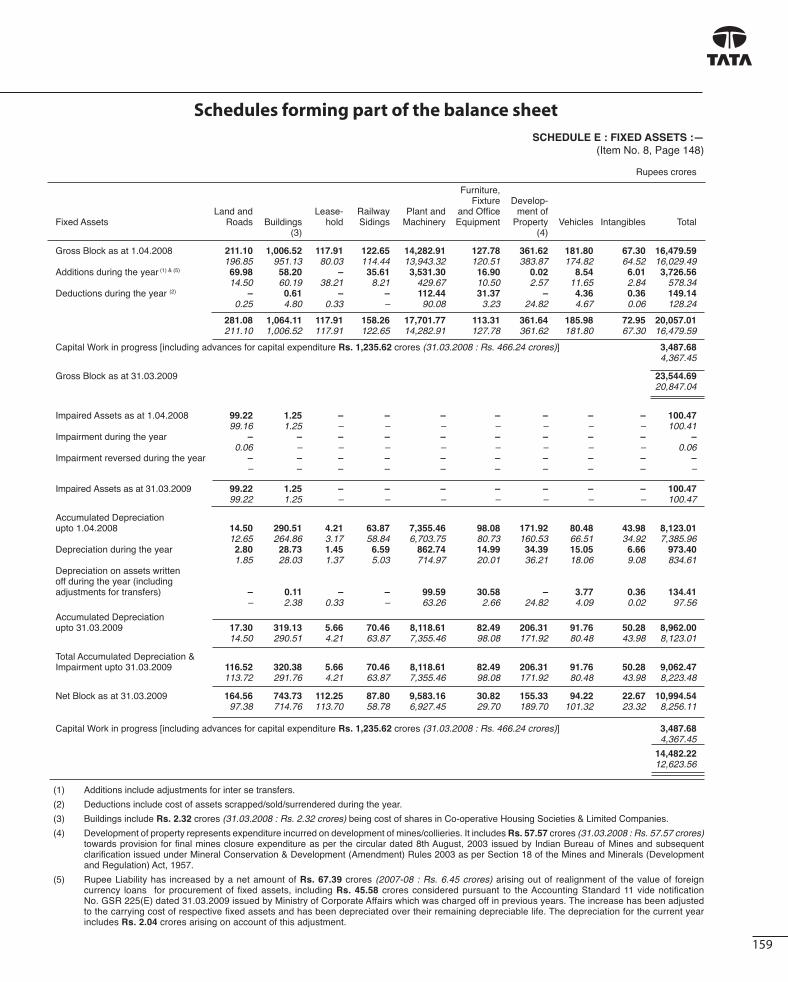
159
Schedules forming part of the balance sheetSCHEDULE E : FIXED ASSETS :—
(Item No. 8, Page 148)
Rupees crores
Furniture, Fixture Develop- Land and Lease- Railway Plant and and Offi ce ment of Fixed Assets Roads Buildings hold Sidings Machinery Equipment Property Vehicles Intangibles Total (3) (4)
Gross Block as at 1.04.2008 211.10 1,006.52 117.91 122.65 14,282.91 127.78 361.62 181.80 67.30 16,479.59 196.85 951.13 80.03 114.44 13,943.32 120.51 383.87 174.82 64.52 16,029.49Additions during the year (1) & (5) 69.98 58.20 – 35.61 3,531.30 16.90 0.02 8.54 6.01 3,726.56 14.50 60.19 38.21 8.21 429.67 10.50 2.57 11.65 2.84 578.34Deductions during the year (2) – 0.61 – – 112.44 31.37 – 4.36 0.36 149.14 0.25 4.80 0.33 – 90.08 3.23 24.82 4.67 0.06 128.24
281.08 1,064.11 117.91 158.26 17,701.77 113.31 361.64 185.98 72.95 20,057.01 211.10 1,006.52 117.91 122.65 14,282.91 127.78 361.62 181.80 67.30 16,479.59
Capital Work in progress [including advances for capital expenditure Rs. 1,235.62 crores (31.03.2008 : Rs. 466.24 crores)] 3,487.68 4,367.45
Gross Block as at 31.03.2009 23,544.69 20,847.04
Impaired Assets as at 1.04.2008 99.22 1.25 – – – – – – – 100.47 99.16 1.25 – – – – – – – 100.41Impairment during the year – – – – – – – – – – 0.06 – – – – – – – – 0.06Impairment reversed during the year – – – – – – – – – – – – – – – – – – – –
Impaired Assets as at 31.03.2009 99.22 1.25 – – – – – – – 100.47 99.22 1.25 – – – – – – – 100.47
Accumulated Depreciation upto 1.04.2008 14.50 290.51 4.21 63.87 7,355.46 98.08 171.92 80.48 43.98 8,123.01 12.65 264.86 3.17 58.84 6,703.75 80.73 160.53 66.51 34.92 7,385.96Depreciation during the year 2.80 28.73 1.45 6.59 862.74 14.99 34.39 15.05 6.66 973.40 1.85 28.03 1.37 5.03 714.97 20.01 36.21 18.06 9.08 834.61Depreciation on assets writtenoff during the year (including adjustments for transfers) – 0.11 – – 99.59 30.58 – 3.77 0.36 134.41 – 2.38 0.33 – 63.26 2.66 24.82 4.09 0.02 97.56
Accumulated Depreciationupto 31.03.2009 17.30 319.13 5.66 70.46 8,118.61 82.49 206.31 91.76 50.28 8,962.00 14.50 290.51 4.21 63.87 7,355.46 98.08 171.92 80.48 43.98 8,123.01
Total Accumulated Depreciation &Impairment upto 31.03.2009 116.52 320.38 5.66 70.46 8,118.61 82.49 206.31 91.76 50.28 9,062.47 113.72 291.76 4.21 63.87 7,355.46 98.08 171.92 80.48 43.98 8,223.48
Net Block as at 31.03.2009 164.56 743.73 112.25 87.80 9,583.16 30.82 155.33 94.22 22.67 10,994.54 97.38 714.76 113.70 58.78 6,927.45 29.70 189.70 101.32 23.32 8,256.11
Capital Work in progress [including advances for capital expenditure Rs. 1,235.62 crores (31.03.2008 : Rs. 466.24 crores)] 3,487.68 4,367.45
14,482.22 12,623.56
(1) Additions include adjustments for inter se transfers.
(2) Deductions include cost of assets scrapped/sold/surrendered during the year.
(3) Buildings include Rs. 2.32 crores (31.03.2008 : Rs. 2.32 crores) being cost of shares in Co-operative Housing Societies & Limited Companies.
(4) Development of property represents expenditure incurred on development of mines/collieries. It includes Rs. 57.57 crores (31.03.2008 : Rs. 57.57 crores) towards provision for fi nal mines closure expenditure as per the circular dated 8th August, 2003 issued by Indian Bureau of Mines and subsequent clarifi cation issued under Mineral Conservation & Development (Amendment) Rules 2003 as per Section 18 of the Mines and Minerals (Development and Regulation) Act, 1957.
(5) Rupee Liability has increased by a net amount of Rs. 67.39 crores (2007-08 : Rs. 6.45 crores) arising out of realignment of the value of foreign currency loans for procurement of fi xed assets, including Rs. 45.58 crores considered pursuant to the Accounting Standard 11 vide notifi cation No. GSR 225(E) dated 31.03.2009 issued by Ministry of Corporate Affairs which was charged off in previous years. The increase has been adjusted to the carrying cost of respective fi xed assets and has been depreciated over their remaining depreciable life. The depreciation for the current year includes Rs. 2.04 crores arising on account of this adjustment.

Hundred and second annual report 2008-09
160
Schedules forming part of the balance sheetSCHEDULE F : INVESTMENTS :—(Item No. 9, Page 148)
As at 31-03-2008 No. of equity shares of Rupees Rupees Rupees Rupees Face Value of Rs. 10 each crores crores crores crores fully paid-up unless otherwise specifi edA. LONG TERM INVESTMENTS (At Cost less provision for diminution in value)Trade Investments :SHARES AND DEBENTURES (Quoted) —1. Tata Motors Ltd. ..................................................................... 3,79,16,139 335.31 147.03 (55,37,729 Shares of face value subscribed during the year)2. Tata Motors Ltd. – DVR – A ................................................... 55,37,729 168.90 – (55,37,729 Shares of face value subscribed during the year)3. The Tinplate Company of India Ltd. ....................................... 88,75,000 29.68 29.684. TRF Ltd. ................................................................................. 19,13,314 4.67 4.675. Kumardhubi Fireclay and Silica Works Ltd. ........................... 1,50,001 – – (Book Value : Re. 1)6. Tata Construction and Projects Ltd. (Book Value : Re. 1) ..... 5,61,335 – –7. Indian Steel Rolling Mills Ltd. (Book Value : Re. 1) ............... 3,30,315 – –8. Wellman Incandescent India Ltd. (Book Value : Re. 1) ......... 8,99,100 – –9. Sanderson Industries Ltd. (Book Value : Re. 1) .................... 2,27,642 – –10. Tata Sponge Iron Ltd. ............................................................ 61,19,960 7.20 7.2011. Tata Construction & Projects Ltd.– 10% Convertible Debentures 43,000 – – of Rs.100 each (Non-Convertible Portion) (Book Value : Re. 1)12. Standard Chrome Ltd. (Book Value : Re. 1) .......................... 5,58,000 – –13. The Tata Power Company Ltd. .............................................. 56,81,818 100.00 100.0014. Housing Development Finance Corporation Ltd. ................... 1,580 0.01 0.0115. Other Rs. 40,272 (31.03.2008: 40,272) ................................. 0.01 0.01 (See Note 3, Page 162) 645.78 288.60 SHARES AND DEBENTURES (Unquoted)16. Kumardhubi Metal Casting and Engineering Ltd. ................. 10,70,000 – – (Book Value : Re. 1)17. Tata Industries Ltd. (Face value of Rs. 100 each) ................. 56,28,388 72.23 72.2318. Tata Services Ltd. (Face value of Rs. 1,000 each) ................ 1,621 0.16 0.1619. Tata International Ltd. (Face value of Rs. 1,000 each) .......... 3,740 0.49 0.4920. Tata Projects Ltd. (Face value of Rs. 100 each) .................... 90,000 0.18 0.18 (75,000 Bonus Shares received during the year)21. Rallis India Ltd. (7.50% cumulative preference shares) ........ 85,00,000 8.50 8.5022. IFCI Venture Capital Funds Ltd. ............................................ 1,00,000 0.10 0.1023. Kalinga Aquatics Ltd. (Book Value : Re. 1) ............................ 10,49,920 – –24. Jamipol Ltd. ........................................................................... 31,75,000 3.18 3.1825. mjunction services ltd. ........................................................... 40,00,000 4.00 4.0026. Tata Teleservices Ltd. (Reduction in Share capital to half; .... 6,31,53,638 134.06 145.20 52,46,590 shares sold during the year)27. Tata Teleservices Ltd. (0.10% Redeemable ......................... 6,83,54,569 50.00 50.00 Non-Cumulative Convertible Preference Shares)28. Tata Ryerson Ltd. ................................................................... 3,41,25,000 34.12 34.1229. The Tinplate Company of India Ltd. ...................................... 1,09,90,000 108.17* 106.70* 12.5% Optionally Convertible Redeemable Non-Cumulative Preference Shares (Face value of Rs. 100 each) (1,46,000 Shares acquired during the year)30. Tata Autocomp Systems Ltd. ................................................ – – 7.00 (7% Cumulative Redeemable Preference Shares) (70,00,000 Shares sold during the year)31. Nicco Jubilee Park Ltd. (Book Value : Re. 1) ......................... 3,40,000 – –32. The Dhamra Port Co. Ltd....................................................... 15,85,59,106 158.56 123.56 (3,50,00,000 Shares of face value Rs. 10 each subscribed during the year; 1,78,50,000 shares pledged during the year)
Carried forward .............................. 573.75 645.78 555.42 288.60
* Includes Rs. 0.03 crore incurred towards stamp duty.

161
Schedules forming part of the balance sheet
33. Tata BlueScope Steel Ltd. .................................................... 32,80,00,000 328.00 261.00 (6,70,00,000 Shares subscribed during the year)34. Panatone Finvest Ltd. ............................................................ 45,000 0.05 0.0535. Tarapur Environment Protection Society ............................... 15,726 0.16 0.1636. Industrial Energy Ltd. ............................................................. 8,65,80,000 86.58 26.00 (6,05,80,000 Shares subscribed during the period)37. Tata NYK Shipping Pte Ltd (Face value of USD 1 each) ....... 2,47,00,000 108.85 21.01 (1,97,00,000 Shares subscribed during the year)38. Steelscape Consultancy Private Limited ............................... 50,000 0.05 0.0539. Bhubneshwar Power Private Limited ..................................... 1,42,270 0.14 – (1,42,270 Shares subscribed during the year)40. Strategic Energy Technology Systems .................................. 25,000 0.03 – (25,000 Shares subscribed during the year)41. S &T Mining Company Private Ltd......................................... 5,25,000 0.53 – (5,25,000 Shares subscribed during the year)42. Others Rs. 32,495 (31.03.2008: 32,495) ............................... – – (See Note 4, Page 162) 1,098.14 863.69Investments in Subsidiary Companies : SHARES (Quoted) –43. Tata Metaliks Ltd. ................................................................... 1,17,99,992 11.80 11.8044. The Indian Steel & Wire Products Ltd. (Book Value : Re. 1) ... 54,74,030 – –45. Tayo Rolls Ltd. ....................................................................... 55,87,372 48.57 3.36 (35,88,022 Shares subscribed during the year) 60.37 15.16 SHARES (Unquoted) –46. Kalimati Investment Co.Ltd. ................................................... 1,63,87,469 86.68 86.6847. Tata Refractories Ltd.............................................................. 1,48,98,360 90.97 90.9748. The Tata Pigments Ltd. (Face value of Rs. 100 each) .......... 75,000 0.70 0.7049. Tata Korf Engineering Services Ltd. (Book Value : Re. 1) ..... 2,40,386 – –50. Tata Incorporated (Face value of US $ 1,000 each) .............. 1,500 1.64 1.6451. TM International Logistics Ltd. ............................................... 91,80,000 9.18 9.1852. Lanka Special Steels Ltd. (Face value of LKR 10 each) ....... 25,00,000 1.16 1.1653. Jamshedpur Utilities & Services Co.Ltd. ............................... 2,03,50,000 20.35 0.35 (2,00,00,000 Shares subscribed during the year)54. NatSteel Asia Pte. Ltd. (Face value of S$ 1 each) ................ 28,00,00,000 768.41 768.4155. Sila Eastern Ltd. (Face value of THB 100 each) ................... 9,800 0.10 0.1056. Hooghly Met Coke & Power Co. Ltd. .......................................... 54,76,63,618 548.36 514.20 (3,34,63,462 Shares purchased during the year)57. Tata Steel (KZN) (Proprietary) Ltd. (Face value of ZAR1 each) .... 12,96,00,000 84.70 84.7058. Tata Steel Holdings Pte. Ltd. (Face value of GBP 1 each) .... 432,32,92,418 35,633.38 0.72 (Formerly Tata Steel Asia Holdings Pte. Ltd.) (4,32,32,10,757 Shares subscribed during the year)59. Adityapur Toll Bridge Co. Ltd. (Book Value : Re. 1) ............... 5,63,600 – – (1,00,000 Shares subscribed during the year)60. Rawmet Ferrous Industries Ltd ............................................. 3,86,00,071 51.53 43.53 (80,00,000 Shares subscribed during the year)61. Gopalpur SEZ Ltd .................................................................. 10,00,000 1.00 1.0062. Tata Steel (Thailand) Public Company Ltd. (Face value ....... – 295.60* of THB 1 each) (2,10,45,43,058 Shares sold during the year) 37,298.16 1,898.94
As at 31-03-2008 No. of equity shares of Rupees Rupees Rupees Rupees Face Value of Rs. 10 each crores crores crores crores fully paid-up unless otherwise specifi ed
Trade Investments :SHARES AND DEBENTURES (Unquoted) –
SCHEDULE F : INVESTMENTS :— continued(Item No. 9, Page 148)
Carried forward .............................. 39,102.45 3,066.39
Brought forward ............................. 573.75 645.78 555.42 288.60
* Includes Rs. 15.92 crores expenduture in connection with investment.

Hundred and second annual report 2008-09
162
Schedules forming part of the balance sheet
No. of equity shares of As at Face Value of Rs. 10 each 31-03-2008 fully paid-up unless Rupees RupeesNotes : otherwise specifi ed crores crores
(1) Aggregate amount of Quoted Investments ................................................. 706.15 312.72 Market value as at 31.03.2009 : Rs. 1,491.89 crores (31.03.2008 : Rs. 3,260.65 crores)
(2) Aggregate amount of Unquoted Investments ............................................. 41,665.63 3,790.47
42,371.78 4,103.19
(3) Shares and Debentures (Quoted) — Others include : Rupees Rupees
(a) Reliance Firebrick and Pottery Co. Ltd. ............................................. 16,800 1 1 (partly paid up) (Book Value : Re. 1)
(b) Reliance Firebrick and Pottery Co. Ltd. (Book Value : Re. 1) ............. 2,400 1 1
(c) Sijua (Jherriah) Electric Supply Co. Ltd. ............................................. 4,144 40,260 40,260
(d) Timken India Ltd. ................................................................................ 1 10 10
40,272 40,272
(4) Shares and Debentures (Unquoted) — Others include : (a) Bokaro and Ramgarh Ltd. ................................................................... 100 16,225 16,225
(b) Jamshedpur Educational and Cultural Co-operative Society Ltd. ...... 50 5,000 5,000 (Face value of Rs. 100 each)
(c) Barajamda Iron Ore Mine Workers’ Central Co-operative Stores Ltd. 200 5,000 5,000 (Face value of Rs. 25 each)
(d) Joda East Iron Mine Employees’ Consumer Co-operative Society Ltd. 100 2,500 2,500 (Face value of Rs. 25 each)
(e) Ferro-Manganese Plant Employees’ Consumer Co-operative Society Ltd. 100 2,500 2,500 (Face value of Rs. 25 each)
(f) Jamshedpur Co-operative House Building Society Ltd. ..................... 10 1,000 1,000 (Face value of Rs. 100 each) (g) Jamshedpur Co-operative Stores Ltd. (Face value of Rs. 5 each) ..... 50 250 250
(h) Malusha Travels Pvt. Ltd. ................................................................... 2 20 20
32,495 32,495
SCHEDULE F : INVESTMENTS :— continued(Item No. 9, Page 148)
As at 31-03-2008 No. of equity shares of Rupees Rupees Rupees Rupees Face Value of Rs. 10 each crores crores crores crores fully paid-up unless otherwise specifi ed
B. CURRENT INVESTMENTS (at lower of cost and fair value) Other Investments (Quoted) :1. 6.75% Tax Free Bonds of Unit Trust of India ........................ – – 8.96 (Face value of Rs. 100 each) (8,95,982 sold during the year)
Other Investments (Unquoted) :2. Investment in Mutual Fund / Bonds: Fixed Maturity Funds ............................................................ – – Liquid Funds .......................................................................... 3,269.33 1,027.84 3,269.33 1,027.84
42,371.78 4,103.19
Brought forward ............................. 39,102.45 3,066.39

163
Schedules forming part of the balance sheetSCHEDULE F : INVESTMENTS :— continued
(Item No. 9, Page 148)
(5) INVESTMENT IN MUTUAL FUNDS
Balance Purchased during Sold during Balance As at 1.04.2008 the year the year As at 31.03.2009 Name of Mutual Fund No. of Rupees No. of Rupees No. of Rupees No. of Rupees Units crores Units crores Units crores Units crores
FIXED MATURITY FUNDS
Birla Sun Life Interval Income Fund Monthly
Plan - Series II - Institutional Plan - Growth – – 4,71,40,459.71 50.00 4,71,40,459.71 50.00 – –
Canara Robeco Interval Scheme - Monthly -
Institutional Plus - Dividend – – 5,03,02,939.32 50.32 5,03,02,939.32 50.32 – –
Canara Robeco Interval Scheme - Monthly -
Institutional Plus - Growth – – 9,37,27,682.54 99.08 9,37,27,682.54 99.08 – –
ICICI Prudential FMP - Series 44 - 1M -
Plan A - Ret - Dividend – – 25,00,00,000.00 250.00 25,00,00,000.00 250.00 – –
ICICI Prudential FMP - Series 44 - 1M -
Plan C - Ret - Dividend – – 12,50,00,000.00 125.00 12,50,00,000.00 125.00 – –
ICICI Prudential FMP - Series 44 - 1M -
Plan D - Ret - Dividend – – 15,00,00,000.00 150.00 15,00,00,000.00 150.00 – –
ICICI Prudential Interval Fund -
Monthly Interval I - IP - Growth – – 15,00,00,000.00 150.00 15,00,00,000.00 150.00 – –
ICICI Prudential Interval Fund -
Monthly Interval III - Dividend – – 10,06,31,122.20 100.63 10,06,31,122.20 100.63 – –
ICICI Prudential Interval Fund -
Monthly Interval III - Institutional - Growth – – 5,00,00,000.00 50.00 5,00,00,000.00 50.00 – –
Religare Monthly Interval Fund -
Plan A - Dividend – – 5,06,64,297.43 50.66 5,06,64,297.43 50.66 – –
Principal PNB FMP 30 Days -
Series I - IP - Growth – – 9,99,72,116.99 99.97 9,99,72,116.99 99.97 – –
Reliance Interval Fund - Monthly Series I -
IP - Dividend – – 53,70,51,335.78 537.29 53,70,51,335.78 537.29 – –
UTI Fixed Income Interval Fund -
Monthly Plan I - IP - Dividend – – 12,58,97,807.50 125.90 12,58,97,807.50 125.90 – –
UTI Fixed Income Interval Fund -
Monthly Plan II - IP - Growth – – 3,93,78,217.94 40.00 3,93,78,217.94 40.00 – –
TOTAL FIXED MATURITY FUNDS – – 186,97,65,979.41 1,878.85 186,97,65,979.41 1,878.85 – –
LIQUID FUNDS
Birla Sun Life Cash Plus - Institutional
Premium Plan - Daily Dividend 21,67,36,204.41 217.16 97,88,95,526.23 980.81 119,56,31,730.64 1,197.97 – –
Birla Sun Life Cash Plus -
Institutional Premium Plan - Growth – – 224,43,02,961.46 3,101.48 193,50,37,085.34 2,666.98 30,92,65,876.12 434.50
Birla Sun Life Savings Fund -
Institutional Plus - Daily Dividend – – 55,97,38,577.67 560.12 55,97,38,577.67 560.12 – –
Birla Sun Life Savings Fund -
Institutional Plus - Growth – – 100,29,75,070.19 1,618.70 100,29,75,070.19 1,618.70 – –
Canara Robeco Liquid -
Institutional Plus - Growth – – 27,65,50,509.71 424.50 27,65,50,509.71 424.50 – –
Canara Robeco Liquid -
Institutional Plus - Daily Dividend – – 31,49,03,339.93 316.19 31,49,03,339.93 316.19 – –
Canara Robeco Liquid -
Super Institutional Plus - Growth – – 123,51,40,881.10 1,260.58 123,51,40,881.10 1,260.58 – –
Canara Robeco Treasury Advantage Fund -
Institutional Plus - Daily Dividend – – 25,25,06,490.03 313.29 25,25,06,490.03 313.29 – –
Canara Robeco Treasury Advantage Fund -
Super Institutional Plus - Growth – – 32,96,34,777.56 415.00 32,96,34,777.56 415.00 – –
DWS Insta Cash Plus Fund - Super Institutional
Plus - Daily Dividend 5,08,35,377.21 50.94 4,52,56,493.05 45.35 9,60,91,870.26 96.29 – –
DWS Insta Cash Plus Fund -
Super Institutional Plus - Growth – – 192,94,25,766.22 2,185.50 167,42,85,702.22 1,894.50 25,51,40,064.00 291.00

Hundred and second annual report 2008-09
164
SCHEDULE F : INVESTMENTS :— continued(Item No. 9, Page 148)
Schedules forming part of the balance sheet
Balance Purchased during Sold during Balance As at 1.04.2008 the year the year As at 31.03.2009 Name of Mutual Fund No. of Rupees No. of Rupees No. of Rupees No. of Rupees Units crores Units crores Units crores Units crores
DWS Ultra Short-Term Fund -
Institutional Plus - Growth – – 44,29,20,652.67 454.02 44,29,20,652.67 454.02 – –
HDFC Cash Mgmt Fund - Savings Plan -
Daily Dividend 13,89,552.92 1.48 74,56,89,566.35 793.15 74,70,79,119.27 794.63 – –
HDFC Cash Mgmt Fund - Savings Plan - Growth – – 68,26,07,778.52 1,231.62 68,26,07,778.52 1,231.62 – –
HDFC Cash Mgmt Fund - Treasury Advantage -
WP - Daily Dividend – – 52,26,80,677.72 524.33 52,26,80,677.72 524.33 – –
HDFC Cash Mgmt Fund - Treasury Advantage -
WP - Growth – – 67,49,91,121.64 1,265.90 67,49,91,121.64 1,265.90 – –
HDFC Liquid Fund - Premium Plus Plan - Growth – – 92,32,11,606.29 1,619.50 45,39,40,902.83 791.50 46,92,70,703.45 828.00
HSBC Cash Fund - Institutional Plus -
Daily Dividend 1,01,32,014.52 10.14 68,05,94,552.44 680.98 69,07,26,566.96 691.12 – –
HSBC Cash Fund - Institutional Plus - Growth – – 19,47,85,904.99 257.54 19,47,85,904.99 257.54 – –
HSBC Ultra Short Term Bond Fund -
IP Plus - Growth – – 34,80,51,209.20 404.05 34,80,51,209.20 404.05 – –
HSBC Ultra Short Term Bond Fund -
IP Plus - Daily Dividend – – 43,84,93,186.31 439.05 43,84,93,186.31 439.05 – –
ICICI Prudential Flexible Income Plan -
Premium - Daily Dividend – – 55,75,60,592.37 589.54 55,75,60,592.37 589.54 – –
ICICI Prudential Flexible Income Plan -
Premium - Growth – – 99,65,54,442.88 1,578.68 99,65,54,442.88 1,578.68 – –
ICICI Prudential Liquid - Super IP -
Daily Dividend 3,99,49,087.85 39.95 162,91,61,932.22 1,629.24 166,91,11,020.07 1,669.19 – –
ICICI Prudential Liquid - Super IP - Growth – – 225,00,61,449.35 2,850.67 191,51,66,041.54 2,416.17 33,48,95,407.81 434.50
IDFC Cash Fund - Plan C - Super I P - Growth – – 110,60,49,877.28 1,176.00 110,60,49,877.28 1,176.00 – –
IDFC Liquid Fund - Daily Dividend 4,399.89 0.44 25,54,594.86 255.49 25,58,994.76 255.93 – –
IDFC Liquid Fund - Growth – – 3,77,893.21 46.00 3,77,893.21 46.00 – –
IDFC Liquidity Manager Fund Plus - Growth – – 49,976.33 5.95 49,976.33 5.95 – –
IDFC Money Manager - Invest Plan -
Plan B - Daily Dividend – – 17,16,65,118.54 171.76 17,16,65,118.54 171.76 – –
IDFC Money Manager - Invest Plan -
Plan B - Growth – – 5,16,09,151.77 66.76 5,16,09,151.77 66.76 – –
IDFC Money Manager - Treasury Plan -
Plan B - Growth – – 58,54,38,410.87 813.40 58,54,38,410.87 813.40 – –
ING Liquid Fund - Super IP - Daily Dividend 7,42,24,803.56 74.26 64,08,69,257.21 641.18 71,50,94,060.77 715.44 – –
ING Liquid Fund - Super IP - Growth – – 25,30,81,495.61 317.00 25,30,81,495.61 317.00 – –
ING Treasury Advantage Fund - IP -
Daily Dividend – – 37,78,57,148.67 377.98 37,78,57,148.67 377.98 – –
JM High Liquidity - Super I P - Daily Dividend 4,05,98,057.69 40.67 50,046.34 0.05 4,06,48,104.03 40.72 – –
Kotak Flexi Debt Fund - Daily Dividend – – 39,74,45,421.23 398.68 39,74,45,421.23 398.68 – –
Kotak Flexi Debt Fund - IP - Daily Dividend – – 37,04,98,645.47 372.26 37,04,98,645.47 372.26 – –
Kotak Flexi Debt Fund - IP - Growth – – 67,21,76,386.58 691.26 67,21,76,386.58 691.26 – –
Kotak Floater - LT - Growth – – 39,73,22,860.26 549.21 39,73,22,860.26 549.21 – –
Kotak Liquid - Institutional Premium Plan -
Daily Dividend 46,75,126.10 5.72 45,70,47,503.44 558.88 46,17,22,629.54 564.60 – –
Kotak Liquid - Institutional Premium Plan - Growth – – 139,44,87,298.66 2,442.60 118,95,53,158.32 2,077.60 20,49,34,140.34 365.00
LIC MF Liquid Fund - Daily Dividend 23,74,277.68 2.61 17,82,58,795.60 195.73 18,06,33,073.29 198.34 – –
LIC MF Liquid Fund - Growth – – 34,09,57,835.90 540.00 24,75,34,816.47 390.00 9,34,23,019.43 150.00
Lotus India Liquid Fund - Super IP - Growth – – 1,15,93,775.13 13.26 1,15,93,775.13 13.26 – –
Lotus India Liquid Plus Fund - IP - Daily Dividend – – 50,05,31,726.42 501.32 50,05,31,726.42 501.32 – –
Lotus India Liquid Plus Fund - IP - Growth – – 27,79,29,885.45 316.32 27,79,29,885.45 316.32 – –
Lotus India Liquid Fund- Super IP -

165
SCHEDULE F : INVESTMENTS :— continued(Item No. 9, Page 148)
Schedules forming part of the balance sheet
Balance Purchased during Sold during Balance As at 1.04.2008 the year the year As at 31.03.2009 Name of Mutual Fund No. of Rupees No. of Rupees No. of Rupees No. of Rupees Units crores Units crores Units crores Units crores
Daily Dividend 1,43,66,597.63 14.37 73,26,61,376.55 732.89 74,70,27,974.18 747.26 – –
PRINCIPAL Cash Mgmt Fund LO -
Inst Prem. Plan - Daily Dividend 16,57,10,412.08 165.72 45,35,68,280.86 453.60 61,92,78,692.93 619.32 – –
PRINCIPAL Cash Mgmt Fund LO -
Inst Prem. Plan - Growth – – 87,15,30,590.70 1,162.04 87,15,30,590.70 1,162.04 – –
PRINCIPAL Floating Rate Fund - FMP -
IP - Daily Dividend – – 35,64,38,281.90 356.88 35,64,38,281.90 356.88 – –
PRINCIPAL Floating Rate Fund - FMP -
IP - Growth – – 36,38,82,275.47 486.45 36,38,82,275.47 486.45 – –
PRINCIPAL Money Manager Fund -
IP - Monthly Dividend – – 9,68,66,735.34 100.75 9,68,66,735.34 100.75 – –
Reliance Liquidity Fund - Daily Dividend 7,54,65,350.11 75.49 103,21,66,755.62 1,032.49 110,76,32,105.73 1,107.98 – –
Reliance Liquidity Fund - Growth – – 83,11,78,677.34 1,069.98 83,11,78,677.34 1,069.98 – –
Reliance Money Manager Fund -
IP - Daily Dividend – – 44,33,691.76 443.87 44,33,691.76 443.87 – –
Reliance Money Manager Fund - IP - Growth – – 29,75,761.90 343.87 29,75,761.90 343.87 – –
Religare Liquid Fund - Super IP - Growth – – 74,60,66,568.15 899.00 53,82,56,321.43 648.00 20,78,10,246.73 251.00
Religare Ultra Short Term Fund - IP - Growth – – 25,14,90,917.99 301.14 25,14,90,917.99 301.14 – –
SBI Premier Liquid Fund - Super IP -
Daily Dividend – – 43,20,51,589.06 433.46 43,20,51,589.06 433.46 – –
SBI Premier Liquid Fund - Super IP - Growth – – 15,97,11,120.03 217.46 15,97,11,120.03 217.46 – –
SBI SHF - Ultra Short Term - IP - Daily Dividend – – 40,60,42,017.76 406.25 40,60,42,017.76 406.25 – –
SBI SHF - Ultra Short Term - IP - Growth – – 47,09,29,832.85 518.27 47,09,29,832.85 518.27 – –
Sundaram BNP Paribas Money Fund -
Super IP - Daily Dividend 5,46,23,873.12 55.14 1,50,343.89 0.15 5,47,74,217.00 55.29 – –
Tata Dynamic Bond Fund - Option B - Dividend – – 99,35,91,921.03 1,018.95 99,35,91,921.03 1,018.95 – –
Tata Dynamic Bond Fund - Option B - Growth – – 74,94,72,947.42 1,018.94 74,94,72,947.42 1,018.94 – –
Tata Floater Fund - Daily Dividend – – 44,78,11,003.25 449.41 44,78,11,003.25 449.41 – –
Tata Floater Fund - Growth – – 64,39,09,507.61 813.14 64,39,09,507.61 813.14 – –
Tata Liquid Fund - SHIP - Daily Dividend 1,56,323.30 17.41 67,41,075.63 751.31 68,97,398.93 768.72 – –
Tata Liquid Fund - SHIP - Growth – – 2,18,92,982.24 3,464.17 1,95,37,499.17 3,081.06 23,55,483.08 383.11
Templeton India TMA - Super IP - Daily Dividend 3,57,993.01 35.81 14,55,509.60 145.63 18,13,502.60 181.44 – –
Templeton India TMA - Super IP - Growth – – 1,28,81,362.75 1,635.00 1,28,81,362.75 1,635.00 – –
Templeton India Ultra Short Bond Fund -
Super IP - Growth – – 21,64,41,637.94 232.00 21,64,41,637.94 232.00 – –
UTI Liquid Cash Plan Institutional -
Daily Income Reinvestment 21,63,260.38 220.53 24,68,230.26 251.62 46,31,490.64 472.15 – –
UTI Liquid Fund - Cash Plan - IP - Dly Dividend – – 31,00,753.71 316.11 31,00,753.71 316.11 – –
UTI Liquid Fund - Cash Plan - IP - Growth – – 71,95,296.68 1,017.11 62,79,773.72 884.89 9,15,522.96 132.22
UTI Money Market - Growth – – 14,95,83,782.90 366.00 14,95,83,782.90 366.00 – –
UTI Treasury Advantage Fund - IP -
Daily Dividend – – 10,21,233.81 102.15 10,21,233.81 102.15 – –
UTI Treasury Advantage Fund - IP - Growth – – 74,95,426.93 862.44 74,95,426.93 862.44 – –
TOTAL LIQUID FUNDS 1,027.84 57,393.41 55,151.92 3,269.33
TOTAL MUTUAL FUNDS INVESTMENTS 1,027.84 59,272.26 57,030.77 3,269.33

Hundred and second annual report 2008-09
166
SCHEDULE G : STOCK-IN-TRADE :—(Item No. 11A(b), Page 148)
As at 31-03-2008 Rupees Rupees crores crores
(a) Finished and semi-fi nished products produced and purchased by the Company, at lower of cost and net realisable value (including purchased goods-in-transit) ................................................... 1,361.85 1,074.27
(b) Work-in-progress (at lower of cost and net realisable value) ........................................................ 73.17 71.48
1,435.02 1,145.75
(c) Coal, iron ore and other raw materials produced and purchased by the Company, at lower of cost and net realisable value (including purchased raw materials-in-transit) ............................ 1,433.26 901.56
2,868.28 2,047.31
SCHEDULE H : SUNDRY DEBTORS :—(Item No. 11A(c), Page 148)
As at 31-03-2008 Rupees Rupees crores crores
(a) Over six months old ....................................................................................................................... 42.36 73.25
(b) Others ............................................................................................................................................ 619.51 503.90
661.87 577.15
Less — Provision for doubtful debts ........................................................................................... 25.89 33.67
635.98 543.48
As at 31-03-2008 Rupees Rupees crores crores
Sundry debts, unsecured and considered good ................. 635.98 543.48 Sundry debts, considered doubtful ..................................... 25.89 33.67
661.87 577.15
Schedules forming part of the balance sheet

167
SCHEDULE J : LOANS AND ADVANCES :—(Item No. 11(B), Page 148)
As at 31-03-2008 Rupees Rupees crores crores
(a) Advances with public bodies1 ......................................................................................................... 379.78 369.98
(b) Other advances2 ............................................................................................................................. 3,739.24 1,621.32
(c) Advance against equity
(i) Tata Steel Holdings Pte. Ltd. .................................................................................................. 237.61 30,326.12
(ii) Others ..................................................................................................................................... 10.00 570.04
(d) Loans and Advances to subsidiary companies3 ............................................................................. 187.50 480.38
(e) Advance payment against taxes ..................................................................................................... 95.80 63.48
4,649.93 33,431.32 Less — Provision for doubtful advances ........................................................................................ 71.89 82.58
4,578.04 33,348.74
As at 31-03-2008 Rupees Rupees crores crores
Loans and Advances, unsecured and considered good ................ 4,578.04 33,348.74
Loans and Advances, considered doubtful .................................... 71.89 82.58
4,649.93 33,431.32
Notes : 1. Advances with public bodies include balances with Customs, Port Trust, etc. Rs. 340.16 crores (31.03.2008 : Rs. 357.53 crores). 2. Other advances include : (a) Loan due by an Officer of the Company Rs. 73,750 (31.03.2008 : Rs. 88,750). Maximum balance during the year
Rs. 88,750 (2007-08 : Rs. 1,03,750). (b) Intercorporate deposits of Rs. 17.07 crores (31.03.2008 : Rs. 89.80 crores). 3. Loans and Advances to subsidiary companies include Loans and Advances in the nature of Loans given to subsidiaries
Rs. 148.28 crores (31.03.2008 : Rs. 454.16 crores) - [See Note 10(c), Page 173].
Schedules forming part of the balance sheet
SCHEDULE I : CASH AND BANK BALANCES :—(Item No. 11A(e), Page 148)
As at 31-03-2008 Rupees Rupees crores crores(a) Cash in hand [including cheques : Rs. 70.09 crores (31.03.2008 : Rs. 124.03 crores)] ................ 70.58 124.51(b) Remittance in transit ...................................................................................................................... 1.07 13.11(c) Current accounts with Scheduled Banks ....................................................................................... 390.90 326.50(d) Current account with Bank of Bhutan (v Rs. 1,000.00) ................................................................ v * v *(e) Current account with CitiBank Singapore ....................................................................................... 0.15 0.19 *(f) Current account with Standard Chartered Bank, London .............................................................. 0.88 0.69 *(g) Deposit accounts with Scheduled Banks ...................................................................................... 1,127.02 0.04 1,590.60 465.04
* Maximum balances in current account with. 2008-09 2007-08 Rupees Rupees crores crores 1. Bank of Bhutan (# Rs. 1,000.00) .................................................................................................... # # 2. CitiBank Singapore ........................................................................................................................ 0.27 0.30 3. Standard Chartered Bank, London ................................................................................................ 0.88 3,555.95

Hundred and second annual report 2008-09
168
SCHEDULE K : CURRENT LIABILITIES :—(Item No. 12(A), Page 148) As at 31-03-2008 Rupees Rupees Rupees crores crores crores (a) Sundry creditors : (i) For supplies/services ...................................................................................... 2,230.41 2,182.52 (ii) For accrued wages and salaries .................................................................... 653.07 469.16 (iii) For other liabilities ......................................................................................... 959.30 591.74 3,842.78 3,243.42(b) Subsidiary companies ............................................................................................. 1,358.12 115.74(c) Interest accrued but not due .................................................................................... 506.68 231.05(d) Advances received from customers ........................................................................ 297.37 226.03(e) Liability towards Investors Education and Protection Fund under Section 205C of the Companies Act, 1956 Due as on (i) Unpaid Dividends ........................................................................................... – – (ii) Application Money Pending Refund ............................................................... – – (iii) Unpaid Matured Deposits ............................................................................... 0.01 0.02 (iv) Unpaid Matured Debentures .......................................................................... – – (v) Interest Accrued on (i) to (iv) above ................................................................ 0.07 0.08
Not due as on (i) Unpaid Dividends ........................................................................................... 33.08 29.33 (ii) Application Money Pending Refund ............................................................... 0.24 5.65 (iii) Unpaid Matured Deposits ............................................................................... 1.03 1.73 (iv) Unpaid Matured Debentures .......................................................................... 0.14 1.79 (v) Interest Accrued on (i) to (iv) above ................................................................ 0.34 0.42 6,039.86 3,855.26
As at 31-03-2008 Rupees Rupees crores crores Note : Sundry creditors for other liabilities include: Liability for Employees Family Benefi t Scheme ...................................................... 54.54 48.02
Schedules forming part of the balance sheet
SCHEDULE L : PROVISIONS :—(Item No. 12(B), Page 148) As at 31-03-2008 Rupees Rupees crores crores
(a) Provision for employee benefi ts [including provision for leave salaries Rs. 312.99 crores (31.03.2008: Rs. 228.52 crores)] .............................................. 1,143.08 848.54(b) Provision for taxation .............................................................................................. 493.59 854.74(c) Provision for fringe benefi t tax ................................................................................ 19.12 19.12(d) Proposed dividends ................................................................................................ 1,278.40 1,191.12
2,934.19 2,913.52
Signatures to Schedules 1 to 4 and A to L and Notes on pages 169 to 192
J C BHAMCompany SecretaryMumbai, 25th June, 2009
For and on behalf of the BoardRATAN N TATA ChairmanJAMES LENGNUSLI N WADIAS M PALIA ISHAAT HUSSAINJAMSHED J IRANI DirectorsSUBODH BHARGAVA JACOBUS SCHRAVENANDREW ROBBB MUTHURAMAN Managing DirectorKIRBY ADAMS DirectorH M NERURKAR Executive Director
}
169
1. Accounting Policies (a) Basis for Accounting The fi nancial statements are prepared under the historical cost convention on an accrual basis of accounting in accordance with the
generally accepted accounting principles, Accounting Standards notifi ed under Section 211(3C) of the Companies Act, 1956 and the relevant provisions thereof.
(b) Revenue Recognition (i) Sales comprises sale of goods and services, net of trade discounts. (ii) Export incentive under the Duty Entitlement Pass Book Scheme has been recognised on the basis of credits afforded in the
pass book.
(c) Employee Benefi ts (i) Short-term employee benefi ts are recognised as an expense at the undiscounted amount in the Profi t and Loss Account of the
year in which the related service is rendered.
(ii) Post employment benefi ts are recognised as an expense in the Profi t and Loss Account for the year in which the employee has rendered services. The expense is recognised at the present value of the amount payable towards contributions. The present value is determined using the market yields of government bonds, at the balance sheet date, as the discounting rate.
(iii) Other long-term employee benefi ts are recognised as an expense in the Profi t and Loss Account for the period in which the employee has rendered services. Estimated liability on account of long-term benefi ts is discounted to the current value, using the market yield on government bonds, as on the date of balance sheet, as the discounting rate.
(iv) Actuarial gains and losses in respect of post employment and other long-term benefi ts are charged to the Profi t and Loss Account. (v) Miscellaneous Expenditure In respect of the Employee Separation Scheme (ESS), net present value of the future liability for pension payable is amortised
equally over fi ve years or upto fi nancial year ending 31st March, 2010, whichever is earlier. The increase in the net present value of the future liability for pension payable to employees who have opted for retirement
under the Employee Separation Scheme of the Company is charged to the Profi t and Loss Account.
(d) Fixed Assets All fi xed assets are valued at cost less depreciation. Pre-operation expenses including trial run expenses (net of revenue) are
capitalised. Borrowing costs during the period of construction is added to the cost of fi xed assets. Blast Furnace relining is capitalised. The written down value of the asset consisting of lining/relining expenditure embedded in the
cost of the furnace is written off in the year of fresh relining.
(e) Depreciation (I) Capital assets whose ownership does not vest in the Company is depreciated over their estimated useful life or fi ve years,
whichever is less. (II) In respect of other assets, depreciation is provided on a straight line basis applying the rates specifi ed in Schedule XIV to the
Companies Act, 1956 or based on estimated useful life whichever is higher. However, asset value upto Rs. 25,000 is fully depreciated in the year of acquisition. The details of estimated life for each category of assets is as under :
(i) Buildings — 30 to 62 years.
(ii) Plant and Machinery — 6 to 21 years.
(iii) Railway Sidings — 21 years.
(iv) Vehicles and Aircraft — 5 to 18 years.
(v) Furniture, Fixtures and Offi ce Equipment — 5 years.
(vi) Intangibles (Computer Software) — 5 to 10 years.
(vii) Development of property for development of mines and collieries are depreciated over the useful life of the mine or lease period whichever is less, subject to maximum of 10 years.
(viii) Blast Furnace relining is depreciated over a period of 10 years (average expected life).
(ix) Freehold land is not depreciated.
(x) Leasehold land is amortised over the life of the lease.
(xi) Roads — 30 to 62 years.
(f) Foreign Currency Transactions Foreign Currency Transactions (FCT) and forward exchange contracts used to hedge FCT (including fi rm commitments and
forecast transactions) are initially recognised at the spot rate on the date of the transaction/contract. Monetary assets and liabilities relating to foreign currency transactions and forward exchange contracts remaining unsettled at the end of the year are translated at year end rates.
The company has opted for accounting the exchange differences arising on reporting of long term foreign currency monetary items in line with Companies (Accounting Standards) Amendment Rules 2009 relating to Accounting Standard 11 (AS-11) notifi ed by
SCHEDULE M : NOTES ON BALANCE SHEET AND PROFIT AND LOSS ACCOUNT

Hundred and second annual report 2008-09
170
SCHEDULE M : NOTES ON BALANCE SHEET AND PROFIT AND LOSS ACCOUNT :– continued
Government of India on 31st March, 2009. Accordingly the effect of exchange differences on foreign currency loans of the company is accounted by addition or deduction to the cost of the assets so far it relates to depreciable capital assets and in other cases by transfer to “Foreign Currency Monetary Items Translation Difference Account” to be amortised over the balance period of the long-term monetary items or 31st March, 2011 whichever is earlier. Exchange difference recognised in the Profi t & Loss Account up to last fi nancial year ended 31st March, 2008 relating to said long term monetary items in foreign currency has been adjusted against opening revenue reserve as provided in the rules.
The differences in translation of FCT and forward exchange contracts used to hedge FCT (excluding the long term foreign currency monetary items accounted in line with Companies (Accounting Standards) Amendment Rules 2009 on Accounting Standard 11 notifi ed by Government of India on 31st March, 2009) and realised gains and losses, other than those relating to fi xed assets are recognised in the Profi t and Loss Account. The outstanding derivative contracts at the balance sheet date other than forward exchange contracts used to hedge FCT are valued by marking them to market and losses, if any, are recognised in the Profi t and Loss Account.
Exchange difference relating to monetary items that are in substance forming part of the Company’s net investment in non integral foreign operations are accumulated in Foreign Exchange Fluctuation Reserve Account.
(g) Investments Long term investments are carried at cost less provision for permanent diminution, if any, in value of such investments. Current
investments are carried at lower of cost and fair value. When investment is made in partly convertible debentures with a view to retain only the convertible portion of the debentures, the excess of the face value of the non-convertible portion over the realisation on sale of such portion is treated as a part of the cost of acquisition of the convertible portion of the debenture.
(h) Inventories Finished and semi-fi nished products produced and purchased by the Company are carried at lower of cost and net realisable
value. Work-in-progress is carried at lower of cost and net realisable value. Coal, iron ore and other raw materials produced and purchased by the Company are carried at lower of cost and net realisable
value. Stores and spare parts are carried at cost. Necessary provision is made and charged to revenue in case of identifi ed obsolete and
non-moving items. Cost of inventories is generally ascertained on the ‘weighted average’ basis. Work-in-progress and fi nished and semi-fi nished
products are valued on full absorption cost basis.
(i) Relining Expenses Relining expenses other than expenses on Blast Furnace relining are charged as an expense in the year in which they
are incurred.
(j) Research and Development Research and Development costs (other than cost of fi xed assets acquired) are charged as an expense in the year in which they
are incurred.
(k) Deferred Tax Deferred Tax is accounted for by computing the tax effect of timing differences which arise during the year and reverse in
subsequent periods.
2. Contingent Liabilities (a) Guarantees The Company has given guarantees aggregating Rs. 81.22 crores (31.03.2008 : Rs. 106.22 crores) to banks and fi nancial
institutions on behalf of others. As at 31st March, 2009, the contingent liabilities under these guarantees amounted to Rs. 81.22 crores (31.03.2008 : Rs. 106.22 crores).
(b) Claims not acknowledged by the Company As at As at 31.03.2009 31.03.2008 Rs. crores Rs. crores
(i) Excise 340.61 193.47 (ii) Customs 13.68 13.66 (iii) Sales Tax 456.01 446.89 (iv) State Levies 154.67 96.78 (v) Suppliers and Service Contract 70.52 81.35 (vi) Labour Related 34.63 32.98 (vii) Income Tax 176.60 57.83
(c) Claim by a party arising out of conversion arrangement - Rs. 195.82 crores (31.03.2008 : Rs. 195.82 crores). The Company has not acknowledged this claim and has instead fi led a claim of Rs. 139.65 crores (31.03.2008 : Rs. 139.65 crores) on the party. The matter is pending before the Calcutta High Court.

171
SCHEDULE M : NOTES ON BALANCE SHEET AND PROFIT AND LOSS ACCOUNT :– continued
(d) The Excise Department has raised a demand of Rs. 235.48 crores (31.03.2008 : Rs. 235.48 crores) denying the benefi t of Notifi cation No. 13/2000 which provides for exemption to the integrated steel plant from payment of excise duty on the freight amount incurred for transporting material from plant to stock yard and consignment agents. The Company fi led an appeal with CESTAT, Kolkata and the order of the department was set aside. The department has fi led an appeal in Supreme Court where the matter is pending.
(e) The State Government of Orissa introduced “Orissa Rural Infrastructure and Socio Economic Development Act 2004” with effect from February 2005 levying tax on mineral bearing land computed on the basis of value of minerals produced from the mineral bearing land. The Company had fi led a Writ Petition in the High Court of Orissa, challenging the validity of the Act. Orissa High Court held in November 2005 that State does not have authority to levy tax on minerals. The State Government of Orissa moved the Supreme Court against the order of Orissa High Court and the case is pending with Supreme Court. The liability, if it materialises, as at 31.03.2009 would be Rs. 1,041.67 crores (31.03.2008 : Rs. 588.78 crores).
(f) The Industrial Tribunal, Ranchi has passed an award on 20.10.1998 with reference to an industrial dispute regarding permanent absorption of contract labourers engaged by the Company prior to 1981, directing the Company to absorb 658 erstwhile contract labourers w.e.f. 22.08.1990. A single bench of the Patna High Court has upheld this award. The Company challenged this award before the division bench of the Jharkhand High Court which has set aside the order of the single bench of Patna High Court as well as the Tribunal and remanded back the case to the tribunal for fresh hearing on all issues in accordance with law. The Industrial Tribunal, Ranchi by its award dated 31.03.2006 pronounced on 13.06.2006, held that the contract workers were not engaged by the management of the Company in the permanent and regular nature of work before 11.2.1981 and they are not entitled to permanent employment under the principal employer. The Tata Workers Union has fi led SLP against this award in the Supreme Court. The liability, if it materialises, would be to the tune of Rs. 155.79 crores (31.03.2008 : Rs. 133.10 crores).
(g) In terms of the agreements entered into between Tata Teleservices Ltd. (TTSL), Tata Sons Ltd. (TSL) and NTT DoCoMo, Inc. of Japan (Strategic Partner-SP), the Company was given by Tata Sons an option to sell 52,46,590 equity shares in TTSL to the SP, as part of a secondary sale of 25,31,63,941 equity shares effected along with a primary issue of 84,38,79,801 shares by TTSL to the SP. Accordingly, the company realised Rs. 60.91 crores on sale of these shares resulting in a profit of Rs. 49.77 crores.
If certain performance parameters and other conditions are not met, should the SP decide to divest its entire shareholding in TTSL, acquired under the primary issue and the secondary sale, and should TSL be unable to find a buyer for such shares, the Company is obligated to acquire the shareholding of the SP, at the higher of fair value or 50 percent of the subscription purchase price, in proportion of the number of shares sold by the company to the aggregate of the secondary shares sold to the SP, or if the SP divests the shares at a lower price pay a compensation representing the difference between such lower sale price and the price referred to above.
Further, in the event of breach of the representations and warranties (other than title and tax) and covenants not capable of specific performance, the Company is liable to reimburse TSL, on a pro rata basis, upto a maximum sum of Rs. 78.75 crores. The exercise of the option by SP being contingent on several variables the liability, if any, is remote and indeterminable.
(h) The Company has been paying royalty on coal extracted from its quarries pursuant to the judgement and order dated 23.07.2002 passed by the Jharkhand High Court. However, the State Government demanded royalty on processed coal at rates applicable to processed coal. Though the Company has contested the above demand, it has started paying, under protest, royalty on processed coal from November 2008. The incremental royalty, paid under protest, during November 2008 to March 2009 of Rs. 4.07 crores has been charged off to Profi t and Loss Account. The incremental amount, if payable, for the period till October 2008 works out to Rs. 232.57 crores (31.03.2008 : Nil) and has been considered as a contingent liability.
(i) Uncalled liability on partly paid shares and debentures Rs. 0.01 crore (31.03.2008 : Rs. 0.01 crore). (j) Bills discounted Rs. 472.14 crores (31.03.2008 : Rs. 434.52 crores). (k) Cheques discounted : Amount indeterminate. 3. The Company has given undertakings to (a) IDBI Bank Ltd. and IFCI not to dispose of its investment in The Tinplate Company of India
Limited, (b) ICICI Bank Ltd. (formerly ICICI), IFCI and IIBI not to dispose of its investment in the Indian Steel Rolling Mills Ltd. (ISRM). The ISRM is under liquidation, (c) IDBI not to dispose of its investment in Wellman Incandescent India Ltd., (d) IDBI and ICICI Bank Ltd. (formerly ICICI) not to dispose of its investment in Standard Chrome Ltd., (e) SBI, State Bank of Indore, State Bank of Hyderabad, State Bank of Patiala and WBIDC Ltd., not to dispose of its investment in Hooghly Met Coke and Power Co. Ltd., (f) State Bank of India not to dispose of its investment in Tata BlueScope Ltd. (g) Standard Chartered Bank and Hong Kong and Shanghai Banking Corporation, not to dispose of majority stake in Tata Steel (KZN) (Pty) Ltd., (h) Mizuho Corporate Bank Limited, not to dispose of its investments in Tata NYK Shipping Pte. Limited, (minimal stake required to be able to provide a corporate guarantee towards long term debt), without the prior consent of the respective fi nancial institutions/banks so long as any part of the loans/facilities sanctioned by the institutions/banks to these eight companies remains outstanding.
The Company has furnished a Security Bond in respect of its immovable property to the extent of Rs. 20 crores in favour of the Registrar of the Delhi High Court and has given an undertaking not to sell or otherwise dispose of the said property.
The Promoters’ (i.e. L & T Infrastructure Development Projects Ltd. and Tata Steel Ltd.) combined investments in The Dhamra Port Company Ltd., (DPCL) representing 51% of DPCL’s paid-up equity share capital are pledged with IDBI Trusteeship Services Ltd.
The Promoters’ (i.e. The Tata Power Company Limited. and Tata Steel Ltd.) combined investments in Industrial Energy Limited., (IEL) representing 51% of IEL’s paid-up equity share capital are pledged with Infrastructure Development Corporation Limited (IDFC).
The Company has provided a fi nancing commitment to the extent of £ 425 million to Tata Steel Europe Limited, an indirect wholly-owned subsidiary of the Company, to enable it to meet the fi nancial covenants of the Senior Facilities Agreements with its Lenders.

Hundred and second annual report 2008-09
172
SCHEDULE M : NOTES ON BALANCE SHEET AND PROFIT AND LOSS ACCOUNT :– continued
4. The Company had, on 20th August, 2005, signed an agreement with the Government of Jharkhand to participate in a special health insurance scheme to be formulated by the Government of Jharkhand for the purpose of providing medical facilities to the families of the people below poverty line. The state government would develop a suitable scheme and the Company has agreed to contribute to such scheme, when operational, a sum of Rs. 25.00 crores annually for a period of 30 years or upto the year of operation of the scheme whichever is less. The scheme is yet to be formed and no contribution has been made till 31st March, 2009.
5. The Board of Industrial and Financial Reconstruction (BIFR) sanctioned a scheme for rehabilitation of The Indian Steel and Wire Products Limited (ISWP), a sick Company in FY 2003-04. In terms of the scheme, the Company –
(a) took management control of ISWP; (b) acquired 4,74,130 Equity Shares from the existing promoters at Re. 1/- per share; (c) converted Rs. 5.00 crores of dues into 50,00,000 fully paid Equity Shares at Rs. 10 each and Rs. 10.88 crores into unsecured loan to be repaid by ISWP in 8 annual installments starting from FY 2004-05; (d) has an advance of Rs. 19.47 crores as at 31.03.2009 (31.03.2008: Rs. 27.12 crores) with ISWP towards one time settlement with fi nancial institutions for capital expenditure and margin for working capital.
6. The Company had issued during 1992-93, 1,15,50,000 Secured Premium Notes (SPN) of Rs. 300 each aggregating to Rs. 346.50 crores with Warrants attached for subscribing to one ordinary share of Rs. 10 each per SPN at a premium of Rs. 70 per share. The warrant holders have exercised their option in respect of 1,11,61,201 Detachable Warrants. For the balance of 3,88,799 Detachable Warrants for which option has not been exercised, the option is deemed to have lapsed except in respect of approximately 12,446 Detachable Warrants applicable to matters which are in dispute and for which the option is deemed to be kept alive for the time being. In terms of issue of SPNs, they have been redeemed on 24.08.1999.
7. Estimated amount of contracts remaining to be executed on Capital Account and not provided for : Rs. 10,152.99 crores (31.03.2008 : Rs. 6,633.20 crores).
8. The Company has taken on lease Plant and Machinery, having an aggregate cost of Rs. 3.79 crores (31.03.2008 : Rs. 3.79 crores). The element of the lease rental applicable to the cost of the assets has been charged to the Profi t and Loss Account over the estimated life of the asset and fi nancing cost has been allocated over the life of the lease on an appropriate basis. The total charge to the Profi t and Loss Account for the year is Rs. 0.73 crore (2007-08 : Rs. 0.73 crore). The break up of total minimal lease payments due as at 31st March, 2009 and their corresponding present value are as follows :
Rs. crores
As at 31.03.2009 As at 31.03.2008
Period Minimum Lease Present Value Minimum Lease Present Value Payments Payments
Not later than one year 0.46 0.42 0.72 0.66 Later than one year but not later than fi ve years – – 0.48 0.40 Later than fi ve years – – – –
Total 0.46 0.42 1.20 1.06
9. Profi t and Loss Account a) i) Provision for employee separation compensation has been calculated on the basis of net present value of the future monthly
payments of pension and lump sum benefi ts under the scheme including Rs. 76.93 crores (31.03.2008 : Rs. 57.31 crores) in respect of schemes introduced during the year.
ii) The amounts payable within one year under the ESS aggregates to Rs. 199.93 crores (31.03.2008 : Rs. 204.73 crores). iii) The amount shown under Miscellaneous Expenditure on ESS account, represents the balance amount to be amortised over
fi ve years or the fi nancial year ending 31st March, 2010, whichever is earlier. b) The manufacturing and other expenses and depreciation shown in the Profi t and Loss Account include Rs. 37.65 crores (2007-08 :
Rs. 34.47 crores) and Rs. 2.05 crores (2007-08 : Rs. 1.90 crores) respectively in respect of Research and Development activities undertaken during the year.
c) The company has opted for accounting the exchange differences arising on reporting of long term foreign currency monetary items in line with Companies (Accounting Standards) Amendment Rules 2009 relating to Accounting Standard 11 (AS-11) notifi ed by Government of India on 31st March, 2009.
As a result of this change in the accounting, the exchange difference of Rs. 529.15 crores (net of tax) recognised in the Profi t & Loss Account up to last fi nancial year ended 31st March, 2008 relating to long term monetary items in foreign currency has been adjusted against opening revenue reserve. As on 31st March, 2009, Rs. 471.66 crores remains to be amortised in the “Foreign Currency Monetary Items Translation Difference Account” after taking a charge of Rs. 30.79 crores in the Profi t & Loss Account and Rs. 32.54 crores (net of deferred tax Rs. 16.76 crores) adjusted against Securities Premium Account during the current fi nancial year on account of amortisation. Consequently the Depreciation for the year ended 31st March, 2009 is higher by Rs. 2.04 crores and the Profi t before taxes for the year ended 31st March, 2009 is higher by Rs. 889.47 crores.
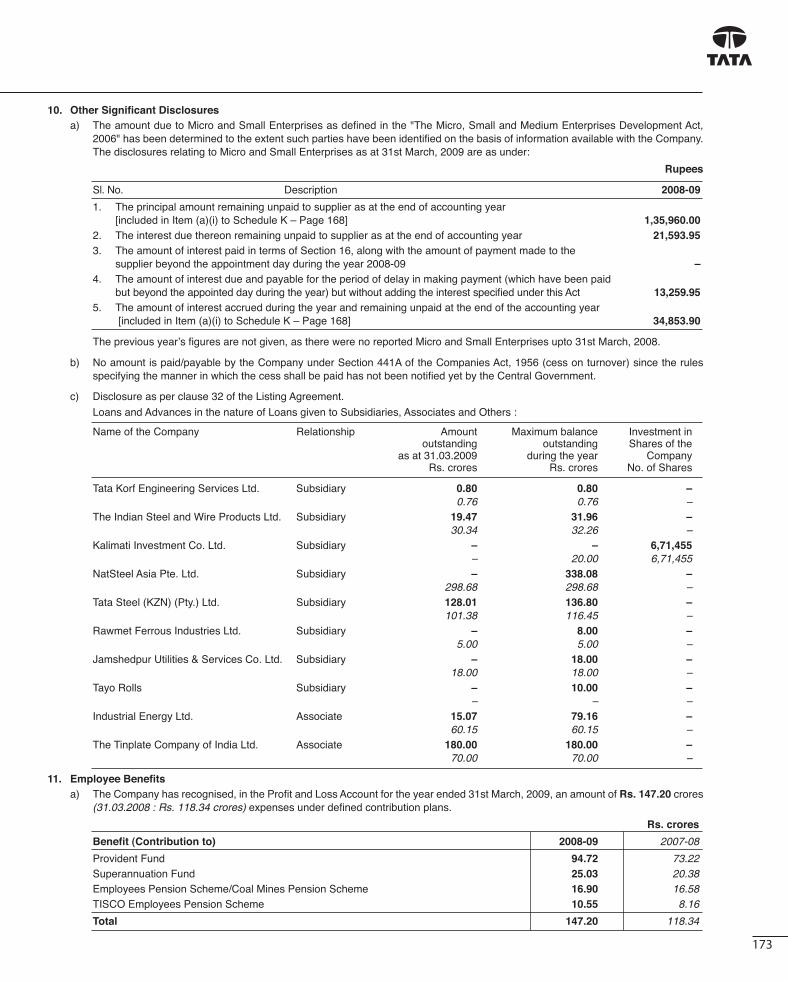
173
10. Other Signifi cant Disclosures a) The amount due to Micro and Small Enterprises as defi ned in the "The Micro, Small and Medium Enterprises Development Act,
2006" has been determined to the extent such parties have been identifi ed on the basis of information available with the Company. The disclosures relating to Micro and Small Enterprises as at 31st March, 2009 are as under:
Rupees
Sl. No. Description 2008-09
1. The principal amount remaining unpaid to supplier as at the end of accounting year [included in Item (a)(i) to Schedule K – Page 168] 1,35,960.00 2. The interest due thereon remaining unpaid to supplier as at the end of accounting year 21,593.95 3. The amount of interest paid in terms of Section 16, along with the amount of payment made to the supplier beyond the appointment day during the year 2008-09 – 4. The amount of interest due and payable for the period of delay in making payment (which have been paid but beyond the appointed day during the year) but without adding the interest specifi ed under this Act 13,259.95 5. The amount of interest accrued during the year and remaining unpaid at the end of the accounting year [included in Item (a)(i) to Schedule K – Page 168] 34,853.90
The previous year’s fi gures are not given, as there were no reported Micro and Small Enterprises upto 31st March, 2008.
b) No amount is paid/payable by the Company under Section 441A of the Companies Act, 1956 (cess on turnover) since the rules specifying the manner in which the cess shall be paid has not been notifi ed yet by the Central Government.
c) Disclosure as per clause 32 of the Listing Agreement.
Loans and Advances in the nature of Loans given to Subsidiaries, Associates and Others :
Name of the Company Relationship Amount Maximum balance Investment in outstanding outstanding Shares of the as at 31.03.2009 during the year Company Rs. crores Rs. crores No. of Shares
Tata Korf Engineering Services Ltd. Subsidiary 0.80 0.80 – 0.76 0.76 – The Indian Steel and Wire Products Ltd. Subsidiary 19.47 31.96 – 30.34 32.26 – Kalimati Investment Co. Ltd. Subsidiary – – 6,71,455 – 20.00 6,71,455 NatSteel Asia Pte. Ltd. Subsidiary – 338.08 – 298.68 298.68 – Tata Steel (KZN) (Pty.) Ltd. Subsidiary 128.01 136.80 – 101.38 116.45 – Rawmet Ferrous Industries Ltd. Subsidiary – 8.00 – 5.00 5.00 – Jamshedpur Utilities & Services Co. Ltd. Subsidiary – 18.00 – 18.00 18.00 – Tayo Rolls Subsidiary – 10.00 – – – – Industrial Energy Ltd. Associate 15.07 79.16 – 60.15 60.15 – The Tinplate Company of India Ltd. Associate 180.00 180.00 – 70.00 70.00 –
11. Employee Benefi ts a) The Company has recognised, in the Profi t and Loss Account for the year ended 31st March, 2009, an amount of Rs. 147.20 crores
(31.03.2008 : Rs. 118.34 crores) expenses under defi ned contribution plans.
Rs. crores
Benefi t (Contribution to) 2008-09 2007-08
Provident Fund 94.72 73.22 Superannuation Fund 25.03 20.38 Employees Pension Scheme/Coal Mines Pension Scheme 16.90 16.58 TISCO Employees Pension Scheme 10.55 8.16
Total 147.20 118.34

Hundred and second annual report 2008-09
174
SCHEDULE M : NOTES ON BALANCE SHEET AND PROFIT AND LOSS ACCOUNT :– continued
The Company’s Provident Fund is exempted under Section 17 of Employees’ Provident Fund Act, 1952. Conditions for grant of exemption stipulates that the employer shall make good defi ciency, if any, in the interest rate declared by Trust over statutory limit. Having regard to the assets of the Fund and the return on the investments, the Company does not expect any defi ciency in the forseeable future.
b) The Company operates post retirement defi ned benefi t plans as follows: a. Funded i. Post Retirement Gratuity b. Unfunded i. Post Retirement Medical Benefi ts ii. Pensions to Directors iii. Farewell Gifts iv. Packing and Transportation Costs on Retirement c) Details of the post retirement gratuity plan are as follows: Rs. crores
Description 2008-09 2007-08
1. Reconciliation of opening and closing balances of obligation a. Obligation as at the beginning of the year 761.17 694.99 b. Current Service Cost 35.26 30.17 c. Interest Cost 57.97 54.84 d. Actuarial (Gain)/Loss 272.27 41.74 e. Benefi ts paid (73.05) (60.57) f. Obligation as at the end of the year 1,053.62 761.17
2. Change in Plan Assets (Reconciliation of opening & closing balances) a. Fair Value of Plan Assets as at beginning of the year 709.14 645.68 b. Expected Return on Plan Assets 57.14 52.34 c. Actuarial Gain/(Loss) 33.35 (6.02) d. Contributions 83.35 77.72 e. Benefi ts Paid (73.05) (60.57) f. Fair Value of Plan Assets as at the end of the year 809.93 709.14
3. Reconciliation of fair value of assets and obligations a. Fair Value of Plan Assets as at the end of the year 809.93 709.14 b. Present Value of Obligation as at the end of the year 1,053.62 761.17 c. Amount Recognised in the Balance Sheet (243.69) (52.03)
4. Expense recognised in the period a. Current Service Cost 35.26 30.17 b. Interest Cost 57.97 54.84 c. Expected Return on Plan Assets (57.14) (52.34) d. Actuarial (Gain)/Loss 238.92* 47.76 e. Expense Recognised during the year 275.01 80.43
*Includes impact on account of wage settlement, provision for which was earlier included under wages and salaries, including bonus.
% invested % invested 5. Investment Details 31.03.2009 31.03.2008
a. GOI Securities 15.07 16.45 b. Public Sector Unit Bonds 36.28 37.81 c. State/Central Guaranteed Securities 11.79 8.91 d. Special Deposit Schemes 11.49 27.11 e. Private Sector Bonds 5.65 4.80 f. Others (including bank balances) 19.72 4.92
100.00 100.00
6. Assumptions 31.03.2009 31.03.2008 a. Discount Rate (per annum) 7.75% 8.00% b. Estimated Rate of Return on Plan Assets (per annum) 8.00% 8.00% c. Rate of Escalation in Salary (per annum) 6 to 10% 5 to 10%
The long term estimate of the expected rate of return on the fund assets have been arrived at based on the asset allocation and prevailing yield rates on such assets. The major portions of the assets are invested in PSU bonds and Special Deposits. Assumed rate of return on assets is expected to vary from year to year refl ecting the returns on matching Government Bonds.
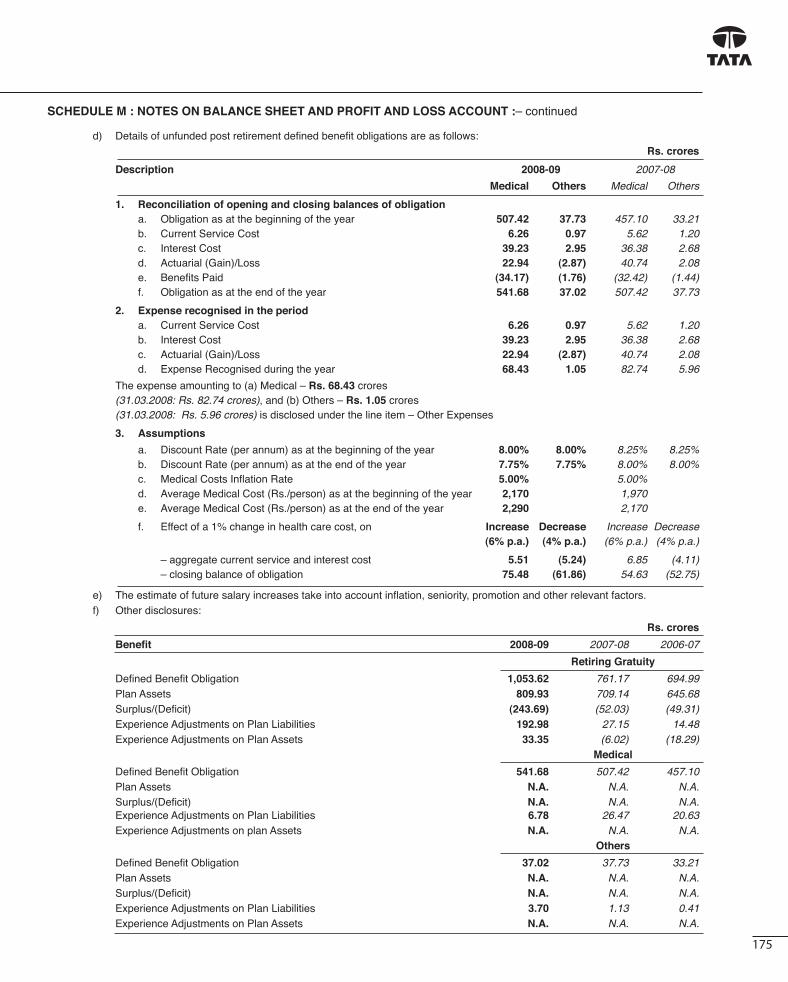
175
SCHEDULE M : NOTES ON BALANCE SHEET AND PROFIT AND LOSS ACCOUNT :– continued
d) Details of unfunded post retirement defi ned benefi t obligations are as follows: Rs. crores
Description 2008-09 2007-08
Medical Others Medical Others
1. Reconciliation of opening and closing balances of obligation a. Obligation as at the beginning of the year 507.42 37.73 457.10 33.21 b. Current Service Cost 6.26 0.97 5.62 1.20 c. Interest Cost 39.23 2.95 36.38 2.68 d. Actuarial (Gain)/Loss 22.94 (2.87) 40.74 2.08 e. Benefi ts Paid (34.17) (1.76) (32.42) (1.44) f. Obligation as at the end of the year 541.68 37.02 507.42 37.73
2. Expense recognised in the period a. Current Service Cost 6.26 0.97 5.62 1.20 b. Interest Cost 39.23 2.95 36.38 2.68 c. Actuarial (Gain)/Loss 22.94 (2.87) 40.74 2.08 d. Expense Recognised during the year 68.43 1.05 82.74 5.96
The expense amounting to (a) Medical – Rs. 68.43 crores (31.03.2008: Rs. 82.74 crores), and (b) Others – Rs. 1.05 crores (31.03.2008: Rs. 5.96 crores) is disclosed under the line item – Other Expenses
3. Assumptions
a. Discount Rate (per annum) as at the beginning of the year 8.00% 8.00% 8.25% 8.25% b. Discount Rate (per annum) as at the end of the year 7.75% 7.75% 8.00% 8.00% c. Medical Costs Infl ation Rate 5.00% 5.00% d. Average Medical Cost (Rs./person) as at the beginning of the year 2,170 1,970 e. Average Medical Cost (Rs./person) as at the end of the year 2,290 2,170
f. Effect of a 1% change in health care cost, on Increase Decrease Increase Decrease (6% p.a.) (4% p.a.) (6% p.a.) (4% p.a.)
– aggregate current service and interest cost 5.51 (5.24) 6.85 (4.11) – closing balance of obligation 75.48 (61.86) 54.63 (52.75)
e) The estimate of future salary increases take into account infl ation, seniority, promotion and other relevant factors. f) Other disclosures:
Rs. crores
Benefi t 2008-09 2007-08 2006-07
Retiring Gratuity
Defi ned Benefi t Obligation 1,053.62 761.17 694.99 Plan Assets 809.93 709.14 645.68 Surplus/(Defi cit) (243.69) (52.03) (49.31) Experience Adjustments on Plan Liabilities 192.98 27.15 14.48 Experience Adjustments on Plan Assets 33.35 (6.02) (18.29) Medical
Defi ned Benefi t Obligation 541.68 507.42 457.10 Plan Assets N.A. N.A. N.A. Surplus/(Defi cit) N.A. N.A. N.A. Experience Adjustments on Plan Liabilities 6.78 26.47 20.63 Experience Adjustments on plan Assets N.A. N.A. N.A. Others
Defi ned Benefi t Obligation 37.02 37.73 33.21 Plan Assets N.A. N.A. N.A. Surplus/(Defi cit) N.A. N.A. N.A. Experience Adjustments on Plan Liabilities 3.70 1.13 0.41 Experience Adjustments on Plan Assets N.A. N.A. N.A.
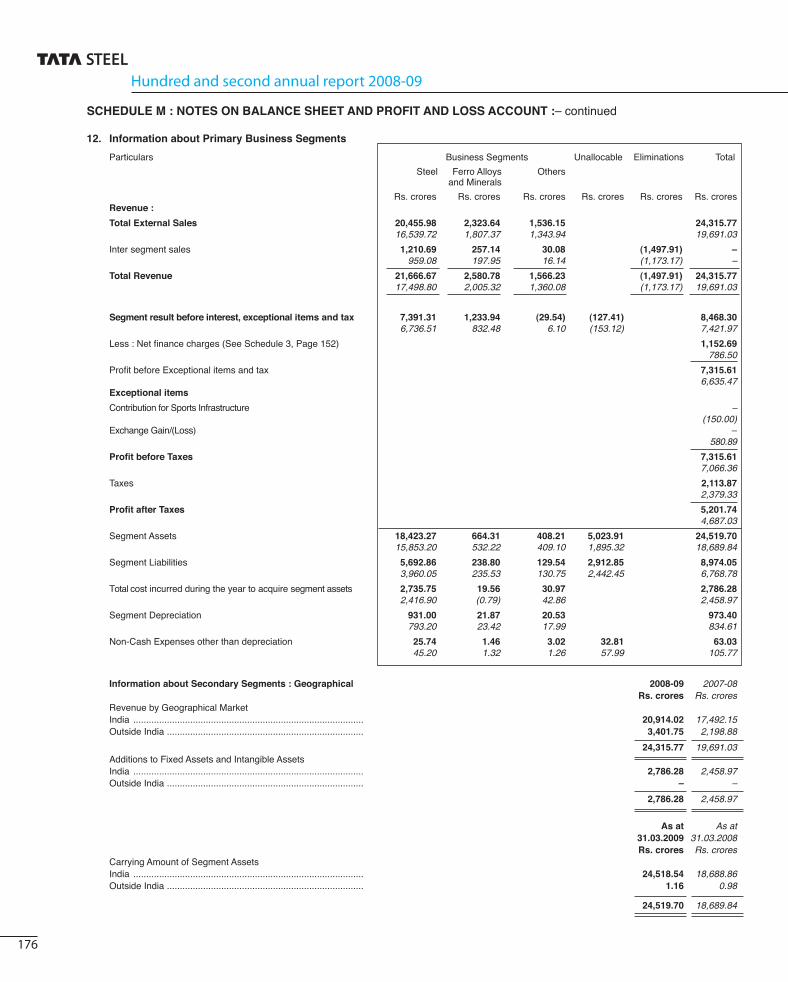
Hundred and second annual report 2008-09
176
SCHEDULE M : NOTES ON BALANCE SHEET AND PROFIT AND LOSS ACCOUNT :– continued
12. Information about Primary Business Segments
Particulars Business Segments Unallocable Eliminations Total
Steel Ferro Alloys Others and Minerals
Rs. crores Rs. crores Rs. crores Rs. crores Rs. crores Rs. crores Revenue :
Total External Sales 20,455.98 2,323.64 1,536.15 24,315.77 16,539.72 1,807.37 1,343.94 19,691.03
Inter segment sales 1,210.69 257.14 30.08 (1,497.91) – 959.08 197.95 16.14 (1,173.17) –
Total Revenue 21,666.67 2,580.78 1,566.23 (1,497.91) 24,315.77 17,498.80 2,005.32 1,360.08 (1,173.17) 19,691.03
Segment result before interest, exceptional items and tax 7,391.31 1,233.94 (29.54) (127.41) 8,468.30 6,736.51 832.48 6.10 (153.12) 7,421.97
Less : Net fi nance charges (See Schedule 3, Page 152) 1,152.69 786.50
Profi t before Exceptional items and tax 7,315.61 6,635.47 Exceptional items
Contribution for Sports Infrastructure – (150.00) Exchange Gain/(Loss) – 580.89
Profi t before Taxes 7,315.61 7,066.36
Taxes 2,113.87 2,379.33
Profi t after Taxes 5,201.74 4,687.03
Segment Assets 18,423.27 664.31 408.21 5,023.91 24,519.70 15,853.20 532.22 409.10 1,895.32 18,689.84
Segment Liabilities 5,692.86 238.80 129.54 2,912.85 8,974.05 3,960.05 235.53 130.75 2,442.45 6,768.78
Total cost incurred during the year to acquire segment assets 2,735.75 19.56 30.97 2,786.28 2,416.90 (0.79) 42.86 2,458.97
Segment Depreciation 931.00 21.87 20.53 973.40 793.20 23.42 17.99 834.61
Non-Cash Expenses other than depreciation 25.74 1.46 3.02 32.81 63.03 45.20 1.32 1.26 57.99 105.77
Information about Secondary Segments : Geographical 2008-09 2007-08 Rs. crores Rs. crores Revenue by Geographical Market India ......................................................................................... 20,914.02 17,492.15
Outside India ............................................................................ 3,401.75 2,198.88
24,315.77 19,691.03 Additions to Fixed Assets and Intangible Assets India ......................................................................................... 2,786.28 2,458.97 Outside India ............................................................................ – –
2,786.28 2,458.97
As at As at 31.03.2009 31.03.2008 Rs. crores Rs. crores Carrying Amount of Segment Assets India ......................................................................................... 24,518.54 18,688.86 Outside India ............................................................................ 1.16 0.98
24,519.70 18,689.84

177
SCHEDULE M : NOTES ON BALANCE SHEET AND PROFIT AND LOSS ACCOUNT :– continued
Notes :(i) The Company has disclosed Business Segment as the primary segment. Segments have been identifi ed taking into account the nature of the
products, the differing risks and returns, the organisational structure and internal reporting system. The Company’s operations predominantly relate to manufacture of Steel and Ferro Alloys and Minerals business. Other business segments comprise Tubes and Bearings.
(ii) Segment Revenue, Segment Results, Segment Assets and Segment Liabilities include the respective amounts identifi able to each of the segments as also amounts allocated on a reasonable basis. The expenses, which are not directly relatable to the business segment, are shown as unallocated corporate cost. Assets and liabilities that cannot be allocated between the segments are shown as unallocated corporate assets and liabilities respectively.
(iii) Total Unallocable Assets exclude :
As at As at 31.03.2009 31.03.2008 Rs. crores Rs. crores
Investments ...................................................................................... 42,371.78 4,103.19 Advance against Equity/Shareholders' Loan .................................... 247.61 30,896.16 Foreign Currency Monetary Item Translation Difference Account ......... 471.66 – Miscellaneous Expenditure .............................................................. 105.07 155.11
43,196.12 35,154.46
Total Unallocable Liabilities exclude : Secured Loans ................................................................................. 3,913.05 3,520.58 Unsecured Loans ............................................................................. 23,033.13 14,501.11 Provision for Employee Separation Compensation .......................... 1,033.60 1,071.30
Deferred Tax Liability (Net) ............................................................... 585.73 681.80
28,565.51 19,774.79
(iv) Transactions between segments are primarily for materials which are transferred at market determined prices and common costs are apportioned on a reasonable basis.
13. Related Party Disclosures(a) List of Related Parties and Relationships
A. Subsidiariesi) Adityapur Toll Bridge Company Ltd. India
ii) Gopalpur Special Economic Zone Ltd. India
iii) Hooghly Met Coke & Power Company Ltd. India
iv) Jamshedpur Utilities & Services Company Ltd. India
1. Haldia Water Management Limited * India
2. Naba Diganta Water Management Ltd. India
3. SEZ Adityapur Ltd. India
v) Kalimati Investment Company Ltd. India
1. Bangla Steel & Mining Co. Ltd. Bangladesh
vi) Lanka Special Steels Ltd. Sri Lanka
vii) NatSteel Asia Pte. Ltd. Singapore
1. NatSteel Iranian Private Joint Stock Company Iran
2. NatSteel Middle East FZE UAE
3. Tata Steel Asia (Hong Kong) Ltd. Hongkong
4. Tata Steel Resources Australia Pty. Ltd. Australia
5. Wuxi NatSteel Metal Products Co. Ltd.* China
viii) Rawmet Ferrous Industries Ltd. India
xi) Sila Eastern Ltd. Thailand
x) Tata Incorporated USA
xi) Tata Korf Engineering Services Ltd. India
xii) Tata Metaliks Ltd. India
1. Tata Metaliks Kubota Pipes Ltd. India
xiii) Tata Refractories Ltd. India
1. TRL Asia Pvt. Limited Singapore
2. TRL China Limited China
xiv) Tayo Rolls Ltd.* India
xv) Tata Steel (KZN) (Pty) Ltd. South Africa
xvi) Tata Steel Holdings Pte. Ltd. Singapore
a) Tata Steel Global Holdings Pte Ltd.* Singapore
I Corus International (Singapore) Holding Pte. Ltd. Singapore
1. Corus Asia Limited Hong Kong
2. Corus Holdings (Thailand) Ltd. Thailand
3. Corus International (Guangzhou) Ltd. China
4. Corus International (Shanghai) Ltd. China
5. Corus International Trading Limited Hong Kong
6. Corus Metals (Malaysia) Sdn. Bhd. Malaysia
7. Corus Metals (Thailand) Limited Thailand
8. Corus South East Asia Pte Limited Singapore
II NatSteel Holdings Pte. Ltd.* Singapore
1. Best Bar (Vic) Pte. Ltd. Australia
2. Best Bar Pty. Ltd. Australia
3. Burwill Trading Pte. Ltd. Singapore
4. Easteel Construction Services Pte. Ltd. Singapore
Name of the Party Country Name of the Party Country

Hundred and second annual report 2008-09
178
SCHEDULE M : NOTES ON BALANCE SHEET AND PROFIT AND LOSS ACCOUNT :– continued
5. Easteel Services (M) Sdn. Bhd. Malaysia
6. Eastern Steel Fabricators Phillipines, Inc. Phillipines
7. Eastern Steel Services Pte. Ltd. Singapore
8. Eastern Wire Pte. Ltd. Singapore
9. Materials Recycling Pte. Ltd. Singapore
10. Natferrous Pte. Ltd. Singapore
11. NatSteel (Xiamen) Ltd. China
12. NatSteel Asia (S) Pte. Ltd. Singapore
13. NatSteel Australia Pty. Ltd. Australia
14. NatSteel Equity IV Pte. Ltd. Singapore
15. NatSteel Trade International (Shanghai) Company Ltd. China
16. NatSteel Trade International Pte. Ltd. Singapore
17. NatSteel Vina Co. Ltd. Vietnam
18. PT Materials Recycling Indonesia Indonesia
19. Siam Industrial Wire Company Ltd. Thailand
20. Wuxi Jinyang Metal Products Co. Ltd. China
III Orchid Netherlands (No.1) B.V. * Netherlands
IV Tata Steel Europe Ltd. UK
1. Almana Steel Dubai (Jersey) Limited Jersey
2. Aluminium Delfzijl B.V. * Netherlands
3. Apollo Metals Ltd. USA
4. Ashorne Hill Management College UK
5. Augusta Grundstucks GmbH Germany
6. Automotive Laser Technologies Limited UK
7. Automotive Tailored Blanks B.V. * Netherlands
8. B S Pension Fund Trustee Ltd. UK
9. Bailey Steels Limited * UK
10. Beheermaatschappij Industriele Produkten B.V. Netherlands
11. Belfi n Beheermaatschappij B.V. Netherlands
12. Bell & Harwood Limited UK
13. Blastmega Limited (United Steel Forgings Ltd.) UK
14. Blume Stahlservice GmbH Germany
15. Blume Stahlservice Polska Sp. Z.O.O Poland
16. Bore Samson Group Ltd. UK
17. Bore Steel Ltd. UK
18. British Guide Rails Ltd. UK
19. British Steel Holdings B.V. Netherlands
20. British Steel Nederland International B.V. Netherlands
21. British Steel Benelux B.V. Netherlands
22. British Steel Corporation Ltd UK
23. British Steel De Mexico S.A. de C.V. Mexico
24. British Steel Directors (Nominees) Limited UK
25. British Steel Employee Share Ownership Trustees Ltd. UK
26. British Steel Engineering Steels (Exports) Limited UK
27. British Steel International B.V. Netherlands
28. British Steel Samson Limited UK
29. British Steel Service Centres Ltd. UK
30. British Steel Tubes Exports Ltd. UK
31. British Transformer Cores Ltd. UK
32 British Tubes Stockholding Ltd. UK
33. Bs Quest Trustee Limited UK
34. Bskh Corporate Services (UK) Limited UK
35. Burgdorfer Grundstuecks GmbH Germany
36. Business Park Ymond B.V. * Netherlands
37. C V Benine Netherlands
38. C Walker & Sons (Steel) Ltd. UK
39. C Walker & Sons Ltd. UK
40. Catnic GmbH Germany
41. Catnic Limited UK
42. Cbs Investissements SAS France
43. Cladding & Decking (UK) Limited UK
44. Cogent Power Inc. Canada
45. Cogent Power Inc. Mexico
46. Cogent Power Inc. USA
47. Cogent Power Limited UK
48. Cold Drawn Tubes Ltd. UK
49. Color Steels Limited UK
50. Corbeil Les Rives SCI France
51. Corby (Northants) & District Water Co. UK
52. Cordor (C& B) Limited UK
53. Corus - Sistemas Constructivos E Revestimentos Metalicos, Lda Portugal
54. Corus Aerospace Service Centre Suzhou Co Ltd * China
55. Corus Aluminium Beheer B.V. Netherlands
56. Corus Aluminium Limited UK
57. Corus Aluminium Verwaltungsgesellschaft Mbh Germany
58. Corus Aluminium Voerde GmbH * Germany
59. Corus America Holdings Inc. USA
60. Corus America Inc. USA
61. Corus Batiment Et Systemes SAS France
62. Corus Belgium Bvba Belgium
63. Corus Benelux B.V. Netherlands
64. Corus Beteiligungs GmbH Germany
65. Corus Brokers Limited UK
66. Corus Building Systems Bulgaria AD * Bulgaria
67. Corus Building Systems N.V. Belgium
68. Corus Building Systems SAS France
69. Corus Byggesystemer A/S Denmark
70. Corus Byggsystem AB Sweden
71. Corus Byggsystemer A/S Norway
72. Corus Central Europe S.R.O. Czech Republic
73. Corus Cic Holdings Inc. Canada
74. Corus Cic Inc. Canada
75. Corus CNBV Investments UK
76. Corus Coatings Usa Inc. USA
77. Corus Cold Drawn Tubes Limited UK
78. Corus Construction Products (Thailand) Limited Thailand
79. Corus Consulting And Technical Services B.V. Netherlands
Name of the Party Country Name of the Party Country

179
SCHEDULE M : NOTES ON BALANCE SHEET AND PROFIT AND LOSS ACCOUNT :– continued
80. Corus Consulting B.V. Netherlands
81. Corus Consulting Limited UK
82. Corus Consulting Romania SRL Romania
83. Corus Degels GmbH Germany
84. Corus Denmark A/S Denmark
85. Corus Deutschland GmbH Germany
86. Corus Distribution Europe BV Netherlands
87. Corus Electrical Limited UK
88. Corus Engineering Limited UK
89. Corus Engineering Steels (UK) Limited UK
90. Corus Engineering Steels Holdings Limited UK
91. Corus Engineering Steels Limited UK
92. Corus Engineering Steels
Overseas Holdings Limited UK
93. Corus Finance Limited UK
94. Corus Finland Oy Finland
95. Corus France SAS France
96. Corus Group Limited UK
97. Corus Holdings Ltd. UK
98. Corus Holdings SA France
99. Corus Hungary Trading Limited Liability Company Hungary
100. Corus India Ltd. India
101. Corus International (India) Pvt. Limited India
102. Corus International (Overseas Holdings) Limited UK
103. Corus International Bulgaria Limited * Bulgaria
104. Corus International Deutschland GmbH Germany
105. Corus International Limited UK
106. Corus International Nigeria * Nigeria
107. Corus International Representacoes Do Brasil Ltda. Brazil
108. Corus International Romania SRL Romania
109. Corus International Services N.V Belgium
110. Corus International Trading Limited UK
111. Corus International Trading Limited USA
112 Corus Investment B.V. Netherlands
113. Corus Investments Ltd. UK
114. Corus Ireland Ltd. Ireland
115. Corus Italia SRL Italy
116. Corus Laminacion Y Derivados, S.L. Spain
117. Corus Large Diameter Pipes Limited UK
118. Corus Liaison Services (India) Limited UK
119. Corus Management Limited UK
120. Corus Met B.V. Netherlands
121. Corus Metal Iberica S.A Spain
122. Corus Metals Limited UK
123. Corus Middle East FZE UAE
124. Corus Multi-Metals Limited UK
125. Corus Nederland B.V. Netherlands
126. Corus New Zealand Limited New Zealand
127. Corus Norge A/S Norway
128. Corus Packaging Plus Belgium N.V Belgium
129. Corus Packaging Plus Norway A/S Norway
130. Corus Perfo B.V. Netherlands
131. Corus Polska Sp.Z.O.O. Poland
132. Corus Primary Aluminium B.V. Netherlands
133. Corus Properties (Germany) Limited UK
134. Corus Property UK
135. Corus Quest Trustee Limited UK
136. Corus Rail Consultancy Limited UK
137. Corus Rail France S.A France
138. Corus Rail Limited UK
139. Corus Republic Of Ireland Subsidiaries Pension Scheme Trustee Limited Ireland
140. Corus Schweiz AG Switzerland
141. Corus Service Center Milano Spa Italy
142. Corus Service Centre Maastricht B.V. Netherlands
143. Corus Services Nederland B.V. Netherlands
144. Corus Sheet & Tube Inc. USA
145. Corus Special Strip Asia Limited Hong Kong
146. Corus Staal B.V. Netherlands
147. Corus Stahl GmbH Germany
148. Corus Stainless Limited UK
149. Corus Stainless Nl B.V. Netherlands
150. Corus Stainless UK Ltd. UK
151. Corus Star-Frame B.V. Netherlands
152. Corus Steel Limited UK
153. Corus Steel Usa Inc. USA
154. Corus Sverige AB Sweden
155. Corus Technology B.V. Netherlands
156. Corus Trico Holdings Inc. USA
157. Corus Tubes B.V. Netherlands
158. Corus Tuscaloosa Corp. USA
159. Corus UK Healthcare Trustee Limited * UK
160. Corus UK Limited UK
161. Corus Vlietjonge B.V. Netherlands
162. Corus Yasan Metal Sanayi Ve Ticaret AS Turkey
163. Cpn 85 Limited UK
164. Crucible Insurance Company Ltd. I of Man
165. Demka B.V. Netherlands
166. Dsrm Group Plc. UK
167. Ees Group Services Limited UK
168. Ees Nederland B.V. Netherlands
169. Eric Olsson & Soner Forvaltnings AB Sweden
170. Esmil B.V. Netherlands
171. Euro-Laminations Limited UK
172. European Electrical Steels Limited UK
173. European Profi les Limited * UK
174. Europressings Limited UK
175. Firsteel Coated Strip Limited * UK
176. Firsteel Cold Rolled Products Limited * UK
177. Firsteel Group Limited UK
178. Firsteel Group Pension Trustee Limited UK
179. Firsteel Holdings Limited UK
180. Firsteel Resources Limited * UK
181. Firsteel Steel Processing Limited UK
Name of the Party Country Name of the Party Country

Hundred and second annual report 2008-09
180
SCHEDULE M : NOTES ON BALANCE SHEET AND PROFIT AND LOSS ACCOUNT :– continued
182. Firsteel Strip Mill Products Limited UK
183. Fischer Profi elen NV Belgium
184. Fischer Profi l GmbH Germany
185. Gamble Simms Metals Ltd. Ireland
186. Grant Lyon Eagre Ltd. UK
187. H E Samson Ltd. UK
188. Hadfi elds Holdings Ltd. UK
189. Hammermega Limited UK
190. Harrowmills Properties Ltd. UK
191. Hille & Muller GmbH Germany
192. Hille & Muller Italia SRL. Italy
193. Hille & Muller Usa Inc. USA
194. Holorib GmbH Germany
195. Hoogovens (UK) Limited UK
196. Hoogovens Aluminium UK Limited UK
197. Hoogovens Finance B.V. Netherlands
198. Hoogovens Technical Services Coahuila B.V. Netherlands
199. Hoogovens Technical Services Mexico De S. De R.L. De C.V. Mexico
200. Hoogovens Technical Services Monclova B.V. Netherlands
201. Hoogovens Tubes Poland Spolka Z.O.O Poland
202. Hoogovens Usa Inc. USA
203. Huizenbezit “Breesaap” B.V. Netherlands
204. Ickles Cottage Trust UK
205. Immobilliere De Construction De Maubeuge Et Louvroil SAS France
206. Industrial Steels Limited UK
207. Inter Metal Distribution SAS France
208. K&S Management Service Limited UK
209. Kalzip Asia Pte Singapore
210. Kalzip GmbH Austria
211. Kalzip GmbH Germany
212. Kalzip Guanhzou Limited China
213. Kalzip Inc USA
214. Kalzip Limited UK
215. Kalzip Spain S.L.U. Spain
216. Lister Tubes Ltd. Ireland
217. London Works Steel Company Ltd. UK
218. Midland Steel Supplies Ltd. UK
219. Mistbury Investments Limited UK
220. Montana Bausysteme AG Switzerland
221. Myriad Deutschland GmbH Germany
222. Myriad Espana Sl Spain
223. Myriad Nederland B.V. Netherlands
224. Myriad SA France
225. Myriad United Kingdom Limited UK
226. Namascor B.V. Netherlands
227 Nationwide Steelstock Limited UK
228. Nebam Nedelandse Bevrachting En Agentuur Maatschappij B.V. Netherlands
229. Oostfl ank B.V. Netherlands
230. Orb Electrical Steels Limited UK
231. Ore Carriers Ltd. UK
232. Oremco Inc. USA
233. Plated Strip International Limited UK
234. Precision Metal Forming Limited UK
235. Precoat International Limited UK
236. Precoat Limited UK
237. Rafferty-Brown North Carolina Co. * USA
238. Rafferty-Brown Steel Co Inc Of Conn. USA
239. Richard Thomas And Baldwins 1978 Limited New Zealand
240. Richard Thomas And Baldwins (Australia) Pty Ltd. Australia
241. Round Oak Steelworks Ltd. UK
242 Runblast Limited UK
243. Runmega Limited UK
244. S A B Profi el B.V. Netherlands
245. S A B Profi l GmbH Germany
246. SA Intertubes Belgium
247. Sacra-Nord SAS France
248. Scrap Processing Holding B.V. Netherlands
249. Seamless Tubes Ltd. UK
250. Sia Corus Building Systems Latvia
251. Simiop Investments Ltd. UK
252. Simiop Ltd. UK
253. Simms Steel Holdings Ltd. UK
254. Skruv Erik AB Sweden
255. Societe Europeenne De Galvanisation (Segal) Sa Belgium
256. Staalverwerking En Handel B.V. Netherlands
257. Steel Company (N.I.) Ltd. UK
258. Steel Stockholdings Ltd. UK
259. Steelstock Ltd. UK
260. Stewarts & Lloyds Of Ireland Ltd. Ireland
261. Stewarts And Lloyds (Overseas) Ltd. UK
262. Stocksbridge Cottage Trust UK
263. Strata-Color (Coated Steels) Limited * UK
264. Surahammar Bruks AB Sweden
265. Swinden Housing Association UK
266. Tata Steel Netherlands B.V. Netherlands
267. Tata Steel UK Ltd. UK
268. Telmag (Holdings) Limited UK
269. Telmag Magnetic Components Limited UK
270. The Newport And South Wales Tube Company Ltd. UK
271. The Stanton Housing Company Ltd. UK
272. The Steel Company Of Ireland Limited Ireland
273. The Templeborough Rolling Mills Ltd. UK
274. Thomas Processing Company USA
275. Thomas Steel Strip Corp. USA
276. Tinsley Trailers Limited UK
277. Toronto Industrial Fabrications Ltd. UK
278. Trierer Walzwerk GmbH Germany
279. Tulip Netherlands (No. 1) B.V. Netherlands
280. Tulip Netherlands (No. 2) B.V. Netherlands
Name of the Party Country Name of the Party Country

181
SCHEDULE M : NOTES ON BALANCE SHEET AND PROFIT AND LOSS ACCOUNT :– continued
281. Tulip UK Holdings (No. 2) Ltd. UK
282. Tulip UK Holdings (No. 3) Ltd. UK
283. U.E.S. Bright Bar Limited UK
284. UK Steel Enterprise Ltd. UK
285. Ukse Fund Managers Limited UK
286. Ukse Fund Mangers (General Partner) Limited UK
287. United Steels Co (N Z) Ltd. New Zealand
288. Unitol SAS France
289. Walker Manufacturing And Investments Ltd. UK
290. Walkersteel (Ni) Ltd. * UK
291. Walkersteelstock Ireland Limited Ireland
292. Walkersteelstock Ltd. UK
293. Westwood Steel Services Ltd. UK
294. Whitehead (Narrow Strip) Ltd. UK
V Tata Steel Global Minerals Holdings Pte Ltd. Singapore
1. Al Rimal Mining LLC Oman
2. Black Ginger 461 Proprietary Ltd South Africa
3. Kalimati Coal Company Pty. Ltd. Australia
4. Tata Steel Cote D’ Ivoire S.A.*# Ivory Coast
VI Tata Steel (Thailand) Public Company Ltd. Thailand
1. NTS Steel Group Plc Thailand
2. The Siam Construction Steel Co. Ltd. Thailand
3. The Siam Iron And Steel (2001) Co. Ltd. Thailand
xvii) TM International Logistics Ltd. India
1. International Shipping Logistics FZE UAE
2. TKM Global China Ltd.* China
3. TKM Global GmbH Germany
4. TKM Global Logistics Ltd. India
xviii) The Indian Steel and Wire Products Ltd. India
xix) The Tata Pigments Ltd. India
B. Associates through
i) Kalimati Investment Company Ltd.
1. Rujuvalika Investments Ltd. India
ii) NatSteel Asia Pte. Ltd.
1. Steel Asia Development and Management Corp. Singapore
2. Steel Asia Industries Inc. Singapore
3. Steel Asia Manufacturing Corp. Singapore
iii) Tata Incorporated
1. TKM Overseas Ltd. India
iv) Tata Refractories Ltd.
1. Almora Magnesite Ltd. India
v) Tata Steel Ltd.
1. Indian Steel Rolling Mills Ltd. India
2. Industrial Energy Ltd. India
3. Jamipol Ltd. India
4. Kalinga Aquatics Ltd. India
5. Kumardhubi Fireclay & Silica Works Ltd. India
6. Kumardhubi Metal Casting & Engineering Ltd. India
7. Nicco Jubilee Park Ltd. India
8. Tata Construction & Projects Ltd. India
9. Tata Sponge Iron Ltd. India
10. Tayo Rolls Ltd.* India
11. Tinplate Company of India Ltd. India
12. TRF Ltd. India
vi) Tata Steel Holdings Pte. Ltd.
a) Tata Steel Global Holdings Pte Ltd.
I Corus International (Singapore) Holding Pte. Ltd.
1. European Profi les Malaysia (M) Sdn.Bhd. Malaysia
II NatSteel Holdings Pte. Ltd.
1. Southern Steel, Berhard Malaysia
III Tata Steel Europe Ltd.
1. Ab Norskstal AS Norway
2. Albi Profi ls SRL France
3. Altos Hornos De Mexico S.A. de C.V. Mexico
4. Antheus Magnesium B.V. * Netherlands
5. Appleby Frodingham Cottage Trust Limited UK
6. Combulex B.V. Netherlands
7. Cv Gasexpansie Ijmond Netherlands
8. Danieli Corus Canada Inc. Canada
9. Danieli Corus Asia B.V. Netherlands
10. Danieli Corus B.V. Netherlands
11. Danieli Corus Braseq Ltda. Brazil
12. Danieli Corus Construction Services B.V. Netherlands
13. Danieli Corus Construction Services Usa Inc. USA
14. Danieli Corus Do Brasil Ltda. Brazil
15. Danieli Corus Inc. USA
16. Danieli Corus Services Usa Inc. USA
17. Danieli Corus South Africa Pty. Ltd. South Africa
18. Danieli India (PVT) Ltd * India
19. Endex European Energy Derivates Exchanges N.V. Netherlands
20. European Profi les (Marketing) Sdn. Bhd. Malaysia
21. Galvpro LP. USA
22. Gietwalsonderhoudcombinatie B.V. Netherlands
23. Hoogovens Court Chrome Vof Netherlands
24. Hoogovens Gan Multimedia S.A. De C.V. Mexico
25. Isolation Du Sud SA France
26. Issb Limited UK
27. MDC Sublance Probe Technology * Shanghai
28. Regionale Ontwikkelingsmaatschappij Voor Het Noordzeekanaalgebied N.V. Netherlands
29. Richard Lees Steel
Decking Asia Snd. Bhd. Malaysia
30. Rsp Holding B.V. Netherlands
31. Schreiner Fleischer AS Norway
32. Shanghai Bao Yi Beverage Can Making Co Ltd. China
Name of the Party Country Name of the Party Country
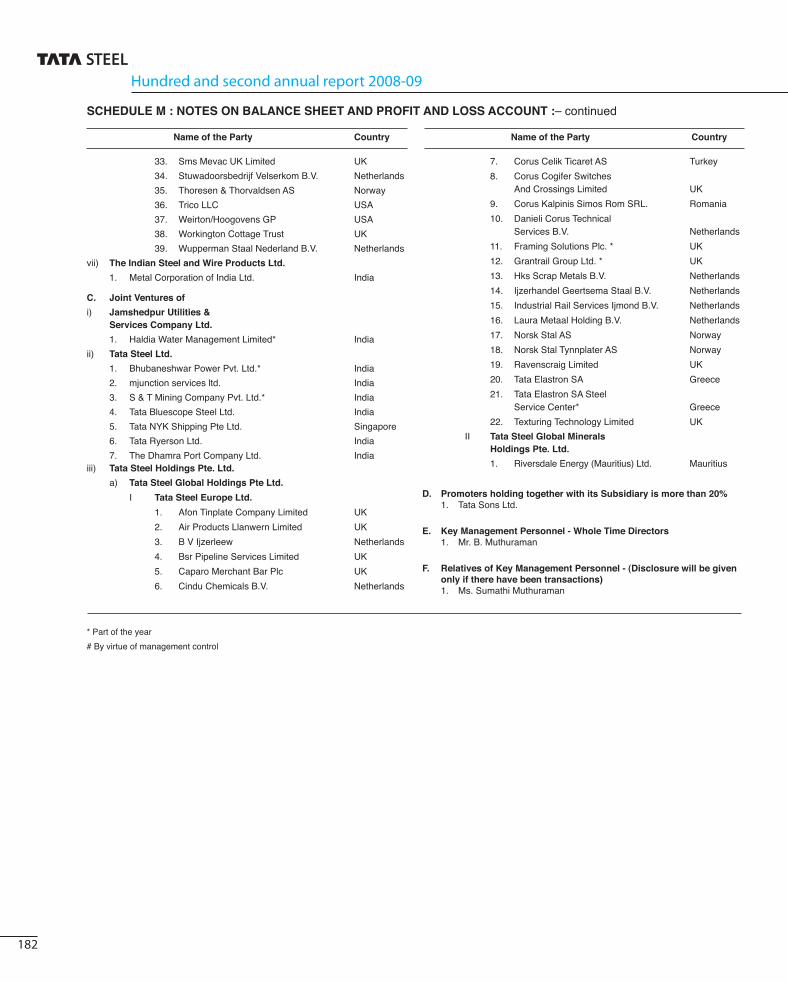
Hundred and second annual report 2008-09
182
SCHEDULE M : NOTES ON BALANCE SHEET AND PROFIT AND LOSS ACCOUNT :– continued
33. Sms Mevac UK Limited UK
34. Stuwadoorsbedrijf Velserkom B.V. Netherlands
35. Thoresen & Thorvaldsen AS Norway
36. Trico LLC USA
37. Weirton/Hoogovens GP USA
38. Workington Cottage Trust UK
39. Wupperman Staal Nederland B.V. Netherlands
vii) The Indian Steel and Wire Products Ltd.
1. Metal Corporation of India Ltd. India
C. Joint Ventures of
i) Jamshedpur Utilities & Services Company Ltd.
1. Haldia Water Management Limited* India
ii) Tata Steel Ltd.
1. Bhubaneshwar Power Pvt. Ltd.* India
2. mjunction services ltd. India
3. S & T Mining Company Pvt. Ltd.* India
4. Tata Bluescope Steel Ltd. India
5. Tata NYK Shipping Pte Ltd. Singapore
6. Tata Ryerson Ltd. India
7. The Dhamra Port Company Ltd. India iii) Tata Steel Holdings Pte. Ltd.
a) Tata Steel Global Holdings Pte Ltd.
I Tata Steel Europe Ltd.
1. Afon Tinplate Company Limited UK
2. Air Products Llanwern Limited UK
3. B V Ijzerleew Netherlands
4. Bsr Pipeline Services Limited UK
5. Caparo Merchant Bar Plc UK
6. Cindu Chemicals B.V. Netherlands
Name of the Party Country Name of the Party Country
7. Corus Celik Ticaret AS Turkey
8. Corus Cogifer Switches And Crossings Limited UK
9. Corus Kalpinis Simos Rom SRL. Romania
10. Danieli Corus Technical Services B.V. Netherlands
11. Framing Solutions Plc. * UK
12. Grantrail Group Ltd. * UK
13. Hks Scrap Metals B.V. Netherlands
14. Ijzerhandel Geertsema Staal B.V. Netherlands
15. Industrial Rail Services Ijmond B.V. Netherlands
16. Laura Metaal Holding B.V. Netherlands
17. Norsk Stal AS Norway
18. Norsk Stal Tynnplater AS Norway
19. Ravenscraig Limited UK
20. Tata Elastron SA Greece
21. Tata Elastron SA Steel Service Center* Greece
22. Texturing Technology Limited UK
II Tata Steel Global Minerals Holdings Pte. Ltd.
1. Riversdale Energy (Mauritius) Ltd. Mauritius
D. Promoters holding together with its Subsidiary is more than 20% 1. Tata Sons Ltd.
E. Key Management Personnel - Whole Time Directors 1. Mr. B. Muthuraman
F. Relatives of Key Management Personnel - (Disclosure will be given
only if there have been transactions) 1. Ms. Sumathi Muthuraman
* Part of the year
# By virtue of management control

183
SCHEDULE M : NOTES ON BALANCE SHEET AND PROFIT AND LOSS ACCOUNT :– continued
13. (b) Related Party TransactionsRs. crores
Transactions Subsidiaries Associates Key Relatives of Key Promoter Grand Total & JVs # Management Management Personnel Personnel
Purchase of Goods TS Resources Australia Pte Ltd 3,065.56 – – – – 3,065.56 666.24 – – – – 666.24 Others 165.73 136.66 – – – 302.39 120.90 181.64 – – – 302.54
3,231.29 136.66 – – – 3,367.95 787.14 181.64 – – – 968.78
Sale of Goods TS Asia (Hongkong) Pte. 1,072.31 – – – – 1,072.31 819.62 – – – – 819.62 Tata Ryerson Ltd. – 773.31 – – – 773.31 – 795.12 – – – 795.12 Others 510.49 454.59 – – – 965.08 294.95 428.58 – – – 723.53
1,582.80 1,227.90 – – – 2,810.70 1,114.57 1,223.70 – – – 2,338.27
Receiving of Services Jamshedpur Utilities & Services Co. Ltd. 229.82 – – – – 229.82 227.26 – – – – 227.26 T M International Logistics Ltd. 178.69 – – – – 178.69 242.66 – – – – 242.66 Tinplate Company of India Ltd. – 358.63 – – – 358.63 – 222.73 – – – 222.73 Hoogly Metcoke & Power Co. Ltd. 165.07 – – – – 165.07 8.66 – – – – 8.66 Others 222.20 112.51 – – 53.83 388.54 180.77 112.93 0.02 0.02 0.69 294.43
795.78 471.14 – – 53.83 1,320.75 659.35 335.66 0.02 0.02 0.69 995.74
Rendering of Services The Indian Steel & Wire Products Ltd. 13.68 – – – – 13.68 10.89 – – – – 10.89 Tinplate Company of India Ltd. – 45.19 – – – 45.19 – 35.83 – – – 35.83 Hoogly Metcoke & Power Co. Ltd. 14.14 – – – – 14.14 1.01 – – – – 1.01 Others 33.76 23.14 – – 0.24 57.14 19.37 28.01 – – 0.14 47.52
61.58 68.33 – – 0.24 130.15 31.27 63.84 – – 0.14 95.25
Purchase of Fixed Assets TRF Ltd. – 17.10 – – – 17.10 – 43.25 – – – 43.25 Others 0.91 0.06 – – – 0.97 0.32 – – – – 0.32
0.91 17.16 – – – 18.07 0.32 43.25 – – – 43.57
Dividend expense Tata Sons Ltd. – – – – 333.07 333.07 – – – – 260.81 260.81 Others 1.08 – * ** – 1.08 1.04 – *** **** – 1.04
1.08 – * ** 333.07 334.15 1.04 – *** **** 260.81 261.85
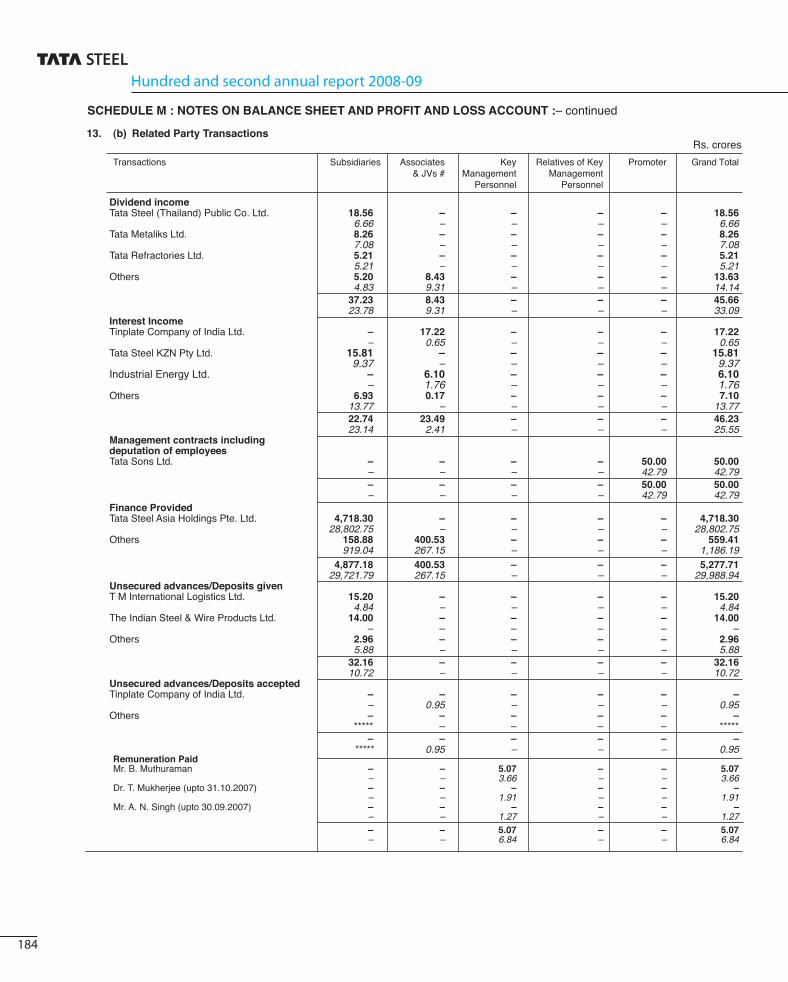
Hundred and second annual report 2008-09
184
Dividend income Tata Steel (Thailand) Public Co. Ltd. 18.56 – – – – 18.56 6.66 – – – – 6.66 Tata Metaliks Ltd. 8.26 – – – – 8.26 7.08 – – – – 7.08 Tata Refractories Ltd. 5.21 – – – – 5.21 5.21 – – – – 5.21 Others 5.20 8.43 – – – 13.63 4.83 9.31 – – – 14.14 37.23 8.43 – – – 45.66 23.78 9.31 – – – 33.09 Interest Income Tinplate Company of India Ltd. – 17.22 – – – 17.22 – 0.65 – – – 0.65 Tata Steel KZN Pty Ltd. 15.81 – – – – 15.81 9.37 – – – – 9.37 Industrial Energy Ltd. – 6.10 – – – 6.10 – 1.76 – – – 1.76 Others 6.93 0.17 – – – 7.10 13.77 – – – – 13.77 22.74 23.49 – – – 46.23 23.14 2.41 – – – 25.55 Management contracts including deputation of employees Tata Sons Ltd. – – – – 50.00 50.00 – – – – 42.79 42.79 – – – – 50.00 50.00 – – – – 42.79 42.79 Finance Provided Tata Steel Asia Holdings Pte. Ltd. 4,718.30 – – – – 4,718.30 28,802.75 – – – – 28,802.75 Others 158.88 400.53 – – – 559.41 919.04 267.15 – – – 1,186.19 4,877.18 400.53 – – – 5,277.71 29,721.79 267.15 – – – 29,988.94 Unsecured advances/Deposits given T M International Logistics Ltd. 15.20 – – – – 15.20 4.84 – – – – 4.84 The Indian Steel & Wire Products Ltd. 14.00 – – – – 14.00 – – – – – – Others 2.96 – – – – 2.96 5.88 – – – – 5.88 32.16 – – – – 32.16 10.72 – – – – 10.72 Unsecured advances/Deposits accepted Tinplate Company of India Ltd. – – – – – – – 0.95 – – – 0.95 Others – – – – – – ***** – – – – ***** – – – – – – ***** 0.95 – – – 0.95 Remuneration Paid Mr. B. Muthuraman – – 5.07 – – 5.07 – – 3.66 – – 3.66 Dr. T. Mukherjee (upto 31.10.2007) – – – – – – – – 1.91 – – 1.91 Mr. A. N. Singh (upto 30.09.2007) – – – – – – – – 1.27 – – 1.27 – – 5.07 – – 5.07 – – 6.84 – – 6.84
SCHEDULE M : NOTES ON BALANCE SHEET AND PROFIT AND LOSS ACCOUNT :– continued
13. (b) Related Party TransactionsRs. crores
Transactions Subsidiaries Associates Key Relatives of Key Promoter Grand Total & JVs # Management Management Personnel Personnel

185
Bad Debts Recovered The Indian Steel & Wire Products Ltd. 2.16 – – – – 2.16 – – – – – – 2.16 – – – – 2.16 – – – – – – Guarantees and collaterals given Tinplate Company of India Ltd. – 25.00 – – – 25.00 – – – – – – – 25.00 – – – 25.00 – – – – – – Guarantees outstanding Others – – – – – – – 25.00 – – – 25.00 – – – – – – – 25.00 – – – 25.00 Outstanding Receivables Tata Steel Asia Holdings Pte. Ltd. 237.61 – – – – 237.61 30,326.12 – – – – 30,326.12 Tinplate Company of India Ltd. – 191.18 – – – 191.18 – 115.48 – – – 115.48 Tata Steel KZN Pty. Ltd. 153.39 – – – – 153.39 131.00 – – – – 131.00 Others 183.55 49.30 – – 4.01 236.86 1,068.98 140.54 0.01 0.01 3.36 1,212.90 574.55 240.48 – – 4.01 819.04 31,526.10 256.02 0.01 0.01 3.36 31,785.50 Outstanding Payables TS Resources Australia Pte Ltd 1,231.91 – – – – 1,231.91 – – – – – – Others 126.21 68.10 – – 55.68 249.99 115.74 81.50 – – 46.95 244.19 1,358.12 68.10 – – 55.68 1,481.90 115.74 81.50 – – 46.95 244.19
Notes: * 43,389.30 ** 20,828.81 *** 33,883.00 **** 19,995.00 ***** 30,000.00
# Transactions with Joint Ventures have been disclosed at full value.
SCHEDULE M : NOTES ON BALANCE SHEET AND PROFIT AND LOSS ACCOUNT :– continued
13. (b) Related Party TransactionsRs. crores
Transactions Subsidiaries Associates Key Relatives of Key Promoter Grand Total & JVs # Management Management Personnel Personnel

Hundred and second annual report 2008-09
186
16. Deferred Tax Liability (Net) (Item No. 5, Page 148) Deferred Tax Current year Deferred Tax (Asset)/Liability charge/(credit) (Asset)/Liability as at as at 1.04.2008 31.03.2009 Deferred Tax Liabilities Rs. crores Rs. crores Rs. crores
(i) Difference between book and tax depreciation ........................ 1,606.35 254.29 1,860.64 (ii) Prepaid Expenses ..................................................................... 38.54 (6.88) 31.66 (iii) Revaluation of Foreign Currency Loans ................................... 248.37 (248.37) –
1,893.26 (0.96) 1,892.30
Deferred Tax Assets (i) Employee Separation Compensation ....................................... (503.69) (0.52) (504.21) (ii) Wage Provision ........................................................................ (65.28) (4.19) (69.47) (iii) Provision for doubtful debts & advances .................................. (33.03) (2.93) (35.96) (iv) Disallowance under Section 43B .............................................. (111.97) (53.89) (165.86) (v) Provision for Leave Salary ........................................................ (135.69) (7.54) (143.23) (vi) Provision for Employee Benefi ts ................................................ (70.52) – (70.52) (vii) Other Deferred Tax Assets/Liabilities ....................................... (12.76) (5.10) (17.86) (932.94) (74.17) (1,007.11) 960.32 (75.13) 885.19 (viii) Deferred Tax Assets adjusted against Securities Premium Account (See Note 27, Page 192) .............................................. (278.52) (20.94) (299.46)
Deferred Tax Liability (Net) 681.80 585.73
15. Earnings Per Share (EPS) 2008-09 2007-08 Rs. crores Rs. crores
(i) Profi t after tax ........................................................................................................... 5,201.74 4,687.03 Less : Preference dividend including tax thereon..................................................... 128.05 25.96
Profi t attributable to ordinary shareholders ............................................................... 5,073.69 4,661.07
Profi t attributable to ordinary shareholders – for Diluted EPS .................................. 5,464.58 4,642.31
Nos. Nos. (ii) Weighted average No. of Ordinary Shares for Basic EPS ...................................... 73,05,84,834 69,77,48,601 Add : Adjustment for 8,750 (2007-08 : 8,750) Convertible Alternative Reference Securities (See Note 27, Page 192) ............................................................. 6,27,16,057 3,59,84,623 Adjustment for Options relating to 12,446 (2007-08 : 12,446) Detachable Warrants (See Note 6, Page 172) ................................................................ 7,613 11,010 Adjustment for 54,72,66,011 (2007-08 : 54,72,51,605) Cumulative Convertible Preference Shares (See Note 2 to Schedule A, Page 155) ....... 9,12,08,752 2,36,74,364
Weighted average no. of Ordinary Shares for Diluted EPS ...................................... 88,45,17,256 75,74,18,598
(iii) Nominal value of Ordinary Shares ............................................................................ Rs. 10.00 Rs. 10.00 (iv) Basic Earnings per Ordinary Share .......................................................................... Rs. 69.45 Rs. 66.80 (v) Diluted Earnings per Ordinary Share ........................................................................ Rs. 61.78 Rs. 61.29
14. The Company has the following Joint Ventures as on 31st March, 2009 and its proportionate share in the Assets, Liabilities, Income and Expenditure of the Joint Venture Companies is given below :
Rs. crores
Name of the Joint Country of Percentage Contingent Capital Venture Company Incorporation of Holding Assets Liabilities Liabilities Commitment Income Expenditure
Tata Ryerson Ltd. India 50% 234.34 118.28 30.49 10.21 649.00 641.94 253.27 143.39 30.40 18.10 640.83 620.55 mjunction services ltd. India 50% 60.29 30.24 0.32 – 34.14 24.08 38.62 18.63 0.29 – 33.00 24.53 The Dhamra Port Company Ltd. India 50% 750.93 593.10 – 432.99 – 0.09 343.27 220.34 – 518.20 – 0.05 Tata BlueScope Steel Ltd. India 50% 380.73 109.89 13.36 172.37 178.87 206.32 308.60 47.31 7.91 135.96 143.57 151.50 Tata NYK Shipping Pte. Ltd. Singapore 50% 138.71 5.75 – 439.44 250.59 249.35 32.58 7.47 – – 145.94 140.76 Bhubaneshwar Power Private Ltd. India 26% 0.96 0.70 1.00 – – – – – – – – – S & T Mining Company Private Ltd. India 50% 0.45 0.10 0.25 – – 0.17 – – – – – –
SCHEDULE M : NOTES ON BALANCE SHEET AND PROFIT AND LOSS ACCOUNT :– continued
As at 31st March, 2009 For the year ended 31st March, 2009
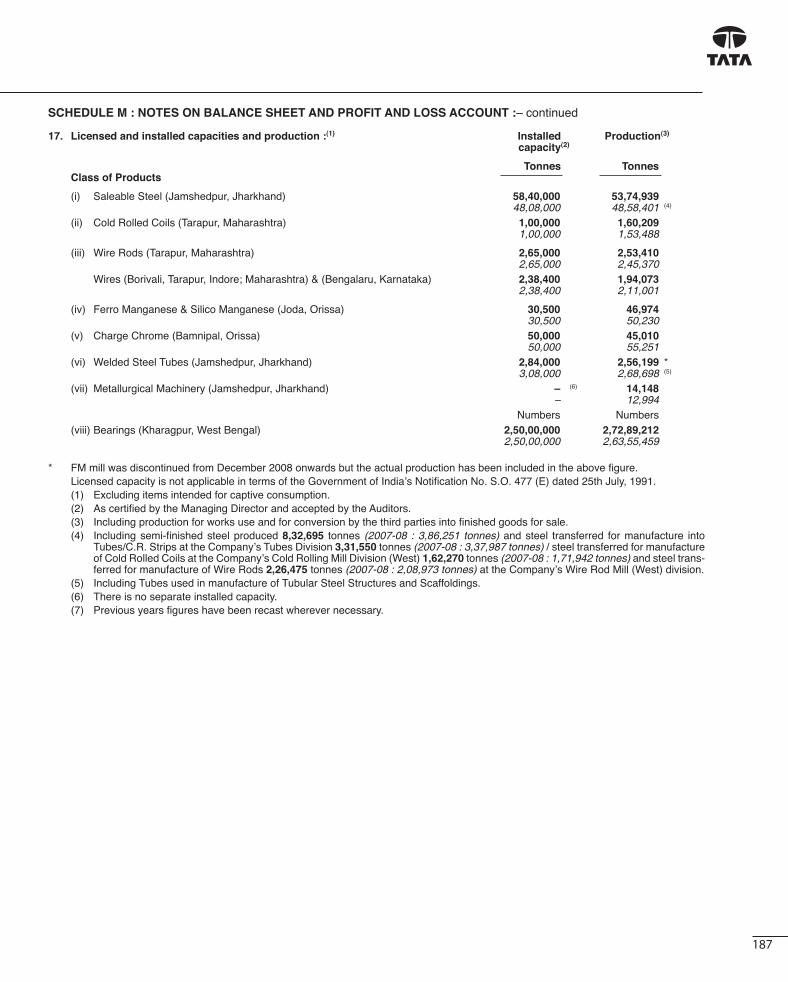
187
17. Licensed and installed capacities and production :(1) Installed Production(3)
capacity (2)
Tonnes Tonnes Class of Products
(i) Saleable Steel (Jamshedpur, Jharkhand) 58,40,000 53,74,939 48,08,000 48,58,401 (4)
(ii) Cold Rolled Coils (Tarapur, Maharashtra) 1,00,000 1,60,209 1,00,000 1,53,488
(iii) Wire Rods (Tarapur, Maharashtra) 2,65,000 2,53,410 2,65,000 2,45,370 Wires (Borivali, Tarapur, Indore; Maharashtra) & (Bengalaru, Karnataka) 2,38,400 1,94,073 2,38,400 2,11,001
(iv) Ferro Manganese & Silico Manganese (Joda, Orissa) 30,500 46,974 30,500 50,230 (v) Charge Chrome (Bamnipal, Orissa) 50,000 45,010 50,000 55,251 (vi) Welded Steel Tubes (Jamshedpur, Jharkhand) 2,84,000 2,56,199 * 3,08,000 2,68,698 (5)
(vii) Metallurgical Machinery (Jamshedpur, Jharkhand) – (6) 14,148 – 12,994 Numbers Numbers (viii) Bearings (Kharagpur, West Bengal) 2,50,00,000 2,72,89,212 2,50,00,000 2,63,55,459
* FM mill was discontinued from December 2008 onwards but the actual production has been included in the above fi gure. Licensed capacity is not applicable in terms of the Government of India’s Notifi cation No. S.O. 477 (E) dated 25th July, 1991. (1) Excluding items intended for captive consumption. (2) As certifi ed by the Managing Director and accepted by the Auditors. (3) Including production for works use and for conversion by the third parties into fi nished goods for sale. (4) Including semi-fi nished steel produced 8,32,695 tonnes (2007-08 : 3,86,251 tonnes) and steel transferred for manufacture into
Tubes/C.R. Strips at the Company’s Tubes Division 3,31,550 tonnes (2007-08 : 3,37,987 tonnes) / steel transferred for manufacture of Cold Rolled Coils at the Company’s Cold Rolling Mill Division (West) 1,62,270 tonnes (2007-08 : 1,71,942 tonnes) and steel trans-ferred for manufacture of Wire Rods 2,26,475 tonnes (2007-08 : 2,08,973 tonnes) at the Company’s Wire Rod Mill (West) division.
(5) Including Tubes used in manufacture of Tubular Steel Structures and Scaffoldings. (6) There is no separate installed capacity. (7) Previous years fi gures have been recast wherever necessary.
SCHEDULE M : NOTES ON BALANCE SHEET AND PROFIT AND LOSS ACCOUNT :– continued

Hundred and second annual report 2008-09
188
SCHEDULE M : NOTES ON BALANCE SHEET AND PROFIT AND LOSS ACCOUNT :– continued
18. Turnover, Closing and Opening Stocks
Turnover Closing Stock Opening Stock Tonnes Rs. Tonnes Rs. Tonnes Rs. Class of Products crores crores crores
(i) Saleable Steel (Finished)(1) ................. 47,60,572 19,313.42 3,25,699 671.38 3,39,546 646.63 44,75,886 16,010.10 3,39,546 646.63 3,86,455 683.64
Agrico Products ................................... 116.21 6.33 9.67 111.23 9.67 5.07
19,429.63 677.71 656.30 16,121.33 656.30 688.71
(ii) Semi-fi nished Steel and Scrap ............ 4,46,069 1,004.86 5,10,653 488.25 2,80,630 230.57 2,54,959 571.68 2,80,630 230.57 2,57,121 217.73
(iii) Welded Steel Tubes(2).......................... 2,27,156 1,130.92 18,680 51.67 19,861 48.21 2,33,413 1,018.47 19,861 48.21 24,508 57.19
(iv) Carbon and Alloy Steel Bearing Rings – – – – – – 417 1.99 – – 417 3.46
(v) By-products, etc. ................................. 166.07 1.51 3.09 95.25 3.09 4.15
(vi) Raw Materials :
(a) Ferro Manganese ........................ 34,515 290.73 – – – – 40,631 219.29 – – – –
(b) Charge Chrome/Ferro Chrome(3) ... 1,77,029 1,251.47 – – – – 1,86,384 978.24 – – – –
(c) Other Raw Materials .................... – 1,879.93 – – – – – 1,661.38 – – – –
(vii) Other Products(4) ................................ 465.52 119.59 96.44 379.69 96.44 65.03 Numbers Numbers Numbers (viii) Alloy Steel Ball Bearing Rings(5) ........ 2,280 0.07 – – 4,89,680 0.90 13,77,379 8.56 4,89,680 0.90 17,51,468 11.34
(ix) Bearings .............................................. 2,63,39,660 144.00 39,68,430 22.97 28,39,692 13.14 2,76,12,219 149.90 28,39,692 13.14 40,39,790 19.85
Tonnes Tonnes Tonnes (x) Metallurgical Machinery ...................... 14,148 165.17 – – – – 12,994 172.70 – – – – (xi) Sale of Purchased Materials (a) Saleable Steel (fi nished/converted) 2,017 10.67 21 0.15 6,945 25.62 1,516 6.91 6,945 25.62 2,963 10.62
(b) Raw Materials/Scrap/Other Materials – 6.41 – – – – – 7.00 – – – –
25,945.45 1,361.85 1,074.27 21,392.39 1,074.27 1,078.08
Notes : (1) Including steel material converted by re-rollers : 9,16,548 tonnes (2007-08 : 9,57,743 tonnes). (2) Includes Welded Steel Tubes converted under conversion arrangement 60,213 tonnes (2007-08 : 48,585 tonnes). (3) Turnover includes Ferro Chrome converted under conversion arrangement 1,28,576 tonnes (2007-08 : 1,04,269 tonnes). (4) Includes tubular steel structures Rs. 399.62 crores (2007-08 : Rs. 327.37 crores). (5) Turnover includes sale proceeds of Salvaged Rings, Stock includes Semi-Finished Rings/Flanges. (6) Previous years fi gures have been regrouped and recast wherever necessary.

189
SCHEDULE M : NOTES ON BALANCE SHEET AND PROFIT AND LOSS ACCOUNT :– continued
Tonnes Rs.19. Purchase of Finished, Semi-Finished Steel and Other Products : crores
A. For Resale : Finished/Semi-Finished Steel Materials ....................................................... 2,466 22.51 994 9.11 B. For Own Consumption : (i) Finished/Semi-Finished Steel Materials (1) .................................................. 52,147 319.80 86,310 319.74 (ii) Sponge/Pig Iron ............................................................................................ 7,085 13.19 40,064 58.32 (iii) Others ........................................................................................................... 3.37 0.77
358.87 387.94
(1) Includes components for manufacture of metallurgical machinery Rs. 67.10 crores (2007-08 : Rs. 40.02 crores)
20. Raw materials consumed : @ Tonnes Rs. crores
(i) Iron ore ......................................................................................................... 95,45,665 504.52 86,81,492 445.35 (ii) Coal [excluding 47,46,755 tonnes (2007-08 : 33,71,551 tonnes) valued at Rs. 2,874.19 crores (2007-08 : Rs. 987.71 crores)] used for manufacturing coke 7,51,972 455.32 7,06,076 206.85
(iii) Coke ............................................................................................................. 33,15,206 3,695.00 30,88,582 1,873.60
(iv) Limestone and Dolomite ............................................................................... 19,49,523 391.89 18,65,223 318.45
(v) Ferro Manganese ......................................................................................... 18,895 62.99 16,165 48.52
(vi) Zinc and Zinc Alloys ..................................................................................... 22,137 210.03 22,325 345.30 (vii) Spelter, sulphur and other materials [excluding 22,82,034 tonnes valued at Rs. 129.77 crores (2007-08 : 2,34,830 tonnes valued at Rs. 80.75 crores) used in the manufacture of Ferro Manganese .............................................. 12,00,105 877.30 11,57,095 529.48
6,197.05 3,767.55 Note : @ The consumption figures shown above are after adjusting excess
and shortages ascertained on physical count, unserviceable items, etc.
21. Value of direct imports (C.I.F. Value)
Rs.
crores
(i) Raw materials .................................................................................................... 4,146.75
1,542.79
(ii) Semi-fi nished products ...................................................................................... 28.02
16.44
(iii) Components, stores and spare parts ................................................................ 288.42
233.18
(iv) Capital goods .................................................................................................... 542.28
433.23

Hundred and second annual report 2008-09
190
22. The value of consumption of directly imported and indigenously obtained raw materials, stores and spare parts and the percentage of each to the total consumption:
Raw materials Components, stores and spare parts
Rs. % Rs. % crores crores
(a) Directly imported ........................................................... 4,266.89 68.85 419.02 17.33 1,950.22 51.76 364.97 18.26
(b) Indigenously obtained ................................................... 1,930.16 31.15 1,999.42 82.67 1,817.33 48.24 1,633.41 81.74
6,197.05 100.00 2,418.44 100.00 3,767.55 100.00 1,998.38 100.00
Less : Consumption charged to other revenue accounts ..... 942.75 892.32
1,475.69 1,106.06
Notes : (i) The consumption fi gures shown above are after adjusting excess and shortages ascertained on physical count, unserviceable items, etc.
(ii) In respect of items which are purchased both from indigenous and imported sources, the identity of individual items consumed cannot be established but segregation of consumption between imported and indigenous sources has been made on a reasonable approximation determined from the Company’s records.
23. Expenditure in foreign currency Current Year Previous Year Rs. Rs. crores crores (i) Technical Know-how and Technical Consultants’ Fees (net of taxes) including Rs. 319.53 crores (2007-08 : Rs. 107.20 crores) on capital account ....................... 320.83 109.30 (ii) Interest and Commitment charges payable in foreign currencies ............................... 569.42 502.95 (iii) Commission ................................................................................................................ 15.29 12.75 (iv) Payable on other accounts [including Rs. 6.15 crores (2007-08 : Rs. 15.28 crores) on capital account] ...................................................................................................... 232.21 157.47
24. Remittance in foreign currencies for dividends
The Company has not remitted any amount in foreign currencies on account of dividends during the year and does not have information as to the extent to which remittances, if any, in foreign currencies on account of dividends have been made by/on behalf of non-resident shareholders. The particulars of dividends payable to non-resident shareholders which were declared during the year, are as under :
Current Year Previous Year
(i) Number of non-resident shareholders .......................................................................... 5,914 4,461
(ii) Number of Ordinary shares held by them ..................................................................... 14,85,95,480 13,60,48,173
(iii) Gross amount of dividends ........................................................................................... Rs. 237.75 crores Rs. 210.87 crores
25. Earnings in Foreign Exchange
(i) Export of steel and other materials (at F.O.B. value) Rs. 3,308.67 crores (2007-08 : Rs. 2,120.98 crores) [including value of exports through export houses].
(ii) Interest received Rs. 19.01 crores (2007-08 : Rs. 33.45 crores).
(iii) Others Rs. 46.87 crores (2007-08 : Rs. 131.75 crores).
SCHEDULE M : NOTES ON BALANCE SHEET AND PROFIT AND LOSS ACCOUNT :– continued

191
SCHEDULE M : NOTES ON BALANCE SHEET AND PROFIT AND LOSS ACCOUNT :– continued
26. Derivative Instruments
I) The Company has entered into the following derivative instruments :
a) The Company uses foreign currency forward contracts to hedge its risks associated with foreign currency fl uctuations relating
to certain fi rm commitments and forecasted transactions. The use of foreign currency forward contracts is governed by the
Company’s strategy approved by the Board of Directors, which provide principles on the use of such forward contracts consistent
with the Company’s Risk Management Policy. The Company does not use forward contracts for speculative purposes.
Outstanding Short Term Forward Exchange Contracts entered into by the Company on account of payables :
As at No. of Contracts US Dollar Equivalent (million) INR Equivalent (Rs. crores )
31.03.2009 34 347.80 1,764.02
31.03.2008 – – –
Outstanding Short Term Forward Exchange Contracts entered into by the Company on account of receivables :
As at No. of Contracts US Dollar Equivalent (million) INR Equivalent (Rs. crores )
31.03.2009 16 62.18 315.32
31.03.2008 5 30.64 122.91
(Forward exchange contracts outstanding as on 31st March 2009 include Forward Sales of Great Britain Pound, Euro and
United States Dollar against Indian National Rupees, Forward Sales of United States Dollar against Japanese Yen, Forward
Sales of Euro against USD, Forward Purchases of Euro and Great Britain Pound against United States Dollars and Forward
Purchase of Euro and United States Dollars against Indian National Rupees for contracted exports and imports and planned
remittances between April 2009 and February 2010).
Outstanding Long Term Forward Exchange Contracts entered into by the Company :
As at No. of Contracts US Dollar Equivalent (million) INR Equivalent (Rs. crores)
31.03.2009 39 1,967.17 9,977.47
31.03.2008 35 1,885.86 7,564.18
(Long Term Forward Exchange Contracts outstanding as on 31st March, 2009 have been used to hedge the Foreign Currency
Risk on repayment of External Commercial Borrowings of the Company).
b) The Company also uses derivative contracts other than forward contracts to hedge the interest rate and currency risk on its
capital account. Such transactions are governed by the strategy approved by the Board of Directors which provide principles
on the use of these instruments, consistent with the Company’s Risk Management Policy. The Company does not use these
contracts for speculative purposes.
i) Outstanding Interest Rate Swaps to hedge against fl uctuations in interest rate changes :
As at No. of Contracts US Dollar Equivalent (million) INR Equivalent (Rs. crores)
31.03.2009 15 636.11 3,226.36
31.03.2008 1 17.34 69.54
ii) Outstanding Currency Options to hedge against fl uctuations in exchange rate :
As at No. of Contracts US Dollar Equivalent (million) INR Equivalent (Rs. crores)
31.03.2009 – – –
31.03.2008 2 2.75 11.03

Hundred and second annual report 2008-09
192
SCHEDULE M : NOTES ON BALANCE SHEET AND PROFIT AND LOSS ACCOUNT :– continued
II) The year end foreign currency exposures that have not been hedged by a derivative instrument or otherwise are given below :
As at 31.03.2009 As at 31.03.2008
US Dollar INR US Dollar INR
Equivalent Equivalent Equivalent Equivalent
(million) (Rs. crores) (million) (Rs. crores)
A. Amounts receivable in foreign currency on account of the following :
Loans Receivable 25.24 128.01 25.28 101.38
Interest receivable 5.20 26.39 0.79 3.17
Bill Discounted and Debtors Outstanding 38.36 194.52 62.60 251.08
B. Amounts payable in foreign currency on account of the following :
Import of goods and services 68.37 346.80 19.34 77.57
Capital imports 23.97 121.58 27.02 108.39
Interest and commitment charges payable 47.73 242.07 14.22 57.06
Loans payable 1,160.72 5,887.19 1,162.91 4,665.61
27. The Company raised Rs. 3,578.75 crores (US $ 875 million) through the issue of Foreign Currency Convertible Alternative Reference Securities (“CARS”) during FY 2007-08. The CARS will be convertible into either qualifying securities (which may be in the form of depository receipts with restricted rights of withdrawal representing underlying ordinary shares with differential rights as to voting) or ordinary shares only between 4th September, 2011 to 6th August, 2012 and are redeemable in foreign currency only in September, 2012, if not converted into equity. The CARS will be convertible at a conversion price of Rs. 758.10 per share as adjusted for the rights issue. The CARS carry a coupon rate of 1% p.a. The outstanding CARS, if any, at maturity will be redeemable at a premium of 23.34% of the principal amount, with an effective YTM of 5.15%.
Premium payable on redemption and the expenses related to the issue of CARS are adjusted against the Securities Premium Account. Changes to premium payable on account of exchange fl uctuation is transferred to “Foreign Currency Monetary Items Translation Difference Account” in line with Companies (Accounting Standards) Amendment Rules 2009 relating to Accounting Standard 11 (AS-11) notifi ed by Government of India on 31st March, 2009. Such exchange fl uctuation on the premium payable is amortised over the balance period of CARS but not beyond 31st March, 2011, by adjusting the same to Securities Premium Account. Accordingly, an amount of Rs. 32.54 crores (net of deferred tax Rs. 16.76 crores) has been amortised and adjusted against Securities Premium Account during the current fi nancial year. During 2007-08, Rs. 10.51 crores (net of deferred tax Rs. 5.41 crores) being the gain on revaluation of the premium payable was adjusted against the Securities Premium Account. Fees to Mandated Lead Arrangers for revision in certain terms and conditions of standby letter of credit in the issue of CARS has been considered as issue expenses based on a legal opinion. The issue expenses of Rs. 229.74 crores (2007-08: Rs. 111.86 crores) has been adjusted to Securities Premium Account.
28. Previous year’s fi gures have been recast/restated wherever necessary.
29. Figures in italics are in respect of the previous year.

193
I. Registration Details
Registration No. 260 State Code 11
Balance Sheet Date 31 03 2009
Date Month Year
II. Capital raised during the year (Amount in Rs. Thousands)
Public Issue Rights Issue Nil 3,886
Bonus Issue Private Placement Nil Nil
III. Position of Mobilisation and Deployment of Funds (Amount in Rs. Thousands)
Total Liabilities Total Assets 58,74,17,548 58,74,17,548
Sources of Funds Paid-up Capital Reserves & Surplus 6,20,34,472 23,97,28,098
Secured Loans Unsecured Loans 3,91,30,558 23,03,31,286
Other Liabilities 1,61,93,134
Application of Funds Net Fixed Assets Investments 14,48,22,126 42,37,17,819
Net Current Assets Misc. Expenditure 1,31,10,363 57,67,240
IV. Performance of the Company (Amount in Rs. Thousands) Turnover Total Expenditure 24,62,40,432 17,30,84,372
Exceptional Items Profi t/(Loss) Before Tax Nil 7,31,56,060
Profi t/(Loss) After Tax Earnings per Share in Rs. 5,20,17,360 (Weighted Average - Basic) 69.45 Dividend rate % 160
V. Generic Names of Principal Products/Services of Company (as per monetary terms)
Item Code No. (ITC Code) 72082600
Product Description Flat Rolled Products of Non Alloy Steel of a width of 600 mm and
more hot rolled coils of thickness 1.66 mm to 12 mm
Item Code No. (ITC Code) 73045901
Product Description Tubes/Pipes etc. of circular section with outer diameter upto
114.3 mm, not cold rolled
Item Code No. (ITC Code) 72091600/72091700
Product Description Flat Rolled Products of Iron or Non Alloy Steel, of a width of
600 mm or more, cold rolled (cold-reduced), not clad, plated
or coated of a thickness of 0.5 mm or more but less than 3 mm
Balance Sheet Abstract and Company's General Business Profi le

Hundred and second annual report 2008-09
194
Production Statistics(’000 Tonnes)
Year Iron Coal Iron Crude Rolled/ Plates Sheets Hot Rolled Cold Rolled Railway Semi- Total Ore Steel Forged Coils/ Coils Materials Finished Saleable Bars & Strips for Sale Steel Structurals
1955-56 2,001 1,536 1,168 1,076 246 61 148 — — 130 227 8121956-57 1,999 1,528 1,169 1,088 220 64 161 35 — 106 226 8121957-58 2,074 1,488 1,109 1,122 210 72 161 71 — 103 182 7991958-59 2,198 1,590 1,149 1,166 212 71 134 103 — 77 302 8991959-60 2,551 1,705 1,591 1,555 298 89 134 164 — 98 454 1,237
1960-61 2,275 1,714 1,586 1,622 369 85 132 161 — 112 404 1,2631961-62 2,104 1,700 1,645 1,643 449 77 134 173 — 114 371 1,3181962-63 2,616 2,047 1,764 1,799 472 90 149 178 — 131 393 1,4131963-64 2,953 2,173 1,809 1,892 534 96 154 162 — 127 434 1,5071964-65 3,125 2,264 1,885 1,956 548 101 164 197 — 133 425 1,568
1965-66 3,232 2,175 1,917 1,979 555 98 166 181 — 128 440 1,5681966-67 3,009 2,088 1,926 2,001 556 104 152 177 — 114 465 1,5681967-68 2,728 1,974 1,798 1,933 518 111 155 138 — 118 494 1,5341968-69 2,821 2,108 1,715 1,816 510 110 163 186 — 125 371 1,4651969-70 2,564 2,172 1,624 1,708 479 104 159 179 — 120 399 1,440
1970-71 2,402 1,959 1,664 1,716 512 101 164 180 — 78 340 1,3751971-72 2,844 1,940 1,631 1,709 497 106 184 185 — 85 330 1,3871972-73 3,231 1,997 1,681 1,690 530 99 175 187 — 55 412 1,4581973-74 2,922 2,134 1,435 1,514 482 93 131 169 — 22 303 1,2001974-75 2,940 2,209 1,668 1,722 562 103 166 179 — 38 413 1,461
1975-76 2,965 2,181 1,652 1,787 547 111 164 173 — 46 445 1,4861976-77 3,138 2,135 1,754 1,908 522 112 146 178 — 48 544 1,5501977-78 2,972 2,239 1,762 1,968 510 107 129 165 — 56 634 1,6011978-79 2,808 2,134 1,672 1,866 493 103 132 180 — 53 555 1,5161979-80 2,549 2,065 1,516 1,781 409 73 122 154 — 34 656 1,448
1980-81 2,698 2,196 1,648 1,875 381 82 121 148 — 28 777 1,5371981-82 2,991 2,327 1,774 1,962 525 99 151 149 — 22 660 1,6061982-83 3,224 2,671 1,793 1,957 501 103 137 119 — 11 750 1,6211983-84 3,137 3,335 1,746 1,973 488 107 129 138 — 20 744 1,6261984-85 3,454 3,582 1,804 2,049 512 122 139 168 — 19 754 1,714
1985-86 3,184 3,739 1,752 2,094 484 108 134 169 — 18 859 1,7021986-87 3,305 3,796 1,940 2,250 436 93 122 152 — 13 1,091 1,8611987-88 3,237 3,793 2,018 2,275 591 99 127 155 — 13 929 1,8621988-89 3,569 3,793 2,238 2,313 637 93 131 166 — 13 904 1,9001989-90 3,726 3,754 2,268 2,323 553 91 117 155 — 17 1,033 1,913
1990-91 3,509 3,725 2,320 2,294 558 88 118 153 — 14 1,013 1,9011991-92 3,996 3,848 2,400 2,415 599 92 123 170 — 9 1,045 1,9781992-93 4,126 3,739 2,435 2,477 575 78 122 163 — 7 1,179 2,0841993-94 4,201 3,922 2,598 2,487 561 — 124 281 — 6 1,182 2,1171994-95 4,796 4,156 2,925 2,788 620 — 137 613 — 2 1,074 2,391
1995-96 5,181 4,897 3,241 3,019 629 — 133 1,070 — — 869 2,6601996-97 5,766 5,294 3,440 3,106 666 — 114 1,228 — — 811 2,7831997-98 5,984 5,226 3,513 3,226 634 — 60 1,210 — — 1,105 2,9711998-99 6,056 5,137 3,626 3,264 622 — — 1,653 — — 835 3,0511999-2000 6,456 5,155 3,888 3,434 615 — — 2,057 — — 615 3,262
2000-01 6,989 5,282 3,929 3,566 569 — — 1,858 356 — 647 3,4132001-02 7,335 5,636 4,041 3,749 680 — — 1,656 734 — 566 3,5962002-03 7,985 5,915 4,437 4,098 705 — — 1,563 1,110 — 563 3,9752003-04 8,445 5,842 4,466 4,224 694 — — 1,578 1,262 — 555 4,0762004-05 9,803 6,375 4,347 4,104 706 — — 1,354 1,445 — 604 4,074
2005-06 10,834 6,521 5,177 4,731 821 — — 1,556 1,495 — 679 4,5512006-07 9,776 7,041 5,552 5,046 1,230 — — 1,670 1,523 — 506 4,9292007-08 10,022 7,209 5,507 5,014 1,241 — — 1,697 1,534 — 386 4,8582008-09 10,417 7,282 6,254 5,646 1,350 — — 1,745 1,447 — 833 5,375
Notes :Figures of total saleable steel are adjusted for :(a) From 1985-86 and onwards - steel transferred to and produced at the Company’s Tubes Division.(b) Total saleable steel for 2003-04 includes production of the erstwhile Tata SSL Ltd., pursuant to its merger with the Company.

195
Financial Statistics(Rupees Crores)
CAPITAL ACCOUNTS REVENUE ACCOUNTS
Capital Reser- Borrow- Gross Net Invest- Gross Expen- Depre- Profi t Taxes Profi t Net Divi-Year ves and ings Block Block ments Reve- diture ciation before after Transfer dends Surplus nue Taxes Taxes to Reserves
1956-57 25.94 20.20 21.53 93.45 54.79 5.38 44.14 32.69 2.47 8.98 3.42 5.56 3.70 1.931957-58 30.66 24.50 60.19 147.06 105.04 5.41 48.26 38.47 3.91 5.88 0.90 4.98 2.92 2.411958-59 30.72 26.15 83.78 171.79 124.78 5.94 56.12 47.72 5.53 2.87 0.17 2.70 0.57 2.471959-60 38.97 27.09 77.07 177.92 122.95 8.84 76.46 62.31 8.47 5.68 — 5.68 1.92 3.76
1960-61 38.97 27.67 69.04 185.52 116.76 8.85 87.08 68.07 13.92 5.09 — 5.09 0.52 4.651961-62 38.97 27.97 64.08 190.23 109.06 8.87 92.48 73.24 13.15 6.09 — 6.09 1.44 4.651962-63 38.97 40.27* 54.62 195.88 103.32 8.85 103.44 81.22 11.66 10.56 0.80 9.76 4.86 4.891963-64 38.97 47.41* 47.27 200.38 100.15 9.86 115.20 90.76 7.97 16.47 4.75 11.72 6.45 5.251964-65 38.97 50.94* 43.74 204.45 94.52 10.62 126.91 102.06 10.14 14.71 6.15 8.56 3.30 5.25
1965-66 38.97 56.35* 34.87 211.87 92.27 11.66 134.00 106.86 10.40 16.74 7.10 9.64 4.40 5.251966-67 50.00 48.44* 51.47 238.03 107.36 11.26 130.78 107.32 11.49 11.97 4.40 7.57 2.32 5.271967-68 50.00 50.23* 50.23 251.56 109.07 11.29 137.67 117.21 12.12 8.34 2.45 5.89 0.62 5.271968-69 50.00 51.82* 44.05 258.08 103.62 12.28 142.87 120.11 12.94 9.82 3.60 6.22 0.95 5.271969-70 50.00 52.71* 37.73 268.31 101.51 12.22 151.21 126.69 13.19 11.33 5.20 6.13 0.86 5.27
1970-71 50.00 55.58* 36.10 287.86 106.02 12.21 158.51 128.29 16.10 14.12 6.70 7.42 2.15 5.271971-72 50.00 56.92* 43.80 305.78 109.98 12.22 171.95 143.91 16.07 11.97 5.80 6.17 0.90 5.271972-73 50.00 58.46* 48.03 329.74 118.36 12.24 210.22 187.19 17.51 5.52 — 5.52 0.25 5.271973-74 50.00 63.16* 49.49 346.18 121.31 12.17 197.95 167.10 16.63 14.32 4.45 9.77 6.48 3.29**1974-75 50.00 75.55* 63.45 366.57 127.30 11.01 279.72 236.63 15.11 27.98 12.80 15.18 10.07 5.11**
1975-76 50.00 77.97 88.30 395.84 142.34 11.09 287.63 258.76 16.20 12.67 3.25 9.42 4.59 4.831976-77 62.86 71.17 94.36 417.99 149.57 11.14 332.84 297.51 17.28 18.05 6.00 12.05 6.06 5.991977-78 62.86 73.60 87.68 438.51 156.02 11.17 361.30 335.18 18.25 7.87 0.10 7.77 1.27 6.501978-79 62.86 80.26 77.74 464.30 165.11 11.45 380.85 335.83 20.12 24.90 7.35 17.55 10.53 7.021979-80 62.86 88.11 84.82 499.70 184.51 12.05 454.94 407.04 22.97 24.93 9.00 15.93 8.14 7.79
1980-81 62.86 106.01 104.65 550.48 216.76 14.01 520.86 445.10 23.70 52.06 25.60 26.46 17.90 8.561981-82 83.44 120.60 233.74 650.14 304.05 14.04 704.69 599.83 27.21 77.65 30.00 47.65 34.56 13.09†
1982-83 83.44 152.80 310.34 789.76 420.31 20.04 798.16 729.52 23.77 44.87 — 44.87 31.78 13.091983-84 72.02+ 160.61 380.62 843.64 453.46 20.22 889.54 826.39 43.14 20.01 — 20.01 7.77 12.241984-85 72.02 230.24 398.52 911.55 451.55 103.12 1105.02 938.33 69.95@ 96.74 12.00 84.74 69.62 15.12
1985-86 82.74 334.19 447.43 1115.76 577.41 144.54 1285.51 1078.55 49.28 157.68 50.00 107.68 90.88 20.601986-87 82.63 401.05 517.83 1299.84 708.09 130.12 1416.39 1259.27 57.60 99.52 12.00 87.52 66.86 20.661987-88 136.01 476.33 576.65 1525.46 861.88 163.52 1526.78 1340.65 73.98 112.15 20.00 92.15 62.81 29.341988-89 156.09 645.53 611.64 1753.13 998.71 234.44 1861.77 1587.74 93.69 180.34 26.00 154.34 108.17 46.171989-90 229.43 1103.11 954.11 2062.76 1200.09 795.32 2135.57 1840.95 118.79 175.83 27.30 148.53 97.94 50.59
1990-91 229.89 1194.22 1183.75 2703.29 1713.79 571.86 2330.83 1955.67 137.03 238.13 78.00 160.13 88.79 71.341991-92 230.12 1315.36 2051.30 4026.16 2878.19 248.77 2869.70 2426.65 164.89 278.16 64.00 214.16 133.61 80.551992-93 278.45 1707.94 3039.55 5463.13 4107.64 170.06 3423.33 3094.84 215.37 127.12 — 127.12 62.30 64.821993-94 335.21 2189.53 3428.59 6439.94 4924.39 261.62 3822.64 3464.10 177.70 180.84 — 180.84 84.29 96.551994-95 336.87 2351.17 3561.24 6962.89 5213.48 220.65 4649.06 4120.01 247.93 281.12 — 281.12 162.88 118.24
1995-96 367.23 3375.17 3842.14 7408.46 5393.56 410.94 5879.96 5016.56 297.61 565.79 — 565.79 408.82 156.971996-97 367.38 3606.64 4082.65 7850.82 5526.40 664.90 6409.43 5540.39 326.83 542.21 73.00 469.21 286.98 182.23#
1997-98 367.56 3697.32 4579.14 8948.52 6300.04 623.45 6516.58 5810.02 343.23 363.33 41.25 322.08 160.10 161.98#
1998-99 367.97 3796.45 4938.93 10032.17 7058.58 585.44 6335.60 5638.19 382.18 315.23 33.00 282.23 118.94 163.29#
1999-2000 517.97 4040.43 4907.23 10668.33 7426.38 803.10 6943.33 6040.20 426.54 476.59 54.00 422.59 250.69 171.90#
2000-01 507.97 4380.46 4672.22 11258.17 7538.09 846.92 7810.05 6715.36 492.25 602.44 49.00 553.44 335.83 217.61#
2001-02 367.97 3077.99 4705.48 11742.44 7543.70 912.74 7682.70 6906.95 524.75 251.00 46.10 204.90 55.51 149.39#
2002-03 369.18 2816.84 4225.61 12393.79 7543.80 1194.55 9843.66 8025.68 555.48 1262.50 250.19 1012.31 679.30 333.01#
2003-04 369.18 4146.68 3382.21 13269.47 7857.85 2194.12 12069.62 8778.55 625.11 2665.96 919.74 1746.22 1329.97 416.25#
2004-05 553.67 6506.25 2739.70 14957.73 9112.24 2432.65 16053.48 10137.42 618.78 5297.28 1823.12 3474.16 2652.79 821.37#
2005-06 553.67 9201.63 2516.15 16470.71 9865.05 4069.96 17398.98 11383.92 775.10 5239.96 1733.58 3506.38 2685.95 820.43#
2006-07 727.73 13368.42 9645.33 18426.52 11040.56 6106.18 20196.24 13115.30 819.29 6261.65 2039.50 4222.15 3117.82 1104.332007-08 6203.30 21097.43 18021.69 20746.57 12623.56 4103.19 22526.80 14625.83 834.61 7066.36 2379.33 4687.03 3293.48 1393.552008-09 6203.45 23972.81 26946.18 23444.22 14482.22 42371.78 27152.00 18862.99 973.40 7315.61 2113.87 5201.74 3709.24 1492.50#
* Inclusive of Dividends subsequently paid from Reserves and Surplus.** Payable as per the Companies (Temporary Restrictions on Dividends) Act, 1974.† Including an additional Jubilee Dividend of Rs. 2 per share.+ Excluding Preference Shares which have been cancelled with effect from 1-4-1983 and Non-Convertible Bonds issued in lieu thereof.@ Including Rs. 15.05 crores additional depreciation for 1983-84.# Including tax on dividends.

�
Hundred and second annual report 2008-09
196
Dividend Statistics Ordinary First Preference Second Preference (Rs. 75 upto 1975-76 Deferred TotalYear (Rs. 150)a (Rs. 100)a Rs. 100 from 1976-77b (Rs. 30)c
and Rs. 10 from 1989-90)h
Rate Amount Rate Amount Rate Amount Rate Amount Rs. a.p. Rs. lakhs Rs. a.p. Rs. lakhs Rs. a.p. Rs. lakhs Rs. a.p. Rs. lakhs Rs. lakhs
1955-56 9.00 4.50 7.80 52.04 10.80d 134.92 — — 191.461960-61 9.00 4.50 7.50 79.89 10.36 380.65 — — 465.041961-62 9.00 4.50 7.50 79.89 10.36 380.66 — — 465.051962-63 9.00 4.50 7.50 79.89 11.00 404.17 — — 488.561963-64 9.00 4.50 7.50 79.89 12.00 440.92 — — 525.311964-65 9.00 4.50 7.50 79.89 12.00 440.92 — — 525.311965-66 9.00 4.50 7.50 79.89 12.00 440.92 — — 525.311966-67 9.00 4.50 7.50 79.89 8.60e 442.39 — — 526.781967-68 9.00 4.50 7.50 79.89 8.60 442.39 — — 526.781968-69 9.00 4.50 7.50 79.89 8.60 442.39 — — 526.781969-70 9.00 4.50 7.50 79.89 8.60 442.39 — — 526.781970-71 9.00 4.50 7.50 79.89 8.60 442.39 — — 526.781971-72 9.00 4.50 7.50 79.89 8.60 442.39 — — 526.781972-73 9.00 4.50 7.50 79.89 8.60 442.39 — — 526.781973-74 9.00 4.50 7.50 79.89 4.75 244.34 — — 328.731974-75 9.00 4.50 7.50 79.89 8.30 426.95 — — 511.341975-76 9.00 4.50 7.50 79.89 7.75 398.66 — — 483.051976-77 9.00 4.50 7.50 79.89 10.00 514.40 — — 598.791977-78 9.00 4.50 7.50 79.89 11.00 565.84 — — 650.231978-79 9.00 4.50 7.50 79.89 12.00 617.28 — — 701.671979-80 9.00 4.50 7.50 79.89 13.50 694.44 — — 778.831980-81 9.00 4.50 7.50 79.89 15.00 771.60 — — 855.991981-82 9.00 4.50 7.50 79.89 17.00ef 1224.28 — — 1308.671982-83 9.00 4.50 7.50 79.89 17.00 1224.28 — — 1308.671983-84 — — — — 17.00 1224.28 — — 1224.281984-85 — — — — 21.00 1512.34 — — 1512.341985-86 — — — — 25.00 2059.43 — — 2059.431986-87 — — — — 25.00 2065.72 — — 2065.721987-88 — — — — 25.00e 2934.29 — — 2934.291988-89 — — — — 30.00g 4616.74 — — 4616.741989-90 — — — — 3.00hi 5059.30 — — 5059.301990-91 — — — — 3.10 7134.23 — — 7134.231991-92 — — — — 3.50 8054.78 — — 8054.781992-93 — — — — 2.50j 6482.21 — — 6482.211993-94 — — — — 3.00k 9655.44 — — 9655.441994-95 — — — — 3.50l 11823.94 — — 11823.941995-96 — — — — 4.50m 15697.11 — — 15697.111996-97 — — — — 4.50 18222.25n — — 18222.25n
1997-98 — — — — 4.00 16198.05o — — 16198.05o
1998-99 — — — — 4.00 16329.05p — — 16329.05p
1999-2000 — — — — 4.00 17189.87q,r — — 17189.87q,r
2000-01 — — — — 5.00 21760.67s,t,u — — 21760.67s,t,u
2001-02 — — — — 4.00 14939.21v — — 14939.21v
2002-03 — — — — 8.00 33299.88w — — 33299.88w
2003-04 — — — — 10.00 41625.77x — — 41625.77x
2004-05 — — — — 13.00 82137.22y — — 82137.22y
2005-06 — — — — 13.00 82042.66z — — 82042.66z
2006-07 — — — — 15.50 110432.51* — — 110432.51*2007-08 — — 0.41 2596.11# 16.00 136759.54@ — — 139355.652008-09 — — 2.00 12805.48 16.00 136443.72 — — 149249.20
a Subject to deduction of Company’s Income-tax from Preference Dividends upto 1958-59.b Free of tax upto 1958-59 and gross (i.e. inclusive of tax deducted at source) from 1959-60.c Out of 48,750 Deferred Shares, 26,250 Deferred Shares were issued in 1917 at a premium of Rs. 370 per share.d On increased number of Ordinary Shares from 1953-54 onwards after conversion of Deferred Shares into Ordinary Shares and issue of Bonus Shares.e Including on Bonus Shares issued during the year.f Including an additional Jubilee Dividend of Rs. 2 per share.g On the Capital as increased by Rights Issue of Ordinary Shares during 1987-88.h The Ordinary Shares of Rs. 100 each have been sub-divided into Ordinary Shares of Rs. 10 each during 1989-90 and the rate of Dividend is per Ordinary Share of Rs. 10 each.i On the Capital as increased by shares allotted on Conversion of Convertible Debentures.j On the Capital as increased by Rights Issue of Ordinary Shares during 1992-93.k On the Capital as increased by Ordinary Shares issued during 1993-94 against Detachable Warrants.l On the Capital as increased by Ordinary Shares issued during 1994-95 against Detachable Warrants and Foreign Currency Convertible Bonds.m On the Capital as increased by Ordinary Shares issued during 1995-96 against Detachable Warrants, Foreign Currency Convertible Bonds and Naked Warrants.n Includes 10% tax of Rs. 1656.57 lakhs on dividend.o Includes 10% tax of Rs. 1472.55 lakhs on dividend.p Includes 11% tax of Rs. 1618.19 lakhs on dividend.q Includes 11% tax of Rs. 1703.50 lakhs on dividend.r Includes Dividend of Rs. 775.50 lakhs on 9.25% Cumulative Redeemable Preference Shares.s Includes tax of Rs. 2151.38 lakhs on dividends.t Includes Dividend of Rs. 22.30 lakhs on 9.25% Cumulative Redeemable Preference Shares for the period 1st April, 2000 to 27th June, 2000.u Includes Dividend of Rs. 1198.40 lakhs on 8.42% Cumulative Redeemable Preference Shares for the period 1st June, 2000 to 31st March, 2001.v Includes Dividend of Rs. 207.20 lakhs on 8.42% Cumulative Redeemable Preference Shares and tax of Rs. 21.13 lakhs on Preference Dividends.w Includes tax of Rs. 3781.33 lakhs on Dividend.x Includes tax of Rs. 4727.58 lakhs on Dividend.y Includes tax of Rs. 10185.74 lakhs on Dividend.z Includes tax of Rs. 10092.00 lakhs on Dividend.* Includes tax of Rs. 16041.72 lakhs on Dividend# Dividend paid for 74 days on Cumulative Convertible Preference Share. Includes tax Rs. 377.12 lakhs on Dividend.@ Includes tax of Rs. 19866.05 lakhs on Dividends on Ordinary Shares.
Includes tax Rs. 1860.16 lakhs on Dividend on Cumulative Convertible Preference Share. Includes tax of Rs. 19549.31 lakhs on Dividends on Ordinary Shares.
��
�

197
2008-09 2007-08 2006-07 2005-06 2004-05 2003-04 2002-03 2001-02 2000-01 1999-00
1 EBIDTA/Turnover 38.83% 41.93% 41.34% 40.35% 41.89% 31.82% 24.34% 16.87% 20.05% 16.36%
2 PBT/Turnover 30.09% 33.70% 35.68% 34.44% 36.34% 24.83% 14.48% 3.51% 8.85% 4.95%
3 Return on Averaage Capital Employed 16.12% 20.53% 32.37% 40.81% 49.43% 28.02% 16.29% 6.35% 11.22% 7.58%
4 Return on Avg. Net Worth 18.33% 22.84% 36.09% 42.90% 62.01% 46.28% 35.88% 6.38% 14.38% 11.51%
5 Asset Turnover 99.17% 105.36% 76.54% 108.13% 110.13% 100.41% 77.97% 63.07% 72.12% 66.05%
6 Inventory Turnover (in days) 43.00 42.00 43.00 45.00 37.00 39.00 43.00 50.00 47.00 55.00
7 Debtors Turnover (in days) 9.00 11.00 12.00 13.00 16.00 27.00 43.00 64.00 58.00 65.00
8 Gross Block to Net Block 1.63 1.65 1.68 1.68 1.65 1.69 1.64 1.56 1.49 1.44
9 Net Debt to Equity 0.78 0.81 (0.15) 0.02 0.18 0.42 1.15 1.34 1.09 1.23
10 Current Ratio 1.12 0.90 2.18 1.10 1.10 1.03 1.35 1.53 1.54 1.64
11 Interest Cover ratio 7.35 9.44 37.01 43.08 29.21 22.76 5.14 1.64 2.82 1.95
12 Networth per share (post CCPS conversion) 360.18 376.28 214.80 171.68 123.68 78.77 86.35 66.81 107.90 101.43
13 Earnings per share (Basic) 69.45 66.80 65.28 63.35 62.77 31.55 27.44 5.51 14.64 11.28
14 Dividend Payout 29.00% 30.00% 26.00% 23.00% 24.00% 24.00% 33.00% 73.00% 39.00% 41.00%
15 P/E Ratio 2.97 10.38 6.89 8.47 6.39 12.16 4.87 17.72 8.36 10.27
1. EBIDTA/Turnover : Earnings Before Interest Depreciation Tax and Exceptional Items/Turnover.
(EBIDTA : Profi t before Taxes +(-) Exceptional Items + Net Finance Charges + Depreciation).
(Turnover : Sales & Other Operating Income less Excise Duty).
2. PBT/Turnover : Profi t Before Tax/Turnover.
( Profi t before Taxes +(-) Exceptional Items).
3. Return on Average Capital Employed : EBIT/Average Capital Employed.
(Capital Employed : Total Funds Employed – Miscellaneous Expenses to the extent not written off or adjusted – Foreign Currency Monetary Translation Diff Account)).
(EBIT : Profi t before Taxes +(-) Exceptional Items + Net Finance Charges).
4. Return on Average Net Worth : Profi t after Taxes/Average Net Worth.
(Net Worth : Equity Share Capital + Preference Share Capital + Reserves & Surplus – Miscellaneous Expenses to the extent not written off or adjusted - Foreign Currency Monetary Translation Diff Account).
5. Asset Turnover : Net Sales/(Total Assets - Investments – Misc Expenses to the extent not written off or adjusted – Foreign Currency Monetary Translation Diff Account – Advance Against Equity + Current Liabilities & Provisions).
6. Inventory Turnover : Average Inventory/Sale of Products in days.
7. Debtors Turnover : Average Debtors/Turnover in days.
8. Gross Block to Net Block : Gross Block/Net Block.
9. Net Debt to Equity : Net Debt/Average Net Worth.
(Net Debt :Secured Loan+Unsecured loan – Cash & Bank – Current Investments).
10. Current Ratio : Current Assets (excluding advance against equity)/Current Liabilities.
11. Interest Cover Ratio : Earnings Before Interest and Tax/Net Finance Charges.
12. Net Worth per share : Net Worth/Average Number of Equity Shares (post CCPS conversion).
13. Earnings per share(Basic) : Profi t attributable to Ordinary Shareholders/Weighted average number of ordinary shares.
14. Dividend Payout : Dividend/Profi t after Taxes.
15. P/E Ratio : Market Price/Earnings per share (Basic).
Financial Ratios

Hundred and second annual report 2008-09
198
Corporate Governance Report for the year 2008-09(as required under Clause 49 of the Listing Agreements entered into with the Stock Exchanges)
1. The Company’s Corporate Governance Philosophy
The Company has set itself the objective of expanding its capacities and becoming globally competitive in its business. As a part of its growth strategy, the Company believes in adopting the ‘best practices’ that are followed in the area of Corporate Governance across various geographies. The Company emphasises the need for full transparency and accountability in all its transactions, in order to protect the interests of its stakeholders. The Board considers itself as a Trustee of its Shareholders and acknowledges its responsibilities towards them for creation and safeguarding their wealth.
In accordance with the Tata Steel Group Vision, Tata Steel Group (‘the Group’) aspires to be the global steel industry benchmark for value creation and corporate citizenship. The Group expects to realise its Vision by taking such actions as may be necessary in order to achieve its goals of value creation, safety, environment and people.
2. Board of Directors
The Company has a non-executive Chairman and the number of Independent Directors is more than one-third of the total number of Directors. As on 31st March, 2009, the Company has 14 Directors on its Board, of which 8 Directors are independent. The number of Non-Executive Directors (NEDs) is more than 50% of the total number of Directors. The Company is in compliance with of clause 49 the Listing Agreement pertaining to compositions of
directors.
None of the Directors on the Board is a Member on more than 10 Committees and Chairman of more than 5 Committees (as specifi ed in Clause 49), across all the companies in which he is a Director. The necessary disclosures regarding Committee positions have been made by the Directors.
The names and categories of the Directors on the Board, their attendance at Board Meetings during the year and at the last Annual General Meeting, as also the number of Directorships and Committee Memberships held by them in other companies are given below :
Name Category No. of Whether No. of No. of Committee Board attended Directorships positions held in Meetings AGM held in other other public attended on 28th public companies* companies** during August, as on 31.03.2009 as on 31.03.2009 2008-09 2008 Chairman Member Chairman Member
Mr. R. N. Tata (Chairman) Not Independent 9 Yes 9 1 — — Non-Executive
Mr. James Leng Independent 6 Yes — — — —Non-Executive
Mr. Nusli N. Wadia -do- 8 No 3 4 — —
Mr. S. M. Palia -do- 9 Yes — 6 3 3
Mr. Suresh Krishna -do- 5 Yes 4 4 2 2
Mr. Ishaat Hussain Not Independent 9 Yes 2 11 3 4 Non-Executive
Dr. J. J. Irani -do- 10 Yes 3 6 — 2
Mr. Subodh Bhargava Independent 9 Yes 2 9 3 5 Non-Executive

199
Mr. Jacobus Schraven Independent Non-Executive 5 Yes — — — —
Dr. Anthony Hayward -do- 1 Yes — — — —
Mr. Andrew Robb -do- 7 Yes — — — —
Dr. T. Mukherjee Not Independent 7 Yes — 1 — —(Resigned w.e.f. 31-03-2009) Non-Executive
Mr. Philippe Varin -do- 7 Yes — — — —
Mr. B. Muthuraman Not Independent 10 Yes 1 3 — 1(Managing Director) Executive
*
** Represents Chairmanships/Memberships of Audit Committee and Shareholders’/Investors’ Grievance Committee.
Ten Board Meetings were held during the year 2008-09 and the gap between two meetings did not exceed four months. The dates on which the Board Meetings were held were as follows:
8th April 2008, 26th June 2008, 31st July 2008, 28th August 2008, 24th October 2008, 2nd December 2008, 18th December 2008, 8th January 2009, 28th January 2009 and 27th February 2009.
Dates for the Board Meetings in the ensuing year are decided well in advance and communicated to the Directors. Board Meetings are held at the Registered Offi ce of the Company. The Agenda along with the explanatory notes are sent in advance to the Directors. Additional meetings of the Board are held when deemed necessary by the Board.
The information as required under Annexure IA to Clause 49 is being made available to the Board.
The Board periodically reviews compliance reports of all laws applicable to the Company. Steps are taken by the Company to rectify instances of non-compliance, if any.
During 2008-09, the Company did not have any material pecuniary relationship or transactions with Non-Executive Directors, other than Dr. J. J. Irani and Dr. T. Mukherjee, to whom the Company paid retiring benefi ts aggregating to Rs. 35.68 lakhs and Rs. 28.86 lakhs respectively.
The Company has adopted the Tata Code of Conduct for Executive Directors, Senior Management Personnel and other Executives of the Company. The Company has received confi rmations from the Executive Director as well as Senior Management Personnel regarding compliance of the Code during the year under review. It has also adopted the Tata Code of Conduct for Non-Executive Directors of the Company. The Company has received confi rmations from the Non-Executive Directors regarding compliance of the Code for the year under review. Both the Codes are posted on the website of the Company.
3. Audit Committee The Company had constituted an Audit Committee in the year 1986. The scope of the activities of the Audit
Committee is as set out in Clause 49 of the Listing Agreements with the Stock Exchanges read with Section 292A of the Companies Act, 1956. The terms of reference of the Audit Committee are broadly as follows :
a. To review compliance with internal control systems;
b. To review the fi ndings of the Internal Auditor relating to various functions of the Company;
c. To hold periodic discussions with the Statutory Auditors and Internal Auditors of the Company concerning the accounts of the Company, internal control systems, scope of audit and observations of the Auditors/Internal Auditors;
Name Category No. of Whether No. of No. of Committee Board attended Directorships positions held in Meetings AGM held in other other public attended on 28th public companies* companies** during August, as on 31.03.2009 as on 31.03.2009 2008-09 2008 Chairman Member Chairman Member
Excludes Directorships in associations, private, foreign and Section 25 companies.

Hundred and second annual report 2008-09
200
d. To review the quarterly, half-yearly and annual fi nancial results of the Company before submission to the Board;
e. To make recommendations to the Board on any matter relating to the fi nancial management of the Company, including Statutory & Internal Audit Reports;
f. Recommending the appointment of statutory auditors and branch auditors and fi xation of their remuneration.
Mr. Subodh Bhargava, Chairman of the Audit Committee was present at the Annual General Meeting held on 28th August, 2008.
The composition of the Audit Committee and the details of meetings attended by the Directors are given below :
Names of Members Category No. of Meetings attended during the year 2008-09
Mr. Subodh Bhargava Independent, Non-Executive 8 Chairman
Mr. S. M. Palia, Member -do- 8
Mr. Ishaat Hussain Not Independent, Non-Executive 9 Member, Chartered Accountant
Mr. Andrew Robb, Member Independent, Non-Executive 6
Audit Committee meetings are attended by the Group Chief Financial Offi cer, Chief (Corporate Audit) and Chief Financial Controller (Corporate) and Representatives of Statutory Auditors. The Company Secretary acts as the Secretary of the Audit Committee.
Nine Audit Committee Meetings were held during 2008-09. The dates on which the said meetings were held were as follows :
8th April, 2008, 23rd June 2008, 30th July, 2008, 27th August, 2008, 24th October, 2008, 2nd December, 2008, 28th January, 2009, 29th January 2009 and 26th February 2009.
The necessary quorum was present at the meetings.
Whistle Blower Policy
The Audit Committee at its meeting held on 25th October, 2005, approved framing of a Whistle Blower Policy that provides a formal mechanism for all employees of the Company to approach the Ethics Counsellor/Chairman of the Audit Committee of the Company and make protective disclosures about the unethical behaviour, actual or suspected fraud or violation of the Company’s Code of Conduct. The Whistle Blower Policy is an extension of the Tata Code of Conduct, which requires every employee to promptly report to the Management any actual or possible violation of the Code or an event he becomes aware of that could affect the business or reputation of the Company. The disclosures reported are addressed in the manner and within the time frames prescribed in the Policy. Under the Policy, each employee of the Company has an assured access to the Ethics Counsellor/ Chairman of the Audit Committee.
4. Remuneration Committee
The Company had constituted a Remuneration Committee in the year 1993. The broad terms of reference of the Remuneration Committee are as follows :
a. Review the performance of the Managing Director and the Whole-time Directors, after considering the Company’s performance.
b. Recommend to the Board remuneration including salary, perquisites and commission to be paid to the Company’s Managing Director and Whole-time Directors.
c. Finalise the perquisites package of the Managing Director and Whole-time Directors within the overall ceiling fi xed by the Board.
d. Recommend to the Board, retirement benefi ts to be paid to the Managing Director and Whole-time Directors under the Retirement Benefi t Guidelines adopted by the Board.

201
The Remuneration Committee also functions as the Compensation Committee as per SEBI guidelines on the Employees’ Stock Option Scheme. The Company, however, has not yet introduced the Employees’ Stock Option Scheme.
The composition of the Remuneration Committee and the details of meetings attended by the Directors are given below :
Names of Members Category No. of Meetings attended during the year 2008-09
Mr. Suresh Krishna, Chairman Independent, Non-Executive —
Mr. R. N. Tata, Member Not Independent, Non-Executive 1
Mr. S. M. Palia, Member Independent, Non-Executive 1
One meeting of the Remuneration Committee was held on 26th June, 2008.
The Chairman of the Remuneration Committee, Mr. Suresh Krishna was present at the Annual General Meeting held on 28th August, 2008.
The Company has complied with the non-mandatory requirement of Clause 49 regarding the Remuneration Committee.
Remuneration Policy
The Company while deciding the remuneration package of the senior management members takes into consideration the following items :
(a) employment scenario
(b) remuneration package of the industry and
(c) remuneration package of the managerial talent of other industries.
The annual variable pay of senior managers is linked to the performance of the Company in general and their individual performance for the relevant year measured against specifi c Key Result Areas, which are aligned to the Company’s objectives.
The Non-Executive Directors (NEDs) are paid remuneration by way of Commission and Sitting Fees. In terms of the shareholders’ approval obtained at the AGM held on 5th July, 2006, the Commission is paid at a rate not exceeding 1% per annum of the profi ts of the Company (computed in accordance with Section 309(5) of the Companies Act, 1956). The distribution of Commission amongst the NEDs is placed before the Board. The Commission is distributed on the basis of their attendance and contribution at the Board and certain Committee Meetings as well as time spent on operational matters other than at the meetings.
The Company pays sitting fees of Rs. 20,000 per meeting to the NEDs for attending the meetings of the Board, Executive Committee of the Board, Remuneration Committee, Audit Committee and Committees constituted by the Board from time to time. For other meetings, viz. Investor Grievance Committee and Ethics Committee, the Company pays to the NEDs sitting fees of Rs. 5,000 per meeting.
The Company pays remuneration by way of salary, perquisites and allowances (fi xed component) and commission (variable component) to Managing and Whole-time Directors. Salary is paid within the range approved by the Shareholders. Annual increments effective 1st April each year, as recommended by the Remuneration Committee, are approved by the Board. The ceiling on perquisites and allowances as a percentage of salary, is fi xed by the Board. Within the prescribed ceiling, the perquisites package is approved by the Remuneration Committee. Commission is calculated with reference to net profi ts of the Company in a particular fi nancial year and is determined by the Board of Directors at the end of the fi nancial year based on the recommendations of the Remuneration Committee, subject to overall ceilings stipulated in Sections 198 and 309 of the Companies Act, 1956. Specifi c amount payable to such directors is based on the performance criteria laid down by the Board which broadly takes into account the profi ts earned by the Company for the year.

Hundred and second annual report 2008-09
202
Details of remuneration for 2008-09 Non-Wholetime Directors (Rs. lakhs)
Name of the Director Commission* Sitting Fees
1. Mr. R. N. Tata 200.00 3.20 2. Mr. James Leng 15.00 2.20 3. Mr. Nusli N. Wadia 34.00 2.40 4. Mr. S. M. Palia 61.00 4.60 5. Mr. Suresh Krishna 10.00 1.10 6. Mr. Ishaat Hussain 60.00 4.90 7. Dr. J. J. Irani 25.00 @ 3.20 8. Mr. Subodh Bhargava 40.00 3.40 9. Mr. Jacobus Schraven 10.00 1.00 10. Dr. Anthony Hayward 25.00 0.20 11. Mr. Andrew Robb 10.00 2.60 # 12. Dr. T. Mukherjee 10.00 @@ 1.40 13. Mr. Philippe Varin – 2.40 #
Total 500.00 32.60
* Payable in 2009-10. # Includes amount of Rs. 20,000/- paid in 2009-10. @ Excluding retirement benefi ts of Rs. 35.68 lakhs paid to Dr. Irani. @@ Excluding retirement benefi t of Rs. 28.86 lakhs paid to Dr. Mukherjee.
Managing Director
Name Salary Perquisites & Commission@ Stock Options Allowances Rs. lakhs Rs. lakhs Rs. lakhs
Mr. B. Muthuraman 88.00 69.21 350.00 Nil Managing Director
@ Payable in 2009-10.
Shareholding of the Directors in the Company as on 31st March, 2009
Director No. of Ordinary Shares No. of Cumulative Convertible of Rs. 10/- each held Preference Shares (CCPS) of Rs. 100/- as sole/fi rst holder each held as sole/fi rst holder
Mr. R. N. Tata (Chairman) 21203 21709 Mr. James Leng Nil Nil Mr. Nusli N. Wadia Nil Nil Mr. S. M. Palia 2047 2869 Mr. Suresh Krishna Nil Nil Mr. Ishaat Hussain 1936 1684 Dr. J. J. Irani 6528 5278 Mr. Subodh Bhargava 900 675 Mr. Jacobus Schraven Nil Nil Dr. Anthony Hayward Nil Nil Mr. Andrew Robb Nil Nil Dr. T. Mukherjee Nil Nil Mr. Philippe Varin Nil Nil Mr. B. Muthuraman 3654 2282
Total 36268 34497

203
Service Contracts, Severance Fees and Notice Period
Period of Contract of MD : From 22.07.2006 to 30.09.2009
The Contract may be terminated by either party giving the other party six months’ notice or the Company paying six months’ salary in lieu thereof.
There is no separate provision for payment of severance fees.
5. Shareholders’ Committee
An Investors’ Grievance Committee was constituted on 23rd March, 2000 to specifi cally look into the redressal of Investors’ complaints like transfer of shares, non-receipt of balance sheet and non-receipt of declared dividend, etc.
One meeting of the Investors’ Grievance Committee was held on 31st March, 2009. The composition of the Investors’ Grievance Committee is given below :
Names of Members Category No. of Meetings attended during 2008-09
Mr. Ishaat Hussain, Chairman Not Independent, 1 Non Executive
Mr. Suresh Krishna, Member Independent, 1 Non-Executive
Name, designation & address of Name, designation & address of Compliance Offi cer : Investor Relations Offi cer :
Mr. J. C. Bham Mr. Praveen Sood
Company Secretary Head (Investor Relations - India & Asia)
Bombay House, Bombay House,
24, Homi Mody Street, 24, Homi Mody Street,
Fort, Mumbai 400 001. Fort, Mumbai 400 001.
Phone : (022) 6665 7279 Phone : (022) 6665 7306 Fax : (022) 6665 7724 / 6665 7725 Fax : (022) 6665 8113 Email : [email protected] Email : [email protected]
Shareholder/Investor Complaints :
Complaints pending as on 1st April, 2008 : 391
During the period 1st April, 2008 to 31st March, 2009, complaints identifi ed and
reported under Clause 41 of the Listing Agreements : 2647
Complaints disposed off during the year ended 31st March, 2009 : 3032
Complaints unresolved to the satisfaction of shareholders as on 31st March, 2009 : 6
No. of pending share transfers as on 31st March, 2009
i) Ordinary Shares : 49*
ii) Cumulative Convertible Preference Shares : 14*
* Transfers lodged in the last two weeks of March, 2009 and hence pending as on 31st March, 2009.

Hundred and second annual report 2008-09
204
Sr. Description Total Total TotalNo. Received Replied Pending
ComplaintsA Letters received from Statutory bodies1. SEBI 703 700 32. DOCA — — —3. STOCK EXCHANGES 148 148 —4. NSDL/CDSL 14 14 —
Total Nos. 865 862 3
B Legal Matters
Court/Consumer Forum Matters 15 13 2
Total Nos. 15 13 2
C Dividends
1. Non-receipt of Dividend/Interest warrants 312 312 — (pending recon. at the time of receipt of letters)2. Fraudulent Encashment of Dividend/Interest/ 1 — 1 Redemption warrants
Total Nos. 313 312 1
D Allotments/refund Orders/Equity Shares/CCPS
1. Non-receipt of refund order 581 581 —2. Non-receipt of allotment (Equity) 413 413 —3. Non-receipt of allotment (CCPS) 459 459 —
Total Nos. 1453 1453 —
E Letters in the nature of 1 1 — reminders/complaints
Total Correspondence Statistics 2647 2641 6
Note :
The Correspondence identifi ed as investor complaints are letters received through Statutory/Regulatory bodies and
those related to Court/Consumer forum matters, (where the Company/Registrar is involved and is accused of defi ciency
in service) fraudulent encashment and non-receipt of dividend amounts where reconciliation of the payment is in
progress/completed after the end of the quarter and non-receipt of refund orders/allotment of shares (equity & CCPS)/
share certifi cates pertaining to Rights Issues.
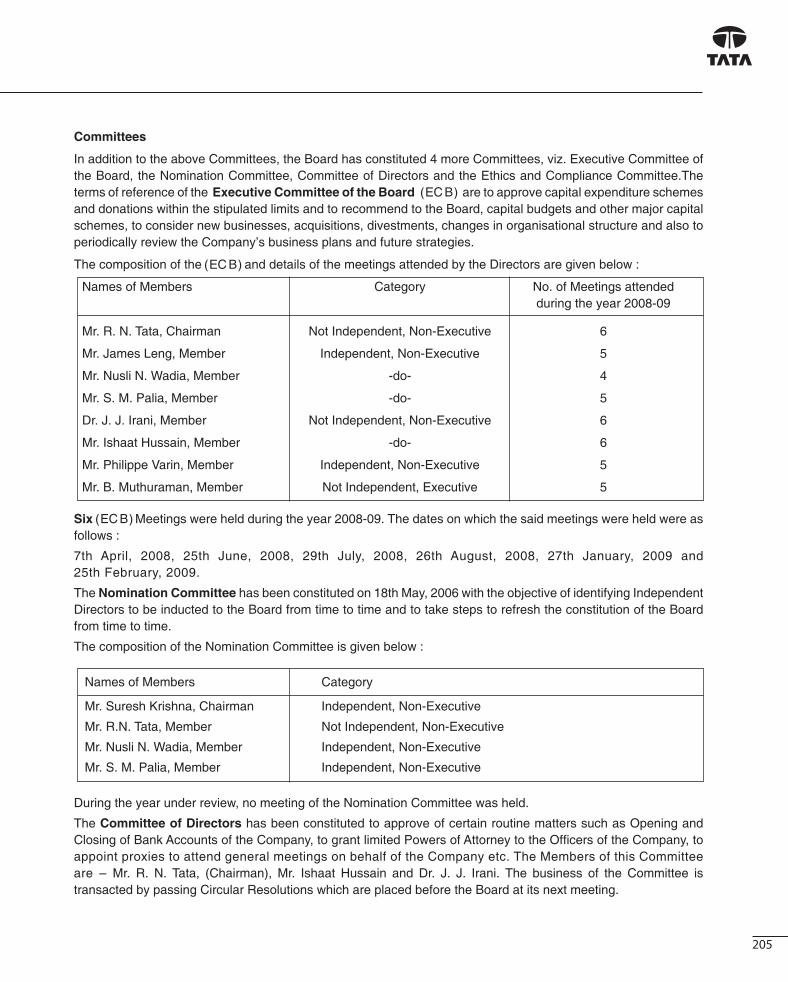
205
Committees
In addition to the above Committees, the Board has constituted 4 more Committees, viz. Executive Committee of the Board, the Nomination Committee, Committee of Directors and the Ethics and Compliance Committee.The terms of reference of the Executive Committee of the Board (EC B) are to approve capital expenditure schemes and donations within the stipulated limits and to recommend to the Board, capital budgets and other major capital schemes, to consider new businesses, acquisitions, divestments, changes in organisational structure and also to periodically review the Company’s business plans and future strategies.
The composition of the and details of the meetings attended by the Directors are given below :
Names of Members Category No. of Meetings attended during the year 2008-09
Mr. R. N. Tata, Chairman Not Independent, Non-Executive 6
Mr. James Leng, Member Independent, Non-Executive 5
Mr. Nusli N. Wadia, Member -do- 4
Mr. S. M. Palia, Member -do- 5
Dr. J. J. Irani, Member Not Independent, Non-Executive 6
Mr. Ishaat Hussain, Member -do- 6
Mr. Philippe Varin, Member Independent, Non-Executive 5
Mr. B. Muthuraman, Member Not Independent, Executive 5
Six Meetings were held during the year 2008-09. The dates on which the said meetings were held were as follows :
7th April, 2008, 25th June, 2008, 29th July, 2008, 26th August, 2008, 27th January, 2009 and 25th February, 2009.
The Nomination Committee has been constituted on 18th May, 2006 with the objective of identifying Independent Directors to be inducted to the Board from time to time and to take steps to refresh the constitution of the Board from time to time.
The composition of the Nomination Committee is given below :
Names of Members Category
Mr. Suresh Krishna, Chairman Independent, Non-Executive
Mr. R.N. Tata, Member Not Independent, Non-Executive
Mr. Nusli N. Wadia, Member Independent, Non-Executive
Mr. S. M. Palia, Member Independent, Non-Executive
During the year under review, no meeting of the Nomination Committee was held.
The Committee of Directors has been constituted to approve of certain routine matters such as Opening and Closing of Bank Accounts of the Company, to grant limited Powers of Attorney to the Offi cers of the Company, to appoint proxies to attend general meetings on behalf of the Company etc. The Members of this Committee are – Mr. R. N. Tata, (Chairman), Mr. Ishaat Hussain and Dr. J. J. Irani. The business of the Committee is transacted by passing Circular Resolutions which are placed before the Board at its next meeting.
(EC B)
(EC B)

Hundred and second annual report 2008-09
206
Ethics and Compliance Committee
In accordance with the Securities and Exchange Board of India (Prohibition of Insider Trading) Regulations, 1992, as amended (the Regulations), the Board of Directors of the Company adopted the revised Tata Code of Conduct for Prevention of Insider Trading and the Code of Corporate Disclosure Practices (the Code) to be followed by Directors, Offi cers and other Employees. The Code is based on the principle that Directors, Offi cers and Employees of a Tata Company owe a fi duciary duty to, among others, the shareholders of the Company to place the interest of the shareholders above their own and conduct their personal securities transactions in a manner that does not create any confl ict of interest situation. The Code also seeks to ensure timely and adequate disclosure of Price Sensitive Information to the investor community by the Company to enable them to take informed investment decisions with regard to the Company’s securities.
In terms of the said Code, a Committee has been constituted on 30th May, 2002, called Ethics and Compliance Committee.
One meeting of the Ethics and Compliance Committee was held on 31st March, 2009.
The composition of the Ethics and Compliance Committee is given below :
Names of Members Category No. of Meetings attended during 2008-09
Mr. Ishaat Hussain, Chairman Not Independent, Non-Executive 1
Mr. Suresh Krishna, Member Independent, Non-Executive 1
The Board has also appointed the Group Chief Financial Offi cer as the Compliance Offi cer to ensure compliance and effective implementation of the Regulations and also the Code across the Company.
During the year under review, the Compliance Offi cer submitted Monthly Committee Report of the Tata Code of Conduct for Prevention of Insider Trading to the Board of Directors.
6. General Body Meetings
a) Location and time, where last three Annual General Meetings (AGMs) were held :
Financial Year Details of Location Date & Time
2007-08 Birla Matushri Sabhagar, 28th August, 2008 at 3.30 p.m.
2006-07 19, Sir Vithaldas Thackersey Marg, 29th August, 2007 at 3.30 p.m.
2005-06 Mumbai 400 020. 5th July, 2006 at 11.00 a.m.
b) No Extra-Ordinary General Meeting of the shareholders was held during the year.
c) No Postal Ballot was conducted during the year. None of the resolutions proposed for the ensuing Annual General Meeting need to be passed by Postal Ballot.
d) Special Resolutions passed in previous 3 Annual General Meetings :
At the last Annual General Meeting held on 28th August, 2008, no Special Resolutions were passed.
At the Annual General Meeting held on 29th August, 2007, Special Resolutions were passed for a) Increase in the authorised share capital, b) Alteration of the Memorandum of Association, c) Alteration of the Articles of Association, d) Further issuance of Securities and e) Change in place of keeping Registers and Records. The resolutions were passed unanimously.
At the Annual General Meeting held on 5th July, 2006, Special Resolutions were passed for a) Commission to Directors other than the Managing and Whole-time Directors, b) Increase in the Authorised Share Capital, c) Alteration of the Articles of Association of the Company and d) Raising additional long term funds. The resolutions at items a), b) and c) were passed unanimously. The resolution at item d) was passed by requisite majority.

207
7. Disclosures
i) The Board has received disclosures from key managerial personnel relating to material, fi nancial and commercial transactions where they and/or their relatives have personal interest. There are no materially signifi cant related party transactions which have potential confl ict with the interest of the Company at large.
ii) The Company has complied with the requirements of the Stock Exchanges, SEBI and other statutory authorities on all matters relating to capital markets during the last three years. No penalties or strictures have been imposed on the Company by the Stock Exchanges, SEBI or other statutory authorities relating to the above.
iii) The Company has adopted a Whistle Blower Policy and has established the necessary mechanism in line with clause 7 of the Annexure 1D to Clause 49 of the Listing Agreement with the Stock Exchanges, for employees to report concerns about unethical behaviour. No personnel has been denied access to the Ethics Counsellor/Chairman of the Audit Committee.
iv) The Company has fulfi lled the following non-mandatory requirements as prescribed in Annexure 1D to Clause 49 of the Listing Agreement with the Stock Exchanges :
a) The Company has set up a Remuneration Committee. Please see para 4 for details.
b) The Company has moved towards a regime of unqualifi ed fi nancial statements.
Secretarial Audit A qualifi ed practicing Company Secretary carried out a secretarial audit to reconcile the total admitted capital with
National Securities Depository Limited (NSDL) and Central Depository Services (India) Limited (CDSL) and the total issued and listed capital. The audit confi rms that the total issued/paid up capital is in agreement with the total number of shares in physical form and the total number of dematerialised shares held with NSDL and CDSL.
8. Means of Communication Half-yearly report – The half-yearly results of the Company are published in the newspapers and posted on the website of the
Company.
Results – The quarterly and annual results along with the Segmental Report are generally published in The Times of India,
The Indian Express, Nav Shakti, Free Press Journal, Loksatta and also displayed on the website of the Company www.tatasteel.com shortly after its submission to the Stock Exchanges.
Presentation to Institutional Investors or to analysts –
Offi cial news releases and presentations made to Institutional Investors and analysts are posted on the Company’s website.
Management Discussion & Analysis Report – The MD&A Report forms a part of the Directors’ Report. All matters pertaining to industry structure and developments,
opportunities and threats, segment/product wise performance, outlook, risks and concerns, internal control and systems, etc. are discussed in the said report.
Company’s Corporate Website – The Company’s website is a comprehensive reference on Tata Steel’s management, vision, mission, policies,
corporate governance, corporate sustainability, investor relations, sales network, updates and news. The section on ‘Investor Relations’ serves to inform the shareholders, by giving complete fi nancial details, shareholding patterns, corporate benefi ts, information relating to stock exchanges, registrars, share transfer agents and frequently asked questions. Investors can also submit their queries and get feedback through online interactive forms. The section on ‘Newsrooms’ includes all major press reports and releases, awards, campaigns.

Hundred and second annual report 2008-09
208
9. General Shareholder Information AGM : Date, time & venue – 27.08.2009 at 3.30 p.m. Birla Matushri Sabhagar, 19, Sir Vithaldas Thackersey Marg, Mumbai 400 020.
As required under Clause 49 IV(G)(i), particulars of Directors seeking reappointment are given in the Explanatory Statement to the Notice of the Annual General Meeting to be held on 27th August, 2009.
Financial Calendar – Year ending March 31 AGM August Dividend Payment Generally in August
Date of Book Closure – Wednesday, 8th July, 2009 to Tuesday, 14th July, 2009 (both days inclusive)
Dividend Payment Date – The dividend warrants will be posted on or after 28.08.2009.
Unclaimed Dividend –
l All unclaimed/unpaid dividend amounts upto the fi nancial year ended 31.03.1995 have been transferred to the General Revenue Account of the Central Government. Shareholders, who have not yet encashed their dividend warrant(s) for the said period are requested to forward their claims in prescribed Form No. II to The Companies Unpaid Dividend (Transfer to General Revenue Account of the Central Government) Rules, 1978 to :-
Offi ce of Registrar of Companies
Central Government Offi ce Bldg., ‘A’ Wing,
2nd Floor, Next to Reserve Bank of India
CBD, Belapur 400 614.
l All unclaimed/unpaid dividend amounts for the fi nancial years 1995-96 to 2000-01 have been transferred to Investor Education & Protection Fund and no claims will lie against the Company or the Fund in respect of the unclaimed amounts so transferred.
l The unclaimed dividend declared in respect of the fi nancial year 2001-02 is in the process of being transferred to IEPF.
Listing on Stock Exchanges –
The Company’s Ordinary shares and CCPS are listed on the following 2 Stock Exchanges in India :
Bombay Stock Exchange Limited National Stock Exchange of India Ltd.
Phiroze Jeejeebhoy Towers, Exchange Plaza, Bandra-Kurla Complex,
Dalal Street, Mumbai 400 001. Bandra East, Mumbai 400 051.
Global Depository Receipts (GDRs) issued by the Company in the International Market have been listed on the Luxembourg Stock Exchange and the Stock Code is USY8547N1139.
The Company has paid annual listing fees to each of the above Stock Exchanges for the fi nancial year 2008-09.
Stock Codes/Symbols -
Bombay Stock Exchange Limited -
Ordinary Shares (demat form) … … 500470
CCPS 710049
National Stock Exchange of India Ltd.
Ordinary Shares … … TATASTEEL
CCPS TATASTEEL Q1
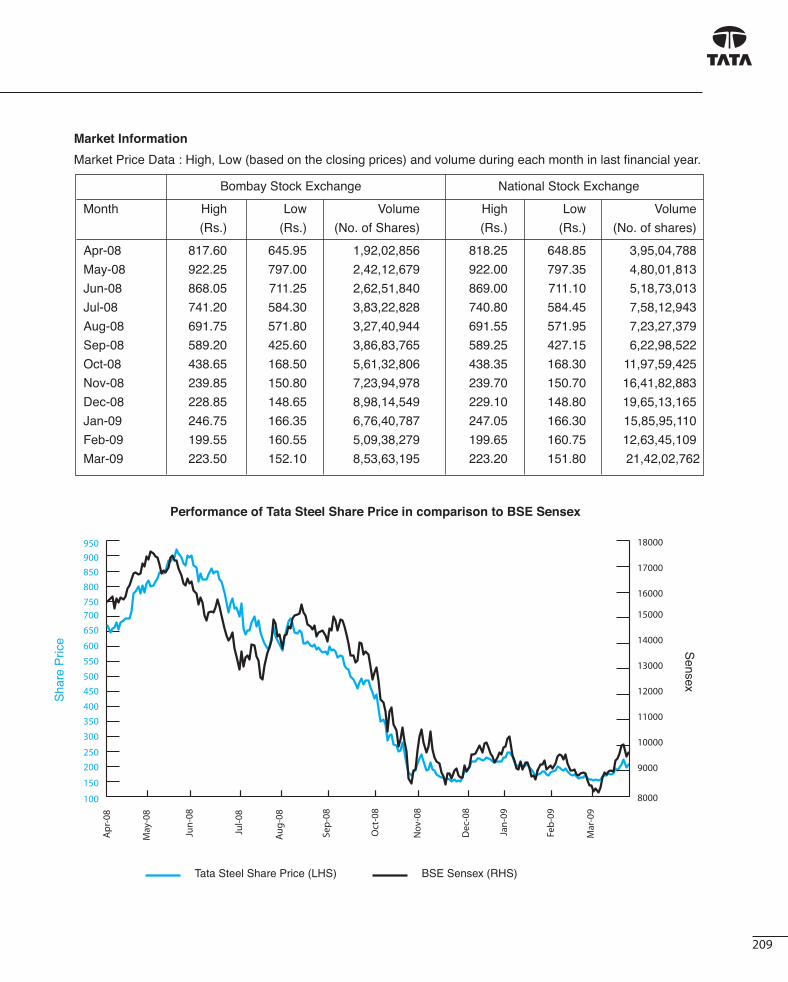
209
Market Information
Market Price Data : High, Low (based on the closing prices) and volume during each month in last fi nancial year.
Bombay Stock Exchange National Stock Exchange
Month High Low Volume High Low Volume
(Rs.) (Rs.) (No. of Shares) (Rs.) (Rs.) (No. of shares)
Apr-08 817.60 645.95 1,92,02,856 818.25 648.85 3,95,04,788
May-08 922.25 797.00 2,42,12,679 922.00 797.35 4,80,01,813
Jun-08 868.05 711.25 2,62,51,840 869.00 711.10 5,18,73,013
Jul-08 741.20 584.30 3,83,22,828 740.80 584.45 7,58,12,943
Aug-08 691.75 571.80 3,27,40,944 691.55 571.95 7,23,27,379
Sep-08 589.20 425.60 3,86,83,765 589.25 427.15 6,22,98,522
Oct-08 438.65 168.50 5,61,32,806 438.35 168.30 11,97,59,425
Nov-08 239.85 150.80 7,23,94,978 239.70 150.70 16,41,82,883
Dec-08 228.85 148.65 8,98,14,549 229.10 148.80 19,65,13,165
Jan-09 246.75 166.35 6,76,40,787 247.05 166.30 15,85,95,110
Feb-09 199.55 160.55 5,09,38,279 199.65 160.75 12,63,45,109
Mar-09 223.50 152.10 8,53,63,195 223.20 151.80 21,42,02,762
Performance of Tata Steel Share Price in comparison to BSE Sensex

Hundred and second annual report 2008-09
210
Registrar and Transfer Agents :
TSR Darashaw Limited are the Registrar and Share Transfer Agents of the Company. Address for correspondence is as below:
TSR Darashaw Limited 6-10 Haji Moosa Patrawala Industrial Estate, 20, Dr. E. Moses Road, (Near Famous Studio) Mahalaxmi, Mumbai 400 011. Tel. : (022) 6656 8484 Fax : (022) 6656 8494 / 6656 8496 E-mail : [email protected] website : http://www.tsrdarashaw.com
For the convenience of shareholders based in the following cities, transfer documents and letters will also be accepted at the following branches/agencies of TSR Darashaw Limited :
Branches of TSR Darashaw Limited
1. TSR Darashaw Limited 2. TSR Darashaw Limited
503, Barton Centre, 5th Floor, Bungalow No.1, ‘E’ Road,
84, Mahatma Gandhi Road, Northern Town, Bistupur,
Bangalore 560 001. Jamshedpur 831 001.
Tel. : (080) 2532 0321 Tel. : (0657) 242 6616
Fax : (080) 2558 0019 Fax : (0657) 242 6937
E-mail : [email protected] E-mail : [email protected]
3. TSR Darashaw Limited 4. TSR Darashaw Limited
Tata Centre, 1st Floor, Plot No. 2/42, Sant Vihar
43, Jawaharlal Nehru Road, Ansari Road, Darya Ganj
Kolkata 700 071. New Delhi 110 002.
Tel. : (033) 2288 3087 Tel. : (011) 2327 1805
Fax : (033) 2288 3062 Fax : (011) 2327 1802
E-mail : [email protected] E-mail : [email protected]
Agent of TSR Darashaw Limited
Shah Consultancy Services Pvt. Limited
3, Sumatinath Complex,
Pritamnagar, Akhada Road
Ellisbridge
Ahmedabad 380 006
Telefax : 079 26576038
E-mail: [email protected]
Share Transfer System : Share Transfers in physical form can be lodged with TSR Darashaw Limited at the above mentioned addresses. The Transfers are normally processed within 10-12 days from the date of receipt if the documents are complete in all respects. Certain Directors and the Company Secretary are severally empowered to approve transfers.

211
Distribution of Shareholding – Ordinary Shares
Number of Ordinary shares held Number of Shareholders
31.03.2009 31.03.2008 % %
1 to 100 64.19 60.41
101 to 500 28.38 31.06
501 to 1000 4.03 4.53
1001 to 10000 3.20 3.76
10001 and above 0.20 0.24
Total 100.00 100.00
Categories of Shareholders – Ordinary Shares
Category Number of Voting Number of Shareholders strength % Ordinary Shares held
31-03-2009 31-03-2008 31-03-2009 31-03-2008 31-03-2009 31-03-2008
Individuals 848,619 679,760 23.99 21.49 175,312,080 156,958,458
Unit Trust of India 1 1 0.01 0.01 47,986 43,818
Life Insurance Corporation of India 1 1 11.68 10.15 85,334,595 74,166,549
Govt. & Other Public Financial Institutions 19 16 4.44 4.41 32,412,124 32,186,415
Tata Group Companies 16 16 * 33.95 * 33.94 248,065,857 247,993,096
Companies 7,500 6,969 6.90 4.56 50,417,848 33,348,515
Nationalised Banks, Mutual Funds and Trusts 509 376 5.83 5.96 42,588,762 43,539,500
Foreign Institutional Investors 376 425 13.20 19.48 96,413,219 142,347,969
Total 857,041 687,564 100.00 100.00 730,592,471 730,584,320
* This includes 6,71,455 (As on 31st March, 2008 : 6,71,455) shares allotted to Kalimati Investment Company
Limited pursuant to the Bombay High Court Order dated 3rd April, 2003, approving the Scheme of Amalgamation
of Tata SSL Limited with the Company. These shares do not carry any voting rights.

Hundred and second annual report 2008-09
212
Top Ten Equity Shareholders of the Company as on 31st March, 2009
Sr. No. Name of the Shareholder No. of shares held % of holding
1. Tata Sons Limited 213,822,295 29.27 2. Life Insurance Corporation of India 85,334,595 11.68 3. Tata Motors Limited 21,440,882 2.93 4. HSBC Global Investment Funds A/c. 13,600,190 1.86 HSBC Global Investments Funds Mauritius Limited 5. HDFC Standard Life Insurance Company Limited 9,806,254 1.34 6. The New India Assurance Company Limited 9,005,715 1.23 7. National Insurance Company Limited 8,600,000 1.18 8. The Oriental Insurance Company Limited 6,478,606 0.89 9. UCO Bank A/c. Birla Education Trust 5,108,208 0.70
10. Pilani Investment And Industries Corporation Limited 5,078,385 0.70
Distribution of Shareholding – CCPS
Number of CCPS held Number of Shareholders Number of Shareholders 31-03-2009 31-03-2008 % %
1 to 100 50.01 52.11
101 to 500 37.58 37.58
501 to 1000 6.11 5.41
1001 to 10000 5.75 4.56
Over 10000 0.55 0.34
100.00 100.00
Categories of Shareholders – CCPS
Category Number of Voting Number of Shareholders strength % CCPS held
31-03-2009 31-03-2008 31-03-2009 31-03-2008 31-03-2009 31-03-2008
Individuals 374,323 363,420 28.10 20.41 153,783,603 111,706,144
Unit Trust of India 1 1 0.00 0.00 19,868 63
Life Insurance Corporation of India 1 1 11.13 11.13 60,905,551 60,905,551
Govt. & Other Public Financial Institutions 8 8 4.68 4.68 25,604,112 25,604,112
Tata Group Companies 10 10 36.90 36.91 201,966,140 201,966,140
Companies 3,528 3,377 8.70 5.34 47,580,371 29,218,335
Nationalised Banks, Mutual Funds and Trusts 154 148 3.67 2.66 20,092,327 14,571,576
Foreign Institutional Investors 56 141 6.82 18.87 37,314,039 103,279,684
Total 378,081 367,106 100.00 100.00 547,266,011 547,251,605

213
Top Ten CCPS Holders of the Company as on 31st March, 2009
Sr. No. Name of the Shareholder No. of shares held % of holding
1. Tata Sons Limited 171,602,978 31.36
2. Life Insurance Corporation of India 60,905,551 11.13
3. Tata Motors Limited 23,949,693 4.38
4. HSBC Global Investment Funds A/c. HSBC Global Investments Funds Mauritius Limited 11,173,740 2.04
5. Bajaj Allianz Life Insurance Company Limited 9,298,539 1.70
6. The New India Assurance Company Limited 7,953,023 1.45
7. National Insurance Company Limited 6,370,605 1.16
8. The Oriental Insurance Company Limited 5,066,046 0.93
9. Morgan Stanley Mauritius Company Limited 4,741,820 0.87
10. Pilani Investment And Industries Corporation Limited 4,731,748 0.86
Dematerialisation of shares as on 31st March, 2009 and Liquidity
The Company’s shares are compulsorily traded in dematerialised form and are available for trading on both the Depositories in India – National Securities Depository Limited (NSDL) and Central Depository Services (India) Ltd. (CDSL).
689,341,051 Ordinary Shares of the Company representing 94.35% of the Company’s share capital is dematerialised as on 31st March, 2009.
536,807,674 Cumulative Convertible Preference Shares (CCPS) of the Company representing 98.09% of the Company’s share capital is dematerialised as on 31st March, 2009.
The Company’s shares are regularly traded on Bombay Stock Exchange Limited and National Stock Exchange of India Limited, as is seen from the volume of shares indicated in the Table containing Market Information.

Hundred and second annual report 2008-09
214
Under the Depository System, the International Securities Identifi cation Number (ISIN) allotted to the Company’s shares is INE 081A01012 and CCPS is INE 081A03018.
As per Clause 5A of the Listing Agreements with the Stock Exchanges, the details of shares in the suspense account of Link Intime India Pvt. Ltd., (formerly Intime Spectrum Registry Ltd.) the Registrars to the Rights Issue - 2007 are given below:
Securities As on 1-04-2008 Shareholders who Balance approached the Registrars as on 31-03-2009 and Shares transferred in their favour during the year
No. of No. of No. of No. of No. of No. of records shares records shares records shares
Ordinary Shares 2,866 118,260 2,683 109,207 183 9,053
CCPS 2,925 585,618 2,642 543,285 283 42,333
The voting rights in respect of the balance shares in the suspense account will be freezed, in the event of a poll at the general meetings of the Company.
Outstanding GDRs/ADRs/ : 3,867 GDRs (each GDR representing 1 Ordinary share of the Company) Warrants or any Convertible The Company had issued detachable warrants (along with Secured instruments, conversion date Premium Notes) for subscribing to 1 Ordinary Share of Rs. 10 each at a and likely impact on equity premium of Rs. 70 per share. In respect of approximately 12,446 detachable warrants applicable to matters which are in dispute, the option to get the shares is kept alive for the time being.
In September 2007, the Company issued US$ 0.875 billion of 1% Foreign Currency Convertible Alternative Reference Securities (CARS). Between 4th September, 2011 and 8th August, 2012 each security is convertible at the option of holder of the security, at a conversion price of Rs. 876.6 per share (subsequently adjusted to Rs. 757.9721 on account of Rights Issue) into a Qualifying Security issued by the Company. The Company must redeem all outstanding CARS at 123.349% of their principal amount together with accrued and unpaid interest no later than 5th September, 2012.
As on 31st March 2009, the Company has allotted 547,266,011 – 2% CCPS of Rs. 100/- each on a rights basis to the shareholders of the Company in the ratio of 9:10. As per the terms of the issue, six CCPS of Rs. 100 each are compulsorily and automatically convertible on 1st September, 2009, into one Ordinary Share of Rs. 10 each, at a premium of Rs. 590 per share.
Address for Correspondence : Tata Steel Limited Bombay House, 24, Homi Mody Street, Fort, Mumbai 400 001. Phone : (022) 6665 8282 Fax : (022) 6665 7724 / 6665 7725 E-mail : [email protected] Website : www.tatasteel.com

215
Major Plant Locations Tata Steel : Company’s Steel Works and Tubes Division .. Jamshedpur (Jharkhand) Bearings Division .. Kharagpur (West Bengal) Ferro Manganese Plant .. Joda (Orissa) Charge Chrome Plant .. Bamnipal (Orissa) Cold Rolling Complex .. Tarapur (Maharashtra) Mines, Collieries & Quarries .. States of Jharkhand, Orissa and Karnataka Wire Division .. Borivli (Mumbai) Tarapur (Maharashtra) Bangalore (Karnataka) Indore (Madhya Pradesh)
Corus : Steel .. Port Talbot, UK Scunthorpe, UK Teesside, UK Rotherham, UK Ijmuiden, Netherlands
10. Other information to the shareholders
Dividend History for the Last 10 years
Financial Year Dividend Date Rate
2007-08 29.08.08 160% 2006-07 30.08.07 155% 2005-06 06.07.06 130% 2004-05 28.07.05 130% 2003-04 23.07.04 100% 2002-03 24.07.03 80% 2001-02 12.06.02 40% 2000-01 20.07.01 50% 1999-00 23.05.00 40% 1998-99 30.07.99 40%
Bank Details
Shareholders holding in the physical form are requested to notify/send the following to TSR Darashaw Limited to facilitate better servicing :-
i) any change in their address/mandate/bank details, and
ii) particulars of the bank account in which they wish their dividend to be credited, in case have not been furnished earlier.
Shareholders are advised that respective bank details and address as furnished by them or by NSDL/CDSL to the Company, for shares held in the physical form and in the dematerialised form respectively, will be printed on their dividend warrants as a measure of protection against fraudulent encashment.
Nomination Facility
Shareholders who hold shares in the physical form and wish to make/change a nomination in respect of their shares in the Company, as permitted under Section 109A of the Companies Act, 1956, may submit to TSR Darashaw Limited the prescribed Form 2B. The Form can be downloaded from the Company’s website www.tatasteel.com under the section ‘Investor Relations’.

Hundred and second annual report 2008-09
216
Shares held in Electronic Form
Shareholders holding shares in electronic form may please note that :
l Instructions regarding bank details which they wish to have incorporated in future dividend warrants must be submitted to their Depository Participants (DP). As per the regulations of NSDL and CDSL, the Company is obliged to print bank details on the dividend warrants, as furnished by these depositories to the Company.
l Instructions already given by them for shares held in physical form will not be automatically applicable to the dividend paid on shares held in electronic form.
l Instructions regarding change of address, nomination and power of attorney should be given directly to the DP.
Electronic Clearing Service (ECS) Facility
The Company, with respect to payment of dividend to shareholders, provides the facility of ECS at the following cities :
Agra, Ahmedabad, Allahabad, Amritsar, Aurangabad, Bangalore, Baroda, Bhopal, Bhubaneshwar, Chandigarh, Chennai, Coimbatore, Cochin, Delhi, Guwahati, Gwalior, Hyderabad, Indore, Jabalpur, Jaipur, Jalandhar, Jamshedpur, Jodhpur, Kanpur, Kolhapur, Kolkata, Lucknow, Ludhiana, Madurai, Mangalore, Mumbai, Mysore, Nagpur, Nasik, Patna, Pune, Panjim, Rajkot, Surat, Trichur, Trichy, Trivandrum, Udaipur, Varanasi, Vijayawada and Vishakapatnam.
Shareholders holding shares in the physical form, who wish to avail the ECS facility, may send their ECS mandate in the prescribed form to the Company, in the event they have not done so earlier. The ECS mandate form can be downloaded from the Company’s website www.tatasteel.com under the section ‘Investor Relations’.
Depository Services
Shareholders may write to the respective Depository or to TSR Darashaw Limited for guidance on depository services. Address for correspondence with Depository are as follows:-
National Securities Depository Limited Central Depository Services (India) Limited
Trade World, 4th Floor, Phiroze Jeejeebhoy Towers,
Kamala Mills Compound, 16th Floor,
Senapati Bapat Marg, Lower Parel, Dalal Street,
Mumbai 400 013. Mumbai 400 023.
Telephone : (022) 2499 4200 Telephone : (022) 2272 3333
Facsimile : (022) 2497 2993/2497 6351 Facsimile : (022) 2272 3199/2272 2072
E-mail : [email protected] E-mail : [email protected]
Website : www.nsdl.co.in Website : www.cdslindia.com
Odd Lot Facility
Having regard to the diffi culties experienced by shareholders in disposing of the shares held by them in physical form, TSR Darashaw Limited, Registrars of the Company has framed a Scheme for the purchase of such shares. Interested shareholders may contact TSR Darashaw Limited for further details.
l Shareholders holding shares in the dematerialised form should address their correspondence to their respective DPs, other than for dividend, which should be addressed to TSR Darashaw Limited.
l Shareholders are requested to provide their e-mail address, telephone/fax numbers and quote their account numbers/DP ID & Client ID numbers in all correspondence with TSR Darashaw Limited to facilitate prompt response.

217
Certifi cate
To the Members of
TATA STEEL LIMITED
We have examined the compliance of conditions of Corporate Governance by Tata Steel Limited, for the year ended on
31st March, 2009, as stipulated in Clause 49 of the Listing Agreement of the said Company with stock exchanges.
The compliance of conditions of Corporate Governance is the responsibility of the management. Our examination
has been limited to a review of the procedures and implementations thereof adopted by the Company for ensuring
compliance with the conditions of Corporate Governance as stipulated in the said Clause. It is neither an audit nor an
expression of opinion on the fi nancial statements of the Company.
In our opinion and to the best of our information and according to the explanations given to us and the representations
made by the Directors and the management, we certify that the Company has complied with the conditions of Corporate
Governance as stipulated in Clause 49 of the above mentioned Listing Agreement.
We further state that such compliance is neither an assurance as to the future viability of the Company nor of the
effi ciency or effectiveness with which the management has conducted the affairs of the Company.
For DELOITTE HASKINS & SELLS
Chartered Accountants
P. R. RAMESHPartnerMembership No. : 70928
Mumbai, 25th June, 2009

Hundred and second annual report 2008-09
218
Sum
mar
y o
f Fin
anci
al In
form
atio
n o
f Su
bsi
dia
ry C
om
pan
ies
Rs.
cro
res
Sl.
No
.N
ame
of
Su
bsi
dia
ry C
om
pan
yR
epo
rtin
g
Cu
rren
cyE
xch
ang
e R
ate
Cap
ital
Res
erve
sTo
tal
Ass
ets
Tota
l L
iab
iliti
es
Inve
stm
ent
incl
ud
ed in
To
tal A
sset
sTu
rno
ver
Profi
t b
efo
re
Taxa
tio
n
Pro
visi
on
fo
r Ta
xati
on
Profi
t af
ter
Taxa
tio
n
Pro
po
sed
D
ivid
end
Co
un
try
1A
dity
apur
Tol
l Brid
ge C
ompa
ny L
td.
INR
1.00
0.94
3.50
14.4
410
.00
––
––
––
Indi
a
2G
opal
pur
Spe
cial
Eco
nom
ic Z
one
Ltd.
INR
1.00
1.00
0.05
1.05
––
–0.
050.
020.
03–
Indi
a
3H
oogh
ly M
etco
ke A
nd P
ower
C
ompa
ny L
td.
INR
1.00
547.
6612
.28
1,09
8.50
538.
55–
145.
8728
.73
12.5
816
.15
–In
dia
4Ja
msh
edpu
r U
tiliti
es &
Ser
vice
s C
ompa
ny
Ltd.
INR
1.00
20.3
575
.84
101.
094.
903.
3034
8.15
27.9
28.
0019
.93
–In
dia
5H
aldi
a W
ater
Man
agem
ent L
td.
INR
1.00
2.54
–2.
54–
–13
.14
(2.1
3)(0
.69)
(1.4
4)–
Indi
a
6N
aba
Dig
anta
Wat
er M
anag
emen
t Ltd
.IN
R1.
004.
35–
9.93
5.58
––
(0.1
4)–
(0.1
4)–
Indi
a
7S
EZ
Adi
tyap
ur L
td.
INR
1.00
0.05
–0.
05–
––
––
––
Indi
a
8K
alim
ati I
nves
tmen
t Com
pany
Ltd
.IN
R1.
0016
.39
250.
8526
7.24
–26
0.18
21.5
221
.48
0.29
21.1
8–
Indi
a
9B
angl
a S
teel
& M
inin
g C
o. L
td.
BD
T0.
730.
07(0
.05)
0.03
––
––
––
–B
angl
ades
h
10La
nka
Spe
cial
Ste
els
Ltd.
LKR
0.44
1.09
2.29
5.76
2.37
–43
.49
1.48
1.23
0.25
–S
ri La
nka
11N
atS
teel
Asi
a P
te. L
td.
SG
D33
.34
933.
5229
0.71
1,22
4.23
––
1,56
1.31
141.
627.
6313
3.99
–S
inga
pore
12N
atS
teel
Iran
ian
Priv
ate
Join
t Sto
ck
Com
pany
SG
D33
.34
0.49
(1.3
9)(0
.89)
––
–(0
.80)
–(0
.80)
–Ir
an
13N
atS
teel
Mid
dle
Eas
t FZ
ES
GD
33.3
44.
08(2
.03)
2.05
––
1.29
(0.8
7)–
(0.8
7)–
UA
E
14Ta
ta S
teel
Asi
a (H
ongk
ong)
Ltd
.S
GD
33.3
4–
31.8
370
.08
38.2
5–
1,90
1.40
17.2
92.
7914
.50
–H
ong
Kon
g
15Ta
ta S
teel
Res
ourc
es A
ustr
alia
Pty
. Ltd
.S
GD
33.3
4–
6.40
6.40
––
3,21
5.07
6.89
0.18
6.71
–A
ustr
alia
16R
awm
et F
erro
us In
dust
ries
Ltd.
INR
1.00
38.6
05.
7780
.90
36.5
30.
1299
.15
6.78
2.21
4.57
–In
dia
17S
ila E
aste
rn L
td.
TH
B1.
430.
294.
956.
150.
91–
55.9
31.
460.
421.
04–
Tha
iland
18Ta
ta In
corp
orat
edU
SD
50.7
17.
6147
.94
55.5
5–
0.38
12.9
50.
540.
190.
34–
US
A
19Ta
ta K
orf E
ngin
eerin
g S
ervi
ces
Ltd.
INR
1.00
0.40
(9.0
0)(5
.37)
3.23
––
(0.3
9)–
(0.3
9)–
Indi
a
20Ta
ta M
etal
iks
Ltd.
INR
1.00
25.2
918
.40
518.
7947
5.10
38.2
51,
122.
98(1
65.4
6)(1
6.72
)(1
48.7
4)–
Indi
a
21Ta
ta M
etal
iks
Kub
ota
Pip
es L
td.
INR
1.00
75.0
0(2
.91)
268.
6619
6.57
––
(1.5
8)0.
30(1
.88)
–In
dia
22Ta
ta R
efra
ctor
ies
Ltd.
INR
1.00
20.9
020
2.18
358.
5013
5.42
3.89
735.
8253
.90
19.4
634
.44
12.2
3In
dia
23T
RL
Asi
a P
vt. L
imite
dS
GD
33.3
443
.40
(0.1
1)43
.31
0.01
–0.
030.
01–
0.01
–S
inga
pore
24T
RL
Chi
na L
imite
dC
NY
7.41
48.2
8–
71.3
223
.04
–90
.08
(1.3
1)–
(1.3
1)–
Chi
na
25Ta
yo R
olls
Ltd
.IN
R1.
0010
.26
79.6
017
9.07
89.2
10.
3241
.93
(8.2
6)0.
10(8
.36)
–In
dia
26Ta
ta S
teel
(K
ZN
) (P
ty)
Ltd.
ZA
R5.
3577
.00
(226
.62)
473.
5462
3.16
–23
2.95
(181
.37)
–(1
81.3
7)–
Sou
th A
fric
a
27Ta
ta S
teel
Hol
ding
s P
te. L
td.
GB
P72
.50
31,3
41.7
2(4
50.3
9)31
,129
.48
238.
16–
–24
.39
–24
.39
–S
inga
pore
28Ta
ta S
teel
Glo
bal H
oldi
ngs
Pte
Ltd
.G
BP
72.5
0–
(173
.35)
30,9
72.3
231
,145
.67
28,3
56.9
1–
(153
.99)
19.3
6(1
73.3
5)–
Sin
gapo
re
29C
orus
Inte
rnat
iona
l (S
inga
pore
) H
oldi
ng
Pte
. Ltd
.S
GD
33.3
432
0.06
(0.0
2)32
0.24
0.19
314.
06–
(0.0
2)–
(0.0
2)–
Sin
gapo
re
30C
orus
Asi
a Li
mite
dH
KD
6.53
–29
.60
89.6
260
.02
1.09
304.
677.
251.
335.
92–
Hon
g K
ong
31C
orus
Hol
ding
s (T
haila
nd)
Lim
ited
TH
B1.
430.
02(0
.10)
0.01
0.09
––
(0.0
4)–
(0.0
4)–
Tha
iland
32C
orus
Inte
rnat
iona
l (G
uang
zhou
) Lt
d.C
NY
7.41
0.49
0.12
0.80
0.19
0.02
2.61
0.16
0.04
0.12
–C
hina
33C
orus
Inte
rnat
iona
l (S
hang
hai)
Ltd.
CN
Y7.
410.
49(0
.08)
0.55
0.14
0.07
4.07
0.03
0.11
(0.0
8)–
Chi
na
34C
orus
Inte
rnat
iona
l Tra
ding
Lim
ited
HK
D6.
53–
26.6
934
.55
7.87
0.78
411.
688.
691.
447.
25–
Hon
g K
ong
35C
orus
Met
als
(Mal
aysi
a) S
dn B
hdM
YR
14.0
0–
0.10
0.41
0.32
–3.
800.
160.
060.
10–
Mal
aysi
a
36C
orus
Met
als
(Tha
iland
) Li
mite
dT
HB
1.43
0.29
9.00
13.0
03.
710.
0815
.05
4.32
1.15
3.17
–T
haila
nd
37C
orus
Sou
th E
ast A
sia
Pte
Lim
ited
SG
D33
.34
5.67
(17.
21)
219.
7923
1.34
6.23
486.
01(8
0.53
)(0
.74)
(79.
79)
–S
inga
pore
38N
atS
teel
Hol
ding
s P
te. L
td.
SG
D33
.34
666.
8823
.16
2,08
0.18
1,39
0.14
5.61
2,40
4.75
26.2
22.
2623
.96
–S
inga
pore
39B
est B
ar (
Vic
) P
te. L
td.
SG
D33
.34
–43
.95
43.9
5–
–21
2.63
32.2
2(0
.01)
32.2
3–
Aus
tral
ia

219
Sum
mar
y o
f Fin
anci
al In
form
atio
n o
f Su
bsi
dia
ry C
om
pan
ies
Rs.
cro
res
Sl.
No
.N
ame
of
Su
bsi
dia
ry C
om
pan
yR
epo
rtin
g
Cu
rren
cyE
xch
ang
e R
ate
Cap
ital
Res
erve
sTo
tal
Ass
ets
Tota
l L
iab
iliti
es
Inve
stm
ent
incl
ud
ed in
To
tal A
sset
sTu
rno
ver
Profi
t b
efo
re
Taxa
tio
n
Pro
visi
on
fo
r Ta
xati
on
Profi
t af
ter
Taxa
tio
n
Pro
po
sed
D
ivid
end
Co
un
try
40B
est B
ar P
ty. L
td.
SG
D33
.34
11.1
016
.78
27.8
8–
–24
7.10
16.4
114
.59
1.82
–A
ustr
alia
41B
urw
ill T
radi
ng P
te. L
td.
SG
D33
.34
36.3
4(7
.58)
28.7
6–
–0.
03(0
.01)
–(0
.01)
–S
inga
pore
42E
aste
el C
onst
ruct
ion
Ser
vice
s P
te. L
td.
SG
D33
.34
3.33
7.64
10.9
7–
–0.
170.
150.
010.
14–
Sin
gapo
re
43E
aste
el S
ervi
ces
(M)
Sdn
. Bhd
.S
GD
33.3
4–
1.01
1.02
0.01
–1.
960.
380.
090.
30–
Mal
aysi
a
44E
aste
rn S
teel
Fab
ricat
ors
Phi
llipi
nes,
Inc.
SG
D33
.34
14.4
8(4
3.16
)(2
8.68
)–
––
––
––
Phi
lippi
nes
45E
aste
rn S
teel
Ser
vice
s P
te. L
td.
SG
D33
.34
33.3
45.
9639
.30
––
0.06
0.05
–0.
05–
Sin
gapo
re
46E
aste
rn W
ire P
te. L
td.
SG
D33
.34
27.8
424
.83
55.4
82.
81–
3.49
1.94
0.11
1.83
–S
inga
pore
47M
ater
ials
Rec
yclin
g P
te. L
td.
SG
D33
.34
0.83
(0.8
3)–
––
––
––
–S
inga
pore
48N
atfe
rrou
s P
te. L
td.
SG
D33
.34
33.3
475
.43
113.
965.
19–
1,01
9.39
6.38
0.96
5.41
–S
inga
pore
49N
atS
teel
(X
iam
en)
Ltd.
SG
D33
.34
123.
0630
.99
329.
3517
5.31
–66
9.20
(63.
73)
(12.
28)
(51.
45)
–C
hina
50N
atS
teel
Asi
a (S
) P
te. L
td.
SG
D33
.34
6.67
1.34
8.00
––
0.20
(0.0
7)–
(0.0
7)–
Sin
gapo
re
51N
atS
teel
Aus
tral
ia P
ty. L
td.
SG
D33
.34
32.9
8(5
6.68
)39
.30
63.0
0–
283.
1914
.99
–14
.99
–A
ustr
alia
52N
atS
teel
Equ
ity IV
Pte
. Ltd
.S
GD
33.3
4–
100.
0010
0.00
––
––
––
–S
inga
pore
53N
atS
teel
Tra
de In
tern
atio
nal (
Sha
ngha
i) C
ompa
ny L
td.
SG
D33
.34
1.13
(0.6
5)0.
48–
––
(0.1
2)–
(0.1
2)–
Chi
na
54N
atS
teel
Tra
de In
tern
atio
nal P
te. L
td.
SG
D33
.34
9.81
30.5
440
.35
–0.
051,
903.
96(2
.44)
2.04
(4.4
8)–
Sin
gapo
re
55N
atS
teel
Vin
a C
o. L
td.
SG
D33
.34
44.6
514
.31
58.9
6–
–15
8.11
(11.
49)
(0.8
7)(1
0.62
)–
Vie
tnam
56P
T M
ater
ials
Rec
yclin
g In
done
sia
SG
D33
.34
0.89
(0.9
5)(0
.06)
––
(0.8
0)(0
.41)
–(0
.41)
–In
done
sia
57S
iam
Indu
stria
l Wire
Com
pany
Ltd
.S
GD
33.3
436
.41
262.
3830
0.02
1.23
–38
6.88
(13.
36)
(1.5
9)(1
1.77
)–
Tha
iland
58W
uxi J
inya
ng M
etal
Pro
duct
s C
o. L
td.
SG
D33
.34
74.8
072
.59
188.
7441
.35
–24
6.30
5.74
1.26
4.48
–C
hina
59O
rchi
d N
ethe
rland
s (N
o.1)
B.V
. I.O
. *E
UR
67.
47
0.1
2 –
0
.12
–
–
–
–
–
–
–
Net
herla
nds
60Ta
ta S
teel
Eur
ope
Ltd
GB
P72
.50
25,4
80.9
9(1
82.6
3)25
,403
.28
104.
9225
,397
.44
–(1
07.1
5)(4
.96)
(102
.20)
–U
K
61A
lman
a S
teel
Dub
ai (
Jers
ey)
Lim
ited
UA
E13
.78
0.08
45.1
695
.76
50.5
2–
106.
35(1
7.43
)–
(17.
43)
–Je
rsey
62A
pollo
Met
als
Ltd.
US
D50
.71
28.3
2(7
8.85
)95
.90
146.
43–
158.
52(3
.35)
1.07
(4.4
3)–
US
A
63A
shor
ne H
ill M
anag
emen
t Col
lege
GB
P72
.50
–56
.18
63.4
77.
29–
36.6
45.
40–
5.40
–U
K
64A
ugus
ta G
rund
stuc
ks G
mbH
EU
R67
.47
–0.
7616
.28
15.5
2–
–(1
.39)
–(1
.39)
–G
erm
any
65A
utom
otiv
e La
ser
Tech
nolo
gies
Lim
ited
GB
P72
.50
––
––
––
––
––
UK
66B
S P
ensi
on F
und
Trus
tee
Ltd.
GB
P72
.50
15.5
60.
4916
.05
––
––
––
–U
K
67B
aile
y S
teel
s Li
mite
dG
BP
72.5
00.
143.
218.
775.
41–
25.7
10.
900.
090.
80–
UK
68B
ehee
rmaa
tsch
appi
j Ind
ustr
iele
Pro
dukt
en
B.V
.E
UR
67.4
70.
12(4
1.48
)49
.15
90.5
146
.86
–(3
.78)
(0.9
8)(2
.80)
–N
ethe
rland
s
69B
elfi n
Beh
eerm
aats
chap
pij B
.V.
EU
R67
.47
90.3
3(8
9.87
)0.
45–
0.45
––
––
–N
ethe
rland
s
70B
ell &
Har
woo
d Li
mite
dG
BP
72.5
0–
(9.1
6)–
9.16
––
––
––
UK
71B
last
meg
a Li
mite
d (U
nite
d S
teel
For
ging
s Lt
d.)
GB
P72
.50
–67
4.28
674.
290.
0267
4.29
––
––
–U
K
72B
lum
e S
tahl
serv
ice
Gm
bHE
UR
67.4
734
.48
30.0
048
8.84
424.
360.
081,
736.
92(2
.33)
0.45
(2.7
8)–
Ger
man
y
73B
lum
e S
tahl
serv
ice
Pol
ska
Sp.
Z.O
.OP
LZ14
.50
0.08
(6.4
7)10
.70
17.0
8–
12.1
7(2
.87)
–(2
.87)
–P
olan
d
74B
ore
Sam
son
Gro
up L
tdG
BP
72.5
015
2.24
(43.
44)
163.
2754
.47
163.
27–
––
––
UK
75B
ore
Ste
el L
td.
GB
P72
.50
115.
997.
6012
3.60
––
––
––
–U
K
76B
ritis
h G
uide
Rai
ls L
td.
GB
P72
.50
2.17
33.0
535
.22
––
––
––
–U
K
77B
ritis
h S
teel
Hol
ding
s B
.V.
EU
R67
.47
0.13
1,70
9.69
1,85
7.64
147.
821,
850.
35–
112.
23(2
.32)
114.
5521
.00
Net
herla
nds

Hundred and second annual report 2008-09
220
Sum
mar
y o
f Fin
anci
al In
form
atio
n o
f Su
bsi
dia
ry C
om
pan
ies
Rs.
cro
res
Sl.
No
.N
ame
of
Su
bsi
dia
ry C
om
pan
yR
epo
rtin
g
Cu
rren
cyE
xch
ang
e R
ate
Cap
ital
Res
erve
sTo
tal
Ass
ets
Tota
l L
iab
iliti
es
Inve
stm
ent
incl
ud
ed in
To
tal A
sset
sTu
rno
ver
Profi
t b
efo
re
Taxa
tio
n
Pro
visi
on
fo
r Ta
xati
on
Profi
t af
ter
Taxa
tio
n
Pro
po
sed
D
ivid
end
Co
un
try
78B
ritis
h S
teel
Ned
erla
nd In
tern
atio
nal B
.V.
EU
R67
.47
0.12
1,83
7.47
1,84
0.98
3.39
1,83
7.13
–26
3.47
1.41
262.
0612
1.35
Net
herla
nds
79B
ritis
h S
teel
Ben
elux
B.V
.E
UR
67.4
724
5.47
3.51
249.
760.
7917
4.18
–55
.63
2.06
53.5
7–
Net
herla
nds
80B
ritis
h S
teel
Cor
pora
tion
Ltd
GB
P72
.50
131.
0490
.09
221.
14–
––
––
––
UK
81B
ritis
h S
teel
De
Mex
ico
S.A
. de
C.V
.U
SD
50.7
1–
––
––
––
––
–M
exic
o
82B
ritis
h S
teel
Dire
ctor
s (N
omin
ees)
Lim
ited
GB
P72
.50
––
––
––
––
––
UK
83B
ritis
h S
teel
Em
ploy
ee S
hare
Ow
ners
hip
Trus
tees
Ltd
.G
BP
72.5
0–
––
––
––
––
–U
K
84B
ritis
h S
teel
Eng
inee
ring
Ste
els
(Exp
orts
) Li
mite
dG
BP
72.5
0–
–0.
090.
09–
––
––
–U
K
85B
ritis
h S
teel
Inte
rnat
iona
l B.V
.E
UR
67.4
70.
1535
2.79
1,49
5.18
1,14
2.24
1,45
4.65
–29
9.43
(0.0
8)29
9.50
–N
ethe
rland
s
86B
ritis
h S
teel
Sam
son
Lim
ited
GB
P72
.50
–7.
257.
25–
––
––
––
UK
87B
ritis
h S
teel
Ser
vice
Cen
tres
Ltd
.G
BP
72.5
00.
140.
240.
570.
180.
17–
––
––
UK
88B
ritis
h S
teel
Tub
es E
xpor
ts L
td.
GB
P72
.50
0.18
–0.
18–
––
––
––
UK
89B
ritis
h Tr
ansf
orm
er C
ores
Ltd
.G
BP
72.5
07.
25(3
.75)
3.50
––
––
––
–U
K
90B
ritis
h Tu
bes
Sto
ckho
ldin
g Lt
d.G
BP
72.5
072
.50
3.85
76.3
4–
––
––
––
UK
91B
s Q
uest
Tru
stee
Lim
ited
GB
P72
.50
––
––
––
––
––
UK
92B
skh
Cor
pora
te S
ervi
ces
(UK
) Li
mite
dG
BP
72.5
0–
––
––
––
––
–U
K
93B
urgd
orfe
r G
rund
stue
cks
Gm
bHE
UR
67.4
715
.55
1.48
18.7
31.
71–
–0.
060.
020.
03–
Ger
man
y
94C
V B
enin
eE
UR
67.4
7–
30.5
916
0.01
129.
42–
––
––
–N
ethe
rland
s
95C
Wal
ker
& S
ons
(Ste
el)
Ltd.
GB
P72
.50
25.2
390
.48
115.
71–
––
34.4
8–
34.4
8–
UK
96C
Wal
ker
& S
ons
Ltd.
GB
P72
.50
25.3
792
.42
504.
9138
7.12
16.9
5–
––
––
UK
97C
atni
c G
mbH
EU
R67
.47
0.17
9.14
17.8
18.
50–
55.9
84.
220.
443.
78–
Ger
man
y
98C
atni
c Li
mite
dG
BP
72.5
01.
6310
3.74
105.
37–
105.
37–
––
––
UK
99C
bs In
vest
isse
men
ts S
AS
EU
R67
.47
0.54
(0.1
0)6.
375.
93–
6.78
(0.0
3)–
(0.0
3)–
Fra
nce
100
Cla
ddin
g &
Dec
king
(U
K)
Lim
ited
GB
P72
.50
32.6
2(2
8.24
)13
.12
8.74
13.1
2–
––
––
UK
101
Cog
ent P
ower
Inc.
CA
D40
.84
1.23
83.9
721
4.35
129.
160.
0247
3.75
27.7
69.
9517
.81
–C
anad
a
102
Cog
ent P
ower
Inc.
CA
D40
.84
1.23
83.9
721
4.35
129.
160.
0247
3.75
27.7
69.
9517
.81
–M
exic
o
103
Cog
ent P
ower
Inc.
CA
D40
.84
1.23
83.9
721
4.35
129.
160.
0247
3.75
27.7
69.
9517
.81
–U
SA
104
Cog
ent P
ower
Lim
ited
GB
P72
.50
309.
31(2
01.7
6)32
6.86
219.
3030
9.31
–8.
540.
178.
37–
UK
105
Col
d D
raw
n Tu
bes
Ltd.
GB
P72
.50
166.
74(1
27.9
0)38
.84
–38
.84
––
––
–U
K
106
Col
or S
teel
s Li
mite
dG
BP
72.5
00.
3332
.54
108.
1475
.27
108.
14–
––
––
UK
107
Cor
beil
Les
Riv
es S
CI
EU
R67
.47
4.32
3.95
8.30
0.03
1.33
––
––
–F
ranc
e
108
Cor
by (
Nor
than
ts)
& D
istr
ict W
ater
Co.
GB
P72
.50
1.88
2.07
5.16
1.20
–3.
75–
(0.0
3)0.
03–
UK
109
Cor
dor
(C&
B)
Lim
ited
GB
P72
.50
2.36
–2.
36–
––
––
––
UK
110
Cor
us –
Sis
tem
as C
onst
ruct
ivos
E
Rev
estim
ento
s M
etal
icos
,Lda
EU
R67
.47
3.03
(2.3
5)1.
550.
87–
–10
.07
–10
.07
–P
ortu
gal
111
Cor
us A
eros
pace
Ser
vice
Cen
tre
Suz
hou
Co
Lim
ited
US
D50
.71
1.27
–1.
27–
––
––
––
Chi
na
112
Cor
us A
lum
iniu
m B
ehee
r B
.V.
EU
R67
.47
4.92
(4.1
4)0.
78–
––
(51.
59)
0.11
(51.
70)
–N
ethe
rland
s
113
Cor
us A
lum
iniu
m L
imite
dG
BP
72.5
0–
––
––
––
––
–U
K
114
Cor
us A
lum
iniu
m V
erw
altu
ngsg
esel
lsch
aft
Mbh
EU
R67
.47
0.06
(15.
47)
30.2
345
.65
28.3
6–
––
––
Ger
man
y

221
Sum
mar
y o
f Fin
anci
al In
form
atio
n o
f Su
bsi
dia
ry C
om
pan
ies
Rs.
cro
res
Sl.
No
.N
ame
of
Su
bsi
dia
ry C
om
pan
yR
epo
rtin
g
Cu
rren
cyE
xch
ang
e R
ate
Cap
ital
Res
erve
sTo
tal
Ass
ets
Tota
l L
iab
iliti
es
Inve
stm
ent
incl
ud
ed in
To
tal A
sset
sTu
rno
ver
Profi
t b
efo
re
Taxa
tio
n
Pro
visi
on
fo
r Ta
xati
on
Profi
t af
ter
Taxa
tio
n
Pro
po
sed
D
ivid
end
Co
un
try
115
Cor
us A
mer
ica
Hol
ding
s In
c.U
SD
50.7
13,
301.
74(2
,961
.63)
597.
5125
7.40
792.
13–
49.4
526
.23
23.2
2–
US
A
116
Cor
us A
mer
ica
Inc.
US
D50
.71
45.0
569
7.00
1,05
7.48
315.
4227
2.88
1,06
0.43
36.7
30.
5136
.21
–U
SA
117
Cor
us B
atim
ent E
t Sys
tem
es S
AS
EU
R67
.47
50.5
1(1
0.67
)27
5.21
235.
3873
.12
––
––
–F
ranc
e
118
Cor
us B
elgi
um B
vba
EU
R67
.47
0.10
7.28
7.41
0.03
––
0.16
–0.
16–
Bel
gium
119
Cor
us B
enel
ux B
.V.
EU
R67
.47
0.12
6.56
8.68
2.00
–5.
500.
760.
340.
42–
Net
herla
nds
120
Cor
us B
etei
ligun
gs G
mbH
EU
R67
.47
0.01
20.0
920
.10
–17
.66
–0.
07–
0.07
–G
erm
any
121
Cor
us B
roke
rs L
imite
dG
BP
72.5
00.
010.
240.
260.
02–
–0.
01–
0.01
–U
K
122
Cor
us B
uild
ing
Sys
tem
s B
ulga
ria A
DLE
V34
.43
0.17
(3.2
0)23
.92
26.9
5–
0.16
(2.8
5)–
(2.8
5)–
Bul
garia
123
Cor
us B
uild
ing
Sys
tem
s N
.V.
EU
R67
.47
0.91
6.03
8.76
1.81
––
0.22
–0.
22–
Bel
gium
124
Cor
us B
uild
ing
Sys
tem
s S
AS
E
UR
67.4
720
.20
(15.
56)
9.44
4.80
4.23
4.92
0.11
–0.
11–
Fra
nce
125
Cor
us B
ygge
syst
emer
A/S
DK
K9.
040.
4542
.00
76.4
333
.98
–12
9.47
0.07
–0.
07–
Den
mar
k
126
Cor
us B
yggs
yste
m A
BS
EK
6.20
0.62
29.5
039
.88
9.76
0.51
93.3
14.
911.
413.
49–
Sw
eden
127
Cor
us B
yggs
yste
mer
A/S
NO
K7.
620.
936.
1936
.21
29.1
0–
130.
461.
450.
341.
11–
Nor
way
128
Cor
us C
entr
al E
urop
e S
.R.O
.C
ZK
2.47
0.30
0.29
1.29
0.70
–4.
190.
250.
140.
11–
Cze
ch R
epub
lic
129
Cor
us C
ic H
oldi
ngs
Inc.
CA
D40
.84
0.04
144.
0914
4.53
0.39
141.
62–
2.12
1.19
0.93
–C
anad
a
130
Cor
us C
ic In
c.C
AD
40.8
493
.98
(83.
62)
13.4
83.
1212
.40
–2.
450.
082.
37–
Can
ada
131
Cor
us C
NB
V In
vest
men
tsG
BP
72.5
0–
5.78
5.78
–5.
78–
––
––
UK
132
Cor
us C
oatin
gs U
sa In
c.U
SD
50.7
1–
3.87
4.35
0.48
––
(0.1
0)–
(0.1
0)–
US
A
133
Cor
us C
old
Dra
wn
Tube
s Li
mite
dG
BP
72.5
036
.25
(48.
74)
–12
.49
––
––
––
UK
134
Cor
us C
onst
ruct
ion
Pro
duct
s (T
haila
nd)
Lim
ited
TH
B1.
43–
––
––
–(5
.14)
–(5
.14)
–T
haila
nd
135
Cor
us C
onsu
lting
And
Tec
hnic
al S
ervi
ces
B.V
.E
UR
67.4
760
.61
14.0
616
6.91
92.2
513
7.52
–38
.86
(1.7
3)40
.59
–N
ethe
rland
s
136
Cor
us C
onsu
lting
B.V
.E
UR
67.4
70.
3015
.14
21.4
86.
04–
–0.
310.
140.
17–
Net
herla
nds
137
Cor
us C
onsu
lting
Lim
ited
GB
P72
.50
7.14
(11.
37)
8.13
12.3
6–
12.6
4(1
.53)
(0.3
5)(1
.17)
–U
K
138
Cor
us C
onsu
lting
Rom
ania
SR
L.R
ON
15.8
6–
0.11
0.11
––
0.01
––
––
Rom
ania
139
Cor
us D
egel
s G
mbH
EU
R67
.47
0.20
9.51
254.
5124
4.80
–98
1.35
24.9
93.
9521
.04
13.2
1G
erm
any
140
Cor
us D
enm
ark
A/S
DK
K9.
040.
820.
572.
981.
59–
5.56
0.69
0.19
0.51
0.88
Den
mar
k
141
Cor
us D
euts
chla
nd G
mbH
GB
P72
.50
––
––
––
––
––
Ger
man
y
142
Cor
us D
istr
ibut
ion
Eur
ope
BV
EU
R67
.47
4.92
(13.
00)
(1.3
5)6.
73–
–(5
.15)
(2.1
1)(3
.04)
–N
ethe
rland
s
143
Cor
us E
lect
rical
Lim
ited
GB
P72
.50
––
––
––
––
––
UK
144
Cor
us E
ngin
eerin
g Li
mite
dG
BP
72.5
0–
––
––
––
––
–U
K
145
Cor
us E
ngin
eerin
g S
teel
s (U
K)
Lim
ited
GB
P72
.50
72.5
025
9.58
332.
08–
332.
08–
––
––
UK
146
Cor
us E
ngin
eerin
g S
teel
s H
oldi
ngs
Lim
ited
GB
P72
.50
3,01
4.94
233.
854,
121.
1187
2.31
4,07
8.20
––
––
–U
K
147
Cor
us E
ngin
eerin
g S
teel
s Li
mite
dG
BP
72.5
03,
349.
9497
.58
3,44
7.52
–3,
447.
52–
––
––
UK
148
Cor
us E
ngin
eerin
g S
teel
s O
vers
eas
Hol
ding
s Li
mite
dG
BP
72.5
02.
904.
3114
.18
6.97
4.66
––
––
–U
K
149
Cor
us F
inan
ce L
imite
dG
BP
72.5
00.
36(0
.17)
0.19
––
––
––
–U
K
150
Cor
us F
inla
nd O
yE
UR
67.4
70.
850.
194.
002.
96–
5.09
0.15
0.05
0.10
–F
inla
nd
151
Cor
us F
ranc
e S
AS
EU
R67
.47
242.
4452
.87
308.
1112
.80
–31
.63
23.6
98.
1515
.54
–F
ranc
e
152
Cor
us G
roup
Lim
ited
GB
P72
.50
12,6
82.7
311
,059
.87
25,3
14.4
51,
571.
8524
,909
.68
–38
4.06
120.
0726
4.00
1,81
2.38
UK

Hundred and second annual report 2008-09
222
Sum
mar
y o
f Fin
anci
al In
form
atio
n o
f Su
bsi
dia
ry C
om
pan
ies
Rs.
cro
res
Sl.
No
.N
ame
of
Su
bsi
dia
ry C
om
pan
yR
epo
rtin
g
Cu
rren
cyE
xch
ang
e R
ate
Cap
ital
Res
erve
sTo
tal
Ass
ets
Tota
l L
iab
iliti
es
Inve
stm
ent
incl
ud
ed in
To
tal A
sset
sTu
rno
ver
Profi
t b
efo
re
Taxa
tio
n
Pro
visi
on
fo
r Ta
xati
on
Profi
t af
ter
Taxa
tio
n
Pro
po
sed
D
ivid
end
Co
un
try
153
Cor
us H
oldi
ngs
Ltd.
GB
P72
.50
1.81
53.7
756
.47
0.89
––
–1.
17(1
.17)
–U
K
154
Cor
us H
oldi
ngs
SA
EU
R67
.47
272.
81(9
6.61
)1,
093.
2091
7.01
528.
45–
(5.7
3)(3
.75)
(1.9
8)–
Fra
nce
155
Cor
us H
unga
ry T
radi
ng L
imite
d Li
abili
ty
Com
pany
HU
F0.
220.
070.
120.
220.
04–
0.78
0.03
–0.
03–
Hun
gary
156
Cor
us In
dia
Ltd
INR
1.00
0.16
0.77
0.93
0.01
––
0.02
–0.
02–
Indi
a
157
Cor
us In
tern
atio
nal (
Indi
a) P
vt. L
imite
dIN
R1.
0027
.84
7.14
40.1
65.
18–
5.72
3.84
0.76
3.07
–In
dia
158
Cor
us In
tern
atio
nal (
Ove
rsea
s H
oldi
ngs)
Li
mite
dG
BP
72.5
01,
023.
671,
665.
912,
698.
108.
522,
665.
24–
110.
320.
4810
9.84
–U
K
159
Cor
us In
tern
atio
nal B
ulga
ria L
tdLE
V34
.43
0.02
0.05
0.10
0.03
–0.
140.
05–
0.05
–B
ulga
ria
160
Cor
us In
tern
atio
nal D
euts
chla
nd G
mbH
EU
R67
.47
0.01
4.97
27.7
422
.76
––
––
––
Ger
man
y
161
Cor
us In
tern
atio
nal L
imite
dG
BP
72.5
03,
554.
88(1
,444
.98)
2,39
6.76
286.
862,
245.
46–
980.
15(3
0.79
)1,
010.
93–
UK
162
Cor
us In
tern
atio
nal N
iger
iaN
GN
0.34
––
––
––
––
––
Nig
eria
163
Cor
us In
tern
atio
nal R
epre
sent
acoe
s D
o B
rasi
l Ltd
a.U
SD
50.7
11.
01(1
.96)
0.79
1.75
––
0.15
0.07
0.08
–B
razi
l
164
Cor
us In
tern
atio
nal R
oman
ia S
RL.
RO
N15
.86
0.01
0.24
0.32
0.07
–0.
790.
070.
020.
05–
Rom
ania
165
Cor
us In
tern
atio
nal S
ervi
ces
N.V
EU
R67
.47
4,57
8.63
1,60
8.08
8,13
4.79
1,94
8.08
7,33
5.63
–33
8.87
34.9
930
3.88
238.
11B
elgi
um
166
Cor
us In
tern
atio
nal T
radi
ng L
imite
dG
BP
72.5
012
.02
56.1
015
3.17
85.0
5–
3,56
8.45
(10.
71)
(1.3
1)(9
.39)
–U
K
167
Cor
us In
tern
atio
nal T
radi
ng L
imite
dU
SD
50.7
191
.10
64.5
036
2.51
206.
91–
1,61
2.82
12.2
90.
2412
.05
–U
SA
168
Cor
us In
vest
men
t B.V
.E
UR
67.4
76,
796.
471,
017.
169,
526.
461,
712.
836,
968.
71–
1,29
6.69
24.5
71,
272.
122,
550.
53N
ethe
rland
s
169
Cor
us In
vest
men
ts L
td.
GB
P72
.50
159.
494.
9316
4.42
––
––
––
–U
K
170
Cor
us Ir
elan
d Lt
d.E
UR
67.4
7–
11.8
314
.11
2.27
–7.
111.
400.
530.
87–
Irel
and
171
Cor
us It
alia
SR
L.E
UR
67.4
70.
346.
2014
.46
7.92
–16
.85
8.11
2.58
5.52
9.00
Italy
172
Cor
us L
amin
acio
n Y
Der
ivad
os, S
.L.
EU
R67
.47
122.
22(1
16.6
2)39
4.30
388.
712.
6268
6.19
(167
.20)
39.3
0(2
06.5
0)–
Spa
in
173
Cor
us L
arge
Dia
met
er P
ipes
Lim
ited
GB
P72
.50
214.
2731
3.07
538.
4311
.08
538.
43–
––
––
UK
174
Cor
us L
iais
on S
ervi
ces
(Ind
ia)
Lim
ited
GB
P72
.50
7.25
(24.
50)
1.60
18.8
6–
–(0
.01)
–(0
.01)
–U
K
175
Cor
us M
anag
emen
t Lim
ited
GB
P72
.50
–(3
28.7
1)1,
782.
052,
110.
771,
670.
98–
––
––
UK
176
Cor
us M
et B
.V.
EU
R67
.47
269.
37(1
2.74
)51
5.56
258.
93–
403.
8840
.41
13.6
426
.77
–N
ethe
rland
s
177
Cor
us M
etal
Iber
ica
S.A
EU
R67
.47
1.01
11.0
017
.32
5.30
–13
.18
1.33
0.02
1.31
–S
pain
178
Cor
us M
etal
s Li
mite
dG
BP
72.5
0–
––
––
––
––
–U
K
179
Cor
us M
iddl
e E
ast F
ZE
UA
E13
.78
62.0
159
.49
656.
6753
5.17
–1,
890.
45(4
3.88
)–
(43.
88)
–U
AE
180
Cor
us M
ulti–
Met
als
Lim
ited
GB
P72
.50
––
––
––
––
––
UK
181
Cor
us N
eder
land
B.V
.E
UR
67.4
72,
610.
277,
421.
3022
,881
.50
12,8
49.9
321
,885
.67
–2,
247.
20(2
31.5
1)2,
478.
7075
0.16
Net
herla
nds
182
Cor
us N
ew Z
eala
nd L
imite
dN
ZD
28.9
043
.93
105.
1023
0.76
81.7
3–
380.
3915
.44
5.52
9.92
–N
ew Z
eala
nd
183
Cor
us N
orge
A/S
NO
K7.
620.
151.
101.
880.
63–
1.32
0.05
0.04
0.01
–N
orw
ay
184
Cor
us P
acka
ging
Plu
s B
elgi
um N
.VE
UR
67.4
717
1.28
15.1
622
8.62
42.1
810
.96
203.
4030
.39
–30
.39
–B
elgi
um
185
Cor
us P
acka
ging
Plu
s N
orw
ay A
SN
OK
7.62
0.09
(254
.98)
11.3
626
6.25
–16
8.19
(150
.63)
–(1
50.6
3)–
Nor
way
186
Cor
us P
erfo
B.V
.E
UR
67.4
73.
77(2
5.09
)0.
4021
.71
––
0.78
0.20
0.58
–N
ethe
rland
s
187
Cor
us P
olsk
a S
p.Z
.O.O
.P
LZ14
.50
12.7
77.
3652
.21
32.0
7–
124.
682.
120.
481.
64–
Pol
and
188
Cor
us P
rimar
y A
lum
iniu
m B
.V.
EU
R67
.47
11.2
924
.76
467.
3943
1.35
410.
82–
(323
.30)
(45.
11)
(278
.19)
–N
ethe
rland
s
189
Cor
us P
rope
rtie
s (G
erm
any)
Lim
ited
GB
P72
.50
–(0
.26)
–0.
26–
––
––
–U
K
190
Cor
us P
rope
rty
GB
P72
.50
––
0.01
0.01
––
––
––
UK
191
Cor
us Q
uest
Tru
stee
Lim
ited
GB
P72
.50
––
––
––
––
––
UK

223
Sum
mar
y o
f Fin
anci
al In
form
atio
n o
f Su
bsi
dia
ry C
om
pan
ies
Rs.
cro
res
Sl.
No
.N
ame
of
Su
bsi
dia
ry C
om
pan
yR
epo
rtin
g
Cu
rren
cyE
xch
ang
e R
ate
Cap
ital
Res
erve
sTo
tal
Ass
ets
Tota
l L
iab
iliti
es
Inve
stm
ent
incl
ud
ed in
To
tal A
sset
sTu
rno
ver
Profi
t b
efo
re
Taxa
tio
n
Pro
visi
on
fo
r Ta
xati
on
Profi
t af
ter
Taxa
tio
n
Pro
po
sed
D
ivid
end
Co
un
try
192
Cor
us R
ail C
onsu
ltanc
y Li
mite
dG
BP
72.5
0–
7.12
88.7
481
.62
–13
6.25
11.2
83.
347.
94–
UK
193
Cor
us R
ail F
ranc
e S
.AE
UR
67.4
739
0.38
(132
.35)
1,06
3.99
805.
97–
1,63
6.83
45.7
1(1
7.19
)62
.89
–F
ranc
e
194
Cor
us R
ail L
imite
dG
BP
72.5
0–
––
––
––
––
–U
K
195
Cor
us R
epub
lic O
f Ire
land
Sub
sidi
arie
s P
ensi
on S
chem
e Tr
uste
e Li
mite
dE
UR
67.4
7–
––
––
––
––
–Ir
elan
d
196
Cor
us S
chw
eiz
AG
CH
F44
.25
0.44
0.41
1.89
1.04
–3.
380.
210.
050.
160.
23S
witz
erla
nd
197
Cor
us S
ervi
ce C
ente
r M
ilano
Spa
EU
R67
.47
10.1
0(1
.37)
101.
8693
.13
–15
2.99
(12.
22)
0.10
(12.
32)
–Ita
ly
198
Cor
us S
ervi
ce C
entr
e M
aast
richt
B.V
.E
UR
67.4
70.
3699
.45
181.
8682
.04
–21
5.72
33.5
98.
0525
.54
–N
ethe
rland
s
199
Cor
us S
ervi
ces
Ned
erla
nd B
.V.
EU
R67
.47
2.86
101.
3039
2.60
288.
4416
.79
–(4
1.39
)12
.87
(54.
26)
–N
ethe
rland
s
200
Cor
us S
heet
& T
ube
Inc
US
D50
.71
––
––
––
––
––
US
A
201
Cor
us S
peci
al S
trip
Asi
a Li
mite
dH
KD
6.53
––
––
––
(0.7
4)–
(0.7
4)–
Hon
g K
ong
202
Cor
us S
taal
B.V
.E
UR
67.4
721
.04
13,4
19.5
722
,005
.15
8,56
4.55
650.
4523
,953
.26
1,69
8.03
441.
981,
256.
0511
,757
.19
Net
herla
nds
203
Cor
us S
tahl
Gm
bHE
UR
67.4
70.
0246
7.95
523.
0055
.04
425.
760.
7433
.26
9.41
23.8
532
.59
Ger
man
y
204
Cor
us S
tain
less
Lim
ited
GB
P72
.50
––
––
––
––
––
UK
205
Cor
us S
tain
less
Nl B
.V.
EU
R67
.47
0.12
0.66
0.92
0.14
––
0.01
–0.
01–
Net
herla
nds
206
Cor
us S
tain
less
UK
Ltd
.G
BP
72.5
0–
––
––
––
––
–U
K
207
Cor
us S
tar–
Fra
me
B.V
.E
UR
67.4
73.
03(2
3.89
)0.
5521
.42
––
––
––
Net
herla
nds
208
Cor
us S
teel
Lim
ited
GB
P72
.50
––
––
––
––
––
UK
209
Cor
us S
teel
Usa
Inc.
US
D50
.71
104.
1167
.44
177.
616.
0685
.18
–8.
813.
005.
81–
US
A
210
Cor
us S
verig
e A
BS
EK
6.20
0.06
1.32
4.86
3.48
–12
.60
0.88
0.27
0.61
0.60
Sw
eden
211
Cor
us T
echn
olog
y B
.V.
EU
R67
.47
0.12
218.
9251
6.92
297.
8823
.53
454.
0939
.92
16.8
423
.08
–N
ethe
rland
s
212
Cor
us T
rico
Hol
ding
s In
c.U
SD
50.7
1–
––
––
––
––
–U
SA
213
Cor
us T
ubes
B.V
.E
UR
67.4
738
.59
231.
4599
2.24
722.
2013
.00
2,54
1.93
(37.
32)
(7.5
4)(2
9.78
)–
Net
herla
nds
214
Cor
us T
usca
loos
a C
orp.
US
D50
.71
2,90
2.82
(2,7
73.9
8)12
8.84
––
–29
7.18
–29
7.18
–U
SA
215
Cor
us U
K H
ealth
care
Tru
stee
Lim
ited
GB
P72
.50
––
––
––
––
––
UK
216
Cor
us U
K L
imite
dG
BP
72.5
016
,248
.31
5,81
9.73
41,5
57.6
019
,489
.56
6,89
9.30
46,2
78.9
892
.25
394.
58(3
02.3
4)–
UK
217
Cor
us V
lietjo
nge
B.V
.E
UR
67.4
751
.52
55.8
117
2.00
64.6
815
.12
283.
2810
.31
2.32
7.99
90.0
2N
ethe
rland
s
218
Cor
us Y
asan
Met
al S
anay
i Ve
Tica
ret A
SU
SD
50.7
120
.39
(19.
55)
154.
6515
3.81
–32
6.59
(53.
58)
–(5
3.58
)–
Turk
ey
219
Cpn
85
Lim
ited
GB
P72
.50
–(0
.61)
–0.
61–
––
––
–U
K
220
Cru
cibl
e In
sura
nce
Com
pany
Ltd
.G
BP
72.5
03.
6240
8.05
733.
7132
2.04
386.
81–
12.0
5–
12.0
5–
I of M
an
221
Dem
ka B
.V.
EU
R67
.47
41.4
415
.30
58.0
51.
32–
–2.
210.
561.
65–
Net
herla
nds
222
Dsr
m G
roup
Plc
.G
BP
72.5
036
.25
107.
6114
3.85
–14
3.85
––
––
–U
K
223
Ees
Gro
up S
ervi
ces
Lim
ited
GB
P72
.50
435.
04(4
35.0
4)–
––
––
––
–U
K
224
Ees
Ned
erla
nd B
.V.
EU
R67
.47
0.13
0.25
0.38
––
–(0
.01)
–(0
.01)
–N
ethe
rland
s
225
Eric
Ols
son
& S
oner
For
valtn
ings
AB
SE
K6.
200.
062.
762.
850.
022.
23–
0.02
–0.
02–
Sw
eden
226
Esm
il B
.V.
EU
R67
.47
97.7
6(7
9.72
)18
.55
0.50
––
0.77
0.20
0.57
–N
ethe
rland
s
227
Eur
o–La
min
atio
ns L
imite
dG
BP
72.5
00.
01(0
.01)
––
––
(0.2
3)–
(0.2
3)–
UK
228
Eur
opea
n E
lect
rical
Ste
els
Lim
ited
GB
P72
.50
––
––
––
––
––
UK
229
Eur
opre
ssin
gs L
imite
dG
BP
72.5
04.
350.
284.
63–
––
––
––
UK
230
Firs
teel
Gro
up L
imite
dG
BP
72.5
045
.67
84.3
025
6.63
126.
6625
6.63
––
––
–U
K
231
Firs
teel
Gro
up P
ensi
on T
rust
ee L
imite
dG
BP
72.5
0–
––
––
––
––
–U
K

Hundred and second annual report 2008-09
224
Sum
mar
y o
f Fin
anci
al In
form
atio
n o
f Su
bsi
dia
ry C
om
pan
ies
Rs.
cro
res
Sl.
No
.N
ame
of
Su
bsi
dia
ry C
om
pan
yR
epo
rtin
g
Cu
rren
cyE
xch
ang
e R
ate
Cap
ital
Res
erve
sTo
tal
Ass
ets
Tota
l L
iab
iliti
es
Inve
stm
ent
incl
ud
ed in
To
tal A
sset
sTu
rno
ver
Profi
t b
efo
re
Taxa
tio
n
Pro
visi
on
fo
r Ta
xati
on
Profi
t af
ter
Taxa
tio
n
Pro
po
sed
D
ivid
end
Co
un
try
232
Firs
teel
Hol
ding
s Li
mite
dG
BP
72.5
00.
0556
.06
125.
6369
.52
125.
63–
––
––
UK
233
Firs
teel
Ste
el P
roce
ssin
g Li
mite
dG
BP
72.5
054
.37
0.09
54.4
6–
––
––
––
UK
234
Firs
teel
Str
ip M
ill P
rodu
cts
Lim
ited
GB
P72
.50
63.0
711
.04
74.1
1–
74.1
1–
––
––
UK
235
Fis
cher
Profi e
len
NV
EU
R67
.47
0.84
(0.8
4)–
––
––
––
–B
elgi
um
236
Fis
cher
Profi l
Gm
bHE
UR
67.4
768
.87
5.57
215.
6414
1.20
5.28
703.
26–
(0.4
1)0.
40–
Ger
man
y
237
Gam
ble
Sim
ms
Met
als
Ltd.
EU
R67
.47
4.28
91.4
697
.63
1.89
97.6
3–
––
––
Irel
and
238
Gra
nt L
yon
Eag
re L
td.
GB
P72
.50
2.72
39.9
842
.70
––
––
––
–U
K
239
H E
Sam
son
Ltd.
GB
P72
.50
27.1
910
.68
37.8
6–
––
––
––
UK
240
Hadfi e
lds
Hol
ding
s Lt
d.G
BP
72.5
00.
72(5
8.98
)3.
8462
.09
––
––
––
UK
241
Ham
mer
meg
a Li
mite
dG
BP
72.5
016
.31
–16
.31
––
––
––
–U
K
242
Har
row
mill
s P
rope
rtie
s Lt
d.G
BP
72.5
00.
0113
8.06
138.
07–
––
––
––
UK
243
Hill
e &
Mul
ler
Gm
bHE
UR
67.4
714
0.04
34.0
841
7.24
243.
130.
1051
0.62
21.2
8(1
.89)
23.1
631
.65
Ger
man
y
244
Hill
e &
Mul
ler
Italia
SR
L.E
UR
67.4
70.
31(0
.31)
––
––
(1.3
6)–
(1.3
6)–
Italy
245
Hill
e &
Mul
ler
Usa
Inc.
US
D50
.71
–67
.25
80.9
713
.71
59.5
850
.28
4.87
(1.1
6)6.
02–
US
A
246
Hol
orib
Gm
bHE
UR
67.4
70.
170.
300.
520.
04–
0.79
0.10
0.03
0.07
–G
ER
MA
NY
247
Hoo
gove
ns (
UK
) Li
mite
dG
BP
72.5
014
4.99
(141
.58)
17.9
114
.49
13.1
9–
––
––
UK
248
Hoo
gove
ns A
lum
iniu
m U
K L
imite
dG
BP
72.5
010
.77
(8.3
7)4.
822.
42–
–0.
69–
0.69
–U
K
249
Hoo
gove
ns F
inan
ce B
.V.
EU
R67
.47
917.
0040
8.08
1,32
9.51
4.44
1,32
9.47
–47
.51
12.1
135
.39
–N
ethe
rland
s
250
Hoo
gove
ns T
echn
ical
Ser
vice
s C
oahu
ila
B.V
.E
UR
67.4
70.
12(1
1.81
)16
.35
28.0
4–
–25
.23
6.43
18.7
9–
Net
herla
nds
251
Hoo
gove
ns T
echn
ical
Ser
vice
s M
exic
o D
e S
. De
R.L
. De
C.V
.U
SD
50.7
1–
(20.
39)
3.41
23.8
0–
–(1
0.36
)(3
.11)
(7.2
5)–
Mex
ico
252
Hoo
gove
ns T
echn
ical
Ser
vice
s M
oncl
ova
B.V
.E
UR
67.4
70.
12(0
.12)
––
––
––
––
Net
herla
nds
253
Hoo
gove
ns T
ubes
Pol
and
Spo
lka
Z.O
.OE
UR
67.4
70.
100.
204.
434.
13–
7.81
0.09
–0.
09–
Pol
and
254
Hoo
gove
ns U
sa In
c.U
SD
50.7
130
7.95
46.1
136
1.68
7.62
318.
87–
1.15
5.65
(4.5
1)–
US
A
255
Hui
zenb
ezit
“Bre
esaa
p” B
.V.
EU
R67
.47
0.31
(6.8
4)(0
.79)
5.74
–0.
09(0
.45)
(0.1
1)(0
.34)
–N
ethe
rland
s
256
Ickl
es C
otta
ge T
rust
GB
P72
.50
–(0
.04)
0.53
0.57
–0.
610.
05–
0.05
–U
K
257
Imm
obill
iere
De
Con
stru
ctio
n D
e M
aube
uge
Et L
ouvr
oil S
AS
EU
R67
.47
0.69
0.14
1.10
0.27
–1.
170.
250.
080.
17–
Fra
nce
258
Indu
stria
l Ste
els
Lim
ited
GB
P72
.50
–26
.62
69.1
942
.57
–31
.03
(26.
28)
(11.
40)
(14.
87)
–U
K
259
Inte
r M
etal
Dis
trib
utio
n S
AS
EU
R67
.47
0.51
30.3
561
.70
30.8
4–
221.
992.
840.
961.
88–
Fra
nce
260
K&
S M
anag
emen
t Ser
vice
Lim
ited
GB
P72
.50
––
––
––
––
––
UK
261
Kal
zip
Asi
a P
teS
GD
33.3
411
.70
15.1
413
4.95
108.
11–
151.
224.
39(1
.12)
5.50
–S
inga
pore
262
Kal
zip
Gm
bHE
UR
67.4
70.
240.
290.
810.
28–
2.39
0.16
0.06
0.10
–A
ustr
ia
263
Kal
zip
Gm
bHE
UR
67.4
743
.06
(0.2
9)28
9.03
246.
26–
416.
615.
541.
474.
07–
Ger
man
y
264
Kal
zip
Gua
ngzh
ou L
td.
CN
Y7.
4118
.27
9.17
97.0
569
.61
–90
.60
6.54
0.50
6.04
–C
hina
265
Kal
zip
Inc.
U
SD
50.7
10.
26(5
.31)
(3.4
0)1.
66–
6.00
(3.6
6)–
(3.6
6)–
US
A
266
Kal
zip
Ltd.
GB
P72
.50
26.8
226
.35
106.
5653
.38
–25
1.37
8.06
3.77
4.29
–U
K
267
Kal
zip
Spa
in S
.L.U
. E
UR
67.4
76.
062.
098.
940.
79–
7.26
1.25
0.23
1.02
–S
pain
268
List
er T
ubes
Ltd
.E
UR
67.4
7–
10.9
010
.90
––
––
––
–Ir
elan
d
269
Lond
on W
orks
Ste
el C
ompa
ny L
td.
GB
P72
.50
–(7
4.71
)40
.59
115.
31–
––
––
–U
K

225
Sum
mar
y o
f Fin
anci
al In
form
atio
n o
f Su
bsi
dia
ry C
om
pan
ies
Rs.
cro
res
Sl.
No
.N
ame
of
Su
bsi
dia
ry C
om
pan
yR
epo
rtin
g
Cu
rren
cyE
xch
ang
e R
ate
Cap
ital
Res
erve
sTo
tal
Ass
ets
Tota
l L
iab
iliti
es
Inve
stm
ent
incl
ud
ed in
To
tal A
sset
sTu
rno
ver
Profi
t b
efo
re
Taxa
tio
n
Pro
visi
on
fo
r Ta
xati
on
Profi
t af
ter
Taxa
tio
n
Pro
po
sed
D
ivid
end
Co
un
try
270
Mid
land
Ste
el S
uppl
ies
Ltd.
GB
P72
.50
––
––
––
––
––
UK
271
Mis
tbur
y In
vest
men
ts L
imite
dG
BP
72.5
014
.86
(18.
38)
19.8
023
.33
19.8
0–
––
––
UK
272
Mon
tana
Bau
syst
eme
AG
CH
F44
.25
53.1
014
6.30
259.
1859
.78
0.22
386.
0234
.45
4.76
29.6
9–
Sw
itzer
lnd
273
Myr
iad
Deu
tsch
land
Gm
bHE
UR
67.4
70.
671.
442.
710.
60–
5.97
(0.1
5)(0
.01)
(0.1
4)–
Ger
man
y
274
Myr
iad
Esp
ana
Sl
EU
R67
.47
0.02
1.73
1.84
0.09
–0.
65(0
.08)
–(0
.08)
–S
pain
275
Myr
iad
Ned
erla
nd B
.V.
EU
R67
.47
0.32
0.71
1.15
0.11
–1.
28–
–(0
.01)
–N
ethe
rland
s
276
Myr
iad
SA
EU
R67
.47
146.
0770
.60
889.
0367
2.36
8.11
2,42
9.93
(33.
67)
(11.
50)
(22.
17)
–F
ranc
e
277
Myr
iad
Uni
ted
Kin
gdom
Lim
ited
GB
P72
.50
0.07
0.64
1.11
0.40
–0.
990.
030.
08(0
.05)
–U
K
278
Nam
asco
r B
.V.
EU
R67
.47
41.2
577
.40
258.
2113
9.56
–75
0.51
14.4
23.
7110
.72
–N
ethe
rland
s
279
Nat
ionw
ide
Ste
elst
ock
Lim
ited
GB
P72
.50
–(0
.01)
–0.
01–
––
––
–U
K
280
Neb
am N
edel
ands
e B
evra
chtin
g E
n A
gent
uur
Maa
tsch
appi
j B.V
.E
UR
67.4
70.
15–
0.15
–0.
15–
––
––
Net
herla
nds
281
Oos
tfl an
k B
.V.
EU
R67
.47
0.12
41.0
552
.11
10.9
4–
–1.
41(3
.59)
5.00
–N
ethe
rland
s
282
Orb
Ele
ctric
al S
teel
s Li
mite
dG
BP
72.5
023
1.98
3.04
235.
03–
3.23
––
––
–U
K
283
Ore
Car
riers
Ltd
.G
BP
72.5
014
.74
5.95
20.7
00.
0120
.05
––
––
–U
K
284
Ore
mco
Inc.
US
D50
.71
0.51
1.03
30.6
629
.12
––
0.30
0.09
0.21
–U
SA
285
Pla
ted
Str
ip In
tern
atio
nal L
imite
dG
BP
72.5
016
.33
(3.6
1)13
.31
0.59
––
––
––
UK
286
Pre
cisi
on M
etal
For
min
g Li
mite
dG
BP
72.5
00.
2438
.49
38.7
3–
38.7
3–
––
––
UK
287
Pre
coat
Inte
rnat
iona
l Lim
ited
GB
P72
.50
5.97
58.6
381
.18
16.5
880
.68
––
––
–U
K
288
Pre
coat
Lim
ited
GB
P72
.50
7.98
(9.8
0)35
.39
37.2
135
.10
––
––
–U
K
289
Raf
fert
y–B
row
n S
teel
Co
Inc
Of C
onn.
US
D50
.71
75.4
817
.94
100.
076.
65–
–1.
11–
1.11
–U
SA
290
Ric
hard
Tho
mas
And
Bal
dwin
s (1
978)
Li
mite
dN
ZD
28.9
0–
––
––
––
––
–N
ew Z
eala
nd
291
Ric
hard
Tho
mas
And
Bal
dwin
s (A
ustr
alia
) P
ty L
td.
AU
D35
.10
0.21
–0.
21–
––
––
––
Aus
tral
ia
292
Rou
nd O
ak S
teel
wor
ks L
td.
GB
P72
.50
21.7
5(3
69.0
9)0.
8734
8.21
––
––
––
UK
293
Run
blas
t Lim
ited
GB
P72
.50
62.1
031
5.14
377.
24–
––
––
––
UK
294
Run
meg
a Li
mite
dG
BP
72.5
03.
15–
3.15
––
––
––
–U
K
295
S A
B P
rofi e
l B.V
.E
UR
67.4
70.
9231
1.57
419.
6610
7.17
169.
4175
0.00
30.0
97.
7822
.31
–N
ethe
rland
s
296
S A
B P
rofi l
Gm
bHE
UR
67.4
70.
2057
.69
76.6
318
.74
–25
5.32
20.2
67.
0913
.17
–G
erm
any
297
SA
Inte
rtub
esE
UR
67.4
70.
420.
651.
260.
19–
1.50
0.27
0.03
0.24
–B
elgi
um
298
Sac
ra–N
ord
SA
SE
UR
67.4
741
3.27
148.
7288
5.80
323.
8186
9.34
–(5
.99)
(9.0
1)3.
02–
Fra
nce
299
Scr
ap P
roce
ssin
g H
oldi
ng B
.V.
EU
R67
.47
0.73
35.2
737
.20
1.19
––
1.42
(4.6
4)6.
07–
Net
herla
nds
300
Sea
mle
ss T
ubes
Ltd
.G
BP
72.5
014
4.99
(10.
38)
134.
61–
––
––
––
UK
301
Sia
Cor
us B
uild
ing
Sys
tem
sLA
T94
.90
0.57
(1.5
5)1.
332.
31–
6.84
(0.3
8)–
(0.3
8)–
Latv
ia
302
Sim
iop
Inve
stm
ents
Ltd
.G
BP
72.5
0–
27.5
027
.50
––
––
––
–U
K
303
Sim
iop
Ltd.
GB
P72
.50
69.4
9–
69.4
9–
69.4
9–
––
––
UK
304
Sim
ms
Ste
el H
oldi
ngs
Ltd.
GB
P72
.50
0.07
(0.0
9)–
0.02
––
––
––
UK
305
Skr
uv E
rik A
BS
EK
6.20
0.06
1.45
1.65
0.15
––
(0.0
9)–
(0.0
9)–
Sw
eden
306
Soc
iete
Eur
opee
nne
De
Gal
vani
satio
n (S
egal
) S
aE
UR
67.4
784
.18
38.9
321
9.06
95.9
5–
488.
1915
.08
4.56
10.5
2–
Bel
gium
307
Sta
alve
rwer
king
En
Han
del B
.V.
EU
R67
.47
303.
042,
284.
943,
167.
3257
9.34
3,15
7.68
–(2
7.11
)(6
.91)
(20.
19)
–N
ethe
rland
s

Hundred and second annual report 2008-09
226
Sum
mar
y o
f Fin
anci
al In
form
atio
n o
f Su
bsi
dia
ry C
om
pan
ies
Rs.
cro
res
Sl.
No
.N
ame
of
Su
bsi
dia
ry C
om
pan
yR
epo
rtin
g
Cu
rren
cyE
xch
ang
e R
ate
Cap
ital
Res
erve
sTo
tal
Ass
ets
Tota
l L
iab
iliti
es
Inve
stm
ent
incl
ud
ed in
To
tal A
sset
sTu
rno
ver
Profi
t b
efo
re
Taxa
tio
n
Pro
visi
on
fo
r Ta
xati
on
Profi
t af
ter
Taxa
tio
n
Pro
po
sed
D
ivid
end
Co
un
try
308
Ste
el C
ompa
ny (
N.I.
) Lt
d.G
BP
72.5
00.
04–
0.04
––
––
––
–U
K
309
Ste
el S
tock
hold
ings
Ltd
.G
BP
72.5
027
.55
5.66
33.4
00.
19–
––
––
–U
K
310
Ste
elst
ock
Ltd.
GB
P72
.50
0.14
–55
.71
55.5
6–
––
––
–U
K
311
Ste
war
ts &
Llo
yds
Of I
rela
nd L
td.
EU
R67
.47
0.64
(2.2
1)–
1.56
––
––
––
Irel
and
312
Ste
war
ts A
nd L
loyd
s (O
vers
eas)
Ltd
.G
BP
72.5
014
8.33
0.04
148.
37–
148.
37–
––
––
UK
313
Sto
cksb
ridge
Cot
tage
Tru
stG
BP
72.5
0–
0.47
0.54
0.07
–0.
34(0
.02)
–(0
.02)
–U
K
314
Sur
aham
mar
Bru
ks A
BS
EK
6.20
37.2
314
7.59
302.
2111
7.39
6.20
593.
18(5
.98)
–(5
.98)
–S
wed
en
315
Sw
inde
n H
ousi
ng A
ssoc
iatio
nG
BP
72.5
0–
3.83
5.84
2.01
–0.
260.
01(0
.01)
0.01
–U
K
316
Tata
Ste
el N
ethe
rland
s B
.V.
EU
R67
.47
34,2
37.5
42,
577.
1868
,110
.05
31,2
95.3
366
,951
.96
–1,
447.
26(3
03.7
0)1,
750.
96–
Net
herla
nds
317
Tata
Ste
el U
K L
td.
GB
P72
.50
25,3
54.9
854
8.95
31,1
57.7
45,
253.
8130
,376
.11
–45
.35
(420
.47)
465.
82–
UK
318
Telm
ag (
Hol
ding
s) L
imite
dG
BP
72.5
011
.64
(11.
64)
––
––
––
––
UK
319
Telm
ag M
agne
tic C
ompo
nent
s Li
mite
dG
BP
72.5
00.
01(0
.01)
––
––
––
––
UK
320
The
New
port
And
Sou
th W
ales
Tub
e C
ompa
ny L
td.
GB
P72
.50
3.86
–3.
86–
––
––
––
UK
321
The
Sta
nton
Hou
sing
Com
pany
Ltd
.G
BP
72.5
00.
436.
556.
98–
––
––
––
UK
322
The
Ste
el C
ompa
ny O
f Ire
land
Lim
ited
EU
R67
.47
101.
12(2
0.47
)15
0.83
70.1
880
.15
139.
24(5
.10)
0.41
(5.5
1)–
Irel
and
323
The
Tem
pleb
orou
gh R
ollin
g M
ills
Ltd.
GB
P72
.50
21.7
593
.32
115.
07–
––
––
––
UK
324
Tho
mas
Pro
cess
ing
Com
pany
US
D50
.71
–10
4.83
105.
330.
49–
14.2
03.
09–
3.09
–U
SA
325
Tho
mas
Ste
el S
trip
Cor
p.U
SD
50.7
135
.43
(257
.98)
377.
7160
0.27
19.1
155
4.74
(60.
74)
0.15
(60.
89)
–U
SA
326
Tins
ley
Trai
lers
Lim
ited
GB
P72
.50
13.0
5–
13.0
5–
––
––
––
UK
327
Toro
nto
Indu
stria
l Fab
ricat
ions
Ltd
.G
BP
72.5
00.
12(3
.71)
–3.
60–
––
––
–U
K
328
Trie
rer
Wal
zwer
k G
mbH
EU
R67
.47
31.1
6(2
.37)
156.
0112
7.21
–14
2.55
4.01
(0.1
1)4.
122.
92G
erm
any
329
Tulip
Net
herla
nds
(No.
1) B
.V.
EU
R67
.47
34,2
37.5
48.
4934
,248
.94
2.91
34,2
39.0
9–
1.44
0.37
1.08
–N
ethe
rland
s
330
Tulip
Net
herla
nds
(No.
2) B
.V.
EU
R67
.47
34,2
37.5
4(4
13.2
1)34
,378
.09
553.
7634
,247
.98
–7.
761.
985.
78–
Net
herla
nds
331
Tulip
UK
Hol
ding
s (N
o.2)
Ltd
.G
BP
72.5
025
,397
.44
2.39
25,4
00.1
30.
3025
,400
.13
––
0.24
(0.2
4)–
UK
332
Tulip
UK
Hol
ding
s (N
o.3)
Ltd
.G
BP
72.5
025
,400
.13
(88.
73)
27,2
30.1
01,
918.
7027
,167
.36
–(1
01.5
7)4.
72(1
06.2
8)–
UK
333
U.E
.S. B
right
Bar
Lim
ited
GB
P72
.50
10.8
74.
9914
6.89
131.
02–
575.
1415
.86
–15
.86
–U
K
334
UK
Ste
el E
nter
pris
e Lt
d.G
BP
72.5
072
.50
72.5
223
1.08
86.0
740
.86
21.5
8(1
.04)
0.01
(1.0
5)–
UK
Uks
e F
und
Man
ager
s Li
mite
dG
BP
72.5
00.
250.
070.
460.
13–
0.01
0.02
0.01
0.01
–U
K
336
Uks
e F
und
Man
gers
(G
ener
al P
artn
er)
Lim
ited
GB
P72
.50
––
––
––
––
––
UK
337
Uni
ted
Ste
els
Co
(N Z
) Lt
d.N
ZD
28.9
0–
––
––
––
––
–N
ew Z
eala
nd
338
Uni
tol S
AS
EU
R67
.47
0.83
31.1
360
3.12
571.
1649
.84
1,52
0.73
(103
.79)
–(1
03.7
9)–
Fra
nce
339
Wal
ker
Man
ufac
turin
g A
nd In
vest
men
ts
Ltd.
GB
P72
.50
3.86
108.
1511
2.01
–7.
83–
––
––
UK
340
Wal
kers
teel
stoc
k Ir
elan
d Li
mite
dE
UR
67.4
765
.73
38.6
811
5.30
10.9
011
2.80
––
––
–Ir
elan
d
341
Wal
kers
teel
stoc
k Lt
d.G
BP
72.5
07.
25–
7.25
–0.
14–
––
––
UK
342
Wes
twoo
d S
teel
Ser
vice
s Lt
d.G
BP
72.
50
170
.36
–
170
.36
–
–
–
–
–
–
–
UK
343
Whi
tehe
ad (
Nar
row
Str
ip)
Ltd.
GB
P 7
2.50
6
5.25
1
7.90
8
3.14
–
–
–
–
–
–
–
U
K
344
Tata
Ste
el G
loba
l Min
eral
H
oldi
ngs
Pte
Ltd
.U
SD
50.7
1–
(8.3
8)1,
336.
421,
344.
801,
251.
37–
(4.9
5)–
(4.9
5)–
Sin
gapo
re
345
Al R
imal
Min
ing
LLC
OM
R13
1.71
13.2
3(2
.05)
11.1
8–
––
(1.6
4)–
(1.6
4)–
Om
an
335

227
Sum
mar
y o
f Fin
anci
al In
form
atio
n o
f Su
bsi
dia
ry C
om
pan
ies
NO
TE
:T
he In
dian
rup
ee e
quiv
alen
ts o
f the
fi gu
res
give
n in
the
fore
ign
curr
enci
es in
the
acco
unts
of t
he s
ubsi
diar
y co
mpa
nies
, hav
e be
en g
iven
bas
ed o
n th
e ex
chan
ge r
ates
as
on 3
1.03
.200
9.
Rs.
cro
res
Sl.
No
.N
ame
of
Su
bsi
dia
ry C
om
pan
yR
epo
rtin
g
Cu
rren
cyE
xch
ang
e R
ate
Cap
ital
Res
erve
sTo
tal
Ass
ets
Tota
l L
iab
iliti
es
Inve
stm
ent
incl
ud
ed in
To
tal A
sset
sTu
rno
ver
Profi
t b
efo
re
Taxa
tio
n
Pro
visi
on
fo
r Ta
xati
on
Profi
t af
ter
Taxa
tio
n
Pro
po
sed
D
ivid
end
Co
un
try
346
Bla
ck G
inge
r 46
1 P
ropr
ieta
ry L
tdZ
AR
5.35
–(1
.45)
9.11
10.5
6–
0.40
(1.6
0)–
(1.6
0)–
Sou
th A
fric
a
347
Kal
imat
i Coa
l Com
pany
Pty
. Ltd
.A
UD
35.1
028
.35
(18.
71)
134.
0112
4.37
–24
.45
4.78
(11.
01)
15.7
9–
Aus
tral
ia
348
Tata
Ste
el C
ote
D’ I
voire
S.A
.F
CFA
0.10
–(1
.95)
0.79
2.75
––
(1.7
4)–
(1.7
4)–
Ivor
y C
oast
349
Tata
Ste
el (
Tha
iland
) P
ublic
Com
pany
Ltd
.T
HB
1.43
1,20
2.64
941.
993,
070.
9992
6.35
–42
.81
24.7
66.
1618
.60
91.4
0T
haila
nd
350
NT
S S
teel
Gro
up P
lc.
TH
B1.
4346
4.60
63.7
01,
557.
951,
029.
65–
2,31
3.19
(100
.58)
(34.
15)
(66.
44)
–T
haila
nd
351
Sia
m C
onst
ruct
ion
Ste
el C
o. L
td.
TH
B1.
4324
9.91
75.0
132
4.94
0.03
–2,
216.
8131
.98
9.48
22.4
9–
Tha
iland
352
Sia
m Ir
on A
nd S
teel
(20
01)
Co.
Ltd
.T
HB
1.43
17.1
468
.09
223.
2013
7.97
–1,
521.
4374
.29
22.2
952
.00
–T
haila
nd
353
TM
Inte
rnat
iona
l Log
istic
s Lt
d.IN
R1.
0018
.00
62.3
784
.48
4.11
2.90
125.
4714
.49
4.41
10.0
82.
16In
dia
354
Inte
rnat
iona
l Shi
ppin
g Lo
gist
ics
FZ
EA
ED
14.1
01.
2479
.77
81.0
1–
–32
5.88
23.7
8–
23.7
8–
UA
E
355
TK
M G
loba
l Chi
na L
td.
CN
Y7.
414.
390.
134.
52–
–0.
18(0
.52)
–(0
.52)
–C
hina
356
TK
M G
loba
l Gm
bHE
UR
67.4
70.
2737
.53
37.9
50.
15–
89.6
717
.04
5.77
11.2
7–
Ger
man
y
357
TK
M G
loba
l Log
istic
s Lt
d.
INR
1.00
0.11
12.1
013
.15
0.93
5.49
134.
095.
872.
003.
88–
Indi
a
358
The
Indi
an S
teel
and
Wire
Pro
duct
s Lt
d.IN
R1.
005.
99(3
2.94
)10
.02
36.9
7–
107.
174.
510.
154.
35–
Indi
a
359
The
Tat
a P
igm
ents
Ltd
.IN
R1.
000.
7513
.37
14.1
70.
05–
28.2
01.
210.
450.
760.
23In
dia

Hundred and second annual report 2008-09
228
Auditors’ Report on Consolidated Financial Statements
TO THE BOARD OF DIRECTORS OF TATA STEEL LIMITED
1. We have audited the attached Consolidated Balance Sheet of TATA STEEL LIMITED (“the Company”) and
its subsidiaries (the Company and its subsidiaries constitute “the Group”) as at 31st March, 2009, and also
the Consolidated Profi t and Loss Account and the Consolidated Cash Flow Statement for the year ended on
that date both annexed thereto. These fi nancial statements have been approved by the Board of Directors
of the Company. These fi nancial statements are the responsibility of the Company’s management and
have been prepared by the management on the basis of separate fi nancial statements and other fi nancial
information regarding components. Our responsibility is to express an opinion on these fi nancial statements
based on our audit.
2. We conducted our audit in accordance with the auditing standards generally accepted in India. This
Standard requires that we plan and perform the audit to obtain reasonable assurance about whether
the fi nancial statements are free of material misstatement. An audit includes examining, on test basis,
evidence supporting the amounts and disclosures in the fi nancial statements. An audit also includes
assessing the accounting principles used and signifi cant estimates made by the management, as well as
evaluating the overall fi nancial statement presentation. We believe that our audit provide a reasonable
basis for our opinion.
3. (a) Attention is invited to the Note 11(d) of Schedule N to the fi nancial statements regarding change in
accounting policy for recognition of actuarial valuation change of Rs. 5496.58 crores (net of taxes)
[Gross: Rs. 6098.20 crores] in the pension funds of Tata Steel Europe Limited, a subsidiary, for reasons
specifi ed therein. Had the company followed the previous practice of recognizing actuarial valuation
changes in the profi t and loss account, the deferred tax expense would have been lower by Rs. 601.62
crores and the profi t after taxes, minority interest and share of profi ts of associates would have resulted
in a loss of Rs. 545.68 crores.
(b) i) The fi nancial statements of Singapore Branch and of overseas subsidiaries whose fi nancial
statements refl ect total assets (net) of Rs. 64,833.26 crores as at 31st March, 2009, total revenue
of Rs. 123,165.92 crores and net cash fl ows amounting to Rs. 682.74 crores have been audited
by auditors in the respective countries.
ii) The fi nancial statements of certain subsidiaries in India, whose fi nancial statements refl ect total
assets (net) of Rs. 491.42 crores as at 31st March, 2009, total revenue of Rs. 800.41 crores and
net cash fl ows amounting to Rs. 5.72 crores have been audited by other auditors.
Our report is based solely on the report furnished by these auditors.
(c) As stated in Note 13 and 14 of Schedule N, in the case of certain other subsidiaries and joint ventures
of the Company, having total assets (net) of Rs. 500.95 crores as at 31st March, 2009 and total
revenue of Rs. 4,208.55 crores for the year ended 31st March, 2009 and in the case of associate
companies having a carrying value of Rs. 175.00 crores as at 31st March, 2009 the fi gures used for
the consolidation are based on the management’s estimates and are not audited by their auditors.
Tata Steel Limited and its Subsidiaries

229
(d) As stated in Note 1 of Schedule N, in case of certain associates, the fi nancial statements as on
31st March, 2009 are not available. The investments in these associates valued at Re 1 each in the
Financial Statements of the Company, have not been adjusted in Consolidated Financial Statements
in the absence of their fi nancial statements as on 31st March, 2009.
4. Subject to the matters referred to in paragraphs 3 (c) and 3 (d) and read with our comments in
paragraph 3 (a) above :
(a) We report that the Consolidated Financial Statements have been prepared by the Company’s
management in accordance with the requirements of Accounting Standards (“AS”) 21, Consolidated
Financial Statements, AS 23 Accounting for Investments in Associates in Consolidated Financial
Statements and AS 27 Financial Reporting of Interests in Joint Ventures, as notifi ed under the
Companies (Accounting Standards) Rules, 2006.
(b) Based on our audit and on consideration of the reports of the other auditors on separate fi nancial
statements and on the other fi nancial information of the components, and to the best of our information
and according to the explanations given to us, we are of the opinion that the attached Consolidated
Financial Statements give a true and fair view in conformity with the accounting principles generally
accepted in India :
(i) in the case of the Consolidated Balance Sheet, of the state of affairs of the Group as at
31st March, 2009;
(ii) in the case of the Consolidated Profi t and Loss Account, of the profi t of the Group for the year
ended on that date;
(iii) in the case of the Consolidated Cash Flow Statement, of the cash fl ows of the Group for the year
ended on that date.
For DELOITTE HASKINS & SELLS Chartered Accountants,
P. R. RAMESH Partner. Membership No.: 70928
Mumbai, 25th June, 2009

Hundred and second annual report 2008-09
230
As atSchedule Page 31-03-2008 FUNDS EMPLOYED : Rupees Rupees Rupees crores crores crores
A 236 1. SHARE CAPITAL ................................................................................ 6,202.78 6,202.63 B 236 2. RESERVES AND SURPLUS .............................................................. 21,511.50 27,971.35
3. TOTAL SHAREHOLDERS' FUNDS .................................................... 27,714.28 34,173.98
4. WARRANTS ISSUED BY A SUBSIDIARY COMPANY...................... 17.46 17.46
5. MINORITY INTEREST ....................................................................... 894.88 832.70
6. LOANS C 237 a. Secured ...................................................................................... 34,329.26 35,414.99 D 237 b. Unsecured .................................................................................. 25,571.24 18,209.75
c. Total Loans.................................................................................. 59,900.50 53,624.74
7. DEFERRED TAX LIABILITY (See Note 21, Page 270) .......................... 1,785.55 2,464.68
8. PROVISION FOR EMPLOYEE SEPARATION COMPENSATION (See Note 11(a), Page 257) ................................................................. 1,042.41 1,080.05
9. TOTAL FUNDS EMPLOYED .............................................................. 91,355.08 92,193.61
APPLICATION OF FUNDS : E 238 10. FIXED ASSETS a. Gross Block ................................................................................ 1,08,388.74 1,05,128.71 b. Less — Impairment ................................................................... 3,225.07 3,223.50 c. Less — Depreciation .................................................................. 59,858.09 59,938.92
d. Net Block ..................................................................................... 45,305.58 41,966.29
F 239 11. INVESTMENTS ................................................................................... 6,411.10 3,367.43
12. FOREIGN CURRENCY MONETARY ITEM TRANSLATION
DIFFERENCE ACCOUNT (See Note 11(c), Page 257).......................... 471.66 – 13. GOODWILL ON CONSOLIDATION.................................................... 15,364.92 18,049.96
14. DEFERRED TAX ASSET (See Note 21, Page 270) ............................. 76.12 10.26
15. A. CURRENT ASSETS
a. Stores and spare parts................................................................ 1,852.71 1,654.97 G 239 b. Stock-in-trade.............................................................................. 19,815.99 21,409.37 H 240 c. Sundry debtors............................................................................ 13,031.63 18,697.82 d. Interest accrued on investments ................................................. 6.81 8.96 I 240 e. Cash and Bank balances ............................................................ 6,148.36 4,231.86
40,855.50 46,002.98 J 240 B. LOANS AND ADVANCES ........................................................... 13,015.73 15,459.81
53,871.23 61,462.79 16. Less : CURRENT LIABILITIES AND PROVISIONS K 241 A. Current Liabilities ........................................................................ 23,093.30 26,360.74 L 241 B. Provisions ................................................................................... 7,157.71 6,458.01
30,251.01 32,818.75
17. NET CURRENT ASSETS ................................................................... 23,620.22 28,644.04 M 241 18. MISCELLANEOUS EXPENDITURE (to the extent not written off or adjusted) ......................................................................................... 105.48 155.63
19. TOTAL ASSETS (Net) ......................................................................... 91,355.08 92,193.61 Contingent Liabilities (See Note 3, Page 254)
N 242 NOTES ON BALANCE SHEET AND PROFIT AND LOSS ACCOUNT
Consolidated Balance Sheet as at 31st March, 2009Tata Steel Limited and its Subsidiaries
J C BHAMCompany Secretary
As per our report attached
For DELOITTE HASKINS & SELLSChartered Accountants,
P R RAMESHPartner.
Mumbai, 25th June, 2009
For and on behalf of the BoardRATAN N TATA ChairmanJAMES LENGNUSLI N WADIAS M PALIA ISHAAT HUSSAINJAMSHED J IRANI DirectorsSUBODH BHARGAVA JACOBUS SCHRAVENANDREW ROBBB MUTHURAMAN Managing DirectorKIRBY ADAMS DirectorH M NERURKAR Executive Director
}

231
Previous YearSchedule Page Rupees Rupees Rupees INCOME : crores crores crores
1 234 1. SALES AND OTHER OPERATING INCOME ................................................. 1,49,984.94 1,34,086.77 Less — EXCISE DUTY ................................................................................... 2,655.68 2,553.14 1,47,329.26 1,31,533.63 2 234 2. OTHER INCOME ............................................................................................ 265.67 475.86 1,47,594.93 1,32,009.49
EXPENDITURE : 4 235 3. MANUFACTURING AND OTHER EXPENSES .............................................. 1,29,984.66 1,14,298.96 4. DEPRECIATION ............................................................................................. 4,265.39 4,136.95
1,34,250.05 1,18,435.91 5. Less — EXPENDITURE (OTHER THAN INTEREST) TRANSFERRED TO CAPITAL AND OTHER ACCOUNTS .................. 783.07 547.76
1,33,466.98 1,17,888.15
3 234 6. NET FINANCE CHARGES ............................................................................. 3,290.18 4,085.41
7. TOTAL EXPENDITURE .................................................................................. 1,36,757.16 1,21,973.56
PROFIT BEFORE TAXES AND EXCEPTIONAL ITEMS ........................................ 10,837.77 10,035.93
8. a. CONTRIBUTION FOR SPORTS INFRASTRUCTURE ........................... – (150.00) b. EXCHANGE GAIN/(LOSS) ..................................................................... – 578.29 c. ACTUARIAL GAIN/(LOSS) ON FUNDS FOR EMPLOYEE BENEFITS ........ – 5,906.84
d. RESTRUCTURING, IMPAIRMENT AND DISPOSALS ........................... (4,094.53) – (See Note 24, Page 271)
(4,094.53) 6,335.13
PROFIT BEFORE TAXES ....................................................................................... 6,743.24 16,371.06
9. TAXES a. CURRENT TAX ....................................................................................... 1,997.12 3,353.73 b. DEFERRED TAX .................................................................................... (121.93) 674.58 c. FRINGE BENEFIT TAX ........................................................................... 18.81 20.99
1,894.00 4,049.30
PROFIT AFTER TAXES ........................................................................................ 4,849.24 12,321.76 10. MINORITY INTEREST .................................................................................... 40.94 (139.94) 11. SHARE OF PROFITS OF ASSOCIATES ...................................................... 60.72 168.16
101.66 28.22 PROFITS AFTER TAXES, MINORITY INTEREST AND SHARE OF PROFIT OF ASSOCIATES ................................................................................... 4,950.90 12,349.98 12. BALANCE BROUGHT FORWARD FROM LAST YEAR/PREVIOUS PERIOD ...................................................... 8,234.03 4,840.39
AMOUNT AVAILABLE FOR APPROPRIATIONS ................................................ 13,184.93 17,190.37 13. APPROPRIATIONS : a. PROPOSED DIVIDENDS ........................................................................ 1,167.88 1,167.86 b. DIVIDEND ON CUMULATIVE CONVERTIBLE PREFERENCE SHARES ... 109.45 22.19 c. TAX ON DIVIDENDS ............................................................................... 217.64 207.75 d. SPECIAL RESERVE................................................................................ 4.24 6.32 e. ACTUARIAL GAIN/(LOSS) ...................................................................... – 5,906.84 f. STATUTORY RESERVE.......................................................................... 51.53 96.30 g. GENERAL RESERVE.............................................................................. 672.23 1,549.08
2,222.97 8,956.34 BALANCE CARRIED TO BALANCE SHEET ...................................................... 10,961.96 8,234.03
Basic Earnings per Share (Rs.) (See Note 20, Page 270) .................................... 66.07 176.81 Diluted Earnings per Share (Rs.) (See Note 20, Page 270) ................................... 58.99 162.62 N 242 NOTES ON BALANCE SHEET AND PROFIT AND LOSS ACCOUNT
Consolidated Profi t and Loss Account for the year ended 31st March, 2009
J C BHAMCompany Secretary
As per our report attached
For DELOITTE HASKINS & SELLSChartered Accountants,
P R RAMESHPartner.
Mumbai, 25th June, 2009
For and on behalf of the BoardRATAN N TATA ChairmanJAMES LENGNUSLI N WADIAS M PALIA ISHAAT HUSSAINJAMSHED J IRANI DirectorsSUBODH BHARGAVA JACOBUS SCHRAVENANDREW ROBBB MUTHURAMAN Managing DirectorKIRBY ADAMS DirectorH M NERURKAR Executive Director
}

Hundred and second annual report 2008-09
232
Year Ended Year Ended 31-03-2009 31-03-2008 Rupees crores Rupees crores
A. Cash Flow from Operating Activities :
Profi t before Taxes, Minority Interest &
Share of Profi ts of Associates 6,743.24 16,371.06
Adjustments for :
Depreciation 4,265.39 4,136.95
Income from other investments (79.62) (77.00)
(Profi t)/Loss on sale of other investments (114.45) (18.41)
(Profi t)/Loss on sale of assets/discarded assets written off (44.94) (254.36)
Restructuring, Impairment and disposals 4,094.53 –
Interest and income from current investments (500.51) (453.96)
Interest charged to profi t and loss account 3,790.69 4,539.37
(Gain)/Loss on cancellation of forward covers/options (26.66) (124.30)
Amortisation of employee separation compensation 223.70 227.12
Contribution for sports infrastructure written off – 150.00
Exchange (Gain)/Loss on revaluation of foreign currency loans 159.84 (741.02)
Unrealised Foreign exchange on consolidation net (gain)/loss (100.66) (285.87)
Preliminary expenditure written off 0.01 2.63
Actuarial (gain)/loss on funds for employee benefi ts – (5,906.84)
Provision for wealth tax 1.68 1.73
Other amortisation and non-cash expenditure 380.17 735.25
12,049.17 1,931.29
Operating Profi t before Working Capital Changes 18,792.41 18,302.35
Adjustments for :
Trade and other receivables 2,945.06 3,858.53
Inventories 1,012.02 (2,701.34)
Trade payables and other liabilities (3,731.70) (3,379.87)
225.38 (2,222.68)
Cash Generated from Operations 19,017.79 16,079.67
Direct taxes paid (3,387.87) (2,686.02)
(3,387.87) (2,686.02)
Net Cash from Operating Activities 15,629.92 13,393.65
B. Cash Flow from Investing Activities :
Purchase of fi xed assets (8,433.46) (8,419.73)
Sale of fi xed assets 72.68 423.05
Pre-operative expenses (0.07) –
Purchase of investments (60,892.93) (33,389.53)
Acquisition of subsidiaries/joint ventures (net of disposals) (182.75) (40,740.45)
Sale of investments 58,068.33 35,353.45
Interest and income from current investments received 503.09 464.74
Dividend received 108.41 110.02
Net Cash from Investing Activities (10,756.70) (46,198.45)
Consolidated Cash Flow Statement for the year ended 31st March, 2009

233
Consolidated Cash Flow Statement for the year ended 31st March, 2009
Year Ended Year Ended 31-03-2009 31-03-2008 Rupees crores Rupees crores
C. Cash Flow from Financing Activities : Issue of equity capital 0.25 4,881.45 Capital contribution received 14.15 3.87 Issue of cumulative convertible preference shares 0.14 5,472.52 Proceeds from borrowings 10,508.52 52,465.30 Repayment of borrowings (8,456.42) (35,458.06) Amount received on cancellation of forward covers/options (10.12) 134.41 Long term loan expenses paid (36.63) (1,737.00) Interest paid (3,547.25) (4,272.09) Dividend paid (1,226.62) (947.82) Net Cash from Financing Activities (2,753.98) 20,542.58
Net increase/(decrease) in Cash and Cash equivalents (A+B+C) 2,119.24 (12,262.22)
Opening Cash and Cash equivalents (iii) 4,029.12 (iv) 16,494.08 (as per Schedule I, Page No. 240)
Closing Cash and Cash equivalents (v) 6,148.36 4,231.86 (as per Schedule I, Page No. 240)
Notes : (i) Figures in brackets represent outfl ows.
(ii) Interest paid is exclusive of, and purchase of fixed assets is inclusive of, interest capitalised Rs. 75.70 crores (2007-08 : Rs. 49.27 crores).
(iii) Includes Rs. 63.74 crores of opening cash and cash equivalents in the books of Tayo Rolls Limited which became a subsidiary during the year and excludes Rs. 51.99 crores in respect of a joint venture and Rs. 214.49 crores in respect of subsidiaries of Tata Steel Europe Limited which were disposed off during the year.
(iv) Includes Rs. 5,606.13 crores of opening cash and cash equivalents in the books of Corus Group Limited (Rs. 5,579.73 crores), Tata Metaliks Ltd. (Rs. 25.82 crores) and Tata Steel Global Minerals Holdings Pte. Limited (Rs. 0.58 crore) which became subsidiaries of the group during the year.
(v) Cash and cash equivalents include unrealised gain of Rs. 30.20 crores (31.03.2008: unrealised loss Rs. 275.49 crores) on account of translation of foreign currency cash and bank balances.
Also includes Rs. 0.24 crore (31.03.2008: Rs. 5.65 crores) refund orders issued on account of over subscription of rights issue of equity shares not encashed as on 31st March, 2009.
(vi) Previous year fi gures have been recast/restated wherever necessary.
J C BHAMCompany Secretary
As per our report attached
For DELOITTE HASKINS & SELLSChartered Accountants,
P R RAMESHPartner.
Mumbai, 25th June, 2009
For and on behalf of the BoardRATAN N TATA ChairmanJAMES LENGNUSLI N WADIAS M PALIA ISHAAT HUSSAINJAMSHED J IRANI DirectorsSUBODH BHARGAVA JACOBUS SCHRAVENANDREW ROBBB MUTHURAMAN Managing DirectorKIRBY ADAMS DirectorH M NERURKAR Executive Director
}

Hundred and second annual report 2008-09
234
Schedules forming part of the Consolidated profi t and loss account
SCHEDULE 1 : SALES AND OTHER OPERATING INCOME :—(Item No. 1, Page 231)
Previous Year Rupees Rupees crores crores
(a) Sale of products .................................................................................................... 1,47,085.83 1,32,558.71
(b) Sale of power and water........................................................................................ 647.38 568.06
(c) Income from town, medical and other services .................................................... 608.79 517.18
(d) Other operating income ......................................................................................... 1,642.94 442.82
1,49,984.94 1,34,086.77
SCHEDULE 2 : OTHER INCOME :—(Item No. 2, Page 231)
Previous Year Rupees Rupees crores crores
(a) Income from other Investments ............................................................................. 79.62 77.00
(b) Profi t on sale/redemption of other investments ......................................................... 114.45 18.41
(c) Profi t on sale of capital assets (net of loss on assets sold/scrapped/written off) ........ 44.94 254.36
(d) Gain from swaps and cancellation of forward covers/options ............................ 26.66 124.30
(e) Miscellaneous Income ........................................................................................... – 1.79
265.67 475.86
SCHEDULE 3 : NET FINANCE CHARGES :—(Item No. 6, Page 231)
Previous Year Rupees Rupees Rupees crores crores crores1. Interest on
(i) Debentures and Fixed loans ....................................................................... 3,644.20 4,409.38 (ii) Others ......................................................................................................... 222.19 179.26
3,866.39 4,588.64
Less — Interest capitalised .................................................................................. 75.70 49.27
3,790.69 4,539.37
2. Less : (i) Interest received on sundry advances, deposits, customers’ balances etc. .. 259.54 355.61 (ii) Income from current investments ................................................................... 104.84 86.68 (iii) Profi t/(loss) on sale of current investments .................................................... 136.13 11.67
500.51 453.96
3,290.18 4,085.41

235
Schedules forming part of the Consolidated profi t and loss accountSCHEDULE 4 : MANUFACTURING AND OTHER EXPENSES :—
(Item No. 3, Page 231)
Previous Year Rupees Rupees Rupees crores crores crores
1. PURCHASE OF FINISHED, SEMI-FINISHED STEEL AND OTHER PRODUCTS............................................................................................. 31,405.91 26,969.38
2. RAW MATERIALS CONSUMED ......................................................................... 41,531.74 33,259.31
3. PAYMENTS TO AND PROVISION FOR EMPLOYEES : (a) Wages and salaries, including bonus .......................................................... 15,058.69 14,607.75 (b) Company’s contributions to provident and other funds ............................... 2,916.37 2,291.82
17,975.06 16,899.57
4. OPERATION AND OTHER EXPENSES : (a) Stores and spares consumed ..................................................................... 9,519.81 8,412.75 (b) Fuel oil consumed ....................................................................................... 1,027.71 719.01 (c) Repairs to buildings..................................................................................... 575.83 431.78 (d) Repairs to machinery .................................................................................. 5,817.25 6,345.38 (e) Relining expenses ....................................................................................... 100.82 63.01 (f) Conversion charges .................................................................................... 1,085.73 879.71 (g) Purchase of power ...................................................................................... 5,957.39 4,929.32 (h) Rent............................................................................................................. 3,689.03 3,757.18 (i) Royalty ........................................................................................................ 234.99 177.81 (j) Rates and taxes .......................................................................................... 627.45 571.07 (k) Insurance charges....................................................................................... 276.02 376.33 (l) Commission, discounts and rebates ........................................................... 376.65 380.76 (m) Provision for wealth tax ............................................................................... 1.68 1.73 (n) Adjustments relating to previous years (net) ............................................... (15.01) 10.40 (o) Other expenses ............................................................................ 1,656.81* 5,631.21
30,932.16 32,687.45
5. FREIGHT AND HANDLING CHARGES ................................................................ 6,024.85 6,038.51
6. PROVISION FOR DOUBTFUL DEBTS AND ADVANCES .................................... 174.57 58.29
7. EXCISE DUTY ...................................................................................................... (35.57) 35.60
1,28,008.72 1,15,948.11
8. (ACCRETION)/REDUCTION IN STOCKS OF FINISHED AND SEMI-FINISHED PRODUCTS AND WORK-IN-PROGRESS (DEDUCTED)/ADDED: (a) Opening Stock............................................................................................ 14,052.69# 13,131.32 (b) Foreign exchange movement..................................................................... (634.42) (758.62) (c) Less – Closing Stock.................................................................................. 11,442.33 14,021.85 1,975.94 (1,649.15)
1,29,984.66 1,14,298.96
# Includes Rs. 30.84 crores for Tayo Rolls Ltd. which became a subsidiary during the year.
* Includes goodwill written off Rs. 30.15 crores (2007-08 : Rs. 127.59 crores).

Hundred and second annual report 2008-09
236
SCHEDULE B : RESERVES AND SURPLUS :—(Item No. 2, Page 230) As at 31-03-2008 Rupees Rupees crores crores
(a) Securities premium account .................................................................................... 6,112.77 6,392.14(b) Amalgamation reserve ............................................................................................. 1.12 1.12(c) Debenture redemption reserve ................................................................................ 646.00 646.00(d) Capital redemption reserve ...................................................................................... 20.78 20.78(e) Capital reserve ......................................................................................................... 19.30 16.45(f) Capital reserve (arising on consolidation) ............................................................... 16.47 16.21(g) General reserve ....................................................................................................... 7,839.36 7,697.15(h) Investment allowance (utilised) reserve ................................................................... 0.23 0.23(i) Export profi ts reserve .............................................................................................. 1.25 1.25(j) Foreign exchange fl uctuation reserve ...................................................................... 14.00 39.71(k) Foreign currency translation reserve ....................................................................... (4,871.18) (1,273.33)(l) Contributions for capital expenditure ...................................................................... 57.17 46.52(m) Contingency reserve ................................................................................................ 100.00 100.00(n) Debenture forfeiture reserve .................................................................................... 0.04 0.04(o) Special reserve ........................................................................................................ 34.14 29.91(p) Statutory reserve ..................................................................................................... 147.83 96.30(q) Actuarial gain/(loss) ................................................................................................. 410.26 5,906.84(r) Profi t and loss account ........................................................................................... 10,961.96 8,234.03
21,511.50 27,971.35
Schedules forming part of the Consolidated balance sheetSCHEDULE A : SHARE CAPITAL :—(Item No. 1, Page 230)
As at 31-03-2008 Rupees Rupees crores croresAuthorised : 1,75,00,00,000 Ordinary Shares of Rs. 10 each .................................................. 1,750.00 1,750.00 (31.03.2008 : 1,75,00,00,000 Shares of Rs. 10 each)
2,50,00,000 Cumulative Redeemable Preference Shares of Rs. 100 each ............ 250.00 250.00 (31.03.2008 : 2,50,00,000 Shares of Rs. 100 each)
60,00,00,000 2% Cumulative Convertible Preference Shares of Rs. 100 each ........ 6,000.00 6,000.00 (31.03.2008 : 60,00,00,000 Shares of Rs. 100 each)
8,000.00 8,000.00Issued : 73,06,98,048@ Ordinary Shares of Rs. 10 each ................................................... 730.70 730.70 (31.03.2008 : 73,06,98,048 Shares of Rs. 10 each)
54,80,75,571 2% Cumulative Convertible Preference Shares of Rs. 100 each ........ 5,480.76 5,480.76 (31.03.2008 : 54,80,75,571 Shares of Rs. 100 each)
Subscribed :
72,99,21,016@ Ordinary Shares of Rs. 10 each fully paid up .................................. 729.92 729.91 (31.03.2008 : 72,99,12,865 Shares of Rs. 10 each) Add — Amount paid up on 3,89,516 Shares forfeited ........................ 0.20 0.20 (31.03.2008 : 3,89,516 Shares of Rs. 10 each) 730.12 730.11
54,72,66,011 2% Cumulative Convertible Preference Shares of Rs. 100 each ........ 5,472.66 5,472.52 (31.03.2008 : 54,72,51,605 Shares of Rs. 100 each)
6,202.78 6,202.63@ Excludes 6,71,455 (31.03.2008 : 6,71,455 shares) Ordinary Shares held by a Subsidiary.

237
As at 31-03-2008 Rupees Rupees crores crores
(a) Fixed deposits (including interest accrued and due) .............................................. 6.82 14.43
(b) Housing Development Finance Corporation Ltd. ..................................................... 3.03 5.50
(c) Privately placed non-convertible debentures ........................................................... 3,250.00 –
(d) Banks and fi nancial institutions ................................................................................ 16,156.68 13,008.76
(e) 1% Convertible Alternative Reference Securities – US $ 875 million equivalent (See Note 23, Page 270) .......................................................................................... 5,473.92 4,329.92
(f) Assets under lease .................................................................................................. 633.93 793.12
(g) Interest free loans under Sales Tax Deferral Scheme ............................................. 0.45 0.46
(h) Others ...................................................................................................................... 46.41 57.56
25,571.24 18,209.75
SCHEDULE C : SECURED LOANS :—(Item No. 6(a), Page 230)
As at 31-03-2008 Rupees Rupees crores crores
(a) Joint plant committee-steel development fund [including funded
interest Rs. 233.91 crores (31.03.2008 : Rs. 227.82 crores)] .................................. 1,752.40 1,700.63
(b) Privately placed non-convertible debentures........................................................... 86.83 83.42
(c) Banks and fi nancial institutions ................................................................................ 31,726.86 32,726.12
(d) Working capital demand loan from banks .............................................................. 26.51 119.96
(e) Cash credits/packing credits from banks ................................................................. 368.40 368.72
(f) Government of India ................................................................................................ 0.02 0.02
(g) Assets under lease .................................................................................................. 368.24 416.12
34,329.26 35,414.99
Schedules forming part of the Consolidated balance sheet
SCHEDULE D : UNSECURED LOANS :—(Item No. 6(b), Page 230)

Hundred and second annual report 2008-09
238
Schedules forming part of the Consolidated balance sheetSCHEDULE E : FIXED ASSETS :—(Item No. 10, Page 230)
Rupees crores
Furniture, Fixture and Develop- Live-Fixed Assets Land and Lease- Railway Plant and Offi ce ment of stock & Roads Buildings hold Sidings Machinery Equipment Property Vehicles Intangibles Total (4) (5)
Gross Block as at 1.04.2008 1,283.85 8,708.36 2,298.72 677.99 80,202.99 1,174.56 361.63 236.21 1,285.04 96,229.35 389.90 1,773.54 236.56 116.92 16,668.86 202.14 383.87 195.81 116.18 20,083.78 Assets of New Companies (1) – 4.65 0.05 – 95.36 1.25 – 0.70 5.24 107.25 871.73 6,889.89 2,066.71 513.35 61,633.92 976.70 – 24.67 894.99 73,871.96 Additions during the year (2) & (6) 125.07 375.36 45.54 53.71 7,579.55 80.98 18.55 18.40 443.75 8,740.91 29.69 333.31 79.91 35.04 5,156.29 35.39 2.57 24.33 271.69 5,968.22 Exchange Movement 21.55 19.22 (82.78) 6.71 (2,720.49) 88.03 0.81 4.91 (6.46) (2,668.50) 6.89 (99.45) (63.70) 12.68 (1,942.04) 69.26 – 0.59 5.02 (2,010.75) Deductions during the year (3) 60.68 153.62 63.38 28.56 2,534.12 55.40 – 5.57 49.01 2,950.34 14.36 188.93 20.76 – 1,314.04 108.93 24.81 9.19 2.84 1,683.86
Gross Block as at 31.03.2009 1,369.79 8,953.97 2,198.15 709.85 82,623.29 1,289.42 380.99 254.65 1,678.56 99,458.67 1,283.85 8,708.36 2,298.72 677.99 80,202.99 1,174.56 361.63 236.21 1,285.04 96,229.35 Capital work-in-progress [including advances for capital expenditure Rs. 1,310.65 crores (31.03.2008 : Rs. 961.81 crores)] 8,930.07 8,899.36
1,08,388.74 1,05,128.71
Impaired Assets as at 1.04.2008 162.73 104.66 41.36 – 2,837.60 0.46 – – 24.89 3,171.70 99.16 1.25 – – – – – – – 100.41 Impairment of New Companies (1) – – – – – – – – – – 59.10 71.69 31.22 – 2,715.24 0.37 – – 26.63 2,904.25 Impairment during the year 9.40 65.32 61.56 14.96 814.33 – – – – 965.57 0.07 32.29 12.44 – 204.26 0.10 – – – 249.16 Impairment on assets written off 1.59 27.54 1.41 – 695.27 0.02 – – – 725.83 – – – – 8.36 – – – – 8.36 Exchange Movement 3.24 (7.62) (8.26) (1.14) (212.34) (0.04) – – (2.24) (228.40) 4.40 (0.57) (2.30) – (73.54) (0.01) – – (1.74) (73.76)
Impaired assets as at 31.03.2009 173.78 134.82 93.25 13.82 2,744.32 0.40 – – 22.65 3,183.04 162.73 104.66 41.36 – 2,837.60 0.46 – – 24.89 3,171.70
Accumulated Depreciation upto 1.04.2008 292.89 5,719.47 1,059.99 527.91 50,472.35 1,047.24 171.92 110.68 536.47 59,938.92 48.02 729.38 12.09 61.89 7,824.67 135.07 160.52 77.81 39.76 9,089.21 Depreciation on New Companies (1) – 1.40 – – 70.77 0.67 – 0.32 5.19 78.35 247.41 5,068.73 872.33 445.69 42,167.71 920.25 – 17.67 360.35 50,100.14 Depreciation during the year 14.17 278.24 153.91 14.56 3,614.99 44.62 34.59 23.73 143.35 4,322.16 12.19 271.53 203.70 11.64 3,460.39 37.79 36.21 22.79 123.68 4,179.92 Depreciation on assets written off during the year 0.40 153.64 33.39 28.57 1,768.40 58.19 – 5.45 17.25 2,065.29 3.17 173.18 (0.90) 2.50 1,184.99 118.00 24.81 7.84 (6.78) 1,506.81 Exchange Movement (20.79) (101.23) (50.63) 5.40 (2,340.20) 81.53 – 2.36 7.51 (2,416.05) (11.56) (176.99) (29.03) 11.19 (1,795.43) 72.13 – 0.25 5.90 (1,923.54)
Accumulated Depreciation upto 31.03.2009 285.87 5,744.24 1,129.88 519.30 50,049.51 1,115.87 206.51 131.64 675.27 59,858.09 292.89 5,719.47 1,059.99 527.91 50,472.35 1,047.24 171.92 110.68 536.47 59,938.92
Total Accumulated Depreciation & Impairment upto 31.03.2009 459.65 5,879.06 1,223.13 533.12 52,793.83 1,116.27 206.51 131.64 697.92 63,041.13
455.62 5,824.13 1,101.35 527.91 53,309.95 1,047.70 171.92 110.68 561.36 63,110.62
Net Block as at 31.03.2009 910.14 3,074.91 975.02 176.73 29,829.46 173.15 174.48 123.01 980.64 36,417.54 828.23 2,884.23 1,197.37 150.08 26,893.04 126.86 189.71 125.53 723.68 33,118.73 Impairment on Capital work-in-progress 42.03 51.80
Capital Work in progress [including advances for capital expenditure Rs. 1,310.65 crores (31.03.2008 : Rs. 961.81 crores)] 8,888.04 8,847.56
45,305.58 41,966.29
(1) Represents assets, impaired assets and accumulated depreciation of Tayo Rolls Limited which became part of Tata Steel Group during the year.
(2) Additions include adjustments for inter se transfers.
(3) Deductions include cost of assets scrapped/sold/surrendered during the year.
(4) Buildings include Rs. 2.32 crores (31.03.2008 : Rs. 2.32 crores) being cost of shares in Co-operative Housing Societies & Limited Companies.
(5) Development of property represents expenditure incurred on development of mines/collieries.
(6) Rupee Liability has increased by a net amount of Rs. 76.62 crores (2007-08 : Rs. 6.45 crores) arising out of realignment of the value of foreign currency loans for procurement of fi xed assets, including Rs. 54.81 crores considered pursuant to the Accounting Standard 11 vide notifi cation No. GSR 225(E) dated 31.03.2009 issued by Ministry of Corporate Affairs which was charged off in previous years. The increase has been adjusted to the carrying cost of respective fi xed assets and has been depreciated over their remaining depreciable life. The depreciation for the current year includes Rs. 2.04 crores arising on account of this adjustment.
(7) Depreciation charge in the profi t and loss account is net of Rs. 56.77 crores (2007-08 : Rs. 42.97 crores) on account of an asset against which a specifi c grant has been received.

239
Schedules forming part of the Consolidated balance sheet
SCHEDULE G : STOCK-IN-TRADE :— (Item No. 15A(b), Page 230)
As at 31-03-2008 Rupees Rupees crores crores(a) Finished and semi-finished products produced and purchased by the
Company, at lower of cost and net realisable value (including purchased goods-in-transit) ...................................................................................................... 7,861.08 9,359.99(b) Work-in-progress (at lower of cost and net realisable value) ................................. 3,581.25 4,661.86 11,442.33 14,021.85(c) Coal, iron ore and other raw materials produced and purchased by the Company, at lower of cost and net realisable value (including purchased raw materials-in-transit) ......................................................................................... 8,373.66 7,387.52
19,815.99 21,409.37
SCHEDULE F : INVESTMENTS :—(Item No. 11, Page 230)
As at 31-03-2008 Rupees Rupees Rupees crores crores croresA. LONG TERM INVESTMENTS (At Cost less provision for diminution in value)1. In Associates (see Note 1, Page 250) Cost of investment ................................................................................................. 361.09 302.79 (including Rs. 12.66 crores (31.03.2008 : Rs. 12.69 crores) of Goodwill net of Capital Reserve arising on consolidation) Add – Share of post acquisition profi t (net of losses) ............................................ 290.68 259.08 651.77 561.872. Others (a) Shares (Quoted) ........................................................................................... 717.72 363.88 (b) Shares (Unquoted) ........................................................................................ 1,537.10 1,153.81
B. INVESTMENT PROPERTIES ................................................................................ 106.77 154.13C. CURRENT INVESTMENTS (at lower of cost and fair value)
(Quoted)3. Units in Unit Trust of India ...................................................................................... – 10.214. Others ..................................................................................................................... 6.97 1.74 6.97 11.95
(Unquoted)5. Investment in Mutual Funds ................................................................................... 3,390.77 1,111.70 6. Others ..................................................................................................................... – 10.09 6,411.10 3,367.43

Hundred and second annual report 2008-09
240
SCHEDULE I : CASH AND BANK BALANCES :—(Item No. 15A(e), Page 230)
As at 31-03-2008 Rupees Rupees crores crores(a) Cash in hand [including cheques in hand] .......................................................... 83.77 139.22(b) Remittance in transit ............................................................................................. 4.86 16.07(c) Balance in current and deposit accounts (i) With scheduled banks ................................................................................... 1,683.28 392.47 (ii) With other banks ............................................................................................ 4,376.45 3,684.10
6,148.36 4,231.86
SCHEDULE J : LOANS AND ADVANCES :—(Item No. 15B, Page 230) As at 31-03-2008 Rupees Rupees crores crores(a) Advances with public bodies .................................................................................. 588.15 566.48(b) Other advances ...................................................................................................... 12,423.75 14,969.46(c) Advance payment against taxes ............................................................................. 186.01 126.05 13,197.91 15,661.99 Less — Provision for doubtful advances ................................................................ 182.18 202.18 13,015.73 15,459.81
As at 31-03-2008 Rupees Rupees crores croresLoans and Advances, secured and considered good ...................................................... – 0.08Loans and Advances, unsecured and considered good .................................................. 13,015.73 15,459.73Loans and Advances, considered doubtful ...................................................................... 182.18 202.18
13,197.91 15,661.99
Schedules forming part of the Consolidated balance sheet
SCHEDULE H : SUNDRY DEBTORS :—(Item No. 15A(c), Page 230)
As at 31-03-2008 Rupees Rupees crores crores(a) Over six months old ................................................................................................ 804.28 752.27(b) Others .................................................................................................................... 12,714.33 18,420.94 13,518.61 19,173.21 Less — Provision for doubtful debts .................................................................... 486.98 475.39 13,031.63 18,697.82
As at 31-03-2008 Rupees Rupees crores crores Sundry debts, secured and considered good ......................................................... 2,234.86 4,403.70 Sundry debts, unsecured and considered good ..................................................... 10,796.77 14,294.12 Sundry debts, considered doubtful ......................................................................... 486.98 475.39 13,518.61 19,173.21
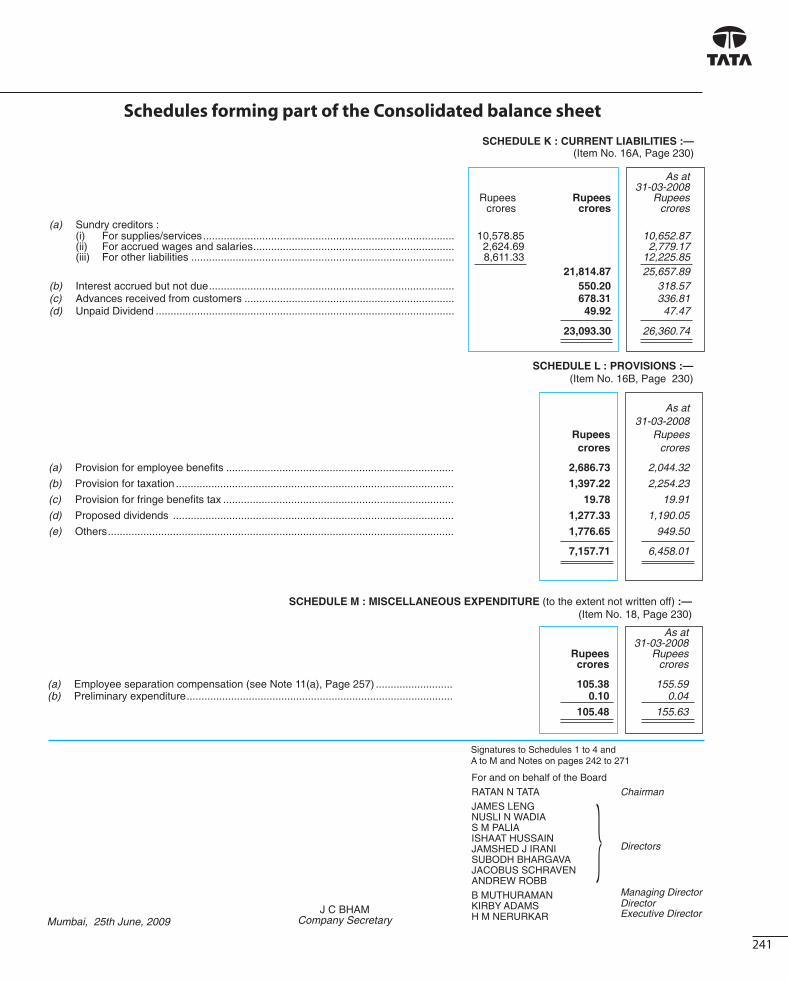
241
Schedules forming part of the Consolidated balance sheet
SCHEDULE L : PROVISIONS :—(Item No. 16B, Page 230)
As at 31-03-2008 Rupees Rupees crores crores
(a) Provision for employee benefi ts ............................................................................. 2,686.73 2,044.32
(b) Provision for taxation .............................................................................................. 1,397.22 2,254.23
(c) Provision for fringe benefi ts tax .............................................................................. 19.78 19.91
(d) Proposed dividends ............................................................................................... 1,277.33 1,190.05
(e) Others ..................................................................................................................... 1,776.65 949.50
7,157.71 6,458.01
Signatures to Schedules 1 to 4 and A to M and Notes on pages 242 to 271
SCHEDULE M : MISCELLANEOUS EXPENDITURE (to the extent not written off) :—(Item No. 18, Page 230)
As at 31-03-2008 Rupees Rupees crores crores
(a) Employee separation compensation (see Note 11(a), Page 257) .......................... 105.38 155.59(b) Preliminary expenditure .......................................................................................... 0.10 0.04
105.48 155.63
SCHEDULE K : CURRENT LIABILITIES :—(Item No. 16A, Page 230)
As at 31-03-2008 Rupees Rupees Rupees crores crores crores
(a) Sundry creditors : (i) For supplies/services ..................................................................................... 10,578.85 10,652.87 (ii) For accrued wages and salaries .................................................................... 2,624.69 2,779.17 (iii) For other liabilities ......................................................................................... 8,611.33 12,225.85 21,814.87 25,657.89(b) Interest accrued but not due ................................................................................... 550.20 318.57(c) Advances received from customers ....................................................................... 678.31 336.81(d) Unpaid Dividend ..................................................................................................... 49.92 47.47
23,093.30 26,360.74
J C BHAMCompany SecretaryMumbai, 25th June, 2009
For and on behalf of the BoardRATAN N TATA ChairmanJAMES LENGNUSLI N WADIAS M PALIA ISHAAT HUSSAINJAMSHED J IRANI DirectorsSUBODH BHARGAVA JACOBUS SCHRAVENANDREW ROBBB MUTHURAMAN Managing DirectorKIRBY ADAMS DirectorH M NERURKAR Executive Director
}
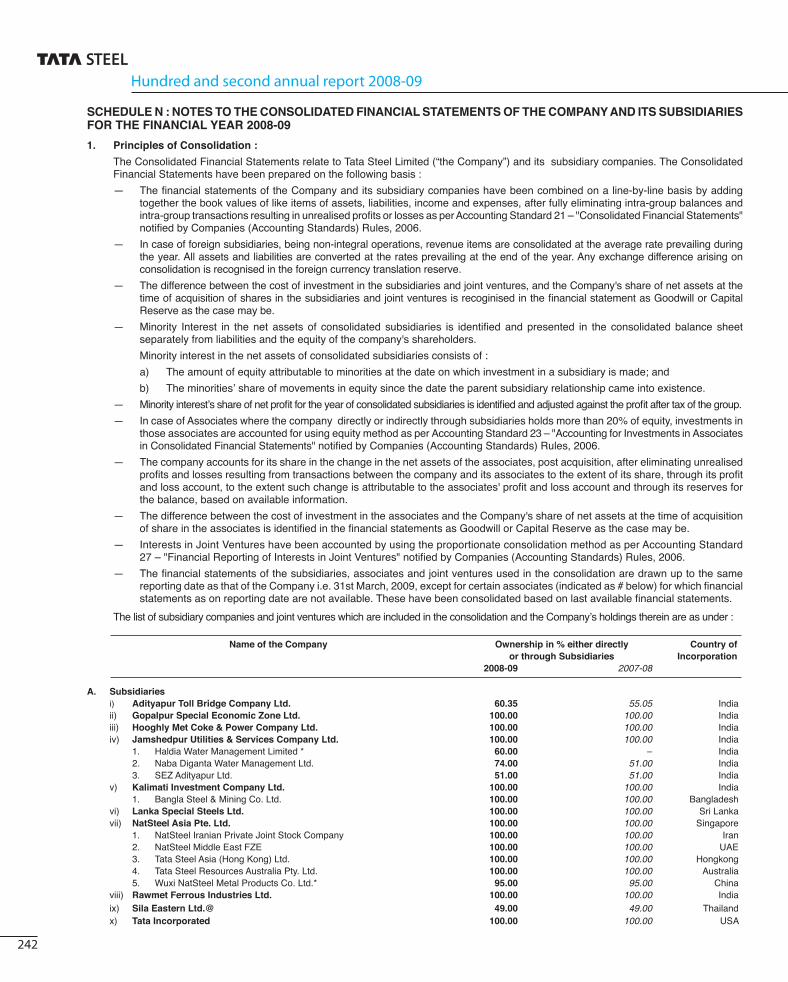
Hundred and second annual report 2008-09
242
SCHEDULE N : NOTES TO THE CONSOLIDATED FINANCIAL STATEMENTS OF THE COMPANY AND ITS SUBSIDIARIES FOR THE FINANCIAL YEAR 2008-09
1. Principles of Consolidation :
The Consolidated Financial Statements relate to Tata Steel Limited (“the Company”) and its subsidiary companies. The Consolidated Financial Statements have been prepared on the following basis :
— The fi nancial statements of the Company and its subsidiary companies have been combined on a line-by-line basis by adding together the book values of like items of assets, liabilities, income and expenses, after fully eliminating intra-group balances and intra-group transactions resulting in unrealised profi ts or losses as per Accounting Standard 21 – "Consolidated Financial Statements" notifi ed by Companies (Accounting Standards) Rules, 2006.
— In case of foreign subsidiaries, being non-integral operations, revenue items are consolidated at the average rate prevailing during the year. All assets and liabilities are converted at the rates prevailing at the end of the year. Any exchange difference arising on consolidation is recognised in the foreign currency translation reserve.
— The difference between the cost of investment in the subsidiaries and joint ventures, and the Company's share of net assets at the time of acquisition of shares in the subsidiaries and joint ventures is recoginised in the fi nancial statement as Goodwill or Capital Reserve as the case may be.
— Minority Interest in the net assets of consolidated subsidiaries is identifi ed and presented in the consolidated balance sheet separately from liabilities and the equity of the company's shareholders.
Minority interest in the net assets of consolidated subsidiaries consists of :
a) The amount of equity attributable to minorities at the date on which investment in a subsidiary is made; and
b) The minorities’ share of movements in equity since the date the parent subsidiary relationship came into existence.
— Minority interest’s share of net profi t for the year of consolidated subsidiaries is identifi ed and adjusted against the profi t after tax of the group.
— In case of Associates where the company directly or indirectly through subsidiaries holds more than 20% of equity, investments in those associates are accounted for using equity method as per Accounting Standard 23 – "Accounting for Investments in Associates in Consolidated Financial Statements" notifi ed by Companies (Accounting Standards) Rules, 2006.
— The company accounts for its share in the change in the net assets of the associates, post acquisition, after eliminating unrealised profi ts and losses resulting from transactions between the company and its associates to the extent of its share, through its profi t and loss account, to the extent such change is attributable to the associates' profi t and loss account and through its reserves for the balance, based on available information.
— The difference between the cost of investment in the associates and the Company's share of net assets at the time of acquisition of share in the associates is identifi ed in the fi nancial statements as Goodwill or Capital Reserve as the case may be.
— Interests in Joint Ventures have been accounted by using the proportionate consolidation method as per Accounting Standard 27 – "Financial Reporting of Interests in Joint Ventures" notifi ed by Companies (Accounting Standards) Rules, 2006.
— The fi nancial statements of the subsidiaries, associates and joint ventures used in the consolidation are drawn up to the same reporting date as that of the Company i.e. 31st March, 2009, except for certain associates (indicated as # below) for which fi nancial statements as on reporting date are not available. These have been consolidated based on last available fi nancial statements.
The list of subsidiary companies and joint ventures which are included in the consolidation and the Company’s holdings therein are as under :
Name of the Company Ownership in % either directly Country of or through Subsidiaries Incorporation 2008-09 2007-08
A. Subsidiaries i) Adityapur Toll Bridge Company Ltd. 60.35 55.05 India ii) Gopalpur Special Economic Zone Ltd. 100.00 100.00 India iii) Hooghly Met Coke & Power Company Ltd. 100.00 100.00 India iv) Jamshedpur Utilities & Services Company Ltd. 100.00 100.00 India 1. Haldia Water Management Limited * 60.00 – India 2. Naba Diganta Water Management Ltd. 74.00 51.00 India 3. SEZ Adityapur Ltd. 51.00 51.00 India v) Kalimati Investment Company Ltd. 100.00 100.00 India 1. Bangla Steel & Mining Co. Ltd. 100.00 100.00 Bangladesh vi) Lanka Special Steels Ltd. 100.00 100.00 Sri Lanka vii) NatSteel Asia Pte. Ltd. 100.00 100.00 Singapore 1. NatSteel Iranian Private Joint Stock Company 100.00 100.00 Iran 2. NatSteel Middle East FZE 100.00 100.00 UAE 3. Tata Steel Asia (Hong Kong) Ltd. 100.00 100.00 Hongkong 4. Tata Steel Resources Australia Pty. Ltd. 100.00 100.00 Australia 5. Wuxi NatSteel Metal Products Co. Ltd.* 95.00 95.00 China viii) Rawmet Ferrous Industries Ltd. 100.00 100.00 India ix) Sila Eastern Ltd.@ 49.00 49.00 Thailand x) Tata Incorporated 100.00 100.00 USA

243
SCHEDULE N : NOTES TO THE CONSOLIDATED FINANCIAL STATEMENTS OF THE COMPANY AND ITS SUBSIDIARIES FOR THE FINANCIAL YEAR 2008-09 :– continued
xi) Tata Korf Engineering Services Ltd. 100.00 99.99 India xii) Tata Metaliks Ltd. 50.04 50.04 India 1. Tata Metaliks Kubota Pipes Ltd. 25.52 25.52 India xiii) Tata Refractories Ltd. 71.28 71.28 India 1. TRL Asia Pvt. Limited 62.73 62.73 Singapore 2. TRL China Limited 71.28 71.28 China xiv) Tayo Rolls Ltd.* 54.45 – India xv) Tata Steel (KZN) (Pty) Ltd. 90.00 90.00 South Africa xvi) Tata Steel Holdings Pte. Ltd. 100.00 100.00 Singapore a) Tata Steel Global Holdings Pte Ltd.* 100.00 – Singapore I Corus International (Singapore) Holding Pte. Ltd. 100.00 100.00 Singapore 1. Corus Asia Limited 100.00 100.00 Hong Kong 2. Corus Holdings (Thailand) Ltd. 100.00 100.00 Thailand 3. Corus International (Guangzhou) Ltd. 100.00 100.00 China 4. Corus International (Shanghai) Ltd. 100.00 100.00 China 5. Corus International Trading Limited 100.00 100.00 Hong Kong 6. Corus Metals (Malaysia) Sdn. Bhd. 100.00 100.00 Malaysia 7. Corus Metals (Thailand) Limited 100.00 100.00 Thailand 8. Corus South East Asia Pte Limited 100.00 100.00 Singapore II NatSteel Holdings Pte. Ltd.* 100.00 – Singapore 1. Best Bar (Vic) Pte. Ltd. 71.00 71.00 Australia 2. Best Bar Pty. Ltd. 71.00 71.00 Australia 3. Burwill Trading Pte. Ltd. 100.00 100.00 Singapore 4. Easteel Construction Services Pte. Ltd. 100.00 100.00 Singapore 5. Easteel Services (M) Sdn. Bhd. 100.00 100.00 Malaysia 6. Eastern Steel Fabricators Phillipines, Inc. 67.00 67.00 Phillipines 7. Eastern Steel Services Pte. Ltd. 100.00 100.00 Singapore 8. Eastern Wire Pte. Ltd. 100.00 100.00 Singapore 9. Materials Recycling Pte. Ltd. 100.00 100.00 Singapore 10. Natferrous Pte. Ltd. 100.00 100.00 Singapore 11. NatSteel (Xiamen) Ltd. 100.00 100.00 China 12. NatSteel Asia (S) Pte. Ltd. 100.00 100.00 Singapore 13. NatSteel Australia Pty. Ltd. 100.00 100.00 Australia 14. NatSteel Equity IV Pte. Ltd. 100.00 100.00 Singapore 15. NatSteel Trade International (Shanghai) Company Ltd. 100.00 100.00 China 16. NatSteel Trade International Pte. Ltd. 100.00 100.00 Singapore 17. NatSteel Vina Co. Ltd. 56.50 56.50 Vietnam 18. PT Materials Recycling Indonesia 100.00 100.00 Indonesia 19. Siam Industrial Wire Company Ltd. 100.00 100.00 Thailand 20. Wuxi Jinyang Metal Products Co. Ltd. 95.00 95.00 China III Orchid Netherlands (No.1) B.V. * 100.00 – Netherlands IV Tata Steel Europe Ltd. 100.00 100.00 UK 1. Almana Steel Dubai (Jersey) Limited 100.00 100.00 Jersey 2. Aluminium Delfzijl B.V. * 100.00 100.00 Netherlands 3. Apollo Metals Ltd. 100.00 100.00 USA 4. Ashorne Hill Management College 100.00 100.00 UK 5. Augusta Grundstucks GmbH 100.00 100.00 Germany 6. Automotive Laser Technologies Limited 100.00 100.00 UK 7. Automotive Tailored Blanks B.V. * 100.00 100.00 Netherlands 8. B S Pension Fund Trustee Ltd. 100.00 100.00 UK 9. Bailey Steels Limited * 100.00 – UK 10. Beheermaatschappij Industriele Produkten B.V. 100.00 100.00 Netherlands 11. Belfi n Beheermaatschappij B.V. 100.00 100.00 Netherlands 12. Bell & Harwood Limited 100.00 100.00 UK 13. Blastmega Limited (United Steel Forgings Ltd.) 100.00 100.00 UK 14. Blume Stahlservice GmbH 100.00 100.00 Germany 15. Blume Stahlservice Polska Sp. Z.O.O 100.00 100.00 Poland 16. Bore Samson Group Ltd. 100.00 100.00 UK 17. Bore Steel Ltd. 100.00 100.00 UK
Name of the Company Ownership in % either directly Country of or through Subsidiaries Incorporation 2008-09 2007-08
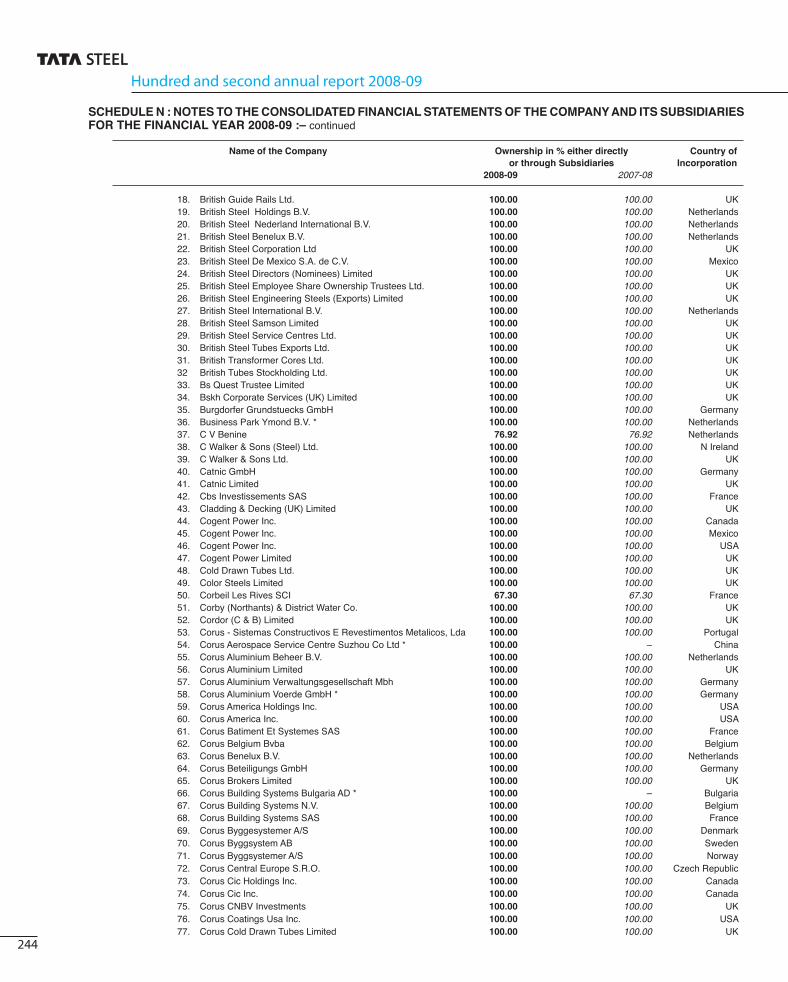
Hundred and second annual report 2008-09
244
Name of the Company Ownership in % either directly Country of or through Subsidiaries Incorporation 2008-09 2007-08
SCHEDULE N : NOTES TO THE CONSOLIDATED FINANCIAL STATEMENTS OF THE COMPANY AND ITS SUBSIDIARIES FOR THE FINANCIAL YEAR 2008-09 :– continued
18. British Guide Rails Ltd. 100.00 100.00 UK 19. British Steel Holdings B.V. 100.00 100.00 Netherlands 20. British Steel Nederland International B.V. 100.00 100.00 Netherlands 21. British Steel Benelux B.V. 100.00 100.00 Netherlands 22. British Steel Corporation Ltd 100.00 100.00 UK 23. British Steel De Mexico S.A. de C.V. 100.00 100.00 Mexico 24. British Steel Directors (Nominees) Limited 100.00 100.00 UK 25. British Steel Employee Share Ownership Trustees Ltd. 100.00 100.00 UK 26. British Steel Engineering Steels (Exports) Limited 100.00 100.00 UK 27. British Steel International B.V. 100.00 100.00 Netherlands 28. British Steel Samson Limited 100.00 100.00 UK 29. British Steel Service Centres Ltd. 100.00 100.00 UK 30. British Steel Tubes Exports Ltd. 100.00 100.00 UK 31. British Transformer Cores Ltd. 100.00 100.00 UK 32 British Tubes Stockholding Ltd. 100.00 100.00 UK 33. Bs Quest Trustee Limited 100.00 100.00 UK 34. Bskh Corporate Services (UK) Limited 100.00 100.00 UK 35. Burgdorfer Grundstuecks GmbH 100.00 100.00 Germany 36. Business Park Ymond B.V. * 100.00 100.00 Netherlands 37. C V Benine 76.92 76.92 Netherlands 38. C Walker & Sons (Steel) Ltd. 100.00 100.00 N Ireland 39. C Walker & Sons Ltd. 100.00 100.00 UK 40. Catnic GmbH 100.00 100.00 Germany 41. Catnic Limited 100.00 100.00 UK 42. Cbs Investissements SAS 100.00 100.00 France 43. Cladding & Decking (UK) Limited 100.00 100.00 UK 44. Cogent Power Inc. 100.00 100.00 Canada 45. Cogent Power Inc. 100.00 100.00 Mexico 46. Cogent Power Inc. 100.00 100.00 USA 47. Cogent Power Limited 100.00 100.00 UK 48. Cold Drawn Tubes Ltd. 100.00 100.00 UK 49. Color Steels Limited 100.00 100.00 UK 50. Corbeil Les Rives SCI 67.30 67.30 France 51. Corby (Northants) & District Water Co. 100.00 100.00 UK 52. Cordor (C & B) Limited 100.00 100.00 UK 53. Corus - Sistemas Constructivos E Revestimentos Metalicos, Lda 100.00 100.00 Portugal 54. Corus Aerospace Service Centre Suzhou Co Ltd * 100.00 – China 55. Corus Aluminium Beheer B.V. 100.00 100.00 Netherlands 56. Corus Aluminium Limited 100.00 100.00 UK 57. Corus Aluminium Verwaltungsgesellschaft Mbh 100.00 100.00 Germany 58. Corus Aluminium Voerde GmbH * 100.00 100.00 Germany 59. Corus America Holdings Inc. 100.00 100.00 USA 60. Corus America Inc. 100.00 100.00 USA 61. Corus Batiment Et Systemes SAS 100.00 100.00 France 62. Corus Belgium Bvba 100.00 100.00 Belgium 63. Corus Benelux B.V. 100.00 100.00 Netherlands 64. Corus Beteiligungs GmbH 100.00 100.00 Germany 65. Corus Brokers Limited 100.00 100.00 UK 66. Corus Building Systems Bulgaria AD * 100.00 – Bulgaria 67. Corus Building Systems N.V. 100.00 100.00 Belgium 68. Corus Building Systems SAS 100.00 100.00 France 69. Corus Byggesystemer A/S 100.00 100.00 Denmark 70. Corus Byggsystem AB 100.00 100.00 Sweden 71. Corus Byggsystemer A/S 100.00 100.00 Norway 72. Corus Central Europe S.R.O. 100.00 100.00 Czech Republic 73. Corus Cic Holdings Inc. 100.00 100.00 Canada 74. Corus Cic Inc. 100.00 100.00 Canada 75. Corus CNBV Investments 100.00 100.00 UK 76. Corus Coatings Usa Inc. 100.00 100.00 USA 77. Corus Cold Drawn Tubes Limited 100.00 100.00 UK

245
SCHEDULE N : NOTES TO THE CONSOLIDATED FINANCIAL STATEMENTS OF THE COMPANY AND ITS SUBSIDIARIES FOR THE FINANCIAL YEAR 2008-09 :– continued
78. Corus Construction Products (Thailand) Limited 82.35 82.35 Thailand 79. Corus Consulting And Technical Services B.V. 100.00 100.00 Netherlands 80. Corus Consulting B.V. 100.00 100.00 Netherlands 81. Corus Consulting Limited 100.00 100.00 UK 82. Corus Consulting Romania SRL 100.00 100.00 Romania 83. Corus Degels GmbH 100.00 100.00 Germany 84. Corus Denmark A/S 100.00 100.00 Denmark 85. Corus Deutschland GmbH 100.00 100.00 Germany 86. Corus Distribution Europe BV 100.00 100.00 Netherlands 87. Corus Electrical Limited 100.00 100.00 UK 88. Corus Engineering Limited 100.00 100.00 UK 89. Corus Engineering Steels (UK) Limited 100.00 100.00 UK 90. Corus Engineering Steels Holdings Limited 100.00 100.00 UK 91. Corus Engineering Steels Limited 100.00 100.00 UK 92. Corus Engineering Steels Overseas Holdings Limited 100.00 100.00 UK 93. Corus Finance Limited 100.00 100.00 UK 94. Corus Finland Oy 100.00 100.00 Finland 95. Corus France SAS 100.00 100.00 France 96. Corus Group Limited 100.00 100.00 UK 97. Corus Holdings Ltd. 100.00 100.00 UK 98. Corus Holdings SA 100.00 100.00 France 99. Corus Hungary Trading Limited Liability Company 100.00 100.00 Hungary 100. Corus India Ltd. 100.00 100.00 India 101. Corus International (India) Pvt. Limited 100.00 100.00 India 102. Corus International (Overseas Holdings) Limited 100.00 100.00 UK 103. Corus International Bulgaria Limited * 100.00 – Bulgaria 104. Corus International Deutschland GmbH 100.00 100.00 Germany 105. Corus International Limited 100.00 100.00 UK 106. Corus International Nigeria * 100.00 – Nigeria 107. Corus International Representacoes Do Brasil Ltda. 100.00 100.00 Brazil 108. Corus International Romania SRL 100.00 100.00 Romania 109. Corus International Services N.V 100.00 100.00 Belgium 110. Corus International Trading Limited 100.00 100.00 UK 111. Corus International Trading Limited 100.00 100.00 USA 112 Corus Investment B.V. 100.00 100.00 Netherlands 113. Corus Investments Ltd. 100.00 100.00 UK 114. Corus Ireland Ltd. 100.00 100.00 Ireland 115. Corus Italia SRL 100.00 100.00 Italy 116. Corus Laminacion Y Derivados, S.L. 100.00 100.00 Spain 117. Corus Large Diameter Pipes Limited 100.00 100.00 UK 118. Corus Liaison Services (India) Limited 100.00 100.00 UK 119. Corus Management Limited 100.00 100.00 UK 120. Corus Met B.V. 100.00 100.00 Netherlands 121. Corus Metal Iberica S.A 100.00 100.00 Spain 122. Corus Metals Limited 100.00 100.00 UK 123. Corus Middle East FZE 100.00 100.00 UAE 124. Corus Multi-Metals Limited 100.00 100.00 UK 125. Corus Nederland B.V. 100.00 100.00 Netherlands 126. Corus New Zealand Limited 100.00 100.00 New Zealand 127. Corus Norge A/S 100.00 100.00 Norway 128. Corus Packaging Plus Belgium N.V 100.00 100.00 Belgium 129. Corus Packaging Plus Norway A/S 100.00 100.00 Norway 130. Corus Perfo B.V. 100.00 100.00 Netherlands 131. Corus Polska Sp.Z.O.O. 100.00 100.00 Poland 132. Corus Primary Aluminium B.V. 100.00 100.00 Netherlands 133. Corus Properties (Germany) Limited 100.00 100.00 UK 134. Corus Property 100.00 100.00 UK 135. Corus Quest Trustee Limited 100.00 100.00 UK 136. Corus Rail Consultancy Limited 100.00 100.00 UK
Name of the Company Ownership in % either directly Country of or through Subsidiaries Incorporation 2008-09 2007-08

Hundred and second annual report 2008-09
246
SCHEDULE N : NOTES TO THE CONSOLIDATED FINANCIAL STATEMENTS OF THE COMPANY AND ITS SUBSIDIARIES FOR THE FINANCIAL YEAR 2008-09 :– continued
137. Corus Rail France S.A 100.00 100.00 France 138. Corus Rail Limited 100.00 100.00 UK 139. Corus Republic Of Ireland Subsidiaries Pension Scheme Trustee Limited 100.00 100.00 Ireland 140. Corus Schweiz AG 100.00 100.00 Switzerland 141. Corus Service Center Milano Spa 100.00 100.00 Italy 142. Corus Service Centre Maastricht B.V. 100.00 100.00 Netherlands 143. Corus Services Nederland B.V. 100.00 100.00 Netherlands 144. Corus Sheet & Tube Inc. 100.00 100.00 USA 145. Corus Special Strip Asia Limited 100.00 100.00 Hong Kong 146. Corus Staal B.V. 100.00 100.00 Netherlands 147. Corus Stahl GmbH 100.00 100.00 Germany 148. Corus Stainless Limited 100.00 100.00 UK 149. Corus Stainless Nl B.V. 100.00 100.00 Netherlands 150. Corus Stainless UK Ltd. 100.00 100.00 UK 151. Corus Star-Frame B.V. 100.00 100.00 Netherlands 152. Corus Steel Limited 100.00 100.00 UK 153. Corus Steel Usa Inc. 100.00 100.00 USA 154. Corus Sverige AB 100.00 100.00 Sweden 155. Corus Technology B.V. 100.00 100.00 Netherlands 156. Corus Trico Holdings Inc. 100.00 100.00 USA 157. Corus Tubes B.V. 100.00 100.00 Netherlands 158. Corus Tuscaloosa Corp. 100.00 100.00 USA 159. Corus UK Healthcare Trustee Limited * 100.00 – UK 160. Corus UK Limited 100.00 100.00 UK 161. Corus Vlietjonge B.V. 100.00 100.00 Netherlands 162. Corus Yasan Metal Sanayi Ve Ticaret AS 88.00 62.50 Turkey 163. Cpn 85 Limited 100.00 100.00 UK 164. Crucible Insurance Company Ltd. 100.00 100.00 I of Man 165. Demka B.V. 100.00 100.00 Netherlands 166. Dsrm Group Plc. 100.00 100.00 UK 167. Ees Group Services Limited 100.00 100.00 UK 168. Ees Nederland B.V. 100.00 100.00 Netherlands 169. Eric Olsson & Soner Forvaltnings AB 100.00 100.00 Sweden 170. Esmil B.V. 100.00 100.00 Netherlands 171. Euro-Laminations Limited 100.00 100.00 UK 172. European Electrical Steels Limited 100.00 100.00 UK 173. European Profi les Limited * 100.00 100.00 UK 174. Europressings Limited 100.00 100.00 UK 175. Firsteel Coated Strip Limited * 100.00 100.00 UK 176. Firsteel Cold Rolled Products Limited * 100.00 100.00 UK 177. Firsteel Group Limited 100.00 100.00 UK 178. Firsteel Group Pension Trustee Limited 100.00 100.00 UK 179. Firsteel Holdings Limited 100.00 100.00 UK 180. Firsteel Resources Limited * 100.00 100.00 UK 181. Firsteel Steel Processing Limited 100.00 100.00 UK 182. Firsteel Strip Mill Products Limited 100.00 100.00 UK 183. Fischer Profi elen NV 100.00 100.00 Belgium 184. Fischer Profi l GmbH 100.00 100.00 Germany 185. Gamble Simms Metals Ltd. 100.00 100.00 Ireland 186. Grant Lyon Eagre Ltd. 100.00 100.00 UK 187. H E Samson Ltd. 100.00 100.00 UK 188. Hadfi elds Holdings Ltd. 62.50 62.50 UK 189. Hammermega Limited 100.00 100.00 UK 190. Harrowmills Properties Ltd. 100.00 100.00 UK 191. Hille & Muller GmbH 100.00 100.00 Germany 192. Hille & Muller Italia SRL. 100.00 100.00 Italy 193. Hille & Muller Usa Inc. 100.00 100.00 USA 194. Holorib GmbH 100.00 100.00 Germany
Name of the Company Ownership in % either directly Country of or through Subsidiaries Incorporation 2008-09 2007-08

247
SCHEDULE N : NOTES TO THE CONSOLIDATED FINANCIAL STATEMENTS OF THE COMPANY AND ITS SUBSIDIARIES FOR THE FINANCIAL YEAR 2008-09 :– continued
195. Hoogovens (UK) Limited 100.00 100.00 UK 196. Hoogovens Aluminium UK Limited 100.00 100.00 UK 197. Hoogovens Finance B.V. 100.00 100.00 Netherlands 198. Hoogovens Technical Services Coahuila B.V. 100.00 100.00 Netherlands 199. Hoogovens Technical Services Mexico De S. De R.L. De C.V. 100.00 100.00 Mexico 200. Hoogovens Technical Services Monclova B.V. 100.00 100.00 Netherlands 201. Hoogovens Tubes Poland Spolka Z.O.O 100.00 100.00 Poland 202. Hoogovens Usa Inc. 100.00 100.00 USA 203. Huizenbezit “Breesaap” B.V. 100.00 100.00 Netherlands 204. Ickles Cottage Trust 100.00 100.00 UK 205. Immobilliere De Construction De Maubeuge Et Louvroil SAS 100.00 100.00 France 206. Industrial Steels Limited 100.00 100.00 UK 207. Inter Metal Distribution SAS 100.00 100.00 France 208. K&S Management Service Limited 100.00 100.00 UK 209. Kalzip Asia Pte 100.00 100.00 Singapore 210. Kalzip GmbH 100.00 100.00 Austria 211. Kalzip GmbH 100.00 100.00 Germany 212. Kalzip Guanhzou Limited 100.00 100.00 China 213. Kalzip Inc 100.00 100.00 USA 214. Kalzip Limited 100.00 100.00 UK 215. Kalzip Spain S.L.U. 100.00 100.00 Spain 216. Lister Tubes Ltd. 100.00 100.00 Ireland 217. London Works Steel Company Ltd. 100.00 100.00 UK 218. Midland Steel Supplies Ltd. 100.00 100.00 UK 219. Mistbury Investments Limited 100.00 100.00 UK 220. Montana Bausysteme AG 100.00 100.00 Switzerland 221. Myriad Deutschland GmbH 100.00 100.00 Germany 222. Myriad Espana Sl 100.00 100.00 Spain 223. Myriad Nederland B.V. 100.00 100.00 Netherlands 224. Myriad SA 100.00 100.00 France 225. Myriad United Kingdom Limited 100.00 100.00 UK 226. Namascor B.V. 100.00 100.00 Netherlands 227 Nationwide Steelstock Limited 100.00 100.00 UK 228. Nebam Nedelandse Bevrachting En Agentuur Maatschappij B.V. 100.00 100.00 Netherlands 229. Oostfl ank B.V. 100.00 100.00 Netherlands 230. Orb Electrical Steels Limited 100.00 100.00 UK 231. Ore Carriers Ltd. 100.00 100.00 UK 232. Oremco Inc. 100.00 100.00 USA 233. Plated Strip International Limited 100.00 100.00 UK 234. Precision Metal Forming Limited 100.00 100.00 UK 235. Precoat International Limited 100.00 100.00 UK 236. Precoat Limited 100.00 100.00 UK 237. Rafferty-Brown North Carolina Co. * 100.00 100.00 USA 238. Rafferty-Brown Steel Co Inc Of Conn. 100.00 100.00 USA 239. Richard Thomas And Baldwins 1978 Limited 100.00 100.00 New Zealand 240. Richard Thomas And Baldwins (Australia) Pty Ltd. 100.00 100.00 Australia 241. Round Oak Steelworks Ltd. 100.00 100.00 UK 242 Runblast Limited 100.00 100.00 UK 243. Runmega Limited 100.00 100.00 UK 244. S A B Profi el B.V. 100.00 100.00 Netherlands 245. S A B Profi l GmbH 100.00 100.00 Germany 246. SA Intertubes 100.00 100.00 Belgium 247. Sacra-Nord SAS 100.00 100.00 France 248. Scrap Processing Holding B.V. 100.00 100.00 Netherlands 249. Seamless Tubes Ltd. 100.00 100.00 UK 250. Sia Corus Building Systems 100.00 100.00 Latvia 251. Simiop Investments Ltd. 100.00 100.00 UK 252. Simiop Ltd. 100.00 100.00 UK 253. Simms Steel Holdings Ltd. 100.00 100.00 UK
Name of the Company Ownership in % either directly Country of or through Subsidiaries Incorporation 2008-09 2007-08

Hundred and second annual report 2008-09
248
SCHEDULE N : NOTES TO THE CONSOLIDATED FINANCIAL STATEMENTS OF THE COMPANY AND ITS SUBSIDIARIES FOR THE FINANCIAL YEAR 2008-09 :– continued
254. Skruv Erik AB 100.00 100.00 Sweden 255. Societe Europeenne De Galvanisation (Segal) Sa 100.00 100.00 Belgium 256. Staalverwerking En Handel B.V. 100.00 100.00 Netherlands 257. Steel Company (N.I.) Ltd. 100.00 100.00 UK 258. Steel Stockholdings Ltd. 100.00 100.00 UK 259. Steelstock Ltd. 100.00 100.00 UK 260. Stewarts & Lloyds Of Ireland Ltd. 100.00 100.00 Ireland 261. Stewarts And Lloyds (Overseas) Ltd. 100.00 100.00 UK 262. Stocksbridge Cottage Trust 100.00 100.00 UK 263. Strata-Color (Coated Steels) Limited * 100.00 100.00 UK 264. Surahammar Bruks AB 100.00 100.00 Sweden 265. Swinden Housing Association 100.00 100.00 UK 266. Tata Steel Netherlands B.V. 100.00 100.00 Netherlands 267. Tata Steel UK Ltd. 100.00 100.00 UK 268. Telmag (Holdings) Limited 100.00 100.00 UK 269. Telmag Magnetic Components Limited 100.00 100.00 UK 270. The Newport And South Wales Tube Company Ltd. 100.00 100.00 UK 271. The Stanton Housing Company Ltd. 100.00 100.00 UK 272. The Steel Company Of Ireland Limited 100.00 100.00 Ireland 273. The Templeborough Rolling Mills Ltd. 100.00 100.00 UK 274. Thomas Processing Company 100.00 100.00 USA 275. Thomas Steel Strip Corp. 100.00 100.00 USA 276. Tinsley Trailers Limited 100.00 100.00 UK 277. Toronto Industrial Fabrications Ltd. 100.00 100.00 UK 278. Trierer Walzwerk GmbH 100.00 100.00 Germany 279. Tulip Netherlands (No. 1) B.V. 100.00 100.00 Netherlands 280. Tulip Netherlands (No. 2) B.V. 100.00 100.00 Netherlands 281. Tulip UK Holdings (No. 2) Ltd. 100.00 100.00 UK 282. Tulip UK Holdings (No. 3) Ltd. 100.00 100.00 UK 283. U.E.S. Bright Bar Limited 100.00 100.00 UK 284. UK Steel Enterprise Ltd. 100.00 100.00 UK 285. Ukse Fund Managers Limited 100.00 100.00 UK 286. Ukse Fund Mangers (General Partner) Limited 100.00 100.00 UK 287. United Steels Co (N Z) Ltd. 100.00 100.00 New Zealand 288. Unitol SAS 100.00 100.00 France 289. Walker Manufacturing And Investments Ltd. 100.00 100.00 UK 290. Walkersteel (Ni) Ltd. * 100.00 100.00 UK 291. Walkersteelstock Ireland Limited 100.00 100.00 Ireland 292. Walkersteelstock Ltd. 100.00 100.00 UK 293. Westwood Steel Services Ltd. 100.00 100.00 UK 294. Whitehead (Narrow Strip) Ltd. 100.00 100.00 UK V Tata Steel Global Minerals Holdings Pte Ltd. 100.00 100.00 Singapore 1. Al Rimal Mining LLC 70.00 70.00 Oman 2. Black Ginger 461 Proprietary Ltd 100.00 100.00 South Africa 3. Kalimati Coal Company Pty. Ltd. 100.00 100.00 Australia 4. Tata Steel Cote D’ Ivoire S.A.*@ 85.00 – Ivory Coast VI Tata Steel (Thailand) Public Company Ltd. 67.90 67.90 Thailand 1. NTS Steel Group Plc 67.67 67.67 Thailand 2. The Siam Construction Steel Co. Ltd. 67.89 67.89 Thailand 3. The Siam Iron And Steel (2001) Co. Ltd. 67.89 67.89 Thailand xvii) TM International Logistics Ltd. 51.00 51.00 India 1. International Shipping Logistics FZE 51.00 51.00 UAE 2. TKM Global China Ltd.* 51.00 – China 3. TKM Global GmbH 51.00 51.00 Germany 4. TKM Global Logistics Ltd. 51.00 51.00 India xviii) The Indian Steel and Wire Products Ltd. 91.36 91.36 India xix) The Tata Pigments Ltd. 100.00 100.00 India
Name of the Company Ownership in % either directly Country of or through Subsidiaries Incorporation 2008-09 2007-08

249
B. Joint Venture of i) Jamshedpur Utilities & Services Company Ltd. 1. Haldia Water Management Limited* 33.00 – India ii) Tata Steel Ltd. 1. Bhubaneshwar Power Pvt. Ltd.* 26.00 – India 2. mjunction services ltd. 50.00 50.00 India 3. S & T Mining Company Pvt. Ltd.* 50.00 – India 4. Tata Bluescope Steel Ltd. 50.00 50.00 India 5. Tata NYK Shipping Pte Ltd. 50.00 50.00 Singapore 6. Tata Ryerson Ltd. 50.00 50.00 India 7. The Dhamra Port Company Ltd. 50.00 50.00 India iii) Tata Steel Holdings Pte. Ltd. a) Tata Steel Global Holdings Pte Ltd I Tata Steel Europe Ltd. 1. Afon Tinplate Company Limited 64.00 64.00 UK 2. Air Products Llanwern Limited 50.00 50.00 UK 3. B V Ijzerleew 50.00 50.00 Netherlands 4. Bsr Pipeline Services Limited 50.00 50.00 UK 5. Caparo Merchant Bar Plc 25.00 25.00 UK 6. Cindu Chemicals B.V. 50.00 50.00 Netherlands 7. Corus Celik Ticaret AS 50.00 50.00 Turkey 8. Corus Cogifer Switches And Crossings Limited 50.00 50.00 UK 9. Corus Kalpinis Simos Rom SRL. 50.00 50.00 Romania 10. Danieli Corus Technical Services B.V. 50.00 50.00 Netherlands 11. Framing Solutions Plc. * 50.00 50.00 UK 12. Grantrail Group Ltd. * 50.00 50.00 UK 13. Hks Scrap Metals B.V. 50.00 50.00 Netherlands 14. Ijzerhandel Geertsema Staal B.V. 50.00 50.00 Netherlands 15. Industrial Rail Services Ijmond B.V. 50.00 50.00 Netherlands 16. Laura Metaal Holding B.V. 49.00 49.00 Netherlands 17. Norsk Stal AS 50.00 50.00 Norway 18. Norsk Stal Tynnplater AS 50.00 50.00 Norway 19. Ravenscraig Limited 100.00 100.00 UK 20. Tata Elastron SA 50.00 50.00 Greece 21. Tata Elastron SA Steel Service Center* 50.00 – Greece 22. Texturing Technology Limited 50.00 50.00 UK II Tata Steel Global Minerals Holdings Pte. Ltd. Singapore 1. Riversdale Energy (Mauritius) Ltd. 35.00 35.00 Mauritius
* Part of the Year . @ By virtue of management control.
SCHEDULE N : NOTES TO THE CONSOLIDATED FINANCIAL STATEMENTS OF THE COMPANY AND ITS SUBSIDIARIES FOR THE FINANCIAL YEAR 2008-09 :– continued
Name of the Company Ownership in % either directly Country of or through Subsidiaries Incorporation 2008-09 2007-08

Hundred and second annual report 2008-09
250
SCHEDULE N : NOTES TO THE CONSOLIDATED FINANCIAL STATEMENTS OF THE COMPANY AND ITS SUBSIDIARIES FOR THE FINANCIAL YEAR 2008-09 :– continued
The Associates of the Company and the ownership interest are as follows : Name of the Company % Share Original Goodwill/ Accumulated Carrying held Cost of (Capital Profi t/(Loss) amount of Investment Reserve) as at Investments 31.03.2009 as at 31.03.2009 Rs. crores Rs. crores Rs. crores Rs. crores
Ab Norskstal AS 50.00 – – – – 50.00 – – – –
Albi Profi ls SRL (b) $ – – – – – 30.00 0.11 – 0.01 0.12
Almora Magnesite Limited 39.00 0.78 – 0.38 1.16 39.00 0.78 – 0.16 0.94
Altos Hornos De Mexico S.A. de C.V. 4.50 – – – – 4.50 – – – –
Antheus Magnesium B.V. 25.00 – – – – 25.00 – – – –
Appleby Frodingham Cottage Trust Limited 33.30 – – – – 33.30 – – – –
Business Park (b) $ – – – – – 50.00 0.01 – (0.01) –
Combulex B.V. 50.00 10.97 – 2.57 13.54 50.00 10.97 – 1.24 12.21
Cv Gasexpansie Ijmond 50.00 0.26 – 0.04 0.30 50.00 0.26 – 0.03 0.29
Danieli Corus Canada Inc. 50.00 – – – – 50.00 – – – –
Danieli Corus Asia B.V. 50.00 – – – – 50.00 – – – –
Danieli Corus Braseq Ltda 50.00 – – – – 50.00 – – – –
Danieli Corus B.V. 50.00 – – – – 50.00 – – – –
Danieli Corus Construction Services B.V 50.00 – – – – 50.00 – – – –
Danieli Corus Construction Services USA Inc. 50.00 – – – – 50.00 – – – –
Danieli Corus Do Brasil Ltda 50.00 – – – – 50.00 – – – –
Danieli Corus Inc. 50.00 – – – – 50.00 – – – –
Danieli Corus Services USA Inc. 50.00 – – – – 50.00 – – – –
Danieli Corus South Africa Pty. Ltd. 50.00 – – – – 50.00 – – – –
Danieli India (Pvt.) Ltd. (b) 50.00 – – – –
– – – – –
Endex European Energy Derivates Exchanges NV 0.23 – – – –
0.23 – – – –
European Profi les (Marketing) Sdn. Bhd. 10.20 – – – –
10.20 – – – –
European Profi les Malaysia (M) Sdn. Bhd. 20.00 6.35 – 0.69 7.04
20.00 6.35 – 0.11 6.46
Galvpro LP 45.50 – – – –
45.50 – – – –
Gietwalsonderhoudcombinatie B.V. 50.00 9.66 – 4.53 14.19
50.00 9.66 – 3.50 13.16
Hoogovens Court Chrome Vof 50.00 9.86 – 3.57 13.43
50.00 9.86 – 2.25 12.11

251
SCHEDULE N : NOTES TO THE CONSOLIDATED FINANCIAL STATEMENTS OF THE COMPANY AND ITS SUBSIDIARIES FOR THE FINANCIAL YEAR 2008-09 :– continued
Hoogovens Gan Multimedia S A de CV 50.00 – – – –
50.00 – – – –
Indian Steel Rolling Mills Limited (Re.1/-)(a) 20.56 – – – –
20.56 – – – –
Industrial Energy Limited 26.00 86.58 – (0.21) 86.37
26.00 26.00 – – 26.00
Isolation Du Sud Sa 0.33 – – – –
0.33 – – – –
Issb Limited 50.00 – – – –
50.00 – – – –
Jamipol Limited 31.78 4.38 0.01 13.52 17.90
30.00 3.38 0.01 10.92 14.30
Kalinga Aquatics Limited (Re.1/-)(a)# 30.00 – – – –
30.00 – – – –
Kumardhubi Fireclay & Silica Works
Limited (Re.1/-)(a)# 27.78 – – – –
27.78 – – – –
Kumardhubi Metal Casting & Engineering
Limited (Re.1/-)(a)# 49.31 – – – –
49.31 – – – –
Metal Corporation of India Limited (Re.1/-)(a)# 42.05 – – – –
42.05 – – – –
MDC Sublance Probe Technology (b) 50.00 – – – –
– – – – –
Nicco Jubilee Park Limited (Re.1/-)(a)# 23.46 0.38 – (0.38) –
21.60 0.35 – (0.35) –
Regionale Ontwikkelingsmaatschappij
Voor Het Noordzeekanaalgebied NV 6.67 0.92 – 0.15 1.07
6.67 0.92 – 0.08 1.00
Richard Lees Steel Decking Asia Snd. Bhd. 10.00 – – – –
10.00 – – – –
Rsp Holding B.V. 13.19 – – – –
13.19 – – – –
Rujuvalika Investments Limited 24.12 0.60 (0.29) 4.36 4.96
24.12 0.60 (0.29) 3.73 4.33
Schreiner Fleischer AS 50.00 – – – –
50.00 – – – –
Shanghai Bao Yi Beverage Can Making Co. Ltd. 12.50 – – – –
12.50 – – – –
SMS Mevac UK Limited 45.00 3.70 – (3.16) 0.54
45.00 3.70 – (0.24) 3.46
Southern Steel, Berhad 27.03 100.13 – 73.71 173.84
27.03 100.13 – 97.66 197.79
Steel Asia Development and Management
Corporation (Re.1/-)(a) 40.00 – – – –
40.00 – – – –
Steel Asia Industries, Inc. (Re.1/-)(a) 50.00 – – – –
50.00 – – – –
Steel Asia Manufacturing Corporation (Re.1/-)(a) 40.00 – – – –
40.00 – – – –
Name of the Company % Share Original Goodwill/ Accumulated Carrying held Cost of (Capital Profi t/(Loss) amount of Investment Reserve) as at Investments 31.03.2009 as at 31.03.2009 Rs. crores Rs. crores Rs. crores Rs. crores

Hundred and second annual report 2008-09
252
Stuwadoorsbedrijf Velserkom B.V. 50.00 5.76 – (1.78) 3.98
50.00 5.76 – (0.14) 5.62
Tata Construction & Projects Limited (Re.1/-)(a)# 29.66 – – – –
29.66 – – – –
Tata Sponge Iron Limited 43.24 20.74 11.42 146.86 167.60
43.24 20.74 11.42 98.41 119.15
Tayo Rolls Limited* – – – – –
36.53 3.36 0.03 13.37 16.73
Tinplate Company of India Limited 32.34 30.26 – (0.60) 29.66
32.12 30.09 – (14.93) 15.16
Thoresen & Thorvaldsen AS 50.00 – – – –
50.00 – – – –
TKM Overseas Limited 49.00 1.13 – (0.75) 0.38
49.00 1.13 – (0.83) 0.30
TRF Limited 36.49 6.11 1.52 42.98 49.09
36.49 6.11 1.52 31.01 37.12
Trico Llc 25.00 – – – –
25.00 – – – –
Weirton/hoogovens Gp 50.00 – – – –
50.00 – – – –
Workington Cottage Trust 33.00 – – – –
33.00 – – – –
Wupperman Staal Nederland B.V. 30.00 62.52 – 4.20 66.72
30.00 62.52 – 13.10 75.62
Total 361.09 12.66 **290.68 **651.77 302.79 12.69 **259.08 **561.87
* Earlier an associate, became a subsidiary during the year. Carrying value of investment on the date of becoming a subsidiary Rs. 35.13 crores. ** Includes exchange fl uctuation and other adjustments to carrying value not routed through the profi t and loss account. (a) Investment in these associates have been reported at Nil value as the Company’s share of losses exceeds the carrying amount of investment. (b) Part of the year. $ Disposed off during the year.
SCHEDULE N : NOTES TO THE CONSOLIDATED FINANCIAL STATEMENTS OF THE COMPANY AND ITS SUBSIDIARIES FOR THE FINANCIAL YEAR 2008-09 :– continued
Name of the Company % Share Original Goodwill/ Accumulated Carrying held Cost of (Capital Profi t/(Loss) amount of Investment Reserve) as at Investments 31.03.2009 as at 31.03.2009 Rs. crores Rs. crores Rs. crores Rs. crores

253
SCHEDULE N : NOTES TO THE CONSOLIDATED FINANCIAL STATEMENTS OF THE COMPANY AND ITS SUBSIDIARIES FOR THE FINANCIAL YEAR 2008-09 :– continued
2. Accounting Policies (a) Basis for Accounting The fi nancial statements are prepared under the historical cost convention on an accrual basis of accounting in accordance with the
generally accepted accounting principles, Accounting Standards notifi ed under Section 211(3C) of the Companies Act, 1956 and the relevant provisions thereof.
(b) Revenue Recognition (i) Sales comprises sale of goods and services, net of trade discounts. (ii) Export incentive under the Duty Entitlement Pass Book Scheme has been recognised on the basis of credits afforded in the
pass book. (iii) In one of the subsidiaries, income from services are recognised upon completion of the relevant shipping activities and related
services. Income and expenses relating to incomplete voyages are carried forward as voyages-in-progress. Despatch earnings are accounted for on receipt basis.
(c) Employee Benefi ts (i) Short-term employee benefi ts are recognised as an expense at the undiscounted amount in the Profi t and Loss Account of the
year in which the related service is rendered. (ii) Post employment benefi ts are recognised as an expense in the Profi t and Loss Account for the year in which the employee has
rendered services. The expense is recognised at the present value of the amount payable towards contributions. The present value is determined using the market yields of government bonds, at the balance sheet date, as the discounting rate. In some foreign subsidiaries, the present value is determined using the AA rated corporate bonds.
(iii) Other long-term employee benefi ts are recognised as an expense in the Profi t and Loss Account for the period in which the employee has rendered services. Estimated liability on account of long-term benefi ts is discounted to the current value, using the market yield on government bonds, as on the date of balance sheet, as the discounting rate.
(iv) Actuarial gains and losses in respect of post employment and other long-term benefi ts are recognised in the Profi t and Loss Account.
However in one of the subsidiary (Tata Steel Europe Limited) because of potential volatility caused by periodic changes in the assumptions underlying the computation of the pension liabilities, it is not considered practicable to adopt a common accounting policy for accouting for the pension liability of the company and Tata Steel Europe Limited. The actuarial gains and losses for these pension plans of Tata Steel Europe Limited have been accounted in Reserves and Surplus.
(v) Miscellaneous Expenditure In respect of the Employee Separation Scheme (ESS), net present value of the future liability for pension payable is amortised
equally over fi ve years or upto fi nancial year ending 31st March, 2010, whichever is earlier. The increase in the net present value of the future liability for pension payable to employees who have opted for retirement
under the Employee Separation Scheme of the Company is charged to the Profi t and Loss Account. (d) Fixed Assets All fi xed assets are valued at cost less depreciation. Pre-operating expenses including trial run expenses (net of revenue) are
capitalised. Borrowing costs during the period of construction is added to the cost of fi xed assets. Blast Furnace relining is capitalised. The written down value of the asset consisting of lining/relining expenditure embedded in the
cost of the furnace is written off in the year of fresh relining. (e) Depreciation (I) Capital assets whose ownership does not vest in the Company is depreciated over their estimated useful life or fi ve years,
whichever is less. (II) In respect of other assets, depreciation is provided on a straight line basis applying the rates specifi ed in Schedule XIV to the
Companies Act, 1956 or based on estimated useful life whichever is higher. However, asset value upto Rs. 25,000 is fully depreciated in the year of acquisition. The details of estimated life for each category of assets is as under :
(i) Buildings — 30 to 62 years. (ii) Plant and Machinery — 6 to 21 years. (iii) Railway Sidings — 21 years. (iv) Vehicles and Aircraft — 5 to 18 years. (v) Furniture, Fixtures and Offi ce Equipment — 5 years. (vi) Intangibles (Computer Software) — 5 to 10 years. (vii) Development of property for development of mines and collieries are depreciated over the useful life of the mine or
lease period whichever is less, subject to maximum of 10 years. (viii) Blast Furnace relining is depreciated over a period of 10 years (average expected life). (ix) Freehold land is not depreciated. (x) Leasehold land is amortised over the life of the lease. (xi) Roads — 30 to 62 years. In some subsidiaries, joint ventures and associates depreciation is calculated on written down value basis and
intangible assets are amortised over the period for which the rights are obtained. The depreciation charge in respect of these units is not signifi cant in the context of the consolidated fi nancial statements.
In case of certain foreign subsidiaries, the assets are depreciated on a straight line basis over the estimated useful life of the assets.
(f) Foreign Currency Transactions Foreign Currency Transactions (FCT) and forward exchange contracts used to hedge FCT (including fi rm commitments and
forecast transactions) are initially recognised at the spot rate on the date of the transaction/contract. Monetary assets and liabilities relating to foreign currency transactions and forward exchange contracts remaining unsettled at the end of the year are translated at year end rates.
The company and its Indian subsidiaries and joint ventures have opted for accounting the exchange differences arising on reporting of long-term foreign currency monetary items in line with Companies (Accounting Standards) Amendment Rules 2009 relating

Hundred and second annual report 2008-09
254
SCHEDULE N : NOTES TO THE CONSOLIDATED FINANCIAL STATEMENTS OF THE COMPANY AND ITS SUBSIDIARIES FOR THE FINANCIAL YEAR 2008-09 :– continued
to Accounting Standard 11 (AS-11) notifi ed by Government of India on 31st March, 2009. Accordingly the effect of exchange differences on foreign currency loans of the company is accounted by addition or deduction to the cost of the assets so far it relates to depreciable capital assets and in other cases by transfer to “Foreign Currency Monetary Items Translation Difference Account” to be amortised over the balance period of the long-term monetary items or 31st March, 2011 whichever is earlier. Exchange difference recognised in the Profi t & Loss Account up to last fi nancial year ended 31st March, 2008 relating to said long term monetary items in foreign currency has been adjusted against opening revenue reserve as provided in the rules.
The differences in translation of FCT and forward exchange contracts used to hedge FCT (excluding the long term foreign currency monetary items accounted in line with Companies (Accounting Standards) Amendment Rules 2009 on Accounting Standard 11 notifi ed by Government of India on 31st March, 2009) and realised gains and losses, other than those relating to fi xed assets are recognised in the Profi t and Loss Account. The outstanding derivative contracts at the balance sheet date other than forward exchange contracts used to hedge FCT are valued by marking them to market and losses, if any, are recognised in the Profi t and Loss Account.
Exchange difference relating to monetary items that are in substance forming part of the Company’s net investment in non integral foreign operations are accumulated in Foreign Exchange Fluctuation Reserve Account.
(g) Investments Long term investments are carried at cost less provision for permanent diminution, if any, in value of such investments. Current
investments are carried at lower of cost and fair value. Stock in trade in case of one of the subsidiaries, being an investment company, has been valued at cost or at market quotation whichever is lower scripwise. When investment is made in partly convertible debentures with a view to retain only the convertible portion of the debentures, the excess of the face value of the non-convertible portion over the realisation on sale of such portion is treated as a part of the cost of acquisition of the convertible portion of the debenture.
(h) Inventories Finished and semi-fi nished products produced and purchased by the Company are carried at lower of cost and net realisable
value. Work-in-progress is carried at lower of cost and net realisable value. Coal, iron ore and other raw materials produced and purchased by the Company are carried at lower of cost and net realisable value. Stores and spare parts are carried at cost. Necessary provision is made and charged to revenue in case of identifi ed obsolete and
non-moving items. Cost of inventories is generally ascertained on the ‘weighted average’ basis. Work-in-progress and fi nished and semi-fi nished
products are valued on full absorption cost basis. (i) Relining Expenses Relining expenses other than expenses on Blast Furnace relining are charged as an expense in the year in which they
are incurred. (j) Research and Development Research and Development costs (other than cost of fi xed assets acquired) are charged as an expense in the year in which they
are incurred. (k) Deferred Tax Deferred Tax is accounted for by computing the tax effect of timing differences which arise during the year and reverse in
subsequent periods. (l) Taxes on Income i) Indian Companies : Tax on income for the current period is determined on the basis of taxable income and tax credits computed in accordance with
the provisions of Income Tax Act, 1961. ii) Foreign Companies : Foreign Companies recognise tax liabilities and assets in accordance with the applicable local laws. (m) In case of certain subsidiaries, goodwill is amortised over a period of 60 months.3. Contingent Liabilities (a) Guarantees The Company has given guarantees aggregating Rs. 930.97 crores (31.03.2008 : Rs. 1,109.67 crores) to banks and fi nancial
institutions on behalf of others. As at 31st March, 2009 the contingent liabilities under these guarantees amounted to Rs. 930.97 crores (31.03.2008 : Rs. 1,109.67 crores).
(b) Claims not acknowledged by the Company : As at As at 31.03.2009 31.03.2008 Rs. crores Rs. crores (i) Excise 410.35 226.62 (ii) Customs 13.88 13.86 (iii) Sales Tax 473.87 452.56 (iv) State Levies 161.78 99.32 (v) Suppliers and Service Contract 70.66 81.35 (vi) Labour Related 36.04 33.84 (vii) Income Tax 179.97 63.87 (viii) Others 564.96 404.14 (c) Claim by a party arising out of conversion arrangement - Rs. 195.82 crores (31.03.2008 : Rs. 195.82 crores). The Company has
not acknowledged this claim and has instead fi led a claim of Rs. 139.65 crores (31.03.2008 : Rs. 139.65 crores) on the party. The matter is pending before the Calcutta High Court.

255
SCHEDULE N : NOTES TO THE CONSOLIDATED FINANCIAL STATEMENTS OF THE COMPANY AND ITS SUBSIDIARIES FOR THE FINANCIAL YEAR 2008-09 :– continued
(d) The Excise Department has raised a demand of Rs. 235.48 crores (31.03.2008 : Rs. 235.48 crores) denying the benefi t of Notifi cation No. 13/2000 which provides for exemption to the integrated steel plant from payment of excise duty on the freight amount incurred for transporting material from plant to stock yard and consignment agents. The Company fi led an appeal with CESTAT, Kolkata and the order of the department was set aside. The department has fi led an appeal in Supreme Court where the matter is pending.
(e) The State Government of Orissa introduced “Orissa Rural Infrastructure and Socio Economic Development Act 2004” with effect from February 2005 levying tax on mineral bearing land computed on the basis of value of minerals produced from the mineral bearing land. The Company had fi led a Writ Petition in the High Court of Orissa, challenging the validity of the Act. Orissa High Court held in November 2005 that State does not have authority to levy tax on minerals. The State Government of Orissa moved to Supreme Court against the order of Orissa High Court and the case is pending with Supreme Court. The liability, if it materialises, as at 31.03.2009 would be Rs. 1,041.67 crores (31.03.2008 : Rs. 588.78 crores).
(f) The Industrial Tribunal, Ranchi has passed an award on 20.10.1998 with reference to an industrial dispute regarding permanent absorption of contract labourers engaged by the Company prior to 1981, directing the Company to absorb 658 erstwhile contract labourers w.e.f. 22.08.1990. A single bench of the Patna High Court has upheld this award. The Company challenged this award before the division bench of the Jharkhand High Court which has set aside the order of the single bench of Patna High Court as well as the Tribunal and remanded back the case to the Tribunal for fresh hearing on all issues in accordance with law. The Industrial Tribunal, Ranchi by its award dated 31.03.2006 pronounced on 13.06.2006, held that the contract workers were not engaged by the management of the Company in the permanent and regular nature of work before 11.02.1981 and they are not entitled to permanent employment under the principal employer. The Tata Workers Union has fi led SLP against this award in the Supreme Court. The liability, if it materialises, would be to the tune of Rs. 155.79 crores (31.03.2008 : Rs. 133.10 crores).
(g) In terms of the agreements entered into between Tata Teleservices Ltd. (TTSL), Tata Sons Ltd. (TSL) and NTT DoCoMo, Inc. of Japan (Strategic Partner-SP), the Company was given by TSL an option to sell 52,46,590 equity shares in TTSL to the SP, as part of a secondary sale of 25,31,63,941 equity shares effected along with a primary issue of 84,38,79,801 shares by TTSL to the SP. Accordingly, the company realised Rs. 60.91 crores on sale of these shares resulting in a profi t of Rs. 49.77 crores.
If certain performance parameters and other conditions are not met, should the SP decide to divest its entire shareholding in TTSL, acquired under the primary issue and the secondary sale, and should TSL be unable to fi nd a buyer for such shares, the Company is obligated to acquire the shareholding of the SP, at the higher of fair value or 50 percent of the subscription purchase price, in proportion of the number of shares sold by the company to the aggregate of the secondary shares sold to the SP, or if the SP divests the shares at a lower price pay a compensation representing the difference between such lower sale price and the price referred to above.
Further, in the event of breach of the representations and warranties (other than title and tax) and covenants not capable of specifi c performance, the Company is liable to reimburse TSL, on a pro rata basis, upto a maximum sum of Rs. 78.75 crores. The exercise of the option by SP being contingent on several variables the liability, if any, is remote and indeterminable.
(h) The Company has been paying royalty on coal extracted from its quarries pursuant to the judgement and order dated 23.07.2002 passed by the Jharkhand High Court. However, the State Government demanded royalty on processed coal at rates applicable to processed coal. Though the Company has contested the above demand, it has started paying, under protest, royalty on processed coal from November 2008. The incremental royalty, paid under protest, during November 2008 to March 2009 of Rs. 4.07 crores has been charged off to Profi t and Loss Account. The incremental amount, if payable, for the period till October 2008 works out to Rs. 232.57 crores (31.03.2008 : Nil) and has been considered as a contingent liability.
(i) Uncalled liability on partly paid shares and debentures Rs. 0.01 crore (31.03.2008 : Rs. 0.01 crore). (j) Bills discounted Rs. 497.90 crores (31.03.2008 : Rs. 450.02 crores). (k) Cheques discounted : Amount indeterminate. 4. The Indian Steel and Wire Products Limited (ISWPL), a subsidiary, was declared a sick industrial company within the meaning of
Section 3(i)(o) of the Sick Industrial Companies (Special Provisions) Act, 1985 (hereinafter referred to as 'SICA'). The Board for Industrial and Financial Reconstruction (BIFR) sanctioned a scheme vide its Order dated 22nd October, 2003, 21st November, 2003 and 18th December, 2003 for rehabilitation of the ISWPL by takeover of its management by Tata Steel Limited.
The signifi cant notes appearing in the accounts of The Indian Steel and Wire Products Limited are given below : As per clause 6.12 (xiii) of BIFR order dated 21st November, 2003, all liabilities not disclosed in the audited balance sheet for the
year ended 31st March, 2002 including notes on accounts as then would be the personal responsibility of the erstwhile promoters to discharge. In view of the above, the following liabilities, which were not disclosed in the said balance sheet including the notes on accounts, have not been provided for or recognised in the accounts for fi nancial year 2004-05, 2005-06, 2006-07, 2007-08 as well as accounts for fi nancial year 2008-09.
Particulars Rs. crores Show cause notices/Demand raised by Central Excise Authorities (Under Appeal) 2.99 The Sales Tax Assessment is pending from the year 1998-99 onwards. Additional liability, if any, for pending assessments has not been ascertained (Under Appeal) 4.77 Employee State Insurance demand (Under Appeal) 1.49 Gratuity for ex-employees – Leave liability for ex-employees 0.33 Labour court cases 0.01 Income tax demand (Under Appeal) 3.05 Railway dues 0.04 Power dues 6.21 Liability for loan for Learjet Aircraft purchase 1.49 Wealth tax 3.90 Liability for Security Services 0.32

Hundred and second annual report 2008-09
256
SCHEDULE N : NOTES TO THE CONSOLIDATED FINANCIAL STATEMENTS OF THE COMPANY AND ITS SUBSIDIARIES FOR THE FINANCIAL YEAR 2008-09 :– continued
The items indicated above are not exhaustive and any other liability, which may come to the notice of the present management also would be the personal liability of the erstwhile promoters.
5. The Company has given undertakings to (a) IDBI Bank Ltd.and IFCI not to dispose of its investment in Tinplate Company of India Limited, (b) ICICI Bank Ltd. (formerly ICICI), IFCI and IIBI not to dispose of its investment in the Indian Steel Rolling Mills Ltd. (ISRM). The ISRM is under liquidation, (c) IDBI not to dispose of its investment in Wellman Incandescent India Ltd., (d) IDBI and ICICI Bank Ltd. (formerly ICICI) not to dispose of its investment in Standard Chrome Ltd., (e) SBI, State Bank of Indore, State Bank of Hyderabad, State Bank of Patiala and WBIDC Ltd., not to dispose of its investment in Hooghly Met Coke and Power Co. Ltd., (f) State Bank of India not to dispose of its investment in Tata BlueScope Ltd. (g) Standard Chartered Bank and Hong Kong and Shanghai Banking Corporation, not to dispose of majority stake in Tata Steel (KZN) (Pty) Ltd., (h) Mizuho Corporate Bank Limited, not to dispose of its investments in Tata NYK Shipping Pte. Limited, (minimal stake required to be able to provide a corporate guarantee towards long term debt), (i) IL&FS Trust Company Ltd. not to transfer, dispose off, assign, charge or lien or in any way encumber its holding in Taj Air Ltd., without the prior consent of the respective fi nancial institutions/banks so long as any part of the loans/facilities sanctioned by the institutions/banks to these nine companies remains outstanding.
The Company has furnished a Security Bond in respect of its immovable property to the extent of Rs. 20 crores in favour of the Registrar of the Delhi High Court and has given an undertaking not to sell or otherwise dispose of the said property.
The Promoters’ (i.e. L & T Infrastructure Development Projects Ltd. and Tata Steel Ltd.) combined investments in The Dhamra Port Company Ltd., (DPCL) representing 51% of DPCL’s paid-up equity share capital are pledged with IDBI Trusteeship Services Ltd.
The Promoters’ (i.e. The Tata Power Company Limited. and Tata Steel Ltd.) combined investments in Industrial Energy Limited., (IEL) representing 51% of IEL’s paid-up equity share capital are pledged with Infrastructure Development Corporation Limited (IDFC).
The Company has provided a fi nancing commitment to the extent of £ 425 million to Tata Steel Europe Limited, an indirect wholly-owned subsidiary of the Company, to enable it to meet the fi nancial covenants of the Senior Facilities Agreements with its Lenders.
6. The Company had, on 20th August, 2005, signed an agreement with the Government of Jharkhand to participate in a special health insurance scheme to be formulated by the Government of Jharkhand for the purpose of providing medical facilities to the families of the people below poverty line. The state government would develop a suitable scheme and the Company has agreed to contribute to such scheme, when operational, a sum of Rs. 25 crores annually for a period of 30 years or upto the year of operation of the scheme whichever is less. The scheme is yet to be formed and no contribution has been made till 31st March, 2009.
7. The Company had issued during 1992-93, 1,15,50,000 Secured Premium Notes (SPN) of Rs. 300 each aggregating to Rs. 346.50 crores with Warrants attached for subscribing to one ordinary share of Rs. 10 each per SPN at a premium of Rs. 70 per share. The warrant holders have exercised their option in respect of 1,11,61,201 Detachable Warrants. For the balance of 3,88,799 Detachable Warrants for which option has not been exercised, the option is deemed to have lapsed except in respect of approximately 12,446 Detachable Warrants applicable to matters which are in dispute and for which the option is deemed to be kept alive for the time being. In terms of issue of SPNs, they have been redeemed on 24.08.1999.
8. The company completed the restructuring of its foreign subsidiaries during the current year with Tata Steel Global Holdings Pte. Ltd. Singapore (TSGH) (a subsidiary of Tata Steel Ltd.) as the international holding company of the Tata Steel Group. Tata Steel Global Holdings holds investments of steel business of Europe and South East Asia and also the international raw materials assets of the group.
Further as a part of the restructuring process the following transactions were also affected during the year:
a) Shares of Tata Steel (Thailand) Public Company Ltd., previously held by Tata Steel Ltd. and NatSteel Asia Pte Ltd. (NSA Group) were transferred to Tata Steel Global Holdings Pte Ltd.
b) Shares of eight erstwhile subsidiaries of Tata Steel Europe Group namely Corus Asia Ltd., Corus South East Asia Pte. Ltd., Corus Holdings (Thailand) Ltd. and Corus Metal Thailand Ltd. were transferred to Corus International (Singapore) Holdings Pte. Ltd., a subsidiary of Tata Steel Global Holdings Pte. Ltd.
c) The steel business units of NatSteel Asia Pte. Ltd. (NSA Group) were transferred to NatSteel Holdings Pte. Ltd., (NSH Group), a subsidiary of Tata Steel Global Holdings Pte. Ltd.
9. The notes to accounts of Tata Korf Engineering Services Limited (TKES), a subsidiary, state that : The accumulated losses of the Company as at 31st March, 2009 exceed its paid up Share Capital. The Company has practically closed its operations. Pending the preparation of a scheme, the fi nancial statements have been prepared on a "going concern" basis. The report of the auditors to the members of TKES contains an audit qualifi cation on this account.
Tata Korf Engineering Services Ltd. has a negative net worth as on 31.03.2009 of Rs. 8.60 crores (31.03.2008 : Rs. 8.21 crores).
10. Fixed Assets a) Estimated amount of contracts remaining to be executed on Capital Account and not provided for : Rs. 13,525.33 crores
(31.03.2008 : Rs. 10,072.51 crores). b) The Company has taken on lease Plant and Machinery, having an aggregate cost of Rs. 3.79 crores (31.03.2008 : Rs. 3.79 crores).
The element of the lease rental applicable to the cost of the asssets has been charged to the Profi t and Loss Account over the estimated life of the asset and fi nancing cost has been allocated over the life of the lease on an appropriate basis. The total charge

257
to the Profi t and Loss Account for the year is Rs. 0.73 crore (2007-08 : Rs. 0.73 crore). The break up of total minimal lease payments due as at 31st March, 2009 and their corresponding present value are as follows :
Rs. crores
As at 31.03.2009 As at 31.03.2008
Period Minimum Lease Present Value Minimum Lease Present Value Payments Payments
Not later than one year 0.46 0.42 0.72 0.66 Later than one year but not later than fi ve years – – 0.48 0.40 Later than fi ve years – – – –
Total 0.46 0.42 1.20 1.06
The break-up of total minimum lease payments for operating lease due as on 31st March, 2009, entered into by the company, its subsidiaries and joint ventures are as follows:
Rs. crores
As at 31.03.2009 As at 31.03.2008
Period Minimum Lease Minimum Lease Payments Payments
Not later than one year 1,225.02 898.23 Later than one year but not later than fi ve years 3,101.24 2,313.64 Later than fi ve years 1,271.37 1,724.82
Total 5,597.63 4,936.69 The total charge to the Profit and Loss Account for the year on account of operating lease is Rs. 999.68 crores (2007-08:
Rs. 815.58 crores).
The company, its subsidiaries and joint venture have taken certain leaseholds on fi nance lease, having an aggregate cost of Rs. 1,596.84 crores (31.03.08: 1,729.84 crores). The break up of total minimum lease payments for fi nance lease due as on 31st March, 2009 and their corresponding present values, are as follows :
Rs. crores
As at 31.03.2009 As at 31.03.2008
Period Minimum Lease Present Value Minimum Lease Present Value Payments Payments
Not later than one year 137.53 121.83 192.06 147.84 Later than one year but not later than fi ve years 597.69 378.67 600.59 464.59 Later than fi ve years 589.37 501.80 708.38 605.94
Total 1,324.59 1,002.30 1,501.03 1,218.37
11. Profi t and Loss Account a) i) Provision for employee separation compensation has been calculated on the basis of net present value of the future monthly
payments of pension and lump sum benefi ts under the scheme including Rs. 76.93 crores (31.03.2008 : Rs. 57.31 crores) in respect of schemes introduced during the year.
ii) The amounts payable within one year under the ESS aggregates to Rs. 203.37 crores (31.03.2008 : Rs. 208.75 crores). iii) The amount shown under Miscellaneous Expenditure on ESS account, represents the balance amount to be amortised over fi ve
years or the fi nancial year ending 31st March, 2010, whichever is earlier. b) The manufacturing and other expenses shown in the profi t and loss account include Rs. 912.02 crores (2007-08 : Rs. 617.91
crores) in respect of Research and Development activities undertaken during the year. c) The company and its Indian subsidiaries and joint ventures have opted for accounting the exchange differences arising on reporting
of long term foreign currency monetary items in line with Companies (Accounting Standards) Amendment Rules 2009 relating to Accounting Standard 11 (AS-11) notifi ed by Government of India on 31st March, 2009.
As a result of this change in the accounting, the exchange difference of Rs. 530.03 crores (net of tax) recognised in the Profi t & Loss Account up to last fi nancial year ended 31st March, 2008 relating to long term monetary items in foreign currency has been adjusted against opening revenue reserve. As on 31st March, 2009, Rs. 471.66 crores remains to be amortised in the “Foreign Currency Monetary Items Translation Difference Account” after taking a charge of Rs. 30.79 crores in the Profi t and Loss Account and Rs. 32.54 crores (net of deferred tax Rs. 16.76 crores) adjusted against Securities Premium Account during the current fi nancial year on account of amortisation. Consequently the depreciation for the year ended 31st March, 2009 is higher by Rs. 2.04 crores and the profi t after taxes, minority interest and share of profi t of associates for the year ended 31st March, 2009 is higher by Rs. 899.58 crores.
d) The consolidated Profi t and Loss Account includes the consolidated results of Tata Steel Europe Limited and its subsidiaries whose income contributes 71% of the consolidated total income. The pension liability of Tata Steel Europe Limited is computed and accounted for in accordance with International Financial Reporting Standards (IFRS). IFRS permits the impact of changes in the assets and liabilities, inter alia, due to assumption of variables like bond yield rates, infl ation and demographic assumptions to be accounted for in “Reserves and Surplus”. This practice is consistently followed by Tata Steel Europe Limited. The Indian Accounting Standard (AS-15) is different from the above and requires such changes to be accounted for in the Profi t and Loss
SCHEDULE N : NOTES TO THE CONSOLIDATED FINANCIAL STATEMENTS OF THE COMPANY AND ITS SUBSIDIARIES FOR THE FINANCIAL YEAR 2008-09 :– continued

Hundred and second annual report 2008-09
258
Account. Given the large share of Tata Steel Europe Limited in the consolidated Profi t and Loss Account of the company, and the potential volatility caused by periodic changes in the assumptions underlying the computation of the pension liabilities, it is not considered practicable to adopt a common accounting policy for accounting for the actuarial gains/losses in respect of the pension liability of the Company and Tata Steel Europe Limited. Accordingly the actuarial loss of Rs. 5,496.58 crores (Net of tax) recognised in Tata Steel Europe Limited has been accounted in Reserves and Surplus in the consolidated fi nancial statements in accordance with IFRS principles and as permitted by Accounting Standard 21 – Consolidated Financial Statements. Had the Company followed the previous practice of recognising changes in actuarial valuations in respect of the pension plans of Tata Steel Europe Limited, in the Profi t and Loss Account, the profi t after taxes, minority interest and share of profi t of associates would have been lower by Rs. 5,496.58 crores.
12. The effect of acquisition and disposal of subsidiaries on the fi nancial position and results as included in the consolidated fi nancial statements for the year ended 31st March, 2009 are given below :
Rs. crores
Acquisition Disposal
FUNDS EMPLOYED Share Capital 10.26 371.76 Reserves & Surplus 79.60 (55.83) Secured Loans 85.71 1.78 Unsecured Loans 0.84 400.47 Deferred Tax Liability – 15.94 Current Liabilities 41.82 386.75 Provisions 18.24 203.71
APPLICATION OF FUNDS Net Block (including CWIP) 141.92 93.70 Investment 4.16 – Deferred Tax Asset – 36.04 Current Assets 78.88 1,194.84 Loans & Advances 10.39 – Miscellaneous Expenditure 1.12 –
INCOME Sales and other Operating Income 42.06 2,564.73 Other Income (0.13) –
EXPENDITURE Manufacturing and other Expenses 50.14 2,725.37 Depreciation 1.13 27.84 Expenditure Transferred to Capital (2.32) (4.89) Net Finance Charges 1.24 12.71 Exceptional Items – 389.10
PROFIT/(LOSS) FOR THE YEAR (8.26) (585.40)
13. NatSteel Asia Pte. Ltd. and its subsidiaries (NSA Group) had an unquoted equity investment in an associate company, Southern Steel Berhad ("SSB"), which was transferred to NatSteel Holdings Pte. Ltd., (NSH Group) w.e.f. 1st August, 2008 in the business restructuring of the group. The investment in this associate company is stated in the fi nancial statement at the carrying value of S$ 52,142,000 (31.03.2008 : S$ 68,079,000). The carrying value is arrived at after accounting for share of results in SSB's loss after tax and minority interest, translation loss and dividend of S$ 6,345,000, S$ 3,499,000 and S$ 5,923,000 respectively for the fi nancial year ended 31st March, 2009. (31.03.2008 : pro after tax and minority interest S$ 30,822,000, translation loss S$ 1,314,000 and dividend S$ 6,254,000). The fi gures used for equity accounting of SSB's results for the fi nancial year from 1st April, 2008 to 31st March, 2009 used for the purpose of consolidation are unaudited and are prepared under the Financial Reporting Standards in Malaysia.
14. For the following companies unaudited Financial Statements have been considered for consolidation: Corus International (Singapore) Holding Pte. Ltd., Corus Asia Limited, Corus Holdings (Thailand) Ltd., Corus International (Guangzhou)
Ltd. ,Corus International (Shanghai) Ltd., Corus International Trading Limited , Corus Metals (Malaysia) Sdn. Bhd., Corus Metals (Thailand) Limited, Corus South East Asia Pte Limited, Easteel Services (M) Sdn. Bhd., Eastern Steel Fabricators Phillipines, Inc., Materials Recycling Pte. Ltd., NatSteel Equity IV Pte. Ltd., NatSteel Middle East FZE, NatSteel Trade International (Shanghai) Company Ltd., PT Materials Recycling Indonesia, Wuxi NatSteel Metal Products Co. Ltd., TRL Asia Pte. Ltd. and TRL China Ltd., Orchid Netherlands (No. 1) B.V. being subsidiaries.
mjunction services ltd. being a joint venture.
Almora Magnesite Ltd., Steel Asia Development and Management Corp., Steel Asia Industries Inc., Steel Asia Manufacturing Corp. and Southern Steel, Berhard being associates.
SCHEDULE N : NOTES TO THE CONSOLIDATED FINANCIAL STATEMENTS OF THE COMPANY AND ITS SUBSIDIARIES FOR THE FINANCIAL YEAR 2008-09 :– continued
f ti

259
SCHEDULE N : NOTES TO THE CONSOLIDATED FINANCIAL STATEMENTS OF THE COMPANY AND ITS SUBSIDIARIES FOR THE FINANCIAL YEAR 2008-09 :– continued
15. In one subsidiary, in terms of the Licence Agreement dated 29.01.2002 with Board of Trustees for the Port of Kolkata, the subsidiary is required to invest in equipment and infrastructure as follows :
Sl. No. Purpose of Investment Phasing of Investment (Rs. crores)
Within 18 Within 24 Within 36 Total months months months
1. For Procurement of Equipment for ship to 23.06 2.85 – 25.91 shore handling & vice versa and horizontal transfer of cargo 2. Storage of cargo – 1.74 1.20 2.94 3. Offi ce building, workshop etc. – 0.75 0.25 1.00 4. Utility Services – 0.22 – 0.22
Total 23.06 5.56 1.45 30.07
As at 31st March, 2009 the subsidiary's investments in equipments and infrastructure aggregate to Rs. 25.80 crores (31.03.2008 : Rs. 25.80 crores). The management of the subsidiary company has requested the Port Trust Authorities for suitable modifi cation to the investment obligation in view of the changes in the business and economic scenario. The Port Trust Authorities have, subject to sanction of Central Government approved the changes proposed by the subsidiary in the specifi cations of the equipments and other required infrastructure.
16. In respect of joint ventures the contingent liabilities and capital commitment are as follows :
Name of the Joint Venture Company Country of Contingent Capital Incorporation Liabilities Commitment Rs. crores Rs. crores
Tata Ryerson Limited India 30.49 10.21 30.40 18.10 mjunction services ltd. India 0.32 – 0.29 – The Dhamra Port Company Limited India – 432.99 – 518.20 Tata BlueScope Steel Limited India 13.36 172.37 7.91 135.96 Tata NYK Shipping Pte. Ltd. Singapore – 439.44 – – Bhubaneshwar Power Private Ltd. India 1.00 – – – S & T Mining Company Private Ltd. India 0.25 – – –

Hundred and second annual report 2008-09
260
17. Employee Benefi ts
a) The Company has recognised, in the profi t and loss account for the current year, an amount of Rs. 237.50 crores (31.03.2008: Rs. 203.56 crores) as expenses under the following defi ned contribution plans :
Rs. crores
Benefi t Contribution to 2008-09 2007-08
Provident Fund 116.55 96.49 Superannuation Fund 32.67 28.87 Employees Pension Scheme/Coal Mines Pension Scheme 77.20 69.07 TISCO Employees Pension Scheme 10.98 8.56 Employees State Insurance 0.10 0.57
Total 237.50 203.56
b) The Company operates post retirement defi ned benefi t plans as follows : a. Funded i. Post Retirement Gratuity ii. Post Retirement Pension Plan b. Unfunded i. Post Retirement Medical Benefi ts ii. Pensions to Directors iii. Farewell Gifts iv. Packing and Transportation Expenses
c) Details of the Post Retirement Gratuity Plan are as follows: Rs. crores
Description 2008-09 2007-08
1. Reconciliation of opening and closing balances of obligation a. Obligation as at the beginning of the year 814.42 740.00 b. Current Service Cost 40.49 33.16 c. Interest Cost 61.80 56.92 d. Obligation of New Companies 8.43 1.96 e. Actuarial (Gain)/Loss 284.23 48.29 f. Exchange Rate Variation 3.15 (0.43) g. Benefi ts Paid (79.56) (65.48) h. Obligation as at the end of the year 1,132.96 814.42
The defi ned benefi t obligation as at 31.03.2009 is funded except in the case of Hooghly Met Coke and Power Company Ltd., Tata BlueScope Steel Ltd., NatSteel Asia Pte. Ltd., NatSteel Holdings Pte. Ltd. and Lanka Special Steel Ltd.
2. Change in Plan Assets (Reconciliation of opening & closing balances) a. Fair Value of Plan Assets as at beginning of the year 731.31 663.13 b. Expected Return on Plan Assets 59.67 53.94 c. Assets of New Companies 7.45 0.96 d. Actuarial Gain/(Loss) 33.62 (5.82) e. Employers' Contributions 91.05 84.58 f. Benefi ts Paid (77.98) (65.48) g. Fair Value of Plan Assets as at end of the year 845.12 731.31
3. Reconciliation of fair value of assets and obligations a. Fair Value of Plan Assets as at end of the year 845.12 731.31 b. Present Value of Obligation as at end of the year 1,132.96 814.42 c. Amount recognised in the Balance Sheet : 287.84 83.11
– Provisions 287.93 83.18 – Loans and Advances (0.09) (0.07)
4. Expense recognised in the period a. Current Service Cost 40.49 33.16 b. Interest Cost 61.80 56.92 c. Expected Return on Plan Assets (59.67) (53.94) d. Actuarial (Gain)/Loss 250.61 54.11 e. Exchange Rate Variation 3.15 (0.43) f. Expense recognised during the year 296.38 89.82
SCHEDULE N : NOTES TO THE CONSOLIDATED FINANCIAL STATEMENTS OF THE COMPANY AND ITS SUBSIDIARIES FOR THE FINANCIAL YEAR 2008-09 :– continued

261
% invested % invested 5. Investment Details a. GOI Securities 15.00 16.00 b. Public Sector Unit Bonds 36.00 37.00 c. State/Central Government Guaranteed Securities 11.00 9.00 d. Special Deposit Schemes 12.00 27.00 e. Private Sector Unit Bonds 5.00 5.00 f. Others (including bank balances) 21.00 6.00
100.00 100.00
6. Assumptions
a. Discount Rate (per annum) 1.65-8.50% 8.00% b. Estimated Rate of return on Plan Assets (per annum) 8-9.58% 8.00% c. Rate of Escalation in Salary (per annum) 3.6-10% 3-12%
7. Other Disclosures a. Experience Adjustment on Plan Liabilities – Gain / (Loss) (202.65) 30.68 b. Experience Adjustment on Plan Assets – Gain / (Loss) 33.62 (5.38)
The basis used to determine overall expected rate of return on assets and the effect on major categories of plan assets is as follows:
The major portions of the assets are invested in PSU bonds and Special Deposits. Based on the asset allocation and prevailing yield rates on these asset classes, the long term estimate of the expected rate of return on the fund assets have been arrived at. Assumed rate of return on assets is expected to vary from year to year refl ecting the returns on matching Government bonds.
d) Details of Post Retirement Pension plans are as follows:
Rs. crores
Description 2008-09 2007-08
1. Reconciliation of opening and closing balances of obligation a. Obligation as at beginning of the year 1,06,330.88 – b. Current Service Cost 1,106.62 1,451.10 c. Interest Cost 6,655.43 5,425.12 d. Obligation of New Companies – 1,13,518.77 e. Actuarial (Gain)/Loss (9,834.03) (6,051.73) f. Exchange Rate Variation (4,341.28) (2,958.28) g. Services and Curtailments (31.40) – h. Benefi ts Paid (5,823.50) (5,680.71) i. Employee Contribution 604.33 577.14 j. Past Service Cost 54.94 49.47 k. Obligation as at end of the year 94,721.99 1,06,330.88
2. Change in Plan Assets (Reconciliation of opening & closing balances) a. Fair Value of Plan Assets as at beginning of the year 1,17,619.62 – b. Expected Return on Plan Assets 6,804.55 6,422.75 c. Actuarial Gain/(Loss) (15,932.23) (222.61) d. Assets of New Companies – 1,17,226.30 e. Contributions Employee 1,891.46 577.14 f. Contributions Employer – 2,456.97 g. Benefi ts Paid (5,862.74) (5,705.45) h. Exchange Rate Variation (4,818.26) (3,135.48) i. Net Fair Value of Plan Assets as at end of the year 99,702.40 1,17,619.62 3. Reconciliation of fair value of assets and obligations a. Fair Value of Plan Assets as at end of the year 99,702.40 1,17,619.62 b. Present Value of Obligation as at end of the year 94,721.99 1,06,330.88 c. Amount recognised in the Balance Sheet – Assets 4,980.41 11,288.74
– Provisions (509.84) Nil – Loans and Advances 5,490.25 11,288.74
SCHEDULE N : NOTES TO THE CONSOLIDATED FINANCIAL STATEMENTS OF THE COMPANY AND ITS SUBSIDIARIES FOR THE FINANCIAL YEAR 2008-09 :– continued
Rs. crores
Description 31.03.2009 31.03.2008

Hundred and second annual report 2008-09
262
4. Expense recognised in the period a. Current Service Cost 1,106.62 1,451.10 b. Interest Cost 6,655.43 5,425.12 c. Expected Return on Plan Assets (6,804.55) (6,422.75) d. Actuarial (Gain)/Loss 6,098.20* (5,829.12) e. Past Service Cost 54.94 49.47 f. Exchange Rate Variation – – g. Services and Curtailment (31.40) – h. Expense recognised during the year 7,079.24 (5,326.18)
31.03.2009 31.03.2008
5. Investment Details % invested % invested a. Equities 23.00 25.00 b. Bonds 65.00 62.00 c. Property 8.00 7.00 d. Others (including Bank Balances) 4.00 6.00
100.00 100.00
6. Assumptions
a. Discount Rate (per annum) 3.9-7% 4.7-6.6% b. Estimated Rate of return on Plan Assets (per annum) 3.5-9.10% 3.5-9.10% c. Rate of Escalation in Salary (per annum) 2-4% 2.5-4.5%
7. Other Disclosures
a. Experience Adjustment on Plan Liabilities – Gain/(Loss) (2,150.46) (923.42) b. Experience Adjustment on Plan Assets – Gain/(Loss) (15,908.68) (222.61)
* The amount has been accounted in Reserves and Surplus.
e) Details of unfunded Post Retirement defi ned benefi t obligations are as follows:
Rs. crores
Description 2008-09 2007-08
Medical Others Medical Others
1. Reconciliation of opening and closing balances of obligation a. Obligation as at beginning of the year 513.23 685.80 461.72 34.18 b. Current/Employer Service Cost 6.55 24.73 5.99 10.97 c. Interest Cost 39.91 34.72 36.73 60.43 d. Obligation of New Companies 2.82 1.50 – 656.28 e. Actuarial (Gain)/Loss 25.50 (2.20) 41.40 (72.04) f. Past Service Cost – 7.85 – (16.11) g. Exchange Rate Variation – (5.61) – 38.49 h. Benefi ts Paid (34.56) (182.66) (32.61) (26.40) i. Obligation as at end of the year 553.45 564.13 513.23 685.80 2. Expense recognised in the period a. Current/Employer Service Cost 6.55 24.73 5.99 10.97 b. Interest Cost 39.91 34.72 36.73 60.43 c. Past Service Cost – 7.85 – (16.11) d. Exchange Rate Variation – (5.61) – 38.49 e. Actuarial (Gain)/Loss 25.50 (2.20) 41.40 (72.04) f. Expense recognised during the year 71.96 59.49 84.12 21.74 3. Assumptions a. Discount Rate (per annum) on beginning of the year 8.00% 4.40-8.00% 8.00% 4.20-8.00% b. Discount Rate (per annum) on end of the year 7.75-8% 4.40-8.00% 8.00% 4.40-8.00% c. Medical Costs Infl ation Rate 5.00% 5.00% 5.00% 5.00% d. Average Medical Cost (Rs./person) on beginning of the year 2,170.00 1,970.00 e. Average Medical Cost (Rs./person) on end of the year 2,290.00 2,170.00 f. Effect of a 1% change in (Health Care Cost) Increase Decrease Increase Decrease
– aggregate current service and Interest cost 5.51 (5.24) 6.85 (4.11) – closing balance of obligation 75.48 (61.86) 54.63 (52.75) 4. Other Disclosures
a. Experience Adjustment on Plan Liabilities – Gain/(Loss) (9.02) 3.57 26.98 (7.05) b. Experience Adjustment on Plan Assets – Gain/(Loss) – – – –
SCHEDULE N : NOTES TO THE CONSOLIDATED FINANCIAL STATEMENTS OF THE COMPANY AND ITS SUBSIDIARIES FOR THE FINANCIAL YEAR 2008-09 :– continued
Rs. crores
Description 2008-09 2007-08
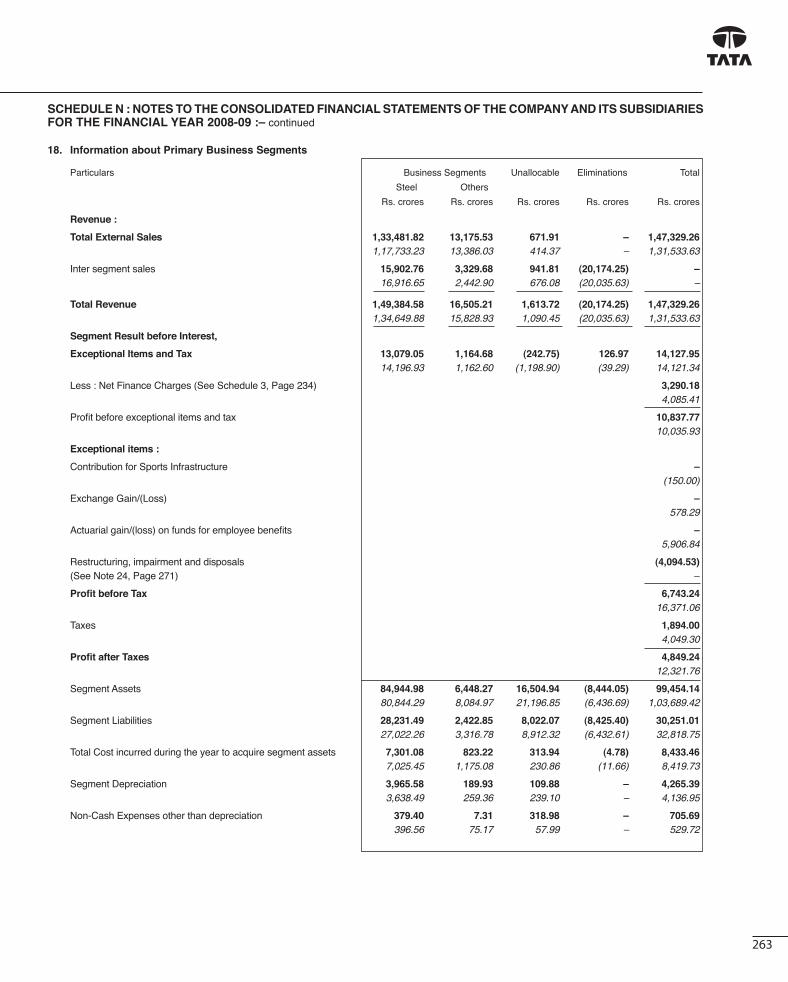
263
SCHEDULE N : NOTES TO THE CONSOLIDATED FINANCIAL STATEMENTS OF THE COMPANY AND ITS SUBSIDIARIES FOR THE FINANCIAL YEAR 2008-09 :– continued
18. Information about Primary Business Segments
Particulars Business Segments Unallocable Eliminations Total
Steel Others
Rs. crores Rs. crores Rs. crores Rs. crores Rs. crores
Revenue :
Total External Sales 1,33,481.82 13,175.53 671.91 – 1,47,329.26 1,17,733.23 13,386.03 414.37 – 1,31,533.63
Inter segment sales 15,902.76 3,329.68 941.81 (20,174.25) – 16,916.65 2,442.90 676.08 (20,035.63) –
Total Revenue 1,49,384.58 16,505.21 1,613.72 (20,174.25) 1,47,329.26 1,34,649.88 15,828.93 1,090.45 (20,035.63) 1,31,533.63
Segment Result before Interest,
Exceptional Items and Tax 13,079.05 1,164.68 (242.75) 126.97 14,127.95 14,196.93 1,162.60 (1,198.90) (39.29) 14,121.34
Less : Net Finance Charges (See Schedule 3, Page 234) 3,290.18 4,085.41
Profi t before exceptional items and tax 10,837.77 10,035.93
Exceptional items :
Contribution for Sports Infrastructure – (150.00)
Exchange Gain/(Loss) – 578.29
Actuarial gain/(loss) on funds for employee benefi ts – 5,906.84
Restructuring, impairment and disposals (4,094.53) (See Note 24, Page 271) –
Profi t before Tax 6,743.24 16,371.06
Taxes 1,894.00 4,049.30
Profi t after Taxes 4,849.24 12,321.76
Segment Assets 84,944.98 6,448.27 16,504.94 (8,444.05) 99,454.14 80,844.29 8,084.97 21,196.85 (6,436.69) 1,03,689.42
Segment Liabilities 28,231.49 2,422.85 8,022.07 (8,425.40) 30,251.01 27,022.26 3,316.78 8,912.32 (6,432.61) 32,818.75
Total Cost incurred during the year to acquire segment assets 7,301.08 823.22 313.94 (4.78) 8,433.46 7,025.45 1,175.08 230.86 (11.66) 8,419.73
Segment Depreciation 3,965.58 189.93 109.88 – 4,265.39 3,638.49 259.36 239.10 – 4,136.95
Non-Cash Expenses other than depreciation 379.40 7.31 318.98 – 705.69 396.56 75.17 57.99 – 529.72

Hundred and second annual report 2008-09
264
SCHEDULE N : NOTES TO THE CONSOLIDATED FINANCIAL STATEMENTS OF THE COMPANY AND ITS SUBSIDIARIES FOR THE FINANCIAL YEAR 2008-09 :– continued
Information about Secondary Segments : Geographical 2008-09 2007-08 Rs. crores Rs. crores
Revenue by Geographical Market India ...................................................................................... 26,299.57 20,170.88 Outside India ......................................................................... 1,21,029.69 1,11,362.75
1,47,329.26 1,31,533.63 Additions to Fixed Assets and Intangible Assets India ...................................................................................... 3,723.56 3,252.16 Outside India ......................................................................... 4,709.90 5,167.57
8,433.46 8,419.73
As at As at 31.03.2009 31.03.2008 Rs. crores Rs. crores
Carrying Amount of Segment Assets India ...................................................................................... 29,340.63 22,021.93 Outside India ......................................................................... 70,113.51 81,667.49
99,454.14 1,03,689.42
Notes :
(i) The Company has disclosed Business Segment as the primary segment. Segments have been identifi ed taking into account the nature of the products, the differing risks and returns, the organisational structure and internal reporting system. The Company's operations predominantly relate to manufacture of Steel. Other business segments comprises of Tubes, Bearings, Refractories, Pigments, Port operations, town services and Investment activities.
(ii) Segment Revenue, Segment Results, Segment Assets and Segment Liabilities include the respective amounts identifi able to each of the segments as also amounts allocated on a reasonable basis. The expenses, which are not directly relatable to the business segment, are shown as unallocated corporate cost. Assets and liabilities that cannot be allocated between the segments are shown as unallocated corporate assets and liabilities respectively.
(iii) Total Unallocable Assets exclude : As at As at 31.03.2009 31.03.2008 Rs. crores Rs. crores
Investments .......................................................................... 6,133.77 3,107.09
Miscellaneous Expenditure ................................................... 105.48 155.63
Goodwill on consolidation ..................................................... 15,364.92 18,049.96
Deferred Tax Asset ................................................................ 76.12 10.26
21,680.29 21,322.94 Total Unallocable Liabilities exclude :
Secured Loans ...................................................................... 34,329.26 35,414.99
Unsecured Loans .................................................................. 25,571.24 18,209.75
Provision for Employee Separation Compensation .............. 1,042.41 1,080.05
Deferred Tax Liability ........................................................... 1,785.55 2,464.68
Share Warrants issued by a subsidiary company ................. 17.46 17.46 Minority Interest .................................................................... 894.88 832.70
63,640.80 58,019.63
(iv) Transactions between segments are primarily for materials which are transferred at market determined prices and common costs are apportioned on a reasonable basis.

265
19. Related Party Disclosures
(a) List of Related Parties and Relationships
Party Relationship
A. i) Kalimati Investment Company Ltd. Associate – 1. Rujuvalika Investments Ltd. Where the Company ii) NatSteel Asia Pte. Ltd. exercises signifi cant infl uence 1. Steel Asia Development and Management Corp. 2. Steel Asia Industries Inc. 3. Steel Asia Manufacturing Corp. iii) Tata Incorporated 1. TKM Overseas Ltd. iv) Tata Refractories Ltd. 1. Almora Magnesite Ltd. v) Tata Steel Ltd. 1. Indian Steel Rolling Mills Ltd. 2. Industrial Energy Ltd. 3. Jamipol Ltd. 4. Kalinga Aquatics Ltd. 5. Kumardhubi Fireclay & Silica Works Ltd. 6. Kumardhubi Metal Casting & Engineering Ltd. 7. Nicco Jubilee Park Ltd. 8. Tata Construction & Projects Ltd. 9. Tata Sponge Iron Ltd. 10. Tayo Rolls Ltd.* 11. Tinplate Company of India Ltd. 12. TRF Ltd. vi) Tata Steel Holdings Pte. Ltd. a) Tata Steel Global Holdings Pte Ltd. I Corus International (Singapore) Holding Pte. Ltd. – European Profi les Malaysia (M) Sdn. Bhd. II NatSteel Holdings Pte. Ltd. – Southern Steel, Berhard III Tata Steel Europe Ltd. 1. Ab Norskstal AS 2. Albi Profi ls SRL 3. Altos Hornos De Mexico S.A. de C.V. 4. Antheus Magnesium B.V. * 5. Appleby Frodingham Cottage Trust Limited 6. Combulex B.V. 7. Cv Gasexpansie Ijmond 8. Danieli Corus Canada Inc. 9. Danieli Corus Asia B.V. 10. Danieli Corus B.V. 11. Danieli Corus Braseq Ltda. 12. Danieli Corus Construction Services B.V. 13. Danieli Corus Construction Services Usa Inc. 14. Danieli Corus Do Brasil Ltda. 15. Danieli Corus Inc. 16. Danieli Corus Services Usa Inc. 17. Danieli Corus South Africa Pty. Ltd. 18. Danieli India (PVT) Ltd * 19. Endex European Energy Derivates Exchanges N.V. 20. European Profi les (Marketing) Sdn. Bhd. 21. Galvpro LP. 22. Gietwalsonderhoudcombinatie B.V. 23. Hoogovens Court Chrome Vof 24. Hoogovens Gan Multimedia S.A. De C.V. 25. Isolation Du Sud SA 26. Issb Limited 27. MDC Sublance Probe Technology * 28. Regionale Ontwikkelingsmaatschappij Voor Het Noordzeekanaalgebied N.V. 29. Richard Lees Steel Decking Asia Snd. Bhd. 30. Rsp Holding B.V. 31. Schreiner Fleischer AS 32. Shanghai Bao Yi Beverage Can Making Co. Ltd.
SCHEDULE N : NOTES TO THE CONSOLIDATED FINANCIAL STATEMENTS OF THE COMPANY AND ITS SUBSIDIARIES FOR THE FINANCIAL YEAR 2008-09 :– continued

Hundred and second annual report 2008-09
266
33. Sms Mevac UK Limited 34. Stuwadoorsbedrijf Velserkom B.V. 35. Thoresen & Thorvaldsen AS 36. Trico LLC 37. Weirton/Hoogovens GP 38. Workington Cottage Trust 39. Wupperman Staal Nederland B.V.
vii) The Indian Steel and Wire Products Ltd. 1. Metal Corporation of India Ltd.
B. i) Jamshedpur Utilities & Services Company Ltd. Joint Venture 1. Haldia Water Management Limited*
ii) Tata Steel Ltd. 1. Bhubaneswar Power Pvt. Ltd.* 2. mjunction services ltd. 3. S & T Mining Company Pvt. Ltd.* 4. Tata Bluescope Steel Ltd. 5. Tata NYK Shipping Pte Ltd. 6. Tata Ryerson Ltd. 7. The Dhamra Port Company Ltd.
iii) Tata Steel Holdings Pte. Ltd. a) Tata Steel Global Holdings Pte Ltd I Tata Steel Europe Ltd. 1. Afon Tinplate Company Limited 2. Air Products Llanwern Limited 3. B V Ijzerleew 4. Bsr Pipeline Services Limited 5. Caparo Merchant Bar Plc 6. Cindu Chemicals B.V. 7. Corus Celik Ticaret AS 8. Corus Cogifer Switches And Crossings Limited 9. Corus Kalpinis Simos Rom SRL 10. Tata Elastron SA 11. Danieli Corus Technical Services B.V. 12. Framing Solutions Plc. * 13. Grantrail Group Ltd. * 14. Hks Scrap Metals B.V. 15. Ijzerhandel Geertsema Staal B.V. 16. Industrial Rail Services Ijmond B.V. 17. Laura Metaal Holding B.V. 18. Norsk Stal AS 19. Norsk Stal Tynnplater AS 20. Ravenscraig Limited 21. Tata Elastron SA Steel Service Center 22. Texturing Technology Limited
II Tata Steel Global Minerals Holdings Pte. Ltd. 1. Riversdale Energy (Mauritius) Ltd.
C. Tata Sons Ltd. Promoters' holding together with its Subsidiaries is more than 20%
D. Key Management Personnel Whole Time Director
Mr. B. Muthuraman
E. Relatives of Key Management Personnel Relative of Whole Time Director
Ms. Sumathi Muthuraman
* Part of the year.
SCHEDULE N : NOTES TO THE CONSOLIDATED FINANCIAL STATEMENTS OF THE COMPANY AND ITS SUBSIDIARIES FOR THE FINANCIAL YEAR 2008-09 :– continued
Party Relationship

267
SCHEDULE N : NOTES TO THE CONSOLIDATED FINANCIAL STATEMENTS OF THE COMPANY AND ITS SUBSIDIARIES FOR THE FINANCIAL YEAR 2008-09 :– continued
19. (b) Related Party Transactions Rs. crores
Transactions Associates Key Relatives of Key Promoter Total & JVs Management Management # Personnel Personnel
Purchase of Goods Gietwalsonderhoudcombinatie B.V. 131.00 – – – 131.00 85.09 – – – 85.09 Wupperman Staal Nederland B.V. 109.20 – – – 109.20 98.49 – – – 98.49 BSR Pipeline Services Limited 71.07 – – – 71.07 41.92 – – – 41.92 Caparo Merchant Bar Plc 68.33 – – – 68.33 194.50 – – – 194.50 Jamipol Ltd. 61.04 – – – 61.04 50.79 – – – 50.79 Others 159.24 – – – 159.24 347.29 – – – 347.29
599.88 – – – 599.88 818.08 – – – 818.08
Sale of Goods Southern Steel, Berhard 1,599.00 – – – 1,599.00 1,111.59 – – – 1,111.59 Tata Ryerson Ltd. 773.31 – – – 773.31 795.12 – – – 795.12 Wupperman Staal Nederland B.V. 612.53 – – – 612.53 489.33 – – – 489.33 Others 784.42 – – – 784.42 795.46 – – – 795.46
3,769.26 – – – 3,769.26 3,191.50 – – – 3,191.50
Receiving of Services Tinplate Company of India Ltd. 358.63 – – – 358.63 222.73 – – – 222.73 Tata NYK Shipping Pte Ltd. 219.55 – – – 219.55 – – – – – Tata Ryerson Ltd. 88.77 – – – 88.77 92.32 – – – 92.32 Others 23.74 – – 53.83 77.57 20.60 0.02 0.02 0.69 21.33
690.69 – – 53.83 744.52 335.65 0.02 0.02 0.69 336.38 Rendering of Services Tinplate Company of India Ltd. 45.41 – – – 45.41 35.83 – – – 35.83 Tata Blue Scope Steel Ltd. 37.04 – – – 37.04 27.08 – – – 27.08 Others 19.56 – – 0.24 19.80 11.03 – – 0.14 11.17
102.01 – – 0.24 102.25 73.94 – – 0.14 74.08
Purchase of Fixed Assets TRF Ltd. 17.10 – – – 17.10 43.25 – – – 43.25 Others 0.40 – – – 0.40 7.33 – – – 7.33
17.50 – – – 17.50 50.58 – – – 50.58
Dividend and Fraction Bonus amount paid to Shareholders Tata Sons Ltd. – – – 333.07 333.07 – – – 260.81 260.81 Others – * ** – 0.01 – *** **** – 0.01
– * ** 333.07 333.08 – *** **** 260.81 260.82
Dividend income Norsk Stal AS 38.46 – – – 38.46 28.22 – – – 28.22 Danieli Corus Technical Services B.V. 19.49 – – – 19.49 – – – – – Southern Steel, Berhard 18.93 – – – 18.93 18.05 – – – 18.05 Others 56.74 – – – 56.74 65.16 – – – 65.16
133.62 – – – 133.62 111.43 – – – 111.43

Hundred and second annual report 2008-09
268
Interest Expense Danieli Corus Technical Services B.V 2.17 – – – 2.17 3.05 – – – 3.05
2.17 – – – 2.17 3.05 – – – 3.05
Interest Income Tinplate Company of India Ltd. 17.21 – – – 17.21 0.64 – – – 0.64 Industrial Energy Ltd. 6.10 – – – 6.10 1.76 – – – 1.76 Others 2.07 – – – 2.07 163.47 – – – 163.47
25.38 – – – 25.38 165.88 – – – 165.88
Management contracts including deputation of employees Tata Sons Ltd. – – – 50.00 50.00 – – – 42.79 42.79
– – – 50.00 50.00 – – – 42.79 42.79
Finance Provided Tinplate Company of India Ltd. 110.00 – – – 110.00 70.00 – – – 70.00 Tata NYK Shipping Pte Ltd. 87.84 – – – 87.84 21.01 – – – 21.01 Industrial Energy Ltd. 130.53 – – – 130.53 86.15 – – – 86.15 Others 72.28 – – – 72.28 90.00 – – – 90.00
400.65 – – – 400.65 267.16 – – – 267.16
Unsecured advances/Deposits accepted Tinplate Company of India Ltd. – – – – – 0.95 – – – 0.95
– – – – – 0.95 – – – 0.95
Remuneration Paid Mr. B. Muthuraman – 5.07 – – 5.07 – 3.66 – – 3.66 Dr. T. Mukherjee (upto 31.10.2007) – – – – – – 1.91 – – 1.91 Mr. A. N. Singh (upto 30.09.2007) – – – – – – 1.27 – – 1.27
– 5.07 – – 5.07 – 6.84 – – 6.84
Guarantees and collaterals given Tinplate Company of India Ltd. 25.00 – – – 25.00 – – – – –
25.00 – – – 25.00 – – – – –
Guarantees outstanding Others – – – – – 25.00 – – – 25.00
– – – – – 25.00 – – – 25.00
19. (b) Related Party TransactionsRs. crores
Transactions Associates Key Relatives of Key Promoter Total & JVs Management Management # Personnel Personnel
SCHEDULE N : NOTES TO THE CONSOLIDATED FINANCIAL STATEMENTS OF THE COMPANY AND ITS SUBSIDIARIES FOR THE FINANCIAL YEAR 2008-09 :– continued

269
Outstanding Receivables Tinplate Company of India Ltd. 191.18 – – – 191.18 115.48 – – – 115.48 Ravenscraig Limited 158.90 – – – 158.90 164.32 – – – 164.32 Norsk Stal AS 152.53 – – – 152.53 27.65 – – – 27.65 Others 618.25 – – 4.01 622.26 390.84 0.01 0.01 3.36 394.22
1,120.86 – – 4.01 1,124.87 698.29 0.01 0.01 3.36 701.67
Outstanding Payables Tinplate Company of India Ltd. 33.78 – – – 33.78 11.69 – – – 11.69 Tata Sons Ltd. – – – 55.68 55.68 – – – 46.95 46.95 Gietwalsonderhoudcombinatie B.V. 19.67 – – – 19.67 19.77 – – – 19.77 Others 61.54 – – – 61.54 152.61 – – – 152.61
114.99 – – 55.68 170.67 184.07 – – 46.95 231.02
Notes : * Rs. 43,389 ** Rs. 20,829 *** Rs. 33,883 **** Rs. 19,995
# Transactions with Joint Ventures have been disclosed at full value.
SCHEDULE N : NOTES TO THE CONSOLIDATED FINANCIAL STATEMENTS OF THE COMPANY AND ITS SUBSIDIARIES FOR THE FINANCIAL YEAR 2008-09 :– continued
19. (b) Related Party TransactionsRs. crores
Transactions Associates Key Relatives of Key Promoter Total & JVs Management Management # Personnel Personnel

Hundred and second annual report 2008-09
270
SCHEDULE N : NOTES TO THE CONSOLIDATED FINANCIAL STATEMENTS OF THE COMPANY AND ITS SUBSIDIARIES FOR THE FINANCIAL YEAR 2008-09 :– continued
20. Earnings per Share (EPS) 2008-09 2007-08 Rs. crores Rs. crores (i) Profi t after Tax and Minority Interest ................................................................... 4,950.90 12,349.98 Less: Preference dividend including tax thereon ................................................ 128.05 25.96 Profi t attributable to ordinary shareholders ........................................................ 4,822.85 12,324.02 Profi t attributable to ordinary shareholders – for Diluted EPS ............................. 5,213.74 12,305.26
Nos. Nos. (ii) Weighted Average No. of Ordinary Shares for Basic EPS .................................. 72,99,13,379 69,70,12,514 Add : Adjustment for 8,750 (2007-08: 8,750) Convertible Alternative Reference Securities .................................................................................................. 6,27,16,057 3,59,84,623
Adjustment for Options relating to 12,446 (2007-08: 12,446) Detachable Warrants (See Note 7, Page 256) .................................................... 7,613 11,010 Adjustment for 54,72,66,011 (2007-08: 54,72,51,605) Cumulative Convertible Preference Shares ............................................................................................. 9,12,08,752 2,36,74,364
Weighted Average No. of Ordinary Shares for Diluted EPS ............................... 88,38,45,801 75,66,82,511
(iii) Nominal Value of Ordinary Shares ...................................................................... Rs. 10.00 Rs. 10.00 (iv) Basic Earnings per Ordinary Share ..................................................................... Rs. 66.07 Rs. 176.81 (v) Diluted Earnings per Ordinary Share .................................................................. Rs. 58.99 Rs. 162.62
21. Deferred Tax Liability (Net) Deferred Tax (Asset)/Liability as at 31-03-2009 31-03-2008 Deferred Tax Liabilities Rs. crores Rs. crores (i) Difference between book and tax depreciation................................................. 3,067.17 2,783.86 (ii) Prepaid expenses ............................................................................................. 32.56 38.53 (iii) Actuarial Gain / (Loss) ...................................................................................... 1,281.65 2,759.96 (iv) Others ............................................................................................................... 1,037.21 847.77
(A) 5,418.59 6,430.12 Deferred Tax Assets (i) Employee Separation Compensation ............................................................... (504.87) (503.87) (ii) Wage Provision ................................................................................................ (70.19) (65.28) (iii) Provision for doubtful debts and advances ....................................................... (38.95) (35.23) (iv) Disallowance under Section 43B .................................................................... (172.40) (117.64) (v) Provision for Leave Salary ................................................................................ (149.73) (140.62) (vi) Provision for Employee Benefi ts ....................................................................... (78.24) (77.46) (vii) Differences in written down value of development of property ......................... (66.48) (13.39) (viii) Other Provisions ............................................................................................... (2,328.62) (2,743.69) (ix) Redemption premium on CARS (See Note 23, Page 270) .............................. (299.68) (278.52)
(B) (3,709.16) (3,975.70)
Deferred Tax Liability (Net) (A+B) 1,709.43 2,454.42
22. Figures pertaining to the subsidiary companies and joint ventures have been reclassifi ed wherever necessary to bring them in line with the Company’s fi nancial statements.
23. The Company raised Rs. 3,578.75 crores (US $ 875 million) through the issue of Foreign Currency Convertible Alternative Reference Securities (“CARS”) during FY 2007-08. The CARS will be convertible into either qualifying securities (which may be in the form of depository receipts with restricted rights of withdrawal representing underlying ordinary shares with differential rights as to voting) or ordinary shares only between 4th September, 2011 to 6th August, 2012 and are redeemable in foreign currency only in September, 2012, if not converted into equity. The CARS will be convertible at a conversion price of Rs. 758.10 per share as adjusted for the rights issue. The CARS carry a coupon rate of 1% p.a. The outstanding CARS, if any, at maturity will be redeemable at a premium of 23.34% of the principal amount, with an effective YTM of 5.15%.

271
Premium payable on redemption and the expenses related to the issue of CARS are adjusted against the Securities Premium Account. Changes to premium payable on account of exchange fl uctuation is transferred to “Foreign Currency Monetary Items Translation Difference Account” in line with Companies (Accounting Standards) Amendment Rules 2009 relating to Accounting Standard 11 (AS-11) notifi ed by Government of India on 31st March, 2009. Such exchange fl uctuation on the premium payable is amortised over the balance period of CARS but not beyond 31st March, 2011, by adjusting the same to Securities Premium Account. Accordingly, an amount of Rs. 32.54 crores (net of deferred tax Rs. 16.76 crores) has been amortised and adjusted against Securities Premium Account during the current fi nancial year. During 2007-08, Rs. 10.51 crores (net of deferred tax Rs. 5.41 crores) being the gain on revaluation of the premium payable was adjusted against the Securities Premium Account. Fees to Mandated Lead Arrangers for revision in certain terms and conditions of standby letter of credit in the issue of CARS has been considered as issue expenses based on a legal opinion. The issue expenses of Rs. 229.74 crores (2007-08: Rs. 111.86 crores) has been adjusted to Securities Premium Account.
24. Restructuring, impairment and disposals included in exceptional items relate to disposal/impairment of assets and restructuring arising out of the 'Fit for the Future' programme at Tata Steel Europe Limited.
25. Previous year’s fi gures have been recast/restated wherever necessary.
26. Figures in italics are in respect of the previous year.
SCHEDULE N : NOTES TO THE CONSOLIDATED FINANCIAL STATEMENTS OF THE COMPANY AND ITS SUBSIDIARIES FOR THE FINANCIAL YEAR 2008-09 :– continued

Hundred and second annual report 2008-09
272
Consolidated Financial Ratios
2008-09 2007-08 2006-07 2005-06 2004-05 2003-04 2002-03 2001-02
1. EBIDTA/Turnover 12.55% 13.90% 30.73% 32.23% 39.35% 31.19% 23.79% 15.85%
2. PBT/Turnover 7.43% 7.65% 25.09% 27.20% 34.08% 24.27% 14.10% 3.04%
3. Return on Avg. Capital Employed 15.57% 21.13% 23.31% 39.47% 48.31% 27.71% 16.12% 6.32%
4. Return on Avg. Net Worth 16.18% 50.96% 34.16% 43.57% 62.02% 45.96% 35.60% 7.68%
5. Asset Turnover 128.54% 108.27% 76.65% 120.89% 107.44% 100.15% 79.18% 65.43%
6. Inventory Turnover (in days) 56.00 37.00 46.00 45.00 42.00 40.00 45.00 55.00
7. Debtors Turnover (in days) 39.00 28.00 21.00 23.00 24.00 30.00 47.00 63.00
8. Gross Block to Net Block 2.39 2.51 1.65 1.67 1.65 1.70 1.65 1.57
9. Net Debt to Equity 1.65 1.99 0.84 0.06 0.22 0.42 1.14 1.82
10. Current Ratio 1.78 1.87 2.45 1.35 1.11 1.07 1.39 1.63
11. Interest Cover ratio 4.32 3.46 16.38 35.21 28.52 21.89 5.09 1.56
12. Networth per share
(post CCPS conversion) 330.70 472.27 223.35 181.53 128.95 81.52 89.23 68.16
13. Earnings per share 66.07 176.81 64.66 67.62 65.27 32.40 28.00 5.17
14. Dividend Payout 30.00% 11.00% 26.00% 22.00% 23.00% 23.00% 32.00% 78.00%
15. P/E Ratio 3.12 3.92 6.95 7.93 6.14 11.84 4.78 18.89
1. EBIDTA/Turnover : Earnings Before Interest Depreciation Tax and Exceptional Items/Turnover.
(EBIDTA : PAT after minority & share of associates + Taxes +(-) Exceptional Items + Net Finance Charges + Depreciation).
(Turnover : Sales & Other Operating Income less Excise Duty).
2. PBT/Turnover : Profi t Before Tax/Turnover.
( PAT after minority & share of associates + Taxes +(-) Exceptional Items).
3. Return on Average Capital Employed : EBIT/Average Capital Employed.
(Capital Employed : Total Funds Employed – Miscellaneous Expenses to the extent not written off or adjusted - Foreign Currency Monetary
Translation Diff Account)).
(EBIT : PAT after minority & share of associates + Taxes +(-) Exceptional Items + Net Finance Charges).
4. Return on Average Net Worth : PAT after minority & share of associates/Average Net Worth.
(Net Worth : Equity Share Capital + Preference Share Capital + Reserves & Surplus – Miscellaneous Expenses to the extent not written off or
adjusted - Foreign Currency Monetary Translation Diff Account).
5. Asset Turnover : Net Sales/(Total Assets - Investments - Misc Expenses to the extent not written off or adjusted - Foreign Currency Monetary
Translation Diff Account - Advance Against Equity + Current Liabilities & Provisions).
6. Inventory Turnover : Average Inventory/Sale of Products in days.
7. Debtors Turnover : Average Debtors/Turnover in days.
8. Gross Block to Net Block : Gross Block/Net Block.
9. Net Debt to Equity : Net Debt/Avg. Net Worth.
(Net Debt :Secured Loan+Unsecured loan -Cash & Bank - Current Investments).
10. Current Ratio : Current Assets (excluding advance against equity)/Current Liabilities.
11. Interest Cover Ratio : Earnings Before Interest and Tax/Net Finance Charges.
12. Net Worth per share : Net Worth/Average Number of Equity Shares (post CCPS conversion).
13. Earnings per share(Basic) : Profi t attributable to Ordinary Shareholders/Weighted average number of ordinary shares.
14. Dividend Payout : Dividend/PAT after minority & share of associates.
15. P/E Ratio : Market Price/Earnings per share (Basic).

The Deming Application Prize, established in December 1950 in honour of W. Edwards Deming,
was originally designed to reward Japanese companies for major advances in quality improvement.
Tata Steel India’s Award of the Deming Application Prize-2008 for excellence in
Total Quality Management was a fi rst to an integrated steel company outside Japan.
Mr. B. Muthuraman, Managing Director, Tata Steel, received the coveted medal from
Mr. Fujio Mitarai, Chairman of The Deming Prize Committee in Japan.
The Deming Application Prize
Final_Cover.indd 2Final_Cover.indd 2 7/25/09 5:13:36 PM7/25/09 5:13:36 PM

102nd Annual Report2008-2009
Endurance • Continuous Improvement • Growth
Bombay House 24 Homi Mody Street Mumbai 400 001
Final_Cover.indd 1Final_Cover.indd 1 7/8/09 1:22:02 PM7/8/09 1:22:02 PM