A Holocaust Memorial or a Memorial to Germany's Vicarious Trauma?
Upload
khangminh22Category
view
0download
0
Mrs Sheetal GawareMrs. Sheetal GawareHaematopathology labTata Memorial HospitalTata Memorial Hospital
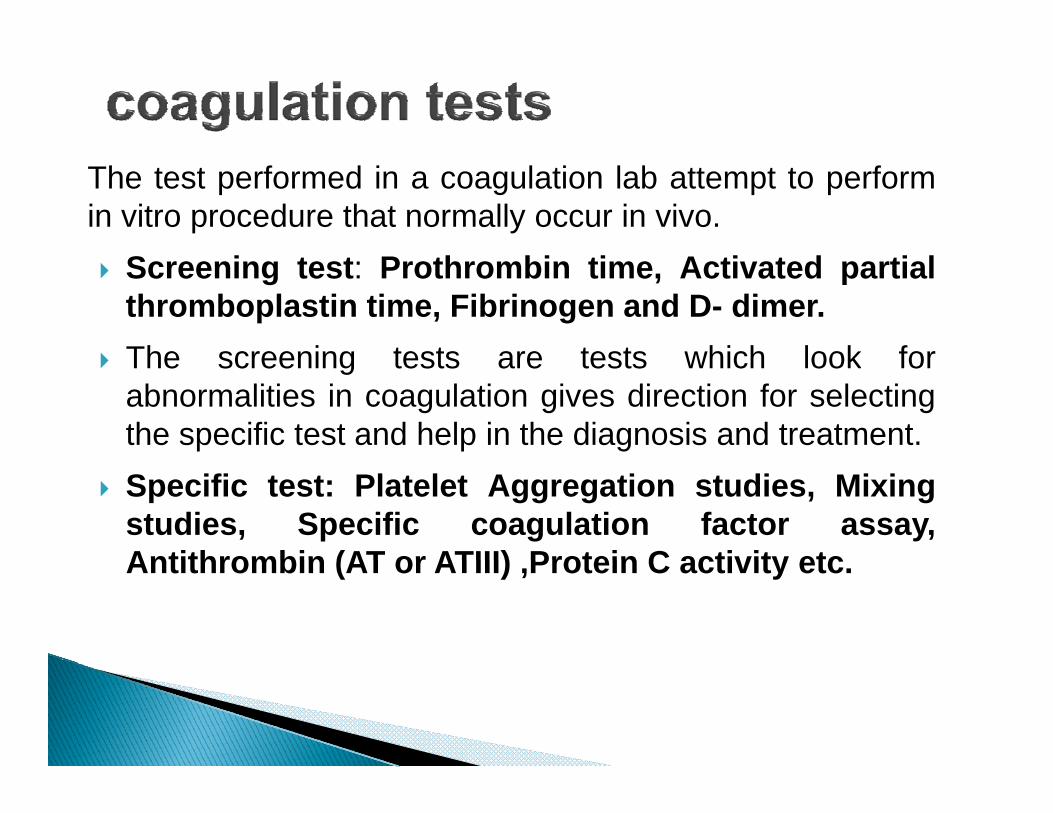
The test performed in a coagulation lab attempt to performin vitro procedure that normally occur in vivo. Screening test: Prothrombin time, Activated partial
thromboplastin time, Fibrinogen and D- dimer. The screening tests are tests which look for The screening tests are tests which look for
abnormalities in coagulation gives direction for selectingthe specific test and help in the diagnosis and treatment.
Specific test: Platelet Aggregation studies, Mixingstudies, Specific coagulation factor assay,Antithrombin (AT or ATIII) Protein C activity etcAntithrombin (AT or ATIII) ,Protein C activity etc.
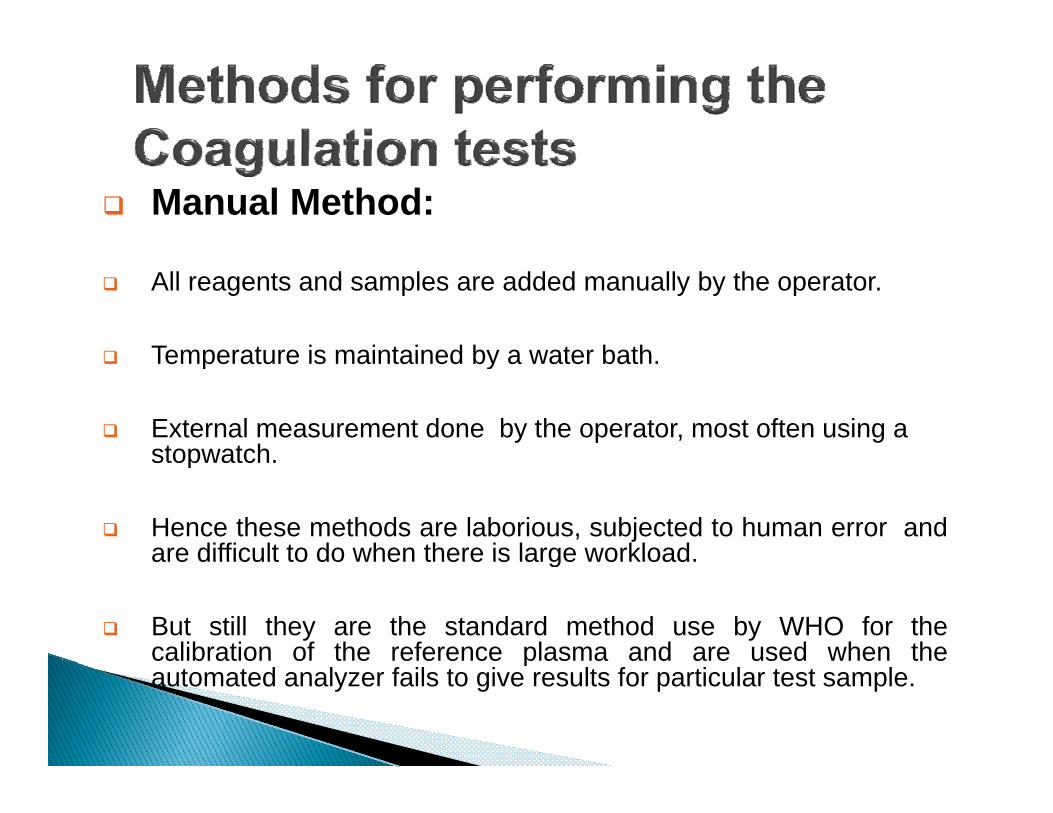
Manual Method:
All reagents and samples are added manually by the operator.
Temperature is maintained by a water bath Temperature is maintained by a water bath.
External measurement done by the operator, most often using a stopwatchstopwatch.
Hence these methods are laborious, subjected to human error andare difficult to do when there is large workload.are difficult to do when there is large workload.
But still they are the standard method use by WHO for thecalibration of the reference plasma and are used when thepautomated analyzer fails to give results for particular test sample.
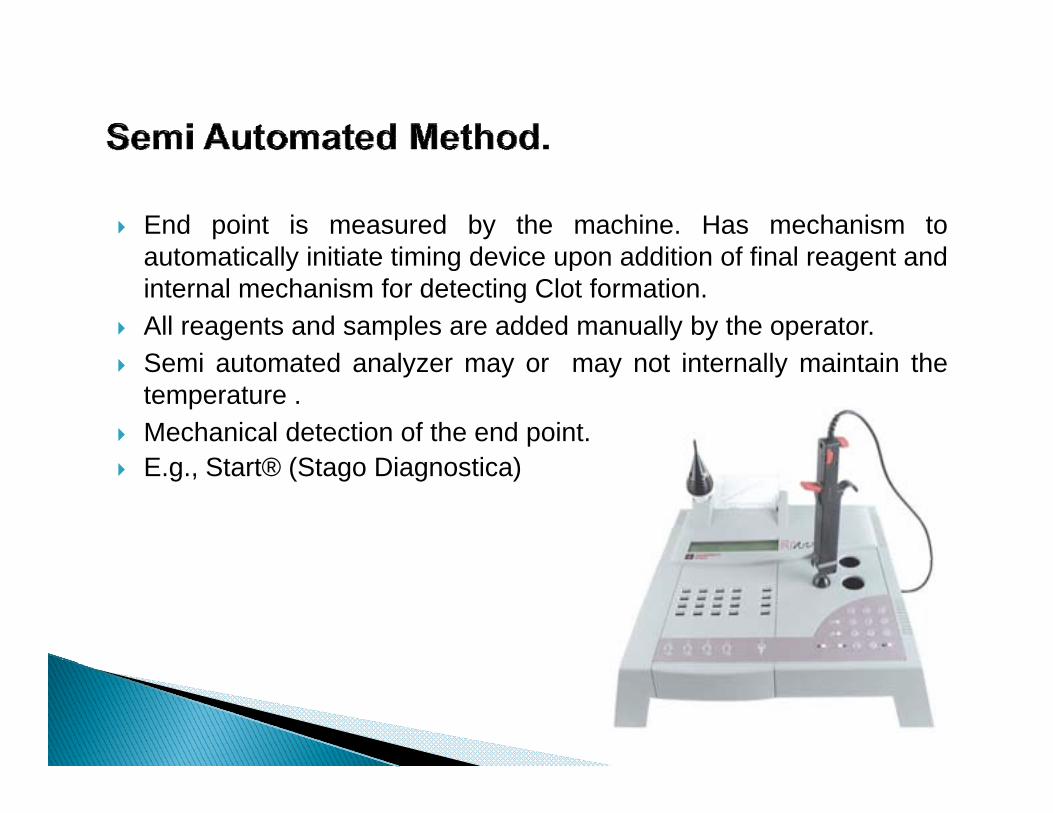
End point is measured by the machine. Has mechanism toautomatically initiate timing device upon addition of final reagent andautomatically initiate timing device upon addition of final reagent andinternal mechanism for detecting Clot formation.
All reagents and samples are added manually by the operator.S i t t d l t i t ll i t i th Semi automated analyzer may or may not internally maintain thetemperature .
Mechanical detection of the end point.E St t® (St Di ti ) E.g., Start® (Stago Diagnostica)

Sources of human errors are eliminated, such as in sampleidentification, end point detection and addition of sample and, p preagents.
Maintains and check the temperature and monitors regent levels. Perform auto dilutions mainly for the single factor assays and Perform auto dilutions mainly for the single factor assays and
calibration and plot the reaction curve which gives additionalinformation.
It stores large no. of patient data and control result and plot the It stores large no. of patient data and control result and plot theLevy-Jennings graph to see the accuracy and the precision.
Generates flagging for sample abnormality and instrumentalmalfunctioning.malfunctioning.
Batch processing of multiple samples for single test or no. of teston a single sample can be performed.

The choice depends on workload, repertoire, cost, temperaturep p pcontrol, mechanism of detection of end point.
Mendatory requirement:Mendatory requirement: 1)Performance of clotting, chromogenic and immunological
assay 2) Closed vial or cap piercing 3) Storage for QC data and patient data, Reagent stability,
Sample throughput bidirectional interfacing and continualSample throughput, bidirectional interfacing and continualsample loading etc.

BCS-XPSysmexca 7000CS
ACL-7000 ElitePro

Clotting assay: Formation of fibrin clot is measured.
Chromogenic assay: Development of the colour is measuredmeasured.
Immunological assay: Formation of the Ag-Ab complex g y gleads to increase in turbidity of the test solution.Alsocalled as immunoturbidimetric methods.

In this sample and reagent are mixed together to form a clot.
End point of the reaction i.e., clot is detected by two different methods:different methods:
Mechanical method: Primary methodology utilized for the clot detection
Nephelometric method: Photo optical method
Test based on formation of clot as a end point of Test based on formation of clot as a end point of reaction are PT, APTT, TT, Fib ,single factor assay etc.

Magnetic( Steel Ball Method)
Mechanical clot detection involves monitoring themovement of a steel ball within the test solution As clotmovement of a steel ball within the test solution. As clotformation occurs, the movement of the ball changes,which is detected by the sensor.
This method is utilized in the semi automated instrumentlike Start from Stago Diagnosticalike Start from Stago Diagnostica.

1. A change in the movement of the steel ball maybe detected when there is increased viscosity ofbe detected when there is increased viscosity ofthe test solution.
2. Or by a break in contact with the magneticsensors when the steel ball becomes incorporatedinto a fibrin clot as the cuvette rotates.into a fibrin clot as the cuvette rotates.

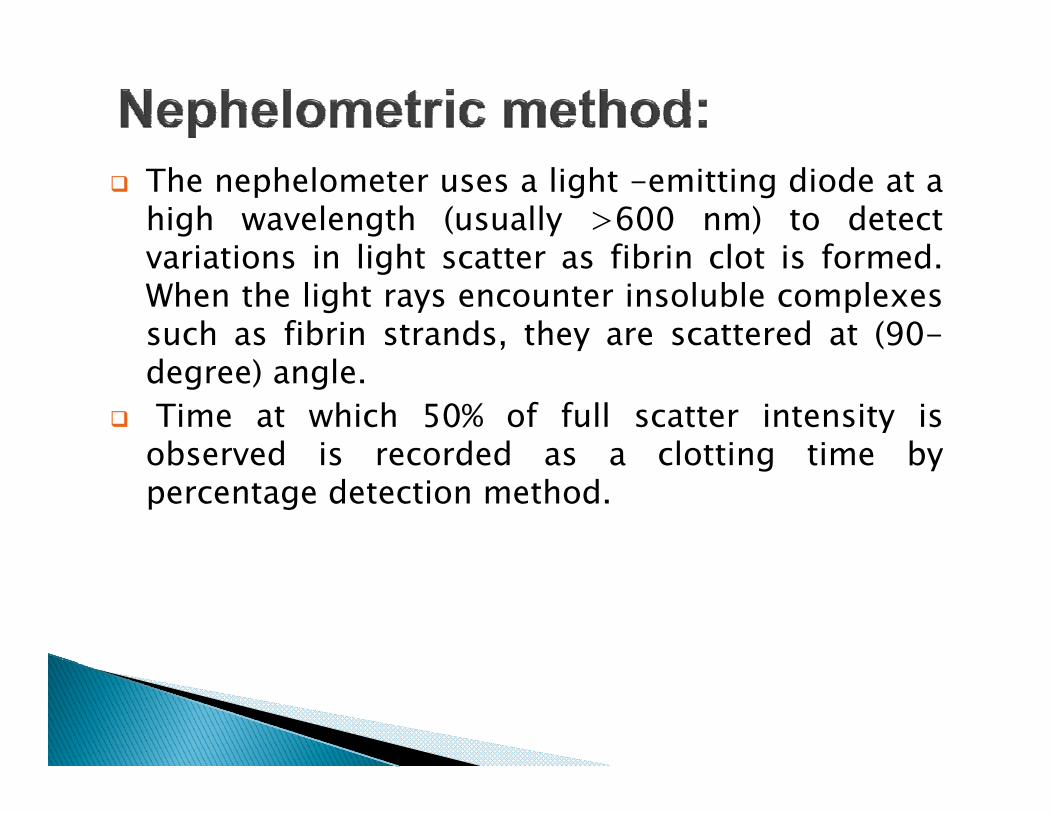
The nephelometer uses a light -emitting diode at ahigh wavelength (usually >600 nm) to detectvariations in light scatter as fibrin clot is formedvariations in light scatter as fibrin clot is formed.When the light rays encounter insoluble complexessuch as fibrin strands, they are scattered at (90-degree) angle.
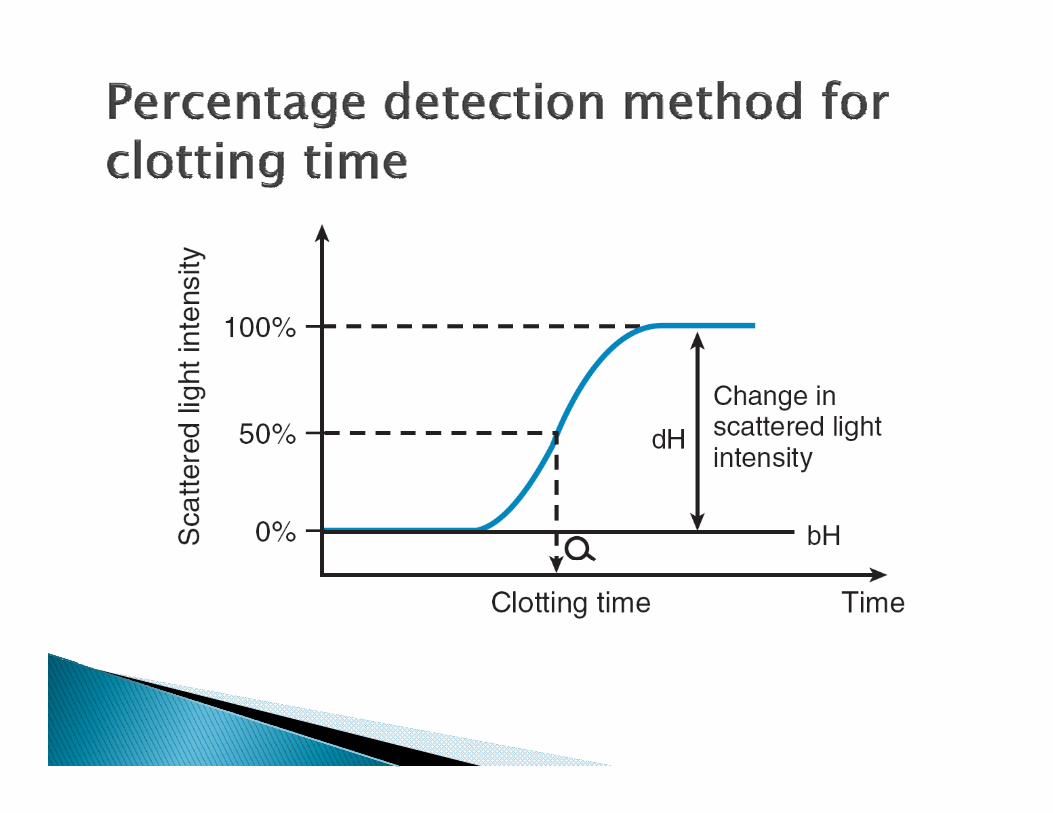
Time at which 50% of full scatter intensity isobserved is recorded as a clotting time byobserved is recorded as a clotting time bypercentage detection method.


Chromogenic or amidolytic methodology is based on the use of aspecific color-producing substance known as a chromophore. Thechromophore normally used in the coagulation laboratory is para-nitroaniline (p-nitroaniline or pNA), which has an opticalabsorbance peak at 405 nm on a spectrophotometer.
End point of the reaction is the decrease in transmission of lightand increase in OD of the reaction mixture which is detected withthe help of the photo optical method. Change in OD per unit time iscalculated with the help of rate method.
E.g. of the test based on chromomeric method are Antithrombin III,gProtein C Activity, Anti Xa factor activity

Light source Detector

Immunologic assays are based on antigen-antibodyreactions.
Latex Micro particles are coated with a specific antibodydirected against Ag A beam of monochromatic light isdirected against Ag. A beam of monochromatic light isthen passed through the suspension of micro latexparticles. Formation of agglutination lead to increase inturbidity of the test solution and increase in Absorbanceturbidity of the test solution and increase in Absorbancewhich, in turn, is proportional to the antigen levelpresent in the sample, which is read from a standardcurve.


Method Advantages DisadvantagesMechanical No interference due to
physical characteristics suchas lipemia or hemolysis.
Impossible to observe graphics of clot formation.
p y
Some analyze whole bloodremoving the need forcentrifugation
May present problems of endpointdetection in some samples withlow fibrinogencentrifugation low fibrinogen
Photo-optic Possibility of graphics on Interference due to lipemia,p y g pclot formation.
Optical checks forhemolysis lipemia icterus
p ,hemolysis, hyperbilirubinemiaSome system may present
Very short coagulation periodshemolysis, lipemia, icteruson some optical systems
Very short coagulation periodsmay go undetected owing to delayof prior initiation of monitoring

U i l f l l dh i Uses stimulators of platelet adhesionand aggregation in an environmentthat stimulates an injured bloodjvessel wall.
More sensitive screening test than the bleeding time methodthe bleeding time method
Nonspecific test- not diagnostic for any single disordery g
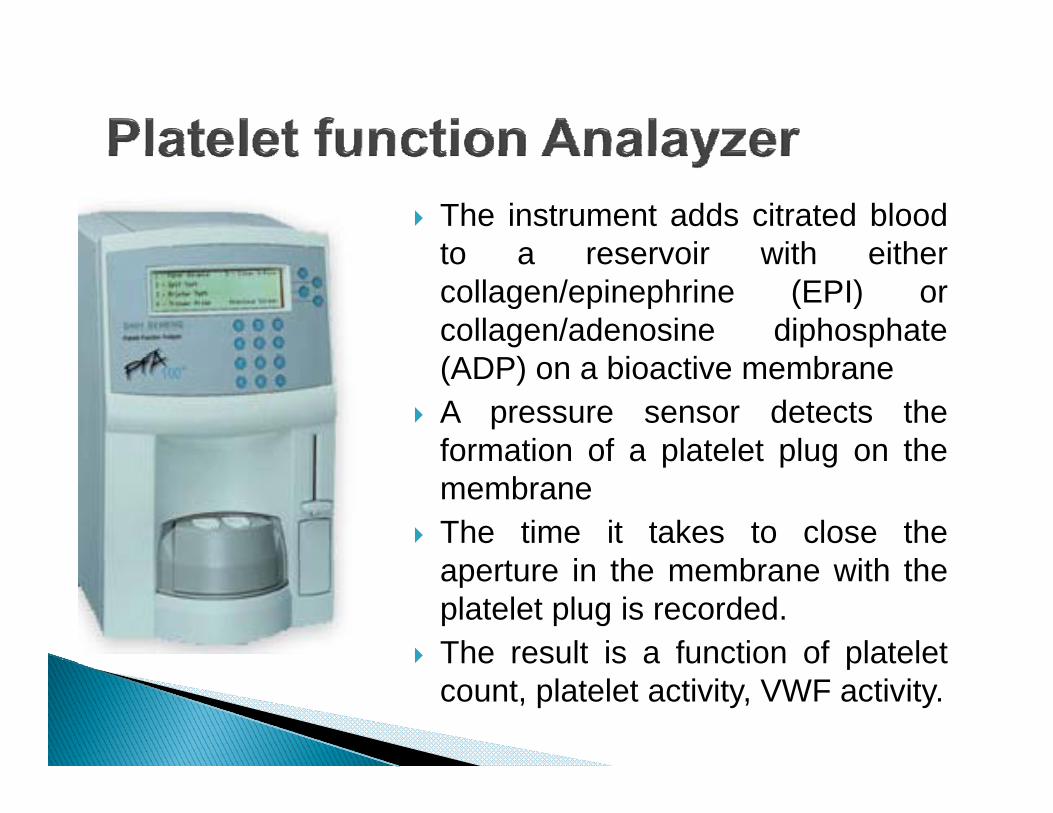
The instrument adds citrated bloodto a reservoir with eitherto a reservoir with eithercollagen/epinephrine (EPI) orcollagen/adenosine diphosphate(ADP) on a bioactive membrane
A pressure sensor detects theformation of a platelet plug on theformation of a platelet plug on themembrane
The time it takes to close thet i th b ith thaperture in the membrane with the
platelet plug is recorded. The result is a function of platelet The result is a function of platelet
count, platelet activity, VWF activity.

Performed in specialized labs byexperienced laboratory professionals
Performed on Aggregometer utilizingphotometryphotometry
Measures light transmittance over aperiod of time

Slowly centrifuged citrate sample yields platelet-richplasma (PRP).
The PRP must be adjusted with the patients PPP toreach a standard number of 200,000/µL, µ
The sample is stirred, warmed to 37°C in a photometricaggregometer
The aggregating reagent (agonist) is added The aggregating reagent (agonist) is added◦ In this case, Ristocetin
The platelets begin to aggregate which leads to ah i ti l d it (OD) f th PRP dchange in optical density (OD) of the PRP as measured
by a absorbance detector. The aggregometer records the changes in OD in a
graphic curve.

Auto calibration is performed with the help of a calibrator.dilution of the calibrator is made and the graph ofconcentration Vs time is plotted.
Two levels of control viz., Normal and Abnormal are rundaily and normal control with every test to check for the
l ianalysis. Control results are stored in the analyzer and Levey-
Jennings graph is plotted to calculate the mean valueJennings graph is plotted to calculate the mean valueand the % CV.

Maintenance is done as per the manufacturer guidelinesto maintain the analyzer in the good condition.
Maintenance include daily check for the temp of the Maintenance include daily check for the temp of thereagent, reaction well. Some programmed checks areperformed.

Copyright © 2022 FDOKUMEN