Discussion Materials
42
Discussion Materials July 13, 2022
-
Upload
khangminh22 -
Category
Documents
-
view
3 -
download
0
Transcript of Discussion Materials

Discussion MaterialsJuly 13, 2022

Monetary Policy in a Stagflationary Environment
2
In a typical recession with low nominal growth and low inflation, policymakers can ease monetary policy to stimulate demand
E.g., easing cycles in the early 1990s, early 2000s and 2008 – 2009 recessions
In a stagflationary environment with low real growth but high nominal growth, policymakers need to adopt restrictive monetary policy to reduce inflation
Under the Volcker-era tightening cycle of the early 1980s, inflation expectations stabilized
Result: Federal Reserve maintains its inflation-fighting credibility
Prematurely easing monetary policy in a stagflationary environment when real GDP growth slows with inflation remaining high has been a serious policy mistake
Under the Arthur Burns-era monetary policy in the 1970s, inflation expectations became unanchored
Result: Federal Reserve lost its inflation-fighting credibility
Even if real GDP growth is negative, inflation can remain persistently high due to continuing supply-demand imbalances, which are exacerbated by easy monetary policy
A stagflationary environment is fundamentally different from a typical recession and therefore requires a different monetary policy response

3
The last three recessions prior to the pandemic were characterized by negative real GDP growth, modest or negative nominal GDP growth and low inflation
Monetary Policy Response During Typical Recessions
GDP Growth, Fed Funds Rate & Economic Conditions During Last Three Pre-Pandemic Recessions:
Source: Bureau of Economic Analysis
In response to these typical recessions, the Federal Reserve appropriately lowered the Fed Funds rate to stimulate demand and economic growth
Q4 Q1 Q1 Q2 Q3 Q1 Q2 Q3 Q4 Q1 Q2QoQ Growth Annualized:
Nominal GDP Growth (0.7%) 2.0% 1.3% 5.0% 0.0% (0.2%) 4.4% 0.9% (7.6%) (4.8%) (1.4%)Implicit Price Deflator 2.9% 3.9% 2.6% 2.5% 1.6% 1.4% 2.1% 3.0% 0.9% (0.2%) (0.7%)
Real GDP Growth (3.6%) (1.9%) (1.3%) 2.5% (1.6%) (1.6%) 2.3% (2.1%) (8.5%) (4.6%) (0.7%)
Monetary Policy Response:Fed Funds Rate 7.0% 6.0% 5.0% 3.8% 3.0% 2.3% 2.0% 2.0% 0.1% 0.1% 0.1%
Economic conditions (as of quarter-end):Unemployment Rate 6.3% 6.8% 4.3% 4.5% 5.0% 5.1% 5.6% 6.1% 7.3% 8.7% 9.5%Core CPI - YoY 5.2% 5.2% 2.7% 2.7% 2.6% 2.4% 2.4% 2.5% 1.8% 1.8% 1.7%
2008 20091990 - 1991 2001
4
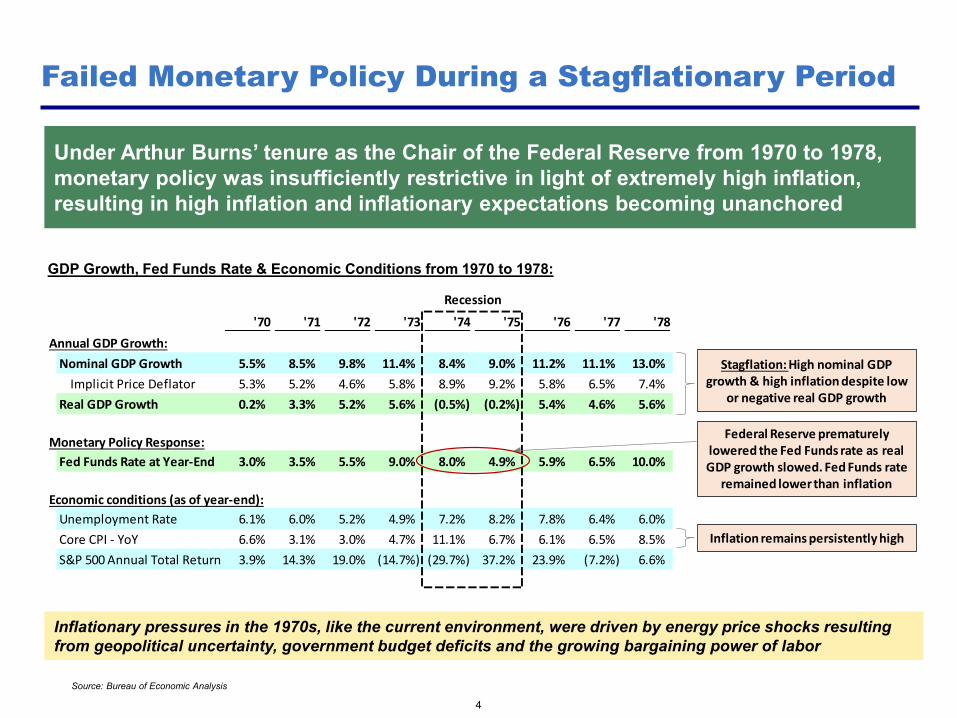
Under Arthur Burns’ tenure as the Chair of the Federal Reserve from 1970 to 1978, monetary policy was insufficiently restrictive in light of extremely high inflation, resulting in high inflation and inflationary expectations becoming unanchored
Failed Monetary Policy During a Stagflationary Period
Source: Bureau of Economic Analysis
Inflationary pressures in the 1970s, like the current environment, were driven by energy price shocks resulting from geopolitical uncertainty, government budget deficits and the growing bargaining power of labor
GDP Growth, Fed Funds Rate & Economic Conditions from 1970 to 1978:
'70 '71 '72 '73 '74 '75 '76 '77 '78Annual GDP Growth:
Nominal GDP Growth 5.5% 8.5% 9.8% 11.4% 8.4% 9.0% 11.2% 11.1% 13.0%Implicit Price Deflator 5.3% 5.2% 4.6% 5.8% 8.9% 9.2% 5.8% 6.5% 7.4%
Real GDP Growth 0.2% 3.3% 5.2% 5.6% (0.5%) (0.2%) 5.4% 4.6% 5.6%
Monetary Policy Response:Fed Funds Rate at Year-End 3.0% 3.5% 5.5% 9.0% 8.0% 4.9% 5.9% 6.5% 10.0%
Economic conditions (as of year-end):Unemployment Rate 6.1% 6.0% 5.2% 4.9% 7.2% 8.2% 7.8% 6.4% 6.0%Core CPI - YoY 6.6% 3.1% 3.0% 4.7% 11.1% 6.7% 6.1% 6.5% 8.5%S&P 500 Annual Total Return 3.9% 14.3% 19.0% (14.7%) (29.7%) 37.2% 23.9% (7.2%) 6.6%
Recession
Stagflation: High nominal GDP growth & high inflation despite low
or negative real GDP growth
Federal Reserve prematurely lowered the Fed Funds rate as real GDP growth slowed. Fed Funds rate
remained lower than inflation
Inflation remains persistently high

5
Under Paul Volcker’s tenure as the Chair of the Federal Reserve from 1979 to 1987, monetary policy was successful in moderating inflation by maintaining a high Fed Funds rate even in the face of slowing real GDP growth
Successful Monetary Policy During a Stagflationary Period
Source: Bureau of Economic Analysis
As a result of decisive and aggressive monetary policy, the Federal Reserve was able to restore its inflation fighting credibility
GDP Growth, Fed Funds Rate & Economic Conditions from 1979 to 1987:
'79 '80 '81 '82 '83 '84 '85 '86 '87Annual GDP Growth:
Nominal GDP Growth 8.7% 11.1% 7.5% 5.5% 6.0% 7.9% 7.7% 5.7% 3.3%Implicit Price Deflator 5.5% 11.3% 4.9% 7.4% 1.4% 0.6% 3.5% 2.2% (0.2%)
Real GDP Growth 3.2% (0.2%) 2.6% (1.9%) 4.6% 7.3% 4.2% 3.5% 3.5%
Monetary Policy Response:Fed Funds Rate at Year-End 14.0% 18.0% 12.0% 8.5% 9.5% 8.3% 7.8% 6.0% 6.9%
Economic conditions (as of year-end):Unemployment Rate 6.0% 7.2% 8.5% 10.8% 8.3% 7.3% 7.0% 6.6% 5.7%Core CPI - YoY 11.3% 12.2% 9.5% 4.5% 4.8% 4.7% 4.3% 3.8% 4.2%S&P 500 Annual Total Return 18.49% 32.40% (4.9%) 21.6% 22.6% 6.2% 31.7% 18.7% 5.3%
Recession
Federal Reserve maintained a high Fed Funds rate, in excess of
inflation, even as inflation declined

6
In Q1 2022, both nominal GDP growth and inflation remained high despite negative real GDP growth
A Future U.S. Recession Will Likely Be Stagflationary
Real and Nominal GDP Growth:
Source: Bureau of Economic Analysis
Q1 2022 real GDP growth was negatively impacted by approximately 320bps due to a historically large net export deficit. Excluding the impact of net exports, Q1 2022 GDP would have grown by 1.6% on a QoQ annualized basis
2022
Q1 Q2 Q3 Q4 Q1 Q2 Q3 Q4 Q1QoQ GDP Growth Annualized:
Nominal GDP Growth (3.9%) (32.4%) 38.7% 6.6% 10.9% 13.4% 8.4% 14.5% 6.6%Implicit Price Deflator 1.2% (1.2%) 4.9% 2.1% 4.6% 6.7% 6.1% 7.6% 8.2%
Real GDP Growth (5.1%) (31.2%) 33.8% 4.5% 6.3% 6.7% 2.3% 6.9% (1.6%)
Monetary Policy Response:Fed Funds Rate at Quarter-End 0.1% 0.1% 0.1% 0.1% 0.1% 0.1% 0.1% 0.1% 0.4%
Economic conditions (as of quarter-end):Unemployment Rate 4.4% 11.0% 7.9% 6.7% 6.0% 5.9% 4.7% 3.9% 3.6%Core CPI - YoY 2.1% 1.2% 1.7% 1.6% 1.6% 4.5% 4.0% 5.5% 6.5%
2020 2021

Inflation is Extremely High and Likely to Persist

Current Run-rate Inflation Remains Extremely High
8
On a month-over-month basis, headline CPI and PCE figures are currently increasing at a high-single-digit to low-double-digit annualized growth rate, well in excess of the Federal Reserve’s 2% inflation target
CPI & PCE month-over-month inflation:
Source: Bureau of Labor Statistics (CPI Report), Bureau of Economic Analysis (PCE Data)
Nov-21 Dec-21 Jan-22 Feb-22 Mar-22 Apr-22 May-22
CPI 0.7% 0.6% 0.6% 0.8% 1.2% 0.3% 1.0%MoM Annualized 8.7% 7.1% 8.0% 10.0% 15.9% 4.1% 12.3%Trailing 3 Month Annualized 8.2% 8.9% 8.0% 8.4% 11.3% 9.9% 10.7%
Core CPI 0.5% 0.6% 0.6% 0.5% 0.3% 0.6% 0.6%MoM Annualized 6.5% 7.0% 7.2% 6.2% 4.0% 7.0% 7.8%Trailing 3 Month Annualized 5.7% 7.0% 6.9% 6.8% 5.8% 5.7% 6.3%
PCE 0.6% 0.5% 0.5% 0.5% 0.9% 0.2% 0.3%MoM Annualized 7.1% 6.3% 6.2% 6.6% 11.3% 3.0% 3.9%Trailing 3 Month Annualized 6.4% 7.1% 6.6% 6.4% 8.0% 6.9% 6.0%
Core PCE 0.5% 0.5% 0.4% 0.3% 0.3% 0.3% 0.3%MoM Annualized 5.9% 6.3% 5.4% 3.7% 4.0% 4.2% 3.9%Trailing 3 Month Annualized 4.9% 6.0% 5.9% 5.1% 4.4% 4.0% 4.1%

CPI is the Most Relevant Inflation Measure
9
We believe the Federal Reserve should carefully monitor CPI inflation in addition to PCE inflation even though CPI is not explicitly identified as a target measure
CPI more accurately represents inflation in out-of-pocket expenditures, particularly for low- to middle-income consumers
CPI has outsized headline and media relevance compared with PCE, and therefore has a greater role in shaping consumer and business inflation expectations
CPI is a key input variable in cost-of-living adjustments, wage negotiations and various other lagged price escalators
“I look a lot at CPI and I know PCE headline is our number but I like both of them. The CPI is more heavily weighted towards shelter and one reason I like to look at that is that’s more consistent with what lower and moderate income groups face. They face a much bigger share of their disposable income going to shelter, food and energy than upper income groups do.
So I don’t mind CPI as being kind of a good example of what lower and moderate income group in terms of inflation so I don’t dismiss it. I look at it very seriously.”
– Christopher Waller, Member of the Federal Reserve Board of Governors Virtual NABE Event, July 7, 2022

CPI / PCE Discrepancy is Primarily Due to Scope Differences
10
PCE inflation has lagged CPI inflation primarily due to its lower weighting of out-of-pocket expenditures like shelter and energy and its higher weighting of categories that reflect imputed costs like healthcare and financial services
CPI & PCE Category Weightings:
Source: Bureau of Labor Statistics (CPI Report), Bureau of Economic Analysis (PCE Data)
“Scope effects. The CPI measures the change in the out-of-pocket expenditures of all urban households and the PCE index measures the change in goods and services consumed by all households, and nonprofit institutions serving households.
This conceptual difference means that some items and expenditures in the PCE index are outside the scope of the CPI. For example, the expenditure weights for medical care services in the CPI are derived only from out-of-pocket expenses paid for by consumers. By contrast, medical care services in the PCE index include those services purchased out of pocket by consumers and those services paid for on behalf of consumers—for example, medical care services paid for by employers through employer-provided health insurance, as well as medical care services paid for by governments through programs such as Medicare and Medicaid.”
– Bureau of Labor Statistics
PCE inflation was not formally adopted as the Federal Reserve’s target inflation measure until the January 2012 FOMC meeting. Prior to 2012, both PCE and CPI inflation were referenced by FOMC participants in their discussion of the Federal Reserve’s price stability mandate
CPI PCEOut-of-pocket expenditures:
Energy 8% 5%Food (incl. away from home) 13% 14%Shelter 33% 16%
Energy, food & shelter 54% 34%
Categories with imputed costs:Healthcare services 7% 16%Financial services 0% 5%
Healthcare & financial services 7% 21%

Inflation is Increasingly Driven by Services
11
CPI in recent months has been increasingly driven by inflation in core services, which tends to be more persistent and has a ~60% weighting in the overall index
Month-Over-Month CPI Inflation by Consumption Category:
Source: Bureau of Labor Statistics (CPI Report)
% of CPI Nov-21 Dec-21 Jan-22 Feb-22 Mar-22 Apr-22 May-22
CPI 100% 0.7% 0.6% 0.6% 0.8% 1.2% 0.3% 1.0%Food 13% 0.8% 0.5% 0.9% 1.0% 1.0% 0.9% 1.2%Energy 8% 2.4% 0.9% 0.9% 3.5% 11.0% (2.7%) 3.9%
Core CPI 78% 0.5% 0.6% 0.6% 0.5% 0.3% 0.6% 0.6%Annualized MoM 6.5% 7.0% 7.2% 6.2% 4.0% 7.0% 7.8%
from Shelter Only 2.4% 2.2% 1.5% 2.6% 2.6% 2.6% 3.1%from Core Services Only 3.4% 3.1% 3.9% 4.7% 5.3% 6.5% 5.5%
Trailing 3M Annualized 5.7% 7.0% 6.9% 6.8% 5.8% 5.7% 6.3%
Core goods:New cars & used cars 8% 1.8% 2.2% 0.7% 0.0% (1.8%) 0.4% 1.4%Household furnishings 4% 0.8% 1.2% 1.6% 0.8% 1.0% 0.5% 0.1%Other core goods 9% 0.2% 0.3% 1.0% 0.7% 0.1% (0.1%) 0.3%
Core goods 21% 0.9% 1.2% 1.0% 0.4% (0.4%) 0.2% 0.7%
Core services:Shelter 32% 0.5% 0.4% 0.3% 0.5% 0.5% 0.5% 0.6%Airline fares 1% 1.9% 2.5% 2.3% 5.2% 10.7% 18.6% 12.6%Other core services 24% 0.2% 0.2% 0.6% 0.5% 0.5% 0.5% 0.3%
Core services 57% 0.4% 0.3% 0.4% 0.5% 0.6% 0.7% 0.6%% Core CPI Inflation from Core Services 52% 44% 54% 76% 134% 92% 70%
Contribution from shelter alone accounts
for ~3% annualized run-rate inflation in
Core CPI

Shelter Inflation is Likely to Remain Elevated
12
CPI and PCE shelter inflation measures understate observed market trends
CPI and PCE report approximately 5% to 6% year-over-year increase in shelter costs
CoreLogic and Zillow market indices show an approximately 20% year-over-year increase in home prices and a mid- to high-teens year-over-year increase in asking rents
Higher mortgage rates and higher cost of home ownership drive rental demand
Rental markets likely to face additional pricing pressure as households increasingly view renting as a more affordable alternative to homeownership
New housing will remain supply constrained
Rent control & rent stabilization policies, environmental concerns and NIMBY-ism have discouraged the construction and increased the cost of new affordable housing
We believe shelter inflation, which accounts for approximately a third of overall CPI, is likely to remain elevated

Trimmed CPI and PCE Show Inflation Accelerating
13
Trimmed mean measures of CPI & PCE, which exclude outlier categories, are rapidly rising, reflecting the increasingly broad-based nature of underlying inflation
Year-over-year growth in CPI / PCE and Trimmed Mean CPI / PCE:
Source: Bureau of Labor Statistics (CPI Report), Bureau of Economic Analysis (PCE Data), Federal Reserve Bank of Cleveland, Federal Reserve Bank of Dallas
Month-over-month change: Dec-21 Jan-22 Feb-22 Mar-22 Apr-22 May-22CPI 0.6% 0.6% 0.8% 1.2% 0.3% 1.0%Cleveland Fed - 16% Trimmed Mean CPI 0.5% 0.6% 0.5% 0.5% 0.4% 0.8%PCE 0.5% 0.5% 0.5% 0.9% 0.2% 0.6%Dallas Fed 24% Lower / 31% Upper Tail Trimmed Mean PCE 0.4% 0.5% 0.3% 0.2% 0.2% 0.4%
4.0%
6.3% 6.5%
8.6%
0.0%1.0%2.0%3.0%4.0%5.0%6.0%7.0%8.0%9.0%
CPI PCE Cleveland Fed Trimmed Mean CPI Dallas Fed Trimmed Mean PCE

One-Year-Ahead Inflation Expectations Have Become Unanchored
14
Survey-based measures of near-term inflation expectations have become unanchored, anticipating approximately 4% to 7% inflation over the next year
Median One-Year-Ahead Inflation Expectations:
Source: Business Inflation Expectations Survey conducted by the Federal Reserve Bank of Atlanta; University of Michigan Survey of Consumers, Survey of Consumer Expectations conducted by the Federal Reserve Bank of New York.
Although the Federal Reserve and market participants place greater importance on long-term inflation expectations, one-year-ahead inflation expectations likely play a pivotal role in shaping price-setting behavior by firms and increased wage demands of employees
3.6%
5.3%
6.8%
1.0%
2.0%
3.0%
4.0%
5.0%
6.0%
7.0%
Atlanta Fed Business Inflation Expectations, 1 Year Ahead(n = ~300 businesses of various sizes)
U. of Michigan Consumer Inflation Expectations, 1 Year Ahead(n = ~600 households)
NY Fed Survey of Consumer Expectations, 1 Year Ahead(n = ~1,300 households)

Long-Term Inflation Expectations Are Rising
15
Survey-based measures of longer-term inflation expectations have also risen sharply over the last twelve months, currently projecting approximately 3% to 4% inflation per annum over the next five- to ten-year period
Median Long-Term Inflation Expectations:
Source: Business Inflation Expectations Survey conducted by the Federal Reserve Bank of Atlanta; Survey of Professional Forecasters conducted by the Federal Reserve Bank of Philadelphia; University of Michigan Survey of Consumers, Survey of Consumer Expectations conducted by the Federal Reserve Bank of New York.
3.5%
2.9% 3.1%
3.6%
1.0%
1.5%
2.0%
2.5%
3.0%
3.5%
4.0%
4.5%
Atlanta Fed Business Inflation Expectations, next 5 to 10 Years(n = ~300 businesses of various sizes)
Survey of Professional Forecasters, 5-Year PCE Inflation(n = 34 Forecasters)
U. of Michigan Consumer Inflation Expectations, next 5 to 10 Years(n = ~600 households)
NY Fed Survey of Consumer Expectations, next 3 Years(n = ~1,300 households)

Wage Inflation Remains High
16
On a month-over-month basis, average hourly earnings have consistently grown at a 4% to 5% annualized rate. For production and non-supervisory employees, who represent approximately 80% of the labor force, hourly earnings are growing at an even faster pace of approximately 5% to 6%
Average hourly earnings of all employees on private nonfarm payrolls by industry (seasonally adjusted):
Rising inflation expectations and high levels of wage inflation create a self-reinforcing cycle that drives higher levels of future price and wage inflation
Source: Bureau of Labor Statistics (Employment Situation Report)
Dec-21 Jan-22 Feb-22 Mar-22 Apr-22 May-22 Jun-22All Private Nonfarm Employees:
Average Hourly Earnings $31.4 $31.6 $31.6 $31.8 $31.9 $32.0 $32.1YoY Growth 4.9% 5.4% 5.2% 5.6% 5.5% 5.3% 5.1%MoM Growth 0.5% 0.6% 0.1% 0.5% 0.3% 0.4% 0.3%MoM Annualized 5.9% 7.1% 1.5% 5.8% 4.2% 4.6% 3.8%Trailing 3 Month Growth Annualized 6.1% 5.9% 4.8% 4.8% 3.9% 4.9% 4.2%
Production and Non-Supervisory Employees:Average Hourly Earnings $26.7 $26.9 $27.0 $27.1 $27.2 $27.3 $27.5
YoY Growth 6.2% 6.7% 6.7% 6.7% 6.6% 6.4% 6.4%MoM Growth 0.7% 0.5% 0.3% 0.4% 0.4% 0.5% 0.5%MoM Annualized 8.9% 6.0% 3.6% 5.0% 5.5% 6.4% 5.9%Trailing 3 Month Growth Annualized 7.5% 7.0% 6.2% 4.9% 4.7% 5.6% 5.9%

Inflationary Pressures Likely to Persist
17
We believe inflationary pressures arising from the current supply-demand imbalance are likely to persist due to a combination of elevated nominal spending and continued tight supply conditions
Rotation in spending from goods to services
Significant excess household savings of ~$2.6 trillion Equal to approximately 11% of nominal GDP and 15% of nominal PCE
Large untapped borrowing capacity Record low loan-to-deposits ratio in banking system Modest household leverage levels relative to history
Aggregate wage growth driven by both job gains and hourly wage inflation
Nominal Spending Likely to Remain Elevated
Supply Conditions Likely to Remain Tight Labor market is extremely tight, with a 3.6% unemployment rate that is near historical lows
Nearly twice the number of job openings as the number of unemployed persons
Industrial capacity utilization rates at peak levels
Inventories on a real basis, adjusted for inflation, are in-line with historical levels

Nominal Spending Likely to Remain Elevated

Shift in Consumption from Goods to Services
19
While recession concerns have focused on the recent decline in goods spending, services spending – which accounts for ~60% of real personal consumption – has maintained consistent growth and remains below trend
Real Personal Consumption Expenditure (PCE) by Category as % of December 2019 Levels:
Source: Bureau of Economic Analysis
105%
113%
107%
101%
75%
80%
85%
90%
95%
100%
105%
110%
115%
120%
125%
Dec-
19Ja
n-20
Feb-
20M
ar-2
0Ap
r-20
May
-20
Jun-
20Ju
l-20
Aug-
20Se
p-20
Oct
-20
Nov
-20
Dec-
20Ja
n-21
Feb-
21M
ar-2
1Ap
r-21
May
-21
Jun-
21Ju
l-21
Aug-
21Se
p-21
Oct
-21
Nov
-21
Dec-
21Ja
n-22
Feb-
22M
ar-2
2Ap
r-22
May
-22
% o
f Dec
embe
r 201
9 Le
vel
Real PCE Goods (39% of Real PCE)
Real PCE Trendline ('14 - '19 CAGR: 2.7%) Services (61% of Real PCE)

Approximately $2.6 Trillion in Excess Savings
20
A combination of significantly above-trend disposable income and below-trend personal consumption during the pandemic has resulted in the accumulation of approximately $2.6 trillion in excess savings, equal to 11% of nominal GDP
Quarterly Disposable Personal Income and Consumption | Trendline vs Actual (Nominal $ in trillions):
Source: Bureau of Economic Analysis
$2.5
$3.0
$3.5
$4.0
$4.5
$5.0
Q3 2019 Q4 2019 Q1 2020 Q2 2020 Q3 2020 Q4 2020 Q1 2021 Q2 2021 Q3 2021 Q4 2021 Q1 2022
$ in
trill
ions
Disposable Personal Income - Trend Disposable Personal Income - ActualPersonal Consumption Expenditures - Trend Personal Consumption Expenditures - Actual
~$1.7tn in cumulative above-trend disposable income driven by government stimulus programs (CARES Act in March 2020, American Rescue Plan in March 2021)
and a rapid recovery in aggregate wages
~$0.9tn in cumulative below-trend personal consumption as a result of pandemic
related closures and restrictions

Personal Savings Rate Remains Within Long-Term Historical Range
21
The personal savings rate recently declined to 5.4%, below its pre-pandemic level of ~7.4%, but consistent with levels seen before the GFC in 2008
Personal Savings Rate (Personal Savings / Disposable Personal Income):
Source: Bureau of Economic Analysis
5.4%
0.0%
5.0%
10.0%
15.0%
20.0%
25.0%
30.0%
35.0%
'14 - '19 Average: 7.4%

22
The monthly savings deficit resulting from the recent decline in the savings rate represents a relatively small portion of the approximately $2.6 trillion in cumulative excess savings
We believe the substantial excess savings reserve will continue to allow consumers to fund a high level of nominal spending growth even as their savings rate declines
Monthly Personal Income & Outlays | Seasonally Adjusted (nominal $ in trillions):
Even if the savings rate were to reach and stay at 0%, it
would take approximately two years for consumers to fully
deplete the approximately $2.6 trillion in excess savings
Excess Savings Buffer Can Sustain a Low Savings Rate
Source: Bureau of Economic Analysis
Dec-21 Jan-22 Feb-22 Mar-22 Apr-22 May-22Disposable Personal Income $1,527 $1,508 $1,517 $1,525 $1,532 $1,540
Less: Personal Outlays (1,395) (1,420) (1,428) (1,445) (1,453) (1,456)Personal Savings (A) $133 $87 $88 $80 $79 $84
Savings rate 8.7% 5.8% 5.8% 5.3% 5.2% 5.4%
Normalized Personal Savings (B) $113 $112 $112 $113 $114 $114'14 - '19 Avg. Savings Rate 7.4% 7.4% 7.4% 7.4% 7.4% 7.4%
Savings Surplus / (Deficit) (A - B) $19 ($25) ($24) ($33) ($35) ($30)% of Excess Savings 0.8% (1.0%) (0.9%) (1.3%) (1.3%) (1.2%)

Share of Excess Savings by Income Level
23
Excess savings are estimated to be concentrated within households in the top 20% of the income distribution, which account for nearly 40% of all spending
Goldmans Sachs Estimate of the Share of Excess Savings by Income Level:
Source: Goldman Sachs Research
“People in the bottom 20% of the income distribution spend some 31% of their after-tax income on gasoline and food at home, where prices are up 30% and 7% respectively since last September, when extended/enhanced unemployment benefits ended. But these households account for only about 9% of total consumption; they don’t drive the economic cycle. By contrast, the top 20 of the income distribution account for 39% of all spending.”
–Ian Shepherdson, Chief Economist Pantheon Macroeconomics
May 23, 2022
40% 40%
20%
Top 20% 40% - 80% Bottom 40%
The economic cost of inflation is most acute for lower income households who have a lower level of excess savings and spend an outsized portion of their income on necessities like food and energy, which have experienced substantial inflation

Aggregate Wage Growth Remains Robust
24
Aggregate wages for private nonfarm employees is currently increasing at an annualized rate of approximately 7%, driven by job gains and wage inflation
Aggregate wages for private nonfarm employees:
Even if consumers do not draw from their excess savings or borrowing capacity, we believe robust growth in aggregate wages should sustain a high level of nominal spending growth
Source: Bureau of Labor Statistics (Employment Situation Report)
Dec-21 Jan-22 Feb-22 Mar-22 Apr-22 May-22 Jun-22
Private Nonfarm Employees (mm) 127.1 127.6 128.3 128.7 129.0 129.4 129.8Payroll adds (K) 561 492 704 385 368 336 381MoM Growth 0.4% 0.4% 0.6% 0.3% 0.3% 0.3% 0.3%MoM Annualized 5.5% 4.7% 6.8% 3.7% 3.5% 3.2% 3.6%YoY Growth 5.2% 5.2% 5.2% 5.0% 5.1% 5.0% 4.9%
Average Hourly Earnings $31.4 $31.6 $31.6 $31.8 $31.9 $32.0 $32.1MoM Growth 0.5% 0.6% 0.1% 0.5% 0.3% 0.4% 0.3%MoM Annualized 5.9% 7.1% 1.5% 5.8% 4.2% 4.6% 3.8%YoY Growth 4.9% 5.4% 5.2% 5.6% 5.5% 5.3% 5.1%Average Weekly Hours 34.8 34.6 34.7 34.6 34.6 34.5 34.5
Aggregate Wages (Annualized bn) $7,217 $7,245 $7,315 $7,351 $7,397 $7,423 $7,468MoM Growth 0.9% 0.4% 1.0% 0.5% 0.6% 0.3% 0.6%MoM Annualized 11.7% 4.7% 12.3% 6.0% 7.9% 4.2% 7.5%YoY Growth 10.7% 9.7% 11.0% 9.9% 9.9% 9.4% 9.3%

Significant Lending Capacity in Banking System
25
The substantially lower growth in credit relative to deposits has resulted in a historically low loan-to-deposits ratio of only 63%, which is down 13 percentage points from its pre-pandemic level of 76%
Loan-to-Deposits Ratio | U.S. Commercial Banking System:
We believe a normalization of the loan-to-deposits ratio can substantially offset the impact of quantitative tightening on deposit and credit growth. If deposits were to stay at the same level, a return to the pre-pandemic loan-to-deposits ratio of 76% would support approximately $2.4 trillion in additional lending
76%
63%
40%
50%
60%
70%
80%
90%
100%
110%
Source: Federal Reserve (Release H.8 Assets and Liabilities of Commercial Banks in the United States)

Modest Household Leverage
26
Gross household leverage is in-line with historical levels. Net leverage, as a result of an accumulation in excess savings and cash holdings, has decreased materially relative to its pre-pandemic level
Gross and net household leverage:
Source: Federal Reserve (Release Z.1 Financial Accounts), Bureau of Economic AnalysisNote: Gross household debt is comprised of home mortgages, consumer credit and other household liabilities. Net household debt is gross household debt less cash and cash-like deposits. Disposable personal income denominator reflects the average disposable personal income of the trailing four quarters.
1.0x
0.0x0.0x
0.2x
0.4x
0.6x
0.8x
1.0x
1.2x
1.4x
Mar
-90
Mar
-91
Mar
-92
Mar
-93
Mar
-94
Mar
-95
Mar
-96
Mar
-97
Mar
-98
Mar
-99
Mar
-00
Mar
-01
Mar
-02
Mar
-03
Mar
-04
Mar
-05
Mar
-06
Mar
-07
Mar
-08
Mar
-09
Mar
-10
Mar
-11
Mar
-12
Mar
-13
Mar
-14
Mar
-15
Mar
-16
Mar
-17
Mar
-18
Mar
-19
Mar
-20
Mar
-21
Mar
-22
Gross household debt / Disposable Personal Income Net household debt / Disposable Personal Income

Supply Conditions Likely to Remain Tight

Strong Labor Market
28
The economy has nearly recovered the entirety of the employment shortfall caused by the pandemic, with total employment only 755K jobs lower than its level in February 2020
Current vs Pre-Pandemic Employment Summary | Figures in millions:
Source: Bureau of Labor Statistics (Employment Situation Report)(1) U-6 unemployment rate represents total unemployed, plus all persons marginally attached to the labor force, plus total employed part time for economic reasons, as a percent of the civilian laborforce plus all persons marginally attached to the labor force
The headline U-3 unemployment rate is only 10bps higher than its February 2020 level. The U-6 unemployment rate is 30bps below its February 2020 level and is at a historical low
Feb-20 Jun-22 Difference
Total employed in labor force 158.9 158.1 (0.8)
Unemployed in labor force 5.7 6.0 0.2 Headline U-3 unemployment rate 3.5% 3.6% 0.1%
U-6 unemployment rate 1 7.0% 6.7% (0.3%)
Total civilian labor force 164.6 164.0 (0.6) Labor force participation rate 63.4% 62.2%
Total civilian non-institutional population (16+) 259.6 263.8 4.2 Employed / Population 61.2% 59.9%

Unemployment Rate at Historical Lows
29
Over the last 50 years, there have only been three months when the headline unemployment rate was lower than the current level of 3.6%
Headline U-3 & U-6 Unemployment Rate:
Source: Bureau of Labor Statistics (Employment Situation Report)
0.0%
2.0%
4.0%
6.0%
8.0%
10.0%
12.0%
14.0%
16.0%
18.0%
20.0%
Headline U-3 Unemployment Rate U-6 Unemployment Rate
3.6%
50-Year-Low Unemployment Level: 3.5%Reached September 2019, January & February 2020
6.7%

Job Openings at Historical Highs
30
Number of Job Openings and Total Unemployed Persons in Labor Force | Figures in millions:
Source: Bureau of Labor Statistics (Job Openings and Labor Turnover Survey)
There are an unprecedented 11.3 million job openings in the economy, 5.3 million more than the number of unemployed persons, the widest gap since job openings data first became available
5.9
11.3
0.0
2.0
4.0
6.0
8.0
10.0
12.0
14.0
16.0
18.0
20.0
22.0
Unemployed persons Job openings

Recovery in Labor Demand vs Supply
31
Labor demand (employment plus job openings) has rapidly recovered with approximately 4 million more jobs available today than in December 2019, whereas the labor force remains approximately 300k workers below its December 2019 level
Labor Demand (Employment plus Job Openings) & Labor Supply (Labor Force) | Figures in millions:
Source: Bureau of Labor Statistics (Job Openings and Labor Turnover Survey)
100
110
120
130
140
150
160
170
Total Employed Job Openings Labor Demand (Employed plus Openings) Labor Supply (Labor Force)

Low Job Layoff and High Voluntary Quit Rates
32
Current high rate of job separations is primarily comprised of voluntary quits. Job layoffs, as a percentage of nonfarm payrolls, are at their lowest level since data first became available
Monthly job layoffs and job quits as % of nonfarm payrolls:
Source: Bureau of Labor Statistics (Job Openings and Labor Turnover Survey)
2.8%
0.9%
0.00%
0.50%
1.00%
1.50%
2.00%
2.50%
3.00%
3.50%
Job quits as % of nonfarm payrolls Job layoffs as % of nonfarm payrolls

Recent (June 29, 2022) Commentary from Paychex Confirms Economic Strength and Continued Job Growth
33
Paychex is a leading provider of payroll and human resource outsourcing services for small- to medium-sized businesses
“Macroeconomic trends have been positive this year, but with inflation at a 40-year high, there are concerns for potential of a recession in the near future. We continue to monitor key leading indicators for any signs of a change in the macroeconomic environment, but have not seen any signs of deterioration at this time.
Typically, the first signs of a macroeconomic recession would be a decline in employment levels at existing clients and uptick in non-processing clients or a slowdown in sales activities. These indicators continue to trend in a positive direction.
The latest Paychex IHS Small Business Employment Watch reflected a 12-month consecutive -- a 12th consecutive month of increasing hourly earnings gains, though we did notice slowing a bit of the pace of job growth in May. However, this is more reflective of being near full employment and the difficulty of finding employees.
Job growth at U.S. small businesses remained strong in the face of a tight labor market and inflation pressures.”
– Martin Mucci, Chairman and CEO of PaychexPaychex Q4 FY 2022 Earnings Call, June 29, 2022

U.S. Industrial Capacity Growth Remains Limited
34
Whereas industrial production is highly cyclical, industrial capacity is relatively inelastic and has typically grown at a low-single-digit rate per annum
Year-over-year growth in U.S. industrial capacity & production:
Source: Federal Reserve (Release G.17 Industrial Production and Capacity Utilization)
(20.0%)
(15.0%)
(10.0%)
(5.0%)
0.0%
5.0%
10.0%
15.0%
20.0%
Industrial Capacity Growth Industrial Production Growth

Industrial Capacity Utilization at Peak Levels
35
Current industrial capacity utilization is nearing peak levels seen over the last twenty years
U.S. Industrial Capacity Utilization (Production / Capacity):
Source: Federal Reserve (Release G.17 Industrial Production and Capacity Utilization)
79.0%
60.0%
65.0%
70.0%
75.0%
80.0%
85.0%
90.0%
Capacity Utilization

Real Inventory as % of GDP Is Below Historical Trend
36
Real private inventory levels, which reflect inventory units on a price-adjusted basis, do not appear to be at unsustainably high levels relative to real GDP
Real Private Inventories as % of Real GDP:
Source: Bureau of Economic Analysis
The economy may stabilize at a higher level of real private inventories relative to GDP as companies recalibrate towards a “just in case inventory” vs a “just in time inventory” operating model
Private Inventories% of Real GDP
2000s 15.3%2010s 15.0%Q4 '19 15.1%Q1 '22 14.6%
14.6%
13.5%
14.0%
14.5%
15.0%
15.5%
16.0%
16.5%
17.0%

Retail Inventory-to-Sales In-line With Historical Levels
37
Current nominal inventory-to-sales ratios are in-line with their historical pre-pandemic levels across most retail sales categories
Nominal inventory-to-sales ratios by category:
Source: Census Bureau Monthly Retail Trade Report
% Above / (Below)% of Sales '00-'09 '10-'19 2019 2020 2021 Current '10-'19 2019
Total Retail Sales 100% 1.54x 1.44x 1.47x 1.34x 1.13x 1.18x (18%) (20%)Total Ex. Motor Vehicle and Parts 78% 1.37x 1.24x 1.22x 1.15x 1.07x 1.15x (7%) (6%)
Motor Vehicle and Parts 22% 2.04x 2.11x 2.31x 2.07x 1.32x 1.28x (39%) (45%)Furniture, Electronics, & Appliance 3% 1.76x 1.61x 1.57x 1.65x 1.34x 1.62x 1% 3%Building Materials & Garden 7% 1.72x 1.83x 1.84x 1.66x 1.72x 1.87x 2% 2%Food and Beverage 13% 0.81x 0.79x 0.79x 0.73x 0.74x 0.78x (1%) (2%)Clothing & Accessories 4% 2.55x 2.42x 2.42x 4.24x 1.90x 2.12x (12%) (12%)General Merchandise 12% 1.66x 1.44x 1.37x 1.27x 1.26x 1.58x 10% 15%Department Stores 2% 2.11x 2.11x 2.07x 2.11x 1.76x 2.12x 1% 2%Other 36% 2.10x 2.11x 2.07x 2.11x 1.76x 2.12x 1% 2%
Historical Averages

Rapid Inventory Growth is Driven by Inflation
38
Although inventory levels appear to be growing rapidly on a nominal basis, the growth is entirely due to elevated levels of price inflation. In Q1 2022, on a price-adjusted basis, real inventories (units) were only up 1% year-over-year
Year-over-year growth in nominal and real private inventories:
Source: Bureau of Economic Analysis
We expect that large growth in nominal inventories due to price should have very different discounting dynamics than large growth primarily due to units, which suggests that widespread discounting is unlikely
Inventory Growth - YoYNominal Real Price
2000s 6% 2% 4%2010s 3% 3% 1%2019 3% 3% 0%Q1 '22 18% 1% 17%
(20%)
(15%)
(10%)
(5%)
0%
5%
10%
15%
20%
Nominal Inventories YoY Growth Real Inventories YoY Growth

Long-Term Structural Headwinds to Supply Growth
39
Renewed focus on national and resource security Desire for energy independence drives local resource production
De-globalization and re-shoring of supply chains Recent supply chain disruptions have highlighted the need for improved supply chain control
and redundancy
Adoption of ESG standards and de-carbonization Long-term capacity growth for commodities production (e.g., new mines, pipelines, drilling rigs)
remains highly challenged due to environmental and regulatory considerations
Labor bargaining power Rise of unionization (e.g., Starbucks and Amazon)
Lack of immigration
Stakeholder capitalism
Several emerging structural forces, which are not yet reflected in recently reported data, will likely add substantial long-term inflationary pressures

Conclusion
40
High inflation is a tax on economic growth
Inflation has an outsized negative impact on low- to middle- income households
Persistently high inflation hampers the ability of consumers and businesses to plan and invest for the long-term
Historical precedents suggest that prematurely easing monetary policy in a stagflationary environment is a serious policy mistake
Insufficiently restrictive monetary policy in the 1970s led to high persistent inflation and inflationary expectations becoming unanchored
Raising and maintaining the Fed Funds rate at a sufficiently high level has been the only proven policy response to stabilizing inflation and inflationary expectations
Once inflation has been quelled, the economy can experience a lengthy and robust expansion similar to the recovery that followed the Volcker-era tightening cycle
While there are some early signs of a slowdown in real economic growth, we believe inflationary pressures are likely to persist due to ongoing supply-demand imbalances

Prudent Risk Management & Inflation Expectations
41
“In the current situation, from a risk-management perspective, it is important for policymakers to ask which situation would be more costly: erroneously assuming longer-term inflation expectations are well anchored at the level consistent with price stability when, in fact, they are not? Or erroneously assuming that they are moving with economic conditions when they are actually anchored? Simulations of the Board’s FRB/US model suggest that the more costly error is assuming inflation expectations are anchored when they are not. If inflation expectations are drifting up and policymakers treat them as stable, policy will be set too loose. Inflation would then move up and this would be reinforced by increasing inflation expectations. If, on the other hand, inflation expectations are actually stable and policymakers view the drift up with concern, policy will initially be set tighter than it should. Inflation would move down, perhaps even below target, but not for long, since inflation expectations are anchored at the goal.
These simulation results, coupled with research suggesting that persistent elevated inflation poses an increasing risk that inflation expectations could become unanchored, strongly argue against policymakers being complacent about a rise in longer-term expectations. Indeed, inflation expectations are determined not only by movements in inflation but also by policymakers’ actions to follow through on their strongly stated commitment to return inflation to its longer-run goal, thereby justifying the public’s belief in the central bank’s commitment.”
– Loretta Mester, President of the Federal Reserve Bank of ClevelandThe Role of Inflation Expectations in Monetary Policymaking: A Practitioner’s Perspective
June 29, 2022
We agree with Cleveland Federal Reserve President Loretta Mester’s proposed risk management approach to monetary policy and inflation expectations

Disclaimer
42
Bill Ackman is the CEO of Pershing Square Capital Management, L.P. (“Pershing Square”), a registered investment adviser. Pershing Square considers inflation and increasing interest rates to be material risks to equity markets and owns interest rate swaptions to hedge these risks. Pershing Square may purchase, hold, sell, or otherwise change the form of its investments at any time and for any reason. Pershing Square hereby disclaims any duty to provide any updates or changes to the information in this presentation or information regarding the manner or type of any Pershing Square investment. All information provided herein is for information purposes only. The information provided in this presentation should not be considered a recommendation to purchase or sell any particular financial instrument.