Taste Quality and Intensity of 100 Stimuli as Reported by Rats: The Taste–Location Association...
24
BEHAVIORAL NEUROSCIENCE ORIGINAL RESEARCH ARTICLE published: May 2012 doi: 10.3389/fnbeh.2012.00019 Taste quality and intensity of 100 stimuli as reported by rats: the taste–location association task Shree Hari Gautam, Michelle R. Rebello and JustusV.Verhagen* The John B. Pierce Laboratory and the Department of Neurobiology,Yale University School of Medicine, New Haven, CT, USA Edited by: Martin Giurfa, Université Paul Sabatier-Toulouse III, France Reviewed by: Patricia M. Di Lorenzo, Binghamton University, USA Robert J. Contreras, Florida State University, USA *Correspondence: Justus V. Verhagen, The John B. Pierce Laboratory, Department of Neurobiology,Yale University School of Medicine, 290 Congress Avenue, New Haven, CT 06519, USA. e-mail: [email protected] The interpretation of neural activity related to sensory stimulation requires an understand- ing of the subject’s perception of the stimulation. Previous methods used to evaluate the perception of chemosensory stimuli by rodents have distinct limitations. We developed a novel behavioral paradigm, the taste–location association task, to complement these methods. First we tested if rats are able to learn associations between five basic taste stimuli and their spatial locations. This spatial task was based on four prototypical tastants and water. All four rats trained to perform the task reached levels of performance well above chance. Control trials demonstrated that the rats used only taste cues. Further, the learned stimulus set was resistant to interference, allowing for generalization experiments performed subsequently. We tested the rats’ gustatory generalizations of 100 tastants to the five trained stimuli, both regarding their taste qualities as well as intensity ratings. The taste profiles generated by these experiments contribute to the understanding of how per- ception of the specific taste stimuli relate to the perception of the five basic taste qualities in intact behaving rats. In this large taste space we found that intensity plays a major role. Furthermore, umami stimuli were not reported as being similar to other basic tastants. Our new paradigm enables neurophysiological studies of taste-based learning and memory in awake, freely moving animals. Keywords: flavor, taste, gustation, conditioned taste aversion, behavioral taste categorization, Morrison task, taste generalization, place learning INTRODUCTION The neural basis of flavor perception has only recently begun to be investigated in humans using functional imaging, and in mon- keys using single-unit recording methods. While these methods have advanced understanding of flavor processing, there is a need to complement these approaches with multi-site recording and imaging methods that offer the ability to manipulate neural cir- cuits (e.g., with optogenetic methods) in order to assess their roles in flavor perception. To this end we felt a need to establish a rodent model for taste and flavor research that incorporates novel neural and behavioral methodologies. Behavioral methods that accurately assess stimulus perception are crucial for the development of valid and sensitive animal models of sensory processes. Two paradigms have been used suc- cessfully to query the rat about its suprathreshold taste perception by way of taste similarities. The first involves the generalization of conditioned taste aversions (CTAs). After ingestion of a refer- ence taste (conditioned stimulus, CS), the animal is made sick by intraperitoneal LiCl injection (unconditioned stimulus, US), and the degree of intake suppression of a range of stimuli is tested on subsequent days (Nachman, 1963; Tapper and Halpern, 1968; Ninomiya et al., 1984; Frank, 1985). Smith and colleagues investi- gated the relationship between brainstem taste neuron responses and CTA-generalizations (Smith et al., 1979). Yamamoto and col- leagues investigated the degree of correspondence between various coding schemes applied to responses of chorda tympani fibers and cortical gustatory neurons, and behavioral similarity among taste stimuli (Yamamoto et al., 1985; Yamamoto and Yuyama, 1987). The second approach, called the “Morrison task” (Morrison, 1967; Ganchrow and Erickson, 2000), consisted of a 2-bar oper- ant generalization task. The perceptual similarity between tastants was related to the similarity of neural response patterns to these tastants (Ganchrow and Erickson, 2000). This task was expanded by Spector and colleagues (Grobe and Spector, 2008). It has the general advantage over CTA-generalization tasks in that it does not require aversive/toxic US–CS conditioning, and far fewer animals are needed to investigate the response similarity among a large number of stimuli. However, the Morrison task is labor intensive and only pair-wise comparisons can be tested on each trial. We chose to investigate an alternative approach for studying flavor perception based on work by Youngentob and colleagues (Youngentob et al., 1990, 1991), who established a multi-odor identification task using rats. In their method rats identify up to 10 odorants by choosing one of the odor-associated tunnels that contain a response lick cup. Rats learned to perform this confu- sion matrix task at high levels of accuracy (∼95% correct) and remained accurate (>70% correct) across a 40-fold range of odor concentrations (Youngentob et al., 1990). This behavioral para- digm has been successfully applied to relate rodent odor perception to optically recorded epithelial odor–response patterns (Kent et al., 1995, 2003) and to 2-DG spatial response patterns in the olfactory bulb (Youngentob et al., 2006). The approach has also successfully Frontiers in Behavioral Neuroscience www.frontiersin.org May 2012 |Volume 6 | Article 19 | 1 10
-
Upload
independent -
Category
Documents
-
view
2 -
download
0
Transcript of Taste Quality and Intensity of 100 Stimuli as Reported by Rats: The Taste–Location Association...

BEHAVIORAL NEUROSCIENCEORIGINAL RESEARCH ARTICLE
published: May 2012doi: 10.3389/fnbeh.2012.00019
Taste quality and intensity of 100 stimuli as reported byrats: the taste–location association taskShree Hari Gautam, Michelle R. Rebello and Justus V. Verhagen*
The John B. Pierce Laboratory and the Department of Neurobiology, Yale University School of Medicine, New Haven, CT, USA
Edited by:
Martin Giurfa, Université PaulSabatier-Toulouse III, France
Reviewed by:
Patricia M. Di Lorenzo, BinghamtonUniversity, USARobert J. Contreras, Florida StateUniversity, USA
*Correspondence:
Justus V. Verhagen, The John B.Pierce Laboratory, Department ofNeurobiology, Yale University Schoolof Medicine, 290 Congress Avenue,New Haven, CT 06519, USA.e-mail: [email protected]
The interpretation of neural activity related to sensory stimulation requires an understand-ing of the subject’s perception of the stimulation. Previous methods used to evaluate theperception of chemosensory stimuli by rodents have distinct limitations. We developeda novel behavioral paradigm, the taste–location association task, to complement thesemethods. First we tested if rats are able to learn associations between five basic tastestimuli and their spatial locations.This spatial task was based on four prototypical tastantsand water. All four rats trained to perform the task reached levels of performance wellabove chance. Control trials demonstrated that the rats used only taste cues. Further, thelearned stimulus set was resistant to interference, allowing for generalization experimentsperformed subsequently. We tested the rats’ gustatory generalizations of 100 tastants tothe five trained stimuli, both regarding their taste qualities as well as intensity ratings. Thetaste profiles generated by these experiments contribute to the understanding of how per-ception of the specific taste stimuli relate to the perception of the five basic taste qualitiesin intact behaving rats. In this large taste space we found that intensity plays a major role.Furthermore, umami stimuli were not reported as being similar to other basic tastants. Ournew paradigm enables neurophysiological studies of taste-based learning and memory inawake, freely moving animals.
Keywords: flavor, taste, gustation, conditioned taste aversion, behavioral taste categorization, Morrison task, taste
generalization, place learning
INTRODUCTIONThe neural basis of flavor perception has only recently begun tobe investigated in humans using functional imaging, and in mon-keys using single-unit recording methods. While these methodshave advanced understanding of flavor processing, there is a needto complement these approaches with multi-site recording andimaging methods that offer the ability to manipulate neural cir-cuits (e.g., with optogenetic methods) in order to assess their rolesin flavor perception. To this end we felt a need to establish a rodentmodel for taste and flavor research that incorporates novel neuraland behavioral methodologies.
Behavioral methods that accurately assess stimulus perceptionare crucial for the development of valid and sensitive animalmodels of sensory processes. Two paradigms have been used suc-cessfully to query the rat about its suprathreshold taste perceptionby way of taste similarities. The first involves the generalizationof conditioned taste aversions (CTAs). After ingestion of a refer-ence taste (conditioned stimulus, CS), the animal is made sick byintraperitoneal LiCl injection (unconditioned stimulus, US), andthe degree of intake suppression of a range of stimuli is testedon subsequent days (Nachman, 1963; Tapper and Halpern, 1968;Ninomiya et al., 1984; Frank, 1985). Smith and colleagues investi-gated the relationship between brainstem taste neuron responsesand CTA-generalizations (Smith et al., 1979). Yamamoto and col-leagues investigated the degree of correspondence between variouscoding schemes applied to responses of chorda tympani fibers and
cortical gustatory neurons, and behavioral similarity among tastestimuli (Yamamoto et al., 1985; Yamamoto and Yuyama, 1987).
The second approach, called the “Morrison task” (Morrison,1967; Ganchrow and Erickson, 2000), consisted of a 2-bar oper-ant generalization task. The perceptual similarity between tastantswas related to the similarity of neural response patterns to thesetastants (Ganchrow and Erickson, 2000). This task was expandedby Spector and colleagues (Grobe and Spector, 2008). It has thegeneral advantage over CTA-generalization tasks in that it does notrequire aversive/toxic US–CS conditioning, and far fewer animalsare needed to investigate the response similarity among a largenumber of stimuli. However, the Morrison task is labor intensiveand only pair-wise comparisons can be tested on each trial.
We chose to investigate an alternative approach for studyingflavor perception based on work by Youngentob and colleagues(Youngentob et al., 1990, 1991), who established a multi-odoridentification task using rats. In their method rats identify up to10 odorants by choosing one of the odor-associated tunnels thatcontain a response lick cup. Rats learned to perform this confu-sion matrix task at high levels of accuracy (∼95% correct) andremained accurate (>70% correct) across a 40-fold range of odorconcentrations (Youngentob et al., 1990). This behavioral para-digm has been successfully applied to relate rodent odor perceptionto optically recorded epithelial odor–response patterns (Kent et al.,1995, 2003) and to 2-DG spatial response patterns in the olfactorybulb (Youngentob et al., 2006). The approach has also successfully
Frontiers in Behavioral Neuroscience www.frontiersin.org May 2012 | Volume 6 | Article 19 | 1
10

Gautam et al. Novel rat taste-location association task
established the perceptual effects of OMP gene deletion in mice(Youngentob et al., 2001).
Similar to the approach developed by Youngentob et al. (1990,1991) for odorants, here we describe and test a new paradigm forthe study of taste processing. This paradigm is designed to enablethe future study of cross-modal flavor generalizations in real-timewhile performing chronic electrophysiological recordings. In thepresent study, first we asked if rats can associate a taste qualityin the mouth with a specific location outside. This question wasnever tested before. Then, we tested if rats can learn to simulta-neously associate five different taste qualities with five differentplaces. We show that rats can learn to go to and lick one of fivewater spouts after having received one of five taste stimuli froma manifold at the center of a circular arena. Cue-control trialsshowed that the behavior was taste-guided. To our knowledge thisis the first demonstration of (non-devaluative) taste–location asso-ciative learning in rodents. Further, we report the rats’ gustatorygeneralizations of ∼100 tastants to the five trained stimuli, regard-ing their taste qualities as well as intensity ratings. The taste profilesgenerated by these experiments contribute to the understanding ofhow perception of the specific taste stimuli relate to the perceptionof five basic taste qualities in intact behaving rats and establish themost complete taste space of a non-human animal to date.
MATERIALS AND METHODSANIMALSFour female Long–Evans rats initially weighing ∼200 g were used.Rats were on a 22 h water deprivation schedule for the entireexperiment. To maximize the rats’ cognitive abilities they weregroup-housed in an enriched environment. The cage consisted ofa “Ferret Nation” cage (model 141, Midwest, Muncie, IN, USA).The dimensions were 36′′L × 25′′W × 38 1/2′′H, and the cage hadtwo levels connected via stairs. The cage was painted with Rus-toleum for rust prevention and improved for daily transport withlarger coasters. A custom plastic base contained bedding and arunning wheel (“Safety Wodent Wheel – Senior”) enhanced witha more stable base. It also contained several pieces of 4′′ PVC pipeconnectors as well as wood chewing blocks (“Block Bites”). Theenvironment was further enriched with paper napkins placed ontop of the cage. Rats were identified by tattooed numbers on theirtail and outer ears. Twenty months later they were individuallyhoused because of the appearance of pododermatitis in two rats(see Results). All procedures were approved by the John B. PierceAnimal Care and Use Committee.
TESTING ARENAThe testing arena consists of a round box of 23′′ diameter, witha transparent polycarbonate side of 210 mm height (Figure A1 inAppendix). A metal grid floor was located 50 mm above the baseof the box. At five evenly spaced locations along the perimeter wallwere lick spouts, connected to a lickometer (Med Associates, St.Albans, VT, USA) and water-tube from a gustometer. Spouts werenumbered 1–5 in clockwise fashion, with spout 1 on the right of themanifold. These spouts were located 60 mm above the grid floor.A taste manifold was lowered into the center of the arena from thecenter of the metal grid ceiling. (The taste manifold was invertedabove the metal grid floor from day 157 onward, as discussed
later). This manifold used an optical lickometer (Schoenbaumet al., 2001). The test arena, used throughout the experiment, wasfilled with fresh bedding weekly and the grid was wiped clean aftereach rat and cleaned and dried daily. The testing arena, gustometervalves, and PC monitor were placed on top of a steel table.
GUSTOMETERThe gustometer and procedure was fully automated using Labview.The gustometer consisted of a set of taste bottles, pressurized bynitrogen and connected via 2-way valves to a taste manifold andthe five surrounding water reward spouts.
Tastants used as training stimuli consisted of deionized water,0.3 M NaCl, 5 mM quinine HCl, 30 mM HCl, and 0.5 M sucrose,dissolved in deionized water (Table 1). They were stored in media-bottles using Omnifit (Danburry, CT, USA) Omni-lok caps andconnectors. The inlets connected to 2.5 PSI source of nitrogen[Airgas (Salem, NH, USA), BIP, 99.999%]. The outlets were con-nected to gustometer two-way valves via nylon connectors. Alltubing was made of Teflon (PTFE, 1/8′′ OD, 1/16′′ ID). All chem-icals were reagent grade and obtained from Sigma-Aldrich (St.Louis, MO, USA). All stimuli were at room temperature (22˚C).
All valves [2-way Neptune Research (West Caldwell, NJ, USA),Teflon body] were individually calibrated by adjusting their ener-gizing time in order to provide 20 ± 0.5 μl of fluid upon licking.They were energized by drive-current minimizing (and henceheat-minimizing) valve driver boards (Neptune Research). After a1 s delay liquid was removed from the taste manifold by vacuumapplied at 5l/min for 2 s and rinsed for 1 s with deionized water300 ms after the vacuum onset (to prevent cross-contamination).The next lick on the next trial refilled the manifold’s dead-space.The surrounding reward spouts presented 40 ± 5 μl of deionizedwater once upon correct licks were made. To reduce the occur-rence of orthonasal olfaction the lick spout was surrounded by astainless steel conical ring. The ∼2-mm concentric space betweenthe ring and spout is continuously vacuumed at 5 l/min. Beforethe start of daily testing all tubing was flushed to remove air andspouts were cleaned and dried.
BEHAVIORAL PROCEDURERats were gradually trained to lick a stimulus from taste manifoldat the center of the testing arena and then lick from one of fivewater spouts surrounding the manifold.
A trial started with a 250ms beep of 5 kHz every 1 s. When therat licked from the central taste manifold the beeping stopped anda tastant was presented. If the rat did not subsequently lick anyof the surrounding reward spouts within 15 s the trial timed outand a new trial started. If the rat licked the correct reward spout
Table 1 | Learned set of taste stimuli.
Chemical Abbr. Conc. (M) Valve
Sucrose S 0.5 1
HCl H 0.03 2
Water W 3
NaCl N 0.3 4
Quinine HCl Q 0.005 5
Frontiers in Behavioral Neuroscience www.frontiersin.org May 2012 | Volume 6 | Article 19 | 2

Gautam et al. Novel rat taste-location association task
water was presented and a new trial started after a 0.5-s delay. Ifthe rat licked a wrong reward spout no water was presented, a toneof 2 kHz played for 250 ms and a new trial was started after a 10-sadditional delay as mild punishment. Irrespective of whether theanimal would lick the stimulus or not each stimulus presentationwas followed by vacuuming and rinsing of the stimulus manifoldto clean out the stimulus, thereby removing any chance of cross-contamination. All relevant trial parameters as well as the rats’responses were automatically stored on the PC in a text file forsubsequent analysis in Microsoft Excel 2007.
BEHAVIORAL TRAININGRoom lights were always turned off during the daily sessions. Adoor to a bright room was however always left open. During 3-day familiarization, each rat was placed in test chamber for 30 minand allowed to lick water from the central taste manifold. Next,the rat was guided to alternate between the central manifold andsurrounding reward water spout 1 (Tables 2 and 3). An LED was litunderneath spout 1 after licking water from the central manifold.A new trial started after licking spout 1 or after timing out (15 s).No other spout was responsive.
After several days, rats alternated between the taste manifoldand the water spout at least 60% of the trials (Figure A2 in Appen-dix). The second stimulus was then introduced, the taste qualityof which varied across the four rats (Table 2). The stimulus pre-sentation likelihood was evenly distributed across all stimuli untilday 78. At this point we did not introduce quinine as it wouldbe presented in about 50% of the trials, and this raised concernsregarding its aversive properties. Across rats, we introduced qui-nine as third taste (rat 4), fourth taste (rat 2), or fifth taste (rat 1and rat 3; Table 2). Where rats had to go to obtain water rewardafter having licked the secondly introduced tastant was also variedacross rats (Table 3). For example, rat 1 had to go to spout 2 aftersucrose, and rat 2 to spout 3 after NaCl, both having to go to spout 1after water. As before, an LED lit up to guide the rat toward the cor-rect spout. We accordingly introduced all five tastants to the fourrats, each rat having their own unique taste–location mapping.
We gradually removed the LED cues that guided the rats to gotoward the correct spout. Table 4 describes how the LED guidance
Table 2 | Order of introducing tastants for each rat.
Rat 1 2 3 4 5
1 W S N H Q
2 W N S Q H
3 W N H S Q
4 W H Q N S
Table 3 |Taste-to-spout mapping for each rat.
Rat W S H N Q
1 1 2 3 4 5
2 1 3 4 5 2
3 1 4 5 2 3
4 1 5 2 3 4
associated with the first stimulus (water) was discontinued whenthe performance for the third stimulus (second tastant, T2) wasat least 60% (square symbols in Figure A2 in Appendix). Once allLED guidance was discontinued we continued training for a totalof 200 training sessions. The Video in Supplementary Materialshows 15 consecutive trials of rat 1 on test day 215.
BEHAVIORAL TESTINGRats were always tested in the same order (rat 1–4). It was takenout of the home cage, weighed, and placed on the grid of the test-ing arena, after the Labview software was started. After a testingsession of 45 min the rat was taken out of the arena and was placedinto a regular cage with a bottle of water available for ad lib drink-ing. Then the next rat’s session was started. At the end of this nextrat’s session we moved the previous rat into the group cage. Thiswas continued until all four rats had gone through all these stages.
During a session tastants were presented in randomized (non-blocked) order. We did not limit the number of times the samestimulus could consecutively be presented. Starting test day 78 weemployed an “error feedback” based on the performance errors ofthe preceding day to increase the frequency of the stimuli that weremostly poorly identified. For each rat on any session the % chanceto be presented with stimulus A was calculated as follows (PCa ispercent correct for stimulus A during the previous session for anindividual rat):
% of trials with stimulus A = 4 + 80
× [(100 − PCa)
/(500 − (PCa + PCb + PCc + PCd + PCe))
]
(1)
As rats performed several hundred trials per session the actuallypresented stimulus fractions approached these calculated targetfractions. Equation 1 was adjusted when other stimuli were tested,to sum to either 70% or 90% (see below). None of the rats weretested/trained during the following four breaks (4/13/10-4/26/10,5/26/10-6/8/10, 6/21/10-7/15/10, and 9/2/2010-10/14/2010).
CUE CONTROLSTo verify that the spout choices were mediated by the taste ofthe stimuli and not other cues (e.g., the sound of a valve of thegustometer), we presented the same stimuli also on new lines ofthe gustometer on two occasions: day 109–111 and day 185–189(Figure A2, bottom and Figure 2). During the first instance, wepresented HCl, NaCl, and water at 10% incidence each on each
Table 4 | LED guidance turn-off schedule.
After learning Turn-off LED for spout of
W
T1
T2 W
T3 T1
T4 T2
Delay 1 T3
Delay 2 T4
Frontiers in Behavioral Neuroscience www.frontiersin.org May 2012 | Volume 6 | Article 19 | 3

Gautam et al. Novel rat taste-location association task
day (30% of total presentations). Initially we opted not to choosesucrose, as it was distinctly more viscous and required longervalve-open times (other valve times were identical). Correct per-formance on sucrose control trials would hence not have allowedus to conclude that the choices were taste-guided.
On the second control set we presented only one cue-controlstimulus daily on a new gustometer line on days 180–185 for H,N, W, Q, and S, respectively, at 10% of the total stimulus presen-tations. During a third set of tests (day 194–197) we presentedgeneralization stimuli, being the training stimuli (Table 1), butat 10% of the original concentrations on 10% of trials each day:
0.03 M NaCl on day 194, 0.5 mM quinine HCl on day 195, 3 mMHCl on day 196 and 0.05 M sucrose on day 197 (Figure 1B).
On all control presentations reward was available irrespec-tive of which spout they licked. This was chosen so that, in asubsequent study, we could evaluate to what extent the perfor-mance would be disturbed by moderately changing the rewardcontingencies, which would be necessary in case of generalizationstudies using similar stimuli. For example, to test generalization toa different concentration of the training tastants, any responsewould have to be rewarded in order not to bias subsequentgeneralizations.
0
20
40
60
80
100
50 60 70 80 90 100 110 120 130 140 150 160 170 180 190 200
Accu
racy
(%)
training day
rat 1rat 2rat 3rat 4
chance
setup error inverted lick spoutconc10%
50 60 70 80 90 100 110 120 130 140 150 160 170 180 190 200training day
W
S
N
H
Q
wshnq
timeoutwshnq
timeoutwshnq
timeoutwshnq
timeoutwshnq
timeout
#resp
0
20
40
setup error
A
B
food
1
23
45
2nd cuecontrol
1st cuecontrol
FIGURE 1 | (A) The number of times rat 1 chose a spout (small letters) ortimed out per day for each taste presented at the central manifold(capitalized). All LEDs were turned off from day 69 onward, each markedby a red bar. (B) Average taste-guided performance of each rat.
Cue-control generalization to training stimuli is indicated. Lick spout wasmounted on bottom at indicated day for more natural lick behavior. Chanceperformance is 20%. Two setup errors are highlighted with a vertical bar,one affecting only rat 1.
Frontiers in Behavioral Neuroscience www.frontiersin.org May 2012 | Volume 6 | Article 19 | 4
Gautam et al. Novel rat taste-location association task
Water
sucrose 0.5M
HCl 0.03M
NaCl 0.3M
Quinine HCl 5mM
timeout
-0.50
-0.25
0.00
0.25
0.50
0.75
1.00
corr
elat
ion
(mea
n ±
sem
)
water sucrose 0.5M
HCl 0.03M
NaCl 0.3M
Quinine HCl 5mM
0%
10%
20%
30%
40%
50%
60%
70%
80%
90%
100%
% o
f res
pons
e al
tern
ativ
es(m
ean
± se
m)
water sucrose 0.5M
HCl 0.03M
NaCl 0.3M
Quinine HCl 5mM
A
B
RESPONSE SPOUTS:
Water
sucrose 0.5M
HCl 0.03M
NaCl 0.3M
Quinine HCl 5mM
TRAININGSTIMULI:
TEST STIMULI
TEST STIMULI
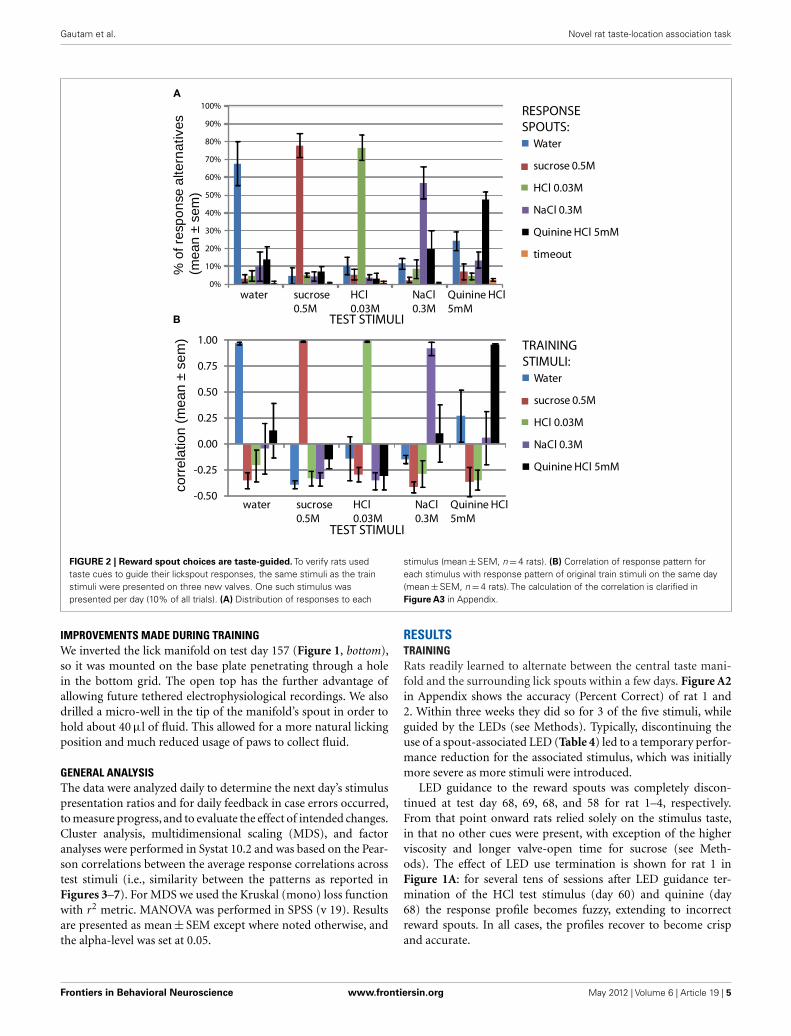
FIGURE 2 | Reward spout choices are taste-guided. To verify rats usedtaste cues to guide their lickspout responses, the same stimuli as the trainstimuli were presented on three new valves. One such stimulus waspresented per day (10% of all trials). (A) Distribution of responses to each
stimulus (mean ± SEM, n = 4 rats). (B) Correlation of response pattern foreach stimulus with response pattern of original train stimuli on the same day(mean ± SEM, n = 4 rats). The calculation of the correlation is clarified inFigure A3 in Appendix.
IMPROVEMENTS MADE DURING TRAININGWe inverted the lick manifold on test day 157 (Figure 1, bottom),so it was mounted on the base plate penetrating through a holein the bottom grid. The open top has the further advantage ofallowing future tethered electrophysiological recordings. We alsodrilled a micro-well in the tip of the manifold’s spout in order tohold about 40 μl of fluid. This allowed for a more natural lickingposition and much reduced usage of paws to collect fluid.
GENERAL ANALYSISThe data were analyzed daily to determine the next day’s stimuluspresentation ratios and for daily feedback in case errors occurred,to measure progress, and to evaluate the effect of intended changes.Cluster analysis, multidimensional scaling (MDS), and factoranalyses were performed in Systat 10.2 and was based on the Pear-son correlations between the average response correlations acrosstest stimuli (i.e., similarity between the patterns as reported inFigures 3–7). For MDS we used the Kruskal (mono) loss functionwith r2 metric. MANOVA was performed in SPSS (v 19). Resultsare presented as mean ± SEM except where noted otherwise, andthe alpha-level was set at 0.05.
RESULTSTRAININGRats readily learned to alternate between the central taste mani-fold and the surrounding lick spouts within a few days. Figure A2in Appendix shows the accuracy (Percent Correct) of rat 1 and2. Within three weeks they did so for 3 of the five stimuli, whileguided by the LEDs (see Methods). Typically, discontinuing theuse of a spout-associated LED (Table 4) led to a temporary perfor-mance reduction for the associated stimulus, which was initiallymore severe as more stimuli were introduced.
LED guidance to the reward spouts was completely discon-tinued at test day 68, 69, 68, and 58 for rat 1–4, respectively.From that point onward rats relied solely on the stimulus taste,in that no other cues were present, with exception of the higherviscosity and longer valve-open time for sucrose (see Meth-ods). The effect of LED use termination is shown for rat 1 inFigure 1A: for several tens of sessions after LED guidance ter-mination of the HCl test stimulus (day 60) and quinine (day68) the response profile becomes fuzzy, extending to incorrectreward spouts. In all cases, the profiles recover to become crispand accurate.
Frontiers in Behavioral Neuroscience www.frontiersin.org May 2012 | Volume 6 | Article 19 | 5

Gautam et al. Novel rat taste-location association task
-0.60
-0.40
-0.20
0.00
0.20
0.40
0.60
0.80
1.00
S 16.7mM S 0.05M S 0.167M S 0.5M-0.60
-0.40
-0.20
0.00
0.20
0.40
0.60
0.80
1.00
H 1mM H 3mM H 0.01M H 0.03M H 0.1M
-0.60
-0.40
-0.20
0.00
0.20
0.40
0.60
0.80
1.00
N 10 mM N 0.03M N 0.1M N 0.3M N 1M-0.60
-0.40
-0.20
0.00
0.20
0.40
0.60
0.80
1.00
Q 0.167mM Q 0.5mM Q 1.67mM Q 5mM Q 16.7mM
-0.60
-0.40
-0.20
0.00
0.20
0.40
0.60
0.80
1.00
Cf 10mM Cf 33mM Cf 0.1M
-0.60
-0.40
-0.20
0.00
0.20
0.40
0.60
0.80
1.00
Ta 0.01M Ta 0.03M Ta 0.1M
-0.60
-0.40
-0.20
0.00
0.20
0.40
0.60
K 0.1M K 0.33M K 1M
-0.60
-0.40
-0.20
0.00
0.20
0.40
0.60
0.80
1.00
Nh 0.1M Nh 0.3M Nh 1M-0.60
-0.40
-0.20
0.00
0.20
0.40
0.60
0.80
1.00
Mg 0.03M Mg 0.1M Mg 0.3M
-0.60
-0.40
-0.20
0.00
0.20
0.40
0.60
0.80
1.00
C 3.3mM C 10 mM C 33mM
water
sucrose 0.5M
HCl 0.03M
NaCl 0.3M
quinine HCl 5mM
A
B
C
sucrose HCl
NaCl
0.80
1.00
quinine
caffeine KCl
MgCl2 NH4Cl
tartaric acid citric acid
** *** *
** **
** *
**** *
**
**
**
*p=0.065
corr
elat
ion
(mea
n ±
sem
)
FIGURE 3 | Concentration–response generalization curves. Thecorrelation-based similarity between the response profile to each stimulus(seeTable 6 for abbreviations) at each concentration and each of the stimuli
(Table 1). See text for details. *P < 0.05, ** P < 0.01, *** P < 0.001(MANOVA on concentration). (A) The four trained stimuli. Concentrations ofthe learned set are boldfaced. (B) Bitter tastants. (C) Sour tastants.
Frontiers in Behavioral Neuroscience www.frontiersin.org May 2012 | Volume 6 | Article 19 | 6

Gautam et al. Novel rat taste-location association task
-0.60
-0.40
-0.20
0.00
0.20
0.40
0.60
0.80
1.00
G 0.1M G 0.33M G 1M
-0.60
-0.40
-0.20
0.00
0.20
0.40
0.60
0.80
1.00
Gy 0.1M Gy 0.33M Gy 1M -0.60
-0.40
-0.20
0.00
0.20
0.40
0.60
0.80
1.00
Se 0.1M Se 0.33M Se 1M
-0.60
-0.40
-0.20
0.00
0.20
0.40
0.60
0.80
1.00
Sa 0.01M Sa 0.03M Sa 0.1M
-0.60
-0.40
-0.20
0.00
0.20
0.40
0.60
0.80
1.00
Sl 0.025mM Sl 0.25mM Sl 2.52mM Sl 25.2mM Sl 252M
water
sucrose 0.5M
HCl 0.03M
NaCl 0.3M
quinine HCl 5mM
-0.60
-0.40
-0.20
0.00
0.20
0.40
0.60
0.80
1.00
F 0.083M F 0.1M F 0.25M F 0.33M F 0.75M F 1M
-0.60
-0.40
-0.20
0.00
0.20
0.40
0.60
0.80
1.00
Neo 0.3mM Neo 0.9mM Neo 2.6mM Neo 7.9mM
-0.60
-0.40
-0.20
0.00
0.20
0.40
0.60
0.80
1.00
S 0.1M+Sa0.01M S 0.1M+Sa0.03M S0.1M+Sa0.1M-0.60
-0.40
-0.20
0.00
0.20
0.40
0.60
0.80
1.00
S 0.1M+Sl 2.5mM S 0.1M+Sl 7.5mM S 0.1M+Sl 25mM
A
B
C
D
glucose fructose
l-serineglycine
sucralosesaccharin
neotame
sucrose and sucralosesucrose and saccharin
*
** *
*
** * ** * ** *
** *
corr
elat
ion
(mea
n ±
sem
)
FIGURE 4 | Concentration–response generalization curves of sweet tastants. *P < 0.05, **P < 0.01, ***P < 0.001 (MANOVA on concentration).(A) Sugars. (B) Amino acids. (C) Artificial sweeteners. (D) Sucrose mixtures.
Given the five response options, 20% accuracy is consid-ered chance level. All four rats were responding above chancelevel (average 35%, range 28–42%) when LED guidance was
discontinued around day 70 (Figure 1B), and performance steadilyincreased at 0.5% per day to an average accuracy of 64% at day130 (range 59–75%). A setup error, during which we erroneously
Frontiers in Behavioral Neuroscience www.frontiersin.org May 2012 | Volume 6 | Article 19 | 7

Gautam et al. Novel rat taste-location association task
-0.60
-0.40
-0.20
0.00
0.20
0.40
0.60
0.80
1.00
M 0.1M M 0.3M M 1M-0.60
-0.40
-0.20
0.00
0.20
0.40
0.60
0.80
1.00
MPG 0.1M MPG 0.3M MPG 1M
-0.60
-0.40
-0.20
0.00
0.20
0.40
0.60
0.80
1.00
IMP 0.01M IMP 0.03M IMP 0.1M-0.60
-0.40
-0.20
0.00
0.20
0.40
0.60
0.80
1.00
M 0.1M+IMP 0.01M M 0.3M+IMP 0.03M M 1M+IMP 0.1M
water
sucrose 0.5M
HCl 0.03M
NaCl 0.3M
quinine HCl 5mM
MSG MPG
IMP MSG + IMP
*
** *
corr
elat
ion
(mea
n ±
sem
)
FIGURE 5 | Concentration–response generalization curves of umami stimuli. *P < 0.05, ** P < 0.01, *** P < 0.001 (MANOVA on concentration).
-0.60
-0.40
-0.20
0.00
0.20
0.40
0.60
0.80
1.00
Am 10 uM Am 30 uM N 0.1M+Am N 0.3M+Am M 0.3M+Am Sa 0.03M+Am
water
sucrose 0.5M
HCl 0.03M
NaCl 0.3M
quinine HCl 5mM
amiloride mixtures
****
corr
elat
ion
(mea
n ±
sem
)
FIGURE 6 | Amiloride addition blocks generalizations to salt. *P < 0.05, **P < 0.01, ***P < 0.001 (MANOVA on concentration).
rinsed the manifold with HCl (day 100–102), and the firstcue-control generalization test temporarily reduced performance.
ASYMPTOTIC PERFORMANCEAfter test day 130 performance reached a plateau. However, rat 4was unable to acquire the correct association between NaCl andspout 3. This animal failed to perform above 50% accuracy afterthe LED guidance was discontinued (between day 58 and 80).Unlike the other three rats, for whom we never again used any
of the LEDs, LED guidance was introduced again for rat 4 forthe NaCl stimulus on test day 81, 83, 85, 88, and 91, as well as forvarious stimuli between day 122 and 154 (explaining the large day-to-day variability in Figure 1, bottom). Only from day 167 onwarddid rat 4 perform above 50% (Figure 1B).
We observed that rats occasionally used their paws to collect thestimulus. This could lead to stimulus contamination and therebylimit performance. On day 157 we inverted the taste manifold,mounting it on the base plate of the arena instead of hanging
Frontiers in Behavioral Neuroscience www.frontiersin.org May 2012 | Volume 6 | Article 19 | 8

Gautam et al. Novel rat taste-location association task
-0.60
-0.40
-0.20
0.00
0.20
0.40
0.60
0.80
1.00
H+N H+Q H+S N+Q N+S Q+S
water
sucrose 0.5M
HCl 0.03M
NaCl 0.3M
quinine HCl 5mM
-0.60
-0.40
-0.20
0.00
0.20
0.40
0.60
0.80
1.00
H+N+Q H+N+S H+Q+S N+Q+S H+N+Q+S
B
A
binary mixtures
tertiary and quaternary mixtures
sup
add
sup
supsup sup
supsup
** * * ** ** * * * *
* ** * ** * ** * ** * ** *
(add)
*
*
** *
water
sucrose 0.5M
HCl 0.03M
NaCl 0.3M
quinine HCl 5mM
*
p=0.056
corr
elat
ion
(mea
n ±
sem
)
FIGURE 7 | Generalization curves of mixtures of the trained stimuli.
(A) Binary mixtures. *P < 0.05, **P < 0.01, ***P < 0.001 (MANOVA onstimuli). (B) Tertiary and quaternary mixtures. *P < 0.05, **P < 0.01,***P < 0.001 (MANOVA on tertiary stimuli). Asterisks at y = 0 indicate theelements of the mixture. Pink horizontal lines are drawn to indicate theoretical
maximum similarities assuming an even distribution of responses across the“correct” spouts associated with the elements of the mixture (binaryr = 0.61 ± 0.05, tertiary r = 0.41 ± 0.06, quaternary r = 0.25 ± 0.07). “sup”:suppression of the element, “add”: additivity of (domination by) the element.See Discussion for Monte Carlo derivation.
down from the lid. Performance temporarily dropped, but fullyrecovered ∼20 days later. Paw use was nearly completely halted.It did not appear to ultimately enhance accuracy, being at 72% atday 200 (range 67–80%). For comparison to the results of Youn-gentob et al. (1990) we include Table 5, displaying the mean, SD,and range for each rat over training days 181–200. Across all ratsperformance accuracy (PC) was 70 ± 10%. Actual behavior of rat1 during 15 trials using this setup on test day 215 is shown in theVideo S1 in Supplementary Material.
CUE CONTROLS AND GENERALIZATIONAs described in the Methods section, we applied taste–cue-controlson two occasions: days 109–111 (W, H, and N, 10% each, 30% oftotal trials per day) and 185–189 (one daily, H, N, W, Q, andS, respectively, at 10% total). For the first set of controls onday 109, there was no difference in accuracy between the orig-inal stimulus (55.7 ± 18%) and the control stimulus presentedin new bottles and gustometer lines (54.4 ± 16.2%; P = 0.350,n = 12, 1-sided paired t -test). Hence, it was clear that the ratsused taste cues but not sound cues to determine their choice of
Table 5 | Performance on days 181–200 (compare toYoungentob et al.,
1990 ,Table 2).
Animal Rat 1 Rat 2 Rat 3 Rat 4 All
Mean 80.9 67.4 72.5 57.7 69.7
SD 4.6 4.3 5.0 5.3 9.7
Range 69–89 57–75 59–79 46–67 46–89
reward spout for these three stimuli. Furthermore, rats performedwell above chance level (P < 10−4; 1-sided paired t -test vs. 20%).These data also showed evidence of interference, in that accuracydropped from 58.3 ± 2.2% at day 108 to 50.0 ± 5.2% on day 112(Figure 1B), suggesting that employing 30% of presentations as(always rewarded) generalization stimuli is too large a fraction tomaintain performance.
The results of the second control set of all five stimuli are shownin Figure 2. The top graph shows the mean percentage of the trials,averaged across the four rats, that the rats chose a spout mappedto a training stimulus during the session it was presented. For
Frontiers in Behavioral Neuroscience www.frontiersin.org May 2012 | Volume 6 | Article 19 | 9

Gautam et al. Novel rat taste-location association task
example, upon presenting the cue-control water stimulus, ratschose the reward spout mapped to water 67.5 ± 12.3% of thetotal number of water control trials (mean ± SEM), and chose thespout mapped to sucrose only 3.2 ± 2.3% of the time (Figure 2A).All responses were well above chance level (67.5, 77.8, 76.5, 56.8,and 47.6% correct, respectively for W, S, H, N, Q, means acrossfour rats; P < 10−12, paired two sample t -test for means, vs. 20%,n = 20). This would not have been the case if rats were dependingon non-gustatory cues. As shown in Figure 1 (B,“2nd cue control”)these control tests had a mild downward effect on accuracy butthis was rapidly reversed.
We next asked how similar these response profiles are to theactual training set, to provide a quantitative similarity measure ofthese cue-control responses in particular, and as a generally usefulmethod to study generalization. For this similarity measure we cal-culated the Pearson correlation coefficient between each responseprofile for a cue-control/test stimulus and the response profileto each trained stimulus (Figure 2B). This method is explained inFigure A3 in Appendix. As expected, the control stimulus responseprofiles and trained stimulus response profiles were very similar toeach other. The mean correlations for water, sucrose, HCl, NaCl,and quinine were all above 90%. As there is some mutual confusionbetween water and quinine (r = 0.13 ± 0.26 and r = 0.27 ± 0.25,of water to quinine-mapped spout and of quinine stimulus towater-mapped spout, respectively), the quinine stimulus may havebeen of low intensity. These correlations form a reference forthe generalization experiments mentioned below. We expect thataccuracy can be no higher than that of the cue controls.
CONCENTRATION GENERALIZATIONStimulus intensity is a fundamental sensory dimension. We eval-uated the rats’ generalization to the basic training stimuli from0.5 log unit above training concentration down to 10.5 log unitsbelow, in 0.5 log unit steps (Figure 3A). Sucrose was evaluatedonly at lower concentrations than the reference training concen-tration, where the profile at 0.5 log unit below reference (0.167 M)remained similar to the reference. At 16.7 mM the rats’ sucrosereport dropped rapidly as water report increased to r = 0.81.MANOVA showed a highly significant effect of sucrose concen-tration only on sucrose report (F 3,15 = 46.7, P < 0.001) and onwater report (F 3,15 = 26.5, P < 0.001). This profile was quite sim-ilar to the other three stimuli, showing stable responses 0.5 logunits around the reference concentration (r > 0.9, except 1 MNaCl and 1.67 mM quinine). Below 0.5 log units the report tothe presented stimulus dropped to r = −0.1–0.51 (1 log unit) andr = −0.49–0.29 at the lowest concentration, while that of waterincreased to r = 0.70–0.81. At these lower concentrations onlyHCl was selected (r = 0.08–0.26), suggesting these taste stimuliwere perceived mainly as fairly pure tastes of varying inten-sity with only a mild sournote. Concentration had a significanteffect on the reported equivalent lickspout for all basic stimuli(see Figure 3A; HCl: F 4,19 = 27.8, P < 0.001; NaCl: F 4,19 = 8.2,P < 0.001; quinine: F 4,19 = 5.2, P < 0.01; MANOVA). We furtherestablished that MANOVA across all these 19 stimuli showed asignificant effect of concentration (normalized to training con-centration), molecular identity, and their interaction on the entireresponse set (F 20, 224 = 4.6, P < 0.001, F 15,165 = 19.9, P < 0.001,
and F 55,285 = 2.8, P < 0.001, respectively). Thus, our paradigmyields robust datasets with as few as four animals.
BITTER TASTANTSWe further evaluated the rats’generalization to four stimuli, looselytermed “bitter tastants” (Table 6). Figure 3B shows that caffeine,often used as prototypical bitter stimulus in rat experiments, onlyevoked a mild bitterness response profile at 10, 33, and 100 mM(r < 0.46), showed no positive relationship to any other tastant,and a relatively high correlation to water (r = 0.34–0.67). Thismay be considered a weak, but pure bitter (i.e., quinine-like) tasteto these rats. A very similar concentration profile was evidentfor KCl (Figure 3B). Magnesium chloride was highly similar toquinine at 0.3 M (r = 0.72) with minor HCl-like taste (r = 0.17),dropping to nearly pure water response at 30 mM. Ammoniumchloride (Nh) was reported as moderately sour (r = 0.45–0.56)and mildly bitter (r = 0.27–0.29) at 0.3 and 1 M and as a weakermixture thereof at 100 mM. We found no evidence of pure andintense quinine-like stimuli among these tastants. Concentrationhad a significant effect on the reported quinine-likeness for MgCl2(F 2,11 = 8.3, P < 0.01; see Figure 3B).
SOUR TASTANTSUnlike the bitter stimuli, the sour tastants generalized purely toHCl (Figure 3C). Report to tartaric acid was similar to HCl(r = 0.86 at 30 and 100 mM). This concentration–response profilewas very similar to citric acid, the latter reaching only r = 0.63and r = 0.71 similarity to HCl at 10 and 33 mM, respectively.Of the tastants, only quinine reached positive correlation withthese sour-like stimuli (r < 0.09). Concentration had a significanteffect on the reported HCl-likeness for tartaric acid (F 2,11 = 5.3,P < 0.05) and nearly so for citric acid (F 2,11 = 3.8, P = 0.065); seeFigure 3B).
SWEET TASTANTSTo explore the rats’ generalization to monosaccharides we pre-sented them with glucose (0.1, 0.33, and 1 M) and fructose (0.083–1 M). As expected, both yielded near-identical response patternsto sucrose (r = 0.99 at 1 M, Figure 4A), and had steeply declin-ing curves with decreasing concentration (r = 0.12 and 0.48 at0.33 M for glucose and fructose, respectively). Note that we pre-sented three pairs of similar concentrations of fructose, to whichthe rats responded similarly. Water was chosen at r = 0.90 at orbelow 0.1 M of the sugars. Concentration had a significant effecton the sucrose report for both glucose (F 2,15 = 29.9, P < 0.001)and frucose (F 5,23 = 11.1, P < 0.001) as well as water report (seeFigure 4A).
We also presented the rats with amino acids that have beensuggested to be sweet to rats (Figure 4B). Indeed, l-glycine at1 M yielded r = 0.76, and l-serine a more moderate correlation of0.61, while similarity to other response options did not go abover = 0, indicating a rather pure sweetness (i.e., saccharin-likeness).At lower concentrations l-glycine appeared to be sweet–sour (HClr = 0.28–0.29) of decreasing intensity (increasing water similar-ity). L-serine also became mildly sour at the lowest concentrationon 0.1 M (r = 0.36 with HCl, r = 0.50 with water). These aminoacids did not contain HCl.
Frontiers in Behavioral Neuroscience www.frontiersin.org May 2012 | Volume 6 | Article 19 | 10

Gautam et al. Novel rat taste-location association task
Table 6 | Stimulus list.
Stimulus Abbrev. Group Structure Conc. (mM)
Water W Trained ref Solvent
Sucrose S Trained ref Disaccharide 16.7, 50, 100, 167, 500
HCl H Trained ref Acid 1, 3, 10, 30, 100
Quinine HCl Q Trained ref Alkaloid 0.167, 0.5, 1.67, 5, 16.7
NaCl N Trained ref Salt 10, 30, 100, 300, 1000
Caffeine Cf Bitter Alkaloid 10, 33, 100
KCl K Bitter Salt 100, 330, 1000
MgCl2 Mg Bitter Salt 30, 100, 300
NH4Cl Nh Bitter Salt 100, 300, 1000
Citric acid C Sour Acid 3.3, 10, 33
Tartaric acid Ta Sour Acid 10, 30, 100
Fructose F Sweet Mono 83, 100, 250, 330, 750, 1000
Glucose G Sweet Mono 100, 330, 1000
Sucralose Sl Sweet Artificial 0.0025, 0.025, 0.25, 2.5, 25, 252
Saccharin Sa Sweet Artificial 10, 30, 100
Neotame Neo Sweet Artificial 0.29, 0.88, 2.6, 7.9
Glycine Gy Sweet Amino acid 100, 330, 1000
Serine Se Sweet Amino acid 100, 330, 1000
Sucrose + sucralose S + Sl Sweet Purer gustatory 50 + 25, 100 + 2.5, 100 + 7.5, 100 + 25
Sucrose + saccharin S + Sa Sweet Purer gustatory 100 + 10, 100 + 30, 100 + 100
msg M Umami Amino acid 100, 300, 1000
mpg MPG Umami Amino acid 100, 300, 1000
imp IMP Umami Ribonucleotide 10, 30, 100
msg + imp M + MPG Umami Mix 100 + 10, 300 + 30, 1000 + 100
Amiloride Am Salt blocker Control 0.01, 0.03
Amiloride + saccharin Sa +Am Salt blocker Purer sweet 0.03 + 33
Amiloride + msg M +Am Salt blocker Purer umami 0.03 + 300
Amiloride + NaCl N +Am Salt blocker Tasteless 0.03 + 300
S + H S + H Ref mix Binary 500 + 30
N + H N + H Ref mix Binary 300 + 30
Q + H Q + H Ref mix Binary 5 + 30
S + N S + N Ref mix Binary 500 + 300
S + Q S + Q Ref mix Binary 500 + 5
N + Q N + Q Ref mix Binary 300 + 5
S + N + H S + N + H Ref mix Tertiary 500 + 300 + 30
S + H + Q S + H + Q Ref mix Tertiary 500 + 30 + 5
S + N + Q S + N + Q Ref mix Tertiary 500 + 300 + 5
H + N + Q H + N + Q Ref mix Tertiary 30 + 300 + 5
S + H + N + Q S + H + N + Q Ref mix Quaternary 500 + 30 + 300 + 5
Variable results have been reported for the apparent sweetnessof artificial sweeteners between strains and sexes. Our rats reportedsaccharin as moderately sweet (Figure 4C), peaking at the interme-diate concentration (0.03 M, r = 0.63 to sucrose), but with a ratherhigh watery component (r = 0.46). We tested a 4-log unit rangeof sucralose, and rats reported a fairly exclusively high correlationwith sucrose of r = 0.75 at intermediate concentration of 25.2 mM(water: r = 0.19, rest < 0.00). This apparent sweetness droppedat a relatively shallow slope, being r = 0.34 1 log unit belowand r = 0.29 1 log unit above this peak sweetness concentration.Neotame was exclusively moderately bitter, peaking at r = 0.47at 7.9 mM (water: r = 0.57). Rats did not report taste similarity
below 1 mM Neotame (r < −0.11, water r > 0.98). Concentrationhad a significant effect on the sucralose reported sucrose-likeness(F 4,19 = 4.1, P < 0.05), quinine-likeness (F 4,19 = 4.2, P < 0.05)and water-likeness sucrose-likeness (F 4,19 = 13.9, P < 0.001; seeFigure 4C).
To generate a more purely sweet gustatory stimulus with lowcaloric value, we attempted to create a stimulus that would havea viscosity closer to water (η = 1.0 cP) than 0.5 M sucrose (or 1 Mfructose and glucose), but would retain most of the sweetness ofthese stimuli. The artificial sweeteners by themselves did not showsufficient sweetness intensity or purity. We chose 0.1 M sucrose asour base (Figure 3B) and mixed it with various concentrations of
Frontiers in Behavioral Neuroscience www.frontiersin.org May 2012 | Volume 6 | Article 19 | 11

Gautam et al. Novel rat taste-location association task
artificial sweeteners shown to be sweet (Figure 4D: saccharin andsucralose). Figure 4D shows that the addition of 0.1 M sucroseto the series of saccharin of Figure 4C barely raised the sucrose-likeness over that of saccharin alone (sucrose correlations: 0.59vs. 0.53, 0.71 vs. 0.63, and 0.25 vs. 0.19 from low to high concen-trations). It may have enhanced sweet intensity as reportedly thewater-likeliness dropped from r = 0.46 to −0.01, which in partwas also due to a rise in similarity with HCl. Much more synergis-tic was the combination of sucrose with sucralose (Figure 4D).Sucrose similarity peaked at r = 0.92 at 25 mM sucralose with0.1 M sucrose, higher than r = 0.75 without sucrose (Figure 4C),and did not generalize to other stimuli (r < −0.15), satisfying ourgoal of a pure strong sweet of low viscosity and 1/5th the caloriccontent of our reference of 0.5 M sucrose. At 2.5 and 7.5 mMthe intensity dropped very gradually, like sucralose itself, withcorrelation with 0.5 M sucrose dipping to r = 0.77 and r = 0.63.
UMAMI TASTANTSUmami is considered a fifth basic taste, and was not part of thetraining set. If it is indeed a basic taste, none of the four prototypi-cal tastants of the learned set should be chosen by the animals whenpresented with pure umami stimuli. We first presented 0.1, 0.3, and1 M monosodium glutamate (MSG, M; Figure 5), with its equimo-lar sodium ion. The animals seemed to report some increasingNaCl similarity (r = 0.43, 0.80, and 0.89, respectively), althoughgenerally this was lower than that of NaCl as test stimulus at 0.1and 0.3 M NaCl (r = 0.90 and 0.96, Figure 3A), except at 1 M NaCl(r = 0.77, Figure 3A), likely due to absence of the smaller chlorideion. Other responses remained low (r < 0.00, Figure 5). Concen-tration had a significant effect only on the reported water-likeness(F 2,11 = 5.0, P < 0.05).
Rats did not report saltiness when using monopotassium glu-tamate (MPG, having a K+ ion instead of Na+ ion, Figure 5).Their taste response peaked at 0.3 M with a quinine-likeness ofr = 0.54 and very mild sucrose band of r = 0.08. At 0.1 and 0.33 Mthe profile is quite similar to that of KCl (Figure 3B), but at 1 Mno bitterness was reported here (r = −0.04, Figure 5) vs. r = 0.33there (Figure 3B). For MPG as well concentration had a significanteffect only on the reported watery taste (F 2,11 = 20.6, P < 0.001).
IMP by itself yielded variable mild HCl responses at 0.01 M(r = 0.42 ± 0.32, Figure 5) and variable mild sucrose-likenessat 0.1 M (r = 0.31 ± 0.16, Figure 5), with no taste componentat the intermediate concentration (r < −0.05). Highly variableresponses were also obtained for mixtures of increasing concen-trations of both IMP and MSG, with sucrose responses peaking at0.1 M MSG and 0.01 M IMP (r = 0.32 ± 0.26, Figure 5) and NaClpeaking at 0.3 M MSG and 0.03 M IMP (r = 0.49 ± 0.16). Remark-ably, no tastant was chosen reliably at the peak concentration ofthe mixture despite the presence of 1 M sodium (tastant likenessr < 0.00, Figure 5). The water response was only moderate at thishigh concentration (r = 0.51 ± 0.18), suggesting the presence ofsome taste component. These results substantiate the notion thatumami is a distinct prototypical gustatory stimulus.
AMILORIDETo evaluate the effect of the sodium salt of two of our tastants(MSG and Na-saccharin) we presented the rats with mixtures of
the sodium channel blocker amiloride (Figure 6). We first testedthe amiloride for taste components, and the rats indeed reporteda mild bitterness (r = 0.31 at 10 μM and r = 0.37 at 30 μM).When 30 μM amiloride was mixed with 0.1 and 0.3 M NaCl,it nearly completely abolished the saltiness (r = −0.07 ± 0.25and r = 0.10 ± 0.32, Figure 6), while amiloride’s bitterness wasalso no longer evident (r < −0.05). MSG (0.3 M) mixed with30 μM amiloride had a similar behavioral taste profile as 0.3 MNaCl with amiloride: very low similarity to any taste stimuli, i.e.,NaCl (r = 0.14) and quinine (r = 0.27) and others r < −0.32.Low water similarity does suggest the presence of some taste,but none that could be expressed in terms of the four basics.Sodium saccharin mixed with 30 μM amiloride (Figure 6)yielded a mixed mildly sweet (r = 0.43) and bitter(r = 0.18) pro-file less pure than the sweet (r = 0.63) sodium saccharin alone(Figure 4C).Concentration had a significant effect only on thereported watery taste (F 5,23 = 4.6, P < 0.01) and sucrose-likeness(F 5,23 = 4.8, P < 0.01).
MIXTURESWe evaluated the rats’ report of mixtures of the standard trainingstimuli (Figure 7). Secondary mixtures are shown in Figure 7A.The mean difference between the similarity of the two stimulithat were part of the mixture was 0.26 ± 0.08, and the mean SDwas 0.18 ± 0.05 (e.g., for H + N: H r = 0.45 and N r = 0.17, dif-ference of 0.28, SD of 0.19). The mean similarity to each tastantacross all three mixtures that it was part of was: S r = 0.58 ± 0.04,H r = 0.42 ± 0.03, Q r = 0.40 ± 0.19, and N r = 0.33 ± 0.09 (e.g.,H in H + N r = 0.45, in H + Q r = 0.37 and in H + S r = 0.43,mean = 0.42). Thus the elements of the mixture were typicallyreported to be recognized at mild-moderate similarity, with Sand H being most resistant to mixture suppression and N theleast, in secondary mixtures. Only quinine (r = 0.04) did not sur-vive the mixture with sucrose (r = 0.63; mixture suppression).MANOVA across the stimuli showed a significant effect on thereported NaCl-likeness (F 5,23 = 3.4, P < 0.05), sucrose-likeness(F 5,23 = 3.9, P < 0.05), and most strongly on quinine-likeness(F 5,23 = 8.7, P < 0.001).
Tertiary mixtures and the quaternary mixture are shownin Figure 7B. The mean ± SD between the similarities of thethree stimuli that were part of the mixture was 0.32 ± 0.04.Thus, the recognition of the elements was significantly morevariable in tertiary and the ternary mixtures than the sec-ondary mixtures (t -test, P < 0.05). Typically only one (S inH + N + S) or two (H and Q in H + Q + S) of the elementswere “recognized,” increasing the variance in response amongall three or four elements of the mixture. MANOVA acrossthe stimuli showed a significant effect on the reported waterytaste (F 3,15 = 5.8, P < 0.05) and nearly so on quinine-likeness(F 3,15 = 3.3, P = 0.056).
The mean similarity to each tastant across all four mixturesthat it was part of was: S r = 0.05 ± 0.23, H r = −0.03 ± 0.18,Q r = 0.40 ± 0.10, and N r = 0.12 ± 0.09, altogether significantlylower than in the secondary mixtures (t -test, P < 0.05), see Discus-sion. Clearly, quinine was the most resilient to mixture suppressionand HCl and sucrose the least in more complex mixtures, quite areversal from the secondary mixtures.
Frontiers in Behavioral Neuroscience www.frontiersin.org May 2012 | Volume 6 | Article 19 | 12

Gautam et al. Novel rat taste-location association task
Water similarity was consistently low for all mixtures atr = −0.38 ± 0.04, excluding one outlier at r = 0.50 for theN + Q + S mixture. We could not find a reason for this outlier. Ratsdid not respond to taste mixtures by licking the water-associatedspout.
COMBINED ANALYSISHaving collected response profiles from the same four rats a totalof 100 distinct stimuli, we were in a unique position to explore acomprehensive“taste space” for rodents using statistical multivari-ate dimension reduction. Figure 8 shows a cluster analysis of all100 stimuli (see Table 6 for abbreviations). At an inter-correlationlevel of r = 0.0 five groups are apparent: sour-like stimuli [H(Q)],water-like stimuli (W), salty-like stimuli (N), bitter/mixed stimuli(HNQS), and sweet-like stimuli with a salty side band S(N). Whatstands out is the large number of stimuli part of the water cluster,which at an inter-correlation of 0.57 (Figure 8) divides into three
subgroups: water-like (W1 and W2, consisting of the lowest con-centrations of tastants), amino acid like (AA, low concentrationsweeteners and umami). Seven of the ten umami stimuli belongto the W group. All amiloride stimuli fall in this group as well.The H(Q) group divides into H and HQ, the former contain-ing the reference HCl stimulus (red), the latter the HQ (blue)and HQS mixture (green). The N group does not subdivide fromr = 0 to r = 0.57 and contains the train set NaCl stimulus. HNQSdivides into Q and QS, containing Q, NQ, QS, HNQ, and HNQS.A large number of stimuli fall into the S(N) group, which separatesinto NS (containing NS and HNS) and S (containing most higherconcentration sweeteners).
Figure A4 in Appendix shows a cluster diagram based on onlythe concentration series of the basics. Like Figure 8 this shows alarge water group (W), clearly consisting of the lowest concentra-tions of tastants and water itself (plus outlier NQS). This watergroup exists at a large range of inter-correlation levels (roughly
1 0.5 0 -0.5correla tio n (r)
WS 0 0 1 7
S 0 0 5
S 0 1 7
H 0 0 0 1
H 0 0 0 3
H 0 0 1H 0 1
N 0 0 1
N 0 0 3
N 0 1N 1
Q 0 0 0 0 1 7
Q 0 0 0 0 5
Q 0 0 0 1 7
Q 0 0 1 7
M 0 1M 0 3
M 1
C F 0 0 1
C F 0 0 3 3
C F 0 1
C 0 0 0 3 3
C 0 0 1C 0 0 3 3
F 0 0 8 3F 0 1
F 0 2 5
F 0 3 3
F 0 7 5F 1
G 0 1
G 0 3 3
G 1
S A 0 0 1
S A 0 0 3
S A 0 1
G Y 0 1
G Y 0 3 3
G Y 1
S E 0 1
S E 0 3 3
S E 1
S A 0 0 1 S 0 1
S A 0 0 3 S 0 1
S A 0 1 S 0 1
K 0 1
K 0 3 3K 1
T A 0 0 1
T A 0 0 3T A 0 1
M P G 0 1
M P G 0 3
M P G 1
IM P 0 0 1
IM P 0 0 3
IM P 0 1
M 0 1 IM P 0 0 1
M 0 3 IM P 0 0 3
M 1 IM P 0 1
M G 0 0 3
M G 0 1
M G 0 3
N H 0 1
N H 0 3N H 1
S A C 0 0 3 A M
S05
N03
H003
M G 0 3
H
HQ
K 1
NQS
W1
IM P 0 0 3
M 0 1F 0 2 5
S A 0 1 S 0 1
N 0 1
G
M 0 1 IM P 0 0 1
QS
Q
N
NS
S
NQ
QSNS
HS
HNQ
NQS
HNHQS
HQ
HNS
r=0.57
HNQS
M03AM
AM30U
N03AMN01AM
AM10U
AA
S(N)
HNQS
N
W
H(Q)
r=0.57r=0.00
Q0005
SL0025
SL025
SL2.5
SL252
SL7.5S01SL25S01
SL2.5S01SL25
NEO7.9
NEO2.6
NEO0.8NEO0.3
W2
FIGURE 8 | Cluster analysis across all 100 stimuli. Prototypical trained stimuli are indicated in red font. Binary mixtures in dark blue, tertiary, and quaternary ingreen. Amiloride in cyan. Five clusters are derived at an inter cluster correlation between ∼r = 0.0 and ∼r = 0.3. The largest cluster contains the weakeststimuli and water.
Frontiers in Behavioral Neuroscience www.frontiersin.org May 2012 | Volume 6 | Article 19 | 13

Gautam et al. Novel rat taste-location association task
r = 0.05–0.4) when a total of five groups are evident (S, H, W, N,and Q), each containing the reference stimulus it is labeled with.The water-like group merges with the sour-like group, while thesalty group merges with the bitter-like group, then HW mergeswith NQ, to merge last with S (Figure 4 in Appendix).
Figure 9 shows a good 3D taste space solution across all 100stimuli (r2 = 0.93). A 2D solution explained 15% less of the vari-ance (r2 = 0.78, not shown). The space is notably spherical (shownin all three projections), and not of a tetrahedron shape oftenhypothesized in considerations of the “existence” of four basic
tastes. This notion is somewhat tempered by the tendency ofMDSs based on correlations to form “donut-like” shapes (Erick-son et al., 1993). The stimuli and overall shape are more clearlydepicted in Video S2 in Supplementary Material, which showsthe 3D MDS being rotated. Solutions of meaningful subsets ofthe stimuli explained only little of the data with high stress andare hence not shown. For example, an MDS of all four basicsincluding MSG and all their concentrations and water reachedonly r2 = 0.23.We further established that MANOVA across all100 the stimuli showed a significant effect of stimulus on the
-2-1012
-1
0
1
2
WS0017
S005
S017S05
H0001
H0003
H001H003 H01
N001
N003
N01
N03
N1
Q000017
Q00005Q00017
Q0005Q0017
M01
M03
M1CF001
CF0033CF01
C00033
C001C0033
F0083F01
F025
F033
F075F1
G01G033
G1
SL0025GLSL025
SL2_5
SL25
SL252
SA001
SA003
SA01
NEO03NEO08
NEO2_6
NEO7_9
GY01GY033
GY1
SE01
SE033SE1
SL2_5S01SL7_5S01SL25S01
SA001S01
SA003S01
SA01S01
K01
K033
K1
TA001
TA003TA01
MPG01 MPG03
MPG1
IMP001
IMP003 IMP01
M01IMP001
M03IMP003
M1IMP01
MG003
MG01
MG03
NH01
NH03NH1
AM10UAM30U
N01AMN03AM
M03AM
SAC003AM
HS
HN
HQ
NSQS
NQ
HNS
HQS
NQS
HNQ
HNQS
-2-1012
-1
0
1
2
WS0017
S005
S017S05
H0001
H0003
H001H003H01
N001
N003
N01
N03
N1
Q000017
Q00005Q00017
Q0005Q0017
M01
M03M1CF001
CF0033
CF01
C00033
C001C0033
F0083F01
F025
F033
F075F1
G01
G033
G1
SL0025GLSL025
SL2_5
SL25
SL252
SA001
SA003
SA01
NEO03NEO08
NEO2_6
NEO7_9
GY01GY033
GY1
SE01
SE033 SE1SL2_5S01SL7_5S01
SL25S01
SA001S01
SA003S01
SA01S01
K01
K033
K1
TA001
TA003
TA01
MPG01 MPG03
MPG1
IMP001
IMP003IMP01
M01IMP001
M03IMP003
M1IMP01
MG003
MG01
MG03
NH01
NH03NH1
AM10UAM30U
N01AMN03AM
M03AM
SAC003AM
HS
HN
HQ
NSQS
NQ
HNS
HQS
NQS
HNQ
HNQS
WS0017
S005
S017S05
H0001
H0003
H001
H003
H01
N001
N003
N01
N03
N1
Q000017
Q00005
Q00017
Q0005Q0017
M01
M03M1
CF001CF0033
CF01
C00033
C001
C0033
F0083F01
F025
F033
F075F1
G01
G033
G1
SL0025GLSL025
SL2_5
SL25
SL252
SA001SA003SA01NEO03NEO08
NEO2_6
NEO7_9
GY01
GY033
GY1
SE01SE033
SE1
SL2_5S01
SL7_5S01SL25S01
SA001S01SA003S01
SA01S01
K01
K033K1
TA001
TA003
TA01
MPG01
MPG03
MPG1IMP001IMP003
IMP01
M01IMP001
M03IMP003
M1IMP01
MG003
MG01
MG03
NH01
NH03NH1
AM10U
AM30U
N01AMN03AM
M03AMSAC003AM
HS
HN
HQ
NS
QS
NQ
HNS
HQS
NQS
HNQ
HNQS
-2-1012
-1
0
1
2
X
Z
Y
Z
X
Y
-2-2
FIGURE 9 | 3D MDS taste space of all stimuli. Three projections of the 100-stimulus taste space are provided, showing that it is shaped like a sphere, not atetrahedron. See also Video S2 in Supplementary Material for a rotating version of this MDS.
Frontiers in Behavioral Neuroscience www.frontiersin.org May 2012 | Volume 6 | Article 19 | 14

Gautam et al. Novel rat taste-location association task
entire response set (F 490, 1525 = 3.1, P < 0.001), as well as on eachreported taste category separately (F 98, 403 = 3.0 – 6.4, P < 0.001).
Guided by the cluster analysis (Figure 8), we wanted to quantifythe importance of intensity in the overall dataset. Principal com-ponent analysis with varimax rotation yielded four componentswith eigenvalues over 1, explaining 40, 30, 18, and 12% of the vari-ance. The water similarity ratings of the stimuli correlated highly(r = 0.94) with the first factor. The first factor also correlatedsomewhat negatively with sucrose similarity (r = −0.56). The sec-ond factor correlated with NaCl similarity (−0.47), the third highlywith HCl (r = 0.89), and the fourth with NaCl (r = −0.72) andquinine (r = 0.39). Thus, stimulus intensity explains about 35%of the entire dataset (0.942 × 40%).
INTRA AND INTER-INDIVIDUAL VARIATIONThe test–retest repeatability across the four animals was high.For example, Figure 2B shows that the test–retest correlationamong trained stimuli was 0.97 ± 0.01, where 93 ± 2% variancewas explained. Figure 4A shows another example, where responsesbetween similar concentrations of fructose yielded quite similarresponses (e.g., 0.083 M vs. 0.1 M, 0.25 M vs. 0.33 M, and 0.75 Mvs. 1 M).
RECALLThe rats all showed good performance even after long delaysbetween sessions and even at old age. Regressing the duration ofthese break between tests (including surrounding testing days) andtheir performance showed that the performance was 72.3% – thebreak duration (days)∗0.33% (r2 = 0.74), or about 10% (absolute)per month. In three of four cases performance recovered to pre-break levels within one session, and within two sessions for theother. For the last break of 42 days the performance dropped from75 ± 2 to 60 ± 4% (P < 0.001, 1-sided unpaired t -test), recover-ing the next day to 71 ± 4% (n.s.). Note that this performanceremains well above chance level (20%). No generalization datawas ever collected within 3 days after these long breaks.
DISCUSSIONWe present data showing, for the first time, that rats are ableto learn cross-modal taste–location associations, simultaneouslyfor five primary taste qualities water inclusive. This study alsoestablishes the most complete taste space of a non-human ani-mal regarding not only taste qualities but also intensity ratings.The taste profiles generated by these experiments contribute tothe understanding of how perception of the specific taste stimulirelate to the perception of five basic taste qualities in intact behav-ing rats. Because this method involved no induced conditioning,no use of drugs but only positive reinforcement of spontaneouslearning and memory, the data should be representative of ani-mals’ natural taste perception. Another advantage of the presentmethod over other available methods is the use of the same setof animals across a array of stimuli, thus minimizing the effect ofbetween-animal variation and other variables.
Our taste location association paradigm offers several advan-tages over other taste generalization methods (Smith andTheodore, 1984; Yamamoto et al., 1985; Yamamoto and Yuyama,1987; Gautam and Verhagen, 2010). Unlike the CTA tasks, we do
not use negative reinforcement ensuring that discrimination isbased entirely on the gustatory quality of the taste stimuli. Ournon-aversive task is also less stressful to the animal eliminating anypotential undesirable artifacts. Naturally aversive tastants such asquinine can also complicate interpretation of CTAs when used astest stimuli. The taste location association paradigm circumventsthis, as the hedonic value of the taste stimuli does not play a rolein the generalization assessments.
Like CTA, the Morrison task employs one group of animals percomparison stimulus, such that no single animal makes all com-parisons between test stimuli and training set (Morrison, 1967;Ganchrow and Erickson, 2000; Grobe and Spector, 2008). Thepresent paradigm requires only four rats to measure behavioralgeneralization to tens of stimuli, each rat expressing the similar-ity of a test stimulus to all trained stimuli (four basic tastants andwater in our case). Therefore, besides a reduction in the number ofanimals needed to evaluate multiple taste stimuli, using the sameset of animals to make comparisons across different taste stimuliminimizes inter-individual differences. While it took our rats aconsiderable time to learn the paradigm compared to the afore-mentioned tasks, now that we have optimized this method, futurestudies can be undertaken in combination with measures and/ormanipulations of brain activity to provide extensive informationabout taste quality perception and the neural coding thereof.
We briefly compare our data to those of Grobe and Spec-tor (2008), which is the most developed and relevant method ofmapping the gustatory perceptual space in rodents. They use anoperant taste generalization procedure adapted from the work byMorrison where rats were trained to discriminate a standard stim-ulus from the remaining four basic taste qualities and then testedfor generalization of test compounds to the standard stimuli. Theirdata show that rats behaviorally generalized novel concentrationsof the basic taste stimuli to their respective standards. They foundthat sugars generalized to sucrose, bitter compound denatoniumgeneralized to quinine while tartaric acid generalized to the sourcitric acid. These results are similar to what we obtained using ourtaste location association paradigm (Figures 3C and 4A). Theyalso found that animals treated water as quinine-like, which ispossibly why at low concentrations of the test stimuli a slight qui-nine component was often seen. This was not obvious in our data(Figure 3A). Grobe and Spector also found that KCl produceda complex generalization profile with notable quinine and citricacid components. At a comparable concentration we found KClto be a weak but pure bitter stimulus, though at higher levelsalso HCl-like (Figure 3B). The other notable difference was seenwith MSG, which they found generalized to a mixture of sucroseand NaCl. Our data show that MSG generalized to NaCl aloneand a sucrose component was reported only in presence of IMP(Figure 5). These differences may be attributed to possible strainand/or sex differences as we used female Long–Evans rats, whilein the Grobe and Spector study male Sprague Dawley rats wereused and it is known that strain and sex differences can underliediffering taste responses in rats (Tobach et al., 1974; Kondoh et al.,2000; Curtis et al., 2004; Tordoff et al., 2008). We therefore thinkour study compares favorably with data obtained from Grobe andSpector and represents a viable alternative paradigm to determinetaste quality perception in rodents.
Frontiers in Behavioral Neuroscience www.frontiersin.org May 2012 | Volume 6 | Article 19 | 15

Gautam et al. Novel rat taste-location association task
The overall accuracy was ∼70%, which is well above chance.However, this level of performance was lower than the 5-odorolfactory-location tunnel task (∼94%) developed by Youngentobet al. (1990). It took the rats 70 days to perform above chance andan additional 100 days to reach asymptote. This is considerablylonger than for the odor-tunnel task, which required approxi-mately 3 weeks to acquire (S. Youngentob, personal communica-tion). These performance differences may be based on functionaldifferences between the taste and olfactory modalities. Rozin firstposited in 1982 that the sense of smell has two functions, onebeing more interoceptive and proximal (retronasal smell of food)and the other more exteroceptive and distal (orthonasal smell;Rozin, 1982). The sense of taste, however, lacks this duality, andis exclusively interoceptive and proximal (e.g., food in the mouth)and hence might be difficult to associate with a place outside thebody. We could hence expect that the distal sense of smell would bebetter positioned to form associations with distinct exteroceptivelocations than either retronasal smell or gustation.
The neural circuitry involved in this task likely is centeredaround the entorhinal cortex and hippocampus, known to beinvolved in the encoding of episodic memory in general (Rolls,2000; Buzsaki, 2005; Hasselmo and Brandon, 2008), as well as con-junctions between place and stimuli in particular (Komorowskiet al., 2009). For example, reward–allocentric place associationshave been reported in hippocampal neurons of rhesus monkeys(Rolls and Xiang, 2005). The hippocampus has been shown tobe necessary for rapid food-location matching task in monkeys(Hampton et al., 2004). In rats, hippocampal neurons encodingthe specific odor-place combinations have been reported (Woodet al., 1999). Only recently have hippocampal neurons been foundthat encode taste information depending on location using a visualcue guided lick task in two chambers (Ho et al., 2011). Our par-adigm is highly suitable to more directly assess the role of therodent’s position on hippocampal neuronal responses to tastants.
Our new taste–location association paradigm is a useful toolin exploring the perceptual similarity between the learned set ofbasic tastes and other stimuli, including concentration gradients ofthe same compounds, different taste compounds, as well as odor-ants and the effect of flavor experience on generalization. As withthe odor–location task of Youngentob et al. (1990), the behavioralresponse profiles across the reward spouts allows the generationof similarity matrices and multidimensional scaling.
Our circular response arena is designed to enable tetheredchronic neural recordings, as there are no obstacles between therat and the open top of the arena. This may be a limitation for theodor–location task as published, in that rats have to enter a tunnel.In light of the current findings it appears that a tunnel may not beneeded for that task. Nonetheless, the tunnels and their Y-shapedorientation relative to the odor sampling may help rats to orientthemselves, possibly leading to faster task-acquisition. Due to thelengthy training period it would be most useful to employ a largerbatch of animals if subsequent neurophysiological recordings areattempted, with 10 rodents being about the practical maximumunless test periods are shortened and/or one has more than oneapparatus.
Both of these cross-modal paradigms have the added bene-fit of a reduction in the number of animals needed to evaluate
multiple stimuli, as compared to CTA-generalization tasks. Thelatter requires about four rats per test stimulus to assess general-ization between basic tastes. Like CTA, the Morrison task employsone group of animals per comparison stimulus, such that no singleanimal makes all comparisons between test stimuli and training set(Morrison, 1967; Ganchrow and Erickson, 2000; Grobe and Spec-tor,2008). The present paradigm requires only four rats to measurebehavioral generalization to tens of stimuli, each rat expressingthe similarity of a test stimulus to all trained stimuli (four basictastants and water in our case).
INTENSITYTaste intensity is one of the gustatory dimensions that includequality, hedonics, and time, but has been studied remarkably littlein rodents. Water was included in the 5-stimulus response set toconvey a measure of taste intensity. Our data suggests that rats douse the scale as we intended and was not used to “dump” stimulideviating from the basic training set into the water response cate-gory. Intensity was found to play a major role in our stimulus set,explaining 35% of the response variance, even though most stimuliwere well suprathreshold and their individual concentrations var-ied by only 1 log unit. Yamamoto et al. showed behavioral similar-ity profiles across 5 NaCl concentrations (0.01–1 M) to four basictastes (no water) using CTA-generalization in rats (Yamamoto andYuyama, 1987). The tuning of their concentration–response curvewas remarkably similar to our findings (Figure 3A). They reportedthat the response profiles could be best explained by a spatialcode (across region profile) in the taste cortex, followed by anacross neuron profile for the chorda tympani nerve fibers. Gener-ally, gustatory intensity is encoded by neural response magnitude(Ganchrow and Erickson, 1970; Scott and Perrotto, 1980). Scottand Giza showed relatively fine intensity discriminations via CTA-generalization, with just noticeable differences of 10–18% (Scottand Giza, 1987). Spector and colleagues subsequently showed thatthe chorda tympani interestingly is not crucial for suprathresh-old intensity discriminations in rats, despite strong contributionto detection threshold concentrations (Colbert et al., 2004). Ourtaste–location task informs us about stimulus intensity, but acrossa relatively narrow range (∼1 log unit) as compared to, e.g., CTA-generalization as performed by Scott and Giza where lick countsvary logarithmically across three orders of concentrations (Scottand Giza, 1987). Our taste location task can be modified to expandthe range by using four concentrations of one chemical as trainingstimulus, e.g. 100, 10−1, 10−2, 10−3M NaCl and water, and testmany stimuli against them.
UMAMIWhile the exact number of detectable qualitative taste categoriesvaries across species, umami has come to be considered as thefifth basic taste. MSG is known to elicit an umami taste and alsoexhibits a taste synergism with 5′ ribonucleotides such as IMP, i.e.,when low concentrations of IMP are mixed with MSG, the tasteintensity of the mixture is greater than the sum of the components(Ninomiya et al., 1992).
Using our paradigm, we hypothesized that umami would notgeneralize to any of the four primary taste qualities that the ratswere trained on. MSG showed a high correlation to NaCl due to the
Frontiers in Behavioral Neuroscience www.frontiersin.org May 2012 | Volume 6 | Article 19 | 16

Gautam et al. Novel rat taste-location association task
dominant taste of the sodium ions (Figure 5). Use of the sodiumchannel blocker amiloride along with MSG showed no over-whelming similarity to any of the training taste stimuli (Figure 6).We also used MPG to control for the taste of sodium. A moderatesimilarity with quinine was seen with 0.1 and 0.3 M MPG, simi-lar to what was seen with KCl (Figure 3B). However at the highestconcentration of 1 M MPG this bitterness was absent and MPG didnot generalize to any of the four prototypical tastants. IMP alone aswell as the mixtures of IMP + MSG at low concentrations eliciteda mild sweetness, this mirrors what has been found by behavioraland electrophysiological studies (Yamamoto et al., 1991; Heyeret al., 2004; Grobe and Spector, 2008). CTA-generalization testsbetween MSG and sucrose and the suppression of glutamate andIMP synergistic taste responses recorded in the chorda tympaninerve by a sweet taste inhibitor suggests that MSG may have tastecharacteristics that are shared with sucrose (Sako and Yamamoto,1999). It is believed that rats may perceive the taste of umamias sucrose-like due to convergence of the two pathways, either atthe level of the taste receptor or further downstream the gustatorypathway. The mixture of IMP and MPG at a high concentration didnot specifically generalize to any of the four basic tastes (Figure 5).
Our results clearly show that while umami shares some per-ceptual similarity with sucrose, it also elicits a unique taste in ratsdistinguishable from any of the basic taste stimuli. However, thereremains the possibility that it may taste like a mixture of the basictaste qualities, as is the case for ethanol in mice (Blizard, 2007).Indeed, MSG with amiloride correlated strongly with the ter-tiary mixture N + Q + S (Figures 6 and 7B, r = 0.81, MANOVA,P > 0.7).The taste–location association paradigm can therefore beused to behaviorally categorize and elucidate the perceptual qual-ities of other unconventional taste modalities such as the taste offree fatty acids (Mattes, 2011).
SWEET AMINO ACIDSBehavioral studies in rodents show that sucrose and L-amino acidsare known to share some qualitative features. CTA to sucrose cangeneralize to glycine, L-serine, and L-alanine (Schiffman et al.,1981; Kasahara et al., 1987; Delay et al., 2007). Our tests showedthat glycine and L-serine had a predominant sweet component(Figure 4B), which especially stood out at higher concentrations.While L-amino acids are known to primarily bind to the umamiT1R1/T1R3 receptor (Chaudhari et al., 2000), it is thought thatthat the perceptual similarity to sucrose may be due to the pres-ence of multiple receptors that detect both MSG and L-aminoacids or convergence along the afferent neural pathway.
ARTIFICIAL SWEETENERSSaccharin is considered a poor sugar substitute for rats and atits maximally preferred concentration it is only as attractive asdilute sucrose (Smith and Sclafani, 2002). Indeed, while saccha-rin had a predominant sucrose component, it was not as intenseas pure sucrose (Figure 4C). Combining saccharin with a dilutesucrose also did not enhance the sweetness (Figure 4D). Thereis also considerable variability among species in terms of theirpreference for artificial sweeteners that can be attributed to poly-morphisms in the sweet taste receptor genes. Neotame, while sweetto humans, apes and old world monkeys is not sweet to new world
monkeys and rodents (Liu et al., 2011). In our study we foundthat rats generalized Neotame to a quinine-like taste (Figure 4C).Sucralose is known to have an aversive off-taste that reduces itspalatability to rats but to humans it tastes predominantly sweetwith little or no after taste (Bello and Hajnal, 2005). Our datareflects this, as at a higher concentration of sucralose sweet-liketaste decreased and bitter-like taste increased (Figure 4C). We cre-ated a low viscosity mixture of dilute sucrose (0.1 M) and sucralose.The addition of sucrose had a synergistic effect as the bitter tastewas suppressed as a result of sucrose blocking the bitter off-tasteand the sucrose-likeness was enhanced. We were therefore able tomake this sucralose mixture more attractive to rats while main-taining its low caloric value and keeping its viscosity closer to thatof other taste solutions.
MIXTURESWe presented permutated mixtures of the basic training set tohelp understand how the rats use the “scale”: they conceivablycould report with high water response to non-pure tastes. If not,we could take water report as a measure of intensity. We foundthat the rats indeed did not “dump” stimuli that deviated from thetraining set regarding taste quality (Figure 7): water similarity waswell below r = −0.2 except for 1 outlier NQS.
Although water similarity can be used as intensity measure, thestrength of the similarity with a non-water tastant cannot by itselfserve that purpose. This is due to the limited correlation level thatcan be achieved when responses are distributed across stimuli. Forexample, in the H + S and the N + S mixtures the response simi-larities were similarly high between the components at r = 0.5–0.6.The maximum correlation possible in this case is r = 0.61 whenresponses are evenly distributed across, and only across the two ele-ments, assuming an even distribution across incorrect responsesto the training set (e.g., 100 licks to correct stimulus and ∼10 lickseach to all incorrect stimuli). This is 0.41 for three elements and0.25 for a quaternary mixture.
We confirmed that these “maxima” are reasonable by usingMonte Carlo simulations of 10,000 “sessions” per analysis (inMatlab). For the training set, the correct response was fixed andthe responses to the four incorrect spouts varied between 0 and15% (rel. to the correct response) with a uniformly random-ized response incidence. For the test set (mixtures), we variedthe “incorrect” responses (e.g., W, N, or S for an Q + H mix-ture) between 0 and 15% (rel. to the correct response incidence)per session (e.g., for the prior binary mixture 100 and 100 licksto the “correct” element-associated locations Q and H, and 10,2, and 18 licks to incorrect spouts W, N, and S). We foundthat for one element r = 0.99 ± 0.01, for a two element mixturer = 0.61 ± 0.04, for three r = 0.41 ± 0.05, and four 0.25 ± 0.05(mean ± SD). When up to 15% random licks were also addedto the element itself we found only a slightly higher variation(for one element r = 0.99 ± 0.01, for two r = 0.61 ± 0.05, for threer = 0.41 ± 0.06, and four 0.25 ± 0.07). These levels are indicatedas pink lines in Figure 7, where the width of the line represents thestandard deviation. Deviations above the maxima do occur andare due to averaging across the four rats. In conclusion, water sim-ilarity is inversely proportional to stimulus intensity and tastantsimilarity is proportional to stimulus quality.
Frontiers in Behavioral Neuroscience www.frontiersin.org May 2012 | Volume 6 | Article 19 | 17

Gautam et al. Novel rat taste-location association task
We also included the mixtures in order to address whethersome stimuli would reliably standout of mixtures (suppression)or whether the mixtures would show homogenous additivity.We found evidence of mixture suppression, mainly in the morecomplex mixtures. Two cases of suppression for binary mixtureswere found (i.e., no overlap of the response with the maximain Figure 7): of N in the H + N mixture and of quinine in theQ + S mixture. For the more complex mixtures we found H inH + N + Q, of N in H + N + S, S in H + Q + S and in NQS, andH in the quaternary mixture. Evidence of additivity could be seenin HNQ, where the mixture was rated as Q well above expecta-tion, and nearly so in the quaternary mixture, again suggestingadditivity.
ACKNOWLEDGMENTSWe would like to thank John Buckley for programming the behav-ioral PC interface in Labview, and Michael Fritz, Ron Goodman,and Tom D’Alessandro for designing and constructing the arenaand optical lickspout. We thank Gordon Terwilliger (necropsy),Michael Schadt (histology and histochemistry) and CarmenJane Booth, DVM, PhD (clinicopathologic and histopathologic
analysis) from the Yale Mouse Research Pathology (Section ofComparative Medicine, Yale University). We thank Dr. Ivan deA-raujo for helpful discussions regarding sweet stimuli. We wouldlike to thank Drs. Mark Laubach and Barry Green for helpful com-ments on an earlier version of the manuscript. This work was sup-ported by NIH/NIDCD grants R01DC009994 and R01DC011286to Justus V. Verhagen.
SUPPLEMENTARY MATERIALThe Video S1 and S2 for this article can be found onlineat: http://www.frontiersin.org/Behavioral_Neuroscience/10.3389/fnbeh.2012.00019/abstract
Video S1 | (wmv format, duration: 1:39): This video shows the performance ofrat 1 on 15 consecutive trials (trial 36–50) on test day 215. The five water rewardspouts were numbered. It also shows (upper right insert) the custom Labviewsoftware interface. Actual behavioral choices can be directly compared to thetaste–location map of rat 1. On trial 42 the rat chooses the wrong spout.
Video S2 | (wmv format, duration: 0:44): The 3D MDS solution of Figure 9 beingrotated for clear view of its shape and stimuli. The dense group of stimuliconsists of the low concentration “watery” stimuli, equivalent to the large “W”cluster of Figure 8.
REFERENCESBello, N. T., and Hajnal, A. (2005). Male
rats show an indifference-avoidanceresponse for increasing concentra-tions of the artificial sweetenersucralose. Nutr. Res. 25, 693–699.
Blizard, D. A. (2007). Sweet and bit-ter taste of ethanol in C57BL/6J andDBA2/J mouse strains. Behav. Genet.37, 146–159.
Buzsaki, G. (2005). Theta rhythm ofnavigation: link between path inte-gration and landmark navigation,episodic and semantic memory.Hippocampus 15, 827–840.
Chaudhari, N., Landin, A. M., andRoper, S. D. (2000). A metabotropicglutamate receptor variant functionsas a taste receptor. Nat. Neurosci. 3,113–119.
Colbert, C. L., Garcea, M., and Spec-tor, A. C. (2004). Effects of selectivelingual gustatory deafferentation onsuprathreshold taste intensity dis-crimination of NaCl in rats. Behav.Neurosci. 118, 1409–1417.
Curtis, K. S., Davis, L. M., Johnson,A. L.,Therrien, K. L., and Contreras, R. J.(2004). Sex differences in behavioraltaste responses to and ingestion ofsucrose and NaCl solutions by rats.Physiol. Behav. 80, 657–664.
Delay, E. R., Mitzelfelt, J. D., Westburg,A. M., Gross, N., Duran, B. L., andEschle, B. K. (2007). Comparisonof L-monosodium glutamate and L-amino acid taste in rats. Neuroscience148, 266–278.
Erickson, R. P., Rodgers, J. L., and Sarle,W. S. (1993). Statistical analysis ofneural organization. J. Neurophysiol.70, 2289–2300.
Frank, M. E. (1985). Sensory physiol-ogy of taste and smell discrimina-tions using conditioned food aver-sion methodology. Ann. N. Y. Acad.Sci. 443, 89–99.
Ganchrow, D., and Erickson, R. P.(2000). Taste quality and intensity:lessons from the Morrison tech-nique. Physiol. Behav. 69, 121–133.
Ganchrow, J. R., and Erickson, R. P.(1970). Neural correlates of gusta-tory intensity and quality. J. Neuro-physiol. 33, 768–783.
Gautam, S. H., and Verhagen, J. V.(2010). Evidence that the sweetnessof odors depends on experience inrats. Chem. Senses 35, 767–776.
Grobe, C. L., and Spector, A. C. (2008).Constructing quality profiles fortaste compounds in rats: a novel par-adigm. Physiol. Behav. 95, 413–424.
Hampton, R. R., Hampstead, B. M.,and Murray, A. E. (2004). Selec-tive hippocampal damage in rhesusmonkeys impairs spatial memory inan open-field test. Hippocampus 14,808–818.
Hasselmo, M. E., and Brandon, M.P. (2008). Linking cellular mecha-nisms to behavior: entorhinal persis-tent spiking and membrane poten-tial oscillations may underlie pathintegration, grid cell firing, andepisodic memory. Neural Plast. 2008,658323.
Heyer, B. R., Taylor-Burds, C. C.,Mitzelfelt, J. D., and Delay, E. R.(2004). Monosodium glutamate andsweet taste: discrimination betweenthe tastes of sweet stimuli and glu-tamate in rats. Chem. Senses 29,721–729.
Ho, A. S., Hori, E., Thi Nguyen, P. H.,Urakawa, S., Kondoh, T., Torii, K.,Ono, T., and Nishijo, H. (2011). Hip-pocampal neuronal responses dur-ing signaled licking of gustatorystimuli in different contexts. Hip-pocampus 21, 502–519.
Kasahara, T., Iwasaki, K., and Sato, M.(1987). Taste effectiveness of someD- and L-amino acids in mice. Phys-iol. Behav. 39, 619–624.
Kent, P. F., Mozell, M. M., Youngen-tob, S. L., and Yurco, P. (2003).Mucosal activity patterns as a basisfor olfactory discrimination: com-paring behavior and optical record-ings. Brain Res. 981, 1–11.
Kent, P. F., Youngentob, S. L., andSheehe, P. R. (1995). Odorant-specific spatial patterns in mucosalactivity predict perceptual differ-ences among odorants. J. Neurophys-iol. 74, 1777–1781.
Komorowski, R. W., Manns, J. R., andEichenbaum,H. (2009). Robust con-junctive item–place coding by hip-pocampal neurons parallels learningwhat happens where. J. Neurosci. 29,9918–9929.
Kondoh, T., Mori, M., Ono, T., and Torii,K. (2000). Mechanisms of umamitaste preference and aversion in rats.J. Nutr. 130, 966S–970S.
Liu, B., Ha, M., Meng, X. Y., Kaur,T., Khaleduzzaman, M., Zhang, Z.,Jiang, P., Li, X., and Cui, M. (2011).Molecular mechanism of species-dependent sweet taste toward arti-ficial sweeteners. J. Neurosci. 31,11070–11076.
Mattes, R. D. (2011). Accumulating evi-dence supports a taste component
for free fatty acids in humans. Phys-iol. Behav. 104, 624–631.
Morrison, G. R. (1967). Behaviouralresponse patterns to salt stimuliin the rat. Can. J. Psychol. 21,141–152.
Nachman, M. (1963). Learned aver-sion to the taste of lithium chlo-ride and generalization to othersalts. J. Comp. Physiol. Psychol. 56,343–349.
Ninomiya, Y., Higashi, T., Katsukawa,H., Mizukoshi, T., and Funakoshi,M. (1984). Qualitative discrimina-tion of gustatory stimuli in three dif-ferent strains of mice. Brain Res. 322,83–92.
Ninomiya, Y., Kurenuma, S., Nomura,T., Uebayashi, H., and Kawamura,H. (1992). Taste synergism betweenmonosodium glutamate and 5’-ribonucleotide in mice. Comp.Biochem. Physiol. A Comp. Physiol.101, 97–102.
Rolls, E. T. (2000). Memory systems inthe brain. Annu. Rev. Psychol. 51,599–630.
Rolls, E. T., and Xiang, J.-Z. (2005).Reward-spatial view representa-tions and learning in the primatehippocampus. J. Neurosci. 25,6167–6174.
Rozin, P. (1982). “Taste-smell confu-sions” and the duality of the olfac-tory sense. Percept. Psychophys. 31,397–401.
Sako, N., and Yamamoto, T. (1999).Analyses of taste nerve responseswith special reference to possi-ble receptor mechanisms of umamitaste in the rat. Neurosci. Lett. 261,109–112.
Frontiers in Behavioral Neuroscience www.frontiersin.org May 2012 | Volume 6 | Article 19 | 18

Gautam et al. Novel rat taste-location association task
Schiffman, S. S., Sennewald, K., andGagnon, J. (1981). Comparison oftaste qualities and thresholds of D-and L-amino acids. Physiol. Behav.27, 51–59.
Schoenbaum, G., Garmon, J. W., andSetlow, B. (2001). A novel methodfor detecting licking behavior dur-ing recording of electrophysiologicalsignals from the brain. J. Neurosci.Methods 106, 139–146.
Scott, T. R., and Giza, B. K. (1987).A measure of taste intensity dis-crimination in the rat through con-ditioned taste aversions. Physiol.Behav. 41, 315–320.
Scott, T. R., and Perrotto, R. S.(1980). Intensity coding in pon-tine taste area: gustatory informa-tion is processed similarly through-out rat’s brain stem. J. Neurophysiol.44, 739–750.
Smith, D. V., and Theodore, R. M.(1984). Conditioned taste aversions:generalization to taste mixtures.Physiol. Behav. 32, 983–989.
Smith, D. V., Travers, J. B., and VanBuskirk, R. L. (1979). Brainstemcorrelates of gustatory similarity in
the hamster. Brain Res. Bull. 4,359–372.
Smith, J. C., and Sclafani, A. (2002). Sac-charin as a sugar surrogate revisited.Appetite 38, 155–160.
Tapper, D. N., and Halpern, B. P. (1968).Taste stimuli: a behavioral catego-rization. Science 161, 708–710.
Tobach, E., Bellin, J. S., and Das, D.K. (1974). Differences in bitter tasteperception in three strains of rats.Behav. Genet. 4, 405–410.
Tordoff, M. G., Alarcon, L. K., andLawler, M. P. (2008). Preferencesof 14 rat strains for 17 taste com-pounds. Physiol. Behav. 95, 308–332.
Wood, E. R., Dudchenko, P. A., andEichenbaum, H. (1999). The globalrecord of memory in hippocam-pal neuronal activity. Nature 397,613–616.
Yamamoto, T., Matsuo, R., Fujimoto,Y., Fukunaga, I., Miyasaka, A., andImoto, T. (1991). Electrophysiolog-ical and behavioral studies on thetaste of umami substances in the rat.Physiol. Behav. 49, 919–925.
Yamamoto, T., and Yuyama, N. (1987).On a neural mechanism for cortical
processing of taste quality in the rat.Brain Res. 400, 312–320.
Yamamoto, T., Yuyama, N., Kato, T.,and Kawamura, Y. (1985). Gusta-tory responses of cortical neurons inrats. III. Neural and behavioral mea-sures compared. J. Neurophysiol. 53,1370–1386.
Youngentob, S. L., Johnson, B. A., Leon,M., Sheehe, P. R., and Kent, P. F.(2006). Predicting odorant qualityperceptions from multidimensionalscaling of olfactory bulb glomeru-lar activity patterns. Behav. Neurosci.120, 1337–1345.
Youngentob, S. L., Margolis, F. L.,and Youngentob, L. M. (2001).OMP gene deletion results inan alteration in odorant qualityperception. Behav. Neurosci. 115,626–631.
Youngentob, S. L., Markert, L. M., Hill,T. W., Matyas, E. P., and Mozell, M.M. (1991). Odorant identification inrats: an update. Physiol. Behav. 49,1293–1296.
Youngentob, S. L., Markert, L. M.,Mozell, M. M., and Hornung, D. E.(1990). A method for establishing
a five odorant identification con-fusion matrix task in rats. Physiol.Behav. 47, 1053–1059.
Conflict of Interest Statement: Theauthors declare that the research wasconducted in the absence of any com-mercial or financial relationships thatcould be construed as a potential con-flict of interest.
Received: 06 March 2012; accepted: 16April 2012; published online: May2012.Citation: Gautam SH, Rebello MR andVerhagen JV (2012) Taste quality andintensity of 100 stimuli as reportedby rats: the taste–location associationtask. Front. Behav. Neurosci. 6:19. doi:10.3389/fnbeh.2012.00019Copyright © 2012 Gautam, Rebello andVerhagen. This is an open-access articledistributed under the terms of the Cre-ative Commons Attribution Non Com-mercial License, which permits non-commercial use, distribution, and repro-duction in other forums, provided theoriginal authors and source are credited.
Frontiers in Behavioral Neuroscience www.frontiersin.org May 2012 | Volume 6 | Article 19 | 19
10

Gautam et al. Novel rat taste-location association task
APPENDIXMETHODSHealth and Post-mortem pathology of ratsOur approach allows for a long duration of testing: the four ratswere received January 2009 at 180–200 g BW (roughly 2 monthsold), training starting February 2009, generalization startingNovember 2009 on test day 192 (Figure 1) and ending Decem-ber 2010 on test day 378. Thus, testing extended just beyond 2years of age. We therefore briefly describe their health as minorage-related issues did come up.
Rat 1 and 3 developed pododermatitis (bumble foot) on thehind footpads around the end of August 2010 (a bacterial con-dition). Water restriction was discontinued and they were treatedwith 3 weeks of Baytril and 1 week of Sulfatrim in drinking water,daily application of topical antibiotic ointment, and placed in indi-vidual cages containing an inch of AlphaDri bedding changedthree times per week.
Rat 1 and 3 also had subcutaneous masses surgically removedon September 7 2010. Mammary lobular fibroadenoma was the
morphologic diagnosis in both cases. Fibroadenomas are themost common benign tumor of the rat mammary gland. Bothissues had resolved by the end of September 2010. None ofthe rats were tested for generalization between 9/2/2010 and10/26/2010 and appeared to be in good health until euthana-sia. Indeed their performance remained well above chanceat ∼75%.
During the last 2 months of their lives we collected the dataon the mixtures of the four basic tastants (Figure 7), the fructoseseries (Figure 4A), the Neotame series (Figure 4C) as well as thesucrose-artificial sweetener mixture series (Figure 4D).
Necropsy was performed on all four rats in January 2011.From a pathologic perspective, they had multiple common aginglesions, such as, benign mammary tumors and chronic degenera-tive processes in the heart and kidney. A nasal fungal infection wasdiagnosed in rat 2, and bacterial skin infection (pododermatitis) inrat 3 and 4, which were significant and likely impacted on qualityof life.
Frontiers in Behavioral Neuroscience www.frontiersin.org May 2012 | Volume 6 | Article 19 | 20
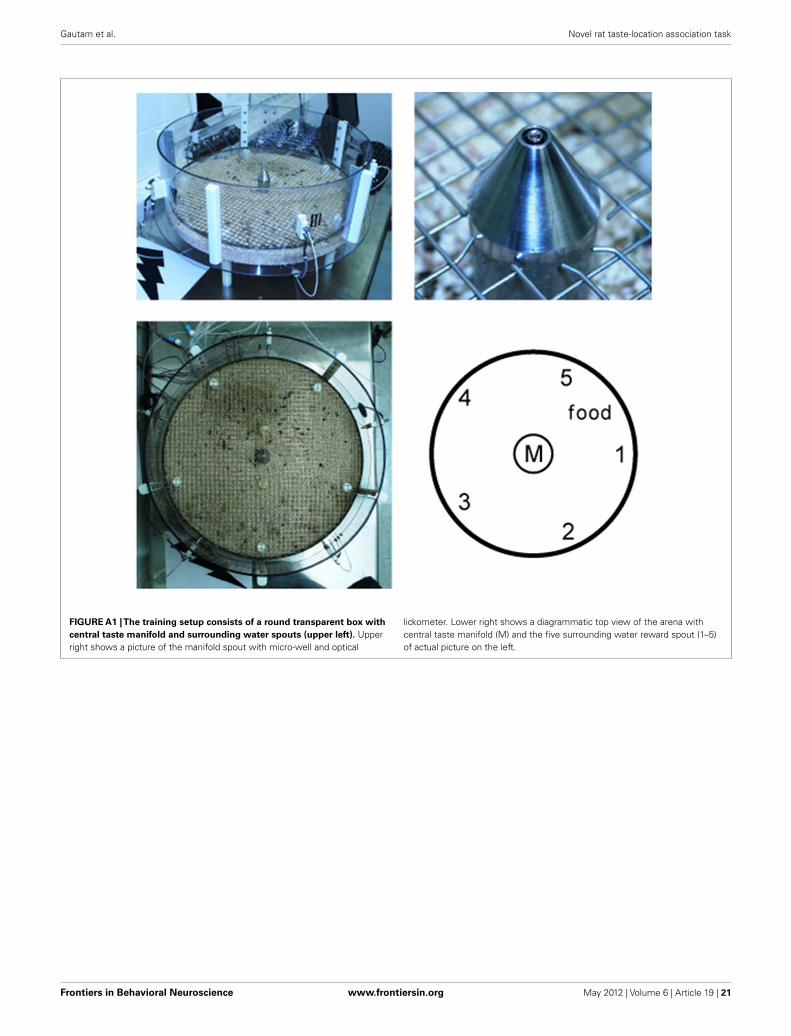
Gautam et al. Novel rat taste-location association task
FIGURE A1 |The training setup consists of a round transparent box with
central taste manifold and surrounding water spouts (upper left). Upperright shows a picture of the manifold spout with micro-well and optical
lickometer. Lower right shows a diagrammatic top view of the arena withcentral taste manifold (M) and the five surrounding water reward spout (1–5)of actual picture on the left.
Frontiers in Behavioral Neuroscience www.frontiersin.org May 2012 | Volume 6 | Article 19 | 21

Gautam et al. Novel rat taste-location association task
0
20
40
60
80
100
Accu
racy
(%)
W
S
N
H
Q
LED off
training day
setup error
1 6 11 16 21 26 31 36 41 46 51 56 61 66 71 76 81 86 9691
chance
introduction of stimulus
0
20
40
60
80
100
Accu
racy
(%)
W
S
N
H
Q
chance
training day1 6 11 16 21 26 31 36 41 46 51 56 61 66 71 76 81 86 9691
LED offintroduction of stimulus setup error
RAT 1
RAT 2
FIGURE A2 | First hundred days of training of rat 1 (top) and 2 (bottom). Stimuli were sequentially added and spout choice guided by LED light. Sequenceswere randomized across rats. LED cues were turned off in same sequence as stimuli were introduced. Chance performance is 20% when only taste cuesremain.
Frontiers in Behavioral Neuroscience www.frontiersin.org May 2012 | Volume 6 | Article 19 | 22

Gautam et al. Novel rat taste-location association task
0
10
20
30
40
50
60
70
water sucrose0.5M
HCl 0.03M
NaCl 0.3M
quinine HCl5mM
TEST: HCl0.03M
# re
spon
ses
watersucrose 0.5MHCl 0.03MNaCl 0.3Mquinine HCl 5mM
sucrose (training) = -0.51 HCl (test) + 11r = -0.32
0
10
20
30
40
0 5 10 15 20 25
TRA
ININ
G: s
ucro
se
(# re
spon
ses)
TEST: HCl (# responses)
HCl versus sucrose rat # 1
HCl (train) = 1.52 HCl (test) + 0.68r = 0.990
10
20
30
40
0 5 10 15 20 25
TRA
ININ
G: H
Cl
(# re
spon
ses)
TEST: HCl (# responses)
HCl versus HCl rat # 1
-0.40
-0.20
0.00
0.20
0.40
0.60
0.80
1.00
Corr
elat
ion
water
sucrose 0.5M
HCl 0.03M
NaCl 0.3M
quinine HCl 5mM
RESPONSE SPOUTS:
TRAINING STIMULI:
TEST STIMULUS:
TEST: HCl
rat # 1
TRAINING STIMULI:
FIGURE A3 | Explanation of calculation of generalization correlation
values of one rat. Top: number of responses (y -axis) per spout (legend) foreach test stimulus (x -axis). Middle left: a low correlation between the rat’sresponses to test stimulus sucrose and the rat’s responses to training
stimulus HCl (r = −0.32). Middle right: the correlation between test stimulusHCl and train stimulus HCl is expectedly much higher (r = 0.99). Bottom: thecorrelation between the test stimulus and all five training stimuli is calculatedfor each rat, and reported as the mean across all four rats (e.g., Figure 2).
Frontiers in Behavioral Neuroscience www.frontiersin.org May 2012 | Volume 6 | Article 19 | 23

Gautam et al. Novel rat taste-location association task
WS0017
S005
S017
H0001
H0003
H001H01
N001
N003
N01N1
Q000017
Q00005
Q00017
Q0017
M01M03
M1
HSHN
HQ
NS
QS
NQ
HNS
HQS
NQS
HNQ
HNQS
1 0.5 0 -0.5correla tio n (r)
HQ
W
Q
N
r=~0.25
NQ
HW
S
r=~0.25r=0.00
H
SS05
H003
N03
Q0005
FIGURE A4 | luster analysis of basics only. Five clusters are derived at an inter cluster correlation between ∼r = 0.0 and ∼r = 0.4. The largest cluster consistsof weak tastants.
Frontiers in Behavioral Neuroscience www.frontiersin.org May 2012 | Volume 6 | Article 19 | 24