Nutrition and Diet Factors in Type 2 Diabetes - MDPI
310
Nutrition and Diet Factors in Type 2 Diabetes Peter Pribis and Hana Kahleova www.mdpi.com/journal/nutrients Edited by Printed Edition of the Special Issue Published in Nutrients nutrients Books MDPI
-
Upload
khangminh22 -
Category
Documents
-
view
0 -
download
0
Transcript of Nutrition and Diet Factors in Type 2 Diabetes - MDPI

Nutrition and Diet Factors in Type 2 Diabetes
Peter Pribis and Hana Kahleova
www.mdpi.com/journal/nutrients
Edited by
Printed Edition of the Special Issue Published in Nutrients
nutrients
Books
MDPI

Nutrition and Diet Factors in Type
2 Diabetes
Special Issue EditorsPeter PribisHana Kahleova
MDPI • Basel • Beijing • Wuhan • Barcelona • Belgrade
Books
MDPI

Special Issue Editors
Peter Pribis
University of New Mexico
USA
Hana Kahleova
Clinical Research, Physicians Committee for Responsible Medicine
USA
Editorial Office
MDPI
St. Alban-Anlage 66
Basel, Switzerland
This edition is a reprint of the Special Issue published online in the open access journal Nutrients
(ISSN 2072-6643) from 2016–2017 (available at: http://www.mdpi.com/journal/nutrients/special
issues/type 2 diabetes).
For citation purposes, cite each article independently as indicated on the article page online and as
indicated below:
Lastname, F.M.; Lastname, F.M. Article title. Journal Name Year, Article number, page range.
First Edition 2018
ISBN 978-3-03842-916-6 (Pbk)
ISBN 978-3-03842-915-9 (PDF)
Articles in this volume are Open Access and distributed under the Creative Commons Attribution
(CC BY) license, which allows users to download, copy and build upon published articles even
for commercial purposes, as long as the author and publisher are properly credited, which
ensures maximum dissemination and a wider impact of our publications. The book taken as a
whole is c© 2018 MDPI, Basel, Switzerland, distributed under the terms and conditions of the
Creative Commons license CC BY-NC-ND (http://creativecommons.org/licenses/by-nc-nd/4.0/).
Books
MDPI

Table of contents
About the Special Issue Editors . . . . . . . . . . . . . . . . . . . . . . . . . . . . . . . . . . . . . vii
Preface to ”Nutrition and Diet Factors in Type 2 Diabetes” . . . . . . . . . . . . . . . . . . . . . ix
Jiri Veleba, Martin Matoulek, Martin Hill, Terezie Pelikanova and Hana Kahleova
“A Vegetarian vs. Conventional Hypocaloric Diet: The Effect on Physical Fitness in Responseto Aerobic Exercise in Patients with Type 2 Diabetes.” A Parallel Randomized Studydoi: 10.3390/nu8110671 . . . . . . . . . . . . . . . . . . . . . . . . . . . . . . . . . . . . . . . . 1
Xin Fang, Hedong Han, Mei Li, Chun Liang, Zhongjie Fan, Jan Aaseth, Jia He,
Scott Montgomery and Yang Cao
Dose-Response Relationship between Dietary Magnesium Intake and Risk of Type 2 DiabetesMellitus: A Systematic Review and Meta-Regression Analysis of Prospective Cohort Studiesdoi: 10.3390/nu8110739 . . . . . . . . . . . . . . . . . . . . . . . . . . . . . . . . . . . . . . . . 8
Ewa Jablonska, Edyta Reszka, Jolanta Gromadzinska, Edyta Wieczorek, Magdalena B. Krol,
Sara Raimondi, Katarzyna Socha, Maria H. Borawska and Wojciech Wasowicz
The Effect of Selenium Supplementation on Glucose Homeostasis and the Expression ofGenes Related to Glucose Metabolismdoi: 10.3390/nu8120772 . . . . . . . . . . . . . . . . . . . . . . . . . . . . . . . . . . . . . . . . 26
Tinashe Chikowore, Pedro T. Pisa, Tertia van Zyl, Edith J. M. Feskens, Edelweiss Wentzel-
Viljoen and Karin R. Conradie
Nutrient Patterns Associated with Fasting Glucose and Glycated Haemoglobin Levels in aBlack South African Populationdoi: 10.3390/nu9010009 . . . . . . . . . . . . . . . . . . . . . . . . . . . . . . . . . . . . . . . . 38
Jia Zheng, Xinhua Xiao, Qian Zhang, Tong Wang, Miao Yu and Jianping Xu
Maternal Low-Protein Diet Modulates Glucose Metabolism and Hepatic MicroRNAsExpression in the Early Life of Offspring †
doi: 10.3390/nu9030205 . . . . . . . . . . . . . . . . . . . . . . . . . . . . . . . . . . . . . . . . 52
Alexander M. Vaiserman
Early-Life Nutritional Programming of Type 2 Diabetes: Experimental and Quasi-Experimental Evidencedoi: 10.3390/nu9030236 . . . . . . . . . . . . . . . . . . . . . . . . . . . . . . . . . . . . . . . . 66
Jesse Bertinato, Kuan Chiao Wang and Stephen Hayward
Serum Magnesium Concentrations in the Canadian Population and Associations withDiabetes, Glycemic Regulation, and Insulin Resistancedoi: 10.3390/nu9030296 . . . . . . . . . . . . . . . . . . . . . . . . . . . . . . . . . . . . . . . . 82
Paolo Tessari and Anna Lante
A Multifunctional Bread Rich in Beta Glucans and Low in Starch Improves Metabolic Controlin Type 2 Diabetes: A Controlled Trialdoi: 10.3390/nu9030297 . . . . . . . . . . . . . . . . . . . . . . . . . . . . . . . . . . . . . . . . 94
Bang-An Luo, Fan Gao and Lu-Lu Qin
The Association between Vitamin D Deficiency and Diabetic Retinopathy in Type 2 Diabetes:A Meta-Analysis of Observational Studiesdoi: 10.3390/nu9030307 . . . . . . . . . . . . . . . . . . . . . . . . . . . . . . . . . . . . . . . . 105
iii
Books
MDPI

Salwa M. K. Almomen, Qiunong Guan, Peihe Liang, Kaidi Yang, Ahmad M. Sidiqi,
Adeera Levin and Caigan Du
Daily Intake of Grape Powder Prevents the Progression of Kidney Disease in Obese Type 2Diabetic ZSF1 Ratsdoi: 10.3390/nu9040345 . . . . . . . . . . . . . . . . . . . . . . . . . . . . . . . . . . . . . . . . 117
Christophe Kosinski and Francois R. Jornayvaz
Effects of Ketogenic Diets on Cardiovascular Risk Factors: Evidence from Animal andHuman Studiesdoi: 10.3390/nu9050517 . . . . . . . . . . . . . . . . . . . . . . . . . . . . . . . . . . . . . . . . 133
Rui Liu, Hui Li, Wenjuan Fan, Qiu Jin, Tingting Chao, Yuanjue Wu, Junmei Huang,
Liping Hao and Xuefeng Yang
Leucine Supplementation Differently Modulates Branched-Chain Amino Acid Catabolism,Mitochondrial Function and Metabolic Profiles at the Different Stage of Insulin Resistance inRats on High-Fat Dietdoi: 10.3390/nu9060565 . . . . . . . . . . . . . . . . . . . . . . . . . . . . . . . . . . . . . . . . 149
M. Gorety Jacobo-Cejudo, Roxana Valdes-Ramos, Ana L. Guadarrama-Lopez,
Rosa-Virgen Pardo-Morales, Beatriz E. Martınez-Carrillo and Laurence S. Harbige
Effect of n-3 Polyunsaturated Fatty Acid Supplementation on Metabolic and InflammatoryBiomarkers in Type 2 Diabetes Mellitus Patientsdoi: 10.3390/nu9060573 . . . . . . . . . . . . . . . . . . . . . . . . . . . . . . . . . . . . . . . . 169
Tanja Diederichs, Christian Herder, Sarah Roßbach, Michael Roden, Stefan A. Wudy,
Ute Nothlings, Ute Alexy and Anette E. Buyken
Carbohydrates from Sources with a Higher Glycemic Index during Adolescence: IsEvening Rather than Morning Intake Relevant for Risk Markers of Type 2 Diabetes inYoung Adulthood?doi: 10.3390/nu9060591 . . . . . . . . . . . . . . . . . . . . . . . . . . . . . . . . . . . . . . . . 180
Mikael Fogelholm, Thomas Meinert Larsen, Margriet Westerterp-Plantenga, Ian Macdonald,
J. Alfredo Martinez, Nadka Boyadjieva, Sally Poppitt, Wolfgang Schlicht, Gareth Stratton,
Jouko Sundvall, Tony Lam, Elli Jalo, Pia Christensen, Mathijs Drummen,
Elizabeth Simpson, Santiago Navas-Carretero, Teodora Handjieva-Darlenska,
Roslyn Muirhead, Marta P. Silvestre, Daniela Kahlert, Laura Pastor-Sanz,
Jennie Brand-Miller and Anne Raben
PREVIEW: Prevention of Diabetes through Lifestyle Intervention and Population Studies inEurope and around the World. Design, Methods, and Baseline Participant Description of anAdult Cohort Enrolled into a Three-Year Randomised Clinical Trialdoi: 10.3390/nu9060632 . . . . . . . . . . . . . . . . . . . . . . . . . . . . . . . . . . . . . . . . 196
Ana Burgeiro, Manuela G. Cerqueira, Barbara M. Varela-Rodrıguez, Sara Nunes, Paula Neto,
Frederico C. Pereira, Flavio Reis and Eugenia Carvalho
Glucose and Lipid Dysmetabolism in a Rat Model of Prediabetes Induced by a High-Sucrose Dietdoi: 10.3390/nu9060638 . . . . . . . . . . . . . . . . . . . . . . . . . . . . . . . . . . . . . . . . 213
Pablo Hernandez-Alonso, Lucıa Camacho-Barcia, Monica Bullo and Jordi Salas-Salvado
Nuts and Dried Fruits: An Update of Their Beneficial Effects on Type 2 Diabetesdoi: 10.3390/nu9070673 . . . . . . . . . . . . . . . . . . . . . . . . . . . . . . . . . . . . . . . . 230
iv
Books
MDPI

Christina M. Gant, S. Heleen Binnenmars, Else van den Berg, Stephan J. L. Bakker,
Gerjan Navis and Gozewijn D. Laverman
Integrated Assessment of Pharmacological and Nutritional Cardiovascular Risk Management:Blood Pressure Control in the DIAbetes and LifEstyle Cohort Twente (DIALECT)doi: 10.3390/nu9070709 . . . . . . . . . . . . . . . . . . . . . . . . . . . . . . . . . . . . . . . . 264
Charlotte E. Pelgrim, Bart A. A. Franx, Jessica Snabel, Robert Kleemann, Ilse A. C. Arnoldussen
and Amanda J. Kiliaan
Butyrate Reduces HFD-Induced Adipocyte Hypertrophy and Metabolic Risk Factors inObese LDLr-/-.Leiden Micedoi: 10.3390/nu9070714 . . . . . . . . . . . . . . . . . . . . . . . . . . . . . . . . . . . . . . . . 280
v
Books
MDPI

Books
MDPI

About the Special Issue Editors
Peter Pribis, Dr., M.D., DR.P.H., is an Associate Professor of Nutrition and Dietetics in the Department
of Individual, Family & Community Education at the University of New Mexico. He graduated from
the School of Medicine at King Charles University in Prague, Czech Republic and from Loma Linda
University, School of Public Health with Dr. P.H. He is a Registered Dietitian and a member of the
Academy of Nutrition and Dietetics. He worked for nine years as the Director of the Master of Science
Program in Nutrition and Wellness at Andrews University in Michigan before moving to New Mexico.
Dr. Pribis has authored more than 20 articles for different health publications, one book chapter
for a nutrition book, 12 research articles for scholarly peer-reviewed journals, and co-authored two
cookery books. His research expertise is studying the potential of plant-based diets in preventing
chronic diseases and nutritional neuroscience. He is an enthusiastic speaker on the benefits of healthy
nutrition and a promoter of evidence-based lifestyle medicine.
Hana Kahleova, Dr., M.D., Ph.D., is a medical doctor specializing in internal medicine and
endocrinology and has a PhD in nutrition and diabetes. She has done several research studies on the
beneficial effects of plant-based diets in type 2 diabetes. Dr. Kahleova enjoys studying how metabolic
function works in regard to diet composition, meal timing, and frequency. She is the director of clinical
research at the Physicians Committee for Responsible Medicine in Washington, DC.
vii
Books
MDPI

Books
MDPI

Preface to ”Nutrition and Diet Factors in Type
2 Diabetes”
Diabetes can be rightly called the new plague of the 21st century. It follows the pandemic of obesity,
usually with a delay of 5–10 years. Approximately seven million people develop diabetes in both
developed and developing countries every year, with the most dramatic increases occurring in Type
2 Diabetes (DM2). Global prevalence of DM2 is approximately 8% presently, and it is likely to grow
substantially in the next few decades. Especially alarming, is the rising incidence of DM2 in obese
children before puberty. Diabetes mellitus has become a major global public health problem. In April
2017, a Special Issue of Nutrients entitled “Nutrition and Diet Factors in Type 2 Diabetes” closed with
19 published papers—eight original studies on humans, five on animals, one brief report and five
reviews. The focus of the issue was on nutrition, diet factors, whole foods, broad dietary and lifestyle
strategies, dietary patterns, intensive personalized treatments, nutritional prevention programs, and
food policies that can be used in the development, treatment, and prevention of DM2.
The five animal studies presented covered a wide array of topics. Xiao et al. provided novel
evidence that maternal low-protein diet may be associated with chronic inflammation in the offspring.
Pelgrim et al. suggested that butyrate, Liu et al. suggested that leucine, and Almomen et al. suggested
that grape powder might be beneficial and attenuate diabetes risk factors. Burgeiro et al. described the
liver glucose and lipid dysmetabolism in an animal prediabetes model induced by high-sucrose diet.
As for the human studies: Jablonska et al.‘s study suggests that selenium may affect glycemic
control at different levels of gene regulation, linked to insulin signaling, glycolysis and pyruvate
metabolism. Jacobo-Cejudo et al. reported that n-3 PUFA supplementation had a beneficial effect on
some selective DM2 risk factors. A descriptive study of Canadians by Bertinato et al. discovered that a
substantial portion of the population is hypomagnesaemic which can be negatively associated with
diabetes, glycemic control and insulin resistance.
Simple interventions such as the inclusion of fiber-rich functional bread into the diet (Tessari et al.)
or avoidance of large amounts of carbohydrates from high-glycemic index sources in the evening
(Diederichs et al.), as reported by the DONALD study, should be considered as preventive dietary
strategies. Studying the black South African population, Chikowore et al. concluded that plant driven
nutrient patterns are associated with low fasting glucose and glycated hemoglobin levels. Veleba
et al.‘s study suggests that in DM2 patients, a vegetarian diet led to more effective improvement in
physical fitness than a conventional diet.
There are two reports from large European-based cohorts. Fogelholm et al. described the design,
methodology and baseline characteristics of the PREVIEW project that was initiated to find the most
effective lifestyle for the prevention of DM2; while Gant at al. reported results from the DIALECT
project that suggest that incorporating nutrition management in routine care would greatly improve
the treatment quality.
As for the five reviews: Fang et al. concluded that combined data support the role for magnesium
in reducing risk of DM2; Luo et al. concluded that there is evidence for an association between vitamin
D deficiency and an increased risk of diabetic retinopathy in DM2 patients; and Hernandez-Alonso et
al. suggest that nuts and dried fruits could play a significant role in the prevention and treatment of
insulin resistance and DM2; Kosinski et al. discussed the role and safety of ketogenic diets in animals
and humans; while Vaiserman summarized recent research regarding early-life nutrition programing
of DM2.
ix
Books
MDPI

Nutrition and Diet Factors in Type 2 Diabetes is written for clinical and academic nutritionists,
for registered dietitians, health professionals, graduate students, and for everybody with a deeper
interest in diabetes care. Studies and reviews presented here demonstrate that diabetes research is
extensive and vibrant and the prevention, treatment and reversal of diabetes are achievable, economical,
powerful, and possible.
Peter Pribis, Hana Kahleova
Special Issue Editors
x
Books
MDPI

Books
MDPI

Books
MDPI

nutrients
Brief Report
“A Vegetarian vs. Conventional Hypocaloric Diet:The Effect on Physical Fitness in Response to AerobicExercise in Patients with Type 2 Diabetes.” A ParallelRandomized Study
Jiri Veleba 1, Martin Matoulek 2, Martin Hill 3, Terezie Pelikanova 1 and Hana Kahleova 1,*
1 Institute for Clinical and Experimental Medicine, Videnska 1958/9, 14021 Prague, Czech Republic;[email protected] (J.V.); [email protected] (T.P.)
2 General University Hospital, 3rd Internal Clinic of Endocrinology and Metabolism,12808 Prague, Czech Republic; [email protected]
3 Institute of Endocrinology, Narodni 8, 11394 Prague, Czech Republic; [email protected]* Correspondence: [email protected]; Tel.: +420-261-362-150; Fax: +420-261-362-820
Received: 26 July 2016; Accepted: 17 October 2016; Published: 26 October 2016
Abstract: It has been shown that it is possible to modify macronutrient oxidation, physical fitnessand resting energy expenditure (REE) by changes in diet composition. Furthermore, mitochondrialoxidation can be significantly increased by a diet with a low glycemic index. The purpose ofour trial was to compare the effects of a vegetarian (V) and conventional diet (C) with the samecaloric restriction (−500 kcal/day) on physical fitness and REE after 12 weeks of diet plus aerobicexercise in 74 patients with type 2 diabetes (T2D). An open, parallel, randomized study designwas used. All meals were provided for the whole study duration. An individualized exerciseprogram was prescribed to the participants and was conducted under supervision. Physical fitnesswas measured by spiroergometry and indirect calorimetry was performed at the start and after12 weeks Repeated-measures ANOVA (Analysis of variance) models with between-subject (group)and within-subject (time) factors and interactions were used for evaluation of the relationshipsbetween continuous variables and factors. Maximal oxygen consumption (VO2max) increased by12% in vegetarian group (V) (F = 13.1, p < 0.001, partial η2 = 0.171), whereas no significant changewas observed in C (F = 0.7, p = 0.667; group × time F = 9.3, p = 0.004, partial η2 = 0.209). Maximalperformance (Watt max) increased by 21% in V (F = 8.3, p < 0.001, partial η2 = 0.192), whereas it did notchange in C (F = 1.0, p = 0.334; group × time F = 4.2, p = 0.048, partial η2 = 0.116). Our results indicatethat V leads more effectively to improvement in physical fitness than C after aerobic exercise program.
Keywords: insulin sensitivity; maximal oxygen consumption; maximal performance; physical fitness;type 2 diabetes; vegetarian diet
1. Introduction
Dietary intervention and physical exercise are both cornerstones in the treatment of type 2 diabetes(T2D) patients [1]. A vegetarian diet is a promising way to reduce energy intake by consuming foodswith a low energy density, with a fair degree of patient adherence [2,3].
The superior effects of a vegetarian diet on body weight, glycemic control, blood lipids, insulinsensitivity and oxidative stress markers compared with a conventional diet have been shown by usand others previously [2–4]. A vegetarian diet was also reported to reduce the content of intramuscularlipids [5].
Physical activity combats insulin resistance by several different mechanisms: by influencingchanges in body composition such as reducing fat mass and volume of visceral fat and increasing
Nutrients 2016, 8, 671 1 www.mdpi.com/journal/nutrients
Books
MDPI

Nutrients 2016, 8, 671
fat-free mass, by enhancing insulin-stimulated glucose disposal in skeletal muscle, morphologicalchanges in muscle, and by decreased glucose production in the liver [6]. To the best of our knowledge,a direct comparison between the effect of a vegetarian diet and a conventional hypocaloric diet onphysical fitness and resting energy expenditure (REE) in subjects with T2D during aerobic exercisetraining has not yet been performed.
It has been shown that it is possible to modify macronutrient oxidation, physical fitness and restingenergy expenditure (REE) by changes in diet composition. Furthermore, mitochondrial oxidation canbe significantly increased by a diet with a low glycemic index. The aim of this secondary analysiswas to compare the effects of vegetarian (V) and conventional diabetic diet (C) with the same caloricrestriction (−500 kcal/day) on physical fitness and REE after 12 weeks of diet plus aerobic exercise inpatients with type 2 diabetes (T2D).
2. Experimental Section
The characteristics of our study population and the methods can be found elsewhere [3].Briefly: In the context of a randomized, open, parallel design, 74 patients with T2D treated by oralhypoglycemic agents, both men (47%) and women (53%) were randomly assigned either into thevegetarian group (V, n = 37) or the control group (C, n = 37) treated by conventional diet. Both diets werecalorie-restricted (−500 kcal/day) according to the indirect calorimetry measurement [7]. The dietaryinterventions were combined with aerobic exercise for 12 weeks, performed under professionalsupervision. All meals were provided for the whole study duration. The study protocol wasapproved by the Institutional Ethics Committee of the Thomayer Hospital and Institute for Clinicaland Experimental Medicine, Prague, Czech Republic. (The approval code is G-08-08-22.)
2.1. Diet
The vegetarian diet (~60% of energy from carbohydrates, 15% protein, and 25% fat) was basedon whole plant foods (whole grains, legumes, vegetables, fruits and nuts). Animal products wererectricted to one portion of low-fat dairy a day. The composition of the conventional diabetic diet metthe dietary guidelines of the Diabetes and Nutrition Study Group (DNSG) of the European Associationfor the Study of Diabetes (EASD) [8]. It derived 50% of energy from carbohydrates, 20% protein,less than 30% fat (≤7% energy from saturated fat, less than 200 mg/day of cholesterol/day).
2.2. Exercise
An individualized exercise program was prescribed to the participantsbased on previous physicalactivity and spiroergometry. Aerobic exercise was performed twice a week at 60% of maximal heartrate for 1 h under professional supervision at the sports center, and the third weekly session took placeeither at the sports center or at home. The participants used a sport-tester and a pedometer.
2.3. Medication
No changes in medication use were made, except for the case of repeated hypoglycemia (plasmaglucose determined at the laboratory <4.4 mmol·L−1 or capillary glucose reading <3.4 mmol·L−1
accompanied by hypoglycemic symptoms). In this case, medications were reduced by a studyphysician following a standard protocol. All participants used an Accu-Chek Go glucometer (Roche,Basel, Switzerland).
2.4. Adherence
All visits to pick up meals were recorded. Three-day dietary records (two weekdays and oneweekend day) were completed by each participant at baseline and at week 12, and analyzed bya registered dietician. High adherence was defined as the average daily energy intake being nomore than 100 kcal in excess of the prescribed, medium adherence was less than 200 kcal in excess.
2
Books
MDPI

Nutrients 2016, 8, 671
Additional criteria for high adherence to vegetarian diet were the average daily cholesterol intake≤50 mg, for medium adherence less than 100 mg. In the control group, the average daily cholesterollimit was ≤200 mg for high adherence, and less than 300 mg for medium adherence.
Adherence to the exercise program was defined as more than 75% of prescribed visits at the sportscenter (18/24).
2.5. Hunger and Depressive Symptoms
Hunger and depressive symptoms were assessed using the Three-Factor Eating Questionnaire [9]and the Beck Depression Inventory [10], respectively.
2.6. Statistical Analysis
The intention-to-treat analysis was used, and all participants were included. To eliminate skeweddata distribution and heteroscedasticity, the original data was transformed to a Gaussian distributionbefore further processing by a power transformation using the statistical software StatgraphicsCenturion, version XV from Statpoint Inc. (Herndon, Virginia, VA, USA). Non-homogeneities inthe data were detected using residual analysis. Repeated-measures ANOVA (Analysis of variance)models with between-subject (group) and within-subject (time) factors and interactions were used.Factors of treatment group, subject and time were included in the model. Interactions between groupand time (group × time) were calculated for each variable.
Paired t-tests were calculated within each group, to check the significance of changes frombaseline. Bonferroni post-hoc correction for seven variables implies that p-values < 0.007 can beconsidered significant.
3. Results
Data are presented as means with 95% confidence intervals. Maximal performance (Watt max)increased by 21% in vegetarian group (V) (F = 8.3, p < 0.001, partial η2 = 0.192), whereas it did notchange in control group (C) (F = 1.0, p = 0.334; group × time F = 4.2, p = 0.048, partial η2 = 0.116;Figure 1A). Maximal oxygen consumption (VO2max) increased by 12% in V (F = 13.1, p < 0.001, partialη2 = 0.171), whereas it did not change significantly in C (F = 0.7, p = 0.667; group × time F = 9.3,p = 0.004, partial η2 = 0.209; Figure 1B). REE remained constant in V (F = 0.6, p = 0.556), whereasit decreased in C (F = 4.1, p = 0.032, partial η2 = 0.113; group × time F = 2.8, p = 0.067; Figure 1C).The respiratory quotient did not change significantly in either group (F = 2.7, p = 0.0673 for V, andF = 1.5, p = 0.224 for C; group × time F = 0.4, p = 0.666; Figure 1D). No change in fasting oxidation of fatwas observed in either group (F = 0.3, p = 0.742 for V, and F = 1.1, p = 0.318 for C; group × time F = 0.4,p = 0.658; Figure 1E). Fasting oxidation of carbohydrates decreased in C by 89% (F = 3.8, p = 0.01, partialη2 = 0.029), while it did not change in V (F = 0.2, p = 0.865; group × time F = 4.0, p = 0.024; partialη2 = 0.139; Figure 1F). Fasting oxidation of protein did not change in either group (F = 0.3, p = 0.742 forV, and F = 1.4, p = 0.259 for C; group × time F = 2.6, p = 0.082; Figure 1G).
Adherence
The diet adherence was high among 55% of participants in V and 32% in C, medium among 22.5%in V and 39% in C, and low among 22.5% in V and 29% in C. Adherence to the exercise program was90.3% in V and 80.6 in C.
3
Books
MDPI

Nutrients 2016, 8, 671
Figure 1. Cont.
4
Books
MDPI

Nutrients 2016, 8, 671
Figure 1. Changes in physical fitness in response to a vegetarian (V, full line and full circles) andconventional diet (C, dashed line and empty circles). Data are means ± 95% confidence intervals.Significant changes from baseline to 12 weeks within groups assessed by paired comparison t-tests areindicated by * for p < 0.05, ** for p < 0.01, and *** for p < 0.001. p-values for the interaction betweenfactors group (vegetarian and control group) and time (0 and 12 weeks) assessed by repeated measures.ANOVA are: p = 0.048 for maximal performance (A), p = 0.004 for maximal oxygen consumption,VO2max (B), p = 0.067 for resting energy expenditure (C), p = 0.666 for respiratory quotient (D), p = 0.793for fasting oxidation of fats (E), p = 0.024 for fasting oxidation of carbohydrates (F), and p = 0.082 forfasting oxidation of protein (G).
4. Discussion
Our results show a slight improvement in physical fitness after a 12-week aerobic training programwith a vegetarian diet compared with a conventional hypocaloric diet. David Nieman demonstratedin his review in 1999 [11] that vegetarianism and veganism do not diminish physical fitness. Severalstudies showed that endurance athletes and marathon runners might benefit from plant-based dietswith an emphasis on high-carbohydrate and antioxidant-rich foods such as pasta, grains, cereals,legumes, vegetables, and dried fruits [12,13].
Numerous comparative studies reveal no fundamental differences in morphological or enzymaticequipment of skeletal muscle in vegetarians/vegans compared to omnivores [14,15]. In our study,we showed that visceral fat decreased more in V compared to C [3]. This might suggest the possibledecrease of ectopic fat in the muscle, potentially related to improved physical fitness. Several studiesreported lower levels of intramyocellular fat in vegetarians/vegans, implying their improved insulinsensitivity. However, the impact of this finding on physical fitness is unclear. Given the describedathlete's paradox [6], where trained athletes have more intramyocellular fat than healthy subjects, andeven more than those with type 2 diabetes, it is questionable if lower intramyocellular fat content canbe expected to be related to better fitness.
Abete et al. showed that a diet with a lower glycemic index increases mitochondrial oxidation [16],which corresponds with our findings. Plant-based diets with an emphasis on whole plant foods havea low glycemic index due to the high fiber content [17]. In addition, it seems that participants in Vwere able to better utilize carbohydrates compared to the control group. Together with the increasedinsulin sensitivity demonstrated previously [3], these are markers of improved metabolic flexibility,which may partly explain the increased maximal performance and VO2max in V.
5
Books
MDPI

Nutrients 2016, 8, 671
Besides physiological mechanisms, we need to mention the potential role of psychological factors.We observed reduced hunger and a reduced Beck depressive score in V [18], pointing to a higherexecutive potential including a positive attitude toward exercise. This hypothesis is also supported bylower levels of leptin in V [3], which may potentiate readiness for physical activity through the centralnervous system [19].
The strengths of the study are represented by the randomized, parallel design, providing all meals,and exercising under professional supervision. The study duration was reasonably long, allowingsufficient time for tracking the changes in response to the diet and exercise. However, the numberof subjects and study duration preclude generalizing our study for free-living conditions. Furtherlarger-scale, long-term studies are essential before offering recommendations in terms of vegetariandiet during aerobic exercise.
5. Conclusions
In conclusion, our results indicate that V leads more effectively to improvement in physicalfitness than C after an aerobic exercise program. We have also observed a decrease in REE only inC in response to aerobic exercise. The lower glycemic index of V, the higher fasting oxidation ofcarbohydrates, and the possible increase in mitochondrial oxidation may be partly responsible fora trend toward greater REE with V after aerobic exercise. V might be a more convenient alternative inthe nutritional treatment of T2D during an aerobic exercise program.
Acknowledgments: This work was supported by the project grant AZV15-27431A from Ministry of Health,Prague, Czech Republic, and Institutional Support MZCR 00023001 (IKEM, Prague, Czech Republic). We thankDavid Warren Hardekopf for great help with text corrections.
Author Contributions: J.V., H.K. and T.P. designed the study, wrote the grant application, recruited the patients,collected the data and wrote the manuscript. M.M. was involved in acquisition and analyses of data. M.H. carriedout the statistical analyses and interpretation of data. All authors had full access to the data and revised andapproved the manuscript for publication. The guarantor is H.K.
Conflicts of Interest: The author declares no conflict of interest.
References
1. American Diabetes Association. Nutrition Recommendations and Interventions for Diabetes: A positionstatement of the American Diabetes Association. Diabetes Care 2008, 31, S61–S78.
2. Barnard, N.D.; Cohen, J.; Jenkins, D.J.; Turner-McGrievy, G.; Gloede, L.; Jaster, B.; Seidl, K.; Green, A.A.;Talpers, S. A low-fat vegan diet improves glycemic control and cardiovascular risk factors in a randomizedclinical trial in individuals with type 2 diabetes. Diabetes Care 2006, 29, 1777–1783. [CrossRef] [PubMed]
3. Kahleova, H.; Matoulek, M.; Malinska, H.; Oliyarnik, O.; Kazdova, L.; Neskudla, T.; Skoch, A.; Hajek, M.;Hill, M.; Kahle, M.; et al. Vegetarian diet improves insulin resistance and oxidative stress markers more thanconventional diet in subjects with Type 2 diabetes. Diabet Med. 2011, 28, 549–559. [CrossRef] [PubMed]
4. Nicholson, A.S.; Sklar, M.; Barnard, N.D.; Gore, S.; Sullivan, R.; Browning, S. Toward improved managementof NIDDM: A randomized, controlled, pilot intervention using a lowfat, vegetarian diet. Prev. Med. 1999, 29,87–91. [CrossRef] [PubMed]
5. Goff, L.M.; Bell, J.D.; So, P.W.; Dornhorst, A.; Frost, G.S. Veganism and its relationship with insulin resistanceand intramyocellular lipid. Eur. J. Clin. Nutr. 2005, 59, 291–298. [CrossRef] [PubMed]
6. Dubé, J.J.; Amati, F.; Stefanovic-Racic, M.; Toledo, F.G.; Sauers, S.E.; Goodpaster, B.H. Exercise-inducedalterations in intramyocellular lipids and insulin resistance: The athlete’s paradox revisited. Am. J. Physiol.Endocrinol. Metab. 2008, 294, E882–E888. [CrossRef] [PubMed]
7. Ferrannini, E. The theoretical bases of indirect calorimetry: A review. Metabolism 1988, 37, 287–301. [CrossRef]8. Mann, J.I.; De Leeuw, I.; Hermansen, K.; Karamanos, B.; Karlström, B.; Katsilambros, N.; Riccardi, G.;
Rivellese, A.A.; Rizkalla, S.; Slama, G.; et al. Evidence-based nutritional approaches to the treatment andprevention of diabetes mellitus. Nutr. Metab. Cardiovasc. Dis. 2004, 14, 373–394. [CrossRef]
9. Stunkard, A.J.; Messick, S. The three-factor eating questionnaire to measure dietary restraint, disinhibitionand hunger. J. Psychosom. Res. 1985, 29, 71–83. [CrossRef]
6
Books
MDPI

Nutrients 2016, 8, 671
10. Steer, R.A.; Cavalieri, T.A.; Leonard, D.M.; Beck, A.T. Use of the Beck depression inventory for primary careto screen for major depression disorders. Gen. Hosp. Psychiatry 1999, 21, 106–111. [CrossRef]
11. Nieman, D.C. Physical fitness and vegetarian diets: Is there a relation? Am. J. Clin. Nutr. 1999, 70, 570S–575S.[PubMed]
12. Eisinger, M.; Plath, M.; Jung, K.; Leitymann, C. Nutrient intake of endurance runners withovo-lacto-vegetarian diet and regular western diet. Z. Ernahrung. 1994, 33, 217–229. [CrossRef]
13. Nieman, D.C.; Butler, J.V.; Pollett, L.M.; Dietrich, S.J.; Lutz, R.D. Nutrient intake of marathon runners. J. Am.Diet Assoc. 1989, 89, 1273–1278. [PubMed]
14. Haub, M.D.; Wells, A.M.; Tarnopolsky, M.A.; Campbell, W.W. Effect of protein source on resistive-training-induced changes in body composition and muscle size in older men. Am. J. Clin. Nutr. 2002, 76, 511–517.[PubMed]
15. Gojda, J.; Patková, J.; Jacek, M.; Potocková, J.; Trnka, J.; Kraml, P.; Andel, M. Higher insulin sensitivity invegans is not associated with higher mitochondrial density. Eur. J. Clin. Nutr. 2013, 67, 1310–1315. [CrossRef][PubMed]
16. Abete, I.; Parra, D.; Martinez, J.A. Energy-restricted diets based on a distinct food selection affecting theglycemic index induce different weight loss and oxidative response. Clin. Nutr. 2008, 27, 545–551. [CrossRef][PubMed]
17. Kahleova, H.; Pelikanova, T. Vegetarian diets in the prevention and treatment of type 2 diabetes. J. Am.Coll. Nutr. 2015, 34, 448–458. [CrossRef] [PubMed]
18. Kahleova, H.; Hrachovinova, T.; Hill, M.; Pelikanova, T. Vegetarian diet in type 2 diabetes—Improvement inquality of life, mood and eating behaviour. Diabet. Med. 2013, 30, 127–129. [CrossRef] [PubMed]
19. Hsuchou, H.; Wang, Y.; Cornelissen-Guillaume, G.G.; Kastin, A.J.; Jang, E.; Halberg, F.; Pan, W. Diminishedleptin signaling can alter circadian rhythm of metabolic activity and feeding. J. Appl. Physiol. 2013, 115,995–1003. [CrossRef] [PubMed]
© 2016 by the authors. Licensee MDPI, Basel, Switzerland. This article is an open accessarticle distributed under the terms and conditions of the Creative Commons Attribution(CC BY) license (http://creativecommons.org/licenses/by/4.0/).
7
Books
MDPI

nutrients
Article
Dose-Response Relationship between DietaryMagnesium Intake and Risk of Type 2 DiabetesMellitus: A Systematic Review and Meta-RegressionAnalysis of Prospective Cohort Studies
Xin Fang 1,*,†, Hedong Han 2,†, Mei Li 3, Chun Liang 3, Zhongjie Fan 4, Jan Aaseth 5,6, Jia He 2,*,
Scott Montgomery 7,8,9 and Yang Cao 1,7
1 Unit of Biostatistics, Institute of Environmental Medicine, Karolinska Institutet, Stockholm 17177, Sweden;[email protected]
2 Department of Health Statistics, Second Military Medical University, Shanghai 200433, China;[email protected]
3 Department of Cardiology, Shanghai Changzheng Hospital, Second Military Medical University,Shanghai 200003, China; [email protected] (M.L.); [email protected] (C.L.)
4 Department of Cardiology, Peking Union Medical College Hospital, Peking Union Medical College,Chinese Academy of Medical Sciences, Beijing 100730, China; [email protected]
5 Faculty of Public Health, Hedmark University of Applied Sciences, Elverum 2411, Norway;[email protected]
6 Innlandet Hospital Trust, Kongsvinger Hospital Division, Kongsvinger 2226, Norway7 Clinical Epidemiology and Biostatistics, School of Medical Sciences, Örebro University, Örebro 70182,
Sweden; [email protected] Clinical Epidemiology Unit, Karolinska University Hospital, Karolinska Institutet, Stockholm 17177, Sweden9 Department of Epidemiology and Public Health, University College London, London WC1E 6BT, UK* Correspondence: [email protected] (X.F.); [email protected] (J.H.); Tel.: +46-700-972-639 (X.F.);
+86-21-8187-1441 (J.H.)† These authors contributed equally to this work.
Received: 12 October 2016; Accepted: 14 November 2016; Published: 19 November 2016
Abstract: The epidemiological evidence for a dose-response relationship between magnesium intakeand risk of type 2 diabetes mellitus (T2D) is sparse. The aim of the study was to summarizethe evidence for the association of dietary magnesium intake with risk of T2D and evaluate thedose-response relationship. We conducted a systematic review and meta-analysis of prospectivecohort studies that reported dietary magnesium intake and risk of incident T2D. We identifiedrelevant studies by searching major scientific literature databases and grey literature resources fromtheir inception to February 2016. We included cohort studies that provided risk ratios, i.e., relativerisks (RRs), odds ratios (ORs) or hazard ratios (HRs), for T2D. Linear dose-response relationshipswere assessed using random-effects meta-regression. Potential nonlinear associations were evaluatedusing restricted cubic splines. A total of 25 studies met the eligibility criteria. These studies comprised637,922 individuals including 26,828 with a T2D diagnosis. Compared with the lowest magnesiumconsumption group in the population, the risk of T2D was reduced by 17% across all the studies;19% in women and 16% in men. A statistically significant linear dose-response relationship wasfound between incremental magnesium intake and T2D risk. After adjusting for age and bodymass index, the risk of T2D incidence was reduced by 8%–13% for per 100 mg/day increment indietary magnesium intake. There was no evidence to support a nonlinear dose-response relationshipbetween dietary magnesium intake and T2D risk. The combined data supports a role for magnesiumin reducing risk of T2D, with a statistically significant linear dose-response pattern within thereference dose range of dietary intake among Asian and US populations. The evidence from Europeand black people is limited and more prospective studies are needed for the two subgroups.
Nutrients 2016, 8, 739 8 www.mdpi.com/journal/nutrients
Books
MDPI
Nutrients 2016, 8, 739
Keywords: magnesium; dietary intake; type 2 diabetes; prospective study; cohort study; meta-analysis
1. Introduction
Type 2 diabetes mellitus (T2D) represents a growing public health burden across the world andis a leading cause of death. In 2013, an estimated 340 million people worldwide had T2D and thisnumber is expected to increase to 400 million or more by 2030 [1,2]. Obesity and diet are widelybelieved to play an important role in the development of T2D [3,4]. Magnesium is the most abundantdivalent intracellular cation, the second most abundant cellular ion next to potassium and the fourthcation in general in the human body. Of the 21–28 g of magnesium present in the adult humanbody, 99% is distributed in the intracellular compartment, and only 1% in the extracellular fluid [5].Magnesium has received considerable interest for its potential in improving insulin sensitivity andpreventing diabetes [6–9]. T2D is often accompanied by altered magnesium status. An increasedprevalence of magnesium deficit has been identified in T2D patients, especially in those with poorlycontrolled glycemic profiles, longer duration of disease and the presence of micro- and macro-vascularchronic complications [10–12]. A number of prospective cohort studies of magnesium intake anddiabetes incidence have been conducted [7,13–24] and statistically significant negative associationsbetween magnesium intake and risk of T2D were reported in previous meta-analyses [25–27]. However,these meta-analyses did not examine whether the association was confounded by other establishedrisk factors such as being overweight and other factors highly associated with magnesium intake,such as amount of cereal fiber, and whether the relationship is linear.
During the past few years, the number of studies on this topic has increased. With mountingevidence, we conducted a meta-analysis of prospective cohort studies for the following purpose:(1) to update the epidemiological evidence on the association between magnesium intake and T2Drisk; (2) to evaluate the association according to characteristics of study designs and population;and (3) to examine the linear and nonlinear dose-response pattern of magnesium intake and T2D risk.
2. Materials and Methods
The protocol for this systematic review was registered in the PROSPERO database of prospectivelyregistered systematic reviews in February 2016 (www.crd.york.ac.uk/PROSPERO; CRD42016033519).The completed review conforms to the standard criteria PRISMA (Preferred Reporting Items forSystematic Reviews and Meta-Analysis) and MOOSE (Meta-analysis of Observational Studies inEpidemiology) [28,29].
2.1. Data Sources and Searches
We conducted a systematic review for all population-based studies that evaluated the associationof magnesium intake with T2D. We searched Pubmed (http://www.ncbi.nlm.nih.gov/), Web ofScience (http://webofscience.com/), ScienceDirect (http://www.sciencedirect.com/) and ChinaKnowledge Resource Integrated Database (http://oversea.cnki.net/kns55/default.aspx) and theCochrane Library (http://www.cochranelibrary.com/) from their inception to 29 February, 2016.The later cut-off date to 30 June 2016 was subsequently revised to include the latest publishedstudies. To avoid publication bias, we also used the National Library of Medicine Gateway(https://gateway.nlm.nih.gov/), Virtual Health Library (http://pesquisa.bvsalud.org/portal/),the System for Information on Grey Literature in Europe (http://www.opengrey.eu/), the NationalAcademic Research and Collaborations Information System (http://www.narcis.nl/?Language=en)and Grey Literature Report (www.greylit.org) to find potential unpublished relevant studies.Key search terms included magnesium intake, type 2 diabetes, diabetes mellitus, prospective study,longitudinal study, cohort study, and nested case-control study, combined with incidence or risk.These searches were supplemented by hand-searching of the reference lists of identified researcharticles or relevant reviews. No language restrictions were imposed.
9
Books
MDPI

Nutrients 2016, 8, 739
2.2. Inclusion Criteria
We only included original research in this meta-analysis. Reviews, editorials, commentariesand letters were not eligible. All population-based cohort studies (including nested case-controlstudies) were included if they fulfilled the following criteria: (1) had a prospective study design;(2) the doses of magnesium intake (dietary and supplemental) were reported; (3) the endpoint ofinterest was incidence of T2D; (4) the risk ratio was reported such as relative risk (RR), odds ratio (OR)or hazard ratio (HR), as well as the associated 95% confidence interval (CI) or other data to estimate thevariance or accuracy (standard deviation or standard error) were reported; (5) the risk assessment hadto be adjusted for potential confounding factors or by other forms of standardization (if applicable).For multiple studies using the same population, only the study with the largest number of events orwith adjustment for additional potential confounders was included. Studies were excluded if they:(1) focused on the populations with disrupted mineral homeostasis (such as patients with heart failureor kidney disease); (2) were narrative reviews, editorial papers, methodological papers, experimentalstudies, case control or cross-sectional; (3) assessed type 1 diabetes; (4) identified a dietary patternthat did not fit into healthy or unhealthy dietary pattern categories; (5) evaluated magnesium only indrinking water or had no reliable magnesium estimates. For included studies only in abstract form,we tried to contact authors to obtain the necessary estimates or risks and relevant accuracy.
2.3. Quality Assessment and Data Extraction
Computerized bibliographic searches of pre-determined literature databases used an optimizedversion of the Cochrane Collaboration search strategy [30]. Three investigators (X.F., C.L. and M.L.)screened all the identified titles and abstracts for relevance (n = 2858). Full papers were downloadedfor all the abstracts judged potentially relevant (n = 60). No new studies were identified among thecited references of all included articles. Of 60 full-text articles reviewed independently, we excluded35 studies for the following reasons: they were not prospective studies (n = 14); outcomes were notT2D (n = 9); did not report dietary magnesium (n = 7); did not assess the risk (n = 3); or duplicatedanother study (n = 1). All papers identified through the screening process were assessed for relevanceindependently by two investigators (C.L. and M.L.) using standardized study assessment and a sortingform. The studies were evaluated and scored based on the guidelines adapted from the tools forassessing quality and susceptibility to bias in observational studies in epidemiology [31]. Inter-rateragreement was substantial (Cohen κ > 0.6) [32]. No studies were excluded by the quality assessment.In total, 25 studies met the inclusion criteria and were included in the meta-analysis.
Full papers were obtained for all abstracts judged potentially relevant. Data extraction wasconducted independently by two investigators (X.F. and M.L.) with the use of a standardized electronicform in Microsoft Excel. The following data were extracted from each study: first author’s surname;study design; location; year the study started, finished and was published; age; sex; ethnicity; samplesize (number of those with T2D and the total number of participants); diseases present at baseline(hypertension or hypercholesterolemia, etc.); magnesium intake modes (dietary or supplemental)and dose; as well as covariates adjusted for in the multivariable analysis. For magnesium intake,data on assessment method used (food frequency questionnaire, dietary recall, other) and whether thedata were energy-adjusted (yes, no) were obtained. For each study, the median magnesium intakefor each quantile (tertile, quartile or quintile) of magnesium intake was assigned as the representativedose. When the median intake per quantile was not provided, we assigned the midpoint of lowerand upper boundaries in each quantile as the average intake. If the lower or upper boundary for thelowest or highest quantile, respectively, was not reported, we assumed that the boundary has the sameamplitude as the closest quantile. The increment of dietary magnesium intake was calculated as thedifference between the representative dose of the higher quantiles and the representative dose of thecontrol quantile.
For each dose quantile, we extracted RR, OR or HR with their measure of uncertainty (standarderror) or variance (95% CI). Risk estimates for continuous exposure were also extracted. If estimateswere presented for more than one multivariate model, we only extracted estimates from the modelmaximally adjusted for potential confounding variables to ensure a conservative conclusion. Becausethere are studies based on the same cohort but conducted at different times, they shared the T2Dpatients. When we calculated the total participants and T2D cases, we only used the studies with thelargest numbers.
10
Books
MDPI
Nutrients 2016, 8, 739
2.4. Statistical Analysis
We used OR and HR as RR in our pooled analysis because when event rates are small, the OR,HR and RR approximate one another [33]. We estimated a pooled risk with 95% CI for a 100 mg/dayincrease in daily magnesium intake for the studies. To maximize all the data for calculating thepooled dose-response, the restricted maximum likelihood (REML) approach proposed by Harbord [34],which provides improved estimation of the between-study variance, was used to compute the lineartrend of the log transformed risk estimates across magnesium intake doses. We also performedsubgroup analysis by level of magnesium intake increment, sex, geographic area and adjustment.
The Higgins’s I2 statistic, a quantitative measure of inconsistency, was calculated to evaluatethe statistical heterogeneity across the studies [35]. I2 > 30% was considered as at least moderateheterogeneity. In view of substantial heterogeneity being detected, we presented the pooled estimatesbased on the random-effects model.
Potential publication bias was assessed by Egger’s test [36]. Because the sample sizes of referencegroups and comparative groups were balanced in all the studies, we used Harbord’s modification toEgger’s test to reduce the false-positive rate [37]. The results were also confirmed by Begg’s test [38]and Peters’s test [39].
Potential nonlinear associations were assessed using restricted cubic splines; we used four knotsat fixed percentiles 5%, 35%, 65% and 95% of the distribution [40]. The study-specific estimates werepooled by using the REML method in a random-effects meta-analysis [41].
We also conducted a sensitivity analysis to investigate the influence of a single study on theoverall risk estimate by dropping one study in each turn. We performed all analyses in Stata(version 14.1; Stata Corp., College Station, TX, USA). A p value < 0.05 was considered statisticallysignificant, except where otherwise specified.
3. Results
3.1. Eligible Studies and Characteristics
Our literature search identified 25 studies from 17 cohorts that met the eligibility criteria(Figure 1). These studies were published between 1997 and 2014 and comprised 637,922 individualsand 26,828 T2D cases after excluding duplicated cohorts (Table 1). There were 16 studies conducted inthe U.S. (including Hawaii), two in Europe (Italy and Germany), and seven in Asia (five in Japan andtwo in China). Studies treated dietary calcium [42–44], red/processed meat [45,46], whole grain [47],fiber [14,15,48], vitamin D [43,44], carbohydrates [14], coffee [49] or glycemic load [15,48,50] as mainexposures, but also reported dietary magnesium intakes which were included in our meta-analysis.The main endpoints of two studies were impaired insulin metabolism [7] and insulin resistance [22],but both studies also reported the incidence of T2D. Participants were predominately middle-aged atbaseline, with a mean age of 51.2 years and a mean BMI of 25.0 kg/m2 across the studies. The lengthof the follow-up period ranged from four to 20 years.
Dietary intake of magnesium was evaluated by food frequency questionnaires (FFQs) in all thestudies and 13 studies indicated that the questionnaires were validated. The median magnesiumintake of the different dose groups ranged from 115 mg/day in U.S. black women [18] (much lowerthan the US Recommended Dietary Allowance of 400 mg/day for men and 310 magnesium forwomen >30 years [51]) to 478 mg/day in a U.S. population [22]. T2D was ascertained by self-reportand 21 studies indicated that the self-reported diagnoses were validated.
For the 16 studies with the magnesium as the main exposure, although the degree of covariate andconfounder adjustment varied in the multivariate models, most studies adjusted for age, body massindex (BMI), total energy intake, smoking, physical activity, family history of diabetes and hypertension;fewer studies adjusted for intake of calcium or other nutrition supplement and education attainment.For the nine studies with other nutrients as main exposure, only crude RRs were extracted.
11
Books
MDPI

Nutrients 2016, 8, 739
Ta
ble
1.
Cha
ract
eris
tics
of25
coho
rtst
udie
spr
ovid
ing
risk
esti
mat
esfo
rdi
etar
ym
agne
sium
inta
kean
dT
2Din
cide
nce.
Fir
stA
uth
or,
Ye
ar,
Stu
dy,
Co
un
try
No
.o
fC
ase
(Co
ho
rtS
ize
)Y
ea
rso
fF
oll
ow
-Up
Die
tary
Ass
ess
me
nt
Me
tho
d
Ca
seA
sce
rta
inm
en
t
Se
x,
Me
an
Ag
ea
tB
ase
lin
e(Y
ea
rs)
Ma
gn
esi
um
Inta
ke
(Ma
gn
esi
um
/Da
y)
for
Hig
he
stv
s.th
eL
ow
est
Qu
an
tile
[RR
(95
%C
I)]
Co
nfo
un
de
rsA
dju
ste
dfo
r
Hru
by,2
014,
FHSO
,U.S
.[7]
179
(258
2)7
Val
idat
edFF
QV
alid
ated
self
-rep
ort
Man
dF,
53.9
395
vs.2
36(0
.49
(0.2
7,0.
88))
Age
,sex
,ene
rgy
inta
ke,f
amily
hist
ory
ofdi
abet
es,B
MI,
phys
ical
acti
vity
,sm
okin
g,al
coho
l,hy
pert
ensi
on,d
ieta
ryfib
er
Oba
,201
3,JP
HC
PS,
Japa
n[5
0]
Men
:690
(27,
769)
5V
alid
ated
FFQ
Val
idat
edse
lf-r
epor
t
M:5
6.5
349
vs.2
32(0
.85
(0.6
9,1.
06))
Cru
de*
Wom
en:5
00(3
6,86
4)F:
56.9
356
vs.2
11(0
.69
(0.5
4,0.
88))
Hat
a,20
13,
His
ayam
a,Ja
pan
[52]
417
(199
9)15
.6FF
QSe
lf-r
epor
tM
and
F,57
.021
5vs
.133
(0.6
3(0
.44,
0.90
))
Age
,sex
,fam
ilyhi
stor
yof
diab
etes
,BM
I.H
DL
chol
este
rol,
trig
lyce
ride
s,hy
pert
ensi
on,s
mok
ing,
alco
hol,
phys
ical
acti
vity
,to
tale
nerg
yin
take
,car
bohy
drat
e,cr
ude
fiber
,sat
urat
edfa
tty
acid
,po
lyun
satu
rate
dfa
tty
acid
and
vita
min
C
Wen
g,20
12,
CV
DFA
CTS
,Ta
iwan
[53]
141
(160
4)4.
6V
alid
ated
FFQ
Self
-rep
ort
Man
dF,
50.0
406
vs.2
12(0
.38
(0.2
1,0.
70))
Age
,sex
,cal
oric
inta
ke,r
esid
entia
lare
a,fa
mily
hist
ory
ofdi
abet
es,
BMI,
educ
atio
n,sm
okin
g,al
coho
l,ph
ysic
alac
tivi
ty,h
yper
tens
ion,
hype
rcho
lest
erol
emia
,hyp
ertr
igly
ceri
dem
ia,l
owH
DL-
chol
este
rol
Hop
ping
,201
0,M
EC,H
awai
i[21
]
Men
:455
5(3
6,25
5)14
FFQ
Val
idat
edse
lf-r
epor
t
M:5
7.4
185
vs.1
29(0
.77
(0.7
0,0.
85))
Ethn
icit
y,BM
I,ph
ysic
alac
tivi
ty,e
duca
tion
,cal
orie
sW
omen
:403
2(3
9,25
5)F:
57.2
200
vs.1
39(0
.84
(0.7
6,0.
93))
Kir
ii,20
10,J
AC
C,
Japa
n[2
3]
Men
:237
(648
0)5
Val
idat
edFF
QV
alid
ated
self
-rep
ort
M:5
3.3
323
vs.1
56(0
.64
(0.4
4,0.
91))
Age
,BM
I,fa
mily
hist
ory
ofdi
abet
es,s
mok
ing,
alco
hol,
phys
ical
acti
vity
,gre
ente
a,co
ffee
,tot
alen
ergy
inta
keW
omen
:222
(11,
112)
F:53
.129
8vs
.159
(0.6
8(0
.33,
0.75
))
Nan
ri,2
010,
JPH
CPS
,Jap
an[2
4]
Men
:634
(25,
872)
5FF
QV
alid
ated
self
-rep
ort
M:5
6.5
348
vs.2
13(0
.86
(0.6
3,1.
16))
Age
,stu
dyar
ea,B
MI,
smok
ing,
alco
hol,
fam
ilyhi
stor
yof
diab
etes
,ph
ysic
alac
tivi
ty,h
yper
tens
ion,
coff
ee,c
alci
umin
take
,to
tale
nerg
yin
take
Wom
en:4
80(3
3,91
9)F:
57.3
333
vs.2
13(0
.92
(0.6
6,1.
28))
Kim
,201
0,C
AR
DIA
,U.S
.[22
]33
0(4
497)
20V
alid
ated
FFQ
Val
idat
edse
lf-r
epor
tM
and
F,24
.947
8vs
.362
(0.5
3(0
.32,
0.86
))A
ge,s
ex,e
thni
city
,stu
dyce
nter
,edu
cati
on,s
mok
ing,
alco
hol,
phys
ical
acti
vity
,fam
ilyhi
stor
yof
diab
etes
,BM
I,bl
ood
pres
sure
,to
tale
nerg
yin
take
,sat
urat
edfa
t,cr
ude
fiber
Kir
ri,2
009,
JPH
CPS
,Ja
pan
[43]
Men
:634
(25,
877)
5FF
QV
alid
ated
self
-rep
ort
M:5
6.5
331
vs.2
45(0
.89
(0.7
2,1.
10))
Cru
deW
omen
:480
(33,
919)
F:57
.331
4vs
.248
(0.7
6(0
.59,
0.98
))
Vill
egas
,200
9,SW
HS,
Chi
na[2
0]22
70(6
4,19
0)7
Val
idat
edFF
QSe
lf-r
epor
tF:
51.0
318
vs.2
14(0
.86
(0.7
5,0.
97))
Age
,ene
rgy
inta
ke,W
HR
,sm
okin
g,al
coho
l,ph
ysic
alac
tivi
ty,
inco
me,
educ
atio
nle
vel,
occu
pati
on,h
yper
tens
ion
Schu
lze,
2007
,EPI
C,
Ger
man
y[1
9]84
4(2
7,55
0)7
Val
idat
edFF
QV
alid
ated
self
-rep
ort
Man
dF,
49.6
359
vs.2
98(0
.75
(0.6
0,0.
94))
Cru
de
Liu,
2006
,WH
S,U
.S.[
42]
651
(14,
874)
10V
alid
ated
FFQ
Val
idat
edse
lf-r
epor
tF:
54.5
340
vs.3
07(0
.88
(0.7
6,1.
04))
Cru
de
Pere
ira,
2006
,IW
HS,
U.S
.[49
]14
15(2
8,81
2)11
FFQ
Val
idat
edse
lf-r
epor
tF:
61.3
334
vs.2
81(0
.60
(0.4
7,0.
76))
Cru
de
12
Books
MDPI

Nutrients 2016, 8, 739
Ta
ble
1.
Con
t.
van
Dam
,200
6,BW
HS,
U.S
.[18
]19
64(4
1,18
6)8
Val
idat
edFF
QV
alid
ated
self
-rep
ort
F:38
.724
4vs
.115
(0.6
5(0
.54,
0.78
))A
ge,e
nerg
yin
take
,BM
I,sm
okin
g,al
coho
l,ph
ysic
alac
tivi
ty,
fam
ilydi
abet
eshi
stor
y,ed
ucat
ion
leve
l,ca
lciu
m,c
offe
e,su
gar,
soft
drin
k,pr
oces
sed
mea
t,re
dm
eat
Pitt
as,2
006,
NH
S,U
.S.[
44]
4843
(83,
779)
20FF
QV
alid
ated
self
-rep
ort
F:46
.131
3vs
.281
(0.7
9(0
.64,
0.96
))C
rude
Song
,200
4,W
HS,
U.S
.[45
]70
8(1
4,92
4)8.
8V
alid
ated
FFQ
Val
idat
edse
lf-r
epor
tF:
53.9
377
vs.3
05(0
.47
(0.4
1,0.
55))
Cru
de
Song
2004
,WH
S,U
.S.[
17]
918
(38,
025)
6V
alid
ated
FFQ
Val
idat
edse
lf-r
epor
tF:
53.9
399
vs.2
52(0
.88
(0.7
1,1.
1))
Age
,sm
okin
g,BM
I,ex
erci
se,a
lcoh
ol,f
amily
hist
ory
ofdi
abet
esan
dto
talc
alor
ies
Fir
stA
uth
or,
Ye
ar,
Stu
dy,
Co
un
try
No
.o
fC
ase
(Co
ho
rtS
ize
)Y
ea
rso
fF
oll
ow
-Up
Die
tary
Ass
ess
me
nt
Me
tho
d
Ca
seA
sce
rta
inm
en
t
Se
x,
Me
an
Ag
ea
tB
ase
lin
e(Y
ea
rs)
Ma
gn
esi
um
Inta
ke
(Ma
gn
esi
um
/Da
y)
for
Hig
he
stv
s.th
eL
ow
est
Qu
an
tile
[RR
(95
%C
I)]
Co
nfo
un
de
rsA
dju
ste
dfo
r
Lope
z-R
idau
ra,
2004
,NH
S,U
.S.[
16]
4085
(85,
060)
18FF
QV
alid
ated
self
-rep
ort
F:46
.137
3vs
.222
([0.
73(0
.65,
0.82
))A
ge,e
nerg
y,fa
mily
hist
ory
ofdi
abet
es,B
MI,
phys
ical
acti
vity
,sm
okin
g,al
coho
l,hy
pert
ensi
on,h
yper
chol
este
role
mia
,oth
erdi
etar
yva
riab
les
Lope
z-R
idau
ra,
2004
,HPF
S,U
.S.
[16]
1333
(42,
872)
12FF
QV
alid
ated
self
-rep
ort
M:5
3.3
457
vs.2
70(0
.72
(0.5
8,0.
89))
Age
,ene
rgy,
fam
ilyhi
stor
yof
diab
etes
,BM
I,ph
ysic
alac
tivi
ty,
smok
ing,
alco
hol,
hype
rten
sion
,hyp
erch
oles
tero
lem
ia,o
ther
diet
ary
vari
able
s
Hod
ge,2
004,
MC
CS,
Ital
y[1
5]36
5(3
1,64
1)4
FFQ
Val
idat
edse
lf-r
epor
tM
and
F,54
.5Pe
r50
0m
agne
sium
incr
emen
t(0.
73(0
.51,
1.04
))
Age
,sex
,cou
ntry
ofbi
rth,
phys
ical
acti
vity
,fam
ilyhi
stor
yof
diab
etes
,alc
ohol
,edu
cati
on,w
eigh
tcha
nge,
ener
gyin
take
,BM
Ian
dW
HR
Schu
lze,
2003
,NH
SII
,U.S
.[46
]74
1(9
2,14
6)8
Val
idat
edFF
QV
alid
ated
self
-rep
ort
F:36
.034
1vs
.281
[0.2
6(0
.20,
0.36
))C
rude
Liu,
2000
,NH
S,U
.S.[
47]
1879
(75,
521)
10V
alid
ated
FFQ
Val
idat
edse
lf-r
epor
tF:
56.5
342
vs.2
48(1
.04
(0.9
0,1.
19))
Cru
de
Mey
er,2
000,
IWH
S,U
.S.[
14]
1141
(35,
988)
6FF
QV
alid
ated
self
-rep
ort
F:61
.536
2vs
.220
(0.6
7(0
.55,
0.82
))A
ge,t
otal
ener
gyin
take
,BM
I,W
TH
rati
o,ed
ucat
ion,
smok
ing,
alco
holi
ntak
e,ph
ysic
alac
tivi
ty
Kao
,199
9,A
RIC
,U
.S.[
13]
Whi
tepe
ople
:739
(950
6)6
FFQ
Val
idat
edse
lf-r
epor
t
Man
dF,
54.2
418
vs.3
08(1
.25
(0.8
8,0.
1.78
))A
ge,s
exed
ucat
ion,
fam
ilyhi
stor
yof
diab
etes
,BM
I,W
HR
,ph
ysic
alac
tivi
ty,a
lcoh
ol,d
iure
tic
use,
diet
ary
calc
ium
,pot
assi
um,
fast
ing
insu
linan
dgl
ucos
eBl
ack
peop
le:3
67(2
622)
Man
dF,
53.0
374
vs.2
64(1
.05
(0.5
8,1.
93))
Salm
eron
,199
7,H
PFS,
U.S
.[48
]52
3(4
2,75
9)6
FFQ
Val
idat
edse
lf-r
epor
tM
:53.
346
1vs
.262
(0.7
2(0
.54,
0.96
))A
ge,B
MI,
alco
hol,
smok
ing,
phys
ical
acti
vity
,fa
mily
hist
ory
ofdi
abet
es
Salm
eron
,199
7,N
HS,
U.S
.[54
]91
5(6
5,17
3)6
FFQ
Val
idat
edse
lf-r
epor
tF:
46.1
338
vs.2
22(0
.62
(0.5
0,0.
78))
Age
,BM
I,al
coho
l,sm
okin
g,ph
ysic
alac
tivi
ty,
fam
ilyhi
stor
yof
diab
etes
*Si
mpl
eri
skra
tio
wit
hout
any
adju
stm
ent.
13
Books
MDPI

Nutrients 2016, 8, 739
Figure 1. Screening and selection of articles on dietary magnesium intake and risk of type 2diabetes mellitus.
3.2. Dietary Magnesium Intake and Type 2 Diabetes Mellitus (T2D) Incidence
We divided the increment of dietary magnesium intake into four categories, i.e., <50 mg/day,50–99 mg/day, 100–149 mg/day and ≥150 mg/day, by subtracting the reference doses from thecompared doses. Heterogeneity was found by Higgins’s test, with I2 = 73.3% (p < 0.001) for allcompared doses, and 67.2% (p < 0.001), 75.0% (p < 0.001), 52.3% (p = 0.005) and 54.5% (p = 0.031) forfour increment categories, respectively. However, the approximately symmetric funnel plot of allbut four doses suggests a moderate homogeneity among the studies (Figure 2). Although there isevidence of publication bias among all compared doses for Egger’s test (p = 0.002), Begg’s, Harbord’sand Peters’s tests show no evidence of publication bias (p = 0.170, 0.401 and 0.105, respectively).
Figure 2. Funnel plot with pseudo 95% confidence limits.
14
Books
MDPI

Nutrients 2016, 8, 739
The overall combined RR for T2D incidence is 0.83 (95% CI: 0.80, 0.86; p < 0.001) for all compareddoses. The results of subgroup analysis are presented in Table 2. A statistically significant negativeassociation between dietary magnesium and risk of T2D incidence was observed across sexes andthe pooled RRs are 0.81 (95% CI: 0.77, 0.86) for women, 0.84 (95% CI: 0.80, 0.88) for men, and 0.85(95% CI: 0.78, 0.94) for the studies that only reported sex-combined risk estimates. The associationwas statistically significant in all the study areas and the largest magnitude association was foundamong U.S. studies (pooled RR = 0.82 in U.S. vs. 0.86 in Europe and 0.85 in Asia), compared with theunadjusted associations (pooled RR = 0.81; 95% CI: 0.74, 0.88), with lower magnitude after adjustment(pooled RR = 0.83; 95% CI: 0.81, 0.86). Two studies investigated the association specially in black peopleand showed a statistically significant association (pooled RR = 0.82; 95% CI: 0.71, 0.94), however, itseems this is mainly observed among black women [18] rather than black men [13].
Table 2. Pooled RRs * for T2D incidence of increased dietary magnesium intake by sex, areaand adjustment.
SubgroupNo. of Studies (Dose
Quantiles)RR (95% CI) I2 (%) Heterogeneity-p
Sex
Women 17 (58) 0.814 (0.774, 0.856) 82.4 <0.001Men 7 (25) 0.838 (0.803, 0.876) 25.7 0.120Both 7 (26) 0.854 (0.775, 0.941) 46.7 0.005
Area
U.S. 16 (67) 0.817 (0.780, 0.857) 81.7 <0.001Europe 2 (5) 0.858 (0.774, 0.951) 0 0.498
Asia 7 (37) 0.846 (0.811, 0.883) 10.2 0.294
Adjustment
Adjusted † 16 (76) 0.830 (0.806, 0.855) 39.6 <0.001Crude ‡ 9 (33) 0.808 (0.741, 0.881) 87.8 <0.001
Black people 2 (7) 0.815 (0.711, 0.935) 59.3 0.022
* Random-effects model was used; † Adjusted for age, BMI, energy intake, smoking, alcohol, physicalactivity, calcium, sugar, soft drink, red meat family and/or other dietary intakes, and/or family history,sociodemographic factors; ‡ Simple risk ratio without any adjustment.
The dose-category-specific pooled RRs for T2D incidence from the included studies are shownin Figure 3a–d, which are 0.88 (95% CI: 0.85, 0.92), 0.81 (95% CI: 0.76, 0.86), 0.77 (95% CI: 0.70,0.83) and 0.72 (95% CI: 0.61, 0.84) for increment <50 mg/day, 50–99 mg/day, 100–149 mg/dayand ≥150 mg/day, respectively. In general, the RR decreases 4% to 7% per 50 mg/day increment(equivalent to 8% to 14% per 100 mg/day increment) in dietary magnesium intake.
3.3. Linear Dose-Response Relationship
After adjusting for age and BMI in random-effects meta-regression models, a statisticallysignificant linear dose-response relationship between incremental dietary magnesium intake andT2D incidence was found across all the studies (see Table 3 and Figure 4). The RRs (95% CI) for theassociation of a 100 mg/day increment in dietary magnesium intake with T2D incidence are 0.92(95% CI: 0.85, 0.99) and 0.88 (0.80, 0.97) for including and excluding one extreme dose, respectively.The statistically significant linear dose-response relationship was also found for men (RR = 0.87; 95%CI: 0.77, 0.98) but not for women (RR = 0.88; 95% CI = 0.76, 1.02). Regarding study areas, significantlylinear dose-response relationship was only found in Asia (RR = 0.87; 95% CI: 0.77, 0.98). No significantlinear dose-response relationship was found in black people (RR = 0.75; 95% CI = 0.23, 2.41).
15
Books
MDPI

Nutrients 2016, 8, 739
Figure 3. Cont.
16
Books
MDPI

Nutrients 2016, 8, 739
Figure 3. Relative risks (RRs) for risk of T2D incidence for different dietary magnesium incrementcategories: (a) <50 mg/day; (b) 50–99 mg/day; (c) 100–159 mg/day; (d) ≥150 mg/day.
17
Books
MDPI

Nutrients 2016, 8, 739
Table 3. Estimated RRs for T2D incidence per 100 mg/day increment in dietary magnesium intake,adjusted for age and BMI.
No. of Studies (Doses) I2 (%) RR (95% CI) p-Value
All studies 25 (105) 69.72 0.916 (0.852,0.985) 0.018
All studies * 24 (104) 69.13 0.882 (0.803,0.969) 0.010
Sex
Women 17 (56) 78.87 0.879 (0.756,1.023) 0.094
Men 7 (23) 0 0.865 (0.767,0.975) 0.020
Both 7 (26) 26.51 0.935 (0.853,1.026) 0.148
Both * 6 (25) 29.00 0.857 (0.695,1.057) 0.141
Area
U.S. 16 (63) 79.09 0.910 (0.796,1.042) 0.169
Europe 2 (5) 0 1.071 (0.264,4.351) 0.644
Europe * 1 (4) - - -
Asia 7 (37) 0 0.867 (0.768,0.978) 0.022
Adjustment
Adjusted 16 (72) 25.73 0.911 (0.864,0.961) 0.001
Adjusted * 15 (71) 24.09 0.885 (0.830,0.944) <0.001
Crude 9 (33) 85.14 0.653 (0.462,0.924) 0.018
Black people 2 (7) 0 0.747 (0.232,2.409) 0.486
* One extreme dose was excluded.
18
Books
MDPI

Nutrients 2016, 8, 739
Figure 4. Dose-response relationship between risk of T2D incidence and incremental dietarymagnesium intake (excluding one extreme dose). The size of the bubble reflects the study-specificanalytical weight, i.e., the inverse of the variance.
In general, the risk of T2D incidence decreases by 8% (across all studies) to 13% (in the Asianpopulation) per 100 mg/day increment in dietary magnesium intake, which is consistent with theresult from dose-category-specific analysis.
3.4. Nonlinear Dose-Response Relationship
We found no evidence of nonlinear associations between dietary magnesium intake and T2Dincidence across all the studies with (p = 0.665) or without (p = 0.980) one extreme dose (Figure 5),adjusting for age and BMI. For subgroup analysis, no evidence of nonlinear association was foundfor women (p = 0.637), men (p = 0.790), sex-combined (p = 0.987), black people (p = 0.787), U.S.population (p = 0.686), Asian population (p = 0.519), adjusted RRs (p = 0.663) and crude RRs (p = 0.250),which suggested that pooling the dose-response estimates from linear trend estimation for dietarymagnesium intake and T2D incidence was appropriate. Because of insufficient dose observations,no nonlinear association was evaluated for European studies.
Figure 5. Examination of nonlinear association between increment in dietary magnesium intake andrisk of T2D incidence by random-effects model with the use of restricted cubic splines.
19
Books
MDPI

Nutrients 2016, 8, 739
3.5. Sensitivity Analysis
Regarding the combined risk of T2D incidence for all studies, the sensitivity analysis omittingone study at a time yielded statistically significant RRs within a very narrow range from 0.82 (95% CI:0.79, 0.84) to 0.84 (95% CI: 0.81, 0.87). The subgroup analyses also showed robust results for women(RR range: 0.80, 0.84), men (RR range: 0.83, 0.85), sex-combined (RR range: 0.79, 0.88), U.S. population(RR range: 0.80, 0.84), Asian population (RR range: 0.83, 0.85), adjusted RRs (RR range: 0.82, 0.84)and crude RRs (RR range: 0.78, 0.86). However, because of a limited number of studies in Europeand black people, the sensitivity analysis generated relatively wide ranges for these two subgroups.The RR ranges were from 0.73 (95% CI: 0.51, 1.04) to 0.87 (95% CI: 0.78, 0.97) and from 0.76 (95% CI:0.67, 0.85) to 1.17 (95% CI: 0.88, 1.54) for European studies and black people, respectively.
The sensitivity analyses for linear and nonlinear dose-response relationships between incrementaldietary magnesium intake and the risk of T2D incidence show similar results. The RRs of lineardose-response relationship across all the studies are statistically significant and range from 0.88(95% CI: 0.80, 0.97) to 0.93 (95% CI: 0.87, 1.00) when omitting one study at a time. The p-values fora nonlinear dose-response relationship across all studies range from 0.52 to 0.96 when omitting onestudy at a time. The results for subgroup analysis also change little except for European studies andblack people (data not show). Overall, the results from sensitivity analyses indicate the robustness ofour findings.
4. Discussion
This meta-analysis of 25 prospective studies showed a statistically significant negative associationbetween dietary magnesium intake and T2D incidence. Compared with the lowest dietary magnesiumconsumption groups in the populations, the risk of T2D could be reduced by 19% in women and 16% inmen (Table 2). The largest reduction of risk was observed for the U.S. population (18%). A statisticallysignificant linear dose-response relationship was found between incremental dietary magnesiumintake and T2D incidence across all the studies, in male and Asian populations, adjusting for ageand BMI. The risk of T2D was associated with a reduction of 8%–13% per 100 g/day increment indietary magnesium intake. After adjusting for age and BMI, we did not find a statistically significantnonlinear dose-response relationship of incremental dietary magnesium intake with T2D risk.The present systematic review, which includes a total of 637,922 participants and 26,828 T2D cases,provides the most robust evidence to date of the linear dose-response relationship between incrementaldietary magnesium intake across its physiological range and risk of T2D.
4.1. Dose-Response Association of Dietary Magnesium Intake with T2D Incidence
A putative protective effect of magnesium intake against T2D incidence has been reportedpreviously [13,14]. The negative association between magnesium intake and T2D incidence isbiologically plausible and may be partially explained by its influence on glucose metabolism, insulinsensitivity and insulin action [5,6]. However, there is no conclusive evidence for the beneficial doseof dietary magnesium. For example, a meta-analysis indicated that 300 mg/day of magnesiumintake was the essential dose for preventing T2D [27]. A cross-sectional study concluded thatmore than 300 mg/day of magnesium intake might not improve insulin sensitivity and have noinfluence [55]. Evidence from a prospective study showed that increased intake of magnesium mightprovide more benefit to participants with magnesium deficiency, as magnesium deficiency andhypomagnesaemia have been associated with the development of insulin resistance [18]. Meta-analysesof magnesium supplementation have also revealed conflicting results. A review including 12 randomizedcontrolled trials (RCTs) assessing the efficacy of magnesium supplementation on insulin sensitivityand glucose levels included studies yielding inconsistent results [56]. However, concerning the effectof dietary magnesium intake on T2D incidence, the previous meta-analyses appeared to reach aconsensus [19,25,27]. A meta-analysis of eight cohort studies showed a significant negative association(RR = 0.77; 95% CI: 0.72, 0.84). Another meta-analysis of 13 prospective cohort studies detecteda significant negative association between magnesium intake and risk of T2D (RR = 0.78; 95% CI:
20
Books
MDPI

Nutrients 2016, 8, 739
0.73, 0.84). A more recent meta-analysis with a total of 539,735 participants and 25,252 incidentdiabetes cases also indicated that magnesium intake was associated with a significant lower risk ofT2D (RR = 0.77; 95% CI: 0.71, 0.82). However, there is less conclusive evidence of dose-responserelationship between dietary magnesium intake and risk of T2D incidence [26]. By combining resultsof seven cohort studies, Larsson et al. observed a statistically significant lower risk of T2D for100 mg/day increase in magnesium intake (RR = 0.85; 95% CI: 0.79, 0.92). Dong et al. also found alinear dose-response relationship for every 100 mg/day increment in magnesium intake (RR = 0.86;95% CI: 0.82, 0.89) [25]. In contrast, a nonlinear relationship (p = 0.003) between magnesium intake andtype 2 diabetes was reported by Xu et al. [27].
Our meta-analysis with a larger number of people with T2D did support existence of a statisticallysignificant linear dose-response relationship between increased dose of dietary magnesium intake andT2D incidence among all the participants, especially in males and in Asian populations. In addition,we found no evidence of nonlinear associations between dietary magnesium intake and T2D incidenceacross all the studies (p = 0.665). The magnitude of the effect for 100 mg/day increment in magnesiumintake in this meta-analysis (8%–13% reduction in risk of T2D) is comparable to those from othermeta-analyses (8%–21% reduction in risk of T2D).
The discrepant findings between women and men might be due to the influence of other factorsthan magnesium intake. For example, the influence of magnesium on T2D incidence in women may bepotentially attenuated by changed endogenous sex hormones in postmenopausal women [57,58];which could accelerate T2D development and counteract the potentially protective influence ofmagnesium. The discrepancy between the Asian population and non-Asian population needs furtherresearch. However, because of the limited number of the included studies in Europe, the discrepancymay have been accidental and a chance finding cannot be ruled out.
It should be noted that our sensitivity analysis revealed robust associations for linear and nonlineardose-response analyses among all the participants.
4.2. Implication for Practice
Magnesium is mainly consumed through diet, and low magnesium consumption is commonworldwide. It has been estimated that magnesium intake in a normal Western diet is often inadequatefor the body’s needs; in the United States, 67% of women and 64% of men consume inadequateamounts of magnesium [59]. For people aged more than 30, the recommended dietary allowance(RDA) of magnesium for men and women is 350 mg/day and 420 mg/day, respectively [51]. On thebasis of the studies we have reviewed, current evidence from population-based prospective cohortstudies support the recommendation for increasing dietary magnesium intake.
4.3. Strengths and Limitations
The population-based evidence on whether increased magnesium intake may reduce T2Dincidence is still sparse. To our knowledge, this study is the largest meta-analysis that investigated thedose-response relationship between dietary magnesium intake and T2D risk. It has several strengths.First, our data providing a systematic review of prospective studies represent the best availableevidence of how dietary magnesium intake may influence risk of T2D incidence. Because of the laggedand cumulative effects of exposure on outcome of chronic diseases, the dose-response relationshipwithout reversed causality would be revealed only by prospective studies rather than cross-sectionalor retrospective studies. In addition, the prospective studies also minimized recall and selection bias.Second, by combining all available doses in included studies across a wide range of exposure, weincreased the validity of the dose-response estimates. Our studies included 141 dietary magnesiumdoses and 108 risk estimates, which enabled us to estimate both linear and nonlinear dose-responserelationship with a high statistical power. Third, age and BMI were adjusted for in our meta-regressionmodel and stratified analyses were used for sex, study areas and adjustment, which reduced thepotential confounding from demographic and other factors. Furthermore, the random-effects model
21
Books
MDPI

Nutrients 2016, 8, 739
considered the heterogeneity among studies, which resulted in a relatively conservative conclusionrather than an exaggerated one.
However, some limitations warrant consideration. First, although the majority of the studiesadjusted for known risk factors for T2D incidence, such as age, BMI, smoking status, education,physical activity level and alcohol consumption, we could only retrieve age and BMI for all thestudies and adjust only for them in our final model. The possible bias from residual confoundersremained. Subgroup analyses that distinguish the studies with and without adjustment for theseconfounders would be informative. For example, we conducted the subgroup analysis for the studiesadjusting for intake of cereal fiber; however, the overall RRs changed little, which were 0.892 (95% CI:0.834, 0.954) and 0.916 (95% CI: 0.852, 0.985) for adjusted and unadjusted studies, respectively. Second,the magnesium intake in these studies were only assessed by FFQ, which do not capture the magnesiumintake from drinking water and nutritional supplementation, and thereby might underestimate totalmagnesium intake and result in potential misclassification. However, the misclassification wouldmost likely lead to an underestimated association. Third, influence of other nutrients or dietarycomponents such as coffee [49], red meat [45], calcium [43] and fiber [14,19] that are correlatedwith dietary magnesium could not be excluded; other nutrients may have been responsible for theobserved association partly or completely. Finally, publication bias may be a problem in our poolinganalysis. Although we tried as much as possible to search for potential unpublished studies, no validstudies were identified from the available grey literature resources. However, the evidence (Harbord’sp = 0.401) did not indicate notable publication bias in our meta-analysis.
5. Conclusions
In conclusion, results from this meta-analysis indicate that dietary magnesium intake is associatedwith a reduced risk of type 2 diabetes (T2D). The greatest magnitude in risk reduction was found inthe US population. A statistically significant linear dose-response relationship was identified across allthe studies, and the largest magnitude association was found in the Asian population. A 100 mg/dayincrement in dietary magnesium intake was associated with an 8%–13% reduction in risk of T2D.No nonlinear dose-response relationship was found between incremental dietary magnesium intakeand T2D incidence. Regarding the dose-response relationship between dietary magnesium intake andT2D in populations in Africa and Europe, more evidence is needed.
Acknowledgments: X.F. is supported by the Karolinska Institutet doctoral research grant (KID-funds).Y.C. is supported by the Junior Faculty Research Grants (C62412022) of the Institute of Environmental Medicine,Karolinska Institutet, Sweden.
Author Contributions: Y.C. and J.A. designed the research; X.F. and J.H. provided study oversight and tookprimary responsibility for the final content of the manuscript; X.F., C.L. and M.L. undertook literature search,screening and data extraction; X.F. and H.H. performed statistical analysis; X.F. drafted the manuscript; Z.F. andS.M. revised the article critically; and all authors contributed to the manuscript writing, made critical revision,read and approved the final manuscript.
Conflicts of Interest: The authors declare no conflict of interest.
Abbreviations
CI Confidence intervalFFQ Food frequency questionnairesHR Hazard ratioOR Odds ratioRCT Randomized controlled trialREML Restricted maximum likelihoodRR Relative riskT2D Type 2 diabetesUS United States
22
Books
MDPI

Nutrients 2016, 8, 739
References
1. Shaw, J.E.; Sicree, R.A.; Zimmet, P.Z. Global estimates of the prevalence of diabetes for 2010 and 2030.Diabetes Res. Clin. Pract. 2010, 87, 4–14. [CrossRef] [PubMed]
2. Shi, Y.; Hu, F.B. The global implications of diabetes and cancer. Lancet 2014, 383, 1947–1948. [CrossRef]3. Colditz, G.A.; Manson, J.E.; Stampfer, M.J.; Rosner, B.; Willett, W.C.; Speizer, F.E. Diet and risk of clinical
diabetes in women. Am. J. Clin. Nutr. 1992, 55, 1018–1023. [PubMed]4. Knowler, W.C.; Barrett-Connor, E.; Fowler, S.E.; Hamman, R.F.; Lachin, J.M.; Walker, E.A.; Nathan, D.M.
Reduction in the incidence of type 2 diabetes with lifestyle intervention or metformin. N. Engl. J. Med. 2002,346, 393–403. [PubMed]
5. Barbagallo, M.; Dominguez, L.J. Magnesium metabolism in type 2 diabetes mellitus, metabolic syndromeand insulin resistance. Arch. Biochem. Biophys. 2007, 458, 40–47. [CrossRef] [PubMed]
6. Balon, T.W.; Jasman, A.; Scott, S.; Meehan, W.P.; Rude, R.K.; Nadler, J.L. Dietary magnesium preventsfructose-induced insulin insensitivity in rats. Hypertension 1994, 23, 1036–1039. [CrossRef] [PubMed]
7. Hruby, A.; Meigs, J.B.; O’Donnell, C.J.; Jacques, P.F.; McKeown, N.M. Higher magnesium intake reduces riskof impaired glucose and insulin metabolism and progression from prediabetes to diabetes in middle-agedAmericans. Diabetes Care 2014, 37, 419–427. [CrossRef] [PubMed]
8. Bo, S.; Pisu, E. Role of dietary magnesium in cardiovascular disease prevention, insulin sensitivity anddiabetes. Curr. Opin. Lipidol. 2008, 19, 50–56. [CrossRef] [PubMed]
9. Barbagallo, M.; Dominguez, L.J.; Galioto, A.; Ferlisi, A.; Cani, C.; Malfa, L.; Pineo, A.; Busardo, A.; Paolisso, G.Role of magnesium in insulin action, diabetes and cardio-metabolic syndrome X. Mol. Asp. Med. 2003, 24,39–52. [CrossRef]
10. Ramadass, S.; Basu, S.; Srinivasan, A.R. Serum magnesium levels as an indicator of status of diabetes mellitustype 2. Diabetes Metab. Syndr. 2015, 9, 42–45. [CrossRef] [PubMed]
11. Ma, J.; Folsom, A.R.; Melnick, S.L.; Eckfeldt, J.H.; Sharrett, A.R.; Nabulsi, A.A.; Hutchinson, R.G.; Metcalf, P.A.Associations of serum and dietary magnesium with cardiovascular disease, hypertension, diabetes,insulin, and carotid arterial wall thickness: The aric study. Atherosclerosis risk in communities study.J. Clin. Epidemiol. 1995, 48, 927–940. [CrossRef]
12. Del Gobbo, L.C.; Song, Y.; Poirier, P.; Dewailly, E.; Elin, R.J.; Egeland, G.M. Low serum magnesiumconcentrations are associated with a high prevalence of premature ventricular complexes in obese adultswith type 2 diabetes. Cardiovasc. Diabetol. 2012, 11, 23. [CrossRef] [PubMed]
13. Kao, W.H.; Folsom, A.R.; Nieto, F.J.; Mo, J.P.; Watson, R.L.; Brancati, F.L. Serum and dietary magnesium andthe risk for type 2 diabetes mellitus: The atherosclerosis risk in communities study. Arch. Intern. Med. 1999,159, 2151–2159. [CrossRef] [PubMed]
14. Meyer, K.A.; Kushi, L.H.; Jacobs, D.R., Jr.; Slavin, J.; Sellers, T.A.; Folsom, A.R. Carbohydrates, dietary fiber,and incident type 2 diabetes in older women. Am. J. Clin. Nutr. 2000, 71, 921–930. [PubMed]
15. Hodge, A.M.; English, D.R.; O’Dea, K.; Giles, G.G. Glycemic index and dietary fiber and the risk of type 2diabetes. Diabetes Care 2004, 27, 2701–2706. [CrossRef] [PubMed]
16. Lopez-Ridaura, R.; Willett, W.C.; Rimm, E.B.; Liu, S.; Stampfer, M.J.; Manson, J.E.; Hu, F.B. Magnesiumintake and risk of type 2 diabetes in men and women. Diabetes Care 2004, 27, 134–140. [CrossRef] [PubMed]
17. Song, Y.; Manson, J.E.; Buring, J.E.; Liu, S. Dietary magnesium intake in relation to plasma insulin levels andrisk of type 2 diabetes in women. Diabetes Care 2004, 27, 59–65. [CrossRef] [PubMed]
18. Van Dam, R.M.; Hu, F.B.; Rosenberg, L.; Krishnan, S.; Palmer, J.R. Dietary calcium and magnesium, majorfood sources, and risk of type 2 diabetes in U.S. black women. Diabetes Care 2006, 29, 2238–2243. [CrossRef][PubMed]
19. Schulze, M.B.; Schulz, M.; Heidemann, C.; Schienkiewitz, A.; Hoffmann, K.; Boeing, H. Fiber and magnesiumintake and incidence of type 2 diabetes: A prospective study and meta-analysis. Arch. Intern. Med. 2007, 167,956–965. [CrossRef] [PubMed]
20. Villegas, R.; Gao, Y.T.; Dai, Q.; Yang, G.; Cai, H.; Li, H.; Zheng, W.; Shu, X.O. Dietary calcium and magnesiumintakes and the risk of type 2 diabetes: The Shanghai women’s health study. Am. J. Clin. Nutr. 2009, 89,1059–1067. [CrossRef] [PubMed]
23
Books
MDPI

Nutrients 2016, 8, 739
21. Hopping, B.N.; Erber, E.; Grandinetti, A.; Verheus, M.; Kolonel, L.N.; Maskarinec, G. Dietary fiber,magnesium, and glycemic load alter risk of type 2 diabetes in a multiethnic cohort in Hawaii. J. Nutr.2010, 140, 68–74. [CrossRef] [PubMed]
22. Kim, D.J.; Xun, P.; Liu, K.; Loria, C.; Yokota, K.; Jacobs, D.R., Jr.; He, K. Magnesium intake in relation tosystemic inflammation, insulin resistance, and the incidence of diabetes. Diabetes Care 2010, 33, 2604–2610.[CrossRef] [PubMed]
23. Kirii, K.; Iso, H.; Date, C.; Fukui, M.; Tamakoshi, A. Magnesium intake and risk of self-reported type 2diabetes among Japanese. J. Am. Coll. Nutr. 2010, 29, 99–106. [CrossRef] [PubMed]
24. Nanri, A.; Mizoue, T.; Noda, M.; Takahashi, Y.; Kirii, K.; Inoue, M.; Tsugane, S.; Japan Public HealthCenter-based Prospective Study Group. Magnesium intake and type ii diabetes in japanese men and women:The Japan public health center-based prospective study. Eur. J. Clin. Nutr. 2010, 64, 1244–1247. [CrossRef][PubMed]
25. Dong, J.Y.; Xun, P.; He, K.; Qin, L.Q. Magnesium intake and risk of type 2 diabetes: Meta-analysis ofprospective cohort studies. Diabetes Care 2011, 34, 2116–2122. [CrossRef] [PubMed]
26. Larsson, S.C.; Wolk, A. Magnesium intake and risk of type 2 diabetes: A meta-analysis. J. Intern. Med. 2007,262, 208–214. [CrossRef] [PubMed]
27. Xu, T.; Chen, G.C.; Zhai, L.; Ke, K.F. Nonlinear reduction in risk for type 2 diabetes by magnesium intake:An updated meta-analysis of prospective cohort studies. Biomed. Environ. Sci. 2015, 28, 527–534. [PubMed]
28. Liberati, A.; Altman, D.G.; Tetzlaff, J.; Mulrow, C.; Gotzsche, P.C.; Ioannidis, J.P.A.; Clarke, M.; Devereaux, P.J.;Kleijnen, J.; Moher, D. The PRISMA statement for reporting systematic reviews and meta-analyses of studiesthat evaluate health care interventions: Explanation and elaboration. PLoS Med. 2009, 6, e1000100. [CrossRef][PubMed]
29. Stroup, D.F.; Berlin, J.A.; Morton, S.C.; Olkin, I.; Williamson, G.D.; Rennie, D.; Moher, D.; Becker, B.J.;Sipe, T.A.; Thacker, S.B. Meta-analysis of observational studies in epidemiology: A proposal for reporting.Meta-analysis of observational studies in epidemiology (MOOSE) group. JAMA 2000, 283, 2008–2012.[CrossRef] [PubMed]
30. Gargon, E.; Williamson, P.R.; Clarke, M. Collating the knowledge base for core outcome set development:Developing and appraising the search strategy for a systematic review. BMC Med. Res. Methodol. 2015, 15, 26.[CrossRef] [PubMed]
31. Sanderson, S.; Tatt, I.D.; Higgins, J.P. Tools for assessing quality and susceptibility to bias in observationalstudies in epidemiology: A systematic review and annotated bibliography. Int. J. Epidemiol. 2007, 36, 666–676.[CrossRef] [PubMed]
32. Carletta, J. Assessing agreement on classification tasks: The kappa statistic. Comput. Linguist. 1996, 22,249–254.
33. Rothman, K.J.; Greenland, S.; Lash, T.L. Modern Epidemiology; Lippincott Williams & Wilkins: Philadelphia,PA, USA, 2008.
34. Harbord, R.M.; Higgins, J.P.T. Meta-regression in Stata. Stata J. 2008, 8, 493–519.35. Higgins, J.P.; Thompson, S.G. Quantifying heterogeneity in a meta-analysis. Stat. Med. 2002, 21, 1539–1558.
[CrossRef] [PubMed]36. Egger, M.; Davey, S.G.; Schneider, M.; Minder, C. Bias in meta-analysis detected by a simple, graphical test.
BMJ 1997, 315, 629–634. [CrossRef] [PubMed]37. Harbord, R.M.; Egger, M.; Sterne, J.A. A modified test for small-study effects in meta-analyses of controlled
trials with binary endpoints. Stat. Med. 2006, 25, 3443–3457. [CrossRef] [PubMed]38. Begg, C.B.; Mazumdar, M. Operating characteristics of a rank correlation test for publication bias. Biometrics
1994, 50, 1088–1101. [CrossRef] [PubMed]39. Peters, J.L.; Sutton, A.J.; Jones, D.R.; Abrams, K.R.; Rushton, L. Comparison of two methods to detect
publication bias in meta-analysis. JAMA 2006, 295, 676–680. [CrossRef] [PubMed]40. Harrell, F.E., Jr.; Lee, K.L.; Pollock, B.G. Regression models in clinical studies: Determining relationships
between predictors and response. J. Natl. Cancer Inst. 1988, 80, 1198–1202. [CrossRef] [PubMed]41. Jackson, D.; White, I.R.; Thompson, S.G. Extending dersimonian and laird’s methodology to perform
multivariate random effects meta-analyses. Stat. Med. 2010, 29, 1282–1297. [CrossRef] [PubMed]42. Liu, S.; Choi, H.K.; Ford, E.; Song, Y.; Klevak, A.; Buring, J.E.; Manson, J.E. A prospective study of dairy
intake and the risk of type 2 diabetes in women. Diabetes Care 2006, 29, 1579–1584. [CrossRef] [PubMed]
24
Books
MDPI

Nutrients 2016, 8, 739
43. Kirii, K.; Mizoue, T.; Iso, H.; Takahashi, Y.; Kato, M.; Inoue, M.; Noda, M.; Tsugane, S. Calcium, vitamin Dand dairy intake in relation to type 2 diabetes risk in a Japanese cohort. Diabetologia 2009, 52, 2542–2550.[CrossRef] [PubMed]
44. Pittas, A.G.; Dawson-Hughes, B.; Li, T.; Van Dam, R.M.; Willett, W.C.; Manson, J.E.; Hu, F.B. Vitamin D andcalcium intake in relation to type 2 diabetes in women. Diabetes Care 2006, 29, 650–656. [CrossRef] [PubMed]
45. Song, Y.; Manson, J.E.; Buring, J.E.; Liu, S. A prospective study of red meat consumption and type 2 diabetesin middle-aged and elderly women: The women’s health study. Diabetes Care 2004, 27, 2108–2115. [CrossRef][PubMed]
46. Schulze, M.B.; Manson, J.E.; Willett, W.C.; Hu, F.B. Processed meat intake and incidence of type 2 diabetes inyounger and middle-aged women. Diabetologia 2003, 46, 1465–1473. [CrossRef] [PubMed]
47. Liu, S.; Manson, J.E.; Stampfer, M.J.; Hu, F.B.; Giovannucci, E.; Colditz, G.A.; Hennekens, C.H.; Willett, W.C.A prospective study of whole-grain intake and risk of type 2 diabetes mellitus in US women. Am. J. PublicHealth 2000, 90, 1409–1415. [PubMed]
48. Salmeron, J.; Ascherio, A.; Rimm, E.B.; Colditz, G.A.; Spiegelman, D.; Jenkins, D.J.; Stampfer, M.J.; Wing, A.L.;Willett, W.C. Dietary fiber, glycemic load, and risk of NIDDM in men. Diabetes Care 1997, 20, 545–550.[CrossRef] [PubMed]
49. Pereira, M.A.; Parker, E.D.; Folsom, A.R. Coffee consumption and risk of type 2 diabetes mellitus: An 11-yearprospective study of 28,812 postmenopausal women. Arch. Intern. Med. 2006, 166, 1311–1316. [CrossRef][PubMed]
50. Oba, S.; Nanri, A.; Kurotani, K.; Goto, A.; Kato, M.; Mizoue, T.; Noda, M.; Inoue, M.; Tsugane, S. Dietaryglycemic index, glycemic load and incidence of type 2 diabetes in japanese men and women: The Japanpublic health center-based prospective study. Nutr. J. 2013, 12, 165. [CrossRef] [PubMed]
51. He, K.; Song, Y.; Belin, R.J.; Chen, Y. Magnesium intake and the metabolic syndrome: Epidemiologic evidenceto date. J. Cardiometab. Syndr. 2006, 1, 351–355. [CrossRef] [PubMed]
52. Hata, A.; Doi, Y.; Ninomiya, T.; Mukai, N.; Hirakawa, Y.; Hata, J.; Ozawa, M.; Uchida, K.; Shirota, T.;Kitazono, T.; et al. Magnesium intake decreases type 2 diabetes risk through the improvement of insulinresistance and inflammation: The Hisayama study. Diabet. Med. 2013, 30, 1487–1494. [CrossRef] [PubMed]
53. Weng, L.C.; Lee, N.J.; Yeh, W.T.; Ho, L.T.; Pan, W.H. Lower intake of magnesium and dietary fiber increasesthe incidence of type 2 diabetes in Taiwanese. J. Formos. Med. Assoc. 2012, 111, 651–659. [CrossRef] [PubMed]
54. Salmeron, J.; Manson, J.E.; Stampfer, M.J.; Colditz, G.A.; Wing, A.L.; Willett, W.C. Dietary fiber, glycemicload, and risk of non-insulin-dependent diabetes mellitus in women. JAMA 1997, 277, 472–477. [CrossRef][PubMed]
55. Ma, B.; Lawson, A.B.; Liese, A.D.; Bell, R.A.; Mayer-Davis, E.J. Dairy, magnesium, and calcium intake inrelation to insulin sensitivity: Approaches to modeling a dose-dependent association. Am. J. Epidemiol. 2006,164, 449–458. [CrossRef] [PubMed]
56. Rodriguez-Moran, M.; Simental, M.L.; Zambrano, G.G.; Guerrero-Romero, F. The role of magnesium in type2 diabetes: A brief based-clinical review. Magnes. Res. 2011, 24, 156–162. [PubMed]
57. Meisinger, C.; Thorand, B.; Schneider, A.; Stieber, J.; Doring, A.; Lowel, H. Sex differences in risk factors forincident type 2 diabetes mellitus: The MONICA Augsburg cohort study. Arch. Intern. Med. 2002, 162, 82–89.[CrossRef] [PubMed]
58. Kalyani, R.R.; Franco, M.; Dobs, A.S.; Ouyang, P.; Vaidya, D.; Bertoni, A.; Gapstur, S.M.; Golden, S.H.The association of endogenous sex hormones, adiposity, and insulin resistance with incident diabetes inpostmenopausal women. J. Clin. Endocrinol. Metab. 2009, 94, 4127–4135. [CrossRef] [PubMed]
59. Moshfegh, A.; Goldman, J.; Cleveland, L. What We Eat in America, NHANES 2001–2002: Usual Nutrient Intakesfrom Food Compared to Dietary References Intake; Agricultural Research Service, U.S. Department of Agriculture:Washington, DC, USA, 2005; pp. 1–56.
© 2016 by the authors. Licensee MDPI, Basel, Switzerland. This article is an open accessarticle distributed under the terms and conditions of the Creative Commons Attribution(CC BY) license (http://creativecommons.org/licenses/by/4.0/).
25
Books
MDPI

nutrients
Article
The Effect of Selenium Supplementation on GlucoseHomeostasis and the Expression of Genes Related toGlucose Metabolism
Ewa Jablonska 1,*, Edyta Reszka 1, Jolanta Gromadzinska 2, Edyta Wieczorek 1,
Magdalena B. Krol 2, Sara Raimondi 3, Katarzyna Socha 4, Maria H. Borawska 4
and Wojciech Wasowicz 2
1 Nofer Institute of Occupational Medicine, Department of Toxicology and Carcinogenesis, Sw. Teresy 8 Street,91-348 Lodz, Poland; [email protected] (E.R.); [email protected] (E.W.)
2 Nofer Institute of Occupational Medicine, Department of Biological and Environmental Monitoring,Sw. Teresy 8 Street, 91-348 Lodz, Poland; [email protected] (J.G.);[email protected] (M.B.K.); [email protected] (W.W.)
3 European Institute of Oncology, Division of Epidemiology and Biostatistics, via Ripamonti 435,Milan 20139, Italy; [email protected]
4 The Medical University of Bialystok, Department of Bromatoloy, A. Mickiewicza 2D Street,15-222 Bialystok, Poland; [email protected] (K.S.); [email protected] (M.H.B.)
* Correspondence: [email protected]; Tel.: +48-42-631-4612
Received: 10 October 2016; Accepted: 24 November 2016; Published: 13 December 2016
Abstract: The aim of the study was to evaluate the effect of selenium supplementation on theexpression of genes associated with glucose metabolism in humans, in order to explain the unclearrelationship between selenium and the risk of diabetes. For gene expression analysis we used archivalsamples of cDNA from 76 non-diabetic subjects supplemented with selenium in the previous study.The supplementation period was six weeks and the daily dose of selenium was 200 μg (as seleniumyeast). Blood for mRNA isolation was collected at four time points: before supplementation, after twoand four weeks of supplementation, and after four weeks of washout. The analysis included 15 genesencoding selected proteins involved in insulin signaling and glucose metabolism. In addition,HbA1c and fasting plasma glucose were measured at three and four time points, respectively.Selenium supplementation was associated with a significantly decreased level of HbA1c but notfasting plasma glucose (FPG) and significant down-regulation of seven genes: INSR, ADIPOR1, LDHA,PDHA, PDHB, MYC, and HIF1AN. These results suggest that selenium may affect glycemic controlat different levels of regulation, linked to insulin signaling, glycolysis, and pyruvate metabolism.Further research is needed to investigate mechanisms of such transcriptional regulation and itspotential implication in direct metabolic effects.
Keywords: selenium; gene expression; insulin signaling; glucose metabolism; glycolysis; pyruvatemetabolism; energy metabolism; glycated hemoglobin; fasting plasma glucose
1. Introduction
Selenium (Se) is a trace element with multiple biological functions. The majority of studiesrelated to this nutrient and human health were devoted to its potential anticancer activity andchemoprevention based on Se supplementation [1–3]. However recent scientific focus has beenswitched towards possible harmful effects of Se supplementation, especially in terms of its unclearlink with glucose metabolism and diabetes [4–6]. The increased risk of diabetes type II (T2DM)in humans associated with elevated Se status has been suggested for the first time on the basis ofreanalysis of a placebo-controlled randomized trial (NPC, Nutritional Prevention of Cancer) conducted
Nutrients 2016, 8, 772 26 www.mdpi.com/journal/nutrients
Books
MDPI

Nutrients 2016, 8, 772
in the USA in the years 1983–1991 in a group of 1312 subjects. In that study, there was a significantincrease in the risk of diabetes among Se-supplemented subjects who had the highest Se status(plasma concentration >121.6 ng/mL) before supplementation (Risk Ratio (RR) = 2.40; p = 0.01) [7].In another American study (SELECT, Selenium and Vitamin E Cancer Prevention Trial) conducted in35,533 individuals, there was a non-significant increase in the risk of diabetes among Se- supplementedarm (RR = 1.07%, p = 0.16) [8]. Results of this large and well-designed, randomized, placebo-controlledtrial generated much controversy and up to now, no clear conclusion have been made with respect to thepotentially diabetogenic properties of Se. Several observational studies, as well as Se supplementationtrials, in which the association between Se status/Se intake and the risk of diabetes or markers ofglucose metabolism has been investigated, generated inconsistent results [4,9–12]. On the other hand,animal studies indicated that Se supplementation may lead to hyperinsulinemia, insulin resistance,and glucose intolerance [13]. To complicate this, previous in vivo studies indicated protective role ofSe in diabetes [14,15]. The link between Se and glucose seems very complex and is supposed to bereflected by a non-linear U-shaped dose-response relationship [16].
The insights from experimental studies in animals indicate that Se is involved in glucosemetabolism via Se-dependent proteins (selenoproteins), which possess redox properties. It is assumedthat they may influence the insulin-dependent metabolic pathways, because both insulin release andinsulin signaling are regulated by the cellular redox potential [17]. In particular, the essential role inthe regulation of both processes is attributed to hydrogen peroxide, which is one of the reactive oxygenspecies produced inter alia by dismutation of superoxide anion radical (catalyzed by superoxidedismutase, SOD). Hydrogen peroxide is reduced to water with the participation of enzymes, such asSe-dependent glutathione peroxidase (GPx) and catalase (CAT). The role of GPx in the metabolismof insulin appears to be significant and complex, which is reflected by a relatively low expression ofmRNA for GPx1 and its low enzymatic activity in the pancreas (1%–5% of the value observed in theliver; the study in mice) [18]. Moreover, it was shown that global overexpression of GPx1 mRNA inmice fed with a normal Se diet (0.4 mg/kg) was associated with hyperglycemia, hyperinsulinemia,and an increase in plasma leptin concentrations [19]. Another selenoprotein potentially importantin the etiology of diabetes is selenoprotein P (Sepp1) which is produced mainly in the liver andsecreted into plasma, acting as a Se transporter, and having also antioxidant properties. Misu et al.observed a positive correlation between the level of Sepp1 mRNA and insulin resistance in humans [20].The same authors also demonstrated in vitro that cells stimulated exogenously with purified Sepp1were characterized by impaired insulin signaling and impaired glucose metabolism [20]. Recently it hasbeen also observed that serum concentration of Sepp1 was positively correlated with fasting plasmaglucose (FPG) concentration (r = 0.35, p = 0.037) and negatively correlated with serum adiponectinlevels (r = −0.355, p = 0.034; r = −0.367, p = 0.028) in patients with T2DM [21].
Altogether, mechanisms of action of Se in humans at the level of glucose metabolism and itspotential role in the etiology of diabetes are unknown and point to the need for more studies relevantto human metabolism. The aim of this study was to assess the effect of Se supplementation on theexpression of genes related to glucose metabolism, including genes encoding hormones responsible forglycemic control (insulin, glucagon, leptin, and adiponectin), receptors for these hormones, enzymesinvolved in glycolysis, as well as key transcription factors involved in the regulation of glycolysis.To our knowledge this is the first study conducted in humans, which aimed to investigate morein-depth molecular effects of Se with respect to glucose homeostasis.
2. Materials and Methods
2.1. Study Design
For the purpose of this study we used archival samples of cDNA obtained from subjects whowere supplemented with Se during the trial conducted by us previously. Details of the trial, as wellas subjects’ exclusion criteria, were described elsewhere [22]. The exclusion criteria for subjects’recruitment included inter alia current smoking and self-reported prevalence of diabetes. Briefly, the 95
27
Books
MDPI

Nutrients 2016, 8, 772
non-smoking and non-diabetic individuals were supplemented with 200 μg of Se/day (in the form ofSe yeast) for six weeks and fasting blood was collected at four time points: at baseline, after two weeksof supplementation, after six weeks of supplementation, and after four weeks of washout. In thepresent study, gene expression analysis was performed with the use of cDNA obtained from 76 subjects,randomly selected out of the entire study group, including 36 males and 40 females. Table 1 presentsbasic characteristics of the subjects. Plasma Se concentration was measured previously (as describedin [22]) and mean plasma Se levels calculated for 76 subjects at each time points are presented alsoin Table 1.
Written informed consent was obtained from all the study participants and the study wasapproved by the Local Ethics Committee (Ethical Institutional Review Board at the Nofer Institute ofOccupational Medicine, Lodz, Poland, Resolution No. 3/2010).
Table 1. Basic characteristics of the study group (76 subjects supplemented with selenium).
Variable All (n = 76) Males (n = 36) Females (n = 40) p (Males vs. Females)
Age (years) 34.8 ± 10.4 35 ± 18 36 ± 18 0.7549 a
BMI (kg/m2) 24.0 ± 2.9 25.0 ± 2.7 23.0 ± 2.9 0.0009 a
Smoking, n (%)
Current 0 (0) 0 (0) 0 (0)Ever 18 (24) 8 (23) 10 (24)Never 58 (76) 27 (77) 31 (76) ns
Use of Se-containing supplements in the past 6 months, n (%)
Yes 5 (7) 3 (9) 2 (5)No 71 (93) 32 (91) 39 (95) ns
Mean plasma Se ± SD (μg/L)
Baseline 65.2 ± 16.5 65.2 ± 16.6 65.3 ± 16.5 0.9729 b
After two weeks 101.1 ± 24.5 98.7 ± 22.8 103.3 ± 26.1 0.3907 a
After six weeks 99.1 ± 20.3 95.0 ± 16.9 102.7 ± 22.4 0.0928 b
After four weeks of washout 76.5 ± 15.6 75.3 ± 15.3 77.6 ± 16.1 0.7777 b
p (ANOVA) <0.0001 <0.0001 <0.0001
a—Mann-Whitney U test; b—Student’s t-test. Significant p values are in bold.
2.2. Gene Expression Experiment
mRNA for gene expression analysis was isolated from white blood cells (WBC). The descriptionof material preservation, mRNA isolation, quantification, and quality assessment were describedpreviously [22]. For reverse transcription we used a QuantiTect Kit (Qiagen, Hilden, Germany).Gene expression was analyzed by means of qPCR and conducted on a QuantStudioTM 12K FlexReal-Time PCR System (Thermo Fisher Scienific, Waltham, MA, USA), using Custom Taqman® arraycards and TaqMan® Universal Master Mix (Thermo Fisher Scienific, Waltham, MA, USA). For eacharray card 6 μg of cDNA was taken. Reaction conditions were as follows: 95 ◦C of initial denaturationfor 10 min followed by 50 cycles of 95 ◦C for 15 s and 60 ◦C for 60 s. The analysis included 15 genesencoding selected proteins involved in insulin signaling and glucose metabolism. The expressionwas normalized against GAPDH. The list of all targets is presented in Table 2. The genes weredivided into four groups according to the type of encoded protein: (1) hormones: insulin (INS),glucagon (GCG), adiponectin (ADIPOQ), and leptin (LEP); (2) hormone receptors: insulin receptor(INSR), glucagon receptor (GCGR), adiponectin receptors (ADIPOR1, ADIPOR2), and leptin receptor(LEPR); (3) enzymes involved in pyruvate metabolism: lactic acid dehydrogenase (LDHA), pyruvatedehydrogenase, alpha subunit (PDHA1) and beta subunit (PDHB); (4) transcription factors or theirinhibitors driving glycolysis: transcription factor HIF1 (HIF1A), HIF1A inhibitor (HIF1AN), and nucleartranscription factor MYC (MYC).
28
Books
MDPI

Nutrients 2016, 8, 772
Table 2. Genes of interest selected for the study.
Gene Locus Gene Product Protein Group
INS 11p15.5 insulin
hormonesGCG 2q36-q37 glucagon
ADIPOQ 3q27 adiponectinLEP 1p31 leptin
INSR 19p13.3-p13.2 insulin receptor
hormone receptorsGCGR 17q25 glucagon receptor
ADIPOR1 1q32.1 adiponectin receptor 1ADIPOR2 12p13.31 adiponectin receptor 2
LEPR 7q31.3 leptin receptor
LDHA 11p15.4 lactate dehydrogenase enzymes involved inpyruvate metabolismPDHA1 Xp22.1 pyruvate dehydrogenase (lipoamide) alpha 1 subunit
PDHB 3p21.1-p14.2 pyruvate dehydrogenase (lipoamide) beta subunit
HIF1A 14q23.2 hypoxia inducible factor 1, alpha subunit transcription factors and theirinhibitors, involved in the
regulation of glycolysisHIF1AN 10q24 hypoxia inducible factor 1, alpha subunit inhibitor
MYC 8q24.21 v-myc avian myelocytomatosis viral oncogene homolog
2.3. HbA1c, Fasting Plasma Glucose
Levels of HbA1c (glycated hemoglobin) were determined in 10 μL of whole blood (heparinized tube)immediately after the blood was collected. The analysis was performed commercially in thecertified laboratory of clinical diagnostics, using immunoturbidimetric assay on an INTEGRA 400system (Roche Diagnostics, Rotkreuz, Switzerland). The enzymic colorimetric method was basedon an oxidase/peroxidase method and the respective commercial kit (Alpha Diagnostics, Warsaw,Poland) was used to analyze FPG. All absorbance values were measured on a UV4 Unicam UV-VISspectrophotometer (Cambridge, UK). Intra- and inter-assay coefficients of variation for FPG analyseswere 2.52% (n = 10) and 4.57% (n = 32), respectively.
2.4. Statistical Analysis
The analysis on gene expression data was performed on the log-transformed values in order tohave a normal distribution. Repeated measures analysis of variance (MANCOVA) with an unstructuredcovariance matrix was carried out to test the effects of time on FPG, HbA1c, and gene expression.With this analysis, markers (FPG, HbA1c, gene expression) at different time points were considered asdependent variables, while covariates (age, sex, BMI, and baseline Se) were included in the modelsas independent variables. The possible correlation between variation of Se and of gene expressionvalues at different time points was investigated by a linear regression model with the difference ofgene expression at two time points as the dependent variable, and the difference of Se, age, sex, BMI,baseline Se, and baseline gene expression as independent variables. All of the analyses were carriedout in the whole group of subjects and separately in women and men. Post-hoc comparisons betweenpairwise time points were performed by contrast tests, using Bonferroni correction. All of the otherstatistical tests were performed at a significance level of α = 0.05. To adjust the results for multiplecomparisons, we performed a false discovery rate (FDR) analysis. Statistical analyses were conductedusing SAS software, version 9.2 (SAS Institute, Cary, NC, USA).
3. Results
3.1. The Effect of Se Supplementation on HbA1c and Fasting Plasma Glucose
Significant changes in HbA1c levels were observed upon Se supplementation (p < 0.0001), withpost hoc tests indicating a significant decrease both after six weeks of supplementation and afterfour weeks of washout (p < 0.0001 and p = 0.02 vs. baseline, respectively) (Table 3). On the contrary,FPG concentration remained unaffected upon supplementation trial (p = 0.553).
29
Books
MDPI

Nutrients 2016, 8, 772
Table 3. The effect of Se supplementation on fasting plasma glucose concentration, HbA1c levels andgene expression. Data for all study subjects (n = 76).
MarkerTime Points
p (MANCOVA *)Baseline Two Weeks Six Weeks Washout
FPG (mg/dL) 91.96 ± 13.94 90.55 ± 14.07 91.00 ± 14.15 91.56 ± 13.79 0.55HbA1c (%) 4.74 ± 0.80 na 4.44 ± 0.63 c 4.57± 0.65 a <0.05
INSR 1.23 ± 0.67 0.98 ± 0.25 b 1.02 ± 0.27 b 0.95 ± 0.25 c 0.005
ADIPOR1 2.05 ± 0.23 2.00 ± 0.18 a 2.07 ± 0.21 2.04 ± 0.23 0.002ADIPOR2 1.88 ± 0.23 1.84 ± 0.18 1.84 ± 0.19 1.80 ± 0.19 0.08LEPR 0.87 ± 0.35 0.80 ± 0.34 0.80 ± 0.29 0.82 ± 0.38 0.26LDHA 2.74 ± 0.30 2.59 ± 0.26 c 2.49 ± 0.21 c 2.51 ± 0.27 c <0.0001
PDHA 2.03 ± 0.29 1.93 ± 0.24 a 1.90 ± 0.20 c 1.90 ± 0.26 b 0.0002
PDHB 1.92 ± 0.25 1.86 ± 0.20 1.81 ± 0.18 c 1.81 ± 0.21 b 0.0008
HIF1A 2.37 ± 0.26 2.29 ± 0.23 2.29 ± 0.24 2.30 ± 0.27 0.16HIF1AN 1.71 ± 0.32 1.61 ± 0.19 b 1.70 ± 0.20 1.67 ± 0.21 0.0001
MYC 2.31 ± 0.29 2.22 ± 0.26 a 2.14 ± 0.22 c 2.18 ± 0.25 a <0.0001
Values significantly different as compared to baseline are in bold, a—p < 0.05, b—p < 0.01, c—p < 0.001;*—Multivariate analysis of covariance, model included age, sex, BMI and baseline selenium; na—not analyzed(HbA1c was not analyzed after two weeks of supplementation).
3.2. The Effect on Gene Expression
In the first step of analysis, we excluded genes which were not expressed or which had verylow expression. These were five genes: INS, GCG, GCGR, ADIPOQ, and LEP. Further analysis of theremaining 10 genes indicated a significant reduction in mRNA expression of seven targets, includingINSR, ADIPOR1, LDHA, PDHA, PDHB, MYC, and HIF1AN. In the case of INSR, LDHA, PDHA, andMYC, a significant decrease was observed at all measurement points as indicated by contrast tests(during supplementation and the washout period). For genes ADIPOR2, LEPR, and HIF1A there wasno statistically significant changes over time (Table 3).
Further analysis aimed to test whether the variation of gene expression depended on the variationof Se. We conducted this analysis for all 10 genes and all time points regardless of the fact whether theoverall effect was significant or not. Significant correlations between Se status and gene expressionwere found in the case of ADIPOR1 after six weeks of supplementation (p = 0.012) and in the case ofHIF1AN after two weeks (p = 0.045) and six weeks (p = 0.002) of supplementation. All data are shownin Table S3.
3.3. Sex Differences
At baseline, males had significantly higher levels of FPG (p = 0.01) as compared to females,however, both sexes did not differ significantly in the level of HbA1c (p = 0.175). No modifying effect ofsex was observed at the level of both markers upon time (during supplementation and after washoutperiod, as assessed in the MANCOVA model; p = 0.55 and p = 0.09 for time interaction with sex forFPG and HbA1c, respectively). Data on FPG, HbA1c, and on gene expression analyzed separately formales and females are presented in the supplementary materials (Tables S1 and S2). The results ofanalysis stratified by sex were less powered and some p-values were no more significant. However,general trends were similar. Analogically to the analyses conducted in the whole group, we testedthe correlation between variations in plasma Se levels and in gene expression. In males significantcorrelation was found for HIF1AN after six weeks of supplementation (p = 0.038). In females significantcorrelations were observed for four genes after six weeks of supplementation: ADIPOR1 (p = 0.047),PDHB (p = 0.034), HIF1AN (p = 0.035), and MYC (p = 0.048). Regression analysis data are shown inTables S4 (for males) and S5 (for females).
30
Books
MDPI

Nutrients 2016, 8, 772
3.4. False Discovery Rate Analysis
P-values for the effect on gene expression (Table 3, Tables S1 and S2) were still statisticallysignificant after FDR adjustment for multiple comparisons, except for two genes in women: ADIPOR1and HIF1AN (in both cases the FDR-adjusted p-value was 0.06).
4. Discussion
In this study we observed that six weeks of supplementation with 200 μg of Se in the form ofSe yeast had significantly decreased the level of HbA1c in the subjects with relatively low baselineSe status. On the other hand we did not observe any changes at the level of FPG. However, FPGreflects the glycemic status at the time of measurement. HbA1c is regarded as a more reliable markersince it indicates long-term changes in the glycemic control. Thus, the impact of Se supplementationon HbA1c levels observed in this study confirms that Se is involved in the metabolism of glucose.Moreover, significant decrease in HbA1c levels was maintained four weeks after supplementationdiscontinuation, which clearly shows that the effect of Se on the glycemic control was relatively strong.There are only a few other studies reporting the effect of Se supplementation on glucose homeostasis inhumans. Three of them, being all randomized, placebo-controlled trials (RCTs), have shown beneficialeffect of short-term Se supplementation in specific groups of women. In the first study, 70 womenwith gestational diabetes were supplemented with Se at a dose of 200 μg per day for six weeks.Improved glucose homeostasis was observed as reflected by decreased levels of FPG and serum insulinas well as decreased HOMA-IR values (homeostasis model of assessment of insulin resistance) [23].The second study was conducted in 70 women with polycystic ovary syndrome. After eight weeks ofsupplementation with Se at 200 μg per day, there was a significant decrease in serum insulin levels,HOMA-IR, HOMA-B (homeostatic model of assessment of beta-cell function) values, and an increasein QUICKI (quantitative insulin sensitivity check index), whereas FPG remained unchanged [24].The last study investigated the effect of Se supplementation in women with central obesity. After sixweeks of Se supplementation (200 μg/day), significant decrease in serum insulin levels and HOMA-IRvalues was observed [25]. Another study which was conducted in 60 subjects of both sexes (20 malesand 40 females) diagnosed with T2DM and coronary heart disease also showed beneficial effects of Sesupplementation (200 μg/day for eight weeks) in terms of decreased insulin, HOMA-IR, HOMA-Bparameters, and increased QUICKI [26]. On the contrary, only one RCT, conducted in patients withT2DM (n = 60, including 34 males and 26 females), indicated that three months of Se supplementation(200 μg/day) led to the increased FPG levels [27]. To compare with short term supplementation,long-term RCTs did not indicate any effects on glucose homeostasis upon Se supplementation, asshown at the level of serum glucose concentration in 140 men with prostate cancer (supplemented withSe at dose 200 μg/day for five years) or at the level of FPG in 3146 participants of the SU.VI.MAX trial(supplemented with 100 μg of Se in combination with zinc (Zn) and vitamins C, E, and beta-carotene,for 7.5 years) [28,29]. Overall, the inconsistent results of the above RCTs coincide with a lack ofcompliance in the observational studies investigating the link between Se and diabetes. These studiesalso suggest that Se-induced effects may largely depend on specific health conditions (notably noneof them has been conducted in the general population). A similar conclusion has been drawn fromrecent studies in mice, which were fed with a high-fat diet in order to induce insulin resistance [30].It was observed that pre-treatment with Se protected animals against developing insulin resistance,whereas post-treatment with Se exacerbated this metabolic disorder. The effects of pre-treatmentand post-treatment with Se were different in the context of adipogenesis and lipolysis, showingincreased adipocyte differentiation and fat accumulation in adipose tissue in pre-treated mice, whereaspost-treated mice were characterized by increased lipolysis and ectopic lipid deposition [30]. The abovestudy clearly shows that Se exerts differential effects under different health conditions.
Along with HbA1c decrease upon Se supplementation, we have observed in this studya significant decrease of leukocyte mRNA levels for seven genes involved in different steps of glucosemetabolism regulation. The first group of mRNA targets (INSR and ADIPOR1) concerned receptors for
31
Books
MDPI

Nutrients 2016, 8, 772
endocrine hormones: insulin and adiponectin, which are key players in insulin signaling responsiblefor cellular glucose uptake. Suppressive effects of Se on insulin receptors was observed previouslyin a study of gestating rats and their offspring [31]. In that experiment, decreased mRNA expressionfor Insr, as well as other insulin signaling genes, including Irs-1 (insulin receptor substrate 1), Irs-2(insulin receptor substrate 2), and Akt2 (serine/threonine protean kinase 2), was observed in the liverof dams supplemented with 3 mg Se/kg diet (as compared to dams fed basal diet). Importantly,similar changes in the liver, additionally accompanied by decreased protein levels of insulin receptors,were observed in the offspring of dams also receiving a high Se diet. At the same time, highSe diet was associated in both dams and the offspring with hyperinsulinemia, insulin resistanceand glucose intolerance [31]. The impact of a high Se diet on protein levels for insulin receptorswas also investigated in pigs, showing tissue-specific changes, with up-regulation in the liver anddown-regulation in the muscle. However, no changes in both tissues were observed for insulinreceptors at the level of mRNA [32]. Similarly, another study conducted in pigs also failed to showany effect of supranutritional intake of Se on insulin receptor mRNA levels, analyzed in liver, muscle,and visceral adipose tissue [33]. Significant reduction of mRNA expression for the adiponectinreceptor, ADIPOR1, observed in our study after two weeks of supplementation, was accompanied by aborderline significant decrease in ADIPOR2 (p = 0.08). AdipoR2 is expressed mainly in the liver; thus,in blood leukocytes it was more probable to observe a significant effect in the case of AdipoR1, whichis expressed ubiquitously [34]. Both receptors bind adiponectin, a hormone produced by adipocytesand involved in glucose metabolism via modulating insulin sensitivity [34]. Though our study maysuggest some effect of Se on adiponectin signaling, two supplementation trials failed to show any effectof Se administration on plasma adiponectin levels in humans [35,36]. Nevertheless, the suppressiveeffect on INSR and ADIPOR1 indicated in this study deserves further research, as decreased expressionof mRNA levels for these receptors has been linked to insulin resistance and diabetes in humansand animals [37–39]. Decreased expression of essential genes involved in glucose metabolism, suchas those encoding receptors for insulin and adiponectin, may indicate rather detrimental effects ofSe supplementation in the study group. On the other hand, the effect at the level of HbA1c wassomewhat positive. The hypothetical explanation for these contradictory observations may be thatthe potentially beneficial decrease in HbA1c level reflects an adaptive response which counteracts theadverse effects of the metalloid on glucose homeostasis and that this response is rather short-term.This adaptive mechanism when induced in a constant manner (by introducing the factor day byday for several weeks) may be strong enough to influence the level of HbA1c, however, not in thelong-term. The hypothesis about short-term adaptive response is in line with overall observationsfrom Se supplementation trials, indicating mainly beneficial effects of Se on glucose metabolism inthe case of short-term administration and, on the other hand, null or negative effects upon long-termsupplementation with this nutrient. Alternative explanation for decreased levels of HbA1c upon Se isthe possibility that Se may prevent the process of hemoglobin glycation. This may be suggested onthe basis of a recent study by Yu and colleagues, showing Se nanoparticles prevent protein glycationin vitro [40]. Nevertheless, it is not clear whether changes observed in our study at the level ofleukocyte gene expression reflect changes in insulin-sensitive tissues. If they do, down-regulation ofINSR and ADIPOR1 in blood leukocytes could serve as an early biomarker of adverse health effects ofSe supranutrition in humans, leading to impaired glucose homeostasis.
The second group of down-regulated genes in this study included LDH, PDHA, and PDHB,all three encoding enzymes involved in pyruvate metabolism. Pyruvate is the end product of glycolysisand its further metabolism depends on cellular oxygen concentration. Under anaerobic conditions,it is transformed by lactate dehydrogenase (LDH) to lactic acid whereas, under normal aerobicconditions, it is metabolized by pyruvate dehydrogenase complex (PDC) to acetyl coenzyme A(acetyl CoA). The latter reaction links glycolysis to the Krebs cycle. Importantly, pyruvate recycling(occurring across mitochondrial membranes) is an important regulator of insulin secretion due tothe generation of NADPH (the reduced form of nicotinamide adenine dinucleotide phosphate), the
32
Books
MDPI

Nutrients 2016, 8, 772
pivotal molecule required for insulin granule exocytosis in beta cells [41]. Pyruvate metabolism wasshown to be implicated in diabetes, as reflected by increased activity of pyruvate dehydrogenasekinase (PDK) in diabetic subjects (PDK plays significant role in glucose disposal as it decreases theactivity of PDC) [42]. In general, glycolytic pathway was shown to be dysregulated in diabetes [43].A study in rats showed, for example, that an alloxan-induced diabetic state significantly altered theactivities of glycolytic enzymes in lymphocytes [44]. Importantly, recent animal studies suggestthat Se interferes with glycolytic targets and pyruvate metabolism, supporting our observation.Pigs fed with a supranutritional dose of Se exhibited decreased expression of mRNA for pyruvatekinase (enzyme responsible for pyruvate synthesis in the last step of glycolysis) [33]. Interestingly,increased pyruvate levels in the liver and increased expression of pyruvate metabolizing enzymes(pyruvate carboxylase (Pcx) and pyruvate dehydrogenase (Pdh)) were shown in mice with a knockedout gene for selenocysteine lyase (SCLY, the enzyme catalyzing conversion of selenocysteine intoalanine and selenide, an important step in Se metabolism, as selenide is a substrate for selenoproteinbiosynthesis) [45]. Recently it has been also shown that Se affects glycolysis in cancer cells, suggestingthat down-regulation of glycolytic enzymes is a novel mechanism of Se toxicity in cancer and thatthis mechanism targets the well-known metabolic hallmark of cancer cells associated with enhancedglycolysis, which is called the Warburg effect [46]. In our study we have observed, additionallythat Se may affect also transcriptional regulation of glycolysis, leading to significantly decreasedexpression of MYC. c-MYC protein, encoded by MYC gene, is responsible for transcriptional regulationof all glycolytic targets, including pyruvate kinase, pyruvate kinase dehydrogenase and lactatedehydrogenase [47]. Importantly, it was also shown to regulate the expression of glucose transporter2 (GLUT2) and 4 (GLUT4) [47]. mRNA expression of the second major transcriptional regulatorof glycolytic targets, HIF1 [47] was not affected upon Se supplementation in our study, whereas asignificant decrease was observed for its inhibitor (but only after two weeks of supplementation).Altogether, these results suggest the need for a more in-depth investigation of the link between Se andglycolysis in humans.
We were not able to detect the expression of genes encoding: insulin (INS), glucagon (GCG),adiponectin (ADIPOQ), and leptin (LEP) in leukocytes. This was not surprising as all of these hormonesare produced either by pancreas (insulin, glucagon) or by adipocytes (adiponectin, leptin). Similarly,GCGR levels were not detectable in leukocytes, which was also expected, as the glucagon receptor isexpressed mainly in the liver, in which it mediates glucagon effects: glycogen breakdown and glucoserelease into the bloodstream.
The last analysis in this study concerned the correlation between the variation in gene expressionand variation in plasma Se concentrations at a particular time point. There were only a few significantcorrelations and those that were significant were very small, indicating that changes in gene expressionwere not high enough to correlate with changes in Se.
Since this report presents secondary outcomes of the supplementation trial, it has severalweaknesses. First of all, due to the short-term supplementation (six weeks) we were not able toassess changes in HbA1c levels after the whole life span of erythrocytes (which is about 120 days).HbA1c levels reflect the cumulative history of glycemic control in the past two to three months [48].After this period the measurement of HbA1c levels is most indicative. However it is possible toobserve changes earlier, as shown by studies investigating the effects of glucose-lowering drugs [49].Since erythrocytes are produced constantly (meaning that the whole pool of erythrocytes containscells of different ages) the effect observed in our study resulted from HbA1c reduction in the youngesterythrocytes. Nevertheless, one could speculate that these changes might have occurred due to somepotential confounders present in the study during several weeks before the beginning of the trial,such as pharmacological or dietary factors. However, none of the supplemented subjects declaredto be taking any drugs or supplements that could affect glucose metabolism (we asked all subjectsabout their use of glucose-lowering drugs or supplements before and during the trial). As for theinfluence of diet, none of the individuals reported a change to his/her dietary habits during the trial.
33
Books
MDPI
Nutrients 2016, 8, 772
The second major weakness of this study is attributable to the fact that the trial was not randomized(subjects were selected for the study according to genotype) and not placebo controlled (for detailssee [22]). Since no separate control group was investigated, we compared all data with respect tobaseline values, measured on the first day of the trial, before taking the first pill with the supplement.Finally, gene expression was analyzed in this study in blood leukocytes and it is not clear whetherthese changes reflect general reactions to Se at the molecular level in humans or if they are tissuespecific. In addition we did not analyze the protein levels for genes of interest; thus, we were unable toshow any correspondence between transcriptomic and proteomic expression and elucidate whetherobserved subtle changes in mRNA have any further consequences.
To conclude, results of this study suggest that Se may affect glycemic control at different levelsof regulation, linked not only to insulin signaling, but also to glycolytic pathway and pyruvatemetabolism. Further research is needed to investigate mechanisms of negative transcriptionalregulation in blood leukocytes upon Se treatment, its relevance to other tissues, correspondenceto protein levels and, finally, potential implications in direct metabolic and cellular effects. Overall,findings of this study added more insight into the controversial topic of possible diabetogenic effects ofSe supplementation in humans. What is the exact impact of Se supplementation on glucose homeostasisand the risk of diabetes remains still an open question. The answer will not be obtained without studiesunraveling the underlying mechanisms, as well as factors which may modify Se effects with respectto glucose homeostasis, in addition to these already suggested, such as sex and genotype [50,51],as well as Se speciation [52,53]. Explaining the link between Se, glucose metabolism, and diabetesis currently one of the priority goals in Se research because it will determine the further direction ofstudies focusing on Se as a potential chemopreventive agent.
Supplementary Materials: The following are available online at http://www.mdpi.com/2072-6643/8/12/772/s1,Table S1: The effect of Se supplementation on fasting plasma glucose concentration, HbA1c levels and geneexpression. Data for male subjects (n = 36); Table S2: The effect of Se supplementation on fasting plasma glucoseconcentration, HbA1c levels and gene expression. Data for female subjects (n = 40); Table S3: Correlation betweenchanges in Se and changes in gene expression measured between two different time points. Data for all subjects(n = 76); Table S4: Correlation between changes in Se and changes in gene expression measured between twodifferent time points in male subjects (calculated only for genes which were shown to be significantly changedupon Se supplementation). Data for male subjects (n = 36); Table S5: Correlation between changes in Se andchanges in gene expression measured between two different time points in all subjects (calculated only for geneswhich were shown to be significantly changed upon Se supplementation). Data for female subjects (n = 40).
Acknowledgments: This study was supported by The Polish Ministry of Science and Higher Education(grant 1666/B/P01/2011/40) and NIOM Internal Grant IMP 1.36/2015-2016).
Author Contributions: E.J. designed the study, performed data analysis and wrote the manuscript, E.R. andE.W. performed gene expression experiments, S.R. performed statistical analysis, M.B.K. collected blood andquestionnaire data from the subjects and performed biochemical analyses, K.S. analyzed plasma for seleniumconcentration, J.G., M.H.B. and W.W. supplied materials and reagents, E.R. revised the manuscript. All authorshave read and accepted the final version of the manuscript.
Conflicts of Interest: The authors declare no conflict of interest.
References
1. Labunskyy, V.M.; Hatfield, D.L.; Gladyshev, V.N. Selenoproteins: Molecular pathways and physiologicalroles. Physiol. Rev. 2014, 94, 739–777. [CrossRef] [PubMed]
2. Hatfield, D.L.; Tsuji, P.A.; Carlson, B.A.; Gladyshev, V.N. Selenium and selenocysteine: Roles in cancer,health, and development. Trends Biochem. Sci. 2014, 39, 112–120. [CrossRef] [PubMed]
3. Vinceti, M.; Dennert, G.; Crespi, C.M.; Zwahlen, M.; Brinkman, M.; Zeegers, M.P.A.; Horneber, M.;D’Amico, R.; Del Giovane, C. Selenium for preventing cancer. Cochrane Database Syst. Rev. 2014, 3, CD005195.
4. Rayman, M.P.; Stranges, S. Epidemiology of selenium and type2 diabetes: Can we make sense of it? Free Radic.Biol. Med. 2013, 65, 1557–1564. [CrossRef] [PubMed]
5. Mueller, A.S.; Mueller, K.; Wolf, N.M.; Pallauf, J. Selenium and diabetes: An enigma? Free Radic. Res. 2009,43, 1029–1059. [CrossRef] [PubMed]
34
Books
MDPI

Nutrients 2016, 8, 772
6. Rocourt, C.R.; Cheng, W.H. Selenium supranutrition: Are the potential benefits of chemopreventionoutweighed by the promotion of diabetes and insulin resistance? Nutrients 2013, 5, 1349–1365. [CrossRef][PubMed]
7. Stranges, S.; Marshall, J.R.; Natarajan, R.; Donahue, R.P.; Trevisan, M.; Combs, G.F.; Cappuccio, F.P.;Ceriello, A.; Reid, M.E. Effects of long-term selenium supplementation on the incidence of type 2 diabetes:A randomized trial. Ann. Intern. Med. 2007, 147, 217–223. [CrossRef] [PubMed]
8. Lippman, S.M.; Klein, E.A.; Goodman, P.J.; Lucia, M.S.; Thompson, I.M.; Ford, L.G.; Parnes, H.L.;Minasian, L.M.; Gaziano, J.M.; Hartline, J.A.; et al. Effect of selenium and vitamin e on risk of prostatecancer and other cancers: The selenium and vitamin e cancer prevention trial (select). JAMA 2009, 301, 39–51.[CrossRef] [PubMed]
9. Gao, H.; Hagg, S.; Sjogren, P.; Lambert, P.C.; Ingelsson, E.; van Dam, R.M. Serum selenium in relation tomeasures of glucose metabolism and incidence of type 2 diabetes in an older swedish population. Diabet. Med.A J. Br. Diabet. Assoc. 2014, 31, 787–793. [CrossRef] [PubMed]
10. Wei, J.; Zeng, C.; Gong, Q.Y.; Yang, H.B.; Li, X.X.; Lei, G.H.; Yang, T.B. The association between dietaryselenium intake and diabetes: A cross-sectional study among middle-aged and older adults. Nutr. J. 2015,14, 18. [CrossRef] [PubMed]
11. Yuan, Z.; Xu, X.; Ye, H.; Jin, L.; Zhang, X.; Zhu, Y. High levels of plasma selenium are associated withmetabolic syndrome and elevated fasting plasma glucose in a chinese population: A case-control study.J. Trace Elem. Med. Biol. 2015, 32, 189–194. [CrossRef] [PubMed]
12. Thompson, P.A.; Ashbeck, E.L.; Roe, D.J.; Fales, L.; Buckmeier, J.; Wang, F.; Bhattacharyya, A.; Hsu, C.H.;Chow, H.H.; Ahnen, D.J.; et al. Selenium supplementation for prevention of colorectal adenomas and risk ofassociated type 2 diabetes. J. Natl. Cancer Inst. 2016, 108. [CrossRef] [PubMed]
13. Zhou, J.; Huang, K.; Lei, X.G. Selenium and diabetes-evidence from animal studies. Free Radic. Biol. Med.2013, 65, 1548–1556. [CrossRef] [PubMed]
14. Ezaki, O. The insulin-like effects of selenate in rat adipocytes. J. Biol. Chem. 1990, 265, 1124–1128. [PubMed]15. Müller, A.S.; Most, E.; Pallauf, J. Effects of a supranutritional dose of selenate compared with selenite on
insulin sensitivity in type II diabetic dbdb mice. J. Anim. Physiol. Anim. Nutr. 2005, 89, 94–104. [CrossRef][PubMed]
16. Wang, X.L.; Yang, T.B.; Wei, J.; Lei, G.H.; Zeng, C. Association between serum selenium level and type 2diabetes mellitus: A non-linear dose-response meta-analysis of observational studies. Nutr. J. 2016, 15, 48.[CrossRef] [PubMed]
17. Steinbrenner, H. Interference of selenium and selenoproteins with the insulin-regulated carbohydrate andlipid metabolism. Free Radic. Biol. Med. 2013, 65, 1538–1547. [CrossRef] [PubMed]
18. Lenzen, S.; Drinkgern, J.; Tiedge, M. Low antioxidant enzyme gene expression in pancreatic islets comparedwith various other mouse tissues. Free Radic. Biol. Med. 1996, 20, 463–466. [CrossRef]
19. McClung, J.P.; Roneker, C.A.; Mu, W.; Lisk, D.J.; Langlais, P.; Liu, F.; Lei, X.G. Development of insulinresistance and obesity in mice overexpressing cellular glutathione peroxidase. Proc. Natl. Acad. Sci. USA2004, 101, 8852–8857. [CrossRef] [PubMed]
20. Misu, H.; Takamura, T.; Takayama, H.; Hayashi, H.; Matsuzawa-Nagata, N.; Kurita, S.; Ishikura, K.; Ando, H.;Takeshita, Y.; Ota, T.; et al. A liver-derived secretory protein, selenoprotein p, causes insulin resistance.Cell Metab. 2010, 12, 483–495. [CrossRef] [PubMed]
21. Misu, H.; Ishikura, K.; Kurita, S.; Takeshita, Y.; Ota, T.; Saito, Y.; Takahashi, K.; Kaneko, S.; Takamura, T.Inverse correlation between serum levels of selenoprotein p and adiponectin in patients with type 2 diabetes.PLoS ONE 2012, 7, e34952. [CrossRef] [PubMed]
22. Jablonska, E.; Raimondi, S.; Gromadzinska, J.; Reszka, E.; Wieczorek, E.; Krol, M.B.; Smok-Pieniazek, A.;Nocun, M.; Stepnik, M.; Socha, K.; et al. DNA damage and oxidative stress response to selenium yeast in thenon-smoking individuals: A short-term supplementation trial with respect to gpx1 and sepp1 polymorphism.Eur. J. Nutr. 2015, 55, 2469–2484. [CrossRef] [PubMed]
23. Asemi, Z.; Jamilian, M.; Mesdaghinia, E.; Esmaillzadeh, A. Effects of selenium supplementation onglucose homeostasis, inflammation, and oxidative stress in gestational diabetes: Randomized, double-blind,placebo-controlled trial. Nutrition 2015, 31, 1235–1242. [CrossRef] [PubMed]
35
Books
MDPI

Nutrients 2016, 8, 772
24. Jamilian, M.; Razavi, M.; Fakhrie Kashan, Z.; Ghandi, Y.; Bagherian, T.; Asemi, Z. Metabolic responseto selenium supplementation in women with polycystic ovary syndrome: A randomized, double-blind,placebo-controlled trial. Clin. Endocrinol. (Oxf.) 2015, 82, 885–891. [CrossRef] [PubMed]
25. Alizadeh, M.; Safaeiyan, A.; Ostadrahimi, A.; Estakhri, R.; Daneghian, S.; Ghaffari, A.; Gargari, B.P.Effect of L-arginine and selenium added to a hypocaloric diet enriched with legumes on cardiovasculardisease risk factors in women with central obesity: A randomized, double-blind, placebo-controlled trial.Ann. Nutr. Metab. 2012, 60, 157–168. [CrossRef] [PubMed]
26. Farrokhian, A.; Bahmani, F.; Taghizadeh, M.; Mirhashemi, S.M.; Aarabi, M.H.; Raygan, F.; Aghadavod, E.;Asemi, Z. Selenium supplementation affects insulin resistance and serum hs-crp in patients with type 2diabetes and coronary heart disease. Horm. Metab. Res. 2016, 48, 263–268. [CrossRef] [PubMed]
27. Faghihi, T.; Radfar, M.; Barmal, M.; Amini, P.; Qorbani, M.; Abdollahi, M.; Larijani, B. A randomized,placebo-controlled trial of selenium supplementation in patients with type 2 diabetes: Effects on glucosehomeostasis, oxidative stress, and lipid profile. Am. J. Ther. 2014, 21, 491–495. [CrossRef] [PubMed]
28. Algotar, A.M.; Stratton, M.S.; Stratton, S.P.; Hsu, C.H.; Ahmann, F.R. No effect of selenium supplementationon serum glucose levels in men with prostate cancer. Am. J. Med. 2010, 123, 765–768. [CrossRef] [PubMed]
29. Czernichow, S.; Couthouis, A.; Bertrais, S.; Vergnaud, A.C.; Dauchet, L.; Galan, P.; Hercberg, S. Antioxidantsupplementation does not affect fasting plasma glucose in the supplementation with antioxidant vitaminsand minerals (Su.Vi.Max) study in France: Association with dietary intake and plasma concentrations. Am. J.Clin. Nutr. 2006, 84, 395–399. [PubMed]
30. Wang, X.; Wu, H.; Long, Z.; Sun, Q.; Liu, J.; Liu, Y.; Hai, C. Differential effect of Se on insulin resistance:Regulation of adipogenesis and lipolysis. Mol. Cell Biochem. 2016, 415, 89–102. [CrossRef] [PubMed]
31. Zeng, M.-S.; Li, X.; Liu, Y.; Zhao, H.; Zhou, J.-C.; Li, K.; Huang, J.-Q.; Sun, L.-H.; Tang, J.-Y.; Xia, X.-J.; et al. Ahigh-selenium diet induces insulin resistance in gestating rats and their offspring. Free Radic. Biol. Med. 2012,52, 1335–1342. [CrossRef] [PubMed]
32. Zhao, Z.; Barcus, M.; Kim, J.; Lum, K.L.; Mills, C.; Lei, X.G. High dietary selenium intake alters lipidmetabolism and protein synthesis in liver and muscle of pigs. J. Nutr. 2016, 146, 1625–1633. [CrossRef][PubMed]
33. Pinto, A.; Juniper, D.T.; Sanil, M.; Morgan, L.; Clark, L.; Sies, H.; Rayman, M.P.; Steinbrenner, H.Supranutritional selenium induces alterations in molecular targets related to energy metabolism in skeletalmuscle and visceral adipose tissue of pigs. J. Inorg. Biochem. 2012, 114, 47–54. [CrossRef] [PubMed]
34. Freitas Lima, L.C.; Braga, V.A.; do Socorro de Franca Silva, M.; Cruz, J.C.; Sousa Santos, S.H.; de OliveiraMonteiro, M.M.; Balarini, C.M. Adipokines, diabetes and atherosclerosis: An inflammatory association.Front. Physiol. 2015, 6, 304. [CrossRef] [PubMed]
35. Rayman, M.P.; Blundell-Pound, G.; Pastor-Barriuso, R.; Guallar, E.; Steinbrenner, H.; Stranges, S.A randomized trial of selenium supplementation and risk of type-2 diabetes, as assessed by plasmaadiponectin. PLoS ONE 2012, 7, e45269. [CrossRef] [PubMed]
36. Mao, J.; Bath, S.C.; Vanderlelie, J.J.; Perkins, A.V.; Redman, C.W.; Rayman, M.P. No effect of modestselenium supplementation on insulin resistance in UK pregnant women, as assessed by plasma adiponectinconcentration. Br. J. Nutr. 2016, 115, 32–38. [CrossRef] [PubMed]
37. Kadowaki, T.; Yamauchi, T.; Kubota, N.; Hara, K.; Ueki, K.; Tobe, K. Adiponectin and adiponectin receptorsin insulin resistance, diabetes, and the metabolic syndrome. J. Clin. Investig. 2006, 116, 1784–1792. [CrossRef][PubMed]
38. Foti, D.; Chiefari, E.; Fedele, M.; Iuliano, R.; Brunetti, L.; Paonessa, F.; Manfioletti, G.; Barbetti, F.; Brunetti, A.;Croce, C.M.; et al. Lack of the architectural factor hmga1 causes insulin resistance and diabetes in humansand mice. Nat. Med. 2005, 11, 765–773. [CrossRef] [PubMed]
39. Boucher, J.; Kleinridders, A.; Kahn, C.R. Insulin receptor signaling in normal and insulin-resistant states.Cold Spring Harb. Perspect. Biol. 2014, 6, a009191. [CrossRef] [PubMed]
40. Yu, S.X.; Zhang, W.T.; Liu, W.; Zhu, W.X.; Guo, R.C.; Wang, Y.S.; Zhang, D.H.; Wang, J.L. The inhibitoryeffect of selenium nanoparticles on protein glycation in vitro. Nanotechnology 2015, 26, 145703. [CrossRef][PubMed]
41. Luo, X.; Li, R.; Yan, L.J. Roles of pyruvate, NADH, and mitochondrial complex I in redox balance andimbalance in beta cell function and dysfunction. J. Diabetes Res. 2015, 2015, 512618. [CrossRef] [PubMed]
36
Books
MDPI

Nutrients 2016, 8, 772
42. Jeoung, N.H. Pyruvate dehydrogenase kinases: Therapeutic targets for diabetes and cancers. Diabetes Metab. J.2015, 39, 188–197. [CrossRef] [PubMed]
43. Guo, X.; Li, H.; Xu, H.; Woo, S.; Dong, H.; Lu, F.; Lange, A.J.; Wu, C. Glycolysis in the control of blood glucosehomeostasis. Acta Pharm. Sin. B 2012, 2, 358–367. [CrossRef]
44. Otton, R.; Mendonca, J.R.; Curi, R. Diabetes causes marked changes in lymphocyte metabolism. J. Endocrinol.2002, 174, 55–61. [CrossRef] [PubMed]
45. Seale, L.A.; Gilman, C.L.; Hashimoto, A.C.; Ogawa-Wong, A.N.; Berry, M.J. Diet-induced obesity in theselenocysteine lyase knockout mouse. Antioxid. Redox Signal. 2015, 23, 761–774. [CrossRef] [PubMed]
46. Bao, P.; Chen, Z.; Tai, R.Z.; Shen, H.M.; Martin, F.L.; Zhu, Y.G. Selenite-induced toxicity in cancer cellsis mediated by metabolic generation of endogenous selenium nanoparticles. J. Proteome Res. 2015, 14,1127–1136. [CrossRef] [PubMed]
47. Yeung, S.J.; Pan, J.; Lee, M.H. Roles of p53, myc and hif-1 in regulating glycolysis—The seventh hallmark ofcancer. Cell Mol. Life Sci. 2008, 65, 3981–3999. [CrossRef] [PubMed]
48. Sherwani, S.I.; Khan, H.A.; Ekhzaimy, A.; Masood, A.; Sakharkar, M.K. Significance of hba1c test in diagnosisand prognosis of diabetic patients. Biomark. Insights 2016, 11, 95–104. [PubMed]
49. Hirst, J.A.; Stevens, R.J.; Farmer, A.J. Changes in hba1c level over a 12-week follow-up in patients with type2 diabetes following a medication change. PLoS ONE 2014, 9, e92458. [CrossRef] [PubMed]
50. Ogawa-Wong, A.N.; Berry, M.J.; Seale, L.A. Selenium and metabolic disorders: An emphasis on type 2diabetes risk. Nutrients 2016, 8, 80. [CrossRef] [PubMed]
51. Hellwege, J.N.; Palmer, N.D.; Ziegler, J.T.; Langefeld, C.D.; Lorenzo, C.; Norris, J.M.; Takamura, T.;Bowden, D.W. Genetic variants in selenoprotein p plasma 1 gene (sepp1) are associated with fasting insulinand first phase insulin response in hispanics. Gene 2014, 534, 33–39. [CrossRef] [PubMed]
52. Mueller, A.S.; Pallauf, J.; Rafael, J. The chemical form of selenium affects insulinomimetic properties of thetrace element: Investigations in type ii diabetic dbdb mice. J. Nutr. Biochem. 2003, 14, 637–647. [CrossRef][PubMed]
53. Kiersztan, A.; Lukasinska, I.; Baranska, A.; Lebiedzinska, M.; Nagalski, A.; Derlacz, R.A.; Bryla, J. Differentialeffects of selenium compounds on glucose synthesis in rabbit kidney-cortex tubules and hepatocytes. In vitroand in vivo studies. J. Inorg. Biochem. 2007, 101, 493–505. [CrossRef] [PubMed]
© 2016 by the authors. Licensee MDPI, Basel, Switzerland. This article is an open accessarticle distributed under the terms and conditions of the Creative Commons Attribution(CC BY) license (http://creativecommons.org/licenses/by/4.0/).
37
Books
MDPI

nutrients
Article
Nutrient Patterns Associated with Fasting Glucoseand Glycated Haemoglobin Levels in a Black SouthAfrican Population
Tinashe Chikowore 1,*, Pedro T. Pisa 2, Tertia van Zyl 1, Edith J. M. Feskens 3,
Edelweiss Wentzel-Viljoen 1,4 and Karin R. Conradie 1
1 Centre for Excellence in Nutrition, North-West University, Potchefstroom 2520, North West Province,South Africa; [email protected] (T.v.Z.); [email protected] (E.W.-V.);[email protected] (K.R.C.)
2 Wits Reproductive Health and HIV Institute, University of the Witwatersrand, Johannesburg 2000,South Africa; [email protected]
3 Division of Human Nutrition, Wageningen University, P.O. Box 17, 6700 AA Wageningen,The Netherlands; [email protected]
4 Medical Research Council Research Unit for Hypertension and Cardiovascular Disease,Faculty of Health Sciences, North-West University, Potchefstroom 2520, South Africa
* Correspondence: [email protected]; Tel.: +27-7-8116-9789
Received: 27 September 2016; Accepted: 19 December 2016; Published: 19 January 2017
Abstract: Type 2 diabetes (T2D) burden is increasing globally. However, evidence regarding nutrientpatterns associated with the biomarkers of T2D is limited. This study set out to determine thenutrient patterns associated with fasting glucose and glycated haemoglobin the biomarkers of T2D.Factor analysis was used to derive nutrient patterns of 2010 participants stratified by urban/ruralstatus and gender. Principal Component Analysis (PCA) was applied to 25 nutrients, computed fromthe quantified food frequency questionnaires (QFFQ). Three nutrient patterns per stratum, whichaccounted for 73% of the variation of the selected nutrients, were identified. Multivariate linearregression models adjusted for age, BMI, smoking, physical activity, education attained, alcoholintake, seasonality and total energy intake were computed. Starch, dietary fibre and B vitaminsdriven nutrient pattern was significantly associated with fasting glucose (β = −0.236 (−0.458; −0.014);p = 0.037) and glycated haemoglobin levels (β = −0.175 (−0.303; −0.047); p = 0.007) in rural women.Thiamine, zinc and plant protein driven nutrient pattern was associated with significant reductions inglycated haemoglobin and fasting glucose ((β = −0.288 (−0.543; −0.033); p = 0.027) and (β = −0.382(−0.752; −0.012); p = 0.043), respectively) in rural men. Our results indicate that plant driven nutrientpatterns are associated with low fasting glucose and glycated haemoglobin levels.
Keywords: plant based; fasting glucose and glycated haemoglobin; T2D; dietary patterns
1. Introduction
Type 2 diabetes (T2D) prevalence and the burden it places on populations is increasing globally,thereby making it a public health challenge which requires urgent attention [1]. For instance, theglobal prevalence of T2D among women increased from 5% to 7.9% from 1980 to 2014 [2]. The diabetesprevalence in Africa is projected to have the largest increase of 109% compared to other regions in theworld by 2035 [3]. Urban black South Africans have not been spared from the T2D burden. The highestprevalence of T2D in Sub Saharan Africa was reported among urban black South Africans, with 60% ofthese cases being reported amongst women [4]. Black South African women also have the highestprevalence of obesity, which has been reported to be rising together with T2D in this population [5].
Nutrients 2017, 9, 9 38 www.mdpi.com/journal/nutrients
Books
MDPI

Nutrients 2017, 9, 9
The adoption of Westernised lifestyles by urban dwellers is suggested to be among the leadingfactors resulting in the increase in non-communicable diseases (NCDs) such as T2D in developingcountries [6]. The migration of populations from rural to urban areas has been accompanied byan increase in meat consumption as well as an increase in the consumption of sugary foods inSouth Africa [7]. Both of these foods are recognised as dietary risk factors for T2D [6]. However,improvements in micronutrient intake among black South African women in urban areas is suggestedto be a result of the increased consumption of fruits and vegetables which are protective of T2Drisk [8–10]. Thus, the role of diet as a risk factor for T2D is complex among the black South Africanwomen. In addition, people eat meals with a variety of nutrients which have interactive and synergisticeffects on health [11]. Therefore, it is difficult to determine the separate effect of a food or nutrienton disease development as it is highly interrelated with other nutrients [11]. There is need of dietarypattern analysis methods which are able to evaluate the diet as a whole and clarify the effects ofthe consumption of sugary foods and meat products, together with improved intakes of fruits andvegetables, related to T2D risk amongst this population group.
Dietary pattern (or food pattern) approaches comprise data driven methods such as factor analysis,which allow the dietary information (or food intake) at hand to determine the unique dietary patternfor the population group being evaluated [10]. Although dietary patterns have been associatedwith disease risk, their effect is considered to be through nutrient intake; therefore, it is pivotal todetermine nutrient patterns that are associated with T2D risk [12]. This information will aid in theunderstanding of the aetiology of T2D. The foods that people eat are governed by their cultural normsand beliefs, which vary amongst ethnic groups, making dietary patterns limited and not applicableacross divergent population groups [12]. Evidence exists that the Western dietary pattern associationwith fasting glucose varies among different ethnic groups [13]. However, nutrients are universal,thereby making nutrient patterns associations with disease risk applicable for multiple populationgroups [14]. To the best of our knowledge, no study has reported on the association of the nutrientpatterns with fasting glucose and glycated haemoglobin levels among apparently healthy individuals.T2D is a complex and multifactorial diseases, however glycated haemoglobin and fasting glucoselevels are proxies for the development of this disease which are affected by diet [15]. Fasting glucoselevels are indicative of the short term changes in glucose metabolism, while glycated haemoglobindepicts the long term changes [15]. This study seeks to evaluate the association of nutrient patternsderived by factor analysis with fasting glucose and glycated haemoglobin levels among apparentlyhealthy black South Africans.
2. Materials and Methods
2.1. Study Population
The study participants (n = 2010) were recruited from two urban and rural areas of the NorthWest Province into the South African arm of the Prospective urban and rural epidemiological (PURE)study using a population based sampling strategy. Apparently healthy male and female volunteersbetween the ages of 35 and 60 years were recruited by the fieldworkers. Individuals were consideredto be apparently healthy if they were not using any medication for chronic disease and if they were notdiagnosed with a chronic medical condition/disease. The international PURE study is a large-scaleepidemiological study, which comprises research participants recruited from 17 low, middle, and highincome countries [16]. The South African arm of the PURE study was initiated in 2005 with initialfive-year follow-up intervals up to 2015. At baseline in 2005 and at the five-year intervals during thecourse of the study, medical history, lifestyle behaviour (physical activity and dietary intake), bloodcollection (for both genetic and biochemical analyses), an electrocardiogram, and anthropometricassessments were performed to determine the role of risk factors in the development of cardiovasculardiseases [16]. Our study was nested in the 2005 PURE study baseline data. Stratified nutrient patternanalysis was conducted according to gender and urban/rural status among the 2010 participants of
39
Books
MDPI
Nutrients 2017, 9, 9
the PURE study. However, significant associations of the nutrient patterns with fasting glucose andglycated haemoglobin were noted only among the rural women and rural men. Therefore, the detailednutrient pattern and association results of the rural participants are elaborated in the main text whileresults of the urban men and women are illustrated in the Supplementary Materials.
2.2. Ethical Approval
The participants gave written informed consent before participating in the study and the studywas conducted according to the Declaration of Helsinki principles [17]. Ethical approval wasgranted by the Ethics Committee of the North-West University, Potchefstroom Campus, with ethicsnumber NWU-00016-10-A1.
2.3. Dietary, Anthropometric and Physical Activity Assessments
The trained fieldworkers captured the dietary intake of the participants using a standardisedquantitative food frequency questionnaire (QFFQ) which had been validated for the same ethnicpopulation group of the study participants [18,19]. The reproducibility of the QFFQ was also assessedand found to be good in this specific study population [20]. The dietary intake data were coded,analysed and nutrient intakes were computed using the South African Food Composition Database [21].Body weight measurements were performed in duplicate by the PURE research team members using aportable electronic scale (Precision Health Scale, A & D Company, Tokyo, Japan), after which the meanwas recorded. The heights of the subjects were determined by the PURE study research team membersusing a stadiometer (IP 1465, Invicta, and London, UK). The BMI of the participants was computedusing the formula: BMI = weight (kg/height (m2)). The Baecke physical activity questionnaire (BPAQ)which was validated for South Africa was used to collect the physical activity information of theparticipants [22]. The questionnaire was used to compute a physical activity index score as describedelsewhere [22,23]. This physical activity index scores were used in the multivariate regression analysisto adjust for physical activity.
2.4. Biochemical Measurements
The research participants were required to fast (at least 8 h with no food or beverages, includingwater before measurements) and their blood glucose levels were measured by the PURE research team.These fasting glucose levels were measured using the SYNCHRON® System from fluoride plasma.The Bio-Rad D-10TM, HbA1c kit (Bio-Rad Laboratories, Inc., Hercules, France), which operates viacation exchange high performance liquid chromatography was used to assess HbA1c levels fromwhole blood ethylenediaminetetraacetic acid (EDTA) treated samples. The coefficient of variation ofthe glycated haemoglobin and fasting glucose tests were 1.16% and 2.1%, respectively.
2.5. Statistical Analysis
The statistical analysis was performed using the statistical package for social scientists (SPSS)version 23. Normality tests for the continuous variables were performed using the Q-Q plots.Twenty-five nutrients were used to determine the nutrient patterns as has been reported previouslyby Pisa et al. [24]. Among these 25 nutrients, total protein was split into animal protein and plantprotein; total carbohydrates were divided into total sugar, starch, and total dietary fibre; and total fatwas categorised into saturated fat, monounsaturated fat and polyunsaturated fat. The total dietaryfibre comprised soluble and insoluble dietary fibre. Alcohol was not regarded as a nutrient and notincluded in deriving the nutrient pattern analysis. However, in view of the reported association ofalcohol intake with glycated haemoglobin, it was adjusted for in the multivariate linear models forthe association of the derived nutrient patterns with glycated haemoglobin and fasting glucose [25].The nutrient intake variables from the quantitative food frequency questionnaire (QFFQ) were logtransformed to remove bias due to variance as a result of the different measures of scale used toquantify the nutrients. These nutrients were adjusted for log alcohol free energy using the multivariate
40
Books
MDPI

Nutrients 2017, 9, 9
(standard) method [11]. The multivariate method was selected as it yielded more cumulative varianceand interpretable nutrient patterns compared to the standard nutrient density method of adjustingfor total energy intake [11]. Principal component analysis (PCA) was the factor reduction tool usedto determine the nutrient patterns from the 25 selected nutrients. The PCA was performed with thevariance based on the covariance matrix and Varimax rotation. The retained principal components (PC)were used to identify the nutrient patterns. The scree plot (Figure 1) was used to determine the numberof PCs to retain. The nutrient patterns were named using the nutrients with loadings greater than±0.47 on the PCs. The total variances explained by the retained PCs were also evaluated to determinethe relevance of the extracted PCs. The PCA was a suitable data reduction approach for the nutrientdata in this study as was indicated by a Kaiser–Meyer–Olkin measure of sampling adequacy of 0.911,and a Bartlett’s test of sphericity which was significant at p < 0.001. The PCs were categorised intotertiles and analysis of variance ANOVA (for continuous variables) and Chi-square (for categoricalvariables) tests were used to determine the descriptive characteristics of the study participants acrossthe tertiles of the extracted PCs.
Figure 1. Scree plot of the nutrients and the extracted principal components among rural women.
Crude and adjusted multiple linear regression models were computed to assess the associationbetween the extracted PCs with glycated haemoglobin and fasting glucose as dependent variablesseparately through varied models. In these models, regression coefficients for 1 standard deviation(SD) increase in the PC scores (and their 95% confidence intervals) were computed for four models:M1: (crude); M2: (adjusted for M1 plus Log Total Energy); M3: (adjusted for M2 plus Body MassIndex); and M4: (adjusted for M3 plus age, smoking, physical activity, education level, seasonality,alcohol intake and other PCs). Seasonality was adjusted based on the months in which the dietaryassessments were conducted. Thus, for the rural participants, seasonality was adjusted basing onAugust and September; and the months of October and November were used to adjust for seasonalityin the urban participants. Partial R2 values were computed to express the variance explained by eachmodel. Statistical significance was regarded at p value less than 0.05.
41
Books
MDPI

Nutrients 2017, 9, 9
3. Results
3.1. Nutrient Patterns
Three nutrient patterns (Table S1) were extracted from the PCA, which explained 73% of thetotal variation of the selected nutrient factors among the rural women. The first nutrient pattern wasdepicted as “Magnesium, phosphorus and plant protein driven nutrients”. This pattern consisted ofhigher loadings for magnesium, phosphorus and plant protein. The second nutrient pattern was termed“Fat and animal protein driven nutrients” as it had higher loadings of cholesterol, monounsaturatedfat, animal protein, polyunsaturated fat and saturated fat. The “Starch, dietary fibre and B vitaminsdriven” based nutrient pattern was the third extracted nutrient pattern. This nutrient pattern had highloadings of starch, folate, vitamin B6, dietary fibre and thiamine as illustrated in Table S1.
Three nutrient patterns were extracted among rural men and named according to the nutrientswith the highest loadings as indicated in Table S1. These were the “Thiamine, zinc and plant proteindriven nutrients”, “Fat and animal protein driven nutrients”, and “Retinol and vitamin B12 drivennutrients”. Three similar nutrients patterns were extracted among the rural men, urban men and urbanwomen, which explained 76%, 77% and 76% (Tables S1 and S2) variance of the nutrients, respectively.However, some considerable differences were noted in the plant driven nutrient patterns, whichaccounted for the greater variation of the nutrients among the urban and rural participants (Table S3).
3.2. Descriptive Characteristics of the Study Population
The study participants included 659 rural women, 347 rural men, 605 urban women and 399 urbanmen. The mean fasting glucose levels and glycated haemoglobin were 4.96 ± 1.57 mmol·L−1 and5.64% ± 0.88%, respectively [26]. The women had a mean BMI of 26.73 ± 7.21, which signified thata considerable proportion of the women were overweight. Overall, in the whole study population,39.4% of the participants were overweight and 87.3% of these were women. The mean total energyintake was 7707.13 ± 3692.36 KJ. The high scores of magnesium, phosphorus and plant protein drivennutrient pattern were associated with high total energy intake and energy from alcohol in rural women,as indicated in Table 1. The high scores for the fat and animal protein driven nutrient pattern wassignificantly associated with tertiary education status, as indicated inTable 1.
High scores for the thiamine, zinc and plant protein nutrient pattern were associated with higherenergy and alcohol intake compared to other nutrient patterns among the rural men (Table 2).
3.3. Nutrient Patterns Associations with Fasting and Glycated Haemoglobin Levels
The association results of glycated haemoglobin and fasting glucose levels with 1 SD increasesin the extracted nutrient patterns are shown in Tables 3–6 for the rural women and rural men.The magnesium, phosphorus and plant protein driven nutrient pattern was associated with a consistenttrend of increases in fasting glucose and glycated haemoglobin among rural women, as illustrated inTable 3.
Conversely, the starch, dietary fibre and B vitamins nutrient pattern was consistently associatedwith reduced glycated haemoglobin and fasting glucose levels in all evaluated linear models, forinstance the M4 model: −0.175% (−0.303; −0.047); p = 0.007) and −0.236 mmol·L−1 (−0.458; −0.014);p = 0.037), respectively, as indicated in Tables 3 and 4 among rural women.
The thiamine, zinc and plant protein nutrient pattern was associated with reduced glycatedhaemoglobin and fasting glucose levels in rural men as illustrated in Tables 5 and 6. For instance, theM4 models, which explained the highest variances of the fasting glucose and glycated haemoglobin,indicated reductions of these outcome variables to be −0.382 mmol·L−1 (−0.752; −0.012; p = 0.043)and −0.288% (−0.543; −0.033; p = 0.027), respectively, as illustrated in Tables 5 and 6.
42
Books
MDPI

Nutrients 2017, 9, 9
Ta
ble
1.
Des
crip
tive
char
acte
rist
ics
for
the
rura
lwom
enof
the
stud
ypo
pula
tion
acco
rdin
gto
the
low
esta
ndhi
ghes
tter
tile
sof
the
thre
enu
trie
ntpa
tter
ns(P
C).
Ma
gn
esi
um
,P
ho
sph
oru
sa
nd
Pla
nt
Pro
tein
Dri
ve
nN
utr
ien
tsF
at
an
dA
nim
al
Pro
tein
Dri
ve
nN
utr
ien
tsS
tarc
h,
Die
tary
Fib
rea
nd
BV
ita
min
Dri
ve
nN
utr
ien
ts
T1
T3
pT
1T
3p
T1
T3
p
Age
48.7
2±
10.2
347
.51±
9.57
0.24
747
.94±
8.89
47.7
3±
10.1
60.
837
49.1
5±
10.4
046
.94±
8.99
0.03
6Bo
dyM
ass
Inde
x25
.28±
6.63
25.2
7±
6.58
0.98
825
.31±
6.75
26.1
3±
6.85
0.26
225
.26±
6.41
25.6
5±
7.11
0.60
5To
tale
nerg
y43
22.9
6±
1217
.30
8365
.01±
2476
.92
<0.0
0156
31.3
3±
2816
.62
6883
.88±
2189
.38
<0.0
0158
93.0
8±
2645
.21
6567
.51±
2425
.60
0.01
3A
lcoh
ol(%
TE)
0.76
±2.
567.
42±
12.5
6<0
.001
5.54
±11
.70
1.47
±4.
40<0
.001
5.36
±11
.91
1.69
±5.
01<0
.001
Prot
ein
(%TE
)11
.26±
1.96
10.7
7±
1.64
0.00
810
.27±
1.33
11.6
7±
1.81
<0.0
0111
.23±
2.05
10.9
1±
1.31
0.09
2C
urre
ntSm
oker
s(%
)33
.536
.80.
168
38.0
34.7
0.00
530
.636
.40.
595
Phys
ical
Act
ivit
yIn
dex
8.19
±1.
428.
28±
1.42
0.59
38.
29±
1.29
8.32
±1.
550.
854
8.23
±1.
378.
44±
1.45
0.20
5Te
rtia
ryed
ucat
ion
(%)
33.7
24.5
0.05
826
.542
.90.
028
28.6
38.8
0.85
4Fa
stin
ggl
ucos
e(m
mol·L
−1)
4.73
±0.
784.
93±
1.47
0.21
94.
91±
1.18
4.87
±1.
020.
784
5.12
±2.
414.
88±
0.83
0.16
0H
bA1C
(%)
5.64
±0.
535.
67±
0.93
0.78
55.
68±
0.91
5.69
±0.
580.
843
5.84
±1.
235.
62±
0.55
0.02
7
p=
pva
lue
base
don
AN
OVA
orC
hi-s
quar
ete
stw
here
appr
opri
ate;
Alc
ohol
(%TE
)=pe
rcen
tage
ofto
tale
nerg
ydu
eto
alco
holi
ntak
e;Pr
otei
n(%
TE)=
perc
enta
geof
tota
lene
rgy
due
topr
otei
nin
take
;T1
=lo
wes
tter
tile
;T3
=hi
ghes
tter
tile
,TE
=to
tale
nerg
y;H
bA1C
=gl
ycat
edha
emog
lobi
n.
Ta
ble
2.
Des
crip
tive
char
acte
rist
ics
for
the
rura
lmen
ofth
est
udy
popu
lati
onac
cord
ing
toth
elo
wes
tand
high
estt
erti
les
ofth
eth
ree
nutr
ient
patt
erns
(PC
).
Th
iam
ine
,Z
inc
an
dP
lan
tP
rote
inD
riv
en
Nu
trie
nts
Fa
ta
nd
An
ima
lP
rote
inD
riv
en
Nu
trie
nts
Re
tin
ol
an
dV
ita
min
B1
2D
riv
en
Nu
trie
nts
T1
T3
pT
1T
3p
T1
T3
p
Age
47.9
5±
9.99
50.1
9±
10.6
90.
156
48.4
3±
9.97
51.4
2±
11.4
50.
057
49.6
6±
10.0
149
.57±
9.95
0.95
4Bo
dyM
ass
Inde
x20
.86±
4.15
20.5
4±
4.31
0.60
620
.86±
3.99
20.9
4±
4.65
0.89
420
.30±
3.57
20.9
5±
4.19
0.29
7To
tale
nerg
y46
93.6
0±
1584
.26
10,6
37.0
0±
2887
.76
<0.0
0163
19.6
3±
3228
.51
8220
.85±
3228
.51
<0.0
0171
64.1
4±
2975
.31
7855
.83±
3672
.65
0.15
9A
lcoh
ol(%
TE)
5.98
±9.
4013
.82±
13.7
0<0
.001
11.1
9±
13.4
15.
70±
9.16
0.00
26.
65±
11.2
39.
19±
11.7
90.
159
Prot
ein
(%TE
)11
.51±
2.69
10.7
6±
1.53
0.01
410
.09±
1.43
12.1
9±
2.33
<0.0
0110
.64±
1.69
11.5
0±
2.48
0.00
5C
urre
ntSm
oker
s(%
)32
.435
.90.
636
40.0
26.2
0.00
331
.731
.70.
577
Phys
ical
Act
ivit
yIn
dex
8.25
±1.
648.
02±
1.44
0.38
08.
03±
1.65
7.99
±1.
790.
861
7.92
±1.
617.
97±
1.63
0.84
7Te
rtia
ryed
ucat
ion
(%)
44.2
20.9
0.14
123
.337
.20.
514
27.9
37.2
0.45
1Fa
stin
ggl
ucos
e(m
mol·L
−1)
4.90
±0.
934.
68±
0.90
0.11
34.
75±
0.79
4.96
±1.
240.
138
4.94
±2.
414.
75±
0.78
0.19
0H
bA1C
(%)
5.59
±0.
525.
51±
0.81
0.38
65.
49±
0.34
5.62
±0.
970.
169
5.57
±0.
835.
53±
0.49
0.67
8
p=
pva
lue
base
don
AN
OVA
orC
hi-s
quar
ete
stw
here
appr
opri
ate;
Alc
ohol
(%TE
)=pe
rcen
tage
ofto
tale
nerg
ydu
eto
alco
holi
ntak
e;Pr
otei
n(%
TE)=
perc
enta
geof
tota
lene
rgy
due
topr
otei
nin
take
;T1
=lo
wes
tter
tile
;T3
=hi
ghes
tter
tile
;TE
=to
tale
nerg
y;H
bA1C
=gl
ycat
edha
emog
lobi
n.
43
Books
MDPI

Nutrients 2017, 9, 9
Ta
ble
3.
Reg
ress
ion
coef
ficie
nts
for
fast
ing
gluc
ose
for
1SD
incr
ease
inth
ede
rive
dnu
trie
ntpa
tter
nsc
ores
amon
gru
ralb
lack
Sout
hA
fric
anw
omen
.
Ma
gn
esi
um
,P
ho
sph
oru
sa
nd
Pla
nt
Pro
tein
Dri
ve
nN
utr
ien
tsF
at
an
dA
nim
al
Pro
tein
Dri
ve
nN
utr
ien
tsS
tarc
h,
Die
tary
Fib
rea
nd
BV
ita
min
Dri
ve
nN
utr
ien
ts
B(9
5%
CI)
pV
alu
eR
2B
(95
%C
I)p
Va
lue
R2
B(9
5%
CI)
pV
alu
eR
2
M1
0.12
9(−
0.01
4;0.
271)
0.07
70.
007
0.00
9(−
0.14
1;0.
160)
0.90
20.
000
−0.1
64(−
0.31
1;−0
.018
)0.
027
0.00
8M
20.
196
( −0.
063;
0.45
5)0.
138
0.00
7−0
.020
(−0.
183;
0.14
3)0.
813
0.00
3−0
.197
(−0.
349;−0
.049
)0.
011
0.01
6M
30.
278
( −0.
001;
0.28
0)0.
034
0.04
5−0
.038
(−0.
198;
0.12
3)0.
645
0.03
7−0
.203
(−0.
351;−0
.054
)0.
008
0.05
1M
40.
147
( −0.
360;
0.65
5)0.
569
0.08
6−0
.004
(−0.
290;
0.28
1)0.
976
0.08
6−0
.236
(−0.
458;−0
.014
)0.
037
0.08
6
M1:
(cru
de);
M2:
(adj
uste
dfo
rM
1pl
usLo
gTo
talE
nerg
y);M
3:(a
djus
ted
for
M2
plus
Body
Mas
sIn
dex)
;M4:
(adj
uste
dfo
rM
3pl
usag
e,sm
okin
g,ph
ysic
alac
tivi
ty,a
lcoh
olin
take
,se
ason
alit
y,ed
ucat
ion
leve
l,PC
1,PC
2an
dPC
3);M
1=
mod
el1;
M2
=m
odel
2;M
3=
mod
el3;
M4
=m
odel
4;PC
1=
Mag
nesi
um,p
hosp
horu
san
dpl
antp
rote
ind
rive
nnu
trie
nts;
PC2
=Fa
tand
anim
alpr
otei
nd
rive
nnu
trie
nts;
PC
3=
Star
ch,d
ieta
ryfi
bre
and
Bvi
tam
ind
rive
nnu
trie
nts
Fast
ing
glu
cose
uni
tsm
mol·L
−1=
mill
imol
espe
rlit
re;S
D=
stan
dar
dde
viat
ion;
CI=
confi
denc
ein
terv
al.
Ta
ble
4.
Reg
ress
ion
coef
ficie
nts
for
glyc
ated
haem
oglo
bin
for
1SD
incr
ease
inth
ede
rive
dnu
trie
ntpa
tter
nsc
ores
amon
gru
ralb
lack
Sout
hA
fric
anw
omen
.
Ma
gn
esi
um
,P
ho
sph
oru
sa
nd
Pla
nt
Pro
tein
Dri
ve
nN
utr
ien
tsF
at
an
dA
nim
al
Pro
tein
Dri
ve
nN
utr
ien
tsS
tarc
h,
Die
tary
Fib
rea
nd
BV
ita
min
Dri
ve
nN
utr
ien
ts
B(9
5%
CI)
pV
alu
eR
2B
(95
%C
I)p
Va
lue
R2
B(9
5%
CI)
pV
alu
eR
2
M1
0.02
9(−
0.05
5;0.
112)
0.50
20.
001
0.03
2(−
0.05
6;0.
120)
0.47
70.
001
−0.1
38(−
0.22
4;−0
.053
)0.
002
0.02
0M
20.
048
( −0.
104;
0.19
9)0.
538
0.00
10.
028
(−0.
067;
0.12
3)0.
563
0.00
1−0
.145
(−0.
234;−0
.056
)0.
001
0.02
1M
30.
112
( −0.
036;
0.26
0)0.
139
0.06
90.
014
(−0.
078;
0.10
6)0.
766
0.06
5−0
.151
(−0.
237;−0
.065
)0.
001
0.08
7M
40.
107
( −0.
188;
0.40
1)0.
478
0.15
0−0
.011
(−0.
175;
0.15
4)0.
478
0.15
0−0
.175
(−0.
303;−0
.047
)0.
007
0.15
0
M1:
(cru
de)
;M2:
(ad
just
edfo
rM
1p
lus
Log
Tota
lEne
rgy)
;M3:
(ad
just
edfo
rM
2p
lus
Bod
yM
ass
Ind
ex);
M4:
(ad
just
edfo
rM
3p
lus
age,
smok
ing,
phy
sica
lact
ivit
y,al
coho
lin
take
,sea
sona
lity,
edu
cati
onle
vel,
PC
1,P
C2
and
PC
3);M
1=
mod
el1;
M2
=m
odel
2;M
3=
mod
el3;
M4
=m
odel
4;P
C1
=M
agne
siu
m,p
hosp
horu
san
dp
lant
pro
tein
dri
ven
nutr
ient
s;PC
2=
Fata
ndan
imal
prot
ein
driv
ennu
trie
nts;
PC3
=St
arch
,die
tary
fibre
and
Bvi
tam
indr
iven
nutr
ient
s.G
lyca
ted
haem
oglo
bin
unit
=pe
rce
nt;S
D=
stan
dard
devi
atio
n;C
I=co
nfide
nce
inte
rval
.
44
Books
MDPI

Nutrients 2017, 9, 9
Ta
ble
5.
Reg
ress
ion
coef
ficie
nts
for
fast
ing
gluc
ose
for
1SD
incr
ease
inth
ede
rive
dnu
trie
ntpa
tter
nsc
ores
amon
gru
ralb
lack
Sout
hA
fric
anm
en.
Th
iam
ine
,Z
inc
an
dP
lan
tP
rote
inD
riv
en
Nu
trie
nts
Fa
ta
nd
An
ima
lP
rote
inD
riv
en
Nu
trie
nts
Re
tin
ol
an
dV
ita
min
B1
2D
riv
en
Nu
trie
nts
B(9
5%
CI)
pV
alu
eR
2B
(95
%C
I)p
Va
lue
R2
B(9
5%
CI)
pV
alu
eR
2
M1
−0.0
57(−
0.17
2;0.
057)
0.32
60.
004
0.05
4(−
0.06
1;0.
169)
0.35
50.
003
−0.0
39(−
0.15
6;0.
077)
0.50
40.
002
M2
−0.2
37(−
0.49
2;0.
019)
0.06
90.
013
0.06
1(−
0.06
4;0.
186)
0.33
50.
004
−0.0
55(−
0.17
3;0.
064)
0.36
30.
003
M3
−0.2
55(−
0.49
6;0.
014)
0.03
80.
117
0.05
5(−
0.06
3;0.
172)
0.36
30.
115
−0.0
82(−
0.19
4;0.
030)
0.15
30.
120
M4
−0.3
82(−
0.75
2;−0
.012
)0.
043
0.18
2−0
.051
(−0.
241;
0.13
9)0.
596
0.18
2−0
.109
(−0.
229;
0.03
2)0.
074
0.18
2
M1:
(cru
de);
M2:
(adj
uste
dfo
rM
1pl
usLo
gTo
talE
nerg
y);M
3:(a
djus
ted
for
M2
plus
Body
Mas
sIn
dex)
;M4:
(adj
uste
dfo
rM
3pl
usag
e,sm
okin
g,ph
ysic
alac
tivi
ty,a
lcoh
olin
take
,se
ason
alit
y,ed
ucat
ion
leve
l,PC
1,PC
2an
dPC
3);M
1=
mod
el1;
M2
=m
odel
2;M
3=
mod
el3;
M4
=m
odel
4;PC
1=
Mag
nesi
um,p
hosp
horu
san
dpl
antp
rote
ind
rive
nnu
trie
nts;
PC2
=Fa
tand
anim
alpr
otei
nd
rive
nnu
trie
nts;
PC
3=
Star
ch,d
ieta
ryfi
bre
and
Bvi
tam
ind
rive
nnu
trie
nts
Fast
ing
glu
cose
uni
tsm
mol·L
−1=
mill
imol
espe
rlit
re;S
D=
stan
dar
dde
viat
ion;
CI=
confi
denc
ein
terv
al.
Ta
ble
6.
Reg
ress
ion
coef
ficie
nts
for
glyc
ated
haem
oglo
bin
for
1SD
incr
ease
inth
ede
rive
dnu
trie
ntpa
tter
nsc
ores
amon
gru
ralb
lack
Sout
hA
fric
anw
omen
.
Th
iam
ine
,Z
inc
an
dP
lan
tP
rote
inD
riv
en
Nu
trie
nts
Fa
ta
nd
An
ima
lP
rote
inD
riv
en
Nu
trie
nts
Re
tin
ol
an
dV
ita
min
B1
2D
riv
en
Nu
trie
nts
B(9
5%
CI)
pV
alu
eR
2B
(95
%C
I)p
Va
lue
R2
B(9
5%
CI)
pV
alu
eR
2
M1
−0.0
39(−
0.11
7;0.
038)
0.32
00.
000
0.04
6(−
0.03
1;0.
123)
0.24
10.
005
0.01
2(−
0.06
5;0.
090)
0.75
40.
000
M2
−0.2
14(−
0.38
4;0.
044)
0.01
40.
024
0.05
3(−
0.03
1;0.
138)
0.21
30.
006
0.01
5(−
0.06
5;0.
094)
0.71
30.
001
M3
−0.2
30(−
0.39
2;−0
.067
)0.
006
0.11
30.
050
(−0.
030;
0.13
1)0.
219
0.09
20.
001
(−0.
075;
0.07
7)0.
975
0.08
6M
4−0
.288
(−0.
543;−0
.033
)0.
027
0.17
4−0
.057
(−0.
189;
0.07
5)0.
396
0.17
4−0
.018
(−0.
100;
0.06
4)0.
662
0.17
4
M1:
(cru
de)
;M2:
(ad
just
edfo
rM
1p
lus
Log
Tota
lEne
rgy)
;M3:
(ad
just
edfo
rM
2p
lus
Bod
yM
ass
Ind
ex);
M4:
(ad
just
edfo
rM
3p
lus
age,
smok
ing,
phy
sica
lact
ivit
y,al
coho
lin
take
,sea
sona
lity,
edu
cati
onle
vel,
PC
1,P
C2
and
PC
3);M
1=
mod
el1;
M2
=m
odel
2;M
3=
mod
el3;
M4
=m
odel
4;P
C1
=M
agne
siu
m,p
hosp
horu
san
dp
lant
pro
tein
dri
ven
nutr
ient
s;PC
2=
Fata
ndan
imal
prot
ein
driv
ennu
trie
nts;
PC3
=St
arch
,die
tary
fibre
and
Bvi
tam
indr
iven
nutr
ient
s.G
lyca
ted
haem
oglo
bin
unit
=pe
rce
nt;S
D=
stan
dard
devi
atio
n;C
I=co
nfide
nce
inte
rval
.
45
Books
MDPI

Nutrients 2017, 9, 9
The plant driven nutrient patterns had significant results as has been shown above among theurban and rural participants. However, some notable differences were depicted in the plant drivennutrient patterns illustrated in Table S3. The following nutrient patterns, “thiamine, zinc and plantprotein driven nutrients”, “thiamine, starch and folate driven nutrients”, and “magnesium, phosphorusand plant protein driven nutrients” extracted from the urban men, urban women and rural women,respectively, had higher loadings for animal protein, saturated fat, mono-saturated fat and sugarcompared to the “thiamine, zinc and plant protein driven nutrients” and “the starch, dietary fibreand B vitamin driven nutrients patterns”, which were associated with significant reductions in fastingand glycated haemoglobin among the rural men and women respectively (see factor loadings in boldin Table S3). These two nutrient patterns that had significant associations with fasting glucose andglycated haemoglobin had very low cholesterol and saturated fat as illustrated in Table S3.
4. Discussion
We set out to determine the nutrient patterns associated with fasting glucose and glycatedhaemoglobin levels among apparently healthy volunteers. The principal component analysis methodenabled the extraction of three nutrient patterns among a black South African population whichexplained about 73% of the variation of the nutrient factors in the urban/rural and gender stratifications.The magnesium, phosphorus and plant protein driven nutrient pattern was associated with a trendof increasing fasting glucose and glycated haemoglobin levels per 1 SD increase in the pattern inthe rural women while the thiamine, zinc and plant protein nutrient pattern was associated with apositive trend of increasing glycated haemoglobin among urban men. Notably, the starch, dietaryfibre and B vitamin nutrient pattern was associated with decreases in glycated haemoglobin andfasting glucose levels, −0.175% ((−0.303; −0.047); p = 0.007) and −0.236 mmol·L−1 ((−0.458; −0.014);p = 0.037), respectively, among rural women. The thiamine, zinc and plant protein driven nutrientpattern was associated with significant reductions in fasting glucose and glycated haemoglobin of−0.382 mmol·L−1 (−0.752; −0.012; p = 0.043) and −0.288% (−0.543; −0.033; p = 0.027) in rural men.These associations were significantly maintained after adjusting for age, BMI, log total energy intake,smoking, physical activity, alcohol intake, seasonality and education level attained thus indicating anindependent association of the starch, dietary fibre and B vitamin nutrient pattern and the thiamine,zinc and plant protein driven nutrient pattern with fasting glucose and glycated haemoglobin in therural women and rural men strata’s, respectively.
Comparable studies evaluating the associations of nutrients patterns with fasting glucose andglycated haemoglobin are scarce. However, evidence exists of dietary patterns which have evaluatedthis phenomenon [10]. The Health/Prudent dietary pattern has been associated with decreases infasting glucose and glycated haemoglobin levels while the Western dietary pattern has been associatedwith increases in these biomarkers of T2D [27,28]. However, the association of the Western dietarypattern, which is characterised with high intakes of animal proteins and snacks, with fasting glucoselevels was noted to vary among ethnic groups [13]. The Western dietary pattern was reported in onestudy to be only significantly associated with high fasting glucose levels and glycated haemoglobinlevels among Dutch and not among the Moroccans and Turkish groups [13]. Dietary patterns areknown to vary among different ethnic groups, therefore nutrient patterns that were considered in ourstudy are considered helpful in indicating a non-ethnic insight into this phenomenon.
In our study, we noted that fat and animal protein driven nutrients were also not associatedwith fasting glucose and glycated levels, as had been depicted in dietary pattern analysis studiesamong different ethnic groups [13]. This disparity from the Western populations where the animalbased/Western dietary patterns are associated with increasing fasting glucose levels has been explainedby the realisation that ethnic groups such as Asians may adopt the Western diets but their intakeof animal products will remain lower as they also continue to consume traditional cereals andvegetables [29]. Similarly, in this study population, the intake of fat and animal protein nutrients werelower in the plant driven nutrients patterns that accounted for the greatest variance among the three
46
Books
MDPI

Nutrients 2017, 9, 9
nutrients patterns extracted per stratum as illustrated in Table S3. In other local studies, the proteinand fat intakes as percentage of total energy intake for urban women from 1975 to 2005 did not changedrastically though evidences of the adoption of Western dietary patterns were being noted and thegreater proportion of the energy intake was still being contributed by the carbohydrate intake as hadbeen noted in the Asians [6]. From 1975 to 2005, the percentage of energy of protein intake changedfrom 14% to 13%, while fat intake as percentage of energy changed from 21% to 30% and carbohydrateintake changed from 67% to 57% of total energy intake [6]. Thus, the intake of fat and animal proteindriven nutrients in this population group might have been lower and thus not associated with increasesin fasting glucose and glycated haemoglobin as was expected.
The magnesium, phosphorus and plant protein driven nutrient pattern indicated a positive trendassociation with increases in fasting glucose and glycated haemoglobin levels among rural women,while the thiamine, zinc and plant protein driven nutrient pattern was associated with a trend ofincreasing glycated haemoglobin levels in the urban men (Table S7). However, plant protein andzinc, which were high in these nutrient patterns, have been reported to independently lower fastingglucose levels [30–33]. In addition, the thiamine, zinc and plant protein driven nutrient pattern wasassociated with a trend of decreasing glycated haemoglobin and fasting glucose levels in the ruralmen. In view that the study population comprised people who consumed diets with both animaland plant based nutrients and not purely vegetarians, the discrepancies in the associations of theplant driven nutrients can be explained by the varied proportions of animal protein, saturated fat,mono-saturated fat, cholesterol and sugar among these plant driven nutrient patterns, as illustratedin Table S3. The magnesium, phosphorus and plant protein driven nutrient pattern in rural womenand the thiamine, zinc and plant protein driven nutrient pattern in urban men had higher loadings ofanimal protein, saturated fat, mono-saturated fat, cholesterol and sugar compared to the other nutrientpatterns discussed below such as the starch, dietary fibre and B vitamins driven nutrient patternamong rural women and the thiamine, zinc and plant protein nutrient pattern among rural men whichassociated with low fasting glucose and glycated haemoglobin levels. Animal protein, saturated fat,cholesterol and sugar are high in Western dietary patterns which have been previously associatedwith increased risk of T2D and this helps clarify the positive trend of association of the magnesium,phosphorus and plant protein driven nutrient pattern in rural women and the thiamine, zinc and plantprotein driven nutrient pattern in urban men with the study outcome variables [34]. The comparisonsof the varied constituents of the plant driven nutrients as discussed above and illustrated in Table S3indicates the attractiveness of the PCA approach of nutrient pattern determination as it allows a wholebased approach of the effect of nutrients to particular outcomes to be evaluated.
The starch, dietary fibre and B vitamins driven nutrient pattern was consistently associatedwith reduced fasting glucose and glycated haemoglobin levels in all the multivariate linear modelswhich were considered in this study among rural women. The thiamine, zinc and plant proteinnutrient pattern was also associated with significant reductions in glycated haemoglobin and fastingglucose among rural men. These findings are similar to the results of other studies on plant baseddietary patterns and T2D risk [10,34]. It has been consistently reported that plant based diets areprotective against T2D risk [10,34,35]. A number of mechanisms have been proposed to explain thisphenomenon [10]. Plant based diets which are rich in dietary fibre are suggested to reduce T2D riskby reducing postprandial insulin demand, improving insulin sensitivity and the antioxidants foundin these diets may help enhance β-cell function [36,37]. Dietary fibre from cereal foods which arealso high in starch has been consistently shown across eight European countries to be associated withreduced T2D risk [38]. Maize meal fortified with iron, zinc and B vitamins which is largely consumedamong the black South African population group is known to contain resistant starches that arepartially digested and have been associated with improved insulin sensitivity which may then lead toreductions in fasting glucose levels [39,40]. Thiamine was also high in this nutrient pattern. Evidenceexists that dietary fibre beneficial effects might also be due to its concomitant intake together withthiamine [41]. The results of this study suggest that starch, dietary fibre and B vitamins nutrients, zinc
47
Books
MDPI

Nutrients 2017, 9, 9
and plant protein consumed together may lead to the lowering of fasting and glycated haemoglobinlevels as has been postulated elsewhere [35].
The strengths of the current study include the use of a validated QFFQ and recruitment criteria ofselecting apparently healthy individuals who were not taking chronic medications or suffering fromchronic diseases. This might have helped to prevent the confounding of drugs and T2D to the nutrientpattern association results with glycated haemoglobin and fasting glucose levels. The factor analysisapproach used to derive the nutrient patterns is known for depicting real-world dietary behaviours [42].However, this approach is based on a number of subjective decisions such as naming nutrient patterns,method of rotation and selection of food groups which can lead to an overall measurement error [10,42].Since this approach is a posteriori analysis tool, it derives nutrient patterns based on data at hand andthis makes comparisons with other studies difficult [10,42]. However, regardless of the differencesin the constituents of the nutrient patterns due to the data driven approaches used to derive them,consistent similarities of the dietary factors associated with T2D risk as reported in this study, has beendepicted in multiple populations [10,34,37]. It might be probable that the residual confounding effectof total energy intake might have led to distortions in the association of the nutrient patterns withfasting glucose and glycated haemoglobin levels. Residual confounding is a result of measurementerror in a confounder included in the model [43]. Although the nutrient and total energy intake basedon the QFFQs are not precisely measured, adjustment for total energy intake should control for totalenergy intake confounding [44]. However, evidence exists that the control of total energy intake is notcomplete in epidemiological studies involving QFFQs thereby leading to residual confounding [44,45].Therefore, there is need to further explore the association of the nutrient patterns in isocaloric clinicaltrials which are better designed to control for confounding for total energy intake [45].
5. Conclusions
In summary, our results indicate the beneficial associations of plant driven nutrient patterns withreductions in fasting glucose and glycated haemoglobin levels. However, the small variances thatwere explained by the models explored in this study are suggestive of the presence of other factorsthat affect the variation of fasting glucose and glycated haemoglobin which were not accounted for inthis study. Thus, more studies are required to further explore the association of nutrient patterns withfasting glucose and glycated haemoglobin.
Supplementary Materials: The following are available online at http://www.mdpi.com/2072-6643/9/1/9/s1,Table S1. Extracted nutrient patterns and factor loadings of rural women and rural men, Table S2. Nutrientpatterns and factor loadings for urban participants, Table S3. Comparison of the factors loadings in the plantdriven nutrient patterns among the urban and rural participants, Table S4. Regression coefficients for fastingglucose for 1 SD increase in the derived nutrient pattern scores among urban black South African women, Table S5.Regression coefficients for glycated haemoglobin for 1 SD increase in the derived nutrient pattern scores amongurban black South African women, Table S6. Regression coefficients for fasting glucose for 1 SD increase inthe derived nutrient pattern scores among urban black South African men, Table S7. Regression coefficientsfor glycated haemoglobin for 1 SD increase in the derived nutrient pattern scores among urban black SouthAfrican men.
Acknowledgments: This research was supported by a grant National Research Foundation of South Africa(87970). Tinashe Chikowore is supported by the National Research Foundation of South Africa (89117). We wouldlike to acknowledge A. Kruger and the PURE research team, funders and participants.
Author Contributions: T.C. conceptualized the paper, analysed the data and wrote the draft article. P.T.P. designedthe data analysis plan and contributed to the writing of the paper. E.W.-V. designed the dietary data collectiontools, coded and analysed the data for nutrients and contributed to the writing of the paper. T.v.Z., E.J.M.F. andK.R.C. supervised and contributed to the writing of the paper.
Conflicts of Interest: The authors declare no conflict of interest.
48
Books
MDPI

Nutrients 2017, 9, 9
References
1. Chen, L.; Magliano, D.J.; Zimmet, P.Z. The worldwide epidemiology of type 2 diabetes mellitus—Presentand future perspectives. Nat. Rev. Endocrinol. 2012, 8, 228–236. [CrossRef] [PubMed]
2. Collaboration, N.C.D.R.F. Worldwide trends in diabetes since 1980: A pooled analysis of751 population-based studies with 4.4 million participants. Lancet 2016, 387, 1513–1530.
3. Guariguata, L.; Whiting, D.R.; Hambleton, I.; Beagley, J.; Linnenkamp, U.; Shaw, J.E. Global estimates ofdiabetes prevalence for 2013 and projections for 2035. Diabetes Res. Clin. Pract. 2014, 103, 137–149. [CrossRef][PubMed]
4. Peer, N.; Steyn, K.; Lombard, C.; Lambert, E.V.; Vythilingum, B.; Levitt, N.S. Rising diabetes prevalenceamong urban-dwelling black South Africans. PLoS ONE 2012, 7, e43336. [CrossRef] [PubMed]
5. Sartorius, B.; Veerman, L.J.; Manyema, M.; Chola, L.; Hofman, K. Determinants of obesity and associatedpopulation attributability, South Africa: Empirical evidence from a national panel survey, 2008–2012. PLoSONE 2015, 10, e0130218. [CrossRef] [PubMed]
6. Vorster, H.H.; Kruger, A.; Margetts, B.M. The nutrition transition in Africa: Can it be steered into a morepositive direction? Nutrients 2011, 3, 429–441. [CrossRef] [PubMed]
7. Vorster, H.H.; Kruger, A.; Wentzel-Viljoen, E.; Kruger, H.S.; Margetts, B.M. Added sugar intake in SouthAfrica: Findings from the adult prospective urban and rural epidemiology cohort study. Am. J. Clin. Nutr.2014, 99, 1479–1486. [CrossRef] [PubMed]
8. Vorster, H.H.; Margetts, B.M.; Venter, C.S.; Wissing, M.P. Integrated nutrition science: From theory to practicein South Africa. Public Health Nutr. 2005, 8, 760–765. [CrossRef] [PubMed]
9. Hattingh, Z.; Walsh, C.M.; Bester, C.J.; Oguntibeju, O.O. Evaluation of energy and macronutrient intake ofblack women in Bloemfontein: A cross-sectional study. Afr. J. Biotechnol. 2008, 7, 4019–4024.
10. McEvoy, C.T.; Cardwell, C.R.; Woodside, J.V.; Young, I.S.; Hunter, S.J.; McKinley, M.C. A posteriori dietarypatterns are related to risk of type 2 diabetes: Findings from a systematic review and meta-analysis. J. Acad.Nutr. Diet. 2014, 114, 1759–1775. [CrossRef] [PubMed]
11. Hu, F.B. Dietary pattern analysis: A new direction in nutritional epidemiology. Curr. Opin. Lipidol. 2002, 13,3–9. [CrossRef] [PubMed]
12. Salehi-Abargouei, A.; Esmaillzadeh, A.; Azadbakht, L.; Keshteli, A.H.; Feizi, A.; Feinle-Bisset, C.; Adibi, P.Nutrient patterns and their relation to general and abdominal obesity in Iranian adults: Findings from theSepahan study. Eur. J. Nutr. 2016, 55, 505–518. [CrossRef] [PubMed]
13. Dekker, L.H.; van Dam, R.M.; Snijder, M.B.; Peters, R.J.; Dekker, J.M.; de Vries, J.H.; de Boer, E.J.; Schulze, M.B.;Stronks, K.; Nicolaou, M. Comparable dietary patterns describe dietary behavior across ethnic groups inThe Netherlands, but different elements in the diet are associated with glycated hemoglobin and fastingglucose concentrations. J. Nutr. 2015, 145, 1884–1891. [CrossRef] [PubMed]
14. Freisling, H.; Fahey, M.T.; Moskal, A.; Ocke, M.C.; Ferrari, P.; Jenab, M.; Norat, T.; Naska, A.; Welch, A.A.;Navarro, C.; et al. Region-specific nutrient intake patterns exhibit a geographical gradient within andbetween European countries. J. Nutr. 2010, 140, 1280–1286. [CrossRef] [PubMed]
15. Koenig, R.J.; Peterson, C.M.; Jones, R.L.; Saudek, C.; Lehrman, M.; Cerami, A. Correlation of glucoseregulation and hemoglobin AIc in diabetes mellitus. N. Engl. J. Med. 1976, 295, 417–420. [CrossRef] [PubMed]
16. Teo, K.; Chow, C.K.; Vaz, M.; Rangarajan, S.; Yusuf, S. The Prospective Urban Rural Epidemiology (PURE)study: Examining the impact of societal influences on chronic noncommunicable diseases in low-, middle-,and high-income countries. Am. Heart J. 2009, 158, 1–7. [CrossRef] [PubMed]
17. Arie, S. Revision of Helsinki declaration aims to prevent exploitation of study participants. BMJ 2013, 347,f6401. [CrossRef] [PubMed]
18. MacIntyre, U.E.; Venter, C.S.; Vorster, H.H.; Steyn, H.S. A combination of statistical methods for the analysisof the relative validation data of the quantitative food frequency questionnaire used in the THUSA study.Public Health Nutr. 2001, 4, 45–51. [CrossRef] [PubMed]
19. Wolmarans, P.; Danster, N.; Dalton, A.; Rossouw, K.; Schönfeldt, H. Condensed Food Composition Tables forSouth Africa; Medical Research Council: Cape Town, South Africa, 2010.
20. Wentzel-Viljoen, E.; Laubscher, R.; Kruger, A. Using different approaches to assess the reproducibility ofa culturally sensitive quantified food frequency questionnaire. S. Afr. J. Clin. Nutr. 2011, 24, 143–148.[CrossRef]
49
Books
MDPI
Nutrients 2017, 9, 9
21. Wolmarans, P.; Chetty, J.; Danster-Christians, N. Food composition activities in South Africa. Food Chem.2013, 140, 447–450. [CrossRef] [PubMed]
22. Kruger, H.; Venter, C.; Steyn, H. A standardised physical activity questionnaire for a population in transition:The THUSA study. Afr. J. Phys. Health Educ. Recreat. Dance 2000, 6, 54–64.
23. Oyeyemi, A.L.; Moss, S.J.; Monyeki, M.A.; Kruger, H.S. Measurement of physical activity in urban and ruralSouth African adults: A comparison of two self-report methods. BMC Public Health 2016, 16, 1004. [CrossRef][PubMed]
24. Pisa, P.T.; Pedro, T.M.; Kahn, K.; Tollman, S.M.; Pettifor, J.M.; Norris, S.A. Nutrient patterns and theirassociation with socio-demographic, lifestyle factors and obesity risk in rural South African adolescents.Nutrients 2015, 7, 3464–3482. [CrossRef] [PubMed]
25. Boeing, H.; Weisgerber, U.M.; Jeckel, A.; Rose, H.J.; Kroke, A. Association between glycated hemoglobinand diet and other lifestyle factors in a nondiabetic population: Cross-sectional evaluation of data from thePotsdam cohort of the European Prospective Investigation into Cancer and Nutrition Study. Am. J. Clin. Nutr.2000, 71, 1115–1122. [PubMed]
26. Alberti, K.G.; Zimmet, P.Z. Definition, diagnosis and classification of diabetes mellitus and its complications.Part 1: Diagnosis and classification of diabetes mellitus provisional report of a who consultation. Diabet. Med.1998, 15, 539–553. [CrossRef]
27. Kim, H.S.; Park, S.Y.; Grandinetti, A.; Holck, P.S.; Waslien, C. Major dietary patterns, ethnicity, and prevalenceof type 2 diabetes in rural Hawaii. Nutrition 2008, 24, 1065–1072. [CrossRef] [PubMed]
28. Liese, A.D.; Weis, K.E.; Schulz, M.; Tooze, J.A. Food intake patterns associated with incident type 2 diabetes:The insulin resistance atherosclerosis study. Diabetes Care 2009, 32, 263–268. [CrossRef] [PubMed]
29. Gilbert, P.A.; Khokhar, S. Changing dietary habits of ethnic groups in Europe and implications for health.Nutr. Rev. 2008, 66, 203–215. [CrossRef] [PubMed]
30. Roberts-Toler, C.; O’Neill, B.T.; Cypess, A.M. Diet-induced obesity causes insulin resistance in mouse brownadipose tissue. Obesity (Silver Spring) 2015, 23, 1765–1770. [CrossRef] [PubMed]
31. Capdor, J.; Foster, M.; Petocz, P.; Samman, S. Zinc and glycemic control: A meta-analysis of randomisedplacebo controlled supplementation trials in humans. J. Trace Elem. Med. Biol. 2013, 27, 137–142. [CrossRef][PubMed]
32. Hruby, A.; Ngwa, J.S.; Renstrom, F.; Wojczynski, M.K.; Ganna, A.; Hallmans, G.; Houston, D.K.; Jacques, P.F.;Kanoni, S.; Lehtimaki, T.; et al. Higher magnesium intake is associated with lower fasting glucose andinsulin, with no evidence of interaction with select genetic loci, in a meta-analysis of 15 CHARGE ConsortiumStudies. J. Nutr. 2013, 143, 345–353. [CrossRef] [PubMed]
33. Khattab, M.; Abi-Rashed, C.; Ghattas, H.; Hlais, S.; Obeid, O. Phosphorus ingestion improves oral glucosetolerance of healthy male subjects: A crossover experiment. Nutr. J. 2015, 14, 112. [CrossRef] [PubMed]
34. Alhazmi, A.; Stojanovski, E.; McEvoy, M.; Garg, M.L. The association between dietary patterns and type 2diabetes: A systematic review and meta-analysis of cohort studies. J. Hum. Nutr. Diet. 2014, 27, 251–260.[CrossRef] [PubMed]
35. Sabate, J.; Wien, M. A perspective on vegetarian dietary patterns and risk of metabolic syndrome. Br. J. Nutr2015, 113 (Suppl. 2), S136–143. [CrossRef] [PubMed]
36. Barclay, A.W.; Petocz, P.; McMillan-Price, J.; Flood, V.M.; Prvan, T.; Mitchell, P.; Brand-Miller, J.C. Glycemicindex, glycemic load, and chronic disease risk—A meta-analysis of observational studies. Am. J. Clin. Nutr.2008, 87, 627–637. [PubMed]
37. Montonen, J.; Knekt, P.; Harkanen, T.; Jarvinen, R.; Heliovaara, M.; Aromaa, A.; Reunanen, A. Dietarypatterns and the incidence of type 2 diabetes. Am. J. Epidemiol. 2005, 161, 219–227. [CrossRef] [PubMed]
38. InterAct Consortium. Dietary fibre and incidence of type 2 diabetes in eight European countries:The epic-interact study and a meta-analysis of prospective studies. Diabetologia, 2015; 58, 1394–1408.
39. Brites, C.M.; Trigo, M.J.; Carrapico, B.; Alvina, M.; Bessa, R.J. Maize and resistant starch enriched breadsreduce postprandial glycemic responses in rats. Nutr. Res. 2011, 31, 302–308. [CrossRef] [PubMed]
40. Gower, B.A.; Bergman, R.; Stefanovski, D.; Darnell, B.; Ovalle, F.; Fisher, G.; Sweatt, S.K.; Resuehr, H.S.;Pelkman, C. Baseline insulin sensitivity affects response to high-amylose maize resistant starch in women:A randomized, controlled trial. Nutr. Metab. (Lond.) 2016, 13, 2. [CrossRef] [PubMed]
50
Books
MDPI

Nutrients 2017, 9, 9
41. Bakker, S.J.; Hoogeveen, E.K.; Nijpels, G.; Kostense, P.J.; Dekker, J.M.; Gans, R.O.; Heine, R.J. The associationof dietary fibres with glucose tolerance is partly explained by concomitant intake of thiamine: The hoornstudy. Diabetologia 1998, 41, 1168–1175. [CrossRef] [PubMed]
42. Moeller, S.M.; Reedy, J.; Millen, A.E.; Dixon, L.B.; Newby, P.K.; Tucker, K.L.; Krebs-Smith, S.M.; Guenther, P.M.Dietary patterns: Challenges and opportunities in dietary patterns research an experimental biologyworkshop, April 1, 2006. J. Am. Diet. Assoc. 2007, 107, 1233–1239. [CrossRef] [PubMed]
43. Fewell, Z.; Davey Smith, G.; Sterne, J.A. The impact of residual and unmeasured confounding inepidemiologic studies: A simulation study. Am. J. Epidemiol. 2007, 166, 646–655. [CrossRef] [PubMed]
44. Willett, W. Nutritional Epidemiology; Oxford University Press: New York, NY, USA, 1998.45. Jakes, R.W.; Day, N.E.; Luben, R.; Welch, A.; Bingham, S.; Mitchell, J.; Hennings, S.; Rennie, K.; Wareham, N.J.
Adjusting for energy intake—What measure to use in nutritional epidemiological studies? Int. J. Epidemiol.2004, 33, 1382–1386. [CrossRef] [PubMed]
© 2017 by the authors. Licensee MDPI, Basel, Switzerland. This article is an open accessarticle distributed under the terms and conditions of the Creative Commons Attribution(CC BY) license (http://creativecommons.org/licenses/by/4.0/).
51
Books
MDPI

nutrients
Article
Maternal Low-Protein Diet Modulates GlucoseMetabolism and Hepatic MicroRNAs Expression inthe Early Life of Offspring †
Jia Zheng, Xinhua Xiao *, Qian Zhang, Tong Wang, Miao Yu and Jianping Xu
Department of Endocrinology, Key Laboratory of Endocrinology, Ministry of Health, Peking Union MedicalCollege Hospital, Diabetes Research Center of Chinese Academy of Medical Sciences & Peking Union MedicalCollege, Beijing 100730, China; [email protected] (J.Z.); [email protected] (Q.Z.);[email protected] (T.W.); [email protected] (M.Y.); [email protected] (J.X.)* Correspondence: [email protected]; Tel./Fax: +86-10-6915-5073† Parts of this study were presented in abstract form at the American Diabetes Association’s 76th Scientific
Sessions, 10–14 June 2016 in New Orleans, Louisiana.
Received: 28 December 2016; Accepted: 23 February 2017; Published: 27 February 2017
Abstract: Emerging studies revealed that maternal protein restriction was associated with increasedrisk of type 2 diabetes mellitus in adulthood. However, the mechanisms of its effects on offspring,especially during early life of offspring, are poorly understood. Here, it is hypothesized that impairedmetabolic health in offspring from maternal low-protein diet (LPD) is associated with perturbedmiRNAs expression in offspring as early as the weaning age. We examined the metabolic effects onthe C57BL/6J mice male offspring at weaning from dams fed with LPD or normal chow diet (NCD)throughout pregnancy and lactation. Maternal LPD feeding impaired metabolic health in offspring.Microarray profiling indicated that mmu-miR-615, mmu-miR-124, mmu-miR-376b, and mmu-let-7ewere significantly downregulated, while, mmu-miR-708 and mmu-miR-879 were upregulated inLPD offspring. Bioinformatic analysis showed target genes were mapped to inflammatory-relatedpathways. Serum tumor necrosis factor-α (TNF-α) levels were higher and interleukin 6 (IL-6) had atendency to be elevated in the LPD group. Finally, both mRNA and protein levels of IL-6 and TNF-αwere significantly increased in the LPD group. Our findings provide novel evidence that maternalLPD can regulate miRNAs expression, which may be associated with chronic inflammation statusand metabolic health in offspring as early as the weaning age.
Keywords: maternal low-protein diet; metabolic health; microRNAs; inflammation; early life; offspring
1. Introduction
The prevalence of type 2 diabetes mellitus (T2DM) is increasing significantly throughout theworld. However, the pathogenesis of diabetes has not been clearly demonstrated. Traditionally, it isgenerally believed that genes and adult lifestyle are critical factors of some metabolic diseases. Recently,several epidemiological studies of human populations highlighted that maternal nutrition, includingover-nutrition and under-nutrition, may strongly influence the risks of developing metabolic diseasesin adult life [1–3]. The mechanism underlying the increased susceptibility of T2DM in offspring ofmaternal malnutrition is poorly determined.
Recently, it seems as though epigenetic modifications may be one of the major mechanismsexplaining the association between early life malnutrition and late-onset diseases, such as obesity,insulin resistance, impaired glucose tolerance, and T2DM [4–7]. MicroRNAs (miRNAs) have emergedas important epigenetic modifications in recent years. They are a major class of small non-coding RNAswith about 20–22 nucleotides, which can mediate posttranscriptional regulation of gene expressions.
Nutrients 2017, 9, 205 52 www.mdpi.com/journal/nutrients
Books
MDPI

Nutrients 2017, 9, 205
miRNAs can specifically bind to the 3′-untranslated regions (3′-UTR) of target genes, resulting intranslation inhibition [8]. Numerous studies show that miRNAs play critical roles in the pathogenesisof diabetes, such as glucose uptake, transport, and insulin secretion [9].
Human studies have revealed that poor intrauterine environment elicited by maternal dietaryinsufficiency or imbalance increased the risk for intrauterine growth restriction (IUGR) and led tometabolic diseases in the offspring during adulthood, such as insulin resistance, impaired glucosetolerance, and T2DM [3,10]. The maternal protein restriction model, with 5%–9% protein, as comparedto 20% protein in normal diet, has been one of the most extensively studied models [11]. However,these studies were confined to long-term influences in offspring of a maternal low-protein diet (LPD)with varying durations range from 1 to 18 months (adulthood to aging) [12–14], yet the metabolichealth in the early life of offspring, such as at weaning, has not been well documented. Furthermore,little information is known about the role of miRNAs between maternal low-protein diet (LPD) andglucose metabolism in the early life of offspring, such as at weaning. It is noted that computationalpredictions of miRNA targets based on several databases exhibits that one single miRNA can affect agamut of different genes, ranging from several to hundreds, suggesting that a large proportion of thetranscriptome is subjected to miRNA modulation [15]. Thus, using a trans-generational mouse modelof maternal protein restriction and microarray platform, we address the hypothesis that impairedmetabolic health in offspring from LPD-fed dams is associated with perturbation of the programmedexpression of key miRNAs in offspring as early as at weaning age.
2. Materials and Methods
2.1. Animals and Diets
The seven-week-old C57BL/6J female and male mice were purchased from the Institute ofLaboratory Animal Science, Chinese Academy of Medical Sciences and Peking Union Medical College(Beijing, China). All of the mice were maintained under controlled conditions with room temperatureat 22 ± 2 ◦C and 12-h light/dark cycle. The mice were fed a normal chow diet (NCD) (D02041001,Research Diets, New Brunswick, NJ, USA) for one week for acclimatization. Then, mating wasperformed by housing males with females together (male:female = 1:2) until a vaginal plug wasdetected, which was considered day 0.5 of pregnancy. Pregnant females were single-housed and wererandomly assigned to either isocaloric LPD (9.6% protein, 80.2% carbohydrate, and 10.2% fat as kcal%,D02041002, Research Diets, New Brunswick, NJ, USA) or NCD (23.5% protein, 66.3% carbohydrate,and 10.2% fat as kcal%, D02041001, Research Diets, New Brunswick, NJ, USA) during pregnancy andlactation. Thus, offspring were divided into two groups according to maternal diets as the LPD groupand the NCD group. At day 1 after birth, all of the litters were adjusted to six pups each to ensureno litter was nutritionally biased. Birth weight was measured by calculating the average of one litter.All offspring were weaned at 21 days postnatal. At weaning, only one male offspring was randomlyselected from one litter and was sacrificed in each group (one mouse per litter, n = 6 to 8 per group).The female offspring were not examined in our present study in order to prevent confounding factorsrelated to their hormone profile and estrus cycle. Blood samples were taken from the intraorbitalretrobulbar plexus after 12-h of fasting in anesthetized mice, and the liver samples were quicklyremoved, snap frozen in liquid nitrogen, and stored at −80 ◦C for further analysis. Body weightin offspring and food intake of dams were monitored weekly. All of the animal experiments wereconducted in accordance with the Guide of the Care and Use of Laboratory Animals (NIH PublicationNo. 86-23, revised 1996) and were approved by the Animal Care and Use Committee of the PekingUnion Medical College Hospital (Beijing, China, MC-07-6004).
2.2. Glucose Tolerance Tests
The tolerance test was performed as described previously [16]. Mice were overnight-fasted(12–16 h) and fasted blood glucose was measured in tail vein blood samples. Mice were injected
53
Books
MDPI

Nutrients 2017, 9, 205
intraperitoneally with glucose (2 g/kg body weight), and blood glucose was measured at 30 min,60 min, and 120 min following injection using a glucometer (Bayer, Beijing, China). Blood glucoseresponse to glucose tolerance tests was calculated as the area under the glucose curve for each mouseaccording to the trapezoidal method, as previously described [17].
2.3. Measurement of Serum Insulin and Inflammatory Factors
Serum insulin levels were measured using the mouse ultrasensitive insulin enzyme-linkedimmunosorbent assay (ELISA) kit (80-INSMSU-E01, ALPCO Diagnostics, Salem, NH, USA). Seruminterleukin 6 (IL-6) and tumor necrosis factor-α (TNF-α) concentrations were measured by mouseELISA kits (ab100712 and ab108910, Abcam, MA, USA), respectively.
2.4. Microarray Profiling of MiRNAs in Offspring
Because of financial constraints, we could not perform a whole genome array for each mousein the LPD and NCD groups. Thus, in order to obtain a relatively reliable estimate of the meangene expression, each group contained three biological replicates, which were randomly selectedfrom each group. We performed the microarray with pooled RNA samples, a method that has beenshown to be appropriate and statistically valid for efficient microarray experiments, according toprevious studies [18,19]. As our study previously described [20], total RNA was extracted from theliver tissues in LPD and NCD offspring using Trizol reagent (Life Technologies Inc., Carlsbad, CA,USA), according to the manufacturer’s instructions. MiRNAs expressions in livers were detected byGeneChip microRNA 3.0 Array (Affymetrix, Inc., Santa, CA, USA), which provides for 100% miRBasev17 coverage [21,22].
2.5. Differential MiRNAs Expression Analysis in Offspring
Robust Multi-array Analysis (RMA) was utilized to convert raw data into recognizable miRNAexpression data. Then it was followed by median normalization and log2 transformation using Affypackage [23]. Differentially-expressed miRNAs between the LPD and NCD groups were analyzedby the Limma package of R language [23], which is based on the combined two criteria for truepositive differences: (1) |FC (fold change)| ≥ 2 and (2) p value < 0.05 [21], which is a relatively robustcutoff point.
2.6. Bioinformatics Analysis of Predicted Targets for MiRNAs in Offspring
All of the microarray data were also pooled for further analysis. According to our previouslypublished work [24], target genes of differentially expressed miRNAs between the two groups wereidentified using the miRWalk database [25], which can provide validated target genes information onmiRNAs for mouse [26]. To further reveal the potential biological functions and pathways of the targetgenes, the target genes were analyzed with the Kyoto Encyclopedia of Genes and Genomes (KEGG)pathways [27] using Database for Annotation, Visualization and Integrated Discovery (DAVID) [28].p value < 0.05 was the criterion for significant KEGG pathway terms.
2.7. Validation of Differentially Expressed MiRNAs in Offspring
In order to validate the expressions of differential miRNAs, quantitative real-time PCR (qRT-PCR)were utilized to detect the relative expression of differentially-expressed miRNAs, with samplesenlarged in each group (n = 6 to 8 per group) using the TaqMan detection system (Life Technologies,Foster City, CA, USA). All of the mice in each group were included for the validation. Total RNA wasreversely transcribed using the TaqMan MicroRNA Reverse Transcription kit (Applied Biosystems,Life Technologies, Foster City, CA, USA). All of the miRNA-specific reverse-transcription primerswere provided with the TaqMan MicroRNA Assay and purchased from Life Technologies Corporation(Applied Biosystems, Life Technologies, Foster City, CA, USA). The primers were mmu-miR-615
54
Books
MDPI

Nutrients 2017, 9, 205
(ID 2353), mmu-miR-124 (ID 2197), mmu-miR-376b (ID 2452), mmu-let-7e (ID 2407), mmu-miR-708(ID 1643), and mmu-miR-879 (ID 2473). U6 small nuclear RNA (ID 1973) was used as an endogenouscontrol. Gene expression was quantified by qRT-PCR and performed on an ABI prism Vii7 SequenceDetection System platform (ABI Prism® Vii7, Applied Biosystems, Life Technologies, Foster City, CA,USA). Data were analyzed and the fold change was calculated using the comparative Ct method.All reactions were carried out with three biological replicates, and each analysis consisted of threetechnical replicates.
2.8. Target Gene Expression by Quantitative Real-Time PCR
For the validation of miRNA target genes, mRNA expressions of target genes were performedusing SYBR Green. Prior to PCR, total RNA of each sample was processed with Rnase-free Dnase(Qiagen, New York, NY, USA). The RNA was reverse transcribed by 1 μg of total RNA fromeach sample using the Power cDNA Synthesis kit (A3500, Promega BioSciences LLC, Sunnyvale,CA, USA). We used Oligo 7.0 software (Molecular Biology Insights, Inc., Cascade, CO, USA)to design the sequences of the primers for IL-6, TNF-α, and housekeeping gene β-actin. Thesequences of the primers are as following: IL-6, forward 5′-CCAAGAGGTGAGTGCTTCCC-3′,reverse 5′-CTGTTGTTCAGACTCTCTCCCT-3′; TNF-α, forward 5′-CCCACGTCGTAGCAAACCA-3′,reverse 5′-ACAAGGTACAACCCATCGGC-3′; MAPK1, forward 5′-AATTGGTCAGGACAAGGGCT-3′,reverse 5′-GAGTGGGTAAGCTGAGACGG-3′; β-actin, forward 5′-TGTTACCAACTGGGACGACA-3′
reverse 5′-GGGGTGTTGAAGGTCTCAAA-3′. The reaction production was accurately measuredby the ABI prism Vii7 Sequence Detection System (ABI Prism® Vii7, Applied Biosystems, LifeTechnologies, Foster City, CA, USA). Data were analyzed and quantified using the comparativeCt method, as described in the preceding section.
2.9. Immunohistochemical Staining
The liver tissues from offspring mice were rapidly dissected. Then, they were fixed overnight in afreshly-prepared 10% buffered formaldehyde solution. The tissue samples were ethanol-dehydratedand embedded in paraffin wax. Serial 5 μm paraffin embedded tissue sections were mounted on slides.Then, the slides were stained with the primary antibodies overnight at 4 ◦C, which were IL-6 (1:300;ab83339, Abcam, Cambridge, MA, USA) and TNF-α (1:50, ab6671, Abcam, Cambridge, MA, USA),while negative controls were incubated with phosphate-buffered saline (PBS). The slices were thenwashed and incubated for 1 h at 37 ◦C with secondary antibodies (1:1000, Cell Signaling, Danvers, MA,USA). Then, the slides were stained with 3, 3′-diaminobenzidine (DAB) and hematoxylin. Brownishyellow granular or linear deposits were identified as positive. Image-Pro Plus 5.0 (Media Cybernetics,Silver Spring, MD, USA) was used for semi-quantitative analysis.
2.10. Statistical Analysis
Results are expressed as the mean ± SEM. Statistical analyses were performed with Student’st-tests of unpaired samples. The comparisons of glucose tolerance tests were analyzed with a two-wayANOVA. Fisher’s exact test was used for KEGG pathway analysis. A p value < 0.05 was consideredstatistically significant. Prism version 6.0 (GraphPad Software Inc., San Diego, CA, USA) was used forstatistical analysis.
3. Results
3.1. Effects of Diets on Body Weight and Glucose Tolerance in Dams
By the end of lactation, there was no significant difference in maternal body weight between thedams (noted as F0) fed with LPD and NCD (Figure 1a). Glucose tolerance testing showed that bloodglucose was indistinguishable between the two groups, as well as with the area under the curve (AUC)(Figure 2b,c). There was no significant difference in food intake between dams fed with LPD and NCD.
55
Books
MDPI

Nutrients 2017, 9, 205
Figure 1. Effects of diets during pregnancy and lactation on metabolic phenotype in dams. (a) Bodyweight; (b) intraperitoneal glucose tolerance tests; and (c) area under the curve (AUC) of glucosetolerance tests. Data represented as the mean ± SEM (n = 6 to 8, per group). Dams were noted as F0;LPD, low-protein diet; NCD, normal chow diet.
3.2. Effects of Maternal Diet on Metabolic Profile in Offspring at Weaning
At birth, newborns whose mother was fed with LPD during pregnancy and lactation showedlower body weight compared to offspring of control diet mothers (p < 0.05, Figure 2a). No significantdifference was found in litter size between LPD and NCD groups (Figure 2b). At weaning, the maleoffspring of LPD-fed dams exhibited significantly lower body weight, compared with the offspringof dams fed a control diet (p < 0.05, Figure 2c). There was no difference of fasted blood glucose inthe LPD and NCD male offspring at weaning. However, the blood glucose of the male offspring inLPD group was higher at 30 min (p < 0.05) after intraperitoneal glucose administration (Figure 2d).Consistently, the area under the curve (AUC) of the glucose tolerance test was greater in LPD offspring(p < 0.05, Figure 2e). We further examined insulin concentration of the male offspring. As consistentwith previous studies [15,29], LPD offspring showed lower fasted insulinemia at weaning, comparedto control offspring (Figure 2f), which may be caused by aberrant insulin secretion due to intrauterinegrowth restriction.
Figure 2. Metabolic profile and serum insulin concentration in offspring at weaning. (a) Birth weight;(b) litter size; (c) body weight at weaning; (d) intraperitoneal glucose tolerance test; (e) area undercurve (AUC) of glucose tolerance test; and (f) serum insulin level. Data represented as the mean ± SEM(n = 6 to 8, per group). * p < 0.05, ** p < 0.01 vs. the NCD group. LPD, low-protein diet; NCD, normalchow diet.
56
Books
MDPI

Nutrients 2017, 9, 205
3.3. Differential MiRNAs Expression in Offspring
Six miRNAs were shown to be significantly differentially expressed (|fold change| ≥ 2 andp value < 0.05) between LPD and NCD groups. In the livers of LPD offspring, mmu-miR-615,mmu-miR-124, mmu-miR-376b, and mmu-let-7e were significantly downregulated (fold change ≤ −2and p value < 0.05). Meanwhile, mmu-miR-708 and mmu-miR-879 were significantly upregulated(fold change ≥ 2 and p value < 0.05) (Table 1, Figure 3).
Table 1. Differentially-expressed miRNA (|fold change| ≥ 2 and p-value < 0.05).
Probe Set ID Fold Change p Value Sequence Length Sequence
mmu-miR-615 −7.61 0.004 22 GGGGGUCCCCGGUGCUCGGAUCmmu-miR-124 −4.37 0.014 22 CGUGUUCACAGCGGACCUUGAU
mmu-miR-376b −3.81 0.016 21 AUCAUAGAGGAACAUCCACUUmmu-let-7e −2.60 0.000 22 CUAUACGGCCUCCUAGCUUUCC
mmu-miR-708 3.89 0.007 23 AAGGAGCUUACAAUCUAGCUGGGmmu-miR-879 10.05 0.034 22 GCUUAUGGCUUCAAGCUUUCGG
Figure 3. The volcano plot of the miRNA array. This graph shows log2 (fold change) in the expressionmiRNAs and p value from the t-test between LPD and NCD offspring. The vertical blue line indicatesthat the threshold of |log2 (fold change)| is 1. The horizontal red line indicates that the p valuethreshold is 0.05. It showed six miRNAs were significantly differentially expressed (|fold change| ≥ 2and p value < 0.05) between LPD and NCD offspring. LPD, Low-protein diet; NCD, normal chow diet.
3.4. Validation of Differentially Expressed MiRNAs
To verify the results of microRNA array, all the six differentially-expressed miRNAs were validatedby increasing the quantity of samples in LPD and NCD groups using qRT-PCR (n = 6 to 8, per group).It showed that the expression levels of all the six miRNA were consistent with the results of microRNAarray analysis, which were analyzed and quantified by qRT-PCR (Figure 4).
57
Books
MDPI

Nutrients 2017, 9, 205
Figure 4. Differentially-expressed miRNAs were detected by miRNA array and validated by qRT-PCR.Data represented as the mean ± SEM (n = 6 to 8, per group). The fold change was calculated using thecomparative Ct method. qRT-PCR: quantitative real time-PCR.
3.5. Functional Enrichment Analysis for Target Genes by Bioinformatics Analysis
Furthermore, target genes of these six differentially-expressed miRNAs were identified by themiRWalk database. The six miRNAs, including mmu-miR-615, mmu-miR-124, mmu-miR-376b,mmu-let-7e, mmu-miR-708, and mmu-miR-879 had a total of 349 validated target genes in the miRWalkdatabase (Table 2). By utilizing the Database for Annotation, Visualization and Integrated Discovery(DAVID) and Kyoto Encyclopedia of Genes and Genomes (KEGG) databases, the functional enrichmentanalysis of these 349 validated genes were mapped in the MAPK signaling pathway, TGF-beta signalingpathway, Jak-STAT signaling pathway, cytokine-cytokine receptor interaction, chemokine signalingpathway, adipocytokine signaling pathway, and Toll-like receptor signaling pathway (Table 3), whichare all associated with inflammation responses.
Table 2. Validated targeted genes for differentially-expressed miRNAs.
MiRNA Count Target Genes
mmu-miR-615 6 Msx2, Hoxa7, Mbp, Lin28, Cdkn2a, Igf2
mmu-miR-124 87
Dll1, Sox9, Camk2g, Zic2, Fabp7, Hod, Pou5f1, Dicer1, Fgf8, Fgf10, H1foo, Bmp4, Lin28, Tcfap2b, Calb2,Btg2, Dcx, Pax6, Ifitm3, Dppa3, Mapk14, Evi1, Nr4a2, Mtpn, Nefm, Eomes, Cpeb1, Ctdspl, Mstn, Gata1,Stmn2, Rest, Trpm3, Mbp, Hprt1, Th, Oog4, Des, Uchl1, Foxp2, Rho, Eif2c3, Efnb1, Dnmt3b, Dbh ,H2afx,Npy, Med13, Prkca, Eif2c2, Fgf21, Phox2a, Mos, Gbx2, Emx1, Myh6, Mt1, Eif2c1, L1cam, Phox2b, Ctdsp1,Lmx1b, Tbr1, Nppa, Ccne1, Ccnb2, Eif2c4, Casp3, Tcfap2a, Sycp1, Gja1, Zp3, Rfpl4, Cdh1, Vax2, Slc6a3,Dlk1, Ntrk2, Pou3f3, Myh7, Sycp3, H2afz, Stat3, Wnt1, Foxa2, Ntrk3, Gja5
mmu-miR-376b 28 Hprt1, Oog4, Dnmt3b, H2afx, Fgf21, Mos, Dlk1, Mt1, Mbp, Ccne1, Ccnb2, Lin28, Zp3, Rfpl4, Gpr172b,Sycp3, H2afz, Timp4, Camk2g, Dicer1, Atg4c, Pou5f1, H1foo, Frap1, Ifitm3, Dppa3, Cpeb1, Ctdspl
mmu-let-7e 217
Lin28, Casp3, Ptch1, Zfp106, Mov10, Fgf16, E2f6, Fgf21, Ptges, Akt1, Scpep1, Rad52, Mgst1, Cdc34, Git1,Ebp, Mos, Kras, Il6, Capn10, Col1a1, Smad4, Hace1, Igfbp3, Fas, Hmga2, Fgfr1, Sox2, Irf4, Mt1, Kcnj16,Socs1, Mmp9, Prl, Nr2e1, Sp1, Il10, Trim71, Notch1, Nrip1, Lamc1, Acvr2a, Smox, Igf2, Cdkn1a, Egr1,Ccne1, Tagln, Akt1, Ccnb2, Vsnl1, Spp1, Egfr, Syne1, Mdk, Hnf4a, Msi1, Dnmt3a, Cd4, Sparcl1, Hspd1,Tppp3, Vim, Smad3, Tnf, Cyp2b10, Gtf2h4, Zp3, Hyou1, E2f2, Csf1r, Rfpl4, Akap6, Stat3, Golph3, Snai1, Arc,Scamp2, bp1, Mov10, Nanog, Clock, Acvr1, Wnt1, Bcl2l1, BC060632, Cdkn2a, Trp53, Fn1, Sycp3, Tpm1,Scpep1, Lpar1, H2afz, Gmfb, Pten, Arc, Snai1, Dync1i1, Mapre1, Dcn, Bcl2, Scpep1, Hras1, Igf1, E2f6, Grb2,Camk2g, Ogt, Pgc, Ctcf, Dicer1, Mapk1, Scpep1, Cxcr4, Rcan1, Clu, Dut, Piwil2, Ifng, Mtpn, Dclk1, Igfbp3, ,Igf1r, Akt1, Kdr, Nanog, Hras1, Neurod1, Dppa3, H1foo, Bmpr2, Ebp, Hmox1, Gpd1, Cyp2b10, Socs3, Inha,Eif2c2, Epb4.1l3, Serpina1c, Ssr3, E2f2, Dicer1, Mstn, Pten, Ifitm3, Dhcr24, Racgap1, Dppa3, Gad1, Ccr4,Ddit3, Nr4a1, Hmga1, Ppargc1a, Bcl2, Nr6a1, Gadd45a, Scpep1, Ptp4a2, Nanog, Runx2, Zeb1, Bak1, Ghr,Birc2, Sall4, Cpeb1, Capn8, Il23r, Ctdspl, Ptges3, Ephb2, Rpe, Syt4, Trim32, Foxp1, Scpep1, Mmp14, Bcl2,Gnb1, Madd, Pgc, Gnrh1, Hmox1, Myc, Mycn, Socs1, Jarid1b, Hprt1, Cyp2b10, Oog4, Pdzd7, Cdkn1a, Cebpb,Aqp4, Rdx, Mbp, Hand1, Bcl2, Lancl1, Mapk3, Casp9, Fmr1, Klf15, Dnmt3b, Adora1, Stx1a, Kitl, Cd34,H2afx, Itgb1, Smad5, Pou5f1
mmu-miR-708 9 Foxo3, Cd34, Mbp, Lin28, Stat5a, Cd34, E2f6, Aqp1, Bmi1
mmu-miR-879 2 Mbp, Lin28
58
Books
MDPI

Nutrients 2017, 9, 205
Table 3. Validated target genes enriched by the Kyoto Encyclopedia of Genes and Genomes(KEGG) pathway.
KEGG ID Term Count % p Value Genes
mmu04010MAPK signaling
pathway 24 9.7 2.8 × 10⁻⁸
Egfr, Prkca, Trp53, Fgfr1, Fgf8, Tnf , Grb2,Fgf16, Fgf10, Nr4a1, Fgf21, Ddit3, Hras1,Akt1, Mapk1, Casp3, Kras, Mapk14, Ntrk2,Mapk3, Mos, Fas, Myc, Gadd45a
mmu04350TGF-beta signaling
pathway 14 5.7 7.3 × 10⁻⁸Bmp4, Tnf , Smad5, Bmpr2, Smad4, Smad3,Dcn, Mapk1, Acvr2a, Sp1, Ifng, Mapk3,Myc, Acvr1
mmu04630Jak-STAT signaling
pathway 14 5.7 4.4 × 10⁻⁵ Il6, Il23r, Socs3, Grb2, Stat5a, Socs1, Bcl2l1,Stat3, Il10, Akt1, Ifng, Myc, Prl, Ghr
mmu04060Cytokine-cytokinereceptor interaction 17 6.9 1.4 × 10⁻⁴
Egfr, Il6, Tnf , Il23r, Bmpr2, Kitl, Il10, Kdr,Acvr2a, Ccr4, Cxcr4, Ifng, Fas, Prl, Acvr1,Ghr, Csf1r
mmu04062Chemokine signaling
pathway 11 4.5 9.3 × 10⁻³ Akt1, Mapk1, Kras, Ccr4, Gnb1, Cxcr4,Grb2, Mapk3, Foxo3, Stat3, Hras1
mmu04920Adipocytokine
signaling pathway 6 2.4 1.9 × 10⁻² Akt1, Tnf , Npy, Socs3, Ppargc1a, Stat3
mmu04620Toll-like receptor
signaling pathway 7 2.8 2.7 × 10⁻² Akt1, Mapk1, Il6, Tnf , Mapk14,Mapk3, Spp1
MAPK: mitogen-activated protein kinase; TGF: transforming growth factor; Jak-STAT: janus kinase-signal transducerand activator of transcription. Il-6 and Tnf were marked as bold.
3.6. Effects of Maternal Diet on Serum Pro-Inflammatory Cytokines in Offspring
Our functional enrichment analysis indicated that target genes of our six differentially-expressedmiRNAs were mapped in inflammatory pathways (Tables 2 and 3). IL-6 and Tnf were two importanttarget genes, which were located in several pathways (marked as bold in Table 3). Therefore, wefirst measured two important pro-inflammatory cytokines (serum IL-6 and TNF-α) in male offspringof dams fed with LPD and NCD, to determine whether maternal diets modulated the levels ofinflammatory markers in the early life of offspring. It showed there was a tendency to be higher ofserum IL-6 level in LPD male offspring (p = 0.07) (Figure 5a), and it also showed the level of serumTNF-α was significantly elevated in LPD male offspring at weaning (p < 0.05) (Figure 5b). However,no difference of MAPK1 expression was observed in offspring (data not shown).
Figure 5. Effect of maternal LPD on serum IL-6 and TNF-α concentrations and mRNA expression inthe offspring at weaning. (a) Serum IL-6; (b) serum TNF-α; and (c) IL-6 and TNF-α mRNA expressionin the livers of offspring. Data represented as the mean ± SEM (n = 6 to 8, per group). * p < 0.05, vs.the NCD group. LPD, low-protein diet; NCD, normal chow diet; IL-6: interleukin-6; TNF-α: tumornecrosis factor-α.
59
Books
MDPI

Nutrients 2017, 9, 205
3.7. Differential Expression of Pro-Inflammatory Markers in Offspring
Next, we measured Il-6 and TNF-α expression in liver samples of male offspring of LPD- andNCD-fed dams using qRT-PCR. It indicated that IL-6 and TNF-α expression were significantly increasedin the LPD group, and the fold change of IL-6 and TNF-α expression is about 1.8 and 2.2, respectively(p < 0.05, Figure 5c). To further determine whether the protein expressions of IL-6 and TNF-α inoffspring were modulated by maternal LPD, the protein expressions of these two genes were examinedby immunohistochemistry. As shown in Figure 6, there was a statistically significant increase in theimmunoreactivities of IL-6 and TNF-α in the early life of offspring exposed to maternal LPD duringpregnancy and lactation, compared to offspring of NCD-fed dams (p < 0.05).
Figure 6. Immunohistochemistry for IL-6 and TNF-α expression and semi-quantitative assessments.(left) IL-6 and TNF-α staining in NCD and LPD groups. (right) Semi-quantitative scores of IL-6 andTNF-α. Data represented as the mean ± SEM (n = 6 to 8, per group). * p < 0.05, vs. the NCD group.LPD, low-protein diet; NCD, normal chow diet; IL-6: interleukin-6; TNF-α: tumor necrosis factor-α.
4. Discussion
Epidemiological studies and animal experiments have indicated that adverse maternal nutritureinfluence organ development and metabolism of progeny, which may increase the susceptibility ofdeveloping diabetes in later life, and even in the following generation [30,31]. Maternal nutrition haslong-term metabolic effects on offspring, which was known as the “fetal programming hypothesis” [32].Here, our findings demonstrate that the exposure of LPD feeding during pregnancy and lactationresulted in low birth weight, impaired glucose tolerance, and lower insulin secretion in offspring, at asearly as weaning age. We also observed that offspring from LPD-fed dams showed perturbation ofthe programmed expression of some key miRNAs in offspring at weaning. Thus, using microarrayprofiling, bioinformatics approaches, and functional enrichment analysis, all of the target genes ofmisexpressed miRNAs were mapped in seven inflammatory-related pathways. Finally, we showedthat that serum levels of pro-inflammatory cytokines IL-6 and TNF-α were also increased in offspringfrom LPD-fed dams. Furthermore, the mRNA expression and protein levels of IL-6 and TNF-α weresignificantly increased in offspring from maternal LPD feeding. Therefore, these results show thatmaternal LPD consumption may regulate the expression of miRNAs, which may be associated withchronic inflammation status and glucose intolerance in offspring as early as weaning age (Figure 7).
60
Books
MDPI

Nutrients 2017, 9, 205
Figure 7. The possible mechanism of maternal low-protein diet during pregnancy and lactationon offspring at weaning. Maternal nutrition has long-term metabolic effects on offspring, which isknown as the “fetal programming hypothesis”. Epigenetics (such as miRNAs) has been deemedas an important molecular basis of maternal nutrition and metabolic health in offspring. Usingfunctional enrichment analysis, the target genes of differentially-expressed miRNAs were mappedinto seven pathways, which are all associated with inflammation. Thus, it may be related to chroniclow-grade inflammation, which may cause impaired insulin secretion and glucose intolerance. MAPK:mitogen-activated protein kinase; TGF: transforming growth factor; Jak-STAT: Janus kinase-signaltransducer and activator of transcription.
Obesity, insulin resistance, and diabetes mellitus are associated with chronic low-gradeinflammation [33–35]. One recent review summarized that chronic inflammation is characterizedby increased levels of pro-inflammatory cytokines in response to physiological and environmentalstimuli that can arrest the immune system in a low-level activation state [36]. Our study demonstratesthat maternal protein restriction diet during pregnancy and lactation may induce an inflammatorystate in offspring at weaning age. Similar to our study, one recent study showed that male Wistarrats exposed to a low-protein (8%) diet in utero that had a low birth weight, but then underwentpostnatal catch-up growth exhibited higher indexes of inflammatory, with increased hepatic expressionof interleukin-6 (IL-6) levels, tumor necrosis factor α (TNF-α), and monocyte chemotactic protein-1(MCP-1) at 12 months of age [37]. Sílvia et al. also showed that maternal low-protein (6%) diet duringpregnancy and lactation showed increased transcription of nuclear factor kappa B (NF-κB) and IL-6,with reduced transcription of interleukin-6 (IL-10) (an anti-inflammatory cytokine) at 90 days of age inoffspring [38]. However, the inflammatory state of offspring was examined at an adult or even olderage in the aforementioned studies. Here our findings demonstrate that maternal LPD feeding duringpregnancy and lactation can induce an inflammatory state in the offspring as early as weaning age.In our previous study, we found that a maternal high-calorie diet is associated with altered hepaticmicroRNA expression and impaired metabolic health in offspring at weaning age [20]. The compositionof the high-calorie diet is 16.4% protein, 25.6% carbohydrate, and 58% fat as the kcal%. However, wefound that both of the two studies showed that maternal nutrition are associated with inflammation in
61
Books
MDPI

Nutrients 2017, 9, 205
offspring. We cannot draw a conclusion that the same biological mechanisms are at play in these twostudies because our study is very preliminary, which needs further experimentation and validation.However, we can speculate that maternal malnutrition (whether over-nutrition or under-nutrition)may be associated with aberrant metabolic health and inflammation status in offspring at weaning.
Increasing evidence showed that epigenetic information could be inherited as a trans-generationalcarrier between generations. It showed that nutrient-dependent regulation of miRNAs may triggerdisease susceptibility and metabolic complications in offspring [39]. One clinical study indicated thatplacental expression of miR-210 increased in preeclampsia and was inversely related to birth weight andgestational age [40]. It showed that a maternal low-protein diet exhibited impaired glucose toleranceand suppressed pancreatic β-cell proliferation in mouse offspring via miR-15b at 12 weeks of age [41].In addition to maternal nutrition, the advanced fetal programming hypothesis proposes that maternalgenetic variants may influence the offspring’s phenotype indirectly via epigenetic modification. Hocheret al. showed that altered expression of hepatic microRNA was observed in offspring of femaleeNOS −/+ mice, demonstrating that a maternal genetic defect can epigenetically alter the phenotypeof the offspring, without inheritance of the defect itself [42]. Recently, inflammatory signaling hasbeen identified as an epigenetic mediator and increasing evidence has shown the epigenetics canregulate inflammatory gene expression, which can ultimately result in multiple adverse physiologicalconsequences [43]. Our study shows that validated target genes of differentially-expressed miRNAsin offspring from LPD-fed dams are part of inflammatory signaling pathways. IL-6 and TNF are twovalidated target genes of let-7e. Recent findings offer a putative role of non-coding RNAs, especiallymiRNAs, in the progression and management of the inflammatory response [44]. The let-7 family ofmiRNAs is highly conserved across diverse animal species, and plays critical roles in the regulationof cell proliferation and differentiation [45]. In addition to cancer, an altered expression of let-7 hasbeen reported in inflammation. Let-7 miRNAs demonstrated to be repressed in inflammation, whichresulted in increased expression of pro-inflammatory cytokines and increased inflammatory status [46],which is consistent with our results. One clinical study showed that let-7e target genes were predictedto be associated with ulcerative colitis susceptibility [47]. In addition, several miRNAs, such as miR-126,miR-132, miR-146, miR-155, and miR-221 have also emerged as important transcriptional regulators ofsome inflammation-related mediators [44]. Therefore, we propose that maternal protein restriction dietinduce altered hepatic microRNA expression, which may be associated with enhanced inflammatoryresponses in offspring as early as at weaning age.
To the best of our knowledge, our study provides the first evidence that maternal LPD feedingmay regulate the expression of miRNA, which may be associated with chronic inflammation statusand glucose intolerance in offspring as early as weaning age. However, some limitations should beconsidered in our study. First, we agree with the reviewer that our data is preliminary and cannotexclude the possibility that the association between miRNAs and markers of inflammation is due toa state of chronic systemic inflammation causing altered hepatic miRNA, rather than the other wayaround. Second, our present study focused on the mechanisms between maternal protein restrictionand its detrimental effects on offspring during early life of offspring and there was no data on long-termeffects in adulthood of our model. Our further research will be focused on the miRNAs expressionand inflammation status in older mice offspring to examine the long-term effects in adulthood ofour model. Third, the function of miRNA analysis, which showed to be related to inflammation,is mainly based on microarray profiling, bioinformatics analysis, and some preliminary molecularbiology experiments. Therefore, using in vivo and in vitro experiments, further studies should beinvestigated to demonstrate the role of perturbed miRNA expression on glucose metabolism andinflammation status. A fourth limitation is that it is unknown when the critical time window ofmaternal LPD consumption is; during the gestation period or lactation period, or both periods. Ourundergoing work aims to determine the effects of LPD in the dams on glucose metabolism in offspringin specific time window. Furthermore, recent reviews showed that paternal nutritional challengescan also cause programming of glucose impairment in the offspring and alterations of noncoding
62
Books
MDPI

Nutrients 2017, 9, 205
sperm micro-RNAs, histone acetylation, and targeted, as well as global, DNA methylation seem to beparticularly involved in paternal programming of offspring’s diseases in later life [48,49]. Therefore,our future study will be interested in examining the underlying epigenetic mechanism linking paternalnutrition and its programming effect on offspring.
In conclusion, here we demonstrated that maternal protein restriction diet with IUGR predisposesto impaired glucose tolerance in the offspring as early as weaning age. This study contributes tothe current knowledge on the putative role of miRNAs between maternal low-protein diet andmetabolic health in offspring, which are likely to be associated with inflammatory responses. A betterunderstanding of the function of these miRNAs might open the way to the development of newstrategies for the early prevention of diabetes. Thus, further studies in the field of trans-generationaleffects to clarify the underlying mechanisms are urgently warranted.
Acknowledgments: This work was supported by the National Natural Science Foundation of China (No. 81570715and No. 81170736), National Key Research and Development Program of China (No. 2016YFA0101002), NationalNatural Science Foundation for Young Scholars of China (No. 81300649), and the National Key Program of ClinicalScience and Peking Union Medical College Hospital.
Author Contributions: Xinhua Xiao conceived and designed the experiments. Qian Zhang, Jia Zheng and TongWang carried out the experiments. Miao Yu and Jianping Xu analysed data. All authors were involved in writingthe paper and had final approval of the submitted and published versions.
Conflicts of Interest: The authors declare no conflict of interest.
References
1. Curhan, G.C.; Willett, W.C.; Rimm, E.B.; Spiegelman, D.; Ascherio, A.L.; Stampfer, M.J. Birth weight andadult hypertension, diabetes mellitus, and obesity in US men. Circulation 1996, 94, 3246–3250. [CrossRef][PubMed]
2. Gniuli, D.; Calcagno, A.; Caristo, M.E.; Mancuso, A.; Macchi, V.; Mingrone, G.; Vettor, R. Effects of high-fatdiet exposure during fetal life on type 2 diabetes development in the progeny. J. Lipid Res. 2008, 49, 1936–1945.[CrossRef] [PubMed]
3. De Rooij, S.R.; Painter, R.C.; Phillips, D.I.; Osmond, C.; Michels, R.P.; Godsland, I.F.; Roseboom, T.J. Impairedinsulin secretion after prenatal exposure to the Dutch famine. Diabetes Care 2006, 29, 1897–1901. [CrossRef][PubMed]
4. Gluckman, P.D.; Hanson, M.A.; Buklijas, T.; Low, F.M.; Beedle, A.S. Epigenetic mechanisms that underpinmetabolic and cardiovascular diseases. Nat. Rev. Endocrinol. 2009, 5, 401–408. [CrossRef] [PubMed]
5. Stefan, M.; Zhang, W.; Concepcion, E.; Yi, Z.; Tomer, Y. DNA methylation profiles in type 1 diabetes twinspoint to strong epigenetic effects on etiology. J. Autoimmun. 2014, 50, 33–37. [CrossRef] [PubMed]
6. Waddington, C.H. The epigenotype. 1942. Int. J. Epidemiol. 2012, 41, 10–13. [CrossRef] [PubMed]7. Januar, V.; Desoye, G.; Novakovic, B.; Cvitic, S.; Saffery, R. Epigenetic regulation of human placental function
and pregnancy outcome: Considerations for causal inference. Am. J. Obstet. Gynecol. 2015, 213 (Suppl. 4),S182–S196. [CrossRef]
8. Reddy, M.A.; Natarajan, R. Epigenetic mechanisms in diabetic vascular complications. Cardiovasc. Res. 2011,90, 421–429. [CrossRef] [PubMed]
9. Deiuliis, J.A. MicroRNAs as regulators of metabolic disease: Pathophysiologic significance and emergingrole as biomarkers and therapeutics. Int. J. Obes. (Lond.) 2016, 40, 88–101. [CrossRef] [PubMed]
10. Kahn, H.S. Glucose tolerance in adults after prenatal exposure to famine. Lancet 2001, 357, 1798–1799.[CrossRef]
11. Zohdi, V.; Lim, K.; Pearson, J.T.; Black, M.J. Developmental programming of cardiovascular disease followingintrauterine growth restriction: Findings utilising a rat model of maternal protein restriction. Nutrients 2014,7, 119–152. [CrossRef] [PubMed]
12. Jousse, C.; Parry, L.; Lambert-Langlais, S.; Maurin, A.C.; Averous, J.; Bruhat, A.; Jockers, R. Perinatalundernutrition affects the methylation and expression of the leptin gene in adults: Implication for theunderstanding of metabolic syndrome. FASEB J. 2011, 25, 3271–3278. [CrossRef] [PubMed]
63
Books
MDPI

Nutrients 2017, 9, 205
13. Erhuma, A.; Salter, A.M.; Sculley, D.V.; Langley-Evans, S.C.; Bennett, A.J. Prenatal exposure to a low-proteindiet programs disordered regulation of lipid metabolism in the aging rat. Am. J. Physiol. Endocrinol. Metab.2007, 292, E1702–E1714. [CrossRef] [PubMed]
14. Watkins, A.J.; Ursell, E.; Panton, R.; Papenbrock, T.; Hollis, L.; Cunningham, C.; Eckert, J.J. Adaptiveresponses by mouse early embryos to maternal diet protect fetal growth but predispose to adult onsetdisease. Biol. Reprod. 2008, 78, 299–306. [CrossRef] [PubMed]
15. Dumortier, O.; Hinault, C.; Gautier, N.; Patouraux, S.; Casamento, V.; van Obberghen, E. Maternal proteinrestriction leads to pancreatic failure in offspring: Role of misexpressed microRNA-375. Diabetes 2014, 63,3416–3427. [CrossRef] [PubMed]
16. Zheng, J.; Xiao, X.; Zhang, Q.; Yu, M.; Xu, J.; Wang, Z. Maternal high-fat diet modulates hepatic glucose, lipidhomeostasis and gene expression in the PPAR pathway in the early life of offspring. Int. J. Mol. Sci. 2014, 15,14967–14983. [CrossRef] [PubMed]
17. Purves, R.D. Optimum numerical integration methods for estimation of area-under-the-curve (AUC) andarea-under-the-moment-curve (AUMC). J. Pharmacokinet. Biopharm. 1992, 20, 211–226. [CrossRef] [PubMed]
18. Peng, X.; Wood, C.L.; Blalock, E.M.; Chen, K.C.; Landfield, P.W.; Stromberg, A.J. Statistical implications ofpooling RNA samples for microarray experiments. BMC Bioinform. 2003, 4, 26. [CrossRef] [PubMed]
19. Bruce, K.D.; Cagampang, F.R.; Argenton, M.; Zhang, J.; Ethirajan, P.L.; Burdge, G.C.; McConnell, J.M.Maternal high-fat feeding primes steatohepatitis in adult mice offspring, involving mitochondrialdysfunction and altered lipogenesis gene expression. Hepatology 2009, 50, 1796–1808. [CrossRef] [PubMed]
20. Zheng, J.; Zhang, Q.; Mul, J.D.; Yu, M.; Xu, J.; Qi, C.; Xiao, X. Maternal high-calorie diet is associated withaltered hepatic microRNA expression and impaired metabolic health in offspring at weaning age. Endocrine2016, 54, 70–80. [CrossRef] [PubMed]
21. Luo, Y.; Zhang, C.; Tang, F.; Zhao, J.; Shen, C.; Wang, C.; Chen, R. Bioinformatics identification of potentiallyinvolved microRNAs in Tibetan with gastric cancer based on microRNA profiling. Cancer Cell Int. 2015,15, 115. [CrossRef] [PubMed]
22. The miRBase Sequence Database. Release 21. Available online: http://www.mirbase.org (accessed on24 June 2014).
23. Methods for Affymetrix Oligonucleotide Arrays. Available online: http://www.bioconductor.org/packages/release/bioc/html/affy.html (accessed on 24 June 2015).
24. Zhang, Q.; Xiao, X.; Li, M.; Li, W.; Yu, M.; Zhang, H.; Xiang, H. Acarbose Reduces Blood Glucose byActivating miR-10a-5p and miR-664 in Diabetic Rats. PLoS ONE 2013, 8, e79697. [CrossRef] [PubMed]
25. MiRWalk2.0 Database. Available online: http://www.umm.uni-heidelberg.de/apps/zmf/mirwalk/(accessed on 29 April 2015).
26. Dweep, H.; Gretz, N. miRWalk2.0: A comprehensive atlas of microRNA-target interactions. Nat. Methods2015, 12, 697.
27. Kyoto Encyclopedia of Genes and Genomes (KEGG) Database. Release 74.0. Available online:http://www.kegg.jp/ (accessed on 1 April 2015).
28. Database for Annotation, Visualization and Integrated Discovery (DAVID) Database. Available online:https://david.ncifcrf.gov (accessed on 1 April 2015).
29. Petrik, J.; Reusens, B.; Arany, E.; Remacle, C.; Coelho, C.; Hoet, J.J.; Hill, D.J. A low protein diet altersthe balance of islet cell replication and apoptosis in the fetal and neonatal rat and is associated with areduced pancreatic expression of insulin-like growth factor-II. Endocrinology 1999, 140, 4861–4873. [CrossRef][PubMed]
30. Hales, C.N.; Barker, D.J. Type 2 (non-insulin-dependent) diabetes mellitus: The thrifty phenotype hypothesis.Diabetologia 1992, 35, 595–601. [CrossRef] [PubMed]
31. Jimenez-Chillaron, J.C.; Isganaitis, E.; Charalambous, M.; Gesta, S.; Pentinat-Pelegrin, T.; Faucette, R.R.;Patti, M.E. Intergenerational transmission of glucose intolerance and obesity by in utero undernutrition inmice. Diabetes 2009, 58, 460–468. [CrossRef] [PubMed]
32. Kermack, A.J.; van Rijn, B.B.; Houghton, F.D.; Calder, P.C.; Cameron, I.T.; Macklon, N.S. The “DevelopmentalOrigins” Hypothesis: Relevance to the obstetrician and gynecologist. J. Dev. Orig. Health Dis. 2015, 6,415–424. [CrossRef] [PubMed]
64
Books
MDPI

Nutrients 2017, 9, 205
33. Verdile, G.; Keane, K.N.; Cruzat, V.F.; Medic, S.; Sabale, M.; Rowles, J.; Newsholme, P. Inflammation andOxidative Stress: The Molecular Connectivity between Insulin Resistance, Obesity, and Alzheimer’s Disease.Mediat. Inflamm. 2015, 2015, 105828. [CrossRef] [PubMed]
34. Chen, H. Cellular inflammatory responses: Novel insights for obesity and insulin resistance. Pharmacol. Res.2006, 53, 469–477. [CrossRef] [PubMed]
35. Samuel, V.T.; Shulman, G.I. The pathogenesis of insulin resistance: Integrating signaling pathways andsubstrate flux. J. Clin. Investig. 2016, 126, 12–22. [CrossRef] [PubMed]
36. Davinelli, S.; Maes, M.; Corbi, G.; Zarrelli, A.; Willcox, D.C.; Scapagnini, G. Dietary phytochemicals andneuro-inflammaging: From mechanistic insights to translational challenges. Immun. Ageing 2016, 13, 16.[CrossRef] [PubMed]
37. Tarry-Adkins, J.L.; Fernandez-Twinn, D.S.; Hargreaves, I.P.; Neergheen, V.; Aiken, C.E.; Martin-Gronert, M.S.;Ozanne, S.E. Coenzyme Q10 prevents hepatic fibrosis, inflammation, and oxidative stress in a male ratmodel of poor maternal nutrition and accelerated postnatal growth. Am. J. Clin. Nutr. 2016, 103, 579–588.[CrossRef] [PubMed]
38. Reis, S.R.; Feres, N.H.; Ignacio-Souza, L.M.; Veloso, R.V.; Arantes, V.C.; Kawashita, N.H.; Latorraca, M.Q.Nutritional recovery with a soybean diet after weaning reduces lipogenesis but induces inflammation in theliver in adult rats exposed to protein restriction during intrauterine life and lactation. Mediat. Inflamm. 2015,2015, 781703. [CrossRef] [PubMed]
39. Ferland-McCollough, D.; Fernandez-Twinn, D.S.; Cannell, I.G.; David, H.; Warner, M.; Vaag, A.A.; Siddle, K.Programming of adipose tissue miR-483-3p and GDF-3 expression by maternal diet in type 2 diabetes.Cell Death Differ. 2012, 19, 1003–1012. [CrossRef] [PubMed]
40. Lee, D.C.; Romero, R.; Kim, J.S.; Tarca, A.L.; Montenegro, D.; Pineles, B.L.; Mittal, P. miR-210 targetsiron-sulfur cluster scaffold homologue in human trophoblast cell lines: Siderosis of interstitial trophoblastsas a novel pathology of preterm preeclampsia and small-for-gestational-age pregnancies. Am. J. Pathol. 2011,179, 590–602. [CrossRef] [PubMed]
41. Su, Y.; Jiang, X.; Li, Y.; Li, F.; Cheng, Y.; Peng, Y.; Wang, W. Maternal Low Protein Isocaloric Diet SuppressesPancreatic beta-Cell Proliferation in Mouse Offspring via miR-15b. Endocrinology 2016, 157, 4782–4793.[CrossRef] [PubMed]
42. Hocher, B.; Haumann, H.; Rahnenführer, J.; Reichetzeder, C.; Kalk, P.; Pfab, T.; Püschel, G.P. Maternal eNOSdeficiency determines a fatty liver phenotype of the offspring in a sex dependent manner. Epigenetics 2016,11, 539–552. [CrossRef] [PubMed]
43. Zhou, D.; Pan, Y.X. Pathophysiological basis for compromised health beyond generations: Role of maternalhigh-fat diet and low-grade chronic inflammation. J. Nutr. Biochem. 2015, 26, 1–8. [CrossRef] [PubMed]
44. Marques-Rocha, J.L.; Samblas, M.; Milagro, F.I.; Bressan, J.; Martínez, J.A.; Marti, A. Noncoding RNAs,cytokines, and inflammation-related diseases. FASEB J. 2015, 29, 3595–3611. [CrossRef] [PubMed]
45. Pasquinelli, A.E.; Reinhart, B.J.; Slack, F.; Martindale, M.Q.; Kuroda, M.I.; Maller, B.; Spring, J. Conservationof the sequence and temporal expression of let-7 heterochronic regulatory RNA. Nature 2000, 408, 86–89.[PubMed]
46. Iliopoulos, D.; Hirsch, H.A.; Struhl, K. An epigenetic switch involving NF-kappaB, Lin28, Let-7 MicroRNA,and IL6 links inflammation to cell transformation. Cell 2009, 139, 693–706. [CrossRef] [PubMed]
47. Coskun, M.; Bjerrum, J.T.; Seidelin, J.B.; Troelsen, J.T.; Olsen, J.; Nielsen, O.H. miR-20b, miR-98, miR-125b-1*,and let-7e* as new potential diagnostic biomarkers in ulcerative colitis. World J. Gastroenterol. 2013, 19,4289–4299. [CrossRef] [PubMed]
48. Li, J.; Yang, X.; Hocher, B. Paternal programming of offspring cardiometabolic diseases in later life.J. Hypertens. 2016, 34, 2111–2126. [CrossRef] [PubMed]
49. Reichetzeder, C.; Dwi Putra, S.E.; Li, J.; Hocher, B. Developmental Origins of Disease—Crisis PrecipitatesChange. Cell. Physiol. Biochem. 2016, 39, 919–938. [CrossRef] [PubMed]
© 2017 by the authors. Licensee MDPI, Basel, Switzerland. This article is an open accessarticle distributed under the terms and conditions of the Creative Commons Attribution(CC BY) license (http://creativecommons.org/licenses/by/4.0/).
65
Books
MDPI

nutrients
Review
Early-Life Nutritional Programming ofType 2 Diabetes: Experimental andQuasi-Experimental Evidence
Alexander M. Vaiserman
D.F. Chebotarev Institute of Gerontology, Kiev 04114, NAMS, Ukraine; [email protected];Tel.: +38-044-431-0558
Received: 11 February 2017; Accepted: 23 February 2017; Published: 5 March 2017
Abstract: Consistent evidence from both experimental and human studies suggest that inadequatenutrition in early life can contribute to risk of developing metabolic disorders including type 2 diabetes(T2D) in adult life. In human populations, most findings supporting a causative relationship betweenearly-life malnutrition and subsequent risk of T2D were obtained from quasi-experimental studies(‘natural experiments’). Prenatal and/or early postnatal exposures to famine were demonstratedto be associated with higher risk of T2D in many cohorts around the world. Recent studies havehighlighted the importance of epigenetic regulation of gene expression as a possible major contributorto the link between the early-life famine exposure and T2D in adulthood. Findings from these studiessuggest that prenatal exposure to the famine may result in induction of persistent epigenetic changesthat have adaptive significance in postnatal development but can predispose to metabolic disordersincluding T2D at the late stages of life. In this review, quasi-experimental data on the developmentalprogramming of T2D are summarized and recent research findings on changes in DNA methylationthat mediate these effects are discussed.
Keywords: type 2 diabetes; famine; natural experiment; quasi-experimental design; epigenetics
1. Introduction
Type 2 diabetes (T2D) is one of most common chronic diseases, constituting a serious socialand economic problem in modern societies, both developed and developing. It is caused by insulinresistance resulting from decreased activity and enhanced obesity levels that occur with increasingage. T2D is considered to be adult-onset disease, since it typically occurred in middle-age and oldadults. Generally, T2D occurs after the age of 40, although it is now increasingly diagnosed in youngerpatients [1]. Over the last decades, a rapid increase in the prevalence of obesity arising from highcaloric diet intake and sedentary lifestyle is driving a global pandemic of T2D. Currently, 415 millionpeople (about 9% of whole adult population) across the world have T2D. During the next decade,the number of T2D patients is expected to rise to around 642 million persons [2]. Obviously, geneticsplays a crucial role in driving this disease; however, the dramatic increase in T2D incidence across theglobe cannot be explained by genetic factors alone but must involve environmental factors as well [3].There is increasing experimental and epidemiological evidence that the risk of development of T2Dcan be influenced not only by actual adult-life environmental conditions (primarily, lifestyle ones)but also by conditions in early life [3]. Convincing evidence that risk of T2D cannot be completelyattributable to genetic predisposition and/or adult-life environmental factors was obtained, e.g., in astudy on Pima Indian nuclear families in which at least one sibling was born before and other after themother was diagnosed with T2D [4]. In this research, those siblings conceived after the mother hasbeen diagnosed with T2D were 3.7 times more likely to have T2D compared to siblings born beforetheir mother developed diabetes, even though they lived in similar conditions the rest of their life.
Nutrients 2017, 9, 236 66 www.mdpi.com/journal/nutrients
Books
MDPI

Nutrients 2017, 9, 236
In the present review, we have summarized and discussed findings on this topic fromepidemiological studies conducted with quasi-experimental design (‘natural experiments’).
2. Conceptual Framework for Developmental Nutritional Programming of Type 2 Diabetes (T2D)
According to the developmental programming of health and disease (DOHaD) hypothesis, whichhas been confirmed by many research findings over the past decades, the physiology and structureof the developing organism may be adapted in response to unfavourable environmental conditions,thereby predisposing it to many pathological conditions in adult life [5]. In particular, poor nutritionalenvironments in early life can induce structural and functional changes in key organs responsiblefor nutrient regulation, including brain, liver, adipose tissue, muscle and pancreas [6]. Presently, thisview is commonly referred to as the ‘predictive adaptive response (PAR)’ concept [7]. Exposure toadverse environmental factors such as inadequate or unbalanced nutrient supply during in uterodevelopment may ‘program’ for the long term appetite regulation, feeding behaviour, as well asadipose tissue and pancreatic beta cell dysfunction in the developing foetus [3]. As a result ofthese processes, the foetus may be adapted to adverse nutritional conditions by reducing abilityto produce insulin and by occurrence of insulin resistance. According to the ‘thrifty phenotype’hypothesis [8], such metabolic adaptation may provide short-term survival benefit in a poor postnatalenvironment via enhanced capacity to store fat in conditions of irregular availability of food resources,but may predispose the child to T2D development in conditions of food abundance in postnatallife. More specifically, in malnourished conditions when the foetus exhibits poor growth in utero(commonly referred to as intrauterine growth restriction, IUGR), the foetal adaptation to undernutritionis realized by a variety of mechanisms responsible for the energy and glucose metabolism, such asenhanced peripheral insulin sensitivity for glucose utilization, increased hepatic glucose production,lowered insulin sensitivity for protein synthesis in muscle, and impaired pancreatic development [9].All these mechanisms provide obvious survival benefit for the IUGR foetuses by promoting bothenergy uptake and utilization, reducing the demand for amino acids and anabolic hormone production,and elevating glucose production to maintain glucose supply to vital organs, primarily the heart andbrain. These adaptations lead to asymmetrical growth restriction of the foetus. The muscle andsubcutaneous tissues exhibit the most pronounced growth restriction, while the least pronouncedgrowth restriction is peculiar to the growing brain. Collectively, such adaptations allow IUGR foetaltissues to maintain the energy-dependent basal metabolic functions at the expense of body growthin conditions of reduced nutrient supply. If these adaptive modifications persist, or are more readilyinducible later in life, they have the potential to promote energy absorption beyond metabolic capabilitywhen energy supplies increase, thereby causing insulin resistance, obesity and T2D in adulthood [9].Among the factors affecting the risk of metabolic dysfunctions, including T2D, in adulthood, theprenatal and early postnatal malnutrition (both under- and overnutrition) is currently believed to bemost important [10,11]. It should be noted that in this review only one aspect of malnutrition i.e.,undernutrition but not overnutrition will be discussed.
The majority of early population studies used birth weight as a proxy for foetal conditions.From the data obtained, it has been initially concluded that low birth weight is a risk factor forT2D and that birth weight is inversely related to the disease risk [12]. In addition to T2D, low birthweight is a predictor of other T2D-associated conditions and complications later in life, including theimpaired body composition and fat distribution [13], fasting lipid profile, blood pressure and insulinresistance [14], life-long activation of the hypothalamic-pituitary-adrenal axis [15], as well as coronaryheart disease in adulthood [16]. Several more recent studies, however, found that a relationshipbetween birth weight and risk of T2D is not linear but rather U-shaped, and high birth weight (>4000 g)is associated with an increased risk of T2D to the same extent as low birth weight (<2500 g) [17].
An association between low birth weight and risk of T2D in later life is most thoroughly studiedto date. This association is apparently mediated by catch-up growth early in life which is an importantrisk factor for later T2D. The catch-up growth leads to a disproportionately enhanced rate of fat
67
Books
MDPI
Nutrients 2017, 9, 236
gain in comparison with lean tissue gain [18]. Such preferential catch-up fat is partly driven bymechanisms of energy conservation operating through suppression of thermogenesis and resultingin the development of thrifty ‘catch-up fat’ phenotype generally characterized by insulin and leptinresistance. Abnormalities in the growth hormone/insulin-like growth factor-1 (GH/IGF-1) axis, knownto play a central role in promoting human growth and development, have been repeatedly reported inchildren born small for gestational age (SGA) [19]. Such long-lasting abnormalities of IGF-1 in SGAchildren with catch-up growth are believed to be critically implicated in the association with metabolicdisorders, including T2D, later in life.
Precise molecular mechanisms responsible for the nutritional developmental programming ofT2D are not yet thoroughly characterized. In many recent studies, compelling evidence was providedthat changes in epigenetic regulation of gene expression (heritable alterations in gene function withoutchanges in the nucleotide sequence) is the most plausible mechanism for the link between unfavourableconditions in early development and adverse health outcomes in later life [20]. The main epigeneticmechanisms are DNA methylation and post-translational modifications of histone tails, as well asregulation by non-coding RNAs (microRNAs and long non-coding RNAs) [21]. Evidence for the keyrole of DNA methylation and other epigenetic mechanisms in mediating the risk of T2D and obesityhas been repeatedly documented over the past years [22]. Initial evidence for the role of epigeneticregulation in obesity and T2D has been mainly provided by studies in animal models. These studiesreported changes in epigenetic marks in key metabolic tissues following feeding with high-fat diet andby human investigation that demonstrated epigenetic alterations in T2D and obesity candidate genesin obese and/or diabetic persons. More recently, rapid technological advances and price reduction inepigenetic methodologies led to a rapid expansion of epigenome-wide association studies (EWAS) inhuman epidemiological examinations [22]. These studies clearly demonstrated epigenetic differencesbetween diabetic and healthy control individuals, as well as epigenetic alterations associated withlifestyle interventions.
Within the DOHaD concept, an important point is that throughout embryonic and foetaldevelopment, intense epigenetic remodelling takes place that is necessary for the establishmentof transcriptional programs responsible for cellular proliferation and differentiation. Duringthese sensitive developmental periods, the epigenome is especially plastic and most sensitive toenvironmental disturbances [23]. Numerous research findings suggest that early-life adverse events(i.e., insufficient nutrition in utero) might be epigenetically ‘imprinted’ and ‘remembered’ decadeslater, thereby permanently influencing the metabolic phenotype [24]. There is convincing evidencethat epigenetic alterations, including those triggered by early-life events and persisting throughadulthood, is an important etiological factor in the development of T2D. Changes in DNA methylationand associated changes in patterns of expression of genes implicated in various aspects of glucosemetabolism such as β-cell dysfunction, glucose intolerance and insulin resistance, have been shown tobe critically involved in the pathogenesis of T2D [25]. The specific DNA methylation markers havebeen repeatedly identified in peripheral blood and pancreatic islets of the T2D patients (for review,see [26]).
A schematic representation of hypothetical regulatory pathways responsible for developmentalnutritional programming of T2D is presented in Figure 1.
68
Books
MDPI

Nutrients 2017, 9, 236
Figure 1. Schematic representation of hypothetical regulatory pathways responsible for developmentalprogramming of type 2 diabetes (T2D) through prenatal undernutrition followed by catch-up growthin a nutrient-rich postnatal environment.
3. Evidence from Animal Models
The bulk of evidence linking intrauterine and/or early postnatal nutrient environment andpredisposition to beta-cell failure and T2D in adulthood comes from animal models (for review,see [27–29]). Most of these studies have used rodent models of 50% maternal dietary restriction(DR) during pregnancy to examine the postnatal beta-cell mass development in pups exposed toeither normal or restricted post-natal nutritional conditions. Rodents exposed to intrauterine DR andsubsequent normal or restricted post-natal nutrition exhibited diminished beta-cell mass both at birth(30%–50% vs. control) and throughout the early postnatal development (50%–70% vs. control) [30–33].In adulthood, these animals were unable to adaptively enhance beta-cell mass in response to risingmetabolic demand and consequent insulin resistance. As a result, they developed diabetic phenotypescharacterized by beta-cell failure due to insufficient expansion of beta-cell mass, impaired insulinsecretion, glucose intolerance and fasting hyperglycaemia [34,35]. For example, in a study usingcross-fostering methodology to isolate effects of selective pre- and postnatal 50% DR [36,37], prenatalDR resulted in a ~50% reduction in beta-cell mass whereas postnatal DR led to decreased bodyweight, but both beta-cell mass and beta-cell fractional area were increased compared with controlanimals. These findings indicate that prenatal DR largely determines endocrine cell developmentwhile postnatal DR primarily impacts development of the exocrine pancreas [37].
Currently, molecular mechanisms responsible for impaired formation of beta-cell mass inresponse to early-life DR have come under intensive investigation. Among them, mechanisms ofepigenetic regulation of gene activity seem to play a dominant role [38–40]. Inadequate nutritionalenvironment during intrauterine development suppressed transcription of key genes regulatingbeta-cell development in rats [39]. Feeding pregnant females with a low-protein diet led tohypomethylation of genes encoding glucocorticoid receptor and peroxisome proliferator-activatedreceptor gamma in the offspring livers. In a rat model, maternal DR also resulted in a significantreduction in the levels of expression of genes encoding key transcription factors regulating embryonicbeta-cell development such as the pancreatic and duodenal homeobox 1 (PDX-1) [41,42]. Such changeson the epigenetic level were accompanied by reduced postnatal beta-cell formation and incapability toexpand beta-cell mass in response to metabolic stress. Moreover, maternal DR diminished the postnatalexpression of Pdx-1 gene in pancreatic exocrine ducts which is suspected to harbor a putative pool ofpancreatic beta-cell progenitor population in adult rodents [39]. Other factors potentially contributingto these effects are hormones that operate during foetal life, such as insulin, insulin-like growth factors,glucocorticoids, as well as some specific molecules such as taurine [43].
In several studies, maternal protein restriction has been shown to program an insulin-resistantphenotype in rodents, especially in consequence of catch-up growth following intrauterine growth
69
Books
MDPI

Nutrients 2017, 9, 236
restriction. Such mode of malnutrition resulted in expression of early markers of insulin resistanceand metabolic disease risk, including alterations in adipocyte cell size and expression levels ofseveral insulin-signalling proteins through post-transcriptional mechanisms [44]. Catch-up growthfollowing maternal protein restriction also favoured the development of obesity in adult male ratoffspring [45]. In a mice model, a protein restriction during foetal life followed by catch-up growthled to obesity in adult male mice [46]. These changes were associated with increased relative fat mass,hypercholesterolemia, hyperglycaemia and hyperleptinemia, and also with altered expression profileof several gene-encoding enzymes involved in lipid metabolism.
4. Quasi-Experimental Design in Studying the Developmental Origin of T2D
The experimental research of developmental programming in human populations is notapplicable, either for ethical reasons and because the long-term follow-up is required to observelife-long outcomes of early-life experiences. In this regard, an important point is that observationalstudies in appropriate populations may be realized. The consistent evidence linking the early-lifeconditions with adult health status has been accumulated from studies conducted with aquasi-experimental design (‘natural experiments’), defined as “naturally occurring circumstancesin which subsets of the population have different levels of exposure to a supposed causal factor,in a situation resembling an actual experiment where human subjects would be randomly allocatedto groups” [47]. Both natural and man-made disasters such as famine obviously provide a lot ofadvantages to their use in quasi-experimental studies. In the sections below, empirical findings fromsuch a line of research across countries are reviewed.
4.1. Dutch Famine of 1944–1945
The long-term health consequences of the Dutch famine (‘Hunger Winter’) are the mostcomprehensively studied up to now. This famine, caused by the Nazi food embargo, affected thewestern Netherlands from November 1944 to May 1945. Many features of the Dutch famine can beused in a quasi-experimental design. It was a severe famine, distinctly defined in time and place andoccurred in a society with a well-developed structure of administrative control. Therefore, exposureto this famine may be accurately defined by region and date of birth in relation to distribution of thefood rations and the level of calories consumed. Such circumstances of the Hunger Winter famineprovide the opportunity to thoroughly examine the link between inadequate maternal nutrition duringparticular trimesters of pregnancy and the offspring’s adult health status. While a normal daily rationis 2000 kcal and 2500 kcal for women and men, respectively, the average daily rations during thefamine were less than 700 kcal [48]. The population that suffered from severe food shortage throughoutthe famine was generally well fed before and after this period. These features of the Dutch famineprovide the researchers with a near-ideal quasi-experimental research design to examine how maternalmalnutrition throughout the critical early-life time windows can affect the life-course offspring healthstatus. The prenatal exposure to the Dutch famine has been repeatedly shown to be related to theimpaired metabolic phenotypes such as elevated levels of plasma lipids and body mass index (BMI),as well as enhanced risks of obesity and cardiovascular disease (CVD) later in life (for reviews, seerefs. [48–50]). Most of these associations have been critically dependent on the timing of exposure.In the majority of the studies, early gestation was found to be the most vulnerable period [48–51].Childhood and puberty are other sensitive periods with high potential to trigger programming effects.The link between exposure to the Dutch famine between age 0 and 21 years and T2D in adulthoodwas clearly evident, e.g., from the study by van Abeelen et al. [52]. This relationship was found to bedose-dependent: in those women who self-reported moderate famine exposure during their childhoodand young adulthood, the age-adjusted hazard ratio for T2D was 1.36, and in those who reportedsevere famine exposure, the hazard ratio was 1.64 compared to unexposed women. The exposure tosevere malnutrition during the Dutch famine at ages 11−14 was found to be considerably associated
70
Books
MDPI

Nutrients 2017, 9, 236
with enhanced probability of developing T2D and/or peripheral arterial diseases at ages 60−76 inwomen, but not in men [53].
In the Dutch famine study, compelling evidence has been obtained that exposure to famineduring prenatal development may result in persistent epigenetic changes. Although no relationshipbetween the prenatal exposure to the Dutch famine and overall global DNA methylation in adulthoodwas observed [54], levels of methylation of particular genes were clearly associated with prenatalfamine exposure. The methylation levels of the imprinted gene encoding an insulin-like growth factor2 (IGF2), known to play a crucial role in human growth and development, have been estimated byHeijmans et al. [51]. This gene was selected for analysis because its methylation marks are stable up toadult age, making IGF2 gene a good candidate for such a study. In this research, those subjects exposedto the Dutch famine during their early gestation period had much lower IGF2 methylation levelscompared to control unexposed individuals six decades after the hunger exposure. Subsequently, thisobservation has been extended by examination of a set of 15 additional candidate loci responsible fordevelopment of metabolic and cardiovascular phenotypes [55]. Levels of methylation of six of theseloci (GNASAS, IL10, LEP, ABCA1, INSIGF and MEG3) have been found to be associated with prenatalexposure to famine.
4.2. Famines in 20th-Century Austria
Findings from the Dutch Hunger Winter Study on the developmental origin of T2D were alsoconfirmed in populations of other countries such as Austria, which has been subjected to three massivefamine episodes during the 20th century. These famines occurred in 1918–19 during the collapse of theAustro-Hungarian Empire; in 1938, following the economic crisis, harvest failure, and food embargofrom Nazi Germany; and in 1946–1947 in the period following the Second World War. Based on thedata set including 325,000 Austrian diabetic patients, Thurner et al. [56] observed an excess risk of T2Din those persons who were born during or immediately after the periods of these famine episodes.For instance, up to 40% higher chances of having T2D in those individuals who were born in 1919–1921compared to those who were born in 1918 or 1922, have been revealed in different Austrian regions.Noteworthy, the excess risk of T2D was practically absent in those Austrian provinces that were lessaffected by hunger. Furthermore, T2D rates have been correlated with the economic wealth of particularregions. The authors concluded that the revealed peaks of T2D in subjects born during and afterthe periods of severe starvation obviously demonstrate importance of environmental determinantsin the period from conception to early childhood, in addition to genetic predisposition and sharedlife-course factors. These determinants clearly include nutritional triggers, although contribution ofother triggering factors such as the famine-related stress and infectious factors, including rodent-borneviral infections, cannot be excluded [57]. The data obtained from this research, however, collectivelyfavoured the hunger hypothesis as the leading explanation for the effects observed [56,58].
4.3. Ukrainian Famine of 1932–1933
The association between prenatal exposure to the famine and adult risk of T2D has been recentlyexamined in large birth cohorts (total n = 43,150) born before, during and after the Great UkrainianFamine of 1932–1933 (‘Holodomor’) [59]. This famine was caused by the Soviet Union government’sforced agriculture collectivization throughout the early 1930s and led to the deaths from starvationof several million people with a ten-fold increase of mortality rate in April−July 1933 compared tothe pre- and post-famine times. The cohorts born during the famine can be well defined with respectto the timing of the famine exposure in relation to the stage of pregnancy and the severity of thefamine around the birth date. The odds ratios (ORs) for developing T2D were 1.47 in those individualsborn in the first half of 1934 in regions affected by extreme famine, 1.26 in those born in regions withsevere famine, and there was no increase (OR = 1.0) in those born in regions with no famine, comparedto the births in other examined time periods. The associations observed between T2D and famineexposure around the time of birth have been found to be similar in men and women. The data obtained
71
Books
MDPI

Nutrients 2017, 9, 236
showed a dose-response relationship between the famine severity during the prenatal developmentand the risk of T2D later in life, and assumed that early gestational stage is a critical time window formodulating the prenatal environment to affect the adult T2D risk.
4.4. Leningrad Siege of 1941–1944
The Nazi Siege of the Russian city of Leningrad (the modern-day St. Petersburg) in 1941–1944resulted in extreme hunger and death of about a million city residents. The siege-induced starvationcaused an average fall in birth weight of 500–600 g [60]. Follow-up of 549 subjects born in Leningradbefore or during the siege, however, demonstrated no effect of intrauterine undernutrition during thesiege on dyslipidaemia, glucose intolerance, hypertension and the risk of CVD in adulthood [61,62].Starvation-exposed individuals demonstrated only evidence for endothelial dysfunction and for astronger influence of obesity on blood pressure. These results seem to contradict the thrifty phenotypeconcept since in utero undernutrition was not related to glucose intolerance in adult persons, althoughprenatal malnutrition influenced their blood pressure and differ from those obtained in the DutchHunger Winter study. One possible explanation for such a contradiction suggested by some authors indiscussing these data is that the Leningrad siege research was complicated by the fact that malnutritionextended into the postnatal period. Thus, the conflict between prenatal and postnatal environmentsdid not occur [63]. Indeed, in the Netherlands, the food supplies become fully adequate after the warended, while those babies who were born throughout the Leningrad siege remained malnourishedduring all their childhood, since this famine lasted for years rather than months and nutrition waspoor in subsequent years as well. The association between starvation during the Leningrad siegein early life and the risk of T2D development in adulthood was, however, observed in several morerecent studies. Both the increasing incidence and decreasing age of onset of T2D without obesityhave been found in women exposed to starvation throughout the Siege of Leningrad during theirchildhood [64]. This cohort was characterized by higher incidence of conditions associated withmetabolic dysregulation such as severe arterial hypertension, and also atherosclerosis of coronary,brain and carotid arteries [65]. Similar health problems were also demonstrated in cohorts exposed tostarvation during the Leningrad Siege in their childhood and puberty. Women who were 6−8 yearsold and men who were 9−15 years old throughout the peak of the famine demonstrated higher systolicblood pressure in their adulthood as compared with unexposed individuals who were born during thesame period. Moreover, men exposed to hunger at age 6−8 and 9−15 were characterized by increasedmortality from ischaemic heart disease and cerebrovascular disease, respectively [66].
4.5. Chinese Famine of 1959–1961
The long-term health consequences of the Chinese Famine of 1959–1961 (‘Great Leap ForwardFamine’) are extensively studied now. This massive famine occurred in China in the late 1950sfollowing the disastrous social agricultural reform commonly referred to as ‘Great Leap Forward.’Over the years of the famine, 25 to 30 million more deaths and 30 to 35 million fewer births wereregistered in China than would have been expected under normal conditions [67]. In recent years, theGreat Leap Forward Famine is the most actively studied famine episode across the globe. It shouldbe noted, however, that one methodological limitation of the Chinese Famine study is that famineexposure data are not available by month; therefore, the periods of the famine exposure cannot be asprecisely defined as in the Dutch famine study or in the Ukrainian study.
In most of the studies of long-term impacts of the Chinese Famine, the evidence was obtained thatT2D as well as associated metabolic abnormalities were more common among adult Chinese residentsborn during the famine than among control individuals born after the famine (for a systematic review,see [68]). More specifically, in areas which were severely affected by famine, those subjects who wereexposed to famine prenatally had a 3.9-fold enhanced risk of hyperglycaemia in comparison withnon-exposed individuals; this difference was not seen in less severely affected regions. Remarkably,the hyperglycaemia risk was 7.6-fold higher in those prenatally exposed subjects who followed an
72
Books
MDPI

Nutrients 2017, 9, 236
affluent/Western dietary pattern and 6.2-fold higher in those who had a higher economic status inlater life compared to non-exposed controls [69]. In a more recent study by Wang et al. [70], bothprenatal and childhood exposures to famine were shown to result in higher risk of being diagnosedwith T2D in adulthood (1.5-times and 1.8-times, respectively), compared with non-exposed subjects.Individuals residing in Chinese regions with high economic status had a greater T2D risk (OR = 1.46).Interestingly, the timing of association between the famine exposure in early life and adult T2Dwas gender-specific: an elevated risk of T2D development was evident in the foetal-exposed men(OR = 1.64) and childhood-exposed women (OR = 2.81). These findings were further confirmedin subsequent research by the same authors, where a significant association between the famineseverity in the areas of exposure and the risk of T2D was found [71]. Those subjects who wereexposed to severe famine during the foetal and childhood periods had substantially higher oddsestimates (1.90 and 1.44, respectively). A significant interaction between the level of famine severityin the areas of exposure throughout the prenatal and childhood periods and the risk of T2D inadulthood has been observed. In another Chinese population, 1.44-fold higher risk of T2D developmentin the middle-childhood-exposed group, and 1.5-fold higher risks of hyperglycaemia in both themiddle- and late-childhood-exposed groups were demonstrated compared to the unexposed group [72].Remarkably, those individuals who experienced more severe famine in childhood had a 38% higherrisk of T2D development than those exposed to less severe famine. The revealed association was,however, sex-specific and has been found in women, but not in men. Similar associations have beenobserved for the hyperglycaemia risk as well.
In a recent study conducted in Suihua, China, the evidence was obtained that programmingeffects can be manifested not only in those prenatally exposed to famine population (F1 generation),but also in the F2 progeny [73]. In this research, prenatal exposure to the Chinese Famine hasbeen linked to a 1.75-fold enhanced risk of T2D and 1.93-fold enhanced risk of hyperglycaemiain F1 adult offspring in comparison with unexposed individuals. Furthermore, F2 offspring ofexposed ancestors had a 2.02-fold elevated risk of adult hyperglycaemia compared to the offspring ofnon-exposed ancestors. These findings suggest that famine-induced effects can be transmitted via thegerm line across generations and translated into increased T2D susceptibility in the descendants of thefamine-exposed individuals.
4.6. Nigerian Famine of 1967–1970
The Nigerian Famine (commonly referred to as ‘Biafran Famine’) occurred during the NigerianCivil War from 1967–1970. Of the one to three million Nigerians that died during this civil war, onlya relatively small fraction (about 10%) had lost their lives from military action as such; the majoritydied from war-associated starvation [74]. The risks of glucose intolerance, hypertension and beingoverweight 40 years after prenatal exposure to the Biafran Famine have been assessed in the Hult et al.study [75]. The studied cohorts (total n = 1339) included those adults born before (1965−1967), during(1968−1970), or after (1971−1973) the years of famine. The exposure to famine during both foetal andinfant periods has been found to be associated with significantly increased systolic and diastolic bloodpressure, higher levels of p-glucose and waist circumference, as well as with substantially elevatedrisks of systolic hypertension (OR = 2.87), impaired glucose regulation (OR = 1.65) and overweight(OR = 1.41) in adulthood compared with persons who were born after the famine. As in the case of theChinese Famine study, the lack of birth weight data and the resulting impossibility to separate effects ofprenatal and infant famine exposure is the main methodological weakness of Biafran Famine research.
4.7. Holocaust (1939−1945)
The Holocaust was a genocide in which Nazi Germany and its collaborators killed about sixmillion Jews. It was obviously associated with severe starvation and stress in affected populations.The long-term health outcomes of exposure to the Holocaust in the period from preconception to earlyinfancy were determined in recent studies conducted in Israel. The pilot study involved 70 European
73
Books
MDPI

Nutrients 2017, 9, 236
Jews born in countries under Nazi rule during the period 1940−1945 (exposed group) and 230 age-and sex-matched Israeli-born individuals (non-exposed group) who self-reported the presence ofchronic diseases [76]. The exposed individuals have been shown to be at a higher risk of adultmetabolic disturbances, including enhanced BMI, as well as 1.46-fold increased risk of hypertension,1.58-fold increased risk for dyslipidaemia, and 1.89-fold increased risk of T2D compared to theHolocaust-unexposed group. The associations observed were further confirmed on larger groupsof participants (exposed group, n = 653; non-exposed group, n = 433) [77]. The higher risks ofhypertension (OR = 1.52), T2D (OR = 1.60), metabolic syndrome (OR = 2.14) and vascular disease(OR = 1.99) were found in exposed individuals.
In general, findings from quasi-experimental studies suggest that exposure to famine in early lifemay result in serious metabolic disturbances in later life including high risk of development of T2Dand associated conditions. The main findings from these studies are summarized in Table 1.
Table 1. Summary of main findings from research on long-term metabolic health consequences ofearly-life undernutrition exposure
Country Cause of Starvation Period Adult consequence Ref.
Netherlands(‘Dutch HungerWinter’)
Nazi food embargo 1944–1945
Impaired glucose regulationAtherogenic lipid profilesObesity, CVDT2DLower IGF2 methylationChanged methylation of ABCA1, GNASAS,IL10, LEP, INSIGF and MEG3 genes
[78][79–81][49,81][49][51][55]
AustriaEmpire’s collapseNazi food embargoPost-war period
1918–191919381946–1947
High risk of T2D [56]
Ukraine(‘Holodomor’)
Agriculturecollectivization 1932–1933 High risk of T2D [59]
Russia Leningrad Siege 1941–1944
Endothelial dysfunction, stronger influence ofobesity on blood pressureIncreasing incidence of T2DAtherosclerosis, arterial hypertension
[61,62]
[64][65,66]
China(‘Great LeapForward Famine’)
Disastrous socialagricultural reform 1959–1961 Hyperglycemia
High risk of T2D[69,73][70–73]
Nigeria(‘Biafran Famine’) Civil war 1967–1970
Increased blood pressure, higher levels ofp-glucose, increased waist circumference,overweight, high risks of impaired glucoseregulation and systolic hypertension
[75]
Europe(‘Holocaust’) Nazi genocide 1939–1945 Enhanced BMI, hypertension, dyslipidemia,
high risk of T2D and CVD [76,77]
Spain Seasonal malnutrition 1935−1954 High systolic blood pressure [82]United Kingdom Seasonal malnutrition 1920–1930 Obesity [83]Canada Seasonal malnutrition 1943–1995 Obesity [84]United Kingdom Seasonal malnutrition 1924–1943 Dyslipidaemia, insulin resistance and CVD [85]USA Seasonal malnutrition 1968–1995 High risk of T2D [86]Netherlands Seasonal malnutrition 1920–1948 High risk of T2D [87]Ukraine Seasonal malnutrition 1930–1938 High risk of T2D [88]
5. Seasonality of Birth
Season of birth also can be used in quasi-experimental design to examine associations betweenearly-life exposures, including nutritional ones, and later-life health outcomes. In this regard, monthof birth presents a good instrument which may help to examine later-life outcomes of early-lifeexposures independently of life-course factors. This is true since decades ago there were strongseasonal variations in nutrition, especially in developing countries. Availability of cereals, vegetables,fruits and animal proteins varied significantly according to the season. Such differences in the supplyof high-quality food might potentially affect the foetal and neonatal development depending on themonth of gestation [89]. Other potentially confounding factors for early-life disease programming,
74
Books
MDPI

Nutrients 2017, 9, 236
including temperature [90], infections [91], sunlight/photoperiod and, correspondingly, production ofmelatonin and vitamin D [92], as well as maternal lifestyle factors such as physical activity [93] andalcohol intake [94], also tend to vary seasonally.
Seasonal conditions around the period of birth were demonstrated to significantly determinebirth weight: lower birth weights were observed in the winter-born newborns and higher birthweights in summer-born newborns in the high- and low-latitude areas, while the summer birth wasassociated with relatively lower birth weight in the mid-latitude areas [95]. Seasonality of birth has beendemonstrated for many aspects of metabolic syndrome, including high systolic blood pressure [82],obesity [83,84] and also dyslipidaemia, insulin resistance and CVD [85]. The seasonal pattern of birthfor childhood autoimmune (type 1) diabetic patients was reported repeatedly (see, e.g., [96]), while theseasonality of birth for T2D adult persons was observed only in a few studies. Seasonal patterns ofbirth were reported, e.g., in small-sample studies conducted in 155 adolescent African-Americans [86]and in 282 T2D patients in the Netherlands [87].
By now, the most obvious evidence for the seasonality of birth in T2D patients is provided inresearch conducted in a Ukrainian population [88]. In this study, those persons who were born inApril−May had increased risk ofT2D development. In the climatic conditions characteristic of theUkraine, these subjects ordinarily experienced their foetal life in the nutritionally marginal periodfrom late autumn to early spring and passed the first neonatal months during the relatively plentifulseason. In contrast, a decreased risk of T2D was observed in those born in November–December. Inthese individuals, prenatal development in a nutritionally abundant season would have been followedby early infancy in the season of relative scarcity (winter−spring). The first scenario is apparentlymore high-risk for developing T2D than the second one. These results are highly consistent with thethrifty phenotype hypothesis [8]. Interestingly, the seasonal pattern of birth was found to be verysimilar in type 1 and type 2 diabetic patients, suggesting shared early-life etiological causation forboth disorders [97]. In more recent research by Jensen et al. [98], no evidence for seasonality of birthin Danish patients with T2D was found. The authors assumed that difference in effects obtainedin Denmark and the Ukraine may be explained by standards of living or by differences in latitudebetween the countries. Indeed, as the seasonal variations in both weather and nutrition were muchmore pronounced in the Ukraine than in Denmark throughout the study periods, and since the Ukrainebelonged to low-income countries for much of that time, its residents experienced more pronouncedseasonal extremes than those experienced by people in a more prosperous country like Denmark.
In discussing the mechanistic basis for seasonal programming of adult-life diseases, one possibleexplanation is that seasonal factors operating around the time of birth may trigger persistent epigeneticchanges that have adaptive significance in postnatal development but can predispose to chronicdisorders, including the metabolic ones, at the late stages of life. The evidence for the link betweenseason of birth and long-term changes in DNA methylation has been recently obtained in theepigenome-wide association study (EWAS) by Lockett et al. [99], where methylation at 92 CpGdinucleotides was significantly associated with season of birth. The networks related to the cell cycle,development and apoptosis have been found to be enriched among these differentially methylatedCpG sites. Interestingly, the season-associated methylation patterns have been mainly absent innewborns, suggesting they arise postnatally. Although these findings were not confirmed in a morerecent study by Dugué et al. [100], they, however, suggest that changes in DNA methylation mightmechanistically underlie the season-of-birth effects on the risk of later-life disease.
6. Conclusions and Future Perspectives
A trend to a dramatic enhancing incidence of type 2 diabetes (T2D) has become a serious problemacross the globe over the past years. Metabolic syndrome and associated risk factors includingdyslipidaemia, high blood pressure, impaired glucose metabolism and T2D, are among the maincauses of death in both developed and developing countries. It is widely believed that risk of T2Dis mostly dependent on genetic and lifestyle factors. However, while genetic factors undoubtedly
75
Books
MDPI

Nutrients 2017, 9, 236
contribute to an individual susceptibility to development of obesity and T2D, the identified geneticvariants can explain only part of the variation [22,101]. Recent research has demonstrated that exposureto unfavourable environmental stimuli early in life is another important determinant of the risk ofT2D and associated conditions during adulthood. Findings from several of these studies suggest thatepigenetic regulation can be largely contributed to development of these pathological states. Sinceepigenetic marks may persist long term, epigenetic modifications triggered by environmental cuesthroughout early sensitive stages may lead to lasting effects on the metabolic functioning, therebyaffecting the risk of metabolic disorders, including T2D, later in life [102]. Prenatal and early postnatalnutrition is likely the most important factor affecting the adult risk of T2D. For instance, in studyingthe long-term health consequences of prenatal exposure to the Dutch famine, a link between poornutritional intake in utero and impaired glucose regulation, atherogenic lipid profiles and obesity laterin life, all known to be risk factors for development of T2D, has been demonstrated [99–102]. Therefore,it is not surprising that cohorts exposed to starvation in early life are at higher risk of T2D development.In a very recent meta-analysis of 11 published articles, a strong association between exposure tofamine in early life and increased risk of T2D in adulthood has been observed (the pooled relativerisk (RR) = 1.38, 95% CI 1.17−1.63) [103]. RRs for T2D development were 1.36 (95% CI 1.12−1.65) forcohorts exposed prenatally or during the early postnatal period and 1.40 (95% CI 0.98−1.99) for thosecohorts who were exposed in their childhood compared to the unexposed cohorts.
In offspring born to mothers experiencing famine during pregnancy, differential methylation ofgenes, including those associated with pathogenesis of T2D, has been observed [51,55], indicating theimportance of epigenetic processes in mediating early-life starvation exposure to the risk of later-lifedisease. Data from reviewed studies suggest that a focus on very early periods of gestation, andperhaps even on the periconceptional period, should constitute the next frontier for prevention of T2Dover the human life course [104]. Some studies have indicated that epigenetic effects contributing todevelopment of T2D could be transmitted across several generations. In research conducted in theÖverkalix, an isolated community in northern Sweden, the possibility of transgenerational effectson T2D mortality was observed. The transgenerational consequences of the ancestors’ nutritionthroughout their slow growth period (SGP, aged 9 to 12 years), the period of higher susceptibilityof organism to environmental influences, were investigated in cohorts born in this region in 1890,1905 and 1920 [105,106]. In case of limited food availability in the father’s SGP, then the descendantcardiovascular mortality was low, while the overeating of paternal grandfathers led to a four-foldincrease in diabetes mortality in the offspring [105,106]. Such transgenerational effects were shown tobe gender-specific: the paternal grandmother’s nutrient supply affected granddaughters’ mortality risk,while the paternal grandfather’s nutrient supply was shown to be associated with the mortality risk ingrandsons [106]. Since epigenetic alterations unlike genetic mutations are potentially reversible [107],pharmacological modification of epigenetic marks contributing to T2D development can provide anovel approach to prevention and treatment of T2D and associated disorders.
Acknowledgments: The author would like to thank Oksana Zabuga for the technical assistance in preparingthis manuscript.
Conflicts of Interest: The authors declare no conflict of interest.
References
1. Wilmot, E.; Idris, I. Early onset type 2 diabetes: Risk factors, clinical impact and management. Ther. Adv.Chronic. Dis. 2014, 5, 234–244. [CrossRef] [PubMed]
2. Jaacks, L.M.; Siegel, K.R.; Gujral, U.P.; Narayan, K.M. Type 2 diabetes: A 21st century epidemic. Best Pract.Res. Clin. Endocrinol. Metab. 2016, 30, 331–343. [CrossRef] [PubMed]
3. Nielsen, J.H.; Haase, T.N.; Jaksch, C.; Nalla, A.; Søstrup, B.; Nalla, A.A.; Larsen, L.; Rasmussen, M.;Dalgaard, L.T.; Gaarn, L.W. Impact of fetal and neonatal environment on beta cell function and developmentof diabetes. Acta Obstet. Gynecol. Scand. 2014, 93, 1109–1122. [CrossRef] [PubMed]
76
Books
MDPI

Nutrients 2017, 9, 236
4. Dabelea, D.; Hanson, R.L.; Lindsay, R.S.; Pettitt, D.J.; Imperatore, G.; Gabir, M.M.; Roumain, J.; Bennett, P.H.;Knowler, W.C. Intrauterine exposure to diabetes conveys risks for type 2 diabetes and obesity: A study ofdiscordant sibships. Diabetes 2000, 49, 2208–2211. [CrossRef] [PubMed]
5. Eriksson, J.G. Developmental Origins of Health and Disease—From a small body size at birth to epigenetics.Ann. Med. 2016, 48, 456–467. [CrossRef] [PubMed]
6. Kim, J.B. Dynamic cross talk between metabolic organs in obesity and metabolic diseases. Exp. Mol. Med.2016, 48, e214. [CrossRef] [PubMed]
7. Nettle, D.; Bateson, M. Adaptive developmental plasticity: What is it, how can we recognize it and when canit evolve? Proc. Biol. Sci. 2015, 282, 20151005. [CrossRef] [PubMed]
8. Hales, C.N.; Barker, D.J. Type 2 (non-insulin-dependent) diabetes mellitus: The thrifty phenotype hypothesis.1992. Int. J. Epidemiol. 2013, 42, 1215–1222. [CrossRef] [PubMed]
9. Thorn, S.R.; Rozance, P.J.; Brown, L.D.; Hay, W.W., Jr. The intrauterine growth restriction phenotype: Fetaladaptations and potential implications for later life insulin resistance and diabetes. Semin. Reprod. Med. 2011,29, 225–236. [CrossRef] [PubMed]
10. Carolan-Olah, M.; Duarte-Gardea, M.; Lechuga, J. A critical review: Early life nutrition and prenatalprogramming for adult disease. J. Clin. Nurs. 2015, 24, 3716–3729. [CrossRef] [PubMed]
11. Tarry-Adkins, J.L.; Ozanne, S.E. Nutrition in early life and age-associated diseases. Ageing Res. Rev. 2016.[CrossRef] [PubMed]
12. Whincup, P.H.; Kaye, S.J.; Owen, C.G.; Huxley, R.; Cook, D.G.; Anazawa, S.; Barrett-Connor, E.;Bhargava, S.K.; Birgisdottir, B.E.; Carlsson, S.; et al. Birth weight and risk of type 2 diabetes: A systematicreview. J. Am. Med. Assoc. 2008, 300, 2886–2897. [PubMed]
13. Kensara, O.A.; Wootton, S.A.; Phillips, D.I.; Patel, M.; Jackson, A.A.; Elia, M.; Hertfordshire Study Group.Fetal programming of body composition: Relation between birth weight and body composition measuredwith dual-energy X-ray absorptiometry and anthropometric methods in older Englishmen. Am. J. Clin. Nutr.2005, 82, 980–987. [PubMed]
14. Morrison, K.M.; Ramsingh, L.; Gunn, E.; Streiner, D.; van Lieshout, R.; Boyle, M.; Gerstein, H.; Schmidt, L.;Saigal, S. Cardiometabolic health in adults born premature with extremely low birth weight. Pediatrics 2016,138. [CrossRef] [PubMed]
15. Stirrat, L.I.; Reynolds, R.M. The effect of fetal growth and nutrient stresses on steroid pathways. J. Steroid.Biochem. Mol. Biol. 2016, 160, 214–220. [CrossRef] [PubMed]
16. Frankel, S.; Elwood, P.; Sweetnam, P.; Yarnell, J.; Smith, G.D. Birthweight, body-mass index in middle ageand incident coronary heart disease. Lancet 1996, 348, 1478–1480. [CrossRef]
17. Harder, T.; Rodekamp, E.; Schellong, K.; Dudenhausen, J.W.; Plagemann, A. Birth weight and subsequentrisk of type 2 diabetes: A meta-analysis. Am. J. Epidemiol. 2007, 165, 849–857. [CrossRef] [PubMed]
18. Dulloo, A.G. Thrifty energy metabolism in catch-up growth trajectories to insulin and leptin resistance.Best Pract. Res. Clin. Endocrinol. Metab. 2008, 22, 155–171. [CrossRef] [PubMed]
19. Cho, W.K.; Suh, B.K. Catch-up growth and catch-up fat in children born small for gestational age.Korean J. Pediatr. 2016, 59, 1–7. [CrossRef] [PubMed]
20. Ong, T.P.; Ozanne, S.E. Developmental programming of type 2 diabetes: Early nutrition and epigeneticmechanisms. Curr. Opin. Clin. Nutr. Metab. Care 2015, 18, 354–360. [CrossRef] [PubMed]
21. Paluch, B.E.; Naqash, A.R.; Brumberger, Z.; Nemeth, M.J.; Griffiths, E.A. Epigenetics: A primer for clinicians.Blood Rev. 2016, 30, 285–295. [CrossRef] [PubMed]
22. Van Dijk, S.J.; Tellam, R.L.; Morrison, J.L.; Muhlhausler, B.S.; Molloy, P.L. Recent developments on the role ofepigenetics in obesity and metabolic disease. Clin. Epigenet. 2015, 7, 66. [CrossRef] [PubMed]
23. Vaiserman, A. Epidemiologic evidence for association between adverse environmental exposures in earlylife and epigenetic variation: A potential link to disease susceptibility? Clin. Epigenet. 2015, 7, 9. [CrossRef][PubMed]
24. Geraghty, A.A.; Lindsay, K.L.; Alberdi, G.; McAuliffe, F.M.; Gibney, E.R. Nutrition during pregnancy impactsoffspring’s epigenetic status—Evidence from human and animal studies. Nutr. Metab. Insights 2016, 8, 41–47.[CrossRef] [PubMed]
25. Alam, F.; Islam, M.A.; Gan, S.H.; Mohamed, M.; Sasongko, T.H. DNA methylation: An epigenetic insightinto Type 2 diabetes mellitus. Curr. Pharm. Des. 2016, 22, 4398–4419. [CrossRef] [PubMed]
77
Books
MDPI

Nutrients 2017, 9, 236
26. Kwak, S.H.; Park, K.S. Recent progress in genetic and epigenetic research on type 2 diabetes. Exp. Mol. Med.2016, 48, e220. [CrossRef] [PubMed]
27. Green, A.S.; Rozance, P.J.; Limesand, S.W. Consequences of a compromised intrauterine environment onislet function. J. Endocrinol. 2010, 205, 211–224. [CrossRef] [PubMed]
28. Portha, B.; Chavey, A.; Movassat, J. Early-life origins of type 2 diabetes: Fetal programming of the beta-cellmass. Exp. Diabetes Res. 2011. [CrossRef] [PubMed]
29. Pinney, S.E. Intrauterine growth retardation–A developmental model of type 2 diabetes. Drug Discov TodayDis. Models. 2013, 10, e71–e77. [CrossRef] [PubMed]
30. Dumortier, O.; Blondeau, B.; Duvillie, B.; Reusens, B.; Breant, B.; Remacle, C. Different mechanisms operatingduring different critical time-windows reduce rat fetal beta cell mass due to a maternal low-protein orlow-energy diet. Diabetologia 2007, 50, 2495–2503. [CrossRef] [PubMed]
31. Garofano, A.; Czernichow, P.; Breant, B. In utero undernutrition impairs rat beta-cell development.Diabetologia 1997, 40, 1231–1234. [CrossRef] [PubMed]
32. Garofano, A.; Czernichow, P.; Breant, B. Beta-cell mass and proliferation following late fetal and earlypostnatal malnutrition in the rat. Diabetologia 1998, 41, 1114–1120. [CrossRef] [PubMed]
33. Petrik, J.; Reusens, B.; Arany, E.; Remacle, C.; Coelho, C.; Hoet, J.J.; Hill, D.J. A low protein diet altersthe balance of islet cell replication and apoptosis in the fetal and neonatal rat and is associated with areduced pancreatic expression of insulin-like growth factor-II. Endocrinology 1999, 140, 4861–4873. [CrossRef][PubMed]
34. Garofano, A.; Czernichow, P.; Breant, B. Effect of ageing on beta-cell mass and function in rats malnourishedduring the perinatal period. Diabetologia 1999, 42, 711–718. [CrossRef] [PubMed]
35. Blondeau, B.; Garofano, A.; Czernichow, P.; Breant, B. Age-dependent inability of the endocrine pancreas toadapt to pregnancy: A long-term consequence of perinatal malnutrition in the rat. Endocrinology 1999, 140,4208–4213. [CrossRef] [PubMed]
36. Thamotharan, M.; Shin, B.C.; Suddirikku, D.T.; Thamotharan, S.; Garg, M.; Devaskar, S.U. GLUT4 expressionand subcellular localization in the intrauterine growth-restricted adult rat female offspring. Am. J. Physiol.Endocrinol. Metab. 2005, 288, E935–E947. [CrossRef] [PubMed]
37. Matveyenko, A.V.; Singh, I.; Shin, B.C.; Georgia, S.; Devaskar, S.U. Differential effects of prenatal andpostnatal nutritional environment on ss-cell mass development and turnover in male and female rats.Endocrinology 2010, 151, 5647–5656. [CrossRef] [PubMed]
38. Ong, T.P.; Ozanne, S.E. Developmental programming of type 2 diabetes: Early nutrition and epigeneticmechanisms. Curr. Opin. Clin. Nutr. Metab Care 2015, 18, 354–360. [CrossRef] [PubMed]
39. Simmons, R.A. Developmental origins of diabetes: The role of epigenetic mechanisms. Curr Opin. Endocrinol.Diabetes Obes. 2007, 14, 13–16. [CrossRef] [PubMed]
40. Simmons, R.A. Developmental origins of adult disease. Pediatr. Clin. N. Am. 2009, 56, 449–466. [CrossRef][PubMed]
41. Blondeau, B.; Avril, I.; Duchene, B.; Breant, B. Endocrine pancreas development is altered in foetuses fromrats previously showing intra-uterine growth retardation in response to malnutrition. Diabetologia 2002, 45,394–401. [CrossRef] [PubMed]
42. Park, J.H.; Stoffers, D.A.; Nicholls, R.D.; Simmons, R.A. Development of type 2 diabetes followingintrauterine growth retardation in rats is associated with progressive epigenetic silencing of Pdx1.J. Clin. Investig. 2008, 118, 2316–2324. [CrossRef] [PubMed]
43. Reusens, B.; Theys, N.; Dumortier, O.; Goosse, K.; Remacle, C. Maternal malnutrition programs the endocrinepancreas in progeny. Am. J. Clin. Nutr. 2011, 94, 1824S–1829S. [CrossRef] [PubMed]
44. Berends, L.M.; Fernandez-Twinn, D.S.; Martin-Gronert, M.S.; Cripps, R.L.; Ozanne, S.E. Catch-up growthfollowing intra-uterine growth-restriction programmes an insulin-resistant phenotype in adipose tissue.Int. J. Obes. (Lond.) 2013, 37, 1051–1057. [CrossRef] [PubMed]
45. Bieswal, F.; Ahn, M.T.; Reusens, B.; Holvoet, P.; Raes, M.; Rees, W.D.; Remacle, C. The importance of catch-upgrowth after early malnutrition for the programming of obesity in male rat. Obesity (Silver Spring) 2006, 14,1330–1343. [CrossRef] [PubMed]
46. Bol, V.V.; Delattre, A.I.; Reusens, B.; Raes, M.; Remacle, C. Forced catch-up growth after fetal proteinrestriction alters the adipose tissue gene expression program leading to obesity in adult mice. Am. J. Physiol.Regul. Integr. Comp. Physiol. 2009, 297, R291–R299. [CrossRef] [PubMed]
78
Books
MDPI

Nutrients 2017, 9, 236
47. Last, J.M. A Dictionary of Epidemiology, 3rd ed.; Oxford University Press: New York, NY, USA, 1995.48. Heijmans, B.T.; Tobi, E.W.; Lumey, L.H.; Slagboom, P.E. The epigenome: Archive of the prenatal environment.
Epigenetics 2009, 4, 526–531. [CrossRef] [PubMed]49. Lumey, L.H.; Stein, A.D.; Susser, E. Prenatal famine and adult health. Annu. Rev. Public Health 2011, 32,
237–262. [CrossRef] [PubMed]50. Roseboom, T.J.; Painter, R.C.; van Abeelen, A.F.; Veenendaal, M.V.; de Rooij, S.R. Hungry in the womb: What
are the consequences? Lessons from the Dutch famine. Maturitas 2011, 70, 141–145. [CrossRef] [PubMed]51. Heijmans, B.T.; Tobi, E.W.; Stein, A.D.; Putter, H.; Blauw, G.J.; Susser, E.S.; Slagboom, P.E.; Lumey, L.H.
Persistent epigenetic differences associated with prenatal exposure to famine in humans. Proc. Natl Acad.Sci. USA 2008, 105, 17046–17049. [CrossRef] [PubMed]
52. Van Abeelen, A.F.; Elias, S.G.; Bossuyt, P.M.; Grobbee, D.E.; van der Schouw, Y.T.; Roseboom, T.J.;Uiterwaal, C.S. Famine exposure in the young and the risk of type 2 diabetes in adulthood. Diabetes2012, 61, 2255–2260. [CrossRef] [PubMed]
53. Portrait, F.; Teeuwiszen, E.; Deeg, D. Early life undernutrition and chronic diseases at older ages: The effectsof the Dutch famine on cardiovascular diseases and diabetes. Soc. Sci. Med. 2011, 73, 711–718. [CrossRef][PubMed]
54. Lumey, L.H.; Terry, M.B.; Delgado-Cruzata, L.; Liao, Y.; Wang, Q.; Susser, E.; McKeague, I.; Santella, R.M.Adult global DNA methylation in relation to pre-natal nutrition. Int. J. Epidemiol. 2012, 41, 116–123.[CrossRef] [PubMed]
55. Tobi, E.W.; Lumey, L.H.; Talens, R.P.; Kremer, D.; Putter, H.; Stein, A.D.; Slagboom, P.E.; Heijmans, B.T.DNA methylation differences after exposure to prenatal famine are common and timing- and sex-specific.Hum. Mol. Genet. 2009, 18, 4046–4053. [CrossRef] [PubMed]
56. Thurner, S.; Klimek, P.; Szell, M.; Duftschmid, G.; Endel, G.; Kautzky-Willer, A.; Kasper, D.C. Quantificationof excess risk for diabetes for those born in times of hunger, in an entire population of a nation, across acentury. Proc. Natl. Acad. Sci. USA 2013, 110, 4703–4707. [CrossRef] [PubMed]
57. Klitz, W.; Niklasson, B. Viral underpinning to the Austrian record of type 2 diabetes? Proc. Natl. Acad.Sci. USA 2013, 110, E2750. [CrossRef] [PubMed]
58. Thurner, S.; Klimek, P.; Szell, M.; Duftschmid, G.; Endel, G.; Kautzky-Willer, A.; Kasper, D.C. Reply to Klitzand Niklasson: Can viral infections explain the cross-sectional Austrian diabetes data? Proc. Natl. Acad.Sci. USA 2013, 110, E2751. [CrossRef]
59. Lumey, L.H.; Khalangot, M.D.; Vaiserman, A.M. Association between type 2 diabetes and prenatal exposureto the Ukraine famine of 1932–33: A retrospective cohort study. Lancet Diabetes Endocrinol. 2015, 3, 787–794.[CrossRef]
60. Sparén, P.; Vågerö, D.; Shestov, D.B.; Plavinskaja, S.; Parfenova, N.; Hoptiar, V.; Paturot, D.; Galanti, M.R.Long term mortality after severe starvation during the siege of Leningrad: Prospective cohort study.Br. Med. J. 2004, 328, 11. [CrossRef] [PubMed]
61. Stanner, S.A.; Bulmer, K.; Andrès, C.; Lantseva, O.E.; Borodina, V.; Poteen, V.V.; Yudkin, J.S. Does malnutritionin utero determine diabetes and coronary heart disease in adulthood? Results from the Leningrad siegestudy: A cross sectional study. Br. Med. J. 1997, 315, 1342–1348. [CrossRef] [PubMed]
62. Stanner, S.A.; Yudkin, J.S. Fetal programming and the Leningrad Siege study. Twin Res. 2001, 4, 287–292.[CrossRef] [PubMed]
63. Bateson, P. Fetal experience and good adult design. Int. J. Epidemiol. 2001, 30, 928–934. [CrossRef] [PubMed]64. Khoroshinina, L.P.; Zhavoronkova, N.V. Starving in childhood and diabetes mellitus in elderly age.
Adv. Gerontol. 2008, 21, 684–687.65. Khoroshinina, L.P. Peculiarities of somatic diseases in people of middle and old age survived Leningrad
siege at childhood. Adv. Gerontol. 2004, 14, 55–65. (In Russian)66. Koupil, I.; Shestov, D.B.; Sparén, P.; Plavinskaja, S.; Parfenova, N.; Vågerö, D. Blood pressure, hypertension
and mortality from circulatory disease in men and women who survived the siege of Leningrad.Eur. J. Epidemiol. 2007, 22, 223–234. [CrossRef] [PubMed]
67. Jowett, A.J. The demographic responses to famine: The case of China 1958-61. GeoJournal 1991, 23, 135–146.[CrossRef] [PubMed]
68. Li, C.; Lumey, L.H. Exposure to the Chinese famine of 1959–61 in early life and current health conditions:A systematic review and meta-analysis. Lancet 2016, 388, S63. [CrossRef]
79
Books
MDPI

Nutrients 2017, 9, 236
69. Li, Y.; He, Y.; Qi, L.; Jaddoe, V.W.; Feskens, E.J.; Yang, X.; Ma, G.; Hu, F.B. Exposure to the Chinese faminein early life and the risk of hyperglycemia and type 2 diabetes in adulthood. Diabetes 2010, 59, 2400–2406.[CrossRef] [PubMed]
70. Wang, N.; Wang, X.; Han, B.; Li, Q.; Chen, Y.; Zhu, C.; Chen, Y.; Xia, F.; Cang, Z.; Zhu, C.; et al.Is exposure to famine in childhood and economic development in adulthood associated with diabetes?J. Clin. Endocrinol. Metab. 2015, 100, 4514–4523. [CrossRef] [PubMed]
71. Wang, N.; Cheng, J.; Han, B.; Li, Q.; Chen, Y.; Xia, F.; Jiang, B.; Jensen, M.D.; Lu, Y. Exposure to severe faminein the prenatal or postnatal period and the development of diabetes in adulthood: An observational study.Diabetologia 2017, 60, 262–269. [CrossRef] [PubMed]
72. Wang, J.; Li, Y.; Han, X.; Liu, B.; Hu, H.; Wang, F.; Li, X.; Yang, K.; Yuan, J.; Yao, P.; et al. Exposure tothe Chinese Famine in childhood increases type 2 diabetes risk in adults. J. Nutr. 2016, 146, 2289–2295.[CrossRef] [PubMed]
73. Li, J.; Liu, S.; Li, S.; Feng, R.; Na, L.; Chu, X.; Wu, X.; Niu, Y.; Sun, Z.; Han, T.; et al. Prenatal exposureto famine and the development of hyperglycemia and type 2 diabetes in adulthood across consecutivegenerations: A population-based cohort study of families in Suihua, China. Am. J. Clin. Nutr. 2016, 105,221–227. [CrossRef] [PubMed]
74. Miller, J.P. Medical relief in the Nigerian civil war. Lancet 1970, 760, 1330–1334. [CrossRef]75. Hult, M.; Tornhammar, P.; Ueda, P.; Chima, C.; Bonamy, A.K.; Ozumba, B.; Norman, M. Hypertension,
diabetes and overweight: Looming legacies of the Biafran famine. PLoS ONE 2010, 5, e13582. [CrossRef][PubMed]
76. Bercovich, E.; Keinan-Boker, L.; Shasha, S.M. Long-term health effects in adults born during the Holocaust.Isr. Med. Assoc. J. 2014, 16, 203–207. [PubMed]
77. Keinan-Boker, L.; Shasha-Lavsky, H.; Eilat-Zanani, S.; Edri-Shur, A.; Shasha, S.M. Chronic health conditionsin Jewish Holocaust survivors born during World War II. Isr. Med. Assoc. J. 2015, 17, 206–212. [PubMed]
78. Watson, P.E.; McDonald, B.W. Seasonal variation of nutrient intake in pregnancy: Effects on infant measuresand possible influence on diseases related to season of birth. Eur. J. Clin. Nutr. 2007, 61, 1271–1280. [CrossRef][PubMed]
79. Flouris, A.D.; Spiropoulos, Y.; Sakellariou, G.J.; Koutedakis, Y. Effect of seasonal programming on fetaldevelopment and longevity: Links with environmental temperature. Am. J. Hum. Biol. 2009, 21, 214–216.[CrossRef] [PubMed]
80. Finch, C.E.; Crimmins, E.M. Inflammatory exposure and historical changes in human life-spans. Science2004, 305, 1736–1739. [CrossRef] [PubMed]
81. Lowell, W.E.; Davis, G.E., Jr. The light of life: Evidence that the sun modulates human lifespan.Med. Hypotheses. 2008, 70, 501–507. [CrossRef] [PubMed]
82. Smith, A.D.; Crippa, A.; Woodcock, J.; Brage, S. Physical activity and incident type 2 diabetes mellitus:A systematic review and dose-response meta-analysis of prospective cohort studies. Diabetologia 2016, 59,2527–2545. [CrossRef] [PubMed]
83. Vaiserman, A.M. Early-life exposure to substance abuse and risk of type 2 diabetes in adulthood.Curr. Diabetes Rep. 2015, 15, 48. [CrossRef] [PubMed]
84. Chodick, G.; Flash, S.; Deoitch, Y.; Shalev, V. Seasonality in birth weight: Review of global patterns andpotential causes. Hum. Biol. 2009, 81, 463–477. [CrossRef] [PubMed]
85. Banegas, J.R.; Rodríguez-Artalejo, F.; de la Cruz, J.J.; Graciani, A.; Villar, F.; del Rey-Calero, J. Adult menborn in spring have lower blood pressure. J. Hypertens. 2000, 18, 1763–1766. [CrossRef] [PubMed]
86. Phillips, D.I.; Young, J.B. Birth weight: Climate at birth and the risk of obesity in adult life. Int. J. Obes. Relat.Metab. Disord. 2000, 24, 281–287. [CrossRef] [PubMed]
87. Wattie, N.; Ardern, C.I.; Baker, J. Season of birth and prevalence of overweight and obesity in Canada.Early Hum. Dev. 2008, 84, 539–547. [CrossRef] [PubMed]
88. Lawlor, D.A.; Davey-Smith, G.; Mitchell, R.; Ebrahim, S. Temperature at birth, coronary heart disease, andinsulin resistance: Cross sectional analyses of the British women’s heart and health study. Heart 2004, 90,381–388. [CrossRef] [PubMed]
89. Laron, Z.; Lewy, H.; Wilderman, I.; Casu, A.; Willis, J.; Redondo, M.J.; Libman, I.; White, N.; Craig, M.Seasonality of month of birth of children and adolescents with type 1 diabetes mellitus in homogenous andheterogeneous populations. Isr. Med. Assoc. J. 2005, 7, 381–384. [PubMed]
80
Books
MDPI

Nutrients 2017, 9, 236
90. Grover, V.; Lipton, R.B.; Sclove, S.L. Seasonality of month of birth among African American children withdiabetes mellitus in the City of Chicago. J. Pediatr. Endocrinol. Metab. 2004, 17, 289–296. [CrossRef] [PubMed]
91. Jongbloet, P.H.; van Soestbergen, M.; van der Veen, E.A. Month-of-birth distribution of diabetics andovopathy: A new aetiological view. Diabetes Res. 1988, 9, 51–58. [PubMed]
92. Vaiserman, A.M.; Khalangot, M.D.; Carstensen, B.; Tronko, M.D.; Kravchenko, V.I.; Voitenko, V.P.;Mechova, L.V.; Koshel, N.M.; Grigoriev, P.E. Seasonality of birth in adult type 2 diabetic patients in threeUkrainian regions. Diabetologia 2009, 52, 2665–2667. [CrossRef] [PubMed]
93. Vaiserman, A.M.; Khalangot, M.D. Similar seasonality of birth in type 1 and type 2 diabetes patients: A signfor common etiology? Med. Hypotheses 2008, 71, 604–605. [CrossRef] [PubMed]
94. Jensen, C.B.; Zimmermann, E.; Gamborg, M.; Heitmann, B.L.; Baker, J.L.; Vaag, A.; Sørensen, T.I. No evidenceof seasonality of birth in adult type 2 diabetes in Denmark. Diabetologia 2015, 58, 2045–2050.
95. Lockett, G.A.; Soto-Ramírez, N.; Ray, M.A.; Everson, T.M.; Xu, C.J.; Patil, V.K.; Terry, W.; Kaushal, A.;Rezwan, F.I.; Ewart, S.L.; et al. Association of season of birth with DNA methylation and allergic disease.Allergy 2016, 71, 1314–1324. [CrossRef] [PubMed]
96. Dugué, P.A.; Geurts, Y.M.; Milne, R.L.; Lockett, G.A.; Zhang, H.; Karmaus, W.; Holloway, J.W. Is there anassociation between season of birth and blood DNA methylation in adulthood? Allergy 2016, 71, 1501–1504.[CrossRef] [PubMed]
97. Desiderio, A.; Spinelli, R.; Ciccarelli, M.; Nigro, C.; Miele, C.; Beguinot, F.; Raciti, G.A. Epigenetics: Spotlighton type 2 diabetes and obesity. J. Endocrinol. Investig. 2016, 39, 1095–1103. [CrossRef] [PubMed]
98. Sterns, J.D.; Smith, C.B.; Steele, J.R.; Stevenson, K.L.; Gallicano, G.I. Epigenetics and type II diabetes mellitus:Underlying mechanisms of prenatal predisposition. Front. Cell Dev. Biol. 2014, 2, 15. [CrossRef] [PubMed]
99. Ravelli, A.C.; van der Meulen, J.H.; Michels, R.P.; Osmond, C.; Barker, D.J.; Hales, C.N.; Bleker, O.P. Glucosetolerance in adults after prenatal exposure to famine. Lancet 1998, 351, 173–177. [CrossRef]
100. Lussana, F.; Painter, R.C.; Ocke, M.C.; Buller, H.R.; Bossuyt, P.M.; Roseboom, T.J. Prenatal exposure to theDutch famine is associated with a preference for fatty foods and a more atherogenic lipid profile. Am. J.Clin. Nutr. 2008, 88, 1648–1652. [CrossRef] [PubMed]
101. Lumey, L.H.; Stein, A.D.; Kahn, H.S.; Romijn, J.A. Lipid profiles in middle-aged men and women afterfamine exposure during gestation: The dutch hunger winter families study. Am. J. Clin. Nutr. 2009, 89,1737–1743. [CrossRef] [PubMed]
102. Roseboom, T.; de Rooij, S.; Painter, R. The Dutch famine and its long-term consequences for adult health.Early Hum. Dev. 2006, 82, 485–491. [CrossRef] [PubMed]
103. Liu, L.; Wang, W.; Sun, J.; Pang, Z. Association of famine exposure during early life with the risk of type 2diabetes in adulthood: A meta-analysis. Eur. J. Nutr. 2016. [CrossRef] [PubMed]
104. Gillman, M.W. Prenatal famine and developmental origins of type 2 diabetes. Lancet Diabetes Endocrinol.2015, 3, 751–752. [CrossRef]
105. Kaati, G.; Bygren, L.O.; Edvinsson, S. Cardiovascular and diabetes mortality determined by nutrition duringparents’ and grandparents’ slow growth period. Eur. J. Hum. Genet. 2002, 10, 682–688. [CrossRef] [PubMed]
106. Pembrey, M.E. Male-line transgenerational responses in humans. Hum. Fertil. (Camb.) 2010, 13, 268–271.[CrossRef] [PubMed]
107. Vaiserman, A.M.; Pasyukova, E.G. Epigenetic drugs: A novel anti-aging strategy? Front. Genet. 2012, 3, 224.[CrossRef] [PubMed]
© 2017 by the author. Licensee MDPI, Basel, Switzerland. This article is an open accessarticle distributed under the terms and conditions of the Creative Commons Attribution(CC BY) license (http://creativecommons.org/licenses/by/4.0/).
81
Books
MDPI

nutrients
Article
Serum Magnesium Concentrations in the CanadianPopulation and Associations with Diabetes,Glycemic Regulation, and Insulin Resistance
Jesse Bertinato 1,2,*, Kuan Chiao Wang 3 and Stephen Hayward 3
1 Nutrition Research Division, Food Directorate, Health Products and Food Branch, Health Canada,Sir Frederick G. Banting Research Centre, 251 Sir Frederick Banting Driveway, Ottawa,ON K1A 0K9, Canada
2 Department of Biochemistry, Microbiology and Immunology, University of Ottawa, Ottawa,ON K1H 8M5, Canada
3 Bureau of Food Surveillance and Science Integration, Food Directorate, Health Products and Food Branch,Health Canada, Ottawa, ON K1A 0K9, Canada;[email protected] (K.C.W.); [email protected] (S.H.)
* Correspondence: [email protected]; Tel.: +1-613-957-0924; Fax: +1-613-946-6212
Received: 26 January 2017; Accepted: 14 March 2017; Published: 17 March 2017
Abstract: Total serum magnesium (Mg) concentration (SMC) is commonly used to assess Mg status.This study reports current SMCs of Canadians and their associations with demographic factors,diabetes, and measures of glycemic control and insulin resistance using results from the CanadianHealth Measures Survey cycle 3 (2012–2013). Associations were examined in adults aged 20–79 yearsusing linear mixed models. Mean SMCs and percentile distributions for 11 sex-age groups between3 and 79 years (n = 5561) are reported. SMCs were normally distributed and differences (p < 0.05)among sex and age groups were small. Between 9.5% and 16.6% of adult sex-age groups had a SMCbelow the lower cut-off of a population-based reference interval (0.75–0.955 mmol·L−1) establishedin the United States population as part of the NHANES I conducted in 1971–1974. Having diabeteswas associated with 0.04 to 0.07 mmol·L−1 lower SMC compared to not having diabetes in thevarious models. Body mass index, glycated hemoglobin, serum glucose and insulin concentrations,and homeostatic model assessment of insulin resistance were negatively associated with SMC. This isthe first study to report SMCs in a nationally representative sample of the Canadian population.A substantial proportion of Canadians are hypomagnesaemic in relation to a population-basedreference interval, and SMC was negatively associated with diabetes and indices of glycemic controland insulin resistance.
Keywords: Canada; diabetes; glycemic regulation; homeostatic model assessment of insulinresistance; serum magnesium concentration
1. Introduction
Magnesium (Mg) is a mineral nutrient that functions as a catalytic co-factor and structuralcomponent of enzymes and plays an important role as a calcium antagonist [1]. Mg is essentialfor many biological processes including the synthesis of organic molecules, cell proliferation,energy production, muscle contraction and relaxation, bone development, mineral metabolism,and glucose homeostasis [1–4]. In North America, Mg intakes fall short of dietary recommendationsfor a large segment of the population [5–7]. However, the extent of Mg deficiency in the generalpopulation and related health risks are unclear because of the uncertainty regarding Mg intakesneeded for optimal health. This is underscored by the large differences in recommended intakes for
Nutrients 2017, 9, 296 82 www.mdpi.com/journal/nutrients
Books
MDPI

Nutrients 2017, 9, 296
Mg established by different scientific bodies [8–10]. In addition, current information on Mg status ofthe North American population is lacking.
Total serum Mg concentration is the most widely used nutritional biomarker for assessingMg status [1,11,12]. A recent meta-analysis of randomized controlled trials showed that serum(or plasma) Mg concentrations were significantly increased by oral Mg supplementation in a dose-and time-dependent manner [13]. Notably, little or no change in serum Mg was observed with higherbaseline circulating Mg concentrations. Together, these results suggest that serum Mg concentrationscan provide meaningful information on Mg status.
Information on serum Mg concentrations in the Canadian or United States populations fromnationally-representative health surveys is limited. The last national estimates were based on datacollected over 40 years ago in the first National Health and Nutrition Examination Survey (NHANES I)conducted in the United States between 1971 and 1974 [14]. These estimates were used to establisha population-based reference interval for adults of 0.75–0.955 mmol·L−1. Based on this referenceinterval, a serum Mg concentration below 0.75 mmol·L−1 is usually defined as hypomagnesaemia(low serum Mg concentration).
Low Mg intakes and/or serum Mg concentrations have been associated with a number of diseasesand health conditions including hypertension [15,16], sudden cardiac death [17,18], reduced bonemineral density [19], cardiovascular disease events [20,21], and colorectal cancer [22,23]. Poor Mgstatus may also impair growth of lean body mass [24] and decrease physical performance [25].Diabetes (both type 1 and type 2) is the most common metabolic disorder associated with Mgdeficiency [26–30], with reported incidence rates of hypomagnesaemia in diabetics as high as13.5%–47.7% [27]. Multiple factors likely contribute to the hypomagnesaemia, including increased Mgloss through excretion by the kidneys. The higher renal Mg excretion is caused by reduced tubular Mgreabsorption resulting from glucose-induced osmotic diuresis and possibly insulin resistance [27,31].Serum Mg has been negatively associated with fasting glucose and insulin concentrations and glycatedhemoglobin (HbA1c), a measure of long-term glycemic control [32–34]. Negative associations have alsobeen reported with indirect indices of insulin resistance including quantitative insulin sensitivity checkindex (QUICKI), homeostatic model assessment of insulin resistance (HOMA-IR), and McAuley’sindex [32,35].
Nationally-representative data are preferred over non-national data for the development ofnutrition policies and regulations. National estimates of serum Mg concentrations have never beenreported for Canadians. The primary objective of this study was to report current national estimatesof serum Mg concentrations for the Canadian population for ages 3–79 years using results from theCanadian Health Measures Survey (CHMS) cycle 3 conducted between 2012 and 2013. In Canada,the high prevalence of obesity [36] and co-morbidities such as insulin resistance and diabetes [37] mayhave a negative effect on the Mg status of the population. Thus, secondary analyses were performedto examine population-level associations between serum Mg concentrations and demographic factors,diabetes, and measures of glycemic regulation and insulin resistance in adults in order to add to ourunderstanding of subpopulations at increased risk for Mg deficiency.
2. Materials and Methods
2.1. Survey Design
The CHMS is a cross-sectional, population-based survey that collects health information througha household interview and direct physical measures. The CHMS used a multi-stage sampling design.For cycle 3 of the survey, anthropometric measurements and biological samples were collected ina mobile examination centre (MEC) over 2 years from January 2012 to December 2013. Samples werecollected from ~5700 volunteers aged 3 to 79 years from 16 collection sites stratified in five regionsacross Canada: Atlantic, Quebec, Ontario, Prairies, and British Columbia. The survey was designed toprovide national estimates for children 3–5 years and for ages 6–11, 12–19, 20–39, 40–59, and 60–79 years
83
Books
MDPI

Nutrients 2017, 9, 296
for both sexes. Cycle 3 included members of the populations of the 10 provinces. Persons living in theterritories, living on reserves and other aboriginal settlements in the provinces, full-time members ofthe Canadian Forces, the institutionalized, and persons living in certain remote areas were excludedfrom the survey. Altogether, these exclusions represent ~4% of the target population. The CHMScycle 3 was approved by the Health Canada and Public Health Agency of Canada Research EthicsBoard. Informed written consent was obtained from all participants older than 14 years of age.Parents or legal guardians provided written consent for younger children and the child gave assent.More detailed information on the aims of the CHMS, target population, and methodologies can befound elsewhere [38].
2.2. Biochemical Measurements
Fasted (≥12 h) and nonfasted blood samples were collected and processed in a MEC. Wholeblood was collected in 10 mL K2EDTA tubes (CABD366643L, VWR International, Mississauga,ON, Canada). Serum was isolated from blood collected in 4 mL serum tubes (CABD367812L,VWR International). Whole blood and serum samples were shipped to the Nutrition Laboratory,Health Canada for measurement of HbA1c (whole blood) and serum Mg, albumin, triglyceride,and glucose concentrations using the Vitros 5.1 FS clinical chemistry analyzer (Ortho ClinicalDiagnostics, Mississauga, ON, Canada). Serum insulin concentration was measured using the AdviaCentaur XP immunoassay analyzer (Siemens Healthcare Diagnostics, Mississauga, ON, Canada).The inter-assay (within lab precision) coefficients of variability (low–high concentration range) forHbA1c, Mg, albumin, triglycerides, glucose and insulin were 1.9%–3.1%, 1.7%–0.9%, 1.7%–0.9%,1.4%–0.9%, 1.5%–1.2%, and 5.9%–4.8%, respectively. Triglycerides and insulin were only measured infasted participants. Results from samples with degree of hemolysis exceeding the threshold value forthe assay were excluded from the analyses.
2.3. Collection of Demographic Information
Information on age, sex, race (i.e., white, South Asian, Chinese, black, Filipino, Latin American,Arab, Southeast Asian, West Asian, Korean, Japanese, other), diabetes, and yearly household incomewas collected at a household interview with the participants. The interview was conducted by trainedinterviewers using a computer-assisted interviewing method [38].
2.4. Calculations
QUICKI, HOMA-IR, and McAuley’s index were calculated using the following equations:QUICKI, (log insulin (μIU·mL−1) + log glucose (mg·dL−1))−1; HOMA-IR, (glucose (mmol·L−1)× insulin (μIU·mL−1)) 22.5−1; and McAuley’s index, exp(2.63 − 0.28 ln insulin (μIU mL−1) − 0.31 lntriglycerides (mmol·L−1)). BMI was calculated from weight and height measurements.
2.5. Statistical Analyses
The CHMS cycle 3 sampling design yields national estimates when survey weights are applied.Bootstrap weights were used for all variance estimations to account for the complex samplingdesign [39]. The 16 collection sites from five regional strata restricted the statistical analyses to11 degrees of freedom. Descriptive statistics are presented as arithmetic means and percentiles with 95%confidence intervals. A t-test or ANOVA followed by Tukey’s test was used for pairwise comparisonof means. Association of serum Mg concentration with demographic and biochemical characteristicswere assessed via linear mixed models. Age, sex, race (white or non-white), diabetes (type 1 andtype 2 combined), BMI, and yearly household income were designated as fixed effects. HbA1c,QUICKI, HOMA-IR, McAuley’s index, and serum albumin, glucose, insulin, and triglycerideconcentrations were modeled as random effects to account for the inherent variability associatedwith these measurements during sampling. Model 1 included the full adult sample set (fasted andnonfasted participants), and associations between Mg concentrations and age, sex, race, diabetes, BMI,
84
Books
MDPI
Nutrients 2017, 9, 296
household income, albumin, and HbA1c were examined. Two additional models were developedusing the fasted subsample. In model 2, associations with glucose, insulin, and triglycerides wereinvestigated in addition to the variables examined in Model 1. In Model 3, associations with theindirect indices of insulin resistance QUICKI, HOMA-IR, and McAuley’s index were examined insteadof the direct measures glucose, insulin, and triglycerides. The SURVEYREG procedure with backwardselimination was used to develop the final models. For the purpose of interpretation, estimates for thecontinuous variables were also determined after a transformation using the 5th and 95th percentiles:
Y = (X − 5th percentile of X) ÷ (95th percentile of X − 5th percentile of X) (1)
Pregnant women (n = 19) and participants with a missing or invalid value were excluded fromthe analyses. The coefficients of variation for all estimates were <16.6% and considered acceptable forunrestricted release based on the CHMS sampling variability guidelines [40]. Statistical significancewas set a p < 0.05. Statistical analyses were performed using SAS/STAT® 9.3 software (SAS InstituteInc., Cary, NC, USA).
3. Results
Means and percentile distributions for total serum Mg concentration for 11 sex-age groupsbetween 3 and 79 years are presented in Table 1. Distributions were symmetrical and thus arithmeticmeans were reported. In general, differences (p < 0.05) among sex and age groups were small. For ages6–11 years, 20–39 years and 40–59 years females had lower means compared to males. Estimations foradolescents and adults at the 10th percentile were below a population-based reference interval foradults of 0.75–0.955 mmol·L−1 [14]. Between 9.5% and 16.6% of the adult sex-age groups had a serumMg concentration below 0.75 mmol·L−1 (Figure 1). Estimates for the 25th and 95th percentiles for allsex-age groups were within the reference interval (Table 1). Boxplots show a greater number of olderadults of both sexes with serum Mg concentration below the lower fence (i.e., 1.5 × interquartile range)(Figure S1).
Mean serum Mg concentration between fasted and nonfasted participants were similar (p ≥ 0.05)for most sex-age groups (Table S1). However, fasted males and females 6–11 years had lower meansthan corresponding nonfasted participants. Conversely, fasted females aged 60–79 years had a highermean compared to non-fasting females of the same age range.
Association of serum Mg concentration with demographic factors, diabetes and measures ofglycemic control and insulin resistance were examined in adults aged 20–79 years using mixed models(data for children and adolescents aged 3–19 years were excluded from these analyses). Serum albuminconcentration was included in the models because of a linear relationship with serum Mg at high andlow concentrations [41]. For continuous variables associations were estimated for a defined unit changeand after transformation using the 5th and 95th percentiles. After transformation the estimated changein serum Mg corresponds to the change in the continuous variable from the 5th to the 95th percentile inthe population. This is a better indication of the relative strengths of the associations among variablessince the magnitudes of associations are compared without confounding by their scales. Estimates ofthe 5th and 95th percentiles for each continuous variable are presented for each model.
In Model 1, associations were estimated in fasted and nonfasted adults (Table 2). Being male wasassociated with higher serum Mg, whereas white race (compared to non-white) or having diabetes(type 1 or type 2) was associated with lower Mg concentrations. Age, household income, and serumalbumin concentration were positively associated with serum Mg, while BMI and HbA1c showeda negative association.
In Models 2 and 3, associations were examined in fasted adults. In Model 2, serum Mg waspositively associated with age and household income and negatively associated with diabetes andserum glucose and insulin concentrations (Table 3). In Model 3, age and household income showedpositive associations, whereas diabetes and HOMA-IR showed negative associations (Table 4).
85
Books
MDPI

Nutrients 2017, 9, 296
Ta
ble
1.
Mea
nsan
ddi
stri
buti
ons
ofse
rum
mag
nesi
umco
ncen
trat
ions
byse
xan
dag
ein
the
Can
adia
npo
pula
tion
.
Se
xa
nd
Ag
en
Se
rum
Ma
gn
esi
um
Dis
trib
uti
on
of
Se
rum
Ma
gn
esi
um
Co
nce
ntr
ati
on
s
5th
10
th2
5th
50
th7
5th
90
th9
5th
Ari
thm
eti
cM
ea
n1
95
%C
IE
stim
ate
95
%C
IE
stim
ate
95
%C
IE
stim
ate
95
%C
IE
stim
ate
95
%C
IE
stim
ate
95
%C
IE
stim
ate
95
%C
IE
stim
ate
95
%C
I
mm
ol·L
−1
All
2
3–5
year
s50
50.
830.
82,0
.84
0.74
0.72
,0.7
60.
760.
74,0
.77
0.78
0.77
,0.8
00.
820.
80,0
.84
0.86
0.84
,0.8
80.
900.
87,0
.93
0.92
0.90
,0.9
5
Mal
e3
6–11
year
s49
30.
83a,
*0.
82,0
.84
0.73
0.71
,0.7
60.
760.
73,0
.78
0.79
0.78
,0.8
10.
830.
82,0
.84
0.86
0.85
,0.8
80.
880.
86,0
.91
0.91
0.88
,0.9
412
–19
year
s49
00.
80c
0.78
,0.8
10.
710.
68,0
.74
0.73
0.70
,0.7
50.
760.
72,0
.79
0.79
0.77
,0.8
10.
830.
80,0
.85
0.87
0.84
,0.8
90.
880.
87,0
.90
20–3
9ye
ars
510
0.81
b,c,
*0.
80,0
.82
0.69
0.64
,0.7
40.
730.
70,0
.76
0.77
0.74
,0.7
90.
800.
79,0
.82
0.84
0.83
,0.8
60.
870.
86,0
.89
0.90
0.87
,0.9
240
–59
year
s53
80.
82a,
b,*
0.81
,0.8
30.
710.
68,0
.73
0.74
0.71
,0.7
70.
780.
76,0
.80
0.82
0.80
,0.8
40.
860.
84,0
.88
0.90
0.88
,0.9
20.
910.
88,0
.94
60–7
9ye
ars
509
0.81
b0.
81,0
.82
0.69
0.67
,0.7
10.
720.
71,0
.74
0.77
0.75
,0.7
90.
820.
80,0
.84
0.86
0.84
,0.8
70.
890.
88,0
.91
0.91
0.89
,0.9
3
Fem
ale
3
6–11
year
s45
50.
82a
0.81
,0.8
30.
740.
72,0
.76
0.75
0.73
,0.7
80.
780.
77,0
.80
0.82
0.80
,0.8
40.
850.
83,0
.86
0.88
0.86
,0.8
90.
890.
88,0
.90
12–1
9ye
ars
486
0.79
d0.
78,0
.80
0.70
0.68
,0.7
20.
720.
70,0
.73
0.75
0.73
,0.7
70.
780.
77,0
.80
0.82
0.80
,0.8
30.
860.
84,0
.87
0.88
0.86
,0.9
020
–39
year
s51
10.
80c,
d0.
79,0
.80
0.71
0.70
,0.7
20.
730.
71,0
.75
0.76
0.74
,0.7
80.
790.
77,0
.80
0.82
0.80
,0.8
40.
850.
82,0
.88
0.87
0.85
,0.8
940
–59
year
s53
20.
81b,
c0.
80,0
.82
0.69
0.64
,0.7
40.
720.
69,0
.76
0.76
0.74
,0.7
80.
810.
79,0
.82
0.85
0.83
,0.8
70.
880.
86,0
.89
0.89
0.87
,0.9
260
–79
year
s53
20.
82a,
b0.
81,0
.83
0.67
0.65
,0.6
90.
710.
69,0
.73
0.77
0.75
,0.7
90.
820.
80,0
.83
0.86
0.84
,0.8
80.
900.
88,0
.92
0.93
0.90
,0.9
71
Val
ues
ina
colu
mn
and
wit
hin
ase
xgr
oup
wit
hout
aco
mm
onsu
pers
crip
tlet
ter
diff
er,p
<0.
05.*
Diff
eren
tcom
pare
dto
fem
ales
inth
esa
me
age
grou
p,p
<0.
05;2
Incl
udes
nonf
aste
dm
ales
and
fem
ales
;3In
clud
esfa
sted
and
nonf
aste
dpa
rtic
ipan
ts.
Ta
ble
2.
Ass
ocia
tion
ofse
rum
Mg
wit
hde
mog
raph
icfa
ctor
s,di
abet
esan
dbi
oche
mic
alm
easu
res
1 .
IVE
stim
ate
(95%
CI)
2,3
Est
imate
(95%
CI)
3,4
pD
istr
ibu
tio
no
fC
on
tin
uo
us
IV
mm
ol·L
−1
5th
(95%
CI
)95th
(95%
CI
)
Mal
e5
0.01
(0.0
0,0.
01)
-<0
.01
--
Whi
tera
ce6
−0.0
1(−
0.02
,−0.
00)
-<0
.001
--
Dia
bete
s7
−0.0
4(−
0.05
,−0.
02)
-<0
.001
--
Age
,yea
r0.
01(0
.01,
0.01
)0.
05(0
.04,
0.05
)<0
.001
21.1
(18.
3,23
.9)
71.7
(70.
1,73
.3)
BMI,
kg·m
−2−0
.002
(−0.
002,−0
.001
)−0
.03
(−0.
03,−
0.02
)<0
.001
19.7
(19.
1,20
.3)
36.3
(34.
7,38
.0)
Hou
seho
ldin
com
e,K
0.00
05(0
.000
1,0.
0008
)0.
01(0
.00,
0.01
)<0
.01
15.0
(11.
5,18
.5)
196.
7(1
66.2
,227
.2)
Seru
mal
bum
in,g
·L−1
0.00
2(0
.001
,0.0
03)
0.02
(0.0
1,0.
03)
<0.0
0137
.8(3
6.3,
39.3
)48
.9(4
7.4,
50.5
)H
bA1c
,%−0
.01
(−0.
02,−
0.01
)−0
.02
(−0.
03,−
0.02
)<0
.001
4.8
(4.6
,5.0
)6.
5(6
.1,6
.9)
1R
esul
tsfr
omfa
sted
and
nonf
aste
dad
ults
aged
20–7
9ye
ars,
n=
2838
(Mod
el1)
.Sex
,rac
e,di
abet
es,a
ge,B
MI,
hous
ehol
din
com
e,se
rum
albu
min
conc
entr
atio
nan
dH
bA1c
wer
ete
sted
inth
em
odel
.All
vari
able
sw
ere
stat
istic
ally
sign
ifica
nt(p
<0.
05)a
ndre
tain
edin
the
final
mod
el.H
bA1c
,gly
cate
dhe
mog
lobi
n;IV
,ind
epen
dent
vari
able
s;M
g,m
agne
sium
;2C
hang
esin
seru
mM
gco
ncen
trat
ions
asso
ciat
edw
ithbe
ing
mal
e(c
ompa
red
tofe
mal
e),w
hite
race
(com
pare
dto
non-
whi
tera
ce),
diab
etes
,a10
year
sin
crem
enti
nag
e,a
1kg
·m−2
incr
emen
tin
BMI,
a$1
0K
incr
emen
tin
year
lyho
use
hold
inco
me,
a1
g·L−1
incr
emen
tin
seru
mal
bum
inco
ncen
trat
ion
and
a1%
incr
emen
tin
HbA
1c;3
Est
imat
esar
ead
just
edfo
ral
lIV
inth
em
odel
;4
Con
tinu
ous
vari
able
sw
ere
tran
sfor
med
usin
gth
e5t
han
d95
thpe
rcen
tile
spr
ior
toan
alys
is;5
Mal
es,n
=14
38;6
Whi
tes,
n=
2331
;7D
iabe
tics
,n=
217.
86
Books
MDPI

Nutrients 2017, 9, 296
Ta
ble
3.
Ass
ocia
tion
ofse
rum
Mg
wit
hde
mog
raph
icfa
ctor
s,di
abet
esan
dse
rum
gluc
ose
and
insu
linco
ncen
trat
ions
1 .
IVE
stim
ate
(95
%C
I)2
,3E
stim
ate
(95
%C
I)3
,4
pD
istr
ibu
tio
no
fC
on
tin
uo
us
IV
mm
ol·L
−1
5th
(95
%C
I)
95
th(9
5%
CI
)
Dia
bete
s5
−0.0
6(−
0.07
,−0.
04)
-<0
.001
--
Age
,yea
r0.
01(0
.01,
0.01
)0.
04(0
.03,
0.05
)<0
.001
20.6
(17.
9,23
.3)
70.8
(69.
1,72
.4)
Hou
seho
ldin
com
e,K
0.00
08(0
.000
4,0.
0012
)0.
02(0
.01,
0.02
)<0
.001
14.5
(10.
3,18
.7)
199.
0(1
62.5
,235
.6)
Seru
mgl
ucos
e,m
mol·L
−1−0
.01
(−0.
01,−
0.00
)−0
.01
(−0.
02,−
0.01
)<0
.001
4.3
(4.1
,4.4
)6.
6(5
.9,7
.4)
Seru
min
sulin
,pm
ol·L
−1−0
.000
08(−
0.00
013,−0
.000
04)
−0.0
1(−
0.02
,−0.
00)
<0.0
0125
.1(2
1.9,
28.2
)18
0.1
(156
.7,2
03.4
)1
Res
ults
from
fast
edad
ults
aged
20–7
9ye
ars,
n=
1621
(Mod
el2)
.Sex
,rac
e,di
abet
es,a
ge,B
MI,
hous
ehol
din
com
e,se
rum
albu
min
conc
entr
atio
n,H
bA1c
,ser
umgl
ucos
eco
ncen
trat
ion,
seru
min
sulin
conc
entr
atio
nan
dse
rum
trig
lyce
rid
eco
ncen
trat
ion
wer
ete
sted
inth
em
odel
.Sta
tist
ical
lysi
gnifi
cant
(p<
0.05
)var
iabl
esw
ere
sele
cted
byba
ckw
ard
sel
imin
atio
nan
dre
tain
edin
the
final
mod
el.I
V,in
depe
nden
tvar
iabl
es;M
g,m
agne
sium
;2C
hang
esin
seru
mM
gco
ncen
trat
ions
asso
ciat
edw
ithdi
abet
es,a
10ye
ars
incr
emen
tin
age,
a$1
0K
incr
emen
tin
year
lyho
useh
old
inco
me,
a1
mm
ol·L
−1in
crem
enti
nse
rum
gluc
ose
conc
entr
atio
nan
da
1pm
ol·L
−1in
crem
enti
nse
rum
insu
linco
ncen
trat
ion;
3Es
timat
esar
ead
just
edfo
ral
lIV
inth
em
odel
;4C
onti
nuou
sva
riab
les
wer
etr
ansf
orm
edus
ing
the
5th
and
95th
perc
enti
les
prio
rto
anal
ysis
;5D
iabe
tics
,n=
99.
Ta
ble
4.
Ass
ocia
tion
ofse
rum
Mg
wit
hde
mog
raph
icfa
ctor
s,di
abet
esan
dH
OM
A-I
R1 .
IVE
stim
ate
(95
%C
I)2
,3E
stim
ate
(95
%C
I)3
,4
pD
istr
ibu
tio
no
fC
on
tin
uo
us
IV
mm
ol·L
−1
5th
(95
%C
I)
95
th(9
5%
CI
)
Dia
bete
s5
−0.0
7(−
0.08
,−0.
06)
-<0
.001
--
Age
,yea
r0.
01(0
.01,
0.01
)0.
04(0
.03,
0.05
)<0
.001
20.6
(18.
0,23
.3)
70.8
(69.
1,72
.5)
Hou
seho
ldin
com
e,K
0.00
08(0
.000
4,0.
0012
)0.
02(0
.01,
0.02
)<0
.001
14.5
(10.
3,18
.7)
199.
0(1
62.0
,236
.0)
HO
MA
-IR
−0.0
03(−
0.00
4,−0
.002
)−0
.02
(−0.
02,−
0.01
)<0
.001
0.80
(0.6
7,0.
93)
6.99
(6.3
4,7.
65)
1R
esul
tsfr
omfa
sted
adul
tsag
ed20
–79
year
s,n
=16
21(M
odel
3).S
ex,r
ace,
diab
etes
,age
,BM
I,ho
useh
old
inco
me,
seru
mal
bum
inco
ncen
trat
ion,
HbA
1c,s
erum
trig
lyce
ride
conc
entr
atio
nan
dH
OM
A-I
Rw
ere
test
edin
the
mod
el.S
tatis
tical
lysi
gnifi
cant
(p<
0.05
)var
iabl
esw
ere
sele
cted
byba
ckw
ards
elim
inat
ion
and
reta
ined
inth
efin
alm
odel
.HO
MA
-IR
,hom
eost
atic
mod
elas
sess
men
tof
insu
linre
sist
ance
;IV
,in
dep
end
ent
vari
able
s;M
g,m
agne
siu
m;
2C
hang
esin
seru
mM
gco
ncen
trat
ions
asso
ciat
edw
ith
dia
bete
s,a
10ye
ars
incr
emen
tin
age,
a$1
0K
incr
emen
tin
year
lyho
useh
old
inco
me
and
anin
crem
ento
f1fo
rH
OM
A-I
R;3
Estim
ates
are
adju
sted
for
allI
Vin
the
mod
el;4
Con
tinuo
usva
riab
les
wer
etr
ansf
orm
edus
ing
the
5th
and
95th
perc
enti
les
prio
rto
anal
ysis
;5D
iabe
tics
,n=
99.
87
Books
MDPI

Nutrients 2017, 9, 296
Sex and age group
M & F 3-
5 y
M 6-11
y
M 12-19
y
M 20-39
y
M 40-59
y
M 60-79
y
F 6-11
y
F 12-19
y
F 20-39
y
F 40-59
y
F 60-79
y
Per
cent
age
with
ser
um M
g <
0.75
mm
ol L
-1
0
5
10
15
20
25
Figure 1. Percentage of each sex and age group with a serum Mg concentration below 0.75 mmol·L−1.The total number of participants (n) examined for each sex-age group is shown in Table 1. F, females;M, males; y, years.
4. Discussion
This study describes current (2012–2013) estimates of serum Mg concentrations in a nationallyrepresentative sample of the Canadian population for ages 3–79 years. These results are the firstnational estimates in Canada or the United States since the NHANES I conducted between 1971 and1973 [14]. Results from that study showed a normal distribution for serum Mg concentration, with 95%of adults aged 18–74 years having a value between 0.75 and 0.955 mmol·L−1. Those estimates wereconsidered as normative for the United States population and were used to establish a population-basedreference interval. Serum Mg concentrations in the present study were also normally distributed.Substantial proportions of the adult sex-age groups (9.5%–16.6%) and adolescents aged 12–19 years(15.8%–21.8%) had a serum Mg concentration below 0.75 mmol·L−1, the lower cut-off of the referenceinterval. All estimates at the 10th percentile for adolescents and adults were also below 0.75 mmol·L−1.In addition, means in this study were lower than means reported in the NHANES I for comparablesex-age groups [14]. Collectively, these results suggest that present-day serum Mg concentrationsin Canada are lower compared to concentrations in the United States population in the early 1970s.Since it has been suggested that a serum Mg concentration below 0.75 mmol·L−1 represents relativelysevere Mg deficiency [11], these results raise suspicions of Mg deficiency in the Canadian population.Estimates at the 95th percentile for all sex-age groups were within the reference interval indicating therarity of hypermagnesaemia in the population.
Similar to results from the NHANES I, only small differences in serum Mg concentrationswere found among sex and age groups. Serum Mg concentrations were highest for childrenand showed a small increase with age from adolescents 12–19 years to older adults 60–79 years.Among demographic factors, age was the strongest predictor of serum Mg concentration in adults.The magnitudes of associations with sex, race, and household income were considerably smaller.A major finding from the NHANES I was the lower serum Mg in black Americans compared to whiteAmericans [14]. In the present study, being white was associated with a lower serum Mg concentration
88
Books
MDPI

Nutrients 2017, 9, 296
than being non-white. It should be mentioned that because of the small sample sizes for all racialgroups other than whites (including blacks), comparison among races in this study was restricted tothe general groups of whites and non-whites.
Boxplot analyses revealed a greater number of older adults with serum Mg values below thelower fence (outliers) indicating that older adults are more prone to marked hypomagnesaemia.Possible explanations include lower dietary Mg intakes, reduced gastrointestinal Mg absorption,and increased renal Mg excretion in the elderly [42]. The higher occurrence of health conditions(e.g., diabetes) and other factors (e.g., use of hypermagnesuric diuretics) that alter Mg metabolism mayalso contribute [43].
Serum Mg concentrations were compared between fasted and nonfasted participants. Mean serumMg concentrations were found to be lower for fasted children aged 6–11 years, but higher for fastedfemales aged 60–79 years. It is presently unclear what accounts for these differences. While thedifferences could be considered modest, these data offer a caution when interpreting results froma routine serum Mg test for these sex-age groups.
Inverse associations between serum Mg and diabetes and comorbidities such as poor glycemiccontrol and insulin resistance have been well established. However, it is likely that these relationshipsare affected by factors that can differ among countries or change in populations over time(e.g., dietary Mg intakes, supplement and medication use). Thus, in this study associations ofserum Mg concentration with diabetes and measures of glycemic regulation and insulin resistancewere investigated in adults to determine the magnitude of these associations in a relatively currentnationally-representative dataset. Diabetes was a strong predictor of serum Mg concentration.The estimated lower serum Mg in diabetics (ranging from −0.04 to −0.07 mmol·L−1 in the variousmodels) accounts for ~20% to 34% of the spread between the lower and upper limits of the normalreference interval. These estimates are substantial and likely have clinical relevance. Serum Mg wasalso negatively associated with HbA1c and fasting serum glucose concentration. A negative effect ofdiabetes on Mg status is noteworthy given the high prevalence of diabetes in Canada which is expectedto rise to over 10% by the year 2020 [37].
The hyperinsulinemic euglycemic clamp is considered the “gold standard” for assessmentof insulin sensitivity, but the complexity of the method limits its use in large studies [44].In this study, associations between serum Mg and more practical surrogate indices of insulinresistance [45] were examined. Fasting insulin concentration correlates strongly with insulinresistance [46] and HOMA-IR is considered a robust tool for the evaluation of insulin resistancein large epidemiological studies [47,48]. Serum Mg showed a negative association with both fastinginsulin and HOMA-IR, indicating a positive relationship between serum Mg and insulin sensitivity.Notably, these relationships were observed in models controlling for diabetes. It should be mentionedthat HOMA-IR was determined to be a better predictor of serum Mg concentration compared to otherproxy measures of insulin resistance such as QUICKI or McAuley’s index that were insignificant(p ≥ 0.05) in our selection process.
There is evidence indicating that the relationship between Mg deficiency and type 2 diabetes isbidirectional. Mg deficiency is a common manifestation in type 1 and type 2 diabetics [26,27] and mayalso increase the risk of diabetes and its complications [29–31]. The negative associations betweenserum Mg and measures of glycemic regulation observed in this study are in agreement with studiesindicating that poor glycemic control lowers serum Mg concentrations [33,34]. However, lower serumMg may also contribute to poorer glycemic regulation and insulin sensitivity. Studies indicate thatMg supplementation improves glucose and insulin sensitivity parameters [49,50]. A meta-analysisof randomized controlled trials showed that Mg supplementation for over four months improvedfasting glucose and HOMA-IR in diabetic and non-diabetic subjects [49]. In another meta-analysis,Mg supplementation was shown to reduce fasting plasma glucose in diabetics and improve HOMA-IRand plasma glucose (in a 2 h oral glucose tolerance test) in persons at high risk of diabetes [50].The mechanisms by which Mg deficiency may increase diabetes risk are poorly understood but may
89
Books
MDPI

Nutrients 2017, 9, 296
involve increased oxidative stress and inflammation [35,51,52]. It is important to mention that thisstudy does not provide any information on the temporality of the reported associations with serumMg given the cross-sectional design.
The main strength of this study is the CHMS cycle 3 study design, including the large samplesize that is representative of the Canadian population that is ideal for estimating national serum Mgconcentrations and population distributions. The use of mixed models and continuous variables(rather than dichotomizing continuous variables) is also a strength. Limitations include the absenceof Mg intake data (including supplement use) for comparison with serum Mg concentrations.The different methodologies used to measure serum Mg in this study and the NHANES I (colorimetricvs. atomic absorption spectroscopy) limits, to some extent, the comparison of results between studies;however, serum Mg measurements by the colorimetric method (the most commonly used method)or atomic absorption show excellent agreement (R > 0.99) [53]. Also, based on the responses to thehousehold questionnaire, many diabetics in this study could not be categorized as having type 1 ortype 2 diabetes. Thus, in our analyses, diabetics included participants with type 1 or type 2 diabetesor both.
The limitations of total serum Mg concentration as a biomarker of Mg status also merit discussion.Only a small fraction (~0.3%) of total body Mg is present in the serum and fluctuations in serum proteinssuch as albumin can alter Mg concentrations [41]. Furthermore, serum Mg may not always accuratelyreflect intracellular Mg deficiency. Serum Mg concentration is tightly regulated primarily at the levelof renal excretion. Bone also maintains circulating concentrations by acting as a store for Mg andsupplementing the serum under conditions of deficiency. This homeostatic regulation is likely a majorfactor accounting for the poor association observed between serum Mg concentrations and dietaryMg intakes, particularly when intakes meet nutrient requirements [54,55]. Despite these limitations,low serum Mg is usually indicative of Mg deficiency. Serum Mg is decreased in a dose-dependentmanner in animal models of dietary Mg deficiency, demonstrating that low Mg intakes (Mg deficiency)reduce serum Mg concentration [56,57]. Human studies have shown that serum Mg is responsiveto long-term changes in dietary Mg intakes [58] and increases with Mg supplementation [13,59,60].A meta-analysis of randomized controlled trials showed that serum Mg concentrations increase ina dose- and time-dependent manner with oral Mg supplementation, and the response is greaterwhen baseline circulating Mg concentrations are lower, suggesting that serum Mg provides usefulinformation about underlying Mg status [13]. It has been suggested that a serum Mg value below0.75 mmol·L−1 is a useful measure of relatively severe Mg deficiency, but Mg deficiency cannot beexcluded for persons with a value between 0.75 and 0.85 mmol·L−1 [11,12].
5. Conclusions
This study reports serum Mg concentrations for 11 sex-age groups between 3 and 79 years in theCanadian population. Between 9.5% and 16.6% of the adult sex-age groups were hypomagnesaemic(serum Mg < 0.75 mmol·L−1) in relation to a population-based reference interval [14]. There is a needto establish an evidence-based reference interval (or at minimum a lower cut-off value) for health thatwill allow more accurate assessment of the prevalence of Mg deficiency in Canada and related healthrisk based on results from this study [61]. Among demographic factors, age was the strongest predictorof serum Mg concentration. Serum Mg concentration was negatively associated with diabetes, BMI,serum glucose, serum insulin, HbA1c, and HOMA-IR. These results are consistent with a growingbody of evidence indicating a negative effect of diabetes, poor glycemic control, and insulin resistanceon Mg status.
Supplementary Materials: The following are available online at http://www.mdpi.com/2072-6643/9/3/296/s1,Figure S1: Boxplots of serum Mg concentrations by sex-age group, Table S1: Means and distributions of serummagnesium concentrations by sex and age in fasted and nonfasted Canadians.
Acknowledgments: This research was funded by the Bureau of Nutritional Sciences and the Bureau of FoodSurveillance and Science Integration, Health Canada.
90
Books
MDPI
Nutrients 2017, 9, 296
Author Contributions: J.B. conceived the study; J.B., K.C.W. and S.H. analyzed the data; J.B. wrote the paper.
Conflicts of Interest: The authors declare no conflict of interest.
References
1. Swaminathan, R. Magnesium metabolism and its disorders. Clin. Biochem. Rev. 2003, 24, 47–66. [PubMed]2. Volpe, S.L. Magnesium in disease prevention and overall health. Adv. Nutr. 2013, 4, 378S–383S. [CrossRef]
[PubMed]3. Elin, R.J. Magnesium: The fifth but forgotten electrolyte. Am. J. Clin. Pathol. 1994, 102, 616–622. [CrossRef]
[PubMed]4. Wolf, F.I.; Cittadini, A. Magnesium in cell proliferation and differentiation. Front. Biosci. 1999, 4, D607–D617.
[CrossRef] [PubMed]5. Moshfegh, A.; Goldman, J.D.; Ahuja, J.; Rhodes, D.; LaComb, R. What We Eat in America, NHANES 2005–2006:
Usual Nutrient Intakes from Food and Water Compared to 1997 Dietary Reference Intakes for Vitamin D, Calcium,Phosphorus, and Magnesium; U.S. Department of Agriculture, Agriculture Research Service: Washington, DC,USA, 2009.
6. Health Canada. Do Canadian Adults Meet Their Nutrient Requirements through Food Intake Alone?Available online: http://www.hc-sc.gc.ca/fn-an/surveill/nutrition/commun/art-nutr-adult-eng.php(accessed on 23 February 2017).
7. Ford, E.S.; Mokdad, A.H. Dietary magnesium intake in a national sample of US adults. J. Nutr. 2003, 133,2879–2882. [PubMed]
8. Food and Nutrition Board, Institute of Medicine. Dietary Reference Intakes for Calcium, Phosphorus, Magnesium,Vitamin D, and Fluoride; National Academy Press: Washington, DC, USA, 1997; pp. 190–249.
9. EFSA Panel on Dietetic Products, Nutrition and Allergies (NDA). Scientific opinion on dietary referencevalues for magnesium. EFSA J. 2015, 13, 4186.
10. Joint FAO/WHO Expert Consultation. Vitamin and Mineral Requirements in Human Nutrition: Report of a JointFAO/WHO Expert Consultation, 2nd ed.; World Health Organization: Geneva, Switzerland, 2004.
11. Arnaud, M.J. Update on the assessment of magnesium status. Br. J. Nutr. 2008, 99, S24–S36. [CrossRef][PubMed]
12. Elin, R.J. Assessment of magnesium status for diagnosis and therapy. Magnes. Res. 2010, 23, S194–S198.[PubMed]
13. Zhang, X.; Del Gobbo, L.C.; Hruby, A.; Rosanoff, A.; He, K.; Dai, Q.; Costello, R.B.; Zhang, W.; Song, Y.The circulating concentration and 24-h urine excretion of magnesium dose- and time-dependently respondto oral magnesium supplementation in a meta-analysis of randomized controlled trials. J. Nutr. 2016, 146,595–602. [CrossRef] [PubMed]
14. Lowenstein, F.W.; Stanton, M.F. Serum magnesium levels in the United States, 1971–1974. J. Am. Coll. Nutr.1986, 5, 399–414. [CrossRef] [PubMed]
15. Ma, J.; Folsom, A.R.; Melnick, S.L.; Eckfeldt, J.H.; Sharrett, A.R.; Nabulsi, A.A.; Hutchinson, R.G.;Metcalf, P.A. Associations of serum and dietary magnesium with cardiovascular disease, hypertension,diabetes, insulin, and carotid arterial wall thickness: The ARIC study. Atherosclerosis Risk in CommunitiesStudy. J. Clin. Epidemiol. 1995, 48, 927–940. [CrossRef]
16. Zhang, X.; Li, Y.; Del Gobbo, L.C.; Rosanoff, A.; Wang, J.; Zhang, W.; Song, Y. Effects of magnesiumsupplementation on blood pressure: A meta-analysis of randomized double-blind placebo-controlled trials.Hypertension 2016, 68, 324–333. [CrossRef] [PubMed]
17. Kieboom, B.C.; Niemeijer, M.N.; Leening, M.J.; van den Berg, M.E.; Franco, O.H.; Deckers, J.W.; Hofman, A.;Zietse, R.; Stricker, B.H.; Hoorn, E.J. Serum magnesium and the risk of death from coronary heart diseaseand sudden cardiac death. J. Am. Heart Assoc. 2016, 5, e002707. [CrossRef] [PubMed]
18. Peacock, J.M.; Ohira, T.; Post, W.; Sotoodehnia, N.; Rosamond, W.; Folsom, A.R. Serum magnesium and riskof sudden cardiac death in the Atherosclerosis Risk in Communities (ARIC) Study. Am. Heart J. 2010, 160,464–470. [CrossRef] [PubMed]
19. Orchard, T.S.; Larson, J.C.; Alghothani, N.; Bout-Tabaku, S.; Cauley, J.A.; Chen, Z.; LaCroix, A.Z.;Wactawski-Wende, J.; Jackson, R.D. Magnesium intake, bone mineral density, and fractures: Results from theWomen’s Health Initiative Observational study. Am. J. Clin. Nutr. 2014, 99, 926–933. [CrossRef] [PubMed]
91
Books
MDPI

Nutrients 2017, 9, 296
20. Del Gobbo, L.C.; Imamura, F.; Wu, J.H.; de Oliveira Otto, M.C.; Chiuve, S.E.; Mozaffarian, D. Circulating anddietary magnesium and risk of cardiovascular disease: A systematic review and meta-analysis of prospectivestudies. Am. J. Clin. Nutr. 2013, 98, 160–173. [CrossRef] [PubMed]
21. Qu, X.; Jin, F.; Hao, Y.; Li, H.; Tang, T.; Wang, H.; Yan, W.; Dai, K. Magnesium and the risk of cardiovascularevents: A meta-analysis of prospective cohort studies. PLoS ONE 2013, 8, e57720. [CrossRef] [PubMed]
22. Chen, G.C.; Pang, Z.; Liu, Q.F. Magnesium intake and risk of colorectal cancer: A meta-analysis of prospectivestudies. Eur. J. Clin. Nutr. 2012, 66, 1182–1186. [CrossRef] [PubMed]
23. Qu, X.; Jin, F.; Hao, Y.; Zhu, Z.; Li, H.; Tang, T.; Dai, K. Nonlinear association between magnesium intake andthe risk of colorectal cancer. Eur. J. Gastroenterol. Hepatol. 2013, 25, 309–318. [CrossRef] [PubMed]
24. Bertinato, J.; Lavergne, C.; Rahimi, S.; Rachid, H.; Vu, N.A.; Plouffe, L.J.; Swist, E. Moderately low magnesiumintake impairs growth of lean body mass in obese-prone and obese-resistant rats fed a high-energy diet.Nutrients 2016, 8, 253. [CrossRef] [PubMed]
25. Veronese, N.; Berton, L.; Carraro, S.; Bolzetta, F.; De Rui, M.; Perissinotto, E.; Toffanello, E.D.; Bano, G.;Pizzato, S.; Miotto, F.; et al. Effect of oral magnesium supplementation on physical performance in healthyelderly women involved in a weekly exercise program: A randomized controlled trial. Am. J. Clin. Nutr.2014, 100, 974–981. [CrossRef] [PubMed]
26. De Valk, H.W. Magnesium in diabetes mellitus. Neth. J. Med. 1999, 54, 139–146. [CrossRef]27. Pham, P.C.; Pham, P.M.; Pham, S.V.; Miller, J.M.; Pham, P.T. Hypomagnesemia in patients with type 2
diabetes. Clin. J. Am. Soc. Nephrol. 2007, 2, 366–373. [CrossRef] [PubMed]28. Kao, W.H.; Folsom, A.R.; Nieto, F.J.; Mo, J.P.; Watson, R.L.; Brancati, F.L. Serum and dietary magnesium and
the risk for type 2 diabetes mellitus: The Atherosclerosis Risk in Communities Study. Arch. Intern. Med. 1999,159, 2151–2159. [CrossRef] [PubMed]
29. Larsson, S.C.; Wolk, A. Magnesium intake and risk of type 2 diabetes: A meta-analysis. J. Intern. Med. 2007,262, 208–214. [CrossRef] [PubMed]
30. Weng, L.C.; Lee, N.J.; Yeh, W.T.; Ho, L.T.; Pan, W.H. Lower intake of magnesium and dietary fiber increasesthe incidence of type 2 diabetes in Taiwanese. J. Formos. Med. Assoc. 2012, 111, 651–659. [CrossRef] [PubMed]
31. Gommers, L.M.; Hoenderop, J.G.; Bindels, R.J.; de Baaij, J.H. Hypomagnesemia in type 2 diabetes: A viciouscircle? Diabetes 2016, 65, 3–13. [CrossRef] [PubMed]
32. Bertinato, J.; Xiao, C.W.; Ratnayake, W.M.; Fernandez, L.; Lavergne, C.; Wood, C.; Swist, E. Lower serummagnesium concentration is associated with diabetes, insulin resistance, and obesity in South Asian andwhite Canadian women but not men. Food Nutr. Res. 2015, 59, 25974. [CrossRef] [PubMed]
33. Arpaci, D.; Tocoglu, A.G.; Ergenc, H.; Korkmaz, S.; Ucar, A.; Tamer, A. Associations of serum magnesiumlevels with diabetes mellitus and diabetic complications. Hippokratia 2015, 19, 153–157. [PubMed]
34. Sinha, S.; Sen, S. Status of zinc and magnesium levels in type 2 diabetes mellitus and its relationship withglycemic status. Int. J. Diabetes Dev. Ctries. 2014, 34, 220–223. [CrossRef]
35. Kim, D.J.; Xun, P.; Liu, K.; Loria, C.; Yokota, K.; Jacobs, D.R., Jr.; He, K. Magnesium intake in relation tosystemic inflammation, insulin resistance, and the incidence of diabetes. Diabetes Care 2010, 33, 2604–2610.[CrossRef] [PubMed]
36. Shields, M.; Carroll, M.D.; Ogden, C.L. Adult obesity prevalence in Canada and the United States.NCHS Data Brief 2011, 56, 1–8.
37. Public Health Agency of Canada. Diabetes in Canada: Facts and Figures from a Public Health Perspective.Available online: http://www.phac-aspc.gc.ca/cd-mc/publications/diabetes-diabete/facts-figures-faits-chiffres-2011/index-eng.php (accessed on 23 February 2017).
38. Statistics Canada. Canadian Health Measures Survey (CHMS). Available online: http://www23.statcan.gc.ca/imdb/p2SV.pl?Function=getSurvey&Id=136652 (accessed on 23 February 2017).
39. Giroux, S. Canadian Health Measures Survey: Sampling strategy overview. Health Rep. 2007, 18, S31–S36.40. Statistics Canada. Canadian Health Measures Survey (CHMS) Data User Guide: Cycle 1. Available online:
http://www23.statcan.gc.ca/imdb-bmdi/document/5071_D2_T1_V1-eng.htm (accessed on 23 February 2017).41. Kroll, M.H.; Elin, R.J. Relationships between magnesium and protein concentrations in serum. Clin. Chem.
1985, 31, 244–246. [PubMed]42. Seelig, M.S.; Preuss, H.G. Magnesium metabolism and perturbations in the elderly. Geriatr. Nephrol. Urol.
1994, 4, 101–111. [CrossRef]
92
Books
MDPI

Nutrients 2017, 9, 296
43. Barbagallo, M.; Belvedere, M.; Dominguez, L.J. Magnesium homeostasis and aging. Magnes. Res. 2009, 22,235–246. [PubMed]
44. DeFronzo, R.A.; Tobin, J.D.; Andres, R. Glucose clamp technique: A method for quantifying insulin secretionand resistance. Am. J. Physiol. 1979, 237, E214–E223. [PubMed]
45. Singh, B.; Saxena, A. Surrogate markers of insulin resistance: A review. World J. Diabetes 2010, 1, 36–47.[CrossRef] [PubMed]
46. Olefsky, J.; Farquhar, J.W.; Reaven, G. Relationship between fasting plasma insulin level and resistance toinsulin-mediated glucose uptake in normal and diabetic subjects. Diabetes 1973, 22, 507–513. [CrossRef][PubMed]
47. Matthews, D.R.; Hosker, J.P.; Rudenski, A.S.; Naylor, B.A.; Treacher, D.F.; Turner, R.C. Homeostasis modelassessment: Insulin resistance and beta-cell function from fasting plasma glucose and insulin concentrationsin man. Diabetologia 1985, 28, 412–419. [CrossRef] [PubMed]
48. Gutch, M.; Kumar, S.; Razi, S.M.; Gupta, K.K.; Gupta, A. Assessment of insulin sensitivity/resistance. Indian J.Endocrinol. Metab. 2015, 19, 160–164. [CrossRef] [PubMed]
49. Simental-Mendia, L.E.; Sahebkar, A.; Rodriguez-Moran, M.; Guerrero-Romero, F. A systematic review andmeta-analysis of randomized controlled trials on the effects of magnesium supplementation on insulinsensitivity and glucose control. Pharmacol. Res. 2016, 111, 272–282. [CrossRef] [PubMed]
50. Veronese, N.; Watutantrige-Fernando, S.; Luchini, C.; Solmi, M.; Sartore, G.; Sergi, G.; Manzato, E.;Barbagallo, M.; Maggi, S.; Stubbs, B. Effect of magnesium supplementation on glucose metabolism inpeople with or at risk of diabetes: A systematic review and meta-analysis of double-blind randomizedcontrolled trials. Eur. J. Clin. Nutr. 2016, 70, 1354–1359. [CrossRef] [PubMed]
51. Zheltova, A.A.; Kharitonova, M.V.; Iezhitsa, I.N.; Spasov, A.A. Magnesium deficiency and oxidative stress:an update. BioMedicine 2016, 6, 8–14. [CrossRef] [PubMed]
52. Barbagallo, M.; Dominguez, L.J. Magnesium and type 2 diabetes. World J. Diabetes 2015, 6, 1152–1157.[CrossRef] [PubMed]
53. Instructions for Use. VITROS Chemistry Products Mg Slides. Available online: https://www.cmmc.org/cmmclab/IFU/Mg_MP2-47_EN_I.pdf (accessed on 23 February 2017).
54. Lakshmanan, F.L.; Rao, R.B.; Kim, W.W.; Kelsay, J.L. Magnesium intakes, balances, and blood levels of adultsconsuming self-selected diets. Am. J. Clin. Nutr. 1984, 40, 1380–1389. [PubMed]
55. Misialek, J.R.; Lopez, F.L.; Lutsey, P.L.; Huxley, R.R.; Peacock, J.M.; Chen, L.Y.; Soliman, E.Z.; Agarwal, S.K.;Alonso, A. Serum and dietary magnesium and incidence of atrial fibrillation in whites and in AfricanAmericans: Atherosclerosis Risk in Communities (ARIC) Study. Circ. J. 2013, 77, 323–329. [CrossRef][PubMed]
56. Bertinato, J.; Lavergne, C.; Plouffe, L.J.; El Niaj, H.A. Small increases in dietary calcium above normalrequirements exacerbate magnesium deficiency in rats fed a low magnesium diet. Magnes. Res. 2014, 27,35–47. [PubMed]
57. Bertinato, J.; Plouffe, L.J.; Lavergne, C.; Ly, C. Bioavailability of magnesium from inorganic and organiccompounds is similar in rats fed a high phytic acid diet. Magnes. Res. 2014, 27, 175–185. [PubMed]
58. Klevay, L.M.; Milne, D.B. Low dietary magnesium increases supraventricular ectopy. Am. J. Clin. Nutr. 2002,75, 550–554. [PubMed]
59. Witkowski, M.; Hubert, J.; Mazur, A. Methods of assessment of magnesium status in humans: A systematicreview. Magnes. Res. 2011, 24, 163–180. [PubMed]
60. Song, Y.; He, K.; Levitan, E.B.; Manson, J.E.; Liu, S. Effects of oral magnesium supplementation on glycaemiccontrol in type 2 diabetes: A meta-analysis of randomized double-blind controlled trials. Diabet. Med. 2006,23, 1050–1056. [CrossRef] [PubMed]
61. Costello, R.B.; Elin, R.J.; Rosanoff, A.; Wallace, T.C.; Guerrero-Romero, F.; Hruby, A.; Lutsey, P.L.; Nielsen, F.H.;Rodriguez-Moran, M.; Song, Y.; et al. Perspective: The case for an evidence-based reference interval forserum magnesium: the time has come. Adv. Nutr. 2016, 7, 977–993. [CrossRef] [PubMed]
© 2017 by the authors. Licensee MDPI, Basel, Switzerland. This article is an open accessarticle distributed under the terms and conditions of the Creative Commons Attribution(CC BY) license (http://creativecommons.org/licenses/by/4.0/).
93
Books
MDPI

nutrients
Article
A Multifunctional Bread Rich in Beta Glucans andLow in Starch Improves Metabolic Control in Type 2Diabetes: A Controlled Trial
Paolo Tessari 1,* and Anna Lante 2
1 Department of Medicine (DIMED), University of Padova, 35128 Padova PD, Italy2 Department of Agronomy, Food, Natural Resources, Animals & Environment (DAFNAE),
University of Padova, 35123 Padova PD, Italy; [email protected]* Correspondence: [email protected]; Tel.: +39-049-821-1748; Fax: +39-049-821-7878
Received: 28 December 2016; Accepted: 9 March 2017; Published: 17 March 2017
Abstract: Design: Functional foods may be useful for people with diabetes. The soluble fibers betaglucans can modify starch digestion and improve postprandial glucose response. We analyzedthe metabolic effects of a specifically designed ‘functional’ bread, low in starch, rich in fibers(7 g/100 g), with a beta glucan/starch ratio of (7.6:100, g/g), in people with type 2 diabetesmellitus. Methods: Clinical and metabolic data from two groups of age-, sex- and glycatedhemoglobin-matched diabetic subjects, taking either the functional bread or regular white bread,over a roughly six-month observation period, were retrieved. Results: Bread intake did not changeduring the trial. The functional bread reduced glycated hemoglobin by ~0.5% (absolute units) vs.pre-treatment values (p = 0.028), and by ~0.6% vs. the control group (p = 0.027). Post-prandial andmean plasma glucose was decreased in the treatment group too. Body weight, blood pressure andplasma lipids did not change. The acceptance of the functional bread was good in the majorityof subjects, except for taste. Conclusions: A starch-restricted, fiber-rich functional bread, with anincreased beta glucan/starch ratio, improved long term metabolic control, and may be indicated inthe dietary treatment of type 2 diabetes.
Keywords: plasma glucose; beta glucan; starch; metabolic control; fibers
1. Introduction
Background and Aims
Type 2 diabetes mellitus (T2DM) is a disease with high prevalence and increasing incidence.The world population currently affected by T2DM is about 400 million, and it is expected to growto more than 600 million by 2040 [1]. The increase of T2DM is largely due to changes of lifestyle [2],i.e., excess dietary intake combined to low physical activity. Therefore, diet represents a cornerstone forboth prevention and therapy of T2DM, and a tool to maintain plasma glucose values close to normal.
Carbohydrates (CHO) are the key nutritional factors conditioning circulating glucose levels,particularly in the post-prandial state. In order to prevent excessive post-prandial glycemicexcursions,dietary CHO should be predominantly represented by starch (>90% of total CHO), with less than 10%by either mono- or di-saccharides [3]. Furthermore, since T2DM is associated with a constellationof conditions (obesity, dyslipidemia, hypertension) and risk factors (e.g., for cardiovascular disease)recognized in the concept of the ‘metabolic syndrome’ [4–6], food capable of addressing most, if not allthese abnormalities, can be recommended. Thus, current understanding is that foods and diets forT2DM patients are considered, for the present, to be energy controlled, with a low glycemic index (GI),and with favorable effects on blood pressure and dyslipidemia. A reduction of cardiovascular (CV)
Nutrients 2017, 9, 297 94 www.mdpi.com/journal/nutrients
Books
MDPI

Nutrients 2017, 9, 297
risk and the prevention of long term diabetic complications are also expected to result from long-termuse of such ‘ideal’ foods.
Post-prandial glucose increments in diabetes may be blunted by foods containing starch and/orsimple CHO with a slow absorption rate, thus resulting in a low GI. Besides by the CHO type itself,CHO absorption may be modulated by a variety of additional factors, such as starch characteristics(i.e., resistance to digestion), fiber type and content, and by the presence of other compounds thatcan decrease carbohydrate intestinal digestion and absorption. Conversely, the guidelines for dietarytreatment of hypertension, obesity and dyslipidemia include a reduction of sodium and energy intakes,and a control of intestinal lipid absorption. Thus, targeting some, if not all, these risk factors, by meansof functional foods seems to be both recommended and promising in the dietary management ofboth diabetes and the metabolic syndrome, through health-beneficial properties conveyed by naturalcomponents and/or by added ingredients [7].
Functional foods rich in natural fibers, such as beta glucans, are among those most-widely studiedand employed. Beta glucans are naturally-occurring soluble fibers of some cereals (oats and barley),composed of mixed-linkage (1,3)(1,4)-β-D-glucose units, mainly consisting of the linear polysaccharide(1→3), (1→4)-β-D-glucan. Beta glucans increase viscosity in the upper digestive tract, thus reducingpostprandial glucose and insulin responses [8]. An optimal beta glucan/starch ratio has been proposedas a method to decrease starch digestion in functional breads [9].
Bread is a staple food and a fundamental source of CHO worldwide in everyday diet. Therefore,the design of a bread with targeted functional properties could retain a major impact on nutrition andon metabolic parameters.
In this study, we examined the metabolic effects of long-term (roughly six months) substitution ofregular white bread with a functional bread, starch-restricted and rich in fiber (mostly beta glucans),in the everyday diet of persons with type 2 diabetes.
2. Methods
2.1. Study Design and Participants
In the context of a comprehensive analysis of clinical and biochemical parameters of people withtype 2 diabetes mellitus, data from T2DM subjects of both sexes, collected at their regularly-scheduledoutpatient visits at the Diabetes Center of the Padova University Hospital, Italy, were retrieved.This was an observational, controlled study with parallel groups, performed following recentlypublished guidelines and format (http://www.consort-statement.org/). The subjects’ inclusion criteriawere: a diabetes duration longer than 2 years; an unsatisfactory diabetes control (HbA1c values greaterthan 7%); age between 50 and 80 years; treatment with diet only, or diet plus oral hypoglycemic agents(OHA) and/or basal insulin; and a reported daily intake of at least 50 g CHO as either white bread,breadsticks or other bread substitutes. The patients were visited at 3–6 months intervals.
2.2. Interventions
The patients had routinely been recommended to consume foods considered to be beneficial topeoples with diabetes, such as low calorie items, with CHO predominantly represented by starch,with a high fiber content and/or a low glycemic index, and low amounts of fats of animal origin.Furthermore, the patients had been informed about the availability in supermarkets, of flour productsenriched with fibers and/or other compounds that could be beneficial to control glucose levels.They were encouraged to prepare homemade bread using any of these flour products, as a substituteof their usually consumed white bread made of refined flour.
At subsequent examinations, the type of bread used by every subjects was recorded. Therefore,two groups of subjects could be selected over time: those who had shifted to the use of one of thefunctional bread types (‘functional bread’ group), and those who had been still using their regularwhite bread (‘control’ group). Among the former, the starting time of consumption of either the
95
Books
MDPI

Nutrients 2017, 9, 297
functional flour and/or bread, and its type, were retrieved and recorded. For the sake of homogeneity,we report here data of those subjects consuming only one type of these fiber-enriched products, i.e.,a flour labelled Salus® (produced by Ruggeri srl, Padova, Italy), that was the most largely used.These subjects were included into the ‘functional bread’ group. The data of the case-control group,i.e., that of patients who were consuming their regular bread, were collected in a similar fashion.The matching criteria with the ‘functional bread’ group were age, sex, absolute HbA1c values as wellas absence of HbA1c changes between the two selected time intervals (i.e., approximately ~6–7 months.apart), greater than ±1% (absolute value). For both groups, other inclusion criteria were: no variationin both hypoglycemic and other drug therapy, and no major intercurrent diseases over the chosenobservation periods. A total of eleven subjects in each group were selected.
The target observations interval after the ‘start’ time point was set between 3 and 12 months.Each patient had been advised to maintain his/her usual dietary habits and nutrient intake, exceptfor the type of bread used. The 24-h recall method was used to assess dietary intake of the day beforeeach visit. The data of each patients were handled rigorously in anonymous fashion. Of the 20 subjectsoriginally enrolled into the ‘functional bread group’, only eleven completed the intended observationaltime period. The causes for drop-out were: insufficient bread intake (less than 40 g of starch equivalentsper day, possibly preventing the detection of a significant effect by substitution with the functionalbread); intercurrent diseases and/or changes of therapy; major dietary changes and/or failure toobserve the standard recommendations for people with T2DM.
As controls, two sets of data were used. First, each patient’s own HbA1c value(s) in the 3–12 monthperiod antecedent either the start of consumption of the functional bread/flour, or a comparable periodof use of the regular bread in the ‘control’ group, were recorded. These data are referred to as the‘previous’ time points. Each patient was thus the control of him/herself. Second, data collected afteruse of either the ‘functional bread’ and of the ‘control bread’, as described above, recorded over thesubsequent 3–12 months from the ‘start’ time point, were retrieved.
The subjects were either in the fasting state or had consumed their breakfast at home beforecoming to the Diabetes Centre. Breakfast composition was pretty reproducible in the same subjecton the two/three visits, but different from patient to patient. In general, the patients consumed amedium-to-low-calorie Italian breakfast, consisting of milk, coffee (or tea), cereals (or bread slices),dressed with a thin layer of jam with a low sugar content, and/or one fruit, and/or one portionof yoghurt.
On the occasion of each visit, the patients’ glucose value (either in the fasting state or 2-hpost-breakfast, the latter labeled as ‘post-prandial’ value), were determined by a reflectometer.These directly determined values were averaged with those retrieved from the home glucosemonitoring of each patients, in the two–three days preceding the visit. Thus, both the fasting andpost-breakfast data were the mean of these values.
The local Ethics Committee of Padova University Hospital had approved, as part of broaderclinical data investigations in diabetes, the retrieval in anonymous form, of clinical and biochemicaldata from medical records of the diabetic patients (Approval N. 14809, released on 11 March 2016).
2.3. Bread Preparation
The functional bread was prepared at home by every subject using the instructions of theproducer(s). Typically, a Moulinex bread machine (model. OW 3101, Moulinex, Groupe Seb Italia Spa,Milan, Italy) was employed. The composition of the functional bread (Salus®) flour and that of therefined flour used for the preparation of the control white bread, are reported on Table 1. The botanicalsource of the Beta-glucans was oat, as reported by the producers on the label of flour Salus (see Reg.(CE) n. 1924/2006 and Reg. (CE) n. 1160/2011). The mix of ingredients to prepare the functional breadwas contained in packs of 500 g containing about 20 g of β-glucan and 200 g of starch.
96
Books
MDPI
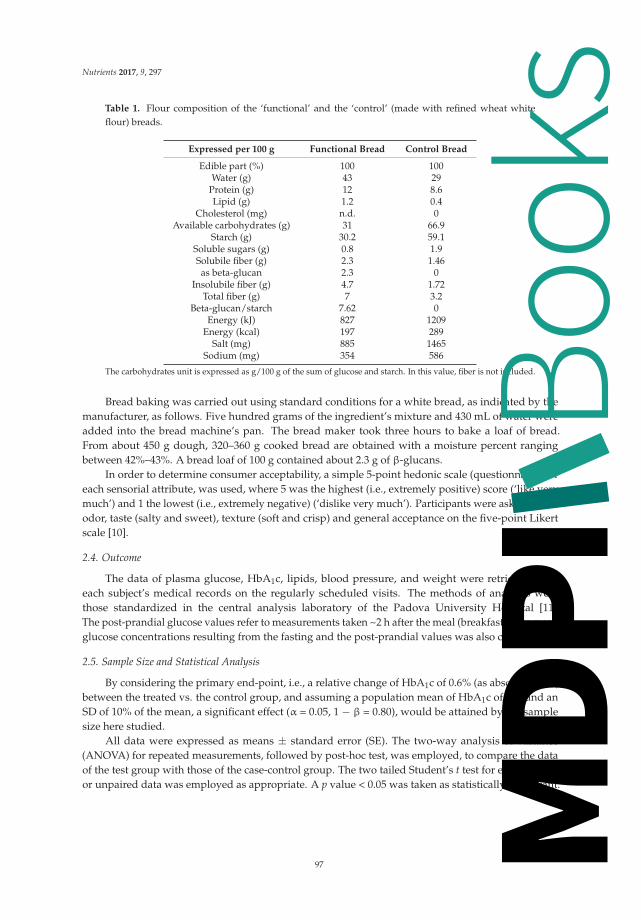
Nutrients 2017, 9, 297
Table 1. Flour composition of the ‘functional’ and the ‘control’ (made with refined wheat whiteflour) breads.
Expressed per 100 g Functional Bread Control Bread
Edible part (%) 100 100Water (g) 43 29
Protein (g) 12 8.6Lipid (g) 1.2 0.4
Cholesterol (mg) n.d. 0Available carbohydrates (g) 31 66.9
Starch (g) 30.2 59.1Soluble sugars (g) 0.8 1.9Solubile fiber (g) 2.3 1.46as beta-glucan 2.3 0
Insolubile fiber (g) 4.7 1.72Total fiber (g) 7 3.2
Beta-glucan/starch 7.62 0Energy (kJ) 827 1209
Energy (kcal) 197 289Salt (mg) 885 1465
Sodium (mg) 354 586
The carbohydrates unit is expressed as g/100 g of the sum of glucose and starch. In this value, fiber is not included.
Bread baking was carried out using standard conditions for a white bread, as indicated by themanufacturer, as follows. Five hundred grams of the ingredient’s mixture and 430 mL of water wereadded into the bread machine’s pan. The bread maker took three hours to bake a loaf of bread.From about 450 g dough, 320–360 g cooked bread are obtained with a moisture percent rangingbetween 42%–43%. A bread loaf of 100 g contained about 2.3 g of β-glucans.
In order to determine consumer acceptability, a simple 5-point hedonic scale (questionnaire) foreach sensorial attribute, was used, where 5 was the highest (i.e., extremely positive) score (‘like verymuch’) and 1 the lowest (i.e., extremely negative) (‘dislike very much’). Participants were asked to rateodor, taste (salty and sweet), texture (soft and crisp) and general acceptance on the five-point Likertscale [10].
2.4. Outcome
The data of plasma glucose, HbA1c, lipids, blood pressure, and weight were retrieved fromeach subject’s medical records on the regularly scheduled visits. The methods of analyses werethose standardized in the central analysis laboratory of the Padova University Hospital [11].The post-prandial glucose values refer to measurements taken ~2 h after the meal (breakfast). The meanglucose concentrations resulting from the fasting and the post-prandial values was also calculated.
2.5. Sample Size and Statistical Analysis
By considering the primary end-point, i.e., a relative change of HbA1c of 0.6% (as absolute units)between the treated vs. the control group, and assuming a population mean of HbA1c of 8%, and anSD of 10% of the mean, a significant effect (α = 0.05, 1 − β = 0.80), would be attained by the samplesize here studied.
All data were expressed as means ± standard error (SE). The two-way analysis of variance(ANOVA) for repeated measurements, followed by post-hoc test, was employed, to compare the dataof the test group with those of the case-control group. The two tailed Student’s t test for either pairedor unpaired data was employed as appropriate. A p value < 0.05 was taken as statistically significant.
97
Books
MDPI

Nutrients 2017, 9, 297
3. Results
The basal, pre-treatment clinical data of the patients are reported on Table 2. There was nostatistical difference between the treatment and the control groups in any clinical or biochemicalparameter. Although there were some differences between the two groups in drug consumption, nosubject modified his/her current therapy (including both hypoglycemic agents and other drugs) duringthe test period, both in the test and in the control group. The subjects allocated to the ‘functional bread’group had reported a daily intake of CHO (as bread, breadsticks, cereals or other bread substitutes)of approximately 70 ± 10 g. In the control group, the estimated intake of CHO (starch)-equivalentswas similar. From medical records there were no evidence of changes in everyday diet in any of theselected subjects.
Table 2. Clinical characteristics of the type 2 diabetic subjects, included in either the functional breador the control group. Data are expressed as means ± SE.
Parameter Functional Bread Group Control Bread Group
Number 11 11Sex (M/F) 4/7 4/7
Age (years) 68.6 ± 1.9 68.0 ± 2.3Body weight (kg) 72.9 ± 3.6 76.2 ± 4.0
BMI (kg/m2) 27.8 ± 1.2 27.9 ± 1.3Months between measurements 6.0 ± 0.5 6.9 ± 0.8
range 4–9 3–11Therapy:
Metformin 8 10Sulphonylureas/Glinides 3 2
Insulin 1 2Incretins 5 7Statins 2 8
ACE-I/ARB 2 7Beta-blockers/Antiadrenergics 4 1
Diuretics 2 4Aspirin 2 1Other 7 4
Abbreviations: BMI: Body Mass Index; ACE-I: angiotensin-conversion-enzyme inhibitors; ARB: angiotensin-receptor-blockers.
Following the time point defined as ‘start’, clinical and biochemical data were retrieved, after6.0 ± 0.5 months in the ‘treatment’ group, and after 6.9 ± 0.8 months in the control group (p = NSbetween the two groups).
In the treatment group, the use of the functional bread resulted in (insignificantly) lowerfasting glucose concentrations (by −20.4 ± 16.7 mg/dL, i.e., −1.15 ± 0.92 mmol/L, p > 0.05 bypaired t test), but in significantly lower postprandial glucose concentrations (by −16.4 ± 6.3 mg/dL,i.e., −0.91 ± 0.35 mmol/L, p = 0.045 by paired t test). The resulting average glucose concentrationswere reduced by −17.4 ± 8.0 mg/dL (i.e., by −0.97 ± 0.44 mmol/L, p = 0.08 by paired t test) (Table 3).
In contrast, in the control group, modest though insignificantly greater fasting(by +2.8 ± 9.9 mg/dL, i.e., +0.15 ± 0.55 mmol/L), post-prandial (by +29.0 ± 10.6 mg/dL, i.e.,+1.6 ± 0.6 mmol/L) and mean (by +12.7 ± 6.6 mg/dL, i.e., +0.71 ± 0.34 mmol/L) plasma glucoseconcentrations were observed. As a result, a significant difference between the two groups wasobserved (by ANOVA, as interaction effect), as regards both the post-prandial (p = 0.011) and the mean(p = 0.02) glucose concentrations (Table 3).
98
Books
MDPI

Nutrients 2017, 9, 297
Table 3. Hemoglobin A1c (HbA1c) (as percent, %), fasting plasma glucose (FPG), post-prandial plasmaglucose (PPG) and mean plasma glucose (MPG), in the ‘functional bread’ and in the ‘control’ treatmentgroups, before (‘start’) and after (‘end’) the observation periods. Data are expressed as means ± SE.
Functional Bread Group Control Group
Start End Start End p Value
HbA1c (%) 7.97 ± 0.36 7.45 ± 0.31 * 8.03 ± 0.34 8.10 ± 0.31 0.0265FPG (mmol/L) 9.1 ± 0.8 8.0 ± 0.5 8.7 ± 0.7 8.8 ± 0.5 0.29PPG (mmol/L) 9.2 ± 0.5 8.4 ± 0.6 * 8.7 ± 0.4 9.9 ± 0.6 0.0113MPG (mmol/L) 9.2 ± 0.6 8.2 ± 0.4 * 8.5 ± 0.6 9.0 ± 0.5 0.02
* Significant difference between the ‘functional bread’ and the ‘control’ groups. The reported p values are thoseresulting from the two-way analysis of variance for repeated measurements, interaction effect.
The HbA1c values are shown in Figure 1. Between the ‘previous’ and the ‘start’ observationtime points, no difference between the functional and the control bread groups were observed, bothgroups showing a slight trend (albeit insignificant) towards worsening of HbA1c. The observationperiods between these two time points were not different between the two groups (treatment group:6.6 ± 0.6 months; control group: 7.7 ± 1.0 months, p = 0.34 between the two).
6,0
6,5
7,0
7,5
8,0
8,5
9,0
Previous Start End
HemoglobinA 1c(%)
Functional bread
Control bread
p<0.03
9.0
8.5
8.0
7.5
7.0
6.5
6.0
Figure 1. The effect of the functional bread on roughly six-month metabolic control as reflected byHbA1c. Hemoglobin A1C values (expressed as percent, mean ± SE) in the seven to eight monthsbefore (‘previous’), at the beginning (‘start’) and after six to seven months (‘end’) of intake of either thefunctional bread (open symbols) or the control white bread (filled symbols). The data are expressed asmean ± SE. The p value in the figure indicates the significant difference in the changes of HbA1c %values, before and following the intake of between either the functional bread or the control bread(by ANOVA).
Following the ‘start’ time point, in the group treated with the functional bread, a −0.52% decrease(as absolute value) of HbA1c levels (p < 0.028 by the pair t test, Figure 1) was observed. In contrast, in thecontrol group HbA1c did not change (+0.21% ± 0.13%). As a result, there was a significant differencebetween the two groups in the post-treatment HbA1c values (p = 0.027 by ANOVA, interaction effect).Again, there was no difference in the duration of the observation periods between the ‘start’ and the‘end’ time points, between the treatments and the control group (Table 2). No significant differencesbetween the two groups were however observed in the other clinical and metabolic parameters (Table 4),
99
Books
MDPI

Nutrients 2017, 9, 297
such a systolic and diastolic blood pressure, total, low-density lipoprotein (LDL) and high-densitylipoprotein (HDL) cholesterol.
Table 4. Body weight, systolic and diastolic blood pressure, and fasting lipid concentrations, in thegroups treated with either the ‘functional’ or the ‘control’ bread, before (‘start’) and after (‘end’) theobservation periods. Data are expressed as means ± SE.
Functional Bread Control Bread
Parameter Start End Start End
Weight (kg) 72.9 ± 3.4 73.9 ± 3.5 77.6 ± 3.3 76.9 ± 3.2Systolic pressure (mm·Hg) 139.7 ± 5.4 138.6 ± 4.2 137.3 ± 4.9 136.4 ± 6.1Diastolic pressure (mm·Hg) 75.0 ± 3.4 77.3 ± 3.1 78.6 ± 1.7 79.6 ± 1.9Total cholesterol (mmol/L) 4.60 ± 0.33 4.55 ± 0.48 4.26 ± 0.16 4.32 ± 0.26HDL cholesterol (mmol/L) 1.50 ± 0.10 1.46 ± 0.12 1.67 ± 0.08 1.57 ± 0.12LDL cholesterol (mmol/L) 2.23 ± 0.25 2.36 ± 0.48 2.08 ± 0.15 2.26 ± 0.18
Triglycerides (mmol/L) 1.90 ± 0.29 * 1.60 ± 0.16 * 1.11 ± 0.06 1.08 ± 0.12
* p < 0.05 between the ‘functional’ and the ‘control’ bread groups (by ANOVA, group effect). Abbreviations: HDL:high-density lipoprotein; LDL: low-density lipoprotein.
Although plasma triglyceride concentrations were greater (p < 0.015) in the functional than inthe control group at the ‘start’ time point, they did not significantly change in either group betweenthe start and the end periods. Body weight increased by roughly one kilogram in the treatment group(p = 0.05 by paired t test vs. baseline), but it did not significantly change in the controls (though withoutsignificance differences between the groups by ANOVA).
The data on consumer acceptability are reported in Supplementary material. The overall responsewas satisfactory, and positive judgments on texture, odor and general acceptance, were delivered,with ranges between 60% and 80%. In contrast, the responses regarding taste were on the whole‘neutral’, as they did not elicit any prevalence between sweet and salty taste. As a matter of fact, thefunctional bread was well accepted by the subjects who completed the study. The relatively largedrop-out rate (9 out of originally enrolled 20 subjects) was due to reasons other than bread acceptability(see Methods). Most subjects really appreciated the functional bread and are still continuing to useit regularly.
4. Discussion
Bread is a staple food, and one of the main sources of carbohydrates and energy worldwide.The diet recommended for a person with diabetes should contain 40%–50% energy as carbohydrates,15% to 20% as proteins and ~30% as fat. A fiber daily intake of 20–40 g is also suggested [3,12].Foods with a low glycemic index and/or a low glycemic load would be preferred in diabetes, sincethey blunt post-prandial hyperglycemia [13,14]. Absolute fiber content [15], type (soluble/insoluble),as well as the presence of active compounds interacting with starch, are important modifiers ofcarbohydrate digestion and absorption particularly in diabetes. Therefore, the design of a flourcontaining active ingredients, to be employed for bread preparations, is a ‘hot’ issue today.
In this study, we report the results of roughly six months’ administration of a home-prepared‘functional’ bread, made up with a flour enriched with fiber (mainly beta glucan), low in starch andsalt, as a substitute for common bread, in subjects with type 2 diabetes in everyday life conditions.
We report that this ‘functional bread’ significantly improved the metabolic control in the T2DMsubjects, as shown by significant reductions of glycated hemoglobin, of post-prandial and meanglucose concentrations. In contrast, both HbA1c and glucose concentrations did not change in the‘control’ bread group (Figure 1 and Table 3). Furthermore, in the six to seven months preceding theobservation periods, HbA1c was nearly stable in both groups (Figure 1). Therefore, these data indicatethat the intake of the functional bread was effective in the improvement of metabolic control in type2 diabetes.
100
Books
MDPI

Nutrients 2017, 9, 297
This study was conducted on everyday life conditions, and based on data retrieval of a limitednumber of patients regularly visited at the diabetes Centre. Although larger prospective, controlledstudies would be required to confirm these findings, our data nevertheless suggest that daily intakeof a functional bread could be useful in subjects with T2DM. Notably, in this group the percentreduction of HbA1c (−0.52%, as absolute values) was consistent with the concurrent reduction of meanplasma glucose (−17 mg/dL). Indeed, it is well established that a ‘one-point’ reduction of % HbA1c isassociated with a reduction of 30–40 mg/dL of mean plasma glucose [16]. In addition, the decrease ofHbA1c values here observed is within the range of changes previously observed after high fiber dietsin type 2 diabetes [15].
The efficacy of the functional bread here tested could be due to several, concurring factors. First,as reported in Table 1, the starch content was about half that of the reference, regular bread preparedwith refined white wheat flour, on a bread-weight basis. However, no patient reported a decreasein bread intake (as grams) with the use of the functional bread. Rather, some of them informed theinvestigators about a (small) increase in the intake of the functional bread, once they realized thatthe post-prandial glucose values were improved. Thus, a decrease in the intake (as grams) of thefunctional bread is very unlikely. Second, the functional bread contained beta glucans, that wereabsent in the reference bread. Third, the beta glucan/starch ratio in the functional bread was 7.6/100.Such a ratio, although lower than that previously reported to be the optimal value to reduce starchdigestion/absorption, could have nevertheless produced a favorable effect [9]. On the other hand,greater ratios than those here tested could further improve post-prandial glucose excursions and themetabolic control in T2DM, should bread palatability be preserved. Fourth, the beta-glucans containedin the functional bread, due to their hydrophilic effect, were probably responsible for its greater watercontent that, on turn, contributed to bread weight despite the lower starch content. Finally, the totalfiber content of the functional bread was nearly double that of the reference bread (Table 1). Therefore,several concurrent variables in the composition of the functional bread could have contributed to itsbeneficial effects. However, the aim of this study was not to analyze separately the impact of eachvariable on glucose control in type 2 diabetes. We rather tested the effects of the chosen flour product,available in the supermarket, on glucose control and on sensorial aspects in everyday life conditions.
A high (>40 g/day) dietary fiber intake is usually recommended to subjects with type 2diabetes [3–12]. However, the fiber effect on medium- as well as on long-term metabolic controlin T2DM remains controversial [17,18]. A fiber effect had usually been demonstrated when associatedto intake of foods with low glycemic index. On the other hand, a high fiber diet may be difficultto be maintained in the long term, because of its poor palatability [19]. In addition, the large gelvolume associated to the intake of fibers such as guar gum, despite their efficacy, is often a hurdle infood consumption. In contrast, using beta glucans, the amount of fiber per serving may be increasedwithout either expanding the volume to be ingested or reducing palatability [20]. In this respect, thepeculiar composition of the ‘functional flour’ here reported may represent an optimal balance betweenfiber intake, starch reduction, bread ‘mass’ (i.e., weight), and, last but not least, palatability.
Beta glucans have been reported to improve satiety and to decrease caloric intake and appetite [21].These effects are likely driven by an increased viscosity [22], a delay in CHO absorption [23],and a ‘bulking action’ [24]. Beta glucans have also been reported to improve glucose and insulinresponses [20]. In addition, the consumption of three grams per day of oat or barley beta-glucans dailywas sufficient to decrease blood cholesterol levels [25]. Since beta-glucans reduce the rapidly-digestiblestarch (RDS) fraction, while increasing that of slowly digestibly starch (SDS) [8], these combinedeffects would result in a relative increase of resistant starch (RS). However, the beta-glucan-associatedreduction of starch digestion rate may also be product- and process-dependent [26]. As a matter offact, the relationships among beta glucan to starch ratio, starch gelatinization and solubility, and RSformation, are quite complex. At beta glucan to starch ratios below 2 [9], starch solubility was lowerat the 1.6/10 than at the 1.1/10 ratio, leading to higher RS and lower SDS values. Our beta-glucanto starch ratio of 0.76/10 probably lead to some increase, although not maximal, of the SDS fraction.
101
Books
MDPI

Nutrients 2017, 9, 297
Conversely, others reported that a beta glucan to starch ratio of 0.5/10 ratio nevertheless resulted in asignificant reduction in starch gelatinization and in its breakdown rate evaluated in vitro [27]. Furtherresearch need to be carried out to elucidate these difficult issues.
An association between beta glucan-induced decrease of post-prandial insulin levels, increasesatiety and decrease caloric intake, with increase of cholecystokinin, has also been suggested [28].In our study, neither cholecystokinin nor insulin were measured. Therefore, no conclusions on possiblerelationships between changes in these two hormones and the observed effects, can be drawn.
Body weight was not significantly different between the two groups (an analyzed by ANOVA).However, a one kilogram positive change in the treatment group was observed (p = 0.05 vs. basalvalue), whereas weight did not change at all in the control groups. As an explanation of such anunexpected finding, as reported above, some subjects of the treatment group admittedly reportedthat they had increased the bread intake because they realized that their plasma glucose values wereimproving, as well as because an increased sense of hunger. Nevertheless, the functional bread wascapable to improve the metabolic control, thus independently from any major body weight change.It should also be considered that the raw amount and the energy intake of the diet was generallyreported to be unchanged in either group.
At variance with the improvement of the glycemic control, other clinical and biochemicalparameters, such systolic and diastolic blood pressure, total, LDL, and HDL cholesterol, wereunchanged by the functional bread intake, being rather stable in both groups. Lack of any effect ofblood pressure might be due to the hypotensive treatment of most of our subjects (Table 2). Conversely,despite the reported hypocholesterolemic effects of beta glucan [25,29], in our study lack of any changein cholesterol could be due to the already near-normal values of our subjects, of total as well as LDLcholesterol, (also in respect to target values) (Table 2). Nevertheless, the hypolipidemic effects of betaglucans t in medium-term studies (four weeks) are controversial [29].
Since high-fiber products may decrease palatability [19], our subjects were accurately tested forsensorial responses. The overall response to the functional bread was however satisfactory, withpositive judgments on texture, odor and general acceptance recorded in >50% of the subjects, and avirtually neutral response regarding taste (see Table S1 in the Supplementary material). In this regard,other authors [30,31] reported that beta-glucan inclusion improves both the rheological and the sensoryproperties of bread.
Although there were some differences in the pharmacological therapy (other than thehypoglycemic agents) between the two groups, with a lower use of statins and ACE-I/ARB, andincreased consumption of beta-blockers, in the functional bread group, these differences likely didnot affect the results, since no subject modified drug therapy throughout the study. Although statinshave been reported to exhibit deleterious effects on plasma glucose [32], plasma glucose was actuallyunchanged in the control group. Furthermore, the control subjects as well as those of the functionalgroup were on long term therapy with statins. Therefore, statins use per se should not represent a biasin this study.
5. Conclusions
In conclusion, regular intake of a low-starch functional bread, enriched with beta glucan fibers,could improve the medium- to long-term glycemic control in type 2 diabetes mellitus in addition tothe drugs used to control of blood glucose.
Supplementary Materials: The following are available online at http://www.mdpi.com/2072-6643/9/3/297/s1.
Acknowledgments: This study was supported by Institutional Grants of the University of Padova (DOR grants)and by a non conditioned grant from the ‘Granaio delle Idee’-Maserà di Padova, Italy.
Author Contributions: P.T. designed the study along with A.L., searched for the clinical and biochemical data inthe databases, analyzed the results and wrote the paper. A.L. addressed the technological issues of the functionalbread, cooperated in the calculation of the results and co-wrote and reviewed the paper.
Conflicts of Interest: The authors declare no conflict of interest.
102
Books
MDPI

Nutrients 2017, 9, 297
Abbreviations
The following abbreviations are used in this manuscript:
CHO carbohydratesBMI Body Mass IndexT2DM Type 2 Diabetes MellitusHbA1c glycated hemoglobinCV cardiovascularGI Glycemic IndexACE-I angiotensin converting enzyme inhibitorsARB angiotensin receptors blockers
References
1. International Diabetes Federation. IDF Diabetes Atlas, 7th ed.; International Diabetes Federation: Brussels,Belgium, 2015.
2. Pereira, M.A.; Kartashov, A.I.; Ebbeling, C.B.; van Horn, L.; Slattery, M.L.; Jacobs, D.R., Jr.; Ludwig, D.S.;Jacobs, D.R. Fast-food habits, weight gain, and insulin resistance (the CARDIA study): 15-year prospectiveanalysis. Lancet 2005, 365, 36–42. [CrossRef]
3. AMD-SID. Standard Italiani per la Cura del Diabete Mellito 2014. Available online: http.//www.standarditaliani.it (accessed on 11 November 2016).
4. Reaven, G.M. Insulin resistance, the insulin resistance syndrome, and cardiovascular disease.Panminerva Med. 2005, 47, 201–210. [PubMed]
5. Pawar, K.; Thompkinson, D.K. Multiple functional ingredient approach in formulating dietary supplementfor management of diabetes: A review. Crit. Rev. Food Sci. Nutr. 2014, 54, 957–973. [CrossRef] [PubMed]
6. Zarich, S.W. Cardiovascular risk factors in the metabolic syndrome: Impact of insulin resistance on lipids,hypertension, and the development of diabetes and cardiac events. Rev. Cardiovasc. Med. 2005, 6, 194–205.[PubMed]
7. Grajek, W.; Olejnik, A.; Sip, A. Probiotics, prebiotics and antioxidants as functional foods. Acta Biochim. Pol.2005, 52, 665–671. [PubMed]
8. Regand, A.; Tosh, S.M.; Wolever, T.M.; Wood, P.J. Physicochemical properties of beta-glucan in differentlyprocessed oat foods influence glycemic response. J. Agric. Food Chem. 2009, 57, 8831–8838. [CrossRef][PubMed]
9. Regand, A.; Chowdhury, Z.; Tosh, S.M.; Wolever, T.M.S.; Wood, P. The molecular weight solubility andviscosity of oat beta-glucan affect human glycemic response by modifying starch digestibility. Food Chem.2011, 129, 297–304. [CrossRef]
10. Lawless, H.T.; Heymann, H. Sensory Evaluation of Food: Principles and Practices; Chapman & Hall: New York,NY, USA, 1998; pp. 341–372.
11. Graziani, M.S.; Ceriotti, F.; Zaninotto, M.; Catapano, A.L.; Medea, G.; Parretti, D.; Gulizia, M.; Averna, M.;Ciaccio, M. La diagnostica di laboratorio delle dislipidemie. Documento di consenso SIBIoC, SISA, SIMG,ANMCO. Biochim. Clin. 2014, 40, 338–346.
12. Evert, A.B.; Boucher, J.L.; Cypress, M.; Dunbar, S.A.; Franz, M.J.; Mayer-Davis, E.J.; Neumiller, J.J.;Urbanski, P.; Verdi, C.L.; Nwankwo, R. American Diabetes Association. Nutrition therapy recommendationsfor the management of adults with diabetes. Diabetes Care 2013, 36, 3821–3842. [CrossRef] [PubMed]
13. Augustin, L.S.; Kendall, C.W.; Jenkins, D.J.; Willett, W.C.; Astrup, A.; Barclay, A.W.; Björck, I.;Brand-Miller, J.C.; Brighenti, F.; Buyken, A.E.; et al. Glycemic index, glycemic load and glycemic response:An International Scientific Consensus Summit from the International Carbohydrate Quality Consortium(ICQC). Nutr. Metab. Cardiovasc. 2015, 25, 795–815. [CrossRef] [PubMed]
14. Riccardi, G.; Rivellese, A.A.; Giacco, R. Role of glycemic index and glycemic load in the healthy state, inprediabetes, and in diabetes. Am. J. Clin. Nutr. 2008, 87, 269S–274S. [PubMed]
15. Silva, F.M.; Kramer, C.K.; de Almeida, J.C.; Steemburgo, T.; Gross, J.L.; Azevedo, M.J. Fiber intake andglycemic control in patients with type 2 diabetes mellitus: A systematic review with meta-analysis ofrandomized controlled trials. Nutr. Rev. 2013, 71, 790–801. [CrossRef] [PubMed]
103
Books
MDPI

Nutrients 2017, 9, 297
16. Rohlfing, C.L.; Wiedmeyer, H.M.; Little, R.R.; England, J.D.; Tennill, A.; Goldstein, D.E. Defining therelationship between plasma glucose and HbA(1c): Analysis of glucose profiles and HbA(1c) in the DiabetesControl and Complications Trial. Diabetes Care 2002, 25, 275–278. [CrossRef] [PubMed]
17. Beattie, V.A.; Edwards, C.A.; Hosker, J.P.; Cullen, D.R.; Ward, J.D.; Read, N.W. Does adding fiber to a lowenergy, high carbohydrate, low fat diet confer any benefit to the management of newly diagnosed overweighttype II diabetics? Br. Med. J. (Clin. Res. Ed.) 1988, 296, 1147–1149. [CrossRef]
18. Scott, A.R.; Attenborough, Y.; Peacock, I.; Fletcher, E.; Jeffcoate, W.J.; Tattersall, R.B. Comparison of high fibrediets, basal insulin supplements, and flexible insulin treatment for non-insulin dependent (type II) diabeticspoorly controlled with sulphonylureas. BMJ 1988, 297, 707–710. [CrossRef] [PubMed]
19. Wood, P.J. Cereal beta-glucans in diet and health. J. Cereal Sci. 2007, 46, 230–238. [CrossRef]20. Jenkins, A.L.; Jenkins, D.J.; Zdravkovic, U.; Würsch, P.; Vuksan, V. Depression of the glycemic index by
high levels of beta-glucan fiber in two functional foods tested in type 2 diabetes. Eur. J. Clin. Nutr. 2002, 56,622–628. [CrossRef] [PubMed]
21. Rebello, C.J.; O’Neil, C.E.; Greenway, F.L. Dietary fiber and satiety: The effects of oats on satiety. Nutr. Rev.2016, 74, 131–147. [CrossRef] [PubMed]
22. Dikeman, C.L.; Fahey, G.C. Viscosity as related to dietary fiber: A review. Crit. Rev. Food Sci. Nutr. 2006, 46,649–663. [CrossRef] [PubMed]
23. Battilana, P.; Ornstein, K.; Minehira, K.; Schwarz, J.M.; Acheson, K.; Schneiter, P.L.; Burri, J.; Jequier, E.;Tappy, L. Mechanism of action of beta-glucan in postprandial glucose metabolism in healthy men. Eur. J.Clin. Nutr. 2001, 55, 327–333. [CrossRef] [PubMed]
24. Burton-Freeman, B. Dietary fibre and energy regulation. J. Nutr. 2000, 130, 272S–275S. [PubMed]25. Tiwari, U.; Cummins, E. Meta-analysis of the effect of beta-glucan intake on blood cholesterol and glucose
levels. Nutrition 2011, 27, 1008–1016. [CrossRef] [PubMed]26. Brennan, C.S. Dietary fibre, glycaemic response, and diabetes. Mol. Nutr. Food Res. 2005, 49, 560–570.
[CrossRef] [PubMed]27. Symons, L.J.; Brennan, C.S. The effect of barley beta-glucan fiber fractions on starch gelatinization and
pasting characteristics. J. Food Sci. 2004, 69, FCT257–FCT261.28. Beck, E.J.; Tosh, S.M.; Batterham, M.J.; Tapsell, L.C.; Huang, X.F. Oat beta-glucan increases postprandial
cholecystokinin levels, decreases insulin response and extends subjective satiety in overweight subjects.Mol. Nutr. Food Res. 2009, 53, 1343–1351. [CrossRef] [PubMed]
29. Zhou, X.; Lin, W.; Tong, L.; Liu, X.; Zhong, K.; Wang, L.; Zhou, S. Hypolipidaemic effects of oat flakes andβ-glucans derived from four Chinese naked oat (Avena nuda) cultivars in Wistar-Lewis rats. J. Sci. Food Agric.2016, 96, 644–649. [CrossRef] [PubMed]
30. Flander, L.; Salmenkallio-Marttila, M.; Suortti, T.; Autio, K. Optimization of ingredients and baking processfor improved wholemeal oatbread quality. LWT 2007, 40, 860–870. [CrossRef]
31. Skendi, A.; Biliaderis, C.G.; Papageorgiou, M.; Izydorczyk, M.S. Effects of two barley beta-glucan isolates onwheat flour dough and bread properties. Food Chem. 2010, 119, 1159–1167. [CrossRef]
32. Erqou, S.; Lee, C.C.; Adler, A.I. Statins and glycaemic control in individuals with diabetes: A systematicreview and meta-analysis. Diabetologia 2014, 57, 2444–2452. [CrossRef] [PubMed]
© 2017 by the authors. Licensee MDPI, Basel, Switzerland. This article is an open accessarticle distributed under the terms and conditions of the Creative Commons Attribution(CC BY) license (http://creativecommons.org/licenses/by/4.0/).
104
Books
MDPI

nutrients
Article
The Association between Vitamin D Deficiencyand Diabetic Retinopathy in Type 2 Diabetes:A Meta-Analysis of Observational Studies
Bang-An Luo 1, Fan Gao 2 and Lu-Lu Qin 2,3,*1 Department of Mental Health, Brain Hospital of Hunan Province, Changsha 410007, Hunan, China;
[email protected] Department of Social Medicine and Health Management, Xiangya School of Public Health,
Central South University, Changsha 410078, Hunan, China; [email protected] Department of Prevention Medicine, Medical School, Hunan University of Chinese Medicine,
Changsha 410208, Hunan, China* Correspondence: [email protected]; Tel.: +86-731-8845-9423
Received: 22 January 2017; Accepted: 15 March 2017; Published: 20 March 2017
Abstract: Emerging evidence from in vivo and in vitro studies have shown that vitamin D may playan important role in the development of diabetic retinopathy (DR), but individually published studiesshowed inconclusive results. The aim of this study was to quantitatively summarize the associationbetween vitamin D and the risk of diabetic retinopathy. We conducted a systematic literaturesearch of Pubmed, Medline, and EMBASE updated in September 2016 with the following keywords:“vitamin D” or “cholecalciferol” or “25-hydroxyvitamin D” or “25(OH)D” in combination with“diabetic retinopathy” or “DR”. Fifteen observational studies involving 17,664 subjects were included.In this meta-analysis, type 2 diabetes patients with vitamin D deficiency (serum 25(OH)D levels<20 ng/mL) experienced a significantly increased risk of DR (odds ratio (OR) = 2.03, 95% confidenceintervals (CI): 1.07, 3.86), and an obvious decrease of 1.7 ng/mL (95% CI: −2.72, −0.66) in serumvitamin D was demonstrated in the patients with diabetic retinopathy. Sensitivity analysis showedthat exclusion of any single study did not materially alter the overall combined effect. In conclusion,the evidence from this meta-analysis indicates an association between vitamin D deficiency andan increased risk of diabetic retinopathy in type 2 diabetes patients.
Keywords: vitamin D; diabetic retinopathy; type 2 diabetes; meta-analysis
1. Introduction
Diabetes mellitus (DM) is a large public health problem which affects more than 300 millionindividuals in the world, with significant morbidity and mortality worldwide [1]. In addition to thedeleterious effects of the disease itself, its long-term complications can conspicuously decrease thequality of life of diabetes patients. Diabetes patients with uncontrolled or poorly-controlled bloodglucose are at high risk of microvascular complications. Diabetic retinopathy (DR) is among the mostcommon diabetic complications, and is the leading cause of blindness among working-aged individualsworldwide [2]. The prevalence of DR varies from 20% to 80% in different studies. Recent estimatessuggest that the number of people with diabetic retinopathy will increase to 191 million by 2030 [3].Diabetic retinopathy has a complex process. Many risk factors for DR have been established, such aspoor glycemic control, long duration of diabetes, smoking, inflammation, obesity, and hypertension.Stratton et al. have given evidence that poor glycemic control and long duration of diabetes areindependent risk factors of DR [4]. Praidou et al. found that increased physical activity is associatedwith less severe levels of DR, independent of the effects of HbA1c and body mass index (BMI) [5].However, detailed pathophysiological mechanisms and other DR risk factors are not fully clarified.
Nutrients 2017, 9, 307 105 www.mdpi.com/journal/nutrients
Books
MDPI

Nutrients 2017, 9, 307
Vitamin D is a multi-functional fat-solute metabolite required for humans’ growth anddevelopment. Vitamin D deficiency (VDD) is seen across all ages, races, and geographic regions.Due to the wide functionality of vitamin D and because vitamin D deficiency is epidemic,vitamin D’s non-classical functions are gaining more attention for the close association betweenvitamin D deficiency and cancers, infectious diseases, autoimmune diseases, diabetes, and diabeticcomplications [6–8]. The prevalence of vitamin D deficiency is high in type 2 diabetes mellitus (T2DM)patients [9–11]. Vitamin D receptors are expressed extensively in the retina [12], and an animal studyshowed that calcitriol was a potent inhibitor of retinal neovascularization in an oxygen-inducedischemic retinopathy mouse model [13]. This evidence indicated that vitamin D may play a role in thepathogensis of diabetic retinopathy.
While there are accumulating studies on the effect of vitamin D on diabetic retinopathy,the association between vitamin D and diabetic retinopathy are conflicting. According to somestudies, vitamin D deficiency is associated with an increasing risk of diabetic retinopathy. Patrick et al.found an association between serum 25-hydroxyvitamin D concentration and diabetic retinopathy ina cohort of 1790 type 2 diabetes patients [14]. Inukai et al. reported that serum 25-hydroxyvitamin D(25(OH)D) levels were decreased in type 2 patients with retinopathy when compared with type 2patients who had no microangiopathy [15]. However, others suggested that no significant differences invitamin D status were found between type 2 diabetes with or without diabetic retinopathy. Alam et al.found no association between serum 25(OH)D levels and the presence and the severity of diabeticretinopathy [16].
Currently, there is insufficient evidence showing whether serum vitamin D deficiency is related todiabetic retinopathy, and the determination of this relationship has rarely been conducted. To addressthese issues, we carried out this meta-analysis by pooling the results from observation studies toexamine the potential association between vitamin D and diabetic retinopathy.
2. Methods
2.1. Data Sources
Relevant articles were identified by a systematic literature search of Pubmed, Medline,and EMBASE through September 2016, using the following keywords: “vitamin D” or “cholecalciferol”or “25-hydroxyvitamin D” or “25(OH)D” in combination with “diabetic retinopathy” or “retinopathy”or “DR”. Additionally, we manually searched all eligible original articles, reviews, and other relevantarticles. This meta-analysis was performed following the guidelines for observation study protocols(Meta-analysis Of Observational Studies in Epidemiology (MOOSE) guidelines) [17].
2.2. Study Selection
Original articles evaluating the relationship between serum vitamin D status and diabeticretinopathy were reviewed and selected if they met the following inclusion criteria: (a) the studypopulation was type 2 diabetes patients; (b) DR was the outcome, and the control group consisted oftype 2 diabetes patients without DR; (c) the study presented sample sizes and odds ratios (OR) with95% confidence intervals (CI) or information that could be used to infer these results; (d) vitamin Ddeficiency was defined as a 25(OH)D level below 20 ng/mL, and vitamin D insufficiency was definedas 25(OH)D levels of 21–29 ng/mL; (e) the study was published in English; and (f) the study metthe predefined methodological quality assessment criteria for observational studies (SupplementaryData Box 1). Animal experiments, chemistry, or cell-line studies and editorials, commentaries, reviewarticles, and case reports were excluded. Other exclusion criteria consisted of studies with a score of 0for any item or a total score <7 out of 10 maximal points [18].
Two independent reviewers (Bang-An Luo and Fan Gao) reviewed all the literature searches andacquired full-length articles for all citations meeting the predefined selection criteria. Final inclusion or
106
Books
MDPI

Nutrients 2017, 9, 307
exclusion decisions were made after reading the full text. We resolved any disagreements throughconsensus or arbitration by a third reviewer (Lu-Lu Qin).
The following information was extracted from each article: the last name of first author,publication year, location of study, study design, sample size, 25(OH)D assay methods, 25(OH)Dconcentration, and the prevalence of vitamin D deficiency. In the case of relevant missing data, contactswere made to the main authors for more information.
2.3. Statistical Analysis
We performed this meta-analysis with RevMan Software (Version 5.2, Cochrane Collaboration,London, UK). The odds ratio (OR) and weight mean difference (WMD) were used as measures ofassociations between vitamin D status and risk for DR. If the OR and 95% CI were not available for themeta-analysis, these data were extracted from the selected articles to construct 2 × 2 tables of serumlow vitamin D status versus the presence or absence of diabetic retinopathy.
We used forest plots to visually assess pooled estimates and corresponding 95% CIs for eachstudy. The heterogeneity among the results of the included studies was evaluated with I2 statisticaltests. The percentage of I2 < 25, near 50, and >75 indicated low, moderate, and high heterogeneity,respectively. A fixed-effects model or a random-effects model was used to combine the study resultsaccording to the heterogeneity. Once the effects were found to be heterogeneous (I2 > 50%), a randomeffects model was used. Otherwise, a fixed effect model was used.
Potential publication bias was assessed using the funnel plots. A sensitivity analysis wasconducted to test the robustness of results, as well as to investigate the effect of a single articleon the overall risk estimated by removing one article in each turn. Additionally, a subgroup analysiswas performed to explore the possible explanations for heterogeneity. All the p-values were fora two-tailed and p < 0.05 was considered as statistically significant.
3. Results
3.1. Search Results
Of the 238 articles identified from our initial search, a total of 15 studies were finally identified aseligible for inclusion in this meta-analysis through a strict screening process (Figure 1). The qualityassessment showed that the quality scores of these studies ranged from 8.5 to 10 according to theMOOSE guidelines, which indicates that all of the selected studies were of high quality (SupplementaryTable S1).
3.2. Characteristics of the Included Studies
The characteristics of these articles in this meta-analysis are summarized in Table 1. These studieswere published from 2000 to 2016. Among these studies, nine were conducted in Asia, two each inNorth America and Europe, one in Africa, and one each in three countries (Australia, New Zealand,and Finland). Seven studies had cross-sectional design, five were case–control, two were prospectivecohort, and one had a retrospective cohort design. Four different assay techniques were used tomeasure the serum 25(OH)D levels, and four different ways were used to diagnose DR. Eight of theincluded studies explored the association between vitamin D deficiency and diabetic retinopathy, fourexplored the association between vitamin D insufficiency and diabetic retinopathy, and ten exploredthe mean difference in vitamin D status among diabetic retinopathy and non-diabetic retinopathy.
The diversity of participant characteristics was considerable in these studies. Out of 17,664participants, 3455 (19.6%) were diagnosed with diabetic retinopathy, consisting of different ages andraces. In addition, the age of type 2 diabetes participants were older than 18 years and the meanBMI—if provided by articles—varied from 13.9 to 42.0 kg/m2. The vitamin D status of diabeticretinopathy ranged from 9.2 to 32.6 ng/mL.
107
Books
MDPI

Nutrients 2017, 9, 307
Figure 1. Flow chart of literature search and study selection.
3.3. Main Analysis
The relationship between serum vitamin D deficiency (VDD) and the risk of diabetic retinopathyis shown in Figure 2 and Supplementary Table S2. Eight studies involving 13,435 participants wereincluded. As the results of this meta-analysis show, type 2 diabetes with vitamin D deficiency (serum25(OH)D levels <20 ng/mL) had an increased risk of developing diabetic retinopathy (OR = 2.03,95% CI: 1.07, 3.86) in the random-effects model.
Figure 2. The meta-analysis of the association between vitamin D deficiency (VDD) and diabeticretinopathy (DR).
Based on four studies, the pooled OR for vitamin D insufficiency (VDI, serum 25(OH)Dlevels <30 ng/mL) was calculated as (OR = 0.89, 95% CI: 0.20, 4.02) (Supplementary Table S2 andSupplementary Figure S1). Only the result of vitamin D deficiency showed that low serum vitamin Dstatus increased the risk of diabetic retinopathy.
108
Books
MDPI

Nutrients 2017, 9, 307
The comparison of the mean difference between the DR group and the control group (non-DRgroup) is shown in Figure 3. From the results of the random-effects model, the pooled effect was−1.7 ng/mL (95% CI: −2.75, −0.66) and significant heterogeneity was observed (I2 = 80%, p < 0.001).It showed that serum 25(OH)D levels were significantly lower in diabetic retinopathy patients than thecontrol in type 2 diabetes. This result demonstrated that vitamin D deficiency is significantly relatedwith an increased risk of DR.
Figure 3. Meta-analysis of the association between 25-hydroxyvitamin D (25(OH)D) levels and DR.
109
Books
MDPI

Nutrients 2017, 9, 307
Ta
ble
1.
Cha
ract
eris
tics
ofob
serv
atio
nals
tudi
esin
clud
edin
this
met
a-an
alys
is.
Au
tho
ran
dY
ear
Co
un
try
Stu
dy
Desi
gn
Sam
ple
Siz
e(n
)V
DA
ssay
Meth
od
DR
Dia
gn
osi
sV
DD
Pre
vale
nce
(%)
Mean
25(O
H)D
ng
/mL
(SD
)S
ign
ifica
nt
Ad
just
men
t
DR
ND
RD
RN
DR
Aks
oy(2
000)
[19]
Turk
eyC
ross
-sec
tiona
l66
RIA
Oph
thal
mol
ogis
tsN
AN
A12
.6±
5.5
11.9±
4.2
Yes
No
Suzu
ki(2
006)
[20]
Japa
nC
ase–
cont
rol
581
RIA
Oph
thal
mol
ogis
tsN
AN
A15
.7±
7.3
17.6±
6.6
Yes
Age
,BM
I,du
rati
on,
HbA
1c,t
reat
men
t
Payn
e(2
012)
[21]
US
Cro
ss-s
ectio
nal
123
CL
Oph
thal
mol
ogis
tsN
AN
A22
.3±
10.5
24.3±
10.3
Yes
Mul
tivi
tam
inus
e
Ahm
adie
h(2
013)
[22]
Leba
non
Cro
ss-s
ectio
nal
136
RIA
Oph
thal
mol
ogis
ts78
.853
.8N
AN
AYe
sBM
I,du
rati
on,s
mok
ing
Baja
j(20
14)[
23]
Indi
anC
ase–
cont
rol
158
NA
Oph
thal
mol
ogis
ts79
.649
.0N
AN
AYe
sN
o
He
(201
4)[2
4]C
hina
Cro
ss-s
ectio
nal
1520
CL
The
Inte
rnat
iona
lClin
ical
DR
Seve
rity
Scal
e75
.763
.616
.6±
5.8
18.9±
7.1
Yes
Age
,sex
,dur
atio
n
Jee
(201
4)[2
5]K
orea
Cro
ss-s
ectio
nal
2113
RIA
The
Earl
yTr
eatm
entD
iabe
tic
Ret
inop
athy
Stud
yse
veri
tysc
ale
NA
NA
18.3±
6.6
18.7±
3.4
Yes
Sex
Long
o-M
benz
a(2
014)
[26]
Con
goC
ase–
cont
rol
150
HPL
CTh
em
odifi
edA
irlie
Hou
secl
assi
ficat
ion
syst
emN
AN
A10
±5.
915
.2±
4.5
Yes
No
Alc
ubie
rre
(201
5)[2
7]Sp
ain
Cas
e–co
ntro
l28
3C
LO
phth
alm
olog
ists
61.9
50.7
19.2±
10.1
20.5±
8.1
Yes
Rac
e,se
ason
,ph
ysic
alac
tivi
ty
Bona
kdar
an(2
015)
[10]
Iran
Cro
ss-s
ectio
nal
235
RIA
Oph
thal
mol
ogis
tsN
AN
A9.
2±
7.0
10.3±
9.4
No
Age
,sex
,dur
atio
n,BM
I,H
bA1c
,BM
I,se
x,H
bA1c
Her
rman
n(2
015)
[28]
Aus
tral
ia,
New
Zea
land
,an
dFi
nlan
dPr
ospe
ctiv
e95
24C
LO
phth
alm
olog
ists
56.5
51.7
NA
NA
Yes
Age
,sex
,eta
l.*
Red
dy(2
015)
[29]
Indi
anC
ase–
cont
rol
164
HPL
CTh
em
odifi
edA
irlie
Hou
secl
assi
ficat
ion
syst
em27
.023
.0N
AN
AN
oD
urat
ion
Usl
uogu
llari
(201
5)[3
0]Tu
rkey
Ret
rosp
ecti
ve55
7H
PLC
Oph
thal
mol
ogis
ts45
.254
.220
.0±
7.7
19.7±
8.4
No
Age
,BM
I,se
x,H
bA1c
Zop
pini
(201
5)[3
1]It
aly
Cro
ss-s
ectio
nal
715
CL
Oph
thal
mol
ogis
tsN
AN
AN
AN
AYe
sA
ge
Mill
en(2
016)
[32]
US
Pros
pect
ive
1339
LC-M
STh
em
odifi
edA
irlie
Hou
secl
assi
ficat
ion
syst
em49
.638
.8N
AN
AYe
sR
ace,
dura
tion
,HbA
1c,
hype
rten
sion
DR
:dia
beti
cre
tino
pat
hy;V
D:v
itam
inD
;VD
D:v
itam
inD
defi
cien
cy;N
DR
:no
dia
beti
cre
tino
pat
hy;N
A:n
otav
aila
ble.
CL
:che
milu
min
esce
nce;
HP
LC
:hig
hp
erfo
rman
celiq
uid
chro
mat
ogra
phy;
RIA
:rad
ioim
mun
oass
ay;L
C-M
S:hi
gh-s
ensi
tivi
tym
ass
spec
trom
etry
;SD
:sta
ndar
dde
viat
ion;
etal
.*:d
iabe
tes
dura
tion
,HbA
1c,s
ysto
licbl
ood
pres
sure
,BM
I,lip
ids
(tri
glyc
erid
esan
dhi
gh-d
ensi
tylip
opro
tein
(HD
L)an
dlo
w-d
ensi
tylip
opro
tein
(LD
L)ch
oles
tero
l),s
mok
ing,
base
line
use
ofor
alhy
pogl
ycem
icag
ents
,and
base
line
use
ofin
sulin
.
110
Books
MDPI

Nutrients 2017, 9, 307
3.4. Sensitivity and Subgroup Analysis
To explore the impact of various exclusion criteria on the overall risk estimate, we conductedsensitivity and subgroup analyses to examine the potential sources of heterogeneity in thismeta-analysis. In the result of the pooled ORs, the study conducted in China [24] was responsiblefor most of the heterogeneity in this meta-analysis. After excluding this study, the heterogeneitywas down to 67% and the pooled OR was 1.50 (95% CI: 1.41, 1.98). Besides, there were no obviouschanges in the pooled ORs as a result of the exclusion of any other single study. In the comparison ofthe mean difference between the DR group and the control group, moderate heterogeneity (I2 = 70%,p < 0.001) was observed among the remaining studies after the exclusion Jee’s study [25]. Jee’s studywas responsible for most of the heterogeneity. Further exclusion of any single study did not alterthe overall combined relative risk, with a range from −2.2 ng/mL (−3.28, −1.17) to −1.6 ng/mL(−2.43, −0.69), and each outcome had statistical significance.
In the subgroup with study design, there were moderate heterogeneities in cross-sectionaland prospective cohort studies for the pooled OR (I2 = 52%, p = 0.15 for cross-sectional studies;I2 = 61%, p = 0.11 for prospective cohort studies) (Supplementary Materials Figure S2). We found thatthere were obvious heterogeneities in the cross-sectional and the case–control studies for the pooledWMD (I2 = 79%, p = 0.0007 for cross-sectional studies; I2 = 76%, p = 0.006 for case–control studies)(Supplementary Materials Figure S3). In the subgroup with VD assay methods, there were highheterogeneities in the chemiluminescence (CL) vitamin D assay method for the pooled OR (I2 = 99%,p < 0.0001), and the study conducted in China [24] was responsible for the heterogeneities. Afterexcluding this study, the heterogeneity in the CL subgroup was down to 8% and the pooled OR was1.25 (95% CI: 1.06, 1.48) (Supplementary Materials Figure S4). In the subgroup with DR diagnosis, therewere modern heterogeneities in the ophthalmologists group (OR = 1.71, 95% CI: 1.11, 2.62, I2 = 74%,p = 0.0004) (Supplementary Materials Figure S5). Subgroup analyses of BMI, season, duration ofdiabetes, race, and age were not conducted due to insufficient data in some studies.
3.5. Publication Bias
No obvious publication bias was observed in the funnel plots of this meta-analysis (SupplementaryMaterials Figure S6).
4. Discussion
Vitamin D’s non-classical functions have attracted much public health attention for its closerassociation with some diseases. This is the first meta-analysis of the relationship between serumvitamin D status and DR in type 2 diabetes. In this meta-analysis, the results of 15 observational studiesprovided strong evidence that serum 25(OH)D levels were associated with an increased risk of DR intype 2 diabetes patients. Both the results of the pooled OR for vitamin D deficiency (serum 25(OH)Dlevels <20 ng/mL) and the pooled effect of WMD showed that the serum 25(OH)D levels in type 2diabetes had a relationship with DR, while the pooled OR for vitamin D insufficiency (serum 25(OH)Dlevels <30 ng/mL) did not. Considering the results of vitamin D deficiency and that serum 25(OH)Dlevels were more reliable and accurate than the result of vitamin D insufficiency (only four studies),we concluded that low 25(OH)D levels were associated with an increased risk of DR.
The quality of the studies included in this meta-analysis was high. From the funnel plots,we concluded that there was no obvious publication bias in this meta-analysis. We further conductedsensitivity and subgroup analyses to explore potential sources of heterogeneity. From the forest plots,we observed high heterogeneity among the pooled OR and WMD as the association of DR (Figures 2and 3), which was not surprising given the different characteristics of participants and adjustments forconfounding factors. Regarding the results of sensitivity analyses, two studies probably contributed tothe heterogeneity [24,25]. After excluding the two studies, there was moderate heterogeneity, and theremay be other factors contributing to the heterogeneity in this study. Firstly, there was no consensus
111
Books
MDPI

Nutrients 2017, 9, 307
on the levels of vitamin D denoting deficiency and insufficiency, and the diagnosis standards ofDR might not be uniform among different ophthalmologists in these studies. Secondly, there werefour methods for measuring vitamin D, such as HPLC (high performance liquid chromatography)and RIA (radioimmunoassay). Thirdly, the time of collecting blood sample were different. Fourthly,the heterogeneity might be a result of differences in the study populations—there were severalraces included in this meta-analysis. Fifthly, the duration of diabetes, the age of patients, the diet,the treatment of diabetes, and the sunlight exposure are confounding factors in this meta-analysis.Hence, more studies are needed to give full proof.
There is an epidemic of vitamin D deficiency around the world [6]. From this meta-analysis, theprevalence of vitamin D deficiency was high among type 2 diabetes patients, although it may varyfrom different latitude, ethnicity, body mass index, season, and supplementation of vitamin D. VDDwas consistent with previous studies [9–11]. For patients with diabetes, the association with vitamin Ddeficiency and risk of developing diabetes has been acknowledged. Vitamin D deficiency is associatedwith an increased risk for diabetes [9,22,29].
In patients with diabetic retinopathy, the level of serum 25(OH)D was lower than patients withoutdiabetic retinopathy. The characteristic feature of diabetic retinopathy is the appearance of vascularlesions of increasing severity, ending up in the growth of new vessels (neovascularization). Vitamin Dhas anti-inflammation properties and inhibits vascular smooth muscle cell growth and effects onthe expression of transforming growth factor β1 [13,33–35]. Vitamin D is an important regulator ofhundreds of genes regulating key biological processes from cell division to apoptosis [36]. It is wellknown that poor glycemic control is a risk factor for the development and progression of DR, andvitamin D deficiency has been shown to impair insulin synthesis and secretion in animal modelsof diabetes [37]. On the other hand, an optimal concentration of vitamin D is strongly proven tobe necessary for efficient insulin secretion and function [38–40], and vitamin D receptors (VDR)are ubiquitously expressed in every human tissue, including retina. Active vitamin D mediates itsbiological function by binding to vitamin D receptors. Vitamin D receptors have been found to beassociated with insulin secretion and sensitivity, and have been identified in pancreatic beta cells [41].Additionally, some genes associated with the development of diabetic retinopathy have been found,such as Bsm1, rs2228570, and TT. So, vitamin D status is related with the development and progressionof diabetic retinopathy among type 2 diabetes patients.
Increasing studies have given more evidence of this. Annwelier et al. found that the serum25(OH)D levels were associated with optic chiasm volume [42], and in a vitro experiment, vitamin Dwas found to inhibit neovascularization in retinal tissue in a model of ischemic retinopathy [13]. Whatis more, proof of the VDR polymorphisms related with diabetic retinopathy was found. Hong et al.showed that patients with the B allele (BB or Bb) of Bsm1 polymorphism in VDR were associated withlower risk of diabetic retinopathy compared to patients without the B allele (bb) in Korean type 2diabetic patients [41]. Bucan et al. showed that the bb genotype in VDR has a higher risk of developingdiabetic retinopathy [43]. Zhong et al. found that rs2228570 was associated with increased risk ofdiabetic retinopathy in Han Chinese type 2 diabetes patients [44]. Benjamin et al. reported that theanticipation of retinopathy onset is significantly associated with the exaggeration of oxidative stressbiomarkers or decrease of antioxidants in African type 2 diabetics, and supplementation with vitaminD should be recommended as complement therapies of T2DM [26]. Therefore, low serum 25(OH)Dlevels are association with an increased risk of diabetic retinopathy, but more studies are required toidentify the mechanism of the relationship between vitamin D and diabetic retinopathy fully.
It is well known that one of the two major sources of vitamin D is cutaneous synthesis by solarultraviolet B radiation and the other is dietary intake. The cutaneous synthesis of vitamin D is affectedby many factors, such as season, latitude, time of day, skin pigmentation, the amount of skin exposed,and whether makeup with sunscreen is used, so serum 25-hydroxyvitamin D levels vary betweenareas and persons. Hence, dietary vitamin D supplementation and physical activity might be a feasibleway for patients with diabetes to maintain sufficient 25-hydroxyvitamin D levels. Physical activity
112
Books
MDPI

Nutrients 2017, 9, 307
may increase blood 25-hydroxyvitamin D concentrations as a consequence of an associated increase insunlight exposure. Praidou et al. reported that increased physical activity is associated with less severelevels of diabetic retinopathy, independent of the effects of HbA1c and BMI [5]. Lee et al. showedthat 3 months of vitamin D supplementation improved neuropathic symptoms by 50% in diabeticpatients whose 25-hydroxyvitamin D status was deficient at baseline [45]. However, there has yet to bea dietary vitamin D supplementation trial on diabetic retinopathy. Thus, large randomized controlledtrials researching on reducing diabetic retinopathy in type 2 diabetes are needed to accurately evaluatethe potential benefits of these low-cost interventions in the future.
Diabetic retinopathy may develop and progress to advanced stages without producing anyimmediate symptoms to the patient. Screening for DR is essential in order to establish early treatmentof sight-threatening retinopathy and has been demonstrated to be successful at achieving visionloss [46]. Considering the heavy burden of DR and the association between serum 25(OH)D level anddiabetic retinopathy, low 25(OH)D levels may help us to find more early stage diabetic retinopathypatients. Therefore, screening low 25(OH)D levels may be a potential simple way for screening diabeticretinopathy among type 2 diabetes in primary hospitals—especially where there is a shortage ofophthalmic equipment or ophthalmologists.
The main strength of this study is giving strong evidence of the association of serum vitamin Dand diabetic retinopathy. However, there were several limitations in this study. Firstly, differentdiagnostic criteria of diabetic retinopathy and different measured assays could have influenced thepooled effect. Secondly, there were some confounding factors in this meta-analysis, such as age,race, diet, the treatment of diabetes, sun exposure, physical activity, and so on. Some, but not all,of the studies generated adjusted OR, so we could not pool the findings by adjusting for confoundingfactors. Thirdly, there was a lack of access to complete data of all related published papers, despitecorrespondence with the authors. Fourthly, the association between vitamin D and the severity ofdiabetic retinopathy was not analyzed in this meta-analysis because of a lack of enough data andinformation. Finally, only published articles in English were included.
5. Conclusions
In conclusion, this meta-analysis indicates an association between vitamin D deficient type 2diabetes mellitus patients and an increased risk of diabetic retinopathy. Type 2 diabetes patients withvitamin D deficiency experienced an increased risk of diabetic retinopathy. However, further studiesare required to better understand the relationship between vitamin D deficient type 2 diabetes patientsand diabetic retinopathy, and well-designed randomized controlled trials are needed to determine theexplicit effect of vitamin D supplementation on the prevention of diabetic retinopathy. Consideringthe high prevalence of vitamin D deficiency and the burden of the diabetic retinopathy, screening type2 diabetes patients who are at risk of vitamin D deficiency should be considered.
Supplementary Materials: The following are available online at http://www.mdpi.com/2072-6643/9/3/307/s1,Table S1. Quality scores of included studies on vitamin D status and pregnancy outcomes. Table S2. Results ofmeta-analysis according to 25-hydroxyvitamin D (25(OH)D) level. DR: diabetic retinopathy; NDR: no diabeticretinopathy. Figure S1. Meta-analysis of the association between vitamin D insufficiency (<30 ng/mL) and DR.Figure S2. Subgroup analysis of pooled ORs according to study design. Figure S3. Subgroup analysis of weightmean difference (WMD) according to study design. Figure S4. Subgroup analysis of pooled ORs accordingto vitamin D assay method. Figure S5. Subgroup analysis of pooled ORs according to different DR diagnosis.Figure S6. Result of funnel plots.
Author Contributions: All authors participated in the process of this meta-analysis.
Conflicts of Interest: The authors declare no conflict of interest.
References
1. Sherwin, R.; Jastreboff, A.M. Year in diabetes 2012: the diabetes tsunami. J. Clin. Endocrinol. Metab. 2012, 97,4293–4301. [CrossRef] [PubMed]
2. Klein, B.E. Overview of epidemiologic studies of diabetic retinopathy. Ophthalmic Epidemiol. 2007, 14,179–183. [CrossRef] [PubMed]
113
Books
MDPI

Nutrients 2017, 9, 307
3. Zheng, Y.; He, M.; Congdon, N. The worldwide epidemic of diabetic retinopathy. Indian J. Ophthalmol. 2012,60, 428–431. [PubMed]
4. Stratton, I.M.; Kohner, E.M.; Aldington, S.J.; Turner, R.C.; Holman, R.R.; Manley, S.E.; Matthews, D.R.UKPDS50: Risk factors for incidence and progression of retinopathy in Type II diabetes over 6 years fromdiagnosis. Diabetologia 2001, 44, 156–163. [CrossRef] [PubMed]
5. Praidou, A.; Harris, M.; Niakas, D.; Labiris, G. Physical activity and its correlation to diabetic retinopathy.J. Diabetes Complicat. 2017, 31, 456–461. [CrossRef] [PubMed]
6. Holick, M.F. Vitamin D deficiency. N. Engl. J. Med. 2007, 357, 266–281. [CrossRef] [PubMed]7. Holick, M.F.; Chen, T.C. Vitamin D deficiency: A worldwide problem with health consequences. Am. J.
Clin. Nutr. 2008, 87, 1080s–1086s. [CrossRef] [PubMed]8. Mitri, J.; Muraru, M.D.; Pittas, A.G. Vitamin D and Type 2 diabetes: A systematic review. Eur. J. Clin. Nutr.
2011, 65, 1005–1015. [CrossRef] [PubMed]9. Rhee, S.Y.; Hwang, Y.C.; Chung, H.Y.; Woo, J.T. Vitamin D and diabetes in Koreans: Analyses based on the
Fourth Korea National Health and Nutrition Examination Survey (KNHANES), 2008–2009. Diabet. Med.2012, 29, 1003–1010. [CrossRef] [PubMed]
10. Bonakdaran, S.; Shoeibi, N. Is there any correlation between vitamin D insufficiency and diabetic retinopathy?Int. J. Ophthalmol. 2015, 8, 326–331. [PubMed]
11. Isaia, G.; Giorgino, R.; Adami, S. High prevalence of hypovitaminosis D in female type diabetic population.Diabetes Care 2001, 24, 1496. [CrossRef] [PubMed]
12. Taverna, M.J.; Selam, J.L.; Slama, G. Association between a protein polymorphism in the start codon ofthe vitamin D receptor gene and severe diabetic retinopathy in C-peptide-negative type 1 diabetes. J. Clin.Endocrinol. Metab. 2005, 90, 4803–4808. [CrossRef] [PubMed]
13. Albert, D.M.; Scheef, E.A.; Wang, S.; Mehraein, F.; Darjatmoko, S.R.; Sorenson, C.M.; Sheibani, N. Calcitriol isa potent inhibitor of retinal neovascularization. Investig. Ophthalmol. Vis. Sci. 2007, 48, 2327–2334. [CrossRef][PubMed]
14. Patrick, P.A.; Visintainer, P.F.; Shi, Q.; Weiss, I.A.; Brand, D.A. Vitamin D and Retinopathy in Adults withDiabetes Mellitus. Arch. Ophthalmol. 2012, 130, 756–760. [CrossRef] [PubMed]
15. Inukai, T.; Fujiwara, Y.; Tayama, K.; Aso, Y.; Takemura, Y. Alterations in serum levels of 1 alpha, 25(OH)2 D3and osteocalcin in patients with early diabetic nephropathy. Diabetes Res. Clin. Pract. 1997, 38, 53–59.[CrossRef]
16. Alam, U.; Amjad, Y.; Chan, A.W.; Asghar, O.; Petropoulos, I.N.; Malik, R.A. Vitamin D Deficiency Is NotAssociated with Diabetic Retinopathy or Maculopathy. J. Diabetes Res. 2016, 2016, 6156217. [CrossRef][PubMed]
17. Stroup, D.F.; Berlin, J.A.; Morton, S.C.; Olkin, I.; Williamson, G.D.; Rennie, D.; Moher, D.; Becker, B.J.;Sipe, T.A.; Thacker, S.B. Meta-analysis of observational studies in epidemiology: A proposal for reporting.Meta-analysis of observational studies in epidemiology (moose) group. JAMA 2000, 283, 2008–2012.[CrossRef] [PubMed]
18. Duckitt, K.; Harrington, D. Risk factors for pre-eclampsia at antenatal booking: Systematic review ofcontrolled studies. BMJ (Clin. Res. Ed.) 2005, 330, 565. [CrossRef] [PubMed]
19. Aksoy, H.; Akçay, F.; Kurtul, N.; Baykal, O.; Avci, B. Serum 1,25 Dihydroxy Vitamin D (1,25(OH)2D3), 25Hydroxy Vitamin D (25(OH)D) and Parathormone Levels in Diabetic Retinopathy. Clin. Biochem. 2000, 33,47–51. [CrossRef]
20. Suzuki, A.; Kotake, M.; Ono, Y.; Kato, T.; Oda, N.; Hayakawa, N.; Hashimoto, S.; Itoh, M. Hypovitaminosis Din type 2 diabetes mellitus: Association with microvascular complications and type of treatment. Endocr. J.2006, 53, 503–510. [CrossRef] [PubMed]
21. Payne, J.F.; Ray, R.; Watson, D.G.; Delille, C.; Rimler, E.; Cleveland, J.; Lynn, M.J.; Tangpricha, V.;Srivastava, S.K. Vitamin D Insufficiency in Diabetic Retinopathy. Endocr. Pract. 2012, 18, 185–193. [CrossRef][PubMed]
22. Ahmadieh, H.; Azar, S.T.; Lakkis, N.; Arabi, A. Hypovitaminosis D in Patients with Type 2 Diabetes Mellitus:A Relation to Disease Control and Complications. ISRN Endocrinol. 2013, 2013, 641098. [CrossRef] [PubMed]
23. Bajaj, S.; Singh, R.P.; Dwivedi, N.C.; Singh, K.; Gupta, A.; Mathur, M. Vitamin D levels and microvascularcomplications in type 2 diabetes. Indian J. Endocrinol. Metab. 2014, 18, 537–541. [CrossRef] [PubMed]
114
Books
MDPI

Nutrients 2017, 9, 307
24. He, R.; Shen, J.; Liu, F.; Zeng, H.; Li, L.; Yu, H.; Lu, H.; Lu, F.; Wu, Q.; Jia, W. Vitamin D deficiency increasesthe risk of retinopathy in Chinese patients with Type 2 diabetes. Diabet. Med. 2014, 31, 1657–1664. [CrossRef][PubMed]
25. Jee, D.; Han, K.; Kim, E.C. Inverse Association between High Blood 25 Hydroxyvitamin D Levels andDiabetic Retinopathy in a Representative Korean Population. PLoS ONE 2014, 9, e115199. [CrossRef][PubMed]
26. Longo-Mbenza, B.; Mvitu Muaka, M.; Masamba, W.; Muizila Kini, L.; Longo Phemba, I.; KibokelaNdembe, D.; Tulomba Mona, D. Retinopathy in non diabetics, diabetic retinopathy and oxidative stress:A new phenotype in Central Africa? Int. J. Ophthalmol. 2014, 7, 293–301. [PubMed]
27. Alcubierre, N.; Valls, J.; Rubinat, E.; Cao, G.; Esquerda, A.; Traveset, A.; Granado-Casas, M.; Jurjo, C.;Mauricio, D. Vitamin D Deficiency Is Associated with the Presence and Severity of Diabetic Retinopathy inType 2 Diabetes Mellitus. J. Diabetes Res. 2015, 2015, 374178. [CrossRef] [PubMed]
28. Herrmann, M.; Sullivan, D.R.; Veillard, A.S.; McCorquodale, T.; Straub, I.R.; Scott, R.; Laakso, M.; Topliss, D.;Jenkins, A.J.; Blankenberg, S.; Burton, A.; et al. Serum 25-Hydroxyvitamin D: A Predictor of Macrovascularand Microvascular Complications in Patients With Type 2 Diabetes. Diabetes Care 2015, 38, 521–528.[CrossRef] [PubMed]
29. Reddy, G.B.; Sivaprasad, M.; Shalini, T.; Satyanarayana, A.; Seshacharyulu, M.; Balakrishna, N.;Viswanath, K.; Sahay, M. Plasma vitamin D status in patients with type 2 diabetes with and withoutretinopathy. Nutrition 2015, 31, 959–963. [CrossRef] [PubMed]
30. Usluogullari, C.A.; Balkan, F.; Caner, S.; Ucler, R.; Kaya, C.; Ersoy, R.; Cakir, B. The relationship betweenmicrovascular complications and vitamin D deficiency in type 2 diabetes mellitus. BMC Endocr. Disord. 2015,15, 33. [CrossRef] [PubMed]
31. Zoppini, G.; Galletti, A.; Targher, G.; Brangani, C.; Pichiri, I.; Trombetta, M.; Negri, C.; de Santi, F.; Stoico, V.;Cacciatori, V.; et al. Lower levels of 25-hydroxyvitamin D3 are associated with a higher prevalence ofmicrovascular complications in patients with type 2 diabetes. BMJ Open Diabetes Res. Care 2015, 3, e000058.[CrossRef] [PubMed]
32. Millen, A.E.; Sahli, M.W.; Nie, J.; LaMonte, M.J.; Lutsey, P.L.; Klein, B.E.; Mares, J.A.; Meyers, K.J.;Andrews, C.A.; Klein, R. Adequate vitamin D status is associated with the reduced odds of prevalentdiabetic retinopathy in African Americans and Caucasians. Cardiovasc. Diabetol. 2016, 15, 128. [CrossRef][PubMed]
33. Zittermann, A.; Koerfer, R. Protective and toxic effects of vitamin D on vascular calcification: Clinicalimplications. Mol. Asp. Med. 2008, 29, 423–432. [CrossRef] [PubMed]
34. Targher, G.; Bertolini, L.; Padovani, R.; Zenari, L.; Scala, L.; Cigolini, M.; Arcaro, G. Serum25-hydroxyvitamin D3 concentrations and carotid artery intima–media thickness among Type 2 diabeticpatients. Clin. Endocrinol. (Oxf.) 2006, 65, 593–597. [CrossRef] [PubMed]
35. Ren, Z.; Li, W.; Zhao, Q.; Ma, L.; Zhu, J. The impact of 1,25-dihydroxy vitamin D3 on the expressions ofvascular endothelial growth factor and transforming growth factor-b1 in the retinas of rats with diabetes.Diabetes Res. Clin. Pract. 2012, 98, 474–480. [CrossRef] [PubMed]
36. Temmerman, J.C. Vitamin D and cardiovascular disease. J. Am. Coll. Nutr. 2011, 30, 167–170. [CrossRef][PubMed]
37. Mathieu, C.; Gysemans, C.; Giulietti, A.; Bouillon, R. Vitamin D and diabetes. Diabetologia 2005, 48, 1247–1257.[CrossRef] [PubMed]
38. Michos, E.D. Vitamin D deficiency and the risk of incident Type 2 diabetes. Future Cardiol. 2009, 5, 15–18.[CrossRef] [PubMed]
39. Danescu, L.G.; Levy, S.; Levy, J. Vitamin D and diabetes mellitus. Endocrine 2009, 35, 11–17. [CrossRef][PubMed]
40. Cavalier, E.; Delanaye, P.; Souberbielle, J.C.; Radermecker, R.P. Vitamin D and type 2 diabetes mellitus: wheredo we stand? Diabetes Metab. 2011, 37, 265–272. [CrossRef] [PubMed]
41. Hong, Y.J.; Kang, E.S.; Ji, M.J.; Choi, H.J.; Oh, T.; Koong, S.S.; Jeon, H.J. Association between Bsm1Polymorphism in Vitamin D Receptor Gene and Diabetic Retinopathy of Type 2 Diabetes in KoreanPopulation. Endocrinol. Metab. (Seoul) 2015, 30, 469–474. [CrossRef] [PubMed]
115
Books
MDPI

Nutrients 2017, 9, 307
42. Annweiler, C.; Beauchet, O.; Bartha, R.; Graffe, A.; Milea, D.; Montero-Odasso, M. Association betweenserum 25-hydroxyvitamin D concentration and optic chiasm volume. J. Am. Geriatr. Soc. 2013, 61, 1026–1028.[CrossRef] [PubMed]
43. Bucan, K.; Ivanisevic, M.; Zemunik, T.; Boraska, V.; Skrabic, V.; Vatavuk, Z.; Galetovic, D.; Znaor, L.Retinopathy and nephropathy in type 1 diabetic patients association with polymorphysms of vitaminD-receptor, TNF, Neuro-D and IL-1 receptor 1 genes. Coll. Antropol. 2009, 33, 99–105. [PubMed]
44. Zhong, X.; Du, Y.; Lei, Y.; Liu, N.; Guo, Y.; Pan, T. Effects of vitamin D receptor gene polymorphism andclinical characteristics on risk of diabetic retinopathy in Han Chinese type 2 diabetes patients. Gene 2015,566, 212–216. [CrossRef] [PubMed]
45. Lee, P.; Chen, R. Vitamin D as an analgesic for patients with type 2 diabetes and neuropathic pain.Arch. Intern. Med. 2008, 168, 771–772. [CrossRef] [PubMed]
46. Stitt, A.W.; Curtis, T.M.; Chen, M.; Medina, R.J.; McKay, G.J.; Jenkins, A.; Gardiner, T.A.; Lyons, T.J.;Hammes, H.P.; Simó, R.; et al. The progress in understanding and treatment of diabetic retinopathy.Prog. Retin. Eye Res. 2016, 51, 156–186. [CrossRef] [PubMed]
© 2017 by the authors. Licensee MDPI, Basel, Switzerland. This article is an open accessarticle distributed under the terms and conditions of the Creative Commons Attribution(CC BY) license (http://creativecommons.org/licenses/by/4.0/).
116
Books
MDPI

nutrients
Article
Daily Intake of Grape Powder Prevents theProgression of Kidney Disease in Obese Type 2Diabetic ZSF1 Rats
Salwa M. K. Almomen 1, Qiunong Guan 1,2, Peihe Liang 1,3, Kaidi Yang 1, Ahmad M. Sidiqi 1,4,
Adeera Levin 4 and Caigan Du 1,2,*
1 Department of Urologic Sciences, University of British Columbia, Vancouver, BC V6H3Z6, Canada;[email protected] (S.M.K.A.); [email protected] (Q.G.); [email protected] (P.L.);[email protected] (K.Y.); [email protected] (A.M.S.)
2 Immunity and Infection Research Centre, Vancouver Coastal Health Research Institute,Vancouver, BC V6H3Z6, Canada
3 Department of Urology, The Second Affiliated Hospital, Chongqing Medical University,Chongqing 400010, China
4 Division of Nephrology, Department of Medicine, University of British Columbia,Vancouver, BC V6Z1Y6, Canada; [email protected]
* Correspondence: [email protected]; Tel.: +1-604-875-4111 (ext. 63793)
Received: 10 March 2017; Accepted: 29 March 2017; Published: 31 March 2017
Abstract: Individuals living with metabolic syndrome (MetS) such as diabetes and obesity are at highrisk for developing chronic kidney disease (CKD). This study investigated the beneficial effect ofwhole grape powder (WGP) diet on MetS-associated CKD. Obese diabetic ZSF1 rats, a kidneydisease model with MetS, were fed WGP (5%, w/w) diet for six months. Kidney disease wasdetermined using blood and urine chemical analyses, and histology. When compared to Vehiclecontrols, WGP intake did not change the rat bodyweight, but lowered their kidney, liver andspleen weight, which were in parallel with the lower serum glucose and the higher albumin oralbumin/globin ratio. More importantly, WGP intake improved the renal function as urinationand proteinuria decreased, or it prevented kidney tissue damage in these diabetic rats. The renalprotection of WGP diet was associated with up-regulation of antioxidants (Dhcr24, Gstk1, Prdx2, Sod2,Gpx1 and Gpx4) and downregulation of Txnip (for ROS production) in the kidneys. Furthermore,addition of grape extract reduced H2O2-induced cell death of cultured podocytes. In conclusion,daily intake of WGP reduces the progression of kidney disease in obese diabetic rats, suggestinga protective function of antioxidant-rich grape diet against CKD in the setting of MetS.
Keywords: metabolic syndrome; chronic kidney disease; grape powder; antioxidants; natural products;dietary supplements
1. Introduction
Chronic kidney disease (CKD) is multifactorial, and is defined as abnormalities of kidney structureor function that is present for more than three months. While not progressive in all, it can lead toend-stage renal disease (ESRD)—total and permanent kidney failure [1,2]. CKD places a major publichealth burden on our community as it affects more than 10% of adults aged 20 years or older, or morethan 40% in those aged 65 years or older in the United States (source: Centers for Disease Control andPrevention), and 12.5% of adults, representing approximately three million, in Canada [3,4]. Like otherchronic diseases, many cases of CKD are not curable, but there are substantial numbers of peoplewho can benefit from prevention or delay of progression [5], suggesting that an effective and feasiblepreventive strategy is expected to reduce the burden of CKD in our community. However, there are
Nutrients 2017, 9, 345 117 www.mdpi.com/journal/nutrients
Books
MDPI

Nutrients 2017, 9, 345
a limited number of these that are proven or used in our daily practice. Recently, there is an increasinginterest in diet, the interaction of gut microbiome and CKD progression. Dietary supplements ornatural health products is definitely an attractive and feasible strategy for CKD prevention.
Metabolic syndrome (MetS) is a collective term for several clinical measures, which includeinsulin resistance, high serum glucose, overweight or obesity, high triglyceride or low high-densitylipoprotein cholesterol and hypertension [6]. Literature suggests that MetS may increase the riskof the development of CKD [7–9], mainly seen as hypertensive and diabetic nephropathy (DN).While the etiology for MetS-induced CKD remains unknown [9], oxidative stress is theorized to a playa role [8,10,11]. The oxidative stress is induced by the imbalance between the level of reactive oxygenspecies (ROS, free radicals) and the capacity of antioxidant defenses, which leads to the generation ofexcessive ROS and consequently tissue damage [11,12]. One of major antioxidant defense mechanismsin our body is exogenous antioxidants, such as flavonoids, vitamins, resveratrol, anthocyanine,curcumin and phenolic acid that come from our food and other dietary sources [11,13–15]. There aresome data that antioxidant rich berry diet has benefit in preventing or mitigating MetS [15,16],suggesting that a dietary strategy of using antioxidant-rich food may be a novel strategy to employ toreduce the incidence of CKD among individuals who are living with MetS.
Grapes are one of the most widely cultivated and popularly consumed fruits in the world, and containover 1600 phytonutrients including some major antioxidant flavonoids, such as catechins (catechin andepicatechin), anthocyanins (peonidin, cyaniding, and malvidin), flavonols (quercetin, kaempferol,and isorhamnetin) and resveratrol (source: the California Table Grape Commission report, Fresno,CA, USA). The renoprotective activities of these compounds have been demonstrated in variousexperimental models. For example, epicatechin, quercetin or resveratrol has been shown to lower theoxidative stress in the kidneys and reduce renal damage in animals with cisplatin nephropathy [17–19],and feeding with anthocyanin-rich food reduces diabetes-associated kidney failure in db/db mice [20].A recent study shows that daily drinking of whole grape powder (WGP) prevents age-related declineof kidney function in rats [21], but its beneficial effect on MetS-associated CKD, a common publichealth problem in our community [22], has not been investigated. Obese ZSF1 male rats are generatedby a cross between a Zucker diabetic fatty (ZDF) female and a spontaneously hypertensive heartfailure (SHHF) male rat, which have MetS similar to humans, including hypertension, type 2 diabetes,hyperlipidemia and nephropathy [23–27]. Hence, these rats have been widely used as a disease modelfor renal failure in the condition of MetS [27–30]. The objective of this study was to examine the effectof daily feeding with the WGP on the progression of kidney disease in obese ZSF1 rats, as compared tocontrol animals.
2. Materials and Methods
2.1. Animals and Cells
Obese ZSF1 male rats (~300 g bodyweight, 8 weeks old) were purchased from Charles RiverLaboratories International, Inc. (Wilmington, MA, USA). These rats were F1 hybrids from a crossbetween a female ZDF rat and a male SHHF rat [27], and were maintained in the animal facility ofthe Jack Bell Research Centre (Vancouver, BC, Canada). All animal experiments were performed inaccordance with the Canadian Council on Animal Care guidelines under protocols approved by theAnimal Use Subcommittee at the University of British Columbia (Vancouver, BC, Canada).
Heat-sensitive mouse podocyte (HSMP) cell line was a gift from Dr. Stuart Shankland(University of Washington School of Medicine, Seattle, WA, USA). HSMP cells were maintainedand grown in RPMI 1640 culture medium supplemented with 10% fetal bovine serum and 0.2 ng·mL−1
of IFN-γ in a CO2 incubator at 33 ◦C as described previously [31]. To induce quiescence and thedifferentiated phenotype for experiments, HSMP cells were grown at 37 ◦C in the same medium but inthe absence of IFN-γ (growth restrictive conditions) [31].
118
Books
MDPI

Nutrients 2017, 9, 345
2.2. Whole Grape Powder (WGP)
WGP was provided by the California Table Grape Commission (CTGC), and was a freeze-driedgrape product developed for the usage of research purposes only. WGP was composed of seeded andseedless varieties of fresh green, red and black California grapes that were initially frozen, and thenground with food-quality dry ice. The processing and storage of the WGP were done properly forpreserving the bioactivities of the compounds found in the grapes. Approximately 90% of the WGPby weight was sugars (glucose and fructose found in a 1:1 ratio), and the remainder consisted oforganic acids, phenolic compounds, nitrogenous compounds, aroma compounds, and mineralsand pectic substances. Antioxidants, such as resveratrol, flavans (including catechin), flavonols(including quercetin), anthocyanins and many simple phenolics (as per the CTGC report) werealso found. This product was stored at −80 ◦C in moisture-proof containers until it was mixedwith regular rat chow for the animal experiments.
2.3. Food Supplements
According to the CTGC guideline of the usage of WGP as food supplements for animal studies,WGP supplement food (denoted as WGP here) was prepared for this study by mixing regularchow (95%, w/w) with WGP (5%, w/w), and its Vehicle control the regular chow (95.5%, w/w)with 2.25% (w/w) glucose and 2.25% (w/w) fructose. Rats were randomly assigned to two groups(WGP and Vehicle), in which they were fed with either WGP or sugar control. The animal experimentwas repeated twice with total 15 rats in each group. One rat in WGP group suffered a urinary tractinfection diagnosed early during the second month of the feeding experiment, and was consequentlyexcluded from the experiment and data analysis.
2.4. Preparation of WGP Extract
The WGP extract was prepared for both cell culture experiments to determine its antioxidativeactivity. In brief, WGP (4 g) was dissolved in 200 mL of methanol (anhydrous, 99.8%) and was stirred for72 h at room temperature, followed by centrifugation at 3000 rpm for 15 min. The resultant supernatantfraction was subsequently dried by lyophilization using a centrifugal evaporator. Around 3.3 g ofWGP-methanol extract was produced from 4 g of WGP by this procedure. The stock solution of WGPextract was prepared by dissolving the dried extract pellet in culture medium at the concentrationof 5 mg·mL−1.
2.5. Primary Outcomes from This Study
Our primary outcomes were to measure renal function through assessment of urine volume,proteinuria, urine protein to creatinine ratio (uPCR), and estimated glomerular filtration rate (GFR).Renal injury was also measured via the kidney organ index and histological analysis.
2.6. Urine Collection and Determination of Kidney Function
A 24-h urine sample was collected using metabolic caging, in which the rat had unrestrictedaccess to food and drinking water. The collected urine was immediately centrifuged at 3000 rpm for15 min to remove any food scraps and fecal matters. After its volume was measured, the sample wasstored in aliquots at −20 ◦C until all the samples were collected for the determination of both proteinand creatinine levels at the same time.
The levels of urine creatinine (UCr) were measured in the Chemistry Laboratory at the VancouverCoastal Health Regional Laboratory Medicine (Vancouver, BC, Canada) by using the DimensionVista® System with CRE2 reagent cartridges (Siemens Healthcare Diagnostics Inc., Newark, DE, USA).The levels of urine protein were determined using Bio-Rad protein assay following manufacturer’sinstruction (Bio-Rad Laboratories-Canada, Mississauga, ON, Canada). In brief, the protein in the urinewas precipitated using 10% trichloroacetic acid, followed by centrifugation at 10,000 rpm for 10 min.
119
Books
MDPI

Nutrients 2017, 9, 345
The protein pellet was suspended in 3% sodium hydroxide (NaOH) solution, and 1 μL of this proteinsolution was added to 200 μL of Bio-Rad dye (10 × dilution). The optical density (OD) of urine proteinsamples, background control and bovine serum albumin (BSA) standards at 595 nm was measuredusing an ELx808 Ultra Microplate Reader (BioTek, Winooski, VT, USA), and protein concentration(mg·mL−1) in the urine sample was calculated based on the BSA standard curve.
2.7. Blood Collection and Chemical Analysis
Blood samples were collected from the tail vein using a lithium heparin tube after 1, 3 and6 months of WGP feeding. A comprehensive metabolic panel of 14 blood substances, including alanineaminotransferase (ALT), albumin (ALB), alkaline phosphatase (ALP), amylase (AMY), total calcium(Ca2+), creatinine (CRE), globulin (GLOB), glucose (GLU), phosphorus (PHOS), potassium (K+),sodium (Na+), total bilirubin (TBIL), total protein (TP), and urea nitrogen (BUN), were determinedusing the VetScan® Comprehensive Diagnostic Profile reagent rotor with the VetScan ChemistryAnalyzer VS2 (Abaxis, Inc., Union City, CA, USA) in the Animal Unit Hematology DiagnosticLaboratory at Jack Bell Research Centre (Vancouver, BC, Canada).
2.8. Glomerular Filtration Rate (GFR)
The renal function was estimated using GFR that was calculated based on the creatinine clearanceusing the following: GFR = (UCr × V)/SCr, where UCr was creatinine level in urine sample,V the volume of the 24-h urine sample, and SCr the creatinine in serum.
2.9. Renal Histopathology
The kidney tissues (6 rats/group) were randomly selected. The tissues were fixed in 10% neutralbuffered formalin, followed by embedding in paraffin wax. Sections were cut at 4-μm thickness,and were stained with hematoxylin and eosin (HE) or periodic acid-Schiff (PAS). The stained tissuesections were scanned with Leica SCN400 Slide scanner (Leica Microsystens Inc., Concord, ON,Canada), and the pathological parameters of renal disease were determined in two separate sections ofeach kidney using the Digital Image Hub—A slidepath Software Solution (Leica Microsystems Inc.)in a blinded fashion.
The number of intratubular protein cast formation or glomerular atrophy in each microscopicview was counted in HE-stained section, and the average number of at least 20 randomly selectedviews under 40× magnification represented these two parameters in each kidney.
A semi-quantitative scoring system using a 0 to 4 scale was established to determine the severityof the tubular atrophy (including tubular dilution and/or cellular flatting) in the renal cortex ofHE-stained kidney sections. The scale/score was measured based on the percentage of damagedtubules occupying a microscopic view: 1 (0%–24% of the area affected with damaged tubules),2 (25%–49%), 3 (50%–74%), and 4 (>75%). The average of at least 30 randomly selected views under200× magnification represented the tubular atrophy in each kidney.
The mesangial expansion was also determined using a 0 to 4 scale based on the percentage ofthe area stained strongly with PAS, indicating the mesangial expansion in an affected glomerulus:1 (0%–24% of the area affected with densely stain, minimal ), 2 (25%–49%, mild), 3 (50%–74%, moderate),and 4 (>75%, severe). A range of 180 to 250 glomeruli were counted and averaged for each kidney.
2.10. PCR Array Analysis of Oxidative Stress
The expression of 84 oxidative stress-associated genes in kidney tissues was quantitativelyexamined using PCR Arrays kits (Cat. No.: PARN-065Z, SABiosciences—QIAGEN Inc., Valencia,CA, USA) following manufacturer’s instruction. Four samples/rats (one from each rat) wererandomly selected from each group. In brief, one piece of kidney cortex was snap-frozen in liquidnitrogen and stored at −80 ◦C until all the samples were ready for the experiment. The totalRNA from the tissues was extracted and purified using the RNeasy Microarray Tissue Mini kit
120
Books
MDPI

Nutrients 2017, 9, 345
(QIAGEN), and converted to cDNA using RT2 First Strand Kit (QIAGEN). The expression ofselected genes was amplified by real-time PCR using RT2 Profile PCR arrays (QIAGEN). Data wereanalyzed using Web-based PCR Array Data Analysis Software at the website of the manufacturer(http://www.SABiosciences.com/pcrarraydataanalysis.php).
2.11. Flow Cytometric Analysis
Cell death or viability was quantitatively determined by using fluorescence-activated cell sorter (FACS)analysis following the manufacturer’s protocol (BD Biosciences, Mississauga, ON, Canada). Annexin-Vconjugated with phycoerythrin (Annexin-V-PE) stained apoptotic cells, and 7-amino-actinomycin D(7-AAD) positivity indicated late apoptotic and necrotic cells. Briefly, cells were stained with bothAnnexin-V-PE and 7-AAD for 15 min in the dark, and cell apoptosis and necrosis were detectedby using a flow cytometry and further quantified using FlowJo software (Tree Star Inc., Ashland,OR, USA). In a FACS graph, the lower right quadrant—only Annexin V positive indicated earlyapoptosis; the upper right quadrant—Annexin V/7-AAD double positive showed late apoptosis;and the upper left quadrant—7-AAD positive cells were necrosis. Finally, negative staining (the lowerleft quadrant—Annexin V/7-AAD double negative) showed the population of viable cells.
2.12. Statistical Analysis
Data were presented as mean ± standard derivation (SD) of each group. Statistical analysis ofdifference between groups was performed using GraphPad Prism software (GraphPad, San Diego,CA, USA) by t-test or analysis of variance (ANOVA) as indicated in the text. A p value of ≤0.05 wasconsidered statistically significant.
3. Results
3.1. Daily Intake of WGP Is Associated with Lower Organ Index of the Kidney, Liver and Spleen but Does NotAffect Bodyweight in Obese Diabetic Rats
Both bodyweight and diet consumption were monitored once a week. As shown in Figure 1,the weight gain of rats during six months of WGP feeding was the same as sugar-fed Vehicle controlgroup, indicated by a complete overlap of growth curves between these two groups (WGP vs. Vehicle:p = 0.7701, two-way ANOVA). This observation was correlated with their diet consumption,which remained the same at 25 ± 2 g·day−1·animal−1 between these two groups throughout theexperiment. Interestingly, at the end of feeding experiment, significantly lower organ weight index wasseen in the kidney (WGP vs. Vehicle: p = 0.0127, two-tailed t-test), liver (WGP vs. Vehicle: p < 0.0001,two-tailed t-test) and spleen (WGP vs. Vehicle: p = 0.0341, two-tailed t-test) of WGP-fed rats comparedto Vehicle controls, whereas both the heart and the lung remained the same (Table 1). The datasuggested that daily intake of WGP reduced the weight/size of these three organs—the liver, kidneyand spleen—as compared to those in control group in these obese diabetic rats.
The bodyweight of rats in both Vehicle (n = 15) and WGP (n = 14) groups was recorded duringa period of six months of dietary supplements. Data were presented as mean ± SD of each group.Vehicle vs. WGP: p = 0.7701 (two-way ANOVA).
Table 1. Organ index (organ weight/bodyweight) after six months of feeding sugar (Vehicle) or wholegrape powder (WGP).
Kidneys Liver Spleen Heart Lung
Vehicle (n = 15) 0.0070 ± 0.00072 0.0627 ± 0.00418 0.00135± 0.00010 0.00289 ± 0.00115 0.00356 ± 0.00096WGP (n = 14) 0.0063 ± 0.00069 0.0544 ± 0.00546 0.00129 ± 0.00001 0.00251 ± 0.00022 0.00371 ± 0.00103
p value * 0.0127 <0.0001 0.0341 0.2351 0.6880
* The difference between Vehicle and WGP was compared using two-tailed t-test.
121
Books
MDPI

Nutrients 2017, 9, 345
Figure 1. No effect of daily intake of whole grape powder (WGP) on bodyweight gain or obesity inobese diabetic ZSF1 rats.
3.2. Daily Intake of WGP Is Associated with Higher Serum Albumin and Lower Blood Glucose in ObeseDiabetic Rats
The overall metabolism status of these rats was determined by using the changes ina comprehensive metabolic panel of 14 blood substances that represent the basic metabolism (GLU),electrolytes (Na+, K+, Ca2+, and PHOS) and both kidney and liver functions (BUN, CRE, ALB, GLOB.ALB/GLOB ratio, ALP, ALT, AMY, TP and TBIL). Over six months of feeding experiment, the ratsin both groups experienced a significant decline in ALB (including ALB/GLOB ratio), ALP, BUN,K+ and PHOS, and at the same time an increase in GLU, AMY, TBIL, GLOB, TP, Ca2+ and Na+
(Table S1). Only CRE and ALT remained unchanged (Table S1). The importance for this examinationwas that as compared to the Vehicle group, WGP-fed rats had significantly higher levels of serum ALB(p = 0.0013, two-way ANOVA) or ALB/GLOB ratio (p = 0.0092, two-way ANOVA), and lower levels ofblood GLU (p = 0.0276, two-way ANOVA) (Table S1 and Figure 2), at the end of the six-month period.
Months
Months
GLU
(mmolL1 )
ALB/GLOBratio
p = 0.0092
p = 0.0276
B
C
ALB
(gL1 )
p = 0.0013
A
Months
Figure 2. Daily intake of WGP has beneficial effect on the maintenance of blood albumin and thereduction of blood glucose in obese diabetic ZSF1 rats. The blood levels of albumin (ALB), globulin(GLOB) and glucose (GLU) were measured in randomly selected rats in Vehicle (n = 8–12) or WGP(n = 8–11) group after one, three or six months of dietary supplements. Data were presented asmean ± SD of each group. (A) Blood ALB levels. Vehicle vs. WGP: p = 0.0013 (two-way ANOVA);(B) ALB/GLOB ratio. Vehicle vs. WGP: p = 0.0092 (two-way ANOVA); (C) Blood GLU levels. Vehicle vs.WGP: p = 0.0276 (two-way ANOVA).
122
Books
MDPI

Nutrients 2017, 9, 345
3.3. Daily Intake of WGP Significantly Is Associated with Lower Urine Volume and Urine Protein Excretionbut Does Not Impact GFR after Six Months in Obese Diabetic Rats
The baseline ranges for renal function in obese ZSF1 rats at the age of eight weeks were164.8 ± 14.5 mL·kg−1·day−1 of urine volume, 307 ± 23 mg·kg−1·day−1 of proteinuria or 5.98 ± 0.41 ofurine protein to creatinine ratio (uPCR) [28], and the average of bodyweight of the rats at this age wasapproximately 300 g (Figure 1). After six months of feeding, a 24-h urine sample was collected fromeach rat. As shown in Figure 3A, WGP-fed rats had lower urine output than Vehicle controls (p = 0.0092,one-tailed t-test). Similarly, the WGP group had significantly lower proteinuria (p = 0.0412, one-tailedt-test) (Figure 3B), and uPCR (p = 0.0084, one-tailed t-test) (Figure 3C), when compared to the Vehiclecontrols. When GFR (mL·24 h−1) between these two groups was compared, no significant differencewas found between the WGP-fed and control groups (p = 0.3474, one-tailed t-test) (Figure 3D).
p = 0.0092
24hurinevolume(mL)
p = 0.0412
24hurineprotein(g)
uPCR
p = 0.0084
GFR
(mL24h1 )
p = 0.3474
A B
C D
Figure 3. Daily intake of WGP reduces urine production and proteinuria but no effect on GFR in obesediabetic ZSF1 rats. A 24-h urine sample was collected from each rat in both Vehicle (n = 15) and WGP(n = 14) at the end of six months of dietary supplements. (A) Total volume of urine production fromeach rat during 24 h. Vehicle vs. WGP: p = 0.0092 (one-tailed t-test); (B) Total amount of protein in24-h urine sample of each rat. Vehicle vs. WGP: p = 0.0412 (one-tailed t-test); (C) Protein to creatinineratio (uPCR) in the urine sample of each rat. Vehicle vs. WGP: p = 0.0084 (one-tailed t-test); (D) GFR ofeach rat calculated based on creatinine clearance. Vehicle vs. WGP: p = 0.3474 (one-tailed t-test).Line: mean with the standard error of the mean (SEM).
3.4. Daily Intake of WGP Partially Prevents Renal Pathological Changes in Obese Diabetic Rats
To further explore the beneficial effect of daily intake of WGP on the prevention of kidney damagein obese diabetic rats, histological analysis of kidney sections was performed and compared betweenthese two groups. The histological score of all four renal pathological parameters in WGP groupwere significantly lower than that in Vehicle group (Figure 4A–E). The WGP group had lower scoresof glomerular atrophy per view (p = 0.0225, two-tailed t-test, n = 9) (Figure 4B), reduced mesangialexpansion (p < 0.0001, two-tailed t-test, n = 9) (Figure 4C), fewer tubular protein cast formation per view(p = 0.0006, two-tailed t-test, n = 12) (Figure 4D), and less severe tubular dilation and atrophy (p = 0.0036,
123
Books
MDPI

Nutrients 2017, 9, 345
two-tailed t-test, n = 12) (Figure 4E), when compared to the Vehicle controls. Together, the histologicaldata indicated less kidney injury in all compartments of the kidneys in WGP-fed rats.
Figure 4. Cont.
124
Books
MDPI

Nutrients 2017, 9, 345
Figure 4. Daily intake of WGP reduces kidney injury in obese diabetic ZSF1 rats. At the end ofsix months of dietary supplements, six kidneys/rats were randomly selected from each group(Vehicle vs. WGP), and kidney sections were stained with either hematoxylin and eosin (HE)or Periodic acid-Schiff (PAS). (A) Typical microscopic images of renal cortex, outer medulla anda glomerulus in each group (Vehicle: top panel; WGP: bottom panel); data showed the samearea of renal cortex and outer medulla stained with either HE or PAS. PC: protein cast formation;black stars (*): damaged glomerulus (glomerular atrophy); arrows: PAS-stained mesangial expansion;(B) The glomerular atrophy was scored in at least 20 randomly selected views in two separate sectionsof each kidney, and was presented in average per view; data are presented as mean ± SD of each group(n = 9); vehicle vs. WGP: p = 0.0225 (two-tailed t-test); (C) The mesangial expansion was determinedusing a 0 to 4 scale based on the percentage of the area stained strongly with PAS; a range of 180 to250 glomeruli were counted and averaged for each kidney. Data are presented as mean ± SD ofeach group (n = 9); vehicle vs. WGP: p < 0.0001 (two-tailed t-test); (D) The number of intratubularprotein cast formation in each microscopic view was counted in HE-stained section, and the averagenumber of at least 20 randomly selected views under 40× magnification represented in each kidney;data are presented as mean ± SD of each group (n = 12); vehicle vs. WGP: p = 0.0006 (two-tailedt-test); (E) Tubular dilation and atrophy were determined using a 0–4 scale based on the percentageof damaged tubules occupying an area in each microscopic view; the average of at least 30 randomlyselected views under 200× magnification represented the tubular atrophy in each kidney; data arepresented as mean ± SD of each group (n = 12). Vehicle vs. WGP: p = 0.0036 (two-tailed t-test).
3.5. Daily Intake of WGP Is Associated with Increasing Local Antioxidant Defense in the Kidney of ObeseDiabetic Rats
To understand the mechanisms by which the daily intake of WGP reduced the progression ofkidney disease in these rats, the transcriptional profile of 84 genes that are involved in oxidative stressand antioxidant defense in the kidney was examined using PCR array. In the kidneys of WGP-fed ratscompared to Vehicle controls, the expression levels of antioxidants (Gpx1, Gpx4, Gstk1 and Prdx2) andreactive oxygen species (ROS) metabolism (Sod2, Cyba, Dhcr24 and Park7) were significantly up-regulatedwhile oxidative stress response genes (Hmox1, Ercc6, Gstp1 and Txnip) downregulated (Table S2 andTable 2). These results suggest an increase in antioxidant defense in the kidneys by WGP diet.
Table 2. Significant changes of oxidative stress-related gene expression in renal cortex of WGP-fed ratsas compared to Vehicle controls, analyzed using PCR array.
Gene Symbol Gene Names Functions Fold Change * p Value (n = 4)
Dhcr24 24-dehydrocholesterol reductase H2O2 scavenger, preventingH2O2-induced cell death 4.265 0.00222
Cyba Cytochrome b-245, alpha polypeptide NADPH oxidase subunit,optimizing immunity 4.215 0.00875
Gstk1 Glutathione S-transferase kappa 1 Cellular detoxification(lipid peroxide detoxification) 1.1475 0.01279
Prdx2 Peroxiredoxin 2 H2O2 and Alkylhydroperoxide antioxidant 1.7625 0.02746
Sod2 Superoxide dismutase, mitochondrial Limiting ROS detrimental effect, andmoderating ROS release 2.3375 0.02983
125
Books
MDPI

Nutrients 2017, 9, 345
Table 2. Cont.
Gene Symbol Gene Names Functions Fold Change * p Value (n = 4)
Park7 Parkinson disease (autosomalrecessive, early onset) 7 Redox-sensitive chaperone 1.24 0.03723
Gpx4 Glutathione peroxidase 4 H2O2, lipid peroxide andhydroperoxide reduction 1.96 0.03756
Gpx1 Glutathione peroxidase 1 H2O2 antioxidant 3.235 0.04614
Hmox1 Heme oxygenase (decycling) 1 Heme degradation to CO −101.533 0.01283
Ercc6Excision repair cross-complementing
rodent repair deficiency,complementation group 6
Damaged DNA repair −3.9575 0.02908
Gstp1 Glutathione S-transferase pi 1 Cellular detoxification −22.4875 0.0405
Txnip Thioredoxin interacting protein Increasing ROS production −37.8825 0.04436
* Minus: decreased.
3.6. Addition of WGP Extract Reduced H2O2-Induced Cell Death in Cultured Podocytes
Podocyte injury plays a key role in the initiation and early progression of DN [32]. To investigate ifthe antioxidant compounds from WGP prevented podocyte injury under oxidative stress, the protectiveactivity of WGP extract was tested in cultured podocytes in the presence of H2O2. Methanol extractionof WGP exhibited a high antioxidative activity, indicated by the equivalence of approximately 1.7 mgof the extract to 5 μg of ascorbic acid in all three different assays (Figure S1). H2O2 induced significantpodocyte cell death through apoptosis (positive stain with Annexin-V) (Figure 5A). However, cells thatwere co-treated with WGP extract (200 mg·mL−1) and H2O2 had significantly more cell viability thancells that were treated with H2O2 only (p = 0.037, two-tailed t-test, n = 8). The viability of cells treatedwith both H2O2 and WGP extract was not different from that in cultures treated with the extract only(p = 0.2732, two-tailed t-test. n = 8), suggesting that the extract significantly inhibited H2O2-inducedcell death under this condition.
Figure 5. Grape extract protects cultured podocytes from H2O2-induced cell death. Grape extractwas prepared by using methanol extraction. HSMP cells (0.25 × 10⁶ cells/well) were grown inRPMI 1640 culture medium in 24-well plates at 37 ◦C overnight, followed by grape extract treatment(200 mg·mL–1) in the presence or absence of H2O2 (1 μM). (A) Cell viability or apoptosis wasdetermined by FACS analysis with Annexin-V-PE and 7-AAD staining after 24-h treatment withthe grape extract. Data were represented as a typical FACS graph in each group; (B) Cell viabilityrepresented the percentage of viable cells (double-Annexin-V-PE/7-AAD negative cells in lowerleft quadrant). Data were presented as mean ± SD of eight separate experiments in each group.Untreated vs. H2O2, p = 0.0033 (two-tailed t-test); H2O2 vs. H2O2 + Extract, p = 0.037 (two-tailed t-test);or Extract vs. H2O2 + Extract, p = 0.2732 (two-tailed t-test).
126
Books
MDPI

Nutrients 2017, 9, 345
4. Discussion
CKD is a major health problem in our society. In addition to pharmacological therapy, such asthrough angiotensin converting enzyme (ACE) inhibitors or angiotensin receptor blockers (ARB) forproteinuria and/or hypertension control, nutritional interventions have been widely recommended inthe management of CKD [33]. A low-protein diet is a popular and practical nutritional managementof CKD [34–36]. Interestingly, a recent pilot clinical study shows that dietary supplementation withtwo gram of grape seed extract a day for six months can improve some kidney function parameters of2–4 stage CKD in patients, in which the grape seed extract likely acts through the strong antioxidativeactivity and anti-inflammation of phytochemicals [37]. This study may suggest that a diet containingthe antioxidative grape extract can potentially become a nutritional management strategy for theprevention of CKD.
In the present study, when the rats started diet supplement at 8 weeks old, compared to thereference range [38] (Table S3), they had significant higher levels of blood GLU, BUN, TBIL, ALT, ALPand AMY, which may represent a sign of mild diabetes (higher GLU), pancreatic (higher AMY) andnonalcoholic fatty liver disease (higher ALT, ALP, TBIL and BUN). During six months of feedingexperiments, the serum levels of AMY, Ca2+, GLOB, GLU, Na+, TBIL and TB were increased and ofALB (including ALB/GLOB ratio), ALP, BUN, K+ and PHOS decreased in both groups (Table S1).These data may suggest progressively worsening diabetic (high GLU) and pancreatic (high AMY),fatty liver (high GLOB, TB and TBIL, low ALB and BUN), and kidney disease (low ALB or ALB/GLOBratio for albumin loss, and the imbalance of Na+, Ca2+, K+ and PHOS). When compared to the vehiclecontrol group, with no difference in their bodyweight (Figure 1) the lower organ index of WGP-fedrats may indicate the reduced fatty liver, kidney hypertrophy and perhaps low-degree systemicimmune response activity (indicated by the smaller size of the spleens) (Table 1). Further chemical testsshowed that daily intake of WGP improved blood ALB and ALB/GLOB ratio and decreased GLU levels(Figure 2), and lower proteinuria, uPCR and urination (probably due to higher renal water reabsorption)(Figure 3). Histologically, we found that glomerular atrophy, mesangial expansion, tubular injuryand protein cast formation, all of which are elevated in early stages of diabetic related CKD [39,40],were reduced in the WGP-fed rats (Figure 4). In vitro, the grape extract inhibited H2O2-induced celldeath in cultured podocytes and exhibited a high antioxidative activity (Figure 5). In consistent withour study, a recently study demonstrates similar benefits of the grape powder to age-related kidneyfunctions in Fischer 344 rats [21].
We described higher urine volumes in the vehicle fed rats versus WGP fed rats (Figure 3A),which may be due to either a manifestation of higher glycemic levels (Figure 2C) or worsened MetS,resulting in increasing hyperfiltration and renal injury. Hyperglycemia-induced hyperfiltration is anearly manifestation of diabetes that causes polyuria and is an early predictor of glomerular damagein late stages of kidney disease [41–43]. While there was no evidence of better renal function (eGFRlevels) in the WGP group (Figure 3D), this may have been due to the short duration of the study, sincedecline in GFR is a late marker of nephropathy when around 50% of nephrons are already lost [39,44].The obese ZSF1 rats in this study indeed show the signs of early stages of CKD where an evidence ofkidney damage such as proteinuria is present with normal or slightly decreased eGFR.
The renal protective pathway of WGP diet in obese diabetic ZSF1 rats is not fully understood.A previous study has demonstrated that the kidney disease of these rats is mostly independenton hypertension and/or hypertensive nephropathy [45], suggesting the attribution of renalpathophysiology strictly to other components of MetS, such as obesity and/or hyperglycemia. Indeed,many studies in literature use these rats as an appropriate model for the purposes of investigatingMetS-related kidney disease or DN [28,46]. Our data show that the daily intake of WGP had noimpact on the bodyweight or obesity of these rats (Figure 1). Therefore, the beneficial effect of WGPdiet on the diseased kidney may act through direct and/or indirect pathways, which include theimprovement of glucose metabolism and/or fatty liver disease (Figure 2), and the probability ofsuppressing low-degree immune response activity as indicated by the smaller size of the spleens
127
Books
MDPI

Nutrients 2017, 9, 345
(Table 1), but not relate to hypertension and obesity. The mechanism by which a WGP diet protectsthe kidney under the influence of both diabetic mellitus and fatty liver disease remains unknown andrequires further investigation.
Oxidative stress is induced by the excess levels of ROS that are generated in many differentsituations, including the mitochondrial injury [47], the increased activity of oxidases (e.g., cytochromep450s, xanthine oxidase, 5-lipoxygenase, and NADPH oxidase) in the response to inflammatorystimuli (e.g., hypoxia and immunologic stimuli) [48–50] and the loss of antioxidant defense systemthat includes enzymes (e.g., SOD, CAT and GSH-Px) and small molecular antioxidant scavengers(e.g., vitamin E, N-acetylcysteine and α-lipoic acid) [51,52]. The oxidative stress or ROS causescellular damage by reacting with and/or denaturing cellular macromolecules including lipid, proteinand nucleic acids, and/or even mediating or activating intracellular death signaling pathways [53],which plays an important role in the pathogenesis and progression of diabetes, fatty liver disease andtheir associated CKD including DN [52,54–56]. Grape products are rich in antioxidant chemicals,such as phenolic, flavonoid, and anthocyanidin [57–59], and exhibit anti-oxidative activities inboth humans and animals [37,60,61]. Our study showed that each gram of WGP extract frommethanol extraction contained approximately 21.5 mg of phenolics (reference: tannic acid), 0.25 mgof total flavonoids (reference: quercetin) and 5.2 mg of proanthocyandins (reference: catechine).The antioxidative activity of approximately 1.7 mg of this extract was equivalent to that of 5 μg ofascorbic acid in all three different assays (ABTS, DPPH, and FRAP) (Figure S1), and addition of thisextract prevented H2O2-induced podocyte injury in cultures (Figure 5). Consist with these data, theanti-oxidative stress system in the kidneys of the rats receiving WGP diet was improved (Table 2).Taken together, these findings from both the literature and our study imply that WGP diet may improveantioxidant capability not only systemically (e.g., in the liver and the immune system/spleen andglucose metabolism) but also locally specific in the kidneys, resulting in less cellular damage in thesetting of MetS and CKD.
The US Department of Agriculture considers 1.5 to 2 cups (250 g to 340 g, or 3.125 g·kg−1 to4.25 g·kg−1 based on 80 kg, an average bodyweight of an adult) of fresh grapes per day as a standardserving size. In this experimental study, each ZSF1 rat (300 g to 600 g) consumed an average ofapproximately 25 g of food or 1.25 g of WGP a day that was equal to 2.8 g·kg−1·day−1. There aretwo simple ways to converse this dose between rats and humans [62]; one is based on theequivalent surface area (1 for rats = 1/7 for humans), so that the equivalent dose for humanswill be 2.8 × 1/7 = 0.4 g·kg−1; the other is based on the representative surface area to weight ratio(Km), whereas rat Km = 5.9 and human (adult) Km = 37, then the dose for adult humans willbe 2.8 × (5.9/37) = 0.45 g·kg−1. The result from both calculations is similar. Given that grapes areapproximately 80% water by weight, 0.45 g·kg−1 of WGP dose equals to 2.25 g·kg−1 of fresh grapes,indicating that the dose we used in this experimental study was less than the standard serving sizerecommended by the US Department of Agriculture.
There are several limitations of this study. First, this is an experimental study using a relativelysmall number of animals from one strain, so the results may just limit to this strain and diseasetype. It is not certain if the same results would be seen in different species, or in different modelsof kidney disease. Second, a relatively short duration of this study may not represent the most ofmetabolic conditions and strategies that require life-long exposure and long duration of intervention.Finally, if the findings of the renoprotective effects of WGP diet are possibly attributable to betterglycemic control, so there is a need to test the WGP diet in non-diabetic animal models.
5. Conclusions
CKD has been known as an initially silent condition where clinical manifestations are usuallyunderreported at its early stages. By the time SCr reaches abnormally high levels, there already is50% nephron loss in the kidneys [44]. This highlights the importance of early stage management, suchas lifestyle and dietary modifications, which may be able to improve disease prognosis [63]. In this
128
Books
MDPI

Nutrients 2017, 9, 345
experimental study, we demonstrate that a daily intake of WGP for six months shows renoprotectionin a MetS animal model (obese diabetic ZSF1 rats), as evidenced by decreased proteinuria, lower uPCR,improved diabetic uremia and reduced renal injury in DN (early stages of CKD). Our findings suggestthat a daily intake of grape product rich in antioxidants may delay the progression of early CKD tolate or ESRD in humans, and warrants further investigation.
Supplementary Materials: The following are available online at http://www.mdpi.com/2072-6643/9/4/345/s1,Figure S1: Antioxidant activity of WGP extract, Table S1: The blood chemistry of obese male ZSF1 rats oversix months of daily intake of whole grape powder (WGP) compared to sugar (Vehicle) group, Table S2: Oxidativestress-related gene expression in kidney cortex of WGP-fed rats compared to Vehicle controls at the end ofsix months of feeding experiment, Table S3: Blood chemistry of metabolism of obese male ZSF1 rats (approximatelyeight weeks old) compared with a reference in the literature [36].
Acknowledgments: This study was supported by a grant from the California Table Grape Commission (CA, USA);S.M.K.A. received the scholarship from King Abdullah Scholarship Program of the Kingdom of Saudi Arabia;P.L. the funding support from the Second Affiliated Hospital of Chongqing Medical University; and K.Y. theCanadian Mitacs Globalink Internship.
Author Contributions: A.L. and C.D. were responsible for the concept and design of the study; S.M.K.A., Q.G.,P.L. and K.Y. for the lab work; S.M.K.A., Q.G., A.M.S., A.L. and C.D. for the data analysis and interpretation;S.M.K.A., A.M.S., A.L. and C.D. for drafting the article; and A.M.S., A.L. and C.D. for revising the article criticallyfor intellectual content. All authors gave the approval of the final version to the manuscript.
Conflicts of Interest: The authors declare no potential conflicts of interest.
References
1. Coresh, J.; Astor, B.C.; Greene, T.; Eknoyan, G.; Levey, A.S. Prevalence of chronic kidney disease and decreasedkidney function in the adult us population: Third national health and nutrition examination survey. Am. J.Kidney Dis. 2003, 41, 1–12. [CrossRef] [PubMed]
2. Levin, A.; Hemmelgarn, B.; Culleton, B.; Tobe, S.; McFarlane, P.; Ruzicka, M.; Burns, K.; Manns, B.; White, C.;Madore, F.; et al. Guidelines for the management of chronic kidney disease. CMAJ 2008, 179, 1154–1162.[CrossRef] [PubMed]
3. Stigant, C.; Stevens, L.; Levin, A. Nephrology: 4. Strategies for the care of adults with chronic kidney disease.CMAJ 2003, 168, 1553–1560. [PubMed]
4. Arora, P.; Vasa, P.; Brenner, D.; Iglar, K.; McFarlane, P.; Morrison, H.; Badawi, A. Prevalence estimates ofchronic kidney disease in canada: Results of a nationally representative survey. CMAJ 2013, 185, E417–E423.[CrossRef] [PubMed]
5. Levey, A.S.; Coresh, J. Chronic kidney disease. Lancet 2012, 379, 165–180. [CrossRef]6. Kaur, J. A comprehensive review on metabolic syndrome. Cardiol. Res. Pract. 2014, 2014, 943162. [CrossRef]
[PubMed]7. Singh, A.K.; Kari, J.A. Metabolic syndrome and chronic kidney disease. Curr. Opin. Nephrol. Hypertens. 2013,
22, 198–203. [CrossRef] [PubMed]8. Prasad, G.V. Metabolic syndrome and chronic kidney disease: Current status and future directions.
World J. Nephrol. 2014, 3, 210–219. [CrossRef] [PubMed]9. Thomas, G.; Sehgal, A.R.; Kashyap, S.R.; Srinivas, T.R.; Kirwan, J.P.; Navaneethan, S.D. Metabolic syndrome
and kidney disease: A systematic review and meta-analysis. Clin. J. Am. Soc. Nephrol. 2011, 6, 2364–2373.[CrossRef] [PubMed]
10. Nashar, K.; Egan, B.M. Relationship between chronic kidney disease and metabolic syndrome:Current perspectives. Diabetes Metab. Syndr. Obes. 2014, 7, 421–435. [CrossRef] [PubMed]
11. Asmat, U.; Abad, K.; Ismail, K. Diabetes mellitus and oxidative stress-a concise review. Saudi Pharm. J. 2016,24, 547–553. [CrossRef] [PubMed]
12. Betteridge, D.J. What is oxidative stress? Metabolism 2000, 49, 3–8. [CrossRef]13. Sadowska-Bartosz, I.; Bartosz, G. Effect of antioxidants supplementation on aging and longevity.
Biomed. Res. Int. 2014, 2014, 404680. [CrossRef] [PubMed]14. Williamson, G.; Faulkner, K.; Plumb, G.W. Glucosinolates and phenolics as antioxidants from plant foods.
Eur. J. Cancer Prev. 1998, 7, 17–21. [PubMed]
129
Books
MDPI

Nutrients 2017, 9, 345
15. Vendrame, S.; Del Bo, C.; Ciappellano, S.; Riso, P.; Klimis-Zacas, D. Berry fruit consumption and metabolicsyndrome. Antioxidants (Basel) 2016, 5, 34. [CrossRef] [PubMed]
16. Kowalska, K.; Olejnik, A. Current evidence on the health-beneficial effects of berry fruits in the preventionand treatment of metabolic syndrome. Curr. Opin. Clin. Nutr. Metab. Care 2016, 19, 446–452. [CrossRef][PubMed]
17. El-Mowafy, A.M.; Salem, H.A.; Al-Gayyar, M.M.; El-Mesery, M.E.; El-Azab, M.F. Evaluation of renalprotective effects of the green-tea (EGCG) and red grape resveratrol: Role of oxidative stress and inflammatorycytokines. Nat. Prod. Res. 2011, 25, 850–856. [CrossRef] [PubMed]
18. Sanchez-Gonzalez, P.D.; Lopez-Hernandez, F.J.; Perez-Barriocanal, F.; Morales, A.I.; Lopez-Novoa, J.M.Quercetin reduces cisplatin nephrotoxicity in rats without compromising its anti-tumour activity.Nephrol. Dial. Transplant. 2011, 26, 3484–3495. [CrossRef] [PubMed]
19. Tanabe, K.; Tamura, Y.; Lanaspa, M.A.; Miyazaki, M.; Suzuki, N.; Sato, W.; Maeshima, Y.; Schreiner, G.F.;Villarreal, F.J.; Johnson, R.J.; et al. Epicatechin limits renal injury by mitochondrial protection in cisplatinnephropathy. Am. J. Physiol. Ren. Physiol. 2012, 303, F1264–F1274. [CrossRef] [PubMed]
20. Li, J.; Kang, M.K.; Kim, J.K.; Kim, J.L.; Kang, S.W.; Lim, S.S.; Kang, Y.H. Purple corn anthocyanins retarddiabetes-associated glomerulosclerosis in mesangial cells and db/db mice. Eur. J. Nutr. 2012, 51, 961–973.[CrossRef] [PubMed]
21. Pokkunuri, I.; Ali, Q.; Asghar, M. Grape powder improves age-related decline in mitochondrial and kidneyfunctions in fischer 344 rats. Oxid. Med. Cell. Longev. 2016, 2016, 6135319. [CrossRef] [PubMed]
22. Laguardia, H.A.; Hamm, L.L.; Chen, J. The metabolic syndrome and risk of chronic kidney disease:Pathophysiology and intervention strategies. J. Nutr. Metab. 2012, 2012, 652608. [CrossRef] [PubMed]
23. Tofovic, S.P.; Kusaka, H.; Kost, C.K., Jr.; Bastacky, S. Renal function and structure in diabetic, hypertensive,obese ZDFxSHHF-hybrid rats. Ren. Fail. 2000, 22, 387–406. [CrossRef] [PubMed]
24. Baynes, J.; Murray, D.B. Cardiac and renal function are progressively impaired with aging in zucker diabeticfatty type II diabetic rats. Oxid. Med. Cell. Longev. 2009, 2, 328–334. [CrossRef] [PubMed]
25. Rafikova, O.; Salah, E.M.; Tofovic, S.P. Renal and metabolic effects of tempol in obese ZSF1 rats—Distinctrole for superoxide and hydrogen peroxide in diabetic renal injury. Metab. Clin. Exp. 2008, 57, 1434–1444.[CrossRef] [PubMed]
26. Vora, J.P.; Zimsen, S.M.; Houghton, D.C.; Anderson, S. Evolution of metabolic and renal changes in theZDF/DRT-fa rat model of type II diabetes. J. Am. Soc. Nephrol. 1996, 7, 113–117. [PubMed]
27. Tofovic, S.P.; Jackson, E.K. Rat models of the metabolic syndrome. Methods Mol. Med. 2003, 86, 29–46.[PubMed]
28. Bilan, V.P.; Salah, E.M.; Bastacky, S.; Jones, H.B.; Mayers, R.M.; Zinker, B.; Poucher, S.M.; Tofovic, S.P. Diabeticnephropathy and long-term treatment effects of rosiglitazone and enalapril in obese ZSF1 rats. J. Endocrinol.2011, 210, 293–308. [CrossRef] [PubMed]
29. Tofovic, S.P.; Kusaka, H.; Jackson, E.K.; Bastacky, S.I. Renal and metabolic effects of caffeine in obese(fa/fa(cp)), diabetic, hypertensive ZSF1 rats. Ren. Fail. 2001, 23, 159–173. [CrossRef] [PubMed]
30. Zhang, X.; Jia, Y.; Jackson, E.K.; Tofovic, S.P. 2-methoxyestradiol and 2-ethoxyestradiol retard the progressionof renal disease in aged, obese, diabetic ZSF1 rats. J. Cardiovasc. Pharmacol. 2007, 49, 56–63. [CrossRef][PubMed]
31. Griffin, S.V.; Hiromura, K.; Pippin, J.; Petermann, A.T.; Blonski, M.J.; Krofft, R.; Takahashi, S.; Kulkarni, A.B.;Shankland, S.J. Cyclin-dependent kinase 5 is a regulator of podocyte differentiation, proliferation,and morphology. Am. J. Pathol. 2004, 165, 1175–1185. [CrossRef]
32. Brosius, F.C.; Coward, R.J. Podocytes, signaling pathways, and vascular factors in diabetic kidney disease.Adv. Chronic Kidney Dis. 2014, 21, 304–310. [CrossRef] [PubMed]
33. Anderson, C.A.; Nguyen, H.A.; Rifkin, D.E. Nutrition interventions in chronic kidney disease. Med. Clin.N. Am. 2016, 100, 1265–1283. [CrossRef] [PubMed]
34. Chan, M. Protein-controlled versus restricted protein versus low protein diets in managing patients withnon-dialysis chronic kidney disease: A single centre experience in Australia. BMC Nephrol. 2016, 17, 129.[CrossRef] [PubMed]
35. Shah, B.V.; Patel, Z.M. Role of low protein diet in management of different stages of chronic kidneydisease—Practical aspects. BMC Nephrol. 2016, 17, 156. [CrossRef] [PubMed]
130
Books
MDPI

Nutrients 2017, 9, 345
36. Wang, M.; Chou, J.; Chang, Y.; Lau, W.L.; Reddy, U.; Rhee, C.M.; Chen, J.; Hao, C.; Kalantar-Zadeh, K.The role of low protein diet in ameliorating proteinuria and deferring dialysis initiation: What is old andwhat is new. Panminerva Med. 2017, 59, 157–165. [PubMed]
37. Turki, K.; Charradi, K.; Boukhalfa, H.; Belhaj, M.; Limam, F.; Aouani, E. Grape seed powder improves renalfailure of chronic kidney disease patients. EXCLI J. 2016, 15, 424–433. [PubMed]
38. Bernardi, C.; Moneta, D.; Brughera, M.; DiSalvo, M.; Lamparelli, D.; Mazue, G.; Iatropoulos, M.J. Haematologyand clinical chemistry in rats: Comparison of different blood collection sites. Comp. Haematol. Int. 1996, 6,160–166. [CrossRef]
39. Vassalotti, J.A.; Stevens, L.A.; Levey, A.S. Testing for chronic kidney disease: A position statement from thenational kidney foundation. Am. J. Kidney Dis. 2007, 50, 169–180. [CrossRef] [PubMed]
40. Arici, M. Management of Chronic Kidney Disease: A Clinician’s Guide; Springer: Berlin/Heidelberg, Germany, 2014.41. Spira, A.; Gowrishankar, M.; Halperin, M.L. Factors contributing to the degree of polyuria in a patient with
poorly controlled diabetes mellitus. Am. J. Kidney Dis. 1997, 30, 829–835. [CrossRef]42. Ahloulay, M.; Schmitt, F.; Dechaux, M.; Bankir, L. Vasopressin and urinary concentrating activity in
diabetes mellitus. Diabetes Metab. 1999, 25, 213–222. [PubMed]43. Mogensen, C.E. Early glomerular hyperfiltration in insulin-dependent diabetics and late nephropathy.
Scand. J. Clin. Lab. Investig. 1986, 46, 201–206. [CrossRef]44. Ahmed, S.; Lowder, G. Severity and stages of chronic kidney disease. Age 2012, 140, 13–25.45. Griffin, K.A.; Abu-Naser, M.; Abu-Amarah, I.; Picken, M.; Williamson, G.A.; Bidani, A.K. Dynamic blood
pressure load and nephropathy in the ZSF1 (fa/fa cp) model of type 2 diabetes. Am. J. Physiol. Renal. Physiol.2007, 293, F1605–F1613. [CrossRef] [PubMed]
46. Tofovic, S.P.; Salah, E.M.; Jackson, E.K.; Melhem, M. Early renal injury induced by caffeine consumption inobese, diabetic zsf1 rats. Ren. Fail. 2007, 29, 891–902. [CrossRef] [PubMed]
47. Rocha, M.; Hernandez-Mijares, A.; Garcia-Malpartida, K.; Banuls, C.; Bellod, L.; Victor, V.M.Mitochondria-targeted antioxidant peptides. Curr. Pharm. Des. 2010, 16, 3124–3131. [CrossRef] [PubMed]
48. Novo, E.; Parola, M. Redox mechanisms in hepatic chronic wound healing and fibrogenesis.Fibrogenesis Tissue Repair 2008, 1, 5. [CrossRef] [PubMed]
49. Babior, B.M. NADPH oxidase: An update. Blood 1999, 93, 1464–1476. [PubMed]50. Forman, H.J.; Torres, M. Redox signaling in macrophages. Mol. Aspects Med. 2001, 22, 189–216. [CrossRef]51. Birben, E.; Sahiner, U.M.; Sackesen, C.; Erzurum, S.; Kalayci, O. Oxidative stress and antioxidant defense.
World Allergy Organ. J. 2012, 5, 9–19. [CrossRef] [PubMed]52. Du, C.; Wang, X.; Chen, H. Oxidative stress to renal tubular epithelial cells—A common pathway in renal
pathologies. In Systems Biology of Free Radicals and Anti-Oxidants; Laher, I., Ed.; Springer: Berlin/Heidelberg,Germany, 2014; pp. 2606–2624.
53. Rhee, S.G. Redox signaling: Hydrogen peroxide as intracellular messenger. Exp. Mol. Med. 1999, 31, 53–59.[CrossRef] [PubMed]
54. Turkmen, K. Inflammation, oxidative stress, apoptosis, and autophagy in diabetes mellitus and diabetickidney disease: The four horsemen of the apocalypse. Int. Urol. Nephrol. 2016. [CrossRef] [PubMed]
55. Sunny, N.E.; Bril, F.; Cusi, K. Mitochondrial adaptation in nonalcoholic fatty liver disease: Novel mechanismsand treatment strategies. Trends Endocrinol. Metab. 2017, 28, 250–260. [CrossRef] [PubMed]
56. Newsholme, P.; Cruzat, V.F.; Keane, K.N.; Carlessi, R.; de Bittencourt, P.I., Jr. Molecular mechanisms of ROSproduction and oxidative stress in diabetes. Biochem. J. 2016, 473, 4527–4550. [CrossRef] [PubMed]
57. Yilmaz, Y.; Toledo, R.T. Major flavonoids in grape seeds and skins: Antioxidant capacity of catechin,epicatechin, and gallic acid. J. Agric. Food Chem. 2004, 52, 255–260. [CrossRef] [PubMed]
58. Ross, C.F.; Hoye, C., Jr.; Fernandez-Plotka, V.C. Influence of heating on the polyphenolic content andantioxidant activity of grape seed flour. J. Food Sci. 2011, 76, C884–C890. [CrossRef] [PubMed]
59. Yang, J.; Xiao, Y.Y. Grape phytochemicals and associated health benefits. Crit. Rev. Food Sci. Nutr. 2013, 53,1202–1225. [CrossRef] [PubMed]
60. Aloui, F.; Charradi, K.; Hichami, A.; Subramaniam, S.; Khan, N.A.; Limam, F.; Aouani, E. Grape seedand skin extract reduces pancreas lipotoxicity, oxidative stress and inflammation in high fat diet fed rats.Biomed. Pharmacother. 2016, 84, 2020–2028. [CrossRef] [PubMed]
131
Books
MDPI

Nutrients 2017, 9, 345
61. Oueslati, N.; Charradi, K.; Bedhiafi, T.; Limam, F.; Aouani, E. Protective effect of grape seed and skinextract against diabetes-induced oxidative stress and renal dysfunction in virgin and pregnant rat.Biomed. Pharmacother. 2016, 83, 584–592. [CrossRef] [PubMed]
62. Freireich, E.J.; Gehan, E.A.; Rall, D.P.; Schmidt, L.H.; Skipper, H.E. Quantitative comparison of toxicity ofanticancer agents in mouse, rat, hamster, dog, monkey, and man. Cancer Chemother. Rep. 1966, 50, 219–244.[PubMed]
63. Johnson, D.W. Evidence-based guide to slowing the progression of early renal insufficiency. Intern. Med. J.2004, 34, 50–57. [CrossRef] [PubMed]
© 2017 by the authors. Licensee MDPI, Basel, Switzerland. This article is an open accessarticle distributed under the terms and conditions of the Creative Commons Attribution(CC BY) license (http://creativecommons.org/licenses/by/4.0/).
132
Books
MDPI

nutrients
Review
Effects of Ketogenic Diets on Cardiovascular RiskFactors: Evidence from Animal and Human Studies
Christophe Kosinski 1 and François R. Jornayvaz 2,*
1 Service of Endocrinology, Diabetes and Metabolism, Lausanne University Hospital (CHUV), Avenue de laSallaz 8, 1011 Lausanne, Switzerland; [email protected]
2 Service of Endocrinology, Diabetes, Hypertension and Nutrition, Geneva University Hospitals,Rue Gabrielle-Perret-Gentil 4, 1205 Geneva, Switzerland
* Correspondence: franç[email protected]; Tel.: +41-22-372-9302
Received: 7 March 2017; Accepted: 16 May 2017; Published: 19 May 2017
Abstract: The treatment of obesity and cardiovascular diseases is one of the most difficult andimportant challenges nowadays. Weight loss is frequently offered as a therapy and is aimed atimproving some of the components of the metabolic syndrome. Among various diets, ketogenicdiets, which are very low in carbohydrates and usually high in fats and/or proteins, have gained inpopularity. Results regarding the impact of such diets on cardiovascular risk factors are controversial,both in animals and humans, but some improvements notably in obesity and type 2 diabetes havebeen described. Unfortunately, these effects seem to be limited in time. Moreover, these diets are nottotally safe and can be associated with some adverse events. Notably, in rodents, development ofnonalcoholic fatty liver disease (NAFLD) and insulin resistance have been described. The aim of thisreview is to discuss the role of ketogenic diets on different cardiovascular risk factors in both animalsand humans based on available evidence.
Keywords: ketogenic diets; obesity; NAFLD; fibroblast growth factor (FGF21); insulin resistance;type 2 diabetes; cardiovascular risk factors
1. Introduction
As a consequence of the rising obesity prevalence in industrialized countries, the incidence ofcardiovascular diseases also increases [1]. Obesity is also a major risk factor for insulin resistanceand type 2 diabetes [2]. This state of insulin resistance is frequently associated with ectopic lipidaccumulation, notably in the liver and skeletal muscle. This can lead to the development of nonalcoholicfatty liver disease (NAFLD), which is an independent predictor of cardiovascular disease [3,4]. NAFLDis defined as steatosis which is not due to excess consumption of alcohol, viral or autoimmune causes,and iron overload [5,6]. No evidence-based pharmacological treatment for NAFLD exists so far.NAFLD is an important risk factor for the development of insulin resistance and type 2 diabetes, whichmay be associated with other cardiovascular risk factors such as dyslipidemia and high blood pressure.As NAFLD is present in almost 90% of obese patients [7], weight loss represents one of the pillars ofthe treatments among others, such as physical activity.
In the literature, diets rich in carbohydrates, and notably rich in refined sugars and fructose,are associated with the metabolic syndrome [8,9]. Therefore, to lose weight, different diets havebeen suggested. Among them, carbohydrate restriction has been proposed to be the single mosteffective intervention for reducing all features of the metabolic syndrome [10–12]. Since the publicationof Atkins’s book in the early 1970s [13], low-carbohydrate diets have become increasingly popular,particularly ketogenic diets (KD). These diets are known for being very low in carbohydrates, butusually high in fats and/or proteins. In practice, KD are characterized by a reduction in carbohydrates(usually less than 50 g/day) and a relative increase in the proportions of proteins and fats [14]. Some
Nutrients 2017, 9, 517 133 www.mdpi.com/journal/nutrients
Books
MDPI

Nutrients 2017, 9, 517
variations exist, like very-low-carbohydrate KD, which are even more restrictive, with less than30 g/day (Table 1).
Table 1. Standard composition of ketogenic diets in adults * (calculated for a 2000 kcal diet/day).
Classical KDDefined as <130 g carbohydrate per day or <26% of caloric
intake by the American Diabetes Association
Modified Atkins Diet 65% caloric intake from fat, 30% protein, 6% carbohydratesVery low-carbohydrate KD Carbohydrates < 30 g/day
KD, Ketogenic Diet. * Adapted from Kossoff et al. [15], Feinman et al. [16], Accurso et al. [17].
After a few days of such diets, glucose reserves (i.e., glycogen stored in liver and skeletal muscle)become insufficient to provide body energy needs. This leads to the production of ketone bodies by theliver, which will be used as an alternative energy source notably by the central nervous system [18].
KD are known to be efficient in the treatment of seizures and can be used as an alternativetreatment [19], but this aspect will not be discussed in this review. Nevertheless, for about forty years,the potential use of KD has also been investigated in the prevention and treatment of cardiovascularrisk factors. The aim of this review is to discuss the available evidence in animal and human studies,and the role of KD on different cardiovascular risk factors, namely obesity, NAFLD, insulin resistanceand type 2 diabetes, dyslipidemia and high blood pressure. To our knowledge, this is the first reviewcomparing the effects of KD on cardiovascular risk factors in animals and humans.
2. Method
This article is neither a systematic review nor a meta-analysis. We searched Medline (PubMed) fortrials in animals and humans, reviews or meta-analyses, using the query “ketogenic diet” + “weightloss”, “obesity”, “fibroblast growth factor (FGF21)”, “NAFLD”, “diabetes”, “insulin resistance”,“dyslipidemia” or “blood pressure”. Then, we selected the most recent papers (less than 15 years) andpublications with potential practical usefulness. Finally, we only kept studies of adults, not children.
3. Results
3.1. KD and Obesity
Studies in rodents (obese or non obese) show that KD are efficient for weight loss [20,21].Nevertheless, it is important to assess body composition changes, as it is always better to lose fat massthan lean mass. Indeed, in a study by Garbow et al., after 12 weeks KD led to a significantly lowerweight gain compared to chow-fed and high-simple-carbohydrate high-fat Western diet fed mice,but lean mass was significantly reduced in KD-fed mice compared to chow-fed mice [22]. In anotherstudy, accumulation of visceral fat mass was significantly higher (at least 30%) in rats fed a KD(two compositions of KD were tested: a high-protein “Atkins-style” or a low-protein diet, both with alow-carbohydrate and high-fat content), compared with chow-fed controls, after 4 weeks of diet [23].Finally, Jornayvaz et al. showed that KD-fed mice during 5 weeks gained significantly less weightthan regular-chow fed mice. Nevertheless, KD-fed mice had an increased fat mass percentage thanregular-chow fed mice, without differences in the percentage of lean body mass between diets [24].
It is also important to assess whether weight loss can be maintained. Long-term studies revealan absence of weight loss after 22 weeks of KD in mice, despite an initial weight loss during thefirst week of diet [25]. Moreover, another study showed that mice fed a KD for 80 weeks initiallylost weight, but after 18 weeks, their weight returned to baseline and then increased gradually [26].Nevertheless, they gained less weight than chow-fed mice, and, with body composition analysis,the authors showed that this difference resulted from both a lower lean mass and a lower fat mass.Moreover, the survival curves were the same between the two diets. Finally, KD-fed mice also had anincreased energy expenditure and a loss of the diurnal pattern of the respiratory exchange ratio, which
134
Books
MDPI

Nutrients 2017, 9, 517
indicated continuous use of fatty acids as an energy substrate [26]. This rise in energy expenditure wasanalyzed in another study which showed that KD promotes weight loss (20% of total body weight)through an increased energy expenditure and this correlated with a rise in plasma fibroblast growthfactor 21 (FGF21) levels [27]. The role of FGF21 in KD will be further discussed later. In anotherstudy, compared to non-KD, rats fed a low protein (10% of total content) KD had a waste of energy inurine. [28]. Indeed, KD-fed rats had a lower urine nitrogen excretion due to a lower protein intake anda urine energy-to-nitrogen ratio almost twice as high as the other diets.
Overall, an increase in energy expenditure in mice fed a KD compared to mice fed a chow dietcould be the mechanism responsible for decreased weight gain or weight loss seen in rodents, despite asimilar caloric intake [24]. As a potential component of the increased energy expenditure, other authorsperformed microarrays in the liver of KD-fed mice and described an increased expression of genesinvolved in fatty acid oxidation and a reduced expression in genes involved in lipid synthesis [20].
A recent study analyzed the effects of KD on exercising rats and sedentary rats [29]. Compared toother diets (Western diet, standard chow), after 6 weeks, sedentary KD-fed rats had an approximately25% lower body mass, a lower size of adipocytes from omental adipose tissue, 80% lower levels ofserum insulin, 50% lower levels of glucose, 55% lower levels of triglycerides and 20% lower levels oftotal cholesterol. Activity did not confer a benefit, as KD-fed exercising rats did not show better resultsthan the sedentary rats. Nevertheless, exercising rats had 40% lower serum β-hydroxybutyrate levelsthan sedentary rats, independent of diet, while they had more favorable adipose tissue characteristics.These results suggest that body fat regulation (e.g., reduced adipose tissue mass and cell size) under aKD (with or without exercise) could rather be due to lower insulin levels. Therefore, increased serumketones may have a smaller role.
In humans, KD are known to be an effective weight-loss therapy [30–33] (in average up to 5%of body weight at 6 months), but the mechanisms are not clearly established. Some authors suggestthat it results simply from reduced caloric intake and an increased satiety effect of proteins [34].Other studies suggest a metabolic effect of KD: possibly, the use of energy from proteins in KDis an expensive process and therefore increases weight loss [35–37]. Also, there is the suggestionthat gluconeogenesis, which is increased with carbohydrate restriction, is energy demanding [35,38].Another hypothesis of KD-induced weight loss is decreased appetite induced by ketosis [39]. Someauthors also suggest digestive metabolic changes: with ketogenic very-low energy diets, ghrelin levelsand subjective appetite (usually increased in a hypocaloric diet) were reduced when patients werein a ketotic state [39]. Surprisingly, leptin levels were lower under ketosis. A study in 132 severelyobese patients (mean body mass index (BMI) 43 kg/m2) with a high prevalence of type 2 diabetes ormetabolic syndrome showed that participants using a low-carbohydrate diet lost more weight thanthose using other diets, suggesting a greater reduction in overall caloric intake, rather than a directeffect of macronutrient composition [32].
As discussed in rodents, the problem is that a lot of studies are of short duration. For example,a small study [40] of 17 obese men, randomized to two different high-protein diets (one low-carbohydrate,“ketogenic”; one medium-carbohydrate, “non-ketogenic”) with a cross-over design, eating ad libitumduring 4 weeks each, revealed that KD reduced hunger and was associated with a lower food intake.Weight loss was also significantly greater with the ketogenic diet than with the non-ketogenic diet, andweight loss was equally comprised of fat mass and fat-free mass. Only 35% of the difference in totalweight loss between the two diets was due to water depletion; the remainder was attributed to fat massand lean mass loss [40]. In a bigger study of 311 participants [41], a very low-carbohydrate KD followedby a period of slow re-insertion of a Mediterranean diet and alimentary education was associatedwith an overall improvement (mean total body weight loss of 14 ± 10 kg, BMI 5 ± 3 kg/m2, waistcircumference 13 ± 7 cm) at 1–4 months, which remained stable after 1 year [41]. The limitations werethe composition of the diet (low-carbohydrate, but also low-fat) and the fact that it was an observationalstudy. Other authors [42] compared different diets in the same group of patients eating alternatively aKD (two different periods of 20 days), a low-carbohydrate non-KD (two different periods of 20 days),
135
Books
MDPI

Nutrients 2017, 9, 517
and a normal Mediterranean diet (4 months during the rotation of the two other diets, then 6 months)during 1 year. Significant weight loss and reduction of body fat percentages were observed only duringketogenic periods compared to the two other diets. Moreover, if the patients were compliant to theprescribed Mediterranean diet (which was relatively strict: 1800 kcal/day) during the maintenanceperiod, no weight regain was observed at 12 months [42]. In an older study in obese non-diabeticparticipants, a low-carbohydrate diet led to a greater weight loss after 6 months, but no significantdifference at 1 year [33]. The authors suggested that weight loss was probably due to a greater energydeficit, but the mechanisms remain unknown, and no relation between weight loss and ketosis wasfound at any time during the study. Finally, in a study with obese type 2 diabetes patients [43], theauthors compared a low-carbohydrate high unsaturated fat diet to a high-carbohydrate low-fat diet,in adjunction with structured exercise: weight loss was similar in both groups (−9.1%), but a trendtoward regaining more weight was observed in the low-carbohydrate diet group at 52 weeks. Weightloss is usually related to a high intensity of lifestyle interventions. Thus, it would be interesting toknow the evolution on the next months/years of follow-up, and if the weight loss would be maintainedwithout structured exercise. Exercise has an impact on body weight, but also on body composition asdescribed in a study that analyzed the association of KD or regular diet in combination with exercise(resistance training) in overweight women [44]. The KD group lost fat mass without experiencing asignificant alteration in lean mass, while the other group gained lean mass without a significant changein fat mass [44].
To summarize, in rodents and humans, KD seem to have a benefit on weight loss, notably byincreased energy expenditure in animals and decreasing food intake in humans. In humans, weightloss affects both fat mass and lean mass. Greater weight loss is also associated with structuredprofessional support, which may be difficult and expensive to maintain over time. Long-term studiesare nevertheless needed to assess the evolution of weight loss.
3.2. KD and NAFLD
In mice, KD induce hepatic inflammation and lipid accumulation [22], while inflammation isreduced in white adipose tissue [27]. KD also lead to hepatic steatosis in both short-term [24,25] andlong-term feeding in mice [26]. Biological markers such as aspartate aminotransferase (AST) andalanine aminotransferase (ALT) are increased at least twofold in parallel with increased intrahepatictriglyceride content [24,25]. On the contrary, a study described that compared to other diets (Westerndiet, standard chow), KD-fed mice display reduced ALT levels, hepatic triglyceride accumulation andmarkers of liver inflammation [29]. The authors explained that these results, different from previousstudies, could be due to the protein content of the diet (they used a KD with 20% protein, versus <10%in other studies) and differences in animal models (rat in this study, versus mice in others). Thus,this shows the importance of the diet’s composition. Another study reported an increase in hepatictriglyceride content in KD-fed mice after 12 weeks, and this correlated with an elevation in ALT levels,suggesting that chronic KD feeding causes an injury pattern similar to a NAFLD phenotype [22].Another interesting marker of NAFLD is FGF21. In humans, FGF21 levels are increased in NAFLD andcorrelate with hepatic triglyceride content [45–47]. Nevertheless, the role of FGF21 in NAFLD inducedby a KD has mostly been studied in rodents [26,27,48,49]. Notably, a study in mice showed that FGF21plasma levels and liver expression are increased by 5 weeks of KD feeding, and this was accompaniedby an increased hepatic fat content as revealed by increased hepatic triglycerides, diacylglycerols andceramides levels [24]. Moreover, KD-fed mice developed hepatic insulin resistance and this was dueto increased hepatic diacylglycerol content, as diacylglycerols are known to activate protein kinaseCε [50]. In this study [24], the authors suggested that increased plasma FGF21 levels and hepaticexpression in KD-fed mice was probably secondary to hepatic fat accumulation and may representa compensatory mechanism to counteract hepatic insulin resistance, suggesting that FGF21 may bebeneficial in reversing hepatic insulin resistance. This has been further verified in high-fat diet fedmice treated with exogenous FGF21. In a study in wild-type mice, FGF21 decreased hepatic fat content,
136
Books
MDPI

Nutrients 2017, 9, 517
notably hepatic diacylglycerol content, and improved hepatic insulin sensitivity [51]. The beneficialrole of FGF21 on hepatic insulin sensitivity was also shown by other authors [52]. Moreover, micelacking FGF21 gain weight, have an increased fat mass and develop glucose intolerance. Moreover,when the chow diet was changed for a KD, these mice not only gained weight and developed glucoseintolerance, but also developed NAFLD [53]. Finally, another study revealed that FGF21 knock-outmice fed a KD develop NAFLD and severe hepatic insulin resistance as assessed by the gold-standardtechnique, the hyperinsulinemic-euglycemic clamp [54]. Finally, FGF21 has been shown to act as anendocrine signal of protein restriction [55]. In summary, these studies suggest an important role ofFGF21 in the pathophysiology of NAFLD.
In humans, liver fat content was shown to be increased during an isocaloric high-fatlow-carbohydrate diet [56]. This result should be analyzed with caution, as with 31% of carbohydratesthe diet is not a “real” KD. Caloric restriction also had an impact: compared to the high-carbohydrate(“standard”) hypocaloric diet, reduction of liver fat content was significantly higher with thehypocaloric low-carbohydrate diet [57,58]. This effect was limited in time, with no significant differenceat 11 weeks [57]. KD have also been associated with a higher decrease in liver volume compared witha standard hypocaloric diet, probably due to the depletion of liver glycogen [59]. Finally, the responseto KD may be influenced by genetic predisposition to NAFLD, as shown by two studies with a betterresponse to KD for patients with variants of the PNPLA3 gene [60,61]. When fed a KD, subjects withPNPLA3 variants had a lower liver fat content than controls.
To summarize, the effect of KD on the liver was mostly investigated in rodents. The results arerather negative, with induction of hepatic inflammation and NAFLD, but these findings have not beenreported in humans. An alteration of FGF21 expression could be a potential cause or consequence.More studies are warranted in humans to assess whether KD could induce or improve NAFLD.
3.3. KD and Insulin Resistance / Type 2 Diabetes
Obesity is often associated with the development of NAFLD, insulin resistance and type 2 diabetes.Notably, as already discussed, KD can lead to decreased weight gain in mice but with concomitantdevelopment of NAFLD and associated hepatic insulin resistance [24]. In the latter study, mice fed aKD for 5 weeks developed whole body insulin resistance despite reduced basal plasma glucose andinsulin levels. In this case, the use of indices of insulin sensitivity, such as the homeostatic modelassessment for insulin resistance (HOMA-IR) and quantitative insulin-sensitivity check index (QUICKI)indices, would lead to the conclusion that insulin sensitivity is improved in KD fed mice [62]. However,using the hyperinsulinemic-euglycemic clamp, glucose infusion rates were 47% lower in KD-fed micethan in chow-fed mice, demonstrating whole body insulin resistance in KD-fed mice [24]. KD-fedmice also had an impaired insulin ability to suppress endogenous glucose production confirminginsulin resistance at the level of the liver. In this case, KD induced severe hepatic insulin resistance inmice despite lower body weight gain, and this was attributed to an increased hepatic diacylglycerolcontent. Finally, insulin resistance was also attributed to a decreased insulin-stimulated whole bodyglucose disposal, which was notably due to decreased glucose uptake in brown adipose tissue and theheart [24].
In another study, mice fed a KD during 12 weeks remained euglycemic, but had reducedmean serum insulin levels and HOMA-IR indices, and exhibited glucose intolerance as assessedby intra-peritoneal glucose tolerance tests [22]. However, despite mild hepatic steatosis, systemicresponse to insulin was preserved, unlike in other studies. The authors explained this discrepancy by arelatively reduced lean body mass in KD-fed mice, resulting in higher insulin dose in insulin-tolerancetests. Also, hepatic insulin resistance may confer a smaller contribution to overall glucose homeostasisthan peripheral glucose disposal [22]. In studies using rats, KD also induced glucose intolerance andinsulin resistance [23,63], despite reduced glucose and insulin levels [23]. In the latter study, the authorsshowed that these effects were not due to energy overconsumption. Moreover, as KD-fed rats had asignificant accumulation of visceral fat, the effects on glucose homeostasis were not dependent upon
137
Books
MDPI

Nutrients 2017, 9, 517
visceral fat mass. In the same study, short term KD feeding in rats was also associated with decreasedβ-cell mass, but this effect could be due to a lower lean body mass of KD fed rats [23]. Nevertheless,these findings were corroborated by another study where long term KD feeding in mice led to glucoseintolerance that was associated with insufficient insulin secretion from β-cells, potentially due to adecrease in β-cell mass [25]. Interestingly, after only 6 days of KD feeding, mice showed impairmentsin glucose tolerance and insulin sensitivity, and this was attributed to a possible adaptation to maintainblood glucose levels against insufficient amounts of carbohydrates [48]. In this case, insulin signalingwas impaired only in white adipose tissue, but not in liver and muscle. The authors suggested that thisimpairment in white adipose tissue could not be the only culprit for whole body glucose intolerancein KD fed mice. Indeed, a low-carbohydrate diet might account for an impaired nutritional statecompared to a chow diet. These results were explained by a lower lean mass and a proportionallyhigher insulin dose in insulin tolerance tests. The possible role of KD in inducing insulin resistance isnevertheless controversial. Indeed, several authors reported that long term KD fed mice had normalglucose tolerance, lower baseline insulin levels and improved insulin sensitivity [26,29].
In humans, the effect of KD on glucose homeostasis is more controversial, and notably dependson the presence of type 2 diabetes or not at baseline. A study showed that a high-fat, low-carbohydrateintake reduces the ability of insulin to suppress endogenous glucose production in healthy men,by using the gold standard method, the hyperinsulinemic-euglycemic clamp [64]. The limitation isthe small number of participants (only 6). Other studies described the opposite: with a KD, obesenon-diabetic participants had a significant lower HOMA-IR and fasting glucose after a KD than atbaseline [40], and an improvement in insulin sensitivity using the QUICKI [32]. Finally, another trialalso described a better insulin sensitivity by consuming a KD [33], but this improvement does notseem to be permanent. Indeed, Forster et al. found a significant improvement in insulin sensitivity at6 months, but not at 1 year [33]. This reduction in insulin levels could be explained by the satietogeniceffect of this diet [65].
In type 2 diabetic patients, KD could be an interesting approach, as most patients have glycemicvariability due to food carbohydrate content. A lot of studies have been designed around this purpose.KD are frequently associated with a diminution of blood glucose levels (up to 0.5 mmol/L) [41,66–68],glycosylated hemoglobin (HbA1c (up to 0.3%) [41,66,68,69], glycemic variability [70] and improvementin insulin sensitivity [32,68], sometimes without weight loss [67]. Low-carbohydrate diets can leadto a reduction in medications in type 2 diabetic patients [69–74]. An important aspect is to assessthe long-term effect of a KD on these outcomes. In studies in obese type 2 diabetic patients feda KD, a significant improvement in fasting glucose levels was seen after 12 weeks and continuedafter 56 weeks [75]. Nevertheless, in another study, a short-term decrease in HbA1c was observedat 6 months, but was not sustained at 24 months [76]. The latter study is probably more relevantto daily clinical practice because it was a low-intensity intervention. A recent study in obese type 2diabetic patients compared a hypocaloric high-unsaturated/low-saturated fat very-low-carbohydratediet to a high-carbohydrate low-fat diet [43]. After 52 weeks, the low-carbohydrate diet group showeda decrease in glycemic variability two times greater that the low-fat diet group, which indicates agreater diurnal blood glucose stability. However, improvement in HbA1c was similar in both diets(−1%). Nevertheless, the low-carbohydrate diet led to a greater reduction in antidiabetic medications,which could overall be helpful to optimize glycemic control [43]. Still, long-term effects of such dietarychanges need to be evaluated.
In a prospective cohort of non-diabetic men, health professionals younger than 65 years oldfollowed during 20 years, a low-carbohydrate diet high in animal proteins and fats was associatedwith a twofold increased risk of type 2 diabetes [77]. On the other hand, a low-carbohydrate diethigh in vegetal proteins and fats was associated with a decreased risk of type 2 diabetes [77]. Thesefindings suggest that a low-carbohydrate diet should contain proteins and fats from foods other thanred and processed meat. However, these results were found from non-ketogenic diets. Therefore,further studies with “vegetal versus animal protein and fat content” KD are necessary to assess if these
138
Books
MDPI

Nutrients 2017, 9, 517
assumptions are validated. In another trial [32], a greater decrease of mean fasting glucose levels (−9%)was observed in all subjects of the low-carbohydrate group, but was significant only in diabetic patients(−15%), with more reduction of oral hypoglycemic agents or insulin in the low-carbohydrate group.Interestingly, in a study in obese non diabetic patients, after 8 weeks, a very-low-energy KD led to arise in postprandial glucose levels, but not in fasting glucose levels [39]. The authors postulated thatKD reduces insulin ability to suppress endogenous glucose production and impairs insulin-stimulatedglucose oxidation, suggesting that there may be a different effect of ketosis on glucose homeostasisbetween diabetic and non-diabetic patients. For example, in obese type 2 diabetic patients, a stronginverse correlation between circulating ketones and hepatic glucose output has been described [78],suggesting that higher levels of ketones are associated with more favorable effects on glycemic controlin these subjects.
An interesting study using biology systems approaches found a strong relationship between theinsulin resistance pathway and the ketosis main pathway, providing a possible explanation for theimprovement in glucose homeostasis found in clinical trials using low-carbohydrate diets. Notably,maps analyses suggest a direct implication of glucose transporters and inflammatory processes [79].
In summary, in rodents, KD mostly induces insulin resistance and glucose intolerance, while intype 2 diabetic humans KD is associated with a better control in glucose homeostasis and a reductionin antidiabetic medications. Nevertheless, these improvements seem to be limited in time. Furtherstudies should evaluate if a higher weight loss correlates with a better glucose control or with higherketones levels.
3.4. KD and Dyslipidemia
Dyslipidemia is a well-known risk factor for cardiovascular diseases. As KD are usually high infats, it is necessary to assess their potential effect on the lipid profile.
In rodents, short term (14 days) studies showed no change in fatty acids and triglycerides levelsin mice fed a KD [48]. The duration and the composition of KD feeding are very important. In astudy of 4 weeks, Bielohuby et al. compared the effects on rats of chow diet and two different KD:one with 78.7% fat, 19.1% protein, 2.2% carbohydrates, and the other with 92.8% fat, 5.5% protein,1.7% carbohydrates. The very high-fat KD-fed group had a reduction in high-density lipoproteins(HDL) cholesterol levels and higher triglycerides levels. No significant difference in total cholesterollevels was found between the three groups [23]. It should be noticed that the authors did not mentionthe effect on low-density lipoproteins (LDL) cholesterol levels. In another study, Jornayvaz et al.showed that mice fed a KD during 5 weeks had similar levels of LDL cholesterol than mice fed achow diet [24]. In longer term (28–80 weeks) studies, KD fed mice displayed a twofold increase inplasma total cholesterol and triglyceride levels [25,26]. On the opposite, a recent study reported thatmice fed a KD during 6 weeks had lower total cholesterol and triglycerides levels than with otherdiets [29]. The authors suggested that there was a KD-induced reduction in insulin levels, whichfurther decreased liver fatty acids and cholesterol biosynthesis pathways [20,29]. Overall, most studiesin animals used KD rich in saturated fats, which may have detrimental effects on the lipid profilecompared to KD rich in unsaturated fats, and therefore limits definitive conclusions on the role of KDon dyslipidemia.
In humans, KD have been associated with significant reductions in total cholesterol [75], increasesin HDL cholesterol levels [33,70,75,80–83], decreases in triglycerides levels [32,33,70,75,82,83] andreductions in LDL cholesterol levels [75]. These results were obtained in non epileptic obeseparticipants with [32,70,75,83] or without [33,82] at least one risk factor of the metabolic syndrome,but also in healthy normal weight participants [80]. This is of importance as the effects of KD on thelipid profile may differ in epileptic subjects [84]. KD have also been associated with an increase insize and volume of LDL cholesterol particles, which is considered to reduce cardiovascular risk bydecreasing atherogenicity [81]. Nevertheless, several studies showed an increase in LDL cholesterollevels [82,83,85,86], but not significantly in the trial by Westman et al. [85]; in these cases, KD were
139
Books
MDPI

Nutrients 2017, 9, 517
mostly composed of saturated fats. In other studies, total and LDL cholesterol were significantlymore reduced with a high-protein medium-carbohydrate diet than with a KD [40]. Another study [33]reported no significant difference in total and LDL cholesterol levels after 12 months of a KD comparedto a conventional diet, except at 3 months, where LDL cholesterol levels were lower in the conventionaldiet group. The absence of improvement suggests that weight loss with a low-carbohydrate diet isnot associated with a decrease in LDL cholesterol usually observed with moderate weight loss [33].Interestingly, the effect of a KD on lipid profile may be associated with ethnicity: in a study, whitesubjects lost more weight and had a bigger decrease in triglycerides levels than black subjects [32].However, in this study, there was no significant change in total cholesterol, HDL cholesterol and LDLcholesterol levels.
As discussed for other cardiovascular risk factors, the composition of the diet used is veryimportant. For example, in a study that reported a benefit of a KD on triglycerides and HDL cholesterollevels [70], the authors decided to use a low-carbohydrate diet rich in unsaturated but low in saturatedfatty acids, which may greatly influence the lipid profile, but also the development of other metaboliccomplications such as NAFLD, insulin resistance and type 2 diabetes, as discussed earlier.
The impact of KD on the lipid profile differs between rodents and humans. In rodents, KD seemto be associated with worsened levels of total, HDL and LDL cholesterol, and triglycerides. In humans,the opposite is reported. These differences are mostly explained by differences in the compositionof the diets, which are usually higher in total fat, but also in saturated fat in animal studies. Both inrodents and humans, comparison between saturated fat and unsaturated fat KD in long-term studieswould be necessary. Later in this review, we will discuss whether saturated fat diets are as harmful asonce thought.
3.5. KD and Blood Pressure
Studies reporting a potential effect of KD on blood pressure are scarce. We could not find studiesin animals. In humans, KD are usually associated with a slight but not significant reduction insystolic and/or diastolic blood pressure [32]. Moreover, no change in antihypertensive therapy wasobserved [32,33]. Nevertheless, a study described an improvement in both systolic and diastolicblood pressure in obese participants when fed a KD during 48 weeks compared to a low-fat diet plusorlistat [69]. Weight loss was not a confounding factor as weight loss was similar in both arms. Finally,a reduction in systolic blood pressure was found in a study using a KD, but only after 3 months,without change after 1 year of observation [41].
Overall, there is a clear lack of conclusive data on the potential beneficial effect of KD on arterialblood pressure and further studies are therefore needed.
4. Discussion
Both in rodents and humans, controversies remain regarding the effect of KD on metabolic riskfactors such as NAFLD, insulin resistance, type 2 diabetes and dyslipidemia. The potential beneficialand adverse effects of KD are summarized in Figure 1, and the effects of KD on different biomolecularmarkers in Figure 2.
140
Books
MDPI

Nutrients 2017, 9, 517
Figure 1. Effects of ketogenic diets in rodents and humans.
Figure 2. Effects of ketogenic diets on biomolecular markers. FGF21: fibroblast growth factor-21; ALT:alanine aminotransferase; AST: aspartate aminotransferase; QUICKI: quantitative insulin-sensitivitycheck index; HOMA-IR: homeostasis model assessment of insulin resistance.
Overall, KD composition greatly differs between studies. KD used in rodents are usually notsimilar to KD used in humans (almost no carbohydrates and low protein content in rodent KD).Moreover, low-carbohydrate diets can be different in macronutrient composition, i.e., high-fat versushigh-protein content, which may account for some of the differences between the studies. Moreover, aspreviously mentioned, fat composition can substantially differ between studies, some using KDrich in unsaturated fatty acids and others rich in saturated fatty acids. Nevertheless, a recentsystematic review and meta-analysis revealed that saturated fat intake was not associated withall-cause and cardiovascular mortality, coronary heart disease, ischemic stroke or type 2 diabetes,
141
Books
MDPI

Nutrients 2017, 9, 517
but with heterogenous evidence [87]. The authors conclude that trans fats were associated withall-cause and cardiovascular mortality and also with coronary heart disease. Moreover, it is wellknown that different ratios of some unsaturated and saturated fatty acids in diet compositions canalter metabolic parameters such as insulin sensitivity [9]. Therefore, it is a real challenge for physiciansto advise patients with different metabolic diseases about the best diet composition to use. If a KDhas to be prescribed, maybe it could be better to favor a vegetable-based KD, as vegetable-basedlow-carbohydrate diets have been correlated with a decrease in all-cause and cardiovascular-relatedmortality [88]. In the latter study, two US cohorts (121,700 females, 51,529 males) were followed during26 and 20 years, respectively. Both in men and women, animal-based low-carbohydrate diets werefound to be associated with higher all-cause (especially cardiovascular mortality) and cancer mortality,compared to vegetable-based low-carbohydrate diets. Nevertheless, similar studies with “real” KDneed to be performed to confirm this assumption, as a low-carbohdyrate diet is not necessarily inducingketosis and is therefore not a ketogenic diet per se. Another problem when using a KD is the long-termeffect and sustainability of effects, notably due to a lack of long-term studies in metabolic diseasessuch as type 2 diabetes. Restrictive diets are often associated with poor long-term adherence [89].Nevertheless, some evidence suggests that adherence to low-carbohydrate diets is better than to low-fatdiets, because of the allowance to unlimited access to food as long as carbohydrates are reduced, giventhat proteins and fats are known to induce satiety [16].
Three meta-analyses about the effect of KD on cardiovascular risk factors were publishedrecently [90–92]. Their conclusions are unanimous about general positive effects, but not unanimousabout each single variable. Santos et al. concluded in 2012 that low-carbohydrate diets lead to asignificant decrease in body weight, BMI, abdominal circumference, both systolic and diastolic bloodpressure, triglycerides levels, fasting plasma glucose and HbA1c, an increase in HDL cholesterollevels, and no change in LDL cholesterol levels. As we mentioned before, the authors suggesteda possible duration effect, specifically for body weight and blood pressure, where benefits seem todecrease over time [90]. Bezerra Bueno et al. compared very-low carbohydrate diets to low-fat dietsand their effects after a follow-up of at least 12 months. Very-low carbohydrate diets confer a greaterweight loss, reduction in triglycerides and diastolic blood pressure, and increase in HDL and LDLcholesterol levels. There was however no difference in systolic blood pressure. There was no significantdifference between diets for fasting blood glucose and insulin levels, and HbA1c. It is interesting tonote that in the studies (only 4) with 24 months of follow-up, only the change in HDL cholesterol levelsremained significant [91]. The latest meta-analysis on KD by Naude et al. included 19 randomizedcontrolled trials (RCT) and revealed that there is probably little or no difference in changes in weight orcardiovascular risk factors when comparing low-carbohydrate diets to isoenergetic diets (both showedweight loss) after two years of follow-up. These results were found in overweight and obese patients,with or without type 2 diabetes. This meta-analysis showed that strict adherence failed and declinedwith follow-up in most trials [92].
It is also important to keep in mind that KD could have some adverse side effects when chronicallyused. Indeed, studies in children using KD to treat epilepsy and other neurological disorders show anincrease in kidney stones, osteoporosis, hyperlipidemia and impaired growth [93,94]. While severalauthors found that a low-carbohydrate high-protein diet was not associated with higher mortalityafter 12 years of follow-up [95], others described a weak statistically significant higher mortality rateafter 10 years [96]. However, they did not evaluate sources of proteins and fats.
Finally, it should be mentioned that it is difficult to really know in studies if low-carbohydratediets were “real” KD. Indeed, most of the time there is no report about a potential induction of ketosis,by for example reporting measurements of plasma ketone bodies.
5. Conclusions
Based on the available literature, KD may be associated with some improvements in somecardiovascular risk factors, such as obesity, type 2 diabetes and HDL cholesterol levels, but these effects
142
Books
MDPI

Nutrients 2017, 9, 517
are usually limited in time. As KD are often rich in fats, some negative effects could happen. Mainly inrodents, developments of NAFLD and insulin resistance were described. In humans, insulin resistanceis also a potential negative effect, but some studies have shown improvements in insulin sensitivity.Nevertheless, many subjects contemplating such diets are overweight or obese at baseline, and even amoderate weight loss could be metabolically beneficial for them. However, it is mandatory to maintainbody weight after weight loss, which is usually a major problem. More studies are therefore warrantedto better assess the effects of long term use of KD on metabolic diseases and cardiovascular risk factors,but also to better define which dietary macronutrient composition is optimal.
Acknowledgments: F.R.J. is supported by a grant from the Gottfried und Julia Bangerter-Rhyner-Stiftung andfrom the Fondation de l’Association Suisse du Diabète.
Author Contributions: C.K. and F.R.J. wrote the paper and contributed equally.
Conflicts of Interest: The authors declare no conflict of interest.
References
1. Ng, M.; Fleming, T.; Robinson, M.; Thomson, B.; Graetz, N.; Margono, C.; Mullany, E.C.; Biryukov, S.;Abbafati, C.; Abera, S.F.; et al. Global, regional, and national prevalence of overweight and obesity inchildren and adults during 1980–2013: A systematic analysis for the Global Burden of Disease Study 2013.Lancet 2014, 384, 766–781. [CrossRef]
2. Koh-Banerjee, P.; Wang, Y.; Hu, F.B.; Spiegelman, D.; Willett, W.C.; Rimm, E.B. Changes in body weight andbody fat distribution as risk factors for clinical diabetes in US men. Am. J. Epidemiol. 2004, 159, 1150–1159.[CrossRef] [PubMed]
3. Fabbrini, E.; Magkos, F.; Mohammed, B.S.; Pietka, T.; Abumrad, N.A.; Patterson, B.W.; Okunade, A.; Klein, S.Intrahepatic fat, not visceral fat, is linked with metabolic complications of obesity. Proc. Natl. Acad. Sci. USA2009, 106, 15430–15435. [CrossRef] [PubMed]
4. Fabbrini, E.; Sullivan, S.; Klein, S. Obesity and nonalcoholic fatty liver disease: Biochemical, metabolic, andclinical implications. Hepatology 2010, 51, 679–689. [CrossRef] [PubMed]
5. Chalasani, N.; Younossi, Z.; Lavine, J.E.; Diehl, A.M.; Brunt, E.M.; Cusi, K.; Charlton, M.; Sanyal, A.J.The diagnosis and management of non-alcoholic fatty liver disease: Practice guideline by the AmericanGastroenterological Association, American Association for the Study of Liver Diseases, and AmericanCollege of Gastroenterology. Gastroenterology 2012, 142, 1592–1609. [CrossRef] [PubMed]
6. Gariani, K.; Philippe, J.; Jornayvaz, F.R. Non-alcoholic fatty liver disease and insulin resistance: From benchto bedside. Diabetes Metab. 2013, 39, 16–26. [CrossRef] [PubMed]
7. Machado, M.; Marques-Vidal, P.; Cortez-Pinto, H. Hepatic histology in obese patients undergoing bariatricsurgery. J. Hepatol. 2006, 45, 600–606. [CrossRef] [PubMed]
8. McKeown, N.M.; Meigs, J.B.; Liu, S.; Saltzman, E.; Wilson, P.W.F.; Jacques, P.F. Carbohydrate nutrition,insulin resistance, and the prevalence of the metabolic syndrome in the Framingham Offspring Cohort.Diabetes Care 2004, 27, 538–546. [CrossRef] [PubMed]
9. Asrih, M.; Jornayvaz, F.R. Diets and nonalcoholic fatty liver disease: The good and the bad. Clin. Nutr. 2014,33, 186–190. [CrossRef] [PubMed]
10. Volek, J.S.; Fernandez, M.L.; Feinman, R.D.; Phinney, S.D. Dietary carbohydrate restriction induces aunique metabolic state positively affecting atherogenic dyslipidemia, fatty acid partitioning, and metabolicsyndrome. Prog. Lipid Res. 2008, 47, 307–318. [CrossRef] [PubMed]
11. Volek, J.S.; Phinney, S.D.; Forsythe, C.E.; Quann, E.E.; Wood, R.J.; Puglisi, M.J.; Kraemer, W.J.; Bibus, D.M.;Fernandez, M.L.; Feinman, R.D. Carbohydrate restriction has a more favorable impact on the metabolicsyndrome than a low fat diet. Lipids 2009, 44, 297–309. [CrossRef] [PubMed]
12. Volek, J.S.; Feinman, R.D. Carbohydrate restriction improves the features of Metabolic Syndrome. MetabolicSyndrome may be defined by the response to carbohydrate restriction. Nutr. Metab. 2005, 2, 31. [CrossRef][PubMed]
13. Atkins, R.C. Dr Atkins’ Diet Revolution: The High Calorie Way to Stay Thin Forever; D. McKay Co.: New York,NY, USA, 1972.
143
Books
MDPI

Nutrients 2017, 9, 517
14. Veech, R.L. The therapeutic implications of ketone bodies: The effects of ketone bodies in pathologicalconditions: Ketosis, ketogenic diet, redox states, insulin resistance, and mitochondrial metabolism.Prostaglandins Leukot. Essent. Fat. Acids 2004, 70, 309–319. [CrossRef] [PubMed]
15. Kossoff, E.H.; Cervenka, M.C.; Henry, B.J.; Haney, C.A.; Turner, Z. A decade of the modified Atkins diet(2003–2013): Results, insights, and future directions. Epilepsy Behav. 2013, 29, 437–442. [CrossRef] [PubMed]
16. Feinman, R.D.; Pogozelski, W.K.; Astrup, A.; Bernstein, R.K.; Fine, E.J.; Westman, E.C.; Westman, E.C.;Accurso, A.; Frassetto, L.; Gower, B.A.; et al. Dietary carbohydrate restriction as the first approach in diabetesmanagement: Critical review and evidence base. Nutrition 2015, 31, 1–13. [CrossRef] [PubMed]
17. Accurso, A.; Bernstein, R.K.; Dahlqvist, A.; Draznin, B.; Feinman, R.D.; Fine, E.J.; Gleed, A.; Jacobs, D.B.;Larson, G.; Lustig, R.H.; et al. Dietary carbohydrate restriction in type 2 diabetes mellitus and metabolicsyndrome: Time for a critical appraisal. Nutr. Metab. 2008, 5, 9. [CrossRef] [PubMed]
18. Owen, O.E.; Morgan, A.P.; Kemp, H.G.; Sullivan, J.M.; Herrera, M.G.; Cahill, G.F. Brain metabolism duringfasting. J. Clin. Invest. 1967, 46, 1589–1595. [CrossRef] [PubMed]
19. Kessler, S.K.; Neal, E.G.; Camfield, C.S.; Kossoff, E.H. Dietary therapies for epilepsy: Future research.Epilepsy Behav. 2011, 22, 17–22. [CrossRef] [PubMed]
20. Kennedy, A.R.; Pissios, P.; Otu, H.; Roberson, R.; Xue, B.; Asakura, K.; Furukawa, N.; Marino, F.E.; Liu, F.F.;Kahn, B.B.; et al. A high-fat, ketogenic diet induces a unique metabolic state in mice. Am. J. Physiol.Endocrinol. Metab. 2007, 292, E1724–E1739. [CrossRef] [PubMed]
21. Badman, M.K.; Kennedy, A.R.; Adams, A.C.; Pissios, P.; Maratos-Flier, E. A very low carbohydrate ketogenicdiet improves glucose tolerance in ob/ob mice independently of weight loss. Am. J. Physiol. Endocrinol. Metab.2009, 297, E1197–E1204. [CrossRef] [PubMed]
22. Garbow, J.R.; Doherty, J.M.; Schugar, R.C.; Travers, S.; Weber, M.L.; Wentz, A.E.; Ezenwajiaku, N.; Cotter, D.G.;Brunt, E.M.; Crawford, P.A. Hepatic steatosis, inflammation, and ER stress in mice maintained long termon a very low-carbohydrate ketogenic diet. Am. J. Physiol. Gastrointest. Liver Physiol. 2011, 300, G956–G967.[CrossRef] [PubMed]
23. Bielohuby, M.; Sisley, S.; Sandoval, D.; Herbach, N.; Zengin, A.; Fischereder, M.; Menhofer, D.; Stoehr, B.J.M.;Stemmer, K.; Wanke, R.; et al. Impaired glucose tolerance in rats fed low-carbohydrate, high-fat diets. Am. J.Physiol. Endocrinol. Metab. 2013, 305, E1059–E1070. [CrossRef] [PubMed]
24. Jornayvaz, F.R.; Jurczak, M.J.; Lee, H.-Y.; Birkenfeld, A.L.; Frederick, D.W.; Zhang, D.; Zhang, X.M.;Samuel, V.T.; Shulman, G.I. A high-fat, ketogenic diet causes hepatic insulin resistance in mice, despiteincreasing energy expenditure and preventing weight gain. Am. J. Physiol. Endocrinol. Metab. 2010, 299,E808–E815. [CrossRef] [PubMed]
25. Ellenbroek, J.H.; van Dijck, L.; Tons, H.A.; Rabelink, T.J.; Carlotti, F.; Ballieux, B.E.; de Koning, E.J.P. Long-termketogenic diet causes glucose intolerance and reduced B- and a-cell mass but no weight loss in mice. Am. J.Physiol. Endocrinol. Metab. 2014, 306, E552–E558. [CrossRef] [PubMed]
26. Douris, N.; Melman, T.; Pecherer, J.M.; Pissios, P.; Flier, J.S.; Cantley, L.C.; Locasale, J.W.; Maratos-Flier, E.Adaptive changes in amino acid metabolism permit normal longevity in mice consuming a low-carbohydrateketogenic diet. Biochim. Biophys. Acta 2015, 1852, 2056–2065. [CrossRef] [PubMed]
27. Asrih, M.; Altirriba, J.; Rohner-Jeanrenaud, F.; Jornayvaz, F.R. Ketogenic Diet Impairs FGF21 Signaling andPromotes Differential Inflammatory Responses in the Liver and White Adipose Tissue. PLoS ONE 2015, 10,e0126364. [CrossRef] [PubMed]
28. Frommelt, L.; Bielohuby, M.; Menhofer, D.; Stoehr, B.J.M.; Bidlingmaier, M.; Kienzle, E. Effects of lowcarbohydrate diets on energy and nitrogen balance and body composition in rats depend on dietaryprotein-to-energy ratio. Nutrition 2014, 30, 863–868. [CrossRef] [PubMed]
29. Holland, A.M.; Kephart, W.C.; Mumford, P.W.; Mobley, C.B.; Lowery, R.P.; Shake, J.J.; Patel, R.K.; Healy, J.C.;McCullough, D.J.; Kluess, H.A.; et al. Effects of a ketogenic diet on adipose tissue, liver, and serumbiomarkers in sedentary rats and rats that exercised via resisted voluntary wheel running. Am. J. Physiol.Regul. Integr. Comp. Physiol. 2016, 311, R337–R351. [CrossRef] [PubMed]
30. Partsalaki, I.; Karvela, A.; Spiliotis, B.E. Metabolic impact of a ketogenic diet compared to a hypocaloric dietin obese children and adolescents. J. Pediatr. Endocrinol. Metab. 2012, 25, 697–704. [CrossRef] [PubMed]
31. Saisho, Y.; Butler, A.E.; Manesso, E.; Elashoff, D.; Rizza, R.A.; Butler, P.C. β-cell mass and turnover in humans:Effects of obesity and aging. Diabetes Care 2013, 36, 111–117. [CrossRef] [PubMed]
144
Books
MDPI

Nutrients 2017, 9, 517
32. Samaha, F.F.; Iqbal, N.; Seshadri, P.; Chicano, K.L.; Daily, D.A.; McGrory, J.; Williams, T.; Williams, M.;Gracely, E.J.; Stem, L. A Low-Carbohydrate as Compared with a Low-Fat Diet in Severe Obesity. N. Engl.J. Med. 2003, 348, 2074–2081. [CrossRef] [PubMed]
33. Foster, G.D.; Wyatt, H.R.; Hill, J.O.; McGuckin, B.G.; Brill, C.; Mohammed, B.S.; Szapary, P.O.; Rader, D.J.;Edman, J.S.; Klein, S. A Randomized Trial of a Low-Carbohydrate Diet for Obesity. N. Engl. J. Med. 2003, 348,2082–2090. [CrossRef] [PubMed]
34. Westerterp-Plantenga, M.S.; Nieuwenhuizen, A.; Tomé, D.; Soenen, S.; Westerterp, K.R. Dietary protein,weight loss, and weight maintenance. Annu. Rev. Nutr. 2009, 29, 21–41. [CrossRef] [PubMed]
35. Fine, E.J.; Feinman, R.D. Thermodynamics of weight loss diets. Nutr. Metab. 2004, 1, 15. [CrossRef] [PubMed]36. Feinman, R.D.; Fine, E.J. Nonequilibrium thermodynamics and energy efficiency in weight loss diets.
Theor. Biol. Med. Model. 2007, 4, 27. [CrossRef] [PubMed]37. Halton, T.L.; Hu, F.B. The effects of high protein diets on thermogenesis, satiety and weight loss: A critical
review. J. Am. Coll. Nutr. 2004, 23, 373–385. [CrossRef] [PubMed]38. Veldhorst, M.A.B.; Westerterp-Plantenga, M.S.; Westerterp, K.R. Gluconeogenesis and energy expenditure
after a high-protein, carbohydrate-free diet. Am. J. Clin. Nutr. 2009, 90, 519–526. [CrossRef] [PubMed]39. Sumithran, P.; Prendergast, L.A.; Delbridge, E.; Purcell, K.; Shulkes, A.; Kriketos, A.; Proietto, J. Ketosis and
appetite-mediating nutrients and hormones after weight loss. Eur. J. Clin. Nutr. 2013, 67, 759–764. [CrossRef][PubMed]
40. Johnstone, A.M.; Horgan, G.W.; Murison, S.D.; Bremner, D.M.; Lobley, G.E. Effects of a high-protein ketogenicdiet on hunger, appetite, and weight loss in obese men feeding ad libitum. Am. J. Clin. Nutr. 2008, 87, 44–55.[PubMed]
41. Cicero, A.F.G.; Benelli, M.; Brancaleoni, M.; Dainelli, G.; Merlini, D.; Negri, R. Middle and Long-Term Impactof a Very Low-Carbohydrate Ketogenic Diet on Cardiometabolic Factors: A Multi-Center, Cross-Sectional,Clinical Study. High Blood Press. Cardiovasc. Prev. 2015, 22, 389–394. [CrossRef] [PubMed]
42. Paoli, A.; Bianco, A.; Grimaldi, K.A.; Lodi, A.; Bosco, G. Long term successful weight loss with a combinationbiphasic ketogenic Mediterranean diet and Mediterranean diet maintenance protocol. Nutrients 2013, 5,5205–5217. [CrossRef] [PubMed]
43. Tay, J.; Luscombe-Marsh, N.D.; Thompson, C.H.; Noakes, M.; Buckley, J.D.; Wittert, G.A.; Yancy, W.S.;Brinkworth, G.D. Comparison of low- and high-carbohydrate diets for type 2 diabetes management:A randomized trial. Am. J. Clin. Nutr. 2015, 102, 780–790. [CrossRef] [PubMed]
44. Jabekk, P.T.; Moe, I.A.; Meen, H.D.; Tomten, S.E.; Høstmark, A.T. Resistance training in overweight womenon a ketogenic diet conserved lean body mass while reducing body fat. Nutr. Metab. 2010, 7, 17. [CrossRef][PubMed]
45. Morris-Stiff, G.; Feldstein, A.E. Fibroblast growth factor 21 as a biomarker for NAFLD: Integratingpathobiology into clinical practice. J. Hepatol. 2010, 53, 795–796. [CrossRef] [PubMed]
46. Dushay, J.; Chui, P.C.; Gopalakrishnan, G.S.; Varela-Rey, M.; Crawley, M.; Fisher, F.M.; Badman, M.K.;Martinez-Chantar, M.L.; Maratos-Flier, E. Increased fibroblast growth factor 21 in obesity and nonalcoholicfatty liver disease. Gastroenterology 2010, 139, 456–463. [CrossRef] [PubMed]
47. Li, H.; Fang, Q.; Gao, F.; Fan, J.; Zhou, J.; Wang, X.; Zhang, H.; Pan, X.; Bao, Y.; Xiang, K.; et al. Fibroblastgrowth factor 21 levels are increased in nonalcoholic fatty liver disease patients and are correlated withhepatic triglyceride. J. Hepatol. 2010, 53, 934–940. [CrossRef] [PubMed]
48. Murata, Y.; Nishio, K.; Mochiyama, T.; Konishi, M.; Shimada, M.; Ohta, H.; Itoh, N. Fgf21 Impairs AdipocyteInsulin Sensitivity in Mice Fed a Low-Carbohydrate, High-Fat Ketogenic Diet. PLoS ONE 2013, 8, e69330.[CrossRef] [PubMed]
49. Badman, M.K.; Pissios, P.; Kennedy, A.R.; Koukos, G.; Flier, J.S.; Maratos-Flier, E. Hepatic fibroblast growthfactor 21 is regulated by PPARalpha and is a key mediator of hepatic lipid metabolism in ketotic states.Cell Metab. 2007, 5, 426–437. [CrossRef] [PubMed]
50. Jornayvaz, F.R.; Shulman, G.I. Diacylglycerol activation of protein kinase Cε and hepatic insulin resistance.Cell Metab. 2012, 15, 574–584. [CrossRef] [PubMed]
51. Camporez, J.P.G.; Jornayvaz, F.R.; Petersen, M.C.; Pesta, D.; Guigni, B.A.; Serr, J.; Zhang, D.; Kahn, M.;Samuel, V.T.; Jurczak, M.J.; et al. Cellular mechanisms by which FGF21 improves insulin sensitivity in malemice. Endocrinology 2013, 154, 3099–3109. [CrossRef] [PubMed]
145
Books
MDPI

Nutrients 2017, 9, 517
52. Xu, J.; Lloyd, D.J.; Hale, C.; Stanislaus, S.; Chen, M.; Sivits, G.; Vonderfecht, S.; Hecht, R.; Li, Y.S.;Lindberg, R.A.; et al. Fibroblast growth factor 21 reverses hepatic steatosis, increases energy expenditure,and improves insulin sensitivity in diet-induced obese mice. Diabetes 2009, 58, 250–259. [CrossRef] [PubMed]
53. Badman, M.K.; Koester, A.; Flier, J.S.; Kharitonenkov, A.; Maratos-Flier, E. Fibroblast growth factor21-deficient mice demonstrate impaired adaptation to ketosis. Endocrinology 2009, 150, 4931–4940. [CrossRef][PubMed]
54. Camporez, J.P.G.; Asrih, M.; Zhang, D.; Kahn, M.; Samuel, V.T.; Jurczak, M.J.; Jornayvaz, F.R. Hepatic insulinresistance and increased hepatic glucose production in mice lacking Fgf21. J. Endocrinol. 2015, 226, 207–217.[CrossRef] [PubMed]
55. Laeger, T.; Henagan, T.M.; Albarado, D.C.; Redman, L.M.; Bray, G.A.; Noland, R.C.; Münzberg, H.;Hutson, S.M.; Gettys, T.W.; Schwartz, M.W.; et al. FGF21 is an endocrine signal of protein restriction.J. Clin. Investig. 2014, 124, 3913–3922. [CrossRef] [PubMed]
56. Westerbacka, J.; Lammi, K.; Häkkinen, A.-M.; Rissanen, A.; Salminen, I.; Aro, A.; Yki-Järvinen, H. Dietary fatcontent modifies liver fat in overweight nondiabetic subjects. J. Clin. Endocrinol. Metab. 2005, 90, 2804–2809.[CrossRef] [PubMed]
57. Kirk, E.; Reeds, D.N.; Finck, B.N.; Mayurranjan, S.M.; Mayurranjan, M.S.; Patterson, B.W.; Klein, S. Dietaryfat and carbohydrates differentially alter insulin sensitivity during caloric restriction. Gastroenterology 2009,136, 1552–1560. [CrossRef] [PubMed]
58. Browning, J.D.; Baker, J.A.; Rogers, T.; Davis, J.; Satapati, S.; Burgess, S.C. Short-term weight loss and hepatictriglyceride reduction: Evidence of a metabolic advantage with dietary carbohydrate restriction. Am. J.Clin. Nutr. 2011, 93, 1048–1052. [CrossRef] [PubMed]
59. Bian, H.; Hakkarainen, A.; Lundbom, N.; Yki-Järvinen, H. Effects of dietary interventions on liver volume inhumans. Obesity 2014, 22, 989–995. [CrossRef] [PubMed]
60. Sevastianova, K.; Kotronen, A.; Gastaldelli, A.; Perttilä, J.; Hakkarainen, A.; Lundbom, J.; Orho-Melander, M.;Lundbom, N.; Ferrannini, E.; Rissanen, A.; et al. Genetic variation in PNPLA3 (adiponutrin) conferssensitivity to weight loss-induced decrease in liver fat in humans. Am. J. Clin. Nutr. 2011, 94, 104–111.[CrossRef] [PubMed]
61. Shen, J.; Wong, G.L.-H.; Chan, H.L.-Y.; Chan, R.S.-M.; Chan, H.-Y.; Chu, W.C.-W.; Cheung, B.H.-K.;Yeung, D.K.-W.; Li, L.S.; Sea, M.M.-M.; et al. PNPLA3 gene polymorphism and response to lifestylemodification in patients with nonalcoholic fatty liver disease. J. Gastroenterol. Hepatol. 2015, 30, 139–146.[CrossRef] [PubMed]
62. Jornayvaz, F.R. Fibroblast growth factor 21, ketogenic diets, and insulin resistance. Am. J. Clin. Nutr. 2011,94, 955. [CrossRef] [PubMed]
63. Kinzig, K.P.; Honors, M.A.; Hargrave, S.L. Insulin sensitivity and glucose tolerance are altered bymaintenance on a ketogenic diet. Endocrinology 2010, 151, 3105–3114. [CrossRef] [PubMed]
64. Bisschop, P.H.; de Metz, J.; Ackermans, M.T.; Endert, E.; Pijl, H.; Kuipers, F.; Meijer, A.J.; Sauerwein, H.P.;Romijn, J.A. Dietary fat content alters insulin-mediated glucose metabolism in healthy men. Am. J. Clin. Nutr.2001, 73, 554–559. [PubMed]
65. Westman, E.C.; Feinman, R.D.; Mavropoulos, J.C.; Vernon, M.C.; Volek, J.S.; Wortman, J.A.; Yancy, W.S.;Phinney, S.D. Low-carbohydrate nutrition and metabolism. Am. J. Clin. Nutr. 2007, 86, 276–284. [PubMed]
66. Hussain, T.A.; Mathew, T.C.; Dashti, A.A.; Asfar, S.; Al-Zaid, N.; Dashti, H.M. Effect of low-calorie versuslow-carbohydrate ketogenic diet in type 2 diabetes. Nutrition 2012, 28, 1016–1021. [CrossRef] [PubMed]
67. Gannon, M.C.; Nuttall, F.Q. Control of blood glucose in type 2 diabetes without weight loss by modificationof diet composition. Nutr. Metab. 2006, 3, 16. [CrossRef] [PubMed]
68. Boden, G.; Sargrad, K.; Homko, C.; Mozzoli, M.; Stein, T.P. Effect of a low-carbohydrate diet on appetite,blood glucose levels, and insulin resistance in obese patients with type 2 diabetes. Ann. Intern. Med. 2005,142, 403–411. [CrossRef] [PubMed]
69. Mayer, S.B.; Jeffreys, A.S.; Olsen, M.K.; McDuffie, J.R.; Feinglos, M.N.; Yancy, W.S. Two diets with differenthaemoglobin A1c and antiglycaemic medication effects despite similar weight loss in type 2 diabetes.Diabetes Obes. Metab. 2014, 16, 90–93. [CrossRef] [PubMed]
70. Tay, J.; Luscombe-Marsh, N.D.; Thompson, C.H.; Noakes, M.; Buckley, J.D.; Wittert, G.A.; Yancy, W.S.;Brinkworth, G.D. A Very Low-Carbohydrate, Low–Saturated Fat Diet for Type 2 Diabetes Management: ARandomized Trial. Diabetes Care 2014, 37, 2909–2918. [CrossRef] [PubMed]
146
Books
MDPI

Nutrients 2017, 9, 517
71. Gannon, M.C.; Nuttall, F.Q. Effect of a high-protein, low-carbohydrate diet on blood glucose control inpeople with type 2 diabetes. Diabetes 2004, 53, 2375–2382. [CrossRef] [PubMed]
72. Halton, T.L.; Liu, S.; Manson, J.E.; Hu, F.B. Low-carbohydrate-diet score and risk of type 2 diabetes in women.Am. J. Clin. Nutr. 2008, 87, 339–346. [PubMed]
73. Yancy, W.S.; Foy, M.; Chalecki, A.M.; Vernon, M.C.; Westman, E.C. A low-carbohydrate, ketogenic diet totreat type 2 diabetes. Nutr. Metab. 2005, 2, 34. [CrossRef] [PubMed]
74. Saslow, L.R.; Kim, S.; Daubenmier, J.J.; Moskowitz, J.T.; Phinney, S.D.; Goldman, V.; Murphy, E.J.; Cox, R.M.;Moran, P.; Hecht, F.M. A randomized pilot trial of a moderate carbohydrate diet compared to a very lowcarbohydrate diet in overweight or obese individuals with type 2 diabetes mellitus or prediabetes. PLoS ONE2014, 9, e91027. [CrossRef] [PubMed]
75. Dashti, H.M.; Al-Zaid, N.S.; Mathew, T.C.; Al-Mousawi, M.; Talib, H.; Asfar, S.K.; Behbahani, A.I. Longterm effects of ketogenic diet in obese subjects with high cholesterol level. Mol. Cell. Biochem. 2006, 286, 1–9.[CrossRef] [PubMed]
76. Iqbal, N.; Vetter, M.L.; Moore, R.H.; Chittams, J.L.; Dalton-Bakes, C.V.; Dowd, M.; Williams-Smith, C.;Cardillo, S.; Wadden, T.A. Effects of a low-intensity intervention that prescribed a low-carbohydrate vs. alow-fat diet in obese, diabetic participants. Obesity 2010, 18, 1733–1738. [CrossRef] [PubMed]
77. De Koning, L.; Fung, T.T.; Liao, X.; Chiuve, S.E.; Rimm, E.B.; Willett, W.C.; Spiegelman, D.; Hu, F.B.Low-carbohydrate diet scores and risk of type 2 diabetes in men. Am. J. Clin. Nutr. 2011, 93, 844–850.[CrossRef] [PubMed]
78. Gumbiner, B.; Wendel, J.A.; McDermott, M.P. Effects of diet composition and ketosis on glycemia duringvery-low-energy-diet therapy in obese patients with non-insulin-dependent diabetes mellitus. Am. J.Clin. Nutr. 1996, 63, 110–115. [PubMed]
79. Farrés, J.; Pujol, A.; Coma, M.; Ruiz, J.; Naval, J.; Mas, J.; Molins, A.; Fondevila, J.; Aloy, P.Revealing the molecular relationship between type 2 diabetes and the metabolic changes induced bya very-low-carbohydrate low-fat ketogenic diet. Nutr. Metab. 2010, 7, 88. [CrossRef] [PubMed]
80. Sharman, M.J.; Kraemer, W.J.; Love, D.M.; Avery, N.G.; Gómez, A.L.; Scheett, T.P.; Volek, J.S. A ketogenicdiet favorably affects serum biomarkers for cardiovascular disease in normal-weight men. J. Nutr. 2002, 132,1879–1885. [PubMed]
81. Volek, J.S.; Sharman, M.J.; Forsythe, C.E. Modification of lipoproteins by very low-carbohydrate diets. J. Nutr.2005, 135, 1339–1342. [PubMed]
82. Foster, G.D.; Wyatt, H.R.; Hill, J.O.; Makris, A.P.; Rosenbaum, D.L.; Brill, C.; Stein, R.I.; Mohammed, B.S.;Miller, B.; Rader, D.J.; et al. Weight and metabolic outcomes after 2 years on a low-carbohydrate versuslow-fat diet: A randomized trial. Ann. Intern. Med. 2010, 153, 147–157. [CrossRef] [PubMed]
83. Brinkworth, G.D.; Noakes, M.; Buckley, J.D.; Keogh, J.B.; Clifton, P.M. Long-term effects of avery-low-carbohydrate weight loss diet compared with an isocaloric low-fat diet after 12 mo. Am. J.Clin. Nutr. 2009, 90, 23–32. [CrossRef] [PubMed]
84. Lima, P.A.; de Brito Sampaio, L.P.; Damasceno, N.R.T. Ketogenic diet in epileptic children: Impact onlipoproteins and oxidative stress. Nutr. Neurosci. 2015, 18, 337–344. [CrossRef] [PubMed]
85. Westman, E.C.; Yancy, W.S.; Mavropoulos, J.C.; Marquart, M.; McDuffie, J.R. The effect of a low-carbohydrate,ketogenic diet versus a low-glycemic index diet on glycemic control in type 2 diabetes mellitus. Nutr. Metab.2008, 5, 36. [CrossRef] [PubMed]
86. Stern, L.; Iqbal, N.; Seshadri, P.; Chicano, K.L.; Daily, D.A.; McGrory, J.; Williams, M.; Gracely, E.J.; Samaha, F.F.The effects of low-carbohydrate versus conventional weight loss diets in severely obese adults: One-yearfollow-up of a randomized trial. Ann. Intern. Med. 2004, 140, 778–785. [CrossRef] [PubMed]
87. De Souza, R.J.; Mente, A.; Maroleanu, A.; Cozma, A.I.; Ha, V.; Kishibe, T.; Uleryk, E.; Budylowski, P.;Schünemann, H.; Beyene, J.; et al. Intake of saturated and trans unsaturated fatty acids and risk of all causemortality, cardiovascular disease, and type 2 diabetes: Systematic review and meta-analysis of observationalstudies. BMJ 2015, 351, h3978. [CrossRef] [PubMed]
88. Fung, T.T.; van Dam, R.M.; Hankinson, S.E.; Stampfer, M.; Willett, W.C.; Hu, F.B. Low-carbohydrate diets andall-cause and cause-specific mortality: Two cohort studies. Ann. Intern. Med. 2010, 153, 289–298. [CrossRef][PubMed]
89. Ye, F.; Li, X.-J.; Jiang, W.-L.; Sun, H.-B.; Liu, J. Efficacy of and Patient Compliance with a Ketogenic Diet inAdults with Intractable Epilepsy: A Meta-Analysis. J. Clin. Neurol. 2015, 11, 26. [CrossRef] [PubMed]
147
Books
MDPI

Nutrients 2017, 9, 517
90. Santos, F.L.; Esteves, S.S.; da Costa Pereira, A.; Yancy, W.S., Jr.; Nunes, J.P. Systematic review andmeta-analysis of clinical trials of the effects of low carbohydrate diets on cardiovascular risk factors: Lowcarbohydrate diets and cardiovascular risk factors. Obes. Rev. 2012, 13, 1048–1066. [CrossRef] [PubMed]
91. Bueno, N.B.; de Melo, I.S.; de Oliveira, S.L.; da Rocha Ataide, T. Very-low-carbohydrate ketogenic diet v.low-fat diet for long-term weight loss: A meta-analysis of randomised controlled trials. Br. J. Nutr. 2013, 110,1178–1187. [CrossRef] [PubMed]
92. Naude, C.E.; Schoonees, A.; Senekal, M.; Young, T.; Garner, P.; Volmink, J. Low carbohydrate versusisoenergetic balanced diets for reducing weight and cardiovascular risk: A systematic review andmeta-analysis. PLoS ONE 2014, 9, e100652. [CrossRef] [PubMed]
93. Bergqvist, A.G.C. Long-term monitoring of the ketogenic diet: Do’s and Don’ts. Epilepsy Res. 2012, 100,261–266. [CrossRef] [PubMed]
94. Kossoff, E.; Wang, H.-S. Dietary Therapies for Epilepsy. Biomed. J. 2013, 36, 2. [CrossRef] [PubMed]95. Lagiou, P.; Sandin, S.; Weiderpass, E.; Lagiou, A.; Mucci, L.; Trichopoulos, D.; Adami, H.-O. Low
carbohydrate-high protein diet and mortality in a cohort of Swedish women. J. Intern. Med. 2007, 261,366–374. [CrossRef] [PubMed]
96. Trichopoulou, A.; Psaltopoulou, T.; Orfanos, P.; Hsieh, C.-C.; Trichopoulos, D. Low-carbohydrate-high-protein diet and long-term survival in a general population cohort. Eur. J. Clin. Nutr. 2007, 61,575–581. [CrossRef] [PubMed]
© 2017 by the authors. Licensee MDPI, Basel, Switzerland. This article is an open accessarticle distributed under the terms and conditions of the Creative Commons Attribution(CC BY) license (http://creativecommons.org/licenses/by/4.0/).
148
Books
MDPI

nutrients
Article
Leucine Supplementation Differently ModulatesBranched-Chain Amino Acid Catabolism,Mitochondrial Function and Metabolic Profiles at theDifferent Stage of Insulin Resistance in Rats onHigh-Fat Diet
Rui Liu, Hui Li, Wenjuan Fan, Qiu Jin, Tingting Chao, Yuanjue Wu, Junmei Huang, Liping Hao
and Xuefeng Yang *
Department of Nutrition and Food Hygiene, Hubei Key Laboratory of Food Nutrition and Safety,MOE Key Laboratory of Environment and Health, School of Public Health, Tongji Medical College,Huazhong University of Science and Technology, Wuhan 430030, Hubei, China; [email protected] (R.L.);[email protected] (H.L.); [email protected] (W.F.); [email protected] (Q.J.);[email protected] (T.C.); [email protected] (Y.W.); [email protected] (J.H.);[email protected] (L.H.)* Correspondence: [email protected]; Tel.: +86-(0)27-8365-0522
Received: 3 April 2017; Accepted: 26 May 2017; Published: 2 June 2017
Abstract: The available findings concerning the association between branched-chain amino acids(BCAAs)—particularly leucine—and insulin resistance are conflicting. BCAAs have been proposedto elicit different or even opposite effects, depending on the prevalence of catabolic and anabolicstates. We tested the hypothesis that leucine supplementation may exert different effects at differentstages of insulin resistance, to provide mechanistic insights into the role of leucine in the progressionof insulin resistance. Male Sprague-Dawley rats were fed a normal chow diet, high-fat diet (HFD),HFD supplemented with 1.5% leucine, or HFD with a 20% calorie restriction for 24 or 32 weeks.Leucine supplementation led to abnormal catabolism of BCAA and the incompletely oxidizedlipid species that contributed to mitochondrial dysfunction in skeletal muscle in HFD-fed rats inthe early stage of insulin resistance (24 weeks). However, leucine supplementation induced noremarkable alternations in BCAA catabolism, but did enhance mitochondrial biogenesis with aconcomitant improvement in lipid oxidation and mitochondrial function during the hyperglycaemiastage (32 weeks). These findings suggest that leucine trigger different effects on metabolic signaturesat different stages of insulin resistance, and the overall metabolic status of the organisms should becarefully considered to potentiate the benefits of leucine.
Keywords: leucine; BCAAs; BCAA catabolism; insulin resistance; metabolomic; mitochondria
1. Introduction
Branched-chain amino acids (BCAAs), comprising leucine, isoleucine and valine, are essentialamino acids and important nutrient signals that have direct and indirect effects on metabolism.Substantial evidence indicates that increased dietary intake of BCAAs, particularly leucine, haspositive effects on the regulation of body weight, muscle protein synthesis, glucose homeostasis, lipidmetabolism, and the ageing process [1–4]. Nevertheless, the idea that BCAAs or their supplementationmight have a positive role in glucose metabolism and insulin resistance remains controversial. In otherstudies, leucine supplementation has no effect, or leads to deterioration in insulin sensitivity [5,6].Along with these effects on metabolic health, it has long been recognized that elevated levels of
Nutrients 2017, 9, 565 149 www.mdpi.com/journal/nutrients
Books
MDPI

Nutrients 2017, 9, 565
circulating BCAAs and related metabolites are strongly associated with obesity and insulin resistanceand are predictive of future type 2 diabetes mellitus (T2DM) in humans and in some rodentmodels [7–10]. The mechanisms underlying these paradoxical findings are not completely understood.
BCAAs modulate insulin resistance via multiple mechanisms. Generally, BCAAs have been shownto induce insulin resistance by phosphorylation of serine IRS-1 via activating mammalian targets of therapamycin complex 1 (mTORC1) signaling pathway, and lead to a negative feedback loop of insulinsignaling [11]. However, several previous studies, including a study conducted in our laboratory,have indicated that BCAA–associated mTORC1 activation is not required or sufficient to elicit insulinresistance [12,13]. Alternatively, the Lynch group have observed that abnormal tissue-specific BCAAmetabolism in obesity results in the accumulation of BCAAs and related toxic metabolites, therebytriggering “anaplerotic stress” and mitochondrial dysfunction associated with insulin resistance andtype 2 diabetes mellitus (T2DM) [14,15]. In contrast, BCAAs supplementation has been shown topromote mitochondrial biogenesis and extend the lifespan of yeast and middle-aged mice [16]. Recently,BCAAs and leucine have been hypothesised to elicit different or even opposing effects, dependingon the catabolic and anabolic states of the organism [17]. Development of T2DM is a time-dependentprocess accompanied with different metabolic characteristics [18]. Notably, during the progressionof insulin resistance to T2DM, the predominantly anabolic processes transition to predominantlycatabolic processes, with the loss of insulin activity. This complexity introduces interpretive limitations,when using data derived from a static time point, on understanding how BCAAs affect the progressionof insulin resistance [19].
In the present study, we performed comprehensive metabolic and physiological profiling toinvestigate dynamic alterations in BCAA catabolism, mitochondrial function, and metabolic responsesto long-term leucine supplementation in rats with hyperinsulinaemia or hyperglycaemia induced bya high-fat diet (HFD). We aimed to provide mechanistic insights into the role of leucine in insulinresistance progression. Furthermore, we compared the effects of leucine with those of calorie restriction(CR), a well-known approach for improving insulin sensitivity.
2. Materials and Methods
2.1. Animals, Diets and Treatments
Male Sprague-Dawley rats at six weeks of age (160–180 g) were obtained from Sino-British Sipper/BKLab Animal Co., Ltd. (Shanghai, China) and housed in a temperature- and humidity-controlledenvironment on a 12 h light/dark cycle with free access to food and water. After acclimation, therats were randomly divided into four groups (n = 20 per group) based on body weight and feda normal chow diet (ND; D12450B, Research Diet Inc., New Brunswick, NJ, USA), HFD (D12451,Research Diet Inc., New Brunswick, NJ, USA), HFD supplemented with 1.5% leucine (HFD + Leu) orHFD with 20% CR (HFD + CR). The administered leucine dose was determined in our preliminaryexperiments [12] and nearly doubled the total daily leucine intake from food. The diet of the HFD + Leugroup was also supplemented with small amounts of valine and isoleucine to prevent valine andisoleucine deficiencies. The HFD was rendered isonitrogenous and isocalorie to the HFD + Leu dietby the addition of a mixture of non-essential amino acids (alanine, glycine, proline, aspartate andserine in isomolar amounts) (Table 1). Food intake was monitored daily, and that of HFD controlswas used as a reference to calculate the amount of food provided to the rats subjected to CR (80% offood consumption of controls). Half of the rats in each group were killed at week 24, and the otherhalf were killed at week 32 after overnight fasting. Blood samples were obtained and centrifugedat 4000× g for 20 min. The serum was then collected and stored in a freezer at −80 ◦C until furtheranalysis. Tissues were rapidly excised, weighed, flash-frozen in liquid nitrogen and then stored at−80 ◦C until use. All animal studies were conducted in accordance with the National Institutes ofHealth guide for the Care and Use of Laboratory Animals and approved by the Institutional Animal
150
Books
MDPI

Nutrients 2017, 9, 565
Care and Use Committee of Tongji Medical College, Huazhong University of Science and Technology(IACUC No. 417, Date: 2015.3.28).
Table 1. Composition of the experimental diets (/100g).
ND HFD HFD + Leu
Macronutrients (g)
Protein 20.3 20.3 20.3Carbohydrate 64.5 44.6 44.6
Fat 4.5 24.4 24.4Fiber 5.0 5.0 5.0
Minerals 3.0 3.0 3.0Calories (kcal) 379.7 479.2 479.2Fat (energy %) 10.7 45.8 45.8
Protein (energy %) 21.3 17.0 17.0Carbohydrate (energy %) 68.0 37.2 37.2
Amino acids (g)
Leucine 1.3 1.5 2.9Isoleucine 0.6 0.7 1.0
Valine 0.7 0.9 1.1Alanine 0.8 0.8 0.5
Aspartic acid 1.5 1.6 1.2Glycine 0.7 0.5 0.3
Threonine 0.7 0.7 0.7Serine 0.8 1.0 0.8
Glutamic acid 3.4 3.2 3.2Tyrosine 0.5 0.7 0.6
Phenylalanine 0.7 0.8 0.8Lysine 1.1 1.2 1.2
Histidine 0.5 0.5 0.4Proline 1.2 1.7 1.6
Arginine 1.0 0.5 0.6Methionine 0.4 0.3 0.4
Serine 0.8 1.0 0.8
ND: Normal chow diet; HFD: High fat diet.
2.2. Insulin Sensitivity Analysis
After 24 or 32 weeks on the respective diets, the fasting serum glucose levels were determinedby colorimetric assay (Nanjing Jiancheng Bioengineering Institute, Nanjing, China), and insulinlevels were assessed using a commercial ELISA kit (Mercodia AB, Uppsala, Sweden), according tothe manufacturer’s instructions. The HOMA-IR index was calculated using the following formula:HOMA-IR = [fasting glucose levels (mmol/L)] × [fasting serum insulin (mU/L)]/22.5. The glucosetolerance test (GTT) and insulin tolerance test (ITT) were performed following intragastric glucoseadministration and intraperitoneal insulin injection, respectively, after overnight starvation of the rats.Blood samples were collected from the tail vein at 0, 15, 30, 60 and 120 min, and the glucose levelswere measured with a Glucose Meter (Roche Diagnostics, Shanghai, China).
2.3. Western Blot Analysis
Frozen gastrocnemius muscle, liver and adipose tissues were lysed in RIPA buffer (BeyotimeBiotechnology, Shanghai, China) supplemented with phosphatase inhibitors and PMSF (Roche, Ltd.,Basel, Switzerland) before use. For the total MitoProfile Oxidative phosphorylation complexes(OXPHOS) analysis, mitochondrial proteins were extracted from the gastrocnemius muscle accordingto the manufacturer’s instructions (Nanjing Jiancheng Bioengineering Institute, Nanjing, China).Protein concentrations were assayed using a bicinchoninic acid (BCA) kit (Beyotime Biotechnology,Shanghai, China). A total of 20–50 μg of protein were resolved on SDS-PAGE gels and then transferred
151
Books
MDPI

Nutrients 2017, 9, 565
to polyvinylidene difluoride (PVDF) membranes. Information regarding the primary antibodies usedin this study is provided in Table S1. Protein bands were visualized with Molecular Imager VersaDocMP 4000 System (Bio-Rad, Berkeley, CA, USA).
2.4. Transmission Electron Microscopy
The mitochondrial morphology was investigated using electron microscopy. Briefly, gastrocnemiusmuscles were isolated and fixed with 2.5% glutaraldehyde for 1 day. The muscles were washed and cutlongitudinally into 0.5 mm thick strips. Following osmification with 2% osmium tetroxide and 1% uranylacetate en bloc, the stained tissue was routinely dehydrated in a methanol gradient and embeddedin Eponate-12. After polymerization, the ultrastructural features of the mitochondria were observedand photographed using a Tecnai G2 12 transmission electron microscope (FEI Company, Holland,The Netherlands).
2.5. Quantitative Real-Time PCR Analysis
Total RNA was extracted from gastrocnemius muscles with Trizol reagent (Invitrogen, New York,NY, USA) and reverse transcribed into cDNA using a high-capacity cDNA archive kit (Takara,Dalian, China). Real-time PCR was performed using the StepOnePlusTM Real-Time PCR System(Applied Biosystems, Grand Island, NY, USA) with the cDNA templates, gene-specific primers andthe SYBR Green qPCR Master mix (Takara, Dalian, China). Calculations were performed usinga comparative method (2−ΔΔCt), with GAPDH as the internal control. Total DNA was extractedfrom the gastrocnemius muscles using acommercial kit (Tiangen Biotech Co., Ltd., Beijing, China),according to the manufacturer’s instructions. The mitochondrial DNA (mtDNA) content was assessedusing RT-PCR by measuring the threshold cycle ratio of a mitochondria-encoded gene (COXII) to anucleus-encoded gene (β-globin). All RT-PCR experiments were performed in triplicate using thesame sample. The primer pairs for each gene are shown in Table S2.
2.6. Statistical Analysis
Unless otherwise stated, data are presented as means ± SD. Statistical analyses were performedusing the SPSS 15.0 software package (SPSS, Inc., Chicago, IL, USA). Significant differences wereassessed by student t test or one-way ANOVA followed by the Student-Newman-Keuls test. p < 0.05were considered statistically significant.
2.7. Serum Preparation and Metabolite Profiling
A targetedLC-MS/MSbased analysis was performed in the State Key Laboratory of QualityResearch in Chinese Medicine at Macau University of Science and Technology and Beijing MassSpectrometry Medical Research Co., Ltd. Broad metabolite profiling of serum was performed usingLC-MS/MS (ACQUITYTM ultra-Performance LC (Waters, Milford, MA, USA) equipped with an AB4000 Q-TRAP mass spectrometer (Applied Biosystems, Grand Island, NY, USA). Serum (200 μL) wasmixed with 200 μL of n-Ethylmaleimide (10 mol/L) in PBS buffer and 1000 μL of methanol containingthe internal standard L-phenylalanine-d5 (Phe-d5) at a concentration of 10 ng/mL. The mixture wasincubated at −20 ◦C for 20 min and centrifuged at 12,000 rpm for 10 min at 4 ◦C. The supernatant wasevaporated under a vacuum, and the dry residue was reconstituted with distilled water in preparationfor analysis.
In addition to the internal standards used for quality control, a quality control (QC) sample wasprepared and analyzed after every 10 serum samples. The blank serum used for QC was preparedfrom serum that had been stripped of endogenous materials by adding 6 g of charcoal activatedpowder (Sigma-Aldrich, St. Louis, MO, USA) to 100 mL of serum. This suspension was stirred at roomtemperature for 2 h and centrifuged at 13,500 rpm for 20 min at 4 ◦C. Then, the supernatant was filteredusing a Millipore Express PES Membrane (Merck Millipore, Ltd., Hesse, Germany). The obtainedblank serumwas confirmed to be free of biomarkers using LC-MS/MS.
152
Books
MDPI

Nutrients 2017, 9, 565
For quantitative amino acid profiling, the LC-MS/MS analysis was performed on an UltiMate3000(Dionex, Sunnyvale, CA, USA) equipped with an API 3200 Q TRAP MS System (Applied Biosystems,Grand Island, NY, USA). The samples were thawed, extracted and derivatized before analysis. In detail,after dilution with 80 μL of water, the sample was extracted with 500 μL of a mixture of methanol andacetonitrile (1:9, v/v). The extraction procedure was performed at −20 ◦C for 10 min after 2 min ofvortexing and 1 min of ultrasonication. Then, the residue was re-dissolved in 100 μL of a mixture ofmethanol and water (1:1, v/v) with 1 μg/mL of L-2-chlorophenylalanine, and the same steps wererepeated (vortexing, ultrasonication and centrifugation). The supernatant (80 μL) was transferred intothe sample vial for the analysis.
2.8. Metabolomics Data Processing and Multivariate Analysis
The pre-processed LC-MS/MS data were log-transformed, and the resulting data were analyzedby orthogonal partial least squares projection to latent structure-discriminant analysis (OPLS-DA)using SIMCA-P version 14.0 (Umetrics, Umea, Sweden). OPLS-DA was also used to identify and ranksignature metabolites that discriminated the different groups. Qualities of the OPLS-DA models wereassessed by R2 indicative of variation described by all components in the model and by Q2, measuringthe model ability to predict class membership.
Variables with a variable importance in the projection (VIP) score >1 were considered relevantfor group discrimination. Serum metabolite concentrations in HFD + Leu and HFD + CR rats atdifferent time points were compared with their age-matched HFD controls and significantly changedmetabolites were analyzed by One-way ANOVA. p value < 0.05 was considered statistically significant.In addition, metabolic pathway interpretation of differential metabolites were performed using theMetaboAnalyst 3.0 and KEGG database.
3. Results
3.1. Body Weight and Calorie Intake
As expected, HFD-fed rats exhibited a higher body weight than controls. However, HFD-inducedweight gain was significantly attenuated by CR or leucine supplementation from 3 or 13 weeks,respectively. The rats supplemented with leucine had significantly higher body weight when comparedto CR rat from 7 weeks (Figure S1A). Consistent with our experimental design, the total calorie intakeof CR rats was reduced by 20% over the 32-week feeding period compared with that of HFD-fed rats.Leucine addition to the high fat diet did not significantly alter calorie intake across all time points,with the exception of a slight decrease during week 3 (Figure S1B). The average daily leucine intake inND, HFD, HFD + CR and HFD + Leu-fed rats were 0.68 g, 0.69 g, 0.54 g and 1.28 g, respectively.
3.2. Insulin Sensitivity
As shown in Figure 1A,B, the 24-week HFD did not alter fasting blood glucose but significantlyincreased fasting serum insulin. Leucine addition to the HFD for 24 weeks had no obvious effectson fasting serum glucose or insulin, but CR prevented the HFD-induced increase in fasting insulin.Accordingly, the HOMA-IR index was unchanged in leucine-supplemented rats, but was decreased inCR rats (Figure 1C). CR rats had lower insulin level and HOMA-IR than HFD + Leu rats at 24 weeks(Figure 1B,C). After 32 weeks, both fasting blood glucose and insulin were elevated in HFD-fed ratscompared with ND-fed rats. HFD + Leu diet induced no significant effect on fast serum glucoseand insulin levels. CR largely prevented HFD-induced hyperglycaemia and hyperinsulinaemia(Figure 1A,B). The HOMA-IR index was lower in rats treated with either leucine or CR than that in thecorresponding HFD-fed controls (Figure 1C), while the CR rats had lower glucose than HFD + Leu ratsat 32 weeks (Figure 1A). The results of the OGTT and ITT confirmed that CR or leucine-supplementedrats were significantly more glucose-tolerant and insulin-sensitive than HFD-fed rats (Figure 1D–I) atthe two time points. As expected, insulin-stimulated Protein kinase B (PKB/AKT) phosphorylation
153
Books
MDPI

Nutrients 2017, 9, 565
in the skeletal muscle was increased in CR rats compared with the HFD-fed controls at both timepoints (Figure 1J). However, leucine-induced AKT phosphorylation was only observed at 32 weeks.The insulin-stimulated AKT phosphorylation protein expression in CR rats was higher than HFD + Leurats at week 24 (Figure 1J).
Figure 1. Leucine supplementation improved insulin sensitivity in HFD-fed rats. (A) Serum glucoseand (B) insulin levels were measured after overnight fasting. (C) HOMA-IR indices were calculatedfrom fasting glucose and insulin levels. (D,E) The intraperitoneal ITT (0.8 IU/kg.bw) and (G,H) OGTT(2 g/kg.bw) were performed after overnight fasting at the end of 24 and 32 weeks, respectively. (F,I) Thearea under the curve was calculated (n = 8). The results are presented as the mean ± SD. (J) AKT andphospho-AKT (Ser473) protein levels in skeletal muscle before (insulin−) and after (insulin+) 2 IU/kginsulin stimulation for 15 min were determined by immunoblotting (n = 3–6). * p < 0.05 versus ND-fedrats, # p< 0.05 versus HFD-fed rats, & p < 0.05 versus HFD + CR rats. HFD: High fat diet; ND: Normalchow diet; CR: Calorie restriction; ITT: Insulin tolerance test; OGTT: Oral glucose tolerance test; AKT:Protein kinase B.
3.3. Serum Amino Acid Profiles
Over 24 weeks of feeding, serum concentrations of BCAAs (valine and leucine), glucogenogenicamino acids (alanine, asparagine and glutamate), and gluconeogenic and ketogenic amino acids(phenylalanine and tryptophan) were significantly lower in HFD-fed rats relative to ND control, Whilethe ketogenic amino acids (lysine) was significantly increased (Table 2). However, BCAA (exceptfor isoleucine) concentrations were significantly elevated after leucine supplementation for 24 weeks
154
Books
MDPI

Nutrients 2017, 9, 565
compared with those in HFD-fed rats. The concentrations of other amino acids, such as aromatic aminoacids (phenylalanine and tryptophan) and several gluconeogenic amino acids (asparagine, proline andalanine), were also significantly elevated (Table 3).
Table 2. Amino acids profile in HFD rats.
Parameter 24 weeks 32 weeks
BCAAsisoleucine 1.01 (0.93, 1.09) 0.97 (0.89, 1.06)
valine 0.62 (0.55, 0.70) * 1.04 (0.96, 1,11)leucine 0.70 (0.56, 0.84) * 0.92 (0.84, 1.01)
Glucogenogenic amino acids
alanine 0.48 (0.37, 0.59) * 1.02 (0.89, 1.16)asparagine 0.72 (0.65, 0.80) * 1.36 (1.14, 1.59) *
aspartic acid 1.01 (0.60, 1.43) 1.01 (0.83, 1.20)cysteine 1.06 (0.92, 1.20) 1.33 (1.24, 1.42) *
glutamate 0.79 (0.69, 0.90) * 1.65 (1.38, 1.92) *glutamine 1.04 (0.98, 1.10) 1.08 (1.02, 1.14)
glycine 1.46 (1.24, 1.68) 0.94 (0.83, 1.05)histidine 1.02 (0.95, 1.09) 0.83 (0.77, 0.88) *
methionine 1.01 (0.93, 1.08) 1.09 (0.94, 1.24)proline 0.91 (0.84, 0.99) 1.23 (1.06, 1.41) *serine 1.23 (1.04, 1.42) 1.08 (1.02, 1.15)
arginine 1.19 (1.06, 1.32) 0.95 (0.83, 1.08)
Gluconeogenic and ketogenic amino acids
phenylalanine 0.54 (0.48, 0.59) * 1.10 (0.94, 1.25)threonine 1.05 (0.95, 1.15) 1.34 (1.25, 1.42) *
tryptophan 0.76 (0.68, 0.85) * 0.90 (0.83, 0.98)tyrosine 1.12 (0.95, 1.29) 0.89 (0.82, 0.96)
Ketogenic amino acids
lysine 1.37 (1.20, 1.54) * 1.46 (1.21, 1.71) *
Data were expressed as mean fold difference (95% CI) of HFD-fed rats relative to their corresponding ND-fedcontrols at week 24 and 32, respectively (n = 8). * p < 0.05 versus age-matched ND controls. HFD: High-fat diet; ND:Normal chow diet; CR: Calorie restriction; BCAAs, branched-chain amino acids.
At week 32, serum BCAA levels were not significantly changed in HFD rats compared tocorresponding controls, but glucogenogenic amino acids (asparagine, cysteine, glutamate andproline), gluconeogenic and ketogenic amino acids (threonine) and ketogenic amino acid lysinewere significantly increased (Table 2). However, after 32 weeks of leucine treatment, serum BCAAand aromatic amino acid levels did not significantly differ, whereas asparagine and glycine weresignificantly reduced and proline was increased. The concentrations of most amino acids in CR ratswere reduced at week 24 compared with those in HFD controls, but the observed differences were notstatistically significant (except for leucine, isoleucine, alanine, phenylalanine and lysine). However,CR-induced alterations in serum amino acid concentrations were not remarkable at 32 weeks, butalanine and proline were significantly increased (Table 3).
155
Books
MDPI

Nutrients 2017, 9, 565
Table 3. Amino acids profile.
24 weeks 32 weeks
Parameter CR HFD + Leu CR HFD + Leu
BCAAs
isoleucine 0.82 (0.76, 0.88) * 0.91 (0.84, 0.98) 0.88 (0.79, 0.96) 0.94 (0.77, 1.11)valine 0.91 (0.86, 0.96) 1.38 (1.18, 1.58) * 0.94 (0.85, 1.03) 0.95 (0.74, 1.15)leucine 0.85 (0.79, 0.91) * 1.43 (1.02, 1.84) * 0.91 (0.84, 0.98) 0.98 (0.69, 1.27)
Glucogenogenic amino acids
alanine 0.79 (0.71, 0.87) * 1.49 (1.34, 1.65) * 1.29 (1.02, 1.56) * 0.92 (0.71, 1.12)asparagine 0.91 (0.76, 1.06) 1.49 (1.25, 1.72) * 0.90 (0.73, 1.06) 0.79 (0.60, 0.98) *
aspartic acid 0.93 (0.82, 1.03) 0.91 (0.74, 1.08) 1.08 (0.96, 1.20) 1.14 (0.97, 1.31)cysteine 1.19 (1.08, 1.30) * 0.96 (0.85, 1.08) 1.09 (0.93, 1.25) 0.93 (0.77, 1.08)
glutamate 0.93 (0.80, 1.07) 1.07 (0.92, 1.23) 1.08 (0.86, 1.31) 1.00 (0.83, 1.17)glutamine 0.93 (0.85, 1.01) 0.92 (0.84, 1.00) 1.03 (0.88, 1.18) 1.06 (0.91, 1.21)
glycine 0.96 (0.90, 1.03) 0.95 (0.91, 0.99) 0.89 (0.81, 0.98) 0.82 (0.71, 0.93) *histidine 0.98 (0.90, 1.05) 0.97 (0.83, 1.11) 1.09 (0.98, 1.20) 1.05 (0.92, 1.18)
methionine 0.94 (0.86, 1.03) 1.01 (0.94, 1.08) 0.94 (0.86, 1.02) 0.97 (0.89, 1.04)proline 1.04 (0.80, 1.29) 1.28 (1.00, 1.57) * 1.24 (1.00, 1.49) * 1.27 (1.02, 1.52) *serine 0.98 (0.91, 1.04) 0.92 (0.85, 0.98) 1.08 (0.98, 1.18) 0.95 (0.84, 1.05)
arginine 0.86 (0.82, 0.91) 0.98 (0.84, 1.12) 1.08 (1.00, 1.15) 1.16 (0.96, 1.36)
Gluconeogenic and ketogenic amino acids
phenylalanine 0.89 (0.83, 0.95) * 1.35 (1.20, 1.50) * 0.94 (0.90, 0.97) 1.07 (0.91, 1.21)threonine 1.17 (1.05, 1.29) 0.92 (0.81, 1.02) 1.08 (0.92, 1.25) 1.09 (0.97, 1.21)
tryptophan 1.00 (0.69, 1.31) 1.43 (1.17, 1.69) * 1.22 (0.94, 1.50) 0.97 (0.77, 1.16)tyrosine 0.87 (0.71, 1.04) 1.00 (0.87, 1.14) 1.08 (0.92, 1.25) 1.09 (0.97, 1.21)
Ketogenic amino acids
lysine 0.82 (0.74, 0.90) * 0.65 (0.55, 0.74) * 0.90 (0.75, 1.06) 0.99(0.79, 1.19)
Data were expressed as mean fold difference (95% CI) of HFD + Leu and HFD + CR rats relative to theircorresponding HFD control at week 24 and 32, respectively (n = 8). * p < 0.05 versus age-matched HFD controls.HFD: High-fat diet; CR: Calorie restriction.
3.4. Serum Metabolic Profiles
An LC-MS/MS-based metabolic approach was used to obtain more insights into the mechanismsunderlying the different effects of leucine supplementation on insulin resistance. OPLS-DA modelwas carried out for ND, HFD, HFD + Leu and HFD + CR groups at week 24 and 32, respectively, andthe R2 and Q2 values confirmed good qualities for all models (Figure 2A,B). The score plots for eachmodel showed clear separation among the different groups suggesting they had different metabolicfeatures at different pathological stages of HFD induced insulin resistance.
The metabolites detected in the serum were almost decreased in HFD-fed rats compared tothe ND controls at week 24. Prominent decreases were observed for metabolites from aminoacids including aromatic amino acid catabolites (5-hydroxytryptophan, 4,6-dihydroxyquinoline, andL-kynurenine), methionine catabolites (spermidine and S-adenosylhomocysteine) and nitrogenouscompounds derived from amino acid catabolism (creatinine, Creatine, and uridine), fatty acidmetabolites (3-hydroxybutyric, Acetylcarnitine and Carnitine), tricarboxylic acid (TCA) cycleintermediates (Fumaric acid and a-Ketoglutaric acid), bile acid metabolites (Ursodeoxycholic acid,Glycochenodeoxycholic acid) and some lysophosphatidylcholines (LPCs). However, fatty acidmetabolism (palmitic acid) and TCA intermediate (malic acid) were marked elevated (Table 4).The serum metabolites that discriminated between leucine-supplemented and HFD-fed rats wereprimarily involved in the TCA cycle, fatty acid, bile acid and amino acid metabolism (Table 5).Specifically, the serum levels ofTCA intermediates (fumaric acid, malic acid and α-ketoglutarate) andmetabolites related to lipid metabolism (acylcarnitine, palmitoyl-L-carnitine, carnitine, palmitic acid
156
Books
MDPI

Nutrients 2017, 9, 565
and 3-hydroxybutyrate) were markedly higher in leucine-treated rats than in HFD-fed controls atweek 24.
Figure 2. Orthogonal partial least squares projection to latent structure-discriminant analysis(OPLS-DA) score plots displaying the separation of the ND-fed, HFD-fed, Calorie-restricted andHFD + leurats after (A) 24 and (B) 32 weeks of treatment. Model parameters: (A) R2X = 0.944,Q2 = 0.424; (B) R2X = 0.938, Q2 = 0.652.HFD: High-fat diet; ND: Normal chow diet.
Table 4. Fold difference of serum metabolites significantly changed in HFD rats relative to thecorresponding ND controls.
Metabolites 24 weeks 32 weeks
Amino acids derivatives
L-Kynurenine 0.72 (0.64, 0.79) * 1.09 (0.87, 1.31)5-hydroxytryptophan 0.55 (0.44, 0.66) * 1.11 (0.93, 1.29) *
Spermidine 0.52 (0.48, 0.57) * 1.26 (1.10, 1.42)2-hydroxyisobutyrate 0.86 (0.77, 0.95) 2.23 (1.87, 2.59) *
2-hydroxyglutarate 0.55 (0.47, 0.62) * 1.37 (1.20, 1.54) *S-(adenosyl)-L-homocysteine 0.49 (0.41, 0.58) * 1.28 (0.96, 1.60)
4,6-dihydroxyquinoline 0.55 (0.49, 0.62) * 1.20 (0.93, 1.46)Creatinine 0.43 (0.33, 0.54) * 1.19 (0.98, 1.40)Creatine 0.41 (0.31, 0.52) * 1.34 (1.04, 1.64) *Uridine 0.39 (0.25, 0.52) * 1.36 (1.17, 1.54) *
Fatty acid metabolism
3-hydroxybutyric 0.77 (0.70, 0.85) * 1.92 (1.56, 2.27) *Palmitic acid 3.92 (3.25, 4.59) * 1.53 (0.93, 2.12)
Acetylcarnitine 0.70 (0.64, 0.77) * 1.02 (0.84, 1.19)Palmitoyl-L-carnitine 0.91 (0.75, 1.08) 1.48 (1.11, 1.86)
Carnitine 0.46 (0.38, 0.54) * 1.04 (0.68, 1.41)
Phospholipids
Lysophosphatidylcholine (C18:1) 0.50 (0.43, 0.57) * 1.18 (0.99, 1.37)Lysophosphatidylcholine (C16:1) 0.38 (0.34, 0.41) * 0.99 (0.82, 1.16)Lysophosphatidylcholine (C16:0) 0.65 (0.58, 0.72) * 0.97 (0.83, 1.12)Lysophosphatidylcholine (C20:4) 0.16 (0.12, 0.20) * 1.21 (0.94, 1.48)
TCA cycle intermediates
Fumaric acid 0.82 (0.74, 0.89) * 1.12 (0.93, 1.31)Malic acid 3.54 (2.81, 4.27) * 1.23 (1.07, 1.39) *Citric acid 0.91 (0.80, 1.03) 1.22 (1.10, 1.34) *
a-Ketoglutaric acid 0.52 (0.45, 0.59) * 1.13 (0.98, 1.29)
157
Books
MDPI

Nutrients 2017, 9, 565
Table 4. Cont.
Metabolites 24 weeks 32 weeks
Bile acid metabolism
Ursodeoxycholic acid 0.28 (0.19, 0.38) * 1.15 (0.73, 1.56)Glycochenodeoxycholic acid 0.32 (0.28, 0.35) * 0.73 (0.60, 0.86)
Glycocholic acid 0.71 (0.13, 1.28) 0.65 (0.22, 1.08)
Purine metabolism
Xanthosine 0.71 (0.46, 0.96) 0.93 (0.71, 1.16)Allantoin 0.42 (0.33, 0.50) * 1.00 (0.85, 1.14)Uric acid 0.88 (0.77, 0.98) 1.10 (0.95, 1.25)Xanthine 0.83 (0.56, 1.09) 1.00 (0.71, 1.29)
Data were expressed as mean fold difference (95% Confidence Interval) of HFD-fed rats relative to theircorresponding ND controls at week 24 and 32, respectively (n = 8). * p < 0.05 versus age-matched ND controls. HFD:High fat diet; ND: Normal chow diet; TCA, tricarboxylic acid.
Table 5. Fold difference of serum metabolites significantly changed in HFD + CR or HFD + Leu ratsrelative to the corresponding HFD-fed controls.
24 weeks 32 weeks
Metabolites HFD + CR HFD + Leu HFD + CR HFD + Leu
Amino acids derivatives
L-Kynurenine 1.30 (0.66, 1.95) 1.70 (1.23, 2.19) * 1.10 (0.43, 1.78) 1.10 (0.81, 1.39)5-hydroxytryptophan 1.10 (0.96, 1.25) 1.58 (1.16, 1.92) * 1.29 (0.82, 1.76) 1.43 (1.07, 1.79) *
Spermidine 1.17 (1.02, 1.33) * 1.43 (1.26, 1.60) * 1.18 (1.04, 1.32) * 1.05 (0.89, 1.21)2-hydroxyisobutyrate 0.90 (0.70, 1.10) 1.54 (1.26, 1.81) * 0.82 (0.56, 1.09) 0.67 (0.38, 0.95) *
2-hydroxyglutarate 0.88 (0.73, 1.03) 1.71 (1.50, 1.92) * 1.07 (0.86, 1.28) 1.01 (0.86, 1.16)S-(adenosyl)-L-homocysteine 1.24 (0.87, 1.60) 1.57 (1.28, 1.86) * 1.51 (1.20, 1.83) * 1.34 (1.03, 1.66) *
4,6-dihydroxyquinoline 1.54 (1.21, 1.87) * 1.81 (1.56, 2.06) * 1.50 (1.17, 1.82) * 0.90(0.75, 1.05)Creatinine 1.31 (1.19, 1.43) * 1.50 (1.36, 1.64) * 1.14 (0.91, 1.37) 1.16 (0.91, 1.40)Creatine 0.91 (0.76, 1.06) 1.33 (0.99, 1.68) 1.04 (0.70, 1.37) 1.71 (1.34, 2.08) *Uridine 1.32 (0.93, 1.72) 1.61 (1.37, 1.85* 1.02 (0.88, 1.17) 0.92 (0.68, 1.17)
Fatty acid metabolism
3-hydroxybutyric 0.92 (0.71, 1.13) 1.36 (1.13, 1.59) * 0.92 (0.60, 1.24) 0.91 (0.48, 1.33)Palmitic acid 1.28 (1.03, 1.53) * 1.81 (1.47, 2.15) * 1.55 (1.17, 1.94) * 0.54 (0.38, 0.70) *
Acetylcarnitine 1.12 (0.96, 1.30) 1.34 (1.21, 1.48) * 1.15 (0.92, 1.39) 0.87 (0.67, 1.07)Palmitoyl-L-carnitine 1.17 (0.97, 1.37) 1.90 (1.54, 2.26) * 0.99 (0.59, 1.40) 0.49 (0.39, 0.58) *
Carnitine 1.29 (1.09, 1.48) * 1.86 (1.46, 2.26) * 1.28 (1.09, 1.47) 1.04 (0.93, 1.15)
Phospholipids
Lysophosphatidylcholine (C18:1) 1.35 (1.13, 1.56) * 1.42 (1.19, 1.65) * 1.55 (1.19, 1.90) * 1.49 (1.14, 1.83) *Lysophosphatidylcholine (C16:1) 1.40 (1.15, 1.64) * 1.42 (1.23, 1.60) * 1.41 (1.00, 1.83) * 0.91 (0.71, 1.10)Lysophosphatidylcholine(C16:0) 1.20 (1.05, 1.36) * 1.34 (1.18, 1.49) * 1.31 (1.13, 1.48) * 1.21 (1.03, 1.40) *Lysophosphatidylcholine (C20:4) 1.06 (0.87, 1.25) 1.04 (0.77, 1.30) 0.87 (0.50, 1.24) 3.82 (3.23, 4.41) *
TCA cycle intermediates
Fumaric acid 1.09 (0.93, 1.24) 1.23 (1.08, 1.38) * 1.09 (0.96, 1.22) 0.82 (0.72, 0.93) *Malic acid 0.87 (0.74, 1.00) 1.33 (1.11, 1.55) * 0.97 (0.48, 1.47) 0.15 (0.09, 0.22) *Citric acid 1.02 (0.90, 1.15) 1.18 (0.97, 1.39) 0.94 (0.77, 1.11) 0.86 (0.74, 0.97) *
a-Ketoglutaric acid 0.95 (0.80, 1.09) 1.32 (1.13, 1.50) * 1.23 (1.00, 1.47) 1.05 (0.85, 1.25)
Bile acid metabolism
Ursodeoxycholic acid 1.57 (0.96, 2.19) 2.58 (1.91, 3.24) * 1.37 (1.06, 1.68) * 1.35 (1.08, 1.61) *Glycochenodeoxycholic acid 1.45 (1.19, 1.71) * 1.26 (0.92, 1.60) 1.63 (1.13, 2.13) * 1.43 (1.19, 1.66) *
Glycocholic acid 2.20 (1.04, 3.36) * 4.17 (0.60, 7.74) 3.17 (1.08, 5.27) * 3.76 (1.45, 6.07) *
Purine metabolism
Xanthosine 0.90 (0.63, 1.18) 1.20 (0.77, 1.62) 1.49 (1.13, 1.85) * 1.05 (0.90, 1.19)Allantoin 1.05 (0.86, 1.24) 1.33 (1.00, 1.66) * 1.27 (1.04, 1.50) * 1.41 (1.23, 1.59) *Uric acid 0.91 (0.77, 1.05) 1.24 (1.07, 1.41) * 1.08 (0.93, 1.23) 0.90 (0.83, 0.96)Xanthine 1.05 (0.55, 1.55) 1.26 (0.76, 1.76) 1.71(1.38, 2.02) * 1.12 (0.96, 1.27)
Data were expressed as mean fold difference (95% Confidence Interval) of HFD + Leu and HFD + CR rats relativeto their corresponding HFD controls at week 24 and 32, respectively (n = 8). * p < 0.05 versus age-matched HFDcontrols. HFD: High fat diet; CR: Calorie restriction.
158
Books
MDPI

Nutrients 2017, 9, 565
The amino acid derivatives (5-hydroxytryptophan, 2-hydroxyisobutyrate, 2-hydroxyglutarate,Creatine and Uridine), fatty acid metabolites (3-hydroxybutyric), TCA cycle intermediates (Malic acid,Citric acid) were significantly elevated after 32 weeks of HFD feeding relative to the age-matched NDcontrol (Table 4). Notably, we observed sharp decreases in the levels of TCA intermediates (fumaricacid, malic acid and citric acid) and lipid-related metabolites (palmitoyl-L-carnitine and palmitic acid)at week 32 relative to HFD-fed controls (Table 5).
In addition, leucine supplementation for 24 weeks contributed to the accumulation ofmetabolites associated with amino acid catabolism, including aromatic amino acid catabolites(5-hydroxytryptophan, 4,6-dihydroxyquinoline, and L-kynurenine), methionine catabolites(spermidine and S-adenosylhomocysteine) and nitrogenous compounds derived from amino acidcatabolism (creatinine, uric acid, and uridine).In contrast, at week 32, the levels of amino acidcatabolites that discriminated the leucine group from the HFD-fed controls were reduced. Moreover,prominentincreases in bile acid metabolites and some lysophosphatidylcholines (LPCs) were detectedat both 24 and 32 weeks (Table 5).
Metabolites related to lipid metabolism (palmitic acid and LPCs), bile acid metabolism(glycochenodeoxycholic acid and glycocholic acid) and some amino acid catabolites were significantlyelevated at week 24 and 32 in CR rats compared with the corresponding HFD-fed controls (Table 5).
3.5. BCAA Catabolizing Enzymes and Metabolites
HFD feeding for 24 weeks, the levels of transamination products of BCAAs— branched-chainα-keto acids (BCKAs)—did not change significantly compared with ND-fed control at 24 weeks(Figure 3B). Mitochondrial branched-chain aminotransferase (BCATm) protein expression inskeletal muscle and adipose tissue were both significantly increased. Branched-chain α-keto aciddehydrogenase kinase (BCKDK) protein expression in HFD rats was lower in skeletal muscle, whilehigher in adipose tissue than ND controls (Figure 4A–C). BCATm protein expression was significantlyincreased in skeletal muscle and adipose tissue, concurrent with a significant increase in BCKDKandnochange in branched-chain α-keto acid dehydrogenase E1 α (BCKDHE1α) in skeletal muscles, liversand adipose tissues of leucine-supplemented rats, compared with those of HFD-fed controls at week24 (Figure 4A–C). Furthermore, the levels of transamination products of leucine (α-Ketoisocaproate,KIC) were also increased (Figure 3B).
Figure 3. Leucine supplementation-induced alterations in the levels of BCAA derivatives. (A) Serumlevels of short-chain acylcarnitines (C3 and C5) and (B,C) Branched-chain α-keto acids (BCKAs) (n = 8).The results are presented as means ± SD. * p < 0.05 versus ND-fed rats, # p < 0.05 versus HFD-fed rats,& p < 0.05 versus HFD + CR rats. HFD: High fat diet; ND: Normal chow diet; CR: Calorie restriction.
159
Books
MDPI
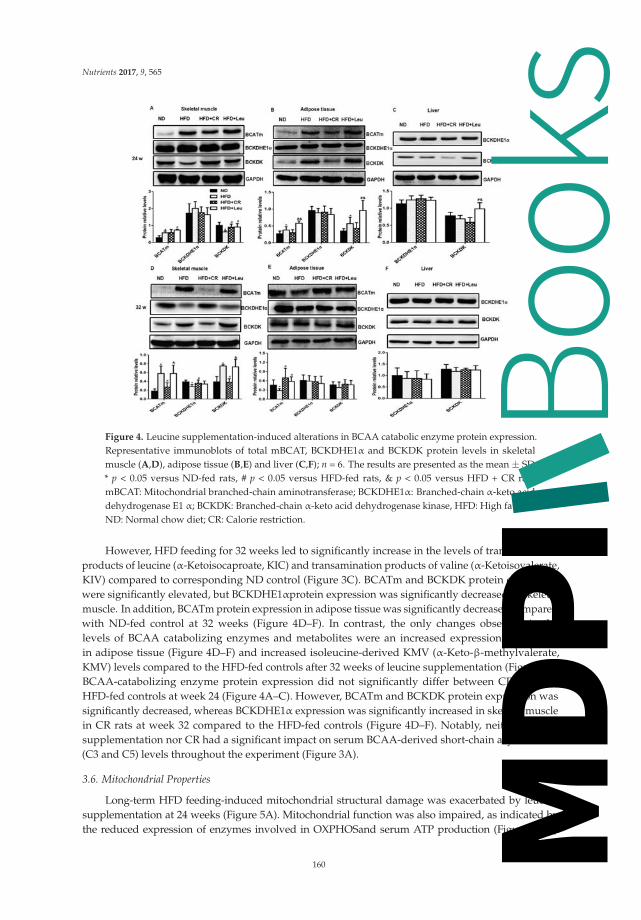
Nutrients 2017, 9, 565
Figure 4. Leucine supplementation-induced alterations in BCAA catabolic enzyme protein expression.Representative immunoblots of total mBCAT, BCKDHE1α and BCKDK protein levels in skeletalmuscle (A,D), adipose tissue (B,E) and liver (C,F); n = 6. The results are presented as the mean ± SD.* p < 0.05 versus ND-fed rats, # p < 0.05 versus HFD-fed rats, & p < 0.05 versus HFD + CR rats.mBCAT: Mitochondrial branched-chain aminotransferase; BCKDHE1α: Branched-chain α-keto aciddehydrogenase E1 α; BCKDK: Branched-chain α-keto acid dehydrogenase kinase, HFD: High fat diet;ND: Normal chow diet; CR: Calorie restriction.
However, HFD feeding for 32 weeks led to significantly increase in the levels of transaminationproducts of leucine (α-Ketoisocaproate, KIC) and transamination products of valine (α-Ketoisovalerate,KIV) compared to corresponding ND control (Figure 3C). BCATm and BCKDK protein expressionwere significantly elevated, but BCKDHE1αprotein expression was significantly decreased in skeletalmuscle. In addition, BCATm protein expression in adipose tissue was significantly decreased comparedwith ND-fed control at 32 weeks (Figure 4D–F). In contrast, the only changes observed in thelevels of BCAA catabolizing enzymes and metabolites were an increased expression of BCATmin adipose tissue (Figure 4D–F) and increased isoleucine-derived KMV (α-Keto-β-methylvalerate,KMV) levels compared to the HFD-fed controls after 32 weeks of leucine supplementation (Figure 3C).BCAA-catabolizing enzyme protein expression did not significantly differ between CR rats andHFD-fed controls at week 24 (Figure 4A–C). However, BCATm and BCKDK protein expression wassignificantly decreased, whereas BCKDHE1α expression was significantly increased in skeletal musclein CR rats at week 32 compared to the HFD-fed controls (Figure 4D–F). Notably, neither leucinesupplementation nor CR had a significant impact on serum BCAA-derived short-chain acylcarnitine(C3 and C5) levels throughout the experiment (Figure 3A).
3.6. Mitochondrial Properties
Long-term HFD feeding-induced mitochondrial structural damage was exacerbated by leucinesupplementation at 24 weeks (Figure 5A). Mitochondrial function was also impaired, as indicated bythe reduced expression of enzymes involved in OXPHOSand serum ATP production (Figure 5B,D).
160
Books
MDPI

Nutrients 2017, 9, 565
The expression of genes controlling mitochondrial biogenesis, including mitochondrial transcriptionfactor A (TFAM), peroxisome proliferator-activated receptor γ coactivator-1-α (PGC-1α) and sirtuin 1(SIRT1), were greatly decreased (Figure 5F) in HFD + Leurats at this time point. In contrast, HFD-inducedmitochondrial damage was partially restored by leucine supplementation at 32 weeks (Figure 5A),accompanied by increases in the mtDNA content (Figure 5E), the expression of genes involved inmitochondrial biogenesis (TFAM) (Figure 5G) and ATP production (Figure 5D). As expected, CRameliorated HFD-induced mitochondrial damage at both time points. At week 24, CR enhancedexpression of enzymes involved in OXPHOS, and the gene expression related to mitochondrial biogenesis(TFAM, NRF-1, PGC-1α and SIRT1) (Figure 5B,F). At week 32, CR-induced mitochondrial biogenesiswas not greatly changed, but ATP production was significantly increasedcompared to HFD controls(Figure 5D,E,G). CR exhibited better effects on improving HFD-induced mitochondrial damage at week24 as demonstrated by increases in OXPHOS protein levels (Figure 5B), ATP production (Figure 5D), andmitochondrial biogenesis compared to leucine supplementation (Figure 5F).
Figure 5. Leucine supplementation-induced alterations in mitochondrial properties. (A) Transmissionelectronic microscopy (×20,000) of the mitochondrial ultrastructure in skeletal muscle (n = 4).(B,C) Protein expression of Oxidative phosphorylation complexes (OXPHOS) complexes I to V inthe electron transport chain in skeletal muscle were analyzed by western blotting (n = 6). (D) SerumATP levels (n = 8). (E) Mitochondrial DNA (mtDNA) copy number (n = 6). (F,G) Expression ofmitochondrial biogenesis-related genes (n = 6). The results are presented as the mean ± SD. * p < 0.05versus ND-fed rats, # p < 0.05 versus HFD-fed rats, & p < 0.05 versus HFD + CR rats. ND: Normalchow diet; HFD: High fat diet; CR: Calorie restriction.
4. Discussion and Conclusions
The effects of BCAA (especially leucine) supplementation on insulin resistance remainselusive. Numerous studies have shown that leucine supplementation may prevent HFD-inducedobesity [1,2,20], modulate glucose metabolism [21,22] and improve insulin sensitivity in rodent models.However, Newgard et al. suggested that excess BCAAs could contribute to development of insulinresistance, at least under conditions of high fat feeding or elevated tissue fatty acid availability [7].The underlying mechanisms contributing to these inconsistent results are incompletely understood.
161
Books
MDPI

Nutrients 2017, 9, 565
Exactly how leucine exerts effects on insulin resistance is complex, and may depend on the studydesign, dietary composition, the animal models typically used and the BCAA concentrations, durationand form of administration. Recently, it has been supposed that BCAAs can trigger different andeven opposite effects, depending on the catabolic and anabolic state of the organisms [17]. Given thedifferent metabolic signature in the progression of T2DM, and leucine’s ability to stimulate bothanabolic and catabolic processes [23], we applied an integrative, time-resolved approach to gain adeeper understanding the effects of leucine supplementation in the complexity of the disease on BCAAmetabolism, mitochondrial properties and metabolic profiling. Several interesting and importantfindings were obtained.
In the present study, HFD feeding induced hyperinsulinaemia at 24 weeks. During this period,the rats became increasingly obese, and exhibited lower concentrations of amino acids and relatedmetabolites, fatty acid metabolites and TCA intermediates compared to corresponding ND controls.Studies have shown that insulin signaling functions at an increased basal level in the presence ofinsulin resistance and hyperinsulinaemia [24,25]. Compensatory increased insulin secretion responseto overnutrition may slow fat oxidation and promote anabolism (syntheses of glycogen, proteins,and fats), leading to body weight gain and glucose homeostasis. In contrast, after HFD feeding for32 weeks, the rats progressively developed hyperglycaemia. The increased insulin level could notmaintain glucose at normal levels, and was accompanied by elevated levels of amino acids and relatedmetabolites, fatty acid metabolites and TCA intermediates relative to corresponding ND-fed rats.These data suggested that at this stage the anabolic response to hyperinsulinaemia was blunted, HFDrats were transition from predominantly anabolic condition to predominantly catabolic condition.
The effect of supplementation of HFD with leucine was examined in these two different metabolicconditions, respectively. Our results indicated that doubling dietary leucine globally improvedHFD-induced insulin resistance but caused different changes in BCAA catabolism in rats withhyperinsulinaemia or hyperglycaemia. These results seem inconsistent with the finding that elevatedcirculation of BCAAs and related metabolites promotes insulin resistance, particularly in response toHFD feeding [5,7]. Leucine supplementation ameliorated HFD-induced insulin resistance to differentextents at the two time points, as indicated by the improved HOMA-IR values, insulin toleranceand glucose tolerance. Interestingly, this leucine-induced elevation in insulin sensitivity may not becorrelated with changes in serum BCAAs, which were increased in HFD + Leu rats at 24 weeks andunaltered at 32 weeks compared with those in HFD-fed rats.
Recent metabolomic, proteomic and genomic studies have suggested that altered BCAAcatabolism contributes to elevated BCAAs [14,26,27]. The enzymes involved in the first two stepsof the BCAA catabolic pathway, BCATm and Branched-chain α-keto acid dehydrogenase (BCKDH),were examined in the present study. Leucine supplementation increased BCATm protein expressionin adipose tissue and skeletal muscle at 24 weeks, suggesting a substrate-induced effect of increaseddietary BCAAs (~70% increase for three BCAAs) compared with that in HFD-fed rats. No differenceswere observed in protein expression of BCKDHE1α, whereas that of BCKDK, a kinase that inactivatesBCKDH by phosphorylating the subunit E1α, was increased in observed tissues, including skeletalmuscle, liver and adipose tissues. BCKDK participates in a key mechanism for the nutritional andhormonal regulation of BCAA oxidative flux [28,29], and its expression is increased by insulin [30].This potentially impaired BCKD activity may contribute to the accumulation of BCKAs, such as KIC, inleucine-supplemented rats during the early stage of insulin resistance, which was characterizedby hyperinsulinaemia in the present study. Following the progression of insulin resistance tohyperglycaemia, no significant leucine-induced alterations were observed in serum BCAAs orBCAA-catabolizing enzyme levels, with the exception of increased BCATm in adipose tissue. This tightregulation of BCAA catabolism suggests that an elegant method exists for increasing the degradationof BCAAs when they are present in excess and sparing them [31] when they are needed for anabolic orother necessary processes during the different stages of insulin resistance.
162
Books
MDPI

Nutrients 2017, 9, 565
In addition to alterations in BCAA catabolism, we identified several leucine-associated changesin TCA cycle intermediates, lipids and other amino acid metabolites in rats with hyperinsulinaemiaor hyperglycaemia. Leucine-induced alterations in serum amino acid concentrations at 24 weeksincluded increased aromatic amino acid (phenylalanine and tryptophan), alanine and asparaginelevels, which may have occurred because BCAAs share a competitive transport system with aromaticamino acids [32]. In addition, BCAA transamination provides a nitrogen source for the synthesisof other dispensable amino acids. The levels of almost all amino acid catabolites investigated inthe present study were increased in leucine-supplemented rats at 24 weeks, but were unaltered ordecreased at 32 weeks, compared with those in HFD-fed controls. It is noteworthy that variousfactors affect serum amino acid concentrations, including protein turnover (protein synthesis anddegradation), and the metabolism of individual amino acids. The exact mechanisms by which leucinesupplementation affect the levels of amino acids and their metabolites at different stage of insulinresistance are still unknown, and warrant further study.
Acylcarnitines are intermediates of fatty acid oxidation, and accumulate as a consequence ofthe metabolic dysfunction resulting from the insufficient integration between β-oxidation and theTCA cycle [33–35]. Elevated BCAAs in a lipotoxic environment have been proposed to inducethe accumulation of BCAA-derived acylcarnitines and incompletely oxidized lipid species [5,7].In HFD-induced hyperinsulinaemic rats in the present study, leucine supplementation caused increasesin acylcarnitine species (carnitine, acylcarnitine and palmitoyl-L-carnitine), but no remarkable changesin BCAA-derived short-chain acylcarnitines (C3 and C5). However, TCA cycle intermediates weresignificantly elevated, reflecting an early compensatory response to substrate overload. Accumulatedby-products of BCAA transamination are catabolized to BCAA-related acetyl-CoAs, ketones andother intermediates, leading to competitive inhibition of lipid-derived acetyl-CoA entry into theTCA cycle [36–38]; in turn, this process may reduce fatty acid oxidation and induce acylcarnitineaccumulation and ketogenesis, as indicated by the results (Table 3). Interestingly, as insulin resistanceprogressed, leucine promoted reductions in the accumulation of serum acylcarnitine species andlevels of multiple TCA cycle intermediates at 32 weeks compared with those in age-matched HFD-fedcontrols.Skeletal muscle serves as a major reservoir of free carnitine and is thought to be a principalcontributor to the serum acylcarnitine pool. The accumulation of acylcarnitine species is mitotoxic andpromotes mitochondrial dysfunction. The above-mentioned alterations in the metabolic phenotypemight be correlated with changes in skeletal muscle mitochondrial properties. Consistent withthis hypothesis, the HFD + Leu treatment caused increased mitochondrial damage, accompaniedby decreases in mitochondrial biogenesis, ATP production and mitochondrial oxidative enzymelevels in skeletal muscle compared with those in HFD-fed controls.These data were seeminglyin conflict with the favorable effects of leucine on overall insulin sensitivity at this stage. It iswell-known that insulin resistance is associated with mitochondrial dysfunction, but the causalityof this association is controversial. More recent findings suggest that mitochondrial dysfunction isnot an early event in the development of insulin resistance [39], but rather an adaptation to excessnutrients [40,41]. Skeletal muscle is the initial site for most BCAA catabolism and major insulin-targettissue. Thus, at this stage, improved insulin sensitivity by leucine supplementation may facilitateboth the anabolic effects of insulin and the adaptive catabolic effects of “nutrient overload” in skeletalmuscle under the background of a HFD, leading to an impaired mitochondrial function. Notably, theHFD-induced mitochondrial damage was relieved and mitochondrial biogenesis was increased byleucine supplementation after 32 weeks. These results are consistent with previous studies reportingthat leucine supplementation increases mitochondrial biogenesis while simultaneously enhancinglipid oxidation [42–44], leading to the reduced accumulation of acylcarnitine species. Therefore, wespeculate that BCAAs are primarily used for anabolism at this stage; thus, BCAAs and their derivativesthat flow into the mitochondria are decreased. This hypothesis is consistent with our observations ofdecreased levels of TCA cycle intermediates and no obvious changes in BCAAs and amino acids relatedcatabolites concentrations in circulation. The reduced mitochondrial load occurred simultaneously with
163
Books
MDPI

Nutrients 2017, 9, 565
improved mitochondrial function, leading to increased ATP production. Thus, altered mitochondrialfunction may partly account for the improvement in skeletal muscle insulin sensitivity. Moreover, Li etal. observed that in HFD-induced obese mice, leucine supplementation prevented obesity and insulinresistance in association with attenuation of mitochondrial dysfunction [45].
Taken together, these results indicated that abnormal BCAA metabolism induced by dietarysupplementation coupled with HFD intake might lead to the accumulation of BCKAs and incompletelyoxidized lipid species, which contributed to mitochondrial dysfunction in skeletal muscle during theearly stage of insulin resistance (24 weeks). In contrast, during the hyperglycaemic stage (32 weeks),when catabolic processes predominate, leucine supplementation enhanced mitochondrial biogenesis,with concomitantly improved lipid oxidation and mitochondrial function in skeletal muscle (Figure 6).
Figure 6. Summary of the possible metabolic alterations induced by leucine supplementation at thedifferent stage of insulin resistance in high-fat diet-fed rats. The red arrows indicate the changesobserved at 24 weeks, whereas the blue arrows represent the changes observed at 32 weeks comparedwith the age-matched high-fat diet-fed controls. The up-arrows indicate an increase in concentration;the down-arrows indicate a decrease in concentration; the dotted lines indicate no significant changein concentration.
CR without malnutrition has long been considered an effective strategy for protectingagainstage-associated disorders by modulating mitochondrial biogenesis and activating the reactiveoxygen species defense system [46–48]. However, long-term CR is hard for compliance and itspossible disadvantages remain to be determined, particularly in the elderly [49]. There has beena growing interest in developing dietary strategies that mimic the beneficial effects of CR. Dietarysupplementation with BCAAs has been shown to improve mitochondrial biogenensis and preventoxidative damage in middle-aged mice [4,16]. In this study, both CR and leucine supplementationimproved HFD-induced insulin resistance, but they differently modulated mitochondrial propertiesat the different stage of insulin resistance. At the hyperinsulinaemia stage, CR improved skeletalmuscle mitochondrial biogenesis and function in HFD rats. However, leucine supplementationincreased metabolic overload in mitochondria of skeletal muscle accompanied by impairedmitochondrial biogenesis and function. Interestingly, at the hyperglycaemic stage, both CR andleucine supplementationalleviate the HFD-induced mitochondrial damage, whereas HFD + Leushowed a more pronounced effect on mitochondrial biogenesis than CR.
164
Books
MDPI

Nutrients 2017, 9, 565
Our study has several limitations. First, T2DM progression and development are long-termprocesses, with different metabolic characteristics at different stages. Our animal studies only revealedalterations at two time points; thus, they may not reflect the total metabolic changes associated withleucine supplementation. Second, the metabolites detected in our study were limited and we onlyobserved the skeletal muscle’s response to leucine supplementation, further investigation should useuntargeted metabolomic analysis to capture a large number of differences in metabolite levels andmetabolic responses in multiple organs to improve our understanding of the relevant mechanisms.Third, our data demonstrated that the effects of leucine supplementation on insulin resistance wereassociated with the metabolic condition of the organisms, but the metabolic conditions of HFD rats inthe progression of insulin resistance were mainly estimated by the serum metabolites in the presentstudy;this should be further verified by other experiments.
To our knowledge, this study is the first to report that leucine exerts different effects duringdifferent stages of insulin resistance in a diet-induced animal model, depending on the prevalenceof catabolic and anabolic signals in the organism [17]. During the early stage of insulin resistance,increased insulin levels to maintain normal blood glucose by promoting anabolism (glycogen, proteinand fat synthesis) and suppressing fat oxidation [50–52]. Thus, strategies that improve insulinsensitivity may facilitate both the anabolic effects of insulin and the adaptive catabolic effectsof “nutrient overload” in the context of a HFD, leading to an adverse metabolic phenotype andmitochondrial dysfunction. Leucine supplementation may not be beneficial if calorie intake is notrestricted at this stage. However, as insulin resistance progresses and insulin loses its effectiveness, thecondition is characterized by a catabolic state. BCAA or leucine supplementation improves insulinsensitivity, mitochondrial function and other metabolic outcomes, as demonstrated in many conditions,including muscle sarcopaenia, burns, trauma and T2DM in elderly patients [53–55]. The findingsof this study help explain the conflicting results reported by different studies and indicate that thepatients’ overall metabolic status should be carefully considered to potentiate the health benefits ofleucine or BCAAs in each clinical setting.
Supplementary Materials: The following are available online at www.mdpi.com/2072-6643/9/6/565/s1.
Acknowledgments: We thank Ying Xie and Zhongwen Yuan at Macau University of Science and Technology andXude Zhang at Beijing Mass Spectrometry Medical Research Co., Ltd. for expert technical support. This studywas supported by The National Natural Science Foundation of China (NSFC) Grant No. 81373006 (to X.Y.).
Author Contributions: R.L. and X.Y. designed the study, analyzed the data and drafted the article. R.L., H.L., W.F.,Q.J., T.C., Y.W., J.H. and L.H. contributed to the animal studies and acquisition of data. All authors interpretedthe data, revised the manuscript critically for important intellectual content and approved the final version to bepublished. X.Y. is the guarantor of the article.
Conflicts of Interest: The authors declare no conflict of interest.
References
1. Zhang, Y.; Guo, K.; LeBlanc, R.E.; Loh, D.; Schwartz, G.J.; Yu, Y.H. Increasing dietary leucine intake reducesdiet-induced obesity and improves glucose and cholesterol metabolism in mice via multimechanisms.Diabetes 2007, 56, 1647–1654. [CrossRef] [PubMed]
2. Eller, L.K.; Saha, D.C.; Shearer, J.; Reimer, R.A. Dietary leucine improves whole-body insulin sensitivityindependent of body fat in diet-induced obese Sprague-Dawley rats. J. Nutr. Biochem. 2013, 24, 1285–1294.[CrossRef] [PubMed]
3. Nagata, C.; Nakamura, K.; Wada, K.; Tsuji, M.; Tamai, Y.; Kawachi, T. Branched-chain amino acid intake andthe risk of diabetes in a japanese community: The takayama study. Am. J. Epidemiol. 2013, 178, 1226–1232.[CrossRef] [PubMed]
4. Valerio, A.; D’Antona, G.; Nisoli, E. Branched-chain amino acids, mitochondrial biogenesis, and healthspan:An evolutionary perspective. Aging (Albany NY) 2011, 3, 464–478. [CrossRef] [PubMed]
165
Books
MDPI

Nutrients 2017, 9, 565
5. Newgard, C.B.; An, J.; Bain, J.R.; Muehlbauer, M.J.; Stevens, R.D.; Lien, L.F.; Haqq, A.M.; Shah, S.H.;Arlotto, M.; Slentz, C.A.; et al. A branched-chain amino acid-related metabolic signature that differentiatesobese and lean humans and contributes to insulin resistance. Cell Metab. 2009, 9, 311–326. [CrossRef][PubMed]
6. Nairizi, A.; She, P.; Vary, T.C.; Lynch, C.J. Leucine supplementation of drinking water does not altersusceptibility to diet-induced obesity in mice. J. Nutr. 2009, 139, 715–719. [CrossRef] [PubMed]
7. Newgard, C.B. Interplay between lipids and branched-chain amino acids in development of insulin resistance.Cell Metab. 2012, 15, 606–614. [CrossRef] [PubMed]
8. Wang, T.J.; Larson, M.G.; Vasan, R.S.; Cheng, S.; Rhee, E.P.; McCabe, E.; Lewis, G.D.; Fox, C.S.; Jacques, P.F.;Fernandez, C.; et al. Metabolite profiles and the risk of developing diabetes. Nat. Med. 2011, 17, 448–453.[CrossRef] [PubMed]
9. Batch, B.C.; Shah, S.H.; Newgard, C.B.; Turer, C.B.; Haynes, C.; Bain, J.R.; Muehlbauer, M.; Patel, M.J.;Stevens, R.D.; Appel, L.J.; et al. Branched chain amino acids are novel biomarkers for discrimination ofmetabolic wellness. Metabolism 2013, 62, 961–969. [CrossRef] [PubMed]
10. Shah, S.H.; Crosslin, D.R.; Haynes, C.S.; Nelson, S.; Turer, C.B.; Stevens, R.D.; Muehlbauer, M.J.; Wenner, B.R.;Bain, J.R.; Laferrere, B.; et al. Branched-chain amino acid levels are associated with improvement in insulinresistance with weight loss. Diabetologia 2012, 55, 321–330. [CrossRef] [PubMed]
11. Sengupta, S.; Peterson, T.R.; Sabatini, D.M. Regulation of the mTOR complex 1 pathway by nutrients, growthfactors, and stress. Mol. Cell 2010, 40, 310–322. [CrossRef] [PubMed]
12. Li, X.; Wang, X.; Liu, R.; Ma, Y.; Guo, H.; Hao, L.; Yao, P.; Liu, L.; Sun, X.; He, K.; et al. Chronic leucinesupplementation increases body weight and insulin sensitivity in rats on high-fat diet likely by promotinginsulin signaling in insulin-target tissues. Mol. Nutr. Food Res. 2013, 57, 1067–1079. [CrossRef] [PubMed]
13. Houde, V.P.; Brule, S.; Festuccia, W.T.; Blanchard, P.G.; Bellmann, K.; Deshaies, Y.; Marette, A.Chronic rapamycin treatment causes glucose intolerance and hyperlipidemia by upregulating hepaticgluconeogenesis and impairing lipid deposition in adipose tissue. Diabetes 2010, 59, 1338–1348. [CrossRef][PubMed]
14. Herman, M.A.; She, P.; Peroni, O.D.; Lynch, C.J.; Kahn, B.B. Adipose tissue branched chain amino acid(BCAA) metabolism modulates circulating bcaa levels. J. Biol. Chem. 2010, 285, 11348–11356. [CrossRef][PubMed]
15. Lynch, C.J.; Adams, S.H. Branched-chain amino acids in metabolic signalling and insulin resistance.Nat. Rev. Endocrinol. 2014, 10, 723–736. [CrossRef] [PubMed]
16. D’Antona, G.; Ragni, M.; Cardile, A.; Tedesco, L.; Dossena, M.; Bruttini, F.; Caliaro, F.; Corsetti, G.;Bottinelli, R.; Carruba, M.O.; et al. Branched-chain amino acid supplementation promotes survival andsupports cardiac and skeletal muscle mitochondrial biogenesis in middle-aged mice. Cell Metab. 2010, 12,362–372. [CrossRef] [PubMed]
17. Bifari, F.; Nisoli, E. Branched-chain amino acids differently modulate catabolic and anabolic states inmammals: A pharmacological point of view. Br. J. Pharmacol. 2016. [CrossRef] [PubMed]
18. Kleemann, R.; van Erk, M.; Verschuren, L.; van den Hoek, A.M.; Koek, M.; Wielinga, P.Y.; Jie, A.;Pellis, L.; Bobeldijk-Pastorova, I.; Kelder, T.; et al. Time-resolved and tissue-specific systems analysisof the pathogenesis of insulin resistance. PLoS ONE 2010, 5, e8817. [CrossRef] [PubMed]
19. Adams, S.H. Emerging perspectives on essential amino acid metabolism in obesity and the insulin-resistantstate. Adv. Nutr. 2011, 2, 445–456. [CrossRef] [PubMed]
20. Macotela, Y.; Emanuelli, B.; Bang, A.M.; Espinoza, D.O.; Boucher, J.; Beebe, K.; Gall, W.; Kahn, C.R. Dietaryleucine—An environmental modifier of insulin resistance acting on multiple levels of metabolism. PLoS ONE2011, 6, e21187. [CrossRef] [PubMed]
21. Binder, E.; Bermudez-Silva, F.J.; Elie, M.; Leste-Lasserre, T.; Belluomo, I.; Clark, S.; Duchampt, A.;Mithieux, G.; Cota, D. Leucine supplementation modulates fuel substrates utilization and glucose metabolismin previously obese mice. Obesity (Silver Spring) 2014, 22, 713–720. [CrossRef] [PubMed]
22. Guo, K.; Yu, Y.H.; Hou, J.; Zhang, Y. Chronic leucine supplementation improves glycemic control inetiologically distinct mouse models of obesity and diabetes mellitus. Nutr. Metab. (Lond.) 2010, 7, 57.[CrossRef] [PubMed]
23. Gannon, N.P.; Vaughan, R.A. Leucineinduced anabolic-catabolism: Two sides of the same coin. Amino Acids2016, 48, 321–336. [CrossRef] [PubMed]
166
Books
MDPI

Nutrients 2017, 9, 565
24. Kim, B.; McLean, L.L.; Philip, S.S.; Feldman, E.L. Hyperinsulinemia induces insulin resistance in dorsal rootganglion neurons. Endocrinology 2011, 152, 3638–3647. [CrossRef] [PubMed]
25. Kim, B.; Sullivan, K.A.; Backus, C.; Feldman, E.L. Cortical neurons develop insulin resistance and blunted aktsignaling: A potential mechanism contributing to enhanced ischemic injury in diabetes. Antioxid. Redox Signal.2011, 14, 1829–1839. [CrossRef] [PubMed]
26. Tai, E.S.; Tan, M.L.; Stevens, R.D.; Low, Y.L.; Muehlbauer, M.J.; Goh, D.L.; Ilkayeva, O.R.; Wenner, B.R.;Bain, J.R.; Lee, J.J.; et al. Insulin resistance is associated with a metabolic profile of altered protein metabolismin Chinese and Asian-Indian men. Diabetologia 2010, 53, 757–767. [CrossRef] [PubMed]
27. She, P.; Van Horn, C.; Reid, T.; Hutson, S.M.; Cooney, R.N.; Lynch, C.J. Obesity-related elevations in plasmaleucine are associated with alterations in enzymes involved in branched-chain amino acid metabolism. Am. J.Physiol. Endocrinol. Metab. 2007, 293, E1552–E1563. [CrossRef] [PubMed]
28. Harris, R.A.; Joshi, M.; Jeoung, N.H. Mechanisms responsible for regulation of branched-chain amino acidcatabolism. Biochem. Biophys. Res. Commun. 2004, 313, 391–396. [CrossRef] [PubMed]
29. Shimomura, Y.; Obayashi, M.; Murakami, T.; Harris, R.A. Regulation of branched-chain amino acidcatabolism: Nutritional and hormonal regulation of activity and expression of the branched-chain alpha-ketoacid dehydrogenase kinase. Curr. Opin. Clin. Nutr. Metab. Care 2001, 4, 419–423. [CrossRef] [PubMed]
30. Nellis, M.M.; Doering, C.B.; Kasinski, A.; Danner, D.J. Insulin increases branched-chain alpha-ketoaciddehydrogenase kinase expression in clone 9 rat cells. Am. J. Physiol.Endocrinol. Metab. 2002, 283, E853–E860.[CrossRef] [PubMed]
31. Brosnan, J.T.; Brosnan, M.E. Branched-chain amino acids: Enzyme and substrate regulation. J. Nutr. 2006,136, 207S–211S. [PubMed]
32. Fernstrom, J.D. Branched-chain amino acids and brain function. J. Nutr. 2005, 135, 1539S–1546S. [PubMed]33. Koves, T.R.; Ussher, J.R.; Noland, R.C.; Slentz, D.; Mosedale, M.; Ilkayeva, O.; Bain, J.; Stevens, R.; Dyck, J.R.;
Newgard, C.B.; et al. Mitochondrial overload and incomplete fatty acid oxidation contribute to skeletalmuscle insulin resistance. Cell Metab. 2008, 7, 45–56. [CrossRef] [PubMed]
34. Aguer, C.; McCoin, C.S.; Knotts, T.A.; Thrush, A.B.; Ono-Moore, K.; McPherson, R.; Dent, R.; Hwang, D.H.;Adams, S.H.; Harper, M.E. Acylcarnitines: Potential implications for skeletal muscle insulin resistance.FASEB J. 2015, 29, 336–345. [CrossRef] [PubMed]
35. Adams, S.H.; Hoppel, C.L.; Lok, K.H.; Zhao, L.; Wong, S.W.; Minkler, P.E.; Hwang, D.H.; Newman, J.W.;Garvey, W.T. Plasma acylcarnitine profiles suggest incomplete long-chain fatty acid beta-oxidation andaltered tricarboxylic acid cycle activity in type 2 diabetic African-American women. J. Nutr. 2009, 139,1073–1081. [CrossRef] [PubMed]
36. Hutson, S.M.; Sweatt, A.J.; Lanoue, K.F. Branched-chain [corrected] amino acid metabolism: Implications forestablishing safe intakes. J. Nutr. 2005, 135, 1557S–1564S. [PubMed]
37. White, P.J.; Lapworth, A.L.; An, J.; Wang, L.; McGarrah, R.W.; Stevens, R.D.; Ilkayeva, O.; George, T.;Muehlbauer, M.J.; Bain, J.R.; et al. Branched-chain amino acid restriction in zucker-fatty rats improvesmuscle insulin sensitivity by enhancing efficiency of fatty acid oxidation and acyl-glycine export. Mol. Metab.2016, 5, 538–551. [CrossRef] [PubMed]
38. Lerin, C.; Goldfine, A.B.; Boes, T.; Liu, M.; Kasif, S.; Dreyfuss, J.M.; De Sousa-Coelho, A.L.; Daher, G.;Manoli, I.; Sysol, J.R.; et al. Defects in muscle branched-chain amino acid oxidation contribute to impairedlipid metabolism. Mol. Metab. 2016, 5, 926–936. [CrossRef] [PubMed]
39. Di Meo, S.; Iossa, S.; Venditti, P. Skeletal muscle insulin resistance: Role of mitochondria and other ROSsources. J. Endocrinol. 2017, 233, R15–R42. [CrossRef] [PubMed]
40. Affourtit, C. Mitochondrial involvement in skeletal muscle insulin resistance: A case of imbalancedbioenergetics. Biochim. Biophys. Acta 2016, 1857, 1678–1693. [CrossRef] [PubMed]
41. Liesa, M.; Shirihai, O.S. Mitochondrial dynamics in the regulation of nutrient utilization and energyexpenditure. Cell Metab. 2013, 17, 491–506. [CrossRef] [PubMed]
42. Vaughan, R.A.; Garcia-Smith, R.; Gannon, N.P.; Bisoffi, M.; Trujillo, K.A.; Conn, C.A. Leucine treatmentenhances oxidative capacity through complete carbohydrate oxidation and increased mitochondrial densityin skeletal muscle cells. Amino Acids 2013, 45, 901–911. [CrossRef] [PubMed]
43. Sun, X.; Zemel, M.B. Leucine modulation of mitochondrial mass and oxygen consumption in skeletal musclecells and adipocytes. Nutr. Metab. (Lond.) 2009, 6, 26. [CrossRef] [PubMed]
167
Books
MDPI

Nutrients 2017, 9, 565
44. Vaughan, R.A.; Mermier, C.M.; Bisoffi, M.; Trujillo, K.A.; Conn, C.A. Dietary stimulators of the PGC-1superfamily and mitochondrial biosynthesis in skeletal muscle. A mini-review. J. Physiol. Biochem. 2014, 70,271–284. [CrossRef] [PubMed]
45. Li, H.; Xu, M.; Lee, J.; He, C.; Xie, Z. Leucine supplementation increases sirt1 expression and preventsmitochondrial dysfunction and metabolic disorders in high-fat diet-induced obese mice. Am. J. Physiol.Endocrinol. Metab. 2012, 303, E1234–E1244. [CrossRef] [PubMed]
46. Lopez-Lluch, G.; Hunt, N.; Jones, B.; Zhu, M.; Jamieson, H.; Hilmer, S.; Cascajo, M.V.; Allard, J.; Ingram, D.K.;Navas, P.; et al. Calorie restriction induces mitochondrial biogenesis and bioenergetic efficiency. Proc. Natl.Acad. Sci. USA 2006, 103, 1768–1773. [CrossRef] [PubMed]
47. Guarente, L. Mitochondria—A nexus for aging, calorie restriction, and sirtuins? Cell 2008, 132, 171–176.[CrossRef] [PubMed]
48. Nisoli, E.; Tonello, C.; Cardile, A.; Cozzi, V.; Bracale, R.; Tedesco, L.; Falcone, S.; Valerio, A.; Cantoni, O.;Clementi, E.; et al. Calorie restriction promotes mitochondrial biogenesis by inducing the expression of enos.Science 2005, 310, 314–317. [CrossRef] [PubMed]
49. Ingram, D.K.; Roth, G.S. Glycolytic inhibition as a strategy for developing calorie restriction mimetics.Exp. Gerontol. 2011, 46, 148–154. [CrossRef] [PubMed]
50. Liu, H.Y.; Hong, T.; Wen, G.B.; Han, J.; Zuo, D.; Liu, Z.; Cao, W. Increased basal level of akt-dependent insulinsignaling may be responsible for the development of insulin resistance. Am. J. Physiol. Endocrinol. Metab.2009, 297, E898–E906. [CrossRef] [PubMed]
51. Cao, W.; Ning, J.; Yang, X.; Liu, Z. Excess exposure to insulin is the primary cause of insulin resistance andits associated atherosclerosis. Curr. Mol. Pharmacol. 2011, 4, 154–166. [CrossRef] [PubMed]
52. Nolan, C.J.; Ruderman, N.B.; Kahn, S.E.; Pedersen, O.; Prentki, M. Insulin resistance as a physiologicaldefense against metabolic stress: Implications for the management of subsets of type 2 diabetes. Diabetes2015, 64, 673–686. [CrossRef] [PubMed]
53. Solerte, S.B.; Fioravanti, M.; Locatelli, E.; Bonacasa, R.; Zamboni, M.; Basso, C.; Mazzoleni, A.; Mansi, V.;Geroutis, N.; Gazzaruso, C. Improvement of blood glucose control and insulin sensitivity during a long-term(60 weeks) randomized study with amino acid dietary supplements in elderly subjects with type 2 diabetesmellitus. Am. J. Cardiol. 2008, 101, 82E–88E. [CrossRef] [PubMed]
54. Leenders, M.; van Loon, L.J. Leucine as a pharmaconutrient to prevent and treat sarcopenia and type 2diabetes. Nutr. Rev. 2011, 69, 675–689. [CrossRef] [PubMed]
55. Kawaguchi, T.; Nagao, Y.; Matsuoka, H.; Ide, T.; Sata, M. Branched-chain amino acid-enrichedsupplementation improves insulin resistance in patients with chronic liver disease. Int. J. Mol. Med.2008, 22, 105–112. [CrossRef] [PubMed]
© 2017 by the authors. Licensee MDPI, Basel, Switzerland. This article is an open accessarticle distributed under the terms and conditions of the Creative Commons Attribution(CC BY) license (http://creativecommons.org/licenses/by/4.0/).
168
Books
MDPI

nutrients
Article
Effect of n-3 Polyunsaturated Fatty AcidSupplementation on Metabolic and InflammatoryBiomarkers in Type 2 Diabetes Mellitus Patients
M. Gorety Jacobo-Cejudo 1, Roxana Valdés-Ramos 1,*, Ana L. Guadarrama-López 1,
Rosa-Virgen Pardo-Morales 2, Beatriz E. Martínez-Carrillo 1 and Laurence S. Harbige 3
1 Faculty of Medicine, Universidad Autónoma del Estado de México, Paseo Tollocan esq. Jesús Carranza,Col. Moderna de la Cruz, Toluca 50180, Mexico; [email protected] (M.G.J.-C.);[email protected] (A.L.G.-L.); [email protected] (B.E.M.-C.)
2 Instlituto Materno-Infantil del Estado de México, Paseo Colón s/n, Col. Villa Hogar, Toluca 50170, Mexico;[email protected]
3 Faculty of Life Sciences and Computing, London Metropolitan University, 166-220 Holloway Road,London N7 8DB, UK; [email protected]
* Correspondence: [email protected]; Tel.: +52-722-217-4831 (ext. 232)
Received: 25 April 2017; Accepted: 1 June 2017; Published: 3 June 2017
Abstract: Background: Type 2 diabetes mellitus (T2DM) is accompanied by chronic low-gradeinflammation, with an imbalance in the secretion of adipokines and, worsening insulin resistance.Supplementation with n-3 PUFA in T2DM decreases inflammatory markers, the purpose of the studywas to investigate the effect of n-3 PUFA supplementation on adipokines, metabolic control, andlipid profile in T2DM Mexican adults. Methods: In a randomized, single-blind, placebo-controlledpilot study, 54 patients with T2DM received 520 mg of DHA + EPA-enriched fish-oil (FOG) or aplacebo (PG) daily. Baseline and 24-week anthropometric and biochemical measurements includedglucose, insulin, glycosylated hemoglobin (Hb1Ac), leptin, adiponectin, resistin, and lipid profile;n-3 PUFA intake was calculated in g/day. Results: Waist circumference and blood glucose showedsignificant reductions in the FOG group (p = 0.001 and p = 0.011, respectively). Hb1Ac (p = 0.009and p = 0.004), leptin (p < 0.000 and p < 0.000), and leptin/adiponectin ratio (p < 0.000 and p < 0.000)decreased significantly in both groups after 24 weeks (FOG and PG respectively). Serum resistin(FOG p < 0.000 and PG p = 0.001), insulin (FOG p < 0.000 and PG p < 0.000), and HOMA-IR (FOGp = 0.000 and PG p < 0.000) increased significantly in both groups. FOG had an overall improvementin the lipid profile with a significant decrease in triacylgycerols (p = 0.002) and atherogenic index(p = 0.031); in contrast, the PG group had increased total cholesterol (p < 0.000), non-HDL cholesterol(p < 0.000), and atherogenic index (p = 0.017). Conclusions: We found a beneficial effect of n-3 PUFAsupplementation on waist circumference, glucose, Hb1Ac, leptin, leptin/adiponectin ratio, and lipidprofile, without significant changes in adiponectin, and increases in resistin, insulin, and HOMA-IRin both groups.
Keywords: type 2 diabetes mellitus; adipokines; lipid profile; n-3 PUFAs
1. Introduction
Type 2 diabetes mellitus (T2DM) is one of the most prevalent chronic diseases around the world,with an increase in its prevalence due to the increase in its risk factors such as obesity and physicalinactivity [1]. According to the National Health and Nutrition Survey, in 2012, in Mexico there were 6.4million people with T2DM, which means an increase in prevalence from 7% in 2006 to 9.2% in 2012 [2].T2DM is characterized by impaired pancreatic β-cell function that causes impaired insulin secretionand insulin resistance (IR) mainly in liver, muscle, and adipose tissue [3].
Nutrients 2017, 9, 573 169 www.mdpi.com/journal/nutrients
Books
MDPI

Nutrients 2017, 9, 573
It is well recognized that the actively secreted products of adipose tissue known as adipokinescan modulate different functions [4]; adipokines play a pivotal role in the regulation of whole-bodymetabolism, as well as in inflammatory and immune responses, and are considered a link betweenobesity and the development of T2DM [5].
Adiponectin is a collagen-like protein exclusively expressed in adipose tissue [6], which possessespotent antidiabetic and anti-inflammatory properties [7]. In humans, plasma adiponectin levels areclosely related to whole-body insulin sensitivity [8] and are correlated negatively with IR and T2DM.Prospective and longitudinal studies have indicated that lower adiponectin levels are associated witha higher incidence of T2DM [4]. Adiponectin regulates glucose and lipid metabolism through thereduction of fat storage (lipogenesis) and the promotion of fat utilization (fatty acid oxidation) [9].
Leptin is a cytokine-like molecule secreted by adipose tissue which regulates adipose tissue massand body weight by inhibiting food intake and stimulating energy expenditure [6], thus maintainingenergy homeostasis. Leptin correlates directly with adipose tissue mass. Obesity and T2DM areassociated with increased plasma leptin levels, which fail to correct hyperglycemia in these patientsbecause of the presence of leptin resistance [5], and these elevated plasma leptin levels are associatedwith IR, independent of obesity and insulin sensitivity [10].
In humans, resistin is mainly secreted by macrophages and monocytes and by organs such asspleen and bone marrow [11]. Since its discovery, resistin has been related to obesity and IR in manyanimal experiments, but the application of these findings to human studies has been difficult todetermine. However, studies in humans have shown that serum resistin levels are higher in obesepatients with T2DM compared with non-diabetic obese and that mRNA levels of resistin are higher infemale patients with T2DM compared to healthy women [12].
Dyslipidemias are very common in type 2 diabetes mellitus and are the cause of cardiovasculardisease in uncontrolled patients. Hypertriacylglyceridemia as well as low HDL-cholesterolconcentrations, together with high LDL- and non-HDL-cholesterol is a common lipid profile patternobserved in subjects with diabetes [13–16].
Eicosapentaenoic acid (EPA) and docosahexaenoic acid (DHA) are polyunsaturated fatty acidsfound at high levels in fish oils [17]. Accumulating evidence suggests that n-3 PUFAs from fish oil maycounteract the adipokine dysregulation that occurs in obesity and its related diseases like T2DM [9],but it is not well established if the consumption of n-3 PUFAs affects circulating adiponectin, resistin,and leptin in humans; the results are inconclusive [18]. Furthermore, research in humans and animalmodels show a lipid normalizing effect of PUFA supplementation [19,20].
For these reasons, we undertook a pilot study with the aim of investigating the effect of asix-month supplementation trial with n-3 PUFAs on adiponectin, resistin, leptin, and the lipid profilein adults with T2DM from Toluca, Mexico.
2. Materials and Methods
2.1. Study Design
This study was a randomized, single-blind and placebo-controlled pilot study conducted ineight Urban Public Health Centers (UPHC) in Toluca, Mexico, from February to September 2015. Theinclusion criteria were the following: men and women with T2DM, between 25 and 60 years, withoutother chronic diseases such as hypertension, arthritis, kidney disease, cancer, and HIV, with a BMI ≤29.9, without fish allergies or insulin treatment, and not lactating or pregnant.
2.2. Methods
Sixty-five Mexican subjects with T2DM were enrolled from the eight UPHC in Toluca as follows:Capultitlán (n = 1), Emiliano Zapata (n = 6), Nueva Oxtototitlán (n = 2), Reforma (21), Seminario (3),Tlacotepec (1), San Diego de los Padres (n = 16), and Ejido de la Y (n = 15). The 65 subjects wererandomly and blindly separated into an experimental group (fish oil group: FOG) of 34 patients
170
Books
MDPI

Nutrients 2017, 9, 573
(10 males, 24 females) and a control group (placebo group: PG) of 31 patients (5 males, 26 females).The majority of patients were medicated with Glibenclamide plus Metformin or Metformin alone andwere controlled by their family practitioner, we did not give them additional dietary or lifestyle advice;we only asked them to continue with their regular medication and diet.
Written informed consent was given to all participants. The study was approved by the Researchand Ethics Committee of the Universidad Autónoma del Estado de Mexico and the Institute for Healthof the State of Mexico’s Research and Education Coordination. The protocol was conducted followingthe regulations of the Helsinki Declaration of 1975 and its amendment of 2013, as well as the principlesfor experiments with human beings from the Nüremberg Code for medical ethics. Individual data isbeing maintained confidential.
Once obtained the sample, the baseline evaluation was performed as follows:
Anthropometric evaluation:
All measurements were recorded with light clothes and height without shoes by a trainednutritionist who was previously standardized. Weight was measured in a TANITA® scale (Mod. 1631)and was registered in kg; height was measured in cm using a portable SECA 206 stadiometer; thepercentage of body fat was obtained by electrical bioimpedance with the same TANITA scale; bodymass index (BMI) was calculated as body weight in kilograms divided by the square of height inmeters. Waist and hip circumferences were measured with a Gülick™ fiberglass tape and the waist/hipratio was calculated.
Biochemical evaluation:
After an overnight fast (≥12 h), collection of a venous blood sample into an 8.5 mL tiger-toptube containing gel and clotting activator for the subsequent biochemical analysis of glucose, insulin,adipokines, and lipid profile was undertaken. Another venous blood sample in a 3 mL tube withEDTA for the analysis of glycosylated hemoglobin was also obtained.
Serum was obtained after centrifugation at 900 g or 3400 rpm for 10 min at 4 ◦C, within 30 minafter blood sample collection; serum samples for glucose and lipid profile were processed within onehour, and the rest of the samples were aliquoted and stored at −80 ◦C until assayed.
Serum glucose, triacylglycerols, total cholesterol, HDL-cholesterol, LDL-cholesterol, andglycosylated hemoglobin levels (in total blood) were measured by enzymatic colorimetric assaysin the auto-analyzer Selectra II (ROCHE™), using reagents from RANDOX™ (Cat. GL1611, Cat. Tr213,Cat. CHO215, Cat. CH3811A, Cat. CH3811B and Cat. HA3830A). Non-HDL-cholesterol was calculatedby difference (total cholesterol − HDL-cholesterol).
Serum levels of insulin were measured with a Human Insulin ELISA kit from EMD MilliporeCorporation® (Cat. # EZHI-14K) according to the manufacturer´s instructions. We evaluated IR withglucose and insulin concentrations using the Homeostatic model assessment as follows:
HOMA-IR = (fasting insulin (μU/mL)) × (fasting glucose (mg/dL))/405 [21].
Commercially available kits from Merck Millipore® (Cat. # HADK1MAG-61K andHADK2MAG-61K) were used to measure the serum levels of adiponectin, resistin, and leptin in theLuminex® 100™ analyzer by luminometry according to the manufacturer’s recommended protocols.
2.3. Supplementation
The supplementation period started after basal evaluation. Patients took two softgels per day ofthe assigned supplement for 24 weeks. Each 1.4 g n-3 PUFAs softgel contained a combination of 160 mgof eicosapentaenoic acid (EPA) with 100 mg of docosahexaenoic acid (DHA) from fish oil, so the totaldaily oral dose was 520 mg of n-3 PUFAs (320 mg of EPA and 200 mg of DHA, 2 g of total fat, 1.2 mgof vitamin E, gelatin and glycerine) during the six months of intervention. PUFA supplements were
171
Books
MDPI

Nutrients 2017, 9, 573
purchased from General Nutrition Centers™. The placebo softgels were identical to the n-3 PUFAssoftgels in appearance and contained cornstarch (1 g carbohydrates and 1.7 mg of sodium per softgel).
2.4. Follow-up
After basal evaluation, patients were monitored by 6 monthly visits, in which they received theircorresponding supplement and were followed-up every two weeks by telephone to make sure thatthey were taking their capsules, as well as to remind them not to change their habitual diet, medication,or physical activity regimes.
2.5. Diet Analysis
A trained nutritionist performed 24-h recalls, one at the beginning and one at the end of the studyto analyze the diet. The dietary nutrient intake and the consumption of polyunsaturated fatty acidswere calculated in grams and percentages using DIAL® (ver 3.3.2., Universidad Complutense, Madrid,Spain) software. In the final 24 h recalls of the FOG, we added the nutritional composition of n-3PUFA softgels.
2.6. Statistical Analysis
Data were expressed as mean ± SD. To compare differences in the same group after intervention,paired t-test was used for parametric variables and Wilcoxon signed rank test for non-parametricvariables. In the diet analysis, unpaired two-sample t-test was used to compare differences betweengroups in a parametric way and a Mann–Whitney U-test for non-parametric data. Normalityof data was assessed by the Kolmogorov–Smirnoff test. All analyses were performed using thestatistical software SPSS (version 19.0; SPSS Inc., Chicago, IL, USA). A p-value < 0.05 was consideredstatistically significant.
3. Results
During the study, 10 subjects, 4 in the omega-3 group and 6 in the placebo group, were eliminatedfor not completing the six-month supplementation for personal reasons, and the drop-out rate in bothgroups was less than 20%. When analyzing the causes for drop-out, it is important to note that allpatients had low-education and socioeconomic levels, and even though we tried to reach them byphone or house-visits, they were not located either to follow-up or to obtain data at the end of the trial.We analyzed basal data for differences between those who dropped out and those who stayed, andthere were no significant differences between groups that indicated that they stopped attending due tothe variables we were evaluating.
Age, gender distribution, and diabetes duration were similar between groups without significantdifferences; in the FOG, 7 subjects were males, and 22 were females; in the PG, 5 subjects were malesand 20 were females. The mean age of the FOG was of 50.4 ± 6.3 years, while in the PG it was48.1 ± 6.8 years (p = 0.208), and the average time of diabetes duration was of 6.6 ± 5.0 years in theFOG and of 6.5 ± 5.8 years in the PG (p = 0.954).
In anthropometric measurements, only the FOG showed a significant decrease in waistcircumference after supplementation (p = 0.001) (Table 1). No significant changes in body weight(p = 0.250 and 0.578), BMI (p = 0.278 and 0.485), body fat (p = 0.889 and 0.614), and waist/hip ratio(p = 0.288 and 0.076) were observed in FOG and PG, respectively, after intervention.
At baseline, there was only a significant difference between groups in serum resistin levels(p = 0.006). The results of biochemical analysis are summarized in Table 2. Glucose serum levels onlyshowed a significant decrease in FOG (p = 0.001), and there were significant reductions in glycosylatedhemoglobin (p = 0.009 and p = 0.004), leptin (p = 0.000 and p = 0.000), and leptin/adiponectin ratioin both groups (FOG and PG, respectively). Adiponectin did not show significant changes (p = 0.177for FOG and p = 0.563 for PG). Contrary to expected, resistin showed a significant increase in bothgroups (p = 0.000 for FOG and p = 0.001 for PG). With respect to IR, there were significant increases in
172
Books
MDPI

Nutrients 2017, 9, 573
insulin serum levels (p = 0.000 for FOG and p = 0.000 for PG) and in HOMA-IR (p = 0.000 for FOG andp = 0.000 for PG).
Table 1. Anthropometric measurements.
Fish Oil Group (n = 29) Placebo Group (n = 25)
Variables Basal Final p Basal Final p
Body weight (kg) 63.0 ± 9.3 62.7 ± 9.4 0.250 60.2 ± 6.4 60.0 ± 7.3 0.578BMI (kg/m2) 25.6 ± 2.4 25.4 ± 2.7 0.278 26.0 ± 1.6 25.9 ± 2.0 0.485Body fat (%) 30.9 ± 9.1 31.1 ± 7.2 0.889 29.9 ± 5.3 30.4 ± 6.1 0.614
Waist circumference (cm) 86.4 ± 7.6 83.1 ± 6.2 0.001 83.2 ± 5.3 83.1 ± 6.1 0.893Waist/hip ratio 0.89 ± 0.05 0.90 ± 0.05 0.288 0.90 ± 0.05 0.92 ± 0.04 0.076
BMI: body mass index. Paired t-test was performed to compare differences in time (before and aftersupplementation). A p-value < 0.05 was considered statistically significant, marked in bold numbers.
Table 2. Biochemical measurements.
Omega-3 (n = 29) Placebo (n = 25)
Variables Basal Final p Basal Final p
Glucose (mg/dL) ‡ 177.2 ± 68.4 156.1 ± 69.4 0.011 184.6 ± 71.1 183.3 ± 53.3 0.326Glycosylated hemoglobin (%) † 9.6 ± 3.1 8.2 ± 1.9 0.009 10.0 ± 2.1 9.0 ± 1.8 0.004
Adiponectin (μg) ‡ 23.6 ± 20.3 24.5 ± 13.0 0.177 22.8 ± 10.5 24.3 ± 13.3 0.563Leptin (ng) † 21.7 ± 15.5 3.9 ± 2.5 0.000 18.4 ± 13.2 3.5 ± 2.3 0.000
Resistin (ng) ‡ 30.2 ± 14.0 65.9 ± 23.4 0.000 39.2 ± 12.5 61.3 ± 20.6 0.000Leptin/adiponectin ratio † 1.3 ± 1.2 0.24 ± 0.26 0.000 0.88 ± 0.68 0.17 ± 0.12 0.000
Insulin μU/mL ‡ 7.6 ± 3.0 14.2 ± 8.2 0.000 6.5 ± 1.6 10.2 ± 3.3 0.000HOMA-IR ‡ 3.1 ± 1.3 5.3 ± 3.8 0.000 2.9 ± 1.2 4.4 ± 1.6 0.000
Total Cholesterol (mg/dL) † 203.38 ± 33.72 199.10 ± 47.63 0.542 180.32 ± 30.56 209.75 ± 36.80 0.000Triacylglycerides (mg/dL) † 186.24 ± 85.58 137.28 ± 65.39 0.002 269.40 ± 169.30 251.20 ± 149.76 0.503HDL-Cholesterol (mg/dL) † 43.52 ± 7.95 48.13 ± 14.59 0.076 38.35 ± 9.51 40.01 ± 9.28 0.384LDL-Cholesterol (mg/dL) † 131.00 ± 34.66 129.82 ± 44.74 0.869 109.40 ± 34.22 127.26 ± 38.80 0.076
Non-HDL-Cholesterol (mg/dL) † 159.52 ± 31.28 150.97 ± 44.26 0.152 141.97 ± 24.98 169.74 ± 38.15 0.000Atherogenic Index † 5.04 ± 1.77 4.37 ± 1.04 0.031 4.86 ± 1.06 5.52 ± 1.63 0.017
† Paired t-test was used for parametric variables and ‡ Wilcoxon signed rank test for non-parametric variables.A p-value ≤ 0.05 was considered statistically significant, marked in bold numbers.
Table 2 shows changes in lipid profile indicators, FOG significantly decreased triacylglycerides(p < 0.01) and the atherogenic index (p < 0.05), whereas the placebo group showed a statisticallysignificant increase in total cholesterol (p < 0.000), non-HDL-cholesterol (p < 0.000), and the atherogenicindex (p < 0.05).
The results of diet analysis are shown in Table 3. The FOG showed a significant increase in totalomega-3 fatty acids (p < 0.001), particularly in EPA and DHA (p < 0.000); n-6 to n-3 ratio decreasedfrom 16:1 to 10:1 (p < 0.05). The placebo group showed a statistically significant increase in protein andmonounsaturated fatty acid intake (p < 0.05). No differences were found in any other nutrient analyzed.
Table 3. Diet analysis.
Variable Omega-3 (n = 29) Placebo (n = 25)
Basal Final p Basal Final p
Energy (kcal/day) 1562.2 ± 387.4 1672.8 ± 665.2 0.476 1751.4 ± 479.9 1875.9 ± 698.5 0.276Protein (g/day) 57.3 ± 17.2 59.4 ± 24.3 0.737 50.8 ± 19.4 60.5 ± 27.8 * 0.030
Carbohydrates (g/day) 192.1 ± 60.4 187.8 ± 68.8 0.729 258.2 ± 73.1 255.0 ± 104.7 0.905Lipids (g/day) 59.5 ± 21.2 72.2 ± 38.4 0.097 54.2 ± 27.7 65.2 ± 31.1 0.092
Saturated fatty acids (g/day) 16.4 ± 7.2 19.3 ± 11.9 0.271 11.4 ± 9.0 14.7 ± 9.7 0.065Monounsaturated fatty acids (g/day) 20.2 ± 8.2 24.6 ± 15.5 0.160 15.4 ± 10.6 22.6 ± 14.3 * 0.013Polyunsaturated fatty acids (g/day) 13.2 ± 8.1 16.5 ± 12.7 0.197 13.2 ± 11.9 13.0 ± 6.4 0.367
Omega-3 fatty acids (g/day) 0.89 ± 0.76 1.32 ± 0.34 * 0.001 0.79 ± 1.12 0.75 ± 0.53 0.178Omega-6 fatty acids (g/day) 10.5 ± 7.7 13.6 ± 12.0 0.221 9.4 ± 11.0 8.8 ± 5.2 0.382
n6:n3 Ratio 14:1 10:1 * 0.025 16:1 14:1 0.882EPA (g/day) 0.077 ± 0.317 0.330 ± 0.018 * 0.000 0.016 ± 0.037 0.047 ± 0.177 0.837DHA (g/day) 0.103 ± 0.236 0.287 ± 0.089 * 0.000 0.086 ± 0.109 0.155 ± 0.187 0.074
Mann–Whitney U test for differences between groups. * A p-value < 0.05 was considered significant, marked withbold numbers.
173
Books
MDPI

Nutrients 2017, 9, 573
4. Discussion
In this study, we investigated the effect of supplementation with n-3 PUFAs on serum levels ofadiponectin, resistin, and leptin in an adult Mexican population with T2DM.
The results of the anthropometric analysis (Table 1) are similar to the results observed in previoussimilar studies such as a study of supplementation with n-3 PUFAs in diabetic patients [22]; patientswith impaired fasting glucose (IFG) or impaired glucose tolerance (IGT) [23]; and two more in womenwith polycystic ovarian syndrome [24,25], which regularly present insulin resistance. All of thesestudies showed no significant change in body weight, BMI, body fat, waist circumference, or waist/hipratio after the supplementation period, even at higher doses of n-3 PUFAs and longer periods ofsupplementation. However, in a crossover model in which 16 T2DM patients were assigned to one oftwo consecutive 3.5-week periods of diabetic diets (foods rich in n-6 or n-3 PUFAs), the authors found aslight but significant reduction in body weight and BMI in both dietary periods [26]. This suggests thatn-3 PUFAs from food are more effective in controlling body weight than n-3 PUFAs from supplements.In our study, supplementation with n-3 PUFAs for 24 weeks only helped to significantly reduce waistcircumference and did not help control body weight or reduce BMI, body fat percentage, or waist/hipratio. Furthermore, one of the studies in women with polycystic ovarian syndrome reported thateffects of n-3 PUFAs on anthropometric measurements might be dependent on gender, age, and BMIof subjects at baseline [25].
The effect of n-3 PUFAs on glucose and glycosylated hemoglobin is not clear. A study ofsupplementation with DHA-rich fish oil in an Iranian diabetic population [27] and reviews of clinicaltrials of supplementation with n-3 PUFAs in different diabetic populations, have not found significantpositive effects on glycemic control [17,28]. However, a recent study [23] showed that n-3 PUFAsupplementation with high doses for 18 months was effective in reducing glycemia and IR in patientsaffected by IFG or IGT and that the regression of the condition of impaired glycemia to normoglycemiaseems to be helpful in delaying the development of T2DM. Flanchs et al. showed in a review thatthe beneficial effects of n-3 PUFAs on insulin sensitivity and glucose metabolism in people withIR are dependent on factors such as disease progression and age [29]. In this study, we found asignificant positive effect of n-3 PUFA supplementation on glycemic control (glucose and glycosylatedhemoglobin), but more studies are needed to test this hypothesis because most of the beneficial effectshave been shown in epidemiologic studies based on a habitual fish diet consumed for years [28].
As expected, there were significant reductions in leptin serum levels and hence inleptin/adiponectin ratio, which has been demonstrated to be related to obesity and T2DM [29].Contrary to expectation, adiponectin did not increase significantly, while resistin increased significantly.Our results are not in line with the results observed in similar studies of supplementation with n-3PUFAs in diabetes [8] and in healthy subjects with a high consumption of fish, which has shownsignificant increases in adiponectin serum levels after various supplementation periods [30]. As thechanges in adipokine profile were similar in both groups, we cannot affirm that higher doses of n-3PUFAs would have led to a decrease in leptin and leptin/adiponectin ratio because there was nolead tendency toward lower leptin concentrations in subjects with the n-3 PUFA supplement than insubjects with the placebo.
Our study population showed higher basal adiponectin and leptin serum levels than have beenreported in other similar studies, for example, in German [31], Finnish [32], Japanese [8], AsianIndian [33], and Arabic diabetic populations [34], which is likely to be due to ethnicity. Resistinshowed similar results compared with serum resistin levels of Egyptians and Japanese althoughslightly lower [35,36].
It has been demonstrated that weight reduction increases plasma adiponectin concentrationsand improves IR [10], but in this study, possibly because there were no significant changes in bodyweight, there were no significant increases in serum adiponectin levels. In a study with ob/ob mice,the administration of recombinant adiponectin, even after the development of diabetes, significantlyameliorated hyperglycemia [37], and it has been reported that serum adiponectin levels correlate
174
Books
MDPI

Nutrients 2017, 9, 573
inversely with IR [5]. Plasma adiponectin levels have also been demonstrated to be negativelycorrelated to IR [4], but in this study, we did not find a negative correlation because adiponectin(non-significant) and HOMA-IR increased.
Leptin correlates directly with adipose tissue mass; [5] however, we did not observe a significantreduction in body weight, BMI, and body fat, despite the reduction in serum leptin levels. When weused a bivariate correlation analysis, we found that serum leptin levels showed a positive correlationwith BMI (R = 0.353 and p = 0.009) and body fat percentage (R = 0.518 and p = 0.000), which is in linewith the results of a similar study [5].
Leptin/adiponectin ratio showed a significant reduction in both groups related to the significantdecrease in leptin levels. Leptin/adiponectin ratio was a useful measure of IR in non-diabetic whiteadults [38], but we did not observe a positive correlation between HOMA-IR and leptin serum levels;despite the reduction in this ratio, there was no reduction in HOMA-IR. However, these findingssuggest the use of the leptin/adiponectin ratio as a useful tool to detect IR. On the other hand, resistinhas been linked to obesity and IR since its discovery [12], but our results are not consistent withthese findings because we found a weak negative correlation between resistin levels and HOMA-IR(R = −0.274 and p = 0.045).
Obesity is the most significant factor contributing to IR and T2DM [39], and although our patientswere not obese, we found a weak but significant positive correlation between body fat percentage andHOMA-IR (R = 0.275 and p = 0.046). This factor might explain the significant increase in HOMA-IR inboth groups because there was a non-significant increase in body fat percentage.
Our results are not in accordance with those of Yamamoto et al., who showed in a supplementationstudy with EPA in hyperlipidemic patients that IR determined by the HOMA-IR was significantlyimproved in the supplemented group, compared with the placebo [21]. In our study, both groupsshowed an increase in HOMA-IR, more studies are therefore necessary to evaluate only the EPA effectin the IR of individuals with T2DM.
Our data show an overall improvement in the lipid profile through the atherogenic index in then-3 PUFA supplemented group, with an overall deterioration in the placebo group. Derosa et al. foundan increase in HDL-cholesterol and a decrease in triacylglycerides after 18 months of supplementationwith n-3 PUFA, in patients with impaired glucose metabolism [23]. While in subjects with type 2diabetes supplemented with DHA-rich fish oil, Mansoori et al. found a decrease in triacylglyceridesindependently of their initial values [27]. However, several trials of supplementation with n-3 PUFAhave not found an effect on lipid profile in adults with T2DM [40,41].
Non-HDL-cholesterol has been recommended as a sensitive proxy of the atherogenic metaboliclipid status; importantly, its values in our study population showed a non-significant decrease in thesupplemented group but a highly significant increase in the placebo group. This may be considereda protective effect of n-3 PUFA supplementation on the lipid metabolic deterioration caused byT2DM [15,16].
With respect to diet analysis, our results are in line with those of a previous study of this groupthat showed that a Mexican population with T2DM had a very low intake of n-3 PUFAs and a highconsumption of lipids, particularly saturated fatty acids [42]. According to the recommendations ofthe Mexican Official Standard NOM-015-SSA2-2010, for prevention, treatment, and control of diabetesmellitus [43], the mean daily energy intake of all groups was adequate, though protein and n-3 PUFAintake in both groups and carbohydrate intake in FOG were lower than recommendations, while thetotal lipid intake and saturated fatty acid intake were higher than recommendations in FOG.
It is well known that the quality of dietary fat is a key determinant of IR and that saturated andtrans fatty acids decrease insulin secretion and worsen insulin sensitivity [10]; a factor which couldexplain the higher increase in HOMA-IR in FOG because of their higher intake of saturated fatty acids.
The quality of fat may have a significant influence on adiponectin concentrations. The data from13 studies in a systematic review showed a modest and significant effect of n-3 PUFA supplementationon adiponectin concentrations [44]. Because of the very low intake of n-3 PUFAs in both our groups, we
175
Books
MDPI

Nutrients 2017, 9, 573
may not have been able to observe significant changes in adiponectin levels. In vitro human adipocytestudies found that EPA and DHA (100 μM) treatment for 48 h, increases adiponectin secretion, andthat only EPA led to higher cellular adiponectin being introduced into the adipocytes, suggesting thatthe regulation of adiponectin by n-3 PUFAs is dose- and time-dependent and that it can be affected bythe maturation stage of adipocytes [9]. However, another study of supplementation with n-3 PUFAsin Mexican children and adolescents with obesity and insulin resistance, showed that for n-3 PUFAs,the duration of treatment is not associated with the effects observed and that the dosage could bemore important, which in this case would suggest that in our study the n-3 PUFA dose we used can beconsidered low [45].
It has been demonstrated that diets high in fish and flaxseed oil lower the serum phospholipid ratioof omega-6/omega-3 fatty acids and that n-3 PUFAs are beneficial in patients affected by inflammatorydiseases. The omega 6/omega 3 ratio is of importance in health and disease; during the Paleolithicperiod of human evolution, there was a different balance between n-6 and n-3, but the last 150 yearshave seen a significant increase, as in Western diets this ratio is now in the range of 15–20:1 [46].Because of the low intake of n-3 PUFAs and the increased amounts of the n-6 PUFA linoleic acid (andhigh levels found in plasma phospholipids to be published elsewhere) in our study population, theomega 6/omega 3 ratios were of 11:1 and of 13:1 in FOG and PG, respectively, very similar to Westerndiets [47].
Although we found a beneficial effect of EPA + DHA supplementation on waist circumference,glucose, glycosylated hemoglobin, leptin, and leptin/adiponectin ratio in this population, thesebeneficial effects may not have been due to the supplement alone because we observed similar resultsin some of these parameters between patients who took the n-3 PUFA supplement and those that tookthe placebo. Similarly, there were significant increases in resistin, serum insulin, and HOMA-IR in bothgroups. It is possible that some of the beneficial effects observed in both groups were due to metforminand that the combined use of n-3 PUFA and metformin gave rise to better outcome measures. However,the significant increase in monounsaturated fatty acids and protein in the placebo group may alsohave contributed to the decrease in glycosylated hemoglobin, leptin, and leptin/adiponectin ratioand the increase in resistin, insulin, and HOMA-IR in this group. Interestingly, Schwingshack etal., 2001, and McAllan et al., 2014, have reported that macronutrient quality and composition, i.e.monounsaturated fat and protein can affect some of the parameters we have measured (leptin andglycosylated hemoglobin) and in the same direction we observed for the placebo group [48,49].
5. Conclusions
Additional research is required to fully understand the associated mechanisms between n-3PUFA-rich fish oil consumption and adipokine secretion/expression. The small sample size anduse of metformin may have limited our findings as well as the use of a relatively low dose of n-3PUFAs, so larger studies with higher doses of n-3 PUFAs are required to confirm and extend ourfindings. It would be important to measure serum levels of other adipokines related to IR and T2DM,such as visfatin and apelin, to determine if the beneficial effects of PUFA n-3 are sustained after thecessation of therapy and to determine if negative effects on insulin sensitivity are actually caused bythe supplement. The different effects of EPA and DHA observed in some studies highlight the need tostudy their actions separately.
In summary and despite the limitations, our study is the first to report serum concentrationsof adiponectin, resistin, and leptin and show a beneficial effect of n-3 PUFA supplementation onwaist circumference, glucose, glycosylated hemoglobin, leptin, and leptin/adiponectin ratio and lipidprofile in a group of Mexican individuals with T2DM. Supplementation with n-3 PUFA and n-3 PUFAcombined with metformin both warrant further investigation in Mexican T2DM.
Acknowledgments: The project from which this article derives was funded by the Consejo Nacional de Ciencia yTecnología (CONACyT), Scientific Development Proposals for the Attention of National Problems No. 212946.México.
176
Books
MDPI

Nutrients 2017, 9, 573
Author Contributions: R.V.-R., A.L.G.-L., B.E.M.-C., and L.S.H. participated in the design and implementationof the study protocol. M.G.J.-C., R.V.-R., A.L.G.-L., and B.E.M.-C. underwent all the fieldwork, biochemical andanthropometric measurements. All authors participated in data analysis, contributed in writing the manuscript,and read and approved the final version. The present manuscript is part of the Master in Health Sciences researchthesis of M.G.J.-C.
Conflicts of Interest: The authors declare no conflict of interest. The founding sponsors had no role in the designof the study; in the collection, analyses, or interpretation of data; in the writing of the manuscript; or in thedecision to publish the results.
References
1. Whiting, D.R.; Guariguata, L.; Weil, C.; Shaw, J. IDF Diabetes Atlas: Global estimates of the prevalence ofdiabetes for 2011 and 2030. Diabetes Res. Clin. Pract. 2011, 94, 311–321. [CrossRef] [PubMed]
2. Gutiérrez, J.P.; Rivera-Dommarco, J.; Shamah-Levy, T.; Villalpando-Hernández, S.; Franco, A.C.-N.L.;Romero-Martínez, M.H.-Á.M. Encuesta Nacional de Salud y Nutrición 2012. Resultados Nacionales(Internet). Cuernavaca Morelos, México. 2012. Available online: http://ensanut.insp.mx/informes/ENSANUT2012ResultadosNacionales.pdf (accessed on 5 June 2014).
3. Kwon, H.; Pessin, J.E. Adipokines mediate inflammation and insulin resistance. Front. Endocrinol. 2013, 4, 71.[CrossRef] [PubMed]
4. Rabe, K.; Lehrke, M.; Parhofer, K.G.; Broedl, U.C. Adipokines and insulin resistance. Mol. Med. 2008, 14,741–751. [CrossRef] [PubMed]
5. Catalán, V.; Gómez-Ambrosi, J.; Rodríguez, A.; Salvador, J.; Frühbeck, G. Adipokines in the treatment ofdiabetes mellitus and obesity. Expert Opin. Pharmacother. 2009, 10, 239–254. [CrossRef] [PubMed]
6. Zhang, M.; Zhao, X.; Li, M.; Cheng, H.; Hou, D.; Wen, Y.; Katherine, C.; Mi, J. Abnormal adipokines associatedwith various types of obesity in Chinese children and adolescents. Biomed. Environ. Sci. 2011, 24, 12–21.[PubMed]
7. Hampe, L.; Radjainia, M.; Xu, C.; Harris, P.W.; Bashiri, G.; Goldstone, D.C.; Brimble, M.A.; Wang, Y.;Mitra, A.K. Regulation and quality control of adiponectin assembly by endoplasmic reticulum chaperoneERp44. J. Biol. Chem. 2015, 290, 18111–18123. [CrossRef] [PubMed]
8. Nomura, S.; Shouzu, A.; Omoto, S.; Inami, N.; Ueba, T.; Urase, F.; Maeda, Y. Effects of eicosapentaenoic acidon endothelial cell-derived microparticles, angiopoietins and adiponectin in patients with type 2 diabetes.J. Atheroscler. Thromb. 2009, 2, 83–90. [CrossRef]
9. Martínez-Fernández, M.L.; Laiglesia, L.M.; Huerta, A.E.; Martínez, J.A.; Moreno-Aliaga, M.J. Omega-3 fattyacids and adipose tissue function in obesity and metabolic syndrome. Prostaglandins Other Lipid Mediat. 2015,121, 24–41. [CrossRef] [PubMed]
10. Bhaswant, M.; Poudyal, H.; Brown, L. Mechanisms of enhanced insulin secretion and sensitivity with n-3unsaturated fatty acids. J. Nutr. Biochem. 2015, 26, 571–584. [CrossRef] [PubMed]
11. Son, Y.M.; Ahn, S.M.; Kim, G.R.; Moon, Y.S.; Kim, S.H.; Park, Y.M.; Lee, W.K.; Min, T.S.; Han, S.H.; Yun, C.H.Resistin enhances the expansion of regulatory T cells through modulation of dendritic cells. BMC Immunol.2010, 11, 33. [CrossRef] [PubMed]
12. Jamaluddin, M.S.; Weakley, S.M.; Yao, Q.; Chen, C. Resistin: Functional roles and therapeutic considerationsfor cardiovascular disease. Br. J. Pharmacol. 2012, 165, 622–632. [CrossRef] [PubMed]
13. Subramanian, S.; Chait, A. Hypertriglyceridemia secondary to obesity and diabetes. Biochim. Biophys. Acta2012, 1821, 819–825. [CrossRef] [PubMed]
14. Wu, L.; Parhofer, K.G. Diabetic dyslipidemia. Metabolism 2014, 63, 1469–1479. [CrossRef] [PubMed]15. Kuryan, R.E.; Jacobson, M.S.; Frank, G.R. Non-HDL-cholesterol in an adolescent diabetes population. J. Clin.
Lipidol. 2014, 8, 194–198. [CrossRef] [PubMed]16. Ram, N.; Ahmed, B.; Hashmi, F.; Jabbar, A. Importance of measuring non-HDL cholesterol in type 2 diabetes
patients. J. Pak. Med. Assoc. 2014, 64, 124–128. [PubMed]17. Nettleton, J.A.; Katz, R. n-3 long-chain polyunsaturated fatty acids in type 2 diabetes: A Review. J. Am. Diet.
Assoc. 2005, 105, 428–440. [CrossRef] [PubMed]18. Wu, J.H.-Y.; Cahill, L.E.; Mozaffarian, D. Effect of fish oil on circulating adiponectin: A systematic review
and meta-analysis of randomized controlled trials. J. Clin. Endocrinol. Metab. 2013, 98, 2451–2459. [CrossRef][PubMed]
177
Books
MDPI

Nutrients 2017, 9, 573
19. Kamat, S.G.; Roy, R. Evaluation of the effect of n-3 PUFA-rich dietary fish oils on lipid profile and membranefluidity in alloxan-induced diabetic mice (Mus musculus). Mol. Cell. Biochem. 2016, 416, 117–129. [CrossRef][PubMed]
20. Christou, G.A.; Rizos, E.C.; Mpechlioulis, A.; Penzo, C.; Pacchioni, A.; Nikas, D.N. Confronting the residualcardiovascular risk beyond statins: The role of fibrates, omega-3 fatty acids, or niacin, in diabetic patients.Curr. Pharm. Des. 2014, 20, 3675–3688. [CrossRef] [PubMed]
21. Yamamoto, T.; Kajikawa, Y.; Otani, S.; Yamada, Y.; Takemoto, S.; Hirota, M.; Ikeda, M.; Iwagaki, H.; Saito, S.;Fujiwara, T. Protective effect of eicosapentaenoic acid on insulin resistance in hyperlipidemic patients andon the postoperative course of cardiac surgery patients: The possible involvement of adiponectin. Acta Med.Okayama 2014, 68, 349–361. [PubMed]
22. Malekshahi, M.A.; Saedisomeolia, A.; Djalali, M.; Djazayery, A.; Pooya, S.; Sojoudi, F. Efficacy of omega-3 fattyacid supplementation on serum levels of tumour necrosis factor alpha, C-reactive protein and interleukin-2in type 2 diabetes mellitus patients. Singap. Med. J. 2012, 53, 615–619.
23. Derosa, G.; Cicero, A.F.; D’Angelo, A.; Borghi, C.; Maffioli, P. Effects of n-3 PUFAs on fasting plasma glucoseand insulin resistance in patients with impaired fasting glucose or impaired glucose tolerance. Biofactors2016, 42, 316–322. [PubMed]
24. Vargas, M.L.; Almario, R.U.; Buchan, W.; Kim, K.; Karakas, S.E. Metabolic and endocrine effects of longchain vs. essential omega-3 polyunsaturated fatty acids in polycystic ovary syndrome. Metabolism 2011, 60,1711–1718. [CrossRef] [PubMed]
25. Mohammadi, E.; Rafraf, M.; Farzadi, L.; Asghari-Jafarabadi, M.; Sabour, S. Effects of omega-3 fatty acidssupplementation on serum adiponectin levels and some metabolic risk factors in women with polycysticovary syndrome. Asia Pac. J. Clin. Nutr. 2012, 21, 511–518. [PubMed]
26. Karlström, B.E.; Järvi, A.E.; Byberg, L.; Berglund, L.G.; Vessby, B.O. Fatty fish in the diet of patients withtype 2 diabetes: Comparison of the metabolic effects of foods rich in n-3 and n-6 fatty acids. Am. J. Clin. Nutr.2011, 94, 26–33. [CrossRef] [PubMed]
27. Mansoori, A.; Sotoudeh, G.; Djalali, M.; Eshraghian, M.R.; Keramatipour, M.; Nasli-Esfahani, E.; Shidfar, F.;Alvandi, E.; Toupchian, O.; Koohdani, F. Effect of DHA-rich fish oil on PPARγ target genes related to lipidmetabolism in type 2 diabetes: A randomized, double-blind, placebo-controlled clinical trial. J. Clin. Lipidol.2015, 9, 770–777. [CrossRef] [PubMed]
28. Hendrich, S. (n-3) Fatty acids: clinical trials in people with type 2 diabetes. Adv. Nutr. 2010, 1, 3–7. [CrossRef][PubMed]
29. Flachs, P.; Rossmeisl, M.; Kopecky, J. The effect of n-3 fatty acids on glucose homeostasis and insulinsensitivity. Physiol. Res. 2014, 63, S93–S118. [PubMed]
30. Al-Hamodi, Z.; AL-Habori, M.; Al-Meeri, A.; Saif-Ali, R. Association of adipokines, leptin/adiponectinratio and C-reactive protein with obesity and type 2 diabetes mellitus. Diabetol. Metab. Syndr. 2014, 6, 99.[CrossRef] [PubMed]
31. Lara, J.J.; Economou, M.; Wallace, A.M.; Rumley, A.; Lowe, G.; Slater, C.; Caslake, M.; Sattar, N.; Lean, M.E.Benefits of salmon eating on traditional and novel vascular risk factors in young, non-obese healthy subjects.Atherosclerosis 2007, 193, 213–221. [CrossRef] [PubMed]
32. Stirban, A.; Nandrean, S.; Götting, C.; Stratmann, B.; Tschoepe, D. Effects of n-3 polyunsaturated fatty acids(PUFAs) on circulating adiponectin and leptin in subjects with type 2 diabetes mellitus. Horm. Metab. Res.2014, 46, 490–492. [CrossRef] [PubMed]
33. Saltevo, J.; Kautiainen, H.; Vanhala, M. Gender differences in adiponectin and low-grade inflammationamong individuals with normal glucose tolerance, prediabetes, and type 2 diabetes. Gend. Med. 2009, 6,463–470. [CrossRef] [PubMed]
34. Snehalatha, C.; Mukesh, B.; Simon, M.; Viswanathan, V.; Haffner, S.M.; Ramachandran, A. Plasma adiponectinis an independent predictor of type 2 diabetes in Asian Indians. Diabetes Care 2003, 26, 3226–3229. [CrossRef][PubMed]
35. Alfadda, A.A. Circulating adipokines in healthy versus unhealthy overweight and obese subjects. Int. J.Endocrinol. 2014, 2014, 170434. [CrossRef] [PubMed]
36. Azab, N.; Abdel-Aziz, T.; Ahmed, A.; El-deen, I.M. Correlation of serum resistin level with insulin resistanceand severity of retinopathy in type 2 diabetes mellitus. J. Saudi Chem. Soc. 2016, 20, 272–277. [CrossRef]
178
Books
MDPI

Nutrients 2017, 9, 573
37. Tokuyama, Y.; Osawa, H.; Ishizuka, T.; Onuma, H.; Matsui, K.; Egashira, T.; Makino, H.; Kanatsuka, A.Serum resistin level is associated with insulin sensitivity in Japanese patients with type 2 diabetes mellitus.Metabolism 2007, 56, 693–698. [CrossRef] [PubMed]
38. Deng, Y.; Scherer, P.E. Adipokines as novel biomarkers and regulators of the metabolic syndrome. Ann. N. Y.Acad. Sci. 2010, 1212, E1–E19. [CrossRef] [PubMed]
39. Finucane, F.M.; Luan, J.; Wareham, N.J.; Sharp, S.J.; O’Rahilly, S.; Balkau, B.; Flyvbjerg, A.; Walker, M.;Hojlund, K.; Nolan, J.J.; et al. Correlation of the leptin: Adiponectin ratio with measures of insulin resistancein non-diabetic individuals. Diabetologia 2009, 52, 2345–2349. [CrossRef] [PubMed]
40. Müllner, E.; Plasser, E.; Brath, H.; Waldschütz, W.; Forster, E.; Kundi, M.; Wagner, K.H. Impact ofpolyunsaturated vegetable oils on adiponectin levels, glycaemia and blood lipids in individuals withtype 2 diabetes: a randomised, double-blind intervention study. J. Hum. Nutr. Diet. 2014, 27, 468–478.[CrossRef] [PubMed]
41. Wong, C.Y.; Yiu, K.H.; Li, S.W.; Lee, S.; Tam, S.; Lau, C.P.; Tse, H.F. Fish-oil supplement has neutral effectson vascular and metabolic function but improves renal function in patients with Type 2 diabetes mellitus.Diabet. Med. 2010, 27, 54–60. [CrossRef] [PubMed]
42. Via, M.A.; Mechanick, J.I. Nutrition in Type 2 Diabetes and the Metabolic Syndrome. Med. Clin. N. Am. 2016,100, 1285–1302. [CrossRef] [PubMed]
43. Guadarrama-López, A.L.; Valdés-Ramos, R.; Kaufer-Horwitz, M.; Harbige, L.S.; Contreras, I.;Martínez-Carrillo, B.E. Relationship between fatty acid habitual intake and early inflammation biomarkersin individuals with and without type 2 diabetes in Mexico. Endocr. Metab. Immune Disord. Drug Targets 2015,15, 234–241. [CrossRef] [PubMed]
44. NORMA Oficial Mexicana NOM-015-SSA2-2010, Para la Prevención, Tratamiento y Control de la DiabetesMellitus. Available online: http://www.salud.gob.mx/unidades/cdi/nom/m015ssa24.html (accessed on 5June 2014).
45. Von Frankenberg, A.D.; Silva, F.M.; de Almeida, J.C.; Piccoli, V.; do Nascimento, F.V.; Sost, M.M.; Leitao, C.B.;Remonti, L.L.; Umpierre, D.; Reis, A.F.; et al. Effect of dietary lipids on circulating adiponectin: A systematicreview with meta-analysis of randomised controlled trials. Br. J. Nutr. 2014, 112, 1235–1250. [CrossRef][PubMed]
46. Juárez-López, C.; Klünder-Klünder, M.; Madrigal-Azcárate, A.; Flores-Huerta, S. Omega-3 polyunsaturatedfatty acids reduce insulin resistance and triglycerides in obese children and adolescents. Pediatr. Diabetes2013, 14, 377–383. [CrossRef] [PubMed]
47. Simopoulos, A.P. The importance of the Omega-6/Omega-3 fatty acid ratio in cardiovascular disease andother chronic diseases. Exp. Biol. Med. 2008, 233, 674–688. [CrossRef] [PubMed]
48. Schwingshackl, L.; Strasser, B.; Hoffmann, G. Effects of Monounsaturated Fatty Acids on Glycaemic Controlin Patients with Abnormal Glucose Metabolism: A Systematic Review and Meta-Analysis. Ann. Nutr. Metab.2011, 58, 290–296. [CrossRef] [PubMed]
49. McAllan, L.; Skuse, P.; Cotter, P.D.; O’ Connor, P.; Cryan, J.F.; Ross, R.P.; Fitzgerald, G.; Roche, H.M.;Nilaweera, K.N. Protein Quality and the Protein to Carbohydrate Ratio within a High Fat Diet InfluencesEnergy Balance and the Gut Microbiota in C57BL/6J Mice. PLoS ONE 2014, 9, e88904. [CrossRef] [PubMed]
© 2017 by the authors. Licensee MDPI, Basel, Switzerland. This article is an open accessarticle distributed under the terms and conditions of the Creative Commons Attribution(CC BY) license (http://creativecommons.org/licenses/by/4.0/).
179
Books
MDPI

nutrients
Article
Carbohydrates from Sources with a Higher GlycemicIndex during Adolescence: Is Evening Rather thanMorning Intake Relevant for Risk Markers of Type 2Diabetes in Young Adulthood?
Tanja Diederichs 1, Christian Herder 2,3, Sarah Roßbach 1, Michael Roden 2,3,4, Stefan A. Wudy 5,
Ute Nöthlings 1, Ute Alexy 1,* and Anette E. Buyken 1,6
1 IEL-Nutritional Epidemiology, DONALD Study, Rheinische Friedrich-Wilhelms-University Bonn,Heinstueck 11, 44225 Dortmund, Germany; [email protected] (T.D.); [email protected] (S.R.);[email protected] (U.N.); [email protected] (A.E.B.)
2 Institute for Clinical Diabetology, German Diabetes Center, Leibniz Center for Diabetes Research atHeinrich Heine University Düsseldorf, Düsseldorf, Auf’m Hennekamp 65, 40225 Düsseldorf, Germany;[email protected] (C.H.); [email protected] (M.R.)
3 German Center for Diabetes Research (DZD), Ingolstädter Landstr. 1, 85764 München-Neuherberg, Germany4 Department of Endocrinology and Diabetology, Medical Faculty, Heinrich Heine University Düsseldorf,
Moorenstraße 5, 40225 Düsseldorf, Germany5 Pediatric Endocrinology and Diabetology, Laboratory for Translational Hormone Analytics,
Peptide Hormone Research Unit, Center of Child and Adolescent Medicine, Justus Liebig UniversityGiessen, Feulgenstraße 10-12, 35392 Gießen, Germany; [email protected]
6 Institute of Nutrition, Consumption and Health, Faculty of Natural Sciences, University Paderborn,Warburger Straße 100, 33098 Paderborn, Germany
* Correspondence: [email protected]; Tel.: +49-231-792210-16; Fax: +49-231-711581
Received: 11 April 2017; Accepted: 7 June 2017; Published: 10 June 2017
Abstract: Background: This study investigated whether glycemic index (GI) or glycemic load (GL)of morning or evening intake and morning or evening carbohydrate intake from low- or higher-GIfood sources (low-GI-CHO, higher-GI-CHO) during adolescence are relevant for risk markers oftype 2 diabetes in young adulthood. Methods: Analyses included DOrtmund Nutritional andAnthropometric Longitudinally Designed (DONALD) study participants who had provided at leasttwo 3-day weighed dietary records (median: 7 records) during adolescence and one blood sample inyoung adulthood. Using multivariable linear regression analyses, estimated morning and evening GI,GL, low-GI-CHO (GI < 55) and higher-GI-CHO (GI ≥ 55) were related to insulin sensitivity (N = 252),hepatic steatosis index (HSI), fatty liver index (FLI) (both N = 253), and a pro-inflammatory-score(N = 249). Results: Morning intakes during adolescence were not associated with any of the adultrisk markers. A higher evening GI during adolescence was related to an increased HSI in youngadulthood (p = 0.003). A higher consumption of higher-GI-CHO in the evening was associated withlower insulin sensitivity (p = 0.046) and an increased HSI (p = 0.006), while a higher evening intake oflow-GI-CHO was related to a lower HSI (p = 0.009). Evening intakes were not related to FLI or thepro-inflammatory-score (all p > 0.1). Conclusion: Avoidance of large amounts of carbohydrates fromhigher-GI sources in the evening should be considered in preventive strategies to reduce the risk oftype 2 diabetes in adulthood.
Keywords: glycaemic index; glycaemic load; daytime; adolescence; type 2 diabetes mellitus
Nutrients 2017, 9, 591 180 www.mdpi.com/journal/nutrients
Books
MDPI

Nutrients 2017, 9, 591
1. Introduction
Diets low in glycemic index (GI) or glycemic load (GL) are related to a lower risk of developingtype 2 diabetes mellitus [1,2]. Their preferred use has hence been advocated particularly during periodsof physiological insulin resistance, such as puberty [3]. This is supported by our recent observationslinking a higher dietary GI/GL during puberty to a lower insulin sensitivity and increased liver enzymeactivities [4] as well as increased levels of interleukin-(IL)-6 [5] in young adulthood, i.e., metabolicmarkers indicating an increased risk of developing type 2 diabetes in later life [6].
Recent discussions on preventive procedures also account for chronobiological aspects ofmetabolism [7]. This originates from the observation that extreme circadian (circa dies (lat.) = about 24 h)misalignment—as experienced during shiftwork—enhances the risk of type 2 diabetes among adults [8].In a subsample from a Finnish population-based study, behavioral traits towards eveningness (basedon a questionnaire assessing morningness-eveningness) were linked to notably higher odds for type 2diabetes [9]. Persons with a late chronotype (i.e., those with a preference for a delayed timing of sleepon free days, i.e., without social obligations) are at particular risk of experiencing mild, but chronicmisalignment resulting from the discrepancy between their circadian clock and socially determined,fixed schedules [10]. Misalignment may extend to their dietary behavior if it does not match metabolicprocesses, most of which follow a circadian rhythm [7]. Hence, dietary misalignment can emerge dueto a discrepancy between the biological and the social timing or result from a general mismatch ofdietary intake to metabolic circadian rhythmicity, e.g., to the decrease in insulin sensitivity over theday [11,12]. It is conceivable that adolescents are vulnerable to dietary misalignment since adolescenceis characterized by a pronounced “lateness” in chronotype, i.e., a preference for a delayed timing ofsleep on free days [13], which may be exacerbated by the physiological insulin resistance occurringduring adolescence [14]. We hence hypothesize that recurring postprandial glycemic excursions elicitedby carbohydrate-containing foods with a higher GI are particularly detrimental in evening hours andwill have longer-term downstream adverse effects on adult metabolic health. It is possible that theseare specific to either the relative glycemic response to the carbohydrate-containing foods consumedin evening hours, i.e., their GI [15], to their estimated postprandial glucose and insulin responses(i.e., their GL) and/or the intake of carbohydrates from low-GI (GI < 55) or higher-GI (GI ≥ 55, thusincluding sources with moderate- as well as high-GI) sources (low-GI-CHO, higher-GI-CHO).
Therefore, the aim of our current analysis was to separately examine the habitual dietary GI andGL of morning and evening intake during adolescence as well as morning and evening low-GI-CHOand higher-GI-CHO intake for prospective associations with risk markers of type 2 diabetes in youngadulthood. Primary outcome measures comprised established risk parameters (insulin sensitivity,hepatic steatosis index (HSI), fatty liver index (FLI) and a pro-inflammatory score). Newly emergingrisk markers of type 2 diabetes (fetuin A, fibroblast growth factor 21 (FGF-21) [16], interleukin-1receptor antagonist (IL-1ra) and omentin [17]) were considered as secondary outcomes.
2. Methods
2.1. DONALD Study
The DONALD (DOrtmund Nutritional and Anthropometric Longitudinally Designed) study isan ongoing, open cohort study conducted in Dortmund, Germany, that was previously described [18].In brief, since 1985, detailed data on diet, growth, development, and metabolism between infancy andearly adulthood have been collected from approximately 1550 healthy children. Each year, 30–35 infantsare newly recruited and first examined at the ages of three or six months. Participants regularly returnto the study center thereafter; assessment during adolescence is scheduled annually. Since 2005,participants aged 18+ years are requested to provide a fasting blood sample in addition to the regularexamination. The study was approved by the Ethics Committee of the University of Bonn (projectidentification code: 098/06, date of approval 21 June 2006); all examinations are performed withwritten consent from the parents and/or the participants.
181
Books
MDPI

Nutrients 2017, 9, 591
2.2. Dietary Assessment
Nutritional data are assessed by 3-day weighed dietary records on three consecutive days.Participants are free to choose the days of recording. Dietary records include information on the timingof meal consumption. Parents and/or participants are instructed by dietitians to weigh all consumedfoods and beverages, including leftovers, to the nearest 1 g. To this end, they receive regularly calibratedelectronic food scales (initially Soehnle Digita 8000 (Leifheit AG, Nassau, Germany), now WEDO digi2000 (Werner Dorsch GmbH, Muenster/Dieburg, Germany)). When exact weighing is not possible,semi-quantitative measures (e.g., number of spoons) are allowed. Moreover, information on recipesand on the types and brands of food items consumed is requested. The dietary records are collected aswell as reviewed by the dietitians and analyzed using the continuously updated in-house nutrientdatabase LEBTAB [19]. It includes information from standard nutrient tables, product labels, or recipesimulations based on the listed ingredients and nutrients.
2.3. Blood Analysis
Venous blood samples are drawn after an overnight fast, centrifuged at 4 ◦C and frozen at −80 ◦Cin the DONALD Study Center. Fasting plasma glucose was determined on a Roche/Hitachi Cobasc 311 analyzer (Basel, Switzerland). Plasma insulin concentration was measured at the Laboratoryfor Translational Hormone Analytics of the University of Giessen using an immunoradiometricassay (IRMA, DRG Diagnostics, Marburg, Germany). All other measurements were performed atthe German Diabetes Center with assay characteristics as described [5,20–22]: plasma activitiesof alanine-aminotransferase (ALT), aspartate-aminotransferase (AST), gamma-glutamyltransferase(GGT), plasma triglycerides (TG) and plasma high-sensitivity C-reactive protein (hsCRP) with theRoche/Hitachi Cobas c311 analyzer (Roche diagnostics, Mannheim, Germany), plasma high-sensitivityinterleukin-(IL)-6 using the Human IL-6 Quantikine HS, plasma adiponectin with the Human TotalAdiponectin/Acrp30 Quantikine ELISA, serum leptin with the Leptin Quantikine ELISA, seruminterleukin-1 receptor antagonist (IL-1ra) with the Human IL-1ra/IL-1F3 ELISA, plasma fibroblastgrowth factor (FGF-21) with the Human FGF-21 kits all from R & D Systems (Wiesbaden, Germany),serum IL-18 using the Human IL-18 ELISA kit from MBL (Nagoya, Japan), and plasma chemerin withthe Human Chemerin ELISA, plasma omentin-1 with the Human Omentin-1 ELISA, plasma chemerinwith the Human Chemerin ELISA and plasma fetuin-A with the Human Fetuin-A ELISA kits fromBioVendor (Brno, Czech Republic).
Insulin sensitivity was assessed using the updated HOMA2 sensitivity (in %) based on fastinginsulin and blood glucose [23]. Indices of hepatic steatosis were calculated as follows:
Hepatic steatosis index (HSI):
• HSI = 8 × ALT/AST + BMI
(+2, if female; +2, if diabetes mellitus, but not applied, as the DONALD study excludes participantswith chronic disease) [24],
• Fatty liver index (FLI):
FLI = ex/(1 + ex) × 100
with x = 0.953 × ln(TG) + 0.139 × BMI + 0.718 × ln(GGT) + 0.053 × waist circumference − 15.745 [25].
To estimate associations with chronic low-grade inflammation a pro-inflammatory score ofestablished inflammation markers—assumed to be more predictive of inflammation than singlemarkers [26]—was obtained by averaging inflammation markers, that were standardized (z) by sex(mean = 0, SD = 1) beforehand. To align anti-inflammatory adiponectin in the pro-inflammatory scoreit was multiplied by −1:
Pro-inflammatory score = (z-hsCRP + z-IL-6 + z-IL18 + z-chemerin + z-adiponectin × (−1) + z-leptin)/6.
182
Books
MDPI
Nutrients 2017, 9, 591
2.4. Anthropometric Data
Anthropometric measurements are performed by trained nurses according to standard procedures,with the participants dressed only in underwear and barefoot. Standing height is measured to thenearest 0.1 cm (digital stadiometer: Harpenden Ltd., Crymych, UK) and body weight to the nearest0.1 kg (electronic scale: model 753 E; Seca, Hamburg, Germany). Waist circumference is measured atthe midpoint between the lower rib and the iliac crest to the nearest 0.1 cm. Measurements of skinfoldthicknesses are taken on the right side of the body at the biceps, triceps, subscapular and suprailiacsites to the nearest 0.1 mm (Holtain caliper: Holtain Ltd., Crymych, UK).
From these measures, adolescent body mass index (BMI, kg/m2) and its sex- and age-specificSD-scores (SDS) were calculated using current German BMI standards [27]. The prevalence of overweight inadolescence was calculated using standards of the International Obesity TaskForce (IOTF) [28]. Percentbody fat (%BF) in adolescence and adulthood was estimated using the Slaughter [29] and theDurnin-Womersley equations [30], respectively. From these, body fat mass (kg) was calculated[(%BF× body mass)/100] and related to the square of height to obtain fat mass index (FMI, kg/m2).
2.5. Family Characteristics
On a child’s admission to the study, information on gestational characteristics and birthanthropometrics are abstracted from a standardized document (Mutterpass), given to all pregnantwomen in Germany. Moreover, parents are interviewed concerning the child’s early life data as wellas family and socio-economic characteristics at regular intervals. Additionally, parents are regularlyweighed and measured using the same equipment used for participants.
2.6. Definition of Morning and Evening Intake
The definition of morning and evening was described in earlier analyses [31,32]. Briefly, for eachage (year), the time between the end of the night and 11 a.m. and the time between 6 p.m. and thestart of the night, respectively, was used to define morning and evening.
For estimation of morning and evening GI and GL as well as morning and evening carbohydrateintake from low- or higher-GI food sources, each carbohydrate containing food recorded in thecorresponding day-time window was assigned a published GI value [33,34], based on glucose asreference food and according to a standardized procedure [35]. Carbohydrate content of each foodconsumed in the morning or in the evening was then multiplied by the food’s GI to obtain the GL of thecorresponding day-time window. Subsequently, overall morning/evening GI was obtained by dividingmorning/evening GL by morning/evening carbohydrate intake. To distinguish carbohydrates fromlow- and higher-GI food sources, a value of 55 (cutoff proposed for low-GI foods [34]) was chosenfor categorization. Accordingly, morning and evening carbohydrate intake from low-GI sources(low-GI-CHO (GI < 55) in g) and from moderate- or high-GI sources (higher-GI-CHO (GI ≥ 55) in g)was calculated.
2.7. Study Sample
Due to the open-cohort design of the study, many subjects have not yet reached young adulthood,when blood samples are taken. At the time of this analysis N = 414 young adults had provided atleast one fasting blood sample, in which risk markers of type 2 diabetes were quantified. As onlyterm (gestational age 37–42 weeks) singletons with a minimum birth weight of 2500 g were includedin the analyses, sample size was reduced to N = 397. To allow estimation of morning and eveningGI, GL, low-GI-CHO and higher-GI-CHO during adolescence (girls: 9–15 years, boys: 10–16 years),at least two 3-day weighed dietary records from three consecutive days were required (N = 298).Participants, who were identified to consistently underreport their energy intake were excluded fromthe study (N = 12, resulting in N = 286). In line with earlier publications [4,5] ‘consistent underreporting’was defined to be present, when more than half of the available food records per participant were
183
Books
MDPI
Nutrients 2017, 9, 591
implausible. A 3-day weighed dietary record was considered implausible, when the total energyintake documented was inadequate in relation to the basal metabolic rate (estimated from Schofieldequations [36]) using cut-offs from Goldberg et al. [37] modified for children and adolescents [38].Finally, anthropometric measurements from adolescence and young adulthood as well as data onrelevant covariates were required, resulting in analyses samples of N = 253 for liver steatosis outcomes,N = 252 for insulin sensitivity and N = 249 for inflammation-related outcomes. Sample sizes for insulinsensitivity and inflammation outcomes were lower because of fasting glucose concentrations belowthe threshold for calculation of HOMA2 sensitivity (reflecting hypoglycemia) or insufficient amountsof blood were available for determination of analytes.
2.8. Statistical Analysis
SAS procedures (SAS version 9.2, SAS Institute, Cary, NC, USA) were used for data analysis.p-values < 0.05 were considered significant. Tests for interaction indicated no sex differences for theprimary outcomes, except for the relevance of evening GL for the pro-inflammatory score. Sincestratified analyses for this association yielded similar non-significant results for males and females,all associations are from pooled analyses.
Characteristics of the study population are presented as medians (25th, 75th percentiles) forcontinuous variables and as absolute (relative) frequencies for categorical variables.
The prospective associations of morning and evening GI, GL, low-GI-CHO and higher-GI-CHOwith the risk markers of type 2 diabetes were analyzed using multivariable linear regression models.To achieve normal distribution in the outcome variables, they were transformed prior to analysis usinglog, double-log, square root or reciprocal transformations, depending on the outcome. In addition,individual outliers which substantially interfered with normal distribution or regression modelingwere winsorized, i.e., outliers were replaced by the sex-specifically closest value fitting a normaldistribution. The procedure concerned IL-6 (N = 4), adiponectin (N = 1) and IL-1ra (N = 2). Exposureswere energy-adjusted for morning and evening energy intake, respectively—except for dietaryGI-using the residual method [39]. To account for sex- and age-dependent differences in nutritionalintake, all variables were standardized (mean = 0, SD = 1) by sex and age (year) and averaged overthe time period of adolescence. Crude models (model A) included the exposure variable as wellas sex and age at blood withdrawal in adulthood. In a further step, adjusted models (model B)were constructed by individual examination of potentially influencing covariates and hierarchicalinclusion [40] of those which substantially modified the exposure’s regression coefficient by ≥10% [41]or independently predicted the outcome variable [42]. Potential confounding covariates consideredfor inclusion in the different hierarchical levels were (1) early life characteristics (gestational weightgain (kg), mother’s age at birth (years), duration of pregnancy (weeks) and birth weight (g), first-bornchild (yes/no), full breastfeeding (≥4 months yes/no)), (2) family and socio-economic characteristics(parental diabetes (yes/no), maternal overweight (≥25 kg/m2 yes/no), maternal educational status(≥12 year of schooling yes/no), smoking in the household (yes/no)), (3) baseline characteristics(adolescent BMI-SDS, intake of saturated fatty acids (SFA, E%) and intake of animal protein (E%)).To ensure comparability, models were adjusted identically according to the strongest exposure-outcomeassociations for closely related outcomes (i.e., for (i) insulin sensitivity, (ii) hepatic steatosis markers(HSI, FLI, fetuin A, FGF-21) and (iii) inflammatory markers (pro-inflammatory score, IL-1ra, omentin)).For significant associations (model B), we additionally ran conditional models including waistcircumferences to examine whether the observed associations are partly attributable to effects ofcarbohydrate nutrition on body composition. As HSI and FLI do by definition already include adultBMI and/or waist circumference, no conditional models were run for these outcomes.
3. Results
Characteristics of the study population at baseline and in young adulthood are shown in Tables 1and 2, respectively (see Section 2.7. for selection of the sample). During adolescence, the GI and GL
184
Books
MDPI

Nutrients 2017, 9, 591
as well as the relative contribution of carbohydrates from low- or higher-GI sources were broadlycomparable between morning and evening intake. Note that the carbohydrate content of morningintake was higher than the carbohydrate content of evening intake. In young adulthood, median ageat blood withdrawal was 21 years (range 18–39 years).
Overall, morning GI and GL as well as morning carbohydrate intake from low- or higher-GIsources were not related to insulin sensitivity (Table S1), the primary hepatic steatosis outcomesHSI and FLI (Tables S2 and S3) or the pro-inflammatory score (Table 3, top) in young adulthood(all p > 0.1). Of note, low-GI-CHO intake during the morning was related to HSI in model A (p = 0.041),however, upon further adjustment this association was no longer statistically significant (Table S2,model B, p = 0.24). Morning exposures were neither related to the secondary outcomes fetuin A(Table S4), FGF-21 (Table S5), and IL-1ra (Table S6) (all p > 0.08). However, a higher morning GIduring adolescence was associated with an increased level of the secondary outcome omentin in youngadulthood (p = 0.011, Table S7); an association that persisted in the conditional model adjusting foradult waist circumference (p = 0.003).
In contrast, a higher evening carbohydrate intake from higher-GI sources during adolescencewas associated with lower insulin sensitivity in young adulthood (p = 0.046, Figure 1). Additionaladjustment for waist circumference rendered this association non-significant (p =0.11). A higherevening GI (p = 0.003) and a higher evening higher-GI-CHO intake (p = 0.006) were related toan increased HSI, whereas higher evening low-GI-CHO intake (p = 0.009) was associated with alower HSI (Figure 2). Similarly, a higher evening GL (p = 0.005) and higher evening higher-GI-CHOintake (p = 0.029) were associated with increased concentrations of the secondary outcome fetuinA (Table S4); neither of these relations was explained by adult waist circumference (p = 0.006 andp = 0.040 respectively). No prospective associations of evening intakes were observed with the primaryoutcomes FLI (Table S3) and the pro-inflammatory score (Table 3, bottom), or with the secondaryoutcomes FGF-21 (Table S5), IL-1ra (Table S6) and omentin (Table S7) (all p > 0.01).
Table 1. Baseline sample characteristics 1 (N = 252).
General Characteristics
Sex ♀ (n (%)) 130 (51.6)Mean age (years) 12.4 (12.0; 13.0)
Early Life Factors
Gestational weight gain (kg) 12 (10; 15)Mothers age at gestation (years) 30.6 (28.2; 33.3)Birth weight (g) 3450 (3130; 3810)Duration of gestation (weeks) 40 (39; 41)First born child (n (%)) 152 (60.3)Fully breastfed, ≥4 months (n (%)) 124 (49.2)
Family Characteristics
Parental diabetes (n (%)) 9 (3.6)Maternal overweight, ≥25 kg/m2 (n (%)) 101 (40.1)Maternal educational status, ≥12 years of schooling (n (%)) 136 (54.0)Smoking in the household (n (%)) 72 (28.6)
Body Composition during Adolescence 2
BMI (kg/m2) 18.6 (16.8; 20.2)BMI Standard Deviation Score −0.13 (−0.87; 0.37)FMI (kg/m2) 3.2 (2.4; 4.5)Overweight (n (%)) 3 31 (12.3)
Nutrition Parameters during Adolescence 2
Number of 3-day dietary records per participant 7 (6; 7)
Daily energy intake (kcal) 1922 (1658; 2158)Total carbohydrates (E% 4) 51.0 (48.4; 54.3)Total protein (E% 4) 13.0 (12.0; 14.1)Animal protein (E% 4) 8.1 (7.2; 9.1)Total fat (E% 4) 35.9 (32.9; 38.1)SFA (E% 4) 15.7 (14.1; 17.1)
185
Books
MDPI
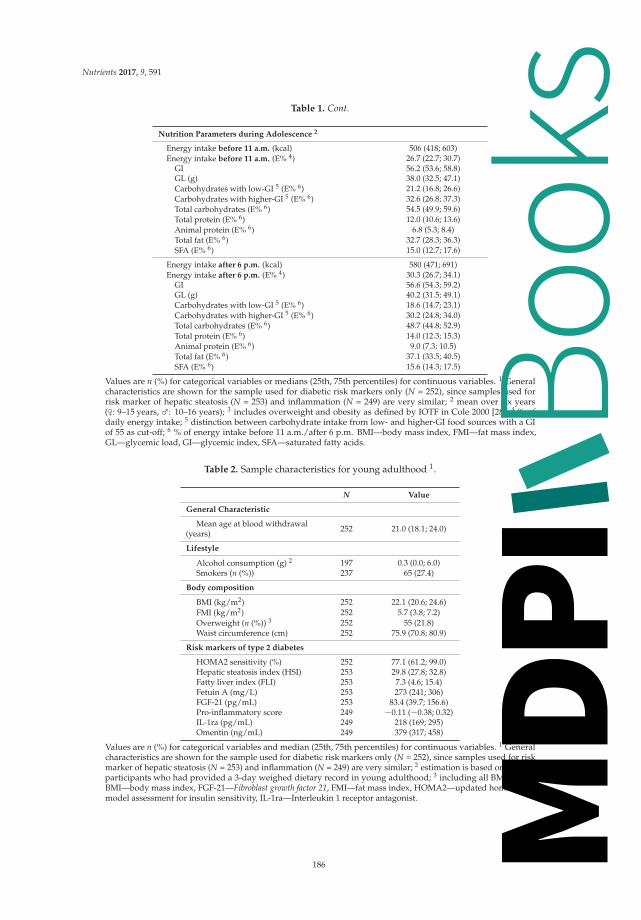
Nutrients 2017, 9, 591
Table 1. Cont.
Nutrition Parameters during Adolescence 2
Energy intake before 11 a.m. (kcal) 506 (418; 603)Energy intake before 11 a.m. (E% 4) 26.7 (22.7; 30.7)
GI 56.2 (53.6; 58.8)GL (g) 38.0 (32.5; 47.1)Carbohydrates with low-GI 5 (E% 6) 21.2 (16.8; 26.6)Carbohydrates with higher-GI 5 (E% 6) 32.6 (26.8; 37.3)Total carbohydrates (E% 6) 54.5 (49.9; 59.6)Total protein (E% 6) 12.0 (10.6; 13.6)Animal protein (E% 6) 6.8 (5.3; 8.4)Total fat (E% 6) 32.7 (28.3; 36.3)SFA (E% 6) 15.0 (12.7; 17.6)
Energy intake after 6 p.m. (kcal) 580 (471; 691)Energy intake after 6 p.m. (E% 4) 30.3 (26.7; 34.1)
GI 56.6 (54.3; 59.2)GL (g) 40.2 (31.5; 49.1)Carbohydrates with low-GI 5 (E% 6) 18.6 (14.7; 23.1)Carbohydrates with higher-GI 5 (E% 6) 30.2 (24.8; 34.0)Total carbohydrates (E% 6) 48.7 (44.8; 52.9)Total protein (E% 6) 14.0 (12.3; 15.3)Animal protein (E% 6) 9.0 (7.3; 10.5)Total fat (E% 6) 37.1 (33.5; 40.5)SFA (E% 6) 15.6 (14.3; 17.5)
Values are n (%) for categorical variables or medians (25th, 75th percentiles) for continuous variables. 1 Generalcharacteristics are shown for the sample used for diabetic risk markers only (N = 252), since samples used forrisk marker of hepatic steatosis (N = 253) and inflammation (N = 249) are very similar; 2 mean over six years(♀: 9–15 years, ♂: 10–16 years); 3 includes overweight and obesity as defined by IOTF in Cole 2000 [28]; 4 % ofdaily energy intake; 5 distinction between carbohydrate intake from low- and higher-GI food sources with a GIof 55 as cut-off; 6 % of energy intake before 11 a.m./after 6 p.m. BMI—body mass index, FMI—fat mass index,GL—glycemic load, GI—glycemic index, SFA—saturated fatty acids.
Table 2. Sample characteristics for young adulthood 1.
N Value
General Characteristic
Mean age at blood withdrawal(years) 252 21.0 (18.1; 24.0)
Lifestyle
Alcohol consumption (g) 2 197 0.3 (0.0; 6.0)Smokers (n (%)) 237 65 (27.4)
Body composition
BMI (kg/m2) 252 22.1 (20.6; 24.6)FMI (kg/m2) 252 5.7 (3.8; 7.2)Overweight (n (%)) 3 252 55 (21.8)Waist circumference (cm) 252 75.9 (70.8; 80.9)
Risk markers of type 2 diabetes
HOMA2 sensitivity (%) 252 77.1 (61.2; 99.0)Hepatic steatosis index (HSI) 253 29.8 (27.8; 32.8)Fatty liver index (FLI) 253 7.3 (4.6; 15.4)Fetuin A (mg/L) 253 273 (241; 306)FGF-21 (pg/mL) 253 83.4 (39.7; 156.6)Pro-inflammatory score 249 −0.11 (−0.38; 0.32)IL-1ra (pg/mL) 249 218 (169; 295)Omentin (ng/mL) 249 379 (317; 458)
Values are n (%) for categorical variables and median (25th, 75th percentiles) for continuous variables. 1 Generalcharacteristics are shown for the sample used for diabetic risk markers only (N = 252), since samples used for riskmarker of hepatic steatosis (N = 253) and inflammation (N = 249) are very similar; 2 estimation is based on N = 197participants who had provided a 3-day weighed dietary record in young adulthood; 3 including all BMI ≥ 25.0;BMI—body mass index, FGF-21—Fibroblast growth factor 21, FMI—fat mass index, HOMA2—updated homeostasismodel assessment for insulin sensitivity, IL-1ra—Interleukin 1 receptor antagonist.
186
Books
MDPI

Nutrients 2017, 9, 591
Figure 1. Predicted least square means (95% confidence interval) of HOMA2 sensitivity by tertiles of(A) glycemic index (GI) after 6 p.m., (B) glycemic load (GL) after 6 p.m., (C) intake of low-GI-CHO1 after 6 p.m. and (D) intake of higher-GI-CHO 1 after 6 p.m. Values are least-square means fortertiles obtained from linear regression models. p-values are based on models using the continuousexposure variables. Models were adjusted for first born child (yes/no), baseline BMI-SDS, baselineevening intake of saturated fatty acids and animal protein (N = 252). Values below the figure refer tomedian intakes (25th; 75th percentiles) in each tertile of the respective exposure. 1 Distinction betweencarbohydrate intake from low- and higher-GI food sources with a GI of 55 as cut-off; 2 % of energyintake after 6 p.m.
Table 3. Prospective relation of GI and GL of morning (before 11 a.m.) and evening (after 6 p.m.) intakeas well as morning and evening intake from low- and higher-GI food sources during adolescence topro-inflammatory score in young adulthood (N = 249).
Predicted Means 1 of Pro-Inflammatory Scoreby Exposure Tertiles
(Exposures: Morning and Evening GI, GL, Low-GI-CHO, Higher-GI-CHO) p for Trend 2
Low Exposure (T1) Average Exposure (T2) High Exposure (T3)
MORNING
Glycemic Index (GI)Median GI 52.2 (50.2; 53.8) 56.2 (55.2; 57.0) 59.5 (58.5; 60.6)Model A 3 −0.10 (−0.22; 0.03) −0.03 (−0.15; 0.10) −0.04 (−0.16; 0.08) 0.15Model B 4 −0.10 (−0.21; 0.02) −0.04 (−0.16; 0.08) −0.02 (−0.13; 0.10) 0.18
Glycemic Load (GL)Median GL 35.7 (30.4; 41.6) 35.9 (30.4; 42.9) 45.4 (37.1; 53.9)Model A 3 −0.08 (−0.20; 0.04) −0.02 (−0.14; 0.10) −0.06 (−0.18; 0.06) 0.40Model B 4 −0.11 (−0.23; 0.02) 0.00 (−0.12; 0.12) −0.05 (−0.17; 0.08) 0.27
CHO with low-GI 5
Median low-GI-CHO (E%) 15.4 (12.4; 17.3) 21.4 (19.5; 23.3) 28.8 (26.5; 32.7)Model A 3 0.01 (−0.12; 0.14) −0.05 (−0.17; 0.08) −0.13 (−0.25; 0.00) 0.16Model B 4 −0.01 (−0.13; 0.11) −0.03 (−0.14; 0.09) −0.11 (−0.23; 0.00) 0.39
CHO with higher-GI 5
Median higher-GI-CHO (E%) 25.0 (22.5; 27.2) 32.9 (31.0; 34.3) 38.6 (36.5; 42.8)Model A 3 −0.15 (−0.26; −0.03) −0.06 (−0.18; 0.07) 0.04 (−0.08; 0.17) 0.06Model B 4 −0.14 (−0.25; −0.02) −0.04 (−0.16; 0.08) 0.03 (−0.10; 0.15) 0.12
187
Books
MDPI

Nutrients 2017, 9, 591
Table 3. Cont.
Predicted Means 1 of Pro-Inflammatory Scoreby Exposure Tertiles
(Exposures: Morning and Evening GI, GL, Low-GI-CHO, Higher-GI-CHO) p for Trend 2
Low Exposure (T1) Average Exposure (T2) High Exposure (T3)
EVENING
Glycemic Index (GI)Median GI 53.3 (52.4; 54.3) 56.6 (55.9; 57.4) 60.2 (59.1; 61.5)Model A 3 0.04 (−0.09; 0.17) −0.05 (−0.17; 0.08) −0.15 (−0.27; −0.03) 0.30Model B 4 0.01 (−0.11; 0.13) −0.04 (−0.16; 0.08) −0.12 (−0.23; 0.00) 0.75
Glycemic Load (GL)Median GL 34.4 (26.9; 44.8) 37.1 (31.3; 44.6) 48.5 (40.0; 55.1)Model A 3 −0.01 (−0.14; 0.12) −0.17 (−0.29; −0.05) 0.02 (−0.10; 0.15) 0.66Model B 4 −0.05 (−0.18; 0.09) −0.13 (−0.24; −0.01) 0.03 (−0.10; 0.16) 0.46
CHO with low-GI 5
Median low-GI-CHO (E%) 13.1 (10.3; 14.7) 18.5 (17.2; 20.0) 24.6 (22.8; 28.2)Model A 3 −0.07 (−0.19; 0.06) −0.06 (−0.18; 0.06) −0.04 (−0.16; 0.09) 0.56Model B 4 −0.05 (−0.17; 0.08) −0.06 (−0.18; 0.06) −0.05 (−0.17; 0.07) 0.84
CHO with higher-GI 5
Median higher-GI-CHO (E%) 22.5 (20.8; 24.9) 30.2 (28.8; 32.0) 35.4 (33.7; 38.1)Model A 3 −0.09 (−0.21; 0.03) −0.07 (−0.19; 0.05) 0.00 (−0.12; 0.13) 0.69Model B 4 −0.11 (−0.23; 0.01) −0.06 (−0.17; 0.06) 0.02 (−0.10; 0.14) 0.44
Values in italic refer to median intakes (25th, 75th percentiles) in each tertile of the respective exposure. 1 Model-values areleast square means (95% confidence intervals) of pro-inflammatory score; 2 p-values for models are based on linearregression analyses using continuous exposure variables; 3 Model A (crude model) adjusted for sex and age at bloodwithdrawal; 4 Model B additionally adjusted for gestational weight gain, maternal educational status (≥12 years ofschooling yes/no), baseline BMI-SDS, baseline morning or evening intake of animal protein; 5 Distinction betweencarbohydrate intake from low- and higher-GI food sources with a GI of 55 as cut-off.
Figure 2. Predicted least square means (95% confidence interval) of hepatic steatosis index (HSI)
by tertiles of (A) glycemic index (GI) after 6 p.m., (B) glycemic load (GL) after 6 p.m., (C) intake oflow-GI-CHO 1 after 6 p.m. and (D) intake of higher-GI-CHO 1 after 6 p.m. Values are least-square meansfor tertiles obtained from linear regression models. p-values are based on models using the continuousexposure variables. Models were adjusted for sex, age at blood withdrawal, gestational weight gain,duration of pregnancy and birth weight, maternal educational status (≥12 years of schooling yes/no),maternal overweight (≥25 kg/m2 yes/no), baseline BMI-SDS, and baseline evening intake of saturatedfatty acids (N = 253). Values below the figure refer to median intakes (25th; 75th percentiles) in eachtertile of the respective exposure. 1 Distinction between carbohydrate intake from low- and higher-GIfood sources with a GI of 55 as cut-off; 2 % of energy intake after 6 p.m.
188
Books
MDPI

Nutrients 2017, 9, 591
4. Discussion
The present study provides novel evidence that adverse longer-term metabolic effects of recurringpostprandial glycemic excursions may be specific to evening carbohydrate consumption. Specifically,adolescents who habitually consumed more carbohydrates from higher-GI food sources in the eveninghad a lower insulin sensitivity and a higher HSI in young adulthood. By contrast, such adverseprospective associations were not observed for morning intakes. The absence of associations with thepro-inflammatory score suggests that day-time specific intake pattern in adolescence may not be oflonger-term relevance for low-grade inflammation among young, healthy adults.
Our observation linking evening higher-GI-CHO to insulin sensitivity is in line with ourhypothesis that evening rather than morning intake of higher-GI foods is potentially detrimentalfor risk factors of type 2 diabetes. A diurnal pattern of insulin sensitivity has been confirmed forboth healthy persons [11] and participants with prediabetes [12]. The observed decrease in insulinsensitivity over the course of the day offers a plausible mechanism for our results. In line with ourfindings, a recent study measuring 20-h day-time profiles from 6 healthy volunteers (4 females, 2 males)reported that estimated postprandial insulin sensitivity was lowest when participants consumed 60%of their daily energy intake in the form of high-GI foods at supper [43]. In an earlier study from thesame group, 8-h daytime profiles were collected from 17 middle-aged men with overweight or obesityand at least one cardiac risk factor [44]. Results revealed higher postprandial glucose and insulinresponses following high-GI lunch and afternoon tea, but not high-GI breakfast compared to thecorresponding low-GI meals. Upon adherence to the assigned diet over 24 days, postprandial insulinresistance had increased in the high-GI diet group compared to the low-GI diet group; thus, there wasno metabolic adaptation to the high-GI diet. Our results expand on these findings in that they suggestthat higher-GI-CHO habitually consumed in the evening by adolescents may have longer-term adverseconsequences for adult insulin sensitivity. Our conditional model suggests that this association may bepartly mediated by adult body composition. This is supported by the fact that lower glycogen synthesisover night was observed in subjects with diabetes mellitus type 2 compared to insulin-sensitivesubjects [45], so that high evening higher-GI-CHO intake may shift glucose metabolites to de-novolipogenesis and subsequent fat storage among adolescents experiencing physiological insulin resistance.Hence, future studies should also address the relevance of higher-GI-CHO consumed in the eveningfor body composition.
Glucose metabolism is closely linked to fatty acid metabolism; therefore insulin resistance andaccumulation of fat in the liver are tightly interrelated [46]. Two studies, although heterogeneousin their methods (intervention vs observational study, extreme (dietary GI 32 vs. 84) vs. habituallow/high-GI diets and determination of liver steatosis severity by 1H magnetic resonance spectroscopyand liver ultrasonography scanning, respectively), suggest that the dietary GI may be related to liverfunction [47,48]. However, it should be noted that imaging methods as used in these studies are time-and cost-intensive and therefore often infeasible in observational studies.
Our study used validated indices, which are preferable over the use of single liver enzymeactivities in that they include more than one metabolic parameter predictive of hepatic steatosis.Our results extend existing evidence [47,48] suggesting that a higher-GI diet and an increased intakeof higher-GI-CHO are both of longer-term relevance for hepatic steatosis and that these associationsare specific to evening intakes.
It is important to note that HSI was shown to reflect the presence as well as the degree of hepaticsteatosis [24]. The cut-off value to rule-out hepatic steatosis is 30, while the cut-off value to postulatethe presence of hepatic steatosis is 36. In our healthy sample, only those in the lowest tertile ofhigher-GI-CHO intake had HSI levels clearly below 30, whereas those in the middle and highesttertiles had mean HSI values between 30 and 31 (Figure 2).
Similarly, albeit non-significant associations were observed with the FLI. Both HSI and FLI havesimilar efficacy to detect steatosis compared to an imaging method and were described as appropriatesurrogate markers for epidemiological studies [49]. The two main differences between HSI and FLI
189
Books
MDPI

Nutrients 2017, 9, 591
are that the latter considers the activity of GGT instead of ALT and AST activities as well as TG andwaist circumference in addition to BMI. In an earlier analysis of ours, dietary GI during adolescencehad been related to both GGT and ALT in young adulthood [4], but a recent meta-analysis does notsupport an independent effect of the GI-level of diets on TG concentrations [50]. Therefore, the FLIcould by definition be less responsive to the exposures under consideration in the present analysis.Yet, chance must be considered as a possible explanation as well. However, it was noted that resultsfor fetuin A—one of our secondary outcomes, which is closely related to hepatic steatosis [16]—are inline with the findings for HSI and were independent of waist circumference.
We did not observe a relation of morning or evening GI, GL, or intake of low-GI-CHO orhigher-GI-CHO to the pro-inflammatory score. In an earlier study of ours, a higher dietary GL aswell as higher daily intakes of higher-GI-CHO during adolescence were associated with increasedlevels of IL-6, but not with hs-CRP, IL-18 or adiponectin in young adulthood [5]. Individual analysesof parameters which are included in the score confirmed these results for the current sample, albeitwithout an indication of a day-time specificity: Both a higher morning and a higher evening GL aswell as higher intakes of morning and evening higher-GI-CHO were associated with increased adultlevels of IL-6 (data not shown).
Conversely, a day-time specificity emerged for omentin. Here, higher morning GI duringadolescence was associated with increased young adult omentin levels. The association was unaffectedby additional adjustment for adult waist circumference. Consistent with our results, data from healthynormal weight children showed higher insulin levels and lower insulin sensitivity in children inthe highest as compared to the lowest tertile of omentin [51]. As omentin is discussed to exertanti-inflammatory actions [17], we speculate that our findings may reflect an upregulation due to ahabitual counter-regulatory omentin increase in response to regular pro-inflammatory signals. Indeed,a high-GI diet—regularly provoking postprandial glycemic spikes—induces increased oxidativestress [52]. In terms of the day-time specificity, it is worth noting that postprandial glycemic spikesfollowing high GI meals are highest after breakfast compared to lunch and tea times [44].
If confirmed by other studies, our findings have several potential implications: First, the timeof day when higher-GI foods are consumed is of relevance, so that a shift in focus is needed from‘what we eat’ also to ‘when do we eat what’. Second, our observations are based on habitual dietaryintake data and reveal that the analyzed population consumed on average more than half of theirmorning and evening carbohydrates from higher-GI food sources, which translates into a third of theirmorning and evening energy intake from higher-GI food sources. Of note, those who consumed lessthan a quarter of their evening energy intake from higher-GI-CHO (i.e., those in the lowest tertile)had a mean HSI below 30. Hence, our data suggest that reducing higher-GI-CHO intake from athird to a quarter of energy intake in the evening offers preventive potential for adult type 2 diabetesrisk. Third, the absence of a relation with morning GI, GL, low-GI-CHO or higher-GI-CHO does notjustify a recommendation to shift high evening intake of high-GI foods to morning hours, as there is apossibility of adverse longer-term effects for chronic subclinical inflammation in response to habitualpostprandial spikes induced in the morning. Moreover, due to the fact that the delay in chronotype(i.e., the preference for a delayed timing of sleep on free days) peaks approximately at the age of20 years [13], encouraging morning food intake may augment circadian misalignment and wouldtherefore be counterproductive for metabolic health in adolescents and young adults.
Our study is limited by the availability of one blood sample in young adulthood only; the use ofsurrogate markers of diabetes risk instead of hard end points can be considered as further limitation.However, our population was too young to have established type 2 diabetes. Moreover, it needs to beassumed that the analyzed outcomes themselves follow individual circadian rhythms [53,54] so thatmeasurement of risk markers takes place in blood samples potentially withdrawn during the acrophase(i.e., the maximum value of one rhythm cycle) of one parameter and the bathyphase (i.e., the minimumvalue of one rhythm cycle) of another parameter. However, withdrawing all blood samples at theapproximately same day-time, i.e., during morning hours in our study, results in a standardization
190
Books
MDPI

Nutrients 2017, 9, 591
of all outcome parameters to day-time. Consequently, differences in the circadian rhythm betweenthe analytes do not affect the calculated indices (HOMA2 sensitivity, HSI, FLI, pro-inflammatoryscore). Concerning our dietary predictors, the GI concept is still contentious. Recent criticism relatesto methodological aspects [55] and GI extrapolation to mixed meals [56]. However, the validity ofdietary GI has been demonstrated repeatedly using different methodological approaches [15,57] andISO-standardization will further reduce methodological errors in measuring the GI of foods [58].It could be criticized that we excluded only participants who regularly under-reported their energyintake from our analyses. However, exclusion of under-reporters is controversial [59] and it shouldbe noted that in our study only a further N = 77 participants had ever underreported their energyintake in any of their protocols (median: 7 protocols). Additional exclusion of these participantsdid not affect our results. Only the association of higher-GI-CHO with HOMA2 sensitivity wasattenuated towards a trend (p = 0.08), which is likely attributable to the lower number of participantsincluded in this sensitivity analysis (data not shown). Overall, our results could be subject to concernsabout multiple testing. However, three separate sets of primary outcomes were considered (insulinsensitivity, hepatic steatosis, subclinical chronic inflammation) and different mechanisms are discussedfor the relevance of GI, GL or CHO from low- or higher-GI sources for these outcomes. Moreover, weabstained from stressing and/or discussing findings that tended to be associated (p-values between0.05 and <0.1). Generally, the DONALD population is characterized by a socio-economic status that isabove average [18], so that extremes in nutritional behavior might not be represented. Consequently,a selection bias is likely introduced. However, the relatively homogeneous sample decreases thevulnerability of the results to residual confounding.
The overall strengths of the study are its prospective design and the detailed repeated dietarydata including day-time specific nutritional information during adolescence. Due to the recruitment ofstudy participants during infancy and the annually repeated data collection, 3-day weighed dietaryrecords are documented by participants accustomed to the procedure. Moreover, availability of dataon several important potential confounders, i.e., early-life characteristics, anthropometrics, familialand socio-economic factors strengthen our analyses.
5. Conclusions
In conclusion, our data suggest that young adult insulin sensitivity and hepatic steatosis markersare responsive to higher evening, but not morning intakes of higher-GI-CHO during adolescence,whereas there was no association with adult subclinical inflammation. Avoidance of large amounts ofhigher-GI-CHO in the evening and/or their replacement by low-GI-CHO during adolescence maypresent a promising preventive strategy to reduce risk of type 2 diabetes in adulthood.
Supplementary Materials: The following are available online at www.mdpi.com/2072-6643/9/6/591/s1.Table S1: Prospective relation of GI and GL of morning (before 11 a.m.) intake as well as morning carbohydrateintake from low- and higher-GI food sources during adolescence to HOMA2 sensitivity in young adulthood(N = 252), Table S2: Prospective relation of GI and GL of morning (before 11 a.m.) intake as well as morningcarbohydrate intake from low- and higher-GI food sources during adolescence to hepatic steatosis index (HSI)in young adulthood (N = 253), Table S3: Prospective relation of GI and GL of morning (before 11 a.m.) andevening (after 6 p.m.) intake as well as morning and evening intake from low- and higher-GI food sources duringadolescence to fatty liver index (FLI) in young adulthood (N = 253), Table S4: Prospective relation of GI andGL of morning (before 11 a.m.) and evening (after 6 p.m.) intake as well as morning and evening intake fromlow- and higher-GI food sources during adolescence to fetuin A (mg/L) in young adulthood (N = 253), Table S5:Prospective relation of GI and GL of morning (before 11 a.m.) and evening (after 6 p.m.) intake as well as morningand evening intake from low- and higher-GI food sources during adolescence to fibroblast growth factor 21(FGF-21, pg/mL) in young adulthood (N = 253), Table S6: Prospective relation of GI and GL of morning (before11 a.m.) and evening (after 6 p.m.) intake as well as morning and evening intake from low- and higher-GI foodsources during adolescence to interleukin 1 receptor antagonist (IL-1ra, pg/mL) in young adulthood (N = 249),Table S7: Prospective relation of GI and GL of morning (before 11 a.m.) and evening (after 6 p.m.) intake as wellas morning and evening intake from low- and higher-GI food sources during adolescence to omentin (ng/mL) inyoung adulthood (N = 249).
191
Books
MDPI

Nutrients 2017, 9, 591
Acknowledgments: This research project is funded by the German Research Foundation (Bu1807/3-1).The DONALD Study is supported by the Ministry of Science and Research of North Rhine Westphalia, Germany.With respect to the co-authorship of C.H. and M.R., the following applies: The German Diabetes Center is fundedby the German Federal Ministry of Health and the Ministry of Innovation, Science, Research and Technologyof the State North Rhine-Westphalia. Their participation in this project was supported in part by a grant fromthe German Federal Ministry of Education and Research to the German Center for Diabetes Research (DZDe.V.). We thank the staff of the DONALD study for carrying out the anthropometric measurements as well as forcollecting and coding dietary records and all participants of the study for providing their data.
Author Contributions: A.E.B., U.A., C.H.: conceived the project; T.D.: conducted the statistical analysis andwrote the manuscript; A.E.B.: supervised the study, provided detailed assistance in the drafting process and hadprimary responsibility for the final content; C.H., M.R., S.A.W.: supervised laboratory measurements of bloodanalytes; all authors: made substantial contributions and read and approved the final manuscript.
Conflicts of Interest: A.E.B. is a member of the International Carbohydrate Quality Consortium. All other authorsdeclare no conflicts of interest. The funding sponsor had no role in the design of the study; in the collection,analyses, or interpretation of data; in the writing of the manuscript, and in the decision to publish the results.
References
1. Bhupathiraju, S.N.; Tobias, D.K.; Malik, V.S.; Pan, A.; Hruby, A.; Manson, J.E.; Willett, W.C.; Hu, F.B.Glycemic index, glycemic load, and risk of type 2 diabetes: Results from 3 large US cohorts and an updatedmeta-analysis. Am. J. Clin. Nutr. 2014, 100, 218–232. [CrossRef] [PubMed]
2. Augustin, L.S.A.; Kendall, C.W.C.; Jenkins, D.J.A.; Willett, W.C.; Astrup, A.; Barclay, A.W.; Bjorck, I.;Brand-Miller, J.C.; Brighenti, F.; Buyken, A.E.; et al. Glycemic index, glycemic load and glycemic response:An International Scientific Consensus Summit from the International Carbohydrate Quality Consortium(ICQC). Nutr. Metab. Cardiovasc. Dis. 2015, 25, 795–815. [CrossRef] [PubMed]
3. Buyken, A.E.; Mitchell, P.; Ceriello, A.; Brand-Miller, J. Optimal dietary approaches for prevention of type 2diabetes: A life-course perspective. Diabetologia 2010, 53, 406–418. [CrossRef] [PubMed]
4. Goletzke, J.; Herder, C.; Joslowski, G.; Bolzenius, K.; Remer, T.; Wudy, S.A.; Roden, M.; Rathmann, W.;Buyken, A.E. Habitually higher dietary glycemic index during puberty is prospectively related to increasedrisk markers of type 2 diabetes in younger adulthood. Diabetes Care 2013, 36, 1870–1876. [CrossRef] [PubMed]
5. Goletzke, J.; Buyken, A.E.; Joslowski, G.; Bolzenius, K.; Remer, T.; Carstensen, M.; Egert, S.; Nothlings, U.;Rathmann, W.; Roden, M.; et al. Increased intake of carbohydrates from sources with a higher glycemicindex and lower consumption of whole grains during puberty are prospectively associated with higher IL-6concentrations in younger adulthood among healthy individuals. J. Nutr. 2014, 144, 1586–1593. [CrossRef][PubMed]
6. Saponaro, C.; Gaggini, M.; Gastaldelli, A. Nonalcoholic fatty liver disease and type 2 diabetes: Commonpathophysiologic mechanisms. Curr. Diabetes Rep. 2015, 15, 607. [CrossRef] [PubMed]
7. Bailey, S.M.; Udoh, U.S.; Young, M.E. Circadian regulation of metabolism. J. Endocrinol. 2014, 222, R75–R96.[CrossRef] [PubMed]
8. Scheer, F.A.J.L.; Hilton, M.F.; Mantzoros, C.S.; Shea, S.A. Adverse metabolic and cardiovascular consequencesof circadian misalignment. Proc. Natl. Acad. Sci. USA 2009, 106, 4453–4458. [CrossRef] [PubMed]
9. Merikanto, I.; Lahti, T.; Puolijoki, H.; Vanhala, M.; Peltonen, M.; Laatikainen, T.; Vartiainen, E.; Salomaa, V.;Kronholm, E.; Partonen, T. Associations of chronotype and sleep with cardiovascular diseases and type 2diabetes. Chronobiol. Int. 2013, 30, 470–477. [CrossRef] [PubMed]
10. Roenneberg, T.; Allebrandt, K.V.; Merrow, M.; Vetter, C. Social jetlag and obesity. Curr. Boil. 2012, 22, 939–943.[CrossRef] [PubMed]
11. Saad, A.; Dalla Man, C.; Nandy, D.K.; Levine, J.A.; Bharucha, A.E.; Rizza, R.A.; Basu, R.; Carter, R.E.;Cobelli, C.; Kudva, Y.C.; et al. Diurnal pattern to insulin secretion and insulin action in healthy individuals.Diabetes 2012, 61, 2691–2700. [CrossRef] [PubMed]
12. Sonnier, T.; Rood, J.; Gimble, J.M.; Peterson, C.M. Glycemic control is impaired in the evening in prediabetesthrough multiple diurnal rhythms. J. Diabetes Complicat. 2014, 28, 836–843. [CrossRef] [PubMed]
13. Roenneberg, T.; Kuehnle, T.; Pramstaller, P.P.; Ricken, J.; Havel, M.; Guth, A.; Merrow, M. A marker for theend of adolescence. Curr. Boil. 2004, 14, R1038–R1039. [CrossRef] [PubMed]
14. Goran, M.I.; Gower, B.A. Longitudinal study on pubertal insulin resistance. Diabetes 2001, 50, 2444–2450.[CrossRef] [PubMed]
192
Books
MDPI

Nutrients 2017, 9, 591
15. Kochan, A.M.; Wolever, T.M.S.; Chetty, V.T.; Anand, S.S.; Gerstein, H.C.; Sharma, A.M. Glycemic indexpredicts individual glucose responses after self-selected breakfasts in free-living, abdominally obese adults.J. Nutr. 2012, 142, 27–32. [CrossRef] [PubMed]
16. Iroz, A.; Couty, J.-P.; Postic, C. Hepatokines: Unlocking the multi-organ network in metabolic diseases.Diabetologia 2015, 58, 1699–1703. [CrossRef] [PubMed]
17. Herder, C.; Carstensen, M.; Ouwens, D.M. Anti-inflammatory cytokines and risk of type 2 diabetes.Diabetes Obes. Metab. 2013, 15, 39–50. [CrossRef] [PubMed]
18. Kroke, A.; Manz, F.; Kersting, M.; Remer, T.; Sichert-Hellert, W.; Alexy, U.; Lentze, M.J. The DONALD Study.History, current status and future perspectives. Eur. J. Nutr. 2004, 43, 45–54. [CrossRef] [PubMed]
19. Sichert-Hellert, W.; Kersting, M.; Chahda, C.; Schäfer, R.; Kroke, A. German food composition database fordietary evaluations in children and adolescents. J. Food Compos. Anal. 2007, 20, 63–70. [CrossRef]
20. Herder, C.; Bongaerts, B.W.C.; Rathmann, W.; Heier, M.; Kowall, B.; Koenig, W.; Thorand, B.; Roden, M.;Meisinger, C.; Ziegler, D. Association of subclinical inflammation with polyneuropathy in the olderpopulation: KORA F4 study. Diabetes Care 2013, 36, 3663–3670. [CrossRef] [PubMed]
21. Herder, C.; Ouwens, D.M.; Carstensen, M.; Kowall, B.; Huth, C.; Meisinger, C.; Rathmann, W.; Roden, M.;Thorand, B. Adiponectin may mediate the association between omentin, circulating lipids and insulinsensitivity: Results from the KORA F4 study. Eur. J. Endocrinol. 2015, 172, 423–432. [CrossRef] [PubMed]
22. Hatziagelaki, E.; Herder, C.; Tsiavou, A.; Teichert, T.; Chounta, A.; Nowotny, P.; Pacini, G.; Dimitriadis, G.;Roden, M. Serum Chemerin Concentrations Associate with Beta-Cell Function, but Not with InsulinResistance in Individuals with Non-Alcoholic Fatty Liver Disease (NAFLD). PLoS ONE 2015, 10, e0124935.[CrossRef] [PubMed]
23. Wallace, T.M.; Levy, J.C.; Matthews, D.R. Use and abuse of HOMA modeling. Diabetes Care 2004, 27,1487–1495. [CrossRef] [PubMed]
24. Lee, J.-H.; Kim, D.; Kim, H.J.; Lee, C.-H.; Yang, J.I.; Kim, W.; Kim, Y.J.; Yoon, J.-H.; Cho, S.-H.;Sung, M.-W.; et al. Hepatic steatosis index: A simple screening tool reflecting nonalcoholic fatty liverdisease. Dig. Liver Dis. 2010, 42, 503–508. [CrossRef] [PubMed]
25. Bedogni, G.; Bellentani, S.; Miglioli, L.; Masutti, F.; Passalacqua, M.; Castiglione, A.; Tiribelli, C. The FattyLiver Index: A simple and accurate predictor of hepatic steatosis in the general population. BMC Gastroenterol.2006, 6, 33. [CrossRef] [PubMed]
26. Calder, P.C. Feeding the immune system. Proc. Nutr. Soc. 2013, 72, 299–309. [CrossRef] [PubMed]27. Robert-Koch-Institut. Beiträge zur Gesundheitsberichterstattung des Bundes: Referenzperzentile für anthropometrische
Maßzahlen und Blutdruck aus der Studie zur Gesundheit von Kindern und Jugendlichen in Deutschland(KiGGS) 2003 bis 2006, 1st ed.; Robert-Koch-Institut: Berlin, Germany, 2011.
28. Cole, T.J.; Bellizzi, M.C.; Flegal, K.M.; Dietz, W.H. Establishing a standard definition for child overweightand obesity worldwide: International survey. BMJ 2000, 320, 1240–1243. [CrossRef] [PubMed]
29. Slaughter, M.H.; Lohman, T.G.; Boileau, R.A.; Horswill, C.A.; Stillman, R.J.; van Loan, M.D.; Bemben, D.A.Skinfold equations for estimation of body fatness in children and youth. Hum. Boil. 1988, 60, 709–723.
30. Durnin, J.V.; Womersley, J. Body fat assessed from total body density and its estimation from skinfoldthickness: Measurements on 481 men and women aged from 16 to 72 years. Br. J. Nutr. 1974, 32, 77–97.[CrossRef] [PubMed]
31. Rossbach, S.; Diederichs, T.; Bolzenius, K.; Herder, C.; Buyken, A.E.; Alexy, U. Age and time trends in eatingfrequency and duration of nightly fasting of German children and adolescents. Eur. J. Nutr. 2016. [CrossRef]
32. Diederichs, T.; Rossbach, S.; Herder, C.; Alexy, U.; Buyken, A.E. Relevance of Morning and Evening Energyand Macronutrient Intake during Childhood for Body Composition in Early Adolescence. Nutrients 2016, 8,716. [CrossRef] [PubMed]
33. University of Sydney (Sydney, Australia). The Official Website of the Glycemic Index and GI Database.Available online: http://www.glycemicindex.com.
34. Atkinson, F.S.; Foster-Powell, K.; Brand-Miller, J.C. International tables of glycemic index and glycemic loadvalues: 2008. Diabetes Care 2008, 31, 2281–2283. [CrossRef] [PubMed]
35. Buyken, A.E.; Dettmann, W.; Kersting, M.; Kroke, A. Glycaemic index and glycaemic load in the dietof healthy schoolchildren: Trends from 1990 to 2002, contribution of different carbohydrate sources andrelationships to dietary quality. BJN 2005, 94, 796–803. [CrossRef]
193
Books
MDPI

Nutrients 2017, 9, 591
36. Schofield, W.N. Predicting basal metabolic rate, new standards and review of previous work. Hum. Nutr.Clin. Nutr. 1985, 39, 5–41. [PubMed]
37. Goldberg, G.R.; Black, A.E.; Jebb, S.A.; Cole, T.J.; Murgatroyd, P.R.; Coward, W.A.; Prentice, A.M. Criticalevaluation of energy intake data using fundamental principles of energy physiology: 1. Derivation of cut-offlimits to identify under-recording. Eur. J. Clin. Nutr. 1991, 45, 569–581. [PubMed]
38. Sichert-Hellert, W.; Kersting, M.; Schoch, G. Underreporting of energy intake in 1 to 18 year old Germanchildren and adolescents. Z. Ernahrungswiss. 1998, 37, 242–251. [CrossRef] [PubMed]
39. Willett, W.C.; Howe, G.R.; Kushi, L.H. Adjustment for total energy intake in epidemiologic studies. Am. J.Clin. Nutr. 1997, 65, 1220S–1228S; discussion 1229S–1231S. [PubMed]
40. Victora, C.G.; Huttly, S.R.; Fuchs, S.C.; Olinto, M.T. The role of conceptual frameworks in epidemiologicalanalysis: A hierarchical approach. Int. J. Epidemiol. 1997, 26, 224–227. [CrossRef] [PubMed]
41. Maldonado, G.; Greenland, S. Simulation study of confounder-selection strategies. Am. J. Epidemiol. 1993,138, 923–936. [CrossRef] [PubMed]
42. Kirkwood, B.R.; Sterne, J.A.C. Essential Medical Statistics, 2nd ed.; Blackwell Science: Malden, MA, USA,2003; pp. 315–342.
43. Morgan, L.M.; Shi, J.-W.; Hampton, S.M.; Frost, G. Effect of meal timing and glycaemic index on glucosecontrol and insulin secretion in healthy volunteers. Br. J. Nutr. 2012, 108, 1286–1291. [CrossRef] [PubMed]
44. Brynes, A.E.; Mark Edwards, C.; Ghatei, M.A.; Dornhorst, A.; Morgan, L.M.; Bloom, S.R.; Frost, G.S.A randomised four-intervention crossover study investigating the effect of carbohydrates on daytimeprofiles of insulin, glucose, non-esterified fatty acids and triacylglycerols in middle-aged men. Br. J. Nutr.2003, 89, 207–218. [CrossRef] [PubMed]
45. Krssak, M.; Brehm, A.; Bernroider, E.; Anderwald, C.; Nowotny, P.; Dalla Man, C.; Cobelli, C.; Cline, G.W.;Shulman, G.I.; Waldhausl, W.; et al. Alterations in postprandial hepatic glycogen metabolism in type 2diabetes. Diabetes 2004, 53, 3048–3056. [CrossRef] [PubMed]
46. Sanders, F.W.B.; Griffin, J.L. De novo lipogenesis in the liver in health and disease: More than just a shuntingyard for glucose. Biol. Rev. Camb. Philos. Soc. 2016, 91, 452–468. [CrossRef] [PubMed]
47. Valtuena, S.; Pellegrini, N.; Ardigo, D.; Del Rio, D.; Numeroso, F.; Scazzina, F.; Monti, L.; Zavaroni, I.;Brighenti, F. Dietary glycemic index and liver steatosis. Am. J. Clin. Nutr. 2006, 84, 136–142. [PubMed]
48. Bawden, S.; Stephenson, M.; Falcone, Y.; Lingaya, M.; Ciampi, E.; Hunter, K.; Bligh, F.; Schirra, J.; Taylor, M.;Morris, P.; et al. Increased liver fat and glycogen stores after consumption of high versus low glycaemicindex food: A randomized crossover study. Diabetes Obes. Metab. 2017, 19, 70–77. [CrossRef] [PubMed]
49. Kahl, S.; Strassburger, K.; Nowotny, B.; Livingstone, R.; Kluppelholz, B.; Kessel, K.; Hwang, J.-H.; Giani, G.;Hoffmann, B.; Pacini, G.; et al. Comparison of liver fat indices for the diagnosis of hepatic steatosis andinsulin resistance. PLoS ONE 2014, 9, e94059. [CrossRef] [PubMed]
50. Goff, L.M.; Cowland, D.E.; Hooper, L.; Frost, G.S. Low glycaemic index diets and blood lipids: A systematicreview and meta-analysis of randomised controlled trials. Nutr. Metab. Cardiovasc. Dis. 2013, 23, 1–10.[CrossRef] [PubMed]
51. Prats-Puig, A.; Bassols, J.; Bargallo, E.; Mas-Parareda, M.; Ribot, R.; Soriano-Rodriguez, P.; Berengui, A.;Diaz, M.; de Zegher, F.; Ibanez, L.; et al. Toward an early marker of metabolic dysfunction: Omentin-1 inprepubertal children. Obesity 2011, 19, 1905–1907. [CrossRef] [PubMed]
52. Hu, Y.; Block, G.; Norkus, E.P.; Morrow, J.D.; Dietrich, M.; Hudes, M. Relations of glycemic index andglycemic load with plasma oxidative stress markers. Am. J. Clin. Nutr. 2006, 84, 70–76. [PubMed]
53. Rivera-Coll, A.; Fuentes-Arderiu, X.; Díez-Noguera, A. Circadian Rhythms of Serum Concentrations of12 Enzymes of Clinical Interest. Chronobiol. Int. 2009, 10, 190–200. [CrossRef]
54. Rahman, S.A.; Castanon-Cervantes, O.; Scheer, F.A.J.L.; Shea, S.A.; Czeisler, C.A.; Davidson, A.J.; Lockley, S.W.Endogenous circadian regulation of pro-inflammatory cytokines and chemokines in the presence of bacteriallipopolysaccharide in humans. Brain Behav. Immun. 2015, 47, 4–13. [CrossRef] [PubMed]
55. Matthan, N.R.; Ausman, L.M.; Meng, H.; Tighiouart, H.; Lichtenstein, A.H. Estimating the reliability ofglycemic index values and potential sources of methodological and biological variability. Am. J. Clin. Nutr.2016, 104, 1004–1013. [CrossRef] [PubMed]
56. Meng, H.; Matthan, N.R.; Ausman, L.M.; Lichtenstein, A.H. Effect of macronutrients and fiber onpostprandial glycemic responses and meal glycemic index and glycemic load value determinations. Am. J.Clin. Nutr. 2017, 105, 842–853. [CrossRef] [PubMed]
194
Books
MDPI

Nutrients 2017, 9, 591
57. Fabricatore, A.N.; Ebbeling, C.B.; Wadden, T.A.; Ludwig, D.S. Continuous glucose monitoring to assessthe ecologic validity of dietary glycemic index and glycemic load. Am. J. Clin. Nutr. 2011, 94, 1519–1524.[CrossRef] [PubMed]
58. International Organization for Standardization. Food Products—Determination of the Glycaemic Index (GI) andRecommendation for Food Classification (ISO 26642:2010); ISO: Geneva, Switzerland, 2010.
59. Castro-Quezada, I.; Ruano-Rodriguez, C.; Ribas-Barba, L.; Serra-Majem, L. Misreporting in nutritionalsurveys: Methodological implications. Nutr. Hospitalaria 2015, 31, 119–127.
© 2017 by the authors. Licensee MDPI, Basel, Switzerland. This article is an open accessarticle distributed under the terms and conditions of the Creative Commons Attribution(CC BY) license (http://creativecommons.org/licenses/by/4.0/).
195
Books
MDPI

nutrients
Article
PREVIEW: Prevention of Diabetes through LifestyleIntervention and Population Studies in Europe andaround the World. Design, Methods, and BaselineParticipant Description of an Adult Cohort Enrolledinto a Three-Year Randomised Clinical Trial
Mikael Fogelholm 1,*, Thomas Meinert Larsen 2, Margriet Westerterp-Plantenga 3,
Ian Macdonald 4, J. Alfredo Martinez 5,6, Nadka Boyadjieva 7, Sally Poppitt 8,
Wolfgang Schlicht 9, Gareth Stratton 10, Jouko Sundvall 11, Tony Lam 12, Elli Jalo 1,
Pia Christensen 2, Mathijs Drummen 3, Elizabeth Simpson 4, Santiago Navas-Carretero 5,6,
Teodora Handjieva-Darlenska 7, Roslyn Muirhead 13, Marta P. Silvestre 8, Daniela Kahlert 14,
Laura Pastor-Sanz 2, Jennie Brand-Miller 13 and Anne Raben 2
1 Department of Food and Environmental Sciences, University of Helsinki, 00014 Helsinki, Finland;[email protected]
2 Department of Nutrition, Exercise and Sports, Faculty of Science, University of Copenhagen,Rolighedsvej 30, Frederiksberg C, DK-1958 Copenhagen, Denmark; [email protected] (T.M.L.);[email protected] (P.C.); [email protected] (L.P.-S.); [email protected] (A.R.)
3 Department of Human Biology, Maastricht University, P.O. Box 616, 6200 MD Maastricht, The Netherlands;[email protected] (M.W.-P.); [email protected] (M.D.)
4 School of Life Sciences, Faculty of Medicine and Health Sciences, University of Nottingham,Nottingham NG7 2UH, UK; [email protected] (I.M.); [email protected] (E.S.)
5 Center for Nutrition Research, University of Navarra, 31008 Pamplona, Spain; [email protected] (J.A.M.);[email protected] (S.N.-C.)
6 CIBERobn, Instituto de Salud Carlos III, 28029 Madrid, Spain7 Department of pharmacology and toxicology, Medical University of Sofia, 1431 Sofia, Bulgaria;
[email protected] (N.B.); [email protected] (T.H.-D.)8 Human Nutrition Unit, School of Biological Sciences, University of Auckland, Auckland 1024, New Zealand;
[email protected] (S.P.); [email protected] (M.P.S.)9 Department of Exercise and Health Sciences, University of Stuttgart, 70569 Stuttgart, Germany;
[email protected] School of Sport and Exercise Sciences, A.STEM Research Centre, Swansea University, Swansea SA1 8EN, UK;
[email protected] National Institute for Health and Welfare THL, 00300 Helsinki, Finland; [email protected] NetUnion sarl, Ave des Figuires 20, 1007 Lausanne, Switzerland; [email protected] Charles Perkins Centre, University of Sydney, Sydney 2006, Australia;
[email protected] (R.M.); [email protected] (J.B.-M.)14 Department of Health Science, University of Education Schwäbisch Gmünd, 73525 Gmünd, Germany;
[email protected]* Correspondence: [email protected]; Tel.: +358-503180302
Received: 14 May 2017; Accepted: 16 June 2017; Published: 20 June 2017
Abstract: Type-2 diabetes (T2D) is one of the fastest growing chronic diseases worldwide. The PREVIEWproject has been initiated to find the most effective lifestyle (diet and physical activity) forthe prevention of T2D, in overweight and obese participants with increased risk for T2D. Thestudy is a three-year multi-centre, 2 × 2 factorial, randomised controlled trial. The impact of ahigh-protein, low-glycaemic index (GI) vs. moderate protein, moderate-GI diet in combinationwith moderate or high-intensity physical activity on the incidence of T2D and the related clinicalend-points are investigated. The intervention started with a two-month weight reduction using a
Nutrients 2017, 9, 632 196 www.mdpi.com/journal/nutrients
Books
MDPI

Nutrients 2017, 9, 632
low-calorie diet, followed by a randomised 34-month weight maintenance phase comprising fourtreatment arms. Eight intervention centres are participating (Denmark, Finland, United Kingdom,The Netherlands, Spain, Bulgaria, Australia, and New Zealand). Data from blood specimens, urine,faeces, questionnaires, diaries, body composition assessments, and accelerometers are collected atmonths 0, 2, 6, 12, 18, 24, and 36. In total, 2326 adults were recruited. The mean age was 51.6 (SD 11.6)years, 67% were women. PREVIEW is, to date, the largest multinational trial to address the preventionof T2D in pre-diabetic adults through diet and exercise intervention. Participants will complete thefinal intervention in March, 2018.
Keywords: diet; protein; carbohydrate; glycaemic index; physical activity; obesity
1. Introduction
Type-2 diabetes (T2D) is a disease associated with serious comorbidities, including microvascular(retinopathy, nephropathy, neuropathy) and macrovascular (cardiovascular) events [1]. The estimatedglobal prevalence is approximately 8% and a prediction suggests that this will increase by 55% up tothe year 2035 [2,3]. An important risk factor for T2D is obesity (BMI > 30 kg/m2) predicting a morethan 10-fold increase in incidence compared to normal weight [4]. Weight gain during adulthood isalso an independent risk factor for T2D [5], as are genetic inheritance, unhealthy dietary habits, andinsufficient physical activity [6–8].
Long-term studies have shown benefits of a lifestyle intervention (diet and exercise), on T2Dincidence in China [9], USA [10], and Finland [11]. Lifestyle change (diet, physical activity, weightloss) may reduce the incidence of T2D by 28–59% [12]. The American Diabetes Prevention Program(DPP) [13], the Finnish Diabetes Prevention Study (DPS) [14], and the Chinese Da Qing DiabetesPrevention Study [15] were all designed to produce weight loss by prescribing a higher carbohydrate(CHO) (>50 percent of energy (E%) from CHO), low-fat (<30 E%) diet approach, which reflected theunderstanding of a prudent diet 20 years ago. No attention was paid to glycaemic index (GI), per se,and, to date, no studies have investigated the role of GI for prevention of type-2 diabetes.
Other dietary prescriptions that produce significant and sustainable weight loss may also beeffective in T2D prevention. Current international recommendations include lower ranges for CHOintake [16] and a recommendation to choose lower GI foods [17]. A combination of lower CHO (45 E%),higher protein, together with lower GI, might be the optimal diet for prevention of T2D [18], perhapsrelated to sustained weight loss as shown in medium term trials [19]. To date these hypotheses havenot been tested in large trials of long duration [20].
The program for physical activity in the trials described above followed the international publichealth recommendations, that is, a total of approximately 150 min per week of moderate-intensityaerobic activities or 75 min of vigorous intensity activity [10,14]. A question, not examined inearlier studies, is whether the metabolic responses are different between higher- and lower-intensityexercise programs. Moderate-intensity exercise relies relatively more on fat oxidation, whereasvigorous-intensity exercise relies more on CHO oxidation and use of intramuscular substrates [21].Houmard et al. found that total exercise time, not intensity or exercise energy expenditure, was associatedwith the greatest improvement of insulin sensitivity in obese participants [22]. However, the hypothesisthat physical activity with different intensity levels may differentially affect T2D prevention has yet tobe tested in any large-scale intervention.
Since obesity is a strong risk factor for T2D, any successful prevention program should be ableto prevent weight regain in individuals after a significant weight loss. The high heterogeneity ofdietary intervention design prevents firm conclusions being drawn regarding preferred macronutrientcomposition [23]. Notably a recent multi-centre trial ‘DiOGenes’ (Diet, Obesity, and Genes) identified ahigher-protein, moderate-CHO, and low-GI diet as superior to other diets of varying macronutrient
197
Books
MDPI

Nutrients 2017, 9, 632
composition in preventing weight regain over six months [19] and in a smaller subset over12 months [24], after two months of rapid weight loss.
Despite the evidence that a lifestyle program combining prudent diet, increased physical activityand weight loss reduces the risk for T2D in susceptible individuals [12], important details remainunanswered. These include the long-term effects and sustainability of diets higher in protein witha lower glycaemic load, combined with the effects of higher intensity exercise. The present paperdescribes PREVention of diabetes through lifestyle Intervention and population studies in Europe andaround the World (PREVIEW), a large multi-centre international randomised controlled trial in adultsdesigned to answer these questions.
2. Methods
2.1. Aims of the Study
The aim is to determine the effects and interactions of two diets and two physical activityprogrammes on the prevention of T2D in overweight, pre-diabetic adults, who have undergone a shortperiod of significant weight loss. Our primary hypothesis is that a higher protein, lower CHO/low GIdiet (based on the DiOGenes study [19]) will be superior in preventing T2D when compared with amoderate protein, higher CHO/moderate GI diet (based on the DPS and DPP studies [10,14]). We alsohypothesise that high-intensity physical activity will be superior compared to moderate-intensityphysical activity [25].
Each participant receives one of the two dietary programs, and one of the two physical activityprograms, thus, we have four groups (high protein diet and high-intensity physical activity; moderateprotein diet and high-intensity physical activity; high protein diet and moderate-intensity physicalactivity; moderate-protein diet and moderate-intensity physical activity). The majority of outcomeswill be analysed by using these four arms. The primary endpoint and statistical power calculations arebased on a two-arm design (diets compared against each other).
2.2. Primary and Secondary Endpoints
The primary endpoint is incidence of T2D in high vs. moderate protein diet measured over a36-month intervention period, based on the WHO criteria [26] of either (i) oral glucose tolerance test(OGTT) with fasting plasma glucose (FPG) > 7.0 mmol/L and/or 2-h post prandial (75 g glucoseload) plasma glucose ≥11.1 mmol/L; or (ii) T2D diagnosed by a medical doctor between the clinicalinvestigation days (CID) of PREVIEW, by using random plasma glucose ≥11.1 mmol/L in the presenceof symptoms of diabetes, OGTT, or glycated haemoglobin (HbA1c). Asymptomatic individuals witha single abnormal value will have to repeat the test within 2–4 weeks to confirm the T2D diagnosis.The secondary endpoints include changes in HbA1c, body weight, body mass index (BMI), waist, andthigh circumference, body composition, insulin sensitivity, including Matsuda Index [27], glucosetolerance assessed by the area under the curve during OGTT, blood pressure, serum lipids, C-reactiveprotein, liver enzymes, perceived quality of life and work ability, habitual well-being, sleep, chronicstress, and subjective appetite sensations.
Other endpoints assessed by sub-group studies include liver fat content using magnetic resonanceimaging (MRI) and proton magnetic resonance spectroscopy (H-MRS); colorectal cancer risk assessedfrom faecal markers; gut microbiome community assessment from faecal collections; maximaloxygen uptake capacity (VO2 max); urine metabolite profiles using metabolomic techniques andfood reward outcomes.
2.3. Study Setting and Design
The PREVIEW intervention study for adult participants has eight study sites: University ofCopenhagen (Denmark), University of Helsinki (Finland), University of Maastricht (The Netherlands),University of Nottingham (UK), University of Navarra (Spain), Medical University of Sofia (Bulgaria),University of Sydney (Australia), and University of Auckland (New Zealand).
198
Books
MDPI

Nutrients 2017, 9, 632
The 36-month intervention consists of two phases (Figure 1): a two-month period of rapid weightreduction achieved using a commercial low-calorie diet (about 800 kcal/day), followed by a 34-monthrandomised lifestyle (diet and physical activity) intervention phase for weight loss maintenance.
Figure 1. PREVIEW intervention: the general study design.
Clinical investigation days (CID) are conducted throughout the intervention, from CID1 (baseline)to CID7 (end of trial). At CID visits, anthropometry, blood tests, and questionnaires are performed andcollection of completed diet records, accelerometers, and 24-h urine samples is done. Adverse (AE)and serious adverse events (SAE) and concomitant medications are recorded. In addition, a total of17 group visits, leaded by instructors, are held throughout the trial to support lifestyle modification.
The CID assessments and group visits are conducted within University settings or associatedClinics. Participants follow the diet and physical activity counselling advice in a “real-life” settingwithout daily supervision from researchers.
2.4. Participants, Recruitment, and Randomisation
The inclusion criteria were: age 25–70 years (from mid-2013 to mid-2014 individuals aged 25–45and 55–70 years were enrolled, and from mid-2014 onwards additionally age-group 45–54 years);BMI > 25 kg/m2; pre-diabetes confirmed by an OGTT using the American Diabetes Association(ADA) criteria (13): (i) increased fasting glucose (IFG), with venous plasma glucose concentrationof 5.6–6.9 mmol/L when fasted; and/or (ii) impaired glucose tolerance (IGT), with venous plasmaglucose concentration of 7.8–11.0 mmol/L at 2 h after oral administration of standard 75 g glucosedose, and fasting plasma glucose <7.0 mmol/L. The main exclusion criteria were T2D, and any illnessand/or medication with known or potential effect on compliance (e.g., unable to follow the physicalactivity program) or the main outcomes. A complete list of inclusion and exclusion criteria is presentedas Supplementary Table S1.
Participants were recruited using multiple methods across the eight study sites, e.g., newspaperadvertisements, newsletters, radio and television advertisements/interviews, and direct contactwith primary and occupational health care providers. Interested individuals were contacted for thepre-screening. In the interview, inclusion and exclusion criteria were queried, including the FinnishDiabetes Risk Score [28] assessment. Potential participants were given written and oral information.Signed informed consent was required prior to commencement of laboratory screening.
The laboratory screening comprised measurements of weight, height, resting blood pressure,electrocardiography (in those aged 55 years or more), and an OGTT. A fasting blood sample wascollected from the ante-cubital vein for later assessment of full inclusion and exclusion criteria, whilstglucose concentration was immediately analysed at each study site (HemoCue™, Angelholm, Sweden;Reflotron™, Roche diagnostics, Switzerland; or EML105 Radiometer, Copenhagen). Participants werethen given a standard glucose drink (75 g glucose, dissolved in 300 mL water), which they had totake within 3–5 min, and a second venous blood sample was collected after 2 h. No other food or
199
Books
MDPI

Nutrients 2017, 9, 632
drinks or smoking were allowed and participants were required to remain sedentary during the test.The 0 and 2 h glucose concentration were used to identify those with pre-diabetes. Potentially eligibleparticipants had fasting blood samples analysed to assess safety with haemoglobin, creatinine andalanine (ALT)/aspartate transaminase (AST).
Upon confirmation of eligibility, participants were enrolled into the trial and randomised to oneof the four treatment groups. Randomisation was stratified by gender and age group (25–45, 46–54,and 55–70 years of age), and sequentially assigned from each stratum to different interventions, hence,securing an even distribution of gender and age group over the four intervention arms in each centre.
2.5. Description of Interventions
2.5.1. Low-Calorie Diet (LCD)
The trial started with a two-month (eight-week) weight reduction program using a commercialLCD, with a requirement to lose ≥ 8% initial body weight in order to continue to the weightmaintenance phase. The LCD consisted of 3.4 MJ (800 kcal), 15–20 E% fat, 35–40 E% protein (84g protein), and 45–50 E% CHO. The daily diet comprised of 4 × 40 g Cambridge Weight Plan® mealreplacement sachets (Cambridge Weight Plan Ltd., Corby, UK), three of which were dissolved in 250mL low fat milk ,or similar lactose-free alternatives, and one in 250 mL water. Energy-free drinkswere permitted. Moreover, a maximum of 400 g of non-starchy, low-CHO vegetables, such as lettuce,asparagus, broccoli, celery, cucumber, mushrooms, radish, tomato, and watercress could be consumed.
During the LCD, participants attended group visits at weeks 2, 4, 6, and 8. Body weight,AE, SAE, and concomitant medications were recorded, LCD sachets dispensed, and dietary andbehavioural instructions given. No specific instructions on physical activity were given duringthe LCD weight-reduction phase. Upon completion of the two months (CID2), participants whofailed to reach the target weight reduction (i.e., ≥ 8% of initial body weight) were excluded fromthe intervention.
2.5.2. Weight Maintenance Phase: Intervention Diets
The two intervention diets are described in Table 1. The moderate protein (MP) diet is basedon the DPS-dietary advice [14] aiming to reach a moderate protein (15 E%) and higher CHO (55 E%)macronutrient distribution with at least moderate dietary GI (>56), following current recommendationsfor prevention of T2D [17]. The (HP) diet has a higher protein (25 E%) and moderate CHO (45 E%)distribution with lower dietary GI (<50), based on the most successful weight-loss maintenance diet inthe DiOGenes study [19]. Protein intake is higher and CHO intake is lower than the recommendedrange for prevention of T2D [16,17].
Both intervention diets are moderate in fat (30 E%) and the target macronutrient profile and foodchoices are supported by evidence for prevention of weight gain and/or T2D [8,23]. Notably, increasedintake of sugar-rich foods or refined grains is not encouraged as a means to reach the higher CHOlevel, nor is increased consumption of red meat encouraged within the higher protein diet.
The diets are consumed ad libitum with respect to energy, with no provision of an individualtarget for daily energy intake. Self-monitoring of total energy consumption is not required. However,participants are instructed about controlling portion sizes of specific food types in order to achievethe macronutrient and GI prescriptions, and in self-monitoring and adjustment of portion sizes ingeneral, in order to maintain their body weight loss. They are also encouraged to follow a regular mealpattern. Additional weight reduction is allowed, but without anything other than adherence to themaintenance diet and physical activity regimens.
The participants are given examples of daily eating plans with foods in appropriate proportionsto reflect the macronutrient and GI requirements of the two interventions. A food-exchange list assistsin self-selected variety, whilst preserving the required macronutrient and GI levels. Cooking books(one for each diet) with recipes suitable for all countries were specifically prepared for PREVIEW.
200
Books
MDPI

Nutrients 2017, 9, 632
Table 1. Description of the PREVIEW dietary interventions.
Higher Protein (25 E% a)Moderate Carbohydrate (45 E%)Low GI b (≤50) Diet
Moderate Protein (15 E%)Higher Carbohydrate (55 E%)Medium GI (≥56) Diet
Comparison between the groups• Protein intake higher• Carbohydrate intake lower• GI lower
• Protein intake lower• Carbohydrate intake higher• GI medium
Food items with increased use(relative to the other group)
• Whole-grain cereals with low GI• Pasta• Low-fat dairy products• Poultry• Fish• Legumes
• Whole-grain cereals withmoderate/high GI, e.g., bread
• Potatoes, sweet potatoes,couscous, rice
• Bananas
Similar use
• Most fruits and vegetables• Vegetable oils, margarine• Red meat (decreased in both)• Sugar-sweetened beverages (decreased in both)
a E%, percentage of energy; b GI, glycaemic index.
2.5.3. Weight Maintenance Phase: Physical Activity Programmes
The trial has two physical activity interventions with a similar target for energy expenditure(>4.2 MJ/week, >1000 kcal/week), comprising high-intensity (HI) exercise or moderate-intensity (MI)exercise, as shown in Table 2. Measured heart rate using a heart rate monitor or wrist palpation,and/or perceived exertion using the Borg scale [29], are the principal methods of controlling theintensity. The participants may choose from several exercise options with similar level of metabolicturnover (energy expenditure divided by resting metabolic rate, i.e., MET values). The specific adviceis based on the U.S. Centres for Disease Control and Prevention (CDC) recommendations of 75 minhigh-intensity (HI) or 150 min moderate-intensity (MI) physical activity weekly [30]. We developed aleaflet and other written instruction materials for the two PA groups. Physical activity is generally notsupervised by the PREVIEW team, but participants are allowed to join supervised exercise groups oftheir own choice.
Table 2. Description of the physical activity interventions.
High-Intensity Physical Activity (HI) Moderate-Intensity Physical Activity (MI)
Heart rate • 76–90% HRmax a or 61–80% HRR b • 60–75% HRmax or 45–60% HRR
Examples of activities(these may vary depending on thefitness level of the participant)
• Bicycling, vigorous effort• Strenuous ball games• Aerobics with very vigorous effort,
e.g., with extra weights• Jogging > 8 km/h• Swimming, vigorous effort• Cross-country skiing
• Bicycling, moderate effort• Leisurely ball games• Most conditioning exercises
(aerobic, power yoga, etc.)• Brisk walking (4–6 km/h)• Swimming, recreational• Downhill skiing
Weekly duration (in total) • at least 75 min • at least 150 min
Recommended weekly frequency • 2–3 times • 3–5 times
Daily duration (guideline) • 25–40 min • 30–50 min (may be broken down intoshorter sessions)
Additional exercises• Muscle conditioning exercises, by using own weight: twice weekly at home,
15–20 min per session.• Stretching: twice weekly, 15–20 min per session
a HRmax = max heart rate, defined as 220—age (220 in children under 16 years of age); b HRR = heart rate reserve,defined as the difference between measured resting HR and estimated HRmax.
A critical issue in PREVIEW is that many participants may be morbidly obese (BMI > 40)and, therefore, their ability to cope with a high-intensity exercise program is likely to be limited,
201
Books
MDPI

Nutrients 2017, 9, 632
and even risky. We addressed this point during the recruitments by specifically asking about perceivedcompetence in coping with our program, and by ECG in all volunteers aged >55 years. Moreover,significant weight reduction (≥ 8% of baseline body weight) during the first two months’ LCD periodwill also simultaneously decrease the cardiovascular risks. The flexibility of our exercise program(only target energy expenditure is specified, the modes of exercise are due to the participant) is alsolikely to improve safety and adherence.
2.5.4. Group Visits and the Behavioural Modification Program
Group visits (8–12 individuals), are conducted throughout the three year intervention to deliverthe behaviour modification information in relation to diet and physical activity [31]. There are 17 groupvisits, each 1–2 h, with decreasing frequency as the trial progresses. The behaviour modificationprogramme is developed based on theories and evidence from health psychology and behaviourchange [32–34]. For example, participants’ beliefs about the consequences of behaviour (i.e., outcomeexpectancies), their intention to change their behaviour in the long run, and their belief in their abilityto achieve the behaviour change goals (self-efficacy) are relevant predictors of successful behaviourchange. Counsellors may apply respective behaviour change techniques [35] that are scheduled tocommon stages of behaviour change [36].
At the beginning of the weight-maintenance phase (i.e., month 2), the participants are instructedon how to plan, to start, and to follow the physical activity programme. In the group sessions,the participants are also instructed on basic principles of increasing physical activity and inmotivational and self-regulative behaviour techniques to overcome barriers to exercise and behaviourmodification. Stretching and home-based muscle-conditioning exercises are also supervised in agroup-based session accompanied with written educational material [31].
2.6. Collection of Data and Description of Analyses
Data are collected from biological specimens (blood, urine, faecal), self-administered recordsand questionnaires, and an activity-monitoring device (ActiGraph GT3X accelerometer; ActiGraph,Pensacola, FL, USA) (see Table 3 with a description of timing). The CIDs are scheduled for a specificweek and the aim is to make the measurements as precisely as scheduled. To accommodate as completea data collection as possible we allow the following visit windows: month 2: −3 to +5 days; month 6:±1 weeks; month 12: ±2 weeks; the remaining measurement points: ±4 weeks.
Blood samples are initially stored locally at −80 ◦C, then transported and analysed centrally atthe National Institution for Health and Welfare (THL) in Helsinki, Finland. Diet records are analysedat each site using local food composition data and software. If available, local GI data for individualfood items are used, and when not available, generic global GI data are used. Accelerometer data aredownloaded at local sites, and collated and analysed centrally at the Swansea University, Wales, UK.
All questionnaires used in PREVIEW were prepared in English, then translated into the locallanguage in Finland, Denmark, The Netherlands, Spain, and Bulgaria using authorized translators.A second authorized translator then back-translated the local versions to English, with this iterativeprocess repeated until a final version of sufficient quality was obtained.
202
Books
MDPI

Nutrients 2017, 9, 632
Table 3. Overview of main data collection methods at different clinical investigation days (CID)in PREVIEW.
Outcome Data Collection Method Assessment Time-Points (Month)
0 2 6 12 18 24 36
CID1 CID2 CID3 CID4 CID5 CID6 CID7
Glucose tolerance/diagnosisof T2D
75 g oral glucosetolerance test × × × × ×
Blood chemistry(lipid metabolism, glucosemetabolism, inflammationmarkers, etc.)
Fasting venousblood specimen × × × × × × ×
Urinary nitrogen 24-h urine collection × × × × ×Risk markers for colon cancer(e.g., Short Chain Fatty Acids) 3-day faecal collection a × ×
Gut microbiota Faecal spot sample a × ×
Weight, height, BMI andanthropometrics
Weight; height (week 0 and156); waist and hipcircumference
× × × × × × ×
Body compositionBody composition by DXA,BodPod or Bioelectricalimpedance (BIA)
× × × × × ×
Blood pressure and restingheart rate
Resting blood pressure andheart rate × × × × × × ×
Nutrient intakes, dietary GIand food consumption 4-day food record × × × × ×
Physical activity7-day accelerometer,7-day physical activity log,Baecke questionnaire
× × × × ×
Maximal oxygen uptake VO2 max test by ergometeror treadmill b × × ×
Psycho-social mediators andmoderators health behaviour
Several questionnaires(listed with references inSupplementary Table S2)
× × × × × ×
Eating behaviour Three Factor EatingQuestionnaire (TFEQ) × × × × × ×
SleepingEpworth Sleepiness Scale(ESS), Pittsburgh SleepQuality Index (PSQI)
× × × × × ×
Stress and moodPerceived Stress Scale (PSS),Profile of MoodScale (POMS)
× × × × × ×
Quality of life WHO Quality of Lifequestionnaire x x x x
Work ability Work Ability Indexquestionnaire x x x x
Cost-effectivenessQuestionnaire designedby the PREVIEWresearch group
x x x x
a In a subgroup (n = 250) in Helsinki and Auckland; b In a subgroup (n = 120) in Copenhagen, Maastricht, Navarraand Nottingham.
2.7. Data Management
All data are stored in a central project database at the University of Copenhagen. The centraldatabase ensures standardized handling and storing of data and the possibility for easy extraction anddelivery of data both within and after the official project period (2013–2018).
Currently, the database receives input from four data sources on a regular basis: (1) All immediatedata measured (e.g., anthropometrics, blood glucose) and interviewed (e.g., use of medication) during
203
Books
MDPI

Nutrients 2017, 9, 632
the CIDs and entered into OpenClinica server (electronic case report form); (2) data on social-cognitivedeterminants of behaviour, on cultural and socio-demographics, as well as socio-economic components,are collected by the questionnaire delivery platform (QDP), designed for PREVIEW by NetUnion.The participants enter their own data into the QDP. A paper version of the questionnaires is alsoavailable; (3) physical activity is reported using the Baecke inventory, and an electronic physical activitylog (PAL), designed by Swansea University, University of Stuttgart, and implemented by NetUnion;(4) the Central Lab at the National Institute for Health and Welfare (THL) enters all laboratory analysesinto the data hub. Data from analyses of the ActiGraph data accelerometers, from food diaries,and from the maximal oxygen uptake (VO2 max) analyses are imported from all sites.
2.8. Governance and Quality Management
The intervention trial is led by Prof. Fogelholm at the University of Helsinki, in collaborationwith the project coordinator, Prof. Raben at the University of Copenhagen. In this large, internationalmulti-centre trial, we are collaborating intensively to ensure data collection of high-quality andconsistency of the intervention across all sites.
Specific working groups were formed with relevant site representatives. The purpose of theseworking groups is to discuss and agree on questions related to dietary topics, physical activity, datamanagement, and other methodological and medical issues.
During the recruitment phase, principal investigators from each centre participated in a monthlyteleconference, which continues at regular intervals throughout the intervention.
The core personnel for each site meet annually at a three-day general assembly for the fullPREVIEW consortium. PREVIEW has a website [37] with both public access and a restricted area forthe PREVIEW researchers.
An electronic trial master file with relevant documents has been designed and is maintained bythe University of Copenhagen within the private part of the PREVIEW website. All written studymaterial is uploaded and made available at the PREVIEW website private area, including the protocoland amendments, standard operating procedures (SOPs), and instruction materials for the interventionsubjects, in order ensure that comparable methods are followed across individual sites. The SOPs arereviewed and revised as needed and also new SOPs are prepared, if necessary.
Representatives from each intervention site participated in two training sessions, each of 2–3 daysduration, in 2013. One session focussed on the main study protocol, the CID protocols, and alloutcome measurements (University of Copenhagen). The other session focused on instructor trainingin group counselling (behaviour change) methods (University of Stuttgart). Attendees then trainedtheir local staff.
2.9. Statistical Power and Basic Analyses
The anticipated three-year incidence of T2D in the PREVIEW trial is 21%, based on data fromthe Finnish DPS and US DPP [10,11]. The power calculation was derived for comparison of the twodietary interventions (HP vs. MP).
It was hypothesized that a risk reduction of one quarter (1/4) in the MP group would reducethe incidence of T2D incidence from 21% to 16%, and that a risk reduction of one half (1/2) in theHP group would reduce the incidence of T2D from 21% to 10.5%. Consequently, the sample sizerequired to detect this difference in T2D incidence (16% vs. 10.5%) was at least 649 per diet group or1298 participants in total (for a two-sided comparison with a power (1-ß) of 80% and p < 0.05), witha 10% drop-out during the first 10 months from month 2 (CID2) onwards, and another 20% drop-outbetween months 12 (CID4) and 36 (CID7). Thus, the number of participants needed for the interventionwas 1802. To allow an estimated drop-out of 25% as a result of failure to lose >8% of initial body weightduring the two-month LCD period, the number of participants required to be enrolled into PREVIEWwas initially estimated to be 2403.
204
Books
MDPI

Nutrients 2017, 9, 632
The primary data are analysed statistically using the principle of ‘intention-to-treat’ (ITT cohort)and also as a completers’ cohort. A ‘completer’ is defined as a participant who has remained in thetrial for the full three year intervention period, or who has been diagnosed with T2D before the end ofthe intervention.
The primary outcome in the adults’ trial is incidence of T2D. For statistical analysis assessing theeffect of the two diets on the T2D is a ‘semi-parametric Cox proportional hazards regression model’.Missing data are addressed using hot-deck imputation. Missing covariate information is addressedusing multiple imputation. Sensitivity analyses (e.g., complete-case analyses without drop-outs) willbe carried out to assess if censoring was informative or non-informative.
For statistical analysis of the continuous secondary outcomes (e.g., blood chemistry, anthropometrics,etc.) a ‘linear mixed model’ is used. For the categorical outcomes (e.g., sex, educational attainment,proportion of subjects maintaining a defined weight loss, etc.), the type of statistical analysis is ‘logistic’or ‘ordinal mixed-effects model’. The parameter of interest is the difference in odds ratio between theintervention groups. Although the main statistical analyses will be done by using the entire cohort,one of the most important stratified analyses will use an age-group (e.g., above and below 65 years)stratification. By comparing older against younger participants we might obtain new insight onwhether dietary protein content in this respect has different effects on, e.g., body composition, weight,and clinical variables.
2.10. Ethical Issues
The study protocol and amendments were reviewed and approved by local Human EthicsCommittees at all study sites. The work of PREVIEW is carried out in full compliance with the relevantrequirements of the latest version of the Declaration of Helsinki (59th WMA General Assembly, Seoul,Korea, October 2008), and the ICH-GCP, The International Conference on Harmonisation (ICH) forGood Clinical Practice to the extent that this is possible and relevant. All participants provided writteninformed consent prior to commencing screening procedures in clinic. All information obtained duringthe trial is handled according to local regulations and the European Directive 95/46/CE (directive onprotection of individuals with regard to the processing of personal data and on the free movement ofsuch data). The trial is registered with ClinicalTrials.gov, NCT01777893.
3. Results
As PREVIEW is an on-going trial, only results obtained from participant screening and baselinephases are presented here. Screening was conducted from June 2013 to February 2015. On average,35% of the pre-screened individuals were eligible for the laboratory screening. Further, 43% of thescreened participants were found to be eligible for the trial. In total, 2326 overweight, pre-diabeticadults were enrolled and randomised into the trial. This was 97% of the original pre-specified target(Figure 2). Approximately half of the participants were 55–70 years at baseline (Table 4).
Baseline characteristics from blood biochemistry and anthropometric assessments are shownassigned to each intervention group in Table 5. The basic characteristics of the groups are similar.A notable feature of the participants is that the mean baseline fasting glucose concentration wasapproximately at the mid of the eligibility range, whereas the mean 2-h glucose concentration wasat the lower cut-off point. According to the OGTT laboratory data, 1389 (62%) of all participants hadincreased fasting glucose at baseline, 506 (23%) had impaired glucose tolerance and 286 (13%) had bothof these pre-diabetic indicators. At baseline (CID1), 25 participants (1%)—who all had been diagnosedwith pre-diabetes at screening—were not diagnosed with pre-diabetes anymore. The prevalence ofpre-diabetes described above were not significantly different between the four study groups.
205
Books
MDPI

Nutrients 2017, 9, 632
Ta
ble
4.
Num
ber
and
age
dist
ribu
tion
ofpa
rtic
ipan
tsre
crui
ted
for
the
PREV
IEW
inte
rven
tion
tria
l.
Sit
eP
re-S
creen
ed
Scr
een
ed
Ran
do
mis
ed
(n)
Men
(n)
Wo
men
(n)
Ag
e25–45
Years
(n)
Ag
e46–54
Years
(n)
Ag
e55–70
Years
(n)
Mean
Ag
eY
ears
(SD
)
UC
PH
2061
908
379
159
220
8662
233
54.2
(10.
9)H
EL
1269
633
289
8820
139
3322
158
.2(8
.9)
UM
675
553
203
9410
942
1714
556
.6(1
0.0)
UN
OT
T39
1497
926
410
216
295
4213
351
.6(1
2.0)
UN
AV
1740
732
307
9321
414
582
9347
.5(1
0.6)
MU
1190
488
368
8728
119
07
158
47.8
(12.
0)U
NS
YD
3108
595
195
5613
959
3610
253
.0(1
0.8)
UO
A16
5458
432
177
244
156
4710
347
.0(1
1.4)
To
tal
15,6
1154
7223
2675
615
7081
232
611
8851
.6(1
1.6)
Abb
revi
atio
nsfo
rst
ud
ysi
tes:
UC
PH
=U
nive
rsit
yof
Cop
enha
gen
(Den
mar
k);H
EL
=U
nive
rsit
yof
Hel
sink
i(Fi
nlan
d);
UM
=M
aast
rich
tUni
vers
ity
(The
Net
herl
and
s);U
NO
TT
=U
nive
rsity
ofN
ottin
gham
(UK
);U
NA
V=
Uni
vers
ityof
Nav
arra
(Spa
in);
MU
=M
edic
alU
nive
rsity
ofSo
fia(B
ulga
ria)
;UN
SYD
=U
nive
rsity
ofSy
dney
(Aus
tral
ia);
UO
A=
Uni
vers
ityof
Auc
klan
d(N
ewZ
eala
nd).
Ta
ble
5.
Num
ber
ofpa
rtic
ipan
ts,a
ge,a
nthr
opom
etri
cre
sult
s,bl
ood
chem
istr
y,an
dbl
ood
pres
sure
for
alli
nter
vent
ion
grou
ps,a
sses
sed
atba
selin
e(C
ID1)
befo
rew
eigh
tred
ucti
on.T
here
sult
sar
esh
own
asth
em
ean
(±SD
).
HP
:H
igh
er
Pro
tein
(25
E%
)M
od
era
teC
arb
oh
yd
rate
(45
E%
)L
ow
GI
( ≤50)
Die
t
MP
:M
od
era
teP
rote
in(1
5E
%)
Hig
her
Carb
oh
yd
rate
(55
E%
)M
ed
ium
GI
( ≥56)
Die
t
Mo
dera
te-I
nte
nsi
tyP
hy
sica
lA
ctiv
ity
Hig
h-I
nte
nsi
tyP
hy
sica
lA
ctiv
ity
Mo
dera
te-I
nte
nsi
tyP
hy
sica
lA
ctiv
ity
Hig
h-I
nte
nsi
tyP
hy
sica
lA
ctiv
ity
No.
(men
/wom
en)
556
(184
/372
)55
6(1
77/3
79)
559
(180
/379
)55
3(1
79/3
74)
Age
,yea
rs51
.6±
11.5
51.8±
11.7
51.4±
11.2
51.4±
11.8
Ant
hrop
omet
rics
Hei
ght,
cm16
8±
916
8±
916
8±
916
8±
10W
eigh
t,kg
99.3±
20.8
100.
6±
21.0
101.
6±
22.6
98.7±
20.9
Body
Mas
sIn
dex,
kg/m
235
.1±
6.5
35.6±
6.7
35.7±
6.6
35.0±
6.4
Wai
stci
rcum
fere
nce,
cm10
9.6±
15.2
111.
0±
15.3
111.
1±
15.4
109.
6±
14.5
Hip
circ
umfe
renc
e,cm
117.
6±
14.5
118.
8±
14.8
119.
2±
13.9
117.
8±
13.8
Body
fat(
%of
wei
ght)
43.0±
7.5
43.5±
7.5
43.5±
7.9
43.1±
7.8
Bloo
dch
emis
try
and
bloo
dpr
essu
refP
-glu
cose
,mm
ol/L
6.2±
0.8
6.2±
0.6
6.2±
0.7
6.2±
0.8
2hP-
gluc
ose,
mm
ol/L
7.8±
2.3
7.7±
2.25
7.5±
2.2
7.7±
2.1
fP-i
nsul
in,m
U/L
13.6±
7.9
14.0±
8.7
13.2±
7.7
13.1±
7.2
HbA
1c,m
mol
/mol
36.6±
3.9
36.8±
3.9
36.7±
4.2
36.7±
4.0
Cho
lest
erol
,mm
ol/L
5.2±
1.0
5.1±
1.0
5.3±
1.0
5.1±
1.0
LDL
chol
este
rol,
mm
ol/L
3.3±
0.9
3.2±
0.8
3.3±
0.9
3.2±
0.8
HD
Lch
oles
tero
l,m
mol
/L1.
3±
0.3
1.3±
0.3
1.3±
0.3
1.3±
0.3
Trig
lyce
ride
s,m
mol
/L1.
5±
0.8
1.5±
0.7
1.5±
0.9
1.5±
0.8
CR
P,m
g/L
5.3±
6.3
6.0±
8.7
5.2±
5.1
5.1±
7.5
Syst
olic
BP,m
mH
g12
8.5±
15.6
129.
7±
16.2
128.
7±
16.3
129.
3±
15.5
Dia
stol
icBP
,mm
Hg
78.2±
10.9
77.6±
11.2
78.4±
11.5
78.3±
10.7
GI=
glyc
aem
icin
dex;
BP=
bloo
dpr
essu
re.
206
Books
MDPI
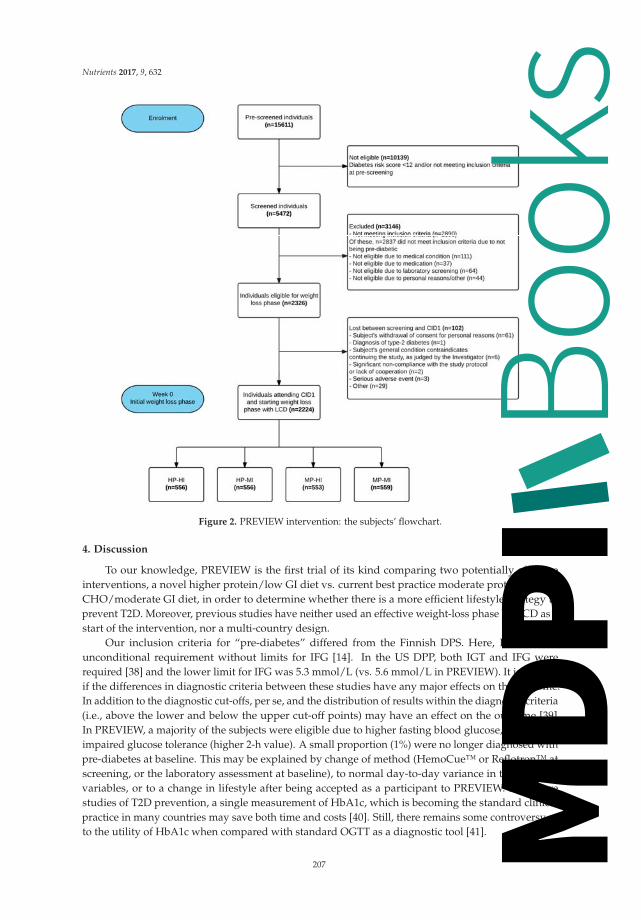
Nutrients 2017, 9, 632
Figure 2. PREVIEW intervention: the subjects’ flowchart.
4. Discussion
To our knowledge, PREVIEW is the first trial of its kind comparing two potentially effectiveinterventions, a novel higher protein/low GI diet vs. current best practice moderate protein, higherCHO/moderate GI diet, in order to determine whether there is a more efficient lifestyle strategy toprevent T2D. Moreover, previous studies have neither used an effective weight-loss phase by LCD as astart of the intervention, nor a multi-country design.
Our inclusion criteria for “pre-diabetes” differed from the Finnish DPS. Here, IGT was anunconditional requirement without limits for IFG [14]. In the US DPP, both IGT and IFG wererequired [38] and the lower limit for IFG was 5.3 mmol/L (vs. 5.6 mmol/L in PREVIEW). It is unclearif the differences in diagnostic criteria between these studies have any major effects on the outcome.In addition to the diagnostic cut-offs, per se, and the distribution of results within the diagnostic criteria(i.e., above the lower and below the upper cut-off points) may have an effect on the outcome [39].In PREVIEW, a majority of the subjects were eligible due to higher fasting blood glucose, rather thanimpaired glucose tolerance (higher 2-h value). A small proportion (1%) were no longer diagnosed withpre-diabetes at baseline. This may be explained by change of method (HemoCue™ or Reflotron™ atscreening, or the laboratory assessment at baseline), to normal day-to-day variance in the assessedvariables, or to a change in lifestyle after being accepted as a participant to PREVIEW. For futurestudies of T2D prevention, a single measurement of HbA1c, which is becoming the standard clinicalpractice in many countries may save both time and costs [40]. Still, there remains some controversy asto the utility of HbA1c when compared with standard OGTT as a diagnostic tool [41].
207
Books
MDPI

Nutrients 2017, 9, 632
PREVIEW is a much larger trial than both the Finnish DPS (n = 522) [11] and Chinese Da Qingstudy (n = 577) [9], although smaller than the DPP (n = 3234) [10]. However, in the DPP a third ofthe participants received ‘Metformin’ in addition to dietary advice; hence, the number of participantswithout medical treatment, but adhering to lifestyle intervention (diet and physical activity) was2161, which is similar to PREVIEW. Of the above interventions, the geographical and ethnic variationis greatest in PREVIEW. The age-range of participants in DPP and DPS was 33–67 years, slightlynarrower than in PREVIEW, but the mean age of participants is similar across the studies (50–55 years).The large proportion of older participants in PREVIEW, (>55 years), was expected since the risk forT2D increases with age [2], and due to the growing health consciousness of this age group, many ofwhom are retired and have the time to participate in a demanding intervention. The smaller proportionof middle age-adults is also explained by later initiation of recruitment in this age group, comparedwith younger and older participants. In general, finding an adequate number of pre-diabetic subjectswas a real challenge in most countries, given the “hidden” status of this condition. Thus, recruitmenttook about three times as long as planned from the beginning of the project.
One major challenge in PREVIEW is related to adherence to the diet and physical activityprograms. The HP-diet is novel and, with the higher protein content, also somewhat outside the currentboundaries of nutritional guidelines [42,43]. Whether the HP diet results in better adherence than theMP diet with high CHO and whole-grain cereal intakes is one of the key interests in PREVIEW. Nutrientintakes and food consumption patterns will be assessed in PREVIEW by repeated 4-d diet-records.The poor accuracy of dietary assessment is well known [44], but it is expected that the differencein dietary protein and CHO intakes should be sufficiently large to be detected using this method.Moreover, protein intake is verified using 24 h urinary nitrogen excretion [45].
It may be more difficult to create a verifiable difference for GI than for protein-to-CHO ratio.Whilst GI values of foods have been shown to provide a good summary of postprandial glycaemia [46],difficulties in attributing GI values to foods for which there are no validated data available may addto the variability [47], particularly in a multi-centre intervention such as PREVIEW. In DiOGenes,the reported observed difference in mean dietary GI was small (56 vs. 60 units) [19] which increasesthe requirements of precision.
The physical activity intervention in PREVIEW is not a supervised training programme.Participants are expected to integrate activity into their daily lives and use local opportunities toachieve their goals. To improve adherence, there is flexibility with the type of activities chosen.A combination of measures of physical activity is used to analyse the compliance to the type ofintervention and our methods allow a description of activities that were used to achieve this.
It is probable that the HI-program will be more challenging in the long-term. Warming-up,cooling-down, muscular conditioning exercises, and stretching are carefully explained to theparticipants in order to decrease the risk for injuries. It should be noted that the HI-program inPREVIEW is not high-intensity interval-training (HIIT). While there are some data on potentialbenefits from HIIT on cardiovascular function and glucose metabolism [48], we considered the data onfeasibility and long-term maintenance of this kind of training still too limited.
In addition to good compliance of the programmes, keeping the drop-out rate as low as possiblewill be challenging. Frequent contact with the research staff is one way to reduce the drop-out rate.However, PREVIEW has been planned to study how behavioural change is realized under ‘real-life’conditions and, hence, the fading visit design where group visits are infrequent during years two andthree of the intervention. Adherence is encouraged through a number of practices, including use ofspecific behavioural change techniques [31], such as implementation intentions, or Facebook groups,one for each randomised group, to promote attendance at group visits and CIDs. In addition, the sitescan also conduct general information lectures, physical activity sessions, and/or send a newsletter tothe participants, once or twice a year.
Compared to DPS and DPP studies, a particular feature of PREVIEW is related to the differentsettings in which the intervention is conducted, including not only genetic background, but also attitudes,
208
Books
MDPI

Nutrients 2017, 9, 632
norms, and socio-economic features. Although the participating countries are well-developed,considerable variations exist, e.g., regarding food attitudes and habits, as well as traditions of practicingphysical activity.
The unique feature in the PREVIEW intervention is the direct comparison of two potentiallyefficacious diet and physical activity intervention programs. Hence, PREVIEW has a clear potential toidentify a recommended optimal diet and physical activity programme to prevent T2D, a programmewhich is also suitable across different countries. It is also possible, however, that PREVIEW data willdemonstrate that there are several, equally efficacious alternatives. Clearly, both answers are importantfrom a public health viewpoint.
Supplementary Materials: The following are available online at www.mdpi.com/2072-6643/9/6/632/s1,Table S1: Inclusion and exclusion criteria in the PREVIEW screening, Table S2: Questionnaires on moderators,mediators, behaviour, and social environment.
Acknowledgments: This study has received grants from the EU 7th Framework Programme (FP7-KBBE-2012),grant agreement No. 312057; the New Zealand Health Research Council, grant No. 14/191; and the NHMRC-EUCollaborative Grant, Australia. All LCD products were provided by Cambridge Weight Plan®, UK. Thissponsorship is highly appreciated. We want to acknowledge, particularly, the following medical and scientificexperts, who have helped us in building up the study: Arne Astrup (Copenhagen, Denmark), Stephen Collagiuri(Sydney, Australia), Peter Mansell (Nottingham, UK), and the PREVIEW Scientific Advisory Board, LouiseDye (Leeds, UK), Richard L. Atkinson (Richmond, VA, USA), Boyd Swinburn (Auckland, New Zealand),Lauren Lissner, (Gothenburg, Sweden), and Grethe Andersen (Copenhagen, Denmark). Moreover, we wantto acknowledge the great staff who have worked and are currently working for PREVIEW, e.g., study nurses,lab technicians, nutritionists, physical activity experts, trainees, and post- and under-graduate students, involvedin the recruitment of all participants and in planning and initiating the weight-reduction phase and intervention.
Author Contributions: A.R., J.B.-M. and M.F.M. were responsible for the initial study conception. T.M.L., M.W.-P.,I.M., J.A.M.H., S.P., W.S., G.S., J.S., T.L., T.H.-D., D.K., J.B.-M. and A.R. were involved in development of thestudy design. All authors, but particularly E.J., P.C., M.D., E.S., S.N.-C., N.B., R.M., M.P.S. and L.P.-S. wereinvolved in the development of the practical implementation of the study. M.F.M. wrote the draft version of themanuscript and all authors were involved in critically revising the paper. All authors have also seen and acceptedthe submitted version.
Conflicts of Interest: The authors declare no conflict of interest. The funding sponsors had no role in the designof the study; in the collection, analyses, or interpretation of data; in the writing of the manuscript, and in thedecision to publish the results.
References
1. American Diabetes Association. Standards of medical care in diabetes—2011. Diabetes Care 2011, 34(Suppl. 1), S11–S61.
2. Guariguata, L.; Whiting, D.R.; Hambleton, I.; Beagley, J.; Linnenkamp, U.; Shaw, J.E. Global estimates ofdiabetes prevalence for 2013 and projections for 2035. Diabetes Res. Clin. Pract. 2014, 103, 137–149. [CrossRef][PubMed]
3. Tamayo, T.; Rosenbauer, J.; Wild, S.H.; Spijkerman, A.M.W.; Baan, C.; Forouhi, N.G.; Herder, C.; Rathmann, W.Diabetes in Europe: An update. Diabetes Res. Clin. Pract. 2014, 103, 206–217. [CrossRef] [PubMed]
4. Guh, D.P.; Zhang, W.; Bansback, N.; Amarsi, Z.; Birmingham, C.L.; Anis, A.H. The incidence of co-morbiditiesrelated to obesity and overweight: A systematic review and meta-analysis. BMC Public Health 2009, 9, 88.[CrossRef] [PubMed]
5. Morimoto, Y.; Schembre, S.M.; Steinbrecher, A.; Erber, E.; Pagano, I.; Grandinetti, A.; Kolonel, L.N.;Maskarinec, G. Ethnic differences in weight gain and diabetes risk: The Multiethnic Cohort Study.Diabetes Metab. 2011, 37, 230–236. [CrossRef] [PubMed]
6. Aune, D.; Norat, T.; Leitzmann, M.; Tonstad, S.; Vatten, L.J. Physical activity and the risk of type 2 diabetes:A systematic review and dose-response meta-analysis. Eur. J. Epidemiol. 2015, 30, 529–542. [CrossRef][PubMed]
7. Bhupathiraju, S.N.; Tobias, D.K.; Malik, V.S.; Pan, A.; Hruby, A.; Manson, J.E.; Willett, W.C.; Hu, F.B.Glycemic index, glycemic load, and risk of type 2 diabetes: Results from 3 large US cohorts and an updatedmeta-analysis. Am. J. Clin. Nutr. 2014, 100, 218–232. [CrossRef] [PubMed]
209
Books
MDPI

Nutrients 2017, 9, 632
8. Ley, S.H.; Hamdy, O.; Mohan, V.; Hu, F.B. Prevention and management of type 2 diabetes: Dietarycomponents and nutritional strategies. Lancet 2014, 383, 1999–2007. [CrossRef]
9. Li, G.; Zhang, P.; Wang, J.; An, Y.; Gong, Q.; Gregg, E.W.; Yang, W.; Zhang, B.; Shuai, Y.; Hong, J.; et al.Cardiovascular mortality, all-cause mortality, and diabetes incidence after lifestyle intervention for peoplewith impaired glucose tolerance in the Da Qing Diabetes Prevention Study: A 23-year follow-up study.Lancet Diabetes Endocrinol. 2014, 2, 474–480. [CrossRef]
10. Knowler, W.C.; Barrett-Connor, E.; Fowler, S.E.; Hamman, R.F.; Lachin, J.M.; Walker, E.A.; et al. Reduction inthe incidence of type 2 diabetes with lifestyle intervention or metformin. N. Engl. J. Med. 2002, 346, 393–403.[PubMed]
11. Tuomilehto, J.; Lindström, J.; Eriksson, J.G.; Valle, T.T.; Hämäläinen, H.; Ilanne-Parikka, P.;Keinänen-Kiukaanniemi, S.; Laakso, M.; Louheranta, A.; Rastas, M.; et al. Prevention of type 2 diabetesmellitus by changes in lifestyle among subjects with impaired glucose tolerance. N. Engl. J. Med. 2001, 344,1343–1350. [CrossRef] [PubMed]
12. Walker, K.Z.; O’Dea, K.; Gomez, M.; Girgis, S.; Colagiuri, R. Diet and exercise in the prevention of diabetes.J. Hum. Nutr. Diet. 2010, 23, 344–352. [CrossRef] [PubMed]
13. Mayer-Davis, E.J.; Sparks, K.C.; Hirst, K.; Costacou, T.; Lovejoy, J.C.; Regensteiner, J.G.; Hoskin, M.A.;Kriska, A.M.; Bray, G.A.; Diabetes Prevention Program Research Group. Dietary intake in the diabetesprevention program cohort: Baseline and 1-year post randomization. Ann. Epidemiol. 2004, 14, 763–772.[CrossRef] [PubMed]
14. Eriksson, J.; Lindström, J.; Valle, T.; Aunola, S.; Hämäläinen, H.; Ilanne-Parikka, P.; Keinänen-Kiukaanniemi, S.;Laakso, M.; Lauhkonen, M.; Lehto, P.; et al. Prevention of Type II diabetes in subjects with impaired glucosetolerance: The Diabetes Prevention Study (DPS) in Finland. Study design and 1-year interim report on thefeasibility of the lifestyle intervention programme. Diabetologia 1999, 42, 793–801. [CrossRef] [PubMed]
15. Pan, X.R.; Li, G.W.; Hu, Y.H.; Wang, J.X.; Yang, W.Y.; An, Z.X.; Hu, Z.X.; Lin, J.; Xiao, J.Z.; Cao, H.B.; et al.Effects of diet and exercise in preventing NIDDM in people with impaired glucose tolerance. The Da QingIGT and Diabetes Study. Diabetes Care 1997, 20, 537–544. [CrossRef] [PubMed]
16. Mann, J.I.; De Leeuw, I.; Hermansen, K.; Karamanos, B.; Karlström, B.; Katsilambros, N.; Riccardi, G.;Rivellese, A.A.; Rizkalla, S.; Slama, G.; et al. Evidence-based nutritional approaches to the treatment andprevention of diabetes mellitus. Nutr. Metab. Cardiovasc. Dis. 2004, 14, 373–394. [CrossRef]
17. Ajala, O.; English, P.; Pinkney, J. Systematic review and meta-analysis of different dietary approaches to themanagement of type 2 diabetes. Am. J. Clin. Nutr. 2013, 97, 505–516. [CrossRef] [PubMed]
18. Buyken, A.E.; Mitchell, P.; Ceriello, A.; Brand-Miller, J. Optimal dietary approaches for prevention of type 2diabetes: A life-course perspective. Diabetologia 2010, 53, 406–418. [CrossRef] [PubMed]
19. Larsen, T.M.; Dalskov, S.-M.; van Baak, M.; Jebb, S.A.; Papadaki, A.; Pfeiffer, A.F.H.; Martinez, J.A.;Handjieva-Darlenska, T.; Kunešová, M.; Pihlsgård, M.; et al. Diets with high or low protein contentand glycemic index for weight-loss maintenance. N. Engl. J. Med. 2010, 363, 2102–2113. [CrossRef] [PubMed]
20. Astrup, A.; Raben, A.; Geiker, N. The role of higher protein diets in weight control and obesity-relatedcomorbidities. Int. J. Obes. 2015, 39, 721–726. [CrossRef] [PubMed]
21. Romijn, J.A.; Coyle, E.F.; Sidossis, L.S.; Gastaldelli, A.; Horowitz, J.F.; Endert, E.; Wolfe, R.R. Regulation ofendogenous fat and carbohydrate metabolism in relation to exercise intensity and duration. Am. J. Physiol.1993, 265 Pt 1, E380–E391. [PubMed]
22. Houmard, J.A.; Tanner, C.J.; Slentz, C.A.; Duscha, B.D.; McCartney, J.S.; Kraus, W.E. Effect of the volume andintensity of exercise training on insulin sensitivity. J. Appl. Physiol. 2004, 96, 101–106. [CrossRef] [PubMed]
23. Fogelholm, M.; Anderssen, S.; Gunnarsdottir, I.; Lahti-Koski, M. Dietary macronutrients and foodconsumption as determinants of long-term weight change in adult populations: A systematic literaturereview. Food Nutr. Res. 2012, 56. [CrossRef] [PubMed]
24. Aller, E.E.J.G.; Larsen, T.M.; Claus, H.; Lindroos, A.K.; Kafatos, A.; Pfeiffer, A.; Martinez, J.A.;Handjieva-Darlenska, T.; Kunesova, M.; Stender, S.; et al. Weight loss maintenance in overweight subjectson ad libitum diets with high or low protein content and glycemic index: The DIOGENES trial 12-monthresults. Int. J. Obes. 2014, 38, 1511–1517. [CrossRef] [PubMed]
25. Watt, M.J.; Heigenhauser, G.J.; Spriet, L.L. Effects of dynamic exercise intensity on the activation ofhormone-sensitive lipase in human skeletal muscle. J. Physiol. 2003, 547 Pt 1, 301–308. [CrossRef] [PubMed]
210
Books
MDPI

Nutrients 2017, 9, 632
26. WHO. Definition and Diagnosis of Diabetes Mellitus and Intermediate Hyperglycaemia. Available online:http://www.who.int/diabetes/publications/diagnosis_diabetes2006/en/ (accessed on 19 July 2017).
27. Matsuda, M.; DeFronzo, R.A. Insulin sensitivity indices obtained from oral glucose tolerance testing:Comparison with the euglycemic insulin clamp. Diabetes Care 1999, 22, 1462–1470. [CrossRef] [PubMed]
28. Silventoinen, K.; Pankow, J.; Lindström, J.; Jousilahti, P.; Hu, G.; Tuomilehto, J. The validity of the FinnishDiabetes Risk Score for the prediction of the incidence of coronary heart disease and stroke, and totalmortality. Eur. J. Cardiovasc. Prev. Rehabil. 2005, 12, 451–458. [CrossRef] [PubMed]
29. Borg, G.A. Psychophysical bases of perceived exertion. Med. Sci. Sports Exerc. 1982, 14, 377–381. [CrossRef][PubMed]
30. 2008 Physical Activity Guidelines for Americans. Available online: http://www.health.gov/paguidelines/guidelines/ (accessed on 19 July 2017).
31. Kahlert, D.; Unyi-Reicherz, A.; Stratton, G.; Meinert Larsen, T.; Fogelholm, M.; Raben, A.; Schlicht, W.PREVIEW Behavior Modification Intervention Toolbox (PREMIT): A Study Protocol for a PsychologicalElement of a Multicenter Project. Front. Psychol. 2016, 7, 1136. [CrossRef] [PubMed]
32. Michie, S.; Abraham, C.; Whittington, C.; McAteer, J.; Gupta, S. Effective techniques in healthy eating andphysical activity interventions: A meta-regression. Health Psychol. 2009, 28, 690–701. [CrossRef] [PubMed]
33. Greaves, .C.J.; Sheppard, K.E.; Abraham, C.; Hardeman, W.; Roden, M.; Evans, P.H.; Schwarz, P.; IMAGEStudy Group. Systematic review of reviews of intervention components associated with increasedeffectiveness in dietary and physical activity interventions. BMC Public Health 2011, 11, 119. [CrossRef][PubMed]
34. Olander, E.K.; Fletcher, H.; Williams, S.; Atkinson, L.; Turner, A.; French, D.P. What are the most effectivetechniques in changing obese individuals’ physical activity self-efficacy and behaviour: A systematic reviewand meta-analysis. Int. J. Behav. Nutr. Phys. Act. 2013, 10, 29. [CrossRef] [PubMed]
35. Michie, S.; Richardson, M.; Johnston, M.; Abraham, C.; Francis, J.; Hardeman, W.; Eccles, M.P.; Cane, J.;Wood, C.E. The behavior change technique taxonomy (v1) of 93 hierarchically clustered techniques: Buildingan international consensus for the reporting of behavior change interventions. Ann. Behav. Med. 2013, 46,81–95. [CrossRef] [PubMed]
36. Prochaska, J.O.; DiClemente, C.C. Stages of change in the modification of problem behaviors. Prog. Behav. Modif.1992, 28, 183–218. [PubMed]
37. PREVIEW. Available online: http://previewstudy.com (accessed on 19 July 2017).38. The Diabetes Prevention Program: Baseline characteristics of the randomized cohort. The Diabetes
Prevention Program Research Group. Diabetes Care 2000, 23, 1619–1629.39. Edelstein, S.L.; Knowler, W.C.; Bain, R.P.; Andres, R.; Barrett-Connor, E.L.; Dowse, G.K.; Haffner, S.M.;
Pettitt, D.J.; Sorkin, J.D.; Muller, D.C.; et al. Predictors of progression from impaired glucose tolerance toNIDDM: An analysis of six prospective studies. Diabetes 1997, 46, 701–710. [CrossRef] [PubMed]
40. Saudek, C.D.; Herman, W.H.; Sacks, D.B.; Bergenstal, R.M.; Edelman, D.; Davidson, M.B. A new look atscreening and diagnosing diabetes mellitus. J. Clin. Endocrinol. Metab. 2008, 93, 2447–2453. [CrossRef][PubMed]
41. Malkani, S.; Mordes, J.P. Implications of using hemoglobin A1C for diagnosing diabetes mellitus. Am. J. Med.2011, 124, 395–401. [CrossRef] [PubMed]
42. Nordic Nutrition Recommendations Project Group. Nordic Nutrition Recommendations 2012. IntegratingNutrition and Physical Activity, 5th ed.; Nordic Council of Ministers: Copenhagen, Denmark, 2014.
43. Dietary Guidelines for Americans. Available online: http://www.cnpp.usda.gov/DietaryGuidelines(accessed on 19 July 2017).
44. Dhurandhar, N.V.; Schoeller, D.; Brown, A.W.; Heymsfield, S.B.; Thomas, D.; Sørensen, T.I.A.; Speakman, J.R.;Jeansonne, M.; Allison, D.B.; Energy Balance Measurement Working Group. Energy balance measurement:When something is not better than nothing. Int. J. Obes. 2015, 39, 1109–1113. [CrossRef] [PubMed]
45. Corella, D.; Ordovás, J.M. Biomarkers: Background, classification and guidelines for applications innutritional epidemiology. Nutr. Hosp. 2015, 31 (Suppl. 3), 177–188. [PubMed]
46. Brand-Miller, J.C.; Stockmann, K.; Atkinson, F.; Petocz, P.; Denyer, G. Glycemic index, postprandial glycemia,and the shape of the curve in healthy subjects: Analysis of a database of more than 1000 foods. Am. J.Clin. Nutr. 2009, 89, 97–105. [CrossRef] [PubMed]
211
Books
MDPI

Nutrients 2017, 9, 632
47. Whelan, W.J.; Hollar, D.; Agatston, A.; Dodson, H.J.; Tahal, D.S. The glycemic response is a personal attribute.IUBMB Life 2010, 62, 637–641. [CrossRef] [PubMed]
48. Ramos, J.S.; Dalleck, L.C.; Tjonna, A.E.; Beetham, K.S.; Coombes, J.S. The impact of high-intensity intervaltraining versus moderate-intensity continuous training on vascular function: A systematic review andmeta-analysis. Sports Med. 2015, 45, 679–692. [CrossRef] [PubMed]
© 2017 by the authors. Licensee MDPI, Basel, Switzerland. This article is an open accessarticle distributed under the terms and conditions of the Creative Commons Attribution(CC BY) license (http://creativecommons.org/licenses/by/4.0/).
212
Books
MDPI

nutrients
Article
Glucose and Lipid Dysmetabolism in a Rat Model ofPrediabetes Induced by a High-Sucrose Diet
Ana Burgeiro 1,†, Manuela G. Cerqueira 1,†, Bárbara M. Varela-Rodríguez 1, Sara Nunes 1,2,
Paula Neto 3, Frederico C. Pereira 1,2, Flávio Reis 1,2,* and Eugénia Carvalho 1,4,5,6,*
1 Center of Neuroscience and Cell Biology (CNC) and CNC.IBILI Research Consortium,University of Coimbra, 3004-504 Coimbra, Portugal; [email protected] (A.B.);[email protected] (M.G.C.); [email protected] (B.M.V.-R.); [email protected] (S.N.);[email protected] (F.C.P.)
2 Laboratory of Pharmacology and Experimental Therapeutics, Institute for Biomedical Imaging and LifeSciences (IBILI), Faculty of Medicine, University of Coimbra, 3000-548 Coimbra, Portugal
3 Service of Anatomical Pathology, Coimbra University Hospital Centre (CHUC), 3000-075 Coimbra, Portugal;[email protected]
4 The Portuguese Diabetes Association (APDP), 1250-203 Lisbon, Portugal5 Department of Geriatrics, University of Arkansas for Medical Sciences, Little Rock, AR 72202, USA6 Arkansas Children’s Hospital Research Institute, Little Rock, AR 72202, USA* Correspondence: [email protected] (F.R.); [email protected] (E.C.);
Tel.: +351-239-480-053 (F.R.); +351-239-820-190 (E.C.)† These authors contributed equally to this work.
Received: 2 April 2017; Accepted: 14 June 2017; Published: 21 June 2017
Abstract: Glucotoxicity and lipotoxicity are key features of type 2 diabetes mellitus, but theirmolecular nature during the early stages of the disease remains to be elucidated. We aimed tocharacterize glucose and lipid metabolism in insulin-target organs (liver, skeletal muscle, and whiteadipose tissue) in a rat model treated with a high-sucrose (HSu) diet. Two groups of 16-week-old maleWistar rats underwent a 9-week protocol: HSu diet (n = 10)—received 35% of sucrose in drinkingwater; Control (n = 12)—received vehicle (water). Body weight, food, and beverage consumptionwere monitored and glucose, insulin, and lipid profiles were measured. Serum and liver triglycerideconcentrations, as well as the expression of genes and proteins involved in lipid biosynthesis wereassessed. The insulin-stimulated glucose uptake and isoproterenol-stimulated lipolysis were alsomeasured in freshly isolated adipocytes. Even in the absence of obesity, this rat model alreadypresented the main features of prediabetes, with fasting normoglycemia but reduced glucose tolerance,postprandial hyperglycemia, compensatory hyperinsulinemia, as well as decreased insulin sensitivity(resistance) and hypertriglyceridemia. In addition, impaired hepatic function, including alteredgluconeogenic and lipogenic pathways, as well as increased expression of acetyl-coenzyme Acarboxylase 1 and fatty acid synthase in the liver, were observed, suggesting that liver glucoseand lipid dysmetabolism may play a major role at this stage of the disease.
Keywords: high-sucrose diet; prediabetes; glucose; lipid; metabolism; hypertriglyceridemia
1. Introduction
Type 2 diabetes mellitus (T2DM) has become an epidemic of noncommunicable diseases, with415 million people worldwide currently living with diabetes [1]. According to the InternationalDiabetes Federation, about 5 million people died from DM in 2015 and the estimates indicate thatthere will be about 642 million people living with DM by 2040. In addition, there are about 318 millionadults with impaired glucose tolerance (IGT), which puts them at high risk for the disease.
Nutrients 2017, 9, 638 213 www.mdpi.com/journal/nutrients
Books
MDPI

Nutrients 2017, 9, 638
Prediabetes (or intermediate hyperglycemia) already displays metabolic alterations and is ahigh risk state for developing T2DM. According to the American Diabetes Association, prediabetes isdistinguished by having impaired fasting glucose (IFG) (100–125 mg/dL glucose), IGT (140–199 mg/dLglucose 2 h after a 75-g oral glucose tolerance test), and glycated hemoglobin (HbA1c) levels between5.7–6.4%. The prevalence of prediabetes is rapidly increasing with over 470 million people projectedwith prediabetes by 2030 [2]. This likely anticipates increased morbidity, mortality, and healthcarecosts in the near future with DM management. Thus, preventing the progression of IGT and/or IFG toT2DM is the most rational and effective way to combat the DM epidemic and lessen healthcare costs.However, before we can succeed, we need to unravel glucose and lipid metabolism at this stage ofthe disease.
Diets enriched in sugars including the intake of sugar-sweetened beverages have been consistentlylinked to the increased risk of hypertriglyceridemia, obesity, T2DM, and cardiovascular disease [3].A central feature of T2DM is hyperglycemia, as a result of excessive hepatic glucose production, insulinresistance, and deficient secretion of pancreatic insulin. An often overlooked feature is the relationshipbetween glucose and lipids, whose fluxes are indeed closely interlinked through the intersection ofmetabolic pathways at the acetyl-CoA formation [4]. Impairment of one pathway can indirectly havea major impact on another [4,5]. Molecular and metabolic abnormalities in insulin action, such asperipheral tissues (muscle, liver, and adipose tissues) insulin resistance, together with minor defects ininsulin secretion, can be clearly identified before the development of obesity or hyperglycemia. Thesefactors contribute to the increased fatty acid influx into the liver and muscle causing accumulationof toxic lipid metabolites. Particularly, chronically increased levels of plasma nonesterified fattyacids (NEFA) and triglyceride (TG)-rich lipoproteins impair lipid metabolism, a process referred to aslipotoxicity [6]. Furthermore, when the NEFA supply exceeds metabolic capacity, lipids accumulate inperipheral tissues, such as liver and muscle, inducing organ dysfunction [6]. Several recent lines ofevidence show that the typical dyslipidemia in T2DM patients, characterized by elevated TGs, low highdensity lipoprotein cholesterol (HDL-c), and the predominance of small-dense low density lipoprotein(LDL) particles, may not only be the consequence of diabetes but may also cause disturbancesof glucose metabolism. In fact, hypertriglyceridemia leads to elevated levels of free fatty acids(FFAs), which contribute to insulin resistance and β-cell dysfunction, putatively by impairing themolecular mechanisms linking insulin receptors with glucose transporters, as well as by directlydamaging β-cells. Moreover, hypertriglyceridemia and elevated FFAs can contribute to inflammation,which boosts insulin resistance and β-cell dysfunction [4–7]. In addition, low HDL-c could alsoinfluence low-grade inflammation and affect glucose metabolism, thus contributing to diabetes [8].Collectively, lipotoxicity and glucotoxicity are associated to the progression of DM and its micro- andmacrovascular complications [5,9]. However, the nature of glucose and lipid deregulation in theprediabetic state remains to be elucidated.
Therefore, we aim to evaluate glucose and lipid metabolism in a prediabetic rat model, inducedby a high-sucrose (HSu) diet [10,11], focusing on the main insulin-target organs: liver, skeletal muscle,and white adipose tissue.
2. Materials and Methods
2.1. Animals and Diets
Male Wistar rats (16 week-old; Charles River Laboratories, Barcelona, Spain) were housed,two per cage, under controlled conditions (12 h light/dark cycle schedule and controlled temperature(22 ± 1 ◦C) and humidity). After an adaptation period of 1 week, rats were randomly divided into twogroups (2 animals per cage) and submitted to a 9-week protocol: (1) control—receiving tap water asvehicle; (2) Hsu—receiving 35% sucrose (S0389; Sigma-Aldrich, St. Louis, MO, USA) in the drinkingwater. All animals were fed standard rat chow, containing 60% of carbohydrates, 16.1% of protein,3.1% of lipids, 3.9% of fibers, and 5.1% of minerals (AO4 Panlab, Barcelona, Spain), ad libitum (except
214
Books
MDPI

Nutrients 2017, 9, 638
during fasting periods). Body weight, food, and beverage consumption were monitored every two daysand presented as weekly variation per rat (which is the mean of the two rats per cage). All experimentswere conducted in accordance with the European Union (EU) Legislation for the protection of animalsused for scientific purposes “Animals (Scientific Procedures) Act”, Directive 2010/63/EU, and withthe National and Local Authorities, under authorization of the Organ Responsible for Animal Welfareof Faculty of Medicine of Coimbra University (07/2016).
2.2. Chemicals
Collagenase type II was from Roche (Lisbon, Portugal). D-[[14C(U)]-glucose (250 mCi/mmol/L)was from Scopus Research BV (Wageningen, The Netherlands). Human insulin, Actrapid, was kindlysupplied by Novo Nordisk A/S (Paço de Arcos, Portugal). N-heptane was from Merck-&-Co., Inc.(Whitehouse Station, NJ, USA). Optiphase Hisafe was from PerkinElmer, Inc. (Waltham, MA, USA).RNeasy® MiniKits were from QIAGEN Sciences (Germantown, MD, USA). High Capacity cDNAReverse Transcriptase kits were from Applied Biosystems (Forest City, CA, USA). PCR primers weredesigned using Beacon Designer software and synthesized by IDT-Integrated DNA Technologies, Inc.(BVBA, Leuven, Belgium). SYBRGreen Supermix was from Quanta Biosciences (Gaithersburg, MA,USA). All other reagents were from Sigma (St. Louis, MO, USA). ECF reagent was from GE Healthcare(Little Chalfont, UK).
2.3. Metabolic Characterization
Metabolic characterization was performed as previously described [10] and is detailed in thesupplemental material. This included a glucose tolerance test (GTT), an insulin tolerance test (ITT),fasting insulin levels, and insulin resistance (evaluated by the homeostatic model assessment of insulinresistance HOMA-IR index), as well as serum TG to HDL-c ratio (TG/HDL-c), TG-glucose (TyG)index, as well as fed and fasted alanine aminotransferase [6] and aspartate aminotransferase (AST)assessment. Caloric intake was calculated based on the daily food intake, and in HSu-treated animals,the energy related to sucrose consumption was also calculated.
2.4. Blood and Tissues Collection
After a 9-week treatment, blood and tissues (liver, skeletal muscle—from the posterior thigh of therat leg—and epididymal adipose tissue) were snap frozen and stored at −80 ◦C. Details are availablein the supplemental material.
2.5. Liver Pathology and Triglyceride Content
Liver TG were extracted and quantified as previously reported [12]. Briefly, 50 mg of liver sampleswere homogenized in 0.5 mL of chlorophorm/methanol (2:1) and incubated for 3 h with agitationat 4 ◦C. 300 μL of milliQ water were then added to the homogenate and centrifuged (13,000 rpm for20 min, room temperature). The organic phase was transferred to a clean Eppendorf tube, allowed toevaporate at 4 ◦C, and finally stored at −20 ◦C. Liver TG quantification was performed with a specificcommercial kit from Spinreact. Colorimetric determination was performed in a spectrophotometer(SPECTRAmax PLUS384, Molecular Devices, Sunnyvale, CA, USA) at a wavelength of 505 nm or490 nm after TG resuspension in 500 μL of chloroform. Intensity of the formed color was proportionalto TG concentration in each sample. Oil red O staining of liver frozen sections was performed toevaluate lipid deposition, according to previously described methodology [13]. Liver pathology wasassessed by hematoxylin and eosin (H&E) in paraffin-embedded sections fixed with paraformaldehydeat the moment of sample collection. Data analysis was performed in a blind fashion by a pathologist.
215
Books
MDPI

Nutrients 2017, 9, 638
2.6. Cell Size and Weight, Glucose Uptake, and Lipolysis in Isolated Epididymal Adipocytes
Epididymal adipocyte size and weight, insulin-stimulated D-[[14C(U)]-glucose uptake, andisoproterenol-stimulated lipolysis in isolated adipocytes were performed as previously described [14,15].Briefly, for the insulin-stimulated glucose uptake, the isolated adipocytes were diluted ten times andwere stimulated or not with human insulin (1000 μU/mL), for 10 min, at 37 ◦C, in a shaking water-bath.Subsequently, 0.86 μM D-[[14C(U)]-glucose was added to the medium and the accumulation of glucosefollowed for 30 min. The cell suspension was then transferred to pre-chilled tubes, containing siliconeoil, allowing cells to be separated from the buffer by centrifugation. Cell-associated radioactivity wasdetermined by liquid scintillation counting, which allowed us to calculate the rate of transmembranarglucose transport, according to the formula: cellular clearance of medium glucose = (c.p.m. cells ×volume)/(c.p.m. medium × cell number × time).
For isoproterenol-stimulated lipolysis, the isolated adipocytes were diluted ten times and wereincubated in the presence or absence of insulin (1000 μU/mL), in a shaking water bath, at 37 ◦C,for 60 min. The medium was also supplemented or not with isoproterenol (1 μM). Following incubation,cells were separated from the medium by centrifugation and glycerol levels were measured in themedium using an assay kit (Zen Bio, Inc., Research Triangle Park, NC, USA). Further details areavailable in the supplemental material.
2.7. Liver, Skeletal Muscle, and Adipose Tissue Gene and Protein Expression
Total RNA from liver, skeletal muscle, and epididymal adipose tissue was extracted, and cDNAsynthesis and relative mRNA levels for glucose transporter-1(Glut1), -2 (Slc2a2), and -4 (Glut4),phosphoenolpyruvate carboxykinase (Pepck), glucose-6-phosphatase (G6pc), acetyl-CoA carboxylase 1(Acc1), fatty acid synthase (Fasn), diglyceride acyltransferase (Dgat1), carbohydrate-responsiveelement-binding protein (Mlxipl/Chrebp), sterol regulatory element-binding transcription factor 1(Srebf1), and hormone-sensitive lipase (Hsl) were measured (by real time-PCR), as previouslydescribed [16]. Protein extraction and Western blot analysis of GLUT1, GLUT2, GLUT4, PEPCK, G6PC,ACC1, FASN, DGAT1, ChREBP, SREBP, and HSL were performed as previously described [14,15].The supplemental material details the protocols and lists the primer sequences (Table S1) and antibodies(Table S2) used.
2.8. Statistical Analysis
Results were expressed as mean ± standard error of the mean, using GraphPad Prism, version 6(GraphPad Software, San Diego, CA, USA). Student’s t-test for normally distributed data or the MannWhitney test for non-normally distributed data were performed when two groups were considered.One-way or two-way ANOVA, followed by Tukey post hoc test, for multiple comparisons, was usedas appropriate. Repeated measures ANOVA, followed by the Tukey post-hoc test, was used to assessthe differences between groups and between basal and insulin-stimulated glucose uptake. Differenceswere considered significant when * p ≤ 0.05, ** p ≤ 0.01, *** p ≤ 0.001, or **** p ≤ 0.0001.
3. Results
3.1. HSu Diet Increases Beverage Consumption and Caloric Intake, Maintaining Body Weight
During 9 weeks of treatment, the body weight evolution was identical in HSu-treated and controlrats (Figure 1A). However, HSu-treated animals had a higher beverage (35% sucrose) consumption buta lower food ingestion (Figure 1B,C). This behavior translated to an increased total caloric intake, mainlyfrom carbohydrates, with a lower calorie consumption from proteins and lipids, when compared withthe control animals ((Figure 1D–G).
216
Books
MDPI

Nutrients 2017, 9, 638
Figure 1. Evolution of body weight (A), beverage (B) and food (C) intake, as well as total caloricconsumption (D) and caloric intake related with carbohydrates (E), protein (F), and lipids (G),throughout the 9 weeks of treatment. Control (n = 12) and HSu (n = 10). ** p < 0.01, *** p < 0.001,**** p < 0.0001.
3.2. HSu Diet Increases Serum Triglyceride Levels and Impairs Liver Function
The serum TG content in HSu-treated rats was significantly higher than in control animals inthe fed state. Also, fed HSu-treated rats presented higher TG concentrations than in fasted HSuanimals (Figure 2A). However, no significant differences were found in liver TG levels (Figure 2B).Regardless of the nutritional status (fasted or fed), serum ALT levels were reduced in the HSu-treatedrats (Figure 2C); however, no significant differences were found in serum AST levels (Figure 2D).In addition, the liver weight/body weight ratio was increased in HSu-treated animals (Figure 2E).
Despite markers of impaired liver function, no changes in liver structure were found whenanalyzed by H&E histology (Figure 3(A1,A2)). Oil red O staining showed a slight deposition of lipidsin the HSu-treated animals, when compared with the control ones (Figure 3(B1,B2)), respectively).
217
Books
MDPI
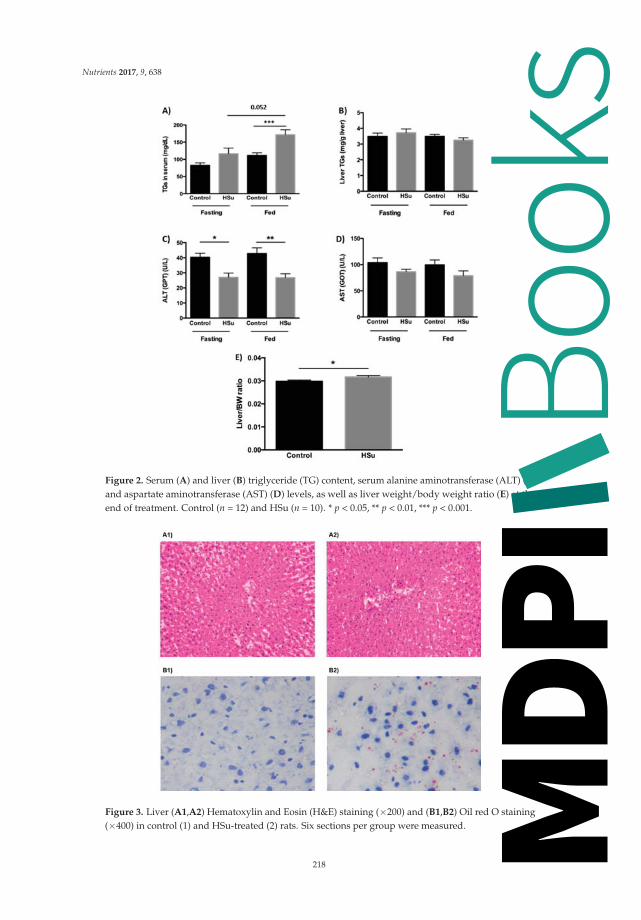
Nutrients 2017, 9, 638
Figure 2. Serum (A) and liver (B) triglyceride (TG) content, serum alanine aminotransferase (ALT) (C)and aspartate aminotransferase (AST) (D) levels, as well as liver weight/body weight ratio (E) at theend of treatment. Control (n = 12) and HSu (n = 10). * p < 0.05, ** p < 0.01, *** p < 0.001.
Figure 3. Liver (A1,A2) Hematoxylin and Eosin (H&E) staining (×200) and (B1,B2) Oil red O staining(×400) in control (1) and HSu-treated (2) rats. Six sections per group were measured.
218
Books
MDPI

Nutrients 2017, 9, 638
3.3. HSu Diet Impairs Glucose Tolerance and Causes Insulin Resistance
Although both groups showed similar fasting glucose levels (Figure 4A,C,E), the HSu-treatedrats had significantly slower glucose excursion during a GTT (2 g/kg body weight of glucose),compared to control animals (Figure 4A,B), revealing glucose intolerance. Blood glucose levels weresignificantly elevated in the HSu-treated rats, 120 min after an insulin injection (0.75 U/kg body weightof insulin) (Figure 4C,D). In addition, serum fasting insulin concentration was significantly elevatedin HSu-treated animals (Figure 4F). Moreover, TG/HDL-c ratio, TyG and HOMA-IR indexes, knownmarkers of insulin resistance, were significantly elevated in the HSu-treated rats, compared to thecontrols (Figure 4G–I).
Figure 4. Glucose tolerance test (GTT) and area under the curve (A,B), insulin tolerance test (ITT)and area under the curve (C,D), fasting glucose (E) and insulin (F) levels, as well as insulin resistancemarkers: triglycerides to high density lipoprotein cholesterol (TG/HDL-c) ratio (G), triglycerideglucose (TyG) index (H) and homeostatic model assessment of insulin resistance (HOMA-IR) index(I) at the end of treatment. Control (n = 12) and HSu (n = 10). * p < 0.05, ** p < 0.01, *** p < 0.001, and**** p ≤ 0.0001.
219
Books
MDPI

Nutrients 2017, 9, 638
3.4. HSu Diet Increases Fat Mass While the Insulin-Stimulated Glucose Uptake in Adipocytes Is Impaired
The epididymal fat pad weight/body weight ratio was significantly higher in the HSu-treatedrats when compared to the controls (Figure 5A), while fat cell diameter and weight were unchangedbetween the groups (Figure 5C,D). Insulin-stimulated glucose uptake was measured in freshly isolatedadipocytes. Basal glucose uptake was not significantly different between groups (p > 0.05). Adipocytesresponded to the stimulatory effect of insulin in the uptake of glucose in both groups (Control − Basal= 20.31 ± 2.59 vs. Insulin = 35.88 ± 4.22, p < 0.001; HSu − Basal = 8.55 ± 1.09 vs. Insulin = 17.48 ± 1.16,p < 0.001); however, the insulin-stimulated glucose uptake was significantly reduced in adipocytesfrom HSu-treated rats compared to the controls (17.48 ± 1.16 vs. 35.88 ± 4.22, p < 0.01, respectively)(Figure 5B).
Figure 5. Epididymal fat pad weight/bw ratio (A), insulin-stimulated D-[[14C(U)]-glucose uptake inisolated adipocytes (B), and adipocyte diameter (C) and weight (D) at the end of treatment. Control(n = 12) and HSu (n = 10). ** p < 0.01, *** p < 0.001.
3.5. HSu Diet Decreased GLUT1 but Increased G6Pase Levels in Liver
The gene and protein levels of mediators of glucose uptake and gluconeogenesis were quantifiedin liver, skeletal muscle (posterior thigh of the leg), and epididymal adipose tissue. There were nochanges in glucose transporter gene levels in all tissues, in the fed state (Figure 6A). Moreover, GLUT1protein levels were reduced in HSu-treated rats versus controls, with no change in GLUT2 expression,in the liver. In addition, no differences were found in either GLUT1 or GLUT4 protein levels in skeletalmuscle or epididymal adipose tissue. To assess hepatic gluconeogenesis, PEPCK and G6Pase gene andprotein levels were evaluated. While there was no alteration in gene expression, there was a significantincrease in only G6Pase protein levels in the HSu-treated group (Figure 6B).
Figure 6. Cont.
220
Books
MDPI
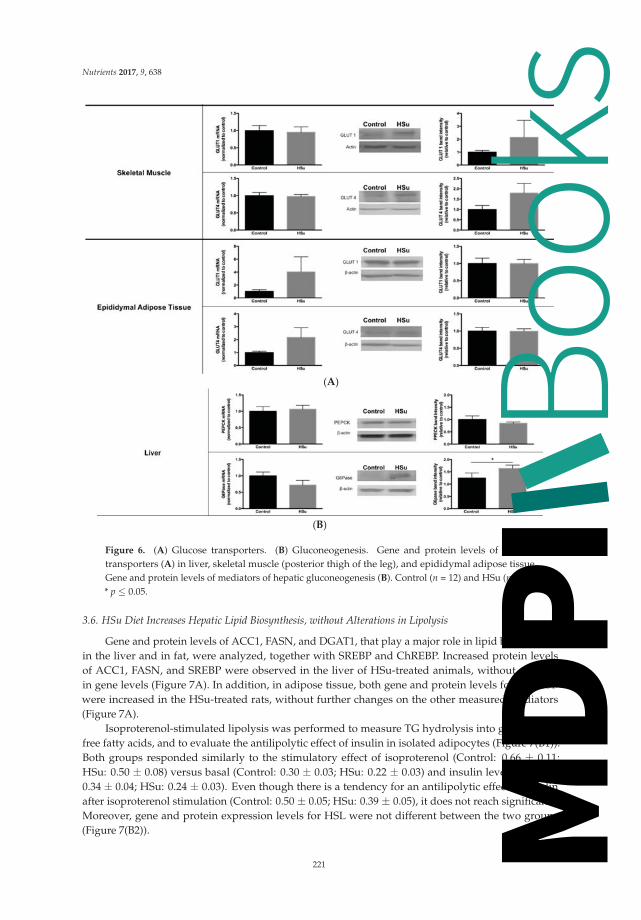
Nutrients 2017, 9, 638
(A)
(B)
Figure 6. (A) Glucose transporters. (B) Gluconeogenesis. Gene and protein levels of glucosetransporters (A) in liver, skeletal muscle (posterior thigh of the leg), and epididymal adipose tissue.Gene and protein levels of mediators of hepatic gluconeogenesis (B). Control (n = 12) and HSu (n = 10).* p ≤ 0.05.
3.6. HSu Diet Increases Hepatic Lipid Biosynthesis, without Alterations in Lipolysis
Gene and protein levels of ACC1, FASN, and DGAT1, that play a major role in lipid biosynthesisin the liver and in fat, were analyzed, together with SREBP and ChREBP. Increased protein levelsof ACC1, FASN, and SREBP were observed in the liver of HSu-treated animals, without changesin gene levels (Figure 7A). In addition, in adipose tissue, both gene and protein levels for ChREBPwere increased in the HSu-treated rats, without further changes on the other measured mediators(Figure 7A).
Isoproterenol-stimulated lipolysis was performed to measure TG hydrolysis into glycerol andfree fatty acids, and to evaluate the antilipolytic effect of insulin in isolated adipocytes (Figure 7(B1)).Both groups responded similarly to the stimulatory effect of isoproterenol (Control: 0.66 ± 0.11;HSu: 0.50 ± 0.08) versus basal (Control: 0.30 ± 0.03; HSu: 0.22 ± 0.03) and insulin levels (Control:0.34 ± 0.04; HSu: 0.24 ± 0.03). Even though there is a tendency for an antilipolytic effect of insulinafter isoproterenol stimulation (Control: 0.50 ± 0.05; HSu: 0.39 ± 0.05), it does not reach significance.Moreover, gene and protein expression levels for HSL were not different between the two groups(Figure 7(B2)).
221
Books
MDPI

Nutrients 2017, 9, 638
(A)
Figure 7. Cont.
222
Books
MDPI

Nutrients 2017, 9, 638
(B1)
(B2)
Figure 7. (A) Lipid biosynthesis. (B1,B2) Lipolysis. (B1) Isoproterenol-stimulated lipolysis. (B2) Hormone-sensitive lipase gene and protein. Gene and protein levels of mediators of lipid biosynthesis (A) inliver and epididymal adipose tissue. Isoproterenol-stimulated lipolysis (B1) and HSL gene and proteinlevels (B2) in epididymal adipose tissue. Control (n = 12) and HSu (n = 10). * p ≤ 0.05, ** p < 0.01, and*** p < 0.001.
4. Discussion
The novel findings from this study indicate that a high-sugar diet induces early glucose and lipiddysmetabolism, in the absence of weight gain, only after 9 weeks of treatment. HSu-treated animalsdeveloped impaired insulin-stimulated glucose uptake and reduced insulin sensitivity (resistance),together with decreased GLUT1 but increased G6Pase protein levels in the liver. These metabolicchanges are paralleled by fed hyperglycemia and hypertriglyceridemia.
Throughout the 9-week treatment, the HSu-treated group had lower food consumption buthigher beverage (35% sucrose) and caloric intake, while maintaining body weight, as previouslydescribed [17–19]. Similar body weight might have been maintained due to: first, differences indigestion and absorption may have modified the amount of ‘bioavailable’ energy, affecting the actualpositive energy balance; second, the composition of weight gain (fat mass and lean mass) mightbe different, as the energy cost of protein deposition is higher than that of adipose tissue. In fact,we observed that HSu-treated animals have a greater adiposity translated by an increased epididymalfat pad weight/body weight ratio. Moreover, dietary protein content was suggested to be a criticaldeterminant of weight gain during ad libitum feeding [20].
This prediabetic animal model presented low food intake, which is enriched in 16.1% protein, andincreased fluid intake of sucrose-enriched water, in agreement with previous studies [18]. This meansthat HSu-treated animals ingested a smaller amount of protein and a greater amount of carbohydrates,which can be translated by higher fat mass and smaller lean mass, which allowed the maintenanceof body weight. This suggestion might be further confirmed by performing an in vivo non-invasiveecographic magnetic resonance imaging (Echo-MRI) analysis to assess whole body fat, lean, free water,and total water masses.
Indeed, epididymal fat pad weight/body weight ratio was significantly higher in HSu-treatedrats. Moreover, high-protein diets are known to reduce adiposity/lipogenesis in the context of high
223
Books
MDPI

Nutrients 2017, 9, 638
carbohydrate consumption in Western diets [21]. In fact, high-sucrose diets may increase adiposity bystimulating liver lipogenesis [22].
After 9 weeks of treatment, the HSu-treated group had higher serum TG levels, in agreementwith previous reports [18,23–25], together with increased lipid deposition in the hepatic tissue, viewedby the Oil Red O staining. In addition, ALT levels were significantly reduced in HSu-treated rats,while a significant increase in the liver weight/body weight ratio was observed, suggesting alteredliver function, without liver lesion at this stage of impaired metabolism. The strongest hypothesis toexplain the reduced liver function and ALT low levels is malnutrition or an altered nutritional pattern.This prediabetes model had lower food consumption (constituted by 16.1% protein) and increasedfluid intake (sucrose-enriched water). Thus, the low serum ALT levels, indicative of liver dysfunction,observed in the HSu-treated rats might be caused by a diet poor in essential nutrients/macromolecules(including proteins and lipids), i.e., malnutrition.
This prediabetes model presented impaired glucose homeostasis. Already at the early stages of thedisease, there were initial metabolic deregulations, evidenced by alterations in glucose tolerance duringthe GTT and ITT, as well as the glucose and insulin levels, indicative of insulin resistance, in agreementwith other studies [18,26,27]. At this stage, although fasting glucose levels are maintained withinnormal values (normoglycemia), due to compensatory hyperinsulinemia, there is already some degreeof glucose intolerance and peripheral insulin resistance, in agreement with other reports [18,28–30].
Insulin resistance was demonstrated not only by the increased HOMA-IR index but also byaugmented TG/HDL-c ratio and the TyG index, which have previously been used as surrogatemeasures of impaired insulin sensitivity in obese adolescents with normoglycemia, in prediabetes, aswell as in T2DM [31].
In an attempt to explain the glucose, insulin, and lipid dysmetabolism in this model at theprediabetic stage, we assessed possible alterations in glucose and lipid metabolism in fat. Accordinglywith previous studies [18], the HSu diet increased fat mass, which is closely linked to the developmentof severe peripheral IR and prediabetes [32,33]. Moreover, under the fed state, the HSu diet impairedinsulin-induced glucose uptake in isolated adipocytes, confirming that visceral adiposity is stronglyassociated with impaired glucose uptake and IR [34]. Additionally, under IGT, adipocytes are resistantto insulin, and its effectiveness may be impaired, contributing to postprandial hyperglycemia inprediabetic states. Furthermore, the decrease in hepatic GLUT1 in the HSu-treated rats might bemediated by the hyperinsulinemia observed in this animal model [35], although supplementaryconfirmation of this hypothesis could be achieved by evaluating GLUT1 expression under fastingconditions. On the other hand, both GLUT2 (in the liver) and GLUT4 protein levels (in theadipose tissue and skeletal muscle), were unchanged. The translocation of both GLUT2 and GLUT4to the plasma membrane is mediated by insulin; however, under IR conditions, this process isimpaired [36,37], leading to decreased insulin-stimulated glucose uptake in hepatocytes (mostlyby GLUT2), while increasing postprandial blood glucose levels. Even though we did not measuretranslocation of glucose transporters in this study, it may be possible that these processes are impaired,thus also contributing to the increased postprandial blood glucose levels.
Another factor that may also be contributing to the postprandial hyperglycemia observed in thisanimal model is that high sucrose consumption increased gluconeogenesis, as previously reported [38].However, under IGT and/or IR conditions, the derangement of hepatic glucose handling, indicated bychanges in GLUT1 and G6Pase may at least in part lead to postprandial hyperglycemia in prediabeticstates [39]. Furthermore, in this animal model of IR, insulin may not inhibit the de novo glucoseproduction by the liver, leading therefore to elevated gluconeogenesis, resulting in elevated bloodglucose levels in the fed state, as previously reported [35], as well as altered glucose tolerance duringa GTT.
Furthermore, the HSu diet increased liver lipid biosynthesis. Our results show that ACC1 andFASN enzymes, as well as the transcription factor SREBP expression levels were increased in the liverof HSu-treated rats, in agreement with previous studies [40–44]. The perturbed liver lipid metabolism
224
Books
MDPI

Nutrients 2017, 9, 638
that was observed might explain the hypertriglyceridemia present in this prediabetic animal model.In addition, high sucrose consumption may also be contributing to hypertriglyceridemia due to theincreased ChREBP gene and protein levels observed in fat [45]. However, the HSu diet did not inducechanges in the isoproterenol-stimulated lipolysis in isolated adipocytes, and the HSL protein levelswere not different. HSL lipolytic activity is regulated by reversible phosphorylation on five criticalresidues [46]. Therefore the absence of alterations in lipolysis suggest that HSL phosphorylationwas not changed by the HSu diet. Finally, insulin did not show a significant antilipolytic effect atthese insulin concentrations. However, it is important to note that we used supra-physiologicalinsulin concentrations (1000 μU/mL), in order to evoke a sustained respond to study the impact ofthe treatment. Testing physiological insulin concentrations are warranted in both control and HSuanimals in future research. In addition, there are other aspects for the forthcoming studies that couldconsolidate this model, namely lipid profiling of FPLC-separated lipoprotein fractions, quantificationof FFA levels, as well as the estimation of VLDL secretion. Furthermore, the impact of the HSu diet onleptin serum levels and on leptin receptor expression would be of interest.
Overall, our study shows that nine week of HSu-diet, which mimics at least in part Westerndiets [10,11,47], can lead to impaired hepatic glucose and lipid metabolism, typical features ofT2DM, already present in this prediabetic model, even in the absence of obesity. This animalmodel of diet-induced prediabetes shows reduced glucose tolerance, postprandial hyperglycemia,hyperinsulinemia, reduced insulin sensitivity (resistance), and hypertriglyceridemia, together withimpaired gluconeogenesis and lipogenesis (Figure 8).
Figure 8. A molecular model describing insulin resistance and prediabetes development after aHSu diet. HSu diet increases serum triglyceride (TG) accumulation and triggers liver lipogenesis,inducing hypertriglyceridemia and interfering with liver function. However, no alterations wereobserved in lipolysis. The HSu diet alters hepatic proteins involved in basal glucose uptake andgluconeogenesis and impairs the insulin-stimulated glucose uptake in adipocytes, leading to impairedglucose homeostasis and increased IR markers. Legend: Apolipoprotein; CE—Cholesterolester; IDL—Intermediate-density protein; LDL—Low-density lipoprotein; LDL—Lipoprotein lipase;TG—Triglycerides; VLDL—Very low-density lipoprotein.
225
Books
MDPI

Nutrients 2017, 9, 638
This study should be viewed as an important wake up call for the lifestyle that the generalpopulation have been gradually adopting, by consuming large amounts of simple sugars in softdrinks [48]. Importantly, exaggerated consumption of these drinks has been associated with anincreased risk for T2DM development by about 26% if the average intake is one/two cans a day, oreven more [49]. This feeding behavior is one of the main causes of the uncontrolled increase of IR,T2DM, and associated complications, such as coronary heart disease [50,51].
5. Conclusions
This animal model of prediabetes induced by high-sucrose consumption presents liver glucoseand lipid dysmetabolism. It is expected that new insights of impaired metabolism at this early stageof the disease might contribute to disclosing new therapeutic targets and strategies to counteractprediabetes and hinder the natural course of T2DM progression.
Supplementary Materials: The following are available online at www.mdpi.com/2072-6643/9/6/638/s1,Supplemental methods; Table S1: Primer sequences for RT-PCR; Table S2: Antibodies used for Western blotting.
Acknowledgments: The authors kindly thank Novo Nordisk A/S for the human insulin (Actrapid), aswell as funding support from: SPD/GIFT award, European Foundation for the Study of Diabetes (EFSD),EXCL/DTP-PIC/0069/2012, CNC.IBILI Strategic Project 2015-UID/NEU/04539/2013 funded by the PortugueseFoundation for Science and Technology (FCT) and by FEDER through Operational Programme CompetitivenessFactors (COMPETE): FCOMP-01-0124-FEDER-028417 and POCI-01-0145-FEDER-007440„ SFRH/BD/109017/2015(Sara Nunes PhD scholarship by FCT) as well as Centro 2020 Regional Operational Programmes(CENTRO-01-0145-FEDER-000012: HealthyAging2020 and CENTRO-01-0145-FEDER-000008: BrainHealth 2020).E.C. is partly supported by NIH P30AG028718 and NIH RO1 AG033761.
Author Contributions: A.B., F.C.P., F.R. and E.C. designed the study. All authors participated in rat housing/feedingand/or in the analytical assays. P.N. performed the histopathological analysis. A.B., M.C., B.M.V.-R. and S.N.performed statistical analyses. A.B. and M.C. prepared figures and drafted the manuscript. A.B., F.C.P., F.R. andE.C. edited and revised the manuscript. All authors read and approved the final version.
Conflicts of Interest: The authors declare no conflict of interest.
References
1. Lau, D.C.; Teoh, H. Current and emerging pharmacotherapies for weight management in prediabetes anddiabetes. Can. J. Diabetes 2015, 39 (Suppl. S5), S134–S141. [CrossRef] [PubMed]
2. Tabak, A.G.; Herder, C.; Rathmann, W.; Brunner, E.J.; Kivimaki, M. Prediabetes: A high-risk state for diabetesdevelopment. Lancet 2012, 379, 2279–2290. [CrossRef]
3. Malik, V.S.; Hu, F.B. Fructose and Cardiometabolic Health: What the Evidence from Sugar-SweetenedBeverages Tells Us. J. Am. Coll. Cardiol. 2015, 66, 1615–1624. [CrossRef] [PubMed]
4. Parhofer, K.G. Interaction between glucose and lipid metabolism: More than diabetic dyslipidemia.Diabetes Metab. J. 2015, 39, 353–362. [CrossRef] [PubMed]
5. Erion, D.M.; Park, H.J.; Lee, H.Y. The role of lipids in the pathogenesis and treatment of type 2 diabetes andassociated co-morbidities. BMB Rep. 2016, 49, 139–148. [CrossRef] [PubMed]
6. Van Raalte, D.H.; van der Zijl, N.J.; Diamant, M. Pancreatic steatosis in humans: Cause or marker oflipotoxicity? Curr. Opin. Clin. Nutr. Metab. Care 2010, 13, 478–485. [CrossRef] [PubMed]
7. Rachek, L.I. Free fatty acids and skeletal muscle insulin resistance. Prog. Mol. Biol. Transl. Sci. 2014, 121,267–292. [PubMed]
8. Drew, B.G.; Rye, K.A.; Duffy, S.J.; Barter, P.; Kingwell, B.A. The emerging role of HDL in glucose metabolism.Nat. Rev. Endocrinol. 2012, 8, 237–245. [CrossRef] [PubMed]
9. Cusi, K. The role of adipose tissue and lipotoxicity in the pathogenesis of type 2 diabetes. Curr. Diabetes Rep.2010, 10, 306–315. [CrossRef] [PubMed]
10. Nunes, S.; Soares, E.; Fernandes, J.; Viana, S.; Carvalho, E.; Pereira, F.C.; Reis, F. Early cardiac changesin a rat model of prediabetes: Brain natriuretic peptide overexpression seems to be the best marker.Cardiovasc. Diabetol. 2013, 12, 44. [CrossRef] [PubMed]
226
Books
MDPI

Nutrients 2017, 9, 638
11. Soares, E.; Prediger, R.D.; Nunes, S.; Castro, A.A.; Viana, S.D.; Lemos, C.; De Souza, C.M.; Agostinho, P.;Cunha, R.A.; Carvalho, E.; et al. Spatial memory impairments in a prediabetic rat model. Neuroscience 2013,250, 565–577. [CrossRef] [PubMed]
12. Silva, A.M.; Martins, F.; Jones, J.G.; Carvalho, R. 2H2O incorporation into hepatic acetyl-CoA and denovo lipogenesis as measured by Krebs cycle-mediated 2H-enrichment of glutamate and glutamine.Magn. Reson. Med. 2011, 66, 1526–1530. [CrossRef] [PubMed]
13. Kho, M.C.; Lee, Y.J.; Park, J.H.; Kim, H.Y.; Yoon, J.J.; Ahn, Y.M.; Tan, R.; Park, M.C.; Cha, J.D.; Choi, K.M.; et al.Fermented red ginseng potentiates improvement of metabolic dysfunction in metabolic syndrome rat models.Nutrients 2016, 8, E369. [CrossRef] [PubMed]
14. Pereira, M.J.; Palming, J.; Rizell, M.; Aureliano, M.; Carvalho, E.; Svensson, M.K.; Eriksson, J.W. mTORinhibition with rapamycin causes impaired insulin signalling and glucose uptake in human subcutaneousand omental adipocytes. Mol. Cell. Endocrinol. 2012, 355, 96–105. [CrossRef] [PubMed]
15. Pereira, M.J.; Palming, J.; Rizell, M.; Aureliano, M.; Carvalho, E.; Svensson, M.K.; Eriksson, J.W.The immunosuppressive agents rapamycin, cyclosporin A and tacrolimus increase lipolysis, inhibitlipid storage and alter expression of genes involved in lipid metabolism in human adipose tissue.Mol. Cell. Endocrinol. 2013, 365, 260–269. [CrossRef] [PubMed]
16. Burgeiro, A.; Fuhrmann, A.; Cherian, S.; Espinoza, D.; Jarak, I.; Carvalho, R.A.; Loureiro, M.; Patrício, M.;Antunes, M.; Carvalho, E. Glucose uptake and lipid metabolism are impaired in epicardial adipose tissuefrom heart failure patients with or without diabetes. Am. J. Physiol. Endocrinol. Metab. 2016, 310, E550–E564.[CrossRef] [PubMed]
17. Ritze, Y.M.; Bardos, G.; D’Haese, J.G.; Ernst, B.; Thurnheer, M.; Schultes, B.; Bischoff, S.C. Effect of high sugarintake on glucose transporter and weight regulating hormones in mice and humans. PLoS ONE 2014, 9,e101702. [CrossRef] [PubMed]
18. Lirio, L.M.; Forechi, L.; Zanardo, T.C.; Batista, H.M.; Meira, E.F.; Nogueira, B.V.; Mill, J.G.; Baldo, M.P.Chronic fructose intake accelerates non-alcoholic fatty liver disease in the presence of essential hypertension.J. Diabetes Complicat. 2016, 30, 85–92. [CrossRef] [PubMed]
19. Glendinning, J.I.; Breinager, L.; Kyrillou, E.; Lacuna, K.; Rocha, R.; Sclafani, A. Differential effects of sucroseand fructose on dietary obesity in four mouse strains. Physiol. Behav. 2010, 101, 331–343. [CrossRef] [PubMed]
20. Galgani, J.; Ravussin, E. Energy metabolism, fuel selection and body weight regulation. Int. J. Obes. 2008, 32(Suppl. S7), S109–S119. [CrossRef] [PubMed]
21. Chaumontet, C.; Even, P.C.; Schwarz, J.; Simonin-Foucault, A.; Piedcoq, J.; Fromentin, G.; Azzout-Marniche, D.;Tomé, D. High dietary protein decreases fat deposition induced by high-fat and high-sucrose diet in rats.Br. J. Nutr. 2015, 114, 1132–1142. [CrossRef] [PubMed]
22. Borsheim, E.; Bui, Q.U.; Tissier, S.; Cree, M.G.; Rønsen, O.; Morio, B.; Ferrando, A.A.; Kobayashi, H.;Newcomer, B.R.; Wolfe, R.R. Amino acid supplementation decreases plasma and liver triacylglycerols inelderly. Nutrition 2009, 25, 281–288. [CrossRef] [PubMed]
23. Simental-Mendia, L.E.; Rodriguez-Moran, M.; Guerrero-Romero, F. The hypertriglyceridemia is associatedwith isolated impaired glucose tolerance in subjects without insulin resistance. Endocr. Res. 2015, 40, 70–73.[CrossRef] [PubMed]
24. Ram, J.; Snehalatha, C.; Nanditha, A.; Selvam, S.; Shetty, S.A.; Godsland, I.F.; Johnston, D.G.; Ramachandran, A.Hypertriglyceridaemic waist phenotype as a simple predictive marker of incident diabetes in Asian-Indianmen with prediabetes. Diabet. Med. 2014, 31, 1542–1549. [CrossRef] [PubMed]
25. Daly, M.E.; Vale, C.; Walker, M.; Alberti, K.G.; Mathers, J.C. Dietary carbohydrates and insulin sensitivity:A review of the evidence and clinical implications. Am. J. Clin. Nutr. 1997, 66, 1072–1085. [PubMed]
26. Giorelli Gde, V.; Matos, L.N.; Saado, A.; Soibelman, V.L.; Dias, C.B. No association between 25-hydroxyvitaminD levels and prediabetes in Brazilian patients. A cross-sectional study. Sao Paulo Med. J. 2015, 133, 73–77.[CrossRef] [PubMed]
27. Jenkins, N.T.; Hagberg, J.M. Aerobic training effects on glucose tolerance in prediabetic and normoglycemichumans. Med. Sci. Sports Exerc. 2011, 43, 2231–2240. [CrossRef] [PubMed]
28. Fiorini, F.; Raffa, M.; Patrone, E.; Castelluccio, A. Glucose metabolism and chronic renal insufficiency.Arch. Ital. Urol. Androl. 1994, 66, 51–56. [PubMed]
29. Pagliassotti, M.J.; Prach, P.A.; Koppenhafer, T.A.; Pan, D.A. Changes in insulin action, triglycerides, and lipidcomposition during sucrose feeding in rats. Am. J. Physiol. 1996, 271, R1319–R1326. [PubMed]
227
Books
MDPI
Nutrients 2017, 9, 638
30. Dutta, K.; Podolin, D.A.; Davidson, M.B.; Davidoff, A.J. Cardiomyocyte dysfunction in sucrose-fed rats isassociated with insulin resistance. Diabetes 2001, 50, 1186–1192. [CrossRef] [PubMed]
31. Mohd Nor, N.S.; Lee, S.; Bacha, F.; Tfayli, H.; Arslanian, S. Triglyceride glucose index as a surrogate measureof insulin sensitivity in obese adolescents with normoglycemia, prediabetes, and type 2 diabetes mellitus:Comparison with the hyperinsulinemic-euglycemic clamp. Pediatr. Diabetes 2016, 17, 458–465. [CrossRef][PubMed]
32. Weiss, R.; Dufour, S.; Taksali, S.E.; Tamborlane, W.V.; Petersen, K.F.; Bonadonna, R.C.; Boselli, L.; Barbetta, G.;Allen, K.; Rife, F.; et al. Prediabetes in obese youth: A syndrome of impaired glucose tolerance, severe insulinresistance, and altered myocellular and abdominal fat partitioning. Lancet 2003, 362, 951–957. [CrossRef]
33. Neeland, I.J.; Turer, A.T.; Ayers, C.R.; Powell-Wiley, T.M.; Vega, G.L.; Farzaneh-Far, R.; Grundy, S.M.;Khera, A.; McGuire, D.K.; de Lemos, J.A. Dysfunctional adiposity and the risk of prediabetes and type 2diabetes in obese adults. JAMA 2012, 308, 1150–1159. [CrossRef] [PubMed]
34. Kim, G.; Jo, K.; Kim, K.J.; Lee, Y.H.; Han, E.; Yoon, H.J.; Wang, H.J.; Kang, E.S.; Yun, M. Visceral adiposity isassociated with altered myocardial glucose uptake measured by (18)FDG-PET in 346 subjects with normalglucose tolerance, prediabetes, and type 2 diabetes. Cardiovasc. Diabetol. 2015, 14, 148. [CrossRef] [PubMed]
35. Tal, M.; Kahn, B.B.; Lodish, H.F. Expression of the low Km GLUT-1 glucose transporter is turned on inperivenous hepatocytes of insulin-deficient diabetic rats. Endocrinology 1991, 129, 1933–1941. [CrossRef][PubMed]
36. Tobin, V.; Le Gall, M.; Fioramonti, X.; Stolarczyk, E.; Blazquez, A.G.; Klein, C.; Prigent, M.; Serradas, P.;Cuif, M.H.; Magnan, C.; et al. Insulin internalizes GLUT2 in the enterocytes of healthy but notinsulin-resistant mice. Diabetes 2008, 57, 555–562. [CrossRef] [PubMed]
37. Carvalho, E.; Rondinone, C.; Smith, U. Insulin resistance in fat cells from obese Zucker rats—Evidence for animpaired activation and translocation of protein kinase B and glucose transporter 4. Mol. Cell. Biochem. 2000,206, 7–16. [CrossRef] [PubMed]
38. Basu, R.; Barosa, C.; Jones, J.; Dube, S.; Carter, R.; Basu, A.; Rizza, R.A. Pathogenesis of prediabetes: Role ofthe liver in isolated fasting hyperglycemia and combined fasting and postprandial hyperglycemia. J. Clin.Endocrinol. Metab. 2013, 98, E409–E417. [CrossRef] [PubMed]
39. Dinneen, S.F. The postprandial state: Mechanisms of glucose intolerance. Diabet. Med. 1997, 14 (Suppl. S3),S19–S24. [CrossRef]
40. Ryu, M.H.; Cha, Y.S. The effects of a high-fat or high-sucrose diet on serum lipid profiles, hepatic acyl-CoAsynthetase, carnitine palmitoyltransferase-I, and the acetyl-CoA carboxylase mRNA levels in rats. J. Biochem.Mol. Biol. 2003, 36, 312–318. [CrossRef] [PubMed]
41. Bruckdorfer, K.R.; Khan, I.H.; Yudkin, J. Fatty acid synthetase activity in the liver and adipose tissue of ratsfed with various carbohydrates. Biochem. J. 1972, 129, 439–446. [CrossRef] [PubMed]
42. Agheli, N.; Kabir, M.; Berni-Canani, S.; Petitjean, E.; Boussairi, A.; Luo, J.; Bornet, F.; Slama, G.; Rizkalla, S.W.Plasma lipids and fatty acid synthase activity are regulated by short-chain fructo-oligosaccharides insucrose-fed insulin-resistant rats. J. Nutr. 1998, 128, 1283–1288. [PubMed]
43. Im, S.S.; Kang, S.Y.; Kim, S.Y.; Kim, H.I.; Kim, J.W.; Kim, K.S.; Ahn, Y.H. Glucose-stimulated upregulation ofGLUT2 gene is mediated by sterol response element-binding protein-1c in the hepatocytes. Diabetes 2005, 54,1684–1691. [CrossRef] [PubMed]
44. Ducluzeau, P.H.; Perretti, N.; Laville, M.; Andreelli, F.; Vega, N.; Riou, J.P.; Vidal, H. Regulation by insulin ofgene expression in human skeletal muscle and adipose tissue. Evidence for specific defects in type 2 diabetes.Diabetes 2001, 50, 1134–1142. [CrossRef] [PubMed]
45. Herman, M.A.; Peroni, O.D.; Villoria, J.; Schön, M.R.; Abumrad, N.A.; Blüher, M.; Klein, S.; Kahn, B.B.A novel ChREBP isoform in adipose tissue regulates systemic glucose metabolism. Nature 2012, 484, 333–338.[CrossRef] [PubMed]
46. Lampidonis, A.D.; Rogdakis, E.; Voutsinas, G.E.; Stravopodis, D.J. The resurgence of Hormone-SensitiveLipase (HSL) in mammalian lipolysis. Gene 2011, 477, 1–11. [CrossRef] [PubMed]
47. Bouchard-Mercier, A.; Rudkowska, I.; Lemieux, S.; Couture, P.; Vohl, M.C. The metabolic signature associatedwith the Western dietary pattern: A cross-sectional study. Nutr. J. 2013, 12, 158. [CrossRef] [PubMed]
48. Hu, F.B. Resolved: There is sufficient scientific evidence that decreasing sugar-sweetened beverageconsumption will reduce the prevalence of obesity and obesity-related diseases. Obes. Rev. 2013, 14,606–619. [CrossRef] [PubMed]
228
Books
MDPI

Nutrients 2017, 9, 638
49. Malik, V.S.; Popkin, B.M.; Bray, G.A.; Despres, J.P.; Willett, W.C.; Hu, F.B. Sugar-sweetened beverages and riskof metabolic syndrome and type 2 diabetes: A meta-analysis. Diabetes Care 2010, 33, 2477–2483. [CrossRef][PubMed]
50. Fung, T.T.; Malik, V.; Rexrode, K.M.; Manson, J.E.; Willett, W.C.; Hu, F.B. Sweetened beverage consumptionand risk of coronary heart disease in women. Am. J. Clin. Nutr. 2009, 89, 1037–1042. [CrossRef] [PubMed]
51. Lana, A.; Rodriguez-Artalejo, F.; Lopez-Garcia, E. Consumption of sugar-sweetened beverages is positivelyrelated to insulin resistance and higher plasma leptin concentrations in men and non overweight women.J. Nutr. 2014, 144, 1099–1105. [CrossRef] [PubMed]
© 2017 by the authors. Licensee MDPI, Basel, Switzerland. This article is an open accessarticle distributed under the terms and conditions of the Creative Commons Attribution(CC BY) license (http://creativecommons.org/licenses/by/4.0/).
229
Books
MDPI

nutrients
Review
Nuts and Dried Fruits: An Update of Their BeneficialEffects on Type 2 Diabetes
Pablo Hernández-Alonso 1,2, Lucía Camacho-Barcia 1,2, Mònica Bulló 1,2,* and
Jordi Salas-Salvadó 1,2,*
1 Human Nutrition Unit, Biochemistry and Biotechnology Department, Faculty of Medicine and HealthSciences, University Hospital of Sant Joan de Reus, IISPV, Universitat Rovira i Virgili, St/Sant Llorenç 21,43201 Reus, Spain; [email protected] (P.H.-A.); [email protected] (L.C.-B.)
2 CIBERobn Physiopathology of Obesity and Nutrition, Instituto de Salud Carlos III, 28029 Madrid, Spain* Correspondence: [email protected] (M.B.); [email protected] (J.S.-S.);
Tel.: +34-977-759-312 (M.B.); +34-977-759-311 (J.S.-S.)
Received: 24 May 2017; Accepted: 22 June 2017; Published: 28 June 2017
Abstract: Nuts and dried fruit are essential foods in the Mediterranean diet. Their frequentconsumption has been associated with the prevention and/or the management of such metabolicconditions as type 2 diabetes (T2D), metabolic syndrome and cardiovascular diseases. Severalprevious reviews of epidemiological studies and clinical trials have evaluated the associations ofnuts and/or dried fruit with various metabolic disorders. However, no reviews have focused on themechanisms underlying the role of nuts and/or dried fruit in insulin resistance and T2D. This reviewaims to report nut and dried-fruit nutritional interventions in animals and humans, and to focus onmechanisms that could play a significant role in the prevention and treatment of insulin resistanceand T2D.
Keywords: diabetes; nuts; dried fruits; insulin resistance; mechanisms; clinical trials
1. Introduction
Nuts and traditional dried fruit (i.e., with no added sugar) are key food categories in theMediterranean diet and other regional diets [1]. Several prospective studies, clinical trials and researchin animals have reported beneficial effects after nut consumption [2]. However, the benefits of driedfruits (DF), mainly raisins, have been less explored [3].
Over time, food consumption has varied. More than 30 years ago, the consumption of nuts and DFwas discouraged because of their high fat and sugar content, respectively. However, at the beginningof the 1990s, several randomized clinical trials (RCT) and animal experiments demonstrated theirpotential beneficial effect on cardiovascular diseases (CVD). Nuts and DF contain various macro andmicronutrients together with other important bioactive compounds that may synergically contribute tomodulate specific metabolic diseases such as hypercholesterolemia, hypertension and type 2 diabetes(T2D) (reviewed in [3,4]). Even so, the specific role of nuts and DF in the development and progressionof insulin resistance (IR) and T2D are still controversial.
In this review, we focus on the role of nuts and DF in the prevention and treatment of T2D.We summarize published in vivo, in vitro, epidemiological and clinical studies, and we review thepotential mechanisms that could explain the beneficial role of nut consumption on glucose and insulinmetabolism, both of which are altered in T2D and in other glucose-impaired states. Given that thepresent article is not a systematic review, we may not have identified some studies and publicationbias should be acknowledged. However, all authors independently conducted the literature search.
Nutrients 2017, 9, 673 230 www.mdpi.com/journal/nutrients
Books
MDPI

Nutrients 2017, 9, 673
1.1. Nuts and Dried Fruits: The Concept
1.1.1. Nuts
Nuts have been part of the human diet since prehistoric times [5,6]. They are an independentfood group and are one of the cornerstones of the Mediterranean diet (MedDiet) [7]. According to thebotanical definition, a nut is simply a dried fruit with one seed (rarely two) in which the ovary wallsare very hard (stony or woody) at maturity, and the seed is unattached or free within the ovary wall.However, the word “nut” is commonly used to refer to any large, oily kernel in a shell that can be eatenas food. In this review, we use the term “nuts” to refer to almonds, Brazil nuts, cashews, hazelnuts,macadamias, peanuts, pecans, pine nuts, pistachios and walnuts. Although peanuts are actuallyclassified as legumes because of their similar nutrient composition and their proven cardiovascularhealth benefits, they are commonly regarded as being a nut.
1.1.2. Dried Fruits
To extend their shelf life, fresh fruits are processed by various techniques to become DFs [3].Dried fruits are a concentrated form of fresh fruits with a lower moisture content. Fruits can be driedwhole (e.g., apricots, berries and grapes), in halves, or in slices (e.g., kiwis, mangoes and papayas).In this form, they are easy to store and distribute, they can be available throughout the year, and theyare a healthier alternative to salty or sugary snacks. Apples, apricots, currants, dates, figs, peaches,pears, prunes, and raisins are referred to as “conventional” or “traditional” DFs. Meanwhile, suchfruits as blueberries, cranberries, cherries, strawberries and mangoes are commonly infused withdifferent types of sugar solution (or fruit juice) concentrate before drying [8] so are not included inthe aforementioned category. Moreover, we have also excluded dried tomato because although it isbotanically a berry-type fruit, it is culinary considered a vegetable and it shares nutrient compositionwith this food category.
1.2. Nutritional Composition of Nuts and Dried Fruits
Nuts and DFs are a matrix of important bioactive compounds such as Vitamins (Vitamin E, niacin,choline and/or folic acid), minerals (magnesium, potassium, calcium and/or phosphorus), phenoliccompounds, carotenoids and/or phytosterols [9]. Importantly, some nuts and DFs are among the50 foods with the highest antioxidant capacity [10] and are also a known source of bioactive compounds,including plant sterols [11]. Pistachios are particularly rich in β-carotenes which have been widelyassociated with a protective T2D role [12,13]. In addition, pistachios are the only nuts that containsignificant amounts of lutein and zeaxanthin [9]. Sun-dried raisins retain the minerals and most ofthe phytochemicals and antioxidants of the grape, including its resveratrol [14,15]. In fact, sun-dryingenhances the antioxidant content of raisins. Because of the dehydration process, phytonutrientsare more concentrated in raisins than in grapes. However, the concentration of some compounds isdecreased by the sun-drying process in DFs and by dry roasting techniques in nuts [9]. Polyphenols andtocopherols from nuts and DF have proved to be rapidly accessible in the stomach, thus maximizingthe possibility of absorption in the upper small intestine, and contributing to the beneficial relationbetween nut and DF consumption and health-related outcomes [8,16].
However, their macronutrient compositions are quite different, which means that their energycontents are also quite different. Nuts contain a high amount of total fat (Range (Re): 43.9–78.8%)with a high amount of unsaturated fat (monounsaturated fatty acids (MUFA) + polyunsaturated fattyacids (PUFA), Re: 31.6–62.4%), a relatively low amount of carbohydrates (CHOs) (Re: 11.7–30.2%) andvegetable protein (Re: 7.9–25.8%) (Table 1).
Conversely, DFs are mainly composed of CHOs (Re: 61.3–72.8%). They have a low content ofprotein (Re: 0.17–4.08%) and a fat content of less than 1% (Table 2). Importantly, both foods also containa considerable amount of dietary fiber. Overall, their unique and varied nutrient composition makesthem key foods to counteract various metabolic diseases.
231
Books
MDPI

Nutrients 2017, 9, 673
Ta
ble
1.
Nut
rien
tcom
posi
tion
ofnu
ts(p
er10
0g
ofra
wnu
t).
Nu
trie
nt
Alm
on
ds
Bra
zil
Nu
tsb
Cash
ew
sH
azeln
uts
Maca
dam
ias
Pean
uts
Peca
ns
Pin
eN
uts
bP
ista
chio
sW
aln
uts
c
Ener
gy,K
cal
579
659
553
628
718
567
691
673
560
654
Wat
er,g
4.4
3.4
5.2
5.3
1.4
6.5
3.5
2.3
4.4
4.1
Fat,
g49
.967
.143
.960
.875
.849
.272
.068
.445
.365
.2SF
A,g
3.8
16.1
7.8
4.5
12.1
6.3
6.2
4.9
5.9
6.1
MU
FA,g
31.6
23.9
23.8
45.7
58.9
24.4
40.8
18.8
23.3
9.0
PUFA
,g12
.324
.47.
87.
91.
515
.621
.634
.114
.447
.2Pr
otei
n,g
21.2
14.3
18.2
15.0
7.9
25.8
9.2
13.7
20.2
15.2
CH
O,g
21.6
11.7
30.2
16.7
13.8
16.1
13.9
13.1
27.2
13.7
Fibe
r,g
12.5
7.5
3.3
9.7
8.6
8.5
9.6
3.7
10.6
6.7
Ca,
mg
269
160
3711
485
9270
1610
598
Mg,
mg
270
376
292
163
130
168
121
251
121
158
Na,
mg
13
120
518
02
12
K,m
g73
365
966
068
036
870
541
059
710
2544
1P,
mg
481
725
593
290
188
376
277
575
490
346
Lute
in-Z
eaxa
nthi
n,μ
g1
022
92N
A0
179
2903
9β
-Car
oten
e,μ
g1
00
11N
A0
2917
305
12α
-Car
oten
e,μ
g0
00
3N
A0
00
100
Phyt
oste
rols
a ,mg
197
123.
515
112
211
6N
A15
8.8
236.
121
411
0.2
Tota
lphe
nols
,mg
287
244
137
687
126
406
1284
3286
715
76V
itam
inE
(α-t
ocop
hero
l),m
g25
.65.
70.
915
.00.
58.
31.
49.
32.
90.
7
Nu
trie
ntin
form
atio
nis
take
nfr
omth
eU
nite
dSt
ates
Dep
artm
ent
ofA
gric
ult
ure
(USD
A)
Nu
trie
ntD
atab
ase
Stan
dar
dR
efer
ence
,R
elea
se28
[9].
CH
O,
carb
ohyd
rate
s;M
UFA
,m
onou
nsat
urat
edfa
tty
acid
s;N
A:n
otav
aila
ble;
PUFA
,pol
yuns
atur
ated
fatt
yac
ids;
SFA
,sat
urat
edfa
tty
acid
s.a
Phyt
oste
rols
,are
the
sum
ofst
igm
aste
rol,
cam
pest
erol
,β-s
itost
erol
and
othe
rph
ytos
tero
ls;b
dry
roas
ted;
cEn
glis
hva
riet
y.
232
Books
MDPI

Nutrients 2017, 9, 673
Ta
ble
2.
Nut
rien
tcom
posi
tion
ofdr
ied
frui
ts(p
er10
0g)
.
Nu
trie
nt
Ap
ple
sa
Ap
rico
tsa
Cu
rra
nts
(Za
nte
)C
ran
be
rrie
sb
Da
tes
cF
igs
Pe
ach
es
aP
ea
rsa
Plu
ms/
Pru
ne
sR
ais
ins
d
Ener
gy,K
cal
243
241
283
308
282
249
239
262
240
299
Wat
er,g
31.7
630
.89
19.2
115
.79
20.5
330
.05
31.8
026
.69
30.9
215
.43
Fat,
g0.
320.
510.
271.
090.
390.
930.
760.
630.
380.
46C
HO
,g65
.89
62.6
474
.08
82.8
075
.03
63.8
761
.33
69.7
063
.88
79.1
8Su
gars
,g57
.19
53.4
467
.28
72.5
663
.35
47.9
241
.74
62.2
038
.13
59.1
9Fr
ucto
se,g
NA
12.4
7N
A26
.96
19.5
622
.93
13.4
9N
A12
.45
29.6
8Pr
otei
n,g
0.93
3.39
4.08
0.17
2.45
3.30
3.61
1.87
2.18
3.07
Fibe
r,g
8.7
7.3
6.8
5.3
8.0
9.8
8.2
7.5
7.1
3.7
Ca,
mg
1455
869
3916
228
3443
50Fe
,mg
1.40
2.66
3.26
0.39
1.02
2.03
4.06
2.10
0.93
1.88
Mg,
mg
1632
414
4368
4233
4132
Na,
mg
8710
85
210
76
211
K,m
g45
011
6289
249
656
680
996
533
732
749
Cu,
mg
0.19
0.34
0.47
0.06
0.21
0.29
0.36
0.37
0.28
0.32
β-c
arot
ene,μ
g0
2163
4327
66
1074
239
40
α-c
arot
ene,μ
g0
01
00
03
057
0Lu
tein
-Zea
xant
hin,
μg
00
013
875
3255
950
148
0V
itam
inA
,IU
036
0473
4610
1021
633
781
0To
talp
heno
ls,m
gG
AE/
100g
e32
424
8N
AN
A66
196
028
367
993
810
65
Dat
ais
for
trad
ition
aldr
ied
frui
tsw
hich
isde
fined
asth
ose
with
noad
ded
suga
rs,t
ypic
ally
sun-
drie
dor
drie
dw
ithm
inim
alpr
oces
sing
.Nut
rien
tinf
orm
atio
nis
take
nfr
omth
eU
nite
dSt
ates
Dep
artm
ento
fAgr
icu
ltu
re(U
SDA
)Nu
trie
ntD
atab
ase
Stan
dar
dR
efer
ence
,Rel
ease
28[9
].C
HO
,car
bohy
dra
tes;
GA
E,g
allic
acid
equ
ival
ents
;IU
,int
erna
tion
alu
nit;
NA
,not
avai
labl
e.a
Sulf
ured
;bsw
eete
ned;
cD
egle
tnoo
ris
the
com
mon
vari
ety;
dse
edle
ss;e
Tota
lphe
nolc
onte
ntw
asob
tain
edfr
omA
lasa
lvar
and
Shah
idi[
8].
233
Books
MDPI

Nutrients 2017, 9, 673
1.3. Diet Quality in the Context of Nut and Dried Fruit Consumption
Epidemiological studies conducted in children and adults have demonstrated a significant positiveassociation between nut consumption and diet quality [17,18]. Furthermore, the results of a clinicaltrial conducted in obese (Ob) subjects (n = 124) showed that the nutritional dietary quality of nutconsumers (reporting to eat 42 g hazelnuts/day for 12 weeks) was remarkably higher than amongother groups consuming chocolate, potato crisps or no additional foods [19]. Moreover, including nutsin energy-restricted diets reduced attrition and increased weight loss, indicating that nuts enhancepalatability and compliance with diets without compromising health [20].
Several studies have examined the associations of whole fruit or 100% fruit juice [21] withnutritional or health outcomes such as T2D but there is a lack of studies examining potential linksbetween DF and diet quality. A prospective study conducted in adult participants (n = 13,292) inthe 1999–2004 National Health and Nutrition Examination Survey (NHANES) demonstrated anassociation between DF consumption and diet quality [22]. DF consumption was associated withimproved nutrient intakes, a higher overall diet quality score, and lower body weight (BW)/adipositymeasures [22]. Moreover, in a cross-sectional study in healthy adults (n = 797) from Hong Kong, aninverse association has been found between the intake of vegetables, legumes, fruits, dried fruitsand Vitamin C and the prevalence of metabolic disorders such as non-alcoholic fatty liver disease(NAFLD) [23].
The 2015 Dietary Guidelines for Americans included the following three healthy dietary patterns:a Healthy US-style Pattern, a Healthy Vegetarian Pattern and a Healthy Mediterranean-style pattern.Fruits, nuts, and seeds play a prominent role in all three of these food-based dietary patterns, whichrecommend 350–440 g/day of fruit, and 16–28 g/day of nuts and seeds [24].
2. In Vivo and In Vitro Studies
Even though much of the research on nuts, dried fruits and T2D is based on observational studiesand human trials, some in vitro and in vivo studies also evaluate their modulatory effect on glucoseand insulin metabolism. In this regard, the effect of nuts on glucose and insulin metabolism hasbeen investigated by evaluating nut extracts [25,26] or nuts as a whole [27–29] mainly in mice or rats.However, dried fruit has been investigated—like their non-dried counterparts—mainly in in vitrostudies [30–33]. Almost all the research has focused on the extracts from non-edible parts, such as theshell [34], leaves [35,36], stems [37] and roots [38], and very little on the nut or fruit kernel [27–29,39].However, this review focuses on those studies evaluating specific nutrients (e.g., polyphenols) oredible parts in both traditional nuts and dried fruits with outcomes related to glucose metabolism, IR,and the T2D oxidation/inflammation axis [32,40].
2.1. Nuts
The in vivo studies on nuts and T2D-related parameters are summarized in Table 3. These studieswere mainly performed using extracts from peanuts or walnuts. Peanut oil supplementation for42 days in diabetes-induced rats significantly reduced glucose and glycated hemoglobin (HbA1c)concentrations and improved lipid metabolism compared to normal rats [27]. Other researchershave found similar improvements in glycaemia in genotypes of diabetes in rats fed with peanut oilextract [41,42] or peanut aqueous extract [25]. In the case of walnuts, a polyphenol-rich walnut extract(PWE) for 4 weeks significantly decreased urinary 8-hydroxy-2′-deoxyguanosin levels (an in vivomarker of oxidative stress) and improved serum TG in db/db mice [26]. Moreover, an HFD with a 21.5%of energy from walnuts tested in mice for 20 weeks significantly reduced TG compared to nut-freeHFD and tended to improve glucose and IR [29].
234
Books
MDPI

Nutrients 2017, 9, 673
Ta
ble
3.
Sum
mar
yof
invi
vost
udie
san
dth
eir
char
acte
rist
ics
inth
eco
ntex
tofn
utco
nsum
ptio
nan
dty
pe2
diab
etes
(T2D
)-re
late
dou
tcom
es.
Fir
stA
uth
or
(Year)
[Refe
ren
ce]
Nu
t(S
tud
yL
en
gth
)A
nim
al
Mo
del
Use
dC
on
tro
lIn
terv
en
tio
nG
luco
sean
dIn
suli
nM
eta
bo
lism
Eff
ect
sO
ther
Ou
tco
mes
Bilb
is,L
.S.;
etal
.(2
002)
[25]
Aqu
eous
extr
act
ofpe
anut
(21
days
)
Allo
xan-
indu
ced
diab
etic
rats
(n=
12)a
ndno
n-di
abet
icra
ts(n
=12
),di
vide
din
to3
equa
lgro
ups
Non
-dia
beti
cw
ith
unre
stri
cted
stan
dard
diet
and:
(a)w
ater
adlib
itum
;(b
)unr
estr
icte
dac
cess
todr
inki
ngw
ater
and
2m
Lof
the
extr
act3
times
/day
;or
(c)f
ree
acce
ssto
the
extr
acta
sth
eon
lydr
inki
ngw
ater
.
Dia
beti
cco
ntro
ls:t
reat
edas
(a),
(b)o
r(c
)
The
extr
act(
alon
eor
plus
wat
er)d
ecre
ased
FBG
inbo
thno
rmal
and
allo
xan-
indu
ced
diab
etic
rats
.
Sign
ifica
ntde
crea
sein
seru
mTG
,TC
,HD
L-C
and
LDL-
Cin
both
norm
alan
dal
loxa
n-in
duce
ddi
abet
icra
ts.
Fuku
da,T
.;et
al.
(200
4)[2
6]
Poly
phen
ol-r
ich
wal
nute
xtra
ct(P
WE)
(4w
eeks
)
db/d
b(n
=15
)and
C57
BL/K
sJ-d
b/db
(n=
6)m
ice
Con
trol
db/d
bm
ice
(n=
8)an
dC
57BL
/KsJ
-db/
+m
mic
e(n
=6,
used
for
the
blan
kgr
oup)
wer
egi
ven
wat
er.
Expe
rim
enta
ldb/
dbm
ice
(n=
7)re
ceiv
edor
alPW
E(2
00m
g/kg
BW)
Sign
ifica
ntde
crea
sein
the
leve
lofu
rina
ry8-
hydr
oxy-
2′-d
eoxy
guan
osin
(in
vivo
mar
ker
ofox
idat
ive
stre
ss)i
nPW
E-fe
dm
ice
Seru
mT
Gle
velw
asim
prov
edaf
ter
PWE
adm
inis
trat
ion
Ram
esh,
B.;e
tal.
(200
6)[2
7]Pe
anut
oil
(42
days
)
Nor
mal
(n=
12)a
ndST
Z-d
iabe
tes
indu
ced
(n=
18)W
ista
rra
ts
G1:
Nor
mal
rats
G3:
Dia
beti
cra
ts
G2:
Nor
mal
rats
+pe
anut
oild
iet(
2%)G
4:D
iabe
tic
rats
+pe
anut
oild
iet(
2%)
G5:
Dia
beti
cra
ts+
GLI
(600
μg/
kgBW
)
Dia
beti
cra
tsfe
dw
ith
pean
utoi
lsig
nific
antl
yre
duce
gluc
ose,
HbA
1C,a
ndG
6Pas
ean
dFB
Pac
tivi
ties
Dia
beti
cra
tsfe
dw
ith
pean
utoi
lsho
wed
asm
allb
utsi
gnifi
cant
redu
ctio
nin
TC
,V
LDL-
C,L
DL-
Can
dT
Gan
dan
incr
ease
inH
DL-
C.
Vas
silio
u,E.
K.;
etal
.(2
009)
[41]
Pean
utoi
l(2
1da
ys)
Mal
eK
KA
y(n
=24
)mic
eK
KA
ym
ice
fed
wit
hno
rmal
diet
(11.
4%fa
t)
Dia
beti
cK
KA
y+
HFD
.D
iabe
tic
KK
Ay
+H
FDw
ith
pean
utoi
l(0.
70m
L/da
y).H
FDis
58%
fat.
Dia
beti
cm
ice
adm
inis
tere
dpe
anut
oilh
adlo
wer
gluc
ose
leve
lsth
anan
imal
sad
min
iste
red
HFD
alon
e.
Cho
i,Y.
;eta
l.(2
016)
[29]
Wal
nuts
(20
wee
ks)
Mal
eC
57BL
/6Jm
ice
( ≥6
mic
e/gr
oup)
Reg
ular
rode
ntch
ow
HFD
(45%
ener
gy-d
eriv
ed)w
ith
orw
itho
utw
alnu
ts(2
1.5%
ener
gy-d
eriv
ed)
Glu
cose
and
insu
linre
sist
ance
tend
edto
impr
ove
wit
hw
alnu
tsu
pple
men
tati
on.
Wal
nuts
uppl
emen
tati
ondi
dno
tcha
nge
the
HFD
-ind
uced
incr
ease
inBW
orV
FM.
How
ever
,die
tary
wal
nuts
sign
ifica
ntly
decr
ease
dth
eam
ount
sof
hepa
tic
TG
obse
rved
inH
FD-f
edm
ice.
Ade
wal
e,O
.F.;
etal
.(2
016)
[42]
Pean
utoi
lPal
moi
l(3
wee
ks)
Nor
mal
(n=
12)a
ndal
loxa
n-in
duce
ddi
abet
icW
ista
rra
ts(n
=36
)N
on-d
iabe
tic
Dia
beti
cno
n-su
pple
men
ted.
Dia
beti
csu
pple
men
ted
wit
hPe
Oor
PaO
(200
mg/
kg/d
ay)
Sign
ifica
ntre
duct
ion
inbl
ood
gluc
ose
ofsu
pple
men
ted
grou
ps(P
eO+
PaO
)co
mpa
red
toth
edi
abet
icno
n-su
pple
men
ted
grou
p.
Plas
ma
Vita
min
sC
and
Ean
dal
bum
inle
vels
wer
esi
gnifi
cant
lyin
crea
sed
inth
esu
pple
men
ted
grou
psve
rsus
the
diab
etic
non-
supp
lem
ente
dgr
oup.
BW,b
ody
wei
ght;
FBG
,fas
ting
bloo
dgl
ucos
e;FB
P,fr
ucto
se-1
,6-b
isph
osph
atas
e;G
6Pas
e,gl
ucos
e6-
phos
phat
ase;
GLI
,glib
encl
amid
e;H
DL-
C,h
igh-
dens
itylip
opro
tein
chol
este
rol;
HFD
,hi
gh-f
atd
iet;
LD
L-C
,low
-den
sity
lipop
rote
inch
oles
tero
l;P
aO,p
alm
oil;
PeO
,pea
nuto
il;P
WE
,pol
yphe
nol-
rich
wal
nute
xtra
ct;S
TZ
,str
epto
zoto
cin;
T2D
,typ
e2
dia
bete
s;T
C,t
otal
chol
este
rol;
TF,t
issu
efa
ctor
;TG
,tri
glyc
erid
es;V
FM,v
isce
ralf
atm
ass;
VLD
L-C
,ver
ylo
w-d
ensi
tylip
opro
tein
.
235
Books
MDPI

Nutrients 2017, 9, 673
In vitro assessment of the T2D-related antioxidant and inflammatory capacity of nuts has largelybeen conducted by examining the ability of extracts to increase the resistance of human plasma orlow density lipoprotein (LDL) to oxidation. Extracts of walnut [43], almond and almond skins [44,45],pistachio [46], and hazelnut [47] have been found to increase the lag time oxidation of LDL. However,little research has focused on their in vitro effects on glucose and insulin metabolism. Specifically,a hydro-ethanolic extract of cashew nut and its principal compound, anacardic acid, significantlystimulated glucose uptake in C2C12 muscle cells in a concentration-dependent manner, suggestingthat it may be a potential anti-diabetic nutraceutical [48]. Moreover, cytoprotective activity of pistachioextracts (methanolic, water or ethyl acetate) against oxidative (reactive oxygen species formation) andcarbonyl stress has also been reported in a T2D model in hepatocytes from rats [49].
2.2. Dried Fruits
Both in vitro and in vivo research has mostly focused on grape. Overman and collaboratorsshowed that a grape powder extract (GPE) significantly attenuated lipopolysaccharide (LPS)-mediatedinflammation in macrophages and decreased the capacity of LPS-stimulated human macrophages toinflame adipocytes and cause IR [30]. Moreover, GPE further attenuated tumor necrosis factor-α(TNF-α) mediated inflammation and IR in primary cultures of human adipocytes [31]. Grapepolyphenol extract modulated in vitro membrane phospholipid fatty acid (FA) composition but alsodecreased muscle TG content and increased muscle glucose transporter type 4 (GLUT4) expressionin high-fat-high-sucrose diet-fed rats. Overall, it improved insulin resistance status (i.e., HOMA-IRparameter) [50]. This is of considerable importance because the accumulation of muscle TG contentand the modification of the muscle phospholipid fatty acid pattern may have an impact on lipidmetabolism and increase the risk of developing T2D [51]. Mice fed with grape skin extract showedhypoglycaemic and anti-hyperglycaemic effects (independent of an increase in insulin release) butare probably dependent on an increase in insulin sensitivity resulting from the activation of theinsulin-signaling cascade in skeletal muscle [52]. Furthermore, grape seed aqueous extract protectedthe pancreas against oxidative stress, inflammation and apoptosis-induced damage while preservingpancreatic function at near normal levels in diabetic rats [53].
Other DF extracts have also been evaluated. Treatment with a date fruit extract was effective atdecreasing behavioral, neurophysiological, and pathological alterations induced by diabetes in theperipheral nerves of streptozotocin (STZ)-induced diabetic rats (well-characterized animal model oftype 1 diabetes) [33]. Moreover, daily consumption of a low- or high-fat diet supplemented with 1%black currant powder extract (with 32% of anthocyanins) for 8 weeks reduced body weight gain andimproved glucose metabolism [54].
The beneficial effect of fruit juices and fermented grape juice (i.e., wine) have also been animportant focus of research. Schmatz and collaborators investigated the ex vivo effects of a moderateconsumption of red wine (RW) and grape juice (GJ), and the in vitro effects of various substances(resveratrol, caffeic acid, gallic acid, quercetin and rutin) on STZ-induced diabetic rats. Theydemonstrated decreased platelet aggregation in diabetic-induced rats after moderate RW and GJconsumption for 45 days [55]. Similarly, resveratrol increased the hydrolysis of adenosine triphosphate(ATP), while quercetin decreased it in platelets [55]. These results were extended using a wine grapepowder supplementation, which prevented hyperglycemia and IR, and reduced oxidative stress in arat model of metabolic syndrome (MetS) [56].
Specific compounds found in both nuts and DFs were also further investigated. Quercetinand trans-resveratrol are plant polyphenols which have showed a significant reduction of IR andinflammation associated with obesity. Eid et al. showed that quercetin (isolated from lingonberry)exerted an anti-diabetic activity by stimulating adenosine monophosphate-activated protein kinase(AMPK) [40]. Moreover, quercetin also enhanced basal glucose uptake in mouse myoblast C2C12muscle cells in the absence of insulin [40] via a mechanism which is highly analogous to metformin.
236
Books
MDPI

Nutrients 2017, 9, 673
Importantly, quercetin seems to be as effective as or more effective than resveratrol in attenuatingTNF-α-mediated inflammation and IR in primary human adipocytes and macrophages [32,57].
3. Epidemiological Studies on Nuts
The relationship between the consumption of different food categories and the incidence orprevalence of metabolic disorders has been explored all over the world. As is shown in Table 4,numerous epidemiological studies have assessed the associations between nut consumption and T2D.However, no studies have been published on the link between DF consumption and risk of T2D.
As far as nuts are concerned, several studies have found an inverse association between thefrequency of consumption and the development of this metabolic pathology [58–64]. In the Nurses’Health Study (NHS) and NHS II cohort, the intake of different types of nut was explored [61,64]. Totalnut, walnut and peanut butter intake were associated with a lower risk of T2D in women. In the NHS(n = 83,818 female subjects), those with the highest nut consumption (28 g/day; ≥5 days a week) had alower relative risk (RR) of developing T2D (0.73 [95% confidence interval (CI), 0.60–0.89]) than thosewho never/almost never consume (0.92 [95% CI, 0.85–1.00]) [61]. Results were similar for peanutbutter: the RR was 0.79 (95% CI, 0.68–0.91) in those women who had a higher intake (5 times or more aweek) than those who never/almost never ate peanut butter [61]. After combining NHS and NHS IIcohorts, in a total of 137,953 female subjects, Pan and collaborators found that walnut consumptionwas inversely associated with risk of T2D [64].
These results are in line with those of a cross-sectional study of 7,210 subjects at high CV riskwithin the context of the PREvención con DIeta MEDiterránea (PREDIMED) study, where the uppercategory of nut consumption had a lower prevalence of T2D than the lower category [63]. A recentprospective study also associated the consumption of nuts—higher than 4 times a week—with a lowerrisk of T2D [60]. A cross-sectional study performed in the context of the National Health and NutritionExamination Survey (NHANES) established a relation between the homeostatic model assessmentof insulin resistance (HOMA-IR) and tree nut consumption. Decreased insulin resistance and lowerlevels of β-cell function markers were found in the nut consumers than the non-consumers [59]. In alarge cohort of the Netherlands Cohort Study (NLCS), the total nut intake was associated to lower T2Dcause-specific mortality in men and women [65].
Even though current evidence shows that nuts have a strong protective effect against the progress ofT2D, especially in women, some epidemiological studies have not identified this relation [66,67]. The latestsystematic review and meta-analysis designed to assess the relation between nut consumption andrisk of cancer and T2D was published in 2015. It included five studies that were linked to T2D. Afterpooling data from studies conducted in both genders, it was found that there was no statisticallysignificant association between nut consumption and risk of developing T2D (RR = 0.98 [95% CI,0.84–1.14]), even though the heterogeneity was significant [68].
237
Books
MDPI

Nutrients 2017, 9, 673
Ta
ble
4.
Sum
mar
yof
epid
emio
logi
cals
tudi
esev
alua
ting
nutc
onsu
mpt
ion.
Fir
stA
uth
or
(Ye
ar)
[Re
fere
nce
]S
tud
yN
am
e(D
esi
gn
)N
um
be
ro
fS
ub
ject
sY
ea
rso
fF
oll
ow
-Up
Ex
po
sure
Fin
din
gs
Jian
g,R
.;et
al.
(200
2)[6
1]N
HS
(Pro
spec
tive
)83
,818
wom
en16
≥5ti
mes
/wee
kvs
.ne
ver/
alm
ostn
ever
Nut
and
pean
utbu
tter
cons
umpt
ion
was
inve
rsel
yas
soci
ated
wit
hth
eri
skof
inci
dent
T2D
.
Net
tlet
on,J
.A.;
etal
.(2
008)
[58]
MES
A(P
rosp
ecti
ve)
5011
men
and
wom
en5
Qui
ntile
sof
low
-ris
kfo
odpa
tter
n
Hig
hin
take
ofw
hole
grai
ns,f
ruit
,nut
s/se
eds,
and
gree
nle
afy
vege
tabl
esw
asin
vers
ely
asso
ciat
edto
the
risk
ofin
cide
ntT2
D.
Vill
egas
,R.;
etal
.(2
008)
[62]
SWH
S(P
rosp
ecti
ve)
64,2
27w
omen
4.6
Qui
ntile
sof
pean
utco
nsum
ptio
nC
onsu
mpt
ion
ofpe
anut
sw
asas
soci
ated
wit
ha
decr
ease
dri
skof
inci
dent
T2D
.
Koc
har,
J.;et
al.
(201
0)[6
7]PH
SI(
Pros
pect
ive)
20,2
24m
en19
.2≥7
serv
ings
ofnu
ts/w
eek
vs.r
arel
yor
neve
rco
nsum
ers
No
stat
isti
cally
sign
ifica
ntas
soci
atio
nw
asfo
und
betw
een
nutc
onsu
mpt
ion
and
T2D
inei
ther
lean
orov
erw
eigh
t/ob
ese
subj
ects
.
Ibar
rola
-Jur
ado,
N.;
etal
.(2
013)
[63]
PRED
IMED
(Cro
ss-s
ecti
onal
)72
10at
high
card
iova
scul
arri
skBa
selin
e<1
serv
ing/
wee
k,1–
3se
rvin
gs/w
eek
and
>3se
rvin
gs/w
eek
The
uppe
rca
tego
ryof
nutc
onsu
mpt
ion
had
alo
wer
prev
alen
ceof
T2D
than
the
low
estc
ateg
ory.
Pan,
A.;
etal
.(2
013)
[64]
NH
S,N
HS
II(P
rosp
ecti
ve)
137,
953
wom
en10
1–3
serv
ings
/mon
th,
1se
rvin
g/w
eek,
and≥2
serv
ings
/wee
kof
wal
nuts
vs.
neve
r/ra
rely
Hig
her
wal
nutc
onsu
mpt
ion
isas
soci
ated
wit
ha
sign
ifica
ntly
low
erri
skof
T2D
inci
denc
e.
O’N
eil,
C.E
.;et
al.
(201
5)[5
9]N
HA
NES
(Cro
ss-s
ecti
onal
)14
,386
men
and
wom
en6
Tree
nutc
onsu
mpt
ion
com
pare
dw
ith
noco
nsum
ptio
n
Tree
nutc
onsu
mpt
ion
was
asso
ciat
edw
ith
low
erH
OM
A-I
R
Buijs
se,B
.;et
al.
(201
5)[6
6]EP
IC-I
nter
Act
Stud
y(C
ase-
coho
rt)
16,1
54m
enan
dw
omen
12.3
Inci
dent
case
sof
T2D
at6.
8
Non
-con
sum
ers
vs.t
hem
iddl
ete
rtile
ofco
nsum
ptio
n.
Con
sum
ptio
nof
nuts
and
seed
sdo
esno
tmod
ify
T2D
risk
unde
ris
ocal
oric
cond
itio
nsan
din
depe
nden
tfro
mBM
I.
Asg
hari
,G.;
etal
.(2
017)
[60]
TLG
S(p
rosp
ecti
ve)
1984
men
and
wom
en6.
2±
0.7
≥4se
rvin
gs/w
eek
vs.1
or<1
serv
ing/
wee
kN
utco
nsum
ptio
nw
asas
soci
ated
with
alo
wer
risk
ofT2
Din
cide
nce.
BM
I,bo
dy
mas
sin
dex
;CV
D,c
ard
iova
scu
lar
dis
ease
;HO
MA
-IR
,hom
eost
atic
mod
elas
sess
men
tofi
nsu
linre
sist
ance
;MI,
myo
card
iali
nfar
ctio
n;T
2D,t
ype
2d
iabe
tes.
Stu
dy
nam
eac
rony
ms:
EPIC
,Eur
opea
nPr
ospe
ctiv
eIn
vest
igat
ion
into
Can
cer;
HPF
S,H
ealth
Prof
essi
onal
sFo
llow
-Up
Stud
y;M
ESA
,Mul
ti-Et
hnic
Stud
yof
Ath
eros
cler
osis
;NH
AN
ES,N
atio
nalH
ealth
and
Nut
riti
onEx
amin
atio
nSu
rvey
;NH
S,N
urse
s’H
ealt
hSt
udy;
NLC
S,N
ethe
rlan
dsC
ohor
tStu
dy;P
HS,
Phys
icia
ns'H
ealt
hSt
udy;
PRED
IMED
,PR
Even
ción
con
DIe
taM
EDit
errá
nea;
SCC
S,So
uthe
rnC
omm
unit
yC
ohor
tStu
dy;S
MH
S,Sh
angh
aiM
en's
Hea
lth
Stud
y;SW
HS,
Shan
ghai
Wom
en's
Hea
lth
Stud
y;T
LGS,
Tehr
anLi
pid
and
Glu
cose
Stud
y.
238
Books
MDPI

Nutrients 2017, 9, 673
4. Human Clinical Trials
The effect of nut consumption on glucose and insulin metabolism has also been researched in acuteand chronic clinical trials. Acute studies mostly demonstrate a decrease in postprandial glycaemia andhyperinsulinemia after nut consumption. In contrast, chronic randomized clinical trials designed toanalyze the effects on glucose metabolism provided controversial results.
4.1. Nuts
4.1.1. Acute Clinical Trials on Nuts
Table 5 summarizes various acute clinical studies of nut consumption, most of which focus onalmonds [69–73]. In a randomized crossover trial in healthy subjects, almond intake decreasedpostprandial glycaemia and insulinaemia [69]. In a dose-response study conducted in healthyindividuals, almond intake attenuated the postprandial glycaemic response of white bread [70].In impaired glucose-tolerant subjects, it was observed that the consumption of almonds with a meal alsodecreased blood glucose in plasma [71]. In a recent crossover study performed in pre-diabetic subjects,a preload of almonds decreased postprandial glycaemia [73]. In healthy and diabetic individuals,Cohen et al. also showed a 30% reduction in postprandial glycaemia after almond consumptioncompared with a starchy meal [72].
The effect of pistachio intake on postprandial glycaemia was investigated by Kendall et al. in tworandomized studies. In overweight (Ow) healthy subjects, pistachio consumption was reported to havea minimal effect on postprandial glycaemia. When pistachios were included in a carbohydrate meal,the relative glycaemic response (RGR) was attenuated [74]. In a crossover trial with 20 subjects withMetS, postprandial glycaemia decreased after the consumption of pistachios (85 g) compared to whitebread. In the same study, a peripheral increase in the glucagon-like peptide-1 (GLP-1) concentrationswas also observed after pistachio consumption compared with the consumption of white bread [75].
For peanuts, a randomized crossover trial conducted in 13 healthy subjects reported a decreasedpostprandial glycaemic response after the consumption of a breakfast containing 63 g of one of thefollowing types of peanuts: raw with skin, roasted without skin and ground-roasted without skin [76].Similarly, in a parallel study conducted in 65 overweight and obese men, peanut consumption reducedpostprandial insulinaemia levels compared to high-oleic peanut consumption [77].
Nut consumption was observed to have similar beneficial effects on glucose and insulinmetabolism in the only study to analyze the effect of a mix of nuts (almonds, macadamias, walnuts,pistachios, hazelnuts and pecans). In this study conducted in 10 diabetic and 14 non-diabetic subjects,nut consumption decreased the RGR compared to white bread. Importantly, this study also reportedthat nut consumption improved short-term glycaemic control in patients with T2D [74].
In summary, nuts seem to have beneficial postprandial glycaemic effects when consumed aloneor in combination with high carbohydrate foods, and so may potentially help to prevent and manageimpaired glucose states.
239
Books
MDPI

Nutrients 2017, 9, 673
Ta
ble
5.
Sum
mar
yof
acut
ecl
inic
alst
udie
san
alyz
ing
the
effe
ctof
nutc
onsu
mpt
ion
onpo
stpr
andi
alre
spon
se.
Fir
stA
uth
or
(Year)
[Refe
ren
ce]
N◦
of
Su
bje
cts
(M/F
)T
yp
eo
fS
ub
ject
(Ag
ein
Years
)
Ty
pe
of
Nu
t(S
tud
yD
esi
gn
)C
on
tro
lG
rou
pIn
terv
en
tio
nG
rou
pG
luco
sean
dIn
suli
nM
eta
bo
lism
Ou
tco
mes
Oth
er
Ou
tco
mes
Jenk
ins,
D.J.
;eta
l.(2
006)
[69]
15(7
/8)H
ealt
hysu
bjec
ts(2
6.3±
8.6)
Alm
onds
(cro
ssov
er)
97g
ofw
hite
brea
d
-A
lmon
dm
eal:
60g
alm
onds
+97
gbr
ead
-Pa
rboi
led
rice
mea
l:68
gch
eese
and
14g
butt
er+6
0g
parb
oile
dri
ce-
Mas
hed
pota
tom
eal:
62g
chee
sean
d16
gbu
tter
+68
gm
ashe
dpo
tato
es
Alm
onds
decr
ease
post
pran
dial
glyc
aem
iaan
din
sulin
aem
ia.
Alm
onds
are
likel
yto
decr
ease
oxid
ativ
eda
mag
eto
seru
mpr
otei
nsby
decr
easi
nggl
ycae
mic
excu
rsio
nan
dpr
ovid
ing
anti
oxid
ants
.
Joss
e,A
.R.;
etal
.(2
007)
[70]
9(7
/2)H
ealt
hysu
bjec
ts(2
7.8±
6.9)
Alm
onds
(cro
ssov
erdo
se-r
espo
nse
stud
y)W
hite
brea
d
-W
hite
brea
d+3
0g
alm
onds
-W
hite
brea
d+6
0g
alm
onds
-W
hite
brea
d+9
0g
alm
onds
The
90-g
alm
ond
mea
lres
ulte
din
asi
gnifi
cant
lylo
wer
GIt
han
the
whi
tebr
ead
cont
rolm
eal
Mor
i,A
.M.;
etal
.(2
011)
[71]
14(8
/6)I
GT
(39.
3±
10.9
)A
lmon
ds(c
ross
over
)75
gof
avai
labl
eC
HO
(No
alm
onds
)
75g
ofav
aila
ble
CH
Ofr
om:
-W
hole
alm
onds
-A
lmon
dbu
tter
-D
efat
ted
alm
ond
flour
-A
lmon
doi
l
Who
leal
mon
dssi
gnifi
cant
lyat
tenu
ated
seco
nd-m
eala
ndda
ylon
gbl
ood
gluc
ose
IAU
C.
GLP
-1co
ncen
trat
ions
did
not
sign
ifica
ntly
vary
betw
een
trea
tmen
ts.
Ken
dall,
C.W
.;et
al.
(201
1)[7
4]10
(3/7
)Ow
heal
thy
subj
ects
(48.
3±
6.4)
Pist
achi
os(c
ross
over
)W
hite
brea
d
Stud
y1:
-28
,56
and
84g
pist
achi
os-
28,5
6an
d84
g
Stud
y2:
-56
gof
pist
achi
os+
diff
eren
tcom
mon
lyco
nsum
edca
rboh
ydra
tefo
ods
(50
gav
aila
ble
carb
ohyd
rate
).
Pist
achi
osco
nsum
edal
one
had
am
inim
alef
fect
onpo
stpr
andi
algl
ycae
mia
.Pis
tach
ios
cons
umed
wit
ha
carb
ohyd
rate
mea
lat
tenu
ated
the
RG
R.
Coh
en,A
.E.a
ndJo
hnst
on,C
.S.
(201
1)[7
2]
20(6
/14)
Hea
lthy
subj
ects
(n=
13)a
ndT2
Dsu
bjec
ts(n
=7)
(Hea
lthy
:53.
0±
3an
dT2
D:6
6.0±
3.3)
Alm
onds
(pos
tpra
ndia
l:cr
osso
ver
tria
l)N
oal
mon
dm
eal
28g
alm
onds
enri
ched
mea
l
The
inge
stio
nof
alm
onds
imm
edia
tely
befo
rea
star
chy
mea
lsig
nific
antl
yre
duce
dpo
stpr
andi
algl
ycae
mia
by30
%.
Ken
dall,
C.W
.;et
al.
(201
1)[7
8]
24(1
1/13
)Hea
lthy
(n=
14)a
ndT2
Dsu
bjec
ts(n
=10
)(H
ealt
hy:3
6.0±
4an
dT2
D:6
8.0±
2)
Mix
ednu
ts(i
.e.,
alm
onds
,m
acad
amia
s,w
alnu
ts,
pist
achi
os,h
azel
nuts
and
peca
ns)(
cros
sove
r)
Whi
tebr
ead
3do
ses
of30
,60
and
90g
ofm
ixed
nuts
Nut
sim
prov
esh
ort-
term
glyc
aem
icco
ntro
lin
pati
ents
wit
hT2
D.
240
Books
MDPI

Nutrients 2017, 9, 673
Ta
ble
5.
Con
t.
Fir
stA
uth
or
(Year)
[Refe
ren
ce]
N◦
of
Su
bje
cts
(M/F
)T
yp
eo
fS
ub
ject
(Ag
ein
Years
)
Ty
pe
of
Nu
t(S
tud
yD
esi
gn
)C
on
tro
lG
rou
pIn
terv
en
tio
nG
rou
pG
luco
sean
dIn
suli
nM
eta
bo
lism
Ou
tco
mes
Oth
er
Ou
tco
mes
Rei
s,C
.E.;
etal
.(2
011)
[76]
13(4
/9)H
ealt
hysu
bjec
ts(2
8.5±
10)
Pean
uts
(cro
ssov
er)
Che
ese
sand
wic
h
63g
of:
-ra
wpe
anut
sw
ith
skin
-ro
aste
dpe
anut
sw
itho
utsk
in-
grou
nd-r
oast
edpe
anut
sw
itho
utsk
in
The
inge
stio
nof
grou
nd-r
oast
edpe
anut
sw
itho
utsk
info
rbr
eakf
astl
eads
toa
low
erC
HO
inta
kean
dre
duce
dpo
stpr
andi
algl
ycae
mic
resp
onse
.
Mor
eira
,A.P
.;et
al.
(201
4)[7
7]65
men
Ow
/Ob
(Ran
ge:
18–5
0)
Con
vent
iona
lpea
nuts
and
high
-ole
icpe
anut
s(p
aral
lel)
56g
bisc
uit
-56
gco
nven
tion
alpe
anut
s(n
=21
)-
56g
high
-ole
icpe
anut
s(n
=23
)
Con
vent
iona
lpea
nut
cons
umpt
ion
was
asso
ciat
edw
ith
decr
ease
dpo
stpr
andi
alin
sulin
aem
ia,w
hich
mig
htbe
bene
ficia
lfor
savi
ngβ
-cel
lfu
ncti
on,i
ndep
ende
ntly
ofth
ein
fluen
ceon
LPS
conc
entr
atio
ns.
Ken
dall,
C.W
.;et
al.
(201
4)[7
5]20
(8/1
2)Su
bjec
tsw
ith
Met
S(5
4.0±
8)Pi
stac
hios
(cro
ssov
er)
Con
trol
1:w
hite
brea
dC
ontr
ol2:
(whi
tebr
ead
+bu
tter
+ch
eese
)
Test
mea
l1:W
B+
85g
ofpi
stac
hios
Test
mea
l2:8
5g
ofpi
stac
hios
Pist
achi
oco
nsum
ptio
nre
duce
dpo
stpr
andi
algl
ycae
mia
com
pare
dw
ith
whi
tebr
ead.
Pist
achi
oco
nsum
ptio
nin
crea
sed
GLP
-1le
vels
com
pare
dw
ith
whi
tebr
ead.
Cro
uch,
M.A
.and
Slat
er,R
.T.
(201
6)[7
3]
20(1
3/7)
Subj
ects
wit
hpr
e-di
abet
es*
(Mea
n:60
.8)
Alm
onds
(cro
ssov
er)
No
alm
onds
12un
its
ofdr
y-ro
aste
dal
mon
dsA
low
-cal
orie
alm
ond
prel
oad
“app
etiz
er”
decr
ease
dpo
stpr
andi
alhy
perg
lyce
mia
.
Age
issh
own
asm
ean±
SDun
less
othe
rwis
est
ated
.BM
I,bo
dy
mas
sin
dex
;CH
O,c
arbo
hyd
rate
;GL
P-1
,glu
cago
n-lik
epe
ptid
e-1;
HbA
1c,g
lyca
ted
hem
oglo
bin;
IAU
C,i
ncre
men
tal
area
und
erth
ecu
rve;
IGT,
impa
ired
gluc
ose
tole
ranc
e;L
PS,l
ipop
olys
acch
arid
e;M
etS,
met
abol
icsy
ndro
me;
M/F
,mal
e/fe
mal
e;O
b,ob
ese;
Ow
,ove
rwei
ght;
RG
R,r
elat
ive
glyc
aem
icre
spon
ses;
T2D
,typ
e2
diab
etes
;WB,
whi
tebr
ead.
*al
soin
clud
e“i
sola
ted
1-h
gluc
ose
>16
0m
g/dL
”.
241
Books
MDPI

Nutrients 2017, 9, 673
4.1.2. Chronic Clinical Trials on Nuts
Most of the RCTs have compared nut-enriched diets with control diets in order to analyze theireffects on lipid profile, and blood glucose and insulin concentrations as a secondary outcome. However,some, mainly conducted in subjects with T2D [72,79–84], but also in pre-diabetic [85], hyperlipemic [86],overweight/obese [87] and healthy individuals [88], were specifically designed to assess changes inglucose or insulin metabolism after nut consumption (Table 6).
In 2002, Lovejoy and coworkers evaluated the effect of an almond-enriched diet in 20 healthy and30 T2D subjects in two different studies [79]. Healthy subjects, supplemented with 100 g almonds/dayfor 4 weeks and advised to reduce their energy intake by an equivalent amount, did not change theirinsulin sensitivity, whereas their body weight increased and their lipid profile improved. In a secondstudy, subjects with T2D were randomized following a crossover design to one of 4 diets with differentfat contents (25% or 37%) with 10% of fat from almonds or from olive or canola oil, with a minimumwashout of 2 weeks between periods. Fat source (almond vs. oil) or fat level (high fat vs. low fat)were not observed to have any significant effect on either the glucose or insulin index. In contrast, in acrossover study conducted in 20 Chinese patients with T2D and mild-hyperlipidemia assigned to eithera control diet (National Cholesterol Education Program (NCEP) step II diet) or an almond-enricheddiet (with almonds replacing the 20% total daily calorie intake) for 4 weeks, a significant decrease infasting insulin and glucose concentrations together with an improvement of HOMA-IR were reportedduring the almond phase [80]. In a similar crossover study conducted in 48 diabetic patients whoreceived 50 g/day of pistachios and a pistachio-free diet (12 weeks each period), with an 8-weekwashout, a significant improvement in fasting blood glucose (FBG) and HbA1c was observed duringthe pistachio consumption, while no changes in HOMA-IR were reported [83]. Recently, Gulati andcoworkers conducted a pre-post intervention study in a group of 50 Asian Indians who consumed 20%of total energy in the form of whole raw almonds for 24 weeks preceded by a control diet free of nuts.Although no changes in FBG were observed during the almond consumption, the authors found asignificant reduction in glycosylated hemoglobin, together with an improvement in other T2D riskfactors such as waist circumference or inflammation status [84]. To determine whether the beneficialeffect of nut consumption on glucose and insulin metabolism could also be extended to pre-diabeticsubjects our group conducted a randomized crossover study in 54 pre-diabetic subjects who consumeda pistachio-supplemented diet (55 g pistachio/day) and a control diet (nut-free diet), each for 4 monthswith a 2-week washout period. We found a beneficial effect of pistachio intake on fasting glucose,insulin, and HOMA-IR. Other cardiometabolic risk markers such as fibrinogen, oxidized LDL, plateletfactor 4 and GLP-1 were also modified appropriately during the consumption of pistachios [85].
Changes in fasting glucose or insulin levels, HOMA-IR and glycosylated hemoglobin have alsobeen assessed as secondary outcomes in several clinical feeding trials with different designs (parallel,crossover) and subject characteristics (i.e., healthy, overweight/obese, TD2, MetS), mainly usingwalnuts and almonds, and with different intervention lengths (from 2 weeks to 2 years). The resultsobtained are controversial. Although most studies found no improvement in glucose/insulinmetabolism [89–103], others reported a significant reduction in FBG levels [89,92,104,105], fastinginsulin or insulin resistance [90,92,106,107] and HbA1c [92]. However, a meta-analysis of RCTsincluding 25 trials with a total of 1,650 particpants who were otherwise healthy or had dyslipidaemia,metabolic syndrome or type 2 diabetes mellitus showed that the consumption of tree nuts led tomodest decreases in fasting blood glucose compared with control diet interventions [108].
242
Books
MDPI

Nutrients 2017, 9, 673
Ta
ble
6.
Sum
mar
yof
chro
nic
clin
ical
tria
lsan
dth
eir
char
acte
rist
ics
inth
eco
ntex
tofn
utco
nsum
ptio
n.
Fir
stA
uth
or
(Year)
[Refe
ren
ce]
N◦
of
Su
bje
cts
(M/F
)T
yp
eo
fS
ub
ject
s(A
ge
inY
ears
)
Nu
tS
tud
yD
esi
gn
(Len
gth
of
the
Inte
rven
tio
n)
Co
ntr
ol
Gro
up
Inte
rven
tio
nG
rou
p(s
)G
luco
sean
dIn
suli
nM
eta
bo
lism
Ou
tco
mes
Oth
er
Ou
tco
mes
Love
joy,
J.C.;
etal
.(2
002)
[79]
30(1
3/17
)T2
Dsu
bjec
ts(m
ean±
SEM
:53
.8±
1.9)
Alm
onds
Cro
ssov
er(1
mon
thpe
rpe
riod
)
HF-
Con
trol
LF-C
ontr
olH
F-H
ALF
-HA
No
sign
ifica
ntch
ange
sin
glyc
aem
iaw
ere
obse
rved
.
Tota
lcho
lest
erol
was
low
esta
fter
the
HF-
HA
diet
.HD
L-C
was
sign
ifica
ntly
decr
ease
daf
ter
the
alm
ond
diet
;ho
wev
er,n
osi
gnifi
cant
effe
ctof
fat
sour
ceon
LDL:
HD
Lw
asre
port
ed.
Jenk
ins,
D.J.
A.;
etal
.(20
08)[
86]
27(1
5/12
)H
yper
lipid
emic
subj
ects
(64±
9)
Alm
onds
Cro
ssov
er(1
mon
thpe
rpe
riod
)
147±
6g/
day
ofm
uffin
s
Alm
onds
(73±
3g/
day)
Hal
fpor
tion
ofal
mon
ds(3
7±
2g/
day)
plus
muf
fins
(75±
3g/
day)
Isoe
nerg
etic
(mea
n,42
3K
cal/
day)
No
sign
ifica
ntch
ange
sw
ere
obse
rved
inFB
G,i
nsul
in,C
-pep
tide
,or
HO
MA
-IR
.Th
e24
-hur
inar
yC
-pep
tide
outp
ut,a
sa
mar
ker
of24
-hin
sulin
secr
etio
n,w
assi
gnifi
cant
lyre
duce
dby
the
half
-and
full-
dose
alm
onds
inco
mpa
riso
nto
the
cont
rolm
uffin
diet
afte
rad
just
men
tfor
urin
ary
crea
tini
neou
tput
.
Ther
ew
ere
nosi
gnifi
cant
trea
tmen
tdi
ffer
ence
sin
BW.
Cla
esso
n,A
.L.;
etal
.200
9[8
8]
25(1
1/14
)H
ealt
hysu
bjec
ts(r
ange
:19–
30)
Pean
uts
Para
llel(
2w
eeks
)
Add
itio
nof
20kc
al/k
g-BW
ofca
ndy
toth
ere
gula
rca
lori
cin
take
.
Add
itio
nof
20kc
al/k
g-BW
ofro
aste
dpe
anut
sto
the
regu
lar
calo
ric
inta
ke.
Plas
ma-
insu
linan
dC
-pep
tide
incr
ease
din
the
cand
ygr
oup,
butn
otin
the
pean
utgr
oup.
FBG
was
notm
odifi
ed.
Ener
gyin
take
incr
ease
dsi
mila
rly
inbo
thgr
oups
.BW
and
WC
incr
ease
dsi
gnifi
cant
lyon
lyin
the
cand
ygr
oup.
Att
heen
dof
the
stud
yLD
L-C
and
Apo
B/A
poA
-1-r
atio
wer
ehi
gher
inth
eca
ndy
grou
pth
anin
the
pean
utgr
oup.
Coh
en,A
.E.;
etal
.(2
011)
[72]
13(7
/6)
T2D
subj
ects
(66.
0±
3.3)
Alm
onds
Para
llel(
3m
onth
s)N
ut-f
ree
diet
Die
tenr
iche
dw
ith
alm
onds
(28
g,5
tim
es/w
eek)
Sign
ifica
ntre
duct
ion
ofH
bA1c
inth
eal
mon
dgr
oup
com
pare
dto
the
nut-
free
diet
grou
p.
Chr
onic
alm
ond
inge
stio
nw
asas
soci
ated
wit
ha
redu
ctio
nin
BMIa
sco
mpa
red
wit
hno
chan
gein
the
nut–
free
diet
grou
p.
Li,S
.C.;
etal
.(2
011)
[80]
20(9
/11)
T2D
subj
ects
(Mea
n:58
)
Alm
onds
Cro
ssov
er(1
mon
thpe
rpe
riod
)
NC
EPst
epII
diet
(con
trol
diet
);C
HO
(56
E%),
prot
ein
(17
E%),
and
fat(
27E%
).
Alm
onds
wer
ead
ded
toth
eco
ntro
ldie
tto
repl
ace
20%
ofto
tald
aily
calo
rie
inta
ke.
Com
pare
dw
ith
subj
ects
inth
eco
ntro
ldi
et,t
hose
inth
eal
mon
ddi
etre
duce
dth
ele
vels
offa
stin
gin
sulin
,FBG
,an
dH
OM
A-I
R.
Alm
ond
inta
kede
crea
sed
TC
,LD
L-C
,an
dLD
L-C
/HD
L-C
.The
alm
ond
diet
enha
nced
plas
maα
-toc
ophe
roll
evel
com
pare
dw
ith
cont
rold
iet.
Dam
avan
di,R
.D.;
etal
.(20
13)[
81]
45(1
5/33
)M
edic
ated
T2D
subj
ects
(55.
68±
7.74
)
Haz
elnu
tsPa
ralle
l(2
mon
ths)
Con
trol
diet
10%
ofto
tald
aily
calo
rie
inta
kew
asre
plac
edw
ith
haze
lnut
sN
osi
gnifi
cant
diff
eren
ces
inFB
Gbe
twee
ngr
oups
.
No
chan
ges
inBM
Iwer
ere
port
ed.
Sign
ifica
ntH
DL-
Cre
duct
ion
inco
ntro
lgr
oup
was
obse
rved
.Alt
houg
hth
eha
zeln
utgr
oup
achi
eved
agr
eate
rre
duct
ion
inT
Gco
ncen
trat
ions
than
the
cont
rolg
roup
,the
sech
ange
sw
ere
non-
sign
ifica
nt.
Her
nánd
ez-A
lons
o,P.
;eta
l.(2
014)
[85]
54(2
9/25
)Su
bjec
tsw
ith
Pre-
DM
ean:
55(r
ange
:53
.4–5
6.8)
Cro
ssov
er(4
mon
ths
per
peri
od)
Nut
-fre
edi
et:t
heen
ergy
inta
keof
othe
rfa
tty
food
s,m
ostly
oliv
eoi
l,w
asad
just
edto
com
pens
ate
for
the
ener
gyfr
ompi
stac
hios
incl
uded
inth
ePD
.
Pist
achi
odi
etw
assu
pple
men
ted
wit
h2
ounc
esof
pist
achi
o(5
7g/
day)
FBG
,ins
ulin
,and
HO
MA
-IR
decr
ease
dsi
gnifi
cant
lyaf
ter
the
chro
nic
pist
achi
ope
riod
com
pare
dw
ith
the
nut-
free
peri
od.
Fibr
inog
en,o
xidi
zed-
LDL,
and
PF-4
sign
ifica
ntly
decr
ease
dun
der
the
pist
achi
ope
riod
com
pare
dto
the
nut-
free
peri
od,w
here
asG
LP-1
incr
ease
d.
243
Books
MDPI

Nutrients 2017, 9, 673
Ta
ble
6.
Con
t.
Fir
stA
uth
or
(Year)
[Refe
ren
ce]
N◦
of
Su
bje
cts
(M/F
)T
yp
eo
fS
ub
ject
s(A
ge
inY
ears
)
Nu
tS
tud
yD
esi
gn
(Len
gth
of
the
Inte
rven
tio
n)
Co
ntr
ol
Gro
up
Inte
rven
tio
nG
rou
p(s
)G
luco
sean
dIn
suli
nM
eta
bo
lism
Ou
tco
mes
Oth
er
Ou
tco
mes
Lasa
,A.;
etal
.(2
014)
[82]
191
(77/
114)
T2D
subj
ects
(Mea
n:67
)
Mix
ednu
tsPa
ralle
l(1
year
)LF
DM
edit
erra
nean
diet
ssu
pple
men
ted
wit
hei
ther
virg
inol
ive
oilo
rm
ixed
nuts
Incr
ease
dva
lues
ofth
ead
ipon
ecti
n/le
ptin
rati
oan
dad
ipon
ecti
n/H
OM
A-I
Rra
tio
and
decr
ease
dva
lues
ofW
Cw
ere
obse
rved
inth
eth
ree
grou
ps.
Inbo
thM
edit
erra
nean
diet
grou
ps,b
utno
tin
the
LFD
grou
p,th
isw
asas
soci
ated
with
asi
gnifi
cant
redu
ctio
nin
BW.
Parh
am,M
.;et
al.
(201
4)[8
3]
44(1
1/33
)T2
Dsu
bjec
ts(M
ean:
51)
Pist
achi
osC
ross
over
(3m
onth
spe
rpe
riod
)
Prev
ious
diet
wit
hout
pist
achi
osTw
osn
acks
of25
gpi
stac
hios
/day
Mar
ked
decr
ease
inH
bA1c
and
FBG
conc
entr
atio
nsin
the
pist
achi
odi
etgr
oup
com
pare
dw
ith
the
cont
rolg
roup
.
Ther
ew
ere
noov
eral
lsig
nific
ant
chan
ges
inBM
I,bl
ood
pres
sure
,H
OM
A-I
R,o
rC
RP
conc
entr
atio
ns.
Le,T
.;et
al.
(201
6)[8
7]
213
wom
enO
w/O
bsu
bjec
ts(M
ean:
50)
Wal
nuts
Para
llel(
1ye
ar)
Con
trol
1:a
low
erfa
t(20
E%),
high
erC
HO
(65
E%)d
iet.
Con
trol
2:lo
wer
CH
O(4
5E%
),hi
gher
fat
(35
E%)d
iet
Wal
nut-
enri
ched
diet
:hig
hfa
t(35
E%),
low
erC
HO
(45
E%)d
iet.
Insu
linse
nsit
ivit
yan
dC
RP
leve
lsim
prov
edaf
ter
wal
nut-
rich
diet
TGde
crea
sed
inal
lstu
dyar
ms
at6
mon
ths.
The
wal
nut-
rich
diet
incr
ease
dH
DL-
Cm
ore
than
eith
erth
elo
wer
fato
rlo
wer
CH
Odi
et.T
hew
alnu
t-ri
chdi
etal
sore
duce
dLD
L-C
.
Age
issh
own
asm
ean±
SDun
less
othe
rwis
est
ated
.Apo
,apo
lipop
rote
in;B
MI,
Body
mas
sin
dex;
BW,b
ody
wei
ght;
CH
O,c
arbo
hydr
ate;
CR
P,C
-rea
ctiv
epr
otei
n;E%
,ene
rgy
perc
enta
ge;
FBG
,fas
ting
bloo
dgl
uco
se;G
LP
-1,g
luca
gon-
like
pept
ide-
1;H
A:h
igh
alm
ond
;HbA
1c,g
lyca
ted
hem
oglo
bin;
HD
L-C
,hig
h-d
ensi
tylip
opro
tein
chol
este
rol;
HF,
high
fat;
HO
MA
-IR
,ho
meo
stat
icm
odel
asse
ssm
ento
fins
ulin
resi
stan
ce;L
DL
-C,l
ow-d
ensi
tylip
opro
tein
chol
este
rol;
LF:
low
fat;
LFD
,LF
die
t;M
/F,m
ale/
fem
ale;
NC
EP,
Nat
iona
lCho
lest
erol
Ed
ucat
ion
Prog
ram
;NS,
non-
sign
ifica
nt;O
b,ob
ese;
Ow
,ove
rwei
ght;
PF-4
,pla
tele
tfac
tor-
4;PM
,pos
t-m
enop
ausa
l;Pr
e-D
,pre
-dia
bete
s;T2
D,t
ype
2di
abet
es;T
C,t
otal
chol
este
rol;
TG,t
rigl
ycer
ides
;W
C,w
aist
circ
umfe
renc
e;W
HtR
,wai
st-t
o-he
ight
rati
o.
244
Books
MDPI

Nutrients 2017, 9, 673
4.2. Dried Fruits
4.2.1. Acute Clinical Trials on Dried Fruits
Less research has been carried out into DFs than into nuts. However, the findings to date point toa beneficial effect of DFs on postprandial glucose regulation and glycaemic control in T2D subjects.
The putative effect of DFs on postprandial glycaemia and insulinaemia has been studied mainlyusing raisins (Table 7). However, some research into dried plums has also been published.
First, in 1989 Rasmussen and coworkers evaluated in healthy and T2D subjects the postprandialeffects of three meals: raw rolled oats, oatmeal porridge, or a mixture of raw rolled oats with raisins,compared to a control glucose ingestion [109]. The substitution of 25% of the starch meal with raisins(i.e., simple sugars) did not affect blood glucose or insulin responses. In addition, a similar glucose andinsulin response in both normal and T2D subjects were reported [109]. Other researchers investigatedthe postprandial effect of raisins consumed alone. When the GI was investigated in three differentgroups (sedentary, aerobically trained or pre-diabetic subjects), no significant differences were foundamong groups, even though the GI (55–69) it seemed moderate for aerobically trained adults, and low(GI, ≤55) for the other groups [110]. Kanellos and collaborators found a moderate GI of raisins inhealthy and T2D subjects [111], whereas Esfahani et al. found that raisins were low-GI and glycaemicload (GL) foods in healthy subjects [112]. Recently, researchers have found that even though thesame available CHO content from raisins and glucose generated a similar postprandial response,raisins significantly modulated the levels of GIP, ghrelin and ghrelin/obestatin ratio, with importantimplications in terms of appetite regulation and overall insulin secretion [113]. In overweight women,researchers determined that dried plums had a lower plasma glucose and insulin incremental areaunder the curve (IAUC) than an isoenergetic low-fat cookie meal [114].
Overall, results suggest that raisins have a beneficial postprandial glucose and insulin effect, whichmay cautiously be extrapolated to other DFs considering their overall macronutrient composition.
245
Books
MDPI

Nutrients 2017, 9, 673
Ta
ble
7.
Sum
mar
yof
acut
ecl
inic
alst
udie
san
alyz
ing
the
effe
ctof
drie
dfr
uitc
onsu
mpt
ion
onpo
stpr
andi
alre
spon
se.
Fir
stA
uth
or
(Year)
[Refe
ren
ce]
N◦
of
Su
bje
cts
(M/F
)T
yp
eo
fS
ub
ject
(Ag
ein
Years
)
Dri
ed
Fru
it(S
tud
yD
esi
gn
)C
on
tro
lG
rou
pIn
terv
en
tio
nG
rou
p(s
)G
luco
sean
dIn
suli
nM
eta
bo
lism
Ou
tco
mes
Oth
er
Ou
tco
mes
Ras
mus
sen,
O.;
etal
.(19
89)[
109]
20(9
/11)
Hea
lthy
(n=
11)a
ndT2
Dsu
bjec
ts(n
=9)
(Hea
lthy
:30±
2;T2
Dsu
bjec
ts:6
7±
2)
Rai
sins
(cro
ssov
er)
75g
(hea
lthy
)or
50g
(T2D
)ofC
HO
Raw
rolle
doa
ts;
oatm
ealp
orri
dge
ora
mix
ture
ofra
wro
lled
oats
wit
hra
isin
s
Subs
titut
ion
of25
%of
the
star
chm
ealw
ithra
isin
s(s
impl
esu
gars
)did
nota
ffec
tblo
odgl
ucos
eor
insu
linre
spon
ses
Inno
rmal
and
T2D
subj
ects
,the
thre
em
eals
prod
uce
sim
ilar
gluc
ose
and
insu
linre
spon
secu
rves
.
Kim
,Y.;
etal
.(2
008)
[110
]
10S;
11A
Tan
d10
Pre-
D(S
(25.
7±
1.3)
,AT
(23.
1±
1.0)
,Pre
-D(5
0.0±
2.6)
)
Rai
sins
(cro
ssov
er)
50g
ofav
aila
ble
CH
Ofr
omgl
ucos
e50
gof
avai
labl
eC
HO
from
rais
ins
NS
diff
eren
ces
amon
ggr
oups
.The
GIo
frai
sins
seem
edlo
wer
(≤55
)in
the
San
dP
grou
psco
mpa
red
tom
oder
ate
(GI,
56–6
9)in
the
Agr
oup.
The
insu
linae
mic
inde
xof
rais
ins
was
not
diff
eren
tam
ong
grou
ps.
Furc
hner
-Eva
nson
,A
.;et
al.(
2010
)[1
14]
19w
omen
owsu
bjec
ts(3
9.2±
0.7)
Dri
edpl
ums
(cro
ssov
er)
Whi
tebr
ead
(238
Kca
l)
Dri
edpl
ums
(238
Kca
l)Lo
w-f
atco
okie
s(2
38K
cal)
Dri
edpl
ums
elic
ited
low
erpl
asm
agl
ucos
ean
din
sulin
IAU
Cth
anlo
w-f
atco
okie
s.
The
sati
ety
inde
xIA
UC
was
grea
ter
for
the
drie
dpl
ums
than
low
-fat
cook
ies,
and
tend
edto
prom
ote
agr
eate
rpl
asm
agh
relin
AO
C
Kan
ello
s,P.
T.;e
tal.
(201
3)[1
11]
30(1
7/13
)H
ealt
hyan
dT2
Dsu
bjec
ts(n
=15
each
)(H
ealt
hy:2
5.9±
0.8;
T2D
:63
.2±
1.7)
Cor
inth
ian
rais
ins
(cro
ssov
er)
50g
ofgl
ucos
e74
gof
Cor
inth
ian
rais
ins;
50g
ofav
aila
ble
CH
O
Sign
ifica
ntly
diff
eren
tglu
cose
peak
sbe
twee
nra
isin
san
dgl
ucos
ein
heal
thy
and
indi
abet
icsu
bjec
ts.G
lyca
emic
and
insu
linae
mic
resp
onse
sw
ere
decr
ease
daf
ter
rais
inco
nsum
ptio
nco
mpa
red
togl
ucos
ein
gest
ion.
Esfa
hani
,A.;
etal
.(2
014)
[112
]
10(4
/6)
Hea
lthy
subj
ects
(39±
11)
Rai
sins
(cro
ssov
er)
108
gof
whi
tebr
ead;
50g
avai
labl
eC
HO
(con
sum
edon
two
sepa
rate
occa
sion
s)
R50
:69
gra
isin
s;50
gav
aila
ble
CH
OR
20:2
8g
rais
ins;
20g
avai
labl
eC
HO
The
rais
inm
eals
,R50
and
R20
,res
ulte
din
sign
ifica
ntly
redu
ced
post
pran
dial
gluc
ose
and
insu
linre
spon
ses
com
pare
dw
ith
whi
tebr
ead
Rai
sins
wer
ede
term
ined
tobe
low
inG
I,G
Lan
din
sulin
aem
icin
dex.
Kal
iora
,A.C
.;et
al.
(201
7)[1
13]
10H
ealt
hyno
rmo-
wei
ght
subj
ects
(26.
3±
0.8)
Rai
sins
(cro
ssov
er)
50g
ofgl
ucos
e74
gof
rais
ins;
50g
ofav
aila
ble
CH
OA
t60
min
,glu
cose
and
insu
linle
vels
wer
em
axim
umin
both
grou
ps.
GIP
was
low
eraf
ter
rais
ing
inta
keco
mpa
red
togl
ucos
ein
take
at60
and
120
min
post
pran
dial
ly.
Ghr
elin
was
low
eraf
ter
rais
inco
mpa
red
togl
ucos
ein
take
at12
0an
dat
180
min
post
-ing
esti
on.N
odi
ffer
ence
sw
ere
repo
rted
for
GLP
-1,a
pelin
orob
esta
tin
inei
ther
tria
l.
Age
issh
own
asm
ean±
SDu
nles
sot
herw
ise
stat
ed.
AT,
aero
bica
llytr
aine
d;A
OC
,are
aov
erth
ecu
rve;
CH
O,c
arbo
hyd
rate
s;G
I,gl
ycae
mic
ind
ex;G
L,g
lyca
emic
load
;GL
P-1
,gl
ucag
on-l
ike
pept
ide-
1;IA
UC
,inc
rem
enta
lare
aun
der
the
curv
e;M
/F,m
ale/
fem
ale;
NS,
non-
sign
ifica
nt;o
w,o
verw
eigh
t;Pr
e-D
,pre
-dia
beti
c;S,
sede
ntar
y;T2
D,t
ype
2di
abet
es;W
B,w
hite
brea
d.
246
Books
MDPI
Nutrients 2017, 9, 673
4.2.2. Chronic Clinical Trials on Dried Fruits
The study of the beneficial effects of chronic DF consumption also focuses on raisins (Table 8).Randomized clinical trials have been conducted in healthy [115], overweight or obese [116,117], T2Dsubjects [118,119], or a combination of the three [120]. In a 6-week parallel trial in healthy subjects,Puglisi et al. included 150 g/day of raisins into subjects’ habitual diet or increased their physicalactivity (or combined them both). Neither FPG nor insulin levels were different among groups orcompared to baseline. However, the inflammation status reported by plasma TNF-α significantlydecreased in the raisin intervention [115].
The results for overweight or obese subjects do not show a significant improvement in glucoseor insulin levels after the consumption of raisins [116] or dried plums [117]. However, these studiesare only short (2 weeks) which makes it impossible to analyze the chronic effect. In fact, in a parallelstudy conducted in Ow/Ob subjects, comparing raisin consumption (270 Kcal/day) with a snack(300 Kcal/day) for 12 weeks, researchers [120] found that even though FGP or insulin were notaffected by either intervention, HbA1c levels and postprandial glucose levels had been reduced byraisin consumption by the end of the trial. This suggests a beneficial effect of raisin consumption onglycaemic control in Ow/Ob subjects with pre-D. Importantly, raisin intake also improved systolicblood pressure (SBP) and diastolic blood pressure (DBP) and had a null effect on body weight [120].
Two studies have been conducted in individuals with T2D. A parallel study comparing theconsumption of 36 g of raisins versus the habitual diet free of raisins or grapes for 24 weeks did notfind any change in either body weight or in glycaemic control and lipid profile, but the total antioxidantcapacity increased and the DBP decreased after raisin consumption [118]. Likewise, the consumptionof raisins as a snack (84 g/day, 270 Kcal/day) for 12 weeks significantly reduced the postprandialglucose response in T2D subjects compared to an alternative snack (300 Kcal/day) for 12 weeks.A non-significant trend to a reduction in fasting glucose and HbA1c was also observed in the samegroup of raisin consumers [119].
The results of DF consumption on glycaemia/insulinaemia point to a beneficial effect. However,novel acute and long-term RCTs assessing other types of DF should be carried out in order tocorroborate and expand what is known about raisins.
247
Books
MDPI

Nutrients 2017, 9, 673
Ta
ble
8.
Sum
mar
yof
chro
nic
clin
ical
tria
lsan
dth
eir
char
acte
rist
ics
inth
eco
ntex
tofd
ried
frui
tcon
sum
ptio
n.
Fir
stA
uth
or
(Ye
ar)
[Re
fere
nce
]
N◦
of
Su
bje
cts
(M/F
)T
yp
eo
fS
ub
ject
(Ag
ein
Ye
ars
)
Stu
dy
De
sig
n(L
en
gth
of
the
Inte
rve
nti
on
)C
on
tro
lG
rou
pIn
terv
en
tio
nG
rou
p(s
)G
luco
sea
nd
Insu
lin
Me
tab
oli
smO
utc
om
es
Oth
er
Ou
tco
me
s
Pugl
isi,
M.J.
;eta
l.(2
008)
[115
]
34(1
7/17
PM)
Hea
lthy
(ran
ge:5
0–70
)
Rai
sin
Para
llel(
6w
eeks
)
Wal
k(i
ncre
ase
inth
est
eps
take
npe
rda
y)
150
g/da
yof
rais
ins.
Wal
k+
150
g/da
yof
rais
ins
Cha
nges
inFB
Gan
din
sulin
valu
esdi
dno
tdiff
eram
ong
inte
rven
tion
grou
psor
from
base
line.
Plas
ma
TNF-α
decr
ease
din
the
rais
ingr
oup
but
nodi
ffer
ence
sw
ere
repo
rted
betw
een
grou
ps.
Plas
ma
TC
and
LDL-
Cde
crea
sed
inal
lthe
inte
rven
tion
grou
ps.
Ran
kin,
J.W.;
etal
.(2
008)
[116
]
17(8
/9)
Ow
(26.
5±
7.6)
Rai
sin
Cro
ssov
er(2
wee
kspe
rpe
riod
)
Jelly
cand
y(2
64K
cal/
day)
90g/
day
rais
ins
(264
Kca
l/da
y)
NS
chan
ges
inFB
Gor
mar
kers
ofin
flam
mat
ion
oren
doth
elia
ldys
func
tion
afte
rth
era
isin
inte
rven
tion
.
Fast
ing
prot
ein-
free
OR
AC
was
mod
estl
yhi
gher
afte
rth
era
isin
inte
rven
tion
than
the
jelly
cand
yin
terv
enti
on.
How
arth
,L.;
etal
.(2
010)
[117
]
26w
omen
Ow
/Ob
(ran
ge:2
5–54
)
Dri
edpl
ums
Cro
ssov
er(2
wee
kspe
rpe
riod
)
Low
-fat
cook
ies
(200
Kca
l/da
y)D
ried
plum
s(2
00K
cal/
day)
No
chan
ges
wer
efo
und
inpl
asm
agl
ucos
eor
insu
linle
vels
inan
yin
terv
enti
on.
Plas
ma
TG
conc
entr
atio
nw
asun
chan
ged
bydr
ied
plum
cons
umpt
ion
and
was
high
eraf
ter
the
cons
umpt
ion
oflo
w-f
atco
okie
s.In
corp
orat
ion
ofdr
ied
plum
sor
low
-fat
cook
ies
into
the
diet
did
nota
lter
ener
gyin
take
orBW
.
And
erso
n,J.W
.;et
al.(
2014
)[12
0]
46(2
1/25
)O
w/O
bw
ith
Pre-
Dor
atT2
Dri
sk.
(sna
ck(m
ean:
61.1
),ra
isin
s(m
ean:
60.3
))
Rai
sins
Para
llel
(12
wee
ks)
Snac
ks(3
00K
cal/
day)
84g/
day
ofra
isin
s(2
70K
cal/
day)
Fast
ing
HbA
1cle
vels
wer
esi
gnifi
cant
lyre
duce
daf
ter
rais
inin
take
,whe
reas
FBG
and
insu
linle
vels
wer
eno
tsig
nific
antl
yaf
fect
edby
the
inta
keof
rais
ins
orsn
acks
.Pos
tpra
ndia
lglu
cose
leve
lsw
ere
sign
ifica
ntly
redu
ced
byra
isin
inta
kevs
.sna
cks.
Rai
sin
inta
kew
asas
soci
ated
wit
hre
duct
ions
inSB
Pan
dD
BP.B
Wdi
dno
tsig
nific
antl
ych
ange
wit
hin
orbe
twee
ngr
oups
.
Kan
ello
s,P.
T.;e
tal.
(201
4)[1
18]
48(2
5/23
)T2
D(r
aisi
ns(6
3.7±
6.3)
,co
ntro
l(63
±8.
5))
Cor
inth
ian
rais
ins
Para
llel
(24
wee
ks)
Usu
aldi
etav
oidi
nggr
apes
and
rais
ins
36g/
day
ofC
orin
thia
nra
isin
s
BW,g
lyca
emic
cont
rol,
and
lipid
profi
lew
ere
not
chan
ged
inei
ther
arm
ofth
ein
terv
entio
n.Pa
tient
sin
the
CR
arm
redu
ced
thei
rD
BPan
din
crea
sed
thei
rto
tala
ntio
xida
ntpo
tent
ialc
ompa
red
wit
hba
selin
eva
lues
and
the
cont
rolg
roup
.
No
chan
gein
CR
Pw
asob
serv
ed.A
sign
ifica
ntdi
ffer
ence
inpl
asm
aci
rcul
atin
gp-
hydr
oxyb
enzo
icac
idw
asob
serv
edbe
twee
ngr
oups
atth
een
dof
the
tria
l.
Bays
,H.;
etal
.(2
015)
[119
]
46(1
9/27
)T2
D(m
ean:
58)
Dar
kra
isin
sPa
ralle
l(12
wee
ks)
Snac
kgr
oup
(300
Kca
l/da
y)
84g/
day
ofda
rkra
isin
sgr
oup
(270
Kca
l/da
y)
Com
pare
dto
the
snac
kgr
oup,
thos
ew
hoco
nsum
edra
isin
sre
duce
dth
eir
post
pran
dial
gluc
ose
leve
ls,a
ndan
NS
tren
dto
are
duct
ion
infa
stin
ggl
ucos
ean
dH
bA1c
.NS
chan
ges
inBW
,fa
stin
gin
sulin
,HO
MA
-IR
orlip
idpr
ofile
betw
een
inte
rven
tion
grou
ps.
Com
pare
dto
alte
rnat
ive
proc
esse
dsn
acks
,tho
sew
hoco
nsum
edra
isin
sha
da
sign
ifica
ntre
duct
ion
inSB
Pbu
tnot
asi
gnifi
cant
redu
ctio
nin
DBP
.
Age
issh
own
asm
ean±
SDun
less
othe
rwis
est
ated
.BW
,bod
yw
eigh
t;C
RP,
C-r
eact
ive
prot
ein;
DBP
,dia
stol
icbl
ood
pres
sure
;FBG
,fas
ting
bloo
dgl
ucos
e;H
bA1c
,gly
cate
dhe
mog
lobi
n;H
OM
A-I
R,h
omeo
stat
icm
odel
asse
ssm
ento
fins
ulin
resi
stan
ce;L
DL-
C,l
ow-d
ensi
tylip
opro
tein
chol
este
rol;
M/F
,mal
e/fe
mal
e;N
S,no
n-si
gnifi
cant
;Ob,
obes
e;O
RA
C,o
xyge
nra
dica
lab
sorb
ance
cap
acit
y;O
w,o
verw
eigh
t;p
re-D
,pre
-dia
bete
s;P
M,p
ostm
enop
ausa
lwom
en;S
BP,
syst
olic
bloo
dp
ress
ure
;T2D
,typ
e2
dia
bete
s;T
C,t
otal
chol
este
rol;
TG
,tri
glyc
erid
es;
TNF-α
,tum
orne
cros
isfa
ctor
-α.
248
Books
MDPI

Nutrients 2017, 9, 673
5. Potential Mechanisms Linking Nut and Dried Fruit Consumption to Glucose and InsulinMetabolism
5.1. Nut- and Dried Fruit-Related Nutrients and Their Role in Glucose and Insulin Metabolism
Fiber Content in Nuts and Dried Fruits
Both nuts and DFs are high in dietary fiber [9]. Diets rich in complex CHO and fiber areassociated with increased insulin sensitivity and reduced plasma insulin levels, promoting betterglycaemic control in diabetic patients [121]. Soluble fiber increases gastric distension, viscosity in thegastrointestinal tract, and slower absorption of macronutrients [122]. As a consequence, the speed ofCHO absorption and the concentration of postprandial glucose tend to be lower after the ingestion offiber-rich foods than foods or meals poor in fibers [123].
Fiber is resistant to enzymatic digestion in the small intestine and thus susceptible to fermentationby bacteria in the colon. It produces short chain fatty acids (SCFA, e.g., acetate, propionate and butyrate)which reduce the production of hepatic glucose and stimulate the secretion of GLP-1 [124,125]. Incretinssuch as GLP-1 and gastric inhibitory polypeptide (GIP) stimulate the secretion of insulin by β-cells andpromote the proliferation of these cells, favoring the maintenance of normal blood glucose levels [125].The secretion of GLP-1—which is mainly performed by enteroendocrine L-cells of the gastrointestinaltract -is partly mediated by monosaccharides, peptides and amino-acids, MUFA and PUFA as well asby SCFA. Therefore, the positive influence of GLP-1 on blood glucose homeostasis, appetite sensations,and food intake provides a strong rationale for its therapeutic potential in the nutritional managementof T2D and obesity [126].
Overall fiber contained in nuts and DFs is also able to decrease postprandial glycaemic levels andthis could be a strategy for increasing insulin sensitivity which improves T2D and several other CVrisk factors for chronic diseases [74,127].
Carbohydrate Content—Glycaemic Index of Nuts and Dried Fruits
It should be noted that nuts are relatively low in CHO (approximately 15% of the total energy)whereas DFs have a high amount of CHO (60–80%). Nuts have a low glycaemic index and thereforeincrease the blood glucose level less and require less insulin secretion, thus favoring the controlof T2D. However, because DFs are high in carbohydrates and fiber, their specific GI has been theobject of considerable study. The GI of raisins was first evaluated in three heterogeneous groups ofsubjects (aerobically trained, sedentary or pre-diabetic) and was described between 49 and 69, thereforecorresponding to the low-to-moderate GI foods [110]. However, later studies have reported that raisinsare in the low GI category in healthy subjects (a GI of 49.4 and an insulinemic index of 47.1) [15].This suggests a favorable postprandial glucose and insulin response [112], that could be explained bythe high proportion of fructose that DFs contain.
Overall, the inclusion of both nuts and DFs in a balanced diet may reduce the overall glycaemicindex of the diet, with benefits to glycaemic and insulinemic control in both healthy and T2Dsubjects [128].
Fat Content in Nuts
The high content of MUFA and PUFA in nuts seems to enhance the reduction of IR, thusconsequently reducing the risk of developing T2D [129–131]. However, the mechanisms by whichthese fatty acids (FA) affect insulin sensitivity are not yet fully understood [132]. It is believed, however,that the FAs present in the phospholipids of different cell membranes are affected by the type of fattyacid intake, thus affecting insulin sensitivity. The different unsaturated FAs that are part of the cellmembrane influence the action of insulin via affecting the binding or affinity of insulin to its cellularreceptor [133]. It is hypothesized that a higher unsaturation of FA in the cell membrane facilitatesthe movement of the glucose receptor to the cell surface, thus increasing insulin sensitivity [134].
249
Books
MDPI

Nutrients 2017, 9, 673
In addition, as we have seen, unsaturated fatty acids act through the stimulation of GLP-1 secretion,thus improving the efficiency of β-cells. SFA and MUFA act on the lipogenic gene expression, whilePUFA inhibit the expression of these genes, partly by binding and activating nuclear receptors, such asthose activated by peroxisome proliferators (PPAR) [131]. It has been suggested that the activationof PPAR has a therapeutic role in the treatment of T2D, because it induces fatty acid clearance by theadipose tissue, decreasing its plasma levels and thus increasing insulin sensitivity in the muscle [135].
Mineral Content in Nuts and Dried Fruits
Nuts contain relatively high quantities of different minerals such as potassium, magnesiumand calcium, whereas DF contains more moderate quantities (mainly potassium, magnesium andboron). Magnesium has been associated with beneficial effects on glycaemic control [136]. Lowmagnesium levels have been implicated in IR development [124]. In fact, kidneys lose the ability toretain magnesium in periods of acute hyperglycemia. It is excreted in the urine, leading to low mineralblood levels. It has been shown that correcting this depletion improves response and insulin action.Magnesium deficiency also interferes with the reactions that use or produce ATP, thus altering theenzyme cascade involved in the CHO metabolism and favoring the development of T2D [137].
Therefore, the minerals present in nuts and DF could explain the relationship observed betweenmagnesium intake and the lower risk of developing T2D and other chronic diseases [138,139].
Other Bioactive Compounds in Nuts and Dried Fruits
The other bioactive compounds contained in nuts and DF could partially explain their protectiveanti-oxidant and anti-inflammatory properties [2] and their implication in glucose and insulinmetabolism (and therefore in T2D). Significant evidence suggests that polyphenol-rich diets havethe ability to protect against diabetes [140]. It appears that anthocyanins (or anthocyanin-richfoods) are inversely associated to the risk of T2D, but there is no association for other polyphenolsubclasses [141,142]. Dietary polyphenols have some benefits for T2D: they protect pancreatic β-cellsagainst glucose toxicity and they have anti-inflammatory and anti-oxidant effects, among otherthings. Quercetin is a member of the flavonoid class of polyphenols which is abundant in suchfoods as fruits, vegetables, nuts and seeds [143]. Several in vitro studies have sought to elucidatethe mechanisms behind the antidiabetic properties of quercetin: for example the inhibition of theα-amylase and α-glucosidase activities, and the prevention of the lipid peroxidation of pancreatic tissuehomogenates [144]. Moreover, ellagic acid (EA) is another polyphenol which naturally occurs in somefruits, such as berries (strawberries and red and black raspberries), nuts, and pomegranates [145]. Thereis emerging in vitro evidence that EA may ameliorate symptoms of chronic metabolic diseases—bydecreasing chronic inflammation at the expression level—which include dyslipidemia, IR andT2D [146–148]. Despite the growing amount of information on EA, a definitive mechanism of actionhas not been established. This may be attributed to the complexity of EA metabolism, which isgoverned by various factors [145].
A growing body of evidence suggests that dietary agents and the non-nutrient components offruits, vegetables and nuts can affect epigenetic processes related to T2D [149,150]. Epigeneticsgenerally refers to heritable and reversible changes affecting gene expression and chromatinorganization that are not due to alterations in the DNA sequence [151,152]. No specific data is availableon the role of nuts and DFs in T2D epigenetics. However, dietary polyphenol resveratrol—mostabundant in the skin of grapes and raisins, but also found in peanuts and cranberries [153]—and otherphytochemicals (e.g., curcumin) have proved to be effective agents against cancer and to act throughepigenetic mechanisms that affect the global epigenome [154,155]. However, future studies are neededto determine the biological importance of the altered tissue-specific DNA methylation in T2D resultingfrom nutritional modifications [152].
250
Books
MDPI

Nutrients 2017, 9, 673
5.2. Cellular and Molecular Mechanisms Linking Nut and Dried Fruit Consumption and the Prevention and/orManagement of T2D/IR
Gene Expression
Some studies have analyzed the effect of nut and DF consumption on changes in the geneexpression of particular cells and/or tissues and its relationship with glucose and insulin metabolismor T2D. In particular, a crossover study conducted in pre-diabetic subjects consuming pistachio for4 months reported a downregulation of interleukin-6 (IL-6) and resistin (RETN) genes in leukocytes,whereas the pistachio diet led to a lower significant increase of solute carrier family 2 member4 (SLC2A4, codifying GLUT4) [85]. Consistent with this attenuation in the expression of glucosetransporters, leukocytes significantly reduced the uptake of glucose following pistachio consumption,suggesting a decrease in the cell hyperactivity described in T2D.
To our knowledge no published studies have evaluated gene expression after the consumption ofDF. However, a translational study conducted in 120 healthy young subjects has shown that individualsin the highest tertile of fruit and vegetable consumption had statistically lower values of the expressionof some pro-inflammatory marker genes such as intercellular adhesion molecule-1 (ICAM-1), IL-6 andTNF-α, in peripheral blood mononuclear cells (PBMC) [156].
Therefore, these results shed new light on the nutrient-gene interactions in nuts and DFs. However,further research is needed.
MicroRNAs
The modulatory role of nuts and DF on the expression of genes related to inflammation, oxidativestress and glucose metabolism can also be mediated by the effect of nutrients on microRNAs.MicroRNAs (miRNAs) are RNA molecules that belong to a family of small non-coding RNAs with 20to 25 nucleotides [157,158] that post-transcriptionally and negatively regulate gene expression.
Research into the nutritional modulation of miRNA is still in its infancy and few studieshave assessed whether a specific dietary pattern, food, supplements or a particular nutrient caninfluence miRNA levels [159]. In humans, consumption of grape extract rich in resveratrol, and Vitaminsupplementation modulated specific miRNAs towards a healthier status [160]. Similarly, a PUFA-enricheddiet including almonds and walnuts was effective at modifying several miRNAs [161]. More recently,pistachio consumption in pre-diabetic subjects significantly diminished the levels of miR-375 andmiR-192, both related to the glucose and insulin metabolism [162]. However, there is still much todiscover about the exact mechanisms linking miRNAs with the glucose and insulin metabolism andthe dietary modulation of miRNA expression.
Microbiota and Metabolomic Modulation
In recent years, many studies have pointed out that the gut microbiome might make an importantcontribution to the development of insulin resistance and T2D. Several mechanisms related to thecomposition of gut microbes—including changes in bowel permeability, endotoxemia and interactionwith bile acids—may contribute to the onset of insulin resistance. On the other hand, it is wellestablished that long-term dietary patterns and shorter-term dietary variation influence gut microbiotacomposition [163]. Many potential prebiotic components can be present in a particular food. Forexample, the fermentation of fiber from nuts and DF to beneficial end-products (e.g., butyric acid) andthe biotransformation of phytochemicals (i.e., tocopherols, phytosterols, and phenolic compounds) areassociated with the transition to a healthier microbiota composition [2,164].
There is little information on the putative effect of nuts and DF on microbiota modulation. In fact,only two publications have evaluated the effect of nut consumption (almonds and pistachios) onchanges in microbiota. Mandalari et al. conducted an in vitro study with almond skins and theyfound that almond fiber significantly altered the composition of gut bacteria, specifically Bifidobacteria,thus showing that almond skins had a potential prebiotic use [165]. Some years later, Ukhanova and
251
Books
MDPI

Nutrients 2017, 9, 673
collaborators carried out two separate crossover feeding trials with nuts and pistachios, and showedthat they both significantly affected microbiota modulation [166]. However, a greater prebiotic effectwas found after pistachio intake. In fact, pistachio increased the number of butyrate-producingbacteria, which are potentially beneficial, whereas the numbers of Bifidobacteria were not affected bythe consumption of either nut [166].
Recently, dietary polyphenols have been found to be involved in gut microbiota dysbiosisprocesses which may lead to a reduction of fat storage, inflammation and IR (reviewed in [167]).In fact, a cranberry extract also altered the gut microbiome of mice by increasing mucin-degradingbacteria, a potential link to reverse the dysbiosis and metabolic inflammation underlying T2D [168].
Very few studies have been made on metabolomic modulation after nut and DF intake.Of the studies that have been made, some have evaluated changes in metabolites after a chronicconsumption of nuts. They showed a modulation in the levels of metabolites such as raffinose,(12Z)-9,10-dihydroxyoctadec-12-enoate, sucrose, together with some modulations of plasma aminoacids and fatty acids [169], and a modulation of gut-related metabolites and cis-aconitate, anintermediate of tricarboxylic acid [170], after pistachio consumption.
Therefore, several specific nutrients—together with their synergic effects—in both nuts and DFsmay explain their beneficial role in glucose and insulin metabolism, which helps to prevent or maintainT2D (Figure 1).
Figure 1. Role of nutrients from nuts and dried fruits in glucose and insulin metabolism, and cellularand molecular mechanisms related to T2D/IR. CHO, carbohydrate; CMF, cellular membrane fluidity;GI, glycaemic index; IR, insulin resistance; MUFA, monounsaturated fatty acid; PUFA, polyunsaturatedfatty acid; T2D, type 2 diabetes.
6. Concluding Remarks
Undoubtedly, the specific composition of nuts and dried fruits means that they can be used toefficiently counteract metabolic diseases such as type 2 diabetes. Their unique profile of macronutrients,micronutrients and other bioactive compounds may explain the beneficial effects observed in clinicaland epidemiological studies. However, the exact mechanisms by which they modulate glucose and
252
Books
MDPI

Nutrients 2017, 9, 673
insulin metabolism and influence T2D have yet to be fully discovered. They contain fiber, fat, mineralsand other bioactive molecules that modulate several gene mechanisms at the cellular and molecularlevel. This may explain some of their beneficial effects. However, further basic and translationalresearch is needed in order to extend their positive health benefits and to find novel mechanisms andtargets to explain their contribution to the management of type 2 diabetes.
Acknowledgments: We thank Carles Munné and Susana Segura (Universitat Rovira i Virgili) for their help aseditor assistance. Lucía Camacho-Barcia is the recipient of a pre-doctoral fellowship from the Generalitat deCatalunya's Department of Universities (FI-DGR 2017).
Author Contributions: Pablo Hernández-Alonso, Lucía Camacho-Barcia, Mònica Bulló and Jordi Salas-Salvadódesigned the review. Pablo Hernández-Alonso, Lucía Camacho-Barcia and Mònica Bulló performed thebibliographical search. Pablo Hernández-Alonso, Lucía Camacho-Barcia, Mònica Bulló and Jordi Salas-Salvadówrote the first draft of the manuscript, and all authors contributed to the editing of the manuscript. All authorsapproved the final manuscript.
Conflicts of Interest: Pablo Hernández-Alonso, Lucía Camacho-Barcia and Mònica Bulló have nothing to declare.Jordi Salas-Salvadó is a nonpaid member of the Scientific Advisory Council of the International Nut Council.
Abbreviations
AMPK adenosine monophosphate-activated protein kinaseAT aerobically trainedATP adenosine triphosphateAOC area over the curveApo apolipoproteinBMI body mass indexBW body weightC cholesterolCHO carbohydrateCI confidence intervalCMF cellular membrane fluidityCRP C-reactive proteinCVD cardiovascular diseaseDF dried fruitEA ellagic acidEPIC European Prospective Investigation into CancerFA fatty acidFBG fasting blood glucoseFBP fructose-1,6-bisphosphataseG6Pase glucose 6-phosphataseGAE gallic acid equivalentsGI glycaemic indexGIP gastric inhibitory polypeptideGL glycaemic loadGJ grape juiceGLI glibenclamideGLP-1 glucagon-like peptide-1GLUT glucose transporter typeGPE grape powder extractHA high almondHbA1c glycated hemoglobinHDL high-density lipoproteinHF high fatHFD high-fat dietHOMA-IR homeostatic model assessment of insulin resistanceHPFS Health Professionals Follow-Up StudyIAUC incremental area under the curveICAM-1 intercellular adhesion molecule-1
253
Books
MDPI

Nutrients 2017, 9, 673
IGT impaired glucose toleranceIL-6 interleukin-6IR insulin resistanceLDL low-density lipoproteinLF low-fatLPS lipopolysaccharideMedDiet Mediterranean dietMESA Multi-Ethnic Study of AtherosclerosisMetS metabolic syndromeMI myocardial infarctionmiRNA and miR microRNAM/F male/femaleMUFA monounsaturated fatty acidsNA not availableNAFLD non-alcoholic fatty liver diseaseNCEP National Cholesterol Education ProgramNHANES National Health and Nutrition Examination SurveyNHS Nurses’ Health StudyNLCS Netherlands Cohort StudyNS non-significantOb obeseORAC oxygen radical absorbance capacityOw overweightPBMC peripheral blood mononuclear cellPF-4 platelet factor-4PHS Physicians' Health StudyPM post-menopausalPPAR peroxisome proliferator-activated receptorspre-D pre-diabetesPREDIMED PREvención con DIeta MEDiterráneaPUFA polyunsaturated fatty acidsPWE polyphenol-rich walnut extractRe rangeRETN resistinRCT randomized clinical trialRGR relative glycaemic responsesRR relative riskRW red wineROS reactive oxygen speciesS sedentarySBP systolic blood pressureSCCS Southern Community Cohort StudySCFA short chain fatty acidsSFA saturated fatty acidsSLC2A4 solute carrier family 2 member 4SMHS Shanghai Men's Health StudySTZ streptozotocinSWHS Shanghai Women's Health StudyT2D type 2 diabetesTC total cholesterolTF tissue factorTG triglyceridesTLGS Tehran Lipid and Glucose StudyTNF-α tumor necrosis factor-αUSDA United States Department of AgricultureVFM visceral fat massWB white breadWC waist circumferenceWHtR waist-to-height ratio
254
Books
MDPI

Nutrients 2017, 9, 673
References
1. Widmer, R.J.; Flammer, A.J.; Lerman, L.O.; Lerman, A. The Mediterranean diet, its components,and cardiovascular disease. Am. J. Med. 2015, 128, 229–238. [CrossRef] [PubMed]
2. Ros, E. Health Benefits of Nut Consumption. Nutrients 2010, 2, 652–682. [CrossRef] [PubMed]3. Chang, S.K.; Alasalvar, C.; Shahidi, F. Review of dried fruits: Phytochemicals, antioxidant efficacies,
and health benefits. J. Funct. Foods 2016, 21, 113–132. [CrossRef]4. Ros, E. Nuts and CVD. Br. J. Nutr. 2015, 113 (Suppl.), S111–S120. [CrossRef] [PubMed]5. Casas-Agustench, P.; Salas-Huetos, A.; Salas-Salvadó, J. Mediterranean nuts: Origins, ancient medicinal
benefits and symbolism. Public Health Nutr. 2011, 14, 2296–2301. [CrossRef] [PubMed]6. Salas-Salvadó, J.; Casas-Agustench, P.; Salas-Huetos, A. Cultural and historical aspects of Mediterranean
nuts with emphasis on their attributed healthy and nutritional properties. Nutr. Metab. Cardiovasc. Dis. 2011,21 (Suppl. 1), S1–S6. [CrossRef] [PubMed]
7. Sofi, F. The Mediterranean diet revisited: Evidence of its effectiveness grows. Curr. Opin. Cardiol. 2009, 24,442–446. [CrossRef] [PubMed]
8. Alasalvar, C.; Shahidi, F. Composition, phytochemicals, and beneficial health effects of dried fruits: An overview.In Dried Fruits: Phytochemicals and Health Effects; Wiley-Blackwell: Oxford, UK, 2013; pp. 372–392.
9. US Department of Agriculture, Agricultural Research Service, Nutrient Data Laboratory. USDA NationalNutrient Database for Standard Reference, Release 28 (revised), Version Current: May 2015. Available online:http://www.ars.usda.gov/ba/bhnrc/ndl (accessed on 3 March 2017).
10. Halvorsen, B.L.; Carlsen, M.H.; Phillips, K.M.; Bøhn, S.K.; Holte, K.; Jacobs, D.R.; Blomhoff, R. Content ofredox-active compounds (ie, antioxidants) in foods consumed in the United States. Am. J. Clin. Nutr. 2006,84, 95–135. [PubMed]
11. Phillips, K.M.; Ruggio, D.M.; Ashraf-Khorassani, M. Phytosterol composition of nuts and seeds commonlyconsumed in the United States. J. Agric. Food Chem. 2005, 53, 9436–9445. [CrossRef] [PubMed]
12. Montonen, J.; Knekt, P.; Jarvinen, R.; Reunanen, A. Dietary Antioxidant Intake and Risk of Type 2 Diabetes.Diabetes Care 2004, 27, 362–366. [CrossRef] [PubMed]
13. Sluijs, I.; Cadier, E.; Beulens, J.W.J.; van der A, D.L.; Spijkerman, A.M.W.; van der Schouw, Y.T. Dietaryintake of carotenoids and risk of type 2 diabetes. Nutr. Metab. Cardiovasc. Dis. 2015, 25, 376–381. [CrossRef][PubMed]
14. Zhao, B.; Hall, C.A. Composition and antioxidant activity of raisin extracts obtained from various solvents.Food Chem. 2008, 108, 511–518. [CrossRef] [PubMed]
15. Anderson, J.W.; Waters, A.R. Raisin consumption by humans: Effects on glycemia and insulinemia andcardiovascular risk factors. J. Food Sci. 2013, 78, A11–A17. [CrossRef] [PubMed]
16. Mandalari, G.; Bisignano, C.; Filocamo, A.; Chessa, S.; Sarò, M.; Torre, G.; Faulks, R.M.; Dugo, P.Bioaccessibility of pistachio polyphenols, xanthophylls, and tocopherols during simulated human digestion.Nutrition 2013, 29, 338–344. [CrossRef] [PubMed]
17. O’Neil, C.E.; Keast, D.R.; Fulgoni, V.L.; Nicklas, T.A. Tree nut consumption improves nutrient intake and dietquality in US adults: An analysis of national health and nutrition examination survey (NHANES) 1999–2004.Asia Pac. J. Clin. Nutr. 2010, 19, 142–150. [PubMed]
18. O’Neil, C.E.; Keast, D.R.; Nicklas, T.A.; Fulgoni, V.L. Out-of-hand nut consumption is associated withimproved nutrient intake and health risk markers in US children and adults: National Health and NutritionExamination Survey 1999–2004. Nutr. Res. 2012, 32, 185–194. [CrossRef] [PubMed]
19. Tey, S.L.; Brown, R.; Gray, A.; Chisholm, A.; Delahunty, C. Nuts improve diet quality compared to otherenergy-dense snacks while maintaining body weight. J. Nutr. Metab. 2011, 2011, 357350. [CrossRef][PubMed]
20. McManus, K.; Antinoro, L.; Sacks, F. A randomized controlled trial of a moderate-fat, low-energy diet comparedwith a low fat, low-energy diet for weight loss in overweight adults. Int. J. Obes. Relat. Metab. Disord. 2001, 25,1503–1511. [CrossRef] [PubMed]
21. Bazzano, L.A.; Li, T.Y.; Joshipura, K.J.; Hu, F.B. Intake of fruit, vegetables, and fruit juices and risk of diabetesin women. Diabetes Care 2008, 31, 1311–1317. [CrossRef] [PubMed]
255
Books
MDPI

Nutrients 2017, 9, 673
22. Keast, D.R.; O’Neil, C.E.; Jones, J.M. Dried fruit consumption is associated with improved diet quality andreduced obesity in US adults: National Health and Nutrition Examination Survey, 1999–2004. Nutr. Res.2011, 31, 460–467. [CrossRef] [PubMed]
23. Chan, R.; Wong, V.W.-S.; Chu, W.C.-W.; Wong, G.L.-H.; Li, L.S.; Leung, J.; Chim, A.M.-L.; Yeung, D.K.-W.;Sea, M.M.-M.; Woo, J.; et al. Diet-Quality Scores and Prevalence of Nonalcoholic Fatty Liver Disease: APopulation Study Using Proton-Magnetic Resonance Spectroscopy. PLoS ONE 2015, 10, e0139310. [CrossRef][PubMed]
24. U.S. Department of Health and Human Services and U.S. Department of Agriculture. 2015–2020Dietary Guidelines for Americans, 8th Edition edDecember 2015. Available online: http://health.gov/dietaryguidelines/2015/guidelines/ (accessed on 10 March 2017).
25. Bilbis, L.S.; Shehu, R.A.; Abubakar, M.G. Hypoglycemic and hypolipidemic effects of aqueous extract ofArachis hypogaea in normal and alloxan-induced diabetic rats. Phytomedicine 2002, 9, 553–555. [CrossRef][PubMed]
26. Fukuda, T.; Ito, H.; Yoshida, T. Effect of the walnut polyphenol fraction on oxidative stress in type 2 diabetesmice. Biofactors 2004, 21, 251–253. [CrossRef] [PubMed]
27. Ramesh, B.; Saravanan, R.; Pugalendi, K. V Effect of dietary substitution of groundnut oil on blood glucose,lipid profile, and redox status in streptozotocin-diabetic rats. Yale J. Biol. Med. 2006, 79, 9–17. [PubMed]
28. Emekli-Alturfan, E.; Kasikci, E.; Yarat, A. Tissue factor activities of streptozotocin induced diabetic rat tissuesand the effect of peanut consumption. Diabetes Metab. Res. Rev. 2007, 23, 653–658. [CrossRef] [PubMed]
29. Choi, Y.; Abdelmegeed, M.A.; Akbar, M.; Song, B.-J.J. Dietary walnut reduces hepatic triglyceride contentin high-fat-fed mice via modulation of hepatic fatty acid metabolism and adipose tissue inflammation.J. Nutr. Biochem. 2016, 30, 116–125. [CrossRef] [PubMed]
30. Overman, A.; Bumrungpert, A.; Kennedy, A.; Martinez, K.; Chuang, C.-C.; West, T.; Dawson, B.; Jia, W.;McIntosh, M. Polyphenol-rich grape powder extract (GPE) attenuates inflammation in human macrophagesand in human adipocytes exposed to macrophage-conditioned media. Int. J. Obes. (Lond.) 2010, 34, 800–808.[CrossRef] [PubMed]
31. Chuang, C.-C.; Bumrungpert, A.; Kennedy, A.; Overman, A.; West, T.; Dawson, B.; McIntosh, M.K. Grapepowder extract attenuates tumor necrosis factor α-mediated inflammation and insulin resistance in primarycultures of human adipocytes. J. Nutr. Biochem. 2011, 22, 89–94. [CrossRef] [PubMed]
32. Chuang, C.-C.; Martinez, K.; Xie, G.; Kennedy, A.; Bumrungpert, A.; Overman, A.; Jia, W.; McIntosh, M.K.Quercetin is equally or more effective than resveratrol in attenuating tumor necrosis factor—Mediatedinflammation and insulin resistance in primary human adipocytes. Am. J. Clin. Nutr. 2010, 92, 1511–1521.[CrossRef] [PubMed]
33. Zangiabadi, N.; Asadi-Shekaari, M.; Sheibani, V.; Jafari, M.; Shabani, M.; Asadi, A.R.; Tajadini, H.; Jarahi, M.Date fruit extract is a neuroprotective agent in diabetic peripheral neuropathy in streptozotocin-induceddiabetic rats: A multimodal analysis. Oxid. Med. Cell. Longev. 2011, 2011, 976948. [CrossRef] [PubMed]
34. Porto, L.C.S.; da Silva, J.; Ferraz, A.B.F.; Ethur, E.M.; Porto, C.D.L.; Marroni, N.P.; Picada, J.N. The Antidiabeticand Antihypercholesterolemic Effects of an Aqueous Extract from Pecan Shells in Wistar Rats. Plant FoodsHum. Nutr. 2015, 70, 414–419. [CrossRef] [PubMed]
35. Tédong, L.; Dzeufiet, P.D.D.; Dimo, T.; Asongalem, E.A.; Sokeng, S.N.; Flejou, J.-F.; Callard, P.; Kamtchouing, P.Acute and subchronic toxicity of Anacardium occidentale Linn (Anacardiaceae) leaves hexane extract inmice. Afr. J. Tradit. Complement. Altern. Med. AJTCAM 2006, 4, 140–147. [CrossRef] [PubMed]
36. Asgary, S.; Parkhideh, S.; Solhpour, A.; Madani, H.; Mahzouni, P.; Rahimi, P. Effect of ethanolic extract ofJuglans regia L. on blood sugar in diabetes-induced rats. J. Med. Food 2008, 11, 533–538. [CrossRef] [PubMed]
37. Ojewole, J.A.O. Laboratory evaluation of the hypoglycemic effect of Anacardium occidentale Linn(Anacardiaceae) stem-bark extracts in rats. Methods Find. Exp. Clin. Pharmacol. 2003, 25, 199–204. [CrossRef][PubMed]
38. Egwim, E. Hypoglycemic potencies of crude ethanolic extracts of cashew roots and unripe pawpaw fruits inguinea pigs and rats. J. Herb. Pharmacother. 2005, 5, 27–34. [CrossRef] [PubMed]
39. Jelodar, G.; Mohsen, M.; Shahram, S. Effect of walnut leaf, coriander and pomegranate on blood glucose andhistopathology of pancreas of alloxan induced diabetic rats. Afr. J. Tradit. Complement. Altern. Med. AJTCAM2007, 4, 299–305. [CrossRef] [PubMed]
256
Books
MDPI

Nutrients 2017, 9, 673
40. Eid, H.M.; Martineau, L.C.; Saleem, A.; Muhammad, A.; Vallerand, D.; Benhaddou-Andaloussi, A.; Nistor, L.;Afshar, A.; Arnason, J.T.; Haddad, P.S. Stimulation of AMP-activated protein kinase and enhancementof basal glucose uptake in muscle cells by quercetin and quercetin glycosides, active principles of theantidiabetic medicinal plant Vaccinium vitis-idaea. Mol. Nutr. Food Res. 2010, 54, 991–1003. [CrossRef][PubMed]
41. Vassiliou, E.K.; Gonzalez, A.; Garcia, C.; Tadros, J.H.; Chakraborty, G.; Toney, J.H. Oleic acid and peanut oilhigh in oleic acid reverse the inhibitory effect of insulin production of the inflammatory cytokine TNF-alphaboth in vitro and in vivo systems. Lipids Health Dis. 2009, 8, 25. [CrossRef] [PubMed]
42. Adewale, O.F.; Isaac, O.; Tunmise, M.T.; Omoniyi, O. Palm oil and ground nut oil supplementation effects onblood glucose and antioxidant status in alloxan-induced diabetic rats. Pak. J. Pharm. Sci. 2016, 29, 83–87.[PubMed]
43. Anderson, K.J.; Teuber, S.S.; Gobeille, A.; Cremin, P.; Waterhouse, A.L.; Steinberg, F.M. Walnut polyphenolicsinhibit in vitro human plasma and LDL oxidation. J. Nutr. 2001, 131, 2837–2842. [PubMed]
44. Chen, C.-Y.; Milbury, P.E.; Lapsley, K.; Blumberg, J.B. Flavonoids from almond skins are bioavailable and actsynergistically with vitamins C and E to enhance hamster and human LDL resistance to oxidation. J. Nutr.2005, 135, 1366–1373. [PubMed]
45. Wijeratne, S.S.K.; Abou-Zaid, M.M.; Shahidi, F. Antioxidant polyphenols in almond and its coproducts.J. Agric. Food Chem. 2006, 54, 312–318. [CrossRef] [PubMed]
46. Gentile, C.; Tesoriere, L.; Butera, D.; Fazzari, M.; Monastero, M.; Allegra, M.; Livrea, M.A. Antioxidantactivity of Sicilian pistachio (Pistacia vera L Var. Bronte) nut extract and its bioactive components. J. Agric.Food Chem. 2007, 55, 643–648. [CrossRef] [PubMed]
47. Shahidi, F.; Alasalvar, C.; Liyana-Pathirana, C.M. Antioxidant phytochemicals in hazelnut kernel (Corylusavellana L) and hazelnut byproducts. J. Agric. Food Chem. 2007, 55, 1212–1220. [CrossRef] [PubMed]
48. Tedong, L.; Madiraju, P.; Martineau, L.C.; Vallerand, D.; Arnason, J.T.; Desire, D.D.P.; Lavoie, L.;Kamtchouing, P.; Haddad, P.S. Hydro-ethanolic extract of cashew tree (Anacardium occidentale) nut and itsprincipal compound, anacardic acid, stimulate glucose uptake in C2C12 muscle cells. Mol. Nutr. Food Res.2010, 54, 1753–1762. [CrossRef] [PubMed]
49. Shahraki, J.; Zareh, M.; Kamalinejad, M.; Pourahmad, J. Cytoprotective Effects of Hydrophilic and LipophilicExtracts of Pistacia vera against Oxidative Versus Carbonyl Stress in Rat Hepatocytes. Iran. J. Pharm. Res. IJPR2014, 13, 1263–1277. [PubMed]
50. Aoun, M.; Michel, F.; Fouret, G.; Schlernitzauer, A.; Ollendorff, V.; Wrutniak-Cabello, C.; Cristol, J.-P.;Carbonneau, M.-A.; Coudray, C.; Feillet-Coudray, C. A grape polyphenol extract modulates musclemembrane fatty acid composition and lipid metabolism in high-fat–high-sucrose diet-fed rats. Br. J. Nutr.2011, 106, 491–501. [CrossRef] [PubMed]
51. Weijers, R.N.M. Lipid composition of cell membranes and its relevance in type 2 diabetes mellitus.Curr. Diabetes Rev. 2012, 8, 390–400. [CrossRef] [PubMed]
52. Soares de Moura, R.; da Costa, G.F.; Moreira, A.S.B.; Queiroz, E.F.; Moreira, D.D.C.; Garcia-Souza, E.P.;Resende, A.C.; Moura, A.S.; Teixeira, M.T. Vitis vinifera L. grape skin extract activates the insulin-signallingcascade and reduces hyperglycaemia in alloxan-induced diabetic mice. J. Pharm. Pharmacol. 2012, 64, 268–276.[CrossRef] [PubMed]
53. Adam, S.H.; Giribabu, N.; Kassim, N.; Kumar, K.E.; Brahmayya, M.; Arya, A.; Salleh, N. Protective effect ofaqueous seed extract of Vitis Vinifera against oxidative stress, inflammation and apoptosis in the pancreas ofadult male rats with diabetes mellitus. Biomed. Pharmacother. 2016, 81, 439–452. [CrossRef] [PubMed]
54. Esposito, D.; Damsud, T.; Wilson, M.; Grace, M.H.; Strauch, R.; Li, X.; Lila, M.A.; Komarnytsky, S. BlackCurrant Anthocyanins Attenuate Weight Gain and Improve Glucose Metabolism in Diet-Induced ObeseMice with Intact, but Not Disrupted, Gut Microbiome. J. Agric. Food Chem. 2015, 63, 6172–6180. [CrossRef][PubMed]
55. Schmatz, R.; Mann, T.R.; Spanevello, R.; Machado, M.M.; Zanini, D.; Pimentel, V.C.; Stefanello, N.;Martins, C.C.; Cardoso, A.M.; Bagatini, M.; et al. Moderate red wine and grape juice consumption modulatesthe hydrolysis of the adenine nucleotides and decreases platelet aggregation in streptozotocin-induceddiabetic rats. Cell Biochem. Biophys. 2013, 65, 129–143. [CrossRef] [PubMed]
257
Books
MDPI

Nutrients 2017, 9, 673
56. Hernández-Salinas, R.; Decap, V.; Leguina, A.; Cáceres, P.; Perez, D.; Urquiaga, I.; Iturriaga, R.; Velarde, V.Antioxidant and anti hyperglycemic role of wine grape powder in rats fed with a high fructose diet. Biol. Res.2015, 48, 53. [CrossRef] [PubMed]
57. Overman, A.; Chuang, C.-C.; McIntosh, M. Quercetin attenuates inflammation in human macrophages andadipocytes exposed to macrophage-conditioned media. Int. J. Obes. (Lond.) 2011, 35, 1165–1172. [CrossRef][PubMed]
58. Nettleton, J.A.; Steffen, L.M.; Ni, H.; Liu, K.; Jacobs, D.R. Dietary patterns and risk of incident type 2 diabetesin the Multi-Ethnic Study of Atherosclerosis (MESA). Diabetes Care 2008, 31, 1777–1782. [CrossRef] [PubMed]
59. O’Neil, C.E.; Fulgoni, V.L.; Nicklas, T.A. Tree Nut consumption is associated with better adiposity measuresand cardiovascular and metabolic syndrome health risk factors in U.S. Adults: NHANES 2005–2010. Nutr. J.2015, 14, 64. [CrossRef] [PubMed]
60. Asghari, G.; Ghorbani, Z.; Mirmiran, P.; Azizi, F. Nut consumption is associated with lower incidence oftype 2 diabetes: The Tehran Lipid and Glucose Study. Diabetes Metab. 2017, 43, 18–24. [CrossRef] [PubMed]
61. Jiang, R.; Manson, J.E.; Stampfer, M.J.; Liu, S.; Willett, W.C.; Hu, F.B. Nut and peanut butter consumptionand risk of type 2 diabetes in women. JAMA 2002, 288, 2554–2560. [CrossRef] [PubMed]
62. Villegas, R.; Gao, Y.-T.T.; Yang, G.; Li, H.-L.L.; Elasy, T.A.; Zheng, W.; Shu, X.O. Legume and soy food intakeand the incidence of type 2 diabetes in the Shanghai Women’s Health Study. Am. J. Clin. Nutr. 2008, 87,162–167. [PubMed]
63. Ibarrola-Jurado, N.; Bulló, M.; Guasch-Ferré, M.; Ros, E.; Martínez-González, M.A.; Corella, D.; Fiol, M.;Wärnberg, J.; Estruch, R.; Román, P.; et al. Cross-sectional assessment of nut consumption and obesity,metabolic syndrome and other cardiometabolic risk factors: The PREDIMED study. PLoS ONE 2013, 8,e57367. [CrossRef] [PubMed]
64. Pan, A.; Sun, Q.; Manson, J.E.; Willett, W.C.; Hu, F.B. Walnut consumption is associated with lower risk oftype 2 diabetes in women. J. Nutr. 2013, 143, 512–518. [CrossRef] [PubMed]
65. van den Brandt, P.A.; Schouten, L.J. Relationship of tree nut, peanut and peanut butter intake with total andcause-specific mortality: A cohort study and meta-analysis. Int. J. Epidemiol. 2015, 44, 1038–1049. [CrossRef][PubMed]
66. Buijsse, B.; Boeing, H.; Drogan, D.; Schulze, M.B.; Feskens, E.J.; Amiano, P.; Barricarte, A.; Clavel-Chapelon, F.;de Lauzon-Guillain, B.; Fagherazzi, G.; et al. Consumption of fatty foods and incident type 2 diabetes inpopulations from eight European countries. Eur. J. Clin. Nutr. 2015, 69, 455–461. [CrossRef] [PubMed]
67. Kochar, J.; Gaziano, J.M.; Djoussé, L. Nut consumption and risk of type II diabetes in the Physicians’ HealthStudy. Eur. J. Clin. Nutr. 2010, 64, 75–79. [CrossRef] [PubMed]
68. Pimpin, L.; Wu, J.H.Y.; Haskelberg, H.; Del Gobbo, L.; Mozaffarian, D. Is Butter Back? A Systematic Reviewand Meta-Analysis of Butter Consumption and Risk of Cardiovascular Disease, Diabetes, and Total Mortality.PLoS ONE 2016, 11, e0158118. [CrossRef] [PubMed]
69. Jenkins, D.J.A.; Kendall, C.W.C.; Josse, A.R.; Salvatore, S.; Brighenti, F.; Augustin, L.S.A.; Ellis, P.R.; Vidgen, E.;Rao, A.V. Almonds Decrease Postprandial Glycemia, Insulinemia, and Oxidative Damage in HealthyIndividuals. J. Nutr. 2006, 136, 2987–2992. [PubMed]
70. Josse, A.R.; Kendall, C.W.C.; Augustin, L.S.A.; Ellis, P.R.; Jenkins, D.J.A. Almonds and postprandialglycemia—A dose-response study. Metabolism. 2007, 56, 400–404. [CrossRef] [PubMed]
71. Mori, A.M.; Considine, R.V.; Mattes, R.D.; Wong, J.; Jenkins, D.; Jiang, R.; Manson, J.; Stampfer, M.; Liu, S.;Willett, W.; et al. Acute and second-meal effects of almond form in impaired glucose tolerant adults:A randomized crossover trial. Nutr. Metab. (Lond.) 2011, 8, 6. [CrossRef] [PubMed]
72. Cohen, A.E.; Johnston, C.S. Almond ingestion at mealtime reduces postprandial glycemia and chronicingestion reduces hemoglobin A1c in individuals with well-controlled type 2 diabetes mellitus. Metabolism2011, 60, 1312–1317. [CrossRef] [PubMed]
73. Crouch, M.A.; Slater, R.T. Almond “Appetizer” Effect on Glucose Tolerance Test (GTT) Results. J. Am. BoardFam. Med. 2016, 29, 759–766. [CrossRef] [PubMed]
74. Kendall, C.W.C.; Josse, A.R.; Esfahani, A.; Jenkins, D.J.A. The impact of pistachio intake alone or incombination with high-carbohydrate foods on post-prandial glycemia. Eur. J. Clin. Nutr. 2011, 65, 696–702.[CrossRef] [PubMed]
258
Books
MDPI

Nutrients 2017, 9, 673
75. Kendall, C.W.C.; West, S.G.; Augustin, L.S.; Esfahani, A.; Vidgen, E.; Bashyam, B.; Sauder, K.A.; Campbell, J.;Chiavaroli, L.; Jenkins, A.L.; et al. Acute effects of pistachio consumption on glucose and insulin, satietyhormones and endothelial function in the metabolic syndrome. Eur. J. Clin. Nutr. 2014, 68, 370–375.[CrossRef] [PubMed]
76. Reis, C.E.G.; Bordalo, L.A.; Rocha, A.L.C.; Freitas, D.M.O.; da Silva, M.V.L.; de Faria, V.C.; Martino, H.S.D.;Costa, N.M.B.; Alfenas, R.C. Ground roasted peanuts leads to a lower post-prandial glycemic response thanraw peanuts. Nutr. Hosp. 2011, 26, 745–751. [PubMed]
77. Moreira, A.P.B.; Teixeira, T.F.S.; Alves, R.D.M.; Peluzio, M.C.G.; Costa, N.M.B.; Bressan, J.; Mattes, R.;Alfenas, R.C.G. Effect of a high-fat meal containing conventional or high-oleic peanuts on post-prandiallipopolysaccharide concentrations in overweight/obese men. J. Hum. Nutr. Diet. 2016, 29, 95–104. [CrossRef][PubMed]
78. Kendall, C.W.C.; Esfahani, A.; Josse, A.R.; Augustin, L.S.A.; Vidgen, E.; Jenkins, D.J.A. The glycemic effectof nut-enriched meals in healthy and diabetic subjects. Nutr. Metab. Cardiovasc. Dis. 2011, 21 (Suppl. 1),S34–S39. [CrossRef] [PubMed]
79. Lovejoy, J.C.; Most, M.M.; Lefevre, M.; Greenway, F.L.; Rood, J.C. Effect of diets enriched in almonds oninsulin action and serum lipids in adults with normal glucose tolerance or type 2 diabetes. Am. J. Clin. Nutr.2002, 76, 1000–1006. [PubMed]
80. Li, S.-C.; Liu, Y.-H.; Liu, J.-F.; Chang, W.-H.; Chen, C.-M.; Chen, C.-Y.O. Almond consumption improvedglycemic control and lipid profiles in patients with type 2 diabetes mellitus. Metabolism 2011, 60, 474–479.[CrossRef] [PubMed]
81. Damavandi, R.D.; Eghtesadi, S.; Shidfar, F.; Heydari, I.; Foroushani, A.R. Effects of hazelnuts consumptionon fasting blood sugar and lipoproteins in patients with type 2 diabetes. J. Res. Med. Sci. 2013, 18, 314–321.[PubMed]
82. Lasa, A.; Miranda, J.; Bulló, M.; Casas, R.; Salas-Salvadó, J.; Larretxi, I.; Estruch, R.; Ruiz-Gutiérrez, V.;Portillo, M.P. Comparative effect of two Mediterranean diets versus a low-fat diet on glycaemic control inindividuals with type 2 diabetes. Eur. J. Clin. Nutr. 2014, 68, 767–772. [CrossRef] [PubMed]
83. Parham, M.; Heidari, S.; Khorramirad, A.; Hozoori, M.; Hosseinzadeh, F.; Bakhtyari, L.; Vafaeimanesh, J.Effects of pistachio nut supplementation on blood glucose in patients with type 2 diabetes: A randomizedcrossover trial. Rev. Diabet. Stud. 2014, 11, 190–196. [CrossRef] [PubMed]
84. Gulati, S.; Misra, A.; Pandey, R.M. Effect of Almond Supplementation on Glycemia and Cardiovascular RiskFactors in Asian Indians in North India with Type 2 Diabetes Mellitus: A 24–Week Study. Metab. Syndr.Relat. Disord. 2017, 15, 98–105. [CrossRef] [PubMed]
85. Hernández-Alonso, P.; Salas-Salvadó, J.; Baldrich-Mora, M.; Juanola-Falgarona, M.; Bulló, M. Beneficial Effectof Pistachio Consumption on Glucose Metabolism, Insulin Resistance, Inflammation, and Related MetabolicRisk Markers: A Randomized Clinical Trial. Diabetes Care 2014, 37, 3098–3105. [CrossRef] [PubMed]
86. Jenkins, D.J.A.; Kendall, C.W.C.; Marchie, A.; Josse, A.R.; Nguyen, T.H.; Faulkner, D.A.; Lapsley, K.G.;Singer, W. Effect of almonds on insulin secretion and insulin resistance in nondiabetic hyperlipidemicsubjects: A randomized controlled crossover trial. Metabolism 2008, 57, 882–887. [CrossRef] [PubMed]
87. Le, T.; Flatt, S.W.; Natarajan, L.; Pakiz, B.; Quintana, E.L.; Heath, D.D.; Rana, B.K.; Rock, C.L. Effects of DietComposition and Insulin Resistance Status on Plasma Lipid Levels in a Weight Loss Intervention in Women.J. Am. Heart Assoc. 2016, 5, e002771. [CrossRef] [PubMed]
88. Claesson, A.-L.; Holm, G.; Ernersson, A.; Lindström, T.; Nystrom, F.H. Two weeks of overfeeding with candy,but not peanuts, increases insulin levels and body weight. Scand. J. Clin. Lab. Invest. 2009, 69, 598–605.[CrossRef] [PubMed]
89. Wien, M.A.; Sabaté, J.M.; Iklé, D.N.; Cole, S.E.; Kandeel, F.R. Almonds vs. complex carbohydrates in a weightreduction program. Int. J. Obes. Relat. Metab. Disord. 2003, 27, 1365–1372. [CrossRef] [PubMed]
90. Esposito, K.; Marfella, R.; Ciotola, M.; Di Palo, C.; Giugliano, F.; Giugliano, G.; D’Armiento, M.; D’Andrea, F.;Giugliano, D. Effect of a mediterranean-style diet on endothelial dysfunction and markers of vascularinflammation in the metabolic syndrome: A randomized trial. JAMA 2004, 292, 1440–1446. [CrossRef][PubMed]
91. Tapsell, L.C.; Gillen, L.J.; Patch, C.S.; Batterham, M.; Owen, A.; Baré, M.; Kennedy, M. Including walnutsin a low-fat/modified-fat diet improves HDL cholesterol-to-total cholesterol ratios in patients with type 2diabetes. Diabetes Care 2004, 27, 2777–2783. [CrossRef] [PubMed]
259
Books
MDPI

Nutrients 2017, 9, 673
92. Tapsell, L.C.; Batterham, M.J.; Teuss, G.; Tan, S.-Y.; Dalton, S.; Quick, C.J.; Gillen, L.J.; Charlton, K.E.Long-term effects of increased dietary polyunsaturated fat from walnuts on metabolic parameters in type IIdiabetes. Eur. J. Clin. Nutr. 2009, 63, 1008–1015. [CrossRef] [PubMed]
93. Ma, Y.; Njike, V.Y.; Millet, J.; Dutta, S.; Doughty, K.; Treu, J.A.; Katz, D.L. Effects of walnut consumption onendothelial function in type 2 diabetic subjects: A randomized controlled crossover trial. Diabetes Care 2010,33, 227–232. [CrossRef] [PubMed]
94. Brennan, A.M.; Sweeney, L.L.; Liu, X.; Mantzoros, C.S. Walnut consumption increases satiation but has noeffect on insulin resistance or the metabolic profile over a 4-day period. Obesity (Silver Spring) 2010, 18,1176–1182. [CrossRef] [PubMed]
95. Wang, X.; Li, Z.; Liu, Y.; Lv, X.; Yang, W. Effects of pistachios on body weight in Chinese subjects withmetabolic syndrome. Nutr. J. 2012, 11, 20. [CrossRef] [PubMed]
96. Katz, D.L.; Davidhi, A.; Ma, Y.; Kavak, Y.; Bifulco, L.; Njike, V.Y. Effects of walnuts on endothelial function inoverweight adults with visceral obesity: A randomized, controlled, crossover trial. J. Am. Coll. Nutr. 2012,31, 415–423. [CrossRef] [PubMed]
97. Richmond, K.; Williams, S.; Mann, J.; Brown, R.; Chisholm, A. Markers of Cardiovascular Risk inPostmenopausal Women with Type 2 Diabetes Are Improved by the Daily Consumption of Almondsor Sunflower Kernels: A Feeding Study. ISRN Nutr. 2013, 2013, 1–9. [CrossRef] [PubMed]
98. Tan, S.Y.; Mattes, R.D. Appetitive, dietary and health effects of almonds consumed with meals or as snacks:A randomized, controlled trial. Eur. J. Clin. Nutr. 2013, 67, 1205–1214. [CrossRef] [PubMed]
99. Liu, J.-F.; Liu, Y.-H.; Chen, C.-M.; Chang, W.-H.; Chen, C.-Y.O. The effect of almonds on inflammation andoxidative stress in Chinese patients with type 2 diabetes mellitus: A randomized crossover controlled feedingtrial. Eur. J. Nutr. 2013, 52, 927–935. [CrossRef] [PubMed]
100. Wu, L.; Piotrowski, K.; Rau, T.; Waldmann, E.; Broedl, U.C.; Demmelmair, H.; Koletzko, B.; Stark, R.G.;Nagel, J.M.; Mantzoros, C.S.; et al. Walnut-enriched diet reduces fasting non-HDL-cholesterol andapolipoprotein B in healthy Caucasian subjects: A randomized controlled cross-over clinical trial. Metabolism2014, 63, 382–391. [CrossRef] [PubMed]
101. Wien, M.; Oda, K.; Sabaté, J. A randomized controlled trial to evaluate the effect of incorporating peanutsinto an American Diabetes Association meal plan on the nutrient profile of the total diet and cardiometabolicparameters of adults with type 2 diabetes. Nutr. J. 2014, 13, 10. [CrossRef] [PubMed]
102. Sauder, K.A.; McCrea, C.E.; Ulbrecht, J.S.; Kris-Etherton, P.M.; West, S.G. Effects of pistachios on thelipid/lipoprotein profile, glycemic control, inflammation, and endothelial function in type 2 diabetes:A randomized trial. Metabolism 2015, 64, 1521–1529. [CrossRef] [PubMed]
103. Njike, V.Y.; Ayettey, R.; Petraro, P.; Treu, J.A.; Katz, D.L. Walnut ingestion in adults at risk for diabetes: Effectson body composition, diet quality, and cardiac risk measures. BMJ Open Diabetes Res. Care 2015, 3, e000115.[CrossRef] [PubMed]
104. Sari, I.; Baltaci, Y.; Bagci, C.; Davutoglu, V.; Erel, O.; Celik, H.; Ozer, O.; Aksoy, N.; Aksoy, M. Effect ofpistachio diet on lipid parameters, endothelial function, inflammation, and oxidative status: A prospectivestudy. Nutrition 2010, 26, 399–404. [CrossRef] [PubMed]
105. Gulati, S.; Misra, A.; Pandey, R.M.; Bhatt, S.P.; Saluja, S. Effects of pistachio nuts on body composition,metabolic, inflammatory and oxidative stress parameters in Asian Indians with metabolic syndrome:A 24-week, randomized control trial. Nutrition 2014, 30, 192–197. [CrossRef] [PubMed]
106. Wien, M.; Bleich, D.; Raghuwanshi, M.; Gould-Forgerite, S.; Gomes, J.; Monahan-Couch, L.; Oda, K. Almondconsumption and cardiovascular risk factors in adults with prediabetes. J. Am. Coll. Nutr. 2010, 29, 189–197.[CrossRef] [PubMed]
107. Casas-Agustench, P.; López-Uriarte, P.; Bulló, M.; Ros, E.; Cabré-Vila, J.J.; Salas-Salvadó, J. Effects of oneserving of mixed nuts on serum lipids, insulin resistance and inflammatory markers in patients with themetabolic syndrome. Nutr. Metab. Cardiovasc. Dis. 2011, 21, 126–135. [CrossRef] [PubMed]
108. Mejia, S.B.; Kendall, C.W.C.; Viguiliouk, E.; Augustin, L.S.; Ha, V.; Cozma, A.I.; Mirrahimi, A.; Maroleanu, A.;Chiavaroli, L.; Leiter, L.A.; et al. Effect of tree nuts on metabolic syndrome criteria: A systematic review andmeta-analysis of randomised controlled trials. BMJ Open 2014, 4, e004660. [CrossRef] [PubMed]
109. Rasmussen, O.; Winther, E.; Hermansen, K. Postprandial glucose and insulin responses to rolled oats ingestedraw, cooked or as a mixture with raisins in normal subjects and type 2 diabetic patients. Diabet. Med. 1989, 6,337–341. [CrossRef] [PubMed]
260
Books
MDPI

Nutrients 2017, 9, 673
110. Kim, Y.; Hertzler, S.R.; Byrne, H.K.; Mattern, C.O. Raisins are a low to moderate glycemic index food with acorrespondingly low insulin index. Nutr. Res. 2008, 28, 304–308. [CrossRef] [PubMed]
111. Kanellos, P.T.; Kaliora, A.C.; Liaskos, C.; Tentolouris, N.K.; Perrea, D.; Karathanos, V.T. A study of glycemicresponse to Corinthian raisins in healthy subjects and in type 2 diabetes mellitus patients. Plant FoodsHum. Nutr. 2013, 68, 145–148. [CrossRef] [PubMed]
112. Esfahani, A.; Lam, J.; Kendall, C.W.C. Acute effects of raisin consumption on glucose and insulin reponses inhealthy individuals. J. Nutr. Sci. 2014, 3, e1. [CrossRef] [PubMed]
113. Kaliora, A.C.; Kanellos, P.T.; Gioxari, A.; Karathanos, V.T. Regulation of GIP and Ghrelin in Healthy SubjectsFed on Sun-Dried Raisins: A Pilot Study with a Crossover Trial Design. J. Med. Food 2017, 20, 301–308.[CrossRef] [PubMed]
114. Furchner-Evanson, A.; Petrisko, Y.; Howarth, L.; Nemoseck, T.; Kern, M. Type of snack influences satietyresponses in adult women. Appetite 2010, 54, 564–569. [CrossRef] [PubMed]
115. Puglisi, M.J.; Vaishnav, U.; Shrestha, S.; Torres-Gonzalez, M.; Wood, R.J.; Volek, J.S.; Fernandez, M.L. Raisinsand additional walking have distinct effects on plasma lipids and inflammatory cytokines. Lipids Health Dis.2008, 7, 14. [CrossRef] [PubMed]
116. Rankin, J.W.; Andreae, M.C.; Oliver Chen, C.-Y.; O’Keefe, S.F. Effect of raisin consumption on oxidativestress and inflammation in obesity. Diabetes Obes. Metab. 2008, 10, 1086–1096. [CrossRef] [PubMed]
117. Howarth, L.; Petrisko, Y.; Furchner-Evanson, A.; Nemoseck, T.; Kern, M. Snack Selection Influences NutrientIntake, Triglycerides, and Bowel Habits of Adult Women: A Pilot Study. J. Am. Diet. Assoc. 2010, 110,1322–1327. [CrossRef] [PubMed]
118. Kanellos, P.T.; Kaliora, A.C.; Tentolouris, N.K.; Argiana, V.; Perrea, D.; Kalogeropoulos, N.; Kountouri, A.M.;Karathanos, V.T. A pilot, randomized controlled trial to examine the health outcomes of raisin consumptionin patients with diabetes. Nutrition 2014, 30, 358–364. [CrossRef] [PubMed]
119. Bays, H.; Weiter, K.; Anderson, J. A randomized study of raisins versus alternative snacks on glycemiccontrol and other cardiovascular risk factors in patients with type 2 diabetes mellitus. Phys. Sportsmed. 2015,43, 37–43. [CrossRef] [PubMed]
120. Anderson, J.W.; Weiter, K.M.; Christian, A.L.; Ritchey, M.B.; Bays, H.E. Raisins Compared with Other SnackEffects on Glycemia and Blood Pressure: A Randomized, Controlled Trial. Postgrad. Med. 2014, 126, 37–43.[CrossRef] [PubMed]
121. Chandalia, M.; Garg, A.; Lutjohann, D.; von Bergmann, K.; Grundy, S.M.; Brinkley, L.J. Beneficial effectsof high dietary fiber intake in patients with type 2 diabetes mellitus. N. Engl. J. Med. 2000, 342, 1392–1398.[CrossRef] [PubMed]
122. Dikeman, C.L.; Fahey, G.C. Viscosity as Related to Dietary Fiber: A Review. Crit. Rev. Food Sci. Nutr. 2006,46, 649–663. [CrossRef] [PubMed]
123. Hopping, B.N.; Erber, E.; Grandinetti, A.; Verheus, M.; Kolonel, L.N.; Maskarinec, G. Dietary fiber,magnesium, and glycemic load alter risk of type 2 diabetes in a multiethnic cohort in Hawaii. J. Nutr.2010, 140, 68–74. [CrossRef] [PubMed]
124. Lovejoy, J.C. The impact of nuts on diabetes and diabetes risk. Curr. Diab. Rep. 2005, 5, 379–384. [CrossRef][PubMed]
125. Heppner, K.M.; Perez-Tilve, D. GLP-1 based therapeutics: Simultaneously combating T2DM and obesity.Front. Neurosci. 2015, 9, 92. [CrossRef] [PubMed]
126. Bodnaruc, A.M.; Prud’homme, D.; Blanchet, R.; Giroux, I. Nutritional modulation of endogenousglucagon-like peptide-1 secretion: A review. Nutr. Metab. (Lond.) 2016, 13, 92. [CrossRef] [PubMed]
127. Brand-Miller, J.; Hayne, S.; Petocz, P.; Colagiuri, S. Low-glycemic index diets in the management of diabetes:A meta-analysis of randomized controlled trials. Diabetes Care 2003, 26, 2261–2267. [CrossRef] [PubMed]
128. Mirrahimi, A.; Chiavaroli, L.; Srichaikul, K.; Augustin, L.S.A.; Sievenpiper, J.L.; Kendall, C.W.C.;Jenkins, D.J.A. The role of glycemic index and glycemic load in cardiovascular disease and its risk factors:A review of the recent literature. Curr. Atheroscler. Rep. 2014, 16, 381. [CrossRef] [PubMed]
129. Storlien, L.H.; Baur, L.A.; Kriketos, A.D.; Pan, D.A.; Cooney, G.J.; Jenkins, A.B.; Calvert, G.D.; Campbell, L.V Dietary fats and insulin action. Diabetologia 1996, 39, 621–631. [CrossRef] [PubMed]
130. Haag, M.; Dippenaar, N.G. Dietary fats, fatty acids and insulin resistance: Short review of a multifacetedconnection. Med. Sci. Monit. 2005, 11, RA359–RA367. [PubMed]
261
Books
MDPI

Nutrients 2017, 9, 673
131. Risérus, U.; Willett, W.C.; Hu, F.B. Dietary fats and prevention of type 2 diabetes. Prog. Lipid Res. 2009, 48,44–51. [CrossRef] [PubMed]
132. Segal-Isaacson, C.J.; Carello, E.; Wylie-Rosett, J. Dietary fats and diabetes mellitus: Is there a good fat? Curr.Diabetes Rep. 2001, 1, 161–169. [CrossRef]
133. Rajaram, S.; Sabaté, J. Nuts, body weight and insulin resistance. Br. J. Nutr. 2006, 96 (Suppl. 2), S79–S86.[CrossRef] [PubMed]
134. Kien, C.L. Dietary interventions for metabolic syndrome: Role of modifying dietary fats. Curr. Diabetes Rep.2009, 9, 43–50. [CrossRef]
135. Grygiel-Górniak, B. Peroxisome proliferator-activated receptors and their ligands: Nutritional and clinicalimplications - a review. Nutr. J. 2014, 13, 17. [CrossRef] [PubMed]
136. Martini, L.A.; Catania, A.S.; Ferreira, S.R. Role of vitamins and minerals in prevention and management oftype 2 diabetes mellitus. Nutr. Rev. 2010, 68, 341–354. [CrossRef] [PubMed]
137. Chaudhary, D.P.; Sharma, R.; Bansal, D.D. Implications of magnesium deficiency in type 2 diabetes: A review.Biol. Trace Elem. Res. 2010, 134, 119–129. [CrossRef] [PubMed]
138. Lopez-Ridaura, R.; Willett, W.C.; Rimm, E.B.; Liu, S.; Stampfer, M.J.; Manson, J.E.; Hu, F.B. Magnesiumintake and risk of type 2 diabetes in men and women. Diabetes Care 2004, 27, 134–140. [CrossRef] [PubMed]
139. Guasch-Ferré, M.; Bulló, M.; Estruch, R.; Corella, D.; Martínez-González, M.A.; Ros, E.; Covas, M.; Arós, F.;Gómez-Gracia, E.; Fiol, M.; et al. Dietary magnesium intake is inversely associated with mortality in adultsat high cardiovascular disease risk. J. Nutr. 2014, 144, 55–60. [CrossRef] [PubMed]
140. Pandey, K.B.; Rizvi, S.I. Current Understanding of Dietary Polyphenols and their Role in Health and Disease.Curr. Nutr. Food Sci. 2009, 5, 249–263. [CrossRef]
141. Xiao, J.B.; Högger, P. Dietary polyphenols and type 2 diabetes: Current insights and future perspectives.Curr. Med. Chem. 2015, 22, 23–38. [CrossRef] [PubMed]
142. Guo, X.; Yang, B.; Tan, J.; Jiang, J.; Li, D. Associations of dietary intakes of anthocyanins and berry fruits withrisk of type 2 diabetes mellitus: A systematic review and meta-analysis of prospective cohort studies. Eur. J.Clin. Nutr. 2016, 70, 1360–1367. [CrossRef] [PubMed]
143. Oboh, G.; Ademosun, A.O.; Ogunsuyi, O.B. Quercetin and Its Role in Chronic Diseases. In Advances inExperimental Medicine and Biology; Springer Science+Business Media: Berlin/Heidelberg, Germany, 2016;Volume 929, pp. 377–387.
144. Meng, Y.; Su, A.; Yuan, S.; Zhao, H.; Tan, S.; Hu, C.; Deng, H.; Guo, Y. Evaluation of Total Flavonoids,Myricetin, and Quercetin from Hovenia dulcis Thunb. As Inhibitors of α-Amylase and α-Glucosidase.Plant Foods Hum. Nutr. 2016, 71, 444–449. [CrossRef] [PubMed]
145. Kang, I.; Buckner, T.; Shay, N.F.; Gu, L.; Chung, S. Improvements in Metabolic Health with Consumption ofEllagic Acid and Subsequent Conversion into Urolithins: Evidence and Mechanisms. Adv. Nutr. 2016, 7,961–972. [CrossRef] [PubMed]
146. Yoshimura, Y.; Nishii, S.; Zaima, N.; Moriyama, T.; Kawamura, Y. Ellagic acid improves hepatic steatosis andserum lipid composition through reduction of serum resistin levels and transcriptional activation of hepaticppara in obese, diabetic KK-Ay mice. Biochem. Biophys. Res. Commun. 2013, 434, 486–491. [CrossRef] [PubMed]
147. Panchal, S.K.; Ward, L.; Brown, L. Ellagic acid attenuates high-carbohydrate, high-fat diet-induced metabolicsyndrome in rats. Eur. J. Nutr. 2013, 52, 559–568. [CrossRef] [PubMed]
148. Ahad, A.; Ganai, A.A.; Mujeeb, M.; Siddiqui, W.A. Ellagic acid, an NF-κB inhibitor, ameliorates renal functionin experimental diabetic nephropathy. Chem. Biol. Interact. 2014, 219, 64–75. [CrossRef] [PubMed]
149. Karachanak-Yankova, S.; Dimova, R.; Nikolova, D.; Nesheva, D.; Koprinarova, M.; Maslyankov, S.;Tafradjiska, R.; Gateva, P.; Velizarova, M.; Hammoudeh, Z.; et al. Epigenetic alterations in patients with type2 diabetes mellitus. Balkan J. Med. Genet. 2015, 18, 15–24. [CrossRef] [PubMed]
150. Paluszczak, J.; Krajka-Kuzniak, V.; Baer-Dubowska, W. The effect of dietary polyphenols on the epigeneticregulation of gene expression in MCF7 breast cancer cells. Toxicol. Lett. 2010, 192, 119–125. [CrossRef] [PubMed]
151. Holliday, R. Mechanisms for the control of gene activity during development. Biol. Rev. Camb. Philos. Soc.1990, 65, 431–471. [CrossRef] [PubMed]
152. Choi, S.-W.; Claycombe, K.J.; Martinez, J.A.; Friso, S.; Schalinske, K.L. Nutritional Epigenomics: A Portal toDisease Prevention. Adv. Nutr. Int. Rev. J. 2013, 4, 530–532. [CrossRef] [PubMed]
153. Das, D.K.; Mukherjee, S.; Ray, D. Resveratrol and red wine, healthy heart and longevity. Heart Fail. Rev. 2010,15, 467–477. [CrossRef] [PubMed]
262
Books
MDPI
Nutrients 2017, 9, 673
154. Lee, K.W.; Lee, H.J.; Lee, C.Y. Vitamins, phytochemicals, diets, and their implementation in cancerchemoprevention. Crit. Rev. Food Sci. Nutr. 2004, 44, 437–452. [CrossRef] [PubMed]
155. Link, A.; Balaguer, F.; Goel, A. Cancer chemoprevention by dietary polyphenols: Promising role forepigenetics. Biochem. Pharmacol. 2010, 80, 1771–1792. [CrossRef] [PubMed]
156. Hermsdorff, H.H.M.; Zulet, M.Á.; Puchau, B.; Martínez, J.A. Fruit and vegetable consumption andproinflammatory gene expression from peripheral blood mononuclear cells in young adults: A translationalstudy. Nutr. Metab. (Lond.) 2010, 7, 42. [CrossRef] [PubMed]
157. Ambros, V. The functions of animal microRNAs. Nature 2004, 431, 350–355. [CrossRef] [PubMed]158. Ambros, V.; Bartel, B.; Bartel, D.P.; Burge, C.B.; Carrington, J.C.; Chen, X.; Dreyfuss, G.; Eddy, S.R.;
Griffiths-Jones, S.; Marshall, M.; et al. A uniform system for microRNA annotation. RNA 2003, 9, 277–279.[CrossRef] [PubMed]
159. Ross, S.A.; Davis, C.D. The emerging role of microRNAs and nutrition in modulating health and disease.Annu. Rev. Nutr. 2014, 34, 305–336. [CrossRef] [PubMed]
160. Tomé-Carneiro, J.; Larrosa, M.; Yáñez-Gascón, M.J.; Dávalos, A.; Gil-Zamorano, J.; Gonzálvez, M.;García-Almagro, F.J.; Ruiz Ros, J.A.; Tomás-Barberán, F.A.; Espín, J.C.; et al. One-year supplementation witha grape extract containing resveratrol modulates inflammatory-related microRNAs and cytokines expressionin peripheral blood mononuclear cells of type 2 diabetes and hypertensive patients with coronary arterydisease. Pharmacol. Res. 2013, 72, 69–82. [CrossRef] [PubMed]
161. Ortega, F.J.; Cardona-Alvarado, M.I.; Mercader, J.M.; Moreno-Navarrete, J.M.; Moreno, M.; Sabater, M.;Fuentes-Batllevell, N.; Ramírez-Chávez, E.; Ricart, W.; Molina-Torres, J.; et al. Circulating profiling revealsthe effect of a polyunsaturated fatty acid-enriched diet on common microRNAs. J. Nutr. Biochem. 2015, 26,1095–1101. [CrossRef] [PubMed]
162. Hernández-Alonso, P.; Giardina, S.; Salas-Salvadó, J.; Arcelin, P.; Bulló, M. Chronic pistachio intakemodulates circulating microRNAs related to glucose metabolism and insulin resistance in prediabeticsubjects. Eur. J. Nutr. 2016. [CrossRef] [PubMed]
163. Conlon, M.A.; Bird, A.R. The Impact of Diet and Lifestyle on Gut Microbiota and Human Health. Nutrients2014, 7, 17–44. [CrossRef] [PubMed]
164. Ansell, J.; Parkar, S.; Paturi, G.; Rosendale, D.; Blatchford, P. Modification of the Colonic Microbiota. Adv. FoodNutr. Res. 2013, 68, 205–217. [PubMed]
165. Mandalari, G.; Faulks, R.M.; Bisignano, C.; Waldron, K.W.; Narbad, A.; Wickham, M.S.J. In vitro evaluationof the prebiotic properties of almond skins (Amygdalus communis L.). FEMS Microbiol. Lett. 2010, 304,116–122. [CrossRef] [PubMed]
166. Ukhanova, M.; Wang, X.; Baer, D.J.; Novotny, J.A.; Fredborg, M.; Mai, V. Effects of almond and pistachioconsumption on gut microbiota composition in a randomised cross-over human feeding study. Br. J. Nutr.2014, 111, 2146–2152. [CrossRef] [PubMed]
167. Anhê, F.F.; Varin, T.V.; Le Barz, M.; Desjardins, Y.; Levy, E.; Roy, D.; Marette, A. Gut Microbiota Dysbiosis inObesity-Linked Metabolic Diseases and Prebiotic Potential of Polyphenol-Rich Extracts. Curr. Obes. Rep.2015, 4, 389–400. [CrossRef] [PubMed]
168. Anhê, F.F.; Roy, D.; Pilon, G.; Dudonné, S.; Matamoros, S.; Varin, T.V.; Garofalo, C.; Moine, Q.; Desjardins, Y.;Levy, E.; et al. A polyphenol-rich cranberry extract protects from diet-induced obesity, insulin resistance andintestinal inflammation in association with increased Akkermansia spp. population in the gut microbiota ofmice. Gut 2015, 64, 872–883. [PubMed]
169. Nieman, D.C.; Scherr, J.; Luo, B.; Meaney, M.P.; Dréau, D.; Sha, W.; Dew, D.A.; Henson, D.A.; Pappan, K.L.Influence of pistachios on performance and exercise-induced inflammation, oxidative stress, immunedysfunction, and metabolite shifts in cyclists: A randomized, crossover trial. PLoS ONE 2014, 9, e113725.[CrossRef] [PubMed]
170. Hernández-Alonso, P.; Cañueto, D.; Giardina, S.; Salas-Salvadó, J.; Cañellas, N.; Correig, X.; Bulló, M. Effectof pistachio consumption on the modulation of urinary gut microbiota-related metabolites in pre-diabeticsubjects. J. Nutr. Biochem. 2017, 45, 48–53. [CrossRef] [PubMed]
© 2017 by the authors. Licensee MDPI, Basel, Switzerland. This article is an open accessarticle distributed under the terms and conditions of the Creative Commons Attribution(CC BY) license (http://creativecommons.org/licenses/by/4.0/).
263
Books
MDPI

nutrients
Article
Integrated Assessment of Pharmacological andNutritional Cardiovascular Risk Management:Blood Pressure Control in the DIAbetes andLifEstyle Cohort Twente (DIALECT)
Christina M. Gant 1,2,†, S. Heleen Binnenmars 1,2,†, Else van den Berg 2, Stephan J. L. Bakker 2 ,
Gerjan Navis 2 and Gozewijn D. Laverman 1,2,*
1 Department of Internal Medicine/Nephrology, Ziekenhuisgroep Twente, Zilvermeeuw 1, 7609 PP Almelo,The Netherlands; [email protected] (C.M.G.); [email protected] (S.H.B.)
2 Department of Internal Medicine, Division of Nephrology, University of Groningen, University MedicalCenter Groningen, Hanzeplein 1, 9713 GZ Groningen, The Netherlands; [email protected] (E.v.d.B.);[email protected] (S.J.L.B.); [email protected] (G.N.)
* Correspondence: [email protected]; Tel.: +3188-7083079† These authors contributed equally.
Received: 15 May 2017; Accepted: 3 July 2017; Published: 6 July 2017
Abstract: Cardiovascular risk management is an integral part of treatment in Type 2 Diabetes Mellitus(T2DM), and requires pharmacological as well as nutritional management. We hypothesize that asystematic assessment of both pharmacological and nutritional management can identify targets forthe improvement of treatment quality. Therefore, we analysed blood pressure (BP) management inthe DIAbetes and LifEstyle Cohort Twente (DIALECT). DIALECT is an observational cohort fromroutine diabetes care, performed at the ZGT Hospital (Almelo and Hengelo, The Netherlands).BP was measured for 15 min with one minute intervals. Sodium and potassium intake wasderived from 24-hour urinary excretion. We determined the adherence to pharmacological andnon-pharmacological guidelines in patients with BP on target (BP-OT) and BP not on target (BP-NOT).In total, 450 patients were included from August 2009 until January 2016. The mean age was63 ± 9 years, and the majority was male (58%). In total, 53% had BP-OT. In those with BP-NOT,pharmacological management was suboptimal (zero to two antihypertensive drugs) in 62% of patients,and nutritional guideline adherence was suboptimal in 100% of patients (only 8% had a sodiumintake on target, 66% had a potassium intake on target, 3% had a sodium-to-potassium ratio on target,and body mass index was <30 kg/m2 in 35%). These data show pharmacological undertreatment anda low adherence to nutritional guidelines. Uncontrolled BP is common in T2DM, and our data show awindow of opportunity for improving BP control, especially in nutritional management. To improvetreatment quality, we advocate to incorporate the integrated monitoring of nutritional managementin quality improvement cycles in routine care.
Keywords: Type 2 diabetes mellitus; blood pressure; pharmacological management; nutrition; dietarysodium intake
1. Introduction
Type 2 Diabetes Mellitus (T2DM), with an estimated number of 422 million patients worldwide,is one of the major conditions associated with cardiovascular events and cardiovascular death [1].Therefore, the prevention of the development and progression of such complications is a main goal inthe treatment of T2DM, and evidence-based recommendations to reach this goal are incorporated intreatment guidelines. Treatment consists of pharmacological and non-pharmacological management,
Nutrients 2017, 9, 709 264 www.mdpi.com/journal/nutrients
Books
MDPI

Nutrients 2017, 9, 709
the latter consisting in large part of nutritional guidance. Still, cardiovascular complications developin the majority of T2DM patients, demonstrating the large challenge of adequate treatment [2,3]. Oneexplanation for this could be a failure to reach guideline treatment targets. Indeed, several studieshave shown that targets for blood pressure, glycemic control, and Low Density Lipoprotein (LDL)cholesterol are not reached in a large number of patients [4–8].
Pharmacological and nutritional management are often studied as separate entities, despite thefact that both are crucial elements of treatment. We hypothesize that a systematic assessment of bothpharmacological and nutritional management can identify targets for the improvement of treatmentquality. The DIAbetes and LifEstyle Cohort Twente (DIALECT) cohort study was specifically designedfor this purpose. DIALECT is an observational study in T2DM patients in a well-defined region in TheNetherlands, and uses validated and detailed real-world data on nutritional habits, pharmacologicaltreatment, and current clinical condition. To obtain non-biased data on individual nutrient intake,24-hour urine collections were used and stored in a biobank to allow for future analyses [9].
We aim to address how well the targets for blood pressure management are reached, and howthis is related to (1) pharmacological management; and (2) nutritional management (i.e., the dietaryintake of salt [10,11], potassium [12,13], body mass index (BMI), and alcohol). Moreover, we assessedadditional nutritional parameters for which no specific counselling was given, but have been shown tobe relevant to cardiovascular risk in diabetic kidney disease (magnesium [14–16] and phosphate [17,18]).Because the presence of diabetic kidney disease implicates different blood pressure targets, we analysedpatients without and with renal involvement separately.
2. Materials and Methods
2.1. Study Design and Participants
DIALECT is a prospective cohort study in patients with T2DM, performed in the ZGT Hospital,which is located in Almelo and Hengelo, The Netherlands. It is designed to study pharmacologicaland non-pharmacological management in a regional T2DM population treated in a secondaryhealth care center. All patients with T2DM and aged 18+ years treated in the outpatient clinic ofour hospital were eligible, with the only exclusion criteria being an inability to understand theinformed consent procedure, insufficient knowledge of the Dutch language, or a dependency on renalreplacement therapy.
This paper reports on the DIALECT-1 population, consisting of the first 450 patients, recruitedbetween September 2009 and January 2016. The inclusion of new patients in DIALECT-2 will beperformed until December 2019, or until the number of 850 is reached. The study is performedaccording to the guidelines of good clinical practice and the Declaration of Helsinki. It has beenapproved by the local institutional review boards (METC-registration numbers NL57219.044.16 and1009.68020), and is registered in the Netherlands Trial Register (NTR trial code 5855).
2.2. Study Procedures
Patients were screened for eligibility in the electronic patient file, and subsequently invited fora study visit. At the clinic, all of the information relevant to the medical condition was recorded ina database (Figure 1, Supplementary Table S1). Height, weight, and waist and hip circumferencewere measured. Body mass index was calculated as weight divided by height squared (kg/m2), andbody surface area was estimated by applying the universally adopted formula of DuBois [19]. Bloodpressure was measured in a supine position by an automated device (Dinamap®; GE Medical systems,Milwaukee, WI, USA) for 15 min with a one-minute interval. The mean systolic and diastolic pressureof the last three measurements was used for further analysis.
265
Books
MDPI

Nutrients 2017, 9, 709
Figure 1. Patient inclusion and data collection.
Physical activity was assessed using the Short Questionnaire to Asses Health enhancing physicalactivity (SQUASH) questionnaire, which was previously validated in [20]. The 24-hour urinary contentof specific substances was measured where possible and appropriate.
Routine laboratory tests were performed in venous blood, including blood count tests, liverfunction tests, renal function tests, HbA1c, and cholesterol. The estimated glomerular filtration rate(eGFR) was calculated using the Chronic Kidney Disease Epidemiology Collaboration (CKD-EPI)formula [21]. From samples of a 24-hour urine collection, the following parameters were measured:sodium, potassium, creatinine, calcium, phosphate, chloride, albumin, protein, urea, and uric acidexcretion. Twenty-four-hour urinary excretion was calculated by multiplying these concentrations withthe volume of the 24-hour urine collection. Creatinine clearance was calculated from the 24-hour urinecreatinine excretion and the plasma creatinine concentration. For the proper collection of the 24-hoururine sample, patients were instructed to dispose of the first morning void urine, and thereafter collectall urine in the provided canister until the first morning void urine of the next day. In between voids,they were instructed to store the canister in a dark cool place, preferably in a refrigerator. A separatesingle morning void urine was used to assess the urinary albumin-to-creatinine ratio.
The samples of blood, 24-hour urine collection, and morning void urine were stored in a biobankat −80 degrees Celsius for additional analyses, as specified in Supplementary Table S1.
2.3. Routine Clinical Care
Diabetes care in the Netherlands is standardised, both in the outpatient clinic and at the generalpractitioner. It consists of three to four outpatient clinic visits per year. The development of albuminuriais assessed yearly using the albumin–creatinine ratio in a single morning void urine. Retinopathy isassessed at one to two year intervals. Neuropathy is assessed yearly using monofilament and vibrationtests with a tuning fork.
Lifestyle management in T2DM consists of guidance regarding weight loss, increasing physicalactivity, and smoking cessation, and of referral to a dietician for dietary guidance on weight loss
266
Books
MDPI

Nutrients 2017, 9, 709
and the adherence to dietary guidelines, including sodium restriction and stimulating an intake offruit and vegetables. The frequency of dietary follow-up visits is targeted at the individual goalsand needs of patients depending on personal preferences as well as comorbidity. At each doctorvisit, target HbA1c and blood pressure are monitored, and pharmacological intervention is adjustedaccordingly. Cholesterol levels are monitored yearly. Targets for HbA1c and LDL cholesterol are oftenindividualized; the general targets are <53 mmol/L and <2.5 mmol/L, respectively.
2.4. Definitions
The blood pressure (BP) targets in our analyses were derived from the international guidelinesfor diabetes management, which have been adopted for use in The Netherlands [22,23]. In patientswith diabetic kidney disease, the BP target was set according to the Kidney Diseases ImprovingGlobal Outcomes (KDIGO) guidelines, which are internationally acclaimed guidelines for chronickidney disease, and are also applied in The Netherlands [23]. Patients with diabetic kidney diseasewithout albuminuria (eGFR <60, no albuminuria) had a BP target of ≤140/90 mmHg, while patientswith albuminuria and either an eGFR ≥60 mL/min or an eGFR <60 mL/min had a BP target of≤130/80 mmHg. For patients with T2DM without diabetic kidney disease, the European Associationfor the Study of Diabetes (EASD) guidelines are used, which stipulate a blood pressure (BP) target of<140/85 mmHg [22]. Accordingly, the patients were grouped by eGFR above or below 60 mL/minand by the presence of albuminuria. Albuminuria was defined as a 24-hour urinary albumin excretion>30 mg/day. As the EASD and KDIGO guidelines for those without albuminuria differ slightly, weperformed all of the analyses using the EASD guidelines for those with eGFR <60 and no albuminuriaas well. The results were virtually similar, and for the sake of conciseness, the data is not shown.
The targets for nutritional management were set according to the Dutch guidelines when available.The target dietary salt intake was ≤6 g/day [24], and the target dietary potassium intake was setat ≥3.5 g/day, according to best evidence [13]. The target alcohol intake was ≤2 units per day forwomen, and ≤3 units per day for men. It should be noted that in 2015, the Health Council of TheNetherlands changed the guidelines for alcohol consumption to zero units per day; however, ourpatients were included in the study before the introduction of these new guidelines [25]. The targetBMI was <30 kg/m2. The target for smoking was either no smoking history, or having previouslystopped smoking.
The data on dietary intake of salt, potassium, and proteins were derived from 24-hour urinaryexcretion. For this, it is important to realise that the patients in our cohort were assessed under steadystate conditions, in which the net renal excretion of sodium is almost equal to the dietary intakeof sodium, with only approximately 5–10% being excreted by other routes (e.g., sweat or feces) [9].Therefore, 24-hour urinary sodium excretion is considered the gold standard for the assessment ofsodium intake [9,26], and dietary salt intake was calculated by multiplying the net 24-hour sodiumexcretion (in mol/day) with the molar weight of salt (NaCl, 58.44 g/mol). Dietary potassium intakewas calculated from urinary potassium excretion under the assumption of a renal excretion rate of77% [13,27]. Dietary protein intake was calculated from urinary urea nitrogen excretion using theMaroni formula [28]. As the renal excretion of magnesium is lower in patients with a low eGFR, dietarymagnesium intake could not be calculated from urinary magnesium excretion with the same formula(using the assumption of an intestinal absorption of 30%) [16]. Therefore, we present the urinarydaily excretion of magnesium. Also, while no consensus exists to calculate dietary phosphate intakefrom the urinary excretion, urinary phosphate excretion does reflect variability in intestinal phosphateuptake [29,30], so we present the urinary excretion values.
2.5. Statistical Analyses
All of the statistical analyses were performed using Statistical Package for the Social Sciences(SPSS), version 23.0. Normally distributed data are presented as mean ± standard deviation. Skewedvariables are expressed as median [interquartile range]. Dichotomous variables are presented in
267
Books
MDPI

Nutrients 2017, 9, 709
number and percentage. First, we divided the population according to the presence of albuminuriaand/or a reduced eGFR (<60 mL/min), as in these groups the target BP is different (<140/85 forthose without diabetic kidney disease, ≤140/90 mmHg for patients without albuminuria and an eGFR<60 mL/min, and ≤130/80 mmHg for those with albuminuria). Second, we divided the populationinto two groups, according to the reached blood pressure. These groups are denoted as “Blood pressureon target” (BP-OT) and “Blood pressure not on target” (BP-NOT), respectively. The differences betweenthe groups were analysed using the student t-test, one-way ANOVA, the Mann–Whitney U test, theKruskall–Wallis test, and the Chi Square test when appropriate. To perform a multivariate analysisof the determinants of not on target BP, multivariate logistic regression was used. In order to adjustfor age and gender, the differences in nutritional data among the groups were also determined usingmixed model analyses with Sidak post-hoc tests.
3. Results
Between September 2009 and January 2016, 1082 eligible patients were identified and invited toparticipate in the study, of whom 470 were enrolled in the study and performed the baseline visit. Themost common causes for not participating in the study were: No interest in research, and inabilitydue to co-morbidity (Figure 2). Twenty patients were excluded after the baseline visit, as in closeranalysis their correct diagnosis was Type 1 Diabetes Mellitus instead of Type 2. All of the remaining450 patients were included in our data analysis.
Figure 2. Patient recruitment flowchart.
3.1. Baseline Pharmacological and Nutritional Characteristics
The baseline data are presented in Table 1, by a break-up according to reduced eGFR (<60 mL/min)and the presence of albuminuria. The mean age of the participants was 63 ± 9 years, and was higherin the groups with eGFR <60 (Table 1). There were more men (58%) than women, and men wereover-represented in the albuminuria groups (74% and 77% respectively for eGFR ≥60 and <60).The mean BMI was 32.9 ± 6.2 kg/m2, reflecting a predominantly obese T2DM population, and BMIdid not differ among the groups (Table 1).
268
Books
MDPI

Nutrients 2017, 9, 709
Ta
ble
1.
DIA
LEC
T-1
Base
line,
nutr
itio
nal,
and
phar
mac
olog
ical
char
acte
rist
ics.
eG
FR≥
60
eG
FR
<6
0
Va
ria
ble
To
tal
Po
pu
lati
on
Alb
um
inu
ria
No
Alb
um
inu
ria
Ye
sA
lbu
min
uri
aN
oA
lbu
min
uri
aY
es
p-V
alu
e
Num
ber
ofpa
tien
ts(%
ofpo
pula
tion
)45
025
7(5
7)85
(19)
52(1
2)51
(11)
Pat
ient
char
acte
rist
ics
Age
(yea
rs)
63±
961
±9
62±
867
±8
*,†69
±7
*,†<0
.001
Mal
e,n
(%)
259
(58)
139
(54)
63(7
4)19
(37)
39(7
7)<0
.001
Year
sT2
DM
(yea
rs)
11(7
–18)
11(7
–18)
14(8
–19)
12(6
–17)
10(6
–15)
0.45
Seru
mH
bA1C
(mm
ol/m
ol)
57±
1258
±11
59±
1354
±11
57±
130.
15In
sulin
use,
n(%
)28
4(6
3)16
0(6
2)64
(75)
31(6
0)28
(55)
0.07
Syst
olic
bloo
dpr
essu
re(m
mH
g)13
9±
1613
6±
1514
0±
1913
1±
13†
139±
170.
009
Dia
stol
icbl
ood
pres
sure
(mm
Hg)
76±
975
±9
76±
1070
±9
*,†75
±10
‡0.
004
BPon
targ
et,n
(%)
236
(53)
155
(60)
28(3
3)41
(79)
12(2
4)<0
.001
Mac
rova
scul
ardi
seas
e,n
(%)
158
(35)
68(2
7)36
(42)
25(4
8)31
(61)
<0.0
01eG
FR(m
L/m
in)
84(6
2–97
)92
(78–
100)
88(7
4–99
)47
(36–
54)
39(3
3–45
)<0
.001
Alb
umin
excr
etio
n(m
g/da
y)11
(3–6
6)5
(2–1
1)94
(62–
202)
4(1
–12)
332
(93–
661)
<0.0
01
Pha
rmac
olog
ical
man
agem
ent
RA
ASi
,n(%
)29
6(6
7)15
2(5
9)63
(74)
39(7
5)42
(82)
0.00
1β
-blo
cker
s,n
(%)
207
(46)
100
(39)
37(4
4)36
(69)
33(6
5)<0
.001
Thia
zide
diur
etic
s,n
(%)
137
(31)
81(3
2)15
(18)
21(4
0)18
(35)
0.02
Cal
cium
anta
goni
sts,
n(%
)10
1(2
3)43
(17)
26(3
1)13
(25)
19(3
7)0.
002
Loop
diur
etic
s,n
(%)
81(1
8)26
(10)
18(2
1)17
(33)
20(3
9)<0
.001
Pota
ssiu
msp
arin
gdi
uret
ics,
n(%
)43
(10)
11(4
)8
(9)
12(2
3)12
(24)
<0.0
01N
umbe
rof
anti
hype
rten
sive
s2
(1–3
)2
(0–3
)2
(1–3
)3
(2–3
)3
(2–4
)<0
.001
No
anti
hype
rten
sive
ther
apy,
n(%
)83
(19)
65(2
5)12
(14)
1(2
)2
(4)
<0.0
01
1dr
ug,n
(%)
101
(23)
61(2
4)17
(20)
6(1
2)6
(12)
2dr
ugs,
n(%
)10
6(2
4)57
(22)
28(3
3)13
(25)
11(2
2)3
drug
s,n
(%)
91(2
0)44
(17)
15(1
8)21
(40)
12(2
4)4
drug
s,n
(%)
56(1
3)24
(9)
10(1
2)8
(15)
13(2
6)5+
drug
s,n
(%)
11(3
)6
(2)
3(4
)3
(6)
7(1
4)H
yper
tens
ion
requ
irin
g4+
drug
s,n
(%)
117
(26)
48(1
9)23
(27)
16(3
1)30
(59)
<0.0
01To
taln
umbe
rof
drug
s7±
36±
37±
28±
3*
9±
3*,†
<0.0
01
269
Books
MDPI

Nutrients 2017, 9, 709
Ta
ble
1.
Con
t.
eG
FR≥
60
eG
FR
<6
0
Va
ria
ble
To
tal
Po
pu
lati
on
Alb
um
inu
ria
No
Alb
um
inu
ria
Ye
sA
lbu
min
uri
aN
oA
lbu
min
uri
aY
es
p-V
alu
e
Non
-pha
rmac
olog
ical
man
agem
ent
BMI(
kg/m
2 )32
.9±
6.2
32.9±
6.5
32.9±
5.4
33.3±
6.2
32.3±
6.1
0.89
Cur
rent
smok
er,n
(%)
74(1
7)41
(16)
15(1
8)10
(19)
8(1
6)0.
93A
lcoh
olin
take
(uni
tspe
rm
onth
)5
(0–3
0)5
(0–2
8)10
(0–4
7)3
(0–2
4)12
(0–4
0)0.
2225
(OH
)Vit
amin
D(n
mol
/L)
42±
2043
±18
37±
1942
±26
44±
220.
09
Uri
nary
excr
etio
n
Uri
nary
crea
tini
neex
cret
ion
(mm
ol/d
ay)
13.8±
4.8
13.9±
4.9
14.8±
5.4
12.8±
4.2
12.8±
3.6
0.03
Uri
nary
mag
nesi
umex
cret
ion
(mm
ol/d
ay)
4.0±
2.1
4.1±
2.1
4.4±
2.3
3.3±
1.7
*,†3.
2±
1.4
*,†0.
001
Uri
nary
phos
phat
eex
cret
ion
(mm
ol/d
ay)
27.5±
11.6
28.2±
12.2
30.3±
12.6
22.7±
7.7
*,†25
.0±
7.9
0.00
1
Sodi
um-t
o-po
tass
ium
rati
o(m
mol
/mm
ol)
2.5±
1.0
2.5±
1.0
2.8±
1.2
2.2±
0.7
†2.
3±
0.8
0.00
4
Cal
cula
ted
inta
ke
Die
tary
salt
inta
ke(g
/day
)10
.9±
4.7
11.0±
4.3
12.7±
5.6
*8.
7±
4.0
*,†9.
7±
3.9
†<0
.001
Salt
inta
ke≤6
g/da
y53
(12)
26(1
0)5
(6)
15(2
9)7
(14)
<0.0
01D
ieta
rypo
tass
ium
inta
ke(g
/day
)3.
9±
1.3
4.0±
1.4
4.1±
1.1
3.5±
1.3
3.6±
0.9
0.01
Pota
ssiu
min
take
≥3.5
g/da
y29
0(6
6)17
3(6
9)62
(73)
27(5
3)29
(59)
0.06
Die
tary
prot
ein
inta
ke(g
/day
)92
±27
94±
2898
±29
80±
23*,†
84±
21†
0.00
1
*p
<0.
05vs
.eG
FR≥6
0/A
lbum
inur
ia(A
lb)−
;†p
<0.
05vs
.eG
FR≥6
0/A
lb+.
‡p
<0.
05vs
.eG
FR<6
0/A
lb−.
Abb
revi
atio
ns:T
2DM
,Typ
e2
Dia
bete
sM
ellit
us;B
P,bl
ood
pres
sure
.
270
Books
MDPI

Nutrients 2017, 9, 709
There was no renal involvement in 57% of the patients (eGFR ≥60/Alb−; Table 1). Of all of thepatients, 30% (n = 136) had albuminuria, either with a preserved (n = 85, eGFR ≥60/Alb+) or reducedrenal function (n = 51, eGFR <60/Alb+). Fifty-two patients (12%) had a reduced renal function withoutalbuminuria (eGFR <60/Alb−). The mean systolic blood pressure was 139 ± 16 mmHg, and themean diastolic BP was 76 ± 9 mmHg. Most of the patients (81%) used one or more antihypertensivedrugs. The target BP was reached in 53% of all patients, while 47% had BP not on target. In patientswith albuminuria, 33% and 24% reached the target blood pressure in eGFR ≥60 and in eGFR <60,respectively (Table 1). Additionally, a blood pressure of ≤140/90 mmHg was reached in 48% and 41% ofalbuminuria patients with an eGFR ≥60 and eGFR <60, respectively. The group with albuminuria andeGFR <60 received the largest number of antihypertensive drugs (3 (2–4) drugs, Table 1). Additionally,the number of patients with hypertension requiring 4+ drugs was highest in this group (59%, p < 0.001).In contrast, the antihypertensive drug use in the eGFR ≥60/Alb+ group is not higher than in theother groups (2 (1–3) drugs). Patients without chronic kidney disease (CKD) (Table 1, group eGFR≥60/Alb−) most commonly used renin-angiotensin-aldosterone-system inhibition (RAASi) (59%),followed by β-blockers (39%), and thiazide diuretics (32%). This was different in those with CKD(groups eGFR ≥60/Alb+, eGFR <60/Alb−, and eGFR <60/Alb+): RAASi (77%), β-blockers (62%),and Calcium antagonists (31%). There were two patients with an eGFR <60 that used a phosphatebinder, one in the Alb− group, and one in the Alb+ group.
The mean dietary salt intake was high, namely, 10.9 g of salt per day, and was considerably higherin the groups with preserved eGFR. When adjusting for age and gender, these differences remainedvirtually similar (data not shown). In the overall population, only 53 patients (12%) adhered tothe dietary guidelines for dietary salt intake, ≤6 g/day, and in the eGFR ≥60/Alb+ group thispercentage was even lower, i.e., 6%. In total, 8% of patients had a salt intake of ≤5 g/day asrecommended by the WHO. The mean potassium intake was 3.9 ± 1.3 g/day, and 66% of patients hadan intake, as recommended, above 3.5 g/day (Table 1). The mean urinary magnesium excretion was4.0 ± 2.1 mmol/day, and as expected was lower in patients with an eGFR <60 mL/min than in thosewith an eGFR ≥ 60mL/min. The mean urinary phosphate excretion was 27.5 ± 11.6 mmol/day, andthe mean calculated dietary protein intake was 92 ± 27 g/day.
3.2. Pharmacological and Nutritional Management in BP-On Target (BP-OT) and BP-Not On Target(BP-NOT) Groups
Table 2 shows the patients’ characteristics by a break-up of BT-OT and BP-NOT. Patients withBP-NOT were more often men (64% vs. 53%, P = 0.018), and had a higher HbA1C (59 ± 12 vs.56 ± 11 mmol/L, P = 0.031). While the presence of albuminuria was a strong predictor of uncontrolledBP (46% vs. 17%, p < 0.001), poor BP control was not associated with an eGFR <60 mL/min(24% vs. 22%).
Patients with BP-OT used loop diuretics more often than those with BP-NOT (Table 2). Therewere no other differences in the pharmacological treatment between the BP groups; neither in thetypes of prescribed drugs, nor in the total number of prescribed antihypertensive drugs. Surprisingly,of the patients with BP-NOT, 21% did not use any antihypertensive drug, while 20% used only one,and 21% used two antihypertensive drugs.
Adherence to the recommended nutritional guidelines by a breakup of BP-OT and BP-NOT isshown in Figure 3. In both groups, adherence to the recommended lifestyle guidelines was poor, andthe total number of lifestyle targets adhered to did not differ between the groups (3 (2–3) in BP-OTvs. 3 (2–3) in BP-NOT, p = 0.22). In patients with BP-NOT, 8% had a dietary salt intake below therecommended 6 g/day, which was lower than those with BP-OT (15%, p = 0.025). Adherence to thepotassium guideline (66% of patients) did not differ among the groups. Only 3% of patients had asodium-to-potassium ratio ≤1.0 in both BP groups. There were only three patients (1%) who adheredto both the recommended intakes of salt and potassium. BMI was ≤30 kg/m2 in 35% of patients, andthis proportion did not differ among the BP groups. The smoking and alcohol guidelines were adhered
271
Books
MDPI

Nutrients 2017, 9, 709
to by 83% and 86% of all patients, and these proportions were not different among the BP groups. Wefound no differences in the other nutritional factors between the BP-OT and BP-NOT groups (Table 2).In the total population, there was only one patient (with BP-OT) who adhered to all of the lifestyleguidelines simultaneously. There were no differences in lifestyle guidelines adherence between thosewith zero to two antihypertensives and those with three-plus antihypertensives.
Table 2. DIALECT-1 pharmacological and nutritional management by a breakup of BP on target/noton target.
Variable BP On Target BP Not On Target p-Value
Patient characteristics n = 239 n = 210Age (years) 63 ± 9 63 ± 9 0.36Male, n (%) 126 (53) 134 (64) 0.02Years T2DM (years) 11 (7–17) 12 (7–18) 0.26Serum HbA1C (mmol/mol) 56 ± 11 59 ± 12 0.03Insulin use, n (%) 149 (62) 136 (65) 0.60Systolic blood pressure (mmHg) 125 ± 10 149 ± 13 <0.001Diastolic blood pressure (mmHg) 70 ± 8 80 ± 9 <0.001eGFR <60, n (%) 53 (22) 51 (24) 0.60Albuminuria, n (%) 40 (17) 95 (46) <0.001
Pharmacological managementRAASi, n (%) 163 (68) 134 (64) 0.33β-blockers, n (%) 115 (48) 93 (44) 0.42Thiazide diuretics, n (%) 71 (30) 66 (31) 0.69Calcium antagonists, n (%) 50 (21) 52 (25) 0.33Loop diuretics, n (%) 52 (22) 29 (14) 0.03Potassium sparing diuretics, n (%) 22 (9) 21 (10) 0.78Number of antihypertensives 2 (1–3) 2 (1–3) 0.51
No antihypertensive therapy, n (%) 39 (16) 44 (21) 0.851 drug, n (%) 47 (20) 42 (20)2 drugs, n (%) 64 (27) 45 (21)3 drugs, n (%) 50 (21) 43 (21)4 drugs, n (%) 29 (12) 27 (13)5+ drugs, n (%) 10 (4) 9 (4)
Hypertension requiring 4+ drugs, n (%) 39 (16) 79 (38) <0.001Total number of drugs 7.0 ± 2.6 6.7 ± 2.8 0.30
Non-pharmacological managementBMI (kg/m2) 32.8 ± 5.8 32.9 ± 6.7 0.89Serum 25 (OH) Vitamin D (nmol/L) 43 ± 20 41 ± 20 0.22
Urinary excretionUrinary creatinine excretion (mmol/day) 13.6 ± 4.9 14.1 ± 4.7 0.22Urinary magnesium excretion (mmol/day) 3.9 ± 2.1 4.0 ± 1.9 0.43Urinary phosphate excretion (mmol/day) 26.9 ± 12.3 28.2 ± 10.7 0.26Sodium-to-potassium ratio (mmol/mmol) 2.5 ± 1.0 2.5 ± 0.9 0.49
Calculated intakeDietary salt intake (g/day) 10.7 ± 4.8 11.1 ± 4.4 0.47Dietary potassium intake (g/day) 3.8 ± 1.3 4.0 ± 1.2 0.15Dietary protein intake (g/day) 90 ± 29 93 ± 26 0.29
In the multivariate logistic regression analysis, albuminuria and the use of loop diuretics remainedthe only significant predictors of BP-NOT (data not shown).
272
Books
MDPI

Nutrients 2017, 9, 709
Figure 3. % Adherence to nutritional guidelines, by a breakup of blood pressure on target/not ontarget. Alcohol intake is self-reported, and the target intake was ≤2 units per day for women and≤3 units per day for men.
4. Discussion
In this paper, we present the blood pressure management of Type 2 diabetes patients (T2DM),using combined data on pharmacological and nutritional management in a real-life secondary healthcare setting. As anticipated, the prevalence of hypertension was high, and 81% of patients were onantihypertensives. However, BP control was poor, as the target BP was not reached in 47% of patients.An integrated assessment of pharmacological and nutritional management demonstrated a largewindow of opportunity for improving BP control in T2DM, both by intensifying antihypertensive drugtreatment, and increasing nutritional guideline adherence.
The proportion of patients with their blood pressure on target (BP-OT) in our cohort is in linewith findings in other T2DM cohorts [31], as well as diabetic kidney disease cohorts [5,32]. Theproportion was lower than found in T2DM patients treated in the primary care setting, in whomadequate blood pressure control was found in 85% of patients [33,34], which may well reflect thereferral policy, with more difficult patients being referred to secondary care. In the baseline data ofthe LEADER-4 trial (a randomized clinical trial in T2DM patients) [31], where 51% of patients hadBP-NOT, the antihypertensive use was lower than we report, as about 80% of all patients used zero totwo antihypertensive drugs. In diabetic kidney disease studies (i.e., studies with T2DM and eitheralbuminuria and/or eGFR <60), the antihypertensive drug use is mostly in line with our findings,with >90% of patients using antihypertensive drugs, and RAASi being the most frequently useddrug [5,32]. In line with our findings, Smits et al. found that RAASi was the most commonly usedclass of antihypertensive drugs in a Dutch T2DM cohort in primary care, followed by betablockers anddiuretics [33]. The number of used antihypertensive drugs they report is largely comparable to ourfindings, albeit that the use of four to five drugs seems more common in our secondary care cohort.It should be noted that in these studies regarding BP control in a real world setting, data regardingnutrient intake is not available.
An important issue when evaluating the pharmacological management of blood pressure istreatment non-adherence, which reportedly ranges from 31 to 40% in patients with poorly controlledblood pressure [35,36]. Thus, establishing an infrastructure that allows the monitoring of adherencewould be of great value. Yet, even assuming a drug-treatment non-adherence rate of 40% in ourpatients, the non-adherence to lifestyle measures seems to stand out as an additional important targetfor intervention.
What can be done to improve BP control in T2DM? Our data, and data from other trials, clearlyshow that true therapy-resistant hypertension, defined as hypertension persisting despite threeantihypertensive drugs at maximum tolerable dosage of which one is a diuretic, is not the issue
273
Books
MDPI

Nutrients 2017, 9, 709
in most patients with BP-NOT. The majority of BP-NOT patients (62%) do not use more than twoantihypertensive drugs, illustrating the opportunity for intensifying pharmacological treatment. Onepromising option in this regard is the removal of excess extracellular fluid with diuretics, especially inthose patients with a high salt intake.
Our data show that, especially for nutritional management, there is a large window of opportunityfor improvement, as in the total population only one patient adhered to all of the nutritional guidelinessimultaneously. This is highly relevant, since lifestyle interventions have the potential to not onlyreduce BP, but to also reduce the overall cardiovascular risk [11,37–40]. Even though dietary counsellinghas already been part of their routine care, the mean daily salt intake in our population was almost11 g/day, roughly twice that of the recommended 6 g/day, and considerably higher than the mean saltintake in the general Dutch population of 8.5 g/day [41]. Previously, Mente et al demonstrated that foreach 1-gram increment in estimated sodium excretion, blood pressure was 2/1 mmHg higher, wherethis slope was more pronounced and steeper in those with hypertension, high-sodium diets (>5g/day),and older persons [42]. Therefore, the most obvious step to improve non-pharmacological managementwould be to reduce dietary salt intake. This is underscored by a previous study, performed in T2DMpatients in the same region, which has shown that, although the aim to reduce dietary salt intake to<6 g/day was not reached, even a relatively modest reduction in salt intake from 12 to 9 g/day canreduce blood pressure by 6/3 mmHg and albuminuria by 42% while under RAASi [43]. Furthermore,reducing salt intake is associated with potentiating the antihypertensive effects of RAASi [44–46].
There is evidence that a combined dietary approach aimed at reducing salt while increasingpotassium intake has the potential to improve cardiovascular risk management [12,47]. However, thepotassium intake in our patients was generally already above the recommended intake of 3.5 g/day.Therefore, the finding that the sodium-to-potassium ratio was higher than the deemed optimal ratio of1 mmol/mmol in 97% of patients is primarily determined by high salt intake.
To improve blood pressure control, dietary intervention could also be aimed at reducing bodyweight. The mean BMI in our cohort was above 30 kg/m2. While a relationship between obesity andblood pressure has previously been demonstrated [7,48], we did not find such an association here.This might be due to the fact that we had few participants with a BMI < 25 kg/m2, and thereforedid not have a large enough dispersion to differentiate between the BP groups. Intentional weightloss has been associated with beneficial effects, both on BP and on other cardiovascular risk factorssuch as LDL cholesterol and glycemic control [49]. Therefore, even though weight loss is notoriouslydifficult to achieve, especially in patients on insulin treatment, it should remain a priority in thenon-pharmacological treatment of T2DM, and also in secondary health care centres.
Finally, an association between the intake of magnesium and phosphate and blood pressure hasbeen reported previously [14,17,18,50,51]. Here, we did not find differences in urinary magnesiumexcretion or in urinary phosphate excretion between those with BP-OT and BP-NOT. As the urinaryexcretion of magnesium and phosphate is lower in those with a low eGFR, these results might bemisleading. However, the proportion of patients with a low eGFR was similar in both the BP-OTand BP-NOT groups, making it less likely that differences in the urinary excretion of magnesium andphosphate between the BP groups were masked by differences in urinary excretion due to a low eGFR.In the general population, a continuous relationship between lower magnesium excretion and the riskfor hypertension was reported [16]; moreover, patients with a low magnesium intake had a greaterrisk of developing ischemic heart disease [52]. While no nutritional recommendations are currentlyavailable for magnesium to stratify adequate/inadequate intake, in our population approximately 28%of patients had a magnesium excretion below the values associated with ischemic heart disease in thegeneral population. Regarding phosphate intake, population-based studies as well as studies in CKDhave shown associations with outcome, albeit not equivocal [53,54], and it has been proposed thatexcess phosphate intake is a risk factor that is generally overlooked in patients with early stages ofCKD by lack of measurements [55]. While more research is needed on the relation between magnesiumand phosphate excretion and adverse outcomes, our data illustrate that 24-hour urine, collected to
274
Books
MDPI

Nutrients 2017, 9, 709
assess the intake of established nutritional targets such as salt and potassium, can simply be usedto establish a more complete nutritional profile, which could be useful for future improvements innutritional studies and counselling.
It should be noted that the adherence to nutritional guidelines was equally poor in the BP-OTand BP-NOT groups. While in the BP-NOT group there is more urgency to adhere to these guidelines,namely to correct BP, the adherence to the guidelines in the BP-OT group should not be overlooked.In regard to salt intake, previously it has been shown that a higher salt intake while under RAASi isassociated with worse cardiovascular outcomes, even independent of BP [46]. Furthermore, as statedabove, intentional weight loss has many benefits that surpass BP management [49], and therefore canalso greatly improve outcomes if BP is already on target. Lastly, in a population-based cohort, lowpotassium intake has been associated with the occurrence of chronic kidney disease [56].
The DIALECT study has several strengths, including the use of real-world data from a cohortrepresentative of secondary health care in T2DM, at least in the context of the Dutch referral healthcare setting. Second, we study the integrated role of non-biased data on both pharmacological andnon-pharmacological parameters on BP, which is an important approach, as in cardiovascular riskmanagement pharmacological and non-pharmacological interventions go hand in hand. Third, throughthe use of 24-hour urine collections, we provide objective measurements of dietary intake and severalrelevant nutrients.
There are also some limitations. An observational study cannot prove causal relationships. Also,there is some risk of response bias, although patient characteristics were similar between those whodid and did not participate.
What are the implications of our study? Adequate management equals the sum of measures takenin combination with compliance. Our data on poor nutritional management do not distinguish betweena lack of adequate nutritional counselling and a lack of compliance. However, it is well established thatsustained lifestyle change is difficult to achieve, demonstrating that currently no modus of adequatecounselling and therefore adequate management exists. The question, therefore, is how to establishthis. Previous well-designed studies, using interventions of intensive nurse practitioner support andself-management, both did not lead to neither long-standing changes in nutritional habits, nor areduction of cardiovascular outcomes [57,58]. As alternative approach, improvement strategies astested for pharmacological management could be considered. In particular, it has been shown that thesystematic evaluation of prescription quality as assessed by prescription quality indicators not onlyimproved pharmacological compliance with guidelines, but also patient outcomes [59]. To the best ofour knowledge, such approaches have never been developed and tested for nutritional management.As several objective parameters are available, such as the urinary excretion of sodium and potassium,this would be feasible in routine clinical care. Therefore, to improve blood pressure control, in ouropinion, the use of nutritional quality indicators may have the potential to improve treatment qualityas a whole.
5. Conclusions
Uncontrolled BP is common in T2DM, especially in those with microalbuminuria. An integratedassessment of pharmacological and nutritional management demonstrated a window of opportunityfor improving BP treatment, especially in nutritional management. We advocate that incorporating theintegrated monitoring of pharmacological and nutritional management in quality control cycles hasthe potential to improve treatment quality in T2DM.
Supplementary Materials: The following are available online at www.mdpi.com/2072-6643/9/7/709/s1,Table S1: Data collection in DIALECT.
Acknowledgments: We thank Willeke van Kampen, Sanne van Huizen, Anne Davina, Jolien Jaspers,and Manon Harmelink for their contribution to patient inclusion. Furthermore, we would like to thankBettine Haandrikman for her help with setting up the biobank. Lastly, we would like to thank Job van der Palenand Marloes Vermeer for their support in statistical analyses.
275
Books
MDPI

Nutrients 2017, 9, 709
Author Contributions: E.v.d.B., S.J.L.B., G.J.N. and G.D.L. conceived and designed the study. C.M.G., H.B. andE.v.d.B. included patients and performed the measurements. C.M.G. and H.B. analysed the data. S.J.L.B., G.J.N.and G.D.L. contributed materials. C.M.G., H.B., S.J.L.B., G.J.N. and G.D.L. wrote the paper.
Conflicts of Interest: The authors declare no conflict of interest.
References
1. World Health Organization. Global Report on Diabetes; WHO Press: Geneva, Switzerland, 2016.2. Tancredi, M.; Rosengren, A.; Svensson, A.M.; Kosiborod, M.; Pivodic, A.; Gudbjornsdottir, S.; Wedel, H.;
Clements, M.; Dahlqvist, S.; Lind, M. Excess Mortality among Persons with Type 2 Diabetes. N. Engl. J. Med.2015, 373, 1720–1732. [CrossRef] [PubMed]
3. Fox, C.S.; Coady, S.; Sorlie, P.D.; Levy, D.; Meigs, J.B.; D’Agostino, R.B., Sr.; Wilson, P.W.; Savage, P.J. Trendsin Cardiovascular Complications of Diabetes. JAMA 2004, 292, 2495–2499. [CrossRef] [PubMed]
4. Langsted, A.; Freiberg, J.J.; Nordestgaard, B.G. Extent of Undertreatment and Overtreatment withCholesterol-Lowering Therapy According to European Guidelines in 92,348 Danes without IschemicCardiovascular Disease and Diabetes in 2004–2014. Atherosclerosis 2016, 257, 9–15. [CrossRef] [PubMed]
5. De Cosmo, S.; Viazzi, F.; Piscitelli, P.; Giorda, C.; Ceriello, A.; Genovese, S.; Russo, G.; Guida, P.; Fioretto, P.;Pontremoli, R.; et al. Blood Pressure Status and the Incidence of Diabetic Kidney Disease in Patients withHypertension and Type 2 Diabetes. J. Hypertens. 2016, 34, 2090–2098. [CrossRef] [PubMed]
6. Gorter, K.; van Bruggen, R.; Stolk, R.; Zuithoff, P.; Verhoeven, R.; Rutten, G. Overall Quality of DiabetesCare in a Defined Geographic Region: Different Sides of the Same Story. Br. J. Gen. Pract. 2008, 58, 339–345.[CrossRef] [PubMed]
7. Baptista, D.R.; Thieme, R.D.; Reis, W.C.; Pontarolo, R.; Correr, C.J. Proportion of Brazilian Diabetes Patientsthat Achieve Treatment Goals: Implications for Better Quality of Care. Diabetol. Metab. Syndr. 2015, 7, 113.[CrossRef] [PubMed]
8. Laxy, M.; Knoll, G.; Schunk, M.; Meisinger, C.; Huth, C.; Holle, R. Quality of Diabetes Care in GermanyImproved from 2000 to 2007 to 2014, but Improvements Diminished since 2007. Evidence from thePopulation-Based KORA Studies. PLoS ONE 2016, 11, e0164704. [CrossRef] [PubMed]
9. McLean, R.M. Measuring Population Sodium Intake: A Review of Methods. Nutrients 2014, 6, 4651–4662.[CrossRef] [PubMed]
10. WHO. Guideline: Sodium Intake for Adults and Children; WHO Press: Geneva, Switzerland, 2012.11. Fox, C.S.; Golden, S.H.; Anderson, C.; Bray, G.A.; Burke, L.E.; de Boer, I.H.; Deedwania, P.; Eckel, R.H.;
Ershow, A.G.; Fradkin, J.; et al. Update on Prevention of Cardiovascular Disease in Adults with Type 2Diabetes Mellitus in Light of Recent Evidence: A Scientific Statement from the American Heart Associationand the American Diabetes Association. Diabetes Care 2015, 38, 1777–1803. [CrossRef] [PubMed]
12. Filippini, T.; Violi, F.; D’Amico, R.; Vinceti, M. The Effect of Potassium Supplementation on Blood Pressurein Hypertensive Subjects: A Systematic Review and Meta-Analysis. Int. J. Cardiol. 2017, 230, 127–135.[CrossRef] [PubMed]
13. WHO. Guideline: Potassium Intake for Adults and Children; WHO Press: Geneva, Switzerland, 2012.14. Zhang, X.; Li, Y.; Del Gobbo, L.C.; Rosanoff, A.; Wang, J.; Zhang, W.; Song, Y. Effects of Magnesium
Supplementation on Blood Pressure: A Meta-Analysis of Randomized Double-Blind Placebo-ControlledTrials. Hypertension 2016, 68, 324–333. [CrossRef] [PubMed]
15. Bain, L.K.; Myint, P.K.; Jennings, A.; Lentjes, M.A.; Luben, R.N.; Khaw, K.T.; Wareham, N.J.; Welch, A.A. TheRelationship between Dietary Magnesium Intake, Stroke and its Major Risk Factors, Blood Pressure andCholesterol, in the EPIC-Norfolk Cohort. Int. J. Cardiol. 2015, 196, 108–114. [CrossRef] [PubMed]
16. Joosten, M.M.; Gansevoort, R.T.; Mukamal, K.J.; Kootstra-Ros, J.E.; Feskens, E.J.; Geleijnse, J.M.; Navis, G.;Bakker, S.J. PREVEND Study Group. Urinary Magnesium Excretion and Risk of Hypertension: ThePrevention of Renal and Vascular End-Stage Disease Study. Hypertension 2013, 61, 1161–1167. [CrossRef][PubMed]
17. Bozic, M.; Panizo, S.; Sevilla, M.A.; Riera, M.; Soler, M.J.; Pascual, J.; Lopez, I.; Freixenet, M.; Fernandez, E.;Valdivielso, J.M. High Phosphate Diet Increases Arterial Blood Pressure Via a Parathyroid Hormone MediatedIncrease of Renin. J. Hypertens. 2014, 32, 1822–1832. [CrossRef] [PubMed]
276
Books
MDPI
Nutrients 2017, 9, 709
18. Mizuno, M.; Mitchell, J.H.; Crawford, S.; Huang, C.L.; Maalouf, N.; Hu, M.C.; Moe, O.W.; Smith, S.A.;Vongpatanasin, W. High Dietary Phosphate Intake Induces Hypertension and Augments Exercise PressorReflex Function in Rats. Am. J. Physiol. Regul. Integr. Comp. Physiol. 2016, 311, R39–R48. [CrossRef] [PubMed]
19. Du Bois, D.; Du Bois, E.F. A Formula to Estimate the Approximate Surface Area if Height and Weight beKnown. 1916. Nutrition 1989, 5, 303–311. [PubMed]
20. Wendel-Vos, G.C.; Schuit, A.J.; Saris, W.H.; Kromhout, D. Reproducibility and Relative Validity of theShort Questionnaire to Assess Health-Enhancing Physical Activity. J. Clin. Epidemiol. 2003, 56, 1163–1169.[CrossRef]
21. Levey, A.S.; Stevens, L.A.; Schmid, C.H.; Zhang, Y.L.; Castro, A.F., 3rd; Feldman, H.I.; Kusek, J.W.; Eggers, P.;Van Lente, F.; Greene, T.; et al. A New Equation to Estimate Glomerular Filtration Rate. Ann. Intern. Med.2009, 150, 604–612. [CrossRef] [PubMed]
22. Authors/Task Force Members; Ryden, L.; Grant, P.J.; Anker, S.D.; Berne, C.; Cosentino, F.; Danchin, N.;Deaton, C.; Escaned, J.; Hammes, H.P.; et al. ESC Guidelines on Diabetes, Pre-Diabetes, and CardiovascularDiseases Developed in Collaboration with the EASD: The Task Force on Diabetes, Pre-Diabetes, andCardiovascular Diseases of the European Society of Cardiology (ESC) and Developed in Collaborationwith the European Association for the Study of Diabetes (EASD). Eur. Heart J. 2013, 34, 3035–3087. [PubMed]
23. Kidney Disease: Improving Global Outcomes (KDIGO) Blood Pressure Work Group. KDIGO ClinicalPractice Guideline for the Management of Blood Pressure in Chronic Kidney Disease. Kidney Int. Suppl. 2012,2, 337–414.
24. Kromhout, D.; Spaaij, C.J.; de Goede, J.; Weggemans, R.M. The 2015 Dutch Food-Based Dietary Guidelines.Eur. J. Clin. Nutr. 2016, 70, 869–878. [CrossRef] [PubMed]
25. Gezondheidsraad. Richtlijnen Goede Voeding 2015; Gezondheidsraad: The Hague, The Netherlands, 2015.26. Bock, H.A.; Stein, J.H. Diuretics and the Control of Extracellular Fluid Volume: Role of Counterregulation.
Semin. Nephrol. 1988, 8, 264–272. [PubMed]27. Holbrook, J.T.; Patterson, K.Y.; Bodner, J.E.; Douglas, L.W.; Veillon, C.; Kelsay, J.L.; Mertz, W.; Smith, J.C., Jr.
Sodium and Potassium Intake and Balance in Adults Consuming Self-Selected Diets. Am. J. Clin. Nutr. 1984,40, 786–793. [PubMed]
28. Maroni, B.J.; Steinman, T.I.; Mitch, W.E. A Method for Estimating Nitrogen Intake of Patients with ChronicRenal Failure. Kidney Int. 1985, 27, 58–65. [CrossRef] [PubMed]
29. Newsome, B.; Ix, J.H.; Tighiouart, H.; Sarnak, M.J.; Levey, A.S.; Beck, G.J.; Block, G. Effect of ProteinRestriction on Serum and Urine Phosphate in the Modification of Diet in Renal Disease (MDRD) Study.Am. J. Kidney Dis. 2013, 61, 1045–1046. [CrossRef] [PubMed]
30. Block, G.A.; Wheeler, D.C.; Persky, M.S.; Kestenbaum, B.; Ketteler, M.; Spiegel, D.M.; Allison, M.A.; Asplin, J.;Smits, G.; Hoofnagle, A.N.; et al. Effects of Phosphate Binders in Moderate CKD. J. Am. Soc. Nephrol. 2012,23, 1407–1415. [CrossRef] [PubMed]
31. Petrie, J.R.; Marso, S.P.; Bain, S.C.; Franek, E.; Jacob, S.; Masmiquel, L.; Leiter, L.A.; Haluzik, M.; Satman, I.;Omar, M.; et al. LEADER-4: Blood Pressure Control in Patients with Type 2 Diabetes and High CardiovascularRisk: Baseline Data from the LEADER Randomized Trial. J. Hypertens. 2016, 34, 1140–1150. [CrossRef][PubMed]
32. Halimi, J.M.; Joly, D.; Combe, C.; Choukroun, G.; Dussol, B.; Fauvel, J.P.; Quere, S.; Fiquet, B. Blood Pressureand Proteinuria Control Remains a Challenge in Patients with Type 2 Diabetes Mellitus and Chronic KidneyDisease: Experience from the Prospective Observational ALICE-PROTECT Study. BMC Nephrol. 2016, 17,135. [CrossRef] [PubMed]
33. Smits, K.P.; Sidorenkov, G.; Kleefstra, N.; Bouma, M.; Meulepas, M.; Voorham, J.; Navis, G.; Bilo, H.J.;Denig, P. Development and Validation of Prescribing Quality Indicators for Patients with Type 2 Diabetes.Int. J. Clin. Pract. 2017, 71. [CrossRef] [PubMed]
34. Walraven, I.; Mast, M.R.; Hoekstra, T.; Jansen, A.P.; Rauh, S.P.; Rutters, F.R.; van der Heijden, A.A.; Elders, P.J.;Moll, A.C.; Polak, B.C.; et al. Real-World Evidence of Suboptimal Blood Pressure Control in Patients withType 2 Diabetes. J. Hypertens. 2015, 33, 2091–2098. [CrossRef] [PubMed]
35. Vrijens, B.; Antoniou, S.; Burnier, M.; de la Sierra, A.; Volpe, M. Current Situation of Medication Adherencein Hypertension. Front. Pharmacol. 2017, 8, 100. [CrossRef] [PubMed]
277
Books
MDPI

Nutrients 2017, 9, 709
36. De Jager, R.L.; de Beus, E.; Beeftink, M.M.; Sanders, M.F.; Vonken, E.J.; Voskuil, M.; van Maarseveen, E.M.;Bots, M.L.; Blankestijn, P.J. SYMPATHY Investigators. Impact of Medication Adherence on the Effect ofRenal Denervation: The SYMPATHY Trial. Hypertension 2017, 69, 678–684. [CrossRef] [PubMed]
37. Dunkler, D.; Kohl, M.; Heinze, G.; Teo, K.K.; Rosengren, A.; Pogue, J.; Gao, P.; Gerstein, H.; Yusuf, S.;Oberbauer, R.; et al. Modifiable Lifestyle and Social Factors Affect Chronic Kidney Disease in High-RiskIndividuals with Type 2 Diabetes Mellitus. Kidney Int. 2015, 87, 784–791. [CrossRef] [PubMed]
38. Knowler, W.C.; Barrett-Connor, E.; Fowler, S.E.; Hamman, R.F.; Lachin, J.M.; Walker, E.A.; Nathan, D.M.Diabetes Prevention Program Research Group. Reduction in the Incidence of Type 2 Diabetes with LifestyleIntervention Or Metformin. N. Engl. J. Med. 2002, 346, 393–403. [PubMed]
39. Bibbins-Domingo, K.; Chertow, G.M.; Coxson, P.G.; Moran, A.; Lightwood, J.M.; Pletcher, M.J.; Goldman, L.Projected Effect of Dietary Salt Reductions on Future Cardiovascular Disease. N. Engl. J. Med. 2010, 362,590–599. [CrossRef] [PubMed]
40. Wong, M.M.; Arcand, J.; Leung, A.A.; Thout, S.R.; Campbell, N.R.; Webster, J. The Science of Salt: A RegularlyUpdated Systematic Review of Salt and Health Outcomes (December 2015–March 2016). J. Clin. Hypertens.(Greenwich) 2017, 19, 322–332. [CrossRef] [PubMed]
41. Hendriksen, M.; Etemad, Z.; van den Bogaard, C.H.; van der A, D.L. Salt, Iodine and Potassium Intake amongAdults in Doetinchem in 2015; RIVM Report 2016–0081; Rijksinstituut voor Volksgezondheid en Milieu:Bilthoven, The Netherlands, 2016.
42. Mente, A.; O’Donnell, M.J.; Rangarajan, S.; McQueen, M.J.; Poirier, P.; Wielgosz, A.; Morrison, H.; Li, W.;Wang, X.; Di, C.; et al. Association of Urinary Sodium and Potassium Excretion with Blood Pressure. N. Engl.J. Med. 2014, 371, 601–611. [CrossRef] [PubMed]
43. Kwakernaak, A.J.; Krikken, J.A.; Binnenmars, S.H.; Visser, F.W.; Hemmelder, M.H.; Woittiez, A.J.; Groen, H.;Laverman, G.D.; Navis, G. Holland Nephrology Study (HONEST) Group. Effects of Sodium Restriction andHydrochlorothiazide on RAAS Blockade Efficacy in Diabetic Nephropathy: A Randomised Clinical Trial.Lancet Diabetes Endocrinol. 2014, 2, 385–395. [CrossRef]
44. Lambers Heerspink, H.J.; de Borst, M.H.; Bakker, S.J.; Navis, G.J. Improving the Efficacy of RAAS Blockadein Patients with Chronic Kidney Disease. Nat. Rev. Nephrol. 2013, 9, 112–121. [CrossRef] [PubMed]
45. Vogt, L.; Waanders, F.; Boomsma, F.; de Zeeuw, D.; Navis, G. Effects of Dietary Sodium andHydrochlorothiazide on the Antiproteinuric Efficacy of Losartan. J. Am. Soc. Nephrol. 2008, 19, 999–1007.[CrossRef] [PubMed]
46. Lambers Heerspink, H.J.; Holtkamp, F.A.; Parving, H.H.; Navis, G.J.; Lewis, J.B.; Ritz, E.; de Graeff, P.A.;de Zeeuw, D. Moderation of Dietary Sodium Potentiates the Renal and Cardiovascular Protective Effects ofAngiotensin Receptor Blockers. Kidney Int. 2012, 82, 330–337. [CrossRef] [PubMed]
47. Kieneker, L.M.; Gansevoort, R.T.; Mukamal, K.J.; de Boer, R.A.; Navis, G.; Bakker, S.J.; Joosten, M.M. UrinaryPotassium Excretion and Risk of Developing Hypertension: The Prevention of Renal and Vascular End-StageDisease Study. Hypertension 2014, 64, 769–776. [CrossRef] [PubMed]
48. Adeniyi, O.V.; Yogeswaran, P.; Longo-Mbenza, B.; Ter Goon, D. Uncontrolled Hypertension and itsDeterminants in Patients with Concomitant Type 2 Diabetes Mellitus (T2DM) in Rural South Africa.PLoS ONE 2016, 11, e0150033. [CrossRef] [PubMed]
49. Zomer, E.; Gurusamy, K.; Leach, R.; Trimmer, C.; Lobstein, T.; Morris, S.; James, W.P.; Finer, N. Interventionsthat Cause Weight Loss and the Impact on Cardiovascular Risk Factors: A Systematic Review andMeta-Analysis. Obes. Rev. 2016, 17, 1001–1011. [CrossRef] [PubMed]
50. Verma, H.; Garg, R. Effect of Magnesium Supplementation on Type 2 Diabetes Associated CardiovascularRisk Factors: A Systematic Review and Meta-Analysis. J. Hum. Nutr. Diet. 2017. [CrossRef] [PubMed]
51. Humalda, J.K.; Keyzer, C.A.; Binnenmars, S.H.; Kwakernaak, A.J.; Slagman, M.C.; Laverman, G.D.;Bakker, S.J.; de Borst, M.H.; Navis, G.J. Concordance of Dietary Sodium Intake and Concomitant PhosphateLoad: Implications for Sodium Interventions. Nutr. Metab. Cardiovasc. Dis. 2016, 26, 689–696. [CrossRef][PubMed]
52. Joosten, M.M.; Gansevoort, R.T.; Mukamal, K.J.; van der Harst, P.; Geleijnse, J.M.; Feskens, E.J.; Navis, G.;Bakker, S.J.; PREVEND Study Group. Urinary and Plasma Magnesium and Risk of Ischemic Heart Disease.Am. J. Clin. Nutr. 2013, 97, 1299–1306. [CrossRef] [PubMed]
278
Books
MDPI

Nutrients 2017, 9, 709
53. Chang, A.R.; Grams, M.E. Serum Phosphorus and Mortality in the Third National Health and NutritionExamination Survey (NHANES III): Effect Modification by Fasting. Am. J. Kidney Dis. 2014, 64, 567–573.[CrossRef] [PubMed]
54. Palomino, H.L.; Rifkin, D.E.; Anderson, C.; Criqui, M.H.; Whooley, M.A.; Ix, J.H. 24-Hour Urine PhosphorusExcretion and Mortality and Cardiovascular Events. Clin. J. Am. Soc. Nephrol. 2013, 8, 1202–1210. [CrossRef][PubMed]
55. Ritz, E.; Hahn, K.; Ketteler, M.; Kuhlmann, M.K.; Mann, J. Phosphate Additives in Food—A Health Risk.Dtsch. Arzteblatt Int. 2012, 109, 49–55.
56. Kieneker, L.M.; Bakker, S.J.; de Boer, R.A.; Navis, G.J.; Gansevoort, R.T.; Joosten, M.M. Low PotassiumExcretion but Not High Sodium Excretion is Associated with Increased Risk of Developing Chronic KidneyDisease. Kidney Int. 2016, 90, 888–896. [CrossRef] [PubMed]
57. Meuleman, Y.; Hoekstra, T.; Dekker, F.W.; Navis, G.; Vogt, L.; van der Boog, P.J.M.; Bos, W.J.W.; vanMontfrans, G.A.; van Dijk, S.; ESMO Study Group. Sodium Restriction in Patients with CKD: A RandomizedControlled Trial of Self-Management Support. Am. J. Kidney Dis. 2017, 69, 576–586. [CrossRef] [PubMed]
58. Van Zuilen, A.D.; Bots, M.L.; Dulger, A.; van der Tweel, I.; van Buren, M.; Ten Dam, M.A.; Kaasjager, K.A.;Ligtenberg, G.; Sijpkens, Y.W.; Sluiter, H.E.; et al. Multifactorial Intervention with Nurse Practitionersdoes Not Change Cardiovascular Outcomes in Patients with Chronic Kidney Disease. Kidney Int. 2012, 82,710–717. [CrossRef] [PubMed]
59. Smits, K.P.J.; Sidorenkov, G.; Navis, G.; Bouma, M.; Meulepas, M.A.; Bilo, H.J.G.; Denig, P. PrescribingQuality and Prediction of Clinical Outcomes in Patients with Type 2 Diabetes: A Prospective Cohort Study.Diabetes Care 2017, 40, e83–e84. [CrossRef] [PubMed]
© 2017 by the authors. Licensee MDPI, Basel, Switzerland. This article is an open accessarticle distributed under the terms and conditions of the Creative Commons Attribution(CC BY) license (http://creativecommons.org/licenses/by/4.0/).
279
Books
MDPI

nutrients
Article
Butyrate Reduces HFD-Induced AdipocyteHypertrophy and Metabolic Risk Factors in ObeseLDLr-/-.Leiden Mice
Charlotte E. Pelgrim 1,†, Bart A. A. Franx 1,† , Jessica Snabel 2, Robert Kleemann 2 ,
Ilse A. C. Arnoldussen 1 and Amanda J. Kiliaan 1,*1 Donders Institute for Brain, Cognition and Behaviour, Preclinical Imaging Centre, Department of Anatomy,
Radboud University Medical Center, 6525 EZ Nijmegen, The Netherlands;[email protected] (C.E.P.); [email protected] (B.A.A.F.);[email protected] (I.A.C.A.)
2 Department of Metabolic Health Research, Netherlands Organisation for Applied Scientific Research (TNO),2301 CE Leiden, The Netherlands; [email protected] (J.S.); [email protected] (R.K.)
* Correspondence: [email protected]; Tel.: +31-24-361-4378† Authors contributed equally to this work.
Received: 10 May 2017; Accepted: 4 July 2017; Published: 7 July 2017
Abstract: Adipose tissue (AT) has a modulating role in obesity-induced metabolic complications liketype 2 diabetes mellitus (T2DM) via the production of so-called adipokines such as leptin, adiponectin,and resistin. The adipokines are believed to influence other tissues and to affect insulin resistance,liver function, and to increase the risk of T2DM. In this study, we examined the impact of interventionwith the short-chain fatty acid butyrate following a high-fat diet (HFD) on AT function and othermetabolic risk factors associated with obesity and T2DM in mice during mid- and late life. In bothmid- and late adulthood, butyrate reduced HFD-induced adipocyte hypertrophy and elevations inleptin levels, which were associated with body weight, and cholesterol and triglyceride levels. HFDfeeding stimulated macrophage accumulation primarily in epididymal AT in both mid- and late lifeadult mice, which correlated with liver inflammation in late adulthood. In late-adult mice, butyratediminished increased insulin levels, which were related to adipocyte size and macrophage contentin epididymal AT. These results suggest that dietary butyrate supplementation is able to counteractHFD-induced detrimental changes in AT function and metabolic outcomes in late life. These changesunderlie the obesity-induced elevated risk of T2DM, and therefore it is suggested that butyrate haspotential to attenuate risk factors associated with obesity and T2DM.
Keywords: obesity; T2DM; high-fat diet; butyrate; adipose tissue; macrophages; adipokines
1. Introduction
In line with the rise of type 2 diabetes mellitus (T2DM) the global prevalence of obesity hasmore than doubled since 1980 [1]. Moreover, obesity is a major risk factor for T2DM, accountingfor 80–85% of the overall risk [2]. Weight or fat loss has the strongest effect on reducing the risk ofdeveloping T2DM [3]. It has been suggested that the relationship between obesity and T2DM existsalready at a young age [4–6]. In addition, obesity is suggested to exaggerate aging processes [7],and aging is associated with impaired insulin signaling [8], which causes an increase in blood glucoselevels. Over time, high blood glucose concentrations combined with high blood pressure and highcholesterol levels affect vascular function, and may evolve into cardiovascular disease, kidney failure,and subsequent cognitive deficits [9,10].
Accumulating evidence suggests that adipose tissue dysfunction—with adipocyte hypertrophyas a first manifestation—may play a role in the development of obesity-induced metabolic conditions
Nutrients 2017, 9, 714 280 www.mdpi.com/journal/nutrients
Books
MDPI

Nutrients 2017, 9, 714
that increase the risk for T2DM [11]. Adipocyte hypertrophy results in an elevated recruitment ofmacrophages surrounding dead or dying adipocytes, which is referred to as crown-like structures(CLS)—an important hallmark of adipose tissue dysfunction— [12]. Macrophages are believed to bemajor sources of inflammatory cytokines with detrimental effects on insulin signaling in obesity [13].In addition, adipocyte hypertrophy may lead to the altered production and secretion of adipokines likeleptin, resistin, serum amyloid A (SAA), and adiponectin [14–16]. These adipokines play importantroles in insulin signaling and the development of a chronic low-grade inflammatory state, which ischaracteristic for obesity. Overall, amelioration of these obesity-induced and adipose tissue-relatedchanges may provide an important approach to attenuate the risk of developing T2DM.
There is a growing interest in short-chain fatty acids—such as butyrate—as dietary interventionfor obesity and related metabolic diseases [17,18]. Butyrate is one of the fatty acids produced duringbacterial fermentation in the distal gut of nondigestible carbohydrates like dietary fiber and resistantstarch. Both intake of butyrate and dietary fibers have shown positive effects on body weight andinsulin sensitivity [17,19–22]. In addition, butyrate has anti-inflammatory properties and affectslipogenesis [17]. A decreased concentration of butyrate-producing bacteria has been observed bothin patients with obesity [23] and T2DM [24]. Butyrate may therefore play an essential role in themaintenance of an optimal metabolic state.
It is acknowledged that obesity may differentially affect various organs and tissues, like thebrain and cardiovascular system, during midlife as opposed to late life [18,25–27]. Recently, wedemonstrated that butyrate is able to restore high-fat diet (HFD)-induced neuroinflammation andchanges in brain function in low-density-lipoprotein receptor knockout (LDLr-/-).Leiden mice inmid-adulthood [18]. In addition, mid-adult mice seem to be more susceptible to the development ofHFD-induced cardiovascular damage as compared to late-adult mice [18]. However, it has not beenelucidated whether diet-induced obesity affects adipose tissue function and its metabolic outcomesdifferentially during mid- and late adulthood. As follow-up of the previous published study [18],we investigated in the current study the effects of a therapeutic butyrate intervention on adipose tissuefunction and adipokine levels in the context of manifested HFD-induced obesity in both mid- andlate-adult LDLr-/-.Leiden mice.
2. Materials and Methods
2.1. Animals and Diets
The adipose tissues and plasma samples analyzed in this experiment originate from a previouslydescribed study [18]. LDLr-/-.Leiden mice were selected because of their high sensitivity to developingHFD-induced obesity and subsequent complications like vascular damage and fatty liver [28–30].Briefly, male LDLr-/-.Leiden mice (TNO Metabolic Health Research, Leiden, The Netherlands) werehoused in individually ventilated cages in a conventional animal room situated in the preclinicalimaging center (PRIME) at the central animal laboratory, Radboudumc Nijmegen, the Netherlands.A maximum of five mice were housed per cage with ad libitum access to acidified tap water andfood (temperature 21 ◦C; relative humidity 50–60%; light-dark cycle 7 a.m.–7 p.m.). The experimentswere approved by an independent ethical committee on animal care and experimentation (Zeist,The Netherlands), approval project number DEC3682 [18] and carried out in accordance to theARRIVE guidelines [31].
The intervention regimen of the study [18] is schematically presented in Figure 1. A total group ofn = 60 LDLr-/-.Leiden mice were divided into a mid- and late-adult cohort (n = 30 each). Both cohortsconsisted of three diet groups. For the cohort representing mid-adulthood, the first group received achow diet from birth until the end of the study (Chow). The second group switched to a HFD at threemonths of age (HFD). The third group switched to a HFD when three months old (m.o.) as well, butthis HFD was subsequently enriched with 5% w/w butyrate from seven months of age until the end ofthe study (HDFB) (Figure 1a). The cohort representing late adulthood was subdivided in the same
281
Books
MDPI

Nutrients 2017, 9, 714
manner, but mice were switched to HFD at six months of age and butyrate intervention started at 10months of age (Figure 1b).
Figure 1. Schematic overview of the study design. (a) Mid-adulthood, exposure of the high-fat diedHFD started at 3 m.o. in the HFD and HFDB groups. At 7 months of age, the butyrate intervention(HFD supplemented with 5% w/w butyrate) started in the HFDB group; (b) Late adulthood, exposureto the HFD started at 6 months of age in the HFD and HFDB groups, and a butyrate interventioninitiated at 10 months of age in the HFDB group. Body weight (individual) and food intake (cagelevel) were monitored weekly. Blood samples were taken after five hours of fasting. At 9 m.o. and 12m.o., mice were sacrificed and both liver and adipose tissues were harvested. These tissues weresubsequently processed for immunohistochemical staining. B = blood sample collection; HFD =high-fat diet; HFDB = high fat diet enriched with butyrate; m.o. = months old.
2.2. Plasma Analyses
Blood was collected after five hours of fasting (8 a.m. to 1 p.m.). Plasma cholesterol, triglycerideand insulin levels were measured using standardized ELISA kits as previously described [18].Moreover, ELISA kits (Quantikine, R&D systems, Inc., Minneapolis, MN, USA) were used todefine plasma leptin (DY498), adiponectin (DY1119), resistin (DY1069) and interleukin-6 (IL-6;M6000B) levels. SAA plasma levels were determined by an ELISA kit as well (KMA0021, Invitrogen,Carlsbad, CA, USA).
2.3. (Immuno)histochemistry
Mice were sacrificed by transcardial perfusion with 0.1 M phosphate buffered saline (PBS) afterbeing anesthetized with isoflurane (3.5%, Nicholas Primal (I) limited, London, UK), as described inArnoldussen et al. [18]. Directly thereafter, the liver and two different adipose tissue depots wereharvested and post-fixed in 4% paraformaldehyde for 24 h. Fat depots seem to be differentially activeand affected by a HFD and, therefore, we dissected in addition subcutaneous (inguinal) and visceral(epididymal) adipose tissue depots [32,33]. Liver outcomes used for correlation analyses were obtainedfrom a previous experiment [18].
Both epididymal and inguinal adipose tissues were processed for immunohistochemistry on5 μm paraffin embedded sections. Briefly, paraffin sections were first deparaffinized in xylene andrehydrated in a series of ethanol followed by endogenous peroxidase blocking with 0.3% H2O2 in0.1 M PBS. Antigen retrieval was achieved by treating the tissue in hot 0.05 M sodiumcitrate with aconstant temperature of 85 ◦C. After pre-incubation with 0.1% bovine serum albumin in 0.1 M PBS
282
Books
MDPI

Nutrients 2017, 9, 714
(PBS-B), the tissue was incubated overnight at room temperature with primary macrophage (MAC-3)antibodies (1:100; eBioscience, 14-1072) [34]. Next, sections were incubated with secondary donkeyanti-rat IgG antibodies (1:200; Jackson ImmunoResearch) in 0.1 M PBS-B at room temperature. Stainingwas visualized using the ABC method with a Vectastain kit (Vector Laboratories, Burlingame, CA,USA) and diaminobenzidine imidazole solution as chromogen. Finally, sections were dehydrated in aseries of ethanol, cleared in xylene, and mounted.
Two entire sections per animal were visualized using a VisionTek live digital microscope (SakuraFinetek, Torrance, CA, USA) at a 10× magnification. Sampling of these sections was carried out withAdobe Illustrator CC 2016 (Adobe, San Jose, CA, USA) using a template with three randomly placedartboards (592.7 × 886.2 mm). Adipocyte cell size (μm2) and the number of CLS were determined in atotal of six samples—three samples per section—per animal. Analyses to determine these measureswere performed using CellProfiler [35] version 2.3.0 together with Ilastik version 0.5 [36] for pixelclassification. Separate pipelines and classifiers for epididymal and inguinal adipose tissue analyseswere used. In order to verify the reliability of these relatively novel analyses, we included an establishedanalysis to determine adipocyte size using ImageJ software as previously described [37]. CLS weredetermined based on intensity of the cell edge, and total numbers of CLS per animal were calculatedper 1000 adipocytes.
2.4. Statistical Analyses
A random and blinded selection procedure was maintained throughout the study. Group meanswere compared using univariate analysis of variance (ANOVA) with Bonferroni correction for multipletesting with a statistical program, SPSS 24 (IBM SPSS Statistics 24, IBM Corporation, Armonk, NY,USA). Parameter correlation tests were performed using Pearson correlations. Nonparametric testswere used when assumptions of normality and homogeneity of variance were not met. p-values lowerthan 0.05 were considered significant. Data are presented as mean ± SEM.
3. Results
3.1. Adipocyte Size
Adipocyte size—measured as area (μm2)—of both epididymal and inguinal adipose tissue depotswere determined to assess morphological adaptations. A HFD increased the average epididymaladipocyte size in both mid- and late-adult mice (mid: p < 0.001; F(1,18) = 26.05, late: p < 0.02;F(1,19) = 7.01) (Figure 2a). Butyrate intervention significantly reduced adipocyte size in both agecohorts (mid: p = 0.001; F(1,18) = 14.95, late: p < 0.02; F(1,18) = 7.14).
Similarly, inguinal adipocyte size was increased by HFD in both mid- and late adulthood(p = 0.001; mid: F(1,18) = 20.49, late: F(1,19) = 14.25) (Figure 2b). After HFD exposure, inguinaladipocyte size was reduced due to butyrate intervention in mid-adult mice (p < 0.001; F(1,18) = 25.69),but not in late-adult mice. Mean inguinal adipocyte size was significantly larger in late adult ascompared to mid-adult high fat diet enriched with butyrate (HFDB) mice (p < 0.01; F(1,18) = 11.28).
In addition, we compared the number of adipocytes as an additional indication of adipose tissuefunction. Our analysis indicated that the epididymal adipose tissue contained a lower number ofadipocytes than inguinal adipose tissue. The mean adipocyte number in epididymal adipose tissuewas higher in mid-adult Chow mice as compared to HFD mice (Table 1). Butyrate interventionincreased epididymal adipocyte number solely in mid-adulthood. In both age cohorts, inguinaladipocyte numbers were significantly higher in Chow mice as opposed to HFD mice (Table 1). Only inmid-adulthood did butyrate intervention increase the inguinal adipocyte numbers.
283
Books
MDPI
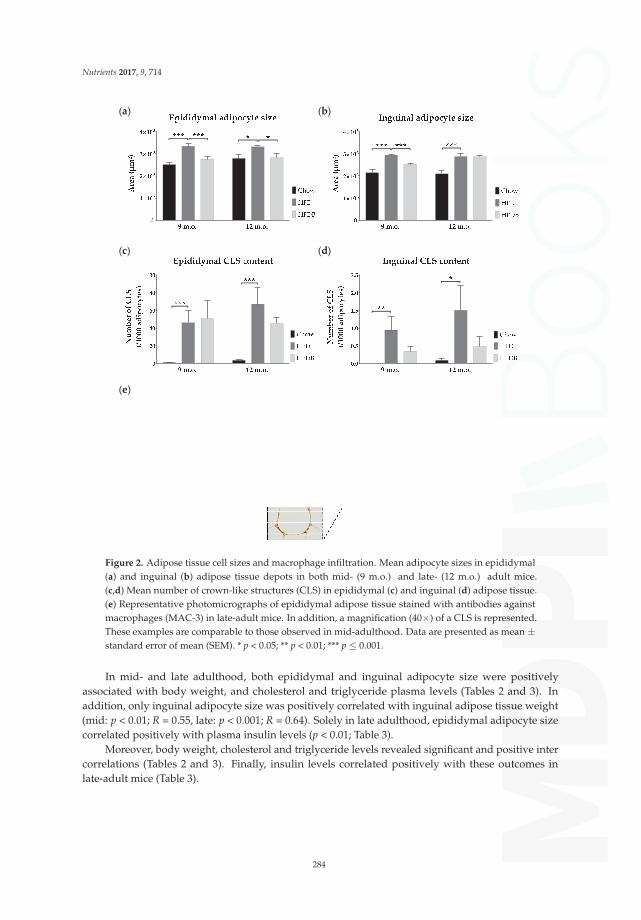
Nutrients 2017, 9, 714
(a) (b)
(c) (d)
(e)
Figure 2. Adipose tissue cell sizes and macrophage infiltration. Mean adipocyte sizes in epididymal(a) and inguinal (b) adipose tissue depots in both mid- (9 m.o.) and late- (12 m.o.) adult mice.(c,d) Mean number of crown-like structures (CLS) in epididymal (c) and inguinal (d) adipose tissue.(e) Representative photomicrographs of epididymal adipose tissue stained with antibodies againstmacrophages (MAC-3) in late-adult mice. In addition, a magnification (40×) of a CLS is represented.These examples are comparable to those observed in mid-adulthood. Data are presented as mean ±standard error of mean (SEM). * p < 0.05; ** p < 0.01; *** p ≤ 0.001.
In mid- and late adulthood, both epididymal and inguinal adipocyte size were positivelyassociated with body weight, and cholesterol and triglyceride plasma levels (Tables 2 and 3). Inaddition, only inguinal adipocyte size was positively correlated with inguinal adipose tissue weight(mid: p < 0.01; R = 0.55, late: p < 0.001; R = 0.64). Solely in late adulthood, epididymal adipocyte sizecorrelated positively with plasma insulin levels (p < 0.01; Table 3).
Moreover, body weight, cholesterol and triglyceride levels revealed significant and positive intercorrelations (Tables 2 and 3). Finally, insulin levels correlated positively with these outcomes inlate-adult mice (Table 3).
284
Books
MDPI

Nutrients 2017, 9, 714
Table 1. Adipocyte numbers. Represented are the combined mean numbers of two slides.
Adipocyte Numbers Per 106 μm2 (Mean ± SEM)
Epididymal
Chow vs. HFDmid 468 ± 34 vs. 376 ± 31 0.05 < p < 0.08 F(1,18) = 3.95late 452 ± 40 vs. 410 ± 21 p = 0.02 F(1,18) = 6.54
HFD vs. HFDBmid 376 ± 31 vs. 496 ± 35 nslate 410 ± 21 vs. 481 ± 47 ns
Inguinal
Chow vs. HFDmid 665 ± 59 vs. 449 ± 16 p < 0.01 F(1,18) = 12.61late 659 ± 44 vs. 474 ± 41 p < 0.01 F(1,19) = 9.54
HFD vs. HFDBmid 449 ± 16 vs. 522 ± 15 p < 0.01 F(1,18) = 11.27late 474 ± 41 vs. 446 ± 18 ns
ns = not significant.
Table 2. Correlation coefficients among mid-adult mice.
BW Chol Trigl eAS iAS eCLS iCLS Leptin SAA
BW xChol 0.80 R + xTrigl 0.58 R + 0.69 R + xeAS 0.53 R + 0.64 R + 0.57 R + xiAS 0.55 R + 0.57 R + 0.37 R + NE x
eCLS 0.53 τb + 0.49 τb + 0.15 τb + 0.24 τb + NE xiCLS 0.31 τb + 0.29 τb + 0.10 τb + NE 0.37 τb + NE xLeptin 0.78 R + 0.87 R + 0.62 R + 0.76 R + 0.67 R + 0.52 τb + 0.37 τb + xSAA 0.56 τb + 0.50 τb + 0.13 τb + 0.17 τb + 0.24 τb + 0.69 τb + 0.28 τb + NE x
Either the Pearson’s (R) or Kendall’s tau (τb) test was used. Not significant. + = positive correlation; Adi =adiponectin; BW = body weight; Chol = cholesterol; eAS = epididymal adipocyte size; eCLS = epididymal CLS; iAS= inguinal adipocyte size; iCLS = inguinal CLS; LI = liver inflammation; NE = not estimated; SAA = serum amyloidA; Trigl = triglycerides.
285
Books
MDPI

Nutrients 2017, 9, 714
Ta
ble
3.
Cor
rela
tion
coef
ficie
nts
amon
gla
te-a
dult
mic
e.
BW
Insu
lin
Ch
ol
Tri
gl
eA
SiA
Se
CL
SiC
LS
LI
Le
pti
nA
di
SA
A
BWx
Insu
lin0.
66R
+x
Cho
l0.
87R
+0.
66R
+x
Trig
l0.
79R
+0.
77R
+0.
81R
+x
eAS
0.52
R+
0.49
R+
0.57
R+
0.53
R+
xiA
S0.
47R
+0.
31R
+0.
54R
+0.
50R
+N
Ex
eCLS
0.43
τb
+0.
30τ
b+
0.55
τb
+0.
34τ
b+
0.23
τb
+N
Ex
iCLS
0.45
τb
+0.
21τ
b+
0.38
τb
+0.
33τ
b+
NE
0.37
τb
+N
Ex
LI0.
41τ
b+
0.33
τb
+0.
45τ
b+
0.30
τb
+0.
15τ
b+
0.22
τb
+0.
57τ
b+
0.21
τb
+x
Lept
in0.
88R
+0.
69R
+0.
91R
+0.
87R
+0.
65R
+0.
64R
+0.
49τ
b+
0.41
τb
+0.
46τ
b+
xA
di0.
56R
−0.
48R
−0.
68R
−0.
47R
−0.
25R
−0.
25R
−0.
19τ
b−
0.30
τb
−0.
28τ
b−
NE
xSA
A0.
42τ
b+
0.29
τb
+0.
57τ
b+
0.46
τb
+0.
19τ
b+
0.53
τb
+0.
58τ
b+
0.30
τb
+0.
44τ
b+
NE
NE
x
Eith
erth
ePe
arso
n’s
(R)o
rK
enda
ll’s
tau
(τb)t
estw
asus
ed.N
otsi
gnifi
cant
.+=
posi
tive
corr
elat
ion;
−=
nega
tive
corr
elat
ion;
Adi
=ad
ipon
ectin
;BW
=Bo
dyw
eigh
t;C
hol=
chol
este
rol;
eAS
=ep
idid
ymal
adip
ocyt
esi
ze;e
CLS
=ep
idid
ymal
CLS
;iA
S=
ingu
inal
adip
ocyt
esi
ze;i
CLS
=in
guin
alC
LS;L
I=liv
erin
flam
mat
ion;
NE
=no
test
imat
ed;S
AA
=se
rum
amyl
oid
A;
Trig
l=tr
igly
ceri
des.
286
Books
MDPI

Nutrients 2017, 9, 714
3.2. Inflammation in Adipose Tissue and Liver
To assess the degree of inflammation in adipose tissue, the number of adipocytes infiltrated bymacrophages—known as crown-like structures (CLS)—has been determined. Both mid- and late-adultmice on HFD showed higher numbers of CLS in epididymal adipose tissue as opposed to Chow-fedmice (Kruskal Wallis: p < 0.001; mid: χ2(1) = 13.50, late: χ2(1) = 13.02) (Figure 2c). No effects of butyrateon CLS number in epididymal adipose tissue were observed. In inguinal adipose tissue, the numberof CLS was increased after HFD exposure in both mid- (Kruskal-Wallis: p < 0.01; χ2(1) = 7.30) andlate- (Kruskal-Wallis: p < 0.02; χ2(1) = 6.16) adult mice (Figure 2d). No significant differences in thenumber of CLS in inguinal adipose tissue were observed between HFD and HFDB mice (Figure 2d).As scales differ between Figure 2c,d, caution should be taken when interpreting these results. InFigure 2e, examples of epididymal adipose tissue stained for macrophages are shown.
In late adulthood, the number of CLS in epididymal adipose tissue correlated significantly withbody weight (p = 0.001), and plasma triglyceride (p < 0.02), cholesterol (p < 0.001) and insulin (p < 0.05)levels (Table 3). In mid-adulthood, epididymal adipose tissue CLS content showed only significantcorrelations with body weight (p < 0.001) and plasma cholesterol levels (p < 0.001) (Table 2).
In addition to CLS in adipose tissue, data including inflammatory aggregates were used [18] toexamine potential relationships to inflammation in the liver, which is another crucial organ regulatinginsulin sensitivity. Liver inflammation was increased after HFD exposure only in late-adult mice [18].No significant changes were observed after butyrate intervention. In this age cohort, the number ofinflammatory aggregates in the liver was positively correlated with the number of CLS in epididymaladipose tissue (p < 0.001) (Table 3).
3.3. Adipokine Plasma Levels
Adipokine plasma levels were determined at either nine or 12 months of age. HFD exposurestrongly increased leptin plasma levels in both age cohorts (p < 0.001; mid: F(1,18) = 50.10, late:F(1,19) = 44.87) (Figure 3a). Late-adult HFD-fed mice showed higher leptin levels as compared tomid-adult mice fed a HFD (p < 0.02; F(1,19) = 7.71). Subsequent butyrate intervention resulted inreduced plasma leptin levels, almost reaching control levels in Chow mice (p < 0.001; mid: F(1,18)= 26.49, late: F(1,18) = 32.88). HFD did not affect plasma resistin levels (Figure 3b). Adiponectinplasma levels were reduced after HFD exposure in late-adult mice (p < 0.001; F(1,19) = 17.57) and weremoderately increased after butyrate intervention (p = 0.053; F(1,18) = 4.29) (Figure 3c). An age effectwas observed in both Chow and HFD animals (p < 0.05; F(1,18) = 4.60 and F(1,19) = 4.55, respectively).Serum amyloid A (SAA) plasma levels were increased in mice fed a HFD when compared to Chow-fedmice in both age cohorts (Kruskal-Wallis: p ≤ 0.001; mid: χ2(1) = 10.14, late: χ2(1) = 14.46) (Figure 3d).Plasma levels of interleukin-6 (IL-6) were below detectable levels in all animals in the absence ofabnormal positive and negative controls.
In both mid- and late adulthood, plasma leptin levels were positively correlated with body weight(p < 0.001), both epididymal and inguinal adipocyte size (p < 0.001), and epididymal CLS content(p < 0.001) (Tables 2 and 3). Solely in late-adult mice, plasma leptin levels positively correlated withinsulin levels (p < 0.001) and liver inflammation (p = 0.001) (Table 3). Only in late adulthood plasmaadiponectin levels showed a negative correlation with body weight (p < 0.01), insulin plasma levels (p< 0.02), and liver inflammation (p < 0.05) (Table 3).
Plasma SAA levels were positively correlated with body weight (mid: p < 0.001, late: p < 0.01) andthe number of CLS in epididymal adipose tissue (p < 0.001) in both mid- and late adulthood (Tables 2and 3). Whereas, SAA plasma levels were positively correlated with insulin levels (p < 0.05), inguinaladipocyte size (p < 0.001), and liver inflammation (p < 0.01) only in late adulthood (Table 3).
287
Books
MDPI
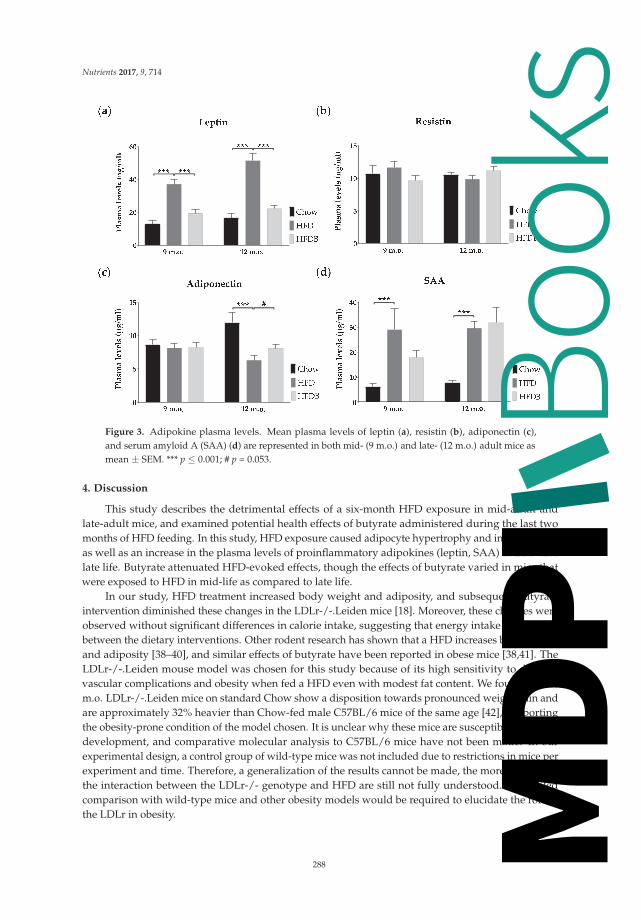
Nutrients 2017, 9, 714
Figure 3. Adipokine plasma levels. Mean plasma levels of leptin (a), resistin (b), adiponectin (c),and serum amyloid A (SAA) (d) are represented in both mid- (9 m.o.) and late- (12 m.o.) adult mice asmean ± SEM. *** p ≤ 0.001; # p = 0.053.
4. Discussion
This study describes the detrimental effects of a six-month HFD exposure in mid-adult andlate-adult mice, and examined potential health effects of butyrate administered during the last twomonths of HFD feeding. In this study, HFD exposure caused adipocyte hypertrophy and inflammation,as well as an increase in the plasma levels of proinflammatory adipokines (leptin, SAA) in mid- andlate life. Butyrate attenuated HFD-evoked effects, though the effects of butyrate varied in mice thatwere exposed to HFD in mid-life as compared to late life.
In our study, HFD treatment increased body weight and adiposity, and subsequent butyrateintervention diminished these changes in the LDLr-/-.Leiden mice [18]. Moreover, these changes wereobserved without significant differences in calorie intake, suggesting that energy intake was similarbetween the dietary interventions. Other rodent research has shown that a HFD increases body weightand adiposity [38–40], and similar effects of butyrate have been reported in obese mice [38,41]. TheLDLr-/-.Leiden mouse model was chosen for this study because of its high sensitivity to developvascular complications and obesity when fed a HFD even with modest fat content. We found that 12m.o. LDLr-/-.Leiden mice on standard Chow show a disposition towards pronounced weight gain andare approximately 32% heavier than Chow-fed male C57BL/6 mice of the same age [42], supportingthe obesity-prone condition of the model chosen. It is unclear why these mice are susceptible to obesitydevelopment, and comparative molecular analysis to C57BL/6 mice have not been made. In ourexperimental design, a control group of wild-type mice was not included due to restrictions in mice perexperiment and time. Therefore, a generalization of the results cannot be made, the more so becausethe interaction between the LDLr-/- genotype and HFD are still not fully understood. A detailedcomparison with wild-type mice and other obesity models would be required to elucidate the role ofthe LDLr in obesity.
288
Books
MDPI

Nutrients 2017, 9, 714
In a previous study, insulin levels were significantly increased in late-adult mice after HFDfeeding, whereas no changes in glucose levels were observed [18]. Plasma insulin levels are extremelyhigh due to the experimental conditions employed in this disease model (>20 ng/mL) and muchhigher than in wild-type mice fed the same diet (<5 ng/mL) [18,30], indicating insulin resistancebut no overt T2DM because glucose levels are not elevated and seem to be controlled. Interestingly,butyrate supplementation restored insulin levels to values found in Chow-fed mice, suggesting animprovement in insulin signaling [18]. Previous research described similar effects of butyrate on insulinlevels and sensitivity in HFD-fed mice [38,43]. It is not clear whether this effect of butyrate is mediatedby improvement of insulin signaling in liver, in peripheral organs, or both. It is possible that bothorgans are involved, given the time frame in which insulin resistance develops under the conditionsemployed. For instance, a time resolved clamp study using C57BL/6 mice that were treated with thesame HFD as used in the current study showed that the adipose tissue develops insulin resistanceafter about six to 12 weeks of HFD feeding [44]. Second, the development of insulin resistance in theliver requires longer periods of HFD feeding (about 24 weeks), i.e., a period that is comparable to theduration of HFD exposure herein [44].
Even in the absence of obesity, metabolic dysfunction in adipose tissue induced by adipocytehypertrophy has consistently been related to insulin resistance and may serve as a predictor forT2DM [45,46]. We observed increased adipocyte size in both epididymal and inguinal adipose tissuedepots after HFD feeding. Adipocyte hypertrophy was reduced by butyrate with the exception ofinguinal adipose tissue in late-adult mice. Epididymal adipocyte sizes were associated with insulinlevels in late adulthood suggesting that epididymal, as opposed to inguinal, adipose tissue may beimportant in mediating the effects on insulin. Previous studies have demonstrated the significantrole of visceral fat in mediating insulin sensitivity in rats [47,48], which may be attributed to thehigher degree of metabolic activity of visceral fat as opposed to subcutaneous fat [16,49,50]. Thebeneficial effects of butyrate on adipocyte size in epididymal adipose tissue have been demonstratedbefore [51]. Although our knowledge about the exact mechanisms is incomplete, it is likely thatbutyrate may reverse adipocyte hypertrophy by promoting fatty acid oxidation in adipose tissue [38].In particular, butyrate may induce a shift from lipid synthesis to utilization resulting in decreasedfat storage in white adipose tissue [43]. Our data confirm this hypothesis as adipocyte sizes weresignificantly associated with both cholesterol and triglyceride levels. Dyslipidemia is a regularlyobserved condition in T2DM patients [52]. HFD-induced elevations in cholesterol and triglycerideswere diminished by butyrate in LDLr-/-.Leiden mice [18], suggesting a mitigation of hyperlipidemiathat is not related to enhanced clearance, suggesting effects on very-low-density lipoprotein (VLDL)production. For instance, butyrate may affect hyperlipidemia as it can induce a switch from lipidsynthesis to utilization [53]. Unfortunately, our study is limited with respect to functional analyses suchas glucose transport, insulin signaling, lipogenesis, and adipogenesis in adipose tissue. Therefore, itwould be valuable to investigate these aspects in future studies. The effects of butyrate supplementationon key regulators of adipogenesis in mid-adult versus late-adult mice may provide insight into thepathways by which butyrate may modulate adiposity. It has been shown that butyrate may reducebody weight and improve insulin sensitivity via the modulation of peroxisome proliferator-activatedreceptor-γ (PPAR-γ) [43], which is a key regulator of adipogenesis [54]. Consistent with this, werecently showed that specific activation of PPAR-γ in adipose tissue attenuates CLS development and,related to this, the development of nonalcoholic fatty liver disease/nonalcoholic steatohepatitis [55].Anti-inflammatory effects in adipose tissue may attenuate the release of inflammatory mediators andmay also affect the development of diseases in other organs such as the liver [56,57]. A notion which isfurther supported by the coordinated and interactive expression of inflammatory genes in adiposetissue and liver during metabolic overload [58].
It is well established that a correlative and causative relation exists between chronic inflammationand both insulin resistance and T2DM in humans and rodents [13,59]. More specifically, a reduction ofmacrophage infiltration in adipose tissue can improve insulin sensitivity in diet-induced obese mice
289
Books
MDPI

Nutrients 2017, 9, 714
by reducing the expression of inflammatory cytokines in adipose tissue [11]. As shown in the presentstudy, HFD feeding results in increased macrophage infiltration mainly in epididymal adipose tissueassociated with body weight and insulin levels. Epididymal adipose tissue was characterized by anabundance of CLS, whereas CLS were almost absent in inguinal adipose tissue, which is consistentwith previous studies investigating adipose tissue inflammation of various adipose tissue depots inthe context of their expandability and maximal storage capacity [30,57]. It is possible that visceralfat may excrete higher amounts of inflammatory proteins and fatty acids affecting insulin signaling,and that macrophages play an important role in this [56,60]. CLS formation in epididymal adiposetissue was not affected by butyrate supplementation in mid-adult mice, whereas a mean reduction ofalmost 33% was observed in late-adult mice. Consistent with the inflammatory cross-talk betweenepidydimal adipose tissue and liver, medial lobular inflammation was not affected in mid-adult mice,whereas the number of inflammatory aggregates in the liver was reduced by 44% after dietary butyrateintervention in late-adult mice [18]. Furthermore, liver inflammation in late-adult mice, indicatedby inflammatory aggregates in the medial lobe [18], correlated significantly with the number of CLSin epididymal adipose tissue in this study. It is not known via which pathways butyrate can affectinflammation, and future studies may examine the expression of inflammatory mediators at tissuelevel, in both adipose tissue and the liver. In addition, mechanistic studies examining the expression oftranscription factors, such as nuclear factor κB, support the notion that the activation of inflammatoryprocesses in adipose tissue and liver are necessary.
Both the increase in pro-inflammatory and the reduction in anti-inflammatory adipokine secretionby adipose tissue can contribute to systemic and tissue-specific inflammation. In this study, HFDexposure results in increased levels of leptin and serum amyloid A (SAA). These findings areaccompanied by a reduction in adiponectin in late adulthood, whereas it remains unclear whyadiponectin was not affected by HFD or butyrate treatment in mid-adult mice. An exaggeratedmetabolic load in adipocytes and inflammatory state may underlie the effects of a HFD on leptin,adiponectin, and SAA levels [16]. Both leptin and SAA are suggested to be pro-inflammatoryadipokines, whereas adiponectin has anti-inflammatory properties [61]. Leptin contributes to theinflammatory state in obesity by modulating TNF-α and activating macrophages [62], and butyratereduced leptin levels in mid-adult and late-adult mice. Leptin can also affect insulin sensitivity bymodulating pancreatic β-cells [60]. It thereby contributes to the observed reduction in plasma insulinby butyrate in late-adult mice the more, because butyrate reduced leptin levels nearly to those ofChow-fed mice. Our finding that leptin levels were significantly related to insulin levels in late-adultmice further supports this notion. Although current evidence for the role of SAA in insulin signaling iscontradictory [63–65], SAA levels have been correlated with insulin resistance and T2DM [66], whichmay be related to the pro-inflammatory properties of SAA [14]. Interestingly, adiponectin plasmalevels were only affected by HFD feeding in late-adult mice. It is possible that the circulating SAA ismainly released from adipose tissue and that butyrate reduced CLS only in adipose tissue of late-adultmice. Low adiponectin levels may add to an impaired insulin signaling via polarization towardsM1 macrophages in adipose tissue [67]. Butyrate intervention reduced changes in both leptin andadiponectin levels, which may in part be attributed to its effect on adipocyte size and its differentialeffects on CLS, i.e., adipose tissue inflammation, in mid-and late-adult mice.
5. Conclusions
This study provides evidence that dietary supplementation with butyrate constitutes a strategyto counteract features of HFD-induced adipose tissue dysfunction and accompanying metabolicdisturbances. These metabolic adaptations often affect insulin signaling and may therefore indicatean increased risk of developing T2DM. Late-adult mice are particularly sensitive to HFD-evokedmetabolic risk factors and adaptations. The findings of the current study provide novel insights aboutthe attenuating effects of butyrate on adipose tissue dysfunction and inflammation. Overall, dietary
290
Books
MDPI

Nutrients 2017, 9, 714
interventions with butyrate may constitute means to ameliorate the risk of developing metabolicdisorders such as T2DM in people with obesity.
Acknowledgments: The authors would like to thank Bram Geenen, Jos Dederen, Peter Wielinga and TimEmmerzaal for their valuable scientific support. In addition, we would like to acknowledge the biotechnicians atTNO Leiden and Preclinical Imaging Centre (PRIME) Radboud university medical center for taking outstandingcare of the animals.
Author Contributions: I.A.C.A. and A.J.K. conceived and designed the experiments; C.E.P., B.A.A.F.and J.S. performed the experiments; C.E.P. and B.A.A.F. analyzed the data; J.S. and R.K. contributedreagents/materials/analysis tools; C.E.P., B.A.A.F., I.A.C.A. and A.J.K. wrote the paper.
Conflicts of Interest: The authors declare no conflict of interest.
References
1. World Health Organization. Fact Sheet 311: Obesity and Overweight. 2016. Available online: http://www.who.int/mediacentre/factsheets/fs311/en/ (accessed on 28 February 2017).
2. Diabetes UK. Facts and Stats. 2016. Available online: https://www.diabetes.org.uk/Documents/Position%20statements/DiabetesUK_Facts_Stats_Oct16.pdf (accessed on 27 February 2017).
3. Hamman, R.F.; Wing, R.R.; Edelstein, S.L.; Lachin, J.M.; Bray, G.A.; Delahanty, L.; Hoskin, M.; Kriska, A.M.;Mayer-Davis, E.J.; Pi-Sunyer, X. Effect of weight loss with lifestyle intervention on risk of diabetes.Diabetes Care 2006, 29, 2102–2107. [CrossRef] [PubMed]
4. Molnar, D. The prevalence of the metabolic syndrome and type 2 diabetes mellitus in children and adolescents.Int. J. Obes. 2004, 28, S70–S74. [CrossRef] [PubMed]
5. Schwartz, M.S.; Chadha, A. Type 2 diabetes mellitus in childhood: Obesity and insulin resistance. J. Am.Osteopath. Assoc. 2008, 108, 518–524. [PubMed]
6. Wabitsch, M.; Hauner, H.; Hertrampf, M.; Muche, R.; Hay, B.; Mayer, H.; Kratzer, W.; Debatin, K.; Heinze, E.Type ii diabetes mellitus and impaired glucose regulation in caucasian children and adolescents with obesityliving in germany. Int. J. Obes. 2004, 28, 307–313. [CrossRef] [PubMed]
7. Pérez, L.M.; Pareja-Galeano, H.; Sanchis-Gomar, F.; Emanuele, E.; Lucia, A.; Gálvez, B.G. ‘Adipaging’:Ageing and obesity share biological hallmarks related to a dysfunctional adipose tissue. J. Physiol. 2016, 594,3187–3207. [CrossRef] [PubMed]
8. Fink, R.I.; Kolterman, O.G.; Griffin, J.; Olefsky, J.M. Mechanisms of insulin resistance in aging. J. Clin. Investig.1983, 71, 1523. [CrossRef] [PubMed]
9. Inzucchi, S.E.; Bergenstal, R.M.; Buse, J.B.; Diamant, M.; Ferrannini, E.; Nauck, M.; Peters, A.L.; Tsapas, A.;Wender, R.; Matthews, D.R. Management of hyperglycemia in type 2 diabetes: A patient-centered approach.Diabetes Care 2012, 35, 1364–1379. [CrossRef] [PubMed]
10. Arvanitakis, Z.; Wilson, R.S.; Bienias, J.L.; Evans, D.A.; Bennett, D.A. Diabetes mellitus and risk of alzheimerdisease and decline in cognitive function. Arch. Neurol. 2004, 61, 661–666. [CrossRef] [PubMed]
11. Jung, U.J.; Choi, M.S. Obesity and its metabolic complications: The role of adipokines and the relationshipbetween obesity, inflammation, insulin resistance, dyslipidemia and nonalcoholic fatty liver disease. Int. J.Mol. Sci. 2014, 15, 6184–6223. [CrossRef] [PubMed]
12. Cinti, S.; Mitchell, G.; Barbatelli, G.; Murano, I.; Ceresi, E.; Faloia, E.; Wang, S.; Fortier, M.; Greenberg, A.S.;Obin, M.S. Adipocyte death defines macrophage localization and function in adipose tissue of obese miceand humans. J. Lipid Res. 2005, 46, 2347–2355. [CrossRef] [PubMed]
13. Olefsky, J.M.; Glass, C.K. Macrophages, inflammation, and insulin resistance. Annu. Rev. Physiol. 2010, 72,219–246. [CrossRef] [PubMed]
14. Poitou, C.; Divoux, A.; Faty, A.; Tordjman, J.; Hugol, D.; Aissat, A.; Keophiphath, M.; Henegar, C.;Commans, S.; Clément, K. Role of serum amyloid a in adipocyte-macrophage cross talk and adipocytecholesterol efflux. J. Clin. Endocrinol. Metab. 2009, 94, 1810–1817. [CrossRef] [PubMed]
15. Skurk, T.; Alberti-Huber, C.; Herder, C.; Hauner, H. Relationship between adipocyte size and adipokineexpression and secretion. J. Clin. Endocrinol. Metab. 2007, 92, 1023–1033. [CrossRef] [PubMed]
16. Bays, H.E.; González-Campoy, J.M.; Bray, G.A.; Kitabchi, A.E.; Bergman, D.A.; Schorr, A.B.; Rodbard, H.W.;Henry, R.R. Pathogenic potential of adipose tissue and metabolic consequences of adipocyte hypertrophyand increased visceral adiposity. Expert Rev. Cardiovasc. Ther. 2008, 6, 343–368. [CrossRef] [PubMed]
291
Books
MDPI

Nutrients 2017, 9, 714
17. Canfora, E.E.; Jocken, J.W.; Blaak, E.E. Short-chain fatty acids in control of body weight and insulin sensitivity.Nat. Rev. Endocrinol. 2015, 11, 577. [CrossRef] [PubMed]
18. Arnoldussen, I.A.; Wiesmann, M.; Pelgrim, C.E.; Wielemaker, E.M.; van Duyvenvoorde, W.; Santos, P.A.;Verschuren, L.; Keijser, B.J.; Heerschap, A.; Kleemann, R.; et al. Butyrate restores hfd induced adaptations inbrain function and metabolism in mid-adult obese mice. Int. J. Obes. 2017, 41, 935–944. [CrossRef] [PubMed]
19. Khan, S.; Jena, G. The role of butyrate, a histone deacetylase inhibitor in diabetes mellitus: Experimentalevidence for therapeutic intervention. Epigenomics 2015, 7, 669–680. [CrossRef] [PubMed]
20. Weickert, M.O.; Möhlig, M.; Schöfl, C.; Arafat, A.M.; Otto, B.; Viehoff, H.; Koebnick, C.; Kohl, A.; Spranger, J.;Pfeiffer, A.F. Cereal fiber improves whole-body insulin sensitivity in overweight and obese women.Diabetes Care 2006, 29, 775–780. [CrossRef] [PubMed]
21. Weickert, M.O.; Pfeiffer, A.F. Metabolic effects of dietary fiber consumption and prevention of diabetes.J. Nutr. 2008, 138, 439–442. [PubMed]
22. Marlett, J.A.; McBurney, M.I.; Slavin, J.L. Position of the american dietetic association: Health implications ofdietary fiber. J. Am. Diet. Assoc. 2002, 102, 993–1000. [CrossRef]
23. Elli, M.; Colombo, O.; Tagliabue, A. A common core microbiota between obese individuals and their leanrelatives? Evaluation of the predisposition to obesity on the basis of the fecal microflora profile. Med.Hypotheses 2010, 75, 350–352. [CrossRef] [PubMed]
24. Qin, J.; Li, Y.; Cai, Z.; Li, S.; Zhu, J.; Zhang, F.; Liang, S.; Zhang, W.; Guan, Y.; Shen, D. A metagenome-wideassociation study of gut microbiota in type 2 diabetes. Nature 2012, 490, 55–60. [CrossRef] [PubMed]
25. Kivipelto, M.; Ngandu, T.; Fratiglioni, L.; Viitanen, M.; Kåreholt, I.; Winblad, B.; Helkala, E.L.; Tuomilehto, J.;Soininen, H.; Nissinen, A. Obesity and vascular risk factors at midlife and the risk of dementia and alzheimerdisease. Arch. Neurol. 2005, 62, 1556–1560. [CrossRef] [PubMed]
26. Boitard, C.; Etchamendy, N.; Sauvant, J.; Aubert, A.; Tronel, S.; Marighetto, A.; Layé, S.; Ferreira, G. Juvenile,but not adult exposure to high-fat diet impairs relational memory and hippocampal neurogenesis in mice.Hippocampus 2012, 22, 2095–2100. [CrossRef] [PubMed]
27. Emmerzaal, T.L.; Kiliaan, A.J.; Gustafson, D.R. 2003–2013: A decade of body mass index, alzheimer’s disease,and dementia. J. Alzheimers Dis. 2015, 43, 739–755. [PubMed]
28. Ma, Y.; Wang, W.; Zhang, J.; Lu, Y.; Wu, W.; Yan, H.; Wang, Y. Hyperlipidemia and atherosclerotic lesiondevelopment in ldlr-deficient mice on a long-term high-fat diet. PLoS ONE 2012, 7, e35835. [CrossRef][PubMed]
29. Radonjic, M.; Wielinga, P.Y.; Wopereis, S.; Kelder, T.; Goelela, V.S.; Verschuren, L.; Toet, K.; vanDuyvenvoorde, W.; Stroeve, J.H.; Cnubben, N. Differential effects of drug interventions and dietary lifestylein developing type 2 diabetes and complications: A systems biology analysis in ldlr−/− mice. PLoS ONE2013, 8, e56122. [CrossRef] [PubMed]
30. Morrison, M.C.; Mulder, P.; Salic, K.; Verheij, J.; Liang, W.; Van Duyvenvoorde, W.; Menke, A.;Kooistra, T.; Kleemann, R.; Wielinga, P. Intervention with a caspase-1 inhibitor reduces obesity-associatedhyperinsulinemia, non-alcoholic steatohepatitis and hepatic fibrosis in ldlr-/-.Leiden mice. Int. J. Obes. 2016,40, 1416–1423. [CrossRef] [PubMed]
31. Kilkenny, C.; Browne, W.J.; Cuthill, I.C.; Emerson, M.; Altman, D.G. Improving bioscience research reporting:The arrive guidelines for reporting animal research. PLoS Biol. 2010, 8, e1000412. [CrossRef] [PubMed]
32. Gesta, S.; Tseng, Y.-H.; Kahn, C.R. Developmental origin of fat: Tracking obesity to its source. Cell 2007, 131,242–256. [CrossRef] [PubMed]
33. Caesar, R.; Manieri, M.; Kelder, T.; Boekschoten, M.; Evelo, C.; Müller, M.; Kooistra, T.; Cinti, S.; Kleemann, R.;Drevon, C.A. A combined transcriptomics and lipidomics analysis of subcutaneous, epididymal andmesenteric adipose tissue reveals marked functional differences. PLoS ONE 2010, 5, e11525. [CrossRef][PubMed]
34. Wielinga, P.Y.; Harthoorn, L.F.; Verschuren, L.; Schoemaker, M.H.; Jouni, Z.E.; van Tol, E.A.; Kleemann, R.;Kooistra, T. Arachidonic acid/docosahexaenoic acid-supplemented diet in early life reduces body weightgain, plasma lipids, and adiposity in later life in apoe* 3leiden mice. Mol. Nutr. Food Res. 2012, 56, 1081–1089.[CrossRef] [PubMed]
35. Carpenter, A.E.; Jones, T.R.; Lamprecht, M.R.; Clarke, C.; Kang, I.H.; Friman, O.; Guertin, D.A.; Chang, J.H.;Lindquist, R.A.; Moffat, J. Cellprofiler: Image analysis software for identifying and quantifying cellphenotypes. Genome Biol. 2006, 7, R100. [CrossRef] [PubMed]
292
Books
MDPI

Nutrients 2017, 9, 714
36. Sommer, C.; Straehle, C.; Koethe, U.; Hamprecht, F.A. Ilastik: Interactive learning and segmentation toolkit.In Proceedings of the 2011 IEEE International Symposium on Biomedical Imaging: From Nano to Macro,Chicago, IL, USA, 30 March–2 April 2011; pp. 230–233.
37. Arnoldussen, I.A.; Zerbi, V.; Wiesmann, M.; Noordman, R.H.; Bolijn, S.; Mutsaers, M.P.; Dederen, P.J.;Kleemann, R.; Kooistra, T.; van Tol, E.A. Early intake of long-chain polyunsaturated fatty acids preservesbrain structure and function in diet-induced obesity. J. Nutr. Biochem. 2016, 30, 177–188. [CrossRef] [PubMed]
38. Gao, Z.; Yin, J.; Zhang, J.; Ward, R.E.; Martin, R.J.; Lefevre, M.; Cefalu, W.T.; Ye, J. Butyrate improves insulinsensitivity and increases energy expenditure in mice. Diabetes 2009, 58, 1509–1517. [CrossRef] [PubMed]
39. Jakobsdottir, G.; Xu, J.; Molin, G.; Ahrne, S.; Nyman, M. High-fat diet reduces the formation of butyrate,but increases succinate, inflammation, liver fat and cholesterol in rats, while dietary fibre counteracts theseeffects. PLoS ONE 2013, 8, e80476. [CrossRef] [PubMed]
40. Bocarsly, M.E.; Fasolino, M.; Kane, G.A.; LaMarca, E.A.; Kirschen, G.W.; Karatsoreos, I.N.; McEwen, B.S.;Gould, E. Obesity diminishes synaptic markers, alters microglial morphology, and impairs cognitive function.Proc. Natl. Acad. Sci. USA 2015, 112, 15731–15736. [CrossRef] [PubMed]
41. Lin, H.V.; Frassetto, A.; Kowalik, E.J., Jr.; Nawrocki, A.R.; Lu, M.M.; Kosinski, J.R.; Hubert, J.A.; Szeto, D.;Yao, X.; Forrest, G. Butyrate and propionate protect against diet-induced obesity and regulate gut hormonesvia free fatty acid receptor 3-independent mechanisms. PLoS ONE 2012, 7, e35240. [CrossRef] [PubMed]
42. Bondolfi, L.; Ermini, F.; Long, J.M.; Ingram, D.K.; Jucker, M. Impact of age and caloric restriction onneurogenesis in the dentate gyrus of c57bl/6 mice. Neurobiol. Aging 2004, 25, 333–340. [CrossRef]
43. Den Besten, G.; Bleeker, A.; Gerding, A.; van Eunen, K.; Havinga, R.; van Dijk, T.H.; Oosterveer, M.H.;Jonker, J.W.; Groen, A.K.; Reijngoud, D.J. Short-chain fatty acids protect against high-fat diet–induced obesityvia a pparγ-dependent switch from lipogenesis to fat oxidation. Diabetes 2015, 64, 2398–2408. [CrossRef][PubMed]
44. Mulder, P.; van den Hoek, A.M.; Kleemann, R. The ccr2 inhibitor propagermanium attenuatesdiet-induced insulin resistance, adipose tissue inflammation and non-alcoholic steatohepatitis. PLoS ONE2017, 12, e0169740. [CrossRef] [PubMed]
45. Wang, Y.; Rimm, E.B.; Stampfer, M.J.; Willett, W.C.; Hu, F.B. Comparison of abdominal adiposity and overallobesity in predicting risk of type 2 diabetes among men. Am. J. Clin. Nutr. 2005, 81, 555–563. [PubMed]
46. Hammarstedt, A.; Graham, T.E.; Kahn, B.B. Adipose tissue dysregulation and reduced insulin sensitivity innon-obese individuals with enlarged abdominal adipose cells. Diabetol. Metab. Syndr. 2012, 4, 42. [CrossRef][PubMed]
47. Gabriely, I.; Ma, X.H.; Yang, X.M.; Atzmon, G.; Rajala, M.W.; Berg, A.H.; Scherer, P.; Rossetti, L.; Barzilai, N.Removal of visceral fat prevents insulin resistance and glucose intolerance of aging. Diabetes 2002, 51,2951–2958. [CrossRef] [PubMed]
48. Barzilai, N.; She, L.; Liu, B.Q.; Vuguin, P.; Cohen, P.; Wang, J.; Rossetti, L. Surgical removal of visceral fatreverses hepatic insulin resistance. Diabetes 1999, 48, 94–98. [CrossRef] [PubMed]
49. Arner, P. Obesity and the adipocyte. Regional adipocity in man. J. Endocrinol. 1997, 155, 191–192. [CrossRef][PubMed]
50. Tan, G.D.; Goossens, G.H.; Humphreys, S.M.; Vidal, H.; Karpe, F. Upper and lower body adipose tissuefunction: A direct comparison of fat mobilization in humans. Obes. Res. 2004, 12, 114–118. [CrossRef][PubMed]
51. Khan, S.; Jena, G. Sodium butyrate reduces insulin-resistance, fat accumulation and dyslipidemia in type-2diabetic rat: A comparative study with metformin. Chem. Biol. Interact. 2016, 254, 124–134. [CrossRef][PubMed]
52. Mooradian, A.D. Dyslipidemia in type 2 diabetes mellitus. Nat. Clin. Pract. Endocrinol. Metab. 2009, 5,150–159. [CrossRef] [PubMed]
53. Den Besten, G.; van Eunen, K.; Groen, A.K.; Venema, K.; Reijngoud, D.J.; Bakker, B.M. The role of short-chainfatty acids in the interplay between diet, gut microbiota, and host energy metabolism. J. Lipid Res. 2013, 54,2325–2340. [CrossRef] [PubMed]
54. Camp, H.S.; Ren, D.; Leff, T. Adipogenesis and fat-cell function in obesity and diabetes. Trends Mol. Med.2002, 8, 442–447. [CrossRef]
293
Books
MDPI

Nutrients 2017, 9, 714
55. Mulder, P.; Morrison, M.C.; Verschuren, L.; Liang, W.; van Bockel, J.H.; Kooistra, T.; Wielinga, P.Y.;Kleemann, R. Reduction of obesity-associated white adipose tissue inflammation by rosiglitazone isassociated with reduced non-alcoholic fatty liver disease in ldlr-deficient mice. Sci. Rep. 2016, 6, 31542.[CrossRef] [PubMed]
56. Morrison, M.C.; Kleemann, R. Role of macrophage migration inhibitory factor in obesity, insulin resistance,type 2 diabetes, and associated hepatic co-morbidities: A comprehensive review of human and rodentstudies. Front. Immunol. 2015, 6, 308. [CrossRef] [PubMed]
57. Mulder, P.; Morrison, M.C.; Wielinga, P.Y.; van Duyvenvoorde, W.; Kooistra, T.; Kleemann, R. Surgicalremoval of inflamed epididymal white adipose tissue attenuates the development of non-alcoholicsteatohepatitis in obesity. Int. J. Obes. 2016, 40, 675–684. [CrossRef] [PubMed]
58. Liang, W.; Tonini, G.; Mulder, P.; Kelder, T.; van Erk, M.; van den Hoek, A.M.; Mariman, R.; Wielinga, P.Y.;Baccini, M.; Kooistra, T.; et al. Coordinated and interactive expression of genes of lipid metabolism andinflammation in adipose tissue and liver during metabolic overload. PLoS ONE 2013, 8, e75290. [CrossRef][PubMed]
59. Xu, H.; Barnes, G.T.; Yang, Q.; Tan, G.; Yang, D.; Chou, C.J.; Sole, J.; Nichols, A.; Ross, J.S.; Tartaglia, L.A.Chronic inflammation in fat plays a crucial role in the development of obesity-related insulin resistance. J.Clin. Investig. 2003, 112, 1821–1830. [CrossRef] [PubMed]
60. Hajer, G.R.; van Haeften, T.W.; Visseren, F.L. Adipose tissue dysfunction in obesity, diabetes, and vasculardiseases. Eur. Heart J. 2008, 29, 2959–2971. [CrossRef] [PubMed]
61. Antuna-Puente, B.; Feve, B.; Fellahi, S.; Bastard, J.P. Adipokines: The missing link between insulin resistanceand obesity. Diabetes Metab. 2008, 34, 2–11. [CrossRef] [PubMed]
62. Loffreda, S.; Yang, S.; Lin, H.; Karp, C.; Brengman, M.; Wang, D.; Klein, A.; Bulkley, G.; Bao, C.; Noble, P.Leptin regulates proinflammatory immune responses. FASEB J. 1998, 12, 57–65. [PubMed]
63. De Oliveira, E.M.; Ascar, T.P.; Silva, J.C.; Sandri, S.; Migliorini, S.; Fock, R.A.; Campa, A. Serum amyloid alinks endotoxaemia to weight gain and insulin resistance in mice. Diabetologia 2016, 59, 1760–1768. [CrossRef][PubMed]
64. Ahlin, S.; Olsson, M.; Olsson, B.; Svensson, P.A.; Sjöholm, K. No evidence for a role of adipose tissue-derivedserum amyloid a in the development of insulin resistance or obesity-related inflammation in hsaa1+/−transgenic mice. PLoS ONE 2013, 8, e72204. [CrossRef] [PubMed]
65. Den Hartigh, L.J.; Wang, S.; Goodspeed, L.; Ding, Y.; Averill, M.; Subramanian, S.; Wietecha, T.; O’Brien, K.D.;Chait, A. Deletion of serum amyloid a3 improves high fat high sucrose diet-induced adipose tissueinflammation and hyperlipidemia in female mice. PLoS ONE 2014, 9, e108564. [CrossRef] [PubMed]
66. Leinonen, E.; Hurt-Camejo, E.; Wiklund, O.; Hultén, L.M.; Hiukka, A.; Taskinen, M.R. Insulin resistanceand adiposity correlate with acute-phase reaction and soluble cell adhesion molecules in type 2 diabetes.Atherosclerosis 2003, 166, 387–394. [CrossRef]
67. Yamauchi, T.; Kamon, J.; Minokoshi, Y.A.; Ito, Y.; Waki, H.; Uchida, S.; Yamashita, S.; Noda, M.; Kita, S.;Ueki, K. Adiponectin stimulates glucose utilization and fatty-acid oxidation by activating amp-activatedprotein kinase. Nat. Med. 2002, 8, 1288–1295. [CrossRef] [PubMed]
© 2017 by the authors. Licensee MDPI, Basel, Switzerland. This article is an open accessarticle distributed under the terms and conditions of the Creative Commons Attribution(CC BY) license (http://creativecommons.org/licenses/by/4.0/).
294
Books
MDPI

MDPISt. Alban-Anlage 66
4052 BaselSwitzerland
Tel. +41 61 683 77 34Fax +41 61 302 89 18
www.mdpi.com
Nutrients Editorial OfficeE-mail: [email protected]
www.mdpi.com/journal/nutrients
Books
MDPI

Books
MDPI

MDPI St. Alban-Anlage 66 4052 Basel Switzerland
Tel: +41 61 683 77 34 Fax: +41 61 302 89 18
www.mdpi.com ISBN 978-3-03842-915-9
Books
MDPI