The Nutrition Transition Diet and Disease in the Developing World
276
Transcript of The Nutrition Transition Diet and Disease in the Developing World


THE NUTRITION TRANSITION:
Diet and Disease in the Developing World

Food Science and TechnologyInternational Series
Series Editor
Steve L. Taylor
University of Nebraska
Advisory Board
Bruce Chassy
University of Illinois, USA
Patrick Fox
University College Cork, Republic of Ireland
Dennis Gordon
North Dakota State University, USA
Robert Hutkins
University of Nebraska, USA
Ronald Jackson
Quebec, Canada
Daryl B. Lund
University of Wisconsin, USA
Connie Weaver
Purdue University, USA
Louise Wicker
University of Georgia, USA
Howard Zhang
Ohio State University, USA
A complete list of the books in this series appears at the end of this volume.

The NutritionTransition:Diet and Disease in theDeveloping World
Editors
Benjamin Caballero and Barry M. Popkin
Amsterdam • Boston • London • New York • Oxford • ParisSan Diego • San Francisco • Singapore • Sydney • Tokyo

This book is printed on acid-free paper.
Copyright 2002, Elsevier Science Ltd. All Rights Reserved.
No part of this publication may be reproduced or transmitted in any form or by any means,
electronic or mechanical, including photocopying, recording, or any information storage
and retrieval system, without permission in writing from the publisher.
Academic Press
An Imprint of Elsevier Science
84 Theobald’s Road, London WC1X 8RR, UK
http://www.academicpress.com
Academic Press
An Imprint of Elsevier Science
525 B Street, Suite 1900, San Diego, California 92101-4495, USA
http://www.academicpress.com
ISBN 0-12-153654-8
Library of Congress Control Number: 2002103917
A catalogue record for this book is available from the British Library
Typeset by Charon Tec Pvt. Ltd, Chennai, India
Printed and bound in China by RDC Group Limited
02 03 04 05 06 07 RD 9 8 7 6 5 4 3 2 1

Contents
Contributors List . . . . . . . . . . . . . . . . . . . . . . . . . . . . . . . . . . . . . . . . . . . vii
Foreword . . . . . . . . . . . . . . . . . . . . . . . . . . . . . . . . . . . . . . . . . . . . . . . . ix
About the Editors . . . . . . . . . . . . . . . . . . . . . . . . . . . . . . . . . . . . . . . . . . xiii
1 Introduction . . . . . . . . . . . . . . . . . . . . . . . . . . . . . . . . . . . . . . . . . . 1
Benjamin Caballero and Barry M. Popkin
Part I The Global Context . . . . . . . . . . . . . . . . . . . . . . . . . . . . . . . . . . . . 7
2 Economic and technological development and their
relationships to body size and productivity . . . . . . . . . . . . . . . . . . . 9
Robert W. Fogel and Lorens A. Helmchen
3 Food production . . . . . . . . . . . . . . . . . . . . . . . . . . . . . . . . . . . . . . 25
Vaclav Smil
4 Can the challenges of poverty, sustainable consumption
and good health governance be addressed in
an era of globalization? . . . . . . . . . . . . . . . . . . . . . . . . . . . . . . . . . 51
Tim Lang
5 Demographic trends . . . . . . . . . . . . . . . . . . . . . . . . . . . . . . . . . . . . 71
Hania Zlotnik
Part II Biological Factors Affecting the Nutrition Transition . . . . . . . . . . 109
6 The dynamics of the dietary transition in the
developing world . . . . . . . . . . . . . . . . . . . . . . . . . . . . . . . . . . . . . . 111
Barry M. Popkin
7 Early nutrition conditions and later risk of disease . . . . . . . . . . . . . . 129
Linda S. Adair

8 Obesity in the developing world . . . . . . . . . . . . . . . . . . . . . . . . . . . 147
Reynaldo Martorell
9 Diabetes . . . . . . . . . . . . . . . . . . . . . . . . . . . . . . . . . . . . . . . . . . . . . 165
Kerin O’Dea and Leonard S. Piers
10 Cardiovascular diseases . . . . . . . . . . . . . . . . . . . . . . . . . . . . . . . . . 191
K. Srinath Reddy
11 The nutrition transition in China: a new stage of
the Chinese diet . . . . . . . . . . . . . . . . . . . . . . . . . . . . . . . . . . . . . . . 205
Shufa Du, Bing Lu, Fengying Zhai, and Barry M. Popkin
12 Trends in under- and overnutrition in Brazil . . . . . . . . . . . . . . . . . . . 223
Carlos A. Monteiro, Wolney L. Conde, and Barry M. Popkin
13 Policy implications . . . . . . . . . . . . . . . . . . . . . . . . . . . . . . . . . . . . . 241
Benjamin Caballero and Barry M. Popkin
Index . . . . . . . . . . . . . . . . . . . . . . . . . . . . . . . . . . . . . . . . . . . . . . . . . . . 251
vi Contents

Linda S. Adair
Associate Professor of Nutrition
University of North Carolina at Chapel Hill
University Square, CB # 8120
123 West Franklin Street
Chapel Hill, NC 27516-3997, USA
Benjamin Caballero
Director, Center for Human Nutrition
Johns Hopkins University
Suite No 2205
615 N Wolfe St
Baltimore, MD 21205, USA
Wolney L. Conde
Carolina Population Center
CB # 8120 University Square
University of North Carolina at Chapel Hill
Chapel Hill, NC 27516-3997, USA
Shufa Du
Nutrition Evaluation Laboratory
School of Public Health
University of São Paulo
Av. Dr. Arnaldo 715
São Paulo 01246-904, Brazil
Robert W. Fogel
Graduate School of Business
The University of Chicago
1101 E. 58th Street
Chicago, IL 60637, USA
Lorens A. Helmchen
Department of Economics
The University of Chicago
1126 E. 59th Street
Chicago, IL 60637, USA
Tim Lang
Director of Centre for Food Policy
Thames Valley University
Wolfson Institute of Health Sciences
Centre for Food Policy, 32–38 Uxbridge Road
Westel House, Ealing W5 2BS, UK
Bing Lu
Carolina Population Center
CB # 8120 University Square
University of North Carolina at Chapel Hill
Chapel Hill, NC 27516-3997, USA
Reynaldo Martorell
Robert W. Woodruff Professor of International
Nutrition, Rollins School of Public Health
Emory University, International Health
1518 Clifton Road, NE
Atlanta, GA 30322, USA
Carlos Monteiro
Director, Center for Epidemiological Studies in
Health and Nutrition (NUPENS/USP)
School of Public Health
University of São Paulo
Av. Dr. Arnaldo, 715
São Paulo 01246-904 SP, Brazil
Contributors List

Kerin O’Dea
Director, Menzies School of Health Research
PO Box 41096
Casuarina, NT 0811, Australia
Leonard S. Piers
Division of Population Health and Chronic Diseases
Menzies School of Health Research
PO Box 41096
Casuarina, N.T. 0811, Australia
Barry M. Popkin
Professor of Nutrition
Carolina Population Center
CB # 8120 University Square
University of North Carolina at Chapel Hill
Chapel Hill, NC 27516-3997, USA
K. Srinath Reddy
Professor of Cardiology
Cardiothoracic Centre
All India Institute of Medical Sciences
Ansari Nagar
New Delhi 110 029, India
Nevin S. Scrimshaw
Institute Professor Emeritus
Massachusetts Institute of Technology
Senior Advisor of Food and Nutrition Program
United Nations University, Box 330
Campton, NH 03223, USA
Vaclav Smil
The University of Manitoba
N306 Duff Roblin Bldg
Winnipeg R3T 2N2, Canada
Fengying Zhai
Professor of Nutrition
Deputy Director
Institute of Nutrition and Food Safety
Chinese Center for Disease Control and
Prevention
29 Nanwei Road
Beijing 100050, China
Hania Zlotnik
Estimates and Projections Sections
Population Division
United Nations
Room DC2-1918
New York, NY 10017, USA
viii Contributors List

Foreword
There have always been transition periods in human history, although they have come at
different times for different countries and regions and have in the past been widely
spread out over time. The transitions described in this book have few precedents in both
the rapidity of the change and the large proportion of the world’s population involved.
The shift from hunting and gathering to agriculture was spread over thousands of years
and the industrial revolution over about 200 years, but transitions are now occurring
within developing countries over a few decades. They are determining the future health
and welfare of human kind and the nature of the environment in which we all must live.
This book contains informative descriptions of past changes and trends, but its impor-
tance lies in its characterization of dynamic current processes and their probable impact
on future history.
It is difficult to conceive that from the 15th to 18th centuries in all of Europe fre-
quent local famines led to starvation, riots, and migrations in search of food
(Scrimshaw, 1987). Mortality rates were far higher than in developing countries today,
life expectancy was about 25 years, and the populations were severely stunted.
Improvement took centuries. In every industrialized country height increased steadily
in the 19th and most of the 20th centuries, for example, from about 166 cm to nearly
180 cm in Sweden (Steckel, 2001). The 1993 Nobel Prize winner in Economics,
Robert Fogel, points out that the mean height of the Dutch in 1860 of 164 cm is one
percentile of their current mean height and that this percentile is the mean height in
India today (Fogel, 2000). Clearly the anthropometric transition for India still lies
ahead.
The high death rates that were associated with infectious disease dropped precipitously
in the late 19th and early 20th centuries well before there were specific therapies and in
some cases before the causative agent was known. McKeown (1976) in The Modern Rise
of Population concluded that this was due, almost entirely, to improving nutrition and not
to any other major factors that could be identified. The further decreases in mortality
from diseases such as measles, diphtheria, whooping cough, tuberculosis, and pneumo-
nia with the advent of antibiotics and immunizations were relatively very small.
In the 1960s, cases of severe protein-calorie malnutrition, kwashiorkor, could still
be demonstrated in children in almost any hospital in the developing world. Only 20
years later, kwashiorkor had essentially disappeared. Earlier this occurred for scurvy,
pellagra, and beri-beri. In the 1930s pellagra was still a major problem in the United
States. Beri-beri persisted in Southeast Asia into the 1950s. The ocular signs of vita-
min A deficiency leading to blindness were still a serious concern in the 1970s but are
now rare even in poor countries. Except for scurvy which largely disappeared earlier,
these transitions occurred in the 20th century. Unfortunately these nutritional disor-
ders have returned in some refugee populations.
Thirty years ago obesity was rare in developing countries and it is now increasing
rapidly in both industrialized and developing countries with seriously adverse impacts
on health. The InterAmerican Atherosclerosis Study published in 1968 examined
aortas and coronary vessels from serial autopsies for three years in eight general hos-
pitals in Latin America and the Caribbean (McGill, 1968). In the populations studied
at that time, atherosclerosis progressed so slowly that cardiovascular disease was
almost unknown. Four decades later, coronary heart disease is a growing problem in
these same countries.
A characteristic of these successive transitions is that they are coming more fre-
quently, are progressing more rapidly, and are increasingly global in scope. This book
documents and interprets the current transition that is occurring in both nutrition and
related socioeconomic conditions in developing nations. They are associated with a
demographic transition in an increasing number of these countries. The nutrition tran-
sition is taking place so rapidly that undernutrition and micronutrient deficiencies
coexist with overnutrition. As a consequence, many developing countries still face the
need to prevent undernutrition and malnutrition at a time when they are facing an
increasing burden of chronic degenerative disease.
The dynamics of the current dietary change and the increasing obesity and diabetes
in the developing world are well described in early chapters. A relatively new theme,
the relationship between early malnutrition and the later occurrence of chronic degen-
erative disease, is also covered. Low birth weight due largely to poor nutrition during
pregnancy and malnutrition during infancy have been shown to increase the risk of
diabetes, hypertension, and coronary heart diseases in later life. Populations with a
relatively high frequency of fetal and infant malnutrition whose rising affluence
led them to more dietary fat and less exercise appear to be at a particularly high risk
of chronic disease as they age. This is a further burden on developing countries in
transition.
Other important topics covered are the roles of governance, globalization, demo-
graphic behavior, and disease trends. China and Brazil are presented as case studies of
what may be happening or will happen to diet, activity levels and health in other parts
of the developing world. The chapter on food wisely avoids predictions of global food
shortages but does express concern that the developing world may not be able to
derive the full benefit from current and future scientific and technical advances in
food production.
This book comes at a time when multiple transitions are coming with great rapid-
ity and globalization has become a dominant theme. It is a valuable documentation
of the food and nutrition components of the most accelerated set of major transitions
in human history. Readers will find it a fascinating and insightful glimpse into the
benefits and threats to health of the unprecedented nutrition, demographic, and economic
x Foreword

changes that are so strongly and rapidly affecting the health and welfare of the popu-
lations of developing countries.
Nevin S. Scrimshaw
Professor Emeritus, Massachusetts Institute of Technology
Senior Advisor, UNU Food and Nutrition Program
Winner of the World Food Prize, 1991
References
Fogel, R. (2000). “The Fourth Great Awakening and the Future of Egalitarianism”.
University of Chicago Press, Chicago.
McGill, H. (ed.) (1968). “The Geographic Pathology of Atherosclerosis”. Williams &
Wilkins, Baltimore.
McKeown, T. (1976). “The Modern Rise of Population”. Academic Press, New York.
Scrimshaw, N.S. (1987). The phenomenon of famine. Ann. Rev. Nutr. 7, 1–21.
Steckel, R.H. (2001). Health and nutrition in the preindustrial era: insights from a mil-
lennium of average heights in Northern Europe. Working Paper 8452. National
Bureau of Economic Research, Boston.
Foreword xi

This Page Intentionally Left Blank

About the Editors
Benjamin Caballero, MD, PhD is Professor of International Health and of Pediatrics,
and Director of the Center for Human Nutrition at the Schools of Public Health and of
Medicine, Johns Hopkins University. He is a member of the Food and Nutrition Board
of the Institute of Medicine, National Academy of Sciences, and of the Nutrition and
Metabolism Study Section, National Institutes of Health. Dr Caballero’s research on
childhood nutrition encompasses protein-energy malnutrition, nutrition and infection
interactions, and obesity, particularly in minorities and developing country populations.
Barry M Popkin, PhD is Professor of Nutrition at UNC-CH where he heads the
Division of Nutrition Epidemiology in the School of Public Health. His special
research focus is the dynamic changes in diet, physical activity and inactivity and body
composition and the factors responsible for these changes. Much of his work on the
nutrition transition focuses on the rapid changes in obesity and their causes. He is
actively involved in research in the US and a number of other countries around the
world; included are detailed longitudinal studies that he directs in China and Russia,
active involvement with longitudinal studies in the Philippines and South Africa, and
related work in Brazil and several other countries. Dr Popkin has an active US research
program in understanding dietary behavior with a focus on eating patterns, trends, and
socio-demographic determinants. Dr Popkin serves on several scientific advisory
organizations including Chair, the Nutrition Transition Committee for the International
Union for the Nutritional Sciences; he has published more than 150 journal articles,
book chapters, and books, and has a PhD in economics.

This Page Intentionally Left Blank

Introduction
Benjamin Caballero and Barry M. Popkin
1
Evolution is transition. Fueled by ideas, war, scientific breakthroughs, and chance, the
relationship of humans with their environment is in constant change, in an endless
quest for equilibrium. Food, as a central component of survival, has always been at the
center of that evolution. But if we are in constant transition, what does the term “nutri-
tion transition” really define?
Arguably, the concept of transition in the study of human populations was first
introduced by Omran in 1971, in an article entitled “The Epidemiologic Transition”
(Omran, 1971). In that paper, the author attempted to offer a systematic process by
which to identify and characterize change, and in doing so, to be able to predict future
trends. Another concept of transition often seen in the literature is the demographic
transition – the shift from a pattern of high fertility and high mortality to one of low
fertility and low mortality, typical of modern industrialized countries. Interpretations
of the demographic and epidemiologic transition share a focus with the nutrition
transition on the ways in which populations move from one pattern to the next. This
concept of transition may also be applied to the study of changes in the food–diet envi-
ronment and its impact on health. The concept of nutrition transition, however, goes
beyond diet, recognizing that most of the health effects of diets in human populations
are also strongly affected by lifestyle, particularly physical activity. We therefore use
the term nutrition transition to encompass these shifts not only in diet but also in phys-
ical activity and their effects on body composition. In other words, we must explicitly
recognize the role of the other nonnutritional factors closely related to the health out-
comes of interest. These three relationships are presented in Fig. 1.1.
Why does the current nutrition transition merit special attention, and define a specific
area of research in nutrition science? First, our ability to identify different patterns of
intake in populations, and to correlate these with health indicators has advanced sub-
stantially over the past decades. Thus, the necessary data have reached a critical mass
from which study can progress and inferences can be made. Second, the rate of change
is such that its effects can frequently be identified in the population within a genera-
tion or two, facilitating their identification and quantification. Third, many of the changes
in the area of nutrition and health are closely connected to economic and political
changes, thus linking the nutrition transition with key determinants of the historical
evolution of countries and regions.
The Nutrition TransitionISBN: 0-12-153654-8
Copyright © 2002 Elsevier Science LtdAll rights of reproduction in any form reserved

This book focuses on the developing world. Our interest centers on the rapid shifts
from a stage often termed the period of receding famine to one dominated by nutrition-
related noncommunicable diseases (NR-NCD). The periods encompassing this transi-
tion are outlined in Fig. 1.2. Our focus is increasingly on patterns 3 to 5, in particular
on the rapid shift in much of the world’s low and moderate income countries from the
stage of receding famine to NR-NCD. The importance of the shift from pattern 3 to 4
is such that for many this is synonymous with the Nutrition Transition.
The most dramatic impact of the changes in food supply, dietary intake and lifestyle
can be observed in the developing world. There are several reasons for this. First, the
projected growth in world population for the next 30 years will occur almost exclusively
in the developing world. Even more importantly, most of that population growth will
occur in urban areas, where, as will be shown, the impact of the nutrition transition is
most evident. Second, the health consequences of the nutrition transition, a continuing
increase in the prevalence of NR-NCD, is having and will continue to have a dramatic
impact in countries that, for the most part, have not yet solved the burden of nutritional
deficiencies.
Traditionally, the diets of poor countries have been considered insufficient in quan-
tity, and inadequate in quality. One reason for this has been the predominance of
higher fiber, lower fat plant sources, which are known to be limited in certain essential
nutrients, to have poor bioavailability for essential nutrients, and a low energy den-
sity. Paradoxically, the hunter–gatherer and the subsequent diet of countries in phase
of receding famine, which are both low in fat and rich in fiber, are today considered
the desired pattern for disease prevention in higher income industrialized countries.
However, the diet of developing countries also has natural contaminants (goitrogenic
substances, natural toxins, pesticides, microbial agents) that are undesirable.
2 Introduction
Demographic transition Epidemiologic transition Nutrition transition
Reduced fertility,aging
Focus on family planning,infectious disease control
Focus on faminealleviation/prevention
Diet-related noncommunicablediseases predominate
Focus on medical intervention, policyinitiatives, behavioral change
Chronic diseasespredominate
Focus on healthy agingspatial redistribution
Receding pestilence, poorenvironmental conditions
High prevalenceinfectious disease
High prevalenceundernutrition
Receding famine
Highfertility/mortality
Reduced mortality,changing age structure
Figure 1.1 Stages of health, nutritional, and demographic change (from Popkin, 2002).

What fuels the rapid shift in the stage of the nutrition transition? Critical elements
include urbanization, internationalization (globalization) of food production and
marketing, expansion of mass media and communications, and changes in the work
market with predominance of low-energy output labor.
Almost 90% of the projected world population growth over the next 20 years will take
place in the developing world. Even more striking is the fact that almost all this growth
will occur in urban areas. Thus, today’s developing world, still largely defined by the
rural poor, will change dramatically in the next two decades, with the progressive dom-
inance of an urban population. Urban dwelling is associated with an array of behaviors
and lifestyles that are associated with higher levels of obesity and other NR-NCD.
Globalization is a term that generates strong reactions, in spite (or perhaps because)
of its vague definition. Included in what we term globalization is a shift in dominance
on the economic, technological, cultural, and consumption level of goods that are
mass produced by modern techniques and a system that is market driven. Although
the term usually applies to recent trends in international trade, globalization has been
an essential element for the continuing expansion of market economies since the
industrial revolution. For example, by 1840, after the consolidation of the industrial
revolution in England, 530 million yards of British cottons were exported to the
“underdeveloped” regions of the world, compared to only 200 million for all of Europe
(Hobsbawm, 1996). Thus, economic expansion of industrialized countries has histor-
ically depended on expansion of markets into the developing world. Market expansion
Introduction 3
Urbanization, economic growth, technological changesfor work, leisure, and food processing, mass media growth
Starchy, low variety,low fat, high fiber
•• Labor-intensive
work/leisure
Increased fat, sugar,processed foods
•• Shift in technology of
work and leisure
Reduced fat increasedfruit, veg, carbohydrate, fiber
•
• Replace sedentarianismwith purposeful changesin recreation, other activity
MCH deficiencies,weaning disease,stunting
Obesity emerges, bonedensity problems
Reduced body fatness,improved bone health
Pattern 4Degenerative disease
Pattern 3Receding famine
Pattern 5Behavioral change
Slow mortality decline Accelerated life expectancy,shift to increased NR-NCD,increased disability period
Extended health aging,reduced NR-NCD
Figure 1.2 Stages of the nutrition transition (from Popkin, 2002).

is achieved by selling goods to increasing numbers of people, and also by creating
new needs. Culture plays a key role in fulfilling this task; linking products to lifestyles,
celebrities, and movies is one of the most effective means of increasing sales of
nonessential products. The importance of culture for trade is such that the opinion-
shaping industry (ad agencies, entertainment, media) is one of the leading exports of
the US and other developed countries. Television is one of the major purveyors of this
cultural context, and it is not surprising that TV ownership and watching are increasing
at high pace throughout the developing world (cf. the China case study). Television has
a double impact on NR-NCD: as a vehicle for dissemination of unhealthy eating
habits, and by promoting physical inactivity.
Globalization of food production affects the nutrition transition in a number of
ways. Use of modern technologies for mass production reduces the price of selected
food items and worldwide distribution and marketing facilitate the introduction of
processed foods to a wide range of countries. In turn, driven by the population growth
mentioned above, a large proportion of global food production will be driven by the
demands of developing countries. A recent study concluded that over the next 20 years,
85% of the increase in the demand for cereals and meat will come from developing
countries (Pinstrup-Andersen et al., 1999).
Because the food share of the household budget is substantially higher in devel-
oping than in developed countries (55% vs. 16% in 1997), changes in food prices and
income tend to have a much stronger impact on people’s dietary intake in developing
than in developed countries. This effect is reinforced by the stronger price elasticity
associated with lower than with higher incomes. Thus, technological advances and
aggressive marketing strategies that reduce prices of certain food items in developing
markets result in increased consumption. A clear example of this is the increase in
consumption of vegetable oils in the developing world (Drewnowski and Popkin, 1997).
Poverty and the nutrition transition
Data from the past decade and projections for the next 20 years (Murray and Lopez,
1996) indicate a continuing rise in the contribution of noncommunicable diseases to
mortality rates in developing countries, where a large proportion of the global poor
lives. But within the developing world population, there are clear differences between
the upper and lower socioeconomic groups. Among the poorest 20%, communicable
diseases still account for about 60% of deaths, whereas they account for only 8% among
the richest 20% (Gwatkin et al., 1999). A confounding factor may be the difference in
population patterns between richer and poorer countries, with the latter having as much
as twice the number of under-15 population, which has higher rates of communicable
disease than older groups. Although it is likely that the younger population of the
developing world still faces infectious diseases as a major threat to health and quality
of life, the burden of noncommunicable diseases continues to mount for the older poor.
As economic status and education improve, populations in developing countries
around the world respond quite consistently by demanding more animal protein in their
4 Introduction

diet. In many cases, this demand is justified, since their typical diet is usually low in
zinc, iron, selenium, retinol, and other essential nutrients found primarily in animal
sources. However, increases in the animal protein content of diets almost invariably
increases the content in saturated fats, which is undesirable.
The role of genes in the human adaptation to rapid environmental changes has been
postulated for many decades, but only with advances in molecular genetics can we iden-
tify with some clarity the interactions between genes and environmental components
such as diet. Populations living under subsistence conditions are forced to maximize
their potential for survival, and it is likely that specific sets of genes are activated to
facilitate this process. Thus, rapid changes in the environment, even when positive
(e.g., more food available) will tend to perturb that precarious equilibrium between
the genome and the environment. If the genetic makeup of some individuals does not
allow for a rapid shift to the new environmental conditions, adverse health effects may
result. This hypothetical but probable phenomenon can be seen within the same gen-
eration, i.e., children who were malnourished early in life becoming more prone to
obesity as adults. The particular genetic makeup of populations in developing coun-
tries, of which we know so little, adds a unique and important element to the impact
of the nutrition transition on health. Individuals “mis-adapted” to the new dietary con-
ditions may have a higher risk of adverse health effects.
Summary
The rapid shifts in the stages of the nutrition transition seen in the developing world
today clearly relate to major changes in food production, urbanization, and globaliza-
tion of trade. This book provides an overview of these factors, as well as the resulting
health outcomes of obesity, diabetes, and cardiovascular diseases. The role of nutrition
during pregnancy and infancy in affecting each person’s risk of later disease is also
addressed. Finally, the impact of the nutrition transition in China and Brazil is pre-
sented in more detail, to highlight the individual characteristics of this process and the
policy responses in these countries. As discussed in the final chapter, a major focus on
prevention in a multinational dimension will be necessary to reduce NR-NCD in the
developing world.
References
Drewnowski, A., and Popkin, B.M. (1997). The nutrition transition: new trends in the global
diet. Nutr. Rev. 55, 31–43.
Gwatkin, D.R., Guillot, M., and Heuveline, P. (1999). The burden of disease among the
urban poor. Lancet 354, 586–589.
Hobsbawm, E. (1996). The industrial revolution. In “The Age of Revolution”. Vintage
Books, New York.
References 5

Murray, C.J.L., and Lopez, A.D. (1996). “The Global Burden of Disease”. Harvard
University Press, Cambridge, MA.
Omran, A.R. (1971). The epidemiologic transition. A theory of the epidemiology of
population change. The Milbank Memorial Fund Q. 49, 509–538.
Pinstrup-Andersen, P., Pandya-Lorch, R., and Rosegrant, M.W. (1999). World food
prospects: critical issues for the early twenty-first century. Food Policy Report, IFPRI,
Washington, DC.
Popkin, B. (2002). An overview on the nutrition transition and its health implications:
The Bellagio meeting. Public Health Nutr. 5, 93–103.
Popkin, B.M., Horton, S., Kim, S., Mahal, A., and Shuigao, J. (2001). Trends in diet,
nutritional status and diet-related noncommunicable diseases in China and India: The
economic costs of the nutrition transition. Nutr. Rev. 59, 379–390.
6 Introduction

The Global Context PART
I
2. Economic and technological development and their relationships
to body size and productivity . . . . . . . . . . . . . . . . . . . . . . . . . . . . . . . . . . . 9
3. Food production . . . . . . . . . . . . . . . . . . . . . . . . . . . . . . . . . . . . . . . . . . . . 25
4. Can the challenges of poverty, sustainable consumption and good health
governance be addressed in an era of globalization? . . . . . . . . . . . . . . . . . . 51
5. Demographic trends . . . . . . . . . . . . . . . . . . . . . . . . . . . . . . . . . . . . . . . . . . 71

This Page Intentionally Left Blank

Economic andtechnologicaldevelopment and theirrelationships to bodysize and productivity
Robert W. Fogel and Lorens A. Helmchen
2
Introduction
From 1948 to 1998, real per capita income nearly tripled in the United States, growing at an average
annual rate of 2.17% (US Department of Commerce, 2000; US Census Bureau, 2000)
Between 1780 and 1979, British per capita income grew at an annual rate of about 1.15%
(Maddison, 1982; Crafts, 1985)
The enormous increase in productivity that these figures reflect is also found when output per capita
is measured in physical units. A case in point is the number of cars in the United States, which rose
from eight thousand in 1900 to more than 200 million in 2000, providing on average each American
adult with a car at the end of the millennium (Caplow et al., 2000).
The growth in material wealth has been matched by changes in body size over the past
300 years, especially during the twentieth century. Perhaps the most remarkable secu-
lar trend has been the reduction in mortality. Between 1900 and 1998, life expectancy
at birth in the United States increased by 65% for women, from 48.3 years to 79.5
years, and by 60% for men, from 46.3 years to 73.8 years (National Center for Health
Statistics, 2001). Table 2.1 provides an overview of the long-term trend in life
expectancy at birth for seven nations. The data show that in England life expectancy
has more than doubled since the early eighteenth century. France has recorded even
larger gains in longevity. French children born today can expect to live nearly three
times longer than their ancestors 250 years ago.
The Nutrition TransitionISBN: 0-12-153654-8
Copyright © 2002 Elsevier Science LtdAll rights of reproduction in any form reserved

Although not as significant numerically, final heights of European men who reached
maturity have also been increasing over the past two centuries, as shown in Table 2.2.
In some countries, average heights increased by as much as 10 cm per century.
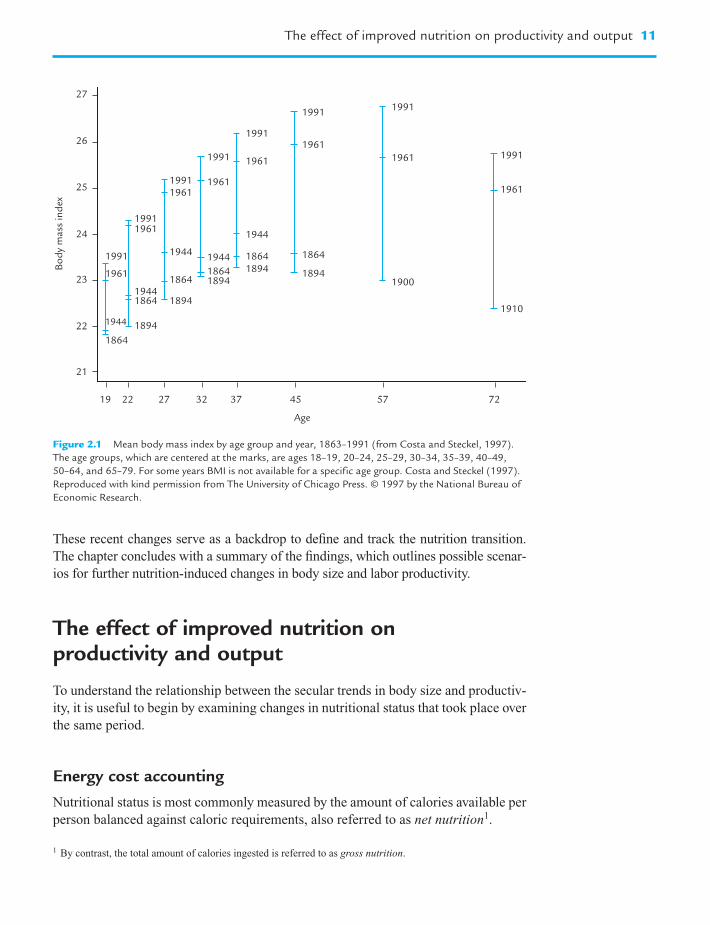
Body weight has also increased. Figure 2.1 shows that for some age groups, the
body mass index (BMI), a measure of weight adjusted for height (equal to kg/m2),
increased by about 10–15% within the past 100 years.
This chapter aims to elucidate the long-run relationship between labor productivity
and body size. In particular, it will be shown that improvements in the nutritional sta-
tus of a number of societies in Western Europe since the early eighteenth century may
have initiated a virtuous circle of technophysio evolution. The theory of technophysio
evolution posits the existence of a synergism between technological and physiological
improvements that has produced a form of human evolution that is biological but not
genetic, rapid, culturally transmitted, and not necessarily stable over time. In the con-
text of the present study, we suggest that an increase in agricultural efficiency and
labor productivity improved human physiology, in turn leading to further gains in
labor productivity.
The next two sections identify how the early modern advances in agriculture and the
increased availability of calories per capita raised labor productivity over the course of
successive generations. This is followed by an analysis of the determinants and conse-
quences of accelerating productivity gains in American agriculture after World War II to
illustrate the changing relationship among nutrition, body size, and labor productivity.
10 Economic and technological development and their relationships to body size and productivity
Table 2.1 Life expectancy at birth (years) in seven nations, 1725–1990 (both sexes combined)
Country 1725 1750 1800 1850 1900 1950 1990
England or UK 32 37 36 40 48 69 76
France 26 33 42 46 67 77
US 50 51 56 43 47 68 76
Egypt 42 60
India 27 39 59
China 41 70
Japan 61 79
Source: Fogel (in press).
Table 2.2 Estimated average final heights (cm) of men who reached maturity between 1750 and
1875 in six European populations, by quarter centuries
Date of maturity by Great Britain Norway Sweden France Denmark Hungary
century and quarter
18-III 165.9 163.9 168.1 168.7
18-IV 167.9 166.7 163.0 165.7 165.8
19-I 168.0 166.7 164.3 165.4 163.9
19-II 171.6 168.0 165.2 166.8 164.2
19-III 169.3 168.6 169.5 165.6 165.3
20-III 175.0 178.3 177.6 172.0 176.0 170.9
Source: Author’s calculations.
These recent changes serve as a backdrop to define and track the nutrition transition.
The chapter concludes with a summary of the findings, which outlines possible scenar-
ios for further nutrition-induced changes in body size and labor productivity.
The effect of improved nutrition on productivity and output
To understand the relationship between the secular trends in body size and productiv-
ity, it is useful to begin by examining changes in nutritional status that took place over
the same period.
Energy cost accounting
Nutritional status is most commonly measured by the amount of calories available per
person balanced against caloric requirements, also referred to as net nutrition1.
The effect of improved nutrition on productivity and output 11
27
26
25
24
23
22
21
19 22 27 32 37
Age
45 57 72
1910
1900
1961
1961 1991
1991
1961
1961
1944
19441944
1944
1944
1894
1864
18941864
18941864
1894
1894
1864
1864
1864
1991
1991
19611961
1991
1991
1961
1961
1991
1991
Bo
dy
mass
in
dex
Figure 2.1 Mean body mass index by age group and year, 1863–1991 (from Costa and Steckel, 1997).
The age groups, which are centered at the marks, are ages 18–19, 20–24, 25–29, 30–34, 35–39, 40–49,
50–64, and 65–79. For some years BMI is not available for a specific age group. Costa and Steckel (1997).
Reproduced with kind permission from The University of Chicago Press. © 1997 by the National Bureau of
Economic Research.
1 By contrast, the total amount of calories ingested is referred to as gross nutrition.

The principal component of the total energy requirement is represented by the basal
metabolic rate (BMR). The BMR, which varies with age, sex, and body size is the
amount of energy required to maintain body temperature and to sustain the function-
ing of the heart, liver, brain, and other organs. For adult males aged 20–39 years
living in moderate climates, BMR normally ranges between 1350 and 2000 kcal/day
depending on height and weight. For comparison across time and different popula-
tions, it is convenient to standardize for the age and sex distribution of a population by
converting the per capita consumption of calories into consumption per equivalent
adult male aged 20–39, also referred to as a consuming unit.
Since the BMR does not allow for the energy required to eat and digest food, or for
essential hygiene, an individual cannot survive on the calories needed for basal
metabolism. The energy required for these additional essential activities over a period
of 24 hours is estimated at 0.27 of BMR or 0.4 of BMR during waking hours. In other
words, a survival diet is 1.27 BMR, or between 1720 and 2540 kcal/day for a con-
suming unit. A maintenance diet contains no allowance for the energy required to earn
a living, prepare food, or any other activities beyond those connected with eating and
essential hygiene.
Whatever calories are available beyond those claimed for basal metabolism and
maintenance can be used at the discretion of the individual, either for work or for
leisure activities.
Chronic malnutrition in late-eighteenth century Europe
According to recent estimates, the average caloric consumption in France on the eve
of the French Revolution was about 2290 kcal per consuming unit, that for England
was about 2700 kcal per consuming unit. These averages, however, do not reveal the
variation in caloric consumption within the French and English populations. Table 2.3
shows the probable French and English distributions of the daily consumption of kcal
per consuming unit toward the end of the eighteenth century.
The principal finding that emerges from this table is the exceedingly low level of food
production, especially in France, at the start of the Industrial Revolution. The French
distribution of calories implies that 2.48% of the population had caloric consumption
below basal metabolism, whereas the proportion of the English population below basal
metabolism was 0.66%. For the remainder of the population, the level of work capacity
permitted by the food supply was very low, even after allowing for the reduced require-
ments for maintenance because of small stature and reduced body mass. In France the
bottom 10% of the labor force lacked the energy for regular work and the next 10% had
enough energy for less than 3 hours of light work daily (0.52 hours of heavy work).
Although the English situation was somewhat better, the bottom 3% of its labor force
lacked the energy for any work, while the balance of the bottom 20% had enough energy
for only about 6 hours of light work (1.09 hours of heavy work) each day.
Thus, at the end of the eighteenth century, the lack of access to sufficient calories
effectively restricted the amount of activity (whether for income or leisure) that most
laborers could perform, and it effectively precluded others from working at all.
12 Economic and technological development and their relationships to body size and productivity

How better nutrition raised output per capita
Table 2.4 shows secular trends in the daily caloric supply in France and Great Britain
from 1700 to 1989. Per capita availability of calories more than doubled in this period
in France, and increased by about 50% in Great Britain, where caloric supply was
30% larger than that in France at the beginning of the period.
Framework
How did the substantial increase in calories per capita affect labor productivity? Labor
productivity can be defined as the output of marketable goods and services that a
The effect of improved nutrition on productivity and output 13
Table 2.3 A comparison of the probable French and English distributions of the daily caloric
consumption (kcal) per consuming unit toward the end of the eighteenth century
Decile France c. 1785 England c. 1790
X–
� 2290 (s/X–
) � 0.3 X–
� 2700 (s/X–
) � 0.3
Daily kcal Cumulative % Daily kcal Cumulative %
consumption consumption
1. Highest 3672 100 4329 100
2. Ninth 2981 84 3514 84
3. Eighth 2676 71 3155 71
4. Seventh 2457 59 2897 59
5. Sixth 2276 48 2684 48
6. Fifth 2114 38 2492 38
7. Fourth 1958 29 2309 29
8. Third 1798 21 2120 21
9. Second 1614 13 1903 13
10. First 1310 6 1545 6
Sources and procedures: Author’s calculations.
Table 2.4 Secular trends in the daily caloric supply in France and Great Britain 1700–1989
(kcal per capita)
Year France Great Britain
1700 2095
1705 1657
1750 2168
1785 1848
1800 2237
1803–12 1846
1845–54 2480
1850 2362
1909–13 2857
1935–39 2975
1954–55 2783 3231
1961 3170
1965 3355 3304
1989 3465 3149
Source: Fogel et al. (in press).

typical worker can produce over the span of one day. Daily output per worker, in turn,
can be decomposed into the output per calorie expended at work and the daily amount
of calories expended on the job by a typical worker. By multiplying the daily output
per worker by the number of workers per inhabitant (which is called the labor force
participation rate) output per worker is transformed into output per capita, which is
used as a measure of the standard of living:
Output of goods and services produced per capita per day
� daily output of goods and services per calorie expended in their production
� daily amount of calories expended in production per worker
� labor force participation rate
In this decomposition, the technological breakthroughs in farming raised yields for a
given effort level, represented here as increases in the output per calorie expended in
production. At given levels of annual calories expended in production per worker and
labor force participation rate, this must have raised the volume of agricultural output
per capita. Higher levels of labor productivity in agriculture also allowed parts of the
labor force to be employed in nonagricultural sectors of the economy without reducing
farm output per person, thus diversifying the range of goods and services produced
domestically.
To understand the full effect of gains in agricultural efficiency, however, it is
necessary to take into account how the additional calories were used. Those adults
who had been working before the development and diffusion of more productive
farming methods could now increase the annual amount of calories expended while
working, either by performing more energy-intensive tasks or by working additional
hours, or both. This increase in calories expended in production by a typical worker
further increased the amount of calories produced (and ultimately consumed) per
capita.
In addition to boosting the calories available to workers, the expansion of the food
supply also made more calories available for members of the poorest segment of the
adult population who had had only enough energy above maintenance for a few hours
of strolling each day – about the amount needed by a beggar – but less on average than
that needed for just one hour of the heavy manual labor required in agriculture. To the
extent that these persons now had the energy to work, they raised the labor force
participation rate, which led to a further increase in per capita output. Table 2.5 sum-
marizes the daily amount of energy available for work in France, and England and
Wales from 1700 to 1980. The most impressive gains are reflected by the data for
France, where calories available for work increased nearly fivefold within less than
200 years.
In total, by increasing agricultural yields per calorie expended, the Second
Agricultural Revolution expanded the availability of calories per capita, drawing
more people into the labor force and raising on-the-job calorie expenditures of those
working. This boost in the population’s productive capacity in turn fueled further
growth not only in food output per capita. It also helped to raise the output in all other,
nonagricultural sectors of the economy that benefited from an increase in workers and
hours worked.
14 Economic and technological development and their relationships to body size and productivity

Empirical estimate
Time series of anthropometric and macroeconomic statistics can be combined to esti-
mate the contribution of better nutrition to the growth of output per person. The most
reliable and complete data in this regard have been collected for England. As noted in
the introduction, between 1780 and 1979 British per capita income grew at an annual
rate of about 1.15% (Maddison, 1982).
Data are now available to measure the changes in calories available for work and
the labor force participation rate. For Britain, it has been estimated that the increases
in the supply of calories lifted as much as one fifth of all consuming units above the
threshold required for work. As a result, the labor force participation rate increased by
25% over 200 years, contributing 0.11% to the annual British growth rate between
1780 and 1980 (1.250.005 � 1 � 0.0011).
The increased supply of calories also raised the average consumption of calories by
those in the labor force from 2944 kcal per consuming unit in c.1790 to 3701 kcal per
consuming unit in 1980. Of these amounts, 1009 kcal were available for work in
c. 1790 and 1569 in 1980, so that calories available for discretionary activities increased
by about 56% during the two centuries. If it is assumed that the proportion of the avail-
able energy devoted to work has been unchanged between the end points of the period,
then the increase in the amount of energy available for work contributed about 0.23%
per annum to the annual growth rate of per capita income (1.560.0053 � 1 � 0.0023).
Thus, in combination, bringing the ultrapoor into the labor force and raising the energy
available for work by those in the labor force, explains about 30% of British growth in
per capita income over the past two centuries [(0.0023 � 0.0011) � 0.0115 � 0.30].
As incomes in OECD countries have risen, the share of discretionary time devoted
to working for income has declined. Consequently, it is unlikely that further increases
in the amount of calories available per person in those countries will raise labor force
The effect of improved nutrition on productivity and output 15
Table 2.5 A comparison of energy available for work daily per consuming unit in France, and
England and Wales, 1700–1980 (in kcal)
Year France England and Wales
1700 720
1705 439
1750 812
1785 600
1800 858
1803–12
1840
1845–54
1850 1014
1870 1671
1880
1944
1975 2136
1980 1793
Source: Fogel et al. (in press).

participation rates or hours worked2. However, the immediate effect of better nutrition
on labor productivity still holds enormous potential in poor countries where malnutri-
tion is widespread.
The self-reinforcing cycle of greater body size and higher productivity
In addition to the direct effect of better nutrition on the growth of output per person,
the conquest of chronic malnutrition has had a long-term effect on human physiology,
which has taken several generations to unfold.
The role of long-term changes of nutritional status in altering body size is inferred
from applying energy cost accounting to an analysis of food balance sheets. In partic-
ular, to have the energy necessary to produce the national product of either France or
England c. 1700, the typical adult male must have been quite short and very light in
weight. The smaller body size reduced the basal metabolic rate and thereby freed up
calories that could be used for work. As per capita food supplies expanded, so did not
only hours worked but also body size. The increase in body size, in turn, improved
health and the capacity of individuals to raise labor productivity further, thus rein-
forcing the initial increase in labor productivity.
The effect of improved nutrition on body size,morbidity and mortality
The gain in weight
As was pointed out earlier, the energy that an individual takes in through food con-
sumption will be spent to maintain body temperature and vital organ functions, as well
as for eating, sleeping, and essential hygiene. The remainder is available for discre-
tionary use, such as work and leisure. It was also shown that the additional calories that
became available in the wake of the Second Agricultural Revolution were used to
engage in more energy-intensive tasks and increase labor force participation. Energy
not used is stored, leading to weight gain. As such, the body mass index may be inter-
preted as a measure of net nutrition, which is defined as the excess of calories ingested
over calories claimed for maintenance and discretionary use. Figure 2.1 documents the
secular increase in body mass index for white men between 1864 and 1991.
16 Economic and technological development and their relationships to body size and productivity
2 In the United States, the labor force participation rate (LFPR) increased from 58.8% to 67.1% between 1948
and 1998. This trend masks important differences between men and women: while the LFPR for men fell from
86.6% to 74.9%, the labor force participation of women rose from 32.7% to 59.8%. These differences are even
more pronounced for the group of 55–64-year olds and imply that men tend to retire at earlier ages than before,
whereas women continue to expand their participation in the labor market. The increase of the female LFPR has
been facilitated by the introduction and adoption of labor-saving technology in the household. As household
work became less time consuming, women could reduce the hours spent working at home and seek paid
employment in the labor market.

It has been shown that eliminating chronic hunger will strengthen the body’s
defenses against infectious diseases, thus lowering the risk of contracting diseases and
premature death. The relationship between weight, as measured by the Body Mass
Index, and mortality was established empirically by Hans Waaler (1984) for
Norwegian men aged 45–49 and confirmed for a sample of Union Army veterans
measured at ages 45–64 and followed for 25 years. Figure 2.2 shows a U-shaped rela-
tionship between BMI and the relative risk of death for both samples. Among both
modern Norwegians and Union Army veterans the curve is quite flat within the range
22–28, with the relative risk of mortality hovering close to 1.0, which represents the
average risk of death in the population. However, at BMIs of less than 22 and over 28,
the risk of death rises sharply as BMI moves away from its mean value.
The gain in height
A larger and better survival diet allowed adult members of the generation that first
witnessed the rise in agricultural efficiency to increase weight, and, consequently, to
improve health and extend life. Better nutrition of pregnant women also improved the
nutritional status of fetuses and infants. Access to sufficient amounts of calories and
other vital nutrients in utero and developmental ages has been shown to affect the off-
spring’s final height. Thus, whereas the immediate effect of the improvements in food
The self-reinforcing cycle of greater body size and higher productivity 17
Rel
ati
ve r
isk
BMI
ModernNorwegianmales
Union Armyveterans
17
0.88
2.14
19 21 23 25 27 29 31 33 35
Figure 2.2 Relative mortality risk by BMI among men 50 years of age, Union Army veterans around 1900
and modern Norwegians (from Costa and Steckel, 1997). In the Norwegian data BMI for 79 084 men was
measured at ages 45–49 and the period of risk was 7 years. BMI of Union Army veterans was measured
at ages 45–64 and the observation period was 25 years. Costa and Steckel (1997). Reproduced with kind
permission from The University of Chicago Press. © 1997 by the National Bureau of Economic Research.

supply was to raise the amount of energy spent at work and to boost body weight, the
long-run impact over the course of several generations has been an increase in stature.
This conclusion is supported by the time series on mean final heights for various
European populations, shown in Table 2.2.
Waaler (1984) also identified the role of body height as a factor influencing mor-
bidity and mortality. Figure 2.3 plots the relationship between relative mortality risk
and height found among Norwegian men aged 40–59 measured in the 1960s and
among Union Army veterans measured at ages 23–49 and at risk between ages 55 and
75. Short men, whether modern Norwegians or nineteenth-century Americans, were
much more likely to die early than tall men. Height has also been found to be an
important predictor of the relative likelihood that men aged 23–49 would be rejected
from the Union Army between 1861 and 1865 because of chronic diseases. Despite
significant differences in ethnicity, environmental circumstances, the array and sever-
ity of diseases, and time, the functional relationship between height and relative risk
are strikingly similar in the two cases.
To gauge the relative importance of height and weight for an individual’s risk of
mortality, an isomortality surface that relates the risk of death to both height and
weight simultaneously is needed. Such a surface, presented in Fig. 2.4, was fitted to
Waaler’s data. Transecting the isomortality map are iso-BMI lines that give the locus of
BMI between 16 and 34. The heavy line transecting the minimum point of each iso-
mortality curve represents the weight that minimizes mortality risk at each height.
Since an individual’s height cannot be varied by changes in nutrition after maturity,
adults can move to a more desirable BMI only by changing their weight. Therefore,
the x-axis is interpreted as a measure of the effect of the current nutritional status of
mature males on adult mortality rates. Moreover, since most stunting takes place
before age three, the y-axis is interpreted as a measure of the effect of nutritional
18 Economic and technological development and their relationships to body size and productivity
Waaler
Union Arm
y vete
rans
62
0.5
1.0
1.5
64 66 68 70 72 74 76 78 80
Height (inches)
Rel
ati
ve r
isk
Figure 2.3 Relative mortality risk among Union Army veterans and among Norwegian males. Author’s
calculations.
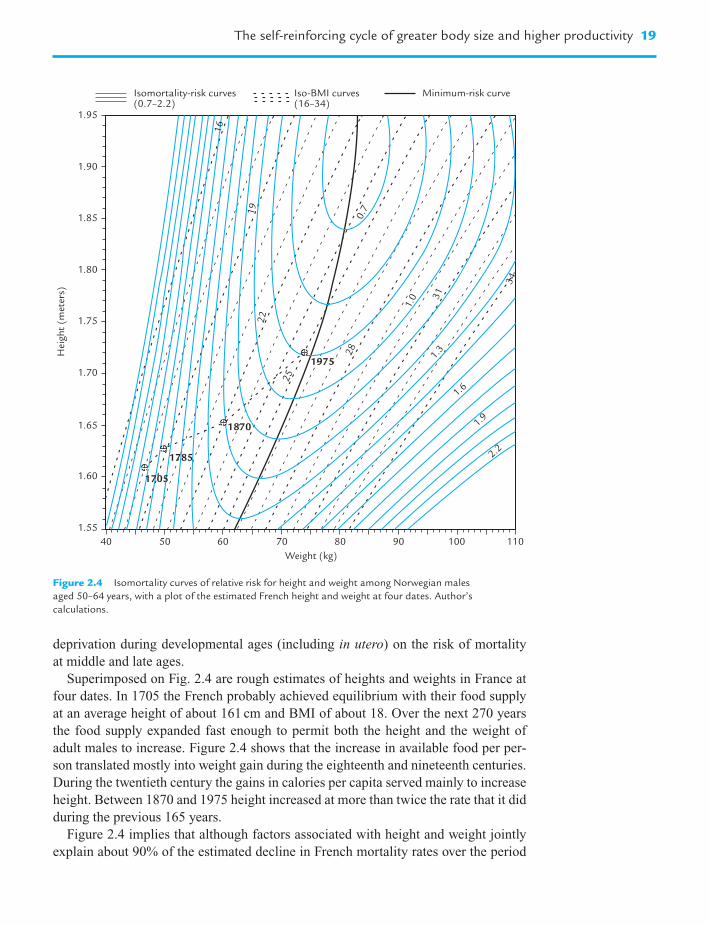
deprivation during developmental ages (including in utero) on the risk of mortality
at middle and late ages.
Superimposed on Fig. 2.4 are rough estimates of heights and weights in France at
four dates. In 1705 the French probably achieved equilibrium with their food supply
at an average height of about 161 cm and BMI of about 18. Over the next 270 years
the food supply expanded fast enough to permit both the height and the weight of
adult males to increase. Figure 2.4 shows that the increase in available food per per-
son translated mostly into weight gain during the eighteenth and nineteenth centuries.
During the twentieth century the gains in calories per capita served mainly to increase
height. Between 1870 and 1975 height increased at more than twice the rate that it did
during the previous 165 years.
Figure 2.4 implies that although factors associated with height and weight jointly
explain about 90% of the estimated decline in French mortality rates over the period
The self-reinforcing cycle of greater body size and higher productivity 19
16
19
22
25
28
31
34
0.7
1.0
1.3
1.6
1.9
2.2
1975
1785
1870
1705
1.95
1.90
1.85
1.80
1.75
1.70
1.65
1.60
1.55
40 50 60 70 80 90 110100
Weight (kg)
Hei
ght
(met
ers)
Isomortality-risk curves(0.7–2.2)
Iso-BMI curves Minimum-risk curve(16–34)
Figure 2.4 Isomortality curves of relative risk for height and weight among Norwegian males
aged 50–64 years, with a plot of the estimated French height and weight at four dates. Author’s
calculations.

between 1785 and c. 1870, they only explain about 50% of the decline in mortality
rates during the past century.
The effect of lower morbidity and mortality on labor productivity
The unprecedented gains in life expectancy over the past 300 years, the reductions in
disease prevalence, and the increasing age at onset of disability have all contributed to
raise the number of years free of disease and disability that a person born today can
expect to live. In addition, the development of cures for many conditions and the pro-
vision of effective symptom management for those conditions that cannot be cured
have eliminated or reduced significantly the age-specific rates of functional impair-
ment that used to be associated with many diseases.
The immediate effect of longer lives is that now more people will be able to use
their accumulated experience longer, and that they are more likely to share more of
their life span with their children and grandchildren.
As a result of improvements in human physiology and major advances in medicine,
the number of disability and symptom-free years of life that remain at any given age
is now much larger than it has ever been. This creates strong incentives for individu-
als to undertake measures aimed at preserving physical functioning and cognitive
ability, also referred to as investments in human capital. Individuals respond by under-
taking more of these investments, which include purchases of preventive and rehabil-
itative medical services as well as the acquisition of new skills and knowledge. For
instance, in 1910, only 13% of adults in the United States were high school graduates
and only 3% were college graduates. By 1998, the comparable percentages were 83
and 24, respectively (Caplow et al., 2000). It is no coincidence that, at the beginning
of the twenty-first century, healthcare and educational services constitute two of the
fastest growing sectors of the US economy, as they do in most other OECD nations.
Not only do these activities maintain or improve the quality of life but they also
enhance labor productivity.
Productivity-induced demographic and economic change in the USA
The relationships between technological development, nutrition, body size, and eco-
nomic change have become most apparent over the course of the past century. They
are perhaps best illustrated by examining the consequences of the dramatic improve-
ments in labor productivity experienced by the agricultural sector in the United States
since the end of World War II.
From 1948 to 1994, agricultural output more than doubled, expanding at an average
annual rate of 1.9% (Ahearn et al., 1998). During the same period, total hours worked
in agriculture, adjusted for quality, fell by more than two-thirds, or 2.7% annually.
20 Economic and technological development and their relationships to body size and productivity

These figures imply that between 1948 and 1994 US agricultural output per hour rose
at an average rate of 4.6% per annum, a more than ninefold increase over the span of
fifty years3.
This surge in agricultural labor productivity is attributable to steadily improving
yields and an increase in the acreage cultivated per hour. For instance, the introduc-
tion of pesticides, herbicides, and fertilizer, combined with higher-yielding crop vari-
eties raised the amount of potatoes per harvested acre by a factor of almost 2.5
between 1948 and 1994 (US Department of Agriculture, 2000). Similarly, the number
of acres cultivated per hour has been raised dramatically by the mechanization of agri-
culture, at an average annual rate of about 3%.
As agricultural labor became more productive, the number of annual hours per
worker as well as the number of workers were cut without curtailing agricultural output.
Although annual hours per agricultural worker declined by 1% per year, the number of
agricultural workers fell even more rapidly, by 1.7% per year (Ahearn et al., 1998).
Those workers who were released from the agricultural sector found employment
in other sectors of the economy, where they helped to raise output of other goods that
consumers wanted, or they stopped working altogether. The fraction of the labor force
employed in agriculture fell from 13% in 1948 to 3.2% in 1998 (US Bureau of the
Census, 1976; Braddock, 1999; Bureau of Labor Statistics, 2001)4.
Despite the sharply declining number of hours worked, the growth of US agricul-
tural output has been outpacing the growth of the population during the past 50 years.
Whereas from 1948 to 1994 agricultural output grew by 1.9% annually, the popula-
tion of the United States grew on average by 1.2% per annum (US Department of
Commerce, 2000). As a result, agricultural output per capita increased at an annual
rate of approximately 0.7%. Compounded over the second half of the twentieth cen-
tury, therefore, agricultural output per capita, which can be used to assess a country’s
capacity to supply its inhabitants with calories, increased by about 40%.
Conclusion and outlook
The sections above have documented how advances in agricultural efficiency after
1700 allowed the societies of Europe and North America to expand and improve their
diets by an unprecedented degree. The rise in agricultural efficiency set off a self-
reinforcing cycle of improvements in nutrition and gains in labor productivity, leading
to a substantial increase in per capita output, which has come to be known as
“modern economic growth”. It was shown how the initial increase in agricultural
Conclusion and outlook 21
3 A century earlier, output per man-hour had increased 2.16 times in 60 years, or 1.3% annually: whereas in 1840
the production of 100 bushels of wheat required 233 man-hours, in 1900 the same output could be produced with
less than half that amount, 108 man-hours. It follows that the growth rate of agricultural productivity accelerated,
perhaps doubled, after World War II (cf. Clark, 1993).4 This drop in agriculture’s employment share was already underway in the nineteenth century; from 1870 to
1920, the fraction of the labor force employed in agriculture fell from 53% to 27%.
efficiency was magnified by providing the population with enough additional calories
to boost the number of acres cultivated per hour, annual hours worked, and the labor
force participation rate. Based on the notion that variations in the size of individuals
have been a principal mechanism in equilibrating the population with the food supply,
improved net nutrition has been identified as the primary long-term determinant of the
sharp increase in the number of disability-free years of life. The gains in longevity, in
turn, have created an incentive for individuals to maintain and upgrade skills and
personal health. This line of argument underpins the prediction that the conquest of
malnutrition may continue to raise the productivity and innovative capacity of the
labor force in the West.
The time series of various components of agricultural output per capita in the
United States since World War II has been analyzed and combined with the data pre-
sented, the following conclusions emerge for the advanced economies of Western
Europe and North America.
• Output per acre cultivated has been increasing throughout the period under study.
• Acres cultivated per hour have been increasing throughout this period, first
because human energy available for work increased, then because animal and
inanimate power complemented and eventually substituted for human energy.
• Annual hours worked per agricultural worker increased at first, as more calories
became available for discretionary use, but have been declining recently and are
expected to continue to decline.
• The rise in agricultural labor productivity has permitted the number of agricul-
tural workers per inhabitant to decline without lowering the amount of calories
available per person.
• The declining share of agricultural workers in the labor force permitted other
sectors of the economy to grow, thus greatly diversifying and expanding the range
of nonagricultural goods and services.
The recent reversal of some key trends in energy intensity of work and labor force
participation rates suggests that the economic and epidemiologic consequences from
the unprecedented improvement of human nutrition in the rich countries are still being
played out.
Up to World War II the energy intensity and quantity of work in Europe was limited
by the availability of food per capita. Since then, however, caloric intake has not only
matched individual caloric requirements but tends to exceed calorie expenditure in an
increasing portion of the population. One indicator of this tendency is the growing
prevalence of obese adults in the United States, which between 1960 and 1994
increased from 13.3% to 23.3% (National Center for Health Statistics, 2001)5.
This trend is compounded by the fact that the progressive substitution of human
energy by inanimate power and the concomitant expansion of sedentary work have led
to a gradual reduction of calories expended per hour worked. The continued increase
in agricultural output per person coupled with lower energy requirements on the job
22 Economic and technological development and their relationships to body size and productivity
5 A person is considered to be obese if that individual’s Body Mass Index is equal to or greater than 30 (National
Center for Health Statistics, 2001).

may portend two, not mutually exclusive, scenarios for the next stage of the nutrition
transition in the world’s richest countries.
1. As more and more people work in occupations that do not place high demands
on calorie supply, they may decide to increase energy spent during leisure hours.
In addition, further gains in stature and weight will raise the calories needed for
maintenance.
2. Alternatively, workers may decide to reduce their overall calorie intake to bring it
into line with the decreased amounts of calories at work. Although expenditure on
food may not decline in absolute terms, consumers may opt to substitute increas-
ingly away from quantity toward quality of calories and become choosier regarding
those calories that they decide to purchase and ingest. To the extent that pressure
for advances in productivity and greater per capita supply of calories wanes in rich
countries, it is conceivable that forms of agriculture that are less productive in calo-
ries will gain popularity to accommodate other criteria in the selection of agricul-
tural products and processes. For example, organic agriculture, which renounces
the use of certain herbicides, pesticides and fertilizers, accepts lower yields per acre
in order to reduce environmental hazards. Similarly, a shift in consumer prefer-
ences may prompt the cultivation of crops that sell at a premium but require more
care or are less nutritious, thus lowering the amount of calories per hour worked.
The situation is very different in poor countries where more than 800 million peo-
ple are chronically undernourished (FAO, 1999). Progress in agricultural productivity
remains the focus of most programs aimed at raising the per capita supply of calories
and other vital nutrients. Yet even in countries where average food consumption is
deemed adequate, an unequal distribution of income may effectively preclude the
poorest parts of the population from obtaining sufficient calories, as was shown for
late eighteenth-century England and France. Recent data from developing countries
confirm the association of greater income inequality with increased food insecurity
and smaller body size (Steckel, 1995; Shapouri and Rosen, 1999).
Whatever the approach to alleviating chronic hunger in developing countries,
improving the food supply could unlock the short-term and long-term effects of bet-
ter nutrition on labor productivity that have had such a lasting impact on the growth
trajectories of Europe and North America.
References
Ahearn, M., Yee, J., Ball, E., and Nehring, R. (1998). “Agriculture Information Bulletin
740”. US Department of Agriculture, Washington, DC.
Braddock, D. (1999). Monthly Labor Rev. 122, 51–77.
Bureau of Labor Statistics (2001). “Labor Force Statistics from the Current Population
Survey”. Available: http://146.142.4.24/cgi-bin/surveymost?lf
Caplow, T., Hicks, L., and Wattenberg, B.J. (2000). “The First Measured Century: An
Illustrated Guide to Trends in America, 1900–2000”. American Enterprise Institute
for Public Policy Research, Washington, DC.
References 23

Clark, G. (1993). In “The British Industrial Revolution – An Economic Perspective”
(J. Mokyr, ed.), pp. 227–266. Westview Press, Boulder.
Costa, D.L., and Steckel, R.H. (1997). In “Health and Welfare During Industrialization”
(R.H. Steckel, and R. Floud, eds.). University of Chicago Press, Chicago.
Crafts, N.F.R. (1985). “British Economic Growth during the Industrial Revolution”.
Clarendon Press, Oxford.
Food and Agriculture Organization (1999). “The State of Food Insecurity in the World”.
Rome. Available: http://www.fao.org/NEWS/1999/img/SOFI99-E.PDF
Fogel, R.W. (1997). In “Handbook of Population and Family Economics”
(M.R. Rosenzweig, and O. Stark, eds.), 1A, pp. 433–481. North-Holland,
Amsterdam.
Fogel, R.W. (in press). “The Escape from Hunger and Premature Death 1700–2000:
Europe, America and the Third World”. The University of Chicago, Chicago.
Fogel, R.W., and Costa, D.L. (1997). Demography 34, 49–66.
Fogel, R.W., Floud, R., and Harris, B. (in progress). “A treatise on technophysio evolution
and consumption”. Center for Population Economics, The University of Chicago,
Chicago.
Maddison, A. (1982). “Phases of Capitalist Development”. Oxford University Press, Oxford.
National Center for Health Statistics (2001). “Health, United States, 2001. With Urban
and Rural Health Chartbook”. Hyattsville, Maryland.
Shapouri, S., and Rosen, S. (1999). Agriculture Information Bulletin 754. US Department
of Agriculture, Washington, DC.
Steckel, R.H. (1995). J. Econ. Lit. 33, 1903–1940.
US Bureau of the Census (1976). “The Statistical History of the United States from
Colonial Times to the Present”. Basic Books, New York.
US Census Bureau (2000). “Historical National Population Estimates: July 1, 1900 to July 1,
1999”. Available: http://www.census.gov/population/estimates/nation/popclockest.txt
US Department of Agriculture (2000). “Track Records United States Crop Production”.
Available: http://www.usda.gov/nass/pubs/trackrec/track00a.htm
US Department of Commerce (2000). “Current Dollar and ‘Real’ Gross Domestic
Product”. Available: http://www.bea.doc.gov/bea/dn/gdplev.xls
Waaler, H. (1984). Acta Med. Scand. 679, S1–S51.
24 Economic and technological development and their relationships to body size and productivity

Food production
Vaclav Smil
3
Humans have relied during the course of their evolution on a number of distinct ways
to secure their food supply. In many places in the tropics the oldest strategies (foraging
and shifting agriculture) had coexisted side by side with subsequent ways of food pro-
vision (pastoralism, sedentary farming) for very long periods of time (Headland and
Reid, 1989). In others, China being a perfect example, the ancient means of sedentary
cultivation were gradually transformed into much more productive ways of growing
crops. Foraging (food gathering and hunting) dominated all hominid and most of
human existence and some of its key nutritional attributes will be noted in the first
section of this chapter offering a brief history of food production. In this section I will
also note a number of traditional agricultural practices, as they are still very much in
evidence throughout the developing world. My review of the current global food sit-
uation will focus primarily on production and consumption gaps between developed
and developing countries (I prefer to label them simply rich and poor).
While looking ahead I will avoid any quantitative point forecasts, as these tend to
become irrelevant almost as soon as they are published; instead, I will identify the
main factors that will be driving changes in food demand during the next 50 years.
Increased demand for animal foods will be a key ingredient of this change and hence
I will devote a separate section to analyzing its likely growth and its consequences for
the global demand for feeds. I will close by stressing the need for two critical kinds of
investment in agriculture: in the maintenance of irreplaceable ecosystemic structures
and services without which no agriculture can succeed, and in genetic engineering
whose advances will help to eliminate malnutrition even as the population of devel-
oping countries keeps expanding.
A brief history of food production
Every new find of hominid remains in East Africa reignites the controversy about the
origin of our species, but at least one conclusion remains unchanged: we have come
from a long lineage of opportunistic foragers, and for millions of years both the natural
diet and the foraging strategies of hominids resembled those of their primate ancestors
Copyright © 2002 Elsevier Science LtdAll rights of reproduction in any form reserved
The Nutrition TransitionISBN: 0-12-153654-8

(Whiten and Widdowson, 1992). Larger brains improved the odds of their survival but
to secure food, hominids relied only on their muscles and on simple stratagems
as scavengers, gatherers, hunters, and fishers helped by stone implements, bows and
arrows and by fibrous or leather lines and nets. Controlled use of fire needed to
prepare cooked food may have come first nearly half a million years ago, but a more
certain time is about 250 000 years ago (Goudsblom, 1992).
Childe’s (1951) idea of Neolithic Revolution has been one of the most unfortunate
caricatures of human evolution: there was no sudden shift from foraging to sedentary
farming. Diminishing returns in gathering and hunting led to a gradual extension of
incipient cultivation present in many foraging societies, and foraging and agriculture
commonly coexisted for very long periods of time (Smil, 1994). Similarly, there were
no abrupt changes in the way most traditional agricultures produced food; some places
experienced prolonged stagnation, or even declines, in overall food output, others
have undergone gradual intensification of crop cultivation that has resulted in higher
yields and more secure food supplies. Even then, traditional farming was able to pro-
duce only monotonous diets and it remained highly vulnerable to environmental
stresses. Only modern agriculture, highly intensive and fossil fuel-based, has been
able to produce enormous surpluses of food in all affluent nations and to raise most of
the world’s populous developing countries at least close to, and for most of the Chinese
even well above, subsistence minima.
Foraging societies
The great diversity of the preserved archaeological record makes it impossible to offer
any simple generalizations concerning prehistoric diets. Modern studies of foraging
societies that have survived in extreme environments (tropical rain forest, semideserts)
into the 20th century have provided very limited insight into the lives of prehistoric for-
agers in more equable climates and more fertile areas. Moreover, these societies have
often been affected by contacts with pastoralists, farmers or overseas migrants. Given
the unimpressive physical endowment of early humans and the absence of effective
weapons, it is most likely that our ancestors were initially much better scavengers than
hunters (Blumenschine and Cavallo, 1992). Large predators often left behind partially
eaten carcasses and this meat, or at least the nutritious bone marrow, could be reached
by enterprising early humans before it was devoured by vultures and hyenas.
Fishing, collecting of shellfish, and near-shore hunting of sea mammals provided
diet unusually rich in proteins and made it possible to live in semipermanent, and even
permanent, settlements (Price, 1991). In contrast, both gathering and hunting were
surprisingly unrewarding in species-rich tropical forests where energy-rich seeds are
a very small portion of total plant mass and are mostly inaccessible in high canopies,
as are most animals, which are also relatively small and highly mobile. Grasslands
and open woodlands offered much better opportunities for both collecting and hunting.
Many highly nutritious seeds and nuts were easy to reach, and patches of large starchy
roots and tubers provided particularly high energy returns. So did the hunting of many
grasslands herbivores which were often killed without any weapons, by driving the
26 Food production

herds over precipices. This hunting was intensive enough to explain the disappearance
of most large herbivores from preagricultural landscapes (Alroy, 2001).
There is no doubt that all preagricultural societies were omnivorous and that although
they collected and killed a large variety of plant and animal species only a few princi-
pal foodstuffs usually dominated their diets. Preference for seeds and nuts among
gatherers was inevitable; they are easy to collect, and they combine high energy con-
tent (13–26 MJ/kg) with relatively high protein shares (commonly above 10%). Wild
grass seeds have as much food energy as cultivated grains (15 MJ/kg), and nuts have
energy densities up to 75% higher. All wild meat is an excellent source of protein
(�20%), but the flesh of small and agile animals (e.g., hares or monkeys) contains
very little fat (�10%) and hence has very low energy density (5–6 MJ/kg). Conse-
quently, there has been a widespread hunting preference for such large and relatively
fatty species, such as mammoths and bisons (containing 10–12 MJ/kg). Even so, except
for maritime hunters of fatty fish (salmon) and mammals (whales, seals), lipids usually
supplied no more than 20% of food energy in preagricultural societies.
The extremes of daily intakes of animal protein among the remaining foraging
populations studied after 1950 range from more than 300 g/capita among Inuit feeding
on whales, seals, fish, and caribou to less than 20 g a day for foragers in arid African
environments subsisting mainly on nuts and tubers (Smil, 1994). Eaton and Konner
(1997) used nutrient analyses of wild plant and animal foods eaten by recent gather-
ers and hunters in order to estimate the dominant composition of prevailing preagri-
cultural diets. They concluded that compared to the typical recent US intakes they
were more than twice as rich in fiber, potassium, and calcium, but contained less than
one-third of today’s sodium consumption.
Prehistoric survival modes and diets were extremely diverse but this fact has not
prevented some anthropologists making inadmissible generalizations. Undoubtedly,
for some groups the total foraging effort was low, only a few hours a day, and this fact,
confirmed by some modern field surveys, led to the portrayal of foragers as “the orig-
inal affluent society” (Sahlins, 1972). This conclusion, based on very limited and
highly debatable evidence, ignored the reality of much of the hard, and often danger-
ous, work in foraging and the frequency with which environmental stresses repeatedly
affected most foraging societies. Seasonal food shortages in fluctuating climates
necessitated the eating of unpalatable plant tissues and led to weight loss, low fertility,
high infant mortalities, infanticide and often to devastating famines (Smil, 1994).
Traditional agricultures
In comparison to foraging, traditional farming nearly always required higher inputs of
human energy (and later also of animal labor), but it could support higher population
densities and provide a more reliable food supply. Whereas foraging (except for mar-
itime hunting) could support no more than a few people per 100 hectares (ha) of terri-
tory used for gathering and hunting, early traditional agricultures managed to support
at least one person/ha of arable land (Fig. 3.1). By the end of the 19th century China’s
nationwide mean was above five people/ha, and double cropping of rice and wheat in
the most fertile areas could yield enough to feed 12–15 people/ha (Smil, 1994).
A brief history of food production 27
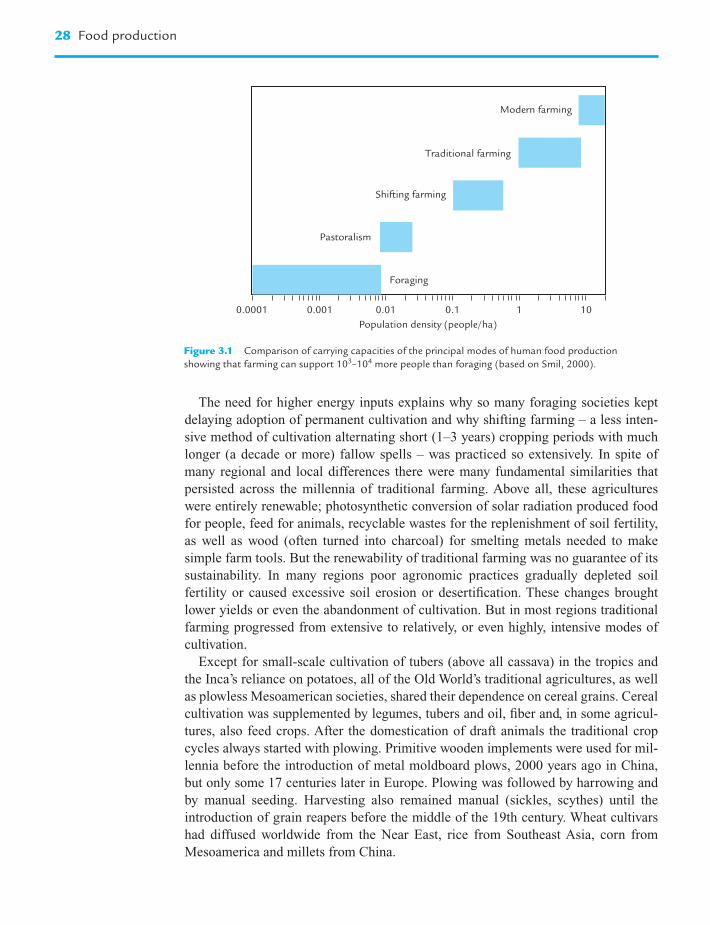
The need for higher energy inputs explains why so many foraging societies kept
delaying adoption of permanent cultivation and why shifting farming – a less inten-
sive method of cultivation alternating short (1–3 years) cropping periods with much
longer (a decade or more) fallow spells – was practiced so extensively. In spite of
many regional and local differences there were many fundamental similarities that
persisted across the millennia of traditional farming. Above all, these agricultures
were entirely renewable; photosynthetic conversion of solar radiation produced food
for people, feed for animals, recyclable wastes for the replenishment of soil fertility,
as well as wood (often turned into charcoal) for smelting metals needed to make
simple farm tools. But the renewability of traditional farming was no guarantee of its
sustainability. In many regions poor agronomic practices gradually depleted soil
fertility or caused excessive soil erosion or desertification. These changes brought
lower yields or even the abandonment of cultivation. But in most regions traditional
farming progressed from extensive to relatively, or even highly, intensive modes of
cultivation.
Except for small-scale cultivation of tubers (above all cassava) in the tropics and
the Inca’s reliance on potatoes, all of the Old World’s traditional agricultures, as well
as plowless Mesoamerican societies, shared their dependence on cereal grains. Cereal
cultivation was supplemented by legumes, tubers and oil, fiber and, in some agricul-
tures, also feed crops. After the domestication of draft animals the traditional crop
cycles always started with plowing. Primitive wooden implements were used for mil-
lennia before the introduction of metal moldboard plows, 2000 years ago in China,
but only some 17 centuries later in Europe. Plowing was followed by harrowing and
by manual seeding. Harvesting also remained manual (sickles, scythes) until the
introduction of grain reapers before the middle of the 19th century. Wheat cultivars
had diffused worldwide from the Near East, rice from Southeast Asia, corn from
Mesoamerica and millets from China.
28 Food production
Foraging
Pastoralism
Shifting farming
Traditional farming
Modern farming
Population density (people/ha)
0.0001 0.001 0.01 0.1 1 10
Figure 3.1 Comparison of carrying capacities of the principal modes of human food production
showing that farming can support 103–104 more people than foraging (based on Smil, 2000).

Continuous primacy of grains in crop cultivation is due to the combination of their
relatively high yields (two or three times higher than legume harvests), good nutritional
value (high in filling, easily digestible carbohydrates, moderately rich in proteins),
relatively high energy density at maturity (at 13–15 MJ/kg roughly five times higher
than for tubers), and low moisture content (�14%) suitable for long-term storage.
Dominance of a particular species has been largely a matter of environmental condi-
tions and taste preferences. Without understanding the nutritional rationale for their
actions all traditional agricultures combined the cultivation of cereal and legume grains
thus assuring complete amino acid supply in largely vegetarian diets. The Chinese
planted soybeans, beans, peas, and peanuts to supplement millets, wheat and rice.
In India protein from lentils, peas, and chickpeas enriched wheat and rice. In Europe
the preferred combinations included peas and beans with wheats, barley, oats, and rye,
in West Africa peanuts and cowpeas with millets, and in the New World corn and beans.
The principal means of agricultural intensification included more widespread and
more efficient use of draft animals, increasing fertilization and regular crop rotations,
more frequent irrigation in arid regions, and multicropping in the places where cli-
mate could support more than a single crop per year. The use of draft animals (horses,
mules, oxen, water buffaloes, camels, donkeys) eliminated the most exhaustive field
work and it also sped up considerably many farmyard tasks (threshing, oil pressing),
improved the quality of plowing (and later also of seeding), allowed for drawing of
water from deeper wells for irrigation. The introduction of collar harness, invented in
China about two millennia ago, iron horseshoes, and heavier animal breeds made field
work more efficient (Smil, 1994). Feeding larger numbers of these animals eventually
required further intensification to produce requisite feed crops.
Irrigation and fertilization moderated, if not altogether removed, the two key
constraints on crop productivity, shortages of water and nutrients. Unaided gravity
irrigation could not work on plains and in river valleys with minimal stream gradients;
the invention and introduction of a variety of simple mechanical, animal- and people-
driven water-lifting devices (mostly in the Middle East and China) solved this chal-
lenge (Molenaar, 1956). Fertilization involved recycling of crop residues and
increasingly intensive applications of animal and human wastes. Extensive practices
used no manure, whereas peak manuring rates in the 19th century Netherlands and in
the most productive provinces in China surpassed 20 t/ha. Green manuring, cultivation
of leguminous cover crops (clovers, vetches) which were then plowed under, was
widely used in Europe ever since ancient Greece and Rome, and it has also been
widely employed in east Asia (Smil, 2001). Even so, nutrient deficiencies commonly
limited traditional crop productivity.
Growing of a greater variety of crops lowered the risk of total harvest failure,
discouraged the establishment of persistent pests, reduced erosion, and maintained
better soil properties. Crop rotations were chosen to fit climatic and soil conditions
and dietary preferences. In poor societies they could substantially improve food
self-sufficiency and food security at the local level. Traditional varieties of crops and
their rotation schemes were enormous. For example, Buck’s (1937) survey of Chinese
farming counted nearly 550 different cropping systems in 168 localities. The adoption
of new crops – most notably the post-1500 introductions of such New World staples
A brief history of food production 29

as corn and potatoes and such versatile vegetables as tomatoes and peppers – had an
enormous impact on food production throughout the world. In spite of these innova-
tions preindustrial agricultures brought only very limited improvements in average
harvests. For example, European wheat yields, except in the Netherlands and the UK,
did not begin to rise decisively before the last decade of the 19th century (Smil, 1994).
Traditional farming also provided no more than basic subsistence diets for most of the
people. Even during fairly prosperous times typical peasant diets, although more than
adequate in terms of total food energy, were highly monotonous and not very palatable.
In large parts of Europe bread (mostly dark, and in northern regions with little or no
wheat flour), coarse grains (oats, barley, buckwheat), turnips, cabbage, and later potatoes,
were the everyday staples. Typical rural Asian diets were, if anything, even more domi-
nated by rice or coarse grain (millet, buckwheat). In many cases traditional peasant diets
also contained less animal protein than did the earlier intakes with higher consumption of
wild animals, birds, and aquatic species. This qualitative decline was not offset by a more
equitable availability of basic foodstuffs: major consumption inequalities, both regional
and socioeconomic, persisted until the 19th century. The majority of people in all tradi-
tional farming society had to live on food supplies that were below the level required for
a healthy and vigorous life and different kinds of malnutrition were common.
Documentary and anthropometric evidence does not demonstrate any consistent
upward trend in per capita food supply across the millennia of traditional farming.
Regardless of the historical period, environmental setting and prevailing mode of
cropping and intensification, no traditional agriculture could consistently produce
enough food to eliminate extensive malnutrition. More importantly, no preindustrial
agriculture could prevent recurrent famines. Droughts and floods were the most com-
mon natural triggers, and as a recent study demonstrates these natural disasters often
represented the worst imaginable climatic teleconnections arising from the El Niño-
Southern Oscillation (ENSO) whose effects are felt far beyond the Pacific realm
(Davis, 2001). The combined (and never to be accurately quantified) toll of large-scale
famines that repeatedly swept late 19th century India and China, and that also severely
affected parts of Africa and Brazil, amounted to tens of millions of casualties.
In China in the 1920s peasants recalled an average of three crop failures brought by
such disasters within their lifetime that were serious enough to cause famines (Buck,
1937). Some famines were so devastating that they remained in collective memory for
generations and led to major social, economic and agronomic changes: the famous
collapse of Phytophthora-infested Irish potato crops between 1845 and 1852, or the
great Indian drought-induced famine of 1876–79. The world’s most devastating
famine, in China between 1958 and 1961, was only secondarily a matter of drought;
the primary causes lie in the delusionary Maoist policies (Smil, 1999a).
Modern farming
New energy sources and three intertwined strands of innovation explain most of the
success of modern farming. In contrast to traditional agricultures, nonrenewable fossil
fuels and electricity are essential inputs in modern farming. They are needed to build
and operate agriculture machinery whose nearly universal adoption mechanized
30 Food production

virtually all field and crop-processing tasks. The second key innovation is the use of
fossil energies and electricity to extract and synthesize fertilizers and pesticides. The
third key advance was to develop and diffuse new crop varieties responsive to higher
inputs of water and nutrients. These innovations brought higher and more reliable
yields, they displaced draft animals in all rich countries and greatly reduced their
importance in the poor ones. The replacement of muscles by internal combustion
engines and electric motors and the substitution of organic recycling by inorganic fer-
tilizers have drastically cut labor needs in agriculture and led to huge declines in rural
populations and to the worldwide rise of urbanization. For example, in the US rural
labor fell from more than 60% of the total workforce in 1850 to less than 40% in 1900,
15% in 1950, and a mere 2% since 1975 (US Bureau of the Census, 1975).
Fertilizers made the earliest, and also the greatest, difference. The use of chemically
treated phosphates became common after the discoveries of new rock deposits in
Florida in 1888, and in Morocco in 1913. After 1850 nitrogen from Chilean nitrates,
supplemented later by the recovery of ammonium sulfate from coking ovens, provided
the first inorganic alternative to organic recycling. The nitrogen barrier was finally bro-
ken by the invention of ammonia synthesis from its elements by Fritz Haber and the sub-
sequent rapid commercialization of the process by Carl Bosch (Smil, 2001). This
invention allowed, for the first time in history, to optimize nitrogen inputs on large scale.
Modern civilization is now critically dependent on the Haber–Bosch synthesis of
ammonia. Recent global applications of nitrogen fertilizers to field crops – and also to
permanent grasslands and tree (orchard, palm) and shrub (coffee, tea) plantations –
have been in excess of 80 million tonnes (Mt) N/year, mostly in the form of urea (IFA,
2001; Fig. 3.2). The process currently provides the means of survival for about 40% of
the world’s population. Only half as many people as are alive today could be supplied
A brief history of food production 31
1950 1960 1970 1980 1990 20000
10
20
30
40
50
60
70
80
90
100
Nit
roge
n f
erti
lizer
pro
du
ctio
n (
Mt
N/y
ear)
Figure 3.2 Post-1950 growth of nitrogen fertilizer production.

by traditional cultivation lacking any synthetic fertilizers and producing very basic,
and overwhelmingly vegetarian, diets; and prefertilizer farming could provide today’s
average diets to only about 40% of the existing population (Smil, 2001). Western
nations, using most of their crop production for feed, could easily reduce their depen-
dence on synthetic nitrogen by lowering their high meat consumption. Populous poor
countries, where all but a small share of grain is eaten directly, do not have that option.
Most notably, synthetic nitrogen provides about 75% of all inputs in China. With some
75% of the country’s protein supplied by crops, more than half of all nitrogen in
China’s food comes from synthetic fertilizers.
In addition to nitrogen the world’s crops now receive also close to 15 Mt of phos-
phorus, and about 18 Mt of potassium a year (IFA, 2001). This massive use of fertil-
izers has been accompanied by the expanding use of herbicides used to control weeds,
and pesticides to lessen insect and fungal infestations. Pesticide use has often been
much maligned and many of these chemicals, especially following improper applica-
tions, undoubtedly leave undesirable residues in harvested products, but their use has
helped to reduce the still excessively large preharvest losses.
Farming mechanization was first accomplished in the US and Canada. Its most
obvious consequence was the precipitous decline in agricultural labor requirements.
For example, in 1850 an average hectare of the US wheat needed about 100 hours of
labor; by 1900 the rate was less than 40 hours/ha, and 50 years later it sank below
2 hours/ha (US Bureau of the Census, 1975). Until the 1950s agricultural mechaniza-
tion proceeded much more slowly in Europe, and in the populous countries of Asia
and Latin America it really started only during the 1960s. Today’s agriculture operates
with more than 26 million tractors of which about 7 million are in developing coun-
tries (FAO, 2001). Mechanization also completely transformed crop processing tasks
(threshing, oil pressing, etc.) and fuel and electric pumps greatly extended field irriga-
tion. The global extent of crop irrigation more than quintupled between 1900 and
2000, from less than 50 to more than 270 million hectares, or from less than 5% to
about 19% of the world’s harvested cropland (FAO, 2001). Half of this area is irrigated
with pumped water, and about 70% is in Asia.
The key attribute common to all new high-yielding varieties (HYV) is their higher
harvest index, that is the redistribution of photosynthate from stalks and stems to har-
vested grain or roots. Straw:grain ratio of wheat or rice was commonly above 2:1 in
traditional cultivars, whereas today’s typical ratio is just 1:1 (Smil, 1999b). HYVs
receiving adequate fertilization, irrigation, and protection against pests did responded
with much increased yields. This combination of new agronomic practices, intro-
duced during the 1960s, became widely known as the Green Revolution and the term
is not a misnomer as the gains rose very rapidly after the introduction of these reward-
ing, but energy-intensive, measures. Higher reliance on intensively cultivated grain
monocultures, narrowing of the genetic base in cropping and environmental impacts
of agricultural chemicals have been the most discussed worrisome consequence
of this innovation, but all of these concerns can be addressed by better agronomic
practices (Smil, 2000).
Aggregate achievements of modern farming have been impressive. Between 1900
and 2000 the world’s cultivated area expanded by about one-third, but the global crop
32 Food production

harvest rose nearly sixfold. This was because of a more than fourfold increase of aver-
age crop yields made possible by a more than 80-fold increase of energy inputs to field
farming (Smil, 2000). But even though the global mean harvest of all cereals more
than doubled between 1950 and 2000 (Fig. 3.3), there are still large gaps between
average yields and best (not record) harvests (FAO, 2001). Global corn harvest aver-
ages just over 4 t/ha but farmers in Iowa are bringing in close to 10 t/ha. Average wheat
yield (spring and winter varieties) is 2.7 t/ha but even national averages in the UK, the
Netherlands or Denmark Western are more than 8 t/ha today. Extensive diffusion of
HYV of rice raised the global mean yield to almost 4 t/ha, whereas Japan or China’s
Jiangsu average in excess of 6 t/ha.
Higher cereal and tuber yields freed more agricultural land for nonstaple species,
above all for oil and sugar crops. Higher cereal yields have also allowed for more and
more efficient animal feeding in rich countries where the abundance of meat and
dairy products has made high-protein diets much more affordable. HYVs also raised
the food output of many developing countries above subsistence minima. However, a
substantial gap still divides the typical agricultural performances of rich and poor
countries, and, given the far greater social inequalities in the latter group, this produc-
tion disparity translates readily into continuing large-scale presence of malnutrition in
scores of African, Asian, and Latin American countries.
Current food production and supply
A word of caution first: only a minority of food production and consumption figures
readily accessible in FAO databases and widely used in assessments of global food
availability and needs is derived from the best available national statistics which may
themselves contain many inaccuracies even when prepared by the most advanced
statistical services of developed countries. Although some of the developing countries
Current food production and supply 33
2000199019801970196019501.0
1.5
2.0
2.5
3.0
3.5
Cer
eal gr
ain
yie
lds
(t/h
a)
Figure 3.3 Post-1950 growth of average cereal grain yields epitomizing the rising productivity of modern
farming (plotted from data in FAO, 2001).

(notably China and India) have massive statistical bureaucracies and issue a great
number of regular reports many of their numbers are known to be highly inaccurate.
For example, for many years Chinese official statistics listed less than 100 million
hectares (Mha) as the total of the country’s cultivated land (about 95 Mha until 2000)
although many people in Beijing bureaucracy and some foreign experts knew that
total was vastly undervalued. China now admits to having 130 Mha of cultivated land
(National Bureau of Statistics, 2000) and the best remote sensing studies based on
classified US information indicate 140, or even 150 Mha (Smil, 1999c). This change
means, of course, that every official yield figure for the past 20 years is inaccurate. And,
obviously, countries with protracted civil wars (several in Africa, Colombia) or with a
disintegrating central government (Indonesia) are in no position to collect and publish
any reliable agricultural statistics. Given these realities it is not surprising that most of
the numbers for most of the developing nations that appear in FAO databases are just the
best expert estimates made in the organization’s Rome headquarters (FAO, 2001).
These realities mean that both exaggerations and underestimates are common and
that often the resulting numbers may not be accurate reflections of the actual situation
but are best used in order to derive fair approximations of the current state of agricul-
tural affairs. It should also be noted that according to the FAO developed countries
numbered 1.3 billion people in the year 2000, the developing ones 4.7 billion, a divi-
sion slightly different from that used by the UN’s population experts (UN, 2001).
These realities should be kept in mind when considering the following brief review of
current food output and availability.
Global food production
Today’s food producers fall mostly into four uneven categories. Several thousand
large agribusiness companies, most of them in North America and Europe, control
extensive areas of food and feed crops and highly concentrated meat production in
giant feedlots. Their production goes directly to large-scale food processors or is des-
tined for export. Several million highly mechanized family-owned farms in affluent
countries rely on intensive practices to achieve high crop and animal productivities.
Tens of millions of the most successful farmers in the most productive agricultural
regions of many developing countries (e.g., China’s Jiangsu and Guangdong or India’s
Punjab) use generally high levels of the best locally available inputs in order to pro-
duce food beyond their family’s and region’s need. And hundreds of millions of sub-
sistence peasants, either landless or cultivating small amounts of often inferior land,
use inadequate inputs, or no modern means of production at all, to grow barely
enough food for their own families.
Cereal grains continue to dominate the global crop harvest. Their annual output is
now just above 2 billion tonnes. Developing countries produce nearly 60% of all
grain, with twice as much rice as wheat (about 570 vs. 270 Mt in 2000), but in per capita
terms their output (about 260 kg/year) is only about 40% of the developed countries
mean (660 kg/year). Most of the poor world’s grain (more than 85%) is eaten directly,
whereas most of the rich world’s grain (more than 60% during the late 1990s) is fed
34 Food production

to animals. Consequently, actual per capita supply of processed food cereals is still
about 25% higher in developing countries (165 vs. 130 kg/year), reflecting simpler
diets dominated by grain staples. Not surprisingly, rich countries enjoy even higher
per capita disparities in production of nonstaple crops, with the differences being
particularly large for sugar (30 vs. 15 kg/year) and meat (almost 80 vs. 25 kg).
Per capita consumption of legumes has been declining for several generations in
every country where pulses previously played a critical nutritional role. Only India’s
annual per capita consumption of legumes remains above 10 kg/year (FAO, 2001).
In contrast, no other crop diffusion in agricultural history has been as rapid and as
economically far-reaching as the cultivation of soybeans for feed. US soybean plant-
ings rose from a few thousand hectares in the early 1930s to more than 20 Mha since
the early 1970s, and they now produce more than 50 Mt/year. Brazilian soybean pro-
duction rose even faster, from a negligible total in the early 1960s to more than 20 Mt
by the early 1990s. These two countries now produce two-thirds of the global soybean
harvest, virtually all of it for animal feed.
Rising affluence combined with concerns about healthy diets has resulted in a
steady growth of fruit production. Global fruit output has tripled since 1950, but this
does not convey the unprecedented variety of fruits, including many tropical imports
as well as winter shipments of subtropical and temperate species from the southern
hemisphere, that are now available virtually year-round in all rich countries. The trend
of rising fruit production recently has been most obvious in rapidly modernizing
China where fruit harvests (now also increasingly for export) rose more than 10-fold
(from less than 7 to more than 70 Mt) between 1980 and 2000 (National Bureau of
Statistics, 2000).
With global annual output of nearly 500 Mt cow’s milk is the most important animal
food. Annual output of all kinds of milk amounts to about 570 Mt. Per capita avail-
abilities of dairy products are large in North America and Western Europe (in excess
of 250 kg/year) and negligible in traditionally nonmilking societies of East Asia.
Pork, with about 80 Mt/year and rising, is by far the most important meat worldwide,
with China and the US slaughtering the largest number of animals. Total meat output,
including poultry, is now over 200 Mt a year, prorating to almost 80 kg/capita in rich
countries and to about 25 kg/capita in the poor world. Poultry production (near
60 Mt/year) is now ahead of the combined beef and veal output and it will continue to
rise. Consumption of hen eggs is now at more than 40 Mt a year, and recent rapid growth
of aquaculture (its combined freshwater and marine output is now close to 30 Mt
a year, equal to nearly a quarter of ocean catch) has put cultured fish, crustaceans, and
mollusks ahead of mutton.
After a period of decline and stagnation the global marine catch began rising once
more during the mid-1990s and is now close to 100 Mt/year but major increases are
highly unlikely. A conservative assessment of the global marine potential concluded
that by 1996 the world ocean was being fully fished, with about 60% of some 200 major
marine fish resources being either overexploited or at the peak of their sustainable
harvest (FAO, 1997). Consequently, if long-term marine catches were to be kept at
around 100 Mt a year then 50 years from now the population growth would cut per
capita fish supply by more than half compared to the late 1990s level. The importance
Current food production and supply 35

of this harvest is due to its nutritional quality. During the late 1990s the world’s aver-
age per capita supply of some 14 kg of marine species contained only a few percent
of all available food energy, but it supplied about one-sixth of all animal protein. More
importantly, aquatic species provide more than a third of animal protein to at least
200 million people, mostly in east and southeast Asia (FAO, 2001).
Food supply
The world’s recent edible crop harvests prorate to about 4700 kcal/day per capita, but
nearly half of the cereal production, worth about 1700 kcal/day, is fed to animals, and
postharvest crop losses amount to some 600 kcal/day (Smil, 2000). This leaves about
2400 kcal/day of plant food and with some 400 kcal/day from animal foods (including
aquatic products) the average per capita availability adds up to roughly 2800 kcal/day,
well above a generous estimate of average needs of 2200 kcal/capita. Similarly, the
world’s mean daily protein supply of 75 g/capita is well above the needed minimum.
An egalitarian global civilization would thus have no problems with adequate nutrition.
Equitable distribution of available food among the planet’s more than 6 billion people
would provide enough protein even if the global food harvests were to be some 10%
lower than they are today.
In the real world these adequate global means hide, as do other global averages,
large inter- and intranational differences. All Western nations enjoy uniformly high per
capita food availabilities averaging about 3200 kcal/day. Their mean per capita supply
of dietary protein is about 100 g/day, including about 55 g from animal foods. No
elaborate calculations are needed to conclude that the average per capita food supply
is more than adequate in all affluent countries. Because the actual requirements of
mostly sedentary populations are no more than 2000–2200 kcal/day it is no exaggera-
tion to label the resulting food surpluses (at least 1000–1200 kcal/day and up to
1600 kcal/day) as obscene.
After all, even when leaving aside the large energy and protein losses in animal feed-
ing, at least 30% of all food available at the retail level in Western societies is wasted!
Average Western diets in general, and the North American one in particular, also contain
excessive amount of lipids, which now supply 30–40% of all food energy compared to
the average of less than 20% in developing countries and to shares below 15% in the
poorest societies (FAO, 2001). Surfeits of food energy and lipids are the two key nutri-
tional factors implicated in the increase of obesity and diabetes and in a high frequency
of cardiovascular disease (see Chapters 9–11). Fortification of many foodstuffs (from
flour to juices) with vitamins and minerals and a fashionable use of dietary supplements
(including recurrent megadose manias) by increasingly health-conscious segments of
the aging population would suggest that there are very few micronutrient deficiencies.
This is, unfortunately, not true as clinical and biochemical studies in the US show that
intakes of calcium, iron, and zinc are not adequate in some groups (Pennington, 1996).
Given the obviously high incidence of overweight and obesity it is not surprising
that hunger and malnutrition in affluent nations have received so little attention,
but their extent is far from negligible (Riches, 1997). Poppendieck’s (1997) estimates
36 Food production

that 22–30 million Americans cannot afford to buy enough food to maintain good
health have been questioned, but even the most conservative estimates acknowledge
that 10–20 million poor Americans could not feed themselves adequately without
assistance, and that far from all of them are actually receiving it. The coexistence
of undernutrition and widespread obesity is thus one of the most peculiar features of
America’s current nutritional situation.
Japan, which is highly dependent on food imports, is the only high-income country
with per capita food supply below 3000 kcal/day (the rate has been steady at about
2900 kcal/day for nearly two decades). Specific features of the country’s food con-
sumption include the already noted world’s highest per capita intake of aquatic products,
exceptionally high intakes of soybeans (eaten mostly as beancurd), and very low con-
sumption of sugar. Average food availability in China is now almost as high as in Japan
(close to 2800 kcal/day), but in spite of impressive post-1980 diversification (Fig. 3.4)
its variety and quality is still much lower. Moreover, unlike in a highly egalitarian Japan,
China’s mean hides large differences between coastal and interior provinces.
India and Indonesia in the late 1990s were, respectively, at about 2400 and
2600 kcal/day. This would have provided adequate nutrition for everybody only if the
two countries had a perfectly egalitarian access to food; in reality, highly skewed
income distribution makes India the country with the largest number of undernour-
ished people (FAO, 2000). Many sub-Saharan African countries average less than
2200 kcal/day, some even less than 2000 kcal/day, and these obviously inadequate
food supplies are reflected in the world’s shortest life expectancies at birth. Even when
adequate in terms of total energy and protein, typical diets in most developing coun-
tries are monotonous. And, unlike in affluent nations where nearly all traces of sea-
sonal food supply have been erased by international trade, diets in many poor
countries still strongly reflect the seasonality of plant harvests or fish catches.
Current food production and supply 37
200
175
150
50
25
01970 1980 1990 1999
An
nu
al su
pp
ly (
kg/c
ap
ita)
Grain
Meat
Fruit
Aquatic products
Figure 3.4 Dramatic changes in China’s average per capita food supply brought by Deng Xiaoping’s
post-1980 economic reforms exemplify a rapid dietary transition in a modernizing country. Based on
data from State Statistical Bureau (1980–2000); these figures exaggerate actual meat consumption
(see the text for details).

Malnutrition in the developing world
Food deficits, regardless of whether they are on national, local or individual level, or
if they range from marginal to crippling, are rarely caused by absolute physical short-
ages. Such cases arise repeatedly only as a result of protracted civil wars (recently in
Afghanistan, Angola, Ethiopia, Mozambique, Somalia, and Sudan) and temporarily
as an aftermath of major natural catastrophes. Chronic undernutrition and malnutri-
tion result from inadequate individual or group access to food that is strongly related
to social status and income. This conclusion is true for both the richest as well as the
poorest countries.
FAO’s past estimates of the global share of undernourished people ranged from a
clearly exaggerated fraction of two-thirds in the late 1940s (an overestimate caused
largely by unrealistically high assumptions regarding average protein needs) to less
than one-seventh in the early 1990s. The latest estimate, for the period between 1996
and 1998, adds up to 826 million undernourished people, or about 14% of the world’s
population at that time (FAO, 2000). As expected, the total is highly unevenly split,
with 34 million undernourished people in the developed and 792 million people in the
developing world. The highest shares of undernourished population (about 70% of the
total) are now in Afghanistan and Somalia, whereas the rates for India and China are,
respectively, about 20% and just above 10%. These shares make India the country
with the largest number of undernourished people (just over 200 million, or roughly
a quarter of the world’s total, spread pretty much all around the country), whereas
China’s aggregate (mostly in the northwestern and southwestern interior provinces) is
about 140 million.
There are, of course, different degrees of undernutrition, ranging from mildly under-
weight (with body mass index of 17–18.5) to severely underweight (with body mass
index below 16; the normal healthy range is 18.5–25). The FAO (1996) also put the
number of stunted children (with low height-for-age) at 215 million, underweight chil-
dren (low weight-for-age) at 180 million, and wasted children (low weight-for-height)
at 50 million. As there are many uncertainties regarding both the data and assumptions
that go into the process of comparing food supplies and needs, all of these figures must
be seen as informative estimates rather than as accurate totals. Nevertheless, there can
be no doubt about the enormous human and socioeconomic toll of this nutritional dep-
rivation. Perhaps the worst health impact arises from the well-documented effect of
undernutrition on early brain development (Brown and Pollitt, 1996).
Shortages of food energy and dietary protein are not the only causes of serious mal-
nutrition as micronutrient deficiencies are even more common. Blindness caused by
shortages of vitamin A is among the most cruel consequences of inadequate diets. The
xerophthalmia syndrome includes night reversible blindness caused by lack of retinol
in the eye’s retina, corneal ulceration and eventually irreversible loss of eyesight. In
addition, low levels of vitamin are associated with higher mortality from respiratory
and gastrointestinal diseases, and with their more severe course. FAO estimates that
the total population at risk is well over half a billion, that there are about 40 million
preschool children with vitamin A deficiency, and that perhaps half a million of them
go blind annually (FAO, 1996).
38 Food production

Some micronutrient deficiencies have environmental origins. The World Health
Organization estimated that 1.6 billion people, or more than a quarter of the world’s
population, have some degree of iodine deficiency (WHO, 1993). Estimates of the
total number of people with goiter, the condition almost always associated with some
mental impairment, are as high as 600 million (Lamberg, 1993). WHO also credits
iodine deficiencies during pregnancy with at least 25 million seriously brain-damaged
children and nearly six millions cretins, whose severe mental retardation is combined
with hearing loss or mutism and abnormal body movements. As for the economic
impact, Arcand (2000) concluded that if the sub-Saharan countries with average
dietary supply below the minimum requirement in 1960 had eliminated hunger by
raising the average per capita food availability to nearly 2800 kcal/day (i.e., essentially
China’s current mean) their per capita GDP in 1990 could have been as much as
$3500 rather than the actual $800.
Future food needs
Three key factors will drive future demand for food. By far the most important is the
continuing population growth throughout the developing world. Second, is the all too
obvious need to close the gap between today’s inadequate food intakes that have to be
endured by some 800 million people throughout the poor world and the minima com-
patible with healthy and productive lives. The third factor is the further improvement
of the quality of diets in poor countries (given the great existing food surplus, getting
rid of nutritional inadequacies throughout the rich world should not call for any
increases in production). At least three principal factors will determine the eventual
outcome: the level of agricultural investment and research; the extent and tempo of
dietary transitions, particularly the higher consumption of animal food in today’s
developing countries; the success in making future food production more compatible
with biospheric limits and services; and the fate of genetic engineering.
Population growth
After decades of accelerating growth the global rate of population increase peaked at
just over 2% a year during the late 1960s, and gradual declines of fertilities also
speeded up the arrival of the absolute peak, at about 86 million people a year, during
the latter half of the 1980s and the annual increase was down to 77 million people by
the year 2000 (UN, 1998, 2001). As a result population projections issued during the
1990s had repeatedly lowered the long-term global forecasts for the next 50 years. The
medium version of the 1998 revision envisaged just 8.9 billion people by the year
2050, down from 9.4 billion forecast in 1996, and 9.8 billion in the 1994 revisions
(UN, 1998). And the high variant in 1998 was well below 12 billion people by the year
2050, in line with increasing indications that yet another doubling of human popula-
tion to 12 billion people is unlikely (Lutz et al., 2001).
Future food needs 39

But the latest UN (2001) projection raised its medium 2050 forecast to 9.3 billion
(Fig. 3.5). The difference of some 400 million people above the 1998 forecast is
explained largely by the assumption of somewhat higher fertilities for the 16 develop-
ing countries whose fertility has not, so far, shown any sustained decline. There is a
different kind of uncertainty concerning the rich world’s population. Without substan-
tial immigration it would start declining as a whole within a few years and by the year
2050 it would be barely above one billion, 20% below its current total (as already
noted, UNO’s and FAO’s definitions of developed and developing populations are not
identical: they differ by about 100 million people). With continued immigration it
would be more or less stable, reaching 1.8 billion in 50 years. Even then many
European nations and Japan would experience substantial population declines. Russia’s
case is particularly noteworthy, as it now appears that there is little chance of revers-
ing its population decline brought on by economic deprivation, social disintegration
and exceptionally high rates of alcoholism. As a result, Russia may have 30 million
fewer people by the year 2050. By that time the US population will, most likely,
approach 340 million.
Inherent uncertainties of long-range forecasting aside, there is no doubt that virtu-
ally all the net population increase of the next two generations will take place in
today’s developing world, and that the global population of 2050 will, most likely, be
50% larger than it is today. Moreover, most of the additional population growth of
some 2.8–3.2 billion people will be concentrated in nations whose agricultural
resources, although absolutely large, are already relatively limited. Brazil is the
only modernizing populous country (i.e., with more than 100 million people) with
abundant reserves of arable land and water (Fig. 3.6). Fifty years from now India, after
adding nearly 600 million people, would have a population more than 50% larger than
today and would be, with just over 1.5 billion, the world’s most populous country, with
China a very close second. Three African and two Asian countries would add more
than 100 million people each: Nigeria, Pakistan, Indonesia, Congo, and Ethiopia.
As a group these nations would have to increase their food harvests by two-thirds
merely to maintain their existing, and in many respects inadequate, diets.
40 Food production
1950 2000 2050
High
Medium
Low
Po
pu
lati
on
(b
illio
ns)
12
11
10
9
8
7
65
4
3
2
1
0
Figure 3.5 The UN’s latest long-term projections of global population growth (UN, 2001).

Only Congo and Nigeria have relatively low population density per hectare of cul-
tivated farmland and large untapped agricultural potential. At the same time, the late
20th-century record of these two countries makes it hard to imagine that they will be
the ones to mobilize their resources effectively and to evolve a civil society deter-
mined to bring widespread economic advances. China and Indonesia are already
the paragons of highly intensive cropping, and India and Pakistan are close behind.
But, some poorly informed and sensationalized judgments notwithstanding (Brown,
1995), there is more hope for China’s farming than is the case with perhaps any other
large populous country (Smil, 1995). As already noted, China has about 50% more
farmland than has been officially acknowledged (which means that its actual average
yields are substantially lower than reported) and it has many opportunities for increas-
ing the productivity of its cropping (Smil, 1999c). India’s situation, though undoubt-
edly highly challenging, appears to be more hopeful than the Indonesian or Pakistani
prospect. As for Ethiopia, natural aridity affects large parts of its territory and already
limits its food production capacity.
Improved food intakes
This is a very broad category of concerns as it embraces both overall quantitative
gains and specific qualitative changes; and most of the eventual demand due to these
needs is also very difficult to quantify because its future levels will be determined by
complex interplays of economic, political, social, and environmental factors. Neverthe-
less, several general conclusions are fairly solid. In those poor countries that have
been peaceful and whose agriculture has not been neglected, the elimination of the
worst nutritional deficiencies is not primarily a matter of higher output but rather of
improved access to food for the poorest groups, and hence a matter amenable to fur-
ther political and economic interventions. Countries living with years, or even decades,
Future food needs 41
0.5
0.4
0.3
0.2
0.1
0.0
0 200 400 600 800 1000 1200
Population (million)
India
Nigeria
Brazil
Pakistan
Indonesia
BangladeshChinaFa
rm lan
d (
ha/c
ap
ita)
Figure 3.6 Brazil and Nigeria are the only two developing countries with considerable reserves of
potentially arable land; in all other populous modernizing countries future increases of food output will
have to come from further intensification of cropping. Plotted from data in FAO (2001).

of conflict have no realistic hope for better nutrition without peace. Unfortunately, if
the past two generations are any guide for the future then the experience of sub-
Saharan Africa, nutritionally the world’s worst afflicted region, offers little hope.
A massive epidemic of autoimmune deficiency syndrome (AIDS) makes African
recovery even more unlikely.
Most of the future demand for improved food supply that has a high likelihood of
being met by increasing domestic production rather than by food aid will thus come
as larger populations will be earning higher incomes in Asian and Latin American
countries. Judging by the experience of every country that has undergone economic
modernization, perhaps the most obvious feature of this qualitative change will be the
higher demand for animal foods. This appears to be a truly universal trend as only a
very small proportion of humanity voluntarily chooses strictly vegetarian diets and
there is also a strong evolutionary argument in favor of omnivory.
Well-documented studies have shown that the closest primate relatives of our
species – the two chimpanzee species Pan troglodytes and Pan paniscus – regularly
hunt colobus monkeys and eat other small vertebrates (Stanford, 1998). Moreover,
Aiello and Wheeler (1995) argue that the only way humans could accommodate larger
brains without raising their average metabolic rate was by reducing the size of another
metabolically expensive organ, and that, unlike liver, heart and kidneys, the gastroin-
testinal tract was the only such tissue whose size could be reduced by including more
digestible animal foods in the regular human diet. Plant-dominated diet supplemented
by meat is thus our evolutionary heritage and strict herbivory is a cultural adaptation.
Archaeological and anthropological evidence for human omnivory is undeniable
and a relatively recent domestication of milking animals extended the human con-
sumption of animal foods to include milk and dairy products from at least half a dozen
mammalian species. When prorated per unit of body mass, chimpanzee meat intakes
are equivalent to eating about 6–17 kg a year and this range clearly overlaps the typical
per capita meat consumption of preindustrial societies. Rates near the lower end of the
range (5–10 kg/capita) were common in those peasant societies where meat was eaten
infrequently and consumed in larger amount only during some festive occasions; most
of the pre-1980 rural China was a perfect example of this pattern of eating.
Increased demand for animal foods
As described in the previous section, affluence changed this consumption pattern but
intakes of animal foods are badly skewed in favor of high-income populations.
Industrialized nations, amounting to only a fifth of the global population total, now
produce a third of hen’s eggs, two-fifths of all meat, and three-fifths of all poultry and
cow’s milk. Animal foods now supply around 30% of all food energy in North America
and Europe, around 20% in those East Asian countries that have reached apparent
satiation levels (Japan, Taiwan) and far below 10% in the most food-deficient coun-
tries of sub-Saharan Africa (FAO, 2001). This means, as already noted, that the daily
food supply of rich nations now averages about 55 g of meat and milk protein per capita,
42 Food production

compared to just 20 g in the developing world, and the actual gap is even larger for
hundreds of millions of subsistence peasants and poor urbanites surviving on diets
virtually devoid of any animal foods.
With meat and dairy intakes being up to an order of magnitude higher in affluent
nations than in many poor countries this means that extending the current per capita
supply means of developed countries (i.e., above 250 kg for milk and close to 80 kg
for meat) to all of today’s low income countries (i.e., to 4.7 billion people), as well as
to the additional three to four billion people that will be added in those countries dur-
ing the next two generations, would call for an impossibly large expansion of feed
production. The three important questions are then as follows. Should such a goal be
seen as being at least theoretically desirable? What are the chances that developing
countries would move as rapidly, and as far, toward the affluent (Western) consump-
tion pattern as their limited resources will allow? And to what extent can we improve
the prevailing feeding efficiencies?
Only the first question has an easy answer. There is no need to present a massive sur-
vey of current nutritional understanding or to engage in polemics on behalf of, or
against, vegetarianism, a nutritional choice that most people will not consider following
voluntarily in any case, or high-level carnivory. What is abundantly clear is that humans
do not need high levels of animal food intakes either to lead healthy and productive lives
or to achieve average population longevities in excess of 70 years, and that no other
known existential benefits are predicated on consuming at least as much meat and dairy
products as the developed countries do today. Moreover, as recent experiences with
some consequences of animal feeding and rearing have demonstrated (European mad
cow disease and foot-and-mouth epizootic leading to large-scale slaughter of cattle and
sheep, and Asian bird viruses resulting in mass killings of poultry) the scale and the
very nature of meat-producing enterprises may actually be a threat to human health, or
at least a costly inconvenience. In contrast to these fairly indisputable conclusions the
pace and the extent of dietary transition is much harder to predict.
Dietary patterns
No other factor will determine the future demand for animal foods as much as the
degree of westernization of diets in developing countries in general, and in populous
Asian nations in particular. Informed discussion of this prospect must start by
acknowledging the fact that, in spite of broad similarities, there are substantial differ-
ences in meat and fat intakes among Western countries. This means that there is no
generic Western diet to which the developing countries might aspire. Although all
major indicators of quality of life are very similar for all of the affluent nations of
Western Europe, per capita supplies of meat differ by about 40%: Norwegians get less
than 60 kg/year, French almost 100 kg/year (FAO, 2001). And whereas Greeks con-
sume less than 5 kg of butter and lard a year per capita, the Finnish mean is close
to 15 kg. Such comparisons make it clear that the European pattern, although very
similar in total energy and protein intakes, spans a range of distinct categories from
the Mediterranean to the Scandinavian diets.
Increased demand for animal foods 43

Taking such differences into account, Seckler and Rock (1995) suggested that two
different patterns of food consumption should be considered when forecasting the
future composition of food intakes in developing countries. They define what they call
the Western model as the daily mean supply of more than 3200 kcal/capita with more
than 30% of food energy coming from animal foodstuffs. But a great deal of evidence
confirms that another model – what they label the Asian–Mediterranean pattern, with
overall food energy availability below 3200 kcal/capita and with animal products sup-
plying less than 25% of food energy – appears to be a more powerful attractor for
many developing countries.
Food balance sheets of the last two generations show that animal food intakes in the
economically most successful developing countries have not been moving rapidly
toward the Western consumption pattern. Egypt and Turkey have basically the same
proportion of meat in their typical diets as they had 30 years ago. Japanese meat
intakes have stabilized at around 40 kg, as did the Malaysian average. Official output
statistics would appear to put China into a different category and forecasts based on
these numbers see China as a gargantuan meat-eating nation, but a closer look shows
that the country will not move rapidly toward the Western attractor. China’s official
output statistics, and hence also FAO food balance sheets based on them, credit
the country with per capita output of about 47 kg meat in 1999, but the China
Statistical Yearbook puts actual per capita purchases of urban households at 25 kg
(unchanged in a decade!) and the meat consumption of rural families at less than
17 kg, up from about 13 kg in 1990 (National Bureau of Statistics, 2000). This means
that the eventual doubling of average nationwide per capita meat consumption would
result in a rate only marginally higher than the current value claimed by official
statistics.
Forecasts of China’s future meat consumption have also been affected by simplisti-
cally extrapolating Taiwan’s experience. The island’s very high average per capita
meat intake (about 80 kg) is not only the highest in Asia, it is even higher than the
British mean, and its very low direct cereal consumption (less than 110 kg) is below the
OECD’s mean of some 130 kg (FAO, 2001). Moreover, differences of scale between
the two countries (1.2 billion vs. some 20 million of people) and the still very limited
purchasing power of most of China’s peasants are two other factors militating against
a further rapid rise of China’s per capita meat consumption.
Finally, it must be noted that the total consumption of meat, although still slowly
rising in the US, has been declining in Europe (for example, in Germany it is down
by 15% since 1980), which means that the Western pattern is actually shifting gradu-
ally toward the alternative attractor. Consequently, there is a fairly high probability
that tomorrow’s developing world, although definitely demanding higher animal food
intakes, will not look toward yesterday’s French, Dutch, or US example. Widespread
assumptions that rising disposable incomes will be readily translated into rapidly, and
virtually universally, rising demand for meat may not come to pass. Whatever its
actual level may be, lower than anticipated demand for animal foods would be much
easier to meet, especially once a concerted commitment is made to improve the
efficiency of feeding as much as practicable. But whatever the pace and the extent of
coming dietary changes may be, the increasing carnivory could have a much lower
44 Food production

demand on agricultural resources and could also result in much reduced environmen-
tal impacts if we were to feed the animals much more efficiently.
Feeding efficiencies
Better management of grasslands, and some of their inevitable, but undesirable,
expansion in Latin America, Africa, and Asia (as nearly all new grazing land will be
created through deforestation) will supply only a small fraction of future increases in
meat and milk production and more than 90% of additional output of animal foods
will have to come from growing more concentrate feeds, above all corn and soybeans,
in direct competition with food crops. This trend has been one of the most obvious
features of the 20th-century cropping. In 1900 just over 10% of the global grain
harvest was consumed by animals; by 1950 the share surpassed 20% and now it is
approaching 50%, with national shares ranging from nearly 70% in the USA to less
than 5% in India.
But future feeding requirements are not irrevocably determined by a given demand
for animal protein. As these proteins are all of the highest quality they are mutually
substitutable and long-term dietary shifts can reduce the relative, or even absolute,
consumption of one kind of animal food while greatly increasing the demand for
another. For example, in 1950 chicken made up less than 10% of average US per capita
meat consumption, but in 2000 its share was about one-third (USDA, 1950–2001).
Consequently, a future combination of animal foodstuffs that is inherently more
efficient to produce can lead to substantial feed savings in comparison to the prevail-
ing consumption pattern.
Milk is by far the most efficient animal food. Highly productive animals need just
1–1.1 kg of concentrate feed per kg of milk. They convert more than 30% of the total
metabolizable feed energy, and 30–40% of feed protein to milk protein. Eggs come
second (current best practices need less than 3 kg of feed per kg of eggs), and chicken
third. Large-scale broiler production requires fewer than 5 units of concentrate feed
per unit of edible tissue and feed proteins are converted into meat proteins with
efficiency averaging 20%, twice as high as in pigs. Pigs grown for their lean meat can
turn more than 20% of metabolizable energy into edible tissues and they need about
7.5 units of concentrate per kg of meat; pigs are also the most efficient convertors of
feed energy into edible lipids which give meat its satisfying palatability.
Conversion efficiencies for beef clearly indicate the extravagant cost of that meat;
feedlot-fed animals need at least 20 kg of corn and soybeans for each kg of meat, and
only 5% of all fed protein is converted into protein in beef. Obviously, only those ani-
mals that do not require any concentrates, i.e., raised completely by grazing, or con-
suming crop-processing residues such as brans and oilseed cakes, that is digesting
biomass that cannot be used by nonruminant species, can be seen as efficient users of
agricultural resources. Consequently, it is difficult to imagine a less-desirable change
of dietary habits than the global expansion of hamburger empires.
Aquacultured herbivorous fishes are better convertors of feed than pork or chicken.
Conversion ratios (kg of feed per kg of live weight) for semi-intensively bred carp in
Increased demand for animal foods 45

warm waters are 1.4–1.8, and for catfish 1.4–1.6. As a smaller share of fish total mass
is wasted in comparison with mammalian or bird carcasses, herbivorous fish need
fewer than 2.5 kg of concentrate feed per unit of edible weight, and their protein con-
version efficiency is as good as chicken (Smil, 2000). Salmon are even better protein
convertors, but these carnivores need fish oils and proteins and their feeding actually
results in a net protein loss. Use of concentrate feed in aquaculture of herbivorous
species is thus an excellent way of increasing global availability of animal protein and
the FAO believes that this rapidly growing enterprise has excellent prospects.
Investing in agriculture
For most people the idea of investing in agriculture conjures the images of extending
credit to farmers or building new irrigation schemes but the most important investments
needed to assure high agricultural productivity are in maintaining viable agroecosys-
tems. Although modern agriculture has eliminated many environmental limits and
insulated itself from many environmental interferences through fertilization, irrigation,
use of pesticides and breeding of better cultivars, crop production remains embedded
within the dynamic complexities of the living biosphere and depends critically on reli-
able provision of many natural services and on the maintenance of essential ecosystem
structures. These necessities range from having sufficiently friable soils containing
large amounts of organic matter and protected against excessive erosion to promoting
practices that will minimize nutrient losses from fertilizer applications and increase
water use efficiencies in irrigation as much as practicable.
Achieving these goals is a matter of complex management that can be effective
only when we use the best understanding of how agroecosystems operate. For example,
the first necessity (maintaining desirable soil structure) requires the use of appropri-
ate tillage methods (including minimum tillage practices), recycling of crop residues
and animal wastes, regular crop rotations, and where possible also planting of legu-
minous cover crops (Agassi, 1995). Without these measures soil bacteria and inverte-
brates could not thrive, high organic matter content able to maintain soil structure
would decline, soil would not be able to hold moisture and would be prone to erosion
losses that would eventually lower its productivity. Similarly, reducing nutrient losses
requires measures ranging from repeated soil and plant testing and split applications
of fertilizers to selecting appropriate cultivars and regular planting of cover crops
(Smil, 2001). These practices require a great deal of understanding and ongoing per-
sonal commitment by individual farmers but most of them now rest on fairly well-
understood principles.
In contrast, new methods of more productive farming will require further inten-
sification of agricultural research and technical innovation. Not surprisingly, many
observers of the current agricultural situation argue for substantially increased public
support of basic and applied agricultural research (Pinstrup-Andersen, 2001), and
there is no shortage of studies to show the efficacy of this approach. For example,
Huang and Rozelle (1996) showed that innovation accounted for almost all of the
46 Food production
growth in agricultural productivity in China during the latter half of the 1980s and in
the early 1990s. Avery (1997) stressed that only further intensification of crop produc-
tion can save the remaining tropical rainforests, and hence most of the world’s existing
biodiversity, from eventual destruction. Virtually every assessment of future agricul-
tural needs prepared by the FAO or by specialized crop research centers (International
Maize and Wheat Improvement Center, International Rice Research Institute) notes
that returns to public investments in agricultural research and extension are very high
and urges that future funding should be increased. In spite of this well-proven reality
research funding remains inadequate throughout the developing world.
Given this state of affairs it is even more worrisome that the developing world may
not be able to take full benefit of one of the most important scientific advances of the
past generation, our increasingly effective ability to confer desirable traits on plants and
animals by means of genetic engineering. Of course, an argument could be made that
the rich countries, with their obscene surplus of food, have really no need to use arcane
techniques in order to further boost their crop and animal production. But a common
view that genetic engineering is a tool of multinational companies geared toward the
rich world’s markets and that developing countries have no chance to benefit from
biotechnology is wrong. As Wambugu (2001) argues, small-scale farmers have profited
by using hybrid seeds and transgenic seeds simply add more value to these hybrids.
This is a very important point that needs constant stressing to scientifically illiterate
critics. All but a few of our currently planted crops are products of extensive breeding
modifications and today’s world could not feed itself without using these hybrid and
high-yielding cultivars. Traditional breeding has made a fundamental difference to the
agricultural productivity of the 20th century; current harvests would be impossible
without hybrid corn (introduced in the 1930s), HYV of rice and wheat (first released
during the 1960s) and hybrid rice (developed in China during the 1970s). Hybrid
corn, the planting of which began slowly in Iowa in the early 1930s, has transformed
US corn harvests since World War II and is now benefiting both small- and large-scale
corn producers throughout the developing world. Hybrid rice, which can boost aver-
age yields by 15–20%, has been finally adapted to tropical climates and is now being
accepted throughout Asia (Virmani et al., 1996).
Genetic engineering is thus only the latest, and the most powerful, tool of agricultural
innovation. Admittedly, it is also a tool with considerable potential for adverse effects
and unwanted complications but this reality should not be the reason for banning the
effort and walking away from the prospect of immense future benefits. After all, this
combination of risks and benefits is nothing unique to genetic engineering. Modern
society constantly confronts such dilemmas and has found ways to deal with them.
Perhaps the most apposite example is that of drug companies and the billions of users
of prescription medicines who must weigh the benefits against a range of potentially
even fatal side effects. Careful research and testing and responsible regulation are the
answers, not a ban on the drugs. Genetic engineering alone will not solve food short-
ages that are now experienced by hundreds of millions of people but it could become
the most powerful tool in that quest.
I will note just a few of the recent bioengineering advances whose potential for
producing larger and better harvests or more desirable animals is self-evident.
Investing in agriculture 47

Broader-leafed rice can deprive weeds of sunlight, thus reducing the need for apply-
ing herbicides or for laborious weeding. Rice with higher vitamin A and iron content
can be the most cost-effective, as well as the most practical, way to end two of the
most persistent micronutrient deficiencies in rice-eating countries. Millions of poor
tropical families cultivating sweet potatoes in their fields and kitchen gardens would
benefit from a transgenic cultivar resistant to feathery mottle virus which can reduce
the yields by up to 80% (Wambugu, 2001). And, to give perhaps the most impressive
example from animal farming, transgenic pigs able to produce phytase (the enzyme
needed to digest phytate phosphorus in their feed) in their saliva will void manure
with phosphorus content reduced by up to 75% (Goloran et al., 2001). This impres-
sive achievement will reduce one of the principal causes of aquatic eutrophication,
algal growth and fish kills in affected waters.
Seeing genetic engineering as the solution to the world’s food problems would be
naïve. Refusing to proceed with careful research and regulated applications might be
one of the most shortsighted human choices ever made as the technique has potential
not only for increased and improved food production but also for enhanced environ-
mental protection. Well-conceived bioengineering research, together with the stress
on environmentally sound farming and higher efficiency in the use of all farm inputs,
should be one of the key ingredients with which to build greater food security for
tomorrow’s developing world.
References
Agassi, M. (ed.) (1995). “Soil Erosion, Conservation and Rehabilitation”. Marcel Dekker,
New York.
Aiello, L.C., and Wheeler, P. (1995). The expensive-tissue hypothesis. Curr. Anthropol.
36, 199–221.
Alroy, J. (2001). A multispecies overkill simulation of the end-Pleistocene megafauna.
Science 292, 1893–1896.
Arcand, J.L. (2000). “Malnutrition and Growth: The Efficiency Cost of Hunger”.
FAO, Rome.
Avery, D.T. (1997). “Agricultural Research: The Most Vital Investment for People and the
Environment”. Senate Agriculture Committee’s Hearing on Agricultural Research.
US Senate, Washington DC.
Blumenschine, R.J., and Cavallo, J.A. (1992). Scavenging and human evolution. Sci. Am.
267(4), 90–95.
Brown, L. (1995). “Who Will Feed China?” W.W. Norton, New York.
Brown, J.L., and Pollitt, E. (1996). Malnutrition, poverty and intellectual development.
Sci. Am. 274(2), 38–43.
Buck, J.L. (1937). “Land Utilization in China”. Nanking University, Nanking.
Childe, V.G. (1951). “Man Makes Himself ”. C.A. Watts, London.
Davis, M. (2001). “Late Victorian Holocausts, El Niño Famines and the Making of the
Third World”. Verso, London.
48 Food production

Eaton, S.B., and Konner, M.J. (1997). Paleolithic nutrition revisited: a twelve-year retro-
spective on its nature and implications. Eur. J. Clin. Nutr. 51, 207–216.
FAO (1996). “The Sixth World Food Survey”. FAO, Rome.
FAO (1997). “The State of World Fisheries and Aquaculture”. FAO, Rome.
FAO (2000). “The State of Food Insecurity in the World 2000”. FAO, Rome. http://
www.fao.org/DOCREP/X8200/X8200E00.HTM
FAO (2001). “FAOSTAT Database”. FAO, Rome. http://apps.fao.org
Goloran, S.P., et al. (2001). Pigs expressing salivary phytase produce low-phosphorus
manure. Nature Biotechnol. 19, 741–745.
Goudsblom, J. (1992). “Fire and Civilization”. Allen Lane, London.
Headland, T.N., and Reid, L.A. (1989). Hunter–gatherers and their neighbors from prehistory
to the present. Curr. Anthropol. 30, 43–66.
Huang, J., and Rozelle, S. (1996). Technological change: rediscovering the engine of
productivity growth in China’s agricultural economy. J. Dev. Econ. 49, 337–369.
International Fertilizer Industry Association (2001). “World Fertilizer Consumption”.
IFA, Paris. http://www.fertilizer.org/ifa/statistics/
Lamberg, B.A. (1993). Iodine deficiency disorders and endemic goitre. Eur. J. Clin. Nutr.
47, 1–8.
Lutz, W., Sanderson, W., and Scherbor, S. (2001). The end of world population growth.
Nature 412, 543–545.
Molenaar, A. (1956). “Water Lifting Devices”. FAO, Rome.
National Bureau of Statistics (2000). “China Statistical Yearbook”. China Statistics Press,
Beijing.
Pennington, J.A.T. (1996). Intakes of minerals from diets and foods: is there a need for
concern? J. Nutr. 126, 2304S–2308S.
Pinstrup-Andersen, P. (2001). Feeding the world in the new millennium. Environment
43, 22–30.
Poppendieck, J. (1997). The USA: hunger in the land of plenty. In “First World Hunger”
(G. Riches, ed.), pp. 134–164. St Martin Press, New York.
Price, T.D. (1991). The Mesolithic of Northern Europe. Annu. Rev. Anthropol. 20, 211–233.
Riches, G. (ed.) (1997). “First World Hunger”. St Martin Press, New York.
Sahlins, M. (1972). “Stone Age Economics”. Aldine, Chicago.
Seckler, D., and Rock, M. (1995). “World Population Growth and Food Demand to 2050”.
Winrock International Institute for Agricultural Development, Morrilton, AK.
Smil, V. (1994). “Energy in World History”. Westview, Boulder, CO.
Smil, V. (1995). Who will feed China? China Quarterly 143, 801–813.
Smil, V. (1999a). China’s great famine: 40 years later. BMJ 319, 1619–1621.
Smil, V. (1999b). Crop residues: agriculture’s largest harvest. BioScience 49, 299–308.
Smil, V. (1999c). China’s agricultural land. China Quarterly 158, 414–429.
Smil, V. (2000). “Feeding the World: Challenge for the 21st Century”. MIT Press,
Cambridge, MA.
Smil, V. (2001). “Enriching the Earth: Fritz Haber, Carl Bosch and the Transformation of
World Agriculture”. MIT Press, Cambridge, MA.
Stanford, C.B. (1998). “Chimpanzee and Red Colobus”. Harvard University Press,
Cambridge, MA.
References 49

United Nations (1998). “World Population Prospects: The 1998 Revision”. UN, New York.
United Nations (2001). “World Population Prospects: The 2000 Revision”. UN, New York.
http://www.un.org/esa/population/wpp2000.htm
US Bureau of the Census (1975). “Historical Statistics of the United States: Colonial
Times to 1970”, pp. 510–512. USGPO, Washington, DC.
US Department of Agriculture (USDA) (1950–2001). “Agricultural Yearbook”. USDA,
Washington, DC. http://www.usda.gov/nass/pubs/agstats.htm
Virmani, S.S., Siddiq, E.A., and Muralidharan, K. (eds.) (1996). “Advances in Hybrid
Rice Technology”. IRRI, Los Banos.
Wambugu, F. (2001). Why Africa needs agricultural biotech. Nature 400, 15–16.
Whiten, A., and Widdowson, E.M. (eds.) (1992). “Foraging Strategies and Natural Diet of
Monkeys, Apes and Humans”. Clarendon Press, Oxford.
WHO (1993). “Global Prevalence of Iodine Deficiency Disorders”. WHO, Geneva.
50 Food production

Can the challenges ofpoverty, sustainableconsumption and goodhealth governance beaddressed in an era ofglobalization?
Tim Lang
4
The nutrition transition has taken different characteristics in various developing coun-
tries, cultures, and historical eras. Huge policy challenges arise. Is the nutrition transi-
tion inevitable? Can its patterns be altered? What policies minimize its adverse health
outcomes most effectively? This chapter, while perhaps adding further complexity to
an already difficult issue, outlines four policy elements that ought to inform and be
part of the debate about the nutrition transition.
The first element relates to the interaction between food and nutrition and the envi-
ronment – the issue of sustainable consumption. The second is social inequality – the
extent of poverty and food insecurity. The third is governance, the notion that, if
human policy “frames” nutrition, then human forces should themselves be shaped to
do this equitably, responsibly, and effectively. The English word “governance” refers
not just to what governments do, but also to the actions of other powerful social forces,
such as private business.
The last element is culture, a key and often a missing component in the nutrition tran-
sition debate. Food culture is the “pull” in the transformation of tastes, just as marketing
and corporate reach are the “push”.
Copyright © 2002 Elsevier Science LtdAll rights of reproduction in any form reserved
The Nutrition TransitionISBN: 0-12-153654-8

Globalization and the nutrition transition
A distinction must be made between the nutrition transition and the wider socioeco-
nomic process of globalization, which refers to the process by which goods, people,
and ideas spread throughout the world. The subject has been the source of much
excitement in sociological and political circles recently, to which the topic of food can
add a suitably gentle corrective. Globalization of food is, of course, nothing new. Plants
have moved and been moved around the globe for centuries. Today, many are grown
52 Can the challenges of socioeconomic processes be addressed in an era of globalization?
Table 4.1 Top economic countries and corporations, 2001 (from Davidson, 2001)
The richest Ranking by country Country or corporation Food roleb GDP or revenue 1999
player ranking or corporationa (millions of US$)
1 1 United States 9 152 098
2 2 Japan 4 346 922
3 3 Germany 2 111 940
4 4 United Kingdom 1 441 787
5 5 France 1 432 323
6 6 Italy 1 170 971
7 7 China 989 465
8 8 Brazil 751 505
9 9 Canada 634 898
10 10 Spain 595 927
23 1 General Motors 176 558
25 2 Wal-Mart Stores Retailer 166 809
26 3 Exxon Mobil 163 881
27 4 Ford Motor 162 558
28 5 Daimler-Chrysler 159 986
32 27 Indonesia 142 511
33 28 Saudi Arabia 139 383
34 29 South Africa 131 127
38 6 Mitsui 118 555
39 7 Mitsubishi 117 766
40 8 Toyota Motor 115 671
41 33 Portugal 113 716
42 9 General Electric 111 630
44 10 Itochu 109 069
45 11 Royal Dutch/Shell Retailer 105 366
Group
46 35 Venezuela, RB 102 222
47 36 Israel 100 840
48 12 Sumitomo 95 701
57 17 BP Amoco Retailer 83 566
72 29 Philip Morris Processor 61 751
and tobacco
75 44 Pakistan 58 154
88 41 Nestlé Processor 49 694
97 46 Metro Retailer 46 664
99 52 Bangladesh 45 961
100 48 Tokyo Electric Power 45 728
a Countries are indicated in normal type; company rankings are shown in bold.b All countries produce food; only those corporations with direct food interests are noted in this column.

far from their site of original cultivation. The same has happened to animals: cows,
poultry, pigs, sheep, and goats. What is new about current globalization is its pace,
scale, and extent, primarily fueled by government and private market forces.
Table 4.1 combines World Bank figures of national Gross Domestic Product (GDP)
(World Bank, 2001) with estimates of corporate turnover from the Fortune 500 (Fortune,
2001). Produced by CAFOD, an international aid agency (Davidson, 2001), it seeks to
measure relative economic “punch”. Of the richest 100, 48 are companies and 52 are
countries. When ordered, one notes that Wal-Mart (26th), a retailer, had revenues greater
than the GDP of Indonesia (32nd), Saudi Arabia (33rd) or South Africa (34th). Phillip
Morris (72nd), a tobacco company which in 1998 was also the world’s largest food
company, had a turnover greater than the GDP of Pakistan (75th). Nestlé (88th) had a
turnover greater than the GDP of Bangladesh (99th).
The diverse reach of modern food corporations is considerable. Food companies are
in discrete markets, mostly either in production or trading of raw commodities – such
as Cargill, the world’s largest grain trader, a private corporation – or in value-adding
industries such as food processing. Table 4.2 provides a picture of the world’s largest
food global corporations. These are key framers of the food system.
Food policy
Food policy poses special challenges to public policy. Key features of the contempo-
rary food system, sometimes, to the detriment of health outcomes, are a focus on
profits as a primary driver, value-adding, brand image, market share and “efficiency”.
Meanwhile in political discourses, health issues are often combined or confounded
with safety, rather than recognized as specific population-based indicators. Conflicting
policies are common, particularly when government subsidies undermine food poli-
cies with a potential benefit to public health. An example can be found in policies over
fish. Although nutritionists generally encourage consumption of fish, environmental
considerations urge if not caution then reduction. Whereas 5% of humanity consumes
Food policy 53
Table 4.2 Largest food corporations, by turnover, 1998 (from FT 500, Financial Times, 28 January
1999, excepting Cargill, website: www.cargill.com)
Sales Profits Chief products Employees
(US$ billion)
Philip Morris 56.11 6.31 Tobacco, cereals, beverages 152 000
Cargill 51.00 4.68 Cereals, seeds, oils, beverages 80 600
Unilever 50.06 7.94 Oils, dairy, beverages, meals 287 000
Nestlé 49.96 4.11 Beverages, cereals, infant food 225 808
Pepsico 20.92 1.49 Beverages, snacks 142 000
Sara Lee 20.01 �0.53 Meat and bakery 139 000
Coca-Cola 18.87 4.13 Beverages, foods 29 500
McDonalds 11.41 1.64 Restaurants 267 000

45% of all meat and fish, the poorest 20% consumes only 5%. North American cod
banks are severely depleted and subject to fishing bans, and according to the FAO,
69% of world fish stocks are in a “dire condition”. The FAO sees the problem as the
world “having too many vessels or excessive harvesting power in a growing number of
fisheries,” yet governments are subsidizing the fish industry an annual $14–20 bn,
equivalent to 25% of sector’s revenues (World Trade Organization, 1999).
Food production has changed dramatically over the 20th century. New products,
processes (both on and off the land), distribution (supply chain management), and
marketing (e.g., advertising) have had major impacts on health, environment, and cul-
ture. A spiral has occurred in which changing supply chain features have both fed and
reacted to changing aspirations and food culture. Table 4.3 gives illustrations of some
key features.
The food economy unfolding worldwide has some features in common. It is char-
acterized by:
• Value-adding – the pursuit of “difference”, i.e., a feature (e.g., packaging, taste,
image) to differentiate between one product and another;
• Company mergers and acquisitions leading to high levels of concentration in the
food economy;
• Quality, which may be defined cosmetically (by how the food looks or can be sold);
• Brand value – name and marketability are to market success;
• The search for new markets – or “new” to the dominant Western food companies,
who desire to open previously untapped markets such as the former Soviet Union,
China and India;
• Trader power – with complex supply chains, there appears to be a rule whereby
whoever dominates the relationship between primary producers and processors,
on the one hand, and end consumers, on the other, is sovereign;
54 Can the challenges of socioeconomic processes be addressed in an era of globalization?
Table 4.3 Some features of the 20th century food revolution
Sector Feature Example Comment
Agriculture Labor efficiency Decline of animal power, Decline in farms, rise
replacement by fossil power in size of holdings
Processing Value-adding Sugar and fruit extract added “New adulterations”
to fermented milk
Distribution Creation of entire new Chill systems of storage More long-distance
sector in modern food food transport
supply chains
Retail Transfer of sales force Electronic Point of Sale Key to supermarket
from direct customer (EPOS) systems using efficiency and
contact laser scanners of “barcodes” logistics control
Catering Bought-in ready-made Soups, gravy mixes De-skilling of cooking
ingredients
Marketing Search for new niche Low calorie drinks Coexistence of niche
markets by use of using artificial sweeteners and mass markets;
advertising market fragmentation

• A two-tier food economy characterized by large transnational corporations with
enormous power on the one hand, and a plethora of small and medium-sized
enterprises restricted to local or subnational markets on the other;
• Social fragmentation – the coexistence of over- and underconsumption (see
Table 4.4).
Food inequalities
Many health disparities are the result of differences in diet availability and intake.
History suggests that food insecurity is not inevitable and that maldistribution of food
is a classic illustration of the social determination of health. In both war and peace, equi-
table public policy can decrease infant mortality and increase overall human health.
That the toll of diet-related inequalities is so sobering is a political challenge. There
is, of course, some good news but 800 million children globally are undernourished
and an estimated two billion people show the effects of poor diet (UNICEF, 2000).
Deficiencies of both macro- and micronutrients are well documented, as is the fact
that women, children, and older people are at greatest risk.
A self-perpetuating cycle of health and income inequalities reflects inequalities in
housing and education, leading to greater exposure to environmental hazards such as
unsafe food, and contaminated air and water. Such life hazards are associated with
rapid urbanization, which can reduce rather than enhance the range of good dietary
ingredients and increase the likelihood of ill-health through pollution and accidents,
which in turn reduces the opportunities for income and education of children. It is the
task of public policy to break such negative cycles.
From the end of World War II, food policy on inequalities was fractured by a clash
of analyses about the way forward. On one side stood those arguing for policies of
national or possibly regional self-reliance. On the other stood those arguing for
greater flow of trade and cross-border food security.
Food inequalities 55
Table 4.4 Some policy options
Fragmented policy Systemic solutions
Intensification Diversification
Cost externalization Cost internalization
Marginalization of health Health central to economics
Food miles More local food
Productionism Sustainability
Individual health Ecological public health
Integrated policy Technical fixes
Short term Long term
Consumerism Citizenship
Health focus mainly on food safety Policy linkage between safety, nutrition and
sustainable food supply

A key thinker in the 1940s was John Boyd Orr, who became the first Secretary
General of the Food and Agriculture Organization (FAO) when it was created in 1946
(Orr, 1966). He tried to bridge the two policy camps, arguing that those that could grow
food, should and those that could not, should be fed by others. The problem was that
countries that needed to import food had to export hard goods, commodities, or other
commercial crops to generate foreign exchange. Boyd Orr argued that countries should
set “targets for tomorrow”. In today’s parlance, he argued for multilevel governance, a
combination of local, national, and international targets that should work to the com-
mon good for health (Orr, 1943). The approach is worth rehearsing, not just for its his-
torical significance, but because it attempted, over half a century ago, to address some
problems in food policy that still exist today. In relation to countries such as the UK,
i.e., with pockets of real deprivation amidst wealth, Boyd Orr argued as follows.
• Countries should set targets within a new global system and foster intergovern-
mental cooperation to help each other over good times and bad, to ease out
booms and slumps in production.
• Targets should be based on nutrition and agricultural science.
• Targets should be set to achieve health. Premature death from undernutrition was
inexcusable; investment in better food would yield health and economic gains
and savings.
• Agriculture should be supported to produce more. Agriculturally rich countries,
such as the UK, ought to emulate the advanced agricultural economies such as the
USA where targets had been set to raise production of fruit and vegetables (up by
75%), milk (up by 39%), eggs (up by 23%), etc.
• Industry should be geared to produce tools to enable agricultural productivity to
rise, e.g., new buildings, tractors, equipment.
• Trade should be encouraged to meet the new markets. Trade would ease the over-
productive capacity of some world areas and match them with underconsumption
in other areas.
• International cooperation would have to follow the (proposed) UN Conference
on Food and Agriculture.
• New organizations would have to be created such as a new International Food
and Agricultural Commission, National Food Boards to monitor supplies,
Agricultural Marketing Boards, Commodity Boards.
This was visionary indeed and was the position Boyd Orr argued with passion in the
post-war reconstruction period. But this mixed approach to food policy – part market,
part state action – which was rejected by some at the time, was marginalized entirely
by the 1980s. Retrospectively, the 1974 World Food Summit may be seen as the high
water mark of the appeal of state-led, national policies of self-reliance. The new neo-
liberal orthodoxy from the 1980s replaced this central role of the State with an emphasis
on market-driven growth. In the process, the definition of food security was altered in
two important ways.
Firstly, a new focus had emerged from researchers who placed more stress on
subnational or local and domestic food security. They argued that countries might
have an overall sufficiency of supply, when at the household or local level, there could
56 Can the challenges of socioeconomic processes be addressed in an era of globalization?

be deficiencies; what was needed, argued the researchers, was attention to the microlevel.
Four core foci emerged (Lang et al., 2001):
• sufficiency of food for an active healthy life;
• access to food and entitlement to produce, purchase or exchange food;
• security in the sense of the balance between vulnerability, risk and insurance;
• time and the variability in experiencing chronic, transitory, and cyclical food
insecurity.
Accompanying this focus on the micro- and household level of food security, were
new macroeconomic frameworks for achieving food adequacy. According to the new
position, economic goals should aim for sufficient purchasing power to ensure that
citizens ate adequately. Considerations of national or regional food security would be
rejected. What mattered was not how much food a nation, state or locality produced
but whether the people could afford to purchase their needs on the open market. If
they could not, the market needed to be opened to imports and at the same time
income generation within economies needed to be maximized. This import–export
model triumphed at the 1994 General Agreement on Tariffs and Trade (GATT).
If the pursuit of food self-reliance was killed in the 1980s, the GATT buried it.
However, as often happens in public policy, when a policy regime celebrates its triumph,
a replacement or opposition can already be waiting in the wings. This has happened with
the import–export neoliberal approach. Largely driven initially by environmental con-
siderations, the 1990s saw the increasing articulation of new models. One might be
termed appropriate localism. This position suggests that meeting environmental goals of
sustainability by producing more diverse foods locally, both empowers people and pro-
tects their capacity to feed themselves (Pretty, 1998). Another position is associated with
the work of Nobel Laureate Amartya Sen, who with Jean Dreze, has articulated a view
that people experience hunger when a political culture denies them “entitlement” (Sen,
1981a, 2000). Social legitimacy is a precursor to adequate food, but social legitimacy
can be made or broken by policy choices.
The amazing gap between rich and poor within and between societies is well docu-
mented. There are 1.2 billion people living on US$1 per day (UNDP, 2000). Mean-
while, the top 200 billionaires doubled their wealth in 1994–98 and just three of their
number have more wealth than the combined Gross National Product (GNP) of all least
developed countries, a total of 600 million people (UNDP, 1999). Michael Jordan, a
US athlete, was paid US$20 million for endorsing Nike trainers, more than the entire
workforce was paid for making them (Klein, 2000). Although our focus here is on the
nutrition transition experienced by developing or recently developed countries, it is
important to remember that even in rich countries, policies can determine the variation
in rates of diet-related health inequalities. In the European Union, for instance, rates of
diet-related ill-health vary considerably (Lang, 1999a). The UK has the worst indices
and, despite being wealthy, has a disproportionate share of European Union low
income (Societe Francais de Santé Publique, 2000). In the period 1979–97, inequalities
in income and health widened due to macroeconomic policy choices under the
Conservative Government. According to the New Labour government’s own health
inquiry, the poorest decile in the UK experienced both real and relative income
Food inequalities 57

decline (Acheson, 1998). As in other countries with far lower incomes, the UK’s lower
socioeconomic groups have a greater incidence of premature and low birthweight
babies, heart disease, stroke, and some cancers in adults. Risk factors including lack
of breast feeding, smoking, physical inactivity, obesity, hypertension, and poor diet
are clustered in lower socioeconomic groups (James et al., 1997).
Sustainable consumption: constraint onconsumerism?
Over the last decades of the 20th century evidence mounted about the deleterious
effect of contemporary food and agricultural policies. These include:
• pollution and chemical contamination from pesticide (over-)use (Conway and
Pretty, 1991);
• falling water tables from over-irrigation and intensive crop production (de Moor,
1998);
• drinking water quality (McMichael, 1999);
• loss of biodiversity (Gardner, 1996);
• degraded soil (Oldeman et al., 1991; McMichael, 2001);
• wasteful use of land and sea (World Resources Institute, 1993).
There is now considerable concern in agricultural policy on whether the earth’s food
infrastructure can feed populations. The Worldwatch Institute has pointed to evidence
of slowing of yield increases, declining crop diversity, declining fish stocks, and the
impact of climate change (Gardner and Halweil, 2000). The challenge of meeting sus-
tainability goals is not just a matter for ecology, but also society. Key trends include
urbanization, rising meat consumption and civil wars, which upset agricultural capac-
ities. The growing debate about sustainable consumption raises additional long-term
questions about the “pull” exerted by consumerism. What are the implications of con-
tinued changing consumer demands for more meat, fish and use of nonrenewable
resources, such as in packaging?
A foretaste of what could follow in the wake of the nutrition transition, if develop-
ing countries adopt the entire Western intensive approach to food production and con-
sumption exemplified by hygienic packaging, can be appreciated by looking at what
the “advanced” economies do. The global packaging industry is worth an annual $100
billion and in some developed countries, packaging accounts for between 10% and
50% of end food costs. The USA’s packaging industry manufactures 32 billon kilograms
of plastic food packaging each year, and its population of 280 million people throws
away 60 million plastic bottles each day, less than 3% are recycled. If the USA is a
world leader in such waste, the UK with a population of 60 million also manages to
use 15 million plastic bottles per day, of which less than 3% are recycled. Where does
this waste go? The choice is either to bury it in landfills or to recycle it.
The European Union has now set the ambitious goal of recovering 50% of all plas-
tic waste and of recycling half of that. But the recycling currently means that shiploads
58 Can the challenges of socioeconomic processes be addressed in an era of globalization?

of plastic waste are taken to China for sorting by cheap labor (Vidal, 2001). Such solu-
tions are probably unsustainable. That what is required is more than palliatives, but
rather a structural rethink, is given further weight by the enormity of carbon emissions.
The UK’s food, drink, and tobacco industries produce 4.5 million tons (Mt) of carbon
a year, and also deposit 6 Mt of waste in landfill sites each year (DETR, 1998). A policy
debate about the relative health value of packaging is urgently required.
A similar challenge for health is raised by the rapid urbanization of global populations.
In policy terms, the questions are: firstly, how are the populations of cities to be fed?
Secondly, who is to do it? In 1900, approximately 5% of the world’s people lived in cities
with populations greater than 100 000. By the 1990s, an estimated 45% – more than 2.5
billion people – lived in large urban centers. And by 2025, that proportion is likely to be
61% of the world’s population (Howson et al., 1998). This is likely to be accompanied by
a considerable growth of the urban poor. As the population in cities continues to expand
into the 21st century, the demand for food to feed urban people will grow. The FAO esti-
mates that in a city of 10 million people, 6000 tonnes of food may need to be imported
on a daily basis (FAO, 1998). By the year 2025, there will be a huge increase in the num-
bers of people in the south living in cities. Between 1950 and 1990, the world’s towns and
cities grew twice as fast as rural areas (World Bank, 1999). In 1950, only two cities had
more than 8 million inhabitants, London and New York (Harrison, 1992). It is estimated
that over the next 20 years, 93% of urban growth will take place, whereas the majority of
the population in the continents of Africa and Asia will remain in the rural areas.
Urbanization poses a special challenge for building a sustainable route to develop-
ment. If just one feature associated with the nutrition transition – meat consumption –
were to be replaced by a greater emphasis on increasing availability and consumption
of vegetables and fruits, patterns of production would have to be markedly different. To
reduce the use of nonrenewable energy via transportation, more local cultivation would
be desirable. The UN Habitat 2 conference in 1996 concluded that urban or peri-urban
agriculture will have to make a come-back, after decades of declining policy focus
(UNDP, 1996). In fact, for half a century, the emphasis in global food policy, and cer-
tainly in the Western model of agriculture, has been specialization and intensification.
Despite this policy marginalization, in 1993 15–20% of world food was produced in
urban or peri-urban areas and was worth US$500 million (WHO-E, 1999).
In cities such as Kathmandu where 37% of urban gardeners already grow all the
vegetables consumed, and Hong Kong, where 45% of demand for vegetables is supplied
from 5–6% of the land mass, a practical alternative to long-distance food exists. The
new global movement of urban agriculture (Pretty, 1998), which tends to be encouraged
on ecological and community self-reliance grounds, is beginning to receive public health
encouragement. The WHO European Region, concerned about diet-related diseases,
has recently produced an ambitious and far-sighted policy document (WHO-E, 1999).
This notes that up to 80% of Siberian or Asian cities are already involved in urban
agriculture, and that in 1997 in Poland, for example, 500 000 tonnes of vegetables
and fruits (one-sixth of the national consumption) were produced on 8000 council
“employees” gardens. In Georgia, home-produced food accounted for 28% of income
and in Bulgaria in 1998, 47% of people were self-sufficient in vegetables and fruit and
90% of urban families make preserves for winter (WHO-E, 1999).
Sustainable consumption: constraint on consumerism? 59

To orthodox Western food economists, a policy emphasis on local urban or peri-urban
food smacks of an irrational return to a mythical halcyon past. But the case for thinking
through the connection between what is produced, grown, processed, and consumed
and how this happens sits at the heart of the new food policy challenge. The issue is
not just quantity but quality. An illustration is the huge amount of nonrenewable
energy (fossil fuels) used in transporting food increasingly long distances, as the food
supply chain intensifies, concentrates, and specializes. To neoliberals, that a developing
country could produce, for example, dessert apples and export them to the UK would
be a good thing. The fact that the UK has a good climate and could grow its own is
secondary. In 1993, 685 000 GJ (equivalent to 14 million liters of fuel) was used to
transport 417 207 tonnes of imported apples (Garnett, 1999). Four out of five pears
and two out of three apples are now imported into the UK (Hoskins and Lobstein,
1998). In 1995, by foods such as these, the UK was a net importer of “ghost hectares”;
in other words, its food needs were produced on 4.1 million hectares of other countries’
land, as well as its own (MacLaren et al., 1998).
In the period 1975–91/93, food transported on UK roads increased by 30% and the dis-
tance traveled by the UK’s total food supply increased by approximately 60% (Hoskins
and Lobstein, 1998). The distance traveled for shopping in general rose by 60% in that
period, and travel by car more than doubled. With the citing of food shops (supermarkets)
in ever larger stores, consumers had to use cars to get their food. So the net result is that
the “modern”, “efficient” food economy externalized environmental costs (Raven and
Lang, 1995). The western model of food shopping is not appropriate as a sustainable con-
sumption paradigm, yet that is the cultural dimension behind the nutritional transition –
a change of lifestyle with consequences for ecological as well as human health.
Food governance
Since the 1994 GATT, the developing world has fractured with some developing
countries benefiting, while others do not. Sub-Saharan Africa, in particular, has been
a net loser. Dissent about the new global institutions of governance symbolized by
the GATT’s creation of the World Trade Organization surfaced at the WTO talks in
Seattle, USA, in December 1999, with demonstrations following in Washington DC,
Melbourne, Gothenborg, Prague, and Genoa. Although much interest has focused on
wider political and economic issues, there are important considerations for the issue
of the nutrition transition and the food–health connection. Two considerations are cen-
tral: firstly, whether the neoliberal model enshrined in the GATT is appropriate for the
ecological and human health challenges of the 21st century and, secondly, whether,
health issues are adequately championed in global governance.
New models for old
As was outlined above in the discussion on Boyd Orr, the dominant model for food pol-
icy dates back to the post World War II period. The model centered on an analysis that
60 Can the challenges of socioeconomic processes be addressed in an era of globalization?

underproduction was the primary policy failure. If science could only unleash nature’s
productive capacity and if capital investment could be suitably made, then farming
could increase output and nutritional deficiencies could be alleviated. As long as there
was efficient distribution and a welfare safety net to “catch” failures in personal income,
then improved public health would surely be the outcome. The model is schematically
represented in Fig. 4.1. By the 1980s, with rising evidence of degenerative diseases,
another “box” was inserted into the package in the form of health education (Fig. 4.2).
The problem with this approach was that it made a number of assumptions which
events proved to be unwarranted. Firstly, it assumed that increased supply would
improve health when in fact rising incomes, urbanization, and changed nature of sup-
ply allowed (or arguably encouraged) the rise of degenerative diseases such as coronary
heart disease, the diet-related cancers, diabetes, and obesity – all the diseases associ-
ated with and highlighted in the nutrition transition.
Secondly, the model assumed that the era of contagion was over when in fact the
opening up of food systems removed barriers to the spreading of diseases. Thus, if
food traveled across continents and if processors and retailers purchase globally, new
opportunities and routes for cross-contamination and spreading of diseases were
created. Key causes of disease include Salmonella, Campylobacter, Escherichia coli,
and new ones such as bovine spongiform encephalophathy (BSE).
Thirdly, changes in the nature of production and distribution opened new chances
for diseases to spread further and faster. Tourism, for instance, turns more than 600
million people each year into disease carriers.
Food governance 61
Increasedproduction
Distribution Health
Capital
Science
Figure 4.1 Food’s impact on health – the mid 20th century model.
Increasedproduction
Healtheducation
Distribution
Health
Capital
Science
Figure 4.2 Food’s impact on health – the mid to late 20th century model.

Fourthly, the model assumed that the “old” banes of food policy, such as adulteration
and contamination, would be consigned to the history books when in fact they have
changed. Some forms of contamination and adulteration have been successfully
controlled whereas new ones such as contamination from pesticides, additives, and
nitrates have been introduced or greatly enhanced.
What is now required is a much more complex and multidimensional model. The
51 member states of the WHO European Region in 2000 agreed to a new simple model
(Fig. 4.3). This suggests that to meet health goals, public policy should give equal empha-
sis to building three pillars: nutrition, food safety, and sustainable food supply. Unless
they are equal, the roof – health – under which all humans can shelter would tilt and not
last. This model is highly appropriate to present this new message, being simple and
intelligible. But it can be argued that in reality, the model ought to be more multifactoral;
there should be many more pillars and understanding required needs to include many sci-
ences. Figure 4.4 shows a more appropriate model, even though this might be hard to sell
to politicians, who famously are both busy and need to be “sold” simple messages.
If public policy is to be built on a comprehensive rather than a partial analysis, it
should integrate the goals of achieving individual, population, and ecological health.
Institutions
When the General Agreement on Tariffs and Trade (GATT) was signed by over 100 coun-
tries in 1994, it was to have profound direct and indirect implications for public health in
62 Can the challenges of socioeconomic processes be addressed in an era of globalization?
Nu
trit
ion
Foo
d s
afe
ty
Su
stain
ab
le f
oo
d s
up
ply
Food Policy
Figure 4.3 WHO European Region model for food and health policy (reproduced from WHO
Regional Committee for Europe, 2000, with permission).

general, and for food and agriculture in particular. It created the immensely powerful
World Trade Organization (WTO) which not only monitors trade rules but runs a system
of arbitration which is de facto a new jurisprudence. This mattered for public health for a
number of reasons.
The institutions through which public health has expressed its views in the post-war
period have been quietly marginalized (Labonte, 1998). A new system of world gov-
ernance, much commented on by its non-governmental organization (NGO) critics, is
emerging in parallel to, and more powerful than, the formerly more democratic insti-
tutions of the United Nations (Navarro, 1999). The WTO (or the World Bank) is more
significant in framing the conditions for public health than the WHO (Banerji, 1999).
The WHO is informed by a World Health Assembly, yet there is no parallel citizen’s
voice for the WTO. Economically, there is no contest as to which is more significant,
the UN system or the new trade system.
The GATT is a key, if not the key, structure in the architecture of the new era of
globalization. Within the many hundreds of pages of the full GATT agreement, pub-
lic health barely registers, except when implied as a threat to free trade. A fear that
health is a fig-leaf for protectionism stalks the neoliberal halls, whereas to proponents
of public health, the notion of “protection”, like prevention, carries positive rather
than negative connotations. In the GATT’s Agreement on Agriculture much effort was
put into ensuring that national governments cannot set food standards or restrict entry
of foods unless they have “sound scientific” justification. This seems reasonable,
although in practice subject to subjective interpretation and commercial pressures.
Food governance 63
Health
EarthEcology
AnimalsBiodiversity
Urban lifePlants
Light
ClimateRural life
Sciences
Water
Culture
Su
stain
ab
le f
oo
d s
up
ply
Nu
trit
ion
So
cial ju
stic
e
Em
plo
ymen
t
Foo
d s
afe
ty
Cap
ital in
vest
men
t
Aff
ord
ab
ility
, acc
ess
an
d a
vaila
bili
ty
Ski
lls
Ap
pro
pri
ate
tec
hn
olo
gy
Figure 4.4 Food’s impact on health: the complex model (from Waltner-Troews and Lang, 2000) with
permission.

Research conducted in 1991–93, before the 1994 GATT was signed, suggested that
Codex was not in a fit democratic state to carry public confidence about its processes
(Avery et al., 1993). Codex is a large system of around 20 committees, which has many
participants at meetings around the world. These working parties are usually hosted by
rich countries and meet over two years and make recommendations to the bi-annual full
meeting of the Codex Commission. Over the full 1991–93 cycle of meetings there were
a total of 2758 participants. Codex is theoretically a meeting of governments but the
study found that nearly a quarter of participants were from large international compa-
nies – the same for whose products were being set standards. Reviewing a full two-year
cycle of Codex meetings, the Cracking the Codex study found that:
• 104 countries participated, as did over 100 of the largest multinational food and
agrochemical companies;
• The vast majority (96%) of nongovernmental participants represented industry;
• There were 26 representatives from public interest groups compared to 662
industry representatives;
• Nestlé, the largest food company in the world, sent over 30 representatives to all
Codex committee meetings combined, more than most countries;
• Most representation came from rich, Northern countries: over 60% came from
Europe and North America with the poor countries of the South dramatically
under represented – only 7% from Africa and 10% from Latin America;
• Of the participants on the working group on standards for food additives and
contaminants, 39% represented Transnational Corporations (TNCs) or industry
federations, including 61 representatives from the largest food and agrochemical
companies in the world;
• Of the 374 participants on the committee on pesticide residue levels, 75 repre-
sented multinational agrochemical and food corporations, 34 from the world’s
top 20 agrochemical companies; only 80 participants represented the interests of
developing countries;
• The USA sent more representatives to Codex than any other country (50% of them
representing industry) and almost twice as many as the entire continent of Africa.
Following the publication of this report and despite requests to “clean up” this inade-
quacy, the GATT secretariat declined to act. In subsequent years, officials and compa-
nies became sensitive to these criticisms, which have been pursued by the consumers’
movement. Some countries now hold tripartite national premeetings with industry, con-
sumers, and government officials before going to Codex meetings. However, this left
practice at the Codex meetings themselves unchanged. One review in 1997 concluded
that little has changed (McCrea, 1997). At the 1997 Codex food labeling committee, for
instance, the US delegation comprised eight government officials, three from NGOs and
ten from industry. Reform is now, happily, beginning, but why so late?
Particularly sensitive is the issue of scientific judgment. The GATT stipulated that
disputes would be arbitrated on grounds of “sound science”, yet consumer groups argue
that science is not the only salient feature, nor indeed is science quite the straightfor-
ward arbiter it is assumed to be. Whose is the research? Who funded it? Is it publicly
available? What questions framed the analysis? The argument between the USA and the
64 Can the challenges of socioeconomic processes be addressed in an era of globalization?

EU over hormone use in meat fattening illustrates the sensitivity of the issue. Since
the early 1980s, the EU has implemented a ban on the use of hormones. This was con-
tested by the US, keen to sell its beef in Europe’s rich markets. The dispute was referred
to Codex and the long-awaited WTO decision was announced in early 1998. Both the
US and EU claimed vindication of their positions (EC, 1998; USTR, 1998). The EU’s
Scientific Committee on Veterinary Measures then argued that further studies suggested
scientific evidence warranting a continued ban (European Commission, 1999).
The food trade issue is now particularly sensitive. For the last few years there has
been a steady stream of high profile cases where food-exporting nations fight over the
right to export surpluses to each other and to markets they deem their own. There have
been wars over lamb between Australia and New Zealand and the USA (International
Centre for Trade and Sustainable Development, 1999); over beef hormones between
the EU and USA; over genetically modified foods between the USA and many coun-
tries but especially the EU. The notion that food security stems from growing most of
one’s food within one’s country (what used to be called self-reliance) is being eroded
by the notion that security stems from being able to purchase food on the open world
markets (WHO-Europe, 1995).
Food security is a concern for most developing country governments whereas rich
countries are more troubled by consumer-driven food safety issues. As the WHO
Regional Office for Europe’s (1999) Food and Nutrition Plan recognizes, from a public
health perspective, both are important and both reflect changes in methods of produc-
tion and distribution and in the food system (Tansey and Worsley, 1995; Lang, 1997).
The Norwegian Government was rare among rich nations in openly criticizing the drift
of the new GATT talks. It should know. Its citizens voted in the early 1990s against join-
ing the EU, in part from hostility to the Common Agricultural Policy undermining the
national nutrition and food policy in place since 1976 (Royal Norwegian Ministry of
Agriculture, 1976). Yet Norway by signing onto the 1994 GATT began to erode exactly
the very same national policy.
In a paper prepared in June 1999, Norway laid down a clear policy challenge: food
security is too important to be left to the vagaries of trade (Royal Ministry of
Agriculture, 1999). Under the Plan of Action agreed at the 1996 World Food Summit, as
at the earlier 1992 International Conference on Nutrition, Governments agreed they
have a moral responsibility to ensure their citizens have adequate food, are free from
hunger and achieve food security (World Food Summit, 1996). The GATT perspective
favors the market approach to food security. Tacitly, it argues that the cheapest food is
best. The new public health perspective suggests that the West’s food revolution has
intensified food production such that when food is cheap, other costs are being exter-
nalized onto the environment (Lang, 1999b). In this intellectual context, Norway’s posi-
tion was pioneering. It argued that the new Round should agree on rules to safeguard
national food security. When wheat or maize prices can rise by 50% in just two years, as
happened in 1993–95, reliance on being able to buy one’s food in the world marketplace
is a form of security only open to the affluent. (Norway, as a small population with
immense oil wealth is ironically one such country.) What are the poor to do in such cir-
cumstances: tighten their belts? As Sen (1981b, 1997) and others have shown, hunger
follows poor purchasing power and is not necessarily a function of food availability.
Food governance 65

The new WTO structures are designed to facilitate cross-border economic activity
and to reduce national control over capital flows, competition and even cultural con-
trol. In the age of the internet, information knows few boundaries yet vast new corpo-
rations are emerging which dominate almost everything humans do or consume. The
irony about the new GATT is that it is based upon the free trade model of globalization
just when evidence about its negative effects is mounting up. According to the tenth
annual UN Human Development Report, the richest 20% of the world now account
for 86% of world GDP, while the poorest 20% have just 1% (UNDP, 1999); 200 of the
world’s richest people have doubled their net worth in the last four years. The richest
three people in the world have assets greater than the combined Gross National
Product of all the least developed countries in the world, 600 million people. There is
little chance of health for all in such a socially divided world.
Another reason for public health involvement in trade talks and debate concerns the
work of public health monitoring itself. Public health action has to be based on a good
understanding of the real world. Perspective is in order. Postwar development has
brought astonishing gains for billions of people, but equally, as the Human Development
Report documents, the scale of contemporary inequality and poor healthcare defies
sanity. The Human Development Report itself came into existence because a decade
ago, UN administrators, social scientists, and politicians were critical of the convention
of measuring development through indicators such as Gross Domestic or National
Product. They disguise intranational inequalities and fail to convey the quality of life
issues. The Human Development Index was created to fill this gap. The Human
Development Report shows that 80 countries have incomes lower today than a decade
ago; 1.3 billion people, over a fifth of humanity, exist on less than US$1 per day.
However it is measured, the gap between the richest and poorest is widening. In 1960,
the gap between the richest fifth and the poorest fifth was 30:1. In 1990 it was 60:1.
In 1997 it was 74:1 (UNDP, 1999). In this context, it is clear that epidemiologists as
much as physicians and health activists have to ask themselves how their work does or
does not confront this obscene accrual of wealth and power. And does the nutrition
transition call for new health indicators? Almost certainly, yes!
The Human Development Report, however, argued that globalization is unstoppable
and that all good people can do is try to give it “development with a human face”. It is
true that proponents of unfettered free trade are more defensive than in 1987–94. Faced
by growing opposition and the sheer weight of evidence of harm, the architects of
inequalities in health now plead that we should still trust them and that (their version of)
growth must continue by a different path (Wolf, 1999). Inequalities may be bad, they
admit, but now is the time to target resources on the poor. We should ignore, they imply,
the accrual of power by the rich as they are the motor force of the new global economy.
Conclusion
The nutrition transition raises immensely important challenges for food policy. This
chapter argues that these need to be accompanied by sensitivity to other challenges
raised by contemporary globalization.
66 Can the challenges of socioeconomic processes be addressed in an era of globalization?

There is a strong case for action on food and health. Interventions much cited in the
literature, such as the North Karelia experiment in Finland, are often rooted in an era
of more interventionist government action. Finland produced a 55% decline in male
mortality due to coronary heart disease in the period 1972–92. So even in the con-
temporary policy climate, interventions can work. As has been illustrated by Thailand,
which engineered a decline in childhood malnutrition from 50% in 1982 to 10% by
1996. The key, according to the Commission on the Nutrition Challenges of the 21st
Century (2000) reporting to the UN, is a combination of political will, health plan-
ning, and community focus.
The good news is that awareness of health as a central element of development is
growing. Pressure to enable the new ecological public health approach is building up.
Policy options and the implications of choices are becoming clear, but much more
coordinated thinking, research, and health action is needed if enormous changes such
as the nutrition transition are to be steered in positive rather than negative directions.
Table 4.5 summarizes some of the policy goals that need to be reviewed and
analyzed more clearly and carefully. The case argued here is that unless such issues
are included in the discourse about the nutrition transition, there is a danger the tran-
sition will be seen as immutable and inevitable. The context presented here reminds
us that the nutrition transition is not an isolated phenomenon. Economic, political and
cultural transitions accompany, facilitate and frame the nutrition transition. It is an
indicator of a wider restructuring of society and lifestyle, part driven by strong forces,
part pulled by aspirations, immensely complex.
Now that so much is known about the nutrition transition, the challenge is to widen
debate to include what to do about it. There are strong forces who argue that the tran-
sition is unimportant, a policy deviation, a side-show in the onward march of social
progress, a matter for consumer choice. They argue that it is beyond governance. One
strand of modern thinking on governance agrees with this analysis, arguing that the
state and public thinking are too diffuse or weak to act on mega-trends such as the
Conclusion 67
Table 4.5 Different Food and Health Policy Frameworks: fragmented or systemic solutions?
Fragmented approach Systemic approach
Food policy focus on productionism & Food policy seeks sustainability & citizenship
consumerism
Marketing appeal to individual health Population approach to public health
Reliance on technical fixes Diet-based approach to preventive health
(drugs, functional foods, etc.)
Marginalization of health from supply Health central to economics
chain thinking
Separation of safety and nutrition Policy linkage between safety, nutrition and
sustainable food supply
Intensification Diversification
Health costs externalized Health costs internalized
Poor links between global, regional, Multilevel governance
national and local governance
Competing frameworks within government Integrated policy across government and food
and corporate sector supply chain

nutrition transition. We know better. The history of public health suggests that there
have always been such siren voices. Good people, armed with evidence, informed
governments like Thailand’s or Finland’s and together with progressive forces in the
food supply chain acted with imagination and persistence to improve public health.
The nutrition transition is an awesome challenge. It requires new alliances, new polit-
ical will and new thinking. And since when were public health challenges easy?
References
Acheson, D. (1998). “Report of the Independent Inquiry into Inequalities in Health”. The
Stationery Office, London.
Avery, N., Drake, M., and Lang, T. (1993). “Cracking the Codex: a report on the Codex
Alimentarius Commission”. National Food Alliance, London.
Banerji, D. (1999). A fundamental shift in the approach to international health by WHO,
UNICEF, and the World Bank: Instances of the practice of “intellectual facism” and
totalitarianism in some Asian countries. Int. J. Health Serv. 29, 227–259.
Boyd Orr, J. (1943). “Food and the People – Target for Tomorrow”, no. 3, pp. 41–55. Pilot
Press, London.
Boyd Orr, J. (1966). “As I Recall”. Macgibbon & Kee, London.
Commission on the Nutrition Challenges of the 21st Century (2000). Ending malnutrition
by 2020: An agenda for change in the millennium. Final Report to the ACC/SCN.
Food Nutr. Bull. 21 Suppl 3, p. 19.
Conway, G., and Pretty, J. (1991). “Unwelcome Harvest: Agriculture and Pollution”.
Earthscan, London.
Davidson, J. (2001). “The Richest 100 Economic Players”. CAFOD, London.
de Moor, A.P.G. (1998). “Subsidizing Unsustainable Development”, S5.1–S5.5. Institute
for Research on Public Expenditure & Earth Council, The Hague.
DETR (1998). “Sustainable Business”. Consultation paper on sustainable development
and business in the UK. Dept of the Environment, Transport and the Regions,
London.
EC (1998). Hormone meat: WTO judgement on EU ban just one step in a long process –
Consumer protection will be upheld! Brussels: Commission of European Com-
munities, Directorate-General XXIV, Background Note from DG XXIV, 16 January.
European Commission (1999). Hormone meat: more evidence of risks. Directorate
General of Agriculture. Newsletter, 12 May. European Commission DG VI, Brussels.
FAO (1998). “The State of Food and Agriculture”. Food Agriculture Organisation, Rome.
Fortune (2001). “Fortune Global 500”. Forbes, New York. http://www.fortune.com
Gardner, G. (1996). “Shrinking Fields: Cropland Loss in a World of Eight Billion”.
Worldwatch Paper 131, Worldwatch Institute, Washington, DC.
Gardner, G., and Halweil, B. (2000). “Underfed and Overfed: The Global Epidemic of
Malnutrition”. Worldwatch paper 150. Worldwatch Institute, Washington, DC.
Garnett, T. (1999). “City Harvest”. Sustainable Agriculture, Food and Environment (SAFE)
Alliance, London.
68 Can the challenges of socioeconomic processes be addressed in an era of globalization?

Harrison, P. (1992). “The Third Revolution: Environment, Population and a Sustainable
World”. I B Tauris 169, New York.
Hoskins, G., and Lobstein, T. (1998). “Food Facts”, no. 3. Sustainable Agriculture, Food
and Environment (SAFE) Alliance, London.
Howson, C., Fineberg, H., and Bloom, B. (1998). The pursuit of global health: the rele-
vance of engagement for developed countries. Lancet 351, 586–590.
International Centre for Trade and Sustainable Development (1999). Australia, New Zealand
Cry Fowl Over U.S. Lamb Decision. Bridges Weekly Trade News Digest 3, 27.
James, W.P.T., Nelson, M., Ralph, A., and Leather, S. (1997). The contribution of nutrition
to inequalities in health. BMJ 314, 1545–1549.
Klein, N. (2000). “No Logo”. HarperCollins, London.
Labonte, R. (1998). Healthy public policy and the World Trade Organisation: a proposal
for an international health presence in future world trade/investment talks. Health
Promotion Int. 13, 245–255.
Lang, T. (1997). The public health impact of globalisation of food trade. In “Diet,
Nutrition and Chronic Disease: Lessons from Contrasting Worlds” (S. Shetty, and
K. McPherson, eds.), pp. 173–186. Wiley, London.
Lang, T. (1999a). Food and nutrition. In “Priorities for Public Health Action in the
European Union” (O. Weil, M. McKee, M. Brodin, and D. Oberle, eds.), pp. 138–156.
European Commission, Brussels.
Lang, T. (1999b). Food as a public health issue. In “Perspectives in Public Health”
(S. Griffiths and D. Hunter, eds.), pp. 47–58. Radcliffe Medical Press, Oxford.
Lang, T., Dowler, E., Caraher, M., and Barling, D. (2001). “Is Food a Global Public Good
for Health?: Food Security and the Challenge to Governance”. Report to World
Health Organisation. Centre for Food Policy, London, unpublished.
McCrea, D. (1997). Codex Alimentarius – in the consumer interest? Consumer Policy Rev.
7(4), 132–138.
MacLaren, D., Bullock, S., and Yousuf, N. (1998). “Tomorrow’s World: Britains Share in
a Sustainable Future”. Earthscan, London.
McMichael, A.J. (1999). From hazard to habitat: rethinking environment and health.
Epidemiology 10(4), 1–5.
McMichael, A.J. (2001). “Human Frontiers, Environments and Disease”. Cambridge
University Press, Cambridge.
Navarro, V. (1999). Health and equity in the world in the era of “globalisation”. Int. J.
Health Serv. 29, 215–226.
Oldeman, L.R., et al. (1991). “World Map of the Status of Human-Induced Soil Degradation”.
Wageningen, Netherlands and Nairobi: International Soil Reference and Information
Centre, and UN Environment Programme, Wageningen, Netherlands and Nairobi.
Pretty, J. (1998). “The Living Land”. Earthscan, London.
Raven, H., and Lang, T. (1995). “Off Our Trolleys?: Supermarkets and the Hypermarket
Economy”. Institute of Public Policy Research, London.
Royal Ministry of Agriculture (1999). “Food Security and the Role of Domestic
Agricultural Food Production”. Royal Ministry of Agriculture, Oslo.
Royal Norwegian Ministry of Agriculture (1976). “On Norwegian Nutrition and Food
Policy”. Report no. 32 to the Storting (1975–76). Royal Ministry of Agriculture, Oslo.
References 69

Sen, A. (1981a). “Poverty and Famines: An Essay on Entitlement and Deprivation”.
International Labour Organisation, Geneva.
Sen, A. (1981b). “Poverty and Famines”. Clarendon Press, Oxford.
Sen, A. (1997). “Inequality Re-examined”. Oxford University Press, Oxford.
Sen, A. (2000). “The Ends and Means of Sustainability”, key note address, International
Conference on Transition to Sustainability, InterAcademy Panel on International
Issues, Tokyo, May.
Societe Francais de Santé Publique (2000). “Health and Human Nutrition: Elements for
Action”. Working Paper of the French Presidency. European Commission, Brussels.
Tansey, G., and Worsley, T. (1995). “The Food System”. Earthscan, London.
UNDP (1996). “Urban Agriculture: Food, Jobs and Sustainable Cities”, Vol. 1, United
Nations Development Programme, New York.
UNDP (1999). “Human Development Report 1999”. Oxford University Press/United
Nations Development Programme, New York.
UNDP (2000). “Human Development Report 2000”. Oxford University Press/United
Nations Development Programme, New York.
UNICEF (2000). “State of the World’s Children”. United Nations’Children Fund, New York.
USTR (1998). “EC Hormone Ban Relating to Meat Imports Violates SPS Agreement
According to Appellate Body”. Office of the US Trade Representative, Washington, DC.
Vidal, J. (2001). Banana world of packaging. The Guardian 24 August, G2, p. 7.
Waltner-Troews, D., and Lang, T. (2000). A new conceptual base for food and agriculture:
the emerging model of links between agriculture, food, health, environment and soci-
ety. Global Change Human Health 1, 116–130.
WHO-E (1999). “Urban Agriculture”. World Health Organisation European Regional
Office, Nutrition Department, Copenhagen.
WHO-Europe (1995). Nutrition Policy in WHO European Member States. Progress report
following the 1992 International Conference on Nutrition. June. WHO-Europe,
Copenhagen.
WHO Regional Office for Europe (1999). Draft Food and Nutrition Action Plan. World
Health Organisation Regional Office for Europe, Copenhagen.
Wolf, M. (1999). A world divided. Financial Times 14 July, p. 16.
World Bank (1999). World Development Report 1999–2000. World Bank, New York.
World Bank (2001). “2001 World Development Indicators Database”.World Bank, New York;
(accessed on 4/11/2001) http://www.worldbank.org/data/databytopic/GDP.pdf
World Food Summit (1996). Rome, Objective 7.4.
World Health Organisation Regional Committee for Europe (2000). “Resolution: The
Impact of Food and Nutrition on Public Health: The Case for a Food and Nutrition
Policy and an Action Plan for the European Region of WHO, 2000–2005”. Fiftieth
session, Copenhagen, 11–14 September, EUR/RC50/R8, 14 September. World Health
Organisation, Copenhagen.
World Resources Institute (1993). “World Resouces 1992–93”. WRI and Oxford
University Press, Washington, DC.
WTO (1999). “Trade and Environment Bulletin”. 30 July.
70 Can the challenges of socioeconomic processes be addressed in an era of globalization?

Demographic trends
Hania Zlotnik1
5
Over the past four centuries the population of the world has increased tenfold, rising
from about 580 million persons in 1600 to slightly over six billion in 2000 (Biraben,
1979; United Nations, 2001a). Most of that growth occurred during the 20th century
when the population nearly quadrupled (Fig. 5.1). Thus, whereas it took three
centuries – from 1600 to 1900 – for the population to increase from 0.6 billion to
1.6 billion, between 1900 and 2000 a further 4.4 billion persons were added to the
world population. Such rapid population growth, unprecedented in human history,
resulted largely from the major reductions of mortality that occurred during the 20th
century. Between 1900 and 2000, life expectancy at the world level nearly doubled,
reaching 65.5 years by the end of the century. Almost universally mortality reductions
preceded changes in fertility. In populations where mortality had been traditionally
high, women had to bear large numbers of children to ensure that enough of them sur-
vived to adulthood. As mortality declined, populations did not immediately adjust
their fertility levels to match the reduced risks of death. As a result, populations grew
rapidly when high fertility persisted even as mortality declined.
The more developed countries of today were the first to experience sustained
declines of mortality. Starting in the 18th century, better hygiene and improving stan-
dards of living contributed to reduce mortality rates in those countries. Between 1750
and 1850, for instance, life expectancy in a number of European countries increased
from 25 years to 35 years (Vallin, 1989) and during the 19th century, as mortality
reductions accelerated, a widespread fertility decline began as well. Although even for
Europe the data available on fertility trends over the 19th century are partial, it would
appear that fertility in the continent declined from about 5–5.5 births per woman in
the early part of the 19th century to about four children per woman in the early part
of the 20th century (Clark, 1968).
The process whereby reductions of mortality are followed by reductions of fertility
sufficient to ensure that overall population growth remains low is known as the demo-
graphic transition. During the 20th century, most developing countries embarked on
the demographic transition. Indeed, with the discovery of antibiotics and other means
1 The views and opinions expressed in this chapter are those of the author and do not necessarily represent those
of the United Nations.
The Nutrition TransitionISBN: 0-12-153654-8
Copyright © 2002 Elsevier Science LtdAll rights of reproduction in any form reserved

to combat the spread of the infectious diseases endemic in developing countries, rapid
reductions of mortality were achieved in those countries after 1945–1950. As in the
more developed countries earlier, the continuation of high fertility as mortality
declined gave rise to very rapid population growth, but fertility reductions in the
developing world have been occurring more rapidly than in the more developed coun-
tries. The availability of modern contraceptives has facilitated such developments. By
the end of the 20th century, most developing countries had initiated the transition to
lower fertility. According to United Nations (2001a) estimates, by 1995–2000 only 16
developing countries had not yet shown signs of a fertility reduction and they com-
prised just 3% of the world’s population.
Not only did the 20th century witness a rapid rise of population but, in addition, it
saw the distribution of the population between rural and urban areas change dramati-
cally. Indeed, although the existence of populous cities with urban attributes dates
back several centuries if not millennia depending on the region under consideration,
the vast majority of the world’s population has lived in rural settings during most of
human history. Even as late as 1800, only 5% of the world population lived in urban
areas and by 1900 that proportion had increased to just over 13% (United Nations,
1980). But over the course of the 20th century the proportion urban more than tripled,
reaching 47% by 2000 (Fig. 5.2). The process of widespread urbanization started ear-
lier in the more developed regions than in the developing world. Already by 1900
one out of every four inhabitants of more developed countries was an urban dweller
whereas in the developing world the equivalent proportion was one in fifteen.
Although levels of urbanization have risen markedly in developing countries, by 2000
less-developed regions are still about half as urbanized as more-developed regions.
Thus, whereas 76% of the population of the latter lives in cities, just 40% of the
population of less-developed countries is made of urban dwellers.
This chapter describes in more detail the evolution of the size and growth of the
world population and the dynamics of the process of urbanization in the major regions
72 Demographic trends
�400 �200 0 200 400 600 800 1000 1200 1400 1600 1800 2000
10.000
9.000
8.000
7.000
6.000
5.000
4.000
3.000
2.000
1.000
0.000
Po
pu
lati
on
(b
illio
ns)
Year
Figure 5.1 Long-term population increase, 400 BC to 2000 AD.

of the world since 1950. It also discusses future prospects and their implications. The
data presented were derived from the 2000 Revision of estimates and projections
of national populations prepared by the United Nations Population Division (United
Nations, 2001a,b) and from the 1999 Revision of World Urbanization Prospects
(United Nations, 2001c). To ensure consistency between the two sets of data, estimates
and projections of the urban and rural populations were derived using the national pop-
ulations produced by the 2000 Revision and the proportions residing in urban areas as
estimated and projected by the 1999 Revision of World Urbanization Prospects.
Population growth
After remaining at very low levels during most of human history, the average annual
rate of population growth for the world began to accelerate at about 1700, when mor-
tality in Europe started to decline steadily. Nevertheless, the rate of population growth
did not rise above 0.5% per year until the first half of the 19th century and remained
well below 1% per year until 1925 (Fig. 5.3). After piercing the 1% barrier in the late
1920s, World War II made the growth rate drop again below 1% per year during the
1940s, but the 1950s witnessed an unprecedented resurgence of growth fueled both by
rising fertility in the more developed countries that experienced a “baby boom” after
the war and by high fertility and declining mortality in developing countries. As mor-
tality reductions in the developing world accelerated, so did population growth, with
the result that during 1965–1970 the population of the world grew at more than 2%
per year, a rate that, if sustained, would have led to a doubling of the world’s pop-
ulation in just 34 years. However, the late 1960s also marked the point where fertil-
ity in a number of developing countries began to show a clear tendency to decline.
As Fig. 5.4 shows, reductions in fertility became more clear cut during the 1970s and
Population growth 73
90
80
70
60
50
40
30
20
10
01800 1825 1850 1875 1900 1925 1950 1975 2000 2025
World Less-developed regions More-developed regions Series 4
Per
cen
tage
urb
an
Year
Figure 5.2 Percentage of population in urban areas, 1800–2030.
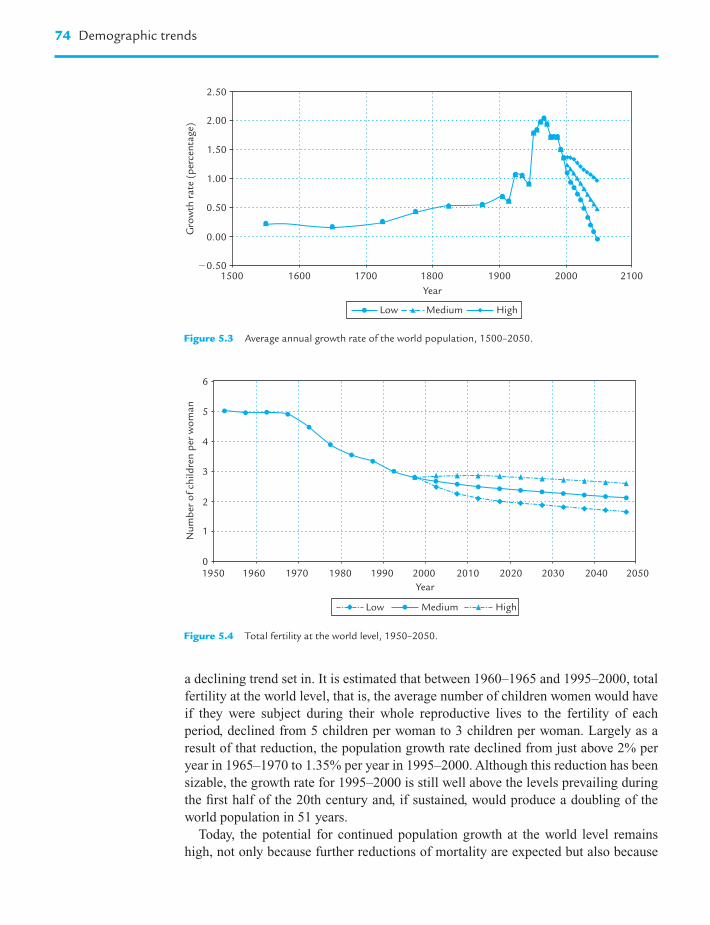
a declining trend set in. It is estimated that between 1960–1965 and 1995–2000, total
fertility at the world level, that is, the average number of children women would have
if they were subject during their whole reproductive lives to the fertility of each
period, declined from 5 children per woman to 3 children per woman. Largely as a
result of that reduction, the population growth rate declined from just above 2% per
year in 1965–1970 to 1.35% per year in 1995–2000. Although this reduction has been
sizable, the growth rate for 1995–2000 is still well above the levels prevailing during
the first half of the 20th century and, if sustained, would produce a doubling of the
world population in 51 years.
Today, the potential for continued population growth at the world level remains
high, not only because further reductions of mortality are expected but also because
74 Demographic trends
2.50
2.00
1.50
1.00
0.50
0.00
1500 1600 1700 1800 1900 2000 2100�0.50
Gro
wth
rate
(p
erce
nta
ge)
Year
Low Medium High
Figure 5.3 Average annual growth rate of the world population, 1500–2050.
Nu
mb
er o
f ch
ildre
n p
er w
om
an
6
5
4
3
2
1
01950 1960 1970 1980 1990 2000 2010 2020 2030 2040 2050
Year
Low Medium High
Figure 5.4 Total fertility at the world level, 1950–2050.

many developing countries still experience moderate to high fertility levels and have,
in addition, young populations where the numbers of future parents already surpass
those belonging to previous generations. The term “population momentum” is used to
denote the tendency of young populations to continue growing even when fertility
declines significantly. To understand the mechanics of population momentum imagine
a population with three generations: grandparents, parents and children. As the popu-
lation moves from one period to the next, children become parents, parents become
grandparents and the original grandparents die. For the population to stop growing,
the number of children that parents have in a period must equal the number of grand-
parents who die. If the population starts by having more children than parents and
more parents than grandparents, when the children become parents their offspring
will surpass the number of grandparents who die even if the new parents have only the
children necessary to replace themselves. That difference will result in population
growth.
What then are the prospects for future population growth? Population projections
prepared by the United Nations (2001a,b) indicate that the world population will con-
tinue to rise over the next few decades but, because the rate at which population grows
is expected to continue declining, there is considerable uncertainty regarding the size
that the world population may attain in the future. In the United Nations projections
future population growth is the result of assumptions made about the paths that fertil-
ity and mortality will take in the future at the country level. For the majority of coun-
tries, mortality is assumed to decline steadily between 2000 and 2050, the exception
being the 45 countries highly affected by the HIV/AIDS epidemic for some of which
mortality levels stagnate or even increase over the medium-term future because of
AIDS. Only one mortality path is projected for each country and that path is com-
bined with each of three different paths for future fertility to produce three projection
variants known as the low, the medium and the high.
Assumptions about future fertility are made separately for three different categories
of countries. The first is constituted of countries whose fertility in 1995–2000 was
estimated to be below replacement level, that is, the level of fertility that would ensure
that each woman has a daughter who survives to reproductive age. In countries with
low mortality replacement-level fertility is about 2.1 children per woman. For coun-
tries that already have fertility below replacement level, future fertility is projected to
remain below replacement level during most of the 2000–2050 period and to reach in
2045–2050 the total fertility level attained by the cohort of women born in the early
1960s2. The second category of countries includes all those where the transition to
low fertility has started but where fertility is still above replacement level. For those
countries, fertility is assumed to reach replacement level (2.1 children per woman) on
or before 2045–2050 and to remain at replacement level once it is reached. Lastly, for
the third category of countries, those in which the transition to low fertility has not yet
started, total fertility is assumed to decline at a rate of one child per decade starting
in 2005 and no fertility change is assumed before that date. Given the high current
Population growth 75
2 For countries lacking cohort data, the total fertility in 2045–2050 is set at 1.7 children per woman if total
fertility in 1995–2000 is below 1.5 children per woman and at 1.9 children per woman otherwise.

levels of fertility that countries in this category have, most of them are projected to
have fertility above replacement level in 2045–2050. This set of assumptions under-
lies the medium projection variant. Low and high variants are produced by letting fer-
tility be approximately 0.5 children below or above, respectively, that of the medium
variant3.
The assumptions about future fertility are based on an analysis of past fertility
trends. Although, as mentioned above, most countries have already embarked on the
transition to low fertility, as of 1995–2000 there was still considerable heterogeneity
among countries in terms of the stage of the transition that they had reached. Using
their 1995–2000 total fertility levels and information on past trends, countries were
classified according to the stage of the transition they were in. As Table 5.1 indicates,
in 2000 about 20% of the world population lived in the 43 countries that had experi-
enced an early transition to low fertility, the large majority of which (35) are located
in Europe. The group also includes Australia, Canada, Georgia, Japan, New Zealand,
and the United States, as well as Argentina and Uruguay, the only two countries that
experienced an early transition but whose fertility has remained well above replace-
ment level. In contrast, all other early-transition countries have been experiencing
below-replacement fertility levels, levels that have been maintained for at least a
decade or two in most cases. It is this persistence of below-replacement fertility in the
more-developed countries that provides the rationale for keeping future fertility
below-replacement level for all countries that have a current fertility lower than 2.1
children for women. Table 5.1 shows that in addition to the early-transition countries
there are 23 countries, accounting for about a quarter of the world population, whose
fertility is also below-replacement level, the largest of which is China. For these coun-
tries as well, fertility is kept below replacement level during the projection period in
the medium variant.
A further 52 countries are already fairly advanced in the transition to low fertility,
with total fertility levels ranging from 2.1 children per woman to 4 children per
woman. In the medium variant most of these countries are assumed to continue expe-
riencing a decline of fertility but only until the level of 2.1 children per woman is
reached. No further reductions of fertility are assumed thereafter. Because this group
of countries accounts for nearly 40% of today’s population, assumptions about their
future fertility have an important impact on long-term prospects for population
growth and, given the experience of developed countries where below-replacement
fertility is the rule, the issue of whether some of the intermediate fertility countries
may reach below-replacement fertility in the future and maintain it thereafter is begin-
ning to be considered. For some of the countries in this group, however, evidence
regarding fertility trends in the recent past has shown that reductions have not been as
fast as previously expected and suggest that stagnation of fertility levels may occur in
the future. This is the case of populous countries such as Bangladesh and Egypt.
Lastly, there are still 69 countries with fertility levels above 4 children per woman.
Among them, 16 have not yet shown signs of embarking on the transition to low
76 Demographic trends
3 In countries with fertility below replacement level, the low variant has a fertility 0.4 children per woman below
the medium and the high variant has a fertility 0.4 children above the medium.

Table 5.1 Distribution of countries according to the stage they have reached in the transition to low fertility by major area, 1995–2000
Major area No transition Decline but Decline to Decline to Decline to Decline to Early transition, Early transition Total
TF still � 5 4 � TF 5 3 � TF 4 2.1 � TF 3 TF 2.1 with with “baby boom”,
2.1 � TF � 3 TF � 2.1
Number of countries
Africa 15 21 8 6 2 1 0 0 53
Asia 1 10 3 11 11 12 0 2 50
Europe 0 0 0 0 1 3 0 35 39
Latin America and 0 0 7 3 14 7 2 0 33
the Caribbean
Northern America 0 0 0 0 0 0 0 2 2
Oceania 0 1 3 2 2 0 0 2 10
World 16 32 21 22 30 23 2 41 187
Percentage of population in each major area
Africa 20.7 43.2 12.4 22.3 1.3 0.1 0.0 0.0 100.0
Asia 0.5 6.3 0.8 37.9 10.9 39.9 0.0 3.6 100.0
Europe 0.0 0.0 0.0 0.0 0.4 0.9 0.0 98.7 100.0
Latin America and 0.0 0.0 8.7 3.7 76.4 3.4 7.8 0.0 100.0
the Caribbean
Northern America 0.0 0.0 0.0 0.0 0.0 0.0 0.0 100.0 100.0
Oceania 0.0 1.5 17.2 3.2 1.5 0.0 0.0 76.5 100.0
World 3.0 9.5 2.9 26.3 13.4 24.6 0.7 19.6 100.0
Source: United Nations (2001a). TF, total fertility, the average number of children a woman would have over her reproductive life if subject to the fertility rates of a given
period, 1995–2000 in this case.

fertility and a further 32 have fertility levels above 5 children per woman. Together,
these two subsets of countries account for one-eighth of the world population. Even if
these high-fertility countries proceed with the transition to low fertility at the average
pace at which developing countries whose fertility has declined in the past 40 years
achieved reductions, their populations will grow very rapidly. In fact, 12 of the 16
countries where the fertility transition has not yet started are projected to have a total
fertility higher than 2.1 children per woman in 2045–2050, and the populations of all
16 countries combined are expected to grow at an average annual rate of nearly 2.8%
during 2000–2050. In consequence, their share of the world population is expected to
rise from 3% in 2000 to nearly 8% in 2050.
The heterogeneity characterizing countries both with respect to current fertility
levels and in terms of expected future trends, results in trends at the world level that
reflect a slowing down of the fertility decline in the medium variant, a more rapid
reduction of future fertility in the low variant, and a slight rise followed by the stag-
nation of fertility levels in the high variant (Fig. 5.4 and Table 5.2). In the medium
variant, total fertility declines from 2.82 children per woman in 1995–2000 to 2.15
children per woman in 2045–2050, thus remaining above replacement level during the
whole projection period. In the low variant, total fertility drops below replacement
level in 2015–2020 and continues to decline so that by 2045–2050 it has reached
1.68 children per woman. In the high variant, fertility remains between 2.8 and 2.9
children per woman until 2025 and then declines slightly to reach 2.62 children per
woman in 2045–2050. In all projection variants, fertility is lower in more developed
regions than in less developed regions, but the tendency is for the fertility levels of
those two groups to converge. Thus, whereas in 1995–2000 the difference in fertility
levels between the more developed and the less developed regions is of approximately
1.5 children per woman – 1.57 children per woman vs. 3.1 children per woman,
respectively – by 2045–2050 the largest difference is found in the high variant and
amounts to just about 0.3 children per woman. That is, in all projection variants
the fertility of less-developed regions declines significantly, whereas that of more-
developed regions remains almost constant in the low variant and increases in the
medium and high variants.
Among the countries in less-developed regions, those classified as least developed
countries by the United Nations4 have, as a group, high levels of fertility (5.5 children
per woman in 1995–2000). Although their fertility is expected to decline markedly
during the next 50 years, by 2045–2050 the medium variant still has them exhibiting
a total fertility of 2.5 children per woman, considerably above replacement level.
In the high variant their fertility surpasses 3 children per woman and only in the low
78 Demographic trends
4 The least-developed countries, as defined by the United Nations General Assembly in 1998, include 48 countries:
Afghanistan, Angola, Bangladesh, Benin, Bhutan, Burkina Faso, Burundi, Cambodia, Cape Verde, Central
African Republic, Chad, Comoros, Democratic Republic of the Congo, Djibouti, Equatorial Guinea, Eritrea,
Ethiopia, Gambia, Guinea, Guinea-Bissau, Haiti, Kiribati, Lao People’s Democratic Republic, Lesotho, Liberia,
Madagascar, Malawi, Maldives, Mali, Mauritania, Mozambique, Myanmar, Nepal, Niger, Rwanda, Samoa,
São Tomé and Príncipe, Sierra Leone, Solomon Islands, Somalia, Sudan, Togo, Tuvalu, Uganda, United Republic
of Tanzania, Vanuatu, Yemen and Zambia. These countries are also included in the less developed regions.

Table 5.2 Total fertility estimates and projected values for the world, major areas and regions, 1950–1955 to 2045–2050
Major area 1950–1955 1975–1980 1995–2000 2000–2005 2020–2025 2045–2050
Low Medium High Low Medium High Low Medium High
World 5.01 3.90 2.82 2.49 2.68 2.87 1.96 2.39 2.83 1.68 2.15 2.62
More-developed regions 2.84 1.91 1.57 1.44 1.50 1.58 1.40 1.65 1.92 1.52 1.92 2.33
Less-developed regions 6.16 4.62 3.10 2.70 2.92 3.13 2.03 2.49 2.95 1.70 2.17 2.65
Least-developed countries 6.60 6.40 5.47 4.91 5.24 5.47 3.40 3.90 4.40 2.02 2.51 3.02
Africa 6.71 6.56 5.27 4.65 4.97 5.21 3.17 3.64 4.10 1.91 2.39 2.88
Asia 5.88 4.17 2.70 2.35 2.54 2.74 1.73 2.19 2.64 1.60 2.08 2.56
Latin America and the Caribbean 5.89 4.49 2.69 2.26 2.50 2.73 1.67 2.16 2.65 1.60 2.10 2.59
Northern America 3.47 1.78 2.00 1.76 1.90 2.09 1.61 1.93 2.32 1.68 2.08 2.48
Europe 2.66 1.97 1.41 1.31 1.34 1.38 1.26 1.47 1.69 1.41 1.81 2.20
Oceania 3.87 2.78 2.41 2.27 2.39 2.50 1.98 2.26 2.57 1.61 2.06 2.50
Source: United Nations (2001a).

variant do they reach replacement-level fertility. Countries in this group not only have
lagged behind other countries in the transition to low fertility but are also character-
ized by higher mortality levels, especially since many of them are highly affected by
the HIV/AIDS epidemic. Given the other social and economic constraints they face,
the likelihood that they may progress rapidly through the demographic transition
seems low. Even the moderate reductions of fertility projected under the medium
variant may be hard to achieve.
Most of the least-developed countries are located in Africa. Among all major areas
of the world, Africa has today the highest fertility: 5.3 children per woman, nearly
double the level in Asia or Latin America and the Caribbean. As Table 5.2 shows,
although fertility in Africa has already declined with respect to the higher levels
prevalent in the late 1970s, most of the continent is still at the early stages of the
transition to lower fertility and both the medium and high variants assume that it will
take the best part of the next 50 years for fertility in Africa to reach levels similar to
those of Asia or Latin America today.
At the other end of the spectrum, Europe is experiencing very low levels of fertil-
ity, levels that are unprecedented in human history and that, if continued, will lead
to a significant reduction of the population. According to past estimates, Europe’s
fertility has been under replacement level since the 1970s and it is not expected to rise
above replacement level in the near future. In fact, further fertility reductions are pro-
jected in all variants for the period 2000–2005 and only a small increase in fertility is
projected by 2020–2025 in the medium and high variants. The rising fertility trend is
maintained in both projection variants thereafter so that by 2045–2050, total fertility
in Europe is projected to be 1.8 children per woman in the medium variant and
2.2 children per woman in the high variant. Only the low variant keeps total fertility
in Europe declining steadily until 2025 and allows for a very small recuperation by
2050. Similar trends are followed by the fertility of Northern America, although the
range of variation is smaller since fertility in that area has not fallen to the low levels
observed in Europe. As for Asia, Latin America and the Caribbean, and Oceania, the
low and medium variants project steady declines of fertility, whereas the high variant
projects slight increases or a virtual stagnation of fertility levels until 2050.
Assumptions about future fertility are a key determinant of future population
growth especially since they vary from one projection variant to the other. However,
declining mortality also makes a significant contribution to population increases.
Only one set of assumptions on future mortality trends is used to produce the various
projection variants. Table 5.3 presents selected past estimates of life expectancy at
birth and the assumed levels for that parameter in the future. At the world level, life
expectancy increased from 46.5 years in 1950–1955 to 65 years in 1995–2000, a gain
of 40%. Large reductions of mortality have been possible in the past because the
interventions to control infectious and parasitic diseases are well known and of mod-
erate cost. However, as infectious diseases come under control, the main causes of
death shift to diseases that are harder to treat and that demand more costly interven-
tions. Consequently, the higher the life expectancy already achieved, the more dif-
ficult it is to increase it further and some deceleration of the improvements of life
expectancy is expected as higher levels are attained. In the case of the projected
80 Demographic trends

Table 5.3 Estimated and projected life expectancy at birth and mortality decline index, world and major areas, 1950–1955 to 2045–2050
Major area Life expectancy at birth (in years) Mortality decline indexa
1950–1955 1975–1980 1995–2000 2000–2005 2020–2025 2045–2050 1950–1955 to 1995–2000 to 1995–2000 to
1995–2000 2025–2030 2045–2050
World 46.5 59.8 65.0 66.0 71.3 76.0 54 32 48
More-developed regions 66.2 72.3 74.9 75.6 79.3 82.1 61 39 55
Less-developed regions 41.0 56.8 62.9 64.1 69.7 75.0 56 32 48
Least-developed countries 35.5 45.3 50.3 51.4 60.6 69.7 33 33 51
Africa 37.8 48.3 51.4 51.3 59.6 69.5 32 29 50
Asia 41.3 58.4 65.8 67.4 73.0 77.1 62 37 51
Latin America and 51.4 63.0 69.3 70.4 74.3 77.8 62 31 45
the Caribbean
Northern America 68.9 73.4 76.7 77.7 80.7 82.7 68 39 53
Europe 65.7 71.5 73.2 73.7 77.7 80.8 51 35 51
Oceania 60.9 67.7 73.5 74.4 77.6 80.6 65 34 49
Source: United Nations (2001a).a The mortality decline index represents the increase in life expectancy actually attained as a percentage of the maximum possible increase over the period indicated, taking
as maximum life expectancy that for Japan.

levels for the world population, it is expected that life expectancy will rise to 76 years
in 2045–2050, an increase of 17% with respect to the level attained in 1995–2000.
To make comparisons between periods and among major areas on the basis of
a more comparable metric, a mortality decline index was calculated by expressing
the increase of life expectancy actually attained over a period as a percentage of the
largest potential increase in life expectancy measured as the difference between
the life expectancy in Japan (the country with the highest life expectancy) and the
level a particular region had attained by the beginning of the period under considera-
tion. Table 5.3 shows the values of the mortality decline index for three periods:
1950–1955 to 1995–2000; 1995–2000 to 2025–2030; and 1995–2000 to 2045–2050.
Over the first period, which encompasses the second half of the 20th century,
the index indicates that more-developed regions were somewhat more successful
in reducing mortality in relative terms than less-developed regions, although less-
developed regions recorded a greater absolute gain in life expectancy than more
developed regions (22 years vs. 9 years). By 1995–2000, however, less developed
regions still had a significantly lower life expectancy than more-developed regions:
63 years vs. 75 years. Among the less-developed regions, the least-developed coun-
tries made very small relative gains in life expectancy, achieving just 33% of the
potential increase. By 1995–2000 their life expectancy still stood at a low 50 years.
Once more, Africa experienced gains similar to those of the least-developed countries,
achieving 32% of the potential rise in life expectancy by 1995–2000. The impact of
the HIV/AIDS epidemic is largely responsible for the low gains made by Africa and
the least-developed countries. In comparison, most of the other major areas fared
better, achieving at least 62% of the potential rise in life expectancy. Only Europe
recorded a lower overall increase, at 51% of the potential maximum, largely because
of the stagnation or even the increases in mortality that have been experienced by
Eastern European countries and, in particular, by the Russian Federation and other
successor states of the former Soviet Union. In fact, Eastern Europe as a whole
achieved only 24% of the potential rise in life expectancy between 1950–1955 and
1995–2000, with its life expectancy increasing by just 4 years over the period, from
64 years to 68 years.
For the future, relative gains in life expectancy are expected to be slightly lower
over the next fifty years than over the past fifty, with most of the major areas achiev-
ing just about 50% of the potential maximum gain. More-developed regions are
expected to make somewhat greater relative gains than less-developed regions, and
the least-developed countries are expected to record fairly low relative gains by
2025–2030 but to improve their performance thereafter so that by the end of the pro-
jection period they are expected to attain 51% of the potential maximum increase in
life expectancy. Yet, by 2045–2050 the least-developed countries are still expected to
lag behind the rest of the developing world in terms of life expectancy (see Table 5.3).
The low levels of the mortality index expected for the least-developed countries and
for Africa by 2025–2030 are largely the result of the HIV/AIDS epidemic whose
impact is projected to be greatest over the next two decades. Over the long run, how-
ever, current projections assume that HIV prevalence will decline significantly so that
the disease has a smaller effect in dampening gains in life expectancy after 2030.
82 Demographic trends
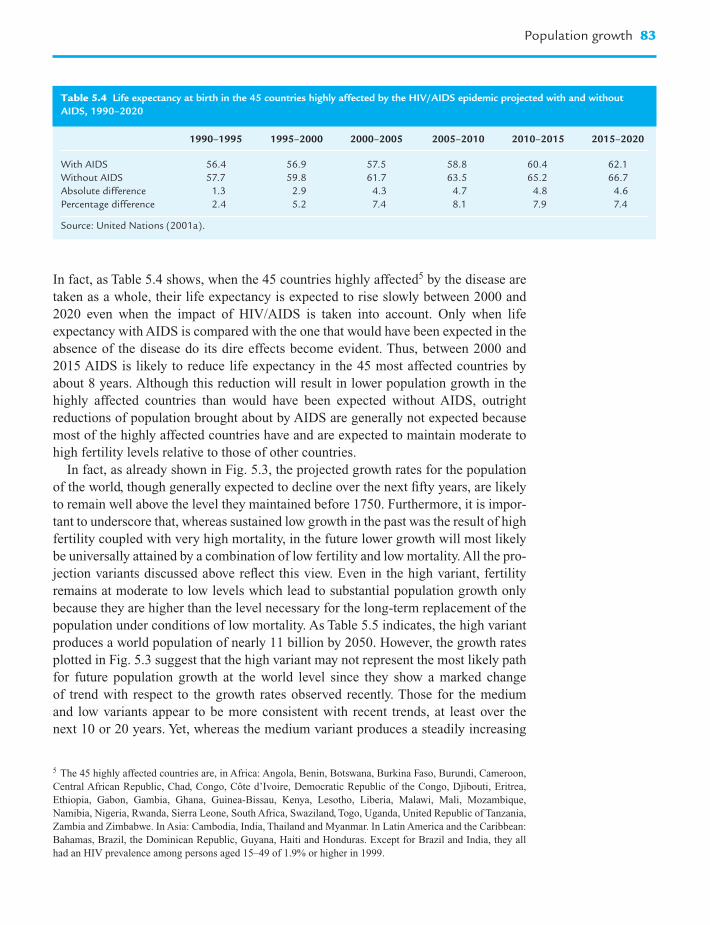
In fact, as Table 5.4 shows, when the 45 countries highly affected5 by the disease are
taken as a whole, their life expectancy is expected to rise slowly between 2000 and
2020 even when the impact of HIV/AIDS is taken into account. Only when life
expectancy with AIDS is compared with the one that would have been expected in the
absence of the disease do its dire effects become evident. Thus, between 2000 and
2015 AIDS is likely to reduce life expectancy in the 45 most affected countries by
about 8 years. Although this reduction will result in lower population growth in the
highly affected countries than would have been expected without AIDS, outright
reductions of population brought about by AIDS are generally not expected because
most of the highly affected countries have and are expected to maintain moderate to
high fertility levels relative to those of other countries.
In fact, as already shown in Fig. 5.3, the projected growth rates for the population
of the world, though generally expected to decline over the next fifty years, are likely
to remain well above the level they maintained before 1750. Furthermore, it is impor-
tant to underscore that, whereas sustained low growth in the past was the result of high
fertility coupled with very high mortality, in the future lower growth will most likely
be universally attained by a combination of low fertility and low mortality. All the pro-
jection variants discussed above reflect this view. Even in the high variant, fertility
remains at moderate to low levels which lead to substantial population growth only
because they are higher than the level necessary for the long-term replacement of the
population under conditions of low mortality. As Table 5.5 indicates, the high variant
produces a world population of nearly 11 billion by 2050. However, the growth rates
plotted in Fig. 5.3 suggest that the high variant may not represent the most likely path
for future population growth at the world level since they show a marked change
of trend with respect to the growth rates observed recently. Those for the medium
and low variants appear to be more consistent with recent trends, at least over the
next 10 or 20 years. Yet, whereas the medium variant produces a steadily increasing
Population growth 83
Table 5.4 Life expectancy at birth in the 45 countries highly affected by the HIV/AIDS epidemic projected with and without
AIDS, 1990–2020
1990–1995 1995–2000 2000–2005 2005–2010 2010–2015 2015–2020
With AIDS 56.4 56.9 57.5 58.8 60.4 62.1
Without AIDS 57.7 59.8 61.7 63.5 65.2 66.7
Absolute difference 1.3 2.9 4.3 4.7 4.8 4.6
Percentage difference 2.4 5.2 7.4 8.1 7.9 7.4
Source: United Nations (2001a).
5 The 45 highly affected countries are, in Africa: Angola, Benin, Botswana, Burkina Faso, Burundi, Cameroon,
Central African Republic, Chad, Congo, Côte d’Ivoire, Democratic Republic of the Congo, Djibouti, Eritrea,
Ethiopia, Gabon, Gambia, Ghana, Guinea-Bissau, Kenya, Lesotho, Liberia, Malawi, Mali, Mozambique,
Namibia, Nigeria, Rwanda, Sierra Leone, South Africa, Swaziland, Togo, Uganda, United Republic of Tanzania,
Zambia and Zimbabwe. In Asia: Cambodia, India, Thailand and Myanmar. In Latin America and the Caribbean:
Bahamas, Brazil, the Dominican Republic, Guyana, Haiti and Honduras. Except for Brazil and India, they all
had an HIV prevalence among persons aged 15–49 of 1.9% or higher in 1999.

population that reaches 9.3 billion by 2050, the low variant leads eventually to nega-
tive population growth (by 2045–2050) and produces a significantly lower population
(7.9 billion in 2050).
The implications of the different projection variants for future population growth
are even more diverse at the level of development groups and major areas. Because of
the diversity of past fertility and mortality levels, the populations of major areas are
already growing at very different rates. Thus, whereas Africa’s population is increasing
at 2.4% per year, Europe’s is decreasing at a rate of �0.04% (Table 5.6). The populations
84 Demographic trends
Table 5.5 Estimated and projected population by major area, development grouping and projection variant, 1950–2050
(in millions)
Major area 1950 1975 2000 2025 2050
Low Medium High Low Medium High
World 2519 4066 6057 7470 7937 8391 7866 9322 10 934
More-developed regions 814 1048 1191 1187 1219 1257 1075 1181 1309
Less-developed regions 1706 3017 4865 6283 6718 7135 6791 8141 9625
Least-developed countries 197 348 658 1112 1186 1255 1545 1830 2130
Africa 221 406 794 1275 1358 1434 1694 2000 2320
Asia 1399 2397 3672 4474 4777 5068 4527 5428 6430
Latin America and the Caribbean 167 322 519 644 695 746 657 806 975
Northern America 172 243 314 369 384 404 389 438 502
Europe 548 676 727 669 684 698 556 603 654
Oceania 13 21 31 39 40 41 42 47 53
Source: United Nations (2001a).
Table 5.6 Estimated and projected average annual population growth rates, for the world and major areas, by projection
variant, 1950–2050
Major area 1950–1975 1975–2000 1995–2000 2000–2025 2025–2050
Low Medium High Low Medium High
World 1.91 1.59 1.35 0.84 1.08 1.30 0.21 0.64 1.06
More-developed 1.01 0.51 0.30 �0.02 0.09 0.21 �0.39 �0.13 0.16
regions
Less-developed 2.28 1.91 1.62 1.02 1.29 1.53 0.31 0.77 1.20
regions
Least-developed 2.26 2.55 2.50 2.10 2.36 2.58 1.32 1.73 2.12
countries
Africa 2.44 2.68 2.41 1.90 2.15 2.37 1.14 1.55 1.92
Asia 2.15 1.71 1.41 0.79 1.05 1.29 0.05 0.51 0.95
Latin America and 2.62 1.91 1.56 0.86 1.17 1.45 0.08 0.59 1.07
the Caribbean
Northern America 1.40 1.02 1.04 0.64 0.80 1.01 0.22 0.53 0.87
Europe 0.84 0.29 �0.04 �0.33 �0.25 �0.17 �0.74 �0.50 �0.26
Oceania 2.09 1.44 1.37 0.96 1.09 1.22 0.36 0.66 0.96
Source: United Nations (2001a).

of Asia, Latin America and the Caribbean, and Oceania are still increasing at robust
rates of 1.4% per year or higher, and even Northern America’s population is growing
at a rate slightly above 1% per year, largely as a result of its moderately high fertility
and net population gains through international migration. Owing to these varied expe-
riences, population growth in the less-developed regions is nearly four times faster
than in the more developed regions, and that differential is expected to become
more accentuated in the future. Thus, during 2000–2025, less-developed regions are
expected to grow 14 times faster than the more-developed regions in the medium vari-
ant and 7 times faster in the high variant, and according to the low variant, the popu-
lation of more-developed regions will decline slowly, whereas that of less-developed
regions will grow at a rate slightly above 1% per year. During 2025–2050, further
reductions in growth rates for the more- and the less-developed regions are expected
in all projection variants, but the differentials between them remain large. In the low
and medium variants in particular, the population of more-developed regions is
projected to decline during that period, whereas very substantial population increases
are expected in the less-developed regions.
With regard to major areas, only Europe is expected to experience a reduction of
the population in all the projection variants and Africa is expected to experience
rapid population growth no matter which variant is considered. Differences between
the variants become more marked the further one moves into the future so that by
2025–2050, the growth rates yielded by the high variant tend to be nearly 1% higher
than those produced by the low variant. Consequently, while in the low variant most
major areas are expected to experience rates of growth that approach zero, in the high
variant the rates of growth are closer to 1%. The exceptions are Africa whose growth
rate in the low variant is close to 1% and in the high is close to 2%, and Europe whose
rate of decline in the low variant is �0.74% and in the high variant is �0.26%.
The marked differences in expected growth rates for the major areas result in
a redistribution of the population among them. The population of more developed
regions, which is expected to be between 1.1 billion and 1.3 billion in 2050, will not
be very different from that of today (1.2 billion), but there will be a redistribution of
the population between the two major areas in the developed world. Thus, whereas
the population of Europe is expected to decline from the 0.73 billion of 2000 to
between 0.56 billion and 0.65 billion, that of Northern America will likely increase
from 0.3 billion to somewhere between 0.4 billion and 0.5 billion. In the developing
world, in contrast, large population increases are expected according to all projection
variants. The population of the less-developed regions is expected to rise from 4.9
billion persons in 2000 to somewhere in the range of 6.8 billion to 9.6 billion, with
the medium variant producing 8.1 billion. Among the major areas in the developing
world, Africa is projected to record the largest relative increase, with its population
doubling or tripling depending on the projection variant. Thus, its population passes
from 0.8 billion in 2000 to 2 billion in 2050 according to the medium variant and
might rise as high as 2.3 billion according to the high variant. The populations of Asia
and Latin America and the Caribbean increase by about 50% according to the medium
variant, so that the population of Asia passes from 3.7 billion in 2000 to 5.4 billion in
2050, and that of Latin America and the Caribbean rises from 0.5 billion in 2000 to
Population growth 85

0.8 billion in 2050. For Asia the low and high variants produce populations that are
lower or higher by nearly 1 billion from that yielded by the medium variant. In the
case of Latin America and the Caribbean, the equivalent difference is of the order of
150 million.
The changes in projected population size imply that by 2050 there will be a greater
concentration of the population in the less-developed regions (Table 5.7). Thus,
whereas in 2000 nearly 80% of the world’s population lived in the less-developed
regions, by 2050 that proportion will rise to between 86 and 88%. Furthermore,
among the major areas in the developing world a marked increase in the proportion
living in Africa is expected: from 13% in 2000 to more than 21% in 2050. In contrast,
the percentage living in Asia will decline slightly, from 61% to between 57 and 58%,
and Europe’s share will decline markedly from 12% in 2000 to between 6 and 7%
in 2050.
The further concentration of the population in the less-developed regions will not
be accompanied by an increasing concentration in a few countries, although most of the
populous countries of the world will be developing countries. As Table 5.8 indicates,
21 countries accounted in 1950 for three-quarters of the world’s population and 10
among them were located in the more-developed regions. By 2000, 24 countries were
needed to account for the same proportion of the world’s inhabitants, but just eight
were developed countries. By 2050, 29 countries are expected to account for 75% of
the world population according to the medium variant with just five belonging to
the more-developed regions. Furthermore, over the next fifty years India will likely
displace China as the most populous country of the world and China’s share of the
population will decline considerably, passing from 21% in 2000 to 16% in 2050
according to the medium variant. Indeed, given the size of China’s population and
the fact that China’s fertility is projected to remain below replacement level after
2000 in the medium variant, China is expected to experience the largest population
86 Demographic trends
Table 5.7 Percentage distribution of the estimated and projected population of the world and
major areas, by projection variant, 1950–2050
Major area 1950 1975 2000 2050
Low Medium High
World 100.0 100.0 100.0 100.0 100.0 100.0
More-developed regions 32.3 25.8 19.7 13.7 12.7 12.0
Less-developed regions 67.7 74.2 80.3 86.3 87.3 88.0
Least-developed countries 7.8 8.6 10.9 19.6 19.6 19.5
Africa 8.8 10.0 13.1 21.5 21.5 21.2
Asia 55.5 58.9 60.6 57.5 58.2 58.8
Latin America and the Caribbean 6.6 7.9 8.6 8.4 8.6 8.9
Northern America 6.8 6.0 5.2 5.0 4.7 4.6
Europe 21.8 16.6 12.0 7.1 6.5 6.0
Oceania 0.5 0.5 0.5 0.5 0.5 0.5
Source: United Nations (2001a).

Table 5.8 Countries accounting for 75% of the world population by order of population size, 1950, 2000, and 2050, medium variant
Country Population in Cumulated Country Population in Cumulated Country Population in Cumulated
1950 (000) percentage 2000 (000) percentage 2050 (000) percentage
1 China 554 760 22 1 China 1 275 133 21 1 India 1 572 055 17
2 India 357 561 36 2 India 1 008 937 38 2 China 1 462 058 33
3 United States 157 813 42 3 United States 283 230 42 3 United States 397 063 37
4 Russian Federation 102 702 47 4 Indonesia 212 092 46 4 Pakistan 344 170 40
5 Japan 83 625 50 5 Brazil 170 406 49 5 Indonesia 311 335 44
6 Indonesia 79 538 53 6 Russian Federation 145 491 51 6 Nigeria 278 788 47
7 Germany 68 376 56 7 Pakistan 141 256 53 7 Bangladesh 265 432 50
8 Brazil 53 975 58 8 Bangladesh 137 439 56 8 Brazil 247 244 52
9 United Kingdom 50 616 60 9 Japan 127 096 58 9 Dem. Rep. of 203 527 55
the Congo
10 Italy 47 104 62 10 Nigeria 113 862 60 10 Ethiopia 186 452 57
11 France 41 829 63 11 Mexico 98 872 61 11 Mexico 146 651 58
12 Bangladesh 41 783 65 12 Germany 82 017 63 12 Philippines 128 383 59
13 Pakistan 39 659 67 13 Vietnam 78 137 64 13 Vietnam 123 782 61
14 Ukraine 37 298 68 14 Philippines 75 653 65 14 Iran 121 424 62
(Islamic Republic of)
15 Nigeria 29 790 69 15 Iran (Islamic 70 330 66 15 Egypt 113 840 63
Republic of)
16 Spain 28 009 70 16 Egypt 67 884 67 16 Japan 109 220 64
17 Mexico 27 737 72 17 Turkey 66 668 69 17 Russian Federation 104 258 66
18 Vietnam 27 367 73 18 Ethiopia 62 908 70 18 Yemen 102 379 67
19 Poland 24 824 74 19 Thailand 62 806 71 19 Uganda 101 524 68
20 Egypt 21 834 74 20 United Kingdom 59 415 72 20 Turkey 98 818 69
21 Turkey 20 809 75 21 France 59 238 73 21 United Rep. of 82 740 70
Tanzania
22 Italy 57 530 74 22 Thailand 82 491 71
23 Dem. Rep. of 50 948 74 23 Afghanistan 72 267 71
the Congo
24 Ukraine 49 568 75 24 Colombia 70 862 72
25 Germany 70 805 73
26 Myanmar 68 546 74
27 Sudan 63 530 74
28 France 61 832 75
29 Saudi Arabia 59 683 76
Source: United Nations (2001a).
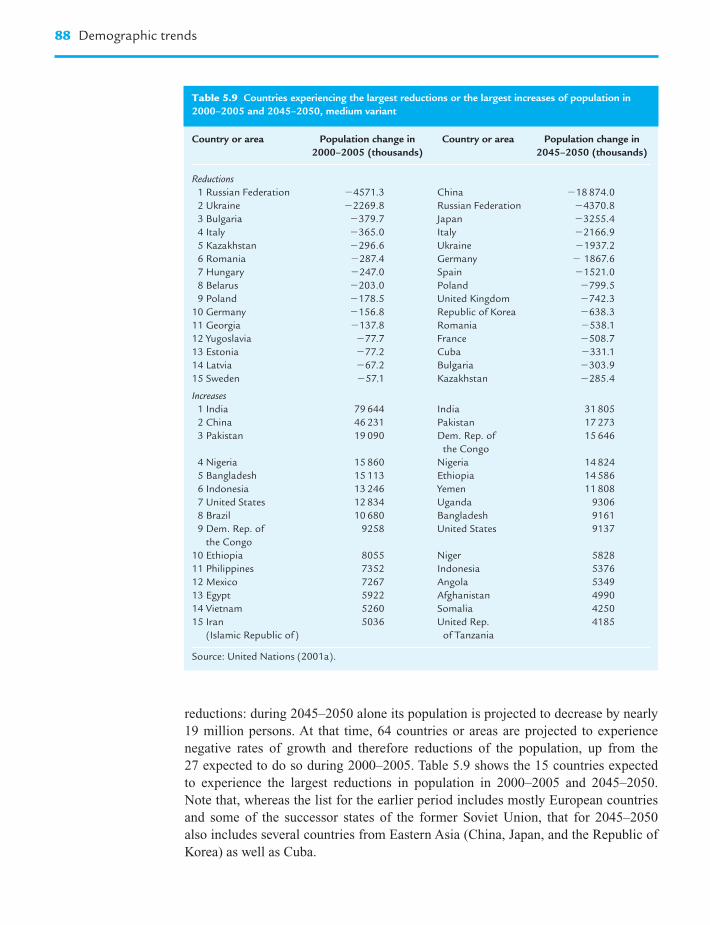
reductions: during 2045–2050 alone its population is projected to decrease by nearly
19 million persons. At that time, 64 countries or areas are projected to experience
negative rates of growth and therefore reductions of the population, up from the
27 expected to do so during 2000–2005. Table 5.9 shows the 15 countries expected
to experience the largest reductions in population in 2000–2005 and 2045–2050.
Note that, whereas the list for the earlier period includes mostly European countries
and some of the successor states of the former Soviet Union, that for 2045–2050
also includes several countries from Eastern Asia (China, Japan, and the Republic of
Korea) as well as Cuba.
88 Demographic trends
Table 5.9 Countries experiencing the largest reductions or the largest increases of population in
2000–2005 and 2045–2050, medium variant
Country or area Population change in Country or area Population change in
2000–2005 (thousands) 2045–2050 (thousands)
Reductions
1 Russian Federation �4571.3 China �18 874.0
2 Ukraine �2269.8 Russian Federation �4370.8
3 Bulgaria �379.7 Japan �3255.4
4 Italy �365.0 Italy �2166.9
5 Kazakhstan �296.6 Ukraine �1937.2
6 Romania �287.4 Germany � 1867.6
7 Hungary �247.0 Spain �1521.0
8 Belarus �203.0 Poland �799.5
9 Poland �178.5 United Kingdom �742.3
10 Germany �156.8 Republic of Korea �638.3
11 Georgia �137.8 Romania �538.1
12 Yugoslavia �77.7 France �508.7
13 Estonia �77.2 Cuba �331.1
14 Latvia �67.2 Bulgaria �303.9
15 Sweden �57.1 Kazakhstan �285.4
Increases
1 India 79 644 India 31 805
2 China 46 231 Pakistan 17 273
3 Pakistan 19 090 Dem. Rep. of 15 646
the Congo
4 Nigeria 15 860 Nigeria 14 824
5 Bangladesh 15 113 Ethiopia 14 586
6 Indonesia 13 246 Yemen 11 808
7 United States 12 834 Uganda 9306
8 Brazil 10 680 Bangladesh 9161
9 Dem. Rep. of 9258 United States 9137
the Congo
10 Ethiopia 8055 Niger 5828
11 Philippines 7352 Indonesia 5376
12 Mexico 7267 Angola 5349
13 Egypt 5922 Afghanistan 4990
14 Vietnam 5260 Somalia 4250
15 Iran 5036 United Rep. 4185
(Islamic Republic of) of Tanzania
Source: United Nations (2001a).

Table 5.9 also shows the countries expected to record the largest increases of
population in 2000–2005 and 2045–2050: they are mostly located in the developing
world. India heads the list in both periods, although its population increment is
expected to drop by more than half between the two periods. Only one developed
country, the United States, is expected to experience large population increments
partly as a result of the high numbers of immigrants projected to move to that coun-
try. In 2000–2005, countries from nearly all major areas are among those expected
to experience large population increases, including two from Latin America (Brazil
and Mexico) and three from sub-Saharan Africa (the Democratic Republic of Congo,
Ethiopia, and Nigeria). By 2045–2050, in contrast, the countries with the highest
population increases in absolute terms are most likely to be in sub-Saharan Africa
(8 out of 15) or in the Indian subcontinent (Bangladesh, India, and Pakistan). Further-
more, the largest increments in 2045–2050 are generally considerably smaller than
those expected in 2000–2005. That is, as a result of the projected long-term reduction of
fertility, expected population increments are expected to decline markedly even in the
most populous countries over the next 50 years.
To complete the picture, let us consider the countries that are expected to
experience the highest and the lowest rates of population growth during 2000–2050
(Table 5.10). The fastest growing countries tend to have relatively small populations
that are projected to grow at sustained rates well above 2% per year over the period.
As a result, their populations will increase dramatically, tripling in most cases but
becoming five times larger than in 2000 in the cases of Liberia, Niger, and Yemen. The
most populous country in this group, the Democratic Republic of Congo, is expected
to see its population quadruple by 2050, rising from 51 million in 2000 to 204 million.
Most of the countries with rapidly growing populations are among those that have not
yet shown clear signs of embarking on the fertility transition or those whose fertility
is still high. Even with the fairly large fertility reductions projected for the future,
their fertility levels remain above those of other countries and have the potential of
leading to very rapid and sustained growth if mortality levels keep on declining as
projected.
At the other end of the distribution, the countries expected to experience the lowest
rates of growth are among those whose populations are expected to decline during the
projection period. Expected rates of population decline, even for the most rapidly
declining populations, are considerably more moderate in absolute terms than the
highest rates of population growth expected. Consequently, they lead in most cases to
moderate reductions of population size over the next fifty years. Only two countries,
Bulgaria and Estonia are expected to see their populations reduced by about half
during 2000–2050. In most countries with rapidly declining populations the overall
reductions over that period are expected to be in the range of 20–30%. The population
of the Russian Federation, for instance, is projected to decline by about 28%, from
145 million in 2000 to 104 million in 2050. Sustained low fertility combined with
mortality levels that are expected to decline more slowly than in other developed
countries contribute to this outcome.
These results underscore the increasing heterogeneity of population dynamics
that has been plain for the past century and that is expected to continue well into the
Population growth 89

21st century as countries undergo the demographic transition to low mortality and low
fertility at different paces and facing different obstacles. Countries that have lagged
behind in the transition to low fertility also tend to be those where mortality levels
remain high. Many are already affected significantly by the HIV/AIDS epidemic and
are therefore facing a more difficult task than in the past to ensure a longer life for
most of their citizens. Whether they can muster the resources needed both to reduce
mortality levels and to provide support for the reduction of fertility is still an open
question. In the developed world, the maintenance of very low fertility levels is
already producing reductions of population, especially in countries where mortality
levels have stagnated or increased over the past two or three decades. In countries with
economies in transition, achieving a steady reduction of mortality in future demands
90 Demographic trends
Table 5.10 Countries with the highest and lowest expected rates of growth during 2000–2050
(medium variant)
Country or area Population (thousands) Growth rate
(percentage)
2000 2050
Highest growth rate
1 Yemen 18 349 102 379 3.44
2 Liberia 2913 14 370 3.19
3 Niger 10 832 51 872 3.13
4 Somalia 8778 40 936 3.08
5 Uganda 23 300 101 524 2.94
6 Angola 13 134 53 328 2.80
7 Burkina Faso 11 535 46 304 2.78
8 Dem. Rep. of the Congo 50 948 203 527 2.77
9 Occupied Palestinian Terr. 3191 11 821 2.62
10 Mali 11 351 41 724 2.60
11 Congo 3018 10 744 2.54
12 Chad 7885 27 732 2.52
13 Oman 2538 8751 2.48
14 Afghanistan 21 765 72 267 2.40
15 Solomon Islands 447 1458 2.36
Lowest growth rate
1 Estonia 1393 752 �1.23
2 Bulgaria 7949 4531 �1.12
3 Ukraine 49 568 29 959 �1.01
4 Georgia 5262 3219 �0.98
5 Guyana 761 504 �0.82
6 Russian Federation 145 491 104 258 �0.67
7 Latvia 2421 1744 �0.66
8 Italy 57 530 42 962 �0.58
9 Hungary 9968 7486 �0.57
10 Slovenia 1988 1527 �0.53
11 Switzerland 7170 5607 �0.49
12 Spain 39 910 31 282 �0.49
13 Gibraltar 27 21 �0.49
14 Austria 8080 6452 �0.45
15 Lithuania 3696 2989 �0.42
Source: United Nations (2001a).

important changes in access to health care, the improvement of health systems, and
the implementation of programs to effect behavioral change at the societal level, inter-
ventions that are both demanding and costly. In addition, several of those countries are
being faced with the spread of infectious diseases, such as tuberculosis and HIV/
AIDS, whose treatment is expensive and requires close supervision by health pro-
fessionals. Under such conditions, it is unlikely that much effort will be expended in
devising measures to promote higher fertility, especially since the evidence on their
effectiveness is weak. Consequently, the likelihood of the continuation of recent trends,
that is, of low fertility and only moderate gains in life expectancy, in the medium-term
future is high. Lastly, varying rates of population aging will also lead to further het-
erogeneity among the world’s population, since countries that embarked early on the
transition to low fertility and those that have been experiencing below-replacement
fertility will experience very marked aging whereas the populations of countries that
are expected to continue growing at a rapid pace will experience a more moderate
aging process. The dynamics of aging will be discussed in the next section.
Population aging
One of the major consequences of the transition to low fertility is the aging of the pop-
ulation. Indeed, sustained fertility reductions lead over time to populations where the
proportion of children declines while that of adults rises, especially that of adults at
older ages. Following the usual definition of children as persons aged 0 to 14, elderly
persons as those aged 60 years or over, and using the term adults from now on to refer
only to persons aged 15 to 59, in 2000, 30% of the world’s population was constituted
by children, 60% by adults and 10% by elderly persons. According to the medium
variant, it is expected that by 2050 the proportion of the elderly will more than double,
reaching 21%, that of children will be reduced by approximately one-third, reaching
also 21%, and that of adults will remain largely unchanged, at 58% (Table 5.11). This
changing distribution of the population by age is brought about by major changes in
the rate of growth of the populations of children and the elderly (Fig. 5.5). Thus,
whereas the growth rate of children declined from about 2.5% per year in the 1950s to
nearly 0.4% per year in 1995–2000 and is expected to stay below that level until 2050,
the growth rate of the elderly has been consistently high, varying largely between 2%
and 2.5% annually since 1960, and is expected to increase even further over the period
2000–2030 to remain above 2.5% per year before declining to 1.6% per year in
2045–2050. The expected high rates of growth of the elderly population will result in
more than a threefold increase in their numbers between 2000 and 2050, from 0.6 bil-
lion to nearly 2 billion, so that whereas in 2000 there were nearly three children for
every elderly person, by 2050 there will be just one child per elderly person.
Because the process of population aging started earlier in the more-developed
regions than in the rest of the world, their age distribution in 2000 is similar to the one
expected at the world level for 2050. Indeed, as of 2000, the more-developed regions
already had as many elderly persons as the number of children, and each of those
Population aging 91

92 Demographic trends
Table 5.11 Age composition of the population by broad age group, major area and region, medium variant, 2000 and 2050
Major area 2000 2050
0–14 15–59 60� 0–14 15–59 60�
Population (thousands)
World 1815 3636 606 1955 5404 1964
More-developed regions 218 742 231 183 603 395
Less-developed regions 1597 2894 374 1771 4801 1569
Least-developed countries 284 342 32 533 1123 173
Africa 338 415 40 559 1236 205
Asia 1111 2240 322 1061 3141 1227
Latin America and the Caribbean 164 314 41 161 463 181
Northern America 67 196 51 80 238 119
Europe 127 453 147 84 298 221
Oceania 8 19 4 9 27 11
Percentage
World 30.0 60.0 10.0 21.0 58.0 21.1
More-developed regions 18.3 62.3 19.4 15.5 51.0 33.5
Less-developed regions 32.8 59.5 7.7 21.8 59.0 19.3
Least-developed countries 43.1 52.0 4.9 29.1 61.4 9.5
Africa 42.6 52.3 5.1 28.0 61.8 10.2
Asia 30.2 61.0 8.8 19.5 57.9 22.6
Latin America and the Caribbean 31.5 60.5 8.0 20.0 57.5 22.5
Northern America 21.5 62.3 16.2 18.3 54.5 27.2
Europe 17.5 62.3 20.3 13.9 49.4 36.6
Oceania 25.4 61.2 13.4 19.4 57.3 23.3
3.5
3.0
2.5
2.0
1.5
1.0
0.5
0.0
Gro
wth
rate
(p
erce
nta
ge)
�0.5
1950–1955
1955–1960
1960–1965
1965–1970
1970–1975
1975–1980
1980–1985
1985–1990
1990–1995
1995–2000
2000–2005
2005–2010
2010–2015
2015–2020
2020–2025
2025–2030
2030–2035
2035–2040
2040–2045
2045–2050
Period
0–14 15–59 Total60�
Figure 5.5 Growth rates of the different age groups at the world level, 1950–2050.

groups accounted for about a fifth of the population (actually, children were less
numerous than the elderly). But aging in the more-developed regions is continuing.
The maintenance of low fertility over the foreseeable future produces a population in
2050 where the elderly are expected to constitute a third of the population and
children will account for only one in every seven persons. In fact, because fertility has
already been very low in the more-developed regions for some time, the proportion of
children is not expected to decline as much (from 18% in 2000 to 15% in 2050) as the
adult population (from 62% in 2000 to 51% in 2050). That is, the population of more-
developed regions is already entering the advanced stages of the aging process as
the population of adults itself becomes considerably older. Another way to gauge the
effects of population aging is to consider the median age of the population, that is, the
age that divides the population into two equal halves. For the more developed regions,
the median age rose from 29 years in 1950 to 37 years in 2000 and is expected to reach
46 years in the medium variant (Table 5.12). Aging would be more pronounced if fer-
tility were to remain even lower, so that the low variant produces a population with a
median age of 50 years, but even the higher fertility of the high variant would lead to
substantial further rises in the median age which would be above 42 years in 2050.
Population aging is also expected in the less-developed regions as a whole, whose
median age is expected to rise from 24 years in 2000 to between 31 and 40 years in
2050, with the medium variant producing a median age of 35 years. According to the
medium variant, the elderly population in the less-developed regions would increase
fourfold during 2000–2050, rising from 0.4 billion to nearly 1.6 billion, whereas the
number of children would remain largely unchanged, passing from 1.6 billion to 1.8
billion. By the end of the projection period the less-developed regions would still have
58% of their population in the adult ages, with about a fifth of the population in each
of the other two categories. Among the less-developed regions, the group of least-
developed countries is expected to experience a more moderate aging, with the median
age rising from 18 years in 2000 to between 24 and 30 years by 2050 (the medium
Population aging 93
Table 5.12 Median age of the population for the world and major areas, by projection variant,
1950, 2000, and 2050
Major area or region 1950 2000 2050
High Medium Low
World 23.6 26.5 31.9 36.2 41.5
More-developed regions 28.6 37.4 42.2 46.4 50.3
Less-developed regions 21.4 24.3 30.8 35.0 40.2
Least-developed countries 19.5 18.2 24.0 26.5 29.5
Africa 19.0 18.4 24.8 27.4 30.5
Asia 22.0 26.2 33.4 38.3 44.2
Latin America and the Caribbean 20.1 24.4 32.6 37.8 44.4
Northern America 29.8 35.6 36.5 41.0 45.4
Europe 29.2 37.7 45.9 49.5 52.7
Oceania 27.9 30.9 34.6 38.1 41.7
Source: United Nations (2001a).

variant produces a median age of 27 years). Nevertheless, in the medium variant
the elderly population of the least-developed countries increases fivefold during
2000–2050, rising from 32 million to 172 million, and its share of the population
nearly doubles, passing from 4.9% to 9.5%. Yet, by 2050 the least-developed countries
will still have about three children for each elderly person, approximating therefore
the age distribution of the less-developed regions of today.
At the level of major areas, Europe is expected to have the most aged population by
2050, whereas Africa will have the least aged. The median age of Europe’s population
is expected to be between 46 and 53 years in 2050, with a medium variant value of
approximately 50 years. By that time, nearly 37% of the population is expected to be
aged 60 or over and slight less than half is expected to be aged 15–59. Children will
account for just 14% of the population and the elderly will outnumber children nearly
3 to 1. In Africa, in contrast, the number of children is expected to be nearly double
that of the elderly, and the latter will likely constitute just 10% of the population. The
median age in Africa is expected to rise considerably, but starting at 18 in 2000 will at
most rise to 30 years by 2050, being more likely to remain in the 20s (24 is projected
under the high variant and 27 under the medium variant).
All other major areas are expected to have similar age distributions in 2050, with
about 22% of the population being aged 60 or over, about 19% being children and
57% being adults aged 15–59. Northern America will have a slightly more aged
population than the other major areas, with a median age of 41 years in 2050 accord-
ing to the medium variant, rather than the 38 years expected for Asia, Latin America
and the Caribbean, and Oceania. However, the convergence of the age distributions
of Asia and Latin America and the Caribbean, in particular, to that of Northern
America is the result of the very rapid aging of the populations of those two major
areas. Indeed, as of 2000 both Asia and Latin America and the Caribbean had a
considerably younger population than that of Northern America: their proportion of
elderly persons was nearly half of that in Northern America and their median ages
were about ten years lower than that of Northern America. The rapid reductions of
fertility projected for Asia and Latin America and the Caribbean, which are largely
based on the very substantial fertility reductions already experienced by some of the
largest countries in those continents, are responsible for accelerating the aging of their
population. That is, these developing regions will have less time to adapt to the eco-
nomic and social implications of an aging population and need to act early to ensure
that their societies are able to cope with the added demands for services, health care
and social security associated with an aging population. The problem will be particu-
larly acute in Asia, where the number of elderly persons is expected to rise fourfold
during 2000–2050, so that by the end of the period Asia will have by far the largest
elderly population in the world (1.2 billion), accounting for six out of every ten
elderly persons in the world at that time. Furthermore, most of the elderly will be
concentrated in the populous countries of Asia, especially in China (437 million),
India (324 million), Indonesia (70 million), Japan (46 million), Bangladesh and
Pakistan (each with 43 million). In Latin America, Brazil and Mexico will also have
large populations of elderly persons: 59 million in Brazil and 36 million in Mexico.
Although the more-developed countries will have more aged populations than most
94 Demographic trends

developing countries, the largest numbers of elderly persons will be increasingly
concentrated in the developing world.
To conclude this analysis of the dynamics of population aging, let us consider
the countries that have had or are expected to have the “oldest” and the “youngest” pop-
ulations in the world. Table 5.13 shows the list of countries with the highest and lowest
median ages in 1950, 2000, and 2050. Over the course of that century, the median age
of the oldest population has been rising steadily and that trend is expected to continue,
so that the highest median age will likely pass from 36 years in Austria in 1950, to 41
years in Japan in 2000 and to a remarkably high 55 years in Spain in 2050. In contrast,
the median age of the youngest population declined from 1950 to 2000 as a result of
reductions in mortality and the consequent increases in the proportions of surviving
children. Thus, the lowest median age declined from 16.5 years in Djibouti in 1950 to a
remarkably low 15 years in Yemen in 2000. However, in future, signs of population
aging are expected even in countries whose fertility is expected to decline at a slower
pace. Indeed, by 2050 the lowest median age is expected to be 20 years in Niger, a full
five years higher than the lowest median age in 2000. For Yemen itself, the median age
is expected to rise by seven years, reaching 21 years by 2050. Consequently, by the mid-
dle of this century countries will vary significantly in terms of the stage they are likely
to have reached in the transition to an older population. Very young populations, such as
those expected in countries like Angola, Niger, Uganda, or Yemen, to name just a few,
Population aging 95
Table 5.13 Countries with the highest and the lowest median ages, 1950, 2000, and 2050,
medium variant
Country or area 1950 Country or area 2000 Country or area 2050
Highest
1 Austria 35.80 1 Japan 41.22 Spain 55.21
2 Channel Islands 35.73 2 Italy 40.19 Slovenia 54.10
3 Belgium 35.55 3 Switzerland 40.18 Italy 54.08
4 Germany 35.37 4 Germany 40.06 Austria 53.70
5 Luxembourg 35.00 5 Sweden 39.70 Armenia 53.45
6 United Kingdom 34.63 6 Finland 39.43 Japan 53.14
7 France 34.51 7 Bulgaria 39.14 Czech Republic 52.37
8 Sweden 34.26 8 Belgium 39.13 Greece 52.32
9 Switzerland 33.33 9 Greece 39.12 Switzerland 52.03
Lowest
1 Occupied Palestinian Terr. 17.19 1 Benin 16.58 Malawi 23.71
2 Malawi 17.12 2 Zambia 16.55 Burundi 23.25
3 Iraq 17.04 3 Burundi 16.03 Mali 22.95
4 Rwanda 16.97 4 Somalia 15.97 Liberia 22.92
5 United Rep. of Tanzania 16.94 5 Angola 15.88 Burkina Faso 22.75
6 Vanuatu 16.78 6 Democratic Rep. 15.58 Uganda 22.11
of the Congo
7 Botswana 16.78 7 Burkina Faso 15.56 Somalia 21.54
8 Fiji 16.58 8 Uganda 15.36 Angola 21.23
9 Samoa 16.56 9 Niger 15.06 Yemen 21.10
10 Djibouti 16.53 10 Yemen 14.97 Niger 20.39
Source: United Nations (2001a).

will coexist with very aged populations, such as those of Austria, Italy, Japan, or Spain.
Diversity in the dynamics of population growth is at the root of such a wide variation of
outcomes and implies that the average trends observed at the world level are not neces-
sarily representative of the experience of many of the countries of the world.
The dynamics of urbanization
If overall population growth during the second half of the 20th century was very rapid,
even more rapid was the growth of the world’s urban population. It is estimated that
96 Demographic trends
Table 5.14 Population in urban and rural areas, and proportion urban, for the world and major
areas, 1950–2030
Development group 1950 1975 2000 2030
Urban population (millions)
World 750 1542 2847 4964
More-developed regions 447 734 906 1017
Less-developed regions 304 808 1941 3948
Least-developed countries 14 50 171 582
Africa 32 102 301 805
Asia 244 592 1348 2638
Latin America and the Caribbean 69 197 391 603
Northern America 110 180 243 334
Europe 287 455 544 554
Oceania 8 15 21 31
Rural population (millions)
World 1769 2524 3210 3306
More-developed regions 367 314 286 200
Less-developed regions 1402 2209 2924 3106
Least-developed countries 183 298 487 732
Africa 189 304 493 684
Asia 1155 1804 2324 2312
Latin America and the Caribbean 98 125 128 121
Northern America 62 64 72 62
Europe 261 221 184 116
Oceania 5 6 9 11
Percentage urban
World 29.8 37.9 47.0 60.0
More-developed regions 54.9 70.0 76.0 83.6
Less-developed regions 17.8 26.8 39.9 56.0
Least-developed countries 7.1 14.4 26.0 44.3
Africa 14.7 25.2 37.9 54.0
Asia 17.4 24.7 36.7 53.3
Latin America and the Caribbean 41.4 61.2 75.3 83.3
Northern America 63.9 73.8 77.2 84.4
Europe 52.4 67.3 74.8 82.7
Oceania 61.6 72.2 70.3 73.5
Source: United Nations (2001a,c).

the number of persons living in cities rose from 0.8 billion in 1950 to nearly 2.9 bil-
lion in 2000, implying a growth rate of 2.67% per year, higher than the rate of 1.75%
per year at which the world population grew over the period (Tables 5.14 and 5.15).
Since the difference between these two rates determines the speed of growth of the
proportion urban, between 1950 and 2000 the world population urbanized rapidly,
with the proportion urban rising at a rate of 0.91% per year and passing from 30% in
1950 to 47% in 2000. Although the urbanization of the world population is expected
to continue, neither the urban population nor the proportion urban is expected to grow
as rapidly in the future. During 2000–2030, the world urban population is projected
to increase at a rate of 1.9% per year, reaching nearly 5 billion in 1930. In addition,
The dynamics of urbanization 97
Table 5.15 Urban and rural rates of population growth and rate of urbanization for the world and
major areas, 1950–2030
Development group 1950–2000 2000–2030
Urban growth rate (%)
World 2.67 1.85
More-developed regions 1.41 0.39
Less-developed regions 3.71 2.37
Least-developed countries 5.00 4.08
Africa 4.46 3.28
Asia 3.42 2.24
Latin America and the Caribbean 3.46 1.44
Northern America 1.59 1.07
Europe 1.28 0.06
Oceania 2.03 1.20
Rural growth rate (%)
World 1.19 0.10
More-developed regions �0.50 �1.19
Less-developed regions 1.47 0.20
Least-developed countries 1.95 1.35
Africa 1.92 1.09
Asia 1.40 �0.02
Latin America and the Caribbean 0.54 �0.20
Northern America 0.29 �0.48
Europe �0.70 �1.52
Oceania 1.25 0.66
Rate of urbanization (%)
World 0.91 0.81
More-developed regions 0.65 0.32
Less-developed regions 1.61 1.13
Least-developed countries 2.60 1.78
Africa 1.90 1.18
Asia 1.49 1.24
Latin America and the Caribbean 1.20 0.34
Northern America 0.38 0.30
Europe 0.71 0.34
Oceania 0.27 0.15
Source: United Nations (2001c).

since the world’s total population will also increase more slowly, the proportion urban
is expected to rise at a robust rate of 0.83% per year so that by 2030 the population of
the world will likely be 60% urban.
In contrast with the rapid rise of the urban population, the growth of the world rural
population has been slowing markedly. In 1950, seven out of every ten persons on
earth lived in rural areas, and they numbered 1.8 billion. Over the course of the next
fifty years, rural population growth averaged 1.19% per year and the rural population
nearly doubled, reaching an estimated 3.2 billion by 2000, but during 2000–2030,
rural population growth is expected to be minimal so that the number of rural inhabi-
tants will have barely risen, reaching 3.3 billion by 2030. Consequently, most of the
population growth expected during 2000–2030 will be absorbed by urban areas. Since
natural increase is generally lower in urban than in rural areas and is expected to
decline in both, a large proportion of the 2.1 billion persons that will be added to
the urban population will be rural–urban migrants or persons who become urban
dwellers as urban settlements expand geographically through the transformation of
rural villages into cities.
The differences in population dynamics between the more- and the less-developed
regions become accentuated when one considers the process of urbanization. Whereas
the rural areas still house the majority of the population of less-developed regions,
cities are the place of residence of most of the population of more-developed regions
(Table 5.14). Moreover, the urban population of the less-developed regions has been
growing considerably faster than that of the more-developed regions and, as a result,
its share of the world urban population has been rising. In 1950 the urban population
of more-developed regions was greater than that of less-developed regions (447 million
vs. 304 million), but by 1975 the latter had surpassed the former (808 million
vs. 734 million) and the difference between the two increased rapidly thereafter. In
2000, 1.94 billion urban dwellers were estimated to live in the less-developed regions
and just 0.9 billion in the more-developed regions (Table 5.14). By 2030, with 3.9 bil-
lion urban dwellers, the less-developed regions are projected to have 79% of the world
urban population, four times as many urban dwellers as the more-developed regions.
To sustain such rapid population growth, the urban areas of the less-developed regions
have been absorbing an increasing share of the annual increment of the urban popula-
tion. Thus, whereas in 1950–1955 they absorbed 55% of the annual increment of the
world urban population, by 1995–2000 they were absorbing 91% and by 2025–2030
they are expected to absorb 97%. In absolute terms, the urban areas of less-developed
regions grew by 52 million persons annually in 1995–2000, whereas those of more-
developed regions grew by just 5 million annually. By 2025–2030 it is expected that
69 million persons will be added annually to the urban population of the less-developed
regions whereas the urban areas of more-developed regions will gain just 2 million
new residents every year.
Not only are the urban areas of less-developed regions absorbing most of the pop-
ulation growth occurring in urban areas worldwide, they are also increasingly absorb-
ing most of the growth of the total world population. Thus, whereas in 1950–1955 the
increase in the population of the urban areas of the less-developed regions accounted
for 28% of the total increment to the world population, by 1995–2000 that increase
98 Demographic trends
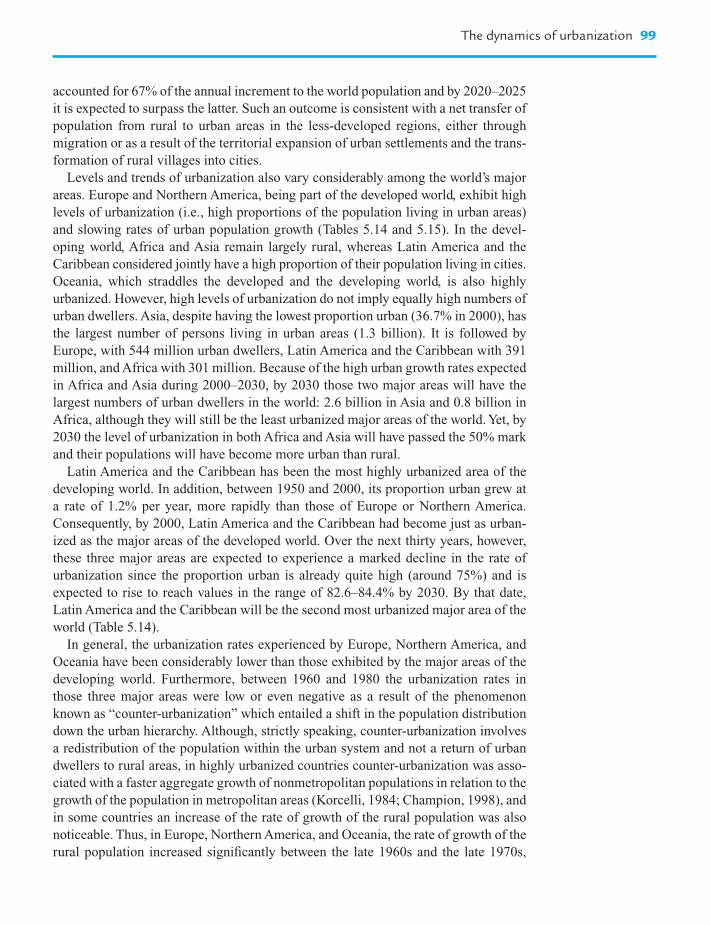
accounted for 67% of the annual increment to the world population and by 2020–2025
it is expected to surpass the latter. Such an outcome is consistent with a net transfer of
population from rural to urban areas in the less-developed regions, either through
migration or as a result of the territorial expansion of urban settlements and the trans-
formation of rural villages into cities.
Levels and trends of urbanization also vary considerably among the world’s major
areas. Europe and Northern America, being part of the developed world, exhibit high
levels of urbanization (i.e., high proportions of the population living in urban areas)
and slowing rates of urban population growth (Tables 5.14 and 5.15). In the devel-
oping world, Africa and Asia remain largely rural, whereas Latin America and the
Caribbean considered jointly have a high proportion of their population living in cities.
Oceania, which straddles the developed and the developing world, is also highly
urbanized. However, high levels of urbanization do not imply equally high numbers of
urban dwellers. Asia, despite having the lowest proportion urban (36.7% in 2000), has
the largest number of persons living in urban areas (1.3 billion). It is followed by
Europe, with 544 million urban dwellers, Latin America and the Caribbean with 391
million, and Africa with 301 million. Because of the high urban growth rates expected
in Africa and Asia during 2000–2030, by 2030 those two major areas will have the
largest numbers of urban dwellers in the world: 2.6 billion in Asia and 0.8 billion in
Africa, although they will still be the least urbanized major areas of the world. Yet, by
2030 the level of urbanization in both Africa and Asia will have passed the 50% mark
and their populations will have become more urban than rural.
Latin America and the Caribbean has been the most highly urbanized area of the
developing world. In addition, between 1950 and 2000, its proportion urban grew at
a rate of 1.2% per year, more rapidly than those of Europe or Northern America.
Consequently, by 2000, Latin America and the Caribbean had become just as urban-
ized as the major areas of the developed world. Over the next thirty years, however,
these three major areas are expected to experience a marked decline in the rate of
urbanization since the proportion urban is already quite high (around 75%) and is
expected to rise to reach values in the range of 82.6–84.4% by 2030. By that date,
Latin America and the Caribbean will be the second most urbanized major area of the
world (Table 5.14).
In general, the urbanization rates experienced by Europe, Northern America, and
Oceania have been considerably lower than those exhibited by the major areas of the
developing world. Furthermore, between 1960 and 1980 the urbanization rates in
those three major areas were low or even negative as a result of the phenomenon
known as “counter-urbanization” which entailed a shift in the population distribution
down the urban hierarchy. Although, strictly speaking, counter-urbanization involves
a redistribution of the population within the urban system and not a return of urban
dwellers to rural areas, in highly urbanized countries counter-urbanization was asso-
ciated with a faster aggregate growth of nonmetropolitan populations in relation to the
growth of the population in metropolitan areas (Korcelli, 1984; Champion, 1998), and
in some countries an increase of the rate of growth of the rural population was also
noticeable. Thus, in Europe, Northern America, and Oceania, the rate of growth of the
rural population increased significantly between the late 1960s and the late 1970s,
The dynamics of urbanization 99

although in the case of Europe the rate of rural growth remained negative. In addition,
particularly low rates of urbanization were recorded in Northern America and
Oceania during the same period. Although the rates of urbanization in Europe were
higher than in the other major areas, by 1990–1995 they had fallen to just 0.35% per
year. During 2000–2030, all three major areas are expected to experience even lower
urbanization rates than during 1950–2000, ranging from 0.15% per year in Oceania to
0.34% per year in Europe (Table 5.15).
The flip side of urbanization is the reduction of rural population growth. In the
major areas of the less-developed world, two types of trends are discernible. In Latin
America and the Caribbean the rural growth rate has declined steadily so that by
1990–1995 it was just 0.05% per year. In contrast, in Africa and Asia, the rate of
rural growth increased during the 1950s, 1960s, and even 1970s, reaching a peak in
1975–1980 in Africa (at 2.22% per year) and in 1965–1970 in Asia (at 2.18% per
year). Since then, the growth rates of the rural population of Africa and Asia have
been declining steadily and are expected to continue declining during 2000–2030. By
2025–2030, the rural populations of all major areas, with the exception of Africa, will
be decreasing. A particularly high rate of decline is projected for the rural population
of Europe (�1.69% per year in 2025–2030), followed in magnitude by those of
Northern America, Asia, Latin America and the Caribbean, and Oceania, whose rates
are expected to range from �0.9 to �0.1% per year. Only Africa’s rural population
will be increasing at a rate of 0.47% per year during 2025–2030. As a result of such
trends, Africa’s rural population is expected to increase by about 40% between 2000
and 2030, whereas the rural populations of other major areas will change little, except
in the case of Europe where a sizable reduction of the rural population is expected
(Table 5.14).
One of the major changes in the spatial distribution of the world population over the
past two centuries is the concentration of large numbers of people in relatively small,
highly urbanized areas known as urban agglomerations. During the 20th century, the
population of certain urban agglomerations rose to levels unprecedented in human
history. By 2000, 19 urban agglomerations had at least 10 million inhabitants each,
implying that the population of a single one of them surpassed the total population
of countries such as Belgium, Hungary, or Sweden. Understandably, such populous
agglomerations have become known as mega-cities. But despite their size and impor-
tance, mega-cities still account for a relatively small share of the world population. In
2000 the population of the 19 mega-cities constituted 4.3% of the world population
and by 2015 the projected population of the 23 mega-cities that will exist then will
account for 5.2% of the world population. In fact, most urban dwellers live in cities
with fewer than 500 000 inhabitants and those cities are expected to account for a
rising share of the urban population (Table 5.16). In both the more-developed and the
less-developed regions, the proportion of persons living in cities with fewer than
500 000 inhabitants has been rising, reaching 40.5% in the more-developed regions
and 19.4% in the less-developed regions by 2000. Because that trend is expected to
continue, by 2015 a quarter of the world population is expected to live in cities with
at most 500 000 inhabitants. In the highly urbanized more-developed regions, such
small cities have accounted for the largest proportion of the population since 1975 and
100 Demographic trends

by 2015 nearly twice as many people in the developed world are expected to live in
small cities than in rural areas. In contrast, rural areas will likely remain the main
areas of residence of the inhabitants of the less-developed regions, accounting for
52% of the total population in developing countries in 2015 and having more than
double the population of the small cities in the developing world at that time.
Among major areas, cities with fewer than 500 000 inhabitants have also provided
residence for the highest proportion of urban dwellers (Table 5.17). In Europe,
Northern America, Oceania, and Latin America and the Caribbean, a higher percent-
age of the population lives in small cities than in rural areas. In 2000, the proportion
of the population living in small cities was 47% in Europe, 36% in Latin America and
the Caribbean, and close to 30% in Northern America and Oceania. In Asia and Africa
those percentages were lower, at 17% and 22%, respectively. Over the next fifteen
The dynamics of urbanization 101
Table 5.16 Distribution of the world population and that of more- and less-developed regions by type of settlement and size of
urban settlement, 1975, 2000, and 2015
Development grouping Type of settlement and Percentage distribution Growth rate (%)
number of inhabitants of
urban settlement 1975 2000 2015 1975–2000 2000–2015
World 10 million or more 1.7 4.3 5.2 5.4 2.4
5 million to 10 million 3.1 2.6 3.5 0.8 3.1
1 million to 5 million 8.0 11.6 14.1 3.1 2.4
500 000 to 1 million 4.3 5.0 5.2 2.2 1.4
Fewer than 500 000 20.8 23.5 25.4 2.1 1.6
Rural areas 62.1 53.0 46.6 1.0 0.3
Total population 100.0 100.0 100.0 1.6 1.1
More-developed regions 10 million or more 3.4 5.7 5.7 2.5 0.2
5 million to 10 million 5.9 3.8 4.2 �1.3 0.8
1 million to 5 million 13.9 18.5 20.6 1.6 0.9
500 000 to 1 million 6.6 7.6 7.9 1.1 0.4
Fewer than 500 000 40.2 40.5 41.4 0.5 0.3
Rural areas 30.0 24.0 20.3 �0.4 �1.0
Total population 100.0 100.0 100.0 0.5 0.1
Less-developed regions 10 million or more 1.1 4.0 5.1 7.1 3.0
5 million to 10 million 2.1 2.3 3.3 2.1 3.9
1 million to 5 million 6.0 10.0 12.7 3.9 3.0
500 000 to 1 million 3.5 4.3 4.7 2.7 1.9
Fewer than 500 000 14.0 19.4 22.1 3.2 2.2
Rural areas 73.2 60.1 52.0 1.1 0.4
Total population 100.0 100.0 100.0 1.9 1.3
Least-developed countries 10 million or more 0.0 1.9 2.3 – 3.6
5 million to 10 million 0.0 0.8 3.5 – 12.2
1 million to 5 million 1.6 6.8 9.3 8.2 4.3
500 000 to 1 million 1.7 2.3 1.9 3.8 1.0
Fewer than 500 000 11.1 14.1 18.0 3.4 3.9
Rural areas 85.6 74.0 64.9 1.9 1.4
Total population 100.0 100.0 100.0 2.5 2.2
Source: United Nations (2001c).

102 Demographic trends
Table 5.17 Distribution of the total population of major areas by type of settlement and size of
urban settlement, 1975, 2000, and 2015
Major area Type of settlement and number of Percentage distribution
inhabitants of urban settlement
1975 2000 2015
Africa 10 million or more 0.0 3.1 3.4
5 million to 10 million 1.5 0.6 2.3
1 million to 5 million 3.2 9.6 12.5
500 000 to 1 million 3.3 3.1 3.5
Fewer than 500 000 17.1 21.5 24.7
Rural areas 74.8 62.1 53.5
Total population 100.0 100.0 100.0
Asia 10 million or more 1.3 4.1 5.5
5 million to 10 million 2.1 2.3 3.2
1 million to 5 million 5.9 9.0 11.7
500 000 to 1 million 3.2 4.4 5.0
Fewer than 500 000 12.1 16.9 19.3
Rural areas 75.3 63.3 55.3
Total population 100.0 100.0 100.0
Europe 10 million or more 0.0 0.0 0.0
5 million to 10 million 5.4 5.2 5.3
1 million to 5 million 12.2 15.2 16.5
500 000 to 1 million 6.9 7.2 7.0
Fewer than 500 000 42.8 47.1 49.8
Rural areas 32.7 25.2 21.4
Total population 100.0 100.0 100.0
Latin America and 10 million or more 6.6 11.4 10.4
the Caribbean 5 million to 10 million 5.3 3.7 5.4
1 million to 5 million 9.9 17.1 21.1
500 000 to 1 million 5.2 7.2 6.7
Fewer than 500 000 34.2 35.9 36.3
Rural areas 38.8 24.7 20.1
Total population 100.0 100.0 100.0
Northern America 10 million or more 6.5 9.6 9.2
5 million to 10 million 6.4 2.2 3.7
1 million to 5 million 21.3 27.2 27.9
500 000 to 1 million 7.0 8.3 7.2
Fewer than 500 000 32.6 29.9 32.9
Rural areas 26.2 22.8 19.1
Total population 100.0 100.0 100.0
Oceania 10 million or more 0.0 0.0 0.0
5 million to 10 million 0.0 0.0 0.0
1 million to 5 million 25.8 39.2 36.6
500 000 to 1 million 15.4 0.0 4.3
Fewer than 500 000 30.6 31.0 30.2
Rural areas 28.2 29.8 28.8
Total population 100.0 100.0 100.0
Source: United Nations (2001c).

years the number of people living in small cities is expected to increase in all major
areas except Oceania. The highest growth rates in small cities are projected for Africa
(3% per year) and Asia (2% per year). Despite such rapid growth in the population
of small cities, by 2015 the numbers of rural dwellers in both Africa and Asia are
expected to be twice the number of residents of small cities. In other major areas, the
population of small cities is expected to outnumber by wide margins the number of
rural dwellers.
In Europe not only does the majority of the urban population (at least 63%) live in
cities with fewer than 500 000 inhabitants but, in addition, cities with populations
ranging from 1 million to 5 million inhabitants have attracted a growing share of the
population to the detriment of larger cities. There are only five urban agglomerations
in Europe with more than 5 million inhabitants, a number that has not changed since
1975. In comparison with Europe, Northern America has seen the share of the popu-
lation in small cities decline while the concentration in medium-sized cities, particu-
larly those with populations ranging from 1 million to 5 million inhabitants, and in
mega-cities has risen. However, during 2000–2015, Northern America is expected to
experience a slight increase in the proportion of the population living in cities with
fewer than 500 000 inhabitants and declines in the proportions living in cities with
500 000 to 5 million inhabitants and in mega-cities.
In Latin America and the Caribbean there has been a tendency for the population
to become more concentrated in medium-sized cities with populations ranging from
1 million to 5 million inhabitants and in mega-cities, and the trend towards a somewhat
greater concentration of the population in the upper echelons of the urban hierarchy is
expected to continue until 2015. In Asia the trend towards a greater concentration
of the population in larger cities, particularly mega-cities, is more clear cut and is
projected to continue, particularly as levels of urbanization rise. In Africa a similar
trend is noticeable, especially if one considers jointly the proportion of the population
living in urban agglomerations with 5 million to 10 million inhabitants and that living
in mega-cities. The overall proportion in those agglomerations has increased from
4.4% in 1975 to 6.4% in 2000 and is projected to reach 8.7% in 2015.
For Oceania, the changes in the distribution of the population by size class are
difficult to interpret because they are affected by the small number of cities in that
major area and the discontinuities associated with the transfer of cities from one cate-
gory to the next. In 1975 the two largest cities in Oceania had populations in the range
of 1 million to 5 million inhabitants. By 2000 the number of cities in that category had
increased to six and that number is expected to remain unchanged until 2015. Those six
cities accounted in 2000 for 55.9% of the urban population of Oceania and are
expected to have 51.5% of the corresponding population in 2015, indicating that the
urban population of the region is highly concentrated in a few urban agglomerations.
To conclude, let us consider the mega-cities of the world. Those populous cities are
not uniformly distributed among major areas, nor are they more likely to exist in the
most highly urbanized regions (Table 5.18). Thus, only one of the five mega-cities that
existed in 1975 was located in Northern America and there were none in Europe. At
that time Asia and Latin America had two mega-cities each and Asia had the largest
number of inhabitants living in mega-cities (31 million in two mega-cities). In 2000,
The dynamics of urbanization 103

Asia had more mega-cities than any other major area and the largest number of peo-
ple living in mega-cities (150 million in 11 mega-cities). In addition, Latin America
has four mega-cities, Northern America had two and Africa, with two mega-cities, had
become the fourth major area having such populous cities. During 2000–2015 Asia is
expected to continue having more mega-cities than any other major area and to have
the largest population living in mega-cities. Yet the relative concentration of the pop-
ulation in mega-cities is and will continue to be considerably lower in Asia than in
most of the other major areas. Thus, just 4.1% of the population of Asia is estimated
to live in mega-cities in 2000, whereas 11.4% of that in Latin America and the
Caribbean, and 9.6% of the population of Northern America does so.
Because mega-cities attract considerable attention from the media, policy-makers
and the public at large, there seems to be a perception that they absorb a large share of
urban growth and tend to grow very rapidly. In fact, the opposite is true. An analysis
of past and future growth rates of the populations of mega-cities has indicated that
as the city population rises its growth rate tends to decline (United Nations, 2001c).
So, although some of today’s mega-cities experienced very high rates of population
growth when they were still medium-sized urban centers, their rates of growth
moderate considerably as they approach the 10 million mark. Thus, in 1950, the only
mega-city at the time, New York, also had the lowest rate of growth among all future
mega-cities (1% per year during 1950–1975). During 1975–2000, four of the mega-cities
104 Demographic trends
Table 5.18 Population of cities with 10 million inhabitants or more, 1950, 1975, 2000, and 2015 (in millions)
City 1950 City 1975 City 2000 City 2015
1 New York 12.3 1 Tokyo 19.8 1 Tokyo 26.4 1 Tokyo 26.4
2 New York 15.9 2 Mexico City 18.1 2 Bombay 26.1
3 Shanghai 11.4 3 Bombay 18.1 3 Lagos 23.2
4 Mexico City 11.2 4 Sao Paulo 17.8 4 Dhaka 21.1
5 Sao Paulo 10.0 5 New York 16.6 5 Sao Paulo 20.4
6 Lagos 13.4 6 Karachi 19.2
7 Los Angeles 13.1 7 Mexico City 19.2
8 Calcutta 12.9 8 New York 17.4
9 Shanghai 12.9 9 Jakarta 17.3
10 Buenos Aires 12.6 10 Calcutta 17.3
11 Dhaka 12.3 11 Delhi 16.8
12 Karachi 11.8 12 Metro Manila 14.8
13 Delhi 11.7 13 Shanghai 14.6
14 Jakarta 11.0 14 Los Angeles 14.1
15 Osaka 11.0 15 Buenos Aires 14.1
16 Metro Manila 10.9 16 Cairo 13.8
17 Beijing 10.8 17 Istanbul 12.5
18 Rio de Janeiro 10.6 18 Beijing 12.3
19 Cairo 10.6 19 Rio de Janeiro 11.9
20 Osaka 11.0
21 Tianjin 10.7
22 Hyderabad 10.5
23 Bangkok 10.1
Source: United Nations (2001c).

or future mega-cities had rates of growth lower or equal to 1% – Beijing, New York,
Osaka, and Shanghai – and all of them had populations of at least 8 million inhabi-
tants. Furthermore, Tokyo, the largest urban agglomeration at the time, grew at just
1.2% per year during 1975–2000. Over the period 2000–2015, 11 of the 23 mega-
cities of 2015 will have growth rates of at most 1% per year and two, Osaka and
Tokyo, are expected to exhibit zero growth. Nevertheless, there are cities that main-
tain high growth rates even when their populations have already soared. Although a
moderation of the rates of growth of all current mega-cities is expected during the
period 2000–2015, cities such as Lagos, Dhaka, Karachi, and Jakarta are projected to
grow at fairly rapid rates, ranging from 3% to 3.6% per year.
An analysis of the patterns of growth of all cities projected to reach a population of
5 million inhabitants or more by 2015 indicates that the population growth rates of
those urban agglomerations have tended to be moderate or low, especially once their
population surpasses the 2 million mark (United Nations, 2001c). The most populous
urban agglomerations of the developed world have exhibited relatively low rates of
growth since 1950 and are expected to grow very slowly if at all during 2000–2015.
Among the urban agglomerations expected to reach the 5 million mark in the future,
the highest rates of population growth have occurred in those agglomerations located
in the less-developed regions of the world, especially over periods when they still had
low numbers of inhabitants. But even among the large urban agglomerations of the
developing world, rates of population growth above 5% sustained over lengthy
periods have been exceptional.
Conclusion
This review of past trends and future prospects of population growth, population
aging, and urbanization has highlighted the crucial changes that world population
dynamics have undergone over the course of the 20th century and the fact that the
demographic transition, being a unique event in human history, still remains to play
itself out to its full extent. Today, when most developing countries are already fairly
advanced in the transition to low fertility and low mortality, the issue of whether the
developing world will embark on the demographic transition has been largely put to rest.
Nevertheless, some issues that had not been expected twenty or thirty years ago when
the transition to low fertility in the developing world was beginning have now taken
center stage and are leading to a reassessment of future prospects of population change.
The first of these developments is the persistence of low fertility in a large number
of countries, especially in those that underwent the demographic transition early, since
such persistence suggests that when couples master the means to control their fertility
and live in societies where the risks of dying before old age are low, the number of
children they will decide to have may be below the number needed to ensure the
long-term replacement of the population. If this behavior becomes the norm rather
than the exception in the countries that are today in the intermediate stages of the tran-
sition to low fertility, the prospects for a sustained and deep reduction of the world
Conclusion 105

population over the coming century increase. However, this issue is only beginning to
be addressed in a systematic way and the possibility of different outcomes cannot be
ruled out, particularly given the heterogeneity that is still evident among the popula-
tions of the world. Furthermore, the persistence of high fertility in a significant
number of countries and evidence suggesting a slowdown in the transition to low
fertility in some of the most populous countries where fertility levels are still at an
intermediate stage suggest that the universal adoption of low fertility norms is not so
readily at hand.
The second development involves reversals of the transition to lower mortality,
especially those stemming from a resurgence of infectious diseases as major causes
of death and from the persistence of high rates of death caused by chronic and degen-
erative diseases such as those affecting the cardiovascular system. In addition, in
a growing number of countries mortality due to violence and accidents has been
increasing and although it is generally not sufficient to cause a sustained reversal of
mortality trends, it may contribute to dampen further mortality reductions in many
countries. These factors, among which the uncertainty about future levels of HIV
prevalence is perhaps the most prominent, suggest that future assumptions about
sustained mortality reductions in the majority of countries may turn out to be too
optimistic. On the other hand, past experience has shown that projections of mortality
decline have tended to err in the other direction, underestimating the reductions of
mortality that have occurred in countries with advanced health systems where new
medical interventions and behavioral change have contributed to reduce mortality in
adult ages more rapidly than expected.
These considerations imply that the results of current projections can at best be
taken as indicative of possible future developments. Nevertheless, as documented in
this chapter, they already cover a wide range of outcomes and provide fairly solid
basis for some key conclusions. The first is that the world population will continue to
increase during the best part of the next fifty years and the potential for continued
growth is large. The second is that population aging will continue and with it the rapid
increase of the elderly population. The third is that the population of the future will be
more urban and that growth of the rural population will be low or negative almost
everywhere. The fourth is that the differences in demographic dynamics between
the more-developed and the less-developed countries will persist for at least the next
fifty years, and there will be considerable variation in the experiences of countries.
A homogeneous world in which all populations have similarly low levels of fertility
and mortality and are equally highly urbanized is still far away in the future.
References
Biraben, J.N. (1979). Essai d’estimation du nombre des hommes. Population 1, 13–26.
Champion, A. (1998). Population distribution in developed countries: has counter-
urbanization stopped? In “Population Distribution and Migration”. Proceedings of
the United Nations Expert Group Meeting on Population Distribution and Migration,
106 Demographic trends
Santa Cruz (Bolivia), 18–22 January 1993. United Nations publication, Sales No.
E.98.XIII.12.
Clark, C. (1968). “Population Growth and Land Use”. Saint Martin’s Press, New York.
Korcelli, P. (1984). The turnaround in urbanization in developed countries. In “Population
Distribution, Migration and Development”. Proceedings of the Expert Group on
Population Distribution, Migration and Development, Hammamet (Tunisia), 21–25
March 1983. United Nations publications, Sales No. E.84.XIII.3.
United Nations (1980). “Patterns of Urban and Rural Population Growth”. United Nations
publication, Sales No. E.79.XIII.9.
United Nations (2001a). “World Population Prospects: The 2000 Revision”. Vol. I:
Comprehensive Tables. United Nations publication, Sales No. E.01.XIII.8.
United Nations (2001b). “World Population Prospects: The 2000 Revision”. Vol. II: Sex
and Age Distribution of the World Population. United Nations publication, Sales
No. E.01.XIII.9.
United Nations (2001c). “World Urbanization Prospects: The 1999 Revision”. United
Nations publication, Sales No. E.01.XIII.11.
Vallin, J. (1989). “La Population Mondiale”. La Découverte, Paris.
References 107

This Page Intentionally Left Blank

Biological FactorsAffecting the NutritionTransition
PART
II
6. The dynamics of the dietary transition in the developing world . . . . . . . . 111
7. Early nutrition conditions and later risk of disease . . . . . . . . . . . . . . . . . 129
8. Obesity in the developing world . . . . . . . . . . . . . . . . . . . . . . . . . . . . . . 147
9. Diabetes . . . . . . . . . . . . . . . . . . . . . . . . . . . . . . . . . . . . . . . . . . . . . . . . 165
10. Cardiovascular diseases . . . . . . . . . . . . . . . . . . . . . . . . . . . . . . . . . . . . . 191
11. The nutrition transition in China: a new stage of the Chinese diet . . . . . 205
12. Trends in under- and overnutrition in Brazil . . . . . . . . . . . . . . . . . . . . . . 223
13. Policy implications . . . . . . . . . . . . . . . . . . . . . . . . . . . . . . . . . . . . . . . . 241

This Page Intentionally Left Blank
The dynamics of thedietary transition in thedeveloping world
Barry M. Popkin
6
Introduction
Human history is characterized by a series of changes in the diet and nutritional
status. This pace of change has quickened considerably over the last three centuries. In
particular in the post-World War II period it appears to have changed at a much more
rapid rate. Before that, major changes in diet and nutritional status occurred infrequently
and one could argue that there were few changes in diet for the first several million years
of existence of the human race. In this chapter, I consider dietary and overall nutritional
change from a broad historical perspective. The concept of transitions or movement
from one state or condition to another is used to capture the dynamic nature of diet, par-
ticularly large shifts in its overall structure. I begin with the premise that it is important
to understand these broad changes in dietary patterns and the factors we consider as
determinants or important correlates of the patterns of dietary change. The ultimate goal
is to understand the various factors which cause or are associated with these dietary
changes so that we can better understand how to promote dietary change systematically.
I posit that the transitions which have occurred in nutrition are avoidable and that an
understanding of the patterns and sources of change will serve as a basis for future inter-
ventions at the population level to lead to more healthful transitions.
The theory of the nutrition transition posits that these changes or stages relate to the
complex interplay of changes in patterns of agricultural, health, and socioeconomic
factors, among others. It is relatively easy to present a case that to understand the
nutrition transition we require a broad-based examination of the patterns and deter-
minants of dietary change. One needs to be concerned with food supply, which relates
to agricultural systems and agricultural technology as well as to the factors which
affect the demand and use of food. The latter include economic resources, demographic
patterns, various cultural and knowledge factors associated with food choice, and also
The Nutrition TransitionISBN: 0-12-153654-8
Copyright © 2002 Elsevier Science LtdAll rights of reproduction in any form reserved

disease patterns, sociological considerations such as the role of women and family
structure.
Broad conceptualization of the nutrition transition
In Table 6.1 the conceptualization of the nutrition transition is laid out. This is a highly
stylized synopsis of patterns of change, presenting the shifts in dietary intake and
nutritional status and some of the possible correlates and/or causes of these trends. It
is important to note the dearth of research which has tried to link dietary patterns
across the centuries and millennia, particularly with some attention being paid to the
pace of change and magnitude of structural shifts and the determinants of these changes.
We have numerous examples of movements from one stage of the nutritional transi-
tion to another which occurred over various periods of time (e.g., the Japanese shift
in diet after World War II produced a rapid change from the third to the fourth stage,
in sharp contrast to much slower changes over the period of a century from the third
to the fourth stage in North America and Western Europe). It is also important to note
that such transitions occur highly unevenly over time and space and change varies
greatly for different geographic and socioeconomic subpopulation groups.
The other factors presented in Table 6.1 represent some of the major relationships
between the nutrition transition, and social, health, and technological change. Many of
these factors have a role in determining the pattern and pace of the nutrition transition;
others occur concurrently or follow this transition. The problem of causality represents
a challenge that cannot be adequately addressed here. Does population growth lead to
dietary change or vice versa? Examples of each abound. Is a stable food supply
required to provide the resources for urban centers to grow or do the requirements
of urban centers lead to increasing food production? Answers to such questions vary
by stage of the nutritional transition and in some cases represent central elements in
longstanding debates about the antecedents and consequences of economic and
demographic change. In many cases, we can make clear statements about causality, in
others, we can not. In many cases, the relationships discussed have not been consid-
ered because the questions have not been posed heretofore.
With the ability to control famines and to gain control over factors affecting the
fluctuations in food supply which occur from season to season and over a series of
years, it was possible for food to be available to fuel the labor force needed for the
industrial revolution and the development of modern urban societies.
Stage 1: Age of collecting food
For the first two–three million years of the existence of humans as we know them
today, food was obtained by hunting and gathering and none was produced. Hunt-
ing only emerged as a significant component of the subsistence pattern in the last
112 The dynamics of the dietary transition in the developing world

Table 6.1 The nutrition transition
Transition profile Pattern 1: Pattern 2: Pattern 3: Pattern 4: Pattern 5:Collecting food Famine Receding famine Degenerative disease Behavioral change
1. Nutrition profileDiet Plants, low-fat wild Cereals predominant; Fewer starchy staples; more More fat (especially from Less fat and processing;
animals; varied diet diet less varied fruits, vegetables, animal animal products), sugar and increased carbohydrates, protein; low variety continues processed foods; less fiber fruits and vegetables
Nutritional status Robust, lean, few Children, women suffer Continued MCH nutrition Obesity; problems for elderly Reduced body fat levels nutritional deficiencies most from low fat intake; problems; many deficiencies (bone health, etc.); many and obesity; improved
nutritional deficiency diseases disappear; weaning diseases disabling conditions bone healthemerge; stature declines emerge; stature grows
2. Economy Hunter–gatherers Agriculture, animal Second agricultural Fewer jobs with heavy Service sector mechanization,husbandry, home-making revolution (crop rotation, physical activity; service industrial robotization begin; shift to monocultures fertilizer); sector and mechanization; dominate; leisure exercise
Industrial revolution; household technology grows to offset sedentarywomen join labor force revolution jobs
Household Primitive; onset Labor-intensive, primitive Primitive water systems; clay Household technology Food preparation cost production of fire technology begins (clay stoves; cooking technology mechanizes and proliferates falls significantly with
cooking vessels) advance technological changeIncome and assets Subsistence; primitive Subsistence; few tools Increasing income disparity; Rapid growth in income Income growth slows;
stone tools agricultural tools; and income disparities; home and leisure industrialization rises technology proliferation technologies increase
3. Demographic profileMortality/fertility Low fertility, high Age of Malthus; high Slow mortality decline, Life expectancy hits Life expectancy extends
mortality, low life natural fertility, low life later rapid; fertility static, unique levels (60s–70s); to 70s, 80s; expectancy expectancy, high infant then declines; small, huge fertility declines disability-free
and maternal mortality cumulative population and fluctuations (e.g., period increasesgrowth, later explodes postwar baby boom)
Morbidity Much infectious Epidemics; endemic TB, smallpox, infection, Chronic disease related Increased health promotion disease; no epidemics disease (plague, smallpox, parasitic disease, polio, to diet, pollution (heart (preventive and therapeutic);
polio, TB); deficiency weaning disease (diarrhea, disease, cancer); rapid decline in CHD, slower disease begins; starving retarded growth) expand, infectious disease declines change in age-specificcommon later decline cancer profile
Age structure Young population Young; very Chiefly young; shift to older Rapid fertility decline; elderly Increasing proportion of few elderly population begins proportion increases rapidly elderly �75
Residency patterns Rural, low density Rural; a few small, Chiefly rural; move to cities Urban population disperses; Lower density cities crowded cities increases; international rural green space reduced rejuvenate; urbanization of
migration begins; rural areas encircling megacities develop cities increases
4. Food processing Nonexistent Food storage begins Storage process (drying, Numerous food Technologies create foods salting); canning and transforming technologies and food constituent processing technologies; substitutes (e.g., increased food refining macronutrient substitutes)and milling
Reprinted with permission from: Popkin, B.M. (1993) Nutritional patterns and transitions. Popul. Dev. Rev. 19, 138–157.

million years (Gordon, 1987). The use or control of fire has been documented during
this period in many locations. During this period in the age of collecting food, there
was a balance of about 50–80% of food coming from plants and 20–50% from animals
(coastal dwellers received more nutrition from fishing; inland residents received more
from hunting; hunting progressed over time from small animals to larger mammals).
Within this period, there were periods of increased consumption of animal food prod-
ucts and many subpopulations that were predominately meat-eaters.
• For the first several million years, humans were felt to be reasonably large in
size and robust in skeletons and musculature (Truswell and Hansen, 1976;
Schoeninger, 1982; Eaton et al., 1988). These persons had short life spans but
reasonable nutritional status, infectious diseases being the major source of
morbidity and death.
• In general the diet was more varied in these traditional, preagricultural societies
(Truswell, 1977). Seasonality and the need to combine hunting and gathering
activities ensured this greater variety. The basic diet came from seeds of grasses,
tree nuts, roots and tubers, fish and aquatic mammals, and herd ungulates (Harris,
1980). Fat content in the diet was low because of its high carbohydrate content
and the low proportion of saturated fat in the meat consumed. Wild animal meat
such as they consumed has five times the proportion of polyunsaturated fat as
does the domestic animal meat consumed today (Eaton et al., 1988). For exam-
ple, the !Kung San who consume very high proportions of energy from meat,
have a cholesterol level of 120 (Truswell and Hansen, 1978; Truswell, 1979).
Although the hunter–gatherer societies studied in the past century live in far
more precarious environments than their predecessors lived in a million years
ago, it is unlikely that their diets differed significantly. Fiber intake, part of which
came from indigestible roughage, was very high.
• Among the proportion of these persons who survived the infectious diseases and
lived to be older, chronic diseases (e.g., coronary heart disease (CHD), hyperten-
sion, cancer, osteoporosis, dental caries, diabetes) were unknown problems (Cavalli-
Sforza, 1981; Eaton et al., 1988). These researchers are unanimous in their feeling
that the absence of diet-related chronic diseases relates to living patterns rather
than the short average live expectancy of these peoples. Obesity was not found;
however, there is some debate as to whether the thin but robust persons who sur-
vived were malnourished or healthy (Harpending, 1976; Truswell and Hansen,
1978). More recent higher quality estimates of the hunter–gatherer diet lead to the
following macronutrient composition: 19–35% of energy from protein; 22–40% of
energy from carbohydrate; and the rest from fat (Cordain et al., 2000). Thus most
of these societies consumed more than 50% of their energy from animal foods.
Stage 2: Age of famine
The age of famine began with the development of agriculture. Deemed the first agri-
cultural revolution, this period saw society develop its first ability to produce food.
Agriculture became dominant at different times in each region of the world (e.g., by
114 The dynamics of the dietary transition in the developing world

about 7000 BC in Southeast Asia and 500 BC in Mexico (Tehuacan Valley agrarian-
based economies were well-established) (Gordon, 1987)). The cause of this shift is
unclear; however, population density increased considerably during the final stages of
the age of collecting food and provides the most convincing explanation. It is impor-
tant to note that the date of the early agricultural period varied from region to region
and only in later periods (the two thousand or fewer years BC) does agriculture become
more complex (e.g., Vargas, 1990). With this revolution, protein content in the diet
declined modestly, complex carbohydrates increased from 50–70% of energy to
60–75%, and fat as a percentage of energy decreased from about 15–30% to 10–15%
(Trowell, 1981). A disproportionate amount of food from plant sources occurred in
some societies and in others, hunting/animal husbandry played a central role.
• In general the onset of animal husbandry and agriculture was associated with a
significant decline in the proportion of meat in the diet and an increase in veg-
etable foods (up to 90% of the diet). There also appears to be an increasing spe-
cialization in activities other than agriculture which led to fewer persons being
involved in farming. Associated with these changes was increased nutritional
stress and a reduction in stature according to numerous studies of skeletal
remains (e.g., Eaton and Konner, 1985; Vargas, 1990). It is estimated that stature
declined by an average of 4 inches (10 cm) (Eaton et al., 1988).
• There was a decrease in robustness as a result of changes in food procurement
and activity levels. There was a shift to increasing dependence on dietary plant
material. Changes in strontium:calcium ratios in bones somewhere between
10 000 and 15 000 years BC indicate a dietary shift in one region but similar data
are unavailable for all regions of the world and patterns of dietary change and
robustness appear to have varied greatly (Schoeninger, 1982).
• The shifts toward agriculture led to a less-varied diet with cereal grains predom-
inant, an increase in alcohol consumption, and the onset of a variety of deficiency
diseases, all directly related to the reduction in dietary variety (Yudkin, 1969).
Social stratification began to appear during the later stages of this stage and
resulted in “intragroup variation in diet along the lines of sex and social status”
(Gordon, 1987).
Stage 3: Age of receding famine
• The second agricultural revolution occurred in the 18th to 19th centuries when
modern technology was first applied to agriculture, including the development of
natural fertilizers and crop rotation systems. This development may partly relate
to the excess food supply which allowed farmers to use rotted vegetables and
animal manure for fertilizer. This technology was associated with an increase in
animal protein. Later irrigation technology, transportation within and across
national and regional borders, and other changes helped to reduce the effects of
climatic fluctuations.
• The Industrial Revolution, in 19th-century Europe, found animal protein content
of diet becoming increasingly adequate. During the second half and later in that
Broad conceptualization of the nutrition transition 115

century, improved transportation, conquests of one people over another (e.g., the
Spanish in the Americas), and other factors led to more complex diets with a
greater mix of plant and animal products (e.g., the practice of animal husbandry
increased). The result was an increase in stature.
• Changes in diet included reduced consumption of all starchy foods (bread and
potatoes); increased consumption of sugar, vegetables, and fruits; and adaptation
of dietary practices which eliminate major deficiency diseases (higher protein,
fat consumption; changes in food processing; etc.). The introduction of tech-
niques for milling grain led to a decline in fiber intake and to a short-term
increase in selected deficiency diseases (e.g., pellagra and beriberi were caused
by excessive milling of corn and rice, respectively).
• Additional features of this period were increases in social inequality, clustering
of the poor in slums and ghettoes, and the evolution of a new set of dietary prob-
lems related to early weaning from the breast during the 17th to 19th centuries.
Combined with poor sanitation and impure water supplies, a new set of infant
nutrition problems occurred. This situation was followed rapidly in the late 19th
and early 20th century by the development of formulations by medical practi-
tioners for feeding infants, the development of tin cans, and the evolution of the
commercial infant formula sector.
• Many lower-income countries have achieved remarkable economic or social
progress during the past century and continue to move through the age of receding
famine into the next stage. Keyfitz (1985) uses descriptive information to docu-
ment some of the more subtle aspects of this shift for one village in Indonesia. One
of the interesting shifts is a change from preoccupation with obtaining food which
entered all aspects of life to one in which it takes much less time to earn a kilo-
gram of rice and the focus of life has shifted. During this stage, the quality of the
staple increases first, often reducing the consumption of inferior staples (e.g., cas-
sava consumption is reduced and rice consumption increased as in Indonesia
(Keyfitz, 1985)). Such changes in the quality of the diet during this stage of the
nutrition transition fits our experience in many low-income countries.
Stage 4: Age of degenerative diseases
This age began with rapid growth in animal husbandry, urbanization, and economic
change, which combined to create the basis for a major shift toward a lower nutrient
density diet which was excessively high in saturated fat and refined sugar.
• Hughes and Jones (1979) document long-term shifts from food balance studies in
rural Wales. Table 6.2 shows the dietary changes which are related to this phase of
the nutrition transition. This is an example of the diet high in fat, sugar, and
processed foodstuffs, and low in fiber and natural foodstuffs, so often found in
combination with an increasingly sedentary life. An increase in the consumption
of sugar, processed foods, total fats, and cholesterol and decreased consumption
of polyunsaturated fatty acids (PUFA) and dietary fiber are general trends.
• The proportion and type of animal fat in meat differs significantly from that
consumed today and during the age of famine (now there is much more fat in
116 The dynamics of the dietary transition in the developing world

subcutaneous tissue and facial planes, and as marbling within the muscle itself).
Domesticated animals not only contain more fat but earlier undomesticated
animal meat was much more likely to be polyunsaturated; also free-living animal
meat has fewer calories and more protein. As an interesting aside, not only does
this explain some of the effects of increased fat-related degenerative diseases such
as coronary heart disease (CHD), but may also explain why our species does not
provide more effective protection (e.g., different modes of utilization) against
high-fat intake from animal products.
• The diet associated with modernization and industrialization is spreading to all
developing countries at a time when the higher-income countries have drastically
altered their diet and face problems of excess rather than deficit. The composition
of the diets of most urban residents and in many rural regions in the low-income
world is beginning to resemble Western diets and there are few exceptions to this
pattern. This is a diet with over 20% of the calories from sugar and a very low
fiber intake.
• Also many Mediterranean countries (Portugal, Italy) are rapidly changing their
healthful, traditional diet (high in olive oil and carbohydrates in Italy and olive
oil, cod, and legumes in Portugal) to a diet similar to that consumed in Western
Europe and North America. This change has meant a significant increase in fat as
a proportion of energy (e.g., Amorin-Cruz, 1987 as cited in Milio, 1990).
Stage 5: Age of behavioral change to revise diet to reducedegenerative diseases and prolong health
The societal changes that brought us to the reduction in the importance of famine and
infectious diseases and an increase in the importance of degenerative diseases, have
begun to trigger a set of behavioral changes in diet felt to be associated with the desire
to prevent degenerative diseases. Whether these changes will be sufficient to produce
large-scale changes in the structure of diet and body composition remains to be seen.
To some extent, the push is to change dietary behavior and return to a diet low in
fat – particularly saturated fat – high in fiber, accompanied by extensive exercise.
A number of researchers have shown that such behavioral changes are particularly
important because they will extend the period of healthful living, that is time free of
disability (Manton and Soldo, 1985; Rogers and Hackenberg, 1987).
Broad conceptualization of the nutrition transition 117
Table 6.2 Dietary intake trends in rural Wales
Diet components 1870 1977
Fat as a percentage of energy 25 40
PUFA as percentage of total fat 18.5 9.1
PUFA :SFA ratio 0.42 0.20
Cholesterol (mg/day) 130 517
Sucrose (g/day) 26 133
Dietary fiber (g/day) 65 21
Source: Hughes and Jones (1979).

• There has been a significant shift in public knowledge about the relationship
between diet and disease, particularly related to cardiovascular disease, hyperten-
sion, osteoporosis, and to a lesser extent selected cancers. Related dietary changes
have occurred mainly in certain higher-income countries and offer the promise of
shaping the next stage of the nutrition transition. Increases in consumption of low-
fat products, reductions in intake of higher fat products, careful attention to choles-
terol intake, and less significant but emerging concern for fiber intake are evidence
of a potentially new phase in the nutrition transition. For example, there have also
been important changes in coronary heart disease patterns in several countries
which have led to speculation that dietary change was responsible for them.
• To a very considerable extent, the changes in eating patterns associated with the
recent reduction in fat intake in the United States (Popkin et al., 2001), Norway
(Milio, 1990), and other higher income countries and the shift toward increased
lower fat food consumption has fueled a revolution in the food industry (Popkin
et al., 1989; Milio, 1990).
Some of the broad outlines of dietary change have been laid out here. As we head
into the new millennium, it is important to present the more recent changes in the
developing world against this backdrop. First, the two major defining characteristics
are focused on – increased dietary diversity and a shift in the structure of the diet
toward more added sugar and fats and a change of staples.
Dietary diversity has improved
The diets of poor societies have been based on a very limited number of foods, and often
consist of little more than starchy roots and coarse grains. Though low in fat and high
in fiber, these foods offer little in the way of diversity or variety, essential components
of eating pleasure. The nutrition transition typically involves a shift from a limited
number of high-carbohydrate staples to a more diverse diet that becomes available to
progressively more people. Improved diversity is not only important for improving the
quality of life but probably has had a marked impact on improved reproductive out-
comes and growth and development. As incomes grow, diets become more diverse,
and more people incorporate meat and fish, milk, eggs, and cheese, as well as vegeta-
bles and fresh fruit into their habitual diets. Insofar as new foods are being introduced
into the diet, they invariably include meat, eggs, and sweets that had been previously
inaccessible to most low-income people. Some of these new foods are high in fats,
simple sugars, or both. As a result, dietary diversity and the proportion of fats in the
diet are sometimes directly linked.
Chapter 11 presents a more careful analysis of the Chinese nutrition transition.
Here, a brief analysis of the Chinese diet, assessed by the 1989–97 China Health and
Nutrition Survey (CHNS) surveys is presented. The 1989 diet of the poor was largely
based on rice, millet, sorghum, cabbage, salted vegetables, soybean sauce, and salt,
with some meat (pork). Higher income respondents replaced coarse grains and starchy
118 The dynamics of the dietary transition in the developing world

tubers with more rice and wheat. As incomes rose, vegetables and pickled vegetables
were replaced with more meat, poultry and eggs, more dairy products, and more fresh
fruit. As more different foods were consumed, portion sizes (g/day/user) generally
dropped for all foods, except meat, fresh fruit, and alcohol.
The analyses of dietary diversity in China are summarized in Table 6.3. The
University of North Carolina at Chapel Hill Institute of Nutrition and Food Hygiene
(UNC-CH-INFH) food grouping system was used. This food grouping system sepa-
rates all foods into 39 useful descriptive and nutrient-based groups. Initially major food
groups were based on food groupings used by the INFH. Then fat and beta-carotene
compositions were used to develop more refined food groupings, and nutrient thresh-
olds were used to separate major food groups into more distinct, nutrient-based food
groups. The number consumed by each person was then summed and presented as
mean intake and the proportion with high, medium, and low numbers of food groups
consumed. What is noteworthy about this is that there is a marked increase in diversity
of the Chinese diet across all socioeconomic status groupings. The urban effect is par-
ticularly noticeable. Over time, the proportion of Chinese of all income groups who
consume less than eight food groups has declined whereas those who consume more
than 10 increased considerably.
The structure of the diet is shifting: more fatand more added sugar is found
Whereas high-fat diets and Western eating habits were once restricted to the rich
industrialized nations, elsewhere evidence has been presented that the nutrition tran-
sition now occurs in nations with much lower levels of gross national product (GNP)
than previously. Even low-income societies now have access to a high-fat and high-
added-sugar diet. Food disappearance data from the Food and Agriculture Organization
of the United Nations (FAOUN) is used to present first the average diet in the 1960s
and then to show how this has shifted in the 1990s for low and high urban areas.
The structure of the diet is shifting: more fat and more added sugar is found 119
Table 6.3 Diversity in the Chinese diets, CHNS 1989 and 1997 among adults aged 20–45
Food groups Urban Rural Low income Mid income High income Total
consumeda tertile tertile tertile
89 97 89 97 89 97 89 97 89 97 89 97
Mean number 9.9 11.6 8.3 9.1 7.6 8.6 9.0 9.8 10.1 11.0 8.8 9.9
�8 23.5% 7.3% 41.6% 26.6% 52.8% 34.1% 31.5% 17.9% 20.6% 11.3% 35.6% 20.3%
8–10 23.3% 15.8% 29.3% 33.3% 29.0% 33.9% 29.1% 30.2% 23.4% 20.5% 27.3% 27.6%
10� 53.2% 76.9% 29.1% 40.1% 18.2% 32.0% 39.4% 51.8% 56.0% 68.2% 37.1% 52.1%
a Using the UNC-CH-INFH food groups that contain 39 food groups based first on the major food groupings and then on
nutrient-based subgroups.
Source: Popkin et al. (in press).

Diets high in fats, especially meat and milk products, used to be tied to a high level
of income, whether at national or individual level. A direct relationship between the
GNP per capita and the global diet structure was documented three decades ago in a
classic study (Perisse et al., 1969; FAOUN, 1970). As shown in Fig. 6.1, analysis of
food balance sheets from the Food and Agriculture Organization (FAO) of the United
Nations for 85 countries in 1962 showed that high GNP levels were associated with
greater percentages of energy derived from sugars and from vegetable and animal fats.
Although the proportion of energy from protein remained constant, diets of rich
nations were largely based on animal rather than vegetable proteins. The proportion
of energy from complex carbohydrates diminished sharply as a function of growing
incomes, a characteristic feature of the nutrition transition.
The estimated regression lines displayed in Fig. 6.2 show that the aggregate
income–fat relationship had undergone a dramatic change from 1962 to 1990. Most
significantly, by 1990 even the poor nations had access to a relatively high-fat diet.
Whereas in 1962, a diet deriving 20% of energy (kcal) from fat was associated with a
GNP of $1475, the same diet in 1990 was associated with a GNP of only $750 (both
in 1992 dollars). This dramatic change arose from a major increase in the consump-
tion of vegetable fats by poor and rich nations alike. The proportion of energy from
vegetable fats accounted for up to 13% of total energy in 1990, compared to 10% in
1962. The availability of animal fats continued to be linked to income, though less
strongly than before. Vegetable fats in 1990 accounted for a greater proportion of
120 The dynamics of the dietary transition in the developing world
Carbohydrate
An
imal p
rote
in
Veg
etab
le p
rote
in
An
nu
al p
er c
ap
ita n
ati
on
al in
com
e (U
S$
lo
g sc
ale
)
Separatedanimal fat Unseparated
fats
Veg
etab
le f
ats
2600
2000
1500
1100
800
600
400
300
200
150
90
50
100% 90%10%
80%20%
70%30%
60%40%
50%50%
40%60%
30%70%
20%80%
10%90%
Percentage of total calories
MM
100%
Added sugar
Figure 6.1 Structure of the diet and income (country-level sources of energy, 1962) (from Drewnowski
and Popkin, 1997).

dietary energy than animal fats for countries in the lowest 75% of the per capita
income distribution. The absolute level of vegetable fat consumption increased, but
there remained at most a weak association of GNP and vegetable fat intake in these
aggregate data.
As a result of these diet adjustments, the lowest income countries now consume
an additional 4–5% of energy from fat. Although meat consumption declined in
high-income countries (by 6–9%), there was little overall reduction in fat intake. The
results in Fig. 6.2 indicate that there has been a substantial shift in the relationship
between GNP and the composition of diets over time. There was little information in
the 1962 GNP–nutritional composition analysis, however, that would have predicted
the form of the relationships in 1990.
There is evidence to show that the structure of the income–diet relationship has
undergone a significant change. First, fat consumption is less dependent on GNP than
ever before. Second, rapid urbanization has a major influence in accelerating the nutri-
tion transition. The analyses were based on sequential FAO food balance sheets for the
period 1962–90, now available in the FAOSTAT database. Data on food availability,
expressed in percentage of daily energy from macronutrients were combined with the
official estimates of GNP, as established by the World Bank. In both cases, GNP per
capita was expressed in 1993 dollars to allow for an easier comparison of the results.
Regression analyses were used to relate dietary data (the proportion of energy from
vegetable and animal fats, carbohydrates, caloric sweeteners, and protein) for those
countries for which full sets of data were available in 1962 and in 1990 to the logarithm
of per capita GNP. This research used all countries for which both sets of data were
available: 98 countries in 1962 and 133 in 1990. Using alternate samples that consisted
of countries with full sets of data in both 1962 and 1990, the results were identical.
The structure of the diet is shifting: more fat and more added sugar is found 121
40
35
30
25
20
15
10
5
00 2000 4000 6000 8000 10 000 12 000 14 000
GNP per capita (in constant 1993 US$)
1990 Total fat
1962 Total fat
1962 Animal fat
1990 Animal fat
1990 Vegetable fat
1962 Vegetable fat
% o
f en
ergy
fro
m f
at
Figure 6.2 Relationship between the percentage of energy from fat and GNP per capita, 1962 and 1990
(from Guo et al., 2000). These are nonparametric regressions run with food balance data from FAOUN and
GNP data from the World Bank.

The regression analysis also included an urbanization variable. Although GNP and
the extent of urbanization were closely linked before World War II, this is clearly no
longer the case and many lower income countries now experience very high rates of
urbanization. In the regression analyses, the percentage of energy from each macro-
nutrient was regressed on GNP per capita, the proportion of the population residing in
urban areas that year, and an interaction term between GNP per capita and the propor-
tion of urban residents. All variables in this regression were highly significant.
The data for 1990 (Figs 6.3 and 6.4) show that the income–fat relationship had
undergone a dramatic change during the intervening three decades. Figure 6.2 showed
the shift in fat intake. The relationship between incomes and energy from sweeteners
also underwent a major change between 1962 and 1990. Figure 6.3 shows a very small
proportion of energy from added sugar in lower-income countries. In contrast, lower-
income urban societies in 1990 have more than 15% of their energy from added sugar
and even less urban more rural societies that are low income have 5–7% of energy
from added sugar.
Urbanization contributes to dietary change
Persons living in urban areas consume significantly different diets from their rural
counterparts. They have led the movement from stage 2 to 3 and 4 of the nutritional
122 The dynamics of the dietary transition in the developing world
Carbohydrates
An
nu
al p
er c
ap
ita n
ati
on
al in
com
e(i
n c
on
stan
t 1
99
3 U
S$
)
Vegetablefats
Animalfats
10 000
7300
6300
4500
2700
2200
1700
1300
1000
700
400
2000% 10% 20% 30% 40% 50% 60% 70% 80% 90%
Percentage of total calories
100%
Sw
eete
ner
s
An
imal p
rote
ins
Veg
etab
le p
rote
ins
Figure 6.3 Relationship between the proportion of energy from each food source and gross national
product per capita with the proportion of the population residing in urban areas placed at 25%,
1990 (from Drewnowski and Popkin, 1997). Food balance data from the FAOUN; GNP data from
the World Bank; regression work by UNC-CH.

transition. Among the distinct differences in eating patterns of urban and rural resi-
dents are the following:
• trend away from consumption of the inferior grains (e.g., corn or millet to rice);
• trend toward consumption of more milled and polished grains (e.g., rice, wheat);
• trend toward increased higher fat food prepared away from the home;
• trend toward more processed foods, higher sugar consumption;
• trend toward more animal protein and fats;
• the extent and duration of breast-feeding are shorter and supplementation occurs
earlier.
These contrasts in eating patterns differentiate urban areas from rural ones to a
greater extent in low-income countries than in higher-income ones. In higher-income
countries, market penetration into rural areas is common and there are national inte-
grated food distribution systems. Nevertheless, there are also important differences in
eating patterns between urban and rural areas in higher-income countries. Foremost
are distinct differences in consumption from away-from-home sources (Popkin et al.,
2001) and greater responsiveness to information and the influences of mass media
(most likely because of the greater extent of media penetration into the denser urban
markets). Even in higher-income countries urban and suburban food and labor markets
differ greatly and, in combination with a variety of other factors related to residence,
create distinct urban dietary and nutritional status patterns.
Urbanization contributes to dietary change 123
2200
Carbohydrates
An
nu
al p
er c
ap
ita n
ati
on
al in
com
e(i
n c
on
stan
t 1
99
3 U
S$
)
Animalfats
10 000
7300
6300
4500
2700
1700
1300
1000
700
400
2000% 10% 20% 30% 40% 50% 60% 70% 80% 90%
Percentage of total calories
100%
Vegetablefats
Sw
eete
ner
s
An
imal p
rote
ins
Veg
etab
le p
rote
ins
Figure 6.4 Relationship between the proportion of energy from each food source and gross national
product per capita with the proportion of the population residing in urban areas placed at 75%,
1990 (from Drewnowski and Popkin, 1997). Food balance data from the FAOUN; GNP data from
the World Bank; regression work by UNC-CH.

There are many reasons for the profound difference in dietary intake and the subse-
quent differences found in nutritional status. Key factors responsible for this difference
include: the way improved transportation and marketing systems provide greater avail-
ability of foodstuffs during periods of seasonal shortage; more extensive penetration of
marketing activities of the processed commercial food sector; more heterogeneous
population with a wide range of dietary patterns; different occupational patterns, many
of which are characterized by reduced compatibility of the jobs with home food prepa-
ration, child and elder care; different household structures related to a wide range of
economic and social factors; and different disease and health service use patterns.
In relative terms, urban growth was modest before the industrial revolution. Since
that time, rapid urban development occurred first in the higher-income countries and
now lower-income countries are undergoing an even more rapid transformation into
urbanized societies. As is shown in the review of demographic change, the last half of
the 20th century has seen an unprecedented demographic revolution which appears to
be continuing unabated into the 21st century. Urbanization brought on by migration
and natural increase has become a dominant factor in all regions. Unlike urbanization
in the world’s higher-income countries, which is associated with major advances in
science, technology, and social organization as well as absorption of large populations,
urbanization in low-income countries has not been accompanied by the same level of
economic and cultural progress (Popkin and Bisgrove, 1988).
An important dimension of urban growth is the pattern of migration found as part
of it. Migration from rural areas either to other rural areas or to cities (and to a lesser
extent from small to larger cities) and international migration has had profound effects
on diet. The historical shifts in food staples are related to international migration in
the Americas and even earlier (for instance in the Americas with corn and potatoes
and in Ireland with potatoes). Similarly the studies of Samoans who moved to San
Francisco, Polynesians and Maori who moved to New Zealand, Japanese who moved
to the United States, and Yemenite Jews who moved to Israel all show a large change
in diet with subsequent large increases in diet-related chronic diseases (Toor et al.,
1957; Marmot et al., 1975; Worth et al., 1975; Prior and Tasman-Jones, 1981). In addi-
tion, migration within countries is felt to have similar profound effects on the diets of
the migrants and their communities of origin and destination. Most of the recent and
future changes in population distribution will occur in lower-income countries where
urban dietary patterns are quite different from those in rural areas and length of stay
in urban areas is associated with a shift to adopt this new pattern of diet.
The results presented in Figs 6.3 and 6.4 summarize the profound ways that urban-
ization has affected the structure of diet.
Income matters but there are other equallyimportant factors
Based on complex longitudinal statistical methods summarized elsewhere, the effect
of income on diet in China was examined (Guo et al., 2000). In particular, the dynamic
124 The dynamics of the dietary transition in the developing world

relationships were explored. The focus here is just on the income–food choice relation-
ships, but the full model incorporated food prices and a large array of sociodemographic
characteristics with time-varying variables, such as age, household size, educational
level, and a vector of time-invariant variables, such as sex, place of residence and
region. In the broader analysis, a study was made of how the effect of income on food
choice changed in China for consumption of wheat and wheat flour, other grain prod-
ucts, rice, pork and edible oil, among others. Here the focus is on pork and edible oil
consumption patterns.
To simplify the presentation for pork and edible oil, only the summary changes in
income elasticities are presented in Figs 6.5 and 6.6. There was a positive income
elasticity for the probability of consuming any pork in 1989. This income elasticity
increased significantly over the 1989–93 period with the increase being somewhat
larger among lower-income groups (Fig. 6.5a). The income elasticity for the quantity
of pork consumed (conditional on positive consumption) became more positive
among all income groups, but higher-income groups experienced the greatest
increases in elasticities (Fig. 6.5b). These shifts are statistically significant for all
per capita incomes above the first quartile. For edible oil, the income elasticity for
the probability of consuming this product is quite small, and there has not been a
significant change over time (Fig. 6.6a). The income elasticity for the amount of oil
consumed (given positive consumption), surprisingly, was negative in 1989, but it
was insignificantly different from zero over almost the entire income range. This
income elasticity rose significantly by 1993, and it was positive at all income values
and significantly different from zero for all but the top few percent of the income
distribution.
During the 1989–93 time span higher-fat foods became much more responsive to
income levels. Pork, edible oils, and eggs had significant increases in their income
Income matters but there are other equally important factors 125
0.2
0
�0.24 5 6 7 8
Log of per capita household income
Ch
an
ge in
in
com
e el
ast
icit
y 95% Confidence interval
95% Confidence interval
(a)
0.3
0
�0.34 5 6 7 8
Log of per capita household income
Ch
an
ge in
in
com
e el
ast
icit
y
95% Confidence interval
95% Confidence interval
(b)
Figure 6.5 Changes in income elasticities pork consumption among adults aged 20–45 in China from
1989 to 1993. (a) Change in income elasticity for the probability of consuming any pork; (b) Change in
income elasticity for the amount of pork consumers consume. From Guo et al. (2000).

elasticities. The quantity of fat in the diets increased significantly and now appears to
increase much more rapidly with increases in incomes.
Instant access to modern mass media mayexplain partially these changes
One of the major shifts of this past few decades is in the area of communications.
Predominantly through access to modern television, there has been a major shift in how
persons in developing countries spend their leisure time. Television ownership has
increased rapidly in the world. Elsewhere we have shown trends worldwide. It is most
useful to look at the proportion of households that own television sets in a country. Again
the CHNS data are used to reflect the types of changes one is setting. Figure 6.7 shows
for households from low, middle and upper income tertiles the proportion that owned
TVs during the 1989–97 period. Overall in China TV ownership increased from 64.7%
of households in 1989 to 88.5% in 1997. It is noteworthy that in China, not only was TV
viewing shifting, but also the types of programs and access to western influences were
shifting. In the 1980s, cable systems in China did not provide outside programming but
by 1997 many provinces provided access to China Star, a system from Hong Kong that
relies heavily on US and British programming and provides modern TV advertising.
Discussion
There is no doubt that dietary changes around the world are rapid and appear to be
accelerating. There is limited evidence for this acceleration. The Chinese case study
126 The dynamics of the dietary transition in the developing world
0.2
0
�0.24 5 6 7 8
Log of per capita household income
Ch
an
ge in
in
com
e el
ast
icit
y
95% Confidence interval
95% Confidence interval
(a)
0.3
0
�0.34 5 6 7 8
Log of per capita household income
Ch
an
ge in
in
com
e el
ast
icit
y
95% Confidence interval
95% Confidence interval
(b)
Figure 6.6 Changes in income elasticities for edible oils consumption among adults aged 20–45 years in
China from 1989 to 1993. (a) Change in income elasticity for the probability of consuming any edible oil;
(b) Change in income elasticity for the amount of edible oils consumers consume. From Guo et al. (2000).

provides evidence for one country. The food balance data that show a shift in the way
lower-income countries have changed their consumption patterns between the 1960s
and 1990s is another.
What is most important is that the dietary changes that appear to be occurring are
related to an increased energy density of the diet and reduced intake of many of the
more important nutrients and food constituents such as fiber. Although food diversity
has increased and malnutrition is receding as a threat in many countries, these food
shifts point toward the potential for a rapid increase in diet-related noncommunicable
diseases in the developing world.
References
Cavalli-Sforza, L.L. (1981). In “Food, Nutrition and Evolution: Food as an Environmental
Factor in the Genesis of Human Variability” (D.N. Walcher, and N. Kretchmer, eds.),
pp. 1–7. Masson, New York.
Cordain, L.J., Miller, B., Eaton, S.B., Mann, N., Holt, S.H.A., and Speth, J.D. (2000).
Am. J. Clin. Nutr. 71, 682–692.
Drewnowski, A., and Popkin, B.M. (1997). The nutrition transition: new trends in the
global diet. Nutr. Rev. 55, 31–43.
Eaton, S.B., and Konner, M. (1985). N. Engl. J. Med. 312, 283–289.
Eaton, S.B., Shostak, M., and Konner, M. (1988). “The Paleolithic Prescription: A
Program of Diet and Exercise and a Design for Living”. Harper and Row, New York.
Food and Agriculture Organization of the United Nations (FAOUN) (1970). “Income
Effect on the Structure of Diet. Provisional Indicative World Plan for Agricultural
Development”, Vol. 2, pp. 500–505. Rome, Italy.
References 127
100
80
60
46.5
67.5
80.1
66.3
80.1
92.5
78.0
90.995.6
40
20
0
1989 1993 1997
% o
f h
ou
seh
old
s w
ith
TV
s
Low income Medium income High income
Figure 6.7 TV ownership in China, 1989–97 (% of Chinese households who own TV).

Gordon, K.D. (1987). In “Nutritional Anthropology” (F.E. Johnson, ed.). Liss, New York.
Guo, X., Mroz, T.A., Popkin, B.M., and Zhai, F. (2000). Econ. Dev. Cultural Change
48, 737–760.
Harpending, H. (1976). In “Kalahari Hunter-gatherers: Studies of the !Kung San and
Their Neighbors” (R.B. Lee, and I. DeVore, eds.). Harvard University Press,
Cambridge, MA.
Harris, D.R. (1980). In “Food, Nutrition and Evolution: Food as an Environmental Factor
in the Genesis of Human Variability” (D.N. Walcher, and N. Kretchmer, eds.).
Masson, Paris.
Hughes, R.E., and Jones, E. (1979). BMJ 1, 1145.
Keyfitz, N. (1985). Popul. Dev. Rev. 11, 695–719.
Manton, K.G., and Soldo, B.J. (1985). Health Society 63, 206–285.
Marmot, M.G., Syme, S.L., Kagan, A., Hiroo, K., and Rhoads, G. (1975). Am. J. Epidemiol.
102, 514–525.
Milio, N. (1990). “Nutrition Policy for Food-rich Countries: A Strategic Analysis”. The
Johns Hopkins University Press, Baltimore.
Perisse, J., Sizaret, F., and Francois, P. (1969). FAO Nutr. Newsl. 7, 1–9.
Popkin, B.M., and Bisgrove, E.Z. (1988). Food Nutr. Bull. 10, 3–23.
Popkin, B.M., Haines, P.S., and Reidy, K.C. (1989). Am. J. Clin. Nutr. 49, 1307–1319.
Popkin, B.M., Siega-Riz, A.M., Haines, P.S., and Jahns, L. (2001). Prev. Med. 32, 245–254.
Popkin, B.M., Lu, B., and Zhai, F. (2002). Publ. Health Nutr.
Prior, I., and Tasman-Jones, C. (1981). In “Western Diseases: Their Emergence and
Prevention” (H.C. Trowell, and D.P. Burkett, eds.). Harvard University Press,
Cambridge, MA.
Rogers, R.G., and Hackenberg, R. (1987). Soc. Biol. 34, 234–243.
Schoeninger, M. (1982). Am. J. Phys. Anthropol. 58, 37–52.
Toor, M., Katchalsky, A., Agmon, J., and Allalouf, D. (1957). Lancet i, 1270–1273.
Trowell, H.C. (1981). In “Western Diseases: Their Emergence and Prevention” (H.C.
Trowell, and D.P. Burkitt, eds.). Harvard University Press, Cambridge, MA.
Truswell, A.S. (1977). “Health and Diseases in Tribal Societies”, Ciba Foundation
Symposium 149. Elsevier, Amsterdam.
Truswell, A.S. (1979). In “Human Nutrition and Dietetics” (S. Davidson, R. Passmore,
J.F. Brock, and A.S. Truswell, eds.), 7th edn. Churchill-Livingstone, Edinburgh.
Truswell, A.S., and Hansen, J.D.L. (1976). In “Kalahari Hunter-gatherers: Studies of the
!Kung San and Their Neighbors” (R.B. Lee, and I. DeVore, eds.). Harvard University
Press, Cambridge, MA.
Vargas, L.A. (1990). In “Disease in Populations in Transition” (A.C. Swedlund, and G.J.
Armelagos, eds.). Greenwood, Westport, CT.
Worth, R.M., Kato, H., Rhoads, G.G., Kagas, K., and Syme, S.L. (1975). Am. J. Epidemiol.
102, 481–490.
Yudkin, J. (1969). In “The Domestication and Exploitation of Plants and Animals”
(P.J. Ucko, and G.W. Dimbleby, eds.). Aldine, Chicago.
128 The dynamics of the dietary transition in the developing world

The Nutrition TransitionISBN: 0-12-153654-8
Copyright © 2002 Elsevier Science LtdAll rights of reproduction in any form reserved
Early nutritionconditions and laterrisk of disease
Linda S. Adair
7
Introduction
Increased attention has been paid, in the past decade, to the hypothesis that chronic
diseases in adulthood have origins in the fetal and early postnatal period. The fetal
programming hypothesis holds that, in response to undernutrition during critical peri-
ods of growth and development, the structure and function of organs and tissues are
“programmed”, or permanently altered in ways that predispose individuals to chronic
disease in later life, most notably diabetes and cardiovascular disease (CVD). The pre-
disposition may take the form of increased susceptibility to chronic disease risk fac-
tors, such as atherogenic diets, excess energy intake and reduced physical activity. If
this is the case, the programming hypothesis may be particularly relevant in the con-
text of the nutrition transition in developing countries. Rates of fetal growth retarda-
tion remain relatively high in these developing countries, while at the same time, rapid
socioeconomic changes are accompanied by an increase in sedentary activity and a
transition to higher energy density diets. Thus, today’s older children and adults in
developing countries are more likely than those in earlier decades to have been small
at birth, but subsequently exposed to more environmental and behavioral risk factors
for chronic disease during their childhood and adult years.
Evidence to support the fetal programming hypothesis has accumulated at a rapid
rate over the past decade. Hundreds of published papers have assessed the relationship
of birth weight to blood pressure, type 2 diabetes, glucose and insulin dynamics, serum
lipids, and cardiovascular disease, among others. The vast majority of studies have
been conducted in the US and Western Europe, where more detailed hospital and
research records allow scientists to identify indicators of poor maternal or fetal nutri-
tion. Relatively few studies have been conducted in developing countries, but this is

changing rapidly, with a substantial increase in papers published since 1995. This
chapter will focus on the relationship of pre- and early postnatal nutrition to the
development of chronic disease in developing countries. Research on populations
undergoing changes in diet, activity, and other chronic disease risk factors may pro-
vide particularly valuable insights into the role of early nutrition in the rapid spread
of chronic diseases.
Rates of obesity and noncommunicable disease are increasing throughout the
developing world (see Chapters 9 and 10). For example, in India, the dramatic
increases in coronary heart disease (CHD) and diabetes have been termed an epi-
demic. There has been a fourfold increase in prevalence of type 2 diabetes, from less
than 3% in the 1970s to about 12% in the 1990s (Ramachandran et al., 1997), and a
fivefold increase in CHD in the same time period (Gupta and Gupta, 1996). It is pro-
jected that CHD will be the leading cause of mortality in India by 2010. The World
Health Organization (WHO) estimates that if current trends continue, 60% of deaths
in Africa in 2030 will be caused by noncommunicable diseases, compared to 41% in
1990. Currently, close to 20 million Africans suffer from hypertension, and diabetes
rates range as high as 20% in some urban populations of Africa.
At the same time, poor maternal nutrition, infections, and other prenatal stresses
continue to produce poor birth outcomes. DeOnis et al. (1998) estimated the regional
incidence of low birth weight related to growth restriction, rather than prematurity
(intrauterine growth retarded low birth weight, IUGR-LBW, is defined as full term
but weighing less than 2500 g at birth). They estimated that at least 13.7 million
infants are born annually with IUGR-LBW. This number represents 11% of all new-
borns in developing countries. Rates of IUGR-LBW are highest in Asia, ranging to
nearly 40% in Bangladesh. Rates in excess of 15% were estimated in Africa for Zaire,
Angola, Guinea and The Gambia. Small size for gestational age (�10th percentile of
birth weight for gestational age) is estimated to occur in nearly 30 million newborns
per year, with 75% of those affected living in Asia. These children, who are likely to
have suffered from inadequate intrauterine nutrition, may be at increased risk of
developing CVD, diabetes, and other noncommunicable diseases as adults.
Epidemiologic studies of fetal programming indeveloping countries
Much of the early programming literature focused on samples of European or North
American adults that included individuals already diagnosed with chronic disease.
Many of these studies were limited by a lack of detailed or accurate information on
maternal nutrition during pregnancy, and birth outcomes other than birth weight.
Birth outcome information was typically obtained from hospital records or existing
research studies. Later, more sophisticated prospective studies, as well as retrospec-
tive studies with more detailed maternal and birth outcome data were conducted
to take us “beyond birth weight.” There is now an extensive literature on human
130 Early nutrition conditions and later risk of disease

epidemiologic studies testing the programming hypothesis, but the majority of stud-
ies are still conducted in developed countries.
In developing countries, a shortage of good population-based, maternal nutrition and
birth outcome data that can be associated with long-term, chronic disease risk factors
or outcomes in adults, limits the ability to test the programming hypothesis. A small
number of retrospective studies have used hospital records, but in developing coun-
tries, historically, hospital births may over-represent higher socioeconomic status women
or those with pregnancy complications. Examples include the studies of adults born
in the Holdsworth Memorial Hospital in Mysore, India (Kumaran and Fall, 2001), a
study of adults born in the Peking Union Medical College (Mi et al., 2000) and a study
of children born in the King Edward Memorial Hospital in Pune, India (Fall et al.,
1995; Yajnik et al., 1995).
An increased appreciation of the potential contribution of early nutrition to the
development of chronic disease risk, and of the importance of studying antecedents of
disease, has resulted in more studies on children and young adults. Some studies are
adding research on fetal programming to ongoing prospective studies of child growth.
For example, the Birth to Ten (BTT) study follows a birth cohort of predominantly
black South Africa children born in 1990 (Levitt et al., 1999; Crowther et al., 2000).
The Cebu Longitudinal Health and Nutrition Survey (CLHNS) follows a cohort of
Filipino youths born in 1983–84 (Adair et al., 2001). The follow-up of the Guatemala
study examines adults who, as children, received nutrition supplementation (Stein
et al., 2001). Recently, several new studies, such as the Pune Maternal Nutrition
Study, were designed and implemented specifically to test the programming hypoth-
esis (Fall et al., 1999). Most of the studies relate to components of the insulin resistance
syndrome and cardiovascular disease, although there are also several studies on pro-
gramming of the immune system (Moore et al., 1997, 1999; McDade et al., 2001a,b).
Cardiovascular disease, blood pressure, and lipids
Studies among adults
Studies in Mysore, India were motivated by the observation of dramatic increases in
CVD in Indian adults in the absence of high rates of typical CVD risk factors such as
high blood pressure, obesity, high dietary saturated fat intakes and smoking
(Kumaran and Fall, 2001). Researchers took advantage of hospital birth records,
maintained since 1934, and recruited a sample of 517 individuals (ages 38–60) who
could be matched to their birth records. CVD prevalence was higher among men and
women who had underweight mothers, and who themselves were shorter, lighter, and
had smaller head circumference at birth. Systolic blood pressure tended to be higher
among those who were longer length at birth (Stein et al., 1996). Kumaran et al.
(2000) found no relationship of blood pressure, arterial compliance or left ventricular
mass to small size at birth in a follow-up study of the same sample designed to
Cardiovascular disease, blood pressure, and lipids 131

examine the basis of elevated CVD risk in more detail. These results led to the
authors’ suggestion that CVD in Indian adults is more related to the insulin resistance
syndrome.
A lack of association of small size at birth with blood pressure in adulthood was
also found among Guatemalan young adults who had been participants in a nutrition
supplementation trial in infancy and childhood. Stein et al. (2001) found no relation-
ship of birth weight to blood pressure in young adult women, but a positive associa-
tion of birth weight and weight at one year of age to blood pressure in men. Birth
weight was positively correlated with adult body mass index (BMI) and blood pres-
sure in a sample of 317 Australian Aboriginal adults (ages 20–38) with a low birth
weight prevalence of 35% (Hoy et al., 1999).
Results from a study of 137 young adult, urban, South Africans are more consistent
with the inverse association of birth weight to blood pressure found in European and
US populations. Levitt et al. (2000) compared adults who had been underweight
(�10th percentile of birth weight for gestational age) or normal weight (25th–75th
percentile). Those who were underweight for gestational age were shorter, had lower
BMI, but had higher systolic and diastolic blood pressure. Similarly, in a cohort of 122
Hong Kong adults (30 years old), Cheung et al. (2000) found that systolic blood pressure
was inversely related to birth weight and length, but positively related to increases in
ponderal index during infancy. They also found diastolic blood pressure was inversely
related to birth length only. Mi et al. (2000) studied 627 adults (41–47 years of age)
who were born at the Peking Union Medical College. After adjusting for sex and BMI,
each kilogram increase in birth weight was associated with a 2.9 mm decrease in systolic
and a 1.7 mm decrease in diastolic blood pressure in men and women.
In the absence of birth outcome data, several studies used adult height as a proxy
for fetal growth retardation. In a study of adult Nigerian civil servants, Olatunbosum
and Bella (2000) found no relationship of current height with blood pressure. Sichieri
et al. (2000) found a U-shaped relationship among Brazilian adults, with the lowest
systolic blood pressure observed in the 3rd quartile of height. In both of these stud-
ies, it is assumed that short stature represents early growth retardation, but there are
no data to identify the timing (pre- or postnatal) of growth retardation.
Many studies in Europe and the US have found that the relationship of birth weight
to blood pressure is strongest among those who were small at birth, but relatively
large at the time of measurement (Law and Schiell, 1996; Huxley et al., 2000). This
pattern is not so clearly evident in the studies cited above.
Several other risk factors for CVD have been studied. Stein et al. (1996) found no
relationship between size at birth and serum lipids, plasma fibrinogen or factor VII in
Indian adults. Kolacek et al. (1993) examined 192 young adult Croatians and found
total cholesterol and low density lipoprotein cholesterol (LDL-C) were highest
among males who were the leanest in the first 3 years of life, but the fattest as adults.
However, there was no significant association of birth weight to lipids in adulthood.
Adult males who were shorter as adults, but of lower socioeconomic status (SES) dur-
ing childhood had the highest total cholesterol and LDL-C levels. In Chinese adults,
Mi et al. (2000) found an inverse relationship of birth weight to serum triglycerides,
total cholesterol and LDL-C.
132 Early nutrition conditions and later risk of disease

Hoy et al. (1999) found that birth weight was inversely correlated with a marker of
renal disease (urine albumin/creatinine ratio) in Australian Aboriginal adults, and low
birth weight explained 27% of the population-based prevalence of overt albuminuria.
Studies of precursors of disease among children andadolescents
Biological changes which foreshadow CVD are already present in childhood (see
Misra, 2000 for a review). Several large studies in the US have documented disease
risk profiles in children. Similarly, a pattern of elevated blood pressure and altered
lipid profiles has been observed in young children in South Africa (Steyn et al.,
2000). Given the tendency for tracking of risk factors throughout life, it is important
to identify determinants of cardiovascular disease risk factors, including elevated
blood pressure and altered serum lipid profiles, early in childhood.
Based on large-scale systematic reviews of studies throughout the world, investiga-
tors concluded that a relationship of size at birth to blood pressure later in life is less
consistently found or is weaker in children and adolescents than in adults (Law and
Schiell, 1996; Leon and Koupilova, 1999; Huxley et al., 2000). The literature from
developing countries shows inconsistencies in all age groups.
There is typically a strong relationship of height and weight to blood pressure in
children and adolescents. In fact, US reference data for blood pressure in children and
adolescents are age-, sex- and height-specific. Thus, it is important to take current
body size into account when assessing the relationship of birth size to later outcomes.
However, this complicates the interpretation of results, since children’s current size
may also be related to their size at birth. Lucas et al. (1999) recommended that
researchers examine crude effects of birth size, birth size after accounting for current
size, and birth size interacted with current size as a means of understanding the rela-
tive importance of size at birth versus postnatal growth.
The relation of birth size to blood pressure in children and adolescents is typically
stronger, or in some cases, observed only after accounting for current size. Results
have been interpreted as indicating that size at birth potentiates the effects of current
size or that it is the combined effect of small size at birth with rapid postnatal growth
that is important. Size at birth, since it reflects a variety of prenatal physiological adap-
tations, may influence susceptibility or response to subsequent risk factors such as diet
and sedentary lifestyle. Although continuing growth retardation into adulthood remains
in many poor communities in developing countries, there are substantial subgroups of
children who were growth restricted at birth, but who grew more rapidly in the post-
natal period. In some cases, there is more compensation in weight than in linear
growth, resulting in children who are relatively heavy but short in stature (Martorell
et al., 1987; Popkin et al., 1996). This combination of being small at birth, but relatively
heavy or fat in childhood is the pattern most often associated with elevated blood
pressure, altered serum lipid profiles and altered glucose and insulin metabolism.
Law et al. (2001) conducted a multicountry study of blood pressure in young
children from China, Chile, Guatemala, Nigeria, and Sweden. They found a strong
Cardiovascular disease, blood pressure, and lipids 133

association of systolic blood pressure with current weight in all samples, and after
accounting for current size, an inverse relationship of systolic blood pressure to some
aspect of size at birth except in Nigerian children was found. A relationship with birth
weight was only found in Guatemalan and Chilean children, whereas the significant
birth measures were head and chest circumference in China, and ponderal index in
Sweden. This points to the importance of assessing other indicators of fetal growth.
However, such indicators are often lacking because they are not routinely collected.
The overall picture that emerges from this comparative study is that elevated systolic
blood pressure in childhood relates most strongly to proportionate growth retardation
that is most often the result of chronic undernutrition throughout gestation. Based on
this study and earlier reviews, Law et al. (2001) suggested that a relation between size
at birth and blood pressure in childhood is less consistent among Africans or those
of African descent. However, this may reflect an imbalance in the number of studies
conducted among blacks compared to other race/ethnic groups.
Among 1- to 9-year-old Gambian children, Margetts et al. (1991) found no associ-
ation of birth weight to blood pressure. In contrast, Levitt et al. (1999) found a
significant inverse relation between blood pressure and birth weight among 5-year-old
children who were participants in the BTT Study, and Woelk et al. (1998) found a
similar relationship among children in Harare, Zimbabwe. Several investigators have
studied children of African descent living in Jamaica. Forrester et al. (1996) found an
inverse association of birth weight to blood pressure in a sample of 1610 Jamaican
school children. In Jamaican children (1–4 years of age), Thame et al. (2000) found
an inverse relationship of systolic blood pressure to birth weight. Blood pressure was
also found to be negatively related to placental volume at 17 weeks, and fetal abdomen
circumference at 20 weeks. Maternal nutritional status during pregnancy was related
to infant birth weight, but not to blood pressure.
Gaskin et al. (2000) compared 120 children (7–8 years old) who were stunted
between 9 and 24 months of age to 220 nonstunted children. Although stunted chil-
dren remained shorter and thinner at age 7–8 years and had higher systolic blood
pressure, their birth weights did not significantly predict blood pressure. In the same
study population assessed at ages 11–12 years, Walker et al. (2001) found that birth
weight significantly predicted systolic blood pressure only after adjusting for current
weight. The effects of current weight were stronger among children with a history of
stunting, leading to the authors’ conclusion that early postnatal growth retardation
potentiates the relation of current weight to blood pressure.
Studies in other parts of the world are also inconsistent. Bergel et al. (2000) mea-
sured systolic blood pressure in a sample of 518 children (ages 5–9) born in a clinic in
Argentina. The mothers’ hemoglobin during pregnancy was positively associated with
blood pressure, but no other measure of maternal nutrition predicted the children’s
blood pressure. A weak inverse association of birth weight with systolic blood pres-
sure was found only among children in the highest quartile of current BMI.
In a study of a large cohort of children born in 1983–84 in the Philippines longitu-
dinal data from the prenatal period to the present allowed for detailed analysis of rela-
tionships of maternal nutrition during pregnancy and birth outcomes to numerous
aspects of current health status in about 2000 adolescents. In addition, fasting
134 Early nutrition conditions and later risk of disease

glucose, insulin, and serum lipids were measured on a subset of about 600 study par-
ticipants. The subset was selected to over-represent those with IUGR. Among the full
sample of adolescents, a significant inverse relationship of birth weight to adolescent
systolic blood pressure was found only among males, and only after controlling for
current body size (Adair et al., 2001). The pattern typically seen, that is, of highest
blood pressure among those relatively small at birth, but relatively large at the time of
measurement is well illustrated in the Filipino sample of nearly 1000 males (ages
15–16) (Fig. 7.1). Our studies also controlled for other factors which may affect cur-
rent blood pressure, including maturation status, physical activity, smoking, and diet.
Overall, the strongest determinants of adolescent blood pressure were measures of
current size, including height and BMI.
Overall, the magnitude of significant effects on blood pressure across all of the
studies range from about 1.4 mm Hg per kg of birth weight in 1–4-year-old Jamaican
children (Thame et al., 2000) to 4.9 mm Hg per kg of birth weight in Chilean children
(Law et al., 2001). Although these mean changes may seem small, and of questionable
biological significance, it is important to note that there may be greater impact when
considering the occurrence of high blood pressure. For example, despite the relatively
weak linear association of birth weight to adolescent male blood pressure in the
Philippines study, we found a strong decline in the likelihood of having relatively high
systolic and diastolic blood pressure with each kilogram increase in birth weight.
Given the changes in blood pressure associated with age and height in adolescents,
high blood pressure was defined as systolic and diastolic values falling in the top 10%
of the age-, sex- and height-specific distribution of the sample of about 2000 partici-
pants. The predicted probability of high blood pressure decreases from about 23%, if
birth weight is 2 kg, to about 6%, if birth weight is 4 kg (controlling for birth length,
current age, height, BMI, maturation status, diet, and SES) (Fig. 7.2).
Cardiovascular disease, blood pressure, and lipids 135
BMI group at birth
Low Middle High
Sys
tolic
blo
od
pre
ssu
re (
mm
Hg)
112
110
108
106
104
102
100
BMI group at age 14–15 High Middle Low
Figure 7.1 Mean systolic blood pressure of Cebu, Philippines adolescent males, in groups defined by
thirds of BMI at birth and at age 14–15 years.

Very few studies in developing country studies have probed the “black box”
represented by size at birth. It is widely assumed that prenatal nutrition is the most
important programming stimulus (Harding, 2001). However, the few studies that
include measures of maternal nutritional stress or nutritional status during pregnancy
provide mixed support for the hypothesis that maternal nutrition is key to programming
in humans.
In our study of Filipino adolescents (Adair et al., 2001), we found a significant
inverse relationship of mothers’ triceps skinfold thickness during pregnancy to systolic
blood pressure among male adolescents, and to diastolic blood pressure in males and
females. Systolic blood pressure among males was significantly inversely related to
mothers’ percentage of energy from protein. Among females, systolic and diastolic
blood pressure were inversely related to mothers’ percentage of calories from fat.
These relationships were not confounded by adolescents’ diet, maturation status,
physical activity, or socioeconomic status.
There are fewer studies related to other CVD risk factors in children. Relatively lit-
tle information is available on the relationship of maternal nutrition during pregnancy
or birth outcomes on serum lipids in children in any setting, much less in developing
countries. Forrester et al. (1996) found no clear or strong relationships of size at birth
to serum lipids in Jamaica. They did observe an inverse association of total choles-
terol with crown–heel length in prepubertal children. In a study of adolescents in
Hungary, Antal et al. (1998) found lower LDL-C and higher ApoA1 in boys who had
been low birth weight. Among Indian children, Bavdekar et al. (1999) reported an
inverse relationship of birth weight to LDL-C but no relationship with plasma trigly-
cerides or high density lipoprotein cholesterol (HDL-C).
136 Early nutrition conditions and later risk of disease
0.25
0.15
0.2
0.1
0
2 3 42.5 3.5
0.05
Birth weight (kg)
Pre
dic
ted
pro
bab
ility
of
hig
h B
P
Figure 7.2 Predicted probability of elevated blood pressure in Cebu, Philippines adolescent males,
according to birth weight. Simulation based on birth weight coefficient from logistic regression model,
outcome � high systolic and diastolic BP, controlling for birth length, current age, height, BMI,
maturation status, energy and fat intake, socioeconomic status.

Diabetes and its precursors
Adults
Rates of type 2 diabetes are increasing dramatically in Asian, Latin American, and
African populations. Of particular note is the suggestion that in Asian populations,
abnormalities of glucose metabolism and type 2 diabetes occur at lower levels of BMI
than is typically observed in Western populations (Ko et al., 1999; International
Diabetes Institute, 2000). Compared to Caucasians, Asians have increased abdominal
or central adiposity at similar levels of BMI (Deurenberg et al., 1998, 1999).
Abdominal obesity is a well-known risk factor for insulin resistance and CVD. The
observation of high rates of CVD in association with the insulin resistance syndrome
(McKeigue et al., 1991, 1993) has led to a series of studies in India, designed to
explain the unexpectedly high rates of diabetes in nonobese individuals. Yajnik
(2001a) has described the clinical picture of diabetes in India: type 2 diabetics are
relatively hyperinsulinemic and insulin resistant, with elevated triglycerides and ele-
vated blood pressure. This pattern is associated with a high waist–hip ratio, even at
lower levels of BMI.
The Mysore studies of Indian adults described above, with respect to blood pres-
sure, also assessed glucose and insulin dynamics. In response to an oral glucose
tolerance test (OGTT), 30-minute insulin values were significantly lower among par-
ticipants with a higher birth weight and ponderal index. Type 2 diabetes, which
occurred in 15% of the sample, was more prevalent in subjects who were short at birth
with a relatively high ponderal index. Insulin resistance was predicted by birth weight
in men, but not women (Fall et al., 1998).
Based on another study of Indian young adults, Raghupathy et al. (2001) presented
preliminary data on the relation of maternal nutrition and fetal growth to CVD risk
factors. They found the risk of diabetes or glucose intolerance was much higher, at the
same level of BMI, in those who weighed less versus those who weighed more than
3 kg at birth. Mi et al. (2000) studied 41–47-year-old Chinese men and women born
in Beijing. Fasting and 2-hour plasma glucose levels (after an oral glucose load), as
well as fasting and 2-hour insulin levels were inversely related to birth weight after
adjusting for sex and current BMI. In addition, 2-hour plasma glucose and insulin
levels were inversely associated with maternal BMI at 38 weeks of pregnancy, with
and without simultaneously adjusting for birth weight.
The importance of abdominal adiposity as a mediator of the relationship of birth
weight to insulin sensitivity in Asians was questioned in a study of Korean young
adults. Choi et al. (2000) found an inverse association of birth weight and insulin
sensitivity, but no relationship of birth weight to measures of abdominal obesity in
healthy young men.
Levitt et al. (2000) undertook a study to elucidate biological mechanisms that might
explain the observed relationship of impaired glucose tolerance and elevated blood
pressure to low birth weight, in nonobese young South African adults. They compared
young adults whose birth weights were below the 10th to those between the 25th and
75th percentile of birth weight for gestational age. Those who were underweight for
Diabetes and its precursors 137

gestational age were shorter and had lower BMI as adults, but higher fasting glucose.
Despite an absence of differences in mean glucose-stimulated insulin levels or home-
ostasis model insulin resistance (HOMA) between the groups, a higher proportion of
those who had been underweight at birth had impaired glucose intolerance. Further-
more, they had higher plasma cortisol levels and a greater cortisol response to adreno-
corticotropic hormone (ACTH) stimulation, leading the authors to suggest that the
hypothalamic-pituitary-adrenal (HPA) axis is a target for early programming. It is
notable that in this young adult population, as well as the populations studied in India,
alterations in insulin sensitivity and glucose tolerance occur in the absence of obesity.
Children
Crowther et al. (2000) assessed glucose and insulin dynamics in a sample of 152 chil-
dren who were part of the South Africa BTT study. Seven-year-old children were cat-
egorized as above or below the sample median weight at birth and at age seven. Those
who were small at both time periods had low pancreatic beta-cell activity. In contrast,
those who were small at birth, but relatively large at age seven, had relatively high
beta cell activity. The authors suggested that poor fetal and neonatal growth gives rise
to low beta-cell numbers but increased efficiency of conversion of proinsulin into
insulin. Despite this adaptation, they still had low insulin concentrations, and ulti-
mately higher blood glucose concentrations and poorer glucose tolerance. Poor fetal
growth followed by rapid postnatal growth resulted in beta cell dysfunction and
insulin resistance. Both groups have elevated risk of type 2 diabetes later in life, par-
ticularly if they become obese.
A series of informative studies focus on urban children in India. In the first,
reported by Yajnik et al. (1995) and Fall et al. (1995), subjects were 4-year-old chil-
dren born in the King Edward Memorial Hospital. All were full term and weighed
more than 2000 g at birth. After accounting for current weight and skinfold thickness,
glucose and insulin levels in response to a glucose load were inversely associated
with birth weight. Fasting insulin-like growth factor (IGF)-1 levels were also
inversely associated with birth weight.
Bavdekar et al. (1999) tracked these children, as well as an additional sample at
age eight, in order to evaluate the relative importance of pre- and postnatal growth. In
a sample of 477 children (190 of whom had been in the earlier study), they found that
higher birth weight was associated with being taller, heavier, and having thicker skin-
folds at age eight. However, they found a significant clustering of insulin resistance
syndrome variables with low birth weight. Birth weight tended to be inversely related
to fasting insulin, and 30-minute plasma glucose and insulin levels, but not to fasting
or 120-minute glucose. As expected, a higher fat mass was associated with insulin
resistance. The highest level of insulin resistance was found among relatively tall
children with short parents.
A new, prospective study of the long-term effects of maternal nutrition during
pregnancy has been initiated in India by Yajnik and colleagues. The Pune Maternal
Nutrition Study is prospectively tracking live births from six villages near Pune. In a
sample of 770 live births, 28% of infants were low birth weight. The Indian babies,
138 Early nutrition conditions and later risk of disease

despite their small size and relative thinness compared to British babies, had similar
subscapular skinfolds. Their low weight was attributable to relatively less lean tissue,
a finding that has important implications for later insulin resistance. Furthermore, the
fattest babies had mothers who were relatively short and fat.
In a review of the “insulin resistance epidemic” in India, Yajnik (2001a,b) high-
lighted the importance of these studies. Cardiovascular risk, including elevated blood
pressure, altered serum lipids, and insulin resistance, is exaggerated among children
who are born small but have more rapid postnatal growth. Yajnik has termed this the
energy adaptation maladaptation syndrome (ENAMAS). He also notes that, as in the
studies of Indian adults, altered disease risk profiles occur in children who are not
obese, despite their more rapid postnatal growth.
The role of overweight and obesity
The epidemiologic evidence summarized above points to the importance of being
small at birth, and relatively large later, as a risk factor for CVD and diabetes. This
raises an important question about the role of body size or fatness as a mediator of the
relationship between early growth and later health outcomes. If intrauterine nutri-
tional stress results in enhanced metabolic efficiency (or a thrifty phenotype), indi-
viduals with a history of poor prenatal nutrition may grow faster and/or have a greater
propensity to store excess energy as fat when they subsequently encounter improved
nutritional circumstances. Based on their work among poor Brazilian children,
Hoffman et al. (2000) proposed that fat oxidation is impaired in stunted children.
Furthermore, they suggested that stunted children may opportunistically overeat,
which in turn, may contribute to their higher risk of overweight.
Whitaker and Dietz (1998), and more recently Martorell et al. (2001) reviewed the
role of prenatal nutrition as a determinant of later adiposity. In general, there is more
substantial literature linking the risk of high birth weight or macrosomia to later risk
of obesity. For example, Hediger et al. (1998) found, in a large US national sample,
that large size for gestational age at birth was associated with persistent fatness in
childhood. In contrast, children who were small for gestational age had persistent
deficits in muscularity, but not in fatness. Evidence accumulating from developing
countries suggests a relationship of early growth restriction, manifested as lower birth
weight or stunting in early childhood, to later adiposity in children than in adults. For
example, Popkin et al. (1996) found a significant association of stunting with overweight
among children in China, Brazil, Russia, and South Africa. In contrast, Martorell et al.
(1998) found that IUGR was related to shorter stature but not to percentage body fat in
17-year-old Guatemalan adolescents. However, in a slightly larger sample of Guatemalan
adults, researchers found a positive association of birth weight to percentage body fat
(Schroeder et al., 1999). After controlling for overall fatness, adults who had been
severely stunted as children had a higher waist-to-hip ratio, suggestive of increased
abdominal adiposity. Similarly, Bavdekar et al. (1999) found that poor intrauterine
growth predicted higher central adiposity in 8-year-old Indian children.
The role of overweight and obesity 139

Increased body fat, particularly central adiposity, is a well-established risk factor
for type 2 diabetes and CVD. An important question in the context of the program-
ming hypothesis is whether fatness carries the same risk irrespective of the nutritional
history of the individual. Studies of the interaction of size at birth with current adi-
posity or BMI suggest that at the same level of adiposity, risk is worsened in those
who were small at birth. This, in turn, suggests the importance of additional pathways
that are independent of current fatness. There is an extensive literature, based largely
on animal models, on the biological mechanisms that may explain the relationship of
small size at birth to later risk of noncommunicable diseases (see Waterland and
Garza, 1999 and Harding, 2001 for reviews).
One basic theme relates to the “thrifty phenotype”, or the proposed alterations in
metabolic efficiency that preserve fetal brain growth at the expense of other organs
and tissues. Eriksson et al. (2000) hypothesize that restricted growth permanently
reduces cell numbers in vital organs, resulting in impaired function. When compen-
satory growth occurs in childhood, there is excessive metabolic demand on limited
cell mass, resulting in elevated disease risk. Studies in India (Yajnik, 2001a,b), point
to the importance of long-term deficits in lean body mass, which affect metabolic rate
as well as insulin resistance. Gale et al. (2001) found long-term associations between
birth weight and adult bone and lean mass, but only weak associations with fat.
Further research which focuses on specific aspects of body composition and fat pat-
terning is needed, particularly given the observations that signs of disease are
observed in the absence of obesity.
Other lines of research suggest that disease risk is associated with early program-
ming of the HPA axis, resulting in heightened responsivity to stress (see Clark, 1998
for a review). Few studies have directly tested this hypothesis in developing countries.
However, Levitt et al. (2000) found that plasma cortisol levels were higher, and
response to ACTH stimulation was greater in adults who were underweight for gesta-
tional age at birth, suggesting that this a promising line of research.
Discussion
The link between fetal and early infant development and later risk of chronic disease is
well established by a wealth of experimental animal and human epidemiologic lit-
erature. There remain questions about the mechanisms, and about the relative impor-
tance of pre- versus postnatal factors in the origins of disease. Although not shown
in all studies, a recurring finding in many settings is that disease risk is enhanced by
the combination of fetal growth retardation and higher current body size, typically
measured by BMI. This pattern of early undernutrition and later overnutrition in sub-
groups of populations in developing countries is a likely consequence of the nutrition
transition.
The key elements of the nutrition transition occur in association with rapid socio-
economic change. They include: (1) changes in the overall structure and composition
of the diet favoring higher fat and sugar content and thus higher energy density; and
140 Early nutrition conditions and later risk of disease

(2) an increase in sedentary activity associated with adoption of more labor-saving
devices, a shift in the physical demands of many economic activities, and an increase
in leisure time (Popkin, 1998, 2001). Economic development is also associated with
improved water supply and better preventive health care, which reduce the prevalence
of childhood diarrheal diseases. These changes are likely to be associated with
improved child growth, and at the extreme, with overweight and obesity. At the same
time, however, there are historically high rates of low birth weight which are relevant
for today’s adult populations, and continuing high rates of poor prenatal growth affect-
ing younger children. Biologically, poor fetal nutrition results in altered structure and
physiological functioning. In response to an inadequate supply of oxygen and nutri-
ents, adaptations which enhance survival and preserve brain growth may result in
deficits in organs and tissues, including smaller kidneys with fewer nephrons, a
reduced number or altered function of pancreatic beta cells, a smaller liver, and
reduced skeletal muscle mass. Furthermore, there is evidence that poor maternal
nutrition or high levels of stress cause reprogramming of the HPA axis such that stress
responses are altered. Together, these adaptations reflect a “thrifty phenotype” (Hales
and Barker, 1992). A child equipped with this altered physiology, who encounters an
adequate or excessive energy and nutrient supply relative to needs, may have an
increased tendency to store energy as fat, and to develop insulin resistance. In coun-
tries undergoing the nutrition transition, the likelihood of encountering such an envi-
ronment is increased, in light of increased availability and altered composition of
foods, and a trend toward more sedentary activity.
Yajnik (2001) suggests that exposure to the urban environment also heightens risk
of chronic disease. Levels of tumor necrosis factor (TNF) alpha and interleukin 6
(proinflammatory cytokines) were found to be elevated among urban Indian popula-
tions, particularly slum dwellers, compared to rural residents (Yudkin et al., 1999a).
Yajnik et al. (1999b) hypothesize that aspects of urban stress trigger the release of
adipose-tissue-derived cytokines, which are in turn associated with endothelial
damage and CVD. This hypothesis is an important one to pursue in urban populations
of developing countries.
When comparing the long-term effects of small size at birth in developed and
developing countries, it is also important to keep in mind that the usual reasons for
small size differ. For example, if low-birth-weight (LBW) infants in the US or
Western Europe are compared with those in developing countries, two major differ-
ences are apparent. First, a much higher percentage of LBW in developed countries
is attributable to prematurity, whereas in developing countries, the majority of LBW
babies are full term but small for gestational age. Furthermore, babies in developing
countries are more likely to be proportionately growth retarded, most likely as a result
of chronic nutritional stress throughout gestation. The Pune studies show that relative
to British babies, Indian babies are lighter and thinner, but subcutaneous fat is pre-
served. Their weight deficits are in skeletal muscle and organs, and it is precisely
these changes that may have long-term importance for the insulin resistance syn-
drome. For example, less skeletal muscle means fewer insulin receptors, and lower
metabolic rates. Many studies show that altered metabolic profiles develop at lower
levels of BMI, particularly among Asian children, such that effects are seen in the
Discussion 141

absence of overweight or obesity. The role of fat patterning and distribution is an
important area for further research in children and adolescents.
In addition to the predominant pattern of countries in transition (early growth restric-
tion followed by compensatory growth), we are also seeing a new pattern emerge.
Impaired glucose tolerance among young adult women who were growth retarded at
birth may affect fetal growth in the next generation: women with impaired glucose
tolerance or gestational diabetes during pregnancy may produce offspring who are rela-
tively large (Yajnik, 2001a). These macrosomic infants may, in turn, show alterations in
glucose metabolism later in their lives. In either scenario, the risk of adult diabetes and
its associated sequlae is elevated. Thus, there is a high level of complexity in the rela-
tionship of maternal nutrition and fetal programming, leading Yajnik to suggest that
“the effects of nutritional factors may vary depending on the position of the population
in the epidemiological and nutrition transition” (Yajnik, 2001b: p. 58).
In summary, the literature on early origins of chronic disease risk in developing
countries is rapidly expanding. Despite some inconsistencies in results across coun-
tries, the following generalizations are supported.
1. Fetal growth restriction and/or poor growth during infancy are significantly asso-
ciated with precursors of chronic disease including elevated blood pressure,
altered serum lipid profiles and altered glucose/insulin metabolism, and altered
immune responses in children, adolescents and young adults. Among older adults,
fetal growth restriction and/or poor growth during infancy are significantly asso-
ciated with precursors of chronic disease and with chronic disease morbidity and
mortality related to type 2 diabetes, CVD, hypertension, and kidney disease.
2. There is an important synergism between early growth restriction and later rapid
growth. The highest risk of adverse risk factors (hyperlipidemia, elevated blood
pressure, hyperinsulinemia) and chronic disease are found among those who
were small at birth but grew relatively fast during childhood.
3. The pattern of early growth restriction (manifested as low birth weight or thin-
ness at birth) followed by more rapid growth (resulting in relatively higher BMI
or fatness) is likely to be typical of populations undergoing the nutrition transi-
tion. In those populations, historically high rates of LBW are now often coupled
with dramatic increases in child and adult overweight.
4. Early growth restriction is likely to be a relatively stronger risk factor for adult
chronic disease in countries undergoing the nutrition transition, compared to
developed countries (where rates of IUGR are low, but exposure to postnatal
lifestyle and dietary risk factors is high).
Given the importance of early nutrition as well as nutrition during the entire period
of growth and development, these findings have several logical and important impli-
cations for health policy. First, we must optimize maternal nutrition, and reduce
maternal infection and stress during pregnancy to optimize fetal growth and infant
health at birth. Second, we must promote a nutritional environment for children and
adults that meets, but does not exceed needs. The latter involves not only attention to
the quality and quantity of the diet, but also to the promotion of healthy levels of
physical activity to maintain energy balance.
142 Early nutrition conditions and later risk of disease

References
Adair, L.S., Kuzawa, C., and Borja, J.R. (2001). Circulation 104, 1034–1039.
Antal, M., Afgalvi, R., Nagy, K., Szepvolgyi, J., Babto, E., Regoly-Merei, A., Biro, L.,
and Biro, G. (1998). Z. Ernahrungswiss. 37 Suppl 1,131–133.
Bavdekar, A., Yajnik, C., Fall, C.V.D., Bapat, S., Pandit, A.N., Deshpande, V., Bhave, S.,
Kellingray, S.D., and Joglekar, C. (1999). Diabetes 48, 2422–2429.
Bergel, E., Haelterman, E., Belizan, J., Villar, J., and Carroli, G. (2000). Am. J. Epidemiol.
151, 594–601.
Cheung, Y.B., Low, L., Osmond, C., Barker, D., and Karlberg, J. (2000). Hypertension
36, 795–800.
Choi, C.S., Kim, C., Lee, W.J., Park, J.Y., Hong, S.K., Lee, M.G., Park, S.W., and
Lee, K.U. (2000). Diabetes Res. Clin. Pract. 49, 53–59.
Clark, P.M. (1998). Eur. J. Pediatr. 157 Suppl 1, S7–10.
Crowther, N.J., Trusler, J., Cameron, N., Toman, M., and Graph, I.P. (2000). Diabetologia
43, 878–885.
deOnis, M., Blossner, M., and Villar, J. (1998). Eur. J. Clin. Nutr. 52 Suppl 1, 5–15.
Deurenberg, P., Yap, M., and Staveren, W.A. (1998). Int. J. Obes. 22, 1164–1171.
Deurenberg, P., Deurenberg-Yap, M., Wang, J., et al. (1999). Int. J. Obes. 23, 537–542.
Eriksson, J., Forsen, T., Tuomilehto, J., Osmond, C., and Barker, D. (2000). Hypertension
36, 790–794.
Fall, C.H., Pandit, A.N., Law, C.M., et al. (1995). Arch. Dis. Child. 73, 287–293.
Fall, C.H., Stenin, C.E., Kumaran, K., Cox, V., Osmond, C., Barker, D.J., and Hales, C.N.
(1998). Diabetic Med. 15, 220–227.
Fall, C.H.D., Yajnik, C.S., Rao, S., and Coyaji, K.J. (1999). In “Fetal Programming
Influences on Development and Disease in Later Life” (P.M. Shaughn O’Brien,
T. Wheeler, and D.J.P. Barker, eds.), pp. 231–245. Royal College of Obstetricians and
Gynaecologists, London.
Forrester, T.E., Wilks, R.J., Bennett, F.I., Simeon, D., Osmond, C., Allen, M., Chung, A.P.,
and Scott, P. (1996). BMJ 312, 156–160.
Gale, C.R., Martyn, C.N., Kellingray, S., Eastell, R., and Cooper, C. (2001). J. Clin.
Endocrinol. Metab. 86, 267–272.
Gaskin, P.S., Walker, S.P., Forrester, T.E., and Grantham-McGregor, S.M. (2000). Eur. J.
Clin. Nutr. 54, 563–567.
Gupta, R., and Gupta, V.P. (1996). Indian Heart J. 48, 241–245.
Hales, C.N., and Barker, D.J. (1992). Diabetologia 35, 595–601.
Harding, J. (2001). Int. J. Epidemiol. 30, 15–23.
Hediger, M.L., Overpect, M.D., Kuczmarski, R.J., McGlynn, A., Maurer, K.R., and
Davis, W.W. (1998). Pediatrics 102, E60.
Hoffman, D.J., Sawaya, A.L., Verreschi, I., Tucker, K.L., and Roberts, S.B. (2000). Am. J.
Clin. Nutr. 72, 202–207.
Hoy, W.E., Rees, M., Kile, E., Mathews, J.S., and Wang, Z. (1999). Kidney Int. 56, 1072–1077.
Huxley, R.R., Shiell, A.W., and Law, C.M. (2000). J. Hypertens. 18, 815–831.
International Diabetes Institute (2000). “The Asia-Pacific Perspective: Redefining Obesity
and its Treatment”. Health Communications Australia Pty Limited, Australia.
References 143

Ko, G.T.C., Chan, J.C.N., Cockram, C.S., et al. (1999). Int. J. Obes. 23, 1136–1142.
Kolacek, S., Kapetanovic, K., Zimolo, A., and Luzar, V. (1993). Acta Paediatr. 82, 699–704.
Kumaran, K., and Fall, C.H. (2001). Int. J. Diabetes Developing Countries 21, 34–41.
Kumaran, K., Fall, C.V.D., Martyn, C.N., Vijayakumar, M., Stein, C., and Rhier, R.
(2000). Int. J. Diabetes Developing Countries 83, 272–277.
Law, C.M., and Schiell, A.W. (1996). J. Hypertens. 14, 935–941.
Law, C.M., Egger, P., Dada, O., Delgado, H., Kylberg, E., Lavin, P., Tang, G.H., von
Hertzen, H., Schiell, A.W., and Barker, D.J. (2001). Int. J. Epidemiol. 30, 52–57.
Leon, D., and Koupilova, I. (1999). In “Fetal Origins of Cardiovascular and Lung
Disease” (D.J.P. Barker, ed.). Marcel Dekker, New York.
Levitt, N.S., Steyn, K., and de Wet, T. (1999). J. Epidemiol. Community Health 53,
264–268.
Levitt, N.S., Lambert, E.V., Woods, D., Hales, C.N., Andrew, R., and Seckl, J.R. (2000).
J. Clin. Endocrinol. Metab. 85, 4611–4618.
Lucas, A., Fewtrell, M., and Cole, T. (1999). BMJ 319, 245–249.
Margetts, B.M., Rowland, M.G.M., Foord, F.A., Cruddas, A.M., Cole, T.J., and Barker, D.J.B.
(1991). Int. J. Epidemiol. 20, 938–943.
Martorell, R., Mendoza, F.S., Castillo, R.O., Pawson, I.G., and Budge, C.C. (1987). Am.
J. Phys. Anthropol. 73, 475–487.
Martorell, R., Ramakrishnan, U., Schroeder, D.G., Melgar, P., and Neufeld, L. (1998).
Eur. J. Clin. Nutr. 52 Suppl 1, S43–52.
Martorell, R., Stein, A.D., and Schroeder, D.G. (2001). J. Nutr. 181, 874s–880s.
McDade, T., and Adair, L.S. (2001). Soc. Sci. Med. 53, 55–70.
McDade, T., Beck, M., Kuzawa, C., and Adair, L.S. (2001a). Am. J. Clin. Nutr.
74, 543–548.
McDade, T., Beck, M., Kuzawa, C., and Adair, L.S. (2001b). J. Nutr. 131, 1225–1231.
McKeigue, P.M., Shah, B., and Marmot, M.G. (1991). Lancet 337, 382–386.
McKeigue, P.M., Ferrie, J.E., and Pierpoint, T. (1993). Circulation 87, 152–161.
Mi, J., Law, C., Zhang, K.-L., Osmond, C., Stein, C., and Barker, D. (2000). Ann. Intern.
Med. 132, 253–260.
Misra, A. (2000). J. Cardiovasc. Risk 7, 215–229.
Moore, S.E., Cole, T.J., Poskitt, E.M., and Sonko, B.J. (1997). Nature 388, 434.
Moore, S.E., Cole, T.J., Collinson, A.C., Poskitt, E.M., McGregor, I.A., and Prentice, A.M.
(1999). J. Epidemiol. 28, 1088–1095.
Olatunbosum, S.T., and Bella, A.F. (2000). J. Natl. Med. Assoc. 92, 265–268.
Popkin, B.M. (1998). The nutrition transition and its health implications in lower income
countries. Public Health Nutr. 1, 5–21.
Popkin, B.M. (2001). In “Fetal Origins of Cardiovascular and Lung Disease” (D.J.P. Barker,
ed.). Marcel Dekker, New York.
Popkin, B.M., Richard, M.K., and Montiero, C.A. (1996). J. Nutr. 126, 3009–3016.
Raghupathy, P., Antonisamy, B., Richard, J., Jose, P.C., and Joseph, S. (2001). Vellore
Study – Preliminary data. Proceedings of the First World Congress on the Fetal
Origins of Adult Disease. Mumbai, India. Abstract.
Ramachandran, A., Snehalatha, C., Latha, E., Vijay, V., and Viswanathan, M. (1997).
Diabetologia 40, 232–237.
144 Early nutrition conditions and later risk of disease

Schroeder, D.G., Martorell, R., and Flores, R. (1999). Am. J. Epidemiol. 149, 177–185.
Sichieri, R., Siqueira, K.S., Pereira, R.A., and Ascherio, A. (2000). Public Health Nutr.
3, 77–82.
Stein, C.E., Fall, C.V.D., and Kumaran, K. (1996). Lancet 348, 1269–1273.
Stein, A.D., Conlisk, A.J., Schroeder, D.G., Barnhart, H.X., Grajeda, R., Torun, B., and
Martorell, R. (2001). Paper presented at the First World Congress on the Fetal
Origins of Adult Disease, Mumbai, India.
Steyn, K., de Wet, T., Richter, L., Cameron, N., Levitt, N.S., and Morrell, C. (2000).
S. Afr. Med. J. 90, 719–726.
Thame, M., Osmond, C., Wilks, R.J., Bennett, F.I., McFarlane-Anderson, N., and
Forrester, T.E. (2000). Hypertension 35, 662–667.
Walker, S.P., Gaskin, P., Powell, C.A., Bennett, F.I., Forrester, T.E., and Grantham-
McGregor, S. (2001). J. Epidemiol. Community Health 55, 394–398.
Waterland, R.A., and Garza, C. (1999). Am. J. Clin. Nutr. 69, 179–187.
Whitaker, R.C., and Dietz, W.H. (1998). J. Pediatr. 132, 768–776.
Woelk, G.B., Emanuel, I., Weiss, N.S., and Psaty, B.M. (1998). Arch. Dis. Child. Fetal
Neonatal Ed. 79, F119–F122.
World Health Organization (1980). World Health Statistics Quarterly 33, 197–224.
Yajnik, C.S. (2001a). Nutr. Rev. 59, 1–9.
Yajnik, C.S. (2001b). Int. J. Epidemiol. 30, 57–59.
Yajnik, C.S., Fall, C.H., and Vaidya, U. (1995). Diabet. Med. 12, 330–336.
Yudkin, J.S., Yajnik, C.S., and Mohammed, A.V. (1999a). Diabetes Care 22, 363–364.
Yudkin, J.S., Stehouwer, C.D.A., and Emeis, J.J. (1999b). Arterioscler. Throm. Vasc. Biol.
19, 972–978.
References 145

This Page Intentionally Left Blank

The Nutrition TransitionISBN: 0-12-153654-8
Copyright © 2002 Elsevier Science LtdAll rights of reproduction in any form reserved
Obesity in thedeveloping world
Reynaldo Martorell
8
Introduction
Popkin and Doak (1998) wrote an article titled “The obesity epidemic is a worldwide
phenomenon” and the World Health Organization (WHO) issued a report with the title
“Obesity – Preventing and Managing the Global Epidemic” (WHO, 1998). These titles
imply that obesity has emerged as a significant public health problem in developed as
well as in developing countries and that rates are increasing rapidly worldwide; so
much so in fact, that it can be labeled an “epidemic”.
The objective of this chapter is to examine whether these claims are true for devel-
oping countries. Emphasis is placed on evidence from nationally representative sur-
veys and comparisons of obesity levels found in various countries are made to the
United States, where obesity is perceived to be a major threat to public health. Attempts
are made to document trends in obesity, difficult to do because of the paucity of data,
as well as to describe the “social mapping” of obesity. By this is meant quantifying
how obesity varies by socioeconomic status, which has relevance to planning because
it identifies the groups most affected within countries. Much of the information pre-
sented is based on prior work by Martorell et al. (2000a,b), with updates from surveys
subsequently released to the public. Because of the variety of criteria used in previous
research, the chapter begins by reviewing the assessment of obesity in adults and chil-
dren. After reviewing the information available about obesity rates for women, men,
school children and preschool children, consideration is given briefly to policy and
program implications.
Assessment
Obesity is a disease of complex, multifactorial causes leading to an imbalance between
energy intake and output, and to the accumulation of large amounts of fat. In normal

individuals, regulation of energy balance is achieved over the long term despite large
fluctuations in both energy intake and output within and between days (Goran, 2000).
Only a very small imbalance is necessary to produce obesity in an individual or a
population. For example, in children, only a 2% discrepancy in energy is necessary
to produce obesity. This is equivalent to about 125 kJ/day in terms of food intake or
15 minutes of daily play traded for watching television (Goran, 2000). These differences
are very small relative to the precision of measurement of intakes and expenditures and
it would be difficult in any population becoming obese to establish with certainty how
much of the imbalance might be due to dietary or physical activity changes.
In adults, obesity is measured most often as excessive weight for a given height
using the Body Mass Index (BMI), which is weight (kg) over height squared (m2). The
WHO assessed the relationship between BMI and health risks and defined overweight
as a BMI between 25.0 and 29.9 kg/m2 and obesity as a BMI of 30.0 kg/m2 or greater
(WHO, 1995). These cut off points are widely accepted.
BMI is not a perfect indicator, particularly for clinical use. For example, athletes
with robust skeletal frames and substantial muscularity may appear to be overweight
when in fact they may not be. Other methods are available to measure fatness directly.
These include fat fold measures of the trunk and extremities (e.g., subscapular and
triceps fat folds) and percentage body fat estimated from determinations of body den-
sity, tritiated or deuterated water and other techniques (Bray, 1996; Pi-Sunyer, 1999).
BMI is linearly related to percentage body fat, with correlations between 0.6 and 0.8
in USA adults, similar to results found in other populations (Gallager et al., 1996).
The appropriateness of BMI has been called into question for populations with sig-
nificant levels of early childhood stunting. Because growth failure occurs with greater
intensity in the first two years of life, when growth of the extremities is faster than of
the trunk, BMI may overestimate fatness among adults who suffered malnutrition as
children and who may therefore have high sitting height to stature proportions (i.e.,
shorter legs). Adaptation to high altitude may also lead to large chest dimensions
to house larger cardiovascular and respiratory capacities and this may also alter the
relationship between BMI and fatness. It is not known how important these biases
might be. Blacks have relatively longer lengths than whites (Martorell et al., 1988)
but the relationship between BMI and percentage body fat is identical in both groups
(Gallagher et al., 1996).
BMI, although a very good measure of overall fatness in adults, does not provide
information about patterns of fat deposition, which carry health risks independent of
overall fatness (Bray, 1996). For this reason measures of upper body and abdominal
fatness are recommended in addition to BMI for epidemiological studies of risk factors.
Measuring obesity in children is complicated by the process of growth and matura-
tion which leads to changes in body proportions, bone mass and percentage body fat;
although BMI correlates well with measures of adiposity in children, these relation-
ships are weaker than among adults (Troiano and Flegal, 1998). Thus, definitions of
overweight and obesity in children take age into account by comparing values found
for study subjects to the age-sex-specific distribution of a reference population.
In the USA, the recommended practice for school children is to define risk of
overweight as a BMI between the 85th and the 94th percentiles and overweight as
148 Obesity in the developing world

at or above the 95th percentile of the NCHS/CDC BMI-for-age percentile curves
(Barlow and Dietz, 1998). Revised versions of these curves are being used by some
USA investigators (Crawford et al., 2001). For clinical purposes, the designation of
“obesity” in children is reserved only when confirmed by further evaluation. For epi-
demiological studies, the designations of overweight for values between the 85th and
94th percentiles and obesity for those at or above the 95th percentile seem appropriate.
An international reference based on six nationally representative countries has been
proposed for use in assessing children 2–18 years of age (Cole et al., 2000). Cut off
points at different ages are proposed that at 18 years pass through the “adult” cut off
points of 25 and 30 kg/m2. Averaging across the six data sets, the cut off point for
overweight corresponds roughly to the 90th percentile of BMI for age and that for
obesity more or less to the 97th percentile. Even though the cut off points correspond
to those used in adults, which is the salient advantage of this approach, the authors
caution that the health consequences for children above these cut off points may differ
from those of adults. The approach proposed by Cole et al. (2000) may become
widely adopted.
The practice for children less than 5 years of age is based on the use of weight for
length (under two years) or weight for height (2–5 years) curves that originate from the
USA but that have come to be known as the WHO/NCHS curves (Hamill et al., 1979).
Weight for length (or height) provides equivalent information as BMI for age in this
age range. WHO defines obesity as any value greater than two standard deviations
above the age- and sex-specific mean in the WHO/NCHS reference population (WHO,
1995) and Martorell et al. (2000b) also defined overweight as greater than 1 standard
deviation. Others define overweight as any value greater than the 95th percentile of
the reference curves (Ogden et al., 1997) or as any value greater than two standard
deviations above the reference mean (de Onis and Blössner, 2000). The various uses
of the words “obesity” and “overweight” require careful attention to the criteria used
across studies.
New reference data for preschool children based on multicountry studies of growth
and development and on subjects that have been breastfed according to WHO recom-
mendation are being developed by WHO and will be available in a few years (Garza
and de Onis, 1999). These reference curves will replace the WHO/NCHS curves for
international use.
The consequences of obesity
The consequences of obesity for adults are well known. It contributes to the develop-
ment of many diseases including diabetes, hypertension, stroke, cardiovascular disease,
and some cancers (Solomon and Manson, 1997). Obesity also increases mortality from
all causes, as well as from cardiovascular disease, cancer and other diseases (Seidell,
1997; Bender et al., 1998; Stevens et al., 1998). Increased mortality risk begins well
below the established criterion of obesity, a BMI less than 30 kg/m2, perhaps from as
low as 22–25 kg/m2 (Stevens et al., 1998; Calle et al., 1999).
The consequences of obesity 149

Childhood obesity is viewed as a problem because it is an important predictor of
adult obesity (Serdula et al., 1993; Whitaker et al., 1997). About a third of obese pre-
school children become obese adults and half of obese school-age children become obese
adults (Serdula et al., 1993). On the other hand, most obese adults were not obese as
children (Strauss, 1999). The influence of childhood obesity on adult status rises with
age. Serdula et al. (1993) report that the risk of adult obesity was 2.0–2.6 times greater
in obese than in nonobese preschool children but 3.9–6.5 times greater for the same
comparison at older ages. Whitaker et al. (1997) found that childhood obesity was not
a significant predictor of adult obesity at 1–2 years of age, but that it did become a
significant predictor at 3–5 years, and even a stronger one at older ages. Also, parental
obesity magnifies the probability that an obese child will become an obese adult
(Whitaker et al., 1997).
There are also important consequences of obesity on child health per se (Dietz, 1998;
Must and Strauss, 1999). The risk of hyperlipidemia, hypertension and abnormal glu-
cose tolerance is increased somewhat among obese children, and in the United States,
childhood obesity has important psychosocial consequences. Obese children frequently
become targets of systematic discrimination and by adolescence, many suffer from
low self-esteem (Dietz, 1998).
Obesity is recognized as an important public health problem in industrialized coun-
tries, but until recently, not in developing countries. WHO (1998) has called attention
to the fact that obesity is increasing worldwide at an alarming rate in both developed
and developing countries. WHO issued this conclusion despite the limited availability
of nationally representative data and the lack of information about trends. This note
of alarm led a team at Emory University (Reynaldo Martorell, Morgen Hughes) and
at the Centers for Disease Control and Prevention (CDC) (Laura Kettel Khan and
Laurence Grummer-Strawn) to analyze data from national nutrition surveys in the last
15 years to ascertain levels and trends in obesity in developing countries (Martorell
et al., 2000a,b). These surveys, mostly Demographic Health Surveys (DHS), were
designed to assess health and malnutrition among women and young children. For this
reason, they provide only limited information about patterns of obesity in developing
countries. They include only height and weight information. Most surveys were from
very poor countries and information from many of the advanced countries from Latin
America and Asia is lacking. Most surveys excluded school children, adolescents,
women past reproductive age and men.
Levels of obesity in women
The percentages of women aged 15–49 years who were overweight (25.0–29.9 kg/m2)
or obese (�30 kg/m2) are given in Table 8.1 for 35 developing countries (13 countries
had two surveys) and the United States. The surveys included are all those previously
analyzed and reported by Martorell et al. (2000a) as well as results from recently
released surveys from DHS (Burkina Faso, 1998/99; Cameroon, 1998; Colombia, 2000;
Ghana, 1998; Guatemala, 1998/99; Kenya, 1998; Nigeria, 1999; Tanzania, 1999;
150 Obesity in the developing world

Levels of obesity in women 151
Table 8.1 Overweight and obesity levels in women aged 15–49 years in developing countries
Country Year Sample % Overweight % Obesesize (25–29.9 kg/m2) (30 kg/m2)
Sub-Saharan AfricaBenin 1996 2266 6.9 2.1Burkina Faso 1992/93 3161 5.9 1.0Burkina Fasoa 1998/99 3202 4.5 0.9Cameroona 1998 1537 17.8 3.5Central African Rep. 1994/95 2025 5.5 1.1Comoros 1996 773 15.9 4.4Côte d’Ivoire 1994 3108 11.0 3.0Ghana 1993 1773 9.3 3.4Ghanaa 1998 2068 11.0 5.0Kenya 1993 3294 11.4 2.4Kenyaa 1998 3240 12.3 2.6Malawi 1992 2323 8.1 1.1Mali 1996 4237 7.2 1.2Namibia 1992 2205 22.5 13.8Niger 1992 3292 6.2 1.2Nigeriaa 1999 2094 15.6 7.3Senegal 1992/93 2895 12.0 3.7Tanzania 1991/92 4597 9.3 1.9Tanzania 1996 3721 10.8 2.6Uganda 1995 3199 7.3 1.2Zambia 1992 3239 11.8 2.4Zambia 1996/97 3838 10.5 2.3Zimbabwe 1994 1968 17.4 5.7Zimbabwea 1999 5121 19.4 7.4Middle East and North AfricaEgypt 1992 4855 33.9 23.5Egypt 1995/96 6769 31.7 20.1Morocco 1992 2850 22.3 10.5South AsiaBangladesh 1995/96 3997 2.2 0.6Nepal 1996 3399 1.5 0.1Latin America and the CaribbeanBolivia 1994 2347 26.2 7.6Brazil 1989 10 189 25.0 9.2Brazil 1996 3158 25.0 9.7Colombia 1995 3319 31.4 9.2Colombiaa 2000 3236 30.5 10.6Costa Ricaa,c 1996 865 33.2 12.7Dominican Rep. 1991 2163 18.6 7.3Dominican Rep. 1996 7356 26.0 12.1Guatemala 1995 4978 26.2 8.0Guatemalaa 1998/99 2373 31.9 12.1Haiti 1994/95 1896 8.9 2.6Honduras 1996 885 23.8 7.8Mexico 1987 3681 23.1 10.4Mexicoa,b 1998 13 887 35.2 24.4Peru 1992 5200 31.1 8.8Peru 1996 10 747 35.5 9.4Central Eastern Europe/Commonwealth of Independent States (CEE/CIS)Kazakstan 1995 3538 21.8 16.7Turkey 1993 2401 31.7 18.6Uzbekistan 1996 4077 16.3 5.4
United States 1988–94 5219 20.7 20.7
a Data not analyzed by Martorell et al. (2000a).b Women 18–49 years.c Women 20–44 years.

Zimbabwe, 1999). Also in Table 8.1 point estimates for Costa Rica for 1996 (Ministerio
de Salud, 1996) and for Mexico for 1998 (Rivera et al., in press) are included but these
refer to women aged 18–49 and 20–44 years respectively.
Regional summaries were then obtained by weighting the latest point estimates
for the countries listed in Table 8.1 by population estimates of women 15–49 years
for 1996 and these are given in Fig. 8.1. Regional designations are those used
by UNICEF. Levels of overweight (25.0–29.9 BMI) and obesity (30 BMI) were
extremely low in South Asia, represented by Bangladesh and Nepal, relatively rare in
sub-Saharan Africa, but nearly as common in other regions as found in the United
States. Although many countries from sub-Saharan Africa and Latin America were
included in generating the estimates in Fig. 8.1, many countries were not and repre-
sentation for other regions was much poorer or absent.
The region of East Asia and the Pacific is not represented in Fig. 8.1 but some data
exist for this region. A representative survey of eight provinces of China in 1991 found
a prevalence of obesity of 4.3% among women aged 20–45 years (Popkin et al., 1995).
Pacific island nations are known to have extremely high levels of obesity. In Western
Samoa, for example, the prevalence of obesity among women aged 25–74 years was
66% in 1991 (Hodge et al., 1994). Other data from the Middle East and North Africa
confirm that this region has among the highest levels of obesity in the world. A national
sample drawn from primary health care clinics in Kuwait found a prevalence of obesity
of 40.2% among women older than 18 years in 1993 (Al-Isa, 1997). Prevalences for
women aged 20–60 years and estimated from national surveys were reported to be
18.3% for Morocco in 1998 and 22.7% for Tunisia in 1997 (Mokhtar et al., 2001).
On the other hand, in southern Iran, only 8% of women and 2.5% of men were obese
in 1993/94 (Pishdad, 1996).
152 Obesity in the developing world
100%
50%
0%
0.12.2 4.4
97.2
12.4
83.2
57.5 57.9 54.158.6
20.728.828.9 26.7
17.215.413.5
20.7
South Asia CEE/CIS United StatesSub-Saharan
Africa
Latin
America and
the Caribbean
Middle East
and North
Africa
Obesity �30 BMI
Overweight 25.0–29.9 BMI
Non-obese �25.0 BMI
Figure 8.1 Percentage distribution of obesity in women aged 15–49 years in different regions of
developing countries and in the United States.

The social mapping of obesity
Knowing how obesity is distributed across socioeconomic groups is important for
policy makers because it informs them of the groups that need to be targeted by pro-
grams. A review of the literature found that whereas obesity among women increases
with greater wealth in developing countries, it decreases in developed countries
(Sobal and Stunkard, 1989). From these findings, WHO (1995) hypothesized that in
very poor countries, few people and only those of high socioeconomic status would be
heavy. In mid-income developing countries, more people would be obese and both
high and low socioeconomic groups would be affected. Finally, in an affluent society,
thinness would become culturally desirable, the rich would become thinner and obesity
would become a marker of poverty.
Martorell et al. (2000a) have tested elements of this hypothesis by examining how
the relationship between socioeconomic status and obesity varies according to level
of national economic development, as defined by gross national product (GNP) per
capita. They defined high socioeconomic status in these data sets in two ways: resi-
dence in urban areas and at least one year of secondary schooling. In Table 8.2, data are
provided for each of the largest countries of the regions included in Fig. 8.1: Bangladesh
(South Asia), Tanzania (sub-Saharan Africa), Egypt (Middle East and North Africa),
Brazil (Latin America and the Caribbean), Turkey (Central and Eastern Europe).
Bangladesh and Tanzania are very poor countries and have low levels of obesity. Further,
obesity levels are much greater among urban and better-educated women. Using
multivariate analysis, obesity was estimated to be between 4 and 7 times more proba-
ble in such women. Egypt is a country with very high levels of obesity for its level of
income; although the relationship between socioeconomic status and obesity was not
as strong as in Bangladesh and Tanzania, values were still over twice as likely among
Egyptian women of higher socioeconomic status. Brazil and Turkey represent countries
well along the nutrition transition defined by Popkin (1994). In these countries, the
The social mapping of obesity 153
Table 8.2 Obesity prevalence in women aged 15–49 years by residence (urban/rural) and educationa in selected countries
(data from Martorell et al., 2000a)
% Obese % Obese Odds ratiosbCountry 1992 GNP per % Obese
Urban Rural High Low Residence Educationcapita (US$) total
education education (urban/rural) (high/low)
Bangladesh (1995/96) 220 0.6 2.7 0.4 1.9 0.3 7.50c 7.07c
Tanzania (1996) 110 2.6 6.0 1.7 8.4 2.3 4.27c 4.22c
Egypt (1995/96) 640 20.1 30.0 13.0 26.1 17.0 2.72c 2.09c
Brazil (1996) 2770 9.7 9.9 8.9 8.8 11.0 1.15 0.81
Turkey (1993) 1980 18.6 19.5 17.1 10.5 20.5 1.24 0.46c
a Education: low, none to completed primary school; high, at least 1 year of secondary schooling.b Estimated from multivariate logistic regressions that included obesity (0 � No, 1 � Yes) as the dependent variable and area of
residence (0 � rural, 1 � urban) or educational level (0 � low, 1 � high) as the independent variable and age squared as a covariate.c P � 0.001.

relationship with socioeconomic status became weaker or even reversed to a point
where there was less obesity among those of higher socioeconomic status. For example,
in Turkey, women with higher education had half the levels of obesity found in women
with lower levels of education.
The relationship between GNP per capita and the within-country distribution of
obesity by socioeconomic level is examined in Fig. 8.2 for the group of countries ana-
lyzed by Martorell et al. (2000a). As in Table 8.2, the odds ratios measure the con-
centration of obesity in urban and higher educated women. Three groups of countries
are defined, those with odds ratios lower than 2, those between 2 and 4.99 and those
greater than 5. There is a significant relationship with GNP. Countries with attenuated
154 Obesity in the developing world
Low (�2) High (�5)Middle (2.00–4.99)
Size of odds ratios
(15)(13)
(9)
(10)
(7)
(8)
2000
1000
0
US$
Figure 8.2 Strength of the relationship between obesity and social class, as indexed by odds ratio
sizes, and gross national product in 1992 (not including the USA). � Residence odds ratios, F �19.4,
P � 0.0001; � Education odds ratios, F �8.5, P � 0.001; ( ) Number of countries.
0
10
2020.1
Middle schoolor less (0–9 years)
(n � 1073)
24.1
High school(10–12 years)(n � 2574)
18.9
University(13–16 years)(n � 1326)
9.1
Graduate school(�16 years)(n � 246)
%
Figure 8.3 Obesity (�30 kg/m2) by years of schooling in the United States among women aged
15–49 years included in NHANES III (1988–1994).
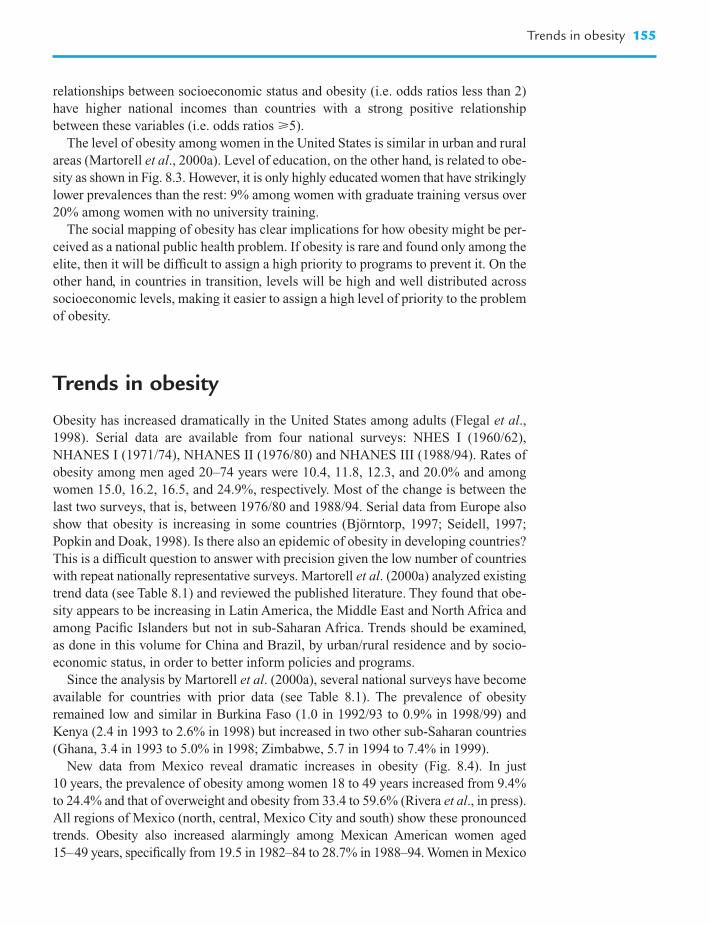
relationships between socioeconomic status and obesity (i.e. odds ratios less than 2)
have higher national incomes than countries with a strong positive relationship
between these variables (i.e. odds ratios 5).
The level of obesity among women in the United States is similar in urban and rural
areas (Martorell et al., 2000a). Level of education, on the other hand, is related to obe-
sity as shown in Fig. 8.3. However, it is only highly educated women that have strikingly
lower prevalences than the rest: 9% among women with graduate training versus over
20% among women with no university training.
The social mapping of obesity has clear implications for how obesity might be per-
ceived as a national public health problem. If obesity is rare and found only among the
elite, then it will be difficult to assign a high priority to programs to prevent it. On the
other hand, in countries in transition, levels will be high and well distributed across
socioeconomic levels, making it easier to assign a high level of priority to the problem
of obesity.
Trends in obesity
Obesity has increased dramatically in the United States among adults (Flegal et al.,
1998). Serial data are available from four national surveys: NHES I (1960/62),
NHANES I (1971/74), NHANES II (1976/80) and NHANES III (1988/94). Rates of
obesity among men aged 20–74 years were 10.4, 11.8, 12.3, and 20.0% and among
women 15.0, 16.2, 16.5, and 24.9%, respectively. Most of the change is between the
last two surveys, that is, between 1976/80 and 1988/94. Serial data from Europe also
show that obesity is increasing in some countries (Björntorp, 1997; Seidell, 1997;
Popkin and Doak, 1998). Is there also an epidemic of obesity in developing countries?
This is a difficult question to answer with precision given the low number of countries
with repeat nationally representative surveys. Martorell et al. (2000a) analyzed existing
trend data (see Table 8.1) and reviewed the published literature. They found that obe-
sity appears to be increasing in Latin America, the Middle East and North Africa and
among Pacific Islanders but not in sub-Saharan Africa. Trends should be examined,
as done in this volume for China and Brazil, by urban/rural residence and by socio-
economic status, in order to better inform policies and programs.
Since the analysis by Martorell et al. (2000a), several national surveys have become
available for countries with prior data (see Table 8.1). The prevalence of obesity
remained low and similar in Burkina Faso (1.0 in 1992/93 to 0.9% in 1998/99) and
Kenya (2.4 in 1993 to 2.6% in 1998) but increased in two other sub-Saharan countries
(Ghana, 3.4 in 1993 to 5.0% in 1998; Zimbabwe, 5.7 in 1994 to 7.4% in 1999).
New data from Mexico reveal dramatic increases in obesity (Fig. 8.4). In just
10 years, the prevalence of obesity among women 18 to 49 years increased from 9.4%
to 24.4% and that of overweight and obesity from 33.4 to 59.6% (Rivera et al., in press).
All regions of Mexico (north, central, Mexico City and south) show these pronounced
trends. Obesity also increased alarmingly among Mexican American women aged
15–49 years, specifically from 19.5 in 1982–84 to 28.7% in 1988–94. Women in Mexico
Trends in obesity 155

are now as fat as women of Mexican origin living in the United States. Women of Mexican
origin are among the heaviest in the American continent. New DHS data for Colombia
for 2000 show a prevalence of obesity of 10.5% among women aged 15–49 years, up
from 9.2% in 1995. Similarly, new DHS data for Guatemala for 1998/99 show that 12.1%
of women aged 15–49 years were obese, a rate greater than the 8.0% found in 1995.
Rapid increases, particularly among women, have been reported recently for North
Africa (Mokhtar et al., 2001). In Tunisia, rates of obesity increased among women
aged 20–60 years old from 8.7 in 1980 to 22.7% in 1997 and in Morocco, rates
increased among women 18 years or older from 5.0 in 1984/85 to 18% in 1998 (these
values were not included in Table 8.1 or used to generate the regional estimates given
in Fig. 8.1 because of the different age range used, 20–60 versus 15–49 years). The
increases in obesity in Morocco and Tunisia are similar in magnitude to those that
occurred in Mexico.
The new data support the previous conclusion by Martorell et al. (2000a). There
continue to be insufficient data about trends in obesity from nationally representative
data but it would appear that rates are increasing dramatically in many countries in
Latin America, in North Africa and the Middle East and in Pacific Island nations but
not in sub-Saharan Africa.
Levels of obesity in men
Few surveys include men but those that do almost always find higher levels of obesity
in women compared to men (Hodge et al., 1994, 1995, 1996; Pishdad, 1996; Al-Isa,
1997). As an example, data are presented in Fig. 8.5 for Morocco and Tunisia
156 Obesity in the developing world
0
60
50
40
30
20
10
Mexico(ages 18–49 years)
United States(ages 15–49 years)
%
1982–84 1988–94
35.2
24.0
1998
24.4
9.4
1988
Overweight (25.0–29.9 kg/m2) Obese (�30 kg/m2)
26.5
28.7
29.4
19.5
Figure 8.4 Increases in obesity among women of Mexican origin living in Mexico (Rivera et al.,
in press) and the United States (Martorell et al., 1998).

(Mokhtar et al., 2001). In Morocco, 51.3% of women were overweight or obese
compared to 33.7% in men; the corresponding values for Tunisia were 50.9% in
women and 30.0% in men. From Fig. 8.5, it is clear that the significant difference
between women and men is in the extent of obesity, which was more than 3 times more
common in women compared to men.
Obesity in preschool children
As noted earlier, nationally representative data are available from many nutrition
surveys for children less than 5 years of age. Two analyses of such data have been
published (Martorell et al., 2000b; de Onis and Blössner, 2000). Data from 50 coun-
tries for children aged 12–60 months were used by Martorell et al. (2000b). Infants
(�12 months) were excluded because their greater levels of overweight compared to
older children, particularly if breastfed, may represent normal growth (Dewey, 1998;
Victora et al., 1998). Obesity was defined as greater than two standard deviations above
the mean, using the NCHS reference population (Hamill et al., 1979). By definition, the
prevalence of obesity in the reference population is 2.3%. Values for obesity by region
are given in Fig. 8.6. Each point represents a country and the dashed line represents the
value in the reference population, 2.3% (Uzbekistan had an extreme value of 12.5%,
which may be erroneous, and is therefore not shown). With the exception of Pakistan,
where 2.6% of children were obese, obesity was rare in South Asia (including repre-
sentation from India) and in Thailand. Sub-Saharan Africa also had low levels of
obesity, with only one country having high values, Malawi with 5.2%. Seven of
13 countries in Latin America and the Caribbean, one of two in the CEE/CIS region,
Obesity in preschool children 157
0
60
50
40
30
20
10
Morocco (1998) Tunisia (1997)
%
28.0
18.3
5.7
28.2
22.7
23.3
6.7
33.0
Women(n � 8200)
Men(n � 9120)
Women(n � 1834)
Men(n � 926)
Overweight (25.0–29.9 kg/m2) Obese (�30 kg/m2)
Figure 8.5 Obesity among women and men in Morocco (18 years) and Tunisia (20–60 years).
(Data from Mokhtar et al., 2001.)

and all four Middle Eastern and North African countries exceeded 2.3%. In the United
States, 3.1% of children were obese. Obesity was more common in urban areas, in
children of mothers with higher education, and in girls. At country level, child obesity
was positively related to GNP, negatively related to per-capita income and stunting. As
in the case of women, the assessment of trends was severely constrained by lack of data.
The analyses by de Onis and Blössner (2000) involved a larger number of national
surveys (160 surveys from 94 countries). They used the same criterion as Martorell
et al. (2000b) but called weight for length/height values greater than two standard
deviations above the WHO/NCHS reference mean “overweight” rather than “obesity”.
An important difference in sample selection is that de Onis and Blössner (2000)
included children younger than 12 months whereas Martorell et al. (2000b) did not.
Thus, obesity prevalences for surveys common to both analyses and which included
children less than 12 months of age will be greater when reported by de Onis and
Blössner (2000).
The conclusions of de Onis and Blössner (2000) were similar to those of Martorell
et al. (2000b): rates of obesity among preschool children were lowest in sub-Saharan
Africa and Asia and highest in the Middle East, North Africa, and Latin America. Of
11 countries from the Middle East and North Africa, only Oman had a prevalence
lower than 2.3%, the value above two standard deviations in the reference population.
The value reported for Oman was 0.9%, which seems oddly low. Several countries
exceeded a rate of 4.6%, which is twice the prevalence of the reference population:
Egypt, 8.6%, Algeria, 9.2%; Morocco, 6.8%; Qatar, 6.8%; Jordan, 5.7%; Kuwait, 5.7%
and Bahrain, 4.7%. Similarly, of 23 countries from Latin America and the Caribbean
included, only Honduras, one of the poorest countries in the region, had prevalences
158 Obesity in the developing world
8
6
4
2
0
South and
East Asia
Latin America
and the Caribbean
Middle East
and North Africa
Sub-Saharan
Africa
CEE/CIS United
States
% O
bes
e
Figure 8.6 Percentage obese (2 Wt/HtZ) in children aged 12–60 months in developing country regions
and in the United States. (Data from Martorell et al., 2000b.)

lower than 2.3%, with a value of 1.4%. Several countries equaled or exceeded rates of
4.6%: Argentina, 7.3%; Chile, 7.0%, Bolivia, 6.5%; Peru, 6.4%; Uruguay, 6.2%; Costa
Rica, 6.2%; Jamaica, 6.6% and Brazil, 4.9%. De Onis and Blössner (2000) analyzed a
total of 38 countries with trend data but they were unable to make firm conclusions.
Although 18 of the 38 countries had values that appear to be rising, there was no par-
ticular regional pattern; a variety of countries in Latin America, the Middle East and
North Africa as well as sub-Saharan Africa had increasing prevalences. Eight countries
had values that appeared to be falling and 14 values that appeared not to have changed.
Thus, the overall impression is one of increases being more common than decreases
but without a particularly defined pattern. On the other hand, there are well entrenched
regional differences in preschool obesity levels, with North Africa and the Middle East
and Latin America and the Caribbean having high levels of obesity.
Documenting trends in preschool children is also difficult in the United States.
Rates of overweight (greater than the 95th percentile of weight for height or length)
did not increase for children younger than three years of age between 1971/74 and
1988/94; however, overweight increased in girls 4 and 5 years old from 5.8 to 10.8%
over the same period. In boys 4 and 5 years old, the increases were only from 4.4 to
5.0% (Ogden et al., 1997).
Obesity in school children
Most of the available information for school age children is not from nationally
representative samples. This does not allow for quantification of the problem or for
estimation of trends. However, the information available suggests that although the
problem of obesity begins in preschool children, it is among school children where the
problem becomes more manifest.
Obesity rates in the United States have tripled over the last two decades among
children 6–19 years old (Crawford et al., 2001) and have more than doubled in Japan
among children aged 6–14 years (Kotani et al., 1997). Rapid changes may also be
occurring in developing countries but this is difficult to demonstrate.
There are many studies of school children in developing countries and many of these
express concern about the high rates of obesity found. Most studies from the Middle
East, for example, suggest that school children in this region are considerably fatter than
the US reference population (Al-Nuaim et al., 1996; Al-Isa and Moussa, 2000; Musaiger
and Gregory, 2000; Musaiger et al., 2000; Hasan et al., 2001; Moktar et al., 2001).
One study from Kuwait was representative of the country’s elementary school
population, 6–10 years of age, and provided data for 1985 (n � 4942) and 1995
(n � 8425) (Al-Isa and Moussa, 2000). The percentage of boys whose weight for
height equaled or exceeded the 95th percentile of the NCHS/CDC reference popu-
lation was 12.1% in 1985 and 21.1% in 1995. The values for girls were 13.8% and
22.7% for 1985 and 1995, respectively. For a rough comparison, the percentage of
children exceeding the 95th percentile of the 2000 CDC BMI for age charts was 13%
in preliminary data for 1999 for US children 6–11 years from NHANES IV
Obesity in school children 159

(Crawford et al., 2001). In a separate study (Al-Isa, 1997), higher levels of obesity
were found in adults from Kuwait during 1980–81 and 1993–94 than reported for the
USA for roughly the same years. Obesity in men increased from 16.9 to 32.3% and in
women from 32.2 to 40.6% across these years in Kuwait; corresponding rates in the
USA were 12.3 and 20.0% for men and 16.5% and 24.9% for women, respectively for
1976/80 and 1988/94 (Flegal et al., 1998).
Lower levels of fatness than for Kuwait were found among Brazilian adolescents
10–19 years of age in a nationally representative survey (n � 13 715) conducted in
1989 (Neutzling et al., 2000). The Brazilian researchers used a lower cut off point, the
85th percentile of the BMI for age reference curves from the USA, but found only
4.8% of boys and 10.6% of girls above the criterion. Recent data from other Latin
American populations suggest high levels of fatness among adolescents. A represen-
tative survey of 10–13-year-old school children from the urban area of San José, Costa
Rica (n � 683) found that 31% of children were overweight (85th to 94th percentile);
it is not clear whether this figure also includes obese children (at or above the 95th
percentile) (Monge et al., 2000). A study of school children aged 9–16 years from a
low to middle income town in the Mexico City area, found that 24% of children were
obese in 1997, defined as higher than the 85th percentile of both the BMI and triceps
skinfold USA reference curves (Hernandez et al., 1999).
Discussion
Any conclusion about obesity in developing countries needs to be viewed with caution
because nationally representative data are lacking for many countries. Few countries
have repeated surveys and information about trends is limited. There are also method-
ological concerns. The reference population used to assess obesity in children is derived
from measurements of US children, who may have higher than desired levels of fatness
and the interpretation of weight for height indices in populations with significant levels
of stunting has been called in question. On the other hand, there is consensus that a BMI
over 30 kg/m2 in adults (the definition of obesity) represents a serious clinical concern.
Risk appears at much lower levels of BMI and a value of 25 or greater (i.e., the definition
of overweight) implies increased health and mortality risk.
Is obesity a problem in developing countries? It depends. Obesity remains rare in
sub-Saharan Africa and in South Asia. In more developed countries of Latin America,
the Middle East and North Africa, and the CEE/CIS region, obesity is as common as
in the United States.
What accounts for the increases in obesity in many developing countries?
Developing countries are undergoing fundamental changes as a result of the economic,
epidemiological, demographic and nutritional transitions (Popkin, 1994; Martorell
and Stein, 2001). Ultimately, these societal changes impact on dietary changes and on
physical activity. The major shifts in diet include increases in the consumption of veg-
etable oils, displacement of course grains by refined ones, more meat and eggs, more
processed foods and more eating away from home (Popkin and Doak, 1998). Among
160 Obesity in the developing world

adults, there is a vast shift towards more capital-intensive and knowledge-based
employment that relies far less on physical activity (Popkin and Doak, 1998). There is
also a shift from active to sedentary recreation. Television viewing is thought to be a
driving force behind the rise in childhood obesity in the United States (Dietz and
Gortmaker, 1985; Robinson, 1999) and is likely to be also important in developing
countries. Reduced energy expenditures from displacement of physical activity and
increased dietary energy intakes due to snacking during viewing or as a result of food
advertisement altering consumption patterns have been suggested as mechanisms
(Robinson, 1999). School children from San José, Costa Rica watch about 2.5 hours
of television per day, more than the 2.2 hours they spend in physical activity (Monge
et al., 2000). School children from low and middle income schools from the Mexico
City area spend 2.4 hours per day watching television, and 1.7 hours watching videos
or playing video games, more than the 1.7 hours of daily moderate and vigorous exer-
cise they report (Hernandez et al., 1999). The impact of these patterns of recreation
cannot be known without information on what was replaced and what the dietary res-
ponse to these changes in physical activity have been. Data of this nature are not gen-
erally available. Only small imbalances between energy intake and expenditure would
be required to produce the obesity levels that have emerged over the last two decades.
Increased adult obesity may also be among the factors responsible for increased
childhood obesity. Maternal obesity and gestational diabetes lead to large birthweights,
which increase the risk of increased fatness later in life among affected children and
adults (Parsons et al., 1999; Martorell et al., 2001). The decline in breastfeeding in
many parts of the world may also be a cause of increasing levels of childhood obesity,
but its relative importance in developing countries is unknown (Dietz, 2001). Also
unclear is whether undernutrition in utero and infancy is an important factor behind
the obesity epidemic (Martorell et al., 2001).
Some of the countries with high levels of obesity still report significant rates of
childhood stunting and of nutritional deficiencies (ACC/SCN, 2000; de Onis and
Blössner, 2000). The existence of a dual nutrition agenda presents a difficult chal-
lenge because resources are limited. In addition, many countries are poorly prepared
to face the changing epidemiology. For many, there is limited information about how
important obesity and related chronic diseases are in the population and hence little
recognition of these entities as public health problems. There is also limited experience
and expertise about chronic diseases as the focus of nutrition policy in many countries
continues to be only undernutrition.
Many measures need to be taken by developing countries to prevent obesity and
related chronic diseases. For example, information systems need to collect data about
chronic diseases in order to generate the data needed for advocacy and for policy and
program definition. These efforts must include school children, elderly women and
men, and not just women of reproductive age and young children. Professionals will
need to be trained to design, monitor, and evaluate programs aimed at the prevention
of chronic diseases. Nutrition and healthy lifestyles should be topics covered well in
the school curriculum and physical activity should be promoted in schools and in the
general population. Urban planners should support this aim by building recreational
facilities, such as parks and playgrounds. Public education should be aggressive and
Discussion 161

effective, as much as commercial advertisement is, in order to promote healthy diet
and lifestyles food and agricultural policies should stimulate the consumption of
healthy diets. Nutrition labeling should be required for all industrially prepared foods
to assist consumers in food selection and the role of industry in developing healthier
products and in promoting public health and nutrition should be recognized and
encouraged. In much of the developing world, the prevention of obesity and related
chronic diseases should be a priority of governments, as well as of international, bilat-
eral and national organizations. At the same time, efforts must continue to eliminate
nutritional deficiencies.
References
ACC/SCN (United Nations Administrative Committee on Coordination, Sub-Committee
on Nutrition) and IFPRI (International Food Policy Research Institute) (2000).
Fourth Report on The World Nutrition Situation. WHO, Geneva.
Al-Isa, A. (1997). Eur. J. Clin. Nutr. 51, 743–749.
Al-Isa, A.N., and Moussa, M.A.A. (2000). Int. J. Food Sci. Nutr. 51, 221–228.
Al-Nuaim, A.R., Bamgboye, E.A., and Al-Herbish, A. (1996). Int. J. Obes. 20, 1000–1005.
Barlow, S.E., and Dietz, W.H. (1998). Pediatrics 102, e29.
Bender, R., Trautner, C., Spraul, M., and Berger, M. (1998). Am. J. Epidemiol. 147, 42–48.
Björntorp, P. (1997). Lancet 350, 423–426.
Bray, G.A. (1996). In “Present Knowledge in Nutrition”, 7th edn (E.E. Ziegler, and
L.J. Filer, Jr, eds.), pp. 19–32. ILSI Press, Washington, DC.
Calle, E.E., Thun, M.J., Petrelli, J.M., Rodriguez, C., and Heath, Jr, C.W. (1999).
N. Engl. J. Med. 341, 1097–1105.
Cole, T.J., Bellizzi, M.C., Flegal, K.M., and Dietz, W.H. (2000). BMJ 320, 1240–1243.
Crawford, P.B., Story, M., Wang, M.C., Ritchie, L.D., and Sabry, Z.I. (2001). Pediatr. Clin.
North Am. 48, 855–878.
de Onis, M., and Blössner, M. (2000). Am. J. Clin. Nutr. 72, 1032–1039.
Dewey, K.G. (1998). J. Human Lact. 14, 89–91.
Dietz, W.H. (1998). Pediatrics 101, 518–525.
Dietz, W.H. (2001). JAMA 285, 2506–2507.
Dietz, W.H., and Gortmaker, S.L. (1985). Pediatrics 75, 807–812.
Flegal, K.M., Carroll, M.D., Kuczmarski, R.J., and Johnson, C.L. (1998). Int. J. Obes.
22, 39–47.
Gallagher, D., Visser, M. Sepúlveda, D., Pierson, R.N., Harris T., and Heymsfield, S.B.
(1996). Am. J. Epidemiol. 143, 228–239.
Garza, C. and de Onis, M. (1999). In “Human Growth in Context” (F.E. Johnston,
B. Zemel, and P.B. Eveleth, eds.), pp. 85–94. Smith-Gordon, London.
Goran, M.I. (2000). Am. J. Clin. Nutr. 73, 158–171.
Hamil, P.V.V., Drizd, T.A., Johnson, C.L., Reed, R.B., Roche, A.F., and Moore, W.M.
(1979). Am. J. Clin. Nutr. 32, 607–629.
162 Obesity in the developing world

Hasan, M.A., Batieha, A., Jadou, H., Khawaldeh, A.K., and Ajlouni, K. (2001). Eur. J.
Clin. Nutr. 55, 380–386.
Hernández, B., Gortmaker, S.L., Colditz, G.A., Peterson, K.E., Laird, N.M., and Parra-
Cabrera, S. (1999). Int. J. Obes. 23, 845–854.
Hodge, A.M., Dowse, G.K., Toelupe, P., Collins V.R., Imo, T., and Zimmet, P.Z. (1994).
Int. J. Obes. Metab. Dis. 18, 419–428.
Hodge, A.M., Dowse, G.K., Zimmet, P.Z., and Collins, V.R. (1995). Obes. Res.
3, 77S–87S.
Hodge, A.M., Dowse, G.K., Gareeboo, H., Tuomilehto, J., and Alberti, K.G.M.M. (1996).
Int. J. Obes. 20, 137–146.
Kotani, K., Nishida, M., Yamashita, S., Funahashi, T., Fujioka, S., Tokunaga, K., Ishikawa, K.,
Tarui, S., and Matsuzawa, Y. (1997). Int. J. Obes. Rel. Metab. Dis. 21, 912–921.
Martorell, R., and Stein, A.D. (2001). In “Present Knowledge in Nutrition”, 8th edn
(B.A. Bowman, and R.M. Russell, eds.), pp. 665–685. ILSI Press, Washington, DC.
Martorell, R., Malina, R.M., Castillo, R.O., Mendoza, F.S., and Pawson, I.G. (1988). Hum.
Biol. 60, 205–222.
Martorell, R., Kettel Khan, L., Hughes, M.L., and Grummer-Strawn, L.M. (1998).
J. Nutr. 128, 1464–1473.
Martorell, R., Kettel Khan, L., Hughes, M.L., and Grummer-Strawn, L.M. (2000a).
Eur. J. Clin. Nutr. 54, 247–252.
Martorell, R., Kettel Khan, L., Hughes, M.L., and Grummer-Strawn, L.M. (2000b).
Int. J. Obes. 24, 959–967.
Martorell, R., Stein, A.D., and Schroeder, D.G. (2001). J. Nutr. 131, 874S–880S.
Ministerio de Salud (1996). “Encuesta Nacional de Nutrición”. Fascículo Antropometría,
San José, Costa Rica.
Mokhtar, N., Elati, J., Chabir, R., Bour, A., Elkari, K., Schlossman, N.P., Caballero, B., and
Aguenaou, H. (2001). J. Nutr. 131, 887S–892S.
Monge, R., Holst, I., Faiges, F., and Rivero, A. (2000). FNB 21, 293–300.
Musaiger, A.O., and Gregory, W. B. (2000). Int. J. Obes. 24, 1093–1096.
Musaiger, A.O., Al-Ansari, M., and Al-Mannai, M. (2000). Ann. Hum. Biol. 27, 507–515.
Must, A., and Strauss, R.S. (1999). Int. J. Obes. 23, S2–S11.
Neutzling, M.B., Taddei, J.A.A.C., Rodrigues, E.M., and Sigulem, D.M. (2000). Int. J.
Obes. 24, 869–874.
Ogden, C.L., Troiano, R.P., Briefel, R.R., Kuczmarski, R.J., Flegal, K.M., and Johnson, C.L.
(1997). Pediatrics 99, 1–7.
Parsons, T.J., Power, C., Logan, S., and Summerbell, C.D. (1999). Int. J. Obes. 23,
S1–S107.
Pishdad, G.R. (1996). Int. J. Obes. 20, 963–965.
Pi-Sunyer, F.X. (1999). In “Modern Nutrition in Health and Disease”, 9th edn (M.E. Shils,
J.A. Olson, M. Shike, and A.C. Ross, eds.), pp. 1395–1418. Williams & Wilkins,
Baltimore.
Popkin, B.M. (1994). Nutr. Rev. 52, 285–298.
Popkin, B.M., and Doak, C.M. (1998). Nutr. Rev. 56, 106–114.
Popkin, B.M., Paeratakul, S., Ge, K., and Fengying, Z. (1995). Am. J. Public Health
85, 690–694.
References 163

Rivera, J.A., Barquera, S., Campirano, F., Campos, I., Safdie, M., and Tovar, V. (in press).
Pub. Nutr.
Robinson, T.N. (1999). JAMA 282, 1561–1567.
Seidell, J.C. (1997). Horm. Metab. Res. 29, 155–158.
Serdula, M.K., Ivery, D., Coates, R.J., Freedman, D.S., Williamson, D.F., and Byers, T.
(1993). Prev. Med. 22, 167–177.
Sobal, J., and Stunkard, A.J. (1989). Psychol. Bull. 105, 260–275.
Solomon, C.G., and Manson, J.E. (1997). Am. J. Clin. Nutr. 66, 1044S–1050S.
Stevens, J., Cai, J., Pamuk, E.R., Williamson, D.F., Thun, M.J., and Wood, J.L. (1998). N.
Engl. J. Med. 338, 1–7.
Strauss, R. (1999). Curr. Probl. Pediatr. 29, 5–29.
Troiano, R.P., and Flegal, K.M. (1998). Pediatrics 101, 497–504.
Victora, C.G., Morris, S.S., Barros, F.C., de Onis, M., and Yip, R. (1998). J. Nutr.
128, 1134–1138.
Whitaker, R.C., Wright, J.A., Pepe, M.S., Seidel, K.D., and Dietz, W.H. (1997).
N. Engl. J. Med. 337, 869–873.
World Health Organization (1995). Report of a WHO Expert Committee, WHO Technical
Report Series 854. WHO, Geneva.
World Health Organization (1998). Report of a WHO Consultation on Obesity, 3–5 June.
WHO, Geneva.
164 Obesity in the developing world

Diabetes
Kerin O’Dea and Leonard S. Piers
9
Prevalence of diabetes in the developing world,current and historical trends
The emergence of type 2 diabetes is a feature of the growing wave of chronic diseases
and can be viewed as a symptom of the changing social norms and lifestyle resulting
from urbanization and economic development. The high and rising prevalence of dia-
betes, its impact on mortality and morbidity, its disproportionate effect on disadvantaged
individuals, communities and nations, and its high human and economic costs clearly
position diabetes as a significant global public health problem (Vinicor, 1994; IDF,
1997; King et al., 1998; Fagot-Campagna et al., 2000, 2001).
The burden of diabetes worldwide is great and continues to grow (King et al.,
1998). Overall, 90–95% of diabetes is type 2, and this form of the disease (traditionally
considered rare in young people) is now increasingly affecting children and adolescents
(Rosenbloom et al., 1999). Type 2 diabetes is being reported in children and adoles-
cents from the United States, Canada, Japan, Hong Kong, Singapore, Bangladesh,
Libya, the United Kingdom, Australia, and New Zealand (Fagot-Campagna et al.,
2000, 2001). It is type 2 diabetes that is so strongly associated with urbanization and
its accompanying changes in diet and lifestyle, and this chapter will therefore focus
exclusively on this form of diabetes.
Prevalence varies widely by ethnic group and country. Adult rates range from �2%
in rural Bantu people in Tanzania to nearly 50% in US Pima Indians and South Pacific
Nauruans (Amos et al., 1997). Rates are also relatively high in migrant and “trans-
planted populations”, such as Asians in Europe (McKeigue et al., 1991) and African
Americans (Harris et al., 1998). The projected increase in rates, however, is universal.
Although it is estimated that 30–50% of diabetes cases remain undiagnosed, there
were approximately 30 million people worldwide diagnosed with diabetes in 1985
(IDF, 1997). By 1995 this had increased to 135 million (4.0% of the world population),
and conservative projections indicate there may be 300 million people with diabetes
(5.4% of the world population) by 2025 (King et al., 1998). Between 1995 and 2025,
the number of people with diabetes is projected to increase from 51 million to 72
million (a 42% increase) in industrialized countries, and from 84 million to 228
The Nutrition TransitionISBN: 0-12-153654-8
Copyright © 2002 Elsevier Science LtdAll rights of reproduction in any form reserved

million (a 170% increase) in industrializing countries. The countries currently with
the largest number of people with diabetes are India, China, and the United States of
America and this will still be the case in 2025. The majority of people with diabetes
in industrialized countries will be aged 65 years and older. However, the majority of
people with diabetes in industrializing countries will be relatively younger, between
45 and 65 years old. Thus, it appears that the diabetes epidemic disproportionately
affects not only industrializing countries, but also people in their economically pro-
ductive years in these countries (Narayan et al., 2000).
Many indigenous populations are at high risk for type 2 diabetes when they make
the transition to western lifestyle. The extremely high prevalence of diabetes in associ-
ation with severe obesity in Pima Indians and Nauruans has already been noted. Other
populations, such as Australian Aborigines and Torres Strait Islanders, are also at high
risk for early onset type 2 diabetes and its complications (Rowley et al., 1997). Although
obesity is the strongest predictor of diabetes risk in Aboriginal populations, risk is
already increased at the upper end of the “healthy weight” range for Europeans, i.e.
body mass index (BMI) above 22 kg/m2 (Daniel et al., 1999).
In industrialized countries, the disease and its complications appear to dispropor-
tionately affect individuals from economically disadvantaged and racial/ethnic minority
communities (CDC, 1998a). In relation to end-stage renal disease among indigenous
Australians not only is there a very strong link to social disadvantage (Cass et al., 2001),
47% of those on dialysis have diabetes. This compares with 14% of nonindigenous
patients on dialysis (Kerr, 2000). Based on data from several countries, the World
Health Organization (WHO) estimated that in 2000, 30–45% of people with diabetes
worldwide had retinopathy, 10–20% had nephropathy, 20–35% had neuropathy and
10–25% had cardiovascular disease (CVD) (IDF, 1997). Hence, the burden of dia-
betes complications is large worldwide.
Race, ethnicity, genetic dimensions
Explanations of mechanisms underlying ethnic variability in disease usually focus on
differences between groups in the prevalence of individual factors such as genetics,
family history and lifestyle. However, there are at least two important gaps in our under-
standing of this relation. First, we need to better understand what “ethnicity” actually is
and how to measure it. Ethnicity transcends racial designation or genotypic groupings
and represents instead the aggregate of cultural practices, lifestyle patterns, social influ-
ences, religious pursuits and racial characteristics that shape the distinctive identity of a
community. Within a single ethnic designation there can be as much or more variability
in disease and in the determinants of disease than between ethnic groups. Asian and
Pacific Islanders, for example, comprise 30–50 ethnic subgroups with tremendous
diversity in language, culture and health status (O’Loughlin, 1999).
Categorizing such groups under a single label can mask the rich diversity that we
should be striving to describe and understand. Ethnic labels may provide guidance in
targeting interventions or research efforts, but they do little to help us understand the
166 Diabetes

underlying causal mechanisms. Moreover, labels such as white, Caucasian, black,
European and minority have little scientific, biologic or anthropologic value (Bhopal
and Donaldson, 1998). Such terminology often carries social meanings that are best
avoided, as well as the assumption that one population represents the standard or norm.
Careful descriptions of the ancestry, geographic origin, birthplace, language, religion
and migration history of populations studied are needed to make the basis for classi-
fication into ethnic groups clear (Bhopal and Donaldson, 1998).
Another major problem is that many studies investigating the relation between
ethnicity and disease do not take potentially confounding factors into account. It is well
established that ethnic minority groups tend to be disproportionately poor, making
socioeconomic status a probable confounder of the relation. Therefore, research that
does not take socioeconomic status into consideration can lead to incorrect conclusions,
such that susceptibility attributed to ethnicity may really relate to poverty (O’Loughlin,
1999). Further, socioeconomic status is difficult to measure comprehensively because
it comprises many factors; these include, among others, educational attainment, income,
employment, access to goods, services and labor markets, access to healthy foods,
safe and inexpensive places to exercise, smoke-free environments, and educational,
economic, political and cultural discrimination. Therefore, even when socioeconomic
status is taken into account, confounding can still be a problem if measurement of
socioeconomic status is incomplete (O’Loughlin, 1999).
Hence, ethnicity is difficult to define, but most definitions reflect self-identification
with cultural traditions that provide both a meaningful social identity and boundaries
between groups (Barot, 1996). This section has considered evidence that uses various
definitions of ethnicity. However, in the main these definitions are those that people
apply to themselves. Thus ethnicity as used here includes cultural identity, place of
origin and skin color, and so includes white and nonwhite groups.
Research comparing health attributes between racial or ethnic groups has a long his-
tory. Notably higher rates of morbidity, mortality or both have been observed with respect
to stroke among Afro-Caribbeans in the UK (Chaturvedi and Fuller, 1996), diabetes and
coronary artery disease among south Asians in the United Kingdom (Chaturvedi and
Fuller, 1996; Yudkin, 1996; Cappuccio, 1997; Mather et al., 1998) and Canada (Sheth
et al., 1999), diabetes, stroke and hypertensive disease among Hispanic people in New
York City (Fang et al., 1997). However, explanations for between-country differences in
health will require an appreciation of the complex interactions of history, culture, politics,
economics, and the status of women and ethnic minorities (Lynch et al., 2001).
Risk factors: environmental, genetic
It is generally assumed that type 2 diabetes arises from an interaction between genetic
and lifestyle factors. Much of the evidence for a genetic base for type 2 diabetes comes
from studies in twins, with higher rates of concordance in monozygotic (MZ) than in
dizygotic (DZ) twin pairs (Kaprio et al., 1992). If conducted and analyzed properly,
studies of the similarities and differences within both MZ and DZ twin pairs can be
Risk factors: environmental, genetic 167

used to make guarded inference about the roles of genetic and nongenetic factors on the
etiology of disease. Twin studies can never prove the existence of a genetic suscepti-
bility, however, and at best can indicate the extent of genetic determination consistent
with a specific model, under certain important assumptions (Hopper, 1999).
A widely cited study from the UK reported rates of concordance for type 2 diabetes
in MZ twin pairs at 1, 5, 10, and 15 years follow-up that were 17%, 33%, 57%, and
76%, respectively. The concordance rate for any abnormality of glucose metabolism
(either type 2 diabetes or impaired glucose tolerance) at 15 years follow-up was 96%
(Medici et al., 1999). However, lower rates of concordance in a study conducted within
the Danish Twin Registry (Poulsen et al., 1999) suggest that there may have been unin-
tended selection bias in the relatively small sample in that original landmark study
(Hopper, 1999). The population-based Danish study suggests that whereas MZ pairs
are concordant for diabetes, and more so than DZ pairs, the difference is not large and
consistent with chance (Poulsen et al., 1999). However, twins share more than genes
in utero. Nongenetic intergenerational mechanisms related to the metabolic milieu include
amniotic fluid growth factors and a range of hormones, plus other maternal exposures.
Lifestyle interventions
Type 2 diabetes has long been linked with behavioral and environmental factors such
as overweight, physical inactivity, and dietary habits. Obesity is by far the strongest
predictor of diabetes risk in all populations examined to date and almost certainly
underlies the increase of type 2 diabetes in most societies, for example “whites” in the
US (Flegal et al., 1998). This change probably underlies the “insulin resistance syn-
drome”, which for many people is likely to increase both the incidence of diabetes and,
through its multiple risk factor associations, cardiovascular risk (Haffner and Miettinen,
1997). Epidemiological data support the roles of obesity (Haffner et al., 1986), fat
intake (Marshall et al., 1994), and low physical activity (Helmrich et al., 1991) as risk
factors for diabetes and have led to a wave of trials to prevent type 2 diabetes by
lifestyle or drug interventions (Hammersley et al., 1997; NIDDK, 2001). These trials
have been preceded by positive results in a large community-based intervention in
Da-Qing, China (Pan et al., 1997) and the beneficial metabolic effects seen in a small
group of urbanized Australian Aborigines who returned temporarily to a traditional
lifestyle about 20 years ago (O’Dea, 1984). In a study on the relationships between
lifestyle and cardiovascular risk factors among the Brazilian Amondava, one of the
world’s most isolated populations Pavan et al. (1999) also concluded that a traditional
lifestyle (no contact with “civilization”, diet based on complex carbohydrates and
vegetables, high energy expenditure) may protect against the development of hyper-
tension, hypercholesterolemia, and diabetes.
In a randomized trial of 522 middle-aged, overweight people with impaired glucose
tolerance Tuomilehto et al. (2001) showed that lifestyle changes can reduce the risk of
progression to diabetes by a striking 58% over four years. Each person in the inter-
vention group received individualized counseling aimed at reducing weight, reducing
intake of total fat and saturated fat and increasing intake of dietary fiber and increasing
physical activity. The net weight loss at the end of two years, 3.5 kg in the intervention
168 Diabetes

group and 0.8 kg in the control group, was modest. However, the cumulative incidence
of diabetes after four years was 11% in the intervention group and 23% in the control
group. The reduction in the incidence of diabetes was directly associated with the
changes in lifestyle. One case of diabetes was preventable for every five subjects with
impaired glucose tolerance treated for five years, or for every 22 subjects treated for
one year. Two earlier studies from Sweden (Eriksson and Lindgarde, 1991) and China
(Pan et al., 1997) showed that lifestyle interventions may delay progression from
impaired glucose tolerance to diabetes. However, the Swedish study was not ran-
domized and the Chinese study was randomized by clinic, rather than by individual.
Thus, the Finnish study offers us the best evidence so far that lifestyle modification
can indeed prevent diabetes.
The putative “thrifty genotype”
The alarmingly high prevalence of diabetes among Pima Indians and Nauruans pro-
vides further important clues to causation. It has been postulated that until recently
such people were hunter–gatherers or agriculturalists and may have acquired an
insulin-sensitive metabolism favoring fat storage at times of plenty but would not nec-
essarily require a similar degree of insulin sensitivity in muscle tissue, where glucose
entry to cells might be largely stimulated by high activity levels (Orchard, 1994). With
westernization, a plentiful supply of energy-dense food has been accompanied by a
reduction in physical activity. Both factors may therefore cause the previously favor-
able metabolic profile seen in “survivors” to become a handicap: the “thrifty genotype
rendered detrimental by ‘progress’ ” (Neel, 1962). Reaven (1998) has recently further
developed this “muscle resistance-thrifty genotype” hypothesis by suggesting that mus-
cle insulin resistance will favor survival by preserving muscle protein, thus enhancing
the ability to hunt and gather.
On the basis of our research on the impact of lifestyle change on diabetes and asso-
ciated conditions in Australian Aborigines, we have proposed an alternative hypo-
thesis of “selective insulin resistance” to explain how the “thrifty genotype” could have
operated to favor survival under conditions of the hunter–gatherer lifestyle, but pro-
mote the development of obesity and type 2 diabetes when populations became urban-
ized (O’Dea, 1992). Under conditions of the hunter–gatherer lifestyle, a metabolism
that could efficiently convert excess energy intake into depot fat would confer survival
advantage. The feasts for hunter–gatherers were usually provided by large animals
(terrestrial or marine). In general wild animals have low carcass fat contents, in stark
contrast to domesticated meat animals such as beef cattle and sheep (Crawford, 1968;
Naughton et al., 1986; O’Dea et al., 1990). Thus the feasts may have often been high
in protein and relatively low in carbohydrate and fat. An efficient system for convert-
ing excess dietary protein into glucose and fat as readily available forms of energy
could be achieved by a high capacity for hepatic gluconeogenesis, which was not sensi-
tive to insulin suppression, coupled with a high capacity for hepatic lipogenesis which
was sensitive to stimulation by insulin. Thus, an efficient system for fat accumulation to
take advantage of the “feasts” could be achieved under conditions of hyperinsulinemia
in which there was resistance to the hypoglycemic actions of insulin but normal
Risk factors: environmental, genetic 169

sensitivity to those actions of insulin involved in fat deposition. We have made obser-
vations consistent with this possibility utilizing glucose turnover studies in Aborigines
at high risk of type 2 diabetes (Proietto et al., 1992). A key question of course is
whether the selective insulin resistance is genetic or acquired.
The “thrifty genotype” hypothesis is now being down played (Bjorntorp, 2001) –
even by its original proposer (Neel, 1999). Over the past 35 years, it has become
increasingly clear that essential hypertension and obesity share many of the epidemio-
logical features of type 2 diabetes. Both are diseases of urbanization, with a very grad-
ual onset. Both are familial, with the disease the result of a complex interplay of genetic
and environmental factors. It has also become clear that genetically type 2 diabetes is
an etiologically heterogeneous entity. A good illustration is the recognition of a distinc-
tive maturity-onset-type diabetes of youth (MODY) in which the impairment of glucose
metabolism has an early onset, progresses slowly, and appears to be inherited as a sim-
ple dominant trait (Spielman and Nussbaum, 1992; Fajans et al., 1994). In the 25 years
since its recognition, MODY has by now been divided into some five subtypes, each
associated with a specific aspect of glucose metabolism, and the locus for each sub-
type generally characterized by numerous different mutations at the molecular level
(Spielman and Nussbaum, 1992; Fajans et al., 1994). There are also a number of other
rare genetic syndromes that seem to carry an increased risk of type 2 diabetes. It does
not appear that these rare, monogenically inherited subtypes will collectively comprise
more than about 10% of what is commonly diagnosed as type 2 diabetes (Neel, 1999).
Obesity
Many investigators studying metabolic diseases have simply used body mass index
(BMI) as a measure of relative body size or obesity and attempted to match groups for
this variable, without considering that BMI does not account for the fact that people
with similar BMI may have widely varying amounts and distribution of their adipose
tissue. When the relationship between insulin sensitivity and BMI in a group of 93
healthy subjects �45 years old was examined by Kahn et al. (1993), it was found that
these two variables are not simply linearly related. Even individuals who would be
considered to be lean (BMI �25 kg/m2) had a broad range of insulin sensitivity with
some of these apparently lean subjects having insulin sensitivity values that were as
low as those observed in individuals who would be considered to be obese and insulin
resistant. The reason(s) for this lack of a simple relationship between body size and
insulin sensitivity, especially in relatively lean subjects, is complex because it is well
recognized that insulin sensitivity can be influenced by factors such as dietary nutrients
(Mann, 2000), body fat distribution (Bjorntorp, 1993; Fujimoto et al., 1994; Abate et al.,
1995; Goodpaster et al., 1999), genetics (Barroso et al., 1999), acute exercise (Prigeon
et al., 1995), physical fitness (Kahn et al., 1990), and medications (Kahn et al., 1989).
Body fat distribution
It is becoming abundantly clear that the pattern of body fat distribution is a major
determinant of the residual variation of insulin sensitivity. Accumulation of body fat
170 Diabetes

centrally is associated with insulin resistance, whereas distribution of body fat in a
peripheral pattern is less metabolically important from the standpoint of impairing
insulin action (Kahn et al., 2001). However, although it is clear that central adiposity
is of greater importance metabolically (Despres et al., 1990; Bjorntorp, 1993), there is
still debate about which of the central depots is more important. Although many groups
have proposed the role of the intra-abdominal depot (Bjorntorp, 1993; Fujimoto et al.,
1994), others have argued that it is central subcutaneous fat accumulation that is the
critical determinant of reduced insulin sensitivity (Abate et al., 1995, 1996). Also, the
association between abdominal obesity and hyperglycemia is stronger in the presence
of a parental history of diabetes (van Dam et al., 2001).
If intra-abdominal fat depot is an important contributor to insulin sensitivity, then
interventions that reduce adipose tissue mass within the peritoneal cavity should be
associated with improvements in insulin sensitivity. This is illustrated by the results of
a 3-month weight loss program in 21 older men that was associated with an average
4.5 kg (10%) weight loss, of which 80% was fat. This decrease in fat mass was associ-
ated with a 24% reduction in intra-abdominal fat area, a 58% improvement in insulin
sensitivity and the development of a less atherogenic lipid profile (Purnell et al., 2000).
Similar findings of the effect of weight loss on body fat distribution and insulin sensi-
tivity were also reported by Goodpaster et al. (1999).
Although the issue of which of the central depots is the most important is still being
debated and how these fat depots may predict this reduction in whole body insulin
sensitivity is also unclear, it is apparent that marked variability in these parameters
occurs even in healthy subjects and may contribute to differences in disease risk among
these individuals.
Public health implications of the obesity pandemic
The increase in obesity worldwide will have an important impact on the global incidence
of cardiovascular disease, type 2 diabetes, cancer, osteoarthritis, work disability, and
sleep apnea. Obesity has a more pronounced impact on morbidity than on mortality.
Disability due to obesity-related type 2 diabetes will increase particularly in indus-
trializing countries, as insulin supply is usually insufficient in these countries. As
a result, in these countries, an increase in disabling macrovascular (atherosclerosis)
and microvascular (nephropathy, neuropathy, and retinopathy) disease is expected.
Increases in the prevalence of obesity will potentially lead to an increase in the
number of years that subjects suffer from obesity-related morbidity and disability. A
1% increase in the prevalence of obesity in such countries as India and China leads to
20 million additional cases of obesity. Thus the focus should be on prevention pro-
grams to stem the obesity epidemic more efficiently than weight-loss programs, which
have a poor record of sustainability over the long term (Visscher and Seidell, 2001).
The role of physical inactivity
The goal of treatment in type 2 diabetes is to achieve and maintain near-normal blood
glucose levels and optimal lipid levels, in order to prevent or delay the microvascular,
Risk factors: environmental, genetic 171
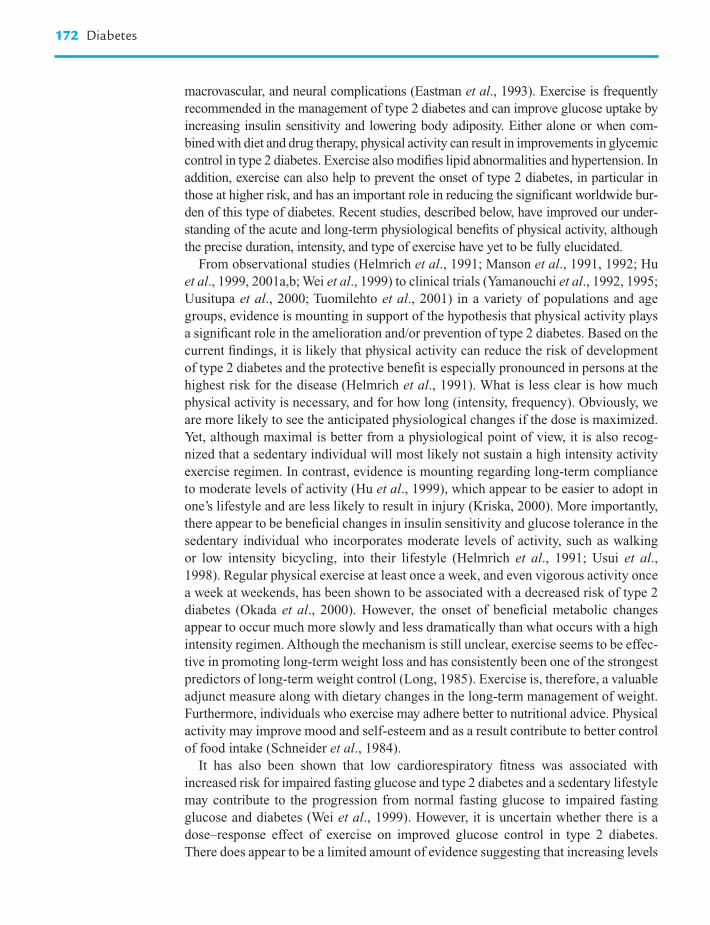
macrovascular, and neural complications (Eastman et al., 1993). Exercise is frequently
recommended in the management of type 2 diabetes and can improve glucose uptake by
increasing insulin sensitivity and lowering body adiposity. Either alone or when com-
bined with diet and drug therapy, physical activity can result in improvements in glycemic
control in type 2 diabetes. Exercise also modifies lipid abnormalities and hypertension. In
addition, exercise can also help to prevent the onset of type 2 diabetes, in particular in
those at higher risk, and has an important role in reducing the significant worldwide bur-
den of this type of diabetes. Recent studies, described below, have improved our under-
standing of the acute and long-term physiological benefits of physical activity, although
the precise duration, intensity, and type of exercise have yet to be fully elucidated.
From observational studies (Helmrich et al., 1991; Manson et al., 1991, 1992; Hu
et al., 1999, 2001a,b; Wei et al., 1999) to clinical trials (Yamanouchi et al., 1992, 1995;
Uusitupa et al., 2000; Tuomilehto et al., 2001) in a variety of populations and age
groups, evidence is mounting in support of the hypothesis that physical activity plays
a significant role in the amelioration and/or prevention of type 2 diabetes. Based on the
current findings, it is likely that physical activity can reduce the risk of development
of type 2 diabetes and the protective benefit is especially pronounced in persons at the
highest risk for the disease (Helmrich et al., 1991). What is less clear is how much
physical activity is necessary, and for how long (intensity, frequency). Obviously, we
are more likely to see the anticipated physiological changes if the dose is maximized.
Yet, although maximal is better from a physiological point of view, it is also recog-
nized that a sedentary individual will most likely not sustain a high intensity activity
exercise regimen. In contrast, evidence is mounting regarding long-term compliance
to moderate levels of activity (Hu et al., 1999), which appear to be easier to adopt in
one’s lifestyle and are less likely to result in injury (Kriska, 2000). More importantly,
there appear to be beneficial changes in insulin sensitivity and glucose tolerance in the
sedentary individual who incorporates moderate levels of activity, such as walking
or low intensity bicycling, into their lifestyle (Helmrich et al., 1991; Usui et al.,
1998). Regular physical exercise at least once a week, and even vigorous activity once
a week at weekends, has been shown to be associated with a decreased risk of type 2
diabetes (Okada et al., 2000). However, the onset of beneficial metabolic changes
appear to occur much more slowly and less dramatically than what occurs with a high
intensity regimen. Although the mechanism is still unclear, exercise seems to be effec-
tive in promoting long-term weight loss and has consistently been one of the strongest
predictors of long-term weight control (Long, 1985). Exercise is, therefore, a valuable
adjunct measure along with dietary changes in the long-term management of weight.
Furthermore, individuals who exercise may adhere better to nutritional advice. Physical
activity may improve mood and self-esteem and as a result contribute to better control
of food intake (Schneider et al., 1984).
It has also been shown that low cardiorespiratory fitness was associated with
increased risk for impaired fasting glucose and type 2 diabetes and a sedentary lifestyle
may contribute to the progression from normal fasting glucose to impaired fasting
glucose and diabetes (Wei et al., 1999). However, it is uncertain whether there is a
dose–response effect of exercise on improved glucose control in type 2 diabetes.
There does appear to be a limited amount of evidence suggesting that increasing levels
172 Diabetes

of physical activity contribute to better diabetes control (Yamanouchi et al., 1995).
Clearly, additional studies are needed to determine the influence of physical fitness on
the treatment and prevention of type 2 diabetes (Kelley and Goodpaster, 2001).
Dvorak et al. (1999) hypothesized that metabolically obese, normal-weight
(MONW) women – a hypothesized subgroup of the general population – would dis-
play higher levels of total and visceral fat and lower levels of physical activity than
normal women. They studied a cohort of 71 healthy nonobese women (21–35 years
old), MONW women were identified based on cut off points for insulin sensitivity
(impaired � glucose disposal �8 mg/min/kg of fat-free mass (FFM), n � 13 vs.
normal � glucose disposal �8 mg/min/kg of FFM, n � 58). Body composition was
measured by dual energy X-ray absorptiometry and body fat distribution by computed
tomography, cardiorespiratory fitness from VO2max on a treadmill, physical activity
energy expenditure using doubly labeled water and indirect calorimetry, glucose toler-
ance with an oral glucose tolerance test, serum lipid profile, and dietary intake. They
observed a higher body fat percentage and higher abdominal (both subcutaneous and
visceral) adiposity in the MONW group versus the normal group. The MONW group
showed a lower physical activity energy expenditure, but no difference in cardiorespi-
ratory fitness was noted between groups. Hence, despite a normal body weight and
lack of difference in cardiorespiratory fitness compared to controls, young apparently
healthy MONW women had lower physical activity energy expenditure, which may
have produced a cluster of high risk phenotypic characteristics that predispose to
type 2 diabetes and cardiovascular disease (Dvorak et al., 1999).
Even if activity is known to be beneficial, at the population level we are faced with
the challenge of reaching sedentary individuals who would most likely benefit from an
increase in physical activity. The protective nature of a physically active lifestyle in
preventing type 2 diabetes does not have a lasting impact once a return to a sedentary
way of life is made. Therefore, from a public health viewpoint, long-term commitments
to increased activity are required. In the large prospective Da-Qing study (Pan et al.,
1997), both dietary and physical activity interventions reduced the incidence of type
2 diabetes considerably in a Chinese population. Whether this is also achievable in
other ethnic populations at high risk for developing type 2 diabetes, and whether addi-
tional pharmacological measures are useful, is currently under investigation.
In conclusion, the question is no longer “can increased physical activity benefit the
individual with type 2 diabetes?” The answer is yes. Future research needs to refine
questions regarding type, dose, and magnitude of effects of physical activity (and its
subcategory exercise) on glycemic control, insulin sensitivity, and on risk factors for
cardiovascular disease within the context of program acceptability and feasibility
(Tudor-Locke et al., 2000). The issue of sustainability of increased levels of physical
activity at both the individual and population level is the major challenge, as urban life
becomes increasingly “obesigenic” (Egger and Swinburn, 1997).
Insulin resistance and blood pressure
The relationship between physical activity and type 2 diabetes appears to be mediated
by serum true insulin level and components of the insulin resistance syndrome
Risk factors: environmental, genetic 173
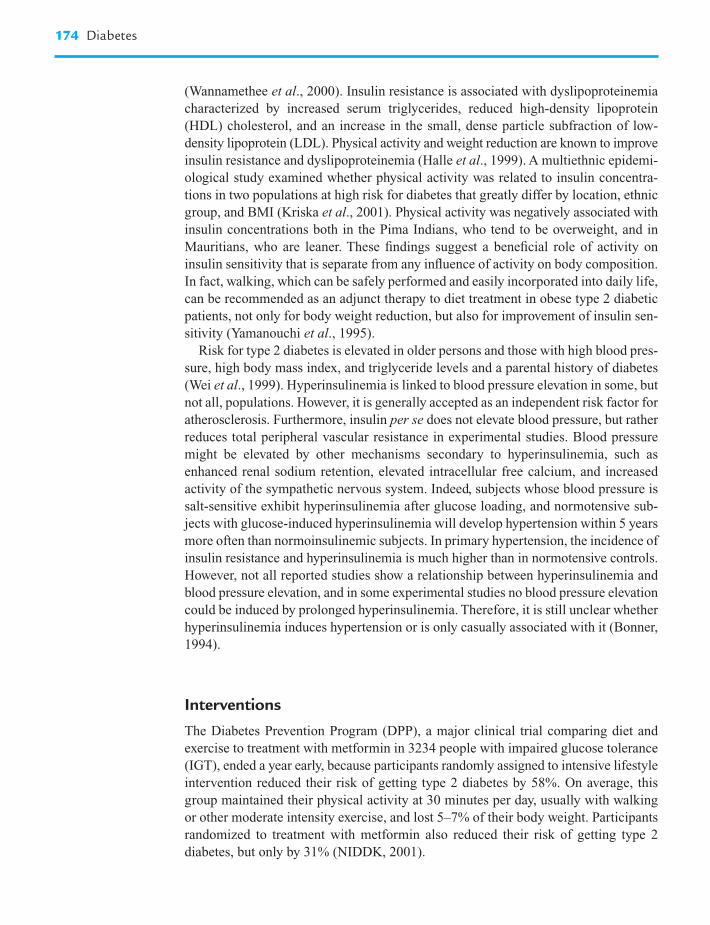
(Wannamethee et al., 2000). Insulin resistance is associated with dyslipoproteinemia
characterized by increased serum triglycerides, reduced high-density lipoprotein
(HDL) cholesterol, and an increase in the small, dense particle subfraction of low-
density lipoprotein (LDL). Physical activity and weight reduction are known to improve
insulin resistance and dyslipoproteinemia (Halle et al., 1999). A multiethnic epidemi-
ological study examined whether physical activity was related to insulin concentra-
tions in two populations at high risk for diabetes that greatly differ by location, ethnic
group, and BMI (Kriska et al., 2001). Physical activity was negatively associated with
insulin concentrations both in the Pima Indians, who tend to be overweight, and in
Mauritians, who are leaner. These findings suggest a beneficial role of activity on
insulin sensitivity that is separate from any influence of activity on body composition.
In fact, walking, which can be safely performed and easily incorporated into daily life,
can be recommended as an adjunct therapy to diet treatment in obese type 2 diabetic
patients, not only for body weight reduction, but also for improvement of insulin sen-
sitivity (Yamanouchi et al., 1995).
Risk for type 2 diabetes is elevated in older persons and those with high blood pres-
sure, high body mass index, and triglyceride levels and a parental history of diabetes
(Wei et al., 1999). Hyperinsulinemia is linked to blood pressure elevation in some, but
not all, populations. However, it is generally accepted as an independent risk factor for
atherosclerosis. Furthermore, insulin per se does not elevate blood pressure, but rather
reduces total peripheral vascular resistance in experimental studies. Blood pressure
might be elevated by other mechanisms secondary to hyperinsulinemia, such as
enhanced renal sodium retention, elevated intracellular free calcium, and increased
activity of the sympathetic nervous system. Indeed, subjects whose blood pressure is
salt-sensitive exhibit hyperinsulinemia after glucose loading, and normotensive sub-
jects with glucose-induced hyperinsulinemia will develop hypertension within 5 years
more often than normoinsulinemic subjects. In primary hypertension, the incidence of
insulin resistance and hyperinsulinemia is much higher than in normotensive controls.
However, not all reported studies show a relationship between hyperinsulinemia and
blood pressure elevation, and in some experimental studies no blood pressure elevation
could be induced by prolonged hyperinsulinemia. Therefore, it is still unclear whether
hyperinsulinemia induces hypertension or is only casually associated with it (Bonner,
1994).
Interventions
The Diabetes Prevention Program (DPP), a major clinical trial comparing diet and
exercise to treatment with metformin in 3234 people with impaired glucose tolerance
(IGT), ended a year early, because participants randomly assigned to intensive lifestyle
intervention reduced their risk of getting type 2 diabetes by 58%. On average, this
group maintained their physical activity at 30 minutes per day, usually with walking
or other moderate intensity exercise, and lost 5–7% of their body weight. Participants
randomized to treatment with metformin also reduced their risk of getting type 2
diabetes, but only by 31% (NIDDK, 2001).
174 Diabetes

As already noted, smaller studies in China (Pan et al., 1997) and Finland (Tuomilehto
et al., 2001) have shown that diet and exercise can delay type 2 diabetes in at-risk
people, but the DPP, conducted at 27 centers across the US, is the first major trial to
show that diet and exercise can effectively delay diabetes in a diverse American
population of overweight people with IGT. In the study of Finnish adults at high risk
for type 2 diabetes showed that losing up to 5 kg, boosting exercise, and switching
to a reduced fat, higher fiber diet reduced the risk of developing diabetes by 58%
(Tuomilehto et al., 2001). Researchers followed 522 Finns, for 2–6 years, who were
all overweight and showed IGT. Half received intensive instruction from a dietitian in
sessions at least once every 3 months and from fitness professionals at a health club
to which participants got free memberships. Those participants developed diabetes
less often than did people in the other half of the group, who received advice about the
importance of a healthy diet and regular exercise but not periodic instruction.
Body weight and the prevalence of obesity are rising so rapidly in many countries
that the World Health Organization has recognized that there is a “global epidemic of
obesity” (WHO, 1997). The prevalence of type 2 diabetes is rising in parallel. While
both obesity and type 2 diabetes have a combined genetic and environmental back-
ground, the epidemic must be due to major changes in the environment. There is a great,
and still insufficiently understood, variation in prevalence of obesity and in the rate of
change of the prevalence. The prevailing contention is that the epidemic is due to the
changes in the society leading to overnutrition and a sedentary life. In Denmark, a steep
rise has taken place in the prevalence of obesity among schoolboys and young men in
two phases linked to the birth cohorts of the 1940s and of the mid-1960s and later
(Sorensen, 2000). This rise is consistent with environmental influences operating
early in life.
Intrauterine factors
The maternal factors of diabetes, obesity, and pregnancy weight gain alter the intrauter-
ine environment and thereby increase the risk of later obesity in the offspring. Of these
maternal factors, evidence is strongest for the role of maternal diabetes. No single
mechanism explains how these maternal factors could change the intrauterine environ-
ment to increase obesity risk. However, all potential mechanisms involve an altered
transfer of metabolic substrates between mother and fetus, which may influence the devel-
oping structure or function of the organs involved in energy metabolism (Whitaker
and Dietz, 1998).
Intrauterine exposure to diabetes per se conveys a high risk for the development of
diabetes and obesity in offspring in excess of risk attributable to genetic factors alone
(Dabelea et al., 2000a). Pettitt and Knowler (1998) studied the long-term effect of the
diabetic pregnancy on Pima Indian offspring to determine how the prevalence of diabetes
during pregnancy was influenced by early life events, such as birth weight and type of
infant feeding, that are known to influence the prevalence of diabetes in nonpregnant
Pima adults. They found that diabetes during pregnancy was a major risk factor for
early onset obesity and type 2 diabetes in the offspring during adolescence and early
adulthood. Diabetes in the next generation was less common among children breast-fed
Risk factors: environmental, genetic 175

for at least 2 months (6.9% and 30.1% among offspring of nondiabetic and diabetic
women, respectively) than among bottle-fed children (11.9% and 43.6%, respectively).
The apparent protective effect of breast-feeding may be related to attenuating the
increased appetite in the babies of diabetic mothers secondary to their hyperinsulin-
emia at birth. It is possible that the increasing fat content of breast milk during each
feed produces greater satiety and helps curb their overconsumption.
The prevalence of diabetes during pregnancy was influenced by other conditions,
such as birth weight, which is known to influence the prevalence of diabetes in this
population in general. The highest rates of diabetes during pregnancy at 25–34 years
of age (25%) were found among women with a birth weight below 2.5 kg. The infant
of the woman with diabetes during pregnancy was at risk of becoming obese and of
developing type 2 diabetes at a young age. Hence, the effects of the diabetic pregnancy
can be thought of as a vicious cycle, with consequences for the offspring extending
well beyond the neonatal period. The young woman whose mother had diabetes during
pregnancy is at risk of perpetuating the cycle by developing diabetes by her child-
bearing years (Dabelea et al., 2000b). The prevalence of diabetes in women of child-
bearing age is influenced by factors occurring early in life (i.e., birth weight and type
of infant feeding). Whether or not the long-term adverse outcomes, including diabetic
pregnancies in the next generation, can be lessened or prevented by meticulous control
of diabetes during pregnancy, careful attention to intrauterine growth, or more general
infant breast-feeding remains unknown (Pettitt and Knowler, 1998), although it has
strong biological plausibility.
The standard risk factors – dyslipidemia, hypertension and smoking – do not fully
explain the raised cardiovascular risk in diabetes. The observations of an association
between short stature and microalbuminuria suggested that intrauterine or early infant
nutrition may represent a common antecedent, these having also been shown to pre-
dict both components of the insulin resistance syndrome and cardiovascular disease in
adult life (Yudkin, 1995). However, in a study on 169 subjects exposed to malnutrition
in utero during the siege of Leningrad (now St Petersburg) in 1941–44, intrauterine
malnutrition was not associated with glucose intolerance, dyslipidemia, hypertension,
or cardiovascular disease in adulthood (Stanner et al., 1997).
In India there is a rapidly escalating epidemic of the insulin resistance syndrome
and its major sequelae (diabetes and coronary heart disease). Contribution of genes
and environment is under debate. Small size at birth coupled with subsequent obesity
increases risk for insulin resistance syndrome in later life. The tendency of Indians to
have higher body fat and central adiposity compared with other races may be pro-
grammed in utero. The adipose tissue releases not only fatty acids but also a number
of proinflammatory cytokines, which increase insulin resistance and cause endothelial
dysfunction. Crowding, infections, and environmental pollution in Indian cities may
increase cardiovascular risk by stimulating cytokine production. Prevention of diabetes
and coronary heart disease in India will need to be addressed through a comprehensive
life course approach. It is clear that such an approach should encompass not only on
the conventional adult risk factors (diet, exercise, lifestyle generally), but also on early
life influences and other factors associated with poverty such as high burden of infectious
diseases (Yajnik, 2001).
176 Diabetes

It has been shown that aspects of maternal diet exert an influence on fetal growth,
especially the dietary intake of carbohydrate, protein and some micronutrients. How-
ever, these relationships are less strong than might have been predicted, especially
when compared with the associations that can be drawn with maternal shape, size and
metabolic capacity. Maternal height, weight and body composition relate to the meta-
bolic capacity of the mother and her ability to provide an environment in which the
delivery of nutrients to the fetus is optimal. Current evidence suggests that the size
of the mother determines her ability to support protein synthesis, and that maternal
protein synthesis, especially visceral protein synthesis, is very closely related to fetal
growth and development. The extent to which the effect of an adverse environment
in utero can be reversed by improved conditions postnatally is not clear (Jackson,
2000).
Is there a role for diet? How might thetransition that we find in the developed world in diet affect the diabetes trends independent of its effect on obesity?
The demographic and economic transition that many developing countries are under-
going is producing important changes in diet and lifestyle that greatly impact on disease
risks. Among the risk behaviors associated with socioeconomic transition and urban-
ization are excessive dietary fat intake, sedentary lifestyle, smoking, and environ-
mental contamination. Combined with a reduced infant mortality and increased life
expectancy, those risk factors lead to an increasing prevalence of chronic disease like
type 2 diabetes and coronary heart disease (Caballero and Rubinstein, 1997).
The average prevalence of obesity (BMI 30 kg/m2) among European centers
participating in the WHO-MONICA study between 1983 and 1986 was about 15% in
men and 22% in women. Prevalence figures ranged in men from 7% in Gothenburg to
22% in Lithuania and in women from 9% to 45% in the same places. Some monitoring
projects or repeated surveys suggest that the prevalence of obesity has been increasing
during the past 15 years in some European countries. Data from The Netherlands suggest
that average weight increase of the order of about 1 kg can be responsible for quite
dramatic increases in the prevalence of obesity. This suggests that only small changes
in the daily caloric balance may be sufficient to increase the number of obese subjects
in populations (Seidell, 1997).
Prospective studies in the US have highlighted the potential role of saturated fat in
increasing the risk of type 2 diabetes. For example, to further investigate the role of
dietary fat and carbohydrate as potential risk factors for the onset of type 2 diabetes,
current diet was assessed among a geographically based group of 1317 subjects with-
out a prior diagnosis of diabetes who were seen in the period from 1984 to 1988 in two
counties in southern Colorado. In this study, 24-hour diet recalls were reported prior
to an oral glucose tolerance test. Persons with previously undiagnosed diabetes
Is there a role for diet? 177

(n � 70) and impaired glucose tolerance (n � 171) were each compared with confirmed
normal controls (n � 1076). The adjusted odds ratios relating a 40 g/day increase in
fat intake to type 2 diabetes and impaired glucose tolerance were 1.51 (95% confidence
interval (CI) 0.85–2.67) and 1.62 (95% CI 1.09–2.41), respectively. Restricting cases
to diabetic persons with fasting glucose greater than 140 mg/dl and persons with
impaired glucose tolerance confirmed on follow-up, the odds ratios increased to 3.03
(95% CI 1.07–8.62) and 2.67 (95% CI 1.33–5.36), respectively. The findings of this
study support the hypothesis that high-fat, low-carbohydrate diets are associated with
the onset of type 2 diabetes in humans (Marshall et al., 1991). In a later study Marshall
et al. (1994) concluded that fat consumption significantly predicts type 2 diabetes risk
in subjects with IGT after controlling for obesity and markers of glucose metabolism.
High intake of trans and saturated fatty acids has been shown to increase the risk of
coronary heart disease. Christiansen et al. (1997) studied the effects of diets enriched
in various fatty acids on postprandial insulinemia and fasting serum levels of lipids and
lipoproteins in obese patients with type 2 diabetes. They concluded that in the pres-
ence of unchanged glycemia, both dietary trans fatty acids and saturated fatty acids
induce an increase in postprandial insulinemia in obese patients with type 2 diabetes.
However, most of these conclusions were reached based on data obtained from self-
reported dietary intakes. Schaefer et al. (2000) conducted a study to investigate the
efficacy of food-frequency questionnaires and diet records in subjects fed natural-food
diets of known composition. They compared the validity of a semi-quantitative food-
frequency questionnaire in assessing intakes of macronutrients (absolute amounts and
percentages of energy) by 19 subjects fed natural-food diets of known composition.
They also tested 3-day diet records in small subsets (n � 5 or 6). In their study each
subject consumed three different diets for 6 weeks and self-reported his or her food
intake by using a food-frequency questionnaire and a diet record. The diets varied
in their chemically analyzed contents of fat (15–35% energy), saturated fat (5–14%),
monounsaturated fat (5–14.5%), polyunsaturated fat (2.5–10.5%), carbohydrate
(49–68%), and cholesterol (108–348 mg/day). The food-frequency questionnaire
significantly underestimated fat, saturated fat, monounsaturated fat, and protein intakes
and significantly overestimated carbohydrate intake with the high-fat diet. The percentage
of energy from fat was significantly underestimated for the high-fat diet and significantly
overestimated for the very-low-fat diet. Estimates from the food-frequency question-
naire differed significantly from actual intakes for fat (absolute and percentage), satu-
rated fat (absolute and percentage), monounsaturated fat (absolute and percentage),
and protein (percentage) in the high-fat diet and for polyunsaturated fat (absolute and
percentage), saturated fat (percentage), fiber (absolute), and cholesterol (daily
absolute; in mg/day) in the lower-fat diet. Estimates from the diet records agreed bet-
ter with actual intakes than did estimates from the food-frequency questionnaire
except for monounsaturated fat (absolute and percentage) in the high-fat diet and
polyunsaturated fat (percentage) in the lower-fat diet and the very-low-fat diet. Their
data indicated that the food-frequency questionnaire did not provide reliable estimates
of absolute amounts of dietary fats or cholesterol (Schaefer et al., 2000). Similarly,
Livingstone et al. (1990) evaluated the seven day weighed dietary record, which is
currently accepted as the most accurate technique for assessing habitual dietary intake
178 Diabetes

in studies investigating the links between diet and health. Energy intake, as measured
by the seven day weighed dietary record, was compared to total energy expenditure
estimated concurrently by the doubly labeled water technique in 31 free-living adults
(16 men and 15 women). Average recorded energy intakes were significantly lower
than measured expenditure in the group overall (9.66 MJ/day vs. 12.15 MJ/day). Among
those in the upper third of energy intakes the mean ratio of intake to expenditure was
close to 1.0, indicating accurate records. In the middle and lower thirds the ratios for
men were only 0.74 and 0.70, respectively and for women 0.89 and 0.61. These results
show a serious bias in reporting habitual energy intake. Thus the conclusions of all
studies using self-reported dietary intake data should be carefully evaluated.
To determine the relations of diet with risk of clinical type 2 diabetes, Colditz et al.
(1992) analyzed data from a prospective cohort of 84 360 US women. During 6 years
of follow-up 702 definite incident cases were identified. Because BMI is a powerful
risk factor for diabetes, they examined the relations of fat (including type), fiber,
sucrose, and other components of self-reported dietary intake to risk of diabetes, among
women with BMI �29 kg/m2. After controlling for BMI, previous weight change, and
alcohol intake, they observed no associations between self-reported intakes of energy,
protein, sucrose, carbohydrate, or fiber and risk of diabetes. Compared with women
in the lowest quintile of energy-adjusted intake, and relative risks (and tests for trend)
for those in the highest quintile were 0.61 (P trend � 0.03) for vegetable fat, 0.62
(P trend � 0.008) for potassium, 0.70 (P trend � 0.005) for calcium, and 0.68
(P trend � 0.02) for magnesium. These data are consistent with a protective effect of
a diet rich in plant food. These inverse associations were attenuated among obese women
(BMI 29 kg/m2). Furthermore, in a more recent study there are data that support a
protective role for grains (particularly whole grains), cereal fiber, and dietary magne-
sium in the development of diabetes in older women (Meyer et al., 2000).
Increase in energy density – link with obesity
The association between type 2 diabetes and adiposity is arguably of even greater
importance than the previously well described association with cardiovascular risk
factors including hypertension, dyslipidemia and hypertension. Although the causes
of obesity are the result of complex interactions between genetic predisposition and
environmental trigger factors, the current epidemic has to be attributed to the “obeso-
genic environment” (Egger and Swinburn, 1997) as the human genome has not changed
in this period. In addressing the environmental facilitators of obesity, we need to consider
both food intake and energy expenditure.
Much of the discourse on the role of diet in the development of obesity highlights
the role of fat, due to its high energy density (kJ/g of food or beverage) and its propen-
sity, if consumed in excess, to be deposited as adipose tissue. However, there is now
evidence that fat gain is similar with overfeeding of carbohydrate or fat (McDevitt et al.,
2000). Spontaneous energy intake is strongly influenced by energy density. Covert
manipulation of energy density results in sustained changes in energy intake (Stubbs
et al., 1998). The increased use of low-fat products, many of which are energy dense
Is there a role for diet? 179

due to their high sugar content, and sugar-containing beverages, now contribute
significantly to total energy intake. Independent of fat content, low energy dense diets
generate greater satiety than energy dense diets, suggesting that an important regula-
tory signal may be the weight or volume of food consumed. Epidemiological studies
confirm that energy intake increases with energy density and thus weight loss may be
best achieved on a low energy dense diet (Poppitt and Prentice, 1996).
Sweetened drinks – link with childhood obesity
Evidence is accumulating that the form in which the sucrose is consumed is also
important. A recent prospective study from Ludwig et al. (2001) demonstrated a clear
cut, graded relation between the consumption of sugar-sweetened drinks and devel-
opment of obesity in children. The prevalence of obesity among children in the United
States doubled between 1980 and 1994 so that 11% are now above the 95th reference
percentile of BMI for age and sex. The observation that this increase paralleled the
increase in sugar-sweetened soft drinks prompted Ludwig et al. (2001) to enroll 548
ethnically diverse school children (average age 11.7 � 0.8 years) in four Massachusetts
communities in a prospective study for 19 months. The difference in measures of
obesity was related to differences in consumption of sugar-sweetened drinks and other
possible determinants of obesity including physical inactivity and fat intake. For each
additional serving of sugar-sweetened drinks both BMI (mean 0.24 kg/m2) and fre-
quency of obesity (odds ratio 1.6) increased after adjustment for anthropometric,
demographic, dietary and lifestyle variables. Differences in diet soda intake were not
related to obesity incidence.
Of course an observational study does not prove causality, but it is of interest that
another recently published study in an entirely different group of older individuals
produced similar results. Elmslie et al. (2001) compared a group of bipolar (manic
depressive) patients and matched controls; the patient group had higher rates of over-
weight and obesity than the controls. The bipolar patients reported a higher energy
intake, the increased energy being derived almost entirely from sucrose in sweetened
drinks. Energy from drinks (regardless of whether it is from sugar, fat, or alcohol)
adds to total energy intake, and does not displace energy from other forms (Poppitt
et al., 1996). Furthermore, compensation at subsequent meals for energy consumed in
the form of liquid appears to be less complete than for energy consumed in solid form
(Mattes, 1996).
Although these new data suggest a potentially untoward effect, in terms of promoting
obesity, of sugar-containing beverages it may also be relevant to recall data published
some thirty years ago (Mann et al., 1970). Free-living middle-aged men were asked to
replace as far as possible sucrose with foods rich in starch in order to maintain energy
balance. Despite regular advice and encouragement from a dietitian they were unable
to maintain energy balance and lost weight presumably because of the greater satiety-
promoting qualities of the starchy foods. Although not providing direct evidence for
sugar as an etiological factor these observations do suggest that recommending a
reduction in sugar (in both beverages and food) may be a potentially useful public
180 Diabetes

health measure in countries where obesity and its co-morbidities have reached
epidemic proportions.
Type of dietary fat
Although a low-fat diet is recommended for diabetic and nondiabetic patients (ADA,
1994), findings from epidemiological studies on the association of total dietary fat with
type 2 diabetes or insulin sensitivity have been inconsistent (Feskens and Kromhout,
1989; Lundgren et al., 1989; Marshall et al., 1991). However, more recent epidemio-
logic and metabolic studies suggest that dietary fat subtypes may be relevant to diabetes
pathophysiology. The impact of various dietary fatty acids on the risk of type 2 diabetes
was examined in the Iowa Women’s Health Study (Meyer et al., 2001), which studied
35 988 women, aged 55–69 years, free of diabetes, and followed them for 11 years,
resulting in 1890 new cases of type 2 diabetes. Intake of fat and fatty acids was
assessed from a validated food-frequency questionnaire. After adjustments for main
risk factors, including BMI, waist-to-hip ratio, physical activity, dietary fiber, magne-
sium, and other dietary fat subtypes, substituting polyunsaturated fatty acid (PUFA)
intake for saturated fatty acid (SFA) was inversely associated with diabetes risk, with
a 16% reduction in the highest quintile. The consumption of vegetable fat was associated
with a 22% reduction in new cases of diabetes in the highest quintile. Interestingly, in
another study on patients with type 2 diabetes, relative to high-monounsaturated-fat
diets, high-carbohydrate diets also caused persistent deterioration of glycemic control
and accentuation of hyperinsulinemia, as well as increased plasma triglyceride and
very-low-density lipoprotein cholesterol levels, which is undesirable (Garg et al., 1994).
People with diabetes in Spain have near-optimal serum lipid levels and maintain rea-
sonably good blood glucose control and BMI, indicating that diabetes management
that includes the usual Spanish diet, which is low in carbohydrates and high in fat,
especially monounsaturated fat (mostly olive oil), might be a useful model (DNCT,
1997). Furthermore, diets enriched with polyunsaturated fatty acids augment insulin
secretion significantly more than a diet comprising primarily saturated fatty acids
(Lardinois et al., 1987). Borkman et al. (1993) observed significant inverse relations
between fasting serum insulin and the content of n-3 and n-6 fatty acids within skeletal-
muscle phospholipids. This implies that the type of polyunsaturated fat (the n-6/n-3
ratio) may also be critical.
Although the mechanism for this increased insulin sensitivity in response to unsat-
urated fats is unknown, there are several mechanisms that have been proposed. Satu-
rated fatty acids have been shown to decrease insulin binding to receptors and to impair
glucose transport (Pelikanova et al., 1989). Specific dietary fatty acids may modify
the phospholipid composition of cell membranes, which in turn may alter the function
of the insulin receptor (Boden, 1996). Dietary PUFAs (n-6 and n-3) have been shown
to reduce triglyceride accumulation in skeletal muscle and possibly in �-cells, by upreg-
ulating the expression of genes encoding proteins involved in fatty acid oxidation
while simultaneously downregulating genes encoding proteins of lipid synthesis (Clarke,
2001). Fatty acids are also known to affect gene expression directly as they act as natural
ligands for genes, such as peroxisome proliferator-activated receptors (PPAR)
Is there a role for diet? 181

(Kliewer et al., 1997). Other potential pathways relating PUFA and vegetable fat to
diabetes risk involve low-grade inflammation. Proinflammatory cytokines, such as
tumor necrosis factor- , may induce insulin resistance by influencing the function of
the insulin receptor (Hotamisligil et al., 1996). Interestingly the production of these
inflammatory cytokines is affected by the ratio of n-6/n-3 PUFA in the diet (Leaf, 1999).
Implications for health care and quality of life
Diabetes is a lifelong condition that seriously affects a person’s quality of life. Indi-
viduals with the disease have to make major lifestyle changes and learn to live with
monitoring blood glucose, using multiple drugs and injections, and dealing with com-
plications of the disease and their treatment. Diabetes is a complex and multifactorial
disease that is associated with considerable mortality, morbidity, and loss of quality of
life. The complications of type 2 diabetes are both microvascular and macrovascular
in nature and include the following: retinopathy, peripheral and autonomic neuro-
pathy, nephropathy, peripheral vascular disease, atherosclerotic cardiovascular and
cerebrovascular disease, hypertension, and susceptibility to infections and perio-
dontal disease.
The onset of type 2 diabetes is insidious and is usually recognized only 5–12 years
after hyperglycemia develops. During this period of undiagnosed diabetes, hyper-
glycemia, in combination with lifestyle factors (physical inactivity, alcohol use, smok-
ing), and other metabolic (dyslipidemia, obesity, insulin resistance) and hemodynamic
(hypertension) abnormalities frequently associated with type 2 diabetes, promote the
initiation and progression of micro- and macrovascular complications. Furthermore,
when blood glucose levels are increased only slightly and no symptoms are apparent,
the physician may be reluctant to diagnose type 2 diabetes or start treatment. A delay
in diagnosing the disease results in a high prevalence of chronic complications at the
time of actual diagnosis. Indeed, when type 2 diabetes is diagnosed, cardiovascular
disease and neuropathy are found in approximately 10% of cases, and retinopathy and
nephropathy in 15–20% (Muggeo, 1998).
Much of the direct costs of diabetes result from its complications, and hospitaliza-
tion costs are particularly high (IDF, 1997). On average people with diabetes are three
times more likely to be hospitalized than nondiabetic individuals. The risk for hospi-
talization is slightly diversified, venous complications being the least risky (1.7 times)
and heart-related complications the most risky (3.1 times). The risk of premature
death is higher for persons with diabetes compared to those without diabetes, and the
life expectancy is 10–15 years shorter. US data show that diabetes is the leading cause
of blindness and accounts for 40% of the new cases of end-stage renal disease. The
risk for leg amputation is 15–40 times higher and the risk for heart disease and stroke
is two to four times higher for people with diabetes compared with people without
diabetes. Recent studies show that the health care expenditures are as much as five
times higher for individuals with diabetes compared to individuals without diabetes.
In Sweden in 1994, three times more resources were spent on treating complications
182 Diabetes

compared to what was spent on control of the disease. Studies show that intensive
treatments cost more than traditional treatment, but also cut costs substantially for the
treatment of late complications (Bjork, 2001).
Nephropathy has been considered a rare complication of type 2 diabetes in patients
from European or North American populations, in which the highest incidence of this
disease is recorded in individuals aged over 70 years. Other ethnic groups such as
Pima Indians in the USA, Pacific Islanders, and Australian Aborigines have markedly
different incidence patterns of type 2 diabetes, with a high incidence in the 20–50-
year age group. These patients live long enough to develop nephropathy, and they do
so at a similar or higher rate to type 1 diabetes patients. Since the prevalence of type
2 diabetes is increasing worldwide, particularly in the developing world, diabetic
nephropathy will be a growing problem in patients with this disease. The prevention
of end-stage renal failure is possible in most patients, but the treatment of end-stage
renal disease is very expensive (Borch-Johnsen, 1995).
The United Kingdom Prospective Diabetes Study (UKPDS), conclusively demon-
strated that improved blood glucose control in these patients reduces the risk of devel-
oping retinopathy and nephropathy and possibly reduces neuropathy (UKPDS, 1998a,b;
Stratton et al., 2000). The overall microvascular complications rate was decreased by
25% in patients receiving intensive therapy versus conventional therapy. Epidemi-
ological analysis of the UKPDS data showed a continuous relationship between the
risk of microvascular complications and glycemia, such that for every percentage point
decrease in hemoglobin (Hb)A1c (e.g., 9 to 8%), there was a 37% reduction in the risk
of microvascular complications (Stratton et al., 2000).
The proportion of family income spent on diabetes care is higher in disadvantaged
socioeconomic groups in both industrialized and industrializing countries. Diabetes
is expensive for people with the disease and their families and also for nations. For
example, in households with a diabetic patient, a substantial portion of the family
income, 5–25% in India, and 5–10% in the United States, is devoted to diabetes care
(IDF, 1997). At the national level, diabetes exerts a substantial toll on the direct health
care costs in all countries. A person with diabetes costs the health care sector �2.5
times more than a person without the disease (Selby et al., 1997). The estimated total
annual direct health care cost of diabetes in 1998 in industrialized countries varied
from US$ 0.54 billion in Denmark to US$ 60 billion in the United States (IDF, 1997).
Within the ambit of economic aspects of the population in a developing country, the
direct cost of diabetes health care is very high for many people. One study estimated
the annual direct cost of diabetes in India at US$ 2.2 billion (Shobhana et al., 2000).
These large variations in the estimated national costs of diabetes reflect a number of
factors. There may be variations in (a) the methods used for measuring and estimating
costs, (b) differences in clinical practice patterns, (c) differences in the purchasing
power for the same amount of resources, and (d) the effect of competing priorities on
the level of resources allocated for treating diabetes (Narayan et al., 2000).
O’Brien et al. (1998) estimated the direct medical costs of complications resulting
from type 2 diabetes in the US. They calculated event costs (associated with resource
use that is specific to the acute episode and any subsequent care occurring in the first
year) and state costs (the annual costs of continued management), expressed in 1996
Implications for health care and quality of life 183

US dollars. They concluded that more severe or debilitating events associated with
diabetes, such as acute myocardial infarction ($27 630 event cost; $2185 state cost),
generate a greater financial burden than do early-stage complications, such as micro-
albuminuria ($62 event cost; $14 state cost). However, complications that are initially
relatively low in cost (e.g., microalbuminuria) can progress to more costly advanced
stages (e.g., end-stage renal disease, $53 659 state cost). In the CODE-2 Study (Costs
of Diabetes in Europe-Type 2) performed in eight European countries, the total
expenses for type 2 diabetics in Germany were evaluated and analyzed for the first
time. In the German arm of the study, the annual costs caused by type 2 diabetes
patients in Germany in 1998 amounted to 31.4 billion DM. Of these costs, 61% were
covered by statutory and private health insurance. The annual expenses of the Statutory
Health Insurance (SHI) for these patients amounted to 18.5 billion DM, 50% being
spent for inpatient treatment, 13% for ambulatory care, and 27% for medication.
Diabetes medication (insulin, oral antidiabetic drugs) accounted for only 7% of total
SHI costs. Only 26% of all diabetic patients had HbA1c values �6.5%, the therapeutic
target of the European Diabetes policy group. Around 50% of the type 2 diabetic
patients exhibited severe macro- and/or microvascular complications. The costs per
patient compared to the average expenses for SHI insured patients increased with
complication state from the 1.3-fold (no complications) up to the 4.1-fold (macro- and
microvascular complications). Diabetes-related complications and concomitant diseases
are the predominant reasons for these high costs (Liebl et al., 2001).
In conclusion, there is strong evidence that improved glycemic control is effective
at lessening the risks of retinopathy, neuropathy, and nephropathy in type 2 diabetes.
The evidence about the effect on coronary heart disease is limited and equivocal. The
hypoglycemic risk from improved glycemic control is significantly less in type 2 diabetes
than in type 1, and weight gain seems to be modest. Although glycemic goals should
be individualized based on several clinical factors, most patients with type 2 diabetes
would probably benefit from glucose lowering to a HbA1c level between 7% and 8%
(Gaster and Hirsch, 1998).
In addition to these direct costs, diabetes takes a toll on society through several
indirect costs, such as lost productivity due to worker sickness, absences, disability,
premature retirement, and premature mortality. These indirect costs may be as high, if
not higher, than direct costs, and estimates vary from US$ 330 million per year in
Mexico to US$ 54 billion per year in the United States (IDF, 1997).
Population health implications
Both obesity and type 2 diabetes are common consequences of urbanization (increased
sedentary lifestyles and increased energy density of diets). Both are potentially
preventable through lifestyle modification on a population level, but this requires
coherent and multifaceted strategies. The development and successful and sustainable
implementation of such strategies is a major public health challenge globally. There is
an urgent need to develop global and national plans for the prevention and manage-
ment of obesity and type 2 diabetes mellitus (Seidell, 2000). Early diagnosis and
treatment through opportunistic screening of type 2 diabetes may reduce the lifetime
184 Diabetes

incidence of major microvascular complications and result in gains in both life-years
and QALYs. Although current recommendations in industrialized countries like
Australia and the US are that screening should begin at age 45 years, it is becoming
apparent that screening can be more cost-effective at younger ages (CDC, 1998b).
This is particularly the case in developing countries and in other populations at high
risk (minority groups in affluent western countries).
References
Abate, N., Garg, A., Peshock, R.M., Stray-Gundersen, J., and Grundy, S.M. (1995).
J. Clin. Invest. 96, 88–98.
Abate, N., Garg, A., Peshock, R.M., Stray-Gundersen, J., Adams-Huet, B., and Grundy, S.M.
(1996). Diabetes 45, 1684–1693.
ADA (1994). Diabetes Care 17, 519–522.
Amos, A.F., McCarty, D.J., and Zimmet, P. (1997). Diabet. Med. 14 Suppl 5, S1–S85.
Barot, R. (1996). “The Racism Problematic: Contemporary Sociological Debates on Race
and Ethnicity”. Edwin Mellen Press, Lewiston, NY.
Barroso, I., Gurnell, M., Crowley, V.E., Agostini, M., Schwabe, J.W., Soos, M.A.,
Maslen, G.L., Williams, T.D., Lewis, H., Schafer, A.J., Chatterjee, V.K., and
O’Rahilly, S. (1999). Nature 402, 880–883.
Bhopal, R., and Donaldson, L. (1998). Am. J. Public Health 88, 1303–1307.
Bjork, S. (2001). Diabetes Res. Clin. Pract. 54 Suppl 1, 13–18.
Bjorntorp, P. (1993). Adv. Exp. Med. Biol. 334, 279–285.
Bjorntorp, P. (2001). Lancet 358, 1006–1008.
Boden, G. (1996). Diabetes Care 19, 394–395.
Bonner, G. (1994). J. Cardiovasc. Pharmacol. 24 Suppl 2, S39–S49.
Borch-Johnsen, K. (1995). Pharmacoeconomics 8 Suppl 1, 40–45.
Borkman, M., Storlien, L.H., Pan, D.A., Jenkins, A.B., Chisholm, D.J., and Campbell, L.V.
(1993). N. Engl. J. Med. 328, 238–244.
Caballero, B., and Rubinstein, S. (1997). Arch. Latinoam. Nutr. 47, 3–8.
Cappuccio, F. P. (1997). J. Hum. Hypertens. 11, 571–576.
Cass, A., Cunningham, J., Wang, Z., and Hoy, W. (2001). Aust. NZ J. Public Health 25,
322–326.
CDC (1998a). “National Diabetes Fact Sheet”. Center for Disease Control and Prevention,
Atlanta.
CDC (1998b). JAMA 280, 1757–1763.
Chaturvedi, N., and Fuller, J. H. (1996). J. Epidemiol. Community Health 50, 137–139.
Christiansen, E., Schnider, S., Palmvig, B., Tauber-Lassen, E., and Pedersen, O. (1997).
Diabetes Care 20, 881–887.
Clarke, S.D. (2001). J. Nutr. 131, 1129–1132.
Colditz, G.A., Manson, J.E., Stampfer, M.J., Rosner, B., Willett, W.C., and Speizer, F.E.
(1992). Am. J. Clin. Nutr. 55, 1018–1023.
Crawford, M.A. (1968). Lancet i, 1329–1333.
References 185

Dabelea, D., Hanson, R.L., Lindsay, R.S., Pettitt, D.J., Imperatore, G., Gabir, M.M.,
Roumain, J., Bennett, P.H., and Knowler, W.C. (2000a). Diabetes 49, 2208–2211.
Dabelea, D., Knowler, W.C., and Pettitt, D.J. (2000b). J. Matern. Fetal Med. 9, 83–88.
Daniel, M., Rowley, K.G., McDermott, R., Mylvaganam, A., and O’Dea, K. (1999).
Diabetes Care 22, 1993–1998.
Despres, J.P., Moorjani, S., Lupien, P.J., Tremblay, A., Nadeau, A., and Bouchard, C.
(1990). Arteriosclerosis 10, 497–511.
DNCT (1997). Diabetes Care 20, 1078–1080.
Dvorak, R.V., DeNino, W.F., Ades, P.A., and Poehlman, E.T. (1999). Diabetes 48,
2210–2214.
Eastman, R.C., Silverman, R., Harris, M., Javitt, J.C., Chiang, Y.P., and Gorden, P. (1993).
Diabetes Care 16, 1095–1102.
Egger, G., and Swinburn, B. (1997). BMJ 315, 477–480.
Elmslie, J.L., Mann, J.I., Silverstone, J.T., Williams, S.M., and Romans, S.E. (2001).
J. Clin. Psychiatry 62, 486–491.
Eriksson, K.F., and Lindgarde, F. (1991). Diabetologia 34, 891–898.
Fagot-Campagna, A., Pettitt, D.J., Engelgau, M.M., Burrows, N.R., Geiss, L.S., Valdez, R.,
Beckles, G.L., Saaddine, J., Gregg, E.W., Williamson, D.F., and Narayan, K.M.
(2000). J. Pediatr. 136, 664–672.
Fagot-Campagna, A., Narayan, K.M., and Imperatore, G. (2001). BMJ 322, 377–378.
Fajans, S.S., Bell, G.I., Bowden, D.W., Halter, J.B., and Polonsky, K.S. (1994). Life
Sci. 55, 413–422.
Fang, J., Madhavan, S., and Alderman, M.H. (1997). Ethn. Dis. 7, 55–64.
Feskens, E.J., and Kromhout, D. (1989). Am. J. Epidemiol. 130, 1101–1108.
Flegal, K.M., Carroll, M.D., Kuczmarski, R.J., and Johnson, C.L. (1998). Int. J. Obes.
Relat. Metab. Disord. 22, 39–47.
Fujimoto, W.Y., Bergstrom, R.W., Boyko, E.J., Kinyoun, J.L., Leonetti, D.L.,
Newell-Morris, L.L., Robinson, L.R., Shuman, W.P., Stolov, W.C., and
Tsunehara, C.H. (1994). Diabetes Res. Clin. Pract. 24 Suppl, S43–S52.
Garg, A., Bantle, J.P., Henry, R.R., Coulston, A.M., Griver, K.A., Raatz, S.K., Brinkley, L.,
Chen, Y.D., Grundy, S.M., and Huet, B.A. (1994). JAMA 271, 1421–1428.
Gaster, B., and Hirsch, I.B. (1998). Arch. Intern. Med. 158, 134–140.
Goodpaster, B.H., Kelley, D.E., Wing, R.R., Meier, A., and Thaete, F.L. (1999). Diabetes
48, 839–847.
Haffner, S.M., and Miettinen, H. (1997). Am. J. Med. 103, 152–162.
Haffner, S.M., Stern, M.P., Hazuda, H.P., Rosenthal, M., Knapp, J.A., and Malina, R.M.
Diabetes Care 9, 153–161.
Halle, M., Berg, A., Garwers, U., Baumstark, M.W., Knisel, W., Grathwohl, D., Konig, D.,
and Keul, J. (1999). Metabolism 48, 641–644.
Hammersley, M.S., Meyer, L.C., Morris, R.J., Manley, S.E., Turner, R.C., and Holman, R.R.
(1997). Metabolism 46, 44–49.
Harris, M.I., Flegal, K.M., Cowie, C.C., Eberhardt, M.S., Goldstein, D.E., Little, R.R.,
Wiedmeyer, H.M., and Byrd-Holt, D.D. (1998). Diabetes Care 21, 518–524.
Helmrich, S.P., Ragland, D.R., Leung, R.W., and Paffenbarger, R.S. (1991). N. Engl.
J. Med. 325, 147–152.
186 Diabetes

Hopper, J.L. (1999). Diabetologia 42, 125–127.
Hotamisligil, G.S., Peraldi, P., Budavari, A., Ellis, R., White, M.F., and Spiegelman, B.M.
(1996). Science 271, 665–668.
Hu, F.B., Sigal, R.J., Rich-Edwards, J.W., Colditz, G.A., Solomon, C.G., Willett, W.C.,
Speizer, F.E., and Manson, J.E. (1999). JAMA 282, 1433–1439.
Hu, F.B., Leitzmann, M.F., Stampfer, M.J., Colditz, G.A., Willett, W.C., and Rimm, E.B.
(2001a). Arch. Intern. Med. 161, 1542–1548.
Hu, F.B., Manson, J.E., Stampfer, M.J., Colditz, G., Liu, S., Solomon, C.G., and
Willett, W.C. (2001b). N. Engl. J. Med. 345, 790–797.
IDF (1997). International Diabetes Federation Task Force on Diabetes Health Economics,
Brussels.
Jackson, A.A. (2000). Adv. Exp. Med. Biol. 478, 41–55.
Kahn, S.E., Beard, J.C., Schwartz, M.W., Ward, W.K., Ding, H.L., Bergman, R.N.,
Taborsky, G.J., and Porte, D. (1989). Diabetes 38, 562–568.
Kahn, S.E., Larson, V.G., Beard, J.C., Cain, K.C., Fellingham, G.W., Schwartz, R.S.,
Veith, R.C., Stratton, J.R., Cerqueira, M.D., and Abrass, I.B. (1990). Am. J. Physiol.
258, E937–E943.
Kahn, S.E., Prigeon, R.L., McCulloch, D.K., Boyko, E.J., Bergman, R.N., Schwartz, M.W.,
Neifing, J.L., Ward, W.K., Beard, J.C., and Palmer, J.P. (1993). Diabetes 42, 1663–1672.
Kahn, S.E., Prigeon, R.L., Schwartz, R.S., Fujimoto, W.Y., Knopp, R.H., Brunzell, J.D.,
and Porte, D. (2001). J. Nutr. 131, 354S–360S.
Kaprio, J., Tuomilehto, J., Koskenvuo, M., Romanov, K., Reunanen, A., Eriksson, J.,
Stengard, J., and Kesaniemi, Y.A. (1992). Diabetologia 35, 1060–1067.
Kelley, D.E., and Goodpaster, B.H. (2001). Med. Sci. Sports Exerc. 33, S495–S501;
discussion S528–S529.
Kerr, P. (2000). “ANZDATA Registry Report”, Adelaide.
King, H., Aubert, R.E., and Herman, W.H. (1998). Diabetes Care 21, 1414–1431.
Kliewer, S.A., Sundseth, S.S., Jones, S.A., Brown, P.J., Wisely, G.B., Koble, C.S.,
Devchand, P., Wahli, W., Willson, T.M., Lenhard, J.M., and Lehmann, J.M. (1997).
Proc. Natl Acad. Sci. USA 94, 4318–4323.
Kriska, A. (2000). Sports Med. 29, 147–151.
Kriska, A.M., Pereira, M.A., Hanson, R.L., de Courten, M.P., Zimmet, P.Z., Alberti, K.G.,
Chitson, P., Bennett, P.H., Narayan, K.M., and Knowler, W.C. (2001). Diabetes Care
24, 1175–1180.
Lardinois, C.K., Starich, G.H., Mazzaferri, E.L., and DeLett, A. (1987). J. Am. Coll. Nutr.
6, 507–515.
Leaf, A. (1999). Circulation 99, 733–735.
Liebl, A., Neiss, A., Spannheimer, A., Reitberger, U., Wagner, T., and Gortz, A. (2001).
Dtsch Med. Wochenschr. 126, 585–589.
Livingstone, M.B., Prentice, A.M., Strain, J.J., Coward, W.A., Black, A.E., Barker, M.E.,
McKenna, P.G., and Whitehead, R.G. (1990). BMJ 300, 708–712.
Long, B. (1985). Cognit. Ther. Res. 9, 471–478.
Ludwig, D.S., Peterson, K.E., and Gortmaker, S.L. (2001). Lancet 357, 505–508.
Lundgren, H., Bengtsson, C., Blohme, G., Isaksson, B., Lapidus, L., Lenner, R.A., Saaek, A.,
and Winther, E. (1989). Am. J. Clin. Nutr. 49, 708–712.
References 187

Lynch, J., Smith, G.D., Hillemeier, M., Shaw, M., Raghunathan, T., and Kaplan, G. (2001).
Lancet 358, 194–200.
Mann, J.I. (2000). Br. J. Nutr. 83 Suppl 1, S169–S172.
Mann, J.I., Hendricks, D.A., Truswell, A.S., and Manning, E. (1970). Lancet i, 870–872.
Manson, J.E., Rimm, E.B., Stampfer, M.J., Colditz, G.A., Willett, W.C., Krolewski, A.S.,
Rosner, B., Hennekens, C.H., and Speizer, F.E. (1991). Lancet 338, 774–778.
Manson, J.E., Nathan, D.M., Krolewski, A.S., Stampfer, M.J., Willett, W.C., and
Hennekens, C.H. (1992). JAMA 268, 63–67.
Marshall, J.A., Hamman, R.F., and Baxter, J. (1991). Am. J. Epidemiol. 134, 590–603.
Marshall, J.A., Hoag, S., Shetterly, S., and Hamman, R.F. (1994). Diabetes Care 17, 50–56.
Mather, H.M., Chaturvedi, N., and Fuller, J.H. (1998). Diabet. Med. 15, 53–59.
Mattes, R.D. (1996). Physiol. Behav. 59, 179–187.
McDevitt, R.M., Poppitt, S.D., Murgatroyd, P.R., and Prentice, A.M. (2000). Am. J. Clin.
Nutr. 72, 369–377.
McKeigue, P.M., Shah, B., and Marmot, M.G. (1991). Lancet 337, 382–386.
Medici, F., Hawa, M., Ianari, A., Pyke, D.A., and Leslie, R.D. (1999). Diabetologia
42, 146–150.
Meyer, K.A., Kushi, L.H., Jacobs, D.R., Slavin, J., Sellers, T.A., and Folsom, A.R. (2000).
Am. J. Clin. Nutr. 71, 921–930.
Meyer, K.A., Kushi, L.H., Jacobs, D.R., and Folsom, A.R. (2001). Diabetes Care
24, 1528–1535.
Muggeo, M. (1998). Diabet. Med. 15 Suppl 4, S60–S62.
Narayan, K.M., Gregg, E.W., Fagot-Campagna, A., Engelgau, M.M., and Vinicor, F.
(2000). Diabetes Res. Clin. Pract. 50 Suppl 2, S77–S84.
Naughton, J.M., O’Dea, K., and Sinclair, A.J. (1986). Lipids 21, 684–690.
Neel, J.V. (1962). Am. J. Hum. Genet. 14, 353–362.
Neel, J.V. (1999). Nutr. Rev. 57, S2–S9.
NIDDK (2001). “Diabetes Prevention Project”. National Institute of Health, Bethesda.
O’Brien, J.A., Shomphe, L.A., Kavanagh, P.L., Raggio, G., and Caro, J.J. (1998). Diabetes
Care 21, 1122–1128.
O’Dea, K. (1984). Diabetes 33, 596–603.
O’Dea, K. (1992). Diabetes Metab. Rev. 8, 373–388.
O’Dea, K., Traianedes, K., Chisholm, K., Leyden, H., and Sinclair, A.J. (1990). Am. J.
Clin. Nutr. 52, 491–494.
Okada, K., Hayashi, T., Tsumura, K., Suematsu, C., Endo, G., and Fujii, S. (2000). Diabet.
Med. 17, 53–58.
O’Loughlin, J. (1999). Can. Med. Assoc. J. 161, 152–153.
Orchard, T.J. (1994). Diabetes Care 17, 326–338.
Pan, X.R., Li, G.W., Hu, Y.H., Wang, J.X., Yang, W.Y., An, Z.X., Hu, Z.X., Lin, J.,
Xiao, J.Z., Cao, H.B., Liu, P.A., Jiang, X.G., Jiang, Y.Y., Wang, J.P., Zheng, H.,
Zhang, H., Bennett, P.H., and Howard, B.V. (1997). Diabetes Care 20, 537–544.
Pavan, L., Casiglia, E., Braga, L.M., Winnicki, M., Puato, M., Pauletto, P., and Pessina, A.C.
(1999). J. Hypertens. 17, 749–756.
Pelikanova, T., Kohout, M., Valek, J., Base, J., and Kazdova, L. (1989). Metabolism
38, 188–192.
188 Diabetes

Pettitt, D.J., and Knowler, W.C. (1998). Diabetes Care 21 Suppl 2, B138–B141.
Poppitt, S.D., and Prentice, A.M. (1996). Appetite 26, 153–174.
Poppitt, S.D., Eckhardt, J.W., McGonagle, J., Murgatroyd, P.R., and Prentice, A.M. (1996).
Physiol. Behav. 60, 1063–1070.
Poulsen, P., Vaag, A., and Beck-Nielsen, H. (1999). BMJ 319, 151–154.
Prigeon, R.L., Kahn, S.E., and Porte, D. (1995). Metabolism 44, 1259–1263.
Proietto, J., Nankervis, A.J., Traianedes, K., Rosella, G., and O’Dea, K. (1992). Diabetes
Res. Clin. Pract. 17, 217–226.
Purnell, J.Q., Kahn, S.E., Albers, J.J., Nevin, D.N., Brunzell, J.D., and Schwartz, R.S.
(2000). J. Clin. Endocrinol. Metab. 85, 977–982.
Reaven, G.M. (1998). Diabetologia 41, 482–484.
Rosenbloom, A.L., Joe, J.R., Young, R.S., and Winter, W.E. (1999). Diabetes Care 22,
345–354.
Rowley, K.G., Best, J.D., McDermott, R., Green, E.A., Piers, L.S., and O’Dea, K. (1997).
Clin. Exp. Pharmacol. Physiol. 24, 776–781.
Schaefer, E.J., Augustin, J.L., Schaefer, M.M., Rasmussen, H., Ordovas, J.M., Dallal, G.E.,
and Dwyer, J.T. (2000). Am. J. Clin. Nutr. 71, 746–751.
Schneider, S.H., Amorosa, L.F., Khachadurian, A.K., and Ruderman, N.B. (1984).
Diabetologia 26, 355–360.
Seidell, J.C. (1997). Horm. Metab. Res. 29, 155–158.
Seidell, J.C. (2000). Br. J. Nutr. 83 Suppl 1, S5–S8.
Selby, J.V., Ray, G.T., Zhang, D., and Colby, C.J. (1997). Diabetes Care 20, 1396–1402.
Sheth, T., Nair, C., Nargundkar, M., Anand, S., and Yusuf, S. (1999). Can. Med. Assoc. J.
161, 132–138.
Shobhana, R., Rama Rao, P., Lavanya, A., Williams, R., Vijay, V., and Ramachandran, A.
(2000). Diabetes Res. Clin. Pract. 48, 37–42.
Sorensen, T.I. (2000). Diabetes Care 23 Suppl 2, B1–B4.
Spielman, R.S., and Nussbaum, R.L. (1992). Nat Genet 1, 82–83.
Stanner, S.A., Bulmer, K., Andres, C., Lantseva, O.E., Borodina, V., Poteen, V.V., and
Yudkin, J.S. (1997). BMJ 315, 1342–1348.
Stratton, I.M., Adler, A.I., Neil, H.A., Matthews, D.R., Manley, S.E., Cull, C.A., Hadden, D.,
Turner, R.C., and Holman, R.R. (2000). BMJ 321, 405–412.
Stubbs, R.J., Johnstone, A.M., O’Reilly, L.M., Barton, K., and Reid, C. (1998). Int. J.
Obes. Relat. Metab. Disord. 22, 980–987.
Tudor-Locke, C.E., Bell, R.C., and Meyers, A.M. (2000). Can. J. Appl. Physiol.
25, 466–492.
Tuomilehto, J., Lindstrom, J., Eriksson, J.G., Valle, T T., Hamalainen, H., Ilanne-Parikka, P.,
Keinanen-Kiukaanniemi, S., Laakso, M., Louheranta, A., Rastas, M., Salminen, V.,
and Uusitupa, M. (2001). N. Engl. J. Med. 344, 1343–1350.
UKPDS-33 (1998a). Lancet 352, 837–853.
UKPDS-38 (1998b). BMJ 317, 703–713.
Usui, K., Yamanouchi, K., Asai, K., Yajima, M., Iriyama, A., Okabayashi, N., Sakakibara, H.,
Kusunoki, M., Kakumu, S., and Sato, Y. (1998). Diabetes Res. Clin. Pract. 41, 57–61.
Uusitupa, M., Louheranta, A., Lindstrom, J., Valle, T., Sundvall, J., Eriksson, J., and
Tuomilehto, J. (2000). Br. J. Nutr. 83 Suppl 1, S137–S142.
References 189

van-Dam, R.M., Boer, J.M., Feskens, E.J., and Seidell, J.C. (2001). Diabetes Care 24,
1454–1459.
Vinicor, F. (1994). Diabetes Care 17 Suppl 1, 22–27.
Visscher, T.L., and Seidell, J.C. (2001). Annu. Rev. Public Health 22, 355–375.
Wannamethee, S.G., Shaper, A.G., and Alberti, K.G. (2000). Arch. Intern. Med. 160,
2108–2116.
Wei, M., Gibbons, L.W., Mitchell, T.L., Kampert, J.B., Lee, C.D., and Blair, S.N. (1999).
Ann. Intern. Med. 130, 89–96.
Whitaker, R.C., and Dietz, W.H. (1998). J. Pediatr. 132, 768–776.
WHO (1997). “Obesity: Preventing and Managing the Global Epidemic”. WHO, Geneva.
Yajnik, C.S. (2001). Nutr. Rev. 59, 1–9.
Yamanouchi, K., Nakajima, H., Shinozaki, T., Chikada, K., Kato, K., Oshida, Y., Osawa, I.,
Sato, J., Sato, Y., and Higuchi, M. (1992). J. Appl. Physiol. 73, 2241–2245.
Yamanouchi, K., Shinozaki, T., Chikada, K., Nishikawa, T., Ito, K., Shimizu, S., Ozawa, N.,
Suzuki, Y., Maeno, H., and Kato, K. (1995). Diabetes Care 18, 775–778.
Yudkin, J.S. (1995). J. Intern. Med. 238, 21–30.
Yudkin, J.S. (1996). Diabet. Med. 13, S16–S18.
190 Diabetes

Cardiovasculardiseases
K. Srinath Reddy
10
Introduction
One of the most perceptible and pervasive changes that affected human society in the
late 20th century has been the accelerated health transition that has propelled non-
communicable diseases (NCDs) to the forefront of global public health challenges.
In particular, cardiovascular diseases (CVDs) have emerged as the principal cause of
death and disability in most regions of the world (Murray and Lopez, 1996; Reddy
and Yusuf, 1998; Yusuf et al., 2001a,b; Reddy, 2001, 2002). As these advancing epi-
demics threaten to overwhelm health care systems in the developing countries through
their mounting demands and also disrupt development through premature mortality
and prolonged morbidity in mid-life, effective strategies for CVD prevention over the
lifespan become imperatives for early attention and urgent action. Nutrition is a major
determinant of the process and pace of these epidemics and warrants a key position in
the multisectoral matrix of global CVD prevention.
Burdens of CVD: global and regional estimates
According to the World Health Organization, 30% of all global deaths in 1998,
accounting for 15.3 million lives lost that year, were due to CVD. Both men and women
experienced these burdens, with CVD contributing to 28% of deaths in the former and
34% of deaths in the latter (WHO, 1999). The low- and middle-income countries con-
tributed 78% of all CVD deaths and 86.3% of disability adjusted life year (DALY)
loss attributed to CVD that year. Although this is largely due to the larger populations
in those countries, the rise in proportional mortality rates, of CVD deaths as a fraction
of all deaths, portends a growing burden of CVD in these countries (Yao et al., 1993;
Yusuf et al., 2001a). Coronary heart disease (CHD) and stroke are the dominant CVDs,
with rheumatic heart disease (RHD) contributing to the disease burdens only in the
The Nutrition TransitionISBN: 0-12-153654-8
Copyright © 2002 Elsevier Science LtdAll rights of reproduction in any form reserved

countries in an early stage of health transition. CHD and stroke vary across the world
in their relative burdens (Murray and Lopez, 1996). In 1990, the developing countries
accounted for over two-thirds of all stroke deaths and about half of all coronary deaths
in the world (Table 10.1).
CVD-related deaths also occur at a younger age in the developing countries, as
anticipated by their current stage of health transition. Of the CVD-related deaths that
occurred in these countries in 1990, about 46.7% occurred under the age of 70 years,
whereas the corresponding proportion in the industrially advanced countries was only
22.7% (Murray and Lopez, 1996; Reddy and Yusuf, 1998). As these epidemics advance
in the developing countries, the social gradient too is moving from the rich to the poor
as the dominant victims. Although this phenomenon is at present only seen in some
regions, depending on their level of health transition, other regions too are likely to
witness it as their CVD epidemics mature (Pais et al., 1996; Reddy and Yusuf, 1998;
InterAmerican Heart Foundation, 2000).
Projected CVD burdens in 2020
Most available estimates compare the 1990 baseline against projections for 2020,
which are based on demographic and econometric models. The burdens of CVD will
rise in all parts of the world, as populations age. The Global Burden of Disease study
estimates that the developing countries will experience a 137% rise in men and a 120%
rise in women, between 1990 and 2020, in the mortality attributable to CHD (Murray
and Lopez, 1996; Yusuf et al., 2001a). The developed countries will witness a much
smaller rise (48% in men and 29% in women, respectively). Similarly, stroke mortality
would exhibit 124% and 107% increases in men and women, respectively, in the devel-
oping countries, during this period. The corresponding elevations in the developed
countries would be 56% in men and 28% in women. The world, as a whole, would
experience a 100% and 80% rise in CHD mortality in men and women, respectively,
as well as 106% and 78% elevations in stroke mortality (Table 10.2).
According to the Global Burden of Disease study, a 55% rise would occur in CVD
attributable DALY loss, between 1990 and 2020, in the developing countries (Murray and
Lopez, 1996). This would be in contrast to a 14.3% reduction in the proportion of CVD
attributable DALY loss during the same period in the developed countries (including
192 Cardiovascular diseases
Table 10.1 Regional differences in burden of cardiovascular disease (1990) (from Murray and
Lopez, 1996)
Region Population CVD Coronary Cerebrovascular DALYs
(millions) mortality mortality mortality (000’s) lost (000’s)
(000’s) (000’s)
Developed regions 1144.0 5328.0 2678.0 1447.9 39 118
Developing regions 4123.4 9016.7 2469.6 3181.2 108 802
DALYs, disability adjusted life years.

both established market economies and former socialist economies) (Table 10.3). The
gap would widen further if the former socialist economies, which are facing a resur-
gence in CVD, are excluded. In India, CVD-related deaths are expected to rise from
24.2% in 1990 to 41.8% of total deaths in 2020. Thus the increasing burden of CVD
would be mostly borne by the developing countries in the next two decades (Murray
and Lopez, 1996; Reddy, 2002).
The high burdens of mid-life deaths would continue to haunt the developing coun-
tries, even as the CVD epidemics advance to claim a higher share of the global disease
burden (Table 10.4). It has been projected that 6.4 million deaths would occur due to
Projected CVD burdens in 2020 193
Table 10.2 Percentage rise in cardiovascular disease mortality 1990–2020 (from Murray and
Lopez, 1996)
CHD Stroke
Men Women Men Women
Developed countries 48 29 56 28
Developing countries 137 127 124 107
World 100 80 106 78
Table 10.3 Contribution of cardiovascular disease to DALY loss (% of total) (derived from Murray
and Lopez, 1996)
Region CVD DALY loss (as % of total DALY loss)
1990 2020
World 10.8 14.7
Developed countries 25.7 22.0
Developing countries 8.9 13.8
DALY, disability adjusted life year.
Table 10.4 Developing countries: cardiovascular disease profile 2020 AD (based on projections by
global burden of disease study, Murray and Lopez, 1996)
Estimated Proportion Persons dying
deaths in of deaths in middle
2020 between age
(million) 30 and 69 (million)
years (%)
Coronary heart disease Men 4.3 543.3
(heart attacks) Women 3.5 27
Cerebrovascular disease Men 3.2 52.72.5
(strokes) Women 2.7 28
Inflammatory and rheumatic Men 0.6 62.60.6
heart disease Women 0.4 44.4

CVD in the developing countries in 2020 in the age group 30–69 years (Murray and
Lopez, 1996; Reddy, 2002).
These projections do not directly factor in the likely rise in population levels of car-
diovascular risk factors, though developmental patterns in the econometric models
probably account for some such change. If these risk factors rise rapidly (as is likely
from the combined effects of industrialization, urbanization, and globalization), the
global dimensions of the future CVD epidemic may be even larger than is presently
envisioned.
Health transition and CVD: determinants anddirections
The variations across time and geographical regions, in the overall CVD burden as
well as the diversity in relative burdens of different diseases within the CVD spectrum,
are best explained by the model of health transition. The model, which has been modified
since its original description by Omran, explains the changes in the health status of
populations as well as the extent of different CVDs on the basis of progressive devel-
opmental pattern influencing the determinants of health and patterns of disease
(Omran, 1971; Olshansky and Ault, 1986; Pearson et al., 1993). Such an evolutionary
perspective, which has historical validity and predictive value, is superior to static
cross-sectional views which afford only fleeting glimpses of an epidemic in motion.
Countries in the earliest phases of epidemiologic transition have a large burden of
rheumatic heart disease as well as infectious and nutritional cardiomyopathies. Hyper-
tension emerges as a public health problem in the next phase, as salt consumption
rises, and adds hemorrhagic stroke and hypertensive heart disease to the burdens of
rheumatic heart disease. As countries advance further in their demographic and socio-
economic transition, these are largely replaced by thrombotic strokes and coronary heart
disease, with increased fat intake and rising blood lipids contributing to atherothrom-
botic vascular disease (Pearson et al., 1993). Although a decline in the burden of rheu-
matic heart disease is evident in regions experiencing rapid health transition, it is still
an important problem in regions that are at an early stage of demographic and devel-
opmental transition. The transition to the atherothrombotic phase of the epidemic may
be preceded by a sharp fall in the burden of hemorrhagic strokes. The recent decline
in CVD mortality, reported from South Korea, reflects such a fall in the contribution
from hemorrhagic strokes while thrombotic stroke and coronary heart disease burdens
have just begun to rise (Suh, 2001). Large developing countries may have different
regions in different phases of health transition with urban areas usually experiencing
higher CVD burdens at this stage. This phenomenon is evident in Latin America, parts
of Africa, China, and India (Reddy and Yusuf, 1998). The risk factors for cardiovas-
cular diseases also vary regionally and are themselves in transition (Reddy, 2002).
Most of the developed countries have entered the phase of delayed degenerative
disease, where cardiovascular diseases remain the leading contributors to death and
194 Cardiovascular diseases

disability, but mostly manifest at a late age and with an overall decline in mortality.
The task before the developing countries is to shorten the phase of large and escalating
cardiovascular disease burdens in mid-life and rapidly transit to the phase of delayed
and stable cardiovascular disease burdens.
There are several factors, which explain the recent emergence and underlie the
projected escalation of the CVD epidemic in the developing countries (Pearson et al.,
1993; Reddy and Yusuf, 1998; Yusuf et al., 2001a,b; Reddy, 2002). Firstly, there has
been a global surge in life expectancy, especially more so in the developing countries.
As a greater proportion of the population survives into older decades, many more indi-
viduals are exposed to risk factors of CVD for sufficient duration for clinical consequences
to manifest. This epidemiologic transition, due to changing demographic profiles and
a decline in the competing causes of death due to infectious and nutritional disorders,
characterizes the advent of the CVD epidemic along with those of other chronic diseases.
This has been clearly demonstrated in urban China, where mortality attributable to
CVD increased from 86.2 per 100 000 (12.1% of total deaths) in 1957 to 214.3 per
100 000 (35.8% of all deaths) in 1990 (Yao et al., 1993).
Secondly, delayed industrialization and recent urbanization have been associated
with alteration in living habits, with deleterious changes in diet, physical activity, and
tobacco addiction. These environmental changes lead to acquisition or accretion of risk
factors. The increased “dose” of risk factor exposure, coupled to longer duration of
exposure due to demographic changes, leads to enhanced risk of CVD. In China, the
Sino-MONICA study demonstrated that the body mass index (BMI), hypertension,
and blood cholesterol levels in the population of age group 35–64 years rose from
1984–86 to 1988–89 (Yao et al., 1993).
There are also possible adverse effects of poor childhood nutrition (Barker et al.,
1993), which, if conclusively proven, would have an enormous impact on the developing
countries, which still have a substantial fraction of the population which was under-
weight at birth. The possibility of such programming or as yet unascertained genetic
factors may underlie the enhanced susceptibility of some ethnic groups, e.g., South
Asian migrants, to CHD (Enas and Mehta, 1995; Yusuf et al., 2001a). The excess risk
in these groups may be explained by gene–environment interactions or fetal program-
ming, but public health action must focus on the environmental changes which trigger
the expression of susceptibility.
Dynamics of the CVD epidemic in developingcountries
Although the determinants of health transition in the developing countries are similar
to those that charted the course of the epidemics in the developed countries, their
dynamics are different. The compressed time frame of transition in the developing coun-
tries imposes a large double burden of communicable and noncommunicable diseases.
Unlike the developed countries where urbanization occurred in prospering economies,
Dynamics of the CVD epidemic in developing countries 195

urbanization in developing countries occurs in settings of high poverty levels and
international debt, restricting resources for public health responses. Organized efforts
at prevention began in developed countries when the epidemic had peaked and often
accelerated a secular downswing whereas the efforts in the developing countries are
commencing when the epidemic is on the upswing. Strategies to control CVD in the
developing countries must be based on recognition of these similarities and differ-
ences. Principles of prevention must be based on the evidence gathered in developed
countries but interventions must be context-specific and resource-sensitive (Reddy,
2001, 2002).
Tracking the epidemic: risk behaviors to riskfactors to events
Today’s risk behaviors are tomorrow’s risk factors and today’s risk factors are tomor-
row’s events. The natural history of major CVDs plays out the effects of cumulative
exposures to biologic risk factors which result from dominant risk behaviors (diet,
inactivity, tobacco) which operate from the early years of life. The conventional risk
factors may have been underestimated, in terms of their impact, due to (a) regression
dilution bias, (b) lag time effect, (c) dichomotous divisions of risk factors which actually
operate in a continuum, and (d) unquantitated exposures (Yusuf et al., 2001a,b).
The “lag time” effect of risk factors on CVD means that present mortality rates are
the effect of exposure to risk factors in past decades. Present public health strategies,
which intend to reduce future CVD burdens, must focus on current levels of risk behav-
iors, biologic risk factors (which relate principally to those behaviors) as well as the
proximate social determinants of those risk behaviors and risk factors. Inappropriate
nutrition, reduced physical activity and tobacco consumption are among the behaviors
most associated with an increased risk of CVD, whereas overweight, central obesity,
high blood pressure, dyslipidemia, and diabetes are among the risk factors which prin-
cipally contribute to the manifestation of that risk.
A rise in total fat intake and decline in carbohydrate consumption (especially the
complex variety), excess energy intake coupled with micronutrient deficiencies, reduced
physical activity with energy–activity mismatch leading to obesity as well as excess
salt intake characterize the nutrition transition that is becoming increasingly well
documented in many developing countries (Drewnowski and Popkin, 1997). The
falling price of vegetable fat in the international market and the rising price of dietary
fiber (fruit and vegetables) in the domestic markets are economic factors propelling
this change. The proportion of Chinese citizens consuming �30% fat as an energy
source in their daily diet rose steeply across all income classes between 1989 and 1993.
The forces of urbanization and globalization which shift production from the small
farmer to the large corporation, distribution from the shopkeeper to the supermarket,
consumption from fresh to processed foods and supply from local to export markets
are the dynamos of this change in dietary patterns (Lang, 1997). Worldover, food is
becoming part of a “common culture” that reflects the dominant forces in globalization.
196 Cardiovascular diseases
Although nutrition is an essential need, tobacco is an entirely avoidable external
agent which contributes greatly to the risk of CVD. The proportion of all deaths attrib-
utable to tobacco is estimated to rise in India, from 1.4% in 1990 to 13.3% in 2020 and
from 9.2% to 16.0% in China during the same period. The overall global escalation
would be from 6.0% to 12.3% over these 30 years (WHO, 1996). Of the 10 million
lives that would be lost globally in 2025, due to tobacco, 7 million would be from the
developing countries. The declining tobacco consumption patterns and the tactical,
albeit limited, retreat of the tobacco industry in the developed countries are accompa-
nied by aggressive marketing and rising consumption patterns in the developing coun-
tries and CVD would be the largest contributor to these tobacco-related deaths.
Recent reports from many developing countries chronicle rising rates of sedentariness,
overweight, high blood pressure dyslipidemia, diabetes, and tobacco consumption in
their populations (Reddy and Yusuf, 1998; InterAmerican Heart Foundation, 2000;
Yusuf et al., 2001a). These presage a sharp rise in future CVD events, unless effective
public health interventions to prevent, recognize, and reduce risk factors are urgently
introduced and implemented.
The prevalence of hypertension varies according to the definition of hypertension
used in different studies. Recent surveys in China and India confirm the higher urban
prevalence of hypertension compared to rural (Reddy, 1996). The overall prevalence
in China, with threshold values of 140/90 mmHg, was 12.5% in adults aged 35–64
years. Recent Indian studies estimate a prevalence of adult hypertension in India to
be 27.3% in an urban setting and 12.2% in a rural setting. Based on these estimates,
the number of adults with hypertension in India and China together would exceed
100 million. Prevalence estimates of hypertension in adults in sub-Saharan Africa are
in the range of 10–15% with figures as high as 20% in some large studies. The number
of hypertensive adults in this region, according to these studies, has been estimated to
be between 10 and 20 million (Cooper et al., 1998; Fuentes et al., 2000). Prevalence
of hypertension, in a national survey of adults in Mexico in 1993, was found to be
26.6% (Arroyo et al., 1999).
The developing countries are currently contributing to three-quarters of the global
burden attributable to diabetes. The anticipated rise in the number of diabetics in the
world from 135 million in 1995 to 300 million in 2025 would principally be related to
a sharp rise in diabetes prevalence in the developing countries, exemplified by a 195%
rise in India (King et al., 1998). This, in turn, would impact adversely on the CVD
attributable burden of disease in the developing countries. Although urban diabetes
prevalence rates are three- to fourfold higher than rural prevalence rates in most parts
of India, urban prevalence of glucose intolerance (diabetes or impaired glucose toler-
ance) rose in urban Madras (Chennai) from 16.9% in 1988–89 to 20.7% in 1994–95
(Ramachandran et al., 1997). Increase in body mass index as well as central obesity con-
tribute to the rising rates of glucose intolerance. Both of these, in turn, are determined
by changing patterns of diet and physical activity.
In most developing countries, at present, urban populations have higher levels of
cardiovascular risk factors, which are related to diet and physical activity (overweight,
hypertension, dyslipidemia and diabetes) whereas tobacco consumption is more widely
prevalent in rural population (Reddy, 1993). This suggests that tobacco consumption
Tracking the epidemic: risk behaviors to risk factors to events 197

is more influenced by education and is the earliest risk factor to demonstrate a reversal
of the social gradient. The other risk factors are influenced by more complex social
interactions affecting diet and exercise and their social gradients reverse relatively
slowly. This variation indicates the need for specifically targeted prevention programs
addressing the needs of different social groups. It also offers an opportunity for policy-
linked social engineering to influence the dynamics of an advancing epidemic at an
early stage.
Ethnic diversity: variations in the theme
Although the pathways of CVD appear common to all regions of the world, there are
differences in populations which are mediated by ethnicity, just as there are differences
in individuals mediated by genetic influences. Ethnicity transcends racial designations
or genotypic groupings. It represents the conglomeration of cultural practices, lifestyle
patterns, social influences, religious pursuits and racial characteristics that shapes
the distinctive identity of a community. Ethnicity, therefore, extends beyond race and,
although culturally distinctive, is also open to adaptation and alteration (Reddy, 1998).
Ethnic diversity in CVD has been noted at all stages of the CVD epidemic, whether
in terms of the dominant stroke profile or the relative burdens of CHD and stroke or
interpopulation differences in CHD rates at similar levels of economic development.
The Seven Countries Study initially portrayed these differences clearly and provided
variability in total blood cholesterol as the best explanation (Keys, 1980). As knowledge
about the distribution of coronary risk factors in different populations grew, the inter-
play of multiple coronary risk factors contributing to variability in coronary disease
rates between populations became clear. However, some conundrums have continued
to pose challenges to such epidemiologic elucidation. From the “French paradox” to the
“Hispanic paradox”, from the lower than expected rates in Pima Indians to higher than
expected rates in South Asians (based on conventional risk factor levels), there have
been several puzzles which have periodically demanded plausible explanations. These
ethnic differences have been extensively reviewed recently (Yusuf et al., 2001a,b).
Several factors may contribute to these observed interpopulation differences in
the CVD profile. First, countries may be located at different points in the path of
epidemiologic transition, with varied life expectancy, diverse demographic profiles
and differing contributions from the competing causes of death. Thus the total burden
of CVD as well as the composition of the CVD spectrum will vary according to
the dynamics of health transition.
Second, environmental factors related to increased or decreased risk of CVD differ
widely across populations. These differences are partly culture-specific and partly related
to the stage of industrialization. Much of the variability of CVD risk, between and within
populations, has been explained by differences in risk factors which are influenced by
the environment (lifestyle factors). The greater range of risk factor distributions in
interpopulation comparisons demonstrates their association with disease more vividly,
even though unconfounded comparisons are difficult in such ecologic studies.
198 Cardiovascular diseases

Third, genetic factors explain variance in the risk of incident CVD within popula-
tions by providing the basis for differences in individual susceptibility in a shared and
relatively homogenous environment. They also contribute to interpopulation differences,
due to variable frequencies of one or more genetic determinants of risk in different
ethnic groups. Genetic contributions to lipid disorders, obesity, salt sensitivity, insulin
resistance, coagulation derangements and endothelial dysfunction are being unraveled
and investigated for attributable risk.
Fourth, the “programming” effect of factors promoting selective survival may also
determine individual responses to environmental challenges and, thereby, the popula-
tion differences in CVD. The “thrifty gene” has been postulated to be a factor in pro-
moting selective survival, over generations, of persons who encountered an adverse
environment of limited nutritional resources (Reddy, 2001). Although this may have
proved advantageous in surviving the rigors of a spartan environment over thousands
of years, the relatively recent and rapid changes in environment may have resulted
in a metabolic mismatch. Thus the salt-sensitive person whose forefathers thrived
despite a limited supply of salt reacts to a salt-enriched diet with high blood pressure.
Similarly, an insulin-resistant individual whose ancestors may have survived, because
a relative lack of insulin sensitivity in the skeletal muscle ensured adequate blood
glucose levels for the brain in daunting conditions of limited calorie intake and demand-
ing physical challenges, may now respond to a high-calorie diet and a sedentary lifestyle
with varying degrees of glucose intolerance and hyperinsulinemia.
Yet another postulated “programming factor” which may underlie population dif-
ferences in CHD is the state of infant nutrition determined by influences in utero and
in early childhood. An adverse intrauterine growth environment due to poor maternal
nutrition may confer a selective survival advantage to the fetus who has been “pro-
grammed” for reduced insulin sensitivity. Similarly other physiological mechanisms
may be “irreversibly programmed”, by the fetal and infant growth environment to confer
a survival advantage. However, as the child grows and survives into adulthood, such a
programming would result in adverse consequences of high blood pressure, glucose
intolerance and dyslipidemia resulting in an increased risk of CVD in later life.
It is only after demographic profiles, environmental factors and possible program-
ming factors are ascertained and adjusted for that differences in gene frequency or
expression can be invoked as a probable explanation for interpopulation differences in
CVD (Reddy, 1998). The extent to which most chronic diseases, including CVD, occur
within and among different populations is determined by genetic–environmental
interaction which occurs in a wide and variable array, ranging from the essentially
genetic to the predominantly environmental. This is perhaps best illustrated by the
knowledge gained from studies in migrant groups, where environmental changes due
to altered lifestyles are superimposed over genetic influences. These “natural experi-
ments” have been of great value in enhancing the understanding of why CVD rates
differ among racial groups. The classical Ni-Hon-San study of Japanese migrants
revealed how blood cholesterol levels and CHD rates rose from Japan to Honolulu and
further still to San Francisco, as Japanese communities in the three areas were com-
pared (Robertson et al., 1977). The experience gleaned from the study of South Asians,
Chinese and Pima Indians further elucidates the complexities of ethnic variations in
Ethnic diversity: variations in the theme 199

CHD (Yusuf et al., 2001a,b). The comparison of Afro-Caribbeans, South Asians and
Europeans in UK brought out the sharp differences in central obesity, glucose intoler-
ance, hyperinsulinemia and related dyslipidemia between the three groups despite
similar profiles of blood pressure, body mass index and total plasma cholesterol
(Chaturvedi et al., 1994). However, urban–rural comparisons within India as well as
migrant Indian comparison with their nonmigrant siblings reveal large differences in
these conventional risk factors (Reddy, 1993).
Thus, where the environment is common but gene pools differ, the nonconventional
risk factors appear to be explanatory of risk variance, whereas when the same gene
pool is confronted with different environments, the conventional risk factors stand out
in stark relief. Investigation of genetic–environmental interactions in the diverse “ethnic”
groups across the world may supply some of the missing pieces of the atherothrom-
botic puzzle. Identification of characteristic genetic markers of enhanced suscepti-
bility to vascular disease in any ethnic group does not imply that their future lies in gene
therapy (involving millions of individuals) but that relevant environmental changes
must be specifically targeted in that population. Often, the susceptibility attributed to
race may obscure the true association with poverty or inequitable access to health care.
Within as well as between ethnic groups, socioeconomic status is a strong determinant
of lifestyle practices. Environmental components remain dominant in determining the
varied “ethnic” risks for CVD. The mandate of preventive cardiology lies in identifying
and addressing the components most relevant to each community at their present and
projected levels of development and epidemiologic transition.
Back to the future: evaluating evidence forinitiating interventions
Evidence has been accrued from ecological, observational, and experimental studies,
conducted mostly in developed countries, of the principles which underlie CVD risk
and of strategies which are likely to be successful in reducing that risk. Prevention must
aim at risk reduction across the lifespan and be guided by the following facts. First,
risk operates across a continuum for most variables. Second, many more events arise
from the “moderate” middle of the distribution than from the “high-risk” tail. Third,
risk is multiplied when risk factors coexist, which they often do. Fourth, the majority
of CVD events occur in persons with modest levels of multiple risk factors rather than
in those with a high level of single risk factor. Fifth, “comprehensive” or “absolute” CVD
risk is the best guide for individual interventions, whereas “population-attributable
risk” should guide mass interventions, maximizing benefits by bringing about modest
distributional shifts. Sixth, a synergistically complementary blend of cost-effective
“population-wide” and “high-risk” interventions must extend from primary preven-
tion in children to secondary prevention in older adults (Reddy, 2001, 2002; Yusuf
et al., 2001b).
Success of such an approach comes from community-based studies in Finland and
Mauritius (Dowsen et al., 1995; Puska et al., 1995) as well as clinical trials employing
200 Cardiovascular diseases

lifestyle interventions, apart from drug trials. As the evidence from clinical trials rein-
forces the risk associations identified by observational studies, the “preventive norms”
and “clinical norms” move closer, whether it be blood pressure or plasma cholesterol
that is under consideration.
The benefits of healthy diet on reducing CVD risk have been well attested by the
results of interventions in populations as well as in individuals (Pietinen et al., 1996;
De Lorgeril et al., 1999; Sacks et al., 2001). This should provide the basis for global
action for CVD prevention utilizing effective strategies to prevent or reduce the CVD
risk associated with diet, inactivity, and tobacco.
Telescoping the transition: pathways for public health action
The model of health transition offers an opportunity to predict the course of the CVD
epidemic in many regions of the world and to intervene effectively to alter that course.
Developmental and demographic changes will expose more people to the increased
risk of CVD but that can be countered by promoting healthy living habits, especially
in the area of nutrition and physical activity. Experience of diverse countries (Japan
and Southern Europe) suggests that development need not be necessarily accompanied
by high burdens of CHD. The burdens of CVD cannot be totally prevented as they will
continue to be the major contributors in the elderly. However, opportunities exist for
reducing the burdens of mid-life mortality and disability due to CVD, by abbreviating
the most dangerous phase of health transition. The challenge of public health in the
21st century, is to telescope the transition in the developing countries to contain these
avoidable burdens of CVD. Fortunately, nutrition provides a powerful and practical
pathway to meet that challenge. It requires an empowered community and an enlight-
ened policy, catalyzed by an energetic coalition of health professionals, to open up
and utilize that pathway for advancing the agenda of global CVD prevention and
control.
References
Arroyo, P., Fernandez, V., Loria, A., et al. (1999). Hypertension in urban Mexico: the
1992–93 national survey of chronic disease. J. Hum. Hypertens. 13, 671–675.
Barker, D.J.P., Martyn, C.N., Osmond, C., et al. (1993). Growth in utero and serum cholesterol
concentrations in adult life. BMJ 307, 1524–1527.
Chaturvedi, N., McKeigue, P.M., and Marmot, M.G. (1994). Relationship of glucose intol-
erance to coronary risk in Afro-Caribbeans compared with Europeans. Diabetologia
37, 765–772.
Cooper, R., Rotimi, C., Kaufman, J., et al. (1998). Hypertension treatment and control
in sub-Saharan Africa: the epidemiological basis for policy. BMJ 316, 614–617.
References 201

De Lorgeril, M., Salen, P., Martin, J.L., et al. (1999). Mediterranean diet, traditional risk
factors, and the rate of cardiovascular complications after myocardial infarction: final
report of Lyon Diet Heart Study. Circulation 99, 779–785.
Dowsen, G.K., Gareeboo, H., George, K., et al. (1995). Changes in population cholesterol
concentrations and other cardiovascular risk factor levels after five years of
non-communicable disease intervention programme in Mauritius. BMJ 311,
1255–1259.
Drewnowski, A., and Popkin, B.M. (1997). The nutrition transition: new trends in the global
diet. Nutr. Rev. 55, 31–43.
Enas, E.A., and Mehta, J. (1995). Malignant coronary artery disease in young Asian Indians.
Thoughts on pathogenesis, prevention and therapy. Clin. Cardiol. 18, 131–135.
Fuentes, R., Ilmaniemi, N., Laurikainen, E., et al. (2000). Hypertension in developing
economies: a review of population-based studies carried out from 1980 to 1998.
J. Hypertens. 18, 521–529.
InterAmerican Heart Foundation (2000). “Heart Disease and Stroke in the Americans
2000”. InterAmerican Heart Foundation, Dallas, TX.
Keys, A. (1980). “Seven Countries – a Multivariate Analysis of Death and Coronary Heart
Disease”. Harvard University Press, Boston.
King, H., Aubert, R.E., and Herman, W.H. (1998). Global burden of diabetes, 1995–2025.
Prevalence, numeric estimates and projections. Diabetes Care 21, 1414–1431.
Lang, T. (1997). The public health impact of globalisation of food trade. In “Diet, Nutrition
and Chronic Disease” (P.S. Shetty, and K. McPherson, eds.), pp. 173–187. Wiley,
Chichester.
Murray, C.J.L., and Lopez, A.D. (1996). “Global Health Statistics. Global Burden of
Disease and Injury Series”. Harvard School of Public Health, Boston, MA.
Olshansky, S.J., and Ault, A.B. (1986). The fourth stage of the epidemiologic transition:
the age of delayed degenerative diseases. Millbank Mem. Fund Q. 64, 355–391.
Omran, A.R. (1971). The epidemiologic transition: a key of the epidemiology of population
change. Milbank Mem. Fund Q. 49, 509–538.
Pais, P., Pogue, J., Gerstein, H., et al. (1996). Risk factors for acute myocardial infarction
in Indians: a case control study. Lancet 348, 358–363.
Pearson, T.A., Jamison, D.T., Trejo-Gutierrez, H., and Jamison, D.T. (eds.) (1993). “Disease
Control Priorities in Developing Countries”, pp. 577–599. Oxford University Press,
New York.
Pietinen, P., Vartianinen, E., Seppanen, R., et al. (1996). Changes in diet in Finland from
1972 to 1992: impact on coronary heart disease risk. Prev. Med. 25, 243–250.
Puska, P., Tuomilehto, J., Aulikki, N., and Enkki, V. (1995). “The North Karelia Project.
20 Years Results and Experiences”. National Public Health Institute, Helsinki.
Ramachandran, A., Snehlatha, C., Latha, E., et al. (1997). Rising prevalence of NIDDM
in an urban population in India. Diabetologia 40, 232–237.
Reddy, K.S. (1993). Cardiovascular disease in India. World Health Stat. 46, 101–107.
Reddy, K.S. (1996). Hypertension control in developing countries: generic issues. J. Hum.
Hypertens. 10, S33–S38.
Reddy, K.S. (1998). Ethnic diversity: the new challenge of preventive cardiology. CVD
Prevention 1, 6–8.
202 Cardiovascular diseases

Reddy, K.S. (2001). Neglecting cardiovascular disease is unaffordable. Bull. World Health
Organ. 79, 984–985.
Reddy, K.S. (2002). Cardiovascular diseases in the developing countries: dimensions,
determinants, dynamics and directions for public health action. Public Health Nutr.
5, 2317.
Reddy, K.S., and Yusuf, S. (1998). Emerging epidemic of cardiovascular disease in devel-
oping countries. Circulation 97, 569–601.
Robertson, T.L., Kato, H., Rhoads, G.G., et al. (1977). Epidemiologic studies of coronary
heart disease and stroke in Japanese men living in Japan, Hawai and California.
Incidence of myocardial infarction and death from coronary heart disease. Am. J.
Cardiol. 39, 239–249.
Sacks, F.M., Svetkey, L.P., Vollmer, W.M., et al. (2001). Effects on blood pressure of reduced
dietary sodium and the dietary approaches to stop hypertension (DASH) diet. N. Engl.
J. Med. 344, 3–10.
Suh, I. (2001). Cardiovascular mortality in Korea: a country experiencing epidemiologic
transition. Acta Cardiol. 56, 75–81.
WHO (1996). “Tobacco or Health: First Global Status Report”. World Health
Organization, Geneva.
WHO (1999). “The World Health Report 1999 Making a Difference”. World Health
Organization, Geneva.
Yao, C., Wu, W., and Wu, Y. (1993). The changing pattern of cardiovascular disease in
China. World Health Stat. Q. 46, 113–118.
Yusuf, S., Reddy, S., Ounpuu, S., and Anand, S. (2001a). Global burden of cardiovascular
diseases. Part I: General considerations, the epidemiological transition, risk factors,
and impact of urbanization. Circulation 104, 2746.
Yusuf, S., Reddy, S., Ounpuu, S., and Anand, S. (2001b). Global burden of cardiovascular
diseases. Part II: Variations in cardiovascular disease by specific ethnic groups and
geographic regions and prevention strategies. Circulation 104, 2855.
References 203

This Page Intentionally Left Blank

The nutrition transitionin China: a new stageof the Chinese diet
Shufa Du, Bing Lu, Fengying Zhai, and Barry M. Popkin
11
Introduction
China represents one of the more rapidly developing countries in the world. In the past
two decades, the annual growth rate of the gross domestic product (GDP) was more than
8%; the highest rate in recent world history (World Bank, 2001). China has achieved
remarkable economic progress and high levels of education. Annual income per capita
is now almost 20 times greater than 20 years ago (State Statistical Bureau, 2001), reaching
$400 in rural areas and $850 in urban areas in 1999 (Fig. 11.1). As a result, the pro-
portion of the population considered to be poor decreased sharply from 20% in 1978
to lower than 5% in 1999. The proportion of the population with an income below $1
a day declined from 80% in 1978 to 12% in 1998 (World Bank, 2001). Only one-third
of all adults were able to read or write in 1978. By 1998, illiteracy among 15–25 year-
olds was about 7% (World Bank, 2001).
Along with these economic shifts, and many related social changes, has come a
rapid evolution of the Chinese diet. The Chinese cuisine has one of the oldest histo-
ries. By the third century BC, there was a complex theory of cuisine and gastronomy
developed for China. The starting point for modern Chinese cuisine is the cultivation
and consumption of cereals (Legge, 1885). Yi Yin, a famous cook and prime minister,
developed the standards that are still followed. These stress the mastery of cooking
techniques and the harmony of flavors (Chen Qiyou, 1984; Knechtges, 1986). Foods
are classified by nature (hot, cold, temperate, cool) and their flavor (salty, sour, sweet,
bitter, acrid). The absence of excessive oil, other higher fat ingredients, and cooking
options from this traditional cuisine, and even from the regional cuisines that emerged
during the Ching and Manchu dynasties, is surprising. The excessive use of meat in
the overall diet and the heavy additions of oils in modern dishes are new dimensions.
The Nutrition TransitionISBN: 0-12-153654-8
Copyright © 2002 Elsevier Science LtdAll rights of reproduction in any form reserved

There appears to be no ancient precedent for the current “westernization” of the
Chinese diet.
The classic Chinese diet includes cereals (usually rice in the south; wheat and
wheat products in the north) and vegetables with few animal foods. In rural areas, res-
idents did not usually consume animal food, except when guests visited the family
or there was a large festival (e.g., spring festival). Typically, such a diet is low fat,
low-energy density, high in carbohydrates and high in dietary fiber. It is a diet that
many scholars consider most healthful when adequate levels of intake are achieved
(Campbell and Chen, 1994; Campbell et al., 1998).
Earlier research by these authors has shown rapid changes in the diets and body
composition of Chinese adults during the 1980–91 period (Popkin et al., 1993, 1995).
As the classic eating pattern shifts, intake of cereals and many lower-fat mixed dishes
are being replaced. Animal foods are becoming popular and the consumption of
edible oils is also quickly increasing. Most recently, Western fast food companies have
entered China (Watson, 1997). For example, no restaurants sold western fast foods in
Beijing in 1985; there are now more than 100 McDonald’s or Kentucky Fried Chicken
restaurants in Beijing. It is fashionable to eat at these restaurants.
There are five clear stages of the nutrition transition; that is, of dietary and body
composition patterns in human history: collecting food, famine, receding famine,
degenerative diseases and behavioral change (Popkin, 1993). This chapter shows that
China is transforming very rapidly from the pattern of the present receding famine
stage to that of diet-related degenerative diseases.
This shift in the composition of diet and body composition has been accompanied
by many positive and some negative changes. Infectious diseases and hunger, impor-
tant causes of death in the 1950s, no longer affect most of the population. Although
malnutrition and nutrition deficiency diseases are still problems that should not be
overlooked, the burden is shifting to diet-related degenerative diseases with a rapid
206 The nutrition transition in China: a new stage of the Chinese diet
25
20
15
10
5
0
73 77 78 79 81 82 83 84 85 86 87 88 90 93 95 96 97 98 99
900
800
700
600
500
400
300
200
100
0
GN
P 1
99
9 U
S$
Per
cen
t p
oo
r
Year
Figure 11.1 Income and poverty trends in China (from World Bank: World Development Indicators,
2001). ◆, Poverty (%); ■, GNP.

increase in the prevalence of obesity. Mortality, particularly infant and child mortality,
and fertility are declining, and life expectancy has reached high levels. Heart diseases,
cerebrovascular diseases and cancer are now the major sources of mortality. Respira-
tory diseases are rapidly receding in importance.
Subjects and methods
Dietary data
Data were obtained from three sources. The first source, the State Statistics Bureau
(SSB), has had a national random sampling framework since 1952, which was clus-
tered by urban/rural areas and economic levels. A national representative sample was
drawn from this framework. SSB has two survey teams: the Urban Survey Team
and the Rural Survey Team. The two teams are in charge of the urban and rural area
surveys, respectively, and collect data such as economic, occupation, population, mar-
riage, and diet each year. The survey design is similar to a longitudinal survey, but
about 20% of the households in the sampling communities would be changed each
year. In this study, data from 1952 to 2000 were used to analyze the long-term transi-
tions in diet and nutrition in China. Not every year’s data before 1978 were avail-
able and data after 1992 did not include the total consumption of urban and rural
residents.
The second data source was the China National Nutrition Survey (CNNS) which
was conducted as three rounds of a national nutrition survey in 1959, 1982, and 1992.
Unfortunately, since no computer files of data in 1959 were available; data from 1982
and 1992 were used in this chapter. CNNS used a multistage, cluster sampling method
to draw the sample. In 1982, about 1500 persons in each of 178 communities were
surveyed; the sample size was 238 134. Dietary data were collected using a five-
consecutive days weighing method. In 1992, 30 households in each of 960 commu-
nities were surveyed and the sample size was 100 201. Dietary data were collected by
a combination of the weighing method and three consecutive 24-hour recalls.
The third data source was the China Health and Nutrition Survey (CHNS), a longi-
tudinal survey designed to examine the effects of the health, nutrition, and family
planning policies and programs implemented by the national and local governments
and to observe how the social and economic transformation of Chinese society is
affecting the health and nutritional status of its population. The survey originally cov-
ered eight provinces, and now includes nine, that vary substantially in geography,
economic development, public resources, and health indicators. A multistage, random-
cluster process was used to select the sample surveyed in each of the provinces.
In 1989, 190 communities including about 3800 households and 16 000 subjects were
surveyed; they were followed up in 1991, 1993, 1997 and 2000. Three consecutive
days of 24-hour recall and detailed household food consumption data were collected
(Popkin et al., in press). These three days were randomly allocated, from Monday to
Sunday, and are almost equally balanced across the seven days of the week for each
sampling unit. Household food consumption was determined by examining changes
Subjects and methods 207

in inventory, from the beginning to the end of each day, in combination with a weigh-
ing and measurement technique.
Physical activity data
The CHNS collected detailed data on occupation, work character, labor force, work
time and other items related to physical activities. Physical activity was classified into
three categories: light, moderate, and vigorous (Bell et al., 2001). The proportion of
ownership of television (TV) sets was also analyzed to reflect the shifts in physical
activities.
Anthropometric data
Data from both CNNS and CHNS were used. Both surveys measured height and weight
in an elaborate way and these methods were described in Du et al. (2001a) and Ge
et al. (1996). The World Health Organization’s (WHO) cutoff points for body mass index
(BMI) were used to define underweight (BMI �18.5) and overweight (BMI 25).
Overweight and obesity (BMI 30) categories are combined for two reasons. The pro-
portion of BMI 30 was very low (only 1.5% in 1992) and a recent international group
from the WHO-Pacific Region has recommended that a lower BMI cutoff for over-
weight of 23 and obesity of 25 should be used in Asia (Inoue and Zimmet, 2000).
Mortality and causes of death data
These data came from the Annual Death Report from the Ministry of Health of China.
China has a fairly complete death registration system that appears to be of reasonable
quality. In rural areas, village clinics collect death data (including decedant’s name,
gender, age, death date and time, causes of death and diagnostic hospital, etc.) and report
to town hospitals, which totals each village’s data. In urban areas, anti-epidemic
stations at the district level collect all death data from hospitals, clinics, and neigh-
borhoods (the lowest government unit in a city). All data from anti-epidemic stations
are submitted to the Ministry of Health. Diseases are classified according to the
WHO’s International Classification of Disease, Injuries, and Causes of Death, version 9
(ICD-9). Death data before 1973 were not used since they were not complete and the
classification varied slightly from ICD-9.
Results
Food consumption pattern
The shift in the Chinese diet follows a classic westernization pattern. The economic
progress, linked in part to liberalization of food production controls and the introduction
208 The nutrition transition in China: a new stage of the Chinese diet

of a free market for food and food products, are linked to these important shifts in diet
(Guo et al., 1999). Focus was placed on shifts in key, separate components of the
Chinese diet.
Cereals
The long term
In the past, China was an autarkic agriculture country. Over 80% of the population
lived in rural areas. They worked on farms and their main income came from foods they
produced. However, this status has been changing in the last 50 years and this change
is considered historic. There are really five different stages of change (Fig. 11.2). First,
was the shift from an independent China, free of war, between 1949 and 1957. After a
long period of civil wars and anti-Japanese aggression, famine was widespread, mor-
tality was very high, and many people died young. China in 1949 was like a waste-
land, but people received hope from the new government. Farmers got their lands, and
workers got their jobs; economics began to recover, and food products began to
increase. Limited by the poor agriculture mode and poor land sources, food produc-
tion was inadequate and low cereal consumption patterns existed (Fig. 11.2).
In the second period, there was a sharp decrease in food consumption from 1957 to
1962 during the famine linked with the Great Leap Forward. The causes and conse-
quences of the famine during this period are not well documented, but it is clear that
a large-scale famine occurred and there was a major regression in the Chinese econ-
omy during this period (Piazza, 1986). In 1962, cereal intake reached the level of con-
sumption of 1949, only 165 kg per capita, per year.
The third period, between 1962 and 1979, was one of strong recovery. During this
period, per capita intake of cereals increased steadily from 165 kg to 195 kg. This was
an annual per capita increase of only 1.8 kg.
Results 209
300
250
200
150
100
50
0
52 62 65 75 77 79 81 83 85 87 89 91 93 95 97 99
Year
Co
nsu
mp
tio
n (
kg/c
ap
ita/y
ear)
Figure 11.2 Consumption of cereals and vegetables (data from State Statistical Bureau, China Statistical
Yearbook, 1952–2000). ◆, vegetables (rural); ■, vegetables (urban); ▲, cereals.

The fourth or reform period of 1979 to 1985 came after the liberalization of food
production when the annual economic growth rate was over 10%. During this period,
China began to import cereals from the United States and other countries. As a result,
per capita intake of cereals increased by 60 kg within 6 years, 10 kg each year, or a
27.4 g increase each day.
After this rapid growth, further economic improvement led to a shift in energy
requirements. The structure of the Chinese diet shifted and cereal consumption began
to slowly decline; this is the fifth period presented in Popkin et al. (1993).
Large cultural, economic, and communications differences existing between urban
areas and rural areas are linked with different cereal intake patterns. Urban cereal
intake decreased slowly before 1979 and rapidly thereafter. In 1999, the intake of
cereals by urban residents was only 84.9 kg per capita. This was almost half of the
intake of cereals in 1979, or one-third of that for rural residents in 1999.
The short term
Both CNNS and CHNS data showed that intake of cereals decreased considerably
during the past two decades in both urban and rural areas and among all income
groups (Table 11.1). During the eight-year period from 1989 to 1997, the total intake
of cereals decreased by 127 g, per capita, per day (67 g for urban residents and 161 g
for rural residents). The decrease in the low-income group was the highest: 196 g per
capita, compared with their counterparts in mid- and high-income groups (86 g and
85 g, respectively). However, there remains an inverse relationship between income
and cereal intake. For example, in 1997, the intake in low-, mid- and high-income
groups was 615 g, 556 g and 510 g per capita, respectively.
The shift away from coarse grain consumption such as millet, sorghum and corn, is
a key component of this change. CHNS data showed a 38 g decrease in refined cereals
210 The nutrition transition in China: a new stage of the Chinese diet
Table 11.1 Shift in consumption in the Chinese diet (China Health and Nutrition Study, 1989–1997) for adults, ages 20 to 45
Food Mean intake (g/capita/day)
Urban Rural Low income Mid income High income Total
1989 1997 1989 1997 1989 1997 1989 1997 1989 1997 1989 1997
Total grains 556 489 742 581 811 615 642 556 595 510 684 557
Coarse 46 25 175 54 226 68 98 43 78 30 135 46
Refined 510 465 567 527 585 546 544 513 517 479 549 511
Fresh vegetables 309 311 409 357 436 356 360 357 335 325 377 345
Fresh fruit 14.5 35.9 14.9 16.7 5.5 8.0 13.2 18.1 26.1 37.5 14.8 21.7
Meat and meat 73.9 96.6 43.9 57.6 36.3 40.2 57.5 63.9 66.5 96.2 53.3 67.8
products
Poultry and game 10.6 15.5 4.1 11.7 4.1 7.0 6.6 10.2 7.7 20.3 6.1 12.7
Eggs and egg 15.8 31.6 8.5 19.6 6.0 13.9 10.6 21.7 15.8 31.5 10.8 22.7
products
Fish and seafood 27.5 30.5 23.2 26.9 11.8 16.4 28.7 26.0 33.4 40.1 24.6 27.9
Milk and milk 3.7 4.0 0.2 0.9 0.8 0.1 0.2 1.4 3.5 3.6 1.3 1.7
products
Plant oil 17.2 40.4 14.0 35.9 12.9 32.1 15.8 37.1 16.4 41.5 15.0 37.1

between 1989 and 1997, but an even larger decrease in coarse cereal consumption of
89 g. In CNNS data, the intake of refined cereals in 1992 was similar to that in 1982,
but the intake of coarse cereals decreased by 59 g per capita, per day.
Vegetables and fruits
The long term
Figure 11.2 presents a long-term shift in household vegetable consumption. Urban
residents’ intake, which was slightly higher than that of rural residents, decreased
steadily before 1997 and increased slightly thereafter. Among rural residents, there
was a sharp decrease from 1992 to 1993, a smaller decline from 1993 to 1995 and
then a slight increase.
Short term
The intake of vegetables decreased between 1989 and 1997. In contrast, the intake of
fruits, which are much more expensive than vegetables, showed an increase. CHNS
data showed that the urban residents’ intake of vegetables did not change from 1989
to 1997, but the intake of fruits in 1997 was 2.5 times that of 1989 (Table 11.1). As a
result, the total intake of vegetables and fruits in urban areas during this period
increased. The intake of vegetables of rural residents decreased 52 g per capita, per
day (409 g in 1989 to 357 g in 1997), whereas the intake of fruits increased by 1.8 g
per capita, per day during the same period. As a whole, total intake of vegetables and
fruits decreased from 391.8 g per capita per day in 1989 to 366.7 g per capita, per day
in 1997. The largest decrease occurred in the low-income group, where the intake
decreased from 441.5 g to 364 g, or 77.5 g per capita, per day.
Animal foods
Long term
In the past 50 years, annual consumption of animal foods more than tripled from a
very low level of consumption of 11 kg per capita in 1952 to 38 kg per capita in 1992
(Fig. 11.3). Urban residents’ intake increased to 65.3 kg per capita in 1999. There was
a slow rate of increase prior to 1979 but thereafter, it was much higher. From 1952 to
1979, intake increased by only 5.6 kg (0.2 kg annually), but it increased by 21 kg
(1.6 kg annually) between 1979 and 1992. Of the subcomponents, meat and meat
products increased from 8.4 kg to 20.3 kg, poultry and game from 0.6 kg to 2.3 kg, fish
from 3.2 kg to 7.3 kg and eggs from 2.0 kg to 7.8 kg per capita, per year.
Meat and meat products were the main sources of animal foods, but the proportion
decreased from 76% to 58% in rural areas and from 57% to 44% in urban areas. The
proportions of other sources increased, but at a very low level. For example, the pro-
portion of fish, as an animal food, increased from 11% to 16% in rural areas but there
was no change in urban areas (22%); poultry increased from 3% to 10% in rural areas
and from 6% to 12% in urban areas.
Results 211

Short term
Urban residents’ intake of animal foods per capita, per day in 1997 was higher than for
rural residents (178.2 g for urban vs. 116.7 g for rural) and also showed a larger
increase (46.7 g vs. 36.8 g) from 1989 to 1997. The amount and growth of intake of
animal foods was positively associated with income levels. Intake in the low-income
group was 77.6 g per capita, per day in 1997, an increase of 18.6 g, whereas it was
123.2 g and 19.6 g in the mid-income group; and 191.7 g and 64.8 g per capita, per day
for the high-income group. The intake level and the increase in the high-income group
from 1989 to 1997 was almost three times those in the low-income group.
The composition of energy in the diet
Long term
Figure 11.4 presents the long-term shifts in the proportion of energy from each
macronutrient component; trends of energy intake were similar to those of cereals. Total
energy intake increased before 1985; then began to decrease. Total energy intake was
2270 kcal (9.50 MJ) in 1952, 2440 kcal (10.21 MJ) in 1982, and 2328 kcal (9.74 MJ)
in 1992. Among the energy components, there was little change in the proportion of
energy from protein during this period, but the proportion of protein from animals
increased considerably. Only 3.1% of protein came from animal foods in 1952 and
this increased to 18.9% in 1992; intake of fat doubled in this time period (28.3 g vs.
58.3 g). Sources of energy changed remarkably; energy from fat increased two times
(11% vs. 22%), energy from carbohydrates decreased from 77% to 66%, and energy
from animal foods increased from 4.9% to 9.3%.
Short term
Data from the CHNS show the shift away from carbohydrates to fat in the diet. Energy
from carbohydrates (Table 11.2) decreased to 59.8% in 1997 from 68.7% in 1989 for
212 The nutrition transition in China: a new stage of the Chinese diet
40
35
30
25
20
15
10
52 62 65 75 77 79 81 83 85 87 89 91
5
0
Year
Co
nsu
mp
tio
n (
kg/c
ap
ita/y
ear)
Figure 11.3 Consumption of animal foods (data from State Statistical Bureau, China Statistical
Yearbook, 1952–2000). ◆, meat; ■, poultry; ▲, fish; , eggs; , animal.

all residents, and to only 53.3% from 65.8% in 1989 among urban residents, the low-
est for any group. Energy from fat increased sharply from 19.3% in 1989 to 27.3% in
1997. The shift toward a high fat diet is shown more pointedly by examining those
with low and high fat diets and higher animal fat diets from 1989 to 1997 (Table 11.3).
The proportion of adults with a high fat diet increased by 2.5 times (14.7% vs. 38.5%)
within these eight years. Over 60% of urban residents consumed more than 30% of
energy from fat in 1997. The proportion of diets with a fat energy less than 10%
declined considerably (18.4% to 3.1%) over this same eight-year period.
Physical activity
Energy expenditure at work and the proportion of TV set ownership were used to mea-
sure changes in daily physical activities. Large changes in technology in the workplace
Results 213
100
80
60
40
20
052 78 79 80 81 82 83 89 91 93 97 52 78 79 80 81 82 83 89 91 93 97
Urban RuralYear
Carbohydrate Protein Fat
(%)
Figure 11.4 The proportion of energy from macronutrient sources, 1952–1997 (data from State Statistical
Bureau, China Statistical Yearbook, 1978–1983 and China Health and Nutrition Survey, 1989–1997).
Table 11.2 Shifts in energy sources in the Chinese diet for adults, ages 20 to 45 (China Health and
Nutrition Survey, 1989–1997)
Energy from fat (%) Energy from carbohydrates (%)
1989 1991 1993 1997 1989 1991 1993 1997
Urban 21.4 29.7 32.0 32.8 65.8 58.0 55.0 53.3
Rural 18.2 22.5 22.7 25.4 70.0 65.6 65.2 62.1
Low income 16.0 19.3 19.7 23.0 72.9 69.2 68.6 64.5
Mid income 20.3 25.2 25.5 27.1 67.5 62.6 62.2 60.3
High income 21.5 30.0 31.5 31.6 65.4 57.5 55.4 54.8
Total 19.3 24.8 25.5 27.3 68.7 63.2 62.1 59.8

and in leisure activities are linked with rapid declines in physical activity. Economic
activities are shifting toward the service sector, particularly in urban areas (Popkin,
1998). The proportion of urban adults (male and female) working in occupations
where they participate in vigorous activity patterns has decreased, and increased
where the activity pattern is light. In rural areas, however, there has been a shift toward
increased physical activity linked to holding multiple jobs and more intensive effort.
For rural women, there is a shift toward a larger proportion engaged in more energy
intensive work but there are also proportions where light effort is increasing. In con-
trast, for rural men there is a small decrease in the proportion engaged in light work
effort. The results are presented in Table 11.4.
Television set ownership increased considerably during this eight-year period,
especially in rural areas and among lower income groups (Table 11.5). Clearly TV
214 The nutrition transition in China: a new stage of the Chinese diet
Table 11.3 Shifts in consumption of total and saturated fat for adults, ages 20 to 45 (China Health and Nutrition Survey,
1989–1997)
Percentage with energy from Percentage with energy from Percentage with energy from
animal fat �10% fat 30% animal fat 10%
1989 1991 1993 1997 1989 1991 1993 1997 1989 1991 1993 1997
Urban 13.1 2.6 2.1 1.9 19.8 51.4 58.4 60.1 49.8 64.7 69.9 68.9
Rural 21.0 10.4 8.9 3.6 12.1 23.0 23.1 29.5 33.3 41.4 44.3 39.3
Low income 30.4 16.9 13.1 5.8 9.3 14.3 14.2 21.4 26.2 32.5 33.6 32.1
Mid income 14.8 5.4 6.1 2.7 16.2 31.1 31.4 35.5 42.8 50.6 53.2 42.6
High income 10.1 1.5 1.1 1.3 18.5 51.4 56.1 54.6 47.8 63.7 69.6 61.1
Total 18.4 7.9 6.8 3.1 14.7 32.0 33.7 38.5 38.8 48.7 52.0 48.0
Table 11.5 The proportion of ownership of TV sets in China (%) (China Health and Nutrition
Survey, 1989–1997)
1989 1993 1997
Urban 84.6 90.1 94.0
Rural 55.2 75.0 85.8
Total 64.7 79.6 88.5
Table 11.4 Activity distribution among adults, ages 20 to 45 years (China Health and Nutrition
Survey, 1989, 1997)
Light (%) Vigorous (%)
1989 1997 1989 1997
Urban Male 32.7 38.2 27.1 22.4
Female 36.3 54.1 24.8 20.8
Rural Male 19.0 18.7 52.5 59.9
Female 19.3 25.5 47.4 60.0

ownership represents a major potential source of inactivity. In 1997, close to 90% of
Chinese households owned TV sets.
Body composition
There has been a profound rightward shift in the body mass index (BMI) distribution
of Chinese adults particularly at levels of BMI from 23 to 30 as shown in Fig. 11.5.
Overweight and obesity were rare in 1982; only 3.5% of adults in the younger age
(20–45 years of age) range had a BMI above 25 and only 0.2% were classified as
being obese. These rates increased fourfold to 14.1% and 1.3%, respectively, in 1997.
Compared with rural areas, the prevalence was much higher in urban areas (20.9% vs.
14.2%), especially in large cities. In 1992, more than 40% of urban residents in
Beijing were overweight and obese, which would be a serious public health problem
(Ge, 1996). In the past 15 years, there has been almost a one percentage point per year
(0.93 percentage point annually) increase in the prevalence rate or an additional
12 million overweight and obese cases each year.
At the same time, there is still a meaningful proportion of adults facing chronic
undernutrition and having a low BMI as shown in Table 11.6; the prevalence of under-
nutrition was 5.8% in 1997. During the period 1982 to 1992, this proportion decreased
by 0.4 each year, and by 0.2 between 1992 and 1997 (using our CHNS and CNNS data).
Morbidity
Blood pressure data from the CHNS show a modest increase in hypertension between
1991 and 1997 among adults, aged 30–65 years. Hypertension is greater among males
and urban residents, which is not surprising, given the greater obesity found in urban
Results 215
18
16
14
12
10
8
6
4
2
0
14 16 18 20 22 24 26 28 30 32 35 37
BMI
%
Figure 11.5 Shift in the distribution of BMI for Chinese adults aged 20–45 years, CHNS89–97 (from Bell
et al., 2001). ◆, 1989; ■, 1997.

areas. Interestingly, the prevalence of hypertension in males in urban areas decreased
slightly from 1991 to 1997 (the difference was not statistically significant), whereas the
prevalence increased among all other groups, especially in rural males (Fig. 11.6).
Mortality of degenerate chronic diseases
The overall death rate decreased between 1974 and 1984, with no major clear reduc-
tion from 1984 to 1990 and then rose in urban areas. It increased by 34.7 per 100 000
during this latter period (553.4 vs. 588.1). These results are presented in Fig. 11.7.
This shift is noteworthy as it seems to be concurrent with the increase in diet-related
noncommunicable diseases related to the circulatory system and cancer. The 1999
specific mortality of infection and parasite diseases in rural areas, for example, was
one-seventh of the 1974 rate (58.2 vs. 8.0 per 100 000) but the mortality of diabetes in
urban areas increased fivefold in 1999 compared to 1974 (15.4 vs. 3.4 per 100 000).
216 The nutrition transition in China: a new stage of the Chinese diet
Table 11.6 Trends of BMI distribution for 20- to 45-year-old adults (China Health and Nutrition
Survey, 1989–1997)
BMI �18.5 (%) BMI 25 (%)
1989 1991 1993 1997 1989 1991 1993 1997
Urban 7.8 7.8 7.7 6.2 10.6 12.1 12.7 18.7
Rural 8.3 8.4 7.3 5.6 8.4 9.9 10.2 13.7
Male 7.4 7.3 6.2 5.5 6.4 8.2 9.1 14.5
Female 8.7 9.1 8.6 6 11.5 12.7 12.6 16.2
Low Income 6.9 9.8 7.4 6 6.3 6.6 9.5 10.9
Mid Income 10 8.1 7.7 6.3 9.1 11.7 10 14.7
High Income 7.5 6.7 7.2 4.5 10.7 13.6 13.5 19.6
Total 8.1 8.2 7.5 5.8 10.3 10.6 10.9 15.4
25
20
15
10
5
0
22.421
17.8 18.4
15.4
18
12.5
14.6
Urban male Rural maleUrban female Rural female
%
Figure 11.6 Trends in the prevalence of hypertension, adults aged 30–65 years, CHNS 1991 (�) and
1997 (�).
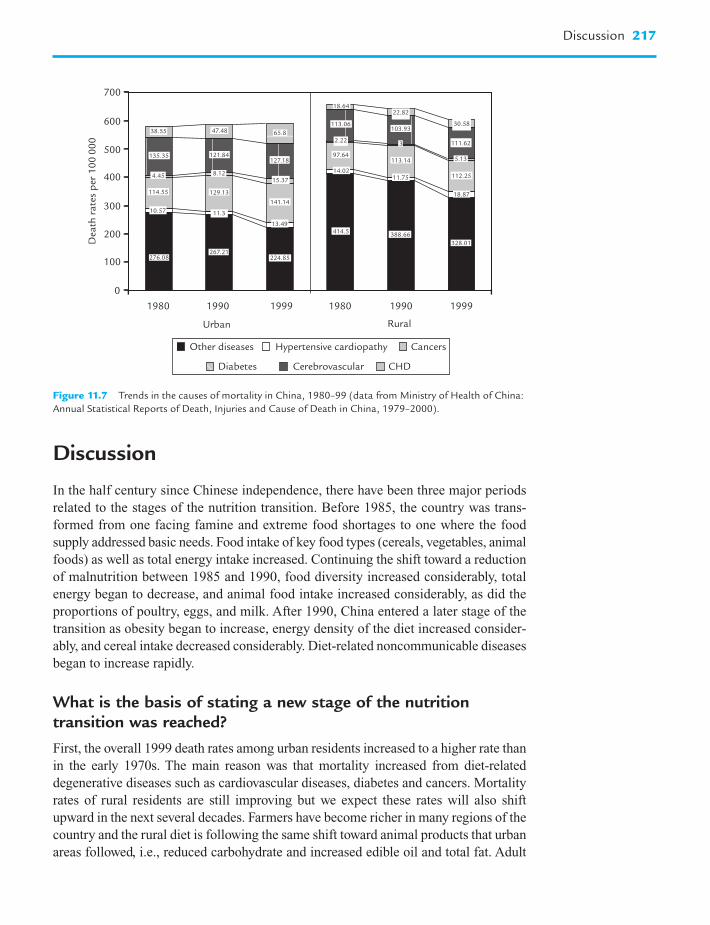
Discussion
In the half century since Chinese independence, there have been three major periods
related to the stages of the nutrition transition. Before 1985, the country was trans-
formed from one facing famine and extreme food shortages to one where the food
supply addressed basic needs. Food intake of key food types (cereals, vegetables, animal
foods) as well as total energy intake increased. Continuing the shift toward a reduction
of malnutrition between 1985 and 1990, food diversity increased considerably, total
energy began to decrease, and animal food intake increased considerably, as did the
proportions of poultry, eggs, and milk. After 1990, China entered a later stage of the
transition as obesity began to increase, energy density of the diet increased consider-
ably, and cereal intake decreased considerably. Diet-related noncommunicable diseases
began to increase rapidly.
What is the basis of stating a new stage of the nutritiontransition was reached?
First, the overall 1999 death rates among urban residents increased to a higher rate than
in the early 1970s. The main reason was that mortality increased from diet-related
degenerative diseases such as cardiovascular diseases, diabetes and cancers. Mortality
rates of rural residents are still improving but we expect these rates will also shift
upward in the next several decades. Farmers have become richer in many regions of the
country and the rural diet is following the same shift toward animal products that urban
areas followed, i.e., reduced carbohydrate and increased edible oil and total fat. Adult
Discussion 217
700
600
500
400
300
200
100
0
1980 1990 1999 1980 1990 1999
Urban Rural
Dea
th r
ate
s p
er 1
00
00
0
Other diseases Hypertensive cardiopathy Cancers
Diabetes Cerebrovascular CHD
38.55
135.35
4.45
114.55
276.08
47.48
121.84
8.12
129.13
267.21276.08
65.8
127.18
15.37
141.14
13.49
11.310.57
224.85
18.64
113.06
97.64
14.02
414.5
22.82
103.93
3
113.14
11.75
388.66
30.58
111.62
5.13
112.25
18.87
328.01
2.22
Figure 11.7 Trends in the causes of mortality in China, 1980–99 (data from Ministry of Health of China:
Annual Statistical Reports of Death, Injuries and Cause of Death in China, 1979–2000).

obesity in rural areas is beginning to increase. Cancer and cardiovascular disease
(CVD) will soon become the major sources of adult and total mortality in rural China.
Second, China is facing both challenges of malnutrition and overnutrition. In past
decades, the government tried its best to solve the malnutrition problem and made
great progress. However, the prevalence of malnutrition is still very high: 35% of pre-
school children were stunting; 20% of preschool children, 22% of school children and
adolescents, and 8% of adults were suffering from undernutrition (Du et al., 2001b).
On the other hand, the prevalence of overweight and obesity has risen to a relatively
high degree. Although details on overweight status among Chinese children were not
presented, other studies have shown large increases in overweight among preschool
children, older children, and teens (Du et al., 1999; Wang et al., in press).
For example, based on the cutoff points of BMI for overweight and obesity from
the International Obesity Task Force (IOTF), 15% (28% in urban areas) of children
aged 2–6 years and 8% (12% in urban areas, 11 times that of 15 years ago) of children
and adolescents aged 7–17 years were overweight and obese (Du et al., 2001b).
The research by Doak et al. (2000) highlights this shift in the distribution of under-
and overnutrition in a different way. Her research identified households in which over-
weight and underweight coexist, and explored causative household levels. In China, the
prevalence of such households was 8% (Doak et al., 2000).
Third, marked shifts in the Chinese diet have been shown. Unlike other East Asian
countries, such as South Korea (which has actively promoted its traditional diets), China
seems to be rapidly relinquishing its traditional diets (Kim et al., 2000). South Korea
has used mass media and other government programs to encourage retention of their
high-vegetable, low-fat traditional cuisine.
The level of fat intake in South Korea is even lower than in China, although China’s
GNP was less than 1/14 of the GNP in South Korea in 1996. Starting in the 1990s,
people in China obtained more than 20% of energy from fat whereas South Koreans
still consumed less than 20% of energy from fat in 1995 (Kim et al., 2000). In China,
edible oil intake increases unabated as does the intake of other animal products
(Drewnowski and Popkin, 1997).
Also, there has recently been a rapid increase in food consumption from away-
from-home sources (Popkin et al., in press). In 1989 only 0.4% of all energy was con-
sumed at restaurants and stalls in China, but by 1997, over 7.4% of energy came from
restaurants and food stalls. Some scholars feel that increased away-from-home food
consumption is a contributing factor to increased overweight and obesity (Binkley
et al., 2000).
Why did the prevalence of overweight and obesity and diet-related noncommunicable disease mortality rise so quickly?
The ongoing demographic and economic transition in China is promoting changes in
diet and lifestyle, as in other developing countries (Popkin, 1993, 1998; Caballero and
Rubinstein, 1997). The shifts in diet and activity have certainly been implicated in the
increase in obesity (Paeratakul et al., 1998). Traditional diets are shifting to high-fat
218 The nutrition transition in China: a new stage of the Chinese diet

and high-energy density diets. China is experiencing the nutrition transition much
sooner and at a much lower level of GNP than the United States and Western
European countries (Drewnowski and Popkin, 1997). The increase in energy density
of the food consumed in the Chinese diet was over 10% during the 1989 to 1997
period (Popkin et al., in press); reports showed energy density was probably responsi-
ble for the increase of energy intake and obesity (Bell et al., 1998; Hill and Peters,
1998; Rolls et al., 1999).
This chapter has shown a large increase in fat from animal sources. Over two-thirds
of urban Chinese consume over 10% of their energy from animal fat. These animal
food sources are predominantly high-fat pork and pork products with less lower fat
and healthier poultry and fish.
Other types of change that might be linked to future accelerations of the diet are
less clear. Other work shows large increases in the speed of consumption changes
(Guo et al., 2000). Media exposure might be a critical element in this shift. A less
clear effect is the role of the rapid increase in away-from-home consumption; it
represents a small proportion of the diet, but it is clear that this will increase
rapidly. Today, all provinces and almost all large cities have either a McDonald’s or
a Kentucky Fried Chicken outlet and the spread in many areas is astounding
(Watson, 1997).
Physical activities in daily life have been reduced due to advances in technology
and transportation (Bell et al., 2001). A large proportion of the people live a sedentary
life and this trend will continue. Also, the large shifts in ownership of TV sets and the
equally large reduction in physical activity at work are important. People spend more
time watching TV, playing electronic games, and working with the computer.
Urbanization plays an important role in the rapid transition found in China. Its
role in shifting occupational patterns and other dimensions of physical activity, as
well as access to a different more processed, higher fat and sugar diet is important
(Drewnowski and Popkin, 1997; Popkin, 1999; Holmboe-Ottesen, 2000). Moreover,
the proportion of the population that resides in urban areas has grown.
A further issue is the potentially greater vulnerability for noncommunicable dis-
eases that persons residing in rural areas face due to early fetal and infant malnutrition
(Barker et al., 1993; Barker, 1997; Hoffman et al., 2000a,b,c). In past decades, there
were very high rates of low birth weight and stunting among Chinese children, all of
which could have enhanced the likelihood of later obesity and other chronic diseases
(Popkin et al., 1996). As they grow, the metabolic balance (that served well in conditions
of undernutrition) may become maladaptive, leading to the development of abnormal
lipid profiles, altered glucose and insulin metabolism, and obesity (Barker et al.,
1993; Hoffman et al., 2000 a,b,c).
Today, diet-related noncommunicable diseases represent the major causes of mor-
tality in China. By 1995, the economic costs of undernutrition and overnutrition were
of similar magnitude in China and diet-related noncommunicable disease costs will
predominate in 2025. The economic cost of diet-related noncommunicable diseases
exceeded 2.1% of the GDP in China in 1995 (B.M. Popkin, S. Horton, S. Kim,
A. Mahal and S. Jin, unpublished results). The question is whether the public health
system, faced with such massive increases in costs from these noncommunicable
Discussion 219

diseases, can rise to the challenge and create the coordinated effort needed to address
China’s emerging problems.
Acknowledgments
This analysis was conducted while Shufa Du was a postdoctoral fellow at the Carolina
Population Center, University of North Carolina at Chapel Hill. Shufa Du and Bing
Lu received funding from the Fogarty International Center, NIH. Also we thank the
National Institutes of Health (NIH) (R01-HD30880 and R01-HD38700) for financial
support for the analysis. We wish to thank Ms Frances L. Dancy for administrative
assistance, Tom Swasey for graphics support, and Ms Zhihong Wang and Ms Hongfei
Hao for research assistance.
References
Barker, D.J. (1997). Br. Med. Bull. 53, 96–108.
Barker, D.J., Gluckman, P.D., Godfrey, K.M., Harding, J.E., Owens, J.A., and Robinson, J.S.
(1993). Lancet 341, 938–941.
Bell, E.A., Castellanos, V.H., Pelkman, C.L., Thorwart, M.L., and Rolls, B.J. (1998).
Am. J. Clin. Nutr. 67, 412–420.
Bell, C., Ge, K., and Popkin, B.M. (2001). Int. J. Obes. Relat. Metab. Disord. 25, 1079–1086.
Binkley, J.K., Eales, J., and Jekanowski, M. (2000). Int. J. Obes. Relat. Metab. Disord.
24, 1032–1039.
Caballero, B., and Rubinstein, S. (1997). Arch. Latinoam Nutr. 47 Suppl 1, 3–8.
Campbell, T.C., and Chen, J. (1994). Am. J. Clin. Nutr. 59, 1153S–1161S.
Campbell, T.C., Parpia, B., and Chen, J. (1998). Am. J. Cardiol. 82, 18T–21T.
Chen, Q. (ed.) (1984). “Lü Shi Chun Qiu Jiao Shi”, Vol. 14. Xuelin Publishing House,
Shanghai, China.
Doak, C., Adair, L., Monteiro, C., and Popkin, B.M. (2000). J. Nutr. 130, 2965–2980.
Drewnowski, A., and Popkin, B.M. (1997). Nutr. Rev. 55(2), 31–43.
Du, S. (1999). In “The Dietary and Nutritional Status of Chinese Population – Children
and Adolescents (1992 National Nutrition Survey)” (K. Ge, and F. Zhai, eds.), Vol. 2,
pp. 12–34. People’s Medical Publishing House, China.
Du, S., Zhai, F., and Ge, K. (2001a). J. Hyg. Res. 30, 339–342.
Du, S., Lu, B., Wang, Z., Zhai, F., and Popkin, B.M. (2001b). J. Hyg. Res. 30, 221–225.
Ge, K. (1996). J. Hyg. Res. 25 Suppl, 1–8 (in Chinese).
Ge, K., Zhai, F., and Yan, H. (eds.) (1996). “ The Dietary and Nutritional Status of Chinese
Population (1992 National Nutrition Survey)”. People’s Medical Publishing House,
China.
Guo, X., Popkin, B.M., Mroz, T.A., and Zhai, F. (1999). J. Nutr. 129, 994–1001.
Guo, X., Mroz, T.A., Popkin, B.M., and Zhai, F. (2000). Econ. Dev. Cult. Change 4, 737–760.
220 The nutrition transition in China: a new stage of the Chinese diet

Hill, J.O., and Peters, J.C. (1998). Science 280, 1371–1374.
Hoffman, D.J., Sawaya, A.L., Coward, A., Wright, A., Martins, P.A., de Nascimento, C.,
Tucker, K., and Roberts, S.B. (2000a). Am. J. Clin. Nutr. 72, 1025–1031.
Hoffman, D.J., Sawaya, A.L., Verreschi, I., Tucker, K.L., and Roberts, S.B. (2000b).
Am. J. Clin. Nutr. 72, 702–707.
Hoffman, D.J., Roberts, S.B., Verreschi, I., Martins, P.A., de Nascimento, C., Tucker, K.L.,
and Sawaya, A.L. (2000c). J. Nutr. 130, 2265–2270.
Holmboe-Ottesen, G. (2000). Tidsskr Nor Laegeforen. 120, 78–82.
Inoue, S., and Zimmet, P. (2000) “The Asia-Pacific Perspective: Redefining Obesity and
its Treatment”. Health Commun, Sydney, Australia.
Kim, S., Moon, S., and Popkin, B.M. (2000). Am. J. Clin. Nutr. 71, 44–53.
Knechtges, D.R. (1986). J. Am. Orient. Soc. 106, 49–63.
Legge, J. (1885). “The Li Ki in The Sacred Books of China, Part 3”, The Royal
Regulations, Sect. III/14, Oxford.
Paeratakul, S., Popkin, B.M., Ge, K., Adair, L.S., and Stevens, J. (1998). Int. J. Obes.
Relat. Metab. Disord. 22, 424–432.
Piazza, A. (1986). “Food Consumption and Nutritional Status in the PRC”. Westview
Special Studies on China, Boulder, CO.
Popkin, B.M. (1993). Pop. Dev. Rev. 19, 138–157.
Popkin, B.M. (1998). Publ. Health Nutr. 1, 5–21.
Popkin, B.M. (1999). World Dev. 27, 1905–1916.
Popkin, B.M., Ge, K., Zhai, F., Guo, X., Ma, H., and Zohoori, N. (1993). Eur. J. Clin. Nutr.
47, 333–346.
Popkin, B.M., Paeratakul, S., Zhai, F., and Ge, K. (1995). Am. J. Publ. Health 85(5),
690–694.
Popkin, B.M., Richards, M.K., and Monteiro, C. (1996). J. Nutr. 126, 3009–3016.
Popkin, B.M., Lu, B., and Zhai, F. (2002). Publ. Health Nutr. (in press).
Rolls, B.J., Bell, E.A., Castellanos, V.H., Chow, M., Pelkman, C.L., and Throwart, M.L.
(1999). Am. J. Clin. Nutr. 69, 863–871.
State Statistical Bureau (2001). “China Statistical Yearbook 2000”. China Statistics Press,
China.
Wang, Y., Monteiro, C., and Popkin, B.M. (2002). Am. J. Clin. Nutr. (in press).
Watson, J.L. (ed.) (1997). “Golden Arches East: McDonald’s in East Asia”, pp. 1–256.
Stanford University Press, Stanford.
World Bank (2001). “World development indicators 2001”. World Bank, Washington, DC.
References 221

This Page Intentionally Left Blank
The Nutrition TransitionISBN: 0-12-153654-8
Copyright © 2002 Elsevier Science LtdAll rights of reproduction in any form reserved
Trends in under- andovernutrition in Brazil
Carlos A. Monteiro, Wolney L. Conde, and Barry M. Popkin
12
Introduction
The process known as nutrition transition refers to major cyclical changes in the
nutritional profile of human populations, produced by modifications in both
dietary and nutrient expenditure patterns, and basically determined by an interplay of
economic, demographic, environmental, and cultural changes occurring in the society
(Popkin, 1993).
Outstanding changes in economic, demographic, environmental, and cultural fac-
tors have been registered in the last quarter of the 20th century in most developing
countries, but the impact of these changes on the nutritional profile of their popula-
tions is still to be fully assessed (Popkin et al., 1995; Popkin, 1998; Popkin and Doak,
1998). The relative burden of disease, represented by under- and overnutrition, the
pace of the transition process among children, adolescents and adults, and the distinct
effects on the social classes are still unclear in these countries.
Brazil is placed in a privileged position concerning the description of the nutrition
transition process. First, demographic, socioeconomic, environmental, and cultural
changes have been impressive in Brazil in the last quarter of the 20th century (Iunes,
2000; Patarra, 2000; Ibge, 2001). Second, in Brazil the availability of repeated nation-
ally representative cross-sectional surveys provides a basis for the careful understanding
of secular trends of the nutritional profile of its population. Third, Brazil has continental
dimensions (it is the fifth largest country in the world) and great economic differences
between the least-developed northern regions and the most-developed southern regions;
this makes it possible to stage the process of the nutrition transition at different levels of
economic development. Fourth, the strong uneven income distribution across the coun-
try permits the dynamics of the nutrition transition among the relatively poorer and
richer social strata to be individualized and compared within each region.

This chapter complements and updates previous analyses on specific aspects of the
nutrition transition in Brazil (Monteiro et al., 1992, 1994, 1995, 2000a,b,c,d, 2001;
Mondini and Monteiro, 1994; Monteiro and Conde, 1999).
Methods
Populations and sampling
Data used in this section come from four successive nationwide surveys undertaken in
Brazil in 1975, 1989, 1996, and 1997 (Estudo Nacional da Despesa Familiar, 1975;
Pesquisa Nacional sobre Saúde e Nutrição, 1989; Pesquisa Nacional sobre Demografia
e Saúde, 1996; Pesquisa sobre Padrões de Vida, 1997). The four surveys were executed
by, or with the support of, the federal agency in charge of national statistics in Brazil
(the Instituto Brasileiro de Geografia e Estatística) using similar probabilistic, census-
based, multistage, stratified, clustering sampling procedures (Ibge/UNICEF, 1982;
Ibge/UNICEF, 1992; Bemfam, 1997; Ibge, 1998). The most recent survey, undertaken
in 1997, was restricted to the northeastern and southeastern regions of Brazil. Therefore,
to allow proper comparisons, all trend analyses presented in this section will consider
only the sample of households studied by the four surveys in those two regions. The
northeastern and southeastern regions are, respectively, the least and the most econom-
ically developed regions in the country (1995 per capita gross domestic product (GDP)
of US$ 1728 and US$ 4913, respectively) (Lavinas and Magina, 1996). Together, these
two regions also concentrate 70% of the total Brazilian population (28% and 42%,
respectively, according to the demographic census of 2000). The number of sampled
households in these two regions was: (a) 36 105 in 1975, (b) 14 602 in 1989, (c) 8922 in
1996, and (d) 11 033 in 1997. In the 1975, 1989, and 1997 surveys¸ all individuals liv-
ing in the households were eligible for nutritional assessment through anthropometry
(weight and height measurements), but in 1996, this assessment was restricted to chil-
dren under five years of age. To avoid age groups where the assessment of the nutritional
status through anthropometry poses more difficulties, our trend analyses are focused on
three age groups:
1. 1–4-year-old individuals – hereafter called the young child group – studied in
1975, 1989, and 1996;
2. 10–17-year-old individuals – hereafter called the old child/adolescent group –
studied in 1975, 1989, and 1997;
3. Individuals aged 20 or more years – hereafter called the adult group – also stud-
ied in 1975, 1989, and 1997.
The coverage of the anthropometrical exams was very high in the four surveys among
all age groups (from 91% to 99%). The absolute number of young children, older chil-
dren and adolescents, and adults examined by each survey, pregnant women excluded,
is shown in Table 12.1.
224 Trends in under- and overnutrition in Brazil

Data collection
The four surveys adopted similar processes for collecting anthropometrical data.
Weight and height measurements were obtained at the households by pairs of trained
and standardized interviewers. Weight was measured using calibrated portable scales
(mechanical in 1975 and microelectronic in the subsequent surveys) with the sampled
individuals wearing light clothes and no shoes. Recumbent length was obtained from
children less than two years of age using a horizontal stadiometer; height was
obtained in older children and adults using inextensible tapes in bare-footed individ-
uals, with the head held in the Frankfort plane. The age of all individuals was calcu-
lated based on birth certificates or equivalent documents. The economic status of
the studied individuals was assessed through the direct collection of family income
data in 1975, 1989, and 1997 whereas the 1996 survey used an inventory of goods in
the household (radio, TV set, video player, refrigerator, vacuum cleaner, washing
machine, and car).
Indicators and data analysis
Height-for-age and weight-for-height indices expressed as z-scores of the international
growth reference (HAZ and WHZ, respectively) were used to assess children’s nutri-
tional status; stunted, wasted and underweight children corresponded to HAZ � �2,
WHZ � �2 and WHZ �2, respectively (WHO, 1995). Body mass index (BMI) or the
weight in kg divided by the height in meters squared (kg/m2), was used to assess the
nutritional status of both adolescents and adults (WHO, 1995). Underweight and over-
weight adolescents corresponded to BMI below the 5th centile or above the 95th cen-
tile, respectively, of a gender and age-specific BMI reference distribution built upon
the whole national sample of adolescents studied in 1989 using the LMS method
(Cole, 1990). Underweight adults corresponded to BMI �18.5 kg/m2 and obese adults
to BMI 30.0 kg/m2 (WHO, 1995).
Methods 225
Table 12.1 Number of individuals studied in four anthropometric surveys by age groups and region.
Brazil: 1975–1997
Year of the survey Region Age group
1–4 years 10–17 years Over 20 years
1975 Northeast 7798 15 870 33 582
Southeast 7335 18 414 44 449
1989 Northeast 1290 2894 6919
Southeast 890 2250 7097
1996 Northeast 1141 – –
Southeast 645 – –
1997 Northeast – 1678 4559
Southeast – 1305 4838

Time-trend analyses consider changes in the prevalence (and correspondent 95%
confidence intervals) of:
1. stunted, wasted, and overweight young children;
2. underweight and overweight old child/adolescents;
3. underweight and obese adults.
Time-trend analyses also consider changes in mean z-scores (and correspondent
95% confidence intervals) of young child HAZ and WHZ, old child/adolescent, and
adult BMI z-scores as well as shifts in the distribution curves of these variables. BMI
z-scores for adolescents were calculated with reference to the previously mentioned
gender and age-specific BMI distribution built on the whole national sample of older
children and adolescents studied in 1989. The BMI z-score for adults was calculated,
in an analogous way, with reference to a gender and age-specific BMI distribution
built on the whole national sample of adults studied in 1989. The analyses will be per-
formed firstly for the combined northeastern and southeastern populations (hereafter
referred to as a proxy of the Brazilian population); separately for each region; and
finally for region-specific quartiles relative to the per capita family income (1975,
1989, and 1997) or the number of goods in the household (1996).
All statistical analyses of this study were carried out using STATA (Stata Corp.,
1997). All estimates accounted for the sampling weights and the sampling design
effects on standard errors (and confidence intervals) resulting from the complex,
stratified, clustered, sample design employed by each survey. Estimates of adult
underweight and adult obesity were age-adjusted by the direct method to the gender-
specific age distribution observed in the last survey in order to control for ageing
trends across the surveys, existing in the case of the adult population. Statistical
significance of changes over time in child, adolescent, and adult nutritional status was
assessed by grouping the individual data files of each survey in one single data file and
running linear or logistic regression analyses in which the continuous or discrete
nutritional status indicators were the dependent variable and the survey year was the
independent variable (age group was a control variable for all analyses involving the
adult population). Tests for linear trends in the logistic models were calculated by
unfactoring the independent variable (the survey year).
Results
Trends in young children
Figures 12.1 and 12.2 display HAZ and WHZ distributions for the 1–4-year-old
Brazilian children studied in 1975, 1989, and 1996 (z-scores relative to the interna-
tional growth reference). The distributions refer to combined genders since no relevant
difference was found between time-trends in boys and girls. The HAZ curve shifts
progressively toward the right (higher values) throughout the three surveys whereas
the WHZ curve shifts slightly toward the right from 1975 to 1989 but then remains
226 Trends in under- and overnutrition in Brazil

relatively unchanged to 1996. In the three successive surveys (1975, 1989, and 1996)
the average child HAZ increased from �1.33 to �0.69 and then to �0.47
(P � 0.0001 for linear trend), whereas the average child WHZ increased from �0.17
to �0.06 (P � 0.0001) and then stabilized near zero (�0.02 in 1996). Although
improving throughout the surveys, the final average child HAZ achieved at the last
1996 survey (�0.47; 95% CI: �0.41; �0.53) remains significantly negative (i.e.,
below the international growth reference) indicating that child stunting is still present
in the population. The average WHZ is significantly negative in 1975 (�0.17; 95%
CI: �0.19; �0.15) but positive and close to zero in the two most recent (1989 and
1996) surveys indicating the control of child wasting in the population.
Table 12.2 presents time-trends in gender combined child stunting, child wasting,
and child overweight. The prevalence of each event in each survey is given with cor-
respondent 95% confidence intervals. Trends are presented for the entire country, for
each region, and, within each region, for extreme income groups (the 25% poorest and
Results 227
0.35
0.3
0.25
0.2
0.15
0.1
0.05
0�5.5 �4.5 �3.5 �2.5 �1.5 �0.5 0.5 1.5 2.5 3.5
HAZ z-score
Freq
uen
cy
1975 1989 1996
Figure 12.1 Height-for-age distribution in 1–4-year-old children. Brazil: 1975–1996.
0.4
0.35
0.3
0.25
0.2
0.15
0.1
0.05
0�4.5 4.5
0.45
�3.5 �2.5 �1.5 �0.5 0.5 1.5 2.5 3.5
WHZ z-score
Freq
uen
cy
1975 1989 1996
Figure 12.2 Weight-for-height distribution in 1–4-year-old children. Brazil: 1975–1996.

the 25% richest children). For the entire country, stunting decreases continuously
throughout the surveys (34.3%, 18.2%, and 11.4%, respectively; P � 0.0001 for
linear trend) while wasting decreases in the first period (from 4.6% to 1.5%;
P � 0.0001) and remains low and relatively constant in the second period (2.0% in
1996). Similar patterns of changes (i.e., strong continuous reductions in stunting
throughout the three surveys and apparent control of wasting by 1989) are seen in all
regional and income strata. The prevalence of young child overweight for the entire
country is relatively low and does not change significantly throughout the three sur-
veys: 3.3%, 3.1% and 4.0%, respectively. Higher rates of child overweight are seen
among the higher income children from the more-developed southeastern region but
these rates also do not change significantly throughout the three surveys (i.e., 6.8%,
10.3%, and 8.6%, respectively).
Changes in stunting affect in a complex way the regional and social distribution of
this event in the population. The regional gap in child stunting is actually increased
throughout the surveys because the pace of the stunting decline in the more-developed
region exceeds that observed in the less-developed region. The income gap in child
stunting increases in the less-developed region but decreases in the more-developed
region due to a more favorable trend among the poorest children. In both regions,
child wasting tends to be more common among lower income families, whereas over-
weight tends to be more common among higher income families. However, this pat-
tern of association with income does not essentially change throughout the surveys.
The relative importance of problems associated with child underfeeding (mostly
stunting in Brazil) and child overfeeding (overweight) clearly changed throughout the
228 Trends in under- and overnutrition in Brazil
Table 12.2 Secular trends in the prevalence (%) of stunted, wasted, and overweight 1–4-year-old children by region and
income group. Brazil: 1975–1996
Region and Stunteda Wastedb Overweightc
income group1975 1989 1996 1975 1989 1996 1975 1989 1996
Northeast 47.1 29.9 19.0 4.1 1.8 2.6 2.9 1.5 2.7
(45.9–48.4)d (27.3–32.6) (16.6–21.5) (3.6–4.7) (1.0–2.5) (1.6–3.6) (2.5–3.3) (0.8–2.2) (1.8–3.7)
25% poorest 60.8 42.4 28.8 5.0 2.6 3.4 2.4 1.2 2.3
(58.3–63.2) (37.4–47.5) (25.0–32.5) (3.9–6.0) (0.9–4.2) (1.8–5.0) (1.7–3.2) (0.1–2.3) (1.0–3.6)
25% richest 26.2 8.6 2.4 2.8 1.0 0.0 3.3 2.8 6.9
(24.0–28.4) (4.9–12.3) (0.3–5.1) (2.0–3.6) (0.0–2.2) – (2.5–4.1) (0.8–4.7) (2.1–11.6)
Southeast 22.7 8.0 4.8 5.0 1.3 1.5 3.7 4.5 5.2
(21.7–23.8) (5.7–10.3) (3.1–6.5) (4.4–5.5) (0.2–2.4) (0.5–2.5) (3.1–4.0) (2.7–6.3) (3.4–6.9)
25% poorest 39.9 17.3 7.2 6.5 2.0 1.9 2.9 2.1 4.0
(37.7–42.1) (11.6–22.9) (4.3–10.2) (5.4–7.7) (0.0–4.5) (0.3–3.4) (2.1–3.7) (0.0–4.6) (1.8–6.2)
25% richest 6.0 3.4 3.0 2.5 0.9 1.2 6.8 10.3 8.6
(4.8–7.3) (0.4–7.3) (0.6–6.5) (1.6–3.3) (0.0–2.8) (1.2–3.7) (5.3–8.3) (4.8–15.8) (2.8–14.4)
Brazil 34.3 18.2 11.4 4.6 1.5 2.0 3.3 3.1 4.0
(33.5–35.1) (16.5–20.0) (9.9–12.8) (4.2–5.0) (0.9–2.2) (1.3–2.7) (3.0–3.6) (2.1–4.1) (3.0–5.1)
a Height-for-age � �2 z-scores of the international growth reference.b Weight-for-height � �2 z-scores of the international growth reference.c Weight-for-height �2 z-scores of the international growth reference.d 95% confidence intervals are given in parentheses.

surveys. For instance, there were 10 cases of child stunting to one case of overweight
in 1975, countrywide, whereas, in 1996, this ratio was reduced to 3:1. Changes were
more pronounced in the more-developed southeastern region, where the ratio of six
cases of stunting to one case of overweight was replaced by an equilibrium between the
two events. Still more dramatic was the change among the higher income children from
the least-developed region, where eight cases of stunting to one case of overweight was
reversed to almost three cases of overweight to one case of stunting. Yet, it should be
noted that, in 1996, the average child living in the country’s least-developed region was
still seven times more susceptible to stunting than to overweight (and twelve times
more susceptible to stunting if he/she belonged to the lower income group).
Trends in old children and adolescents
Figure 12.3 shows BMI z-score distributions from the 10–17-year-old individuals (old
child/adolescents) studied in 1975, 1989, and 1997 (BMI z-score relative to the gen-
der and age-specific total BMI distribution in 1989). Distributions refer to combined
genders since trends did not differ by gender. A clear, progressive shift toward higher
z-score values is seen throughout the three surveys. The average old child/adolescent
BMI z-score in the three successive surveys was: �0.39, �0.04, and �0.11, respec-
tively (P � 0.0001 for linear trend).
Table 12.3 presents time-trends for the prevalence of underweight and overweight
for gender combined old child/adolescents (BMI below the 5th or above the 95th cen-
tile of the adolescent BMI reference mentioned previously). The prevalence of both
underweight and overweight in each survey is given with correspondent 95% confi-
dence intervals. Trends are again presented for the entire country, for each region, and
Results 229
0.25
0.2
0.15
0.1
0.05
0�3.75 �3.25 �2.25�2.75 �1.25�1.75 �0.25�0.75 3.753.252.25 2.751.25 1.750.25 0.75
z-score
Freq
uen
cy
1975 1989 1997
Figure 12.3 BMI distribution in older children and adolescents. Brazil: 1975–1997.

for the extreme income groups within each region. For the entire country, underweight
decreases significantly in the first period (from 8.5% to 4.3%; P � 0.0001) but not
in the second period (5.6% in 1997), whereas overweight increases continuously
throughout the three surveys (1.8%, 5.3%, and 9.2%; P � 0.0001 for linear trend).
Similar patterns of change (i.e., significant reductions in underweight in the first
period and continuous increases in overweight throughout the three surveys) are seen
in all region and income strata. These changes do not essentially alter either the direct
association between level of regional development or individual income and risk of old
child/adolescent overweight nor the inverse association observed with underweight.
Time changes, however, do alter the relative importance of under- and overweight for
the adolescent population. In 1975, the risk of underweight for the whole adolescent
population exceeded the risk of overweight by almost five times whereas, in 1997,
overweight exceeds underweight (by 1.6 times). Similar changes in the relative impor-
tance of under- and overweight were observed in all region and income strata.
Trends in adults
Figures 12.4 and 12.5 display gender-specific BMI z-score distributions of Brazilian
adults, 20 years of age or older, studied in 1975, 1989, and 1997 (BMI z-score rela-
tive to the gender and age-specific total adult BMI distribution in 1989). The BMI
distribution for men shifts progressively toward the right (higher BMI values)
throughout the three surveys and the average BMI z-score increases from �0.31
to �0.02 and then to �0.27 (P � 0.0001 for linear trend). In the case of women,
230 Trends in under- and overnutrition in Brazil
Table 12.3 Secular trends in the prevalence (%) of underweight and overweight in older children
and adolescents by region and income group. Brazil: 1975–1997
Region and Underweighta Overweightb
income group1975 1989 1997 1975 1989 1997
Northeast 8.9 4.9 5.9 1.0 2.5 4.6
(8.4–9.4)c (4.1–5.8) (4.4–7.4) (0.8–1.1) (1.9–3.1) (3.3–5.8)
25% poorest 10.5 6.0 3.4 0.7 1.4 2.5
(9.3–11.7) (4.1–7.8) (1.0–5.9) (0.4–1.1) (0.5–2.4) (0.2–4.9)
25% richest 8.3 5.5 4.5 1.5 4.5 7.2
(7.5–9.2) (3.9–7.2) (2.1–6.9) (1.2–1.9) (3.1–6.0) (4.4–10.1)
Southeast 8.2 3.9 5.3 2.5 7.3 12.9
(7.8–8.7) (2.9–4.9) (3.8–6.8) (2.3–2.8) (5.9–8.6) (10.6–15.2)
25% poorest 10.5 5.9 8.2 0.9 5.0 5.3
(9.4–11.4) (3.3–8.6) (4.4–11.9) (0.6–1.3) (2.4–7.5) (2.5–8.2)
25% richest 5.9 2.9 5.0 4.9 10.7 13.5
(5.2–6.7) (1.1–4.7) (1.8–8.2) (4.3–5.6) (7.3–14.0) (8.9–18.1)
Brazil 8.5 4.3 5.6 1.8 5.3 9.2
(8.2–8.8) (3.6–5.0) (4.5–6.6) (1.7–2.0) (4.5–6.2) (7.8–10.6)
a BMI values lower than the gender and age-specific 5th centile in the 1989 survey.b BMI values higher than the gender and age-specific 95th centile in the 1989 survey.c 95% confidence intervals are shown in parentheses.
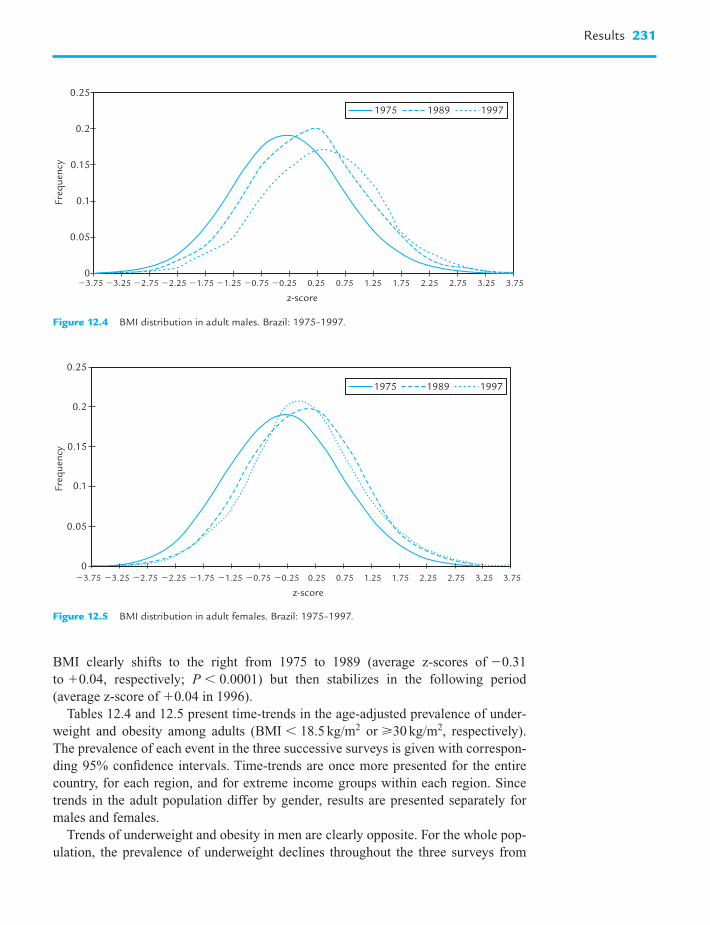
BMI clearly shifts to the right from 1975 to 1989 (average z-scores of �0.31
to �0.04, respectively; P � 0.0001) but then stabilizes in the following period
(average z-score of �0.04 in 1996).
Tables 12.4 and 12.5 present time-trends in the age-adjusted prevalence of under-
weight and obesity among adults (BMI � 18.5 kg/m2 or 30 kg/m2, respectively).
The prevalence of each event in the three successive surveys is given with correspon-
ding 95% confidence intervals. Time-trends are once more presented for the entire
country, for each region, and for extreme income groups within each region. Since
trends in the adult population differ by gender, results are presented separately for
males and females.
Trends of underweight and obesity in men are clearly opposite. For the whole pop-
ulation, the prevalence of underweight declines throughout the three surveys from
Results 231
0.25
0.2
0.15
0.1
0.05
0�3.75 �3.25 �2.25�2.75 �1.25�1.75 �0.25�0.75 3.753.252.25 2.751.25 1.750.25 0.75
z-score
Freq
uen
cy
1975 1989 1997
Figure 12.4 BMI distribution in adult males. Brazil: 1975–1997.
0.25
0.2
0.15
0.1
0.05
0�3.75 �2.75�3.25 �1.25�1.75�2.25 �0.25�0.75 3.753.252.25 2.751.25 1.750.25 0.75
z-score
Freq
uen
cy
1975 1989 1997
Figure 12.5 BMI distribution in adult females. Brazil: 1975–1997.

232 Trends in under- and overnutrition in Brazil
Table 12.4 Secular trends in the prevalence (%) of underweight and obesity in male adults by region
and income group. Brazil: 1975–1997
Region and Underweighta Obeseb
income group1975 1989 1997 1975 1989 1997
Northeast 7.9 5.2 4.2 1.2 2.4 4.4
(7.5–8.4) (4.4–5.9) (3.3–5.1) (1.1–1.4) (1.9–3.0) (3.5–5.3)
25% poorest 7.8 4.8 5.5 0.7 0.8 1.8
(6.8–8.7) (3.4–6.2) (3.1–8.0) (0.4–0.9) (0.4–1.2) (0.9–2.7)
25% richest 7.5 3.5 2.6 2.5 5.1 8.4
(6.7–8.3) (2.2–4.8) (1.6–3.5) (2.1–3.0) (3.6–6.7) (6.3–10.5)
Southeast 8.7 4.8 2.9 2.9 5.8 8.4
(8.3–9.1) (4.1–5.5) (2.2–3.6) (2.7–3.2) (5.0–6.6) (7.2–9.6)
25% poorest 13.0 7.7 3.3 1.6 2.9 3.8
(12.1–14.0) (6.2–9.2) (1.9–4.7) (1.2–1.9) (2.1–3.7) (2.2–5.3)
25% richest 4.1 2.9 2.0 5.4 8.2 10.2
(3.5–4.7) (1.7–4.2) (0.9–3.1) (4.7–6.0) (6.1–10.4) (7.6–12.7)
Brazil 8.3 5.0 3.5 2.1 4.1 6.4
(7.9–8.7) (4.2–5.7) (2.8–4.3) (1.9–2.3) (3.5–4.8) (5.3–7.4)
a Body mass index � 18.5 kg/m2.b Body mass index 30 kg/m2.
Prevalences are age-adjusted according to the age distribution in the 1997 surveys; 95% confidence
intervals in parentheses.
Table 12.5 Secular trends in the prevalence (%) of underweight and obesity in female adults by
region and income group. Brazil: 1975–1997
Gender, region and Underweighta Obeseb
income group1975 1989 1997 1975 1989 1997
Northeast 16.0 9.5 7.6 4.1 7.8 12.5
(15.4–16.6) (8.5–10.5) (6.6–8.7) (3.9–4.4) (6.9–8.7) (11.1–13.8)
25% poorest 17.6 11.2 9.6 3.1 5.2 7.7
(16.3–18.9) (9.0–13.3) (6.7–12.4) (2.5–3.6) (3.8–6.7) (5.2–10.2)
25% richest 12.4 6.1 5.6 6.7 9.8 14.5
(11.4–13.3) (4.6–7.7) (4.1–7.1) (6.0–7.4) (7.9–11.6) (12.1–16.8)
Southeast 10.8 5.4 5.4 7.8 14.0 12.3
(10.3–11.2) (4.6–6.1) (4.5–6.3) (7.5–8.2) (12.8–15.2) (11.0–13.6)
25% poorest 13.9 6.4 8.9 6.1 11.2 14.1
(12.9–14.8) (5.1–7.6) (6.8–11.1) (5.5–6.7) (9.5–13.0) (11.4–16.9)
25% richest 6.8 4.3 3.1 7.9 14.4 8.9
(6.1–7.5) (2.9–5.8) (1.9–4.3) (7.2–8.7) (11.8–17.0) (6.7–11.2)
Brazil 13.4 7.5 6.5 6.0 10.9 12.4
(12.9–13.9) (6.6–8.3) (5.6–7.5) (5.7–6.3) (9.9–12.0) (11.0–13.7)
a Body mass index � 18.5 kg/m2.b Body mass index 30 kg/m2.
Prevalences are age-adjusted according to the age distribution in the 1997 survey; 95% confidence
intervals in parentheses.

8.3% to 5.0% (1975 to 1989) and then to 3.5% (1997) whereas obesity increases from
2.1% to 4.1% and then to 6.4% (P � 0.0001 for linear trend in both cases), respect-
ively. Similar trends of continuous reductions in underweight and increases in obesity
are observed for most region and income strata of the adult male population.
Clear trends toward decreasing underweight and increasing obesity also exist
among women, but only from 1975 to 1989. In this period, underweight declines
among all women from 13.4% to 7.5% (P � 0.0001) while obesity increases from
6.0% to 10.9% (P � 0.0001). Additionally, much lower, and nonsignificant reductions
in female underweight (from 7.5% to 6.5%) and additional increases in obesity (from
10.9% to 12.4%) occur from 1989 to 1997.
The region and income stratification confirms the general tendency toward the
reduction in female underweight (particularly in the first period) and the tendency
toward the increase in female obesity (only in the first period). However, trends in
female obesity from 1989 to 1997 strongly differ according to region and income
level. In this period, female obesity increased significantly in the less-developed
region (from 7.8% to 12.5%) whereas it tended to decline in the more developed
region (from 14.0% to 12.3%). Within the less-developed region, obesity showed minor,
nonsignificant increases among lower income women (from 5.2% to 7.7%) but major,
significant increases among higher income women (from 9.8% to 14.5%). Within the
more-developed region, obesity tended to increase among lower income women (from
11.2% to 14.1%) but decline significantly among higher income women (from 14.4%
to 8.9%). Obesity also increased significantly among the intermediate income groups
from the less-developed region and tended to decrease among the intermediate
income groups from the more-developed region (data not shown).
The recent trends described for female obesity profoundly changed the regional
and income distribution of this event in Brazil. In 1997, contrary to what was
observed in 1975 and 1989, the average woman from the less-developed region was
no longer less exposed to obesity than her counterpart living in the more-developed
region. Still in 1997, in the more developed region, the lower income women (and no
longer the higher income) were the group most vulnerable to obesity. Actually, in
1997, lower income women in the more-developed region were significantly more
susceptible than higher income women to both underweight (8.9% vs. 3.1%,
P � 0.05) and obesity (14.1% vs. 8.9%, P � 0.0001). This simultaneous higher
vulnerability of the lower income women to both underweight and obesity is also seen
when the whole BMI distributions of lower and higher income women are compared
(Fig. 12.6).
The relative importance of underweight and obesity was clearly changed throughout
the surveys in both men and women. In 1975, for the whole country, there were two to
four cases of adult underweight to one case of obesity whereas, in 1996, there were
almost two obese adults to one underweight adult. This pattern of excessive under-
weight being replaced by excessive obesity was found in most region and income strata
of the country. Two exceptions were: (1) lower income adults from the less-developed
region, particularly males, for whom underweight remained more frequent than obe-
sity, even in 1996, and (2) the higher income adults from the more-developed region,
for whom obesity was already more frequent than underweight in 1975.
Results 233

Discussion
Brazil, along with other middle-income countries in Latin America, Asia, and the
Middle East, is far advanced in the processes involving the demographic, economic,
environmental, and cultural transitions. Although Brazil has almost doubled its total
population in the last three decades (from 93 million in 1970 to 170 million in 2000)
population growth has been continuously declining: from near 3% per year in the
1960s to less than 1.5% in the 1990s. Impressive reduction in fertility rates – 5.8
births per woman in 1970 to only 2.3 in 1999 – and the consequent decline in birth
rates – 40.8 per thousand inhabitants in 1970 and 21.2 in 1999 – were decisive for
lowering population growth. The strong decline in fertility and birth rates, combined
with changes in age-specific mortality rates, more than doubled the proportion of
Brazilians over 60 years of age (from 4% in 1970 to 10% in 1999). Another relevant
component of the demographic transition in the period was the continuous
rural–urban migration that reduced the country’s rural population (from 41 million in
1970 to 32 million in 2000) and resulted in more than 80% of the total Brazilian pop-
ulation living in cities (the urbanization rate increased from 56.0% in 1970 to 81.2%
in 2000). The expansion of the Brazilian GDP and the increase in the average family
income (particularly in the 1970s, when both the GDP and family income were dou-
bled) were also relevant in the period from 1970 to 1999. No less important was the
continuous expansion in occupations within the services sector and, to a lesser extent,
within industry, to the detriment of agricultural occupations. Finally, it is also impor-
tant to recognize the great expansion that occurred during the period in the public
infrastructure and essential services (communications, transport, energy supply, water
supply, health care and education) and also the higher public access to durable goods
(cars, refrigerators, TV sets and other household assets) (Ibge, 2001).
234 Trends in under- and overnutrition in Brazil
0.5
0.2
0.15
0.1
0.05
0
0.3
0.25
0.35
0.4
0.45
Freq
uen
cy
�3.5 �2.5 �1.5 �0.5 0.5 1.5 2.5 3.5
z-score
Lower income Higher income
Figure 12.6 BMI distribution in Brazilian women from the southeastern region: lower versus higher
income group in 1997.

However, a known, undesirable characteristic of the Brazilian society, i.e., the enor-
mous interpersonal and interregional concentration of wealth, did not improve in the
period from 1970 to 1999. For instance, during this period, the 10% richest individuals
in the country had an average income 15–20 times higher than the poorest 40%. In the
less-developed northeastern region, where the average income is 2–3 times lower than
in the more-developed southeastern region, the richest 10% had an average income up
to 25 times higher than the poorest 40%. The same concentrated distribution pattern
exists concerning people’s access to the public infrastructure and services. For instance,
in 1999, only 34% of the country’s lower income households were served by both water
supply and sanitation services whereas the same coverage to the higher income house-
holds was 86%. This gap between lower and higher income households was still larger
in the less-developed northeastern region (20% and 67%, respectively) than in the more
developed southeastern region (68% and 97%, respectively) (Ibge, 2001).
Carefully designed and adequately implemented nationwide probabilistic surveys
conducted at three moments within the period from 1975 to 1997 indicated that the
nutritional profile of the Brazilian population responded to the intense demographic,
economic, environmental, and cultural changes that occurred in the country. Clear
declining trends in undernutrition were documented for young children, old children
and adolescents, and adults throughout the country and among all regional and
income strata. Fortunately, there was no evidence that undernutrition (stunting and
wasting) in young children, in any regional or income strata, had been replaced by
obesity. However, increasing trends in overweight or obesity were simultaneous to the
decreasing trends in undernutrition for older children and adolescents, male adults,
and women in the less-developed region. An interesting situation was documented for
women living in the more developed region of the country. Earlier trends (1975–1989)
in undernutrition and obesity for this group were similar to that described earlier for
the other population groups, i.e., declining trends for undernutrition and increasing
trends for obesity, but recent trends (1989–1997) pointed to a stability of both under-
nutrition and obesity. In the particular case of obesity, the observed stability resulted
from increasing disease rates among the lower income women and decreasing rates
among the higher income women.
In most situations, regional and social gaps in undernutrition, unfavorable to the
less-developed region and to lower income individuals in general, were kept
unchanged or even increased throughout the surveys. An auspicious exception to this
occurred with the evolution of undernutrition among young children from the more-
developed region, where the gap in both child stunting and child wasting between
lower and higher income groups was substantially reduced. The association between
income and overweight/obesity remained positive throughout the surveys among all
age, region, and income groups with the single exception of adult females living in the
more developed southeastern region. In this particular group of women, a slight pos-
itive association between income and obesity, existing in 1975, was reversed in 1997
into a significant negative association. Since the negative association between income
and undernutrition for this group was not changed throughout the surveys, lower
income women of the southeastern region are, in 1997, significantly more susceptible
than the higher income women to both undernutrition and obesity.
Discussion 235

The relative importance of under- and overnutrition was perhaps the characteristic that
most changed throughout the surveys. In 1975, cases of undernutrition in children, ado-
lescents, and adults predominated over cases of overweight/obesity. The only exception
to this occurred in the higher income stratum, within the more-developed southeastern
region, where undernutrition and overweight/obesity were in equilibrium. However, in
1997, cases of overweight/obesity were more common than undernutrition among all
higher income individuals (children, adolescents, and adults) from both regions and also
among lower income women from the more-developed southeastern region.
The declining trends in undernutrition among young Brazilian children and the rel-
atively low and stable prevalence of overweight in this group agree with trends
reported for most developing countries in the same period (de Onis et al., 1993; de
Onis and Blössner, 2000; Martorell et al., 2000a). In the United States, an increase in
overweight among young children has been demonstrated for girls, but not boys
(Ogden et al., 1997). Reports on trends in undernutrition among older children, ado-
lescents and adults are rare, in both the developed and the developing countries, and
usually not based on comparable representative surveys, which precludes an adequate
comparison with the results presented here. The systematic increase in overweight
documented in older children and adolescents in Brazil agrees with trends observed
in a few developed countries that count with repeated population-based studies on this
age group (WHO, 1998; Troiano and Flegal, 1998) and also with trends documented
in China (Wang et al., 2001). A recent report on 12–15-year-old school children sug-
gests that adolescent obesity might also be increasing in Taiwan (Chu, 2001). The
increasing trends in adult obesity observed before 1997 in Brazilian males and before
1989 in Brazilian females agree with trends reported by the various population-based
studies undertaken in the developed countries and the few in developing countries
(WHO, 1998; Popkin and Doak, 1998; Martorell et al., 2000b). However, the trends
in female obesity observed from 1989 to 1997 in the more-developed southeastern
region of Brazil (i.e., increasing obesity rates in lower income groups and decreasing
rates in higher income groups) were not described for any developing country.
Actually, an extensive review of studies in both the developing and the developed
countries conducted by the International Obesity Task Force (WHO, 1998) identified
a single setting, two Finnish provinces, where declining obesity in adults (also women
from higher socioeconomic status) had been well documented (Pietinen et al., 1996).
The scarcity of studies relative to changes over time in the social distribution of both
under- and overnutrition, and also in the ratio between the two (under-/overnutrition) in
both the developing and the developed countries, makes the comparison of the present
results very difficult. One review of studies on young child overweight in developing
countries identified that, in one determined point in time, countries with higher rates of
wasting tended to have lower rates of overweight and vice versa but no data on time-
trends were provided for the individual countries (de Onis and Blössner, 2000).
The identification of the specific variables and mechanisms responsible for the
changes documented in the nutritional profile of the Brazilian population is a complex
task. In this respect we should refer to the plausibility of hypotheses rather than strict
hypotheses verification. Elsewhere, we have demonstrated that reductions in young
child undernutrition in Brazil could be attributed to a moderate increase in family
236 Trends in under- and overnutrition in Brazil

income, combined with an exceptional expansion in the public provision of health,
sanitation, and education services. Both these factors were facilitated by favorable
demographic changes which included the rapid urbanization of the country and sub-
stantial declines in fertility rates (Monteiro et al., 1992, 2000b). The same factors
could explain at least part of the reduction in undernutrition among old child/adoles-
cents and adults described in the present study.
The worldwide trend towards increased obesity has been attributed, in both the
developed and the developing countries, to rapid declines in energy expenditures
related to shifts toward much less physically demanding occupations and sedentary
leisure activities. Equally important for many countries may have been the shift
toward a much higher fat, energy-dense diet. In developing countries in particular,
marked increases in urbanization and income, coupled with the increased penetration
of the Western culture, certainly favored shifts in diet and physical activity conducive
to obesity (Popkin, 1998). All these factors are probably underlying the increase in
obesity indicators documented in Brazilian old child/adolescents and adults. As in
most countries, there is no specific secular trend information in Brazil on patterns of
physical activity, although the expansion of the services sector of the economy is in
line with increasingly less physically demanding occupations. Individuals employed
by the services sector increased from 29% in 1970 to 55% in 1999, whereas those
employed in agriculture declined from 55% to 25% (Ibge, 2001). The enormous
increase in the proportion of Brazilian households with TV sets (24% in 1970 and
88% in 1999) could indicate trends toward more sedentary leisure activities and
higher exposure to the Western diet and lifestyles. Secular trend data on dietary intake
in Brazil from 1975 to 1987 – only available at the family level and restricted to met-
ropolitan areas of the country – point to an increase of 2–7 percentage points in the
proportion of energy relative to fat intake (Mondini and Monteiro, 1994). The relative
stability of overweight observed among Brazilian children below 5 years of age is
consistent with the relatively higher energy requirements of this group and the higher
capacity of self-regulation of the energy intake observed in younger children (Birch
and Deysher, 1986; Birch et al., 1991).
It is difficult to explain the interruption of the increase in female obesity observed
from 1989 to 1997 in the more-developed southeastern region of Brazil, and even
harder to explain the reversal in the obesity prevalence documented specifically
among the higher income women. Data from the last metropolitan food expenditure
survey conducted in Brazil in 1996 indicate that the proportion of energy relative to
fat intake had further increased in the relatively poorer cities of the northeastern
region (from 23% in 1987 to 25% in 1996) but remained stable (about 30%) in the
richer cities of the southeastern region (Monteiro et al., 2000d). A more disaggregated
analysis of these data by income levels will be necessary to assess how changes in diet
might explain recent trends of obesity in Brazil. Patterns of leisure time physical
activity were assessed for the first time in the country by the national survey of 1997.
In this survey, the practice of regular physical exercise among women, although
incipient, was more frequent in the more-developed southeastern region than in the
less-developed northeastern region (9.8% and 5.5%, respectively) and much more fre-
quent in higher income than in lower income women (18.0% and 1.3%, respectively).
Discussion 237

Regardless of the immediate determinants involved with the decline in obesity from
1989 to 1997, governmental public health policies are unlikely to have contributed
significantly to it since only recently have the health authorities in Brazil chosen the
control of obesity as a real priority (Ministério da Saúde, 2000). Elsewhere, we
defended the possibility that the intense informal education work done by the
Brazilian mass media vehicles – focused on combating sedentary lifestyles and pro-
moting better food habits – could be one of the factors responsible for the decline of
obesity among the higher income, and better educated, women’s population from the
southeastern region (Monteiro et al., 2000a). The findings of the 1989 national survey,
disclosed in 1992, showed that obesity, and not undernutrition, was the main nutri-
tional problem of the adult population in Brazil. Since then, several major TV net-
works and leading newspapers and magazines have produced, on an almost weekly
basis, extensive information on the health consequences of obesity and the impor-
tance of avoiding energy-dense diets and increasing physical activity. Part of the
media (particularly TV programs targeted to the female population) has also been
engaged in promoting a, sometimes unrealistic, thin image for women.
To conclude this chapter on the description of the nutrition transition in Brazil, it is
necessary to say that in July 1999, after a long and productive process of consultations
with relevant parts of the civil society (e.g., scholars, professional and scientific asso-
ciations, workers unions, and representatives of private companies, among others) and
relevant governmental bodies, the Brazilian Ministry of Health approved a new
national food and nutrition policy that is more in line with the contemporaneous nutri-
tional profile disclosed by the last nationwide survey (Ministério da Saúde, 2000).
The main goal of this new policy is the promotion, protection and support of eating
practices and lifestyles conducive to optimum nutritional and health status for all
rather than the exclusive control of nutritional deficiencies. Its main features are the
formulation of evidence-based priorities and the acknowledgment that intersector
work is essential to assure the control of most nutritional problems. This new policy
has assured continual resources to combat nutritional deficiencies where they still
exist, particularly through well-targeted, integrated interventions but it has also initi-
ated courageous actions, with a great potential to prevent nutritional disorders due to
over- or wrong-feeding (e.g., obligatory nutritional labeling of any processed food
commercialized in the country, the regulation of health claims in foods, and the inclu-
sion of a 70% minimum of fresh or minimally processed foods in the multimillion
dollar national school feeding program) (Ministério da Saúde, 2001). The publicity of
soft drinks and other nonhealthy foods during TV broadcastings directed to children
and adolescents is under study and may also be regulated in the near future. Large-
scale changes in the curriculum of the public primary and secondary schools are also
being implemented to promote healthier eating habits and lifestyles among teachers
and students. Another positive characteristic of the new policy is the stimulus to form
partnerships with local governments and nongovernmental organizations. The best
example in this case is perhaps the series of local initiatives, started in cities of the São
Paulo state, but now spread throughout the country, to promote and support physical
activities in schools, work places and every available public space in the community
(Matsudo, 1997). Although not yet fully evaluated, it is certain that the recent food and
238 Trends in under- and overnutrition in Brazil

nutrition policy established in Brazil will be an important source of information to all
individuals and institutions concerned with the development of policies and programs
consistent with the new nutritional profile found in the developing countries.
References
Bemfam (1997). “Pesquisa Nacional sobre Demografia e Saúde 1996”. Sociedade de
Bem Estar Familiar, Rio de Janeiro.
Birch, L.L., and Deysher, M. (1986). Appetite 7, 323–331.
Birch, L.L., Johnson, S.L., Graciela Andresen, M.S., Peters, J.C., and Schulte, M.C.
(1991). N. Engl. J. Med. 324, 232–235.
Chu, N.-F. (2001). Int. J. Obes. 25, 170–176.
Cole, T.J. (1990). Eur. J. Clin. Nutr. 44, 45–60.
de Onis, M., and Blössner, M. (2000). Am. J. Clin. Nutr. 72, 1032–1039.
de Onis, M., Monteiro, C.A., Akre, J., and Clugston, G. (1993). Bull. WHO 71, 703–712.
Ibge (1998). “Pesquisa sobre padrões de vida 1996–1997”. Instituto Brasileiro de
Geografia e Estatística, Rio de Janeiro.
Ibge (2001). “Síntese de indicadores sociais 2000”. Instituto Brasileiro de Geografia e
Estatística, Rio de Janeiro.
Ibge/UNICEF (1982). “Perfil estatístico de crianças e mães no Brasil: aspectos nutri-
cionais, 1974–75”. Instituto Brasileiro de Geografia e Estatística, Rio de Janeiro.
Ibge/UNICEF (1992). “Perfil estatístico de crianças e mães no Brasil: aspectos de saúde e
nutrição de crianças no Brasil, 1989”. Instituto Brasileiro de Geografia e Estatística,
Rio de Janeiro.
Iunes, R.F. (2000). In “Velhos e novos males da saúde no Brasil: a evolução do país e
de suas doenças” (C.A. Monteiro, ed.), 2nd edn. aumentada, pp. 33–60.
Hucitec/Nupens-USP, São Paulo.
Lavinas, L., and Magina, M. (coordinators) (1996). “Atlas regional das desigualdades.
Banco de dados com indicadores sócio-econômicos por R.F. e macrorregiões”.
IPEA/DIPES, Rio de Janeiro.
Martorell, R., Kettel Khan, L., Hughes, M.L., and Grummer-Strawn, L.M. (2000a). Int. J.
Obes. 24, 959–967.
Martorell, R., Kettel Khan, L., Hughes, M.L., and Grummer-Strawn, L.M. (2000b). Eur.
J. Clin. Nutr. 54, 247–252.
Matsudo, V.K.R. (1997). World Health 50, 16–17.
Ministério da Saúde (2000). “Política nacional de alimentação e nutrição”. Ministério da
Saúde, Brasília.
Ministério da Saúde (2001). “Estratégia nacional para promoção da alimentação saudável
e da atividade física. Fase 1”. Ministério da Saúde, Brasília.
Mondini, L., and Monteiro, C.A. (1994). Rev. Saúde Públ. 28, 433–439.
Monteiro, C.A., and Conde, W.L. (1999). In “Progress in Obesity Research” (G. Ailhaud,
and B. Guy-Grand, eds.), pp. 665–671. John Libbey/8th International Congress on
Obesity.
References 239

Monteiro, C.A., Benicio, M.H.D’A., Iunes, R.F., Gouveia, N.C., Taddei, J.A.A.C., and
Cardoso, M.A. (1992). Bull. WHO 70, 657–666.
Monteiro, C.A., Benicio, M.H.D’A., and Gouveia, N.C. (1994). Ann. Hum. Biol. 21,
381–390.
Monteiro, C.A., Mondini, L., Medeiros de Souza, A.L., and Popkin, B.M. (1995). Eur. J.
Clin. Nutr. 49, 105–113.
Monteiro, C.A., Benicio, M.H.D’A., Conde, W.L., and Popkin, B.M. (2000a). Eur. J. Clin.
Nutr. 54, 342–346.
Monteiro, C.A., Benicio, M.H.D’A., and Freitas, I.C.M. (2000b). In “Velhos e novos
males da saúde no Brasil: a evolução do país e de suas doenças” (C.A. Monteiro, ed.),
2nd edn. aumentada, pp. 393–420. Hucitec/Nupens-USP, São Paulo.
Monteiro, C.A., Benicio, M.H.D’A., and Popkin, B.M. (2000c). Rev. Bras. Nutr. Clin. 15,
253–260.
Monteiro, C.A., Mondini, L., and Costa, R.B.L. (2000d). In “Velhos e novos males da
saúde no Brasil: a evolução do país e de suas doenças” (C.A. Monteiro, ed.), 2nd edn.
aumentada, pp. 359–369. Hucitec/Nupens-USP, São Paulo.
Monteiro, C.A., Conde, W.L., and Popkin, B.M. (2001). J. Nutr. 131, 881s–886s.
Ogden, C.L., Troiano, R.P., Briefel, R.R., Kuczmarski, R.J., Flegal, K.M., and Johnson, C.L.
(1997). Pediatrics 99, 1–11.
Patarra, N.L. (2000). In “Velhos e novos males da saúde no Brasil: a evolução do país e de
suas doenças” (C.A. Monteiro, ed.), 2nd edn. aumentada, pp. 61–78. Hucitec/
Nupens-USP, São Paulo.
Pietinen, P., Vartiainem E., and Mannisto, S. (1996). Int. J. Obes. 20, 114–120.
Popkin, B.M. (1993). Popul. Dev. Rev. 19, 138–157.
Popkin, B.M. (1998). Public Health Nutr. 1, 5–21.
Popkin, B.M., and Doak, C. (1998). Nutr. Rev. 56, 95–103.
Popkin, B.M., Paeratakul, S., and Ge, K. (1995). Obes. Res. 3, 145s–153s.
Stata Corp. (1997). Stata statistical software: release 5.0. College Station, TX: Stata
Corporation.
Troiano, R.P., and Flegal, K.M. (1998). Pediatrics 101, 497–504.
Wang, Y., Monteiro, C.A., and Popkin, B.M. (2002). Am. J. Clin. Nutr. (in press).
WHO (1995). “Physical Status: The Use and Interpretation of Anthropometry”. Report of a
WHO Expert Committee (Technical Report Series 854). World Health Organization,
Geneva.
WHO (1998). “Obesity: Preventing and Managing the Global Epidemic”. Report of a
WHO Consultation on Obesity. World Health Organization, Geneva.
240 Trends in under- and overnutrition in Brazil

The Nutrition TransitionISBN: 0-12-153654-8
Copyright © 2002 Elsevier Science LtdAll rights of reproduction in any form reserved
Policy implications
Benjamin Caballero and Barry M. Popkin
13
The countries in transition face a very different set of circumstances than did higher-
income countries who began their epidemiological transition and faced a period with
a high level of nutrition-related noncommunicable diseases (NR-NCD) in the first
half of the 20th century. First and foremost, NR-NCD are not the only problem of
these countries. Protein-energy malnutrition and single- or multiple-micronutrient
deficiencies are still endemic in several parts of the developing world. The pace of the
nutrition transition is such that in most countries undergoing this transition, the pro-
tracted problems of undernutrition overlap with the emerging threat of overnutrition
and diet-related chronic diseases. To these contrasting situations, many countries must
add the burden of infectious diseases such as malaria and HIV. Developing a compre-
hensive public health policy to address these issues, usually with limited resources, is
perhaps the most difficult challenge for developing countries today.
There is some consensus that prevention is the only viable strategy to reduce
the burden of NR-NCD in developing countries. A traditional medical treatment
approach is not realistic under the conditions of most developing country health sys-
tems. The US is a clear example on how medical care for chronic diseases can demand
an enormous fraction of the health care budget. There is little expectation that the
limited health care budgets of most developing countries will be able to provide con-
tinuing care to the increasing number of persons with diabetes, hypertension, and
cardiovascular diseases. In addition, debilitating chronic diseases reduce work capac-
ity, thus constraining economic growth and creating a vicious circle of poverty and
inadequate health care.
The burden of NR-NCD on the national economy can be substantial, and its impact
can be felt in economies as varied as China’s or India’s. In China, the overall cost of
health care and lost work output due to premature death associated with NR-NCD was
estimated as a minimum of 2.2% of the GDP for 1995. In India, that figure was 1.1%
(Popkin et al., 2001). In contrast the costs of undernutrition are decreasing in these
countries and in 1995 were less than the costs of overnutrition for China and equal
for India.

Constraints to NR-NCD prevention strategies in the developing world
Countries currently in transition face unique challenges in confronting chronic non-
communicable diseases, compared to countries that experienced that transition earlier
in the 20th century. As noted above, NR-NCD in developing countries emerge in con-
ditions in which poverty and undernutrition are still widespread, where there are high
rates of low birth weight and stunting, and within a health care system often frag-
mented, underfunded, and frequently focused on treatment rather than prevention.
Poverty and undernutrition
The association between poverty and health outcomes has been documented in
numerous studies. But as pointed out above, this and other factors operate in a unique
way in populations in transition. First, urban dwelling is frequently associated with a
widening of the gap between rich and poor (Menon et al., 2000), with the potential to
exacerbate health risks associated with income. Second, improvements in socioeco-
nomic status, which could in other contexts result in improvement in health status,
may in fact increase the risk for NR-NCD, for example, by leading to more consump-
tion of saturated and total fat, or to a more sedentary lifestyle (television watching). A
closer look at the data on NR-NCD burden in developing regions indicates that for the
poorest segment of the population in countries in transition, communicable diseases
are still the more serious threat to health (Gwatkin et al., 1999); however as Monteiro
and his collaborators have shown in a series of studies, the burden of NR-NCDs is ris-
ing rapidly for the poor, and not only in Brazil but also in other countries is already
greater for the poor than the rich (Monteiro et al., 2000, 2002). Consistent with this,
data on stunting showed a larger socioeconomic differential in urban than in rural
areas (Menon et al., 2000). Longitudinal data from several countries also indicate that
the burden of NR-NCD is rapidly shifting to the poor (Berrios et al., 1990; Grol et al.,
1997; Guo et al., 2000; Monteiro et al., 2002).
Low birth weight and childhood malnutrition
As discussed in Chapter 7, the possibility that early malnutrition results in a life-long
increase in risk for adult NCD is of obvious importance for the developing world. This
concept, initially based on descriptive epidemiological studies by Barker (1992), has
been supported by data from a number of other cohorts (Phipps et al., 1993; Phillips
et al., 1994; Adair et al., 2001). Thus, efforts to reduce the prevalence of childhood
stunting in developing country populations would constitute an effective prevention
approach for NCD. Similarly, the possible role of breast feeding in reducing the risk
for diabetes (Pettitt et al., 1999) and hypertension (Singhai et al., 2001) in the adult
makes breastfeeding promotion another potentially important intervention for the
prevention of NCD.
242 Policy implications

Limited health care infrastructure
In many developing countries, the health care system is poorly funded, frequently seg-
mented and focused on treatment rather than prevention. Few developing countries
have even begun to recognize the magnitude of NR-NCD. A recent WHO survey
showed that many countries have not yet formulated policies or plans for the preven-
tion and control of noncommunicable diseases (WHO, 2001a). The percentages
ranged from 13% in the African region to 59% in European countries. Other studies
have also shown that only a few countries have started pilot activities in this area
focused on prevention (Doak, 2002). One important consequence of this is the lack of
stable surveillance systems that could allow a better understanding of the magnitude
of the problem and its national or regional characteristics.
Approaches to prevention of NR-NCD
There is general consensus that the three major modifiable factors responsible for the
increase in noncommunicable diseases are smoking, diet, and physical activity. A dis-
cussion of the first factor is beyond the scope of the present work, but it may be men-
tioned that efforts to introduce smoking cessation programs in the developing world
have encountered mixed success. In some cases, powerful economic interests and
aggressive marketing by tobacco companies have limited the actual impact of these
programs.
In the developed world, where NR-NCD have been major public health problems
for decades, several community-based prevention interventions have been developed
and evaluated. One frequently cited as an example of success is the North Karelia
Project, initiated in 1972 in that region of Finland (Puska, 1981). A number of other
interventions and demonstration projects have been implemented in the US and
Europe. Efforts to implement similar NCD prevention programs in developing coun-
tries were undertaken by the WHO and its regional offices. The Interhealth program,
initiated in 1986 by the World Health Organization (Interhealth, 1991), aimed at intro-
ducing health promotion and maintenance interventions at the community level, and
involved some 12 countries, but initially only three were in the developing world
(Mauritius, China, and Chile). A number of similar programs were launched in Latin
America (Cuba, Chile, Central America, and Argentina) with the assistance of the WHO
regional office. Others are being launched independently by the countries themselves
(e.g. Cointinho et al., 2002).
The rapid shift in the stage of the nutrition transition towards the pattern of NR-
NCD creates unique conditions for the implementation of prevention strategies.
Issues like early malnutrition, poverty, and degree of urbanization, which are major
determinants of the stage of the transition, vary widely across developing countries,
and are critical elements to define the best type of preventive strategy. In general, most
of the prevention approaches used in the developed world would be unworkable in
developing countries, due to cost or cultural limitations. The optimal mix of primary
Approaches to prevention of NR-NCD 243

and secondary prevention has also not been adequately identified, an important issue
for countries that already have high rates of one or more NR-NCD. The complex issue
is that a number of developing countries, including lower income ones such as Egypt,
face similar situations. The opposite situation may occur in most countries in transi-
tion, where NR-NCD still affect a smaller proportion of the population, or predomi-
nate only in urban areas. Thus, interventions targeted at the general population have a
better potential for success.
A prevention strategy aimed at delivering simple, inexpensive measures to large
numbers of people may require substantial modifications to the traditional health care
delivery system. These programs also make extensive use of community resources,
such as the media, the school system, churches, and other community institutions. On
the other hand, narrowly targeted interventions for high-risk groups can also be cost-
effective, but they should complement rather than replace population-wide programs.
The appropriate endpoints for primary prevention programs must also be identified.
Some of the more simple indicators, such as body mass index, may not be appropri-
ate for certain types of interventions, but at the same time more specific biochemical
indicators may be impractical or too expensive.
Program and policy options
Each country will require its own combination of integrated set of activities, across a
variety of sectors, to promote healthier dietary and physical activity patterns. There
are several new, innovative programs emerging from several developing countries,
such as Brazil (Cointinho et al., 2002). Other efforts have recently been reviewed
(Doak, 2002; Zhai et al., 2002). These interventions usually involve activities in sev-
eral settings, such as schools, the workplace, and community organizations. The focus
includes changes in food production policy, marketing, and other macroeconomic
efforts. All this requires active involvement in the legislative process.
Improvements of diets
As the Finnish experience has shown, successful food policy can shift the prices and
availability of the foods one wishes to promote and demote in the diet in ways that
radically can shift eating patterns. The relative and absolute prices of high and low sat-
urated fats, salt and many other elements of the Finnish diet were affected by taxation,
import controls, and shifts in agricultural research subsidies, among others. In every
country in transition, the costs and availability of hundreds of food products are
affected by government policies. The Finnish experience was the first to show that
promotion of a healthy diet can effectively use these same levers of policy. Not only
did the Finns affect food prices, they also affected consumer knowledge and attitudes
through systematic public education and social marketing efforts. The campaign to
reduce salt intake in Finland was one such example that involved health care per-
sonnel, and public education in cooperation with the food and catering industry.
244 Policy implications

And there was legislation to reduce the sodium content of the foods and the creation
of new labeling options related to salt intake.
This broad-based macroeconomic incentive system, along with public education,
will also be essential for success in developing countries.
Some countries, most notably Brazil, have begun to develop approaches similar to
those found in Finland. For example, an intervention to improve dietary patterns in
children in Brazil took advantage of the federally funded school lunch program (sim-
ilar to those existing in several countries), requiring that 70% of the resources be spent
on fresh vegetables and fruits. To overcome the problem of convenience and prepara-
tion time, usual justifications for the use of processed foods, the intervention engaged
local producers, who agreed to prepare their produce (clean, cut, sort, and pack) in order
to reduce preparation time at the school. In exchange, local producers would become
selected vendors for the school system (Cointinho et al., 2002). It should be noted that
this effort resulted from a nationwide consensus-building activity, involving health
professionals, consumers, the private sector, and the health authorities at the national,
regional and local levels.
Physical activity
The same type of systematic effort is needed to reduce sedentarism and improve over-
all physical activity patterns. For instance, city planning, building design and trans-
portation system layout must go hand in hand with efforts across all settings and
macro and micro efforts to promote healthy activity patterns. Brazil is again a leader
in this effort. Agita is a multilevel, community-wide intervention designed to increase
the knowledge about benefits and the level of physical activity in Brazil (Matsudo
et al., 2002). With a focus on getting all persons to have at least 30 minutes of physical
activity of moderate intensity, on most days of the week, they have included promotion
of activities in four settings: home, transport, work, and leisure time.
Surveillance
Surveillance is a critical element of any disease prevention policy, but few countries
in transition have developed meaningful surveillance systems. Although there is con-
tinuing progress in this regard, data on specific risk factors, longitudinal national
surveys, and data on biomarkers of risk in different populations are still scarce. The
establishment of national surveillance systems is one approach to overcome those
limitations. For instance, one model is that promoted by the WHO for development of
NCD surveillance, the “STEPwise” approach. As implied by its name, the program
involves progressively more intense data collection, from mortality data and simple
survey questionnaires to identify major risk factors, progressing to disease-specific
mortality (by verbal autopsy) and anthropometric measurements, and advancing to
death rates by death certificate, cause-specific incidence and prevalence, and assess-
ment of biochemical indicators (WHO, 2001b). The use of a standardized protocol
Surveillance 245

would permit comparison of data across countries, as well as sharing resources at the
regional level. An approach for assessing the quality of surveillance activities has also
been proposed by Silva et al. (2001).
Efforts for the prevention of NR-NCD must receive priority consideration by coun-
tries in transition. Although in some of these countries the prevalence of NCD has not
reached the level of developed countries, the economic cost and burden on the health
care system are magnified by the limited health infrastructure in countries in transi-
tion. Existing interventions focused on reducing the prevalence of low birth weight,
promoting breastfeeding, and reducing chronic malnutrition, may all have a positive
impact on adult NR-NCD. Specific programs aimed at providing healthy alternatives
to the demand for “better” diets by populations undergoing the nutrition transition are
also essential. Critical elements for success would include nutrition education from
the early years, community-based health promotion interventions, and market strate-
gies to promote healthier eating habits.
A coherent summary of the rapid shift toward higher rates of NR-NCDs and the
need for systematic program and policy preventive options is the Bellagio Declaration
(2002). The text of this declaration is provided at the end of this chapter.
References
Adair, L.S., Kuzawa, C.W., and Borja, J. (2001). Maternal energy stores and diet compo-
sition during pregnancy program adolescent blood pressure. Circulation 104,
1034–1039.
Barker, D.J.P. (1992). The effects of nutrition of the fetus and neonate on cardiovascular
disease in later life. Proc. Nutr. Soc. 51, 135–144.
Berrios, X., Jadue, L., Zenteno, J., Ross, M.I., and Rodriguez, H. (1990). Prevalence of
risk factors for chronic diseases. A study in the general population of the metropoli-
tan area, 1986–1987. Rev. Med. Chile 118, 597–604.
Cointinho, D., Monteiro, C.A., and Popkin, B. (2002). What Brazil is doing to promote
healthy diets and active life-styles? Public Health Nutr. 5, 263–267.
Doak, C. (2002). Large scale interventions and programs addressing nutrition related
chronic diseases and obesity: examples from fourteen countries. Public Health Nutr.
5, 275–277.
Drewnowski, A., and Popkin, B.M. (1997). The nutrition transition: new trends in the
global diet. Nutr. Rev. 55, 31–43.
Grol, M.E.C., Eimers, J.M., Alberts, J.F., Bouter, L.M., Gerstenbluth, I., Halabi, Y., van
Sonderen, E., and van den Heuvel, W.J.A. (1997). Alarmingly high prevalence of
obesity in Curaçao: data from an interview survey stratified for socioeconomic status.
Int. J. Obes. 21, 1002–1009.
Guo, X., Mroz, T.A., Popkin, B.M., and Zhai, F. (2000). Structural changes in the impact
of income on food consumption in China, 1989–93. Econ. Dev. Cult. Change 48,
737–760.
Gwatkin, D.R., Guillot, M., and Heuveline, P. (1999). The burden of disease among the
urban poor. Lancet 354, 586–589.
246 Policy implications

Interhealth Steering Committee (1991). Demonstration projects for the integrated control
and prevention of noncommunicable diseases: epidemiological background and
rationale. World Health Stat. Q. 44, 48–54.
Matsudo, V., Matsudo, S., Andrade, D., Araujo, T., Andrade, E., de Oliveria, L.C., and
Braggion, G. (2002). Promotion of physical activity in a developing country: the
Agita Sao Paulo experience. Public Health Nutr. 5, 253–261.
Menon, P., Ruel, M., and Morris, S.S. (2000). “Socioeconomic Differentials in Child
Stunting are Consistently Larger in Urban than in Rural Areas.” International Food
Policy Research Institute. http://www.ifpri.org/divs/fcnd/dp.htm
Monteiro, C.A., Benicio, M.H.D’A., Conde, W.L., and Popkin, B.M. (2000). Shifting obe-
sity trends in Brazil. Eur. J. Clin. Nutr. 54, 342–346.
Monteiro, C.A., Conde, W.L., and Popkin, B.M. (2002). Is obesity replacing or adding to
under-nutrition? Evidence from different social classes in Brazil. Public Health Nutr.
5, 105–112.
Pettitt, D.J., Forman, M.R., Hanson, R.L., Knowler, W.C., and Bennett, P.H. (1999).
Breastfeeding and incidence of non-insulin-dependent diabetes mellitus in Pima
Indians. Lancet 350, 166–168.
Phillips, D.I.W., Barker, D.J.P., Hales, C.N., Hirst, S., and Osmond, C. (1994). Thinness at
birth and insulin resistance in adult life. Diabetologia 37, 150–154.
Phipps, K., Barker, D.J.P., Hales, C.N., Fall, C.H., Osmond, C., and Clark, P.M.S. (1993).
Fetal growth and impaired glucose tolerance in men and women. Diabetologia 36,
225–228.
Popkin, B.M., Horton, S., Kim, S., Mahal, A., and Shuigao, J. (2001). Trends in diet, nutri-
tional status and diet-related noncommunicable diseases in China and India: the
economic costs of the nutrition transition. Nutr. Rev. 59, 379–390.
Puska, P. (1981). “The North Karelia Project: Evaluation of a Comprehensive Community
Programme for Control of Cardiovascular Diseases in North Karelia, Finland”.
World Health Organization, Copenhagen.
Puska, P., Pietinen, P., and Uusitalo, U. (2002). Influencing public nutrition for non-
communicable disease prevention: from community intervention to national
programme – experiences from Finland. Public Health Nutr. 5, 245–251.
Silva, L.C., Ordunez, P., Rodriguez, P., and Robles, S. (2001). A tool for assessing the
usefulness of prevalence studies done for surveillance purposes: the example of
hypertension. Rev. Panam. Salud Publica 10, 152–160.
Singhai, A., Cole, T.J., and Lucas, A. (2001). Early nutrition in preterm infants and later
blood pressure: two cohorts after randomised trials. Lancet 357, 413–419.
The Bellagio Declaration (2002). Public Health Nutr. 5, 279–280.
WHO (2001a). “Report: Assessment of National Capacity for Non-communicable Disease
Prevention and Control, Report of a Global Survey”. WHO, Geneva.
WHO (2001b). “Noncommunicable Diseases and Mental Health Cluster. Surveillance
of risk factors for noncommunicable diseases. The WHO STEPwise Approach.”
http://www.who.int/ncd/surveillance
Zhai, F., Dawei, F., Du, S., Ge, K., Chen, C., and Popkin, B. (2002). What is China doing
in policy-making to push back the negative aspects of the nutrition transition? Public
Health Nutr. 5, 269–273.
References 247

Bellagio Declaration: Nutrition and healthtransition in the developing world: the time to act
We from Africa, the Middle East, Asia, Europe and the Americas, met as participants
in the meeting on the Nutrition Transition and its Implications for Health in the
Developing World, held at the Rockefeller Centre at Bellagio, Lake Como, Italy, under
the auspices of the International Union of Nutritional Sciences, declare as follows.
The control and prevention of undernutrition is unfinished work in many countries.
At the same time nutrition-related chronic diseases are now the main causes of dis-
ability and death, not only globally but also in most developing countries.
Evidence presented at our meeting supports and reinforces evidence already
accepted by the World Health Organization and many national governments, and proves
that the patterns of disease throughout the developing world are rapidly changing.
Changes in food systems and patterns of work and leisure, and therefore in diets
and physical activity, are causing overweight, obesity, diabetes, high blood pressure,
cardiovascular disease including stroke, and increasingly cancer, even in the poorest
countries. Malnutrition early in life, followed by inappropriate diets and physical
inactivity in childhood and adult life, increases vulnerability to chronic diseases.
Evidence from many developing countries discussed at the meeting shows that
nutrition-related chronic diseases prematurely disable and kill a large proportion of
economically productive people, a preventable loss of precious human capital. This
includes countries where HIV/AIDS is a dominant problem. Four out of five deaths
from nutrition-related chronic diseases occur in middle and low-income countries.
The burden of cardiovascular disease alone, is now far greater in India, and also in
China, than in all economically developed countries in the world added together. Low
income communities are especially vulnerable to nutrition-related chronic diseases,
which are not only diseases of affluence.
Obesity, itself a disease, also predicts more serious diseases. Current rates of over-
weight and obesity most of all in children, young adults and women, project rapidly
increasing disability and premature death from nutrition-related chronic diseases for
most developing countries. Phenomenal social and economic changes, on a scale and
at a speed unprecedented in history, have resulted in an epidemic of nutrition-related
chronic diseases that must be contained.
Prevention is the only feasible approach to nutrition-related chronic diseases. The
cost of their treatment and management imposes an intolerable economic burden on
developing countries. There is an urgent need for governments, in partnership with all
relevant constituencies, to integrate strategies to promote healthful diets and regular
physical activity throughout life into all relevant policies and programs including
those designed to combat undernutrition.
Chronic diseases are preventable. This has already been demonstrated by successful
programs in a few developed countries. Their chief causes are smoking, inappropriate
diet and nutrition, and physical inactivity. Exposure to these factors is largely deter-
mined by political, economic and commercial policies and practices which reflect
decisions made at national and transnational levels.
248 Policy implications

Effective programs and policies will include not only health promotion and educa-
tion but community empowerment and action to overcome the environmental, social,
and economic constraints to improvement in dietary quality and reduction of seden-
tarism. Finland and Norway have succeeded in reversing, over a short time span,
extremely high levels of nutrition-related chronic diseases through comprehensive
food policy and community involvement.
Several examples of innovative and promising approaches in developing countries
emerged from the meeting. These include: promotion of daily physical activity
through massive community participation as in Agita São Paulo in Brazil; protection
of healthful aspects of the traditional low-fat high-vegetable diet as in South Korea
with a strong support from home economics and dietetic professionals and infrastruc-
ture; selective price policies promoting consumption of soy products in China; devel-
opment of food-based dietary guidelines in several countries based on local disease
patterns and available foods. School based programs to promote healthy diets and
physical activity are an especially valuable opportunity for action early on which
should protect health over the lifespan. Examples are the national school food pro-
gram in Brazil that provides fresh unprocessed food to school children and the new
national physical activity program in Thailand.
Immediate action to control and prevent nutrition-related chronic diseases is not only
a public health imperative but also a political, economic, social necessity. Successful
programs will be multidisciplinary and intersectoral, and will include government,
industry, the health professions, the media and civil society, as well as international
agencies, as partners.
We, present at this meeting, pledge ourselves to be part of this process.
Agreed at the Rockefeller Centre at Bellagio, Lake Como, ItalyThursday 24, August 2001
At the meeting in Bellagio papers were presented from Egypt, Morocco, Tanzania
and South Africa; Cuba, Mexico, Brazil and Chile; Iran; and India, China, Thailand,
Malaysia, and South Korea. Material showing information and trends from Africa,
Latin America, the Middle East and Asia was also reviewed. Senior officials from
the World Health Organization in Geneva, and from the Food and Agriculture
Organization of the United Nations in Rome, were also present at the meeting as
observers.
The group met at Bellagio responsible for this Declaration proposes to continue to
work together, initially as members of the IUNS Task Force on the Nutrition Transition
and its Implications for Health in the Economically Developing World, in consultation
with UN, international and bilateral agencies, national governments, and other con-
stituencies. Other information on the meeting, slide presentations and papers can be
found at: www.nutrans.org or www.nutritiontransition.org
Barry Popkin, Convenor, University of North Carolina at Chapel Hill, USA
Cecilia Albala, Instituto de Nutricion y Tecnologia de los Alimentos (INTA), Chile
Sabah Benjelloun, Institut Agronomique et Vétérinaire Hassan II, Morocco
Lesley Bourne, Medical Research Council, South Africa
Bellagio Declaration 249

Colleen Doak, University of North Carolina at Chapel Hill, USA
Geoffrey Cannon, Rapporteur, World Health Policy Forum, Switzerland
Osman Mahmoud Galal, High Institute of Public Health, Alexandria University,
Egypt
Hossein Ghassemi, Formerly Director, National Study on Food and Nutrition
Security in Iran, Iran
Gail Harrison, UCLA School of Public Health, USA
Vongsvat Kosulwat, Institute of Nutrition, Mahidol University, Thailand
Min-June Lee, The Graduate School of Human Environmental Science, South Korea
Tumsifu Maletnlema, Child Growth Promotion Union, Tanzania
Victor Matsudo, CELAFISCS, Brazil
Carlos Monteiro, São Paulo University, Brazil
Denise Coitinho, Ministry of Health, Brazil
Mohd Ismail Noor, Universiti Kebangsaan Malaysia, Malaysia
K. Srinath Reddy, All India Institute of Medical Sciences, India
Juan Rivera, Instituto Nacional de Salud Publica (INSP), Mexico
Arturo Rodriguez-Ojea, Instituto Superior de Ciencias Medicas de La Habana,
Facultad de Ciencias Medicas, Cuba
Ricardo Uauy, Instituto de Nutricion y Tecnologia de los Alimentos (INTA), Chile
Hester H. Vorster, Potchefstroom University for CHE, South Africa
Zhai Fengying, Chinese Academy of Preventive Medicine, China
Observed and acknowledged by
Pekka Puska, World Health Organization, Geneva
Prakash Shetty, Food and Agriculture Organization of the United Nations, Rome
250 Policy implications

Index
Abdominal (central) obesity 137, 148cardiovascular disease risk 140impaired glucose tolerance/insulin
resistance 171, 176, 197low birth weight relationship 139type 2 diabetes risk 140
Acquired immune deficiency syndrome see AIDS
Additives 62Adolescents
Brazilian study 229–230, 230sweetened drinks–obesity relationship
180–181Adulteration 61, 62Afghanistan 38Africa
cardiovascular disease 194diabetes 130, 137famine 30fertility trends 80hypertension 130life expectancy 82low birth weight 130noncommunicable disease rates 130population growth 84, 85, 86rural populations 99, 100, 103urban populations 99, 103
mega-cities 104Agriculture
agroecosystem management 46animal feeding efficiencies 45–46
demographic changes 28fertilizer use 29, 31, 31, 46, 115genetic engineering 47–48historical development 26, 114–115investment 39, 46–48
mechanization 30–31, 32, 115–116
modern farming 26, 30–33
workforce reduction 14, 31, 32new crop varieties 31, 32pesticides use 31, 32, 58, 62productivity 14, 23, 32–33, 33, 56
secular trends 10, 22USA post-war expansion 20–21, 22
research 46–47traditional farming 26, 27–30
AIDS (acquired immune deficiencysyndrome) 42, 75, 241
future projections of prevalence 82impact on life expectancy 80, 82–83, 83,
90, 91Ammonia fertilizers 31Angola 95Animal feed 45
soybeans 35Animal food products 33
agricultural productivityfeeding efficiencies 45–46
mechanization impact 115Chinese consumption trends 206,
211–212, 212, 217, 219demand in developing world 4–5, 39,
42–46
forcasting intake patterns 44–45early agricultural societies 115global per capita supply 36preagricultural foraging societies
27, 114traditional farming 30urban versus rural populations 123Western countries’ intake 43–44
Argentinafertility trends 76fetal programming studies 134
Asiaagricultural mechanization 32animal protein consumption 42diabetes type 2 137fertility trends 80low birth weight 130obesity 152, 157, 158population aging 94population growth 85, 86, 88rural populations 99, 100, 103urban populations 99, 103
mega-cities 103, 104Asian bird viruses 43Australia
Aboriginal populationsdiabetes type 2 166, 168, 183fetal programming studies 132,
133
selective insulin resistance hypothesis169–170
fertility trends 76food trade disputes 65
Austria 95Away-from-home food consumption
160China 210urban versus rural populations 123
Bangladesh 53childhood diabetes 165fertility trends 76low birth weight 130obesity 153, 153population aging 94population growth prediction 89
Barley 29, 30Basal metabolic rate (BMR) 12, 16Beans 29Beef
feed conversion efficiency 45global production 35hormones in production 64–65
Behavioral dietary change 113,117–118
Bellagio Declaration 246, 248–250
Beriberi 116Biodiversity 47, 58Birth to Ten (BTT) study 131, 134, 138Birth weight 129
adult obesity relationship 139, 161developing world 131diabetes during pregnancy 161, 176see also Fetal programming hypothesis;
Low birth weightBlindness
diabetic retinopathy 182vitamin A deficiency 38
Blood lipidsalterations in children 133cardiovascular risk 197China 195fetal programming hypothesis
studies in adults 132studies in children 136
Page numbers in italic refer to illustrations and tables and those in bold refer to main discussions.

Blood pressureelevation in children 133fetal programming hypothesis
studies in adults 131–132
studies in children 133, 134see also Hypertension
Body fat distributioninsulin sensitivity 170–171see also Abdominal (central) obesity
Body fat percentage estimation 148Body height see Height, bodyBody mass index (BMI)
Braziladults 230, 231, 232children/adolescents 229, 229
Chinese nutrition transition study 215,216
insulin sensitivity relationship 170mortality relationship 17, 17, 18, 19obesity 148overweight 148secular trends 10, 11, 16
Body size secular trends 9–23
labor productivity relationship 16–20Body weight
secular trends 10, 11, 16, 19, 19see also Body mass index (BMI)
Bovine spongiform encephalopathy (BSE;mad cow disease) 43, 61
Brand image 53, 54Brazil
agricultural resources for populationgrowth 40
famine 30fertility reduction 234, 237fetal programming studies 132, 139national food and nutrition policy 238,
244, 245nutrition transition study 223–239
adults 230–233, 231, 232data collection/analysis 225–226older children/adolescents 229–230,
230survey population 224, 225young children 226–229, 227, 228
obesity 153, 153, 231, 231, 232, 233,235, 236, 237–238
children/child overweight 160, 227,228–229, 230, 230, 235, 236
low income associations 233, 234, 235physical activity levels 237, 238population aging 94population growth 89, 234soybean production 35underweight
adults 231, 231, 232, 233child stunting/wasting 227, 228–229,
235, 236older children/adolescents 229, 230,
230, 236urbanization 234, 237
Brazilian Amondava 168Breast feeding 58, 116, 161, 175–176, 242,
246urban versus rural populations 123
Buckwheat 30Bulgaria 59
population decline 89
Calcium 36Campylobacter 61Canada
agricultural mechanization 32diabetes in children/adolescents 165fertility trends 76
Cancer 58, 61, 118China 207
mortality data 216, 217, 217, 218obesity association 149
Cardiovascular disease 36, 58, 61, 118,191–201
China 207mortality data 216, 217, 217, 218
developing world 191–192, 192dynamics of epidemic 195–196
ethnicity influences 198–200health transition model 194–195,
201projections for 2020 192–194, 193public health approaches 201risk behaviors/risk factors 196–197urbanization associations 195–196
diabetes type 2 166, 171, 182influence of intrauterine factors 137,
176fetal programming hypothesis 129, 140,
142insulin resistance association 137studies in adults 131–133
studies in children/adolescents133–136
interventions 196, 200–201
mortality/morbidity 191–194, 192obesity association 140, 149urban stress relationship 141
Caribbeanfertility trends 80fetal programming studies 134, 135,
136mega-cities 104obesity in preschool children 157, 158,
159population aging 94population growth 85–86rural populations 100urbanization 99, 101, 103
Carp aquaculture 45–46Cassava 28Catfish aquaculture 46Cebu Longitudinal Health and Nutrition
Survey (CLHNS) 131, 134–135, 135,136
Central obesity see Abdominal obesityCereals consumption
China 209, 209–211
recent trends 210–211, 210, 217traditional diet 206
early agricultural societies 115milled grains 116urban versus rural populations 123
Cereals productionanimal feed 45global production 33, 33, 34–35, 36historical aspects 28–29
Cheese 118Chickpeas 29Children
Braziloverweight 227, 228–229, 230, 230stunting/wasting 227, 228–229underweight in older children/
adolescents 229, 230, 230cardiovascular disease precursor changes
133diabetes type 2 165
fetal programming studies 138–139
maternal diabetes-related risk 175–176sweetened drinks–obesity relationship
180–181obesity
definitions 148–149measurement 148preschool children 157–159
school-age children 159–160
physical inactivity 161population distribution 91–94, 92
Chilefetal programming studies 133, 134, 135Interhealth program interventions 243
Chimpanzee meat eating habits 42China 205–220
agricultural resources for populationgrowth 40, 41
animal food products consumption 44,206, 211–212, 212
blood cholesterol levels 195cancer 207cardiovascular disease 194, 195, 207cereals consumption 209, 209–211
recent trends 210–211, 210urban/rural differences 210
diabetes type 2 166lifestyle interventions 168, 169, 173,
175diet composition
diversity 118–119, 119effect of income 124–125, 125energy sources 212–213, 213, 214, 219
famine 30, 209fat intake 196, 212, 213, 213, 214, 219fertility trends 76fetal programming studies 132, 133,
137, 139birth outcome epidemiological data
131food production 25, 26, 34, 37, 37
fruit 35mean rice harvest 33traditional farming 27, 28, 29
fruit consumption 211healthcare costs of nutrition-related
noncommunicable diseases 241hypertension 195, 197, 215–216, 216income/poverty trends 205, 206Interhealth program interventions 243
252 Index

mortality 208, 216, 217degenerative chronic diseases 216,
217, 217life expectancy 207
nitrogen fertilizer use 32nutrition transition study
anthropometric data 208body mass index (BMI) 215, 216data collection 207–208dietary intake surveys 207–208food consumption patterns 208–213,
209, 210, 211, 212, 213rapidity of disease rate changes
218–220stages of transition 206, 217–218
obesity 152, 171, 195, 207, 215, 217,218, 219
physical activity 208, 213–215, 214, 219population aging 94population growth 86, 88television ownership 126, 127, 219tobacco-related deaths 197traditional diet 205–206traditional farming 29
stages of change 209–210, 209undernutrition 38, 215urbanization 219vegetables consumption 211
Western food company markets 54fast food outlets 206, 219
China Health and Nutrition Survey (CHNS)207, 210, 212
China National Nutrition Survey (CNNS)207, 210, 211
Civil war 38, 58Climate change 58CODE-2 Study 184Codex 63–64, 65Collecting food see ForagingCommunications expansion 3Company mergers 54Congo
agricultural resources for populationgrowth 40, 41
population growth prediction 89Consumer-driven food safety issues 65Consuming unit 12Contamination 2, 61, 62Corn 29, 30, 47, 123, 124, 210
animal feed 45global mean harvest 33historical cultivation 28
Coronary heart disease 117, 118, 191, 192
developing world 130health transition model 194projections for 2020 192
dietary influences 178ethnic variability 167, 198
Corporate turnover 52, 53Counter-urbanization 99Cowpeas 29Croatia 132Crop rotation 29, 46, 115Culture 4, 51
Dairy productscurrent dietary shifts 120global production 35
Deficiency diseases 115, 116Degenerative diseases 113, 116–117
China 206preventive behavioral changes
117–118
Demographic transition 71, 72Demographic trends 1, 2, 71–106
data sets 73developing world 2, 3population aging 91–96, 92, 93, 95population growth 71, 72, 73–91
productivity-related changes in USA20–21
traditional farming impact 27, 28urbanization 72, 73, 96, 96–105, 97
Denmark 175Developing world
agricultural mechanization 32animal food products
consumption 42–43demand 4–5, 42–46
forcasting intake patterns 44–45cardiovascular disease see
Cardiovascular diseasecharacteristic features of diet 2demographic change 2, 3diabetes prevalence 165–166, 197fertility trends 72, 73, 74, 75, 89
least-developed regions 78, 80transition to low fertility 75–76, 77,
78
fetal programming see Fetalprogramming hypothesis
food production 4, 34–35low birth weight (intrauterine growth
retardation) 129, 130mortality (life expectancy) 72, 73, 81,
82, 195noncommunicable diseases 2, 3, 130obesity 130, 147–162, 175
men 156–157
preschool children 157–159, 158school-age children 159–160
social mapping 153–155, 153, 154trends 155–156women 150–156, 151, 152, 153
period of receding famine 2population aging 93population growth 2, 3, 40, 73, 75
agricultural resources 40, 41least-developed regions 85, 86predictions for future 84, 84–86, 86,
87, 88, 88–89
population momentum 75poverty 4–5
prevention strategies for non-communicable diseases 242,243–244
diet 244–245physical activity 245surveillance 245–246
seasonality of food supply 37
undernutrition 23, 38–39
economic impact 39micronutrient deficiencies 38–39
urbanization 3, 72, 96, 97, 98–99Diabetes 36, 61, 165–185
cardiovascular disease risk 197Chinese mortality data 216, 217, 217developing world 130fetal programming hypothesis 129, 140,
142studies in adults 137–138
studies in children 138–139
Indian populations 137obesity relationship 140, 149prevalence in developing world
165–166, 197Diabetes Prevention Program (DPP)
174–175
Diabetes type 2children/adolescents 180–181complications 166, 182
blood glucose control relationship183, 184
cardiovascular disease 166, 171, 176,182
nephropathy 166, 171, 182, 183, 184neuropathy 166, 171, 182, 183, 184public health implications 171retinopathy 166, 171, 182, 183, 184treatment costs 182–183, 184
dietary influences 177–182
fat intake 177, 178, 181–182increased energy density 179–180sweetened drinks 180–181
ethnic variability in prevalence 166–167genetic heterogeneity 170genetic risk factors 167–168health care 182–185
hypertension association 174insulin resistance 173–174intrauterine factors 175–177
maternal diabetes 175lifestyle interventions 168–169, 172–173
Diabetes Prevention Program (DPP)174–175
obesity/overweight association 166, 168,170, 175, 179
physical inactivity association 168,171–173
prevention at population level 184–185screening 185socioeconomic factors 166thrifty genotype hypothesis 169–170
Dietary intakeagriculture mechanization impact
115–116cardiovascular disease risk 196, 201Chinese nutrition transition study
data collection 208food consumption patterns 208–213,
209, 210, 211, 212, 213current shifts 1, 2, 119–122
income relationship 120, 120, 121,121, 122
vegetable fats 120–121
Index 253

Dietary intake cont.degenerative disease prevention
strategies 117–118, 244–245diabetes type 2 influence 177–182
diversity improvements 118–119, 119early agricultural societies 115foraging societies 114income–food choice relationship
124–126industrialization-related changes 117migration impact 124post-Industrial Revolution 116–117, 117self-report studies 178–179urbanization impact 119, 121, 122–124,
123see also Food intake (calories per capita)
Diversity of diet 118–119, 119Djibouti 95Draft animals 31
historical aspects 29Dreze, Jean 57Drinking water quality 58Drought 30
Early nutritional deprivation 129–142, 148see also Fetal programming hypothesis
Eastern Europe 82Economic change 1
productivity-related in USA 20–21Eggs 42, 118, 119, 160
Chinese consumption 211, 212, 217feed conversion efficiency 45global production 35income-related consumption 125–126production targets 56
Egyptfertility trends 76meat consumption 44obesity levels 153, 153
El Niño Southern Oscillation (ENSO) 30Elderly people
population distribution 91–94, 92see also Population aging
Energy adaptation maladaptation syndrome(ENAMAS) 139
Energy requirement 11–12maintenance diet 12
Escherichia coli 61Estonia 89Ethiopia
agricultural resources for populationgrowth 40
population growth prediction 89Ethnicity
cardiovascular disease risk variations198–200
definitions 166–167diabetes type 2 prevalence variations
166–167health attribute comparisons 167socioeconomic considerations 167
Europeagricultural mechanization 32animal protein consumption 42, 43, 44demography 40
diabetes treatment costs 184diet-related health inequalities 57fertility trends 71, 76, 80
fetal programming studies 132food production 34
dairy products 35late-eighteenth century chronic
malnutrition 12, 13mean cereal harvest 33mortality trends 9, 10, 71, 73, 82population growth reduction 84, 85, 86technophysio evolution 10traditional farming 29, 30urbanization 99, 100, 101, 103waste recycling 58–59
Eutrophication 48Exercise (physical activity levels)
Brazil 237, 238China 208, 213–215, 214, 219degenerative disease prevention 117, 245diabetes management 172–173, 174insulin resistance improvement 174serum lipid response 174weight loss 172
Famine 30, 113, 114–115
China 209, 217preindustrial societies 30
Fat fold measurements 148Fat intake 116, 117, 196, 242
behavioral dietary change 117, 118China 212, 213, 213, 214, 219coronary heart disease risk 178current dietary shifts 119–122, 120
low-income countries 119, 121diabetes relationship 177, 178, 181–182
dietary diversity relationship 118foraging (hunting and gathering)
societies 27, 114income-related consumption 120, 120,
121, 121, 122, 125–126meat 116–117obesity relationship 179urban versus rural populations 123vegetable fats 120–121Western diets 36, 43
Feed crops 33traditional farming 29
Fertility trends 71, 72, 73–74, 74least-developed countries 78, 80projections for population growth
prediction 75–78, 79, 83, 89transition to low fertility (‘fertility
transition’) 75–76, 77, 78, 80, 90Brazil 234population aging effect 91, 94
Fertilizer use 31, 31, 46, 115historical aspects 29
Fetal programming hypothesis 129, 199coronary heart disease risk 195role of overweight/obesity 139–140
studies in developing worldblood lipids 132, 133, 136blood pressure 131–132, 133, 134cardiovascular disease 131–136
diabetes 137–139
epidemiological data collection130–131
Fiber intake 2, 116, 117agriculture mechanization 116behavioral dietary change 117, 118foraging (hunting and gathering)
societies 114Finland
animal fat consumption 43preventive interventions 243, 244
cardiovascular disease 200diabetes 168–169, 175
Fish 114, 118Chinese consumption 211, 212, 219feed conversion efficiency 45–46food policy 53–54global production
aquaculture 35marine catch 35–36
preagricultural foraging societies 26stocks decline 58
Fishing bans 54Flood 30Food corporations turnover 52, 53, 53Food intake (calories per capita)
European secular trend 13, 13, 22excesses in Western diet 36global inequalities 36, 55–58
future improvement 41–42labor productivity effect 13–16, 15
empirical estimates 15–16see also Dietary intake
Food policy 53–55, 55economic framework for food security
56–57food inequalities 55–58
governance 60–66
multilevel 56health goals 63
WHO European Region model 62, 62
institutions 62–66
Food prices, globalization impact 4Food production 25–48, 54, 54
agricultural investment 46–48
animal products demand in developingworld 4–5, 42–46
current global levels 34–36
current per capita food supply 36–37data sources 33–34foraging societies 25, 26–27
future needs 39–42
local urban/peri-urban 59–60modern farming 26, 30–33
traditional farming 26, 27–30
Food security 56–57, 65Food-borne infections 61Foot-and-mouth epizootic 43Foraging (hunting and gathering) societies
25, 26–27, 112, 113, 114
thrifty genotype hypothesis 169Former Soviet Union 54
mortality trends 82Formula feeding 116
254 Index

Francebody height/body weight 16, 19, 19food intake (calories per capita) 13, 13late-eighteenth century chronic
malnutrition 12, 13energy available for work 14, 15
meat consumption 43mortality (life expectancy) 9, 10,
19–20Fruit 118, 119, 196, 245
Chinese consumption trends 211
global production 35local urban/peri-urban production 59production targets 56
General Agreement on Tariffs and Trade(GATT) 57, 60, 62, 63, 64, 65, 66
Agreement on Agriculture 63Genetic engineering 39, 47–48Genetic factors 5
cardiovascular disease 199, 200diabetes 167–168
Georgiafertility trends 76local food production 59
Gestational diabetes 142, 161Global Burden of Disease Study 192Global food corporations 52, 53, 53Global food production 34–36
inequalities 34Global population growth 39–41, 40Globalization 3–4, 52–53, 196–197
cultural context 4Goiter 39Governance 51, 60–66
multilevel 56Greece 43Green manuring 29Green Revolution 32Guatamala
fetal programming studies 131, 132, 133,134, 139
obesity 156
Harrowing 28Harvesting 28Health care infrastructure 20, 243
diabetes impact 182–185
Health changes (epidemiological transition)2
Health inequalitiesdiet-related 55food policy influences 53, 60–61, 61implications of General Agreement on
Tariffs and Trade (GATT) 62–66
Height, bodymorbidity relationship 18mortality relationship 18, 18, 19secular trends 10, 10, 17–18, 19, 19
Herbicides 32High altitude adaptation 148High-yielding crop varieties 32, 47History of food production 25–33
HIV infection see AIDSHominid foraging behavior 25–26
Hong-Kongchildhood diabetes 165fetal programming studies 132local food production 59
Hormones in meat fattening 64–65Human capital investment 20Human Development Index 66Human Development Report 66Hunting 112
meat composition 116–117preagricultural foraging societies 26–27
Hybrid seed 47Hypertension 58, 118
cardiovascular disease risk 197China 195, 215–216, 216developing world 130diabetes association 174ethnic variability 167health transition model 194obesity association 149prevalence 197urbanization association 170
Impaired glucose tolerance 142, 199dietary fat influence 178fetal programming studies 137, 138lifestyle interventions 168–169
Diabetes Prevention Program (DPP)174–175
prevalence in developing world 197Income
dietary intake impact 120, 120, 121,121, 122
China 124–125, 125food choice 124–126, 125, 126
obesity associations in Brazil 233, 234,235
Indiaagricultural resources for population
growth 40, 41cardiovascular disease 130, 176, 193, 194diabetes 130, 137, 138, 139, 166, 176,
183, 197famine 30fetal programming studies 131–132, 139
birth outcome epidemiological data131
food production 34, 35, 37hypertension 197insulin resistance syndrome 137, 139,
176noncommunicable diseases 130
healthcare costs 241obesity 171population aging 94population growth 86, 89Pune Maternal Nutrition Study 131,
138–139tobacco-related deaths 197traditional farming 29undernutrition 38Western food company markets 54
Indonesia 53, 116agricultural resources for population
growth 40, 41
food supply 37population aging 94
Infectious cardiomyopathy 194Infectious diseases 4, 80, 114, 241
China 206mortality data 216
Insulin resistancebody mass index (BMI) relationship
170central obesity 171diabetes type 2 173–174dyslipoproteinemia 174exercise responsiveness 174fetal programming hypothesis 137,
139, 141thrifty genotype hypothesis 169
Insulin resistance syndrome 132, 137, 139,168, 173–174, 176
Interhealth program 243Intrauterine factors
diabetes type 2 175–177see also Fetal programming hypothesis
Inuit 27Iodine deficiency 39Iowa Women’s Health Study 181Iran 152Irish potato famine 30Iron 5, 36, 48Irrigation 29, 58
mechanization 32Italy 95
Japananimal protein consumption 42, 44children
diabetes 165obesity 159
demography 40fertility trends 76food supply 37mean rice harvest 33population aging 94, 95
Japanese migrant groups 199Jordan, Michael 57
!Kung San 114Kuwait 159–160
Labor force participation rateagricultural advances impact 14UK 15USA 16, 21
Latin Americacardiovascular disease 194diabetes 137fertility trends 80Interhealth program interventions 243mega-cities 103, 104obesity 155, 156
preschool children 157, 158, 159school-age children 160population aging 94population growth rate 85, 89rural populations 100urbanization 99, 101, 103
Index 255

Legumes 46global production 35historical aspects 28, 29
Leisure-related energy expenditure 23Lentils 29Liberia 89Libya 165Life expectancy see MortalityLifestyle change 1, 3Low birth weight 58, 141, 176, 242, 246
developing world 130obesity relationship 139–140, 142
Low fat food consumption 118
Mad cow disease (bovine spongiformencephalopathy; BSE) 43, 61
Maintenance diet 12Malaria 241Malaysia 44Malnutrition (undernutrition) 23, 55, 241,
242, 246affluent countries 36–37Brazilian children
stunting/wasting 227, 228–229, 235underweight in older children/
adolescents 229, 230, 230China 206, 217developing world 38–39
early nutritional deprivation 19, 148impact on brain development 38
India 37late-eighteenth century Europe 12, 13micronutrient deficiencies 38–39sub-Saharan Africa 37traditional farming societies 30work capacity impact 12, 16
Manuring 115historical aspects 29
Market share 53, 54Market-driven growth 56Mass media 3, 126, 127
globalization 4influence in urban versus rural
populations 123Maturity-onset-type diabetes of youth
(MODY) 170Mauritius 174
cardiovascular disease preventiveinterventions 200
Interhealth program 243Meat consumption 32, 53, 58, 59, 118,
119China 211, 212current dietary shifts 120, 160dietary fat intake 116–117early agricultural societies 115hunting societies 114
Meat production 42, 43global levels 35
Mediterranean diet 43Mega-cities (urban agglomerations) 100,
103–105, 104Metabolically obese, normal-weight
(MONW) women 173Metformin 174
Mexicoobesity 155–156, 156
school-age children 160population aging 94population growth 89
Micronutrient deficiencies 36, 38–39, 241Middle East
obesity 152, 155preschool children 158, 159school-age children 159
Migrant/transplanted populations 124,199–200
diabetes type 2 165Milk 42, 118
Chinese consumption trends 217feed conversion efficiency 45global production 35production targets 56
Millet 28, 29, 30, 118, 123, 210Morbidity
body height relationship 18cardiovascular disease 191, 192labor productivity impact 20
MortalityAIDS impact 75, 80, 82–83, 83, 90, 91body height relationship 18, 18, 19body mass index (BMI) relationship 17,
17, 18, 19cardiovascular disease 191Chinese nutrition transition study 207,
208, 216, 217developing world 195
least-developed regions 80developmental malnutrition-related risk
19labor productivity impact 20obesity-related risk 149projections for population growth
prediction 75, 80, 81, 82, 83, 90–91secular trends 9, 10, 19–20, 71, 72, 73, 74
Mortality decline index 82Multicropping 29Multilevel governance 56
National Gross Domestic Product (GDP)52, 53
Naurua 169diabetes 165, 166
Neolithic Revolution 26Nephropathy, diabetes type 2 166, 171, 182,
183, 184Neuropathy, diabetes type 2 166, 171, 182,
183, 184New Zealand
fertility trends 76food trade disputes 65
Nigermedian age of population 95population growth prediction 89
Nigeriaagricultural resources for population
growth 40, 41fetal programming studies 132, 133population growth prediction 89
Nitrate contamination 62
Nitrogen fertilizers 31–32, 31Noncommunicable diseases (NCD) 191
see also Nutrition-relatednoncommunicable diseases
North Africaobesity 152, 155, 156–157, 157
preschool children 158, 159North Karelia Project 243Norway 65
behavioral dietary change 118meat consumption 43
Nutrition transitiondynamics 111–127
globalization relevance 52–53
poverty 4–5rapidity of shift 2, 3stages 2, 2, 3, 112, 113, 114–118
China 206urbanization 196–197see also Dietary intake
Nutrition-related noncommunicable diseases(NR-NCD) 2, 61, 114, 130, 241
fetal programming hypothesis 129prevention strategies in developing world
242–243Nutritional cardiomyopathy 194Nutritional status
body height relationship 17–18measurement (net nutrition) 11productivity impact 11–16
secular trend 16–17Nuts 26, 27, 114
Oats 29, 30Obesity 3, 22, 36, 37, 58, 61, 196
assessment 147–149body fat distribution 170–171Brazil 231, 231, 232, 233, 235, 236,
237–238cancer risk 149cardiovascular disease risk 140, 149childhood malnutrition association 5, 150China 207, 217, 218, 219consequences 149–150definition 148developing world 130, 147–162, 175
men 156–157
preschool children 157–159, 158school-age children 148, 159–160
social mapping 153–155, 153, 154trends 155–156women 150–156, 151, 152, 153
diabetes type 2 association 140, 149,166, 168, 170, 175, 179
energy balance discrepancy 147–148energy density of diet 179–180Europe 177hypertension association 149impaired glucose tolerance 197intrauterine factors 175low birth weight relationship 139–140,
142mortality risk 149prevention at population level 184–185public health implications 171
256 Index

stroke association 149sweetened drinks consumption 180–181thrifty genotype hypothesis 139, 140,
141, 199diabetes type 2 169–170
urbanization association 170USA 22see also Overweight
Oceaniafertility trends 80obesity 155, 156population aging 94population growth rate 85urbanization 99, 100, 101, 103
Oil crops 33Oils consumption 125, 126Organic agricultural products 23Organic recycling 31Orr, John Boyd 56Osteoporosis 118Output per capita 14Overfishing 35–36Overweight
Brazilian children 227, 228–229, 230,230, 235, 236
definitions 148childhood 149
diabetes type 2 association 166low birth weight relationship 139–140
see also Obesity
Packaging waste 58–59Pakistan 53
agricultural resources for populationgrowth 40, 41
obesity in children 157population aging 94population growth prediction 89
Peanuts 29Peas 29Pellagra 116Peppers 30Period of receding famine 2, 113, 115–116
Pesticides 31, 32, 62pollution 58
Philippines, Cebu Longitudinal Health andNutrition Survey (CLHNS) 131,134–135, 135, 136
Phosphate fertilizers 31, 32Physical activity see ExercisePhysical inactivity 1, 58, 116, 129, 161,
242cardiovascular disease risk 196, 197, 201children 161diabetes risk 168, 171–173
leisure time 161television in promotion 4
Pima Indians 169, 174, 183, 198, 199diabetes type 2 165, 166, 183effects of diabetic pregnancy 175
Plowing 28Poland 59Pollution 55, 58Polyunsaturated fatty acids (PUFA) 116, 181,
182
Population age/sex distributionstandardization 12
Population aging 91–96, 92, 93, 95Population growth 71, 72, 73–91, 74
developing world 73, 75, 84, 84–86, 86,87, 88, 88, 89
population momentum 75projections for future 75–76, 78, 80,
83–86, 84, 86, 87, 88, 88–90
negative growth rates 84, 85, 86, 88,88, 89
Population momentum 75Pork 118
Chinese consumption 219feed conversion efficiency 45global production 35income-related consumption 125, 125
Potatoes 28, 30, 124Poultry 42, 119
Chinese consumption 211, 212, 217, 219feed conversion efficiency 45global production 35
Poverty 51, 57–58, 242
cardiovascular disease risk in developingworld 196
health inequalities 58nutrition transition 4–5
post-Industrial Revolution 116USA 36–37
Premature birth 58Processed foods 4, 116, 160, 238
nutrition labeling 162urban versus rural populations 123, 124
Productivityagricultural advances impact 14body size relationship 10, 16
self-reinforcing cycle 16–20
definition 13–14output per capita 14
demographic/economic impact in USA20–21
effect of improved nutrition 11–16
modern farming 32–33, 33mortality/morbidity reduction impact 20nutritional status-related increase 13–16,
15empirical estimate 15–16
secular trends 9–23
see also Work capacityProfits 53Protein, global per capita food supply 36Pune Maternal Nutrition Study 131,
138–139, 141
Recycling waste 28, 46, 58–59Retinol 5Retinopathy, diabetes type 2 166, 171, 182,
183, 184Rheumatic heart disease 191, 194Rice 29, 47, 118, 119, 123
bioengineering advances 48Chinese traditional diet 206global mean harvest 33high-yielding varieties 32historical aspects 28
Rural population dynamics 98, 99–100Russia
demography 40fetal programming studies 139mortality trends 82population decline 89
Rye 29
Salmon aquaculture 46Salmonella 61Salt intake 196, 199
reduction in Finland 244–245Saturated fat intake 5, 116
coronary heart disease 178diabetes 177, 178, 181
Saudi Arabia 53Scandinavian diet 43Seasonality of food supply 37, 114Sedentary lifestyle see Physical inactivitySeeds 26, 27, 114Selenium 5Self-reliance policies 56, 57, 65Self-report dietary intake studies
178–179Sen, Amartya 57Seven Countries Study 198Shifting farming 28Shopping by car 60Siege of Leningrad 176Singapore 165Sino-MONICA 195Skinfold measurement see Fat fold
measurementsSoil structure 46, 58Somalia 38Sorghum 118, 210South Africa 53
Birth to Ten (BTT) study 131, 134, 138
cardiovascular disease precursor changesin children 133
fetal programming studies 132, 134,137, 138, 139
South Asian migrant groups 199, 200Soybeans 29, 37, 118
animal feed 45global production 35
Spaindiabetes 181population aging 95
State-led self-reliance policies 56, 57STEPwise approach 245Straw:grain ratio 32Stroke 58, 191, 192
developing world 198health transition model 194projections for 2020 192
ethnic variability 167, 198obesity association 149
Sub-Saharan Africa 60animal protein consumption 42food supply 37, 42hypertension 197obesity 152, 155, 157, 158, 159population growth prediction 89
Index 257

Sugar intake 37, 116, 117childhood obesity 180–181current dietary shifts 119–122, 120, 122,
122urban versus rural populations 123
Sugar production 33global levels 35
Surveillance systems 245–246Sustainable consumption 51, 58–60
appropriate localism approach 57Sweden
diabetes type 2 182lifestyle interventions 169
fetal programming studies 133, 134Sweet potato 48Sweetened drinks–obesity relationship
180–181Sweets consumption 118
Taiwan 42, 44Tanzania
diabetes type 2 165obesity levels 153, 153
Technophysio evolution 10Television 4, 126, 127, 161, 242
Brazil 237, 238China 213, 214–215, 214, 219
Tobacco 58, 243cardiovascular disease risk 196,
197–198, 201Tomatoes 30Torres Straits Islanders 166Total energy requirement 12Trade power 54Traditional farming 26, 27–30
intensification 29renewability 28
Transgenic pigs 48Transgenic seed 47Transnational food corporations 55
Codex meetings participation 64turnover 52, 53, 53
Transport of food 60, 124Tuberculosis 91Tubers 28, 114Turkey
meat consumption 44obesity levels 153, 153, 154
Uganda 95UK
diabetes in children/adolescents 165diet-related health inequalities 57ethnic variability in disease 167fruit imports 60life expectancy 9, 10
malnutrition (undernutrition) 56late-eighteenth century 12, 13
mean cereal harvest 33migrant groups 200poverty 57–58secular trends
body size 16energy available for work 14, 15, 15food intake (calories per capita) 13,
13, 15Undernutrition see MalnutritionUnited Kingdom Prospective Diabetes
Study (UKPDS) 183Urban agglomerations (mega-cities) 100,
103–105, 104Urbanization 3, 31, 55, 58, 59, 101, 196
Brazil 234, 237cardiovascular disease association
195–196demographic trends 72, 73, 96, 96–105,
97developing world 98–99size of settlements 100, 101, 101,
102, 103diet composition impact 119, 121,
122–124, 123hypertension association 170local food production 59low-income countries 122, 124obesity association 170patterns of migration 124stress response 141urban agglomerations 100, 103
Uruguay 76USA
agricultural mechanization 32agricultural output 20–21, 22animal protein consumption 42, 44behavioral dietary change 118cardiovascular disease precursor changes
in children 133demography 40diabetes type 2 166, 177–178, 182,
183–184, 185children/adolescents 165lifestyle interventions 174–175
fat intake 36fertility trends 76, 80fetal programming studies 132food packaging 58food production 34, 36–37
dairy products 35mean cereal harvest 33soybeans 35
life expectancy 9, 10micronutrient deficiencies 36
obesity 22children 158, 159, 180social mapping 154, 155trends 155
population aging 94population growth rate 85, 89poverty 36–37productivity 10
demographic/economic change20–21
trade disputes 64, 65urbanization 99, 100, 101, 103
mega-cities 104
Value-adding 53, 54Vegetable oils/fats 4, 160, 181, 182, 196Vegetables 118, 119, 196, 245
Chinese consumption 211, 217traditional diet 206
local urban/peri-urban production 59production targets 56
Vitamin A 48deficiency 38
Weight lossbody fat distribution 171diabetes management 174physical activity 172
Wheat 29, 30, 47, 119, 123Chinese traditional diet 206global mean harvest 33high-yielding varieties 32historical aspects 28world market prices 65
WHO-MONICA 177Work capacity
energy available for workagricultural advances impact 14secular trends 14, 15
food supply relationship 13–14, 15empirical estimates 15–16
late-eighteenth century Europe 12output per capita 14
Work changes 3World Food Summit 65World Health Organization (WHO) 63World Trade Organization (WTO) 60, 63,
65, 66
Xerophthalmia syndrome 38
Yemenmedian age of population 95population growth prediction 89
Zinc 5, 36
258 Index

Food Science and TechnologyInternational Series
Maynard A. Amerine, Rose Marie Pangborn, and Edward B. Roessler, Principles of
Sensory Evaluation of Food. 1965.
Martin Glicksman, Gum Technology in the Food Industry. 1970.
Maynard A. Joslyn, Methods in Food Analysis, second edition. 1970.
C. R. Stumbo, Thermobacteriology in Food Processing, second edition. 1973.
Aaron M. Altschul (ed.), New Protein Foods: Volume 1, Technology, Part A – 1974.
Volume 2, Technology, Part B – 1976. Volume 3, Animal Protein Supplies,
Part A – 1978. Volume 4, Animal Protein Supplies, Part B – 1981. Volume 5,
Seed Storage Proteins – 1985.
S. A. Goldblith, L. Rey, and W. W. Rothmayr, Freeze Drying and Advanced Food
Technology. 1975.
R. B. Duckworth (ed.), Water Relations of Food. 1975.
John A. Troller and J. H. B. Christian, Water Activity and Food. 1978.
A. E. Bender, Food Processing and Nutrition. 1978.
D. R. Osborne and P. Voogt, The Analysis of Nutrients in Foods. 1978.
Marcel Loncin and R. L. Merson, Food Engineering: Principles and Selected
Applications. 1979.
J. G. Vaughan (ed.), Food Microscopy. 1979.
J. R. A. Pollock (ed.), Brewing Science, Volume 1 – 1979. Volume 2 – 1980. Volume 3 –
1987.
J. Christopher Bauernfeind (ed.), Carotenoids as Colorants and Vitamin A
Precursors: Technological and Nutritional Applications. 1981.
Pericles Markakis (ed.), Anthocyanins as Food Colors. 1982.
George F. Stewart and Maynard A. Amerine (eds.), Introduction to Food Science and
Technology, second edition. 1982.
Malcolm C. Bourne, Food Texture and Viscosity: Concept and Measurement. 1982.
Hector A. Iglesias and Jorge Chirife, Handbook of Food Isotherms: Water Sorption
Parameters for Food and Food Components. 1982.
Colin Dennis (ed.), Post-Harvest Pathology of Fruits and Vegetables. 1983.
P. J. Barnes (ed.), Lipids in Cereal Technology. 1983.
David Pimentel and Carl W. Hall (eds.), Food and Energy Resources. 1984.

Joe M. Regenstein and Carrie E. Regenstein, Food Protein Chemistry: An Introduc-
tion for Food Scientists. 1984.
Maximo C. Gacula, Jr., and Jagbir Singh, Statistical Methods in Food and Consumer
Research. 1984.
Fergus M. Clydesdale and Kathyrn L. Wiemer (eds.), Iron Fortification of Foods. 1985.
Robert V. Decareau, Microwaves in the Food Processing Industry. 1985.
S. M. Herschdoerfer (ed.), Quality Control in the Food Industry, second edition.
Volume 1 – 1985. Volume 2 – 1985. Volume 3 – 1986. Volume 4 – 1987.
F. E. Cunningham and N. A. Cox (eds.), Microbiology of Poultry Meat Products.
1987.
Walter M. Urbain, Food Irradiation. 1986.
Peter J. Bechtel, Muscle as Food. 1986.
H. W.-S. Chan, Autoxidation of Unsaturated Lipids. 1986.
Chester O. McCorkle, Jr., Economics of Food Processing in the United States. 1987.
Jethro Jagtiani, Harvey T. Chan, Jr., and William S. Sakai, Tropical Fruit Processing.
1987.
J. Solms, D. A. Booth, R. M. Dangborn, and O. Raunhardt, Food Acceptance and
Nutrition. 1987.
R. Macrae, HPLC in Food Analysis, second edition. 1988.
A. M. Pearson and R. B. Young, Muscle and Meat Biochemistry. 1989.
Dean O. Cliver (ed.), Foodborne Diseases. 1990.
Marjorie P. Penfield and Ada Marie Campbell, Experimental Food Science, third
edition. 1990.
Leroy C. Blankenship, Colonization Control of Human Bacterial Enteropathogens in
Poultry. 1991.
Yeshajahu Pomeranz, Functional Properties of Food Components, second edition.
1991.
Reginald H. Walter, The Chemistry and Technology of Pectin. 1991.
Herbert Stone and Joel L. Sidel, Sensory Evaluation Practices, second edition. 1993.
Robert L. Shewfelt and Stanley E. Prussia, Postharvest Handling: A Systems
Approach. 1993.
R. Paul Singh and Dennis R. Heldman, Introduction to Food Engineering, second
edition. 1993.
Tilak Nagodawithana and Gerald Reed, Enzymes in Food Processing, third edition.
1993.
Dallas G. Hoover and Larry R. Steenson, Bacteriocins. 1993.
Takayaki Shibamoto and Leonard Bjeldanes, Introduction to Food Toxicology. 1993.
John A. Troller, Sanitation in Food Processing, second edition. 1993.
Ronald S. Jackson, Wine Science: Principles and Applications. 1994.
Harold D. Hafs and Robert G. Zimbelman, Low-fat Meats. 1994.
Lance G. Phillips, Dana M. Whitehead, and John Kinsella, Structure–Function
Properties of Food Proteins. 1994.
Robert G. Jensen, Handbook of Milk Composition. 1995.
Yrjö H. Roos, Phase Transitions in Foods. 1995.
Reginald H. Walter, Polysaccharide Dispersions. 1997.
260 Food Science and Technology: International Series

Gustavo V. Barbosa-Cánovas, M. Marcela Góngora-Nieto, Usha R. Pothakamury, and
Barry G. Swanson, Preservation of Foods with Pulsed Electric Fields. 1999.
Ronald S. Jackson, Wine Science: Principles, Practice, Perception, second edition. 2000.
R. Paul Singh and Dennis R. Heldman, Introduction to Food Engineering, third
edition. 2001.
Ronald S. Jackson, Wine Tasting: A Professional Handbook. 2002.
Malcolm C. Bourne, Food Texture and Viscosity: Concept and Measurement, second
edition. 2002.
Dean O. Cliver and Hans P. Riemann (eds.), Foodborne Diseases, second edition. 2002.
Food Science and Technology: International Series 261