Fish Nutrition Research in.Asia
176
ARCH IV 45349
-
Upload
khangminh22 -
Category
Documents
-
view
3 -
download
0
Transcript of Fish Nutrition Research in.Asia

ARCH IV 45349

I ~·~ •.;.11
FJ"oac-~tiiiJ 4 s ~ 11 ~ · L, "" .'* )~~/- I~ c fo~ I
-\-="I L t':'- rJo, : 3 -A - ?:. "=/- - l.f Co O l
I.
;•
? ,I
' '
-- _-.:... ---- - -

Fish Nutrition Research in.Asia
Proceedings of the Third Asian Fish Nutrition Network Meeting
Edited by
S.S. De Silva
1989
Published by the Asian Fisheries Society in association with the
International Development Research Centre of Canada
1 1991
f\P(r\ IV
(p~CL c\ (S\ 0,)
- - --- -- -----
\\

Fish Nutrition Research in Asia
Proceedings of the Third Asian Fish Nutrition Network Meeting
Edited by
S.S. DE SILVA
1989
Printed in Manila, Philippines
De Silva, S.S., editor.·1989. Fish nutrition research in Asia. Proceedings of the Third Asian;Fish Nutrition Network Meeting. Asian Fish. Soc. Spec. Publ. 4: ~66 p. Asian Fisheries Society,
Ml!Ilila, Philippines. " < ', .· 1 ... ,
. . ~ ' .
·,/ ...
Copyrigh~; 1989, Asian Fisheries '.s&iety, Philippines, and InteI)lational Develcipmerit Research Centre of Canada
.... ' .. ~~-.:L~:.:.:,_-·m .... -
ISBN 971-1022-66-4
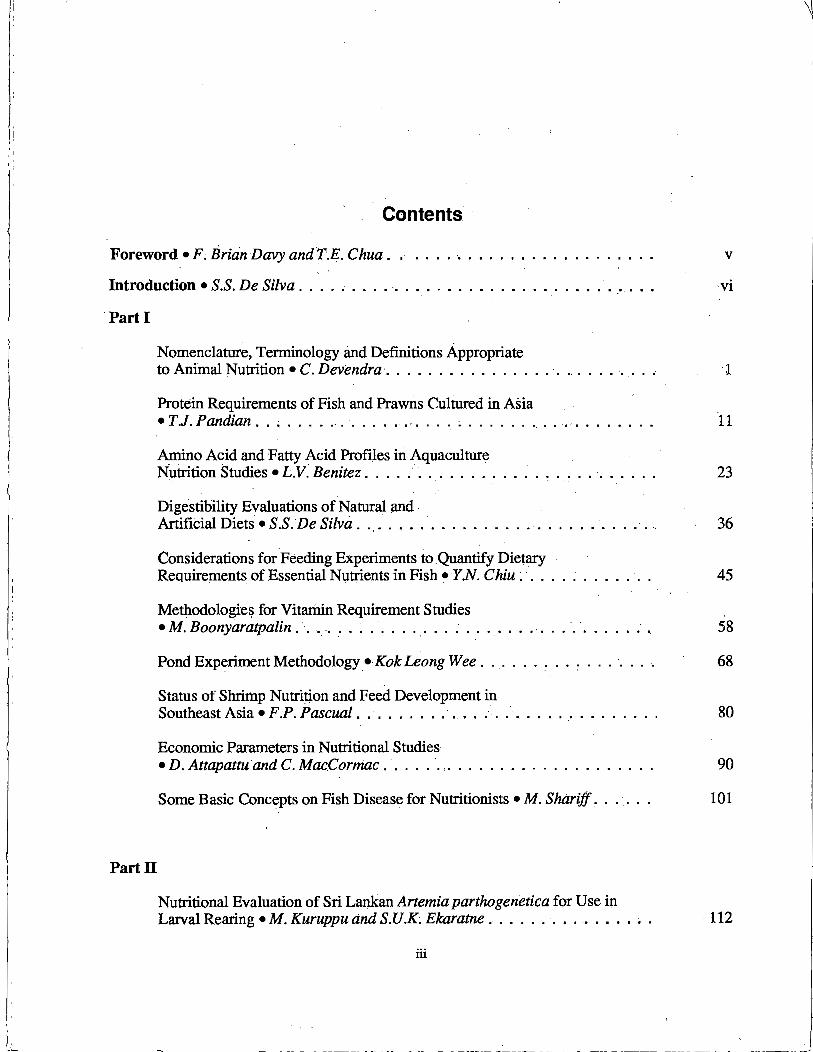
Contents
Foreword • F Brian Davy and T.E. Chua . . ..... . v
Introduction• S.S. De Silva. . . . .. . . . . . . . . . . . . . . . . . . . . . . . . . . . . . ·vi
Part I
Part II
Nomenclature, Terminology and Definitions Appropriate to Animal Nutrition• C. Dev'endra . ............... . ...... · . . . . · l
Protein Requirements of Fish and Prawns Cultured in Asia • T.J. Pandian . .............. ·" .... ~ ... . 11
Amino Acid and Fatty Acid Profiles in Aquaculture Nui:rition Studies• L.V. Benitez . ................. . 23
Digestibility Evaluations of Natural and . Artifieial Diets • S.S.De Silva . . . . . . . . . . . . . . . . . . . . . . . . . . . . . . 36
Considerations for Feeding Experiments to .Quantify Dietary Requirements of Essential Nutrients in Fish• Y N. Chiu~· . ....
Methodologies for Vitamin Requirement Studies • M. Boonyaratpalin . . . . . . ~ . . . . . . . . . . . . . . . . · . .
Pond Experiment Methodology • Kok Leong Wee . . . .
Status of Shrimp Nutrition and Feed Development in
45
58
.... · ... 68
Southeast Asia• F~P. Pascual . ........ ·. . . . . . . . . . . . . . . . . . . . 80
Economic Parameters in Nutritional Studies • D. Attapattu and C. Mac.Cormac ..... ·. , .
Some Basic Concepts on Fish Disease for Nutritionists• M. Shariff . ..
Nutritional Evaluation of Sri Lankan Artemia parthogenetica for Use in
90
101
Larval Rearing • M. Kuruppu and S.U.K Ekaratne . . . . . . . . . . . . . . . . 112
iii
\\

The Digestibility ofSeveral Feedstuffs in Red Tilapia • M.S. Kamarudin, K.M. Kaliapan and S.S. Siraj . ..................... ~ . . . . . . 118 ·
Growth Response, Feed Conversion and Metabolism of the Air-Breathing Fish, Anabas testudineus (Bloch) to Different Dietary Protein Sources• A.K.Ray and B.C. Patra. . . . . . . . . . . . . . . . 123
Effect of Feeding Regimes on Growth and Survival of Bighead Carp · (Aristichthys riobilis Richardson) Fry• C.B. Santiago and O.S, Reyes . . ·. . .. 130
Growth Performance of an Indian Major Carp, Cat/a catld (Ham.) of Fishmeal-Free Diets •.M.C. Nandeesha, GK. Srikanth, T.J. Varghese, P. Keshavanath and HP.C. Shetty . .... ~ . . . . . . . . . . . . . . . . . . . . 137
Utilization of Aquatic Weed Mixture Pellet as Feed for Nile Tilapia (Ofeochromis niloticus) and Pig• S. Chiayvareesajja, C. Wohgwit, A; Cronin, K. Supamataya, C. Tantikitti and R. Tansakul. . . . . . . . . . . . . 143
Impr:ovementof Meat Quality of Grass Carp, Ctenopharyngodon idellus (Cuv. et Val,) •Lin Ding, MaoYongqing andLiaoXianghua. . . . . . . . . . 148
Culture of Banana Prawn (Penaeus merguiensis) and Tilapia (Oreochromis mossambicus) by Using Aquatic Weed Mixtilre Pellet • S. ChiayvareesaJia andR. Tanasakul. ......... _ ..... , . . . . . . 153
Summary of the Discussions .......... ~ .... : . . . . . . . . . . . . . . 157
. Workshop Recommendations . . . . . . . . . . . . . . . . . . . . . . . . . . • . . . 160
Annex: Asian Fish Nutrition Network. . . .. . . . . . . . . . . . . . . . . . . . . 162
List of Participants .... · ............... ; . . . . . . . . . . . . . . . 164
iv

Foreword
This publication provides a summary of the discussions held at the Asian Institute of Technology near- Bangkok, Thailand, 6-10 June 1988. This workshop was the third in a series funded by the International Development Research Centre (IDRC) to develop a more coordinated regional fish nutrition research program in Asia.
The workshop consisted of two parts: review papers on topics selected at the Second Fish Nutrition Workshop (Manila, 1986) and invited research papers from other scientists in the region. The review papers were part of an attempt to develop more standardized terminology and research protocols for the region. The invited papers were opportunities_ for some scientists to present their latest research results and seek critical inpys from their colleagues under ·the · workshop format.
In addition, an economist (D. Atapattu) and a fish disease worker (M. Shariff) from the region joined the workshop to present papers related to nutrition and to make the nutrition researchers aware of issues from these related disciplines. It had been agreed -at the earlier workshops that broader issues need to be considered and this was a first attempt on this approach. Other disciplines will likely be encouraged to participate in future meetings.
A variety of follow-up actions were- discµssed at ·this meeting- and these are summarized in the discussion sessions. A fourth meeting in ·12-18 months was one of the suggested future activities.
The meeting agreed· to formalize an Asian Fish Nutrition Network (AFNN) to provide a -more formal structure for this activity. It is hoped that the AFNN can be affiliated with the Asian Fisheries Society initially as a study group and later as a section. IDRC has agreed to provide partial funding for some of the proposed AFNN follow-up activities. Asian fish nutrition scientists interested in collaborating with AFNN should contact Dr. S.S. De Silva_at the Faculty of Science, University of Ruhuna, Matara, Sri Lanka.
IDRC is very pleased with th<; developments taking place under the· AFNN. IDRC would like to thank Dr. T. Watanabe and Dr. C. Young Cho for acting as resource persons at this workshop, Dr. Kok Leong Wee for his assistance in making the· local arrangements at AIT and Dr. S.S. De Silva for most of the work in arranging the program,- scientific papers and producing the proceedings. -
The Asian Fisheries Society wa~ a natural .partner for the Network in publishing these proceedings. The Second Finfish Nutrition Workshop from which many of the papers here were derived was held during the Society's First Asian Fisheries Forum and -this close linkage is expected to increase if-the Network forms a section of the Society in the future. _
This publication is the fourth in the Society's Special Publicatioµ series, which are provided free to members. In this way the Asian Fisheries Society _htdps its -members overcome the
_ difficulties associated with keeping up with advances in their field. - -
F. BRIAN DA VY Associate Director (Fisherie~) International Development Research Centre Singapore
v
CHUA THIA ENG President Asian Fisheries Society Manila

Introduction
More than 50% of the world aquaculture production i~ attributed to Asia, the· cradle of aquaculture. However, in most Asian countries. aquaculture is practiced at a subsistence level.
· Conflicting demands for space and water in particular have called upon intensification of the traditional practices; supplementary feeding is basic to intensification. The highest recurring cost in intensified practices is attributed .to feed cost, and therefore nutritional research in the region is becoming increasingly important.
· Development of suitable, low cost feeds . for fin· and shellfish species cultured in most of Asia is still in the early stages. Basic research into investigations on nutritional requirements are not known for many of the cultured species .in the region. Unlike in temperate waters the contribution from natural production in the ponds is likely to play a· significant role .in the nutrition of most cultured species; quantification of this component will enable a saving in the feed cost.
This volume contains papers presented at the Third Workshop on Fish Nutrition held at the Asian Institute of Technology, Bangkok; Thailand in June 1988 .. The volume is divided into two parts for convenience and clarity. The first part includes presentations· made on basic_ nutritional requirements and methodologies related to experimental design iri the laboratory as well as in· outdoor facilities, .and the second part contains the presentations made in ongoing original nutrition research in the -region~ Attempts have been made to obtain a fairly representative crosssection of the ongoing research on fish nutrition in the region, species-wise, depicting the : immediate nutritiml needs for intensification of the practices in the region. ·
Th,is volume, 1.ike its predecessors, does not claim . to be a treatise for . fish nutrition researchers. This is an addition to the· much needed relevant·and appropriate documentation for the growing number of researchers in the region. It is however, hoped that in the course -0f the next few years these . volumes will provide a. comprehensive reference work on fish nutrition . research in tropical Asia.
I am thankful to Drs .. C. Young Cho, T. WatanaJ:>e, Kok Leong Wee and F. Brian Davy for their help in the editing ..
The proceedings were edited when I was on attachment to the Department of Zoology, National University of Singapore (NUS), and I am grateful to the NUS for giving me this opportunity.
SENA S.DE SILVA
vi

Part 1·
Nomenclature, Terminology and Definitions Appropriate to Animal Nutrition
C.DEVENDRA Diviszon of Agriculture
Food and Nutrition Sciences International Development Research Centre
Tang/in, P.O. Box 101 Singapore 9124
Devendra:, C. 1989. Nomenclature, terminology and definitions appropriate to animal nutritirin, p. ·1-10. /n s:s. De Silva (ed.) Fish Nutrition Research in Asia. Proceedings of the Third Asian Fish Nutrition Network Meeting. Asian Fish. Soc. Spec. Puhl. 4, 166 p. Asian Fisheries Society, Manila, Philippines. ·
The paper attempts to present a comprehensive i:overage of nomenclature, terininology and definitions appropriate to animal nutrition which are relevant to fish production .. Particular focus is made to the expression of energy and protein that are· currently used, inter-conversion of energy values and methods of measuring protein quality. Of the energy systems, the metabolizable energy (ME) system is the most widely applied. Concerning proteins, digestible crude protein (DCP) and true protein values are also widely used. Reference is a).so made to efficiency as it applies to the overall production process· and especially to feed efficiency, including various measures of it. A glossary of common terms used in aniinal nutrition is also included: ·
In a previous publication (Devendra 1986), the general approaches to animal nutrition research and thei.i- relevance to fish production were discussed with reference to four objectives as follows: ·
(i) Identification and definition of the feed resources. (ii) Assessment of nutritive value. (iii) Utilisation in efficient and economic feeding systems, and (iv) Determination of nutrient requirements. The paper also referred to the significance of nutrient variables that influence production
responses, the importance of feeding. standards and a strategy for fish feed formulation. ·Reference is also made in thts context to the publication by Cho et al. (1985) ·on the methodological details to research and development in fish nutrition.
In a continuation of the focus on fish nutrition, this paper is concerned with nomenclature, terminology and definitions appropriate to animal putrition. The reference. to these aspects has a bearing on an understanding of research in fish nutrition. ·
It is not proposed to deal exhaustively with all aspects. of the subject since much of the information can be found in various books on animal nutrition" although this is likely to be scattered. Thus, for example, little or no reference will be made to identification and definition· of the various types of agro-industrial by-products, incluqing non-conventional feeds, which are
· potentially useful as energy or protein feeds for fish. Attention will. be focused on the energy and· protein systems in use, and the importance of efficiency in animal nutrition which may be of relevance to fish nutrition.
1

2
Expressions of Energy
Quantitatively, energy is the most important nutrient in the diet of animals. Several expressions of energy systems exist. It is now known that over a wide range of forages and concentrate · feeds, the assessment of energy values using different systems is variable and inaccurate. In general the efficiency of energy utilization increases with dietary; energy density. This does riot occur at a constant rate and is dependent on the physiological conditions and functions of the animal. The following expressions of energy are used:
(i) Starch Equivalent (SE) - United Kingdom (ii) The Scandinavian Fodder Unit (SFU) - Denmark (iii) Fattening Fodder Units (FFU) - Denmark (iv) The French systems of Fodder Equivalent - France (v) Rostock NEF system - Germany (vi) Net Energy oflactation system - Netherlands (vii) California system - USA (viii) Total Digesti~le Nutrients (TDN) - USA (ix) Metabolisable Energy (ME) - United Kingdom (x) Digestible Energy (DE) - United Kingdom. Alderman (1983) has reviewed the status of the newer European feeding systems and
concluded that the ME value was basic to all systems. More recently, Alderman ( 1985) has also reviewed the different methods for the prediction of the energy value of compound feeds for ruminants; poultry and pigs. Of the systems in use, it is clear that the ME system is the most widely applied presently. It has .become the preferred expression of feed value (MAAF 1975; Van Eys et al. 1978; ARC 1980; Sibbald 1982; Dewhurst et al. 1986) since the deduction of energy losses in urine and fermentation gases. fro:µi DE provide a more accurate estimate of productive energy. ME can be ·calculated from DE from the equation ME = 0.81 DE based on methane and urine energy as a constant fniction (Armstrong 1964). Evidence that the ME system is superior to the SE system is seen in the results of studies by Brabender et al. (1978) and Hill (1977). The former used 55 different diets of dairy cows to compare the total energy intake with each animal's requirements for maintenance and production within each system. It was found that th.e ·ME system fitted the actual energy requirements better than the SE system. Similar results were also reported by Hill (1977) for dairy cows. Both reports indicated that the SE system underestimated the energy requirements of the cows.
ME or DE for each type of animal is usually calculated from the average ME or DE in dry matter or from various published equations. For poultry, it can also be calculated from the
i average true.ME (TME) using the method of Sibbald (1982). DE is calculated as follows:
DE = Gross energy of feed in DM X.Gross energy digestion coefficient.
· Energy Conversions
It is appropriate to keep iri perspective that it is feasible to convert different feed units in terms of energy, with the full knowledge that these are approximations and subject to error. The interconversion of energy values enables the expression of nutritive values of the same feed in different laboratories and locations. The following conversions are important:
1 kg starch equivalent (SE) "'""· 5.082 Meal DE = 4.167 Meal ME = 1.15 kg TDN

3
= . 1.10 kg DOM = 2.356 kcal NE .
1 kg Scandinavian feed unit (SFU) = · 2.820 Meal ME 1 feed fattening unit (FFU) = 1.650 Meal ME 1 kgTDN = 4.409Mcal DE
= 3.620 Meal ME 1 Kilo joule (KJ) = 0.239 Kcal 1 Kcal = 4.184 joule 1 Meal = 4.184 MJ 1 Meal ME, = 0.81 Meal DE
· Expressions of Protein
A number of expressions of protein value exit. They are: (i) Digestible crude protein (DCP) (ii) True protein (TP) (iii) Protein efficienc-y ratio (PER) (iv) Net protein retention (NPR) (v) Gross protein value (GPV) (vi) Protein replacement value (PRV) (vii) Biological value (BV) (viii) Net protein utilisation (NPU) (ix) Net protein value (NPV) (x) Biological assays (xi) Protein equivalent (PE) (xii) . Degradability It is perhaps appropriate to focus oil those methods that are more relevant. DCP for example .
is not an entirely satisfactory method of expressing protein value since the efficiency with which the absorbed protein is used differs from one species to another and even breeds within a species. It also does not indicate the usefulness to the animal. In comparison to DCP, true protein values are also used. The latter separates out the non-protein nitrogen (NPN} portion within the total protein. DCP is calculated as follows:
(a) DCP =
% protein in DM x Digestibility coefficient of protein
100
In addition to DCP, and in view of the limitations in it, other methods are used as follows:
(c) NPR =
Gain in body weight (g)
Protein consumed (g)
Weight gain of TPG - weight loss of NPG
Weight of protem consumed
Where TPG = group fed on test protein NPG = non-protein group

4
A (d) GPV =
Where A = g increased weight gain/g test protein Ao = g increased weight gain/g casein
A-B (e) PRV = ---
N intake
Where A = N balance for standard protein in mg/basal KJ B = N balance for protein under investigation in mg/basal KJ
N intake - (faecal N - l'vIFN) - (urinary N" EUN) (t) BV = -------------
N intake - (faecal N - :MFN)
Where MNF = Metabolic faecal nitrogen EUN= Endogenous urinary nitrogen
(g) NPU = Digestibility x BV
(h) NPV = NPU x crude protein
% DCP + % Digestible protein (i) PE =
2
Of these expressions, GPV is the most commonly" used biological method for evaluating proteins. GPV measures the ability of proteins to supplement diets containing mainly cereals. The use of protein degradability is a relatively recent one, and one which is more appropriate to ruminant nutrition. The extent of the degradability of a protein source within the rumen reflects the usefulness in terms of amino acid supply posterior to the rumen. This is influenced by such factors as solubility and also the tanin content.
Effidency
With reference to dietary nutrient supply to meet the requirements for maintenance and production, and the manner in which these are utilized, the final expression of these aspects is reflected in the general term efficiency. It is pertinent therefore to consider this issue briefly.
Efficiency in animal and fish production is the sum total of a number of interacting factors, genetic and phenotypic. It. is developed through research aimed at maximizing genetic, nutritional .and physiological potential of individual animal species. It is also dependent on improved management practices, reduced effects of the environment and disease factors.

5
The components which influence the measurem~ntof efficiency are: (i) . Efficiency of feed conversion,_ which is influenced by the nutritional quality of the
diet, level of feeding, processing of ingredients, use of feed additives, prices and genetic potential.
(ii) Ability. to reproduce efficiently, which is the sum total of age .at first breeding, conception rate, number of off spring born and breeding interval. Survival of the young and wastage in adult life are influenced by several factors of · which environmental adaptation, management and disease resistance··. are particularly important.
(iii) Age, duration and size of maturity for biomass production. (iv) Reduced disease incidence.
Feed Efficiency.·
The effieiency with which farm ruiimals·convert feedstuffs into food for man is a subject of much interest, and has particular significance in animal and fish nutrition. In recent years, it is a subject that has received much attention (see for example Reid 1970; Holmes 1971).
The ·efficiency of feed- conversion is influenced by several factors and. include inter alia inherent genetic capacity, diet quality, level of feeding; processing and level of ingredient used,. potential response and price of the product. Related to these is the time scale involved. ·
There are several measures of efficiency. The type of index is influenced by the type of units used. The indices below reflect the more common ones. used in animal nutrition. Reference is made t~ each method as well as how each one is derived:
Amount of meat produced (a) Apparent efficiency =
(meat) Quantity of feed consumed
(b) Gross efficiency -(meat)
(c) Gross energy (GE)% =
Apparent efficiency
Dressing percentage
Edible energy
Total GE consumed
Edible energy
x 100
( d) Metabolisable energy = x 100 (ME)% Total ME consumed
Edible protein (e) Edible protein(%) =
Total feed protein consumed x 100
.. \

6
. (f) Edible protein .... (g/MJME)
(g) Edible protein = (g/MJGE)
Edible protein . .
Total ME consumed (MJ)
Edible protein
Total GE con.sumed (MJ)
Glossary of Terms
A wide variety of terms are used in animiil nutrition associated with nomenclature, terminok>gy, various expressions of dietary energy.andprotein, and measures of efficiency. It is impossible and also impractical to draw reference to all the terms used, however, an attempt is made to bring together the· ones that aie more commonly used. Appendix I presents this compilation to reflect the . range of ·terms used, an understanding of the use of the tenris, · especially with regard to description of research methodology, results and discussion appropriate. to an.imal nutrition. It is hoped that this compilation will be helpful to fish nutritionists.
References
.·ARC. 1980: The nutrient requirements of niminant livestock. Agriculture Re~earch Council. Commonwealth Agricuitu~ Bure~u. Farnham Royal, Bucks, England, xvi+ 351 p. .
Alderman, G. 1983. Status of the newer European feeding systems. Proceedings 2nd INFIC Symppsium, Sydney, Australia, p. 305-321. Alderman;G. 1985. Prediction of the energy value of compolinds feeds. In W. Haresign and D.J.A. Cole (eds.) Recent advances in animal
·nutrition, p.1"52. Butterworth, London, England. · .. · Armstrong, D.G. 1964. Evaluation of artificially-dried grass as a source of energy for sheep. Journal of Agricultural Science, Cambridge 62: 399-. 4~ .. .
Brabander, D.L., RJ. Moeiman, J.-V. Aerts and F.X .. Buyne. 1978. Is the new energy system (VEM) for dairy cows bener than the starch value · system?Revuedel'Agriculwre31:619-629. · \ · . Cho, C. Y,, C.B. Cowey and T. Watanabe. 1985~ Fish nutrition in Asia. lntematiooal Development-Research Centre, Onawa, Canada, 154 p.
· Devendra, C. 1986. General approaches to animal nutrition research and their relevance to production in the Asian region. In S.S. De Silva (ed.) · Fish nutriticin research in Asia. Proceedings Fish Nutrition Workshop, Manila, Philippines. 129 p.
Dewhurst, RJ., A.J.F. Webster, F.W. Wolnman and P.J.C. Dewey. 1986. Prediction of true metabolisable energy concentration in forages for ruminants. Animal Production 43: 183-194.
Hill, R. 1971. Comparison of the stare~ equivalent (SE) and metabolisable energy. (ME) systems in feeding cattle. Veterinary Records 101: 381-3~ . .
Holmes, W. 1971. Animals forfoOd. Proceedings Nutrition Society 29: 237-244. · MAAF. 1975. Ministry of Agriculture, Fisheriea and.Food. Energy allowances and feeding systems for ruminants. Technical Bulletin, 33, HMSO;
· London, United Kingdom. . · . . . Reid, J.T. 1970. The future role of ruminants in animal production .. In A.T. Phillipson (ed.) Physiology of digestion and, metabolism in the . ruminant, p. 1-22. Oriel Press, Newcastle upon Tyne, England. ·
Sibbald, LR. 1982. Measurement ofbioavailable energy in poultry feeding sbJffs: a review. Canadian Journal of Animal Sciences 62: 983-1048. Van. Eys, AJ.H., M. Vermorel and H. Bickel 1978. Feed evaluation for ruminants: new energy systems in the ·Netherlands, .France and
Switzerland. Livestock Production Science 5: 527-330. ·

Additives
Biological value (BV)
Cake
Calorie
Concentrate
Crude fibre
Crude protein
Degradability
Digestibility
Digestible crude protein
Digestible energy (DE)
----- - - ------ -
"APPENDIXI
Glossary
Feed materials such ;is antibiotics, ·colouring matter, flavours, hohnone8 and medicants.
of a proteinis a measure of.protein retention to protein absorption.
The residue that results from pressing seeds or meat to extract oil, fat aild other liquids. .
. The unit for measuring the energy in feeds. . 1000 cal = 1 Kcal
1000 Kcal = 1 Meal 1 cal = 4.184joules (J)
Class of feeds that are low· in crilde fibre and high in total digestible nutrients such as cereal grains and high quality by-products like fish meal and groundnut cake. It is usually used to improve the total nutritive value of a diet for production.
The ash-free- residue .of a food which remains after boiling for 30 minutes successively in 1.25% suiphuric acid and 1.25% sodium hydroxide. With most foods, crude fibre represents some 90 to 95% cellulose, the remainder being hemicellulose, lignin. and other plan~ cell wall constituents.
Refers to the true protein component and all the nitrogen (N) in the·feed. It is determined by multiplying the total · N by 6.25; the latter represents th~ average N content in· most foods.
Of dry matter or of a protein is the measure of the extent to which it is degraded in the rumen of ruminants.
Is that proportion· of a feed which is not excreted in the . faeces and is assuined to be absorbed by the animal.
Refers to the protein of the (DCP) dietary proteins which are digested and absorbed.
The portion of the gross food energy (GE) ·minus the faecal energy that has been -appa-rently absorbed. DE = . .
(GE of feed per unit dry wt x dry wt of feed) - (GE of faeces per unit dry wt. x dry wt. of faeces).
7

8
Digestible nutrients
Dry matter (DM)
Essential amino acids. (EAA)
Energy feeds
Ether extract
Feed efficiency
Feeding standards
Gross energy (GE)
Fleatincrement(III)
Intake·
Maintenance
Meal
The portion of the dietary nutrients which is digested and absorbed by the animal body. These usually refec fu carbohydrates, fats and proteins.
Refers to the moisture-free residue of animal sample. It is detem1ined by keeping a sample in an oven at 105 C until it reaches constant weight
Are amino acids which are essential to the animal and which the animal body cannot synthesize fast enough to meet the requirements. These include arginine, histidine, leucine, isoleucine, threonine, phenylalanine, threonine, tryptophan and valine.
Ingredients with less than 20% protein and less than 18% crude fibre.
Also called crude fat The material extractable with any anhydrous solvent, for example, petroleum spirit or diethyl ether. It contains neutral fats and all fat-soluble materials.
Refers to the ability with which animals can convert the feed consumed into edible and other products. Its accurate determination is dependent on the inputs used and outputs derived.
Statements of the amounts of nutrients required by anin:ials and fishes. The term is synonymous with nutrient requirements and allowances.
Is the amount of heat released from a feed when it is completely oxidized in a bomb calorimeter containing_ 25 to 30 aunospheres of oxygen.
Is tbe increase in heat production following consumption of a feed or ration when the ani-mal is in a thermally neutral environment. It consists of increased heats of fermentation produced in the digestive tract as a result of microbial action and during intermediary meta-bolism and absorption. m is wasted except when the temperature of the environment is below the animal, s critical temperature.
Refers to the amount of feed consumed and available for digestion, usually expressed in DM. Intake is the result of either restricted or ad libitum feeding.
State of energy equilibrium of an animal when there is no net gain or loss of energy in body tissues.
Describes the physical form of · a feed that has been _reduced to a particle size larger than that of flour.
Metabolisable energy (ME)
Minerals
Net energy (NE)
Nitrogen-free extraet (NFE)
Non-essential am.I.no acids
Non-protein nitrogen (NPN)
·Nutrient balance
Pellets
Pressed
Protein quality
Protein supplement
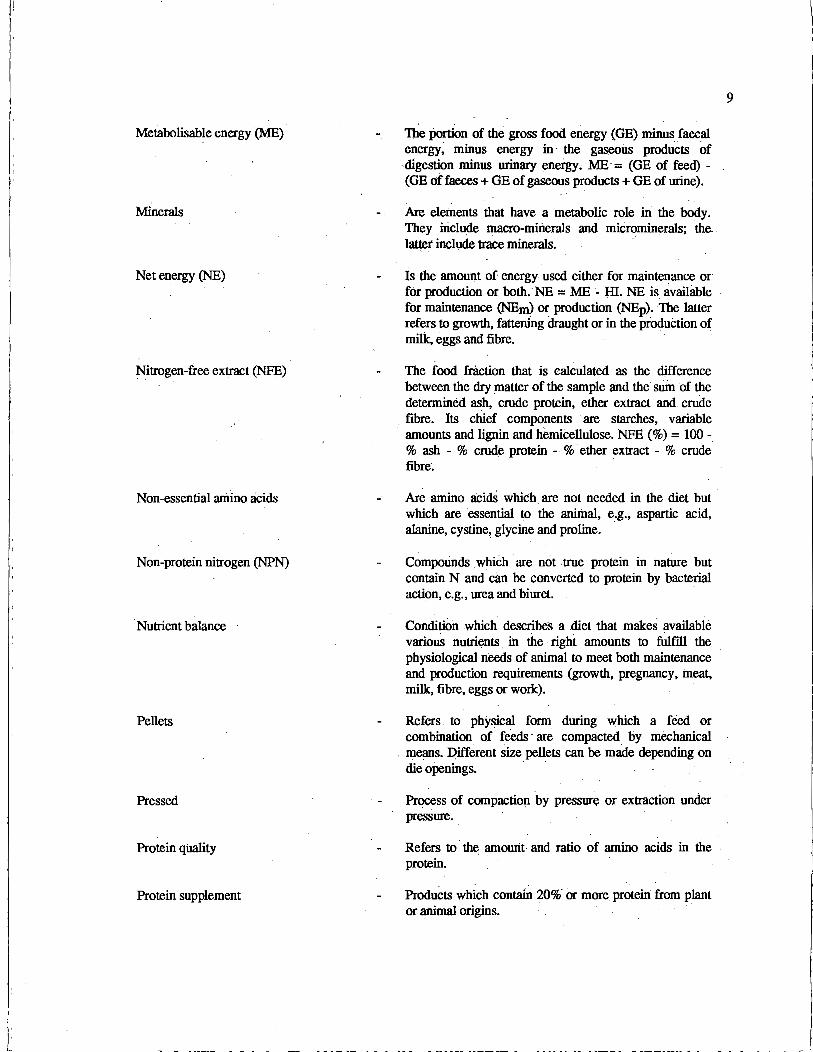
The portion of the gross food energy (GE) minus faecal energy; minus energy . in . the gaseous products of digestion minus urinary energy. ·ME·= (GE of feed) -(GE of faeces+ GE of gaseous products+ GE of urine).
Are elements that have a metabolic role in the body. They iriclude macro-mi.Ii.erals and miCrominerals; the. latter' include traee minerals.
Is the amount of energy used either for maintenance or for production or both.· NE = ME - HI. NE is. available for maintenance (NEm) or production (NEp). The latter refers to growth, fattening draught or in the production of milk, eggs and fibre.
The food fraction that is calculated as the difference between the dry matter of the sample and the sum of the determined ash,. crude protein, ether extract and crude
. fibre. Its . chief components are starches, variable · amounts and lignin and hemicellulose. NFE (%) = 100 -
% ash - % crude protein - . % ether extract - % crude fibre~
Ar~ amino aeidS which are not needed in the diet but · which are essential to the animal, e.g., aspartic acid, alanine, cystinei glycine and praline.
Comporinds. whiCh are not .true protein in nature but contain N and can be converted to protein by bacterial action, e.g., urea and biuret. ·
Condition which describes a .diet that makes available variou8 nutrients . in the right amounts to fulfill the physiological needs of animal to meet both maintenance and production requl.rements (growth, pregnancy, meat, milk, fibre, eggs or work).
Refers. to physical form during which a feed or combination of feeds · are compacted by mechanical
. means. Different size pellets can be made depending on die oj>enings. ·
Process of compaction by pressure or extraction under pressure ..
Refers to the amourtt and ratio of amino acids in the · protein.
Products which contain 20% or more. protein from plant or animal origins. ·
9

10
Roughages
· Supplement
Total digestible nutrients (IDN)
. True protein
Vitamins
Class of feeds, usually plant matenals, th~t are very fibrous, bulky.and contain usually more than 18% crude fibre. They are low in total digestible nutrients, such as straws. and stovers;
A feed, either alone or in combination which is used to increase the availability of nutrients and also performance of animals. Can be an energy, protein, mineral and/or vitamin sapplement
Is the sum of ail digestible organic materials (proteins, fibre, fat · and NFE). TDN = Digestible crude · protein x 1 % . + . digestible crude fibre x 1 % + digestible NFE · x 1 % and ·digeStible ether extract x 2.25%.
The protein oCihe protein source which is composed only of amino adds:
· Are. important organic coml>ounds in animal nutrition that are associated in enzyme systems and metabolism .for various body functions.

Protein Requirements of .Fish and Prawns Cultured in Asia*
T.J. PANDIAN School of Biological Sciences MaduraiKamaraj Uniw;rsity
Madurai - 625 021, India
Pandian, T.J, 1989. Protein requirements of fish and prawns cultured in Asia, p. 11-22. In S~S. De Silva (ed.) Fish Nutrition Research in Asia. Proceedings of the Third Asian Fish Nutriti0n Network Meeting. Asian Fish. Soc. Spec. Puhl. 4, 166 p. Asian Fisheries Soc_iety, Manila, Philippines.
In general, fish are better convertors than prawns. Tropical fish grow faster at relatively lower optimwn dietary protein density but less efficiently than temperate fish. Penaeids grow faster but less efficiently than Palae~onids. Optimum dietary protein density requirement of brooder prawns is higher than the juveniles. Prawns lose over 20% of the converted body substance at moulting. Nitrogen requirement per unit ingested food (kJ) is in the range of 15 and 21 mg for fish and prawns, respectively. ·
Feed constitutes the major fraction of the operational cost in aquaculture. Protein is generally the niost expensive component of artificial diets. Unlike in mammals; protein acts both as a structural component and as an energy source in fish (Brett and Groves 1979) and decapods (Castell and Budson 1974). Consequently, the dietary protein requirements of these organisms are higher. However, an excess dietary protein may not only cost more but also increase the energy cost of assimilation by hiking the Specific Dynamic Action (LeGrow and Beamish 1986). Therefore, this paper presents a critical summary of available information on protein requirements of fish and decapods cultured in Asia. .
Available information on the qualitative (Phillips 1969; Cowey and Sargent 1972; Halver 1972; Cowey 1979) and quantitative (e.g., Brett and Groves 1979; Pandian 1987) aspects of fish nutrition has been critically summarized from time to time by different authors. Unfortunately, relatively less information is available on decapod nutrition and even that is scattered in the literature, and a comprehensive review is yet to· be published. Hence this review gives greater importance to decapod nutrition. A hierarchy of terms are now used; Jobling (1983) reviewed the terms used to indicate the rate or efficiency of a process of energy transformation and recommended specific terms as well as methodology to be used in fish growth and nutrition studies. A corresponding review for decapod nutrition is not available. Therefore, the reviewer has to subjectively depend on values reported from selected publications.
lr Protein Requirements of Fish
The protein requirements of fish are about 2 to 3 times higher than that of mammals (Pandian 1987). Table 1 summarizes available information on. protein requirement of finfish
*Dedicated to Prof. S. Krishnaswarny on his 6lst birthday.
11

12
Table 1. Protein requirements of some fish (from Pandian 1987; modified).
Species Tested diet Mid body wt Feeding rate Protein requirement (g) (%body wt d-1) (% dry wt of food)
Carnivores Anguilla japonica casein 4.4 ad lib 45 A. anguilla 62 Channa micrope/tes fish meal 21 1.8 52 Chrysophrys aura/a casein/amino acids 8.9 1.8 52 C.major 55 Fugu rubripes casein· 3.2 3.2 47 Morone saxatilis fish/soymeal 6.0 2.8 55 Oncorhynchus tshawytscha 48 Pleuronectes platessa cod muscle 22.3 1.8 50 Sa/mo gairdneri casein/gelatin 12.6 ad lib 1.7 43 S. salar 40 Sa/velinus alpinus fish meal 40 Serio/a quin7ueradiata 50 S. gairdneri Tubifex/Pellet 3.5 2.5, 4, 5.5 S. gairdneri2 Pellet 6.5 5.0 40.7 Oncorhynchus kisutch3 Pellet 4.3 51
Omnivores Cyprinus carpio fish meal 13.6 2.9 54 C. carpio4 Pellet 150 lctalurus puncla/us 40 I. punctatus5 pellet 24 2-6 40 I. punclatus6 Hermetia illucens/ 30
Pellet Micropterus sa/moides fish/gelatin/a. acids 3.5 2.9 40 M.dolomieu fish/gelatin 3.6 2.4 45
amino acids M. sa/moides7 Pellet 14.4 35.8 M. salmoides7 Pellet 14.4 35.9 Tilapia aureusB fish/soymeal- 4.4 3.5 36 T.aurea casein/albumin 2.5 2.0 56 T.aurea casein/albumin 2.5 10.0 34 T. aurea Hermetia illucens 30 3.0
Herbivores Chanos chanos casein 0.11 8.2 39 Ctenopharyngodon idella casein 0.34 42 Tilapia mossambicus9 fish meal ·5.1 4;7 42 T. mossambica fish meal 6-30 3 35 T. niloticus fish meal 0.31 6.4 35 0 reochromis ni/oticusl 0 pellet 0.185 2.5-5.5 30 Sarotherodon mossambicus pellet 5.1 6 40
Arabic numbers (1,2,3,4,5,6,7,8,9 and 10) are additions and the corresponding references are: 1 Philips & Butler (1979), 2 Zeitoun et al .. (1976), 3 Fagerlund et al. (1983), 4 Schwarz et al. (1985), 5 Andrews& Stickney (1972), 6 Bondari &·Sheppard (1981), 7 Tandler & Beamish (1978), 8 Davis & Stickney (1978), 9 Jauncey (1982), 10 De Silva (1985). ·
species. Pandian (1987) pointed out that most workers have chosen juvenile fish, fixed low ratiori and used diets with limited protein sparing action. He concluded that the protein requirement of culturable Asian fish like the carps and tilapias, the mullets and milkfish, which are herbivores/omnivores, is in the range of 25-30%, as against 30-40% protein required by the carnivorous fish like the sal111on and trout, that are cultured in developed countries. It may also be noted that the protein content of natural food of tropical fish like Oreochromis mossambicus (De Silva et al. 1984) and temperate fish like Salmo gairdneri (Yurkowski and Tabachek 1979) is recorded as 25 and 42%, respectively.
Herbivorous/omnivorous fish are reported to economize their protein requirements by (i) reabsorbing digestive enzymes and (ii) reducing protein metabolites. Herbivorous fish, especially
- ---------
1

13
· those with a long intestine, reabsorb over 90% of the digestive enzymes, as against 40%. by the carnivores (Hofer and Schiemer 1981). The·fraction of food nitrogen lost through ammonia is in the range of 3.5% for herbivores (e.g., Caulton 1978; Hofer et al. 1985), which is half of that (7%) excreted by carnivorous fish (Brett and Groves 1979). . . . .
Production Rate and Efficiency
Although several authors have reported · the protein requirements of fish, adequate information on specific growth rate arid conversion efficiency of the tested species was not always provided.· Figs. 1 and 2 lead one. to conclude (i) with respect to rate and efficiency of growth, finfish. are 2 to 3 times better convertors than decapods, and (ii) the range of optimal dietary protein requiremenfof decapods is nearly 2 times wider than that of fish (Fig. 1). Hence protein: ( =feed) and time costs of fish production are cheaper than decapnds. Not surprisingly, many developing countries like India domestically consume the low cost fish, and export the high cost decapods. ·
I >. 0
1J 10 -;;:
~ 8 0 ... .c. ·- 6 ~ 0 ...
. Ol 181 u 4
u .· Q.I a. Ill 2
0
0 10 20 30 40 50 60 70 80 90 100
Optimal dietary protein requirement ( g kg-~ bwt.day-1 J.
Fig. 1. Relationship between optimal dietary protein requirement and specific growth rate of fish and prawns: Fish - 1- Pleuronectes platessa (Cowey et al. 1972); 2 - Chrysophrys aurata (Sabaut & Luqliet 1973); 3 - Channa microspeltes (Wee and Tacon 1982); 4 -Micropterus salmoides (Anderson et al. 1981); 5 - Morone saxatilis (Millikin 1982); 6 - Cyprinus carpio (Jauncey 1981); 7 - Tilapia zilli (Mazid et al. 1979); 8 - Salmo gairdneri (Satia 1974); 9 - Micropterus dolomieu (Anderson et al. 1981); 10 - Oreochromis mossambicus (Jauncey 1982); 11 -Tilapia aurea (Davis and Stickney 1978); 12 - Chanos chanos (Lim et al. 1979); 13 - Oreochromis niloticus (Santiago et al. 1982): Prawns - A - Macrobrachium nobilii (Pandian and Murugadass, in prep.);. B - M. rosenbergii (Boonyaratpalin and New 1982); C - M. rosenbergii (Manik 1976);0 - Penaeus monodon (Lim 1983); E - M. rosenbergii (Millikin et al. 1980); F -P. aztecus (Venkataramiah et al. 1975);; G- P. setiferus (Fennucci et ai. 1980); H -P. styiOstoris (Fennucci 1~81).

14
~ D ~ ,.. u c QI ·u --QI
c. -~ UI· ..... QI ,> c
.o u
30
20
10
b
0. fish O prawn
·. 20 30 40 50
·Optimum I protein requirement C •/, drv. wt. :food )
60·
Fig. 2. · The relationship between optimal dietary protein requirement and conversion efficiency values reported for fish and prawns: Fish - 1 -lctalurus punctatus (Page and· Andrews 1973); 2 -lctalurus punctatus (Page and Andrews 1973); 3 -Tilapia aureus (Davis· and Stickney 1978); 4 - Sarotherodon mossamhicus
· (Jauncey 1982); 5 -- Tilapia mossamhicus (Jauncey 1981); 6 -SalVelinus alpinus (Jobling and Wandsvik 1983); 7 - Salmo gairdneri (Bromley and Smart 1981); 8 - Mor.one saxatilis (Millikin 1982); 9 - Salmo gairdneri (March et al. 1985): Prawn -A - Macrobrachium rosenbergii (Oifford and Bricks 1979); B -M. nobilii (Pandian and Murugadass, in prep.); C - Penaeus aztec~ (Venkaiaramiah et al. 1975); D -· PenaeU.r setiferus (Fennucci et al. 1980); E -Penaeus stylirostris (Fennucci et al. 1980); F - Penaeus monodon (Aiava . and Lim 1983); · G - Penaeus indicus (Colvin 1976). .
A linear relationship between optimal dietary protein requirements and specific growth rate for fish was first reported by Tacon and Cowey (1985). Our observation summarized in Fig. 1
. not only confirms this but also points out that a similar linear relationship also holds good for decapods. Most tropical fish like tilapias, carps and milkfish display a faster specific growth rate than temperate fish. such as trout. The relatively faster growth displayed by tropical fish demand nearly two times higher dietary protein requirements than their temperate counterparts. This is further confirmed by Pandian and Vivekanartdan (1985), who observed that the feeding ra.te of tropical fish is 180% higher than that of temperate species, and that the elevation in feeding rate is . nearly 2.5 times higher than· that (70%) obserV'ed for maintenance metabolism. They concluded that a considerable fraction of this difference may contribute to faster, if not more efficient growth, a characteristic of tropical fish. .
As may be seen from Fig. 1, dietary protein requirements of decapods are reliably estimated only for about 8 Macrobrachium and Penaeus species. In general, the requirements of Macrobrachium spp. are nearly a third of that for penaeids. Not surprisingly, Penaeus spp. grow faster than Macrobrachium spp. Another important point to be noted is that the dietary protein requirement of Penaeus spp. is nearly two times higher than the ma.Ximum required among fish.
The highest conversion efficiency values exhibited by prawns and fish, when fed at their respective optimum dietary protein requirements are shown. in Fig. 2. Temperate species like salmonids are more efficient convertors than tropical fish. Likewise, the relatively slow-growing Macrobrachium spp. exhibit higher efficiency values.than the penaeids. Apparently, tropical fish are tuned to exhibit faster grow.th rate but at low efficiency, and the temperate ones higher efficiency but low rate of growth. Likewise, the penaeids are tuned to grow faster but less
·. efficiently, irt comparison to Macrobrachium spp. Therefore, our: major efforts with reference to fish and penaeids rriust be to provide nutritional and environmental conditions that would further accelerate the rate process of growth and the efficiency process of Macrobrachium ·spp.
Effed of Protein Density
The available information on protein r.equirements of some decapods is summarized in Table 2. Three species of Palaemonidae, 7 species of Penaeus and Homarus americanus have been tested on diets containing protein densities ranging from() to 16%. Using different culture

15
Table 2. Protein requirements of some tested decapod crustaceans. All Macrobrachium were tested in freshwater. containing less than 2°/oo at 26 ± 3°C. Others were tested at 29 ± 3°/oo at 27 ± 3°C (O.P.L. - Optimum protein level).
Species Range of protein level (%dry wt)
Macrobrachium rosenbergii 15-40 M. rosenbergii 15-35 M. rosenbergii. 23-49 M. rosenbergii 25-40 M. rosenbergii 15-35 M. rosenbergii 23-~0 M. rosenbergii 10-30 M.nobilii 10-50. Pa/aemon serralus 12-69 Penaeus japonicus 60-76 P.japonicus 25-50 P.japonicus 52-10 P.japonicus 25-40 P. aztecus 25-40 P. azlecus 40-80 ·P. aztecus 18-35 P. setiferus 14-52 P. setiferus 29-37. P.monodon 25-60 P. indicus 21~53
P. merguiensis 34-42 P. merguiensis 29-55 P. stylirostris 29-37 Homarus americanus 0-60 H. americanus 11-60 H. americanus 30-53 H. americanus 24-57
O.P.L. (%dry wt)
25 35 40 35 35 25 25 30 35 60 50 55 35 40 40 27 30 30 40 43 42 50 30 60 53 30.5 40
K1 (%)
21.5
16.1
16
7.3 13.4 8.2
7.5
Authority
Oifford & Brick (1979) Ba.lazs & Ross (1976) Millikin et al. (1980) Balazs et al. (1973) Boonyaratpalin & New (1982) Manik (1976) Perry et al. (1984) Pandian & Murugaciass (in prep) Forster & Beard (1973) Deshirnaru & Shigano (1972) Deshirnaru & Kuroki (1974) Deshirnaru & Yone (1978) Balazs et al. (1973) Balazs et al. (1973) Venkatararniah et al. (1975) Shewbart et al. (1973) Andrews et al. (1972) Fennuci et al. (1980) Aiava & Lim (1983) Colvin (1976) Sedgwick (1979) Aquacop (1978) Fennuci et al. (1980) Castell & Budson (1974) Gallagher et al. (1976) D' Abramo et al. (1981) Conklin et al. (1975)
techniques, terminologies and methods, different workers have evaluated nutritional values of these decapods and reported dietary optimum protein densities that range from 25 to 60%.
The following generalizations could be made from Fig. 3; Macrobrachium spp. are better convertors than Penaeus spp; they exhibit higher efficiency values of about 16%, when fed on diet containing 20-30% protein. Penaeus spp. display lower efficiency values ranging from 7-14%, when fed 40-50% protein diets. Hence, Macrobrachium spp. display higher efficiency values at lower protein density than Penaeus spp. (Fig. 3). Briefly, the. production cost of Macrobrachium spp. is likely to be cheaper than Penaeus spp.
Dietary Protein and Egg Production
Freshly spawned decapod eggs are known to contain 50% protein and 25% lipid (Pandian 1967, 1970 a,b, 1972; Katre 1977; Mathavan et al. 1986). Hence the reproductive growth, namely vitellogenesis must be a lipoprotein demanding process (Dehn et al. 1983). Evidently, the dietary protein requirement of brooders is likely to be higher than that of juvenile decapods. Although commercial firms are already selling speeific diets for larvae, juveniles and brooders, to the best of the reviewer's knowledge, no worker has so far reported dietary protein requirement of brooders with specific reference to egg production in decapods. Murugadass (1989) is perhaps the first to experimentally determine the protein requirements of juveniles and brooders of Macrobrachium nobilii. Irrespective of changes in feeding regime and other culture conditions, M. nobilii, a diecdysic riverine prawn, attains sexual maturity when it grows to 600 mg weight. Therefore, it is possible to separately determine the dietary protein requirement of juveniles ( < 600 mg) and brooders (> 600 mg).

16
The trends obtained for growth rate and conversion efficiency of juvenile and brooder M. nobilii fed on diets containing 10, 15, 25, 35 and 50% protein are shown in Fig. 4. Both from the points of rate and efficiency of growth, brooders proved to be better convertors than juveniles. The brooders are most efficient, when fed 45-50% protein diet, but in juveniles conversion is best when fed 35% protein diet (upper panel). Consequently, the optimum protein requirement level shifts from 35% for the juveniles to 46.5% for the brooders. Expectedly, fecundity per intermoult period is higher when the brooders are fed 45-50% protein diet (Fig. 5). Quality of the eggs, as noted by the dry weight is maximal when the brooders are fed the optimum protein diet.
. 20
16
-if!.
:.:: 12
>-u c .!!! u
Ill 8 c
-~ "' ~ 111. > c 0 u
4
O'--~--"--~~~~'--~~~~~~~~~~~
0 20 40 60 80
Protein density ( 01. dry wt.)
Fig. 3. Relationship between dietary protein density and conversion efficiency of Macrobrachium and Penaeus spp. M. rosenbergii ( • ); M. nobili ( • ); Penaeus aztecus (.A); P. indicus , (Ll); P. setiferus (0).
I >-0 'O
I Cl
Ill
0 .... ~ -~ 0
l5
120 . --.Conversion efficiency .:. ___ Growth rate 0 Brooder n
0 Juvenile· -- --o 0 o- :>
< / ~ /
80 ·/ 32 "' / o· /0 ....------0 :>
~ / /0 ·n· I o ·•- .~· -1/ - -..... :> 0 ./ .... n
I , ..... '-' •.<
40 IO . ' e 16 / . X'
I / --·---. I/• . • ~ I/•. v • •/ '• ,'1
OL--<... .......... ~~-'--~~....-'"'--~~~~--'
0 20 40. 60
Protein density ( •t. dry. wt )
Fig. 4. Relationship between dietary protein density and rate and efficiency of growth in juveniles and brooder M. nobilii (from Murugadass 1987; modified).
-0- number
Fig. 5. Relationship between protein density, egg production (from 5 intermoult periods) and dry weight of egg of M. nobilii (Murugadass 1987; modified).
01 01 Cl.I -01 ::J..
-~ >-L..
Cl
-D- weight 28
27
26
25 0 20
Prate.in density
6 rn IO IO
"O "'\ 0
4 .a. c: n .... c;· ::>.
2 :>< 0
w .._;
0 40 60
(°lo dry wt.)

I'
17
Energy Partitioning
As stated elsewhere, finfish are better convertors than decapods. A major reason for this poor performance of decapods is that they lose a significant fraction of the converted energy at each moult. Estimations on the energy cost of moulting should include the structural and functional costs of moulting. The estimation reported on the functional cost of moulting in M. nobilii by Sindhu ·and Pandian (1988) stands as a single report in the literature; from respirometric studies, they estimated the functional cost of moulting as· equivalent to 4667 J for juvenile, i.e. 40% of total energy cost of moulting. For want of corresponding information, the reviewer has concentrated on structural cost of moulting in tested decapods. Several workers have not cared to indicate the fraction of food energy lost on exuvia (e.g., Andrews et al. 1972; Balazs and Ross 1976; Colvin 1976; Clifford and Brick 1979; Fennuci et al. 1980; Alava and Lim 1983); however, a few (Ponnuchamy et al. 1981; Sindhu and Pandian 1987; Pandian and Murugadass, in prep.) have reported the structural energy cost of exuvia, but it is not clear, whether this was included in tqe calculation of growth rate or growth efficiency. Table 3 shows the structural energy cost of moulting in some crustaceans. The cost appears to depend on dietary protein and life stage .. For instance, it fluctuates between 56 and 83% in a· juvenile Macrobrachium nobilii, and 33 and 45% in a brooder (Fig. 6). It should be pointed out that in future studies considerable effort should be made to estimate the structural energy cost of moulting. · · ·
Table 3. Structural cost (~xuvia production) of moulting in some decapods (Ex - exuvia as % of conversion; *, ** represent animals fed on 10 or 50% dietary protein).
Species Life Stage Ex Authority
Macrobrachiwn lanchesteri Juvenil.e 37 Ponnuchamy et al. (1981) M.nobilii Juvenile* 83 l\1urugadass (1989)
** 56 Adult*
** 30 Caridina caju/hari Juvenile 25 Ponnuchamy et al. (1984) Panu/irus homarus Adult 64 Vijayakumaran & Radhakrishnan (1984) Menippe mercenaria Zoea & megalopa 23 l\1ootz & Epifania (1974) Rhithropanopeus harrisii Zoea & megalopa 23 Levine & Sulkin (1979) Carcinus maenas Adult 39 Eriksson & Edlund (1977) Carcinus maenas Zoe a 8 Dawirs (19.83) Cancer irroratus Zoea I to III 3 to 12 Johns (1982)
Converted energy is partitioned between somatic growth and exuvial output in a decapod juvenile but between somatic growth, exuvial output and egg production in a brooder. The energy partitioning patterns in juvenile and brooder M. nobilii, when fed on diets containing different protein levels is shown in Fig. 6. In the brooders fed on diets containing 45-50% protein a good fraction of the converted energy is channelled for egg production. It may be noted that it is wasteful to feed juveniles 25% protein diet, as more than 80% of the converted energy is lost on structural cost of moulting. On the whole, there is an urgent need for more information on brooders of a few more decapods before generalizations could be made.
Energy-Protein Interaction
In the recent years, attempts have also been made to study the energy-protein interaction and to estimate the optimum protein requirement per unit of ingested food equivalent to 1 kJ. Two

18
Cl c c 0
... 0 Cl.
>Cl ... .. c w
Cl c c 0
.... 0 Cl.
>Cl ..... ... c
·w
100 -
80"'"
60 -
40 >-
.2_0 >-
800 -
600 -
400 -
200 -
0 20 40
Proiein density C'i, dry wt. J
. 60
Fig. 6. Relationship between dietary protein density and pattern of energy partitioning in juvenile and brooder M. nobilii (from Murugadass 1987; modified). Circles (o), triangles (ti.) and squares ( O ) represent somatic growth, exuvial production and egg production, respectively. Closed circles (•) and triangles (ti.) represent juveniles. Open circles (o), triangles (ti.) and squares (0) represent the contribution of brooders .
kinds of experiments have been undertaken; in the first, a fish or decapod is fed on a wide range of isocaloric but anisonitrogenous diets, as well as isonitrogenous but anisocaloric diets. In the second experiment, the energy requirement of the tested fish or decapod is previously determined; subsequently, the composition of the determined unit of diet is altered to estimate the optimum nitrogen required per kJ by it (LeGrow and Beamish 1986). The optimum level is believed to let least energy loss on the account of Specific Dynamic Action.
A substantial fraction of energy is lost in the form of heat after food ingested by the animal. The energy loss in this process is termed as Specific Dynamic Action (SDA). The magnitude of SDA is dependent on quantity and quality of food, especially the protein content, as deamination is energetically a costly process. When the rate of ingestion of amino acids exceeds the rate of their utilization in protein synthesis, the excess amino a:cids are deaminated (Cowey and Sargent 1972). Therefore, when the dietary protein level exceeds the optimum, it may not result in a concomitant increase in the efficiency but may even decrease it. In this context, it is relevant to consider the hypothesis of De Silva (1985) that daily presentation of high protein diet could be wasteful and that presentation of high and low protein diets alternatively might provide a means of reducing the feed cost, perhaps by depressing the SDA. Selected examples for the nitrogen requirements of fish and prawns are presented in Fig. 7. Critical examination of very limited data available on protein-energy interaction indicate that per unit (kJ) ingested food, nitrogen requirement is in the range of 15-20 mg for fish (Adron ei al. 1976; Jobling 1983; Jobling and Wahdsvik 1983; LeGrow and Beamish 1986) and about 21 mg for prawns like Macrobrachium nobilii (Murugadass 1989).

>u c: .. -~ --... c: .2
"' ... .. > c: 0 u.
30 -
. 25.
20 -
15 ~
10 ._;·
5
-· . Conversion. efficiency - - - Growth rate
A . ~ .. alpinus ..:-A""" A M. nobilii '\
....
A---A--.,.,..-o . --,,. --A
.,,.A"' !:::(
Protein to energy ratio of diet (mg kr1 )
- 300
- 200 s. .CD
a. c -<
100 !..
Fig. 7. Rate and efficiency of growth of selected fish and prawns as. functions of protein-energy ratio of diet.. Original data collected for M. nobilii from Murugadass (1987) and for S. a/pinus from Jobling and Wandavik (1983).
Conclusions
19
1. From the points of specific growth rate and conversion efficiency, fish are proved to be better convertors than decapods.
2. · Tropical fish grow faster at relatively lower optimum dietary protein density, while temperate fish grow more efficiently but requires relatively higher optimum protein levels. Penaeids grow faster than palaemonids.
3. Efficiency values of decapods fed on 25-70% protein diet indicate that in general, palaemonids are more efficient and require lower protein diet than penaeids.
4. Optimum dietary protein density required for brooder is higher ( = 50%) than the juvenile (35%) Macrobrachium nobilii. Brooders receiving optimum protein diet display the highest efficiency and are most fecund and produce better quality eggs.
5. A substantial fraction (= 20%) of converted energy is lost on moulting. Decapods receiving low protein diet (< 25%) almost exhaust the converted energy on exuvia production.
6. Limited studies on energy-protein interaction indicate that nitrogen required per unit ingested food (kJ) is in the range of 15-20 mg for fish and 21 mg for decapods to achieve optimum growth.
Acknowledgements
It is with pleasure, I record my very sincere thanks to my collaborators, Dr. M. Peter Marian . and Mr. S. Murugadass for their co-operation and help.

20
References
Adron, J.W., A. Blair, C.B. Cowey and A.M. Shanks. 1976. Effects of dietary energy level and dietary energy source on growth, feed conversion and body composition of turbot Scophlhalmus maximus. Aquaculture 7: 125-132. ·
Alava, V.R. and C. Lim. 1983. The quantitative dietary protein requirement of Penaeus monodon juveniles in a controlled environment. Aquaculture 30: 53-61.
Andrews, J.W., L.V. Sick and G.J. Baptist 1972. The influence of dietary protein and energy levels on growth and survival of penaeid shrimp. Aquaculture 1: 341-347.
Andrews, J.W. and R.R. Stickney. 1972. Interactions of feeding rates and environmental temperature on growth, food conversion and body composition of channel catfish. Transactions American Fisheries Society 101: 94-99.
Anderson, R.J, E.W. Kleinholz and S.A. Flickinger. 1981. Protein requirements of smallmouth bass and largemouth bass, Journal of Nutrition 111: 1085-1097.
Aquacop. 1978. Study of nutritional requirements and growth of Penaeus merguiensis in tanks by means of purified and artificial diets. Proceedings World Mariculture Society 8: 225-234.
Balazs;G., F. Ross and C. Books. 1973. Preliminary studies on the preparation and feeding of crustacean diets. Aquaculture 2: 369-377. Balazs, G. and F. ·Ross. 1976. Effect of protein source and level on growth and performance of captive freshwater prawn, Macrobrachiwn
rosenbergii. Aquaculture 7: 229-313. Bondari, K. and D.C. Sheppard. 1981. Soldierlly larvae as feed in commercial fish production. Aquaculture 24: 103-109. Boonyaratpalin, M. and M.B. New. 19.82. Evaluation of diets for.Macrobrachium rosenbergii reared in concrete ponds. In M.B. New (ed.) Giant
Prawn Farming, p. 249-256. Elsevier Scientific Publishers, New York. Brett, J.R. and T.D.D. Groves. 1979. Physiological energetics. In W.S. Hoar and R.J. Randall (eds.) Fish physiology, Vol. 8, p. 279-352.
Academic Press, New York. Castell, J.D. and S.D. Budson: 1974. Lobster nutrition: the effect on Homarus americanus of dietary protein levels. Journal of the Fisheries
Research Board, Canada 31: 1363-1370. Caulton, M.S. 1978. The importance of habitat temperatures for growth in the tropical cichlid Tilapia renda/li Boulenger. Journal of Fish Biology
13: 99-112. Oifford, H.C. and R.W. Brick. 1979. A physiological approach to the study of growth and bioenergetics in the freshwater shrimp. Proceedings
World Mariculture Society 10: 701-719. Conklin, D.E., K. Devers and R.A. Shleser. 1975. Initial development of artificial diets for the lobster Homarus americanus: Proceedings 6th
Annual Meeting World Mariculture Society, p. 237-248. Colvin, P.M. 1976. Nutritional studies on penaeid prawns: protein requirements in compounded diets for juvenile Penaeus indicus (Milne
Edwards). Aquaculture 7: 315-326. Cowey, C.B. 1979. Proteins and amino acid requirements of finfish. In J.E. Halver and K. Tiews (eds.) Finfish Nutrition and Fishfeed
Technology, Vol. I., p. 3-16. Cowey, C.B. and J.R. Sargent. 1972. Fish nutrition, p. 383-492. In F.S. Russel and M. Yonge (eds.) Advances in Marine Biology, 10. Academic
Press, London. Cowey, C.B., I.A. Pope, J.W. Adron and A. Blair. 1972. Studies on the nutrition of marine flatfish. The protein requirements of plaice
(Pleuronectes plalessa). British Journal of Nutrition 28: 447-456. D' Abramo, L.R., D.E. Conklin, C.E. Bordner, N.A. Baum, and A. Norman-Boudreau. 1981. Successful artificial diets for the culture of juvenile.
lobsters. Proceedings World Mariculture Society 12: 325-332. Davis, A.T. and R.R. Stickney. 1978. Gro.wth response of Ti/apia aurea to dietary protein quality and quantity. Transactions American Fisheries
Society 107: 478-483. Dawirs, R.R. 1983. Respiration, energy balance and development during· growth and starvation of Carcinus maenus L. larvae (Decapoda:
Portunidae). Journal of Experimental Marine Biology and Ecology 69: 105-128. Dehn, P.F., D.E. Aiken and S.L. Waddy. 1983. Aspects of vitellogenesis in the lobster Homarus americanus. Canadian Technical Report,
Fisheries and Aquatic Sciences 1161: 1-24. Deshirnaru; 0. and K. Shigeno. 1972. Introduction to the artificial diet for prawn Penaeus japonicus. Aquaculture 1: 115-133. Deshirnaru, 0. and K. Kuroki. 1974. Studies on a purified diet for prawn. I. Basal composition of diet. Bulletin Japanese Society of Scientific
Fisheries 40: 413-419. . De Silva, S.S. 1985. Performance of Oreochromis nilolicus L. fry maintained on mixed feedings schedules of differing protein content.
Aquaculture and Fisheries Management 16: 331-340: De Silva, S.S., M.K. Perera and P. Maitipe. 1984. The composition, nutritional status and digestibility of the diets of Sarotherodon mossambicus
from nine man-made lakes in Sri Lanka. Environmental Biology of Fishes 11: 205-219. Eriksson, S. and A. Edlund. 1977. On the ecological energetics of 0 group Carcinus maenus L. Gullman Fjord, Sweden. Journal of Experimental
Marine Biology and Ecology 30: 233-248. Fagerlund, U.H.M., D .. A. Higgs, J.R. McBride, M.D. Plotnikoff, B.S. Dosanjh and J.R. Market. 1983. Implications of varying dietary protein,
lipid and 17-methyltestosterone content on growth and utilization of protein and energy in juvenile coho salmon Oncorhynchus kisutch. Aquaculture 30: 109-124.
Fennuci, J.L, Z.P. Zein-Eldin and A.L. Lawrence. 1980. The nutritional response of two penaeid species to various levels of squid meal in a prepared feed. Proceedings World Mari culture Society 11: 403-409.
Forster, J.R.M. and T.W. Beard. 1973. Growth experiments with the prawn Palaemon serratus fed with fresh compounded food.· Fisheries Investigation Series II, 27: 1-16. ·
Gallagher, M.L., D.E. Conklin and W.D. Brown. 1976. The effects of pelleted protein diets on growth, moulting and survival of juvenile lobsters. Proceedings World Mariculture Society 6: 363-378.
Halver, J.E. 1972. Fish nutrition. Academic Press, New York, N. Y., JJ· 713. Hofer, R. and F. Schiemer. 1981. Proteolytic activity in the digestive tract of several species of fish with different feeding habits. Oecologia 48:
342-345. Hofer, R., G. Krewedl and F. Koch. 1985. An energy budget for an omnivorous cyprinoid, Rutilus rut ii us L. Hydrobiologia 122: 53-59.

21
Jauncey, K. 1981. The effects of dietary composition in the rivet carp (Cyprinus carpio) maintained in thermal effluents and laboratory recycling system. Proceedings World Symposium and Aquaculture on Heated Effluents Recirculating Systems, 1980. Vol. 2. Heenemann, Berlin, p. 247-261.
Jauncey, K. 1982. The effect of varying dietary protein level on the growth, food conversion, protein utilization and body composition of juvenile tilapia Sarolherodon mossambicus. Aquaculture 27: 43-54.
Jobling, M. 1983. A short review and critique of methodology used in fish growth and nutrition studies. Journal Fish Biology 23: 685-703. Jobling, M. and A. Wandsvik. 1983. An investigation of factors controlling food intake in Arctic charr, Salvelinus alpinus L. Journal Fish Biology
16: 629-638. Johns, D.M. 1982. Physiological studies on Cancer:irroratus larvae Ill Effects of temperature and salinity on the partitioning of energy resources
during developinent. Marine Ecology, Progress Series 8: 75-85. . Katre, S. 1917. Yolk utilization in the freshwater prawn Macrobrachium lamarrei. Journal Animal Morphology and Physiology 24: 13-20. LeGrow, S.M. and F.W.H. Beamish. 1986. Influence of dietary protein and lipid on apparent heat ·increment of rainbow trout Sa/mo gairdneri.
Canadian Journal of Fisheries and Aquatic Sciences 43: 19-25. Levine, D.M, and S.D. Sulkin. 1979. Partitioning and utilization of energy during the larval development of the Zanthid crab, Rhithropanopeus
harrisii(Gould). Journal of Experimental Marine Biology and Ecology 40: 247-257. Lim, C., S. Sukhawongs and E.P. Pascual. 1979. A preliminary study on the protein requirements of Chanos chanos Forsskal fry in a controlled
environment. Aquaculture 17: 195-201. Manik, R. 1976. Preliminary studies on the effect of different pelletized formulated feeds on the growth of Macrobrachium rosenbergii. Bulletin
Shrimp-Culture Research Centre 187-193. March, B.E., C. Macmillan and F.W. Ming. 1985. Techniques for evaluation of dietary protein quality for the rainbow trout (Sa/mo gairdneri).
Aquaculture 47: 275-292. Mathavan, S., S. Murugadass and M.P. Marian. 1986. Ontogenic changes in composition and energy density of the commercially important
riverine prawn, Macrobrachium malcolmsonii. ln J. Maclean, L.B. Dizon and L.V. Hosillos (eds.) First Asian Fisheries Forum, p. 647-650. Asian Fisheries Society, Manila.
Mazid, M.A., Y. Taneka, M. Asadur, K. Rahman, L. Simpson and C.O. Chichester. 1979. Growth response of Tilapia zillii fingerlings fed isocaloric diets with variable protein levels. Aquaculture 18: 115-122.
Millikin, M.R. 1982. Qualitative and quantitative nutrient requirements of fishes, a review. Fish. Bull. 80: 653-684. Millikin, M.R., R. Fortner, P.H. Fair and V. Sick. 1980. Influence of dietary protein concentration on growth, feed conversion and general
metabolism of juvenile.prawn. Proceedings World Mari culture Society 11: 3 85-391. Mootz, C.A. and C.E. Epifanio. 1974. An energy budget for Menippe mercenaria larvae fed Artemia nauplii. Biological Bulletin (Woods Hole,
Mass.) 146: 44-55. Murugadass, S. 1989. Growth, moulting and egg production of Macrobrachium nobilii fed on different dietary protein densities (under
preparation). · · Pandian, T.J. 1967. Changes in chemical composition and calorific content of developing eggs of the shrimp Crangon crangon. Helgolander Wiss
Meeresuntersuchung 16: 216-224. Pandian, T.J. 1970a. Ecophysiological studies on the developing eggs and embryos of the European lobster Homarus gammarus. Marine Biology
5: 157-167. Pandian, T.J. 1970b. Yolk utilization and hatching time in the Canadian lobster Homarus americanus. Marine Biology 7: 249-254. Pandian, T.J. 1972. Egg incubation and yolk utilization in the isopod Ligia oceanica. Proceedings Indian National Science Academy 38: 430-441. Pandian, T.J. 1987. Fish energetics, p. 357-465. In T.J. Pandian and F.J. Vernberg (eds.) Animal energetics, Vol. 2. Academic Press, New Y6rk. Pandian, T.J. and E. Vivekanandan. 1985. Energetics of feeding and digestion. In P. Tytler and P. Calow (eds.) Fish energetics: New perspectives,
pp. 99-124. Croom Helm Publishers, London. Pandian, T.J. and S. Murugadass 1989. Influence of dietary protein densities on moult, growth and egg production of Macrobrachium nobilii
(under preparation). Perry, W.G., J.V. Hunter and J.W. Avault. 1984. Production trials of prawns comparing a marine reaction, catfish diet and agricultural range
pellet. Journal World Mariculture Society 15: 120-128, Phillips, A.M. 1969. Nutrition, digestion and energy utilization. In W.S. Hoar and D.J. Randall (eds.) Fish Phy6iology, Vol., 1. pp. 391-432.
Academic Press, New York. Phillips, G.R. and D.R. Butler. 1979. Influence of dieldrin on the growth and body composition of fingerling rainbow trout Sa/mo gairdneri fed
Oregon moist pellets ortubificid worms (Tubifex spp.). Journal Fisheries Research Board, Canada 36: 77-80. Ponnuchamy, R., S.R. Reddy and S. Katre. 1981. Effects of eyestalk ablation on growth and food conversion efficiency of the freshwater prawns
Macrobrachiwri lanchesteri (de Man). Hydrobiologia 77: 77-80. Ponnuchamy, R., S.R. Reddy, S. Katre and K.V. Anantharaman. 1984. Laboratory studies on the food utilization of Caridina rajadhari
(Decapoda: Atyidae). Comparative Physiology and Ecology 9: 417-420. Sabaut, J.J. and P. Luquet. 1973. Nutritional requirements of the gilthead bream Chrysophrys aurata. Quantitative protein requirements. Marine
Biology 18: 50-54. Santiago, C.B., M. Beues-Aldeba, M.A. Laron. 1982. Dietary crude protein requirement of Tilapia nilotica fry. Philippine Journal of Biology 11:
255-259. Satia, B.P. 1974. Protein requirements of rainbow trout. Progressive Fish Culturist 36: 80-86. Schwarz, F.J., M.H. Zeritler and M. Kirchgessner. 1983. Wachstum und Nahrstoffaufwand bei karpfen (Cyprinus carpio L.) mit
underschieldlicher protein und Energieversorgung. 2. Mitteilung Gewichtsentwicklumg, Futterreerwertung, Protein and Energieaufwant. Zeitschrift fur Tierphysiologic Tierernahrung. Futtermmittelkunde 49: 88-98.
Sedgwick, R.W. 1979. Influence of dietary protein and energy on growth, food consumption and food conversion efficiency in P. merguiensis de Man. Aquaculture 16; 7-30.
Shewbart, K.L., W.L. Mies and P.D. Ludwig. 1973. Nutritional requirements of the brown shrimp, Penaeus aztecus. U.S. Dept. Comm. Rep. No. Com-73-11794. NOAA, Office of Sea Grants, Rockville, MD. 52 p. ·
Sindhu, K. and T.J. Pandian. 1987. Effect of unilateral eyestalk ablation on moulting, growth, reproduction and energy budget of Macrobrachium nobilii. Asian Fisheries Science 1: 1-17.
Sindhu, K. and T.J. Pandian. 1988. Moulting· and eyestalk ablation in Decapod crustaceans, a review.· Advances in Aquatic Biology and Fisheries, p. 293-312.

22
Tacon, A.CJ. and C.B. Cowey. 1985. Protein and amino acid requirements. In P. Tytler and P. Ca!Ow (eds.) Fish Energetics: new perspectives, pp. 155-184. Croom Helm press. London.
Tandler, A. and F.W.H. Beamish. 1979. Mechanical and biochemical components of apparent specific dynamic action in largemouth bass, . Micropterus salmoides Lacepede. Journal Fish Biology 14: 343-350. . .
Vijayakumaran, M. and E.V. Radhakrishnan. 1984. Eftect of eyestalk ablation in the spiny lobster Panulirus homarus (Linriaeus): 2. On food intake and conversion. Irtdian Journal of Fisheries 31: 148-155.
Venkataramiah, A., GJ. Lakshmi and G. Gunter. 1975. Effect of protein level and vegetable matter on growth and food conversion efficiency of brown shrimp. Aqua·culture 6: 115-125. .
Wee, K.L. and A.CJ. Tacon. 1982. A preliminary study of dietary protein requirement of juvenile snakehead. Nippon Suisan Gakkishi 48: 1463-1482.
Yurkowski, M. and J.L. Tabachek. 1979. Proximate and amino acid composition of some natural fish foods. Proc. World Symp. on finfish nutrition and fish. Vol. I., p. 435-448. Heenemann, Berlin.
Zeitoun, I.H., D.E. Ullrey, W.T. Magee, J.L. Gill and W.G. Berge. 1976. Quantifying the nutrient requirement of fish. Journal of Fisheries Research Board, Canada 33: 167-172.

I I
Amino Acid and Fatty Acid Profiles in Aquaculture Nutrition Studies
L.V .. BENITEZ* Southeast Asian Fisheries Development Center
P.O.Box256 Iloilo City, Philippines
Benitez, L.V. 1989. Amino acid and fatty acid profiles in aquaculture nutrition studies, p. 23'-35. /n S.S. De Silva (ed.) Fish Nutrition Research in Asia~ Proceedings of the Third Asian Fish Nutrition Network Meeting. Asian Fish. Soc. Spec. Puhl. 4, 166 p. Asian Fisheries Society, Manila, Philippines.
The amino acid profile is an important par~eter in the evaluation of protein quality and in requrrement studies. Amino acid profiles are usually determined in two steps: hydrolysis of the protein to constituent amino acids followed by quantitative analysis of the amino acids in the hydrolysate. The ten a!T\ino acids known to be essential in most animals have been found to be essential in all fish so far studied. The reference amino acid profiles used· in the amino acid requirement studies of various fish species include that of whole chicken, egg, fish egg and fish muscle. The amino acid profile of fish muscle provides a useful first approximation of the amino acid requirement of the young, growing fish in which the greatest proportion of weight gain is in the form of muscle. . . .
Fatty acids are important components of lipids. Determination of fatty acid profiles involve the extraction of total lipids with organic solvents and the transesterification of the lipid to form the fatty acid methyl esters which are then analyzed by gas chromatography. The fatty acid composition of fish is dependant on such factors. as temperature, salinity and diet. Coldwater fish contain higher levels of polyunsaturated fatty acids than warm water fish. Freshwater. fish tend to have higher levels of s.aturated fatty acids than marine fish. The essential fatty acid requirement (EFA) of fish seem to vary from species to spe~ies. Coldwater and marine fishes require medium chain ro3 or highly unsaturated long chain ro3 fatty acids. The EFA requirement of warmwater fish is more diverse. Som.e fish require ro6 and others require a combination of ro3 an ro6 fatty- acids.
Amino Acid Profiles
Proteins are a major component of fish tissues constituting about 65-75% of the total on a dry weight basis. Dietary proteins which constitute up to 50% of the diets are converted to free amino acids through the action of various digestive enzymes. The free amino acids released are absorbed in the intestinal tract and used by various tissues for synthesis of tissue proteins. Excess amino acids are used as an energy source. Proteins often constitute the most expensive item of fish diets. Thus, research in aquaculture nutrition. invariably starts with the determination of gross protein requirement of the fish. This information however, is of limited value without data on essential amino acid requirements since protem quality depends largely on its amino acid composition and digestibility. The determination of amino acid profiles is helpful in the design of amino acid test diets for research studies· on arrrino acid requirements. !t is al~o an important parameter in the evaluation of protein quality of feedstuff.
. *Editorial note: Immediately after submission of this paper, Dr. L.V. Benitez died _in an air-crash. As a tribute to her the artic~e is published in ~~~~ . ..
23

24
Determination of Amino Acid Profiles
The determination of amino acid profiles usually consists of two steps: hydrolysis of the protein to constituent amino acids followed by the quantitative estimation of the amino acids in the hydrolysate.
Protein Hydrolysis
The complete hydrolysis of protdris may be accomplished by use of strong acid, strong base or proteolytic enzymes; strong ·acid is normally preferred. The inost frequently employed acid is constant boiling 6N hydrochloric acid.
The reaction is carried out in .evacuated sealed tubes at about l 10°C for periods ranging from 20 to 70 hours. The tubes have to be thoroughly cleaned with chromic acid and rinsed with distilled water and with lN HCl. The residual HCl is removed in an air oven at 10ooc. Thickwalled Pyre~ ·test tubes have been used in the hydrolytic reaction. About 5 mg of proteins is suspended in 1 ml of 6N HCI and a section of the. tube 3 cm from the top is constricted to about 1 mm bore using an oxygen flame. The lower half of the tube is then frozen in a dry ice-ethanol bath. When the sample is frozen, the tube is connected into a vacuum line and the entire system is evacuated. The tube is sealed under vacuum after frozen sample is allowed tothaw slowly and then refrozen to allow complete degassing (Glazer et al. 1976).
The tedious method of evacuating and sealing of test tubes for hydrolysis has been largely simplified by the use of specially designed hydrolysis tubes· with teflon screw seals and with side-arm fur rapid e"acuation.
The three sulfur containing amino acids cysteine, cystine and methionine are susceptible to oxidation .. Even when great care has been taken to remove oxygen from hydrolysis tubes, considerable losses of cysteine and cystine are found after acid hydrolysis and this prevents direct quantification of these amino acids. Total cysteine and half...:cystine content may be determined as cysteic acid after performic acid oxidation. Methionine will be present as methionine sulfone cysteine and cystine as cysteic acid.
Perlormic acid is prepared by allowing a mixture of 1.0 ml of 30% (w/v) H202 and 9.0 ml .of 88% (w/v) formic acid to stand at room temperature for 1 hour after which it is cooled to 0°C. A _known amount of protein,. usually the amount used for routine hydrolysis is dissolved in about 2 ml of the reagent in a cooled hydrolysis tube. The mixture is kept at 0°C for 4 hours after which excess performic acid is destroyed by addition of 0.15 ml of cold 48% (w/v) HBr per ml of performic acid used. The bromine which forms, as well as the formic acid can be removed by rotary evaporation under high vacuum (More 1963). Acid hydrolysis of the oxidized sample and analysis of the resulting hydrolysates are performed in the usual manner.
Tryptophan is completely destroyed by acid hydrolysis, thus,_ for accurate determination of this amino acid alkaline hydrolysis would have to.be resorted to. Alkaline hydrolysis is however,·. of limited application because cysteine, cystine, serine and threonine are decomposed in the process.
For this procedure, the proteins (1-5 mg) are hydrolyzed at 110°C in about 0.6 ml of 4.2N NaOH containing 25 mg of hydrolyzed starch. The addition of 5 µl of 1 % 1-octanol was observed to greatly suppress foaming during evacuation. The reaction vessel is a thin-walled Pyrex test tube fitted with a polypropylene inner lining. The Pyrex test tube, as in acid hydrolysis was constricted with an oxygen flame to about 2 mm. A thin-walled tube is preferred since this constriction can be accomplished rapidly without overheating the plastic insert.

I.
25
The lower portion of the tube was cooled in an acetone-dry ice bath chill, but not to freeze the solution. The tube was evacuated with a high vacuum line and then sealed. The sealed hydrolysis tubes were heated in an oven at l 10°C. For most proteins, 16 hours of hydrolysis is adequate. Peptides containing tryptophan bound to isoleucine and valine are very resistant to hydrolysis and require a longer reaction time, sometimes as much as 98 hours. The long-term hydrolysis required at l 10°C may be avoided if the temperature is increased to 135°C for about 48 hours (Hugli and Moore 1972). ·
There is an alternative procedure which affords high recovery of tryptophan and precise analysis of amino acid composition from a single hydrolysate. This· method utilizes 4N methanesulfonic acid containing 0.2% 3-(2-aminoethyl) indole rather than 6N HCl as a catalyst for hydrolysis. The hydrolysis is carried out in vacuum at 115°C.for 22 to 72 hours. Half-cystine is determined as S-sulfocysteine by treating the hydrolysate with dithiothreitol followed by excess tetrathionate. The values of all amino acids including tryptophan and half-cystine were close to expected theoretical values (Simpson et al. 1976).
Amino Acid Analysis
After complete hydrolysis of a protein the analysis is completed by obtaining quantitative analysis of each of the amino acids. Both acid and alkaline hydrolysate would have to be neutralized prior to amino acid analysis. The separation of a mixture of amino acids is readily done by ion-exchange chromatography usually on a cationic exchanger. The amino acid mixture is often taken up in an acid buffer and loaded on the ion exchange column.
The more basic amino acids are most tightly bound and those with acidic groups the least. The column is then eluted gradually with buffers of increasing pH and ionic strength. The acidic amino acids such as glutamic acid and aspartic acid are removed readily from the resin followed by neutral amino acids and finally by basic amino acids. Each amino acid can be cleanly separated from the other. As they are eluted from the column, they are collected individually in an automatic fraction collector. Once separated, the individual amino acids are quantified by reaction with ninhydrin and resultant color intensity is measured by spectrophotometry. Commercial amino acid analyzers automatically separate amino acids on an ion exchange column, control and programme column temperature during elution, programme shift in buffers, collecteluted amino acids, add ninhydrin, heat to develop the color, record color intensity in the form of a plot and integrate area under each curve.
The identity of each amino acid is established on the basis of its position on the chromatogram and is estimated quantitatively on the basis of area under each curve. The more recent computerized amino acid analyzers have most of the analytical operations preprogrammed and finely controlled. Amino acid analysis will not be described in detail in this paper. Several publications can be consulted for the detailed description of amino acid analysis (Moore and Stein 1983; Bailey 1967; Glazer et al. 1976).
The amino acid composition of some feedstuffs were studied by seven collaborating laboratories. The feedstuff included casein, egg white, beef, soy isolate, rapseed concentrate, pea flour and wheat flour. Samples were hydrolyzed with 6N. HCl, performic acid + 6N HCl and 4.2N NaOH. Amino acids were then determined by ion-exchange chromatography using automatic analyzers. Interlaboratory variatibn of tryptophan (coefficient of variation, CV, up to 24% ), ~ystine and methionine (CV up to 17%) was greater than that of most other amino acids (CV up to 10%). Within each laboratory, the variation for all amino acid was less than 5% (Sarwar et al. 1983).
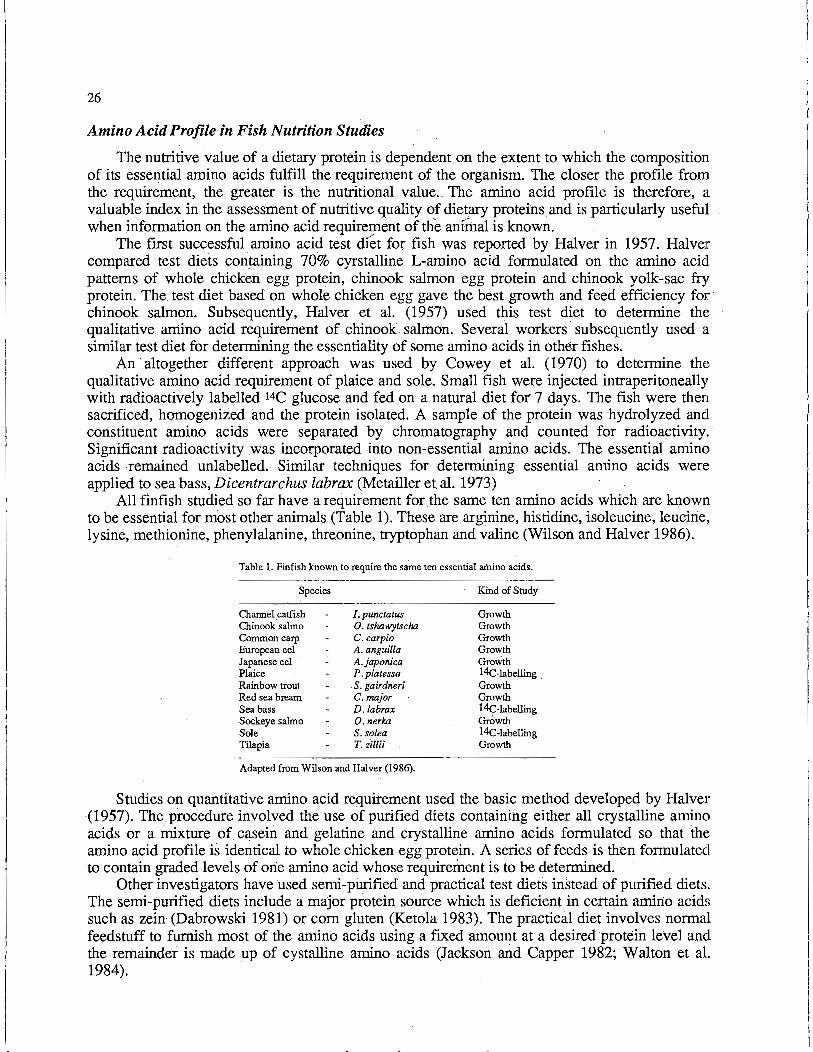
26
Amino Acid Profile in Fish Nutrition Studies
The nutritive value of a dietary protein is dependent on the extent to which the composition of its essential amino acids fulfill the requirement of the organism. The closer the profile from the requirement, the greater is the nutritional value __ The amino acid profile is therefore, a valuable index in the assessment of nutritive quality of dietary proteins and is particularly useful when information on the amino acid requirement of the anlrrtal is known.
The first successful amino acid test met for fish was reported by Halver in 1957. Halver compared test diets containing 70% cyrstalline L-amino acid formulated on the amino acid patterns of whole chicken egg protein, chinook salmon egg protein and chinook yolk-sac fry protein. The test diet based on whole chicken egg gave the best growth and feed efficiency for· chinook salmon. Subsequently, Halver et al. (1957) used this test diet to determine the qualitative amino add requirement of chinook salmon. Several workers subsequently used a similar test diet for determining the essentiality of some amino acids in other fishes.
An · altogether different approach was used by Cowey et al. ( 1970) to determine the qualitative amino acid requirement of plaice and sole. Small fish were injected intraperitoneally with radioactively labelled 14C glucose and fed on a natural diet for 7 days. The fish were then sacrificed, homogenized and the protein isolated. A sample of the protein was hydrolyzed and constituent amino acids were separated by chromatography and counted for rad~oactivity. Significant radioactivity was incorporated into non-essential amino acids. The essential amino acids remained unlabelled. Similar techniques for determining essential amino acids were applied to sea bass, Dicentrarchus labrax (Metailler et al. 1973)
All finfish studied so far have a requirement for .the same ten amino acids which are known to be essential for most other animals (Table 1). These are arginine, histidine, isoleucine, leucirie, lysine, methionine, phenylalanine, threonine, tryptophan and valine (Wilson and Halver 1986).
Table 1. Finfish known to require the same ten essential amino acids.
Species
Channel .catfish Chinook sahno Common carp European eel Japanese eel · Plaice Rainbow trout Red sea bream Sea bass Sockeye sahno Sole Tilapia
I. punctatus 0. tshawytscha C. carpio A. anguilla A.japonica P.platessa
. S. gairdneri C.major D. labrax 0. nerka S. so/ea T. zillii
Adapted from Wilson and Halver (1986).
Kind of Study
Growth Growth Growth Growth GroWth 14C-labelling Growth Growth 14C-labelling Growth l 4C-labelling Growth
Studies on quantitative amino acid requirement used the basic·method developed by Halver (1957). The procedure involved the use of purified diets containing either all crystalline amino acids or ·a mixture of casein and· gelatine and crystalline amino acids formulated so that the amino acid profile is identical to whole chicken egg protein. A series of feeds is then formulated to contain graded levels of on:e amino acid whose requirement is to be determined. ·
Other investigators have used semi-purified and practical test diets instead of purified diets. The semi-purified diets include a major protein source which is deficient in certain amino acids such as zein (Dabrowski 1981) or coin gluten (Ketola 1983). The practical diet involves normal feedstuff to furnish most of the amino acids using a fixed amount at a desired protein level and the remainder is made up of cystalline amino acids (Jackson and Capper 1982; Wal ton et al. 1984).

27
Several reference amino acid patterns have. been used by various investigators. As mentioned earlier, the amino acid profile of whole chicken egg proved useful in the design of amino acid test diets of chinook salmon. The amino acid profile of fish egg has been used for formulating feeds for amino acid requirement studies in some fish (Ketola 1982). The composition of fish egg also provided an effective guide for successful amino acid supplementation of protein in fish feeds for Atlantic salmon and rainbow trout.
Cowey and Tacon (1983) have identified several problems in the accurate determination of amino acid requirements of fish based on growth studies. Some of these problems are:
1. Growth rates commonly obser\red in the amino acid test diets are frequently inferior or lower than those observed with proteins (Murai et al. 1981; Walton et al. 1982).
n. Some of the anlino acids in test diets may leach out during feeding.
iii. The interpretation of the break-point on the growth response curve 1s frequently subjective.
In young growing animals, the greatest proportion of body weight is in the form of muscle. It is reasonable to infer that the dietary essential amino acid requirement will be closely related to and or governed by the amino acid profile of muscle protein (Cowey and Tacon 1983). This hypothesis was examined by Boorman (1980) for pigs and chicken. Amino acid requirement is closely correlated to the amino acid profile of muscle protein (Fig. 1). Based on this relationship Boorman concluded that, "in the absence of more detailed information, the pattern of essential amino acid in the product can be used for the pattern in the diet".
A similar correlation is shown in Fig. 2 for common carp (Cyprinus carpio). The requirement values for 10 essential amino acids were obtained from dose-response curves using amino acid test diets (Nose 1979). The relationship of the essential amino acid requirement with
0.40
z a: w I-
0.30 ~· I-z w ::;;
0.20 w "f!; :J 0 w a:
0.10
0
Lys ..
e PIGS
0 Lys
0 CHICKS
O.lo" 0.20 0.30 0.40·
Tl SSUE PATTERN
Fig. 1. Relationships between pattern of amino acid requirements determined/deduced from · feeding· experiments for lysine (Lys), methionine plus cysteine (SAA), isoleucine (Ile); threonine (THr) and trypthophan (Trp) and the pattern of the same amino acids in musele tissues of growing pigs and chicks. (Adapted from Boorman 1980).
z 0: w I-
0.200
~ 0.150
I-
· ~ Ii! 0.100
3 0 w a:
0.050
e Lys
ArR
•Leu
0.050 0.100 0.150 0.200
WHOLE BODY TISSUE PATTERN .
Fig. 2. Relationships between pattern of requirements determined/deduced from feeding experiments for ten essential amino. acids as determined by using .amino acid test diets and the pattern of the same amino acids in the whole body of growing carp' (Cyprinus carpio) (adapted from Nose 1979). ·

28
the amino acid profile of muscle or whole body tissue is very close except in the case of leucine and lysine where the requirement appears to be lower than the level body tissue (Nose 1979). The amino acid profile for muscle protein provides a very useful first approximation for the amino acid requirement of fish.
Fatty Acid Profiles
Lipids are major sources of metabolic energy in fish. They are also the source of essential fatty acids for cell structure and membrane function .and are carriers of oil-soluble vitamins. Fatty acids are among the most well-studied components of lipids. The fatty acid profile like the amino acid profile can be used as an index of quality of dietary lipids. Many useful inferences on dietary lipid requirements can be derived from data on fatty acid profiles of fish tissues.
Lipid Extraction
To obtain a fatty acid profile of animal tissues, it is necessary to first extract the total lipid from the particular tissues. Lipids exist in tissue in a variety of forms. In adipose tissues of animals for example, lipids are found as discrete droplets in separate compartments from· most other cellular coristituents. In other tissues, lipids occur in association with other cell components especially proteins and may be strongly bound to them (Christie 1984).
Lipids can be isolated quantitatively from tissues by extraction with suitable organic solvents. The extracts must be freed of non-lipid contaminants by appropriate washing procedures. The solvents selected must be sufficiently polar to disrupt the association between lipids and other tissue components but should not react with lipids in any way. Single -pure · solvents are rarely used for lipid extractions. The most commonly used solvent mixture for lipid extraction is chloroform-methanol although the water present in a given tissue is considered a third component of the solvent mixture.
Under optimum conditions,· tissues should be extracted as soon as possible to minimize oxidative and hydrolytic changes that may alter the lipid composition of the samples. If immediate extraction is not possible, the sample should be stored in glass containers, frozen rapidly at -20°C in an atmosphere of nitrogen.
One of the more commonly used procedures for total lipid extraction of fish tissues is the procedure of Bligh and Dyer (1959). This procedure is preferred when rapid extraction of a large amount of sample and less than complete recovery of lipid is acceptable. Recoveries of most lipids are likely to be about 95%. The fresh tissue is assumed to contain 80% water. The schematic diagram of the procedure is presented in Fig. 3.
The extraction procedure of Folch et al. (1957) is most often used when more exhaustive recoveries of lipids are required. This procedure which is schematicaliy described in Fig. 4 gives recoveries of the order of 95 to 99% with most animal tissues. ·
Preparation of Methyl Esters
Fatty acids in lipids are mostly in the form of glycerol esters. However, for mariy analytical purposes, it is preferable that fatty acids be converted to less polar and more volatile methyl ester derivatives. It is not necessary to hydrolyze l:i.pids prior to esterification as they can be easily transesterified directly in the presence of an excess of methanol by means of a suitable catalyst (Christie 1984). A method for preparing methyl esters (Metcalfe et al. 1966) from lipids by trarisesterification is outlined in Fig. 5, and utilizes boron trifluoride as a catalyst ·

SAMPLE (100 g wet tissues)
+ 100 ml CHC13 and 200 ml MeOH homogenized in a Waring .blender for 4 minutes
+ 100 ml CHC13 homogenized for 2 minutes
+ lOOml H20 (CHCl3-MeOH-H2) = 2:2: 1.8 at this step filtered with a Buchner filtration apparatus. or with a filter paper
FIL1RATE RESII>.UE
Upper layer (water-layer) discard
EX1RACT
transferred into a separatory funnel
+ 100 ml, 0.88% KCl shake
LOWER LAYER (CHCl3-layer)
concentrated to dryness . (If the extract contain water,
add benzene and concentrate again)
TOTAL LIPIDS
If necessary, reextract with CHCJ3-MeOH-H20 (2:2:1.8)3
RESIDUE (discard)
Fig. 3. Schematic diagram indicating the method of extraction of lipids (Bligh and Dyer·1959).
Fatty Acid Analysis
29
Complex mixtures of fatty acid methyl esters derived from lipids can be quantitatively determined by gas chromatography. The procedure of gas chromatography (GC) will not be described in detail in this paper as there is much written on· this subject (see for example: James 1960; Mangold et al. 1984). Gas chromatography is essentially a prqcess of partition on which components to be separated are distributed between two immiscible phases, one phase is held stationary in the column, the other is a moving phase-the carrier gas, in gas chromatography.
The essential features of the technique include: i. a source of carrier gas at constant pressure, ii. a column containing the stationary phase which is liquid but non-volatile at column
temperature and provides inert support for the stationary phase, iii. a system for heating the column and detector,

30
SAMPLE (lg, wet tissues)
+ 30 ml CHC13-methanol (2:1)
homogenized in a Waring · blender or with Teflon · homogenized after mincing)
FIL1RATE
+ 1/5 vol. of0.74% KCl'solutian shaked and mixed thoroughly centrifuged or use separatory funnel but allow some time to settle)
LOWER LA YER Upper layer (discard)
+ 1/4 vol. of CHC13-MeOH-H20 (3:48:47)
washed twice with the above solvent
concentrated to dryness
(lf the extract contains water, remove the water by rotary evaporator after addition of benzene) .
TOTAL LIPIDS
Fig. 4. Schematic diagram indicating the method of extraction of lipids (Folch et al. 1957).
Upper Layer
I
Upper Layer
I . concentrated to dryness under.
vacuum on a rotary evaporator
FAME (fatty acid methyl esters)
LIPID SAMPLE (200 mg)
placed in 20 x 150 mm screw-capped tube
+ 4 nl, 0.50N methanolic NaOH cover tightly and heat on a steam bath for 5 min.
+ 5 pl BF3-methanol boil for 5 more min. transfer to separatory funnel
+ add enough saturated NaCl until methyl esters float
Lower Layer ·(drain off and discard)
Lower Layer (drain off and discard)
Fig. 5. Schematic diagram indicating the steps involved in the preparation of fatty acid methyl esters.
!
f

I
31
iv. the detector whose function is to measure the concentration of vapour in each zone leaving the column,
v. a recorder that responds to the emergence of compounds in the form of amplified electrical signals and records this in the form of a chromatogram.
The chromatogram is the basis for qualitative and quantitative information· on the fatty acid composition of t.he sample. As in the amino acid analyzer gas chromatographs are ·now computerized and controlled with better precision.
' ' '
Fatty Acid Profiles in Fish NutritionStudies
Fish oils contain a ·greater variety of fatty acids in comparison with other oils or fats. Fish oils also contain highly polyunsaturated fatty acids of considerably longer carbon chain (20 or 22 carbon chain length), most of which belong to the ro3 family of fatty acids (Stansby 1982). The long chain fatty acids generally make up on,e-fourth to one-third of all fatty acids in fish oils. This contrasts sharply with the proportion of long chain fatty acids in most vegetable oils which seldom exceeds 5% and is frequently less than 1 %. Likewise, polyunsaturated fatty acids in fish oils generally occur to an extent of 15-30%, yet they almost never total even 1 %Jn vegetable oils. Many useful inferences on the· dietary lipid requirement of fish can be derived from their fatty acid profiles. The composition .of fatty acids in fish is affected by a number of environmental factors foremost· of which are salfoity, temperature and diet. . Fish live in environments of varying salinity, the extreme being represented by freshwat~r and marine conditions. A comparison of the fatty acid composition of some freshwater and marine fishes is shown in Table 2. The general trend suggests that the total satµrated fatty acids are slightly higher in freshwater species than marine species. Freshwater fish have higher levels· of medium
Table 2. Distribution of major fatty acids in various fish lipids.
Fatty Acids Fresh water Species Percent Fatty Acids .
Marine Species. ,
A B c x y z 14:0 2.8 6.7 2.1 5.1 3.7 2.2 14:1 1.0 0.7 0.8 0.4 0.1 0.2 16:0 16.6 14.6 11.9 10.9 12.6 ' 17.0/ 16:1 17.7 14.7 8.2 12.0 9.3
,/
4.1 18:0 3.3 1.5 4.1 1.2 2.3 3.2 18:1 26.1 18.2 19.8 12.6 22.7 21.4 18:2oo6 4.3 3.7 4.6 0.7 i.5 2.0 18:3co3 3.6 3.6 5.2 0.3 0.6 1.0 20:1 2.4 1.6 3.0 16.1 7.5 5.4 20:4oo6 2.6 2.4 2.2 0.4 1.4 0.9 20:5003 ' 2.7 8.2 5.0 7.4- 12.9 6.7 22:1 0.3 0.4 1.3 19.4 6.2 9.4 22:6co3 2.0 6.0 19.0 3.9 12.7 16.1 Total saturated · 22.7 22.8 18.1 17.2 18.6 22.4 Total rnonoenoic
Medium 44.8 33.6 28.8 25.0 32.2 25.7 Long 2.7 2.0 4.3 35S 13.7 14.8
Total 003 10.3 19.3 31.8 12.7 '27.9 26.1 Total oo6 7.3 6.5 7.4 1.1 4.1 3.5 Ratio oo3/oo6 1.4 3.0 4.3 11.5 6.8 7.5 Total unsaturated 65.1 61.4 72.3 74.3 77.5 . 70.1
A - sheepsherd; B - alewife; C - ~ainbow trout; X - Atlantic herring; Y - Atlantic cod; Z - Chinook. salmon (adapted from Ackman 1967) · · · · '·

32
chain monolenoic acids than marine species. However, marine species contain more longer chain polyunsaturated fatty acids than freshwater species. The ratio of ro3/ro6 fatty acids is greater for marine species than freshwater species (Ackman 1967; Castell 1979). The same trend in fatty acid composition is ex.pressed in fish that migrate from freshwater to marine environments and vice versa. Table 3 shows changes in fatty acid composition in sweet smelt (Plecoglossus altivelis) as it migrates from marine to freshwater (Ota and Takagi 1977) and for masu salmon (Oncorhynchus masu)' as they migrate from freshwater to seawater (Ota 1976). The most significant change is observed in the ratio of ro3/ro6. For smelts migration from marine to freshwater was accompanied by a decrease in the ro3/ro6 ratio from 7.5 to 3.5. In contrast, an increase in the ro3/ro6 ratio from 3.8 to 10.0 was observed in salmon during its migration from freshwater to seawater. The general observatiqn th~t ro3/ro6 ratio is higher for. marine species holds true even for migratory fish where a change in salinity seems to cause a change in fatty acid profile.
Table 3. Changes in fatty acid-composition in triglycerides of migratory fishes.
Percent Fatty Acids Fatty Acids Smelt Masu Salmon
Marine Freshwater ·Freshwater Marine
April May May Jiine 14:0 8.0 10.0 5.2 5.7 16:0 21.6 . 18.7 19.9 . 20.0 16:1 10.0 17.0 11.6 8.7 18:0 2.8 2.9 4.6 3.9 18:1 12.8 11.5 23.3 21.7 18:2oo6 2.8 4.3 3.9 1.7 18:3oo3 3.0 5.1 3.0 1.3 20:1 1.1 3.0 6.7 20:4oo6 1.4 1.5 1.0 0.6 20:4003 1.9 1.8 1.5 1.2 20:5oo3 8.2 6.3 4.2 7.0 22:1 1.9 4.2 22:5oo6 1.1 22:5003 1.4 1.2 1.8 2.4 22:6003 12.1 5.2 6.7 9.0 Total saturated 32.4 31.6 . 29.7 29.6 Total monoenoic
Medium 22.8 28.5 34.9 30.4 Long 1.1 4.9 10.9
Total 003 31.7 23.9 18.6 23.2 Total oo6 4.2 6.9 4.9 2.3 Ratio oo3/oo6 7.5 3.5 3.8 10.0 Total unsaturated 59.8 59.3 63.3 66.8
Adapted from Castell 1979.
Temperature is a major factor widely known to cause differences in fatty acid composition. Fish that live in warmer waters contain more saturated fatty acids. A decrease in temperature induces an increase in the degree of unsaturation in fish lipids, the accumulation of long chain (C20 and C22) polyunsaturated fatty acids and an increase in the ro3/ro6 ration (Knipprath and Mead 1968; Patton 1975; Fatkas and Csengeri 1976).
The results suggest that fish and crustaceans alike manipulate their levels of polyunsaturated fatty acids to maintain membrane integrity and function in the cold (Farkas 1979). The effect of temperature on fatty acid composition has been studied using the same fish fed the same diet but acclimated at different temperatures. Table 4 shows that fish reared at higher temperature had more saturated fatty acids accumulated than the cold-acclimated fish (Castell 1979) ..

Table 4. Effect of temperature on fatty acid composition of guppies.
Guppies Fatty Acids 17°C 24°C
14:0 1.5 0.9 16:0 22.9 0.9 16:1 15.9 36.0 18:0 8.2 9.8 18: 1 18.3 15.0 18:3co3 1.4 0.8 20:4co6 2.0 2.0 20:5co3 4.8 4.6 22:5co3 6.1 7.3 22:6co3 16.5 11.5 Total saturated 32.6 46.7 Total monoenoic 34.2 23.9
co3 28.8 24.2 co6 3.3 3.0 co3/co6 8.7 8.0
Total unsaturated 66.3 51.1
Adapted from Castell 1979;
33
If the trends in fatty acid composition can be taken as a clue to the essential fatty acid requirements of fish, the w3 requirement would be greater for· coldwater fish: Warmwater fish may do better with a mixture of w6 and w3 (Castell 1979). Coldwater fish are likely to be more demanding in their requirement for essential fatty acids than warmwater fish because constraints imposed in maintaining membrane fluidity are greater at low temperature (Hazel 1979).
The essential fatty acid (EFA) requirement in fish has been reviewed by several workers (Castell 1979; Watanabe 1982). Studies have demonstrated that the EFA requirements of fish differ considerably from species to species. The EFA requirements of rainbow trout is the best known. It was shown that .the EFA requirement was about 1 % 18:3w3 in the diet and no combination of 18:3w3 and 18:2w6 resulted in as fast a growth rate or efficient feed conversion as 1 % 18:3w3 (Castell et al. 1972a,b; Watanabe et al. 1974).
On the other hand, carp (Cyprinus carpio), one of the most important cultured fish in Japan had an EFA requirement of both 18:2w6 and 18:3w3 (Watanabe et al. 1975). The best weight gain and feed conversion were obtained in fish receiving a diet with both 1 % 18 :2w6 and 1 % 18:3w3. The eel (Anguilla japonica), another important cultured warmwater fish also has a requirement for both 18:2w6 and 18:3w3 at a level of 0.5% each (Takeuchi et al. 1980). A tropical herbivore, Tilapia zillii was found to require w6 rather than w3 fatty acids. The dietary requirement for 18:2w6 or 20:4w6 was about 1 %in the diet (Kanazawa et al. 1980).
Highly unsaturated w3 fatty acids with more than 20 carbon atoms (w3 HUFA) are essential in the nutrition of some marine fish such as red sea bream ·and yellow tail. The requirement of red sea bream for w3 HUFA is about 0.5% in the diet (Yone 1978). The requirement for long chain polyunsaturated fatty acids has been traced to the limited ability of some marine fishes to chain elongate and desaturate medium chain fatty acids (Cowey et al. 1976; Yamada et al. 1980).
Most cold water and marine fish require either w3 or w3 HUF A fatty acids. The situation with warmwater fish is presently more confused. Some species require both co3 and co6 fatty acids, others co6. Moreover, growth inhibition at certain levels of w3 and w6 has been observed (Stickney and Hardy 1987). Clearly, different species require different EFAs and the diversity is much more so in warmwater than in coldwater fishes.

c__
34
References
Ackman, R.G. 1967. Characteristics of the fatty acid compos_ition and biochemistry of some freshwater fish oils and lipids in ciimparison with marine oils and lipids. Comparative Biochemistry and Physiology 22: 9ITT-922.
Bailey, J.L. 1967. Techniques in protein chemistry. Elsevier Publishing Co., Amsterdam 62-109. Bligh, E.G. and W.J. Dyer. 1959. A rapid method of total lipid extraction and purification. Canadian Journal of Biochemistry and Physiology 37:
911-917. Bo.orman, K.N. 1980. Dietary constraints on nitrogen retention. In P.S. Buttery and D.B. Lindsay (eds.) Protein Deposition in Animals, pp. 147-
166. Butterworth and Co. Ltd., London. Castell, J.D. 1979. Review of lipid requirements of finfish. ln J.E. Halver'and K. Tiews (eds.) Finfish Nutrition and Fishfeed Technology. Vol. I,
pp. 59-84. Proceedings of World Symposium, Hamburg, Germany. Castell, J.D., D.J. Lee and R.O. Sinnhuber. 1972a. Essential fatty acids in the diet of the rainbow trout (Sa/mo gairdneri): lipid metabolism and
fatty acid composition. Journal of Nutrition 102: 93-100. · Castell, J.D., R.O. Sinnhuber, J.H. Wales and D.J. Lee. 1972b. Essential fatty acids in the diet of rainbow trout (Sa/mo gairdneri): growth, feed
conversion and some gross deficiency symptoms. Journal of Nutrition 102: 77-86. Christie, W.W. 1984. ·Extraction and hydrolysis of lipids and some reactions of their fatty acid components in lipids. In H.K. Mangold, G. Zweig
and I. Shenna (eds.) CRC Handbook of Chromatography. CRC Press, Inc., Florida, USA. Cowey, C.B. and A.G.J. Tacon. 1983. Fish nutrition - relevance to marine invertebrates. In G.D. Pruder, C.J. Langdon and D.E. Conklin (eds.)
Proceedings of the Second International Conference on Aquaculture Nutrition: Biochemical and Physiological Approaches to Shellfish Nutrition;pp. 13-30. Baton Rouge, Louisiana State University.
Cowey, C.B., J.W. Adron and A. Blair. 1970. Studies on the nutrition of marine flatfish. The essential amino acid requirements of plaice and sole. Journal of the Marine Biology Association of the United Kingdom 50: 87-95.
Cowey, C.B., J.W. Adron, J.M. Owen and R.J. Roberts. 1976. The effect of different dietary oils on tissue fatty acids ;md tissue pathology in turbot, Scophthalmus maximus. Comparative Biochemistry and Physiology 53B: 399-403.
Dabrowski, K. 1981. Tryptophan requirement of common carp (Cyprinus carpio L.) fry. Zeitschrift fur Tierphysiologie Tierrenahrung and Futtermittelkunde, 46: 64-71.
Farkas, T. 1979. Adaptation of fatty acid compositions _to temperature - a study on planktonic crustaceans. Comparative Biochemistry and Physiology 64B: 71-76.
Farkas, T. and I. Csengeri. 1976. Biosynthesis of fatty acids by carp, Cyprinus carpio L. in relation to environmental temperature. Lipids 11: 401-4~ .
Folch, J., M. Lees and G.H. Stariley. 1957. A simple method for the isolation and purification of total lipids from animai tissues. Journal of Biological Chemistry 226: 497-509.
Glazer, A.M., R.G. Delange and D.S. Sigman. 1976. Chemical modification of protein. In T.S. Work and J.E. Work (eds.) Laboratory Techniques in Biochemistry and Molecular Biology, pp. 1-206. North-Holland .Publishing Co., Amsterdam.
Halver, J.E. 1957. Nutrition o( salmonid fishes. IV. An amino acid test diet for chinook salmon. Journal of Nutrition 62: 245-254. Halver, J.E., D.C. Delong and E.T. Mertz. 1957. Nutrition of salmonid fishes. V. Classification of essential amino ~cids for chinook salmon.
Journal of Nutrition, 63: 95-105. Hazel, J.R. 1979. Influence of thermal acclimation on membrane lipid composition of rainbow trout liver. American Journal of Physiology 236:
91-101. Hugli, E.T. and S. Moore. 1972. Determination of the tryptophan content of proteins by ion exchange chromatography of alkaline hydiolysate.
Journal of Biological Chemistry 247: 2828-2834. Jackson, A.J. and B.S. Capper. 1982. Investigation into the requirements of tilapia, Sarotherodon mossambicus for dietary methionine, lysine and
arginine in semisynthetic diets. Aquaculture 29: 289-297. . James, A.T. 1960. Qualitative and quantitative determination of fatty acids by gas-liquid chromatography. In Glick, D. (ed.) Methods of
Biochemical Analysis, pp. 1-59. Interscience Publishers, Inc., New York, USA. Kanazawa, A., S. Teshima, M. Sakamoto and Md. A. Awal. 1980. Requirement of Tilapia zillii for essential fatty acids. Bulletin of the Japanese
Society of Scientific Fisheries46: 1353-1356. Ketola, H.G. 1982. Amino acid nutrition of fishes: requirement and supplementation of diets. Comparative Biochemistry and Physiology 73B: 17-
24. Ketola, H. 1983. Requirement for dietary lysine and arginine by fry of rainbow trout. Journal of Animal Science 56: iOl-107. Knipprath, W.G. and J.F. Mead. 1968. The effect of environmental temperature on the fatty acid composition and on the incorporation of (I-14C)
acetate in goldfish. Lipids 3: 121-128. Mangold, H.K., Zweig and J. Shenna. 1984. Lipids: CRC Handbook of Chromatography. CRC Press Inc., Florida, USA. Metailler, R., A. Febvre and E. Alliot. 1973. Preliminary note on the essential amino acids of the sea bass, Dicentrarchus labrax (Linn.). Standard
Review GFCM 52: 91-96. . Metcalfe, L.D., A.A. Schmitz and J.R. Pelka. 1966. The rapid preparation of fatty acid methyl esters from lipids for gas chromatographic analysis.
Analytical Chemistry 38: 514. Moore, S. 1963. On the determination of cystine as cysteic acid. Journal of Biological Chemistry 238: 235-237. Moore, S. and W.H. Stein. 1963. Chromatographic determination of amino acids by use of automatic recording equipment. In S.P. Colonick and
N.O. Kaplan (eds.) Methods of Enzymology, Vol. VI, pp. 819-831. Academic Press, New York. Murai, T., T. Akiyama and T. Nose. 1981. Use of crystalline amino acids coated with casein in diets of carp. Bulletin of the Japanese Society of
Scientific Fisheries 47: 523-527. · Nose, T. 1979. Summary report on the requirements of essential amino acids for carp. In J.E. Halver and K. Tiews (eds.) Finfish Nutrition and
Fishfeed Technology, Vol. 1, pp. 145-156. I.H. Heeneman GmbH and Co., Berlin. Ota, T. 1976. Lipids of masu salmon. IV. Changes of lipid composition and fatty acid composition in flesh lipids of juvenile masu salmon in the
early stages of seawater life. Bulletin of the Faculty of Fisheries, Hokkaido University 27: 30-36. Ota, T. and T. Takagi. 1977. A comparative study on the lipid class composition and fatty acid composition of sweet smelt, Pleocog/ossu altive/is
from marine and freshwater habitat. Bulletin of the Faculty of Fisheries, Hokkaido University 28: 47-56. Patto·n, J.S. 1975. The effect of pressure and temperature on phospholipid arid triglyceride fatty acids of fish white muscle: a comparison of
deepwater and surface marine species. Comparative Biochemistry and Physiology 5~B: 105-110.

35
Sarwar, G., D.A. Christensen, A.J. Finlayson, M. Friedman, L.R. Hackler, S.L Mackenzie, P.L. Pellett and R. Tkachuk. 1983. Inter and intra.laboratory variation in amino acid analysis of food proteins. Journal of Food Science 48: 5.26-531.
Simpson, RJ., M,R. Neuberger and T.Y. Liu. 1976. Complete amino acid analysis of proteins from a single hydrolysate. Journal of Biological Chemistry 251: 1936-1940.
Stans by, M.E. 1982. Properties of fish oils and their application to handling ·of fish. and to nutritional and industrial Use. In R.E. Martin, G J. Flick, C.E. Hebard and D.R. Ward (ed.), pp. 75-92. Api Publishing Co., Westpoint, Conn., USA.
Stickney, R.R. and R.W. Hardy. 1987. Lipid requirement of fishes: the enigma of warmwater species (abstract). International Symposium on .. · Feeding and Nutrition iii Fish, Bergeri, Norway.
Takeuchi, T., S. Arai, T. Watanabe and Y. Shimma. 1980. Requirement of eel, Anguilla japonica for essential fany acids. Bulletin of the Japanese . Society of Scientific Fisheries 46: 345-353.
Walton, M.J.; C.B. Cowey and J.W. Adron. 1982. Methionine metabolism in rainbow trout fed 'diets of differing methionine and cystine contents. Journal of Nutrition 112: 1525-1535.
Walton, M.J., C.B. Cowey and J.W. Adron. 1984. The effect of dietar}' lysine levels on groWth and metabolism of rainbow trout (Salmo gairdneri). British Journal of Nutrition 52: 115-122.
Watanabe, T. 1982: Lipid nutrition in fish. Comparative Biochemistry and Physiology 73B: 3-15. Watanabe, T., F. Takashima and C. Ogino. 197 4. Effect of dietary methyl linolenate on growth of rainbow trout. Bulletin of the Japanese Society
of Scientific Fisheries 40: 181-188. Watanabe, T., T. Takeuchi an4 C. Ogino. 1975. Effects of dietary methyl linoleate and linolenate on growth of carp. Bulletin of the Japanese
Society of Scientific Fisheries 41: 263-269. Wilson, R.P. and J.E. Halver. 1986. Protein and amino acid requirements of fishes. Annual Review of Nutrition 6: 225-244.
·Yamada, K., K. Kobayashi and Y. Yone. 1980. Conversion oflinolenic acid to w3 highly unsaturated fatty acids in marine fishes and rainbow . trout. Bulletin of.the Japanese Society of Scientific Fisheries 46: 1231-1233.
Yon.e, Y. 1978. Essential fatty acids and lipid requirements of-marine fish. In Koseisha-Koseihaku (ed.) Japan Society of Scientific Fisheries, Tokyo 43-59. ·

Digestibility Evaluations of Natural and Artificial Diets
SENA S. DE SILVA Departments of Fisheries Biology and Zoology
University of Ruhuna Matara, Sri Lanka
De Silva, S.S. 1989. Digestibility evaluations of natural and artificial .diets, p. 36-45. In S.S. De Silva (ed.) Fish Nutrition Research in Asia. Proceedings of the Third Asian Fish Nutrition Network Meeting. Asian Fish. Soc. Spec. Pub!. 4, 166 p: Asian Fisheries Society, Manila, Philippines.
Digestibility is the quantitative evaluation of the usefulness of a diet and/or its nutrient components. Digestibility could be estimated directly where the total food and or nutrient(s) consumed and that voided as faeces are determined and or indirectly by utilizing a marker. The markers or indicators used are either external when a foreign non-digestible substance is added to the diet or internal when a non-digestible component of the diet itself is used. The mei:its and demerits of the direct and the indirect methods and the use of internal and external markers are discussed. Factors that are known to affect digestion are dealt with briefly and the need for standardization of the techniques involved in digestibility estimates are discussed.
Digestion includes the process by which the ingested food material is broken down into suitably absorbable nutrients across the gut wall into the blood system. The digestive processes are essentially enzymatic, and the biochemistry of enzyme digestion and nutrient absorption in fish have been adequately reviewed by Fange and Grove (1979). Digestion has to be considered separately from the passage of food along the gut and their digestibility. The latter is a more quantitatve aspect of the digestive process and refers. essentially to the degree to which a food or its nutrient components are made absorbable by an individual; in other words it is a measure of the nutritional usefulness of food. The nutritional usefulness of a given food material is variable between and within a species and is dependent on a host of other factors. Also the differences between digestibility· and rate . of digestion and rate of passage of food through the gut, also known as the gut transient time, should be clearly understood, in spite of a degree of dependence of digestibility on these parameters (Kapoor et al. 1975).
Studies on digestibility in fish are relatively recent and commenced as a sequel to intensification in aquaculture which· went hand in hand with development and dependance on artificial diets. A knowledge of digestibility of basic dietary nutrients is essential for the study of fish energetics and for evaluation of the dietary value of foodstuffs and feed ingredients; digestibility studies are pivotal· to feed development. Apart from its use in aquaculture, digestibility studies of naturally ingested food material of natural or quasi-natural populations are proving to be useful to evaluate and understand the success/failure of a species (Bowen 1981; De Silva 1985a).
36

37
Terminology
Generally, digestibility is not determined for mineral elements and vitamins, and it is not a term that is equally useful and descriptive for all nutrients. For example dietary protein could be broken down in the alimentary canal by digestive fluids as well as micro organisms. As a result, the faecal material could contain protein of bacterial origin. In addition, previously digested proteins could be metabolized and re-excreted into the digestive tract as enzymes and get voided with faeces. Faeces could also contain nitrogen from the abraded gut mucosa. Therefore, it is evident that when digestibility is estimated, the extent to which the dietary protein alone was digested is not accurately reflected. ·
Sugar and or some other nutrients for example may behave in different ways; sugar is normally absorbed fully and metabolic by-products are eliminated completely either as C02 or as water, unlike fats or minerals such as calcium. Apparent digestibility of total dry matter or a nutrient component is the fraction of the ingested amount that is not recovered in the faeces; when this fraction is expressed as a percentage of the ingested amount it is known as the coefficient of digestibility.
Basic Methodology
Aspects of basic methodology for digestibility studies were recently reviewed by Cho et al. (1985) and Talbot (1985) amongst others.
The digestibility coefficient (D%) could be determined directly or indirectly. Directly by determining the amount of feed (or nutrient) ingested and voided a_s faeces.
amount of food (nutrient) ingested -amount of food (nutrient) egested
D% = amount of food (nutrient ingested)
This method however, demands that food consumed and faecal material voided ·are accurately determined, collected and quantified. This is time consuming _and subjected to a high degree of experimental error. The quantitative collection of faecal material and maintenance of quantitative records of feed intake is avoided with the use of indicator substances or markers. Markers were originally utilized for domestic animals by Edin (1918). Since then a wide variety of markers have been used in digestibility estimations in fish. An evaluation was made by Leavitt (1985) on the gravimetric and inert marker techniques in digestibility studies. Noue and Choubert (1986) made a similar comparison of the two methods and concluded that reliable digestibility estimates could be obtained by the direct method (total collection of faeces) with an automatic fish faeces collector. In essence both methods pose the common difficulty of obtaining a collection of a representative faecal sample.
Markers could also be of two forms; artificial foreign substances introduced into the feed in small quantities or substances that are a component of the feed itself (Table 1). In either case, the markers have to conform to four basic criteria in that they should not
(i) interfere with the digestive metabolism of the animal;
(ii) be absorbed through the lumen,
(iii) move along the gut at a differential velocity from the rest of the food material, and
(iv) be toxic.

38
Table 1. Different types of internal (indigenous) and external markers used in digestibility studies and authorities for chemical determination (cd) of some of the more widely used components (* De Silva 1985a).
Marker (Abbreviation) Used by cd
Internal Hydrolysis Resistant Ash (HRA) or 1,3,8,9 14,18* Acid Insoluble Ash (AIA) Hydrolysis Resistant Organic 4,5,8,9 5*
Matter (HROM) Crude Fibre (CF) 4,8,9,15 14* Ash 9 9 Cellulose 4,17 4,7* Silica 12 11 &ternai Chromic Oxide . (numerous) 10
e.g.,2,6 32P (insoluble Ammonium molybdate) 12 Titanium IV oxide 13 Celite (as a supplementation to AIA) 1 Polythene 16
1 - Atkinson et al. (1984); 2 - Austreng (1978); 3 - Bowen (1981); 4 & 5 .- Buddington (197~, 1980); 6 - Cho et al. (1974); 7 - Crampton & Maynard (1938); 8 - De Silva & Perera (1983); 9 - De Silva et al. (1984); 10 - .Fukurawa & Tsukahara (1966) ; 11 -Hickling (1966); 12 - Hirao et al. (1960); 13 - Lied et al. (1979); 14 - Tacon & Fems (1979); 15 - Tacon et al. (1983); 16 - Tacon & Rodrigues (1984); 17 - Van Keulen & Young (1977); 18 - Van Dyke & Sutton (1979). ·
Even though Cr203 is widely used and continues to be used as an external marker, Bowen (1978) found that in Tilapia mossambica Cr203 moved at a different rate than the rest of the food. Hilton et al. (1981) found that extruded-pellet feed moved slower than steam-pelleted feed due to the lower density of the latter. De Silva and Owoyemi (1983) reported that the specific gravity of the diet affects its rate of passage through the gut. The above observations raise some doubt regarding the use of external markers, This points out to the need of more extensive controlled experiments to determine artd evaluate the degree of accuracy in digestibility estimates obtained using external markers as against the use of internal markers and the direct method.
Of the internal markers (Table 2) that are generally used in digestibility estimations, CF has shown to be assimilated to a very small extent at least by certain species (Niederholzer and Hofer 1979; Van Dyke and Sutton 1977) and similarly even a small fraction of HR.OM from the detriial aggregate by Tilapia mossambica (Bowen 1981). Thonney (1981) demonstrated that deliberate
·addition to supplement an endogenous marker, in this case a supplement to HR.A (or Acid Insoluble Ash-AIA) increased the precision of the measurements. These observations were endorsed by Atkinson et al. (1984) who used celite to supplement HR.A in their practical diets for rainbow trout. De Silva and Perera (1983) compared the validity of HR.OM, HR.A and CF as markers based on experiments with the Asian cichlid, Etroplus suratensis (Bloch) fed the aquatic weed, Hydrilla and concluded that HR.OM was the most appropriate on the basis of the degree of precision that could be achieved in quantification.
Table 2. The chief individual components of int_emal markers used in digestibility studies.
Marker
CF HROM HRA (=AIA)
Components
Cellulose and lignin fractions Cellulose, chitin Minerals, ash resistant to acid d.igestion; primarily silica

39.
The use of indigenous markers in · digestiblity . estimates are gradually gm.rung favour (Atkinson et al. I984; Hilton and Slinger I986). This is partly because of the increasing awareness of the hazards involved in the determination of Cr which is the most widely used external marker, and the increasing degree of preeision that could be achieved with internal markers with or without supplementation. Moreover, it has been shown .that in poultry, external· indicators tend to separate from the feed or are excreted with a diurnal pattern variation thereby making complete recovery of the indicator in the faeces difficult (Thonney et al. I984).
In essence there is still a controversy as to whether internal or external indicators are more. suitable and or reliable and which specific ones are to be used in digestibility estimations in fish.
· The balance of evidence tends to indicate that· indigenous markers,. which are found in appreciable quantity in the diet, are more suitable than external markers. For example, when · using AIA as a marker Thonney et al. (1984) recommend that it is desirable that the diet contains · AIA in excess of 0.75%. Utilization of .an internal and or an indigenous marker also eliminates an additional step of mixing the marker into the diet. ·
Ch~mical Analysis
Whichever indicator is finally chosen upon,· apart from dry-matter digestibility estimates made using total faecal collections · all the other ei;timates of dry-matter and nµtrient digestibilities involve chemical analyses of feeds and the faecal matter for the indicators as well as for the nutrient component(s) that are being evaluated. It is not intended here to go into methods of detailed chemical analyses. the original authorities for the ·indigenous markers are cited in Table I and summarized by De Silva (1985b). In addition most of the methods are given in the AOAC (1980).
Digestibility Experiments
Digestibility experiments are basically of two kinds; th~se experiinerits which are designed to determine the digestibility of a diet and its nutrient components and those designed to evaluate the digestibility of a test ingredient and its nutrients .. The steps_. involved for the former estimations could be schematically indicated as follows:
Diet Mixing IA
+ Decision on Internal or External Market
IB
Nutrient Analysis of prepared diet
IC
+

40
Commence · feedlng
lD (minimum five days
acclimatization to the diet)
+· Collection ·of faeces
non-quanutative lE
(time of collection,·pqoling of faecal samples, etc., to be decided on the basis of the
experiment, the amount of faecal material collected, etc.)
t estimation of dry matter, nutrients and l.ndicator
estimations in the faeces lF
t Calculations
(Cho et al. 1985) 10 .
Evaluation of Digestibility ofa Single Dietary Ingredient and its Nutrients
. . . .
A single ingredient, particularly a plant component when fed to fish, is not readily accepted and may also influence the digestive physiology so that a true indication of the extent of· its digestibility niay not be obtained. Therefore, to evaluate the digestibility of a single ingredient a test diet arid a reference diet are used, their diy-matter and nutrient digestibilities determined independently as described earlier. The steps involved could be summarized as follows: ·
Reference diet (RD) -- as used in the earlier.case Test diet. (TD) · -- 70% RD + 30% test ingredient.
Group I -- determine digestibility of RD as· indicated earlier (steps lA to lG)
Group II -- feed TD -- collect faeces and analyze ·as _in step lF · t . Calculations
(Cho et al. 1985)

41
Briefly, the Apparent Digestibility Coefficient (ADC) of the Test Ingredient is calculated by the ratio: ·
ADC of TD- 0.7 ADC of RD ADC of Test Ingredient =
0.3 ADC of TD
General Aspects
Within the framework of the above basic concepts the experiments could differ in detail, depending on the objective. Details such as, for example, the time of collection of faeces, pooling of faecal samples, the feeding regime to be adopted, etc. could vary. Nevertheless, in all digestibility experiments certain basic precautions need to be adopted. These could be summarized as follows: ·
(i) fish should be acclimatized to the diet and the selected feeding regime for a minimum of 3 to 5 days, preferably more,
(ii) a host of factors are known to influence apparent digestibility of diets and nutrients (Table 3) and therefore, care should be taken to minimize/reduce these influences: such as for, e.g., the fish should be of uniform size, and
(iii) the design of the experimental tanks should be such that leaching of nutrients from faeces, mixing of food particles and faeces, and. mechanical breaking up of faecal particles when collections are made minimized. That is the system should be geared for collection of a representative faecal sample. The "Guelph System (CYAQ-2)"
Table 3. Some factors known to affect or investigated for their influence on the apparent dry-maner or nutrient digestibility.
Factor
Feeding level, meal size
Size, age, density
Dietary components -protein, lipid, fibre, etc.
Type of nutrient (e.g., protein)
Physical state of diet
Protein: Energy ratio
Temperature, salinity
Species
Clarias gariepinus Cyprinus carpio Salmo gairdneri
S. gairdneri
S. gairdneri
Oreochromis·niloticus S. gairdneri S. gairdneri 0. niloticus
S. gairdneri
S. gairdneri
C. carpio
S. gairdneri Colisa fasciatus 0. niloticus
Authority
Henken e~ al. (1985) von Gongnet et al. (1987) Windell et al. (1978)
Hastings (1969); Windell et al. (1978)
Rychly & Spannhof (1979) Cho et al. (1976) De Silva & Perera (1984) . Beamish & Thomas (1984) Hanley (1987) De Silva & Perera (1984)
Nose & Toyama (1966)
Bergot & Breque (1983)
von Gongnet et al. (1987)
Windell et al. (1978) Pandey & Singh (1980) De Silv.a & Perera (1984) ·

42
. developed by Cho ei al. (1976) meets most of the above criteria and also permits · three replicates to be carried out simultaneouly. The methods rised for obtaining a representative faecal sample has been summarized by Noue and Choubert (1986) and the merits and demerits enumerated. It is claimed by these authors that the automatic faeces. collector developed by Choubert et al. (1982) meets most of these inadequacies and also permits collection of faeces over a long-term, and therefore enables the use of the direct method of digestibility estimation.
(iv) the time gap between collection of. f~eces and the last feeding should be kept· constant, and
(v) as. far as pos~ible the experiment~ tanks should be distributed randomly and favourabl~ environmental conditions· such as adequate oxygen,· proper pH, constant
· light and dark regimes, etc. provided.
Estimation of Digestibility of Food in Natural Populations .
As mentioned earlier estimations of digestibility in natural populations could be relevant to understanding its failure or success. It is also becoming increasingly apparent that under tropical culture conditions the naturally produced food in the system is utilized (Little and Muir 1987) .
. Therefore, estimations .of this contribution will provide· a further tool for manipulation of this naturally produced resource to the benefit of the farmer.
Digestibility studies on natural fish populations are very few (Bowen 1981; De Silva et al. 1984; De Silva 1985a). In digestibility estimations of natural populations, it is assumed that contents in the stomach are representative of the previously ingested material and material about to be voided in the rectal region. Based on this assumption, the concentration of an indigenous · marker such as CF, HR.OM, ·HRA and or ash (De Silva et al. 1984) in the rectal contents as compared to that in the stomach contents is estimated. Similarly, the nutrient components in the storp.ach and the rectal contents. are evaluated and the digestibility (total) of the individual nutrients calculated using ah indigenous component as"the marker. The very narrow coefficieIJ.ts of variation in the estimations between individual fish taken from the same locality is ·perhaps
. indicative of the validity of the assumptions made · as well as the validity of the method. This approach has the advantage that the individual fish are not distµrbed before their capture (death) and as such the results obtained will be a reasonable reflection of the natural state. De Silva et al. (1984) also pointed out that ash could be used reliably, to estimate digestibility, and argued that this was possible because the ingested material in 0. mossambicus has a high proportion of ash; even if ash was assimilated to a small extent, the final estimations would not be affected to a . significant extent. Use of a,sh as a marker relieves the· investigators and saves the problem of performing intricate chemical analyses. The validity of this observation however, has to be tested for other species with comparable food habits. ·
Future Trends in J?igestibility Research
There· is an increasing amount of research in the region, as elsewhere on the evaluation of the -suitability of locally available plant products incorporated into practical diets.

43
The first step in this screening would be to determine the digestibility (total and nutrient) of theindividual ingredients by different species, and within a species at different stages of growth. However, screening of all plant ingredients with a potential would be an uphill task for any one group of researchers. It is suggested therefore, that basic criteria be developed to determine the potential suitability of plant ingredients based on the proximate composition, amino acid profile, presence of growth inhibitors, fibre content, etc. and ingredients representative of each group be chosen for further experimentation. In determining the suitability for further experimentation the availability, cost and experimental work carried out hitherto on these should be taken into consideration.
Unlike in terrestrial animals, husbandry practices have received little attention in fish culture practices. It has been demonstrated that the daily food consumption in fish is variable (Smagula and Adelman 1982; De Silva et al. 1986). This daily variability is likely to have an influence on digestibility (De Silva and Perera 1984) about which little is known. Investigations on diurnal variation in digestibility may also provide another means of adjusting the quantity of food· presented or provide mixed dietary regimes of low and high protein content and thereby provide a means of reducing feed costs.
Standardization of the techniques in faecal collection, pooling of faecal collection for chemical analysis and time of collection of faeces are desirable. In the scientific literature in most instances these details are not presented. It is possible that somewhat contradictory observations that have been made on the influence of various environmental and other factors such as size on digestibility could be at least partially a result of such differences.
An aspect of digestibility in fish which has received scanty attention is the role of microbes. Although microbes may be of lesser or insignificant importance in digesting pelleted, low fibre diets they may be of importance for herbivorous and omnivorous species (Moriarty 1976; Trust. et al. 1979). In tropical Asia, a good number of cultured fish are herbivore/omnivore types and are known to obtain significant quantities of food from what is produced naturally in the system. In such a context? it will be important to assess the role of microbes in digestion with a view to providing more optimal conditions for effective utilization of such food materials.
References
Association of Official Analytical Chemists. 1980. Official methods of analysis, Washington, DC, USA. Atkinson, J.L., J.W. Hilton and S.J. Slinger. 1984. Evaluation of acid-insoluble ash as an indicator of feed digestioility in rainbow tiout (Sal#W
gairdneri). Canadian Journal of Fisheries and Aquatic Sciences 41: 1384~1386. Austreng, E. 1978. Digestibility determinations in fish using chromic oxide marker and analysis of contents from different segments of the
gastrointestinal tract. Aquaculture 13: 265-272. Beamish, F.W. and E. Thomas. 1984. Effect of dietary· protein and lipid.nitrogen losses in rainbow trout, Salf7W gairdneri. AquacultUre 41: 359-
371. Bergot, F. and J. Breque. 1983. Digestibility of starch by rainbow trout: effects of physical state of starch and of the intake level. Aquaculture 34:·
203-212. Bowen, S.H. 1978. Chromic acid in assimilation studies - a caution. Transactions American Fisheries Society 107: 755-756. Bowen, S.H. 1981. Digestion and assimilation ofperiphytic detrital aggregate by Tilapia f7Wssambica. Transactions American Fisheries Society
110: 239-245. Buddington, R.K. 1979. Digestion of an aquatic macrophyte by Tilapia· zilli. Journal of Fish Biology 15: 449-456. Buddington, R.K. 1980. Hydrolysis resistant organic matter as.a reference for measurement for fish digestive efficiency. Transactions American
Fisheries Society 109: 653-656. . Cho, C.Y., H.S. Bayley and S.J. Slinger. 1974. Partial replacement of herring meal with soybean meal and other changes in a diet for rainbow
trout (Salf7W gairdneri). Journal of Fisheries Research Board, Canada 31: 1523-1528. Cho, C. Y., H.S. Bayley and S.J. Slinger. 1976. Influence of level and type of dietary protein, and level of feeding on feed utilization by rainbow
trout. Journal of Nutrition 106: 1547-1556. · Cho, C.Y., C.B. Cowey and T. Watanabe. 1985. Methodological approaches to research and development. In C.Y. Cho,'C.B. Cowey and T.
Watanabe (eds.) Finfish Nutrition in Asia, pp. 10-80. International Development Research Centre (Canada), Ottawa. Choubert, O., J. de la Noue and P. Luque!. 1982. Digestibility in fish: improved device for the automatic collection of feces. Aquaculture 29: 185-
i89. . . .
Crampton, E.W. and L.A. Maynard. 1938. The relation of cellulose .and lignin content to the nutritive value of animal feeds. Journal of Nutrition 15: 383-395.

44
De Silva, S.S. 1985a. Body condition and nutritional ecology of Oreochromis mossambicus (Pisces, Cichlidae) populations of man-made lakes in Sri Lanka. Journal of Fish Biology 27: 621-633.
De Silva, S.S. l 985b. Evaluation of the use of internal and external markers ·in digestibility studies. In C. Y. Cho, C.B. Cowey and T. Watanabe (eds.) Finfish Nutrition in Asia, pp. 96-102. International Development Research Centre (Canada), Ottawa. ·
De Silva, S.S. and A.A. Owoyemi. 1983. Effect of dietary quality on the gastric evacuation and intestinal passage in Sarotherodon mossambicus (Peters) fry. Journal of Fish Biology 23: 347-355.
De Silva, S.S. and M.K. Perera. 1983. Digestibility of an.aquatic macrophyte by the cichlid Etroplus suratensis with observations on the relative merits of three indigenous components as markers and daily changes in protein digestibility. Journal of Fish Biology 23: 675-684.
De Silva, S.S. and M.K. Perera. 1984. Digestibility iii Sarotherodon niloticus fry: effect of dietary protein level and salinity with further observations on daily variability in digestibility. Aquaculriire 38.: 293-306. ·
De Silva, S.S., M.K. Perera and P. Maitipe. 1984. Food, nutritional status and digestibility of Sarotherodon mossambicus populations of twelve man-made lakes in Sri Lanka. Environmental Biology of Fishe·s 11:205-219.
De Silva, S.S., C. Keembiyahetty and R.M. Gunasekera. 1986. Optimum ration and feeding frequency in Oreochromis niloticus young. In J.L. Maclean, L.B. Dizon and L.V. Hosillos (eds.) The First Asian Fisheries Forum, pp. 559c564. Asian Fisheries Society, Philippines.
Edin, H. 1918. Orienterande forsok over anvandbarheten av en pa. "ledkr~ppsprincipen" grundad metod alt bestamma en foderblandings smaltbarhet. Forsoksvasendet Jordbruk Stockholm Medd: stands 165: 1-28. ·
Fange, R. and D. Grov~. 1979. Digestion. In M.B. Brown (ed.) The Physi~logy of Fishes, Vol. VIIl, pp. 162-260. Academi~ Press, London. Furukawa, A, and H. Tsukahara. !966. On the acid digestion method for the determination of chromic oxide as an index substance in the study of
digestibility in fish feed. Bulletin of the Japanese Society of Scientific Fisheries 32: 502-506. Hanley, F. 1987. The digestibility of foodstuffs and the effects of feeding selectivity on digestibility determinations in tilapia, Oreochromis
niloticus Aquaculture 66: 163-179. . . Hastings, W.H. 1969. Nutritional scores. In O.W. Neuhaus and J.C. Halver (eds.) Fish in Research, p. 263-293. Academic Press, New York. Henken, A.M., D.W. Kleingeld and P.A.T. Tijssen. 1985. The effects of feeding level on apparent digestibility of dietary dry matter, crude protein
· and gross energy in the African catfish Clarias gariepinus.(Burchell 1822). Aquaculture 51: 1-11. Hickling, C.F. 1966. Oil the feeding process in the white amur Ctenopharyngodon idella. Journal of Zoology, London 148: 408-419. Hirao, S., J. Yamada and R. Kikuchi. 1960. On improving efficiency of feed for fish culture. I. Transit and digestibility of diet in eel and rainbow
trout observed by use of P32. Bulletin of the Tokai Regional Fisheries Laboratory 7: 67-74. Hilton, J.W. and S.J. Slinger. 1986. Nutrition and feeding of rainbow trout. Canadian Fisheries· and Aquatic Sciences, Special Publication 55: 15
p. Hilton, J.W., C.Y. Cho and S.J. Slinger. 1981. Effect of extrusion processing and steam pelleting diets on pellet durabilit)', pellet water absorption
and physiological response of rainbow trout (Sa/mo gairdneri R.). Aquaculture 25: 185-194. Kapoor, B.G., H. Smit and I.A.· Verighina. 1975. The alimentary canal and digestion in teleosts. In F.S. Russel and C.M. Young (eds.) Advances
in Marine Biology, pp. 105-239. Academic Press, London. · Leavitt, D.F. 1985. An evaluation of gravimetric and inert marker techniques to measure digestibility in the American lobster. Aquaculture 47:
131-142. Lied, E., K. Julshamn and O.R. Braekkan. 1979. Determination of protein digestibility in Atlantic cod (Gadus morhua) with internal and external
· indicators. Canadian Journal of Fisheries and Aquatic Sciences 39: 854-858. · . Little, D. and J. Muir. 1987. A guide to integrated warm water aquaculture. University of Stirling, Scotland, 238 p. Moriarty, D.J.W. 1976. Quantitative studies on bacteria and alg·ae in the food of the mulet Mug ii cephalus L. and prawn Metapenaeus bennettae
(Racek & Dall). Journal of Experimental Marine Biology and Ecology 22: 131-143. Niederholzer, R. and R. Hofer. 1979. The adoptatioil of digestive enzymes to temperature, season and diet in roach Rutilus rutilus L. and rudd
Sardines erythrophthalamus L. Cellulase. Journal Fish Biology 15: 411-416. Noue, J. dda and G. Choubert. 1986. Digestibility in rainbow trout:·Comparisons of the direct and indirect methods of measurement. Progressive
Fish-Culturist 48:190-195. Nose, ·T. and K. Toyama. 1966. Protein digestibility of brown fishmeal in rainbow trout. Bulletin Freshwater Fisheries Research Laboratory 15:
213-224. Pandey, H.S. and R.P. Singh. 1980. Protein digestibility by Khosti fish Colisa fasciatus (Pisces, Anabantidae) under the influence of certain
factors. Acta Hydrochimica Hydrobiologia 8: 583-585. Rychly, J. and L. Spannhof. 1979. Nitrogen balance in trout. 1. Digestibility of diets containing varying levels of protein and carbohydrater. .
. Aquaculture 16: 39-46. Smagula, 0.M. and I.R. Adelman. 1982. Day to day variation in food consumption by largemouth bass. Transactions American Fisheries Society
111: 543-548. Tacon, A.G.J. and P.N. Fems. 1979. Activated sewage sludge - a potential animal foodstuff. 1. Proximate and mineral content: seasonal variation.
Agriculture and Environment 4: 257-269. Tacon, A.G.J. and A.M.P. Rodrigues. 1984: Comparisor;i of chromic oxide, crude fibre, polythylene and acid-insoluable ash as dietary markers for
the estimation of apparent digestibility coefficient in rainbow trout. Aquaculture 43: 391-399. Tacon, A.G.J., J. V. Haaster, P.B. Featherstone, K. Kerr and J.A. Jackson. 1983. Studies on the utilization of full-fat soybean and solvent extracted
soybean meal in a complete diet for rainbow trout. Bulletin of the Japanese Society for Scientific Fisheries 49: 1437-1.443. Talbot, C. 1985. Laboratory methods in fish feeding and nutritional studies. In P. Tytler and P. Calow (eds.) Fish Energetics: New Perspectives, p.
125-154. Croom Helm Publishers, London. Thonney, M.L. 1981. Acid insoluble ash as a digestion marker. Proceedings Cornell Nutrition Conference for Feed Manufacturs, p. 118-120.
Cornell University, Ithaca, New York. · Thonney, M.L., B.A. Palhof, M.R. Decarlo, D.A. Ross, N.L. Firth, R.L. Quaas, D.J. Perosio, D.J. Duhaime, S.R. Rolline and A.Y.M. Nour. 1984.
Sources of variation of dry matter digestibility measured by the a<;:id insoluble l1.Sh marker. Journal of Dairy Science 69: 661-668. Trust, T.J., M. Bull, B.R. Currie and J.T. Buckley. 1979. Obligate anaerobic bacteria in the gastrointestinal microflora of the grass carp
(Ctenopharyngodon idella),goldfish (Carassius auratus), and rainbow trout (Sa/mo.gairdneri). Journal Fisheries Research Board, Canada 36: 1174-1179.
Van Dyke, J.M. and D.L. Sutton. 1977. Digestion of duckweek (Lemna spp.) by grass carp (Ctenopharyngodon idella). Journal of Fish Biology 11: 273-278. .

45
Van Keulen, J. and B.A. Young. 1977. Evaluation of acid-insoluble ash as a natural marker in ruminant digestibility studies. Journal of Animal Science 44: 282-287.
Von Gongnet et al. 1987. The influence of different protein/energy rations and increasing feeding level on nitrogen excretion in growing mirror carp (Cyprinus carpio L.) Journal of Animal Physiology and Animal Nutrition 58: 173-188.
Windell, J. T., J. W. Foltz anci"J.A. Sarokon. 1978. Effect of fish size, temperature and amount fed on nutrient digestibility of a pelleted diet by rainbow trout, Salmo gairdneri. Transactions American Fisheries Society 107: 613-616. ·

Considerations for Feeding Experiments . to Quantify Dietary Requirements
of Essential Nutrients in Fish
YVONNE N. CHIU College of Fisheries
University of the Philippines in the Visayas 5000 Iloilo City
Philippines
Chiu, Y.N. 1989. Considerations forfeeding experiments to quantify dietary requirements of essential nutrients in fish, p. 46c57. ln S.S. De Silva (ed.) Fish Nutrition Research in Asia. Proceedings of the Third Asian Fish Nutrition Network Meeting. Asian Fish. Soc. Spec. Puhl. 4, 166 p. Asian Fisheries Society, Manila, Philippines.
Standard. methods in feeding experiments conducted to quantify nutrient requirements· in fish are needed so that results are widely applicable and comparisons can be made between studies. Environmental factors th.at affect growth ·Should be optimal. Th.ese parameters, including aspects of the experimental setup that influence water quality should be reported .. Characteristics of the fish that influence its growth response including strain, s.ize. state of maturation, sex, among others need to be specified. The composition of diets and feeding managements should provide for maximum growth. Both feeding rate and feeding frequency contribute to differences in growth response and feed efficiency. Consideration of the objectives in an investigation should be made in the choice of method and diet. Other parameters such as tissue levels of nutrients can be used as adjuncts to the analysis of the growth response but cannot be used alone. The experiment should anempt to answer 'one question and the design should aUow for proper statistical analysis. Nutrient interaction contributes to differences in requirements and the response to deficiency, so levels of interacting nutrients should be reported.
The worldwide expansion of fish culture has resulted in a considerable increase in its contribution to fish production. Information on the nutrition of fish is important in promoting further development of fish culture, but has lagged behind that of other farmed animals. Among fish, the nutrient requirements of coldwater chinook salmon and rainbow trout (NRC 1981), and warmwater chanriel catfish and common carp (NRC 1983) have been most studied. Scanty information is available on other species such as the tilapias, milkfish and the different species of Indian and Chinese carp that are widely cultured in Asia. Most of the reported requirement levels have been determined using feeding studies with growth as the primary response parameter. Feeding trials remain the most useful method in obtaining results that have direct application to feeding practices. Thus, the validity of other parameters. of measurement, such as carcass deposition or tissue and plasma levels of nutrients are often verified by comparison with the conventional growth response curve. Although widely accepted, this method takes time to conduct and permits the evaluation of one nutrient at a time.
There are more. species of fish than there are of mammals and their dietary nutrient requirements and feeding habits are as varied as those of mammals. Many of the feahlfes of methods for assessing nutrient requirements in fish however, are common because the aquatic environment provides common limitations and problems. Standardizing methods for requirement studies would result in the increased applicability of results and allow the comparison of results,
46

47
intra and inter specifically. Much effort has been directed towards this goal and guidelines for the· standardization of experimental design and evaluation have been formulated (Castell and Tiews 1980). .
The objective of this paper IS to identify the major issues in nutrient requirement studies involving feeding trials. The factors that influence the reported requirements are emphasized,· so that these parameters can be defined and considered in the planning of experimental designs.
Environmental Conditions . . - . . . -. ' . . -
In feeding experiments .• the experimental tanks should be set up such that the environment is favorable for.maximum growth of the fish. Environmental factors inf1uence growth through four different ways: 1) terpperature and pH, as controlling factors, govern rates of reaction and consequently the rate of food consumption, 2) oxygen, carbon_ dioxide, ammonia and nitrite; as limiting factors for growth are involved in restricting the Supply or removal of metabolites as links in the metabolic chain, 3) salinity and turbidity are masking factors in that they modify the effect of other environmental, factors through regulation, and 4) light quility and photoperiod, as directive factors, cue the fish to select or respond to particular characteristics of the ·environment (Fry 1971; Brett 1979). ·. . . . . · ' ' The quality of water is influenced PY the fish biomass (weight x density), the velocity of
water flow and the source of water. Water may be recirculated or flowing through, exposed to treatment (filtration,. exposure to 0 3, UV, etc.) or riot at all .. A flow thro~gh system, designed to remove extraneous sources of nutrient~ is preferred. the various environmental parameters that affec;t rate of growth should be uniform in all tanks and should be defined. ·
·.Experimental Fish
The species. used in feeding studies should be identified by its scientific and commori name. The size, age; state of maturation, sex· and strain affect growth and therefore should be reported. Body stores of nutrients can· affect nutrient requirement as high levels may reduce the minimum level for maximum response or lengthen the assay time to produce a deficiency. This can be.· defined by determining preassay levels of nutrients, or providing infonnation on the source'of .fish and previous . reanng conditions ' including the feed used and the ' conditions during acclimation. Gradual conditioning tb the experimental diet and set-up is necessary in· attaining maximum growth response. · · · ·
!dentijication and analysis of diets and irtgreditnts
Experimental Diet
In order to standardize the· identification of diets and dietary· irigredients, the foll recognized name and .International Feed Number of allingredieilts' should be given for all prepared feeds. If this is not possible, source, species and part' of material from which ingredients were prepared should· he given together with.details of stage of maturity, grade and processing method. The chemical formula and quality of mineral components and forms and quality of vitamins should be reported. If a commercially prepared diet or ingiedient is used, ~he full name of the diet and manufacturer, '\vith the manufacturer's code.and lot number should be given (~astell and Tiews· 1980); ' ',

48
The chemical composition of diets is usually defined by the standard proximate composition (AOAC 1984) following the analysis of diets and feedstuff by the Weende System. This broadly divides the material into six fractions, namely: moisture; crude protein, crude fibre, crude fat or ether extract, mineral matter or ash and nitrogen-free extract. The moisture content is defined·as the loss of weight of a sample dried to corn~tant weight but not longer than 24 hr at 104 °C. Crude protein is defined as the product of 6.25 (assumes protein contairis 16% N) ttmes the nitrogen content of the sample, usually analyzed using the Kjeldahl method. It provides a crude estimate of protein content because not all protein contains 16% N and not all N-containing compounds are proteins (e.g., ammoniacal nitrogen containing materials such as urea, amino acids, amides, . glycosides,.etc.). The crude fibre fraction includes all materials that are insoluble in boiling weak acids and bases, less the ash content of this residue. Although it mainly. consists of the fibrous materials like cellulose, lignin and chitin, the separation is not complete and is at best an
. approximation of materials that are of low digesti~ility. Crude fat is determined by extracting ground samples continuously for a few hours with ether. The ·ash 'fraction is that portion remaining after burning off all organic material in a muffle furnace beyond 500°C. The ash fraction doe~ .not indicate the spedfic elements present and may include carbon from organic matter as carbonate when base forming minerals .are in excess. The nitrogen-free extract (NFE) generally includes the more digestible carbohydrates, mostly sugars and starches. It also includes some of the more soluble hemicellulose and lignin. This fraction is not determined directly but is determined.by the difference between 100· and the other five fractions. The errors of the other analyses would therefore be added in the determination of NFE.
The composition of feeds may be expressed on the basi.s of its dry matter content and this should be specified either as: 1) fed on wetbasis, 2) air-dry basis or 3) oven-dry or moisture-free · basis. Moisture content should be provided on the first .two expressions ·so that data can be converted to dry basis. . · . . . . ·
The standard proximate analysis does not define the concentration of the individual required nutrients. Additional analyses to determine the concentration of nutrients under study of the nutrients that niay affect the requiiement levels should be conducted: The pH .of the diet shoulcll be monj.tored and adjusted to neutrality. Studies have shown that diets which are acidic result in poor growth and feed efficiency (Nose et al. 1974; Wilson et ai.1977; Deshimaru et al. 1982).
Fish, like many terrestrial animals; regulate food· consumption to attain a certain level of energy 'intake, so that expressing some nutrient concentration relative fo the dietary energy level is very useful. This is exemplified by expressions of dietary protein requirements (Cowey 1979) .
. ·At present, researchers express dietary energy as total, digestible or metabolizable energy. and use niany different methods for estimating these values {Jobling 1983). The experimental determination of. metabolizable. energy has been performed extensively only for trout· (NRC 1981) and reported values for other species have been calculated from unreliable assumptions. Jobling (1983) noted.that the use of caloric conversion coefficients and assumed digestibility can lead to seriou~ errors since these values change with many factors including the species of fish, quality of nutrient and rate of inclusion. He suggested that total and. digestible nutrients should be measured directly. Consideration should also be made on the protein intake and the balance between digestible protein.and energy because thes~ affect the metabolizable and net 'energy of fish diets (Cho and Kaushik _ 1985). In many cases, it is not possible to perform digestibility measurements prior to a nutrient requirement study because of technical, financial or manpower problems. Because ingredients used for nutriorit requirement .studies are relatively pure and digestible and are added within certain levels which are known to be optimal, it would be better to assume digestibility values to attain diets of an approximate energy content than not to consider dietary energy at all. The values used by Jauncey (1982) for tilapia, namely: 4Skcal/g protein (Smith 1971), 8.5 kcal/g dextrin (Chiou and Ogino 1975) would assume about 90% .
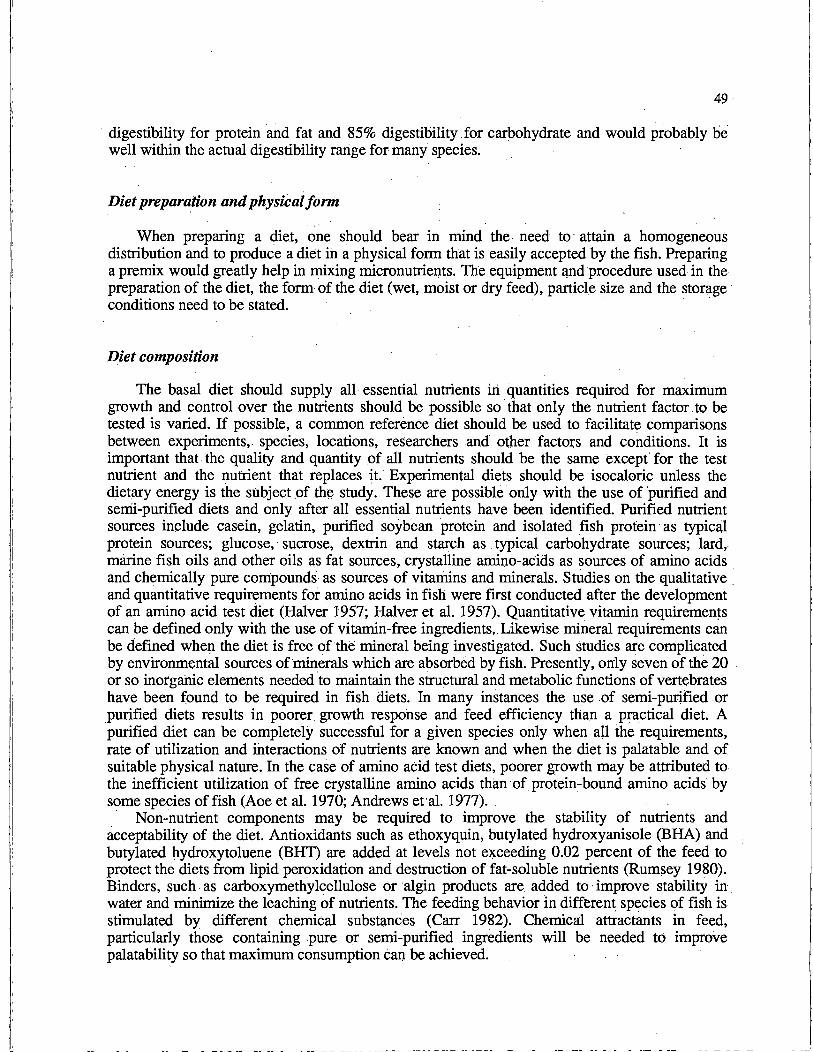
49
· digestibility for protein and fat and 85% digestibility for carbohydrate and would probably be well within the actual digestibility rarige for many species.
Diet preparation and physicalfonn
When preparing a diet, one should bear in mind the need to· attain a homogeneous distribution and to produce a diet ih a physical form that is easily accepted by the fish. Preparing a premix would greatly help in mixing micronutrie:Q.ts. The equipment and procedure used in the preparation of the diet, the form of the diet (wet, moist or dry feed), particle size and the storage conditions need to be stated. · ·
Diet composition
The basal diet should supply all essential nutrients iii quantities required for maximum growth and control over the nutrients should be possible so that only the nutrient factor.to be tested is varied. If possible, a common reference diet should be used to facilitate comparisons between experiments,. species, locations, researchers and other facto:r:s and conditions. It is important that the quality and quantity of all nutrients should be the same except fot the test nutrient and the nutrient that replaces it. Experimental diets should be isocaloric unless the dietary energy is the subject of the study. These are possible only with the use of 'purified and senii-purified diets and only after all essential nutrients have been identified. Purified nutrient sources include· casein, gelatin, purified soybean protein and isolated .fish protein · as typical protein sources; glucose, · sucrose, dextrin and starch as typical carbohydrate sources; lard,. marine fish oils and other oils as fat sources, crystalline amino-acids as sources of amino acids and chemically pure compounds as sources of vitamins and minerals. Studies on the qualitative . and quantitative requirements for amino acids in fish were first conducted after the development of an amino acid test diet (Halver 1957; Halver et al. 1957). Quantitative vitamin requiremen~s can be defined only with the use of vitamin-free ingredients, Likewise mineral requirements can be defined when the diet is free of the mineral being investigated. Such studies are complicated by environmental sources of ·minerals which are absorbed by fish. Presently, only seven of the 20 . or so inorganic elements needed to maintain the structural and metabolic functions of vertebrates have been found to be required in fish diets. In many instances the use of semi-purified or purified diets results in poorer. growth response and feed efficiency than a Practical diet. A purified diet can be completely successful for a given species only when all the requirements, rate of utilization and iilteractions of nutrients are known and when the diet is palatable and of suitable physical nature. In the case of amino acid test diets, poorer growth may be attributed to the inefficient utilization of free crystalline amino acids than ·of protein:-bound amino acids by some species of fish (Aoe et al. 1970; Andrews et·al. 1977).
Non-nutrient components may be required to improve the stability of nutrients and acceptability of the diet. Antioxidants such as ethoxyquin, butylated hydroxyanisole (BHA) and butylated hydroxytoluene (BHT) are added at levels not exceeding 0.02 percent of the feed to protect the diets from lipid peroxidation anci destruction of fat-soluble nutrients (Rum~ey 1980). Binders, such . as carboxymethy !cellulose or algin products are added to improve stability in water and minimize the leaching of nutrients. The feeding behavior in different species of fish is stimulated by different chemical substances (Carr 1982). Chemical attractants in feed, particularly those containing pure qr semi-purified ingredients will be needed to improve palatability so that maximum consumption can be achieved.

50
Table 1. Factors that have been demonstrated to alter nutritional requirements of fish.
Required Change in Species Nutrient Requirement Parameter Change in Parameter
Ictalurus punctatusl protein 35%->25% fish size 14g~>l14g Cyprinus carpio2 Sa/mo gairdneri2 protein 59%->35% rate of feeding 2.5% - >3.5% of body weight. Sa/mo gairdneri3 protein 50-60->40% rate offeeding restricted - >satiated Onchorynchus tshawytscha4 .protein 40%->55.% temperature 8.3°C ->14.4°C Sa/mo gairdneri5 protein 40%->45% salinity 10 ppt - >20 ppt . Salina gairdneri6 arginine 3.0% - >2.5%. salinity freshwater.- >seawa.ter Sa/mo gairdneri1 arginine 4.2%->3.5% rate of feeding restricted - >satiated Sa/mo gairdneri1 arginine increase . electrolyte balance 0 meg/kg - >200 meg/kg
Sa/mo gairdneri8 tocopherol increas·e (Na+ K-0) temperature decrease
1-Page and Andrews 1973; 2-0gino 1980; 3-Cho et al. 1976; 4-De Long et al. 1973; 5-Zeitoun et al. 1973; 6-Kaushik 1979; 7-Chiu et al. 1988; 8-Bell and (;owey 1985.
Management of Feeding
Proper management of feeding is important for the attainment of maximum growth and feed efficiency. It involves the management of feeding rate .and frequency. Both parameters vary with many factors including the species and size of fish, water temperature and dietary energy level. Even with the same species of fish, inanagement of feeding practices vary among different groups of researchers. · · ·
Feeding rate
The rate of feeding affects nutrient intake and feed efficiency. The accuracy of measurement of these two parameters on the other hand, depends on the feeding rate as excess feeding may lead to leaching; Limiting the amount of feed available may not permit the fish to reach its full growth potential. The method of determination of feeding rate would therefore depend oh the objective of specific studies.
The methods of deten:nining feeding rate can generally be Classified into: 1) feeding at a given percentage of body weight, and 2) feeding to satiation. Feeding at a certain percentage of body weight is a simple and common practice. The me.thod does not take into consideration the exponential (Y = a-b log X) relation between the capacity of the stomach (in % of body weight) and fish weight (Brett 1971), so that the level of dietary restriction is not the same (greater at the earlier stage). The feed given can be restrictive, thereby limiting the potential for growth resulting from an experimental diet; or it can be in excess of consumption. The latter makes it difficult to quantify any depression of feed intake or to measure feed efficiency and many even caqse the degradation of water quality. Feeding to satiation corrects these problems but requires more effort to conduct. However, the determination of the point of satiation is subjective.
Nutrient requirements of fishes have been demonstrated to differ yvith .feeding rate. Lower requirement for protein (Cho et al. 1976; Ogino 1980) and for arginine (Chiu et al. 1988) has been demonstrated when trout is fed at a higher rate (Table 1). At the required levels, ,the total arginine fed per day using the two feeding rates were found to be comparable (Chiu et al. l 988). The requirements for nutrients should therefore not only. be expressed in concentrations such as percentage but also in terms of intake (g nutrient kg body weight-I day-1 ).
l
I

51
Feeding frequency
Growth and feeding frequency are positively related. Fish at· the higher feeding regime naturally grow faster. However, there is a maximum limit to extensive feeding at which the increase is negligible wheri considering the amount of food given (Chua and Teng 1978), and
· this is defined as the optimal feeding frequency. Optimal fe~ng frequency differs among different species of fish which vary considerably in gut morphology and is influenced by other factors such as fish size and meal size (Table 2)~ 'The use of optimal feeding frequency to attain the best growth response in nutrient requirement studies is preferred; however, the· mairi objective of the experiment should talce priority: For example,. increased number of feedings per· day is suggested when a study involves . the use of amino acids because the utilization of . crystalline amino acids improve with increased feeding (Yamada et al.)981): Increased number of feedings is also suggested for fishes at the earlier stages of developmentto minimize leaching -of diets prepared in fine particulates.
Table 2. Feeding frequency required to promote optimum growth and feed efficiency in different species ~f fish ..
-Optimum Initial Species of fish feeding frequency_ fish size Reference
Cyprinus carpio 3 x I day 0.17 g Charles et al. 19S4 Chanos chanos 8 x I day_ 0.60g Chiu et al. i9S7b Salmo gairdneri 2x/day 7.6-16.0 g Grayton and Beamish 1977 Epinephelus lauvina .lx2/days 70g Chua & Teng 1978 Heteropneusles fossilis 1-2 x I day 4.5-9 g Marian et al. 1982
Singh & Srivastava 1984 lctalurus puf!ct4tus 2 x/day Andrews and Page 1975 Channa striatus 1 x I day 0.66g Sampath 1984 Clarias lazera continuous. 0.5 g Hogendoom 1981 Oreochromis niloticus 1 x I day 6:8 g De Silva et al. 1986
Response Parameters
Growth is the most widely accepted response used to evaluate nutrient status. Measurements of body weight and/or length to determine· growth should be done in regular subperiods, preferably no less than twice a morith. Measurements at the start and end of the experiment are inadequate and would not give any information of the growth pattern as influenced by -the diet under the experimental conditions. The procedure for measurement, the frequency of measurement and the duration of the experiment should be described. Growth can be expressed in absolute terms as the difference (gain or loss) in the initial and final weight or length or as the partial difference in each sub-period. Growth is sometimes expressed in relative terms, so that comparisons can be made with fish having different initial weights. Relative growth is growth expressed as a percentage of the initial body weight. When the growth of fish is characterized by an exponential cur\i'e, a constant instantaneous or specific rate can be derived as the difference in the ·natural logarithm of the initial and final . weight over a period. Equations for growth measurements are summarized as follows:
Absolute growth
W2-Wi ·
Absolute growth rate

52
Relative growth·
Relative growth rate
Instantaneous or sp~cific growth rate
.·
where W1 and W2 are weights· at periods ti and ti, respectively. The efficiency of food utilization can strictly be quantified only when feeding is managed so
that excess food is negligible. Two most widely used parameters are feed conversion ratio (FCR) and feed effidency. FCR is the dry weight .of feed per u·nit wet weight gain (feed/gain) while feed efficiency is its reciprocal (gain/feed). The latter is preferred in scientific papers because it conforms to the usual understanding about efficiency in that it is an expression of output over input, value increases with a better diet and the expression becomes zero when the fish ·is not·
. growing, while FCR ·becomes infinity (Baker 1986). FCR is preferred in practice because it. allows one to easily relate the quantity ·of feed and increase in weight to the cost of production.
· When a measure of the biological value of protein is involved, protein efficiency ratio (PER = weight gain/protein intake) and productive protein value (PPV = N retained/N consumed) would be useful parameters. Like feed efficiency, higher values for both parameters indicate better efficiency of utilization. Both parameters provide for a relative rating of protein utilization but do not take into·consideration the requirements for maintenance.
The number of fish lost. during the experiment ·should be. indicated. Any difference in percentage mortality . attributable to dietary. treatment should be noted. When mortality is · substantial, gross and histological necropsy of mortalities .should be conducted to provkle an e~planation. Deficiency symptoms of a nutri~nt should be monitored.
Growth .is a poor indicator of the status of some nutrients. such as for some. minerals (Baker 1986). Respqnse parameters specific. to certain nutrients can be as adjuncts to growth measurements in evaluating nutrient requirements. For many vitamins, which have a coenzyine function; the. activity of the enzyme would be an indicator· of vitamin status .. However, requirements. based on such measurements do not always comcide with that derived from the growth response (Cowey 1976). The use of other biochemical parameters for other nutrients likewise do not always provide a response comparable to that of growth and would not be advisable to use on its own in requirement determinations (Walton et.al. 1986). ·
.. Identification of objectives and experimental design
Experimental Design
An experiment should attempt to answer only one clearly .defined question at a time. Where facilities permit two questions can be tested thiough a factorial design. The experimental design is determined by the question(s) asked and replicates should be provided to allow one to take advan~ge.of proper statistical analysis. In feeding experiments where. tanks are the experimental

53
units, consideration of replication should be inade on the number of fish per tank and the number of tanks per treatment. The goals are to set a level of significance (usually 0.05) that will be .used to ascertain whether a treatment has an effect and to provide the number of replicates needed in an experiment to detect important differences. The number of replicates would therefore depend on the variation associated with· the experimental unit and on the size of the difference which is of importance to the study. Calculations can be made following the method describ~ by Cochran and Cox (1957). A complete description of the statistical method used including the
. reference for the method should be provided:
Determination of nutrient requirementfrom growth data
Growth, derived from a feeding trial involviilg dose-response of.the species in question, still remains. the most useful and practical method for · determining nutrient requirements. The comparison of response can be predictive . if the nutrient does and observed response · are quantified and their relationships expressed mathematically through models. Regression analysis is favored over the. analysis of variance ~d multiple comparisons of the mean from dose- . response data: because it is continuous arid more accurate. The broken line method, with· a horizontal and a positively sloping vertical line fitted by the method of least squares is more commonly used. It is based on the assumption that· a: growing animal will respond linearly to additions of a limiting, indispensable nutrient until the exact requirement is met, after which no further growth response will be observed (Robbins et al. 1979). In many cases, the· response · curve cannot fit into the broken line model, . and a curvilinear model is needed. For example, in
· some cases a certain high concentration of nutrient can result in growth depression so that nonlinear models such as a parabolic (second order polynomial) curve would be more suitable. Requirements may be· defined as the concentration resulting in maximum growth or. as the minimum nutrient level that does not reflect any . significant difference from maximum growth. The latter which would result in a lower requirement . level has been successfully used to determine .economic protein requirement (Zeitoun et al. 1976), tr}rptophan (Poston and Rumsey 1983) and arginine (Chiu et al. 1988) requirements of rainbow· trout Other curvilinear models such as the sigmoidal (Robbins et al. 1979) and the four-parameter kinetic model (Mercer et al. 1978) have b~n tested and found useful. The final choice of the model should be based on the simplest model that can describe the responses of fish.to a wide range of dosages'.
Identification of relevant nutrient parameters
Information regarding the qualitative requirement for nutrients is needed for the .least cost formulation of diets. The nutrients that have been found to be essential for fish are listed in Table 3. The essential nutrients are common among different species of fish except for essential fatty' acids which differ according to the type of fish (Kariazawa 1985). The essentiality of some micronutrieilts such as minerals is difficult to demonstrate because of possible absorption from environmental sources. .
Among the species of fish for which nutrient requirements have been detennined, many .of the reported requirement levels from different laboratories differed significantly. Differences may be attributed to dietary components and the manner of expression of concentration (Tables 3 . and 4) or to other parameters including the rate of feeding, size of fish, temperature and salinity

54
Table 3. Major considerations in the study of essential nutrients.
Required Nutrients
Protein
Amino acids: Arginine Histidine Isoleucine Leucine Lysine
Fatty acids: 18:2ro6/ 18:3ro3/ 20:5003/
Vitamins: Fat soluble - A,D,E,K Water soluble -
ascorbic biotin choline cobolamine folic acid
Minerals: macrominerals - Ca, P,
Mg, Na, K, 0, S microminerals - Fe, Zn, Cu, Mg
Se, I, Ni, Co, Mb, Cr, F, .Si, Va, As
Methioniile Pheny lelanine Threonine Tryptophan Valine
niacin pantothenic acid pyridoxine · riboflavin thiamin
Major Research Considerations
*Requirements depend on the quality of protein, with a ''balanced" amino acid profile resulting in lower requirement. Thus; a common high quality protein (standard reference protein) is preferred.
*Requirement can be reduced with adequate dietary energy. The relative protein sparing action of carbohydrate and lipids vary ~onsiderably among different species of fish.
*A constant relation.ship ex.ists between amino acid requirement and protein intake, so requirement shocld also be expressed as- a percentage of dietary protein *Considerable variation in .the ability to utilize free amino acids _exists among different species of fish. This may cause problems in quantifying requirements because crystalline amino acids are used to vary dietary level (Aoe et al. 1970).
*Essential fatty acid (EFA).requirement is dependent on total lipid le'fel, so expressing it as a·percentage of total lipid would be useful (Takeuchi and Watanabe 1971).
. *Different species of fish have different requirement for fatty· acids. _Generally, EFA requirement can be grouped as 18:2ro6 tilapia, 18:3ro3 rainbow trout - and 20:3ro5 red sea bream types. Lecithin is an essential dietary component of some larval fish (Kanazawa 1985).
*Vitamin requirement vary with species .. of fish size, age, environment and state of maturation. Requirements for maximum growth under optimum conditions increase up to terifold when fish are exposed to conditions of stress or disease (Halver 1985).
*The allowanc~ needed to compensate. for leaching and processing losses may resclt in significantly higher requirements. The losses vary in different vitamins and is particularly •high in ascorbic acid (Slinger et al. 1979). Leaching losses are particclarly greater in larval feeds.
*Studies on requirement are masked by the contribution-. of minerals from the environment. Thus, only-Ca, P, Mg, Fe, ZiI, Cu, Mn, Se and I have been demonstrated to be required by fish.· *Deficiency is associated with deficiency symptom~ and in most cases, ~roWth is a poor indicator to mineral status.
(Table l), These factors have to be clearly defined in experiments, for purposes of standardization. If an optimum condition is known to exist, the experiment should be set-up to provide for it. In investigations involving nutrients known to have a marked interaction with ·another, a factorial design involving both parameters is preferred. Nutrient interactions result in the alternation of the requirement of a nutrient by a second, often closely related nutrient or in the exacerbation of the deficiency of one nutrient by another (Table 4). If a factorial design is not possible, the level of the interacting nutrient should be specified. .
wlieh scanty information is available regarding the nutrient requirement of a cultured fish, it is best to start out with nutrients that are limiting .and are a major cost in diets. Studies on the nutrients, of which a great difference in requirements has been observed in other species, would be very· useful. Protein is one of the most expensive dietary components, especially for fish which.have ·high dietary protein requirements compared to terrestrial animals (Rumsey 1981). Thus, the ·number of studies conducted to determine protein requirement is enormous, but insufficient attention has· been given to major factors that affect it; protein quality, dietary energy from· the carbohydrate arid food intake. On the other hand, nutrients needed in trace quantities.

Table 4. Nutrient interactions demonstrated in fish.
Essential Interacting Observed response Nutrient Nutrient Nutrient Relationship in fish R,eference
Protein Dietary energy Fats and carbohydrates Increase in protein NRC 1981; NRC 1983 can spare protein as· requirement at low a source of energy dietary energy
Essential fatty Lipid EF A requirement is Increase in EF A Takeuchi and acid (EFA) dependent on total requirement at high Watanabe 1977
lipid level lipid level
Methionine (Met) Cystin (cys) M!!t is a precursor of Met requirement is Harding et al. 1977 Cys so Cys can spare lower in the presence Rumsey et al. 1983 some Met ofCys
Phenylalanine (Phe) Tyrosine (Tyr) Phe is a precursor of Phe requirement is Robinson et al. 1980 Tyr· so Tyr can spare lqwer in the presence some Phe ofTyr
Lysine (Lys)/ Arginine (Arg)/ Lys and Arg are basic Arg exacerbated the Chiu et al. 1987 a Arginine (Arg) Lysine (Lys) and thus, cationic growth depression due
to excess Lys
Leucine (Leu) Isoleucine (Ile) All here are branch- Excess leucine depressed Robinson et al. 1984 and Valine (Val)' chain amino acids growth of fish fed diets
deficient in Ile and Val
Calcium (Ca) Phosphorus (P) Highlevels of P affect Ca requirement, with higher· Sakamoto and Yone 1973. ·Ca absorptiori; need to dietary P · c0nsider Ca:P ratio
Magnesium (Mg) Ca · Reduction of Mg Increase in Mg requirement, Cowey et al. 1977 availability · poor growth, renal calcinosis.
Zinc (Zn) Tricalphos Reduction of Zn Increase in Zn requirem.ent, Ketola 1979 phytic acid availability poor growth, cataracts Satoh et al. 1987a
Richardson et al. 1985
CaandP Counteron on compound Difference in binding Difference in availability, . Nakamura and Yamada 1980 to which they are bound and solubility response varies with fish species NRC 1983
Ca Vitamin D Stimulation of binding Vitamin D deficiency may . Lovell and Li 1978 result In Ca deficiency
a-Tocopherol Lipid .. a-tocopherol acts as a-tocopherol requirement Watanabe et al. 1977 PUFA lipid-soluble intra- increases with increasing dietary Satoh et al. l 987b
cellular anti-oxidant lipid, particularly unsaturated fat
VI VI

56
may not be a major cost factor and may be extremely difficult to evaluate. because of the difficulty of producing diets that are adequately low in the nutrient but contain adequate levels of all other nutrients to attain maximum growth. Apparently there is a need to define common reference diets for ihe determinatibn of the requirement for specific nutrients. -
References
Andrews, J.W. and J.W. Page. 1975. The effects of frequency of feeding 0n culture of catfish. Transactions of the American Fisheries Society 104: 317-321.
Andrews, J.W., J.W. Page and M.W. Murray. 1977. Supplementation of a semi-purified casein diet for catfish with free amino acids and gelatin. Journal of Nutrition 107: 1151-1156.
AOAC (Association of Official Analytical Chemists). 1984. Official methods of analysis. 14th Edition S. Williams (ed:), Arlington, Virginia, 1141~ -
Aoe, H., I. Matsudo, I. Abe, T. Saito, T. Toyoda and K. Kitamura. 1970. Nutrition of protein in young carp. 1. Nutritive value of free amino acids. Nippon Suisan Gakkaishi 26: 407-413.
Austreng, E. 1978. Digestibility determination in fish using chromic oxide marking and analysis of oontents of different segments of the _ gastrointestinal tract. Aquaculture 13: 265-272. _ _ _
Baker, D.H. 1986. Problems and pitfalls in animal experiments design_ed to establish dietary requirements for essential nutrients. Journal of Nutriti9n 116: 2339-2349.
Bell, J.G. and C.B. Cowey. 1985. Roles of vitamin E and selenium in the prevention of pathologies related to fatty acid oxidation in salmonids. bi C.B. Cowey, A.M. Mackie and J.G. Bell (eds.) Nutrition and feeding in fish, pp. 333-347. New York, Academic Press.
Brett, J.R. 1971. Satiation time, appetite and maximum food intake of sockeye salmon (Oncorhynchus nerka). Journal of the Fisheries Research Board of Canada 32: 409-415. _
Brett, J.R. 1979. Environmental factors and growth. In W.S. Hoar, D.J. Randall and J.R. Brett (eds.) Fish physiology, Vol. VII, p. 599-675. Academic Press, New York. _
Carr, W.E.S. 1982. Chemical stimulation of feeding behavior. In T.S. Hara (ed.) Chemoreception in fishes, p. 259-273 .. Elsevier Scientific Publication, New York.
Castell, J.D. and K. Tiews (eds.). 1980. Report of the EIFAC, IUNS and ICES Working Group on the standardization of methodology of fish nutrition research. Hamburg, Federal Republic of Germany, 21-23 March, 1979. EIFAC Tech. Paper (36). 24 p.
Charles, P.M., S.M. Sebastian, M.C.V. Ray and M.P. Marian. 1984. Effects of feeding frequency on growth and food conversion of Cyprinus carpio fry. AquacUlture 40: 293-300. _
Chiou, J.D. and C. Ogino. 1975. Digestibility _of starch in carp. Nippon Suisan Gakkaishi 41: 465-466. Chiu, Y.N., R.E. Austin and G.LRumsey. 1987a. Interactions among dietary minerals, arginine and lysine in rainbow trout (Sa/mo gairdneri).
Fish Physiology and Biochemistry 4: 45-55. _ Chiu, Y.N., N.S. Sumagaysay and M.A.S. Sastrillo. 1987b. Effect of feeding frequency and feeding-rate on the growth and feed efficiency of
milkfish Chanos chanos Forsskaljuveniles. Asian Fisheries Science 1: 27-31. _ Chiu, Y.N.~ R.E. Austin arid G.L. Rumsey. 1988. Effect of feeding level and dietary electrolytes on arginine requirement in rainbow trout (Sa/mo
gairdneri). Aquaculture 69: 79-91. _ Cho, C.Y. and S.J. Kaushik. 1985. Effects of protein intake on metabolizable and net energy values of fish diets. In C.B. Cowey, A.M: Mackie
· and J.G. Bell (eds.) Nutrition and feeding in fish, p. 95-117. Academic;.Press, New York. Cho, C.Y. and SJ. Slinger and H.S. Bayley. 1976. Influence of level and type of dietary protein, and of level of feeding on feed utilization of - rainbow trout. Journal of Nutrition 106: 1547-1556. . . , Chua, T.E. and S.K. Teng. 1978. Effects'of feeding frequency on the growth of young estuarine grouper,Epinephalus lalll'ina (Forsskal), cultured
in floating cages. Aquaculture 14: 31-47. Cochran; W.G. and G.M. Cox. 1957. Experimental designs, Second Ed. New York, John Wiley and Sons, 611 p. Cowey, C.B. 1976. Use of synthetic diets and biochemical criteria in the assessment of nutrient requirements of fish.-Joumal of the Fisheries
Research Board of Canada 33: 1040-1045. _ Cowey, C.F. 1979~ Nutrition. In W.S. Hoar, D.J. Randall and J.R. Brett (eds.) Fish physiology Vol. VIII, pp. 1-69. Academic Press, New York. Cowey, C.B., D. Knox, J.W. Adron, S. George and B. Pirie. 1977. The production of renal calcinosis by magnesium deficiency in rainbow trout
(Sa/mo gairdneri). British Journal of Nutrition 38: 127-135. _ De Long, O.C., J.E. Halver and E.T. Mertz. 1958. Nutrition of salmonid fishes. VI. Protein requirements of chinook salmon at two water
temperatures. Journal ofll!utrition 65: 589-599. Deshirnaru, O., K. Katsunobu and Y. Yone. 1982. Purified basal diet fot yellow tail. Nippon Suisan Gakkaishi 48: 1151-1154. De Silva, S.S., R.M. Gunasekara and C. Keembiyahetty. 1986. _Optimum ration !llld feeding frequency in Oreochromis niloticus young. In J.L.
Maclean, L.B. Dizon and_ L.V. Hosillos (eds.) The First Asian Fisheries Forum, p. 559-564. Asian Fisheries Society, Manila, Philippines._ -
Fry, F.E.J. 1971. The effect of environmental factors on the physiology of fish. fn W.S. Hoar and D.J. Randall (eds.) Fish physiology. Vol. 6, p. 1-98. Academic Press, New York. ·
Grayton, B.O. and F.W.H. Beamish. 1977. Effect of feeding frequency oidood intake, growth and body composition of rainbow trout (Sa/mo gairdneri). Aquaculture 11: 159-172. _
Halver, J.E. 1957 .. Nutrition of salmonid fishes. IV. An amino acid test diet for chinook salmon.foumal of Nutrition 62: 245-254. Halver, J.E., D.c: Delong and E.T. Mertz. 1957. Nutrition of salmonid ·fishes. V. Classification of essential amino acids for chinook salmon.
Journal of Nutrition 63: ~5-105. · · Halver, J.E. 1985. Recent advances in vitamin nutrition and metabolism in fish.In C.B. Cowey, A.M. Mackie and J.G. Bell (eds.) Nutrition and
- feeding in fish, pp. 414-429. Academic Press, New York. - -

57
Harding, D.E., 0.W. Allen arid R.P. Wilson. 1977. Sulfur amino acid requirement of channet"catfish. L-rnethionine and L-cystine. Journal of Nutrition 107: 2031-2035. · · ·
Hogendoorn, H. 1981. Controlled propagation of the African catfish, C/arias /azera (C. and V.). IV. Effect of feeding regime in frngerling culture. Aquaculture 24: 123-131.
Jauncey, K. 1982. The effect of varying dietary protein level on the groWth; food conversion; protein utilization and body composition of juvenile tilapias (Sarotherodon mossambicus). Aquaculture 27:A3-54. .
Jobling, M. 1983. A short review and critique of methodology used iii fish growth and nutrition studies: Journal of Fish Biology 23: 685-703. Kanazawa, A. 1985. Essenti3.I fany acid and lipid requirement offish. In C.B. Cowey, A.M. Mackie and J.G. Bells teds.) Nutrition and feeding in
fish, p. 281-298. Academic Press, New York. Kaushik, S. 1979. Application of biochemical method for the estimation of amino acid needs in fish: quantitative arginine requirements of
rainbow trout in different salinities. In J.E. Halver and K. Tiews (eds.) Finfish Nutrition and Fishfeed Technology, Vol. II, pp. 198-208. I.H. Heenernann GrnbH and Co., Berlin.
Ketola, H.G. 1979. Influence ofdietary zinc on cataract in rainbow trout (Sa/mo gairdneri). Journal of Nutrition 109; 965-969. LOvell, R.T. and Y.P. Li. 1978. Essentiality of vitamin Din the diets of channel catfish (Icta/Urus punctalus). Transactions of the American.
Fisheries Society 107: 809-811. · . Marian, M.P,, A.G. Ponniah, R. Pitchairaj and M. Narayanan. 1982. Effect of feeding· frequency on surfacing activity and growth in the air
breathing fish Heteropneuslesfossilis. Aquaculture 26: 237-244. · · · Mercer, L.P., N.W. Flodin and P.H. Morgan. 1978. New methods for comparing the biological efficiency of alternative nutrient .sources. Journal
· of Nutrition 108: 1244-1249. · · Nakamura, Y. and J. Yamada. 1980. Effects of dietary calcium level CafP ratios and calcium coinponents .on the calcium absorption rate in carp.
Bulletin of the Faculty of Fisheries, Hokkaido University 31: 277-282. National Research Council. 1981. Nutrient requirements of coldwater fishes. National Academy of .Sciences 16, 63 p. National Research Council. 1983. Nutrient requirement of warrnwater fishes. National Academy of Sciences 16, 102 p. Nose, T., S. Arai, D. Lee and Y. Hashimoto. 1974. A note on amino acid essential for growth of young carp. Nippon Suisan Gakkaishi' 40: 903-
908. Ogino, C. 19.80. Protein requirement of carp and rainbow trout. Nippon Suisan.Gakkaishi 40: 383-388. Page, J.W. and J.W. Andrews. 1973. Interactions of dietary levels of protein. and energy on· charniel catfish (Icta/wus punctatus). Journal of
Nutrition 103: 1339-1346. . . Poston, H.A. and J.L. Rumsey. 1983. Factors affecting dietary requirement and deficiency signs of L-tryptophan in rainbow trout. Journal of
Nutrition 113: 2568-2577. Richardson, N:, D.A. Higgs, R.M. Beames and J.R. McBridge. 1985. Influence of dietary calcium, phosphorus, zinc. and sodium phytate level'on
cataract incidenae, growth and histopathology of juvenile chinook salmon (Onchorynchus tshawytscha). Journal of Nutrition 115: 553-5~ . .
Robbins;· K.R., H.W. Norton and D.H. Baker. 1979. Estimation of nutrient requirements from growth data. Journal of Nutrition 109: 1710-1714, Robinson, E.H., R.P. Wilson and W.E. Poe. 1980. Total aromatic amino acid requirements, phenylalanine requirement and tyrosine replacement
value for frngerling channel catfish. Journal of Nutrition 110: 1805-1812. Robinson, E.H., W.)i Poe and R.P. Wilson. 1984. Effects of feediilg diets containing on imbalance of branched-chain amino acids on fingerling
channel catfish. Aquaculture 37: 51-62. Rumsey, G.L. 1980. Antioxidants in compounded feeds. In. T.V:R. Pillay (ed.) Fish Feed Technology. Aquaculture development and
Coordination Programme ADCP/REP/80/11, pp. 177-182. FAO, Rome. Rumsey, G.L. 1981. Why does the salrnonid require a high protein diet? Salrnonid 5: 20-24. Rumsey, G.L., J.W. Page and M.L. Scon. 1983. Methionine and cystine requirements of rainbow trout. Progressive Fish-Culturist 45: 139-143. Sakamoto; S. and Y. Yone. 1973. Effect of dietar}' calcium/phosphorus ratio upon growth, feed efficiency and blood serum Ca and P level in red
sea bream. Nippon Suisan Gakkaishi 39: 343-348. · Sampath, K. 1984. Preliminary report on the effects of feeding frequency in Channa slrialus. Aquaculture 40: 30F306. . Satoh, S., K. Tabata, K. Izurne, T. Takeuchi and T. Watanabe. 1987a .. Effect of dietary tricalciurn pho_sphate on availability of zinc to rainbow
trout. Nippon Suisan Gakkaishi 53: 119-1205. . Satoh, S., T. Takeuchi and T. Watanabe. 1987b. Requirement of Tilapia for ri.-Tocopherol. Nippon Suisan.Gakkaishi 53: 119-124. Singh, R.P. and A.K. Srivastava. 1984. Effect of feeding frequency on the groMh, consumption and gross conversion efficiency in silutoid catfish
Heteropneustes fossili.s (Bloch). Bamidgeh 36: 80-90. Slinger, S.J., A. Razzaque and C.Y. Cho. 1979. Effect of feed processing and leaching on losses of certain vitamins in fish diets. In J.E. Halver
and K. Tiews (eds.)Finfish Nutrition and Fishfeed Technology'. Vol. II, pp. 425-434. I.H. Heenernann GrnbH and Co., Berlin. Smith, R.R. 1971. A method for measuring digestibility and rnetabolizable energy of fish feeds. Progressive Fish-Culturist 33: 132-134. Takeuchi, T. and T. Watanabe. 1977. Dietary levels of methyl laurate and essential fatty acid requirement of rainbow trout. Nippon Suisan
Gakkaishi 43: 893-898. Walton, M.J., C.V. Cowey, R.M. Coloso and J.W. Adron. 1986. Dietary requirement of rainbow trout.for tryptophan, lysine and arginine
determined by growth and biochemical measurements. Fish Physiology and Biochemistry 2: 161-169. Watanabe, T., T. Takeuchi, M. Matsui, C. Ogino and T. Kawabata. 1977. Effect of a-tocopherol deficiency on carp. VII. The relationship
between dietary levels of linoleate and a-tocopherol requirement. Nippon Suisan Gakkaishi 43: 935-946. Wilson, R.P., D.E. Harding and D.L. Garling, Jr. 1977. Effect of dietary pH on amino acid utilization and lysine requirement offrngerling channel
catfish. Journal of Nutrition 107: 166-170. Yamada, S., Y. Tanaka and T. Katayama. 1981. Feeding experiments. with carp fry fed on amino acid by increasing the number of feeding per
day. Nippon Suisan Gakkaishi 47: 1247. · Zeitoun, I.H., J.E .. Halver, D.E. Ullrey and P.I. Tack. 1973. Influence of salinity on protein requirement of rainbow trout (Sa/mo gairdneri)
fingerliiigs. Journal of the Fisheries Research Board of Canada 30: 1867-1873. Zeitoun, I.H., D.E. Ullrey, W.T. Magee, J.L. Gill and W.G. Bergen. 1976. Quantifying nutrient requirement of fish. Journal of the Fisheries
Research Board of Canada 33: 167-172.

Methodologies for Vitamin Requirement Studies
MALI BOONYARATPALIN National Inland Fisheries Institute
Kasetsart University Campus Bangkhen, Bangkok 10900
Thailand
Boonyaratpalin, M. 1989. Methodologies for vitamin requirement studies, p. 58-67. In S.S. De Silva (ed.) Fish Nutrition Research in Asia. Proceedings of the Third Asian Fish Nutrition Network Meeting. Asian Fish. Soc. Spec. Publ. 4, 166 p. Asian Fisheries Society, Manila, Philippines.
An overview of the methodologies used for the study of the vitamin requirements of fish is provided, with an emphasis on the composition of test diets and. on the evaluation of results.
Vitamins are organic compounds required in small quantities in animal diets for normal growth or function~ The group wa:s named ·Vitamins by Funlc who thought they were the chemical compound amines vital for life. The name vitamin comes from "vital amines". It is known that vitamins are essential to all fish species; All vitamins are not essential to all fish species, and a vitamin becomes essential when it cannot be synthesized in the body.
Qualitative vitamin requirement experiments generally aim at determining the essential vitamins needed by the fish are limited by the experimental capacity. The experimental design normally uses one-way classification where the vitamins studied are classified as treatments and a complete diet serves as a control diet. In quantitative vitamin requirement experiments a twofactorial design may be recommended; for example testing of two vitamins, each with 4 levels, resulting in 2 x 4 = 8 treatments, the levels should be ·graded to Cover the expected-requirement level.
Number of Fish and Replications for Treatment
A general recommendation on the number of fish/replicates cannot be given since it depends on experimental conditions such as size of tanlc, water exchange rate, size of fish and duration of feeding trial amongst others. Nevertheless, utilization of a small number of fish/replicates may invalidate the conclusions for practical conditions and this shoulo be taken into account in the design of the experiment. ·
The number of replicates/treatments depends on the degree of differences expected between the treatments. For large-scale experiments with 50-180 fish, 2 replicates may suffice if a big difference between the treatments is expected, but 3-4 replicates are desirable. RepHcation is of outstanding importance because it enables the experimenter to perform reliable statistical analysis.
58

59
Statistical Evaluation ·
Experiments must be designed to allow statistical analysis. No experiment should be considered as completed before statistical analysis is performed. For the· majority of fish nutrition experiments, due to the limited experimental capacity, range tests such as Duncan's multiple range test or orthogonal comparison seem more suitable than distribution tests. However, it is desirable to give the standard· errors of the means whenever possible.
Experimental Diet Formulation
The control diet should cover all known nutrient requirements with a: certain margin of safety. In the experimental diets only the factor to be tested should be varied. For the species for which nutrient requirements are unknown the experimental diet can. be formulated based on data such as the follqwing:
i. Modifications of dietary formulae derived for fish, such as salmon and channel catfish, can be employed to dev~lop .suitable test diets for seabass and Clarias sp.
11. The composition of natural food consumed and the carcass composition of healthy fish provides a certain amount of information about the nutrition requirements of fish.
Using the information obtained from (i) and/or (ii) experimental diets for iriitial experimentation can be formulated. As a starting point, the test diet (H-440) which the author refers to is that used by Halver (1957) (Tables 1 and 2). ··
Table 1 ~ Composition of vitamin test diet for salmon and red sea bream (MDF-molecular distilled fish oil).
Ingredients
Vitamin-free casein Gelatin Corn Oil Tristearin Cod liver oil MDF Pollack residual oil White dextrin a-cellulose Vitamin Mixd Mineral Mixe L-Phe L-Arg. HCI L-Cys L-Try L-His. HCI.H20 DL-Ala L-Asp. Na L-Lys.HCI L-Val Gly Water
H-440a (g)
38 12 6
3
28 8 1 4
200
YR-IC (g)
52 11
9 8 2.3866 0.6134 8 0.6 . 1.3 0.7 0.2 0.2 1.3 1.0 0.6 0.7 0.4
200
H-440b (g)
38 12
6
3
28 8 1 4
200
a-Composition of Halver (1957) w~ter-soluble vitamin test diet; b-Composition of Halver (p.c.) fat-soluble vitamin test diet; c-Composition of Yone (1975) vitamin test diet; d-Composition shown in Table 2; eComposition shown in Table 3.
Table 2. ·Composition of vitamin mix for test diets from Halver 1957.
Thiamin-HCI · Riboflavin Pyridoxin-HCI Choline Chloride Nicotinic acid Calcium pantothenate Inositol Biotin Folic acid. L-ascorbic acid Vitamin B 12 Menadione (K) a-Tocopherol acetate. (E)
H-440 (mg/100 g feed)
5 ·20
5 500 75 50
200 0.5 1.5
100 0.01 4
40

60
Yone et al. (1971) found that Halver's (1957) test diet for salmonids. was apparently not tasteful to red sea bream, Chrysophrys major and they attempted to _modify it (Yone et al. 1974). The modifications were: (a) addition ·of phenylalanine and aspartic acid capable of attracting the fish, (b) replacement of corn oil with a pollack residual oil, (c) modification of the mineral mix (Table 3) and, (d) a further additional supplement of certain essential amino acids su.ch as arginine, tryptophan and valine as shown in diet YR-1 (Table 1). Red sea bream accepted the modified diet very well, and the growth and feed efficiency were considerably improved. In their. · studies, YR-1 was primarily emplciyed as the basal diet. Vitamin test diets prepared from purified ingredients (except pollack residual oil), to which all crystalline vitamins have been added are used as a basal diet to determine essentiality of water-soluble vitamins for fishes compared with vitamin deleted diets (Table 4 ). Cod liver oil has various levels of vitamin A and . D. Therefore in fat-soluble vitamin requirement experiments vitamin A and D free oil should be used. For quantitative vitamin requirement experiments, graded levels (amounts) of deleted vitamins are added to the test vitamin-free diet and fed to the experimental fish. An example is shown in Table 5.
Table 3. Composition of the miner;u mix for vitamin test diet.
Ingredient
NaCl. MgS04.7H20 NaH2P04.2H20 KH2P04 Ca (H2P04)2.H20 KCl Fe-Citrate Ca-Lactate A1Cl3 Kl .
Cu Cl MnS04 Co02 ZnS04 a.-cellulose
USPNo.12 YR-1 (g/100 g of mixture)
4.33 13.63 8.67
23.86 13.51
. 2.95 32°.53
O.Q15 0.015 0.010 0.080 0.100 0.300
30.81
5.18 1.49
19.74 0.009 0.0085 0.0055 0.0400 0.0525 0.1785
42.486
Table 4. Composition of qualitative water soluble vitamins (1biamine, Riboflavin and Pyridoxine) requirement test diets.
Diet Ingredient Basal -Bl -B2 -B6
(%) (%) (%) (%)
Vitamin free casein 38 38 38 38 Gelatin 12 1'2 12 12 Com Oil 6 6 6 6 Cod liver oil 3 3 3 3 White dextrin 28 28 28 28 CMC 3 3 3 3 Cellulose 5 5 5 5
· Complete Vitamin Mix 1 B1-Free Vitamin Mix B2-Free Vitamin Mix B6-Free Vitamin Mix 1 MineralMix 4 4 4 4

61
Table 5. Composition oftest diets for quantitative vitamfu.•requirement studies (MDF-molecular distilled fish oil).
Diet No. (g) Ingredient 2 3 4 5 6
Vitamin Free Casein 38 38 38 38 38 38 Gelatin 12 12 12 12 12 12 Tristearin .6 6 6 6 6 6 MDF ·3 3 3 3 3 3 White dextrin 28 2~ 28 28 28 28 CMC 3 3 3 3 3 3 A acetate free 1 1 1 1 1 1 vitamin mix
Mineral mix 4 4 4 4 4 4 Vitamin A acetate (IU) 0 50 100 200 300 500 a-cellulose (------------,- b.alance ----~----------)
Since some fish species will not accept the semi-purified diet at the commencement of an experiment there should be an ~cclimatization period duririg which the practical-type diet is gradually replaced with .the semi-purified ~est diet. If the test diets are still not accepted readily the practical-type diets with and without tested vitamins or graded levels of test vitamins should be used (Tables 6, 7). The requirement was found to be a function of food intake in salmon and catfish. Vitamin requirements are expressed in mg of vitamin· per kg of feed (mg vit./kg feed). Theoretically, the vitamin requirements are best expressed· in concentration per unit dietary energy. However, many factors (taste, texture) override the tendency of fish to eat to satisfy energy needs (Cowey 1987). · ·
Table 6. Composition of qualitative vitamin: test diet for seabass.
Diet No. Ingredient 1 2 3 4 5
(%) (%) (%) (%) (%)
Fish meal 76.35 76.35 76J5 76.35 76.35 Mineral mix 4.00 4.00 4.00 4.00 4.00 CMC 6.00 6.00 6.00 6.00 6.00 a-starch 7.00 7.00 7.oo 7.00 7.00 Fish oil 4.65 4.65. 4.65 4.65 4.65 Vitamin mix 2.00 B 1-free vitamin mix 2:00 B2-free vitamin mix 2.00 B6-free vitamin mix 2.00 C free vitamin mix - 2.00
Table 7. Composition of quantitative vitamin test diet.for sea bass.
Diet No. Ingredient 1. 2 3 4 5
(%) (%) (%) (%) (%)
Fishmeal 76.35 16.35 76.35 76.35 76.35 Mineral mix 4.00 4.00 4.00 4.00 4.00 CMC 6.00 6.00 6.00 ·6.00 6.00 a-starch 7.00 . 7.00 7.00 7.00 7.00 Fish oil 4.65 4.65 4.65 4.65 4.65 Ascorbic acid free
vitamin mix · 1.40 i.40 1.40 1.40 1.40 Ascorbic acid (mg) 0.00 0.05 0.10 0.15 0.20 a-cellulose 0.60 0.55 0.50 0.45 0.40
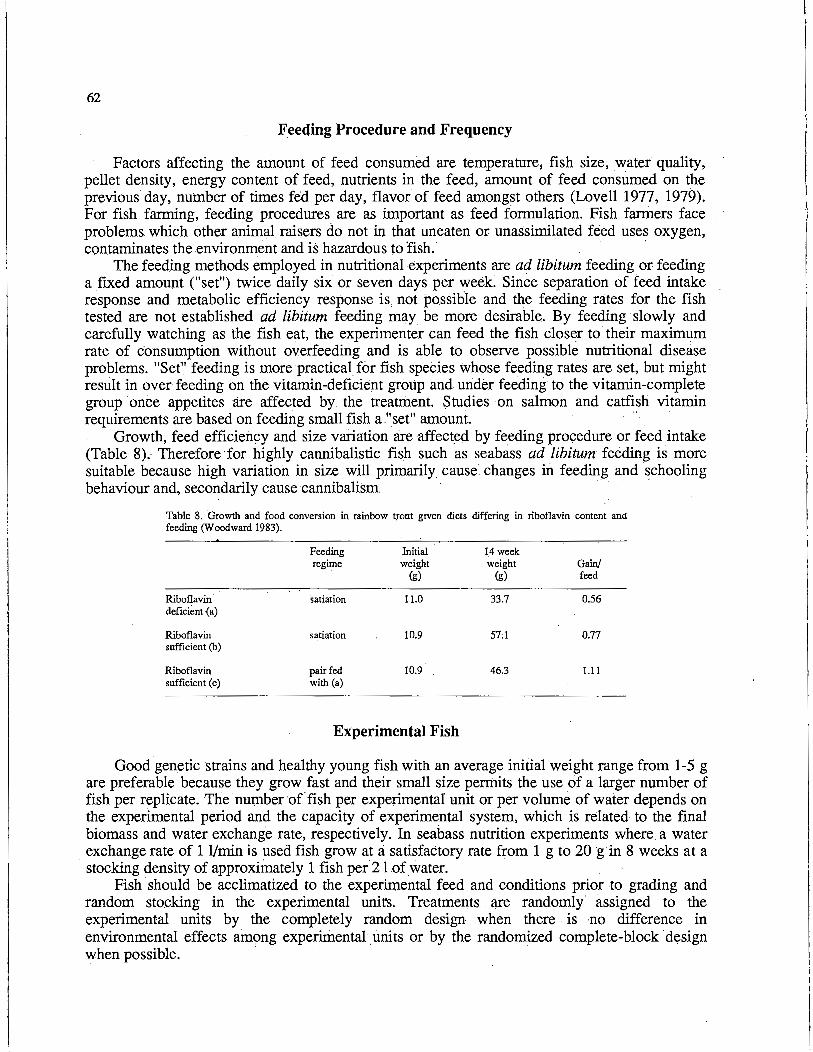
62
Feeding Procedure and Frequency
Factors affecting the amount of feed consumed are temperature; fish size; water quality, pellet density, energy content of feed, nutrients in the feed, amount of feed consumed on the previous day, number of times fed per day, flavor of feed amongst others (Lovell 1977, 1979). For fish farming, feeding procedures are as important as feed formulation. Fish farmers face problems. which other animal raisers do not in that uneaten or unassimilated feed uses oxygen, contaminates the environment and is hazardous to 'fish. · .
The feeding methods employed in nutritional experiments are ad libitum feeding or feeding a fixed amount ("set") twice daily six or seven days per week. Since separation of feed intake response and metabolic efficiency response is not possible and the feeding rates for the fish tested are not established ad libitum feeding may be more desirable. By feeding slowly and carefully watching as the fish eat, the experimenter can feed the fish closer to their maximum rate of consumption without overfeeding and is able to observe possible nutritional disease problems. "Set" feeding is more practical for fish species whose feeding rates are set, but might result in over feeding on the vitamin-deficient group and under feeding to the vitamin-complete group once appetites are affected by the treatment. Studies on salmon and catfish vitamin requirements are based on feeding small fish a "set" amount. ·
Growth, feed efficiency and size variation are affect.ed by feeding procedure or feed intake (Table 8). Therefore· for highly cannibalistic fish such as seabass ad libitum feeding is more suitable because high variation in size will primarily cause'. changes in feeding and schooling behaviour and, secondarily cause cannibalism. · ·
Table 8. Growth and food conversion in rainbow t)'out given diets differing in riboflavin content and feeding (Woodward 1983).
Feeding Initial 1.4 week regime weight weight Gain/
(g) (g) feed
Riboflavin satiation 11.0 33.7 0.56 deficient (a)
Riboflavin satiation 10.9 57:1 0.77 sufficient (b)
Riboflavin pair fed 10.9 46.3 1.11 sufficient ( c) with (a)
Experimental Fish
Good genetic strains and healthy young fish with an average initial weight range from 1-5 g are preferable because they grow fast and their small size permits the use of a larger number of
. fish per replicate. The· number of fish per experimental unit or per volume of water depends on the experimental period and the capacity of experimental system, which is related to the final biomass and water exchange rate, respectively. In seabass nutrition experiments where. a water exchange rate of 1 I/min is used fish grow at a satisfactory rate from 1 g to 20 gin 8 weeks at a stocking density of approximately 1 fish per.21 of water.
Fish ·should be acclimatized to the experimental feed and conditions prior to grading and random stocking in the experimental unirs. Treatments are randomly assigned to the experimental units by the completely random design when there is no difference in environmental effects among experimental units or by the randomized complete-block design when possible. ·

63
Experimental Units
In controlled environment experiments glass aquaria or circular fibreglass tanks located in an indoor wet laboratory could be used. Each aquarium or tank (experimental unit) is ideally equipped with an individual air and water supply at the opposite end from the water drain or with central drainage. A continuous flow through system is desirable.
Small circular fibreglass tanks are preferable to glass aquaria for many reasons: they are easier to keep clean, lasts longer and most importantly according to our observations fish grow faster.
Management
Each test diet should be fed in 3-4. replicate tanks containing 20-50 fish each. The fish should be fed twice daily, 6-7 days per week at "set" or ad libitum, and the amount consumed recorded daily; fish weighed fortnightly and observed for gross signs of test vitamin deficiencies (Cho et al. 1985; NRC 1983; Robinson 1984; Tacon 1985). The insides of all tanks should be scrubbed twice weekly to minimize algal, fungal and bacterial growth. Fortnightly when the fish are removed for weighfog, the tanks are emptied of water and cleaned thoroughly. Fish are fed the experimental diet until deficiency signs develop, when half of the replicates or a portion of fish are separated and tr an sf erred to the complete diet. The experiment should be terminated after the growth and deficiency signs have disappeared in the latter group .
. In quantitative vitamin requirement expenments data pertaining to blood enzyme activities, blood parameters, level of vitamins stored in the liver or kidney sho~ld be monitored with a view to interpreting the results. These essential parameters will be considered as judgment criteria for the level of vitamin required in each situation. ·
Evaluation of Vitamin Requirement Experiments
The principles of experimental evaluation depend on the design establishing experimental criteria. Growth rate, ·feed consumption and feed efficiency are the most important but nevertheless rather approximate parameters of feeding success are also useful. In addition, biological criteria such as liver or kidney vitamin storage are highly desirable for water-soluble vitamin experiments. Furthermore, clinical (blood parameters, enzymes) and histological assessment of the -experimental fish is deemed ·necessary. All tests giving information about qualitative or quantitative metabolic alterations of the organism are of value for a better understanding of the influence of the feeding regimes. ·
Growth Rate
Measurement of body weight at the start and the end of the experiment appears insufficient. Weighing in subperiods (once every 2-3 weeks) is preferred. For small scale experiments taking the total weight of all the fish in each replicate is recommended. When the minimum dietary vitamins required for maximum growth can be estimated. Worthwhile additional information may be obtained by measuring length distribution at the end of the·experiment. Feeding fish with vitamin-deficient diet may result in large variations in size at the end of an experiment. The experiment should be continued until there has. been a ten or twenty fold increase in animal size. Growth rate (weight and length) is preferably recorded in absolute terms {Figs; 1 and 2).

0
Pani:othe<late
.. 0 . 16 32 47 63 79· 91 L02
DAYS
2290
z . 2000 .... . ·~ . !;;
<!) 1800
i
. 1200
VITAMiN A ACETATE
s , ss .· , sr.-:.5~5S-T 0 . 500 1000 2000 3000 5000 10000 20000 .
UNiTS VITAMIN/KILOGRAM FEED.
Fig. 1. Growth of fish fed diets deficient in pantothenate, choline or vitamin Bs (Yone 1975).
Fig. 2. Effect of·vitamin A acetate. on the growth of channel catfish. Growth was linear with vitamin A acetate content of the purified diets fi:om 0 to 1,000 units/kg feed. Higher levels of vitamin suppressed growth (Dupree 1975).
Feed Intake
The feed intake must be. recorded daily or for each subperiod as cumulative figures.'· An understanding of which vitamin effects feed intake and an .optimal feeding table can be obtained from feed intake and feed efficiency information.
. Gross Deficien.cy Signs, . Mortality and Blood Parameters
Gross deficiency signs and number of dead fish are examined and recorded during daily feeding. Possible factors affecting mortality must be recorded. If the rate of mortality exceeds 5%, additional comments or examination of gross necropsy using animal. tissue techniques and histochemical techniques and disease diagnosis are required. An explanation for increased . mortality· should be attempted.
Blood parameters such as hematocrit, hemogl_obin; ·erythrocyte fragility, erythrocyte fragmentation, are made on individual fish or groups of fish on vitamin (E, C, Folic. acid, B12,
Biotin) requirement experiments. · ·
Feed Efficiency
Feed efficiency has traditionally been given special· attention but is unfortunately often presented in an undefined form. Two terms seem to dominate the literature.

Feed intakea Feed conversion ratio =
Weight gainh
Weight gainb' or Feed conversion efficiency =
a Feed intake = b Weight
Feed intakea
feed eaten by· the fish on a dry matter basis; a weightincrease on wet matter basis.
65
As they contain the same factors in inverse :relation, they are frequently mixed up. Feed conversion efficiency has been recently preferred by more researchers since it is positively correlated with growth and PER. In addition, if weight gain is zero,· weight gain/feed intake is zero but feed intake/weight gain is infinite, which is difficult to interpret biologically.
Body Storage of Vitamins
Liver or kidney storage of vitamins is affected by the dietary vitamin level (Fig. 3). Watersoluble vitamins are stored in the liver up to the point of saturation; then the excess is excreted through urine~ except for vitamin C where liver storage does not level off but accumulates at a very low rate. High levels of vitamin C in the diet and in the liver are required to provide resistance to diseases. Therefore the water-soluble vitamin requirement level can be estimated from the lowest dietary vitamin level which gives the highest or acceptable tissue storage.·
This value is relatively higher than the level- of dietary vitamins required for maximum vitamin-related enzyme activity and for maximum growth.
.-< .. ·> .. ......
j 1! ... " "' "' ... .,,.
I
··: .0 I u' ::t:.-81 ""' ·! l; .....
.. ·I . . .. .. 2 3 . 4
I I I
I I I I I I I
. : 4-1. ·:
I ; ~ I ;:3 ·I O' I ~ .,
I .. 5 . 6 r
-........
9
Wound . r.epai r Resistance. to disease (·
10 . 11 12 13 14 . 15 . .
Water - soluble vitamin intake
Fig. 3. Tissue vitamins storage level in fish fed grade level of dietazy water soluble vitamin (Halver, pers; colnm.)
0 - 0 vitamin C - vitamin B

66
There is debate over what is the most appropriate definition of the dietary vitamin requirement of fish. Some nutritionists believe that since vitamins are expensive only the minimum amount required for maximum growth should be incorporated into feeds. Halver (1980) believes that sufficient quantities of vitamins should be incorporated into feeds to allow maximum liver storage.
Liver vitamin levels are determined by microbiological or chemical assay or high-pressure liquid chromotography at adequate intervals, i.e., at start middle, break point and at the end of the experiment.
Vitamin Related Enzymes
Maximal activities of vitamin-dependent enzymes in serum, liver or muscles of fish which were fed graded level of test vitamin diets should be determined by pooling the fish collected from each experimental unit. This clinical chemistry assay should be carried out at adequate experimental intervals, with enzyme tests for specific vitamins· (Table 9). For example, Erythrocyte · transketolase; glutathione reductase and/or liver D-amino acid oxidase; muscle aspartate amino transperase; Acetyl coenzyme A; blood serum alkaline phosphatase; and liver pyruvate carboxylase for B 1; B2; B6; Pantothenic; ascorbic acid; and biotin; respectively. ·
Table 9. Effect of graded l~vels of dietary riboflavin on rainbow trout (Cowey 1987).
Dietary Initial Final liver DAOO activity riboflavin weight weight · flavin unit/q liver x 102 (mg/kg) (g) (g) (mg/kg) -FAD +FAD
0.57 60.5 189.8* 4.40* 0.16* 0.64* 1.62 56.8 220.6 9.92 . 4:1,5 6.68** 3.22 60.4 221.4 11.35 9.63 11.00 5.81 57.0 221.1 11.81 7.68 9.86
Requirements
The dietary vitamin level which gives the maximal activity of vitamin dependent enzymes is the amount required not only for maximum growth but .also for good health condition. The dietary vitamin level required for maximum liver storage is relatively higher (the highest) since vitamins are stored in the liver when more than the amount for immediate metabolic needs is present. This. level of vita,niins is recommended when the dietary intake is low or when the animal is threatened by stress and disease or when a rapid increase in metabolic activity occurs.
Acknowledgement
I would like to acknowledge the valuable technical assistance provided by John Halver and Colin Cowey and to thank Sena De Silva and Michael New for their helpful comments on the text.
References
Cho, C.Y., C.B. Cowey and T. Watanabe, Editors. 1985. Finfish nutrition in Asia. Methodological Approaches to Research and Development. International Development Research Centre, Ottawa, Canada, 154 p. ·
Cowey, C. 1987. Recoinmended dietary vitamin requirements, relevance and biochemical significance. Presented at International Symposium on Feeding and Nutrition in Fish, Bergen, Norway. (in press)·
I
I 67
Dupree, H.K. 1975. Studies on nutrition and feeds of warm water fish. In K.S: Price, W.N. Shaw and K.S. Danberg (eds.) Proceedings of the First International Conference on Aquactilture Nutrition, pp. 60-74. 1.elNes/Rehoboth, University of Delaware:
Halver J.E. 1957. Nutrition of salmonid fishes. III. Water spluble vitam.in requirements of chinook salmon. Journal of Nutrition 62: 225-243. Halver; J.E. 1980. The vitamins. In Fish Feed Technology. Rome, uNDP/FAO ADCP/REP/80/11: 65-103. Lovell, R.T. 1977. Feeding practices. In R.R. Stickney and R.T. Lovell (f:d.s.) Nutrition and feeding of channel catfish. Southern Cooperative
Series Bu:lletin No. 218, pp. 50-55. Auburn University: . Lovell, R.T. 197.9. Factori affecting voluntary food consumption by channel. catfish. Proceedings. of the Annual Conference of Southeast
Association of Fish and Wildlife Agency 33, 563-57L National Research Council (NRC). 1983. Nutrient requirement of.warmwaterfishes and shellfishes. Washington, D.C., National Academy Press,
102p. Robinson, E.H. 1984 .. Vitamin requirement. In E.M. Robinson and R.T. Lovell (eds.) Nutrition and feeding of channel catfish. Southern
Cooperative Services Btilletin No. 296, pp. 21-25. · Tacon, A.G.J. 1985. Nutritional fish pathology. Rome UNDP/FAO ADCP/REP/85{22: 33 p. Woodward, B. 1983. Sensitivity of hepatic D-arnino acid oxidases and glutathione reductase to the riboflavin status of the rainbow trout (Sa/mo·
gairdneri). Aquactilture 34: 193-201. Yone, Y., M. Furuichi and K. Shitanda. 1971. Studies on the nutriti~ of ied seabrearn. III. Nutrient value and optimum content of lipids in diet.
Report of the Fisheries Research Laboratory, Kyushu Universicy (Japan) 1: 49-60. Yone Y., S. Sakamoto and M. Furuichi. 1974. Sttjdies· on nutrition of red sea bream-IX. The basal diet for nutrition studies. Report of the
Fisheries Research Laboratory, Kyushu University 2: 13-24. Yone, Y. 1975. Nutrition studies on red sea brearn.1n K.S. Price, W,N. Shaw and K.S. Danbert (eds;) ·Proceedings of the First International
Conference on Aquactilture Nutrition, pp. 34-59. Lewes/Rehoboth, Univer8ity of Delaware.

Pond Experiment Methododology
KOK LEONG WEE* Division of Agricultural & Food Engineering
Asian Institute of Technology P.O. Box 2754, Bangkok 10501
Thailand
Kok Leong Wee. 1989. Pond experiment methodology, p. 68-79. ln S.S. De Silva (ed.) Fish Nutrition Research in Asia. Proceedings of the Third Asian Fish Nutriti<in Network Meeting. Asian Fish. Soc. Spec. Puhl. 4, 166 p. Asian Fisheries Society, Manila, Philippines.
Aquaculture as an art began centuries ago in China but as a science is less than a hundred years old. Pond based aquaculture research is even more recent, starting approximately 50 years ago. Aquacultural research in ponds is thus in its infancy compared to agricultural research in which the design, execution and evaluation of experiments ai:e relatively well understood. Production techniques employed in agronomy and animal husbandry have largely been standardized. In contrast, pond experimen.tation remains to be standardized with different worke!'S seldom conducting experiments in a comparable manner. Different confounded components in the treatments are therefore, almost inevitable even if basic experimental designs are the same.
A substantial amount of information has been collected over the past 100 years in agronomy and animal husbandry but the data base for aquaculture remains weak, particularly in the tropics, Comparatively little is known about the two major components fish and the environment, and their interaction. To reach the level of competency of agricultural research, aquacultural scientists need to conduct more basic research about the interactions and relationships of fishfish, fish-environment and environmental changes to generate a sufficiently large information base from which the rapidly developing aquaculture industry can extract details for its needs. The deficiency in standardized methodology has long been recognized and the need for the formulation of a set of standards in designing, operating and evaluating aquacultural (mainly pond) research wasidentified more than twenty years ago at the 'fAO World Symposium on Waimwater Pond Fish ·Culture held in Rome in 1966 (Prowse 1968; Alikunhi · 1968; Swingle 1968).
The purpose of this paper is to discuss fish pond experimentmethodology with emphasis on specific problems normally encountered in the operation of such experiments.
Basic Experimental Design
Aquacu.ltural· research seeks answers to key questions ip. production which could lead to significant changes and improvements in existing aquacultural practices. The key questions to be answered are generally expressed as a statement or hypothesis that has to be verified or
*Present address: The School of Applied Science, Tasmanian_ State Institute of Technology, P.O. Box 1214, Launceston 7250, Tasmania, Australia.
68

69
disproved through experimentation. Hypo.thesis are usually suggested by past experience and observations, and at times by theoretical considerations (Gomez and Gomez 1984). Experimental methodology has the following steps:
(a) ·Formulation of a hypothesis (b) Planning an experiment to objectively test the hypothesis ( c) Careful ~bservatioil and collection of data (d) Interpretation of experimental results to confirm, reject or alter the hypothesis (e) Recycling the procedlire until a suitable explanation or solution is achieved.
A well planned experiment should be simple. Measurements of parameters should be done with an appropriate degree of precision without systematic error, and should provide an adequate range of validity of conclusions and a proviSion for calculation of the degree of uncertainty (Cox 1966). . .
The following steps should be considered in planning an experiment (Little and Hills 1978):
1. Definition of problem 2. Statement of objective 3. Selection of treatments 4. Selection of experimental materials 5. Selection of experimental design 6. Selection of the unit for observation and the number of replications 7. Control of the effects of adjacent units on each other 8. Consideration of data to be collected 9. Outline of statistical analyses
10. Conduct of the experim~nt 11. Analysis the data and interpretation of the result 12. Preparation of the report
The selection of an appropriate experimental design depends on the objective of the experiment. Some basic equations such as the species of fish an.d. the types of feeds or fertilizers to use depend on the culture system to be studied. However, the experinienter should be familiar with the subject matter and be observant during the experiment for unexpected results~ The experimenter should be aware of possible solutions to the specific question as well as others that may be suggested during the course of the experiment. Above all the scientist should have an open mind, devoid of personal bias towards a certain expected or desirable result Personal bias in scientific experimentation can be reduced by the establishment of not one but a series· of initial hypotheses.
Experimental Variation
Widely variable pr~duction among replicates of a single treatment is a common occurrence in aquaculture; Some variability may be due to human experimental error in conducting the experiment, but biological material is variable in itself and in its response to the environment The variation due to chance discussed above needs .to be separated from that due to treatment effects in the experiments.
To overcome the problems which arise from variability, three basic principles need to be incorporated into the experiment: (a) control (b) replication and (c) randomization (Roberts 1983), .. ".

70
Control
The word control can be used in two contexts in experimentation. Firstly, .it can mean the standard or normal-treatment of the experiment, the norm (an "untreated control") against which, the other treatment (a deliberate variation of the experimental conditions which is to be investigated) is to be compared._ An untreated control is essential to provide an internal standard of performance against which the novel treatments can be compared, otherwise the latter can· only be compared with vague concepts such as "typical" or an "average" performance from other separate experimerits in which experimental conditions may have varied ..
The second meaning of control is in the sense of control over experimental variability such as carrying out the experiment in uniform conditions, by a systematic approach to experimental procedures and by using uniform stock. Experimental fish should be of the same breed, ·the .same age and weight, same sex and· from the same origin, as far as possible. However,· the search for uniformity of the stock fish should not be too rigidly followed, e.g., highly inbred stock may be uniform but may be so different in respect from commercial stock that their reaction to accuracy would have limited applicability (Roberts 1983).
A dilemma frequently faced by the scientist in pond experimentation is that the environmental conditions change to such an extent in some treatments during the experiment, usually in response to increasing eutrophieation, that fish mortality . occurs. The desire to interfere with the initial treatment to "save the fish" should be resisted. Some treatments need to lead to suboptimal growth, or even mortality, to enable the fish production response to a wide range of treatments to be properly asc~rtained. · · ·
Replication
Replication, or the repetition of treatments on a number of subjects has two distinct benefits. Firstly, it has the effect of reducing the inherent variability, thereby improving the expected accuracy of the experiment. For example, a sample of 5 fish is taken from a population and their average weight taken. This can be repeated for a number of samples and it will be observed that the averages show less vanation than do the separate memb~rs .. Secondly, it enables the internal variability of an experiment to be measured. It is necessary to assess how extensive the effects of chance may be to determine if an experimental effect did not occur by chance.
This leads to the question most asked by aquacultural scientists, how many replicates are required? It is possible to calculate the number ofreplicates required if the following are known: (a) the size of difference (between means of treatments) which is to be detected, (b) the size of the standard deviation for experimental error in the unit concerned or the coefficiept of variation where the standard deviation is expressed as a percentage of the mean (S.D./mean x 100%), and (c) the level of probability of detection of the difference, if any. Roberts (1983) derived a table from Davies (1954) ·which gives the replication appropriate to the variation of the named quantities (Table 1). Both the required difference and the standard deviation are expressed as percentages of the mean. Typical coefficients of variation derived from experiments with different species of livestock, conducted over many years, are available for ·livestock nutrition studies to calculate the required replication; Therefore; prior information oil experimental error is important in determining the degree of replication required. However, it is diffl.cult in a new or relatively new area such as aquacultural pond research to obtain this estimate of variation in advance. . . . ·
However, a considerable amount of information on experimental error in aquaculture has accumulated through the years at Auburn University (Tables 2 and 3; Shell 1983). Although

71
Table 1. Number of replicates required to detect a difference between treatments (significance Ieyel 0.05) (from Roberts 1983).
Difference to be Probability Difference to be Probability detected (expressed as of detection detected (expressed as of detection . % of mean) 0.9 0.8 0.5 % of mean) 0.9 0.8 0.5
Coefficient of Coefficient of. variation 2% ·, ,:;_· __ :.. variation 8%
2% 23 17 9 2% 124 3% 11 9 5 3% 100 50 4% 7 6 4 4% 86 64 32 5% 5 4 5% 60 45 23 6% 4 4 6% 39 29 15 7% 4 3 7% 27 21 11 8% 3 8% 23 17 9
9% 19 14 8 Coefficient of 10% 16 12 7 variation 4% 11% 12 10 6
2% 86 64 32 12% 11 9 5 3% 39 29 15 15% 7 6 4 4% 23 17 9 20% 5. 4 5% 16 12 7 25% 4 4 6% 11 9 5 30% 3 7% 8 6 4 9% 6 5 Coefficient of
10% 5 4 variation 10% 11% 4 4 3% 87 12% 4 4 4% 100 50 15% 3 5% 86 64 32
6% 60 45 23 Coefficient of 7% 44 34 17 variation 6% 8% 34 '26 14
2% 87 9%· 27 21 11 3% 86 64 32 10% 23 17 9 4% 44 34 17 11% 19 14 8 5% 34 26 14 12% 16 12 7 6% 23 17 9 15% 11 9 5 7% 16 12 7 '20% 7 6 4 8% 14 11 6 25% 5 4 9% 11 9 5 30% 4 4
10% 9 7 4 35% 4 3 11% 8 6 4 40% 3 12% 7 6 4 15% 5 4
'20% 4 3 25% 3
direct-use of the information in other parts of the world may not be valid, it may serve as a guide for the magnitude. of variation in response that. might be expected. Coefficients of variation in production experiments in various types of experimental units were variable, although a majority were in a relatively narrow range with 31 of 51 of the coefficients 15% or less. Apparently, there is a degree of constancy in coefficients of variation in production experiments wit.h fish as well as· corn (Snedecor and Cochran 1967). However, coefficients obtained from earthen pond experiments .varied widely within a range of 4.2 to 34.6% and were similar for all species of fish studied, which reinforces that wide variations can be observed in pond studies which makes it difficult to interpret results from such studies. Feeding seemed to result in lower coefficients in earthen ponds as compared to fertilization. The lowest coefficients were obtained in rather artificial environments such as cages or troughs where the fish were stocked at high rates and fed a nutritionally complete ration. · · ,
The actual number of replicates per treatment used in experiments can also be influenced by other non-statistical factors .. such as (a) the . availability of sufficient number of ponds for

72
Table 2. Range ot coefficients of variation obtained in a number of production e~perirnents .with several· species of fish and in several types of eiperirnental units (from Shell 1983). ·
Species of fish
Channel catfish
White catfish (lctalurus catus)
Common carp (Cyprinus carpio)
Largemouth bass (Micropterus sa/moides)
and bluegill (Lepomis macrochirus).
Java tilapia (filapia mossambica)
Fathead minnow (Pimeohalespromelas)
Earthen pond Feed · Fertilizer
15.1-15.7
9.4
3.1-11.5
11.5-23.3
8.6-18.3. 12.3-22.7
4.2-10.1. 10.4-24.8
Experimental unit Plastic pool)!
Feed Fertilizer
56.6-81~5
11.6-32.3
ll.9-51.9
Table 3. Frequency of occurrence of coefficients of variation from 13 fish producti90 experiments recorded in Table 2 (from Shell 1983).
Class values of ooefficients
1- 5 6-10
11-15 16-20 21-25 26-30 31-35
Frequency
8 13 IO 7 6 4 3
Cages Feed
3.2-5.5
Troughs Feed
1.6-6.8
replication, (b) the logistics of operating a large number of ponds, each needing to be sampled uniformly, e.g., sampling dissolved oxygen concentrations at dawn in large numbers of ponds, and (c) ·the experimental design, i.e., the number of· treatments designated. The CRSP (Collaborative Research Support Program) - Pond Dynamics/Aquaculture· program had seven stations in various regions ofthe world, each having· 10 or 12 ponds for experimentation (Egna et al. 1987). The first of the series of experiments, to determine baseline data on pond dynamics using one fertilizer (P205) at a fixed rate of 8 kg/h;:i/tno, had 10 or 12 replicates depending on the sites because there was only 1 treatment. Subsequent experiments were designed to look at varying levels of fertilizer inputs which thus increased the number of treatments and decreased the number of replicates per treatment to 2 treatments with 6 replicates (C. Kwei Lin, -pers. comm). ·
A perusal of selected papers in the literature indicated that treatments in most experiments had only 2 or 3 replicates, with no justification given for the degree of replication used.
In view of the wide range of coefficient of variation within treatments in earthen fish ponds, which may be high on occasion, the maximum number of replicates that is logistically feasible should be chosen. Although a minimum of two replicates is necessary to calculate experimental error the usual. replication of treatments in duplicate and "triplicate should be considered as an

73
absolute minimum. The problem of inadequate availability of ponds and the need for replication is compounded with the need for factorial experiments which are essential in fish nutrition experiments with the need for different fish stocking densities with diets of varying nutritional value, and with different rates of feeding.
Randomizatio.-i
· Replication reduces systematic error and ·enables it to be estimated. Randomization of treatments to experimental units can further reduce systematic error and by special procedures such as randomized blocking and Latin squares systematic error can be reduced even further.
Experimental Units
Size
Ideally, the appropriate size of the experimental units (ponds) should approximate the size of the ponds in which the results will be utilized; i.e., commercial size ponds. However, large ponds are problematic for experimentation in terms of (a) filling with water which may take several days in series of ponds, e.g., .in Malaysia (Anon. 1965) 0.4 ha ponds, the quality of the source of water may change with tim:e, (b) difficulty in sampling of fish for growth determination_ and feeding rate calculations, (c) supply -of water in areas where water is a premium and (d) cost of experimentation increases with pond size.
Therefore; the size of experimental ponds should be commensurate with being manageable in terms of filling with water, sampling for fish and water quality measurements, cost of the experiment including feed cost _if supplementary feed is given, and draining during harvesting. Ponds should be of a size to permit the construction of adequate numbers to enable proper replication of treatments. In other words, the most appropriate size is· the smallest one which permits a range of replicated treatments from which the data are representative of usually larger commercial size ponds. From a survey of the literature, it can be noted that ponds vary in size at institutes where aquaculture research is carried out:
Israel (DOR) Thailand (AIT) USA (Auburn University) CRSP (six regions)
mainly 0.04 ha mainly 0.02 ha 0.02 to 0.4 ha 0.02 to 0.1 ha
Problems may arise when data obtained from experiments conducted in ponds of varying size are converted to a common denominator, normally an extrapolation to one ha. Little research has been done to show whether such extrapolations are valid. Since replicate ponds of the same size often show results with considerable variation in experiments, ponds of different sizes undoubtedly would result in even more variation (Shell 1983).
While information concerning pond dimensions is usually given, often the volume of water can not be calculated because water depth is not provided. The volume of water may be more important than surface area in experiments in which fish are provided supplementary feed because the natural food production depends ultimately on solar radiation which is more a function of pond area. For experiments concerning benthos feeding species, the degree of slope on the bottom of ponds may be important because shallow water may be more productive than deeper water as a function of surface area, although this information is seldom provided.

74
Age and past use of ponds
Age of pond and the history. of use are important in pond experimentation. Natural productivity in ponds is important in experiments concerned with herbivorous/omnivorous species, which comprise most species of fish farmed. Water quality and the level of natural productivity may be affected by residual fertilizer effects from past treatments if the ponds are not properly treated prior to experimentation.
Sediment built up from the previous experiment should be removed before a new experiment is commenced although this is seldom the practice. However, it is the normal procedure at AIT to remove sediment between experiments to avoid residual fertilizer effects, especially in large ponds. While sediment removal is considered to be of vital ·importance in pond experimentation at AIT sediment build-up might be desirable to a certain extent in commercial farms as it increases the fertility of the ponds.
Water sources
Ponds should be filled with water from the same source, and at the same time, as the nutrient content of· the water may differ with source and may also change with time. Another problem related to water source is sometimes encountered when there is considerable water loss through seepage, usually in new ponds. This necessitates continual topping up with water which may change the environmental conditions with a high degree of replacement.
Weed species and predators
Competitor and predator. organisms should be controlled as their. entry into experim~ntal ponds could ruin properly and carefully designed experiments. Fences of fine mesh nylon netting surround experimental ponds at AIT to keep out predatory fish such as snakehead (Channa strfata), walking catfish (Clarias spp.) and climbing perch· (Anabas testudineus). Entry of carnivorous fish particularly during the initial stages of the experiment when stocked fish are normally small, can seriously disrupt an. experiment. Water should be properly screened when filling ponds to prevent entry of wild fish. Ponds should be properly drained and all extraneous organisms eliminated through poisons before the start of a new experiment.
Dense growth of aquatic macrophytes in ponds can drastically reduce the production of most fish (Huner and Dupree 1984). Macrophytes take up nutrients from the water that could be used in the production of phytoplankton, and limi~ th.e access of the fish to food organisms produced on and in the pond bottom soils. Dense vegetation interferes with the feeding of prepared rations and may contribute to lOwered water quality if the fish c;annot reach feed that s~ttles on the vegetation. Aquatic macrophytes also compete with fish for space and for oxygen at night. Seining is severely hampered by vegetation and may interfere with pond draining by clogging screens and drains and by trapping fish. Another consequence of aquatic weed infestation is the increase in experimental error when the infestation is unequal and varies.from pond topond. The prime consideration in the cc_:mtrol of vegetatiqn is prevention. The ponds should be constructed with the smallest possible area of shallow water (less than 1 m deep) commensurate with stable dikes.

75
. Experimental Fish·
Experimental fish should be stocked at a uniform rate unless the determination of the optimum stocking rate is the object of the experiment when a range of stocking rates would be the treatments. Stocking rates should normally be similar to those used on commercial farms to enable meaningful utilization of data. Stocking rates should also be at a magnitude at which they can be managed easily in terms of sampling and harvestiµg, without financial constraints.
Experimental fish should have the same dietary history. This is particularly important in feeding trials using essential nutrient formulation as fish with different nutritional backgrounds may have varying amounts of nutrients such :;i.s fat solUble vitamins, fatty acids, amino acids or minerals stored in their body. The deficiency syndrome would not manifest itself until these stores were exhausted.
The initial stocking weight is of some importance in designing experimeuts. Too low an initial stocking weight may exert little if any effect, particularly during the early part of the experimental period. Hepher ( 1967) suggested that low population density in experimental ponds may explain the lack of effect of fertilization on food production of fish food organisms. Increasing food supply through fertilization will have little effect on production when fish have such a low density that they already have adequate food. Too high an initial stocking weight has the opposite effect in that the carrying capacity of the pond may be reached before the end of the experimental period and other factors such as deteriorating water quality may play a significant role.
Duration of Experiment
The duration of experiments can be varied depending on the type of research. If the research concerns some sequence of the production cycle, then the duration should approximate those normally experienced on commercial farms. Other factors may be considered, such as budget constraints, if the experiment is more· basic in nature. The desired treatment effects may not appear if the experimental period is too short whereas the effects may be blurred if it is too long. For example, if the duration of the experiment is too long, those experimental .fish in a treatment more conduCive to growth may go into the growth plateau phase of the growth curve, whilst fish in treatments less conducive to growth may still be growing. Dupree's (1966) worlc on the vitamin B 12 requirement of channel catfish illustrated the significance of the duration of the experiment in arriving at a valid conclusion (Fig. 1). Channel catfish required vitamin B 12 but it was not apparent for 21 weeks until those fish which had not been provided with it had depleted the stored supply in their body. The need for vitamin B 12 would not have been demonstrated h<1:9-the experiments been terminated before 21 weeks.
Frequency of Sampling for . Growth Calculations
Sampling is stressful to fish and changes the pond environment by stirring up sediment which affect water quality, fertility, and the production of natural food. Bence the.frequency of sampling should be a compromise between minimizing fish stress and disturbance.of the water column, and determination of accurate growth rates'. In experiments in which supplementary feeding is. provided ·the interval between sampling· is of. importance. ·Feeding rate normally calculated as percent of feed given per body weight of fish and the amount to be given.to each

76
Average wt., g
110
100
90'
BO 70
60
50
40
30
20
10 0
0 '' 6
Complete. diet
B 12 de.ficient diet
12 ,· 18. 24 30 ' ,36.
Weeks
Fig.1. Average weights of channel catfish fed a vitamin-complete diet and a vitamin B-i2 deficient diet. Data from Dupree (1966) (Figure obtained from Shell 1983).
pond is thus obtained from the average weight of sampled fish extended to the biomass of fish in the pond. ,A lengthy interval between sampling actively growing fish· results in the fish getting less than the required or intended amount towards the later part .of the period as the fish have grown since the last ·sampling; in fact, the daily feeding rate steadily becomes underestimated~ · Ori the other hand,· the feeding .rate immediately .after adjustment is probably wasteful, although accurate, as the fish acclimatize themselves to the sudden increase in the amount of feed.
,A minimum frequency of sampling should be two weeks if supplementary foed is provided.· A two-week sampling frequency could also. be used in relatively short term e~periments in which the experimental. stocked fish are .in the exponential phase of growth .. Less frequent monthly sampling.could be used inJonger duration experiments without supplementary. feed;
· . Sample Size • ! ;
The appropriate sample size depends on the number of fish in the pond, decreasing with increasing number. A sample of 20-30 fish per pond is usually considered sufficient at AIT. Prowse (1966) suggested a sample size of 30% of the stocked fish as the minimum. However, in sampling, especially using a seine net it.is not always possible to capture the desired number in one seining. Repeated seining has disadvantag~s of stressing the fish as well a:s disturbing the water column .. In this context, large· ponds are more difficult to sample for.fish than ·small ponds. The capture (method also needs to be standardized as fish learn to escape the nets and the sample may not be· truly representative of the fish present in the pond.· In addition', some species ate more difficult to catch thaii: others,.e.g., tilapia is more elusive than Chinese carps. In studies· on polyculture, it is difficult , to· get the desired number of fish of ·the desired species without numerous attempts at capture. ' : ' .

Methods of expr'!s~ing data ,
t ' · Standing· c!ops.
. Evaluating Experiments ·
77
· · Sta.Ilding crop is defined as the fish biomass at a 'giveninstant of tiine; e.g., after orie niqnth: The statlding crop measured·when thlfish biomass iil a.· pond ceases to increase is the carrying capacity; Maiimum standing crop can oe defined as . the maximum weight of fish which can be sustained by a pond, this weight of fish being at balance, without gain.·ot loss iii weight; with the food produced by the pond or made available to the fish (Hickling 1971). It is a most useful parameter because it represents fish biomass under a certain set of pond conditions. . '" ... ·. '. . .
2. Net production
Net production is defined as 'the incrrease in weight of fish in: the. experimental iunit during the ex.perimenf. It is the .difference between .the stocking weight and the standing crop and hen¢e. indiGates by how much the biomass changed which is the basis for aquaculture. Its disadvantage is that it does not give any idea of the w.eight of fish supported in, fl pond at .the time. of· final harvest, the standing crop at harvest, .. . . . · .
:•',
3. Relative weight gain
Relative weight gain can also be called relative growth rate or percentage growth rate. It is. defined as the net production divided by the·initial stocking wdghrexpressed·as a percentage. Ir measures the degree to which initial weight is compounded during the experimental period. Relative wdghc'gain is useful as it adjusts;. to some" degree, "mathematically the' problem of unequal stocking weights: However, it.does not.correct for biologfoai effectsofthe differences iii weights of '.fish stocked, i.e., conditions in a pond which' contain. a htgher weight of stocked '.fish may be different from those in a pond with a lower stocking weight. -"rh.e ·advru;itage of: the · method is that it is a measure of the dynamics of biomass production. U nfoitunately, the quantity' expressed is without units. · ·
4. ·Weight gainper day
Weight gain· per day .is a method of expressirig growth or yield; i.e., the net production over a given period of time divided -by the number of days in the period. A dilemma in using this method is whether. to. calcula_te the average gain: per day over the whole experimental period as defined, or to monitor changes at regular intervals as the gain per day changes with time, i.e.; the overall average.gainper day calculated atthe end of the experiment may be quite different from the gain per day at specific time periods during the ex.perimental period ..
5. Growth curves
'The growth curve shows the change in biomass with.time and is an dtiniate of the. weight of fish in the expeiilnental unit plotted against time.at intervals throughout the experimeJ)t~ period~·

78
This method enables one to see the response to treatments at various stages of the experiment. An-advantage of this method is that it is possible to determine the approximate time in which th~ treatments begin to exert a significant effect on growth or production, and where the effect of the treatments appear early, the experiment can p~ terminated early, thus reducing cost. Growth curves are essentially a series of standing crop data obtained over time. When fish are confined in relatively small experimental units such as cages and tanks where weighing of all fish is feasible, an accurate measure of the standing crop is possible. However, in ponds it is difficult to estimate standing crops periodically because the fish are only sampled which does not give a measure of mortality of stocked fish. · ·
Miscellaneous Problems That May Be Encountered During Experiments
Reproduction of fish in the pond ·
Reproduction of stocked fish can lead to difficulty in evaluation of the results. As the reproduction is uncontrolled, variable number of young may be produced resulting in variable yields. As such reproduction of stocked fish should be avoided where possible. However, it would appear that only tilapia species breed in ponds within a short experimental period. In other experiments, reproduction of stockec;l fish is expeeted and may be beneficial as the overall net production increases although relative growth rate of individual fish declines. For example, experiments where the objectives are to produce fish biomass for animal feeds or for domestic consumption where the· size of harvested fish is unimportant. ·
Changes in environmental conditions
It may be possible to observe changes in environmental conditions within experimental units during . the· experimental period. In static water systems· suppl~ed with fertilization and supplementary feeding, the water quali.ty changes with time. This may culminate in fish mortality in some treatments as· a result of lack of dissolved oxygen in treatments with . high fertilizer and/or feed inputs. · , · · ·
Mortality of stocked fish
Mortality of experimental fish which is not treatment related is often observed in pond experiments. In some cases, when the mortality is monitored, the dead fish can be replaced without loss of information- with fish from the same stock or with the same history of those that died. In this case·, a replication of stocked fish may be Stocked for replacement purposes. A major problem is how much mortality can be tolerated with the replication remaining as part of the experiment. . ·
·Another problem "is if the mortality -went unnoticed, as not all dead fish float and dead fish · could be removed by animals before being recorded. This problem is compounded in feeding experiments as feeding rates are calculated using average fish weights obtained during regular · sampling of the surviving population/community. If the mortality rate is not known, the feeding rate may be overestimated and feed given wasted which could ·1ead to misleading poor feed utilization efficiency when in fact the feed was not eyen consumed (Edwards et al .. 1988).
The best solution is to· prevent mortality by making certain that healthy stock fish are purchased and handled with minimum care durjng stocking and sampling.

79
References
Alikunhi, K.H. 1968. Standardization of biological studies in fish culture research. Proc. of the World Symposium on Water"Water.Po11d Fish Culture. FAQ Fish Bulletin 44(4): 430-474.
Anonymous. 1965. Tropical Fish Culture Research Institute, Malacca. Report for 1964-1965. Cox, D.R. 1966. Planning of Experiment. Wiley International Edition, p. 308. Dupree, H.K. 1966. Vitamins Essential for the Growth of Channel Catfish (lctalurus punctatus). U.S. Bureau of Sport Fish and Wildlife.
Technical Paper?. · · ·Edwards, P., C. Polprasert and K.L. Wee. 1987. Resource Recovery and Health Aspects of Sanitation. AIT Research Report No. 205.
Egna, H.S., N. Brown and M. Leslie. 1987. Pond dynamics/aquaculture Collaborative Research Data Report. Volume 1 Office of International Research and Development, Snell Hall, Oregon State University, U.S.A.
Gomez, K.A. and A.A. Gome.z. 1984. Statistical Procedures for Agricultural Research. 2nd ed. John Wiley & Sons, Inc. New Y mk, p. 680. Hepher, B. 1967. Some Biological.Aspects of Warm-Water Pond Management. In S. Geiking (ed.) The Biological Basis of Freshwater Fish
Production, pp. 417-427. John Wiley and Sons, New York, N. Y. Hickling, C.F. 1971. Fish Culture. 2nd ed. Faber and Faber, London. 317 p. Huner, J. V. and H.K. Dupree. 1984. Pond Management. In H.K. Dupree and J. V. Huner (ed.) Third Report to the Fish Farmers, p. 270. U.S. Fish
and Wildlife Service, Washington, D.C. . . . . Little, T.M. and F~J. Hills. 1978. Agricultural Experimentation - Design and Analysis. John Wiley & Sons, New Yolk, N. Y. Prowse, G.A. 1968. Staridardization of Statistical Methods in Fish Culture Research. Proc. of the World Symposium on Warm-Water Pond Fish
Culture. FAQ Fisheries Bulletin 44(4): 386-396. Roberts, P. 1983: The Number of Replicates and Other Considerations in the Design of Field Trials. In w'. Haresign (ed.) Studies in the
Agricultural and Food Science Series - Recent Advances in Animal Nutrition, 242 p. Butterworths, England. · Snedecor, G.W. and W.G. Cochran. 1967. Statistical Methods. The Iowa State Univ. Press. Ames, Iowa: . Swingle, H.S. 1968. Standardization of Biological Methods in Fish Culture Research. Proc. of the World Symposium on Warm-Water Pond Fish.
Culture. PAO Fish Bulletin 44(4): 422-429.

Status of Shrimp Nutrition and Feed Development in Southeast Asia
FELICITAS PIEDAD-PASCUAL Aquaculture Department
Southeast Asian Fisheries Development Center Tigbauan, Iloilo, Philippines ·
Pasci!al, F.P. 1989. Status of shrimp nutrition :md feed developm~nt in Southeast Asia, p. 80-~9. In S.S. De Silva (ed.) Fish Nutrition Research in Asia. Proceedings of the. Third Asian Fish Nutrition Network Meeting, Asian Fish. Soc . . Spec. Publ. 4, 166 p. Asian Fisheries Society, Manila, Philippines.
World demand for shrimp has increased significantly in the last decade. Of the 32 species investigated, the most commonly cultured in Southeast Asia is the Penaeus monodon. Formulated feed constitutes around 50% of the operational
- costs in shrimp culture and hence there is a need to develop low, cost effective feeds. However, due to limited information on feeding habits and nutritional requirements, development of feeds for P. monodon has been mainly dependent on data derivc;:d from other penaeid species. . ·
Studies on P. monodon nutrition and feed development and constraints to shrimp culture common to the Southeast Asian region are reviewed. Standardization of methodologies for nutrition research and husbandry to hasten collection of data is recommended.
The total world crustacean production in 1985 approximates 265.7 thousand mt, 74.7% of which is attributed to Asia (Table 1). The production of shrimp since 1975 has increased to around 201.1 thousand mt in: 1985 and is projected to be 800 thousand mt by year 2000. (Table 1). Most of the crustaceans produced in this region are of high value and exported to major developed countries, like Japan, U.S.A. and Western Europe.
Table 1. Cultured crustacean production in Asia and estimated production by 2000 from Csavas (1988) (figures within par~theses are estimations).
YEAR Country 1975 1980 1985 2000
-Bangladesh (1.6) 2.7 7.6 6o Burma (0.2) 0.3 (0.7) 5 China, PR of 0.5 l.2 42.7 200 India 4.0 (7.0) (17.0) 50 Indonesia 10.0 24,0 38.0 120 Japan 0.9 1.6 2.1 3 Korea, Rep of 0.1 0.1 0.1 5 Malaysia 0.1 0.1 0.2 8 Philippines 1.1 1.4 29.9 100 Singapore 0.0 0.0 0.3 2 Taiwan PC 0.3 3.8 31.0 85 Thailand 3.3 8.1 18.5 110 Vietnam (3.0) 5.4 13.0 30
TOTAL (mt) 25.1 55.5 201.1 800
80

81
' World demand for shrimp products increased significantly and importation was 80% higher irt 1986 than in 1976 (Cruz 1987). It is estimated· that by 1990 the demand will exceed 2 million mt. Presentiy ·around 5-6% of shrimps in: the world :market is from aquaculture and is expected to rise to 15.20% by 1990. , . · , .
· · ·There are some 32 species that have been investigated and cultured throughout the world (Liao 1987). Seven· species are· now commereially·cultured: Penaeus monodon, P. indicus, P. merguiensis, P. japoniczis and P~ orientalis in Asia (Table 1). Macrobrachiumrosenbergii; a 'freshwater prawn is also extensively cultivated in Thailand and P. vannamei; P. stylirostris and P. schmitti in Latin America. · ·
Shrimp farming was previously dependent on the collection of wild post-larvae and gravid' females. But when broodstock and larvae were produced tri captivity shrimp farming was intensified. ·
The information gained from the culture of P. japonicus has been used in the culture of other penaeids. The knowledge gathered about P. japonicus, as well as its nutritional requirements and feed technology, has made it the most widely studied of all cultured penaeids.
Technology Constraints
In 1972 three research priorities for intensification of prawn culture were identified; · completing the life cycle, nutritional requirements and deveIOpment of economical commercial feeds. · · · ·
Still limitations exist in the technology and Liao' (1987) identified these constraints as iack . of:
i. hatchery bred larvae and_post-larvae,_
ii. efficient, complete, and inexpensive feeds suitable for each stage in the life cycle,
iii. studies on optimal culture conditions,
iv. . preventive measures against pollution, contamination and fish v_aceination, . .
v. a gene pool and knowledge of aiti.ficiaI insemination for contiimou_s supply of fry,
vi. research in: genetic engineering for prqductio~ of disease as well as cold resistant, fast growing shrimps with high survival rates for better market value, ·
vii. aquaculture technology itself as aquaculture is stili an art rather than. a technology, and ·
viii. aqua engineering information for better pond design, harvesting equipment and post-harvest handling.· · · ·
Formulated feeds constitute the most expensive component of the· shrirnp industry, approximating 50:-60% of operational costs. This makes it highly desirable to study nutrient requirements as well as to develop feeds from locally available material and on industrial waste products with a view to producing.cheaper and more effective feeds. .

82
The problem of larval rearing is, "not to be able to produce postlarvae but to optimize the technique,s" (Aquacop 1985). To simplify hatchery operations, research must be focused on full replacement of ,natural food by inert feeds such as micro bound and microencapsulated diets. , ,
, For nursery systems better fee_ds are needed, efficient counting systems, pond design for easy control and harvesting, and benthic algal control to avoid trapping of postlarvae. In earthen ponds, quantification of the role of natural productivity in , relation to soil preparation, fertilization and water management and harvesting ,should be studied.
The most important phase in the economics of the prawn industry is the grow-out phase which involves major costs of labor, feeding, the,development of the low cost commercial feeds using local products and by-products of the industry,Jeeding frequencies, distribution techniques and the adjustment of the feeding rate to pond conditions. _
It is therefore, evident that more studies in nutrition, feeds and husbandry are urgently needed. P. monodon is the penaeid most commonly cultured in Southeast Asia. Known as the tiger prawn in the Philippines and the grass shrimp in Taiwan, it is sturdy and grows to a larger size than other prawns in the area. I will attempt to review what is known in terms of nutritional requirements and feed development for P. monodon. Although feeds for grow out have been developed in Taiwan, Chuang et al. (1986) have indicated the need for more studies on nutrition requirements for P. monodon to be able to formulate more efficient feeds. To develop a suitable feed for shrimps, knowledge of feeding habits, and nutrient requirements are necessary.
Food and Feeding Habits
Prawn larvae are omnivorous; they prefer phytoplankton from zoea to mysis, and zooplankton such as.rotifers from mysis to post-larvae (Villaluz et al. 1969). Feeding habits of different developmental stages of P. monodon in the wild are summarized in Table 2. Gut transient time for 95% of food ingested from the foregut is around five hours (Marte 1980).
Table 2. Food habits of P. monodon in the wild at different developmental stages.
Life stages Food Location Authors of study
:ZOea to Mysis Phytoplankton Philippines Villaluz et al. 1969
Mysis to Postlarvae :ZOoplankton and Philippines Villaluz et al. 1969 small crustaceans
Postlarvae Small crabs "
Philippines Marte 1980 Shrimp Molluscs Polychaetes
, Ophiuroids Fish debris Sand Silt
Adults Crustaceans Sudanese El Hag 1984 , Annelids Red Sea Coast Algae and Mud Kerapuglia Thomas 1972 Unidentified matter Estuary,,
India
Molluscs Philippines Marte 1982 Crustaceans Fish remains

83
. Healthy prawns feed on the weak ones. · Exuviae are reinjested but this remains to be determined (Cuzon pers. comm.). Prawns move aroup.d the perimeter of the pond in the late afternoon and evening .and although they feed at any time during the day, they prefer to bottom feed when there is light (Apud et al. 1980) .
. NutritiOnal Requirements
Due to lack of information on the nutrient requirements of P. monodon feeds have been formulated using the limited information available and quantities derived from other species,. mainly those gathered from P. japonicus:
Protein and amino acids
High protein diets such as Anemia which have been found to be suitable for P. monodon larvae seem to suggest that higher amounts of protein are required by the larvae. The reported nutrient requirements fot P. monodon are summarized in Table 3. Ten essential amino acids for P. monodon are knoWll (Coloso and Cruz 1980). These are similar to those reported by Deshimaru (1981) for P. japonicus and P. aztecus (Shewbartet al. 1972). Several investigators have analyzed the amino acid pattern ofP. monodon (Catedral and Penaflorida 1977; Kanazawa and Teshima 1981; Coloso and· Cruz 1980). Preliminary results on the reqµired amount .of arginine and histidine in the diet showed that a level nearest the amount in the amino acid pattern of the prawn post-larvae· gave the best results (Pascual, unpublished). According to Penaflorida (pers. comm.) except for arginine the esseJ;Itial amino acid pattern is similar throughout the life cycle of P. monodon .. A semi-:-purified type of complete diet was formulated by following the amino acid pattern of· P. monodon post-larvae compared to diets that were defieient in single. amino acid (Pascual and Kanazawa 1986). Although mean percentage weight gains and survival were not significantly different from each other, some trends indicate that some amino acids seemed to be more critical in the diet than others.
Lipid and Fatty Acids
Generally, the fatty acid composition of post-larvae is related to the fatty acid composition of the diets (Yashiro 1982). Millamena and Quinitio (1985) reported a decrease in lipid content with developmental stage (egg to post-larvae) indicating that lipids are utilized for energy during larval development and metamorphosis. .
There is a predominance of higher long chain polyunsaturated fatty acids (PUF A) arachidonic,. eicosapentaenoic and docosahexaenoic . acids in prawn broodstock -Ovaries, hepatopancreas and tail muscle from the wild (Millam~na et al. 1985) ..
Other lipids needed by prawns are cholesterol and lecithin (Table 3).
Carbohydrates
Sucr9se, dextrin; maltose, molasses, cassava starch, com starch, sago palm starch, trehalose and glucose are carbohydrates that have been studied by Pascual·et al .. (1983) and Aiava and Pascual (1987). Diets with 10% molasses caused mortality within ten days of culture, whereas sucrose and sago palm starch at the same level gave better survival rates. Sucrose and trehalose

84
Table 3. Protein and lipid requirements of P.-.manodon.
Nutrient % of Stage Source of Authors di:y diet Nutrient
Protein . juvenile 40 Shrimp meal. Ala:va&
Squid meal Lim (1983) Fishmeal Casein Soybean meal
40-50 juvenile Casein& B.autista (1986) Gela:tin
55 juvenile Prawn muscle Nezaki (1986a) Casein Gelatin Whole egg Protein
50-55. broods tock Fishmeal Millamena Squid meal et al. (1986)
· Shrimp head meal
Lipid juvenile Cod liver 5-10 oil and soy- Bautista (1986)
bean oil
11.7 juvenile Cod liver Mendoza (1982) oil and soy-. ·beaii oil
12 broods tock Millamena et al. (1986)
Lecithin juvenile Soy lecithin 3 Pascual (1986) 4 juvenile Soy lecithin Nezaki (1986b)
Cholesterol 0.5-1 Nalzaro (1982) Polyunsaturated fatty acids, n3 series 0.5"1 Chuen (1986)
proved to be the better sugars compared to glucose at 20% of the diet (Aiava and Pascual 1987). Abdel-Rahman et al. (1979) concluded that glucose remains in the bloodstream for as long as 24 hr and therefore, is detrimental to P.japonicus. ·
·Energy
Energy content between 2.85 and 3.70 Kcal/kg resulted in good growth, survival andJeed conversion.ratio depending on the protein, carbohydrate and fat content. The diet that contained 40 to 50% protein, 5-10% lipid and 20% carbohydrate gave the best growth, survival and feed conversion ratio (Bautista 1986).

85
Vitamins and Minerals
Only exploratory; preliminary work on vitamins and minerals have been done. on P. nionodon. Preliminary studies with juveniles fed under laboratory conditions showed that· some vitamins may not be needed in practic3.l formulated diets. Growth efficiency of the diets was comparable to the growth obtained for prawns fed a complete. diet when one of each of the vitamins was omitted from the diet (Pascual, unpublished). Catacutan and Kanazawa (1985) obtained similar results with purified diets.
Diet Development
Apart from the basic nutritional requirements . other factors have ~o be considered in the development of formulated or artificial diets. ·.Amongst them are, the physical characteristics such as water stability, attractability, size, shape, density and texture of the diets; Such factors ~ould differ from one stage of the life" cycle of the prawn-from larval to grow-out to broodsiock.
Larval, Grow-out and Broodstock Diets
Larvae that are pelagic and swim continuously within the water column need diets that are. suspended in the water column for a certain period. · . . . .
A microparticulate feed containing 58% crude protein, 16% crude fat, 1% .crude fiber, 8% crude ash, nitrogen free extract of0.2% and 8% moisture was cor:npared to Artemia as feed"for shrimp fry. Preliminary ·results 'showed survival rat~s of 40% for fry feo a combination of
. micropaiticulate diets, and was 20% for those fed only Anemia (Kuo 1986). Acetis sp. frozen, fresh and dried when fed · to larvae . was found to give good stirvival
(Kungvankij et al. 1986) while Quinitio et al. (1983) found that soybean meal is a good substitute for algal food in the larval stages.
V ariolis larval feeds . have been developed - microparticulate, microencapsulated, . microbound diets. There are commercially available larval diets but refined techniques for total
. algal replacement are still necessary. Use of non-live foods are associated with problems of water pollution; however, wlth proper
management microparticulate diets offer a potential substitute for ·traditional ·. algal food (Kanazawa 1985). Bautista (unpublished) has developed a microbound diet that is presently being tested.
Physical Characteristics of Pellets Water Stability
Sweet potato meal, cassava starch, extract of shark fins, gracilaria, gum arabic, alginate, glutinous rice, rupha-potato starch, carboxymethyl cellulose, carrageenan, corn starch, polymethylolcarbamide (Pascual et al. 1978; Pascual and Tabbu 1979; Murai et al..1981; Pascual and Sumalangcay 1982; Pascual, unpublished) and sago palm starch (Lim and Destajo 1979) have been studied for their possible use as binders in practical and/or semi-purified diets. Sweet potato starch at 5% of the diet has poor ~inding capacity. Other binders are either too expensive or not commercially available. Steaming the diet has been found to further increase water stability of the pellet

86
Attractants
Shrimp, mussel, squid; fish extract, arid mussel .ex~act in purified diets hav:e been found to be good attractants (Pascual 1980). Krill meal, earthworm meal, glycine, sucrose and mussel water were used as attractants in a practical diet by Murai et al. (1983). Glycine a:nd mussel significantly improved attractability while krill meal, earthworm . meal and sucrose improved attractability only to a certain exterit. ·
Feed and Feedstuff Resources Protein sources
Squid meal, shrimp meal,· mussel meat, fish meal, shrimp head meal and earthworm meal have been found to be good animal· protein sources (Lim et al. 1979; Pascual and Destajo 1979; Pascual 1985). They also provided the attractants and contain essential amino arid fatty acids. Shrimp ~al a:nd other crustacean meals contain astaxanthin, the· carotenoid that gives the bright red-orange color to the prawn when Cooked (Benjamin 1982). Pascual et al. (1986) showed that soybean meal can substitute for fish meitl up to 45% in the diet.
Lipid sources
Mangalik (1979) reported that fish oil is .best for juvenile prawns, followed by beef tallow, "-~ soybean oil, copra oil and pork lard in descending order. A 1: l ratio of cod liver oil and soybean
oil, preferably the crude degummed soya oil, has. been found effective in diets for juvemles (Pascual 1986). Better survival and growth were obtained with diets fortified with Artemia oil compared to those fed soybean oil (Chen and Tsai 1986). ·
Apparent Digestibility
Apparent digestibility of some protein sources were analyzed for male and female prawn of approximately 30 g. Peruvian fish meal was poorly digested, while full fat and defatted soybean meal were equally digestible (Catacutan, pers. comin.).
. Although in the last few years researchers and food producers have been successful in the development of various formulated feeds sufficient to sustain present needs, many improvements are still needed. Aquacop (1985) identified the following research priorities:
i. Determination of nutritional requirements for each species in each stage of the life cycle and·standardization of nutritional tests,
ii. reduction in the leaching of water-solubl~ products,
iii. finding specific growth factors,
iv. ··development of adequate and low cost feeds for larvae, broodstock and grow out by replacement of costly animal protein with plant protein, and
v. improving digestibility of carbohydrates.

.87
With the use of various feed ingredients most of which are industrial by-products, and the keen competition in the marketing of shrimp, color and· flavor of the shrimp may become very important factors in determining its marketability .. Thus, post-harvest handling, ·studies· and consumer acceptance will have to be pursued.
Shrimp culture activity is just emerging from its infancy. The success of the broiler industry was achieved only after more than 20 years of intensive scientific and commercial effort and the shrimp industry is. likely to follow the same. The rate of development will ·depend on how closely researchers will work with producers to identify the constraints and to integrate available techniques according- to the socio-economic conditions of each country. This has been clearly shown to be so in the development of the shrimp cul.ture industry in Taiwan (Chien and Liao 1987).
In the Philippines for example, although formulated diets are developed under laboratory conditions, there is a fear in the take off into pond conditions as· no fish farmer or few of them are willing to spend for research. They would rather rely on funding agencies · like the government. . Research support is hard to come by. unless applied ·research ·is pursued .. Verification of .these feeds takes a long time and is fraught with tie-ups. It is more lucrative for · the business to rely on technology that can be imported from other countries than to develop one's capabilities as this is going to take time and money. ·
The lack of trained, dedicated labor force, peace and order situation, socio-economic conditions, are deterrents to the progress of the shrimp industry. .
Constraints to shrimp culture development will vary from country to country. Common to the region are: · ·
i. inadequate supply of wild spawners,
ii. lack of efficient formulated feeds for broods tock, grow out and larval feeds,
iii. ·presence of diseases in hatcheries and rearing. ponds under intensive method of culture,
iv. lack of culture techniques for P. monodon.
Although there are techniques, these have to be refined, standardized, packaged and tested in different environments and disseminated to shrimp farmers. Techniques developed or established in one country may not be directly ·applicable to other countries. Hence, shrimp · farming techniques are often a secret and will remain undisclosed until such time that aquaculturists and researchers are confident that research results can be packaged into a standard technology. Furthermore, many of the feed formulations are proprietary to the company and are trade secrets. ·
Acknowledgement
I sincerely thank Dr. Sena De Silva for his valuable suggestions in the preparation of the manuscript and to the International Development Research Centre of Canada for the opportunity to present this paper.

88
References
Abdel-Rahman; S;H., A. Kanazawa and S. Teshima. 1979. Effects of dietary carbohydrates on the growth and the levels of the hepatopancreatk . glycogen and serum glucose of prawns. Bulletin Japanese Society of Scientific Fisheries 45(12): 1491-1494.
Alava, V.R. and C. Lim. 1983. The quantitative dietary protein requirement of Penaeus monodon juveniles in a controlled envrronment. .Aquaculture 30(1): 53-61. ·
Alava, V.R. and F.P. Pascual. 1987. Carbohydrate requirements of P. monodon Fabricius juveniles. Aquaculture 61: 211-217. Apud, F.D., N. Deatras and R.G. Gonzales. 1980. Feeding behavior and food preferences of Penaeus monodon Fabricius with scrap Tilapia
mossambica. Quarterly Research Repon Southeast Asian Fisheries Development Center, Aquaculture Depanment, 4(3): 19-21. Aquacop. 1985. Overview of penaeid culture research: impact on COIIUl).ercial culture activity. In Y. Taki, J.H. Primavera, J.A. Llobrera (eds.)
Proceedings of the First International Conference on the Culture of Penaeid Prawns/Shrimps, p. 3-10. Iloilo City, Philippines. Bautista, M.N. 1986. The response of P enaeus monodon juveniles to varying protein/energy ratios iii test diets. Aquaculture. 53: 229-242. Benjamin, G. 1982. Ensilage treatment of shrimp head wastes. Abstract, M.S. Thesis, Louisiana State University, 95 p. Catacutan, M. and A. Kanazawa. 1985 .. Effect of some water soluble vitamins on the growth of Penaeus monodon juvenile. In Y. Taki, J.H.
Primavera and J.A. Llobrera (eds.) Proceedings of the First International Conference. on the Culture of Penaeid Prawn/Shrimps. October 1985, Iloilo City, Philippines:p. 182.
Catedral, F. and V. Penaflorida. 1977. Amino acid anillysis of P. monodon muscle. Quanerly Research Repon Southeast Asian Fisheries Development Center,-Aquaculture Depanment 1(4): 1-2.
Chen, H.Y. and R.H. Tsai. 1986. The dietary effectiveness of Artemia nauplii and microeilcapsulated foods for postlarval P. monodon. In J.L. Chuang and S.Y. Shian (eds.) Research and Development of aquatic Animal Feeds in Taiwan Vol. 1, p. 73.
Chien, Yew-Hu and l.C. Liao. 1987. Bioeconomic consideration of prawn farming. Paper presented in ''Prawn Farming for Profit - Potential for Su~cess" Seminar in 1987 (Taipei, Taiwan). Manuscript.. · _
Chuang, J.L., P.W. Yuan and S.L Shin. 1986. Aquaculture in Taiwan - Review and Outlook. In J.L. Chuang and S. Y. Shian (eds.) Research and Development of Aquatic Animal Feed in Taiwan Vol. 1, p. 15-28.
Chuen-Hemg Wu. 1986. Requirement of lipids and cholesterol in diet grass shrimp. In J.L. Chuang and S.Y. Chian (eds.) Research and Development of Aquatic Animal Feed in Taiwan Vol. 1, p. 69.
Coloso, R.M. and LJ. Cruz. 1980. Preliminary studies in some aspects of amino acid biosynthesis in juveniles of Penaeus monodon Fabricius. Bulletin: Philippine Biochemical Society 3(1&2): 12-22.
Cruz, S.P.F. 1987. Status and prospects of the shrimp industry. Technical Considerations for the Management and operations of Intensive Prawn · Farms. U.P. Aquacultrire Society, College of Fisheries, University of the Philippines in the Visayas, Iloilo Cit}', Philippmes, p. 7-10.
Csavas, I. 1988. Shrimp famiing developments in Asia. Infofish International, 2 (March/April) 1988; p. 11-16. Deshimaru, 0. 1981. Studies on nutrition and diet for prawns, Penaeus japonicus.- Memoirs Kagoshima Prefecture Fisheries Experiment Station.
No. 12, Pee. 118 p. . . El Hag, E.A. 1984. Food and food selection of the penaeid prawns Penaeus monodon (Fabricius). Hydrobiologia 110: 213-217. Kanazawa, Akio. 1985. Nutrition of penaeid- prawns and shrimps. In Y. Taki, J.H. Primavera, J.A. Llobrera (eds.) Proceedings of the First
International Conferences on the cµlture of Penaeid Prawns/Shrimps, pp. 123-130. Iloilo City, Philippines, October 1985. · Kanazawa, A. and S. Teshima . .1981. Essential amino acid of the prawns. Bulletin of the Japanese Society of Scientific Fisheries 47: 1375-1377. Kungvankij, P.A., G. Tacon, K. Corre, B.P. Pudadera, G. Taleon, E. Borlongan and 1.0. Potestas. 1986. Ascetes as prime food for Penaeus
monndon larvae. In J.L. Maclean, L.B. Dizon and L.V. Hosillos (eds.) The First Asian Fisheries Forum, pp. 581-58_4. Asian Fisheries Society, Manila, Philippines.
Kuo, Chin-Chao. 1986. Micropaniculated diet for grass shrimp larvae. In J.L.. Chuang and S,J. Shian (eds.) Research and Development of Animal Aquatic Feed in Taiwan; Vol. 1, p. 81. .
Liao, I. Chiu. 1987. Future technology in prawn production. Paper presented at the Special Session during the 18th Annual Meeting of the World Aquaculture Society Guayaquil, Ecuador 18-23 Jan. .
Lim, C. and w;H. Destajo. 1979. Effects of crude, semi-purified, and purified starch of sago (Metroxylon sagu Ronh) on the water stability of pelleted shrimp diets. Fisheries Research Journal of the Philippines 4(1): 19-21. ·
Lim, C., P. Suraniranat and R.R. Platon. 1979. Evaluation of:various protein sources of P. monodon postlarvae:Kalikasan Philippine Journal of Biology 8: 29-36
Mangalik, A. 1979. Effects of various lipid sources on the growth and survival rates of Penaeus monodon Fabricius from post larvae.to juveniles · in a controlled environment. M.S. Thesis. College of Fisheries, University of the Philippines, 65 p.
Marte, C.L. 1980. The food and feeding habit of Penaeus monodon Fabricius collected from Makato River, Aklan, Philippines (Decapoda: Natantia). Crustaceana 38: 225-236.
Marte, C.L. 1982. Seasonal variation in food and feeding Penaeus monodon Fabricius (Decapoda: Natantia). Crustaceana 42: 250-255. Mendoza, E.C. 1982. Qu3I!titative dietary lipid requirement of P. monodon juveniles in a controlled environment. M.S. Thesis, College of
Fisheries, University of the Philippines in the Visayas, 33 p. Millamena, 0. and E.T. Quinitio. 1985. Lipids and essential fatty acids in the nutrition of Penaeus monodon larvae, p. 180. In Taki, Y., J.H.
Primavera and J.A. Llobrera (eds.) Proceedings of the First International <;:onference on the culture of Penaeid Prawn/Shrimps. Oct. 1985, Iloilo City, Philippines. ' ·
Millamena, O.M., T. Pudadera, M, Catacutan, F. Pascual, P. and K. Simpson. 1985. The fatty acid composition and tissue of lipid content of unablated and ablated P. monodon broodstock from the wild. In press. World MaricultureSociety.
Millamena:, O.M., J.H. Primavera, R.A. Pudadera and R.V. Caballero. 1985. The effect of diet on the reproductive performance of pond-reared Penaeus monodon Fabricius broodstock, p. 593-596. ln JL. Maclean, L.B. Dizon and L.V. Hosillos (eds.) The First Asian Fisheries Forum. Asian Fisheries Society,"Manila, Philippines.
Murai, T., A. Sumalangcay artd F.P. Pascual. 1981. The water stability of shrimp diets with various polysaccharides as binding agents. Quarterly Research Repon SEAFDEC AQD 5(2): 18-22.
Murai, T., A. Sumalangcay and F.P. Pascual. 1983. Supplement of vafious attractants to a practical diet for juvenile Penaeus monodon Fabricius. Fisheries Research Jorimal of the Philippines 8: 2-6. ·
Nalzaro, G.G. 1982. Quantitative dietary cholesterol requirement of Penaeus monodon juveniles. M.S. Theses, College of Fisheries, University of the Philippines in the Visayas, 47 p.

89
Nezaki, G. 1986a. Nutritional ·requirements of prawn (Penaeus monodon Fabricius)-IL Effect of dietary protein and carbohydrate. U.npublished Terminal Report. Aqua Dept SEAFDEC, Tigbauan, Iloilo, Philippines.
Nezaki, G. 1986b. Nutritional requirement of prawn (Penaeus monodon Fabricius)-IV. Effect of dietary lecithin. Unpublished Terminal Repon. Aqua. Dept. SEAFDEC, Tigbauan, Iloilo, Philippines.
Pascual, F.P. 1980. Attractants in purified diets. Quarterly Research Repon SEAFDEC AQD 6(1): 7. Pascual, F.P. 1985. An evaluation of three annelids as feed ingredients in formulated diet for juvenile Penaeus monodon. Fisheries Research
Journal of the Philippines 10(1-2): 9. Pascual, F.P. 1986. Effect of supplemental lecithin and lipid soutces on growth and survival of P. monodon juveniles. In .J.L. Maclean, L.B.
Dizon, & L.V. Hosillos (eds.) The First Asian Fisheries' Forum, pp. 615-618. Asian Fisheries Society, Manila, Philippines. . Pascual, F.P., R. Coloso and C. Tarrise. 1983. ~urvival and some 'histological changes in P. monodon Fabricius juveniles fed various
carbohydrates. Aquaculture 31: !'69-180. Pascual, F.P. and W. Destajo. 1979. Growth and survival of Penaeus monodon postlarvae fed shrimp head meal and fish meal as primary animal
sources ofprotein .. Fisheries Research Journal of the Philippines 4(1): 29-36. Pascual, F.P. and A. Kanazawa. 1986. Specific amino acid free semi~purified diets for P. monodon juveniles. Memoirs Kagoshima University,
Research Center for the South Pacific 7: 65-72. Pascual, F.P. and A. Sumalangcay, Jr. 1982. Gum arabic, carrageenan of various types and sago palm starch as binders in prawn diets. Fisheries
Research Journal of the Philippines 7: 54. · Pascual, F.P. and M. Tabbu. 1979; Fishwater and agar as binders in a prawn diet. Quanerly Research Repon SEAFDEC AQD 3(1): 1. Pascual, F., P. Bandonil and W.H. Destajo. 1978. Thi: effect of different binders on the water stability of feeds for prawns. Qtianerly Research
Repon SEAFDEC AQD 2(1): 31-35. . Pascual, F.P., E.M. Cruz and A. Sumalangcay, Jr. 1986. Practical diets for P. monodonjuvenile containing various levels of defatted soybean
meal (Unpublished manuscript). · . Quinitio, E.T., D. de la Peiia and F. Pascual. 1983. The use of substitute feeds in larval rearing of Penaeus monodon, p. 337-342. ln G.L. Rogers,
R. Day, A. Lim (eds.) Proceedings at the First International Biennial Conference on Warmwater Aquaculture, Crus\acea. Loie, Hawaii. Shewban, K.L., W.L., Mies and P.D. Ludwig 1972. Identification and quantitative analysis of the amino acids present in protein of the brown
shrimp,Penaeus aztecus. Marine Biology 16: 64-67. · Thomas, M.M. 1972. Food and feeding habits of Penaeus monodon Fabricius from Korapuzlia estuary. Indian Journal 'Fisheries 19: 202-204. Villaluz, D.k., A. Villaluz, B. Ladrera, M. Sheik and A. Gonzaga. 1969. Reproductive larval development and cultivation of sugpo (Penaeus
monodon Fabricius). Philippine Journal Science 98(3-4): 205-233. · Yashiro, R.H. 1982. The effect of Anemia fed with different diets on the growth and survival of Penaeus monodon Fabricius postlarvae. M.S.
Thesis University of the Philippines in the Visayas 48 p.

Economic Parameters in Nutritional Studies
DANNY ATTAPATTU Department of Economics
University ofRuhuna Matara, Sri Lanka
CHRISTOPHER MacCORMAC International Development Research Cen,tre
P.O. Box JOI Singapore 9124
Attapattu, D. and C. MacCormac. 1989. Economic parameters in nutritional studies, p. 90-100. fa S.S. De Silva (ed.) Fish Nutrition Research in Asia. Proceedings of the Third Asian Fish Nutrition Network Meeting. Asian Fish. _Soc .. Spec. Publ. 4, 166 p. Asian Fisheries Society, Manila, Philippines.
Economic analysis of aspects on nutrition can play an important role in determining the commercial viability of aquaculture production systems. Changes in feed formulation and methods of feeding must be subjected to an economic analysis before they are recommended for use by aquaculture producers. Economic analysis techniques are readily availablr..for this purpose. This paper focuses mainly on the application of economic analysis to the following issues: (a) estimation of input-output relationships and determination of economically optimal level of feed use (b) determination of least cost combination of different feeds (c) determination of output mix and, (d) derivation of minimum cost feed formulation.
Finfish culture is an animal husbandry process. It has many similarities to other types of land based animal husbandry, one of them be_ing that prepared feeds is an important, if not the most important input in the production process. The objectives of providing prepared feeds in aquaculture are similar to land based animal production, i.e., maximize growth rates, increase production per unit area per unit time, increase reproductive efficiency, increase resistance to disease, and minimize mortality (Cole and Ronning 1986). The cost of feeds in aquaculture can often exceed 50 percent of total production costs, rising to as high as 75 percent (Shang 1981). This is comparable to hog, beef cow, feeder cattle and caged layer livestock enterprises (Herbst 1968).
The preparation of feeds requires scarce resources, i.e., feed ingredients, labour, capital. All of these resources hav~ alternative uses and 'values' associated with those uses. If they are not allocated to preparing fish feeds, they could be used for other livestock feeds, other farming and/or industrial activities. Economics is the science of the allocation of scarce resources among competing uses. With reference to animal feeds and feeding methods economic analysis is an accepted and integral part of commercial livestock operations and experimental research in both developed and developing countries (Fine and Lattimore 1982).
While the authors cannot claim to have conducted an extensive review of the finfish nutrition literature in Asia, it seems fairly safe that economic analysis of commercial and
90

91
experimental finfish feeding practices in Asia is ·very limited .. There are, of course, exceptions (see Pullin and Shehadeh 1980; Hopkins and Cruz 1982). There are probably three main reasons for this. First, a historical lack of trained and experienced aquaculture economists in Asia; second and perhaps more important is that the state of knowledge of tropical Asian finfish nutrition itself, for both laboratory and producer level environmental conditions, is. significantly less as compared to temperate species and producer culture environments. This means that the specific (species,, culture system)'objectives offeeding are not as well defined, nor are the technical relationships and their efficiencies between feed and species performance. While recognizing that the known nutritional requirements for all commercial temperate species is far from complete, it appears to be even less so for the tropical species (Cho et al. 1985). This means that economic analysis of feeds and feedings; as an aquaculttire enterprise management practice provides more accurate estimates of· probability of economic feasibility in proportion to the certainty of the feed input/species performance relationship. Third, tropical Asian finfish aquaculture is not relatively °'industrialized' as for example, the non-ruminant livestock sectors. This relates to feeds in the sense that the quality of feed ·used by producers in aquaculture is highly variable due to local formulation, non-standard processing (ingredient content, balance of ingredients, storage, etc.), varying local availability on ingredients for use as feeds and a wide range of mostly manualfeeding methods (Cho et al. 1985). A high degree of vanabiiity in feed quality both within and between aquaculture enterprises growing similar species makes. it extremely difficult for the econoniist or aquaculture producer to formulate least-cost feed formulations or diets, with broad application. Unless there is a minimum level of certainty as to the feed (or ingredient) quality, it is not possible to calculate a least cost ration. Such a calc~lation (as will be shown later) ,depends on an estimate of the marginal rate of technical subs~jf1JtiOn of alternative (feed) inputs to maintain a given level of species performance.' The .authors are not arguing for highly industrialized finfish production in Asia, but stressing the need for the development of feeds of relatively kllown quality when used by producers, otherwise the economic feasibility of the use of those feeds is very difficult to calculate .
. In addition to the economic analysis of specific techniCal objectives for providing feeds (as stated above), there is an additional economic analysis of finfish that is important. That is the comparison of the economics of supplementary feeding to achieve species/system performance as compared to alternative, i.e., capital intensive technologies. In Asia, where access to large water areas and/or. borrowed capital to develop extensive and/or capital intensive (controlled environment) systems is often not feasible, supplementary feeding is probably the principal means of intensifying production per unit area per unit time. This. is especially true for small scale rural producers. Also, supplementary feeding provides producer with a high degree of flexibility and control in varying his or her production and total production costs. This allows the producer to react more economically to changes in local demand (quantities and price) for fish.·
It appeaj"s from this discussion that economic analysis of nutrition can play a very important role in determining the commercial viability of aquaculture production systems. ' The major objective of this paper is to examine the application of economic theory and techniques to the decision making problems faced by fish farmers with respect to the use of supplementary feeds as a major input in their production systems. Basically these decisions are concerned with the· following issues related to finfish nutrition:
a. Estimation of input-output relationships and determination of economically optimal level of feed use ·
b. Determination of least cost combination of different feeds

92
c. Combination of fish species output using a single type of feed, and
d. Derivation of minimum cost feed formulations.
·The.areas of microeconomics dealing with the theory of production and costs are obviously useful in making decisions on these.issues. The applications of economic theory to analyse each of the above issues are presented in .this paper. ·
Estimation of Input-Output Relationships and Determination of Economically
Optimal Level of Feed
One of the most important practices in aquaculture is the use . of supplementary feed to improve the productivity and nutritional level of fish.- ·Decisions on inputs and outputs cannot of course, be. taken independently as there are technologicai relationships betWeen inputs and outputs which restrict the options available to management. ·This technologi~al relationship between input and output is commonly referred to as the production function. Production function specifies the maximum possible output that can be produced for a given amount of inputs or, alternatively, the minimum quantity of inputs necessary to produce a given level of output. Production functions are determined by the technology available to . the firm. Any improvement in technology result~ in a new production function. .
The basic properties of production functions can _be illustrated by examining a simple unconstrained single-output,· single-input productiori process. Consider a simple aquaculture production system where the output of fish (Q) is dependent.upon the quantity of supplementary feed (X) used. ·An other inputs and technical knowledge are _assumed to be fixed during the period of production: .The production function for this system can be expressed as the following unspecified ·relationship:
Q =f(X)
Where Q is.quantity of fish produced and'X is qmµ1tity of supplementary feed consumed. Table 1 illustrates a hypothetical production function for this single-input, single-output production system. This Table shows the maximum quantity of fish (Q) that can be produced with a specific quantity of supplementary feed (X) while other factors remain constant.
Table I. Hypothetical producti0n function for a ·single input, output_ system.
Units of Units of lytarginal Average Price of Marginal . Feed Fish Product ·Product Fish Revenue (Bags) (kg) (MP) (AP) ($/kg) Product
(kg) (kg) (MRP)$
I 9 9 9 2.00 18.00 2 32 23 16 2.00 46.00 3 63 31 21 2.00 6200 4 96 33 24 2,00 66.00 5 125 31 25 2.00 62.00 6 144 19 24 2.00 38.00 7 147 3 21 2.00 6.00
This production function can be expressed mathematically as.: Q = 10 X2 -X3.
Marginal Total Factor Revenue Cost $
(MFC) $/Bag
38.00 18.00 38.00 64.00 38.00 126.00 38.00 192.00 38.00 250.00 38.00 288.00 38.00 294.00
Total Cost
$
38.00 76.00
114.00 152.00 190.00. 228.00 266.00
Profit $
-20 -12
12 40 60 60 28

c: .~ .... u ::J
"'C 0 t..
a..
. .c .!!! LL.
93
The input-output relationship given in Table 1 can also be displayed graphically as shown in Fig. 1 assuming that the underlying production function is continuous in nature .. Fig. 1 shows that as more of supplementary feed is employed ;while all other inputs being held constantm1tput of fish will first tend to rise but eventually, at least, a point will be reached where additional quantity of feed will yield diminishing marginal contribution to total output.
.Total Product .
0 -...,......-------------. \ x2
Units of Feed
C'I . =.+ c: 0
Stage .1 , I . .
Stage 11 : Sta~e 111 ·
Average
~ o r-------,---.. -x ___ ....,.. __ ] 1 t.. -a.
Marginai
[ b)
I a 1 Fig. l. The productl.on function and its i:elationship to inarginal and average pr~duct.
This relation is known in prod~ction theory as the "Law of Diminishing Returns"; The marginal product of an input X (MPx) is defined as the change in output (Q) resulting from. a very small· change of this input keeping ·all .other things constant. For a discrete total product function, the marginal product is.estimated by the relationship:
~Q
MPx =
For a continuous total product function the marginal produet can be derived by taking the partial derivative of the production function with respect to the input. Thus the marginal product of input X is given by:
~Q
MPx =
Graphically the marginal product is equal to the slope· of the total product curve. In our hypothetical production function presented in Table 1, marginal product of feed continues to iricrease ·until four bags of supplementary feed have been added but starts to decline wh,en the fifth bag is .added. Therefore, with the fifth bag we encounter diminishing returns, eventhough the total fish output continues to increase until the seventh bag of feed is used.

94
Another important concept which is frequently used in input-output relationship is the average product (AP) and defined as the total output (Q) divided by the number of units of variable input (X) used:
Q APx =
x
The average and marginal product curves that correspond to the total product curve in Fig. 1 (a) are shown in Fig. 1 (b). We can see from Fig. 1 (b) that there are three ranges of input utilization which can be used to identify the rational and irrational stages of production~ Stage I is characterized by an excessive amount of fixed input relative to the quantity of variable input employed. Average product ~f the variable input in this stage is increasing, compelling the producer to increase the use of variable input within this stage which extends from the origin to X1• The input utilization in Stage I does not lead to cost minimization for any level of production. .
The operation·in Stage III is also irrational as the marginal product of the variable input is negative in that range. Stage II lies between X1 and X2 is characterized by diminishing returns io the variable input over its entire range which is known as the area of rational economic production: Therefore, if production is to take place it will occur somewhere in Stage II.
· In order to realize maxiinum profits a firm must find out the rates at which to ~pply the inputs. The production function relationships discussed so far are insufficient to determine the optimal (profit maximizing) input use in a production system. It is necessary to combine this technological information with economic data such as the prices of inputs and outputs prevailing in the factor and product markets in order to determine the economically efficient input level the producer should use. To achieve this, the firm must balance the returns from employing supplementary feed against the cost of feed.
The addition to a firm's total revenue when one more unit of variable input (feed) is employed is called the marginal revenue .product (MRP) of that input.. It is· equal to the marginal product of the variable input multiplied by the firni's marginal revenue (if the firm is a price taker in the product market, firm's marginal revenue will be identical to the market price of the product). The corresponding addition to the firm's total cost resulting from applying additional unit of variable input (feed), all other inputs unchanged, is called the marginal factor cost (MFC). A firm is in profit maximizing position with respect to input utilization, if the marginal revenue product of the variable input is equal to its marginal factor cost (Asiniakopulos 1978). This equilibrium condition can be written as:
MRPx = MFCx
So long as marginal revenue product exceeds marginal factor cost, profits must increase and the firm will increase the employment of inputs if it aims at profit maximization. Similarly, when the marginal revenue product is less than the cost of the factor, marginal profit is negative, so the firm would decline to employ additional units of that factor. As shown in Table 1, profits are maximized with the use of six units of feed when MRP equals MFC.
Least-Cost Co.mbination of Different.Feed Inputs
The presence of more than one complementary/substitutable feed inputS in aquaculture production systems makes the analysis of optimal combination of feed inputs more intricate.

95
When there are only two feed inputs in the production function, the choice of optimal combination of two inputs can be analysed graphically using isoquants and isocost curves. An isoquant is a line joining all points representing combinations of two variable inputs' which when combined efficien>ly, produce a specified level of output. In Fig. 2 a production function with two variable inputs is depicted in the form of a set of isoquants. The isoquant labeled Qi shows the various combinations.of rates-of inputs X and Y that produce 300 kg of fish;
a1
[ 300 Kg.]
0 X1 Input X
Fig. 2. Optimal input combination;
The numerical value of the slope of an isoquant provides the key to the substitutability .of the two inputs. The slope of the isoquant shown in Fig. 2 is simply the change in input Y (~ Y) divided by the change _in input X (~). This. relationship known as the margiµal rate of technfoal substitution· (MRTSxy) of the two variable inputs proviqes a measlire of the amount of one iriput factor that must be substituted for one unit of the other factor if output is to remain unchanged. Thus:
SY dY MRTSxy ·=· --·· = - = Slope of theisoquant.
~· dX
It can be deducted thatthe MRTS is equal to the ratio of the marginal products of the two inputs . as follows:
MRTSxy =-- = ~ MPY
The production function shown in the form of a set of isoquants alone cannot determine the optimal combination of the tv.io inputs producing a srecified level of output. Data on input prices are required to determine the optimal input combination; Graphically, input prices can be

96
introduced into the production function by adding an isocosf line to the diagram of production isoquants. Isocost line is the focus of all combinations of factors the firm can purchase for the same expenditure, The slope of the isocost line is equal to the relative prices of theinputs, X and Y. Thus: · ·
Slope of isocost line =
Combining the production isoquants with the isocost line, it is possible to determine .the optimal input combination required to produce a specified level of output. In Fig·.· 2, the optimal. input
. combination occurs at point E where the isocost line and the isoquant are tangent. The optimal
. combination of factors required to produce the level of output Q1 is Xr and Y1. At the point of tangenc;y (E), the slope of the isocost line (relative input price: Px/Py) is equal to_.the slope of the isoquant (ratio of marginal products: MPx!MPy). Therefore, for optimal input combination, the ratio of ·prices of inputs must be equal to the· ratio of their marginal products (Pappes and Brigham 1979). That is:
=
Or, alternatively, the ratio of marginal product to price must be equal for each input:
=
Th~ economic principle for least-cost combination of inputs as shown above states that the firm employs various inputs iri such a way that as the last dollar spent on each input contributes the same amount to output as a dollar spent C1n any other input. For example, with Px = $2 arid Py·= $4, a solution.could be 6/$2 = 12/$4 or·2/$2 = 4/$4, which means the last dollar spent on each input will bring forth the same amount of output.
When the number of variable inputs in the production system is greater. than two, it is not possible to use the graphicai method to determine:. the optimality though the requirements for production at least cost would still be the same: This optimality condition can be expressed when the number of variable inputs is n, as:
= = = Pn
When there are a number of inputs in the production system, the marginal productivity of different inputs are to be derived from an empirically estimated production function through differential . calculus. Estimation of production functions involves the application of statistical techniques to cross-section or time series data (Heathfield 1971).

Combination of Fish Species Output Using a Single Type of Feed
97
A fish farmer may have been engaged in raising two types of fish species (A and B) using a single type of feed input. The farmer can produce more of either A or B product by reallocati_ng its feed inputs between the two outputs. Graphically, this can be represented by a production possibility frontier (PP') as shown in Fig. 3. A production possibility curve shows all possible combinations of two products (A and B) that can be produced with all inputs available to the firm. When there is a resource constraint on the producer engaged in producing two products, he must find the optimal product mix which brings maximum profits.
CD B _, ::I a. -::I
0
(
p
Ai
Output A Fig. 3.Di:termination.of optimal product mix.
The slope of the production possibility curve reflects the marginal rate of product substitution (MRPS) which· indicates the amount one product (B) changes in.quantity.when the other product (A) iS increased by successive equal units, when total resources used remain constarit. MRPS is equal to the ratio of marginal products of the resource used. Thus:
MRPSAorB = --=-.--llA MPA
To determine the optimal product mix, we need an additional tool, the isorevenue line which represents all possible combinations of two products (A and B) that, if sold, will give a fixed amount of revenue to the firln. This is drawn as C-D in Fig. 3. The slope of the isorevenue line is determined by the price ratios of the two products PA and Ps. The isorevenue line may be derived from the equation:
R = PA (A) + Py (B)
where R is total revenue; PA and Ps are_ prices of A and B respectively and A and B are quantities of two products.

98
Graphically the optimal condition is defined by the point of tangency of the production possibility curve (P-P') and the isorevenue line (C-D). This point of tangency (E) fulfills the profit maximization criterion and leads to the most profitable combination of two products, A1 and Bi. At the optimal point, the slopes of production possibility curve and the isorevenue line are equal: ·
MPB PA =
This equilibrium condition known as the principle of equimarginal returns states that the last unit of expenditure (or cost of feed) on producing one product generates the same revenue as it would if applied to any other product, that is:
(Allen et al. 1984).
Minimum Cost Feed Formulations: Linear Programming Approach
Linear programming is a class of mathematical programming models concerned with the efficient allocation of limited resources to known activities with the objective of meeting desired goals such as maximizing profit or minimizing cost. The distinct characteristic of linear programming models is that the functions representing the objective and the constraints are linear. Linear progtamming technique can be applied to the problems dealing with the determination of optimal feed mix for meeting the desired nutritional objectives at the least cost for the aquatic organisms. The application of this technique for optimization problems can best be explained by means of a simple illustration.
Assume for the sake of simplicity, that there are two. types of feed stuffs or ingredients from which the supplementary feed is formulated. The nutritional elements to be considered for this formulation are protein and fat. The nutritive content and price of each ingredient are known. The constraint of the model is the minimum daily nutrient requirements for fish. Suppose the daily requirement of supplementary feed mix is 100 kg, now the problem is to determine the comoination of two feed ingredients which will satisfy the daily nutrient requirements and entail the least-cost. The above information is summarized in Table 2.
The problem can be stated mathematically as follows:
Minimize C = 0.6X1 + 0.8X2
Table,2. Hypothetical example of cost and nutritive content of two feed ingredients.
Ingredient
X1 X2
Min.imurn daily requirement
Units per kg of ingredient Protein Fat
0.10 0.50
22%
0.40 0.08
8%
Cost($) per kg
0.60 0.80

Subject to
and
0.40X1 + 0.08X2 >! 0.08 x 100 0.10X1+0.50X2 >/ 0.22 xlOO
X1+X2=100
99'
The first equation represents the cost function based ·on price information of feed ingredients and constitutes the objective function of the linear programme. The inequalities that follow are' the constraints necessitated by daily requirements of nutrients. Let X1 and X2 be the amounts of feed ingredients used in producing 100 kg of feed mix. The last inequality refers to the nonnegativity restriction. The above mathematical representation of least cost feed formulation problem can be easily solved with the help of a computer programme which is readily available at present.
Use of Micro Computers
Micro Computers and related software are valuable tools for conducting economic analysis of feed formulation and supplementary feeding trials. They are used for similar Tesearch in the livestock and food processing industries (Castle and Becker 1972). They have also been used in aquaculture (Ailen et al. 1984). Hand held programmable calculators are often sufficient for analysing results of aquacultural feeding trials where quantity and type of feed are varied (and perhaps one or two_other variables i.e. stocking deQ.sity and spec~es). The micro computer is an efficient way of analysing large quantities of survey data which attempts to identify· the contribution of feed and feeding technology to output, using production fuq.ction analysis (IDRC 1982; Hopkins and Cruz 198.2). The authors recommend that fish nutritionists in: the economics of supplementary feeding first attempt to involve a·national fisheries economist in their work. If that is not possible, then contact a scientific research group known to be inv'qlved in livestock nutrition. It is quite likely that they will have an associate agricultural economist involved in related economic analysis or will be using software prepared and/or recommended by the economist for the analysis. Such software could be modified to fish nutrition/feeding research. The exception could be multi-species polyculture aquaculture systems with complex feeding relationship, due to the inclusion of species that feed at different 'levels' of the food chain. Special software would have to be written for these.
Conclusions and Recommendations
Economic analysis of new feeds, changes in feed formufations and methods of feeding are essential before they are.recommended for use by aquaculturists. Given the significant cash costs of feeds relativeto a producer's total cost, and that often these feeds have potential value in food production (i.e., fertilizer) or as human food their use must be as economic.as possible in order to maximize both private and social benefits (i.e., improved nutrition) from increase in finfish production. It is recognized that adequate feeding is essential in order to have sufficient output and revenue to provide returns to other non-feed input use (i.e., fixed costs for pen, cage or pond construction). Supplementary feedi11g may also be economically justified if it can be

100.
demonstrated to be the most economic means of increasing production, compared to alternative. extensive and/or capital intensive· means. These .latter methods often have associated 'social
. costs', i.e., environmental, abuse of traditional land/water use rights, income distribution; which can be partially avoided by intensifying economic production from "small scale" rural producers.
. Economic analysis techniques are readily available for application to firtfish · nutrition research. Agricultural econoniists . involved in livestock nutrition or preferably. fisheries economists, should be associated with the definition and results analysis (and interpretation of the results) of experiments that evaluate new feed technology. Micro Computer technology is· now within the means of most research institutions, and can be used for the economic analysis.
Given .the above; there is no reason why the. next few years should not. see a .significant increa~e in publication of finfish nurption research results th~t includes the economic assessment of the new feed technology. Published nutrition research that excludes. an econofilic assessment will be of less direct interest to individual producers, the aquaculture industry, or government, all C?f whom are potential investors in the new nutrition technology:
References
Allen, P., W. Botsford, A.M. Louis, A. Schuur and W.E. Johnston. 1984. Bioeconomics of aquacultilre. Elsevier Science Publishers, Amsterdam, .. m~ . . . . .
Asimakopulos, A. 1978. Microeconomics. Oxford University Press, Toronto, 450 p. ·Brown, E.E. 1983. World fish farming: cultivation and economics. AVJ. Publishing Company Inc., Westport, 516 p. ·Castle, E.N. and H.M. Becker. 1972. Farm business manage111enL Mai:millan; New York, 320 p. · · Cho, C.Y., C.B. Cowey and T. Watanabe. (eds.). 1985. Finfish nutrition in Asia: methodological approaches to research and development. IDRC
. (Canada), 154 p. · . : . . · ·. . . · .· Cole, H.H. and M. Ronning. (eds.). 1986. Animal agriculture. W.H. Freeman and Company, San Francisco. Fine, J.C; and R.G. Lattimore. (eds.). 1982. Livestock in Asia: issues and policies. IDRC (Omada). Heathfield, D.F. 1971. Production functions. Macmillan, London, 91 p. Herbst, J.H. 1968. Farm· manageinenL Stipes Publishing Company, Illinois. . . Hopkins: K.D. and E.M. Cruz. 1982. Integrated animal-fish farming project: fmal reporL ICLARM Technical Reports 5. International Center for
Living Aquatic Resources Management, Philippines: 96 p. IDRC. 1982. Aquaculture economic research in Asia: Proceedings of a Workshop Held in Singapore 2-5 June, 1981, 128 p. Kifle, W.B., G.R. Potts and R.M: Drysdale. (eds.); 1983. Bycprodu~ utilization for animal proouction. IDRC (Canada), 158 p. Pappes, J.L. and E.F.Brigham. 1979. Managerial Economics. Dryden Press, Illinois; 656 p. Pullin, R.S.V. and Z;H. Shehadeh (eds.) 1980; Integrated agriculture-aquaculture farming systems: ICLARM Conferenc~ Proceedings No. 4. ·
International center for Living. Aquatic Resources M;anagement, Philippines. i58 p . . Shang, Y:c. 1981. Agriculture economics. Westview Press, Colorado.

Some Basic Concepts on Fish Disease for Nutritionists
MOHAMED SHARIFF .. Faculty of Fisheries and Marine Science.
UniversitiPertanicin Malaysia · 43400 Serdang, Setangor ·
Malaysia
Shariff, M. 1989. Some basic concepts on fish disease for nutritionists, p. 101-111. In S:S. De Silva (ed.) Fish Nutrition Research in Asia.· Proceedings of the 1bird Asian Fish Nutrition Netwoik Meeting. Asian Fish. Soi:. Spec. Puhl. 4, 166 p. Asian Fisheries Society, Manila, PliilipPines. -
Disease is orie of the most serious limiting factors in .the devel~ment of aquaculture. Disease is. not only restricted to commercial farms which practice high stocking density but also causes mortalities in laboratory and other experimental systems. Interplay ·between three main factors, the fish (the host), the environment, and . the pathogen ileterrnines the outbreak of disease. When in ·a stable situation these facto.rs may interact without resultant disease. However, when there is a change in one or more of the three factors, the delicate balance among them is disrupted and disease .may result. Basic understanding of these three factors and their interrelationships is important in planning for prevention and control of disease and in making a correct diagnosis. ·
Studies. in fish nutrition require testing. and analysing the performartce of diets and this is usually done with the use. of live fish. Fish, like any other animal is susceptible to diseases. The outbreak of disease during an experiment can result in the loss of all or some of the test animals, while fish that survive are usually not suitable for future experiments. ·
It is unfortunate t!J.at frequently, nutritionists, when planning experimental desl.gns and methodology do not ensure tliat experimental animals are disease free and that they will not encounter any disease throughout the study. Lack of awareness of the need for disease.free fish and their proper maintenance can lead to an outbreak·of disease. Experiments may have to be repeated, doubling or tripling the research budget and costing the nutritionist valuable time.
In some instances, disease occurs due to the use of a ·new feed. which may have either excessive elements or. which is lacking in some essential components. In both instances disease may result .. Sometimes disease may not be evident due to lack of obvious clinical signs and thus may go unrecorded. l;'hus it is important to recognise an abnormal situation and to seek assistance to interpret the results correctly. Some knowledge about fish .diseases thus forms an integral part onhe basic information required by a nutritionist. . . .
This paper will provide guidelines on the possible causes of disease and will discuss how the balance between the environment, host and pathogen can be altered to cause disease. Basic understanding of disease.· diagnosis, prevention, and. some aspects of control will also be · discussed.
101

102
Causes of Disease
Disease is a complex interaction between fish, disease agent and the environment (Warten 1983). A pathogen can be present on the host, but will not cause disease if the bhlance among
. these factors is well maintained. A change in any factor may disrupt the balance of the relationship, resulting in the outbreak of disease. Therefore, it is best to .understand the relationship between the three factors in·1olved and the causes· that could create an imbalance. ·
Environment
Water forms the immediate environment that surrounds the fish. Adequate supply of clean water is essential for the maintenance of good fish health. Thus water used in experimental tanks or fish ponds must be of acceptable quality. ·
· pll, light, salinity, alkalinity; temperature, depth of water and other physiological requirements must be maintained within the optimal limits for each host species. In addition, the water mu~t alsri be free of pollutants, pathogens and their larval stages. Some of the . important water quality parameters for fishes are listed in Table 1.
Table 1. Selected environmental parameters for fish health and their recommended ·safe levels .. (Adapted from Munro 1978, Wedemeyer et al. 1976).
Water chemistry
pH
Cadmium (mg/1) Otlorine (mg/1) Chromium'(nig/1) Copper
Cyanide (mg/1) Lead (mg/1) • Mercury (mg/1) Nitrite (mg/1) Poly chlorinated bipheti.ylS (PCBs)
Suspended solids High level of pmiection .
. Moderate level of pmtection Low level of protection
·Undissociated ·ammonia (mg/1) Undissociated hydrogen sulphite (mg/1) ·
'•
. Upper limits for continuous exposure Freshwater · · Seawater.
6.5-8.5 0ptimal + 0.5units 6.0-9.0 permissible of normal range 3.0in hard water 0.2 0.003 0.05 .o.os 0.1 X LCso of water O.Ol X LC50 of
water 0.005 0.005 0.03 0.01 0.05 unknown 0.1 0,1
0:002ppm
<25 Tue nature of solid material
25-80 may greatly 80-400 influence safe
level
0.02 o:oi
0.002 0.005 '
Any rapid· change in the environment will cause stress to fish. Stress as defined· by Brett (1958) 11
•••• is' a stage produced by an ·environmental or other factors which extends the adaptive responses of an animal beyond the normal range, or whjch disturbs the functioning to ·such an extent that the Chances of survival are significantly reduced. 11 Any form of Stress thus increases the susteptibility of fish to dise.ase. Wedemeyer et al. (1976) identified several factors which in .their opinion can cause stress and hence predispose fish to disease. These factors are:· handling, crowding, low oxygen levels, low temperatures, elevated- ammonia, low total water hardness, excessive size variation of fish in ponds, chronic sublethal levels of heavy metals, pesticides and suspended solids. Besides these factors, Ingrarrt (1988) reported that uneven distribution of feed ~ong fish can also cause stress.

· 103.
Sudden drastic variations in temperature ovetshort intervals or a wide range of changes over 24 hours will cause stress. Low temperatures over a long duration (e.g., during the rainy season) or a hot dry period can also cause stress. High rates of ulceration were observed in situations where there was rapid change in salinity and temperature (Rodgers and Burke 1981). Extremes of salinity and temperature lead to high malformation rates in fish larvae (Koo and Johnston 1978). The author has·frequently observed the ·occurrence of white spot clisease in his experimental tanks during the rainy season, when the water temperature was 2-3°C below the normal range. A survey on fish mortaiities at the breeding stations in Malaysia revealed that higher mortalities were encountered during periods of high temperature fluctuation (Shariff and Vijarungam 1986); Thus in tropical countries, where temperature fluctuation is diurnal and seasonal (wet or dry), temperature should be considered as an important factor in inducing disease outbreaks.
Several examples will illustrate a wide .range of stress factors and their effects on fish. Low oxygen levels in. conjunction with high ammonia levels were.reported to cause severe ulcerations and mortalities in a riverine fish population (Shariff and Law 1981) .. Milkfi~h Chanos chanos fingerlings, when subjected to stress during transport due to high stocking density, a drop in dissolved oxygen levels, increa~ed water turbidity ·and abrupt changes in salinity suffered increased susceptibility to secondary infection by bacteria and subsequent mortalities· (Llobrera 1987). Environmental ·gill disease is considered to be caused py high population density, low dissolved oxygen levels, water temperature fJ,uctuation, andenvironmental pH(Snieszko 1974). High temperatures (34-35°C), and on·another occasion, oxygen depletion as a result of pollution and silting, resulted it,l mass mortalities in a reservoir in Sri ~a:nka (Balasuriya 1987).
Poor water quality, a result of the breakdown of a circulation water pump, resulted in low digestibility of feed in Leptobarbus hoeveni (Bleeker) (Dr. A.T. Law, pers; comm).
Pathogens
Many of the pathogens that cause disease in fishes are normally present in the water, host, substrate or the pond bottom. They .are mmnly facultative and will cause disease only when the host is under stress.· Some pathogens however, are virulent arid will cause disease on contact with the ho~t. Pathogens can.be categorised into bacteria, fungi, parasites and viruses. Many of these pathogens cause infectious dis~ases which can spread with ease via water, or by· direct physical contact. . .
The most commonly reported diseases of fish in .the South arid Southeast A~ian region are caused by ectoparasites and bacteria (Arthur 1987). Recently a virus has also been implicated as a cause of the wide spread epizootic ulcerative syndrome ·(Roberts et al. 1986). Ectoparasl.tes, mainly protozoans and monogeneans, are more frequently the cause of mortalities than are bacteria. The ·common ectoparasites in South. and Southeast Asia are the protozoans, Ichthyophthirius, Cryptoc(!.ryon, Tric;hodina and related genera, Chilodonella, Piscinoodinium, IchthyQbodo, Epistylis andZoothwnnium, the inohogeans and the crustaceans, Dactylogyrus and Gyrodactylus, Argulus, Lernaea, Ergasilus andNerocila (Arthur 1987).
Ubiquitous protozoans, when present in small numbers, do not cause measurable harm to the host. However, when the host is subjected to stress, these parasites may multiply and cause disease. Tettahymena have been reported to cause 100% mortalities in fish larvae in which feeding was delayed by 3-5 days in an experimental trial (Dr. P. Arumugam pers. coinm.). Death
·in these instances, usually occurs due to hypoxia, i.e., when large numbers of parasites cover the gill filaments completely. Chilodonella infection causing mortalities . was reported to be associated with incorrect feeding (Shariff 1984).

104
Some parasites .can cause severe damage to host tissue during feeding or while penetrating the host These parasites, when present even in small numbers can cause severe mortalities of fish fry .. ~11vasiori by other parasites that do not cause mortality can result in slow growth rates; for. example. fish infected with Lernaea, have been reported. to have 35 % lower gr.owth rates as compared to non-in(ected fish (Shariff and Sommerville 1986). · .. Bacteria, such as Aeromonas hydrophila, Pseudomonas fluorescens, and flexibacter columnaris are commonly isolated from freshwater fishes, while Vibrio parahaemolyticus ~d V. alginolyticus are typically recovered from marine fishes (Leong 1987). However, none of these bacteria have been implicated as primary pathogens. The occurr:ence of vibriosis · is generally secondary in nature, occurring as a ·S~quel ·to trauma or primary infection by Protozoa (Arion 1987). . . . . ' . .
Aeromonas hydrophila, which is always isolated from fish with epizootic ulcerative syndrome (EUS), is believed to be a secondary pathogen. In Malaysia, EUS occurs during the drought season when water temperatures are higher than normal. In contrast the same disease is prevalent during ·cool temperatures in Thailand and the. Philippines. Thus occurrence of EUS is believed Jo be the result of depression of the immune system of the host due to viral infection which leads to the outbreak of disease during adverse environmental conditions. Bacteria and ectoparasites. are secondary infectious agents. .
. The author has also observed the frequent occurrence of bacterial infections in the presence of abundant organiC matter together· with high stocking densities iii pond and tanks. Organic matter in these situations is either accumula.tion from droppings or excess feed. . . .
Host.
When the host is provided clean water and higp quality nutrition and in the absence of stress factors or vinilent strains of pathogens, it will usually not succumb to disease. Fish have several non-specific defence mechanisms that provide protection against infectious agents. The mucus covering the body contains lysozymes . which provide protection against microbial pathogens '(Ellis 1978). Removal of mucus due to rough handling can provide an· opportunity for microbes to invade the host. Several other chemicals and immune mechanisms that provide protection to · the host are described by Ellis (1978). In addition, it is also worth mentioning that inflammation, a very common phenomena; is among the first line· of defence that provides protection to the host. Inflammation is the reaction of the host's tissue to any form of irritation. The series ·of changes that takes place during inflammation helps dilute the effect of the irritant (infectious agent), restrict hs spread to surrounding tissue arid restore the injured tissue to its nom'lal form.
. The fish in its healthy state is thus able to protect itself against microbial invasions. It is when the host is subjected· to stress . that . its defence mechanisms respond poorly and, as a consequence, the host succumbs to disease: Stress causes .immunodepression due to release of corticosteriod horinones (Ellis 1981). Temperature also has a marked ~ffect on ~e immune ·response in fish. Optimum temperatures are reported to produce the best response.in vaccination of fish (Ellis 1982) while low temperatures delay or completely inhibit antibody production (Ellis 1978). Other stress factors that suppress antibody production are high stocking density, handling and abnormal light conditions (Ellis 1978).
Nutritional Disorders
Nutritional requirements differ with species and age of fish. If an unbalanced diet is provided, the fish may not feed and die of starvation. The various components of the diet are also

105
important factors for the normal growth ·of fish. Essential amino· acids, vitamins, essential fatty acids and minerals have to be given in the right combination for a particular species and age of fish. Malnourished fish cannot maintain good health regardless of the quality of the environment.
Fish subjected ·to nutritional deficierides or imbalances of diet may nor show obvious symptoms and the condition may go undetected. Under these circumstances, if the host is infected by secondary infection with biological agents, the situation can be misinterpreted. Thus the nutritional condition could be camouflaged and diagnosed as a disease caused by a secondary pathogen. Lipoid liver degeneration, avitaminosis, toxicity of minerals, mycotoxins and bacterial toxiCosis are some .of the conditions frequently described.· Cowey a,nd Roberts (1978) have described the causes of nutritional diseases.
Tr~nsmission of Diseases Via Feeding Trash Fish
Fish feeds could also be a source of biological agents causing diseases. Diseases that can be · transmitted by feeds are viral haemorrhagic · septicaemis, mycobacteriosis (tuberculosis), furunculosis, vibriosis, ichyophoniasis, amebiasis, capillariosis and acanthocephalosis (Ghittino
. 1979).
Recognizing Disease Conditions
In the event of an outbreak of disease, one should be able to recognise the disease condition, its probable cause or causes and take necessary measures so as to ensure that it does not occur . . .
. agam~ The most common symptoms ih many disease conditions are:
1. Anorexia - i.e., the fish does not feed.
2. Lethargy.
3. Loss of colour or darker body colour.
4. Change in swimming behaviour.
5. Loss of weight.
Since most of the symptoms mentioned are common to many disease conditions, it is important that a thorough investigation be conducted before any conclusions are made as to the cause or causes of a disease. · · ·
A basic understanding of the time frame of mortalities and its causes will be useful.
1. Preacute: Sudden mortalities without any prior clinical signs.
High mortalities over short periods are usually due to sudden changes iri environmental factors which can lead to severe stress, e.g., salfo.ity or temperature . change. Other common causes of preacute mortalities. are:
a) hypoxia, due to low oxygen levels, b) toxic conditions such as high ammonia levels,
- - -- _:,
106
c) other toxic chemicals such as pesticides, and d) viral infection.
2. Acute: Mortalities occur.within two or three days on the. appearance ofdiriicalsigns_.
The following are the common causes of acute mortalities:
a) lower degree. or levels of physicochemical factors such as those causing preacute mortalities, ·
b) biological agents; viruses, bacteria and ectoparasites,
As the time frame indicates, acute and preacute mortalities can cause severe losses in short periods without advance warning.
Initially virulent strains of pathogens cause severe mortalities when first introduced into a population, but after some time the host adapts or acquires resistance against them. These strains· will then cause disease only when the host is exposed to other stress factors.
Many of the protozoan ectoparasites multiply by binary fission and several thousand parasites can develop within a short period. Some protozoans can cause suffocation when present in large numbers on the gills. On the other hand, some ectoparasites, e.g., Lernaea, can also cause tissue damage and in small fish only a few are needed to cause death. The other groups of ectoparasites are the monogeneans and the crustaceans.
3. Chronic: Incidences of mortalities are spread over a long period, a few weeks or months, after the appearance of clinical signs. This pattern of mortality rriay be caused by:
a) endoparasites,
b) nutritional diseases,
c) mycobacteriosis (piscine tuberculosis),
d) less deleterious levels of physicochemical factors as compared to those found to cause acute mortalities, and
e) Ichthyophonus (fungal infection)
Diagnosis
There are many causes for acute and chronic mortalities and the symptoms seen may differ or be similar for different diseases. Anorexia and retarded growth may be the only symptoms seen for nutritional diseases. and these symptoms may· seem similar to those for other chronic diseases. Thus it would be appropriate to 9btain the assistance of a specialist to investigate and diagnose the condition. ·
1. Diagnosis of a disease condition is :p.ot a simple procedure. It involves a systematic approach whereby all possible causes are kept.in rnind and all. aspects· are examined to
.I I

107
pinpoint the cause or causes of the disease. The systematic approach is the golden rule to correct diagnosis.
2. The systematic approach includes the following studies;
a) investigation of environmental factors, water quality and stress related factors;
b) investigation for possible biological agents (parasites, bacteria, viruses and fungi); and
c) histopathology. ·
In many· instances histopathological studies are used to confirm the diagnosis. Most nutritional deficiency conditions can.be diagnosed by histopathological studies.·
3. The cause of preacute mortalities is difficult to diagnose. In most instances, by the time attempts are made to examine the case, the evidence is lost. However, efforts should be made to examine the environment thoroughly for changes in oxygen levels; pH, ammonia
· ·levels, salinity and other water quality parameters. Minor changes in water quality may escape detection when examined by crude methods such as the HACH kit, though such changes may result in mortalities in fingerlings, which are sensitive to minor changes. It it important to monitor the environmental parameters regularly so as to be familiar with normal standards. This will also allow detection of abnormal fluctuation with ease.
4. Although ectoparasites can be easily identified by preparing a wet mount of the mucus from the skin and gills of the infected.fish, their presence may not necessarily mean that they are the primary cause of disease. The opinion of a specialist should always be sought.
5. Selection of a laboratory where samples can be submitted for diagnosis is also important. For a systematic approach, it is important that samples be submitted to a laboratory which is equipped to study all possible causes of disease. An ideal laboratory should have facilities for water quality determination, parasitology, pathology, bacteriology, mycology and virology. In instances where some of these facilities may not be available, samples should be also sent to other laboratories to have a complete result.
6. Information on the history of the disease condition contributes significantly towards making a correct diagnosis. The following are some important particulars that should be provided to the laboratory: · ·
a) source of fish fingerlings,
b) age group affected,
c) clinical signs,
d) percentage affected,
e) percentage mortalities (preacute, acute, or chronic), ·

108
f) feeding habits,
g) type of feed provided,
h) water quality,
i) pond condition, and
j) other relevant information such as stocking density, etc.
7. All fish samples must be sent live to the laboratory. These should be packed in the same water as the fish were collected from. The laboratory should be informed of the shipment of samples before hand so that arrangements can be made to examinethem immediately upon arrival. Never send dead fish to a laboratory for diagnosis.
8. In circumstances where live fish cannot be sent to the laboratory, live fish should be saerificed and fixed immediately in 10% buffered formalin (40% formaldehyde 100 ml, distilled water. 900 ml, N aH2P04H20 4g,. N a2HP04 6 g) .. The tissue should be no larger than 5 mm thick and should be from all organs, including the gills, skin, eyes and the alimentary tract. These should be placed .in a bottle containing 10% . buffered formalin which is at least 10 times the volume of the tissue,. labelled correctly and sent to the laboratory. Do not attempt to substitute normal 10% formalin for buffered formalin as this may give rise to artifacts in the sections and may result in an incondusive diagnosis.
Prophylaxis
With knowledge on the factors involved in the outbreak of diseases, one should be able to take precautionary measures to minimize the occurrence of disease: The following are some guidelines which should be made a common practice.
1. Use cleanfish
It is important to start an experiment with fish that are free of pathogens. Viral infections are particularly difficult to diagnose and the host may be a carrier showing no signs of the disease condition. Under these circumstances if would be advisable to obtain fish from a stock that is known to be free Of virus.
2. Treat for ectoparasites
Since ectoparasites are a common cause of mortalities in the region, all fish for experimental purposes -must be treated· to remove them. Simple dip or bath in chemical solution will rid the host of most ectoparasites. Formalin at 100 ppm/hr (10 ml/100 1) or 50 ppm/24 hr (5 ml/100 1) has been used in our laboratory routinely to remove ectoparasites.
3. Hygienic measures
During the experiment, care mlist be taken to ensure that no new pathogens are introduced via new introductions of infected fish or via net or by other means. Strict hygienic measures,

109
. such as the use of individual nets for each tank and ·discouraging visitors and animals to the laboratory must be adopted to ensure that no new pathogens are introduced into the system.
4. I deal system
a) Since the environment, the pathogen and the host are interrelated in the outbreak of disease, it is important to consider the three factors and. other rdated factors that could cause their imbalance in· designing a system.
b) , · The i;ystem should, as far as possible, meet all physiological requirements for fish. Good water quality that is free of pathogens must be a priority. It is critical in the hatchery that more emphasis should be placed on the water quality because fingerlings are sensitive arid easily susceptible to diseases. It is important that water is filtered to remove organic matter together with larval and adult stages of pathogens. The water may also be treated with ultraviolet light to remove smaller pathogens which cannot be removed by gravel filter.
c) It is important to have an area for quarantine where new fish can be examined and treated before they are introduced into ponds or mixed with other fish.
5. Good management
a) Tanks should be disinfected and dried after every experiment. Similarly, ponds should be : dried and treated with lime. Maintain ideal condition to avoid all possible stress factors affecting fish.
b) As far as possible. ·avoid using antibiotics for prophylaxis. Constant use of antibiotics usually results in development of resistant strains ..
c) Wild fish, and other .animals that· are intermediate or final host (snails, birds and mammals) should be kept out of the ponds,.
d) Broodstock and fingerlings or fry should be maintained ·separately. Broodstock which may carry disease with no apparent symptoms are a health hazard when
. kept together with young fish.
e) · Never try to look for a disease causing agent without giving consideration to other factors, such as the environment, which may be causing stress to the host.
f) Treatment, without proper diagnosis may further aggravate the situation, as addition of chemicals into water causes further stress on fish. In a pond condition, chemotherapy may not be practical due to the large surf ace area. Prevention is always better than cure. · ·
g) During an outbreak of disease, as far as possible avoid handling the fish, as this. will subject them to additional stress.
h) Unn~cessary stress and injury to fish can be av9ided by using an anaesthestic agent such as MS-222 (tricaine methane sulphonate), quinaldine . (2 methylquinone) or benzocaine before handling or during transport.

110
In Case of Emergency
Disease that results in mortalities can occur. at any moment without prior warning. Losses can be minimized by following the guidelines set below:
l. If there is an outbreak of disease, get immediate help from a disease specialist. If a specialist is unable to come immediately provide detail~ over the phone to get instructions on how to reduce the mortalities. ·
2. In the case of ectoparasitic infection,. flushing of the pond or tank will remove the larval stages and thus prevent further infection;
3. Increased aerati~n will provide more dissolved qxygen and help fish.with infected gills in uptake of oxygen, thus reducing a prime stress factor:
4. Reduce stocking densities. This will help prevent the spread of infectious disease ·through physical contact and will also reduce the possibility of fish being subjected to stress.
5. Check for all possible stress factors such as high organic level and drastic fluctuation in temperature and take appropriate measures to overcome the problem. It is important that stress factors be removed before any chemicals are introduced into the pond/tank for treatment. Introduction of chemicals without prior removal of stress factors will further increase mortalities.
6. Maintain records of all activities (observations, treatment, dosage applied, etc.) as they will serve as a valuable reference for the future.
Summary
· Successful disease control involves an understanding of the basic concepts of fish diseases · and a careful program of fish health management that will prevent the introduction of infectious
agents and reduce stress factors by maintainiilg optimum conditions. The outbreak of disease n:iay indicate poor fish health management.
The systematic approach is essential for a correct diagnosis and in many instances, the disease may not be primarily caused by an infectious agent but by a complex interaction between
. host, environment and the pathogen. ·
Acknowledgements
I would like to thank Dr. J.R. Arthur, and Mr. Cheah Sin Hock for reviewing the manuscript.
References
Anonymous. 1987. Current status of problems related to mortalities in farmed marine food fish in Singapore. In J.R. Arthur (ed.), Fish quarantine and fish diseases in sonth and southeast Asia: 1986 npdate. Asian Fisheries Society Special Publication No. 1, pp. 29-35. Asian Fisheries Society, Manila, Philippines.
111
Arthur, J.R. 1987. Fish quarantine and fish diseases in South and.Southeast Asia: 1986 update. Asian Fisheries Society Special Publication No. 1, 86 p. Asian Fisheries Society, Manila, Philippines.
Balasuriya, L.K.S.W. 1987. Current fish disease problems in Sri Lanka. In J.R. Arthur (ed.) Fish quarantine and fish diseases in Southeast Asia: 1986 update. Asian Fisheries Society Special Publication No. 1, pp. 36-40. Asian Fisheries Society, Manila, Philippines.
Brett, J.R. 1958. Implications and assessments of environmental stress in the investigation of fish power problems. H.R. Mac Millan lectures on fisheries, University of British Colombia. . . .
Cowey, C.B. and R.J. Roberts. 1978. Nutritional pathology of teleosts: In R.J. Roberts (ed.) Fish Pathology, pp. 216-226. Bailliere Tindall, London. ·
Ellis, A.E. 1978. The immunology of teleosts. In R.J.Roberts (ed.) Fish pathology, pp. 92-104. Bailliere Tindall, London. Ellis, A.E. 1981. Stress and the modulation.of the irnrnllile response in fish. In A.D. Pickering (ed.) ~tress and Fish, pp. 147-169. Academic Press,
London. · · Ellis, A.E. 1982. Differences between the immune mechanisms of fish and higher vertebrates . .Jn R. J. Roberts (ed.) Microbial diseases of Fish,
pp. 1-29. Academic Press, London. · · · Ghittino, P. 1979. Fish disease vectors in feed. In J.E. Halver and K. Tiews (eds.) Finfish nutrition and fishfeed technology. Vol. 11, pp. 330-333.
Satz and Druck, H. Heenernann GrnbH & Co, Berlin. · Ingram, I. 19.88. The stress factor: fish or farmer? Fish Farming International 15: 36-37 Koo, T.S. and M.L. Johnston. 1978. Larval defomiity in striped bass, Marone siu:atilis (Walbaurn), and blueback herring, Alosa estivalis
(Mitchill), due to heat shock treatment of developing eggs. Environmental Pollution 16: 137-149. Leong, T.S. 1987. Recent fish disease problems in south and southeast Asia and their economic impact. In J.R. Arthur (ed.) Fish quarantine and.
fish diseases in South and Southeast Asia: 1986 update, pp. 1-3. Asian Fisheries Society Special Publication No. 1. Asian Fisheries Society, Manila, Philippines. . . .
Llobrera, A.T. 1987. Current fish disease problems in the Philippines and their eonornic impact. In J.R. Arthur (ed.) Fish quarantine and fish diseases in South and Southeast Asia: 1986 update. Asian Fisheries Society Special Publication no. 1, pp. 22-28.
Munro, A.LS. 1978: The aquatic environment, p. 1-12. Jn R.J Roberts (ed.) Fish Pathology. Bailliere Tindall~ London. Rodgers, L.J. and J.B. Burke. 1981. Seasonal variation in the prevalence of "red spot" disease in estuarine fish with particular reference to the sea
mullet, Mug ii cephalus L. Journal Fish Diseases 4: 297-307. Roberts, R.J., J. Macintosh, K. Tonguthai, S. Boonyaratpalin, N. Tayaputch, M.J. Phillips and S.D. Millar. 1986. Field and laboratory
investigations into ulcerative fish disease in the.Asian-Pacific Region. Tech. Rep. FAO Project TCP/RAS/4508, Bangkok. 214 p. Shariff, M. and A.F. Vijiarungarn. 1986. Occurrence of parasites at the fish-breeding stations·in Peninsular Malaysia and.their control. In Chan
Hooi Har, Ang Kok Jee, law Ah Theern, Mohd Ibrahim Hj, Moh.arned, Ishak Hj. Oriiar (eds.) International Conference on Development and Management of Tropical Living Aquatic Resources, pp. 68-73, University Pertanian Malaysia, August 2-5, 1983.
Shariff, M. 1984. Occurrence of Chilodonella hexaslicha (Kiernik 1909) (Protozoa, Ciliata) from big he.ad carp Aristichthys nobilis (Richardson) in Malaysia. Tropical Biomedicine 1: 69-75. · · · · · ·
·Shariff, M. and A.T. Law. 1981. An-incidence of fish mortality in Be~ok River, Johore, Ml\laysia. In M. Nordin, A. Lltiff, M.C. Mahani and S.C. Tan (eds.) "Proceedings of International Symposium on Conservation Inputs from Life Sciences", pp. 153-162. University of Kebangsaan Malaysia, Bangi, Malaysia.
Shariff, M and C. Sommerville. 1986. Effects of Lernaea polymdrpha on the growth of bighead carp, Aristichthys nobilis. In M.J. Howell (ed.) Handbook of Sixth International Congress of Parasitology, p. 227. Australian Academy of Science. (abstract)
Snieszko, S.F. 197 4. The effect of environmental stress on outbreak of infectious diseases of fishes. Journal of Fish Biology 6: 197-208. Warren, J.W. 1983. The nature of fish diseases. In F.P, Meyer, J.W. Warren and T.G. Carey. (eds.) A guide to intergrated fish health management
in the Great lake Basin. Great lakes Fisheries Cornrnision, Michigan. Special Publication No. 82-3, pP. 7-13 .. Wedemeyer, G.A.~ Meyer, F.P. and L. Smith. 1976. Environmental stress· and fish diseases. In S.F. Sneiszko and H.R. Axelrod (eds.) Diseases of
Fishes. T.F.H. Publications Inc.; Ltd. Neptune City.

Part II
Nutritional Evaluation of Sri Lankan Artemia parthenogenetica for Use
in Larval Rearing
M.M. KURUPPU National Aquatic Resources Agency
Crow Island, Colombo 15 Sri Lanka
S.U.K. EKARATNE Dept. of'Zoology
University of Colombo Colombo 3 Sri Lanka
Kuruppu, M.M. and S.U.K. Ekaratne. 1989. Nutritional evaluation of Sri Lankan Artemia parthenogenetica for use in·. larval rearing, p. 112-117. In S.S. De Silva (ed.) Fish Nutrition Research in Asia. Proceedings of the Third Asian Fish Nutrition Network Meeting. Asian Fish. Soc. Spec. Publ. 4, 166 p. Asian Fisheries Society, Manila, Philippines. ·
Jn Sri .Lanka t1rtemia parthenogenetica, a parthenogenetic strain, is found in solar salt ponds in Hambantota (6°8'N;81"7'E). Cyst production from 83ha of salt pans was 256 kg and 309 kg wet weight in 1986 and 1987, respectively. Cyst diameter was 267_.9 µm and length of Instar 1 _nauplius was 475.4 µm. Hatching percentage of cysts was 77.9 and hatching efficiency was 175 ,360 nauplii/g product. . · The protein content of cysts was 45%, essential amino acids were present at 51.8 g/100 g protein and total amino acids amounted to 43.9 g/100 g cysts. Freshly-hatched nauplii contained 33.5% total lipids. The total amount of 003-Highly Unsaturated Fatty Acids (HUFA > 20:3003) in nauplii was 22.8 mg/g dry weight. HUFA 20:5003 considered essential in the nutrition of marine fish and crustacean larvae was present at 15.8 mg/g dry weight. HUFA 22:6003 generally absent in most strains, was present at 0.9 mg/g dry weight. On the basis of the above results, the Sri Lankan Artemia can be classified as of the_ 20:5003 type (or the marine type) and is considered suitable for marine fish and crustacean larvae.
The last few years have witnessed the expansion of fin-fish and shellfish culture to an industrial scale in developed as well as in developing countries (Versichele et al.· 1985). The development of the aquaculture industry was hampered for a considerable period due to the inconsistent supply of naturally available fry. This has been overcome to a large extent with development of hatching techniques so that a ·reliable supply of hatchery reared fry is increasingly becoming available to the commercial aquaculturist. The brine shrimp Artemia (Anostraca, Artemiidae), has been widely used as a suitable and convenient source of nutrition for the successful rearing of fish and shellfish fry in hatcheries (Kinne 1977; Leger et al. 1986; Sorgeloos 1980; Versichele et al. 1985). Artemia is available in many parts of the world, yet important biological and nutritional quality variations have been found to exist among strains
. from different geographical origins (Schaeur .et al. 1980; Vanhaecke and Sorgeloos 1980; Leger et al. 1986). Artemia cysts are imported into Sri Lanka at a high cost - in 1986 imports to a value of Sri Lankan Rupees 6.56 x 10⁶ (US$ 2.2 x 10⁵) have been recordeda.
aExternal Trade Statistics, 1986, Sri Lanka Customs.
112

113
The present study evaluates the nutritional quality, hatching characteristics and availability of Artemia parthenogenetica cysts in a saltern in Sri Lanka with a view to provide culturists with a suitable low-cost feed.
Materials and Methods.
The Mahalewaya salterns at Hatrtbantota, · iocated in the southern coast of Sri Lanka (6°8'N;81°7'E) is a major solar saltern of 265 ha. Investigations ·were carried out in three shallow condenser pans of 42.5, 20.8 and 19.6 ha, respectively. The mean depth of water in these ponds during the dry production months was 15 cin. Cysts were collected in 1986 (MLI) and 1n 1987. The results relating to nutritional quality, biometrics and hatching are· based on cysts collected in 1986 (MLI). .
Artemici cysts were harvested when available in 1986 and 1987 during the morning hours using hand nets of 220 µm mesh. The wet weight of harvested cysts was recorded and the cysts were stored at the salterns in a cement tank containing super-saturated ·brine, and later transported to the laboratory for processing and analysis.
Brine shrimp cysts were hydrated with diluted sea water (10 ppt) for two hours and kept overnight after addition of lml 1 % Lugol solution (Vanhaeck~ et al. 1980). The diameter of 100 cysts was determined using a micrometer eyepiece. Cysts were decapsulated following the procedure given by Sorgeloos et al.(1986). Decapsulation solution was made of 71 g bleaching powder, 67 g Na2C03 and 1400 ml sea water per 100 g cysts. For estimating naupliar length, Instar 1 larvae were.obtained by incubating hydrated cysts in normal sea water (35 ppt) at 25°C under constant illumination, gentle aeration and a pff of 8.2. The body length of 100 larvae was
· · measured microscopically using a micrometer eyepiece. The hatching percentage and hatching efficiency (number of Iiauplii/g cysts) were estimated
using the methods given by Sorgeloos et al. (1986) .. The protein content of decapsulated Artemia cysts, . and the amino acid content were
analysed at the Laboratorium voor Bromatologie, Ghent; Belgium. Lipids were extracted and the · . fatty acid composition determined according to the method of Leger and Candreva (1987) at the Artemia Reference Centre, Ghent, Belgium.
Results
The salterns yielded a total of 256 kg wet weight of cysts from June to October 1986. In 1987, a total 309 kg wet weight of cysts was collected from April to October. Cyst production and salinity ranges during the months of cyst production in 1986 and 1987 are shown in Fig. 1 and some relevant data on the cysts and nauplii are summarized in Table l:'The amino acid profile is presented in Table 2. · The total amino acid content ·was 43.96 g/100 g cysts (decapsulated), and the essential amino acids (EAA) 51.8 g/100 g protein. Table 3 gives the Fatty Acid Methyl Ester (FAME) composition of freshly-hatched nauplii. The total amount of ro3-Highly Unsaturated Fatty Acids (HUFA > 20:3ro3) amounted to 22.8 mg/g dry weight.. HUFAs 20:5ro3 and 22:6ro3 were present at 15.8 and 0~9 mg/g dry weight, respectively. 18:3ro3 · was low at 0. 7 mg/g dry weight in nauplii.
Discussion
Artemia cyst production season in the Mahalewaya coincides with the season of' salt production. In the Mahalewaya, the average cyst production was 3.1 and 3.73 kg/ha in 1986 and
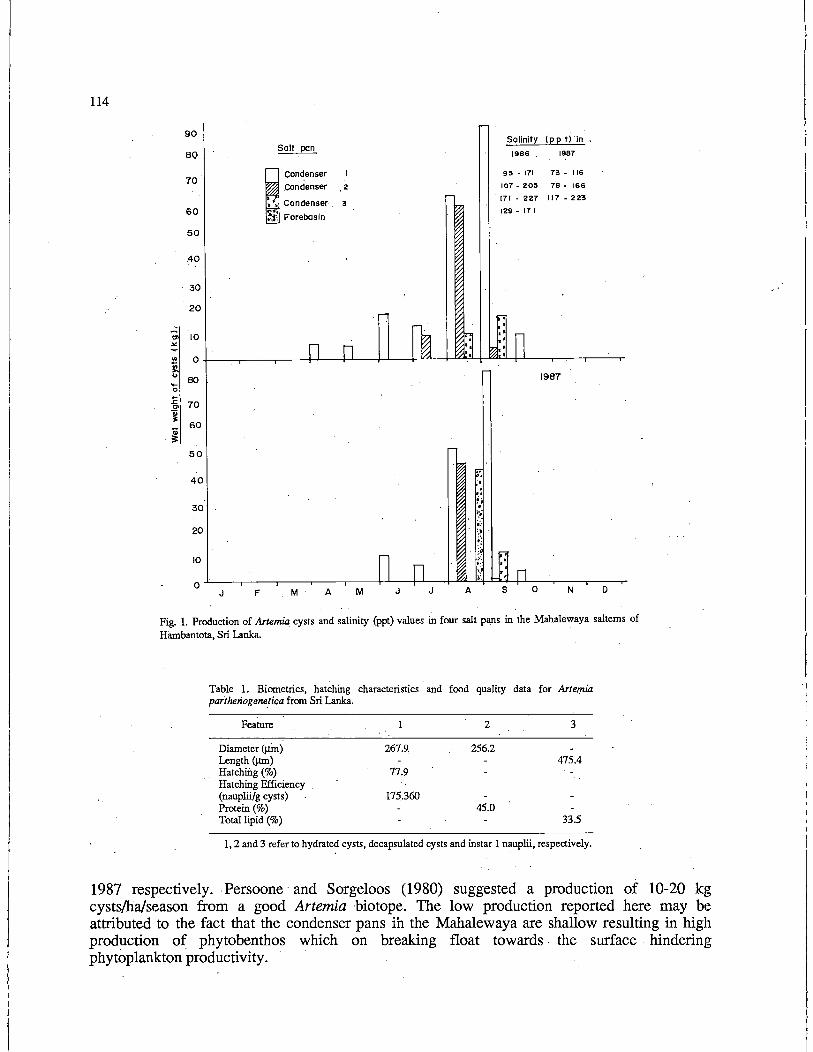
114
90
SQ
·Salinity Cp~ tl'in Salt pan
1986 1987
70
60
i Coo~~' 9~ - 171 73 - 116
.Condenser 2 107 - 2a~ 78 - 166
Condenser 171 - 227 117 - 223
3 . 129 - 171 Forebasin
50
40
30
20
"' 10 ~
"' 0 ~ u .... 80 1987 0 ~
~ 70 "' Qj 3:
o; 60
3::
50
40
30
20
10
0 J F M A M J J A s 0 N D
Fig. 1. Production of Artemia cysts and salinity (ppt) values in four salt pans in the Mahalewaya saltems of Hambantota, Sri Lanka.
Table 1. Biometrics, hatching characteristics and food quality data for Arlef!lia parihenogeneti<;a from Sri Lanka.
Feature 2 3
Diameter (µm) 267.9. 256.2 Length(µm) 475.4 Hatching(%) 77.9 Hatching Efficiency (nauplii/g cysts) 175 . .360 Protein(%) 45.0 Total lipid (%) 33.5
1, 2 and 3 refer to hydrated cysts, decapsulated cysts and instar 1 nauplii, respectively.
1987 respectively .. Persoone and Sorgeloos (1980) suggested a production of 10-20 kg cysts/ha/season from a good Artemia biotope. The low production reported here may be attributed to the fact that the condenser pans ih the Mahalewaya are shallow resulting in high production of phytobenthos which on breaking float towards . the surface hindering phytoplankton productivity.
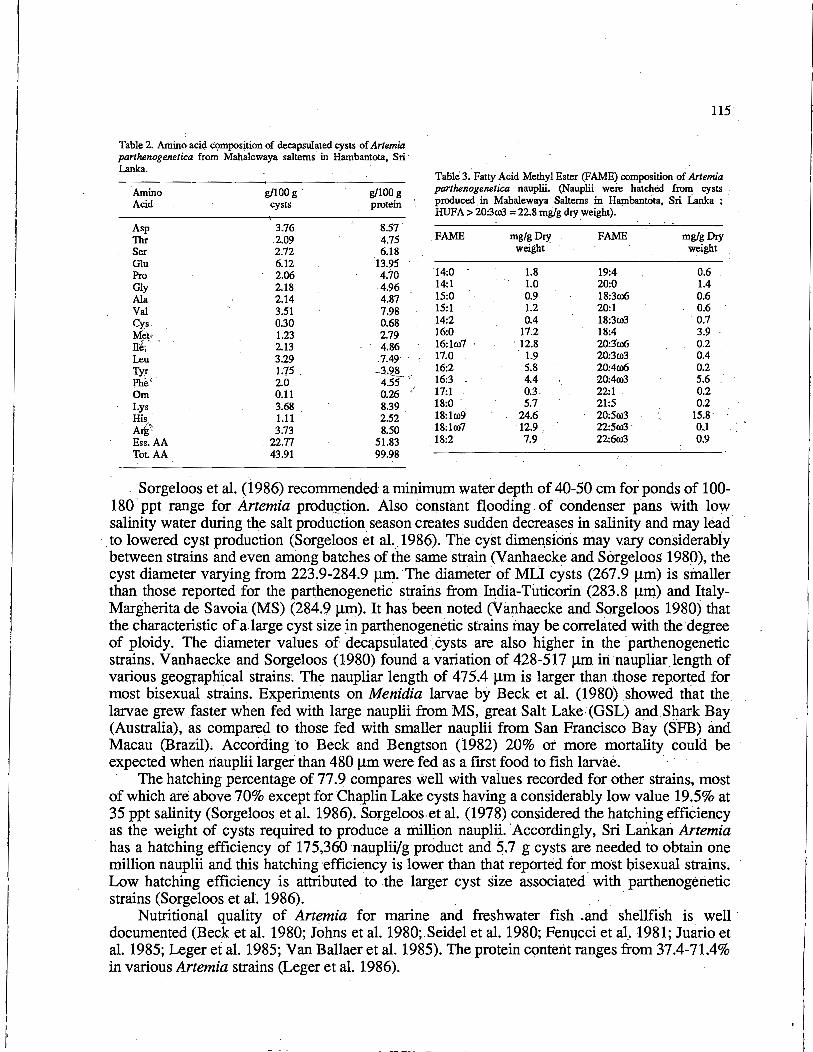
Table 2. Amino acicl. C<?ffiposition of decapsulated cysts of Artemia parthenogenetica from Mahalewaya saltems in Hambantota, .Sri· Lanka.
Amino g/100 g . g/100 g Acid cysts protein
Asp 3.76 8.57 Tur .2.09 4.75 Ser 2.72 6.18 Glu 6.12 13.95 Pro 2.06 4.70 Gly 2.18 4.96 Ala 2.14 4 .. 87 Val 3.51 7.98 Cys. 0.30 0.68 Mev 1.23 2.79 Il~;- 2.13 4.86 Leu 3.29 7.49· . Tyr. 1.75 . -3..~ ... ·. Phi:' 2.0 4.55 Om 0.11 0.26 Lys 3.68 8.39 His 1.11 2.52 Arll'; 3.73 8.50 Ess. AA 22.77 51.83 ToLAA 43.91 99.98
;
115
. .
Table 3. Fatty Acid Methyl Ester (FAME) composition of Artemia parthenogenetica nauplii. (Nauplii were hatched from cysts produced. in Mahalewaya Saltems in H~bantota, Sri Lanka ; . HUF A> 20:3ro3 = 22.8 mg/g dry weight).
.FAME
14:0 14:1 15:0 15:1 14:2 16:0 16:1ro7 · 17.0 16:2 16:3 -17:1 18:0 . 18:1ro9. 18:lro7 18:2
mg/g Dry weight·
1.8 1.0 0.9 1.2 0.4
17.2 . 12.8
1.9 5.8 4.4 0.3 5.7
24.6 ·12.9 .
7.9
FAME
19:4 20:0 18:3ro6 . 20:1 18:3ro3 18:4 20:3ro6 20:3ro3 20:4ro6. 20:4ro3 22:1 21:5 20:5ro3 22:5ro3 · 22:6ro3
mg/g Dry weight
0.6 1.4 0.6 0.6 0.7 3.9 0.2 0.4 0.2 5.6 0.2 0.2
15.8· 0,1 0.9
Sc;>rgeloos et al. ( 1986) recommended a minimum water depth of 40-50 cm for ponds of 100-180 · ppt range for Artemia produ¢tion. Also constant flooding of condenser pans With low salinity water during the salt production season creates sudden decreases in salinity and may lead·
·.to lowered cyst production (Sorgeloos et al._ 1986). The cyst dime~sions may vary considerabiy between strains and even among batches of the same strain (V anhaecke and Sorgeloos 1980), the cyst diameter varying from 223.9-284.9 µm. The diameter of MLI cysts (267.9 µm) is smaller than those reported for the parthenogenetic strains from India-Tuticorin (283.8 µm) and ItalyMargherita de Savoia (MS) (284~9 µm). It has been noted (Vanhaecke and Sorgeloos 1980) that the characteristic of a large cyst size in parthenogenetic strains inay be correlated with the degree of ploidy. The diameter values of decapsulated.cysts are also higher in the parthenogenetic strains. Vanhaecke and Sorgeloos (1980) found a variation of 428-517 µm irt naupliar_length of various geographical strains·. The naupliar length of 475.4 µmis larger than those reported for most bisexual strains. Experiments on Menidia larvae by Beck et al. (1980) .showed that the larvae grew ,faster when fed with large nauplii from MS, great Salt Lake '(GSL) and Sliark Bay (Australia), as compared to those fed with smaller nauplii from San Francisco Bay (SFB) and Macau (Brazil), According to Beck and Bengtson (1982) 20% ot more mortality could be expected when Iiauplii larger than 480 µm were fed as a first food to fish larvae. ·
The hatching percentage of 77.9 compares well with values recorded for other strains, most of which are above 70% except for Chaplin Lake cysts having a considerably low value 19.5% at 35 ppt salinity (Sorgeloos et al. 1986). Sorgeloos et al. (1978) considered the hatching efficiency as the weight of cysts required to produce a million nauplii. Accordingly, Sri Larlkrui Artemia has a hatching efficiency of 175,360 nauplii/g product and 5.7 g cysts are needed to obtain one million nauplii and this hatching efficiency is lower than that reported for. mo·st bisexual strains. Low hatching efficiency is attributed to the larger cyst size associated with parthenogerietic strains (Sorgeloos et al. 1986). ·
Nutritional quality of Artemia for marine and freshwater fish .and shellfish is well · documented (Beck et al. 1980; Johns et al. 1980; Seidel et al. 1980; FenQcci et al. 1981; Juario et al. 1985; Leger et al. 1985; Van Ballaer et al. 1985). The protein content ranges from 37.4:. 71.4% in various Artemia strains (Leger et al. 1986).

116
Most of the values estimated for amino acids in Sri Lankan Artemia compared favourably with those reported by Seidel et al. (1980) for Artemia from different geographical locations, while lower values were found for the EAAs leucirie, tyrosine, phenyl alanine, histidine; lysine and arginine. Valine was exceptionally high at 7.98 g/100 g protein. Watanabe et al .. (1978a) found 3.2 g valine/100 g protein in Artemia salina. In the Sri Lankan Artemia, all the amino acid values specially the EAA values were higher than those.estimatedby Watanabe et al. (1978a) for A. salina and other living organisms used as food in fish culture in Japan ..
Freshly hatched nauplii of MLl cysts contained 33.5% total lipids. This is higher than 23.3% (Royan 1980) recorded for the India-Tuticorin parthenogenetic strain. The lipid content of nauplii from various strains range from 11.6 to 30.0% (Leger et al. 1986).
The nutritional· quality of Artemia has been assessed based on the HUF A content of the various strains. Accordingly Artemia has been classified into two types: one with a large amount of the HUFA 18:3ro3 which is required for freshwater fish and the other with a large amount of 20:5ro3 essential for marine fish (Watanabe et al. 1978b). ·
ro3-Fatty Acid Methyl Esters (FAME> 20:3ro3) are considered to be Essential Fatty Acids (EFA) for marine fish and prawns. The present results indicate a high total v(\}ue of 22.8 mg/g dry weight of ro3-FAME content in the Sri LankanArtemia nauplii. Leger et al. (1985) observed 2.8 mg/g dry wt. of total ro3-FAME in SFBR 1628 nauplii. These nauplii when fed with an enrichment diet yielded 15.1 mg/g dry wt. of total ro3-FAME. Watanabe et al. (1978) demonstrated the importance of the FAME 20:5ro3 for survival of the red seabream. High mortality in these larvae was observed when the amount of 20:5ro3 was lower than that of 18:3ro3 in the diet. Penaeus stylirostris has shown a high requirement for 20:5ro3 during postlarval metamorphosis and higher amounts of 22 :6ro3 have been effective in promoting better growth (Leger et al. 1985). In the Sri Lankan Artemia, 15.8 and 0.9 mg/g dry wt. of 20:5ro3 and 22:6ro3 respectively have been observed. Reports indicate that in most Artemia strains the level of 20:5ro3 is inversely related to the level of 18:3ro3 (Watanabe et al. 1978b; Siedel et al. 1980). This rdationship has been observed in the Sri Lankan Artemia too, the latter amounting to 0.7 mg/g dry wt. Schaeur and Simpson (1985) mentioned that 18:3ro3 i.s converted to 20:5ro3 in· freshwater fish and that this conversion is very low in marine fish.
Work on P. stylirostris using formulated diets has shown that the FAME 18 :2 ro6 is also important in the diet of prawns (Fenucci et al. 1981). According to Fujita et al. (1980) the food value of Artemia is significantly affected by its EFA content.
The single most important factor so far identified in defining the nutritional quality of Artemia nauplii for marine fish and crustaceans is the content of essential fatty acids such as 20:5ro3 which should be in quantities above 4% (Leger et aL 1986). As stated earlier the Sri LankanArtemia strain contains high amounts of 20:5ro3. Based on these results, the Sri Lankan Artemia can be said to possess a high nutritional quality for aquaculture purposes. It can be classified as the 20:5ro3 type or the marine-type and can be highly recommended for marine fish and crustacean larvae.
Acknowledgements
The authors are grateful to the Arterllia Reference Centre, Ghent, Belgium, for sample analysis, the National Aquatic Resources Agency (NARA) and the University of Colombo, Sri Lanka for facilities provided, the Natural resoQrces Energy and Science Authority (NARESA), Sri Lanka, for funding the project (Research Grant RG/87 /B/3) and the Sri Lanka National Salt Corporation for assistance provided throughout.

117
References
Beck, A.D. and D.A. Bengtson. 1982. International study onArtemia XXII. Nutrition in aquatic toxic~logy - diet quality of geographical strains of Artemia. In J.G. Pearson, R.B. Foster and W.E. Bishop (eds.) Aquatic toxicology and Hazard Assessment, pp. 161-169. American Society for Testing and Materials, Philadelphia, USA.
Beck, A.D., D.A. Bengtson and W.H. Howell. 1980. Internatio_nal Study on Artemia. V~ Nutritional value of five geographical strains of Arlemia: effects on survival and growth of larval Atlantic silverside, Menidia menidia. In G. Persoone, P. Sorgeloos, 0. Roels and E. Jaspers (eds.) The Brine shrimp Arlemia. Vol. 3. Ecology, Culturing, Use in aquaculture, pp. 249-259. Universa Press, Wetteren, Belgium.
Fenucci, J.L., A.L. Lawrence, and Z.P. Zein-Eldin. 1981. The effects of fatty acid, and shrimp meal composition of prepared diets on growth of juvenile shrimp, Penaeus stylirostrls. World MaricultureSociety 1: 315-324.: · , .
Fujita, S., T. Watanabe and C. Kitajima. 1980. Nutritional quality of of Arternia from different localities as a living feed for marine fish from the viewpoint of essential fatty acids. In G. Persoone, P. Sorgeloos, 0. Roels and E. Jaspers (eds.) The Brine Shrimp Artemia. Vol. 3: Ecology, Culturing, use in Aquaculture, pp. 277-290. Universa Press, Wetteren, Belgium. ·
Johns, D.M., M.KJ. Peters and A.D. Beck. 1980. International Study on Artemia. VI. Nutritional value of geographical and temporal strains of Artemia: Effects on survival and growth of two species of Brchyuran larvae. In G. Persoone; P. Sorgeloos, 0. Roels and E. Jaspers (eds.) The Brine shriinp Artemia. Vol. 3. Ecology, Culturing, Use in Aquaculture, pp. 291-304. Universa Press, Wetteren, Belgium.
Juario, J.V., M.N. Duray, V.M. Duray, J. Nacario and J.M:E. A)mendras. 1985. Breeding and larval rearing of the rabbitfish, Siganus gutlalus (Bloch). Aquaculture 44: 91-101.
Kinne, 0. (ed.). Marine Ecology, Vol. 3, Part 2, p. 743-761. John Wiley & Sons, 1977. Leger, P., D.A. Bengtson, K.L. Simpson and P. Sorgeloos. 1986. The use and nutritional value of Arlemia as a food source. In Margaret Barnes
(ed.) Oceanography and Marine Biology, Annual Review 24, pp. 521-623. Aberdeen University Press, Aberdeen, UK. Leger, P., D.A. Bengtson, P. Sorgeloos, K. Simpson aiid A.D. Beck. 1985. The Nutritional value of Artemia: A review. Paper presented at the
2nd International Symposium on the Brine Shrimp Arlemia, Antwerp, (Belgium); Sept. 1-5, 1985. Leger, P., G.F. Bieber and P. Sorgeloos.1985. International Study on Artemia. XXXIIl. Promising result_s in larval rearing of Penaeus stylirostris
using a prepared diet as algal substitute and for Artemia enrichment. Journal World Mariculture Society 16: 354-367. Leger, P. and P. Candreva. 1987. Sample preparation for total lipid extraction and Fatty Acid Methyl Ester Analysis (unpublished). Anemia ·
Reference Centre, Rozier 44, B-9000 Ghent, Belgium. · Persoone, G. and P. Sorgeloos. 1980. General aspects the ecology and biogeography of Arlemia. ln G. Persoone, P. Sorgeloos, 0. Roels and E.
Jaspers (eds.) The Brine Shrimp Artemia. Vol. 3. Ecology, ·culturing, Use in Aquaculture, pp. 3-24. Universa .Press. Weteren, ~~ . .
Royan, J.P. 1980. Laboratory and field studies on an Indian strain of the brine shrimp Artemia. In G. Persoone, P. Sorgeloos, 0. Roels and E. Jaspers (eds.) The Brine shrimp Artemia. Vol. 3. Ecology, Culturing, Use in Aquaculture, pp. 223-230. Universa Press, Wetteren, Belgium. . . .
Schaeur, P.S. and K.L. Simpson. 1985. Bioaccumulation and bfoconversion of dietary labelled fatty acids in Artemia and winter flounder (Pseudopleuronecles americanus). Canadian Journal of Fisheries and Aquatic Sciences 42: 1430-1438.
Schaeur, P.S., D.M; Johns, C.E. Olney, and K.L. Simpson. 1980. International Study ori Artemia, p. 365-373. IX. Lipid level, energy content and fatty acid composition of the cysts and newly hatched nauplii from five geographical strains of Arlemia. In G. Persoone, P. Sorgeloos, 0. Roels and E. Jaspers (eds.) The Brine shrimp Arteinia. Vol. 3. Ecology, Culturing, Use in Aquaculture. Universa Press, Wetteren, Belgium.
Seide, C.R., J. Kryznowek and K.L. Simpson. 1980. International study on Artemia. XI. Amino acid composition and electrophoretic protein patterns of Artemia from five geographical locations. In G. Persoone,.P. Sorgeloos, 0. Roels and E. Jaspers (eds.) The brine shrimp Artemia. Vol. 3. Ecology, Culturing, Use in Aquaculture; pp. 375-382. Universa Press, Wetteren, Belgium.
Soigeloos, P. i980. The use of the brine shrimp Artemia in aquaculfure. In G. Persoone, P-. Sorgeloos, 0. Roels and E. Jaspers (eds.) The Brine Shrimp Artemia. Vol. 3. Ecology, Culturing, Use in Aquaculture, pp. 25-46. Universa Press, Wetteren, Belgium.
Sorgeloos, P., P. Lavens, P. Leger, W. -Tackaert and D. Versichele. 1986. Manual for the Culture and Use of Brine. Shrimp Anemia. in Aquaculture. Artemia reference Centre, Wetti::rn, Belgium, 319 p. ·
Sorgeloos, P., G. Persoone, M. Baeza, E. Bossuyt and E. Bruggeman. 1978. The Use of Anemia cysts in Aquaculture; The Concept of 'Hatching efficiency' and Description of a new method for cyst processing. In J.W. Avault, Jr. (ed.) Proceedings. 9th Annual Meeting World Mariculture_Society, pp. 715-721. Louisiana State University,_Baton Rouge, LA.
Van Ballaer, E., F. Amat, F. Hontoria, P. Leger, and P. Sorgeloos. 1985. Preliminary results on the nutritional evaluation of w3-HUFA-Enriched Artemia nauplii for larvae of the sea bass, Dicentrarchus labrax. Aquaculture 49: 223-229. . .
Vanhaecke, P. and P. Sorgeloos. 1980. International study on Artemia. N. The biometrics of Artemia strains from different geographical origin, p. 393-405. In G. Persoone, P. Sorgeloos, 0. Roels and E. Jaspers (eds.) The Brine·shrimp Artemia. Vol 3. Ecology, Culturing, Use in Aquaculture. Universa Press, Wetteren, Beligiurn.
Vanhaecke, P., H. Swyaert and P. Sorgeloos. 1980. International Study op Anemia. III. The use of Coulter Counter equipment for the biornetrical analysis of Artemia cysts; Methodology and mathematics. In. G. Persoone, P. Sorgeloos, 0. Roels and E. Jaspers (eds.) the brine shrimp.Artemia. VoL 1 Morphology, Genetics Radiobiology, Toxicology, pp. 107-115. Universa Press, Wetteren, Belgium.
Versichele, D., P. Sorgeloos, P. Baert, P. Lavens, P. Leger arid W. Tackaert. 1985. Improved aquaculture production of marine fish and crustaeeans through progress in Anemia research and applications. Proceedings_ 'Progress in Beigiurn Oceanographic Research'; Brussels, March 1985.
Watanabe,.T., T. Arakawa, C. Kitajima and S. Fujita. 1978a. Nutritional evalilation of proteins of living feeds used in seed production of fish. Bull, Japan Soc. Sci. Fish. 44: 985-988.
Watanabe, T., F. Oowa, C. Kitajima and S. Fujita. 1978b. Nutritional quality of brine shrimp, Artemia salina, as a living feed from the view -point of essential fatty acids for fish. Bulletin Japanese Society of Scientific Fisheries 44: 1115-1121.

The Digestibility of Several Feedstuffs In Red Tilapia
M.S. KAMARUDIN K.M. KALIAPAN
S.S. SIRAJ Department of Aquaculture
Faculty of Fisheries. & Marine Science Universiti Pertanian Malaysia
Selangor Darul Ehsan Malaysia\
Karnarudin, M.S., K.M: Kaliapan and S.S. Siraj. 1989. The digestibility of several feedstuffs in red tilapia, p. 118-122. In S.S: De Silva (ed.) Fish Nµtrition Research in Asia. Proceedings of the Tliird Asian Fish Nutrition Network Meeting. Asian Fish. Soc. Spec. PubL 4, 1'66 p; Asian Fisheries Society, Manila, Philippines .
.A digestibility study of rea tilapia on six different feedstuffs were conducted .. The feedstuffs tested \Vere·fi~hmeal, shrimp meal, soybean meal, copra meal, corn meal and ricebran. The test diet composed of 30% of the test feedstuff and 70% of the reference diet of 40% protein. One percent chromic oxide was added to ~ach diet as an internal indicator.
The results showed that -the apparent· digestion «:oefficients of dry matter in the feedstuffs used were above 80% __ except for soybean meal (63.90%) .. The digestioffcoefficients of protein in ricebran was 99.85%, followed by fish meal (99.45%), shrimp meal (99.42%), copra meal (99.09%), soybean meal (91.56%) and corn meal (89.40%). The mean fat digestion coefficients for ricebran, copra meal, fishmeal and shrimp meal were significantly higher (P < 0.01) than those values for corn meal and soybean meal. Carbohydrates in soybean meal and fishmeal were poorly digested by red tilapia while those in corn meal and ricebran were well digested. The mean ash digestion coefficients of ricebran and copra rneai -were significantly higher (P < 0.01) than those of other feedstuffs. Fishmeal and shrimp meal gave significantly _higher energy digestion coefficients (P < 0.01) than other feedstuffs for red tilapia.
Feed cost is one of the major constraints in aquaculture. To reduce the price of a wellbalanced feed, locally available ingredients should be included in the feed, especially agricultural by-products. Being an agricultural-based country, Malaysia has a number of agricultural by-products that can be used as animal feed and may also be suitable for fish
. - /
(Devendra 1975). Other than looking at growth responses, the digestibility of nutrients contained in the feedstuffs could be used to assess the suitability of the feedstuffs as ingredients in fish feeds. Few studies had been carried out to detern1me the nutrient digestibility of local feedstuffs in several fish species commonly cultured in Malaysia (Law 1984, 1986: Law et al. 1985, 1987). The results showed that the digestibility of a feedstuff differs with species ..
Red tilapia is one of the most important and popular cultured food fish in Malaysia (Siraj et al. 1987). It is easy to culture, has a fast growth rate and readily accepts, artificial feed. Furthermore, it cominands a high market price. However, there is little known ori\ its response to local feedstuffs. In this study, the nutrient digestibility of several feedstuffs in red tilapia was determined. '
118

119
Materials and Methods
Six funnel-shaped experimental tanks as described by Law (1984) were used in the study. Twenty fish with an average weight of 36.6 g were placed in each tank. The average water-flow into each tank was 201/hr.
Six test diets, each composed of 30% of the test feedstuff and 70% of the reference diet (Table 1) were prepared. The feedstuffs tested were fishmeal, shrimp meal, soybean meal, copra meal, corn meal and ricebran. A 40% protein diet was used as the reference diet (Y aha ya 1986). 1 % chromium oxide '(Cr203) was added to all diets as an internal marker. Each diet was assigned to a tank at random and 3 runs were made for each diet.
Table 1. Composition of the reference (control) diet.
Ingredients 1 ·
Fishmeal Shrimp meal Soybean meal Cornmeal Rice bran Copra meal Vitamin premix2 Mineral premix2·
%
28.89 28.89 28.89 3.03 3.03 3.03 0.60 3;65
1 The proximate compositions of the feedstuffs were as follows: Fishmeal - 62.5% protein, 5.12% lipid, 19.8% ash, 12.4% moisture, 3483.0 cal/g energy; shrimp meal - 27% protein, 2.27% fat; 44.3% ash; 10.8% moisture, 2639.7 cal/g; soybean meal - 44.1% protein, 1.6% fat, 6.0% ash, 12.3% moisture, 4523.4 cal/g energy; com meal - 9.07% protein, 4.5% fat, 2.2% ash, 11.5% moisture, 4253.6 cal/g: ricebran - 10.9% protein, 10.79% fat; 12.3% ash; 11.8% moisture, 4859.1 cal/g energy; copra meal - 16.8% protein, 8.4% fat; 6.39% ash; 11.8% moisture, 4565.4 cal/g energy.
2 As recom~ended by NRC (1977).
The fish were fed twice daily (Siraj et al. 1987) at 2% body weight/day at 0700 and 1300 hr while the faeces were collected at 1230 and 1830 hr. The procedures for feeding and fecal collection, the analyses of crude protein, fat, ash, carbohydrate, dry matter, gross energy and chromic oxide were similar to those described by Law (1984).
The apparent digestibility of dry matter and nutrients in the diets were determined according to Schneider and Flatt (1975) while the apparent digestion coefficients of the nut:rients in the feedstuffs were estimated according to Cho and Slinger (1979). All data were analysed. using 1-way ANOVA (Schefler 1980) and the differences between the means were tested using Duncan's New Multiple Range Test (Duncan 1955).
Results and Discussion
The proximate analyses of the feed and faeces of the reference and test diets are given in Table 2 while the apparent digestion coefficients of the nutrients and dry matter of the tested feedstuffs in red tilapia are given in Table 3.

120
Table 2. Proximate analyses of feed and faeces of the reference diet and test diets in red tilapia (dry. weight basis).
Control (Reference
diet) Feed Faeces --
Protein 39.80* 12.99 (%) ± ±
0.29 0.91
Fat 2.40 1.47 (%) ± ±
0.06 0.08
Carbohydrate 29.81 45.52 (%) ± ±
0.74 0.43
Ash(%) 27.98 40.02 (%) ± ±
0.40 0.58
Gross energy 3564.27 1906.25 (cal/g) ± ±
70.55 89.59
Cri03 (%) 0.77 3.29 ± ± 0.03 ·0.04
*Mean ± Standard Deviation
Table 2. (continued)
Control +
Soybean meal Feed Faeces
45.o4 13.04* ± ± 0.14 0.54
2.37 1.57 ± ± 0.06 0.05
,29.01 56.80 ± ± 0.18 0.69
23.58 28.59 ± ± 0.18 0.31
3756.60 2146.55 ± ±
58.15 54.80.
0.80 2.94 ± ± ...,. 0.02 0.04
· Control +
Corn meal Feed Faeces
32.67 13.26 ± ± 0.20 0.59
2.79 1.88 ± ± 0.13 0.13
44.00 57.15 ± ± 0.45 1.09
20.55 27.71 ± ± 0.15 0.60
3708.67 2518.10 ± ±
69.84 57.54
0.79 3.76 ± ± 0.03 0.03
Feed
50.31 :J:: 0.28
3.38 ± 0.04
21.15 ± L19
25.15 ± 0.90
3849.70 ±
84.95
0.78 ± 0.03
Control +
Fishmeal Faeces
13.90 ± 0.41
1.73 ± 0.10
48.50 ± 0.43
35.86 ± 0.58
1956.70 ±
67.03
3.91 ± 0.02
Control +
Copra meal Feed Faeces
35.30 8.94 ± ± 0.41 0.12
5.24 1.78 ± ± ·0.04 0.16
37.15 63.99 ± ± 0.86 0.39
22.30 25.29 ± ± 0.47 0.44
3789.77 2433.27 ± ±
70.76 8.36
0.77 3.47 ± ± 0.01 0.05
Control +
Shrimp meal Feed Faeces
37.81 9.75 ± ± 0.28' 0.30
2.71 1.40 ± ± 0:04 0.06
23.75 38.19 ± ± 0.57 0.06
35.73 50.66 ± ± 0.80 0.39
3142.35 1558.60 ± ±
58.19 81.90
0.73 3.41 ± ± 0.01 0.05
Continued
Control +
Rice bran Feed Faeces
34.38 9.42 ± ± 0.37 0.41
5.79 2:35 ± ± 0.62 0.12
35.56 55.96 ± ± 0.42 0.55
24.27 32.28 ± ± 0.33 0.49
3805.13 2437.53 ± ±
75.48 72.85
0.78 4.07 ± ± 0.01 0.05

121
Table 3. Apparent digestion coefficients of dry matter an.d nutrients in the tested feedstuffs.
Feedstuff Nutrient Fish Shrimp Soyabean Corn Copra Rice
meal meal meal meal meal bran
Dry matter 88.lld* 83.24bC 63.90a 84.57C 80.63b 90.72d ±0.34 ±1.05 ±1.23 ±0.56 ±1.07 ±0.79
Protein 99.45b 99.42b 91.56a 89.40a 99.09d 99.85b ±0.54 ±0.57 ±1.09 ±1.27 ±0.25 ±0.25
F.at 98.95C 96.57c 73.36a 86.26b IQOC lOQC ±1.33 ±1.58 ±1.92 ±3.27 ±0.00 ±0.00
Carbohydrate 30.90b 68.64d 5.69a 92A2f 55.98C 82.86e ±1.36 ±0.19 ±2.00 ±1.74 ±0.78 ±0.99
Ash 83.30C 76.93b 68.I3a 83.67C 94.22d 93.I4d ±1.54 ±0.78 ±1.20 ±2.05 .±1.46 ±1.29
Gross energy 95.41C 93.89C 77.38a 81.65a 8I.71a 88.28b ±1.16 ±1.97 ±1.32 ±1.09 ±0.75 ±1.23
*Mean± Standard Deviation Means within the same row and followed by a same letter were not significantly different (p > 0.01).
The results show that the mean apparent digestion coefficients of dry matter in the test.ed feedstuffs were between 63.90% and 90.72%, The apparent dry matter digestion coefficient was
. highest in ricebran, followed by fishmeal, com meal, shrimp meal, copra meai and soybean meal. Contrary to these results, Law (1986) and Law et al. (1987) noted that ricebran was poorly digested by grass carp and giant gourami but soybean meal was well digested by both species. Law (1986) also found that copra meal was poorly digested by grass carp.
The proteins in all the tested feedstuffs were very well digested by red tilapia. More than 99% of the proteins in ricebran, fishmeal, shrimp meal and copra meal were digested while 91.56% and 89.40% of the proteins in soybean meal and com meal were digested, respectively. Similar observations were made by Law et al. (1987) in giant gourami. lnjelawat, only fishmeal protein was well digested (Law 1984) while only fishmeal and soybean meal proteins were well digested in grass carp (Law 1986).
The fat contents in copra meal and ricebran were all digested by red tilapia. Except for soybean meal, the fats contained in other feedstuffs were also well digested. The mean apparent fat digestion coefficients of the feedstuffs were between 73.36 and 100%. In contrast, fats in ricebran were poorly digested by jelawat (Law 1984) while fats in com meal were slightly digested by grass carp (Law 1986). The apparent fat digestibility of soybean meal were also lower than fishmeal in giant gourami andjelawat (Law 1984; Law et al. 1987).
The mean apparent carbohydrate digestion coefficient was highest in com meal, followed by ricebran, shrimp meal, copra n:l'eal, fishmeal and soybean meal. The results showed that red tilapia did not efficiently digest the carbohydrates contained in the high protein feedstuffs. Similar observations were also seen in giant gourami and grass ·carp (Law 1986; Law et al. 1987). However, they also noted that ricebran carbohydrates were poorly digested in both species.
The results also showed that copra meal and ricebran had very high ash digestion coefficients in red tilapia. In contrast, the ash contents of copra meal and ricebran were not digestible in grass carp (Law 1986) and were poorly digested by giant gourami (Law et al. 1987). The minerals of copra meal were also poorly digested by jelawat (Law 1984).

122
The apparent energy digestion coefficients of all feedstuffs were high. Except for fishmeal and shrimp meal, these values were much higher than those of jelawat (Law 1984). Fishmeal had the highest apparent digestion coefficient for energy (95.41%) while soybean meal had the lowest (77.38%). In other studies, fishmeal had also the highest energy digestion coeffioients (Law 1984, 1986; Law et al. 1987). .
The study showed that ricebran was the most digestible feedstuff for red tilapia in terms of dry matter and nutrients. Ricebran is one of the local agricultural by-products. It is cheap and abundant. Thus ricebran should be one of the major ingredients for red tilapia feed.
Despite low digestibility of carbohydrates, fishmeal was the second most digestible feedstuff. This suggests that fishmeal is the most important protein source in red tilapia feed. Soybean meal, though not well digested by the fish, had a high protein digestion coefficient. Therefore, the results indicated that soybean meal could be used to replace some portion of fishmeal in the feed. Such substitutions of fishmeal in fish feeds has been increased lately (Viola et al. 1982) and it would, of course, reduce the cost of feed. In general, all the tested feedstuffs are suitable ingredients for formulating a well-balanced red tilapia feed.
Acknowledgement
We would like to thank Dr. A.T. Law for his cooperation and encouragement, Zakaria Md; Sah and the staff of Faculty of Fisheries and Marine Science, Universiti Pertanian Malaysia for their technical assistance and cooperation. This project was funded by UPM research fund.
References
Cho, C.Y. and S.J. Slinger 1979. Apparent digestibility measurement in feedstuffs for rainbow trout. In J.E. Halver and K. Tiews (eds.) Proc. World Symposium on Finfish Nutrition and Fishfeed Technology, Vol. II, pp. 239-247. Heenemann, Berlin.
Devendra, C. 1975. Agricultural by-products for animal feeding in Malaysia. MARDI Report No. 31. 44 p. Duncan, D.B. 1955. Multiple range and multiple F tests.Biometrics 11: 1-42. Law, A. T. 1984. Nutritional study of jela wat (Leptobarbus hoevenii Bleeker), fed pelleted feed. Aquaculture 41: 227-233. Law, A.T. 1986. Digestibility of low-cost .ingredients in pelleted feed by grass carp (Ctenopharyngodon idella). Aquaculture 51: 97-103. Law, A.T. S.H. Cheah and K.J. Ang. 1985. An evaluation of the apparent digestibility of some locally available plants and a pelleted feed in three
finfish in Malaysia. In C.Y. Cho, C.B. Cowey and T; Watanabe (eds.) Finfish Nutrition In Asia, pp. 90-95. IDRC (Canada), Ottawa. Law, A.T, K.K. Chong and K.J. Ang. 1987. Digestibility of ingredients in a pelleted feed by giant gourami, Osphronemus goramy (Lacepede). In
R.I. Hutagalung, C.P. Chen, W.M. Wan Embong, A.T. Law and S. Sivarajasingam (eds.) Proceedings 10th Annual Conference Malaysian Society of Animal Production, pp. 206-209.
Schefler, W.C. 1980. Statistics for the biological sciences. Addison-Wesley Piibl. Co., 260 p. Schneider, B.H. and W.P. Flatt. 1975. The evaluation of feed through digestibility experiments. University of Georgia Press, Athe~ 423 p. Siraj, S.S., Z. Kamaruddin, M.K.A. Satar and M.S. Kamarudin. 1987; Effects of feeding frequency on growth, food conversion-~~\~urvival of
red tilapia fry. Presented in the 2nd Intemationat Symposium on Tilapia in Aquaculture. 16-20 March, 1987. Bangkok. Thail'apd. Yahaya, M.Z. 1986. Optimal dietary protein level for red tilapia cultured in glass aquaria. B.S. Thesis. Univ. Pertanian Malaysia. 44 p.

Growth Response, Feed Conversion and Metabolism of the Air-Breathing Fish,
Anabas testudineus (Bloch) to Different Dietary Protein Sources
ARUN KUMAR RAY BIDHAN CHANDRA PATRA
Fisheries Laboratory Department of Zoology
ViS'la-Bharati University Santiniketan 731 235 West Bengal, India
Ray, A.K. and RC. Patra. 1989. Growth response, feed conversion and metabolism of. the air-breathing fish, Anabas testudineus (Bloch) to different dietary protein sources, p. 123-129. In S.S. De Silva (ed.) Fish Nutrition Research in Asia. Proceedings of the Third Asian Fish Nutrition Network Meeting. Asian Fish. Soc. Spec. Puhl. 4, 166 p. Asian Fisheries Society, Manila, Philippines.
A 60 day laboratory feeding trial was conducted to examme the effects· of different dietary protem sources on the weight gain, feed conversion, protein efficiency ratio (PER), protein synthesis and protease activity of the air-breathing fish, Anabas testudineus. Specific growth rate, feed conversion and protein efficiency ratios were highest in fish fed with diet D4 (containing carcass waste, .ricebran and groundnut oil cake) followed by fish fed with diet D3 (dried goat bloOd, ricebran, wheat·bran and ground nut oil cake)·and Dl (soybean meal, wheat bran and mustard oil cake) in decreasing order. Rates of protein.synthesis in terms of amino acid (14C L-leucine) incorporation (cpm/mg tissue protein) in the liver and muscle increased significantly (P < 0.001) with all the diets except with D 1 where the increase was not significant in the muscle. Protein synthesis. rates followed the same trend as growth rates. The protease activity in the hepatopancreas, stomach and intestine also increased significantly with all the diets following a similar trend. ·
The dietary formulation of a nutritionally balanced diet to meet the requirements is one of the major aspects in the development of aquaculture. Protein is considered as the most important arid expensive component of fish diets. The characteristics of the protein solirces used in fish diets should also be considered, since the response of the fish could vary depending on protein quality and gross protein level of the diet. The present experiment was therefore designed to study the influence of diets with different protein sources on the growth, feed conversion, protein synthesis and protease activity of the air-breathing fish, Anabas testudineus (Bloch).
. '
Materials and Methods
Four isonitrogenous (crude protein -level - 35%) experimental diets using either soybean meal or fish meal or dried goat blood or carcass waste as the main protein source were ·formulated (Table 1) and pelleted.
123

124
Table 1. Proportion of different ingredients (% dry matter) and proximate composition of the experimental dietS .
INGREDIENTS
Soybean meal Mustard oil cake Groundriut oil cake Wheat bran Rice bran Fish meal Dried goat blood Carcass waste Vitamin and mineral mixture+
Proximate composition++(%) Moisture ·
· Dry matter (DM) Ash .
Protein Crude lipid Crude fibre Nitrogen free extract (NFE) Total carbohydrate Calcium
· Phosphorus Gross energy (K CaUg) PIE ratio (mg protein/K Cal) Cost (Rs/Kg)
+ Vitarninate forte, Roche India Ltd. ++ On dry matter basis;
Dl
50.94 30.58
17.68
0.80
5.27' 94.73 5.95
34.68 13.60 6.59
33.91 40.50
1.62. 0.96
04.90 70.70
3.99
. DIETS D2 D3
25.49 27.27 10.18 16.84 10.00 20.0ci 51.75
36.87
0.80 0.80
3.90 6.05 96.10 93.95 16.28 8.97 33.67 34.84
6.99 5.45 6.67 8.13
32.50 36.56 39.17' 44.69 6.09 2.05 0.96 0.56 4.17 4.37
80.80 79.69 3.09 2.60
D4
24)9
37.09
37.32 0.80
3.72 96.28 16.09 34.83 12.80 13.13 19.43 32.56
3.27 1.17 4.51
77.22 2.66
A. testudineus (average weight 10.0 g and total length 10.0 cm) were obtained locally and after acclimatization for 10 days, were segregated and divided into 4 groups of 20 fish each and keptin specially designed fibre glass aquaria (76 x 40 x 35 cm) in approximately 70 1 of water. Each treatment was conducted in duplicate .. Initial body weight and total length of the fish were recorded prior to commencement of the experiment. · Each diet was fed to the experimental fish at 5% of the total body weight throughout the experimental period of 60 days adjusting the ration every fortnight on the basis of average weight of the fish. Left over food was collected after four hours of feeding and weighed after drying in an air oven. Individual fish were weighed every fortnight.
Aquaria were drained out every 24 hrs through the outlet situated at the bottom through· a filter of 22 Bolt silk cloth to collect faecal matter. The faecal matter was dried in an air oven at 100 ± 5°C and weighed. For each feeding trial, a 15 day composite faecal matter was pooled for digestibility estimates. Digestibility study was terminated after 15 days but feeding was continued upto 60 days .. Th,e faecal samples were analysed for proximate composition following the methods of AOAC (1975). Digestibility was calculated as:
Digestibility (%) =
Nutrient intake -nutrient in faecal matter x 100
Nutrient intake
At the end of 60 days protease activity w~s measured in the hepatopancreas; stomach and intestine using the method of Moore and Stein (1948). Initial activity of the enzyme was measured prior to the commencement of the feeding experiment.

125
Protein synthesis in the liver and muscle was measured as incorporation of 14C L-leucine (specific activity 282 mCi/ m mol: obtained from Bhabha Atomic Research Centre, Trombay, Bombay). The fish from each group were given intramuscular injection of the isotope at the rate of 0.05 µCi/100 g both before commencement and at the termination of feeding experiment. The injected fish were sacrificed after 2 and 4 hr fot counting the radioactivity in the liver .and muscle, respectively. Protein was finally precipitated with 5% concentration of trichloroacetic acid. The precipitate was processed and the radioactivity was counted in an automatic EC (Electronic Corporation of India) Liquid Scintillation Counter (Model No. LSS-20). Protein was estimated by the method of Lowry et al. (1951).
The water temperature during the experimental period ranged frotn.29.5 to 35.5°C. The pH, dissolved oxygen and alkalinity of the water ranged between 7.0 and 7.1, 325 and 5.85 mg/]. and 104.04.and 116.13 mg/]., respectively.
Results
The general performance of the fish on different diets is presented in Table 2. The average daily dry matter intake per 100 g of fish was highest for diet D4 followed by Dl, D3 and D2. The growth performance of the fish in terms of average weight gain (%)is presented in Fig. 1. The average weight gain was highest in fish fed diet D4 (161.43%) and lowest (79.99%) with diet Dl. The overall specific growth rate was also higher with diet D4 (1.60), followed by diets D3 (1.24), D2 (1.18) and Dl (0.98). .
Table 2. Ev3.J.~ation of different experimental diets for.A. testudineus.
DIETS PARAMETERS Dl. 02 03 04
Feed intake and weight gain Initial body wt.(g) 10.56 10.46 10.64 10.67 Live Wt. gain (g) 8.45 10.73 11.73 17.22 Weight gain(%) 79.99 102.56 110.11 161.43 Specific growth rate .(%/day) 0.98 1.18 1.24 1.60 Ave.rage daily DM intake (g/100 g body wt/day} 2.6 2.37 2.58 3,3.3 Average daily faeces release
. (mg/100 g body wt/day) 300 631 511 579.
Digestibility cp-efficients (%) Crude protein · 86.88 77.34 84.64 86.81 Crude lipid 89.11. 79.51 87.14 87.55 Gross energy 86.93 74.74 84.07 84.66
Nitrogen balance N-intake (mg/100 g fish/day) 146 128 M4 186 Faecal-N (mg/100 g fish/day) 15 29 22 25 N-absorbed (mg/100 g fish/day) 131 99 122 161
Energy balance Energy intake (K Cal/100 g
fish/day) 12.753 9.892 11.292 15.023 Faecal energy (K Cal/100 g
fish/day) 1.319 2.475 1.816 2.292 Energy absorbed (K Cal/100 g
fish/day) 11.434 7.417 9.476 12.731
Nutritive value Feed conversion ratio (FCR) i..93 1.39 1.41 1.24 Protein efficiency ratio (PER) 1.50 2.14 2.04 2.32
.

126
25•5
20·5
~
~
~ ·; ~ a ~ ~
> 15"5 <
. 10•5
---0- 01 ( P< O·OO\; n •10) ___....__ Do ( p< O·OOl 1 n •10)
-fr- 03 (P<o·OOI; n•IO)
- 04 (P< 0'001; n•IO)
+-~~~r~~~~~~~-r-~~---,.--~
00 15 30 45 60
F"dlng period (Days)
Fig. 1. Average weight gain of A. testudineus fed with experimental diets.
The best conversion ratio was obtained with diet D4 followed by D2, D3 and D 1. Protein efficiency ratio, on the other hand, showed a different trend. PER was highest with diet D4, followed by D3, D2 and D 1 (Table 2).
Digestibility values of protein and lipid did not show a marked difference for the diets Dl, D3 and D4 although their values were little higher for diet D 1 (Table 2} A lower value of the protein and lipid digestibility was, however, recorded with diet D2.
The specific protease activity in the hepatopancreas, stomach and intestine increased significantly (P < 0.001) in all the feeding trials. The activity was, however, higher in fish fed with diet D4 (Table 3). ·
The rates of protein synthesis in the liver were significantly higher (P < 0.001) in fish fed with the experimental diets. Protein synthesis rates in the muscle of fish fed with the diet Dl did not increase significantly. The rates increased significantly in the muscle of fish fed with other three diets being higher with diet D4, followed by D2 and D3 (Fig. 2).
Table 3. Specific protease activity (mean ± S.E) in the hepatopancreas, stomach and intestine of A. lestudineus after 60 days of feeding experiment (µg of.glycine liberated/hour/mg of protein ; +p < 0.001, n = 5).
Final Organ Initial Dl D2 D3 D4
Hepatopancreas 31.716 33.567+ 41.129+ 41.015+ 47.128+ ±0.030 ±0.032 ± O.D18 ±0.543 ±0.037
Stomach 45.652 47.114+ 53.437+ 52.812+ 62.216+ ±0.308 ±0.024 ±0.037 ± 0.058 ±0.028
Intestine 28.708 31.937+ 32.311+ 33.109+ 41.63o+ ± 0.031 ±0.029 ±0.028 ±0.044 ±0.006

1800·0
1600·0
1400·0
'! 1200·0 . .~ Q. . " ~ 1000·0
"' E ~ 0800·0 Q.
·u
0600·0
0400·0
0200 0
* * * ,I,J S. E. OF. ME AN
I I} MEAN
Initial
··' 01 . 0
NS =Not Significant t;Ji ** = P<O·OI
Dz *** = p< o·OOI ( n =·5)
LIVER MUSC,LE
Fig. 2. Incorporation of 14C L-Leu~ine in the liver arid muscle of .A. testudineus fed the experimental diets.
Discussion
127
All four diets used in the present study were isonitrogenous (35% crude protein). This level of crude protein has been reported to result in good growth in A .. testudineus of similar size (Patra and Ray 1988). Since all the diets. were isonitrogenous, the differences in growth performance in the various .groups of fish may be expected to be related main~y to the differences in protein quality.
The better growth of fish recorded with carcass waste based diet (D4) indicates the. relatively poor nutritional status of the other three diets. The lowest growth rate was recorded in fish fed with diet containing plant protein sources (Dl). The results indicate that among the animal protein sources, the protein in carcass waste (D4) was efficiently utilized by the fish followed by goat blood (D3) and fish meal (D2) diets. Partial replacement of fish meal with plant and animal sources have resulted in almost equal or higher growth· in ~ number of fish species in comparision with fishmeal based diets (Gropp e~ al. 1976; Akiyama et al. 1984; Viola and Zohar 1984; Nandeesha et al. 1986). The supe.ri6r growth of A. testudineus recorded with diets D4 and D3 as compared to the fish meal diet (D2) indicates that the fish meal can be totally replaced by either carcass waste or dried goat blood in A. testudineus diets. Venkatesh et al. (1986) however, considered fish meal and silk worm pupae as better sources of protein in the diets of Clarias batrachus. The plant protein based soybean meal diet resulted in low growth rate and poor feed conversion and protein efficiency ratios. Venkatesh et al. (1986) also recorded reduced growth rate, feed conversion and protein efficiency ratios in C. batrachus with a plant protein based oil cake diet. Protein from soybean meal diet, therefore, appears to be nutritionally poor for growth of A. testudineus. ·

128
The digestibility values of. protein and lipid did not differ significantly iri the test diets. Protein digestibility however, iricreased for diet Dl (containing plant protein source) where rice bran was not used. Wannigama et al. (1985) al~o reported a higher value of protein.. digestibility· in Sarotherodon niloticus for . diets devoid of rice bran. But the cause of increase in protein digestibility for diets D4 and D3 is inexplicable because both diets contained a high proportion of rice :bran (37.09 and 20.0%, respectively). Andrews et al. (1978) showed that ability of channel catfish to digest fat may be influenced by temperature and the level of fat in the diet. An increased value of lipid digestibility for diet Dl (soybean meal diet) may also be a result of an increased level of crude lipid (13.60%) in the diet
The rates of protein synthesis in the liver and muscle in fish fed with different diets increased significantly except on diet Dl. The increase in rates of protein synthesis, nevertheless, followed a similar trend exhibited by the growth rate. This indicates that A. testudineus can efficiently utilize the animal protein source which in turn increases the rates of protein synthesis in the liver and muscle. Venkatesh et al. (1986) also reported higher rates of protein synthesis in the liver of C. batrachus when maintained on diets prepared with animal protein components.
The present investigation indicates that the leyel of protease activity was higher in fish.fed with predominantly animal protein diets. Although the dietary. protein level is known to influence the prote~se activity infish (Kawai and Ikeda 1972; Mukhopadhyay et al. 1978; Steffens, 1981), there is no evidence to show any' relationship between the protein source and protease activity in fish. However, variations in the enzyme activity may be related to the structure of protein and duration of retention of feed in the digestive tract which in turn depends on the fibre content and physical consistency of the diet (Venk:atesh et al. 1986). A higher protease activity in .the intestine of the fish fed 9n diet D4. inay be due to a high cnide fibre content in the diet (13.13%). . .
The present study indicates that a predominantly plant protein diet is not nutritiorially adequate for A. testudineus. A comparison of the growth rate, feed conversion efficiency and physiological parameters of the fish fed with diets D2 (fish meal diet), D3 (goat blood diet} and D4 (carcass waste diet) indicates that carcass waste diet compares well with those of the goat blood and fish meal diets. Fowl~r and Banks (1976) and Asgard and Austreng (1986) .recorded better growth in rainbow trout and salmon fed with diets containing protein from the blood of cattle in comparison to diets without blood. It can be concluded that carcass waste and. goat blood are better sources Of protein in the. diet of A. testudineus than a mixture of soybean meall, mustard oil cake and wheat bran. · ·
Acknowledgements
. This work was supported by a research grant from the Council of Scientific & Industrial · Research (CSIR), Government of India. The authours wish to extend their sincere thanks to Prof.
Samir Bhattacharya, Department of Zoology, Visva-Bharati University for his klnd help in the . radioactivity measlirements.
References
AOAC. 1975. Official Methods of Analysis. Association of Official Agricultural Chemists, Washington, D.C. Akiyama; T., T. Murai, Y. Hirasawa and T. Nose. 1984. Supplementation of various meals to fish meal diet for chum salmon fry: Aquaculture
. 37(3): 217-222. . . Andrews, J.W., M.W. Munay and J.M. Davis. 1978. The influence of ~ietary fat levels and environmental t.emperature on digestible energy and
absorbability of animal fat in channel catfish. Journal of Nutrition, 108: 749-752. Asgard T. ilnd E. Austreng. 1986. BlOod, ensiled.or frozen, as feed for salmonids. Aquacnlture 55: 263-284.

129
Fowler, L. G. and J.L. Banks . .1976. Animal and vegetable substitutes for fishmeal in the Abematy diet, 1973. Progressive Fish~Cuiturjst 38: 123" 126.
Gropp, J., H. Koops, K. Tiews and H. Beck. 1976. Replacement of fish meal in trout feeds by other feed stuffs. In T.V.R. Pillay and W.A. Dill (eds.) Advances in Aquaculture, pp. 596-600. Fishing News Book Limited, Farnham, Surrey, England. ·
Kawai, S. and S. Ikeda. 1972. Stlidies on digestive enzymes offishes .. II. Effect of dietary change on the activities of digestive enzymes in carp intestine. Bulletin of Japanese Society of Scientific Fisheries 38: 265-270.
Lowry, D.H., N.J. Rosenborough, A.L. Farr and R.J. Randall. 1951. Protein measurement with folin phenol reagent Journal of Biological Chemistry 193: 265-275.
Moore, S. and W.W. Stein. 1948. Photometric ninhydrin method for use in the chromatography of amino acids. Journal· of Biological Chemistry 176: 367-388. . .
' . Mukhopadhyay, P.K., P.V. Dehadrai and S.K. Banerjee. 1978. Stuaies on intestinal protease: isolation, purification and effect of different dietary
proteins on alkaline protease activity of the air-breathing fish, Clarias batrachus: Hydrobiologia 57: 11-15. Nandeesha, M.C., K.V. Devar;ij and N.S. Sudhakara. 1986. Growth response of four species of carps to different protein sources in pelleted feeds.
· In J.L. Maclean, i...B. Dizon and L;V, Hosillos (eds.) First As\an·Fisheries Forum, pp. 603-608~ Asian Fisheries Society, Manila, Philippines.
Patra, B.C. and A.K. Ray. 1988. Influence of varying levels of dietary protein on the muscle pi;otein and lipid contents in the air-breathing fish, Anabas testudineus (Bloch). Indian Biologist 20(1): 38-43. . .
Steffens, W. 1981. Prote.in utilisation by rainbow trout (Salmo gairqneri) and carp (Cyprinus carpio): a brief review. Aquaculture 23: 337-345. Venkatesh, B., A.P. Mukherji, P.K. Mukhopadhyay and P. V. Deh~drai. 1986. Growth and metabolism of the catfish Cl arias batrachus (Linn.) fed
with differenr experimental diets' Proceedings of Indian Academy of Science (Animal Science) 95: 457-462. Viola, S. and G. Zohar. 1985. Nutrition studies with market size hybrids of tilapia (Oreochromis) m intensive culture.3. Protein levels and
sources. Bamidgeh 36: 3-15. Wannigama, N.D., D.E.M. Weerakoon and G. Muthukumarana. 1985. Cage culnire of S.qiloticus in Sri Lanka: effect of stocking density and
dietary crµde protein levels on growth. In C.Y. Cho, C.B. Cowey and T. Watanabe (eds.) Finfish Nutrition in Asia: methodological approaches to research and development, Part II, pp. 113-118. IDRC, Ottawa, Ontario, Canada.

Effect of Feeding Regimes on Growth and Survival of Bighead Carp
(Aristichthys nobilis Richardson) Fry
CORAZON B. SANTIAGO OFELIA S. REYES
SEAFDEC Aquaculture Department Binangonan Freshwater Station Binangonan, Rizal, Philippines
Santiago, C.B. and O.S. Reyes. 1989. Effect of feeding regimes on growth and survival of bighead carp (Aristichthys nobilis Richardson) fry, p. 130-136. /n S.S. De Silva (ed.) Fish Nutrition Research in Asia. Proceedings of the Third Asian Fish Nutrition Network Meeting. Asian Fish. Soc. Spec. Publ. 4, 166 p. Asian Fisheries Society, Manila, Philippines.
Two five-week feeding trials were undertaken to evaluate growth and survival of bighead carp fry of 1.9-2.4 mg mean weight reared on various feeding regimes. In Treatment 1, the carp fry were fed with Brachionus alone. In Treatment 2, 3, 4 and 5, the fry were fed with Brachionus for 2, 4, 6 and 10 days, respectively, and then with an artificial diet for the remaining period. The carp fry were fed with the combination of Brachionus and artificial diet in Treatment 6 and with artificial diet alone ht Treatment 7. Results showed that the combination of Brachionus and artificial diet was·the best feeding regime in enhancing the growth of the bighead carp fry. Mean weights of the fry fed with Brachionus for 2,4,6 and 10 days prior to the shifting to artificial diet were similar to that of the fry fed with Brachionus alone or artificial diet alone. There was no distinct trend in survival as a function of feeding regime. However, Brachionus alone gave the highest survival rate in both trials.
The demand for bighead carp (Aristichthys nobilis) fingerlings in the Philippines has increased in recent years. In areas surrounding Laguna Lake alone, about 16 privately-owned carp hatcheries with a capacity to produce from 0.1 to 1.5 million fingerlings every six months have been set up to serve the requirements for stocking in an aggregate area of 1,862 ha devoted to bighead carp grow-out as of 1985-1986 (Almazora 1987). Assuming a minimum stocking density of 10,000 fish/ha, some 19 million bighead carp fingerlings would be needed every 6-8 months (Fermin 1987).
Bighead carp larvae are produced by induced spawning of carp broodstock. Larvae are usually reared in indoor nursery tanks for 30-45 days before they are harvested for stocking in cages (Fermin 1987). One serious problem in nursery operations in the Philippines, and probably elsewhere, is the shortage or unavailability of live food organisms when needed. Various artificial diets have been tested to partially or completely replace live foods for larvae of different species of carp (Appelbaum and Dor 1978; Appelbaum and Uland 1979; Dabrowski et al. 1983; Szlaminska and Przylbyl 1986; Csengeri and Petitjean 1987).
The present study was conducted to determine the response of bighead carp fry to different feeding regimes.
130
l

131
Materials and Methods
Bighead carp fry were obtained in two batches from the hatchery of the SEAFDEC Aquacultlire Department, Binangonan Freshwater Station, for two feeding. trials. Th~ fry were stocked in glass aquaria containing 20 1 of tap water at 200 fry/aquarium; For each trial, there were seven feeding treatments (Table 1) with· three replicates each. ·
Table 1. Mean body weight (BW), total length (IL).and survival rate (SR) of bighead carp fry on different feeding regim~s for 5 weeks (Trial I)*. Values. with the same superscript are not significantly different at 5% level.
Treatment Feeding regime BW TL SR (mg) (mm) (%)
1; . Brachionus alone 40.9B IS.SB 86.2A 2. Brachionus for 2 days, 26.SB 14.SC 38.0C
then artificial diet 3. Brachionus for 4 days, 29.IB ·14.9C 20.3D
then artificial diet 4. Brachionus for 6 days, 38.0B 16.0C 40.0C
then artificial diet 5. Brachionus for 10 days, 36.IB 16.IC 62.2B
then artificial diet 6. · Combination of Brachionus 139.9A 23.7A 64.2B
and artificial diet 7. Artificial diet alone 25.5B 14.6C 32.0C
* Initial mean body weight was 1.9 mg and total length was 8:2 mm.
Brachionus plicatilis, a marine rotifer, was cultured in tanks containing brackish water using the combination of baker's yeast and Chlorella. Brachionus was harvested by. siphoning the culture medium which was filtered with a plankton net. The concentrated rotifers were washed and presented to the carp fry twice a day such that the density in the rearing medium ranged from 5-8 rotifers/ml for the first five treatments and 2-4 rotifers/ml for Treatment 6. The artificial diet (Table 2) was a slight modification of the M-2 diet formulated previously for milkfish fry (Santiago et al. 1983). Daily feeding rate ranged from i00-30% of the fish biomass. The ration was suspended in about 50 ml of water .before it was given to the fry. Each feeding trial lasted for five weeks.
Table 2. Percentage composition of the artificial diet fed to bighead carp fry.
Ingredient g/100 g diet
Fishmeal 56.6 Soybean meal 11.4 Shrimp meal 9.0 Rice bran 12.7 ·cod liver oil i.5 Corn oil 25 Starch 1.0 Vitamin mix.I 0.7 Mineral mix.I 3:6
Nutrients (as{ed basis) Crude protein 41.5 Crude fat 11.9 Ash· 12.5 Nitrogen"free extract 24.5
1 C~posltion · as reported for common carp and other wannwaterfishes (NRC 1983).

132
Fish were sampled at weekly intervals .to determine growth and for adjustment of the ration. Daily mortalities were recorded.' Aquaria were provided with adeql,late aeration and cleaned.once or twice daily with two-:thifds of the water replenished. .
·In Trial I, water temperature ranged from 26:.31°c; dissolved oxygeff (D.Q.), 55:· 7~5 mg/I; pH, 7.8-8.6; tc;>tal NHrN, 70-1242 µg/l. In Trial II, water temperature ranged from .26-30°C; D.o:, 5.4-7.S-.mg/l; pH, 7.5-8.0; total NHrN, 30.:941 µg/l. ·
Results
friaj, I
Bighead carp fry fed with the combination of Brachionus and artificial diet (Treatment 6) consistenily had the highest mean body. weight among all treatments from w~ekl to week 5 (Fig. 1) .. Feeding the Carp fry with Brachionus for 2, 4, 6 or 10 days and artificial diet on the
140
al E 80
.. ~ .c al ·-GI 40 ;: .> "V 30 a .a
c 20 Ill GI
::!! 10·
1 3 4
Weeks
Fig. 1; Growth of bighead carp fry on various feedinj!; regimes in Trial 1
5
Dietary treatments: 1. Brachionus alone 2. Bracionus for 2 days (B-2) then artificial diet (AD) 3. B-4, then AD 4. B-6, theri AD 5: B-10, then AD 6. Combination of B.and AD 7.ADalone·
succeeding days (Treatments 2, 3, 4 and 5) did not increase the body weight beyond that attained by the fry fed solely with Brachionus (Treatment 1). Fry fed the artificiaI diet alone had the lowest final mean body weight which was not significantly different (p > 0.05) from that of fry iri Treatments 1 to 5 (Table 1 ). The final mean total length was likewise highest for fry fed with the combination of Brachionus and.artificial diet followed by those· fed with Brachionus alone. For all other treatments, the totaI lengths were not significantly different from each other (Table 1).
Survival ra,te was highest for fry fed with Brachionus alone followed by fry fed with the combination of Brachionus and artificial diet; and fry fed with Brachionus for 10 days prior to artificial diet (Table 1). All other treatments had significanµy low survival rates.

133
Trial II
The general trend of growth in Trial II was similar to that in Trial I (Fig. 2). Again, highest body weight and total length were attained by fry on the combination of Brachiqnus and artificial diet. Growth of fry in all other treatffients were not significantly different (p > 0.05), although it was slightly increased by offering Brachionus for several day~ prior to the artificial diet (Table 3). ' .
6 100
DI 60 E ..
50 .c DI ·-GI
3: 40
> ·"Cl
0 ;30 .a.
c r; ·. 20 GI
~ 10
Weeks
Fig. 2. Growth of bighead carp on various feeding regimes in. Trial II.
Table 3. Mean body weight (BW), total length (TL) and survival rate (SR) of bighead carp fry on different feeding regimes for 5 weeks (Trial II)*. Values with the same superscript are not significantly different at 5% level. ·
Treatment Feeding regime BW TL SR (mg) (mm) (%)
1. Brachionus alone 30.5B 16.3B 94.oA· 2. Brachionus for 2 days, 39.3B 16.7B 66:5B
then artificial diet 3. Brachionus for 4 days, . 28.9B 15.5B 57.SCD
then artificial diet 4. Brachionus for 6 days, 33.4B 15.SB 54.2D
then artificial died 5. Brachionus for 10 days, 29.0B 15.3B 62.9BC
then artificial diet 6. Combination of Brachionus 103.3A 21.SA 63.zBC
and artificial diet 7. Artificial diet alone 27.9B 15:1B 54.0D
* Initial mean body weight was 2.4 mg and total length was 8.5 mm.
Survival rates were higher in Trial II than in Trial I (Tables 1 and 3). As in Triru I, fry fed with Brachionus had the highest survival (Table 3). Fry fed with artificial diet alone had the lowest survival rate but it was not signifkantly different (p > 0.05) from that of fry in Treatments 3 and4.

134
Discussion
The combination of Brachionus and artificial diet was the best feeding regime in accelerating the growth of bighead carp fry. It took only 2-3 weeks for the carp fry given the feed combination to attain the same growth achieved in 5 weeks by those fed with Brachionus alone. ·
Survival rates were generally increased by feeding the fry with Brachionus for 2, 4, 6 or 10 days prior to feeding with artificial diet. In both trials, survival rate of the fry fed with Brachionus for 10 days and then artificial diet for the remaining days was near the survival rate of the fry given the feed combination. It was observed in the course of the feeding trials that high mortality occurred from one to two hours after feeding the fry with the artificiru diet; typically the fry would feed vigorously, eventually swim erratically, settle at the bottom, and die. It was presumed that the physical quality of the diet such as particle size when wet rather than its nutritional quality was directly responsible for such mortalities.
B, plicatilis is a favored live food for larval fish due to its small size ranging from 92-276 µm depending oh the strain and food of the rotifer (Yufera 1982). The cladoceran, Moina macrocopa, is much larger but was also found suitable for bighead carp larvae (Baldia et aL 1985). The artificial diet offered to the bighead carp. fry in the present study ranged in size from 21-370 µm when dry. About 85% of the particles measured less than 150 µm.
Bryant and Matty (1981) reported that common carp (Cyprinus carpio) larvae with an initial body weight ~ 9.5 mg have better ability to ut,ilize and survive on artificial diet alone than smaller larvae. An initial weight of 15 mg was considered the common carp larvae's adaptation weight to an artificial diet. For bighead carp fry in our study the weight of about 15 mg was attained after three weeks of feeding with Brachionus alone or Brachionus for 2, 4, 6 or 10 days and then the artificial diet.
Dabrowski (1984) has demonstrated that the larvae of four cyprinids could be transferred directly to a dry diet at a much lower individual wet weight (5-6 mg), which meant 15 days of feeding with zooplankton in the case of bighead carp larvae. Although feeding of bighead carp larvae with artificial diets for 12 days from an initial weight of 5.6 mg gave high final body weights (about 79-110 mg); survival rates were low (23-38%) after a total of 27 days inclusive of 15 days of feeding with zooplankton. In comparison, bighead carp fry primed with Brachionus prior to giving artificial diet in our study had relatively higher survival rates after five weeks but growth was lower.
Lieder and Helms (1981 in Dabrowski 1984) observed good growth of silver carp (Hypophthalmichthys molitrix) and bighead carp reared on a dry diet alone or in combination with live phytoplankton and zooplankton, but survival was rarely above 50%. There are other studies that have shown that the combination of live· food and artificial .diet is a much better food for the larvae' of Chinese carps than artificial diet alone.
Growth rate of grass carp (Ctenopharyngodon idella) fry was higher when fed for 20 days with an excess of a mixed diet consisting of coconut meal and filtered zooplankton (1 :3 by wet weight) than when fed with coconut meal alone (De Silva and Weerakoon 1981). The study of Lubzens et al. (1984) likewise showed that the common carp larvae raised on a combination of a commercial dry food and rotifers (B. plicatilis) grew three times faster than those on the artificial food alone for 16 days. In a seven-day experiment, Szlaminska and Przybyl (1986) found better growth of common carp fry fed with a mixed food (encapsulated dry diet and zooplankton of mixed species) compared to those fed with the encapsulated diet alone or zooplankton alone. It was observed farther that the encapsulated diet alone, consisting mainly of Torula yeast and lyophilized pork liver and pancreas, and zooplankton alone as feeds had an additive effect on body weight of common carp larvae. The combination of.Brachionus and artificial diet in our

135
present work on bighead carp fry had a synergistic effect on growth since the final mean body weight of those given the feed combination was approximately twice as much as the sum of the mean weights of fry given Brachionus alone and artificial diet alone for 35 days. Bighead carp fry was also shown earlier to grow best on a combination of Moina macrocopa and an artificial feed (40%-crude protein), and mean survival rate after 12 weeks was 24% (Fermin 1985). When "green water" was added to Moina + artificial feed, survival rate increased to 53% but growth did not improve. It was postulated' that "green water" enhanced survival rate by maintaining good water quality.
Panov et al. (1969 in Szlaminska and Pr;zybyl 1986) repprted that bighead and silver carp larvae.started to take food when the density of living prey in the water was 500 individuals/dm3 and the optimal density of zooplankton was 1000 individuals/dm3. In terms of density per cc or ml, this amounts to.0.5-1 individual/ml which is much lower than what was used in our present study. Lubzens et al. (1984) found that B. plicatilis supplied at 5/ml with artificial food seemed optimum for common carp larvae based on growth and the development of dorsal and caudal fins; increasing the density of the rotifers to 20/ml in the presence or absence of artificial food decreased growth rates.
In practical nursery operations, the ultimate objective is to promote both fast growth and high survival rate because young fish of a particular size are usually sold or stocked based on number rather than on biomass. It was shown in our present study that the combination of Brachionus and artificial diet given throughout the rearing period was the best feeding regime in enhancing the growth of bighead carp fry. The survival rate, however, needs improvement. Although BrachionUs .alone as feed for the fry gave .the highest survival rate, it also gave a significantly lower growth. The artificial diet alorie as feed gave a relatively low growth which was not significantly different from that of fry given Brachionus alone or Brachfonus for a few days (2-10 days) followed by the artificial diet. Thus, future studies should be geared towards further improvement of the nutritional quality as well as the physical characteristics of artificial diets for the carp fry.
Acknowledgement
We would like to thank the team headed by Armando C. Fermin for providing us the experimental fish and Manuel A. Laron for mass-producing Brachionus for the study.
References
Almazora, R.R. 1987. A project feasibility study for a carp hatchery and grow-out financing schem.e. MBA Thesis. Asian Institute of Management. Makati, Metro Manila, Philippines. 136 p.
Appelbaum S. and U. Dor. 1978. Ten-day experimental nursing of carp (Cyprinus carpio L) larvae with dry feed. Bamidgeh 30(3): 85-88. Appelbaum, S. and B. Uland. 1979. Intensive rearing of grass carp larvae Ctenopharyngodon idella (Valenciennes 1844) under controlled
conditions. Aquaculture 17: 175-179. Baldia, S.F., J.B. Pantastico and J.P. Baldia. 1985. Acceptability of selected zooplankton and phytoplankton for growing larvae/fry of bighead
carp (ArislichJhys nobilis). Paper presented at the Asian Symposium on Freshwater Fish culture. Oct. 10-15, 1985. Beijing, China. 11 p.
Bryant, P.L. and A.I. Matty. 1981. Adaptation of carp (Cyprinus carpio) larvae to artificial diets. I. Optimum feeding rate and adaptation age for a commercial diet. Aquaculture 23: 275-286.
Csengeri, I. and M. Petitjean. 1987. Fresh liver powder: a new starter diet for the larvae of a cyprinid fish. Aquaculture 65: 189-192. Dabrowski, K. 1984. Influence of initial weight during the change from live to compound feed on the survival and growth of four cyprinids.
Aquaculture 40: 27-40. Dabrowski, K., R. Bardega and R. Przedwojski. 1983. Dry diet formulation study with common carp (Cyprinus carpio L.) larvae. Z,eitschrift fur
Tierphysiologie, Tieremahrung und Futtermittelkunde 50(1): 40-52. De Silva, S.S, and D.E.M. Weerakoon. 1981. Growth, food intake and evacuation rates of grass carp, Clenopharyngodon idella fry. Aquaculture
25(1): 67-76. .

136
Fermin, A.C. 1985. Growth and sUivival of bighead carp, (Aristichthys nobilis) fry fed different types of feed and their combination. M.S Thesis. Central Luzon State University, Nueva Ecija, Philippines. 49 p. ·
Fermin, A.C; 1987. Broodstock development and management and seed production of carp and tilapia. Report on ADSEA '87 Seminar on. Aquaculture Development-in Southeast Asia, p .. 272-292.
· Lubzens, E;, G. Sagie; G. Minkoff, E. Meragelman and A. Schneller. 1984. Rotifers (Brachionus plicatilisJ. improve growth rate of carp (Cyprinus ·carpio) larvae. Bamidgeh 36(2): 41-46. ·
National Research Council (NRC). 1983. Nutrient Requirements of Warmwater Fishes and Shellfishes. National Academy Press, Washipgton, . D.C. 102 p:· . . . . . Santiago, C.B.; M.B. Aldaba and E.T. Songalia. 1983. Effect of artificial-diets on growth and survivill of mikfish fry in fresh water. Aquaculture
34: 247~252. . . . . Sz!aminska, M. ·and A. Przybyl 1986. Feeding of carp (Cyprinus carpio L.) larvae with an artificial dry food, living rooplankton and mixed food.
Aquaculture 54: 77-82. ·· · · Yufera, M. 1982. Morphornetric characterization of a small.sized strain of Brachionus plicatilis in culture, Aquaculture 27: 55-61.

Growth Performance ·of an Indian Major Carp, Cat/a cat/a (Ham.) on Fishmeal-Free Diets
M.C. NANDEESHA G.K. SRIKANTH T.J. VARGHESE
P. KESHA V ANATH H.P.C. SHETTY College of Fisheries
University of Agricultural Sciences Mangalore 575002
India
Nandeesha, M.C., ·G.k. Srikanth, T.J. Varghese, P. Keshavanath and H.P.C. Shetty. 1989. Growth perl'ormance of an Indian major carp, Cat/a cat/a (Ham.) on fishmeal-free diets, p. 137-142. ln S.S. De Silva (ed.) Fish Nutrition Research in Asia. Proceedings of the Third Asian Fish Nutrition Netwmk Meeting. Asian Fish. Soc: Spec. _Puhl. 4, 166 p. Asian Fisheries So~iety, Manila, Philippines.
Three eJi:perimental diets incorporated with either defaned soybean meal (pellet SY), noncdefatted. silkworm pupa (pellet SP) or defatted silkworm pupa (pellet DP) as the principal ingredient were evaluated in compariSon to a fishmeal based reference diet (pellet FM) on the Indian major carp, Cat/a cat/a _(Ham_.). The rearing eJi:periment was conducted for 156 days in cement cisterns (25 m2), with catla fry (0.8 g) at a density of 10,000 ha-1 arid fed with one of the test diets at 5% body weight day-1. The growth offish was consistently higher with pellet SP, while the other diets induced almost equal growth. The final average weights anained were 97.96, 87.63, 84.63, and 84.56 g with pellets SP; SY, DP, and FM, respectively. There was no significant difference (P < 0.05) between treatments. The average specific growth rates were 3.0!i, 3.01, 2.99, and 2.99 in treatments SP, SY, DP, and FM respectively. The feed conversion ratio was bener in treatment DP (3.50), followed by SY (3.64), SP (3.68) arid FM (3.75).
· · The mean panel scores for organcileptic evaluations based on color, texture, odour and flavour indicaied that fish grown on pellet FM could be graded as the best, followed by pellets SY, DP, and SP. Flesh protein values in fish grown on pellets SY and DP were higher wheri compared to the other two treatments. The fish grown on noncdefatted silkworm pupa based diet had a higher fat contenL ·
In India, the area under carp culture is increasing rapidly; yet there is no standard fish feed available iri the market. The industry is now in urgent need of nutritionally balanced, costeffective feeds as a further step in increasing production. Though fishmeal incorporated diets are. known to induce good growth in carps, in recent years the availability of fishmeal has become uncertain and costly. Therefore, investigations on alternative cheaper· sources of protein are needed to develop cost-effective diets. With this objective, defatted soybean meal, non-defatted silkworm pupa and defatted si~worm pupa were evaluated by conducting a feeding experiment on the Indian major carp, Cat/a cat/a (Ham.) .
. Materials and Methods
Fishmeal based diet was taken as the standard.reference diet (FM). In the test diets, fishmeal was replaced with. the ingredients selected for screening (Table 1) and levels adjusted as to make
137

138
all test diets isonitrogenous (Table 2). The experimental diets were designated as SY (defatted soybean meal), SP (non -defatted silkworm pupa) and DP (defatted silkworm pupa). The diets were prepared in pellet form following the procedure described by Jayaram and Shetty.(1981).
Table 1. C.1lemical composition of the principal test ingredients (%)"'.
Ingredient/ Defatted Non-defatied Defatted component soybean silkworm silkworm
meal pupa pupa
Moisture 7.43 '6.90 6.49 Crude protein 53;77 41.23 63.25• Crude fat 1.87 17.94 1.26 Ash 10.03 11.84 18.65
"'Average of three values.
Ta,ble 2. Ingredient proportion and proximate composition of experimental diets.
Diet Ingredients (%) SY SP
Defatted soybean flour 27 Silkworm pupa 30 Defatted silkworm pupa Fishmeal -Groundnut cake 25 25 Rice bran 37 34 Tapioca flour 10 lO Vitamin and mineral mix"' 1 1 % Composition""" Moisture 7.54 6.24 Crude protein 29.31 28.17 Crude fat 4.44 8.79 Crude fibre 9.22 8.47 Ash 12.77 13.82 Nitrogen free extract 36.72 34.51 Caloric content (Kcal/g) 3.33 3.58
. "' Nuvimin Forte - Supplied by Sarabhai Chemicals _Ltd., India. """ Average of three values .
DP
24
25 40 10
1
6.02 30.91 4.31
10.88 15.80 32.08
3.22
Fish meal
8.50 55.04 7.60
16.41
FM
24 25 40 10 1
6.95 29.92
6.11 10.21 15.22 31.59
3.31
. The growth of fish was assessed on test diets .over a period of 156 days, employing uniform sized duplicate cement cisterns of 25 m2 (5 x 5 x 1 m). The cisterns were devoid of soil bed and stocked with uniform sized catla fry at 10,000 fish/ha (25 fish/cistern) and fed with the test diets at 5% body weight day-I throughout the experimental period. The feed quantity was regulated based on fortnightly sampling.
Moisture, protein, fat, ash and fibre were analysed employing AOAC (1975) methods and nitrogen free extract was calculat~d according to Hastings (1979). The ·water stability of the feeds was determined following the wet durability test of Hastings (1964);· Statistical analysis was carried out using Duncan's multiple range test (Duncan 1955).
On termination of the experiment, fish under different treatments were judged by 14 trained panelists for qualities such as colour, texture, odour and flavour of raw and cooked (in 1.5% salt solution) flesh. In addition, fish grown on non-defatted silkworm pupa diet and fishmeal based diet were fried in Indian style and served to the same group of panelists. The differences in individual attributes were tested employing tlie method recomrrtended by Kramer and Twigg (1970) andthe overall quality was assessed according to Udupa and· Jayaram (1979).

139
Results and Discussion
The water temperature in the experimental cisterns varied from 24.0 to 29.5~C during the period of rearing. After fortnightly sampling, water in the cisterns was replenished partially .. ·
Water stability of all the diets was found to be satisfactory even at the end of six hours (Table 3).The higher fat content of diets SP and FM and better gelatinization of carbohydrate content of diet SY appear to have improved the stability of these pellets as compared to that of diet DP. The fat content is known to give compactness to the pellets by preventing the entry of water (Jayaram and Shetty 1981). Diets which are stable for at least 2-4 hours are preferred for major carps since they are slow feeders.
Table 3. Stability of formulated diets.
Time 'Diet 1 hr 2hr 4hr 6hr
SY 92.73b 90.26b 88.11b 82.66b
·SP 90.11a 88.66a 86.20!> 80.42b
DP 90.09a 88.42a 84.85C 79.29a
FM 90.61a 89.0lab 85.52a 81.23C
SEM* 0.48 0.41 0.09 0.13
Figures in the same column having the same superscript are not si~ificantly different (P < 0.05). *Standard error of I1,1eans. ,
Growth studies
Since there was no significant difference in growth of fish between replicates, the data were averaged (Fig. 1). Non-defatted silkworm pupa based diet induced the highest growth in·weight of ca.tla. The second best gr.owth was recordecfwith diet SY, except for a slight fall back between the42 and 84 days. In DP treatment;though the growth was relatively poor until the 84th day, it improved satisfactorily, ultimately attaining slightly higher weight than in the FM treatment at the termination of the experiment. The overall average specific growth rate for weight was found to be. betterwith diets SP and SY; while it was almost equal with diets DP and FM.Though the food conversion rate (dry weight of food-:- wet body weight gairi) was found to be slightly better with diet DP (3.50), there was no marked difference between other diets. The-overall survival of fish was better in SP·and DP treatments (Table 4).
Table 4. Growth, food conversion and survival of catia fed on different diets.
Diet · ··Parameter SY SP DP FM
Final average weight (g) 87.63 97.96 84.63 84.56 Net weight gain (g) · . 86.83 97.16 83.83 83.76 Average specific growth 3.01 3.08 2.99 '2.99 rate(%) Daily weight gain 0.56 0.62 0.54 0.54 (g/fish/day) Daily food intake 2.04 2.28 1.89 2.03 (g/fishf day) ... Food conversion ratio · 3.64 3.68 3.50 3.75 Overall survival (%) 86.00 98.00 96.00 84.00

140 100" ,._____.,5p
D----<l FM ~SY
90 <>---<>DP
75
~60 I-I
"' w ~
45 w
"' ..: Cl'. w '> ..: :io.
15
O'---:':-~---':--~----'-----"'~"---'--;_.L,.~ ......... ,_. 1' .' ,2 70 . 98 . 126. . 156
D A y· S
Fig. 1. The mean weight of catla fiy reared under different food regimes.
Silkworm pupa is extensively 11sed in carp diets in China and Japan (Hora and Pillay 1962) and is known to induce good growth in carps~ The superior growth of catla on diet SP appears to be due to its high f '\t content, sparing protein for growth. The silkworm pupa is known to. contain some attractants and appetite stimulants (Ina 1976; Tsushima and Ina 1978) which are known to result in better acceptability of the pellets and hence growth. In a rearing experiment using catla; rohu (Labeo rohita) and common carp (Cyprinus carpio), Jayaram and Shetty (1980b) recorded better growth in catla and common carp with a diet containing non-defatted silkworm pupa. In contrast to non-defatted silkworm pupa, defatted silkworm pupa based diet induced poorer growth of catla in the present experiment, though it was comparable to fishmeal base.d diet. It is possible that.in defatted pupa the attractaJits and· appetite stimulants are lost in the process.of oil extraction and probably this accounts for relatively low growth. Interestingly soybean meal based diet induced good growth though it is known to be poor in lysine and.methionine contents. Viola et al, (1982) · suggested lysine and methionine supplementation and oil· enrichment of soybean meal based diets to obtain the.growth of.common carp equivalent to that of fishmeal based diet. In a feeding trial using soybean meal based diet, Bhat et al. (1986) obtained growth of silver carp (Hypophthaimichthys molitrix), rohu and common carp comparable to that with fish meal based diets .. ThoU.gh soybean is known to contain some antinutritional factors other thari .trypsin inhibitors (Wilson and Poe 1985) proper cooking removes these factors (Spinelli et al. 1979). '. '
It rriay be of interest to state here that some progressive nsh farmers in Andhra Pradesh, India, are using soybean meal in carp diets with encouraging results. Nandeesha et al. (1987) obtained highly significant growth of common carp when soybean meal was combined with . .
squilla meal (Oratosquilla nepa) which is rich in lysine and adequate in methionine. Though it may be too early to conclude that soybean meal could completely replace fishmeal in major carp diets, the encouraging results obtained in the present experiment suggest the need for further investigations on this aspect..

141
Proximate composition of fish flesh
The moisture and fat contents were higher and protein content lower in fish raised bn diets SP and FM as compared to the other two treatments (Table 5). An inverse relationship between moisture and protein is observed in catla in contrast to that between moisture and fat in tilapia (Appler and Jauncey 1983; Edwards et al. 1985). The higher fat content of diets SP and FM appears to have resulted in higher fat deposition .. The ash content was lower only in the SY treatment The chemical composition of flesh mainly depends on the composition of diets and digestibility of nutrients (Dabrowski and Kozak 1979; Jayaram and Shetty 1980a).
Table 5. Proximate composition of flesh of catla.
Body composition (%) Diet Moisture Protein Fat.
SY 78.66ab 16.82b 2.58C SP 79.81C 15.0la 3.27b. DP 78.55a 16.9lb 2.25a FM 79.47hc 15.17a 2.8od
SEM* 0.24 0.17 0.08
Figures in the same column having the same superscript are insignificantly different (P < 0.05). ·*Standard error of means.
Organoleptic evaluation
Ash
u2a . l.69b l.93C l.99d
0.02
The overall quality of flesh of catla grown on fish meal based diet was superior (Table 6). Based on the mean panel scores it could be observed that diet SP resulted in comparatively poor flesh quality. The overall quality of raw flesh of the SP treatment was significantly inferior to SY and FM treatments. However, no statistical difference could be.observed in cooked flesh. Among the individual attributes, the texture of cooked flesh and colour of raw. flesh were significantly better in fish grown on diets FM and SY. However, no difference in odour, flavour and texture could be noticed by the panelists when the fish grown on diets SP and I<:M were fried. Nondefatted silkworm pupa is known to induce some off.flavours in tbe flesh of carps when its incorporation in the diet is high (Hora and Pillay 1962). It appears that its incorporation upto 30% level has no adve1se effect on odour and flavour. It is reported that in Japan fish are depurated before marketing when silkworm pupa is used in the diet to avoid the odour problem . (Spinelli 1979).
Table 6. Mean panel scores for overall quality and individual attributes of fish flesh (a-colour and gloss of skin).
Diet a Colour Odour Texture Flavour Overall quality Raw Raw Cooked Raw Cooked Raw Cooked Cooked Raw Cooked
SY 3.50 3.5QC 3.00 3.21 3.14 3.57 3.36ab 3.07 3_39ab 3.07
SP 3.07 2.86a 2.79 2.86 3.00 3.43 3.07a 2.93 3.05C 2.88
DP 3.14 3.ooab 3.00 2.86 3.07 3.29 2.43C 3.07 3.09bc 3.00
FM 3.50 3.36bc 3.14 3.36 3.14 3.71 3_79b 3.14 3.48a 3.13
Figures in the same column having the same superscript/without super script are not significantly different (P < 0.Q5).

142
The present investigation indicates the possibility of utilizing silkworm pupa and soybean · meal in the diet of catla. These ingredients ate 40-50% cheaper than fishmeal, and their use in
. carp diets. would reduce the costof .production significantly. ·
Acknowledgements
This work forms part of the project funded by International Foundation for Sdence, Swederi (A/1003-1). The authors are thankful to Professor K.S. Udupa for help in the statistical analysis.
References
Appler, H.N. and K. Jauncey. 198~. The utilization of a filamentous green algae (Cladophora glomerata (L) Kutzin)' as a protein source in pelleted feeds for Sarotherodon (I'ilapia) niloticus fingerlings. Aquaculture 30: 21-30.
Association of Official Analytical Chemists (AOAC). 1975. Official methods of analysis. Washington, DC, USA, 1094 p. Bhat, K.G., H.P.C. Shetty and M.C. Nandeesha 1986. Formulation and evaluation of pelleted fish feed based on soybean meal and squilla meal.
In J.L. Madean, L.B. Dizon, L.V. Hosillos (eds.) First Asiari Fisheries Forum, pp. 539-542. Asian .Fisheries Society, Manila, Philippines. ·
Dabrowski, K and B. Kozak. 1979. The use of fish meal and soybean meal as a protein source in 'the diet of grass crup fry. Aquaculture 18: 107-1 M. .
Duncan, D.B.· f955. Multiple range and multiple F-tests, Biom~trics 11: 1-42. Edwards, P., M. Kamal and K.L. Wee. 1985. Incorporation of composted and dried water hyacinth in pelleted feed for tilapia Oreochromis
niloticus (Peters). Aquaculture and Fisheries Management 16: 233-248. Hastings,.W.B. 1964. Fish feed processing research. Feed Stuffs 36: 13. Hastings, W.H. 1979. Fish nutrition and fish feed manufacture. In T.V.R. Pillay and W.A. Dill (eds.), pp. 568-574. Fishing News books Ltd.,
Farnham, Surrey, England. Hora; S.L. and T.V.R. Pillay. 1962. Handbook on fish culture in the Indo-pacific fisheries region. PAO Fisheries Biology Technical paper, No.
14, p. 203. Ina, K. 1976. Fish behaviour. Kagaku To Seibutsu 14: 648-653. Jayaram, M.G. and H.P.C. Shetty. 1980a. Studies on the growth rates of catla, rohu and common carp fed on different formulated feeds. The
Mysore Journal of Agiicultural Sciences 14: 589-606. · , Jayaram, M.G. and H.P.C. Shetty 1980b. Influence of different diets on the proximate body composition of Cat/a cat/a, Labeo rohita and·
Cyprinus carpio. The.Mysore Journal of Agricultural Sciences 14: 381-384. . . Jayaram, M.G. and H.i>.C. Shetty. 1981. Formulation, processing and water stability of two new pelleted fish feeds. Aquaculture 23: 355-359. Kramer, A. and B.A: Twigg. 1970. Quality control for thefood industry. Vol. I. AVI publishing Co., Westport, 566 p. Nari.deesha, M.C., N. Basavaraja, P. Keshavanath, T.J. Varghese, H.P.C. Shetty and G.K. Srikanth. 1987. Influence of soybean meal and squilla
nieal based diets enriched with sardine oil on the growth and organoleptic qualitY of common carp, Cyprinus carpio (Linn.) Paper presented at the international Symposium on Feeding and Nutrition in Fi,h. 23"27 August, Bergen, Norway.
Spinelli, J, 1979. Influence of feed on finfish quality. In J.E. _Halver and K. Tiews (eds.) Proceedings of the World Symposium on Finfish · · Nutrition and Fishfeed Technology, Vol. II, pp. 346-352. Hamburg, Berlin. ·
Spinelli, J., C. Mahnken and M. Steinberg. 1979. Alternate sourcas of proteins for fishmeal in sa!Il1onial diets. In J.E. H·alver and K. Tiews (eds.). Proceedings of the world Symposium on Finfish Nutrition and Fishfeed Technology, Vol. II, pp: 132-139. Hamburg, Berlin.
Tsushima, J. and K. Ina . .1978. Survey of feeding stimulants for caip, Cyprinus carpio. Nippon Nogei Kagaku Kaishi, 52: 225-229. . Udupa, K.S. and M.G. Jayaram. 1979. A' note on the statistical analysis of panel test data of food products by sensory evaluation. Current
ResearCh 18: 106-_107. • . · . Viola, S., V. Mokady, U. Rappaport and Y. Arieli. 1982. Partial and comolete reolacement of fishmeal by soybean meal in feeds for intensive
culture of carp. Aquaculture 26: 223-236. Wilson, R.P. and W.E. Poe. 1985. Effects of feeding soybean meal with varying trypsin inhibitor activities on growth of fingerlings channel
. catfish. Aquaculture 46: 19-25.

. . . -
Utilization of ,Aquatic Weed Mixture Pellet as Feed for Nile Tilapia .
(Oreochrornis niloticus) and· Pig .
. S. CHIA YV AREESAJJA C.WONGWIT
A.CRONIN K. SUPAMATAYA.
C. TANTIKITTI Department of Aquatic Science Faculty of Natural Resources Prince of Songkla University Haad Yai, Songkhla 90110
Thailand
R. TANSAKUL Department of Biology
Faculty of Science Prince of Songkla University Haad Yai, Songkhla 90110
·Thailand
chiayVareesajja; S., C. Wongwit, A. Cronin, K. Supamataya, C. Tantilo.tti and R. Tansakul: 1989. Utilization of aquatic · weed mixture pellet as feed for Nile tilapia (Oreochromis niloticus) and pig, p: 143-147. In S.S. De Silva (ed.)
Fish Nutrition Research in Asia. Proceedings of the Third Asian Fish Nutrition Network Meeting. Asian Fish. Soc. Spec. Puhl. 4, 166 p. Asian Fisheries Society, Manila, Philippines.
Dry aquatic weed (Ceratophyllum demersum), rice bran and .fish meal were mixed in a ratio of 4:3:1 in. order to produce aquatic wee4 mixture pellet for the rearing of Nile tilapia ( Oreochromis niloticus/ and pig. Two culture systems; tilapia culture in ponds with formulated feed at a feeding rate of 10% body weight per day; and an integration of pig-tilapia using the same formulated feed as pig feed at a feeding rate ·of 10% body weight per day were carried out in triplicate. During the six-month culture period, pig and· tilapia growth, water quality parameters ·(pH, temperature; DO, conductivity and turbidity) ·were monitored at monthly mtervals. Tilapia production in the integrated system was slightly higher than in the monoculture system; production from the monoculture system and the integrated system being 4467 and 5499 kg/ha respectively: The pig grew well on the formulated feed and a good quality carcass was obtained. The results suggest that the integration of pig-tilapia using aquatic weed mixture pellet as pig feed is practical and useful.
In certain. areas in Thailand, such as :Thale Noi, pigs are .fed with fresh Ceratophyllum demersum, one of the most abundant aquatic macrophytes in the uppepnost part of Songkhla Lake in. l'hale Noi. The nutritive value of C. demersum is relatively .low (Boyd 1968). The moistm;e content, crude protein, crude lipid and ash contents of sun dried C. demersum in order were 15.72%, 16.23%, 1.48%, 19.66 and 8.25% (Chiayvareesajja et aL 1987).
This study' was undertaken in order to evaluate the utilization of this aquatic weed incorporated into pellet form as feed for the. rearing of Nile tilapia, Oreochromis niloticus (L.) and pig: Furthermore, in order to maximize the limited resources, tilapia production using pig manure was also studied. ·
143

144
Materials and Methods
Two earthen ponds; 480 m2 each, were partitioned into three compartments with plastic sheets. One pond was used for monoculture of tilapia, while the other was used for the integration of pig and tilapia. A pigsty of 4 m2 was constructed over each compartment and adjacent to the bank in the latter pond. Both ponds were dried and limed with quick lime (10-15 kg/compartment) before stocking. Tilapia (approximate length 5 cm) were stocked at a density of 640 fish/compartment (160 m2). Three pigs, approximately 6 kg each, were stocked in each pigsty.
Sun-dried C. demersum, rice bran and fish meal, were mixed in a ratio of 4:3: 1 and 1 g of livestock vitamin supplement (OVIMIN) was added for every 4 kg feed. The semi-moist pellet was made daily with a simple extruder. Tilapia in the monoculture system and pigs in the integrated system were fed this formulated feed at a rate of 10% body weight/day, twice a day. Piggery waste was directly dispersed into the integrated pond. The amount of feed was adjusted after each sampling period. ··
The experiment lasted 6 months during which pig and tilapia growth, loadings of pig manure into the pond and water quality parameters were monitored at monthly intervals. The water quality parameters pH, temperature, dissolved oxygen (DO), conductivity and turbidity were monitored by a Horiba water checker (Horiba U-7, Horiba Ltd., Japan).
Proximate composition of formulated feed and pig faeces were determined according to the methods recommended by AOAC (1975), and gross energy with a ballistic bomb calorimeter (Gallerikamp). The statistical significance of tilapia growth and production were analysed using the Micro Quasp package.
Results
Water quality parameters in the two systems are presented in Table 1. The ranges observed of the different parameters were comparable in the two systems. In both systems the ranges did appear to exceed beyond the tolerance limit of 0. niloticus.
Table 1. The range in water quality parameters in the two culture systems from 30 May to 22 November 1987.
Culture pH Temperature DO Conductivjty Turbidity System (QC) (:mg/l) mS/cm (NTU)
Monoculture 6.30-6.55 ·30.2-30.8 3.48-6.12 O.o7-0.48 17.50->100 Integrated 6.11-6.60 30.0-30.8 2.82-8.67 0.13-0.57 0.76-50.0
The nutritive value of formulated feed was much higher than that of pig faeces. The crude protein and lipid contents of the formulated feed and pig faeces were (on dry weight basis) 24.25% and 12.69% and 14.15% and 5.66%, respectively (Table 2.).
All the pigs grew well and the percentage weight gain was high (1074.68%). The amount of piggery waste loading increased as the pig grew (Fig. 1): The average loadings of pig faeces and urine were 6A2 kg/3 pigs/day and 6.24 kg/3 pigs/day, respectively.
Growth performance of tilapia in the two systems was not apparently different (Fig. 2). However, although there was no significant difference between tilapia production in the two systems the production in the integrated system was slightly higher than in the integrated system (87.99 and 71.47 kg/compartment, respectively: Table 3). The percentage weight gain of tilapia

e-e· URINE
·-~· FAECES
Table 2. Proximate composition of formulated feed and pig faeces (mean ± SE), air dry basis.
Item
Moisture (%) Crude protein(%) Lipid(%) Crude fibre (%) Ash(%) Ca(%) p (%)
. Gro~s energy (Kcal/kg)
,~·---- --- ---~·
· Formulated Feed
42.97±2.13 24.25±4.06 14.1.5 ± 5.44 9.75 ± 0.29
19.24±0.76 2.29 ± 0.53 3.30±0.79
4660.72± 130
Pig Faeces
79.40± 1.27 12.69 ± 0.12 5.66± 1.86
14.86±0.76 26.09±1.01 3.62± 1.29. 4.62±0.54
4457.1~ ± 275
70.
65
60
55.
......... MONOCULTURE SYSTEM
•--e INTEGRATED SYSTEM
~50
e 45
145
~ 40 ;;; "' 35· --~-----·
2
2 4.
TRIAL PERIOD (MONTHS)
Fig. 1. Daily loading of piggery waste into the integrated system ..
~ 30 .... ;;: 25
20
15
10
0
,----------- ______ ...:·- __ .. --------
TRIAL PERIOD (MONTHS)
Fig. 2~ Growth pexformance of tilapia in the two systems.
Table 3. Growth pexformance of tilapia and pig (mean± SE) during 30 May to 22 November 1987.
Integration Item Tilapia Tilapia Pig
.Initial number (No/compartment) 640 640 3 Final catch (No/compartment) 1155±185 2360±450 3±0 % by number of final catch
5 - 10 cm class 11.10 ± 1.21 11.85 ± 1.79 10 - 15 cm class 42.93 ± 1.27 72.08± 1.60
> 15 cm class 45.97 ± 1.24 16.08 ±2.47 Average Initial weight** 4.39±0.2la 5.60±0.13b 5.92±0.20 Average Final weight** 62.39 ± 1.73C 37.11±0.71 d 69.44±0.44 Average % weight gained** 1329.80 ± 102.74e 563.82 ± 26.88f 107 4.68 ± 34.25 Total Produ,ction (kg/unit)** 71.47±9.77n 87.99±17.75Il 208.33 ± 0.28 Food Conversion Rate 4.05±0.69 25.77±4.25 7.39±0.28
** unit of initial or final weight g/individual for tilapia and kg/individual for pig; for values along each horizontal line those with a common superscript was not significantly different at P < 0.05. · ·
in the monoculture system was much higher than in the other. The food conversion ratio (FCR) of tilapia, on the formulated feed ( 4.05) was much better than in tilapia fed on piggery waste (25.77). The FCR of 7.39 of pigs fed on aquatic weed mixture pellet was relatively high.
At the final harvesting, the number of tilapia in both systems were higher than the number stocked, and that in the integrated system was twice that of tilapia in the monoculture system, (2360 and 1155 fish/compartment, respectively). Furthermore, most tilapia in the integrated system (72.08%) were of 10-15 cm, and in the other (45.97%) were of >15 cm.

146
Discussion
The growth of pigs fod on aquatic weed; mixtirre pellet is considered to be poorer than growth obtained in general commercial pig fanning in Thale NoL Generally, pigs are fed with a commercial feed and it takes only 4 months toteach the marketable size (over 100 kg). The FCR of pigs fed on the commercial feed is about 4;1 (Anon. n.d.). In this study the poor growth of pigs could be due to a poor inanagement a:n4 a nutritionally inadequate f~ed as compared to that in coIIUiiercial pig fanns. While the· formulated feed contains. 24.25% crude protein, a commercial pig feed (Hogdonal 252) contains 37 .76% crude protein (Chiayvareesajja et al. 1987). After a 6-month period on a formulated feed, pigs were·fed_·a. colnmercial pig feed at ad libitum for one month when they reached the marketable size. These results show that there is a potential for utilization of aquatic weed mix~ure pellet as pig feed. · It is very difficult to analyse the significance of tilapia growth_ in the two systems since there were a large number of young produced. The average final w~ight of tilapia in the monoculture system.was significantly higher than in the integrated system but the total final number of fish was niuch lower in the first system. · Tue· production of tilapia in the . integrated system was . slightly higher than in · the . monoculture system. This may be due to a big difference of nutrient loading into each system. The aveFage value of daily loading of pig faeces was 6.42 kg/compartment, which was equhl to · 0.81 kg crude protein/compartment/day while in the monoculture system it was 1:46 kg of feed/compartment/day which was equal to 0.35 kg crude protein/compartment/day.
. ·These results suggest that the integratipn of pig-tilapia using aquatic weed mixture-pellet as pig feed is practical and useful on the basis of maximizing the limited resources and reducing the fish production costs. The cost of supplemental fish feed is- the largest operating cost in fish culture, usually 50% of the total operating costs, Polyculture of common carps and Chinese carps (Woynarovich 19801 and/or Indian carps and Chinese carps (Jhingran and Sharma 1980) are known to utilize all available food types resulting in a higher production. The introduction of a new fish species instead oftilapia in the integration of pig-fish fanning is also feasibie. Fang et al. (1986) reported that pig manure is suitable for the growth of Carassius cuvieri. In order to avoid oxygen depletion a:nd. to maintain an adequate supply of nutrient loading into fish ponds the amount of piggery waste loading_ should be adjusted. In manure loaded ponds which
, produced high fish yields, manure (dry orgariic matter) was added daily at a rate of about 2 to 4% of fish biomass (Schroeder 1980). Woynarovich (1980) ·reported that the total manure loading per ha of pond surface is between 40 and 80 pigs/ha which is similar to that reported by Cruz arid Shehadeh (1980) with 60 pigs/ha, and Jhingran and Sharma (1980), with 35-40 pigs/ha. Chen and 'Li(l980) reported that waste loading can be as high as 250 pigs/ha. Moreover, some carnivorus species such ai; Ophicephalus striatus (Cruz and Shehadeh 1980) and Lateolabrax
·. japonicus (Chen and Li 1980) are stocked in the ponds ill order to control overcrowding of tilapia. Cruz and Shehadeh (1980) reported. that the highest net yields were obtained with the 60 pigs/20,000 fish (85% Sarotherodon niloticus, 14% Cyptinus carpio and 1 % :ophicephalus · striatus)/ha.
Acknowledgement . . ' .
This ~tudy was supported -by the International Develop~ent Research Centre of Canada under grant number 3-P-85-0266. Special thanks are given to P. Sirimontraporn, D. Dhesprasit, W. Phromkunthong and field research personnel:in Thale Noi village for kind co-operation ·and assistance in data collection that made this_ study possible. .
147
References -
Anonymous. n.d. Manual for rearing of fanening pig. Division of Advertising and Marketing Promotion, Charoen Pokphand Industry Co. Ltd. Bangkok. 24 pp. (in Thai). · ·
Association of Official Analytical Chemists (AOAC). 1975. Officiiil methods of analysis. 12 edition. Washington, DC. USA. 1094 pp. Boyd, C.E. 1968. Fresh water plants: a potential source of protein. Economic Botany 22: 239-168. Chen, T.P and Y. Li. 1980. Integrated Agriculture-Aquaculture Studies in Taiwan. In R.S.V. Pullin and Z.H. Shehadeh (eds.) Integrated
Agriculture-Aqu~culture Farming Systems, pp. 239-241. ICLARM Conference Proceedings 4, Manila, Philippines. Chiayvareesajja, S., B. Sirikul, P. Sirirnontraporn, S. Rakkeaw, R. Tansakul, and A. Sornprasit. 1987. Tilapia Cage Culture with Aquatic weed
Mixture Pellet in Thale Noi, Thailand. Paper presented at the Second International Symposium on Tilapia in Aquaculture, during 16-20 March, 1987. ·Bangkok. (in press).
Cruz, E.M. and Z.H. Shehadeh. 1980. Preliminary Results of Integrated Pig-Fish and. Duck-Fish Production Tests. In R.S.V. Pullin and Z.H. Shehadeh (eds;) Integrated Agriculture-Aquaculture Farming systems, pp. 225-238. ICLARM Conference Proceedings 4, Manila, Philippines. ·
Fang, Y.X., X.Z. Guo,, J.K. Wang, X.Z. Fang, and Z.Y. Liu. 1986. Effects of Different Animal Manures on Fish Farming. In J.L. Maclean, L.B. Dizon and L.V. Hosillos (eds.) The First Asian Fisheries Forum, pp. 117-120. Asian Fisheries Society, Manila, Philippines.
Jhingran V.G. and B.K. Sharma. 1980. Integrated Livestock-Fish Farming in" India. In R.S.V. Pullin and Z.H. Shehadeh (eds.) Integrated Agriculture-Aquaculture Farming Systems, pp. 135-142. ICLARM Conference Proceedings 4, Manila, Philippines.
Schroeder, G.L. 1980. Fish Farming in .Manure-Loaded Ponds. In R.S.V. Pullin and Z.H. Shehadeh (eds.) Integrated Agriculture-Aquaculture Farming Systems, pp. 73-86. ICLARM Conference Proceedings 4, Manila, Philippines.
Woynarovich, E. 1980. Utilization of Piggery Waste in Fish Ponds. In R.S.V. Pullin and Z.H. Shehadeh (eds.) Integrated Agriculture-Aquaculture Farming Systems. pp. 125-128. ICLARM Conference Proceedings 4, Manila, Philippines.

1m·provement of Meat Quality of Grass Carp, Ctenopharyngodon idellus
(Cuv. et Val.)
LIN DING MAO YONGQING LIAO XIANGHUA Ichthyology Laboratory
Zhongshan University, Guangzhou China
Ding, L., M. Yongqing and L. Xianghua. 1989. Improvement of meat quality of grass carp, Ctenopharyngodon Ukllus (Cuv. et Val.), p. 148-152. In S.S. De Silva (ed.) Fish Nutrition Research in Asia. Proceedings of the Third Asian Fish Nutrition Network Meeting. Asian Fish. Soc. Spec. Publ. '4, 166 p. Asian Fisheries Society, Manila, Philippines.
Deterioration of the meat quality of grass carp in recent years is ·mairily attributed to improper feed formulation which results in the production of big-belly grass carp.
Big-belly grass carp is stout, with protuberant belly. Ratio of viscera and mesentery fat to body weight is 11 % and 4.2% respectively. Water content is 80.6% and protein 16.6%. The musculature is flabby and lacks elasticity. Histological examination of m\lscle tissues reveals that the arrangement of myofibrils is loose, with 7-9 fibrils within 0.01 mm, the spacings between the fibrils are wide and the zonation of dark and bright bands is indistinct.
Grass carp fed experimental formulation as compared to those fed green manure show little difference in body shape. However, in the former, the ratio of viscera and of mesentery fat to body weight is 7.9% and 1.8%; and in the latter the ratio is 6;2% and 0.8%. The moisture, protein and total amino acid content of muscle differ in the two group.
In grass carp fed experimental formulations the arrangement of myofibrils in muscle is compact, with 12-14 fibrils within 0.01 mm; the spacings.narrower; the zonation of dark and bright bands distinct and the muscle elastic. The fish has a better taste than green manure fed grass carp.
With the development of grass carp culture it has been a common practice for fish farmers to use mono-feedstuff as the main feed source. Consequently, the resulting nutritional imbalance leads to a deterioration ofmeat quality and the production of the kind of grass carp referred to as big-belly grass carp;
Morphologically big-belly grass carp is stout, with protuberant belly and a high accumulation of mesenteric fat. The edible part of the fish is thus reduced and the taste is 'flat'.
This phenomenon is attributable to different factors. In the present study the effects of three different feedstuffs, greens, mono-feedstuff and well- balanced feed on the meat quality of grass carp were investigated.
Materials and Methods
Eighty to one hundred grass carp of 200-300 g in weight were stocked in three ponds each of 533 m2 and 1.5 m deep. The experiment period lasted from May to November when the fish had grown to a marketable size.
148

149·
Three different feeds were applied through the experimental period: green manure, mainly grass of monocotyledon, mono-diet, soaked whole com or wheat, or chopped beancake and pellet feed of experimental formulation. ·
At the end of the experiment all fish were measured and weighed. The viscera were then dissected and weighed and the hepatopancreas and adipose tissues were separated from the mesenteries. Samples of liver and muscle taken from apiaxial were dried at 105°C .. Crude protein, fat and ash contents were determined and tissues and liver were fixed in Bouin's solution and paraffin-sectioned for histological studies.
Results
The belly of fish fed on mono-feedstuff is swollen and drooping (Plate l), unlike in the other groups, the condition factor being 2.00. The condition factor of those fed greens was 1.81 and of those fed mixed pellets 1.79.
The proportion of the viscera to the body weight in the mono-feedstuff group was 11.8%, whereas that in the balanced diet group 8.86% and in the green manure feeding group 6.5%.
The proportions of the liver and the mesenteric adipose tissue to the body weight in grass carp fed on mono-feedstuff are the highest, being 3.2% and 4.2%, as compared with those in the balanced diet group which were 2.3% and 1.6% and those in the grass feeding group 2.3% and 0.8%.
Plate 1. External features and gross anatomy of grass carp . fed on three different feedstuffs. A. Grass carp fed on mono-feedstuff. B. Grass carp fed on green manure. C. Grass carp fed on balanced diet.

150
The moisture content of fish fed on balanced diet is the lowest, 77.8%, as compared with that in the mono-feedstuff group which was 80.6% and 78.9% of that in the grass fed group. The crude protein content was the highest in the balanced diet group (Table 1).
The glutamic acid content of 15.0%, in the muscles of the fish that gives the fish its delicious taste was highest in the balanced diet. group. The proline content of 5.45%, and the histidine content of 2.89% were also the highest in this group (Table 2).
The phenylalanine content was k>west in the balanced diet group. The histological structure of the muscles of fish maintained on three different feeds shows a
marked difference (Table 3). Grass carp fed on mono-feedstuff has a higher lipid content in the liver, ·amounting to 8.65%
against 6.90% in fish fed on the balanced diet (Table 4).
Table 1. Moisture and proximate composition of fish maintained on three different feeds expressed as % of the fresh weight.
Feed Moisture
Mono-feedstuff 80.58 ±0.80
Greens 78.98 ±0.48
Balanced diet 76.84±0.24
· Protein
16.64
18.82±0/09
19.41±0.47
Fat
1.56 ± 0.04
0.45 ±0.08
1.36 ± 1.41
Table 2. Amino acid in the muscles offish maintained on three different feeds (dry wt.%).
Feed Total Glutamic Pro line Phenyla-amino acid lanine acids
Mono-feedstuff 81.16 12.60 0.16 4.51
Greens 82.52 12.70 2.48 5.11
Balanced diet 88.56 15.0 5.45 4.27
Table 3. Histological structure of the muscles of fish maintained on three different feeds
Number of Feed fibrils Spacings Zona ti on
within 0.01 mm
Mono-feedstuff 7-9 wide indistinct
Greens 11-13 narrow distinct
Balanced diet 12-14 narrow distinct
Table 4. Liver composition of flsh maintained on th~e different feeds expressed as % of the fresh weight
Feed Water Crude protein Crude fat
Mono-feedstuff 71.21±2.68 10.4'.2. 8.56±2.39
Greens 72.80±3.18 11.35 ± 1.63 2.36±2.14
Balanced 66.26± 3.43 12.10 ± 0.-31 6.90±0.81
Ash
1.12
1.19 ± 0.05
1.'22 ± 0.05
Histidine
·2.08
2.19
2.89
Elas-ticity
poor
good
good
Ash
1.58
1.12 ± 0.04
1.02±0.07

151
Histological studies reveal that among the three groups the liver cells of grass carp maintained on mono-feedstuff are the most seriously deteriorated because of the infiltration of lipoid into the hepatopancreas. The deterioration was manifested in the dislocation of the nucleus, the distortion of hepatic muralia and the loss of cytoplasm staining affinity. As to the balanced diet fed grass carp, the situation was not so serious though there was an accumulation of lipoid in the liver cells and some cells increased in size. The grass fed fish seem to be the least affected as the liver cells contain little lipoid (Pl~te 2).
A
c
B
Plate 2. Photomicrograph of liver ce1ls of grass carp fed on three different feedstuffs. A. Liver cells of grass carp fed on mono-feedstuff x 250. B. Liver cells of grass carp fed on green manure x 250. C. Liver cells of grass carp fed on balanced diet x 250.
Discussion
The improvement of meat quality of aqua-products compels attention. Factors affecting the quality of aqua-products are manifold, among which imbalanced diet seems to be the chief one. Results of the present investigation show that it is feasible to improve the meat quality of grass carp through the application of a balanced diet. ·
Food intake and energy expenditure are more or less in a state of constant turnover in wild animals (Heisuke 1985). Voluntary activities expend much energy and thus the energy reserve in the body is reduced. But grass carp under cultivation and maintained on mono-feedstuff or imbalanced diet tend to have excessive energy, probably more than the optimal level. The nutrients may be improperly utilized and transferred into accumulated fat.

152
Ingredients of mono-feedstuffs used in China are mainly vegetative; such as corn, wheat middlings and a small proportion of soybean cake and peanut cake. The PIE ratio is not balanced, as the diet is composed of low level dietary protein and high level carbohydrate. Excessive carbohydrate may stimulate lipogenic enzyme activities both in the liver and in the mesenteric adipose tissues. The indispensable amino acids in the vegetative protein source are not balanced as well, and the low level methionine can not satisfy the needs of the fish for CH3.
Hidetoshi (1985) in his studies on the improvement of meat quality of yellowtail Serio/a quinqueradite (T. et S.) pointed out that differently formulated feedstuffs have different effects on the fat accumulation. Fat accumulates when fish are fed with low protein and high fat diets. It could be inferred that a balanced diet should take into consideration the balance of protein and energy as well as the overall balance of amino acids. Quick transformation of the diet can reduce excessive energy and in the end improve upon the fatness of the fish.
It is generally acknowledged that nutrients in the diet have a distinct effect on the fat accumulation in the fish muscle. Our experiments show that the water and fat contents in the muscles of fish fed on mono-feedstuff or imbalanced diet are high while the protein content is low.
The differences in histological structure between the muscle of grass carp fed on monofeedstuff and those fed with experimental formulations are distinct. Balanced diet has a positive effect ·on the arrangement of the myofibrils, the zonation of dark and bright bands and the degree of elasticity. Toshiyuki (1985) in his paper on the meat quality of red bream snapper Pagrus major (T. et S.) studied the relationship of feedstuff and muscle elasticity. He compared the degree of muscle deterioration of cultured fish with that of sea caught fish. The myofibrils of the former started to deteriorate on the first day after the death of the fish, and became fractionized on the third day, while in the latter the myofibrils remained in good condition thirteen days after the death of the fish. In our experiment the firmness of the meat of grass carp maintained on different diets was tested in boiling water. The meat of different diet groups of fish was sliced into pieces of about 1 mm in thickness and boiled separately for 2-3 min. Results show that the meat of fish fed or an imbalanced diet soon fractured but not so in fish fed on balanced diet.
The protein content and some free amino acids, such as glutamic acid, praline and histidine, give fish its delicious taste. Balanced diet improves the meat quality of grass carp because the muscles of the fish thus fed are firm and because some free amino acids are found in higher quantities. Hidetoshi (1985) in his studies on the improvement of meat of yellowtail S. quinqueradite obtained similar results.
The improvement of meat quality poses a challenging and intriguing problem for researchers of nutritional physiology of fish. The effect of feeds on fish meat quality is but one factor affecting the meat quality of aqua-products, and shows it is necessary to encourage further interdisciplinary coordination among researchers.
References
Heisuke, N. 1985. The importance of meat quality of cultured fishes. Fish Culture 11: 48-51. Hidetoshi, K. 1985. Studies on the importance of meat quality of yellowtail Serio/a quinqueradite (T. et S.). Fish Culture 11: 52-55 Liao Xianghua, Lin Ding and Mao Yongqing. 1985. On the nutrition of grass carp Ctenopharyngodon idellus (C. et V.) and mud carp Cirrhinus
molitorella (C. et V.). Asian Symposium on Freshwater fish Culture, October 10-15, 1988. Beijing (in press). Lin Ding, Mao Yongqing and Cai Fasheng. 1985. On the lipid liver.disease of grass carp Ctenopharyngodon idellus (C. et V.). Asian Symposium
on Freshwater Fish Culture, October 10-15, 1985. Beijing (in press). Toshiyuki, K .. 1985. Studies on the importance of meat quality of red bream snapper Pagrus major (T. et S.). Fish Culture 11: 56-59.

Culture of Banana Prawn (Penaeus merguiensis) and Tilapia (Oreochromis niloticus) by Using Aquatic Weed· Mixture Pellet
S. CHIAYV AREESAJJA Department of Aquatic Science Faculty of Natural Resources Prince of Songkla University Haad Yai, Songkhla 90110
Thailand ·
R. TANSAKUL Department of Biology
Faculty of Science Prince of Songkla University HaadYai, Songkhla 90110
Thailand
Chiayvareesajja; S. and R. Tansakul. 1989. Culture of banana prawn (Penaeus merguiensis) and tilapia (Oreochromis niloticus) by using aquatic weed mixture pellet, p. 153-156. In S.S. De Silva (ed.) Fish Nutrition Research in Asia. Proceedings of the Third Asian Fish Nutrition Network Meeting. Asian Fish. Soc. Spec. Pub!. 4, 166 p. Asian Fisheries Society, Manila, Philippines.
Culture of banana prawn (Penaeus merguiensis) and Nile tilapia (Oreochromis niloticus) in 0.43 m3 plywood tanks at 20 ppt salinity on an aquatic weed mixture pellet was studied. The aquatic weed mixture pellet composed of dry weed (Ceratophyllum demersum), rice bran and fish meal in a ratio of 4:3:1. Experiments were carried.out on monoculture of prawns, fish and polyculture of prawn and fish in ratios of 1:1, 1:2 and 1:4, for 9 weeks. It was found that the tilapia in all treatments grew well. A poor growth rate and survival rate of prawns were obs.erved in the polyculture systems.
Aquatic macroppytes may be used directly as human food, as livestock fodder, as fertilizer and as food for herbivorous fishes (Edwards 1980). Aquatic weeds can also in addition be used for water purification (Little 1979). In our aquatic plants utilization project in Songkhla Lake, it was found that Ceratophyllum demersum, a submerged aquatic plant, can be used as feed for herbivorous fish (Puntius gonionotus, Oreochromis niloticus, Labeo rohita), chicken and pigs (Tansakul 1987).
This preliminary study attempts to evaluate the utilization of dry C. demersum as fish pellet for the banana prawn (P. merguiensis), and the feasibility of culturing Nile tilapia (0. niloticus) in the same system with penaeus shrimp. If the system is proven to be feasible, it will benefit the small farmers and induce them to take up more profitable penaeus shrimp culture.
Materials and Methods
The experimental design consisted of 5 treatments with 3 replicates of each. In treatment 1, -14 P. merguiensis were reared in a marine plywood tank (10 shrimp/m2). ·In treatment 2, only 0. niloticus were reared in a tank (14 tilapia/tank). In treatments 3, 4 and 5 shrimp and fish were
153

154
reared in an integrated system with ratios of shrimp:fish, 1:1, 1:2 and 1:4 (14 shrimp with 14, 28, 56 fish, respectively).
Banana prawn (P. merguiensis) collected from Songkhla Lake at 7 cm total length and tilapia (0. niloticus) of 7 cm from the Department of Aquatic Science, Prince of Songkla University were acclimatized in 20 ppt sea water for 7 days before commencing the experiments. The experiment was done in a small closed system of 1.2 x 1.2 x 0.4 m marine plywood tanks with 30 cm water depth. Aeration was carried out as shown irt Fig. 1. The system was covered by fine polyethylene nets to prevent the fish jumping, and the salinity maintained at 20 ppt during the experiment.
.--~==- Aeration 1 ine corinected to aerator
. 3 ·Plywood tank, 1.2 x· ·1.2 ·X o.4 m
£.C~c::cz:::;f--+-.,.__ Drilled PVC pipe
f:~~~~~~~~fj./---- Overflow channel, 30 cm from bottom
Fig. 1. Plywood tank for rearing of prawn and tilapia.
Experimental aquatic weed pellets composed of dry C. demersum, rice bran and fish meal in a ratio of 4:3:1 by weight plus vitamins and minerals (OVIlvlIN) supplementation up to 2% (Table 1) was used as the feed. Fish and shrimp were fed at.5% of body weight, 2 times daily at 0900 hr and 1700 hr ..
The water quality of the system was checked for DO, pH, temperature with a HORIBA water checker (Horiba Co., Japan) every 3 weeks. Fish and shrimp were weighed for growth every third Week and the ration adjusted accordingly. ·
Table 1. Proximate composition of C. demersum and the formulated feed, air dry basis.
C. demersum Feed"' Freshl Fresh2 Dry3
Moisture (%) 94.80 96.39 15.72 9.95 Crude protein (%) 21.70 29.08 16.23 23.18 Lipid(%) 5.97 11.91 1.48 5.20 Crude fibre (%) 8.25 9.69 Ash(%) 20.60 19.66 23.09 Gross energy (Kcal/Kg_) 3710.00 3127.02"'."'
1 Boyd, 1968; 2 Sitasit et al. 1982; 3 Chiayvareesajja et al. 1987;"' analysed by A.O.A.C. methods (A.0.A.C., 1975); "'*analysed with a Ballistic bomb calorimeter (Gallenkamp).
Results
The experiment was carried out from 5 September to 26 November 1987 for 9 weeks. It was found that in the integrated system shrimp lost weight and survival was low, while the system with only shrimp or fish showed better growth• (Table 2 and Fig. 2). In treatment 1, which had only shrimp P. merguiensis the body weight increased by 17.85% and 69.05% survival was recorded (Table 2).

155
Tilapia in every treatment showed an iQcrease in the' body weight (Table 2 and Fig. 3). treatment 3 (fish: shrimp, l:l) showed t~e best growth (426.33%) and survival rate (97.62%).
Table 2. Growth and survival rate, (mean± SE) of banana prawn· and Nile tiiap_ia from 2S September ~o 26 November 1987.
Treatment Weight (g) Gain· Survival' Initial Final (%) (%)
Banana prawn (P. merguiensis) Tl 3.53 ±0.24 4.16 ±0.3S 17.8S 69.0S ± 2.38. ' Tz 0 0 0 0 .
T3 3.14 ± 0.19 2.34±0.02 -2S.48 2'6.19 ± :i.38 T4 3.23 ± 0.10 2.46±0.06 -23.84 21.43 ± 7.14 TS 3.lS ± 0.10 3.~±0.0S - 1.90 9.52 ± 2.38'
Nile tilapia ( 0. niloticus) Tl ·o 0 0 0 T2 3.07±0.0S 12.82 ± 1.S7 317.S9 8S.71 ±7.14 T3 '3.19±0.16 16.79 ± 0.46 426.33 97.62±2.38 T4 2.8S ±0.10 12.4S ± 0.60 336.84 91.67 ± S.19 TS 2.86 ±0.D7 8.33 ±0.23 191.26 93.4S±2S9
TI = Monoculture of prawn; T2 = Monoculture of"tilapia; T3 = Polyculture of prawn and .tilapia in a ratio of 1:1; T4 = Poly culture of prawn and tilapia in a ratio of 1:2; TS= Polyculture of prawn and tilapia in a ratio of 1 :4. ·
_4 e
... 0
¢--<> PRAWN : TH.APIA = 1 : 1
......... PRAWN : TILAPIA = 1 :· 2
0--0 PRAWN : TILAPIA ="1 : 4
REARING PERIOD (WEEKS)
Fig. 2. Growth of prawn in each treatm.ent.
9:
18
16
14.
' :s 12
~-10 ~ ... 0 8
ffi ~ 6
tll lli 4 l:!' <
~ TILAPIA
Q--¢ PRAWN : TILAPIA = 1 : 1:
._. . PRAWN : TILAPIA. = 1 : 2.
0--0 PRAWN : TILAPIA = '1 : 4
REARING PE~IOD (WEEKS)
Fig. 3.· Growth of tilapia in each treatment.
Water quality parameters in the 5 treatments during the experiment were notdifferent; DO between 8.00 and 9.00 am was in the range of 4.47-5.83 ppm, temperature ranged from 26.23 to 30.10°C and pH ranged from 6.10 to 7.33. ·
Discussion
It was found that dry C. demersum can be utilized in pellet form, for feeding P. merguiensis and 0. niloticus. However, the growth of shrimp and fish were not as good as expected, probably due to lower protein content of the pellet. Boonyaratapalin (1987) recommended that pellets for P. merguiensis should have a crude protein level of 30-42%. Also the crude protein in fish pellets for· tilapia should be 30-35% (Jauncey and Ross 1982). De Silva and Perera (1985) have shown that young 0. niloticus grow best !it 10-15 ppt salinity and that a protein level of 30% is optimal. Modification of weed pellet formula could improve the growth of the Penaeus shrimp and tilapia in the system.

156
There appears to be a potential to use this small closed system for Penaeus prawn culture. The low capital investment and low running costs, and practical method of operation were among so111e of the reasons to demonstrate Penaeus prawn culture for small farmers in fishing villages in Thailand. If this system can be improved to make it profitable, it will be of great benefit to small farmers. · ·
In this study, it was also found that banana prawn and Nile tilapia may be reared together as in other polyculture systems. The best system for shrimp and fish rearing was treatment 3 (shrimp:fish = 1:1), in which tilapia gained 426.33% of the body weight but shrimp weight was reduced by 25.48% and the survival rate was only 26.19%. This low growth rate may be due to the shallow water depth used in the system (30 cm) which was probably insufficient for shrimp and tilapia to separate their feeding territories. When tilapia stocking density/ratio was increased to 2-4 times of the shrimp, it resulted in lower shrimp growth and survival. Integrated culture of Penaeus shrimp and tilapia has also been studied in earthen ponds in the Philippines (Pudadera et al. 1986) and it was -found that the best ratio for shrimp and tilapia was 5,000 P. indicus to 1,500 0. niloticus and 200 Chanos chanos in 1,000 m2 earthen pond~ It is hoped that integrated systems of Penaeus shrimp and tilapia or even with pig and chicken rearing will be developed in the near future. ·
Acknowledgement
This study was supported by the International Development Research Centre of Canada under grant number 3-P-85-0266. Special thanks are given to Dr. Anne Cronin, a V.S.O. in Dept. of Aquatic Science, for her critical rea,ding of this manuscript.
References
Association of Official Analytica Chemists. 1975. Official methods of analysis. 12th Edition. Washington, DC, USA. 1094 p. Boonyaratapalin, M. 1987. Nutrition an.d feeding techniques for tiger prawns. Extension sheet, National Inland Fisheries Institute, Department of
Fisheries, Ministry of Agriculture and Cooperative, Bangkok. 41 p. (in Thai). Boyd, C.E. 1968. Fresh water plants: a potential source of protein. Economic Botany 22: 359-368. Cbiayvareesajja, S., B. Sirikul, P. Sirirnontraporn, S. Rakkeaw, R. Tansakul and A .. Sornprasit. 1988. Comparison between natural feeding done
and supplemental feeding with pellets containing locally available ingredients for cage culture of Oreochromis niloticus.in Thale Noi, Thailand, p. 323-327. ln R.S. V. Pullin, T. Bhukaswan, K. Tonguthai and J.L. Maclean (eds.) The Second International Symposium on Tilapia in Aquaculture. ICLARM Conference Proceedings 15, 623 p. ·
De Silva, S.S. and W.M.K. Perera. 1985. Effects of dietary protein level on growth, feed conversion and protein use in young Tilapia nilotica at four salinities. Transactions of the American Fisheries Society l 14·:·584-589.
Edwards, P. 1980. Food potential· of aquatic niacrophytes. International Center for Living Aquatic Resources Management, Manila, Philippines. 51 p~ .
Jauncey, K. and B. Ross. 1982. A guide to tilapia feeds and feeding. Institute of Aquaculture, University of Stirling, Scotland. 111 p. Little, E.C.S. 1979. Handbook of utilization of aquatic plants. FAO Fisheries Technical Paper No. 187. 176 p. Pudadera, B.J.J., K.C. Corre, E. Coniza and G.A. Taleon. 1986. Integrated farming of broiler chickens with fish and shrimp in brackishwater
ponds. In J.L. Maclean, L.B. Dizon and L.V. Hosillos (eds.) The First Asian Fisheries Forum, pp. 141-144. Asian Fisheries Society, Manila, Philippines.
Sitasit, P., M. Boonyaratapalin and N. Ounprasert. 1982. Fish nutrition. National Inland Fisheries Institute, Department of Fisheries, Ministry of Agriculture and Cooperative. Bangkok. p. 77, 88. (in Thai). ·
Tansakul, R. 1987. Aquatic weeds (Thailand) Phase Il, first year report. Department of Biology, Faculty of Science, Prince of Songkla University, Haad YaL 37 p.

Summary of the Discussions
The workshop was divided into six sessions, in which the review papers were presented in the first two and the original papers in the other four. This summary entails the main points that were discussed~
1. STANDARDIZATION
Fish nutrition researchers in Asia, as elsewhere tend to use a wide array of terminology and as such there is Confusion in the manner in which data are presented; such as for example the amount of feed presented and/or consumed, efficiency of food utilization etc. are expressed in different forms by different authors. The workshop was of the view that. it would be desirable to agree upon common terminology so that exchange and comparisons of data from different studies woµld be facilitated.
2. LAB.ORATORY TRIALS
It was pointed out that when conducting feeding experiments, in particular in re.lation to evaluation of diets under 1aboratory conditions it would be desirable to:
a) consider the economic aspects in the formulation of the experimental and or. test diets;.
b) conduct growth experiments over an appreciable period of time, such as for example until a 5 to 10 fold increase in the mean weight is obtained;
c) take extreme care to minimize food wastage and to feed at least twice a day to satiation (unless the experiments are designed to evaluate the ration size and/or feeding frequency);
d) avoid undue stress on the fish by weighing individual fish at regular intervals, for example, fortnightly; it was felt· that depending on the size of the fish and the duration of the experiment; interrriediate weighings are best restricted to 'group weighings', if possible without anaesthetization, and
e) provide optional evironmental conditions such as pH,. dissolved oxygen and lighting.
157

158
3. POND TRIALS
In experiments associated with supplemental feeding, mostly in ponds, attempts should be made to monitor the key environmental 'variables' such as temperature, ·dissolved oxygen and natural food production through estimation of chlorophyll, algal and zooplankton biomass regularly. It was also pointed out that in such experiments regular feeding regimes need to. be maintained and as far as possible and 10-20% of the fish should be sampled at regular intervals to'_moriitor growth. The difficulties in assessing the fish biomass at times of sampling was discussed and it was felt that no exact guidelines could be provided for such experiments and the researcher's alertness would play. a key role in the success of the experiment
. ! .
4. LARVAL EXPERIMENTS
It was apparent that at present most marine fish larvae can not be economically raised on artificial diets and that live'· foods such as rotifers are still preferred; nutrient requirement studies on larval fish often· require . bioenrichment of ·live foods such as rotifers as · exemplified by the fatty acid requiremeJ?.t evaluations of the yellow tail (Serio/a sp.) of T.Watanabe; It was also pointed out that generally, to date Brachionus or comparable live feeds are taken as the reference feeds and that if results contrary to this are obtained in larval growth experiments the researchers should repeat the experiments and carefully consider all possible errors that could have occurred before interpretation of data. In
· particular one would have to consider the size of the live food in relation to mouth-size · and whether sufficient.quantities of food were presented and the like. .
In growth and feed response experiments with larvae and fry in particular, it is necesary to account for and make allowance for food ingested by those animals which die in the course of the experiment; if not the food conversion and protein efficiency ratios are . likely to be influenced significantly, resulting in erroneous interpretation of the data.
5. DIGESTIBILITY
It was agreed that there is no rationale for using the terms coefficient with respect to the. dry matter and/or nutrient digestibility which are expressed as percentages. The difficulties encountered in defining the differences between 'true' and 'apparent' digestibilities were dealt with and it was agreed that evaluation· of the apparent digestibility of the total feed, ingredients br their nutrient components were sufficient. It was noted that: .
a) in evaluation of the digestibility of an ingredient that an experimental diet composed of 70% of a well-:-defined reference diet and 30% of the ingredient to be tested should be used;
b) when results on ingredient digestibilities !lfe presented the proximate/nutrient composition of them should be made available; and

159
c) when diet formulation is made wit-h ingredients whose digestibilities are not known it was best to make estimates based on their proximate composition and equivalent energy values used in recent comparable studies· but not on the 'physiological fuel equivalents'.
6. GENERAL
The role of zeolite in shrimp feeds was discussed. It was agreed that its main role was in retention and uniform distribution of the lipids. In addition, zeolite· was al.so thought to · reduce the ammonia, hydrogen sulphide and other toxic compounds in the water. ·
On site (on farm) preparation of supplemental feeds and aspects related to storage of commercial feeds were discussed. It was agreed that commercial feeds should be stored in a manner that ground contact is minimized and. in places with a good air-circulation. The feeds are best utilized within three months of the date of manufacture. It was noted that iri most feeds manufactured i11 Asia the date of manufacture is not recorded.
In' general, 1t was. felt that there is a potential in the use of a variety of waste-products as base ingredients for supplemental feeds and that more detailed investigation - one on these as well as on the variety of materials used indigenously by srliall- scale farmers and the practice employed would be desirable.
All participants were in agreement that attempts should be made to disseminate the results of studies on fish nutrition in internationally accepted journals and that it would be desirable to make it imperative for results of studies funded by donor agencies tc> attempt to publish the findings in international journals. Such attempts by themselves would in the longer term, cater to a standardization of the methodologies used and upliftment in fish nutritional research.
Participants recognized that recommendations made at the 2nd Fish Nutrition Workshop held in Manila, in May 1986 have been taken into consideration as apparent from the · increasing research effort on aspects on use of non-conventional resources in feeds, supplemental feeding and a narrowing of the number of species worked on. It was however, felt that the problems of standardization of the terminology and. research methodology have been insufficiently addressed, as yet.
Apart from the above ·discussions on .the individual presentations considered specific elements of each, which· undoubtedly would be taken into account by the individual researchers.

Workshop Recommendations
The Workshop recognized that:
1. There is a lack of standard texts, and that something similar to a manual in fish nutrition in relation to the Asian context is needed. As a result of this deficiency a high degree of variability is apparent in the research methodology amongst researchers from different countries -in the region thereby hindering the use of research findings elsewhere.
To parti"ally overcome this situation the workshop recommended that Part A of IDRC publication233e (Finfish Nutrition in Asia. Methodological Approaches to Research and Development by C.Y. Cho, C.B.-Cowey and T. Watanabe(editors), 1985, 184 pp.) be revised and -updated with examples from Asia incorporated- into the text, where appropriate.
The workshop also recommended that a quick reference manual be prepared by a group of researchers drawn from-the region on the more important themes in fish nutrition, and that the IDRC liaises with ADCP as ADCP is considering a related effort.
2. The group was of the view that in most institutions in the region sophisticated analytical instruments are available but are underutilized; the underutilization often resulted from malfunctioning of the instruments and the lack of trained technicians.
The workshop recommended that provision of analytical services (for most nutrition analyses) between institutions in the region should be encouraged, that future grantees should be encouraged to_ make estimates on the cost of obtaining analytical services within the region and the IDRC to explore the possibilities of providing selected technician training in institutions where appropriate in return for providing a particular service(s) to other researchers in the region.
3. The participants were of the view that the degree of staff exchanges between institutions involved in fish nutrition research in the region is very limited, and recommended that such exchanges should be encouraged where appropriate, perhaps through the 'Networking' system.
The workshop also recommended that where possible researchers should be encouraged to select post-graduates from other countries in the region for scholarships which would limit 'inbreeding' and also that it would be an effective means of transferring and exchanging research methodologies and approaches.
160

. 16-1
4. The participants were in agreement that there was a dearth of training courses available in the region in fish nutrition. The workshop recommended that:
a) Attachments to institutions for middle and senior res.earchers be encouraged and such attachments should be, where relevant, to institutions in the region;
·b) 'Satellite' courses in Experimental Design, Re.search Methods and Data Analysis be conducted; and
c) Attempts should be made to d~velop a comprehensive training course in fish nutrition in a regional instituti<;>n, cominencing with a 3-4 ·week course, initially, once the needed type and numbers for training are better defined.
5. The participants endorsed· the need to form an Asian Fish Nutrition Network and approved that they be the initial 'core' group. It was generally agreed that the network would function in a fashion similar to the other disciplinary research networks in the region, with the primary objective being to promote and adopt mechanisms that would upgrade and provide direction to fish nutrition research that is of · relevance and application in the region. The document prepared by Prof. Sena S. De Silva on the Fish Nutrition Network (Annex) was adopted.
6. The workshop considered that there was a need to facilitate ways and means of making information transfer among scientists in the region more effective and the need to utilize the information services already available in the region. It Was agreed that as a first step, copies ofreprints authored by the participants would be exchanged.
7. The Workshop also recommended that regular meetings and workshops should be held to bring fish nutrition researchers together. to enable them to interact effectively. The Workshop recommended that future workshops:
a) should be conducted ip a similar fashion to this meeting including sufficient time being allotted for interaction and discussion;
b) that the practice of presenting full papers be continued;
c) have a main workshop theme, but time be also allotted for presentation of other workon fish nutrition; · ·
d) to have a person(s) deliver a keynote address( es) on a subject related to the main theme ofthe workshop; an.d
e) that all attempts be made to 'draw-in' and encourage younger scientists in fish nutrition research.
8. The Workshop recommended that the main theme for the next meeting be on aspects related to development and use of home made or on-farm prepared feeds, and be .held toward the end of 1989 or in early 1990.

ANNEX
ASIAN FISH NUTRITION NETWORK
(1) BACKGROUND:
Two fish nutrition workshops have been held todate, the first in Singapore in September 1983 and the second in Manila in May 1986. It was agreed during these Workshops that it would be desirable to have more coordination amongst fish nutrition researchers in the region with ::i. view to optimizing research inputs within the region and to bring about a more effective exchange of information amongst the researchers. This is of particular relevance to' the Asian region which is embarking on intensification of the aquacultural practices even at the rural fish farmer level. Intensification goes hand in hand with increasing feed inputs into the 'systems'. It is accepted that feed costs is one of the highest, if not the highest recurring costs in fish culture. There is therefore, a need for an increasing emphasis on finfish nutrition research in the region; to develop low cost diets, to evaluate optimal husbandry practices for diffent systems and cultivated species, to evaluate the,role of natural food in the system - to name a few priorities.
(2) RATIONALE:
In accordance with the recommendations made by researchers in the region, and in recognition of the need to increase the emphasis on fish nutrition research and coordination of activity amongst fish nutrition researchers in the region, the International Development Research Centre (Canada) has come forward to partially support the establishment of an Asian Fish Nutrition Network.
(3) OBJECTIVES:
The primary objectives of the Asian Fish Nutrition Network would be
(a)to bring together periodically researchers in fish nutrition in the region to develop a more coordinated research framework among Asian fish nutrition scientists;
(b)to provide information of on-going fish nutrition researchin the region;
( c) to prepare and guide the preparation and publication of material/manuals of reference for fish nutrition research in the region; and
(d)to efft<ft exchange of information and collaboration between researchers in other specialities which are of direct relevance to fish nutrition.
162

163
(4) The above is only a brief outline on the Asian Fish Nutrition Network. You will appreciate that a lot more effort is needed to make it a functional and an effective unit which would hopefully have a direct bearing on increasing the protein availability, at a reasonable price, to the rural poor in the region, as well as increasing the standard of living of the small fish farmer.
Obviously, the success of the network in meeting its objectives depends on each of us and our concerted efforts and commitment to the cause.·
I shall be grateful if you would come back to me with your own ideas and suggestions on the network.
24 Nov. 1987 PROF. SENA S. DE SILVA - . ·1 .....

List of Participants' 3rd Fish Nutrition Workshop
(6-lOth .Tune 88)
INDIA Mr. M.C. Nandeesha College of Fisheries University of Agr1cultural
Sciences · Man galore 57 5002
Karnataka
Dr. S.N. Mohanty CIFA (ICAR) Kausalyagarig Bhubaneswaran 751002 Orissa
JAPAN Dr. Takeshi Watanabe,·· Fish Nutrition Laboratory, Tokyo .University of Fisheries 4-5-7 Konan Minato-Ku,. Tokyo
.MALAYSIA Mr. M.S. Kamarudin Faculty of Fisheries & ·
Marine Science Universiti Pertanian
Malaysia 43400 Serdang Selangor
PHILIPPINES Dr. F. Pascual AQD/SEAFDEC Tigbauan Iloilo
164
Prof. T.J. Pandian School of Biological
Sciences Madurai Kamaraj University Madurai 625021
Dr. Arun Kumar Ray Department of Zoology Visva-Bharati University Santinekatan 731235 West Bengal
Dr. Mohamed Shariff Faculty of Fisheries & . Marine Science
Universiti Pertanian Malaysia
43400 Serdang Selangor
Dr. C. Santiago AQD/SEAFDEC Binangonan Rizal

Dr. Yvonne Chiu College of Fisheries U.P. in the Visayas 5000 Iloilo City
SINGAPORE Dr. Dean Akiyru.na American Soybean Association 531 Orchard Road # 11,..03 Liat Towers Singapone 0902
SRI LANKA Prof. D. Attapattu Department of Economics University of Ruhuna Matara
Ms. M.M. Kuruppu National Aquatic.Resources·
Agency (NARA) Crow Island Mattakkuliya Colombo 15
TAIWAN Dr. Jan-Lung Chuang Dept. of Aquaculture · National Taiwan College of Marine· Science & Technology 39-7 Lin-Y, Street Taipei~ Taiwan
THAILAND Dr.Mali Boonyaratpalin NIFI, Bangkhen Bangkok 10900
Dr. R. Tansakul Faculty of Sciences Prince of Songkla University Haad Yai Songkla 90112
Ms. Ilda G. Borlongan AQD/SEAFDEC Tigbauan Iloilo
Prof. Sena S. De Silva University of Ruhuna Matara ·
Mr. S,Chiayvareesajja Prince of Songkla
University Haad Yai Songkla 90112
Dr. Kok Leong Wee AIT, GPO Box 2754 Bangkok 10501 ·
165

166
IDRC Dr. Brian Davy IDRC Regional Office Tanglin P.O.Box 101 Singapore 9124
Prof. C. Young Cho Fish Nutrition Laboratory Department of Nutritional Sciences University of Guelph Ontario, Canada_NlG 2Wl
Dr. C. Devendra IDRC Regional Office Tanglin P.0.Box 101 Singapore 9124
OBSERVERS
Kenneth Chin 33, Ialan Petaling Larkin Iridustrial Estate P.O. Box 311 80730; lohoro Baru Malaysia
Mr. Wutiporu Phsonkunthong, Dept. of Aquatic Science Fae. of Natural Resources Prince of Songkla Univ. Haad Yai, Songhkla Thailand 90110
Mr. Michael New -ASEAN-EEC-Aquac:ulture Development and Coordination
Programme (ADCP) GPOBox774 Bangkok 10501, Thailand
Miss. Nunthiga Porn-Ngam Dept. of Fisheries Satul Brackishwater Fisheries Station S atul, Thailand 91110
I
\.
I