Community Health Nutrition Programs
22
1053 Rapid improvements in health and nutrition in developing countries may be ascribed to specific, deliberate, health- and nutrition-related interventions and to changes in the underly- ing social, economic, and health environments. This chapter is concerned with the contribution of specific interventions, while recognizing that improved living standards in the long run provide the essential basis for improved health. Consideration of the environment as the context for interven- tions is crucial in determining their initiation and in modifying their effect, and it must be taken into account when assessing this effect. Undoubtedly much change has stemmed from scientific advances, immunization being a prominent case. However, the organizational aspects of health and nutrition protection are equally critical. In the past several decades, people’s contact with trained workers has been instrumental in improving health in developing countries. This factor applies particularly to poor people in poor countries but is relevant everywhere; indeed, it is a reason that social services have essentially elimi- nated almost all occurrences of child malnutrition in Europe (where, when malnourished children are seen, it is caused by neglect). Community-based programs under many circumstances provide this crucial contact. Their role is partly in improving access to technology and resources, but it is also important in fostering behavior change and, more generally, in supporting caring practices (Engle, Bentley, and Pelto 2000; UNICEF 1990). Such programs may also play a part in mobilizing social demand for services and in generating pressure for policy change. In community-based programs, workers—often volunteers and part-time workers—interact with households to protect their health and nutrition and to facilitate access to treatment of sickness. Mothers and children are the primary focus, but others in the household should participate. Commonly, people go regularly to a central point in their community—for exam- ple, for growth monitoring and promotion—or are visited at home by a health and nutrition worker. The existence, training, support, and supervision of the community worker—based in the community or operating from a nearby health facility—are indispensable features of these programs. Thus community organizations are a key aspect of community-based health and nutrition programs (CHNPs). This chapter focuses on large-scale (national or state) pro- grams. Although these programs are primarily initiated and run at the local level, links with the national level and levels in between are necessary. Both horizontal and vertical organiza- tions are needed. Local organizations make action happen, but they need input and resources, such as training, supervision, and supplies, from more central levels. The experience on which this chapter is based comes from a considerable number of national and large-scale programs. Most of these programs include both nutrition and health activities, aimed particularly at the health and survival of reproductive-age women and children. We draw on these expe- riences as we try to put forward principles on which future pro- grams can be based—programs that may have broader health objectives for other population groups and diseases. As of 2001, some 19 percent of global deaths were among children—and 99 percent of all child deaths took place in low- and middle-income countries. The disability-adjusted life years (DALYs) lost attributed to zero- to four-year-olds—plus maternal and perinatal conditions, nutrition deficiencies, and endocrine disorders—amount to 42 percent of the total disease Chapter 56 Community Health and Nutrition Programs John B. Mason, David Sanders, Philip Musgrove, Soekirman, and Rae Galloway
-
Upload
independent -
Category
Documents
-
view
0 -
download
0
Transcript of Community Health Nutrition Programs
1053
Rapid improvements in health and nutrition in developingcountries may be ascribed to specific, deliberate, health- andnutrition-related interventions and to changes in the underly-ing social, economic, and health environments. This chapteris concerned with the contribution of specific interventions,while recognizing that improved living standards in the longrun provide the essential basis for improved health.Consideration of the environment as the context for interven-tions is crucial in determining their initiation and in modifyingtheir effect, and it must be taken into account when assessingthis effect.
Undoubtedly much change has stemmed from scientificadvances, immunization being a prominent case. However, theorganizational aspects of health and nutrition protection areequally critical. In the past several decades, people’s contactwith trained workers has been instrumental in improvinghealth in developing countries. This factor applies particularlyto poor people in poor countries but is relevant everywhere;indeed, it is a reason that social services have essentially elimi-nated almost all occurrences of child malnutrition in Europe(where, when malnourished children are seen, it is caused byneglect).
Community-based programs under many circumstancesprovide this crucial contact. Their role is partly in improvingaccess to technology and resources, but it is also important infostering behavior change and, more generally, in supportingcaring practices (Engle, Bentley, and Pelto 2000; UNICEF1990). Such programs may also play a part in mobilizing socialdemand for services and in generating pressure for policychange.
In community-based programs, workers—often volunteersand part-time workers—interact with households to protect
their health and nutrition and to facilitate access to treatmentof sickness. Mothers and children are the primary focus, butothers in the household should participate. Commonly, peoplego regularly to a central point in their community—for exam-ple, for growth monitoring and promotion—or are visited athome by a health and nutrition worker. The existence, training,support, and supervision of the community worker—based inthe community or operating from a nearby health facility—areindispensable features of these programs. Thus communityorganizations are a key aspect of community-based health andnutrition programs (CHNPs).
This chapter focuses on large-scale (national or state) pro-grams. Although these programs are primarily initiated andrun at the local level, links with the national level and levels inbetween are necessary. Both horizontal and vertical organiza-tions are needed. Local organizations make action happen, butthey need input and resources, such as training, supervision,and supplies, from more central levels.
The experience on which this chapter is based comes from aconsiderable number of national and large-scale programs.Most of these programs include both nutrition and healthactivities, aimed particularly at the health and survival ofreproductive-age women and children. We draw on these expe-riences as we try to put forward principles on which future pro-grams can be based—programs that may have broader healthobjectives for other population groups and diseases.
As of 2001, some 19 percent of global deaths were amongchildren—and 99 percent of all child deaths took place in low- and middle-income countries. The disability-adjusted lifeyears (DALYs) lost attributed to zero- to four-year-olds—plusmaternal and perinatal conditions, nutrition deficiencies, andendocrine disorders—amount to 42 percent of the total disease
Chapter 56Community Health and Nutrition Programs
John B. Mason, David Sanders, Philip Musgrove, Soekirman, and Rae Galloway
burden (all ages, both sexes) from all causes for developingregions. CHNPs address about 40 percent of the disease bur-den. In terms of prevention, Mason, Musgrove, and Habicht(2003) estimated that eliminating malnutrition would removeone-third of the global disease burden. Comparative studies byEzzati, Lopez, and others (2002) and Ezzati, Vander Hoorn, andothers (2003) have reemphasized malnutrition as the predom-inant risk factor and improvement of nutrition as playinga potentially major role in reducing the burden. Clinicaldeficiencies contribute directly to malnutrition, but even more,malnutrition is a risk factor for infectious diseases (table 56.1).Furthermore, changes in child malnutrition levels in develop-ing countries are closely related to the countries’ mortalitytrends (Pelletier and Frongillo 2003).
Dealing with women and children’s health and nutritionaddresses a substantial part of global health problems.Moreover, the experience of community-based programs linkedto nutrition constitutes a significant part of the body of knowl-edge on ways of improving it.A number of large-scale, sustainedhealth interventions, such as those described by Sanders andChopra (2004), use a mix of improved access to facilities andcommunity health workers. These interventions include theComprehensive Rural Health Project, Jamkhed, India; com-munity health projects in Brazil (Ceará, Pelotas); and the workof the Bangladesh Rural Advancement Committee (BRAC).Table 56.2 describes the program experiences drawn on.
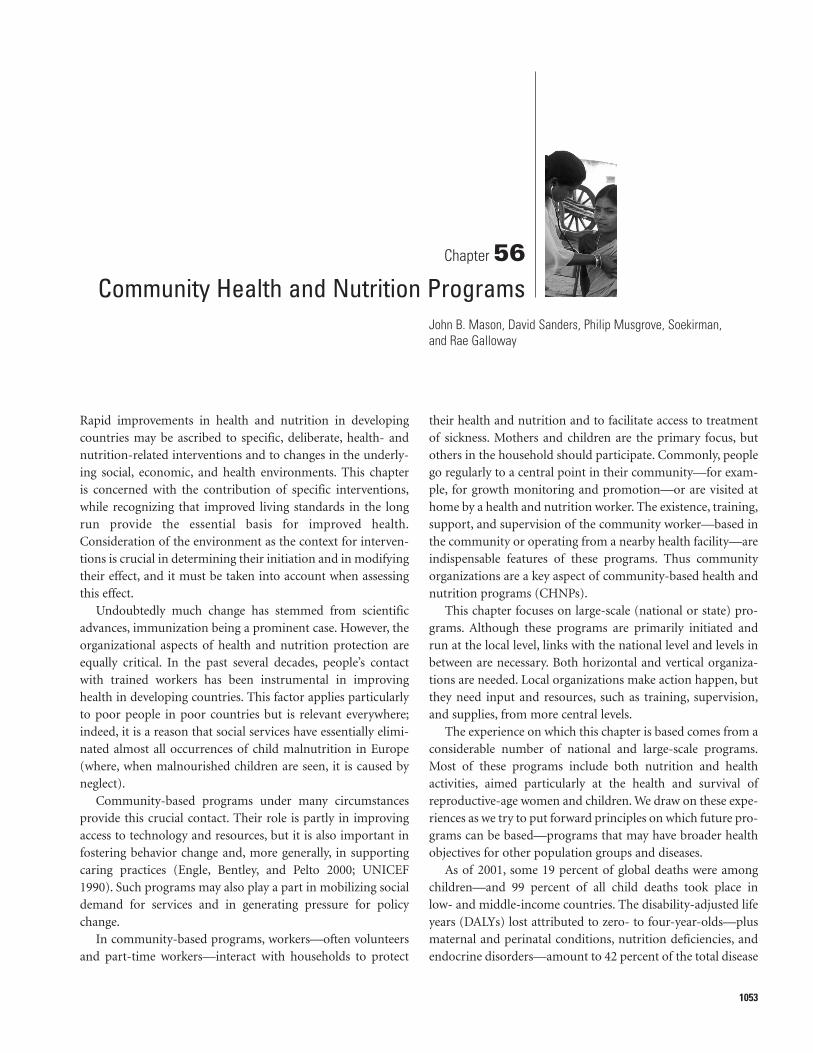
The evidence is clear that significant differences occurbetween countries in the rates of change in health and nutri-tional status. Figure 56.1 shows a comparison of Indonesia, thePhilippines, and Thailand. As is common, the indicator used isunderweight children, which is likely to reflect broader condi-tions of health and survival. For Thailand, the figure shows thenow-well-known rapid improvement in the 1980s and 1990s.For Indonesia, it shows slower but consistent improvement.The Philippines had little progress until recently, and the startof an improving trend coincided with increases in the numberof village health workers and implementation of high-coverageinterventions such as iodized salt and vitamin A supplementa-tion (FNRI 2004). A crucial issue is how much of the improve-ments was caused by interventions that could be replicated—and within that issue is subsumed how much was because of
context, how much was programmatic, and what were theinteractions. The contrasts between these three countries areinstructive in part because they have several similar contextualfactors; for instance, the status of women is relatively good, andsocial exclusion1 is not extensive (compare both of these in, forexample, South Asia). Thus programs may account for a signif-icant part of the differences seen in improvement.
The benefits from CHNPs extend well beyond child nutri-tion (which is used as a summary measure). These benefitshave not been quantified but would include improved educa-bility (see chapter 49) and probably increased earning capacityassociated with it and with physical fitness.
WHAT IS KNOWN ABOUT EFFICACYAND EFFECTIVENESS
The efficacy of health and nutrition interventions in develop-ing countries has been established for decades (for example,Gwatkin, Wilcox, and Wray 1980). Prospective studies in sev-eral settings showed that health interventions with or withoutsupplementary foods caused children to thrive and survivebetter: studies in Narangwal, India (Kielmann and others 1978;Taylor, Kielmann, and Parker 1978); by the Institute forNutrition for Central America and Panama (Delgado andothers 1982); in Jamaica (Waterlow 1992); and in The Gambia(Whitehead, Rowland, and Cole 1976) are examples.2 Thesestudies showed the effect of interventions on growth and (usu-ally) mortality but did not generally factor out the relative con-tributions of health and nutrition. In fact, results fromNarangwal showed similar mortality effects from food or healthcare; results from The Gambia indicated interaction such thatsick children did not grow even with adequate food intake(appetite also playing an important role), and well children didnot grow with inadequate food intake (Gillespie and Mason1991, annex 2).
By the early 1980s, the conclusion, based on data at theexperimental level (not from routine large-scale programs),was that better health and better nutrition are both required forchild survival and development. This conclusion remains gen-erally agreed on today; furthermore, concern exists that healthinterventions may become less effective unless nutrition is con-currently addressed (Measham and Chatterjee 1999; Pelletierand Frongillo 2003). In their chapter on malnutrition in thefirst edition of this book, Pinstrup-Andersen and colleagues(1993) drew largely on efficacy findings, with an emphasis onfood supplementation. Those studies are not revisited here, butwe can continue to build on their conclusions.
The efficacy studies were followed by a number of nationalor other large-scale programs in several countries. Some ofthose were a direct follow-on; for example, the World BankTamil Nadu Integrated Nutrition Program (TINP) followed the
1054 | Disease Control Priorities in Developing Countries | John B. Mason, David Sanders, Philip Musgrove, and others
Table 56.1 Estimated Contributions to the Disease Burden inDeveloping Countries
DALYs lost (percentage)
Factor Direct effect As risk factor Total
General malnutrition 1.0 14.0 15.0
Micronutrient deficiencies 9.0 8.5 17.5
Total 10.0 22.5 32.5
Source: Mason, Musgrove, and Habicht 2003, table 10.

Narangwal study, which was supported by the U.S. Agency forInternational Development (USAID). A number of overviewsand analyses of these programs have been conducted—forexample, Allen and Gillespie (2001); Berg (1981, 1987);Gillespie, Mason, and Martorell (1996; includes a summary ofoverviews, 60); Gillespie, McLachlan, and Shrimpton (2003);Jennings and others (1991); Mason (2000); Sanders (1999); andShrimpton (1989). These plus some newer examples providecase studies for this chapter, and the sources for the case stud-ies are included in table 56.2.
Underweight prevalences are improving at about 0.5 per-centage points (ppts) per year except in Sub-Saharan Africa,which is largely static (ACC/SCN 1989, 1992, 1996, 1998,2004). Programs are needed to accelerate this trend. Cost data
from an earlier study (Gillespie and Mason 1991, 76), com-bined with the estimated improvements from large-scaleprograms, led to the assertion that “there seems to be someconvergence on around $5 to $10 per head (beneficiary) peryear being a workable, common level of expenditure in nutri-tion programmes, though not generally including supplemen-tary food costs . . . effective programmes, with these levels ofexpenditure, seem to be associated with reducing underweightprevalences by around 1–2 percentage points per year”(Gillespie, Mason, and Martorell 1996, 69–70).
A further important consideration is that the effect is likelyto be nonlinearly related to the expenditure, showing the famil-iar dose-response S-shaped curve. Thus, the first expendituresproduce little effect on the outcome, and one needs a minimum
Community Health and Nutrition Programs | 1055
Table 56.2 Country Experiences in Community-Based Programs
Country and program Program experience
Africa
Tanzania: Iringa
Tanzania: Child Survival andDevelopment Program
Zimbabwe: SupplementaryFeeding Programme
Asia
Bangladesh: BangladeshIntegrated Nutrition Programand national
Bangladesh: Bangladesh RuralAdvancement Committee
India: Integrated ChildDevelopment Services
India: Tamil Nadu IntegratedNutrition Program
Indonesia
Philippines: national
Thailand
Americas
Costa Rica
Jamaica
Nicaragua
Area program with UNICEF and WHO inputs, 1984–91. After rapid initial drop in child malnutrition, moderate steadyimprovement. Program not sustained.
1985–95, World Bank support. Results similar to Iringa.
Wide-scale program following independence, 1980–90; infant mortality rate (IMR) dropped from 110 to 53 (1988). Not sustained.
BINP: area targeted covering 7 percent of population. Rapid improvement at start (1997); final evaluation not seen.
National: program coverage expanding from 2000 on. Substantial improvement in anemia and child underweight seen inBangladesh starting 1995.
Community-based health services with village health workers. Wide coverage since 1980s; particular focus on diarrhea.
Implemented since 1976. Village program with community health (anganwadi ) worker. Accelerated improvement reported insome states.
Implemented 1980 to mid 1990s. Village program in Tamil Nadu with World Bank support; growth monitoring, supplementaryfeeding, and so on. Substantial improvement in underweight reported.
Massive expansion of village programs 1975–90, covering all villages by 1990. Steady decrease in underweight during thistime. Program not sustained in 1990s; now planned to restart.
No wide CHNPs despite national decree in 1974. No significant improvement in child nutrition.
National program from late 1970s; 600,000 village health volunteers trained (1 percent of population). Rapid improvement1980–90; for example, 36 percent to 13 percent underweight children.
Expanding rural health services from 1970s following malaria control. Rapid fall in IMR, 1965–80; in stunting, 1979–89.
Expanded health services with community health aides from mid 1970s. Rapid fall in underweight, 1985–89.
Community health movement, 1979–90, reduced IMR, eliminated polio; about 1 percent of population as village health volunteers.
Source: Authors, from data derived as follows: Tanzania—Gillespie and Mason 1991; Gillespie, Mason, and Martorell 1996; Jennings and others 1991, 117; Kavishe and Mushi 1993; Pelletier 1991;Sanders 1999; Zimbabwe—Sanders 1999; Tagwireyi and Greiner 1994; Werner and Sanders 1997; Bangladesh—BINP and UNICEF 1999; BRAC 2004; Chowdhury 2003; INFS and Department ofEconomics, University of Dhaka 1998; Mason and others 1999, 2001; Save the Children U.K. 2003; India—Administrative Staff College of India 1997; Mason and others 1999, 2001; Measham andChatterjee 1999; Reddy and others 1992; Shekar 1989; Indonesia—Berg 1987; Jennings and others 1991, 108; Rohde 1993; Soekirman and others 1992; the Philippines—Guillermo-Tuazon and Briones1997; Heaver and Hunt 1995; Heaver and Mason 2000; Mason 2003; Thailand—Kachondam, Winichagoon, and Tontisirin 1992; Tontisirin and Winichagoon 1999; Winichagoon and others 1992; CostaRica—Horwitz 1987; Jennings and others 1991, 77–81; Muñoz and Scrimshaw 1995; Honduras—Fiedler 2003; Jamaica—ACC/SCN 1989, 1996; Samuda personal communication, 2004; Robinson per-sonal communication, 2004; Nicaragua—Sanders 1985; Werner and Sanders 1997.

input level of resource use before a worthwhile response isachieved (Habicht, Mason, and Tabatabai 1984). This factorgenerally applies to drawing inferences from cost-effectivenessratios, which often assume linearity. If the relation is S-shaped,the implication is important: applying too few resources doesnot simply solve the problem more slowly but does not solve itat all and is a waste. Therefore, program intensity (resourcesper person) is a critical measure.
Effective interventions must include a range of activitiesrelating to health and nutrition. They should be multifaceted,not just for effectiveness but also for organizational efficiency.The structure needed for community-based programs couldnever make sense or be sustainably set up for single interventionsalone. One often-argued case (for example, by Save the ChildrenU.K. 2003) concerns children’s growth monitoring: evidentlygrowth monitoring in isolation from activities that improve chil-dren’s growth is not going to achieve anything (or worse, con-sidering the opportunity cost); however, weighing children andcharting their weight can be a useful part of broader programs(for example, as growth monitoring and promotion).
COMMUNITY- AND FACILITY-BASED PROGRAMS
Protecting and improving health, especially in poor communi-ties, requires a combination of community- and facility-basedactivities, with support from central levels of organization, aswell as some centrally run programs (for example, food fortifi-cation). The place of these activities in a strategy is likely tovary, depending on level of development (of infrastructure,health services, and socioeconomic status) and on many localfactors. For the poorest societies, the first priorities are basic
preventive services, notably immunization, access to basicdrugs, and management of the most serious threats to health,such as some access to emergency care. Moving up the devel-opment scale, starting community-based activities may soonbecome cost effective for prevention, referral, and managementof some diseases (notably diarrhea) when coverage of healthservices is poor. Community-based programs continue to playa key role until health services, education, income, and com-munications have improved to the point that maternal andchild mortality has fallen substantially and malnutrition ismuch reduced; at this intermediate development level, theneeds are less felt, and health services again take on a moreprominent role. In this scheme, the widely felt need for betteraccess to emergency obstetric services is problematic, requiringa well-developed human and physical infrastructure, yetarguably being one of the highest priorities.
Facility-based programs can be seen either as linking withthe community program (referrals, home visits from clinics,and so forth) or as actually being part of the same enterprise. Adistinction is that community-based activities take place out-side the health facility, in the home or at a community centralpoint, even if they may be supported by health personnel basedin health facilities. The local workers in community-based pro-grams may be drawn from the community itself, may be homevisitors from a health center or clinic, or may sometimes be vol-unteers supervised by these home visitors. Many community-based programs come under the health sector, whatever theexact arrangements with local health services. Regarding spe-cific program components, we return to the relative role ofcommunity programs and facilities later.
The integrated management of infant and childhood illness(IMCI) program provides guidance mainly on the curativehealth aspects and contains a number of nutrition activities(for example, administration of vitamin A capsules). Links tolocal health facilities are essential for the maintenance of thecommunity activities and for referral in cases of illness (seechapter 63). As the IMCI training and implementation pro-gresses, it should integrate directly with CHNPs (in fact,become part of the same exercise), which will add treatment ofadditional diseases. IMCI addresses diarrhea, acute respiratoryinfection (ARI), malaria, nutrition, immunization, safe moth-erhood, and essential drugs (WHO 1997). The 16 key practicesfor child survival defined in the context of IMCI (Kelley andBlack 2001, S115) are exactly those to be promoted withinCHNPs, and most are already included (four are nutritional).
Decentralization should be considered in this context.Although decentralized systems might be thought to be moreeffective in supporting CHNPs, the evidence for this assump-tion is scarce. Decentralization can reduce resources available atthe local level if it involves devolving responsibility without theconcomitant budgetary resources (Mills 1994). For example, inKenya, decentralization did not accompany devolving authority
1056 | Disease Control Priorities in Developing Countries | John B. Mason, David Sanders, Philip Musgrove, and others
1970 19901980 2000 2010
50
40
30
Prevalences of underweight children
20
10
Sources: ACC/SCN 2004; FNRI 2004; Mason, Rivers, and Helwig 2005.Note: a. �2 standard deviations NCHS/WHO standards; ages 0–60 months.
Indonesia
Philippines
Thailand
Figure 56.1 Comparison of Trends in Underweight Children inIndonesia, the Philippines, and Thailand

for raising revenue locally. In other cases (for example, thePhilippines), decentralization has involved a shifting ofresources, but with priorities set in the local government unitsby locally elected officials (municipal and city mayors), theseresources may be used for shorter-term priorities than underprevious, centrally decided, policies.
SUCCESS FACTORS
A number of useful concepts grew in the 1990s in relation toeffective community-based programs. The concept of successfactors helped sort out complex interactions: when numerouspossibilities exist, understanding the successful pathway toeffectiveness is more important than trying to disentangle whatdid not work. Focusing on successful programs helps simplifycomplexity and identify success factors, only some of which are
programmatic (directly under the influence of the interventionitself); others are contextual.
The importance of context, within which programs are ini-tiated and run, thus emerged as crucial, and priority factorswere proposed from studies of community-based programs inAsia (Gillespie, Mason, and Martorell 1996, 67; Jonsson 1997).Sanders (1999) described similar concepts under the headingsof community participation and political will. This distinctionand interplay between context and program factors is helpful inidentifying required supporting policies to improve the contextto make programs work. Details are in the later section titled“Contextual Factors.”
An overall framework (figure 56.2) for causal links to childsurvival and nutrition, put forward by the United NationsChildren’s Fund (UNICEF 1990), gave a basis for a commonlanguage—even if the details might be questioned—revolving
Community Health and Nutrition Programs | 1057
Malnutritionand death
Insufficient healthservices and unhealthy
environment
Formal and nonformalinstitutions
Inadequate care formothers and children
Potential resources
Inadequateaccess to food
Inadequate education
Political structure
Economic structure
Inadequatedietary intake Disease
Outcomes
Immediatecauses
Underlyingcauses
Basiccauses
Source: Redrawn from UNICEF 1990.
Figure 56.2 Conceptual Framework for the Causes of Malnutrition in Society

around food, health, and care as proximal causes to be addressedthrough programs. Improving these factors attacks hunger, dis-ease, and neglect, which are the converse of food, health, andcare. Basic causes are, like context, open to influence throughpolicy decisions and acting through directly influencing food,health, and care and by modifying the effect of programs. Heremalnutrition is seen as the outcome of processes in society, anddirect interventions are seen as both shortcutting the neededbasic improvements in living conditions and being dependenton these improvements in the long run for sustainability.
COMMUNITY-BASED PROGRAMS—WHATARE THEY?
Community health and nutrition programs are often initiatedand run by the health sector, but sometimes a separate ministry(for example, in India and Indonesia) or service (for example,in Bangladesh) is set up. Attempts to use a national coordinat-ing body appear to be less effective in leading to widespreadcommunity programs; an example existed in the Philippinesuntil approximately 2000 (Heaver and Mason 2000). This inef-fectiveness stems from the tendency of the coordinating bodynot to have direct authority over fieldworkers or the budget tocreate a national program with sufficient coverage and intensityto have a measurable effect. In some other cases, the serviceslinked to poverty alleviation and social welfare programs canplay this role (for example, the Samurdhi program in SriLanka). Involvement of the health services remains crucial,sometimes as the operational agency responsible for the pro-grams and certainly always for referral.
CHNPs have so far been much more relevant to communi-cable diseases than to noncommunicable diseases in conditionsof poverty and where undernutrition is common. (An excep-tion occurs if CHNPs help prevent intrauterine growthretardation with later risks of noncommunicable diseases.)However, in areas where diet-related chronic diseases aredeveloping in conditions of poverty (for example, much ofLatin America and the Caribbean) and obesity is rising rapidly,the promotion of behavior change through counseling inCHNPs may become increasingly important. Promotinghealthier diets requires access to outlets for fruit and vegetables,often displaced by fast foods, which should be a concern ofcommunity activities, as should lifestyle improvements such asuse of exercise and recreational facilities.
CHNPs often include activities well beyond direct preven-tion and behavior change. As envisaged with primary healthcare, water, sanitation, and other aspects of environmentalhealth are frequently included, as well as agricultural interven-tions (for example, Zimbabwe in the 1980s). In Thailand, thevillage programs are part of the “Basic Minimum Needs”approach, which includes housing and environment, family
planning, community participation, and spiritual and ethicaldevelopment.
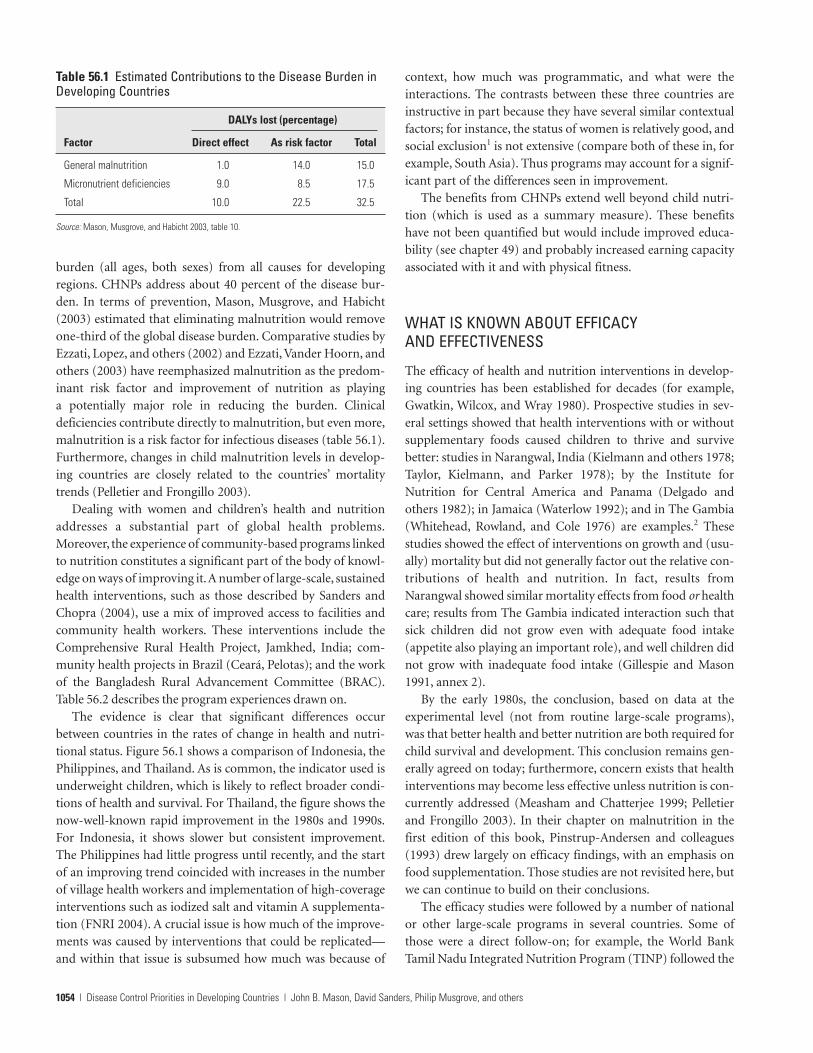
A diagram of the structure, derived from Thailand’s program(figure 56.3), shows the relations between services that providesupervision and contacts with the community (“facilitators”)and with community workers, referred to as “mobilizers.”
The activities undertaken in CHNPs—the programcontent—are familiar and are described here only briefly.Program components, implemented by village workers or infacilities, come under the following headings, which form amenu, with the actual mix depending on local capabilities andconditions (UNICEF 1998, 84; see chapter 24):
• Prenatal care includes checking weight gain in pregnancy,prepregnancy weight, anemia, and blood pressure;providing multiple micronutrient supplementation andimmunization (tetanus); counseling on diet, workload,breastfeeding; and predicting and arranging for delivery.
• Women’s health and nutrition entails counseling on healthand nutrition and checkups, promoting improved statusand resource allocation in home and outside, promotingimproved access to health services, and often offeringfamily-planning services (these services may even be aninitiating factor for CHNPs, for example, in Indonesia).
• Breastfeeding includes providing knowledge on practices (ini-tial, exclusive, continued); arranging mutual support; build-ing confidence; preventing misinformation and undermin-ing factors; facilitating time for breastfeeding; and providinginformation along the lines of the infant formula code.
• Complementary feeding includes providing knowledge andcounseling (timing of introduction, type, energy density,frequency, and so on); sometimes promoting village orurban area production of weaning foods; sometimesmarketing inexpensive food; facilitating mother’s time allo-cation; and promoting technology—storage, preservation,hygiene methods (fermentation, even refrigerators).
• Growth monitoring and promotion requires equipment(scales, charts, manuals); training and supervision; needstraining of weigher to interpret charts and counsel mother;and a referral system for problems (for treatment, counsel-ing, or other preventive intervention if growth is faltering).Weighing at birth and monthly weighing should beincluded, if possible, and adequate weight gain (rather thanachieved weight or any gain) should be used for guidance oncounseling or other intervention.
• Micronutrient supplementation should include vitamin Afor nonpregnant and pregnant women (low dose weekly,preferably as part of multinutrients); for women within onemonth of delivery (massive dose to protect infant throughbreast milk); for infants and children (massive dose at ninemonths immunization contact and thereafter every sixmonths and when medically indicated). It should also
1058 | Disease Control Priorities in Developing Countries | John B. Mason, David Sanders, Philip Musgrove, and others

include vitamin A—daily or weekly, with immunizationcampaigns, and so forth—and iron—daily or weekly forwomen (especially during pregnancy) as well as for childrenand adolescents. Iron is usually provided together with folicacid and may also be provided as part of multiple micronu-trient supplementation. Iodine is usually provided by forti-fication and can be an infrequent (six-monthly) oral sup-plement, if necessary, but it should be part of multiplemicronutrients for pregnancy.
• Micronutrient fortification is not usually included locally,although it is an important central program, but local mon-itoring is a coming opportunity, especially of iodized salttesting kits.
• Supplementary feeding, using external supplies may some-times be appropriate in emergencies and in conditions ofextreme poverty (for example, the Bangladesh IntegratedNutrition Program, or BINP), providing 200 to 500 kilo-calories per person per day, but otherwise it is to be avoidedas costly, with high opportunity cost, and not very effective;moreover, it can distort programs, which come to be seenlargely as a source of free food.
• Supplementary feeding, using local supplies can be useful forcomplementary feeding (weaning) if carefully organized(which requires some resources). Village community pro-duction and processing are useful, if feasible (for example,in Zimbabwe), and the system can move to coupon method(for example, in Thailand).
• Oral rehydration includes highly effective local preparationsfor dehydration in acute diarrhea, as well as (or better than)oral rehydration salts. These preparations require counsel-ing of mothers and take a lot of parents’ time. Persistentdiarrhea requires other intervention, especially nutritional.Care of children during sickness—especially continuedbreastfeeding and other foods—needs to be stressed(applies also to other illnesses).
• Immunization includes informing, referring, and facilitating.• Deworming requires distribution and dosage supervision of
mebendazole every few months, a highly effective nutritionintervention. Distribution methods are an issue.
The relative suitability of community- and facility-basedoperations for the different components again depends onlocal conditions, and these operations should be complemen-tary. Community activities are essential for infant and childfeeding, other caring practices, environmental sanitation, andthe like. Facilities have a key role in immunization, prenatalcare, and—of course—referral for treatment. Growth monitor-ing, micronutrient interventions, oral rehydration, and similaractivities may be focused in either. Because it has more regularcontact with clients, a community-based program may bemore effective in actually reaching mothers and children withthe component interventions than one that is facility based.Box 56.1 compares two programs in Honduras that offered thesame content but differed in where the programs were based.
Community Health and Nutrition Programs | 1059
Mobilizers
1:10–20mobilizers
1:10–20families
Facilitators
ServicesGovernment, NGO—health,
education, agriculture, and so forth
CommunityPlan, implement, monitor, …
Interface
Supervision, training,information, support
Counseling, organization, supplies,and referral for prenatal care,child care practices, growthmonitoring, micronutrients …
Families
Source: Adapted from Tontisirin (1996, personal communication).NGO = nongovernmental organization
Figure 56.3 General Structure for Community-Based Programs, Based on Thailand’s Program

PROGRAMMATIC FACTORS
Programmatic factors are considered first in terms of the char-acteristics of the activities—their population coverage and tar-geting, how much resources are applied per head (intensity),and the technologies used. Then the needs for initiating andsustaining these activities are discussed—the training needs,supervision methods, and (importantly) incentives and remu-neration for field workers.
Coverage, Targeting, Resource Intensity, and Technology
Even effective programs improve the health and nutrition onlyof those they reach, so achieving as complete coverage aspossible of those at risk is a major determinant of the effect.Although variations in the content of programs are seen indifferent circumstances, most activities are common to mostprograms. Variations in effect stem from factors such as cover-age and adequacy of resources. How have CHNPs fared inreaching large sections of the population with adequateresources—and, indeed, what is the gap that would need to befilled? The achievements of the 14 programs drawn on here ascase studies are summarized in table 56.3.
The programs expanded to include most of the communi-ties within the areas targeted. The common evolution was totarget select areas and specific biological groups within thoseareas—generally women and children—but not to give priorityto any great extent to poorer or less healthy communities.Screening is sometimes done of individuals for admittance into
the programs (a form of targeting), based on nutritional status,as in growth monitoring and promotion, as well as on a one-time basis (for example, thin children in Zimbabwe). Recentthinking suggests that because mortality risk, growth failure,and morbidity are concentrated in children less than two orthree years of age, in contrast to an earlier focus on childrenunder five, these younger children should increasingly be afocus of CHNPs. A common policy observed in practice, there-fore, is to aim for complete coverage within the areas partici-pating, adding new sites until the entire region is covered.Relatively untargeted expansion to universal coverage may havebeen at the expense of establishing adequate resources andquality in the areas initially covered. In at least one case(Thailand), having achieved broad coverage and reduced mal-nutrition, the program became more targeted to areas in whichprogress was lagging. The coverage figures in table 56.3,although approximate, demonstrate considerable success ininitiating and implementing CHNPs on a large scale—usuallyenough to have a substantial effect if the other factors neededfor success were met.
How complete a coverage of the population should one rec-ommend? This factor relates to targeting, to the additionalresource requirements to reach the nonparticipants, and totheir level of risk. Usually risk is spread throughout the popu-lation, although the extent varies considerably—at least adoubling of indicators of risk is usually seen between better-and worse-off areas or groups (for example, see Mason andothers 2001, figures 1.4–1.7, 1.10–1.13). The remoter areas—or
1060 | Disease Control Priorities in Developing Countries | John B. Mason, David Sanders, Philip Musgrove, and others
Differential Effectiveness of Community- and Facility-Based Programs
Box 56.1
Effectiveness is more likely to be possible throughcommunity-based programs because contact with care-givers is typically more frequent and consistent. For ex-ample, 83 percent of children enrolled in a community-based growth monitoring and promotion program inHonduras (Atención Integral a la Niñez Comunitaria, orAIN-C) were weighed two or more times in a giventhree-month period, whereas only 70 percent of childrenwere weighed with the same frequency in a facility-basedprogram. Workers visited 30 percent of mothers partici-pating in the community program in their homes at leastonce for follow-up when their children were sick, werenot growing, or had missed a weighing session.Controlling for a range of maternal and socioeconomicfactors, researchers found that children 6 to 24 months of
age participating in the community-based program were1.6 times more likely to be appropriately fed than werechildren not enrolled in growth monitoring and promo-tion. Children participating in the community programalso were more likely to have received vitamin A and ironsupplements than children participating in the facility-based program. Results show that consistent participa-tion in the community-based program was associatedwith better weight for age. When a range of maternal andsocioeconomic factors were taken into account, childrenparticipating fully in the community program were435 grams heavier than children who were enrolled butparticipated infrequently. In the facility-based program,there was little difference in weight for children based onlevels of participation.
Source: Plowman and others 2002.

Community Health and Nutrition Programs | 1061
Table 56.3 Characteristics of Selected Programs
Country Coverage, targeting Resources, intensity
Africa
Tanzania: Iringa
F: (�)
Tanzania: Child Survivaland Development Program
F: 0
Zimbabwe: SupplementaryFeeding Programme
F: ��
Asia
Bangladesh: BINP
F: �
Bangladesh: BRAC
India: ICDS
F: ��/�
India: TINP
F: �
Indonesia
F: (�)
Philippines: national
F: 0
Thailand: Primary HealthCare � Poverty AlleviationProgram � Basic MinimumNeeds
F: (�)
Population served � 250,000 in 6 districts, 610villages, 46,000 children, of which 33,700 par-ticipated (73 percent). Targeting: children � 5years and women; no socioeconomic selectionof communities. Progressed from 168 to 610villages 1984–88.
9 of 20 regions (population total approximately12 million; 2 million children). Aimed for com-plete coverage.
Population served: 56,000–96,000 with supple-mentary feeding; up to 60 percent of all chil-dren in community-based growth monitoring.
BINP: in 6 thanas, or subdistricts (7 percent ofpopulation), children � 2 years, 8 million preg-nant and lactating women.
Health coverage 25 percent. Nutrition withBINP, now expanding.
Children 0–6 years and pregnant and lactatingwomen, in 3,900 of 5,300 blocks, or subdis-tricts; approximately 74 percent of population.Coverage expanded without targeting exceptby area.
Children 6–36 months, pregnant and lactatingwomen. Children with growth failure selected.40 percent of blocks in Tamil Nadu; 20 percentof children in 1990.
By 1990, 60,000 villages (of 65,000: 92 per-cent) had posyandus (village health/nutritioncenter). Women and young children.
Several programs, all targeted (for example, topoorer areas), none with national coverage.
Expanded over about 5 years to cover 95 per-cent of villages. 600,000 village health commu-nicators (1 percent of population) trained;60,000 village health volunteers.
US$8 to US$17/child/year (approximately US$30/child/year from total costs:approximately US$6 million)
2 village health workers/village � 1,220 total; approximately 1:40 children
[Volunteers]
US$2 to US$3/child/year
[Volunteers]
External: US$3 million over 10 years
For example, 1990, US$0.5 million, approximately US$0.50/child/year(Approximately 1:10–200, based on numbers per project)
[Extension agents]
US$14 million/year; approximately US$18/child/year
1 community worker per 1,000 population
Approximately 1:200 children
[Project supported]
1 community health volunteer per 300 households; 1 community nutritionpromoter per 200 households; community nutrition centers, 1:120 mothers andchildren; supervision of community nutrition promoters by community nutritionorganizer, 1:10
Nonfood costs: approximately US$2/child/year.
1 community worker (anganwadi worker, or ANW) per 200 children; 1 supervisor per 20 ANWs
[ANW paid, at low rate]
US$9/child/year, plus approximately US$3 on food.
1 community nutrition worker per 300 children; 1 supervisor per 10 community nutrition workers
[Project supported]
US$2–11/child/year, depending on supplemental food; Rohde (1993) gives� US$1 recurrent.
Village workers (approximately 3 million total), 1 per 60 people, approximately1 per 10 children; supervision 1 per 200.
[Volunteer]
US$0.40/child/year in targeted areas.
Village workers (barangay nutrition scholars) approximately 1:300
[Low allowance given]
Ministry of Public Health; approximately US$11/head/year (1990)
1 village health communicator or volunteer per approximately 20 children;1 supervision extension worker per 24 village health communicators andvolunteers
[Volunteer]
(Continues on the following page.)

groups that are hard to include for other reasons—may bemore expensive to reach. Clearly the calculations depend onconditions and have to be made on a case-by-case basis. Theprinciple is obvious: only those areas and people included inCHNPs are going to benefit; so wherever need exists, programsare indicated. The implementation strategy, in theory, mayneed to begin with the most urgent needs, although in practice,programs may expand from the easier, more accessible areas;this practice seems reasonable, provided that the expansionreally occurs and leads to equitable use of resources.
The program content is a mix of the components describedearlier, varying with local priorities. The most crucial differenceis whether extensive supplementary feeding is included. Inmiddle-income countries, supplementary feeding was lessprominent, often considered unnecessary, and because expen-sive, perhaps counterproductive (for example, in Costa Rica;Mata 1991). At the other extreme, such as for the IntegratedChild Development Services (ICDS) in India, food distributionbecame the raison d’être of the program but, alone, was againprobably not worthwhile. For some of the intermediate cases,supplementary food played a supporting role, with varyingresults. Except in the very poorest societies, supplementaryfeeding seems unlikely to be cost-effective.
The resources used for the programs found in table 56.3 canbe expressed per participant (referred to as intensity), as totalexpenditures, and in terms of personnel; the latter figures maybe more generalizable. (The outcomes associated with theseresources are shown in table 56.5.) Data such as these have been
the basis for estimating that US$5 to US$10 per child per yearmay be needed for effective programs. The dollar figures varyfrom less than US$1 to more than US$20. Probably the low endof this range (say, less than US$1 per child per year) does explainlow or doubtful effect. Both low coverage and low intensitymay explain the unchanged underweight prevalences in thePhilippines until 2000. Fund levels in Indonesia are unsure;Rohde (1993) gave a figure of less than US$1, but others gavehigher estimates. Most would reckon the intensity in India toolow (Measham and Chatterjee 1999) at about US$2 per childper year. Looked at otherwise, the intensity planned for externalfunding (even if part of such funding is international costs) is inthe US$10 to US$20 range (Bangladesh, India—Tamil Nadu,and Tanzania) and is the same as the estimate for Thailand. Alevel of US$10 to US$20 per participant per year is probablyadvisable for planning and sustaining effective programs.
The intensity measures of workers per mother-child and thesupervision ratios are relevant in assessing needs. The sug-gested norms, originating from the Thai experience are 1:10–20for both. Since then, it has emerged that the full-time equiva-lence of community workers must be taken into account; theThai workers are local volunteers, probably devoting 10 to20 percent of their time. In Honduras, Fiedler (2003) in a care-ful cost study estimated that each volunteer spent 3.5 hours perweek (less than 10 percent of full-time equivalent, or FTE),with a ratio of 1 volunteer to 8 children. The ratio of commu-nity health and nutrition workers (CHNWs) to children may,therefore, be as low as 1:200 for FTEs and as high as 1:8 or 1:10
1062 | Disease Control Priorities in Developing Countries | John B. Mason, David Sanders, Philip Musgrove, and others
Table 56.3 Continued
Country Coverage, targeting Resources, intensity
Americas
Costa Rica
F: �� to 0
Honduras
F: 0
Jamaica
F: 0
Nicaragua
F: 0
Expanded rural health program coverage 19–67 percent (1974–89).
With community health volunteers, AIN-Ccovers � 50 percent of health areas (expanded1991 on), � 90 percent of children � 2 yearsin these; growth monitoring and home follow-up, plus referral and treatment.
Community health aides (CHAs), waged, covermost of country from health centers, withhome visiting.
Community health workers (brigadistas) with“multiplier” approach, training others; 1980approximately 1 percent trained; many morefor malaria control.
Rural health program: US$1.70/child/year
Food and Nutrition Program: US$12.50/child/year
2 health workers (full time) per 5,000 population; approximately 1:350 children
[Health worker]
Cost estimated as US$6/child/year
Volunteer teams 3:25 children, about 3.5 hours/volunteer/week
CHAs (full time) 1:500 households; approximately US$7/household/year
[Health worker]
Volunteers, approximately 1:20 households
Source: See sources for table 56.2. F � role of supplementary feeding in the program; F: �� � mainly a feeding program, or primary role; F: � � significant but not main role, often to selected children; F: (�) � existed but relativelyminor; F: 0 � none. Note: The status of community workers is given in brackets in the last column.

for part-time volunteers. In Jamaica, where the communityhealth aides work full time, the ratio is 1:500 households; in theBRAC program in Bangladesh, it is 1:300, about half-time work(afternoons) (Chowdhury 2003). (An indication of the statusof community workers is shown in brackets in the last columnof table 56.3.) In any event, these ratios provide some basis forgauging the adequacy of personnel, and it seems that an effec-tive ratio may be about 1:500 for community workersemployed full time and 1:10 or 1:20 for local volunteers work-ing part time.
In reality, the ratios of community workers to children areprobably—not surprisingly—on the low side. Thailand, whichtrained 600,000 village workers (1 percent of the population),operated at about 1:20 for part-time volunteers, with similarsupervision ratios. The Indonesian program was similar (orbetter) but had much less supervision. In contrast, the lowresourcing of the ICDS in India shows up in a ratio of 1:200(for part-time anganwadi workers, or ANWs), and in thePhilippines, the ratio has until recently been 1:300 (for essen-tially voluntary workers).
Increased application of technology can contribute to theorganization and running of community-based programs.Technology can be applied easily to methods of assessment andmonitoring of children’s progress; improved weighing scales (orin some circumstances, where rapid assessment in remote areasis important, using arm circumference) can simplify anthro-pometry. Modern computer technology for recordkeepingcould be much more widely used, freeing staff time for homevisits (for example, in Jamaica); e-mail, which is being rapidlyadopted, has great potential for transferring information, trou-bleshooting, and consultation. Cell phone use is beginningto transform communications even in the poorest countries,where it is leapfrogging landline installation and use; as cover-age expands, it will facilitate referral, for example, for emer-gency obstetric care, the need for which may first be identifiedby community workers. Coupled with improved transportationand procedures to allow the use of such transportation in casesof urgent need, modern communications can link communitiesto centers with advanced knowledge for information exchangeand, by facilitating transportation when time is crucial, forreferral. Modern communications may also provide more effi-cient ways of providing training, retraining, and supervision.
Application of current research and resulting technologiescan improve many of the other interventions discussed earlier.In the micronutrient field, periodic supplementation (withvitamin A in high doses) can be extended through communityprograms, and fortified foods and micronutrient “sprinkles”can be promoted (see chapter 28). The prospect of enablingcommunities to test their salt for iodine content with simpleand cheap test kits is intriguing and has often been recom-mended but has not yet been widely applied. Improved immu-nization technology should continue to protect health, for
which CHNPs’ main role is to provide information and toensure that children are taken for immunization (either to reg-ular clinics or for National Immmunization Days and the like).Periodic deworming can be conducted by community pro-grams (and hookworm vaccines currently under developmentmay soon contribute). Supporting the use of insecticide-treatedbednets could be fostered through CHNPs. By far the mostpotentially important application of technology, certainly inSub-Saharan Africa, will be the unprecedented effort to providemillions of people with antiretroviral therapy and associatedcare and support, as discussed later.
Training, Supervision, Incentives, and Remuneration
Community-based health and nutrition programs typicallyinvolve community workers, who may be entirely part-timevolunteers (for example, in Honduras and Thailand) or mayreceive some remuneration financially or in kind (for example,in India). Community workers may be part of the health sys-tem, earning a wage and based in a local clinic (for example, inJamaica) or in the community itself (for example, in CostaRica); or they may be selected by and report to the community(for example, in Tanzania and Thailand). Table 56.3 indicatesthe status of community workers in the programs examinedhere. The training, supervision, and incentives for communityworkers are critical aspects of successful programs.
Inadequate training and supervisory support of communityworkers are common weaknesses. Considerable attention wasgiven to training for the Iringa project (Tanzania), with villagehealth workers trained for up to six months. In the Tamil NaduIntegrated Nutrition Program in India, community workersreceived three months of training and participated in annualrefresher trainings. ICDS (India) initially trained the ANWs forthree months, with two annual refresher courses, but thisprocess declined. In Thailand, volunteers had two to five daysof initial training, with annual refresher courses; Indonesianpractice was similar. In Jamaica, where the community workersare employees of the health system, two months of initial train-ing is provided to recruits with significant prior educationalrequirements. In Bangladesh, the BRAC community health vol-unteers have four weeks of training. The quality of the traininghas varied, poor training having been blamed for inadequateimplementation in cases such as ICDS in India (Measham andChatterjee 1999). Sanders (1985, 176–93) describes experiencesin the 1980s of village health workers (and barefoot doctors)and their relation to the community.
Supervision of community workers is generally done byemployees who are commonly in the sector. Training ofsupervisors (who often take on the role in addition to manyother tasks) for these purposes is highly variable and not alwaysadequate. Providing resources for visits to provide supervisionto community workers is a further constraint. Supervision
Community Health and Nutrition Programs | 1063

ratios in effective programs are about 1:20 (table 56.3, last col-umn, when reported). Supervision and training of communityworkers are closely linked; indeed, supervision (which must besupportive rather than disciplinary) should include a substan-tial element of on-the-job training.
Remuneration and incentives for sustaining motivation arekey issues in replicating the successful features of these pro-grams, and the options vary with the culture. In Thailand, it isargued that village volunteers consider the prestige associatedwith the role of health worker preferable to getting a low wage.In many cases, some right of access to health care is part of theincentive. For the ICDS in India, in contrast, the ANW receivesa small financial remuneration, but the government (as else-where) will not grant formal employment status (and attemptsto form unions have been strongly discouraged). Direct com-parisons of the options of paid remuneration and voluntarywork are rare. One opportunity to study options for remuner-ation is in the Philippines, where under a World Bank EarlyChild Development project, the child development workerreceives a wage, which could be compared to near-volunteers atthe barangay (village) level.
When CHNWs are primarily voluntary, they are selected bythe community and report to community committees in someform. CHNWs on government payrolls may come from thecommunities and thus may be known to and identify with thecommunities, but they may report to supervisors higher up inthe system. Both models can work, depending on the culture.What probably works least well is when the community workeris paid little and receives inadequate support and recognitionfrom the community or even comes from elsewhere.Furthermore, as development progresses, reliance on volun-teerism may become less useful.
For planning CHNPs in terms of community workers, thetotal numbers and resource implications can be estimated asfollows. A full-time equivalent CHNW might visit 5 to 10households per day, averaging a visit to each household roughlyevery two months; a ratio of 1 CHNW to 200 households, there-fore, seems to be in the range within which an effect in terms ofimproving child health and nutrition is expected. Calculationsfrom salaries of community health aides (CHAs) in Jamaicawork out to US$7 per household per year, within the usualrange for expected effect. An important factor in regard tofinancial resources, however, concerns the substantial cadre ofpersonnel who have training and job descriptions for commu-nity work, are based in health centers, and for administrativeand financial reasons seldom leave the health facility. Moreover,funds may not be released to allow travel to nearby villages. Anexample is from Jamaica, where, because of clinic workloads,CHAs spend time helping in clinics rather than on home visits;in fact, technology could free staff time for community workby automating tasks, such as record keeping, that detain theCHAs. More effective deployment of existing personnel may
frequently be an option. Hiring additional personnel as com-munity health workers would consume a significant proportionof typical health budgets (at 1:200 households for FTEs, thiswould amount to US$1 to US$2 per person per year, or about20 percent of public health budgets in low-income countries).A mix of redeployment of existing staff and new hiring frombudget reallocations should, nonetheless, be cost-effective.
Organization
Effective, respected, and socially inclusive organization at thecommunity level seems to have been a key feature of the suc-cess in launching, expanding, and sustaining CHNPs. Most ofthe successful CHNPs drew and built on established communityprocedures; where they did not, effect and sustainability werein doubt. In Thailand, the health services and the religiousorganization at village level were important. The health servicesthemselves play a key role in Costa Rica, Honduras, andJamaica. In Indonesia, it was the community organizations(and women’s groups) together with (initially) the family-planning services. In Iringa, Tanzania, it was the local politicalparty structure, with substantial input from UNICEF. InZimbabwe, immediately after independence, it was the villageorganizations that had fought the war, later helped by a con-sortium of national and international nongovernmentalorganizations (NGOs). The major part of the still-expandingprogram in Bangladesh is run by BRAC, an NGO, and has builton its links to the community for development, food security,and educational activities, as well as for health. In contrast,CHNPs that either failed to launch a wide program (for exam-ple, in the Philippines) or had limited effect (in India, ICDS)probably lacked some of these features. Inclusiveness is proba-bly hard to achieve if not inherent.
Support from the central government is also crucial: CHNPsneed this support for training,supervision,wages,supplies, facil-ities, and the like. Where such support becomes a regular gov-ernment budget item, activities tend to become embedded andare sustained, in contrast to where the support is from donors.
A further issue concerns maintaining the community pro-gram’s preventive orientation. In Indonesia, for example,according to Rohde (1993), the health services co-opted (andmedicalized) the posyandu (weighing post, or communityhealth and nutrition center) system by adding a diagnostic andtreatment module (in fact, a table in the meeting place). Thismodule attracted most of the attention, to the disadvantage ofthe preventive aspects of the program. Thus, if the extension ofIMCI into the community means treatment (by trained but notmedically qualified people) in the community rather thanreferral to facilities, treatment could become the main or evensole focus, shifting attention from prevention. Some parallelsexist to the experience of ICDS in India, where, as noted earlier,food became the raison d’être.
1064 | Disease Control Priorities in Developing Countries | John B. Mason, David Sanders, Philip Musgrove, and others

CONTEXTUAL FACTORS
Community-based programs can work usefully, bringingsteady progress; whether they do depends on myriad factorsrelating to the context. Three different concerns are (a) factorsaffecting widespread initiation of CHNPs of potentially ade-quate coverage, intensity, and content; (b) factors that lead tosustainability; and (c) factors that allow activities to be effectivein improving health and nutrition—at best, when they, them-selves, also contribute to a rapid transitional improvement, asin Thailand, Costa Rica, and Jamaica.
Contextual factors may bring about improvements in healthand nutrition without any additional direct action—throughimproving living conditions, education, and so forth. Often,the changes caused by such nonprogrammatic factors are diffi-
cult to distinguish from program effects (current examples arein Bangladesh and Vietnam, both showing rapid improvementin nutrition). Moreover, the same factors (again, such as edu-cation) may both produce endogenous change and increase theeffect of program activities.
Five contextual factors have been suggested as priorities (inAsia; Mason and others 2001):
• women’s status and education• lack of social exclusion• community organization• literacy• political commitment.
Table 56.4 shows estimates of the positions of countries withcase study programs in regard to these factors. The levels of
Community Health and Nutrition Programs | 1065
Table 56.4 Context in Which Selected CHNPs Start and Run
Level of Women’s Lack of health and Total minus
Approximate status and social Community administrative Political political Country period educationa exclusion organization Literacy infrastructure commitment commitment Total
Tanzania
Iringa starts 1984–90 2 4 4 3 2 5 15 20
Iringa declines 1990– 2 4 2 3 2 2 13 15
Zimbabwe
Supplementary 1981–90 2 4 5 2 2 5 15 20Feeding Programme starts
Supplementary 1990– 2 2 2 2 2 2 10 12Feeding Programme declines
Bangladesh
BINP 1997– 1 3 2 2 3 3 11 14
India
ICDS 1975– 1 1 2 2 2 3 8 11
TINP 1980–9 2 2 3 3 3 4 13 17
Indonesia
UPGK starts 1975– 2 4 3 2 2 4 13 17
UPGK declines 1990– 2 4 2 2 3 2 13 15
Philippinesb 1974–2000 4 4 3 4 3 1 18 19
Thailand 1982– 4 3 4 4 3 4 18 22
Costa Rica
RHP 1973– 4 4 4 3 4 4 19 23
Jamaica 1985– 4 4 3 4 4 4 19 23
Nicaragua 1979–90 3 2 3 3 3 4 14 18
Source: Authors.a. Women’s status and education can be quantified by indicators such as adult literacy rates, females as percentage of males, and secondary school enrollment for girls.b. Since 2000, the Philippines has begun a significantly improving trend, one factor being increased implementation of programs (CHNPs, as well as others, such as salt iodization); this increase iscaused in part by increased political commitment, both as new legislation and resource allocations.Note: 0: worst; 5: best.

health and administrative infrastructure have been added. Thetable also shows changes in these factors that may help explainwhy the CHNPs declined in three cases.
Political commitment can lead to initiating communityprograms and mobilizing resources. It may also respond toemerging community mobilization, as seems to be the casewhen programs start after political upheavals, as in Zimbabweand Nicaragua. Declining political commitment accounts forloss of interest by the government in CHNPs; economic declineundermining resource availability may cause a shift away fromfinancial support of CHNPs (for example, in Tanzania). Intable 56.4, estimates of levels of contextual factors are totaledboth without and including political commitment (last twocolumns). The total without commitment may indicate howfavorable the context is if commitment is then made. CostaRica, Jamaica, and Thailand had a favorable context and, withcommitment, succeeded. The Philippines had comparablefavorable conditions—the position of women is generallygood, there is limited social division (exclusion), and so on.However, the necessary commitment (of resources, in particu-lar) was made only recently, with new legislation, adherence toregulations (for example, iodized salt went from 25 to 65 per-cent coverage), and increased resource allocation and assign-ment of community workers. This new commitment may wellexplain the recently resumed decrease in child malnutrition(figure 56.2). In other examples—such as Indonesia andTanzania—the conditions were moderately favorable, andwhile political support and finance existed, progress was made.In Tanzania, financial crisis denied the programs sustainedsupport; in Indonesia and Zimbabwe, bureaucratization andcentralization of the political process, followed by politicalturmoil, contributed to a similar outcome (Sanders 1993). Thesituations in India and Bangladesh have not been very favor-able. The position of women and social rifts, amounting toexclusion, have probably inhibited effective programs, evenwith political commitment. This context may now be changingin Bangladesh, as seen in the activities of BRAC. Finally, thisanalysis demonstrates the relation of decline in programs tofalling political commitment in Tanzania, Zimbabwe, andIndonesia.
If this analysis approximates the truth, the forward-lookingpolicy implications may be important:
• First, investing initially in a favorable context makes sense(as does possibly committing resources preferentially tointerventions in the more favorable contexts). Supportingpolicies can address social constraints—such as improvingeducation for women—and (relatedly) seek to improvehuman rights. In many cases, human rights may be of over-riding importance for health: Farmer (2003) has made acompelling case for rethinking health and human rights as a
prerequisite for progress and as a responsibility for thoseworking for health, especially of the poor and of the desti-tute sick. This investment may be long term and difficult—as in Kerala, India, for instance—but must be seen asintegral to the struggle for health (Sanders 1985).Operationally, this commitment to human rights putsgreater responsibility on advocates and investors in health tobroaden the dialogue and scope for allocating resources andto avoid committing resources regardless of the prospect ofsuccess as influenced by the social and human rights con-text. In health and nutrition, as in other areas, adjustment ofpolicies to support the success of interventions would bepragmatic as well as the right thing to do.
• Second, even if the context is more favorable, genuine polit-ical commitment is still essential. Excessive donor input mayinhibit this commitment. It is striking that Thailand hadto reject donor influence and make its internal decisionsbefore its programs became successful (Tontisirin andWinichagoon 1999), Costa Rica had to fight and overcomea medicalized approach (Muñoz and Scrimshaw 1995), andIndonesia’s posyandu system was undermined when treat-ment displaced prevention (Rohde 1993).
• Third, it is clear that severe economic stress, political pres-sure, or both have caused unsustainability (Indonesia,Nicaragua, Tanzania, and TINP).
• Fourth, if the context is unfavorable, it might be better towork on improving the context than to commit resources toprograms that may not succeed—but, of course, success inimproving context itself depends on circumstances, notablypolitical commitment.
Considerations like these should contribute to identifyingsupporting policies needed for programs to be effective andmodifications to interventions in particular conditions. Forexample, it is often observed that a particular factor—say,access to health services—is more strongly related to improve-ment among the better off (for example, the educated)population. This interaction of program with context leads toidentifying new needs—in this example, perhaps facilitatingaccess for the illiterate. In the longer run, resources or legisla-tion (for example, to combat social exclusion or discriminationagainst women) may be highlighted as prerequisites before aprogram can be expected to work. Often failure to take accountof context when trying to transfer experiences from a pilot trial(“scaling up”) may explain why efficacious interventions proveineffective in a larger population.
This analysis of contextual circumstances indicates that tar-geting the poor may not always be cost-effective, and someinterventions may not be feasible in certain contexts. An exam-ple is when the health infrastructure and services are almostnonexistent; under those conditions, it can be argued that
1066 | Disease Control Priorities in Developing Countries | John B. Mason, David Sanders, Philip Musgrove, and others

emergency treatment (especially for the diseases addressed byIMCI) should be established and reliable resources put in placefirst. A similar difficulty, often seen in food security, is thatmost interventions may not work for the poorest of the poor.For instance, supporting food (or cash crop) production inlow-potential areas may not be realistic; nonagriculturalemployment may be better.
Thus, community-based programs work in a specific timeand place: programs may start, work for a time, and then evolveor fade away. Even if they fade away, some useful effect maybe achieved: sustainability need not be forever. At the sametime, short project cycles (three years for many donors) can actagainst sustained programs. Some compromise in donor poli-cies to allow assurance of continuity for reasonable periods(such as 10 years) could do a lot to increase the effectiveness ofdonor support to CHNPs.
The essence of time and place is not fully understood.Werner and Sanders (1997) give examples of favorable times,as when the old order is changing (for example, after internalconflict, as in Nicaragua and Zimbabwe) and when there isrenewed vigor and some new organization is in place. Anothergeneralization of a favorable context is when energy and inter-connectedness exist in society. Thailand illustrates both: theThais needed to change the approach, moving away fromdonor influence, in order to initiate the successful communityprograms that helped transform health and nutritionthroughout the country, and that worked in part because ofcohesive features of Thai society (Tontisirin and Winichagoon1999).
In these examples, programs that continued on a largescale—either until the problem was largely resolved, as in CostaRica, Jamaica, and Thailand, or as it was expanding, as in BRACin Bangladesh or AIN-C (Atención Integral a la NiñezComunitaria) in Honduras—clearly had supportive context,but their specific common features (and hence how they couldbe replicated) are elusive. Perhaps one crucial condition forsuccess is that circumstances are such that people and commu-nities begin to have the sense that they can take responsibilityfor—and control of—their health and quality of life.Responsibility comes with the emancipation of societies fromcolonial or other repressive conditions and possibly whengrassroots attention becomes widespread, as it did inBangladesh through an NGO that identified with the people.Evidence is growing that, among the poor in the United States,this sense of control is directly related to better health andreduced exposure to HIV and AIDS; Sampson, Raudenbusch,and Earls (1997) call the concept collective efficacy. Cohen andothers (2000) show that health conditions improve when com-munities themselves fix up their environment—the “brokenwindows” theory. Such ideas may equally apply to poor com-munities, especially urban ones, in developing countries too.
RESULTS
Indicators of progress in implementation—process indicators—referring to coverage, intensity, and so on, are shown in table56.3. As discussed earlier, most programs expanded populationcoverage without much targeting. But usually the level ofresource application (intensity) was on the low side. Moreresearch is needed on the contribution of CHNPs to healthprocess indicators, such as immunization coverage rates, as wellas to nonhealth activities, for instance, in agriculture and com-munity development.
Impact evaluation, which refers to the net effects of inter-ventions on changing health outcomes, is sorely lacking. Theefficacy of most of the component parts of CHNPs, whenresources are adequate and the problems are correctly identi-fied, is established, but in routinely administered large-scaleprograms, the changes in outcome that can be ascribed to pro-gram actions are less known. Although controlled trials by def-inition are not applicable, plausible evidence can be obtained bycareful attention to research design, measurement, and analysis(Habicht, Victora, and Vaughan 1999). Some form of “with andwithout” and “before and after” comparisons is needed; forinstance, such methods as staggered implementation, naturalexperiments, and selection of comparison groups with somestatistical control can yield valuable information now lackingand should be more widely attempted. In this context, it shouldbe noted that because of the timing and level of effort necessaryfor the evaluation, the impact evaluation results (changes inoutcome ascribed to the program) may be more important forpolicy decisions on future programs than for the program thathas been evaluated. Moreover, not all programs require detailedevaluation. Thus, financial support for such policy-relevantevaluations may come from budgets other than that of the pro-gram to be evaluated. The evaluations should also be prospec-tive as far as possible, so decisions on evaluation design andfinance are needed earlier rather than later.
Impact
For the examples used here, inferences were drawn from piec-ing together results either from ad hoc surveys or from pro-gram and administrative data; occasionally such inferenceswere made from the comparison of baseline estimates withmidterm or final assessments, but the comparison groups, ifany, were imperfectly matched. Thus, the conclusions onimpact now put forward are tentative and based on judgmentsfrom available information. Some of these conclusions weredrawn from trend assessments, details for which are in Mason(2000, annex 5).
The most widely available indicators are mortality rates(infant, child, and to a lesser extent, maternal; reliable data on
Community Health and Nutrition Programs | 1067

age zero and cause-specific mortality rates are not usuallyavailable from most developing countries); prevalences ofunderweight in children from national surveys (oftensupported by demographic and health surveys or UNICEFMulti-Indicator Cluster Surveys); and indicators of health serv-ices (notably immunization coverage rates). Estimates of mor-bidity, even of the common diseases (such as diarrhea andARI), are not available systematically enough to judge trends inrelation to programs. Child underweight (or stunting) has aparticular value, because it measures an attribute of all children(age and weight or height), rather than assessing a relativelyrare event, as in mortality estimates. Moreover, experience iswell established of how underweight prevalences behave as arobust indicator, having a useful degree of responsiveness butnot being subject to wide fluctuations with transient events.
Under controlled conditions, improving health and nutri-tion allows rapid catch-up in bodyweight and fast rates ofreduction in underweight prevalence (for example, Pinstrup-Andersen and others 1993, 405). But in the real-world condi-tions of CHNPs, the expected rate is slower. As examples,Thailand maintained a reduction in underweight of about2.9 ppts per year in the 1980s (see figure 56.1); the 22 projectsreviewed as reported by Jonsson (1997) ranged between about1 and 3 ppts per year. A reduction rate of �2 ppts per year, sug-gested earlier as an expectation from successful programs,would lead to very significant improvement if achieved atnational levels: for South Asia, it would mean going from aprevalence of underweight of about 60 percent in 1980 to20 percent in 2000; for Africa, from 30 percent in 1990 to 10percent in 2000.
Detecting this rate can be difficult with the noise of sam-pling and nonsampling errors and with the common seasonalchanges, which can amount to 5 ppts fluctuations or more, cer-tainly in Africa. The potential program-ascribed trend needs tobe separated from the underlying secular trend for the country,roughly 0.5 ppts per year (from 1985 to 1995; ACC/SCN 1996).Clearly the longer the program and the observing periods, theeasier it is to assess trends.
Where the data are detailed enough,an initial rapid fall is seenin severe malnutrition—and probably in mortality,—followedby a slower fall in mild to moderate malnutrition. The reasonsfor the initial rapid fall are presumed to be immediate effects ofimproved health care, immunization, and the use of oral rehy-dration therapy. The outcomes estimated for the programs con-sidered here concentrate on the sustained trend—after a year ortwo of implementation—as summarized in table 56.5.
In Zimbabwe, from 1980 to 1988, the infant mortality rate(IMR) fell from 110 to 53 per 1,000 live births, and severe mal-nutrition fell from 17.7 to 1.3 percent. However, stunting fellonly in 1982–88, from 35.6 to 29 percent (1.1 ppts per year).Tanzania shows a similar effect in Iringa, with severe and mod-erate malnutrition falling much faster for the first two years.
Interestingly, the Child Survival and Development Projects(supported by the World Bank, among others), which covereda much larger population (but with less intensity than inIringa), appeared to show almost the same pattern as in Iringa:a rapid initial fall (as much as 8 ppts per year, for one to twoyears), continuing at 1 to 2 ppts per year.
In Costa Rica, the child mortality rate plummeted in the late1960s, well before stunting fell in the 1970s (Saenz 1995, 129;Vargas 1995, 111). A lag was seen in Thailand, where the childmortality rate started to fall rapidly in 1977, and both severeand moderate malnutrition appeared to start their fall in1983–84. Both these improvements preceded the major growthin gross national product, which began in 1987 (Kachondam,Winichagoon, and Tontisirin 1992, tables 8 and 33). In analyz-ing Indian experience, where the IMR has fallen faster thanchild malnutrition, Measham and Chatterjee (1999) suggestthat further improvements in child survival may be con-strained by the high rates of child malnutrition.
The sustained effects are generally of about an additional1 ppt per year improvement (table 56.5). For Bangladesh (theBINP), Tanzania, and Thailand, it is possible to distinguishthe sustained rate from the initial rapid fall. In Bangladesh, theBINP started during a period of rapid improvement overall, soextracting the underlying trend is especially important to givea plausible view of the “with-project” rate: about 1.6 ppts peryear again seems a reasonable estimate. A similar extraction oflikely with-project changes allowing for underlying trends wasreported previously (Mason 2000, annex 5) for Tamil Nadu,Andhra Pradesh (ICDS), and Orissa, indicating plausibleimprovements for the first two states.
In sum, these results support the contention that after aninitial rapid fall, the sustained rates of improvement in childunderweight prevalence settle down to about an additionalreduction of 1 or 2 ppts per year. This conclusion is the same aspreviously reached (Gillespie and Mason 1991), now supportedby some new results.
Cost-Effectiveness
Therefore, if we use prevalences of underweight children as thebasis for calculation, US$10 per child per year gives a reductionof 2 ppts per year. If we are to translate this cost into an impliedeffect on health and survival, underweight must be related tothe measure of disease burden, DALYs lost. Then the resourcesneeded per DALY saved—dollars per DALY—can be estimated.A 32.5 percent reduction in the loss of DALYs is associated witheliminating general plus micronutrient malnutrition as bothdirect effects and risk factors (see table 56.1, discussed earlier);as a first approximation, the average prevalence for developingcountries of 30 percent underweight can be applied. We cancalculate the associated DALYs gained from reducing malnutri-tion at this rate (and assume that loss of DALYs from all
1068 | Disease Control Priorities in Developing Countries | John B. Mason, David Sanders, Philip Musgrove, and others

Community Health and Nutrition Programs | 1069
Table 56.5 Outcomes and Resources in Selected Programs
Country Outcomes Resources
Africa
Tanzania: Iringa
Tanzania: Child Survivaland Development Program
Zimbabwe: SupplementaryFeeding Programme
Asia
Bangladesh: BINP
Bangladesh: BRAC
India: ICDS
India: TINP
Indonesia
Philippines: national
Thailand
Americas
Costa Rica
Jamaica
Nicaragua
Underweight: 50 to 35 percent (1984–88)
Immunization: 50 to 90 percent
Rates in underweight: initial 2 years, �8 ppts/year; first 4 years, �4.5 ppts/year;sustained (years 2–7), �0.8 ppts/year
Underweight reduction rates similar to Iringa
Stunting: 35.6 to 29 percent (1982–88)
�1.1 ppts/year
IMR: 1980–88: 110 to 53
BINP, first 6 thanas, initial effect (1997):approximately �11 ppts/year; then (toFebruary 1999) approximately �1.6 ppts/yearadditional
Underlying (nonprogram) trend: nationalapproximately �1.7 ppts/year, program areaapproximately �2.4 ppts/year
No program-specific data, but child under-weight and anemia in women have substantialfalling trend in recent years.
Overall underweight prevalence declining onlyslowly; some states reported faster, but link toICDS not shown.
1979–90: �1.4 ppts/year in TINP districts;�0.7 in non-TINP districts: increased improve-ment of approximately �0.7 ppts/year (Reddyand others 1992, 45). From other data,increased improvement of �1.0 ppts/year.
Probably about �1 ppt/year; underlying trendunknown
IMR: 1970, 1980, 1990: 118, 93, 61, respectively
No change found in underweight.
IMR: 1960, 1996: 77, 32, respectively
Approximately �2.9 ppts/year improvement inchild underweight. Breaks down to 1982–84:�7.8 ppts/year; 1985–90, �1.9 ppts/year.
IMR: 1970, 1980, 1990: 73, 55, 27, respectively
Stunting improved by approximately 1–1.5 ppts/year (estimated from Muñozand Scrimshaw 1995, 111), 1979–89.
IMR: 1970, 1980, 1988; 62, 19, 16, respectively
�1.9 ppts/year 1985–89
IMR: 1960, 1996: 58, 10, respectively
IMR fell from (at least) 92 to 80
US$8 to US$17/person/year (US$34/child/year from total costs);
2 village health workers/village � 1,220 total;
Approximately 1:40 children
US$2 to US$3/child/year
External funds, approximately US$0.50/child/year
1 community worker per 1,000 population;
Approximately 1:200 children; US$14 million/year, approximatelyUS$18/child/year
Over all programs, US$196 million in 2003 (approximately US$8/householdover all households); health program covered 31 million people, over 20 percent
1 supervisor to 20 ANWs
US$7–12/child/year
US$2 to US$11/child/year, depending on supplementary food. Rohde (1993)gives � US$1 recurrent.
Village workers (about 3 million total) 1:60 people; approximately 1:10 children; supervision 1:200
Low coverage and intensity
Ministry of Public Health, approximately US$11/head/year (1990)
Village health communicator or volunteer approximately 1:20 children; supervi-sion by extension workers: village health communicators and volunteersapproximately 1:24
Rural health program: US$1.7/child/year
Food and nutrition program: US$12.50/child/year
2 health workers (full time)/5,000 population, approximately 1:350 children
Large numbers community health volunteers trained and supported
Source: See sources for table 56.2.

malnutrition comes down at this rate; CHNPs include someattention to micronutrients). This reduction is then cumulatedthrough time (five years here) and assumes a linear relationbetween cost, underweight reduction, and disease burdenavoided. The calculation also assumes a persistent effect ofreducing malnutrition.
Using these assumptions gives an estimate of US$200 toUS$250 per DALY saved in sustained programs. This estimatedoes not include gains in DALYs from diseases that do notshow up as underweight, which must be substantial. Moreover,if this calculation is applied just to the first rapid fall, typically(in the three cases examined) about 8 ppts per year, the ratiomight fall by a factor of four, to US$50 to US$60 per DALYsaved (but start-up costs are higher too). The sustained figureshould be the more generalizable.
Many further provisos exist. Much of the effect here is ona risk factor—malnutrition—reducing which, in turn, makesother interventions more effective; hence, the comparison ofCHNPs with more direct interventions may not be valid. Butconversely (or perversely) improving nutrition could actuallyreduce the cost-effectiveness of other interventions—such asmeasles immunization—by reducing the mortality risk of chil-dren who are not immunized.
FUTURE APPLICATIONS
The experience so far in CHNPs can be applied more broadly,especially where community organizations can sustain supportfor CHNWs. CHNPs have worked best so far in Asia and LatinAmerica. However, with the HIV/AIDS epidemic in Sub-Saharan Africa needing high-priority attention, application ofCHNP experience to the HIV/AIDS crisis should be explored.
Extending CHNPs’ Coverage and Intensity
In a project sponsored by the Asian Development Bank (ADB)and UNICEF that was aimed at identifying ways of investing inimproved child nutrition, Mason and others (1999, 2001) havereviewed the extent of CHNPs in Asian countries. Resourceswere estimated in terms of annual expenditures per child and ofratios of population to community workers (“mobilizers”). Theproject addressed the needs of eight countries (Bangladesh,Cambodia, China, India, Pakistan, the Philippines, Sri Lanka,and Vietnam), and previous experience in Indonesia andThailand provided additional guidance.
The population coverage of CHNPs was estimated as about5 to 20 percent, except for India with the ICDS, which reportsabout 70 percent coverage. The next indicators refer to estimateswithin programs. The calculated intensity was commonly 200children to 1 community worker (for example, Bangladesh,India, Sri Lanka); ratios of up to 100:1 were reported in Pakistan
and Vietnam and up to 60:1 in the Philippines. Further researchhas stressed the variation in time commitment of CHNWs indifferent places—hence the need to convert to FTEs. The ratioused as the norm, derived from experience in Thailand andIndonesia, of about 1:20 is probably equivalent to 1:200 in FTEs.In India, opinion has been that about a doubling of the ANWnumbers in the ratios is needed to get more effect (Measham andChatterjee 1999). From this perspective, these estimates indicatethat both coverage and intensity are low, although intensity maybe half that needed, whereas coverage (except in India) is far toosmall. Supervision ratios are estimated as about 1:20 and higher.Expanding the numbers of CHNWs also means increasing thenumber of supervisors (usually from the health system), withassociated costs.
Calculations from scarce financial resource data show thatmost government programs cost about US$1 per participantchild per year or less, whereas Bangladesh (BINP, with donorsupport and in line with other donor-supported programs)reached costs of US$15 to US$20 per child per year. By this cal-culation, too, the resources per head, as well as the coverage,were in most cases too low for widespread effect.
The estimates of coverage and intensity can be combined tocalculate the extent of current programs in relation to thatneeded for full coverage at adequate intensity. The results basedon a 1:20 ratio of CHNW to children suggest that less than1 percent of the need was currently available; at 1:200 (whichwould cost more, because the CHNW would work full time)perhaps 10 percent of the need would be covered. Either way, amassive expansion would be called for if CHNPs were to beused as a means for widely improving health (but still callingfor only about 20 percent of the public budget for health).
Expansion requires major resources, and not only financialones. Thailand trained 1 percent of the population as commu-nity health workers (part time) and established an extensivesupervision and support structure, including retraining. Theestimates for the ADB-UNICEF project in financial terms were,for Bangladesh, Cambodia, Pakistan, Sri Lanka, and Vietnam,some US$190 million to US$280 million per year for improve-ment of underweight by an additional 1.5 ppts per year (Masonand others 2001, 64–68).
The Potential Role of CHNPs in Combating HIV and AIDSin Sub-Saharan Africa
Controlling the epidemic of HIV and AIDS in Sub-SaharanAfrica will take an unprecedented effort. As antiretroviral ther-apy becomes available there will be new opportunities to turnthe tide. Supply of antiretroviral therapy drugs, although essen-tial and the cutting edge of new programs, is only part of theneed. Food and income support, care for children (orphansand others affected), counseling, support to promote andsustain behavior change, and rehabilitation of people and
1070 | Disease Control Priorities in Developing Countries | John B. Mason, David Sanders, Philip Musgrove, and others

communities are needed (see chapter 18). Many of these activ-ities have precedents in the types of CHNPs run by communityhealth workers that are discussed here. What lessons aretransferable?
One concern is that CHNPs have a greater history of successin developing countries outside Africa. Those within Africa seemto have been sustained for limited periods, often linked to donorinterests. Reasons may have to do with lower levels of adminis-trative infrastructure, different existing community organiza-tion, and varying political commitment (see table 56.4). Thesefactors may now be weakened as the AIDS epidemic reduces thenumbers of qualified people and undermines communityorganizations. It will be urgent to work on such contextual fac-tors to create conditions in which community organizations canbe refurbished and built on.
Community organizations can work in Africa, as elsewhere,when they have a real function with activities perceived as use-ful to pursue and some resources (including mobilizing theirown) to use. Some transferable lessons are that such localorganizations are crucial; that in regard to supervision andaccess to certain resources, they need to work with the govern-ment structure—often through health system employees; andthat they need sustained resource support, much of whichmust come from donors.
Treatment and rehabilitation of people with AIDS will behome based in most cases and will depend substantially oncommunity support. Nutrition is an important component;improved food intake is likely to enhance the effect of anti-retroviral therapy, and when treatment progresses, nutritionwill help get sick people back on their feet and returned to aproductive life. A village health worker could play a key role inthis process. In much of Africa, HIV and AIDS affect manycommunities, and in southern Africa, where HIV prevalencesreach 30 to 40 percent, almost all communities have chronicallysick adults. This fact means that most communities need pro-grams: the problem is not highly concentrated. On the positiveside, the more developed and accessible communities are thosemost affected by AIDS (Mason and others forthcoming;UNICEF 2004), where establishing programs may be easier.HIV and AIDS are affecting children both directly, as pediatricAIDS, and indirectly, through the impoverishment and destitu-tion of affected households. This effect is seen in worseningchild malnutrition. Here, too, support through CHNPs couldplay a useful role.
The characteristics of CHNPs elsewhere—in terms of inten-sity, training, supervision, and so forth—may provide someguidance for establishing or extending them in Africa.Mechanisms for identifying, supporting, and training village orcommunity health workers in this context can draw on experi-ence with CHNPs; such issues as their identification in thecommunity and links with community and facility programswill arise. A key issue will be the remuneration and incentives
for community workers, and this issue may need some researchand testing of different approaches. The activities of com-munity workers in dealing with treatment (and prevention) ofHIV and AIDS have parallels to malnutrition and would prob-ably include the following items:
• social support and facilitating access to resources (possiblyincluding food aid)
• counseling• treatment and referral for opportunistic infections• promoting rehabilitation to productive life (which may
benefit from improved nutrition) as antiretroviral therapyprogresses.
Schools too have an extremely important role in the fightagainst HIV and AIDS and should be linked to, or part of,CHNPs. Schools provide a refuge and a means of providinghelp for orphans and vulnerable children, and they also providea crucial opportunity for preempting and combating high-riskbehavior.
RESEARCH NEEDS
The question of incentives, training, and support for commu-nity workers urgently needs research, both from current expe-rience and with prospective designs. The issues include thefollowing:
• What is the CHNW’s status, relative to the community or tothe government (or NGO) hierarchy?
• How are CHNWs selected and to whom do they report (forexample, community health committees, supervisorsemployed in the health or other system)?
• What educational background and how much training andretraining—and by what methods—are needed forCHNWs?
• What ratios of CHNWs to households are effective (or mostcost-effective), both as part-time workers (volunteer orotherwise) and as full-time employees?
• What supervision ratios work?• What remuneration and incentives are effective?• How can these efforts be financed?
Enough programs have been in operation for long enoughthat researchers could base on them much of the neededresearch on processes of implementation, launching new trialsonly for processes for which sufficient information does notexist. In contrast, impact evaluation requires new and prefer-ably prospective studies.
A major gap in research is the application of community-based programs to urban areas. Urban communities are
Community Health and Nutrition Programs | 1071

conceived differently from the rural areas of most CHNPs,organizations run along different lines, and so forth. Yet popu-lation growth is in urban areas, and some problems, notablyHIV and AIDS, are worse there.
Finally, the cost-effectiveness analysis results given in an ear-lier section are based on rather few and approximate results.CHNPs may well provide a viable and cost-effective approachunder many circumstances in poor countries, and it maybe necessary to demonstrate this viability better and morequantitatively for support to CHNPs to compete with moretraditional service delivery interventions. That, too, wouldconstitute worthwhile research.
NOTES1. Social exclusion refers to the exclusion of groups from the main-
stream of public actions: lower castes in India, poorer groups in Pakistan,many indigenous ethnic groups throughout Asia and the Americas, andmigrant workers in China and elsewhere; the result for public health isthat excluded people do not participate in programs even if they areavailable.
2. Pinstrup-Andersen and others (1993) provide a more complete list.
REFERENCESACC/SCN (United Nations Administrative Committee on
Coordination/Sub-Committee on Nutrition). 1989. Update on theWorld Nutrition Situation: Recent Trends in Nutrition in 33 Countries.Geneva: ACC/SCN.
———. 1992. Global and Regional Results. Vol. 1 of Second Report on theWorld Nutrition Situation. Geneva: ACC/SCN.
———. 1996. Update on the Nutrition Situation, 1996. Geneva: ACC/SCN.
———. 1998. Third Report on the World Nutrition Situation. Geneva:ACC/SCN.
———. 2004. Fifth Report on the World Nutrition Situation. Geneva:ACC/SCN.
Administrative Staff College of India. 1997. “National Strategy to ReduceChild Malnutrition; Investment Plan; Final Report.” Asian Devel-opment Bank, Manila, December.
Allen, L. H., and S. R. Gillespie. 2001. “What Works? A Review of theEfficacy and Effectiveness of Nutrition Interventions.” ACC/SCNNutrition Policy Paper 19; Asian Development Bank (ADB) Nutritionand Development Series 5, United Nations Administrative Committeeon Coordination/Sub-Committee on Nutrition, Geneva; ADB, Manila.
Berg, A. 1981. Malnourished People: A Policy View. Poverty and Basic NeedsSeries. Washington, DC: World Bank.
———. 1987. Malnutrition: What Can Be Done? Washington, DC: WorldBank; Baltimore: Johns Hopkins University Press.
BINP and UNICEF (Bangladesh Integrated Nutrition Program andUnited Nations Children’s Fund). 1999. “Preliminary Results.”UNICEF.
BRAC (Bangladesh Rural Advancement Committee). 2004. “BRACHealth Programme,” http://www.brac.net/health_programme.pdf, and“BRAC at a Glance,” http://www.brac.net/aboutb.htm.
Chowdhury, M. 2003. “Health Workforce for TB Control by DOTS: TheBRAC Case.” Joint Learning Initiative Working Paper 5-2. http://www.globalhealthtrust.org/doc/JLI%20WG%20Paper%205-2.pdf.
Cohen, D, S. Spear, R. Scribner, P. Kissinger, K. Mason, and J. Wildgen.2000. “‘Broken Windows’ and the Risk of Gonorrhea.” AmericanJournal of Public Health 90 (2): 230–36.
Delgado, H. L., V. E. Valverde, R. Martorell, and R. E. Klein. 1982.“Relationship of Maternal and Infant Nutrition to Infant Growth.”Early Human Development 6 (3): 273–86.
Engle, P. L., M. Bentley, and G. Pelto. 2000. “The Role of Care in NutritionProgrammes: Current Research and a Research Agenda.” Proceedings ofthe Nutrition Society 59 (1): 25–35.
Ezzati, M., A. Lopez, A. Rodgers, S. vander Hoorn, C. J. L. Murray, and theComparative Risk Collaborating Group. 2002. “Selected Major RiskFactors and Global and Regional Burden of Disease.” Lancet 360:1347–60.
Ezzati, M., S. Vander Hoorn, A. Rodgers, A. Lopez, C. D. Mathers, C. J. L.Murray, and the Comparative Risk Collaborating Group. 2003.“Estimates of Global and Regional Potential Health Gains fromReducing Multiple Major Risk Factors.” Lancet 362: 271–80.
Farmer, P. 2003. Pathologies of Power: Health, Human Rights, and the NewWar on the Poor.Berkeley and Los Angeles: University of California Press.
Fiedler, J. L. 2003. “A Cost Analysis of the Honduras Community-BasedIntegrated Child Care Program (Atención Integral a la Niñez-Comunitaria, AIN-C).” Health, Nutrition, and Population DiscussionPaper, World Bank, Washington, DC.
FNRI (Food and Nutrition Research Institute). 2004. “Results of FNRINational Nutrition Surveys, 2001 and 2003.” Department of Scienceand Technology, Food and Nutrition Research Institute, Governmentof the Philippines, Manila.
Gillespie, S., and J. Mason. 1991. “Nutrition-Relevant Actions—SomeExperiences from the Eighties and Lessons for the Nineties.” ACC/SCNState-of-the-Art Series Nutrition Policy Discussion Paper 10, UnitedNations Administrative Committee on Coordination/Sub-Committeeon Nutrition, Geneva. http://www.unsystem.org/scn/archives/npp10/index.htm.
Gillespie, S., J. Mason, and R. Martorell. 1996. “How Nutrition Improves.”ACC/SCN Nutrition Policy Discussion Paper 15, United NationsAdministrative Committee on Coordination/Sub-Committee onNutrition, Geneva. http://www.unsystem.org/scn/archives/npp15/index.htm.
Gillespie, S., M. McLachlan, and R. Shrimpton. 2003. CombattingMalnutrition: Time to Act. Washington, DC: World Bank.
Guillermo-Tuazon, A., and R. M. Briones. 1997. “ComprehensiveAssessment of Nutrition Interventions.” Report prepared for AsianDevelopment Bank–UNICEF Regional Technical Assistance project.University of Philippines at Los Baños, Regional Training Programmeon Food and Nutrition. UNICEF, Manila. Photocopy.
Gwatkin, D., J. Wilcox, and J. Wray. 1980. Can Health and NutritionInterventions Make a Difference? Monograph 13, Overseas Devel-opment Council, Washington, DC.
Habicht, J.-P., J. Mason, and H. Tabatabai. 1984. “Basic Concepts for theDesign of Evaluation during Programme Implementation.” In Methodsfor the Evaluation of the Impact of Food and Nutrition Programmes, ed.D. Sahn, R. Lockwood, and N. Scrimshaw, 1–25. Tokyo: United NationsUniversity.
Habicht, J.-P., C. G. Victora, and J. P. Vaughan. 1999. “Evaluation Designsfor Adequacy, Plausibility, and Probability of Public HealthProgramme Performance and Impact.” International Journal ofEpidemiology 28 (1): 10–18.
Heaver, R. A., and J. M. Hunt. 1995. Improving Early Child Development:An Integrated Program for the Philippines. Washington, DC: WorldBank and Asian Development Bank.
Heaver, R., and J. B. Mason. 2000. Making a National Impact onMalnutrition in the Philippines: You Can’t Get There from Here—A Case
1072 | Disease Control Priorities in Developing Countries | John B. Mason, David Sanders, Philip Musgrove, and others

Study of Government Policies and Programs, and the Role of UNICEFand the World Bank. New York: UNICEF.
Horwitz, A. 1987. “Comparative Public Health: Costa Rica, Cuba, andChile.” Food and Nutrition Bulletin 9 (3): 19–29.
INFS (Institute of Nutrition and Food Science) and Department ofEconomics, University of Dhaka. 1998. “Strategies for Bangladesh.”Dhaka Urban Community Health Program. Asian Development Bank,Manila.
Jennings, J., S. Gillespie, J. Mason, M. Lotfi, and T. Scialfa. 1991.“ManagingSuccessful Nutrition Programmes.” ACC/SCN State-of-the-Art Series,Nutrition Policy Discussion Paper 8, United Nations AdministrativeCommittee on Coordination/Sub-Committee on Nutrition, Geneva.http://www.unsystem.org/scn/archives/npp08/index.htm.
Jonsson, U. 1997. “Success Factors in Community-Based Nutrition-Oriented Programmes and Projects.” In Malnutrition in South Asia:A Regional Profile, ed. S Gillespie, 161–89. ROSA Publication 5.Kathmandu: UNICEF, Regional Office for South Asia.
Kachondam, Y., P. Winichagoon, and K. Tontisirin. 1992. “Nutritionand Health in Thailand: Trends and Actions.” ACC/SCN case study,Institute of Nutrition at Mahidol University, Bangkok, and UnitedNations Administrative Committee on Coordination/Sub-Committeeon Nutrition, Geneva.
Kavishe, F. P., and S. S. Mushi. 1993. Nutrition-Relevant Actions inTanzania. ACC/SCN case study. Tanzania Food and Nutrition Centre,Monograph Series 1. Geneva: United Nations AdministrativeCommittee on Coordination/Sub-Committee on Nutrition. http://www.unsystem.org/scn/archives/tanzania/index.htm.
Kelley, L. M., and R. E. Black. 2001. “Research to Support Household andCommunity IMCI. Report of a Meeting, 22–24 January 2001,Baltimore, Maryland, USA.” Journal of Health, Population, andNutrition 19 (Suppl. 2): S111–54.
Kielmann, A. A., C. E. Taylor, C. DeSweemer, I. S. Uberoi, H. S. Takulia, N.Masih, and S. Vohra. 1978. “The Narangwal Experiment: II. Morbidityand Mortality Effects.” Indian Journal of Medical Research 68 (Suppl.):42–54.
Mason, J. B. 2000. “How Nutrition Improves, and What That Implies forPolicy Decisions.” Paper prepared for World Bank–UNICEF NutritionAssessment, UNICEF, New York, and World Bank, Washington, DC.http://www.tulane.edu/~internut/publications/WB_Bckgrd_Pprs/Narrative/NarrativethreeMason.doc.
———. 2003. “Philippines Case Study.” In Combating Malnutrition: Timeto Act, ed. G. Gillespie, M. McLachlan, and R. Shrimpton, 85–101.Washington, DC: World Bank.
Mason, J., A. Bailes, K. Mason, O. Yambi, U. Jonsson, C. Hudspeth, andothers. Forthcoming. AIDS, Drought, and Child Malnutrition inSouthern Africa. Public Health Nutrition.
Mason, J. B., J. Hunt, D. Parker, and U. Jonsson. 1999. “Investing in ChildNutrition in Asia.” Asian Development Review 17 (1, 2): 1–32.
———. 2001. “Improving Child Nutrition in Asia.” Food and NutritionBulletin 22 (3 Suppl.): 5–80.
Mason, J. B., P. Musgrove, and J.-P. Habicht. 2003. “At Least One-Third ofPoor Countries’ Disease Burden Is Due to Malnutrition.” DiseaseControl Priorities Project Working Paper 1, Fogarty InternationalCenter/National Institutes of Health, Washington, DC. http://www.fic.nih.gov/dcpp/wps/wp1.pdf.
Mason, J., J. Rivers, and C. Helwig, eds. 2005. “Recent Trends inMalnutrition in Developing Regions: Vitamin A Deficiency, Anemia,Iodine Deficiency, and Child Underweight.” Food and NutritionBulletin 26 (1) Special Issue: 1–110.
Mata, L. 1991. “National Nutrition and Holistic Care Programme(NNHCP), Costa Rica.” In Managing Successful Nutrition Programmes,ed. J. Jennings, S. Gillespie, J. Mason, M. Lotfi, and T. Scialfa, 77–81.
ACC/SCN State-of-the-Art Series, Nutrition Policy DiscussionPaper 8. Geneva: United Nations Administrative Committee onCoordination/Sub-Committee on Nutrition.
Measham, A. R., and M. Chatterjee. 1999. Wasting Away: The Crisis ofMalnutrition in India. Washington, DC: World Bank.
Mills, A. 1994. “Decentralization and Accountability in the Health Sectorfrom an International Perspective: What Are the Choices?” PublicAdministration and Development 14: 281–92.
Muñoz, C., and N. S. Scrimshaw. 1995. The Nutrition and Health Transitionof Democratic Costa Rica. Boston: International Nutrition Foundationfor Developing Countries.
Pelletier, D. L. 1991. “The Uses and Limitations of Information in theIringa Nutrition Program, Tanzania.” Cornell Food and NutritionPolicy Program, Working Paper 5, Cornell University, Ithaca, NY.
Pelletier, D. L., and E. A. Frongillo. 2003. “Changes in Child Survival AreStrongly Associated with Changes in Malnutrition in DevelopingCountries.” Journal of Nutrition 133 (1): 107–19.
Pinstrup-Andersen, P., S. Burger, J.-P. Habicht, and K. Peterson. 1993.“Protein-Energy Malnutrition.” In Disease Control Priorities inDeveloping Countries, ed. D. T. Jamison, W. H. Mosley, A. R. Measham,and J. L. Bobadilla, 391–420. New York: Oxford University Press.
Plowman, B., J. I. Picado, M. Griffiths, K. Van Roekel, and V. Vivas deAlvarado. 2002. BASICS II Evaluation of the AIN Program in Honduras.Arlington, VA: Basic Support for Institutionalizing Child SurvivalProject (BASICS II) for the U.S. Agency for International Development.
Reddy, V., M. Shekar, P. Rao, and S. Gillespie, S. 1992. “Nutrition in India.”ACC/SCN case study. National Institute of Nutrition, Hyderabad,India. http://www.unsystem.org/scn/archives/india/index.htm.
Rohde, J. 1993. “Indonesia’s Posyandus: Accomplishments and FutureChallenges.” In Reaching Health for All, ed. J. Rohde, M. Chatterjee, andD. Morley, 135–57. Oxford, U.K.: Oxford University Press.
Saenz, L. 1995. “Evolution of an Epidemiological Profile.” In The Nutritionand Health Transition of Democratic Costa Rica, ed. C. Muñoz and N. S.Scrimshaw, 119–43. Boston: International Nutrition Foundation forDeveloping Countries.
Sampson, R. J., S. E. W. Raudenbusch, and F. Earls. 1997. “Neighborhoodsand Violent Crime: A Multilevel Study of Collective Efficacy.” Science277: 918–24.
Sanders, D. 1985. With R. Carver. The Struggle for Health. London:Macmillan.
———. 1993. “The Potential and Limits of Health Sector Reform inZimbabwe.” In Reaching Health for All, ed. J. Rohde, M. Chatterjee, andD. Morley, 239–66. Oxford, U.K.: Oxford University Press.
———. 1999. “Success Factors in Community-Based Nutrition Pro-grammes.” Food and Nutrition Bulletin 20 (3): 307–14.
Sanders, D., and M. Chopra. 2004. “Child Health.” Paper prepared for Savethe Children U.K., London.
Save the Children U.K. 2003. Thin on the Ground: Questioning the Evidencebehind World Bank Funded Community Nutrition Projects inBangladesh, Ethiopia, and Uganda. London: Save the Children U.K.http://www.savethechildren.org.uk/temp/scuk/cache/cmsattach/666_ThinOnTheGround.pdf.
Shekar, M. 1989. “The Tamil Nadu Integrated Nutrition Programme: AReview of the Project with Special Emphasis on the Monitoring andInformation System.” Paper prepared for the Rockefeller Foundationand the Food and Nutrition Policy Programme, Cornell University,Ithaca, NY.
Shrimpton, R. 1989. “Community Participation in Food and NutritionProgrammes: An Analysis of Recent Governmental Experiences.”Paper prepared for the Food and Nutrition Policy Programme, CornellUniversity, Ithaca, NY.
Community Health and Nutrition Programs | 1073

Soekirman, I. Tarwotjo, I. Jus’at, G. Sumodiningrat, and F. Jalal. 1992.Economic Growth, Equity and Nutritional Improvement in Indonesia.ACC/SCN case study. http://www.unsystem.org/scn/archives/indonesia/index.htm.
Tagwireyi, J., and T. Greiner. 1994. Nutrition in Zimbabwe. Washington,DC: World Bank.
Taylor, C. E., A. A. Kielmann, and R. L. Parker. 1978. “The NarangwalNutrition Study: A Summary Review.” American Journal of ClinicalNutrition 31: 1040–52.
Tontisirin, K. 1996.
Tontisirin, K., and P. Winichagoon. 1999. “Community-Based Programs:Success Factors for Public Nutrition Derived from Thailand’sExperience.” Food and Nutrition Bulletin 20 (3): 315–22.
UNICEF (United Nations Children’s Fund). 1990. “Strategy for ImprovedNutrition of Children and Women in Developing Countries.” PolicyReview Paper E/ICEF/1990/1.6, UNICEF, New York.
———. 1998. State of the World’s Children: Progress against Worms forPennies. New York: UNICEF.
———. 2004. Drought, AIDS, and Child Malnutrition in Southern Africa:Preliminary Analysis of Nutritional Data on the Humanitarian Crisis.Nairobi: UNICEF, Eastern and Southern Africa Regional Office.
Vargas, W. 1995. “Development and Characteristics of Health andNutrition Services for Urban and Rural Communities of Costa Rica.”In The Nutrition and Health Transition of Democratic Costa Rica, ed. C.Muñoz and N. S. Scrimshaw, 68–117. Boston: International NutritionFoundation for Developing Countries.
Waterlow, J. C. 1992. Protein Energy Malnutrition. London: EdwardArnold.
Werner, D., and D. Sanders. 1997. Questioning the Solution: The Politicsof Primary Health Care and Child Survival. Palo Alto, CA:HealthWrights.
Whitehead, R. G., M. G. Rowland, and T. J. Cole. 1976. “Infection,Nutrition, and Growth in a Rural African Environment.” Proceedingsof the Nutrition Society 35 (3): 369–75.
Winichagoon, P., Y. Kachondam, G. Attig, and K. Tontisirin. 1992.Integrating Food and Nutrition into Development: Thailand’sExperiences and Future Visions. UNICEF/EAPRO and Institute ofNutrition at Mahidol University, Bangkok, Thailand.
WHO (World Health Organization). 1997. Improving Child Health.IMCI: The Integrated Approach. WHO/CHD/97.12 Rev 2. Geneva:WHO.
1074 | Disease Control Priorities in Developing Countries | John B. Mason, David Sanders, Philip Musgrove, and others