Personalized Persuasion in Ambient Intelligence - Dr. Maurits ...
234
Personalized Persuasion in Ambient Intelligence
-
Upload
khangminh22 -
Category
Documents
-
view
1 -
download
0
Transcript of Personalized Persuasion in Ambient Intelligence - Dr. Maurits ...

Personalized Persuasionin
Ambient Intelligence

This research was conducted in part at the User Centered Engineeringgroup, Department of Industrial Design, Eindhoven University ofTechnology (Eindhoven, The Netherlands), in part at Philips ResearchLaboratories (Eindhoven, The Netherlands), and in part at theDepartment of Communication, Stanford University (Stanford, CA).This research was commissioned and funded by Philips Research.
An electronic copy of this thesis in PDF format is available fromthe TU/e library website (http://www.tue.nl/lib).
c©2011-2012, Maurits Clemens Kaptein, The NetherlandsAll rights reserved. Reproduction of this publication in whole or inpart is prohibited without the prior permission from the author.
A catalogue record is available from the Eindhoven University of TechnologyLibraryISBN: 978-90-386-3106-6

Personalized Persuasion in Ambient Intelligence
PROEFSCHRIFT
ter verkrijging van de graad van doctor aan deTechnische Universiteit Eindhoven, op gezag van derector magnificus, prof.dr.ir. C.J. van Duijn, voor een
commissie aangewezen door het College voorPromoties in het openbaar te verdedigenop donderdag 29 maart 2012 om 16.00 uur
door
Maurits Clemens Kaptein
geboren te Doetinchem

Dit proefschrift is goedgekeurd door de promotoren:
prof.dr. E.H.L. Aartsenprof.dr. P. Markopoulos
Copromotor:dr. B.E.R. de Ruyter

Contents
1 Introduction 11.1 Background: Persuasion in Intelligent Systems . . . . . . . . . 11.2 Research Problem . . . . . . . . . . . . . . . . . . . . . . . . . 31.3 Outline . . . . . . . . . . . . . . . . . . . . . . . . . . . . . . . 51.4 Key Contributions . . . . . . . . . . . . . . . . . . . . . . . . . 6
2 Related Work 92.1 Persuasive Technologies . . . . . . . . . . . . . . . . . . . . . . 92.2 Attitude and Behavioral Change . . . . . . . . . . . . . . . . . 142.3 Conclusion: Reflections . . . . . . . . . . . . . . . . . . . . . . 26
3 Insight Generation I:Heterogeneity in Responses to Social Influence Strategies 293.1 Introduction . . . . . . . . . . . . . . . . . . . . . . . . . . . . . 293.2 Study 1: Identifying an upper bound in heterogeneity . . . . . 313.3 Study 2: Examining stability of heterogeneity over time . . . . 413.4 Study 3: Stability of heterogeneity across context . . . . . . . . 473.5 Conclusions . . . . . . . . . . . . . . . . . . . . . . . . . . . . . 54
4 Insight Generation II:Choice and Repetition Effects of Influence Strategies 574.1 Introduction . . . . . . . . . . . . . . . . . . . . . . . . . . . . . 574.2 Study 1: Choice Effects . . . . . . . . . . . . . . . . . . . . . . 584.3 Study 2 and 3: Simultaneous Presentation . . . . . . . . . . . . 654.4 Study 4: Simultaneous Presentation in Practice . . . . . . . . . 734.5 Conclusions . . . . . . . . . . . . . . . . . . . . . . . . . . . . . 76
5 Insight Generation III:Meta-Judgemental Measures 795.1 Introduction: Measures of Persuasion Susceptibility . . . . . . . 795.2 Study 1: Initial application of the short STPS . . . . . . . . . 805.3 Study 2: Development and Validation of the STPS . . . . . . . 855.4 Conclusions . . . . . . . . . . . . . . . . . . . . . . . . . . . . . 93

6 Design Requirements 976.1 Conclusions From the Insight Generation Chapters . . . . . . . 976.2 Identification, Representation, and Measurement . . . . . . . . 1026.3 Dynamic Adaptation . . . . . . . . . . . . . . . . . . . . . . . . 1046.4 Properties of Adaptive Persuasive Systems . . . . . . . . . . . . 111
7 Case Studies I:Influencing Health Decisions 1157.1 Introduction: Measures of Susceptibility . . . . . . . . . . . . . 1157.2 Study 1 & 2: Promoting Lunch Walks . . . . . . . . . . . . . . 1157.3 Study 3: Influencing Snacking Behavior . . . . . . . . . . . . . 1227.4 Conclusions . . . . . . . . . . . . . . . . . . . . . . . . . . . . . 136
8 Case Studies II:Dynamically Personalizing Persuasion 1398.1 Introduction: Dynamic Persuasive Systems . . . . . . . . . . . 1398.2 Design 1: APStairs, Promoting Stair Usage . . . . . . . . . . . 1408.3 Design 2: Influencing Docking Behavior . . . . . . . . . . . . . 1488.4 Design 3: E-Selling Applications . . . . . . . . . . . . . . . . . 1578.5 Conclusions . . . . . . . . . . . . . . . . . . . . . . . . . . . . . 166
9 Reflections 1699.1 Advancing the Design of Persuasive Technologies . . . . . . . . 1699.2 The Possible Future(s) of Persuasion Profiles . . . . . . . . . . 1729.3 Ethical Considerations . . . . . . . . . . . . . . . . . . . . . . . 1769.4 Future Research Challenges . . . . . . . . . . . . . . . . . . . . 180
Bibliography 185
Articles by Maurits Kaptein 205
Summary 209
Acknowledgments 211
Curriculum 213
Index . . . . . . . . . . . . . . . . . . . . . . . . . . . . . . . . . . . 215List of Figures . . . . . . . . . . . . . . . . . . . . . . . . . . . . . . 219List of Tables . . . . . . . . . . . . . . . . . . . . . . . . . . . . . . . 222

1Introduction
1.1 Background: Persuasion in Intelligent SystemsPersuasion has been a subject of human investigation for millennia. Theancient Greek deemed the topic of “moving or inducing someone bywords to do something” sufficiently important to give Peitho (Πειθω)—the goddess of persuasion—a place next to the better known Eros andAphrodite. The ability to persuade others to enact a certain behav-ior or adopt a certain opinion has appealed to those studying design,psychology, communication, and marketing. Applications of persuasionare manifold: health care professionals use persuasion to influence theirclients to lead a healthy lifestyle while marketeers use persuasion todrive products sales.
Psychology and communication scholars define persuasion as "...asymbolic process in which communicators try to convince other people tochange their attitudes or behaviors regarding an issue through the trans-mission of a message in an atmosphere of free choice." (Perloff, 2003)This implies that persuasion concerns a persuader who, by the act ofcommunication, changes the attitudes or behavior of a target. Giventhis definition classical conditioning, operant conditioning, the forma-tion of attitudes, and the more contemporary work on perceived andpreferred attitude basis all concern persuasion (Kaptein et al., 2009b).
1
2
These different aspects of persuasion together compose one of the mostwidely studied topics in social science.
Persuasion is traditionally studied in a human-to-human context.However, Reeves and Nass (1996), in their book “The Media Equation:How People Treat Computers, Television and New Media Like RealPeople and Places”, sum up the overwhelming evidence presented inearlier papers (e.g. Nass et al., 1994; Moon and Nass, 1996; Fogg andNass, 1997; Nass, 1997) that people treat computers and other tech-nologies as social actors. Reeves and Nass (1996) replicated some ofthe most compelling results of social science—such as the tendency ofpeople to form teams and the associated between-team rivalry by mererandom assignment of different colored t-shirts (Tajfel, 1982; Mackieand Cooper, 1984; Mackie, 1986)—in the context of human-computeras opposed to human-human interaction. This work and the work ofearlier scholars such as Dennett (1987) and Flavell et al. (1990) “openedthe door for computers to apply [...] social influence strategies (Fogg,2002)”. Thus, interactive technologies and systems have the potentialto engage in the same persuasion processes that humans do.
Fogg (1999), was one of the first to make explicit the importanceof the findings presented in “The Media Equation” (Reeves and Nass,1996) for the design of interactive systems designed with the intent tochange human attitudes or behaviors. With his book on the topic Fogg(2002) initiated a field that is now called persuasive technology. Persua-sive technology researchers study interactive systems that are intention-ally designed to change user’s attitudes or behavior (Oinas-Kukkonenet al., 2008; Chatterjee and Dev, 2009; Ploug et al., 2010; IJsselsteijnet al., 2006, e.g.). While the initial work by Fogg (2002) focused heavilyon the use of computers in their traditional sense—e.g. the screen, key-board, mouse combination commonplace in office buildings around theworld—engineers are now incorporating ubiquitous sensors and mobiledevices in their systems. Because of these recent developments scholarshave argued that in the future persuasive technologies will be more ef-fective than their human counterparts since they can be more persistentand “always on” (Fogg and Eckles, 2007).
Recently, Aarts et al. (2007) combined the notions of ambient in-telligent (AmI) systems—systems that build on the large scale inte-gration of electronic devices and the ubiquitous availability of digitalinformation—and persuasive technologies. In an AmI world, distributeddevices operate collectively while embedded in the environment using in-formation and intelligence that is hidden in the interconnection network

3
(Aarts and Ruyter, 2009). The AmI scenario extends earlier ideas aboutubiquitous computing (Weiser, 1991) and provides numerous opportu-nities for persuasion which are out of reach for traditional computingsystems.
1.2 Research ProblemEven though persuasive technologies are already commercially available(see also 2.1), a number of aspects are poorly understood. Persuasivetechnologies have mainly made their way into marketing applicationswhere positive average effects–effects over groups of people—are a rea-son to adopt new technologies. For example, the average sales of ane-commerce website increases by the use of persuasion. A more re-cent focus of persuasive technologies to support individual attitude andbehavior change1 however benefits less from obtaining these averageeffects. Rather, these technologies should attend to individual level ef-fects: the attitudinal or behavioral change of a single user. More andmore technologies are marketed with the promise of changing the behav-ior of an individual user and thus designers of these systems are requiredto design for individual level behavior change instead of average effects.
The problem of designing for individual behavior change has provennotoriously hard. While the first measurable persuasion effects on av-erage were surprisingly large—as in the infamous Milgram experiment(Milgram, 1974)—establishing predictable behavior or attitude changeat an individual level has failed repeatedly. To illustrate, consider thepersuasion principle that is responsible for the effects observed in theMilgram (1974) study called Authority. Experiments show that author-ity appeals (e.g. “A fitness instructor recommends you to have a 30minute run today”) are on average more effective than similar appealswithout an authority argument (e.g. “You should have a 30 minute runtoday”). However, this finding does not imply that everyone will com-ply or even benefit from usage of the authority strategy (see Chapter3). Actually, even in the well-known experiments performed by Mil-gram (1974), about one third of the participants failed to comply to theauthority argument.
Reliably affecting an individual’s attitudes or behavior through per-suasion (rather than coercion) is a goal that is still out of reach oftoday’s persuasive technologies. Scholars like Fogg and Eckles (2007)
1For example Philips DirectLife (http://directlife.philips.com) or the Lark(http://www.lark.com).

4
have hypothesized that to do so persuasive technologies should deliver(a) the right message, at (b) the right time, in (c) the right way to beable to be effective. This truism identifies three important aspects ofsuccessful attitude and behavioral change: First, the target of the per-suasive attempt needs to be receptive to the end goal of the attempt.Second, the message needs to be delivered at a time that enables theuser to attend to it, and if immediate action is required one that pro-vides the opportunity for the action. Finally, large variation can existin the way in which the request is framed: a 30 minute run can be pro-posed by a fitness expert, but can also be supported by a statementthat 80% of healthy people frequently run for 30 minutes.
While large numbers of theorists and experimentalists in the fieldof persuasive communication have struggled over the number of waysthat can be distinguished to identify a persuasive request, or even whatdefines such a way, adapting the way to the current user or persuadee isadvocated throughout all fields that study persuasion: marketeers ad-vocate to adapt the sales tactic used to endorse a product to a consumer(McFarland et al., 2006), while health-care professionals promote tai-loring of the persuasive strategies used to gain medication compliance(Gerber et al., 2009; Ribeiro et al., 2011). Within the health-care fielda large literature on computer-tailored health education, in which per-sonalization that was traditionally carried out by nutrition counselorsis now (partially) replaced by interactive expert systems (Brug et al.,2003), has also recently emerged (see, e.g. de Vries and Brug, 1999;Kroeze et al., 2006). In most of these cases it is advocated that the“way” instead of the end goal of a persuasive request is personalized toan individual persuadee. Kaptein and Eckles (2010) describe this adap-tation of the “way” by focusing on different means to an end. Thesemeans are the core topic of this thesis.
The question “how can the means in which a persuasive request ismade by a persuasive systems be personalized to increase its impact?”is the main research question addressed in this thesis. The question issplit into several parts which are addressed separately. The first partof this thesis—the insight generation section—focusses on the questionsconcerning human behavior that need to be answered:
1. How large is the heterogeneity—the difference betweenindividuals—in responses to different ways in which persua-sive requests are framed? (Chapter 3)
2. How do people respond to multiple influence strategies (ways)

5
that all support the same request? (Chapter 4)3. Can we measure—using questionnaires—people’s susceptibility to
these different ways in which requests are framed? (Chapter 5)Based on the knowledge that is gained about human behavior by em-pirically answering the above questions two more questions arise:
1. How do we apply the obtained susceptibility profile in the contextof a persuasive system? (Chapter 7)
2. Can a system dynamically (sequentially) “learn” a user’s suscep-tibility based on his or her behavioral responses instead of usingquestionnaire measures? (Chapter 8)
These latter two questions are addressed in the case study section ofthis thesis in which a number of persuasive interventions are designed,implemented, and evaluated.
1.3 OutlineFigure 1.1 shows a graphical overview of the structure of this thesis.Chapter 1 gives a background of the problem that is addressed andstates the contributions of this thesis. Chapter 2 describes the currentstate of the persuasive technology field by reviewing parts of the lit-erature relevant for the questions answered in this thesis. These twochapters together thus provide the reader with an overview of the cur-rent state of the persuasive technology field.
From this starting state the thesis reports a number of experimentalstudies which are presented in the chapters called insight generationchapters, Chapters 3, 4, and 5. These studies explore human responsesto repeated exposure to different persuasion principles and establish theneed to personalize influence attempts at the level of social influencestrategies. These chapters show that (a) the heterogeneity in responsesto social influence strategies is large compared to their average effect, (b)combining multiple strategies does not necessarily increase persuasion,and (c) questionnaire measures can be used to reliably assess people’ssusceptibility to distinct persuasive strategies.
Chapter 6 summarizes the findings from the insight generation stud-ies and presents a generalized solution for the design of adaptive per-suasive systems. The requirements to incorporate the findings from theprevious chapters into design to create personalized persuasive systemsare presented. Next, the case studies presented in the second part ofthis thesis describe the implementation and evaluation of systems whichdirectly apply the findings from previous chapters. In Chapter 7 two

6
1 and 2: Persuasive technologies
3, 4, and 5: Insight generation studies
6: Design requirements
7 and 8: Case studies
9: Conclusions
Figure 1.1: Graphical representation of the structure of this the-sis. The insight generation chapters explore severalquestions regarding influence strategies using an exper-imental approach. In the case studies chapters thesefindings are validated in several field studies.
studies are presented that show how adaptation to individual suscepti-bility to different persuasion strategies increases the success of differenthealth interventions. Next in Chapter 8 three instances of systems thatuse dynamic adaptation based on operative measures are deployed andevaluated. Finally in Chapter 9, the implications of the current findingsfor the design of persuasive technologies, and social science studies intothe effects of persuasive strategies are discussed.
1.4 Key ContributionsThe overall aim of this thesis is to advance the design of successful per-suasive technologies by introducing a method to personalize the meansby which a persuasive message is presented to users. The thesis addsto the current literature by extending our understanding of human be-havior, enhancing the methods used to understand these behaviors, andadvancing technology.
1.4.1 Contributions to our understanding of Human behaviorHistorically human-to-human persuasion attempts have had large im-pact—as manifest in the abilities of good salesmen or debaters to con-vince their audiences—but they have had limited reach: only a limitednumber of individuals could be addresses at the same time. With theemergence of mass media and technology mediated communication thereach of persuasive attempts has increased dramatically but the averageimpact of each individual attempt has decreased. This is evidenced forexample by the fact that conversion rates in physical stores are magni-tudes higher than those in e-commerce (see Moe and Fader, 2004). Themain contribution of this thesis to our understanding of human behav-ior is to provide a description of one of the antecedents of persuasiveeffectiveness, in a way that facilitates usage at a large scale.

7
To examine the impact of persuasion, the thesis estimates theheterogeneity—individual differences—in responses to social influencestrategies. The thesis shows that while different means to an end suchas using authority endorsements or consensus appeals all increase com-pliance on average, the stable differences between people are larger thanthese average effects. Applied to a single individual, using an author-ity appeal to promote a request can have negative effects that are farlarger in size than the positive effect found when averaging over groupsof people. These individual differences prove stable both over time andacross contexts.
The thesis then advances our understanding of responses to persua-sive appeals by specifically comparing different means in which a singlerequest can be framed and by exploring the use of multiple of thesemeans for a single appeal. Thus, an appeal to work out more can besupported both by a health expert (Authority) and by a group of similarothers (Consensus). The studies presented in this thesis show that com-bining persuasive strategies does not increase chances of success (Chap-ter 4). Together, these findings motivate a shift from an understandingof the average behavior of groups, to the repeated behavior of individu-als. The thesis shows that personalized persuasion—persuasion adaptedto individual’s previous responses—outperforms persuasion based ontheories of average effects. Human behavior thus proves variable be-tween people, but consistent within them (see Chapter 3). If we wantto persuade on a large scale and with a large impact, our persuasivetechnologies should implement personalization at the level of social in-fluence strategies.
1.4.2 Contributions to MethodologySocial science experiments and theories are by-and-large based on theexamination of average effects: effects over groups of people. Whilethese average effects are often of interest to researchers and policy mak-ers, they are not necessarily a good summary of the effect of psycho-logical processes within individuals. Only if the effects of the variablesunder study are homogeneous can researchers use the average treatmenteffect as an estimate of the individual level effect. If however effects arelargely heterogeneous, the average treatment effect does not properlycapture the nature of the effect under study and thus should not beused for the development of individual-level theory in social science(Cf. Hutchinson et al., 2001).
This thesis presents the use of hierarchical multi-level models with

8
crossed random effects 2 to study individual differences—instead of us-ing these models to more accurately estimate average treatment effects.The within-subject approach used in a number of the studies presentedin this thesis enables researchers to estimate individual level effects ofpersuasion strategies while controlling for other factors. These modelscan also be used to compare the heterogeneity of responses of individ-uals to the average effect under study. If the heterogeneity is smallcompared to the average effect, then it is sensible that theoretical mod-els of persuasive communication can indeed be based on average effects.However, this thesis shows that for some persuasion processes this isnot the case, and thus theoretical explanations of persuasion that focuson average effects are misplaced.
1.4.3 Contributions to TechnologyAs a final contribution, this thesis guides designers of adaptive person-alized persuasive systems by detailing the three core requirements thatneed to be met to implement personalized persuasion in ambient in-telligence. Identification, a means to identify users, representation, thetechnological ability to change representations of appeals, and measure-ment, the ability to log the success of the persuasive attempt, are neces-sities when creating adaptive personalized persuasive systems. Severalsystems which address each of these three requirements in different waysare presented in this thesis. By detailing these systems and detailingthe implementations of the three design requirements in different appli-cation domains the thesis advances our understanding of the design ofpersuasive technologies.
This thesis presents the core requirements that algorithms used tocreate adaptive personalized persuasive systems need to address. Theproposed multi-level model, in which the higher level model is computeda-synchronously, is both effective in identifying the best way to deliveran appeal to an individual users as well as computationally feasible.Several methods to optimize the explore-exploit trade-off that naturallyarises in the design of adaptive systems are presented to aid designersin creating personalized persuasive systems3.
2See section 3.1.1 or Gelman (2005) for clarification.3This chapter is (partly) based on earlier publication(s): (Kaptein et al., 2009b;
Kaptein and Eckles, 2010).

2Related Work
2.1 Persuasive TechnologiesWe have entered an era of persuasive technology, of interactive com-puting systems intentionally designed to change people’s attitudes andbehaviors (IJsselsteijn et al., 2006). These systems emerged for the firsttime around the 80’s with a small selection of research prototypes ofcomputing systems that were designed to promote health or increaseworkplace productivity. In 1981 a description of a computing systemnamed “Body Awareness Resource Network” (BARN) was published.The system provided health information on topics such as drugs, smok-ing, and exercise to adolescents with the aim of improving health relatedbehaviors (Bosworth et al., 1983). Following the massive growth of theinternet the emergence of persuasive technologies truly took off. Web-site developers started to think actively about attitude and behavioralchange and started implementing findings from social science to maketheir websites more effective.
This chapter describes the current persuasive technology field. Thechapter begins by listing a number of examples of persuasive technolo-gies that are exemplar of the different target behaviors or attitudesthan have gained interest from designers of persuasive systems. Next,the chapter specifically addresses persuasion in ambient intelligence by
9

10
making explicit the ambient intelligence vision and identifying the op-portunities for persuasive systems.
Since this thesis focusses on the use of social influence strategies thechapter briefly reviews parts of the social science literature that are con-cerned with attitude and behavioral change and are deemed relevant forthe design of persuasive systems. The literature on social influence andpossible taxonomies of social influence strategies is brought forward. Aspecial focus in this section is on previous work that identifies individualdifferences in responses to social influence strategies. The overview ofpersuasive systems and the review of the literature on social influencestrategies are then combined to detail the current state of persuasivetechnologies. Two main limitations of the current state are identifiedwhich give rise to the questions that are addressed in Chapters 3, 4,and 5.
2.1.1 Examples of Persuasive TechnologiesThe number of persuasive systems grew rapidly in conjunction with thegrowth of the web. Early persuasive applications focussed on educationof the public. A few years later, the landscape of persuasive technologiesstarted to shape up, and it became clear that four application areaswarranted the most attention of researchers and practitioners: Health,Safety, Environmental conservation, and marketing.
The first health related persuasive systems concerned the 5-A-Day Adventures cd-rom distributed by Dole, and Baby Think It Over(BTIO) (King and Tester, 1997; Lambert, 2001; De Anda, 2006). Thefirst of these used animated characters, music, and small games to en-courage children to eat more fruit and vegetables. BTIO is an inter-active doll first released in 1998 which is still on the market today.Through simulation the doll teaches young potential parents the pitfallsof parenthood. BTIO was included in several obligatory high-schoolcourses to prevent teenage pregnancy. More recently health relatedcommercial products have hit the market that focus on maintainingan active lifestyle (e.g. Philips DirectLife and Nike +) and adopting ahealthy sleeping regime (e.g. Lark and MyZeo). Persuasive technologiesto increase general health also include text-based interventions to aidusers in giving up smoking (Khaled et al., 2008; Preece, 2010) or con-sume less snacks (Long and Stevens, 2004; Bubb, 2007; Arteaga et al.,2009; Kaptein et al., 2011a).
The second thriving field, that of safety, was defined early on bywww.kustomsignals.com. This website educates users of the advan-

11
tages of driving safely and reducing their overall driving speed (Kingand Tester, 1997). Other educative websites that train users to increasesafety in many domains have emerged after this example (Yeo et al.,2009; Mintz and Aagaard, 2010; Chittaro and Zangrando, 2010). Nextto web-based applications persuasive technologies that go beyond the“boxed” computer paradigm have also been developed: the HygieneGuard system by King and Tester (1997) consisted of a series of inter-active badges for restaurant and hospital employees combined with aninteractive system installed in the restrooms. Employees were encour-aged to wash their hands by the public display of their failure to do soon their badges, making the behavior salient to others.
A more recent focus of persuasive technology researchers and practi-tioners has been on the development of systems to increase environmen-tally friendly behaviors. The introduction of Smart (energy) Meters—or the promise of such an introduction—has generated several researchprojects examining the effects of different types of technology initiatedfeedback on user’s energy consumption (see, e.g. Midden et al., 1983;Svane, 2007; Midden et al., 2008; Ham et al., 2009; Bang et al., 2006).Besides providing feedback in the home, several research projects havefocussed on influencing energy behavior of office workers (Lockton et al.,2008). Finally, applications that monitor and display driving behav-ior have been successful at reducing the fuel consumption of drivers(Meschtscherjakov et al., 2009). Given the emergent shortage of oil andother natural resources to satisfy humanities energy needs, more per-suasive applications in this field are likely to be developed in the comingyears.
Persuasive technologies used for marketing purposes have markedboth the initial growth of the field and are still the most salient exam-ple. While starting off by using online implementations of themes thathad worked for decades in the consumer world, persuasive technologiesfor marketing purposes now extend beyond traditional marketing: ap-plications track consumers and their preferences over multiple storesand across media to efficiently target their appeals (see, e.g. Zankeret al., 2009; Amit and Zott, 2001). With this tracking and tailoring—adapting to individual preferences—persuasive marketing applicationsseem to again be a step ahead of their counterparts in different appli-cation domains.
Recently health-care professionals and researchers, most noticeablyin the domain of nutrition education, are following the marketeers inproviding computer-tailored interventions. Here tailored interventions

12
are often created to mimic, to a certain extend, person-to-person coun-seling (de Vries and Brug, 1999; Brug et al., 2003). Both target groupsegmentation — which also initially emerged within marketing (Ty-nan and Drayton, 1987; Plummer, 1974) — and personalization basedon psychological characteristics such as people’s stage-of-change (Bruget al., 1997; Prochaska and Velicer, 1997) are starting to be used. Ini-tial evaluations showed the increased effectiveness of these types ofcomputer-tailored interventions over more traditional, “one size fits all”health education efforts (Brug et al., 1998, 1999; Brug, 1999). Noaret al. (2007) several years later conducted an elaborate meta-analysisof the effects of tailoring on the success of health interventions basedon over 50 published comparisons and derived the same conclusion: tai-lored interventions are more successful than generic ones.
2.1.2 Persuasion in Ambient IntelligenceAlthough persuasive applications initially originated on the web andwere mainly implemented on standard computing systems, currentlypersuasive applications excel in using additional sensing equipment tocreate a more persuasive experience. More and more do persuasivetechnologies combine a number of computing devices for measurement,signaling, and user interaction. With this shift, persuasive systemsdesigners frequently find themselves at the forefront of the ambient in-telligent vision. Ambient Intelligence (AmI) (Aarts, 2010) extends theUbicomp scenario brought forward by Weiser (1991). Similar to ubiq-uitous computing AmI is concerned with the integration of computingdevices in the environment. Different however is the focus on the userinstead of on the technology (Koch and Schlichter, 2001). Ubiquitouscomputing researchers were mainly concerned with the enabling tech-nologies (Aarts and Ruyter, 2009), but AmI researchers work on appli-cations that suit user needs and that combine distributed computingsystems and a high level of system intelligence.
The technology and vision created by AmI researchers and prac-titioners lends itself well to develop persuasive applications. Persua-sive technologies benefit from unobtrusive measurements of their ef-fects, multiple media and devices to reach out to their users, and a highlevel of system intelligence to provide effective persuasion. Services likePhilips DirectLife provide a clear example of persuasion in ambient in-telligence: A measurement device is coupled with interactive (human)coaching via the web and the smartphone. Multiple devices and a highlevel of intelligence—be it partly provided by humans—are combined

13
to serve the goal of the user to lead a more active lifestyle.In three of the most prominent application areas of persuasive tech-
nologies, health, safety, and energy consumption, the AmI vision isalmost a requirement to provide adequate feedback about the effec-tiveness of the persuasive application. For example, to determine theeffectiveness of a persuasive application aimed to reduce energy con-sumption multiple measurement devices to accurately assess actual en-ergy consumption need to be in place. Furthermore, feedback needsto be provided to users at different times, via different channels, andrelevant to the current usage situation.
2.1.3 Persuasive technology designSeveral scholar’s have put effort into the development of frameworks tosupport the design and or evaluation of persuasive systems. Followingthe work of Fogg (2002) researchers and practitioners have tried to cap-ture the complexities that underly the design of successful persuasivetechnologies. The most noticeable of such design frameworks are the8-step design process by Fogg (2009b) and the Persuasive Systems De-sign (PSD) model brought forward by Oinas-Kukkonen and Harjumaa(2008a).
The 8-step design framework by Fogg (2009b) starts with (1) achoice of a target behavior. Next, designers are encouraged to (2) de-termine the target audience and (3) find out why the target behavioris currently not performed. Designers should then (4) find an appro-priate channel to reach the target behavior and (5) find prior examplesof persuasive applications that are relevant for the current problem.Imitation of successful others (6), quick testing and iteration (7), andexpansion on success (8) then finalize the steps to build successful per-suasive technologies according to Fogg (2009b).
The PSD model presented by Oinas-Kukkonen and Harjumaa (2009)also aims at aiding designers in their efforts to create persuasive applica-tions. The PSD model separates three steps in the design of persuasivesystems. First, the designer should understand the key issues behindpersuasive systems. Second, the designer of a persuasive system shouldanalyze the persuasion context by identifying the intend, the event, andthe strategy that is used. Finally, the designer of a persuasive systemshould consider the system qualities further elaborated upon by identi-fying primary task support, dialogue support, credibility support, andsocial support.
The PSD model which was initially published in combination with a

14
clear example for each of the three phases (Oinas-Kukkonen and Harju-maa, 2008b, 2009; Torning et al., 2009) provides designers with guide-lines for the design of persuasive systems. Throughout, the frameworkuses knowledge derived from several social science disciplines—in theform of persuasive principles—to recommend design choices. Oinas-Kukkonen and Harjumaa (2008a) take this even further by evaluatingpersuasive applications by their implementation of these principles, im-plying that successful persuasive applications implement as many prin-ciples as possible.
Both Oinas-Kukkonen and Harjumaa (2009) and Fogg (2009b) thusemphasize the importance of using persuasive tactics—or social in-fluence strategies—to increase the effectiveness of persuasive systems.Fogg (2002, 2009b) identifies 42 of such tactics, and Oinas-Kukkonenand Harjumaa (2009) identifies 28 design principles, most of which canbe found in the social science literature typically described as socialinfluence strategies.
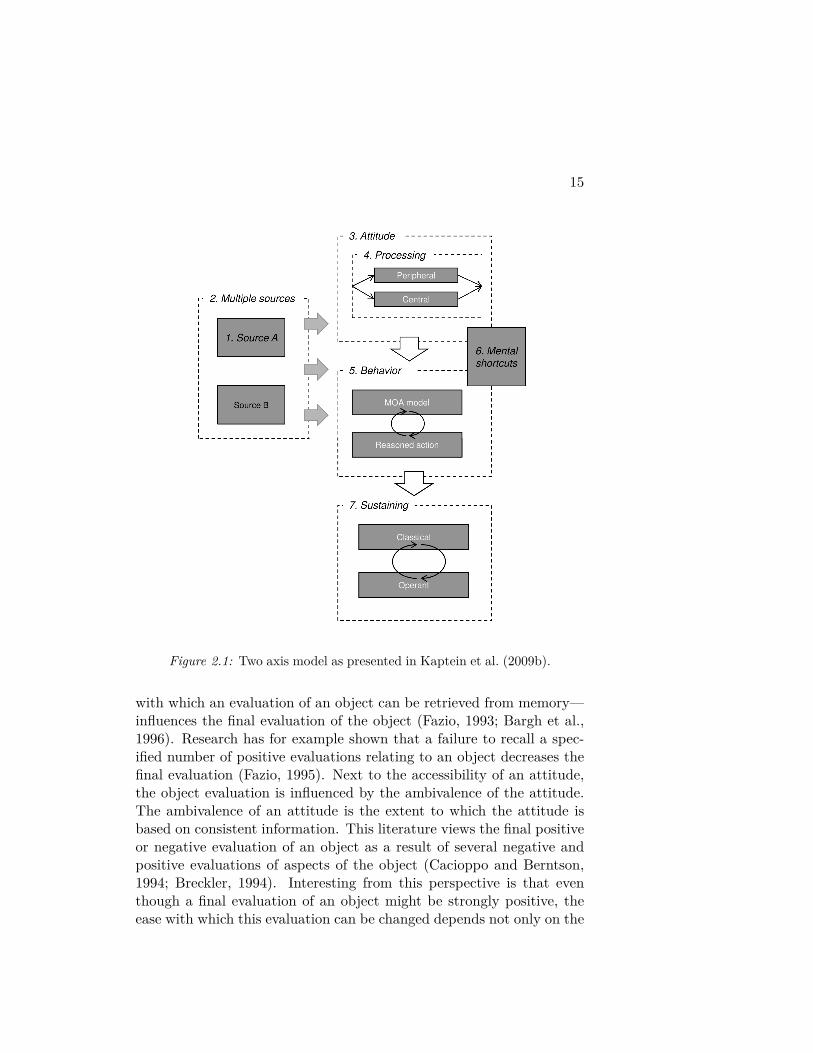
2.2 Attitude and Behavioral ChangeThe study of attitude and behavioral change is too elaborate to properlyreview in this thesis. Based on the work presented in (Kaptein et al.,2009b) this section gives a concise overview of the relevant findings ofthese associated fields for the design of persuasive technologies. Kapteinet al. (2009b) structure the attitude and behavioral change literaturerelevant for the design of persuasive technologies along two axis. Thefirst axis is typified by the attitude-behavior continuum and defines thetarget of the persuasive intervention: Does the intervention try to (a)change attitude, (b) elicit a new behavior, or (c) sustain an alreadyperformed behavior? The second axis distinguishes between the num-ber of sources that are used for a persuasive attempt and ranges fromstrategies that rely on a single source (1), to those relying on the effectsof multiple sources (2). Figure 2.1 gives a graphical overview of theseaxis and provides a structure for the review presented in this section.
Attitudes (a)Attitudes are defined in multiple ways by different scholars, but at thecore is the notion of evaluation: Attitudes are viewed as a summaryof evaluations of objects (thoughts, ideas, products, behaviors, etc.)along a dimension ranging from positive to negative (Petty et al., 1994,1997). The strength of an object-evaluation association—e.g. the ease
15
Figure 2.1: Two axis model as presented in Kaptein et al. (2009b).
with which an evaluation of an object can be retrieved from memory—influences the final evaluation of the object (Fazio, 1993; Bargh et al.,1996). Research has for example shown that a failure to recall a spec-ified number of positive evaluations relating to an object decreases thefinal evaluation (Fazio, 1995). Next to the accessibility of an attitude,the object evaluation is influenced by the ambivalence of the attitude.The ambivalence of an attitude is the extent to which the attitude isbased on consistent information. This literature views the final positiveor negative evaluation of an object as a result of several negative andpositive evaluations of aspects of the object (Cacioppo and Berntson,1994; Breckler, 1994). Interesting from this perspective is that eventhough a final evaluation of an object might be strongly positive, theease with which this evaluation can be changed depends not only on the

16
strength—generally it is assumed that strong attitudes are less easilychanged (Tesser, 1993)—but also on the ambivalence of the base of theattitude: The more pro’s and con’s the attitude was based on, the morecompliance with a counter attitudinal requests increases (Leippe andEisenstadt, 1994).
Research has shown that there is a distinction between attitudeshaving an affective base, and those having a cognitive base, and thatthis origin of attitudes influences how attitudes can be changed. Practi-cally this distinction shows that attitudes towards some topics are moreeasily changed using affective—emotional—arguments, while some ben-efit from cognitive—fact—based arguments (Petty et al., 1994). Thisdistinction could be of importance for the design of ambient persuasivesystems since an attitude with an emotional basis is likely not easilychanged by cognitive arguments and vice versa.
Initial Behavior (b)The MOA, Motivation, Opportunity, and Ability, model was introducedby Maclnnis and Jaworski (1989), and elaborated upon by Rothschild(1999), and is primarily used to explain why a specific behavior occursamongst competing behaviors. The basic principle of the MOA modelis that the likelihood for a single behavior to be performed dependson the motivation to perform the behavior, the opportunity to performthe behavior, and the ability to perform the behavior (de Heer andPoiesz, 1998). Motivation is the predisposition of the person performingthe behavior towards the behavior. Motivation is often split betweenintrinsic and extrinsic motivation (Ryan and Deci, 2000). Intrinsicmotivation refers to motivation to enact a behavior for its inherentsatisfaction—its alignment with ones personal values or attitudes—andnot for some separable external consequence (West et al., 1975; Deci,1975). External motivation refers to motivation which is controlledby externalities that are not part of the activity or behavior they areinfluencing (Deci et al., 2001). The most common examples of externalmotivation are reward and punishment. Internal motivation seems toincrease the likelihood of the behavior being performed, and perhapsmore importantly seems to lead to sustained behavior (Deci, 1975)
Once a person is motivated, be it internally or externally, to per-form a behavior the likelihood of enactment is dependent on theopportunity—the extent to which the external environment enables thebehavior—and a persons ability—the extent to which a person possessesthe skills and knowledge necessary to enact. For example, even though

17
a person is very willing to throw a brick through a window, first oneneeds to find the brink (opportunity) and secondly, one needs to be ableto aim, control the arm muscles, and strike a hit (ability). In a brick-less situation this behavior becomes unlikely even though motivationand ability might be high (Robben and Poiesz, 1993).
Sustain behavior: Conditioning (c)When a desired target behavior is performed it is often important to sus-tain that behavior. The classical psychological approach to sustainingbehavior is that of conditioning. Conditioning can be separated intothe field of classical conditioning (Gormezano et al., 1987)—relatingtwo previously unrelated stimuli—and operant conditioning (For anoverview see Skinner, 1976)—enforcing behavior by the use of rewardand punishment. For persuasive purposes the field of operant condi-tioning, which enables sustaining of voluntary performed behaviors, ismost relevant.
Once favorable attitudes towards a behavior have been formed, andthe behavior is performed for a first time, several methods of stimulatingor inhibiting the behavior can be of use. Traditionally one separatesreinforcements, consequences of the behavior that make the behaviormore likely, and punishments, consequences that render the behaviorless likely. Since both of consequences can either be removed or added,there are four possible reinforcement schemes (Ferster, 1957):
1. Positive reinforcers: A behavior is followed by a positive stimulus(reward).
2. Negative reinforcers: A behavior is followed by the removal of anegative stimulus (punishment).
3. Positive punishment: A behavior is followed by a negative stimu-lus.
4. Negative punishment: A behavior is followed by the removal of apositive stimulus.
All four of these schemes can be used by ambient persuasive sys-tems to reinforce behavior. Since the notion of operant conditioning isrelatively old numerous effects have been described and researched. Alot of work has been done on extinction (e.g. Kirkpatrick et al., 1964;McNaughton, 1984), the effects of neither reinforcing nor punishing abehavior, after a behavior has been conditioned. Typically one observesan extinction boom: a sudden frequent outburst of the behavior. Next toextinction effects a number of different punishment and reinforcement

18
schedules have been researched. The literature also identifies differ-ent schedules of reinforcement and their behavioral outcomes (Ferster,1957). One can distinguish between time reinforcers or ratio reinforcers;a reward or punishment after a number of times the behavior has beenperformed (ratio) or a specific time after the first occurrence of thebehavior (time). Both of these can be done specifically or variable,in which fixed implies that the behavior is reinforced only on regularintervals.
Single Source processes (1)Besides the attitude—behavior—-sustaining behavior continuum thesocial science literature has focussed on important source effects—properties of the persuader—that influence compliance. The next twosections briefly summarize the effects that have been identified for asingle source, and for multiple sources.
Several single source characteristics influence the effectiveness of apersuasive request. Heavily researched of these (single) source effectsare perceived friendliness, perceived similarity, mimicry, and reciprocity.The conclusions are summed below:• A greater perceived legitimate authority increases compliance to
a persuasive request (Milgram, 1974; Miller et al., 1995; Slateret al., 2006).• Sources that are considered friendly, or are liked by the receiver,increase compliance to their requests (Cialdini, 2004; Kapteinet al., 2010b).• A greater similarity of the source of the request and the receiverincreases compliance. (Burger et al., 2004; Festinger, 1954; Mur-ray et al., 1987; Schultz, 1999).• Mimicry—similarities in behavior—by a source relative to a re-ceiver increases compliance (Chartrand and Bargh, 1999; Char-trand et al., 2005; Kaptein et al., 2010b).• People are inclined to return—reciprocate—a favor (Cialdini,2004; James and Bolstein, 1990; Komorita et al., 1991).• Repetition—multiple exposures to the same source over time—increases compliance (Latané et al., 1995; Nowak et al., 1990).
Multiple sources (2)Next to the influence of the perception of the receiver of a single sourcemaking a persuasive request, a number of multiple source effects exist.

19
These effects are distinct from single source effects. Research in thearea of multiple sources acknowledges that the compliance of an indi-vidual to a persuasive request is not merely determined by the currentinteraction between the source and the receiver, but also by previousinteractions with others, interactions with the same source, and thenumber of repetitions. Thus, ones attitude or behaviors are dependentupon the social environment in which one lives. The main findings are:• Social proof is a powerful persuader. In uncertainty people lookat the behavior and attitudes of others to determine their own(Cialdini, 2001; Latané, 1970; Latané and Nida, 1981).• The number of people in reference group (for example in cases ofsocial proof) or the absolute number of sources making a requestinfluences compliance. More sources with a similar cue lead tohigher compliance (Latané, 1996; Latané and Bourgeois, 1996).• Immediacy leads to compliance: people comply with those thatare close or more intimate to them (Latané, 1996; Nowak et al.,1990).• People generally seek consensus. People generally tend to min-imize stress and conflict arising from competing opinions or be-haviors (Asch, 1955).
It is important to note that many scholars identify a positive attitudetowards a behavior key for the behavior to be performed (e.g. Maclnnisand Jaworski, 1989; Fogg, 2009a). As such, the formation of attitudes,and the processing of appeals to influence attitudes, is of importancefor the design of persuasive systems.
2.2.1 Dual Processing ModelsInvestigators in psychology often explain and predict how implementa-tions of influence strategies affect consumer attitudes using dual-processmodels. According to the Elaboration Likelihood Model (ELM) (Ca-cioppo et al., 1986), persuasive messages can affect attitudes throughboth central and peripheral routes. The central route is characterizedby elaboration on and consideration of the merits of presented argu-ments. On the other hand, the peripheral route is characterized byresponses to cues associated with but peripheral to the central argu-ments of the advocacy. The latter occurs through the application ofsimple, cognitively “cheap”, but fallible rules.
Frequently, the use of these cognitively “cheap” rules—such as “aproduct is almost out of stock”—leads to a fast and relatively accurate

20
appraisal of the merits of the product: If the product is almost out ofstock, a large number of prior customers may have bought the productbased on product merits and opportunities to buy in the future may berare or high cost (Verhallen and Robben, 1994). Thus, without engagingin full and cognitively costly processing, a consumer can make a choicebased on an accurate peripheral cue (Goldstein and Gigerenzer, 2002).This suggests why implementations of many social influence strategies—or compliance-gaining tactics in the marketing literature (Payan andMcFarland, 2005)—are effective: via the peripheral route they providea cognitively cheap shortcut to, on average, effective decision makingabout product merits. The central route and the peripheral route labelthe endpoints of a continuum, as any message will have its effects bothvia the central route and the peripheral route, and can affect the use ofeither route (Petty and Cacioppo, 1986; Petty and Wegener, 1999).
2.2.2 Social Influence StrategiesThe array of persuasion and influence tactics that can be used to changeattitudes and behaviors in consumers can be overwhelming. Both re-searchers and practitioners have made extensive use of the categoriza-tion of persuasive messages as implementing more general influencestrategies. Theorists have varied in how they individuate influencestrategies: Cialdini (2001, 2004) develops six principles at length, Fogg(2002) describes 40 strategies under a more general definition of persua-sion, Kellermann and Cole (1994) gather 64 groups from several tax-onomies, and others have listed over 100 (Rhoads, 2007). These differentcounts result from differing levels of exhaustiveness, exclusivity, empha-sis, and granularity (Kellermann and Cole, 1994). Influence strategiesare however a useful level of analysis that helps to group and distin-guish specific influence tactics or implementations of these strategies(Kellermann and Cole, 1994; O’Keefe, 1994). For designers of persua-sive messages, classifying “almost out of stock” as an implementationof the scarcity strategy (Cialdini, 2001) provides research-based expec-tations about that message’s effects—across products and individuals.This thesis focusses on the six influence strategies described by Cialdini(2001). Multiple implementations of each of these strategies have beenshown to be effective in previous laboratory and field experiments.
(1) AuthorityWhen an authority figure tells people something to do, they typicallydo it (Milgram, 1974; Blass, 1991). Consumers are therefore frequently

21
faced with authority endorsements of products such as “expert reviews”.Authority is considered a form of social influence (Kelman and Hamil-ton, 1989; Martin and Hewstone, 2003) that is effective because somelevels of responsibility and obedience to authority are essential for theexistence of every social community (Modigliani and Rochat, 1995; Cial-dini, 2001); thus, obedience has an evolutionary advantage. However,not all psychological theories predict a positive effect of authority en-dorsements: Fuegen and Brehm (2004) use reactance theory to explainhow authority endorsements can lead to negative effects when people’sperception of freedom of choice is threatened. Thus, while frequentlyused to influence consumers, theory allows for authority arguments tohave either a positive or a negative effect on an individual’s attitudesand behaviors.
(2) ConsensusWhen individuals observe multiple others manifesting the same beliefor behavior, they are more likely to believe and behave similarly (Ajzenand Fishbein, 1980; Cialdini, 2004; Goldstein et al., 2008; Zhu andZhang, 2010). This effect of consensus is used to influence people’s de-cision making by stating that products are bestsellers or by displayingother consumers’ positive evaluations of a product. Multiple processeshave been posited to explain the effectiveness of the consensus strategy:Asch (1956) ascribes the observed effects to mere conformity, while oth-ers postulate that implementations of the consensus strategy constituteinformational influence, by serving as “social proof” (Hardin and Hig-gins, 1996; Cialdini, 2001). But theorists have also identified processesthat would lead to adverse effects of consensus. For example, Conwayand Schaller (2005) use attribution theory to explain how individualsmight come to question the value of a consensus opinion and may becompelled to reject it.
(3) Consistency and CommitmentThe Consistency and Commitment strategy refers to people’s strive tomaintain consistent believes and act accordingly (Cialdini, 2001). Thisstrive has been well researched under the heading of reducing cognitivedissonance (Festinger, 1957) and can be also used to explain both at-titudes and behaviors. If a person is asked to write down that he orshe will stop taking the elevator and take the stairs instead they willbe more inclined to do so even if they did not agree on writing it downin the first place (Deutsch and Gerard, 1955). People will try to be
22
consisted with their writing. The consistency principle as such also ex-plains the power of commitment: people will act as they told or wrotethey will.
(4) ScarcityAssumed scarcity increases perceived value of products and opportuni-ties (Cialdini, 2001), so advertisers and salespeople often use phraseslike “limited release”, and “while supplies last” (Lynn, 1991). There isoverwhelming evidence that identifying a product or service as scarcewill favorably affect consumer attitudes and increases the chance of pur-chase (West, 1975; Inman et al., 1997; Eisend, 2008; Lynn, 1989). Mul-tiple psychological processes have been proposed to explain the effectsof scarcity, the most prominent of which is based on commodity the-ory (Brock, 1968) and states that humans desire scarce products morebecause the possession of such products produces feelings of personaldistinctiveness or uniqueness. Other authors have expanded this idea bypositing a psychological trait, the Need for Uniqueness (Fromkin, 1970;Snyder and Fromkin, 1980), which drives people to seek out productsthat make them feel unique. Other theoretical explanations for the ef-fectiveness of the scarcity include reactance theory (Brehm, 1966; Cleeand Wicklund, 1980), personal equity theory (Seta and Seta, 1982), anddissonance theory (Festinger, 1957). Not all of these theories predict apositive effect of scarcity in all situations; for example, reactance the-ory predicts scarcity effects only when the product under considerationrepresents an important right or freedom.
(5) LikingWe say “yes” to people we like. When a request is made by someonewe like, we are more inclined to act accordingly (Cialdini, 2001). Over-whelming evidence of this strategy is presented by studies that exploitincreased liking due to interpersonal similarity. For example, people aremore inclined to return a wallet to the lost and found when the namelisted in the wallet is similar to their own then when it is dissimilar(Hornstein et al., 1968).
(6) ReciprocityPeople are inclined—or actually, people go through a great deal ofeffort—to pay back a favor (Cialdini, 2004). This social influencestrategy—when implemented properly—is exceptionally strong, andseems to work even when it is truly unbeneficial for the persuadee.

23
When a persuadee is in depth to the source, he or she will comply withpersuasive requests to even out this discrepancy. The strategy of re-ciprocation which is also the foundation in the tit-for-tat strategy, themost favorable algorithm to win social dilemma games (Komorita et al.,1991), seems rational. However, it has been shown that people even re-ciprocate to favors they had never asked for (James and Bolstein, 1990).
2.2.3 Individual DifferencesDespite the large body of work investigating social influence strategiesand the theoretical models such as the ELM to explain their effective-ness researchers have had serious difficulties in replicating previous find-ings. For example, a thorough meta-analysis (Johnson and Eagly, 1989)of the research on the effects of argument strength on persuasion—asfrequently used in ELM research to appeal to either peripheral or centralprocessing—has found mixed results. This highlights the importance ofprotocols and well developed stimuli to replicate some of the field’s mostcompelling findings. Because of these, and other, difficulties in replica-tion researchers have investigated properties of context, messages, andindividuals to further understand persuasion processes. The followingsection reviews the most important advances in the studies of individualdifferences in responses to social influence strategies.
Need For CognitionMuch of the work on individual differences in persuasion has directlydrawn on dual-process models—and the ELM in particular—to workout how new or established traits could moderate persuasion. Manyof these studies have examined trait differences in motivations, such asneed for cognition (NfC, Cacioppo et al., 1986), that effect differencesin peripheral and central processing of persuasive messages. Thus, NfCpredicts differences in the effects of argument strength on attitudes, thedegree to which individuals rely on product characteristics versus sourceliking (e.g., Haugtvedt et al., 1992), attitude strength resulting fromprocessing a persuasive message (e.g., Haugtvedt and Petty, 1992), andmetacognition in persuasion (e.g., Tormala and DeSensi, 2009). Moregenerally, for many choice settings in which personal relevance is nei-ther very low nor very high, elaborative processing of stimuli varies withNfC, such that NfC measures an individual difference in propensityto scrutinize and elaborate on arguments via the central route (Ca-cioppo et al., 1996). For example, people high in NfC are more likely

24
to scrutinize whether someone endorsing a product is actually a doctor(or an actor playing an actor) and how this might be informative aboutthe product. High elaboration or personal involvement both lead to in-creased usage of the central route to persuasion and thus less persuasionthrough social influence strategies.
While NfC is the most widely used trait that operationalizes sta-ble motivational heterogeneity in dual-process models, several relatingtraits have been identified and studied (Haugtvedt et al., 2008). Mea-sures of individuals’ need for closure (Webster and Kruglanski, 1994),need to evaluate (Jarvis and Petty, 1996), and need for affect (Maioand Esses, 2001) have all received attention in the persuasion litera-ture. The approach of using the ELM to generate hypotheses abouthow new or established traits affect persuasion processes continues toyield insights into the many relationships between personality and per-suasion. On the other hand, the ELM does not immediately suggesttraits that would be associated with differences in responses to distinctinfluence strategies, but taxonomies of influence strategies are widelyused by those designing influence attempts as detailed in the previoussection. The flexibility of the ELM—whereby any cue can serve in manydifferent roles—can also make it difficult to extract specific predictionsabout how a trait might affect persuasion in practice.
Preference for ConsistencyInvestigators have fruitfully drawn on the categorization of messagesas implementing distinct influence strategies to identify and study per-sonality constructs that are plausibly associated with the posited pro-cesses by which particular influence strategies function. For example,the commitment strategy, including a range of implementations such asin “foot-in-the-door”, functions through the application of motivationsfor consistency. A personality scale that measures these motivations—preference for consistency—predicts responses to the commitment strat-egy, such that for participants low on this trait these strategies are inef-fective (Cialdini et al., 1995; Guadagno et al., 2001). This prior researchhas helped explain the difficulties investigators have had in replicatingconsistency results. Successful use of this approach in studying otherinfluence strategies requires a theory about the psychological processesthat make that strategy effective and how these might vary in the pop-ulation. Such settled theory is not always available; even in the caseof preference for consistency, there has been considerable controversyabout the mechanism(s) by which foot-in-the-door is effective (Burger,

25
1999).
Measurement of Individual DifferencesThe prior research can be described as relying on meta-judgmental mea-sures of personality traits. In the context of attitude strength, Bassili(1996) distinguished between meta-judgmental measures and operativemeasures of attitude strength. A similar distinction applies in the con-text of individual differences in persuasion. Meta-judgmental measuresof personality traits ask individuals to report judgments about the con-sistent, structural properties of their broadly applicable attitudes, pref-erences, beliefs, and behaviors; in these measures, individual’s psy-chological processes serve as objects of their consideration. Manyquestionnaire-based measures of personality traits are meta-judgmentalmeasures. On the other hand, for operative measures individuals’ psy-chological processes are in use: they are operating. For example, anoperative measure of NfC might be a summary of differences in anindividuals’ responses to strong and weak arguments about multipletopics.
One argument in favor of operative measures of individual differ-ences in persuasion is that it has been difficult to construct valid meta-judgmental measures. While the meta-judgmental measure of prefer-ence for consistency is now widely used and accepted (Guadagno andCialdini, 2010), it followed several failed attempts at creating a measurethat would predict heterogeneity in responses to implementations of thecommitment strategy (see Cialdini et al., 1995). There are also reasonsfor using operative measures that follow from issues in applied settings:It might not always be possible to administer questionnaires to users ofa persuasive technology. Finally, meta-judgmental measures might be,due to their context independence and evaluative nature, less predic-tive of responses to a given persuasive system than operative measuresobtained within a specific context.
Discussion on Individual DifferencesWhile investigations of individual differences in responses to persuasionhave proven fruitful in an experimental context, the theories often leavedesigners of persuasive systems uninformed about the ways in whichindividual differences can be addressed when designing persuasive sys-tems. Event though some social influence strategies are theorized tobe ineffective for a part of the user population it is often unclear howthese users should be identified and what changes need to be made to a
26
system to facilitate these users. Within computer-tailored health edu-cation, an active contemporary personalization of persuasion attempt,researchers therefore often rely at least partly on the expertise of prac-titioners (counselors). These experts create a series of “if-then” state-ments that inform the presentation of different persuasive content todifferent individuals (Brug et al., 2003) instead of creating this contentsolely based on theories of attitude and behavioral change.
Given the numerous indications of individual differences in responsesto social influence strategies it is also surprising to see that the mag-nitude of these differences has not been compared to the frequentlyreported upon average effects. The average effects—the effects overmultiple people—defined the formulation of strategies and subsequentlytheir way into the design frameworks for persuasive technologies. How-ever, other than in marketing applications, persuasive technologies oftenfocus on attitude or behavioral changes for individual users and as suchthe average effects are not the core interest: the possible range of effectsof a influence strategy on a specific user will determine the success ofthe persuasive system. The current literature hardly informs design-ers about the relative importance of attending to individual differencesversus implementing different social influence strategies identified in theliterature.
2.3 Conclusion: ReflectionsFogg (2002) identified the core opportunities of persuasive systems: Per-suasive technologies can be more efficient than their human counterpartsby being more persistent, by being always on, and by tailoring their per-suasive attempts to responses by their users. A review of the currentpractice however shows that while the first two objectives are met, thethird one is frequently neglected. This is true even though social scienceinvestigations into the effects of social influence strategies indicate thatthere are individual differences that could be attended to. Differenceswhich, once they are attended to, possibly increase the effectiveness ofpersuasive systems.
This neglect has two causes: First, the social science literature isgenerally not informative enough for designers of persuasive systemsto decide on which individual differences to attend to, and thus whichattributes of persuasive systems to tailor to individuals. While social in-fluence strategies constitute a frequently used feature of persuasive tech-nologies that have received considerable research attention, even there

27
the magnitude of the average effects compared to the individual effectsis unclear. Thus, designers cannot readily estimate the importance oftailoring their use of social influence strategies to individual users. Sec-ond, persuasive technology designers are generally not very concernedabout measuring the effects of their interventions. Many evaluationsof persuasive systems that are deployed in the field concern usabilityevaluations rather than effectiveness evaluations. This point is eminentby the lack of focus on effect measurement in the design frameworksthat are proposed to aid designers in their efforts to design persuasiveapplications (e.g., Oinas-Kukkonen and Harjumaa, 2009; Fogg, 2009b).Thus, often it is unclear what the effects of existing applications onuser’s attitudes and behaviors actually are.
In the subsequent chapters the individual differences in responses tosocial influence strategies, the effects of the usage of multiple strategiesfor a single application, and possible means of measuring individualdifferences are further explored. These chapters focus on uncoveringproperties of social influence strategies, and people’s responses to thesestrategies, that inform designers in their quest to design effective per-suasive technologies 1.
1This chapter is (partly) based on earlier publication(s): (Kaptein et al., 2009b;Kaptein and Eckles, 2010).

28
3Insight Generation I:
Heterogeneity in Responses to SocialInfluence Strategies
3.1 IntroductionThis first insights generation chapter studies the heterogeneity—individual differences—in responses to social influence strategies. Thischapter uses a selection of the social influence strategies as the ba-sis to explore the difference in magnitude between average treatmenteffects—the effects that are usually attended to in the literature onsocial influence strategies—and the individual level effects.
In three studies this chapter examines the size of the individual dif-ferences relative to the average effect of persuasive strategies, and thestability of these individual level estimates over time and contexts. Themethod brought forward here focusses on operative measures: Mea-sures of the effect of different influence strategies at the moment thepsychological processes are at play. All three studies present peoplewith different implementations of a number of influence strategies, andmeasure their responses. Based on the responses an estimate of theeffectiveness of each strategy can be obtained, and this estimate is the
29
30
operative measure of an individual’s persuadability by a specific influ-ence strategy.
3.1.1 Analysis Using Multi Level ModelsAll three studies presented in this chapter use multilevel hierarchicalmodels with crossed-random effects to obtain the operative measures ofthe individual level effects of different influence strategies. This sectiondescribes how these models are build up, and why they provide a goodmethod to estimate and study individual differences. The models ex-tend common linear regression in the sense that some parameters (orbatches of parameters)—called the “random effects”—are constrainedby a prior distribution over their values.
To understand hierarchical models it is convenient to start with anexplanation of the so-called “null” model (Snijders and Bosker, 1999),a model which includes only an overall intercept and varying interceptsfor each individual. In this “null” model, the “scores” of an individualare modeled using the average score across individuals (present for eachindividual) and an individual level estimate. The latter represents thedifference in score of a specific individual from the average score ofothers. The model is written as
yij = µ+µi+σ2err (3.1)
whereµi ∼N (0,σ2
µ) (3.2)for i = 1, ...,N people with j = 1, ...,J observations per person. Thescore of an individual is estimated by the sum of the overall intercept µand the per-participant intercept µi. The latter is constrained to havea Gaussian distribution with mean 0 and variance σ2
µ. Thus, µ, and σ2µ
are the parameters that are estimated.Let us examine how this “null” model represents individual dif-
ferences: Suppose y1j is participant 1’s evaluation of a product j.The model described in equation 3.1 predicts this individual’s evalu-ations based on a weighted average of the evaluations of other partic-ipants, as well as the (prior) evaluations of the same participant. Ifan individual—participant 1—evaluates products more positively thanthe average rater, her individual µ1 will be positive. If multiple partic-ipants score consistently much higher or lower than the grand average,µ, then σ2
µ will be large. Thus, σ2µ is a direct measure of the size of the
heterogeneity in responses between people. This principle can be ex-

31
tended to incorporate effects of multiple influence strategies at the levelof individuals. In this case σ2
µ is replaced by a matrix Σ that holds thevariances and co-variances of the different individual level effects. Allthree of the studies presented in this chapter explicitly investigate Σ todraw conclusions about the individual differences in responses to socialinfluence strategies. These models can be seen as a modern version ofanalysis of variance (ANOVA) for factors with many levels (Gelman,2005).
3.2 Study 1: Identifying an upper bound in heterogene-ity
Study 1 was designed to identify an upper-bound on heterogeneity in theeffects of influence strategies in a product-evaluation context. Study 1estimates an "upper-bound" since this study estimates individual leveleffects of social influence strategies at one specific point in time. Thus,the heterogeneity that is shown by inspection of Σ combines both indi-vidual level traits that cause differences in responses to social influencestrategies, as well as temporary states.
The main in this first study focus was to see whether the heterogene-ity in responses to social influence strategies was large in comparisonto the average effect. Some heterogeneity is expected but two differentscenario’s can be pitted against each other. First, influence strategiescould have a large positive average effect and individual level effects areclose to that average. Thus, the effects of an influence strategy for eachindividual are positive compared to a baseline in which the strategyis not presented. Second, it could be the case that even though influ-ence strategies have a large positive average effect, the heterogeneityis such that for a group of people the effects of the strategies are zeroor even negative. In the latter case the heterogeneity warrants furtherattention.
3.2.1 Method Study 1ProcedureParticipants were invited by email. After signing up for the study,participants received a link to the study Web site. The study wascalled “Evaluating books” and asked prospective participants, “whatwould you like to read?” Participants were then instructed that theywould be presented with 14 science fiction novels, and that they would

32
be asked to evaluate each of these books.1 Participants were showna list of reasons why the books were selected for presentation. Thesemessages implemented three influence strategies as well as one controlmessage (“A random selection”):
1. A random selection: These books are randomly selected from thebook database. (Control)
2. The majority view: These books are selected because they havebeen sold widely or are appreciated by the majority of readers.(Consensus)
3. Rare or special items: These books are selected because they arerare or limited in their run. (Scarcity)
4. The experts recommendation: These books are selected from thebook database because they are recommended by experts in thefield. (Authority)
These messages were selected out of a larger set of messages byfour persuasion researchers. The messages were selected based on theirexternal validity (these messages are actually used on e-commerce web-sites) and the expert judgment that they implemented the social influ-ence strategy. This latter criteria is somewhat arbitrary but the qualityof the messages can be assessed after collecting the data: If the av-erage effect of the messages is in the direction of, and in the order ofmagnitude of, previous findings, one can be confident that the messagesindeed implement the social influence strategies as intended.
After these introduction messages participants then presented withfourteen Web pages in sequence. Each page contained an image of abook, a short textual description, and four questionnaire items. Thebooks were selected from Amazon.com and all fell in the same pricerange ($10 to $12), all had approximately an average rating of threeout of five stars, and none were bestsellers. Descriptions of the bookswere adapted to be of similar length.
Located just above the description and cover image that was pre-sented for each book was a message that either implemented one of theinfluence strategies or was a control message. Two implementations ofeach strategy were delivered in sequence. For example, a participantwould first be presented with two books that were ostensibly selectedbecause they represented “the majority view.” The first book wouldbe accompanied by the first implementation of the strategy (“Over a
1Participants rated two books for each of 14 messages, only eight of which areanalyzed here.

33
Table 3.1: Influence strategies and their respective implementa-tions as used in Study 1.
Strategy ImplementationControl 1. A random selection.
2. This book is randomly selected from our productofferings.
Scarcity 3. This is a limited edition signed by the author!4. There are only 50 copies of this book left nation-wide!
Consensus 5. Over a million copies sold!6. Voted best fictional book by college students!(Princeton Review)
Authority 7. “I would recommend this book to anyone.” -Stephen King.8. “Every household should have a copy of this” -American Authors Book Review Committee.
million copies sold!”) and the second accompanied by the second imple-mentation of the same strategy (“Voted best fictional book by collegestudents”). Each participant was exposed to both implementations ofeach of the strategies. Table 3.1 shows the implementations used in thisstudy. Participants were randomly assigned to different orders of pre-sentation of the influence strategies. Book order was kept constant tocontrol for differences in the appeal of the books. Both order effects aswell as possible interactions between book and implementation effectswere controlled for at a between-subjects level.
MeasuresEach of the books was evaluated by participants on four items on aten-point scale:
1. How likely would you be to recommend this book to your friends?(Very unlikely - Very likely)
2. How much would you enjoy reading this book? (Would not enjoyat all - Would enjoy very much)
3. How would you judge the quality of this book? (Very poor quality- Very good quality)
4. How likely would you be to buy this book if you were going tobuy a novel? (Very unlikely - Very likely)

34
After participants evaluated the books, participants completeda questionnaire addressing several meta-judgmental measures. Thisstarted with the standard 18-item measure of Need for Cognition (NfC)(Cacioppo and Petty, 1982) (Cronbach’s α= 0.893). Next, participantsreported their susceptibility to each of the six influence strategies iden-tified by Cialdini (2001) by responding to 26 items specifically createdfor this purpose (See Chapter 5). Finally, participants were asked abouttheir age, gender, and academic major.
ParticipantsParticipants were 179 english speaking university and community col-lege students enrolled in introductory research methods courses, whoparticipated for partial course credit. Of the participants 111 (62.01%)were females. The mean age of participants was 24.3 (SD = 7.99).
3.2.2 Results Study 1This study resulted in a dataset describing the evaluation of B = 14books by N = 179 subjects. For each participant, the evaluated booksare accompanied by one ofK = 8 implementations of influence strategies(two implementations for each of S = 4 strategies). Finally, each bookwas evaluated using Q = 4 different items, each on a ten-point scale.Data analysis involved a series of comparisons of mixed-effects models(Baayen et al., 2008) and subsequent examination of the estimated pa-rameters of the selected model. These models are: (A) a model with noheterogeneity in the effects of influence strategies, (B) a model in whichonly the effect of using any strategy varies from person to person, and(C) a model in which the effects of each strategy vary from person toperson. Comparison of Models A and B corresponds to testing the nullhypothesis that there are no individual differences in overall “persuad-ability” by the consensus, authority, and scarcity influence strategies.Comparison of Models B and C tests the null hypothesis that individ-ual differences in the effects of influence strategies are exhausted byindividual differences in overall “persuadability”.
Each of these three models can be written
yjbq ∼N (Xjbβj +αb+ηq,σ2err) (3.3)
with βj ∼ N (β,Σβ) for j = 1, ...,J = 179 subjects, αb ∼ N (0,Σα) forb= 1, ...,B = 8, books and ηq ∼N (0,σ2
η) for q = 1, ...,Q= 4 questions.The design matrix Xjb is a 1432×4 matrix consisting of a column
of ones and indicators for each of the three strategies. Thus, β is a

35
179× 4 matrix of intercepts and coefficients for each strategy for eachindividual. Finally, β and Σβ are, respectively, the vector of the meansand the covariance matrix of the individual × strategy coefficients.
In this formulation, the three models differ only in their constraintson Σβ. Model A only allows for between-person variation in an inter-cept, so it has
Σβ =
σ2I 0 0 0
0 0 0 00 0 0 00 0 0 0
(3.4)
where σ2I is the between-person variance of the intercept. Model B
allows for the effect of all three of the strategies to vary together byperson:
Σβ =
σ2I σ2
I,P σ2I,P σ2
I,P
σ2I,P σ2
P σ2P σ2
P
σ2I,P σ2
P σ2P σ2
P
σ2I,P σ2
P σ2P σ2
P
. (3.5)
Here σ2P is the between-person variance of the overall effect of all three
strategies—a measure of general “persuadability”—and σ2I,P is the co-
variance of the intercept and this strategy effect. Finally, in Model Cthe entries of this covariance matrix are unconstrained,
Σβ =
σ2I σ2
I,c σ2I,a σ2
I,s
σ2I,c σ2
c σ2c,a σ2
c,s
σ2I,a σ2
c,a σ2a σ2
a,s
σ2I,s σ2
c,s σ2a,s σ2
s
, (3.6)
where σ2c , σ2
a, and σ2s are the between-person variances of the effects of
the consensus, authority, and scarcity strategies, respectively.Table 3.2 presents the comparisons of these three models. Model C
is preferred. This directly supports the hypothesis that there are indi-vidual differences in the effects of these three influence strategies. Fur-thermore, this heterogeneity is not exhausted by an heterogeneity onlyin an overall effect of the three strategies, as compared to no-strategy.Having rejected the two null hypotheses corresponding Models A andB, the estimated parameters of Model C are now further examined.
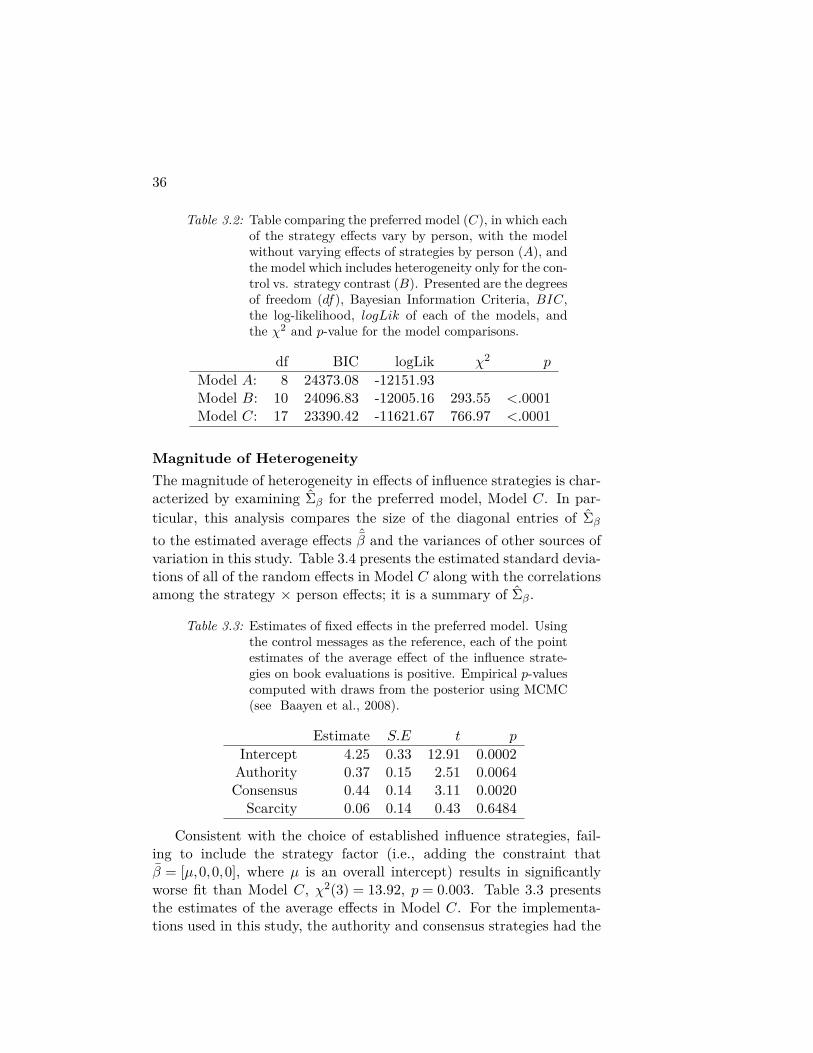
36
Table 3.2: Table comparing the preferred model (C), in which eachof the strategy effects vary by person, with the modelwithout varying effects of strategies by person (A), andthe model which includes heterogeneity only for the con-trol vs. strategy contrast (B). Presented are the degreesof freedom (df), Bayesian Information Criteria, BIC,the log-likelihood, logLik of each of the models, andthe χ2 and p-value for the model comparisons.
df BIC logLik χ2 p
Model A: 8 24373.08 -12151.93Model B: 10 24096.83 -12005.16 293.55 <.0001Model C: 17 23390.42 -11621.67 766.97 <.0001
Magnitude of HeterogeneityThe magnitude of heterogeneity in effects of influence strategies is char-acterized by examining Σβ for the preferred model, Model C. In par-ticular, this analysis compares the size of the diagonal entries of Σβ
to the estimated average effects ˆβ and the variances of other sources ofvariation in this study. Table 3.4 presents the estimated standard devia-tions of all of the random effects in Model C along with the correlationsamong the strategy × person effects; it is a summary of Σβ.
Table 3.3: Estimates of fixed effects in the preferred model. Usingthe control messages as the reference, each of the pointestimates of the average effect of the influence strate-gies on book evaluations is positive. Empirical p-valuescomputed with draws from the posterior using MCMC(see Baayen et al., 2008).
Estimate S.E t p
Intercept 4.25 0.33 12.91 0.0002Authority 0.37 0.15 2.51 0.0064Consensus 0.44 0.14 3.11 0.0020
Scarcity 0.06 0.14 0.43 0.6484
Consistent with the choice of established influence strategies, fail-ing to include the strategy factor (i.e., adding the constraint thatβ = [µ,0,0,0], where µ is an overall intercept) results in significantlyworse fit than Model C, χ2(3) = 13.92, p = 0.003. Table 3.3 presentsthe estimates of the average effects in Model C. For the implementa-tions used in this study, the authority and consensus strategies had the

37
largest estimated effect. The average effects of the authority (p < 0.01)and consensus strategies (p < 0.01) are both significantly positive.
Coefficient value
Den
sity
0.0
0.1
0.2
0.3
−5 0 5
●
●
●●
●
● ●
●
●
● ●
●
●
●
●
●
●
●
●
●
●
● ●
●
●
●
●
●
●
●
●
● ●
●
●
●
●
●
●
●
●
●
●
●
●
●
●
●
●
●
●
●
●
●
●
● ●
●
●
●
●
●
●
●
●
●
●
●●
●
●
●
●
●
●
●
●
●●
●
● ●
●
●
●
●
● ●
●
●
●
●
●
●
●
●
●
●
● ●
●
●
●
● ●
●
●
●
●
●
●
●
●
●
●
●
●
● ●
●
●
● ●
●
●●
●
●
●●
● ●
●
●
●
● ●
●
●
●
●
●
●
●
●
●
●
●
●
●
●
●
●
●
●
●
●
●
●
●
●
● ●
●
●
●
●
●●●
●
●
●
●
●
●
●
●
●
Authority
−5 0 5
●
●
●
●
●
●
●
●
●
●
●
●
●
●
●
●
●
●
●
●
●
●
●
●
●●
●
●
●
●
●
●
●
●
●
●
●
●
●
●
●
●
●
●
●
●
●
●
●
●
●
●
●
●
●
●
●
●
●
●
●
●
●
●
●
●
●
●
●
●
● ●
●
●
●
●
●
●
●
●
●●●
●
●
●
●
●
●
●
●
●
●
●
●
●
●
●
●
●
●
●
●
●
●
●
●
●●
●
●
●
● ●
●
● ●
●
●
●
●
●
●
●
●
●●
●
●
●
●
●
●
●
●
●
● ●
●
●
●
●
●
●
●
●
●
●
●
●
●
●
●
●
● ●
●
●
●
●
●
●
●
●
●
●●
●
●
●
●
●
●
●
●●
●
●
●
Consensus
−5 0 5
●
●
●
●●
●
●
●
●
●
●
●
●
●
●
●
●
●●
●
●
●
●
●
●
●
●
●
●
●
●
●
●
● ●●
●
●
●
●
●
●
● ●
●
●
●
● ●
●
●
●
●
● ●
●
●
●●
●
●
●
●
●
●
●
●●
●
●
●
●
●
●
●
●
●
●
●
●
●
●●
●
●
●
●
●
●
●●
●
●
●●
●
●
●
●
●
●
●
●
●
●●
●
● ●
●
●
●
●
●
●
●
●
●
●
●
●
●
●●
●
●
●
●
●
●
●
●
●
●
●
●
●
●
●
●
●●
●
●
●
●
●
●
●
●●
●
●
●
●
●
●
●
●
●
●
●
●
●
●
●
●
●
●
●
●
● ●
●
●
●
●
●
●
Scarcity
Figure 3.1: Comparison of heterogeneity in the effects of influencestrategies with the average effects of those strategies.The solid black vertical lines are the estimated aver-age effects of each strategy, as compared with the con-trol message. The black curves are the estimated nor-mal distribution of strategy effects for the population,while the gray curves are the density of the estimatesof the strategy effects for this sample. Estimates arefrom Model C.
Figure 3.1 is a graphical comparison of the estimated average effectof each strategy and the estimated distributions of strategy × personeffects. The solid vertical lines indicate the average effect of each strat-egy compared to the control message (vertical dotted line). The solidblack density is the estimated Gaussian distribution of the strategy ×person effects in the population.
As an illustration of the magnitude of individual differences in influ-ence strategy effects, one can consider how common it is for the effectof the consensus strategy to be negative, despite its average effect be-ing significantly positive. This analysis shows that for 41.3% (95% CI[35.8,45.3] 2) of the participants the estimated effect of consensus isnegative.
295% confidence intervals in brackets were computed using the Bayesian pigeon-hole bootstrap with R= 1000 (Owen, 2007).

38
Qualitatively, one can compare the different standard deviations pre-sented in Table 3.4: The estimated standard deviation of participants’responses to books not accompanied by influence strategies (the inter-cept varying by person, σ2
I ) is of similar magnitude as the standarddeviation of the residuals σ2
err. The same is true for the estimatedstandard deviation of participants’ responses to books accompanied byeach of the influence strategies. Thus, in this study the effects of influ-ence strategies differ as much between people as does their evaluationof different books.
Table 3.4: Summary of random effects in Model C. The squareroot of the diagonal elements of Σβ are the first fourrows of the standard deviation column, while the re-maining entries are presented as correlations to theright.
Grouping SD Corr.Person Intercept 1.54
Authority 1.76 -0.35Consensus 1.69 -0.39 0.51Scarcity 1.65 -0.40 0.40 0.59
Book Intercept 0.58Question Intercept 0.53Residual 1.62
Structure of the HeterogeneityComparison of Models A, B, and C supported the hypothesis that thestructure of heterogeneity in influence strategy effects is more complexthan single dimension of overall “persuadability”. In particular, thecovariance matrix for the strategy effects Σβ in Model C allows formore complex relationships among the effects of each strategy. Whilethe effects of the three strategies are moderately correlated, they alsohave substantial unique variation, as manifest in Figure 3.2. This figuremakes clear that for large numbers of individuals one specific socialinfluence strategy leads to higher product evaluations than no-strategy,while for other strategies the sign of the effect is reversed.
Demographics and Meta-Judgmental measures
To examine whether demographic and personality measures that aretypically used in marketing practice would be able to sufficiently cap-ture the individual differences identified a series of model comparisons

39
Authority0
2
4
0 2 4
−6
−4
−2
−6 −4 −2
Consensus0
2
4
0 2 4
−6
−4
−2
−6 −4 −2
Scarcity0
2
4
0 2 4
−6
−4
−2
−6 −4 −2
Figure 3.2: Estimated influence strategy effects for each partici-pant in Model C, as compared to the control messages.Note that for some individuals, the estimated effect ofone strategy is negative, while the estimated effect ofanother strategy is positive.

40
Table 3.5: Table examining the use of demographic and meta-judgmental measures. While both aid significantly inexplaining the variance in responses to social influ-ence strategies, explicitly modeling heterogeneity is stillpreferable according to the log-likelihood comparisons.
df BIC logLik χ2 p
Model A: 8 24373.08 -12151.93Model Ad: 20 24419.88 -12123.42 57.02 <.0001Model Am: 44 23524.52 -11572.80 1101.25 <.0001Model Cm: 53 22733.58 -11138.58 868.45 <.0001
was performed including these measures. Table 3.5 presents these fourmodel comparisons. First, Model A—the baseline model without vary-ing strategy effects—is compared to a model that includes age (split inthree groups) and gender interacting with the social influence strategy,Model Ad. These measures significantly increase model fit and thus aidin explaining the observed responses. Next, both the obtained measuresof NfC as well as the Big Five are added to the model, Model Am. De-spite the large increase in degrees of freedom this model is preferable(even according to conservative BIC). This shows that meta-judgmentalmeasures can indeed be beneficial to attend to individual differences inpersuasion processes. However, the final comparison shows that allow-ing for heterogeneity in responses to influence strategies—as done inModel C—still significantly improves model fit, Model Cm. Thus, thedemographics and meta-judgmental measures included in this analysisseem insufficient to capture all individual level variation.
3.2.3 Discussion Study 1Study 1 enables comparison of the heterogeneity in responses to so-cial influence strategies to the often attended to average effect(s). Theheterogeneity is very large compared to the average effects and thiswarrants further attention. This heterogeneity is not exhausted by dif-ferences in overall responses or persuadability to all of the influencestrategies considered together; rather, according to model selection cri-teria such as the BIC, one should use a model that includes varyingeffects for each of the influence strategies. Furthermore, models includ-ing this heterogeneity were preferable even when including demographicor meta-judgmental measures as independent predictors for responsesto each strategy.

41
3.3 Study 2: Examining stability of heterogeneity overtime
While the analysis of Study 1 produced unbiased estimates of the effectof each influence strategy for each participant, each of these estimateshad relatively high uncertainty and it is expected that the estimated het-erogeneity is upwardly biased. Transient intra-individual variation, suchas that caused by differences in mood, fatigue, and situation, are notseparately identified, as participants only rated books during a singlesession. This problem is common but ignored (cf. Watson and Strayer,2010) in operative measures of traits. In particular, moods—emotionalstates lasting from several hours to several days—can affect elaboration(Bless et al., 1990), thereby moderating the effects of influence strategieson attitudes. To address this issue, in Study 2 participants encounteredimplementations of the same influence strategies over three sessions.
3.3.1 Method Study 2Study 2 was also conducted in a product-evaluation context in whichparticipants rated books. Rather than being a study ostensibly aboutbook preferences, Study 2 was ostensibly a user experience evaluationof a new online bookstore; during each of three sessions approximately aweek apart, participants were guided through as series of tasks in whichthey could freely browse and search this bookstore (see Figure 3.3).In addition to rating a number of books, participants were asked toperform other tasks fitting with the cover story. Like the Amazon.comhomepage—a popular book selling e-commerce website—books were or-ganized under titles that implemented an influence strategy. Individualbook description pages also featured implementations of the social in-fluence strategies used in this study.
ProcedureOnce signed up for the study, participants received an email explainingthat they would receive a link to the study website once every week forthree subsequent weeks. Participants received the emails on Mondaysand were asked to participate in that weeks’ session by that Wednesday.Participants who had not participated by Wednesday morning receiveda reminder email.
Participants began each session by clicking on a link to the studyWeb site in the Monday or Wednesday emails. After an instructionpage, participants were taken to an online bookstore augmented withan instruction and questionnaire “bar” at the bottom of the page. Each

42
Figure 3.3: Appearance of the bookstore in Study 2. The author-ity strategy is implemented in the orange box just be-low the title of the book. The evaluation questions andthe tasks for participants appeared in the bottom bar.
session consisted of approximately 20 tasks such as “Please find a bookcalled [book name] and add it to your shopping cart” ; six of these tasksasked participants to go to the home page of the bookstore, find aparticular book, and rate that book.
The home page of the bookstore displayed books under categoriesimplementing influence strategies. The no-strategy (“random selec-tion”) message was omitted. Study 2 included three different imple-mentations of each of the strategies used in Study 1 (see Table 3.6).
During each session participants were asked to rate six books. Par-ticipants rated two books for each of the three strategies within eachsession. These two books were presented with the same implementa-tion and were rated in sequence. The order of the three strategies overeach session was randomized and the specific implementations used in

43
Table 3.6: Influence strategies and their respective implementa-tions as used in Study 2.
Strategy ImplementationScarcity 1. Limited Edition. This book is a limited edition and
signed by the author. Availability is limited.2. Almost Out of Stock. This book is almost out ofstock. There are only a few copies left so make yourpurchase now.3. Collector’s Item. There are a limited number ofprints of this edition and each book is signed and num-bered. A pure collector’s item.
Consensus 4. Over a Million Copies Sold. This book is a greatbestseller. Over a million copies have been sold world-wide.5. Voted Best Fiction by Readers. This book wasamong the highest rated novels in recent in reader sur-veys. Everyone agrees: this book is a must read.6. International Bestseller. Worldwide sales of thisbook continue to increase. Now it is climbing best-seller charts in the United States also.
Authority 7. Experts’ Choice. This book is generating buzzamong industry experts. Based on the Experts BookExchange Top 20, this book is among the most talkedabout in the past year.8. Recommended by Top Authors. This book is a toppick this season among other top novel authors.9. Critics’ Favorite. Critics might be critical, butnone of them had complaints about this book. Thiscritic’s favorite received positive reviews throughoutthe popular press.
that particular session were randomized. The order of books and thecombination between books and strategy implementation was also ran-domized over participants.
MeasuresParticipants’ demographic data, including age and gender, was collectedat enrollment in the social science course. In Study 2 the same meta-judgmental measures as used in Study 1 were also collected. Due to the

44
longer duration of Study 2 the first of the product evaluation items wasremoved.
ParticipantsParticipants were 70 community college students enrolled in social sci-ence courses participating for partial course credit. 59 (84.3%) ofthe participants were female. The mean age of participants was 25.1(SD = 9.9).
3.3.2 Results Study 2
Session
Sum
med
sco
res
10
20
30
40
1 2 3
●
● ●
●
●
●
●
●
●
Participant A
1 2 3
●
●
●
●
●
●
●
●
●
Participant B
consensus expertise scarcity
Figure 3.4: Summed raw book evaluations for two participantsselected to illustrate variation and consistency in re-sponses to influence strategies over the three sessions.
The analysis of the product evaluations collected in Study 2 is simi-lar to that in Study 1. However, since each participant evaluated booksaccompanied by each of the three strategies during each of three ses-sions, one can separately examine their responses by session. To illus-trate, Figure 3.4 presents two participants’ product evaluations. Acrossthe three sessions, participant A appears to evaluate books accompa-nied by implementations of the consensus strategy most favorably, whileParticipant B evaluated the books accompanied by scarcity more posi-tively.
Model ComparisonsThe dataset collected in Study 2, unlike Study 1, allows analysis ofparticipants’ responses to books accompanied by each strategy over thethree sessions. On the other hand, all books evaluated by participants

45
in Study 2 are accompanied by authority, consensus, or scarcity; thereare no “control” messages for comparison. As in Study 1, a test of thenull hypothesis of no heterogeneity in responses to influence strategiescorresponds to the comparison of a series of mixed-effects models. Thefirst model, Model D, includes varying intercepts for sessions and par-ticipants. The second model, Model E, adds strategy × person effects.
Both models can be written as
yjbq ∼N (µ+Xjbβj +αb+ηq,σ2err) (3.7)
where µ is the overall intercept, βj ∼N (β,Σβ) for j = 1, ...,J = 70 par-ticipants, αb ∼ N (0,σ2
α) for b = 1, ...,B = 18 books, and ηq ∼ N (0,σ2η)
for q = 1, ...,Q= 3 questions.In this model Xjb is a matrix of indicators for strategies and sessions
such that β is a 70×6 matrix of coefficients of the coefficient for eachstrategy and each session for each participant. β(i1,i2,i3) = 0 representsthe absence of “fixed” effects of strategies and sessions. The strategyand session coefficients varying by participant are modeled indepen-dently from each other. Thus, Σβ has a block structure,
Σβ =
Σ(s)β 00 Σ(t)
β
, (3.8)
in which Σ(s)β is the covariance matrix for strategy coefficients and Σ(t)
β isthe covariance matrix for session coefficients. In Model D, each elementof Σ(s)
β is set to zero, while in Model E it is unconstrained.Table 3.7 shows the comparison of these two models. Allowing for
heterogeneous influence strategy effects significantly improves modelfit. This shows that also in this study there is variation in responsesto the different implementations influence strategies. In Study 2 thevariation is observed across the different sessions and is thus not causedby transient intra-individual differences.
Table 3.7: Table comparing Model E with a model without varyingeffects of strategies by person (Model D). The compari-son shows stable heterogeneity in responses to influencestrategies over the three sessions.
df BIC logLik χ2 p
Model D: 10 16045.65 -7981.64Model E: 16 15967.27 -7917.73 127.81 <.0001

46
Table 3.8 summarizes the random effects of Model E. Qualitativecomparison to Table 3.4 shows that the point estimates of the standarddeviations of the strategy × person effects are slightly lower in Study 1than in Study 2: this accords with the expectation that the estimatesin Study 1 are upper bounds because of transient intra-individual vari-ation. The correlations between the strategy × person effects are largerin Study 2. This is expected for two reasons: First, in Study 1, theoverall intercept of each participant is separately identifiable from thestrategy × person effects—which is illustrated by the negative correla-tions between the by person intercepts and the strategy× person effects.In Study 2 this is not the case, and thus the correlations between strate-gies include an overall response tendency. Second, this observation isconsistent with the idea that the estimates in Study 1 include noisefrom transient intra-individual variation and are thus attenuated.
Table 3.8: Summary of random effects of Model E. The squareroot of the diagonal elements of Σ(s)
β and Σ(t)β are rows
one to three and four to six of the standard deviationcolumn respectively, while the remaining entries of eachare presented as correlations to the right.
Grouping SD Corr.Subject Consensus 1.40
Authority 1.51 0.86Scarcity 1.51 0.79 0.80
Subject Session 1 1.03Session 2 1.33 0.77Session 3 1.13 0.70 0.83
Book Intercept 0.36Question Intercept 0.47Residual 1.81
Demographics and Meta-Judgmental Measures
As in Study 1, Study 2 explore several models that use common market-ing measures of consumers—such as gender, age, and personality—toexplain the observed differences. The results are presented in table 3.9.Contrary to Study 1 the demographic measures of age and gender donot aid in explaining differences in responses to social influence strate-gies. Measures of NfC and personality do aid in explaining responsesto social influence strategies. However, these typical measures are again

47
Table 3.9: Table comparing the Model D with models using demo-graphic or meta judgmental measures of personality.
df BIC logLik χ2 p
Model D: 10 16045.65 -7981.64Model Dd: 19 16117.46 -7980.48 2.32 0.9853Model Dm: 37 14441.03 -7070.37 1820.22 <.0001Model Em: 42 14385.46 -7022.29 96.14 <.0001
insufficient to capture the variation that can be modeled using operativemeasures.
3.3.3 Discussion Study 2The large upper bound on the magnitude of heterogeneity in the ef-fects of influence strategies found in Study 1 motivated estimating thisheterogeneity over multiple sessions. The analysis above demonstratesthat the heterogeneity in effects identified in Study 1 largely cannot beattributed to transient intra-individual variation. Rather, the observedvariation is the result of stable individual differences in responses todistinct influence strategies. Even after using meta-judgmental mea-sures of traits as predictors, including strategy × person effects signif-icantly improved model fit. This finding highlights that while meta-judgmental measures might aid in understanding responses to socialinfluence strategies, operative measures—the estimated strategy × per-son coefficients—reflect additional variation. A variation that, givenits magnitude, can be of key-importance for successful persuasion inambient intelligent systems.
3.4 Study 3: Stability of heterogeneity across contextStudy 3 explores whether people’s responses to persuasive strategies inone specific context are predictive for their responses in another context.This is of theoretical importance since it strengthens the assumptionthat the heterogeneity uncovered in Study 1 presents a stable individualtrait that is consistent over different settings. This enables theorists toexplain this heterogeneity at an individual level instead of at the levelof individual and context. Investigation over contexts is also importantin an applied setting: can people’s responses to one persuasive systempredict their responses to another system?

48
3.4.1 Method Study 3Study 3 consisted of two online parts that were, in the perception of theparticipants, unrelated studies. The first study of the set of two was ofthe evaluation of an online bookstore (referred to as “Bookstore Study”)and the second was the evaluation of an online music store (furtherreferred to as “Musicstore Study”). Both studies were conducted online,and in both studies participants were asked to evaluate a new onlinestore. The appearances of the stores were made as distinct as possibleand the contact addresses on both studies were different to ensure thatparticipants did not link the two studies together. Figure 3.3—theimplementation of the bookstore used also in Study 2—and 3.5 showthe different implementations of the online stores used in this study.
Figure 3.5: Appearance of the Musicstore Study. The vertical baron the left is used to present assignments and questionsto participants while they can freely browse the onlinestore.

49
ProcedureBoth of the studies were only open for participation at specific time-intervals. This ensured that participation in the Bookstore study wasat least one week separated from participation in the Musicstore study.In both studies participants were first shown an instruction page. Next,participants were taken to an online store which was augmented with aninstruction and questionnaire “bar” at the bottom—for the Bookstore(see Figure 3.3 study—or at the left side—for the Musicstore study(see Figure 3.5)—of the page. Each study consisted of approximately20 tasks such as “Please find a book called [book name] and add it toyour shopping cart” ; twelve of these tasks asked participants to go tothe home page of the (music)- bookstore, find a particular (album)-book, and evaluate that (album)- book. After locating the product,participants rated the products on the same three questions as used inStudy 2.
Table 3.10: Influence strategies and their respective implementa-tions as used in the Bookstore Study.
Strategy ImplementationControl 1. Random Selection. These books are randomly se-
lected from our book offerings.2. Just a book. . . . Have a look at our books! This isjust an arbitrary selection of the books on our website.
Consensus 3. Over a Million Copies Sold. This book is a greatbestseller. Over a million copies have been sold world-wide.4. International Bestseller. Worldwide sales of thisbook continue to increase. Now it is climbing best-seller charts in the United States also.
Authority 5. Experts’ Choice. This book is generating buzzamong industry experts. Based on the Experts BookExchange Top 20, this book is among the most talkedabout in the past year.6. Recommended by Top Authors. This book is a toppick this season among other top novel authors.
Located just above the description and cover image of the itemspresented in both studies was a message that either implemented oneof the two influence strategies or a control message. Two implemen-tations of each strategy were delivered in sequence. For example, a

50
participant would be instructed to find a specific item. The item waspresented on the front-page under the category “Recommended by TopAuthors”. When selecting the item, participants were shown the imple-mentation of the strategy (“Over a million copies sold!”). Participantsalways rated two items belonging to the same “category” in sequence.The strategy order was randomized in time and in their presentationon the front page. Furthermore, the books presented for each strategywere randomized for each participant. Each participant rated all itemsof a study in a single session and was thus exposed to all the implemen-tations. Table 3.10 shows the implementations used in the Bookstorestudy and Table 3.11 shows those used in the Musicstore study.
Table 3.11: Influence strategies and their respective implementa-tions as used in the Musicstore Study.
Strategy ImplementationControl 1. Random Selection. These albums are a random
selection out of our large bluegrass collection.2. Pure Bluegrass. Here are some arbitrary picks outof our bluegrass offerings.
Consensus 3. Over a Million Copies Sold. This album is a greatbestseller. Over a million copies have been sold world-wide.4. International Bestseller. Worldwide sales of thisalbum continue to increase. It is climbing the chartsin the United States also.
Authority 5. Experts’ Choice. This album is generating buzzamong music industry experts. Based on the ExpertsAlbum Top 20, this album is among the most talkedabout in the past year.6. Recommended by Top Musicians. This album is atop pick this season among top performing musicians.
For each sub-study, after rating 2×2×3 = 12 items—three strate-gies, two implementation per strategy, and two (albums)- books perimplementation—participants were redirected to another website. Forthe Musicstore study participant’s were shown a “thank you for par-ticipating” message and were directly awarded course credits. For theBookstore Study participants were forwarded to a post-questionnaire.

51
MeasuresParticipants’ demographic data, including age and gender, was collectedat enrollment in the social science course. In Study 3 the same meta-judgmental measures were used as in Study 1 and 2.
ParticipantsParticipants were community college students enrolled in a researchmethodology course. As part of the course requirements all students en-rolled in the course had to participate in a number of research projects.Participants could signup online for various studies, of which our Book-store Study—presented in the signup system as “Evaluate an On-line Bookstore”—and Musicstore Study—presented as “Kalua Music”—were two. Participants were unaware of the link between the two studiessince the fast majority of studies posted in the signup system were in-deed unrelated. In total 247 participants participated in the BookstoreStudy, and 162 participated in the Musicstore Study. Since participa-tion in both studies was not enforced in any way the merger of these twodata files lead to the data used in further analysis which describes theBookstore study and Musicstore study outcomes of 153 participants.111 (72.55%) of the recruited participants were female. The mean ageof participants was 24.3 (SD = 8.63). The study was conducted onlineand participants participated from their own computers.
3.4.2 Results Study 3Model ComparisonsStudy 3 is analyzed in a similar fashion as Study 1 and 2. The coremodel comparison(s)—the direct test of the significance of adding in-dividual level effects of the persuasive strategies—is similar to thosepresented in Study 1: Since Study 3 contains a baseline condition itis first tested whether an overall difference in responses to persuasivepersuasive strategies at an individual level increases model fit. Next,it is tested whether responses to distinct strategies increases model fitover the overall persuadability. Similar to Study 2 these individuallevel estimates are established over the two context thus only capturingvariation that is stable over contexts.
The general model can again be written as:
yjbq ∼N (Xjbβj +αb+ηq,σ2err) (3.9)
with βj ∼N (β,Σβ) for j = 1, ...,J = 153 subjects, αb ∼N (0,Σα) for b=1, ...,B = 24, products and ηq ∼N (0,σ2
η) for q = 1, ...,Q = 3 questions.

52
No main effect of context was included in the final model given that itsaverage effect was not statistically significant.
The design matrix Xjb is a matrix consisting of a column of onesand indicators for each of the two strategies used in this study. Thus,β is a 153×3 matrix of intercepts and coefficients for each strategy foreach individual. The three models that are compared again differ onlyin their constraints on Σβ. Model F only allows for between-personvariation in an intercept, so it has
Σβ =
σ2I 0 0
0 0 00 0 0
(3.10)
where σ2I is the between-person variance of the intercept. Model G
allows for the effect of all three of the strategies to vary together byperson:
Σβ =
σ2I σ2
I,P σ2I,P
σ2I,P σ2
P σ2P
σ2I,P σ2
P σ2P
. (3.11)
Here σ2P is the between-person variance of the overall effect of all three
strategies and σ2I,P is the covariance of the intercept and this strategy
effect. In Model H the entries of this covariance matrix are uncon-strained,
Σβ =
σ2I σ2
I,c σ2I,a
σ2I,c σ2
c σ2c,a
σ2I,a σ2
c,a σ2a
, (3.12)
where σ2c and σ2
a are the between-person variances of the effects of theconsensus and authority strategies.
As with Study 1, given the inclusions of a baseline condition, it isinteresting to see whether the implementations of the persuasive strate-gies lead to an overall increase in model fit, and whether the ˆβ’s ofboth Authority and Consensus as a main effect are significantly pos-itive. Model comparisons indeed show a positive main effect of thestrategies: Model fit improves significantly when comparing a simplemodel with only Subject level intercepts and an overall intercept witha model that includes average effects of the two strategies, χ2 = 13.09,dfdelta = 2, p< 0.01. The estimates of ˆβ for Authority is 0.157, t= 2.126,p < .05, and that for Consensus is 0.153, t = 2.270, p < .05. Both are,
53
as expected, significantly positive.After establishing this average effect the heterogeneity in responses
to persuasive strategies is explored. Table 3.12 shows the outcomes ofthe model comparisons of Model F , G, and H. While modeling overallpersuadability—responses to all influence strategies as opposed to nostrategy—significantly improves model fit, allowing for varying effectsof the strategies leads to a large increase of the fit of the model. Thisreplicates the findings obtained in Study 1 and Study 2, but this timeover the two contexts. Thus, the predictions of responses in both thebookstore as well as the musicstore improve when modeling heterogene-ity in responses to persuasive strategies.
Table 3.12: This table shows a comparison of a model without anyeffects of strategy with models that include an overallstrategy effect or a strategy specific effect. It is clearthat the model with varying specific strategy effectsby individual is preferred.
Df BIC logLik χ2 p
Model F : 7 46826.15 -23380.59Model G: 9 46786.00 -23351.23 58.72 < .001Model H: 12 46778.71 -23333.66 35.13 <.001
Similar to the analysis presented in Study 1, table 3.13 shows theestimates of the random effects of Model H. Again it is clear that thereare sizable individual differences—differences that compare to the onesfound in the previous two studies.
Table 3.13: Summary of the random effects of Model H. Thesquare root of the diagonal elements of Σβ are the firstthree rows of the SD column. The remaining entriesare presented as correlations (Corr).
Groups Name Variance SD Corrsubject (Intercept) 1.55 1.24
Consensus 0.32 0.57 -0.10Expertise 0.44 0.67 -0.091 0.619
item (Intercept) 0.09 0.30question (Intercept) 0.34 0.58Residual 4.21 2.05

54
Demographics and Meta-Judgmental measuresSimilar to Study 1 and 2 the effects of both demographics as well aspersonality measures on prediction are examined. Table 3.14 comparesthe model fit of Model F with models including these predictors. Asin the previous studies the addition of personality data improves pre-diction, but does not exhaust the variation caused by the heterogeneityin responses to persuasive strategies. This last fact is eminent by thesignificant increase in model fit from Model Fm to Model Hm: Additionof varying Strategy × Subject effects increases model fit according tothe log-likelihood comparisons.
Table 3.14: Table comparing the Model F with models using de-mographic or meta judgmental measures of personal-ity.
Df BIC logLik χ2 p
Model F : 7 46826.15 -23380.59Model Fd: 15 46894.36 -23377.57 6.04 0.6427Model Fm: 33 40545.01 -20121.78 6511.57 < .001Model Hm: 38 40545.02 -20098.96 45.66 < .001
3.4.3 Discussion Study 3Study 3 extends the results found in Study 1 and 2 by addressing thestability of individual differences in responses to persuasive strategiesover contexts. The results show that while the Study replicated themain effect that is often reported upon in the literature for both Con-sensus as well as Authority, the individual differences are again largerin size. This again leads to the result that the model fit is better whenmodeling individual level effects than when modeling average effects.
3.5 ConclusionsThis chapter explored individual differences in responses to persuasivestrategies using operative measures. The results of Study 1 show thepotential importance of this heterogeneity by comparing the differencesbetween individuals to the often attended to average effects of persua-sive strategies. It is clear that for a number of people some strategiesthat are effective on average have negative effects. This opens the doorfor adaptation of persuasive attempts at the level of the persuasiveprinciples identified by Cialdini (2001).

55
Study 2 extends the findings of Study 1 by identifying the stablepart of the heterogeneity uncovered in Study 1. This stability showsthat the heterogeneity identified in Study 1 is, by and large, identifyingtraits in stead of temporary states. Thus, people who respond in acertain way to a distinct influence strategy right now are likely to do soin the future. This makes the individual differences something that canbe attended to by designers of persuasive systems. Study 3 exploredstability across contexts. The model comparisons show that while theaverage effect(s) significantly improves prediction, the individual leveleffects are even more important to decrease prediction error.
In each of the three studies presented above the possibility of ex-plaining the observed heterogeneity via the use of measurements of in-dividual differences typically used in marketing—such as demographicsand personality measures—is explored. In each case, the heterogeneityobserved in responses to influence strategies is not exhausted by thesecommonly used measures. This does not prove that meta-judgmentalmeasures of individual differences will never sufficiently capture the ob-served variation: it is likely that the inclusion of more, or different,predictors would better explain the heterogeneity. However, the analy-sis does show that the selected meta-judgmental measures fail to fullyexplain the variation observed in operative measures of responses toinfluence strategies.
While the three studies presented in this chapter show the impor-tance of attending to individual differences between people the studiesdo not posit a mechanism through which the heterogeneity can be ex-plained. As is clear in Chapter 2, Section 2.2.2, multiple competingmechanisms have been proposed to explain the success or failure ofdistinct strategies. Each of these mechanisms can be in place whenthe strategies are operated upon. The social science literature is how-ever largely uninformative about the relative importance of differentmechanisms, let alone their interactions. This renders these theoreticalexplanations hardly useful for the design of persuasive systems3.
3This chapter is (partly) based on earlier publication(s): (Kaptein et al., 2011c;Kaptein and Eckles, 2010; Kaptein et al., 2011b; Kaptein and Eckles, 2012).

56

4Insight Generation II:
Choice and Repetition Effects ofInfluence Strategies
4.1 IntroductionThe studies presented in the previous insights generation chapter(Chapter 3) demonstrate that there is large heterogeneity in responsesto influence strategies which is consistent both over time as well as overcontexts. However, all three of these studies concerned instances ofinfluence strategy usage in which (a) the influence strategy used to en-dorse an appeal was selected by the experimenter and (b) only a singleimplementation of an influence strategy was used per persuasive at-tempt. Both of these are however not self-evident: (e.g.) Frequently ine-commerce products are presented with a number of different influencestrategies at the same time (e.g. the product is both a bestseller andalmost out of stock) and users frequently are offered a choice about thestrategy they “prefer”: users can choose to look at the bestseller list, orin persuasive applications for health and wellbeing can choose to con-tact an authority figure for active coaching. There is however no clearguidance provided by the social science literature in these respects: the
57

58
ELM (e.g.) could lead one to believe that all influence strategies—whenregarded peripheral cues—have their effect through the peripheral routeand thus their effects would add up. It could however also lead one tohypothesize that the use of multiple influence strategies increases cen-tral processing and subsequently decreases the effects of the strategies.In this chapter we test these conflicting hypotheses.
This chapter examines the effects of both a choice between influencestrategies as well as the simultaneous usage of these strategies. Study1 examines the effects of choice on the effectiveness of social influencestrategies. Studies 2 to 4 examine the effects of using multiple influ-ence strategies to support a single appeal as opposed to the selection ofone specific strategy. The problem of the simultaneous presentation ofmultiple influence strategies to support a single appeal has been under-studied but is valuable to designers of persuasive systems. Only withinthe marketing literature serious attempts have been made to tackle thisquestions and the results are mixed: Barry and Shapiro (1992) find thatusing multiple social influence strategies—or sales tactics in that branchof literature—can be detrimental for compliance. Thus, when a singleinfluence strategy is used (e.g. this product is almost out of stock) thisseems more effective then using multiple strategies (e.g. the product isout of stock and a bestseller). Falbe and Yukl (2008) however derive adifferent conclusion from observing multiple human to human influenceattempts within a company setting: they show that managers who areflexible and use multiple influence tactics on the same target to sup-port a single appeal are generally more successful than those stickingto a single influence tactic. Both of these existing studies are howevercorrelational and thus they do not provide causal evidence. Studies 2to 4 extend this existing work by experimentally testing the effects ofmultiple influence strategies versus a single influence strategy.
4.2 Study 1: Choice EffectsStudy 1 aimed at manipulating a persuasive scenario to examine theeffects on compliance of two main factors: disclosure, explicitly statingto the user that an influence strategy is being used in an attempt tochange their opinion, and choice, providing users with a choice betweenmultiple persuasive strategies. Arguably, free choice can be a powerfultool for designers to make persuasive technologies more transparent.However, designers must be cognizant of the actual effects of disclosureas it influences user compliance (proven in subsequent findings).

59
Study 1 used a decision task in which participants were asked torank a number of items (Nass et al., 1996). Participants first ranked theitems in the order they believed was most important before they wereostensibly given advice from one of two groups: a group of individualswho previously completed the task successfully (implementing the con-sensus strategy) or by an expert (implementing the authority strategy).This “source of advice” was either randomly assigned to the partici-pant (no choice), assigned ostensibly based on knowledge (no choice,knowledge), or chosen freely by the participant (free-choice). Next, theuse of this strategy for persuasive purposes was either disclosed or not.This results in a 2×3 between subject design with three levels of choiceand two levels of disclosure. Behavioral compliance levels as well asparticipants’ subjective interpretation of the influence strategies wereassessed.
4.2.1 Method Study 1ParticipantsParticipants were recruited from a list of university students registeredfor an introductory research methodology course. A total of 112 par-ticipants were recruited. Fifty three of the participants were female(47.3%) and 59 were male (52.7%). The mean age of participants was22.2 years (SD = 3.3).
ProcedureThe study was conducted entirely online. Participants received a linkto the online study via email and were asked to complete the studywhich would take approximately 30 minutes to complete. The first taskof the study was an item-ranking task in which participants were askedto rank 12 items in order of their importance for survival in the arctic.Participants were introduced to the scenario in the following way:
“You have just survived the crash of a small plane. Both the pilotand co-pilot were killed in the crash.
It is mid-January, and you are in Northern Canada. The dailytemperature is 25 below zero, and the night time temperature is 40 belowzero. There is snow on the ground, and the countryside is wooded withseveral creeks criss-crossing the area. The nearest town is 20 milesaway. You are dressed in city clothes appropriate for a business meeting.You manage to salvage twelve items that you can use to try to survive.”

60
After the introduction, participants were shown the following listof items and given the opportunity to rank the items from 1 (mostimportant to survival) to 12 (least important to survival):
1. A 20’x 20’ piece ofheavy-duty canvas.
2. A cigarette lighter.3. A compass.4. Dehydrated milk
(8 pounds).5. Duct tape (25’ roll).6. An extra shirt and pair of
pants for each survivor.
7. A hand ax.8. Iodine water purification
tablets (50 tablets).9. A loaded .45-caliber pistol.
10. A loud signal whistle.11. One box of matches.12. A sectional air map made of
plastic.
After ranking the items participants were told—after an ostensible6 seconds analysis of their ranking—that “...some of your rankings werecorrect, but some could use improvement. You will now get the chanceto revise your answers.”
Participants then saw a screen which stated that they would havethe opportunity to revise their answers either based on: “The advice ofsuccessful students” or “the advice of an arctic expert”. Both sourcesof advice were presented with a picture of the respective source. Thesedescriptions of the two sources of advice were pre-tested with 145 sub-jects to determine overall strategy preference in this survival scenariocontext. In 144 of the 145 cases, our pilot participants—again collegestudents—chose the expert advice. Hence, it was clear that this imple-mentation of the expert advice is the preferred social influence strategyfor this specific task.
Next, one third of our participants were randomly assigned to re-ceive the message that they would be “randomly assigned to one of thetwo sources of advice”. In reality, everyone was assigned to receive theexpert advice—the preferred advice as based on the pre-test. Anotherthird of our participants received a message that they were assignedto receive the expert advice because “...this is the advice you will likebest”. The ostensible analysis of participants rankings, which was shownto all participants, was implemented to increase the realism of this con-dition. The final third of our participants had the option to select theadvice they would prefer most; these participants had a free-choice be-tween the two strategies. Consistent with our pre-test results all of theparticipants in this condition ended up choosing the expert advice.

61
After the choice manipulation, participants received short feedbackabout 6 of their 12 ranked items. For each participant, irrespectiveof their ranking, it was suggested to: move their most important item(ranked 1) down to rank 7, move the item ranked at 3 to 5, move 5 to12, 7 to 1, 10 to 3, and 12 to 10. These suggestions were presented oneby one, and, during the presentation of these suggestions, the disclo-sure conditions were implemented. Half of the participants received themessage “You ranked [the item] at number [ranking by the participant].The expert ranked [the item] as [more/less] important at number: [sug-gested rank].” The other half of the participants were shown the sameadvice and a message box with the following message: “Please note thatresearch shows that people tend to be persuaded by experts”.
After reading each of the six recommendations, participants wereshown a screen displaying their initial ranking of the twelve items com-pared side by side with the ranking of the expert. Participants couldthen re-rank their items as desired based on the expert’s advice. Forparticipants in the disclosure condition, the aforementioned messagebox was again displayed. After re-ranking the items, participants wereasked to evaluate the advice that was given. The study ended with ashort set of demographic questions.
MeasuresAs a primary measure of the effectiveness of the persuasive attempt,(the advice given by the expert) a compliance score was computed. Thecompliance score is the sum of the number of ranks changed betweeninitial rank and suggested ranks for the items for which a re-rank wassuggested. Hence, if the item that was initially ranked at 1 was moved toposition 5 (suggested position was 7) in the final rankings, participantsreceived a score of (|7−1|−|7−5|) = 4 , (the maximal suggested changeminus the actual distance between the suggested rank and the finalrank) for that item. The maximum compliance score was (6 + 2 + 7 +6 + 7 + 2 =) 28. Negative scores could be obtained when items weremoved in greater rank-distance to the suggestions than the initial rank,however, this did not occur in the study.
In addition to the actual compliance score, the perceived usefulnessof the expert advice and participants confidence in their final rankingwere measured. Perceived usefulness was measured using the following5 ten-point items (Cronbach’s α= 0.934):
1. How useful was the advice provided by the expert?2. How much did you respect the opinion of the expert?

62
3. Did the advice from the expert change your opinion?4. How helpful was the advice from the expert for your ranking in the
arctic survival task?5. How satisfied are you with the help from the expert?Participants’ confidence in the final ranking was measured using the
following 2 ten-point items (Cronbach’s α= 0.859):1. How confident are you in your final ranking?2. How satisfied are you with your final ranking?
4.2.2 Results Study 1ComplianceTo examine the effects of disclosure and choice on compliance, a com-pliance score was computed for each participant and these scores wereanalyzed using a 2×3 between-participants ANOV A. There was a sig-nificant main effect of choice, Mno,random = 18.2, Mno,knowledge = 21.0,Mfree−choice = 22.2, F (2,106) = 3.38, p = 0.038. Furthermore, therewas a statistically significant main effect of disclosure on the compli-ance scores, Mno = 22.1, Myes = 18.8, F (1,106) = 6.55, p = 0.012. Nointeraction between choice and disclosure was found, F (2,106) = 0.10,p= 0.905. Figure 4.1 shows an overview of the results.
It is clear that compliance to the expert’s advice is higher whenthe persuasive intent of this implementation was not disclosed. Usingpost-hoc tests, the main effect of choice was further examined. Thefree-choice condition differed significantly from the random-assignmentcondition, p= 0.011. None of the other conditions differed significantlyfrom each other.
Usefulness of the AdviceA mean usefulness of the advice was computed for each participant.The usefulness score was analyzed using a 2× 3 between-participantsANOVA. There was a significant effect of choice, Mno,random = 7.1,Mno,knowledge = 7.0, Mfree−choice = 8.0, F (2,106) = 4.19, p = 0.018.Also, there was a significant main effect of disclosure on the useful-ness scores, Mno = 7.7, Myes = 7.0, F (1,106) = 4.74, p = 0.032. Nointeraction between choice and disclosure was found, F (2,106) = 0.24,p= 0.787. Figure 4.2 shows an overview of the results.
It is clear that the advice from the expert is perceived as more use-ful when it is not disclosed to participants the fact that advice froman expert tends to influence opinion. Thus, disclosure diminishes the

63
14
16
18
20
22
24
26
No choice, Random No choice, Knowledge Yes, Free choice
Use
fuln
ess
of th
e A
dvic
e gi
ven
by th
e E
xper
t
No disclosure
Disclosure
Figure 4.1: The effects of choice and disclosure on compliance.Shown are the estimated marginal means and stan-dard errors of the compliance scores. On the x-axis,are the three choice levels, and the two separate linesrepresent the two disclosure conditions.
perceived usefulness of this implementation of the authority strategy.Furthermore, it is clear that free-choice increases the perceived useful-ness of the advice over conditions in which participants are not free tochoose for this advice source. Post-hoc tests show that the free choicecondition differed significantly in its perceived usefulness from both theno-choice, random condition, p = 0.031, and the no-choice, knowledgecondition, p= 0.028.
ConfidenceAnalysis of the confidence scores using a 2× 3 ANOVA showed a sig-nificant main effect of choice, Mno,random = 6.1, Mno,knowledge = 6.7,Mfree−choice = 7.7, F (2,106) = 6.20, p = 0.003. No significant maineffect of disclosure, F (2,106) = 3.23, p = 0.076, and no significant in-teraction were found, F (2,106) = 1.22, p= 0.300. Using post-hoc tests,it was clear that the free-choice condition differed significantly fromboth the no choice, random condition, p = 0.001, and the no choice,knowledge condition, p= 0.031.

64
6
6.5
7
7.5
8
8.5
9
No choice, Random No choice, Knowledge Yes, Free choice
Use
fuln
ess
of th
e A
dvic
e gi
ven
by th
e E
xper
t
No disclosure
Disclosure
Figure 4.2: The effects of choice and disclosure on the perceivedusefulness of the advice. Shown are the estimatedmarginal means and standard errors of the usefulnessscores.
4.2.3 Discussion Study 1Study 1 shows that both choice—the ability to select the persua-sive strategy that is used for the specific influence attempts—anddisclosure—the revelation of the effect of this strategy—affect compli-ance. Free-choice led to higher compliance to the request. Disclosureof the fact that the expert advice generally has an influence on others,led to decreased compliance.
Free-choice by users of different persuasive strategies leads to highercompliance, usefulness, and user confidence ratings than system as-signed strategies. This implies that designers of adaptive persuasivesystems should try to involve users in the selection of different influencestrategies. The effectiveness of free-choice is likely a result of the con-sistency principle: Once people make a certain choice, they will go togreat lengths to stick to this choice (Cialdini, 2001). Hence, once a userchooses to comply to an expert, they will try to adapt their behaviorto be consistent with this choice.
Disclosing the general effect of the use of the expert strategy reducedits effectiveness. This was probably due to the fact that disclosing the
65
use of a persuasive strategy leads to a higher elaboration state, reducesperipheral processing, and thus lessens the impact of the influence strat-egy through the peripheral route (see Cacioppo et al., 1986). This find-ing might imply that secrecy about the use of influence strategies canbe beneficial for persuasive systems. The implications of this study forthe design of persuasive systems are further detailed in Chapter 6.
4.3 Study 2 and 3: Simultaneous PresentationWhile Study 1 focused on the effects of both disclosure and choice onthe effectiveness of using influence strategies, Study 2 to 4 focus onthe applied question whether adaptation is actually necessary: Is it notjust possible to use multiple strategies simultaneously? In these studieswe investigate the main effects of the usage of multiple strategies—andthus not the individual differences in responses to multiple strategies.
4.3.1 Method Study 2ParticipantsForty-four undergraduate students volunteered to participate by accept-ing an email invitation with a link to the study website. This emailinvitation went out to a total of 136 possible participants, giving thestudy a 32.4 percent response rate. Of the final sample 25 (56.8 percent)were females. The average age of the sample was 23.8 (SD=7.6).
ProcedureThe first part of the study consisted of the same arctic survival item-ranking task as used in Study 1. After participants were finished rankingthese items, a period of 6 seconds was spent ostensibly analyzing theirranking before participants were told "...some of your rankings werecorrect, but some could use improvement. You will now get the chanceto revise your answers." After this message the experimental manipula-tions were implemented and participants had the opportunity to revisetheir rankings.
ManipulationsIn this experiment four conditions were used on two dimensions: (a)the number of strategies used (one or multiple) and (b) whether, in themultiple strategy condition, the implementations were congruent (yesor no). In the single strategy condition participants received “advice”on how to change their rankings either from an expert or based on theconsensus of a group of similar others. Participants were told: "You

66
will have the chance to revise your answers based on advice from..."and then were shown a picture and a brief textual description of theiradvice source. Despite the different source labels, all participants wereexposed to the same advice.
The authority strategy was implemented as follows: Participantswere told that they would receive advice originating from a “survivalexpert”. This was supported with the notion that: “You will get tipson how to better rank your items based on the knowledge of an arcticexpert.” The consensus strategy was implemented by stating that par-ticipants would receive advice from “Other students” and was furtherelaborated on by stating: “You will get tips on how to improve yourranking of items based on the consensus of other students who havegenerally done well on these types of problems.”
Congruence of sources was nested within the multiple strategy con-dition. In the congruent condition, the advice of both sources agreed.The message read: "The group of successful students agreed with theexpert" for five out of the six suggestions. To increase realism, one ofthe six suggestions stated that the sources disagreed with each other.These two numbers were reversed in the incongruent condition so thatthe two sources disagreed on five out of six suggestions and agreed onone.
These are the four experimental groups in the experiment:
1. Single strategy-Authority. Advice from the authority source only.N=10
2. Single strategy-Consensus. Advice from the consensus source only.N=12
3. Multiple strategy-Congruent. Agreeing advice from the authoritysource and consensus source. N=10
4. Multiple strategy-Incongruent. Disagreeing advice from the au-thority source and consensus source. N=12
MeasuresMeasures in Study 2 were the same as those used in Study 1.
4.3.2 Results Study 2For each of the dependent variables the main-effect of the number ofstrategies was first examined. Next, separate analyses were performedto test the effects of the specific strategy that was used, the number ofstrategies used, and the congruency of the messages under the multiplestrategy condition.

67
ComplianceFor the actual compliance to the advice given in the four experimen-tal conditions, we found no significant main-effect of the number ofsources: The average compliance score for the single source conditions,X = 15.8, S.E = 1.96, was similar to that of the multiple strategy con-dition„ X = 17.2, S.E = 1.62 t(42) = 0.55, p = .582. Within the singlestrategy condition a strong effect—as expected based on the pre-testfor Study 1—of the actual strategy that was used was found: Par-ticipants in the authority condition, X = 23.6, S.E. = 1.87, compliedmuch more to the advice than participants in the consensus condition,X = 9.3, S.E.= 1.61, t(20) = 5.80, p < .001. Within the multiple strat-egy condition both the incongruent group, X = 17.6, S.E = 2.34, andthe congruent group, X = 16.8, S.E = 2.33 had approximately similarmean compliance scores, t(20) = 0.235, p= .816. In all of the conditionsthe compliance scores were significantly higher than 0, indicating thatthe advices in all of the conditions influenced the ratings of participants.
.00
5.00
10.00
15.00
20.00
25.00
30.00
35.00
40.00
Authority Consensus Congruent Incongruent
Single strategy Multiple strategies
Sco
re o
n C
ompl
ianc
e In
dex
Experimental condition
Figure 4.3: The effects of the use of single or multiple strategies,either authority or consensus and congruent or incon-gruent, on compliance.
Figure 4.3 shows the means and standard errors for each of theexperimental groups. When conducting a one-way four level ANOVAon this data, there is a significant main-effect of condition, F (3,40) =8.097, p < .001. Bonferroni corrected pairwise comparisons show thatthe single strategy consensus condition scores significantly lower than

68
all other conditions, while the single strategy authority condition scoressignificantly higher. Table 4.1 shows the mean differences between eachof the four conditions, their standard errors, and the p-value for eachpossible pairwise comparison. The results indicate that when choosingthe optimal single strategy for a specific context, adding other strategiescan have a detrimental effect on compliance. It further shows that whenone of the sources is preferable, the effect of congruency is small.
Table 4.1: Post-hoc comparisons of the experimental conditions inStudy 2. SS=Single strategy, MS=Multiple strategies,Auth=Authority, Cons=consensus, Congr=congruent,Incongr=incongruent.
(A) condition (B) condition (A− B) S.E. p-valueMS Congr SS Cons 8.25 2.79 .005MS Congr MS Incongr 0.78 2.93 .790MS Congr SS Auth -6.02 2.93 .046SS Cons MS Congr -8.25 2.79 .005SS Cons MS Incongr -7.47 2.93 .015SS Cons SS Auth -14.27 2.93 .001MS Incongr MS Congr -0.78 2.93 .790MS Incongr SS Cons 7.47 2.93 .015MS Incongr SS Auth -6.8 3.06 .032SS Auth MS Congr 6.02 2.93 .046SS Auth SS Cons 14.27 2.93 .001SS Auth MS Incongr 6.8 3.06 .032
ConfidenceAnalysis of the confidence scores (Cronbach’s α= 0.783) shows that theaverage confidence score for the single source conditions, X = 7.7, S.E =.29, was similar to that of the multiple strategy condition„ X = 8.1,S.E = .25 t(42) = 0.673, p= .504. Within the single strategy conditionno significant effect of strategy was found: Participants in the authoritycondition, X = 7.8, S.E.= .52, were as confident as participants in theconsensus condition, X = 7.7, S.E.= .61, t(20) = 0.061, p < .952.
Different from the previous results on compliance, a significant effectof congruency was found: Within the multiple strategy condition theconfidence in the final rating based on advice from incongruent sources,X = 7.5, S.E = 0.17, was lower than that based on advice from congru-ent sources, X = 8.8, S.E = .43, t(20) = 2.992, p = .007. Hence, while
69
incongruent advice did not lead to lowered compliance, it did lead to alowered confidence in the final rankings.
4.3.3 Discussion Study 2Study 2 quantitatively shows a predisposition of participants to respondto one preferred social influence strategy, and solely that strategy. Com-pliance was greatest in the condition in which the advice came from onlythe preferential source (authority). Having multiple sources of adviceagree on the recommendation had not only no positive impact on com-pliance levels but actually had a slightly negative effect when comparedto the preferred strategy (Table 4.1, bold). This finding could poten-tially be a result of increasing cognition and elaboration moving from astrictly peripheral processing approach to a, higher elaboration, centralroute. While peripheral processing and central processing should beregarded as end-points on a continuum (Petty and Cacioppo, 1986), amove towards more central processing is likely to lower the effects ofinfluence strategies that are hypothesized to be effective primarily viathe peripheral route.
The authority and consensus strategies employed in this study arelikely to be primarily effective via the peripheral route—although a le-gitimate authority strategy or credible consensus strategy can also beeffective via central processing (see also Petty et al., 1997)—and thussmaller effects of the influence strategies due to an increase in elabora-tion could be expected. The added advice could also have introduced asense skepticism or lack of trust with intention of the application (ob-served in the variance in the usefulness-index across conditions). How-ever, the result is clear that in some situations using multiple strategiescan be detrimental as compared to the presentation of a single, correct,strategy.
Another plausible explanation for the difference in effectiveness ofdifferent strategies (as witnessed in the difference in compliance betweenthe consensus and the authority strategy), as well as the lack of an addi-tive effect of using both strategies, can be found in the work of McGuire(see, e.g. 1981, 1995) on the effectiveness of communication campaigns.McGuire (1981) describes how different response “steps”, ranging fromthe initial exposure to persuasive communication, via attention, com-prehension, behavior change, to structural change may require differentinputs: different types of messages, via different channels, and from dif-ferent sources. It is thus likely that while both of the strategies usedin Study 2 are effective for persuasion, they are effective for different

70
response steps. Combining strategies that are effective inputs for dif-ferent response steps could be ineffective for a specific step, or at leastappear ineffective when only one of the response-steps is measured inan experiment. The possible combination(s) of different persuasion in-puts (such as the different influence strategies used in this study) andtheir effectiveness to influence different response steps is an interestingavenue for further study.
4.3.4 Method Study 3Study 2 raised an important question that still needs to be answered tohave a clear picture of the correct implementation approach: If there isno clearly preferred strategy (i.e. the implementations of both sources ofadvice are equally influential), is a single strategy implementation stilloptimal? In study 3 we address this question by repeating the setup ofStudy 2 but this time with equally preferred sources of advice to see ifthere is any context in which multiple strategies are significantly moreeffective than a single strategy.
Creating Equal Implementations of Influence StrategiesTo create implementations of both the Consensus and Authority strat-egy that were equally preferred sources of advice in the item-rankingscenario we pre-tested a number of different implementations of boththe Authority strategy and the Consensus strategy in a similar way asway pre-tested participants preference towards the strategy in study 2:A group of participants was invited via email to, after being introducedto the item-ranking task, choose which sources of advice they would likeadvice from.
After several changes to our wordings and several small pilots wechoose to reword the implementation of the Authority strategy to makeit less preferential given the item-ranking scenario. Participants weretold that they would receive advice originating from a “doctor”. Thiswas supported with the notion that: “You will get tips on how to betterrank your items based on the knowledge of a doctor.” The consensusstrategy was implemented like in Study 1. A pre-test of these two im-plementations by 69 participants showed that 32 participants wantedto receive advice from the expert, while 37 participants choose the con-sensus advice. Thus, these implementations in Study 3 enable us toexamine the effect of using a single or multiple strategies when thestrategies are (almost) equally preferred.

71
Participants48 undergraduate students volunteered to participate by accepting anemail invitation with a link to the study website. The email invitationwas sent out to a total of 113 possible participants, giving the study a42.5 percent response rate. The final sample consisted of 28 (58.3 per-cent) females. The average age of the sample was 21.3 (SD=2.19). Noneof the participants in Study 3 had previously participated in Study 2.
ProcedureThe procedure used in Study 3 was identical to that of Study 2, withthe exception that the authority source and the consensus source weredesigned to be equally preferential.
4.3.5 Results Study 3ComplianceFor compliance to the advice given in the four experimental conditions,we found no significant main-effect of the number of sources: Theaverage compliance score for the single source conditions, X = 19.0,S.E = 1.49, was not significantly different from that of the multiplestrategy condition, X = 16.7, S.E = 1.70 t(46) = 1.029, p= .309. Withinthe single strategy condition no effect—as expected based on the pre-test —of the actual strategy that was used was found: Participants inthe authority condition, X = 19.5, S.E.= 2.34, complied equally to theadvice as participants in the consensus condition, X = 18.5, S.E.= 1.97,t(22) = 0.300, p= .767. Within the multiple strategy condition partici-pants in the incongruent group, X = 12.3, S.E = 2.52, complied less tothe advices than those in the congruent group, X = 21.1, S.E = 1.51,t(22) = 2.98, p < .01.
Figure 4.4 shows the means and standard errors for each of the ex-perimental groups. When conducting a one-way four level ANOVA onthis data, there is a significant main-effect of condition, F (3,44) = 3.267,p < .05. Bonferroni corrected pairwise comparisons (See Table 4.2)show that the Multiple Source Incongruent condition scores significantlylower than all op the other conditions.
ConfidenceAnalysis of the confidence scores (Cronbach’s α = 0.908) shows thatthe average confidence score for the single source conditions, X = 7.2,S.E = .24, was similar to that of the multiple strategy condition„

72
.00
5.00
10.00
15.00
20.00
25.00
30.00
35.00
40.00
Authority Consensus Congruent Incongruent
Single strategy Multiple strategies
Sco
re o
n C
ompl
ianc
e In
dex
Experimental condition
Figure 4.4: The effects of the use of single or multiple strategies,either authority or consensus and congruent or incon-gruent advice on compliance in Study 3.
Table 4.2: Post-hoc comparisons of the experimental conditions inStudy 3. SS=Single strategy, MS=Multiple strategies,Auth=Authority, Cons=consensus, Congr=congruent,Incongr=incongruent.
(A) condition (B) condition (A− B) S.E. p-valueMS Congr SS Cons 2.5 2.99 .409MS Congr MS Incongr 8.8 2.99 .006MS Congr SS Auth 1.6 2.99 .600SS Cons MS Congr -2.5 2.99 .409SS Cons MS Incongr 6.3 2.99 .043SS Cons SS Auth -.92 2.99 .761MS Incongr MS Congr -8.8 2.99 .006MS Incongr SS Cons -6.3 2.99 .043MS Incongr SS Auth -7.2 2.99 .021SS Auth MS Congr -1.6 2.99 .600SS Auth SS Cons .92 2.99 .761SS Auth MS Incongr 7.2 2.99 .021

73
X = 7.15, S.E = .38 t(46) = 0.837, p= .407. Within the single strategycondition no significant effect of strategy was found: Participants in theauthority condition, X = 7.3, S.E. = .36, were as confident as partic-ipants in the consensus condition, X = 7.1, S.E. = .34, t(22) = 0.340,p < .737. No significant effect of congruency was found: Within themultiple strategy condition the confidence in the final rating based onadvice from incongruent sources, X = 7.5, S.E = 0.65, was the sameas that based on advice from congruent sources, X = 7.5, S.E = .41,t(22) = 0.001, p= 0.99.
4.3.6 Discussion Study 3The results of Study 3 extend the findings of Study 2. In Study 2 itbecame clear that using multiple social influence strategies to supporta single goal does not necessarily lead to increased persuasion. Espe-cially when one of the social influence strategies used is less effectivethan other strategies the overall persuasion is lowered. Study 3 ex-amined whether, when social influence strategy implementations areequally preferred, a similar result holds. The results show that (a) theresults in study 2 are indeed at least partially explained by aversion ofone non-preferential strategy but, (b) even if two strategies are equallyeffective the persuasion does not always add up. This latter finding in-dicates that combining multiple strategies for a single appeal can be anunattractive option for designers: Persuasion might not be increased ifboth strategies are successful, and it can be decreased if one of the socialinfluence strategies selected by the designers is suboptimal. The resultsof both of these studies thus support the idea that designers shouldbe cautious about combining multiple influence strategies to support asingle request.
4.4 Study 4: Simultaneous Presentation in PracticeStudy 2 and 3 demonstrated the importance of a careful implementa-tion approach for persuasive arguments. These studies used controlledlaboratory manipulations to prove that not only is it the type of per-suasive strategy that matters, but more importantly, how and withwhat other strategies an argument is implemented. Study 4 takes theprevious findings and implements the above strategies in a traditionalconsumer-facing advertisement setting.

74
4.4.1 Methods Study 4ParticipantsNorth American Google Search engine users, N = 197102, between theages of 18 and 55 were exposed to one out of six advertisement belongingto one of our experimental conditions.
ProcedureSix Google search advertisements were created to solicit users to par-ticipate in a study. All six advertisements were titled "Participate in aStudy!" with varying 140 character descriptions that fell into two condi-tions: advertisements using only a single social influence strategy versusthose that use multiple social influence strategies. Three social influ-ence strategies were used in this study: a) consensus, b) authority, andc) scarcity. Our main aim was to compare the performance of an adver-tisement that implements all of these strategies to one that implementsonly a single of these strategies.
In the Single Strategy condition an implementation of one of thesocial influence strategies was shown to participants in the textual addto encourage them to participate in our online study:
1. “100s of others have taken this study before.”2. “Professor Ford recommends taking this study.”3. “There are only 18 hours left to participate in this study.”
Where the first implements the influence strategy consensus, the secondauthority, and the third scarcity.
In the Multiple Strategy condition implementations of multiplestrategies in a single advertisements were shown to participants. Tocontrol for implementation order we showed one of the following adver-tisements to participants in this condition:
1. “100s participated, & Professor Ford recommends it. Only 18hours left.”
2. “Prof. Ford recommends it, 100s participated, only 18 hours left.”3. “Only 18 hours left, & Professor Ford recommends it. 100s took
it.”The study ran for 21 days and each advertisement was systematically
alternated over time to ensure an even distribution over the allocatedtime period. Once a participant clicked on the advertisement the suc-cess of that advertisement was logged. After clicking participants weretaken to a landing page that asked if they would like to participate ina study (informed consent). If they selected "Yes", they were taken to

75
the "study" page where they were told to rank pictures one at a timebased on a scale of one to five of how the picture made them feel. Thislatter task was unrelated to the study reported here.
MeasuresThe primary measure of compliance to the conditions was the click-through rate (clicks / views) for the advertisements in each condition.This score measures the direct effectiveness of the multiple versus singlestrategy conditions.
4.4.2 Results Study 4Click-throughTable 4.3 shows the number of views and clicks on each of the adver-tisements. Aggregated over the different stimuli in the two conditionsthere were 87356 views and 316 clicks in the single strategy condition.The click-through rate in this condition was .36 percent. In the multiplestrategy condition the number of views was 109746 and the number ofclicks was 195. This is an average click-through of .18 percent. Themultiple strategy condition thus performed significantly worse than thesingle strategy condition, χ2 = 63.1, p < .001.
Table 4.3: The number of views and the click-through rate of theadvertisements used in Study 4.
Cond. Add text Views Clicks %Single 1. “100s of others. . . ” 25825 123 .47
2. “Professor Ford. . . ” 24509 61 .253. “There are only. . . ” 37022 132 .36
Multiple 1. “100s participated. . . ” 23546 52 .222. “Prof. Ford. . . ” 21390 51 .243. “Only 18 hours left. . . ” 64810 92 .14
To illustrate the effectiveness of each of the advertisements the beta-binomial distribution was used to model the success of each of the ad-vertisements independently (gray lines) and aggregated over conditions(black and gray solid lines). Figure 4.5 plots each of these probabilitydensity distributions. The vertical lines are the 97.5% and 2.5 per-centiles of the distribution. It is clear that each of the advertisementsthat implements a single strategy scores higher than those implementingmultiple strategies. Thus, the effects of the social influence strategiesdo not to add up when used simultaneously in a single advertisement.
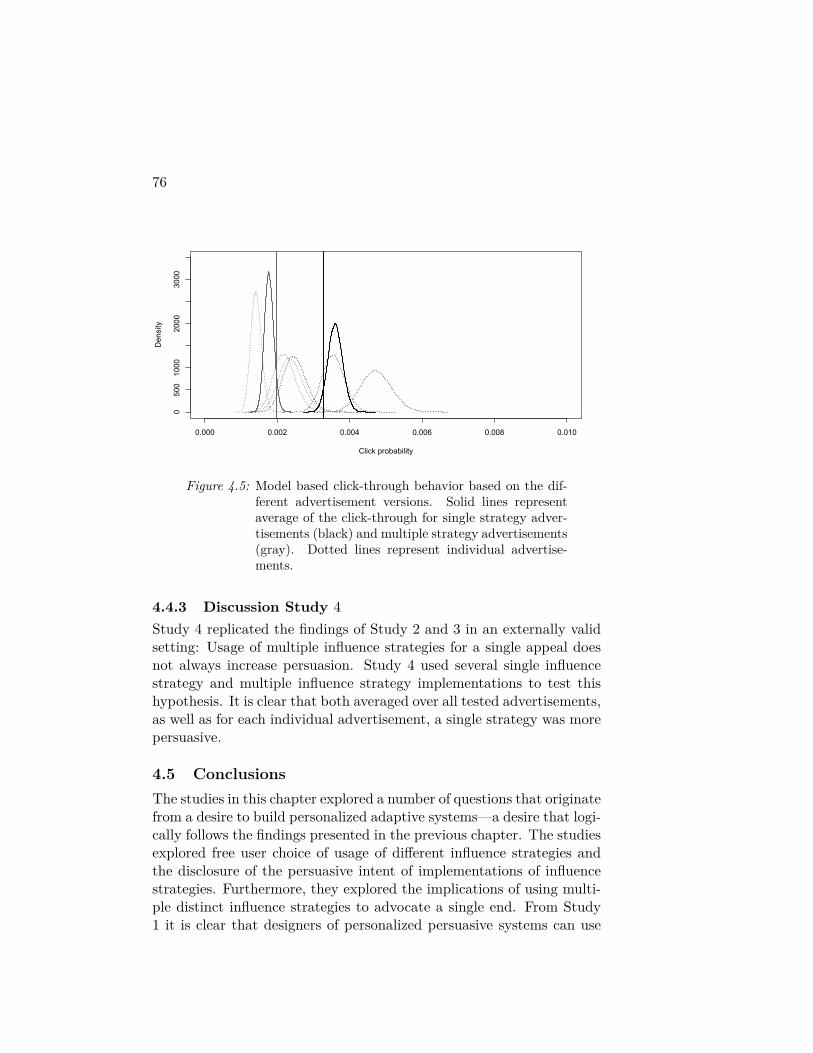
76
0.000 0.002 0.004 0.006 0.008 0.010
05001000
2000
3000
Click probability
Density
Figure 4.5: Model based click-through behavior based on the dif-ferent advertisement versions. Solid lines representaverage of the click-through for single strategy adver-tisements (black) and multiple strategy advertisements(gray). Dotted lines represent individual advertise-ments.
4.4.3 Discussion Study 4Study 4 replicated the findings of Study 2 and 3 in an externally validsetting: Usage of multiple influence strategies for a single appeal doesnot always increase persuasion. Study 4 used several single influencestrategy and multiple influence strategy implementations to test thishypothesis. It is clear that both averaged over all tested advertisements,as well as for each individual advertisement, a single strategy was morepersuasive.
4.5 ConclusionsThe studies in this chapter explored a number of questions that originatefrom a desire to build personalized adaptive systems—a desire that logi-cally follows the findings presented in the previous chapter. The studiesexplored free user choice of usage of different influence strategies andthe disclosure of the persuasive intent of implementations of influencestrategies. Furthermore, they explored the implications of using multi-ple distinct influence strategies to advocate a single end. From Study1 it is clear that designers of personalized persuasive systems can use

77
free-choice as a means of making their applications more persuasive.Users can choose the type of argument or social influence strategy thatappeals to them most. However, when the persuasive intent of the socialinfluence strategy is made salient persuasion is decreased. This latterfinding highlights the importance for designers to be cautious abouttheir presentation of social influence strategies.
Studies 2 to 4 show the importance of choosing the “correct” socialinfluence strategy. The studies in Chapter 3 uncovered large heterogene-ity at an individual level. This chapter adds to this finding by show-ing that using multiple social influence strategies—possibly appealingto different types of people—does not necessarily increase persuasion.Rather, a single influence strategy can be more persuasive. This find-ing was consistent even when two different social influence attempts hadsimilar average effects: combining the strategies does not significantlyincrease persuasion. Study 4 showed that these results also hold in anapplied context. In the presented studies, the combination of influencestrategies converges in its persuasion to the least successful influenceattempt. While these results do not show that every possible combina-tion of influence strategies will always be less effective than the use ofa single strategy, the results do make clear that clear that designers ofpersuasive systems should not always expect additive effects of differentinfluence strategies. The implications of these findings for the design ofpersuasive systems are further discussed in Chapter 61.
1This chapter is (partly) based on earlier publication(s): (Kaptein et al., 2011b,2012).

78

5Insight Generation III:
Meta-Judgemental Measures
5.1 Introduction: Measures of Persuasion SusceptibilityThe previous chapters have shown that (a) large differences betweenindividuals exists in their responses to social influence strategies, and(b) that using multiple social influence strategies to support a singlegoal is not necessarily beneficial to increase compliance. These findingssupport the idea that social influence strategies as identified by Cial-dini (2001) provide a useful taxonomy to distinguish different persua-sive messages. This chapter explores whether the individual differencesobserved in responses to social influence strategies can be measured apriori using meta-judgmental measures.
Designers of persuasive technologies can use the results presentedin the previous chapters in two ways: First, designers can aim to mea-sure possible susceptibility to strategies before deploying the technology.Thus, based on questionnaire measures a profile of an individual usercan be created and used to adapt message presentation of a persuasivesystem. Second, persuasive technologies can be designed that dynami-cally update the representation of persuasive messages based on a user’sresponse to implementations of social influence strategies. This chapter
79

80
explores the first of these two options and presents the development ofthe STPS: The Susceptibility to Persuasive Strategies Scale.
The STPS is not the first instrument designed to assess a-prioripeople’s possible responses to subsequent exposure to social influencestrategies. Initially researchers working on dual-processing models ofattitude change created measures to classify the tendency of people toeither elaborate a lot (take the central route to persuasion) or elabo-rate a little (using the peripheral route). Those with a high tendency toelaborate—those high in the “Need for Cognition” (NfC)—are less sus-ceptible to peripheral cues. Elaborate development of the scale showsthat the 18-item version presented by (Cacioppo and Petty, 1982) isboth internally consistent (reliable) and externally valid. Next to mea-sures of the overall tendency to be persuaded by implementations of so-cial influence strategies researchers have also developed strategy-specificmeasures: Cialdini et al. (1995) present the “Preference for Consistency(PFC)” scale and show that it adequately predicts responses to imple-mentations of the consistency and commitment strategy (Nail et al.,2001).
In this chapter this previous work is extended by developing a scale,called the “Susceptibility to Persuasive Strategies scale (STPS)”, whichaddresses susceptibility to each of the six social influence strategies iden-tified by Cialdini (2001) separately. Study 1 presents an initial attemptto develop such a scale. The 12-item scale that is developed is analyzedto determine its factor structure. Next, participants scores are relatedto behavioral responses to implementations of the consensus and reci-procity strategy. Study 2 further develops the scale by increasing thenumber of items and performing a more formal reliability and validityanalysis. The 26-item scale that is presented in Study 2 has a clear sixfactor solution representing each of the social influence strategies. Thevariance explained by this solution is reasonable, and the overall lowcorrelation to the NfC scale shows that the STPS partly measures adistinct trait. Participants scores on the STPS are finally related toresponses to social influence strategies (as obtained in Study 1 of Chap-ter 3). The STPS measure significantly aids in explaining responses toimplementations of social influence strategies.
5.2 Study 1: Initial application of the short STPS
As an initial test of the STPS an experiment was setup in which (a)susceptibility to each influence strategy was measured using two items,

81
and (b) participants behavioral response to a persuasive request thatwas supported by implementations of social influence strategies wasobserved. In this study a request is made to participants and a sys-tem delivers implementations of multiple influence strategies to try andincrease compliance. The main aim of this first study was to showthat people who are more susceptible to distinct influence strategieswill comply to a greater extent with a request that is supported by animplementation of that influence strategy.
5.2.1 Methods Study 1In Study 1 participants were asked to fill in an online questionnaire ontheir experience of their social relationships. The questionnaire con-sisted of 42-items and was constructed using items from the connect-edness questionnaire as presented by (van Bell and Smulders, 2009) aswell as 12 items measuring respondent’s susceptibility to persuasion.After filling in the questionnaire participants were asked to provide theexperimenter with email addresses of friends that might be willing toparticipate in the same study. This request was either supported (S) ornot supported (NS) by implementations of social influence strategies.
Development of the Short STPSTo measure participants susceptibility to social influence strategies twoitems asking how likely participants would be to respond to an imple-mentation of that strategy were developed. For each social influencestrategy, reciprocity, scarcity, authority, commitment, consensus, andliking, two applied instances of implementations were created. Table 5.1presents all of the 12 items used in this study grouped by social influencestrategy. Participants were asked to specify the extent to which theyagreed or disagreed with the statement. Response categories rangedfrom (1), Completely agree to (7) Completely disagree.
ConditionsTo operationalize the supported (S) and not supported (NS) conditionsthe request to provide several email addresses was either not supportedby any additional message, or was supported by two persuasive state-ments. The first implementation relied on the principle of consensus:“All of the other participants provided several email addresses to us”.The second implementation relied on the principle of reciprocation: “Inreturn for providing us with your friend’s addresses, we will send youa copy of the results of our study”. Both implementations were added

82
Table 5.1: The 12 susceptibility items—presented per influencestrategy—that compose together the short-STPS.
Strategy Item Name Susceptibility itemReciprocation Recip_1 When a family member does me a fa-
vor, I am very inclined to return thisfavor.
Recip_2 I always pay back a favor.Scarcity Scarce_1 I believe rare products (scarce) are
more valuable than mass products.Scarce_2 When my favorite shop is about to
close, I would visit it since it is mylast chance.
Authority Auth_1 I always follow advice from my gen-eral practitioner.
Auth_2 When a professor tells me somethingI tend to believe it is true.
Commitment Commit_1 Whenever I commit to an appoint-ment I do as I told.
Commit_2 I try to do everything I have promisedto do.
Consensus Cons_1 If someone from my social networknotifies me about a good book, I tendto read it.
Cons_2 When I am in a new situation I lookat others to see what I should do.
Liking Like_1 I accept advice from my social net-work.
Like_2 When I like someone, I am more in-clined to believe him or her.
in a clearly visible block right before the presentation of twenty emptytext fields which could be used to supply the email addresses.
Participants454 respondents were invited by email to participate in the study. Emailaddresses were taken from lists of respondents to previous researchprojects in the HCI domain. Participants’ were asked for their age andgender at the end of the questionnaire. Out of the 454 initially invitedparticipants 82 took part in the study leading to a response rate of 8.1%.
83
The email addresses collected during the study—those provided by theparticipants—were not used to invite subsequent participants. Of thosewho completed the study, 47 (57.3%) were male and 35 (42.7%) werefemale. The average age of the respondents was 37 years (SD = 13.3).
5.2.2 Results Study 1Scale ReliabilityThe internal consistency of the responses to the 12-item susceptibilityto persuasive strategies scale was examined using both reliability anal-ysis as well as a principal component analysis. Cronbach’s Alpha ofthe full scale was 0.609 which is relatively low. A Principal Compo-nent Analysis on the 12 items shows that, when rotating the solutionand allowing correlations between the components, 5 components haveEigenvalues higher than one. The items created to address suscepti-bility to implementations of the Liking strategy and those created toaddress Consensus strategy are highly correlated and thus grouped intoone component. The last Liking item loads correlates both to the Con-sensus as well as the Scarcity items. The rotated component loadingsare presented in Table 5.2.
Cumulative, the five components explained 71.6% of the total itemvariance. An average score of all susceptibility items was computed foreach respondent to indicate overall susceptibility. Furthermore, scoreswere computed for the two relevant sub-scales (susceptibility to consen-sus and susceptibility to reciprocity) by averaging the score on the twoitems relating to a specific strategy. In both cases the two respectiveitems correlated highly (r = .620, p < .001, Cronbach’s α= 0.77 for theReciprocity items and r = .672,p < .001, Cronbach’s α = 0.80 for theConsensus items).
Effects on ComplianceThe scores on the compliance measure—the number of provided emailaddresses—were examined for normality. The Kolmogorov-Smirnovstatistic and the Shapiro-Wilk statistic clearly showed that deviationfrom the normal was significant (KS = .319, p < 0.001; KW = .651,p< 0.001). Based on this preliminary analysis non-parametric statisticswere used to test the effects of the S and NS conditions on compliance.
A Mann-Whitney U test showed that the number of email addressesprovided in the S condition (Meanrank = 50.35) was significantlyhigher than that in the NS condition (Meanrank = 31.74, p < 0.001).

84
Table 5.2: Component loadings based on a principal componentsanalysis with oblimin rotation for the 12 items of theshort-STPS. Loadings smaller than .3 are suppressed.
C. 1 C. 2 C. 3 C. 4 C. 5Recip_1 .854Recip_2 .880Scarce_1 .722Scarce_2 .819Auth_1 .717Auth_2 .775Commit_1 .850Commit_2 .850Consens_1 .895Consens_2 .886Like_1 .402Like_2 .657 .403
Furthermore, there was a significant positive relationship between indi-vidual’s overall susceptibility to persuasive strategies and the numberof email addresses provided (ρ= .227, p < .05).
To test whether the scores on the sub-scales of the short−STPSwere predictive of the response of participants to a request supported byimplementations of the two strategies used in this experiment the rela-tionship between participants score on the sub-scale and their responseto the request was further examined. Participants score on the sus-ceptibility to consensus strategy sub-scale correlated highly with theirresponse to the persuasive request when the request was supported bythis strategy: ρ = .672, p < .001. This correlation was much lower forparticipants in the NS condition, ρ = .336, p < 0.05. This latter lowcorrelation is expected since the consensus strategy was not shown inthe NS condition. This interaction between the conditions and thescores on the STPS is statistically significant, p < .051.
For the reciprocity strategy, both in the S as well as the NS condi-tions, no significant correlation between participants score on this sub-scale of the STPS and their subsequent compliance was found. Thefact that, for the reciprocity strategy, the scores on the short-STPS donot relate to the responses to this strategy can be explained by the way
1This difference in ρ’s was tested using the V -statistic as presented by Hays (1973).

85
the reciprocity strategy was implemented: a promise to reciprocate of-ten has a much weaker effect than providing an actual favor in advance(Cialdini, 2001).
5.2.3 Discussion Study 1Study 1 provides initial evidence for the usefulness of the STPS byshowing that compliance to a persuasive request supported by an imple-mentation of the consensus strategy is highly correlated to participantsself-reported susceptibility to this scale. However, the study also high-lights that the two items per strategy as presented here might be toolimited to properly differentiate between each of the six social influencestrategies: the correlations between the Liking and the Consensus itemswere very high2. Also, for the second social influence strategy that wasimplemented to increase compliance—reciprocity—no relationship be-tween self-reported susceptibility and behavioral response was found.While the results obtained in this initial study are thus mixed, the highcorrelation between the behavioral measure and the meta-judgmentalscore on the consensus items inspired further investigation of the op-portunity to measure the susceptibility of respondents to different socialinfluence strategies using a questionnaire.
5.3 Study 2: Development and Validation of the STPS
Based on the results of Study 1 the STPS was further developed. Viastructured brainstorms a more elaborate item set was developed andtested. By creating four to six items measuring participants suscep-tibility to each of the social influence strategies identified by Cialdini(2001), the internal validity of each of the sub-scales is increased. Next,the scores on each of the sub-scales are used to explain responses tothree of the six social influence strategies separately.
5.3.1 Item ConstructionStarting from the 12 item measure used in study 1 additional itemswere created for each of the six latent variables of interest. In a sessionwith a group of five persuasive technology researchers eight or moreitems per variable were composed. Items were constructed to fit theunderlying latent variable as much as possible and to appeal both tospecific instances of the influence strategy (e.g. “I always follow advice
2The alternative explanation that the correlation between Liking and Consensusis so strong in actuality that one will not be able to design a scale that measuresthem separately is proven wrong in Study 2.

86
from my general practitioner”) as well as to broad statements of thelatent variable of interest (e.g. “I am very inclined to listen to authorityfigures”). In a pre-test with N = 9 participants the understandabilityand clarity of each of the items was evaluated and per variable 5− 6items were selected for further testing. The complete item set used forevaluation is presented in table 5.3.
Table 5.3: Items used in the development of the STPS. Itemsmarked with * are selected after the principal compo-nent analysis.
Principle Abbreviation Susceptibility itemReciprocity Recip_1* When a family member does me a
favor, I am very inclined to returnthis favor.
Recip_2* I always pay back a favor.Recip_3* If someone does something for me, I
try to do something of similar valueto repay the favor.
Recip_4* When I receive a gift, I feel obligedto return a gift.
Recip_5* When someone helps me with mywork, I try to pay them back.
Scarcity Scarce_6* I believe rare products (scarce) aremore valuable than mass products.
Scarce_7* When my favorite shop is about toclose, I would visit it since it is mylast chance.
Scarce_8* I would feel good if I was the lastperson to be able to buy something.
Scarce_9* When my favorite shampoo is almostout of stock I buy two bottles.
Scarce_10* Products that are hard to get repre-sent a special value.
Authority Auth_11 I always follow advice from my gen-eral practitioner.
Auth_12 When a professor tells me somethingI tend to believe it is true.
Auth_13* I am very inclined to listen to au-thority figures.
. . . continues on next page

87
Table 5.3: Items used in the STPS (. . . continued)
Strategy Abbreviation Susceptibility itemAuth_14* I always obey directions from my su-
periorsAuth_15* I am more inclined to listen to an
authority figure than a peer.Auth_16* I am more likely to do something if
told, than when asked.Commitment Commit_17* Whenever I commit to an appoint-
ment I always follow through.Commit_18* I try to do everything I have
promised to do.Commit_19* When I make plans I commit to them
by writing them downCommit_20 Telling friends about my future plans
helps me to carry them outCommit_21* Once I have committed to do some-
thing I will surely do it.Commit_22* If I miss an appointment, I always
make it up.Consensus Consens_23* If someone from my social network
notifies me about a good book, I tendto read it.
Consens_24* When I am in a new situation I lookat others to see what I should do.
Consens_25 I will do something as long as I knowthere are others doing it too.
Consens_26* I often rely on other people to knowwhat I should do.
Consens_27* It is important to me to fit in.Liking Like_28 I accept advice from my social net-
work.Like_28 When I like someone, I am more in-
clined to believe him or her.Like_28* I will do a favor for people that I likeLike_28* The opinions of friends are more im-
portant than the opinions of others.. . . continues on next page

88
Table 5.3: Items used in the STPS (. . . continued)
Strategy Abbreviation Susceptibility itemLike_28* If I am unsure, I will usually side
with someone I like.
5.3.2 Scale ValidationTo determine the internal validity of the STPS it was administeredto N = 215 participants. Participants were under-graduates enrolledfor a research methodology course, and the STPS was administered aspart of the intake-questionnaire required for students who intended tosign up for the course. All participants filled out both the 32 items ofthe susceptibility scale as well as the 18 item Need for Cognition scaleCacioppo et al. (1986). Need For Cognition (NfC) was included to alsoassess the external validity of the overall scale by comparison to a knowconstruct.
MethodThe items were administered using a 7-point scale. The end-points ofthe scale were labeled with “Completely Disagree” and “CompletelyAgree” where a score of 7 marked “Completely Agree”. The mid-pointsof the scale were not labeled. Participants were provided with a “Don’tknow” option for each item. The average age of the participants was23.0 years (SD = 7.4). Of the participants 167 were female (75.9%).Participants filled out the questionnaire online using their own computerafter receiving an email with a link to the study.
ResultsSimilar to Study 1, a principal component analysis was conducted toexamine the internal consistency of the scale. Figure 5.1 shows theeigenvalues of all the components with a line superimposed to indicatethe clearest cut-off. It is clear that, contrary to Study 1, a six componentsolution provides an appropriate fit for these data.
The total cumulative variance explained by all six components was52%, which is in a common range for multidimensional constructs. Thesix component solution was further examined using Oblimin rotation.Table 5.4 gives an overview of the loadings of each of the items onthe components. Because of relatively low loadings, or high cross-loadings, it was decided to remove six items from the scale: Auth_11,

89
0 5 10 15 20 25 30
02
46
810
12
Dimension
Eigenvalue
EigenvaluesCut-off
Figure 5.1: Scree plot showing the eigenvalues (y-axis) of each ofthe extracted components (x-axis). A clear increase isvisible from component 6 upwards indicating a properfit of a six factor solution.
Auth_12,Commit_20,Consens_25,Like_28,and Like_32. Refitting thesix component solution to the 26-item scale led to a cumulative varianceexplained of 56%, and no cross-loadings of factors over .3. In table 5.3the 26 items used to compute final scores on the six latent variables ofthe STPS are marked with an *.
For each of the six components a composite score was computedby averaging over the 3−5 items in each sub-scale. Table 5.5 presentseach of the sub-scales with their appropriate descriptives. Overall, thisanalysis indicates that the six factors underlying the STPS are mod-erately internally consistent. The correlations between the scores onthe sub-scales range from .2 to .4. As a check of the external validityof the scale we examined the correlation between the total compositescore of participants on the STPS and their score on NfC (Cronbach’sα= 0.89): The correlation between these two scales was −0.14, p< 0.05.
The sub-scales of the 26-item STPS are moderately internally reli-able, and the correlations between the separate sub-scales are relativelylow, indicating that the STPS indeed measures people’s susceptibil-ity to 6 distinct strategies. The internal reliability of a number of thesub-scales is questionable—particularly that of the Scarcity, Consensusand Liking strategies. This is probably due to the nature of the items,

90
Table 5.4: Component loadings based on a principal componentsanalysis with oblimin rotation for 32 items of the STPS.Loadings smaller than .3 are suppressed.
C. 2 C. 3 C. 1 C. 4 C. 6 C. 5Recip_1 0.34Recip_2 0.72Recip_3 0.73Recip_4 0.67Recip_5 0.67Scarce_6 0.77Scarce_7 0.33Scarce_8 0.44Scarce_9 0.34Scarce_10 0.84Auth_11 0.37 0.45Auth_12 0.44 0.40Auth_13 0.73Auth_14 0.71Auth_15 0.75Auth_16 0.59Commit_17 0.84Commit_18 0.63Commit_19 0.51Commit_20Commit_21 0.80Commit_22 0.76Consens_23 0.54Consens_24 0.53Consens_25 0.40 0.42Consens_26 0.63Consens_27 0.53Like_28 0.64Like_29 0.58Like_30 0.70Like_31 0.51Like_32 0.53
which address both specific persuasion attempts as well as more generaltendencies to comply to the different strategies. An examination of this

91
difference in the specificity of the items, and especially the ability ofparticipants to adequately judge their own responses to distinct influ-ence strategies in different situations, should be a subject for furtherinvestigation.
Table 5.5: Overview of the composite scores of the STPS. Pre-sented are the mean, standard deviation, and Cron-bach’s α of each of its sub-scales.
Sub-scale # items Mean (SD) Cronbach’s αReciprocity 5 5.3 (0.83) 0.75Scarcity 5 4.7 (0.98) 0.63Authority 4 4.3 (1.10) 0.75Commitment 5 5.1 (0.97) 0.81Consensus 4 4.1 (0.98) 0.60Liking 3 5.1 (0.91) 0.61Total Composite 26 4.8 (0.59) 0.85
The negative correlation of the composite STPS with NfC showsthat those high in overall susceptibility to persuasion score low on NfC.This is expected since a higher tendency to elaborate would lead to alowered susceptibility to strategies that function via the peripheral routewhich is likely at least partly the case for the strategies addressed bythe STPS.
Overall, the above analysis shows that the STPS presents a mod-erately internally reliable scale to measure participants susceptibility todistinct influence strategies.
Usage of the STPS to Predict ResponsesTo examine the external validity of the scores obtained using the STPSthe results presented in Study 1 of Chapter 3 are further analyzed byusing the scores obtained on the STPS by participants in this study.The STPS was administered two weeks prior to participation and waspart of a inclusion questionnaire which was one of the requirements ofthe research methods course from which the participants were recruited.Table 5.6 shows the model comparison of the preferred model presentedin the analysis of Study 1, chapter 3 (Model C) to a larger model thatincludes participants scores on the STPS on the sub-scales Authority,Consensus, and Scarcity interacting with the strategy that was used(Model CSuscept).
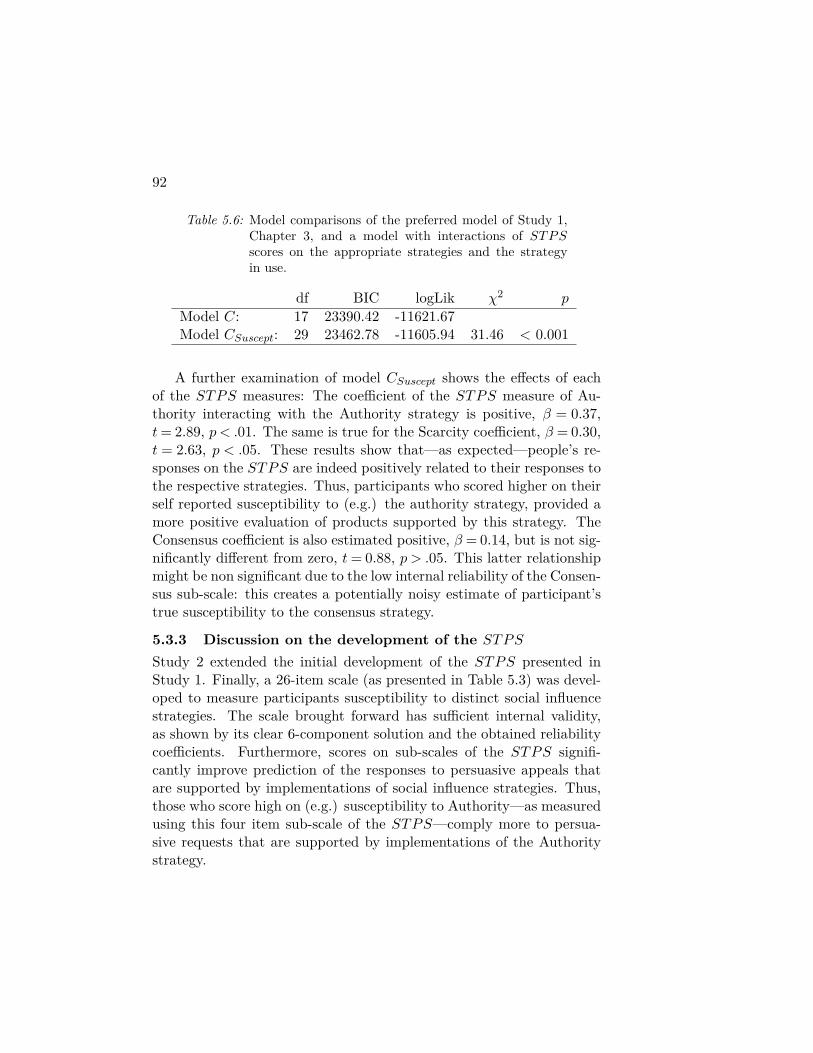
92
Table 5.6: Model comparisons of the preferred model of Study 1,Chapter 3, and a model with interactions of STPSscores on the appropriate strategies and the strategyin use.
df BIC logLik χ2 p
Model C: 17 23390.42 -11621.67Model CSuscept: 29 23462.78 -11605.94 31.46 < 0.001
A further examination of model CSuscept shows the effects of eachof the STPS measures: The coefficient of the STPS measure of Au-thority interacting with the Authority strategy is positive, β = 0.37,t= 2.89, p < .01. The same is true for the Scarcity coefficient, β = 0.30,t = 2.63, p < .05. These results show that—as expected—people’s re-sponses on the STPS are indeed positively related to their responses tothe respective strategies. Thus, participants who scored higher on theirself reported susceptibility to (e.g.) the authority strategy, provided amore positive evaluation of products supported by this strategy. TheConsensus coefficient is also estimated positive, β = 0.14, but is not sig-nificantly different from zero, t= 0.88, p > .05. This latter relationshipmight be non significant due to the low internal reliability of the Consen-sus sub-scale: this creates a potentially noisy estimate of participant’strue susceptibility to the consensus strategy.
5.3.3 Discussion on the development of the STPSStudy 2 extended the initial development of the STPS presented inStudy 1. Finally, a 26-item scale (as presented in Table 5.3) was devel-oped to measure participants susceptibility to distinct social influencestrategies. The scale brought forward has sufficient internal validity,as shown by its clear 6-component solution and the obtained reliabilitycoefficients. Furthermore, scores on sub-scales of the STPS signifi-cantly improve prediction of the responses to persuasive appeals thatare supported by implementations of social influence strategies. Thus,those who score high on (e.g.) susceptibility to Authority—as measuredusing this four item sub-scale of the STPS—comply more to persua-sive requests that are supported by implementations of the Authoritystrategy.

93
5.4 ConclusionsTwo studies explored the possibility of using meta-judgmental measuresof susceptibility to influence strategies to explain subsequent behavioralresponses to requests supported by social influence strategies. In study1, susceptibility to the consensus strategy as indicated on the short-STPS related positively to compliance to an implementation of thisstrategy. In Study 2 the STPS was further developed by adding extraitems to each sub-scale. In a subsequent evaluation, the full STPSproved useful in explaining responses to influence strategies at a laterpoint in time.
While of some success, the results of the studies also show thatpredicting responses to social influence strategies based on meta-judgmental measures is not straightforward. In Study 1 no relationshipbetween self-reported susceptibility to the reciprocity strategy and theactual behavioral response to this strategy was found. In this studythis can be explained by the findings presented in Chapter 4: onlyone of the social influence strategies that was implemented appealedto participants and led to the increase in compliance. However, otherexplanations are also plausible: Reciprocity was not implemented prop-erly (see e.g. Cialdini, 2001), or the short version of the STPS used inthis study fails to properly measure participant’s susceptibility to thisstrategy.
During the advanced scale development in Study 2 it was clear thatfor a number of sub-scales of the STPS the internal reliability was rel-atively low (0.6< α < 0.7). This can have several origins, two of whichare expected based on previous work.
First, there is a relatively large body of literature that shows thatpeople are generally not very capable of judging their own responsesto persuasion (e.g. Bassili, 1996). This would imply that estimatesbased on self-report are noisy, and thus have a low internal reliability.This first is hard to address within the questionnaire itself—althoughmethods for improving ones own meta-judgments by aiding recall ofspecific situations do exist (Bowling, 2005)—and operative measures ofsusceptibility could prove more externally valid than meta-judgmentalones (See also Chapter 8).
Second, the STPS queries susceptibility based on both very generalstatements, as well as specific persuasion attempts. These differencesin specificity between the items might cause different judgments withinthe same sub-scale and thus might lower the internal reliability (e.g.
94
Froggatt, 1969; Aleamoni and Thomas, 1980). This latter issue couldbe addressed in further development of the STPS scale by explicitlyexamining items of general nature and those addressing specific persua-sion attempts. This could improve the reliability of the scale at bothlevels separately.
The negative relationship between the STPS and NfC shows that,partially, the findings presented above might be explained by differencesin elaboration between people that are addressed by the NfC scale.However, the correlation of the STPS to NfC is low, indicating thatat least partially a different mechanism is addressed. This is furtherstrengthened by the fact that different sub-scales of the STPS corre-late to the responses of people to distinct influence strategies. Thus,the STPS—while capturing partly a predisposition to elaborate—alsoproved be useful in predicting the responses to distinct influence strate-gies. Given that the responses to the STPS are meta-judgments, andthus likely occur under central processing, the partial functioning ofthe influence strategies via the central processing route is probably alsocaptured. As noted in 4.5 influence strategies can be effective via bothroutes, and thus the focus on influence strategies, as opposed to theprocessing mechanism itself, can be valuable to predict the responses toinfluence strategies in practice.
While the STPS significantly increased model fit for the data col-lected in Study 1 of Chapter 3 and thus aids in explaining the responsesto different persuasion attempts, the effects are only moderate. Thus,people’s judgments of their own responses to influence strategies didnot correspond one-to-one with their actual responses to the influencestrategies that were used. This could be caused—as discussed above—by the fact that people are not always able to accurately asses theirown susceptibilities. However, it could also be due to the different lev-els of processing between the actual persuasion attempts and the actof filling out the questionnaire. It is likely that the central processingroute (Petty and Cacioppo, 1986; Petty and Wegener, 1999) is mostprominent when filling out a questionnaire, while the influence strate-gies that are used function at least partially via more peripheral, andless conscious, processing.
The development of the STPS as presented in this chapter strength-ens the overall idea that social influence strategies are useful as a levelof analysis to identify differences between individuals. The STPS canaid designers of persuasive systems to tailor their influence attemptsto their users. By measuring user susceptibilities to distinct influence

95
strategies and adapting strategy selection accordingly the effectivenessof persuasive systems is probably increased. However, the STPS shouldbe regarded a starting-point rather than an end-point in the process ofpersonalizing persuasive attempts3.
3This chapter is (partly) based on earlier publication(s): (Kaptein et al., 2009a,2011a).

96

6Design Requirements
6.1 Conclusions From the Insight Generation ChaptersThe three insight generation chapters, Chapter 3, 4, and 5, examinedquestions that are of key importance for designers of persuasive systemsbut have largely been neglected by social science researchers:
1. How large is the heterogeneity in responses to different ways inwhich persuasive requests are framed1?
2. How do people respond to multiple strategies (ways) that supportthe same request?
3. Can we measure—using questionnaires—people’s susceptibility todifferent ways in which requests are framed?
In the current chapter the answers to these questions are used todraw three conclusions that inform the design of ambient persuasivesystems. This chapter argues that designers of adaptive persuasivesystems should attend to individual differences in responses to socialinfluence strategies, should actively choose strategies, and should createpersuasion profiles to manage and use the results derived in the previouschapters.
1Only if this heterogeneity is large it makes sense for designers to attend to it intheir design of persuasive systems.
97
98
After motivating these three conclusions three key implications forthe design of ambient persuasive systems are derived: If designers wantto attend (dynamically) to the individual differences that are uncoveredin the previous chapters then their systems should have the ability toidentify users, represent different social influence strategies, and mea-sure their effectiveness. Finally, this chapter details the conceptualimplementation of an adaptive persuasive systems.
6.1.1 Conclusion 1: Designers of Persuasive Systems shouldattend to Individual Differences in Responses to Per-suasive Strategies
The three studies presented in Chapter 3 demonstrated the difference inmagnitude of the average effect of influence strategies and the individuallevel (or conditional) effects. While the average effects have been ofimportance for the optimization of persuasive systems, persuasion inambient intelligence would clearly benefit from a personalized approach:one in which the conditional effects are attended to.
The average treatment effect (ATE) that is estimated in the mostnoticeable studies on persuasion, such as Milgram (1974)’s early studieson authority and Cialdini (2005)’s studies on the effects of consensus,can be large: in Cialdini (2005)’s study on the use of paper signs toencourage towel re-usage implementations of social influence strategiesled to an increase in re-usage of 26.3%: A strong and important effectthat inspired both researchers and practitioners. In Study 1 of Chap-ter 3 a similar result is found: usage of both authority and consensusstrategies on average significantly increase people’s evaluation of prod-ucts. However, Study 1 of Chapter 3 also enabled estimation of theeffect of different strategies conditional on individuals. For the firsttime the ATE could be contrasted to the conditional effects, as donein figure 3.1. This direct contrast shows the relative importance of theindividual level effects as opposed to the ATE’s: While the ATE’s mightbe statistically significant, the size of these effects is small compared tothe differences in responses between individuals. The ATE as such isa bad predictor of responses of individuals to influence attempts: Evenfor the strategy with the largest positive ATE usage of this ATE to pre-dict an individual level response would have the wrong sign (positivevs. negative) for 41% of the users of a persuasive system.
It is important to consider the different effects that can be observedwhen looking at the effects of social influence strategies. Researchershave classically attended to the main effect of Strategy—the ATE. The

99
studies in the first Insights Generation chapter, Chapter 3, focussedmainly on a Strategy × Person interaction: the effect conditional onthe individual. However, there will probably also be Strategy × Con-text and Strategy × Time interactions: For some persuasive technologyapplication areas one social influence strategy might be more impor-tant than another and this might differ over time. However, as long asthe three-way Strategy × Person × Context, or Time, or. . . interac-tion, is smaller than the Strategy × Person interaction designers canmeaningfully attend to the conditional effects across contexts and timepoints.
The findings in Chapter 3 indicate that while designers of persuasivesystems should consider usage of social influence strategies—both dueto their ATE’s as well as their individual level effects—they should notexpect a homogeneous effect on their users. While averaged over usergroups systems that use social influence strategies are more effective,which explains their prominence on e-commerce and other marketing re-lated systems, they are not necessarily more effective for individual usersand might even have a negative effect. Since the persuasive technologyfield is moving more and more towards individual lifestyle or individualenergy consumption change it is evident that the individual differencesshould be attended to. If designers of ambient persuasive systems wantto deliver on their promise to change an individual behavior they shouldmind the conditional effects. An increase in this conditional effect willeventually also increase the ATE’s, however increasing the ATE itselfshould not be the main aim of designers.
6.1.2 Conclusion 2: Designers of Persuasive Systems shouldSelect Persuasive Strategies
Influence professionals have all through history attended to individualdifferences both in the ends—the goals—of their requests as well as themeans. Persuasive technologies however have mainly been focussed onadapting the end goal of their persuasive request to individuals whileusing the same or similar means. The results presented in Chapter 3clearly indicate that the individual level effects of the ways in which re-quest are made are important and should be attended to. From this con-clusion it is straightforward to ask whether persuasive systems shouldcombine multiple social influence strategies to appeal to each user, orwhether a selection should be made for individual users.
The studies presented in Chapter 4 directly address these issues.Study 2 to 4 examined different combinations of social influence strate-

100
gies used to support a single appeal and measure compliance. In differ-ent contexts, and with different Strategy × Context effects, it is clearin each of these studies that a “well chosen” social influence strategyensures higher compliance than a combination of social influence strate-gies. Even when two strategies have similar expected ATE’s (Study 3)their combination does not increase compliance. However, when onestrategy has a small ATE (Study 2) this decreases the persuasivenessof other social influence strategies leading to lower overall complianceboth for individuals as well as on average. This was true not only in anexperimental setting, but also in a real-life application (Study 4).
Two plausible explanations for the observed effects of the simulta-neous usage of multiple influence strategies exist. First of all, usage ofmultiple strategies probably increases elaboration and as such leads tomore central information processing. The effect of peripheral cues—such as the use of influence strategies—will likely be smaller in highelaboration than in low elaboration. A second explanation is providedby the work on the negativity bias (Rozin and Royzman, 2001): Peoplepay more attention to negative events than positive events. Thus, ifone of the influence strategies does not appeal to a user and as suchhas a negative effect, that negative effect will overshadow any positivepersuasion gained from well chosen social influence strategies.
Combining the results of the three studies on simultaneous usageof influence strategies (2 to 4) with the results obtained in Chapter 3makes clear the need for designers of persuasive technologies to selectsocial influence strategies specifically for individual users. The failure todo so will lead to lowered compliance, and in the case of applications de-signed for individual lifestyle or individual energy consumption changecan lead to averse effects. Study 1 presented in Chapter 4 aids de-signers partially in how to choose persuasive strategies and highlightsthe design challenges involved: While users are able to identify theirpreferential strategy by choosing a “source of advice”, disclosure of thepersuasive attempt of such a source seems to reduce compliance. Thus,designers can actively involve users in the choice of persuasive strategiesbut caution needs to be given to the implementation of such a choicescheme.
6.1.3 Conclusion 3: Designers should Create and Use Per-suasion Profiles
When systems represent individual differences as variation in responsesto influence strategies and adapt to these differences, they are engaging

101
in persuasion profiling. Persuasion profiles are collections of estimatesof the expected effects of different influence strategies for a specificindividual. Hence, an individual’s persuasion profile indicates whichinfluence strategies—one way of individuating means of attitude andbehavior change—are expected to be most effective. Persuasion pro-files can potentially be constructed based on several metrics, includingdemographics, personality measures (meta-judgmental measures), andbehavioral data (operative measures) or combinations of these. Relyingprimarily on behavioral data has recently become a realistic option forinteractive technologies, since vast amounts of data about individuals’behavior in response to attempts at persuasion are currently collected.These data describe how people have responded to presentations ofcertain products (e.g. e-commerce) or have complied to requests bypersuasive technologies (e.g. the DirectLife Activity Monitor (Lacroixet al., 2009)).
Estimated effect
AuthorityCommitmentConsensus
LikingReciprocityScarcity
-0.5 0.0 0.5
Figure 6.1: Example of a persuasion profile. Dots represent the es-timated effect of the respective persuasive strategies,while the bars represent the certainty around this es-timate.
Figure 6.1 shows an example of a persuasion profile. The profileshows the estimates of the effects of different social influence strategieson compliance and the certainty around these estimates. Thus, for thisuser the implementations of the consensus strategy are most efficient.Implementations of the authority strategy are least efficient for this userhowever the estimate of the effect of this strategy is relatively uncertain.An accurate persuasion profile ensures that designers can attend toindividual differences and can choose social influence strategies.
The STPS presented in Chapter 5 presents a validated 26-item scale

102
to determine people susceptibility to different social influence strategiesa priori using meta-judgmental measures. The scores on the STPSindicate people’s susceptibility to each of the six social influence strate-gies identified by Cialdini (2001) and as such can be directly used bydesigners of persuasive systems (or by the systems themselves) to attendto individual differences and choose social influence strategies. In thefollowing case study chapter (Chapter 7) the applied value of profilesbased on measurements obtained using the STPS for health relatedinterventions is assessed.
Next to using meta-judgmental measures to build a persuasion pro-file, the profile can also be build, or updated, by observing behavioralresponses of users to different social influence strategies and thus ob-taining operational measures. This approach allows designers to createadaptive persuasive systems that dynamically adapt their selection ofinfluence strategies to responses to persuasion over time (See Chapter8). Persuasive Technologies likely benefit from an approach in whichboth sources of information about users are combined to obtain accurateconditional estimates.
Persuasion Profiles, employed by interactive systems, can be of useto create computer-tailored interventions as described in the nutritioneducation literature. However, the focus of persuasion profiles is nar-rower: where much of the computer-tailored intervention literature fo-cuses on personalization, feedback, and adaptation (Dijkstra, 2005) —and sometimes feedback includes the use of influence strategies (e.g.Campbell et al., 1999) — persuasion profiles focus only on the use ofinfluence strategies. This narrower focus makes that the “rules” be-hind the selection of strategies do not have to be governed by an expertsystem using “if-else” statements — as is frequently true for more gen-eral computer-tailored interventions (Brug et al., 2003) — and can belearned dynamically based on observations of user behavior (see 6.3).The choice for influence strategies as a level of personalization is moti-vated by the large heterogeneity demonstrated in Chapter 3.
6.2 Identification, Representation, and MeasurementWhen designers attend to the conclusions presented above then theywill design adaptive persuasive systems: “systems that select the appro-priate influence strategy to use for a specific user based on the estimatedsuccess of this strategy.” To be able to build such adaptive persuasivesystems (i.e., systems that use persuasion profiles to adapt their influ-

103
ence strategy usage to individual users), designers should create systemsthat are capable of identifying their users, representing different socialinfluence strategies, and measuring their effectiveness (Kaptein et al.,2011a; Kaptein, 2011b; Sakai et al., 2011).
6.2.1 IdentificationTo be able to adapt to individual differences in responses to social in-fluence strategies, a system must be able to identify individuals (be itjust by a unique key). Only once a user has been identified can thesocial influence strategy that is used to support a persuasive appeal beadapted to this user. Currently, many means of identification exist: Inan online marketing contexts cookies and IP-addresses are already fre-quently used to tailor appeals and this usage can easily be extended toinclude persuasion profiles. However, in an ambient intelligence scenariothe possibilities of identification are more diverse: Designers have usedthe unique bluetooth key that is used by mobile devices (Kostakos,2008), face recognition (Hazen et al., 2003) or fingerprints (Caplan,1990) to identify individual users. When such identification mecha-nisms are combined individual users can be tailored to, both offline aswell as online, and persuasion profiles can be used over a multitude ofpersuasive applications.
6.2.2 RepresentationAdaptive persuasive systems need to be able to implement various socialinfluence strategies. For example, a digital exercise coach can influenceusers to exercise by having users set targets (e.g. commitment), cou-pling users to others (e.g. consensus), or by providing advice from afitness instructor (e.g. authority). To enable usage of persuasion pro-files, systems should have the flexibility to present their end goal (e.g.work out more) in different ways to users. In the system architec-ture designers should distinguish social influence strategies, and theirrespective implementations. Thus, if a persuasive system uses the au-thority strategy then still different expert sources could be used, viadifferent communication channels, to influence users. In each case, theauthority strategy is represented by a different implementation. Pre-vious persuasive technologies largely utilized a single (or a limited set)of implementations of social influence strategies to change user attitudeor behavior. Mostly, the social influence strategies employed used tobe selected based on (large) reported ATE’s in the social science liter-ature and were thus static. To enable representation of different social

104
influence strategies for different users the system infrastructure shouldchange to facilitate such representations.
6.2.3 Measurement of successWhen designers create systems that do not merely used a persuasionprofile based on a priori measurements of the effectiveness of socialinfluence strategies as obtained using the STPS but rather adapt touser’s responses dynamically—e.g. during the usage of the product— itneeds to be possible to measure the effect of an influence attempt. Whilethis sounds straightforward it is not always easy to measure whether anappeal was successful, or even what a measure of success would entail.For example, in a digital exercise coach a prompt by a fitness instructorto run for 30 minutes that is followed by the user running for 20 minutes14 hours after the prompt might constitute a partial success—indicatingthe success of the authority strategy—but might also be due to externalcauses. Furthermore, technologically not all behavioral responses areeasily or reliably measured.
Historically designers of persuasive technologies have not alwaysquantified the outcomes of their interventions. Including measurementas a core requirement of persuasive systems will have a large impact onthe design of, and our ability to evaluate, persuasive technologies.
6.3 Dynamic AdaptationOnce the three prerequisites identified above are met, and thus a per-suasive system is able to identify its users, represent different socialinfluence strategies, and measure the effect of the implementations ofdifferent strategies, the system can be made to adapt to user responses.While different machine learning algorithms could be used for such agoal, this section presents a relatively simple self-learning system2 ca-pable of using persuasion profiles by considering an example in whichidentification, representation, and measurement are relatively easy.
Consider an ambient persuasive system designed to encourage usersto save energy by using a revolving door (which keeps the heat in)instead of a sliding door that is next to it (See Figure 6.2). This setup iscommon in hotels and office buildings and often one can find a paper signmotivating visitors to indeed take the revolving door. Designers coulduse several technologies (e.g. face recognition or Bluetooth scanning,
2The system presented here is called “relatively simple” since the algorithm doesnot include (e.g.) correlations between strategies or possible uneven loss functions.

105
see Chapter 8) to identify visitors when they enter the hotel lobby. Thesame technology can also be used to assess whether a visitor took therevolving door or the sliding door. Based on this knowledge about thevisitor and records of earlier decisions a message implementing the rightinfluence strategy can be selected and displayed on a screen instead ofthe paper note.
Figure 6.2: Graphical representation of a user entering the build-ing (from below). The user is identified, and a messageis displayed on the screen. Next,the user chooses be-tween the sliding door (left) and the revolving door(right).
Suppose there are only two messages to display, one implementingthe authority strategy—“The general manager of this hotel urges youto...”—and one implementing the consensus strategy—“80% of our vis-itors always use...etc.”. The system then needs a mechanism to choosethe message that is most likely to be effective for the current visitor. Itis intuitive that for a new visitor the system should present the mes-sage which has lead to the highest compliance for other, previouslyobserved, visitors. Hence, this would be the message with the highestaverage effect. If this message is successful then there is no need totry different messages on subsequent visits. However, when the selectedmessage is not effective, it might become attractive to present anothermessage on a subsequent visit. This decision depends on the initial suc-cess probabilities of the messages under consideration, the variance ofeffectiveness of messages between visitors, and the number of success orfailures observed for the current visitor.
The probability of a single visitor taking the revolving door on multi-ple occasions can be regarded a binomial random variable B(n,p) wheren denotes the number of approaches the visitor has made to the doorsand p denotes the probability of success: the probability of taking therevolving door. Given M different messages one can compute for each

106
individual, for each message, probability pm = km/nm where km is thenumber of observed successes after representation of message m, nmtimes to a specific visitor. It is reasonable to present an approachingvisitor with the message with the highest probability of success, thusthe message were pm is highest.
For a large number of observations N of one visitor this would makeperfect sense. However, this will not inform a decision for a newlyobserved visitor. For a new visitor one would present the message mfor which pm is maximized for previously observed visitors3. Actually—given Stein’s result (Stein, 1955; Efron and Morris, 1975)—for everyuser a weighted average of the pm for an individual user and those ofother users—one where the estimated pm for an individual is “shrunk”toward the population mean—will provide a better estimate than anestimate based on observations of a single visitor alone. E.g., if theauthority message is effective 70% of the time over all visitors and only30% percent of the time for the specific visitor under consideration, thebest estimate of the (real) effectiveness of the authority message pA forthis visitor is a weighted average of these two.
6.3.1 Adapting to individual behavior using Stein EstimationTo include both the known effectiveness of a message for others, anda specific visitors previous responses to that same message, into a newestimate of message effectiveness, pm, designers can use a Bayesian ap-proach. A common way of including prior information in a binomialrandom process is to use the Beta-Binomial model (Wilcox, 1981). TheBeta(α,β) distribution functions as a conjugate prior to the binomial.The beta distribution can be re-parametrized as follows
π(θ|µ,M) =Beta(µ,M)
where µ= αα+β andM =α+β. The expected value of the distribution is
then given by: E(θ|µ,M) = µm. In our specific scenario, µm representsthe expected probability of a successful influence attempt by a specificmessage. The variance of this estimated success probability is given by:
V ar(θ|µ,M) = σ2 = µ(1−µ)M + 1 .
After specifying the probability of success µm of message m and thecertainty about this estimate σ2
m as the prior expectancy about the ef-3This is assuming the error costs—the effects of presenting the wrong message—
are equal for each message.

107
fectiveness of a specific message and updating this expectancy by multi-plying it by the likelihood of the observations one obtains the posteriorexpectation
p(θ|k) ∝ l(k|θ)π(θ|µ,M)= Beta(k+Mµ,n−k+M(1−µ))
in which k{0,1}, is the outcome of the new observation. The newlyobtained Beta distribution, B(µ,M), functions as our probability dis-tribution of the estimated success with a new point-estimate of theeffectiveness of the presented message given by
E(θ|k) = k+Mµ
n+M.
In this way a persuasive system can keep estimates of the success ofinfluence attempts for different social influence strategies on individ-ual users—a persuasion profile—and update these estimates based onsubsequent observations.
6.3.2 Decision Rule to Choose a persuasive StrategyThe Beta-Binomial model described above allows estimation of the ef-fectiveness of message m, include prior knowledge, and updating theseestimates based on new observations. As such one can maintain a recordof both the point estimate, µm, and its certainty, σ2
m, for each specificvisitor. To determine which message to present next, one could pick themessage which has the highest µm. However, if σ2
m is large this decisionrule might not be feasible given that—from a frequentist perspective—the difference between effectiveness estimates might not be statisticallysignificant. To address this we can choose to show the message with thehighest estimate when this estimate is “certain enough”—in the bino-mial case only once sufficient observations have occurred. In uncertainsituations we can randomly present one of the H messages which havethe highest estimates out of the total set of point estimates of M mes-sages who’s confidence intervals overlap. This decision rule would avoidpresenting each new visitor with only the single most effective messagewhen responses to messages are very variant.
Because the Beta distribution is not necessarily symmetrical thevariance σ2
m provides and inadequate starting point to compute confi-dence intervals. This problem can be solved using simulation methods:By generating a number of draws (say 10.000) from the specified Betadistribution and computing (e.g.) the 20th and 80th percentiles one can

108
compute a more appropriate confidence interval. The above describeddecision rule for M = 2 would can be described as:
Mselected =
1 µ1 > Perc(80)2
2 µ2 > Perc(80)1
Rand(1,2) otherwise.Thus, if the estimated effectiveness of a message 1, p1 = µ1, is higherthan the 80th percentile of message 2, Perc(80)2, the system presentsmessage one4. If the confidence level of one of the two messages overlapswith the highest scoring point estimate the system randomly presentsone of the two messages and observes the response.
Another, more recent, solution to this selection problem—which isanalogous to the multi-armed bandit problem in mathematics—is pre-sented by Scott (2010). His proposed randomized probability matchingdepends on obtaining a single draw of each of the Beta distributionsfor each strategy and comparing theses draws. At a specific occasionthe strategy representing the highest draw will be shown. Scott (2010)shows through simulation that this strategy of selecting from competingrandom variables with differing levels of uncertainty provides an con-sistent and efficient solution to the explore-exploit problem (Macreadyand Wolpert, 1998).
6.3.3 Simulating the effectiveness of the Persuasive StrategyAlgorithm
To test the presented Beta-Binomial approach in the M = 2 scenarioa simulated dataset presenting different visitors observed at multiplepoints in time was created. The simulated data describes the messagesuccess of two different messages for four different groups of visitorswith 20 visitors each on 50 approaches to the doors. The four groupsrepresent (1) general insusceptible visitors—those that respond favor-able to only 10% of the message which implements strategy A and 50%to strategy B, (2) susceptible visitors, A = 40%,B = 90%, (3) visitorssusceptible to message B, A= 10%,B = 90%, and (4) visitors suscepti-ble to message A, A= 90%,B = 10%. Table 6.1 shows an excerpt of thesimulated data.
Based on these simulated data the population estimates of message4The 80th percentile is arbitrarily chosen and should depend on the effectiveness
estimates given the problem at hand.

109
Table 6.1: Overview of the simulated data for the 4 different usergroups.
Types User Occasion Strat A Strat B1 1 1 1 0 02 1 1 2 0 03 1 1 3 0 1.. .. .. .. .. .... .. .. .. .. ..1000 4 20 50 1 0
effectiveness for each message are: pA = 0.38, pB = 0.58. Thus, overallmessage B—the consensus message—was most effective. Next, for eachvisitor, for each occurrence at the doors, the effectiveness is modeled.Strategies are selected as specified by the decision rule and the (simu-lated) outcome is recorded. Next, the algorithm updates its expectancyfor the selected message and iterates through all occurrences. To ensurea flexible starting point for each user the prior variance of each estimateat the first encounter were set to be relatively high: σ2
A = σ2B = 0.05.5
Figure 6.3 shows that the proposed algorithm identifies the four sim-ulated visitor groups. In the upper left panel convergence to strategyB is slow—it takes about 40 observations before B is consistently pre-sented as best strategy. This is due to the low overall compliance ofvisitors in this group. With higher compliance and/or larger differencesin effectiveness of the two strategies convergence is faster: The bottomright panel of figure 6.3 shows how within +/−10 observations strategyA is identified as the most successful strategy.
6.3.4 Limitations of the proposed solutionThere are a number of drawbacks of the proposed Beta-Binomial solu-tion to create adaptive persuasive systems. Besides the fact that whenthe number of strategies grows the number of necessary occasions forconvergence will increase, there are three more fundamental issues whichare not addressed by this algorithm. First the algorithm described heredoes not use a shrunken estimate on each occasion: After including theinitial knowledge of the behavior of other visitors the model is specificfor an individual visitor. While this provides quick adaptation there isno opportunity to adapt estimates based on changing population wise
5One could estimate this variance based on the between visitor variance of thepoint estimates.

110
Occasions
low
er +
mea
n +
upp
er
0.2
0.4
0.6
0.8
0 1020304050
0 1020304050
Occasionslo
wer
+ m
ean
+ u
pper
0.2
0.4
0.6
0.8
0 1020304050
0 1020304050
Occasions
low
er +
mea
n +
upp
er
0.2
0.4
0.6
0.8
0 1020304050
0 1020304050
Occasions
low
er +
mea
n +
upp
er
0.2
0.4
0.6
0.8
0 1020304050
0 1020304050
Figure 6.3: Progression of point estimates and certainty of 2 mes-sages for four users, one from each group.
trends. Population wise trends will be useful to reduce error in the esti-mation of individual level estimates and possibly capture (e.g.) seasonaleffects of distinct strategies on compliance. Second, since the estimatesfor the effectiveness of the strategies are treated independently thereis no way to of “borrowing strength” (Gelman and Hill, 2007) basedon correlations with other strategies. Both of these concerns could beaddressed using a multilevel approach. Finally, the proposed modelprovides no method of including prior believes about the distribution ofvisitor profiles over a population: Multilevel models with flexible priorson the individual level estimates—as opposed to the commonly usedGaussian distribution—could address this difficulty.
111
6.4 Properties of Adaptive Persuasive SystemsIn this chapter the results of the three insight generation chapters weresummarized. These results motivate the need for designers to buildadaptive persuasive systems: Systems that use persuasion profiles toadapt to responses of individual users to increase their effectiveness.The next two Chapters (7 and 8) explore the effects of usage of bothstatic (Chapter 7) and dynamic (Chapter 8) persuasion profiles in per-suasive systems. Before presenting these case studies it is importantto make clear what makes persuasion profiles—and thus profiles thatdescribe people’s susceptibility to different means to an end—distinctfrom other profiles that identify people preferred ends—such as thoseused by recommender systems.
6.4.1 End-independenceMeans-adaptive persuasive technologies—technologies that use persua-sion profiles—are distinctive from other adaptive systems such as rec-ommender systems in their end-independence: a persuasion profile cre-ated in one context can be applied to bringing about other ends inthat same context or to behavior or attitude change in a quite differ-ent context. This feature of persuasion profiling is best illustrated bycontrast with end adaptation. Any adaptation that selects the particu-lar end (or goal) of a persuasive attempt is inherently context-specific.Though there may be associations between individual differences acrosscontext (e.g., between book preferences and political attitudes) theseassociations are themselves specific to pairs of contexts. On the otherhand, persuasion profiles are designed and expected to be independentof particular ends and contexts.
It is important to clarify exactly what is required for end-independence to be obtained. If a persuasion profile is end-independentthan this does not imply that the effectiveness of all social influenceinfluence strategies for a specific individual is constant across all con-texts. Consistent with the results reviewed in Chapter 2, it is clear thatinfluence strategy effectiveness depends on, e.g., the type of behaviorchange or the involvement of users. That is, the most effective influ-ence strategy for a system to employ, even given the user’s persuasionprofile, would depend on both context and target behavior. However,end-independence requires only that the difference between the averageeffect of a strategy for the population and the effect of that strategy fora specific individual is relatively consistent across contexts and ends.

112
6.4.2 Non-disclosureDesigners of means-adaptive persuasive systems can be tempted not todisclose the adaptation of their system. This can be contrasted withend adaptation, in which it is often advantageous for the persuader todisclose the adaption and the adaptation is (potentially) easy to detect.For example, when Amazon.com recommends books for an individualit makes clear that these are personalized recommendations—thus ben-efiting from effects of apparent personalization and enabling presentingreasons why these books were recommended (E.g. Ochi et al., 2010). Incontrast, with means adaptation, not only may the results of the adap-tation be less visible to users (e.g. emphasizing either “Pulitzer Prizewinning” or “International bestseller”), but disclosure of the adaptationmay reduce the target’s attitude or behavior change.
It is hypothesized that the effectiveness of social influence strate-gies is, at least partly, caused by automatic processes. According todual-process models (Cacioppo et al., 1986), under low elaboration mes-sage variables manipulated in the selection of influence strategies leadto compliance without much thought. Disclosure of means adaptationcan increase elaboration. This in turn might decrease the effectivenessof influence strategies which operate primarily via the peripheral route.More generally, disclosure of means adaptation is a disclosure of persua-sive intent, which can increase elaboration and resistance to persuasion(Cf. Tormala and Petty, 2004).
6.4.3 ConclusionsBased on the empirical results presented in the insight generation chap-ters it is clear that persuasive technologies would benefit from personal-ization of the selection of influence strategies. The ambient intelligencescenario provides designers with the opportunity to identify, present,and measure the effects of different influence strategies and is thus par-ticularly suited for the design of such systems. This chapter presentedpersuasion profiles as a means for designers to create systems that per-sonalize their persuasive attempts.
The next two chapters will explore the use of persuasion profiles inactual persuasive interventions. These case study chapters each presentmultiple persuasive systems that are personalized—or adapted—to in-dividuals. The first case study chapter, Chapter 7, focuses on the use ofstatic persuasion profiles obtained using meta-judgmental measures tooptimize several health interventions. The second case study chapter,Chapter 7, presents three persuasive systems that use dynamic persua-

113
sion profiles based on operative measures to increase exercise, and drivesales. Thus, the next chapters explore the use of persuasion profiles ina number of the core application areas of persuasive technologies6.
6This chapter is (partly) based on earlier publication(s): (Kaptein et al., 2011a;Kaptein, 2011b; Sakai et al., 2011).

114

7Case Studies I:
Influencing Health Decisions
7.1 Introduction: Measures of SusceptibilityThe previous chapters set the stage to create persuasive systems thatadapt to the individual susceptibility of users to different social influ-ence strategies. Two distinct approaches can be feasible for designers:(a) designers could use meta-judgmental measures of personality or sus-ceptibility to adapt persuasive interventions, or (b) designers could useoperative measures—people’s responses to persuasive strategies—to dy-namically adapt their persuasive systems. In this chapter the first op-tion is explored. Study 1 and 2 presented in this chapter use a shortversion of the STPS to adapt influence strategy selection to individu-als. Study 3 of this chapter uses the full STPS to adapt a persuasivesystem to individuals at the level of social influence strategies. All threestudies presented here focus on persuasive interventions that encourageusers to lead a healthier lifestyle.
7.2 Study 1 & 2: Promoting Lunch WalksThe first two studies presented in this chapter explore only a distinctionbetween people that score high and low on their susceptibility to per-
115

116
suasion. These studies thus focus only on overall susceptibility to per-suasion instead of distinctions between different strategies. The analysispresented in Study 1 and 3 of Chapter 3 showed that this already is animportant distinction and thus the first applied exploration concernsonly this dimension.
7.2.1 High and low Susceptibility to PersuasionGiven the applied context, Study 1 and 2 in this chapter used a short-ened version of the STPS to determine overall susceptibility of partic-ipants to persuasive strategies. Constraints of the company in whichthe studies were performed led to the selection of a maximum of sevenquestionnaire items to determine participant’s susceptibility. To selectthe most distinctive seven items of the STPS an overall susceptibil-ity to persuasion score—the average over all items of the STPS—wascomputed for each of the participants in the evaluation of the STPSpresented in Chapter 5. Next, a linear regression of all 26 items of theSTPS on the final susceptibility score was used to determine whichof the individual items were most powerful in explaining the the over-all susceptibility to persuasion score. This led to the selection of thefollowing seven items:
1. Products that are “hard to get” represent a special value.2. I would feel good if I was the last person to be able to buy some-
thing.3. I believe rare products (scarce) are more valuable than mass prod-
ucts.4. I always follow advice from my general practitioner.5. I am very inclined to listen to authority figures.6. I always obey directions from my superiors.7. I am more inclined to listen to an authority figure than to a peer.
1933 Knowledge workers located in one single office park were in-vited by email to participate in this 7-item questionnaire to assess theiroverall susceptibility to persuasion. 516 Participants completed the on-line questionnaire. The items were scored on a 7-point scale rangingfrom totally disagree to totally agree (Cronbach’s α= 0.646). For eachparticipant an overall score was computed: the average of the 7 suscep-tibility to persuasion items. Based on the susceptibility to persuasionscores, three profiles were determined: the low susceptible’s, the mod-erately susceptible’s, and the high susceptible’s. Since the studies focuson providing an example of the use of persuasion profiles participants

117
were selected with a considerable difference in susceptibility to persua-sion score. Thus, in this study only participants with either low or highsusceptibility to persuasion scores were selected to participate. The lowsusceptible (N = 136)—the lowest scoring quartile – had scores rangingfrom 1.00 to 3.29. The highly susceptible (N = 140)—the highest scoringquartile—had scores ranging from 4.57 to 6.14.
Both Study 1 and 2 use a so-called Extreme Group Approach (EGA)in which participants are selected based on extreme scores on the shortversion of the STPS. This approach has implications for the accuracyof the effects that are estimated based on the collected data and thepower of the experiment. However, “The use of EGA may be a mat-ter of necessity in situations when a researcher has limited resourcesand wishes to maximize the power for detecting the presence of an ef-fect. [...] In such situations, and with proper considerations, EGA maybe a useful tool to improve the odds of detecting an effect, if it trulyexists” (Preacher et al., 2005). This was exactly the aim of the twoinitial studies: they provide initial evidence for differences in the effectsof influence strategies on people who indicate different susceptibilities.Given limited resources, and a motivation to explore this question in afield experiment with high external validity but inherent lower internalvalidity, the EGA approach was considered appropriate for this goal.
The two studies presented here examined the applicability of persua-sion profiles for promoting health-related behaviors. Study 1 focusedon physical activity and study 2 focused on fruit intake. Below, thecommon methodology used in both studies is presented.
7.2.2 Common methodologyIn both studies the low and the high susceptible to persuasion groupswere invited by email to participate in a health related activity. Study 1focused on physical activity by inviting participants by e-mail to join fora lunch walk. Study 2 focused on fruit intake by inviting participantsby e-mail to express their opinion about an initiative to provide a dailyfruit snack. In both studies half of the participants were randomly as-signed to the persuasive implementation(s), (PI) condition and half ofthe participants were assigned to the no persuasive implementation(s),(NPI) condition. In the PI condition, the invitation e-mail was sup-ported by a number of persuasive messages while in the NPI conditionno persuasive messages were included. The studies thus employed a 2(PI vs NPI) × 2 (Highly vs Low susceptible) between subjects design.
After receiving the invitation email participants were asked to sign

118
up using an online form. To gain insight into the degree of complianceto the invitations, three measures of compliance were distinguished:
1. Interest: Participants’ click on the email.2. Intention: Participants’ response to the main question in the on-
line form (e.g. the sign up for a lunch walk).3. Behavior: Participants’ subsequent behavior.
The first of these measures quantifies the immediate (attitudinal) re-sponse to the persuasive message. The second measure quantifies thebehavioral intention after the message, and the third measure quantifiesthe actual behavior.
7.2.3 Method Study 1: Lunch walksIn Study 1 participants were invited to join a lunch walk. Participantsreceived an email with an invite and a link to sign up for one of twopossible time slots during lunch. After clicking on the link participantscould sign up for one of the two time slots. After signing up participantswere asked to print a form with their name on it and bring it to thelunch walk enabling monitoring of the actual behavioral response.
Participants in the NPI condition received an email stating: ”Wewould like to invite you for the [Company] lunch walk. The [Company]fun4health committee was founded 2 months ago to promote generalhealth of [Company] employees and affiliates.”, the time of the lunchwalk and the link to sign up. Participants in the PI condition receivedthe same email with an addition of the following three messages:
1. Both physicians and general practitioners recommend at least 30minutes of moderate activity, such as walking, during a day. Thelunch walks are a great place to start! [Authority]
2. We expect a lot of people so please sign up before all available slotsare filled. [Scarcity]
3. In other companies 1000’s of people are already joining in on sim-ilar initiatives. [Consensus]
Study 1 was conducted at two points in time—referred to as Study1a and Study 1b—with the same groups of highly and low suscepti-ble participants, because it was expected that unpredictable weatherconditions could be experienced as a barrier for behavioral compliancefor the outdoor activity. Each of our participants worked in the sameindustrial area with a common dining facility which was the startingpoint for the lunch walks.

119
7.2.4 Results study 1In total, 276 respondents were invited to participate in study 1a. Ofthese 136 belonged to the low susceptible group, and 140 belonged tothe highly susceptible group. About half of the participants receivedan email without the persuasive cues and about half received an emailwith persuasive cues. Table 7.1 gives an overview of the results of thestudy 1a. It is clear that in the PI condition participants overall showedsignificantly more interest (PI = 23.4%, NPI = 15.6%, χ2 = 2.700, p=0.050), and have a significantly higher behavioral intention (PI = 8.5%,NPI = 3.0%, χ2 = 3.887, p = 0.024) than in the NPI condition. Nosignificant effect of the use of persuasive messages was found on actualbehavior.
Table 7.1: Results study 1a: Percentage of respondents respondingfavorably.
NPI PI χ2 p (one-sided)Main effect
Interest 15.6% 23.4% 2.700 0.050Intention 3.0% 8.5% 3.887 0.024Behavior 1.5% 3.5% 1.189 0.138
InteractionLow susceptible Interest 17.2% 16.7% 0.007 0.468
Intention 3.1% 6.9% 1.012 0.157Behavior . 1.4% 0.895 0.172
Highly susceptible Interest 14.1% 30.4% 5.426 0.010Intention 2.8% 10.1% 3.124 0.039Behavior 2.8% 5.8% 0.758 0.174
The observed main effect of the use of social influence strategiescan be explained by the high compliance of the high susceptible partic-ipants (e.g. interest: PI = 30.4%, NPI = 14.1%, χ2 = 5.426, p= 0.010).For low susceptible participants no main effect of the persuasive mes-sage is observed (e.g. interest: PI = 16.7%, NPI = 17.2%, χ2 = 0.007,p = 0.468). This interaction between the condition and the suscepti-bility score is statistically significant, χ2 = 10.463, p < .011. Also forthe behavioral intent, χ2 = 14.728, p < .001, and the actual behavior,χ2 = 4.669, p < .05, a significant interaction between the condition and
1A Cochran-Mantel-Haenszel χ2 test of the null hypothesis that two nominalvariables are conditionally independent was used to test these interactions.

120
participant’s susceptibility score was found. Thus, while overall the useof persuasive messages increased the participation in health related be-havior, the actual cause of this effect is a very high compliance by highsusceptible’s while there is no statistically significant difference betweenthe NPI and the PI conditions for the low susceptible’s.
In study 1b, a new invitation was send out to 268 people—eightpeople signed out for any follow up mails after the invite for study 1aand were not invited again. Table 7.2 shows the results of this secondtrial. There was a significant main effect on the interest measure (PI= 10.9%, NPI = 4.6%, χ2 = 3.761, p= 0.026). As in study 1a, this maineffect of persuasive implementation disappeared when looking only atlow susceptible’s (e.g. interest PI = 5.4%, NPI = 8.8%, χ2 = 0.570,p= 0.251). In this second trial it was found that for the intention mea-sure the low susceptible’s complied significantly less when persuasiveimplementations were used in the invitation message (PI = 0.0%, NPI= 7.0%, χ2 = 5.357, p= 0.017). Testing specifically for the interactionsbetween the conditions and the susceptibility score showed that, con-trary to Study 1a, only the interaction on the Interest measure wasstatistically significant, χ2 = 13.412, p < .001.
Table 7.2: Results study 1b: Percentage of respondents respondingfavorably.
NPI PI χ2 p (one-sided)Main effect
Interest 4.6% 10.9% 3.761 0.026Intention 3.1% 2.2% 0.196 0.329Behavior 0.8% 1.5% 0.293 0.294
InteractionLow susceptible Interest 8.8% 5.4% 0.570 0.251
Intention 7.0% . 5.357 0.017Behavior 1.8 . 1.308 0.127
Highly susceptible Interest 1.4% 17.5% 11.049 0.001Intention . 4.8% 3.603 0.029Behavior . 3.2% 2.384 0.062
7.2.5 Methods study 2Study 2 was similar to study 1: Again both high and low susceptible’swere invited to take part in a health related activity. This time anemail was sent to 267 participants which explained that plans were
121
being made to start a fruit distribution service at the main building ofthe office campus. It was explained that participants would be able topick up a piece of fruit every day. The alleged goal of the email wasto inquire about possible interest for such a project. Participants couldclick on a link in the email to state their interest in such a service. In thePI condition the following lines were added to the email: “Eating twopieces of fruit a day is recommended by the World Health organization.Our service would make it easier to reach that target” [Authority]. And:“Other companies have picked up similar ideas by providing fruit duringlunchtime for reduced prices for employees. If we all join in, we couldmake this service happen!” [Consensus].
Contrary to Study 1, only two types of compliance were measured:interest (did the participant click on the email link), and intention (didthe participant respond to the subsequent survey).
7.2.6 Results study 2Table 7.3 shows that the results slightly differ from those obtained instudy 1: There is no significant main effect of the persuasive implemen-tations (e.g. interest PI = 23.4%, NPI = 21.8%, χ2 = 0.149, p= 0.350).When looking at the low susceptible’s and the high susceptible’s sep-arately it is clear that the absence of a main effect is probably bestexplained by an interaction: Low susceptible’s seem to comply less toa message with persuasive implementations (e.g. interest PI = 18.8%,NPI = 25.8%, χ2 = 0.919, p = 0.196) while high susceptible’s seem tocomply more (e.g. interest PI = 27.8%, NPI = 17.2%, χ2 = 2.159,p= 0.071). However, both of the interactions are not statistically signif-icant at a five percent level (two sided test) in Study 2. Thus, contraryto Study 1a and 1b, no decisive evidence the effect of the persuasivemessages differed between the low and high susceptible participantswas collected.
7.2.7 Discussion Study 1 and 2The results presented in these two studies suggest that individuals in-deed differ in their compliance to health-related messages supported bysocial influence strategies. When analyzing these differences betweenhighly susceptible people and low susceptible people it is evident thata positive effect of persuasive messages is obtained only for high sus-ceptible’s and is absent or even negative for low susceptible’s. Whilethe effects identified in these studies are likely over-estimated becauseof the use of the EGA, the two studies do show that at least for a small

122
Table 7.3: Results study 2: Percentage of respondents respondingfavorably.
NPI PI χ2 p (one-sided)Main effect
Interest 21.4% 23.4% 0.149 0.350Intention 15.9% 15.6% 0.004 0.476
InteractionLow susceptible Interest 25.8% 18.8% 0.919 0.196
Intention 21.0% 13.0 1.468 0.082Highly susceptible Interest 17.2% 27.8% 2.159 0.071
Intention 10.9% 18.1% 1.369 0.089
portion of people not using an influence strategy to support a requestcan be more effective than using influence strategies.
The applied value of the distinction between high and low suscep-tible’s in Study 1a and 1b demonstrates that a first step in tailoringpersuasive systems can be provided by focusing not on distinct influ-ence strategies, but rather on the usage of any strategy. This is inlinewith predictions that could be derived from dual processing models ofpersuasion: susceptibility to persuasive strategies describes a tendencyto process messages peripherally. As such, susceptibility to persuasiondirectly relates to NfC as an earlier attempt to measure people’s ten-dency for peripheral or central processing (See also 5.4 for a discussionof the relationship between the STPS and NfC).
7.3 Study 3: Influencing Snacking BehaviorStudy 1 and 2 demonstrated the use of differences in responses to per-suasive strategies as measured using meta-judgmental measures: Dif-ferences in overall susceptibility lead to different responses to requeststhat are either supported by, or not supported by, implementationsof influence strategies. Study 3 extends this finding by using the fullSTPS as brought forward in Chapter 5 to determine susceptibility notjust at an overall level but rather at the level of distinct social influencestrategies. Study 3 describes the development of a persuasive systemthat uses short text messaging to reduce people’s snacking behavior toexamine the effects of personalization on compliance to the system. Thefirst section describes the development of the SMS based system andthe development of persuasive messages that implement different social

123
influence strategies. Next, the empirical evaluation of a system that im-plements either personalized messages, counter-personalized messages,or random messages is presented.
7.3.1 Designing an SMS Intervention to Reduce SnackingTo evaluate whether the STPS could aid in message selection andwhether personalization of influence strategy usage has the desired ef-fects, a two week text-messaging intervention was setup. In the trial,short text messages (SMS) on a mobile phone were used as a prompt toreduce snacking behavior. Mobile phones have frequently been used asa platform to employ persuasive technologies because of their pervasive-ness in everyday life, and their ability to be “at the right place, at theright time” (Kass, 2007). Mobile applications have been developed andtested in all area’s of the persuasive technology field: From applicationsthat help chronic patients manage their decease as those presented byFranklin et al. (2008) to the persuasive service that promotes the sexualhealth of teenagers presented by Parkes et al. (2005). In all instancesboth researchers as well as users recognize the power of mobile devicesfor pervasive persuasion attempts.
The current SMS intervention focussed on reducing snacking behav-ior by sending SMS messages that prompted reduced snacking. Mobileinterventions for a healthy diet have previously not only been part ofthe design research space, but have also made their way into random-ized controlled clinical trials. Patrick et al. (2009) show a larger effecton weight loss of an SMS based intervention program versus a paperbased one over a four month time period. They conclude that “textmessages might prove to be a productive channel of communication topromote behaviors that support weight loss in overweight adults”. Inanother paper by the same team (Consolvo et al., 2009) they arguein favor of the mobile phone as a general carrier for health related in-terventions and underline the impact such technologies can have. Thecurrent study evaluates whether messages that are personalized to theuser—as measured using the STPS—are more effective than messagesthat are not tailored towards this goal.
Design of Persuasive Text MessagesTo design the actual messages that would be sent during the trial twopersuasive technology researchers independently tried to generate asmany messages as possible for each of the six strategies identified byCialdini (2001) that would be usable given the context. In total 42

124
messages were created. After combining the lists it became eminentthat both the Liking as well as the Reciprocity strategies were hard toimplement in the context of mobile text messaging to reduce snackingbehavior. For the Liking strategy to be successfully implemented thereis need for a “bond” between the persuader and the receiver of themessage. Given that there is no clear social actor in play which receiversof the message could relate to this strategy was hard to implement. Forthe Reciprocity strategy to be most effective, a favor has to be doneto the persuadee prior to the persuasive request. These strategy thusboth proved hard to implement and the two created implementationsfor these strategies were omitted.
To be able to evaluate the messages that were created and select themessages to be used in the final intervention an evaluation was setupwith ten researchers with expertise in the field of Human-Computer In-teraction. Each researcher received a small description of each of thefour social influence strategies that we tried to implement to becomefamiliar with these terms. Next, researchers were shown the 40 mes-sages one by one, and were asked to categorize them into the followingcategories: (a) Implements the Authority strategy, (b) Implements theConsensus strategy, (c) Implements the Scarcity strategy, (d) Imple-ments the Commitment strategy, or (e) Other / Don’t know.
After the ten researchers rated each of the messages the ratings wereanalyzed by looking at agreement matrices between the researcher as-cribed categories. For the Authority strategy there was a general highagreement: for all of the messages that intended to implement thisstrategy at least 70% of the researchers ascribed the message to thisstrategy. Three of the implementations designed to implement the Au-thority strategy were selected: one of these was ascribed to this strategyby all raters, the other two by 90% of the raters. Similarly three im-plementations of the Consensus strategy, three of the Scarcity strategy,and three of the Commitment strategy were selected for inclusion inthe trial. It has to be noted that the messages that implemented theScarcity strategy were the least identifiable, with one of the three se-lected messages only ascribed to this strategy by 60% of the raters.Table 7.4 gives an overview of the messages that were selected, thestrategies they aim to implement, and the agreement between raters.

125
Table 7.4: The messages used in the intervention. For each of thefour social influence strategies used in this trial threeimplementations are used.
Strategy Message AgreeAuthority Try not to snack today. According to the
College of Physicians this is an easy way tolead a healthier life.
100%
Authority Dietitians advise to have 3 meals a day with-out snacking. Try to reduce snacking.
90%
Authority The World Health Organization advices notto snack. Snacking is not good for you.
90%
Consensus 90% of people benefit from reducing snackingbetween meals. It will boost your energy andyou will live a healthier life
90%
Consensus Everybody agrees: not snacking betweenmeals helps you to stay healthy
90%
Consensus Reduce snacking. You are not on your own:95% of participants have already reducedsnacking
90%
Commitment The aim of this study is to live healthier. Re-ducing snacking is a way to achieve that.
100%
Commitment Try to obtain your goal for living a healthierlife by not snacking. You are committed!
90%
Commitment You have to continue what you’ve started:you are participating in this test to lead ahealthier life. Reducing snacking.
90%
Scarcity There is only one chance a day to reducesnacking. Take that chance today!
90%
Scarcity This test lasts only 3 weeks: you have theunique opportunity to enhance your healthby reducing snacking
70%
Scarcity Today is a unique opportunity to lead ahealthy life. Reduce snacking
60%

126
7.3.2 Method Study 3A two week long trial to evaluate the different message conditions be-tween subjects was setup. Since snacking behavior is very variable be-tween people, a one week baseline assessment of individual snackingbehavior was included before introducing the different messaging con-ditions and establishing their effects on the snacking behavior within asingle user.
ParticipantsParticipants in this study were recruited via a professional recruitmentagency. A call for participation was sent out via email to potentialDutch participants between 18 and 65 years of age, with fluent under-standing of English, and in possession of a mobile phone. The call forparticipation detailed that the study would take two full weeks andwould entail filling out a several questionnaires and receiving daily textmessages on a mobile phone. In total 334 potential participants clickedon the link in the call that took them to a designated website and werepresented with the introduction questionnaire. At the end of the intro-duction questionnaire participants were asked to provide their mobilephone number. After providing their phone number a text message withan activation code to login at the designated website was sent to par-ticipants. In total 162 participants fully completed the sign up processand activated their study participation.
After signing up participants received text messages for a period oftwo weeks (2×5 days, workdays only). Participants were instructed—both prior to the study as well as via the text messages—to go to thedesignated website every evening to fill out a short diary. The firstweek was used to establish a baseline snacking frequency for each par-ticipant, while the intervention was employed in the second week. Inthe analysis only those participants that filled in at least one diary dur-ing each of the two weeks (e.g. during the baseline measurement andduring the intervention) were included. The final sample was composedof 73 participants. The average age of the participants was 34.9 years(SD = 11.1). Of our final sample 32 (43.8%) were females. Upon com-pletion participants were awarded research participation credits with amonetary value of two Euro’s (default amount provided by the researchagency).
127
Procedure & MeasuresAfter arriving at the designated website all participants in the study firstfilled out a small questionnaire regarding their snacking behavior, theirshopping behavior, and their motivation to decrease snacking. Next,participants were administered the STPS and provided their mobilephone number to sign up for the text messaging part of the study.Participants then received one text message a day (on workdays) for aperiod of two weeks, and subsequently filled out a small online diaryevery day.
The introduction questionnaire included all 32-items of the initialSTPS scale, although only the 26 items that scored consistently on thefactors of interest were used to allocate participants to conditions. Nextto the STPS the questionnaire included the following questions:
1. How often a week do you usually visit a supermarket to buy in-gredients to prepare a dinner?
2. How often (a week) do you prepare your own meals?3. Would you like to eat healthier? (Scored Yes, No)4. Do you feel you generally eat healthy dinners? (Scored Yes, No)
Finally, participants were asked for their age and gender and proceededto the sign up procedure.
During the sign up procedure participants provided their mobilephone number and received a text message with an eight digit autho-rization code. Participants filled in their authorization code on thestudy website to create a personal profile and supplied a user name andpassword for subsequent logins. After logging in with their user nameand password participants were asked to fill in the first diary. Thisdiary—in the first week—consisted of the following questions:
1. How many snacks did you have today? (Open ended)2. How many unhealthy snacks did you have today? (Open ended)3. How healthy was your nutrition today? (Five-point scale, Very
unhealthy to Very healthy)For the first week participants received one text message a day whichasked them to fill in their diary for that day. This phase of the researchwas the baseline period (Phase 1).
After Phase 1 participants entered the second week (Phase 2) inwhich they received the persuasive messages according to the exper-imental condition they were allocated to (See 7.3.2 for details). Thepersuasive message contained an implementation of either the Author-ity, Consensus, Commitment, or Scarcity strategy as described in 7.3.1.

128
After receiving the persuasive message participants were again asked tofill out their online diary. In Phase 2 one additional question was addedto the diary: “How useful was the text message your received?” scored(1) Not at all useful to (6) Very useful. After receiving five persuasivemessages during Phase 2 and filling out their last diary, participantsreceived a “thank you for your participation” message on their screen.
ConditionsBased on participants answers to the STPS a mean score on each ofthe six variables of interest—their self-reported susceptibility to each ofthe six strategies—they were automatically and randomly allocated toone of the following three conditions:
1. The personalized condition (PC): Participants assigned to thiscondition received, during Phase 2, messages that were randomlyselected implementations of the two strategies (of the four im-plemented in this study) that they had the highest susceptibilityscores on. Hence, the messages were adapted to their personalprofile to be most effective.
2. The contra-personalized condition (CPC): Participants assignedto this condition received random implementations of the twostrategies they had the lowest mean scores on as judged fromthe STPS. Hence, the messages were adapted to be the leasteffective.
3. The random condition (RC): Participants in this condition re-ceived randomly selected messages out of the full set of messagespresented in table 7.4. This represents a common usage of per-suasive messages in persuasive systems.
7.3.3 Results Study 3OverviewIn total 506 diaries were filled out by the 73 participants included inthe analysis. Of the included participants a large majority (80.8%)indicated to be motivated to eat healthier—this even though most par-ticipants claimed to eat healthy already (89.0%). All of the participantsindicated to prepare (cook) their own meals at least once a week, and45.2% indicated to prepare their own meals more than five times aweek. 95.9% of participants visited a supermarket to purchase food atleast once a week. These figures indicate that participants were largelyindividually responsible for their own food consumption and shopping

129
habits and thus personal text-messages could possible influence theirbehavior. Based on the scores on the STPS, 22.8% of our respondentsindicated to be most susceptible to the scarcity strategy, 14.9% to theauthority strategy, 53.1% to commitment strategy, and 9.1% to theconsensus strategy.
Snacking BehaviorThe primary test to see whether messages personalized to participant’sscores on the STPS can be effective in reducing snacking behavior isprovided by an examination of the progression of the (self reported)snacking behavior over time between the three experimental groups.The daily diary contained three questions that are indicative for theeffect of adaptive or contra-adaptive messages on snaking behavior andwe examined each separately. The primary measurement—the self-reported number of snacks eaten by participants each day—is graphi-cally represented in Figure 7.1. It is clear from this figure that—whilevariable over days—the snacking consumption decreased over time forboth the RC and the PC conditions while it did not decrease in theCPC. It is eminent that the decrease is largest from timepoint 6 on-wards: this corresponds to the entry into phase 2 of the experiment andthus the actual separation of messages between the three conditions.
Timepoint
Dai
ly n
umbe
r of s
nack
s
1.0
1.5
2.0
2.5
3.0
2 4 6 8
Contra-personalizedRandomPersonalized
Figure 7.1: Overview of the average number of snacks eaten eachday by our participants separated for the three exper-imental conditions.
130
To statistically test the effects of our conditions over time a mul-tilevel model with varying intercepts for participants was fitted to thedata. From the “null” model
yij ∼N (µj ,σ2err) (7.1)
where µj ∼N (0,σµj ) a model is built that includes both time as well ascondition to explain the snacking behavior of our participants. Addingtime—centered around the phase shift—as a fixed factor to the model(Thus yij ∼ N (µj + βtimeXtime,σ
2err) significantly increases model fit
(see table 7.5, model B). In this model the coefficient of time is signif-icantly negative, βtime = −0.06, t = −3.18, p < .01, indicating a smallbut significant overall decrease in the number of snacks consumed byour participants during our trial.
After examining the effects of time, a phase × time interaction wasadded to the model to allow for different effects in the baseline and treat-ment phase. This significantly increases model fit, see table 7.5 modelC, which indicates that the effects of the messages (over time) differsfor the two phases. Finally, to test whether the conditions significantlyinfluence the snacking behavior of our respondents a model is fitted inwhich time during phase two interacts with condition—essentially fit-ting separate time effects for the different conditions during phase two.Here again, model comparisons show a significant increase of model fit,see table 7.5 model D.
Table 7.6 shows the fixed effects of model D—the model allowing fordifferent slopes for the different conditions during phase 2 of the trial.These fixed effects show that, even though averaged over all conditionssnack intake decreased significantly during our intervention, reality ismore granular: During the baseline phase the number of snacks does notdecrease significantly. During the treatment phase the number of snacksconsumed by our participants decreases significantly only for RC andPC participants. The fixed effects table also shows that the estimateddecrease in snack consumption is higher for those in the PC conditionthan those in the RC condition. This latter difference between theslope of the RC condition over time and that of the PC condition overtime is however not statistically significant. The difference between theslope of the CPC condition and that of the RC condition is statisticallysignificant, t= 2.89, p < .05. The same is true for the difference in slopebetween the CPC condition and the PC condition, t= 3.28, p < 0.01.
Figure 7.2 shows the number of snacks per time-point for each par-

131
ticipant (both the time-point as well as the number of snacks are jitteredto prevent overlap). Imposed on these raw data points are the overalltime trend (light gray), the trend in during the first phase of the trial(black solid line), and the three time trajectories during the treatmentphase. Of these latter three the black dashed line shows the CPC fit,the dotted line shows the RC fit, and the dashed and dotted line showsthe PC fit. Participants who received personalized messages decreasedtheir snacking intake during phase two of the experiment. Participantswho received random messages also decreased their snack intake but didso to a slightly smaller extent. Finally, there is no evidence that partic-ipants who received messages that were contra-personalized decreasedtheir snack intake.
Table 7.5: Comparing the null model with models including a timeeffect and different time effects for each condition.
Df AIC logLik χ pModel A: 3 1857.70 -925.85Model B: 4 1849.64 -920.82 10.07 < .01Model C: 5 1843.39 -916.70 8.24 < .01Model D: 7 1837.79 -911.89 9.60 < 0.01
-4 -2 0 2 4
01
23
45
67
Time centered around phase transition (jittered)
Num
ber o
f sna
cks
cons
umed
(jitt
ered
)
Overall trendPhase 1Phase 2 CPCPhase 2 RCPhase 2 PC
Figure 7.2: Overview of the number of snacks eaten each day byour participants with superimposed the regression linesof the effects over time of the different conditions.

132
Results were very similar for the number of unhealthy snacks thatparticipants ate. Again the model including an interaction between con-dition and time was favored by likelihood ratio tests. Snacking signifi-cantly decreased in the random condition, βT ime:RC =−0.13, t=−2.49,p < .01. The effect was even larger in the personalized condition,βT ime:PC =−0.21, t=−3.34, p < .01. The effect of time in phase 2 forthe CPC was not significantly different from zero, βT ime:CPC = −0.02,t=−0.31, p= .68. Direct comparisons between the effects of the condi-tions over time showed that—as for the number of snacks that respon-dents ate—the effect of the PC condition, βT ime:PC , was significantlydifferent from that of the CPC condition, t = 2.96, p < .05. The PCcondition was however not significantly different from the RC condition.
Table 7.6: Overview of the fixed effects of the model includingan interaction between time and condition to predictsnacking behavior (Model D). Empirical p-values arebased on MCMC simulations.
Estimate Std. Error t-value pIntercept 2.16 0.19 11.33 < .001Time Phase 1 0.05 0.04 1.07 .28Phase 2: Time:CPC -0.01 0.08 -0.16 .85Phase 2: Time:RC -0.22 0.07 -3.30 < .001Phase 2: Time:PC -0.30 0.07 -4.29 < .001
Next to the self-reported number of consumed snacks the perceivedhealthiness of the participants diet as a function of the text-messages(and the progression over time) is an interesting indicator of the successof the intervention. Analyzing the progression over time of participant’sresponses to the question “How healthy was your nutrition today” showsthat the perceived healthiness of participants nutrition is relatively sta-ble over time (See table 7.7). Only for the PC participants there is asignificant increase during the treatment phase. Figure 7.3 shows theratings of our participants at each time-point (again jittered to preventoverlap). It is clear that the healthiness ratings are, overall, relativelystable over time. However, the CPC participants perceived their dietduring the treatment phase as less healthy than in the baseline phase,while for CT participants the opposite was the case. Similarly to theprevious comparisons, the effect over time of the PC condition on theperceived healthiness of the diet is significantly higher than that of theCPC condition, t= 2.37, p < .05, but not from the RC condition.

133
Table 7.7: Overview of the fixed effects of the model including aninteraction between time and condition predicting per-ceived healthiness of nutrition.
Estimate Std. Error t value pIntercept 3.44 0.08 41.43 < .001Time Phase 1 0.01 0.03 0.51 .61Phase 2: Time:CPC -0.03 0.05 -0.58 .52Phase 2: Time:RC 0.05 0.04 1.35 .13Phase 2: Time:PC 0.08 0.04 1.88 < .05
-4 -2 0 2 4
12
34
5
Time centered around phase transition (jittered)
Per
ceiv
ed h
ealth
ines
s of
die
t (jit
tere
d)
Overall trendPhase 1Phase 2 CPCPhase 2 RCPhase 2 PC
Figure 7.3: Overview of the perceived healthiness of daily nutritionscore for participants with superimposed the regressionlines of the effects over time of the different conditions.
Additional analysisDuring phase 2 of the experiment (e.g. time-point 6 to 10) participantswere asked to evaluate the usefulness of the messages they received.Figure 7.4 shows the usefulness evaluations per time-point with super-imposed the fixed effect line of the effect of time for each of the threeexperimental conditions. The fixed effects of the interaction betweentime and condition on the perceived usefulness ratings are presented intable 7.8. It is clear that the text messages are perceived as more usefulin the personalized condition than in the contra-personalized condition,

134
with the random condition scoring in between. Here again, the PCdiffered significantly from the CPC condition, t= 4.52, p < .01, but notfrom the RC condition.
6 7 8 9 10
12
34
56
7
Timepoint (in second phase)
Use
fuln
ess
ratin
g
CPC: Contra-personalizedRC: RandomPC: Personalized
Figure 7.4: Overview of the usefulness ratings over time. Addedare the estimated regression lines of the effect of time.
Table 7.8: Overview of the fixed effects of the model including aninteraction between time and condition predicting per-ceived usefulness of the received message.
Estimate Std. Error t value pIntercept 2.58 0.31 8.32 < .001Time:CPC -0.06 0.05 -1.36 .12Time:RC 0.09 0.04 2.17 < 0.01Time:PC 0.15 0.04 3.50 < 0.001
A number of respondents dropped out of the study and the drop-out rates were examined in more detail. Since only from the start ofPhase 2 the messages that are received by participants differ for thethree different experimental conditions it was decided to look closely atthe dropout rates in the second phase of the study as a function of theexperimental condition. Participants who started phase 2 by filling outtheir diary at either time-point 6 or 7 but who did not finish by fillingout diary number 10 were marked as drop-outs. In total 61.1% of our

135
participants dropped out during phase 2. When looking at the differentconditions it is clear that the drop-out rate was higher amongst CPCparticipants (63.8%) than amongst PC participants (56.6%). The effectof condition on dropout rate in phase 2 is however only marginally sta-tistically significant, χ2(2,72) = 4.83, p= .08. No significant differenceswith the RC participants were observed.
7.3.4 Discussion Study 3The SMS trial presented in Study 3, which tested the external validityof measurements obtained using the STPS in a in situ intervention,showed that while persuasive text-messages can be effective in chang-ing people’s behavior (snacking) and attitude (perceived healthinessand usefulness) these changes depend on the right choice of influencestrategy for the right participant. Using contra-personalized persuasivemessages, and hence messages participants thought they would not besusceptible to, did not decrease snacking behavior significantly, and ledto a low estimation of the usefulness of the text messaging intervention.Conversely, the personalized persuasive messages, those adapted to fitwith the profile derived using the STPS, lead to a decrease in snackingbehavior and an increase in the perceived usefulness of the interventionover time. The decrease is estimated to be around 0.3 snacks a dayduring the course of the experiment: Hence, after about three days per-sonalized persuasive messages decrease the daily snack consumption byabout one snack. This is an effect large enough to be of importance forthe physical health of participants.
The personalized messages used in this study also seemed to outper-form a random selection of messages: consistently the estimated effectsof the personalized messages where larger than those of the randommessages. However, these differences were not statistically significant.Future researchers should however try to reduce noise in the measure-ment of snacking behavior when assessed in the wild. The inclusionof additional covariates that explain snacking behavior might increasethe precision of the estimated effects of the different conditions. Also,replication of Study 3 with a larger sample size, or over a longer pe-riod of time, could aid in more consistently estimating the effects ofpersonalized persuasion.
136
7.4 ConclusionsThis first case study chapter examined via three separate persuasiveinterventions the applied benefits of using personalization of persuasionbased on meta-judgmental measures in persuasive technologies. First,Study 1 and 2 demonstrated that meta-judgmental measures of overallsusceptibility to persuasion—people’s tendency to comply to social in-fluence strategies—were useful to improve the effectiveness of differenthealth interventions: using influence strategies was more successful forthose high in susceptibility to overall persuasion than for those low onthis trait. These two studies also show that implementing social influ-ence strategies for those low in susceptibility to these strategies can havea negative effect on compliance. In Study 3 these findings are advancedby showing the use of personalization of social influence strategy usageon the level of distinct strategies. Using implementations of the wrongstrategies—the contra-personalized condition—led to lowered compli-ance in this latter study. This finding emphasizes the importance ofselecting strategies that fit with the individual users of a persuasivetechnology.
The case studies presented in this chapter highlight two of the dif-ficulties that accompany the use of persuasion profiles that are basedonly on meta-judgmental measures. First of all, it is not always possibleto elicit elaborate questionnaire measures from all of the potential usersof a persuasive system. The first two studies had to rely on a very shortmeasure of susceptibility to persuasion due to constrains enforced bythe organization in which the study was carried out. This is likely tohappen more often in applied settings and makes accurate assessment ofa persuasion profile via meta-judgmental measures less likely. Second,each of the studies presented here used a static presentation of socialinfluence strategies: irrespective of responses to the persuasive requestparticipants in a certain condition received a measure implementing, ornot implementing, the social influence strategies that were associatedwith their assigned condition in the experiment. This even though forsome people in some of the conditions the social influence strategiesemployed had an averse effects. The use of meta-judgmental measuresalone for personalized persuasive systems will inherently be relativelystatic and this might lead to suboptimal results. Since people might notbe able to correctly judge their own susceptibility, or susceptibility ismeasured with error, it could be beneficial to update the chosen socialinfluence strategy after observing behavioral responses of the user.
137
Theoretically interesting is the finding that contra-personalizationhas a negative effect on compliance, which might sometimes even belarger than the positive effect of personalization of influence strategies(See e.g. Study 1b). This large effect of employing the “wrong” influencestrategy might be caused by psychological reactance (Brehm, 1966):wrongly selected influence strategies cause some users to contradict therequests because they perceive the influence attempt as a threat to theirbehavioral freedom or autonomy. Roubroeks et al. (2011) have alreadyobserved reactance in people’s responses to persuasive technologies .
The results presented in this chapter provide a first glimpse at theapplied benefits of the use of persuasion profiles. Personalized per-suasion consistently lead to the highest compliance and, in the studiespresented here, to a more active and healthier lifestyle. Even more,contra-personalization led to adverse effects: for some users of the ser-vice the persuasive messages led to lower physical activity or an increasein unhealthy food consumption.
In the next case study chapter these findings are extended by mov-ing from “interventions” to the design of interactive persuasive systems.Three systems that use persuasion profiles based on operative measuresare presented. These systems adapt to the susceptibility of users tosocial influence strategies by observing user’s responses to request ac-companied by implementations of distinct strategies2.
2This chapter is (partly) based on earlier publication(s): (Kaptein et al., 2010a,2011a).

138

8Case Studies II:
Dynamically PersonalizingPersuasion
8.1 Introduction: Dynamic Persuasive SystemsIn Chapter 7 persuasion profiles based on meta-judgmental measuresof susceptibility to social influence strategies were used to manipulatethe selection of persuasive messages in several health related interven-tions. The chapter made clear that personalized messages lead to highercompliance than those that are not personalized. However, in a largenumber of applied situations in which persuasive technologies are used itis hardly possible to obtain meta-judgmental measures from all possibleusers of the system.
The current chapter presents three case studies in which dynam-ically adapted persuasive systems are tested: systems that create apersuasion profile dynamically by observing the behavior response ofusers to implementations of distinct social influence strategies. Thethree systems presented here focus respectively on increasing physicalactivity, increasing user engagement with a health service, and influ-encing consumer decisions. In each of the three designs different means
139

140
of identification, representation, and effect measurement as identifiedin Chapter 6 are implemented. The effectiveness of dynamic adapta-tion is each time assessed by comparing the performance of the systemwhen using persuasion profiles to a similar system that offers persuasivemessages that are not personalized to individual users.
8.2 Design 1: APStairs, Promoting Stair UsageThe first design focusses on increasing the daily physical activity ofusers. Due to the high levels of sedentary work subsequent low levelsof physical activity are a problem for the general health and wellbeingof people (Ades, 2001). The system presented here—called APStairs—focusses on increasing stair climbing at work since benefits of this typeof physical activity are clear and well-accepted. It has been documentedthat being more physically active improves both mental and physicalhealth, which decreases the occurrences of obesity, cancer, cardiovascu-lar diseases, and depression (Ades, 2001; Grediagin et al., 1995; Penedoet al., 2004).
To meet the definition of “physically active”, people are encouragedto accumulate a minimum of 30 minutes of brisk walking, which cor-responds to 4 METs—Metabolic Equivalent of Task, a rate of energyconsumption (Ainsworth et al., 2000)), on at least five days of the week.One possible alternative to brisk walking is climbing stairs. Accordingto Teh and Aziz (2002) the gross energy cost of stair climbing is 9.6METs and the gross energy cost of stair descending is 3.2 METs. Sincemost work sites offer a choice between stairs and elevator and becauseof the clear health benefits of stair use compared to elevator use thiswas the first application area of an adaptive personalized persuasivesystem.
8.2.1 System DesignThe APStairs system, like any dynamic adaptive persuasive system,needs to be able to recognize its users, present a message implementingdifferent social influence strategies, and measure the effect of the mes-sages on user behavior. The following sections describe how these areimplemented in the APStairs system.
IdentificationThe APStairs system was deployed in the lobby of an office building.When users entered the office lobby, they needed to be identified witha unique key to keep track of the effects of the adaptive persuasive

141
system on their individual behavior during multiple visits to the officebuilding. After exploring several options for in-situ identification, it wasdecided to use Bluetooth inquiry-based scanning to uniquely identifyusers. Most mobile phones and laptops include Bluetooth functionality,and a number of people have its discoverable mode always enabled.A previous study which also used Bluetooth signals for identificationreported that 7.5% of people had their Bluetooth enabled (Kostakosand Neill, 2008), allowing for remotely scanning the device ID.
To verify this assumption, a pilot test was run in the lobby wherethe system would be installed. Based on the observation of over ahundred office workers entering the building, it appeared that around8% (N = 153) of the people had Bluetooth enabled on their mobilephones and were detected by the Bluetooth scanners. Thus, the systemcould unobtrusively assign a unique key to 8% of the visitors enteringthe building.
RepresentationThe APStairs system needed to be able to present different implemen-tations of a multitude of social influence strategies to users. This wasrealized by placing a large television screen in the lobby of the officebuilding and displaying persuasive messages on the screen. The mes-sages were aimed at making people take the stairs instead of the eleva-tor. In the selected building, there was a small hallway leading to boththe stairs and the elevators after entering the building. This enabledstrategic placement of the screen to grab user’s attention and presentthe message, while providing them ample time to make a conscious de-cision to use either the stairs or the elevator after reading the persuasivemessage.
Part of the process of creating the representation was the formu-lation of different persuasive messages, each implementing a social in-fluence strategy. A structured brainstorm session with four interactiondesigners resulted in 24 messages, based on Cialdini (2004)’s six prin-ciples of persuasion , intended to persuade office workers to climb thestairs. To verify whether these messages were good representations ofCialdini (2004)’s influence strategies, a closed card-sorting test was con-ducted. Following an explanation of the strategies, participants (n= 20)were asked whether they understood the messages and then requestedto sort them into categories—each category corresponding to one of thesocial influence strategies. In case participants had difficulties assigningmessages to a specific strategy, the option to rate them as “unknown”

142
was provided.During the brainstorm, no valid implementations of the Reciprocity
strategy came up. Since this strategy requires an ongoing interactionwith a social agent, something not present in the APStairs system, itwas decided not to include this strategy. Additionally, many partici-pants did not ascribe the Scarcity and Liking messages generated in thebrainstorm to the intended categories. Based on these results, it wasdecided to only implement messages belonging to the Authority, Com-mitment and Consistency, and Consensus strategies since these wereuniquely defined in the card-sorting task. Finally, an online question-naire was conducted to examine to what extent each of the messageswere understandable, believable and effective.
All 24 messages from the brainstorm session were evaluated by 55participants. All of the messages were generally rated as understand-able. Next, based on the ratings for each message, the three messagesthat were deemed most effective (i.e., obtained the highest score on thequestion “How effective do you think this message is?”) and believable(“To what extend do you believe this message?”) were selected. Table8.1 presents these selected messages.
Measurement of EffectTo measure the success of the messages on a user that was previ-ously identified by the Bluetooth scanner, scanners were installed onevery floor of the five-story office building. Each scanner independentlyscanned for nearby Bluetooth-enabled mobile devices and continuouslyuploaded its scanning results to the central server. These scanning re-sults were sufficient to decide between a user taking the stairs (whichled to a successful scan on each floor of the building), or a user tak-ing the elevator (which led to a scan on the ground floor). Every twohours during deployment of the system, the scanning patterns for eachof the users were rated by a human rater to decide between stair andelevator usage. Ambiguous scanning patterns were transcribed as “un-known” and not used in the computation of the success probability forthe different messages.
Figure 8.1 schematically describes the APStairs system. Near theentrance of the office building, a Bluetooth scanner identified the deviceID of a user entering the office building. This device ID was sent to aserver which in turn retrieved the estimated effectiveness of the differentinfluence strategies for that specific user, and decided which message to

143
Table 8.1: Influence strategies and their implementations as usedin the APstairs system.
Strategy ImplementationCommitment 1. Planned to become healthier? Start by taking
the stairs!2. Committed to get in shape? Start by takingthe stairs!3. Promised yourself to be more physically ac-tive? Take the stairs!
Consensus 4. 70% of the people in this building already takethe stairs. What about you?5. The majority of the people in this buildingtakes the stairs. Join them now!6. Follow many other people; take the stairs!
Authority 7. “You get a good exercise by taking the stairsinstead of the elevator.”—Bert Clarenbeek, gyminstructor.8. Doctors recommend taking the stairs.9. “Taking the stairs helps you shape up yourbuttocks.” — Jessica de Groot, zumba instructor.
show. The message was shown on the screen in the hallway, and thesubsequent response of the user—taking the stairs or the elevator—wasrecorded. Next, the estimate of the effect of the message that was shownwas updated, and the message to show on the user’s subsequent visitwas determined by the algorithm as described in Chapter 6.
8.2.2 System EvaluationTo evaluate the APStairs system, it was employed for five weeks in thehall of an office building. To be able to test the effects of individual leveladaptation as opposed to the mere effect presenting persuasive mes-sages, half of the visitors of the building received dynamically adaptedmessages as they entered the building multiple times, and half receiveda randomly selected message.
MethodThe system was set up in a five-story high office building. The heightof this building is in line with the average flights of stairs an employeeis willing to climb (Kerr et al., 2001). Furthermore, the stairs and

144
msg
ServerMySQL + PHP
Figure 8.1: Schematic setup of our adaptive persuasive system.Bluetooth scanners are present at the building en-trance and at each of the floors.
elevators in this building are easily accessible and centrally located inthe building. To increase the number of successful Bluetooth scans,each week a e 50 voucher was given out randomly to a person who hadhis or her mobile Bluetooth switched on (discoverable mode enabled).Posters and flyers were distributed throughout the building to makepeople aware of this opportunity and to increase Bluetooth activationamongst the office workers in the building.
Users—office workers entering the building whose Bluetooth keywas scanned—were randomly assigned to one of two conditions: (1)the adaptive condition, in which the system chose a random messagebelonging to the persuasion strategy with the highest probability ofsuccess for the identified user, and (2) the non-adaptive condition, inwhich the system chose a random message belonging to one of the threepersuasion strategies. The system was in service for 22 workdays. Dur-ing this time, each identified user was shown either an adapted messageor a random message, depending on their assigned condition and thestage in the deployment. Subsequently, the user’s behavioral responsewas recorded. During the first 15 days of the deployment of the system,the speed of adaptation was set low (by imposing the 80% confidencebounds on the estimates as in Chapter 3) as to explore the responses

145
of each user to each of the strategies. In the next seven workdays, theconfidence bound was limited and the available information about eachuser in the adaptive condition was exploited: users in the adaptive con-dition were only shown messages with a high estimated success rate.After collecting data, the system was also evaluated through a num-ber of short interviews. During these interviews, we asked questionssuch as: “Do you think this message was addressed to you?”, “Do youthink the message is shown at the right moment?”, and “Do you thinkmessages like this will change your behavior?”
ResultsA total of 34 office workers were scanned by three or more scannerslocated throughout the building multiple times, allowing us to tracktheir behavior. However, for eight of these people, the scanning resultsdid not lead to a clear inference pattern to judge stair or elevator usage,so these users were removed from further analysis. As a result, theanalyses as presented here conducted on only 26 users. Of these 26users, 16 were assigned to the adaptive condition, and 10 were assignedto the non-adaptive condition. The number of repeated visits by eachuser ranged from 2 to 16.
Figure 8.2 shows an overview of the estimates of the successful-ness of the persuasive strategies employed by the APStairs system overtime. For each of the two users presented in the figure, the initial esti-mated success of each strategy—again, messages implementing a singlestrategy were treated equally—corresponded to the estimates based onthe pretest. Thus, the estimated success of messages implementing theCommitment and Consistency strategy was highest for each new user.However, due to the large prior uncertainty—which was set manually—surrounding this estimate, this strategy was not necessarily the firststrategy shown to every new user entering the office lobby.
For user 94—see top panel of Figure 8.2—the first message that waspresented implemented the Authority strategy (e.g., “Doctors recom-mend taking the stairs.”). This message was successful—the user tookthe stairs after being shown this message—and thus the estimated suc-cess of this message was adjusted upwards. During the second visit ofthis user, a message implementing the Commitment and Consistencystrategy was shown. This message was also successful for this user and,thus, its estimated success for future visits was adjusted upwards. Onthe third visit, user 94 received an implementation of the Consensusstrategy: “Follow many other people; take the stairs!”. This strategy,

146
User 94
Est
imat
ed e
ffect
iven
ess
0.2
0.4
0.6
0.8
1 2 3 4 5 6
AuthorityCommitmentConsensus
User 14
Est
imat
ed e
ffect
iven
ess
0.2
0.4
0.6
0.8
2 4 6 8
AuthorityCommitmentConsensus
Figure 8.2: Overview of the estimated effectiveness of different so-cial influence strategies for two users of the APStairssystem.
however, was not successful as the user took the elevator after seeingthis message, and its estimated success was adjusted downwards. Onvisit four, user 94 was presented with another implementation of theAuthority strategy, which at that visit was not successful. At this pointin time, the system entered the exploit stage—the last seven days ofdeployment. Thus, for the fifth visit, this user was shown an imple-mentation of the Commitment and Consistency strategy: its estimatedeffect was higher than that of the other strategies and also relativelycertain. As expected, this last message was succeeded by stair usage ofthis user. User 14 clearly converges to a preference for the Commitment
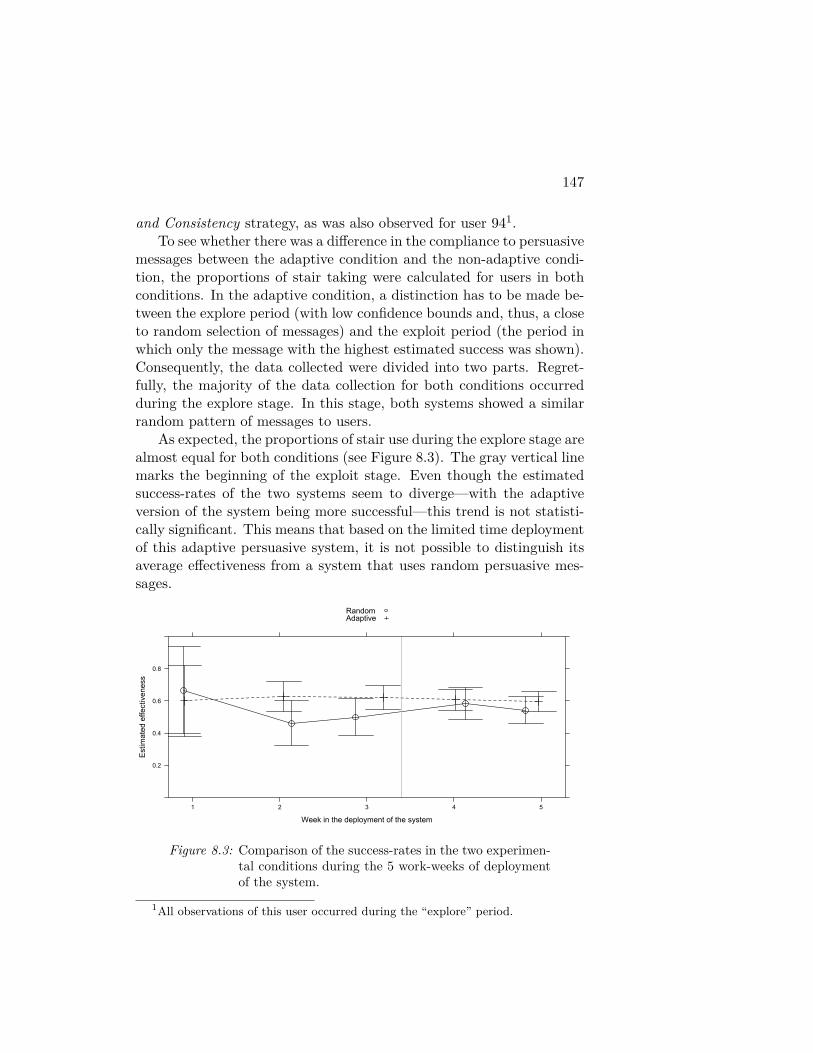
147
and Consistency strategy, as was also observed for user 941.To see whether there was a difference in the compliance to persuasive
messages between the adaptive condition and the non-adaptive condi-tion, the proportions of stair taking were calculated for users in bothconditions. In the adaptive condition, a distinction has to be made be-tween the explore period (with low confidence bounds and, thus, a closeto random selection of messages) and the exploit period (the period inwhich only the message with the highest estimated success was shown).Consequently, the data collected were divided into two parts. Regret-fully, the majority of the data collection for both conditions occurredduring the explore stage. In this stage, both systems showed a similarrandom pattern of messages to users.
As expected, the proportions of stair use during the explore stage arealmost equal for both conditions (see Figure 8.3). The gray vertical linemarks the beginning of the exploit stage. Even though the estimatedsuccess-rates of the two systems seem to diverge—with the adaptiveversion of the system being more successful—this trend is not statisti-cally significant. This means that based on the limited time deploymentof this adaptive persuasive system, it is not possible to distinguish itsaverage effectiveness from a system that uses random persuasive mes-sages.
Week in the deployment of the system
Est
imat
ed e
ffect
iven
ess
0.2
0.4
0.6
0.8
1 2 3 4 5
RandomAdaptive
Figure 8.3: Comparison of the success-rates in the two experimen-tal conditions during the 5 work-weeks of deploymentof the system.
1All observations of this user occurred during the “explore” period.

148
Finally, a total of 12 (possible) users—i.e., office workers entering thebuilding at the day the system was dismantled—were interviewed for aqualitative evaluation of the APStairs system. During these short, tenminute interviews, the office workers displayed diverse responses to thesystem. One interviewee stated to feel that “. . . the messages seemedto address me, I always tried to read them”. Another user, however,remarked that: “In the morning, I do not pay attention to anything”.A number of office workers responded very positively to the system;they interpreted the system as a nice way to make people aware aboutphysical activity. This was true also after the adaptive nature of thesystem was disclosed to them. On the other hand, some office workersalso responded negatively; they did not think that messages like thiswould ever be able to change people’s behavior.
Overall, users commented that the messages were delivered usinga big noticeable screen that was placed in the right location: clear insight, and at the moment of their decision to use either the stairs or theelevator was made. Moreover, the timing and duration of the messageswas found to be adequate, and the content indeed triggered people’sconsciousness about stair taking behavior.
8.2.3 DiscussionThe APstairs system is an adaptive persuasive system created to in-crease stair usage amongst office workers. The system was deployed “inthe wild” for several weeks. Although the evaluation tried to comparethe effectiveness of the adaptive system with a random presentationof messages, it did not collect sufficient data to reach a statisticallysignificant conclusion. However, the APStairs system showed the adap-tation process in its full breadth, and for a number of individuals thesystem seemed to converge to their personal most successful strategy.This demonstration and the detailed description of the implementa-tion of our adaptive persuasive system enables designers of persuasivetechnologies to include personalization at the level of social influencestrategies to possibly increase the effectiveness of their systems.
8.3 Design 2: Influencing Docking BehaviorThe second system that implements dynamic persuasion profiles wascreated to increase user engagement in a health and lifestyle service.The service combines an “activity monitor”—a 3d accelerometer op-timized to detect physical activity patterns—with active human and

149
technology initiated coaching to help users gain a more active lifestyle.During a 12 week program users can set activity goals and monitor theirprogress on the web service that accompanies the product.
Within the service user engagement is key: Coaching happens pri-marily via the web service, and activity data is only stored and analyzedafter it has been updated to the web service. Updating can happen onlyvia a physical connection of the activity monitor to the user’s computer.Users that fail to upload are thus deprived of feedback and coaching andas such the persuasive technology has little impact on their daily activ-ity pattern. To encourage docking—the uploading of the activity datato the web service—docking reminders are send via email to users thathave failed to upload for a certain number of days. The application ofpersuasion profiles presented here focusses on optimizing the effective-ness of these reminder email messages by including implementations ofsocial influence strategies into the messages. The system is called thePersuasive Messaging System (PMS).
8.3.1 System DesignAs with the previous adaptive persuasive system presented in this chap-ter, identification, representation, and measurements are necessary re-quirements to build and use persuasion profiles in the PMS. The PMSonly focusses on the reminder emails and thus identification, represen-tation, and success measurement are only defined in this context.
IdentificationThe PMS used the unique key provided by each activity monitor toidentify individual users. When a user docks—connects their activitymonitor to their computer—the activity data and a unique identifier aresend to the persuasive service. The PMS was implemented on anotherserver that was external to the persuasive service’s own system. Toensure privacy en security the user ID was hashed and a timestamp andthe hashed ID were send to the PMS server. This allowed the PMSserver to log each docking event for each individual user.
RepresentationRepresentation of the persuasive messages was done in the email re-minders that were send to users that had refrained from docking foreither three or six days. Reminders were initiated by the persuasiveservice. The service’s server send a request to the PMS server to re-quest the next social influence strategy to be used for the current user

150
(identified by their hashed ID). The PMS server, upon receipt of the re-quest looked up the persuasion profile for that user (all stored using thehashed user ID’s) and returned the text snippet of one of the persuasiveemail messages that were created for the PMS.
To create the social influence strategy implementations five persua-sive technology researchers brainstormed a large number of messages.Messages were created that implemented the Scarcity, Authority, andConsensus strategies. After the brainstorm a card-sorting test was usedto classify messages according to their strategies, and for each strategytwo messages were selected for use in the trial. The persuasive mes-sages consisted of text snippets containing social influence strategiesthat were added to the standard docking reminder email already in useby the service. This standard reminder mail looked as follows2:
Dear (firstname),
How are you doing? We hope all is well. It is 3 days since thelast time you connected your Activity Monitor.
[Message]
We would like to remind you to connect it to your PC soon andstay in touch with [X]3.
Sincerely,
The [X] Team
The social influence strategy was inserted at the [message] locationof the email reminder email. Table 8.2 gives the implementations of thesocial influence strategies as used in the PMS. Since the original servicereminder message was also used there are four different social influencestrategies in use (one being neutral) in the PMS. By combining thehashed User ID with the message ID the service’s reminder server wasable to dynamically construct a message for a specific individual usersof the persuasive service.
2The email reminders and social influence strategies were translated into fourlanguages, English, Dutch, German, and Spanish, to facilitate all users of the service.
3The reference to the name of the service is omitted in this thesis.
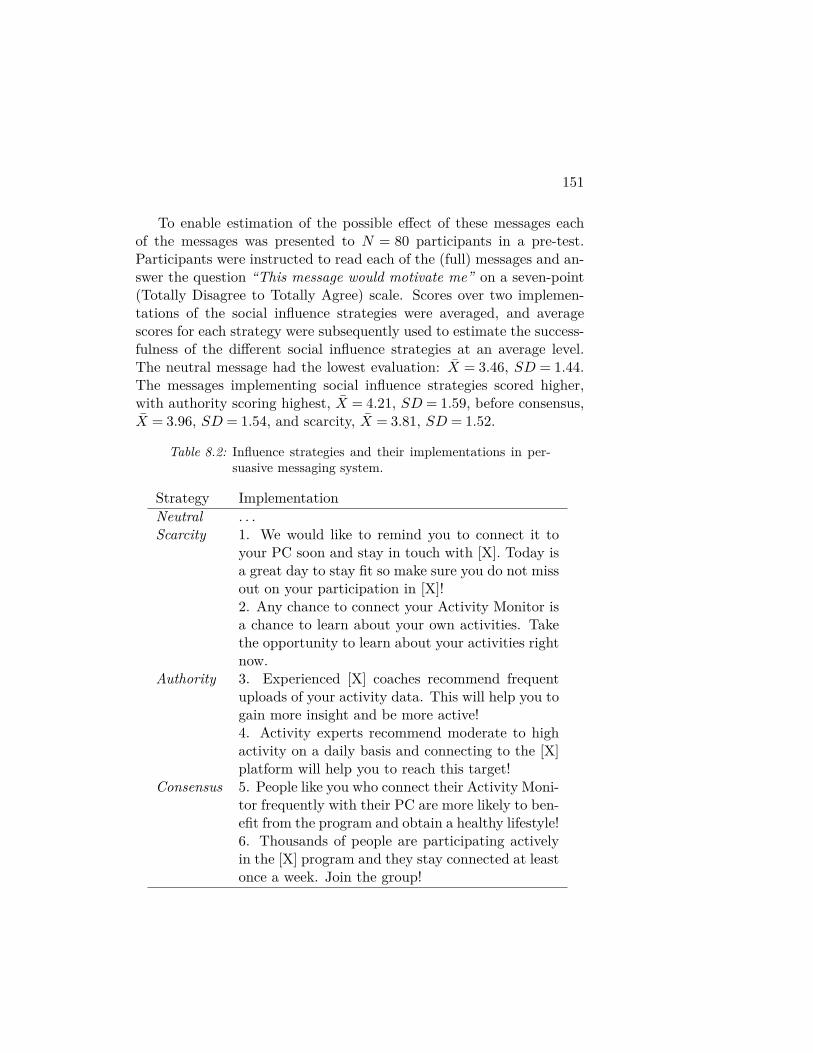
151
To enable estimation of the possible effect of these messages eachof the messages was presented to N = 80 participants in a pre-test.Participants were instructed to read each of the (full) messages and an-swer the question “This message would motivate me” on a seven-point(Totally Disagree to Totally Agree) scale. Scores over two implemen-tations of the social influence strategies were averaged, and averagescores for each strategy were subsequently used to estimate the success-fulness of the different social influence strategies at an average level.The neutral message had the lowest evaluation: X = 3.46, SD = 1.44.The messages implementing social influence strategies scored higher,with authority scoring highest, X = 4.21, SD = 1.59, before consensus,X = 3.96, SD = 1.54, and scarcity, X = 3.81, SD = 1.52.
Table 8.2: Influence strategies and their implementations in per-suasive messaging system.
Strategy ImplementationNeutral . . .Scarcity 1. We would like to remind you to connect it to
your PC soon and stay in touch with [X]. Today isa great day to stay fit so make sure you do not missout on your participation in [X]!2. Any chance to connect your Activity Monitor isa chance to learn about your own activities. Takethe opportunity to learn about your activities rightnow.
Authority 3. Experienced [X] coaches recommend frequentuploads of your activity data. This will help you togain more insight and be more active!4. Activity experts recommend moderate to highactivity on a daily basis and connecting to the [X]platform will help you to reach this target!
Consensus 5. People like you who connect their Activity Moni-tor frequently with their PC are more likely to ben-efit from the program and obtain a healthy lifestyle!6. Thousands of people are participating activelyin the [X] program and they stay connected at leastonce a week. Join the group!

152
MeasurementThe service’s email server, after consulting the PMS, sends emails toremind users to dock their activity monitor. Hence, the reminder mes-sage containing a specific social influence strategy is successful if, withina certain time period after reading the email, the Activity Monitor isindeed docked. To measure this effectiveness a small image was in-serted into the email message body which allowed the PMS to log thefact that a user with a specific hashed ID opened an email. If, andonly if, within 24 hours after opening the email the user with that IDdocked her activity monitor the message was considered a success andthus whatever influence strategy implemented in the opened message(neutral, scarcity, authority, or consensus) was successful for that user.The PMS ran a cron-job every 24 hours to match all opened emails withthe recent docking behavior and update the individual level persuasionprofiles according to the responses to messages send the last 24 hours.
8.3.2 System EvaluationTo evaluate the PMS system an evaluation was setup in which thesystem was deployed for all new users of the persuasive systems fromthe 1st of January 2011 until the 1st of July 2011. The system wasimplemented on a separate server external to the persuasive system.
MethodTo assess the effects of adaptive persuasive messaging as opposed to theoriginal reminder message, or messages using social influence strategiesthat were not adapted to the individual, the system evaluation assignednew users during the evaluation period to one of four conditions:
1. Baseline: Users assigned to this condition received the standarddocking reminder message. This message did not contain any im-plementations of social influence strategies. This condition wasincluded to be able to compare the PMS to the current imple-mentations
2. Best Pre-tested: Users assigned to this condition received ran-domly one of the two messages implementing the authorityadvice—this message was judged most motivating in the pre-testevaluation of the messages. This condition was included to com-pare adaptive selection of social influence strategies to the “best”average strategy.
3. Random: Users assigned to this condition received randomly oneout of the seven versions of the message (with probabilities equal

153
for each of the strategies). This condition was included to compareadaptive messaging with alternating messages.
4. Adaptive: Users assigned to this condition received messages sug-gested by the adaptive persuasive system algorithm as describedin Chapter 3. Thus, for the first few messages the selection wasrandom. If users displayed a clear preference for one of the socialinfluence strategies after receiving multiple reminder emails thereminder message was personalized to include only those strate-gies users were susceptible to.
No interventions other than the changes in the email messages ac-cording to the conditions were implemented in the evaluation. For eachuser the PMS logged each dock event, the email reminders that weresend and opened, and whether or not an email—implementing a spe-cific strategy—was a success or not. This data allows analysis of thedirect effects of the strategies, but also allows analysis of “drop-outs”:people that have not been active—have not docked—in the program for28 days. This latter measure is most important for the service since thisis exactly what the docking reminder messages are trying to prevent.
In the adaptive condition—similar to the APStairs system—theprior expectancy of the success of the different social influence strategieshad to be set. Before the trial no information was available about theeffects of the reminder message and thus the estimates were (a) set closetogether, and (b) set with large uncertainty to be updated quickly bynew data. The prior for the neutral (no social influence) message wasset to: X = 0.39, V ar= 0.1. In line with the pre-test of the messages theauthority strategy prior was set the highest, X = 0.52, V ar = 0.1, be-fore consensus, X = 0.50, V ar = 0.1 and scarcity, X = 0.47, V ar = 0.1.Contrary to the APStairs system, randomized probability matching wasused to select messages in the adaptive condition.
ResultsFor this analysis all users that (a) participated in the service for atleast 30 days, and (b) received at least 3 email reminders during thetrial period, were included in the final dataset. For the period of theevaluation this led to a dataset describing the upload frequency andresponses to reminders of 1129 users. Table 8.3 gives an overview of thenumber of users, the success percentage, and the number of drop-outsin each condition.
The table gives an overview of the aggregated results of the evalu-

154
Table 8.3: Overview of the data from the persuasive messagingsystem evaluation.
Condition Users % Success [S.E.] % dropouts [S.E.]Baseline 271 28.49 [1.7] 25.09 [2.6]Best Pre-test 289 24.01 [1.5] 25.95 [2.6]Random 289 25.41 [1.6] 20.76 [2.4]Adaptive 280 26.49 [1.6] 18.93 [2.3]
ation of the PMS system. It is clear that users are relatively equallydistributed over the conditions. Furthermore, at first glance the ef-fects on the average number of reminders and the overall success of thereminders of the experimental conditions is rather low. However, thenumber of dropouts is lower in the adaptive messaging condition, indi-cating that the adaptive persuasive system is somewhat more successfulin keeping users engaged in the program.
To analyze the data obtained in the PMS evaluation a series ofmultilevel models is fit to the data describing the successes of each ofthe reminders send to users included in the trial. Similar to the model(s)presented in Chapter 3 a null model—although this time with a logitlink given the binomial outcome of the success measure—is first fit tothe data. Thus, the model estimates the success probability of eachmessage that is send to users based on an overall intercept and per-person intercepts that are distributed normally with mean zero and avariance estimated from the data.
Adding average effects for the social influence strategies to the null-model shows no significant effect of strategy on success of the emails,χ2 = 4.75, df = 3, p = 0.19. Thus, this average effect is omitted fromfurther model comparisons. Further model comparisons show a largemain effect of Frequency—the number of the reminder that is send(See Table 8.4, Model A and Model B)—on the probability of a re-minder being successful. Addition of average effects of condition toModel B shows that there is no significant average effect of conditions, χ2 = 3.19, df = 3, p= 0.36. There is however a significant increase inmodel fit when adding varying social influence strategy effects by par-ticipant (Table 8.4 Model B and Model C) which is consistent with thefindings of large heterogeneity in responses to social influence strategiespresented in Chapter 3. Thus, allowing for heterogeneity in the effectsof the different influence strategies explains a significant portion of the

155
variance in responses to the PMS4. Finally, condition interacting withfrequency is added to the model. This interaction significantly improvesmodel fit (See Table 8.4 Model D)
Table 8.4: Model Comparisons used for the analysis of the persua-sive messaging system evaluation.
Model BIC logLik χ2 Df p
Model A : 10903.18 -5449.59Model B : 10486.91 -5240.46 418.26 1 < 0.001Model C : 10480.00 -5228.00 24.92 9 < 0.01Model D : 10474.54 -5222.27 11.46 3 < 0.01
Table 8.5 shows the fixed effects of Model D. The negative coef-ficient for Frequency indicates that the probability of success of a re-minder message decreases over time: the first reminder is successfularound 27.7% of the time (for users in the baseline condition, which isused as a reference) while the fifth reminder is successful only 17.9% ofthe time. The other interactions of condition and frequency can be in-terpreted in the same way: For the random condition—compared to thebaseline condition—the drop in effectiveness of the reminders over timeis lower, while that of the best-pretested condition is higher (althoughboth are not significantly different from 0). The drop in effectiveness ofmessages in the adaptive condition is significantly lower than the base-line condition: The predicted effectiveness of the fifth message in theadaptive condition is 21.5%, which is 3.6% higher than the estimated ef-fectiveness of the fifth message in the baseline condition. For the tenthmessage this difference is even larger: 4.8%. Similarly, the adaptivecondition significantly outperforms the pre-tested condition, t = 3.74,p < .01. The adaptive condition does not significantly outperform therandom condition.
Finally, a key comparison of the evaluation of the PMS systemconcerns the overall drop-out rate obtained in the different conditions.While table 8.2 already shows that the drop-out rate in the adaptivecondition is lower than in the other conditions, a logistic regressionmodel is fitted to the drop-out data to further examine this result.Model comparisons show that the effect of Condition on drop-out is notstatistically significant, χ2 = 5.55, df = 3, p= 0.14. Table 8.6 shows the
4This model comparison is similar to that presented in Study 1 in Chapter 3between Model B and Model C. See also Equation 3.6 in Chapter 3.

156
Table 8.5: Coefficients of the fixed effects of Model D. The tableshows that over time (Frequency) the success of theemail reminders decreases. This decrease over time issignificantly smaller in the adaptive condition than inthe baseline condition.
Estimate S.D. z p
(Intercept) -0.83 0.06 -12.72 < 0.001Frequency (Freq) -0.14 0.01 -11.44 < 0.001Freq. × Random 0.02 0.02 1.10 0.27Freq. × Pre-tested -0.01 0.02 -0.40 0.69Freq. × Adaptive 0.04 0.02 2.74 < 0.01
estimated coefficients of the logistic regression model predicting drop-out probability in the different experimental conditions. Again, thebaseline condition was used as a reference. The model fit shows thatthe estimated drop-out probability for users in the baseline conditionis 25.1%, while that in the adaptive messaging condition is only 18.9%.This difference however is also not statistically significant.
Table 8.6: Fixed effects of the logistic regression model predictingthe drop-out probability of users in the PMS trial.
Estimate S.D. z p
(Intercept) -1.0937 0.1401 -7.81 0.000Pre-tested 0.0452 0.1940 0.23 0.815Random -0.2457 0.2017 -1.22 0.223Adaptive Message -0.3610 0.2071 -1.74 0.081
8.3.3 DiscussionThe second design presents the development and evaluation of the Per-suasive Messaging System for the docking-reminder messages. In thisadaptive persuasive system users are identified by a unique key associ-ated with their activity monitor which is an integral part of their usageof the service. After inactivity—failure to dock—for a period of 3 or 6days users received a reminder email. In this email the authority, con-sensus, and scarcity strategy were implemented to increase compliance.The social influence strategies were added to the email messages in sucha way that they were interchangeable and could thus be personalized.Finally, the effect of the messages was measured by combining logging

157
of the opening of the email messages via a dynamic image in the contentof the email and user’s logged docking behavior.
Results of the evaluation of the PMS system show the benefits ofusing persuasion profiles: the (repeated) success of the reminder mes-sages is higher when using personalized persuasion than when using thedefault message or any of the other message creation methods exploredin the evaluation. More importantly, in the long run, this led to a de-crease in drop-out of the program for this condition compared to thebaseline condition. Even though this signal is not very strong and onlymarginally significant, .05 < p < .10, the estimated business impact issubstantial: on average users that receive personalized reminders were6.2% less likely to drop out of the program than those receiving theoriginal reminder message. This large effect size warrants further in-vestigation. The current estimates, and more specifically the estimateddifference between the random and the adaptive condition, is possiblynot statistically significant because of the limited time period of thestudy: a portion of users that would drop out in the future has notdone so during the evaluation. A study with a larger sample size andover a longer period could improve the precision of these estimates.
8.4 Design 3: E-Selling ApplicationsThe third adaptive persuasive system presented in this chapter focusseson the application of persuasion profiling in a marketing setting. Histor-ically (online) marketing has been on the forefront of persuasive tech-nologies. The e-commerce application presented here provides an op-portunity to test the premises of persuasion profiling on large groups ofpeople and determine the economical relevance.
This third system—called the Persuasion API—is developed on topof an existing e-commerce website. The website kinder-kleertjes.com isan affiliate website that sells children’s clothing primarily to Dutch cus-tomers. Affiliate websites use product feeds—xml files describing theproduct collection—of other online vendors to create a customer facingwebsite aimed at search engine optimization and user experience. Userscan browse the affiliate website for products. Purchase of products how-ever happens at the website of the vendor providing the product feed.The affiliate website receives a share of the revenue that is generatedfrom the lead originating on the affiliate site.
Kinder-kleertjes.com offers a selection of over 1.200 products. Prod-ucts are offered by two affiliate programs and the website aims at at-

158
tracting traffic through search engines and increasing click through tothe two final vendors. The site, in its current form, has been runningfrom the beginning July 2010. The website is rather limited in size,attracting 388 visitors a month on average during from July 2010 tillApril 2011 5.
8.4.1 System DesignThe Persuasion API system was created on top of the original site andimplemented as a Application Programming Interface (API). The web-site kinder-kleertjes.com makes a HTTP call to an external server torequest the appropriate social influence strategy to use for the currentvisitor. The remote server returns the ID of the social influence strat-egy that should be used and this strategy is presented to the visitor ofkinder-kleertjes.com. Finally, after browsing the product that is accom-panied by the suggested social influence strategy kinder-kleertjes.comsends an update to the Persuasion API server to communicate whetheror not the influence attempt was a success. Also in this system iden-tification, representation, and measurement are necessary requirementsto build a system that adapts social influence strategy usage at theindividual level.
IdentificationTo identify users a Javascript visitor tracker which assigned a unique idto each new visitor and stores this as a cookie on the user’s machine wascreated. For each new user, based on their IP address and the currenttime, a unique User ID was created and send to the Persuasion APIserver. This unique ID is also stored on the machine of the user. Everytime a user visits kinder-kleertjes.com the client side Javascript trackswhether a Persuasion API User ID exists, and if not a new User ID iscreated.
RepresentationTo be able to create the adaptive persuasive system, the presenta-tion of different social influence strategies to support the product of-ferings needs to be possible. The home page of the kinder-kleertjes.compresents a “random” selection of the offered products together withpictures of the products and single sentence descriptions (See Figure8.4 on the left). Once a visitor clicks on one of the products (or en-ters the site using a search term directly pointing at a product page)
5The timeframe during which the system evaluations took place.

159
the product is displayed using a large image and a textual description.The social influence strategies were implemented on this product dis-play page. Only two strategies were implemented for this evaluation:Scarcity and Consensus. For the scarcity implementation a image thatsaid “Special offer” and the text “This clothing item is available todayat a special discount rate” was displayed. For the Consensus strategyan image that stated “Bestseller” and the message “This is one of ourbestselling clothing items. This product is popular with many” wereadded. By keeping the original “no strategy” product representationthe evaluation concerned three product display versions that could beused for every product on the site (an example of the consensus strategyimplementation is presented on the right of Figure 8.4).
Figure 8.4: Overview of kinder-kleertjes.com: Left the home page,in the middle a product presentation page. The imple-mentation of the persuasive strategies are shown on theright with their position on the product presentationpage indicated by the arrow.
MeasurementAlso for this adaptive persuasive system a measurement of effect ofthe social influence strategy is necessary. Since the goal of the affiliatestore is to obtain high click-through rates to the vending website ofthe products that are offered, this click-through was used directly as ameasure of success: Any click on the image or link of the product on theproduct page implementing a social influence strategy was regarded asuccess for that strategy. A failure to click—because the user browsed toa different product or left the website—was regarded as an unsuccessfulinfluence attempt. The success of the attempt was communicated backto the external server running the Persuasion API system. When a userleft one of the product pages the UserID, the social influence strategyID, and the success of the social influence attempt, were send to the
160
server and the estimated success of that social influence strategy for thecurrent user was adapted accordingly. Every 12 hours the average levelestimates were also updated based on the new observations.
8.4.2 System EvaluationTo evaluate the implementation of the Persuasion API server on kinder-kleertjes.com two separate tests were setup. First, the system was im-plemented for a period of 3 months and the performance of the kinder-kleertjes.com website during the period in which the system was setupwas compared with its performance on a number of Key PerformanceIndicators (KPI’s) prior to the implementation of the system. Second,during a 4 month period half of the visitors of the kinder-kleertjes.comwebsite were randomly assigned to the version of the website that imple-mented Persuasion API, while the other half of the visitors during thattime period was assigned to browse the original website. This secondevaluation has the methodological advantage that the timeframe of thecomparison is the same between both the original kinder-kleertjes.comwebsite and the version of the site that implements persuasion profiling.
In both evaluations initial estimates of the success of the differentsocial influence strategies, and the certainty around these estimates,were needed to start the system. The estimate of the effectiveness ofthe No Strategy version was manually set to 20% (pm = 0.2), that of theScarcity strategy to 30% and that of the Consensus strategy to 24%.Thus, in line with the literature, the expectation was that the productofferings supported by implementations of social influence strategieswere more successful then the original “no strategy” representation. Bysetting the variances of this estimate high (e.g. σ2
A = 0.1) these initialestimates were very variable to new data and thus had practically noimpact once the system was in place for a period of time. Practicallythis implementation ensures that the first user after deployment of theadaptive persuasive system did not necessarily receive the No Strategyproduct presentation as had been the case in the period prior to thedeployment of the system but received one of the three versions—whichone was in this early stage “random” due to their overlapping confi-dence intervals. Based on the behavior of this first user—either clickingor not clicking on the product—a new estimate of the effectiveness ofthe consensus strategy was made and the product presentation was up-dated accordingly both for the specific user as well as for subsequentusers. Strategies were selected using randomized probability matchingas described by Scott (2010).

161
To evaluate the adaptive persuasive system a number of indicatorsare of interest. First of all it is interesting to see how the effectivenessestimates of the different influence strategies change over time. Thiscan be done both at a between-user level (corresponding to A-B testingthat is flexible over time) but also at a within-user level to see whetherindeed strategy preferences differ between users. Next to examining thefunctioning of the adaptive persuasive system a comparison can be made(a) between the period in which the Persuasion API was implementedwith the period in which only the No Strategy product representationwas used, and (b) between the performance of the system for usersrandomly assigned to the Persuasion API system and those assignedto the no strategy version of the affiliate store. Comparisons of clickthrough rates from the affiliate site to the vendor site per unique visitorand revenues per unique visitor are compared for each of the methodsof evaluation. Evaluation I focussed primarily on the functioning of theadaptive persuasive system by looking into the behavior of individualusers. Evaluation II focusses primarily on the comparison of Key-Indicators.
Results evaluation I: Comparison over timeDuring the baseline period—from the 8th of July till the 21st of Oc-tober 2010—1339 visited kinder-kleertjes.com. Due to organic visitorsand advertisements via Google Adwords to ensure sufficient traffic, 831visited the site during the employment of the adaptive persuasive sys-tem, from the 21st of October until the 8th of November.
The first analysis concerns an overview of the effect of social influ-ence strategies during the deployment phase of the system. Figure 8.5shows the progression of the estimated (between-user) effectiveness ofthe three product presentation versions over time. It is clear that ini-tially the estimates were very variable and were haphazardly updatedbased on new observations. However, after a few days the estimatesquickly stabilized and estimate uncertainty decreases. Both productrepresentations that implement a persuasive strategy significantly out-perform the No-strategy implementation which was previously used onthe website. This replicates the social science finding that implemen-tations of these strategies at an average level are effective to increasecompliance.
While figure 8.5 indicates that using persuasive strategies can aidthe performance of the affiliate store by increasing click through rates,this graph alone does not indicate that different strategies should be

162
Day of the trial
Est
imat
ed e
ffect
iven
ess
0.2
0.4
0.6
Oct 25 Nov 01 Nov 08 Nov 15 Nov 22
No strategyScarcityConsensus
Figure 8.5: Progression of between-user (overall average) effective-ness estimates of the three strategies and indications ofthe certainty of the estimates. Initially the estimatesare very variable but over time they stabilize. Thedates on the x-axis are jittered to increase readability.Error bars are conservative and based on between uservariance not on the total number of observations.
presented to different users—as is done using the Persuasion API sys-tem. To examine whether adaptation is actually necessary (e.g. forsome users the Consensus strategy—which is most effective overall—isnot the preferred strategy) figure 8.6 presents the individual level esti-mates of two users who viewed at least 8 products on the website. Thefigure shows (e.g.) that for a the first users the most effective strategyis not the Consensus strategy but rather the Scarcity strategy. Hence,when adapting to user preference only on a between user level—thusdisplaying the most effective strategy overall to every user—one wouldobtain suboptimal results for a number of users.
Next to examining the predicted strategy effectiveness, analysis con-cerns the performance of the affiliate online store kinder-kleertjes.combefore and after usage of the Persuasion API system. The first interest-ing indicator of the performance of the affiliate website is the propor-tion of clicks on products per user. During the baseline period 14.4%

163
Effe
ct
0.10.20.30.40.5
2 4 6 8
● ● ● ● ●
● ● ● ●
No strategyScarcityConsensus
●
Effe
ct
0.10.20.30.40.5
5 10 15 20 25
● ● ● ● ● ● ● ● ● ● ● ● ● ● ●
● ● ● ● ● ● ● ● ● ● ● ● ●
No strategyScarcityConsensus
●
Effe
ct
0.10.20.30.40.5
5 10 15
● ● ● ● ● ● ● ● ● ● ● ● ● ● ● ● ●
No strategyScarcityConsensus
●
Effe
ct
0.10.20.30.40.5
2 4 6 8 10
● ● ● ●
● ● ● ●● ● ●
No strategyScarcityConsensus
●
Figure 8.6: Estimated effectiveness of the different persuasivestrategies for two randomly selected users (out of thosewho viewed more than 8 products)—x-axis denotes thenumber of products viewed.
of the users of the site eventually clicked on one of the products andwas taken to the vendor’s homepage. In the adaptive persuasion periodthis number was higher: 18.3%, indicating an increase in click throughin the adaptive persuasion period. This increase is statistically signif-icant (χ2 = 5.766, p = 0.016). Furthermore, during the baseline periodeach unique visitor on average created a revenue for the affiliate store ofe 0.037, while in the adaptive persuasion period e 0.046 were generatedper visitor. This latter difference is however, due to the relatively smallincidence of actual purchases, not statistically significant. The aver-age revenue per visitor is thus higher in the adaptive persuasive systemperiod than in the baseline period.
Results evaluation II: Comparison during same timeframeEvaluation I concerned a comparison of the performance of kinder-kleertjes.com prior to implementing the adaptive persuasive system andduring implementation. However, since these time-frames are differentthis is a mayor confound in the results presented: the conversion mighthave been higher due to the effects of time, for example consumers mightbe more inclined to buy product in autumn than in summer. To controlfor this confound the second evaluation considered a single timeframe inwhich half of the consumers used the original no strategy version of thewebsite, while the other half was shown the website implementing the

164
Persuasion API system. During the period between the 20th of Februaryand the 2nd of April 1449 visitors visited kinder-kleertjes.com.
Analysis first again concerns the comparison of the three differentproduct representations: The no-strategy representation, the Scarcityrepresentation, and the Consensus representation. Figure 8.7 shows theperformance of these during the time of the trial. Again, it is clearthat the presentations accompanied by social influence strategies leadto higher conversion than those. Contrary to evaluation I however thepersuasiveness of the scarcity implementation seems to “wear off”.
Day of the trial
Est
imat
ed e
ffect
iven
ess
0.1
0.2
0.3
0.4
0.5
Feb 01 Feb 15 Mar 01 Mar 15 Apr 01
No strategyScarcityConsensus
Figure 8.7: Progression of between-user (overall average) effective-ness estimates of the three strategies and indicationsof the certainty of the estimates. As in the first evalu-ation the products displayed accompanied by a socialinfluence strategy on average have higher conversionrates.
The setup of the second evaluation enables comparison of the no-strategy system performance with the adaptive system performancewithin the same timeframe. Figure 8.8 shows the estimated conversionrate of each of the two systems during evaluation II. While initiallyestimates are unstable due to small sample sizes, the estimates stabilizequickly and already after one month of system usage the conversion rate

165
of the adaptive persuasive system is consistently and significantly betterthan the performance of the original version of the affiliate store. Dur-ing the second evaluation the average conversion rate of the no strategyversion of the site was 9.4% while that of the adaptive persuasive sys-tem was 13.5%. This difference in proportions is statistically significant(χ2 = 6.3856, df = 1, p = 0.012). As in evaluation I the adaptive per-suasive system also led to an increased revenue per visitor: e 0.034 vs.e 0.041. However, also in this study, due to the relatively rare occur-rence of purchases this latter difference is not statistically significant.
Day of the trial
Est
imat
ed c
onve
rsio
n
0.05
0.10
0.15
0.20
0.25
Feb 01 Feb 15 Mar 01 Mar 15
No strategy / holdoutPersuasion API
Figure 8.8: Comparison of estimated conversion rates for con-sumers in the holdout condition—those visiting the nostrategy version of the website—and consumers in thetest condition—those looking at the adaptive persua-sive system.
8.4.3 DiscussionThe third design presented in this chapter tested the use of adaptivepersuasion in an e-commerce setting. The Persuasion API system thatused persuasive strategies and dynamically adapted these strategies toindividual consumers improved conversion in two separate evaluations.The results again show the use of persuasion profiles: for each individ-ual user a profile (see for examples Figure 8.6) which estimates of theeffects of the different persuasion strategies was created and used. In

166
both evaluations a significant increase in conversion was obtained—ascompared to the original implementation of the affiliate store—whenusing the adaptive persuasive system.
8.5 ConclusionsThis case study chapter presented the design and evaluation of threeadaptive persuasive systems. For each of the systems different meansof identification, representation, and effect measurement were used toenable creation and usage of persuasion profiles. In each system user’sresponses to distinct social influence strategies could be identified, andthese differences were attended to by the systems. The description ofthese systems and the evaluations of the effects of adaptive persuasionshould motivate designers to use persuasion profiles in the design oftheir persuasive systems.
For the latter two of the three case studies presented in this chapter,attending to individual differences in responses to influence strategiesled to a significant increase in compliance compared to not using in-fluence strategies at all. Both the docking frequency of the activitymonitor as well as the frequency of ordering products online increasedby using an adaptive persuasive system. These case studies thus (a)are exemplars of implementations of adaptive persuasive systems thatuse dynamic persuasion profiles and (b) strengthen the results broughtforward in the previous chapters that personalized persuasion indeedincreases compliance.
8.5.1 Meta-Analysis: Personalization vs. Random SelectionThe result of a direct comparison between a personalized persuasivesystem and system that uses a random selection of implementations ofinfluence strategies is not as clear as the comparison of personalizedpersuasion with not using influence strategies at all. The comparisonbetween personalization and random selection was only powerfully madein Study 2 of this chapter and Study 3 of Chapter 7. In both of thesestudies the estimates of the success of the personalized condition overtime were higher than those of the random condition. These differenceswere however not (or only marginally) statistically significant.
Given the similarity of the results obtained in these two studiesthat compare the effectiveness of random message presentation overtime with personalized messaging over time it is however possible tocombine the data obtained in both studies to perform a meta-analysis.

167
Figure 8.9 shows a forest plot indicating the effect size of the com-parison between the random and the personalized conditions over time(using unstandardized model coefficients) and the outcomes of the es-timated meta-analysis model. For this comparison the most importantdependent variables of each of the two studies are used: the estimatedreduction in snacking consumption is used from Study 3 of Chapter 7,and the change in estimated success rate of the email reminders is usedfrom Study 2 of this chapter. For both studies the coefficient whichindicated the change in the effectiveness of each subsequent persuasivemessage is used in the analysis.
The meta-analysis shows a small but statistically significant differ-ence between the two different ways of selecting influence strategies,z = 2.08, p < .056. Even though the method of personalizing differs be-tween the two studies—in Study 3 of Chapter 7 the personalization wasbased on meta-judgmental measures while in Study 2 of this chapteroperative measures were used—the results of the meta analysis show adifference in the effectiveness of personalized persuasion as compared torandom message selection. This latter analysis, combined with the factthat the estimated effects of personalized persuasion are large enoughto be of practical importance, justifies further studies into the effectsof personalized persuasion, as well as the use of (adaptive) personalizedpersuasion in practice.
FE Model
-0.1 -0.01 0.08 0.18 0.27
Observed Outcome
Study 2
Study 1
0.03 [ 0.00 , 0.06 ]
0.08 [ -0.05 , 0.22 ]
0.03 [ 0.00 , 0.06 ]
Figure 8.9: Forest plot of the meta-analysis using a fixed effectmodel of the two studies comparing adaptive and ran-dom strategy selection.
6The meta-analysis was done using the [R] metafor package. A fixed effectsmeta-analysis model was estimated using the model coefficients reported earlier.

168
8.5.2 Closing remarksThe three designs presented in this case study chapter, contrary to thestudies presented in Chapter 7, used operative measures of susceptibil-ity to persuasion to dynamically derive persuasion profiles. The twomethods of profiling presented in Chapter 7 and Chapter 8 are how-ever easily combined: Meta-judgmental measures of susceptibility asobtained using the STPS can be used as a starting point for a dynamicprofile, instead of using the average response to a distinct strategy asdone in the designs presented in the current chapter. Meta-judgmentalmeasures can thus be used to (partly) overcome the cold-start problemthat many learning algorithms face (Lam et al., 2008), while dynamicadaptation can overcome changes in user’s responses to social influencestrategies due to time, context, or a suboptimal self-assessment 7.
7This chapter is (partly) based on earlier publication(s): (Kaptein, 2011b; Sakaiet al., 2011; Kaptein, 2011a; Kaptein and van Halteren, 2012).

9Reflections
9.1 Advancing the Design of Persuasive TechnologiesThis thesis advances the persuasive technology field by examining waysin which persuasive technologies can personalize their persuasive at-tempts to gain compliance. The persuasive technology field consistsof a mixture between technology and social science: primarily findingsfrom social science have been used to create and design technology me-diated or initiated interventions. The work in this thesis first adds toour understanding of human decision making as influenced by the us-age of social influence strategies, and second uses this understandingto design and evaluate several persuasive applications. In doing so thethesis opens up a new design space: that of personalized persuasivetechnologies.
The three insight generation chapters (Chapters 3, 4 & 5) in thisthesis first of all replicate the effects of influence strategies on humandecision making on average: on average people’s evaluations of productswere positively influenced by implementations of social influence strate-gies, participants were more likely to change their own opinions, andclick-through on advertisements was improved. However, these insightgeneration chapters also make clear that these average effects are onlya part of the story, and perhaps a relatively uninteresting part: the dif-
169

170
ferences between people in their responses to social influence strategiesare far larger than the similarities, up to a level where a strategy suchas authority can consistently, over time and context, have a negativeeffect on over one third of the people. Chapter 3 clearly showed thatattending to these effects is more beneficial to predict behavior thanattending to the average effects.
From this understanding, questions about measurement of these“susceptibilities” of individuals to distinct influence strategies, and theeffects of possible combinations of multiple influence strategies, natu-rally arise. The answers to the latter question are presented in Chapter4: combinations of multiple influence strategies lead to compliance (onaverage) that is as low as the worst strategy in the context of study.Chapter 5 shows that susceptibilities to influence strategies can be mea-sured a priori: meta-judgmental measures of susceptibility obtained us-ing questionnaires aid in our understanding and prediction of people’sresponses to social influence strategies. These three insight generationchapters together stress the importance of attending to individual dif-ferences in responses to social influence strategies and are exemplar forthe estimation of these differences: the multilevel models presented inChapter 3 enable quantitative comparison of the average effects withthe individual level effects.
The results presented in the insight generation chapters should in-spire technologists to create personalized persuasive technologies. In-fluence strategies prove valuable to do so. People’s susceptibilities todistinct strategies differ, and these differences are large enough to mo-tivate personalization. Also, the differences can be measured and canthus be attended to. These conclusions lead to the development of per-suasion profiles: Individual level collections of estimates of the successof distinct social influence strategies (and the certainty around theseestimates). Persuasion profiles are thus estimates of the Strategy ×Individual effects.
Theorists and practitioners have—and rightfully so—also identifiedStrategy × Context and Strategy × Product effects (see, e.g. Payan andMcFarland, 2005; Midden et al., 2008). Thus, the persuasive strategythat is most effective does not only depend on the individual, but alsoon the context and the behavior change goal at hand (This is also clearin Study 2, Chapter 4). However, this poses no threat for the validityand practical usefulness of persuasion profiles: as long as the Strategy× Individual effects are larger than three way Strategy × Individual ×Context (or product or . . . ) effects then these average effects can easily

171
be controlled for. Specifically, a persuasion profile can be recomputed ineach new context to take Strategy × Context effects into account. Thenewly obtained profile can guide strategy selection in the new context.One of the goals of persuasion research should be to estimate the sizesof these different (interaction) effects and compare these to each other.
Chapter 6 describes two distinct ways of creating a persuasion pro-file: one based on meta-judgmental measures and one based on oper-ative measures. Historically meta-judgmental measures of individualshave been easier to obtain and as such have been the major tool of socialscientists studying individual differences. In line with this tradition theSTPS (See Chapter 5) was presented to obtain measurements of indi-vidual level susceptibility to social influence strategies. However, thanksto the advances in interactive technologies, measurement of behavior isalso within reach of social scientists. This enables usage of operativemeasures: measures of the effects of stimuli based on the process beingin-play instead of being reflected on. Both sources of information arevaluable to start and update a persuasion profile.
The two case study chapters address these two sources of informa-tion about people’s susceptibilities separately: Chapter 7 presents theevaluations of several health related social influence technologies thatare personalized based on meta-judgmental measures, while Chapter 8extends this work by showing examples of dynamic personalized per-suasive technologies based on operative measures. A combination ofthe two is straightforward and should be attended to in the future. InChapter 7 the average effects of choosing the “wrong” influence strategyfor distinct individuals are also shown: Persuasive attempts can have anoverall negative effect if the wrong strategies are deliberately selected.This highlights the importance of personalized persuasion in an appliedsetting.
The three persuasive systems presented in Chapter 8 are more ad-vanced, and should mark the area of persuasive technologies to come.Via identification, representation, and effect measurement designers canbuild adaptive personalized persuasive technologies in ambient intel-ligence. These systems are not only more effective than their non-adaptive or non-personalized counterparts, they also provide opportu-nities to study human behavior that have hitherto been unimaginable.The effects of social influence strategies can, due to technology whichunobtrusively measures behavioral outcomes, be estimated over timeand within individuals. This combination of adaptation and measure-ment is the core of the contribution of this thesis to the persuasive

172
technology field.
9.2 The Possible Future(s) of Persuasion ProfilesThis thesis presents Persuasion Profiles as a means of personalizingpersuasive technologies. Persuasion profiles are collections of estimatesof the effect of distinct social influence strategies (over implementations)for individuals. By also including the certainty around these estimates,persuasion profiles can be used to select social influence strategies totarget individuals while optimizing the explore vs. exploit trade-off(Scott, 2010). Persuasion profiles seem relatively stable over time—they describe people’s susceptibilities as a trait—and are possibly alsouseful for selecting social influence strategies across contexts.
Persuasion profiles can be built using meta-judgmental measures,operative measures, or a combination of both. As suggested in Chap-ter 6 meta-judgmental measures can function as a starting point fora persuasion profile, while operative measures can be used to updatethe estimates and their associated certainty in later stages. While theprofiles presented in Chapter 7 and 8 were relatively simple—e.g. so-cial influence strategies were modeled independently of each other—itis possible to include correlations between strategies, average Strategy× Context effects, or more traditional marketing variables such as de-mographics and personality into the estimation process. Each of thesevariables is likely to improve the accuracy of the estimated effects of so-cial influence strategies. Consequently, including these variables mightimprove the effectiveness of persuasive systems whether they focus onhealth behaviors, education, marketing or any of the other applicationareas of persuasive technologies.
In this thesis persuasion profiles have been built based on the socialinfluence strategy taxonomy proposed by Cialdini (2001). This taxon-omy provides a starting point for the classification of different influenceattempts, as well as for the creation of different implementations of in-fluence strategies. Cialdini (2001)’s taxonomy however is not the onlyone that is of possible use to design adaptive persuasive systems. Es-timates of the number of social influence strategies range from four toover a hundred (see: Rhoads, 2007) and different granularities are prob-ably useful in different domains. It is however not necessary to settle ona definite taxonomy to enable wide-scale usage of persuasion profiles:operative measures and their correlations can be used to distinguishamongst implementations and strategies. Likely, it will be beneficial

173
to start with a sufficiently useful taxonomy, such as the one adaptedin this thesis, while enabling profiles to contain more (or less) strate-gies based on distinctions that prove effective. Thus, data collected tobuild persuasion profiles should distinguish between strategies and theirimplementations. Next, adaptive persuasive systems should be flexibleenough to identify clusters of implementations which subsequently canlead to the discovery of new strategies1.
Given an accurate persuasion profile it is useful to envision the fu-ture use of such a profile. Like any profile that is already created byinteractive technologies persuasion profiles could potentially be sharedacross systems and services, be combined with other profiles, and bedisclosed to their users. The next sections describe each of these inmore detail.
9.2.1 SharingImagine the following scenario 2:
“Eleven-year-old Joey has resisted following his doctor’s weight-loss plan—skipping his daily bike ride to play video games, trading hishealthy lunches for soft drinks, and sneaking snacks at night. His dad,Martin, is frustrated. Joey seems frustrated too. Concerned about somerecent bullying, Martin goes online to check the parental-control settingson his son’s social network account. He then sees something he’s nevernoticed before: Joey’s persuasion profile. During his extensive useof the site, Joey has been shown countless ads for products, games,and other websites. Each time the persuasion profile recorded Joey’sresponse: Did he click the ad? Did he play the game? Reading on,Martin learns that Joey rarely acts on recommendations from expertsor celebrities but likes what his peers like and does what his peers do.Martin thinks, “I wonder if we could use that to help Joey.” He findsan online weight-loss program that helps kids motivate each other bysharing their successes.”
In this scenario, the knowledge gained about Joey in the context ofhis social network service is used by his dad to personalize persuasionin a health related setting. Obviously, this type of sharing of persua-
1It has to be noted that taxonomies that are of large granularity (e.g. are com-posed of a large number of strategies) will in practice require more observations tocreate a persuasion profile.
2This scenario is taken from (Kaptein et al., 2011c).

174
sion profiles is not limited to human interventions: Technologies couldactively leverage persuasion profiles built up in one context (e.g. peo-ple’s responses to social influence strategies in online marketing) and usethese in another context, such as the emerging health related persuasivetechnologies. If the Individual × Strategy ×Context effects are smallcompared to the Individual × Strategy effect, this will lead to highersuccess rates of influence attempts by “borrowing strength” from esti-mates obtained in the other context. Higher success rates of influenceattempts due to sharing of persuasion profiles are of value to designersof persuasive systems, and as such persuasion profiles can become partof the marketing currency of the future (Kaptein et al., 2011c). Oncea single specification for the representation of a persuasion profiles hasbeen established—be it as simple as a JSON standard—sharing, andtrading of profiles is within our near future.
Shared persuasion profiles can however not merely be used for good:While most persuasive technology researchers seem to agree that im-proving the effectiveness of a weight-loss program is a noble cause, otherpurposes are well imaginable. Having learned, on a social network site,that a specific individual is more swayed by consensus arguments, a lo-cal political party might decide to personalize the information presentedin their advertising emails. A goal or practice largely deemed less noble.These possibly detrimental effects of sharing persuasion profiles shouldactively be considered.
9.2.2 Combinations with other profilesPersuasion profiles concern the means—the “ways” in which—peopleare influenced to comply to a request. Most notable personalizationefforts up to now have however focused primarily on the end goals:recommender systems like those used by Amazon.com and heavily re-searched by computer science researchers select the appropriate productto endorse to individuals (end) without systematically varying or adapt-ing the way in which a product is presented (means) (Cf. Gretzel andFesenmaier, 2006; Ochi et al., 2010; Zanker et al., 2009).
It is likely that both methods of personalization will be combined inthe future. Recommender systems determine which target behavior orproduct to offer, while persuasion profiles play a role in presenting thatgoal to people. In this thesis the two have been treated as unrelated,but relationships between ends and means are likely. Thus, both profileswould benefit from integration.
Next to combinations with end personalization, persuasion profiles

175
are also likely to benefit from combinations with other profiles. Tar-get group profiling, as common in marketing practice, has the distinctbenefit of being able to generalize knowledge gained over one set of in-dividuals to other, unknown, sets. For example, if no women has everbought product A, one could decide to refrain from offering productA to new female clients even if no other knowledge about their previ-ous decision making is available. In a similar fashion susceptibilities tosocial influence strategies are likely correlated with gender, age, occu-pation, etc. etc. It is thus most likely beneficial for the effectiveness ofinfluence attempts to combine these target group profiles with persua-sion profiles to obtain more accurate estimates, especially of new usersof a persuasive system.
Finally, persuasion profiles can also be compared to other effortsof tailoring persuasion. Computer-tailored health education (see, e.g.de Vries and Brug, 1999; Brug et al., 2003) is an example of anotherapproach to personalizing persuasion. In this approach often both ends— e.g. what is a realistic health goal for the current individual — aswell as means — e.g. in what way should the information be presented— are tailored. This tailoring is largely done in the following fashion:psychological theory is explored to determine the theoretical constructsthat might be useful for tailoring (such as people’s stage of change, orpeople’s NfC). Next, experts create rules for selecting different contentbased on different values of the theoretical constructs of interest (Dijk-stra and De Vries, 1999; Kreuter, 2000). Persuasion profiles, while morelimited in scope than full breath computer-tailored interventions allowfor a selection of influence strategies — means — based on the measure-ment of user responses to persuasion as opposed to expert judgments.However, both approaches could be combined: expert determined rulescould influence the probability of content selection a priori, while dy-namic adaptation could be used to update these probabilities.
9.2.3 DisclosureNext to sharing persuasion profiles, and combining them with otherexisting profiles, there is an opportunity to disclose persuasion profilesto individuals. A first attempt to examine the effects of this disclosurewas made in Chapter 4, Study 1, in this thesis. The current practice ofprofiling and filtering, of which persuasion profiles are merely one exam-ple, that is more and more an integral part of interactive technologiesis bound to have its effects on individuals and on society as a whole.Authors like Pariser (2011) persuasively describe the possible detrimen-
176
tal effects of personalization and as such the ways in which researchers,designers, and practitioners deal with individual level profiles should bea part of active consideration.
It is however in no way necessary for persuasion profiles or otherprofiles to remain undisclosed to users. Design efforts can make profilesgraphically inspect-able, editable, or removable by users. These actionsallow users to gain control over the filtered world that is more and morea part of their every day lives.
Persuasion profiles, contrary to many of the other profiles collectedfor personalization, have a distinct property that makes their disclosureeven more useful for users. Most end-oriented profiles, such as thosestored by recommendation engines, provide little knowledge to the userthat he or she was not already aware of (Awad and Krishnan, 2006;Goy et al., 2007). Persuasion profiles however likely collect and storeinformation that is not part of the conscious deliberation of users. Thisthought is supported by the lack of predictive power of meta-judgmentalmeasures over operative measures. Apparently people respond consis-tently to social influence strategies, in ways they have difficulties withpredicting themselves. Thus, disclosure of this type of knowledge canbe meaningful for users.
The actual ways of disclosing persuasion profiles needs future at-tention. Study 1 of Chapter 4 showed the possible negative effects oncompliance of disclosure of persuasive intent. This would inhibit de-signers of persuasive systems to disclose persuasion profiles. However,the active selection of social influence strategies by users had beneficialeffects on compliance. This implies that designers could actively involveusers in the creation and maintenance of their own persuasion profiles.This is an opportunity that should be explored further.
9.3 Ethical ConsiderationsAccording to Berdichevsky and Neuenschwander (1999) “persuadershave long stood on uneasy ethical grounds”. From the more recent be-ginning of the study of interactive persuasive technologies researchersand practitioners have questioned the ethics of developing and deploy-ing of persuasive systems. Several attempts to develop frameworks orprinciples for the ethical evaluation of persuasive systems have been un-dertaken (e.g., Berdichevsky and Neuenschwander, 1999; Fogg, 2002).Obviously, personalization, or the use of persuasion profiles, is by nomeans an exception to the standard unease associated with persuasive

177
technologies or persuaders in a broad sense.Theorists have tried to guide designers of persuasive technologies
in their quest to design ethically sound systems. Berdichevsky andNeuenschwander (1999) present a decision tree for ethical evaluation ofpersuasive technologies and the moral responsibility of system design-ers. This decision tree identifies how intent, predictability of outcomes,and ethical judgment interact to determine the proposed judgement andresponse to the system designers. According to this decision tree, thesystem designer is (a) praiseworthy if the outcome is intended and good;(b) not responsible if the outcome is unintended and not reasonably pre-dictable, or if the outcome is reasonably predictable and good but notintended; and (c) otherwise at fault and blameworthy. Berdichevskyand Neuenschwander (1999) additionally offer eight principles that theyregard as heuristics that could be justified within rule-based consequen-tialism.
While useful for designers, this typology, including the heuristics,does not tackle properly the origin of “unease” associated with persua-sion and the design of persuasive systems. The decision tree focussesprimarily on the goal of the persuasive attempt but does not questionthe process of persuasion in itself. Given that personalized persuasionthrough persuasion profiles is an extension of the persuasion process,irrespective of its goals, the ethical discussion of persuasion profilesshould be separated from the discussion of goals or predictability ofunwanted outcomes. Even though these are often related, and thus allan integral part of most frameworks on the ethics of persuasive tech-nologies, there are two distinct mechanisms through which persuasioncan be deemed ethical or unethical irrespective of the end goal. Theseconcern the impact personalization of persuasion has on people’s pri-vacy and autonomy, according to Haworth (1991) the core concepts bywhich to evaluate the ethics of new technologies.
9.3.1 Impact on PrivacyA large number of scholars in different fields have theorized about pri-vacy and threats to privacy in their respective fields (Burgoon et al.,1989; Altman, 1976; Leino-Kilpi et al., 2001). These discussions areoften inspired by the initial meaning of privacy as it derives from theLatin word “privatus” which means “to deprive” (Leino-Kilpi et al.,2001). Hence, privacy is often regarded “the ability of a person towithdraw (parts of) their personal information from the outside world”(Rawnsley, 1980). People deem objects, or thoughts, private which they

178
do not wish to share others with openly. A persuasion profile, and thusa collection of estimates of the success of influence strategies for a dis-tinct individual, will by many be regarded as private. Thus, publicsharing of such a profile—without control or consent—would be con-sidered a violation to their privacy. This property however is shared atlarge with other profiles created about people by their use of interactivetechnologies.
The privacy of digital profiles has received considerable attention inthe public debate. Profiles like those kept by social networking sitesare on one hand by the general public regarded private, while on theother hand much of the information in these profiles is publicly avail-able without a means for individuals to control the distribution of thisinformation. In this sense persuasion profiles do not provide a novelthreat to privacy but rather should be subject to privacy regulationsthat apply to other profiles. Largely, regulators are converging to regu-lations which empower users to a degree in which users have to consentprofiles being created, users can inspect and delete their profiles, andusers have the possibility to stop or limit sharing of their profile. Thesekind of regulations now apply to low level profiles—such as behavioraltargeting information stored in session cookies—as well as elaborateuser profiles on social network sites (Cf. Stallworth, 2010).
Designers of ubiquitous computing applications have also activelyconsidered privacy and the privacy concerns of their users (see e.g.:Iachello, 2005). These attempts mainly focus on providing guidance fordesigners of ubiquitous technologies. Iachello (2005) introduces “theprinciple of proportionality” which enables designers to make decisionsconcerning privacy by balancing the usefulness of an application withits impact on privacy. It seems however that such a framework is insuf-ficient to properly evaluate persuasion profiles: while the usefulness of apersuasion profile for a health intervention might be high and thus pri-vacy concerns can be partly discounted, that same profile can be of usein other persuasive communications which the user does not find usefulat all. The latter would logically lead a designer to impose heavy con-straints on the ability of a system to collect and store personal data. Toproperly evaluate persuasion profiles, and other technologies that storeprivate information which can be used across applications and technolo-gies, new frameworks are needed.
For the time being, the ethical impact of persuasion profiling has tobe evaluated with regard to imposing distinct threats to privacy whichhad not otherwise been imposed by other technologies or applications.

179
Given the large similarity of persuasion profiles to other types of profilesstored by interactive systems it seems that persuasion profiles are nota novel threat to privacy. The existing threat(s) however should beregulated, and persuasion profiling should be made compliant with suchregulations.
9.3.2 Impact on AutonomyAutonomy refers to people’s ability to make rational and un-coercedchoices and decisions. While heated debate is still ongoing as to whetherthere exists any level of autonomy (see, e.g. Ryan and Deci, 2006; Wal-ter, 2001), there is a consensus amongst the general public that by andlarge choices and decisions are made by free will. As a consequence, atleast in the western world, personal responsibility is attributed to suchdecisions with the accompanying praise or punishment.
The empirical studies of the effects of social influence strategies how-ever show that decisions are often impacted by social influence strategieswhich seem to function on the border of conscious awareness (cf. Ol-son and Fazio, 2002). Thus, these types of choices might not be (fully)suspect to free will. Increasing awareness to social influence strategies,and thus elaboration and the ability to make a rational choice, oftenchanges the effect of influence strategies (Petty and Cacioppo, 2001;Booth-Butterfield and Welbourne, 2002; Tormala and Petty, 2004). Ifthe use of social influence strategies is made salient, decisions seem tocome from a higher level of autonomy provided that indeed unconsciouseffects on decisions are largely perceived as threats to autonomy. Fromthis perspective persuasion profiles that are used but not disclosed tousers would pose a direct threat to the autonomy of individuals.
However, once a persuasion profile that has been created based onoperative measures—as opposed to meta-judgmental measures whichquery those susceptibilities that are clearly conscious to people—is dis-closed to users, the profile may very well increase autonomy. By ed-ucating people about their own decision processes people can evaluatewhether they perceive their responses to distinct social influence strate-gies as rational and preferable. If this is not the case then a disclosedpersuasion profile could aid as a prime to make the effects of socialinfluence strategies on decision making more salient and as such bringthem into the space of conscious elaboration. Via this route persua-sion profiling could, opposed to many other types of profiles which arelargely within conscious awareness, enhance autonomy.

180
9.3.3 Reflections on EthicsTo conclude, personalized persuasion itself, when evaluated based onprivacy and autonomy concerns, is not necessarily unethical. How-ever, the ends to which it is brought to bear could very well be, inwhich case designers are, to quote (Berdichevsky and Neuenschwan-der, 1999), “at fault”. Considered in isolation personalized persuasion,and the associated persuasion profiles, do not extend threats to privacybeyond current profiling practices and thus similar regulations shouldapply. Persuasion profiles however, opposed to most other profiles havethe potential to increase human autonomy via education and insightinto ones own behavior. As such when brought to bear for good ends,complying to privacy regulations, disclosed persuasion profiles are notethically “uneasy”.
Next to threats to privacy and autonomy as primary criteria to eval-uate the ethical impact of persuasion profiles one could also approachthe discussion from a different stance. Persuasion itself currently is apart of everyday life: it is (e.g.) the primary tool of parents and educa-tors. As such, the act itself seems to be acceptable. However the factthat persuasion profiles are technology initiated instead of human ini-tiated might raise additional concerns: The technology does not havea “moral compass” to judge its own intends by. Furthermore, tech-nologies are different from human persuaders in their ability to store,remember, and share information. These considerations are importantand should be in the mindset of both researchers and designers workingon persuasive technologies whether they employ persuasion profiling ornot.
9.4 Future Research ChallengesThis thesis presented a new view on the study of social influence strate-gies and their usage in persuasive technologies. The thesis showed thatthe heterogeneity in responses to social influence strategies is far largerthan their average effect, and demonstrated several applications of thisprinciple to influence human behavior. The technologies created to ad-dress this heterogeneity, adaptive persuasive systems, also inspire to newquestions about human behavior and decision making as a function ofsocial influence strategies. Questions which, through the application ofmultilevel models to estimate individual level effects as well as the de-ployment of ubiquitous sensing technologies to measure user behavior,can hopefully be answered in the future. Adaptive persuasive technolo-

181
gies can be a tool for further psychological research and should addressthe effects of social influence strategies at an individual level and overtime. Furthermore, the focus on quantification of effects brought aboutin Chapter 8 warrants further research attention: Researchers both insocial sciences as well as persuasive technology should attend more tothe size and importance of the effects found in their evaluations as op-posed to the mere existence of an effect.
9.4.1 Persuasion at an individual levelBy and large researchers of influence strategies, persuasion, and per-suasive technologies have focussed on average effects of the one termuse of a persuasive intervention or manipulation. This thesis shows theimportance of attending to the individual level effects, rather than theaverage level effects, which can be very different.
The difference between the average level effects and the individuallevel effects of social influence strategies and other psychological phe-nomena warrants future research for two reasons: From an applied per-spective, technologies or interventions should deliver on their promiseto change behavior of their users, not of other users on average. Withits focus areas outside of marketing persuasive technologies frequentlyare designed to influence individuals. These individuals use the persua-sive system to change their own attitudes or behavior and as such thisis what the systems should be designed for. Now that technology hasadvanced to a level where designers can address individual users theirindividual behavior becomes important.
More theoretically important however is the progression and build-ing of theories in social science. Many theories describe how individualsrespond to stimuli, based on average effects of groups responding tothese stimuli. Such an average can—and with sufficient sample sizewill—be statistically significant even though the estimated average ef-fect might not occur for any of the individuals studied. Any individual-level theory that builds on empirical evidence of averages is thus likelyat fault when large heterogeneity is present. Researchers need to un-derstand what causes differences between people and consistency withinpeople, rather than explaining artificial consistencies between people bypostulating individual level processes.
Good examples of studies or theories about individuals and theiraverage effects do already exist: Dynamic Social Impact theory as pro-posed by (Latané and Bourgeois, 1996) proposes a mechanism throughwhich individual attitudes are formed which in turn, when modeled as

182
a group, leads to observable average level effects. Researchers shouldattend to the size of individual level effects versus average effects, definetheories at the appropriate level, and through simulation and empiricalstudies show the link between the two.
9.4.2 Persuasion over timeSystems such as those presented in Chapter 8 enable monitoring of re-sponses to social influence strategies by individuals over time. Up tillnow most studies into the effects of persuasion have concerned singlepoints in time, or single interventions, in which pre- and post measures(or control and treatment groups) are compared. However persuasivesystems are largely built not to promote a single behavior at a singleinstant but rather to change prolonged behavior and even lifestyle oftheir users. It is not very likely that influence strategies that are ef-fective at one point in time remain effective throughout, and perhapsknowledge of conditioning and reinforcement schedules becomes moreimportant when trying to sustain a behavior that was initially elicitedusing social influence strategies. Given that persuasive systems aim toelicit some kind of change in their users designers should understandhow their systems influence users and how subsequently the “changed”user will respond to upcoming interactions with the system.
Future research should thus focus on the dynamics of attitude andbehavior change within individuals over time. Already theorists areconcerned with such questions, as evidenced by the recent work of Fogg(2010). However, without the involvement of sensing technologies it ishard to estimate effects over time. Adaptive persuasive systems, withidentification, representation, and effect measurement, provide a plat-form to study the effects of prolonged influence efforts and to examinethe dynamics of long term behavioral change. Due to technology, forthe first time, human behavior can now be systematically studied overlong periods of time. This type of “technology enabled research” isemerging within social psychology (see e.g. Killingsworth and Gilbert,2010)) and is likely the area in which persuasion and social influenceresearch can flourish in the future.
9.4.3 Effect size and OomphThe last future direction that hopefully becomes more prominent inthe future is more methodological in nature and is a change that hasbeen suggested by scholars in the fields of psychology (Rouder et al.,2009; Siegfried, 2010), sociology, and economics (Ziliak, 2008): a focus

183
on effect size and real-world importance (Oomph) as opposed to withinsample fit and statistical significance. The studies presented in Chapter3 enabled estimation and comparison of sizes of effects as opposed tothe mere proof of a non-null effect. In these studies the effect sizeswere the reason to focus on individual level effects rather than averageeffects.
Effect size and Oomph reappeared several times in this thesis, no-ticeably in Chapter 7 and Chapter 8. While in these studies the es-timated parameter were not always statistically different from 0, theimportance of adaptive persuasion was mainly motivated by the impacton business: More people stayed in the DirectLife program and conver-sion rates in an online affiliate store rose. Here, noisy effects—whicheffects in social science are bound to be in a out-of-laboratory setting—can be extremely meaningful even if they do not “reach” statisticalsignificance.
Only a study of effects, and their quantitative implications, candecide which statistically significant findings scientist should attend toand base theories on. And, on the flip side, quantitative implicationsand Oomph could also drive scientist to attend to non-significant effects.This critical evaluation of quantities, versus the qualitative notion of theexistence of an effect, should be more prominent in all social science andhuman technology research—this thesis provides some examples3.
3This chapter is (partly) based on earlier publication(s): (Kaptein et al., 2011c;Kaptein and Eckles, 2010).

Bibliography
Aarts, E. (2010). Ambient Intelligence. The invisible future the seamlessintegration of technology into everyday life, 5355(5):317–320.
Aarts, E. and Ruyter, B. D. (2009). New research perspectives on Ambi-ent Intelligence. Journal of Ambient Intelligence and Smart Environments,1(1):5–14.
Aarts, E. H. L., Markopoulos, P., and Ruyter, B. E. R. (2007). The Persua-siveness of Ambient Intelligence. In Petkovic, M. and Jonker, W., editors,Security, Privacy and Trust in Modern Data Management. Springer.
Ades, P. A. (2001). Cardiac rehabilitation and secondary prevention of coro-nary heart disease. The New England Journal of Medicine, 345(12):892–902.
Ainsworth, B. E., Haskell, W. L., Whitt, M. C., Irwin, M. L., Swartz, A. M.,Strath, S. J., O’Brien, W. L., Bassett, D. R., Schmitz, K. H., Emplaincourt,P. O., Jacobs, D. R., and Leon, A. S. (2000). Compendium of physicalactivities: an update of activity codes and MET intensities. Medicine &Science in Sports & Exercise, 32(9 Suppl):S498–504.
Ajzen, I. and Fishbein, M. (1980). Understanding attitudes and predictingsocial behavior. Englewood Cliffs, NJ: Prentice-Hall.
Aleamoni, L. M. and Thomas, G. S. (1980). Differential Relationships of Stu-dent, Instructor, and Course Characteristics to General and Specific ItemsOn a Course Evaluation Questionnaire. Teaching of Psychology, 7(4):233–235.
Altman, I. (1976). Privacy: a conceptual analysis. Environment And Behavior,8(1):7–29.
Amit, R. and Zott, C. (2001). Value creation in E-business. Strategic Man-agement Journal, 22(6-7):493–520.
Arteaga, S. M., Kudeki, M., and Woodworth, A. (2009). Combating obesitytrends in teenagers through persuasive mobile technology. ACM SIGAC-CESS Accessibility and Computing, 94(94):17–25.
Asch, S. E. (1955). Opinions and Social Pressure. Scientific American,193(5):31–35.
185

186 Bibliography
Asch, S. E. (1956). Studies of independence and conformity: A minority ofone against a unanimous majority. Psychological Monographs, 70(9):1–70.
Awad, N. F. and Krishnan, M. S. (2006). The personalization privacy paradox:an empirical evaluation of information transparency and the willingness tobe profiled online for personalization. MIS Quarterly, 30(1):13–28.
Baayen, R. H., Davidson, D. J., and Bates, D. M. (2008). Mixed-effects model-ing with crossed random effects for subjects and items. Journal of Memoryand Language, 59(4):390–412.
Bang, M., Torstensson, C., and Katzeff, C. (2006). The PowerHouse : A Per-suasive Computer Game Designed to Raise Awareness of Domestic EnergyConsumption. Persuasive Technology, 3962(3962):123–132.
Bargh, J. A., Chaiken, S., Raymond, P., and Hymes, C. (1996). The Au-tomatic Evaluation Effect: Unconditional Automatic Attitude Activationwith a Pronunciation Task. Journal of Experimental Social Psychology,32(1):104–128.
Barry, B. and Shapiro, D. L. (1992). Influence Tactics in Combination: TheInteractive Effects of Soft Versus Hard Tactics and Rational Exchange. Jour-nal of Applied Social Psychology, 22(18):1429–1441.
Bassili, J. N. (1996). Meta-judgmental versus operative indexes of psycho-logical attributes: The case of measures of attitude strength. Journal ofPersonality and Social Psychology, 71(4):637–653.
Berdichevsky, D. and Neuenschwander, E. (1999). Toward an ethics of per-suasive technology. Communications of the ACM, 42(5):51–58.
Blass, T. (1991). Understanding behavior in the Milgram obedience experi-ment: The role of personality, situations, and their interactions. Journal ofPersonality and Social Psychology, 60(3):398–413.
Bless, H., Bohner, G., Schwarz, N., and Strack, F. (1990). Mood and Persua-sion. Personality and Social Psychology Bulletin, 16(2):331–345.
Booth-Butterfield, S. and Welbourne, J. (2002). The Elaboration LikelihoodModel: Its Impact on Persuasion Theory and Research. In Dillard, J. P. andPfau, M. W., editors, The Persuasion Handbook Developments in Theoryand Practice, pages 195–211. Sage.
Bosworth, K., Gustafson, D. H., Hawkins, R. P., Chewning, B., and Day, T.(1983). Adolescents, health education, and computers: the Body AwarenessResource Network (BARN). Health Education, 14(6):58–60.

Bibliography 187
Bowling, A. (2005). Mode of questionnaire administration can have serious ef-fects on data quality. Journal of public health (Oxford, England), 27(3):281–91.
Breckler, S. J. (1994). A Comparison of Numerical Indexes for Measuring Atti-tude Ambivalence. Educational and Psychological Measurement, 54(2):350–365.
Brehm, J. W. (1966). A theory of psychological reactance. Academic Press.
Brock, T. C. (1968). Implications of Commodity Theory for Value Change. InGreenwald, A. G., Brock, T. C., and Ostrom, T. M., editors, PsychologicalFoundations of Attitudes, pages 243–275. Academic Press, New York.
Brug, J. (1999). Computer-tailored nutrition education: differences betweentwo interventions. Health Education Research, 14(2):249–256.
Brug, J., Campbell, M., and van Assema, P. (1999). The application andimpact of computer-generated personalized nutrition education: A reviewof the literature. Patient Education and Counseling, 36(2):145–156.
Brug, J., Glanz, K., Van Assema, P., Kok, G., and van Breukelen, G. J. P.(1998). The Impact of Computer-Tailored Feedback and Iterative Feed-back on Fat, Fruit, and Vegetable Intake. Health Education & Behavior,25(4):517–531.
Brug, J., Hospers, H. J., and Kok, G. (1997). Differences in psychosocial factorsand fat consumption between stages of change for fat reduction. Psychologyand Health, 12(5):719–727.
Brug, J., Oenema, A., and Campbell, M. (2003). Past, present, and future ofcomputer-tailored nutrition education. American Journal of Clinical Nutri-tion, 77((suppl)):1028–1034.
Bubb, J. A. (2007). Weight Loss Persuasive Technology and Eating Disorder.PhD thesis, University of North Carolina at Chapel Hill.
Burger, J. M. (1999). The Foot-in-the-Door Compliance Procedure: AMultiple-Process Analysis and Review. Personality and Social PsychologyReview, 3(4):303–325.
Burger, J. M., Messian, N., Patel, S., Del Prado, A., and Anderson, C. (2004).What a coincidence! The effects of incidental similarity on compliance.Personality and Social Psychology Bulletin, 30(1):35–43.
Burgoon, J. K., Parrott, R., Le Poire, B. A., Kelley, D. L., Walther, J. B., andPerry, D. (1989). Maintaining and Restoring Privacy through Communi-cation in Different Types of Relationships. Journal of Social and PersonalRelationships, 6(2):131–158.
188 Bibliography
Cacioppo, J. T. and Berntson, G. G. (1994). Relationship between attitudesand evaluative space: A critical review, with emphasis on the separabilityof positive and negative substrates. Psychological Bulletin, 115(3):401–423.
Cacioppo, J. T. and Petty, R. E. (1982). The need for Cognition. Journal ofPersonality and Social Psychology.
Cacioppo, J. T., Petty, R. E., Feinstein, J. A., and Jarvis, W. B. G. (1996).Dispositional differences in cognitive motivation: The life and times of in-dividuals varying in need for cognition. Psychological Bulletin, 119(2):197–253.
Cacioppo, J. T., Petty, R. E., Kao, C. F., and Rodriguez, R. (1986). Centraland peripheral routes to persuasion: An individual difference perspective.Journal of Personality and Social Psychology, 51(5):1032–1043.
Campbell, M. K., Bernhardt, J. M., Waldmiller, M., Jackson, B., Potenziani,D., Weathers, B., and Demissie, S. (1999). Varying the message source incomputer-tailored nutrition education. Patient education and counseling,36(2):157–69.
Caplan, R. (1990). How fingerprints came into use for personal identification.Journal of the American Academy of Dermatology, 23(1):109–114.
Chartrand, T. L. and Bargh, J. A. (1999). The chameleon effect: theperception-behavior link and social interaction. Journal of personality andsocial psychology, 76(6):893–910.
Chartrand, T. L., Maddux, W. W., and Lakin, J. L. (2005). Beyond thePerception-Behavior Link: The Ubiquitous Utility and Motivational Mod-erators of Nonconscious Mimicry. In Hassin, R., Uleman, J. S., and Bargh,J. A., editors, The new unconscious, volume In R. Hass, chapter 13, pages334–361. Oxford University Press.
Chatterjee, S. and Dev, P. (2009). Persuasive Technology, Fourth InternationalConference, PERSUASIVE 2009, Claremont, California, USA, April 26-29,2009. Proceedings. In Chatterjee, S. and Dev, P., editors, PERSUASIVE,volume 350 of ACM International Conference Proceeding Series. ACM.
Chittaro, L. and Zangrando, N. (2010). The Persuasive Power of Virtual Real-ity: Effects of Simulated Human Distress on Attitudes towards Fire Safety.In Ploug, T., Hasle, P., and Oinas-Kukkonen, H., editors, Persuasive Tech-nology, volume 6137, pages 58–69–69. Lecture Notes in Computer Science,Springer Berlin / Heidelberg.
Cialdini, R. (2001). Influence, Science and Practice. Allyn & Bacon, Boston.

Bibliography 189
Cialdini, R. (2004). The science of persuasion. Scientific American Mind,284:76–84.
Cialdini, R. B. (2005). Don’t Throw in the Towel: Use Social Influence Re-search. American Psychological Society Observer, 18(4):33–34.
Cialdini, R. B., Trost, M. R., and Newsom, J. T. (1995). Preference for con-sistency: The development of a valid measure and the discovery of surpris-ing behavioral implications. Journal of Personality and Social Psychology,69:318–328.
Clee, M. A. andWicklund, R. A. (1980). Consumer Behavior and PsychologicalReactance. Journal of Consumer Research, 6(4):389–405.
Consolvo, S., Markle, K., Patrick, K., and Chanasyk, K. (2009). Designing forpersuasion: mobile services for health behavior change. In Proceedings ofthe 4th International Conference on Persuasive Technology, Persuasive ’09,pages 11:1—-11:1, New York, NY, USA. ACM.
Conway, L. G. and Schaller, M. (2005). When authorities’ commands back-fire: attributions about consensus and effects on deviant decision making.Journal of Personality and Social Psychology, 89(3):311–326.
De Anda, D. (2006). Baby Think It Over: evaluation of an infant simula-tion intervention for adolescent pregnancy prevention. Health social work,31(1):26–35.
de Heer, J. and Poiesz, T. (1998). Dynamic characteristics of motivation,ability and opportunity to process commercial information. Advances ofConsumer Research ACR, 25:532–537.
de Vries, H. and Brug, J. (1999). Computer-tailored interventions motivat-ing people to adopt health promoting behaviours: Introduction to a newapproach. Patient Education and Counseling, 36(2):99–105.
Deci, E. L. (1975). Intrinsic motivation, volume 2009 of Perspectives in socialpsychology. Plenum Press.
Deci, E. L., Koestner, R., and Ryan, R. M. (2001). Extrinsic Rewards andIntrinsic Motivation in Education: Reconsidered Once Again. Review ofEducational Research, 71(1):1–27.
Dennett, D. C. (1987). The Intentional Stance, volume 30. MIT Press.
Deutsch, M. and Gerard, H. B. (1955). A study of normative and informationalsocial influences upon individual judgment. Journal of Abnormal and SocialPsychology, 51:629–636.

190 Bibliography
Dijkstra, A. (2005). Working mechanisms of computer-tailored health educa-tion: evidence from smoking cessation. Health education research, 20(5):527–39.
Dijkstra, A. and De Vries, H. (1999). The development of computer-generatedtailored interventions. Patient Education and Counseling, 36(2):193–203.
Efron, B. and Morris, C. (1975). Data Analysis Using {Stein’s} Estimatorand its Generalizations. Journal of the American Statistical Association,70(350):311–319.
Eisend, M. (2008). Explaining The Impact Of Scarcity Appeals In Advertising:The Mediating Role of Perceptions of Susceptibility. Journal of Advertising,37(3):33–40.
Falbe, C. M. and Yukl, G. (2008). Consequences for Managers of Using SingleInfluence Tactics and Combinations of Tactics. The Academy of Manage-ment Journal.
Fazio, R. H. (1993). Variability in the likelihood of automatic attitude activa-tion: data reanalysis and commentary on Bargh, Chaiken, Govender, andPratto (1992). Journal of Personality and Social Psychology, 64(5):753–758;discussion 759–765.
Fazio, R. H. (1995). Attitudes as object-evaluation associations: Determinants,consequences, and correlates of attitude accessibility. In R E Petty andKrosnik, J. A., editors, Attitude strength: Antecedents and consequences,pages 247–282. Erlbaum.
Ferster, C. (1957). Schedules of reinforcement. Prentice-Hall, Englewood CliffsN.J.
Festinger, L. (1954). A Theory of Social Comparison Processes. Human Rela-tions, 7(2):117–140.
Festinger, L. (1957). A Theory of Cognitive Dissonance. Stanford UniversityPress.
Flavell, J. H., Flavell, E. R., Green, F. L., and Korfmacher, J. E. (1990). DoYoung Children Think of Television Images as Pictures or Real Objects ?Media, 34(4):399–419.
Fogg, B. J. (1999). Persuasive technologies: Introduction. Communications ofthe ACM, 42.
Fogg, B. J. (2002). Persuasive Technology: Using Computers to Change WhatWe Think and Do. Morgan Kaufmann.

Bibliography 191
Fogg, B. J. (2009a). A behavior model for persuasive design. Proceedings ofthe 4th International Conference on Persuasive Technology Persuasive 09,page 1.
Fogg, B. J. (2009b). Creating Persuasive Technologies : An Eight-Step DesignProcess. Technology.
Fogg, B. J. (2010). Fogg Behavior Grid. Stanford University, pages 8–10.
Fogg, B. J. and Eckles, D. (2007). Mobile Persuasion: 20 Perspectives on theFuture of Behavior Change. In Fogg, B. J. and Eckles, D., editors, MobilePersuasion, pages 1–166. Stanford Captology Media.
Fogg, B. J. and Nass, C. (1997). How users reciprocate to computers: an exper-iment that demonstrates behavior change. In CHI’97 extended abstracts onHuman factors in computing systems: looking to the future, number March,pages 331–332. ACM.
Franklin, V. L., Greene, A., Waller, A., Greene, S. A., and Pagliari, C. (2008).Patients’s Engagement With “Sweet Talk”: A Text Messaging Support Sys-tem for Young People With Diabetes. Journal of Medical Internet Research.,10:e20.
Froggatt, P. (1969). Questionnaire Design and Attitude Measurement. BritishJournal of Industrial Medicine, 68(3):249.
Fromkin, H. L. (1970). Effects of experimentally aroused feelings of undis-tinctiveness upon valuation of scarce and novel experiences. Journal ofPersonality and Social Psychology, 16(3):521–529.
Fuegen, K. and Brehm, J. W. (2004). The intensity of affect and resistance tosocial influence, pages 39–63. Lawrence Erlbaum.
Gelman, A. (2005). Analysis of Variance: Why It Is More Important thanEver. The Annals of Statistics, 33(1):1–31.
Gelman, A. and Hill, J. (2007). Data Analysis Using Regression and {Multi-level/Hierarchical} Models. Cambridge University Press.
Gerber, B. S., Stolley, M. R., Thompson, A. L., Sharp, L. K., and Fitzgibbon,M. L. (2009). Mobile phone text messaging to promote healthy behaviorsand weight loss maintenance: a feasibility study. Health Informatics Jour-nal, 15(1):17–25.
Goldstein, D. G. and Gigerenzer, G. (2002). Models of ecological rationality:The recognition heuristic. Psychological Review, 109(1):75–90.
192 Bibliography
Goldstein, N. J., Cialdini, R. B., and Griskevicius, V. (2008). A Room witha Viewpoint: Using Social Norms to Motivate Environmental Conservationin Hotels. Journal of Consumer Research, 35(3):472–482.
Gormezano, I., Prokasy, W. F., and Thompson, R. F. (1987). The rabbit inpavlovian conditioning. In Gormezano, I., Prokasy, W. F., and Thompson,R. F., editors, Classical Conditioning, pages 419–432. Laurence ErlbaumAssociates.
Goy, A., Ardissono, L., Petrone, G., Brusilovsky, P., Kobsa, A., and Nejdl,W. (2007). The Adaptive Web, volume 4321 of Lecture Notes in ComputerScience. Springer Berlin Heidelberg, Berlin, Heidelberg.
Grediagin, A., Cody, M., Rupp, J., Benardot, D., and Shern, R. (1995). Exer-cise intensity does not effect body composition change in untrained, mod-erately overfat women. Technical Report 6, 62nd Medical Group, Ft Lewis,Wash. 98433, USA.
Gretzel, U. and Fesenmaier, D. (2006). Persuasion in Recommender Systems.International Journal of Electronic Commerce, 11(2):81–100.
Guadagno, R. E., Asher, T., Demaine, L. J., and Cialdini, R. B. (2001). WhenSaying Yes Leads to Saying No: Preference for Consistency and the Re-verse Foot-in-the-Door Effect. Personality and Social Psychology Bulletin,27(7):859–867.
Guadagno, R. E. and Cialdini, R. B. (2010). Preference for consistency andsocial influence: A review of current research findings. Social Influence,5(3):152–163.
Ham, J., Midden, C., and Beute, F. (2009). Can ambient persuasive technol-ogy persuade unconsciously?: using subliminal feedback to influence energyconsumption ratings of household appliances. Current, pages 1–6.
Hardin, C. D. and Higgins, E. T. (1996). Shared reality: How social verificationmakes the subjective objective., volume 3, pages 28–84. Guilford.
Haugtvedt, C. P., Liu, K., and Min, K. S. (2008). Individual Differences: Toolsfor Theory Testing and Understanding in Consumer Psychology Research.In Handbook of consumer psychology, pages 1161–1176. {CRC} Press.
Haugtvedt, C. P. and Petty, R. E. (1992). Personality and persuasion: Needfor cognition moderates the persistence and resistance of attitude changes.Journal of Personality and Social Psychology, 63(2):308–319.
Haugtvedt, C. P., Petty, R. E., and Cacioppo, J. T. (1992). Need for cognitionand advertising: Understanding the role of personality variables in consumerbehavior. Journal of Consumer Psychology, 1(3):239–260.
Bibliography 193
Haworth, L. L. (1991). Dworkin on Autonomy. Ethics, 102(1).
Hays, W. L. (1973). Statistics for Social Scientists. Holt,Rinehart & Winstonof Canada Ltd.
Hazen, T. J., Weinstein, E., and Park, A. (2003). Towards robust personrecognition on handheld devices using face and speaker identification tech-nologies. Proceedings of the 5th international conference on Multimodalinterfaces ICMI 03, page 289.
Hornstein, H. A., Fisch, E., and Holmes, M. (1968). Influence of a model’s feel-ing about his behavior and his relevance as a comparison other on observers’helping behavior. Journal of Personality and Social Psychology.
Hutchinson, J. W., Kamakura, W. A., and Lynch, J. J. G. (2001). Unob-served Heterogeneity as an Alternative Explanation for “Reversal” Effectsin Behavioral Research. Journal of Consumer Research, 27(3):324–344.
Iachello, G. (2005). Privacy and proportionality: adapting legal evaluationtechniques to inform design in ubiquitous computing. In Conference onHuman factors in computing, pages 91–100.
IJsselsteijn, W., de Kort, Y., Midden, C. J. H., Eggen, B., and van den Hoven,E. (2006). Persuasive Technology for Human Well-Being: Setting the Scene.In IJsselsteijn, W., de Kort, Y., Midden, C. J. H., Eggen, B., and van denHoven, E., editors, Persuasive Technology, First International Conferenceon Persuasive Technology for Human Well-Being, PERSUASIVE 2006,Proceedings., volume 3962 of Lecture Notes in Computer Science, pages 1–5.Springer.
Inman, J., Peter, A., and Raghubir, P. (1997). Framing the Deal: The Roleof Restrictions in Accentuating Deal Value. Journal of Consumer Research,24(1):68–79.
James, J. M. and Bolstein, R. (1990). The Effect of Monetary Incentives andFollow-up Mailings on the Response Rate and Response Quality in MailSurveys. Public Opinion Quarterly, 54(3):346.
Jarvis, W. B. G. and Petty, R. E. (1996). The need to evaluate. Journal ofPersonality and Social Psychology, 70(1):172–194.
Johnson, B. T. and Eagly, A. H. (1989). Effects of Involvement on Persuasion :A Meta- Analysis Effects of Involvement on Persuasion : A Meta-Analysis.Prevention.
Kaptein, M. C. (2011a). Adaptive Persuasive Messages in an E-commerce Set-ting: The use of Persuasion Profiles. In Proceedings of ECIS 2011, Helsinki.

194 Bibliography
Kaptein, M. C. (2011b). Building Persuasion Profiles in the Wild: UsingMobile Devices as Identifiers Maurits Kaptein. (CHI 2011 PINC workshop).
Kaptein, M. C., de Ruyter, B., Markopoulos, P., and Aarts, E. (2009a). Per-suading you: Individual differences in susceptibility to persuasion. In 12thIFIP TC 13 International Conference - INTERACT, pages 24–28, Uppsala,Sweden. ACM Press.
Kaptein, M. C., de Ruyter, B., Markopoulos, P., and Aarts, E. (2011a). Tai-lored Persuasive Text Messages to Reduce Snacking. Transactions on In-teractive Intelligent Systems, IN PRESS.
Kaptein, M. C., Duplinsky, S., and Go, E. M. (2012). Simultaneous Usage ofMultiple Influence Strategies in Online Marketing. Submitted to: Interna-tional Journal of Internet Marketing and Advertising.
Kaptein, M. C., Duplinsky, S., and Markopoulos, P. (2011b). Means basedadaptive persuasive systems. In Proceedings of the 2011 annual conferenceon Human factors in computing systems, CHI ’11, pages 335–344, New York,NY, USA. ACM.
Kaptein, M. C. and Eckles, D. (2010). Selecting Effective Means to Any End:Futures and Ethics of Persuasion Profiling. In Ploug, T., Hasle, P., andOinas-Kukkonen, H., editors, Persuasive Technology, pages 82–93. SpringerBerlin / Heidelberg.
Kaptein, M. C. and Eckles, D. (2012). Heterogeneity in the Effects of OnlinePersuasion. Journal of Interactive Marketing, IN PRESS.
Kaptein, M. C., Eckles, D., and Davis, J. (2011c). Envisioning Persuasion Pro-files: Challenges for Public Policy and Ethical Practice. ACM Interactions,18(5):66–69.
Kaptein, M. C., J, L., and Saini, P. (2010a). Individual Differences in Per-suadability in the Health Promotion Domain. In Ploug, T., Hasle, P.,and Oinas-Kukkonen, H., editors, Persuasive Technology, pages 94–105.Springer Berlin / Heidelberg.
Kaptein, M. C., Markopoulos, P., Ruyter, B., and Aarts, E. (2009b). Persua-sion in ambient intelligence. Journal of Ambient Intelligence and HumanizedComputing, 1(1):43–56.
Kaptein, M. C., Markopoulos, P., Ruyter, B., and Aarts, E. (2010b). Twoacts of social intelligence: the effects of mimicry and social praise on theevaluation of an artificial agent. AI & SOCIETY, 26(3):261–273.
Kaptein, M. C. and van Halteren, A. (2012). Adaptive Persuasive Messaging toIncrease Service Retention. Journal of Personal and Ubiquitous Computing,IN PRESS.

Bibliography 195
Kass, A. (2007). Transforming the Mobile Phone into a Personal PerformanceCoach. In Fogg, B. J. and Eckles, D., editors, Mobile Persuasion: 20 Per-spectives on the Future of Behavior Change. Stanford Captology Media.
Kellermann, K. and Cole, T. (1994). Classifying Compliance Gaining Mes-sages: Taxonomic Disorder and Strategic Confusion. Communication The-ory, 4(1):3–60.
Kelman, C. and Hamilton, V. L. (1989). Crimes of obedience: Toward asocial psychology of authority and responsibility. Yale University Press, NewHaven.
Kerr, J., Eves, F., and Carroll, D. (2001). Six-month observational study ofprompted stair climbing. Preventive Medicine, 33(5):422–427.
Khaled, R., Fischer, R., Noble, J., and Biddle, R. (2008). A QualitativeStudy of Culture and Persuasion in a Smoking Cessation Game. PersuasiveTechnology, 5033:224–236.
Killingsworth, M. A. and Gilbert, D. T. (2010). A Wandering Mind Is anUnhappy Mind. Science, 330(6006):932.
King, P. and Tester, J. (1997). The Landscape of Persuasive Technologies.Communications of the ACM, 42(5):31–38.
Kirkpatrick, D. R., Pavlik, W. B., and Reynolds, W. F. (1964). Partial-reinforcement extinction effect as a function of size of goal box. Journal ofExperimental Psychology, 68:515–516.
Koch, M. and Schlichter, J. (2001). Ubiquitous Computing. In Schwabe,G., Streitz, N., and Unland, R., editors, CSCWKompendium, volume 2 ofLecture Notes in Computer Science, pages 507–517. Springer.
Komorita, S. S., Hilty, J. A., and Parks, C. D. (1991). Reciprocity and Coop-eration in Social Dilemmas. Journal of Conflict Resolution, 35(3):494–518.
Kostakos, V. (2008). Using Bluetooth to capture passenger trips on publictransport buses. CoRR, abs/0806.0.
Kostakos, V. and Neill, E. O. (2008). Cityware : Urban computing to bridgeonline and real-world social networks. Analysis, pages 195–204.
Kreuter, M. (2000). Tailoring health messages: customizing communicationwith computer technology. Routledge.
Kroeze, W., Werkman, A., and Brug, J. (2006). A systematic review of ran-domized trials on the effectiveness of computer-tailored education on phys-ical activity and dietary behaviors. Annals of behavioral medicine : a pub-lication of the Society of Behavioral Medicine, 31(3):205–23.

196 Bibliography
Lacroix, J., Saini, P., and Goris, A. (2009). Understanding user cognitionsto guide the tailoring of persuasive technology-based physical activity in-terventions. In Chatterjee, S. and Dev, P., editors, Persuasive Technology,Fourth International Conference, PERSUASIVE 2009, volume 350 of ACMInternational Conference Proceeding Series, page 9, Claremont, California,USA. ACM.
Lam, X. N., Vu, T., Le, T. D., and Duong, A. D. (2008). Addressing cold-startproblem in recommendation systems. In Proceedings of the 2nd internationalconference on Ubiquitous information management and communication -ICUIMC ’08, page 208, New York, New York, USA. ACM Press.
Lambert, C. L. (2001). Baby think it over. Pediatrics, 107(4):806.
Latané, B. (1970). The unresponsive bystander: why doesn’t he help?Appleton-Century Crofts, New York.
Latané, B. (1996). Dynamic Social Impact: The Creation of Culture by Com-munication. Journal of Communication, 46(4):13–25.
Latané, B. and Bourgeois, M. J. (1996). Experimental Evidence for DynamicSocial Impact : The Emergence n Electronic Groups of Subcultures i. Jour-nal of Communication, 46(4):35–47.
Latané, B., Liu, J. H., Nowak, A., Bonevento, M., and Zheng, L. (1995).Distance Matters: Physical Space and Social Impact. Personality and SocialPsychology Bulletin, 21(8):795–805.
Latané, B. and Nida, S. (1981). Ten years of research on group size andhelping. Psychological Bulletin, 89(2):308–324.
Leino-Kilpi, H., Välimäki, M., Dassen, T., Gasull, M., Lemonidou, C., Scott,A., and Arndt, M. (2001). Privacy: A review of the literature. InternationalJournal of Nursing Studies, 38(6):663–671.
Leippe, M. R. and Eisenstadt, D. (1994). Generalization of dissonance reduc-tion: Decreasing prejudice through induced compliance. Journal of Person-ality and Social Psychology, 67(3):395–413.
Lockton, D., Harrison, D., and Stanton, N. (2008). Making the user more effi-cient: design for sustainable behaviour. International Journal of SustainableEngineering, 1(1):3–8.
Long, J. D. and Stevens, K. R. (2004). Using technology to promote self-efficacy for healthy eating in adolescents. Technical Report 2, LubbockChristian University, 5601 W. 19th Street, Lubbock, TX 79407, [email protected].

Bibliography 197
Lynn, M. (1989). Scarcity effects on desirability: Mediated by assumed ex-pensiveness? Journal of Economic Psychology, 10(2):257–274.
Lynn, M. (1991). Scarcity effects on value: A quantitative review of thecommodity theory literature. Psychology and Marketing, 8(1):43–57.
Mackie, D. and Cooper, J. (1984). Attitude Polarization : Effects of GroupMembership. Journal of Personality and Social Psychology, 46(3):575–585.
Mackie, D. M. (1986). Social identification effects in group polarization. Jour-nal of Personality and Social Psychology, 50(4):720–728.
Maclnnis, D. J. and Jaworski, B. J. (1989). Information Processing fromAdvertisements: Toward an Integrative Framework. Journal of Marketing,53(4):1.
Macready, W. G. and Wolpert, D. H. (1998). Bandit problems and the explo-ration/exploitation tradeoff. IEEE Transactions on Evolutionary Compu-tation, 2(1):2–22.
Maio, G. R. and Esses, V. M. (2001). The need for affect: Individual differencesin the motivation to approach or avoid emotions. Journal of Personality,69(4):583–615.
Martin, R. and Hewstone, M. (2003). Social influence processes of controland change: conformity, obedience to authority, and innovation. In Hogg,M. A. and Cooper, J., editors, Psychological Foundations of Attitudes, pages347–366. {Londo} Sage.
McFarland, R. G., Challagalla, G. N., and Shervani, T. a. (2006). InfluenceTactics for Effective Adaptive Selling. Journal of Marketing, 70(4):103–117.
McGuire, W. J. (1981). Theoretical foundations of campaigns. In Rice, R. andPaisley, W., editors, Public communication campaigns, volume 2nd, chapterChapter 2, pages 41–70. Sage Publications, Inc.
McGuire, W. J. (1995). Transferring research findings on persuasion to improvedrug abuse prevention programs. NIDA research monograph, 155:225–45.
McNaughton, N. (1984). Effects of anxiolytic drugs on the partial reinforce-ment extinction effect in runway and Skinner box. The Quarterly jour-nal of experimental psychology B Comparative and physiological psychology,36(4):319–330.
Meschtscherjakov, A., Wilfinger, D., Scherndl, T., and Tscheligi, M. (2009).Acceptance of future persuasive in-car interfaces towards a more economicdriving behaviour. ACM Press, New York, New York, USA.
198 Bibliography
Midden, C., Mccalley, T., Ham, J., and Zaalberg, R. (2008). Using persuasivetechnology to encourage sustainable behavior. In Workshop paper at 6thInternational Conference on Pervasive Computing, number 1, pages 83–86.Eindhoven University of Technology.
Midden, C. J., Meter, J. E., Weenig, M. H., and Zieverink, H. J. (1983). Usingfeedback, reinforcement and information to reduce energy consumption inhouseholds: A field-experiment. Journal of Economic Psychology, 3(1):65–86.
Milgram, S. (1974). Obedience to Authority. London: Tavistock.
Miller, A. G., Collins, B. E., and Brief, D. E. (1995). Perspectives on Obedienceto Authority: The Legacy of the Milgram Experiments. Journal of SocialIssues, 51(3):1–19.
Mintz, J. and Aagaard, M. (2010). The Application of Persuasive Technol-ogy to educational settings : Some theoretical from the HANDS Project1 Introducing the HANDS Project. In Hasle, P., editor, Persuasive 2010Proceedings of Poster Papers for the Fifth International Conference on Per-suasive Technology, pages 101–104. Oulu University Press.
Modigliani, A. and Rochat, F. (1995). The role of interaction sequences andthe timing of resistance in shaping obedience and defiance to authority.Journal of Social Issues, 51(3):107–123.
Moe, W. W. and Fader, P. S. (2004). Dynamic Conversion Behavior at E-Commerce Sites. Management Science, 50(3):326–335.
Moon, Y. and Nass, C. (1996). Adaptive agents and personality change: com-plementarity versus similarity as forms of adaptation. In Conference com-panion on Human factors in computing systems, pages 287–288, Vancouver,British Columbia, Canada. {ACM} Press.
Murray, D. M., Richards, P. S., Luepker, R. V., and Johnson, C. A. (1987).The prevention of cigarette smoking in children: two- and three-year follow-up comparisons of four prevention strategies. Technical Report 6, Divisionof Epidemiology, School of Public Health, University of Minnesota, Min-neapolis 55455.
Nail, P. R., Correll, J. S., Drake, C. E., Glenn, S. B., Scott, G. M., andStuckey, C. (2001). A validation study of the preference for consistencyscale. Personality and Individual Differences, 31:1193–1202.
Nass, C. (1997). Social and Natural Interfaces : Theory and Design. Media,(March):192–193.

Bibliography 199
Nass, C., Fogg, B. J., and Moon, Y. (1996). Can computers be teammates?International Journal of Human-Computer Studies, 45(6):669–678.
Nass, C., Steuer, J., and Tauber, E. R. (1994). Computers are social actors.Conference companion on Human factors in computing systems CHI 94,94:204.
Noar, S. M., Benac, C. N., and Harris, M. S. (2007). Does tailoring matter?Meta-analytic review of tailored print health behavior change interventions.Psychological Bulletin, 133(4):673–693.
Nowak, A., Szamrej, J., and Latané, B. (1990). From private attitude topublic opinion: A dynamic theory of social impact. Psychological Review,97(3):362–376.
Ochi, P., Rao, S., Takayama, L., and Nass, C. (2010). Predictors of user percep-tions of web recommender systems: How the basis for generating experienceand search product recommendations affects user responses. InternationalJournal of Human-Computer Studies, 68(8):472–482.
Oinas-Kukkonen, H. and Harjumaa, M. (2008a). A Systematic Frameworkfor Designing and Evaluating Persuasive Systems. In Oinas-Kukkonen, H.,Hasle, P. F. V., Harjumaa, M., Segerstå hl, K., and Ø hrstrøm, P., editors,Persuasive Technology, Third International Conference, {PERSUASIVE}2008, Oulu, Finland, June 4-6, 2008. Proceedings, volume 5033 of LectureNotes in Computer Science, pages 164–176. Springer.
Oinas-Kukkonen, H. and Harjumaa, M. (2008b). Towards Deeper Understand-ing of Persuasion in Software and Information Systems. First InternationalConference on Advances in ComputerHuman Interaction, pages 200–205.
Oinas-Kukkonen, H. and Harjumaa, M. (2009). Persuasive Systems Design :Key Issues , Process Model , and System Features. Communications of theAssociation for Information Systems, 24(1):485–500.
Oinas-Kukkonen, H., Hasle, P. F. V., Harjumaa, M., Segerstaahl, K., andOhrstrom, P. (2008). Persuasive Technology, Third International Confer-ence, PERSUASIVE 2008, Oulu, Finland, June 4-6, 2008. Proceedings,volume 5033 of Lecture Notes in Computer Science. Springer.
O’Keefe, D. J. (1994). From Strategy-Based to Feature-Based Analyses ofCompliance Gaining Message Classification and Production. Communica-tion Theory, 4(1):61–69.
Olson, M. A. and Fazio, R. H. (2002). Implicit Acquisition And ManifestationOf Classically Conditioned Attitudes. Social Cognition, 20(2):89–104.

200 Bibliography
Owen, A. B. (2007). The pigeonhole bootstrap. The Annals of Applied Statis-tics, 1(2):386–411.
Pariser, E. (2011). The Filter Bubble. Penguin Press.
Parkes, A., Henderson, M., and Wight, D. (2005). Do sexual health servicesencourage teenagers to use condoms? A longitudinal study. J Fam PlannReprod Health Care., 31:271–280.
Patrick, K., Raab, F., Adams, M. A., Dillon, L., Zabinski, M., Rock, C. L.,Griswold, W. G., and Norman, G. J. (2009). A Text Message Based Inter-vention for Weight Loss: Randomized Controlled Trial. Journal of MedicalInternet Research, 11:1–9.
Payan, J. M. and McFarland, R. G. (2005). Decomposing Influence Strategies:Argument Structure and Dependence as Determinants of the Effectivenessof Influence Strategies in Gaining Channel Member Compliance. Journal ofMarketing, 69(3):66–79.
Penedo, F. J., Schneiderman, N., Dahn, J. R., and Gonzalez, J. S. (2004).Physical activity interventions in the elderly: cancer and comorbidity. Can-cer Investigation, 22(1):51–67.
Perloff, R. M. (2003). The Dynamics of Persuasion: Communication andAttitudes in the 21st Century. Routledge.
Petty, R. E. and Cacioppo, J. T. (1986). The elaboration likelihood model ofpersuasion. Advances in Experimental Social Psychology, 19(1):123–205.
Petty, R. E. and Cacioppo, J. T. (2001). Source Factors and the ElaborationLikelhood Model of Persuasion. Higher Education, (Llm):668–673.
Petty, R. E. and Wegener, D. T. (1999). The elaboration likelihood model:Current status and controversies. In Chaiken, S. and Trope, Y., editors,Dual-process theories in social psychology, page 4172. Guilford Press,New York.
Petty, R. E., Wegener, D. T., and Fabrigar, L. R. (1994). Cognitive Processesin attitude change. In Wyer, R. S. and Srull, T. K., editors, Handbook ofSocial Cognition, pages 69–142. Erlbaum, Hillsdale, NJ, 2 edition.
Petty, R. E., Wegener, D. T., and Fabrigar, L. R. (1997). Attitudes andattitude change. Annual Review of Psychology, 48(1):609–647.
Ploug, T., Hasle, P., and Oinas-Kukkonen, H., editors (2010). PersuasiveTechnology, volume 6137 of Lecture Notes in Computer Science. SpringerBerlin Heidelberg, Berlin, Heidelberg.

Bibliography 201
Plummer, J. T. (1974). The Concept and Application of Life Style Segmenta-tion. Journal of Marketing, 38(1):33–37.
Preacher, K. J., Rucker, D. D., MacCallum, R. C., and Nicewander, W. A.(2005). Use of the extreme groups approach: a critical reexamination andnew recommendations. Psychological Methods, 10(2):178–192.
Preece, J. J. (2010). I Persuade , They Persuade , It Persuades ! Human-Computer Interaction, pages 2–3.
Prochaska, J. O. and Velicer, W. F. (1997). The transtheoretical model ofhealth behavior change. American journal of health promotion, 12(1):38–48.
Rawnsley, M. M. (1980). The concept of privacy. ANS Advances in nursingscience, 2(2):25–31.
Reeves, B. and Nass, C. (1996). The Media Equation: How People Treat Com-puters, Television, and New Media Like Real People and Places. CambridgeUniversity Press.
Rhoads, K. (2007). How Many Influence, Persua-sion, Compliance Tactics & Strategies Are There?http://www.workingpsychology.com/numbertactics.html.
Ribeiro, C., Mehrotra, G., Vey, G., Alhothali, A., and Dimarco, C. (2011).Improving Health Care with a Virtual Human Sleep Coach Technical ReportCS-2011-10. Sleep (Rochester).
Robben, H. S. and Poiesz, T. B. (1993). The Operationalization Of Motivation,Capacity and Opportunity To Process an Advertising Message. In Raaij,W. F. V. and Bamossy, G. J., editors, European Advances in ConsumerResearch Volume 1, pages 160–167. Provo, UT : Association for ConsumerResearch.
Rothschild, M. L. (1999). Carrots, Sticks, and Promises: A Conceptual Frame-work for the Management of Public Health and Social Issue Behaviors. Jour-nal of Marketing, 63(4):24–37.
Roubroeks, M., Ham, J., and Midden, C. (2011). When Artificial Social AgentsTry to Persuade People: The Role of Social Agency on the Occurrence ofPsychological Reactance. International Journal of Social Robotics, 3(2):155–165.
Rouder, J. N., Speckman, P. L., Sun, D., Morey, R. D., and Iverson, G.(2009). Bayesian t tests for accepting and rejecting the null hypothesis.Psychonomic bulletin & review, 16(2):225–37.
202 Bibliography
Rozin, P. and Royzman, E. B. (2001). Negativity Bias, Negativity Dominance,and Contagion. Personality and Social Psychology Review, 5(4):296–320.
Ryan, R. and Deci, E. (2000). Intrinsic and Extrinsic Motivations: Clas-sic Definitions and New Directions. Contemporary Educational Psychology,25(1):54–67.
Ryan, R. M. and Deci, E. L. (2006). Self-regulation and the problem of hu-man autonomy: does psychology need choice, self-determination, and will?Journal of personality, 74(6):1557–85.
Sakai, R., van Peteghem, S., van de Sande, L., Banach, P., and Kaptein,M. C. (2011). Personalized Persuasion in Ambient Intelligence: the APStairsSystem. In Proceedings of Ambient Intelligence (AmI) 2011, Amsterdam.
Schultz, P. W. (1999). Changing Behavior With Normative Feedback Inter-ventions: A Field Experiment on Curbside Recycling. Basic and AppliedSocial Psychology, 21(1):25–36.
Scott, S. L. (2010). A modern Bayesian look at the multi-armed bandit. AppliedStochastic Models in Business and Industry, 26(6):639–658.
Seta, J. J. and Seta, C. E. (1982). Personal equity: An intrapersonal com-parator system analysis of reward value. Journal of Personality and SocialPsychology, 43(2):222–235.
Siegfried, T. (2010). 4/20/2010 Odds Are, It’s Wrong - Science News. Sci-enceNews, 177(7):1–13.
Skinner, B. F. (1976). About Behaviorism. Vintage Books, New York.
Slater, M., Antley, A., Davison, A., Swapp, D., Guger, C., Barker, C., Pis-trang, N., and Sanchez-Vives, M. V. (2006). A Virtual Reprise of the StanleyMilgram Obedience Experiments. PLoS ONE, 1(1):10.
Snijders, T. A. B. and Bosker, R. J. (1999). Multilevel analysis: An introduc-tion to basic and advanced multilevel modeling. Sage Publications Ltd.
Snyder, C. R. and Fromkin, H. L. (1980). Uniqueness: the human pursuit ofdifference. Plenum Press.
Stallworth, B. (2010). Future Imperfect: Googling for Principles in OnlineBehavioral Advertising. Federal Communications Law Journal, (62):465–491.
Stein, C. (1955). Inadmissibility of the Usual Estimator ofr the Mean of a Mul-tivariate Normal Distribution. In Proceedings of the Third Berkeley Sympo-sium on Mathematical Statistics and Probability., pages 197–206. Berkeley:Univ. Cal. Press.
Bibliography 203
Svane, O. (2007). Helping , Informing or Coaxing the Consumer ? exploringPersuasive Technology as applied to households energy use. Policy, 1(11):1–11.
Tajfel, H. (1982). Social identity and intergroup relations, volume 14. Cam-bridge University Press.
Teh, K. C. and Aziz, A. R. (2002). Heart rate, oxygen uptake, and energycost of ascending and descending the stairs. Medicine & Science in Sports& Exercise, 34(4):695–699.
Tesser, A. (1993). The importance of heritability in psychological research:the case of attitudes. Psychological Review, 100(1):129–142.
Tormala, Z. L. and DeSensi, V. L. (2009). The Effects of Minority/MajoritySource Status on Attitude Certainty: A Matching Perspective. Personalityand Social Psychology Bulletin, 35(1):114–125.
Tormala, Z. L. and Petty, R. E. (2004). Resistance to persuasion and attitudecertainty: the moderating role of elaboration. Technical Report 11, De-partment of Psychology, Indiana University, Bloomington, IN 47405, [email protected].
Torning, K., Hall, C., and Oinas-Kukkonen, H. (2009). Persuasive SystemDesign : State of the Art and Future Directions. Information SystemsJournal, page 1.
Tynan, A. C. and Drayton, J. (1987). Market segmentation. Journal of Mar-keting Management, 2(3):301–335.
van Bell, D. and Smulders, K. (2009). Development of the connectednessinventory. Unpublished manuscript, pages 1–23.
Verhallen, T. M. M. and Robben, H. S. J. (1994). Scarcity and preference: Anexperiment on unavailability and product evaluation. Journal of EconomicPsychology, 15(2):315–331.
Walter, H. (2001). Neurophilosophy of free will: from libertarian illusions toa concept of natural autonomy. MIT Press.
Watson, J. M. and Strayer, D. L. (2010). Supertaskers: Profiles in extraordi-nary multitasking ability. Psychonomic Bulletin & Review, 17(4):479–485.
Webster, D. M. and Kruglanski, A. W. (1994). Individual differences inneed for cognitive closure. Journal of Personality and Social Psychology,67(6):1049–1062.
Weiser, M. (1991). The computer for the 21st century. Scientific American,3(3):94–104.

204 Bibliography
West, S. G. (1975). Increaing the attractiveness of college cafeteria food: Areactance theory perspective. Journal of Applied Psychology, 60:656–658.
West, S. G., Gunn, S. P., Hay, W., and Lang, L. (1975). Increasing theAttractiveness of College Cafeteria Food : A Reactance Theory Perspectiveher assistance in conducting the experiment and. Psychology, 60(5):656–658.
Wilcox, R. R. (1981). A Review of the Beta-Binomial Model and Its Exten-sions. Journal of Educational Statistics, 6:3–32.
Yeo, A. C., Rahim, M., and Ren, Y. Y. (2009). Use of Persuasive Technol-ogy to Change End- Users ’IT Security Aware Behaviour : A Pilot Study.SciencesNew York, 1(1):48–54.
Zanker, M., Bricman, M., Jessenitschnig, M., Damiani, E., Jeong, J., Howlett,R., and Jain, L. (2009). New Directions in Intelligent Interactive Multi-media Systems and Services - 2, volume 226 of Studies in ComputationalIntelligence. Springer Berlin Heidelberg, Berlin, Heidelberg.
Zhu, F. and Zhang, X. M. (2010). Impact of Online Consumer Reviews onSales: The Moderating Role of Product and Consumer Characteristics.Journal of Marketing, 74(2):133–148.
Ziliak, S. T. (2008). The Cult of Statistical Significance: How the StandardError Costs Us Jobs, Justice, and Lives. Journal of Economic Literature,47(2):499–503.

Articles by Maurits KapteinJournal Articles:
1. Kaptein, M. C., & van Halteren, A. (2012). Adaptive PersuasiveMessaging to Increase Service Retention. Journal of Personal andUbiquitous Computing, IN PRESS.
2. Kaptein, M. C., Fernandez, N., Castaneda, D., & Nass, C. (2012).Extending the Similarity-Attraction Effect: The Effects of When-Similarity in Mediated Communication. Journal of Computer-Mediated Communication, IN PRESS.
3. Kaptein, M. C., & Eckles, D. (2012). Heterogeneity in the Ef-fects of Online Persuasion. Journal of Interactive Marketing, INPRESS.
4. Kaptein, M. C., de Ruyter, B., Markopoulos, P., & Aarts, E.(2012). Tailored Persuasive Text Messages to Reduce Snacking.Transactions on Interactive Intelligent Systems, IN PRESS.
5. Kaptein, M. C., Eckles, D., & Davis, J. (2011). Envisioning Per-suasion Profiles: Challenges for Public Policy and Ethical Prac-tice. ACM Interactions, 18(5), 66-69.
6. Kaptein, M. C., Markopoulos, P., Ruyter, B., & Aarts, E. (2010).Two acts of social intelligence: the effects of mimicry and socialpraise on the evaluation of an artificial agent. AI & SOCIETY,26(3), 261-273.
7. Kaptein, M. C., Markopoulos, P., Ruyter, B., & Aarts, E. (2009).Persuasion in ambient intelligence. Journal of Ambient Intelli-gence and Humanized Computing, 1(1), 43-56.
8. Kaptein, M. C., Weisscher, A., Terken, J. M. B., & Nelissen, H.(2009). Online contextmapping; using the opportunities of Web2.0 for the contextmapping procedure. CoDesign, 5(4), 213-228.
Peer-reviewed Conference Proceedings:1. Kaptein, M. C., & Robertson, J. (2012). Rethinking Statistical
Methods for HCI. In Proceedings of the 2011 annual conferenceon Human factors in computing systems, CHI 212. IN PRESS.

206 Articles by Maurits Kaptein
2. Sakai, R., Peteghem, S. van, Sande, L. van de, Banach, P., &Kaptein, M. C. (2011). Personalized Persuasion in Ambient In-telligence: the APStairs System. In Proceedings of Ambient In-telligence (AmI) 2011. Amsterdam.
3. Lindholm, J., Kaptein, M. C., & Parvinen, P. (2012). The Trade-off between Online Community Activity and Consumption. InProceedings of HICSS 2012. Hawaii.
4. Kaptein, M. C. (2011). Adaptive Persuasive Messages in an E-commerce Setting: The use of Persuasion Profiles. In Proceedingsof ECIS 2011. Helsinki.
5. Kaptein, M. C., & Eckles, D. (2011). Magnitude and Structure ofHeterogeneity in the Effects of Influence Strategies. In Proceedingsof Persuasive Technology 2011. Ohio.
6. Kaptein, M. C., Duplinsky, S., & Markopoulos, P. (2011). Meansbased adaptive persuasive systems. In Proceedings of the 2011annual conference on Human factors in computing systems (pp.335-344). New York, NY, USA: ACM.
7. Kaptein, M. C., Lacroix, J., & Saini, P. (2010). Individual Differ-ences in Persuadability in the Health Promotion Domain. In T.Ploug, P. Hasle, & H. Oinas-Kukkonen (Eds.), Persuasive Tech-nology (pp. 94-105). Springer Berlin / Heidelberg.
8. Kaptein, M. C., & Eckles, D. (2010). Selecting Effective Means toAny End: Futures and Ethics of Persuasion Profiling. In T. Ploug,P. Hasle, & H. Oinas-Kukkonen (Eds.), Persuasive Technology(pp. 82-93). Springer Berlin / Heidelberg.
9. Scherini, T., Melo, P., van Craenendonck, T., Zou, W., & Kaptein,M. C. (2010). Enhancing the sleeping quality of partners livingapart. In Proceedings of the 8th ACM Conference on DesigningInteractive Systems - DIS 2010 (pp. 171-179). New York, NewYork, USA: ACM Press.
10. Kaptein, M. C., Nass, C., & Markopoulos, P. (2010). Powerful andconsistent analysis of likert-type ratingscales. In Proceedings ofthe 28th international conference on Human factors in computingsystems - CHI 2010 (pp. 2391-2401). New York, New York, USA:ACM Press.
11. Kaptein, M. C., de Ruyter, B., Markopoulos, P., & Aarts, E. H.L. (2009). Simple Ways to Make Friends. In Proceedings of the8th International Workshop on Social Intelligence.

Articles by Maurits Kaptein 207
12. Kaptein, M. C., de Ruyter, B., Markopoulos, P., & Aarts, E.(2009). Measuring the Subjective User Experience. In Proceedingsof the 12th IFIP TC 13 International Conference - INTERACT(pp. 944-945).
13. Kaptein, M. C., de Ruyter, B., Markopoulos, P., & Aarts, E.(2009). Persuading you: Individual differences in susceptibility topersuasion. In Proceedings of the 12th IFIP TC 13 InternationalConference - INTERACT (pp. 24-28). Uppsala, Sweden: ACMPress.
14. Soute, I., Kaptein, M. C., & Markopoulos, P. (2009). Evaluatingoutdoor play for children. In In Proceedings of the Proceedingsof the 8th International Conference on Interaction Design andChildren - IDC 2009 (p. 250). New York, New York, USA: ACMPress.
15. Kaptein, M. C., Slegers, K., Nelissen, H., Weisscher, A., & Terken,J. M. B. (2007). The Digital Workbook: Using Web 2.0 for Gen-erative Research Purposes. In Proceedings of MobileHCI 2007.
16. Al Mahmud, A., Kaptein, M. C., Moran, O., Van De Garde-Perik,E., & Markopoulos, P. (2007). Understanding Compliance to Pri-vacy Guidelines Using Text-and Video-Based Scenarios. In Pro-ceedings of HumanComputer Interaction INTERACT 2007 (pp.156-168). Springer Berlin / Heidelberg.
17. Romero, N., Szóstek, A. M., Kaptein, M. C., & Markopoulos, P.(2007). Behaviours and Preferences when Coordinating MediatedInterruptions : Social and System influence. In Proceedings ofCSCW 2007 (pp. 123-132). Kluwer Press.
Journal Articles Under Submission:1. Kaptein, M. C., Duplinsky, S., & Go, E. M. (2012). Simultane-
ous Usage of Multiple Influence Strategies in Online Marketing.Submitted to: International Journal of Internet Marketing andAdvertising.
2. Kaptein, M. C., & Nass, C. (2012). Nice to Know you: Familiarityand Influence in Social Networks. UNDER SUBMISSION.
3. Kaptein, M. C., & Markopoulos, P. (2012). On the Design ofAdaptive Persuasive Systems. UNDER SUBMISSION.
4. Kaptein, M. C., & Parvinen, P. (2012). Sequential Learning ofProfit Maximizing Sales Prices. UNDER SUBMISSION.

208 Articles by Maurits Kaptein
5. Lindholm, J., Parvinen, P., & Kaptein, M. C. (2012). The Dan-gers of Engagement: How Substitution in Online Services Leadsto Decreasing Revenues. UNDER SUBMISSION.
Informal Conference Proceedings:1. Kaptein, M. C. (2011). Building Persuasion Profiles in the Wild:
Using Mobile Devices as Identifiers Maurits Kaptein. (CHI 2011PINC workshop). Vancouver, British Columbia, Canada.
2. Kaptein, M. C., Markopoulos, P., de Ruyter, B., & Aarts, E.H. L. (2010). Social Connectedness and Compliance (CHI 2010Workshop on Social Connectedness). Atlanta, USA.

SummaryPersonalized Persuasion in Ambient Intelligence
This thesis examines the use of personalized persuasion in ambientintelligence. Persuasive technologies—systems and services intention-ally designed to influence user behavior—are emergent. Applicationsrange from iPhone apps which help users stop smoking, to distributednetworks of smart sensors that persuade users to reduce their energyconsumption. Many of these systems apply social science knowledgeabout influence strategies to increase the effectiveness of their persua-sion attempts.
This thesis first examines user responses to influence strategies. Thework shows that while most influence strategies are effective on average,large individual differences exist. The responses to some strategies arenegative for a large proportion of users despite replicating the averagepositive effect of the use of these strategies. This heterogeneity in re-sponses to social influence strategies proves stable over both time andcontexts.
After showing that a proper selection of a single influence strategyleads to more persuasion than combinations of strategies, the thesis de-velops the idea of creating and utilizing persuasion profiles: collectionsof the estimates, and their associated certainty, of the effects of influ-ence strategies on individuals. The thesis describes how these profilescan be build both via meta-judgmental measures as well as operativemeasures. The Susceptibility to Persuasive Strategies Scales (STPS)is presented for the purpose of creating persuasion profiles based onmeta-judgmental measures.
The thesis next examines the applied value of persuasion profiles.Via several designs the thesis shows that persuasive systems in whichthe influence strategy that is used is adapted to individual users out-perform non-personalized systems. These ideas are further advanced byproposing and evaluating a method for building personalized persuasivetechnologies.
Persuasion Profiles will be a core component of persuasive tech-nologies to come. The ambient intelligence scenario makes it possibleto build dynamic profiles based on unobtrusive measurements. This inturn will help researchers and designers to measure, predict, influence,and ultimately understand human responses to persuasion.


AcknowledgmentsMuch of the thoughts and work presented in this thesis would not
have been possible without the help of my supervisors, co-workers,colleagues, students, and friends.
I would like to thank my core committee: Prof. Emile Aarts, Dr.Boris de Ruyter, and Prof. Panos Markopoulos. Without your helpthis thesis would not have been what it is now. I would also like toacknowledge the help of my reading committee: Prof. Cees Midden,Prof. Huib de Ridder, and Prof. Harri Oinas-Kukkonen.
During my PhD I spend over a year at Stanford University. There,Prof. Clifford Nass taught me about science and life in general. Thankyou! Also, during my stay at Stanford Mike Nowak, Abhay Suku-maran, Hellen Harris, Prof. Jeremy Bailenson, Prof. David Rogosa,Dr. Martha Russel, Dr. Helen Roque, Adelaide Dawes, Erina DuBois,Abe Downey, Katy Harrison, Will Bishop, and Alvin Lacson made itfun and meaningful. Special thanks to Dean Eckles whom I greatlyenjoyed collaborating and BBQ-ing with.
At Philips Research I would like to thank Dr. Aart van Halteren,Dr. Joyca Lacroix, Dr. Gijs Geleijnse, Dr. Martin Pijl, PrivenderSaini, Tess Speelpenning, Dr. Saskia van Dantzig, Elke Deamen, JiaDu, Tommi Maätta, Roger Holmes, and everyone else I have workedwith. A special thanks Dr. Joris Janssen who made Philips Research alot more fun.
At the Technical University of Eindhoven I would like to thank Prof.Berry Eggen, Prof. Jean Bernard Martens, Prof. Jacques Terken, Dr.Jahved Kahn, Dr. Georgios Metaxas, Dr. Evangelos Karapanos, NikosBatalas, Iris Stoute, Alex Uyttendaele, Dr. Nathalia Romero, QonitaShabab, Abdullah al Mahmud, and all others in the UCE group and atthe USI program. I greatly enjoyed working with you and discussingscience.
Many people have helped me out academically, collaborated withme, or provided me with the opportunity to talk about my work. Iwould especially like to thank Prof. Per Hasle, Dr. Judy Robertson,Steven Duplinsky, Arjan Haring, Jay de Groot, Dimitra Retsina,Prof. Samir Chattarjee, Thomas Visser, Prof. Petri Parvinen, JerryLindholm, Dr. Daan van Bel, Jan Kallenbach, and Essi Pöyry.

212 Acknowledgments
I would also like to thank my friends for being supportive of thisproject (either pushing me to start it, to continue it, or to finish it).In no particular order, thank you: Ruud Niesink & Barto Nijenhuis(thanks for being my paranymphs!), Joyce Kemperman, Jula Nijen-huis, Puk Nijenhuis, Tommy Haccou, Gijs Haccou, Eva Haverdil, Petervan Gent (thanks for helping out on the cover design!), Mariëlle Kete-laar, Peter Kolks, Bram van Gemert, Geert van der Velden, Leon vanKervel, Joost Lorenz, Dennis Jesserun, Maurice de Kunder, LaurensKoot, Vincent Gijssen, Daniel Wienke, Anton Thiel (& everyone elseat Waalhalla!), Damiaan Winkelman, Niels Kingma, Hugo Uijlenbroek,Janneke van Ekert, Coen de Bruyn, Sanna Rijpma, Noortje van Laanen,Jaap Gielink, Sietske Oenema, and Samir Hansen.
Also, I would especially like to thank my family: Adrie Kaptein-Vrolijk, Bartjan Kaptein, Reinier Kaptein, Claire Millet-Kaptein,Thomas Kaptein, and Lise Kaptein. Thanks for supporting my“career” choices throughout and providing me with a decent upbring-ing. Also thanks to Jozef Geurtzen, Ans Geurtzen-van Ree, NalineGeurtzen, Gaard Kets, and Ayla Geurtzen for your support.
Most probably I forgot to include a number of you in the listabove. My apologies.
Finally, I would like to thank Rosa Geurtzen. She is cool.

CurriculumMaurits Clemens Kaptein was born on the
9th of March 1983 in Doetinchem, the Nether-lands. After my graduation as Master of Sciencein Economic Psychology at the University ofTilburg in the Netherlands I completed thePost-master User-System Interaction programat the Technical University of Eindhoven. Afterobtaining the PDEng. degree I worked asa research development manager at De Vosand Jansen Market research in Nijmegen, the
Netherlands. In October 2008 I started my PhD. project which hasbeen carried out at the technical University of Eindhoven, the Nether-lands, Philips Research Laboratories, Eindhoven, the Netherlands, andStanford University, Stanford, USA.
With more than 25 publications (conference proceedings and journalarticles) and a patent in the area of persuasion profiling, I have beenan active researcher in Design, Psychology, Economics, and Statistics.During these research projects I have collaborated with research teamsin Philips Research (NL), Philips Directlife (NL), Facebook (USA),PersuasionAPI (NL), Stanford University (USA), Delft University(NL), the Aalto School of Economics (FIN), and Herriot-Watt Uni-versity (UK). My core research interests are persuasive technologiesand research methodology. I have presented my research duringscientific conferences (e.g. CHI, Interact, Persuasive Technology,HICSS) and at several invited presentations (e.g. MediaX Stanford(USA), Aalto School of Economics (FIN), TEDx (NL)). Besides myrole as a researcher I am the chairman of the board of the “StichtingSkateboarding Nijmegen”, a non-profit responsible for the exploitationof the largest concrete indoor skateboard park in Europe.

214
Index
8-step design process, 13
ability, 16adaptation of persuasive at-
tempts, 54adaptive persuasive systems, 6,
8, 98, 140, 166affiliate online store, 157Ambient Intelligence (AmI), 3,
12, 112, 172ambient persuasive systems, 98,
172ANOVA, 31Application Programming In-
terface (API), 158APStairs, 140attitude, 2, 14
ambivalence, 16change, 2, 14perceived attitude basis, 2preferred attitude basis, 2strength, 16
Authority, 3, 18, 21autonomy, 179average treatment effect (ATE),
7, 29, 98, 181
Baby think it over (BTIO), 10BARN, 9Bayesian Information Criteria
(BIC), 35behavior, 16
change, 2, 16sustaining, 17
Beta Binomial model, 107Beta distribution, 107Binomial distribution, 107Bluetooth scanning, 103, 142borrowing strength, 110
card-sorting, 142central processing (see ELM),
19choice effects, 58click-through, 75Cochran-Mantel-Haenszel test,
120Commitment, 22compliance, 20, 61
index, 61score, 61tactics, 20
computer-tailoredhealth education, 4, 12, 26,
175interventions, 26persuasion, 102, 175
conditioning, 17classical, 2, 17operant, 2, 17
Consensus, 19, 21Consistency, 22correlations, 38
between strategies, 38covariance, 31
Σ, 31
decision rule, 107
215

216
demographics, 34, 40dissonance theory, 22dual processing model, 19dynamic adaptation, 102, 104,
140
e-commerce, 157e-selling, 157effect size, 182Elaboration Likelihood Model
(ELM), 19, 24, 80, 179central processing, 19, 80,
179peripheral processing, 19,
80, 179emotional state, 41empirical p-value, 36end-independence, 111, 176ethics, 176expert systems, 4extreme group approach
(EGA), 117, 122
foot-in-the-door, 25
Gaussian distribution, 30
heterogeneity, 5, 7, 29, 31, 98,181
hierarchical models, 8, 30Hygiene Guard, 11
identification, 8, 103immediacy, 19impact, 6individual differences, 10, 23
measurement, 25individual persuasion, 181individual-level effect, 3, 26, 29,
181estimates, 145
individual-level theory, 7, 181influence strategy, 5, 14, 20, 79
choice, 58designing implementations,
124, 150implementation, 33multiple, 7, 58, 100random presentation, 128single, 58susceptibility measurement,
79taxonomy, 10, 20, 173
interactive systems, 2interactive technologies, 2intra-individual differences, 45item loadings, 83, 88item-ranking task, 59
Javascript tracker, 158JSON, 174
key performance indicator, 161Kinder-Kleertjes, 158Kustomsignals, 11
Lark, 3, 10Liking, 18, 22log-likelihood, 35
χ2 model comparisons, 35
MCMC sampling, 36means to an end, 4
means adaptation, 111measurement, 8, 104
behavior, 118click-through, 75, 161email reminders, 149intention, 118interest, 118meta-judgmental, 25, 79,
170

217
operative, 25, 30, 170snacking behavior, 123, 129stair usage, 142
meta-analysis, 166meta-judgmental measures, 25,
79, 136constraints, 136
Metabolic Equivalent of Task(MET), 140
Milgram experiment, 3mimicry, 18mobile devices, 123mood, 41motivation, 16
external, 17internal, 17
multi-armed bandit problem,108
multi-level models, 8, 30, 110,181
MyZeo, 10
Need for Affect, 24Need for Closure, 24Need for Cognition (NfC), 24,
34, 91, 175Need for Uniqueness, 22Need to Evaluate, 24negativity bias, 100Nike +, 10non-disclosure, 112null-model, 30, 130
Oomph, 182operative measures, 25, 30, 54opportunity, 16
Peitho, 1perceived usefulness, 62peripheral processing (see
ELM), 19
personal equity theory, 22personalization, 123
counter-, 123personalized persuasion, 95, 97,
137, 169computer-tailored, 102
personalized persuasive sys-tems, 8
persuadability, 30persuasion, 1, 4, 12
adapting, 4in ambient intelligence, 10,
12, 172over time, 182principle, 3, 5
Persuasion API, 157persuasion profile, 100, 139, 170
combinations with otherprofiles, 174
creation, 100, 172decision rule, 107disclosure, 175dynamic, 102, 104, 139estimation, 106ethical considerations, 176identification, 103, 140,
149, 158, 172measurement, 104, 142,
152, 159, 172representation, 103, 141,
149, 158, 172sharing, 173
persuasive intent, 77Persuasive Messaging System
(PMS), 149PMS server, 152
Persuasive Systems Design, 13model (PSD), 13
persuasive technology, 2, 3, 9,12, 98, 169

218
personalized, 169Philips DirectLife, 3, 10, 13physically active, 140posterior distribution, 107Preference for consistency, 25,
80principal component analysis,
83, 88principle of proportionality, 178prior distribution, 30, 107privacy, 177promoting stair usage, 140
random effects, 8, 30randomized probability match-
ing, 108, 153, 160reach, 6reactance, 22, 137
theory, 22Reciprocity, 23reinforcement, 17
scheme, 17repetition, 18representation, 8, 103resistance to persuasion, 112revolving door, 105
sales tactic, 58Scarcity, 22shrinkage, 106Smart meter, 11SMS intervention, 123social dilemma, 23social influence strategy (see in-
fluence strategy), 14social proof, 19, 21sources, 18
multiple, 18single, 18
stability over time, 47
state, 31Stein estimation, 106strategy × . . . interactions, 99survival task, 59susceptibility, 5, 79, 116, 170
high, 117low, 117
Susceptibility to Persua-sive Strategies Scale(STPS), 34, 79, 116,123, 171
composite scores, 89correlation with NfC, 91,
122full version, 85internal reliability, 89, 93short, 80sub-scales, 85
tailoring, 11, 26, 175technology-mediated communi-
cation, 6text messages, 123The Media Equation, 2trait, 31, 41, 172
ubiquitous computing, 3, 12,178
privacy, 178upper-bound, 31

List of Figures
1.1 Graphical representation of the structure of this thesis.The insight generation chapters explore several questionsregarding influence strategies using an experimental ap-proach. In the case studies chapters these findings arevalidated in several field studies. . . . . . . . . . . . . . 6
2.1 Two axis model as presented in Kaptein et al. (2009b). . 15
3.1 Comparison of heterogeneity in the effects of influencestrategies with the average effects of those strategies.The solid black vertical lines are the estimated averageeffects of each strategy, as compared with the controlmessage. The black curves are the estimated normal dis-tribution of strategy effects for the population, while thegray curves are the density of the estimates of the strat-egy effects for this sample. Estimates are from ModelC. . . . . . . . . . . . . . . . . . . . . . . . . . . . . . . 37
3.2 Estimated influence strategy effects for each participantin Model C, as compared to the control messages. Notethat for some individuals, the estimated effect of onestrategy is negative, while the estimated effect of anotherstrategy is positive. . . . . . . . . . . . . . . . . . . . . . 39
3.3 Appearance of the bookstore in Study 2. The authoritystrategy is implemented in the orange box just below thetitle of the book. The evaluation questions and the tasksfor participants appeared in the bottom bar. . . . . . . . 42
3.4 Summed raw book evaluations for two participants se-lected to illustrate variation and consistency in responsesto influence strategies over the three sessions. . . . . . . 44
3.5 Appearance of the Musicstore Study. The vertical bar onthe left is used to present assignments and questions toparticipants while they can freely browse the online store. 48
219

220
4.1 The effects of choice and disclosure on compliance.Shown are the estimated marginal means and standarderrors of the compliance scores. On the x-axis, are thethree choice levels, and the two separate lines representthe two disclosure conditions. . . . . . . . . . . . . . . . 63
4.2 The effects of choice and disclosure on the perceived use-fulness of the advice. Shown are the estimated marginalmeans and standard errors of the usefulness scores. . . . 64
4.3 The effects of the use of single or multiple strategies,either authority or consensus and congruent or incongru-ent, on compliance. . . . . . . . . . . . . . . . . . . . . . 67
4.4 The effects of the use of single or multiple strategies, ei-ther authority or consensus and congruent or incongruentadvice on compliance in Study 3. . . . . . . . . . . . . . 72
4.5 Model based click-through behavior based on the dif-ferent advertisement versions. Solid lines represent av-erage of the click-through for single strategy adver-tisements (black) and multiple strategy advertisements(gray). Dotted lines represent individual advertisements. 76
5.1 Scree plot showing the eigenvalues (y-axis) of each of theextracted components (x-axis). A clear increase is visiblefrom component 6 upwards indicating a proper fit of asix factor solution. . . . . . . . . . . . . . . . . . . . . . 89
6.1 Example of a persuasion profile. Dots represent the esti-mated effect of the respective persuasive strategies, whilethe bars represent the certainty around this estimate. . 101
6.2 Graphical representation of a user entering the building(from below). The user is identified, and a message isdisplayed on the screen. Next,the user chooses betweenthe sliding door (left) and the revolving door (right). . 105
6.3 Progression of point estimates and certainty of 2 mes-sages for four users, one from each group. . . . . . . . . 110
7.1 Overview of the average number of snacks eaten each dayby our participants separated for the three experimentalconditions. . . . . . . . . . . . . . . . . . . . . . . . . . . 129
221
7.2 Overview of the number of snacks eaten each day by ourparticipants with superimposed the regression lines of theeffects over time of the different conditions. . . . . . . . 131
7.3 Overview of the perceived healthiness of daily nutritionscore for participants with superimposed the regressionlines of the effects over time of the different conditions. . 133
7.4 Overview of the usefulness ratings over time. Added arethe estimated regression lines of the effect of time. . . . 134
8.1 Schematic setup of our adaptive persuasive system. Blue-tooth scanners are present at the building entrance andat each of the floors. . . . . . . . . . . . . . . . . . . . . 144
8.2 Overview of the estimated effectiveness of different socialinfluence strategies for two users of the APStairs system. 146
8.3 Comparison of the success-rates in the two experimentalconditions during the 5 work-weeks of deployment of thesystem. . . . . . . . . . . . . . . . . . . . . . . . . . . . 147
8.4 Overview of kinder-kleertjes.com: Left the home page, inthe middle a product presentation page. The implemen-tation of the persuasive strategies are shown on the rightwith their position on the product presentation page in-dicated by the arrow. . . . . . . . . . . . . . . . . . . . . 159
8.5 Progression of between-user (overall average) effective-ness estimates of the three strategies and indications ofthe certainty of the estimates. Initially the estimates arevery variable but over time they stabilize. The dates onthe x-axis are jittered to increase readability. Error barsare conservative and based on between user variance noton the total number of observations. . . . . . . . . . . . 162
8.6 Estimated effectiveness of the different persuasive strate-gies for two randomly selected users (out of those whoviewed more than 8 products)—x-axis denotes the num-ber of products viewed. . . . . . . . . . . . . . . . . . . 163
8.7 Progression of between-user (overall average) effective-ness estimates of the three strategies and indications ofthe certainty of the estimates. As in the first evaluationthe products displayed accompanied by a social influencestrategy on average have higher conversion rates. . . . . 164
222
8.8 Comparison of estimated conversion rates for consumersin the holdout condition—those visiting the no strat-egy version of the website—and consumers in the testcondition—those looking at the adaptive persuasive sys-tem. . . . . . . . . . . . . . . . . . . . . . . . . . . . . . 165
8.9 Forest plot of the meta-analysis using a fixed effect modelof the two studies comparing adaptive and random strat-egy selection. . . . . . . . . . . . . . . . . . . . . . . . . 167

List of Tables
3.1 Influence strategies and their respective implementationsas used in Study 1. . . . . . . . . . . . . . . . . . . . . . 33
3.2 Table comparing the preferred model (C), in which eachof the strategy effects vary by person, with the modelwithout varying effects of strategies by person (A), andthe model which includes heterogeneity only for the con-trol vs. strategy contrast (B). Presented are the degreesof freedom (df), Bayesian Information Criteria, BIC, thelog-likelihood, logLik of each of the models, and the χ2
and p-value for the model comparisons. . . . . . . . . . 363.3 Estimates of fixed effects in the preferred model. Using
the control messages as the reference, each of the pointestimates of the average effect of the influence strategieson book evaluations is positive. Empirical p-values com-puted with draws from the posterior using MCMC (seeBaayen et al., 2008). . . . . . . . . . . . . . . . . . . . . 36
3.4 Summary of random effects in Model C. The square rootof the diagonal elements of Σβ are the first four rowsof the standard deviation column, while the remainingentries are presented as correlations to the right. . . . . 38
3.5 Table examining the use of demographic and meta-judgmental measures. While both aid significantly inexplaining the variance in responses to social influ-ence strategies, explicitly modeling heterogeneity is stillpreferable according to the log-likelihood comparisons. . 40
3.6 Influence strategies and their respective implementationsas used in Study 2. . . . . . . . . . . . . . . . . . . . . . 43
3.7 Table comparing Model E with a model without varyingeffects of strategies by person (Model D). The compari-son shows stable heterogeneity in responses to influencestrategies over the three sessions. . . . . . . . . . . . . . 45
223

224
3.8 Summary of random effects of Model E. The squareroot of the diagonal elements of Σ(s)
β and Σ(t)β are rows
one to three and four to six of the standard deviationcolumn respectively, while the remaining entries of eachare presented as correlations to the right. . . . . . . . . 46
3.9 Table comparing the Model D with models using demo-graphic or meta judgmental measures of personality. . . 47
3.10 Influence strategies and their respective implementationsas used in the Bookstore Study. . . . . . . . . . . . . . . 49
3.11 Influence strategies and their respective implementationsas used in the Musicstore Study. . . . . . . . . . . . . . 50
3.12 This table shows a comparison of a model without anyeffects of strategy with models that include an overallstrategy effect or a strategy specific effect. It is clearthat the model with varying specific strategy effects byindividual is preferred. . . . . . . . . . . . . . . . . . . . 53
3.13 Summary of the random effects of Model H. The squareroot of the diagonal elements of Σβ are the first threerows of the SD column. The remaining entries are pre-sented as correlations (Corr). . . . . . . . . . . . . . . . 53
3.14 Table comparing the Model F with models using demo-graphic or meta judgmental measures of personality. . . 54
4.1 Post-hoc comparisons of the experimental conditions inStudy 2. SS=Single strategy, MS=Multiple strategies,Auth=Authority, Cons=consensus, Congr=congruent,Incongr=incongruent. . . . . . . . . . . . . . . . . . . . 68
4.2 Post-hoc comparisons of the experimental conditions inStudy 3. SS=Single strategy, MS=Multiple strategies,Auth=Authority, Cons=consensus, Congr=congruent,Incongr=incongruent. . . . . . . . . . . . . . . . . . . . 72
4.3 The number of views and the click-through rate of theadvertisements used in Study 4. . . . . . . . . . . . . . . 75
5.1 The 12 susceptibility items—presented per influencestrategy—that compose together the short-STPS. . . . 82
5.2 Component loadings based on a principal componentsanalysis with oblimin rotation for the 12 items of theshort-STPS. Loadings smaller than .3 are suppressed. . 84

225
5.3 Items used in the development of the STPS. Itemsmarked with * are selected after the principal componentanalysis. . . . . . . . . . . . . . . . . . . . . . . . . . . . 86
5.3 Items used in the STPS (. . . continued) . . . . . . . . . 875.3 Items used in the STPS (. . . continued) . . . . . . . . . 885.4 Component loadings based on a principal components
analysis with oblimin rotation for 32 items of the STPS.Loadings smaller than .3 are suppressed. . . . . . . . . . 90
5.5 Overview of the composite scores of the STPS. Pre-sented are the mean, standard deviation, and Cronbach’sα of each of its sub-scales. . . . . . . . . . . . . . . . . . 91
5.6 Model comparisons of the preferred model of Study 1,Chapter 3, and a model with interactions of STPS scoreson the appropriate strategies and the strategy in use. . . 92
6.1 Overview of the simulated data for the 4 different usergroups. . . . . . . . . . . . . . . . . . . . . . . . . . . . . 109
7.1 Results study 1a: Percentage of respondents respondingfavorably. . . . . . . . . . . . . . . . . . . . . . . . . . . 119
7.2 Results study 1b: Percentage of respondents respondingfavorably. . . . . . . . . . . . . . . . . . . . . . . . . . . 120
7.3 Results study 2: Percentage of respondents respondingfavorably. . . . . . . . . . . . . . . . . . . . . . . . . . . 122
7.4 The messages used in the intervention. For each of thefour social influence strategies used in this trial threeimplementations are used. . . . . . . . . . . . . . . . . . 125
7.5 Comparing the null model with models including a timeeffect and different time effects for each condition. . . . 131
7.6 Overview of the fixed effects of the model including aninteraction between time and condition to predict snack-ing behavior (Model D). Empirical p-values are basedon MCMC simulations. . . . . . . . . . . . . . . . . . . 132
7.7 Overview of the fixed effects of the model including aninteraction between time and condition predicting per-ceived healthiness of nutrition. . . . . . . . . . . . . . . 133
7.8 Overview of the fixed effects of the model including aninteraction between time and condition predicting per-ceived usefulness of the received message. . . . . . . . . 134

226
8.1 Influence strategies and their implementations as used inthe APstairs system. . . . . . . . . . . . . . . . . . . . . 143
8.2 Influence strategies and their implementations in persua-sive messaging system. . . . . . . . . . . . . . . . . . . . 151
8.3 Overview of the data from the persuasive messaging sys-tem evaluation. . . . . . . . . . . . . . . . . . . . . . . . 154
8.4 Model Comparisons used for the analysis of the persua-sive messaging system evaluation. . . . . . . . . . . . . . 155
8.5 Coefficients of the fixed effects of Model D. The tableshows that over time (Frequency) the success of theemail reminders decreases. This decrease over time issignificantly smaller in the adaptive condition than inthe baseline condition. . . . . . . . . . . . . . . . . . . . 156
8.6 Fixed effects of the logistic regression model predictingthe drop-out probability of users in the PMS trial. . . . 156