How Unified is the Australian Agricultural Sector when ... - OSF
24
SocArXiv SocArXiv Preprint : 4 May 2002 10.31235/osf.io/4nge5 How unified is the Australian agricultural sector when talking to policy makers about digitalization? Andrew Terhorst CSIRO Data61 Robert Garrard CSIRO Land & Water Abstract Technological advances are transforming agriculture in many parts of the world. De- spite the importance of agriculture to its economy, Australia lags behind other advanced economies in the adoption of digital agricultural technology. The country risks losing its comparative advantage due to a weak policy around digital agriculture. This study com- bines network analysis and natural language processing to assess 654 public submissions to six government inquiries addressing agricultural innovation, the digital economy, and ru- ral broadband communication networks, held between 2016 and 2018. The analysis shows there is no consistent narrative driving policy development around digital agriculture. A fragmented policy landscape is a concern because it means that current and emerg- ing policies may not address key issues, resulting in sub-optimal outcomes for Australian agriculture. Keywords : Australia, agricultural policy, digital transformation, natural language processing, network analysis. 1. Introduction Technological advances are transforming agriculture in many parts of the world (Daum 2018). Digital agriculture helps farmers increase yields through data-driven decisions and technolo- gies and contributes to improved supply chain transparency (Watanabe et al. 2018; Nolet 2018; Burroughs and Burroughs 2020; Chen 2020; Garrard and Fielke 2020). Moreover, digi- tal agriculture can help improve food security and resilience to the effects of climate change (Raheem et al. 2019). In Australia, the agricultural sector comprises a relatively small proportion of the economy, accounting for approximately 2-3% of the gross domestic product. However, it is crucial not only for feeding the domestic population but also as a significant exporter of premium agricultural products to international markets. Approximately 77% of Australian agricultural
-
Upload
khangminh22 -
Category
Documents
-
view
1 -
download
0
Transcript of How Unified is the Australian Agricultural Sector when ... - OSF
SocArXiv SocArXivPreprint : 4 May 2002 10.31235/osf.io/4nge5
How unified is the Australian agricultural sector when
talking to policy makers about digitalization?
Andrew TerhorstCSIRO Data61
Robert GarrardCSIRO Land & Water
Abstract
Technological advances are transforming agriculture in many parts of the world. De-spite the importance of agriculture to its economy, Australia lags behind other advancedeconomies in the adoption of digital agricultural technology. The country risks losing itscomparative advantage due to a weak policy around digital agriculture. This study com-bines network analysis and natural language processing to assess 654 public submissions tosix government inquiries addressing agricultural innovation, the digital economy, and ru-ral broadband communication networks, held between 2016 and 2018. The analysis showsthere is no consistent narrative driving policy development around digital agriculture.A fragmented policy landscape is a concern because it means that current and emerg-ing policies may not address key issues, resulting in sub-optimal outcomes for Australianagriculture.
Keywords: Australia, agricultural policy, digital transformation, natural language processing,network analysis.
1. Introduction
Technological advances are transforming agriculture in many parts of the world (Daum 2018).Digital agriculture helps farmers increase yields through data-driven decisions and technolo-gies and contributes to improved supply chain transparency (Watanabe et al. 2018; Nolet2018; Burroughs and Burroughs 2020; Chen 2020; Garrard and Fielke 2020). Moreover, digi-tal agriculture can help improve food security and resilience to the effects of climate change(Raheem et al. 2019).
In Australia, the agricultural sector comprises a relatively small proportion of the economy,accounting for approximately 2-3% of the gross domestic product. However, it is crucialnot only for feeding the domestic population but also as a significant exporter of premiumagricultural products to international markets. Approximately 77% of Australian agricultural
2 How Unified is the Australian Agricultural Sector?
output is exported1. Australia enjoys a comparative advantage in agricultural production dueto its large endowment of arable land2. Technological advancement allows for productivitygains, such that more output can be produced with fewer resources3. If Australian agricultureis unable to adopt new technology at a similar rate to other countries, it risks losing thatcomparative advantage. Losing comparative advantage could result in short-run economicpain for Australia if resources currently employed in agriculture slowly reallocate to othersectors.
Preconditions for the uptake of digital tools by farms and agribusiness include access tohigh-speed internet, having sufficient digital literacy, and a coherent legal framework for thegovernance of digital assets (Jakku et al. 2018; Tirado-Morueta et al. 2018; Zhang et al. 2018;Wiseman et al. 2019). The recent rollout of the National Broadband Network (NBN) hashighlighted several gaps in government policy. For instance, the use of hybrid technologiescomplicate policy development as network capability varies according to the technology used.Neither is the planning of digital infrastructure across different levels of government (local,state, and federal levels) well coordinated. Some confusion exists among policymakers aboutthe role of government versus the private sector in developing the digital economy (Alizadeh2017). There is a need for coherent and integrated policy to support the uptake of digitaltools in agriculture.
One channel for affecting government policy in Australia is electronic submissions to parlia-mentary inquiries. Parliamentary inquiries direct a parliamentary committee to inquire intoa topic of interest, usually providing terms of reference determining the scope of the inquiry.When a committee begins an inquiry, it solicits views and opinions from interested membersof the public, both individuals and organizations, with online lodgement of these submissionsbeing preferred. Submissions are screened for relevance to the terms of reference and arepublished on the inquiry’s website. Public hearings usually follow after submissions close anda report is presented to parliament.4.
In this article, we use a combination of network analysis and natural language processing(NLP) to investigate 654 submissions to six Australian parliamentary inquiries relating tothe digital economy. As many other sectors stand to gain from the digital economy, thereis a concern the views of the agricultural sector may be drowned out by other sectors withcompeting interests, such as priority for obtaining NBN access. Our research question is “towhat extent is the agricultural sector unified regarding policy development around the digitaleconomy?”. Answering this question may help the agricultural sector better coordinate itsapproach to the emerging digital economy. We classified each submission as either relatingto the agricultural sector or not by keyword search on terms contained in the document. Wesought to determine whether submissions within the agricultural sector and across inquiriesare similar to each other, suggesting a consistent message, or whether submissions acrosssectors and within inquiries are most similar. We constructed a network linking submissionsthat were sufficiently similar according to their cosine similarity.
Our methodology is similar to that of Asher et al. (2019), who use social network analysis
1See https://www.nff.org.au/farm-facts.html2data.worldbank.org/indicator/AG.LND.AGRI.K2?most recent value desc=true3Although technology does not necessarily lower the input requirements of other resources in all cases. It
depends on whether the technology and other inputs to production are substitutes or complements (Brezina2010).
4See www.aph.gov.au/Parliamentary Business/Committees/House/Making a submission
SocArXiv 3
and NLP to analyse Twitter conversations surrounding parliamentary debates triggered bye-petitions in the United Kingdom. However, our network consists of similarities betweenwhole documents rather than terms frequently used together, although we also capture thisusing bigram frequency within each inquiry. Koltsova and Koltcov (2013) used NLP to mappublic discourse around the 2011-12 Russian presidential election and associated protests byconducting topic modelling on posts harvested from the blog website “LiveJournal”. Here,we also conducted topic modelling and sentiment analysis to extract the main concerns andsentiments being expressed in submissions from both the agricultural and non-agriculturalsectors across inquiries.
We found that the agricultural sector documents tended to be linked more often to non-agricultural sector documents within the same inquiry rather than agricultural documentsin other inquiries. Results of the NLP analysis were also consistent with this finding. Thisindicates the absence of a truly unified message regarding digitalization in the agriculturalsector. However, this does not rule out that such coordination does not exist in other policychannels, nor that successful agricultural policies cannot be achieved in the face of fragmentedpolitics (Hadwiger 1992).
2. Methodology
This study used a combination of natural language processing and network analysis to assess654 public submissions across 6 government inquiries. Manually assessing this many sub-missions in one study would be tedious and time-consuming. Natural language processingallows one to scan hundreds of submissions in a matter of minutes. One can easily surfaceabstract topics hidden in submissions. These can offer interesting insights into key concernsthe public may have. Combining natural language processing with network analysis allowsone to identify relationships between submissions. This is important for identifying commonpolicy concerns across the different inquiries and sectors.
2.1. Data sources
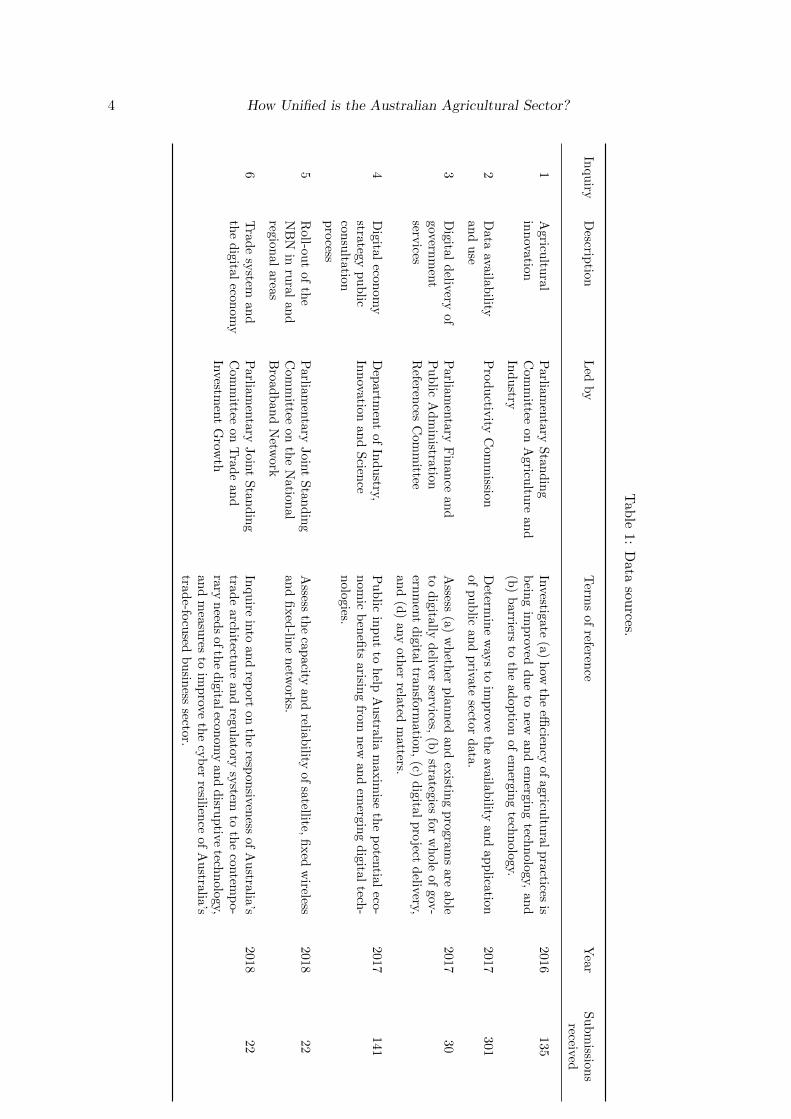
We searched the Parliament of Australia website for inquiries held by senate, house, andrelated joint committees5. Our criteria for inclusion into the data set were that the inquiryhad to relate to digitalization, digital economy, or agricultural innovation, according to itsterms of reference; and that the inquiry was completed sometime between 2011 and 2018,corresponding to the rollout of the NBN. We were able to find 6 relevant inquiries which hadpublished a total of 654 submissions. Table 1 lists the terms of reference, year, and totalnumber of public submissions received by each inquiry.
Submissions were downloaded from each inquiry’s website or from shared folders. Apartfrom those submissions relating to the digital economy strategy consultation process, allsubmissions were downloaded as PDF documents. The digital economy strategy consultationprocess accepted submissions captured via a web form, contained in email messages, and asemail attachments (attached documents). Non-PDF submissions were all converted into PDFfor the text analysis.
5www.aph.gov.au/Parliamentary Business/Committees
4 How Unified is the Australian Agricultural Sector?
Tab
le1:
Data
sources.
Inqu
iryD
escriptio
nL
edby
Term
sof
reference
Year
Subm
issions
received
1A
gricultu
ralin
novation
Parlia
men
tary
Sta
nd
ing
Com
mittee
on
Agricu
lture
an
dIn
dustry
Investig
ate
(a)
how
the
efficien
cyof
agricultu
ralpractices
isb
eing
improv
eddu
eto
new
and
emergin
gtech
nology,
and
(b)
barriers
toth
ead
option
ofem
erging
technology.
2016135
2D
ataava
ilab
ilityan
duse
Pro
ductiv
ityC
om
missio
nD
etermin
ew
ays
toim
prove
the
availability
and
app
licationof
pub
licand
priva
tesector
data.
2017301
3D
igital
delivery
of
governm
ent
services
Parlia
men
tary
Fin
an
ceand
Pu
blic
Ad
min
istratio
nR
eferences
Com
mittee
Assess
(a)
wheth
erp
lann
edan
dex
isting
program
sare
able
todig
itally
deliver
services,
(b)
strategiesfor
whole
ofgov
-ern
men
tdig
ital
tran
sformation
,(c)
digital
pro
jectdelivery,
and
(d)
any
oth
errelated
matters.
201730
4D
igital
econom
ystrateg
ypu
blic
consu
ltationpro
cess
Dep
artm
ent
of
Indu
stry,In
novatio
nand
Scien
ceP
ublic
inp
ut
tohelp
Au
straliam
axim
iseth
ep
otential
eco-nom
icb
enefi
tsarisin
gfrom
new
and
emergin
gd
igitaltech
-nolo
gies.
2017141
5R
oll-o
ut
of
the
NB
Nin
rural
and
region
alareas
Parlia
men
tary
Join
tS
tandin
gC
om
mittee
on
the
Natio
nal
Bro
adb
and
Netw
ork
Assess
the
cap
acity
and
reliability
ofsatellite,
fixed
wireless
and
fixed
-line
netw
orks.
201822
6T
rade
system
and
the
dig
italecon
om
yP
arliam
enta
ryJoin
tS
tandin
gC
om
mittee
on
Tra
de
an
dIn
vestm
ent
Grow
th
Inqu
irein
toand
report
onth
eresp
onsiven
essof
Australia’s
trad
earch
itecture
and
regulatory
system
toth
econ
temp
o-ra
ryn
eeds
ofth
edigital
econom
yan
dd
isruptive
technology,
and
mea
sures
toim
prove
the
cyb
erresilien
ceof
Australia’s
trad
e-focu
sedbu
siness
sector.
201822

SocArXiv 5
Table 2: Corpus statistics. Relevant submissions refers to submissions determined to be related todigitalization in agriculture according to a keyword search on each document.
Inquiry Totalsubmissions
Relevantsubmissions
% Minwords
Maxwords
Meanwords
Agricultural innovation 135 34 25.2 898 69838 5784
Data availability & use 301 26 8.6 964 40475 8135
Digital delivery of governmentservices
30 1 3.3 27574 27574 27574
Digital economy strategy 143 50 35.0 585 26364 6874
NBN roll-out in rural/regionalareas
22 5 22.7 1276 5994 3138
Trade systems & the digitaleconomy
23 3 13.0 1573 3181 2516
654 119
2.2. Pre-processing
We created a corpus by loading by all PDF documents using the R programming language(R Core Team 2019). First, we removed document control characters, numbers, and universeresource locator (URL) references from the corpus. The corpus was then filtered to extractonly those submissions that referenced agriculture or digital technologies. Essentially, thisinvolved filtering documents that either included the morphemes “agri” or “farm” in the caseof the non-agriculture specific inquiries, or the morphene “digit” in the case of the inquiry intoagricultural innovation. This allowed us to classify each submission in the corpus as relatingto digitalization in agriculture or not.
We removed all punctuation and accents, and converted all the words to lower case. Unhelpfulterms were removed from the corpus. This involved limiting the vocabulary and removingstop words (e.g. a, the, we, to, too, this, that, with, when, etc.). A custom dictionarywas created to limit the vocabulary. The custom dictionary included 122806 words from theGrady Augmented word list in the QdapDictionaries package (Rinker 2013) and a list ofcomputing and IT abbreviations6. Stop words are rarely informative about the content of atext. Removing unhelpful terms from the corpus has the benefit of reducing the size of thedata, reducing computational load, and in some cases, also improving accuracy (Welbers et al.2017). Submissions to each inquiry often refer to the inquiry terms of reference. Repeatedreferences to the terms of reference or inquiry itself, can skew word counts and suppress inter-esting sub-texts (interesting content that distinguishes each submission). Hence, additionalfiltering was required to remove repeated references to the inquiry in question.
Each submission in the corpus was then broken down into a list of unigrams (single words) orbigrams (paired words such as“digital technologies”and“cyber security”). Table 2 summarizeskey statistics for the set of unigrams.
6Sourced from en.wikipedia.org/wiki/List of computing and IT abbreviations.
6 How Unified is the Australian Agricultural Sector?
2.3. Network analysis
The aim of the network analysis was to link entities expressing common concerns in theirsubmissions using network analysis. A network was created by measuring the semantic dis-tance between submissions to determine similarity, and then applying a threshold to createedges linking between documents. To measure document similarity, we first constructed a listof unique words that appear in the entire corpus and determine how frequently each wordappears in each document.
We applied word stemming to the corpus to reduce inflectional and derived forms of a wordto a common base or root form. It is easier to relate documents using base or root forms ofwords compared to using morphological variants of words. We computed the“term frequency-inverse document frequency” (tf-idf) statistic for each word in the word-stemmed corpus.This statistic measures the relative importance of a word within each document in a corpus.Essentially, the importance of a word increases proportionally to the number of times itappears in each submission but is offset by how frequently the word appears in the corpus asa whole. The corpus was then transformed into a document-feature matrix, representing thetf-idf weight of stem words for each document in the corpus. Rows of this matrix correspondto each document, columns correspond to the set of unique stem-words in the corpus, andeach entry in the matrix is the tf-idf statistic corresponding to that document and word.
We measured similarity between two documents according to the cosine similarity of theircorresponding rows in the tf-idf matrix7. Cosine similarity measures the extent to whichdocuments share “important” stem words, and ranges from 0 (no similarity) to 1 (completelysimilar).
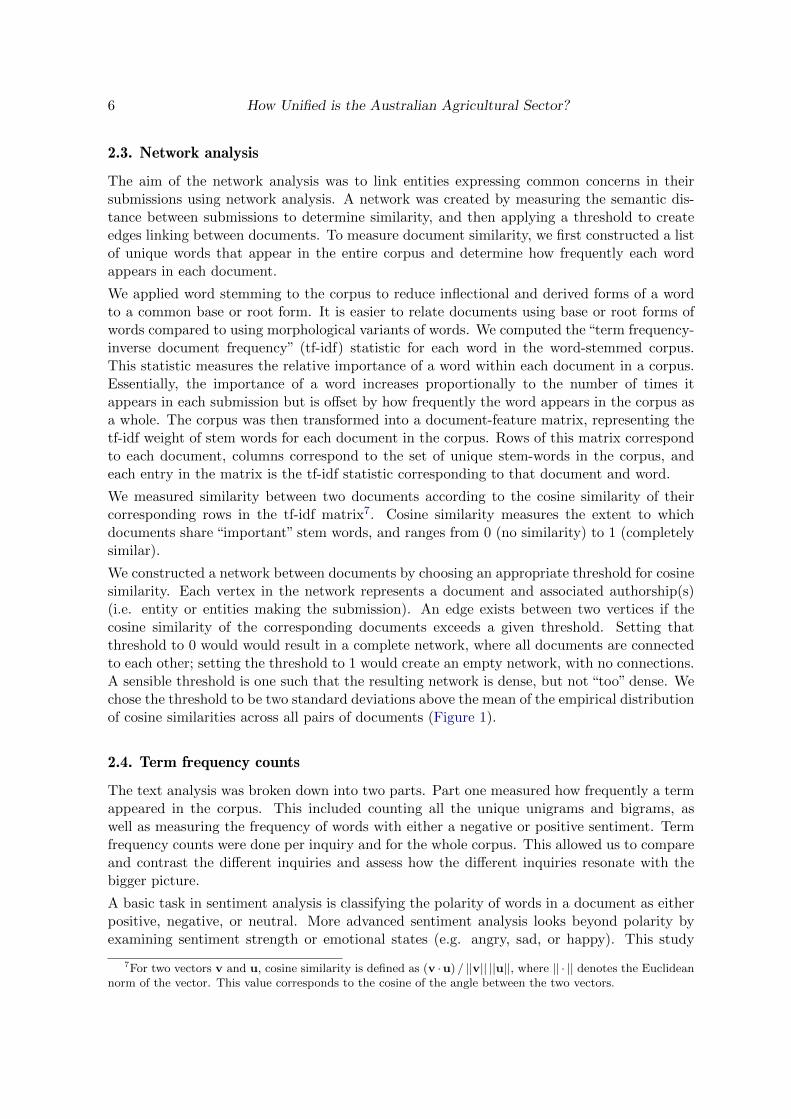
We constructed a network between documents by choosing an appropriate threshold for cosinesimilarity. Each vertex in the network represents a document and associated authorship(s)(i.e. entity or entities making the submission). An edge exists between two vertices if thecosine similarity of the corresponding documents exceeds a given threshold. Setting thatthreshold to 0 would would result in a complete network, where all documents are connectedto each other; setting the threshold to 1 would create an empty network, with no connections.A sensible threshold is one such that the resulting network is dense, but not “too” dense. Wechose the threshold to be two standard deviations above the mean of the empirical distributionof cosine similarities across all pairs of documents (Figure 1).
2.4. Term frequency counts
The text analysis was broken down into two parts. Part one measured how frequently a termappeared in the corpus. This included counting all the unique unigrams and bigrams, aswell as measuring the frequency of words with either a negative or positive sentiment. Termfrequency counts were done per inquiry and for the whole corpus. This allowed us to compareand contrast the different inquiries and assess how the different inquiries resonate with thebigger picture.
A basic task in sentiment analysis is classifying the polarity of words in a document as eitherpositive, negative, or neutral. More advanced sentiment analysis looks beyond polarity byexamining sentiment strength or emotional states (e.g. angry, sad, or happy). This study
7For two vectors v and u, cosine similarity is defined as (v ·u) / ||v|| ||u||, where || · || denotes the Euclideannorm of the vector. This value corresponds to the cosine of the angle between the two vectors.
SocArXiv 7
0
3
6
9
0.0 0.1 0.2 0.3 0.4 0.5Cosine Similarity
Den
sity
Figure 1: Empirical distribution of cosine similarities between pairs of documents in the corpus.
only considered the polarity of words using the “Bing” lexicon, which contains 6786 words, ofwhich 4782 are classed negative and 2006 are classed positive (Hu and Liu 2004). Assessingsentiment on the polarity of words alone has limitations. For example, the phrase “this ispretty bad” expresses a negative sentiment but the words “pretty” and “bad” have oppositepolarity. Despite the high ratio of negative to positive words, and the inability to accountfor qualifiers before a word, the “Bing” lexicon has been shown to capture overall sentimentreasonably accurately (Silge and Robinson 2017).
By counting unigrams and bigrams and then assessing the overall sentiment in each submis-sion, we were able to obtain insights into what issues were of most concern to the entitiesmaking submissions, and how they felt about these issues. However, term frequency countsare unable to tell us much about abstract topics hidden in documents. The topic structure ishidden insofar as we can only observe the documents and words, not the topics themselves.Part two of the text analysis used more advanced statistical text analysis to surface thesehidden topics. Two natural language processing methods were employed to infer the topicstructure, namely Latent Dirichlet Analysis (LDA) and Word Vector Analysis. Both methodsassume that each document in a corpus contains a mix of topics found throughout the corpus.
2.5. Topic modelling using LDA
LDA is a probabilistic topic model and it treats each document as a mixture of topics andeach topic as a mixture of words. This allows documents to “overlap” each other in terms ofcontent, rather than being separated into discrete groups, in a way that mirrors typical useof natural language (Silge and Robinson 2017).
This study used the topicmodels package (Grun and Hornik 2011) to find topics of interestusing LDA. The LDA employed Gibbs sampling (Geman and Geman 1984) to randomly assignwords from each document to one of k topics. This random assignment generates inaccuratetopic representations of all the documents and word distributions of all the topics. To improve
8 How Unified is the Australian Agricultural Sector?
min
imiz
em
axim
ize
2 4 6 8 10 12 14 16 18 20 25 30 35 40 45 50 60 70 80 90 1002 4 6 8 10 12 14 16 18 20 25 30 35 40 45 50 60 70 80 90 1002 4 6 8 10 12 14 16 18 20 25 30 35 40 45 50 60 70 80 90 1002 4 6 8 10 12 14 16 18 20 25 30 35 40 45 50 60 70 80 90 100
0.00
0.25
0.50
0.75
1.00
0.00
0.25
0.50
0.75
1.00
number of topics
metrics:
Griffiths2004
CaoJuan2009
Arun2010
Deveaud2014
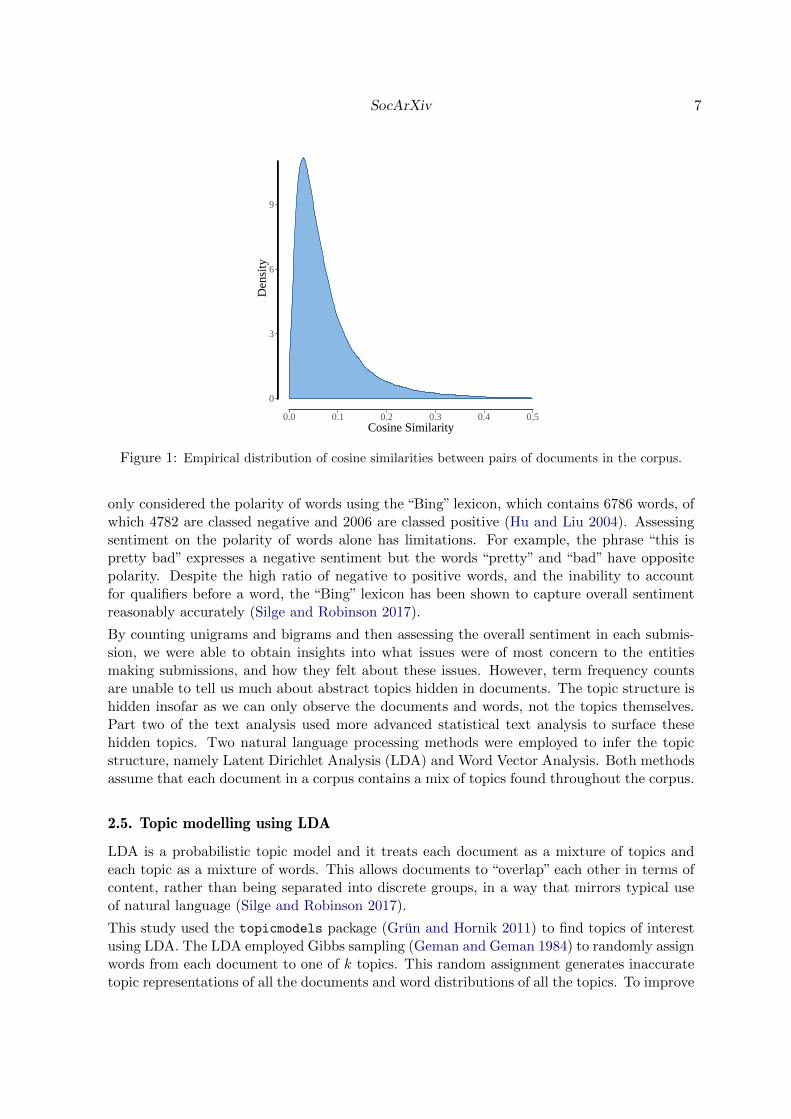
Figure 2: Finding the optimal number of topics to model using LDA. The plot indicates kshould be either 35 according to Arun et al. (2010), 50 according to Cao et al. (2009) andGriffiths and Steyvers (2004), or 18 according to Deveaud et al. (2014). This study usedk = 18.
the accuracy, the algorithm iterates through each document d and for each word w and foreach topic t in d, computes two things: P (topic t | document d) representing the proportionof words in document d that are currently assigned to topic t, and P (word w | topic t) repre-senting the proportion of assignments to topic t over all documents that come from this wordw. The algorithm then reassigns w to a new topic, where it samples topic t with probabilityP (topic t |document d) ·P (word w | topic t). Each iteration assumes all the topic assignmentsexcept for the current word in question are correct. The assignment of the current word isupdated using the assumed mixture of topics and mixture of words (topic model). This isrepeated either for a fixed number of iterations or until a steady state is reached, where theprobability of word w belonging to topic t and the probability of topic t belonging to documentd is high. We can estimate the topic mixtures of each document by counting the proportion ofwords assigned to each topic within that document, and the words associated to each topic bycounting the proportion of words assigned to each topic overall (Liu 2015). Determining thenumber of topics to model is always a challenge with LDA. This study used the ldatuning
package to find the optimal number of topics in a corpus (Nikita 2019). Figure 2 shows thethe optimal number of topics falls between 18 and 50. We chose to use the most parsimoniousvalue and set k = 18.
SocArXiv 9
2.6. Word vector analysis
Though LDA is effective for identifying topics defined by a dense mixture of words, it performsless well when attempting to identify topics with a low density of words. Word vector analysisis a relatively new approach to topic modelling that can deal with this limitation. The wordvector encodes the semantic relationship among words by examining the extent to which atarget word is embedded amongst other words (Mikolov et al. 2013).
A novel “skipgram” approach for word vector analysis was used in this study (Levy et al.2015). This approach, outlined by Moody (2017) and implemented in R by Silge (2017),uses a fixed-size sliding window to count how often a word is found near another word (inour case, we fixed the window to span 8 words). From this, one can calculate which wordpairs occurred together more often than expected based on how often they occurred on theirown (skipgram probabilities). When this number is high, the two words are associated witheach other and are likely to occur together. When this number is low, the two words are notassociated with each other and are unlikely to occur together. The probability of any twowords occurring together is then transformed into a sparse matrix from which word vectorscan be extracted (Levy et al. 2015). This involves compressing the sparse matrix into densesub-matrices that represent semantic relationships among words. These relationships are thendecomposed into word vectors using singular value decomposition. The final step is to applyprincipal component analysis (PCA) to the word vectors to identify topics (Shin et al. 2018).Lower order components are likely to contain general purpose words that account for the mostvariation in the corpus whereas higher order components are more likely to contain technicalor topical words.
3. Results
3.1. Network analysis
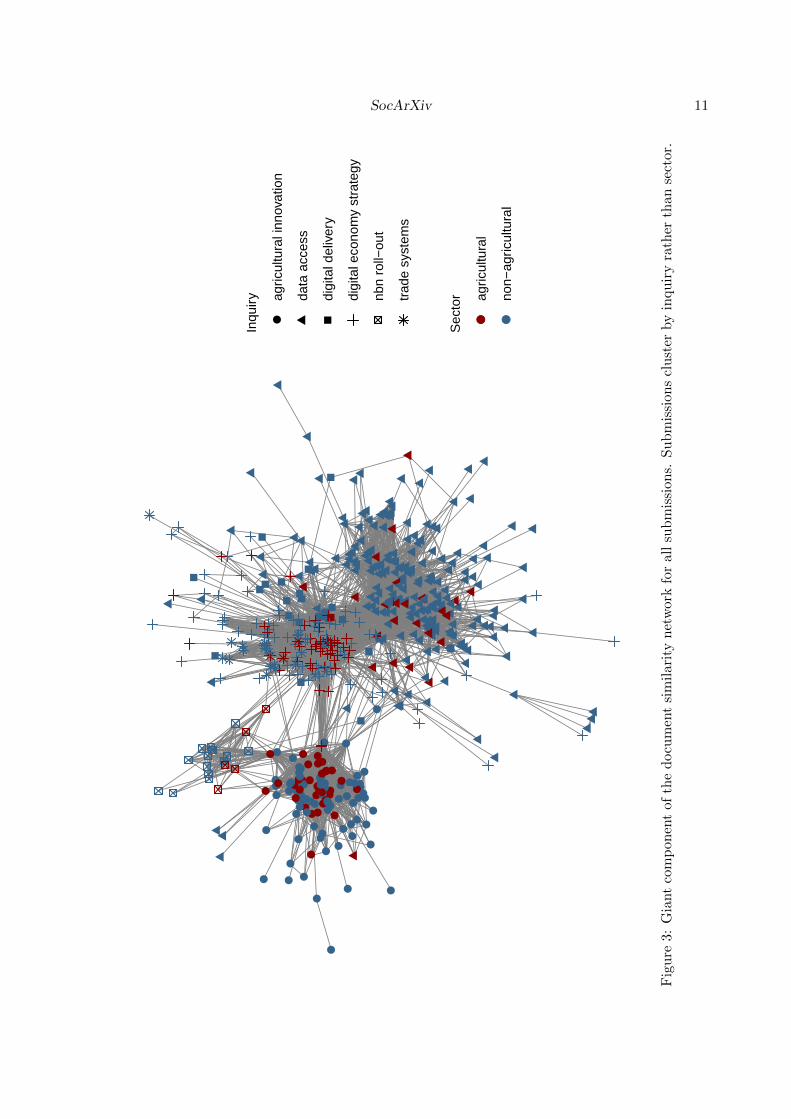
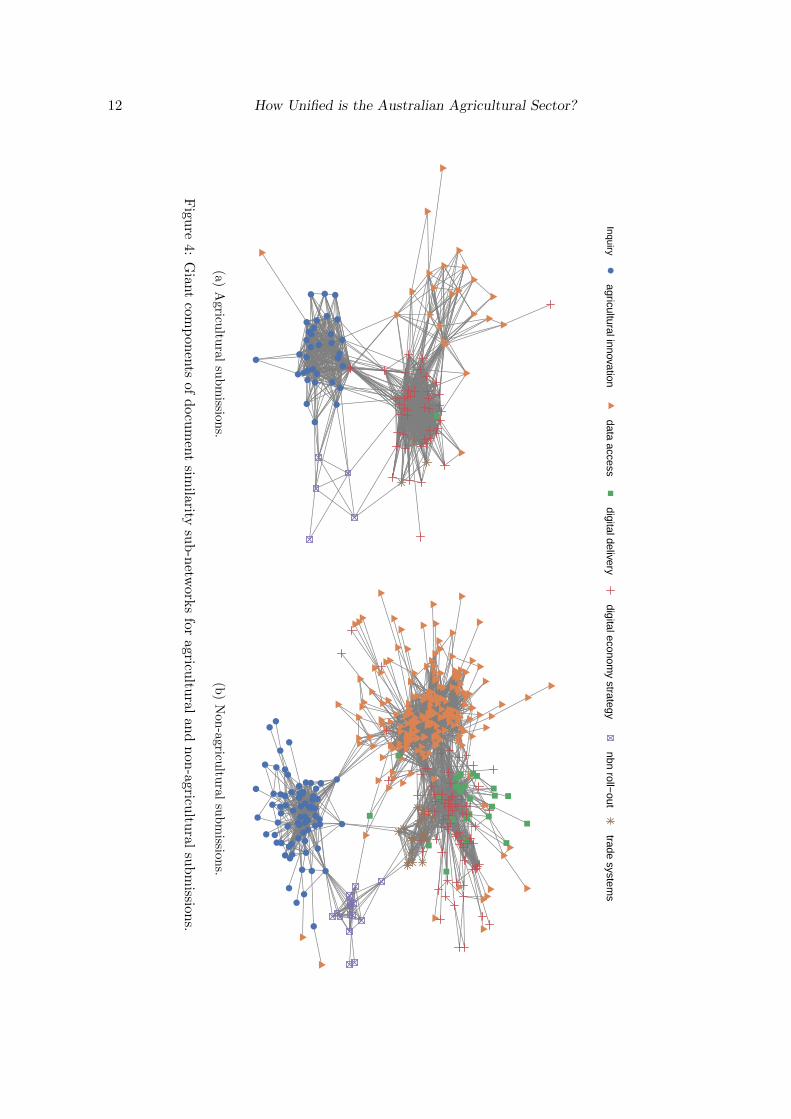
Figure 3 displays the similarity network for all documents. This network has a density of0.048, which is consistent with many real world networks (Melancon 2006)8. The algorithmused to construct the embedding for drawing the graph (Fruchterman and Reingold 1991)forces the graph to be separated into highly connected clusters. Figure 3 uses vertex symbolsto differentiate between the different inquiries and vertex colour to distinguish documents thatreference agriculture specifically and those that do not. Documents clearly cluster by inquiryrather than sector. This is further reinforced by Figure 4 which separates the corpus intotwo sub-networks, one relating to documents that refer to digital agriculture and the otherto documents that do not. We see that digital agriculture submissions also cluster by inquirywith very little between-inquiry connectedness. This level of connectedness is reflected inthe analogous network for non-digital agriculture submissions. We found digital agriculturesubmissions are more similar to non-digital agriculture submissions within the same inquirythan to other digital agriculture submissions in different inquiries. This is not unexpected,given submissions will tend to address the terms of reference for each parliamentary inquiry.
In what follows, we explore the results of our NLP analysis. We performed this analysis on thesubset of documents identified as relating to digital agriculture to elucidate the key concernsof this sector. However, we have also repeated this analysis on the non-digital agriculture
8Density here is defined to be the number of edges present divided by the number of possible edges.
10 How Unified is the Australian Agricultural Sector?
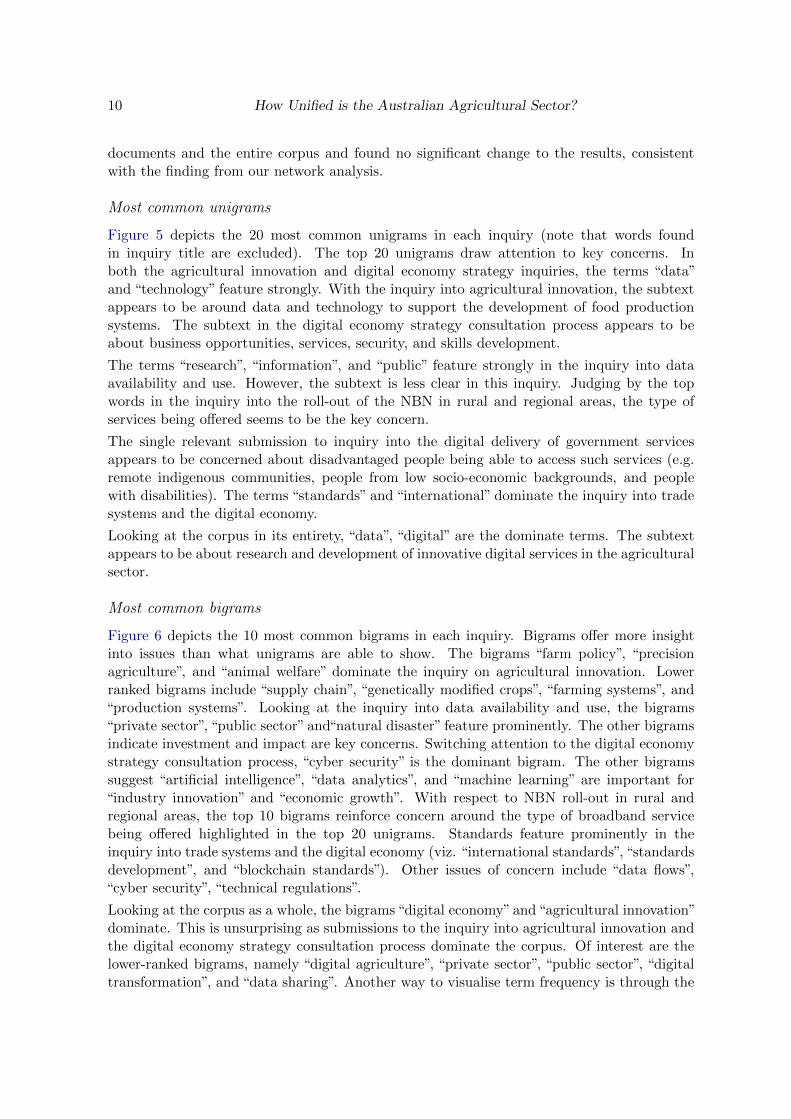
documents and the entire corpus and found no significant change to the results, consistentwith the finding from our network analysis.
Most common unigrams
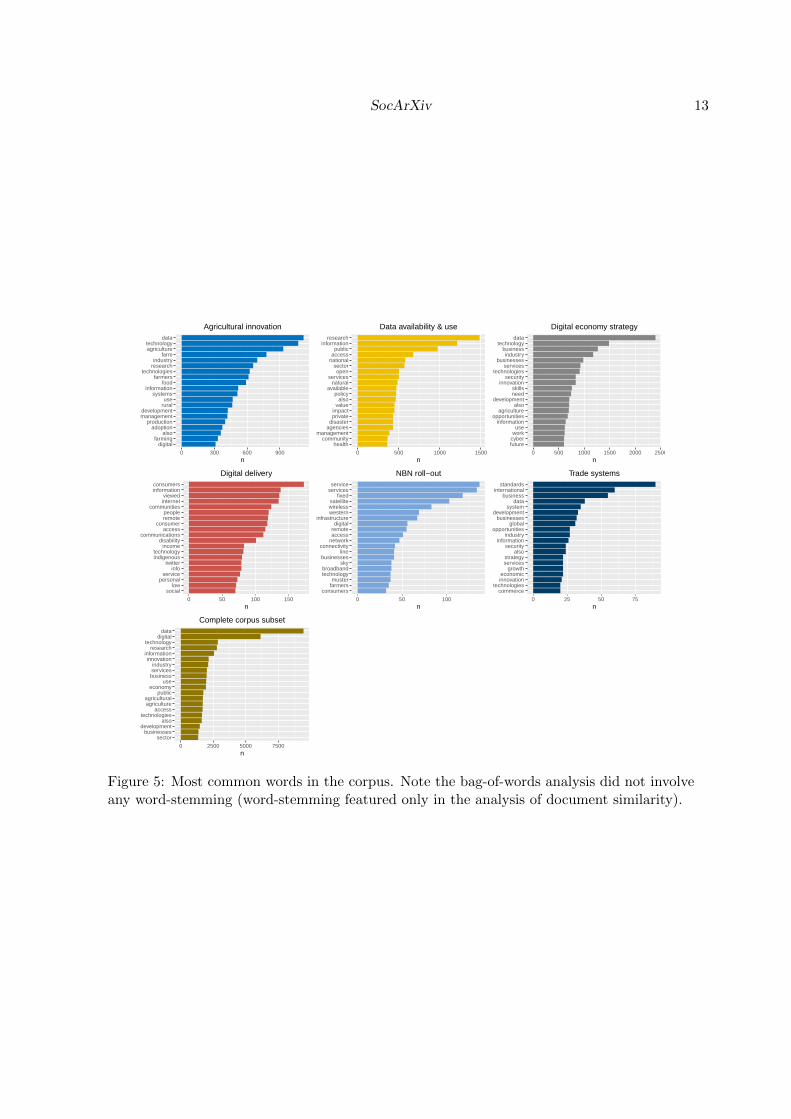
Figure 5 depicts the 20 most common unigrams in each inquiry (note that words foundin inquiry title are excluded). The top 20 unigrams draw attention to key concerns. Inboth the agricultural innovation and digital economy strategy inquiries, the terms “data”and “technology” feature strongly. With the inquiry into agricultural innovation, the subtextappears to be around data and technology to support the development of food productionsystems. The subtext in the digital economy strategy consultation process appears to beabout business opportunities, services, security, and skills development.
The terms “research”, “information”, and “public” feature strongly in the inquiry into dataavailability and use. However, the subtext is less clear in this inquiry. Judging by the topwords in the inquiry into the roll-out of the NBN in rural and regional areas, the type ofservices being offered seems to be the key concern.
The single relevant submission to inquiry into the digital delivery of government servicesappears to be concerned about disadvantaged people being able to access such services (e.g.remote indigenous communities, people from low socio-economic backgrounds, and peoplewith disabilities). The terms “standards” and “international” dominate the inquiry into tradesystems and the digital economy.
Looking at the corpus in its entirety, “data”, “digital” are the dominate terms. The subtextappears to be about research and development of innovative digital services in the agriculturalsector.
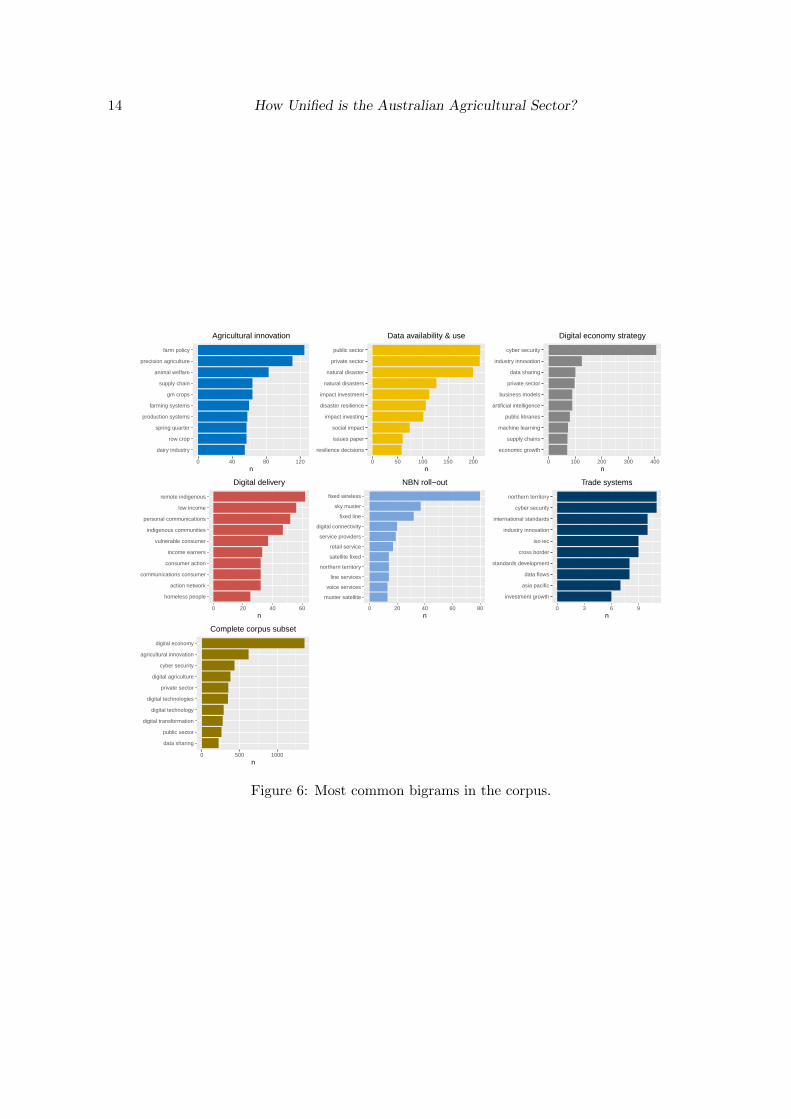
Most common bigrams
Figure 6 depicts the 10 most common bigrams in each inquiry. Bigrams offer more insightinto issues than what unigrams are able to show. The bigrams “farm policy”, “precisionagriculture”, and “animal welfare” dominate the inquiry on agricultural innovation. Lowerranked bigrams include “supply chain”, “genetically modified crops”, “farming systems”, and“production systems”. Looking at the inquiry into data availability and use, the bigrams“private sector”, “public sector” and“natural disaster” feature prominently. The other bigramsindicate investment and impact are key concerns. Switching attention to the digital economystrategy consultation process, “cyber security” is the dominant bigram. The other bigramssuggest “artificial intelligence”, “data analytics”, and “machine learning” are important for“industry innovation” and “economic growth”. With respect to NBN roll-out in rural andregional areas, the top 10 bigrams reinforce concern around the type of broadband servicebeing offered highlighted in the top 20 unigrams. Standards feature prominently in theinquiry into trade systems and the digital economy (viz. “international standards”, “standardsdevelopment”, and “blockchain standards”). Other issues of concern include “data flows”,“cyber security”, “technical regulations”.
Looking at the corpus as a whole, the bigrams “digital economy” and “agricultural innovation”dominate. This is unsurprising as submissions to the inquiry into agricultural innovation andthe digital economy strategy consultation process dominate the corpus. Of interest are thelower-ranked bigrams, namely “digital agriculture”, “private sector”, “public sector”, “digitaltransformation”, and “data sharing”. Another way to visualise term frequency is through the
SocArXiv 11
●
●
●●●
●
● ●●●
●
●
●●
●
●
●
●
●
●
●
●
●
●
●
●●
●
●
●
●
●
●●
●
●●
●●
●●●
● ●●
●
●●
●●
●●
●
●
● ●
●
●
●
● ●
●
●
●
●
●
●●●
●
●● ●●
●
●
●
●
●●●
●
●
●
● ●
● ●●
●
●●● ●●
●
●
● ●● ●●
●●
●
●●
●●
Inqu
iry
●ag
ricul
tura
l inn
ovat
ion
data
acc
ess
digi
tal d
eliv
ery
digi
tal e
cono
my
stra
tegy
nbn
roll−
out
trad
e sy
stem
s
Sec
tor
● ●
agric
ultu
ral
non−
agric
ultu
ral
Fig
ure
3:
Gia
nt
com
ponen
tof
the
docu
men
tsi
milar
ity
net
wor
kfo
ral
lsu
bm
issi
ons.
Su
bm
issi
on
scl
ust
erby
inquir
yra
ther
than
sect
or.
12 How Unified is the Australian Agricultural Sector?
Inquiry●
agricultural innovationdata access
digital deliverydigital econom
y strategynbn roll−
outtrade system
s
●
●
●●
● ●
● ●
●●
●
●
●
●
●●
●
●●
●● ●
●●
●
●
●
● ●
●
●
●
●
●
(a)
Agricu
ltural
subm
issions.
●
●
●
●
●
●●
●●
●
●
●
●●
●
●
●
●
●
●●
●
●●
●●
● ●● ●
●
●●
●
●
●
●● ●
●●
●
●
●
●●
●
●●
●
●●
●●
●
●
●
●●
●●
●●
●
●●
●
●●
●●
●
●
(b)
Non
-agricultu
ralsu
bm
issions.
Fig
ure
4:G
iant
com
ponen
tsof
docu
men
tsim
ilaritysu
b-n
etwork
sfor
agricultu
ralan
dnon
-agricultu
ralsu
bm
issions.
SocArXiv 13
digitalfarming
alsoadoption
productionmanagementdevelopment
ruraluse
systemsinformation
foodfarmers
technologiesresearchindustry
farmagriculturetechnology
data
0 300 600 900n
Agricultural innovation
healthcommunity
managementagenciesdisasterprivateimpact
valuealso
policyavailable
naturalservices
opensector
nationalaccesspublic
informationresearch
0 500 1000 1500n
Data availability & use
futurecyberworkuse
informationopportunities
agriculturealso
developmentneedskills
innovationsecurity
technologiesservices
businessesindustry
businesstechnology
data
0 500 1000 1500 2000 2500n
Digital economy strategy
sociallow
personalservice
infotwitter
indigenoustechnology
incomedisability
communicationsaccess
consumerremotepeople
communitiesinternetviewed
informationconsumers
0 50 100 150n
Digital delivery
consumersfarmersmuster
technologybroadband
skybusinesses
lineconnectivity
networkaccessremotedigital
infrastructurewesternwirelesssatellite
fixedservicesservice
0 50 100n
NBN roll−out
commercetechnologies
innovationeconomic
growthservicesstrategy
alsosecurity
informationindustry
opportunitiesglobal
businessesdevelopment
systemdata
businessinternational
standards
0 25 50 75n
Trade systems
sectorbusinesses
developmentalso
technologiesaccess
agricultureagricultural
publiceconomy
usebusinessservicesindustry
innovationinformation
researchtechnology
digitaldata
0 2500 5000 7500n
Complete corpus subset
Figure 5: Most common words in the corpus. Note the bag-of-words analysis did not involveany word-stemming (word-stemming featured only in the analysis of document similarity).
14 How Unified is the Australian Agricultural Sector?
dairy industry
row crop
spring quarter
production systems
farming systems
gm crops
supply chain
animal welfare
precision agriculture
farm policy
0 40 80 120n
Agricultural innovation
resilience decisions
issues paper
social impact
impact investing
disaster resilience
impact investment
natural disasters
natural disaster
private sector
public sector
0 50 100 150 200n
Data availability & use
economic growth
supply chains
machine learning
public libraries
artificial intelligence
business models
private sector
data sharing
industry innovation
cyber security
0 100 200 300 400n
Digital economy strategy
homeless people
action network
communications consumer
consumer action
income earners
vulnerable consumer
indigenous communities
personal communications
low income
remote indigenous
0 20 40 60n
Digital delivery
muster satellite
voice services
line services
northern territory
satellite fixed
retail service
service providers
digital connectivity
fixed line
sky muster
fixed wireless
0 20 40 60 80n
NBN roll−out
investment growth
asia pacific
data flows
standards development
cross border
iso iec
industry innovation
international standards
cyber security
northern territory
0 3 6 9n
Trade systems
data sharing
public sector
digital transformation
digital technology
digital technologies
private sector
digital agriculture
cyber security
agricultural innovation
digital economy
0 500 1000n
Complete corpus subset
Figure 6: Most common bigrams in the corpus.
SocArXiv 15
rolemany
online
help
example
farm
access
program
based
years
potential
highimpact
education
adoption
informationfa
rme
rscost
issues
provideacross
businesses
growth
digitalmarket
global
ma
ke
data
decision
benefits
public
opportunitiesprivacy
people
standardsneeds
industries
social
food
time
areas
cyb
er
research
system
business
also
future
service
used
risk
development
http use
health
technology
strategy
sta
te
improve
value
regional
including
infr
astr
uctu
re
agriculture
important
work
significant
better
private
support
well
world
security
skills
rural
one
services
sector
national
systems
industry
innovation
investment
need
community
eco
no
mic
making
agricultural
management
policy
international available
within
report
open
tech
no
log
ies
level
economy keyinternet
ensure
precision agriculturepolicy journal
digital economysector data
digital divide
cyber securityemerging technologies
digital transformation
digital infrastructuremachine learning
natural disaster
industr
y innovation
impact investing
public
data
data sets
economy strategy
artificial intelligence
digital technologiessupply chain
social media
rese
arc
h d
ata
real timedigital inclusion
data sharing
fixed wireless
na
tio
na
l d
igita
l
digital delivery
quarter agriculturalsupply chains
digital technology
digital agriculture
business models
private sector
service providers
public sector
linked data
agricultural innovation
se
rvic
e d
eliv
ery
data
managem
ent
disaster resilience
digital literacy
impact investment
agricultural sector
data availability
digital disruption
personal information
digital skills
farm policydata collection
natural disasters
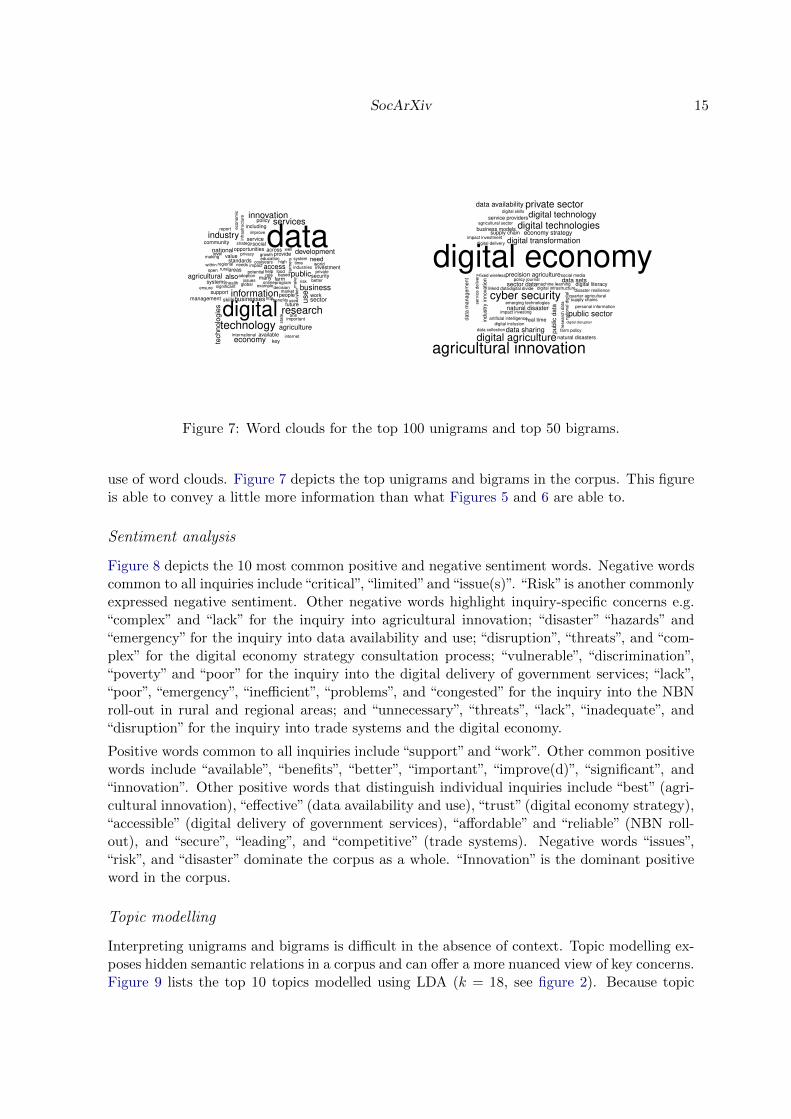
Figure 7: Word clouds for the top 100 unigrams and top 50 bigrams.
use of word clouds. Figure 7 depicts the top unigrams and bigrams in the corpus. This figureis able to convey a little more information than what Figures 5 and 6 are able to.
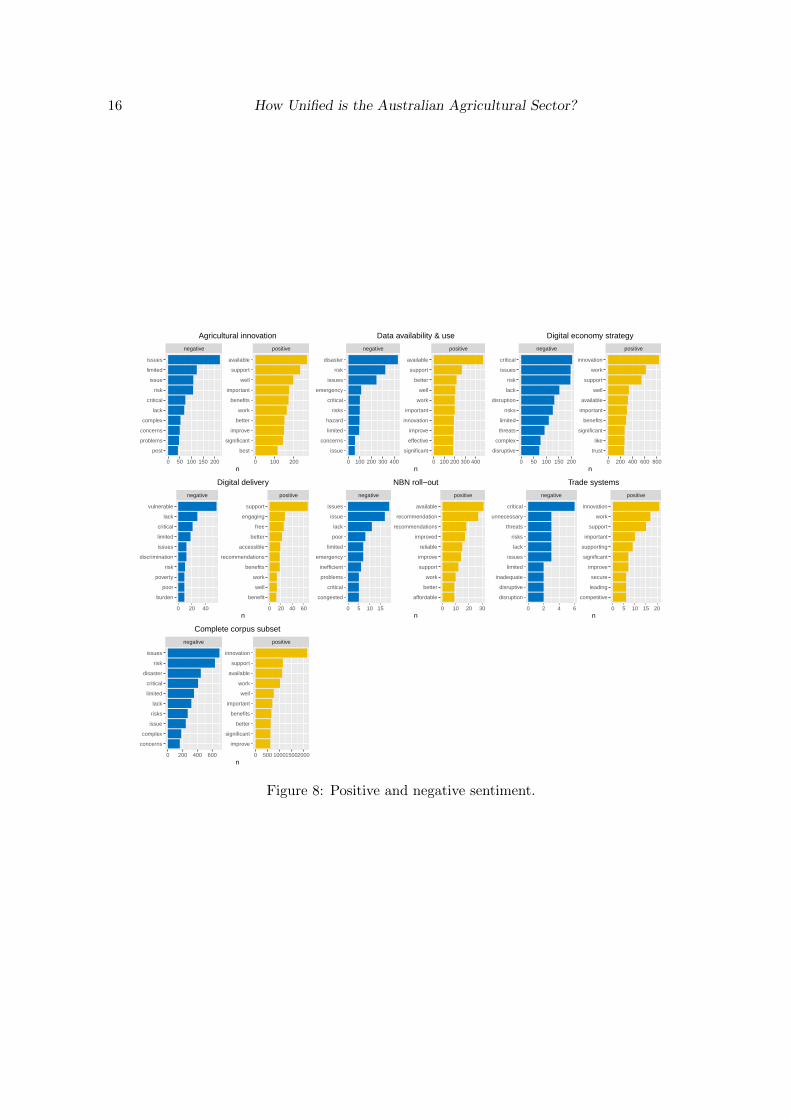
Sentiment analysis
Figure 8 depicts the 10 most common positive and negative sentiment words. Negative wordscommon to all inquiries include“critical”, “limited”and“issue(s)”. “Risk” is another commonlyexpressed negative sentiment. Other negative words highlight inquiry-specific concerns e.g.“complex” and “lack” for the inquiry into agricultural innovation; “disaster” “hazards” and“emergency” for the inquiry into data availability and use; “disruption”, “threats”, and “com-plex” for the digital economy strategy consultation process; “vulnerable”, “discrimination”,“poverty” and “poor” for the inquiry into the digital delivery of government services; “lack”,“poor”, “emergency”, “inefficient”, “problems”, and “congested” for the inquiry into the NBNroll-out in rural and regional areas; and “unnecessary”, “threats”, “lack”, “inadequate”, and“disruption” for the inquiry into trade systems and the digital economy.
Positive words common to all inquiries include “support” and “work”. Other common positivewords include “available”, “benefits”, “better”, “important”, “improve(d)”, “significant”, and“innovation”. Other positive words that distinguish individual inquiries include “best” (agri-cultural innovation), “effective” (data availability and use), “trust” (digital economy strategy),“accessible” (digital delivery of government services), “affordable” and “reliable” (NBN roll-out), and “secure”, “leading”, and “competitive” (trade systems). Negative words “issues”,“risk”, and “disaster” dominate the corpus as a whole. “Innovation” is the dominant positiveword in the corpus.
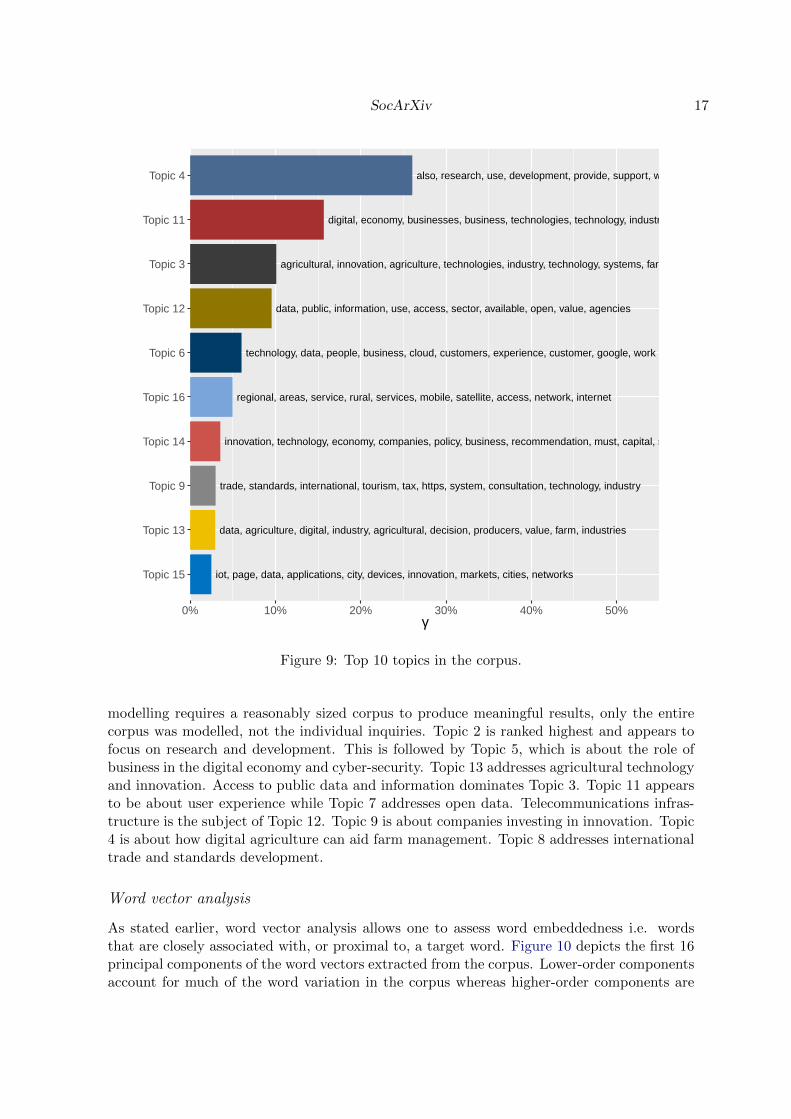
Topic modelling
Interpreting unigrams and bigrams is difficult in the absence of context. Topic modelling ex-poses hidden semantic relations in a corpus and can offer a more nuanced view of key concerns.Figure 9 lists the top 10 topics modelled using LDA (k = 18, see figure 2). Because topic
16 How Unified is the Australian Agricultural Sector?
negative positive
0 50 100 150 200 0 100 200
best
significant
improve
better
work
benefits
important
well
support
available
pest
problems
concerns
complex
lack
critical
risk
issue
limited
issues
n
Agricultural innovation
negative positive
0 100 200 300 400 0 100 200 300 400
significant
effective
improve
innovation
important
work
well
better
support
available
issue
concerns
limited
hazard
risks
critical
emergency
issues
risk
disaster
n
Data availability & use
negative positive
0 50 100 150 200 0 200 400 600 800
trust
like
significant
benefits
important
available
well
support
work
innovation
disruptive
complex
threats
limited
risks
disruption
lack
risk
issues
critical
n
Digital economy strategy
negative positive
0 20 40 0 20 40 60
benefit
well
work
benefits
recommendations
accessible
better
free
engaging
support
burden
poor
poverty
risk
discrimination
issues
limited
critical
lack
vulnerable
n
Digital delivery
negative positive
0 5 10 15 0 10 20 30
affordable
better
work
support
improve
reliable
improved
recommendations
recommendation
available
congested
critical
problems
inefficient
emergency
limited
poor
lack
issue
issues
n
NBN roll−out
negative positive
0 2 4 6 0 5 10 15 20
competitive
leading
secure
improve
significant
supporting
important
support
work
innovation
disruption
disruptive
inadequate
limited
issues
lack
risks
threats
unnecessary
critical
n
Trade systems
negative positive
0 200 400 600 0 500 100015002000
improve
significant
better
benefits
important
well
work
available
support
innovation
concerns
complex
issue
risks
lack
limited
critical
disaster
risk
issues
n
Complete corpus subset
Figure 8: Positive and negative sentiment.
SocArXiv 17
also, research, use, development, provide, support, well, information, based, including
digital, economy, businesses, business, technologies, technology, industry, security, cyber, skills
agricultural, innovation, agriculture, technologies, industry, technology, systems, farmers, farm, soil
data, public, information, use, access, sector, available, open, value, agencies
technology, data, people, business, cloud, customers, experience, customer, google, work
regional, areas, service, rural, services, mobile, satellite, access, network, internet
innovation, technology, economy, companies, policy, business, recommendation, must, capital, space
trade, standards, international, tourism, tax, https, system, consultation, technology, industry
data, agriculture, digital, industry, agricultural, decision, producers, value, farm, industries
iot, page, data, applications, city, devices, innovation, markets, cities, networksTopic 15
Topic 13
Topic 9
Topic 14
Topic 16
Topic 6
Topic 12
Topic 3
Topic 11
Topic 4
0% 10% 20% 30% 40% 50%γ
Figure 9: Top 10 topics in the corpus.
modelling requires a reasonably sized corpus to produce meaningful results, only the entirecorpus was modelled, not the individual inquiries. Topic 2 is ranked highest and appears tofocus on research and development. This is followed by Topic 5, which is about the role ofbusiness in the digital economy and cyber-security. Topic 13 addresses agricultural technologyand innovation. Access to public data and information dominates Topic 3. Topic 11 appearsto be about user experience while Topic 7 addresses open data. Telecommunications infras-tructure is the subject of Topic 12. Topic 9 is about companies investing in innovation. Topic4 is about how digital agriculture can aid farm management. Topic 8 addresses internationaltrade and standards development.
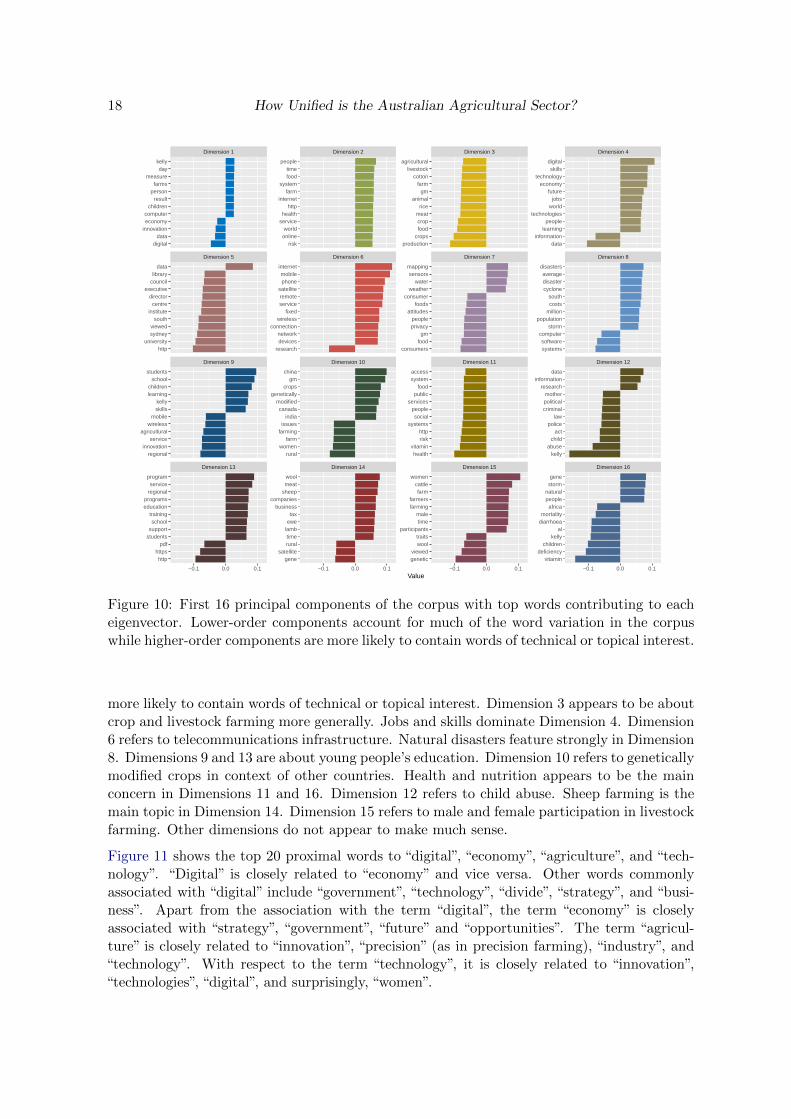
Word vector analysis
As stated earlier, word vector analysis allows one to assess word embeddedness i.e. wordsthat are closely associated with, or proximal to, a target word. Figure 10 depicts the first 16principal components of the word vectors extracted from the corpus. Lower-order componentsaccount for much of the word variation in the corpus whereas higher-order components are
18 How Unified is the Australian Agricultural Sector?
Dimension 13 Dimension 14 Dimension 15 Dimension 16
Dimension 9 Dimension 10 Dimension 11 Dimension 12
Dimension 5 Dimension 6 Dimension 7 Dimension 8
Dimension 1 Dimension 2 Dimension 3 Dimension 4
−0.1 0.0 0.1 −0.1 0.0 0.1 −0.1 0.0 0.1 −0.1 0.0 0.1
datainformation
learningpeople
technologiesworld
jobsfuture
economytechnology
skillsdigital
systemssoftware
computerstorm
populationmillioncostssouth
cyclonedisasteraverage
disasters
kellyabuse
childact
policelaw
criminalpoliticalmother
researchinformation
data
vitamindeficiency
childrenkelly
aldiarrhoeamortality
africapeoplenaturalstormgene
productioncropsfoodcropmeat
riceanimal
gmfarm
cottonlivestock
agricultural
consumersfoodgm
privacypeople
attitudesfoods
consumerweather
watersensors
mapping
healthvitamin
riskhttp
systemssocial
peopleservices
publicfood
systemaccess
geneticviewed
wooltraits
participantstimemale
farmingfarmers
farmcattle
women
riskonlineworld
servicehealth
httpinternet
farmsystem
foodtime
people
researchdevicesnetwork
connectionwireless
fixedserviceremotesatellite
phonemobile
internet
ruralwomen
farmfarmingissues
indiacanada
modifiedgenetically
cropsgm
china
genesatellite
ruraltimelambewetax
businesscompanies
sheepmeatwool
digitaldata
innovationeconomycomputer
childrenresult
personfarms
measureday
kelly
httpuniversity
sydneyviewed
southinstitute
centredirector
executivecouncillibrary
data
regionalinnovation
serviceagricultural
wirelessmobile
skillskelly
learningchildren
schoolstudents
httphttps
pdfstudentssupportschool
trainingeducationprograms
regionalservice
program
Value
Figure 10: First 16 principal components of the corpus with top words contributing to eacheigenvector. Lower-order components account for much of the word variation in the corpuswhile higher-order components are more likely to contain words of technical or topical interest.
more likely to contain words of technical or topical interest. Dimension 3 appears to be aboutcrop and livestock farming more generally. Jobs and skills dominate Dimension 4. Dimension6 refers to telecommunications infrastructure. Natural disasters feature strongly in Dimension8. Dimensions 9 and 13 are about young people’s education. Dimension 10 refers to geneticallymodified crops in context of other countries. Health and nutrition appears to be the mainconcern in Dimensions 11 and 16. Dimension 12 refers to child abuse. Sheep farming is themain topic in Dimension 14. Dimension 15 refers to male and female participation in livestockfarming. Other dimensions do not appear to make much sense.
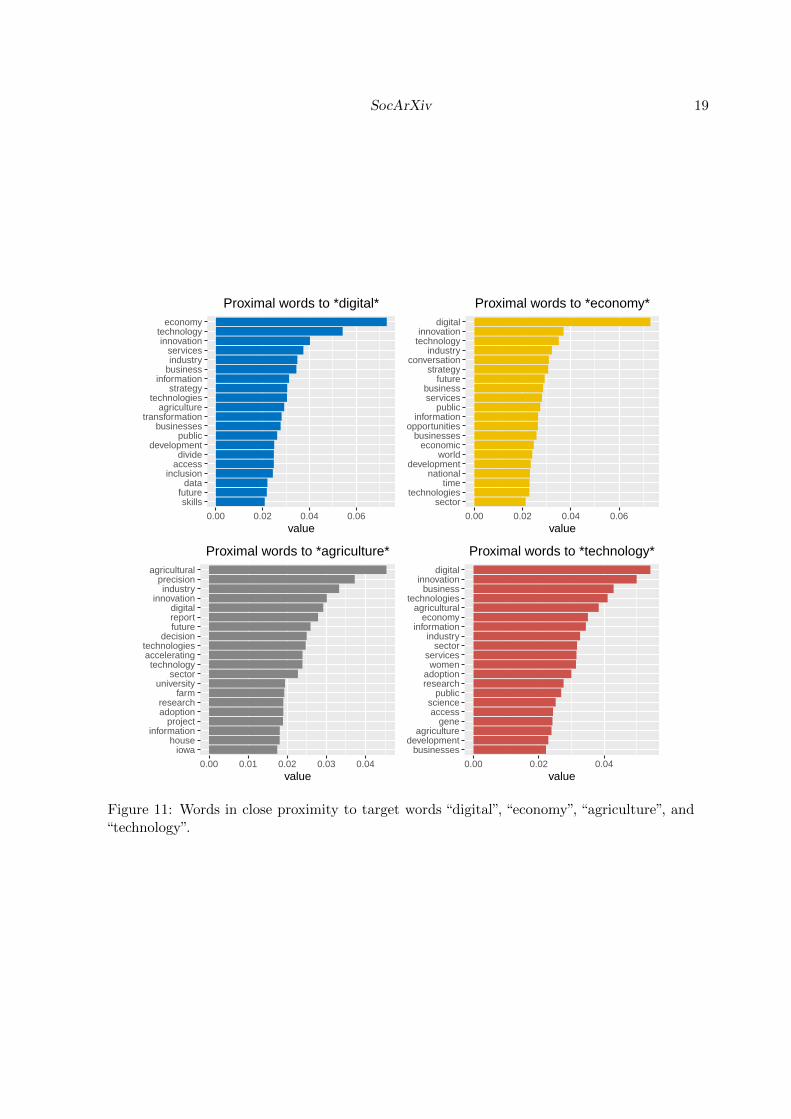
Figure 11 shows the top 20 proximal words to “digital”, “economy”, “agriculture”, and “tech-nology”. “Digital” is closely related to “economy” and vice versa. Other words commonlyassociated with “digital” include “government”, “technology”, “divide”, “strategy”, and “busi-ness”. Apart from the association with the term “digital”, the term “economy” is closelyassociated with “strategy”, “government”, “future” and “opportunities”. The term “agricul-ture” is closely related to “innovation”, “precision” (as in precision farming), “industry”, and“technology”. With respect to the term “technology”, it is closely related to “innovation”,“technologies”, “digital”, and surprisingly, “women”.
SocArXiv 19
skillsfuture
datainclusion
accessdivide
developmentpublic
businessestransformation
agriculturetechnologies
strategyinformation
businessindustryservices
innovationtechnology
economy
0.00 0.02 0.04 0.06value
Proximal words to *digital*
sectortechnologies
timenational
developmentworld
economicbusinesses
opportunitiesinformation
publicservicesbusiness
futurestrategy
conversationindustry
technologyinnovation
digital
0.00 0.02 0.04 0.06value
Proximal words to *economy*
iowahouse
informationproject
adoptionresearch
farmuniversity
sectortechnology
acceleratingtechnologies
decisionfuturereportdigital
innovationindustry
precisionagricultural
0.00 0.01 0.02 0.03 0.04value
Proximal words to *agriculture*
businessesdevelopment
agriculturegene
accessscience
publicresearchadoption
womenservices
sectorindustry
informationeconomy
agriculturaltechnologies
businessinnovation
digital
0.00 0.02 0.04value
Proximal words to *technology*
Figure 11: Words in close proximity to target words “digital”, “economy”, “agriculture”, and“technology”.
20 How Unified is the Australian Agricultural Sector?
4. Discussion
Our results show that one cannot rely on a single type of analysis to make sense of topicsbeing discussed in the corpus. This is especially true when looking at the results of the topicmodelling and word vectors analysis. These make more sense when interpreted together withunigrams, bigrams, and positive/negative sentiment words. Judging by the broad natureof topics discussed, it is clear many of the public submissions made only passing referenceto digital agriculture. This is not surprising, given the terms of reference for each inquirydid not specifically address digital agriculture. The analysis may have benefited from moresophisticated filtering to reduce unhelpful submissions.
Responses to the inquiry into agricultural innovation emphasise the importance of digital tech-nologies for precision farming, improved production, and effective supply chain management.The key issue with the inquiry into data availability and use appears to be disaster resilience.Farming practices hardly rate any mention, which is surprising, given digital agriculture isvery data intensive. The sentiment analysis did indicate better access to data would supportinnovation.
Only one submission to the inquiry into the digital delivery of government services referencedagriculture. This submission was mostly concerned about government services delivered toremote indigenous communities, not so much about agriculture.
In contrast, the digital economy strategy consultation process had the highest proportion ofsubmissions referencing agriculture. Though cyber-security is a major concern, the submis-sions also refer to the economic benefits stemming from agricultural innovation. Artificialintelligence and machine learning appear to be especially important in this respect. The sen-timent analysis highlighted the disruptive and risky nature of the digital economy. One cansee from the network analysis a shared concern around the role of business and cyber-securityin the digital economy.
Unfortunately, the inquiry into the roll-out of the NBN in rural and regional areas is notvery informative. Much of the concern is around the type of NBN service being offered. Howbroadband services can facilitate the uptake of digital agriculture is not really addressed. Nei-ther is the inquiry into trade systems and the digital economy very informative. Agriculturedoes not feature strongly at all. Nonetheless, submissions to this inquiry reinforced broaderconcerns around cyber-security.
Generally, the emerging digital economy is seen by many as a catalyst for innovation. Thetopic modelling and word vector analysis highlight the need for ongoing support of researchand development. Both point to improved farm management and enhanced productivitystemming from the use of digital technologies and the emergence of new and innovativeindustries. Better access to data and investment in skills development and training is alsohighlighted. However, the network analysis shows that the digital agriculture policy landscapeis extremely fragmented. Only the digital economy strategy consultation process showed anysign of coherency.
5. Conclusions
Is the Australian agricultural sector unified when talking to policy makers about digitaliza-tion? From this study, it is clear the digital agriculture policy landscape is quite fragmented.The fragmented policy landscape is a concern because it means that current and emerging
SocArXiv 21
policy may not address key issues, resulting in sub-optimal outcomes for Australian agricul-ture. There does not appear to be a consistent narrative driving policy development arounddigital agriculture. This may be partly due to under-appreciation of the potential economicbenefits arising from the digitalization of agriculture, something that may need to be ad-dressed through stronger advocacy (the under-appreciation is reflected in omission of digitalagriculture in the terms of references for each inquiry).
Natural language processing is a cost-effective approach for assessing public engagement withpolicy development. Not only does it allow one to scan hundreds of public submissionsvery fast, one can also easily surface abstract topics hidden in the submissions. These offerinteresting insights into key concerns the public may have. However, one needs a range ofmeasures to make proper sense of submissions.
This study has some limitations. Focusing only on public submissions to government inquiriesdoes not necessarily highlight all policy concerns. The terms of reference for each inquiry didnot address digital transformation of the agricultural sector specifically. It is clear many of thesubmissions in the corpus only made passing reference to digital agriculture. As a consequence,the corpus is quite noisy and some relevant or important issues may be buried in the noise.Repeated reference to the inquiry in question can skew word counts and suppress interestingcontent that really matters. We tried to address this by filtering out words contained inthe title of the inquiry. However, the effectiveness of this was not assessed. There is meritin in doing a comparative analysis of NLP results with results from traditional qualitativeapproaches (manual coding of texts).
Future studies should not be limited to analysing public submissions to government inquiries.Other data sources may yield valuable policy-related information e.g. social media posts,farmer blogs, research publications, on-line news articles, and industry association newsletters.
Applying more advanced and sophisticated natural language processing techniques shouldalso yield better results. Future natural language processing should also be more targetedto specific concerns. Word vector analysis is particularly useful in this regard. One canuse specific target words to surface important issues (by analysing word associations/wordembeddedness). It would be useful to do repeat studies of this nature to observe trends.Future work should also consider ways to reduce statistical noise in datasets through moresophisticated filtering.
Acknowledgements
The authors wish to acknowledge Ryan McAllister for inspiring this work. Thanks to CSIROData61 colleagues Stephen Wan, James McHugh, and Aditya Joshi for their suggestionsaround natural language processing strategies. CSIRO Land & Water Colleagues Bruce Tay-lor, Emma Jakku, Aysha Fleming, and Simon Fielke provided critical feedback at variousstages of analysis. This work would not have been possible without the online R tutorialsand recipes provided by Julia Silge, David Robinson, Bernhard Learns, and Kailash Awati.CSIRO’s “Digiscape Future Science Platform” funded this study.
References
Alizadeh, T. (2017). Planning Deficiencies and Telecommunication Infrastructure: A Multi-
22 How Unified is the Australian Agricultural Sector?
level Investigation of the National Broadband Network in Australia. disP – The PlanningReview, 53(3):43–57.
Arun, R., Suresh, V., Madhavan, C. V., and Murthy, M. N. (2010). On finding the natu-ral number of topics with latent dirichlet allocation: Some observations. In Pacific-Asiaconference on knowledge discovery and data mining, pages 391–402. Springer.
Asher, M., Leston-Bandeira, C., and Spaiser, V. (2019). Do parliamentary debates of e-petitions enhance public engagement with parliament? an analysis of twitter conversations.Policy & Internet, 11(2):149–171.
Brezina, T. (2010). The impacts of technology on growth: Studies of agriculture and steel.Technology in Society, 32(4):312–323.
Burroughs, B. and Burroughs, W. J. (2020). Digital logistics: Enchantment in distributionchannels. Technology in Society, 62:101277.
Cao, J., Xia, T., Li, J., Zhang, Y., and Tang, S. (2009). A density-based method for adaptivelda model selection. Neurocomputing, 72(7-9):1775–1781.
Chen, Y. (2020). Improving market performance in the digital economy. China EconomicReview, 62:101482.
Daum, T. (2018). Ict applications in agriculture. Encyclopedia of Food Security and Sustain-ability, 1:255–260.
Deveaud, R., SanJuan, E., and Bellot, P. (2014). Accurate and effective latent concept mod-eling for ad hoc information retrieval. Revue des Sciences et Technologies de l’Information- - Serie Document Numerique, 17(1):61–84.
Fruchterman, T. M. and Reingold, E. M. (1991). Graph drawing by force-directed placement.Software: Practice and experience, 21(11):1129–1164.
Garrard, R. and Fielke, S. (2020). Blockchain for trustworthy provenances: A case study inthe australian aquaculture industry. Technology in Society, page 101298.
Geman, S. and Geman, D. (1984). Stochastic relaxation, gibbs distributions, and the bayesianrestoration of images. IEEE Transactions on Pattern Analysis and Machine Intelligence,6(Pami-6):721–741.
Griffiths, T. L. and Steyvers, M. (2004). Finding scientific topics. Proceedings of the Nationalacademy of Sciences, 101(suppl 1):5228–5235.
Grun, B. and Hornik, K. (2011). topicmodels: An R package for fitting topic models. Journalof Statistical Software, 40(13):1–30.
Hadwiger, D. F. (1992). Technology in a fragmented politics: The case of agricultural research.Technology in Society, 14(3):283–297.
Hu, M. and Liu, B. (2004). Mining and summarizing customer reviews. In Proceedings of thetenth ACM SIGKDD international conference on Knowledge discovery and data mining,pages 168–177. Acm.
SocArXiv 23
Jakku, E., Taylor, B., Fleming, A., Mason, C., Fielke, S., Sounness, C., and Thorburn, P.(2018). “if they don’t tell us what they do with it, why would we trust them?” trust,transparency and benefit-sharing in smart farming. NJAS-Wageningen Journal of LifeSciences.
Koltsova, O. and Koltcov, S. (2013). Mapping the public agenda with topic modeling: Thecase of the Russian livejournal. Policy & Internet, 5(2):207–227.
Levy, O., Goldberg, Y., and Dagan, I. (2015). Improving distributional similarity with lessonslearned from word embeddings. Transactions of the Association for Computational Lin-guistics, 3:211–225.
Liu, E. (2015). Latent dirichlet allocation using gibbs sampling.
Melancon, G. (2006). Just how dense are dense graphs in the real world? a methodologicalnote. In Proceedings of the 2006 AVI workshop on BEyond time and errors: novel evaluationmethods for information visualization, pages 1–7.
Mikolov, T., Chen, K., Corrado, G., and Dean, J. (2013). Efficient estimation of word repre-sentations in vector space. arXiv preprint arXiv:1301.3781.
Moody, C. (2017). Stop using word2vec.
Nikita, M. (2019). ldatuning: Tuning of the Latent Dirichlet Allocation Models Parameters.R package version 1.0.0.
Nolet, S. (2018). Seeds of success: Advancing digital agriculture from point solutions toplatforms. United States Studies Centre, 16.
R Core Team (2019). R: A Language and Environment for Statistical Computing. R Foun-dation for Statistical Computing, Vienna, Austria.
Raheem, D., Shishaev, M., and Dikovitsky, V. (2019). Food system digitalization as a meansto promote food and nutrition security in the barents region. Agriculture, 9(8):168.
Rinker, T. W. (2013). qdapDictionaries: Dictionaries to Accompany the qdap Package. StateUniversity of New York at Buffalo, Buffalo, New York. 1.0.7.
Shin, J., Madotto, A., and Fung, P. (2018). Interpreting word embeddings with eigenvectoranalysis.
Silge, J. (2017). Tidy word vectors, take 2!
Silge, J. and Robinson, D. (2017). Text mining with R: A tidy approach. ” O’Reilly Media,Inc.”.
Tirado-Morueta, R., Aguaded-Gomez, J. I., and Angel Hernando-Gomez (2018). The socio-demographic divide in internet usage moderated by digital literacy support. Technology inSociety, 55:47–55.
Watanabe, C., Naveed, N., and Neittaanmaki, P. (2018). Digital solutions transform theforest-based bioeconomy into a digital platform industry - a suggestion for a disruptivebusiness model in the digital economy. Technology in Society, 54:168–188.
24 How Unified is the Australian Agricultural Sector?
Welbers, K., Van Atteveldt, W., and Benoit, K. (2017). Text analysis in r. CommunicationMethods and Measures, 11(4):245–265.
Wiseman, L., Sanderson, J., Zhang, A., and Jakku, E. (2019). Farmers and their data: Anexamination of farmers’ reluctance to share their data through the lens of the laws impactingsmart farming. NJAS-Wageningen Journal of Life Sciences, 90:100301.
Zhang, A., Jakku, E., Llewellyn, R., and Baker, E. I. (2018). Surveying the needs and driversfor digital agriculture in Australia. Farm Policy Journal, 15(1):25–39.
Affiliation:
Andrew TerhorstCSIRO Data61Hobart, AustraliaE-mail: [email protected]: https://people.csiro.au/T/A/Andrew-Terhorst.aspx
SocArXiv Website https://socopen.org/
SocArXiv Preprints https://osf.io/preprints/socarxiv
Preprint 2022 pp. 1–24 Submitted: 4 May 200210.31235/osf.io/4nge5 Accepted: 7 May 2022