
Reliability 1 Guidelines for Establishing Reliability when ... - OSF
25
Reliability 1 Guidelines for Establishing Reliability when Coding Narrative Data Moin Syed and Sarah C. Nelson University of Minnesota This document is a post-print version of: Syed, M., & Nelson, S. C. (2015). Guidelines for establishing reliability when coding narrative data. Emerging Adulthood, 3(6), 375‐387. Contact: [email protected]
-
Upload
khangminh22 -
Category
Documents
-
view
2 -
download
0
Transcript of Reliability 1 Guidelines for Establishing Reliability when ... - OSF

Reliability 1
Guidelines for Establishing Reliability when Coding Narrative Data
Moin Syed and Sarah C. Nelson
University of Minnesota This document is a post-print version of: Syed,M.,&Nelson,S.C.(2015).Guidelinesforestablishingreliabilitywhencodingnarrativedata.
EmergingAdulthood,3(6),375‐387.
Contact: [email protected]

Reliability 2
Abstract
The use of quantitative, qualitative, and mixed methods approaches has been foundational to research on emerging adulthood, yet there remain many unresolved methodological issues pertaining to how to handle qualitative data. The purpose of this article is to review best practices for coding and establishing reliability when working with narrative data. In doing so, we highlight how establishing reliability must be seen as an evolving process, rather than simply a focus on the end product. The review is divided into three broad sections. In the first section, we discuss relatively more quantitatively-focused methods of coding and establishing reliability, whereas in the second section we discuss relatively more qualitatively-focused methods. In the final section, we provide recommendations for researchers interested in coding narrative and other types of open-ended data. This article is intended to serve as an essential resource for researchers working on a variety of topics related to emerging adulthood and beyond. Keywords: Inter-rater reliability, coding, kappa, narrative
Reliability 3
Guidelines for Establishing Reliability when Coding Narrative Data
The use of quantitative, qualitative, and mixed methods approaches has been foundational to research on emerging adulthood (Arnett, 2005; van Dulmen, 2013). Despite this trend, there remain many unresolved methodological issues pertaining to how to handle qualitative data. The purpose of this article is to address in detail two of the foremost of these issues: coding and establishing reliability.
In this article, we will review best practices for coding and establishing reliability when working with narrative data. Narrative data is inherently qualitative, however in this paper we primarily focus on the quantification via coding of narrative data for quantitative analysis. We focus on narrative data as a subset of qualitative data because of its increased representation in published work (see McLean & Syed, 2015) and because the varieties of narrative data are one way to illustrate the complexities of the reliability process. Narrative psychology is the broad field concerned with how individuals both construct and represent their lives through telling stories (McAdams & McLean, 2013). Narrative researchers study stories told through individuals recounting in-depth life histories (Josselson, 2009; Schachter, 2004), memories about specific types of experiences (McAdams et al., 2006; Lilgendahl, McLean, & Mansfield, 2013) and stories in spontaneous conversation between friends, family, or strangers (Korobov, 2009; Pasupathi & Rich, 2005). These varied story types and contexts are collected across a number of different methods, including semi-structured interviews (Lilgendahl & McAdams, 2011), written surveys (Bauer & McAdams, 2010), computer-based surveys (Syed & Azmitia, 2008), transcribed conversations (Morgan & Korobov, 2012), ethnographic methods (Hammack, 2010), and in applied settings such as therapy (Adler, 2012) and alcoholics anonymous (Dunlop & Tracy, 2013). This vast heterogeneity in levels of data and methodological practice helps bring attention to the many ways to establish reliability during the coding process. Additionally, narrative has been lauded as the future of identity research in emerging adulthood, providing access to individual variation and investigation to “the depth the topic requires” (Arnett, 2015, p. 62). This is not to say, however, that the recommendations and guidelines provided in this paper apply only to reliability in the context of narrative data. Instead, we use narrative data as an example of qualitative data for which researchers may be interested in coding and establishing reliability.
It is important to note from the outset that the very notion of “establishing reliability” reflects a quantitative, positivistic bias. Reliability is generally defined as the consistency of a measure, or the degree to which scores approximate each other across multiple assessments of an instrument or multiple ratings of the same event (Cook & Campbell, 1979). In the context of coding open-ended data, reliability is typically referred to as inter-rater reliability, meaning the extent to which raters code the same units of data in the same way (Krippendorff, 2004). Objectivity is inherent in the definition of reliability, as it implies some underlying “truth” that can be assessed by different raters, given the proper training. In other words, the phenomenon exists independent of the individuals who are assessing it. While this approach has long been accepted in mainstream psychological research, it has been heavily criticized by researchers adopting qualitative methodologies, which tend to be situated within a constructivist paradigm (Hammer & Berland, 2014). Constructivism emphasizes subjectivity, interpretation, and reflexivity, and therefore rejects the possibility of an objective “truth” that researchers can assess

Reliability 4
through a well-articulated coding protocol (Lincoln & Guba, 2000). In fact, for the pure qualitative researcher separating data from context is considered undesirable as the “subjective knower is the only source of reality” (Johnson & Onwuebuzie, 2004, p. 14). Accordingly, establishing reliability, at least in the sense in which it is presented in this paper, has not been a prime concern within the broad domain of qualitative research.
In our presentation we will attempt to complicate the dichotomy between quantitative and
qualitative research and argue that decisions about reliability are dependent on the particular data types and research questions being pursued. To be clear about our biases, we generally believe that consistency or replicability is a marker of rigorous research regardless of the method. That is, one individual’s analysis of qualitative data should generally lend itself to be re-captured by another individual who is reasonably familiar with the research question and procedure. While qualitative analytic methods are not homogenous in approach, subjectivity is generally valued over consistency in illuminating constructs (Johnson & Onwuegbuzie, 2004). However, providing evidence of consistency may or may not involve the documentation of formal reliability. This standpoint on consistency should suggest to the reader that we are, as primarily quantitative researchers, more biased towards the positivist and quantitative view, but also quite friendly to the constructivist view. Later in the paper we will briefly review the standpoint on reliability taken by qualitative researchers and the ways in which narrative researchers have used qualitative methods. Our goal in doing so is to establish that qualitative and quantitative analysis need not be in opposition to one another and to suggest that integrating the two approaches may offer a deeper and more nuanced understanding of psychological phenomena.
Our coverage of the major issues involved in reliability is divided into three broad
sections. In the first section, we discuss relatively more quantitatively-focused methods of coding and establishing reliability, whereas in the second section we discuss relatively more qualitatively-focused methods. Our treatment of these two broad approaches is uneven, with much more attention paid to the quantitative methods. This is largely due to the fact that the qualitative methods are much more numerous and idiosyncratic, and thus are difficult to summarize briefly. Nevertheless, we attempt to highlight some of the key variations, and encourage interested readers to consult some of the primary sources referenced. In the final section, we provide recommendations for researchers interested in coding narrative and other types of open-ended data. We hope that this article will serve as an essential resource for researchers working on a variety of topics related to emerging adulthood and beyond.
Before getting into the substance of the article, we want to highlight how the definition of
“qualitative” may not be as straightforward as it may first seem. There is an important distinction to be made between qualitative data and qualitative analysis. Qualitative data refers to any sources of information that are non-numeric in origin, including talk, text, photos, videos, or any combination thereof. The qualitative nature of these data is fully independent of the manner in which they are analyzed. Take for example a short narrative originally published in a study conducted by Benish-Weisman (2009) provided by a 48-year-old Israeli woman who describes her move to Israel when she was a late emerging adult:
I had to travel to the settlements around Tel Aviv. On every trip I had to overcome something. Until I understood that Hevel Hasharon [an area in Israel] was not someone’s

Reliability 5
name and sur- name. . . . You know, all those funny things . . . I saw others in my job [nonimmigrants]; it was so easy for them. They didn’t need to overcome the difficulties I had. For them everything was familiar—the language and so on. For me everything was for the first time. But I overcame the challenges! (p. 958). A researcher could choose to code this narrative for content (such as the presence of a
description of overcoming difficulty), convert these content codes to numbers (presence = 1), and then use the numbers in statistical procedures such as structural equation modeling (see Shallcross, 2013 for an example of this procedure using different trauma narratives). This approach constitutes quantitative analysis of qualitative data.
In contrast, the same narrative could be analyzed using an interpretative approach,
describing themes and variations in how individuals’ cope with trauma (e.g., Benish-Weisman, 2009). In her approach, Benish-Weisman (2009), interpreted the thematic content of the narratives by presenting the results as descriptions of the participants’ narrative structures. She describes the woman as telling a redemptive narrative of her immigration to Israel, and uses the case as an example of the narrative themes found among those who had a successful immigrant experience. This approach, then, is qualitative analysis of qualitative data. When both data and analysis are qualitative, we can comfortably refer to the approach as “qualitative research.” Indeed, it is this particular combination that most psychological researchers have been skeptical of and slow to embrace (Arnett, 2005; Lyons, 2009). The former case, quantitative analysis of qualitative data, has a long and ongoing history in psychological research, represented by stalwart research protocols such as the identity status interview (Marcia, Waterman, Matteson, Archer, & Orlosky, 1993) and the adult attachment interview (Main & Goldwyn, 1993).
We raise this issue here because it is important to be mindful that it is the analytic approach that will dictate the approach to coding and reliability, not the qualitative nature of the data, per se. As the reader has likely deduced, quantitatively analyzing qualitative data is more associated with the positivist tradition, whereas qualitatively analyzing qualitative data is more associated with the constructivist tradition. This alignment is not a perfect one, though, as is made evident in the rise of mixed methods research (e.g., Tashakkori & Creswell, 2007). As we will soon illustrate, analysts approach qualitative data in a wide variety of ways, particularly concerning the reliability process.
As a final note before beginning our discussion of reliability, it is critical to remember that establishing reliability for a coding system provides no information about the validity of the coding system. Reliability is often described as a necessary but insufficient condition for validity, and a research team can very easily develop a reliable coding system that completely misses the mark in terms of assessing the underlying constructs they are attempting to represent. In contrast, qualitative researchers consider validity to be the product of a transparent and complex research process producing findings that: reflect the lived experience of participants (credibility), provide representation of all participant voices (authenticity), detail the researcher’s critical appraisal of findings (criticality), and acknowledge the possibility of error in a “humble” presentation (integrity; p . 534; see Whittemore, Chase, & Mandle, 2001).

Reliability 6
Methods of Coding and Establishing Quantitative Reliability
A key theme of this article is that establishing reliability is a process and not a product; it is about more than a single coefficient presented in a Method section or some other evidence that consensus has been reached. Rather, reliability is a process that involves multiple time-intensive steps. In this section we review some of these steps, including selecting a unit of analysis, developing a coding manual, and training coders. We then provide a review of some of the major indexes used for calculating inter-rater reliability. The Coding Process
Deciding on the unit of analysis. Once the data are in hand, one of the first decisions to make is how to define the unit of analysis. By “unit of analysis” we mean the section of qualitative data that will receive a code. Consider, for example, a hypothetical data set consisting of three self-defining memories for each of 200 participants, similar to what was used in McLean and Fournier (2008). The unit of analysis could be 1) the individual, with codes applied across memories, 2) the memory, where each memory receives its own set of codes, or 3) some defined text (e.g., words, phrases, sentences) within each memory. This latter approach requires a two-stage coding system, in which the data are first parameterized, or sectioned off into codable units, before the data are actually coded (see Korobov & Thorne, 2006, for an example). For example, McLean and Fournier (2008) coded memories for content of self-event connections. A code of “present” for the content category “values” was given to the narrative containing this statement, “We have a code of ethics and I try to live by my code of ethics, never to run anybody down, but to build them up. Uh, never to hold a hand in anger, but to hold out a hand in friendship.” (p. 530). As these narratives were coded at the memory-level, each of the three memories provided by each participant received a code of “present” or “absent” for each of four content categories. In contrast, these researchers could have instead chosen to code at the individual level, in which case the aforementioned participant would have received a single code of “present” for values across all three narratives, even if values was deemed to be present in only one of the three. Finally, the unit of analysis can be the text level, in which the researcher would first have to segment the narrative (e.g., at the sentence level) prior to coding. Thus, this single statement within a single memory would become two units, each coded as “present” for values.
Whatever the choice, the unit of analysis must be determined from the outset to ensure
the coding process is both consistent with the research questions and analytically feasible. For example, defining the unit of analysis as the individual versus the specific memory has different implications for analysis. If the unit is the individual, then the coding process will yield one set of final codes for each individual, and the analysis will be rather straightforward (e.g., Lodi-Smith, Geise, & Roberts, 2009). In contrast, if the unit is the specific memory and each individual provide three memories, then the coding process will yield three sets of final codes per participant. This type of data structure requires analytic decisions, which include aggregating the codes across memories to create singular individual scores (e.g., McAdams et al., 2004; Waters & Fivish, 2014) or using multi-level modeling, nesting memories within individuals (e.g., McLean & Fournier, 2008; McLean, Syed, Yoder & Greenhoot, 2014). A major advantage of the latter approach is that it allows for analyses both within and between individuals, and therefore

Reliability 7
can address a wider variety of research questions. Nevertheless, our purpose here is not to advocate for one approach over another, but rather to highlight the significance of determining the unit of analysis early in the coding process.
Developing a coding manual. A well-articulated coding manual is the bedrock of a
strong and successful coding system. The first step in this process is an examination of the research question and determining what a coding scheme needs to capture to successfully address it. Coding schemes are generally developed in one of two ways: using a deductive theory-driven top-down approach or an inductive data-driven bottom-up approach (Chi, 1997). The theory-driven approach involves deconstructing an existing psychological theory into codes that can be applied to the data whereas the data-driven approach involves the construction of a coding scheme based on the data collected. For example, the theory-driven approach was used by McLean et al. (2014) to develop narrative coding for domain-specific identity development originally specified by Marcia (1966, 1993) and other identity status theorists. In contrast, Syed and Azmita (2008) used the inductive or data-driven approach to find common themes in narratives about ethnicity related experiences using a diverse group of readers. There is also a third approach that approximates a middle ground between the two: a theoretically-driven inductive approach, in which the coding system is generated inductively, but the analysts draw from the theoretical perspective when identifying and naming themes. This approach is illustrated through a study by Syed, Juan, and Juang (2011) examining the role that ethnicity plays in emerging adults’ lives. The researchers used a multi-staged process that first involved inductively generating a large list of initial codes, followed by a process in which the research team searched for themes in the codes informed by the existing literature on the topic. As with all of the recommendations put forth in this paper selecting the appropriate approach and being transparent about the approach that is taken is critical to effectively addressing the research question in the study.
The next step in the process of coding manual development is becoming familiar with the
data (Braun & Clarke, 2006). This is accomplished through a careful reading, watching or listening, and rereading, re-watching, or re-listening of the data collected. It is important that data are either chosen randomly from the sample or that all of the data are reviewed. In general, multiple researchers blind to the demographics of each participant should review data in order to reduce individual researcher bias, bias to the hypotheses of the study, and biases due to demographics of the participants; however in some cases doing so may not be feasible.
As data are reviewed, a “working” coding manual should begin to take form. Themes
should be noted and compiled in a dynamic document. These themes can be based on the theory the researcher is applying or can be derived purely from the data. The compiled list of codes should initially be as exhaustive as possible. The development of a dynamic working coding manual from the very beginning of this process allows for thorough documentation of all decisions made regarding the data. A coding manual should include a description of the code, inclusion and exclusion rules for that code, examples of units coded as that code, as well as negative cases: examples of units that are not captured by that code. Researchers then begin the process of combining these exhaustive coding schemes into more encompassing coding families (Braun & Clarke, 2006; Campbell, Quincy, Osserman, & Pederson, 2013).

Reliability 8
Consistent with our theme of establishing reliability as a process vs. product, developing a coding manual should always be an iterative process. This iterative process is well-captured by Braun and Clarke’s (2006) thematic analysis method, where preliminary coding categories generated from the data are subsequently applied back to the original data to ensure appropriate specificity and accuracy, which will lead to refinement of the categories. A theory-driven approach will require refining based on the data and a data-driven approach will require refining based on the scheme developed, and therefore all coding manual development will be iterative to some degree. This process of reducing, coding, and refining continues until a satisfactory coding scheme is developed.
One of the most important decisions made in coding development is the number of codes
to be used. A large number of codes allows for greater complexity to be captured in the data but comes at the possible cost of decreased reliability due to the complexity of the scheme (Hruschka et al., 2004). The process of developing a coding scheme, therefore, involves the balancing of parsimony and nuance. This is a decision that must be made on a case-by-case basis with attention paid to the both reliability and usefulness of the data (Campbell et al., 2013). Additionally, coding manuals can be hierarchical, in which microcodes are nested within macrocodes. This is the case, for instance in the “facts and interpretations” coding scheme developed by Pasupathi and Wainryb (2010), in which objective information provided by a narrator is coded as a fact, subjective information is coded as an interpretation and units coded as interpretation are further coded as either an interpretation of the narrator, another individual, or unspecified (see Pasupathi, Mansour, & Brubaker, 2007, for a similar approach when coding self-event connections).
While the coding manual begins as a dynamic document, at a certain point the
quantitative researcher must make a decision that the coding scheme has been refined and that the document is now a static coding manual. This change must be distinct to the researcher and to the coders as from this point on all coders begin to use the coding manual as strict coding criteria for inclusion and exclusion. Additionally, at this point reliability analysis begins and all narrative codes are recorded separately for each coder.
Training coders. The method for training coders largely depends on the coding process
undertaken by the researchers. However, the general method for training coders follows a three-step procedure. First, the researcher should provide the coding manual for all coders involved in the project. This manual should be discussed in detail and all initial questions addressed. Second, the researcher should provide sample data randomly drawn from the data set, with which coders can practice the coding scheme. These initial codes should be discussed thoroughly with the coding team, and the exclusion and inclusion process should be detailed. At this stage, the coding manual is often revised to reflect common questions put to the researcher by coders in order to provide documentation of any decisions made in the early training stages.
Upon reaching an understanding of the coding manual, the researcher can begin to assign
small portions of the data set (chosen at random) for coding. It is important to many of the coding processes we will detail, that a certain percentage of data is not coded before reliability is reached so the beginning of the coding process must move slowly and methodically. In some of the coding processes detailed below the coding manual will continue to be updated as difficult

Reliability 9
cases are dealt with and exclusion and inclusion criteria are altered. Once raters are sufficiently trained, they can be assigned cases to code independently. It is important to do periodic reliability checks throughout the coding process to prevent coder drift, which is the tendency for raters to veer away from each other in their interpretations of the coding manual over time (Wolfe, Moulder, & Myford, 2000).
Finally, and perhaps most importantly, the quantitative researcher must make decisions
about coding process, percent to be coded to reach reliability, reliability coefficient needed and any decisions about who will help with the coding process a priori. To make these decisions during the coding process jeopardizes the integrity of most of the quantitative coefficients which rely on assumptions of random agreement. There are four broad methods for how to structure the coding process, to which we now turn.
Gold standard/Master coder. In this approach, one member of the research team serves
as the gold standard or master coder. That individual codes all of the narratives in the dataset. A second member of the research team serves as the reliability coder. The reliability coder codes a subset of the total dataset, but that person’s coding is used only to establish inter-rater reliability with the master coder; it is the coding of the master coder that is used in the final analysis. The proportion coded by the reliability coder will depend on the size and complexity of the dataset, but a common figure is 20% of the total dataset (e.g., Lilgendahl & McAdams, 2011; McLean & Pratt, 2006). Importantly, the goal in coding a proportion of data at random is to obtain a sample from which a reliability coefficient can be calculated and reasonably generalized to the entire data set. Thus, the standard of 20% coded would not be deemed sufficient for generalizability in small data sets or when applying highly complex coding schemes. As with all methodological decisions, the decision of what proportion to code should be made with consideration of the nature of the data in question.
Alternative procedures for establishing reliability include having one master coder and
five reliability coders, with each of latter coding 20% of the data, or two master coders each coding half the data, with a corresponding reliability coder for each. Regardless of the structure, a defining feature of this approach is that discrepancies need not be reconciled as long as adequate inter-rater reliability can be documented, for it is only the master coders’ coding that is actually used in the analysis. This is one of the primary differences between the master coder approach and the other three described below.
Reconcile differences via consensus. Unlike the gold standard/master coder approach,
with this approach two (or more) members of the research team code all of the data, with inter-rater reliability calculated based on the entire set (Bradley, Curry, & Devers, 2007). Any discrepancies in the coding are then discussed by the research team, and resolved through consensus, and thus the final set of codes for analysis are based on multiple researchers’ input, rather than just one. Although this is a strength of this approach, a potential weakness is if the consensus-building process involves one member of the research team convincing the others that he/she is correct.
Third party resolution. A potential solution to avoiding a coercive consensus process is
to have a third member of the research team—neither of the original two coders—resolve the

Reliability 10
discrepancies. To use this approach, it is critical that the person doing the resolving has sound judgment and is well-versed in the coding manual. One of the ways to achieve this is to have the third party code a subset of the data to ensure that he/she is a reliable coder.
Averaging. The final approach to resolving discrepancies is to simply take the average of
the two raters’ coding. Although this approach is the least labor intensive, there are two big caveats to consider before using it. First, it obviously works only for coding categories that are continuous in nature (e.g, most forms of autobiographical reasoning; McAdams et al., 2004; Lilgendahl & McAdams, 2011). One cannot take the average for coding categories that are nominal (e.g, event type). Second, taking an average will have less severe implications when the ratings are near to each other (e.g., a 2 and a 3 on a 5-point scale) than when they are far apart (e.g., a 1 and a 5 on a 5-point scale). Accordingly, before using an averaging approach, researchers should examine their data closely to determine the degree of difference between the ratings.
Selecting the Appropriate Reliability Index There are several different statistics that can be used to index inter-rater reliability, and researchers should take great care to select the most appropriate one. The literature is rife with implicit and explicit endorsements of the idea that Cohen’s kappa represents the highest standard for documenting reliability (e.g., Bakeman & Gottman, 1986; Fiese & Spagnola, 2005). Few researchers seem to be aware, however, of the many limitations of kappa (more on this below). In many cases, other indices such as Delta, intraclass correlation, and percent agreement, among others, may be more appropriate than kappa. There also is the question of what constitutes acceptable levels for a reliability index. There is no hard and fast rule or objective criteria by which to make such a judgment1, and what is acceptable depends on the particular index. Accordingly, when describing each index below, we will describe what we view as conventionally acceptable values. Additionally, we will describe what each index is, how it is calculated, when to use it, and when not to use it. Our exposition is meant to be an introduction and broad summary; those who intend to use any of these indexes are strongly urged to consult the primary sources referenced for each index.
Percent agreement. The percent agreement method is the most straight-forward and intuitive approach to establishing reliability. Percent agreement ( is simply the ratio of items on which two coders agree to the total number of items rated, and is calculated using the following formula:
(1)
100
(2) where is the total number of agreements and is the total number of disagreements. One of the strengths of percent agreement is its flexibility, as it can be used with continuous, ordinal, or 1 As with many statistics, there is a p-value associated with most reliability indexes (e.g., Kappa, ICC, Delta). This p-value tests the null hypothesis that the reliability index is zero. This is of hardly any interest at all to most researchers, and p-values of less than .001 can be obtained for levels of reliability that no serious researcher would ever accept. Of course, one could set the null hypothesis to a value other than zero, but it is not clear what that value should be. As a result, p-values are seldom of interest in the context of inter-rater reliability.
Reliability 11
nominal coding categories. Because it is uncorrected, it is also a literal representation of the degree to which two coders agree. Depending on one’s epistemological stance, this representation could be entirely sufficient.
The fact that it is uncorrected, however, is considered its biggest limitation. When two raters code an item, it is always possible that they did so accidentally, or by chance, rather than because they actually agreed on the appropriate code (Bernard, 2000; Cohen, 1960; Krippendorff, 2011). Thus, the percent agreement includes two sources of agreement—true agreement and chance agreement—and therefore tends to be a liberal index of reliability. Bakeman and Gottman (1986) drew an important distinction between agreement and reliability. The percent agreement method is suitable for establishing agreement, but its failure to account for chance agreement makes it a poor measure of reliability.
That said, percent agreement should not be seen as a useless index. Some narrative
researchers (Korobov & Thorne, 2006; Lilgendahl & McAdams, 2001) have argued that percent agreement may be most appropriate for culling specific units (e.g., stories) from larger chunks of open-ended data (e.g., semi-structured interviews). As Korobov and Thorne (2006) explained, most indexes of reliability (described below) require designating data as either “hits” or “misses,” yet when unitizing specific information, there will be an absurd number of agreements on the “misses” given that most of an interview content will not fall in the target unit. This creates a huge agreement on the “misses,” thereby inflating kappa values.
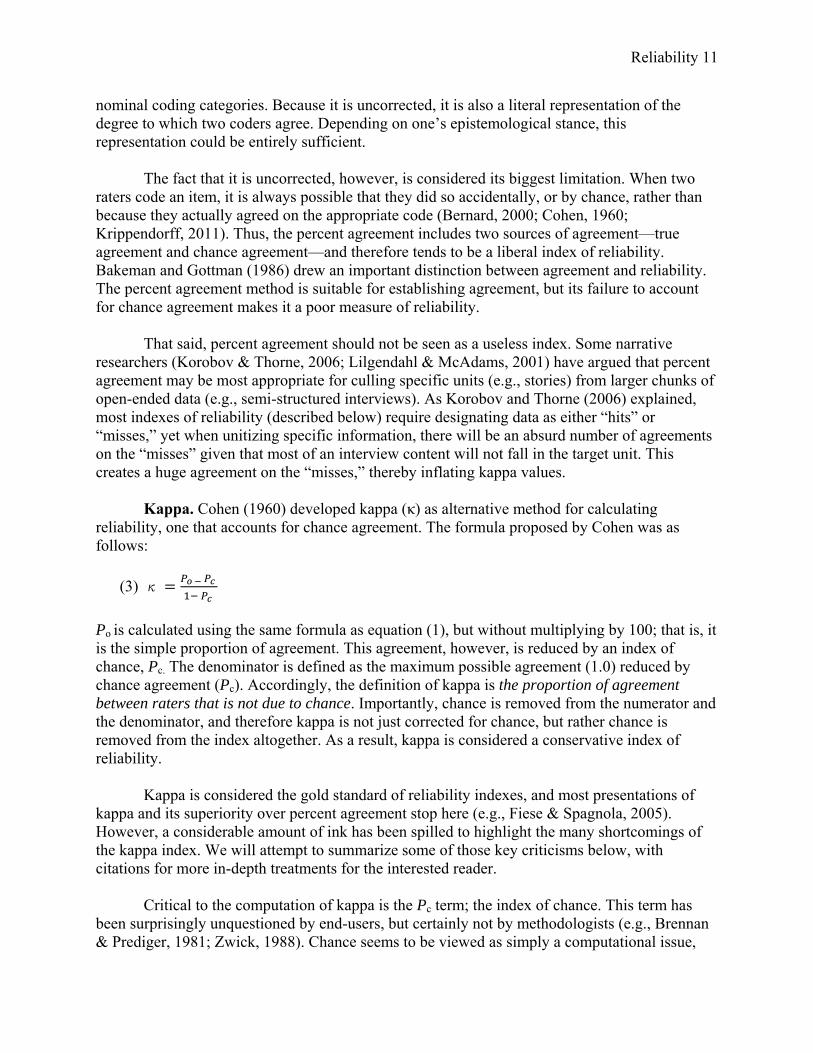
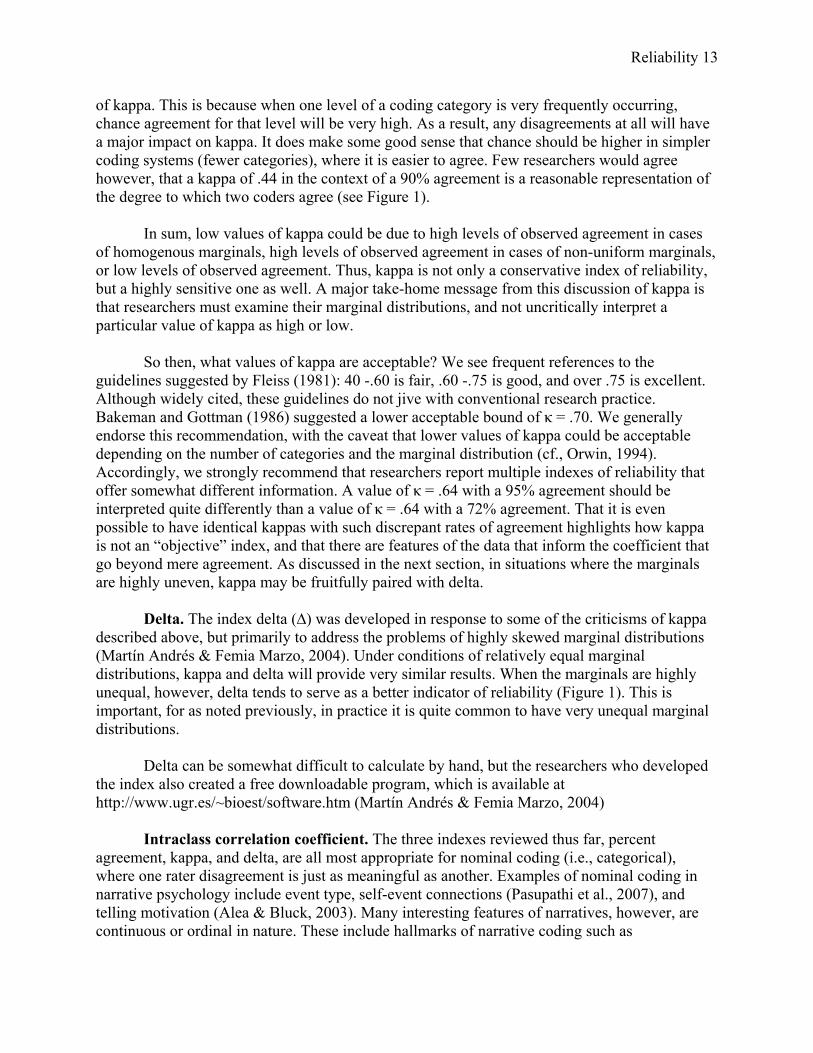
Kappa. Cohen (1960) developed kappa (κ) as alternative method for calculating
reliability, one that accounts for chance agreement. The formula proposed by Cohen was as follows:
(3) κ
Po is calculated using the same formula as equation (1), but without multiplying by 100; that is, it is the simple proportion of agreement. This agreement, however, is reduced by an index of chance, Pc. The denominator is defined as the maximum possible agreement (1.0) reduced by chance agreement (Pc). Accordingly, the definition of kappa is the proportion of agreement between raters that is not due to chance. Importantly, chance is removed from the numerator and the denominator, and therefore kappa is not just corrected for chance, but rather chance is removed from the index altogether. As a result, kappa is considered a conservative index of reliability.
Kappa is considered the gold standard of reliability indexes, and most presentations of kappa and its superiority over percent agreement stop here (e.g., Fiese & Spagnola, 2005). However, a considerable amount of ink has been spilled to highlight the many shortcomings of the kappa index. We will attempt to summarize some of those key criticisms below, with citations for more in-depth treatments for the interested reader.
Critical to the computation of kappa is the Pc term; the index of chance. This term has
been surprisingly unquestioned by end-users, but certainly not by methodologists (e.g., Brennan & Prediger, 1981; Zwick, 1988). Chance seems to be viewed as simply a computational issue,

Reliability 12
but it is a conceptual one as well. Indeed, Zwick (1988) highlighted how equation (2) is a general form of reliability adjusted for chance agreement, with several different available methods for calculating chance.
To understand how the calculation of chance may be a limitation of kappa, we first need
to review how it is done. The calculation is very similar to how expected cell frequencies are determined in the chi-square test of independence, except only the values in the diagonal cells go into the final index (see Figure 1). As can be seen in the figure, chance is determined by the observed marginal distribution. Marginal distributions describe the patterns of random variables collapsed across other variables (Cohen, 1960). For example, in a 2 x 2 contingency table, there are two marginals: the column values collapsed across rows, and the row values collapsed across columns. In inter-rater reliability terms, each marginal represents a given coders’ ratings irrespective of the other coder. In contrast, the individual cell values in the 2 x 2 table are part of the conditional distribution, as they represent the joint probabilities of that code by the two raters. The fact that chance is based on the observed marginal distribution means that chance is determined after the coding is known. This may or may not fit with researchers’ conceptual understanding of chance for a give coding task.
That the calculation of chance is dependent on the data can lead to some oddities in the
results. For example, identical marginals across raters can lead to lower kappa due to increased degree of chance, but chance itself is determined because the raters agreed. To correct for some of these potential problems, several methodologists have suggested replacing calculation of chance through observed marginals (chance given the data) to simply 1/k, where k represents the number of possible categories a rater can use (see Zwick, 1988). This conceptualization of chance is akin to raters randomly and indiscriminately coding the set of items, which, in the long run, should approximate 1/k. This method assumes a naïve rater vis-à-vis the prevalence of certain codes versus other, as the chance of assigning any particular code is equally weighted. This approach stands in contrast to kappa, which assumes a highly informed rater vis-à-vis the relative prevalence of coding categories. There are a variety of other methods for calculating chance, including Bennett, Alpert, and Goldstein’s (1954) S, Scott’s (1955) pi, and Krippendorf’s (2004) alpha. All of these methods share some similarities, and largely differ in assumptions about the marginals and how to optimally handle them (see Brennan & Prediger, 1981, Feinstein & Cicchetti, 1990, and Zwick, 1988 for more details).
Kappa’s reliance on the marginal distributions has broad implications beyond the
selection of an appropriate chance model. Kappa performs the best under conditions of marginal homogeneity (equality across raters) and uniformity (equality of marginal values within raters). A few words about the latter condition, uniformity, are in order2. Put simply, uniformity corresponds to each level of a coding category occurring at the same frequency. By and large, however, this will not be the case; there will almost always be some levels of a coding category that are relatively high and low frequency (see Syed et al., 2011). These deviations from uniformity can have major implications for kappa values (Feinstein & Cicchetti, 1990; Whitehurst, 1984). In particular, highly uneven marginals can lead to unappealingly low values
2 Importantly, our discussion assumes free marginals; that is, raters are free to assign values as they see fit. If the marginals are fixed, where raters are attempting to recapture a known distribution, the implications of deviating from uniformity are quite different. See Brennnan and Prediger (1981) for more information on this issue.
Reliability 13
of kappa. This is because when one level of a coding category is very frequently occurring, chance agreement for that level will be very high. As a result, any disagreements at all will have a major impact on kappa. It does make some good sense that chance should be higher in simpler coding systems (fewer categories), where it is easier to agree. Few researchers would agree however, that a kappa of .44 in the context of a 90% agreement is a reasonable representation of the degree to which two coders agree (see Figure 1).
In sum, low values of kappa could be due to high levels of observed agreement in cases
of homogenous marginals, high levels of observed agreement in cases of non-uniform marginals, or low levels of observed agreement. Thus, kappa is not only a conservative index of reliability, but a highly sensitive one as well. A major take-home message from this discussion of kappa is that researchers must examine their marginal distributions, and not uncritically interpret a particular value of kappa as high or low.
So then, what values of kappa are acceptable? We see frequent references to the
guidelines suggested by Fleiss (1981): 40 -.60 is fair, .60 -.75 is good, and over .75 is excellent. Although widely cited, these guidelines do not jive with conventional research practice. Bakeman and Gottman (1986) suggested a lower acceptable bound of κ = .70. We generally endorse this recommendation, with the caveat that lower values of kappa could be acceptable depending on the number of categories and the marginal distribution (cf., Orwin, 1994). Accordingly, we strongly recommend that researchers report multiple indexes of reliability that offer somewhat different information. A value of κ = .64 with a 95% agreement should be interpreted quite differently than a value of κ = .64 with a 72% agreement. That it is even possible to have identical kappas with such discrepant rates of agreement highlights how kappa is not an “objective” index, and that there are features of the data that inform the coefficient that go beyond mere agreement. As discussed in the next section, in situations where the marginals are highly uneven, kappa may be fruitfully paired with delta.
Delta. The index delta (∆) was developed in response to some of the criticisms of kappa
described above, but primarily to address the problems of highly skewed marginal distributions (Martín Andrés & Femia Marzo, 2004). Under conditions of relatively equal marginal distributions, kappa and delta will provide very similar results. When the marginals are highly unequal, however, delta tends to serve as a better indicator of reliability (Figure 1). This is important, for as noted previously, in practice it is quite common to have very unequal marginal distributions.
Delta can be somewhat difficult to calculate by hand, but the researchers who developed
the index also created a free downloadable program, which is available at http://www.ugr.es/~bioest/software.htm (Martín Andrés & Femia Marzo, 2004)
Intraclass correlation coefficient. The three indexes reviewed thus far, percent
agreement, kappa, and delta, are all most appropriate for nominal coding (i.e., categorical), where one rater disagreement is just as meaningful as another. Examples of nominal coding in narrative psychology include event type, self-event connections (Pasupathi et al., 2007), and telling motivation (Alea & Bluck, 2003). Many interesting features of narratives, however, are continuous or ordinal in nature. These include hallmarks of narrative coding such as

Reliability 14
autobiographical reasoning (e.g., meaning-making, reflection, growth), conflict, coherence, emotionality, and so on. These types of construct tend to be rated on a 3- or 5-point ordered scale reflecting less of more presence of the construct in the narrative (e.g., Lodi-Smith et al., 2009).
Accordingly, for continuous/ordinal data, a reliability index that accounts for similarity
and proximity is necessary. To this end, the optimal index is the intraclass correlation coefficient (ICC; Shrout & Fleiss, 1979). The ICC is calculated using an ANOVA model, with differences between raters modeled as within-subjects variance. Importantly, there are several factors that must be considered when choosing an appropriate ICC model, each of which can have a substantial impact on the final coefficient (see Shrout & Fleiss, 1979 for illustration). Specifically, there are 12 potential methods for calculating ICC based on the model type, number of raters, and definition of similarity. The three models correspond to whether 1) the data are coded by different sets of randomly selected raters (one-way random model), 2) all data are coded by all raters randomly selected from a larger universe of raters (two-way random model), or 3) all data are coded by all raters and the researcher is actually interested in the values assigned by those specific raters (two-way mixed model). The number of raters has to do with whether researchers are 1) interested in the coding of a single rater or 2) taking the average of multiple raters, and the definition of similarity corresponds to 1) consistency or 2) absolute agreement.
As noted, these 12 different models can lead to drastically different ICC coefficients, and
thus interested researchers must become familiar with these variations to select the appropriate index. It is beyond the scope of this article to outline all of the different factors that can lead to selecting one index over another, but in most cases when coding open-ended data the optimal model will be a two-way random model with absolute agreement for either a single rater or multiple raters. The reason for this model is that a) typically raters are trained undergraduate or graduate students selected from a broader pool of possible raters (two-way random), b) when establishing inter-rater reliability, we are generally interested in how much the raters actually agree (absolute) not just whether they are accurate relative to one-another (consistency), and c) the choice of single or multiple raters depends on the different possible structures for the coding process discussed previously (e.g., gold standard, averaging). Despite this general recommendation, researchers are urged to consult primary sources on the ICC to become more familiar with the different options (Shrout & Fleiss, 1979). Finally, in terms of conventions about what constitutes acceptable levels of agreements, a generally agreed upon benchmark for reliability measured by ICC is around .75 - .80 (Cicchetti, 1994; Orwin, 1994).
Weighted kappa. Like the ICC, weighted kappa is a method for calculating reliability
with ordered data (Fleiss & Cohen, 1973). In fact, the ICC is a special case of weighted kappa, wherein the weights assigned to the categories are equally spaced. For example, if assessing narrative coherence on a 1-5 scale, there is a one-unit difference between each code, and therefore ICC and weighted kappa would yield identical coefficients. Weighted kappa, however, allows researchers to be flexible in how they conceptualize differences between the levels of a coding category, establishing certain differences as more or less severe as others.
Correlation coefficient (Pearson’s r, Spearman’s ρ). Although tempting with their
simplicity and ease of calculation, the correlation coefficients r and ρ should generally not be

Reliability 15
used as indexes of inter-rater reliability. The reason is clear: these are indexes of consistency, not agreement, and when establishing reliability it is desirable to have an index that includes both. It is entirely possible to achieve a correlation of 1.0 and have raters disagree on every single item that they rated. As long as the raters are consistent in their disagreements, the correlation will be very strong (Orwin, 1994). Clearly this is not a desirable feature in the context of inter-rater reliability.
What Constitutes Agreement?
In general, for nominal coding schemes kappa and/or delta should be used to establish and report inter-rater reliability. In some cases, it could also be advantageous to report percent agreement alongside them. Reporting multiple indexes has little downside, and yet provides much more information than a single index. For ordinal or continuous coding schemes, the appropriate ICC model should be used if distances between coding choices are unitarily equivalent, and weighted kappa should be used if they are not.
There are two important take home lessons from this exposition. First, there are
numerous factors that can affect the value of a reliability index, including the number of categories (k), the number of items to be rated (n), the difficulty of the coding system, the relative frequency of codes within a category, and the naivety of the raters, among others. These influences make it very difficult to know what make for “good agreement.” Reliability indexes cannot be interpreted objectively or easily compared across categories, as the ingredients that constitute them can vary considerably.
The second take home lesson is that establishing reliability is about more than just the final coefficient that makes it into published articles. Bakeman and Gottman (1986) made an astute point about the dual function of establishing reliability. The final coefficient serves only one function, namely convincing editors, reviewers, and readers that the data were reliably coded. The second function involves developing a coding system, training observers, and refining the understanding of that which the researchers are coding. In this way, it is the coding matrix that is particularly important, rather than the reliability coefficient. Bakeman and Gottman refer to the coding matrix as a “confusion matrix,” highlighting its diagnostic utility (see Fig 4.1, p. 77). The confusion matrix does not just indicate that differences in coding occurred, but it provides information about how and why those differences occurred. Examining the off-diagonal cells—the disagreements—can be especially beneficial for refining a coding system and directing training. The confusion matrix can indicate which levels of a category tend to be confused with each other, and if a rater tends to be particularly prone to over-coding or under-coding a certain category. Using the confusion matrix during training in this way will go a long way to creating a robust and reliable coding system. Thus, it should be quite clear at this point that there is much greater value in the process by which researchers establish reliability than in knowing the final coefficient that represents that reliability.
What is Reliability to a Qualitative Researcher?
Qualitative researchers view participant data contextually: in space, in time, and within the specific context of the research process (Merriam, 2009). This view stands in contrast to most

Reliability 16
who adopt a positivist approach, who tend to interpret their data as “context-free.” Narrative researchers working with quantitative models often state that coders were “blind to participant demographics” or other potentially relevant data (e.g., Adler, Chin, Kolisetty, & Oltmanns, 2012). This common statement suggests that a reliable and valid coding system is best facilitated through a context-free view of the data, and that knowledge of participant characteristics will alter narrative coding in ways that render it unreliable. In contrast, few North American qualitative researchers use the term “reliability” at all in their research (Morse, Barrett, Mayan, Olson, & Spiers, 2002). For example, in the Sage Handbook of Qualitative Research (Denzin & Lincoln, 2011), a 43-chapter authoritative source for the field, the index does not include any entries for reliability or inter-rater agreement. So what, if anything, serves as the parallel concept to reliability for qualitative researchers?
In the qualitative literature the closest thing to reliability is the concept of “rigor” (see
Merriam, 2009). For a qualitative researcher, rigor is a product of the entire research process and “derives from the researcher’s presence, the nature of the interaction between researcher and participants, the triangulation of data, the interpretation of perceptions and rich, thick descriptions” (pp. 165-166; Merriam, 2009). Thus, rigor is as much a product of the researcher and research context, bias, and subjectivity as it is the data (Guba & Lincoln, 1986; Patton, 2002). When we consider the goal of reliable data from this perspective, it is important to be clear that for a qualitative researcher working from a constructivist standpoint there is no single “truth” to be ascertained, thus reliability in coding represents a subjective consensus in a specific group at a specific time, and not an ultimate decontextualized “truth” that exists outside of the data (Merriam, 2009). Many qualitative researchers, in fact, consider the traditional conceptualization of reliability to be “not only fanciful but impossible” (p. 222; Merriam, 2009).
For many qualitative researchers a collaborative research team forms the backbone of the process of developing a coding system and applying it to qualitative data in a manner that is deemed “rigorous”. For example, the Listening Guide method (Taylor, Gilligan, & Sullivan, 1996) emphasizes multiple readings of qualitative data by an “interpretive community” that is diverse with respect to life experiences and social position. Such diversity in research team allows for the discovery of experiences and subtle processes that might otherwise go unnoticed. Consensual qualitative research (CQR), developed by counseling psychologists, (Hill, Thompson, & Williams, 1997) makes no reference to “reliability” but heavily relies on the concept of consensus, which is similar to the process described by Taylor et al.’s (1996) interpretive community. Thus, in general, the idea of consensus or agreement cuts across many (but not all) qualitative and quantitative analytic approaches. The most visible difference is whether or not numbers are used to represent that agreement. Turning to narrative psychology, we can see the great variation in how consensus, agreement, and qualitative reliability are carried out, if at all. Hammack, Thompson, and Pilecki (2009) used a collaborative consensus approach to understand the various identity configurations of sexual identities among youth with same-sex desire. The authors cite hermeneutics (Tappan 1997) as their interpretive perspective and holistic content analysis (Lieblich, Tuval-Mashiach, & Zilber, 1998) as their methodological approach. As a team, they analyzed each participant’s narrative individually to understand the within-person dynamics of identity.

Reliability 17
Hammack (2006) took a similar approach in his study of identity among Palestinian and Israeli youth. In contrast to the collaborative approach used by Hammack et al. (2009), in this study Hammack carried out the analysis individually rather than collaboratively. Although this approach may be criticized by some researchers concerned with bias, it is critical to understand the context of the study. Whereas Hammack et al. (2009) was based on semi-structured interviews conducted with college students, Hammack (2006) was the product of ethnographic methods. As described in the article, his methods involved rigorous fieldwork—participant observation, interviews, and analyses of both historical and current events—multiple times over several years. Thus, the amount of information that Hammack knew about his participants went well beyond the typical psychological study of identity.
Josselson (2000, 2009) has described a similar approach in her longitudinal study of
women’s identity that has spanned nearly 40 years. Her interpretive approach involves individual analysis followed by consultation with knowledgeable outsiders. Somewhat unique to her approach, rather than including disembodied quotes in the article, she includes extensive case material and analysis in order to draw clear lines between her participants’ experiences and her own interpretations (see also Schachter, 2004, 2005), and invites the readers to disagree with her interpretations.
Similarly, narrative studies that examine talk in interaction often rely on the insights of a single analyst (e.g., Bamberg, 2004). This research looks different from much of the other narrative research that has been referenced thus far, as it uses discursive analytic techniques. That is, the analysis does not only consider what is said, but how individuals say it (e.g., intonation, pauses, hedges, discourse markers). Similar to Josselson, extensive excerpts are included in the final articles, along with a deep analysis of the excerpt (e.g., Korobov & Bamberg, 2004). Ironically, this makes for a cleaner distinction between data and analysis than what is often seen in quantitative-based studies, where much of the data themselves go unseen by the reader.
Ethnographic studies need not be solitary endeavors, though. In their longitudinal school-based study of ethnic identity, Way, Santos, Niwa, and Kim-Gervey (2008) used both semi-structured interviews and participant observation to understand how identities were constructed within that context. The analysis of the data was conducted by the research team, and not individually, following a general process of identifying themes and generating consensus among the researchers (e.g., Braun & Clarke, 2006; Hill et al., 1997; Taylor et al., 1996).
There are a few important commonalties in the preceding approaches. First, like just about all forms of qualitative analysis, the purpose of the analysis is to offer interpretations, not to uncover truths (Gergen, 2009). The subjectivities of the researchers are fully acknowledged and, ideally, built into the analysis. In contrast, subjectivities in quantitative research also exist, but conventional practice promotes their invisibility (Simmons, Nelson, & Simonsohn, 2011). Second, all of these approaches involve a “closeness” to the data. The researchers have a deep and intimate knowledge of their participants that goes far beyond the words on paper that tends to be the product of more quantitative approaches. From the standpoint of these researchers, this closeness is what allows for rigor in the interpretative methods and renders trivial the idea that a two-digit coefficient in the Method section as the ultimate sign of rigor.

Reliability 18
Recommendations for Researchers
Although we divided the preceding discussion by quantitative and qualitative approaches, in practice the lines between these two broad descriptors can be quite blurry, and they are not always incompatible. A paper by Korobov and Thorne (2007) is an excellent example. In the paper, the researchers used percent agreement when identifying romantic stories within broader conversations, Cohen’s kappa when identifying different qualities of the stories, and interpretive methods when analyzing the discursive strategies adopted by the speakers. Many narrative studies have used a two-stage approach, where formal reliability was established on the macro/molar coding categories, but not on the more nuanced micro categories (e.g., Syed, 2010). This approach may be appealing to researches who lack strong epistemological convictions and who are instead problem-focused and are therefore simply looking for the best approach for the given question (e.g., in the case of mixed methods research). Flexibility in using multiple approaches seems particularly important when exploring new areas of research such as development in emerging adulthood (Arnett, 2015). Indeed, qualitative or constructivist approaches may be most useful in the early stages of understanding a phenomenon, whereas more positivistic approaches may be especially helpful once a theory has been established and can be tested.
In closing, below we specify seven recommendations that follow from the preceding review. The recommendations are manifestations of our central theme, that reliability must be seen as a process rather than a product, and reflect our ecumenical view on the value of different epistemological and methodological stances:
1. Whether quantitative or qualitative, the process of establishing reliability reported in most
published articles is quite vague (Hill et al., 2005). Indeed, apart from the final coefficient that is reported in quantitative studies, the process of establishing reliability in either approach tends to be the same. We advocate for including greater information about the reliability process in published articles, making use of online supplements if necessary due to page limit constraints.
2. Recognize that decisions about reliability are dependent on the particular type of the data and the research questions being pursued. This pertains both to deciding whether or not to calculate a reliability coefficient as well as which method of reliability to use, quantitative or qualitative.
3. Developing a coding manual should be viewed as an iterative process, using some
combination of top-town and bottom-up approaches. A copy of the coding manual should be included as an online supplement or posted on the researcher’s website for download.
4. Do not uncritically select a reliability index, and eschew notions of “gold standards” in terms
of the appropriate index (i.e., kappa is not always the most appropriate index). 5. Consider reporting multiple reliability indexes that provide clearer information on the nature
of the agreement (e.g., kappa and percent agreement, kappa and delta).

Reliability 19
6. Remember that reliability is not validity. Although all researchers know this quite well, it seems that in the context of coding open-ended data, these two often get conflated. Just because the coding process led to an acceptable ICC or delta value does not indicate that the material coded adequately captures the construct of interest. Although not discussed in this paper, validity is obviously an important issue that narrative researchers should think carefully about (see Fiese & Spagnola, 2005).
7. Recognize that quantitative and qualitative approaches do not have to be in total opposition to one another. Considering research and data in context, as qualitative researchers do, can offer those who quantify qualitative data a novel and valuably rich perspective on their participants’ data. The value of this perspective is clear: more knowledge of the data is always a good thing, and will certainly be helpful for achieving some sense of validity.
Our final plea is for researchers working with qualitative data to be mindful and intentional; to not only think through all of the important issues discussed here, but also to document the thought and action process as thoroughly as possible in their final reports. Doing so contributes to achieving the high level of consistency for which we all strive.

Reliability 20
References
Adler, J. M. (2012). Living into the story: Agency and coherence in a longitudinal study of narrative identity development and mental health over the course of psychotherapy. Journal of Personality and Social Psychology, 102, 367-389.
Adler, J. M., Chin, E. D., Kolisetty, A. P., & Oltmanns, T. F. (2012). The distinguishing characteristics of narrative identity in adults with features of borderline personality disorder: an empirical investigation. Journal of Personality Disorders, 26, 498-512.
Alea, N., & Bluck, S. (2003). Why are you telling me that? A conceptual model of the social function of autobiographical memory. Memory, 11, 165-178.
Arnett, J. J. (2005). The vitality criterion: A new standard of publication for Journal of Adolescent Research. Journal of Adolescent Research, 20, 3-7.
Arnett, J. J. (2015). Identity development from adolescence to emerging adulthood: What we know and (especially) don’t know. In K. C. McLean & M. Syed (Eds). The Oxford handbook of identity development. New York, NY: Oxford University Press.
Bakeman, R., & Gottman, J. M. (1986). Observing behavior: An introduction to sequential analysis. Cambridge, UK: Cambridge University.
Bamberg, M. (2004). Talk, small stories, and adolescent identities. Human Development, 47, 366-369.
Bauer, J. J., & McAdams, D. P. (2010). Eudaimonic growth: Narrative growth goals predict increases in ego development and subjective well-being 3 years later. Developmental Psychology, 46, 761-772.
Benish-Weisman, M. (2009). Between trauma and redemption story form differences in immigrant narratives of successful and nonsuccessful immigration. Journal of Cross-Cultural Psychology, 40, 953-968.
Bennett, E. M., Alpert, R., & Goldstein, A. C. (1954). Communications through limited-response questioning. Public Opinion Quarterly, 18, 303-308.
Bernard H. R. 2000. Social Research Methods: Qualitative and Quantitative Approaches. Thousand Oaks, CA: Sage
Bradley, E. H., Curry, L. A., & Devers, K. J. (2007). Qualitative data analysis for health services research: developing taxonomy, themes, and theory. Health Services Research, 42, 1758-1772.
Braun, V., & Clarke, V. (2006). Using thematic analysis in psychology. Qualitative Research in Psychology, 3, 77-101.
Brennan, R. L., & Prediger, D. J. (1981). Coefficient kappa: Some uses, misuses, and alternatives. Educational and Psychological Measurement, 41, 687-699.
Campbell, J. L., Quincy, C., Osserman, J., & Pedersen, O. K. (2013). Coding in-depth semistructured interviews: Problems of unitization and intercoder reliability and agreement. Sociological Methods & Research, 42, 294-320.
Chi, M. T. H. (1997). Quantifying qualitative analyses of verbal data: A practical guide. Journal of the Learning Sciences, 6, 271–315.
Cicchetti, D. V. (1994). Guidelines, criteria, and rules of thumb for evaluating normed and standardized assessment instruments in psychology. Psychological Assessment, 6, 284.
Cohen, J. (1960). A coefficient of reliability for nominal scales. Educational and Psychological Measurement, 20, 37-46.

Reliability 21
Cook, T. D., & Campbell, D. T. (1979). Quasi-experimentation: Design and analysis for field setting. New York, NY: Rand-McNally.
Denzin, N. K., & Lincoln, Y. S. (Eds.). (2011). The SAGE handbook of qualitative research. Thousand Oaks, CA: Sage.
Dunlop, W. L., & Tracy, J. L. (2013). Sobering stories: Narratives of self-redemption predict behavioral change and improved health among recovering alcoholics. Journal of Personality and Social Psychology, 104, 576.
Feinstein, A. R., & Cicchetti, D. V. (1990). High agreement but low kappa: The problems of two paradoxes. Journal of Clinical Epidemiology, 43, 543-549.
Fiese, B. H., & Spagnola, M. (2005). Narratives in and about families: an examination of coding schemes and a guide for family researchers. Journal of Family Psychology, 19, 51-61.
Fleiss, J. L. (1981). Balanced incomplete block designs for inter-rater reliability studies. Applied Psychological Measurement, 5, 105-112.
Fleiss, J. L., & Cohen, J. (1973). The equivalence of weighted kappa and the intraclass correlation coefficient as measures of reliability. Educational and Psychological Measurement, 33, 613-619.
Gergen, K. J. (2009). Realities and relationships: Soundings in social construction. Cambridge, MA: Harvard University Press.
Guba, E. G., & Lincoln, Y. S. (1986). The countenances of fourth-generation evaluation: Description, judgment, and negotiation. Evaluation Studies Review Annual, 11, 70-88.
Hammack, P. L. (2006). Identity, conflict, and coexistence life stories of Israeli and Palestinian adolescents. Journal of Adolescent Research, 21, 323-369.
Hammack, P. L. (2010). Narrative and the politics of identity: The cultural psychology of Israeli and Palestinian youth. New York, NY: Oxford University Press.
Hammack, P. L., Thompson, E. M., & Pilecki, A. (2009). Configurations of identity among sexual minority youth: Context, desire, and narrative. Journal of Youth and Adolescence, 38, 867-883.
Hammer, D., & Berland, L. K. (2014). Confusing claims for data: A critique of common practices for presenting qualitative research on learning. Journal of the Learning Sciences, 23, 37-46.
Hill, C. E., Thompson, B. J., & Williams, E. N. (1997). A guide to conducting consensual qualitative research. The Counseling Psychologist, 25, 517-572.
Hruschka, D., Schwartz, D., John, D. C., Picone-Decaro, E., Jenkins, R., & Carey, J. (2004). Reliability in coding open-ended data: Lessons learned from HIV behavioral research. Field Methods 16, 307–31.
Johnson, R. B., & Onwuegbuzie, A. J. (2004). Mixed methods research: A research paradigm whose time has come. American Educational Research Association, 33, 14-26.
Josselson, R. (2000). Stability and change in early memories over 22 years: Themes, variations, and cadenzas. Bulletin of the Menninger Clinic, 64, 462-481.
Josselson, R. (2009). The present of the past: Dialogues with memory over time. Journal of personality, 77, 647-668.
Korobov, N. (2009). ‘He's got no game’: young men's stories about failed romantic and sexual experiences. Journal of Gender Studies, 18, 99-114.
Korobov, N., & Bamberg, M. (2004). Positioning a ‘mature’ self in interactive practices: How adolescent males negotiate ‘physical attraction’ in group talk. British Journal of Developmental Psychology, 22, 471-492.

Reliability 22
Korobov, N., & Thorne, A. (2006). Intimacy and distancing young men’s conversations about romantic relationships. Journal of Adolescent Research, 21, 27-55.
Korobov, N., & Thorne, A. (2007). How late-adolescent friends share stories about relationships: The importance of mitigating the seriousness of romantic problems. Journal of Social and Personal Relationships, 24, 971-992.
Krippendorff, K. (2004). Content Analysis: An Introduction to Its Methodology, 2nd ed. Thousand Oaks, CA: Sage.
Krippendorff, K. (2011). Agreement and information in the reliability of coding. Communication Methods and Measures, 5, 93-112.
Lieblich, A., Tuval-Mashiach, R., & Zilber, T. (1998). Narrative research. Reading, analysis and interpretation, Volume 47. Thousand Oaks, CA: Sage.
Lilgendahl, J. P., & McAdams, D. P. (2011). Constructing stories of self‐growth: How individual differences in patterns of autobiographical reasoning relate to well-being in midlife. Journal of Personality, 79, 391-428.
Lilgendahl, J. P., McLean, K. C., & Mansfield, C. D. (2013). When is meaning making unhealthy for the self? The roles of neuroticism, implicit theories, and memory telling in trauma and transgression memories. Memory, 21, 79-96.
Lincoln, Y., & Guba, E. (2000). The qualitative researcher’s companion. Journal of Management, 23, 409-473.
Lodi-Smith, J., Geise, A. C., Roberts, B. W., & Robins, R. W. (2009). Narrating personality change. Journal of Personality and Social Psychology, 96, 679-689.
Lyons, A. (2009). Is the American Psychological Association ready to accept a division for qualitative inquiry? The Humanistic Psychologist, 37, 101-107.
Main M., & Goldwyn R. (2009). Adult attachment classification system. Unpublished manuscript, University of California, Berkeley.
Marcia, J. E. (1966). Development and validation of ego- identity status. Journal of Personality and Social Psychology, 5, 551–558.
Marcia, J. E. (1993). The ego identity status approach to ego identity. In J. E. Marcia, A. S. Waterman, D. R. Matteson, S. L. Archer, & J. L. Orlofsky (Eds.), Ego identity: A handbook for psychosocial research (pp. 1–21). New York, NY: Springer-Verlag.
Marcia, J. E., Waterman, A. S., Matteson, D. R., Archer, S. L. & Orlosky J. L. (Eds.) (1993). Ego identity: A handbook for psychosocial research. New York, NY: Springer.
Martin Andrés, A., & Femia Marzo, P. (2004). Delta: A new measure of agreement between two raters. British Journal of Mathematical and Statistical Psychology, 57, 1-19.
McAdams, D. P., Anyidoho, N. A., Brown, C., Huang, Y. T., Kaplan, B., & Machado, M. A. (2004). Traits and stories: Links between dispositional and narrative features of personality. Journal of Personality, 72, 761-784.
McAdams, D. P., Bauer, J. J., Sakaeda, A. R., Anyidoho, N. A., Machado, M. A., Magrino‐Failla, K., ... & Pals, J. L. (2006). Continuity and change in the life story: A longitudinal study of autobiographical memories in emerging adulthood. Journal of Personality, 74, 1371-1400.
McAdams, D. P., & McLean, K. C. (2013). Narrative identity. Current Directions in Psychological Science, 22, 233-238.
McLean, K. C., & Fournier, M. A. (2008). The content and processes of autobiographical reasoning in narrative identity. Journal of Research in Personality, 42, 527-545.

Reliability 23
McLean, K. C., & Pratt, M. W. (2006). Life's little (and big) lessons: Identity statuses and meaning-making in the turning point narratives of emerging adults. Developmental Psychology, 42, 714-722.
McLean, K. C., & Syed, M. (2015). The field of identity development needs an identity: An introduction to The Oxford Handbook of Identity Development. In K. C. McLean & M. Syed (Eds). The Oxford Handbook of Identity Development. New York: Oxford University Press.
McLean, K. C., Syed, M., Yoder, A., & Greenhoot, A. F. (2014). The role of domain content in understanding identity development processes. Journal of Research on Adolescence. Article available online first.
Merriam, S. B., (2009). Qualitative research: A guide to design and implementation. San Francisco, CA: Jossey-Bass.
Morgan, E. M., & Korobov, N. (2012). Interpersonal identity formation in conversations with close friends about dating relationships. Journal of Adolescence, 35, 1471-1483.
Morse, J. M., Barrett, M., Mayan, M., Olson, K., & Spiers, J. (2008). Verification strategies for establishing reliability and validity in qualitative research. International Journal of Qualitative Methods, 1, 13-22.
Orwin, R. G. (1994). Evaluating coding decisions. In H. Cooper & L.V. Hedges (Eds.), The Handbook of Research Synthesis (pp. 139–162). New York, NY: Russell Sage.
Pasupathi, M., & Rich, B. (2005). Inattentive listening undermines self‐verification in personal storytelling. Journal of Personality, 73, 1051-1086.
Pasupathi, M., Mansour, E., & Brubaker, J. R. (2007). Developing a life story: Constructing relations between self and experience in autobiographical narratives. Human Development, 50, 85-110.
Pasupathi, M., & Wainryb, C. (2010). On telling the whole story: Facts and interpretations in autobiographical memory narratives from childhood through midadolescence. Developmental psychology, 46, 735-746.
Patton, M. Q. (2002). Two decades of developments in qualitative inquiry a personal, experiential perspective. Qualitative Social Work, 1, 261-283.
Schachter, E. P. (2004). Identity configurations: A new perspective on identity formation in contemporary society. Journal of Personality, 72, 167-200.
Schachter, E. P. (2005). Context and Identity formation A theoretical analysis and a case study. Journal of Adolescent Research, 20, 375-395.
Scott, W. A. (1955). Reliability of content analysis: The case of nominal scale coding. Public Opinion Quarterly, 19, 321-325.
Shallcross, S. L. (2013). Social support mediates the relation between attachment and responses to potentially traumatic events. Unpublished doctoral dissertation, University of Minnesota.
Shrout, P. E., & Fleiss, J. L. (1979). Intraclass correlations: uses in assessing rater reliability. Psychological Bulletin, 86, 420-428.
Simmons, J. P., Nelson, L. D., & Simonsohn, U. (2011). False-positive psychology undisclosed flexibility in data collection and analysis allows presenting anything as significant. Psychological Science, 22, 1359-1366.
Syed, M. (2010). Memorable everyday events in college: Narratives of the intersection of ethnicity and academia. Journal of Diversity in Higher Education, 3, 56-69.

Reliability 24
Syed, M., & Azmitia, M. (2008). A narrative approach to ethnic identity in emerging adulthood: bringing life to the identity status model. Developmental Psychology, 44, 1012-1027.
Syed, M., Juan, M. J. D., & Juang, L. P. (2011). Might the survey be the intervention? Participating in ethnicity-related research as a consciousness-raising experience. Identity, 11, 289-310.
Tappan, M.B. (1997) Interpretive psychology: Stories, circles, and understanding lived experience. The Journal of Social Issues, 53, 645-656.
Tashakkori, A., & Creswell, J. W. (2007). Editorial: The new era of mixed methods. The Journal of Mixed Methods Research, 1, 3-7.
Taylor, J. M., Gilligan, C., & Sullivan, A. M. (1996). Missing voices, changing meanings: Developing a voice-centered, relational method and creating an interpretative community. In S. Wilkinson (Ed.), Feminist social psychologies: International perspectives. Buckingham, UK: Open University Press.
van Dulmen, M. H. (2013). Emerging Adulthood—The Journal. Emerging Adulthood, 1, 3-4. Waters, T. E., & Fivush, R. (2014). Relations between narrative coherence, identity, and
psychological well‐being in emerging adulthood. Journal of Personality. Way, N., Santos, C., Niwa, E. Y., & Kim-Gervey, C. (2008). To be or not to be: An exploration
of ethnic identity development in context. New Directions for Child and Adolescent Development, 120, 61-79.
Whitehurst, G. J. (1984). Interrater agreement for journal manuscript reviews. American Psychologist, 39, 22-28.
Whittemore, R., Chase, S. K., & Mandle, C. L. (2001). Validity in qualitative research. Qualitative health research, 11, 522-537.
Wolfe, E. W., Moulder, B. C., & Myford, C. M. (2000). Detecting differential rater functioning over time (DRIFT) using a Rasch multi-faceted rating scale model. Journal of Applied Measurement, 2, 256-280.
Zwick, R. (1988). Another look at interrater agreement. Psychological Bulletin, 103, 374-401.

Reliability 25
Example 1
Po = (45 + 45)/100 = .90
Pc = (25 + 25)/100 = .50
κ . .
. = .80
∆ = .78
% Agreement = 90%
Example 2
Po = (60 + 30)/100 = .90
Pc = (42.3 + 12.3)/100 = .55
κ. .
. = .78
∆ = .78
% Agreement = 90%
Example 3
Po = (85 + 5)/100 = .90
Pc = (81 + 1)/100 = .82
κ . .
. = .44
∆ = .78
% Agreement = 90%
Figure 1. Three hypothetical confusion matrices demonstrating the impact of the marginal distribution on the value of kappa. The shaded cells represent agreements and are the cells that are used to calculate Pc, the term for chance in the kappa equation. The numbers in parentheses are the expected values for the cells based on the marginals, and are calculated by multiplying the row total by the column total and dividing by the overall number of units coded. Po represents observed agreement in the kappa equation, which is equivalent to percent agreement divided by 100.
Rater 1
Yes No
Yes
45 5 50
Rater 2 (25) (25)
No
5 45 50
(25) (25)
50 50 100
Rater 1
Yes No
Yes
60 5 65
Rater 2 (42.3) (22.8)
No
5 30 35
(22.8) (12.3)
65 35 100
Rater 1
Yes No
Yes
85 5 92
Rater 2 (81) (9)
No
5 5 10
(9) (1)
90 10 100