Food and Nutrition Guidelines for Healthy Adults - NZIHF
148
Food and Nutrition Guidelines for Healthy Adults A Background Paper
-
Upload
khangminh22 -
Category
Documents
-
view
2 -
download
0
Transcript of Food and Nutrition Guidelines for Healthy Adults - NZIHF

Food and Nutrition Guidelines for Healthy Adults: A Background Paper i
Food and NutritionGuidelines forHealthy AdultsA Background Paper

Food and Nutrition Guidelines for Healthy Adults: A Background Paperii
Citation: Ministry of Health. 2003. Food and Nutrition Guidelinesfor Healthy Adults: A background paper. Wellington. Ministry of Health.
Published in October 2003
by the Ministry of HealthPO Box 5013, Wellington, New Zealand
ISBN 0-478-25839-9 (Book)
ISBN 0-478-25840-2 (Internet)
HP 3712
This document is available onthe Ministry of Health's website:
http://www.moh.govt.nz
MINISTRY OF
MANATu HAUORA
HEALTH–

Food and Nutrition Guidelines for Healthy Adults: A Background Paper iii
ForewordGood nutrition, physical activity and maintaining a healthy body weight are fundamental tohealth and to the prevention of disease and disability.
Food not only is a means of maintaining and improving physical health but has a valued place inour society. It is a catalyst for social interaction and has a significant part in most celebrations.The cultural and psychological functions of food cannot be overemphasised.
Over recent years there has been a rapid rise in health conditions for which poor nutrition andinadequate physical activity are key risk factors. This trend is particularly evident in the currentobesity epidemic. The Ministry of Health recognises the need for sound, up-to-date technicalinformation to support health professionals, health educators and teachers in the practice ofhealthy nutrition.
This background paper supports three of the key priorities of the New Zealand Health Strategy.It brings together the latest evidence and advice on food and nutrition, physical activity andobesity relevant to the health of adult New Zealanders. In addition, it provides information onimportant nutrition-related health disorders, food safety and quality issues. It will assist healthprofessionals and educators with the implementation of the Healthy Eating – Healthy ActionStrategy, which was launched in March 2003.
Key population groups in New Zealand, including Maori and Pacific peoples, are at particular riskof compromised health due to poor nutritional status. For this reason, one part of this paper isdevoted to nutrition issues relating to the health of these groups.
These guidelines are an important part of the Ministry’s Food and Nutrition Guideline series forNew Zealanders. This paper provides background material for health education resources for thegeneral public. It is envisaged that Food and Nutrition Guidelines for Healthy Adults: Abackground paper will provide sound and practical advice on food and nutrition for healthprofessionals and educators to use in their daily work.
Don Matheson (Dr)Deputy Director-GeneralPublic Health

Food and Nutrition Guidelines for Healthy Adults: A Background Paperiv
AcknowledgementsThe Ministry of Health would like to thank all those who have contributed to the development ofthis document. In particular thanks go to Crown Public Health, the members of the former Foodand Nutrition Advisory Committee, and the staff of the Department of Human Nutrition,University of Otago.
The peer reviewers who dedicated time and energy to reviewing this document at various stagesare acknowledged. The National Heart Foundation and the Cancer Society of New Zealand arealso thanked for their comments.
The many individuals and groups who gave feedback as part of the public consultation processand the specialists who commented on the final draft have shaped this final documentsignificantly. The Ministry of Health appreciates the assistance of the many people who have hadinput during the process.
This document has been produced by the Public Health Policy Group.

Food and Nutrition Guidelines for Healthy Adults: A Background Paper v
ContentsForeword ................................................................................................................................ iii
Introduction ............................................................................................................................. 1
Part I: The New Zealand Food and Nutrition Guidelines ........................................................ 3
1 Background ...................................................................................................................... 3
The background papers and guideline statements of the Food and Nutrition Guidelines .....3New Zealand Food and Nutrition Guideline statements........................................................3Food groups and the nutrients they provide.........................................................................4New Zealand Recommended Dietary Intakes .......................................................................6Recommended energy intakes .............................................................................................6
Part II: Nutrients, Food and Drinks ......................................................................................... 7
2 Energy ............................................................................................................................. 7
Background ......................................................................................................................... 7Recommended energy intakes for adults .............................................................................8Energy intakes in New Zealand.............................................................................................8Sources of energy in the diet ................................................................................................9Practical advice ....................................................................................................................9
3 Protein ............................................................................................................................11
Background ........................................................................................................................ 11Recommended protein intakes for adults........................................................................... 11Protein intakes in New Zealand .......................................................................................... 11Sources of protein in the diet ............................................................................................. 12Practical advice .................................................................................................................. 12
4 Carbohydrate ................................................................................................................. 13
Background ........................................................................................................................ 13Recommended carbohydrate intakes for adults ................................................................. 15Carbohydrate intakes in New Zealand ................................................................................ 15Sources of carbohydrates in the diet .................................................................................. 17Practical advice .................................................................................................................. 17
5 Fat .................................................................................................................................. 18
Background ........................................................................................................................ 18Recommended fat intakes for adults .................................................................................. 19Fat intakes in New Zealand................................................................................................. 19Reducing fat intakes ......................................................................................................... 20Practical advice .................................................................................................................. 21
6 Iron ................................................................................................................................ 22
Background ....................................................................................................................... 22Recommended iron intakes for adults ............................................................................... 24Iron intakes in New Zealand .............................................................................................. 24Sources of iron in the diet ................................................................................................. 25Practical advice ................................................................................................................. 25
7 Calcium .......................................................................................................................... 26
Background ....................................................................................................................... 26Recommended calcium intakes for adults ......................................................................... 26Calcium intakes in New Zealand ........................................................................................ 26

Food and Nutrition Guidelines for Healthy Adults: A Background Papervi
Sources of calcium in the diet ........................................................................................... 27Practical advice ................................................................................................................. 27
8 Sodium .......................................................................................................................... 28
Background ....................................................................................................................... 28Recommended sodium intakes for adults ......................................................................... 28Sodium intakes in New Zealand ........................................................................................ 28Sources of sodium in the diet ............................................................................................ 29Practical advice ................................................................................................................. 29
9 Other nutrients .............................................................................................................. 30
Zinc ................................................................................................................................... 30Iodine ................................................................................................................................. 31Selenium ........................................................................................................................... 32Fluoride ............................................................................................................................. 33Vitamin C ........................................................................................................................... 35Folate ................................................................................................................................ 36Thiamin ............................................................................................................................. 38Vitamin B
12........................................................................................................................ 39
10 Fluids ........................................................................................................................... 41
Background ........................................................................................................................ 41Recommended fluid intakes for adults ............................................................................... 41Fluid intakes in New Zealand .............................................................................................. 41Sources of fluids in the diet................................................................................................ 41Practical advice ................................................................................................................. 42
11 Alcohol ......................................................................................................................... 44
Background ....................................................................................................................... 44Recommendations for alcohol intake ................................................................................ 46Practical advice ................................................................................................................. 47
Part III: Nutrition and Health Outcomes ............................................................................... 49
12 Obesity......................................................................................................................... 49
Background ....................................................................................................................... 49What causes overweight and obesity? .............................................................................. 49Definitions of overweight and obesity ............................................................................... 50Obesity in New Zealand..................................................................................................... 53Financial burden of obesity ............................................................................................... 53Obesity and disease .......................................................................................................... 53Principles of prevention and management of obesity ........................................................ 54Priority groups .................................................................................................................. 55Practical advice ................................................................................................................. 56
13 Coronary heart disease ................................................................................................ 57
Background ....................................................................................................................... 57Coronary heart disease in New Zealand ............................................................................ 57Alcohol and coronary heart disease .................................................................................. 58Physical activity ................................................................................................................ 58Practical advice ................................................................................................................. 58
14 Hypertension................................................................................................................ 59
Background ....................................................................................................................... 59Hypertension in New Zealand ........................................................................................... 59Factors associated with hypertension ............................................................................... 59Practical advice .................................................................................................................. 61

Food and Nutrition Guidelines for Healthy Adults: A Background Paper vii
15 Diabetes mellitus ......................................................................................................... 62
Background ....................................................................................................................... 62The burden of type 2 diabetes in New Zealand .................................................................. 62Dietary and lifestyle prevention strategies for type 2 diabetes.......................................... 63Practical advice ................................................................................................................. 64
16 Cancer .......................................................................................................................... 65
Background ....................................................................................................................... 65Obesity and cancer ........................................................................................................... 65Physical activity and colon cancer ..................................................................................... 67Food and nutrients and colorectal cancer .......................................................................... 67Vegetable and fruit intake and cancer ............................................................................... 68Dietary fibre and cancer .................................................................................................... 68Alcohol and cancer ............................................................................................................ 68Summary........................................................................................................................... 69Practical advice ................................................................................................................. 69
17 Osteoporosis ................................................................................................................ 70
Background ....................................................................................................................... 70Dietary and lifestyle factors .............................................................................................. 70Practical advice .................................................................................................................. 71
Part IV: Physical Activity – A Partner To Nutrition................................................................ 73
18 Physical activity ........................................................................................................... 73
Background ....................................................................................................................... 73Dimensions of physical activity ......................................................................................... 74Extent of physical activity in New Zealand ......................................................................... 74Strategies for increasing levels of physical activity ........................................................... 76Recommendations for levels of activity ............................................................................. 76
Part V: Nutrition and Health in Maori and Pacific Peoples .................................................. 79
19 Maori ........................................................................................................................... 79
Background ....................................................................................................................... 79Maori models of health ..................................................................................................... 79Traditional foods and practices ......................................................................................... 79The burden of disease ....................................................................................................... 80Effective interventions ...................................................................................................... 82Current and future work .................................................................................................... 83
20 Pacific peoples ............................................................................................................ 85
Background ....................................................................................................................... 85Nutrition strategies ........................................................................................................... 86
Part VI: Other Issues............................................................................................................. 89
21 Food security ............................................................................................................... 89
Background ....................................................................................................................... 89Health consequences of food insecurity............................................................................ 89Issues for women .............................................................................................................. 90Food skills ......................................................................................................................... 90Socioeconomic disadvantage ............................................................................................ 90
22 Supplementation and fortification ............................................................................... 92
Supplementation .............................................................................................................. 92Fortification ....................................................................................................................... 93

Food and Nutrition Guidelines for Healthy Adults: A Background Paperviii
23 Food safety .................................................................................................................. 94
Background ....................................................................................................................... 94Foodborne illness notification and trends ......................................................................... 94Commercial food safety..................................................................................................... 94Domestic food safety ........................................................................................................ 95Food safety promotion ...................................................................................................... 95Food safety information .................................................................................................... 96
Appendix 1: Serving sizes of the four food groups and samples of two types ofthree-day meal plans ............................................................................................................ 97
Meal plan 1 with some luxury foods .................................................................................. 99Meal plan 2 with basic foods ............................................................................................ 100
Appendix 2: National Nutrition Survey 1997 ...................................................................... 103
Appendix 3: Australian Recommended Dietary Intakes ...................................................... 105
Appendix 4: Dietary Reference Intakes in the publications of the Institute ofMedicine, United States ...................................................................................................... 107
Appendix 5: United Kingdom Dietary Reference Values .................................................... 109
Appendix 6: Policy Statement on Physical Activity: Minister of Sport, Fitness andLeisure and the Minister of Health ...................................................................................... 111
Glossary and Abbreviations .................................................................................................113
Glossary ........................................................................................................................... 113Name abbreviations ......................................................................................................... 116
References ............................................................................................................................117

Food and Nutrition Guidelines for Healthy Adults: A Background Paper ix
List of tablesTable 1: The four food groups, advice on number of servings and the nutrients
they provide for New Zealand adults ................................................................... 5
Table 2: Energy factors used in the National Nutrition Survey 1997 to determine energyprovided by different food sources .......................................................................7
Table 3: Energy intakes in New Zealand .............................................................................9
Table 4: Percentage contribution to energy from macronutrients ......................................9
Table 5: Protein intakes in New Zealand .......................................................................... 11
Table 6: Classification of major dietary carbohydrates in the diet .................................... 13
Table 7: Carbohydrate intakes in New Zealand ................................................................ 16
Table 8: Total sugar intakes in New Zealand .................................................................... 16
Table 9: Sucrose intakes in New Zealand ......................................................................... 16
Table 10: Dietary fibre intakes in New Zealand .................................................................. 17
Table 11: Fat intakes in New Zealand ................................................................................ 20
Table 12: Spectrum of iron deficiency ............................................................................... 23
Table 13: Australian RDIs for iron (mg/day) ...................................................................... 24
Table 14: Australian RDIs for calcium (mg/day) ................................................................ 26
Table 15: Australian RDIs for zinc (mg/day) ...................................................................... 30
Table 16: Alcohol intake in New Zealand .......................................................................... 46
Table 17: Upper limits for responsible drinking ................................................................ 46
Table 18: Standard drinks contained in typical servings of alcohol ................................... 46
Table 19: WHO classification of overweight and obesity in adults according tobody mass index ................................................................................................ 51
Table 20: Relative risk of health problems associated with obesity .................................. 52
Table 21: Percentage of New Zealanders overweight or obese ......................................... 53
Table 22: Identified risk factors for coronary heart disease .............................................. 57
Table 23: Dietary factors related to blood pressure .......................................................... 59
Table 24: Prevalence of diagnosed diabetes (onset 25–89 years), by genderand ethnicity, 1996 baseline and 2011 forecast .................................................. 63
Table 25: Summary of dietary and physical activity risk factors, protective factorsand other major risk factors for the common cancers ........................................ 66
Table 26: New Zealand Sport and Physical Activity survey categorisations ...................... 74
Table A1.1: Serving size examples ....................................................................................... 97
Table A1.2: Summary of nutritional analyses ...................................................................... 101
Table A3.1: Recommended Dietary Intakes for adults (mean daily intake) .......................... 105
Table A3.2: Australian recommended energy intakes for adults (MJ/day) ........................... 106
Table A4.1: Recommended dietary allowances for men ...................................................... 107
Table A4.2: Recommended dietary allowances for women ................................................. 108
Table A5.1: Reference Nutrient Intakes for nutrients for the United Kingdom andEstimated Average Requirements for food energy ............................................ 109
Food and Nutrition Guidelines for Healthy Adults: A Background Paperx
List of figures
Figure 1: The ecological model of the causes of obesity .................................................. 49
Figure 2: Relative risk of diabetes in relation to body mass index in women .................... 54
Figure 3: Ways of meeting the moderate physical activity guidelines (in daily life) .......... 77

Food and Nutrition Guidelines for Healthy Adults: A Background Paper 1
IntroductionFood and Nutrition Guidelines for Healthy Adults: A background paper is the technicalbackground paper that supports the Food and Nutrition Guideline statements. There are sevenbackground papers in the series. This adult background paper is the most comprehensive of theseries and follows the format of all the other papers. In addition to underpinning the Food andNutrition Guideline statements, it has been written to support health professionals includingdietitians and nutritionists, teachers and health educators in the practice of healthy nutrition.
This document has been divided into six parts.
Part I: The New Zealand Food and Nutrition Guidelines presents the Food and NutritionGuideline statements and the background as to why they were adopted.
Part II: Nutrients, food and drinks considers the role that energy and each of the major nutrientsplay in health. It discusses current and recommended dietary intakes in New Zealand, identifiessources of the nutrient in the New Zealand diet and summarises the evidence available on thetopics covered. Where appropriate, it makes suggestions that can form the basis for nutritionadvice to healthy adult New Zealanders. These suggestions are intended as a guide only, as thenutritional needs of individuals are dependent on many factors.
Part III: Nutrition and health outcomes discusses the most important non-communicablediseases where food and nutrition are significant risk factors. These include obesity, type 2diabetes, coronary heart disease, hypertension, cancer and osteoporosis. These guidelines arenot intended as treatment guidelines but rather emphasise reducing the risk of developing thesediseases.
The document goes on to consider other factors that sit alongside nutrition in contributing togood health.
Part IV: Physical activity – a partner to nutrition considers the complementary role of physicalactivity in reducing the risk of the diseases considered in Part III.
Part V: Nutrition and health in Maori and Pacific peoples considers the cultural approaches tonutrition by Maori and Pacific peoples. It discusses the differential burden of disease thesepopulations carry that can be influenced by nutrition.
Part VI: Other issues examines factors that can influence people’s ability to access goodnutrition in terms of food security, fortification, supplementation and food safety.
This document weaves the relevance of nutritional issues for Maori throughout the document.Specific issues for Maori as a population group are described separately in Part V. However,Maori health must be understood in the wider context of their social, economic, cultural andpolitical position. Integral to working with Maori is a need to understand the special relationshipbetween iwi and the Crown, and the Treaty of Waitangi. The Crown recognises the three guidingprinciples of the Treaty of Waitangi as the basis of any health strategies for Maori. The threeprinciples are:
• partnership – working together with iwi, hapu, whanau and Maori communities to developstrategies for Maori health gain and appropriate health and disability services
• participation – involving Maori at all levels of the sector, in decision-making, planning,development and delivery of health and disability services
Food and Nutrition Guidelines for Healthy Adults: A Background Paper2
• protection and improvement of Maori wellbeing – working to ensure Maori have at least thesame level of health as non-Maori and safeguarding Maori cultural concepts, values andpractices (Minister of Health and Associate Minister of Health 2002).
This background paper draws on an enormous body of national and international literature.
For the major nutrients this information is translated into food-based suggestions at the end ofeach chapter. Food serving sizes and samples of two sets of three-day meal plans have beenprovided in Appendix 1.
In 1999 the Ministry of Health released NZ Food, NZ People: Key results of the 1997 NationalNutrition Survey (Ministry of Health 1999c) and this survey is described in Appendix 2. Theresults of this survey are used throughout to document current intakes, eating patterns andnutrition-related risk factors of New Zealand adults.
In 1991 New Zealand adopted, where practical, the Australian Recommended Dietary Intakespending a comprehensive review of all the recommended levels by Australia or jointly with NewZealand. Throughout this text, where RDIs are detailed, they refer to the Australian value unlessotherwise stated.

Food and Nutrition Guidelines for Healthy Adults: A Background Paper 3
Part I: The New Zealand Food and NutritionGuidelines
1 Background
The background papers and guideline statements of the Food andNutrition Guidelines
In 1991 the New Zealand Nutrition Taskforce recommended the development of population-basedfood and nutrition guidelines for the New Zealand public. The first guidelines developed werethe Food and Nutrition Guidelines for Healthy Adults. These were included in Food for Health:Report of the Nutrition Taskforce (Department of Health 1991). This report included a set ofguideline statements. These statements were designed to be positive, food-oriented statementsthat gave health professionals and teachers simple, understandable guidance on healthy eatingfor the adult population of New Zealand.
Over the next four years, a series of six population-specific background papers were developed inaddition to the Guidelines for Healthy Adults. They offered additional guideline statements forspecific population groups. These population groups include:
• healthy infants and toddlers (1992) reprinted in 2000*
• healthy children (1993) reprinted in 1997*
• healthy adolescents (1993) reprinted in 1998*
• healthy older people (1993) reprinted in 1996*
• healthy pregnant women (1995) reprinted in 1997
• healthy breastfeeding women (1995) reprinted in 1997 (Ministry of Health 1996, 1997a, 1997b,1997c, 1998a, 2000b).
For each set of population-specific guidelines, a technical background paper to supportprofessionals in the use of the guidelines was developed, as were simplified health educationpamphlets for the general public.
In December 2000 the Ministry of Health recommended to the Food and Nutrition AdvisoryCommittee that the Food and Nutrition Guideline statements should be modified. The Committeeagreed to the proposed changes. During a public consultation process for the Food andNutrition Guidelines for Healthy Adults: A background paper, comment was sought on theguideline statements. Feedback was, for the most part, positive. The guideline statements havebeen modified to take account of suggestions raised in the consultation and are as follows.
Food and Nutrition Guidelines for Healthy Adults: A Background Paper4
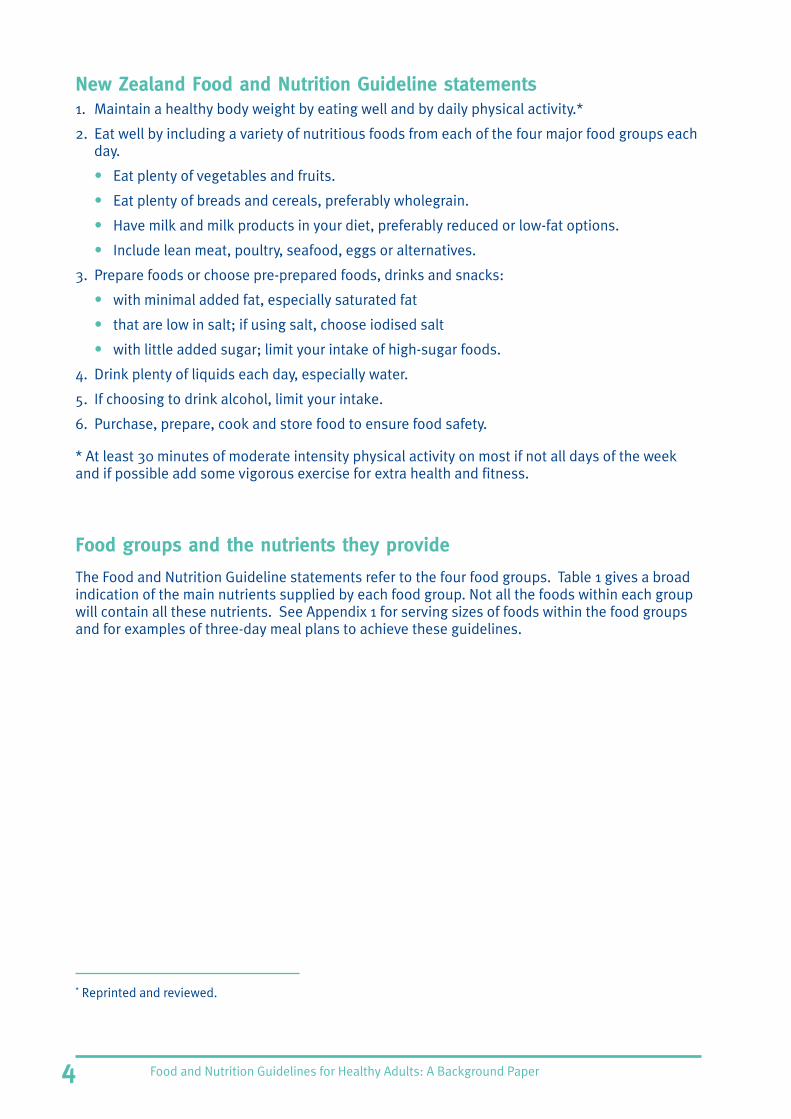
New Zealand Food and Nutrition Guideline statements1. Maintain a healthy body weight by eating well and by daily physical activity.*
2. Eat well by including a variety of nutritious foods from each of the four major food groups eachday.
• Eat plenty of vegetables and fruits.
• Eat plenty of breads and cereals, preferably wholegrain.
• Have milk and milk products in your diet, preferably reduced or low-fat options.
• Include lean meat, poultry, seafood, eggs or alternatives.
3. Prepare foods or choose pre-prepared foods, drinks and snacks:
• with minimal added fat, especially saturated fat
• that are low in salt; if using salt, choose iodised salt
• with little added sugar; limit your intake of high-sugar foods.
4. Drink plenty of liquids each day, especially water.
5. If choosing to drink alcohol, limit your intake.
6. Purchase, prepare, cook and store food to ensure food safety.
* At least 30 minutes of moderate intensity physical activity on most if not all days of the weekand if possible add some vigorous exercise for extra health and fitness.
Food groups and the nutrients they provide
The Food and Nutrition Guideline statements refer to the four food groups. Table 1 gives a broadindication of the main nutrients supplied by each food group. Not all the foods within each groupwill contain all these nutrients. See Appendix 1 for serving sizes of foods within the food groupsand for examples of three-day meal plans to achieve these guidelines.
* Reprinted and reviewed.

Food and Nutrition Guidelines for Healthy Adults: A Background Paper 5
Table 1: The four food groups, advice on number of servings and thenutrients they provide for New Zealand adults
Advice Food group Nutrients provided
Eat at least five servingsper day; at least threeservings of vegetablesand at least two servingsof fruits
Vegetables and fruits* (includesfresh, frozen, canned and dried)
(only one serving of vegetable orfruit juice or dried fruit counts)
If trying to control energy intake,do not eat too much dried fruit anddrain syrup from canned fruit
Carbohydrates
Dietary fibre
Vitamins: especially A (yellow and greenvegetables), C (dark green vegetablesand most fruits, potatoes) and folate
Minerals: magnesium, potassium
Eat at least six servingsper day (try to choosewholegrain)
Breads and cereals(includes all breads, grains, rice,and pasta)
Protein
Carbohydrates
Dietary fibre
Vitamins: all B group (except B12
), E (richin wheat germ)
Minerals: magnesium, calcium, iron, zincand selenium (wholegrain products)
Eat at least two servingsper day (choose low orreduced fat options)
Milk and milk products(includes cheese, yoghurt and icecream)
Protein
Fats: higher proportion of saturated thanpoly- or mono-unsaturated fats especiallyin full fat products
Vitamins: riboflavin, B12
, A
Minerals: especially calcium,phosphorous, zinc and iodine
Eat at least one servingper day
Lean meat, poultry, chicken,seafood, eggs, nuts and seedsand legumes
Protein
Fats: both visible and marbled in meat(mostly saturated fat, cholesterol); mostlyunsaturated fats in seafood, nuts andseeds
Carbohydrates: mainly legumes (driedpeas and beans)
Vitamins: B12
, niacin, thiamin
Minerals: iron, zinc, magnesium, copper,potassium, phosphorous and selenium
* See the Glossary for definitions of ‘vegetable‘ and ‘fruit’.
Source: Modified from Department of Health 1991

Food and Nutrition Guidelines for Healthy Adults: A Background Paper6
New Zealand Recommended Dietary Intakes
One of the requirements of the Nutrition Taskforce was to update the recommendations forselected nutrient levels for New Zealanders, which were first set in 1983 (Nutrition AdvisoryCommittee 1983). The Taskforce recommended that, as an interim measure, the 1990 AustralianRecommended Dietary Intakes (RDIs) be adopted where practical. This recommendation wasaccepted and New Zealand has used these RDIs since then. Reference to RDIs in the text isspecific to these RDIs, unless otherwise stated (Truswell et al 1990).
In November 2002 a joint Australia-New Zealand review of Nutrient Reference Values (NRVs)commenced. New Zealand has recently completed the technical reports on selenium and iodineNRVs which will contribute to this process. The review is being overseen by the National Healthand Medical Research Council of Australia (NHMRC) and is expected to be completed in 2005.
The Australian RDIs are included in Appendix 3.
Recommended energy intakes
Recommended energy intakes are based on estimates of the average requirement of a group ofcomparable individuals. This focus differs from that of other recommended nutrient intakes thatare set to exceed the needs of all but 2 to 3 percent of the population (FAO et al 1985).

Food and Nutrition Guidelines for Healthy Adults: A Background Paper 7
Part II: Nutrients, Food and Drinks
2 Energy
Background
Energy intake
Fat, protein, carbohydrate (macronutrients) and alcohol from food and drinks are the onlysources of energy for humans. They are broken down in the body to provide energy, measured inkilojoules, in the amounts shown in Table 2.
Table 2: Energy factors used in the National Nutrition Survey 1997 todetermine energy provided by different food sources
Food source Energy (kJ) provided by 1 g Carbohydrate 16.7
Fat 37
Protein 16.7
Alcohol 29
Food energy is used by the body for metabolic processes, physiological functions, heatproduction, growth, and synthesis of new tissues. It is also the source of energy for physicalactivity. Excess energy intake is stored as fat, which can lead to overweight and obesity. Inextreme cases, insufficient energy intake results in the body using its sources of stored energy(fat) and leads to muscle wasting and a slowing of all body functions.
Energy expenditure
There are three components to energy expenditure:
• the basal metabolic rate (BMR), which is the energy required to sustain metabolism
• the thermic effect of food (TEF), which is the energy expended in converting food to nutrients
• the energy required for physical activity.
The BMR accounts for 50 to 70 percent of daily energy expenditure. The TEF accounts for afurther (fairly constant) 10 percent. Energy expenditure for physical activity is defined as theincrease in metabolic rate above BMR and TEF. It is the most variable component of energyexpenditure. In affluent countries, it accounts for 20 to 40 percent of total energy expenditure(van Raaij 2002). The energy expenditure from physical activity is dependent on the frequency,intensity, duration and type of activities undertaken throughout the day. Physical activity istherefore a key component of energy balance. See also: Chapter 18, Physical activity.
Energy balance
Energy balance is achieved when the energy from the intake of food and drinks equals the energyexpended for metabolic processes and during physical activity. A change in energy intake oroutput leads to positive or negative energy balance. Positive energy balance results in bodytissue being deposited as fat and an increase in body weight. A negative energy balance results

Food and Nutrition Guidelines for Healthy Adults: A Background Paper8
in body tissue being mobilised and a loss of body weight. The amount of food eaten and theamount of physical activity undertaken determine the state of energy balance (van Raaij 2002).
The mean body weight of New Zealand adults increased from 71.3 kg in 1989 to 74.5 kg in 1997Ministry of Health 1999c). The increase for males and females was 2.6 kg and 3.6 kg respectively.As no data were collected on energy expenditure in the NNS97, it is not known whether theincrease in body weight was the result of increases in energy intake or decreases in energyexpenditure, or a combination of both (see: ‘Energy intakes in New Zealand’ below).
An increase in body weight, particularly in body fatness, may have important implications for thehealth status of New Zealand adults. Specifically, it may increase the risk of diseases such asobesity, cardiovascular diseases, type 2 diabetes and some cancers. See also: Chapter 12,Obesity.
Effects of energy balance on body mass and composition
The state of energy balance can be assessed by changes in body weight and body composition.Body mass index (BMI) is one measure used to quantify changes in energy balance. BMI iscalculated using the following equation:
BMI = weight (kg)/height (m2)
The World Health Organization (WHO) defines a healthy range of BMI as 18.50 to 24.99 kg/m2.Pre-obesity (overweight) is defined as a BMI range of 25.00 to 29.99 kg/m2 and obesity as30.00 kg/m2 or above (WHO 2000). These BMI ranges were used for New Zealand European andOthers in the NNS97. A healthy BMI range for Maori and Pacific peoples was defined as 18.50 to25.99 kg/m2. Overweight was defined as BMI 26.00 to 31.99 kg/m2 and obesity as 32.00 kg/m2 orabove (Ministry of Health 1999c). See also: Chapter 12, Obesity.
Recommended energy intakes for adults
Recommendations for energy intakes for adults are more difficult to determine than theequivalent recommendations for most nutrients. The difficulty lies in the wide range ofrequirements, even among individuals of the same age, sex, weight, height and general patternof activity (Truswell et al 1990). Recommended energy intakes for healthy individuals are basedon estimates of the average requirement of a group of comparable individuals. In contrast, otherrecommended nutrient intakes are set to exceed the needs of all but 2 to 3 percent of thepopulation (FAO et al 1985).
The Australian recommended energy intakes for adults are given in Table A3.2 in Appendix 3. Therecommendations vary by age and gender for a given height and weight. The United StatesDietary Reference Intakes (DRIs) and a reference for recommendations for energy in 30-year-oldadults are given in Appendix 4 and the United Kingdom (Department of Health (UK) 1991) valuesare shown in Appendix 5.
Energy intakes in New Zealand
Males generally have a greater average proportion of lean body mass than females. This,combined with a larger average body size, means males require a higher energy intake thanfemales to maintain energy balance. Therefore the daily median intake of energy for males ishigher than for females. The usual daily median energy intakes of New Zealand males andfemales as measured by the NNS97 are shown in Table 3.

Food and Nutrition Guidelines for Healthy Adults: A Background Paper 9
Table 3: Energy intakes in New Zealand
Usual daily median energy intakeUsual daily median energy intakeUsual daily median energy intakeUsual daily median energy intakeUsual daily median energy intakekJ/day (kcal/day)kJ/day (kcal/day)kJ/day (kcal/day)kJ/day (kcal/day)kJ/day (kcal/day)
Males 11,631 (2769)
Females 7701 (1834)
Source: Ministry of Health 1999c
Males and females aged 19 to 24 years had the highest median energy intake (males 13,037 kJ,females 8783 kJ). Energy intake decreased gradually with advancing age. There were no cleardifferences in energy intake between different socioeconomic groups (Ministry of Health 1999c).
Comparing the energy intakes measured by NNS97 with those of the 1989 Life in New Zealand(LINZ) survey, it appears that mean daily energy intakes have increased. Whether this is a ‘true’increase in energy intake cannot be determined because the differences in sampling andmethodology would be expected to increase reported energy intakes. What can be concluded isthat the proportion of high-energy consumers has increased (Ministry of Health 1999c).
Sources of energy in the diet
The principal sources of energy in the New Zealand diet are: bread (11 percent); potatoes andkümara, including fat added when cooking (7 percent); butter and margarine (6 percent); andmilk, alcoholic beverages, cakes and muffins, non-alcoholic beverages, and sugar/sweets (all5 percent) (LINZ Research Unit 1999).
The ratio of energy supplied by fat, carbohydrate and protein has continued to change (Ministryof Health 1999c). The proportion of energy from fat has decreased as shown in Table 4.
Table 4: Percentage contribution to energy from macronutrients
Percentage contribution to energy
Nutrient 19771 19892 19973
Fat 43 37 35
Carbohydrate 40 44 46
Protein 14 15 16
Sources: 1 Birkbeck 1983; 2 Russell and Wilson 1991; 3 Ministry of Health 1999c
Practical advice• Adjust food intake and energy output to maintain energy balance.
• To reduce dietary energy intake it is important not to remove the foods that contributeimportant nutrients (vegetables and fruits, wholegrain breads and cereals, milk and milkproducts, meat, eggs and legumes) but to choose low-fat alternatives.
• Do not add sugar or fat to foods where possible. Spreads for breads should be the lower fatand sugar options.
• Reduce or limit the intake of foods that are high in energy (kilojoules) but low in essentialnutrients, such as snack foods and convenience food and drinks including cakes, chips,

Food and Nutrition Guidelines for Healthy Adults: A Background Paper10
biscuits, confectionery (sweets and lollies), soft drinks (including carbonated beverages) anddrinks containing alcohol.
• Do at least 30 minutes of moderate intensity physical activity on most if not all days of theweek. If possible add some vigorous exercise for extra health benefit and fitness.
See also: Chapter 4, Carbohydrate; Chapter 5, Fat; Chapter 11, Alcohol; Chapter 12, Obesity; andChapter 18, Physical activity.

Food and Nutrition Guidelines for Healthy Adults: A Background Paper 11
3 Protein
Background
Proteins are composed of amino acids. There are 20 common amino acids, which make up mostproteins. The body can synthesise some amino acids, whereas the ‘essential’ amino acids mustbe obtained from food. Proteins are necessary to build and repair tissue; in hormone, enzymeand antibody synthesis; and for many other body functions. Proteins are found in both animalfoods (meat, seafood, chicken, eggs, milk and milk products) and plant foods (legumes, cerealsand nuts).
Recommended protein intakes for adults
The 1985 FAO-WHO Consultation in Human Nutrition (FAO et al 1985) estimated the daily proteinrequirement for healthy adults to be 0.6 g/kg per day. The safe level of intake was set at0.75 g/kg per day in order to cover the protein needs of 97.5 percent of the population (FAO et al1985). The RDIs for protein for adult New Zealanders are 45 g for women and 55 g for men, basedon the value of 0.75 g/kg per day. These amounts equate to approximately 11 to 15 percent ofenergy being derived from protein (Jackson 2002).
Vegetarian diets are generally adequate in protein because the proteins of dairy products, eggs,legumes, nuts, breads and cereals are rich in essential amino acids. Plant-based diets generallyinclude legumes, nuts and seeds, low-fat milk and/or soy products and eggs. A combination ofdifferent plant foods each day should ensure sufficient protein in a vegetarian diet (Read 1997).
Protein intakes in New Zealand
The protein intake of New Zealand adults is 15 to 16 percent of total energy, as shown in Table 5.According to the NNS97 the dietary protein intake of most New Zealand adults is high at almostdouble that of the United Kingdom Reference Nutrient Intake (RNI; see Appendix 5), but verysimilar to the intake of adult Australians (Department of Health (UK) 1991; Australian Bureau ofStatistics 1998). Protein intake provides a fairly constant proportion of energy across age, sexand ethnic groups.
Table 5: Protein intakes in New Zealand
Usual daily Percentage contributionmedian intake (g) to energy
Males 105 15
Females 71 16
Source: Ministry of Health 1999c
High-protein low-carbohydrate diets
High-protein low-carbohydrate diets, while not new, have recently regained popularity. Thesediets advocate the restriction of carbohydrate foods such as breads and cereals and sometimesvegetables and fruits, while increasing intakes of foods such as meat, milk and sometimes fats.The proposed beneficial effects claimed of these diets include lower rates of obesity,cardiovascular disease and diabetes, and lower blood cholesterol levels.

Food and Nutrition Guidelines for Healthy Adults: A Background Paper12
Much of the evidence in favour of such diets is circumstantial. Further research is requiredbefore concluding that there are any advantages of higher protein diets (Dietitians Association ofAustralia 2000). In a recent review article (Bravata et al 2003) it was found that there wasinsufficient evidence to make recommendations for or against the use of low carbohydrate diets.Among the published studies, decreased energy intake rather than low carbohydrate dietsthemselves was the factor associated with weight loss.
Sources of protein in the diet
The principal sources of protein in the New Zealand diet are beef and veal (14 percent); bread (11percent); milk (10 percent); poultry and fish/seafood (both 7 percent); and bread-based dishesand pork (both 5 percent) (LINZ Research Unit 1999). Lean meat, chicken, seafood, eggs, low-fatmilk, reduced-fat cheese, and dried peas, beans and lentils are all good sources of protein. Thesefoods may be used as part of a balanced diet to ensure adequate protein intakes.
Practical advice• Protein in the diet is provided by a wide range of available foods, including lean meat, chicken
and seafood, eggs and milk. Bread is also an important source.
• Choose low and reduced-fat options from the meat and milk food groups where possible.
• If vegetarian, include protein from diverse plant sources (legumes, nuts, breads and cereals).If lacto-ovo vegetarian, also include eggs and milk products.

Food and Nutrition Guidelines for Healthy Adults: A Background Paper 13
4 Carbohydrate
Background
Carbohydrates provide the largest single source of energy in the diet. Carbohydrates (in the formof glucose) are an easily available form of energy. They maintain blood glucose levels and have arole in gastrointestinal health and functioning. Excess energy intake from carbohydrate in theform of added sugars (especially high-sugar beverages) may contribute to overweight or obesity.
Too little carbohydrate in the diet can result in an imbalance in the blood known as ketosis orketo-acidosis. As the amount of carbohydrate required to avoid ketosis is very small (about 50 gper day), only the most restricted diets risk this condition. Carbohydrate usually provides mostof the energy in any diet.
Classification of carbohydrates
Several classifications of carbohydrates are currently in use. The FAO-WHO Expert Consultationhas recommended that terminology be standardised and classification be based primarily onmolecular size. Specifically, all carbohydrates should be classified as sugars (calledmonosaccharides, disaccharides and polyols), oligosaccharides and polysaccharides (FAO andWHO 1998). Table 6 shows a classification of dietary carbohydrates.
Table 6: Classification of major dietary carbohydrates in the diet
Class Sub-group Examples(number of carbonsin the molecule)
Sugars (1–2) Monosaccharides Glucose, galactose, fructose
Disaccharides Sucrose, lactose, trehalose
Polyols Sorbitol, mannitol
Oligosaccharides (3–9) Malto-oligosaccharides Maltodextrins
Other oligosaccharides Raffinose, stachyose,fructo-oligosaccharides
Polysaccharides (≥ 9) Starch Amylose, amylopectin,modified starches
Non-starch Cellulose, hemicellulose,polysaccharides pectins, hydrocolloids
Source: Adapted from FAO and WHO 1998
Sucrose and other sugars
The term sugars is used to describe the mono-, di- and oligosaccharides. Sugar, by contrast, isused to describe the most common disaccharide, purified sucrose. Other terms used are refinedsugar and added sugar (FAO and WHO 1998). Sucrose is extracted from sugar cane and sugarbeet and is naturally present in variable amounts in vegetables and fruits. Two other sugars thatare added to many foods, often in a syrup form, are fructose and glucose. Fructose is a verysweet sugar.

Food and Nutrition Guidelines for Healthy Adults: A Background Paper14
Almost universally, humans appear to find sweetness a pleasant sensation. Although there is nodirect evidence to support the hypothesis that a high sucrose intake causes obesity, the FAO-WHO Expert Consultation has reiterated that excess energy in any form could contribute to theaccumulation of body fat (FAO and WHO 1998; WHO and FAO 2003).
There is a strong link between dental health and sucrose (sugar) intake. Foods containing sugarsor starch may be easily broken down to produce acid, which increases the risk of dental caries.However, the impact of sugars and starch on dental caries is dependent on many factors. Ratherthan only addressing the consumption of sucrose to eliminate dental caries, health promotioninitiatives should also emphasise fluoridation, adequate oral hygiene and reduction of thefrequency of sucrose intake (see: ‘Fluoride’ in Chapter 9, Other nutrients) (FAO and WHO 1998).
Polysaccharides
The term complex carbohydrates was traditionally used to describe either starch alone or thecombination of all polysaccharides. It was coined to encourage the consumption of what wereconsidered to be the ‘healthy’ carbohydrates, such as wholegrain cereals and legumes. However,it becomes meaningless when used to describe vegetables and fruits, which may be low instarch. It is now clear that starch (by definition a complex carbohydrate) is variable metabolically(see: ‘Non-starch polysaccharides and resistant starch’ below). Some forms of starch are rapidlyabsorbed and have a high glycaemic index, while others are resistant to digestion.
Non-starch polysaccharides and resistant starch
The carbohydrate polymers that originate from plant-cell walls are collectively called non-starchpolysaccharides (NSPs). They provide structure to plant tissues, and are chiefly responsible forthe texture of vegetable foods. NSPs are found in legumes (peas, dried beans, and lentils),wholegrain cereals (barley, wheat, rye, oats, brown rice), and vegetables and fruits. Theconcentration of cell-wall components is highest in the outer layers of plant foods. Presumablythey perform a protective function for the endosperm, which is rich in starch and protein. Peelingvegetables and fruits or milling cereals lowers their NSP content significantly.
Water-insoluble NSPs are the most important contributors to faecal weight. Increasingconsumption of foods rich in these kinds of NSPs (such as wheat bran, cereals and vegetables) isan effective means of preventing and treating constipation, haemorrhoids, diverticular disease,irritable bowel syndrome and anal fissures. High intakes of NSPs may also protect againstgallstones (FAO and WHO 1998).
Water-soluble NSPs are found in peas, oats, dried beans, lentils, barley, pasta and fruits. Theyreduce the glycaemic index of carbohydrate foods, increase bile acid excretion and may reducelow density lipoprotein (LDL) cholesterol levels (Baghurst et al 1996). Soluble and viscous NSPcomponents in diets may delay the absorption of sugars from food and improve metaboliccontrol of glucose. NSP and resistant starch are fermented in the colon, where they stimulate theproliferation of bacteria, resulting in bulky stools. They also have a laxative-promoting effect.
Resistant starch occurs naturally. It can also be produced by the modification of starch duringthe processing of foods (Institute of Medicine 2002b). Resistant starch is defined as ‘starch andstarch degradation products not absorbed in the small intestine in healthy humans’ (Englyst et al1992). Most of the health benefits of resistant starch relate to its impact on the colon. Resistantstarch increases bowel action due to its mild laxative effect. It also increases the beneficialmicroflora of the bowel; reduces secondary bile acids in the faeces; beneficially lowers faecal pH;and increases the level of short-chain fatty acids (especially butyrate and propionate) in thefaeces (Baghurst et al 1996). A proportional, high butyrate supply is thought to be important forthe health of the large bowel epithelium (Brand-Miller 2002). The role of resistant starch andNSP in protecting against colorectal cancer remains to be confirmed in clinical trials.

Food and Nutrition Guidelines for Healthy Adults: A Background Paper 15
Foods that are high in resistant starch are cereals, potatoes, green bananas and legumes.
Dietary fibre
Dietary fibre Dietary fibre Dietary fibre Dietary fibre Dietary fibre is a term that is still in common usage even though some nutritionists have replacedit with other terms. A precise definition of dietary fibre remains to be established. The new NorthAmerican definition of dietary fibre refers not only to the NSP component of dietary fibre but tonon-carbohydrates such as lignin and psyllium (Institute of Medicine 2002b). For New Zealanddietary fibre intakes in the NNS97 refer to NSP intakes only.
Cereals, legumes, vegetables and fruits are the main sources of dietary fibre.
Glycaemic index
The glycaemic index (GI) can be used to classify foods based on their potential to raise blood-glucose levels. Some foods, classified as high GI foods, break down quickly during digestion andtheir blood glucose response is fast. Low GI foods break down slowly, releasing glucosegradually into the blood stream (Brand-Miller et al 1996; Brand-Miller 2002).
Individuals vary in their capacity to metabolise glucose after eating. People with diabetes, forexample, have an impaired capacity to clear glucose from the blood – a process that is under thecontrol of the hormone insulin. The GI is valuable in planning diets for people with diabeteswhere it is important to maintain blood glucose levels within the normal range.
Studies conducted in people with hyperlipidaemia, and people with and without diabetes, havefound that low GI meals and snacks can improve biochemical indices, particularly blood glucoseconcentrations and insulin secretion (Wolever et al 1991, 1992; Frost et al 1996; Wolever 1997).The carbohydrate in low GI foods is generally less digestible than that in high GI foods becauselow GI foods increase the amount of carbohydrate progressing to the colon. This increase, inturn, increases colonic fermentation and short-chain fatty acid production (Brand-Miller et al1996). The GI of foods needs to be evaluated in conjunction with other dietary constituents andrecommendations. The GI has its limitations as high-fat foods have a low GI and may not confernutritional benefits when consumed.
Recommended carbohydrate intakes for adults
The WHO–FAO Expert Consultation (2003) recommends that an optimum diet derives at least 55percent of total energy from a variety of carbohydrate sources. It also recommends that freesugars that are added to foods by the manufacturer, cook or consumer plus the sugars naturallypresent in honey, syrups and fruit juices should be restricted to less than 10 percent of totalenergy. The New Zealand Nutrition Taskforce recommends that New Zealand adults obtain 50 to55 percent of total energy from carbohydrate. Sucrose and other free sugars should be restrictedto no more than 15 percent of total energy because of the potential problems associated withexcess energy and dental caries.
The recommended guideline for dietary fibre in New Zealand is 25 to 30 g per day (Department ofHealth 1991). This recommended dietary fibre intake was based on a definition of fibre thatincluded resistant starch and other components in addition to NSP. Because the NNS97 dietaryfibre intake data are NSP only, direct comparison is inappropriate.
Carbohydrate intakes in New Zealand
Only 36 percent of the adult population met the recommended intake of 50 to 55 percent ofcarbohydrate as a proportion of total energy. The average New Zealander consumes 45 to 47percent of energy as carbohydrate, as shown in Table 7 for carbohydrate intake and Table 8 for

Food and Nutrition Guidelines for Healthy Adults: A Background Paper16
total sugar intake (Ministry of Health 1999c). Table 9 shows intakes of sucrose in New Zealand.Carbohydrate intakes show no consistent pattern across age groups.
Table 7: Carbohydrate intakes in New Zealand
Usual daily median Percentage contributionintake (g) to energy
Males 305 45
Females 214 47
Source: Ministry of Health 1999c
Table 8: Total sugar intakes in New Zealand
Usual daily median intake (g)
Males 131
Females 99
Source: Ministry of Health 1999c
Table 9: Sucrose intakes in New Zealand
Usual daily median intake (g)
Males 62
Females 45
Source: Ministry of Health 1999c
Principal sources of carbohydrate in the New Zealand diet are bread (20 percent); non-alcoholicbeverages (10 percent); potatoes and kumara (10 percent); sugar/sweets (9 percent); and fruits(8 percent) (LINZ Research Unit 1999).
Only about one in five of the population is reaching the New Zealand Nutrition Taskforcerecommendation of at least six servings of breads and cereals per day (Ministry of Health 1999c).For females, the main sources of carbohydrate are vegetables and fruits. Males consume morecarbohydrate as breads and cereals. Median dietary fibre intake as NSP is 20 g, with the specificfigures for males and females shown in Table 10. Approximately half the NSP intake is asinsoluble NSPs and half as soluble NSPs. A low intake of breads and cereals among women maybe related to misunderstandings about the energy density of carbohydrate foods.

Food and Nutrition Guidelines for Healthy Adults: A Background Paper 17
Table 10: Dietary fibre intakes in New Zealand
Usual daily medianintake (g)
Males 23
Females 18
Source: Ministry of Health 1999c
Although only about one-third of New Zealanders are meeting the New Zealand NutritionTaskforce target for carbohydrate intake (50 to 55 percent of total energy), there is a generaltrend towards increasing carbohydrate intake. Increases in carbohydrate came from increasedconsumption of pasta, rice, soft drinks, chocolate and other confectionery. There was alsoincreased consumption of some vegetables and fruits (pears, feijoas, melon, bananas, grapes,broccoli and capsicum). However, this growth was offset by a decrease in other vegetables andfruits (green beans, pumpkin, peas, cabbage, beetroot, avocado, bean sprouts, grapefruit,pineapple, canned fruit in syrup, raisins and stewed fruit) (Ministry of Health 1999c).
Sources of carbohydrates in the diet
Foods rich in carbohydrates include cereal grains, starchy vegetables, leguminous seeds andwholegrain cereals, all of which contain reasonable proportions (3 to 15 percent) of non-starchpolysaccharides. Most other vegetables, as well as most fruits, contain small amounts of bothstarch and NSP, together with variable amounts of sugars. Only a few foods that are not highlyprocessed, such as honey and dried fruits, contain a significant amount of sugars. Manyprocessed foods contain added sugars, usually sucrose. The principal sources of sugar in theNNS97 were non-alcoholic beverages, sugar and sweets, and fruits.
New Zealand adults should be encouraged to achieve a desirable carbohydrate intake byincreasing consumption of vegetables, fruits, legumes, and breads and cereals. The adultguideline is at least six servings of breads and cereals, at least three of vegetables and two offruits.
Practical advice• Eat a variety of foods that provide carbohydrate, including breads, cereals and legumes.
• Include wholemeal/wholegrain breads and cereals in the diet.
• Eat plenty of vegetables and fruits.
• Remember that plant foods such as cereals, breads, vegetables, fruits and legumes are goodsources of dietary fibre.
• Choose food and drinks that are low in sugar to avoid excess energy intake. Remember thatnon-alcoholic beverages such as soft drinks and fruit juices are a dietary source of sugar.
• Sweets, honey, sweet spreads and dried fruits are concentrated sources of sugar.
• Keep high-sugar foods such as cakes and sweets for treat foods.
• To reduce dental decay, restrict the frequency of eating foods and drinking beverages with ahigh sugar content. If eating sugary foods, take them at mealtimes instead of as snacksbetween meals.
See also: Chapter 10, Fluids.

Food and Nutrition Guidelines for Healthy Adults: A Background Paper18
5 Fat
Background
Fats make an important contribution to adequate nutrition and are a source of essential fattyacids. They also provide the mechanism for the absorption of the fat-soluble vitamins (Mann andSkeaff 2002). Associated nutrients are the fat-soluble vitamins A, D, E and K. Dietary fat carriesthese vitamins and facilitates their absorption. Any conditions that interfere with fat absorptionwill also limit the absorption of fat-soluble vitamins. Dietary fat is a concentrated energy sourcecompared to carbohydrate and protein. Fat carries food’s flavour components, assists withsatiety and enhances palatability.
One major health concern for adults in western countries is excessive dietary fat intake. Thisconcern applies particularly to saturated fat, which increases the risk of obesity, cardiovasculardiseases, type 2 diabetes and hypertension (NHF 1999). A high-fat intake has also beenassociated with colorectal cancer (Baghurst et al 1997).
Classification of fats
All fats are a mixture of saturated and unsaturated fatty acids. Triglycerides are the predominantcomponent of fats and oils. Triglycerides are made up of one unit of glycerol combined with threefatty acids, which may be different or the same. Most fatty acids are synthesised in the body.The exceptions are the essential fatty acids (EFA), linoleic and alpha-linolenic acids, which mustbe obtained from food in the diet. The differences in physical properties between one fat andanother are due to the fatty acids they contain. The structure of the fat molecule determineswhether a fat is classed as saturated saturated saturated saturated saturated or unsaturatedunsaturatedunsaturatedunsaturatedunsaturated. Unsaturated fats Unsaturated fats Unsaturated fats Unsaturated fats Unsaturated fats (fatty acids) can befurther divided into mono-unsaturated mono-unsaturated mono-unsaturated mono-unsaturated mono-unsaturated and poly-unsaturated poly-unsaturated poly-unsaturated poly-unsaturated poly-unsaturated fatty acids.
Saturated fatty acids
Certain saturated fats increase total blood cholesterol and low-density lipoprotein (LDL)cholesterol, promote postprandial lipaemia (blood fat levels after eating) and, through theiraction on platelet adhesion, encourage thrombosis (NHF 1999). Saturated fatty acids are foundlargely in animal products. Dairy products such as butter, full-fat milk and cheese contain a largeproportion of saturated fats. Meat fats are a mixture of all types of fatty acids but arepredominantly saturated and mono-unsaturated. Most plant sources of fats are largely mono-unsaturated and/or poly-unsaturated fats. The exceptions are coconut and palm oil whichcontain largely saturated fats. A reduction in consumption of products containing largelysaturated fats, such as high-fat dairy products, is an important means of reducing the risk ofcoronary heart disease (Mann 2002).
Of the ways in which diet can be used to influence the risk factors for coronary heart disease,controlling the level of plasma LDL cholesterol remains the best established. This risk factor hasbeen found to be significant in at least 50 prospective studies involving more than 600,000subjects in 18 countries (NHMRC 2003).
Mono- and poly-unsaturated fatty acids
Unsaturated fatty acids include mono-unsaturated and poly-unsaturated fatty acids. Plant foodsand seafood are usually a mixture of these two types of fatty acids.
Mono-unsaturated fats decrease blood total cholesterol and LDL cholesterol, with little effect onhigh-density lipoprotein (HDL) cholesterol. HDL has been of interest as a protective factor incoronary heart disease (Mann 2002). Mono-unsaturated fats appear to be more resistant to

Food and Nutrition Guidelines for Healthy Adults: A Background Paper 19
oxidation than poly-unsaturated fats (NHF 1999). Examples of foods rich in mono-unsaturatedfatty acids are olive oil, canola oil, macadamia nuts, pistachios, hazelnuts, almonds and avocadooil.
Poly-unsaturated fats can be divided into omega-6 and omega-3 fatty acids. As mentionedabove, there are two essential fatty acids – linoleic acid (an omega-6 fatty acid) and alpha linoleicacid (an omega-3 fatty acid) – that humans cannot synthesise. There are also several otherbiologically important long chain fatty acids (arachadonic, eicosapentaenoic anddocosahexanoic) that can, under certain conditions, be synthesised by humans from theseessential fatty acids. Omega-6 fatty acids are found predominantly in sunflower seed, soyabeanand corn oils. They can lower total and LDL-cholesterol. The omega-3 fatty acids are derivedfrom oily fish or plant products such as soybean, mustard, walnut, canola and linseed (flax) oils.Fish and fish oils may reduce blood pressure. They have also been associated with a reduction inthrombosis, although results are inconsistent (NHF 1999).
Trans fatty acids
Trans fatty acids sometimes form during hydrogenation of vegetable oils in the production ofsome margarines. They are also formed in small quantities during deep frying, and can occurnaturally in small amounts in some foods such as butter. Trans fats, although unsaturated, mayhave metabolic effects similar to those of saturated fatty acids. The adverse metabolic effectsinclude increasing total and LDL-cholesterol, increasing lipoprotein, and decreasing HDL-cholesterol (ASCN-AIN 1996). They are found in some margarines and in manufactured foodsthat contain fat as an ingredient, such as biscuits, cakes, chocolates and convenience foods.However, most table spreads now available in New Zealand and Australia only contain a smallproportion of trans fatty acids (Table spreads 2002).
Recommended fat intakes for adults
In considering the lower limits of acceptable fat intake, four criteria must be met:
• sufficient fat intake to meet energy needs
• an adequate supply of essential fatty acids
• an adequate absorption of fat-soluble vitamins (Jéquier 1999)
• a suitable balance of the different types of fatty acids (Eyres 2000).
For most adults, oils and fats should supply at least 15 percent of their energy intake (Jéquier1999). Women of reproductive age should consume at least 20 percent of their energy from fat(FAO and WHO 1993).
The New Zealand Nutrition Taskforce recommended that the proportions of total energy suppliedby different sources of fats should be:
• total fat: 30 to 33 percent
• saturated fatty acids plus trans fatty acids: no more than 12 percent
• poly-unsaturated fatty acids: approximately 6 to 10 percent
• mono-unsaturated fatty acid: from 10 to 20 percent (Department of Health 1991).
Vegetarian diets can be low in omega-3 fatty acids. It is recommended that vegetarians includesome good sources of these fatty acids in their diets (American Dietetic Association 2003).
Food and Nutrition Guidelines for Healthy Adults: A Background Paper20
Fat intakes in New Zealand
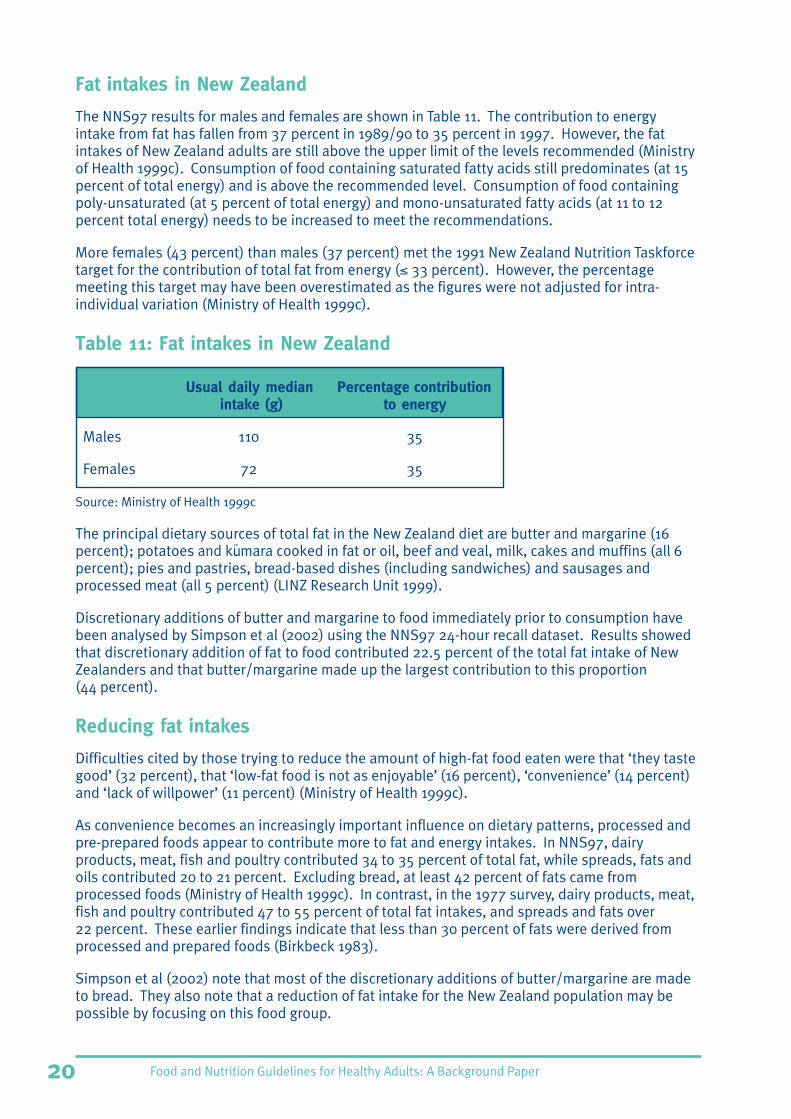
The NNS97 results for males and females are shown in Table 11. The contribution to energyintake from fat has fallen from 37 percent in 1989/90 to 35 percent in 1997. However, the fatintakes of New Zealand adults are still above the upper limit of the levels recommended (Ministryof Health 1999c). Consumption of food containing saturated fatty acids still predominates (at 15percent of total energy) and is above the recommended level. Consumption of food containingpoly-unsaturated (at 5 percent of total energy) and mono-unsaturated fatty acids (at 11 to 12percent total energy) needs to be increased to meet the recommendations.
More females (43 percent) than males (37 percent) met the 1991 New Zealand Nutrition Taskforcetarget for the contribution of total fat from energy (≤ 33 percent). However, the percentagemeeting this target may have been overestimated as the figures were not adjusted for intra-individual variation (Ministry of Health 1999c).
Table 11: Fat intakes in New Zealand
Usual daily median Percentage contribution intake (g) to energy
Males 110 35
Females 72 35
Source: Ministry of Health 1999c
The principal dietary sources of total fat in the New Zealand diet are butter and margarine (16percent); potatoes and kumara cooked in fat or oil, beef and veal, milk, cakes and muffins (all 6percent); pies and pastries, bread-based dishes (including sandwiches) and sausages andprocessed meat (all 5 percent) (LINZ Research Unit 1999).
Discretionary additions of butter and margarine to food immediately prior to consumption havebeen analysed by Simpson et al (2002) using the NNS97 24-hour recall dataset. Results showedthat discretionary addition of fat to food contributed 22.5 percent of the total fat intake of NewZealanders and that butter/margarine made up the largest contribution to this proportion(44 percent).
Reducing fat intakes
Difficulties cited by those trying to reduce the amount of high-fat food eaten were that ‘they tastegood’ (32 percent), that ‘low-fat food is not as enjoyable’ (16 percent), ‘convenience’ (14 percent)and ‘lack of willpower’ (11 percent) (Ministry of Health 1999c).
As convenience becomes an increasingly important influence on dietary patterns, processed andpre-prepared foods appear to contribute more to fat and energy intakes. In NNS97, dairyproducts, meat, fish and poultry contributed 34 to 35 percent of total fat, while spreads, fats andoils contributed 20 to 21 percent. Excluding bread, at least 42 percent of fats came fromprocessed foods (Ministry of Health 1999c). In contrast, in the 1977 survey, dairy products, meat,fish and poultry contributed 47 to 55 percent of total fat intakes, and spreads and fats over22 percent. These earlier findings indicate that less than 30 percent of fats were derived fromprocessed and prepared foods (Birkbeck 1983).
Simpson et al (2002) note that most of the discretionary additions of butter/margarine are madeto bread. They also note that a reduction of fat intake for the New Zealand population may bepossible by focusing on this food group.
Food and Nutrition Guidelines for Healthy Adults: A Background Paper 21
Practical advice
While New Zealanders should be encouraged to continue to reduce the percentage of energyfrom fat, changing the type of fat consumed is also important for health. To reduce fat intake andchange the types of fat eaten, New Zealanders can act as follows.
• Follow the recommended servings of the Food and Nutrition Guidelines in regard to breadsand cereals (at least six servings per day), vegetables and fruits (at least five servings per day,of which at least three are vegetables and at least two are fruits), low-fat milk and milkproducts, yoghurt, cheese or ice cream (at least two servings per day) and lean meat, seafood,chicken, eggs or legumes (at least one serving per day).
• Choose snacks based on vegetables and fruits, breads and cereal and low-fat milk and milkproducts rather than potato crisps, biscuits or pastries.
• Trim all visible fat from meat, choose lean meat and remove the skin from chicken.
• Use less fat in cooking – grill, boil, steam or microwave as an alternative.
• When using fat, choose a vegetable oil or an oil high in mono-unsaturated fat such as olive,canola or avocado oil.
• Use less spread on bread and rolls. When using a spread, choose a poly-unsaturated ormono-unsaturated margarine instead of butter.
• Select lower-fat milk products such as reduced- or low-fat milk and yoghurt, cottage cheese orlower fat cheeses such as Edam and mozzarella.
• Prepare or purchase low-fat sauces and dressings for vegetables, salads and meat.
• Eat sausages, processed meat and luncheon meat less frequently, as they are high in fat,particularly saturated fats. If eating these meats, grill rather than fry them.
• Eat fried foods such as fried fish, fried chicken and chips only occasionally.
• When reducing fat in the diet, take care not to compensate by increasing sugar intake.

Food and Nutrition Guidelines for Healthy Adults: A Background Paper22
6 Iron
Background
Iron is present in haemoglobin and as a carrier of oxygen in the blood, in myoglobin in the musclecells and also in many cell enzymes. The total body iron content is about 50mg/kg. Over60 percent is in the haemoglobin of red blood cells and about 25 percent is in the form of stores,mainly in the liver (MacPhail 2002). In the adult population, iron needs are greatest amongwomen of childbearing age, as iron lost through menstruation must be replaced (Bothwell andCharlton 1981).
Dietary iron and absorption
The quantity of iron absorbed in the body is controlled by gut absorption. The level of absorptionis determined by:
• the iron requirements of the individual
• the amount of iron in the diet
• the presence of dietary factors that enhance or inhibit the absorption of iron.
The percentage of iron absorbed and utilised by the body (iron bioavailability) can vary from lessthan 1 percent to more than 30 percent (Hallberg 1981). The main factor controlling ironabsorption is the amount of iron stores in the body. Iron absorption from the gastrointestinaltract increases when the body’s iron stores are low, and decreases when stores are sufficient. Ahigher rate of red blood cell production can also stimulate iron uptake several-fold (Skikne andBaynes 1994; Bothwell 1995).
Iron absorption also depends on the food source. Haem iron from meat, poultry and fish istypically 20 to 30 percent absorbed. Non-haem iron, found primarily in non-animal sources (suchas plant-based foods, iron supplements and iron fortificants in foods), is usually absorbed at5 percent or less (Hallberg 1981; Skikne and Baynes 1994). Bioavailability of non-haem iron isaffected by the presence of enhancers and inhibitors when they are consumed in the same meal,and by the iron status of the individual. Iron absorption enhancers include muscle proteins inmeat, chicken, fish and seafood (which can enhance absorption of non-haem iron threefold),vitamin C (ascorbic acid), cysteine, alcohol and possibly certain organic acids such as lactic,tartaric and citric acid. Ascorbic acid can increase non-haem iron absorption by two to threetimes, depending on both the dose and the meal matrix (Hallberg and Hulthen 2000). When avariety of foods is consumed, ascorbic acid has a lower absorption-enhancing effect, particularlyif meat is present.
Inhibitors of non-haem iron absorption include polyphenols in tea, coffee, and certainvegetables; phytates in unrefined cereals, nuts and legumes; and factors in soy protein. Single-meal studies have shown that calcium in milk, milk products and supplements inhibits non-haemand haem iron absorption (Hallberg et al 1991). However, the results of whole-diet studies havebeen conflicting, indicating that absorption is dependent on the iron status of the individualsstudied (Gleerup et al 1995; Ilich-Ernst et al 1998). Vegetarian diets are low in readily availablehaem iron. However, by including enhancers of non-haem iron absorption, such as ascorbic acid,in the same meal, iron bioavailability in a vegetarian diet can be enhanced.
Iron deficiency
Table 12 shows the three stages that characterise the development of iron-deficiency anaemia:iron depletion, iron-deficient erythropoiesis and iron-deficiency anaemia. Each stage can bedetected by using a combination of biochemical iron indices, preferably in conjunction with anindex of infection/inflammation, such as serum C-reactive protein. Dehydration, strenuous

Food and Nutrition Guidelines for Healthy Adults: A Background Paper 23
exercise, the presence of pathological conditions such as infection, inflammation or malignancy,and iron storage disorders may elevate serum ferritin and confound the interpretation of theseindices.
Table 12: Spectrum of iron deficiency
Stage 1 Iron depletion Low iron stores based on serum ferritin from 20–12 µg/L;normal haemoglobin
Stage 2 Iron-deficient Depleted iron stores based on serum ferritin < 12 µg/L;erythropoiesis transferrin saturation < 16%; normal haemoglobin
Stage 3 Iron-deficiency Anaemia (based on low haemoglobin) in the presenceanaemia of iron deficiency (based on serum ferritin < 12 µg/L)
Source: Cook and Finch 1979
Iron status of New Zealand adults
The Dunedin longitudinal survey (Fawcett et al 1998) studied iron status in New Zealand. It foundthat for age groups on either side of adolescence, the prevalence of anaemia in predominantlyEuropean females (haemoglobin < 120g/L) increased from 3.1 percent at age 11 years to 5.8percent at age 21 years. The prevalence of iron deficiency (ferritin < 12 µg/L) at age 21 years was0.2 percent for men and 6.7 percent for women, while the prevalence of iron deficiency withanaemia was 0 percent and 2.2 percent respectively.
In another study of Dunedin women of childbearing age, important risk factors for mild irondeficiency (levels equivalent to Stage 1, iron depletion in Table 12) were:
• recent blood donation
• menstrual blood loss (both extent and duration of menstrual bleeding)
• nose bleeds
• low intake of meat, fish and poultry (Heath et al 1999).
Other risk factors for iron deficiency include:
• high parity
• previous diagnosis of iron-deficiency anaemia
• low iron intakes (vegan or vegetarian diets, etc)
• use of intra-uterine contraceptive devices (Galan et al 1998).
Intrauterine contraceptive devices (IUDs) induce high blood loss (Yip and Dallman 1996; Lookeret al 1997). By contrast, oral contraceptive agents reduce menstrual blood loss, and have thusbeen associated with a lower risk of iron deficiency (Bothwell and Charlton 1981; Mooij et al1992; Hallberg et al 1995).
The NNS97 indicated that low iron stores, iron deficiency and iron-deficiency anaemia mainlyaffected females in the 15 to 44 years age group. Males overall are not affected (Ministry ofHealth 1999c). The iron status of New Zealand women appears to be slightly superior to that ofwomen from other western nations despite lower or similar iron intakes. Amongst those who areaffected by sub-optimal iron status there is a potential for negative functional consequences(Ferguson et al 2001). Low iron stores, iron deficiency and iron-deficiency anaemia primarilyaffected females (6 percent, 3 percent and 2 percent respectively). Prevalence was highestamong New Zealand Maori females (11 percent, 9 percent and 6 percent). Of males, only

Food and Nutrition Guidelines for Healthy Adults: A Background Paper24
4 percent of the 15 to 18 years group and 2 percent of the 75+ years group were considered tohave low iron stores, iron deficiency and iron-deficiency anaemia (Ministry of Health 1999c).
Recommended iron intakes for adults
The RDIs for iron shown in Table 13 are based on the estimate that on average 15 to 20 percent ofdietary iron is absorbed (Truswell et al 1990). Australian, United Kingdom and United Statesrecommendations are given in Appendices 3 to 5. Inconsistencies among recommendations aredue in part to the consideration of the dietary habits specific to a country or region, whichinfluence the bioavailability of iron.
Table 13: Australian RDIs for iron (mg/day)
19–54 years 54+ years
Female RDI (g) 12–16 5–7
Male RDI (g) 7 7
Iron intakes in New Zealand
Among males and non-menstruating females, estimates of the prevalence of inadequate intakeare similar to those with low iron stores assessed with biochemical indicators (0 percent males,6 percent females). However, for menstruating females, low iron stores range from 4 to 7percent, considerably below the estimated prevalence of inadequate intake. Reasons for thisfinding may include overestimation of menstrual blood loss, underreporting of food intake andbetter than estimated absorption of dietary iron (Ministry of Health 1999c).
Vegetarianism
Based on the NNS97, 94 percent of all New Zealanders eat a diet that regularly includes animalproducts. Two percent of New Zealanders fall into the category of ‘avoids meats except forchicken’ (Ministry of Health 1999c).
The haemoglobin and serum ferritin levels of New Zealand vegetarians have been shown to besimilar to those of non-vegetarians (Harman and Parnell 1998). Harman and Parnell (1998)reported that the dietary iron intake of the female vegetarians was slightly higher than that ofnon-vegetarians. Not surprisingly, the vegetarians gained a greater proportion of iron fromvegetables and fruits than non-vegetarians.
Individuals choosing a vegetarian-eating pattern should choose foods rich in vitamin C at eachmeal to improve iron absorption. Eggs and cheese, although good sources of protein, do nothave the same enhancing effect on non-haem iron absorption as muscle proteins in meat.
Iron supplements
Generally, iron supplements are only necessary when there is evidence of iron-deficiencyanaemia or low iron stores. When iron supplements are required, they should be used undermedical supervision. General practitioners and other health professionals should monitor irondeficiency status in at-risk women. In New Zealand this monitoring should include young Maoriwomen.
Women of childbearing age and those at risk of iron deficiency should be encouraged to consumeadequate amounts of iron-rich foods, including lean meat, poultry and seafood. It is alsoimportant that iron-rich foods are consumed with a dietary source of vitamin C, especially when

Food and Nutrition Guidelines for Healthy Adults: A Background Paper 25
the iron is in the non-haem form (Department of Health 1991). In some cases, whererecommended by a health professional, it may be appropriate for those at risk of iron deficiencyto consume foods that have been fortified with iron, such as iron-fortified breads and cereals.
Sources of iron in the diet
The principal sources of iron in the New Zealand diet are bread (13 percent); beef and veal(12 percent); breakfast cereals (9 percent); vegetables (8 percent); and potatoes and kumara(7 percent) (LINZ Research Unit 1999). The dietary intake of haem iron has been estimated to bejust under one-third of the total intake and non-haem iron to be about two-thirds (Ministry ofHealth 1999c).
Practical advice• Eat plenty of iron-rich foods. These may include lean red meat, liver, fish and chicken.
• If vegetarian, eat iron-containing foods from plant sources, such as beans and lentils.
• Breakfast cereals and vegetables are an important source of iron in New Zealand.
• To optimise iron absorption, include foods rich in vitamin C at mealtimes such as citrus fruits,kiwifruit, broccoli and potatoes.
• When trying to increase iron intake, minimise the consumption at mealtimes of food anddrinks that inhibit the uptake of iron, such as phytates (bran) and polyphenols (tea, coffee).These foods should be eaten between meals.

Food and Nutrition Guidelines for Healthy Adults: A Background Paper26
7 Calcium
Background
Calcium is required to support the bone formation phase of bone remodelling, a process thatcontinues throughout life. It also has a wide range of metabolic functions for muscle and nerveactivity. Calcium is lost from the gut, in urine and through the skin.
Calcium absorption and excretion
The absorption of calcium from food in the gut is normally at a rate of less than 70 percent. Therate of absorption is affected by biological status; a higher need for calcium is likely to increaseabsorption. Calcium is also reabsorbed into the gut after excretion. One factor that is importantfor absorption is vitamin D status as this vitamin is required for the absorption of calcium. Otherdietary factors such as oxalate, fibre and phytates may interfere with absorption.
Dietary sodium, protein, caffeine and acidifying agents raise calcium losses; and phosphorus,alkaline agents and some diuretics lower excretion (Goulding 2002). Physical activity also has aneffect on bone retention of calcium. Regular moderate physical activity is good for calciumretention in bones whereas excessive physical activity with an inadequate diet is detrimental tobones.
Recommended calcium intakes for adults
Table 14 shows the RDIs for calcium. There is considerable controversy over the optimal dailydietary intake of calcium required to achieve peak bone mass, maintain adult bone mass andprevent loss of bone in later life. Based on United States balance data, the National Academyof Sciences recommends a daily intake of 1200 mg per day for men and women over age 50(Institute of Medicine 1997). However, many people find it difficult to consume more than1000 mg of calcium daily from foods.
Table 14: Australian RDIs for calcium (mg/day)
19–54 years 54+ years
Female RDI (mg/day) 800 1000
Male RDI (mg/day) 800 800
Calcium intakes in New Zealand
The NNS97 indicates that the usual daily median intake of calcium is 766 mg (females 691 mg,males 857 mg). There are significant differences in calcium intake among individuals fromdifferent NZDep96 quartiles. Individuals from NZDep96 quartile IV (most deprived) areas havelower intakes, compared with those from quartile I (least deprived) and quartile II areas. Maorimales were also found to have lower intakes than New Zealand European and Other males.
The estimated prevalence of inadequate calcium intake is 20 percent. A higher prevalence isobserved among females (25 percent) than among males (14 percent), and higher among Maori(females 34 percent, males 24 percent) than among New Zealand European and Others (females22 percent, males 11 percent) (Ministry of Health 1999c).

Food and Nutrition Guidelines for Healthy Adults: A Background Paper 27
Sources of calcium in the diet
The principal dietary sources of calcium are milk (37 percent); cheese (11 percent); bread(6 percent); and vegetables, non-alcoholic beverages and dairy products (all 5 percent) (LINZResearch Unit 1999). Since 1996 permission to fortify some foods with calcium may haveincreased the calcium intake of New Zealanders.
Foods vary greatly in their calcium content. Milk has a particularly high calcium content. Otherexcellent sources include cheeses, yoghurt and fortified soy beverages. Good sources includemilky dairy foods, nuts, canned fish with bones, leafy vegetables and dried fruits (Goulding2002).
In some circumstances, if insufficient calcium is consumed because of dietary restrictions,supplementation of calcium may be used. This option is relevant for those who consume little orno milk or milk products (eg, those with lactose intolerance or allergies to milk and milkproducts) (American Dietetic Association 1996).
Practical advice• Eat foods high in calcium such as low-fat milk and milk products, and lower fat cheese
options.
• Non-milk sources of calcium in foods include wholemeal bread, peanuts, broccoli, fortified soybeverages, canned salmon, sardines, spinach, baked beans and tofu.
• Do at least 30 minutes of moderate intensity physical activity on most if not all days of theweek. If possible, add some vigorous exercise for extra health and fitness.
• Prevent calcium losses by being smokefree, cutting down on salt, keeping alcoholconsumption to a minimum and being physically active.
See also: Chapter 14, Hypertension; and Chapter 17, Osteoporosis.

Food and Nutrition Guidelines for Healthy Adults: A Background Paper28
8 Sodium
Background
Salt has long been a valuable commodity and an integral part of human life and culture.
Common salt is sodium chloride, each gram of which contains 17.1 mmol of sodium (Robinson2002). Sodium is an important component of extracellular fluid. The physiological roles ofsodium include maintenance of acid base balance, energy transfer mechanisms, the uptake ofnutrients, and fluid balance within and outside cells (Department of Health (UK) 1991).
Sodium and health
High sodium intake (principally from salt) is associated with high blood pressure, an importantrisk factor for cardiovascular disease, particularly stroke (Prospective Studies Collaboration2002). There is strong evidence indicating a dose-response relationship between sodium intakeand blood pressure. The sources of this evidence include large observational studies (Elliott et al1996), meta-analyses of observational studies and randomised controlled blood pressurelowering trials (Law et al 1991a, 1991b, 1991c), and the recent well-designed Dietary Approachesto Stop Hypertension trial (Sacks et al 2001). The effect of dietary sodium on blood pressurevaries according to age and baseline blood pressure, with the strongest effect found among olderadults with hypertension. As a result, there continues to be some debate about the importanceof reducing sodium intake in the general population (Alderman 2002). However, even smalldecreases in blood pressure translate into important variations in cardiovascular disease at thepopulation level. For this reason, most countries and organisations recommend a reduction indietary sodium.
Recommended sodium intakes for adults
The RDI for sodium for adult New Zealanders is 920 to 2300 mg of sodium per day (Truswell et al1990). The United Kingdom recommended intake is 1600 mg per day (Department of Health (UK)1991).
Sodium intakes in New Zealand
Assessment of sodium intake by dietary assessment methods is difficult because people adddiscretionary salt to food, and cooked meals may have an unknown salt content. For this reason,dietary sodium intake was not included in the NNS97.
Sodium excretion in the urine is the best indicator of sodium intake (Caggiula et al 1985; Shorttet al 1988). A regional study in New Zealand found a mean sodium excretion of 3105 mg per day.This amount corresponds to a mean sodium intake of 3473 mg per day (Thomson and Colls1998). The results show an estimated intake well above both the Ministry of Health target of2760 mg per day (Ministry of Health 1998c) and the RDI (920 to 2300 mg). This target wasproposed by the Nutrition Taskforce in 1991 as a realistic target to meet by 2005.
Given the evidence is strong (but not conclusive) for the benefits of salt reduction, the latestreviews recommend continuing to promote salt reduction (Thomson and Colls 1998; NHF 1999;Scientific Advisory Committee on Nutrition 2003).

Food and Nutrition Guidelines for Healthy Adults: A Background Paper 29
Sources of sodium in the diet
Sodium is often added during food processing, with up to 85 percent of the average daily sodiumintake coming from processed and manufactured foods (Godlee 1996; Engstrom et al 1997;Young and Swinburn 2002). Sodium chloride (common salt) is the most common source ofsodium in the diet, while food additives are significant but smaller contributors.
The National Heart Foundation (1999) states that sodium intake could be reduced by about1150 mg, or approximately 3 g of salt, by avoiding salty foods and not adding salt during cookingor at the table.
Practical advice• Reduce overall sodium consumption by preparing meals with minimal added salt.
• When purchasing food and drinks that have been prepared away from home, choose thosethat are low in salt.
• When using salt, iodised table salt is recommended.
See also: ‘Iodine’ in Chapter 9, Other nutrients; and Chapter 14, Hypertension.

Food and Nutrition Guidelines for Healthy Adults: A Background Paper30
9 Other nutrients
Zinc
Background
Zinc is essential for many functions, including growth and neurobehavioural development,immune and sensory function, reproduction, antioxidant protection and membrane stabilisation(Cousins 1986).
Zinc absorption and deficiency..... The presence of amino acids (particularly methionine andhistidine) and certain organic acids (lactic, citric, malic and tartaric acid) enhances zincabsorption. A study of 330 premenopausal Dunedin women found that women who included redmeat in their diet had a superior biochemical zinc status compared to those who did not eat redmeat (Gibson et al 2001).
High intakes of phytate, found in unrefined cereals, legumes and nuts, reduce zinc absorption(Oberleas and Harland 1981). In the Dunedin study, there was a significant negative correlationbetween serum zinc and a diet high in phytate-containing foods (Gibson et al 2001). Highcalcium intake when combined with a high phytate intake further inhibits zinc absorption (Gibson1990) such that lacto-vegetarians may be at particular risk of zinc deficiency.
Consumption of high doses of iron supplements is also known to limit zinc absorption (Gibson etal 2002).
Although zinc deficiency can be identified, marginal zinc status is difficult to assess. The onlysure way to confirm diagnosis is to see a clear improvement in functional disturbances (eg,impaired appetite, taste acuity, immune function and linear growth) in response to zincsupplementation (Gibson 1990). Serum zinc concentration is frequently used to assess zincstatus. However, in marginal deficiency, this test may give a false negative result. Urine zincconcentrations are useful only in disease-free people. Hair zinc concentration measured duringchildhood reflects zinc status, but the validity of this test is less certain in adults. Impaired tasteacuity has been used to detect marginal zinc deficiency. This measure should, however, beinterpreted in conjunction with biochemical indices (Gibson 1990).
Recommended zinc intakes for adults
The RDIs for zinc for New Zealand adults are presented in Table 15.
Table 15: Australian RDIs for zinc (mg/day)
19–54 years 54+ years
Female RDI (mg/day) 12 12
Male RDI (mg/day) 12 12
Zinc intakes in New Zealand
The NNS97 found the usual daily median intake of zinc to be 14.5 mg for males and 9.8 mg forfemales. Less than 2 percent of the population are at risk of inadequate intakes of zinc; women in themore deprived areas have the highest risk (4.8 percent) (Ministry of Health 1999c). The principalsources of zinc in the diet of New Zealanders are beef and veal (19 percent); bread (10 percent); milk(8 percent); vegetables (6 percent); and bread-based dishes (5 percent) (LINZ Research Unit 1999).

Food and Nutrition Guidelines for Healthy Adults: A Background Paper 31
Sources of zinc in the diet
Zinc is widely available in the food supply but its bioavailability from different food sources ishighly variable (Samman 2002). Good sources of zinc include animal products and someseafoods. Some nuts, including peanuts, almonds, cashew nuts and sesame seeds, are also highin zinc (Athar et al 2003). In animal food sources, the fat content of the food becomes a majordeterminant of the zinc content as fat tissue contains less zinc than muscle tissue does. Ingeneral, dark-red meat has a higher zinc content than white meat and fish (Samman 2002).Some cereals contain zinc. However, this source of zinc is dependent on milling as zinc is mainlylocated in the outer layers. In highly milled grains (ie, a low extraction rate), the majority of thezinc and other minerals is removed. Because of their high water content, green leafy vegetablesand fruits are only modest sources of zinc (Hallberg et al 2001). Cereal grains, legumes and nutsare rich in phytate, which reduces zinc absorption.
Practical advice• Eat a variety of lean red meats (beef), bread and vegetables.
• If vegetarian, eat nuts (almonds, peanuts), legumes (lima beans), unrefined cereals (includingbread) and low-fat milk and milk products.
Iodine
Background
Iodine is an essential component of the thyroid hormones thyroxine (T4) and
3,5,3'-triiodothyronine (T3). These hormones are required for normal growth and development
and for maintaining a normal metabolic state (Gibson 1990). Most soils in New Zealand are lowin iodine, resulting in low concentrations in locally produced foods (Thomson 2002).
Iodine deficiency. The term iodine deficiency disorder is used to describe a wide range of effectsthat low iodine can have on health. Goitre was endemic in many parts of New Zealand before theintroduction of iodised salt in 1924 (Hercus et al 1925; Purves 1974). The level added to iodisedtable salt was raised in 1938. From 1938 to 2002 the level of iodine fortification required iniodised table salt was 40 to 80 mg of iodide per kilogram (Ministry of Health 1997e). SinceDecember 2002 the level required in iodised salt has been 25 to 65 mg of iodine per kilogram(Food Standards Australia New Zealand 2002; Mann and Aitken 2003). It is estimated that 70percent of table salt is iodised in New Zealand (Sutcliffe 1990).
Recommended iodine intakes for adults
New Zealand has not adopted the Australian RDI for iodine (150 µg per day for men and 120 µgper day for women) because of the extraordinarily low trace-element environment and lowdietary intake in New Zealand. The New Zealand adequate daily intake (ADI), set in 1983, was200 mg per day for both men and women, and this recommendation was retained by theNutrition Taskforce (Department of Health 1991).
Iodine intakes in New Zealand
It is difficult to quantify accurately the dietary intake of iodine, especially from discretionary useof iodised salt. However, iodine status can be assessed by measuring urinary excretion. Twostudies to assess urinary iodine excretion of residents in Otago and Waikato (Thomson et al 1997,1999) showed lower rates of iodine excretion than previously found in New Zealand (Cooper et al1984; Simpson et al 1984). One further study by Thomson and colleagues, which focused onurinary iodine and thyroid status in Otago, indicated that the fall in iodine status is beingreflected in clinical measures of iodine status. These clinical measures include enlarged thyroidglands and elevated thyroglobulin (Thomson et al 2001).

Food and Nutrition Guidelines for Healthy Adults: A Background Paper32
Dietary iodine intake was not assessed in NNS97. However, iodine intake estimates from theNew Zealand Total Diet Surveys (NZTDSs) since 1982 (based on simulated typical diets) suggestthat the iodine intake of New Zealanders has decreased for all age-sex groups, to a point whereiodine intake is now well below the Australian RDI (Vannoort et al 2000). The NZTDS estimates ofiodine intakes do not include discretionary salt intake. There are several reasons for decliningintake. One of the major contributors to New Zealanders’ daily iodine intake has been from dairyindustry cleaning compounds, called iodophors, in milk products. From the 1980s iodophorsstarted to be replaced by other cleaning compounds, resulting in a lower iodine concentration inmilk products (Sutcliffe 1990) and hence a reduced intake. In addition, dietary changes (such asthe use of more ready-to-eat and pre-prepared foods, in which salt is not iodised), together withthe recommendation to reduce salt in cooking and at the table, may account for declining iodineintake (Thomson 2002).
Both the studies on estimates of dietary intake and iodine status indicate that, for some NewZealanders, dietary intake may no longer be adequate. The Ministry of Health and the NewZealand Food Safety Authority are working on a joint project on iodine to address this problem.While iodine intakes are an area of concern, advice for adult New Zealanders needs to be mindfulof the risks associated with a higher intake of salt. For these reasons, the following practicaladvice is given.
Practical advice• Salt intake should be limited but when salt is used for cooking and at the table it should be
iodised salt. (Rock salt and other salts have negligible levels of iodine and are notrecommended.)
• Consider including other important sources of iodine such as low-fat milk products, eggs, fishand seafood. Inclusion of foods that contain seaweed, such as sushi, seameal and alginates(food-thickening agents), also provides a good source of iodine.
• Use of kelp and iodine supplements is not recommended, unless under the supervision of adoctor or a dietitian, as these are usually highly concentrated sources of iodine. High intakesof iodine can be toxic and may have adverse health effects.
See also: Chapter 8, Sodium; and Chapter 14, Hypertension.
Selenium
Background
Selenium is a key component of a number of seleno-proteins essential for health. The bestknown of these is the enzyme glutathione peroxidase which is considered to have a role incellular antioxidant systems (Thomson and Paterson 2001). Selenium also plays an importantrole in the control of thyroid hormone metabolism (Arthur et al 1999) in reproduction, and inimmune functions (Rayman 2000).
New Zealand soils are generally considered to be low in selenium, which affects its concentrationin food (Vannoort et al 2000). Selenium intakes of New Zealanders have been considerably lowerthan those of people from other western countries (Robinson 1989). Selenium status has,however, increased in parts of New Zealand over the past decade (Thomson and Robinson 1996;Winterbourn et al 1992). It appears that New Zealanders may have adapted to their low seleniumintake by excreting selenium more sparingly than people in other western countries (Robinson etal 1985). In addition, there has been an increase in the importation of Australian wheat and otherproducts that have a higher selenium content and an increased use of supplemental selenium inanimal feeds (Vannoort et al 2000; Thomson and Paterson 2001). Overseas studies suggest thatthe selenium status of smokers is lower than that of non-smokers, and that smoking mayincrease the requirements for antioxidants, including selenium (Thomson and Paterson 2001).

Food and Nutrition Guidelines for Healthy Adults: A Background Paper 33
Although potential links of selenium levels to cardiovascular disease and cancer have beenstudied, to date there is no conclusive evidence of a protective effect of selenium against thesediseases (Thomson and Paterson 2001).
Recommended selenium intakes for adults
Recommended selenium intakes for Australia, the United Kingdom and the United States areshown in Appendices 3 to 5. New Zealand did not adopt the Australian RDI for selenium.Thomson and Paterson (2001) have conducted a review of nutrient reference values but a NewZealand reference value has not yet been adopted (Thomson and Paterson 2001).
Selenium intakes in New Zealand
The NNS97 concluded that the estimates of daily selenium intake derived from dietary intakedata (males 56 µg and females 39 µg) were not reliable due to difficulties in establishing foodcomposition data for selenium. These data are, therefore, insufficient to allow definitiveconclusions on the adequacy of the selenium intake of New Zealanders (Ministry of Health1999c).
Sources of selenium in the diet
The principal sources of selenium in the New Zealand diet are fish/seafood (29 percent); bread(11 percent); poultry (6 percent); beef and veal, and eggs and egg dishes (both 5 percent) (LINZResearch Unit 1999).
It is possible to increase the dietary intake of selenium with higher intakes of seafood, non-refined cereals, dried peas and beans, and chicken. Routine selenium supplementation is notrecommended in New Zealand (Thomson and Robinson 1996). It must also be noted that themargin between selenium deficiency and toxicity is narrower than for many other trace elements,and adverse effects have been described in those taking a selenium supplement (Gibson 1990).
Practical advice• The consumption of foods rich in selenium should be encouraged. Examples are fish,
seafood, meat, poultry, eggs and bread.
• Smokers may require a higher intake of selenium-containing foods.
• Use of selenium supplements is not recommended, unless supervised by a doctor. Highintakes of selenium can be toxic and may have adverse health effects.
Fluoride
Background
Fluoride has a role in bone mineralisation and protects teeth against dental caries (Robinson1998). It is a naturally occurring element in the earth’s crust.
All New Zealand water supplies, unless roof-collected, contain some natural level of fluoride. Theexact amount depends on the geology of the area; the range is generally 0.1 to 0.3 ppm (PHC1993). This level is considered an unusually low concentration (Department of Health 1991).Only some reticulated water supplies in New Zealand are fluoridated. In 2002, 84 percent of NewZealanders were on a reticulated water supply. Of these, 62 percent received fluoridated water(Ministry of Health 2003a).
Prevention of dental caries. A significant reduction in dental caries is documented from drinkingwater with fluoride levels of 0.7 to 1.0 ppm and, to a lesser extent, from the use of fluoride-

Food and Nutrition Guidelines for Healthy Adults: A Background Paper34
containing toothpaste. Food and beverages made from fluoridated water but consumed in non-fluoridated areas have probably played a role in reducing differences between fluoridated andnon-fluoridated areas (ESR 1999). However, it appears that water fluoridation provides benefitsabove and beyond those from other fluoride sources alone (WHO 1994).
Water fluoridation provides significant benefits for both deciduous (‘baby’) and permanent teeth.The evidence for a protective effect on dental health is strongest in childhood, but can also bedemonstrated in adults, for whom fluoridated water has been shown to protect against rootcaries (NHMRC 1999a).
In New Zealand, as elsewhere, caries prevalence has declined since the 1950s. From about 1992the prevalence and severity of dental caries have plateaued for children and adolescents. Waterfluoridation has been conservatively estimated to reduce dental decay by about 20 to 40 percent.It is further estimated that the lifetime benefit from drinking fluoridated water is the preventionof a total of 2.4 to 12.0 decayed, missing or filled teeth per person (PHC 1994).
The economic argument for fluoridation is still strong. It is particularly strong in regard tocommunities where the risk of dental decay is high, for example low socioeconomic groups, whocan least afford dental care, and for Maori (ESR 1999). The economic advantages do not includethe intangible benefits of good oral health status, such as freedom from pain and suffering,improved self-esteem, and improved social interaction (Wright et al 2001).
Fluoridation of community drinking water is also a major factor in reducing ethnic andsocioeconomic inequalities in oral health (Public Health Advisory Committee 2003).
Other health effects. Consumption of fluoridated drinking water at the levels of 0.7 to 1.0 ppmdoes not appear to have any significant health effects other than improved oral health status.For example, there is insufficient evidence to establish a link between fluoridated drinking waterand a higher risk of bone or other cancers, or of osteoporosis (NHMRC 1999b; University of York,2002). Mortality rates and health statistics for communities with fluoridated water are similar tothose for communities without fluoridated water. The only marked health difference is in oralhealth. Decay rates are significantly lower in communities with fluoridated drinking water (Bates2000). The only effect that has been associated with water fluoridation is a very mild dentalfluorosis in a small number of children. Mild fluorosis can sometimes be seen as mottling of theteeth (white spots on the teeth).
Recommended level of fluoride in the water supply
The recommended range for the level of fluoride in the water supply is now 0.7 to 1.0 mg/L (PHC1994; Expert Committee on Drinking Water Standards 2000). Along with drinking water withoptimal fluoride content throughout life, the use of fluoride-containing toothpastes isrecommended for the prevention of dental caries (Department of Health 1991; PHC 1994; NHC1997).
Fluoride intakes in New Zealand
New Zealand studies of adult diets have estimated fluoride ingestion as 1.8 mg fluoride per day,with a maximum of 2.7 mg in teenage males (Pickston et al 1985; Pearce et al 1992). Thesefindings are similar to overseas estimates (NRC 1993). Fluoride intakes come primarily fromfluoridated water, tea and seafood, as well as from fluoridated toothpaste. Bottled water usuallydoes not contain fluoride. The relative contributions from the various sources are not accuratelyknown. However, it has been suggested that fluoridated water contributes approximately 50percent of the fluoride intake of those people drinking fluoridated water (Murray et al 1991). Iffluoridated toothpaste is swallowed, fluoride intake can be high. This possibility is of mostconcern in infants and young children (NRC 1993).

Food and Nutrition Guidelines for Healthy Adults: A Background Paper 35
Practical advice• Fluoridated water is an important source of fluoride intake for New Zealanders.
• For people living in an area that does not have a fluoridated water supply, it is suggested thatadvice is sought from a dental or other health professional (eg, dentist or dental therapist)about the best way to increase intake.
Vitamin C
Background
Vitamin C is an essential micronutrient involved in collagen production, brain neurotransmittersynthesis, iron absorption and pituitary peptide hormone production. It is an antioxidantthought to be important in the ageing process and carcinogenesis.
Vitamin C is found in many vegetables and fruits but is unstable and therefore easily destroyed(Truswell et al 1990). The vitamin C content of foods varies according to the quality oftransportation, shelf-time prior to the consumer purchasing the food, and storage, preparationand cooking practices. Boiling vegetables can cause 50 to 80 percent loss. Cooking vegetableswith minimal water or in a microwave oven will decrease losses (Erdman and Klein 1982;Vanderslice and Higgs 1991). Chopping and dicing that expose a large surface area to oxidationalso result in loss of vitamin C.
A recent United States review suggests that there may be health benefits from a dietary vitamin Cintake of 200 mg per day. Diets containing 200 mg or more of vitamin C from food wereassociated with a lower risk of some cancers (Levine et al 1999). It is not clear whether thebenefit arose from the vitamin C intake or from other constituents in vegetables and fruits thatare protective for health. Vitamin C as a supplement has not been shown to decrease cancer risk(Blot et al 1993; Greenberg et al 1994; Schorah 1998).
Recommended vitamin C intakes for adults
Regular daily intake of vitamin C is required because it is readily excreted. With further researchinto disease prevention and the role of antioxidants, the RDI for vitamin C may need to be re-examined. The RDIs for vitamin C for New Zealand adults are set at 40 mg for males and 30 mgfor females (Truswell et al 1990). The current RDI for vitamin C is set at a level to prevent scurvywith a margin of safety.
It has been recognised for many years that smokers have a higher turnover of vitamin C. Tomaintain their body pool and circulating levels near those of non-smokers, the United KingdomPanel on Dietary Reference Values (DRVs) for Nutrients advises that their intake would need to beup to 80 mg/d greater (Department of Health (UK) 1991).
Vitamin C intakes in New Zealand
The NNS97 indicates that the usual daily median intake of vitamin C for the New Zealandpopulation is 102 mg (males 111 mg, females 95 mg). Males and females aged 15 to 18 yearsreported the highest intakes. The overall estimated prevalence of inadequate intakes is less than1 percent.
In a randomised control trial, an increase in consumption of vegetables and fruits from a regularcurrent intake of three servings per day to an intake of seven servings per day led to asubstantial increase in plasma concentration of vitamin C: 63 mg (control group) compared with257 mg (intervention group) (Zino et al 1999).

Food and Nutrition Guidelines for Healthy Adults: A Background Paper36
Sources of vitamin C in the diet
The principal sources of vitamin C in the New Zealand diet are vegetables and non-alcoholicbeverages (both 26 percent); fruits (23 percent); and potatoes and kumara (13 percent) (LINZResearch Unit 1999). Foods rich in vitamin C include vegetables (potatoes, broccoli, spinach,kumara) and fruits (strawberries, kiwifruit, oranges, melon).
Adequate consumption of vegetables and fruits should provide enough vitamin C for mostpeople. New Zealanders should be encouraged to eat at least three servings of vegetables andat least two of fruits each day. Dried fruits are not a good source of vitamin C.
Practical advice• The consumption of foods rich in vitamin C, especially vegetables and fruits, should be
encouraged.
• Adults should be encouraged to choose preparation and cooking methods that minimise lossof vitamin C, such as microwaving and steaming.
See also: Chapter 6, Iron; and Chapter 16, Cancer.
Folate
Background
Folate is a generic term for a group of over 100 compounds that have a common vitamin activity(Department of Health (UK) 2000). Folic acid (pteroylmonoglutamic acid) is a synthetic form offolate. It is the form of folate most often used in fortified foods because of its stability and highbioavailability (Shils and Young 1994). Folate is essential for deoxyribonucleic acid (DNA)synthesis, and is especially important during periods of increased cell replication and growth(Gibson 1990; Institute of Medicine 1998).
Folates are widely distributed in food, especially in green leafy vegetables, legumes and liver (theterm ‘folate’ comes from the same Latin word as ‘foliage’). Other excellent sources are fruits andfruit juices, nuts and seeds and fortified cereals. Heat and oxidation during cooking and storagecan destroy as much as half the folate in foods. Therefore, uncooked vegetables and fruits arebetter sources of folate than cooked.
Inadequate intakes of folate can result in megaloblastic anaemia. Marginal folate deficiency iscommon in almost any group undergoing rapid growth.
Secondary folate deficiency may also result from impaired absorption due to diseases involvingthe small intestine (eg, coeliac disease and Crohn’s disease) as well as chronic alcoholconsumption (Donnelly 2001). Non-steroidal anti-inflammatory drugs, oral contraceptivesmethotrexate and other drugs with antifolate activity have been found to impair folate status(Institute of Medicine 1998).
Smokers are also a risk group for folate deficiency. It is thought that smoking impairs absorption.However, more recent evidence suggests that smoking is not the causal factor. Rather, thedeficiency may be caused by smokers consuming less folate-containing foods (Institute ofMedicine 1998).
Prevention of neural tube defects. There is evidence that a folic acid supplement taken beforeand during the early stages of pregnancy can reduce both the occurrence and recurrence ofneural tube defects (NTDs; see Glossary) by up to 70 percent (Medical Research Council 1991;Czeizel and Dudas 1992; Berry et al 1999). As a consequence, the Ministry of Health recommends

Food and Nutrition Guidelines for Healthy Adults: A Background Paper 37
that women who are planning to become pregnant take a 0.8 mg per day folic acid supplementfor four weeks before, and 12 weeks after, conception in addition to consuming foods that arerich in folate. It is recommended that women at higher risk of NTDs take 5 mg of folic acid perday for the same period (Ministry of Health 1995, 2003d).
Further information on folate and the prevention of NTDs can be found in the Food and NutritionGuidelines for Healthy Pregnant Women: A background paper (Ministry of Health 1997b) andEating for Healthy Pregnant Women (Ministry of Health 1999b).
Folate intake and homocysteine. Folate may have health benefits through lowering bloodhomocysteine levels (Ministry of Health 2003d).
An elevated blood homocysteine level, even a moderate one, has been associated with a higherrisk for cardiovascular disease (Boushey et al 1995; Homocysteine Studies Collaboration 2002;Wald et al 2002). In turn, randomised controlled trials have demonstrated that increased intakesof dietary folate or folic acid supplements significantly reduce blood homocysteine levels(Homocysteine Lowering Trialists’ Collaboration 1998; Wald et al 2001). However, it is unknownwhether consuming folic acid supplements will reduce the risk of cardiovascular disease.Randomised controlled trials are underway to determine whether folic acid supplementation willlead to a lower incidence of cardiac events (Eikelboom et al 1999).
An association between high homocysteine levels and Alzheimer’s disease has also been found(Seshadri et al 2002). Through its effects in reducing homocysteine levels, increased folic acidconsumption could, therefore, be associated with reduced risk of Alzheimer’s disease. Furtherresearch is needed to explain this association.
Recommended folate intakes for adults
The RDI for folate is 200 µg per day for all adults. This RDI is equivalent to that used in theUnited Kingdom and the European Union (Department of Health (UK) 2000).
Folate intakes in New Zealand
The NNS97 indicates that the usual daily median intake of folate from food is 242 µg (males278 µg, females 212 µg), with little variation across age groups (Ministry of Health 1999c).
Although the overall prevalence of inadequate folate intake was 7.1 percent in the NNS97,inadequate intakes are consistently higher for females than for males. Maori females and thosein the most deprived areas have the highest rates of inadequate intakes. However, the surveyauthors have suggested that care should be taken with data interpretation. It is likely that theprevalence of inadequate intake has been overestimated due to difficulty in establishing foodcomposition data for folate (Ministry of Health 1999c).
Sources of folate in the diet
The principal dietary sources of folate in the New Zealand diet are vegetables (18 percent); bread(13 percent), breakfast cereals (11 percent); fruits, potatoes and kumara (8 percent); non-alcoholic beverages (6 percent); and sauces (5 percent) (LINZ Research Unit 1999).
Practical advice
Adherence to the New Zealand Food and Nutrition Guidelines (see: Part I) will help ensure anadequate folate intake for the majority of the adult population. An emphasis on meetingrecommendations for consuming vegetables and fruits, as well as breads and cereals (wholemealand wholegrain, where possible) is recommended.

Food and Nutrition Guidelines for Healthy Adults: A Background Paper38
• The principal sources of folates in the New Zealand diet are vegetables, bread and breakfastcereals (often fortified with folic acid).
• The consumption of foods rich in folate should be encouraged. Examples are leafy greenvegetables such as spinach, citrus such as oranges, wholewheat breads, and legumes such askidney beans. Liver is also a rich source.
• If a woman is planning pregnancy, folic acid supplements are recommended in addition to afolate-rich diet.
See also: Chapter 13, Coronary heart disease; and Chapter 22, Supplementation and fortification.
Thiamin
Background
Thiamin, as a component of the coenzyme thiamin pyrophosphate (TPP), has an important role incarbohydrate metabolism.
Thiamin deficiency. Thiamin deficiency has almost completely disappeared in developedcountries. The exceptions are in selected groups within the population such as people withchronic alcoholism, some older people, and people with chronic disease states involvingvomiting, diarrhoea and anorexia (Gibson 1990). Severe deficiency among people withalcoholism is often associated with Wernicke’s encephalopathy, a neurological disorder arisingfrom prolonged thiamin deficiency. In the early 1990s Australia began fortifying flour for bread-making with thiamin to decrease the high incidence of Wernicke’s-Korsakoff’s syndrome(Department of Health 1991). Although the prevalence is still higher than in most otherdeveloped countries, there has been a significant reduction in Wernicke’s-Korsakoff’s syndromein Australia since fortification began (Harper et al 1998).
Recommended thiamin intakes for adults
The RDIs for thiamin intake are 1.1 mg for males and 0.8 mg for females aged 19 to 54 years, and0.9 mg for males and 0.7 mg for females aged over 54 years (Truswell et al 1990).
Thiamin intakes in New Zealand
The NNS97 indicates the usual daily median intake of thiamin for New Zealanders is 1.4 mg(males 1.7 mg, females 1.2 mg) (Ministry of Health 1999c). The principal dietary sources ofthiamin are bread (29 percent); potatoes and kumara (8 percent); breakfast cereals (7 percent);vegetables (6 percent); and milk and pork (both 5 percent) (LINZ Research Unit 1999). Fortifiedbreakfast cereals and bread mixes are also important sources of dietary thiamin. The intake ofthiamin in the New Zealand population appeared to be satisfactory as even those on the 10thpercentile of usual intake did not fall below the 0.4 mg per day level recommended by the UnitedKingdom DRV panel (Ministry of Health 1999c).
Sources of thiamin in the diet
Wholegrain cereals, pork, dried peas and beans are the richest dietary sources of thiamin. Othersignificant sources are other meat, fish, green vegetables, fruits and milk. Approximately25 percent of the thiamin in foods is lost during cooking, with the greatest losses occurring frommeat and vegetables.

Food and Nutrition Guidelines for Healthy Adults: A Background Paper 39
Practical advice• Principal sources of thiamin in New Zealand are bread, vegetables, breakfast cereals, milk and
pork.
Vitamin B12
Background
Vitamin B12
is produced almost entirely by bacterial synthesis in the colon and small intestine.Vitamin B
12 is found in meat or foods of animal origin (eg, meat, fish, shellfish, milk, cheese and
eggs) (Thurnham et al 2000).
Vitamin B12
is an important factor in the metabolism of folate for DNA synthesis and thus is
important during rapid cell growth (Selhub et al 1993; Shils and Young 1994; Ministry of Health2003d).
Vitamin B12 deficiency. The main cause of vitamin B12
deficiency is not dietary deficiency but afailure of intrinsic factor secretion which assists with the absorption of vitamin B
12 (Department of
Health (UK) 1991). Older people are at the greatest risk of vitamin B12
deficiency because of anage-related decline in absorption. Reduced secretion of intrinsic factor can result frompernicious anaemia (an autoimmune disease) and occur in people who have had gastric surgery.In the adult population, those at risk of a dietary deficiency of vitamin B
12 are vegans (Thurnham
et al 2000).
Deficiency of vitamin B12
may appear either as macrocytic megaloblastic anaemia or neurologicalabnormalities, or both (Bower and Wald 1995; Department of Health, UK, 2000). The majority ofpeople with vitamin B
12 deficiency present with symptoms due to their anaemia. Only one-third
present with predominantly neurological symptoms.
Because of the similarities in the presentation of vitamin B12
and folate deficiency, correctbiochemical diagnosis is essential before treatment for megaloblastic anaemia (Truswell andMilne 1998). Treatment with folic acid can resolve the megaloblastic anaemia of vitamin B
12deficiency but will not treat the neurologic abnormality. In such cases, the deficiency will bemasked, which may delay diagnosis of vitamin B
12 deficiency, possibly leading to irreversible
neurological damage. With this risk in mind, the United States Institute of Medicine has set atolerable upper intake level (UL) of 1000 µg of synthetic folic acid daily. Regular consumption oflevels below the UL is believed to be unlikely to mask vitamin B
12 deficiency (Institute of Medicine
1998).
Recommended Vitamin B12 intakes for adults
The RDI for vitamin B12
is 2.0 µg per day for adults (Truswell et al 1990).
Vitamin B12 intakes in New Zealand
From the NNS97 the usual daily median intake of vitamin B12
is 4 µg (males 5 µg, females 3 µg).The overall prevalence of inadequate intake was 0.4 percent (Ministry of Health 1999c). Theprincipal dietary sources of vitamin B
12 were beef and veal (18 percent); fish and seafood (16
percent); milk (15 percent); other meat (8 percent); pies and pastries, bread-based dishes, andeggs and egg dishes (all 5 percent) (LINZ Research Unit 1999).
In a New Zealand study of vegetarians, the dietary vitamin B12
intake was significantly lower forvegetarians compared with non-vegetarians. Despite this difference, vegetarians and non-vegetarians had similar serum vitamin B
12 levels (Harman and Parnell 1998).

Food and Nutrition Guidelines for Healthy Adults: A Background Paper40
Routine supplementation with vitamin B12
is not recommended for healthy adult New Zealanders.However, health professionals should be aware of the risks of vitamin B
12 deficiency in high-risk
groups such as older people, vegans, and those who have had gastric surgery. Diagnosis shouldbe confirmed using biochemical tests before treatment is initiated.
Sources of vitamin B12 in the diet
Meat, seafood, milk and milk products, egg and liver are rich sources of vitamin B12
.
Practical advice• The consumption of foods rich in vitamin B
12 should be encouraged.
• Vegetarians should be aware of sources of vitamin B12
such as milk and yoghurt.
• Vegans need to eat foods fortified with vitamin B12
or to take vitamin B12
supplements.
• For people with pernicious anaemia or who have had gastric surgery, vitamin B12
injectionsmay be required under a doctor’s supervision.

Food and Nutrition Guidelines for Healthy Adults: A Background Paper 41
10 Fluids
Background
Approximately 70 percent of body weight is water. Water is essential for life and humans cannotsurvive for more than five days at the most without water. Water is required both within andoutside cells and is necessary for biochemical reactions, transport of nutrients, metabolites,waste products, respiratory gases, hormones and heat. Water also provides lubrication for thejoints and body surfaces (Robinson 2002).
Recommended fluid intakes for adults
Approximately 3000 ml of water is required per day for the average man and approximately2200 ml per day for the average woman (NHMRC 2003). Solid food (especially vegetables andfruits) contributes approximately 1000 ml of water, with about 300 ml coming from the waterproduced by the breakdown of food. The remainder of the water needs to come from fluids suchas water, milk, tea, coffee and other beverages.
Fluid intakes in New Zealand
The NNS97 showed that water (80 percent), tea (62 percent) and coffee (61 percent) areconsumed regularly by New Zealanders. Fluid consumption differs across genders. Males morefrequently consume coffee, soft drinks and cordial. Females prefer low energy soft drinks, waterand herbal teas. However, consumption of soft drinks dropped off markedly in the age group of45-plus years for both males and females. Milk is consumed as a beverage at least once per weekby only 35 percent of adult New Zealanders (Ministry of Health 1999c).
Powdered drinks and cordials are more regularly consumed by individuals living in NZDep96quartile IV (most deprived) areas. Fruit juice, tea (males only), water (females only) and coffeeare more popular among individuals living in quartile I (least deprived) and II areas. Pacificpeoples are higher regular consumers of fruit drinks and sports drinks compared with Maori andNew Zealand European and Others. Maori more often have cordial and soft drinks. Maori andPacific peoples drink less coffee, tea and herbal tea than New Zealand European and Others(Ministry of Health 1999c).
Sources of fluids in the diet
Water
Although water consumed as such is a major source of fluid, water consumed in other beveragesis also important.
There is evidence that drinking reticulated water (ie, water supplied by the local water authority)containing fluoride can help to prevent tooth decay. While bottled water is a convenientalternative to tap water, there are no known benefits over reticulated water. Caution should betaken when consuming water from other than reticulated sources (from tanks, etc) as it caneasily be contaminated (eg, with bird or animal faeces).
Milk
Milk is a valuable component of the diet, as an important source of calcium, protein and otheressential nutrients. It should, therefore, be included as part of the fluid intake. Achieving theRDI for calcium without some liquid milk or milk products is difficult. The use of reduced-fat or

Food and Nutrition Guidelines for Healthy Adults: A Background Paper42
low-fat milk products will minimise energy intake while retaining the contribution of calcium. Soybeverages can be a suitable replacement for cow’s milk, but calcium-fortified varieties should beselected.
Caffeinated drinks
Caffeine and similar substances are found in coffee, tea, cocoa, cola-flavoured drinks, or energydrinks containing guarana or cola nut. Coffee contains about three or four times as much caffeineas an equal volume of cola-flavoured drink. Some energy drinks contain substantial amounts ofcaffeine, although no more than strong coffee. Caffeine is a central nervous system stimulant andacts as a mild diuretic. Tea, coffee and soft drinks are among the most frequently consumedbeverages in New Zealand.
Caffeine has recently been associated with increased blood pressure in individuals prone tohypertension (Nurminen et al 1999). Coffee and caffeine may also be associated with cardiacarrhythmias and raised blood lipids (NHF 1999).
Evidence for caffeine intake as a risk factor for fracture frequency or bone loss is contradictory.Several large cohort studies have reported small but significant increases in either fracturefrequency or bone loss associated with increased caffeine intake (Kiel et al 1990; Hernandez-Avila et al 1991; Barrett-Connor et al 1994; Cummings et al 1995). Other studies have found noassociation (Cooper et al 1992; Johansson et al 1992; Cumming and Klineberg 1994; Lloyd et al1997).
An important issue with coffee, tea and energy drinks is the amount of energy (in the form ofsugar) they may contain. The addition of sugar to tea and coffee can add significantly to anindividual’s daily energy intake, thus contributing to overweight and obesity.
Tea, especially green tea but also black tea and to a lesser extent coffee, contains substantialamounts of polyphenols. Polyphenols are substances with antioxidant properties which arepurported to protect against cancer and cardiovascular disease. In the NNS97 the highestfrequency of consumption of herbal teas among New Zealand women was among females 19-64years (10-13 percent) (Ministry of Health 1999c). While herbal teas commercially marketed in NewZealand are very dilute (Mathews 1997), some herbal teas might interact with prescription drugs(Huxtable 1992).
Fruit juices, soft drinks, cordials and sports drinks
Fruit juices, soft drinks, cordials and sports drinks all contain water. As such, they contribute tototal fluid intake. In some cases, they also contribute other nutrients (eg, vitamin C in fruitjuices). However, because they provide energy in the form of sugar, they also contribute toenergy intake and may also contribute to overweight and obesity. If sports drinks are consumedin large amounts, the phosphoric acid and citric acid added to these drinks are likely to damageteeth by eroding tooth enamel. Their erosive potential is related to their low pH (high acidity) andchemical content. Frequency of intake and salivary flow rate are also important factors. Forexample, mouth breathing during physical activity leads to less salivary clearance of acids andcarbohydrates (Vasan 1999). Sports drinks are one of the fastest growing segments in theAustralasian drinks market (Pearce 1996). They are predominantly consumed by people in the15–24 years age group (LINZ Research Unit 2000).
Practical advice• Drink plenty of water every day.
• Take an amount of fluid equivalent to 6-8 glasses of water per day.
• Sometimes choose low-fat milk as a nutritious alternative to water or soft drinks.
Food and Nutrition Guidelines for Healthy Adults: A Background Paper 43
• Limit the consumption of fruit juice, cordial, energy and soft drinks because of their high sugarcontent.
• People susceptible to caffeine should minimise consumption of tea, coffee and othercaffeinated drinks. The National Heart Foundation suggests a maximum of five cups of coffeea day for the general population (NHF 1999).

Food and Nutrition Guidelines for Healthy Adults: A Background Paper44
11 Alcohol
Background
Alcohol use in New Zealand
Alcohol is both a nutrient supplying 29 kJ/g and a drug that is a central nervous systemdepressant (Truswell 2002). Drinking alcohol has health, social and economic costs as well assome benefits. In 2000, 88 percent of men and 83 percent of women consumed alcohol(Habgood et al 2001). While most New Zealanders enjoy alcohol in moderation most of the time,there are significant negative health and social consequences associated with excessivedrinking.1
Health effects
Different levels of alcohol consumption are associated with different levels of health hazard.Modest consumption of alcohol can be protective against, for example, coronary heart diseaseand other diseases with similar pathophysiology, in particular ischaemic stroke but it is notprotective against cancers (Ministry of Health 1999d). Excessive alcohol consumption canproduce detrimental effects. Long-term problems include irreparable damage to the brain, liver,intestines and pancreas. Alcohol is also a significant risk factor for some types of cancer, highblood pressure, haemorrhagic stroke, and cardiac conditions such as cardiomyopathy (Ministryof Health 1998d).
The unsafe use of alcohol also contributes to death and injury on the roads, drowning, suicide,assaults, domestic violence, teenage pregnancy, foetal alcohol syndrome, neurological disorders,sexual harassment, other non-traffic-related mortality and morbidity, some mental healthdisorders and sexual health problems (Ministry of Health 1998c). It has been estimated that atsome time in their lives nearly one in five New Zealanders will suffer an alcohol-use disorder(ALAC and Ministry of Health 2001).
Links between alcohol and cancer. There is strong evidence that alcohol is a risk factor forcancers of the oral cavity, pharynx, oesophagus and larynx. Alcohol is a probable risk factor forcancers of the stomach, colon, rectum, liver, breast and ovary (World Cancer Research Fund1997).
Alcohol consumption is also linked to other cancer risk behaviours such as tobacco smoking(including second-hand smoke), unsafe sex (increasing exposure to HIV), and illicit drug use(increasing exposure to Hepatitis B and C in injecting drug users) (Ministry of Health 2003e).
Links between alcohol and coronary heart disease. Certain subgroups have a lower risk ofcoronary heart disease associated with alcohol intake. These include post-menopausal womenand men over the age of 45 years (NHF 1999). In these groups, light and moderate drinking ofalcohol has consistently been associated with lower risk of coronary heart disease (Marmot andBrunner 1991; Maclure 1993; Shaper et al 1994).
A systematic review of ecological, case-control and prospective studies concluded that allalcoholic drinks were linked with a lower risk of coronary heart disease (Rimm et al 1996).However, beyond three drinks per day for men and two per day for women the disadvantages of
1 It is difficult to review literature on the effects of alcohol consumption since the alcoholic content of drinksvaries from one country to another, self-reporting of consumption is usually underestimated, and differentstudies use different definitions of ‘moderate’ and ‘heavy’ alcohol consumption (Cowie 1997).

Food and Nutrition Guidelines for Healthy Adults: A Background Paper 45
alcohol consumption rapidly outweigh the advantages (Cowie 1997). This is especially true forthose at low risk of death from coronary heart disease. In younger populations, drinking largeramounts of alcohol in one session is associated with injuries and cardiovascular heart diseasemortality (Jurgen et al 2001).
Patterns of alcohol consumption
Total alcohol consumption per adult per year was 8.5 litres in 1998, which was below the Ministryof Health’s target reducing consumption to 8.7 litres by the year 2000 (Ministry of Health 1999e).There has been a slight increase since then, with an estimated average 8.9 litres of pure alcoholconsumed per person aged 15 years and over in 2001 (Ministry of Health 2001c; ALAC andMinistry of Health 2001).
There is considerable variation in the amount of alcohol consumed by New Zealanders. TheAUDIT (Alcohol Use Disorders Identification Test) questionnaire was developed as a screeningtool to identify people at risk of developing alcohol problems (Barbor and Grant 1989), and hasbeen used to investigate drinking patterns. In the 1996/97 New Zealand Health Survey, just over80 percent of New Zealanders reported that they drank alcohol. However, of these nearly two-thirds had an AUDIT score that classified them as relatively safe drinkers. The remaining 17percent of adults had an AUDIT score indicating a pattern of drinking that put them at risk offuture physical or mental health effects from alcohol (Ministry of Health 1999f).
Young people aged 15–24 years, especially males, are more likely to indulge in the high-riskalcohol consumption pattern of binge drinking. For example, young people are over-representedin the groups that drink in excess of five or more drinks on a typical drinking occasion, and morethan six drinks on one occasion at least weekly (Ministry of Health 1999f). In addition, there isevidence that heavier drinking cohorts of young people go on to be heavier drinkers in later lifeand to experience more alcohol-related harm. Older people tend to consume alcohol moreregularly than do younger people. However, they tend to drink less on a single occasion. Theyare also less likely to experience alcohol-related harm than younger drinkers (Habgood et al2001).
Men are more likely than women to drink frequently, and to drink heavily on a typical day whendrinking. For example, a nationwide telephone survey conducted in 1995 showed that menconsume 73 percent of all alcohol in New Zealand, with 5 percent of male drinkers consuming theequivalent of 63 cans of beer a week (Habgood et al 2001).
In 2000, just under one in five men and one in ten women drank alcohol daily. On a typicaldrinking occasion, men consume 72 ml of absolute alcohol on average, which equates to justunder five cans of beer. Women consume on average 52 ml of absolute alcohol, or between threeand four glasses of wine (Habgood et al 2001).
Greater numbers of Maori and Pacific adults abstain from alcohol consumption than do NewZealand European adults. However, disproportionate numbers of Maori and Pacific adults alsodemonstrate potentially hazardous drinking patterns. Maori and Pacific adults who drink alcoholdo so less frequently than New Zealand European adults but are more likely to consume five ormore alcoholic drinks on one occasion (Ministry of Health 1999f).
The NNS97 reported mean intakes for alcohol consumption shown in Table 16.

Food and Nutrition Guidelines for Healthy Adults: A Background Paper46
Table 16: Alcohol intake in New Zealand
Daily mean in (g) Percentage contribution to energy
Males 20 5
Females 8 3
At the 90th centile of intake alcohol contributed 16 percent of energy for males and 10 percent forfemales. For those who drink regularly alcohol is an important contributor to overall energyintake and may contribute to weight gain.
Recommendations for alcohol intake
There is no level of drinking that can be called safe for all people at all times. An individual’stolerance to alcohol varies depending on their age, gender, body size, food intake and generalhealth. The Alcohol Advisory Council (ALAC) has developed guidelines for upper limits forresponsible drinking and these are shown in Table 17. These guidelines are based on ameasurement called the ‘standard drink’. Each standard drink contains 10 g of alcohol.
Table 17: Upper limits for responsible drinking
In any one week, On any one drinking occasion If drinking every day,drink no more than: drink no more than: drink no more than:
21 standard drinks for men 6 standard drinks for men 3 standard drinks for men
14 standard drinks for women 4 standard drinks for women 2 standard drinks for women
Source: ALAC 2002
Examples of standard drinks are shown in Table 18.
Table 18: Standard drinks contained in typical servings of alcohol
Type of Serving of alcohol Number ofalcoholic drink standard drinks
Beer 1 can or stubbie of ordinary-strength beer (5% alcohol) 1.51 glass (300 ml) of ordinary-strength beer 11 pint (a ‘handle’) of ordinary-strength beer 21 jug of ordinary-strength beer 4
Spirits 1 single measure of spirits (25 ml) (eg, whisky, gin, vodka) 11 bottle of spirits (750 ml) (eg, whisky, gin, vodka) 30
Fortified wine 1 glass of fortified wine (eg, sherry, martini, port) 11 bottle of fortified wine (eg, sherry, martini, port) 11.5
Table wine 1 small glass of table wine (80 ml) 1
1 bottle of table wine 7.5
Source: ALAC 1995

Food and Nutrition Guidelines for Healthy Adults: A Background Paper 47
Practical advice• If choosing to drink alcohol, limit your intake.
• Remember alcohol-containing drinks are high in energy density and may contribute to weightgain. Have some alcohol-free days each week.
• To reduce the risk of cancer, no alcohol is recommended (see: Chapter 16, Cancer).
• To reduce cardiovascular risk, consume only moderate amounts of alcohol.
• When serving drinks, ensure non-alcoholic drinks and food are available.
• Provide non-alcoholic and low-alcohol beverages when serving alcohol.
• Eat food when drinking alcohol.
• Restrict or avoid alcohol when driving, when operating machinery or when in the water.

Food and Nutrition Guidelines for Healthy Adults: A Background Paper48

Food and Nutrition Guidelines for Healthy Adults: A Background Paper 49
Part III: Nutrition and Health Outcomes
12 Obesity
Background
Obesity is a major contributor to the global burden of disease and disability. The prevalence ofobesity is increasing world-wide and has already reached epidemic proportions in manycountries and population groups (Kumanyika et al 2002; WHO and FAO 2003). Obesity is also amajor issue for New Zealand (Ministry of Health 2003b; 2003c; Ministry of Health and Universityof Auckland 2003).
Until recently, obesity had been viewed primarily as a condition of overeating, which could becorrected by a reduction in the quantity and energy content of food ingested. As a result of thisoversimplification, obesity has been neglected as a health issue. Obesity is a complex disorderwith multiple interactive causes.
The increase in the prevalence of obesity is largely due to a changing social and physicalenvironment in which people are consuming excess energy through food and drinks and notexpending adequate energy through physical activity. When tackling obesity, it is important tointervene to change the environment that promotes obesity as well as to seek to effect change inan individual’s behaviour.
What causes overweight and obesity?
In simple terms, obesity is a consequence of an energy imbalance: energy intake exceeds energyexpenditure over an extended period. This causes the accumulation of excess body fat to theextent that health may be adversely affected. However, the amount of excess fat, its distributionwithin the body and the associated health consequences, vary considerably between obeseindividuals (WHO 2000).
Egger and Swinburn (1997) have proposed an ecological model to aid the understanding ofobesity and over-fatness, see Figure 1.
Figure 1: The ecological model of the causes of obesity
Source: Egger and Swinburn 1997
Mediators Moderators
Equilibrium fatstores
Energyintake
Energyexpenditure
Physiologicaladjustment
Biology Behaviour Environment
= _ +
Influences

Food and Nutrition Guidelines for Healthy Adults: A Background Paper50
Mediators
At a population level, physical energy expenditure has fallen by more than food energy intake(Egger and Swinburn 1997). This energy imbalance, results in excess energy being stored as fatwith an increasing prevalence of overweight and obesity.
Moderators
‘Physiological adjustments’ are changes that follow an imbalance between energy intake andenergy expenditure. A response to loss of weight may be an appetite increase, or a decrease inphysical activity.
The resting metabolic rate may decline until a new energy balance is achieved. A lower metabolicrate means that a person would then need less food (energy intake) to remain at the sameweight.
Biological influences
Biological factors known to influence body weight and fat levels include:
• ethnicity – some population groups appear to have a greater genetic predisposition to weightgain
• gender – women carry more fat than men
• age – maintenance of a healthy body weight becomes more difficult with age
• hormonal factors
• genetics.
These biological influences explain the variance in body fat in individuals. They do not, however,explain why obesity has increased so significantly at a population level.
Behavioural influences
Eating behaviour and physical activity are the results of complex physiological, psychological andcultural factors, including habits, emotions, conditioning and attitudes.
Environmental influences
Probably the most important cause of the rapid global rise in obesity lies in the profound andrapid changes to the environment and society affecting large parts of the world.
Modernisation, urbanisation and changing occupational structures are creating societies inwhich physical activity levels are low and the availability of high-fat, high-sugar, energy-densefoods has increased. Populations now live in environments that inadvertently promote sedentarylifestyles and overconsumption of energy-dense foods. Maintaining a healthy weight and optimalfat stores requires considerable effort – an effort that is difficult to maintain in an unsupportiveenvironment.
Definitions of overweight and obesity
Body mass index (BMI)
BMI is an index that is commonly used to classify underweight, overweight and obesity in adultpopulations. It is defined as weight in kilograms divided by height in metres squared (kg/m2).

Food and Nutrition Guidelines for Healthy Adults: A Background Paper 51
The classification of overweight and obesity according to BMI is shown in Table 19. Obesity isclassified as a BMI ≥ 30.00. The classification shown in Table 19 is in agreement with thatrecommended by WHO (1995), but includes an additional subdivision at BMI 35.00–39.99. Thisis in recognition of the fact that management options for dealing with obesity differ above a BMIof 35.00. The WHO classification is based primarily on the association between BMI andmortality.
Table 19: WHO classification of overweight and obesity in adultsaccording to body mass index
Classification Body mass index (BMI) Risk of co-morbidities
Underweight ≤ 18.50 Low (but risk of other clinicalproblems increased)
Normal range 18.50–24.99 Average
Overweight: ≥ 25.00
pre-obese 25.00–29.99 Increased
obese class I 30.00–34.99 Moderate
obese class II 35.00–39.99 Severe
obese class III ≥ 40.00 Very severe
Source: WHO 2000
The BMI values in Table 19 are age-independent and the same for both sexes. However, BMI maynot correspond to the same degree of fatness in different populations due, in part, to differencesin body proportions and body build. For example, Swinburn et al (1999) found that Polynesians(Maori and Samoan combined) tend to have a lower proportion of fat mass than European NewZealanders at an identical BMI. Rush et al (1997) demonstrated the same results in a similarstudy on young Polynesian and European New Zealand women. Rush also notes that althoughpercent body fat (% BF) correlates with BMI and mortality and morbidity for European NewZealanders, the correlation of % BF or other adiposity measures in Polynesians needs to bedetermined and considered in the formulation of what is considered normal or low-risk.
In New Zealand, Swinburn et al (1999) defined a healthy body size as a BMI of 18.5–25.0 kg/m2
for New Zealand Europeans and 18.5–26 kg/m2 for Maori and Pacific peoples. Overweight hasbeen defined as a BMI ≥ 26 and < 32 for Maori and Pacific peoples and ≥ 25 and < 30 for allother New Zealanders. Obesity has been defined as a BMI ≥ 32 for Maori and Pacific peoples and≥ 30 for all other New Zealanders (Swinburn et al 1999). These cut-off points were used todetermine the prevalence of overweight and obesity in the NNS97.
Table 20 shows a simplistic relationship between BMI and the risk of co-morbidity. Thisrelationship can be affected by a range of factors, including the type of diet, ethnic group andactivity level (see Part IV: Physical Activity – A Partner to Nutrition). The risks associated withincreasing BMI are continuous and graded, and begin at a BMI under 25. However, theinterpretation of BMI gradings in relation to risk may differ for different populations. Both BMIand a measure of fat distribution (waist circumference or waist/hip ratio (WHR) are important incalculating the risk of obesity co-morbidities.

Food and Nutrition Guidelines for Healthy Adults: A Background Paper52
In summary, BMI can be considered to provide the most useful, albeit crude, population-levelmeasure of obesity. The robust nature of the measurements and the widespread routineinclusion of weights and heights in clinical and population health surveys mean that a moreselective measure of adiposity, such as skinfold thickness measurements, provides additional,rather than primary, information. BMI can be used to estimate the prevalence of obesity within apopulation; it is not as useful to assess obesity-related health risk in individuals without otheranthropometric measures (WHO 2000).
Other measures of overweight and obesity
The distribution of excess body fat is an important determining factor for some diseases. Table20 identifies the degree to which obesity is likely to increase the risk of developing such healthproblems. Excess abdominal fat is a more important predictor of obesity related diseases (egtype 2 diabetes, coronary heart disease) as shown in Table 20 than excess body fat per se. It isuseful, therefore, to be able to distinguish between those at increased risk as a result ofabdominal fat deposition or ‘android obesity’ from those with the less serious ‘gynoid’ fatdistribution, in which fat is more evenly and peripherally distributed around the body (WHO2000). Other measurements that identify individuals at increased risk for obesity-related illnessdue to abdominal fat accumulation are therefore valuable. Two measures; waist/hip ratio (WHR)and waist circumference (WC) have been found to be useful correlates of abdominal fataccumulation.
Table 20: Relative risk of health problems associated with obesity
Greatly increased Moderately increased Slightly increased (relative risk > 3)* (relative risk 2–3)* (relative risk 1–2)*
NIDDM/type 2 diabetes CHD Cancer (breast cancer in post-menopausal women, endometrialcancer, colon cancer)
Gallbladder disease Hypertension Reproductive hormoneabnormalities
Dyslipidaema Osteoarthritis Polycystic ovary syndrome
Insulin resistance Hyperuricaemia Impaired fertility
Breathlessness Low back pain due to obesity
Sleep apnoea Increased anaesthetic riskFoetal defects associated withmaternal obesity
* All relative risk values are approximate.
Source: WHO 2000
A high WHR (> 1.0 in men and > 0.85 in women) has been found to indicate abdominal fataccumulation (Han et al 1997). WC is a better measure than WHR. It is a simpler and moreconvenient measure and is being used increasingly. WC is unrelated to height, correlates closelywith BMI and WHR, and is an appropriate index of intra-abdominal fat mass and total body fat.Also, changes in waist circumference reflect changes in risk factors for cardiovascular diseaseand other forms of chronic disease, even though the risks seem to vary in different populations(WHO 2000).

Food and Nutrition Guidelines for Healthy Adults: A Background Paper 53
Obesity in New Zealand
The NNS97 showed that between 1989 and 1997 there was a 55 percent increase in theprevalence of adult obesity. Obesity now affects 17 percent of New Zealand adults; a further35 percent of adults are overweight. The mean body weight of adults has increased by 3.2 kgover this period (Ministry of Health 1999c). In addition, the NNS97 revealed that that there wasan increasing trend towards central obesity as estimated by WHR and measured by skinfoldmeasures. Central obesity is recognised as a significant precursor of high blood insulin,increased plasma triglycerides, decreased HDL levels and elevated blood pressure as well asincreased morbidity and mortality (Wilson et al 2001).
Rates of obesity among Maori and Pacific peoples were found to be higher than those of thegeneral population all shown in Table 21.
Table 21: Percentage of New Zealanders overweight or obese
NZ European Maori Pacific peoples NZ population
and Others (age 15+)
Male Female Male Female Male Female Male Female
Percentage ofoverweight 41.0 29.8 30.0 32.7 59.2 28.8 40.4 30.1
Percentage ofobese 12.6 16.7 27.0 27.9 26.2 47.2 14.7 19.2
Source: Ministry of Health 1999c
In 1996 obesity was estimated to account for over 15,000 discounted years of life lost andapproximately 1070 deaths (Ministry of Health 1999d). According to projections, there will be a73 percent increase in the prevalence of obesity in New Zealand – from 17 percent of thepopulation to 29 percent – by the year 2011 (Ministry of Health 2002c).
Financial burden of obesity
The estimated cost of obesity to the New Zealand health sector for the year 1991 was $135 millionper annum. This is based on the costs attributable to obesity from coronary heart disease, type 2diabetes, gallstones and some cancers. This estimate was considered to be very conservative(Swinburn et al 1997b).
This cost of $135 million was estimated to be approximately 2.5 percent of New Zealand’s annualhealthcare costs in 1991. Based on 2000/01 healthcare expenditure in New Zealand, this wouldequate to a current financial burden of approximately $247.1 million. The WHO has estimatedthat the cost of obesity for a country is 2 to 7 percent of the annual health budget (WHO 2000).Therefore, the true cost of obesity in New Zealand could be much higher than the 2000/01estimate. With the prevalence of obesity increasing, the cost will also be rising.
Obesity and disease
Overweight and obesity are associated with a number of threats to health and wellbeing. Bothconditions are major risk factors for a wide range of medical and psychosocial problemsincluding:

Food and Nutrition Guidelines for Healthy Adults: A Background Paper54
• chronic, non-communicable diseases that can lead to disability and death (eg, heart disease,type 2 diabetes, hypertension, stroke and some cancers)
• debilitating conditions that can drastically reduce quality of life and are costly in terms ofabsence from work and use of health resources (eg, osteoarthritis, gallbladder disease,respiratory difficulties, infertility and skin problems)
• psychological problems (eg, clinical depression, lowered self-esteem, job discrimination andother forms of social stigmatisation) (Caterson 2002; Kumanyika et al 2002).
One of the most prevalent consequences of overweight and obesity is type 2 diabetes. Thelikelihood of developing type 2 diabetes rises steeply with increasing body fatness.Approximately 85 percent of people with diabetes can be classified as type 2; of these,90 percent are obese. People with type 2 diabetes are at high risk of a range of disablingconditions, including heart disease, hypertension, amputation, stroke, renal failure andblindness. Figure 2 illustrates the relative risk of diabetes in women, based on their BMI.
Figure 2: Relative risk of diabetes in relation to body mass indexin women
Source: Colditz et al 1990
Principles of prevention and management of obesity
In obesity and weight gain, both prevention and treatment are problematic because of thecomplexity of multiple causes of the disease. However, it is now clear that powerful societal andenvironmental forces influence energy intake and expenditure. These may overwhelm thephysiological regulatory mechanisms that operate to keep weight stable. Individual susceptibilityto societal and environmental forces is affected by genetic and other biological factors, such assex, age, ethnicity and hormonal factors. Dietary factors and physical activity patterns areconsidered to be the major modifiable factors underlying excessive weight gain which, ifcorrected, can serve to prevent obesity (WHO 2000).
It is important to recognise that the concept of obesity prevention and management does notsimply mean preventing normal-weight individuals from becoming obese. Rather, it encompassesa range of strategies that aim to:
• prevent the development of overweight in normal-weight individuals
• promote weight loss in the already overweight or obese
RelativeRisk
<22 23 24 25 27 29 31 33 35 >35Body Mass Index in Women
0
10
20
30
40
50
60

Food and Nutrition Guidelines for Healthy Adults: A Background Paper 55
• prevent the progression of overweight to obesity in those who are already overweight
• prevent weight regain in those who have been overweight or obese but who have since lostweight (WHO 2000).
Priority groups
Most adult New Zealanders need to address the issue of energy balance to minimise the risk ofoverweight and obesity. However, some sectors of the population have been identified as beingat higher risk of developing obesity than others. In addition, people are at higher risk of obesityat specific stages of the lifecycle (British Nutrition Foundation 1999). Those in New Zealand athigher risk include:
• children (particularly those with at least one obese parent)
• Maori
• Pacific peoples
• women in low socioeconomic groups
• people with disabilities
• ex-smokers
• women post-pregnancy
• physically inactive people
• people who have been obese previously (Ministry of Health 2003b).
If the population health burden of obesity is to be reduced, interventions should be aimed atchanging the environmental factors which lead to obesity in whole populations. Specialattention should be to directed at prevention and treatment interventions to high risk groups.
Interventions: public health
Public health interventions targeting food consumption and an increase in physical activity –both of which impact on obesity – are delivered to communities or population groups in a varietyof settings. Important settings for obesity intervention are:
• the media – which can influence people’s food purchasing and nutrition knowledge, and couldpromote physical activity
• food consumption and physical activity environments – such as schools, work sites, sportsfacilities, homes
• the food service industry (restaurants and takeaways)
• the food industry – which influences food composition and marketing
• communities – which influence cultural food consumption patterns and provide physicalenvironments to support physical activity
• the primary care setting (Ministry of Health 2003c).
The current international obesity epidemic is not solely related to energy intake. Energy output,which influences energy balance and weight maintenance, is also important. For this reason,interventions to increase physical activity are also vital. (See: Part IV: Physical Activity – APartner to Nutrition, and Appendix 6.)

Food and Nutrition Guidelines for Healthy Adults: A Background Paper56
Interventions: individuals
Obesity is a disease that does not always respond to conventional methods of treatment. Itsmanagement may require an approach tailored to an individual’s needs. Treatment regimes needto focus both on initial weight loss and on maintaining an individual’s long-term weight reduction(British Nutrition Foundation 1999).
There are many different options for treatment on an individual basis, including:
• dietary interventions
• physical activity and exercise interventions (see: Part IV: Physical activity – A Partner toNutrition)
• behavioural interventions
• pharmacological interventions
• surgical treatments.
Practical advice• Most New Zealanders would benefit from a better balance between energy intake and energy
output. Negative energy balance can be achieved by a combination of increasing physicalactivity and/or reducing dietary energy intake (see Appendix 6).
• To reduce dietary energy intake, it is important not to remove the foods that contributeimportant nutrients, such as vegetables and fruits, breads and cereals, milk and milkproducts, and meat, poultry, seafood, legumes and eggs.
• It is best to reduce the intake of foods that are high in energy (kilojoules) but low in essentialnutrients, such as snack foods and convenience food and drinks (cakes, chips, biscuits,sweets, soft drinks and alcohol).
• Where available, choose lower-fat versions of foods, such as low- and reduced-fat milk optionsand lean meat.
See also: Chapter 19, Maori, and Chapter 20, Pacific peoples.

Food and Nutrition Guidelines for Healthy Adults: A Background Paper 57
13 Coronary heart disease
Background
Coronary (ischaemic) heart disease (CHD) is the leading single cause of death in New Zealand(Ministry of Health 1999e). There is strong evidence that nutritional factors contribute to theprogression of coronary heart disease. CHD includes angina pectoris and coronary thrombosis(Mann 2002).
Evidence also shows that dietary modification is important in both prevention and treatment.Lifestyle modification is undoubtedly the most effective means of reducing risk in high-riskpopulations and individuals (Mann 2002).
Coronary heart disease in New Zealand
CHD event rates fell in New Zealand between 1984 and 1993. Rates of non-fatal CHD eventsdeclined on average by 3 percent per year for both men and women (Beaglehole et al 1997). Thistrend is consistent with improvements in medical treatment and the reduction in the prevalenceof major risk factors over this period (Ministry of Health 1999e). Table 22 lists the majoridentified risk factors for CHD.
Table 22: Identified risk factors for coronary heart disease
Irreversible masculine genderincreasing agegenetic traits, including monogenic and polygenic disordersof lipid metabolism
body build
Potentially reversible cigarette smokingdyslipidaemia: increased levels of cholesterol, triglyceride, LDL, VLDLand low levels of HDLoxidisability of LDLobesity, especially when associated with a high WHRhypertensionphysical inactivityhyperglycaemia and diabetesincreased thrombosis: increased haemostatic factors and enhancedplatelet aggregationhigh levels of homocysteine
Psychosocial low socioeconomic groupstressful situationscoronary-prone behaviour patterns: type A behaviour
Geographic climate and season: cold weathersoft drinking water
Notes: HDL = high density lipoproteins; LDL = low density lipoproteins; WHR = waist/hip ratio; VLDL = very low densitylipoproteinsSource: Mann 2002

Food and Nutrition Guidelines for Healthy Adults: A Background Paper58
The risk of CHD to an individual is best determined by considering all of the risk factors shown inTable 22. Risk factors have been shown to act in a synergistic way.
One meta-analysis of controlled experiments has concluded that saturated fatty acids raise totaland LDL-cholesterol; poly-unsaturated fats lower total and LDL-cholesterol; and mono-unsaturated fats are neutral when compared with carbohydrate (Clarke et al 1997). Other recentresearch has focused on the important potential protective effects of other dietary components,including antioxidants such as vitamin E and folic acid (Stampfer et al 1993; Boushey et al 1995).However, current evidence from a randomised controlled trial of 20,536 high-risk individualseffectively rules out supplementation with antioxidant vitamins (Heart Protection StudyCollaborative Group 2002). In contrast to the evidence against supplementation, establishing ahealthy dietary pattern is still to be recommended on the basis of prospective data. Acardioprotective dietary pattern has a low content of saturated and trans fatty acids; a low tomoderately low total fat content; uses few refined foods; and involves a higher consumption offoods that have a high fibre content, including vegetables and fruits, wholegrain breads, cerealsand legumes (Bremer and Chisholm 2000; New Zealand Guidelines Group 2003). Good evidenceof a protective effect associated with higher intakes of plant food has been found in a review of28 studies relating to vegetable and fruit consumption and the risk of CHD (Ness and Powles1997).
There are age- and gender-related trends in plasma cholesterol levels seen both in New Zealand(Department of Health 1991) and overseas (Marsarei et al 1981; Huhtasaari et al 1988; Mann et al1988). Men show a steady increase in mean levels in total and LDL-cholesterol until their mid-40s, after which the mean level stabilises. Women as young adults show lower levels than men,but increases continue through middle age, and older women have higher levels than men of thesame age.
The mean total serum cholesterol of the New Zealand adult population, for both males andfemales, is 5.7 mmol/L. However, in the NNS97, 23 percent of the New Zealand population hadtotal cholesterol levels higher than 6.5 mmol/L (Ministry of Health 1999c). There is a continuousgraded risk with increasing blood cholesterol levels and CHD (New Zealand Guidelines Group2003). The National Heart Foundation (2003) advises that an ‘optimal’ level of blood cholesterollevel is less than 4 mmol/L.
Alcohol and coronary heart disease
See: Chapter 11, Alcohol.
Physical activity
In addition to dietary factors, regular physical activity reduces both the incidence of myocardialinfarction (heart attack) and CHD morbidity and mortality (Sherman et al 1999). A dose-responserelationship exists between physical activity and CHD. Benefits of physical activity increase withgreater intensity (Manson et al 1999; Ades and Coello 2000) and duration (Hakim et al 1999).Where possible, vigorous activity should be included. Physical activity should be performedregularly.
See also: Chapter 2, Energy; Chapter 5, Fat; Chapter 12, Obesity; Chapter 11, Alcohol; and Chapter18, Physical activity.
Practical advice
Following the Food and Nutrition Guideline statements is advised to protect against the risk ofdeveloping CHD. Information specific to those at high risk of CHD is available from the NHFwebsite, www.nhf.org.nz

Food and Nutrition Guidelines for Healthy Adults: A Background Paper 59
14 Hypertension
Background
Hypertension (high blood pressure) is an important risk factor for cardiovascular disease. Whilehypertension is more common in some ethnic groups (eg, Aboriginal Australians and Japanesepeople), the interplay of genetic and lifestyle factors remains unclear (Ball 1997). Hypertensionmay be caused or exacerbated by factors that are related to diet including sodium (salt) intake,body weight and alcohol intake. In addition, physical activity has a role to play in reducinghypertension. An average reduction in systolic blood pressure by 2 mmHg across a population isassociated with significant benefits – namely, lowering death rates for coronary heart diseaseand cardiovascular disease by 4 to 5 percent and lowering all-cause mortality by 3 percent (NHF1999).
Hypertension in New Zealand
Using WHO’s cut-off values and irrespective of whether medication was being taken, the NNS97found 16.5 percent of males and 12.3 percent of females could be considered to be hypertensive.Blood pressure was found to increase markedly with age. Twenty percent of the population hadhigh blood pressure when all individuals who reported taking hypertensive medication and thosewho were hypertensive were included. The prevalence did not alter across ethnic groups butmedication was apparently more effective in the ‘New Zealand European and Other’ ethnicity(Ministry of Health 1999c).
Factors associated with hypertension
Ten potentially modifiable dietary and lifestyle factors have been found to be related to bloodpressure, as summarised in Table 23.
Table 23: Dietary factors related to blood pressure
Major factors
Salt/sodiumBody weightAlcohol
Less significant/questionable factors
PotassiumCalciumVegetarianismFatty acidsDietary fibreCaffeineMagnesium
Source: Mann 2002
Food and Nutrition Guidelines for Healthy Adults: A Background Paper60
Sodium
Decreasing sodium (salt) intake in people with hypertension significantly reduces blood pressure(Simpson 1992; Cutler et al 1997; Stalmer 1997; Tobian 1997). The measurement of sodiumintake is onerous for respondents in dietary surveys because it requires the collection of a 24-hour urine sample. (See also: Chapter 8, Sodium, for details on sodium intakes in New Zealand.)
Body weight
In a review of clinical guidelines for treatment of obesity, the National Heart Lung and BloodInstitute (NHLBI) evaluated the effect of weight loss on blood pressure and hypertension. Thirty-five randomised controlled trials that studied diet and/or physical activity were considered forinclusion. There was strong evidence in both hypertensive and non-hypertensive overweightpeople that weight loss produced by lifestyle modifications reduced blood pressure levels. Thegreater the weight loss, the more the blood pressure is likely to reduce (NHLBI 1998). Also, aslong as weight loss was maintained, blood pressure remained at the lowered level (Stevens et al1993; Stevens 1998). Limited evidence was found to support the relationship between reducedabdominal fat and reduced blood pressure, although this evidence was not independent ofweight loss. There is considerable evidence that increased aerobic activity reduces bloodpressure, independent of weight loss (NHLBI 1998).
Alcohol
The risk of hypertension increases with heavier drinking in men and women (Campbell et al1999). For those who consume large quantities of alcohol, a reduction in consumption willreduce blood pressure and have other beneficial health effects. Adherence to ALAC’s drinkingguidelines is an important non-pharmacological treatment to prevent and control hypertension.
Dietary patterns
The Dietary Approaches to Stop Hypertension (DASH) trial was designed to determine the effectof entire dietary patterns. The DASH combination diet (high in vegetables, fruits, nuts and low-fat dairy products, and emphasising fish and chicken rather than red meat) was found to lowersystolic and diastolic blood pressure by 5.5 and 3 mmHg respectively (Appel et al 1997). TheDASH combination diet may offer an alternative or an addition to drug therapy in hypertensivepeople. (For further consumer information about the DASH diet, see: www.nhlbi.nih.gov/health/public/heart/hbp/dash/)
Increased consumption of vegetables and fruits has also been shown to reduce blood pressureslightly in healthy adults. Small reductions in blood pressure would result in substantialreductions in cardiovascular disease at the population level (John et al 2002).
Physical activity
In addition to dietary factors, aerobic activity can reduce blood pressure in both the short andlong term if the activity level is maintained (Hagberg et al 2000). Results from three meta-analyses show that the extent of the blood pressure reduction depends on the baseline bloodpressure (Halbert et al 1997; Fagard 2001; Whelton et al 2002). They also showed that activity atlower intensities (40 to 70 percent peak oxygen uptake) can have as much impact as higherintensity activity (Fagard 2001). This finding should have important implications for prescribingphysical activity for older people.

Food and Nutrition Guidelines for Healthy Adults: A Background Paper 61
Practical advice• Following the Food and Nutrition Guideline statements is advised for protection against
hypertension.
• Following the guidelines includes having a healthy weight, not drinking too much alcohol,limiting your salt intake, and eating plenty of vegetables and fruits.
• Be physically active every day.

Food and Nutrition Guidelines for Healthy Adults: A Background Paper62
15 Diabetes mellitus
Background
There are two main types of diabetes mellitus (Expert Committee on the Diagnosis andClassification of Diabetes Mellitus 1997; Alberti and Zimmet 1998).
• Type 1 diabetes is an autoimmune disease in which the insulin-producing pancreatic betacells are destroyed. It typically has an abrupt and symptomatic onset, and usually presents inchildren and young adults under 30 years of age. However, cases of later onset in adults areincreasingly being recognised.
• Type 2 diabetes is much more common than type 1 diabetes. It has a more insidious onset,and it is commonly asymptomatic for several years before being diagnosed. Type 2 diabetes iscaused by reduced insulin secretion together with insulin resistance (resistance to the actionof insulin by the body tissues). The incidence of type 2 diabetes increases with increasingage, and it usually presents in adults. However, it is becoming more common in adolescentsand children. Obesity is the most important modifiable risk factor for development of type 2diabetes.
Population groups at high risk of developing type 2 diabetes in New Zealand include Maori,Pacific peoples and people with a family history of diabetes (Ministry of Health 1999e). It hasbeen estimated that diabetes may cost between $250 million and $600 million in health carecosts per year (Simmons 1996).
The WHO has defined diabetes mellitus as a metabolic disorder:
• of multiple aetiology
• characterised by chronic hyperglycaemia with disturbances of carbohydrate, fat and proteinmetabolism
• resulting from defects in insulin secretion or insulin action, or both (WHO 1999).
The burden of type 2 diabetes in New Zealand
The major burden of diabetes in New Zealand relates to type 2 diabetes. This trend mirrors theinternational experience. Of all New Zealanders with diabetes, approximately 85 to 90 percenthave type 2 diabetes. Type 2 diabetes is more common in Maori and Pacific peoples, amongwhom 95 percent of people with diabetes have type 2 diabetes, compared with 89 percent ofNew Zealand Europeans (Health Funding Authority 2000). The overall prevalence of diagnoseddiabetes in New Zealand adults has been estimated to be 3 to 4 percent (Health FundingAuthority 2000).
The Ministry of Health has recently published estimates of the prevalence and mortality burdenof diagnosed type 2 diabetes in New Zealand. It has also published forecasts of the incidence,prevalence and mortality of type 2 diabetes to 2011 (Ministry of Health 2002a, 2002b, 2002c,2002d). This modelling work takes into account the rapid growth in the percentage of thepopulation that is obese – obesity being the most important risk factor for type 2 diabetes. Theestimated prevalence figures for 1996 and forecasts for 2011 are shown in Table 24.

Food and Nutrition Guidelines for Healthy Adults: A Background Paper 63
Table 24: Prevalence of diagnosed diabetes (onset 25–89 years), bygender and ethnicity, 1996 baseline and 2011 forecast
Male Female Total
European Maori Pacific European Maori Pacific
Prevalence rate 3.10 7.95 6.78 2.50 9.78 8.23
Number 1996 31,790 7014 2003 28,707 9291 2686 81,491
Number 2011 51,408 16,202 4991 44,105 21,649 6558 144,913
Percentage increase 62 131 149 54 133 144 78
Source: Modified from Ministry of Health 2002b
People living in more deprived areas and those with lower incomes tended to have higher rates ofdiagnosed diabetes (Ministry of Health 1999e).
Nearly 5 percent of all deaths in New Zealand are attributable to type 2 diabetes. Three to fourtimes as many deaths among Maori and Pacific peoples are attributable to diabetes whencompared with New Zealand Europeans (Ministry of Health 1999d).
Dietary and lifestyle prevention strategies for type 2 diabetes
The importance of preventing diabetes in high-risk individuals is highlighted by the substantialworldwide increase in the prevalence of diabetes in recent years. Genetic susceptibility appearsto play a powerful role in the occurrence of type 2 diabetes in certain populations. However,given that population gene pools shift quite slowly, the current epidemic is likely to reflectmarked changes in lifestyle. Lifestyle changes, characterised by decreased physical activity andincreased energy consumption, have together promoted obesity. Obesity is a strong risk factorfor diabetes that itself is influenced by both genes and behaviour (American Diabetes Association2003). Both cross-sectional and longitudinal studies have found obesity to be a risk factor fordiabetes, with central (abdominal) obesity an independent risk factor (WHO 2000).
Three randomised controlled trials have shown convincingly that prevention or delay in the onsetof diabetes is possible in people with impaired glucose tolerance (IGT) (Pan et al 1997;Tuomilehto et al 2001; Diabetes Prevention Program Research Group 2002). The trials wereconducted in different countries, settings and populations, and all used lifestyle interventions(diet and exercise) in order to achieve weight loss and higher levels of physical activity. In theUnited States Diabetes Prevention Program trial of 3234 people with IGT, 1079 participants in thelifestyle arm of the study had the goals of at least 7 percent weight loss and at least 150 minutesof physical activity per week (Diabetes Prevention Program Research Group 2002). The lifestyleintervention reduced the incidence of diabetes by 58 percent compared to the control group, andone case of diabetes was prevented for every 6.9 people treated for three years.
Other epidemiological data suggest that type 2 diabetes could be reduced by 50 to 75 percent bycontrol of obesity and 30 to 50 percent by increasing physical activity (Manson and Spelsberg1994). Current prevention trials, such as the Early Diabetes Intervention Trial and DiabetesPrevention Programme, and the United States Diabetes Prevention Program are looking at thecombined effect of lifestyle changes and drug treatment in the prevention of type 2 diabetes(Adler and Turner 1999; Diabetes Prevention Program Research Group 2002).

Food and Nutrition Guidelines for Healthy Adults: A Background Paper64
The aim of dietary intervention is to improve all the biochemical and physiological parametersassociated with type 2 diabetes. The maintenance of blood glucose levels alone will help preventthe microvascular complications of diabetes. Because most people die from the cardiovascularcomplications associated with diabetes, dietary advice to lose weight, reduce blood pressure andimprove lipid profiles (including HDL and triglycerides) is important. In addition, reduced intakeof total fat, particularly saturated fat, may reduce the risk for diabetes. Increased diabetesincidence is reported with increased intake of dietary fat, independent of total energy (AmericanDiabetes Association 2003). It appears that all types of dietary fat (except omega-3 fatty acids)may have an adverse effect on insulin sensitivity. Other studies have shown a reduced risk withincreased intake of whole grains and dietary fibre (American Diabetes Association 2003).Although moderate alcohol intake has been related to improved insulin sensitivity, there areinsufficient data to support a specific recommendation for moderate alcohol intake to reduce therisk in developing type 2 diabetes (American Diabetes Association 2003).
Practical advice• Follow the Food and Nutrition Guideline statements for the reduction of risk in developing
type 2 diabetes.

Food and Nutrition Guidelines for Healthy Adults: A Background Paper 65
16 Cancer
Background
Cancer causes over a quarter of all deaths in New Zealand. It is the major cause of years of lifelost in women in New Zealand, and is the second major cause for men (after cardiovasculardisease) (Ministry of Health 1999d).
Rankings for the major cancers in terms of disability-adjusted life years (DALYs) lost are: lungcancer (17,900), colorectal cancer (16,300), breast cancer (13,500), prostate cancer (7400),lymphoma/myeloma (5500) and melanoma (4000) (Ministry of Health 1999d).
Cancer is caused by a variety of identified and unidentified factors. Among those identified arebehavioural factors (eg, physical activity), environmental factors (eg, some forms of pollution)and dietary factors. Except for certain types of familial cancer, the contribution of hereditaryfactors is thought to be relatively minor (Lichtenstein et al 2000). Dietary factors are thought toaccount for about 30 percent of cancers in developed countries (Key et al 2002). A wide range offactors related to food, nutrition and physical activity have been linked to a number of cancers,as shown in Table 25, but the strength of both evidence and association vary.
Obesity and cancer
Both case-control and cohort studies have shown associations between high levels of body fat(as indicated by higher BMI during adult life and/or higher waist/hip ratio) and increased risk forcolon cancer and colon adenomas. This association is seen for both men and women, althoughthe association with BMI is higher among men. The reason for the gender difference is unknown.One possible explanation is that oestrogen could serve to diminish the obesity-related risk inwomen (WHO 2000).
Heavier women have been found to be at increased risk of postmenopausal breast cancer. Thisassociation is in contrast to the evidence on pre-menopausal breast cancer which is not linkedwith body weight. The large majority of cohort and case-control studies have seen positiveassociations between BMI and risk of postmenopausal breast cancer, although increase in riskhas been modest. To date, the most consistent body-size predictor of postmenopausal breastcancer risk is adult weight gain. Breast cancer has a positive association with both BMI andweight gain. The association is positive even after adjusting for a wide variety of lifestyle andreproductive risk factors, including levels of physical activity. Other cancers associated withincreasing BMI and weight gain are endometrial cancer, kidney (renal cell) cancer, andoesophageal and colorectal cancer (International Agency for Research on Cancer 2002).
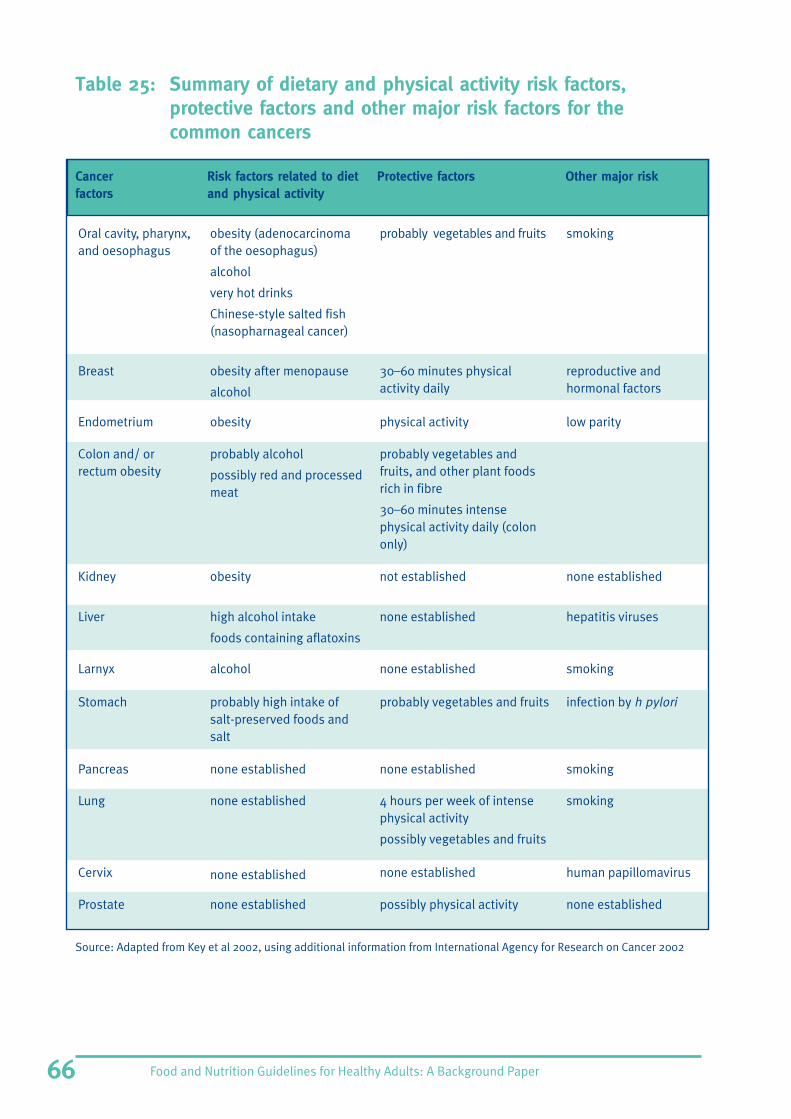
Food and Nutrition Guidelines for Healthy Adults: A Background Paper66
Oral cavity, pharynx,and oesophagus
obesity (adenocarcinomaof the oesophagus)
alcohol
very hot drinks
Chinese-style salted fish(nasopharnageal cancer)
probably vegetables and fruits smoking
Breast obesity after menopause
alcohol
30–60 minutes physicalactivity daily
reproductive andhormonal factors
Endometrium obesity physical activity low parity
Colon and/ orrectum obesity
probably alcohol
possibly red and processedmeat
probably vegetables andfruits, and other plant foodsrich in fibre
30–60 minutes intensephysical activity daily (colononly)
Kidney obesity not established none established
Liver high alcohol intake
foods containing aflatoxins
none established hepatitis viruses
Larnyx alcohol none established smoking
Stomach probably high intake ofsalt-preserved foods andsalt
probably vegetables and fruits infection by h pylori
Pancreas none established none established smoking
Lung none established 4 hours per week of intensephysical activity
possibly vegetables and fruits
smoking
Cervix none established none established human papillomavirus
Prostate none established possibly physical activity none established
Table 25: Summary of dietary and physical activity risk factors,protective factors and other major risk factors for thecommon cancers
Cancer Risk factors related to diet Protective factors Other major riskfactors and physical activity
Source: Adapted from Key et al 2002, using additional information from International Agency for Research on Cancer 2002

Food and Nutrition Guidelines for Healthy Adults: A Background Paper 67
Physical activity and colon cancer
Current evidence suggests that physical activity has an important protective role in manycancers. One of the problems associated with understanding the relationship between physicalactivity and cancers is the difficulty of measuring physical activity in a standardised manner. Inaddition, there is the question of whether to measure occupational activity, leisure time activity,participation in sports or incidental activity. Total activity and specific components of physicalactivity (such as level of intensity at which activities have been performed) have been examinedin a variety of the above settings.
The evidence that physical activity protects against colon (as distinct from rectal) cancer is strongand convincing. The evidence for physical activity being protective against rectal cancer is lessconsistent (NHMRC 1999b). Other cancers for which physical activity has been found to have aprotective effect are shown above in Table 25.
Bauman et al (2002) suggest that at least 60 minutes per day of moderate to vigorous activity isrequired to reduce the risk of cancer.
Food and nutrients and colorectal cancer
There is some evidence to link colorectal cancer with a number of foods and dietary habits. Theproportion of colorectal cancer attributed to dietary factors has been estimated to be about 50percent. One overview of diet and cancer estimates that 66 to 75 percent of colorectal cancercould be prevented by diet and physical activity (NHMRC 1999b).
Case-control studies consistently show a positive association between energy intake andcolorectal cancer risk. The evidence is sufficient to recommend reducing energy intake to preventcolorectal cancer (NHMRC 1999b). Other positive associations of diet with colorectal cancerinclude high-fat intake (except fish oil, where there is an inverse relationship), low folate intake(especially in habitual alcohol consumers) and total alcohol intake (Baghurst et al 1997).
International correlational studies have shown an association between consumption of meat percapita and deaths from colorectal cancer. One meta-analysis suggests that, overall, riskincreases with intake of red meat and processed meat, but risk is not associated with total meatintake (Key et al 2002). However, a yet-to-be-published meta-analysis of cohort studies hasfound increased risk of colorectal cancer for total red meat consumption (Riboli 2002). Thestrongest association was for intake of processed meat, while there was no association betweenintake for fresh red meat and increased risk.
There are several possible explanations as to how meat consumption might increase the risk ofcolorectal cancer. First, when meats are cooked at high temperatures (such as barbecuing),mutagenic heterocyclic amines (HCAs) and polycyclic aromatic hydrocarbons (PAHs) are formed.Second, studies suggest that nitrites and related compounds that are used in smoked, salted andsome processed meats are converted to carcinogenic N-nitroso compounds in the colon. It hasalso been suggested that iron in the colon could increase the formation of mutagenic freeradicals (Key et al 2002).
Further studies are needed to clarify the relationship between red meat and the risk of colorectalcancer. Based on present studies, there is no strong evidence that red meat should not be eatenas part of a normal, balanced diet. (See: Chapter 3, Protein.)
Results from many case-control studies have shown a lower risk of colorectal cancer associatedwith a high consumption of dietary fibre, vegetables and fruits. Key et al (2002) reported that thefindings from large prospective studies have been inconsistent, but subsequently Bingham et al(2003) have reported otherwise. It has also been proposed that cereals (especially insoluble

Food and Nutrition Guidelines for Healthy Adults: A Background Paper68
fibre) and phytonutrient compounds found in vegetables (carotenoids, vitamins C and E, folate,indoles, linolenic acid, allylic sulphides, lycopene and others) are protective against colon cancer.These nutrients have been shown to have a possible protective effect when consumed in foods.Supplementation with isolated nutrients (eg, antioxidant vitamins, carotenoids, calcium, folicacid, selenium), however, has not shown any conclusive protective effect, although in some casesit shows promise (NHMRC 1999b).
Vegetable and fruit intake and cancer
Studies have shown the protective effect of vegetables and fruits especially in relation to cancersof the oral cavity, larynx, oesophagus, stomach and colon. This protective effect may be a resultof the contact that the vegetables and fruits have with the associated tissue. Significantreduction in risk, however, has also been observed with respect to cancers of the lung, andpossibly the breast endometrium and pancreas. The association between vegetable and fruitintake and protection against cancer is recognised to the extent that the United States Food andDrug Administration (1994) has allowed a health claim suggesting that diets low in fat and rich invegetables and fruits may reduce the risk of some cancers.
It has been suggested that consumption of 400 g per day or more of a variety of vegetables andfruits could, by itself, decrease overall cancer incidence by at least 20 percent (World CancerResearch Fund 1997). Vegetable intake seems to be particularly important, especially intake ofcruciferous vegetables, including bok choy, broccoli, brussel sprouts, cabbage, cauliflower,Chinese cabbage, collards, kohlrabi, mustard greens, swedes and turnips.
Dietary fibre and cancer
Dietary fibre assists in regulation of intestinal function. The results of increased dietary fibreinclude reduced transit time, increased faecal weight and improved laxation. These factors,along with dilution of lumenal contents, have been linked to a reduction in colon cancer risk.Correlational epidemiological evidence suggests a relationship between dietary fibre intake andcolon cancer incidence. However, more refined case-control studies have not consistentlysupported this link. The body of evidence is insufficient at present to determine if increased fibreintake leads to decreased colon cancer risk (Institute of Medicine 2002b). Bingham et al (2003)have reported a protective effect of dietary fibre against colorectal cancer in the EuropeanProspective Investigation into Cancer and Nutrition.
Alcohol and cancer
Alcohol consumption is associated with a higher risk for a number of cancers identified in Table25 above. The largest meta-analysis to date considered a total of 235 studies on alcohol andcancer (Bagnardi et al 2001). When the relationship between alcohol consumption and cancerwas studied, major findings were:
• strong trends in risk for cancers of the oral cavity and pharynx, oesophagus and larynx
• weaker direct relations for cancers of the stomach, colon and rectum, liver, breast and ovary
• no significant or consistent relation for cancers of the pancreas, lung, prostate or bladder
• allowance for tobacco appreciably modified the relations with laryngeal, lung and bladdercancers, but not with oral, oesophageal or colorectal cancers
• there was no evidence of a threshold effect for most alcohol-related cancerous tumours.

Food and Nutrition Guidelines for Healthy Adults: A Background Paper 69
Summary
Increasing obesity appears to be an important risk factor for many cancers. Physical activity,particularly of moderate or greater intensity, appears to be protective against some cancers.
Extensive research over the last 30 years has revealed few conclusive dietary determinants ofcancer risk. The shortage of such factors may be a result of inaccuracies inherent whenestimating food and nutrient intakes and the biases in case-control studies. Large prospectivestudies and controlled trials are required to gain a better understanding of the role of diet incancer; the work of the International Agency for Research on Cancer has added to this evidencebase.
At present the most prudent advice for maintaining health and reducing cancer risk is to followthe advice given in the Food and Nutrition Guideline statements with regard to a balanced diet,physical activity and alcohol consumption. In addition, the following recommendations mayreduce risk.
Practical advice• No level of alcohol intake is protective against cancer.
• Consume plenty of vegetables and fruits.
• Consume only moderate amounts of preserved meat (eg, sausages, salami, bacon, ham).
• When barbecuing meat, a plate-style barbecue is preferable to grilling on direct flame, in orderto reduce the risk of HCA formation.
• Limit the consumption of fermented, salted fish.
See also: Chapter 11, Alcohol; and Chapter 12, Obesity.

Food and Nutrition Guidelines for Healthy Adults: A Background Paper70
17 Osteoporosis
Background
Osteoporosis is a serious and expensive public health problem, particularly in women. It causessignificant pain and morbidity among older people (Goulding 2002).
Osteoporosis is characterised by loss of bony tissue from the skeleton and deterioration of bonestructure. It is associated with enhanced bone fragility and increased risk of fracture (ConsensusDevelopment Conference 1991). European and Asian New Zealanders have a higher risk ofosteoporotic fracture than Maori and Pacific peoples (Sainsbury and Richards 1997). If costsfor osteoporosis in New Zealand are extrapolated from Australian data, they may be as high as$150 million to 200 million (Randall et al 1995). An ageing population is likely to increase theburden of osteoporosis in the future.
Dietary and lifestyle factors
The strength of bones depends on the peak bone mass reached during adolescence and youngadulthood. It also depends on the rate of bone mass loss after the age of 40 years. Whileosteoporosis is rare in young adulthood, clues to future bone health may be present at this age.A healthy body weight is the single most important determinant of healthy bone density in youngadults (Reid et al 1995b).
Meeting the body’s calcium needs optimises skeletal health. The amount of calcium-rich foods inthe diet of New Zealanders is insufficient (Ministry of Health 1999c). It has been suggested that,unless daily calcium intake exceeds 1000 mg (O’Brien et al 1993), calcium balance is notmaintained in either men between the ages of 25 and 65 years or pre-menopausal women olderthan 25 years. The rate of skeletal loss as a result of menopause can be reduced by the ingestionof at least 1000 mg per day of calcium during the perimenopausal and postmenopausal years(Cumming 1990; Elders et al 1991; Reid et al 1994; Prince et al 1995; Reid et al 1995a).Suboptimal vitamin K status has also been implicated in the pathogenesis of osteoporosis (Olsonet al 2001).
Changes in bone mass and the development of osteoporosis are multifactorial. Calcium is one ofmany factors. The other major nutrient is vitamin D; low vitamin D status will reduce bonestrength (Sainsbury and Richards 1997). Most adults receive adequate vitamin D from 15 to30 minutes of exposure to ultraviolet B radiation each day. Those most at risk of inadequatevitamin D status include older people, those living in institutions and those with limited exposureto sunlight/ultraviolet (UV) light.
Lifestyle factors influencing bone mass include physical activity, hormonal status, genetics, co-morbidity, medication use, smoking and alcohol (Sainsbury and Richards 1997). People withanorexia are also at higher risk of developing osteoporosis, as are female marathon runners andthose who take excessive exercise (Smith 2001).
Osteoporosis and osteopenia (ie, decreased bone mass) may develop as a consequence ofalcohol misuse. Osteoporosis may also arise as a consequence of cirrhosis of the liver. However,musculoskeletal damage can be halted or often reversed by prolonged abstinence from alcoholand nutritional support (Marshall et al 2001).
There is evidence that moderate and vigorous physical activity in childhood increases bone massand strength. Physical activity is recommended for asymptomatic adults to help preserve bonedensity. Modified physical activity is also recommended for those with osteoporosis to improveposture and muscle strength and maintain bone mass (Forwood and Larsen 2000).

Food and Nutrition Guidelines for Healthy Adults: A Background Paper 71
Prevention of osteoporosis can start in childhood and continue throughout life, andrecommendations apply to those who are healthy as well as those who already haveosteoporosis (Sainsbury and Richards 1997). New Zealanders are encouraged to follow the Foodand Nutrition Guideline statements and the advice below.
Practical advice• Limit your salt intake. (See: Chapter 7, Calcium; and Chapter 8, Sodium)
• Take part in regular, moderate, weight-bearing physical activity, such as walking.
• Be smoke-free.
• Have a small amount of sun exposure each day to ensure adequate vitamin D status.
• Vitamin D supplements may be necessary for the institutionalised who do not have exposureto sunlight.
See also: Chapter 7, Calcium; Chapter 8, Sodium; and Chapter 22, Supplementation andfortification

Food and Nutrition Guidelines for Healthy Adults: A Background Paper72

Food and Nutrition Guidelines for Healthy Adults: A Background Paper 73
Part IV: Physical Activity – A Partner toNutrition
18 Physical activity
Background
Increasing physical activity (as defined in Glossary) is a priority health objective in the NewZealand Health Strategy (Minister of Health 2000a). A joint policy statement of physical activity,setting out key messages, was made in 1999 by the Minister of Sport, Fitness and Leisure and theMinister of Health (see: Appendix 6).
The benefits of regular physical activity for adults are well established. Physical activity has manybenefits for the cardiovascular and musculoskeletal systems, as well as for the functioning of themetabolic, endocrine and immune systems. The health benefits of increased physical activityinclude reducing the incidence of the following diseases.
• Coronary heart disease. Aerobic activity is important for the prevention and control ofcoronary heart disease (Sherman et al 1999). A dose-response relationship exists. Greaterbenefits are obtained through increasing intensity (Manson et al 1999; Ades and Coello 2000)and duration (Hakim et al 1999). Activity should be performed regularly.
• Cerebrovascular accident (stroke). Aerobic activity (particularly vigorous activity) in middle-aged and older adults is associated with a reduction in the risk of ischaemic stroke (Ellekjaeret al 2000; Hu et al 2000). Stroke risk decreases with increasing intensity of aerobic activity(Hu et al 2000). At least some vigorous activity is, therefore, recommended.
• Cancer. Aerobic activity reduces the risk of colon and breast cancers (Batty and Thune 2000;Marrett et al 2000; International Agency for Research on Cancer 2002). Recent evidencesuggests that 45 to 60 minutes of moderate to vigorous activity is required to protect againstcolorectal cancer (International Agency for Research on Cancer 2002). For cancers of theendometrium and prostate, there is some evidence that physical activity has a cancer-preventive effect (International Agency for Research on Cancer 2002).
• Depression. Regular aerobic activity of light or moderate intensity can improve mood in thosewith major depressive disorders (Dimeo et al 2001) and reduce the risk of depression in others(Morgan and Bath 1998).
• Diabetes. Regular moderate-intensity physical activity reduces the risk of developing type 2diabetes (Manson and Spelsberg 1994; Hu et al 1999), especially in those at high risk(Tuomilehto et al 2001). Physical activity should be coupled with a healthy diet andprofessional nutritional advice.
• Hypertension. Aerobic activity can reduce blood pressure in the short term and, if the activitylevel is maintained, in the long term (Hagberg et al 2000).
• Obesity. Regular moderate-intensity physical activity aids in the prevention, maintenance andtreatment of obesity (Grundy et al 1999).
• Osteoporosis. Moderate and vigorous activity is recommended for children to increase bonemass and strength. It is also recommended for asymptomatic adults to help preserve bonedensity and reduce fracture risk. Modified physical activity is recommended in those withosteoporosis to improve posture and muscle strength, and to maintain bone mass (Forwoodand Larsen 2000).
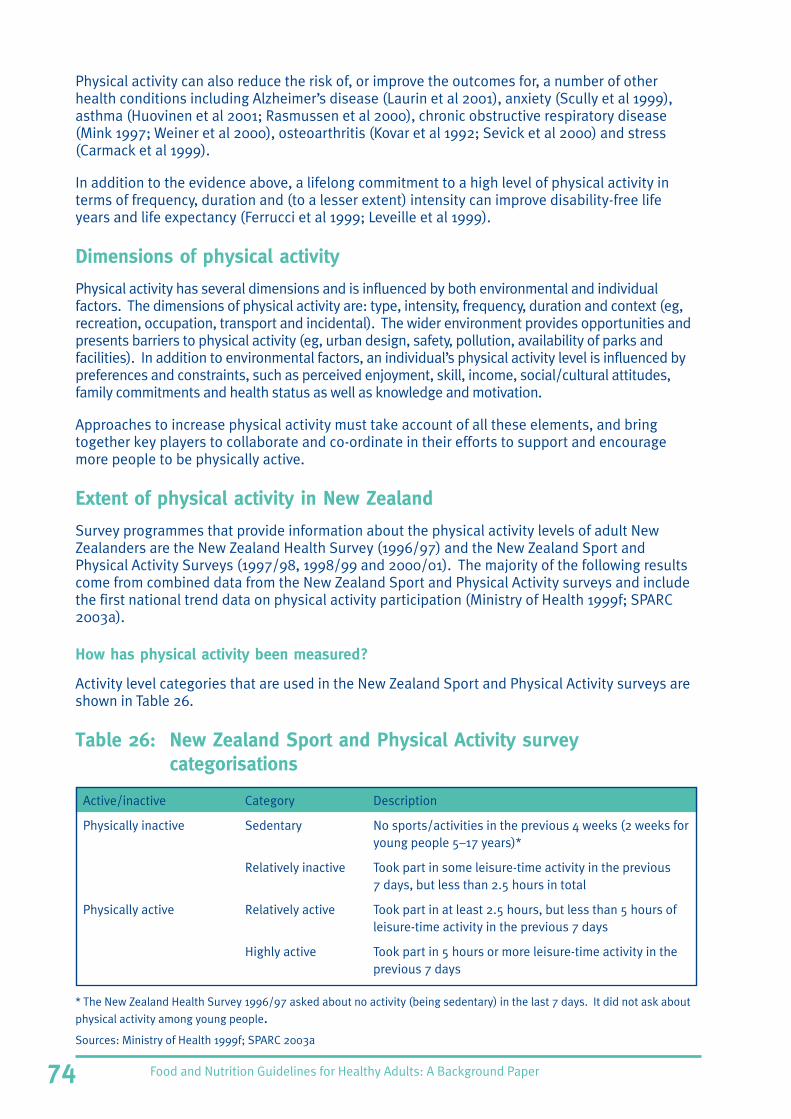
Food and Nutrition Guidelines for Healthy Adults: A Background Paper74
Physical activity can also reduce the risk of, or improve the outcomes for, a number of otherhealth conditions including Alzheimer’s disease (Laurin et al 2001), anxiety (Scully et al 1999),asthma (Huovinen et al 2001; Rasmussen et al 2000), chronic obstructive respiratory disease(Mink 1997; Weiner et al 2000), osteoarthritis (Kovar et al 1992; Sevick et al 2000) and stress(Carmack et al 1999).
In addition to the evidence above, a lifelong commitment to a high level of physical activity interms of frequency, duration and (to a lesser extent) intensity can improve disability-free lifeyears and life expectancy (Ferrucci et al 1999; Leveille et al 1999).
Dimensions of physical activity
Physical activity has several dimensions and is influenced by both environmental and individualfactors. The dimensions of physical activity are: type, intensity, frequency, duration and context (eg,recreation, occupation, transport and incidental). The wider environment provides opportunities andpresents barriers to physical activity (eg, urban design, safety, pollution, availability of parks andfacilities). In addition to environmental factors, an individual’s physical activity level is influenced bypreferences and constraints, such as perceived enjoyment, skill, income, social/cultural attitudes,family commitments and health status as well as knowledge and motivation.
Approaches to increase physical activity must take account of all these elements, and bringtogether key players to collaborate and co-ordinate in their efforts to support and encouragemore people to be physically active.
Extent of physical activity in New Zealand
Survey programmes that provide information about the physical activity levels of adult NewZealanders are the New Zealand Health Survey (1996/97) and the New Zealand Sport andPhysical Activity Surveys (1997/98, 1998/99 and 2000/01). The majority of the following resultscome from combined data from the New Zealand Sport and Physical Activity surveys and includethe first national trend data on physical activity participation (Ministry of Health 1999f; SPARC2003a).
How has physical activity been measured?
Activity level categories that are used in the New Zealand Sport and Physical Activity surveys areshown in Table 26.
Table 26: New Zealand Sport and Physical Activity surveycategorisations
Active/inactive Category Description
Physically inactive Sedentary No sports/activities in the previous 4 weeks (2 weeks foryoung people 5–17 years)*
Relatively inactive Took part in some leisure-time activity in the previous7 days, but less than 2.5 hours in total
Physically active Relatively active Took part in at least 2.5 hours, but less than 5 hours ofleisure-time activity in the previous 7 days
Highly active Took part in 5 hours or more leisure-time activity in theprevious 7 days
* The New Zealand Health Survey 1996/97 asked about no activity (being sedentary) in the last 7 days. It did not ask about
physical activity among young people.Sources: Ministry of Health 1999f; SPARC 2003a

Food and Nutrition Guidelines for Healthy Adults: A Background Paper 75
Key results of New Zealand Sport and Physical Activity Surveys
Overall
• Among adults and among young people aged 5 to 17 years, 68 percent are physically active for2.5 hours each week.
• In total, 10 percent of adults and 9 percent of young people are sedentary.
Gender
• Men (69 percent) and boys (73 percent) are more active than women (66 percent) and girls(64 percent).
Age
• Adults aged 18 to 24 years (70 percent) and older adults aged 50 to 64 years (71 percent) andaged 65+ years (70 percent) are the most active.
Ethnicity
• Maori, New Zealand European and Pacific men are similarly active. Men from other cultures2
are less active. New Zealand European (71 percent) and Maori young people (71 percent) aremore active than young people of Pacific origin (53 percent) and from other cultures (59percent).
• Among women, New Zealand Europeans and Maori are the most active.
• Among sedentary adults, Maori are more likely to be sedentary (12 percent) than New ZealandEuropeans (9 percent) and Pacific peoples (10 percent). Adults from other cultures are themost sedentary (17 percent).
Trends
• Trend analysis shows that adults were more active in 2000/01 (70 percent) than they were in1997/98 (67 percent). In raw figures, this means around 150,000 more adults were active in2000/01 than in 1997/98.
Physical activity by region
• Activity levels for adults are similar across Regional Sports Trust areas.
Detailed results from the New Zealand Sport and Physical Activity Surveys are available atSPARC’s Push Play website (www.pushplay.org.nz).
Socioeconomic status
According to the New Zealand Health Survey (Ministry of Health 1999e), people with a lower levelof education tend to participate in less physical activity. People who have no qualifications aremore likely to be sedentary than those with school and postschool qualifications.
Duration of physical activity is not significantly associated with level of household family incomeor NZDep96 score. Levels of vigorous activity, however, are significantly associated with bothhousehold income and NZDep96 score, as well as with level of education.
2 ‘Other cultures’ refers to all people who did not identify themselves as Maori, European or Pacific peoples.

Food and Nutrition Guidelines for Healthy Adults: A Background Paper76
Strategies for increasing levels of physical activity
Strategies for increasing physical activity are summarised in the District Health Board toolkit onphysical activity (Ministry of Health 2001b), available online on the Ministry of Health’s website(www.moh.govt.nz) and in the Healthy Eating – Healthy Action (HEHA) papers (Ministry of Health2003b, 2003c).
Strategies to promote physical activity need to focus on both the wider environment andindividual lifestyles. Co-ordinated initiatives to support physical activity are required across arange of sectors and settings (eg, health, transport, local government, recreation, sport andfitness, education, the workforce; schools and tertiary institutions; health care settings; and localcommunity settings such as clubs, churches and marae). The health promotion approach inHEHA is based on the Ottawa Charter (WHO et al 1986). It includes building healthy public policy,creating supportive environments, strengthening community action, developing personal skills,monitoring and evaluation, and reorienting services (Ministry of Health 2003c).
Some examples of strategies and programmes are:3
• building healthy public policy – New Zealand Health Strategy (Minister of Health 2000); ajoint policy statement on physical activity (Minister of Sport, Fitness and Leisure and theMinister of Health 1999); Physical Activity Taskforce Report (Hillary Commission 1998); theGraham Report (Graham et al 2001)
• creating supportive environments: Heartbeat Challenge/Let’s Get Moving (National HeartFoundation); Walking School Bus; Active Christchurch (local government, partnerships)
• strengthening community action: Walking School Bus; Push Play television commercials:KiwiWalks; KiwiSeniors; He Oranga Poutama (Kaiwhakahaere programme); Hikoi 2000; GreenBikes (Porirua, Palmerston North)
• developing personal skills: Physical Activity Guidelines
• reorienting health services: Green Prescriptions, whereby doctors and practice nurses writeout a prescription for physical activity, with patients receiving follow-up and support fromRegional Sports Trusts.
Public and personal health providers (government, non-government, Maori and Pacific providers,and primary care) deliver a range of programmes and services to promote physical activity andnutrition, using a combination of the approaches outlined above. They often work in partnershipwith other organisations.
Recommendations for levels of activity
Significant health benefits can be obtained from doing at least 30 minutes of moderate-intensityphysical activity on all or most days of the week (eg, brisk walking, cycling, climbing stairs).Additional benefits can be achieved by including some vigorous activity. This recommendationhas been made for people of all ages (Department of Health and Human Services (US) 1996).Some possible ways of meeting this recommendation are shown in Figure 3.
3 For more examples of physical activity initiatives, see the associated DHB toolkit (Ministry of Health 2001a,online at www.moh.govt.nz) and Ministry of Health (2003b).

Food and Nutrition Guidelines for Healthy Adults: A Background Paper 77
Figure 3: Ways of meeting the moderate physical activity guidelines(in daily life)
Source: Modified from Centers for Disease Control and Prevention 1997
Wherever possible, physical activity must link with nutrition. Good nutrition is essential tosupporting physical activity. Good nutrition and physical activity are particularly important tomaintaining a healthy weight, and to preventing and treating obesity (Grundy et al 1999).
The Hillary Commission (now SPARC) has developed guidelines for promoting physical activityunder the Push Play campaign. Push Play aims to encourage people to become more physicallyactive for the benefit of their health. Its four guidelines are as follows.
• View movement as an opportunity, not an inconvenience.
• Be active every day in as many ways as possible.
• Put together at least 30 minutes of moderate-intensity physical activity on most if not all daysof the week.
• If possible, add some vigorous exercise for extra health and fitness (Hillary Commission 2001).
• Washing and waxing a car for 45–60 minutes• Washing windows or floors for 45–60 minutes• Playing volleyball for 45 minutes• Playing touch rugby for 30–40 minutes• Gardening for 30–45 minutes• Wheeling self in wheelchair for 30–40 minutes• Walking 2.8km in 35 minutes (12.5 min/km)• Basketball – shooting baskets for 30 minutes• Bicycling 8 km in 30 minutes• Dancing fast (social) for 30 minutes• Pushing a stroller for 30 minutes• Raking leaves for 30 minutes• Walking 3.2 km in 30 minutes (9.5 min/km)• Water aerobics for 30 minutes• Swimming laps for 20 minutes• Bicycling 6.4 km in 15 minutes• Skipping for 15 minutes• Running 2.4 km in 15 minutes (6.3 min/km)• Climbing stairs for 15 minutes
More vigorous,less time
Less vigorous,more time

Food and Nutrition Guidelines for Healthy Adults: A Background Paper78

Food and Nutrition Guidelines for Healthy Adults: A Background Paper 79
Part V: Nutrition and Health in Maori andPacific Peoples
19 Maori
Background
Maori are more likely than non-Maori to experience poor health as a consequence ofinappropriate nutrition. The factors that have contributed to this trend include:
• the impacts of colonisation on Maori, including the adoption of a European diet and the loss ofmahinga kai (traditional food-gathering areas) through land loss and the pollution of coastsand waters
• changes to Maori economic and social status, with the result that Maori are concentrated inlow socioeconomic groups
• possible genetic factors (such as those that may predispose Maori to diabetes, or lead tolower rates of bowel cancers)
• cultural factors in Maori society that may affect the types of food eaten (Pomare et al 1995).
There could be significant Maori health gain if all Maori were able to access good nutrition anddental care, and there were fewer barriers to regular physical activity. Health promotionprogrammes have been found to be most effective in reaching Maori when they are tied to apositive promotion of Maori identity. A key element in Maori health gain is developing Maoriproviders that are based in Maori world views and that support Maori aspirations (Ministry ofHealth 1998c). Such providers have been able to improve both the access and quality of serviceprovided to Maori.
This chapter briefly discusses Maori models of health, the place of Maori traditional foods in thediet, the burden of disease, and Maori initiatives to improve Maori nutrition.
Maori models of health
Maori approaches to health are primarily based on the view that hauora, or holistic health, is theproduct of wellbeing at physical, spiritual, psychological and social levels. There are many Maorimodels of health in use that encompass this view. These models include Te Whare Tapa Wha(the four cornerposts of health; Pomare et al 1995), Te Pae Mahutonga (the Southern Cross;Durie 1999) and Te Wheke (the octopus; Pomare et al 1995). Public health services beingdelivered to Maori need to address specific Maori health needs and must reflect anunderstanding of hauora Maori (Minister of Health and Associate Minister of Health 2002a).
Frameworks for improving Maori health need to incorporate the principles of the Treaty ofWaitangi. Effective health care for Maori will recognise their cultural diversity (Health PromotionForum 2001).
Traditional foods and practices
Pre-European Maori had a subsistence economy. Food shortages were not uncommon.Significant effort was required to gather, process and store food. The practices that weredeveloped for gathering and conserving foods served as protective health measures and, at thesame time, were grounded in the spiritual value of food to Maori society. While Maori haveadopted a largely European-style diet, a number of traditional foods still form part of the diet for

Food and Nutrition Guidelines for Healthy Adults: A Background Paper80
many Maori. A significant part of Maori tradition is the retention of traditional foods within theculture. Many iwi have their own significant foods, with particular traditions associated withtheir production and preparation (Department of Health 1991).
Kumara is a special food. It is believed to offer spiritual sustenance not found in other foods.Other traditional vegetables include kamokamo (marrow), puha, watercress, pikopiko (fernfronds) and (postcolonisation) kangawai (steeped corn). Kaimoana (seafood) forms a significantpart of traditional diets in coastal areas; it includes kina (sea urchin), pipi, koura (crayfish),ngaeti (periwinkles), parengo (a type of seaweed), paua, tuna (eels), patiki (flounder), inanga(whitebait) and kuku (mussels). Titi (mutton bird) and rewena (bread) are other highly regardedfoods (Department of Health 1991).
Traditional Maori foods are generally compatible with dietary guidelines. However, the additionof fat, salt, sugar and cream to traditional foods may make them less appropriate as part of ahealthy diet. Foods that have added salt, sugar or fat, or that are naturally high in them (eg, Titi ),should be consumed only occasionally or prepared in a way that removes most of the fat(Department of Health 1991).
Connected to the spiritual and cultural significance of food for Maori are such practices asmanaakitanga (honouring manuhiri or visitors) and mana-a-iwi (food provision demonstrating themana of the hosting group).
In the NNS97, three in ten Maori women and two in ten Maori men reported that theirhouseholds were often or sometimes ‘stressed because they cannot provide the food theywanted for social occasions’ (Ministry of Health 1999c). Not being able to follow tikanga relatingto food practices can lead to feelings of misery and depression (McKerchar 1999).
The burden of disease
The following information on the burden of disease for Maori is drawn from the NNS97 (Ministryof Health 1999c).
Body weight and cholesterol
While mean body weight in the total New Zealand population increased from 71.3 kg in 1989 to74.5 kg in 1997, it did not change significantly for Maori.
Mean total serum cholesterol has decreased from 5.9 to 5.7 for the population. Serumcholesterol is lower for Maori than for New Zealand Europeans and Others.
Body size
Maori are on average heavier (males 87.3 kg, females 75.2 kg) than New Zealand Europeans andOthers (males 78.9 kg, females 67.1 kg) but do not differ significantly in height. In a study ofPolynesians (Maori and Samoan), Swinburn et al (1999) found that although they had more bodyfat on average than Europeans, their corresponding BMI values indicated significantly lower bodyfat.
Using BMI adjusted for Maori and Pacific populations, Maori (males 27 percent, females 27.9percent) are more likely to be classified as obese than New Zealand European and Others (males12.6 percent, females 16.7 percent). However, Maori males are less likely to be classified asoverweight (30 percent) than New Zealand European and Other males (41 percent). Theproportion of overweight females was not affected by ethnic group (Ministry of Health 1999c).

Food and Nutrition Guidelines for Healthy Adults: A Background Paper 81
In the NNS97 a waist/hip ratio equal to or greater than 0.9 for males and 0.8 for females wasused to indicate higher cardiovascular risk (Ministry of Health 1999c). Among Maori, 47.5 percentof males and 38.0 percent of females have an excess WHR. By comparison, among New ZealandEuropeans and Others 46.8 percent of males and 34.4 percent of females are in the samecategory (Ministry of Health 1999c).
Blood pressure
Using the WHO cut-off values for hypertension, 16.5 percent of males and 12.3 percent of femalesin the total population were hypertensive. There were no differences among ethnic groups in theprevalence of hypertension. Close to 10 percent of the population were on some form ofhypertensive medication, and 4.2 percent of respondents were still hypertensive at the time oftheir blood pressure measurement. The medication was apparently more effective in NewZealand European and Others (6.1 percent males and 6.4 percent females) than in Maori (1.6 and3.3 percent respectively).
Cholesterol
The mean total serum cholesterol (mmol/L) of New Zealanders overall was 5.7, with no differencebetween males and females. Twenty-three percent of all New Zealanders had cholesterol levelsgreater than 6.5 mmol/L, which is the WHO cut-off point above which people should becounselled. The proportion of Maori females above the cut-off point (10.0 percent) was lowcompared with New Zealand European and Other females (25.6 percent). Among males, a higherproportion of Maori (27.6 percent) exceeded 6.5 mmol/L than New Zealand Europeans andOthers (23 percent).
Iron
The NNS97 found that low iron stores, iron deficiency and iron-deficiency anaemia primarilyaffected females (6 percent, 3 percent and 2 percent respectively). Prevalence of all threeconditions was highest among Maori females (11 percent, 9 percent and 6 percent). Males werenot affected to the same extent.
Energy intake
In females aged 15 to 24 years, Maori had higher median energy intakes than New ZealandEuropeans and Others. Maori females had a higher mean energy intake from fat.
Household food security
The NNS97 statements on household food security revealed that 13 percent of New Zealanders‘can afford to eat properly only sometimes’. Of these, the highest proportion was young females(31 percent). More Maori (males 24 percent, females 33 percent) reported that their households‘can afford to eat properly only sometimes’ than did New Zealand Europeans and Others (males 9percent, females 10 percent).
About one-third of Maori (26 and 36 percent males and females, respectively) reported that ‘foodruns out’ often or sometimes. By comparison, about one-tenth of New Zealand Europeans andOthers (7 percent and 11 percent, respectively) agreed with the same statement. In response tothe statement, ‘The variety of foods I eat is limited by a lack of money’, a higher proportion ofMaori (males 48 percent, females 47 percent) reported this as an issue for their households.Among New Zealand Europeans and Others, 20 percent of males and 26 percent of femalesreported this as an issue.
In response to the statement ‘I/we rely on others to provide food and/or money for food, for my/our household when I/we don’t have enough money’, more Maori reported this as an issue

Food and Nutrition Guidelines for Healthy Adults: A Background Paper82
‘sometimes or often’ (males 19 percent, females 22 percent) than did New Zealand Europeansand Others (males 3 percent, females 5 percent).
Nineteen percent of Maori females aged 15 to 24 years reported using food grants or food banks;this proportion was higher than for any other group. Feeling stressed because of not havingenough money for food (‘sometimes or often’) was most often experienced by the households offemales aged 24 to 44 years. Among females, Maori were more often in this position than NewZealand Europeans and Others. Among females, Maori were twice as likely to report beingstressed (‘sometimes or often’) because they were unable to provide the food they wanted forsocial occasions than New Zealand Europeans and Others (Ministry of Health 1999c).
Physical activity
Te Puni Kokiri found a number of barriers for Maori wanting to increase physical activity levels. Inaddition to cost, transport difficulties, work and whanau commitments, and lack of childcare, anumber of other issues were raised, including:
• lack of whanau support for Maori women taking time out of childcare for active leisure
• lack of appropriate programmes for Maori
• whakama (sense of shame or embarrassment)
• low self-esteem
• communication difficulties
• transience due to seasonal work
• perception of cost
• low awareness of the impact on their own lives, as well as of the facilities and opportunitiesavailable (Te Puni Kokiri 1997).
Effective interventions
To improve Maori health, effective interventions need to incorporate the principles of the Treatyof Waitangi. They also need to recognise that the ‘collective’ and individual wellbeing of Maoriare equally important. Effective interventions must look beyond just healing physical symptomsto understanding and working with people in their social context. He Korowai Oranga (Ministerof Health and Associate Minister of Health 2002) aims for whanau ora: Maori families beingsupported to achieve their maximum health and wellbeing. It identifies four pathways toprogress whanau ora:
• development of whanau, iwi and Maori communities
• active participation by Maori at all levels of the health and disability sector
• health and disability services that are timely, high quality, effective and culturally appropriateto improve health and reduce inequalities
• taking a leadership role in facilitating work across government sectors and governmentagencies to achieve whanau ora by addressing the broader determinants of health.
Whakatataka: Maori Health Action Plan 2002–2005 (Minister of Health and Associate Ministerof Health 2002b) is the implementation plan for He Korowai Oranga. It provides a frameworkand specific priority action areas to improve Maori health outcomes over the next two to threeyears.
Food and Nutrition Guidelines for Healthy Adults: A Background Paper 83
Nutrition initiatives
In the early 1990s initiatives to improve Maori nutrition focused on getting people to reduce theamount of fat in their meals and increase their intake of vegetables, fruits, breads and cereals.However, dietary behaviour changes were difficult to identify. Services were usually deliveredoutside traditional Maori society – the whanau, hapu and iwi framework – and there was littlerecognition of cultural values, beliefs and practices (Pihema 1998).
Between 1993 and 1995 the Maori community nutrition pilot projects to improve nutrition andphysical activity were implemented (Ministry of Health 2001a). The Government funded fourMaori community nutrition initiatives, set up by iwi and Maori organisations in collaboration withhealth agencies. These initiatives aimed at ‘improving nutrition at a community level by trainingcommunity workers in basic food and nutrition’ (Moewaka Barnes et al 1998a, 1998b, 1998c; Pipiet al 1994; Tunks et al 1998). All the initiatives were based on strong community developmentperspectives, and the approaches used are described in the DHB Toolkit: Improve nutrition(Ministry of Health 1999c).
An example was the Nutrition Kaiawhina Pilot Project, based in the Tairawhiti region. It wasfound from the pilots that:
• tikanga Maori must be an integral part of any nutrition programme for Maori
• there must be clear definitions of roles
• support networks are necessary for the success of the programme
• adequate funding is essential
• relevant information must be recorded (Pihema 1998).
Through evaluation, it was also found that all pilots achieved a great deal of Maori communityinvolvement, empowerment and a sense of local ownership. There was significant change ineach community’s awareness of nutrition issues. There were also some changes in eating habitsand in the kind of food provided at social gatherings. At participating marae in the Tairawhitipilot, for instance, there were significant changes in food offered, including offering morewholemeal bread, vegetables, fruits, lean meat, cereals and water (Maskill and Hodges 2001).There were also spin-off benefits, such as the extension of smokefree initiatives and safer food-handling practices.
These pilots are now being run as programmes. The evaluation findings need to be consideredby all health professionals to assess Maori-specific programmes as well as health servicestargeting the general population that are accessed by Maori.
Current and future work
There is a limited pool of qualified Maori nutritionists and dietitians. However, an increasingnumber of Maori community health workers have some working knowledge of both nutrition andhealth promotion. A number of programmes are available for training community workers innutrition. Examples are those offered by Te Hotu Manawa Maori and specific communitynutrition-based pilot programmes, all of which have undergone formal evaluation (MoewakaBarnes et al 1998a, 1998b, 1998c). These programmes work on a train-the-trainer approach andhave focused on both rural and urban Maori communities (see: ‘Effective interventions’ above).There are also a number of publicly funded Maori health promotion services around New Zealandthat have a specific focus on nutrition in Maori communities.

Food and Nutrition Guidelines for Healthy Adults: A Background Paper84
Current services and programmes have begun to address the need for promoting improvednutrition, increased physical activity and maintenance of a healthy body weight for Maori. Theseinitiatives need to be further supported by encouraging Maori to participate in the planning anddelivery of nutrition and physical activity services at a community level. Such programmesshould focus on increasing access to nutritious foods and opportunities for physical activityamong Maori.
A significant factor in improving nutrition and increasing physical activity for Maori is thedevelopment of a comprehensive Maori public health workforce. Future work should support thedevelopment of ‘by Maori for Maori’ approaches to nutrition and physical activity. But there isalso a need for mainstream providers to increase responsiveness to Maori, in programmedevelopment, implementation and evaluation.
Monitoring and evaluating Maori-specific and mainstream services are essential to ensure theyare effective. These processes will also contribute to a more robust research base. Improveddata collection is important to build a better picture of the nutrition, activity and health status ofMaori and to measure trends over time. In many cases gathering the data needed will requireMaori-specific approaches. For example, the validation phase of the New Zealand Sport andPhysical Activity Survey has a particular focus on establishing the energy and intensity involvedin a number of Maori activities, and optional surveying using te reo Maori.

Food and Nutrition Guidelines for Healthy Adults: A Background Paper 85
20 Pacific peoples
Background
Good nutrition, physical activity and a healthy lifestyle have a major role to play in improving thehealth status in Pacific populations. Lifestyle diseases such as obesity, diabetes mellitus,hypertension and heart disease are more common among Pacific peoples than among NewZealand Europeans. In some cases, these same diseases are more common among Pacificpeoples than among Maori (Tukuitonga et al 1990; Scragg et al 1991). Several factors have beenadvanced as reasons for this link between Pacific peoples and lifestyle diseases, including thefollowing.
• Genetic factors may predispose Pacific peoples to a higher risk for developing diabetes andcoronary heart disease (Simmons et al 1995).
• Impacts of migration include the sudden abundance, ready availability and wider variety offoods as well as changes in the climate, language, housing and living arrangements (Hardinget al 1986). Working to grow, gather and hunt for food has now become an option rather thana necessity. Hence physical activity has decreased (Prior 1976).
• Low socioeconomic status compared with other New Zealanders means that Pacific peoplesare over-represented at the lower end of the socio-economic spectrum (Statistics New Zealand1999). The NNS97 highlighted food security as an issue for Pacific peoples (Ministry of Health1999c).
• Cultural factors form the basis of how Pacific peoples perceive health and the role of food,particularly traditional foods.
Pacific peoples have a holistic view of health. The Fonofale Health Model was created byFuimaono Karl Puluto-Endemann as a Pacific model of health for use in the New Zealand context(Ministry of Health 1997f; Moata‘ane 1999). The concept of the Samoan fale, or house, not onlyreflects what is most important for Pacific peoples – family, culture and spirituality – but alsoidentifies important components of the health of Pacific peoples.
The Fonofale Health Model is based on a metaphor for a house, with a roof and foundations.
• The roof represents the cultural values and beliefs, including traditional methods of healingthat shelter life.
• The foundation represents the family – the foundation of Pacific culture.
• The pou, or posts, connect the roof to the foundations, representing the connection betweenfamily and culture and dimensions of:
– spiritual wellbeing
– physical wellbeing
– mental and emotional wellbeing
– other variables such as gender, sexual orientation, age and social class.
The fale does not exist in isolation. It is influenced by other dimensions, especially theenvironment, time and social context in which people live.
Understanding the underlying concepts of such a model is important when developingframeworks for improving the health status of Pacific peoples. Other important issues includethe diversity of cultures, languages, values, beliefs and ways of doing things among the differentethnic groups that make up the Pacific population. Each Pacific ethnic group interprets healthfrom its own cultural perspective.

Food and Nutrition Guidelines for Healthy Adults: A Background Paper86
Traditional foods and practices
Traditional Pacific island diets tend to consist mainly of coconuts, starchy root vegetables, fish,fruits (when in season), and occasionally chicken or pork (Prior 1976; Pollock 1992). Coconut wasthe main source of fat. Traditional green leafy vegetables such as taro leaves, pele (ediblehibiscus leaves), kumara leaves and fern shoots were occasionally eaten and usually cooked withcoconut cream in an umu (traditional earth oven).
Since migrating to New Zealand, leading to the introduction of processed foods (usually high infat, sugar and salt) and cheap cuts of meat, Pacific peoples have had a higher fat content in theirdiets (Prior 1976; Harding 1986). Pacific peoples tend to choose cheaper cuts of meat such asmutton flaps and corned brisket, which is usually high in fat and salt. In addition to saturated fatfrom fatty meat, coconut cream is still widely used in cooking, particularly in the cooking oftraditional foods such as taro (both the tuber and the leaves) and fish. Starchy root vegetablessuch as taro, cassava (manioka) and kumara are still eaten, but less often as they are usuallymore expensive in New Zealand. Pacific peoples do not seem to consume a great variety of fruitsand green leafy vegetables despite their ready availability all year around.
To be consistent with the Food and Nutrition Guidelines, Pacific peoples should be encouraged togrow and eat more vegetables and fruits and to choose leaner cuts of meat.
Food has an important social function within Pacific cultures (Pollock 1992; Guthrie et al 1998;Moata‘ane and Guthrie 2000). It provides a link with tradition, an affirmation of belonging andidentity. Some foods, such as taro, yams, pork, fish and povi masima (corned beef ), areassociated with wealth and prestige. Although early European settlers and missionariesintroduced corned beef into their diet, it has now become a part of the food culture of Pacificpeoples. Foods such as cassava, kumara, bananas (ripe and green), mangoes, other seasonalfruits and green leafy vegetables are not generally considered to be prestige foods.
Sharing, giving and receiving foods are important aspects of Pacific culture (Moata‘ane andGuthrie 2000). The giving of food is a visible expression of love, care and respect. In the NNS97survey, Pacific peoples were more than twice as likely than other respondents to be stressedbecause they could not provide the foods they wanted for social occasions (Ministry of Health1999c).
In their study of adult Tongans with diabetes, Moata‘ane and colleagues (1996) found that theassociation of food with a higher health risk was a foreign concept to Tongan people. This notionis generally the same in other Pacific cultures. The association of food to lifestyle and healthmust be made clear in health education and promotion programmes.
Nutrition strategies
The Pacific Health and Disability Action Plan outlines the vision, strategic direction and specificactions for improving health outcomes for Pacific peoples (Ministry of Health 2002). Priorityareas include promoting healthy lifestyles and wellbeing. One objective in the plan is toencourage and promote healthy nutrition practice (Objective 3.1). Health promotion actions aimto activate greater community participation and ownership, recognising that Pacific peoples playan important role in determining and improving their own health and wellbeing.
This approach is supportive of by Pacific for Pacific health provider/promotion initiatives(Ministry of Health 1997d, 1997f, 1998b). The Ottawa Charter for Health Promotion (WHO et al1986) and the principles of the Treaty of Waitangi, particularly the principles of partnership andparticipation, will guide the processes; these documents are cited in priority two of The PacificHealth and Disability Action Plan (Minister of Health 2002).

Food and Nutrition Guidelines for Healthy Adults: A Background Paper 87
Community nutrition and physical activity initiatives of Pacific peoples
Several community-based programmes, aimed at improving nutrition and promoting regularphysical activity, have been piloted in Auckland. These pilot programmes were a response byPacific health professionals to a prevalence of non-communicable diseases (such as type 2diabetes) among Pacific peoples in New Zealand (Swinburn et al 1997a; Simmons et al 1998).The programmes encourage positive behaviour changes, with activities such as:
• nutrition education to raise awareness
• practical cooking lessons to demonstrate low-fat and low-salt cooking methods
• supermarket tours to assist programme participants in making healthy food choices
• aerobic exercise classes and walking groups to promote regular physical activity.
Evaluation indicated that these intervention activities were taking root within the targetedcommunities. These pilots are now being run as programmes within Pacific communities inAuckland. Although the Pacific Island Heartbeat Programme of the National Heart Foundation isbased in Auckland, its programmes can be used nationally in conjunction with other projects runby the National Heart Foundation.
Pacific health providers in other regions also offer nutrition education and regular physicalactivity sessions to Pacific peoples in their regions. Agencies for Nutrition Action (ANA 2003)reported that Puniani had been the co-ordinator for an innovative gardening programme thatsupported South Auckland communities to create vegetable and fruit gardens in the Pacific earlychildhood centres. Parents and teachers were all involved in the workshop sessions with inputfrom Auckland Regional Council. Auckland Regional Health Promotion, which was also involved,had the aim of assisting in practical ways to improve nutrition, to increase appropriate foodchoices and physical activity.
The Pacific Health and Disability Action Plan provides a guide to positive nutrition action. Itaims to reduce health risks by improving overall diet and nutrition of Pacific peoples in NewZealand. Effective collaboration is needed between Pacific communities and all key agencies toachieve Pacific nutrition goals.
See also: Chapter 21, Food security.

Food and Nutrition Guidelines for Healthy Adults: A Background Paper88

Food and Nutrition Guidelines for Healthy Adults: A Background Paper 89
Part VI: Other Issues
21 Food security
Background
Definitions
Food security is an internationally recognised term that encompasses the ready availability ofnutritionally adequate and safe foods, and the assured ability to acquire personally acceptablefoods in a socially acceptable way.
Food insecurity is characterised by anxiety about not having enough food to eat, running out offood, and having no money to purchase more (Hamilton et al 1997). Adults who are anxiousthere is not enough food may try to avoid hunger by cutting the size of meals, skipping meals oreven going without food for one or more days (Klein 1996).
Income inequalities
The Rome Declaration on World Food Security affirmed the ‘right of everyone to have access tosafe and nutritious food, consistent with the right to adequate food and the fundamental right ofeveryone to be free from hunger’ (FAO 1996).
Inadequate food intakes and hunger are not confined to developing countries (Ministry ofAgriculture, Fisheries and Food (UK) 1996; Department of Agriculture Center for Nutrition Policyand Promotion (US) 1996). The poorer health of people in the lower socioeconomic groups ofdeveloped countries is also now well recognised (Colhoun and Prescot-Clarke 1996).
In New Zealand, the National Advisory Committee on Health and Disability (1998) concluded thatincome is the single most important modifiable determinant of health and wellbeing. Maori andPacific households are disproportionately represented in the two lowest income quintiles(Statistics New Zealand 1999). Single-parent, Maori and Pacific households experienced thegreatest income reductions between 1991 and 1993. The highest rates of illness and prematuredeath are generally experienced by those who are worst off financially (NHC 1998). In its reportreviewing social policy and food security, the New Zealand Network Against Food Poverty (1999)found that actual food costs were much higher than most low-income households had availableafter meeting their basic expenses such as for housing, power and transport.
Health consequences of food insecurity
Low-income groups are food insecure more often and frequently have higher rates of obesitythan high-income groups (Kuskowska-Wolk and Bergstrom 1993; Ford et al 1994). The WhitehallII Study showed a strong inverse social gradient in the prevalence of risk factors for coronaryheart disease (Brunner et al 1997). Mortality from all cancers is higher in lower socioeconomicgroups, although breast cancer and bowel cancer are more prevalent in higher socioeconomicgroups (Sharp et al 1995).
As food security status worsens, diet quality declines (Cristofar and Basiotis 1992) and eatingpatterns become more disordered (Kendall et al 1996).

Food and Nutrition Guidelines for Healthy Adults: A Background Paper90
Issues for women
Dowler and Calvert (1995) concluded that ‘poor material circumstances combined with severeconstraints on disposable income were the main factors characterising nutritional deprivation inlone parents, and sometimes their children’.
It is also important to understand female poverty and the consequences for children. Whenexamining the distribution of children within New Zealand society, we find that children are likelyto live in households in the lower part of the income distribution. Of all children in 1996, 26percent were in households in the bottom income quintile, and 23 percent in the second-lowestquintile. A significant number of homes where the sole parent is female are in the lowest incomegroups (Statistics New Zealand 1998, 1999). A child of a female sole parent is more likely to be ina home of lower income and, therefore, is at higher risk of nutritional disadvantage.Furthermore, the average income of bottom income quintile households fell by 4 percentbetween 1991 and 1996 in real terms. The position of bottom quintile households relative to thedisposable income of the average equivalent household has also deteriorated (Statistics NewZealand 1999).
In a New Zealand study of low-income households, 70 percent of mothers said they restrictedtheir own meal size to feed their children (Parnell 1997). Parnell (1997) also reported that thesewomen were getting insufficient energy, iron and calcium. These households had been on a lowincome for an average of 4.5 years. Similar studies overseas found that women who reporthunger in their households have significantly lower energy and nutrient intakes than those whodo not (Bell et al 1998; Tarasuk and Beaton 1999).
Food skills
The available evidence on the diets in low-income households indicates that they are low invegetables, fruits, lean red meat and dairy products, but tend to be too high in fat, salt and sugar(Farrell 1994; Ministry of Agriculture, Fisheries and Food (UK) 1996; Parnell 1997). The evidencesuggests that this imbalance is not due to ignorance; that is, low-income households are awarethat they are not eating healthy foods (Lang 1992; Leather 1995; Tarasuk et al 1998). Educationalefforts are unlikely to make much impact if a wide range of socioeconomic factors remainunchanged (New Zealand Network Against Food Poverty 1999).
Socioeconomic disadvantage
The NNS97 included eight statements about access to food, the responses to which provide anationwide assessment of food poverty in New Zealand (Ministry of Health 1999c). Almost half ofMaori and Pacific peoples and a quarter of New Zealand Europeans and Others reported that thevariety of foods they were able to eat was limited by lack of money. Maori and Pacific peopleswere disproportionately more likely to access food banks than others, and women accessed foodbanks more than men (Ministry of Health 1999c). Statistics from food banks suggest that close to10 percent of all households are now seeking help from food banks at least once during the year.These households include people who are in paid work. Waged work does not guarantee theabsence of poverty (Hackwell 1998).
Women living in Maori and Pacific households (31 percent and 32 percent respectively) weremore likely to experience ‘stress because of not having enough money for food’ than wereEuropean and Other women (12 percent) (Ministry of Health 1999c).
The NNS97 made comparisons between those living in households in most and least deprivedareas based on NZDep96 quartiles. There was a significant relationship between living in themost deprived areas of New Zealand and inadequate intakes of zinc, vitamin A, riboflavin andfolate, dietary fibre, calcium and vegetables (particularly for women) and fruits (for both sexes)

Food and Nutrition Guidelines for Healthy Adults: A Background Paper 91
(Ministry of Health 1999c). There was also a strong relationship between female obesity and thelevel of deprivation. Females living in the less deprived areas (13.1 percent) had lower levels ofobesity than those in the more deprived areas (25.4 percent). This relationship was notsignificant for males (Ministry of Health 1999c).
Before giving advice about food to New Zealanders who may be at risk of food insecurity, it isimportant to give forethought to this issue (Parnell 2001). Food insecurity is primarily a result ofinadequate income rather than due to ignorance or lack of education (New Zealand NetworkAgainst Food Poverty 1999).

Food and Nutrition Guidelines for Healthy Adults: A Background Paper92
22 Supplementation and fortification
Supplementation
Good nutrition primarily depends on appropriate food choices. Consuming a wide variety offoods in moderate amounts reduces the risk of both inadequate and excessive nutrient intakes(American Dietetic Association 1996). However, in some circumstances, dietary supplementsmay be used to treat nutritional deficiency, including:
• vitamin B12
for vegans (who eliminate all animal products from their diet)
• injections of vitamin B12
for those who have had gastric surgery
• vitamin D for those with low sunlight exposure, especially the institutionalised and olderpeople
• calcium for those who consume little or no milk or milk products (eg, those with lactoseintolerance or allergies to milk and milk products) (American Dietetic Association 1996).
Supplementation may also be indicated for therapeutic use, such as folic acid for women ofchildbearing age who are planning a pregnancy, to reduce the risk of neural tube defects innewborn babies. There may also be a case for supplementation of some nutrients in other at-riskgroups, such as older people, who require more nutrients because of a reduced physiologicalability to absorb them.
Low-dose multivitamin supplements may benefit those with limited dietary intakes. However,these supplements will provide little advantage to those who eat a variety of foods according todietary guidelines. Ironically, consumers of supplements generally have higher dietary nutrientintakes than those who do not take supplements (Wright 1997; Ministry of Health 1999c).Recommendations for low-dose multivitamin and mineral supplements should be made onlywhere inadequate intakes are identified by individualised dietary assessment.
There has been growing interest in the use of antioxidant supplements for protection againstsome cancers and coronary heart disease. Because there is conflicting evidence as to theefficacy of these supplements, no recommendation can be made (Omenn et al 1996; Woodson etal 1999).
Based on a recent review of literature on randomised controlled trials, the National HeartFoundation concluded that vitamin E supplementation achieves no demonstrated benefit inrelation to the prevention or treatment of cardiovascular disease. Therefore the NHF does notrecommend supplementation with antioxidants. Furthermore, neither ß-carotene nor vitamin Chas proven effective in preventing or managing cardiovascular disease (NHF 1999).
For those who choose to use supplements, the American Dietetic Association (1996) recommendsconsuming supplements with low levels of nutrients, such that a daily dose does not exceed therecommended dietary allowance.
Current dietary supplement use
During the year before the NNS97, about half the respondents (51 percent) used vitamin and/ormineral supplements (Ministry of Health 1999c). Such supplements were used on a regularbasis by 28 percent of the population, while 23 percent used them occasionally. More females(59 percent) than males (42 percent) reported taking vitamin and/or mineral supplements;females aged 19 to 24 years reported the highest use of supplements (69 percent). For bothmales and females, frequency of regular use declined from least deprived to most deprived areasbased on in the NZDep96 quartile (Ministry of Health 1999c).

Food and Nutrition Guidelines for Healthy Adults: A Background Paper 93
Multivitamin and/or mineral supplements were the supplements most frequently chosen byusers (19 percent), followed by vitamin B complex (10 percent). Vitamin C (7 percent) and iron(4 percent) were the most common single supplements used (Ministry of Health 1999c). A varietyof other dietary supplements were also being consumed by the New Zealand population. Theyincluded garlic preparations, evening primrose oil and botanical products. The benefit and safetyof these products are not well documented.
The best nutrition strategy for promoting optimal health and reducing the risk of chronic diseaseis to eat well by including a wide variety of nutritious foods in the diet, as recommended in theFood and Nutrition Guideline statements. Foods contain protective substance as well as vitaminsand minerals, and provide value for money in terms of the protection they provide.
Vitamin and mineral supplementation is only appropriate in specific circumstances, preferably onthe advice of a health professional. For example:
• folic acid supplements, taken four weeks before conception and 12 weeks after conception,are recommended to women planning a pregnancy (Ministry of Health 1995)
• vitamin B12
sources of food or supplementation are necessary for vegans
• vitamin B12
injections may be necessary for other groups at risk such as older people withpernicious anaemia or those who have no intrinsic factor
• vitamin D may be necessary for the institutionalised or the elderly
• iron supplementation may be warranted in the treatment of iron-deficiency anaemia beforeend-stage anaemia.
Fortification
Nutrients are sometimes added to foods to improve the nutritional quality of food or to improvethe dietary intakes of individuals. They are often added by the manufacturer to add value to theproduct without any evidence that there will be any positive benefit to the nutritional status ofthe consumer. Manufacturers are, however, required to ensure that the added nutrients are safeand cause no harm.
In 1995 the New Zealand Government adopted the Australian standard for the addition ofvitamins and minerals to foods. Related legislation came into force in January 1996. The newstandard allowed, for the first time, fortification of a wide range of foods. For example, a numberof ready-to-eat breakfast cereals and beverages now have vitamins and minerals added.
Australian and New Zealand food standards outline the foods that can be fortified in the AustraliaNew Zealand Food Standards Code (Food Standards Australia New Zealand 2002). The Codespecifies the nutrients that can be added, their permitted form, the quantities of nutrients thatcan be added to the food, and how the food should be labelled. Awareness of fortification offood products is particularly important for people with nutrient-related medical conditions sothat they can choose either to consume or to avoid foods that are fortified, to meet their ownparticular nutritional requirements. All packaged foods with added nutrients must identify in thelist of ingredients which vitamin or mineral has been added.

Food and Nutrition Guidelines for Healthy Adults: A Background Paper94
23 Food safety
Background
Since July 2002 the primary government organisation responsible for food safety has been theNew Zealand Food Safety Authority with its own Minister of Food Safety. The Ministry of Health isstill responsible for foodborne illness. To be safe to eat, food should be handled so that it doesnot cause foodborne illness and is free of physical, chemical and microbiological hazards.
Foodborne illness notification and trends
Over the past decade New Zealand has experienced an increase in the incidence of entericfoodborne illness, particularly campylobacteriosis, salmonellosis, shigellosis and shiga-toxin-producing E coli (VTEC/STEC). Recent research estimated there are 119,000 cases of foodborneillness in New Zealand each year, resulting in 19,000 general practice visits, 400 hospitalisationsand 2 deaths (Lake et al 2000). In addition to the costs in terms of human health, the economiccosts are an estimated $55.1 million per year, or $462 per case (Scott et al 2000).
The number of notified cases of campylobacteriosis has risen rapidly since the disease becamenotifiable in 1980 (Ministry of Health 1999a). New Zealand now has the highest reported rate ofcampylobacteriosis of any developed country in the world (Orchard et al 2000). Although thereasons for the continuing rise in campylobacteriosis are not clear, the trend indicates that foodsafety practices are less than optimal. Since 2000 New Zealand has also experienced a rapidincrease in salmonellosis associated with the emergence of a new phage type (DT160) ofSalmonella typhimurium (Thornley et al 2002).
The current ‘passive’ system of communicable disease notification is likely to under-report thetrue rates of foodborne illness in the community. Overseas research has shown that theproportion of cases occurring in the community relative to those reported to national surveillanceis low; for example, 3.2:1 for salmonellosis and 7.6:1 for campylobacteriosis (Wheeler et al 1999).When these ratios are applied to the New Zealand notification data, the annual number ofcommunity cases of campylobacteriosis and salmonellosis is estimated to be in excess of 75,000and 8500 respectively (Lake et al 2000).
The relatively low proportion of notified cases is the result of several factors: the smallpercentage of community cases seeking medical help; a low proportion (25 percent) of thosewith symptoms of foodborne illness being requested by their doctor to supply faecal samples(Sarfati et al 1997), and an even lower proportion complying; and the approximately 20 percentof laboratory-confirmed cases that may not be notified (Simmons et al 2002).
Commercial food safety
There is a growing trend for New Zealanders to eat more meals and snacks prepared outside thehome. For the year ending June 2001, 23 percent of the household food dollar was spent onmeals prepared by the food service industry (Restaurant Association of Zealand 2002). Sales offood purchased outside the home grew by $206 million to $3,024 million in 2000/01. This food isprepared and served by more than 67,500 people (Restaurant Association of Zealand 2002). InNew Zealand, consumption of takeaway and restaurant food has been associated withcampylobacteriosis (Eberhart-Phillips et al 1997) and salmonellosis (Thornley et al 2002).Manufacturers and sellers of food, as part of their food safety programmes, must be able to

Food and Nutrition Guidelines for Healthy Adults: A Background Paper 95
demonstrate that all reasonable steps are taken to ensure the safety of the food they produce,prepare and sell.
The New Zealand Food Safety Authority is encouraging all sectors of the food industry to developfood safety programmes. In 2000 the Ministry of Health produced food safety programmeguidelines for industry and regulators (Ministry of Health 2000a, 2000c). A food safetyprogramme has been designed to identify and control hazards in the production, processing andsale of food. A systematic risk assessment tool, known as hazard analysis critical control pointanalysis (HACCP) (Department of Agriculture (US) 1989), is employed. HACCP is a system used toidentify hazards associated with a food product and ensure that controls are established atcritical points in the process. Its most important controls in relation to foodborne illness dealwith microbial hazards.
Staff training and the support of management are critical to introducing a food safetyprogramme. Food workers must have an understanding of food safety and of how to apply thisknowledge to a food safety programme. Staff must then be supervised and supported to ensurecompliance.
Domestic food safety
Foodborne illnesses are more likely to be traced to food prepared in the home or by the foodservice industry, rather than to the stages of food production or harvesting (Bryan 1988). It isbeing increasingly recognised, however, that there is a need for a collective responsibility forfood safety in New Zealand, spanning all stages from production (farm) to consumption (plate).To this end, safe domestic food-handling practices from the point of sale to the point ofconsumption are critical in order to maintain food safety. A number of consumer-level surveyshave identified a poor level of understanding of basic food safety practices in New Zealand(Bloomfield and Neal 1997; Hodges 1993; Kerslake 1995). Unsafe domestic food handling isthought to contribute between 10 and 40 percent of foodborne illness cases overseas (Lake andSimmons 2002). Data from notified New Zealand foodborne illness outbreaks suggest that atleast 12 percent are due to unsafe domestic food handling (Lake and Simmons 2002).
Inadequate cooking, cross-contamination and storage at ambient temperature, and inadequaterefrigeration have been identified as key critical control point failures likely to affect food safetyand foodborne illness in New Zealand (Simmons et al 2001).
Food safety promotion
In 1998 concern about the high levels of foodborne illness prompted the formation of the NewZealand Foodsafe Partnership. This partnership comprises representatives from the foodindustry, consumer groups, public health services, the Ministry of Health and MAF Food (the NewZealand Food Safety Authority since July 2002). The goalof the partnership is to reduce theincidence of foodborne illness by promoting consistent and appropriate food safety messages toconsumers.
The key food safety messages promoted by the partnership are based on local and internationalliterature documenting unsafe domestic food handling (Simmons et al 2001). These messagesare promoted in an annual food safety campaign similar to that carried out in Australia (Warnock1998). These messages can be summarised as the ‘4 Cs’: clean, cook, cover, chill.
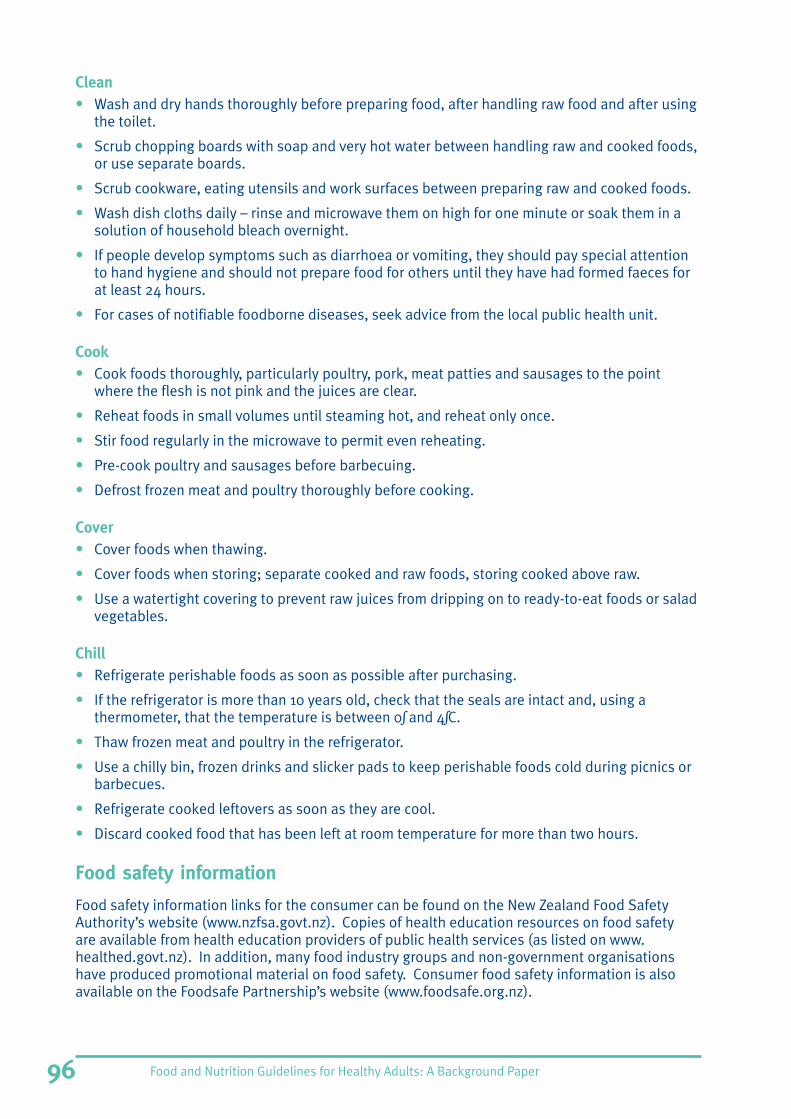
Food and Nutrition Guidelines for Healthy Adults: A Background Paper96
Clean• Wash and dry hands thoroughly before preparing food, after handling raw food and after using
the toilet.
• Scrub chopping boards with soap and very hot water between handling raw and cooked foods,or use separate boards.
• Scrub cookware, eating utensils and work surfaces between preparing raw and cooked foods.
• Wash dish cloths daily – rinse and microwave them on high for one minute or soak them in asolution of household bleach overnight.
• If people develop symptoms such as diarrhoea or vomiting, they should pay special attentionto hand hygiene and should not prepare food for others until they have had formed faeces forat least 24 hours.
• For cases of notifiable foodborne diseases, seek advice from the local public health unit.
Cook• Cook foods thoroughly, particularly poultry, pork, meat patties and sausages to the point
where the flesh is not pink and the juices are clear.
• Reheat foods in small volumes until steaming hot, and reheat only once.
• Stir food regularly in the microwave to permit even reheating.
• Pre-cook poultry and sausages before barbecuing.
• Defrost frozen meat and poultry thoroughly before cooking.
Cover• Cover foods when thawing.
• Cover foods when storing; separate cooked and raw foods, storing cooked above raw.
• Use a watertight covering to prevent raw juices from dripping on to ready-to-eat foods or saladvegetables.
Chill• Refrigerate perishable foods as soon as possible after purchasing.
• If the refrigerator is more than 10 years old, check that the seals are intact and, using athermometer, that the temperature is between 0∫ and 4∫C.
• Thaw frozen meat and poultry in the refrigerator.
• Use a chilly bin, frozen drinks and slicker pads to keep perishable foods cold during picnics orbarbecues.
• Refrigerate cooked leftovers as soon as they are cool.
• Discard cooked food that has been left at room temperature for more than two hours.
Food safety information
Food safety information links for the consumer can be found on the New Zealand Food SafetyAuthority’s website (www.nzfsa.govt.nz). Copies of health education resources on food safetyare available from health education providers of public health services (as listed on www.healthed.govt.nz). In addition, many food industry groups and non-government organisationshave produced promotional material on food safety. Consumer food safety information is alsoavailable on the Foodsafe Partnership’s website (www.foodsafe.org.nz).

Food and Nutrition Guidelines for Healthy Adults: A Background Paper 97
Appendix 1: Serving sizes of the four foodgroups and samples of two types of three-day meal plansNote: These meal plans demonstrate how an eating plan could work using the Food and NutritionGuidelines. They are not intended to be used and followed rigidly.
Table A1.1: Serving size examples
Vegetables and fruits
Vegetables• 1 medium potato, kumara or similar sized root vegetable such as yam or taro (135 g)
• 1⁄2 cup cooked vegetable eg, puha, water cress, parengo or corn (50–80 g)
• 1⁄2 cup salad or mixed vegetables (60 g)
• 1 tomato (80 g)
Fruits• 1 apple, pear, banana or orange (130 g)
• 2 small apricots or plums (100 g)
• 1⁄2 cup fresh fruit salad
• 1⁄2 cup stewed fruit (fresh, frozen or canned) (135 g)
• 1 cup fruit juice 250 ml or a serving of dried fruit (only one counts)
Breads and cereals• 1 bread roll (50 g)
• 1 muffin (80 g)
• 1 medium slice rewena
• 1 medium slice bread (26 g)
• 1 cup cornflakes
• 1⁄2 cup muesli (55 g)
• 1⁄2 cup cooked porridge (130 g)
• 1 cup cooked pasta (150 g)
• 1 cup cooked rice (150 g)
• 1 cup cassava or tapioca (150 g)
• 2 plain sweet biscuits (14 g)

Food and Nutrition Guidelines for Healthy Adults: A Background Paper98
Milk and milk products• 1 large glass milk (250 ml)
• 1 pottle yoghurt (150 g)
• 2 slices cheese (40 g)
• 2 scoops ice cream (140 g)
Lean meat, chicken, seafood, eggs, cooked dried beans, peas, lentils• 2 slices cooked meat (approximately 100 g)
• 3⁄4 cup mince or casserole (195 g)
• 1 egg (50 g)
• 1 medium fillet of fish cooked (100 g)
• 1 medium steak (120 g)
• 3⁄4 cup dried cooked beans (135 g)
• 2 drumsticks or 1 chicken leg (110 g)

Food and Nutrition Guidelines for Healthy Adults: A Background Paper 99
Meal plan 1 with some luxury foods
Day One Day Two Day Three
Breakfast2 slices multigrain toast 1 small bowl muesli flakes 1 cup porridge
2 tsp olive oil margarine 125 ml trim milk 125 ml trim milk
1 Tbsp peanut butter 1 slice multigrain toast 1 slice wholemeal toast1⁄2 tsp Vegemite 1 tsp olive oil margarine 1 tsp olive oil margarine
125 ml trim milk for Milo 1 cup tea 1⁄2 Tbsp berry jam
20 g Milo
1 small banana
Morning tea1 cup latte 1 medium apple 1 cup black tea
50 g cheese scone
1 tsp olive oil margarine
Lunch1 bowl minestrone soup 1 cup fresh pasta 1 sandwich (2 slices bread) beef and2 rolls brown bread 1 Tbsp parmesan cheese vegetables
1 tsp olive oil margarine 1⁄2 cup lettuce salad 1 large kiwifruit
1 medium orange 1 blueberry muffin 2 medium mandarins
1 glass apple/mango juice 1 cup latte
Afternoon tea4 crackers 2 cups instant coffee 1 large glass apple juice
1 cup instant coffee 75 ml trim milk 30 ml trim milk
Dinner1 glass white wine 1 glass fruit juice 1 glass white wine
300 g chicken with 1⁄2 cup lean beef stew 1 125 g fillet gurnard fish, grilled
stir-fried vegetables 1 medium baked potato 1⁄2 cup broccoli
1 cup white rice 1⁄2 cup peas 1 medium tomato
150 g fresh fruit salad 1⁄2 cup carrots 1 cup latte
100 g yoghurt 2 scoops hokey pokey ice cream 1 piece uniced carrot cake2⁄3 cup canned apricots
After dinner1 cup coffee 1 cup coffee 1 cup herb tea
30 ml milk 1 cup Milo
75 ml trim milk

Food and Nutrition Guidelines for Healthy Adults: A Background Paper100
Meal plan 2 with basic foods
Day One Day Two Day Three
Breakfast3 slices multigrain toast 2 biscuits Weetbix 1 cup porridge
3 tsp polyunsaturated margarine 150 ml trim milk 200 ml trim milk
1 Tbsp jam fruit 2 slices wholemeal toast 3 tsp brown sugar
1 glass (180 ml) trim milk 2 tsp polyunsaturated margarine 2 slices white toast
1 cup tea 1 tsp polyunsaturated margarine
30 ml trim milk 1 Tbsp peanut butter
1 small banana
Morning tea1 medium apple 1 cup coffee 1 slice wholemeal toast
30 ml trim milk 1 tsp polyunsaturated margarine1⁄2 Tbsp berry jam
Lunch4 slices multigrain bread 3 slices wholemeal bread 50 g cheese scone
3 tsp polyunsaturated margarine 10 g mayonnaise 1 tsp polyunsaturated margarine
20 g lettuce 25 g mild cheese 1 glass trim milk
1 med tomato 40 g canned tuna
60 g cold roast beef 135 g apple
1 small banana
Afternoon tea2 digestive biscuits 2 digestive biscuits 1 cup latte
1 cup mega latte 2 tsp sugar
2 digestive biscuits
Dinner400 g rice and vegetable 1 glass fruit juice 140 g chicken, leg flesh grilledcasserole with bacon, egg 1⁄2 cup beef mince 1⁄3 cup gravyand cheese 1 medium boiled potato 1 large boiled potato1 cup canned peaches 1⁄2 cup cooked cabbage 1⁄2 cup green peas1⁄2 cup custard 1⁄2 cup carrots 1⁄2 cup pumpkin
1 scoop vanilla ice cream 150 g fruit yoghurt15 g fruity topping
After dinner1 cup coffee 1 cup Milo made with trim milk 1 medium apple
30 ml milk

Food and Nutrition Guidelines for Healthy Adults: A Background Paper 101
The three-day meal plans above were analysed using FoodWorks 2002 with the 2002 version ofFoodFiles. The plans are for healthy New Zealand adults eating about 8000 kJ a day. Plan 1includes some luxury items such as alcohol and some more expensive food choices, whereasPlan 2 comprises basic food items. Table A1.2 summarises approximate nutritional analyses.
Table A1.2: Summary of nutritional analyses
Plan 1 Plan 2average per day average per day
Energy (kJ) 8100 7940
Total fat (g) 61 65
Percentage energy from protein 21 20
Percentage energy from carbohydrate 49 50
Percentage energy from total fat 28 30
Percentage energy from saturated fat About 10 About 10
Calcium (mg) 890 1250
Iron (mg) 13 15
Fibre (NSP) (g) 24 22
Total sugar (g) 118 115
Sucrose (g) 43 39

Food and Nutrition Guidelines for Healthy Adults: A Background Paper102

Food and Nutrition Guidelines for Healthy Adults: A Background Paper 103
Appendix 2: National Nutrition Survey 1997The NNS97 was a voluntary, cross-sectional population survey of 4636 New Zealanders living inselected households, aged 15 years or above. Data were collected over a 12-month periodbeginning December 1996. Survey methods used included 24-hour diet recall, a food frequencyquestionnaire, food-related questions, and a study of environmental chemicals, physicalmeasurements and blood samples. It provides information on food and nutrient intakes, dietaryhabits and nutrition-related clinical measures on a representative sample of New Zealanders(Ministry of Health 1999c).
These findings need to be considered in light of under-reporting of dietary intakes, which is arecognised problem in dietary surveys (Klesges et al 1995; Lafay et al 1997) and is acknowledgedby the author of the NNS97 (Ministry of Health 1999c).
A detailed description of the survey design is included in Food Comes First: Methodologies forthe National Nutrition Survey of New Zealand (Quigley and Watts 1997).

Food and Nutrition Guidelines for Healthy Adults: A Background Paper104
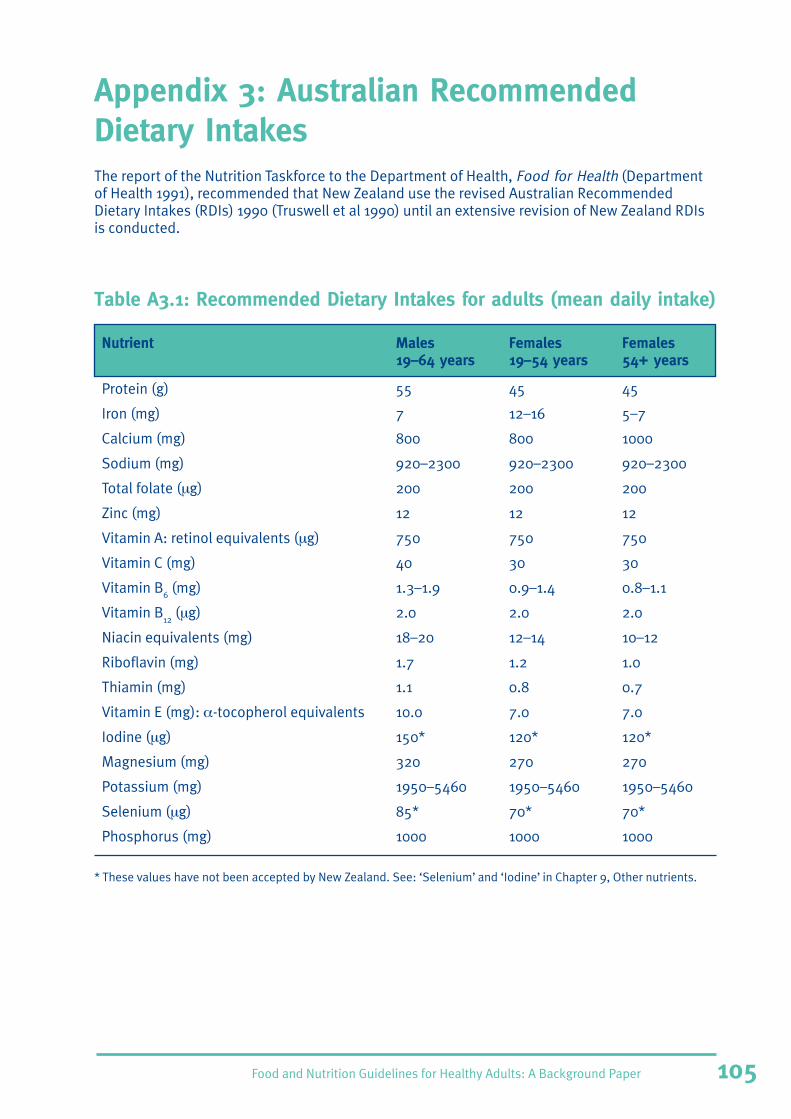
Food and Nutrition Guidelines for Healthy Adults: A Background Paper 105
Appendix 3: Australian RecommendedDietary IntakesThe report of the Nutrition Taskforce to the Department of Health, Food for Health (Departmentof Health 1991), recommended that New Zealand use the revised Australian RecommendedDietary Intakes (RDIs) 1990 (Truswell et al 1990) until an extensive revision of New Zealand RDIsis conducted.
Table A3.1: Recommended Dietary Intakes for adults (mean daily intake)
Nutrient Males Females Females19–64 years 19–54 years 54+ years
Protein (g) 55 45 45
Iron (mg) 7 12–16 5–7
Calcium (mg) 800 800 1000
Sodium (mg) 920–2300 920–2300 920–2300
Total folate (µg) 200 200 200
Zinc (mg) 12 12 12
Vitamin A: retinol equivalents (µg) 750 750 750
Vitamin C (mg) 40 30 30
Vitamin B6 (mg) 1.3–1.9 0.9–1.4 0.8–1.1
Vitamin B12
(µg) 2.0 2.0 2.0
Niacin equivalents (mg) 18–20 12–14 10–12
Riboflavin (mg) 1.7 1.2 1.0
Thiamin (mg) 1.1 0.8 0.7
Vitamin E (mg): α-tocopherol equivalents 10.0 7.0 7.0
Iodine (µg) 150* 120* 120*
Magnesium (mg) 320 270 270
Potassium (mg) 1950–5460 1950–5460 1950–5460
Selenium (µg) 85* 70* 70*
Phosphorus (mg) 1000 1000 1000
* These values have not been accepted by New Zealand. See: ‘Selenium’ and ‘Iodine’ in Chapter 9, Other nutrients.

Food and Nutrition Guidelines for Healthy Adults: A Background Paper106
Table A3.2: Australian recommended energy intakes for adults (MJ/day)
Height (cm) Weight (kg) Males (MJ/day) Females (MJ/day)
Age group 18–30 years
150 50.6 – 7.2–8.3
160 57.6 9.1–10.4 7.9–9.0
170 65.0 9.8–11.2 8.5–9.7
180 72.9 10.5–12.0 9.2–10.5
190 81.2 11.2–12.8 9.9–11.3
200 90.0 12.0–13.7 _
Age group 30–60 years
150 50.6 _ 7.2–8.3
160 57.6 9.0–10.3 7.7–8.8
170 65.0 9.5–10.8 8.0–9.2
180 72.9 10.0–11.4 8.4–9.6
190 81.2 10.6–12.1 8.8–10.1
200 90.0 11.2–12.8 –
Age group over 60 years
150 50.6 – 6.5–7.5
160 57.6 7.4–8.5 6.9–7.9
170 65.0 7.9–9.0 7.3–8.4
180 72.9 8.4–9.6 7.7–8.8
190 81.2 9.0–10.3 8.2–9.3
200 90.0 9.6–11.0 –
Source: Truswell et al 1990

Food and Nutrition Guidelines for Healthy Adults: A Background Paper 107
Appendix 4: Dietary Reference Intakes inthe publications of the Institute ofMedicine, United States
Table A4.1: Recommended dietary allowances for men
Nutrient Reference Men Men Men source 19–30 years 31–50 years 51+ years
Protein (g) 2002c 56 56 56
Iron (mg) 2002a 8 8 8
Dietary folate equivalents (µg) 1998 400 400 400
Zinc (mg) 2002a 11 11 11
Vitamin A: retinol activity equivalents (µg) 2002a 900 900 900
Vitamin C (mg) 2000 90 90 90
Vitamin B6 (mg) 1998 1.3 1.3 1.7
Niacin equivalents (mg) 1998 16 16 16
Riboflavin (mg) 1998 1.3 1.3 1.3
Thiamin (mg) 1998 1.2 1.2 1.0
Vitamin E (mg): α-tocopherol 2000 15 15 15
Iodine (µg) 2002a 150 150 150
Calcium (mg) 1997 1000 1000 1200
AdequateIntake
Magnesium (mg) 1997 400 420 420
Selenium (µg) 2000 55 55 55
Phosphorus (mg) 1997 700 700 700
Note: A table on estimated energy requirements for men and women aged 30 years, based on height and fouractivity levels is available in Table 5-22 in Institute of Medicine 2002c.
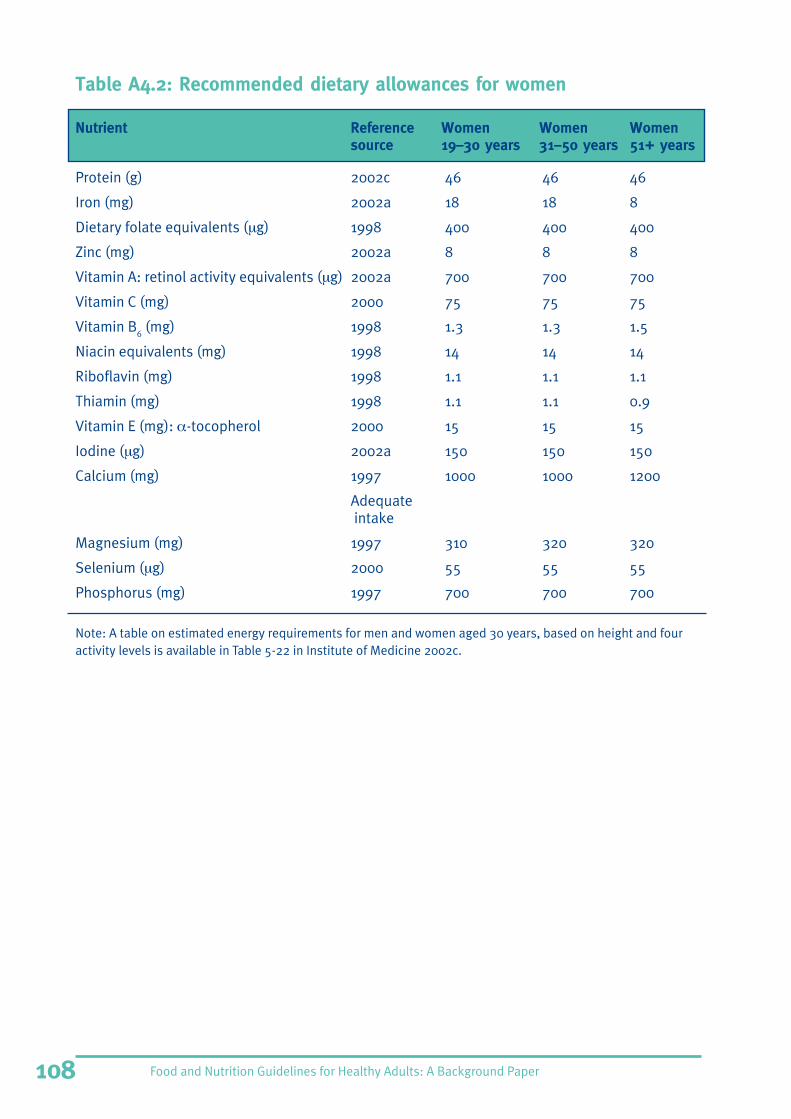
Food and Nutrition Guidelines for Healthy Adults: A Background Paper108
Table A4.2: Recommended dietary allowances for women
Nutrient Reference Women Women Womensource 19–30 years 31–50 years 51+ years
Protein (g) 2002c 46 46 46
Iron (mg) 2002a 18 18 8
Dietary folate equivalents (µg) 1998 400 400 400
Zinc (mg) 2002a 8 8 8
Vitamin A: retinol activity equivalents (µg) 2002a 700 700 700
Vitamin C (mg) 2000 75 75 75
Vitamin B6 (mg) 1998 1.3 1.3 1.5
Niacin equivalents (mg) 1998 14 14 14
Riboflavin (mg) 1998 1.1 1.1 1.1
Thiamin (mg) 1998 1.1 1.1 0.9
Vitamin E (mg): α-tocopherol 2000 15 15 15
Iodine (µg) 2002a 150 150 150
Calcium (mg) 1997 1000 1000 1200
Adequate intake
Magnesium (mg) 1997 310 320 320
Selenium (µg) 2000 55 55 55
Phosphorus (mg) 1997 700 700 700
Note: A table on estimated energy requirements for men and women aged 30 years, based on height and fouractivity levels is available in Table 5-22 in Institute of Medicine 2002c.

Food and Nutrition Guidelines for Healthy Adults: A Background Paper 109
Appendix 5: United Kingdom DietaryReference Values
Table A5.1: Reference Nutrient Intakes for nutrients for the UnitedKingdom and Estimated Average Requirements for foodenergy
Nutrient Males Males Females Females19–50 years 50+ years 19–50 years 50+ years
*Energy (MJ) 10.60 8.10
Protein (g) 55.5 53.3 45.0 46.5
Iron (mg) 8.7 8.7 14.8 8.7
Calcium (mg) 700 700 700 700
Sodium (mg) 1600 1600 1600 1600
Total folate (µg) 200 200 200 200
Zinc (mg) 9.5 9.5 7.0 7.0
Vitamin A: retinol equivalents (µg) 700 700 600 600
Vitamin C (mg) 40 40 40 40
Vitamin B6 (mg) 1.4 1.4 1.2 1.2
Niacin equivalents (mg) 17 16 13 12
Riboflavin (mg) 1.3 1.3 1.1 1.1
Thiamin (mg) 1.0 0.9 0.8 0.8
Iodine (µg) 140 140 140 140
Magnesium (mg) 300 300 270 270
Potassium (mg) 3500 3500 3500 3500
Selenium (µg) 75 75 60 60
Phosphorus (mg) 540 540 540 540
* Estimated average requirement rather than Reference Nutrient Intake.
Source: Department of Health (UK) 1991

Food and Nutrition Guidelines for Healthy Adults: A Background Paper110
Food and Nutrition Guidelines for Healthy Adults: A Background Paper 111
Appendix 6: Policy Statement on PhysicalActivity: Minister of Sport, Fitness andLeisure and the Minister of HealthIn 1999 the Minister of Sport, Fitness and Leisure and the Minister of Health released a JointPolicy Statement on Physical Activity. This document endorses the recommendation of 30minutes of regular, moderate-intensity physical activity on most or all days of the week. It alsoencourages the promotion of the following key messages:
• We can all benefit from regular, moderate-intensity physical activity – including activities suchas brisk walking, taking the stairs, cycling, swimming, active gardening and some types ofhousework (eg washing floors, washing windows).
• Health benefits can be obtained from being moderately active for 30 minutes on all or mostdays of the week.
• Accumulating smaller amounts of physical activity is also beneficial. Ten-minute sessions ofmoderate-intensity physical activity to total at least 30 minutes on all or most days of thework.
• Physical activity can be fun.
• Physical activity doesn’t have to be hard to be good for us.
• Some activity is better than none.
• It is never too late to start being physically active.
• Physical activity should be incorporated into our everyday lives and routines – take the stairsrather than the lift, walk around the farm rather than riding the farm-bike, walk instead oftaking the car.
• Physical activity improves mental health and enhances our ability to perform.
• You don’t have to spend money to gain the benefits of physical activity.
Source: Minister of Sport, Fitness and Leisure and the Minister of Health 1999

Food and Nutrition Guidelines for Healthy Adults: A Background Paper112
Food and Nutrition Guidelines for Healthy Adults: A Background Paper 113
Glossary and Abbreviations
GlossaryAdequate intake (AI)::::: when there is insufficient scientific evidence to set a RecommendedDietary Allowance (RDA) or estimated average requirement (EAR) the AI is set based on theintakes of a nutrient in healthy adults. It is used in the United States.
Adult: a person aged 18 to 65 years.
Alcohol Use Disorders Identification Test (AUDIT): a 10-item screening questionnaire developedby the WHO, which is designed to identify people with potentially hazardous or harmful alcoholconsumption.
Anaemia: a reduction of the haemoglobin below normal for age and sex. A diagnosis of iron-deficiency anaemia is made when anaemia is accompanied by laboratory evidence of irondeficiency, such as low serum ferritin.
Anencephaly: a nural tube defect (NTD) where infants have underdeveloped brains andincomplete skulls. Most infants born with anencephaly do not survive more than a few hoursafter birth.
Antioxidants: agents that prevent or inhibit oxidation of a substance (eg, vitamin C, vitamin E).
Bioavailability: the degree to which a drug, medication or another substance (eg, iron) becomesavailable for use by the body after administering.
Body mass index (BMI): an indicator of body fatness, calculated from the formula weightdivided by height squared, where weight is in kilograms and height is in metres.
Cardiomyopathy: a general term meaning primary heart disease.
CHD: coronary heart disease.
Constipation: infrequent or difficult bowel motions.
Diabetes: diagnosed when levels of glucose are abnormally elevated in blood. It is usuallycaused either by a lack of insulin or by the body’s inability to use insulin efficiently. The two mostcommon types of diabetes mellitus are type 1 and type 2.
Dietary Reference Intake (DRI): a term used in the United States to cover varying levels ofrecommended intakes of nutrients.
Dietary Reference Value (DRV): a term used in the United Kingdom to cover varying levels ofrecommended intakes of nutrients.
Disability adjusted life years (DALYs): a measure with one unit representing the loss of oneyear of healthy life.
Diverticular disease: multiple pouches formed in the large bowel that can become infected,bleed or perforate.
Erythrocyte: red blood cell.
Erythropoiesis: the function of making red blood cells (erythro = red blood cell, poiesis =creating).
Food and Nutrition Guidelines for Healthy Adults: A Background Paper114
Essential amino acids: nine amino acids required for protein synthesis that cannot besynthesised by the body and must be obtained through the diet. These amino acids arehistidine, isoleucine, leucine, lysine, methionine, phenylalanine, threonine, tryptophan andvaline.
Estimated average requirement (EAR): the amount of a nutrient such as protein, or of a vitaminor mineral suitable to recommend for a population.
Ethnicity: for the purpose of reporting ethnicity in the New Zealand Nutrition Survey 1997(NNS97), where participants identified more than one ethnic group the following hierarchicalrules were applied.
• If New Zealand Maori was one of the groups reported, the participant was assigned to NewZealand Maori.
• If any of the Pacific groups was one of the groups reported, the participant was assigned toPacific peoples.
• All remaining participants were assigned to New Zealand European and Others.
Exercise: planned, structured and repetitive bodily movement done to improve or maintain one ormore components of physical fitness.
Fatty acids: a basic component of fats in combination with glycerol, some of which are essential.
Food safety programme (FSP): a written document that, when implemented, should givereasoned assurance that the food produced is safe to consume. Development of FSPs mustemploy the techniques of hazard analysis critical control points (HACCP) and qualitymanagement systems such as the ISO 9000 series.
Food security: access to adequate, safe, affordable and acceptable food.
Fruit: generally includes the sweet, fleshy edible portion of a plant that arises from the base andflower and surrounds the seed.
Glycaemic index (GI): the rise in blood glucose after a portion of carbohydrate-containing foodcompared to the rise in blood glucose after a standard food, usually white bread or glucose. TheGI is normally expressed as a percentage.
Green Prescriptions: a brief intervention that delivers physical activity in a primary health caresetting. The programme is designed to address a range of diseases resulting from inactivity or toreduce the burden of disease. Currently a range of independent practitioner associations,primary health care organisations, District Health Boards and Maori health providers are engagedin the programme.
Haem: the iron-holding part of the haemoglobin and myoglobin proteins. About 40 percent ofthe iron in meat, fish and poultry is bound into haem; the other 60 percent is non-haem iron.
Haemoglobin: the protein carrying oxygen in the red blood cells.
Hazard analysis critical control points (HACCP): a system identifying and controlling criticalpoints in the production of food to ensure safety.
Homocysteine: a byproduct of the amino acid methionine and an intermediate in the synthesis ofthe amino acid cysteine. Elevated levels of homocysteine in blood are associated with coronaryheart disease (CHD).

Food and Nutrition Guidelines for Healthy Adults: A Background Paper 115
Irritable bowel syndrome: a syndrome characterised by lower gastrointestinal symptoms, suchas cramping, bloating, diarrhoea and constipation, without any evidence of underlying disease.
LDL: low density lipoprotein.
Moderate activity: as defined by the New Zealand Guidelines for promoting physical activity(Movement = Health), activity that will cause a slight but noticeable increase in breathing andheart rate. This level of activity is equivalent to brisk walking.
Neural tube defect (NTD): a major group of birth defects where the brain or spinal cord, or thecovering of these organs may not have developed properly. Spina bifida and anencephaly are themost common types of NTD.
New Zealand National Nutrition Survey 1997 (NNS97): a cross-sectional survey of adult NewZealanders aged 15 years and older.
New Zealand Total Diet Survey (NZTDS): examines contaminants and nutrients in a number ofcommonly eaten New Zealand foods.
Non-communicable diseases: those diseases that cannot be transmitted from one person toanother, such as obesity, hypertension, diabetes, cardiovascular disease and gout.
Nutrient Reference Values (NRVs): a term used in New Zealand and Australia to cover varyinglevels of recommended intakes of nutrients.
NZDep96: an index of deprivation based on the individual’s residential address. The index isbased on eight dimensions of deprivation: income, access to a car, living space, home ownership,employment, qualifications, support, and access to a telephone (Salmond et al 1998).
• In the New Zealand National Nutritional Survey 1997 (NNS97), quartile I is defined asindividuals living in the least deprived areas and quartile IV as individuals living in the mostdeprived areas.
• When reported by Statistics New Zealand, quintiles rather than quartiles are used.
Obesity::::: having a body mass index (BMI) ≥ 32 for Maori and Pacific peoples, and a BMI ≥ 30 forall other New Zealanders.
Osteopenia: a reduction in bone mass below normal levels.
Overweight: having a body mass index (BMI) ≥ 26 and < 32 for Maori and Pacific peoples, and aBMI ≥ 25 and < 30 for all other New Zealanders.
Physical activity: the entire spectrum of ‘bodily movements’ that a person can undertake in dailylife, ranging from normal active living conditions to ‘intentional’ moderate physical activities, tostructured and repetitive physical exercises, to physical fitness and training sessions, tocollective sport activities, especially leisure and recreational sports.
Recommended Dietary Allowance (RDA): the amount of a nutrient recommended daily that isenough or more than enough for about 97 percent of people in a population. RDA is a term usedin the United States and is usually based on age and sex.
Reference Nutrient Intake (RNI): the amount of a nutrient that is enough or more than enoughfor about 97 percent of people in a population. This term is used in Australia and the UnitedKingdom.
Socioeconomic status: social position, measured by an ordinal scale, indicating an individual’s(or a family’s or household’s) relative position in the social hierarchy, based on criteria such asincome level, occupational class or educational attainment.

Food and Nutrition Guidelines for Healthy Adults: A Background Paper116
Spina bifida: the most common neural tube defect (NTD). It results from the failure of the spineto close properly during the first month of pregnancy. Children with spina bifida can have varyingdegrees of paralysis of their lower limbs, some children have to use a wheelchair, whereas othershave almost no symptoms at all. The condition can also cause bowel and bladder problems.
Tolerable upper intake level (UL): the highest recommended intake level of a nutrient that islikely to pose no harm for specific population groups. This term is used in the United States.
Vegetable: all leafy greens, members of the crucifer family, all root (including potatoes) andtuber vegetables, edible plant stems, gourd vegetables, allium vegetables and corn.
Vigorous activity: as defined by the New Zealand Guidelines for physical activity (Movement =Health), activity that makes people ‘huff and puff’.
Waist circumference (WC): a measure of health risk in relation to obesity. The WHO definesexcessive waist circumference as ≥ 94cm in males and ≥ 80 cm in females and is thought to beassociated with an increased health risk.
Waist/hip ratio (WHR): the ratio of waist size to hip size, calculated by dividing the waistmeasurement by the hip measurement. A high WHR indicates a central fat distribution; a lowWHR indicates a peripheral fat distribution.
Name abbreviations
AIN American Institute of Nutrition
ALAC Alcohol Advisory Council
ANA Agencies for Nutrition Action
ASCN American Society for Clinical Nutrition
ESR Institute of Environmental Science and Research
FAO Food and Agriculture Organization
IARC International Agency for Research of Cancer
LINZ Life in New Zealand Research Unit
NHC National Advisory Committee on Health and Disability
NHF National Heart Foundation
NHLBI National Heart, Lung and Blood Institute
NHMRC National Health and Medical Research Council of Australia
NNS97 New Zealand National Nutrition Survey 1997
NRC National Research Council
PHC Public Health Commission
SPARC Sport and Recreation New Zealand
WHO World Health Organization

Food and Nutrition Guidelines for Healthy Adults: A Background Paper 117
ReferencesAdes PA, Coello CE. 2000. Effects of exercise and cardiac rehabilitation on cardiovascularoutcomes. Medical Clinics of North America 84: 251–65.
Adler A, Turner R. 1999. The Diabetes Prevention Program. Diabetes Care 22(4): 543–5.
ALAC. 1995. Upper Limits for Responsible Drinking: A guide for the public. Wellington: AlcoholAdvisory Council of New Zealand.
ALAC. 2002. Upper Limits for Responsible Drinking: Policy Statement 6. Wellington: AlcoholAdvisory Council of New Zealand.
ALAC, Ministry of Health. 2001. National Alcohol Strategy 2000–2003. Wellington. AlcoholAdvisory Council of New Zealand and the Ministry of Health.
Alberti KG, Zimmet P. 1998. Definition, diagnosis and classification of diabetes and itscomplications. Part 1: Diagnosis and classification of diabetes mellitus. Provisional report of aWHO Consultation. Diabetes Medicine 15: 539–53.
Alderman MH. 2002. Salt, blood pressure and health: a cautionary tale. International Journalof Epidemiology 31: 311–5.
American Diabetes Association. 2003. Evidence-based nutrition principles andrecommendations for the treatment and prevention of diabetes and related complications.Diabetes Care 26(suppl 1): S51–61.
American Dietetic Association. 1996. Position of the American Dietetic Association: vitaminsand mineral supplementation. Journal of the American Dietetic Association 96: 73–7.
American Dietetic Association. 2003. Position of the American Dietetic Association and Dietitiansof Canada: vegetarian diets. Journal of the American Dietetic Association 103: 748–65.
ANA (Agencies for Nutrition Action). 2003. ANA Update 18: 5.
Appel LJ, Moore TJ, Obarzanek E, et al. 1997. A clinical trial of the effects of dietary patternson blood pressure. DASH Collaborative Research Group. New England Journal of Medicine336: 1117–24.
Arthur JR, Beckett GJ, Mitchell JH. 1999. The interactions between selenium and iodinedeficiencies in men and animals. Nutrition Research Reviews 12: 55–73.
ASCN-AIN (American Society for Clinical Nutrition-American Institute of Nutrition) Task Forceon Trans Fatty Acids. 1996. Position paper on trans fatty acids. American Journal of ClinicalNutrition 63: 663–70.
Athar N, McLaughlin J, Taylor. 2003. The Concise New Zealand Food Composition Tables. (6th Ed.)Wellington: New Zealand Institute for Crop and Food Research Ltd and the Ministry of Health.
Australian Bureau of Statistics. 1998. National Nutrition Survey: Nutrient intakes and physicalmeasurements, Australia, 1995. Cat. No. 4805.0. Canberra: Australian Bureau of Statistics.
Baghurst P, Baghurst K, Record S. 1996. Dietary fibre, non-starch polysaccharides andresistant starch: a review. Food Australia 48(3 suppl): S3–5.
Baghurst P, Record S, Syrette J. 1997. Does red meat cause cancer? Australian Journal ofNutrition and Dietetics 54(4 suppl): S3–44.

Food and Nutrition Guidelines for Healthy Adults: A Background Paper118
Bagnardi V, Blangiardo M, Vecchia CL, et al. 2001. A meta-analysis of alcohol drinking andcancer risk. British Journal of Cancer 85: 1700–5.
Ball M. 1997. Atherosclerotic vascular disease and hypertension. In: ML Wahlqvist (ed). Foodand Nutrition: Australasia, Asia and the Pacific. Sydney: Allen and Unwin.
Barbor TF, Grant M. 1989. International collaboration in the development of the alcohol usedisorders identification test (AUDIT). Alcohol Health Res World 13: 371–4.
Barrett-Connor E, Chang JC, Edelstein SL. 1994. Coffee-associated osteoporosis offset by dailymilk consumption: the Rancho Bernardo Study. Journal of the American Medical Association271: 280–3.
Bates M. 2000. Fluoridation of Water Supplies: An evaluation of the recent epidemiologicalevidence. Porirua: Institute of Environmental Science and Research.
Batty D, Thune I. 2000. Does physical activity prevent cancer? Evidence suggests protectionagainst colon cancer and probably breast cancer. British Medical Journal 321(7274): 1424–5.
Bauman A, Bellow B, Vita P, et al. 2002. Getting Australia Active: Towards better practice forthe promotion of physical activity. Melbourne: National Public Health Partnership.
Beaglehole R, Stewart A, Jackson R, et al. 1997. Declining rates of coronary heart disease inNew Zealand and Australia 1983–1993. American Journal of Epidemiology 145: 707–13.
Bell M, Wilbur L, Smith C. 1998. Nutritional status of persons using a local emergency foodsystem program in middle America. Journal of the American Dietetic Association 98(9): 1031–3.
Berry RJ, Li Z, Erickson JD, et al. 1999. Prevention of neural-tube defects with folic acid inChina. The New England Journal of Medicine 341(20): 1485–90.
Bingham SA, Day NE, Luben R, et al. 2003. Dietary fibre in food and protection againstcolorectal cancer in the European Prospective Investigation into Cancer and Nutrition (EPIC):an observational study. Lancet 361: 1496–501.
Birkbeck JB. 1983. New Zealanders and Their Diet: A report to the National Heart Foundationof New Zealand on the National Diet Survey, 1977. (2nd Ed.) Dunedin: University of Otago.
Bloomfield A, Neal G. 1997. Consumer Food Safety Knowledge in Auckland. Auckland:Auckland Healthcare Public Health Protection.
Blot WJ, Li J-Y, Taylor PR, et al. 1993. Nutrition intervention trials in Linxian, China. Journal ofthe National Cancer Institute 85: 1483–92.
Bothwell TH, 1995. Overview and mechanisms of iron regulation. Nutrition Reviews 53(9):237–45.
Bothwell TH, Charlton RW. 1981. Iron Deficiency in Women. Washington, DC: The NutritionFoundation.
Boushey CJ, Beresford SA, Omenn GS, et al. 1995. A quantitative assessment of plasmahomocysteine as a risk factor for vascular disease: probable benefit of increasing folic acidintakes. Journal of the American Medical Association 274: 1049–57.
Bower C, Wald NJ. 1995. Vitamin B12 deficiency and the fortification of food with folic acid.European Journal of Clinical Nutrition 49: 787–93.

Food and Nutrition Guidelines for Healthy Adults: A Background Paper 119
Brand-Miller J. 2002. Carbohydrates. In: J Mann, S Truswell (eds). Essentials of HumanNutrition. New York: Oxford University Press.
Brand-Miller J, Foster-Powell K, Colagiuri S. 1996. The GI Factor. Australia and New Zealand:Hodder Headline Australia.
Bravata DM, Sanders L, Huang J, et al. 2003. Efficacy and safety of low-carbohydrate diets:a systematic review. Journal of the American Medical Association 289: 1837–50.
Bremer J, Chisholm A. 2000. Cardiovascular health for New Zealanders: the role of diet.Technical support paper to the official position of the New Zealand Dietetic Association.Journal of the New Zealand Dietetic Association 54(2): 61–86.
British Nutrition Foundation. 1999. Obesity Report of the British Nutrition Taskforce. Oxford:Blackwell Science.
Brunner EJ, Marmot MG, Nanchahal K, et al. 1997. Social inequality in coronary risk: centralobesity and the metabolic syndrome. Evidence from the Whitehall II study. Diabetologia40(11): 1341–9.
Bryan M. 1988. Risks of practices, procedures and processes that lead to outbreaks offoodborne diseases. Journal of Food Protection 51: 663–73.
Caggiula AW, Wing RR, Norwalk MP, et al. 1985. The measurement of sodium and potassiumintake. American Journal of Clinical Nutrition 42: 391–8.
Campbell NRC, Ashley MJ, Carruthers SG, et al. 1999. Recommendations on alcoholconsumption. Canadian Medical Association Journal 160(9 suppl): S13–20.
Carmack CL, Boudreaux E, Amaral-Melendez M, et al. 1999. Aerobic fitness and leisurephysical activity as moderators of the stress-illness relation. Annals of Behavioral Medicine21(3): 251–7.
Caterson ID. 2002. Overweight and obesity. In: J Mann, S Truswell (eds). Essentials of HumanNutrition. New York: Oxford University Press.
Centers for Disease Control and Prevention (US). 1997. Ready, Steady, It’s Everywhere You Go.US Department of Health and Human Services.
Clarke R, Frost C, Collings R, et al. 1997. Dietary lipids and blood cholesterol: quantitativemeta-analysis of metabolic ward studies. British Medical Journal 314: 112–7.
Colditz GA, Willett WC, Stampfer MJ, et al. 1990. Weight as a risk factor for clinical diabetes inwomen. American Journal of Epidemiology 132(3): 501–13.
Colhoun H, Prescot-Clarke P. 1996. Health Survey for England 1994. London: HMSO.
Consensus Development Conference. 1991. Diagnosis, prophylaxis and treatment ofosteoporosis. American Journal of Medicine 90: 107–10.
Cook JD, Finch CA. 1979. Assessing iron status of a population. American Journal of ClinicalNutrition 32: 2115–19.
Cooper C, Atkinson EJ, Wahner HW, et al. 1992. Is caffeine consumption a risk factor forosteoporosis? Journal of Bone Mineral Research 7: 465–71.
Cooper GJS, Croxson MS, Ibbertson HK. 1984. Iodine intake in an urban environment: a studyof urine iodide excretion in Auckland. New Zealand Medical Journal 97: 142–5.

Food and Nutrition Guidelines for Healthy Adults: A Background Paper120
Cousins RJ. 1986. Towards a molecular understanding of zinc metabolism. Clinical Physiologyand Biochemistry 4: 20–30.
Cowie MR. 1997. Alcohol and the heart. British Journal of Hospital Medicine 57(9): 457–60.
Cristofar SP, Basiotis PP. 1992. Dietary intakes and selected characteristics of women aged19–50 years and their children aged 1–5 years by reported perception of food sufficiency.Journal of Nutrition Education 24: 53–8.
Cumming RG. 1990. Calcium intake and bone mass. Calcif Tissue International 47: 194–201.
Cumming RG, Klineberg RJ. 1994. Case-control study of risk factors for hip fracture in theelderly. American Journal of Epidemiology 139: 493–503.
Cummings SR, Nevitt MC, Browner WS, et al. 1995. Risk factors for hip fracture in whitewomen. Study of Osteoporotic Fracture Research Group. New England Journal of Medicine332: 767–73.
Cutler JA, Follmann D, Allender PS. 1997. Randomised trials of sodium reduction: an overview.American Journal of Clinical Nutrition 65: S643–51.
Czeizel AE, Dudas I. 1992. Prevention of the first occurrence of neural-tube defects bypericonceptional vitamin supplementation. New England Journal of Medicine 327(26): 1832–5.
Department of Agriculture (US). 1989. A Margin of Safety: The HACCP approach to food safetyeducation. Washington, DC: US Department of Agriculture.
Department of Agriculture Center for Nutrition Policy and Promotion (US). 1996. NutritionAction Themes for the United States: A report in response to the International Conference onNutrition. Washington, DC: US Department of Agriculture.
Department of Health. 1991. Food for Health. Report of the Nutrition Taskforce. Wellington:Department of Health.
Department of Health and Human Services (US). 1996. Physical Activity and Health: A reportof the Surgeon General. Department of Health Report on Health and Social Subjects. Centersfor Disease Control and Prevention, National Center for Chronic Disease Prevention and HealthPromotion. Atlanta: US Department of Health and Human Services.
Department of Health (UK). 1991. Dietary Reference Values for Food Energy and Nutrients forthe United Kingdom. Report of the Panel on Dietary Reference Values of the Committee onMedical Aspects of Food Policy, 41. London: HMSO.
Department of Health (UK). 2000. Report of the Committee on Medical Aspects of Food andNutrition Policy: Folic acid and the prevention of disease (50). London: Department of Health.
Diabetes Prevention Program Research Group. 2002. Reduction in the incidence of type 2 diabeteswith lifestyle intervention or metformin. New England Journal of Medicine 346: 393–403.
Dietitians Association of Australia. 2000. High Protein Diets: Media statement. DietitiansAssociation of Australia. URL: http://www.daa.asn.au/common/statements. Accessed19 September 2003.
Dimeo F, Bauer M, Varahram I, et al. 2001. Benefits from aerobic exercise in patients withmajor depression: a pilot study. British Journal of Sports Medicine 35: 114–7.
Donnelly JG. 2001. Folic acid. Critical Reviews in Clinical Laboratory Sciences. 38: 183–223.

Food and Nutrition Guidelines for Healthy Adults: A Background Paper 121
Dowler E, Calvert C. 1995. Nutrition and Diet in Lone-parent Families in London. London:Family Policy Studies Centre.
Durie M. 1999. Te Pae Mahutonga: A model for Maori health promotion. Keynote presentationat the Health Promotion Forum Conference: Health Promotion on the Move.
Eberhart-Phillips J, Walker N, Garrett N, et al. 1997. Campylobacteriosis in New Zealand:results of a case-control study. Journal of Epidemiology and Community Health 51(6): 686–91.
Egger G, Swinburn B. 1997. An ‘ecological’ approach to the obesity pandemic. British MedicalJournal 315(7106): 477–80.
Eikelboom JW, Lonn E, Genest JJ, et al. 1999. Homocysteine and cardiovascular disease: acritical review of the epidemiologic evidence. Annals of Internal Medicine 131: 363–75.
Elders PJ, Netelenbos JC, Lips P, et al. 1991. Calcium supplementation reduces vertebral boneloss in pre-menopausal women. Journal of Clinical Endocrinology and Metabolism 73: 533–40.
Ellekjaer H, Holmen J, Ellekjaer E, et al. 2000. Physical activity and stroke mortality in women:ten-year follow-up of the Nord-Trondelag health survey, 1984–1986. Stroke 31: 14–8.
Elliott P, Stamler J, Nichols R, et al. 1996. Intersalt revisited: further analyses of 24 hoursodium excretion and blood pressure within and across populations. British Medical Journal312: 1249–53.
Englyst H, Kingman S, Cummings J. 1992. Classification and measurement of nutritionallyimportant starch fractions. European Journal of Clinical Nutrition 46: S33–50.
Engstrom A, Tobelmann RC, Albertson AM. 1997. Sodium trends and food choices. AmericanJournal of Clinical Nutrition 65: S704–7.
Erdman JW, Klein BP. 1982. Harvesting, processing, and cooking influences on vitamin C infoods. In: PA Seib, BM Tolbert (eds). Ascorbic Acid: Chemistry, metabolism and uses.Washington, DC: American Chemical Society.
ESR. 1999. The Cost-effectiveness of Fluoridating Water Supplies in New Zealand: A report forthe New Zealand Ministry of Health. Porirua: Institute of Environmental Science and Research.
Expert Committee on Drinking Water Standards. 2000. Drinking Water Standards for NewZealand 2000. Wellington. Ministry of Health.
Expert Committee on the Diagnosis and Classification of Diabetes Mellitus. 1997. Report of theExpert Committee on the Diagnosis and Classification of Diabetes Mellitus. Diabetes Care 20:1183–97.
Eyres L. 2000. Changes in the lipid composition of New Zealand diets. Proceedings of theNutrition Society of New Zealand 25: 1–9.
Fagard R. 2001. Exercise characteristics and the blood pressure response to dynamic physicaltraining. Medicine and Science 33(6 Suppl): S484–92.
FAO. 1996. Rome Declaration on World Food Security and World Food Summit Plan of Action.World Food Summit, Rome, 13–17 November 1996. Rome: Food and Agriculture Organizationof the United Nations.
FAO, WHO. 1993. Fat and Oils in Human Nutrition: Report of a joint expert consultation.Rome: Food and Agriculture Organization of the United Nations.

Food and Nutrition Guidelines for Healthy Adults: A Background Paper122
FAO, WHO. 1998. FAO/WHO Expert Consultation on Carbohydrates in Human Nutrition. FAOFood and Nutrition paper 66. Rome: Food and Agriculture Organization of the United Nations.
FAO, WHO, UNU. 1985. Energy and Protein Requirements. Report of a joint FAO-WHO-UNUmeeting. Geneva: World Health Organization.
Farrell A. 1994. Diseases of Poverty: A paediatrician’s perspective. Paper presented at theSecond National Foodbank Conference, Wellington.
Fawcett PJ, Brooke M, Beresford CH. 1998. Iron deficiency and anaemia in a longitudinal studyof New Zealanders at ages 11 and 21 years. New Zealand Medical Journal 111: 400–2.
Ferguson E, Morison I, Faed J, et al. 2001. Dietary iron intakes and biochemical status of 15–49 year old women in New Zealand: is there a cause for concern? New Zealand MedicalJournal 114: 134–8.
Ferrucci L, Izmirlian G, Leveille S, et al. 1999. Smoking, physical activity, active life expectancy.American Journal of Epidemiology 149(7): 645–53.
Food and Drug Administration (US). 1994. Center for Food Safety and Applied Nutrition.A Food Labeling Guide. Editorial revisions June 1999 and November 2000.URL: http://vm.cfsan.fda.gov/~dms/flg-6c.html. Accessed August 2003.
Food Standards Australia New Zealand. 2002. Australia New Zealand Food Standards Code.
Ford G, Ecob R, Hunt K, et al. 1994. Patterns of class inequality in health through the lifespan:class gradients at 15, 35 and 55 years in the west of Scotland. Social Science and Medicine39: 1037–50.
Forwood MR, Larsen JA. 2000. Exercise recommendations for osteoporosis: a positionstatement of the Australian and New Zealand Bone and Mineral Society. Australian FamilyPhysician 29(8). URL: http://afp.racgp.org.au/2000/august/forwood.htm. Accessed19 September 2003.
Frost G, Keogh B, Smith D, et al. 1996. The effect of low-glycemic carbohydrate on insulin andglucose response in vivo and in vitro in patients with coronary artery disease. Metabolism 45:669–72.
Galan P, Yoon H-C, Preziosi, et al. 1998. Determining factors in the iron status of adult womenin the SU.VI.MAX study. European Journal of Clinical Nutrition 52: 383–8.
Gibson R. 1990. Principles of Nutritional Assessment. New York: Oxford University Press.
Gibson RS, Heath A-L, Ferguson EL. 2002. Risk of suboptimal iron and zinc nutriture amongadolescent girls in Australia and New Zealand: causes, consequences and solutions. AsiaPacific Journal of Clinical Nutrition 11(Suppl): S543–52.
Gibson RS, Heath A-L, Limbaga MLS, et al. 2001. Are changes in food consumption patternsassociated with lower biochemical zinc status among women from Dunedin, New Zealand?British Journal of Nutrition 86: 71–80.
Gleerup A, Rossander-Hulthen L, Gramatokovski E, et al. 1995. Iron absorption from the wholediet: comparison of the effect of two different distributions of daily calcium intake. AmericanJournal of Clinical Nutrition 61: 97–104.
Godlee F. 1996. The food industry fights for salt. British Medical Journal 312: 1239–40.

Food and Nutrition Guidelines for Healthy Adults: A Background Paper 123
Goulding A. 2002. Major minerals: calcium and magnesium. In: J Mann, S Truswell (eds).Essentials of Human Nutrition. New York: Oxford University Press.
Graham J, Collins D, Devoy S, et al. 2001. Getting Set for an Active Nation: Report of the SportFitness and Leisure Ministerial Taskforce. Unpublished report. Wellington.
Greenberg ER, Baron JA, Tosteson TD, et al. 1994. A clinical trial of antioxidant vitamins toprevent colorectal adenoma. New England Journal of Medicine 331: 141–7.
Grundy SM, Pasternak R, Greenland P, et al. 1999. Assessment of cardiovascular risk by use ofmultiple-risk-factor assessment equations: a statement for health-care professionals from theAmerican Heart Association and the American College of Cardiology. Circulation 100: 1481–92.
Guthrie B, Muimui-Heata S, et al. 1998. Cultural sensitivity in nutrition education: the Tonganexperience. In: J Mann, S Truswell (eds). Essentials of Human Nutrition. New York: OxfordUniversity Press.
Habgood R, Casswell S, Pledger M, et al. 2001. Drinking in New Zealand: National surveyscomparison 1995–2000. Auckland: Alcohol and Public Health Research Unit.
Hackwell K. 1998. Hidden Poverty: A challenge to foodbanks. Paper presented at the FourthNational Foodbank Conference, Wellington, November 1998.
Hagberg JM, Park JJ, Brown MD. 2000. The role of exercise training in the treatment ofhypertension: an update. Sports Medicine 30(3): 193–206.
Hakim AA, Curb JD, Petrovitch H, et al. 1999. Effects of walking on coronary heart disease inelderly men: the Honolulu Heart Programme. Circulation 100(1): 9–13.
Halbert J, Silagy CA, Finucane P, et al. 1997. The effectiveness of exercise training in loweringblood pressure: a meta-analysis of randomised controlled trials of four weeks or longer.Journal of Human Hypertension 11(10): 641–9.
Hallberg L. 1981. Bioavailability of dietary iron in man. Annual Reviews of Nutrition 1: 123–47.
Hallberg L, Brune M, Erlaandsson M, et al. 1991. Calcium: effect of different amounts on non-heme- and heme-iron absorption in man. American Journal of Clinical Nutrition 53: 112–9.
Hallberg L, Hulthen L. 2000. Prediction of dietary iron absorption: an algorithm for calculatingabsorption and bioavailability of dietary iron. American Journal of Clinical Nutrition 71: 1147–60.
Hallberg L, Hulthen L, Bengtsson C, et al. 1995. Iron balance in menstruating women.European Journal of Clinical Nutrition 49: 200–7.
Hallberg L, Sandstrom B, Ralph A, et al. 2001. Iron, zinc and other trace elements. In:JS Garrow, WPT James, A Ralph (eds). Human Nutrition and Dietetics. London: ChurchillLivingstone.
Hamilton WL, Cook JT, Thompson WW, et al. 1997. Household Food Security in the UnitedStates in 1995. Washington, DC: US Department of Agriculture, Food and Consumer Services.
Han TS, Seidell JC, Currall JE, et al. 1997. The influences of height and age on waistcircumference as an index of adiposity in adults. International Journal of Obesity and RelatedMetabolic Disorders 21: 83–9.
Harding WR, Russell CE, Davidson P, et al. 1986. Dietary surveys from the Tokelauan Islandsmigrant study. Ecology of Food and Nutrition 19: 83–97.

Food and Nutrition Guidelines for Healthy Adults: A Background Paper124
Harman SK, Parnell WR. 1998. The nutritional health of New Zealand vegetarian and non-vegetarian Seventh-day Adventists: selected vitamin, mineral and lipid levels. New ZealandMedical Journal 1062(111): 91–4.
Harper CG, Sheedy DL, Lara AI, et al. 1998. Prevalence of Wernicke-Korsakoff syndrome inAustralia: has thiamine fortification made a difference? Medical Journal of Australia 168(11):542–5.
Health Funding Authority. 2000. Diabetes 2000. Wellington: Health Funding Authority.
Health Promotion Forum. 2001. The Tuhanz Memorandum: A Treaty understanding of health inAotearoa New Zealand. Auckland: Health Promotion Forum of New Zealand.
Heart Protection Study Collaborative Group. 2002. MRC/BHF Heart Protection Study ofantioxidant vitamin supplementation in 20536 high-risk individuals: a randomised placebo-controlled trial. Lancet 360(9326): 23–33.
Heath A-L, Skeaff CM, O’Brien S, et al. 1999. The Treatment of Mild Iron Deficiency by IronSupplementation and Diet, and its Impact on Mood. Paper presented at the 2nd South-westPacific Nutrition and Dietetic Conference, Auckland, September 1999.
Hercus CE, Benson WN, Carter CL. 1925. Endemic goitre in New Zealand and its relation to thesoil iodine. Journal of Hygiene 24: 321–402.
Hernandez-Avila M, Colditz G, Stampfer MJ, et al. 1991. Caffeine, moderate alcohol intake, andrisk of fractures of the hip and forearm in middle-aged women. American Journal of ClinicalNutrition 54: 157–63.
Hillary Commission. 1998. Physical Activity Taskforce Report. Wellington: Hillary Commission.
Hillary Commission. 2001. Movement = Health. Wellington: Hillary Commission.
Hodges I. 1993. Raw to Cooked: Community awareness of safe food handling practices.Wellington: Department of Health.
Homocysteine Lowering Trialists’ Collaboration. 1998. Lowering blood homocysteine with folic acidbased supplements: meta-analysis of randomised trials. British Medical Journal 316: 894–8.
Homocysteine Studies Collaboration. 2002. Homocysteine and risk of ischaemic heart diseaseand stroke. Journal of the American Medical Association 288: 2015–22.
Hu FB, Sigal RJ, Rich-Edwards JW, et al. 1999. Walking compared with vigorous physicalactivity and risk of type 2 diabetes in women: a prospective study. Journal of the AmericanMedical Association 282(15): 1433–9.
Hu FB, Stampfer MJ, Colditz GA, et al. 2000. Physical activity and risk of stroke in women.Journal of the American Medical Association 283(22): 2961–7.
Huhtasaari F, Asplund K, Wester PO. 1988. Cardiovascular risk factors in the Northern SwedenMONICA Study. Acta Medica Scandinavica 224(2): 99–108.
Huovinen E, Kaprio J, Laitinen LA, et al. 2001. Social predictors of adult asthma: a co-twincase-control study. Thorax 56(3): 234–6.
Huxtable RJ. 1992. Harmful potential of herbal and other plant products. New Ethicals April:87–93.

Food and Nutrition Guidelines for Healthy Adults: A Background Paper 125
Ilich-Ernst JZ, McKenna AA, Badenhop NE, et al. 1998. Iron status, menarche, and calciumsupplementation in adolescent girls. American Journal of Clinical Nutrition 68: 880–7.
Institute of Medicine. 1997. Dietary Reference Intakes: Calcium, phosphorus, magnesium,vitamin D and fluoride. Standing Committee on the Scientific Evaluation of Dietary ReferenceIntakes. Washington, DC: National Academy Press.
Institute of Medicine. 1998. Dietary Reference Values for Thiamin, Riboflavin, Niacin, VitaminB6, Folate, Vitamin B12, Pantothenic Acid, Biotin and Choline. Report of the StandingCommittee on the Scientific Evaluation of Dietary Reference Intakes and its Panel on Folate,Other B Vitamins, and Choline and Subcommittee on Upper Reference Levels of Nutrients,Food and Nutrition Board. Washington, DC: National Academy Press.
Institute of Medicine. 2000. Dietary Reference Values for Vitamin C, Vitamin E, Selenium andCarotenoids. Report on Dietary Antioxidants and Related Compounds, Subcommittee on UpperReference Levels of Nutrients and Interpretation and Uses of the Dietary Reference Intakes,and the Standing Committee on the Scientific Evaluation of the Dietary Reference Intakes,Food and Nutrition Board. Washington, DC: National Academy Press.
Institute of Medicine. 2002a. Dietary Reference Intakes for Vitamin A, Vitamin K, Arsenic,Boron, Chromium, Copper, Iodine, Iron, Manganese, Molybdenum, Nickel, Silicon, Vanadium,and Zinc. Standing Committee on the Scientific Evaluation of Dietary Reference Intakes, Foodand Nutrition Board. Washington, DC: National Academy Press.
Institute of Medicine. 2002b. Dietary Reference Intakes Proposed Definition of Dietary Fiber.A Report of the Panel of the Definition of Dietary Fiber and the Standing Committee on theScientific Evaluation of Dietary Reference Intakes. Washington, DC: National Academy Press.
Institute of Medicine. 2002c. Prepublication Copy of Dietary Reference Intakes for Energy,Carbohydrate, Fiber, Fat, Fatty Acids, Cholesterol, Protein and Amino Acids. Washington, DC:National Academies Press.
International Agency for Research on Cancer. 2002. IARC Handbooks of Cancer Prevention.Vol 6: Weight Control and Physical Activity. Lyon: IARC Press.
Jackson A. 2002. Protein. In: J Mann, S Truswell (eds). Essentials of Human Nutrition. NewYork: Oxford University Press.
Jéquier E. 1999. Response to and range of acceptable fat intakes in adults. European Journalof Clinical Nutrition 53(suppl 1): S84–93.
Johansson C, Mellstrom D, Lerner U, et al. 1992. Coffee drinking: a minor risk factor for boneloss and fracture. Age and Ageing 21: 20–6.
John JH, Ziebland S, Yudkin P, et al. 2002. Effects of fruit and vegetable consumption onplasma antioxidant concentrations and blood pressure: a randomised control trial. Lancet 359:1969–74.
Jurgen R, Greenfield T, Rogers J. 2001. Average volume of alcohol consumption, patterns ofdrinking, and all-cause mortality: results from the US National Alcohol Survey. AmericanJournal of Epidemiology 153: 64–71.
Kendall A, Olson CM, Frongillo EA. 1996. Validation of the Radimer/Cornell measures of hungerand food insecurity. Journal of Nutrition 125: 2793–801.
Kerslake V. 1995. Community Awareness of Safe Food Handling Practices and Food Poisoning:Knowledge and experience. Wellington: Victoria University.

Food and Nutrition Guidelines for Healthy Adults: A Background Paper126
Key TJ, Allen NE, Spencer EA, et al. 2002. The effect of diet on risk of cancer. Lancet 360:861–8.
Kiel DP, Felson DT, Hannan MT, et al. 1990. Caffeine and the risk of hip fracture: theFramingham Study. American Journal of Epidemiology 132: 675–84.
Klein BW. 1996. Food security and hunger measures: promising future for state and localhousehold surveys. Family Economics and Nutrition Review 9(4): 31–7.
Klesges RC, Eck LH, Ray JW. 1995. Who under-reports dietary intake in a dietary recall?Evidence from the second National Health and Nutrition Examination Survey. Journal ofConsulting and Clinical Psychology 63(3): 438–44.
Kovar PA, Allegrante JP, Mackenzie CR, et al. 1992. Supervised fitness walking in patients withosteoarthritis of the knee: a randomised, controlled trial. Annals of Internal Medicine 116(7):529–34.
Kumanyika S, Jeffery RW, Morabia A, et al. 2002. Obesity prevention: the case for action.International Journal of Obesity 26: 425–36.
Kuskowska-Wolk H, Bergstrom R. 1993. Trends in body mass index and prevalence of obesityin Swedish men 1980–1989. Journal of Epidemiology and Community Health 47: 103–8.
Lafay L, Basdevant A, Charles M-A, et al. 1997. Determinants and nature of dietaryunderreporting in a free-living population: the Fleurbaix Laventie Ville Sante (FLVS) study.International Journal of Obesity 21: 567–73.
Lake R, Baker M, Garrett N, et al. 2000. Estimated number of cases of foodborne infectiousdisease in New Zealand. New Zealand Medical Journal 113: 278–81.
Lake R, Simmons G. 2002. How important is unsafe domestic food handling in the etiology offoodborne illness in New Zealand? New Zealand Public Health Report 8: 89–91.
Lang T. 1992. Food policy and public health. Public Health 106: 91–125.
Laurin D, Verreault R, Lindsay J, et al. 2001. Physical activity and risk of cognitive impairmentand dementia in elderly persons. Archives of Neurology 58(3): 498–504.
Law MR, Frost C, Wald N. 1991a. By how much does dietary salt restriction lower bloodpressure? I – Analysis of observational data among populations. British Medical Journal 302:811–5.
Law MR, Frost C, Wald N. 1991b. By how much does dietary salt reduction lower bloodpressure? II – Analysis of observational data within populations. British Medical Journal 302:815–9.
Law MR, Frost C, Wald N. 1991c. By how much does dietary salt reduction lower bloodpressure? III – Analysis of data from trials of salt restriction. British Medical Journal 302: 819–24.
Leather S. 1995. Fruit and vegetables: consumption patterns and health consequences. BritishFood Journal 97(7): 10–7.
Leveille S, Guralnik J, Ferucci L, et al. 1999. Ageing successfully until death in old age:opportunities for increasing active life expectancy. American Journal of Epidemiology 149(7):654–64.

Food and Nutrition Guidelines for Healthy Adults: A Background Paper 127
Levine M, Rumsey S, Daruwala R, et al. 1999. Criteria and recommendations for vitamin Cintake. Journal of the American Medical Association 281(15): 1415–23.
Lichtenstein P, Niels V, Holm MD, et al. 2000. Environmental and heritable factors in thecausation of cancer. New England Journal of Medicine 343(2): 78–84.
LINZ Research Unit. 1999. 1997 National Nutrition Survey LINZ Tables (Ministry) Volume 3:Dietary sources of nutrients. LINZ Activity and Health Research Unit, Dunedin: University ofOtago.
LINZ Research Unit. 2000. NNS97: Data analysis. Dunedin: University of Otago.
Lloyd T, Rollings N, Eggli D, et al. 1997. Dietary caffeine intake and bone status ofpostmenopausal women. American Journal of Clinical Nutrition 65: 1826–30.
Looker AC, Dallman PR, Carroll MD, et al. 1997. Prevalence of iron deficiency in the UnitedStates. Journal of the American Medical Association 277(12): 973–6.
Maclure M. 1993. Demonstration of deductive meta-analysis: ethanol intake and risk ofmyocardial infarction. Epidemiological Reviews 15: 328–51.
MacPhail P. 2002. Iron. In: J Mann, S Truswell (eds). Essentials of Human Nutrition. New York:Oxford University Press.
Mann J. 2002. Cardiovascular diseases. In: J Mann, S Truswell (eds). Essentials of HumanNutrition. New York: Oxford University Press.
Mann J, Aitken E. 2003. The re-emergence of iodine deficiency in New Zealand? New ZealandMedical Journal 116: 1170. URL: http://www.nzma.org.nz/journal/116-1170/351.
Mann J, Lewis B, Shepard J, et al 1988. Blood lipid concentration and other cardiovascular riskfactors: distribution, prevalence and detection in Britain. British Medical Journal (ClinicalResearch Edition) 296(6638): 1702–6.
Mann J, Skeaff M. 2002. Lipids. In: J Mann, S Truswell (eds). Essentials of Human Nutrition.New York: Oxford University Press.
Manson JE, Hu FB, Rich-Edwards JW, et al. 1999. A prospective study of walking as comparedwith vigorous exercise in the prevention of coronary heart disease in women. New EnglandJournal of Medicine 26: 650–8.
Manson JE, Spelsberg A. 1994. Primary prevention of non-insulin dependent diabetes mellitus.American Journal of Preventative Medicine 10: 172–84.
Marmot M, Brunner E. 1991. Alcohol and cardiovascular disease: the status of the U-shapedcurve. British Medical Journal 303: 565–8.
Marrett LD, Theis B, Ashbury FD, an Expert Panel. 2000. Workshop report: physical activityand cancer prevention. Chronic Diseases in Canada 21(4): 143–9.
Marsarei JR, Lynch WR, Robertson K, et al. 1981. Levels of cholesterol, triglycerides, HDL-cholesterol and protein HDL in an Australian rural population. Pathology 13(4): 725–34.
Marshall WJ, Peters TJ, Preedy VR. 2001. Nutritional management of alcohol-related disorders.In: JS Garrow, WPT James, A Ralph (eds). Human Nutrition and Dietetics. London: ChurchillLivingstone.

Food and Nutrition Guidelines for Healthy Adults: A Background Paper128
Maskill C, Hodges I. 2001. Intersectoral Initiatives for Improving the Health of LocalCommunities: A literature review. Wellington: Ministry of Health.
Mathews M. 1997. Letter to the editor. Journal of the New Zealand Dietetic Association 51(1): 5.
McKerchar M. 1999. Ma te Huruhuru Ka Rere te Manu (with feathers a bird can fly):Development of a support group for Maori people with diabetes. Proceedings of the HealthPromotion on the Move Conference. Napier.
Medical Research Council. 1991. Prevention of neural tube defects: results of the MedicalResearch Council Vitamin Study. Lancet 338 (8760): 131–7.
Minister of Health. 2000. The New Zealand Health Strategy. Wellington: Ministry of Health.
Minister of Health. 2002. The Pacific Health and Disability Action Plan. Wellington: Ministry ofHealth.
Minister of Health and Associate Minister of Health. 2002a. He Korowai Oranga: Maori HealthStrategy. Wellington: Ministry of Health.
Minister of Health and Associate Minister of Health. 2002b. Whakatataka: Maori Health ActionPlan 2002–2005. Wellington: Ministry of Health.
Minister of Sport, Fitness and Leisure, Minister of Health. 1999. Physical Activity: Joint policystatement by the Minister of Sport, Fitness and Leisure and the Minister of Health. Wellington:Office of Tourism and Sport, Ministry of Health.
Ministry of Agriculture, Fisheries and Food (UK). 1996. National Food Survey 1981. London:HMSO.
Ministry of Health. 1995. Folic Acid and Spina Bifida [Code 4147]. Wellington: Ministry ofHealth.
Ministry of Health. 1996. Food and Nutrition Guidelines for Healthy Older People:A background paper. Wellington: Ministry of Health.
Ministry of Health. 1997a. Food and Nutrition Guidelines for Healthy Breastfeeding Women:A background paper. Wellington: Ministry of Health.
Ministry of Health. 1997b. Food and Nutrition Guidelines for Healthy Pregnant Women:A background paper. Wellington: Ministry of Health.
Ministry of Health. 1997c. Food and Nutrition Guidelines for Healthy Children Aged 2–12 years:A background paper. Wellington: Ministry of Health.
Ministry of Health. 1997d. Making a Pacific Difference: Strategic initiatives for the health ofPacific people in New Zealand. Wellington: Ministry of Health.
Ministry of Health. 1997e. New Zealand Food Regulations 1984: Consolidated version.Wellington: Ministry of Health.
Ministry of Health. 1997f. Pacific Peoples Health Education Guidelines. Wellington: Ministry ofHealth.
Ministry of Health. 1998a. Food and Nutrition Guidelines for Healthy Adolescents: Abackground paper. Wellington: Ministry of Health.

Food and Nutrition Guidelines for Healthy Adults: A Background Paper 129
Ministry of Health. 1998b. Making a Pacific Difference in Health Policy. Wellington: Ministry ofHealth.
Ministry of Health. 1998c. Progress on Health Outcome Targets: Te Haere Whakamua ki ngaWhainga Hua mo te Hauora. Wellington: Ministry of Health.
Ministry of Health. 1999a. 1998 a record year for campylobacteriosis and salmonellosis. NewZealand Public Health Report 6(2): 13.
Ministry of Health. 1999b. Eating for Healthy Pregnant Women [Code 6002]. Wellington:Ministry of Health.
Ministry of Health. 1999c. NZ Food, NZ People: Key results of the 1997 National NutritionSurvey. Wellington: Ministry of Health.
Ministry of Health. 1999d. Our Health, Our Future: Hauora Pakari, Koiora Roa. Wellington:Ministry of Health.
Ministry of Health. 1999e. Progress on Health Outcome Targets. Wellington: Ministry of Health.URL: http://www.moh.gov.nz.
Ministry of Health. 1999f. Taking the Pulse: The 1996/97 New Zealand Health Survey.Wellington: Ministry of Health.
Ministry of Health. 2000a. An Introduction to HACCP. Food safety information for New Zealandbusiness. Wellington: Ministry of Health.
Ministry of Health. 2000b. Food and Nutrition Guidelines for Healthy Infants and Toddlers(aged 0–2): A background paper. Wellington: Ministry of Health.
Ministry of Health. 2000c. What Does a Food Safety Programme Look Like? Food safetyinformation for New Zealand business. Wellington: Ministry of Health.
Ministry of Health. 2001a. DHB Toolkit: Improve nutrition. Wellington: Ministry of Health. URL:http://www.moh.govt.nz.
Ministry of Health. 2001b. DHB Toolkit: Physical activity: To increase physical activity.Wellington: Ministry of Health. URL: http://www.moh.govt.nz.
Ministry of Health. 2001c. New Zealand Drug Statistics. Wellington: Ministry of Health.
Ministry of Health. 2002a. Modelling Diabetes: A multi-state life table model. Wellington:Ministry of Health.
Ministry of Health. 2002b. Modelling Diabetes: A summary. Wellington: Ministry of Health.
Ministry of Health. 2002c. Modelling Diabetes: Forecasts to 2011. Wellington: Ministry ofHealth.
Ministry of Health. 2002d. Modelling Diabetes: The mortality burden. Wellington: Ministry ofHealth.
Ministry of Health. 2003a. Fluoridation of Water Supplies: An overview. Unpublished report tothe Ministry of Health.
Ministry of Health. 2003b. Healthy Action – Healthy eating: Oranga Kai – Oranga pumau:A background paper. Wellington: Ministry of Health.

Food and Nutrition Guidelines for Healthy Adults: A Background Paper130
Ministry of Health. 2003c. Healthy Action – Healthy eating: Oranga Kai – Oranga pumau:A strategic framework. Wellington: Ministry of Health.
Ministry of Health. 2003d. Improving Folate Intake in New Zealand: Policy implications.Wellington: Ministry of Health.
Ministry of Health. 2003e. Primary Prevention: Report of the Primary Prevention ExpertWorking Group to the Cancer Control Steering Group. Wellington: Ministry of Health. URL:http://www.moh.govt.nz.
Ministry of Health, University of Auckland. 2003. Nutrition and the Burden of Disease: NewZealand 1997–2011. Wellington: Ministry of Health.
Mink BD. 1997. Exercise and chronic obstructive pulmonary disease: modest fitness gains paybig dividends. The Physician and Sports Medicine 25(11): 43–7, 52, 111–3.
Moata‘ane L. 1999. Nutrition Education for Migrant Pacific People: The interweaving of cultureand science. Master of Science Thesis, University of Otago, Dunedin.
Moata‘ane L, Guthrie BE. 2000. Dietitians perceptions of nutrition education for migrantpeople. Journal of the New Zealand Dietetic Association 54(1): 14–20.
Moata‘ane L, Muimui-Heata S, Guthrie BE. 1996. Tongan perception of diet and diabetesmellitus. Journal of the New Zealand Dietetic Association 50(7): 54–8.
Moewaka Barnes H, Tunks M, Dacey B, et al. 1998a. Kai o Te Hauora – Te Hotu ManawaMaori: Outcome evaluation report. Auckland: Alcohol and Public Health Research Unit,University of Auckland.
Moewaka Barnes H, Tunks M, Dacey B, et al. 1998b. Kai Oranga Tinana mo Waipereira:Outcome evaluation report. Auckland: Alcohol and Public Health Research Unit, University ofAuckland.
Moewaka Barnes H, Tunks M, Dacey B, et al. 1998c. Te Pataka o Te Taitokerau: Outcomeevaluation report. Auckland: Alcohol and Public Health Research Unit, University of Auckland.
Mooij PNM, Thomas CMG, Doesburg WH, et al. 1992. The effects of oral contraceptives andmultivitamin supplementation on serum ferritin and hematological parameters. InternationalJournal of Clinical Pharmacology and Therapeutic Toxicology 30(2): 57–62.
Morgan K, Bath PA. 1998. Customary physical activity and psychological wellbeing: alongitudinal study. Age and Ageing 27(suppl 3): S35–40.
Murray JJ, Rugg-Gunn AJ, Jenkins GN. 1991. Fluorides in Caries Prevention. (3rd Ed.) Oxford:Butterworth–Heinemann.
Ness AR, Powles JW. 1997. Fruit and vegetables and cardiovascular disease: a review.International Journal of Epidemiology 26: 1–13.
New Zealand Guidelines Group. 2003. Dietary Intervention: Best Practice Evidence BasedGuidelines: The assessment and management of cardiovascular risk (Consultation Draft 2003).19–47. URL: http://www.nzgg.org.nz/development/documents/Cardio_Assess_Mana_Consultation.pdf. Accessed 28 August 2003.
New Zealand Network Against Food Poverty. 1999. Hidden Hunger: Food and low income inNew Zealand. Wellington: The Downtown Community Ministry.

Food and Nutrition Guidelines for Healthy Adults: A Background Paper 131
NHC. 1997. Preventive Dental Strategies for Older Populations. Wellington: National AdvisoryCommittee on Health and Disability.
NHC. 1998. The Social, Cultural and Economic Determinants of Health in New Zealand: Actionto improve health. Wellington: National Advisory Committee on Health and Disability.
NHF. 1999. Nutrition and Cardiovascular Disease: An evidence summary. Report No. 77 fromthe National Heart Foundation’s Technical Advisory Committee. Auckland: National HeartFoundation.
NHF. 2003. Low Cholesterol Living. URL: www.nhf.org.nz. Accessed 10 September 2003.
NHLBI. 1998. Clinical Guidelines on the Identification, Evaluation and Treatment of Overweightand Obesity in Adults. The evidence report. San Francisco: National Heart, Lung and BloodInstitute, National Institutes of Health.
NHMRC. 1999a. Review of Water Fluoridation and Fluoride Intake from Discretionary FluorideSupplements. Canberra: Australian Government Publishing Service.
NHMRC. 1999b. The Prevention, Early Detection and Management of Colorectal Cancer: Clinicalpractice guidelines. Canberra: Australian Government Publishing Service.
NHMRC. 2003. Dietary Guidelines for Australian Adults. Canberra: Australian GovernmentPublishing Service.
Nicholls MG, Richards AM. 1999. The salt dilemma: some answers, many questions. MedicalJournal of Australia 170: 178–80.
NRC (National Research Council). 1993. Health Effects of Ingested Fluoride. Washington, DC:National Academy Press.
Nurminen ML, Niittynen L, Korpela R, et al. 1999. Coffee, caffeine and blood pressure: acritical review. European Journal of Clinical Nutrition 53(11): 831–9.
Nutrition Advisory Committee. 1983. Recommendations for Selected Nutrient Intakes of NewZealanders. Wellington: Government Printer.
Oberleas D, Harland BF. 1981. Phytate content of foods: effect of dietary zinc bioavailability.Journal of the American Dietetic Association 79: 433–6.
O’Brien KO, Allen LH, Quatromoni P. 1993. High fibre diets slow bone turnover in young menbut have no effect on efficiency of intestinal calcium absorption. Journal of Nutrition 123:2122–8.
Olson JA, Loveridge N, Duthie GG, et al. 2001. Fat-soluble vitamins. In: JS Garrow, WPT James,A Ralph (eds). Human Nutrition and Dietetics. London: Churchill Livingstone.
Omenn GS, Goodman GE, Thornquist MD, et al. 1996. Effects of a combination of betacarotene and vitamin A on lung cancer and cardiovascular disease. New England Journal ofMedicine 334: 1150–5.
Orchard V, Baker M, Martin, D. 2000. The communicable disease picture in New Zealandtoday. Healthcare Online. URL: http://www.enigma.co.nz/hcro_articles/0005/ vol4no5_001.htm.
Pan X, Li GW, Hu YH, et al. 1997. Effects of diet and exercise in preventing NIDDM in people withimpaired glucose tolerance. The Da Qing IGT and Diabetes Study. Diabetes Care 20: 537–44.

Food and Nutrition Guidelines for Healthy Adults: A Background Paper132
Parnell W. 1997. Socio-economic disadvantage and nutritional status in New Zealand. In:BM Köhler, E Feichtinger, E Barlosius (eds). Poverty and Food in Welfare Societies. Berlin:Sigma.
Parnell W. 2001. Feeding New Zealanders: who is responsible? Proceedings of the NutritionSociety of New Zealand 26: 1–10.
Pearce EIF, Cutress TW, Sissons CH, et al. 1992. Supplementation of domestic sugar (sucrose)with fluoride: effects on experimental dental caries, plaque pH, and fluoride levels in plaqueand enamel. New Zealand Dental Journal 88: 84–8.
Pearce J. 1996. Nutritional analysis of fluid replacement beverages. Australian Journal ofNutrition and Dietetics 53(suppl): S35–42.
PHC. 1993. Fluoridation of Water Supplies: Draft policy statement. Wellington: Public HealthCommission.
PHC. 1994. An Analysis and Monitoring Report: Water fluoridation in New Zealand. Wellington:Public Health Commission.
Pickston L, Brewerton HV, Drysdale JM, et al. 1985. The New Zealand diet: a survey ofelements, pesticides, colours and preservatives. New Zealand Journal of Technology 1: 81–9.
Pihema H. 1998. Training: what’s in it for Maori? Journal of the New Zealand DieteticAssociation 52(1): 3–4.
Pipi K, Moewaka Barnes H, Spinola C. 1994. Te Kai o Te Hauora: Healthy Lifestyles: Focus onFood and Nutrition Project evaluation. Auckland: Alcohol and Public Health Research Unit,University of Auckland.
Pollock N. 1992. These Roots Remain: Food habits in islands of the central and eastern Pacificsince western contact. Honolulu: University of Hawaii Press.
Pomare E, Keefe-Ormsby V, Ormsby C, et al. 1995. Hauora: Maori standards of health 1970–1991. Wellington: Te Ropu Rangahau Hauroa a Eru Pomare.
Prince R, Devine A, Dick I, et al. 1995. The effects of calcium supplementation (milk powder ortablets) and exercise on bone density in postmenopausal women. Journal of Bone MineralResearch 10: 1068–75.
Prior IAM. 1976. Nutritional problems in Pacific Islanders. Proceedings of the Nutrition Societyof New Zealand 1: 1–44.
Prospective Studies Collaboration. 2002. Age-specific relevance of usual blood pressure tovascular mortality: a meta-analysis of individual data for one million adults in 61 prospectivestudies. Lancet 360: 1903–13.
Public Health Advisory Committee. 2003. Improving Child Oral Health and Reducing Child OralHealth Inequalities. Wellington: National Health Committee.
Purves HD. 1974. The aetiology and prophylaxis of endemic goitre and cretinism: the NewZealand experience. New Zealand Medical Journal 80: 477–9.
Quigley R, Watts C. 1997. Food Comes First: Methodologies for the National Nutrition Surveyof New Zealand. Wellington: Ministry of Health.
Randall A, Sambrook PN, Nguyen TV, et al. 1995. Direct clinical and welfare costs ofosteoporotic fractures in elderly men and women. Osteoporosis International 5: 427–32.

Food and Nutrition Guidelines for Healthy Adults: A Background Paper 133
Rasmussen F, Lambrechtsen J, Siersted HC, et al. 2000. Low physical fitness in childhood isassociated with the development of asthma in young adulthood: the Odense schoolchildstudy. European Respiratory Journal 16(5): 866–70.
Rayman MP. 2000. The importance of selenium to human health. Lancet 256: 233–41.
Read RSD. 1997. Protein. In: ML Wahlqvist (ed). Food and Nutrition. Sydney: Allen and Unwin.
Reid IR, Ames RW, Evans MC, et al. 1994. Determinants of the rate of bone loss in normalpostmenopausal women. Journal of Clinical Endocrinology and Metabolism 79: 950–4.
Reid IR, Ames RW, Evans MC, et al. 1995a. Long-term effects of calcium supplementation onbone loss and fractures in postmenopausal women: a randomised controlled trial. AmericanJournal of Medicine 98: 331–5.
Reid IR, Legge M, Stapleton JP, et al. 1995b. Regular exercise dissociates fat mass and bonedensity in premenopausal women. Journal of Clinical Endocrinology and Metabolism 80: 1764–8.
Restaurant Association of New Zealand. 2002. Foodservice Facts. Auckland: RestaurantAssociation of New Zealand.
Riboli E. 2002. How Good is the Evidence for the Nutrition and Cancer Link? The latest resultsfrom the European Prospective Investigation into Cancer and Nutrition (EPIC) Study. Paperpresented to the Eat and Run Satellite Meeting, Wellington. 21 June 2002.URL: http://www.cancernz.org.nz/INFO/PDF/nutr.pdf/Theepicstudyofnutrition.pdf. Accessed6 September 2003.
Rimm EB, Klasky A, Grobbee D, et al. 1996. Review of moderate alcohol consumption andreduced risk of coronary heart disease: is the effect due to beer, wine or spirits? BritishMedical Journal 312: 731–6.
Robinson J. 2002. Water, electrolytes and acid-base balance. In: J Mann, S Truswell (eds).Essentials of Human Nutrition. New York: Oxford University Press.
Robinson JF, Robinson MF, Levander OA, et al. 1985. Urinary excretion of selenium by NewZealand and North American subjects on differing intakes. American Journal of ClinicalNutrition 41(5): 1023–31.
Robinson M. 1998. Trace elements (fluorine). In: J Mann, S Truswell (eds). Essentials of HumanNutrition. New York: Oxford University Press.
Robinson MF. 1989. Selenium in human nutrition in New Zealand. Nutrition Reviews 47: 99–107.
Rush EC, Plank LD, Laulu MS, et al. 1997. Prediction of percentage body fat fromanthropometric measurements: comparison of New Zealand European and Polynesian youngwomen. American Journal of Clinical Nutrition 66: 2–7.
Russell D, Wilson N. 1991. Life in New Zealand Survey: Executive overview. Dunedin: HillaryCommission for Recreation and Sport, in association with the University of Otago.
Sacks FM, Svetkey LP, Vollmer WM, et al. 2001. Effects on blood pressure of reduced dietarysodium and the Dietary Approaches to Stop Hypertension (DASH) diet. New England Journalof Medicine 344: 3–10.
Sainsbury R, Richards R. 1997. Prevention of Osteoporosis in Older Populations: Aconsultation document and report for the National Health Committee. Wellington: Ministry ofHealth.

Food and Nutrition Guidelines for Healthy Adults: A Background Paper134
Salmond C, Crampton P, Sutton F. 1998. NZDep96 Index of Deprivation. Research Report No. 8.Wellington: Health Services Research Centre.
Samman S. 2002. Zinc. In: J Mann, S Truswell (eds). Essentials of Human Nutrition. New York:Oxford University Press.
Sarfati D, Bates M, Garrett N, et al. 1997. Acute gastroenteritis diagnostic practices of NewZealand general practitioners. New Zealand Medical Journal 110: 354–6.
Schorah CJ. 1998. Vitamin C and gastric cancer prevention. In: R Paoletti, H Sies, J Bug, et al(eds). Vitamin C: The state of the art in disease prevention sixty years after the Nobel Prize.Milan: Springer.
Scientific Advisory Committee on Nutrition. 2003. Salt and Health. London: TSO.
Scott W, Scott H, Lake R, et al. 2000. Economic cost to New Zealand of foodborne infectiousdisease. New Zealand Medical Journal 113: 281–4.
Scragg RJ, Baker J, Metcalf P, et al. 1991. Prevalence of diabetes mellitus and impaired glucosetolerance in a New Zealand multi-racial workforce. New Zealand Medical Journal 104: 395–7.
Scully D, Kremer J, Meade MM, et al. 1999. Physical exercise and psychological wellbeing. In:D MacAuley (ed). Benefits and Hazards of Exercise. London: BMJ Books. Chapter 11.
Selhub J, Jacques PF, Wilson PWF, et al. 1993. Vitamin status and intake as primarydeterminants of homocysteinemia in an elderly population. Journal of the American MedicalAssociation 270: 2693–8.
Seshadri S, Beiser A, Selhub J et al. 2002. Plasma homocysteine as a risk factor for dementiaand Alzheimers Disease. New England Journal of Medicine 346: 476–83.
Sevick MA, Bradham DD, Muender M, et al. 2000. Cost-effectiveness of aerobic and resistanceexercise in seniors with knee osteoarthritis. Medicine and Science in Sports and Exercise32(9): 1534–40.
Shaper AG, Wannamethee G, Walker M. 1994. Alcohol and coronary heart disease: aperspective from the British Regional Heart Study. International Journal of Epidemiology 23:482–94.
Sharp L, Finlayson AR, Black RJ. 1995. Cancer incidence and deprivation in Scotland. Journal ofEpidemiology and Community Health 49(suppl 2): S78–80.
Sherman SE, D’Agostino RB, Silbershatz H, et al. 1999. Comparison of past versus recentphysical activity in the prevention of premature death and coronary artery disease. AmericanHeart Journal 138: 900–7.
Shils ME, Young VR (eds). 1994. Modern Nutrition in Health and Disease. (4th Ed.)Philadelphia: Lea and Febiger.
Shortt C, Flynn A, Morrissey PA. 1988. Assessment of sodium and potassium intakes.European Journal of Clinical Nutrition 42: 605–9.
Simmons D. 1996. Diabetes and its complications in New Zealand: an epidemiologicalperspective. New Zealand Medical Journal 109: 245–7.
Simmons D, Flemming C, Voyle J, et al. 1998. A pilot urban church-based programme toreduce risk factors for diabetes among Western Samoans in New Zealand. Diabetic Medicine15(2): 136–42.

Food and Nutrition Guidelines for Healthy Adults: A Background Paper 135
Simmons D, Gatland BA, Leakehe L, et al. 1995. Frequency of diabetes in family members ofdiabetic probands. Journal of International Medicine 237: 315–21.
Simmons G, Lindsay A, Harrison, S. 2001. Evaluation of the inaugural Foodsafe Partnershipfood safety campaign. Journal of the New Zealand Dietetic Association 55(1): 8–13.
Simmons G, Whittaker R, Boyle K, et al. 2002. Could laboratory-based notification improve thecontrol of foodborne illness in New Zealand? New Zealand Medical Journal 115: 237–40.
Simpson F, Parnell WR, Wilson NC. 2002. New Zealand food habits: butter and margarineadditions. Journal of the New Zealand Dietetic Association 56(1): 14–19.
Simpson FO. 1992. Salt and hypertension. Clinical and Experimental Pharmacology andPhysiology 19: 25–7.
Simpson FO, Thaler BI, Paulin JM, et al. 1984. Iodide excretion in a salt-restricted trial. NewZealand Medical Journal 97: 890–3.
Skikne B, Baynes RD. 1994. Iron absorption. In: JH Brock, JW Halliday, MJ Pippard, et al (eds).Iron Metabolism in Health and Disease. London: WB Saunders.
Smith R. 2001. Clinical nutrition and bone disease. In: JS Garrow, WPT James, A Ralph (eds).Human Nutrition and Dietetics. London: Churchill Livingstone.
SPARC. 2003a. SPARC Facts: The results of the New Zealand Sport and Physical ActivitySurveys 1997–2001. Wellington: Sport and Recreation New Zealand.
SPARC. 2003b. Te Rongoaa Kakariki: Green prescription. URL: http://www.sparc.org.nz.Accessed 5 September 2003.
Stalmer J. 1997. The INTERSALT study: background, methods, findings and implications.American Journal of Clinical Nutrition 65: S626–42.
Stampfer MJ, Hennekens CH, Manson JE, et al. 1993. Vitamin E consumption and the risk ofcoronary disease in women. New England Journal of Medicine 328: 1450–546.
Statistics New Zealand. 1998. New Zealand Now: Women. Wellington. Statistics New Zealand.
Statistics New Zealand. 1999. New Zealand Now: Incomes. Wellington. Statistics New Zealand.
Stevens VJ. 1998. Weight loss and blood pressure changes over three years: results of theTrials of Hypertension Prevention (TOHP) Phase II. In: Proceedings of Cardiovascular Health:Coming together for the 21st century. A national conference. San Francisco. National Heart,Lung and Blood Institute.
Stevens VJ, Corrigan SA, Obarzanek E, et al. 1993. Weight loss intervention in phase 1 of theTrials of Hypertension Prevention. The TOPH Collaborative Research Group. Archives ofInternal Medicine 153: 849–58.
Sutcliffe E. 1990. Iodine in New Zealand milk. Food Technology in New Zealand 25: 32–8.
Swinburn B, Amosa H, Bell C. 1997a. The Ola Fa‘atuatu Project: the process of delivering achurch-based health programme. Pacific Health Dialog 4(2): 20–5.
Swinburn B, Gillespie J, Ashton T, et al. 1997b. The health care costs of obesity in NewZealand. International Journal of Obesity and Related Metabolic Disorders 21: 891–6.
Swinburn BA, Ley SJ, Carmichael HE, et al. 1999. Body size and composition in Polynesians.International Journal of Obesity Related Metabolic Disorders 23(11): 1178–83.

Food and Nutrition Guidelines for Healthy Adults: A Background Paper136
Table spreads. 2002. Consumer. 416: 6–9.
Tarasuk V, Beaton G. 1999. Women’s dietary intakes in the context of household foodinsecurity. Journal of Nutrition 129: 672–9.
Tarasuk V, Beaton G, Geduld J, et al. 1998. Nutritional Vulnerability and Food Insecurityamong Women Using Food Banks. Department of Nutritional Sciences, Faculty of Medicine,University of Toronto.
Te Puni Kokiri. 1997. Omangia To Oma Roa (Maori Participation in Physical Leisure).Wellington: Te Puni Kokiri.
Thomson CD. 2002. Australian and New Zealand Nutrient Reference Values for Iodine. Reportto the Ministry of Health. Department of Human Nutrition, Dunedin: University of Otago.
Thomson CD, Colls AJ. 1998. Twenty-four Hour Urinary Sodium Excretion in Seven HundredResidents of Otago and Waikato. Report prepared for the Ministry of Health. Dunedin:Department of Human Nutrition, University of Otago.
Thomson CD, Colls AJ, Conaglen JV, et al. 1997. Iodine status of New Zealand residents asassessed by urinary iodide excretion and thyroid hormones. British Journal of Nutrition 78:901–12.
Thomson CD, Paterson E. 2001. Australian and New Zealand Nutrient Reference Values forSelenium. Report to the Ministry of Health. Department of Human Nutrition, Dunedin:University of Otago.
Thomson CD, Robinson MF. 1996. The changing selenium status of New Zealand residents.European Journal of Clinical Nutrition 50: 107–14.
Thomson CD, Woodruffe S, Colls AJ, et al. 1999. Urinary Iodine and Thyroid Status of OtagoResidents. Paper presented at the 2nd South-west Pacific Nutrition and Dietetic Conference,Auckland.
Thomson CD, Woodruffe S, Colls AJ, et al. 2001. Urinary iodine and thyroid status of NewZealand residents. European Journal of Clinical Nutrition 55: 1–6.
Thornley C, Simmons G, Nicol C, et al. 2002. Investigation of an Outbreak of SalmonellaTyphimurium DT160. Wellington: ESR.
Thurnham DI, Bender DA, Scott J, et al. 2000. Water soluble vitamins. In: JS Garrow,WPT James, A Ralph (eds). Human Nutrition and Dietetics. (10th Ed.) London: ChurchillLivingstone.
Tobian L. 1997. Dietary sodium chloride and potassium have effects on the pathophysiologyof hypertension in humans and animals. American Journal of Clinical Nutrition 65: S606–11.
Truswell AS. 2002. Alcohol. In: J Mann, S Truswell (eds). Essentials of Human Nutrition. NewYork: Oxford University Press.
Truswell AS, Dreosti IE, English EM, et al (eds). 1990. Recommended Nutrient Intakes.Australian Papers. Sydney: Australian Professional Publications.
Truswell S, Milne R. 1998. The B vitamins. In: J Mann, S Truswell (eds). Essentials of HumanNutrition. New York: Oxford University Press.
Tukuitonga CF, Stewart A, Beaglehole R. 1990. Coronary heart disease among Pacific Islandpeople in New Zealand. New Zealand Medical Journal: 103(898): 448–9.

Food and Nutrition Guidelines for Healthy Adults: A Background Paper 137
Tunks M, Moewaka Barnes H, Dacey B. 1998. Taro o Te Ora: Outcome evaluation report.Auckland: Alcohol and Public Health Research Unit, University of Auckland.
Tuomilehto J, Lindstrom J, Eriksson JG, et al. 2001. Prevention of type 2 diabetes mellitus bychanges in lifestyle among subjects with impaired glucose tolerance. New England Journal ofMedicine 344(18): 1343–50.
University of York. 2002. A Systematic Review of Public Water Fluoridation. York: NationalHealth Service Centre for Reviews and Dissemination.
van Raaij J. 2002. Energy. In: J Mann, S Truswell (eds). Essentials of Human Nutrition. NewYork: Oxford University Press.
Vanderslice JT, Higgs DJ. 1991. Vitamin C content of foods: sample variability. American Journalof Clinical of Nutrition 54(suppl): S1323–7.
Vannoort R, Cressey P, Silvers K. 2000. 1997/98 New Zealand Total Diet Survey. Part 2:Elements. Wellington: Ministry of Health.
Vasan N. 1999. Sports dentistry. Synopses: the Newsletter of the Australian and New ZealandSociety of Paediatric Dentistry 19: 10–7.
Wald DS, Bishop L, Wald NJ, et al. 2001. Randomised trial of folic acid supplementation andserum homocysteine levels. Archives of Internal Medicine 161: 695–700.
Wald DS, Law M, Morris JK. 2002. Homocysteine and cardiovascular disease: evidence oncausality from a meta-analysis. British Medical Journal 325: 1202–8.
Warnock F. 1998. Effective communication of food safety: commitment to the vision. FoodAustralia 50(11): 548–9.
Weiner P, Magadle R, Berar-Yanay N, et al. 2000. The cumulative effect of long-actingbronchodilators, exercise, and inspiratory muscle training on the perception of dyspnea inpatients with advanced COPD. Chest 118: 672–8.
Wheeler J, Sethi D, Cowden J, et al. 1999. Study of infectious intestinal disease in England:rates in the community, presenting to general practice, and reported to national surveillance.British Medical Journal 318: 1046–50.
Whelton SP, Chin A, Xue X, et al. 2002. Effect of aerobic exercise on blood pressure: a meta-analysis of randomised control trials. Annals of Internal Medicine 136: 493–503.
WHO. 1994. Fluorides and Oral Health. Expert Committee on Oral Health Status and FluorideUse. WHO Technical Series Report 846. Geneva: World Health Organization.
WHO. 1995. Physical Status: The use and interpretation of anthropometry. Report of a WHOExpert Committee. WHO Technical Series Report 854:329. Geneva: World Health Organization.
WHO. 1999. Definition, Diagnosis and Classification of Diabetes Mellitus and its Complications.Geneva: World Health Organization.
WHO. 2000. Obesity: Preventing and managing the global epidemic. Report of a WHOconsultation. WHO Technical Series Report 894. Geneva: World Health Organization.
WHO, FAO. 2003. Diet, Nutrition and the Prevention of Chronic Diseases. Report of a jointWHO Expert consultation. Geneva: World Health Organization.
WHO, Health and Welfare Canada, Canadian Public Health Association. 1986. Ottawa Charterfor Health Promotion. Ottawa: World Health Organization.

Food and Nutrition Guidelines for Healthy Adults: A Background Paper138
Wilson BD, Wilson NC, Russell DG. 2001. Obesity and body fat distribution in the New Zealandpopulation. New Zealand Medical Journal 114: 127–30.
Winterbourn CC, Saville DJ, George PM, et al. 1992. Increase in selenium status of Christchurchadults associated with deregulation of the wheat market. New Zealand Medical Journal 105:466–8.
Wolever TMS. 1997. The glycemic index: flogging a dead horse? Diabetes Care 20: 452–6.
Wolever TMS, Jenkins DJA, Jenkins AL, et al. 1991. The glycemic index: methodology andclinical implications. American Journal of Clinical Nutrition 54: 846–54.
Wolever TMS, Jenkins DJA, Vuksan V, et al. 1992. Beneficial effect of a low-glycemic index dietin overweight NIDDM subjects. Diabetes Care 15: 562–4.
Woodson K, Tangrea JA, Barrett MJ, et al. 1999. Serum alpha-tocopherol and subsequent riskof lung cancer among male smokers. Journal of the National Cancer Institute 91(20): 1738–43.
World Cancer Research Fund. 1997. Food, Nutrition and the Prevention of Cancer: A globalperspective. Washington, DC: American Institute for Cancer Research.
Wright JC, Bates MN, Cuttress TW, et al. 2001. The cost-effectiveness of fluoridating watersupplies in New Zealand. Australia and New Zealand Journal of Public Health 25: 170–8.
Wright N. 1997. Review of Literature on Vitamin and Mineral Supplement Use. Practicumproject for Post-graduate Diploma in Dietetics. Dunedin: University of Otago.
Yip R, Dallman PR. 1996. Iron. In: EE Ziegler, LJ Filer (eds). Present Knowledge in Nutrition.(7th Ed.) Washington, DC: International Life Sciences Institute Press.
Young L, Swinburn B. 2002. Impact of Pick the Tick food information programme on the saltcontent of foods in New Zealand. Health Promotion International 17(1): 13–9.
Zino S, Skeaff M, Mann J. 1999. Fruit and vegetable preferences amongst low fruit andvegetable consumers. Journal of the New Zealand Dietetic Association 53(1): 5–10.