HEALTHY CHICAGO 2.0
86
2016 - 2020 HEALTHY CHICAGO 2.0 PARTNERING TO IMPROVE HEALTH EQUITY
-
Upload
khangminh22 -
Category
Documents
-
view
2 -
download
0
Transcript of HEALTHY CHICAGO 2.0

2016 - 2020
HEALTHY CHICAGO 2.0PA R T N E R I N G T O I M P R O V E H E A LT H E Q U I T Y

HEALTHY CHICAGO 2.0
Dear Fellow Chicagoans,
Four years ago, I joined the Chicago Department of Public Health (CDPH) to launch Healthy Chicago, the first public health agenda designed to improve the health of all Chicagoans. Since that time, we have made historic strides: tobacco rates for youth have reached an all-time low and life expectancy for Chicagoans has reached an all-time high. These are accomplishments to celebrate. But at the same time, our work is not yet done. Too many Chicagoans continue to be affected by preventable diseases, too many continue to be burdened by and endure the effects of violence and too many do not have access to resources and opportunities that allow them to lead healthy lives. Data show that health inequities are wide and we must do more to eliminate the unjust differences in health that exist among Chicago communities and across the lines of race, ethnicity, socioeconomic status, age, gender identity and sexual orientation.
Healthy Chicago 2.0 is the next step in our ongoing effort to ensure that every resident of Chicago has the opportunity to live a healthy life. Focusing on areas where health disparities remain, this plan provides over 200 actionable strategies to reduce inequities and improve the health and vitality of our residents and our city. By addressing both traditional health issues such as chronic disease and the root causes of poor health such as transportation and housing, Healthy Chicago 2.0 aims to ensure that every child raised in Chicago, regardless of neighborhood and background, has the resources and opportunities to live a healthy life.
I invite you to join our more than 130 partner organizations to put this plan into action as we work to make Chicago the healthiest city in the nation.
Rahm Emanuel Mayor, City of Chicago
HEALTHY CHICAGO 2.0
Dear Partners,
Chicago is my home. My parents came to Chicago after being relocated from the west coast during World War II. With the support of community organizations, churches and extended family, they were able to create a safe, stable and supportive environment for my brothers and me. As a result, we have been able to lead healthy and productive lives and my husband and I have been able to do the same for our two children. My vision is for all Chicago residents to have the same opportunities that have allowed my family and me to thrive. As Commissioner for the Chicago Department of Public Health (CDPH), I have the unique opportunity to lead a department that has the responsibility to do just that.
CDPH is responsible for maximizing the health and well-being of every Chicago resident, but our department alone can’t accomplish that goal. We know that good health depends on numerous factors, including many that are outside of the traditional public health sphere. The availability of economic resources, the conditions of the homes in which we live, our educational opportunities and the degree to which we feel safe and connected in our neighborhoods play critical roles in improving our health. That is why the development of Healthy Chicago 2.0 is an important milestone for Chicago.
Healthy Chicago 2.0 is a plan for the entire city. As part of the planning process, we convened representatives from more than 130 organizations across a broad range of sectors to review data and then identify actionable strategies to address our city’s most pressing health issues and their root causes.
The plan is a result of a collaborative effort. Its implementation, similar to its development, is dependent on partners across the city working together to make the changes necessary to improve health. I am grateful for the businesses, non-profit organizations, philanthropic agencies, faith-based networks, advocacy groups, other government agencies and residents who devoted a great deal of time and energy to create this plan and who have committed resources and human capital to see that the goals in this plan are realized.
Achieving health equity will take time, resources and dedication. I look forward to working together to create a Chicago where every resident has the opportunities, resources and information necessary to live a healthy life.
Julie Morita, M.D. Commissioner, Chicago Department of Public Health
HEALTHY CHICAGO 2.0

TABLE OF CONTENTS
HEALTHY CHICAGO 2.0
TABLE OF CONTENTSIntroduction ............................................................................ 1
Healthy Chicago 2.0 Vision .......................................1Process: Assessment & Action Teams ..................2Framework ......................................................................3Overarching Outcomes ..............................................7Health in All Policies ....................................................8Trauma-Informed City ................................................9
Chapter 1: Expanding Partnerships & Community Engagement .............................................11
Components of Community Engagement ..... 12
Chapter 2: Addressing the Root Causes of Health ..................................................................................15
The Built Environment ............................................ 16Economic Development ......................................... 18Housing ......................................................................... 20Education ..................................................................... 24
Chapter 3: Increasing Access to Health Care & Human Services ..................................................................29
Components of Access ....................................... 32
Chapter 4: Improving Health Outcomes .............35Promoting Behavioral Health ............................... 38Strengthening Child & Adolescent Health ....... 42Preventing & Controlling Chronic Disease ...... 46Reducing the Burden of Infectious Disease ... 52Reducing Violence .................................................... 56
Chapter 5: Utilizing and Maximizing Data and Research ........................................................................61
Chapter 6: Taking the Next Step ..............................65
Healthy Chicago 2.0 Indicators .................................68
Acknowledgments ............................................................72
References ..............................................................................76

Health equity is achieved when every person has the opportunity to attain his or her full health potential.1
1
HEALTHY CHICAGO 2.0 VISION
Healthy Chicago 2.0 has an underlying goal of achieving health equity and a commitment to reducing health inequities in our city. This vision will be achieved when Chicago’s public health system, a multi-sector network of organizations such as health care providers, government agencies, social service providers, advocates, academic institutions, businesses and faith-based organizations, works collectively to improve the health of the population.
A city with strong communities and collaborative stakeholders, where all residents enjoy equitable access to resources, opportunities and environments that maximize their health and well-being.

2
INTRODUCTION
In September 2014, the Chicago Department of Public Health (CDPH), in collaboration with the Partnership for Healthy Chicago, launched a comprehensive community health assessment to collect and analyze health data and, from those findings, identify strategic issues to improve health equity in Chicago. We used the National Association for County and City Health Officials (NACCHO) Mobilizing for Action through Planning and Partnerships (MAPP) to conduct this assessment.2 As part of the community health assessment, nearly 1,000 public health stakeholders and residents participated in reviewing more than ten million data elements to identify health gaps.
Public health stakeholders and residents reviewed data and then identified 10 priority action areas. The priority areas include both health outcomes as well as the root causes of health.
Action Areas:
1. Expanding Partnerships and Community Engagement
2. Improving Social, Economic and Community Conditions
3. Improving Education
4. Increasing Access to Health Care and Human Services
5. Promoting Behavioral Health
6. Strengthening Child and Adolescent Health
7. Preventing and Controlling Chronic Disease
8. Preventing Infectious Diseases
9. Reducing Violence
10. Utilizing and Maximizing Data and Research
After completing the community health assessment, CDPH convened action teams focused on the 10 priority areas. These action teams, each co-chaired by a CDPH staff person and a community partner, engaged over 200 public health stakeholders including community members, non-profit leaders, health care workers, city agency leaders and others.
At the beginning of the process, all action team members received training on developing the plan and then spent five months formulating specific goals, objectives and strategies. These actionable strategies form Healthy Chicago 2.0, Chicago’s four-year community health improvement plan. Each strategy is focused on closing or eliminating health inequities.
PROCESS: ASSESSMENT & ACTION TEAMS
The Partnership for Healthy Chicago is a public-private partnership of multi-sector stakeholders, convened by the Chicago Department of Public Health, who are working together to strengthen the public health system.
3
INTRODUCTION
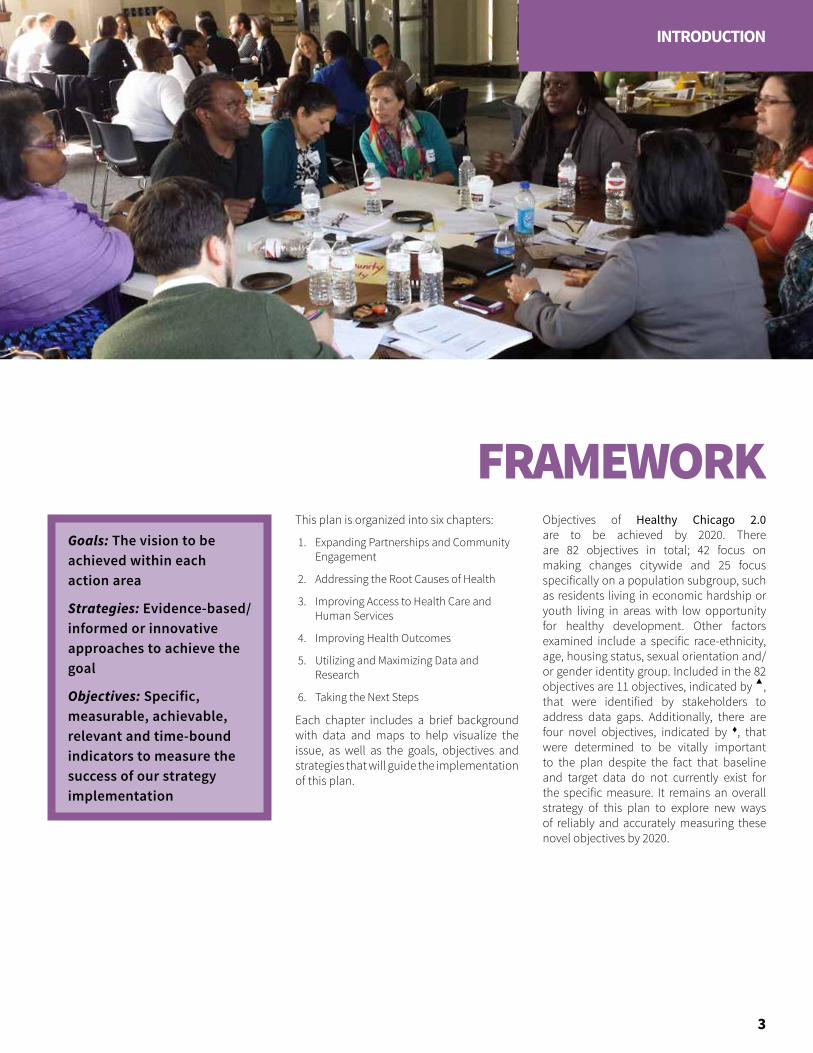
FRAMEWORKThis plan is organized into six chapters:
1. Expanding Partnerships and Community Engagement
2. Addressing the Root Causes of Health
3. Improving Access to Health Care and Human Services
4. Improving Health Outcomes
5. Utilizing and Maximizing Data and Research
6. Taking the Next Steps
Each chapter includes a brief background with data and maps to help visualize the issue, as well as the goals, objectives and strategies that will guide the implementation of this plan.
Objectives of Healthy Chicago 2.0 are to be achieved by 2020. There are 82 objectives in total; 42 focus on making changes citywide and 25 focus specifically on a population subgroup, such as residents living in economic hardship or youth living in areas with low opportunity for healthy development. Other factors examined include a specific race-ethnicity, age, housing status, sexual orientation and/or gender identity group. Included in the 82 objectives are 11 objectives, indicated by , that were identified by stakeholders to address data gaps. Additionally, there are four novel objectives, indicated by , that were determined to be vitally important to the plan despite the fact that baseline and target data do not currently exist for the specific measure. It remains an overall strategy of this plan to explore new ways of reliably and accurately measuring these novel objectives by 2020.
Goals: The vision to be achieved within each action area
Strategies: Evidence-based/informed or innovative approaches to achieve the goal
Objectives: Specific, measurable, achievable, relevant and time-bound indicators to measure the success of our strategy implementation
AB
CD
E
F
G
H
I
J
KL
MN
O
P Q
RS T
U
V
W
X
Y
Z
US Census, American Community Survey, 2014 5-Year Estimate
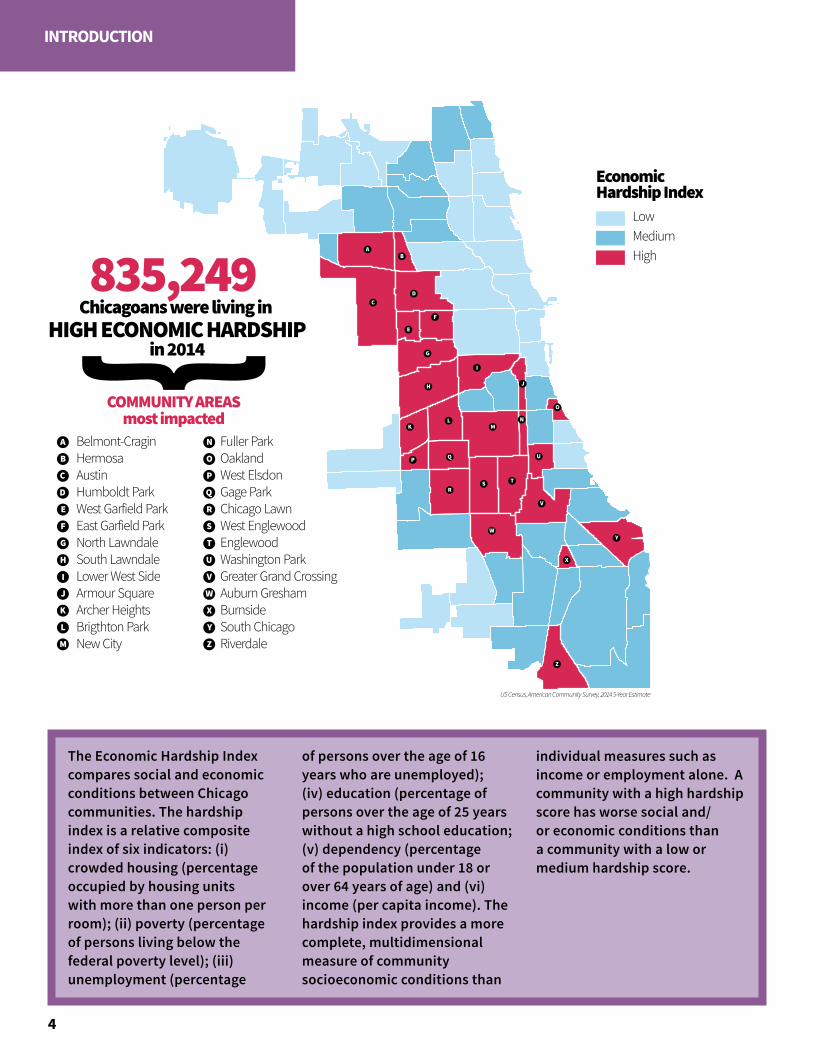
835,249
A
B
C
COMMUNITY AREASmost impacted
D
E
U
V
W
X
Y
Z
Belmont-CraginHermosaAustinHumboldt ParkWest Garfield ParkEast Garfield ParkNorth LawndaleSouth LawndaleLower West SideArmour SquareArcher HeightsBrigthton ParkNew City
Fuller ParkOaklandWest ElsdonGage ParkChicago LawnWest EnglewoodEnglewoodWashington ParkGreater Grand CrossingAuburn GreshamBurnsideSouth ChicagoRiverdale
Chicagoans were living in HIGH ECONOMIC HARDSHIP
in 2014
F
G
H
I
J
K
L
M
N
O
P
Q
R
S
T
LowMediumHigh
EconomicHardship Index
4
INTRODUCTION
The Economic Hardship Index compares social and economic conditions between Chicago communities. The hardship index is a relative composite index of six indicators: (i) crowded housing (percentage occupied by housing units with more than one person per room); (ii) poverty (percentage of persons living below the federal poverty level); (iii) unemployment (percentage
of persons over the age of 16 years who are unemployed); (iv) education (percentage of persons over the age of 25 years without a high school education; (v) dependency (percentage of the population under 18 or over 64 years of age) and (vi) income (per capita income). The hardship index provides a more complete, multidimensional measure of community socioeconomic conditions than
individual measures such as income or employment alone. A community with a high hardship score has worse social and/or economic conditions than a community with a low or medium hardship score.
A
B
C
D
EF
G H
I J
K
L
M
N
O
P
diversitydatakids.org and Kirwan Institute, 2014
Childhood Opportunity Index
Very LowLowModerateHighVery High
Child OpportunityIndex
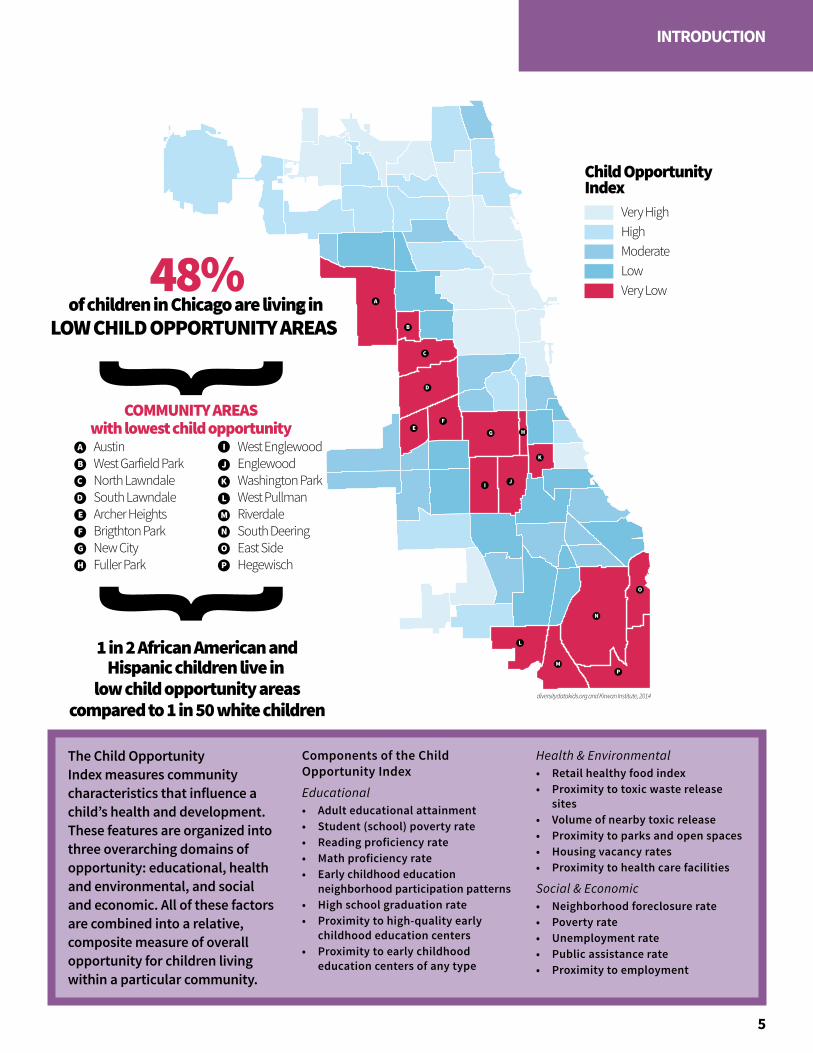
�48%
A
B
C
COMMUNITY AREASwith lowest child opportunity
D
E
AustinWest Garfield ParkNorth LawndaleSouth LawndaleArcher HeightsBrigthton ParkNew CityFuller Park
West EnglewoodEnglewoodWashington ParkWest PullmanRiverdaleSouth DeeringEast SideHegewisch
of children in Chicago are living in LOW CHILD OPPORTUNITY AREAS
1 in 2 African American andHispanic children live in
low child opportunity areascompared to 1 in 50 white children
F
G
H
I
J
K
L
M
N
O
P
Childhood Opportunity Index
Very LowLowModerateHighVery High
Child OpportunityIndex
�48%
A
B
C
COMMUNITY AREASwith lowest child opportunity
D
E
AustinWest Garfield ParkNorth LawndaleSouth LawndaleArcher HeightsBrigthton ParkNew CityFuller Park
West EnglewoodEnglewoodWashington ParkWest PullmanRiverdaleSouth DeeringEast SideHegewisch
of children in Chicago are living in LOW CHILD OPPORTUNITY AREAS
1 in 2 African American andHispanic children live in
low child opportunity areascompared to 1 in 50 white children
F
G
H
I
J
K
L
M
N
O
P
5
INTRODUCTION
The Child Opportunity Index measures community characteristics that influence a child’s health and development. These features are organized into three overarching domains of opportunity: educational, health and environmental, and social and economic. All of these factors are combined into a relative, composite measure of overall opportunity for children living within a particular community.
Components of the Child Opportunity IndexEducational• Adult educational attainment• Student (school) poverty rate• Reading proficiency rate• Math proficiency rate• Early childhood education
neighborhood participation patterns• High school graduation rate• Proximity to high-quality early
childhood education centers• Proximity to early childhood
education centers of any type
Health & Environmental• Retail healthy food index• Proximity to toxic waste release
sites• Volume of nearby toxic release• Proximity to parks and open spaces• Housing vacancy rates• Proximity to health care facilities
Social & Economic• Neighborhood foreclosure rate• Poverty rate• Unemployment rate• Public assistance rate• Proximity to employment
6
INTRODUCTION
7
INTRODUCTION
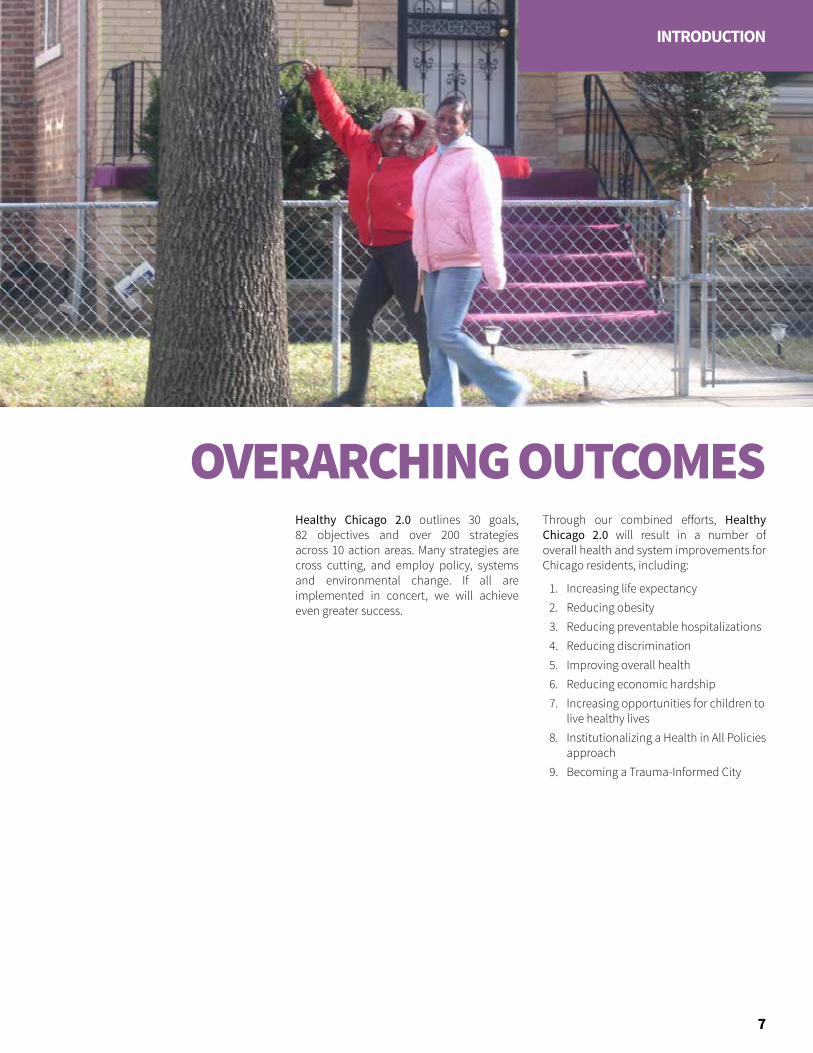
OVERARCHING OUTCOMESHealthy Chicago 2.0 outlines 30 goals, 82 objectives and over 200 strategies across 10 action areas. Many strategies are cross cutting, and employ policy, systems and environmental change. If all are implemented in concert, we will achieve even greater success.
Through our combined efforts, Healthy Chicago 2.0 will result in a number of overall health and system improvements for Chicago residents, including:
1. Increasing life expectancy2. Reducing obesity 3. Reducing preventable hospitalizations4. Reducing discrimination5. Improving overall health6. Reducing economic hardship7. Increasing opportunities for children to
live healthy lives8. Institutionalizing a Health in All Policies
approach9. Becoming a Trauma-Informed City
8
INTRODUCTION
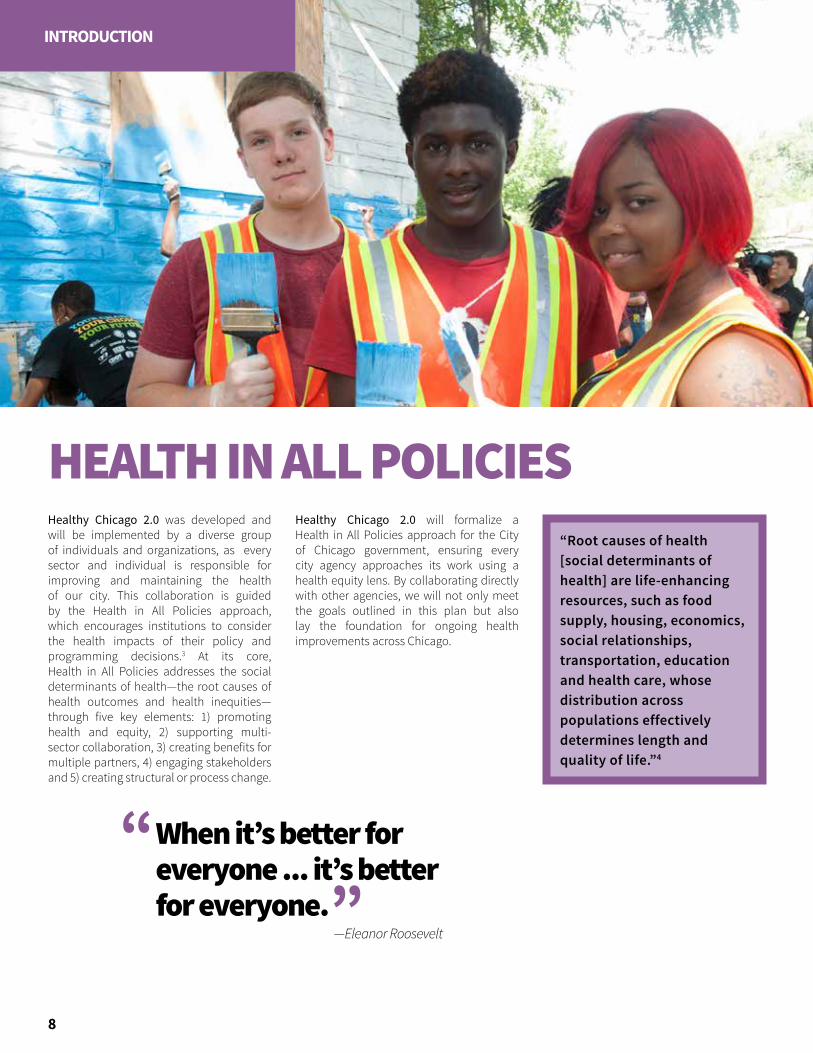
HEALTH IN ALL POLICIESHealthy Chicago 2.0 was developed and will be implemented by a diverse group of individuals and organizations, as every sector and individual is responsible for improving and maintaining the health of our city. This collaboration is guided by the Health in All Policies approach, which encourages institutions to consider the health impacts of their policy and programming decisions.3 At its core, Health in All Policies addresses the social determinants of health—the root causes of health outcomes and health inequities— through five key elements: 1) promoting health and equity, 2) supporting multi-sector collaboration, 3) creating benefits for multiple partners, 4) engaging stakeholders and 5) creating structural or process change.
Healthy Chicago 2.0 will formalize a Health in All Policies approach for the City of Chicago government, ensuring every city agency approaches its work using a health equity lens. By collaborating directly with other agencies, we will not only meet the goals outlined in this plan but also lay the foundation for ongoing health improvements across Chicago.
When it’s better for everyone ... it’s better for everyone.
—Eleanor Roosevelt
“”
“Root causes of health [social determinants of health] are life-enhancing resources, such as food supply, housing, economics, social relationships, transportation, education and health care, whose distribution across populations effectively determines length and quality of life.”4
9
INTRODUCTION
TRAUMA-INFORMED CITYBecoming a Trauma-Informed City will require significant changes in attitude, knowledge and practice.
To further improve health outcomes that are often worsened by exposure to violence, we must work toward making Chicago a Trauma-Informed City. Trauma-Informed is grounded in service delivery, and directed by a thorough understanding of the neurological, biological, psychological and social effects of trauma and violence on humans and groups.4 Functioning as a Trauma-Informed City requires significant changes in attitude, knowledge and practice, with all of our city agencies and community-based organizations becoming trained in the impact that trauma has on our residents. Many organizations have already begun this effort by training their staff and community members in the areas of Trauma 101, Mental Health First Aid and Psychological First Aid.
A Trauma-Informed City utilizes this knowledge to develop policies and system improvements that ensure effective responses to recovery from trauma and to prevent individuals from being re-traumatized by individuals, schools, churches, organizations and government agencies with which they interact. Chicago will strengthen efforts by collecting new data on the impacts of trauma, discrimination and racism. Chicago will also work toward a shared understanding of how trauma impacts communities and will develop approaches to remediate and build resiliency among those most impacted across Chicago.


11
CHAPTER 1
EXPANDING PARTNERSHIPS & COMMUNITY ENGAGEMENT
Healthy Chicago 2.0 was developed through direct engagement with community members and part-ner organizations. Along with CDPH, organizations across many sectors have been involved throughout the assessment and planning phases and will be involved with implementation and evaluation. Over 200 individuals from more than 130 agencies helped design this health improvement plan. Healthy Chicago 2.0 is four-year collaborative plan; as such, the goals and objectives outlined in this report will be met only through ongoing, collaborative engagement in the strategies outlined.
COMPONENTS OF COMMUNITY ENGAGEMENTLeverage Partnerships for Promoting Health Equity Build trust, support and rapport by building multi-sector awareness and focusing community mobilization on health equity
Funding Opportunities Align and expand funding through collaborative funding models with both private and public entities
Educate Community on Public Health Issues Connect Healthy Chicago 2.0 messages about health education and community engagement
12
PARTNERSHIPS & COMMUNITY ENGAGEMENT
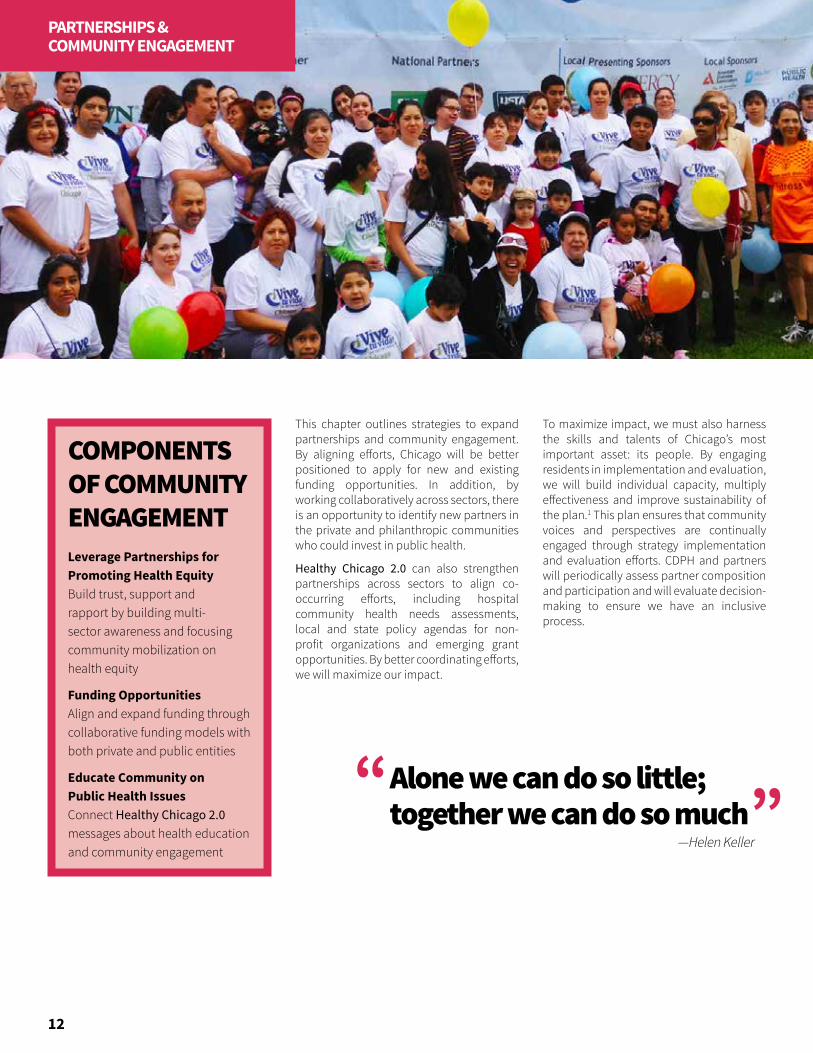
This chapter outlines strategies to expand partnerships and community engagement. By aligning efforts, Chicago will be better positioned to apply for new and existing funding opportunities. In addition, by working collaboratively across sectors, there is an opportunity to identify new partners in the private and philanthropic communities who could invest in public health.
Healthy Chicago 2.0 can also strengthen partnerships across sectors to align co-occurring efforts, including hospital community health needs assessments, local and state policy agendas for non-profit organizations and emerging grant opportunities. By better coordinating efforts, we will maximize our impact.
To maximize impact, we must also harness the skills and talents of Chicago’s most important asset: its people. By engaging residents in implementation and evaluation, we will build individual capacity, multiply effectiveness and improve sustainability of the plan.1 This plan ensures that community voices and perspectives are continually engaged through strategy implementation and evaluation efforts. CDPH and partners will periodically assess partner composition and participation and will evaluate decision-making to ensure we have an inclusive process.
Alone we can do so little; together we can do so much
—Helen Keller
“ ”
13
PARTNERSHIPS & COMMUNITY ENGAGEMENT
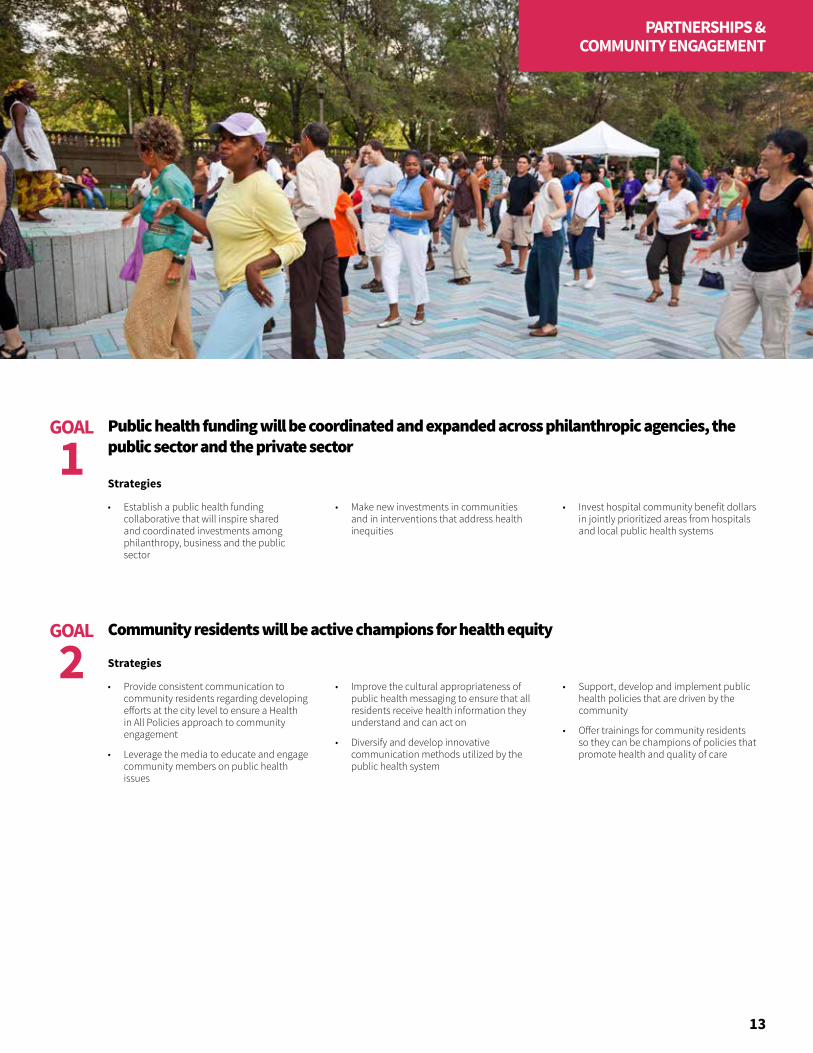
• Establish a public health funding collaborative that will inspire shared and coordinated investments among philanthropy, business and the public sector
• Make new investments in communities and in interventions that address health inequities
• Invest hospital community benefit dollars in jointly prioritized areas from hospitals and local public health systems
• Provide consistent communication to community residents regarding developing efforts at the city level to ensure a Health in All Policies approach to community engagement
• Leverage the media to educate and engage community members on public health issues
• Improve the cultural appropriateness of public health messaging to ensure that all residents receive health information they understand and can act on
• Diversify and develop innovative communication methods utilized by the public health system
• Support, develop and implement public health policies that are driven by the community
• Offer trainings for community residents so they can be champions of policies that promote health and quality of care
Public health funding will be coordinated and expanded across philanthropic agencies, the public sector and the private sector
Community residents will be active champions for health equity
GOAL
1
GOAL
2
Strategies
Strategies
When it comes to health, your zip code matters more than your genetic code.
—Tony Iton, MD, JD
“”

15
CHAPTER 2
ADDRESSING THE ROOT CAUSES OF HEALTH
Health is defined as a state of complete physical, mental and social well-being.1 In Chicago, residents do not have equitable access to the systems and opportunities that contribute to good health. More than our individual behaviors, it is our homes, schools, workplaces and communities that most impact our health. Income, housing quality, community conditions and education quality are root causes–that is, the things in our environment that support or prevent us from being healthy.
The root causes of health include both the social determinants of health and structural inequities, or societal systems that unjustly benefit one population more than another. Health inequities are perpetuated in policies and organizational systems through structural racism, sexism, homophobia, transphobia, discrimination and stigma. The strategies outlined throughout this plan aim to reduce discrimination and structural inequities.
By improving social and structural determinants of health, a significant impact can be achieved for our community’s health. As such, Healthy Chicago 2.0 provides actionable strategies to create the necessary policy, systems and environmental changes (PSE) to impact health. PSE emphasizes strategies that impact entire organizations or communities, or that involve physical or material changes to the economic, social or physical environment.
Economic development and community improvement efforts will require policy and planning approaches that safeguard against the displacement of families and communities. As conditions are improved in high-need communities, it is essential that those who can benefit most from such improvements are able to remain in their homes and communities. Honoring Chicago’s diversity and ensuring inclusiveness of the city are both essential to health equity.
Though there are numerous social determinants that impact the health of our communities, four key areas are included in this plan: the built environment, economic development, housing, and education.

16
ADDRESSING ROOT CAUSES
Sidewalks and streets, public transit, sewers, parks, community centers and landscaping are part of the built environment. The built environment influences health by providing or preventing opportunities for physical activity, adequate transportation and social connectedness.
Inadequate infrastructure for active transportation exists in many low-income communities and communities of color, which are more likely to have poorly maintained sidewalks and streets and increased dangers from traffic. Fatalities from traffic crashes disproportionately impact African American communities.1 In addition, street design neglects the needs of older adults, people with disabilities and children. Even when physical activity resources are available, some residents may limit the use of these resources due to community safety concerns, lack of transportation or user fees.2
Chicago is working to end these inequities. The Chicago Department of Transportation (CDOT) recently expanded its Divvy bike share program to more communities, north to south from Touhy Avenue to 76th Street and east to west from Lake Michigan to Pulaski. The Chicago Transit Authority (CTA) recently renovated the south branch of the Red Line, improving an integral transportation corridor through several economically disadvantaged communities. Healthy Chicago 2.0 builds on these successes with additional strategies to ensure the built environment can support and promote health.
Climate change also impacts public health. Overall temperatures in Chicago are expected to increase, with severe heat waves projected to occur two to five times per decade by mid-century. There is a trend for increased precipitation during storms, leading to an increased potential for flooding; the timing of precipitation may change, as well.3 Both heat waves and flooding cause stress on households, with lower income households having fewer resources to recover from such disasters. Healthy Chicago 2.0 will work to minimize the negative effects of climate change.
The environment is not well-protected or regulated. We must think about the impact on our health.
—Community Conversation Participant
“
”
THE BUILT ENVIRONMENT
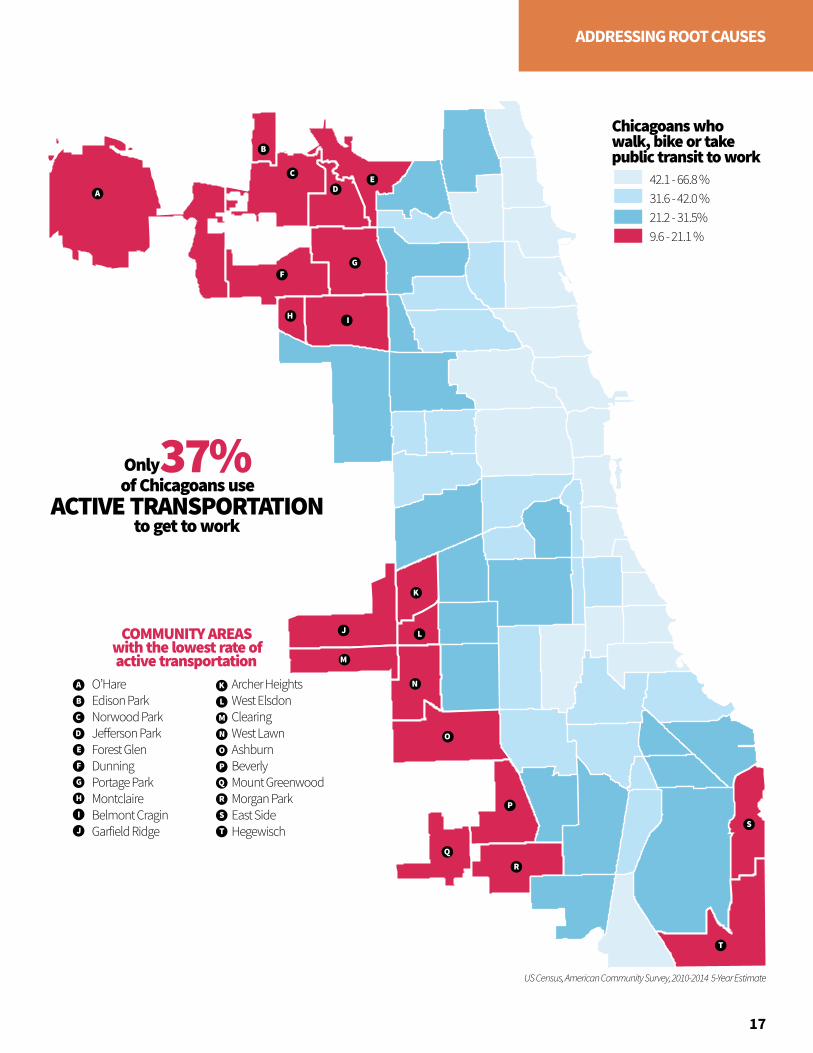
US Census, American Community Survey, 2010-2014 5-Year Estimate
A
A
B
C
DE
FG
I
J
K
L
M
N
O
H
B
C
D
E
O’HareEdison ParkNorwood ParkJe erson ParkForest GlenDunningPortage ParkMontclaireBelmont CraginGarfield Ridge
Archer HeightsWest ElsdonClearingWest LawnAshburnBeverlyMount GreenwoodMorgan ParkEast SideHegewisch
F
G
H
37%
COMMUNITY AREASwith the lowest rate ofactive transportation
to get to work
of Chicagoans useACTIVE TRANSPORTATION
I
J
K
L
M
N
O
P
Q
R
S
T
P
Q
R
S
T
Only
Chicagoans who walk, bike or takepublic transit to work
9.6 - 21.1 %21.2 - 31.5%31.6 - 42.0 %42.1 - 66.8 %
17
ADDRESSING ROOT CAUSES
18
ADDRESSING ROOT CAUSES
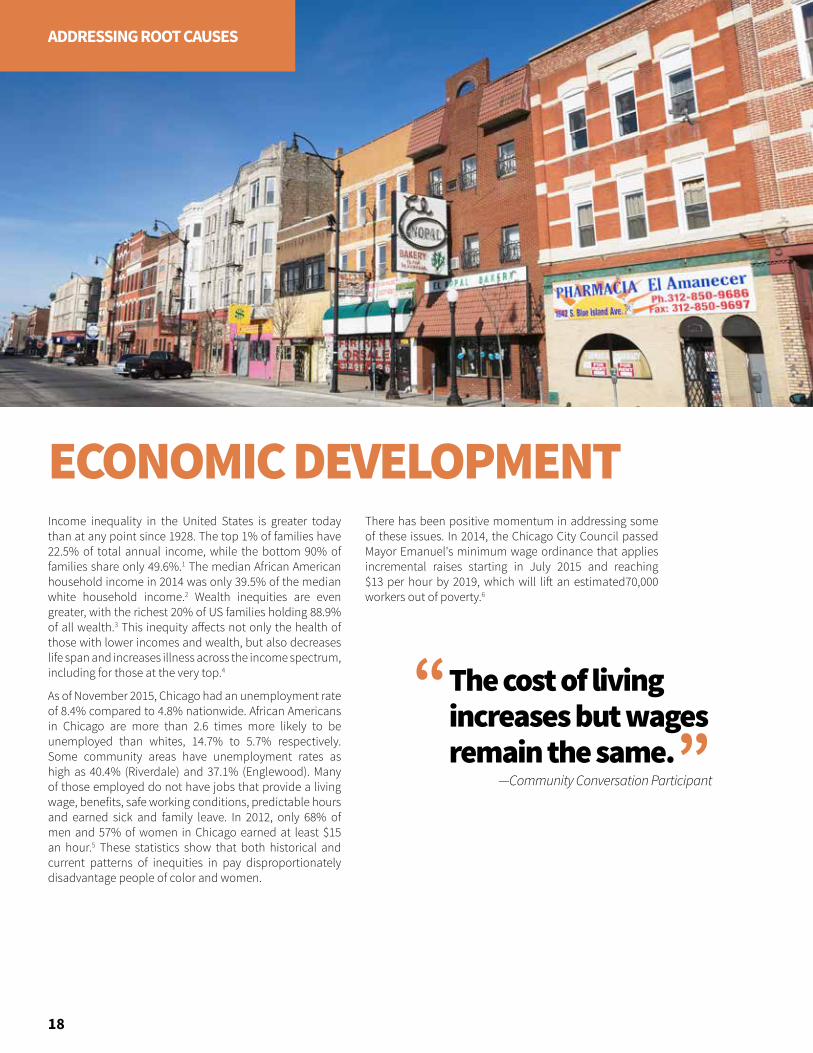
Income inequality in the United States is greater today than at any point since 1928. The top 1% of families have 22.5% of total annual income, while the bottom 90% of families share only 49.6%.1 The median African American household income in 2014 was only 39.5% of the median white household income.2 Wealth inequities are even greater, with the richest 20% of US families holding 88.9% of all wealth.3 This inequity affects not only the health of those with lower incomes and wealth, but also decreases life span and increases illness across the income spectrum, including for those at the very top.4
As of November 2015, Chicago had an unemployment rate of 8.4% compared to 4.8% nationwide. African Americans in Chicago are more than 2.6 times more likely to be unemployed than whites, 14.7% to 5.7% respectively. Some community areas have unemployment rates as high as 40.4% (Riverdale) and 37.1% (Englewood). Many of those employed do not have jobs that provide a living wage, benefits, safe working conditions, predictable hours and earned sick and family leave. In 2012, only 68% of men and 57% of women in Chicago earned at least $15 an hour.5 These statistics show that both historical and current patterns of inequities in pay disproportionately disadvantage people of color and women.
There has been positive momentum in addressing some of these issues. In 2014, the Chicago City Council passed Mayor Emanuel's minimum wage ordinance that applies incremental raises starting in July 2015 and reaching $13 per hour by 2019, which will lift an estimated70,000 workers out of poverty.6
ECONOMIC DEVELOPMENT
The cost of living increases but wages remain the same.
—Community Conversation Participant
“”

Unemployment Rate
22.2% - 40.4%14.0 - 22.1%9.4 - 13.9%4.2 - 9.3%
COMMUNITY AREASmost impacted
by unemploymentNorth LawndaleNew CityFuller ParkGrand BoulevardOaklandChicago LawnWest EnglewoodEnglewoodWashington ParkGreater Grand Crossing
WoodlawnSouth ShoreAuburn GreshamChathamWashington HeightsRoselandPullmanWest PullmanRiverdale
US Census Bureau, American Community Survey, 2010-2014 5-Year Estimates
A
B CD
E
FG H
I
J
K
L
MN
O
P Q
R
S
A
B
C
D
E
F
G
H
I
J
K
L
M
N
O
P
Q
R
S
2.6XAfrican Americans are
MORE LIKELYto be unemployed than whites
19
ADDRESSING ROOT CAUSES
20
ADDRESSING ROOT CAUSES
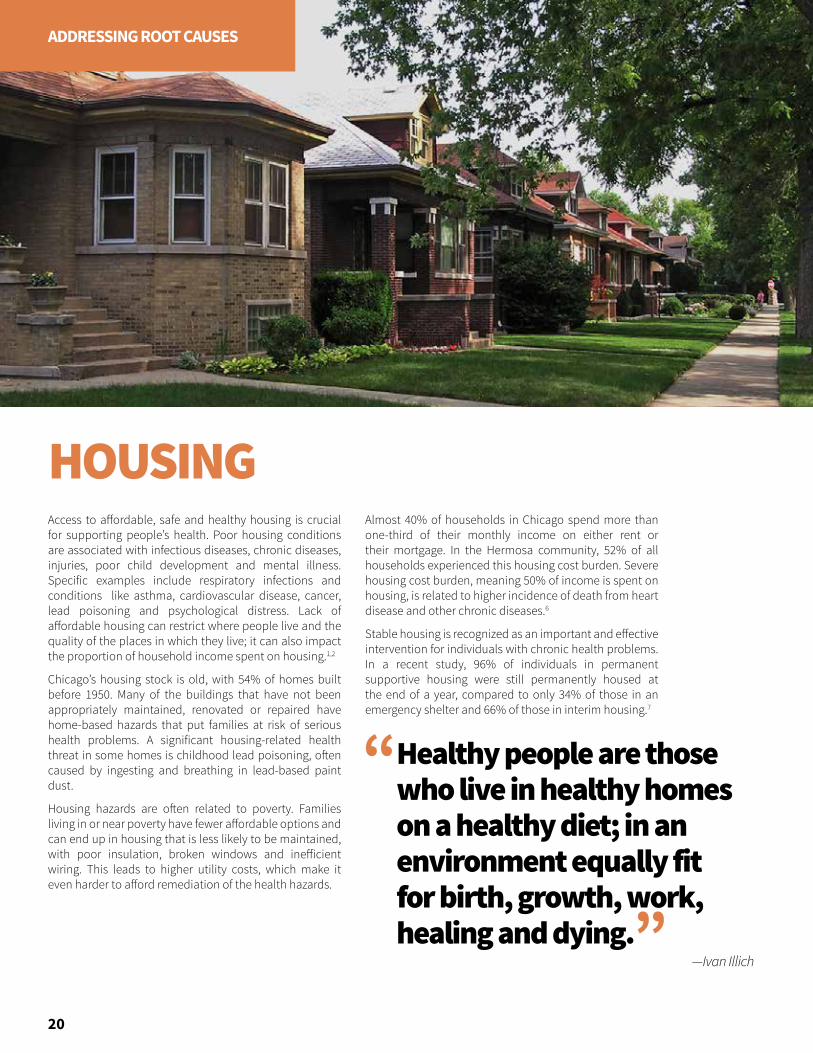
Access to affordable, safe and healthy housing is crucial for supporting people’s health. Poor housing conditions are associated with infectious diseases, chronic diseases, injuries, poor child development and mental illness. Specific examples include respiratory infections and conditions like asthma, cardiovascular disease, cancer, lead poisoning and psychological distress. Lack of affordable housing can restrict where people live and the quality of the places in which they live; it can also impact the proportion of household income spent on housing.1,2
Chicago’s housing stock is old, with 54% of homes built before 1950. Many of the buildings that have not been appropriately maintained, renovated or repaired have home-based hazards that put families at risk of serious health problems. A significant housing-related health threat in some homes is childhood lead poisoning, often caused by ingesting and breathing in lead-based paint dust.
Housing hazards are often related to poverty. Families living in or near poverty have fewer affordable options and can end up in housing that is less likely to be maintained, with poor insulation, broken windows and inefficient wiring. This leads to higher utility costs, which make it even harder to afford remediation of the health hazards.
Almost 40% of households in Chicago spend more than one-third of their monthly income on either rent or their mortgage. In the Hermosa community, 52% of all households experienced this housing cost burden. Severe housing cost burden, meaning 50% of income is spent on housing, is related to higher incidence of death from heart disease and other chronic diseases.6
Stable housing is recognized as an important and effective intervention for individuals with chronic health problems. In a recent study, 96% of individuals in permanent supportive housing were still permanently housed at the end of a year, compared to only 34% of those in an emergency shelter and 66% of those in interim housing.7
HOUSING
Healthy people are those who live in healthy homes on a healthy diet; in an environment equally fit for birth, growth, work, healing and dying.
—Ivan Illich
“
”

0.0 - 1.2 %1.3 - 2.4 %2.5 - 4.0 %4.1 - 10.1%
Children under 3 years with elevated blood lead levels (>6mcg/dl)
Community Areaswith Very LowChild Opportunity
Chicago Department of Public Health, 2014
A
B
C
HermosaAustinHumboldt ParkWest Garfield ParkEast Garfield ParkNorth LawndaleSouth LawndaleNew CityFuller ParkChicago Lawn
West EnglewoodEnglewoodGreater Grand CrossingAuburn GreshamAvalon ParkSouth ChicagoBurnsideRoselandPullman
COMMUNITY AREASwhere more young children
have elevated blood lead levels
3.5%3.5%of Chicago children under 3 have
ELEVATED BLOOD LEAD LEVELS
D
E
F
G
H
I
J
K
L
M
N
O
P
Q
R
S
A
BC
D E
F
G
H I
J K L
M
N O P
R S
Q
21
ADDRESSING ROOT CAUSES
in 2014
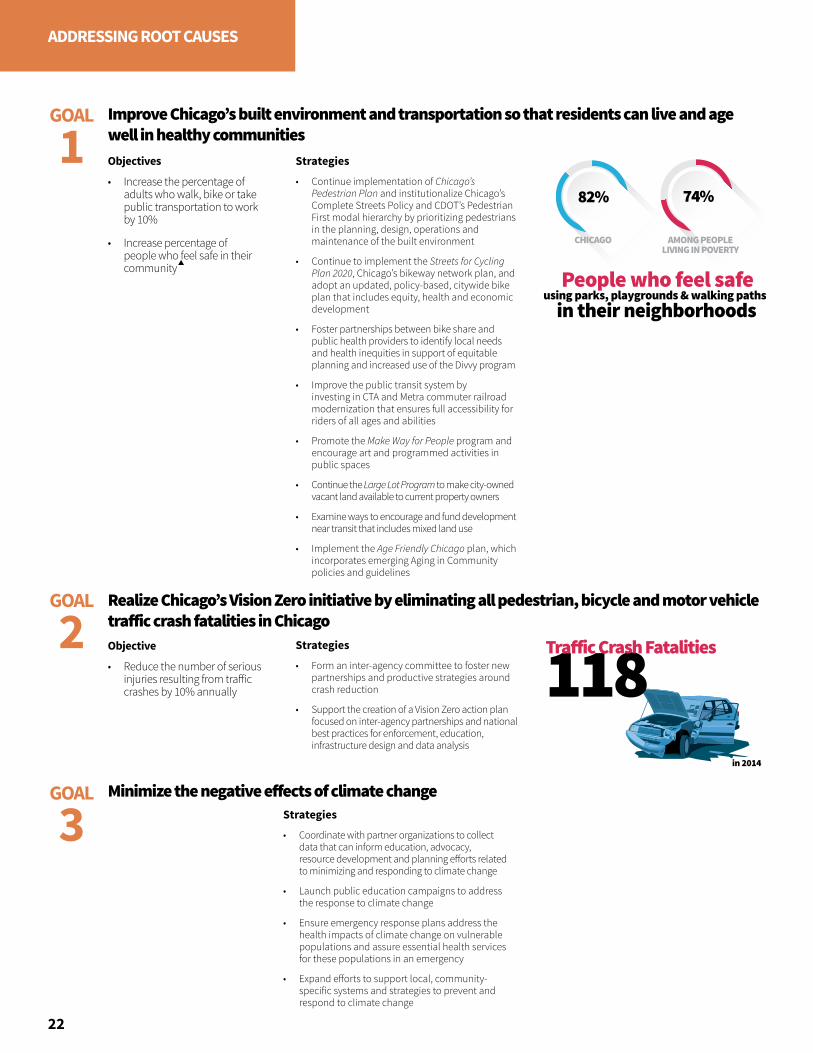
118Tra�ic Crash Fatalities
HCS, 2014
People who feel safein their neighborhoods
using parks, playgrounds & walking paths
82% 74%
CHICAGO AMONG PEOPLELIVING IN POVERTY
22
ADDRESSING ROOT CAUSES
Strategies
• Continue implementation of Chicago’s Pedestrian Plan and institutionalize Chicago’s Complete Streets Policy and CDOT’s Pedestrian First modal hierarchy by prioritizing pedestrians in the planning, design, operations and maintenance of the built environment
• Continue to implement the Streets for Cycling Plan 2020, Chicago’s bikeway network plan, and adopt an updated, policy-based, citywide bike plan that includes equity, health and economic development
• Foster partnerships between bike share and public health providers to identify local needs and health inequities in support of equitable planning and increased use of the Divvy program
• Improve the public transit system by investing in CTA and Metra commuter railroad modernization that ensures full accessibility for riders of all ages and abilities
• Promote the Make Way for People program and encourage art and programmed activities in public spaces
• Continue the Large Lot Program to make city-owned vacant land available to current property owners
• Examine ways to encourage and fund development near transit that includes mixed land use
• Implement the Age Friendly Chicago plan, which incorporates emerging Aging in Community policies and guidelines
Objectives
• Increase the percentage of adults who walk, bike or take public transportation to work by 10%
• Increase percentage of people who feel safe in their community
Improve Chicago’s built environment and transportation so that residents can live and age well in healthy communities
GOAL
1
Strategies
• Coordinate with partner organizations to collect data that can inform education, advocacy, resource development and planning efforts related to minimizing and responding to climate change
• Launch public education campaigns to address the response to climate change
• Ensure emergency response plans address the health impacts of climate change on vulnerable populations and assure essential health services for these populations in an emergency
• Expand efforts to support local, community-specific systems and strategies to prevent and respond to climate change
Minimize the negative effects of climate change
GOAL
2 Objective
• Reduce the number of serious injuries resulting from traffic crashes by 10% annually
Strategies
• Form an inter-agency committee to foster new partnerships and productive strategies around crash reduction
• Support the creation of a Vision Zero action plan focused on inter-agency partnerships and national best practices for enforcement, education, infrastructure design and data analysis
Realize Chicago’s Vision Zero initiative by eliminating all pedestrian, bicycle and motor vehicle traffic crash fatalities in Chicago
GOAL
3
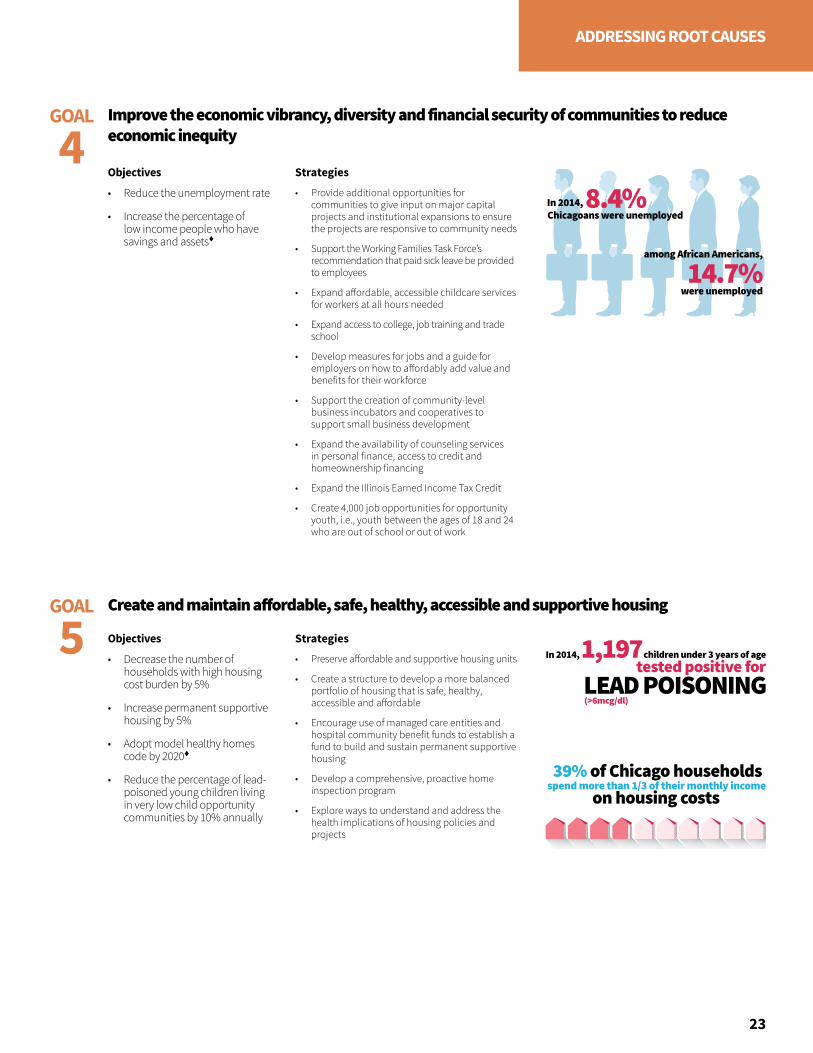
spend more than 1/3 of their monthly income on housing costs
39% of Chicago households
8.4%
14.7%among African Americans,
were unemployed
In 2014,Chicagoans were unemployed
LEAD POISONING(>6mcg/dl)
children under 3 years of age1,197In 2014,tested positive for
23
ADDRESSING ROOT CAUSES
Objectives
• Reduce the unemployment rate
• Increase the percentage of low income people who have savings and assets
Strategies
• Provide additional opportunities for communities to give input on major capital projects and institutional expansions to ensure the projects are responsive to community needs
• Support the Working Families Task Force’s recommendation that paid sick leave be provided to employees
• Expand affordable, accessible childcare services for workers at all hours needed
• Expand access to college, job training and trade school
• Develop measures for jobs and a guide for employers on how to affordably add value and benefits for their workforce
• Support the creation of community-level business incubators and cooperatives to support small business development
• Expand the availability of counseling services in personal finance, access to credit and homeownership financing
• Expand the Illinois Earned Income Tax Credit
• Create 4,000 job opportunities for opportunity youth, i.e., youth between the ages of 18 and 24 who are out of school or out of work
Improve the economic vibrancy, diversity and financial security of communities to reduce economic inequity
GOAL
4
Objectives
• Decrease the number of households with high housing cost burden by 5%
• Increase permanent supportive housing by 5%
• Adopt model healthy homes code by 2020
• Reduce the percentage of lead-poisoned young children living in very low child opportunity communities by 10% annually
Strategies
• Preserve affordable and supportive housing units
• Create a structure to develop a more balanced portfolio of housing that is safe, healthy, accessible and affordable
• Encourage use of managed care entities and hospital community benefit funds to establish a fund to build and sustain permanent supportive housing
• Develop a comprehensive, proactive home inspection program
• Explore ways to understand and address the health implications of housing policies and projects
Create and maintain affordable, safe, healthy, accessible and supportive housingGOAL
5
24
ADDRESSING ROOT CAUSES
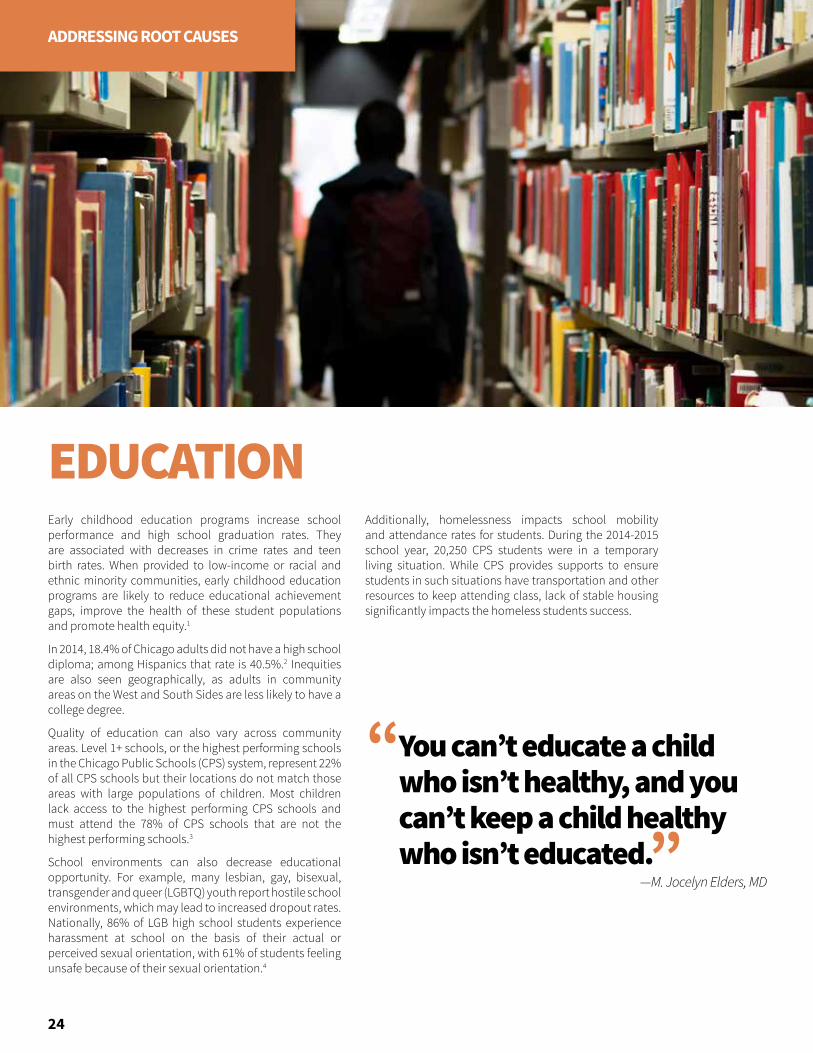
Early childhood education programs increase school performance and high school graduation rates. They are associated with decreases in crime rates and teen birth rates. When provided to low-income or racial and ethnic minority communities, early childhood education programs are likely to reduce educational achievement gaps, improve the health of these student populations and promote health equity.1
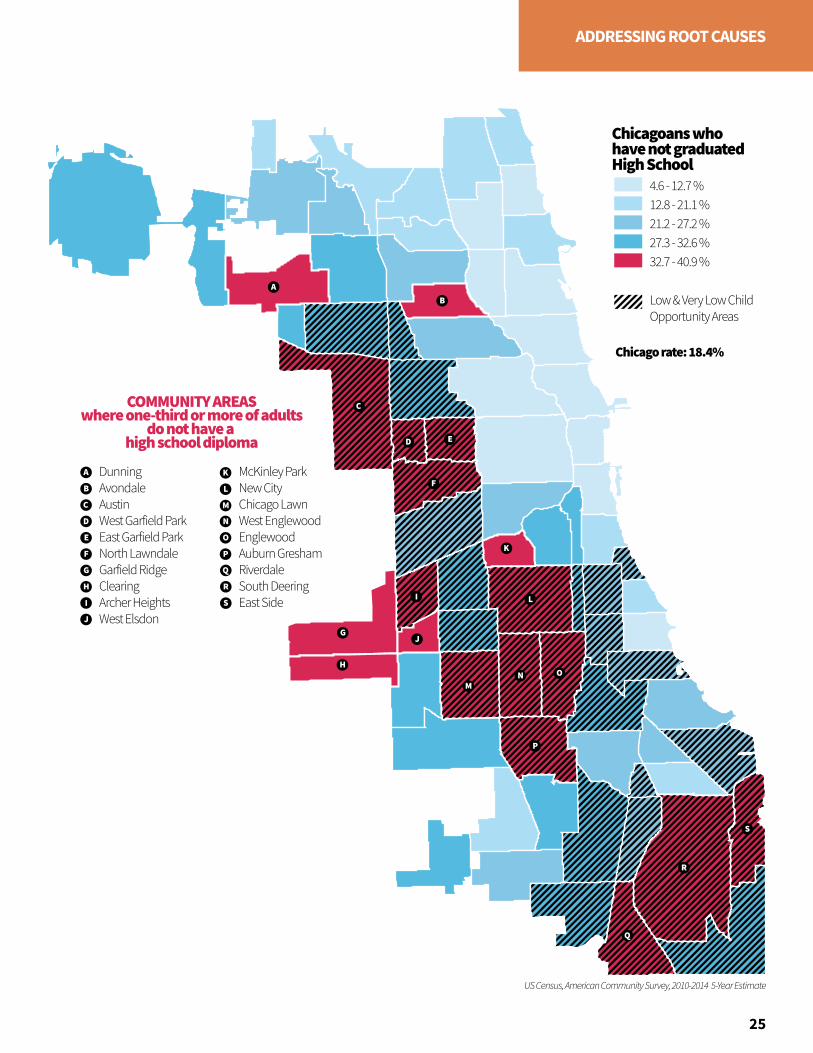
In 2014, 18.4% of Chicago adults did not have a high school diploma; among Hispanics that rate is 40.5%.2 Inequities are also seen geographically, as adults in community areas on the West and South Sides are less likely to have a college degree.
Quality of education can also vary across community areas. Level 1+ schools, or the highest performing schools in the Chicago Public Schools (CPS) system, represent 22% of all CPS schools but their locations do not match those areas with large populations of children. Most children lack access to the highest performing CPS schools and must attend the 78% of CPS schools that are not the highest performing schools.3
School environments can also decrease educational opportunity. For example, many lesbian, gay, bisexual, transgender and queer (LGBTQ) youth report hostile school environments, which may lead to increased dropout rates. Nationally, 86% of LGB high school students experience harassment at school on the basis of their actual or perceived sexual orientation, with 61% of students feeling unsafe because of their sexual orientation.4
Additionally, homelessness impacts school mobility and attendance rates for students. During the 2014-2015 school year, 20,250 CPS students were in a temporary living situation. While CPS provides supports to ensure students in such situations have transportation and other resources to keep attending class, lack of stable housing significantly impacts the homeless students success.
EDUCATION
You can’t educate a child who isn’t healthy, and you can’t keep a child healthy who isn’t educated.
—M. Jocelyn Elders, MD
“
”
4.6 - 12.7 %12.8 - 21.1 %21.2 - 27.2 %27.3 - 32.6 %32.7 - 40.9 %
Low & Very Low ChildOpportunity Areas
Chicagoans who have not graduatedHigh School
Chicago rate: 18.4%
A
A
B
B
C
CCOMMUNITY AREASwhere one-third or more of adults
do not have a high school diploma
D
D
E
E
DunningAvondaleAustinWest Garfield ParkEast Garfield ParkNorth LawndaleGarfield RidgeClearingArcher HeightsWest Elsdon
McKinley ParkNew CityChicago LawnWest EnglewoodEnglewoodAuburn GreshamRiverdaleSouth DeeringEast Side
F
F
G
G
H
H
II
J
J
K
K
L
L
M
M
N
N
O
O
P
P
US Census, American Community Survey, 2010-2014 5-Year Estimate
Q
Q
R
R
S
S
25
ADDRESSING ROOT CAUSES

73%
Eligible 3 and 4 year olds enrolled in
12,000 eligible children are not in early education
EARLY CARE AND EDUCATIONEARLY CARE AND EDUCATION
26
ADDRESSING ROOT CAUSES
Strategies
• Launch a single application and process for all early childhood education programs and expand sites where applications are available
• Conduct awareness campaigns around the importance of early childcare and education, from birth until age five
• Promote Ready to Learn via CTA and city digitals in the five most under-enrolled communities
• Build partnerships with non-traditional systems and organizations, such as faith-based organizations, park districts and aldermanic offices, to build awareness and provide information on early childhood education
• Encourage health care providers to share early childhood enrollment and programmatic information with their patients and families
• Support outreach teams in communities of focus as identified by the Mayor’s Office, Department of Family and Support Services (DFSS) and CPS
• Create messaging and materials to inform grandparents raising grandchildren about early childhood supportive services through providers and local government resources
Objective
• Increase early childhood enrollment for eligible three and four year olds by 10%
Ensure all Chicago children participate in early childhood educationGOAL
1
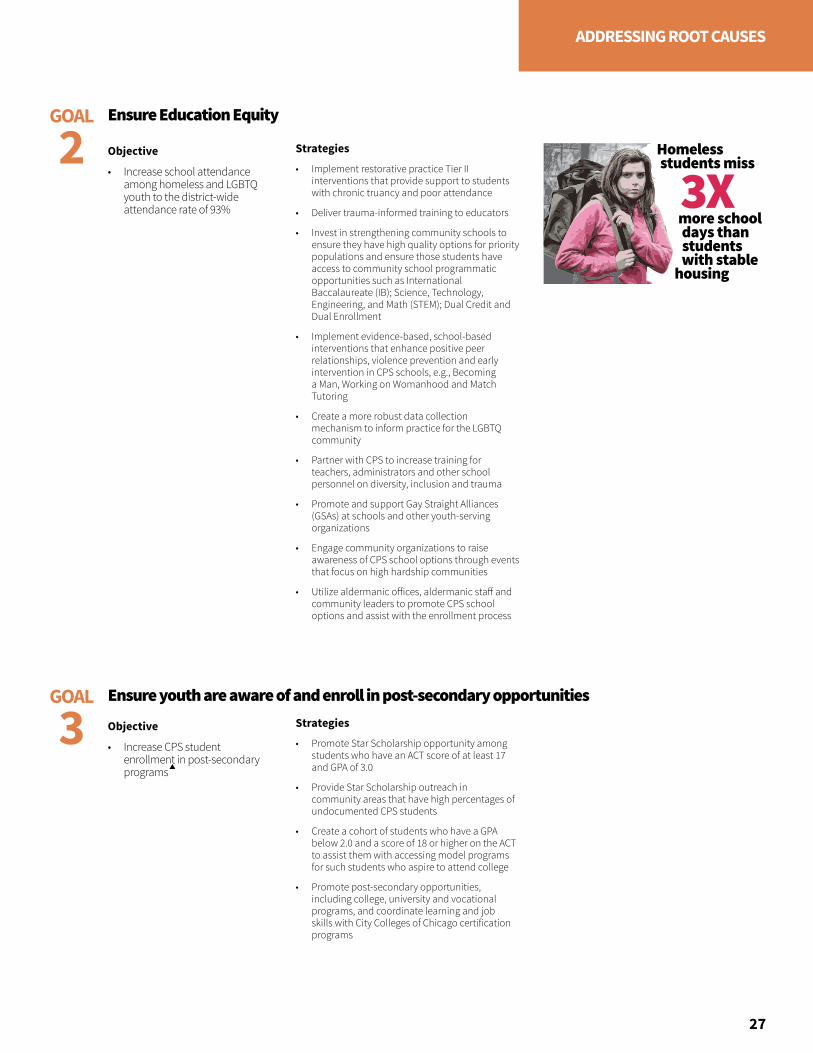
3XHomeless students miss
more school days than students with stable
housing
27
ADDRESSING ROOT CAUSES
Objective
• Increase school attendance among homeless and LGBTQ youth to the district-wide attendance rate of 93%
Objective
• Increase CPS student enrollment in post-secondary programs
Strategies
• Promote Star Scholarship opportunity among students who have an ACT score of at least 17 and GPA of 3.0
• Provide Star Scholarship outreach in community areas that have high percentages of undocumented CPS students
• Create a cohort of students who have a GPA below 2.0 and a score of 18 or higher on the ACT to assist them with accessing model programs for such students who aspire to attend college
• Promote post-secondary opportunities, including college, university and vocational programs, and coordinate learning and job skills with City Colleges of Chicago certification programs
Ensure youth are aware of and enroll in post-secondary opportunities GOAL
3
Strategies
• Implement restorative practice Tier II interventions that provide support to students with chronic truancy and poor attendance
• Deliver trauma-informed training to educators
• Invest in strengthening community schools to ensure they have high quality options for priority populations and ensure those students have access to community school programmatic opportunities such as International Baccalaureate (IB); Science, Technology, Engineering, and Math (STEM); Dual Credit and Dual Enrollment
• Implement evidence-based, school-based interventions that enhance positive peer relationships, violence prevention and early intervention in CPS schools, e.g., Becoming a Man, Working on Womanhood and Match Tutoring
• Create a more robust data collection mechanism to inform practice for the LGBTQ community
• Partner with CPS to increase training for teachers, administrators and other school personnel on diversity, inclusion and trauma
• Promote and support Gay Straight Alliances (GSAs) at schools and other youth-serving organizations
• Engage community organizations to raise awareness of CPS school options through events that focus on high hardship communities
• Utilize aldermanic offices, aldermanic staff and community leaders to promote CPS school options and assist with the enrollment process
Ensure Education EquityGOAL
2

CHAPTER 3
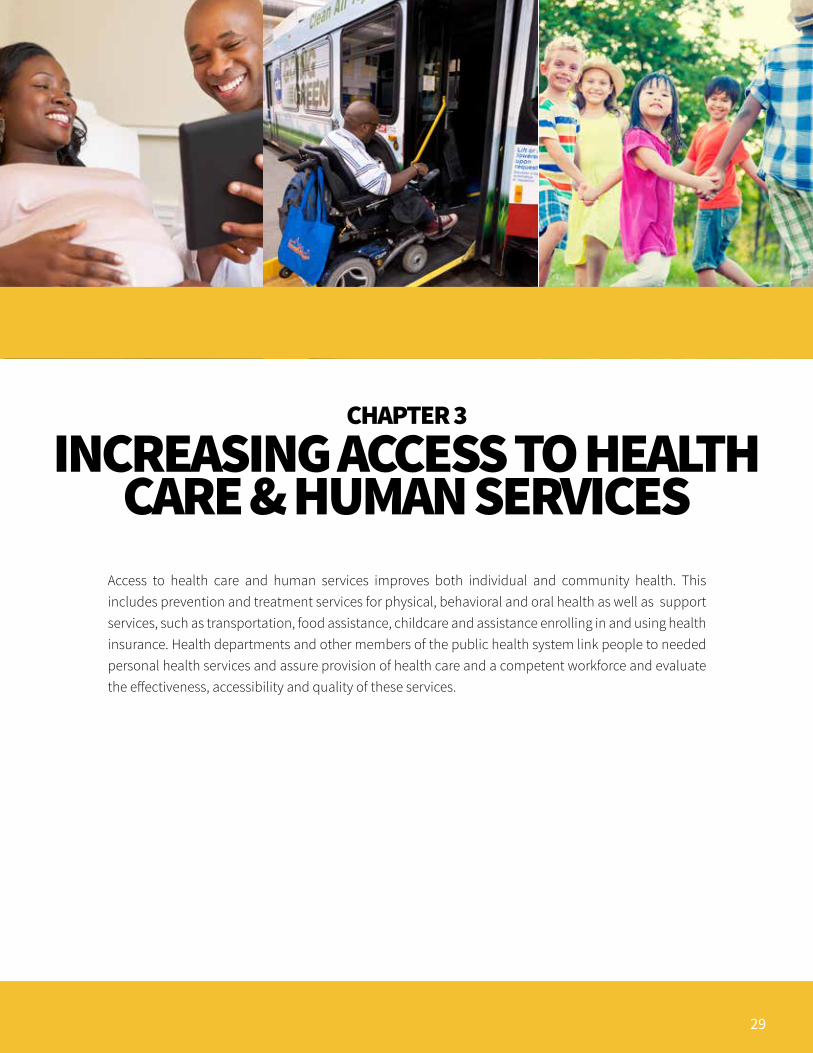
INCREASING ACCESS TO HEALTH CARE & HUMAN SERVICES
29
Access to health care and human services improves both individual and community health. This includes prevention and treatment services for physical, behavioral and oral health as well as support services, such as transportation, food assistance, childcare and assistance enrolling in and using health insurance. Health departments and other members of the public health system link people to needed personal health services and assure provision of health care and a competent workforce and evaluate the effectiveness, accessibility and quality of these services.
CHAPTER 3
INCREASING ACCESS TO HEALTH CARE & HUMAN SERVICES
30
INCREASING ACCESS
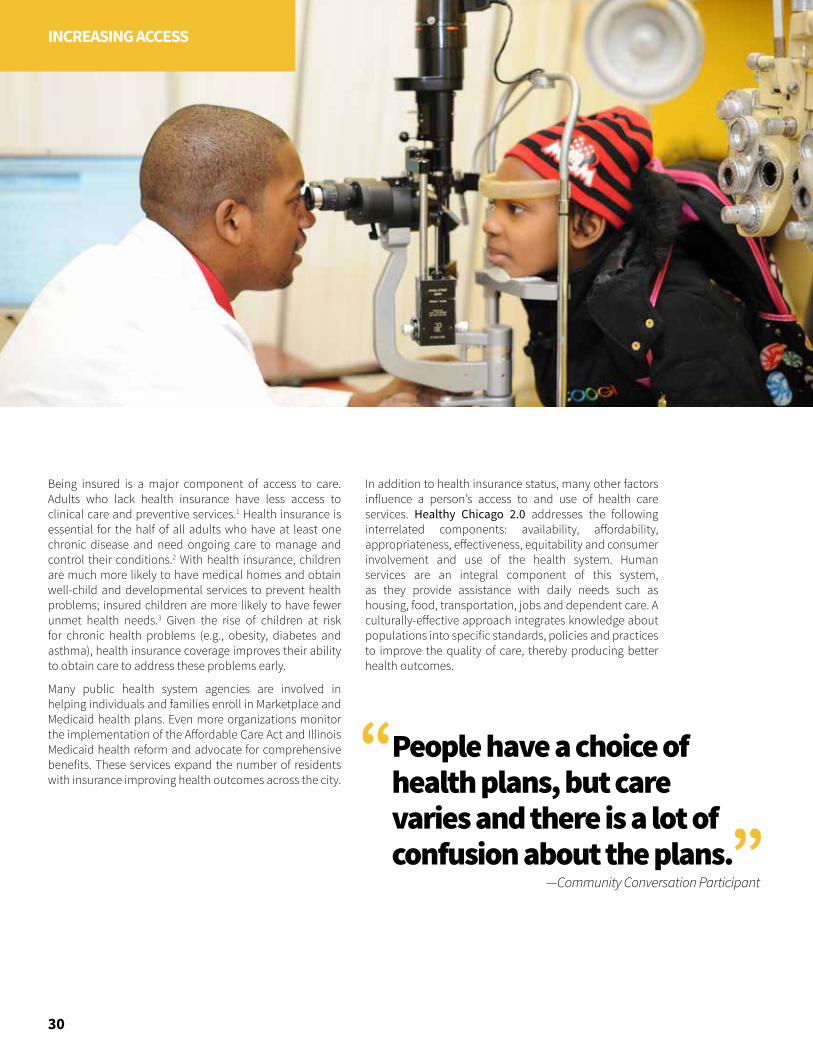
Being insured is a major component of access to care. Adults who lack health insurance have less access to clinical care and preventive services.1 Health insurance is essential for the half of all adults who have at least one chronic disease and need ongoing care to manage and control their conditions.2 With health insurance, children are much more likely to have medical homes and obtain well-child and developmental services to prevent health problems; insured children are more likely to have fewer unmet health needs.3 Given the rise of children at risk for chronic health problems (e.g., obesity, diabetes and asthma), health insurance coverage improves their ability to obtain care to address these problems early.
Many public health system agencies are involved in helping individuals and families enroll in Marketplace and Medicaid health plans. Even more organizations monitor the implementation of the Affordable Care Act and Illinois Medicaid health reform and advocate for comprehensive benefits. These services expand the number of residents with insurance improving health outcomes across the city.
In addition to health insurance status, many other factors influence a person’s access to and use of health care services. Healthy Chicago 2.0 addresses the following interrelated components: availability, affordability, appropriateness, effectiveness, equitability and consumer involvement and use of the health system. Human services are an integral component of this system, as they provide assistance with daily needs such as housing, food, transportation, jobs and dependent care. A culturally-effective approach integrates knowledge about populations into specific standards, policies and practices to improve the quality of care, thereby producing better health outcomes.
People have a choice of health plans, but care varies and there is a lot of confusion about the plans.
—Community Conversation Participant
“
”
AB
C
D
E
FG
H
US Census, American Community Survey, 2010-2014 5-Year Estimate
I
J
K
L
M
NO
P
Q
R
S
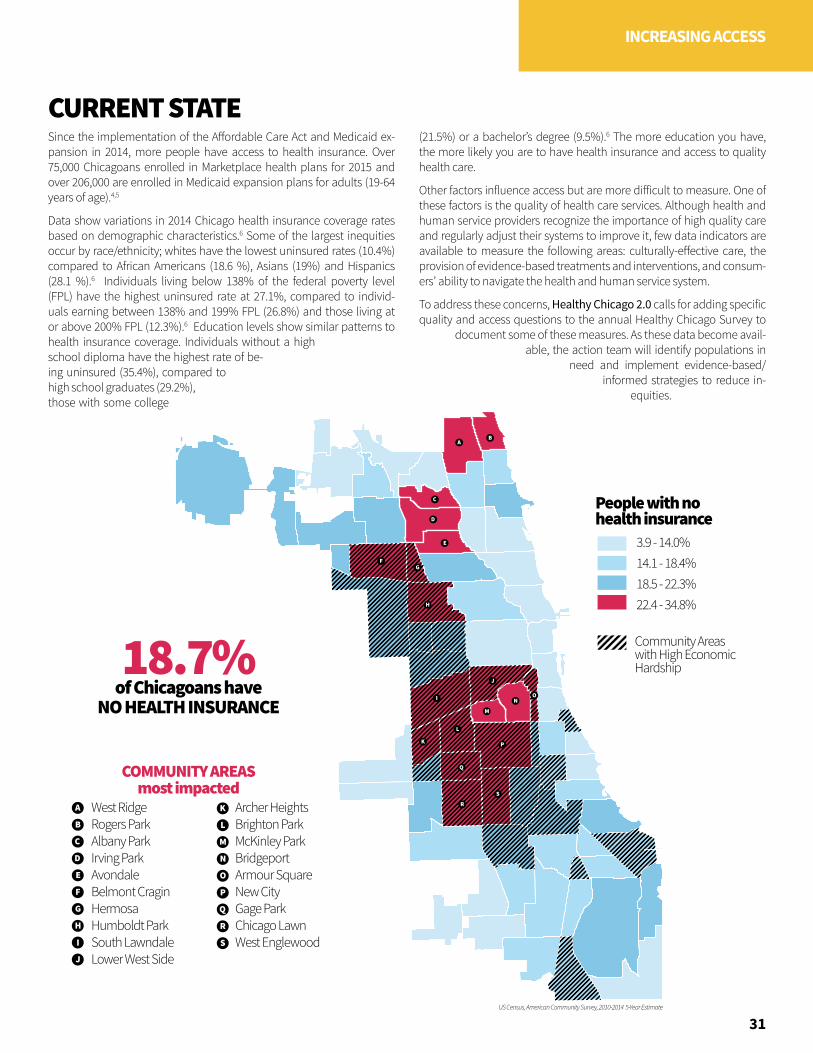
People with no health insurance
Community Areaswith High EconomicHardship
22.4 - 34.8%18.5 - 22.3%14.1 - 18.4%3.9 - 14.0%
18.7%
COMMUNITY AREASmost impacted
West RidgeRogers ParkAlbany ParkIrving ParkAvondaleBelmont CraginHermosaHumboldt ParkSouth LawndaleLower West Side
Archer HeightsBrighton ParkMcKinley ParkBridgeportArmour SquareNew CityGage ParkChicago LawnWest Englewood
of Chicagoans have
A
B
C
D
E
F
G
H
I
J
K
L
M
N
O
P
Q
R
S
NO HEALTH INSURANCE
31
INCREASING ACCESS
Since the implementation of the Affordable Care Act and Medicaid ex-pansion in 2014, more people have access to health insurance. Over 75,000 Chicagoans enrolled in Marketplace health plans for 2015 and over 206,000 are enrolled in Medicaid expansion plans for adults (19-64 years of age).4,5
Data show variations in 2014 Chicago health insurance coverage rates based on demographic characteristics.6 Some of the largest inequities occur by race/ethnicity; whites have the lowest uninsured rates (10.4%) compared to African Americans (18.6 %), Asians (19%) and Hispanics (28.1 %).6 Individuals living below 138% of the federal poverty level (FPL) have the highest uninsured rate at 27.1%, compared to individ-uals earning between 138% and 199% FPL (26.8%) and those living at or above 200% FPL (12.3%).6 Education levels show similar patterns to health insurance coverage. Individuals without a high school diploma have the highest rate of be-ing uninsured (35.4%), compared to high school graduates (29.2%), those with some college
(21.5%) or a bachelor’s degree (9.5%).6 The more education you have, the more likely you are to have health insurance and access to quality health care.
Other factors influence access but are more difficult to measure. One of these factors is the quality of health care services. Although health and human service providers recognize the importance of high quality care and regularly adjust their systems to improve it, few data indicators are available to measure the following areas: culturally-effective care, the provision of evidence-based treatments and interventions, and consum-ers’ ability to navigate the health and human service system.
To address these concerns, Healthy Chicago 2.0 calls for adding specific quality and access questions to the annual Healthy Chicago Survey to
document some of these measures. As these data become avail-able, the action team will identify populations in
need and implement evidence-based/informed strategies to reduce in-
equities.
CURRENT STATE

COMPONENTS OF ACCESSAvailability of ServicesProximity, hours, correct array of services, appropriate capacity
Affordability of ServicesInsurance, payment, coverage, charity care
Appropriate, Effective and Equitable ServicesSocially, culturally and linguistically effective; evidence-based or informed; performed to consumer satisfaction
Partnerships Between Providers and Community Timeliness of services, health homes, prevention and supportive services
1 in 3 Hispanic adults does not have aPRIMARY CARE PROVIDER
of HISPANICSare without health insurance
28%
32
INCREASING ACCESS
Strategies
• Establish a comprehensive health and human services resource system
• Analyze geographic access to health and human services and address gaps in care
• Expand provider capacity by promoting access to community-level data to support successful service expansion grants
• Advocate for sustainability of school-based health centers
• Facilitate the use of waivers to allow individuals convicted of certain felonies to work in the health care and human service professions; expand the list of jobs for which waivers can be requested
• Advocate that the State of Illinois develop State Workforce Scope of Practice Acts that allow health care providers to work at the top of their professional scope of practice and training
• Ensure that high hardship communities have certified application counselors located in their area to assist with Marketplace and Medicaid enrollment
• Develop an outreach and enrollment sustainability plan to ensure ongoing engagement and education on health insurance enrollment and use, including for individuals access to behavioral health care
• Join efforts to create affordable health insurance options for people who are not eligible for government or Marketplace plans
Objectives
• Increase percentage of Hispanic adults who have a regular doctor by 10%
• Decrease percentage of Hispanic adults without health insurance by 20%
Increase capacity and availability of health and human services and maximize impact of existing resources
GOAL
1
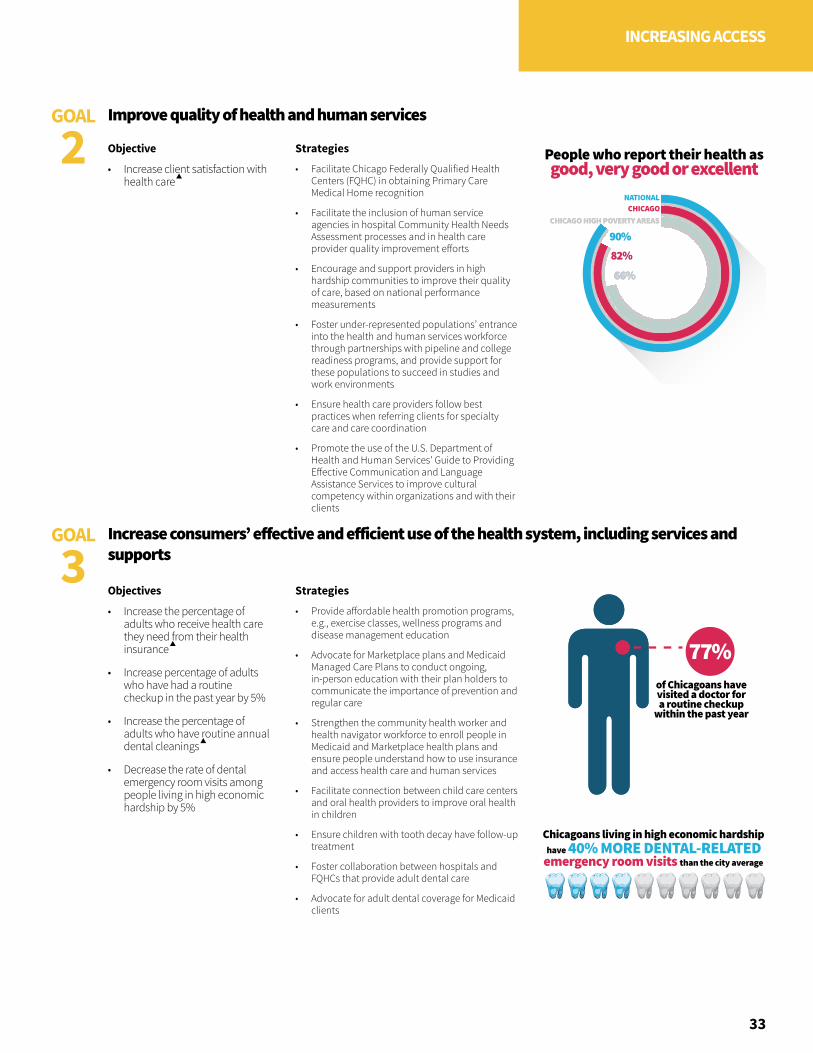
People who report their health as good, very good or excellent
CHICAGO HIGH POVERTY AREAS CHICAGO HIGH POVERTY AREAS
66%66%66%66%
82%82%90%90%
NATIONALCHICAGO
77%of Chicagoans have visited a doctor for a routine checkup
within the past year
Chicagoans living in high economic hardship
than the city averageemergency room visitshave 40% MORE DENTAL-RELATED
33
INCREASING ACCESS
Objective
• Increase client satisfaction with health care
Objectives
• Increase the percentage of adults who receive health care they need from their health insurance
• Increase percentage of adults who have had a routine checkup in the past year by 5%
• Increase the percentage of adults who have routine annual dental cleanings
• Decrease the rate of dental emergency room visits among people living in high economic hardship by 5%
Strategies
• Facilitate Chicago Federally Qualified Health Centers (FQHC) in obtaining Primary Care Medical Home recognition
• Facilitate the inclusion of human service agencies in hospital Community Health Needs Assessment processes and in health care provider quality improvement efforts
• Encourage and support providers in high hardship communities to improve their quality of care, based on national performance measurements
• Foster under-represented populations’ entrance into the health and human services workforce through partnerships with pipeline and college readiness programs, and provide support for these populations to succeed in studies and work environments
• Ensure health care providers follow best practices when referring clients for specialty care and care coordination
• Promote the use of the U.S. Department of Health and Human Services' Guide to Providing Effective Communication and Language Assistance Services to improve cultural competency within organizations and with their clients
Strategies
• Provide affordable health promotion programs, e.g., exercise classes, wellness programs and disease management education
• Advocate for Marketplace plans and Medicaid Managed Care Plans to conduct ongoing, in-person education with their plan holders to communicate the importance of prevention and regular care
• Strengthen the community health worker and health navigator workforce to enroll people in Medicaid and Marketplace health plans and ensure people understand how to use insurance and access health care and human services
• Facilitate connection between child care centers and oral health providers to improve oral health in children
• Ensure children with tooth decay have follow-up treatment
• Foster collaboration between hospitals and FQHCs that provide adult dental care
• Advocate for adult dental coverage for Medicaid clients
Improve quality of health and human services
Increase consumers’ effective and efficient use of the health system, including services and supports
GOAL
2
GOAL
3
35
CHAPTER 4
IMPROVING HEALTH OUTCOMES
Chicago has seen improvements in health outcomes since the Chicago Department of Public Health (CDPH) launched the first Healthy Chicago plan in 2011, including a marked increase in vaccination rates, and decreases in new HIV diagnoses and rates of smoking among youth. Even so, public health challenges remain. Healthy Chicago 2.0 places a renewed emphasis on improving health outcomes by focusing on communities that continue to face the greatest challenges in five priority areas:
• Promoting Behavioral Health
• Strengthening Child and Adolescent Health
• Preventing and Controlling Chronic Disease
• Preventing Infectious Disease
• Reducing Violence
36
IMPROVING HEALTH OUTCOMES
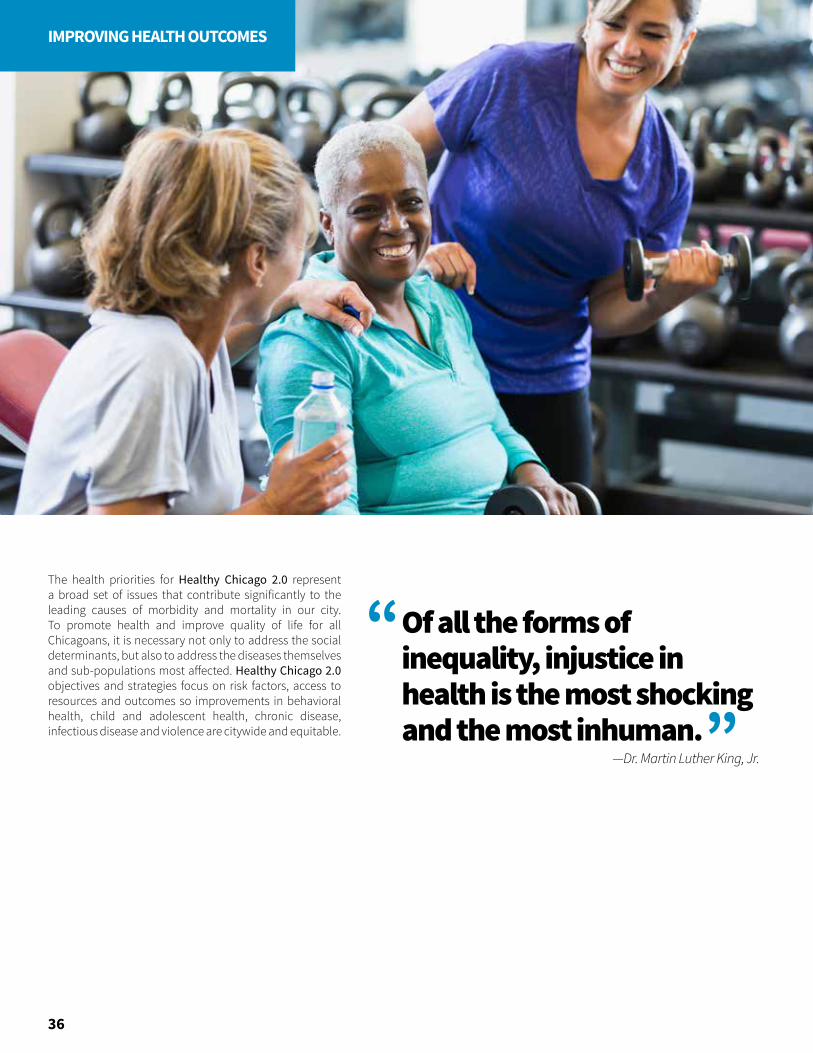
The health priorities for Healthy Chicago 2.0 represent a broad set of issues that contribute significantly to the leading causes of morbidity and mortality in our city. To promote health and improve quality of life for all Chicagoans, it is necessary not only to address the social determinants, but also to address the diseases themselves and sub-populations most affected. Healthy Chicago 2.0 objectives and strategies focus on risk factors, access to resources and outcomes so improvements in behavioral health, child and adolescent health, chronic disease, infectious disease and violence are citywide and equitable.
Of all the forms of inequality, injustice in health is the most shocking and the most inhuman.
—Dr. Martin Luther King, Jr.
“
”
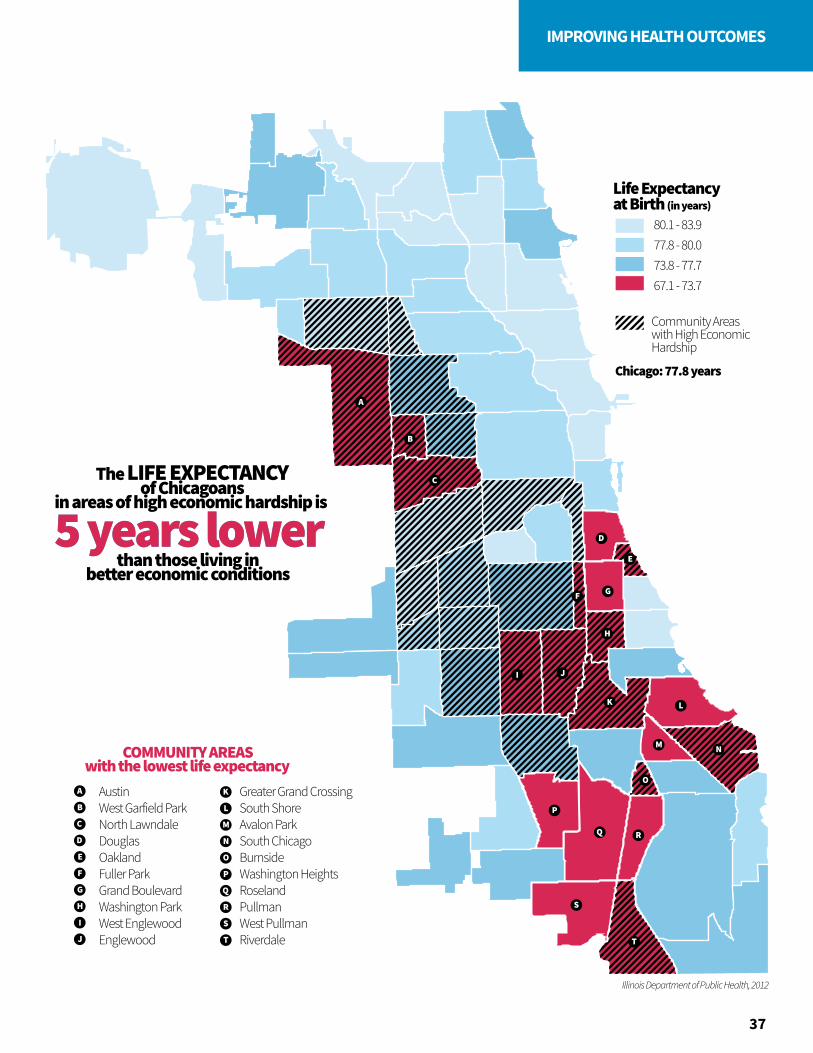
Life Expectancy at Birth (in years)
Community Areaswith High EconomicHardship
67.1 - 73.7
Chicago: 77.8 years
73.8 - 77.777.8 - 80.080.1 - 83.9
A
A
B
B
C
C
D
D
E
E
AustinWest Garfield ParkNorth LawndaleDouglasOaklandFuller ParkGrand BoulevardWashington ParkWest EnglewoodEnglewood
Greater Grand CrossingSouth ShoreAvalon ParkSouth ChicagoBurnsideWashington HeightsRoselandPullmanWest PullmanRiverdale
F
F
G
G
H
COMMUNITY AREASwith the lowest life expectancy
Illinois Department of Public Health, 2012
5 years lower5 years lowerThe LIFE EXPECTANCY
of Chicagoansin areas of high economic hardship is
than those living inbetter economic conditions
H
I
I
J
J
K
K
L
L
M
M
N
N
O
O
P
P
Q
Q
R
R S
S
TT
37
IMPROVING HEALTH OUTCOMES
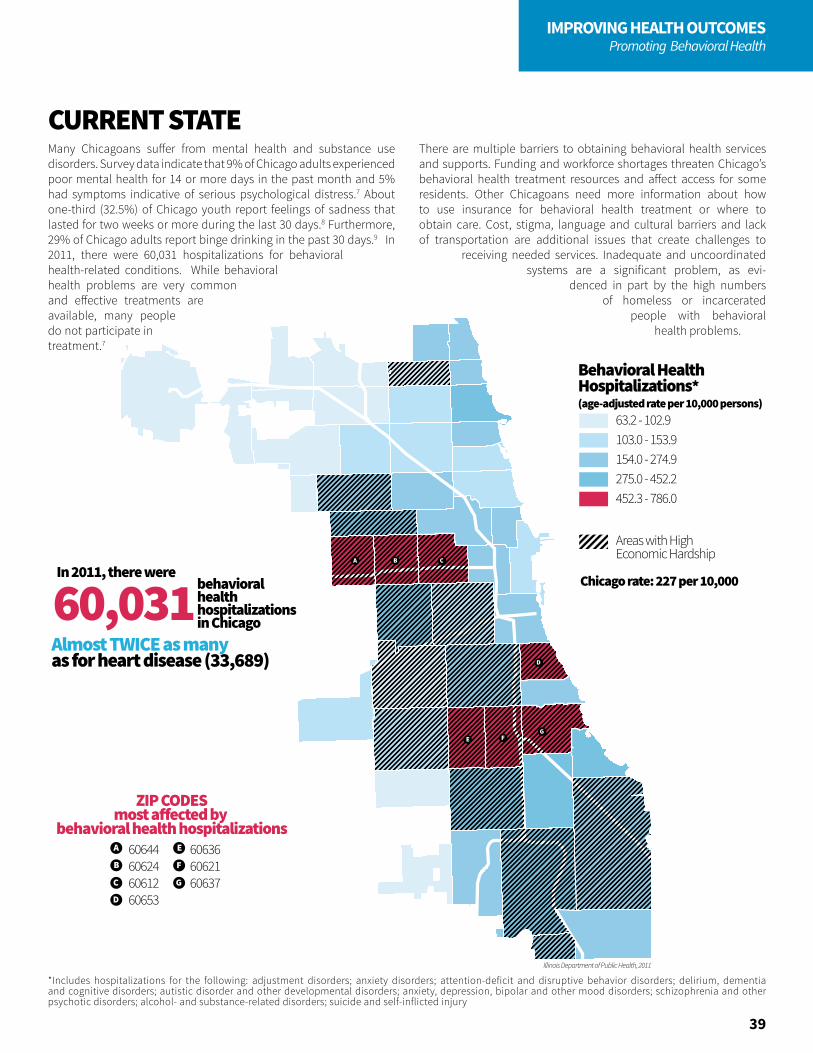
Behavioral HealthHospitalizations*(age-adjusted rate per 10,000 persons)
63.2 - 102.9103.0 - 153.9154.0 - 274.9275.0 - 452.2452.3 - 786.0
Chicago rate: 227 per 10,000
Areas with High Economic Hardship
60,031
A
B
C
D
E
F
G
ZIP CODESmost a�ected by
behavioral health hospitalizations
behavioral healthhospitalizationsin Chicago
Almost TWICE as many as for heart disease (33,689)
In 2011, there were
60644606246061260653
606366062160637
38
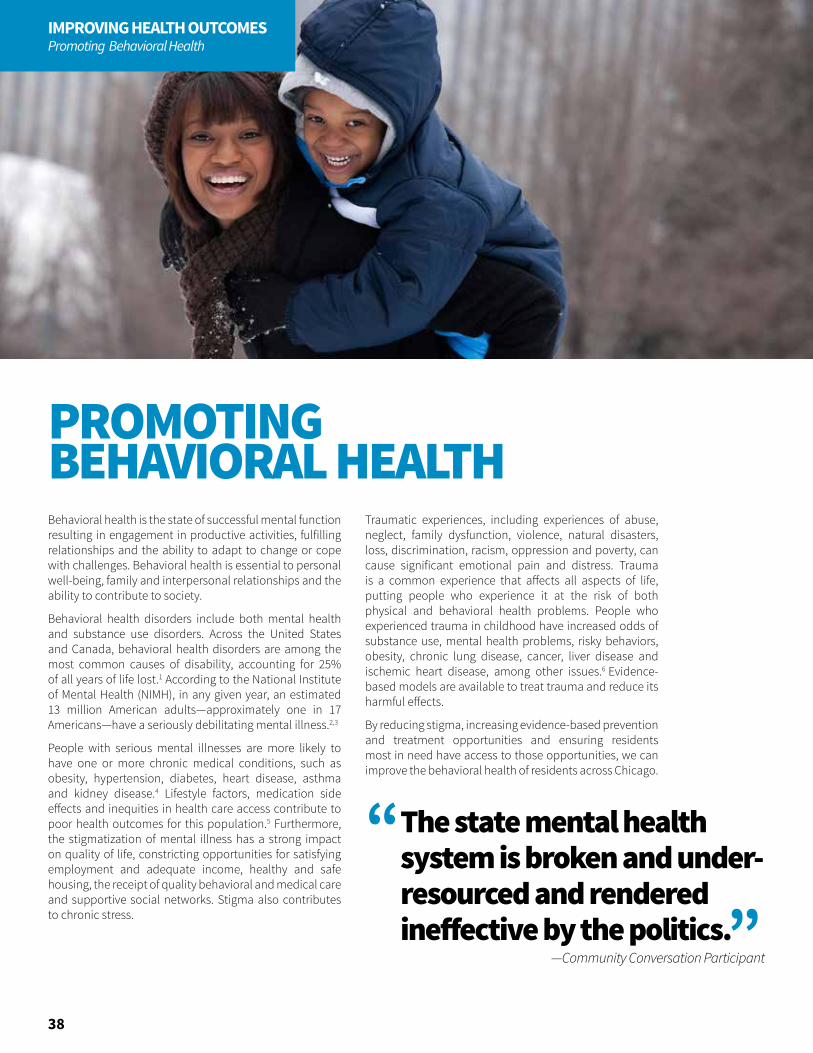
IMPROVING HEALTH OUTCOMESPromoting Behavioral Health
Behavioral health is the state of successful mental function resulting in engagement in productive activities, fulfilling relationships and the ability to adapt to change or cope with challenges. Behavioral health is essential to personal well-being, family and interpersonal relationships and the ability to contribute to society.
Behavioral health disorders include both mental health and substance use disorders. Across the United States and Canada, behavioral health disorders are among the most common causes of disability, accounting for 25% of all years of life lost.1 According to the National Institute of Mental Health (NIMH), in any given year, an estimated 13 million American adults—approximately one in 17 Americans—have a seriously debilitating mental illness.2,3
People with serious mental illnesses are more likely to have one or more chronic medical conditions, such as obesity, hypertension, diabetes, heart disease, asthma and kidney disease.4 Lifestyle factors, medication side effects and inequities in health care access contribute to poor health outcomes for this population.5 Furthermore, the stigmatization of mental illness has a strong impact on quality of life, constricting opportunities for satisfying employment and adequate income, healthy and safe housing, the receipt of quality behavioral and medical care and supportive social networks. Stigma also contributes to chronic stress.
Traumatic experiences, including experiences of abuse, neglect, family dysfunction, violence, natural disasters, loss, discrimination, racism, oppression and poverty, can cause significant emotional pain and distress. Trauma is a common experience that affects all aspects of life, putting people who experience it at the risk of both physical and behavioral health problems. People who experienced trauma in childhood have increased odds of substance use, mental health problems, risky behaviors, obesity, chronic lung disease, cancer, liver disease and ischemic heart disease, among other issues.6 Evidence-based models are available to treat trauma and reduce its harmful effects.
By reducing stigma, increasing evidence-based prevention and treatment opportunities and ensuring residents most in need have access to those opportunities, we can improve the behavioral health of residents across Chicago.
PROMOTING BEHAVIORAL HEALTH
The state mental health system is broken and under-resourced and rendered ineffective by the politics.
—Community Conversation Participant
“
”
Illinois Department of Public Health, 2011
A B C
D
E FG
Behavioral HealthHospitalizations*(age-adjusted rate per 10,000 persons)
63.2 - 102.9103.0 - 153.9154.0 - 274.9275.0 - 452.2452.3 - 786.0
Chicago rate: 227 per 10,000
Areas with High Economic Hardship
60,031
A
B
C
D
E
F
G
ZIP CODESmost a�ected by
behavioral health hospitalizations
behavioral healthhospitalizationsin Chicago
Almost TWICE as many as for heart disease (33,689)
In 2011, there were
60644606246061260653
606366062160637
*Includes hospitalizations for the following: adjustment disorders; anxiety disorders; attention-deficit and disruptive behavior disorders; delirium, dementia and cognitive disorders; autistic disorder and other developmental disorders; anxiety, depression, bipolar and other mood disorders; schizophrenia and other psychotic disorders; alcohol- and substance-related disorders; suicide and self-inflicted injury
39
IMPROVING HEALTH OUTCOMESPromoting Behavioral Health
CURRENT STATEMany Chicagoans suffer from mental health and substance use disorders. Survey data indicate that 9% of Chicago adults experienced poor mental health for 14 or more days in the past month and 5% had symptoms indicative of serious psychological distress.7 About one-third (32.5%) of Chicago youth report feelings of sadness that lasted for two weeks or more during the last 30 days.8 Furthermore, 29% of Chicago adults report binge drinking in the past 30 days.9 In 2011, there were 60,031 hospitalizations for behavioral health-related conditions. While behavioral health problems are very common and effective treatments are available, many people do not participate in treatment.7
There are multiple barriers to obtaining behavioral health services and supports. Funding and workforce shortages threaten Chicago’s behavioral health treatment resources and affect access for some residents. Other Chicagoans need more information about how to use insurance for behavioral health treatment or where to obtain care. Cost, stigma, language and cultural barriers and lack of transportation are additional issues that create challenges to
receiving needed services. Inadequate and uncoordinated systems are a significant problem, as evi-
denced in part by the high numbers of homeless or incarcerated
people with behavioral health problems.

PSYCHOLOGICAL DISTRESS
5%
HIGH POVERTY NEIGHBORHOODShad DOUBLE the Chicago rate
of adults experience SERIOUSPSYCHOLOGICALDISTRESS
People living in
one-THIRDof youth
reportedprolonged
periodsof sadness
40
IMPROVING HEALTH OUTCOMESPromoting Behavioral Health
Objectives
• Increase utilization of mental health treatment among those with greatest need by 10%
Strategies
• Establish a behavioral health oversight and leadership council to improve behavioral health coordination across Chicago
• Hire a new behavioral health leadership position at CDPH
• Conduct an assessment of behavioral health systems capacity and develop a surveillance plan
• Develop and make widely available a behavioral health resource inventory
• Launch the No Wrong Door behavioral health initiative to increase access to care (e.g., behavioral health services based at community-based organizations, behavioral health education and screening at pharmacies)
• Promote universal Crisis Intervention Team (CIT) training for all new Chicago police officers and increase use of mental health liaisons working with CIT-trained officers
• Increase the use of peer-to-peer networks and community health workers to promote access to care
• Advocate for trauma services to be covered by public and private insurance plans
• Promote the development and use of telehealth
• Strengthen and promote programs that provide intensive case management for people leaving jail or prison
• Provide Mental Health and Psychological First Aid training to all city workers
• Promote the use of Screening, Brief Intervention and Referral to Treatment and mental health screening and referral by primary care providers
• Create a workforce development and training plan to increase capacity and address gaps in the supply of behavioral health services
Chicagoans have access to coordinated systems that effectively address behavioral healthGOAL
1

50% are currently in treatment
ONLYof adults who report serious psychological distress
MORE LIKELY 3 TIMES
to attempt suicidethan their heterosexual peers
LGBTQ YOUTH are
HALF OF WHITE MALESreport BINGE DRINKING
CITYWIDE - 29%
NATIONAL - 17%
WHITE MALES - 46%
TRIPLEthe rate of adults
nationally
This is almost
41
IMPROVING HEALTH OUTCOMESPromoting Behavioral Health
Objectives
• Reduce serious mental illness among residents living in poverty by 5%
• Reduce adult binge drinking among young White males by 5%
• Reduce depression among adolescent females by 5%
Objective
• Reduce behavioral health-related hospitalizations by 10%
Objective
• Reduce opiate overdose by 20%
• Reduce prescription opiate abuse
Objective
• Reduce suicide attempts among LGBTQ youth by 10%
Objective
• Increase primary care utilization among people with serious mental illness by 10%
Strategies
• Establish working group to develop and implement the most effective strategies to increase prevention and promote behavioral health
• Ensure evidence-based interventions, including cognitive behavioral therapy, harm reduction and motivational interviewing, are widely available
• Develop and launch a city-wide anti-stigma campaign
• Train the city’s workforce in trauma-informed service delivery
Strategies
• Promote the use of Assertive Community Treatment and programs such as The Living Room that reduce emergency department visits and hospitalizations
• Promote care coordination and the use of bridge models for clients with behavioral health needs who are discharged from hospitals
Strategies
• Promote the use of medication-assisted treatment
• Monitor implementation of the Heroin Crisis Act
• Expand access to opioid use disorder treatment through public information campaigns, physician buprenorphine training and Federally Qualified Health Center (FQHC) treatment capacity
• Expand opioid overdose education and naloxone distribution programming
Strategies
• Promote Social Emotional Learning (SEL) programming in K-12 schools
• Employ technology innovations to increase youth access to support and behavioral health treatment, e.g., crisis text line program, behavioral health screening and referral web application
• Expand the delivery of behavioral health services through community mental health partnerships in schools
Strategies
• Promote evidence-based integration of primary and behavioral health care
• Work with behavioral health providers to ensure that people with serious mental illness visit a primary care doctor regularly and that family members are trained on health maintenance strategies
Effective prevention (primary, secondary and tertiary) and treatment are deliveredGOAL
2
42
IMPROVING HEALTH OUTCOMESStrengthening Child & Adolescent Health
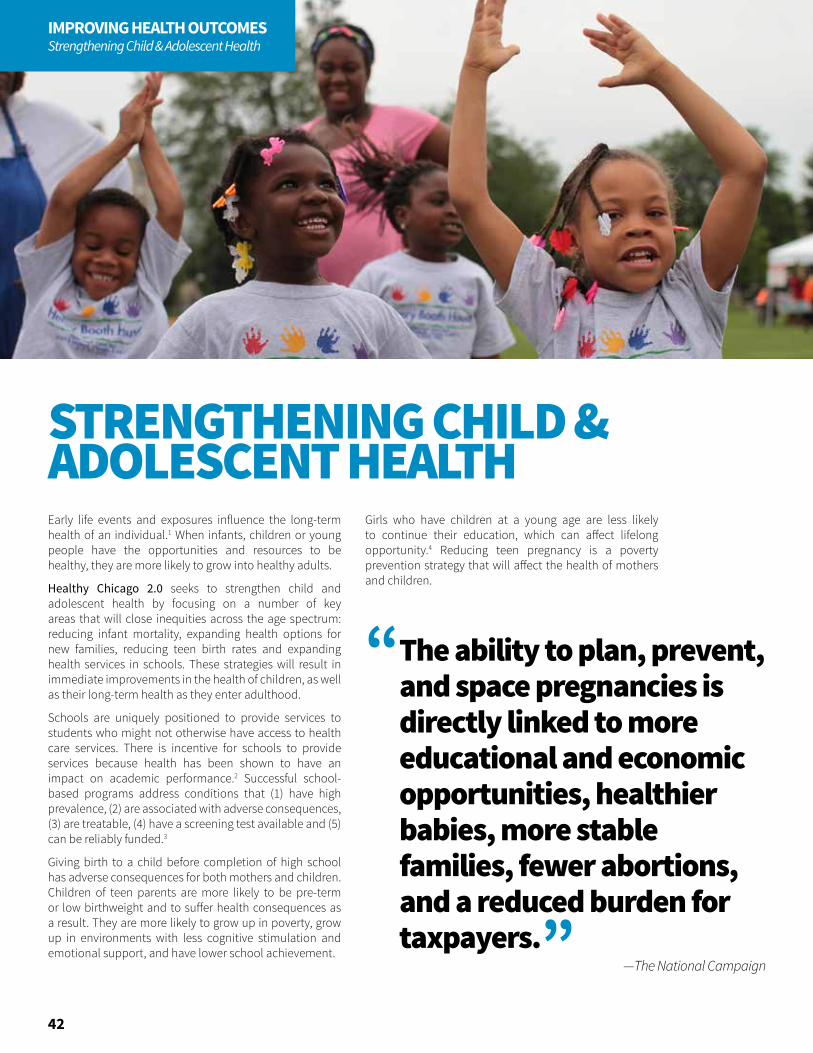
Early life events and exposures influence the long-term health of an individual.1 When infants, children or young people have the opportunities and resources to be healthy, they are more likely to grow into healthy adults.
Healthy Chicago 2.0 seeks to strengthen child and adolescent health by focusing on a number of key areas that will close inequities across the age spectrum: reducing infant mortality, expanding health options for new families, reducing teen birth rates and expanding health services in schools. These strategies will result in immediate improvements in the health of children, as well as their long-term health as they enter adulthood.
Schools are uniquely positioned to provide services to students who might not otherwise have access to health care services. There is incentive for schools to provide services because health has been shown to have an impact on academic performance.2 Successful school-based programs address conditions that (1) have high prevalence, (2) are associated with adverse consequences, (3) are treatable, (4) have a screening test available and (5) can be reliably funded.3
Giving birth to a child before completion of high school has adverse consequences for both mothers and children. Children of teen parents are more likely to be pre-term or low birthweight and to suffer health consequences as a result. They are more likely to grow up in poverty, grow up in environments with less cognitive stimulation and emotional support, and have lower school achievement.
Girls who have children at a young age are less likely to continue their education, which can affect lifelong opportunity.4 Reducing teen pregnancy is a poverty prevention strategy that will affect the health of mothers and children.
STRENGTHENING CHILD & ADOLESCENT HEALTH
The ability to plan, prevent, and space pregnancies is directly linked to more educational and economic opportunities, healthier babies, more stable families, fewer abortions, and a reduced burden for taxpayers.
—The National Campaign
“
”
Illinois Department of Public Health, 2009-2013 5-Year Estimate
E
F
A
B
C
DG
H
IJ
K
L
M
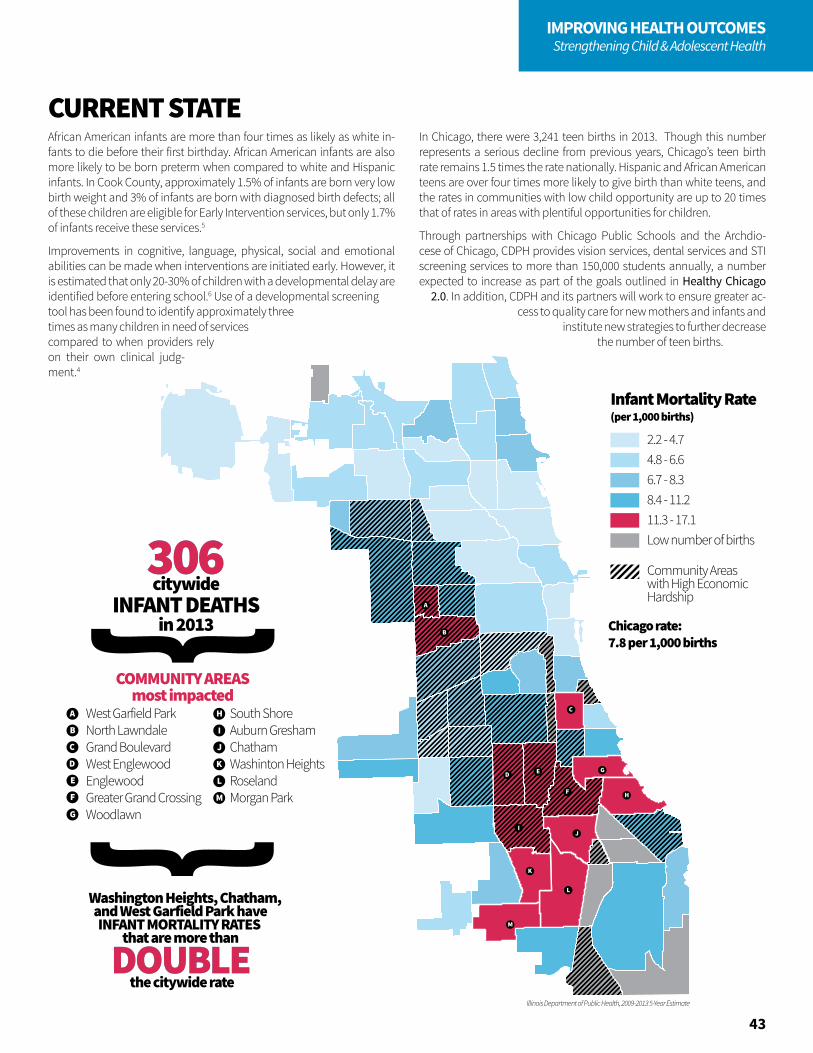
2.2 - 4.74.8 - 6.66.7 - 8.38.4 - 11.211.3 - 17.1Low number of births
Community Areaswith High EconomicHardship
Infant Mortality Rate (per 1,000 births)
Chicago rate: 7.8 per 1,000 births
306306citywide
INFANT DEATHSin 2013
A
B
C
D
E
West Garfield ParkNorth LawndaleGrand BoulevardWest EnglewoodEnglewoodGreater Grand CrossingWoodlawn
South ShoreAuburn GreshamChathamWashinton HeightsRoselandMorgan Park
COMMUNITY AREASmost impacted
F
G
H
I
J
K
L
M
DOUBLEDOUBLE
Washington Heights, Chatham, and West Garfield Park haveINFANT MORTALITY RATES
that are more than
the citywide rate
2.2 - 4.74.8 - 6.66.7 - 8.38.4 - 11.211.3 - 17.1Low number of births
Community Areaswith High EconomicHardship
Infant Mortality Rate (per 1,000 births)
Chicago rate: 7.8 per 1,000 births
306306citywide
INFANT DEATHSin 2013
A
B
C
D
E
West Garfield ParkNorth LawndaleGrand BoulevardWest EnglewoodEnglewoodGreater Grand CrossingWoodlawn
South ShoreAuburn GreshamChathamWashinton HeightsRoselandMorgan Park
COMMUNITY AREASmost impacted
F
G
H
I
J
K
L
M
DOUBLEDOUBLE
Washington Heights, Chatham, and West Garfield Park haveINFANT MORTALITY RATES
that are more than
the citywide rate43
IMPROVING HEALTH OUTCOMESStrengthening Child & Adolescent Health
African American infants are more than four times as likely as white in-fants to die before their first birthday. African American infants are also more likely to be born preterm when compared to white and Hispanic infants. In Cook County, approximately 1.5% of infants are born very low birth weight and 3% of infants are born with diagnosed birth defects; all of these children are eligible for Early Intervention services, but only 1.7% of infants receive these services.5
Improvements in cognitive, language, physical, social and emotional abilities can be made when interventions are initiated early. However, it is estimated that only 20-30% of children with a developmental delay are identified before entering school.6 Use of a developmental screening tool has been found to identify approximately three times as many children in need of services compared to when providers rely on their own clinical judg-ment.4
In Chicago, there were 3,241 teen births in 2013. Though this number represents a serious decline from previous years, Chicago’s teen birth rate remains 1.5 times the rate nationally. Hispanic and African American teens are over four times more likely to give birth than white teens, and the rates in communities with low child opportunity are up to 20 times that of rates in areas with plentiful opportunities for children.
Through partnerships with Chicago Public Schools and the Archdio-cese of Chicago, CDPH provides vision services, dental services and STI screening services to more than 150,000 students annually, a number expected to increase as part of the goals outlined in Healthy Chicago
2.0. In addition, CDPH and its partners will work to ensure greater ac-cess to quality care for new mothers and infants and
institute new strategies to further decrease the number of teen births.
CURRENT STATE

VERY LOWCHILD
OPPORTUNITY
are 60% HIGHER
Teen birth ratesin areas of
than in the city overall
44
IMPROVING HEALTH OUTCOMESStrengthening Child & Adolescent Health
Objective
• Reduce infant mortality in high hardship communities by 10%
Objective
• Increase the number of children with Individualized Family Service Plans
Strategies
• Ensure access and entry into sufficiently early and adequate preconception, prenatal and inter-conception care
• Expand evidence-based and promising practice initiatives with goals of reducing smoking and substance use in pregnant women
• Expand use of evidence-based and promising practice initiatives that facilitate planned pregnancies and encourage partner involvement in family life
• Advocate for reduction in early elective deliveries
• Implement only evidence-based and promising practice initiatives for all home visiting programs
• Promote infant safe sleep strategies
• Promote breastfeeding for the first six months of infancy
• Encourage the provision of pro-family business practices, e.g., paid maternity leave, paid paternity leave and mother-friendly worksites
• Promote the use of car seats and childproofing home strategies
• Facilitate access to positive parenting and child development resources to prevent and address child maltreatment
• Work to identify novel surveillance data to further identify and predict risk factors affecting infant mortality
Strategies
• Promote the use of early developmental screening and standardized evidence-based screening tools
• Include developmental screening and Early Intervention messages in Text 4 Babies and Connect 4 Tots
• Update the definition of “at risk of substantial developmental delay” in the Illinois Administrative Code to increase the number of children who are eligible for Early Intervention services
Ensure access to care and supports for mothers and infants
Ensure families have access to resources necessary to support appropriate health and development for infants and young children ages 0-5
GOAL
1
GOAL
2

115,238Students receiveddental exams
6,399Students testedfor STI
during the 2014-2015 school year
43,878Students received eye exams
during the 2014-2015 school year
45
IMPROVING HEALTH OUTCOMESStrengthening Child & Adolescent Health
Objectives
• Increase school-based vision exams by 10%
• Increase school-based dental exams by 20%
• Increase school-based sexually transmitted infection (STI) screenings by 10%
Objective
• Reduce the teen birth rate in very low child opportunity communities by 10%
Strategies
• Deploy innovative parental consent strategies to increase student participation in school-based health services
• Expand the number of schools participating in school-based health services programs
• Monitor and promote follow-up exams and treatment for students who fail vision and hearing screenings, have dental decay and test positive for STIs
Strategies
• Expand condom availability in public high schools and expand the public outlets where adolescents can access free condoms
• Promote implementation of comprehensive sexual health education in all grades
• Promote the use of school-based health centers for sexual and mental health services
• Provide positive youth development and peer health programs both in and out of school
• Encourage parents and guardians to be involved in educating their children about sexual health, reproductive health services and healthy relationships
• Expand education and access to long-acting, reversible contraception (e.g., IUDs and implants) and emergency contraception
Children and adolescents have the resources and support they need to make healthy choices GOAL
3
46
IMPROVING HEALTH OUTCOMESPreventing & Controlling Chronic Disease
Chronic diseases and conditions such as heart disease, stroke, cancer, diabetes, respiratory diseases and obesity are among the most common, costly and preventable of all health problems.1,2 In Chicago, as in the United States, health risk behaviors and the burden of chronic disease and conditions are not equitable.2,3 Though hospitalizations and deaths due to chronic diseases have decreased over time, inequities persist due to differences in health risk behaviors and underlying social determinants of health, like economic stability, community and the built environment, health care access, social and community context and education.3,4 Moreover, incidence of obesity, diabetes, hypertension and breast cancer in adults is actually increasing in Chicago, while the health risk behaviors that impact these diseases and conditions, such as healthy eating, physical activity, smoking and preventive cancer screenings, have remained the same or worsened. Improvements have been seen in smoking and in physical activity among Chicago youth, and obesity rates appear to be stabilizing in children entering kindergarten. However, similar to adults, the distribution of health risk behaviors and chronic diseases and conditions is not equitable. Inequities in physical activity, smoking, asthma and obesity exist by gender, race-ethnicity, sexual orientation and geography.3
The Centers for Disease Control & Prevention (CDC) recommends addressing chronic disease prevention and control at the individual and population level through coordinated efforts between government agencies and public and private partners, including epidemiology and surveillance, environmental approaches, health care system interventions and community-clinical linkages. Policies changing the context and making healthy lifestyles easier, safer, cheaper and more convenient (e.g., improving social and physical environments) are more likely to help end inequities in chronic disease. Improvements in the delivery and use of quality clinical services can prevent and detect chronic diseases early and manage risk factors better. Finally, ensuring people with or at high risk for chronic diseases have access to effective community resources can help to prevent or manage chronic diseases.2,5
PREVENTING & CONTROLLING CHRONIC DISEASE

A B C
D
E
F
G
H
I
J
K L M
N O
P
R
Chicago Public Schools, 2012-2013
Q
S
Obesity Rates amongK, 6th, & 9th Graders in Chicago Public Schools
12 - 16 %17 - 21 %22 - 24 %25 - 27 %28 - 32 %
A
B
C
D
E
MontclaireBelmont-CraginHermosaAvondaleLogan SquareHumboldt ParkSouth LawndaleLower West SideBrighton ParkMcKinley Park
Garfield RidgeWest ElsdonGage ParkNew CityFuller ParkAshburnBurnsideSouth DeeringEast Side
F
G
H
I
J
K
L
M
N
O
P
COMMUNITY AREASmost impacted
R
Q
S
19%19%of all CPS kids are
OBESE
Obesity Rates amongK, 6th, & 9th Graders in Chicago Public Schools
12 - 16 %17 - 21 %22 - 24 %25 - 27 %28 - 32 %
A
B
C
D
E
MontclaireBelmont-CraginHermosaAvondaleLogan SquareHumboldt ParkSouth LawndaleLower West SideBrighton ParkMcKinley Park
Garfield RidgeWest ElsdonGage ParkNew CityFuller ParkAshburnBurnsideSouth DeeringEast Side
F
G
H
I
J
K
L
M
N
O
P
COMMUNITY AREASmost impacted
R
Q
S
19%19%of all CPS kids are
OBESE47
IMPROVING HEALTH OUTCOMESPreventing & Controlling Chronic Disease
CURRENT STATEChronic diseases and conditions are a significant health burden. In 2013, heart disease, cancer, stroke, chronic lower respiratory diseases, diabetes and chronic kidney disease accounted for 11,624 deaths, or 63.7% of all deaths that year. Hospitalizations due to heart disease, cancer, stroke, asthma and diabetes totaled more than 67,000 in 2011.3
One in four adults in Chicago were obese in 2014, and one in five kindergarteners enrolled in Chicago Public Schools were obese in the 2012-2013 academic year. In 2014, 29.2% of adults consumed the recommended five or more servings of fruits and vegetables daily, while less than 20% of high school students did the same in 2013. Even though more than half of adults met the recommendations for physical activity in 2014, 18.3% of adults participated in no physical activity or exercise. In 2013, only 19.6% of high school students met the recommended federal physical activity guidelines for youth, i.e., daily exercise for 60 minutes.3
Chicago has made progress in reducing smoking among youth; 25% of high school students reported smoking in 2001 compared to 10.7% in 2013. However, smoking in adults has not significantly decreased since 2000, and as of 2014, 18.4% of Chicago adults report being current smokers.3
Clinical preventive services such as can-cer screenings and immunizations are in-strumental in reduc-ing morbidity and mortality through pre-vention and early de-tection. Despite the Affordable Care Act covering these ser-vices for consumers, a number of Chica-goans go without the vaccinations and tests that can protect them
from developing cancer.3,6 In Chicago, 75.6% of women met the breast cancer screening guidelines, with no difference by racial-ethnic group or community hardship. Overall, female breast cancer incidence in Chicago increased by 10% between 1992 and 2011. White women have the high-est rates of breast cancer incidence in Chicago. However, breast cancer mortality is highest among African American women. Differential quality in mammography and treatment are thought to play a role in this ongo-ing inequity between white and African American women.7
Seventy percent of all cervical cancers are associated with two types of HPV. The HPV vaccine is the first of its kind to prevent cancer and is recommended for both male and female adolescents.8 Chicago’s HPV vaccine coverage rates have increased significantly since 2013 and CDPH’s efforts are now seen as a national model. While Chicago’s vaccination rates outpaced state and national rates, there continues to be room for improvement. In 2014, just over half (53%) of Chicago’s
female adolescent population ages 13 to 17 received all three doses of the HPV vaccine, while
only about a quarter (26%) of male adolescents received three
doses.9
Hospitalizations and emergency room visits are indicative of poor-ly controlled asthma.10 Although rates of asthma hospitaliza-tion among children 0-5 years of age have decreased over 50% in the past decade, Chicago’s hospitaliza-tion rate is double the national rate. Both African American and Hispanic children are hospitalized more often than white chil-dren.3
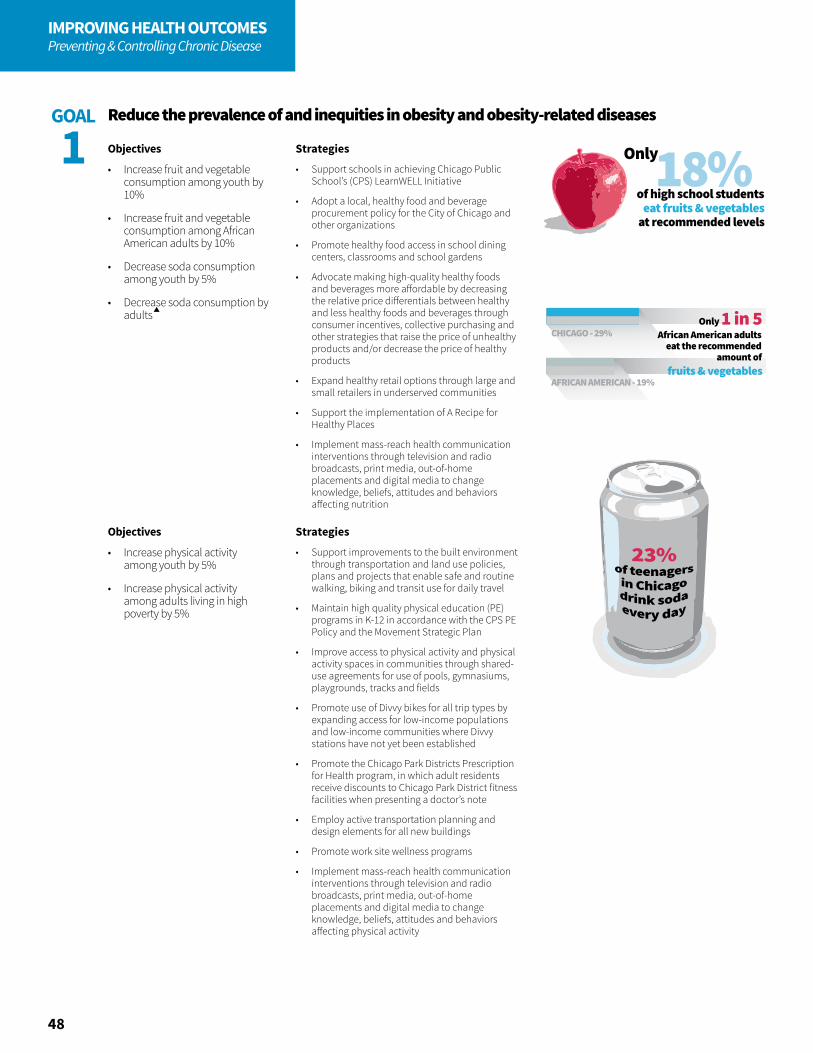
18%Only
of high school studentseat fruits & vegetables
at recommended levels
African American adultseat the recommended
amount of
Only 1 in 5
fruits & vegetables
CHICAGO - 29%
AFRICAN AMERICAN - 19%
48
IMPROVING HEALTH OUTCOMESPreventing & Controlling Chronic Disease
Objectives
• Increase fruit and vegetable consumption among youth by 10%
• Increase fruit and vegetable consumption among African American adults by 10%
• Decrease soda consumption among youth by 5%
• Decrease soda consumption by adults
Objectives
• Increase physical activity among youth by 5%
• Increase physical activity among adults living in high poverty by 5%
Strategies
• Support schools in achieving Chicago Public School’s (CPS) LearnWELL Initiative
• Adopt a local, healthy food and beverage procurement policy for the City of Chicago and other organizations
• Promote healthy food access in school dining centers, classrooms and school gardens
• Advocate making high-quality healthy foods and beverages more affordable by decreasing the relative price differentials between healthy and less healthy foods and beverages through consumer incentives, collective purchasing and other strategies that raise the price of unhealthy products and/or decrease the price of healthy products
• Expand healthy retail options through large and small retailers in underserved communities
• Support the implementation of A Recipe for Healthy Places
• Implement mass-reach health communication interventions through television and radio broadcasts, print media, out-of-home placements and digital media to change knowledge, beliefs, attitudes and behaviors affecting nutrition
Strategies
• Support improvements to the built environment through transportation and land use policies, plans and projects that enable safe and routine walking, biking and transit use for daily travel
• Maintain high quality physical education (PE) programs in K-12 in accordance with the CPS PE Policy and the Movement Strategic Plan
• Improve access to physical activity and physical activity spaces in communities through shared-use agreements for use of pools, gymnasiums, playgrounds, tracks and fields
• Promote use of Divvy bikes for all trip types by expanding access for low-income populations and low-income communities where Divvy stations have not yet been established
• Promote the Chicago Park Districts Prescription for Health program, in which adult residents receive discounts to Chicago Park District fitness facilities when presenting a doctor’s note
• Employ active transportation planning and design elements for all new buildings
• Promote work site wellness programs
• Implement mass-reach health communication interventions through television and radio broadcasts, print media, out-of-home placements and digital media to change knowledge, beliefs, attitudes and behaviors affecting physical activity
Reduce the prevalence of and inequities in obesity and obesity-related diseasesGOAL
1
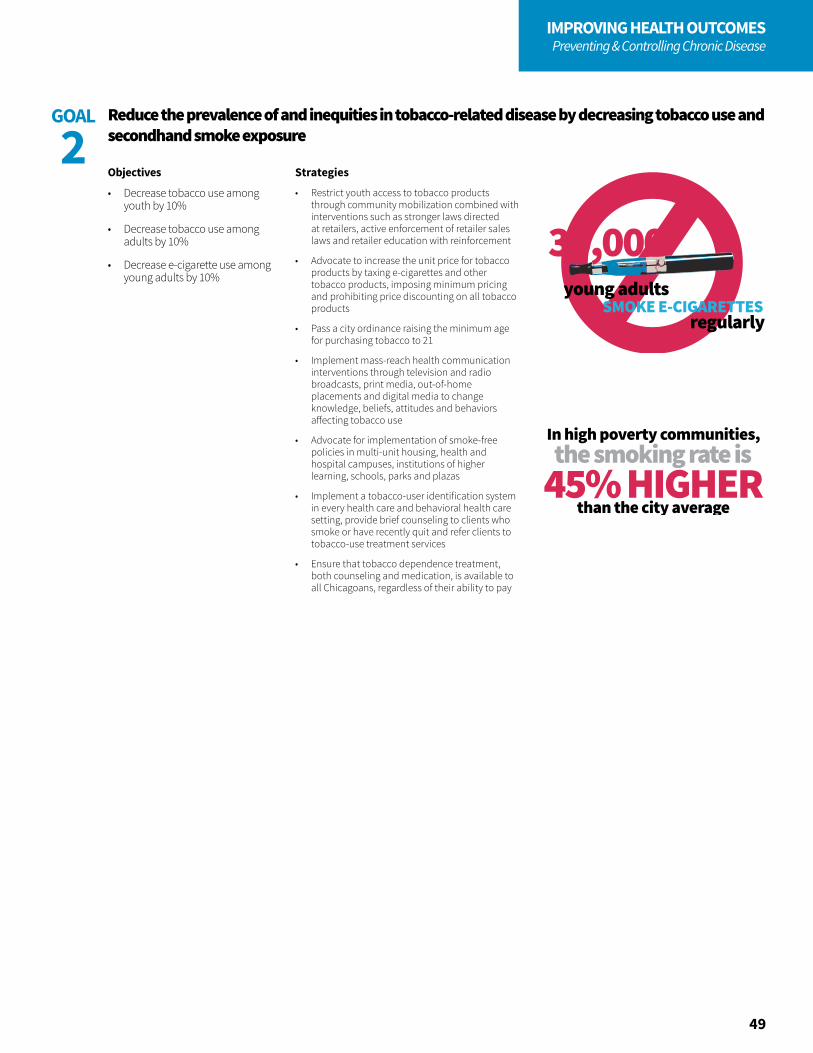
young adults
regularlySMOKE E-CIGARETTES
30,000
In high poverty communities,
45% HIGHERthan the city average
the smoking rate is
49
IMPROVING HEALTH OUTCOMESPreventing & Controlling Chronic Disease
Objectives
• Decrease tobacco use among youth by 10%
• Decrease tobacco use among adults by 10%
• Decrease e-cigarette use among young adults by 10%
Strategies
• Restrict youth access to tobacco products through community mobilization combined with interventions such as stronger laws directed at retailers, active enforcement of retailer sales laws and retailer education with reinforcement
• Advocate to increase the unit price for tobacco products by taxing e-cigarettes and other tobacco products, imposing minimum pricing and prohibiting price discounting on all tobacco products
• Pass a city ordinance raising the minimum age for purchasing tobacco to 21
• Implement mass-reach health communication interventions through television and radio broadcasts, print media, out-of-home placements and digital media to change knowledge, beliefs, attitudes and behaviors affecting tobacco use
• Advocate for implementation of smoke-free policies in multi-unit housing, health and hospital campuses, institutions of higher learning, schools, parks and plazas
• Implement a tobacco-user identification system in every health care and behavioral health care setting, provide brief counseling to clients who smoke or have recently quit and refer clients to tobacco-use treatment services
• Ensure that tobacco dependence treatment, both counseling and medication, is available to all Chicagoans, regardless of their ability to pay
Reduce the prevalence of and inequities in tobacco-related disease by decreasing tobacco use and secondhand smoke exposure
GOAL
2

Adults aged 50-70 years meetingcolon cancer screening
recommendations
61% 48%
CHICAGO HISPANICS
40%
CHICAGO RATE NATIONAL RATE
HPV Vaccination Rate
53%
ALMOST TWICEAfrican American youth have asthma rates
than white youth
THAN WHITE WOMEN
AFRICAN AMERICAN WOMEN
fruits & vegetables
have a 34% higher mortality ratefor breast cancer
50
IMPROVING HEALTH OUTCOMESPreventing & Controlling Chronic Disease
Objectives
• Increase breast cancer screenings among older adult females by 5%
• Increase cervical cancer screenings among adult females by 5%
• Increase colon cancer screenings among older adults living in poverty by 10%
• Reduce breast cancer mortality among African American women by 10 %
• Increase the percentage of adolescent females that are vaccinated against HPV to 80%
Objectives
• Decrease emergency department visits due to asthma in African American children and adolescents by 10%
• Decrease hospitalizations due to diabetes-related complications in high hardship communities by 10%
Reduce the incidence of and inequities in invasive and late stage cancer and cancer mortality
Improve chronic disease management
GOAL
3
GOAL
4
Strategies
• Promote the incorporation of reminder and recall systems into Federally Qualified Health Centers’ (FQHCs’) electronic medical records for cancer screenings
• Increase access to quality mammograms
• Launch an HPV public awareness campaign in focus communities
• Conduct routine provider education on the HPV vaccine in high-volume adolescent clinics
• Explore policy opportunities that ensure the HPV vaccination is a minimum health requirement for school entry
• Expand the amount of school-located HPV vaccine programs
• Promote 80% by 2018 initiatives to detect and treat colorectal cancer
Strategies
• Reduce sodium intake through sodium reduction policy initiatives, e.g., restaurant menu labeling
• Implement home-based, multi-trigger, multicomponent environmental interventions for children and adolescents
• Develop an asthma care implementation program that integrates care for children living with asthma in places where children live, learn, play and receive medical care
• Strengthen community health worker education in chronic disease management
• Promote and support self-management programs like the Chronic Disease Self-Management Program, Asthma Self-Management Program and the National Diabetes Prevention Program; ensure those types of programs are implemented in communities with a high burden of chronic disease
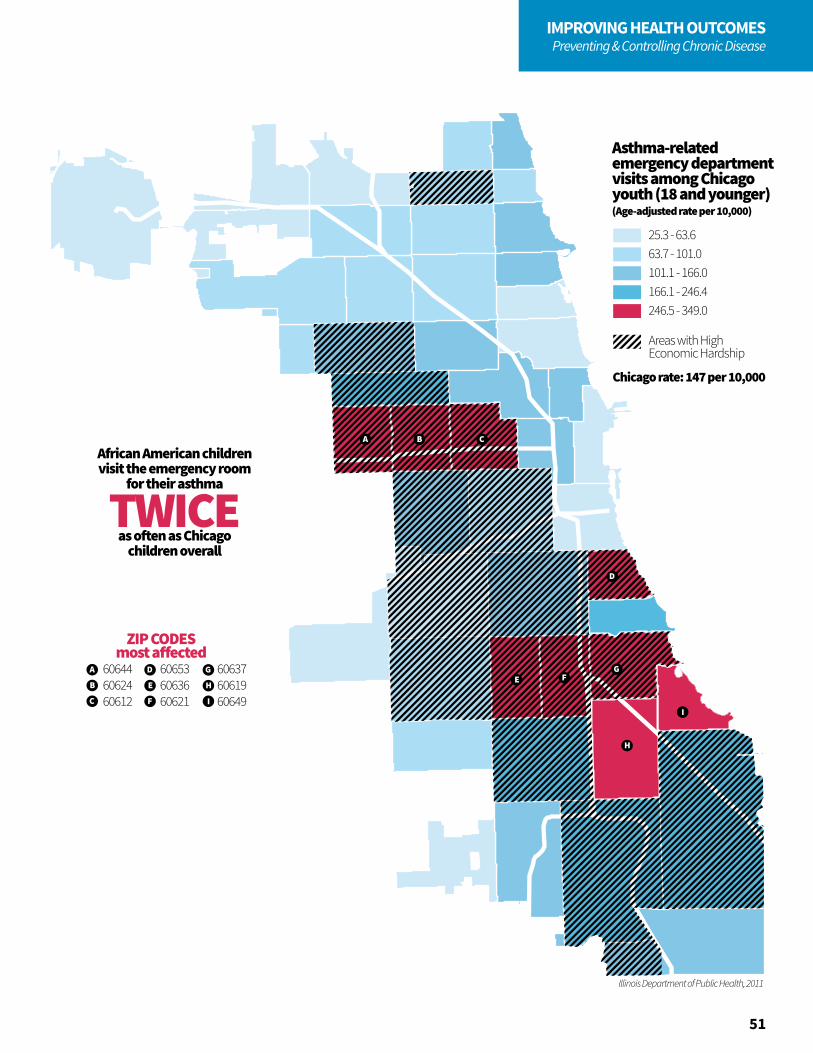
Illinois Department of Public Health, 2011
TWICE
A
B
C
D
E
F
G
ZIP CODESmost a�ected
African American childrenvisit the emergency room
for their asthma
as o�en as Chicagochildren overall
606446062460612
606536063660621
606376061960649
H
I
A B C
D
E FG
H
I
Asthma-related emergency departmentvisits among Chicago youth (18 and younger)(Age-adjusted rate per 10,000)
25.3 - 63.663.7 - 101.0101.1 - 166.0166.1 - 246.4246.5 - 349.0
Areas with High Economic Hardship
Chicago rate: 147 per 10,000
51
IMPROVING HEALTH OUTCOMESPreventing & Controlling Chronic Disease
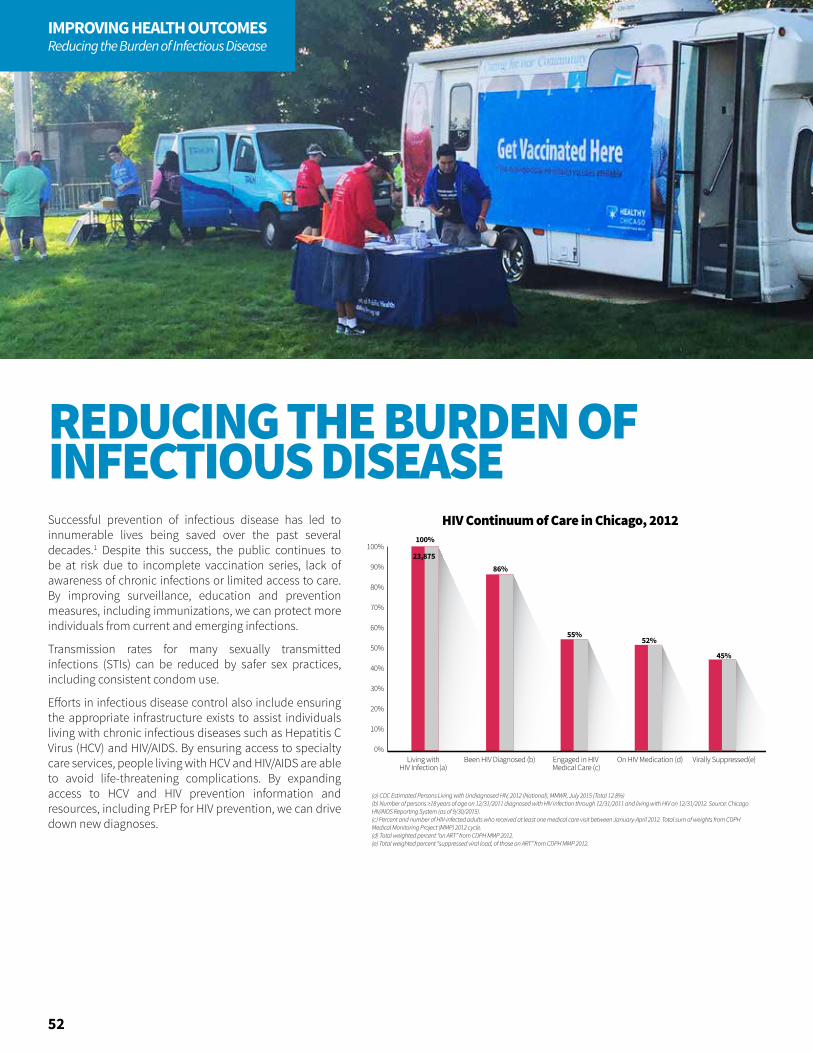
HIV Continuum of Care in Chicago, 2012
90%
100%100%
23,87586%
55%52%
45%
80%
70%
60%
50%
30%
40%
20%
10%
0%Been HIV Diagnosed (b)Living with
HIV Infection (a)Engaged in HIV Medical Care (c)
On HIV Medication (d) Virally Suppressed(e)
(a) CDC Estimated Persons Living with Undiagnosed HIV, 2012 (National), MMWR, July 2015 (Total 12.8%)(b) Number of persons ≥18 years of age on 12/31/2011 diagnosed with HIV infection through 12/31/2011 and living with HIV on 12/31/2012. Source: Chicago HIV/AIDS Reporting System (as of 9/30/2015). (c) Percent and number of HIV-infected adults who received at least one medical care visit between January-April 2012. Total sum of weights from CDPH Medical Monitoring Project (MMP) 2012 cycle. (d) Total weighted percent “on ART” from CDPH MMP 2012. (e) Total weighted percent “suppressed viral load, of those on ART” from CDPH MMP 2012.
52
IMPROVING HEALTH OUTCOMESReducing the Burden of Infectious Disease
Successful prevention of infectious disease has led to innumerable lives being saved over the past several decades.1 Despite this success, the public continues to be at risk due to incomplete vaccination series, lack of awareness of chronic infections or limited access to care. By improving surveillance, education and prevention measures, including immunizations, we can protect more individuals from current and emerging infections.
Transmission rates for many sexually transmitted infections (STIs) can be reduced by safer sex practices, including consistent condom use.
Efforts in infectious disease control also include ensuring the appropriate infrastructure exists to assist individuals living with chronic infectious diseases such as Hepatitis C Virus (HCV) and HIV/AIDS. By ensuring access to specialty care services, people living with HCV and HIV/AIDS are able to avoid life-threatening complications. By expanding access to HCV and HIV prevention information and resources, including PrEP for HIV prevention, we can drive down new diagnoses.
REDUCING THE BURDEN OF INFECTIOUS DISEASE
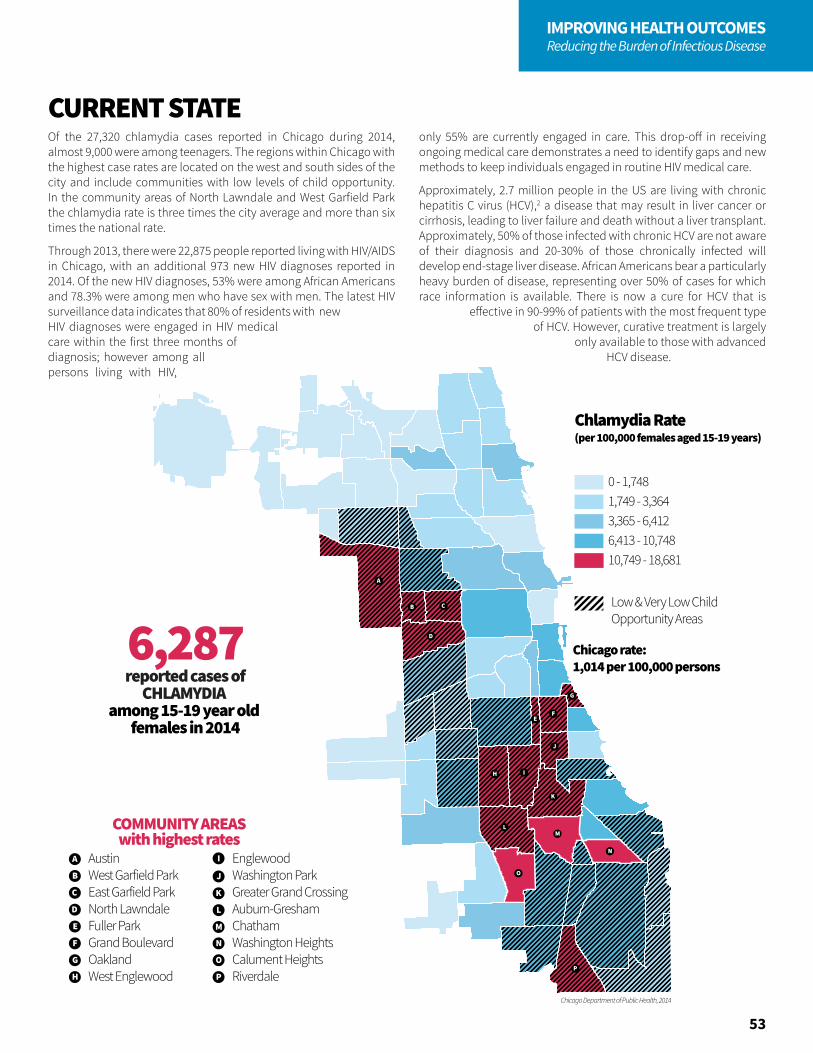
Chlamydia among 15-19 year old females (rate per 100,000)
A
B C
D
EF
G
H I
J
K
LM
N
O
P
Chicago Department of Public Health, 2014
6,287reported cases of
CHLAMYDIA among 15-19 year old
females in 2014
A
B
C
D
E
AustinWest Garfield ParkEast Garfield ParkNorth LawndaleFuller ParkGrand BoulevardOaklandWest Englewood
EnglewoodWashington ParkGreater Grand CrossingAuburn-GreshamChathamWashington HeightsCalument HeightsRiverdale
F
G
H
I
J
K
L
M
N
O
P
COMMUNITY AREASwith highest rates
Chlamydia Rate (per 100,000 females aged 15-19 years)
Low & Very Low ChildOpportunity Areas
0 - 1,7481,749 - 3,3643,365 - 6,4126,413 - 10,74810,749 - 18,681
Chicago rate: 1,014 per 100,000 persons
53
IMPROVING HEALTH OUTCOMESReducing the Burden of Infectious Disease
Of the 27,320 chlamydia cases reported in Chicago during 2014, almost 9,000 were among teenagers. The regions within Chicago with the highest case rates are located on the west and south sides of the city and include communities with low levels of child opportunity. In the community areas of North Lawndale and West Garfield Park the chlamydia rate is three times the city average and more than six times the national rate.
Through 2013, there were 22,875 people reported living with HIV/AIDS in Chicago, with an additional 973 new HIV diagnoses reported in 2014. Of the new HIV diagnoses, 53% were among African Americans and 78.3% were among men who have sex with men. The latest HIV surveillance data indicates that 80% of residents with new HIV diagnoses were engaged in HIV medical care within the first three months of diagnosis; however among all persons living with HIV,
only 55% are currently engaged in care. This drop-off in receiving ongoing medical care demonstrates a need to identify gaps and new methods to keep individuals engaged in routine HIV medical care.
Approximately, 2.7 million people in the US are living with chronic hepatitis C virus (HCV),2 a disease that may result in liver cancer or cirrhosis, leading to liver failure and death without a liver transplant. Approximately, 50% of those infected with chronic HCV are not aware of their diagnosis and 20-30% of those chronically infected will develop end-stage liver disease. African Americans bear a particularly heavy burden of disease, representing over 50% of cases for which race information is available. There is now a cure for HCV that is
effective in 90-99% of patients with the most frequent type of HCV. However, curative treatment is largely
only available to those with advanced HCV disease.
CURRENT STATE
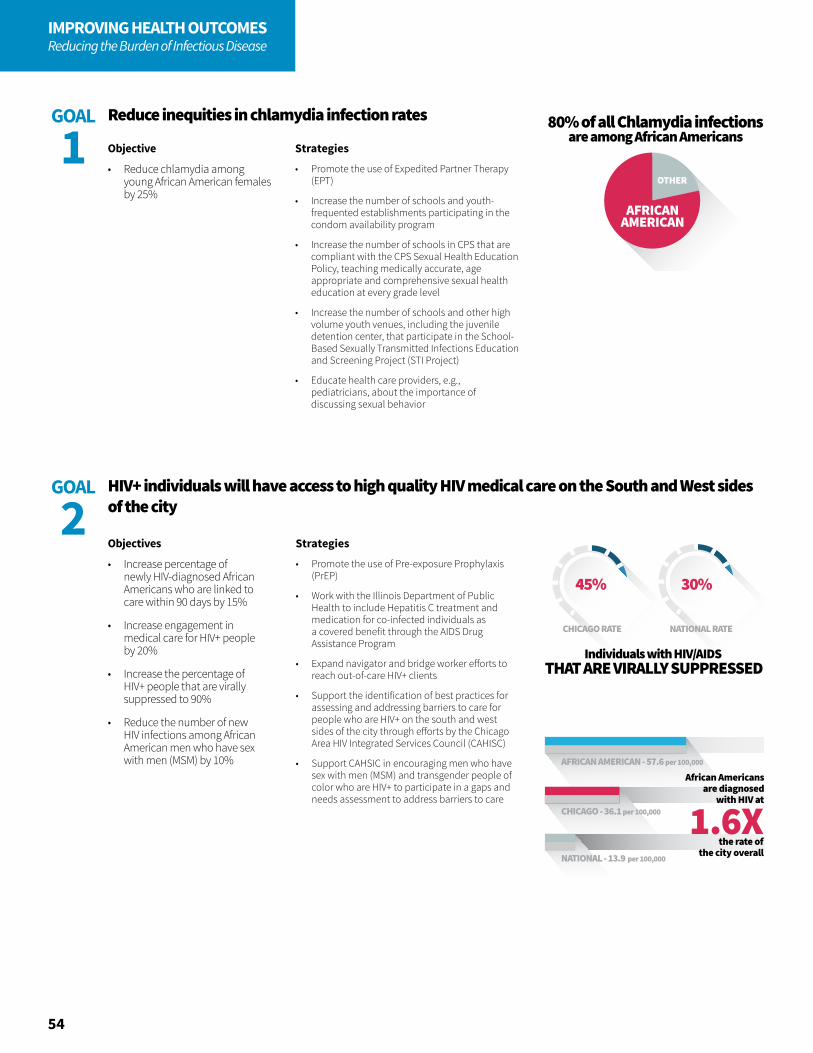
30%
CHICAGO RATE NATIONAL RATE
THAT ARE VIRALLY SUPPRESSEDIndividuals with HIV/AIDS
45%
AFRICANAMERICAN
OTHER
80% of all Chlamydia infectionsare among African Americans
per 100,000
per 100,000
per 100,000
CHICAGO - 36.1
NATIONAL - 13.9
AFRICAN AMERICAN - 57.6
1.6XAfrican Americans
are diagnosedwith HIV at
the rate ofthe city overall
54
IMPROVING HEALTH OUTCOMESReducing the Burden of Infectious Disease
Objective
• Reduce chlamydia among young African American females by 25%
Reduce inequities in chlamydia infection ratesGOAL
1 Strategies
• Promote the use of Expedited Partner Therapy (EPT)
• Increase the number of schools and youth-frequented establishments participating in the condom availability program
• Increase the number of schools in CPS that are compliant with the CPS Sexual Health Education Policy, teaching medically accurate, age appropriate and comprehensive sexual health education at every grade level
• Increase the number of schools and other high volume youth venues, including the juvenile detention center, that participate in the School-Based Sexually Transmitted Infections Education and Screening Project (STI Project)
• Educate health care providers, e.g., pediatricians, about the importance of discussing sexual behavior
Objectives
• Increase percentage of newly HIV-diagnosed African Americans who are linked to care within 90 days by 15%
• Increase engagement in medical care for HIV+ people by 20%
• Increase the percentage of HIV+ people that are virally suppressed to 90%
• Reduce the number of new HIV infections among African American men who have sex with men (MSM) by 10%
Strategies
• Promote the use of Pre-exposure Prophylaxis (PrEP)
• Work with the Illinois Department of Public Health to include Hepatitis C treatment and medication for co-infected individuals as a covered benefit through the AIDS Drug Assistance Program
• Expand navigator and bridge worker efforts to reach out-of-care HIV+ clients
• Support the identification of best practices for assessing and addressing barriers to care for people who are HIV+ on the south and west sides of the city through efforts by the Chicago Area HIV Integrated Services Council (CAHISC)
• Support CAHSIC in encouraging men who have sex with men (MSM) and transgender people of color who are HIV+ to participate in a gaps and needs assessment to address barriers to care
HIV+ individuals will have access to high quality HIV medical care on the South and West sides of the city
GOAL
2
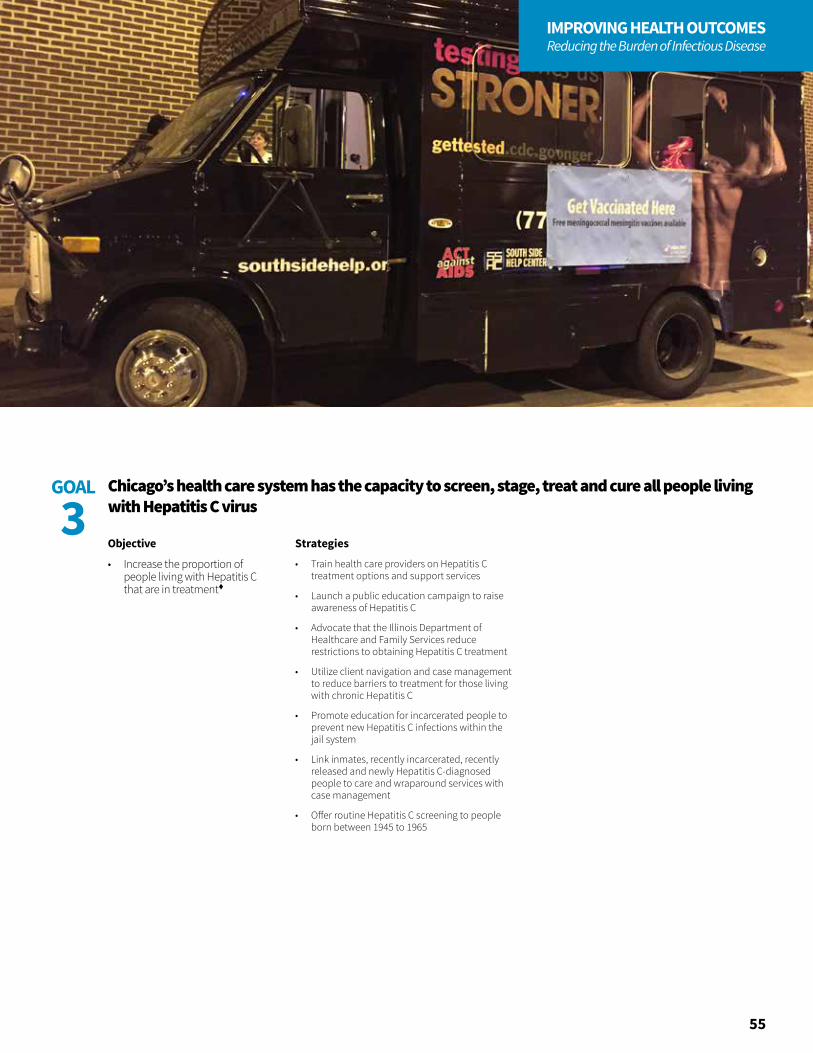
55
IMPROVING HEALTH OUTCOMESReducing the Burden of Infectious Disease
Objective
• Increase the proportion of people living with Hepatitis C that are in treatment
Strategies
• Train health care providers on Hepatitis C treatment options and support services
• Launch a public education campaign to raise awareness of Hepatitis C
• Advocate that the Illinois Department of Healthcare and Family Services reduce restrictions to obtaining Hepatitis C treatment
• Utilize client navigation and case management to reduce barriers to treatment for those living with chronic Hepatitis C
• Promote education for incarcerated people to prevent new Hepatitis C infections within the jail system
• Link inmates, recently incarcerated, recently released and newly Hepatitis C-diagnosed people to care and wraparound services with case management
• Offer routine Hepatitis C screening to people born between 1945 to 1965
Chicago’s health care system has the capacity to screen, stage, treat and cure all people living with Hepatitis C virus
GOAL
3

56
IMPROVING HEALTH OUTCOMESReducing Violence
Too many boys and young men are falling by the wayside, dropping out, unemployed, going to jail, being profiled — this is a moral issue for our country. It’s also an economic issue for our country. When, generation after generation, they lag behind, our economy suffers. Our family structure suffers. Our civic life suffers. Cycles of hopelessness breed violence and mistrust. And our country is less than what we know it can be. So we need to change the statistics — not just for the sake of the young men and boys, but for the sake of America’s future.
—Barak Obama, 2014
Violence is a significant public health problem in Chicago. It affects all people, from infants to the elderly, during all stages of life. Violence occurs within families, schools and communities.
Yet violence is not inevitable; it is preventable. There is a growing list of interventions and policies that have been shown to be effective in preventing violence. Most effective prevention approaches work by focusing on modifiable identified risk and protective factors. Those involved in supporting individuals, families, communities and systems should focus on removing risk factors and ensuring protective factors are in place that protect against violence. The use of restorative practices has proven to provide a safe and caring environment and a reduction in bullying and other interpersonal conflicts.
While the effects of trauma induced by violence may vary from person to person, there is a predictably profound impact on learning, behavior and health.1 Individual choices, parenting and family functioning, school climate and resources, the physical and social environment of communities, access to services and many factors within the social environment influence the overall risk of violence and injury.2,3 Addressing these root causes requires the time, commitment and resources of Chicago’s many dedicated partners across multiple sectors.
Related to the unequal burden of violence and trauma is the problem of mass incarceration and disproportionate contact between police and communities of color. The burden of arrest records and convictions has been found to have a life-altering, disabling impact on individuals'
educational and employment opportunities, as well as a negative impact on their families.4 Research suggests that uneven patterns of police deployment and engagement and sentencing discrepancies for similar offenses contribute to escalated tensions between police and disadvantaged communities.5,6 These additional burdens are felt by at-risk communities and the law enforcement community alike.
REDUCING VIOLENCE
“
”
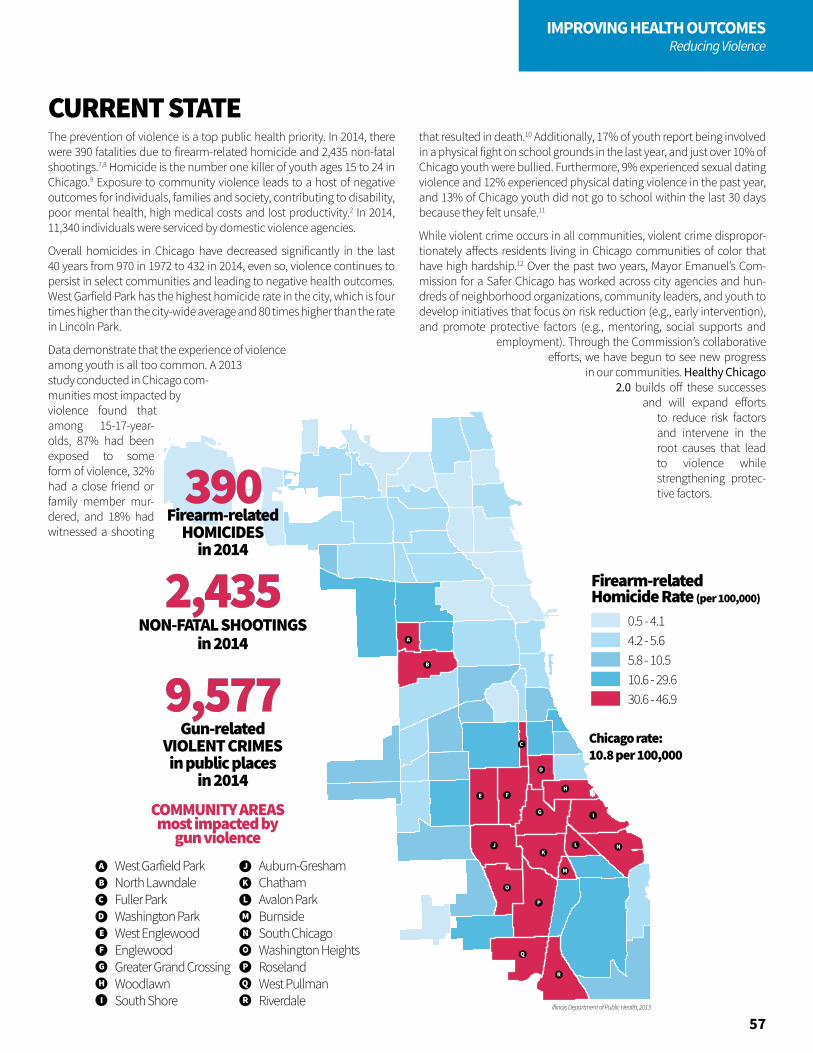
A
B
C
D
E F
G
H
I
JK
L
M
N
O
P
Q
R
Illinois Department of Public Health, 2013
0.5 - 4.14.2 - 5.65.8 - 10.510.6 - 29.630.6 - 46.9
Chicago rate: 10.8 per 100,000390390
Firearm-relatedHOMICIDES
in 2014
A
B
C
D
E
West Garfield ParkNorth LawndaleFuller ParkWashington ParkWest EnglewoodEnglewoodGreater Grand CrossingWoodlawnSouth Shore
Auburn-GreshamChathamAvalon ParkBurnsideSouth ChicagoWashington HeightsRoselandWest PullmanRiverdale
F
G
H
I
J
K
L
M
N
O
P
COMMUNITY AREASmost impacted by
gun violence
R
Q
9,5779,577Gun-related
VIOLENT CRIMESin public places
in 2014
in 2014NON-FATAL SHOOTINGS
2,4352,435
Firearm-relatedHomicide Rate (per 100,000)
57
IMPROVING HEALTH OUTCOMESReducing Violence
The prevention of violence is a top public health priority. In 2014, there were 390 fatalities due to firearm-related homicide and 2,435 non-fatal shootings.7,8 Homicide is the number one killer of youth ages 15 to 24 in Chicago.9 Exposure to community violence leads to a host of negative outcomes for individuals, families and society, contributing to disability, poor mental health, high medical costs and lost productivity.2 In 2014, 11,340 individuals were serviced by domestic violence agencies.
Overall homicides in Chicago have decreased significantly in the last 40 years from 970 in 1972 to 432 in 2014, even so, violence continues to persist in select communities and leading to negative health outcomes. West Garfield Park has the highest homicide rate in the city, which is four times higher than the city-wide average and 80 times higher than the rate in Lincoln Park.
Data demonstrate that the experience of violence among youth is all too common. A 2013 study conducted in Chicago com-munities most impacted by violence found that among 15-17-year-olds, 87% had been exposed to some form of violence, 32% had a close friend or family member mur-dered, and 18% had witnessed a shooting
that resulted in death.10 Additionally, 17% of youth report being involved in a physical fight on school grounds in the last year, and just over 10% of Chicago youth were bullied. Furthermore, 9% experienced sexual dating violence and 12% experienced physical dating violence in the past year, and 13% of Chicago youth did not go to school within the last 30 days because they felt unsafe.11
While violent crime occurs in all communities, violent crime dispropor-tionately affects residents living in Chicago communities of color that have high hardship.12 Over the past two years, Mayor Emanuel’s Com-mission for a Safer Chicago has worked across city agencies and hun-dreds of neighborhood organizations, community leaders, and youth to develop initiatives that focus on risk reduction (e.g., early intervention), and promote protective factors (e.g., mentoring, social supports and
employment). Through the Commission’s collaborative efforts, we have begun to see new progress
in our communities. Healthy Chicago 2.0 builds off these successes
and will expand efforts to reduce risk factors and intervene in the root causes that lead to violence while strengthening protec-tive factors.
CURRENT STATE
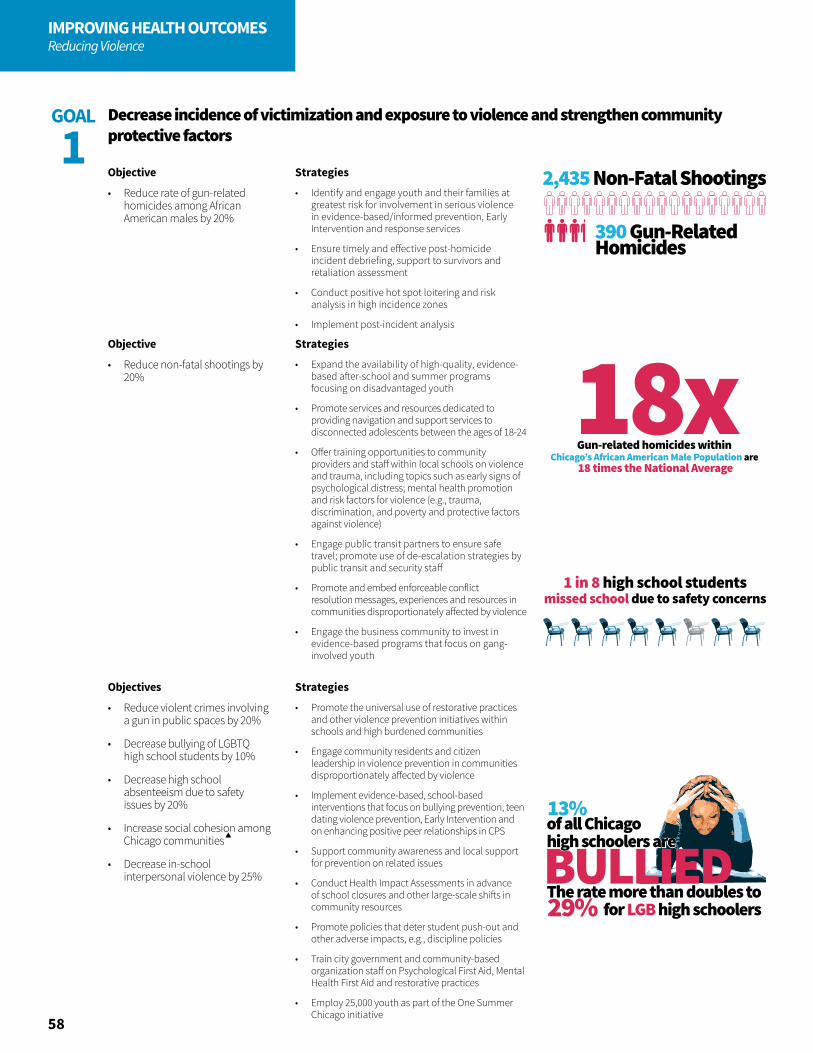
2,435 Non-Fatal Shootings
390 Gun-RelatedHomicides
18x
Chicago’s gun related homicides are
3 times the National Average
Gun related homicides within Chicago’s African American Population is
8 times the National Average
Gun-related homicides within Chicago’s African American Male Population are
18 times the National Average
3x
8x
1 in 8 high school studentsmissed school due to safety concerns
BULLIEDThe rate more than doubles to
for LGB high schoolers
13%of all Chicagohigh schoolers are
29%
58
IMPROVING HEALTH OUTCOMESReducing Violence
Objective
• Reduce rate of gun-related homicides among African American males by 20%
Objective
• Reduce non-fatal shootings by 20%
Objectives
• Reduce violent crimes involving a gun in public spaces by 20%
• Decrease bullying of LGBTQ high school students by 10%
• Decrease high school absenteeism due to safety issues by 20%
• Increase social cohesion among Chicago communities
• Decrease in-school interpersonal violence by 25%
Decrease incidence of victimization and exposure to violence and strengthen community protective factors
GOAL
1Strategies
• Identify and engage youth and their families at greatest risk for involvement in serious violence in evidence-based/informed prevention, Early Intervention and response services
• Ensure timely and effective post-homicide incident debriefing, support to survivors and retaliation assessment
• Conduct positive hot spot loitering and risk analysis in high incidence zones
• Implement post-incident analysis
Strategies
• Expand the availability of high-quality, evidence-based after-school and summer programs focusing on disadvantaged youth
• Promote services and resources dedicated to providing navigation and support services to disconnected adolescents between the ages of 18-24
• Offer training opportunities to community providers and staff within local schools on violence and trauma, including topics such as early signs of psychological distress; mental health promotion and risk factors for violence (e.g., trauma, discrimination, and poverty and protective factors against violence)
• Engage public transit partners to ensure safe travel; promote use of de-escalation strategies by public transit and security staff
• Promote and embed enforceable conflict resolution messages, experiences and resources in communities disproportionately affected by violence
• Engage the business community to invest in evidence-based programs that focus on gang-involved youth
Strategies
• Promote the universal use of restorative practices and other violence prevention initiatives within schools and high burdened communities
• Engage community residents and citizen leadership in violence prevention in communities disproportionately affected by violence
• Implement evidence-based, school-based interventions that focus on bullying prevention, teen dating violence prevention, Early Intervention and on enhancing positive peer relationships in CPS
• Support community awareness and local support for prevention on related issues
• Conduct Health Impact Assessments in advance of school closures and other large-scale shifts in community resources
• Promote policies that deter student push-out and other adverse impacts, e.g., discipline policies
• Train city government and community-based organization staff on Psychological First Aid, Mental Health First Aid and restorative practices
• Employ 25,000 youth as part of the One Summer Chicago initiative
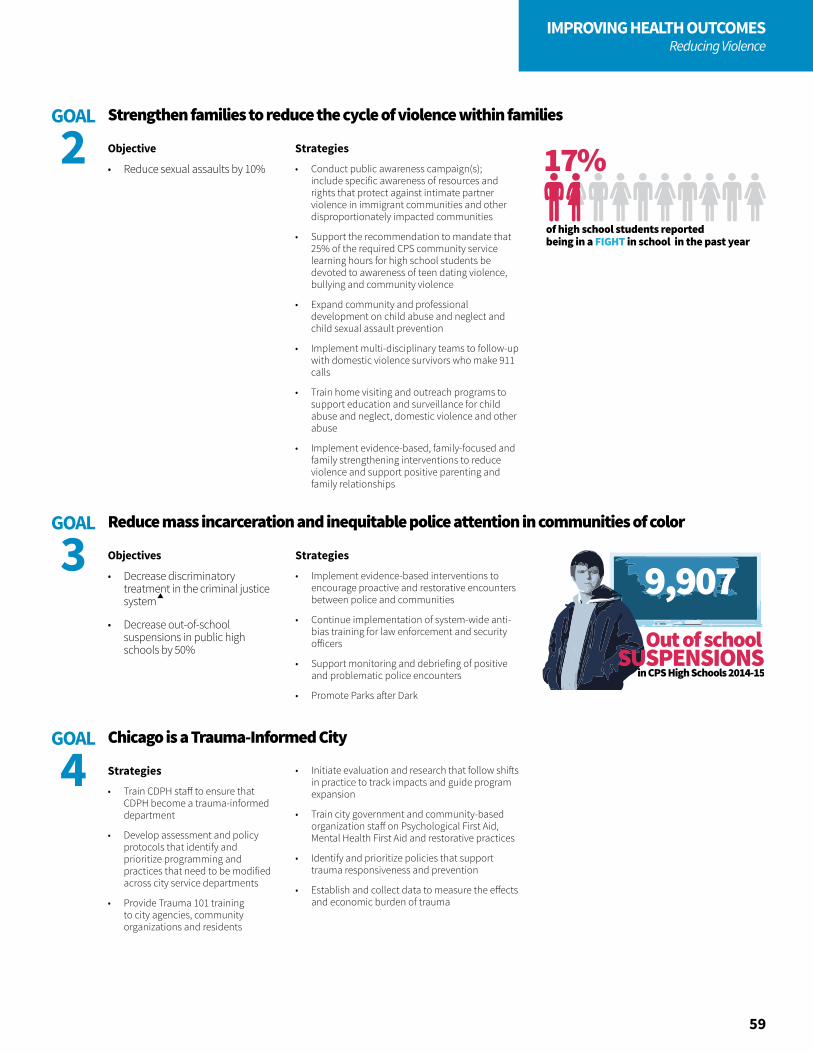
of high school students reported being in a FIGHT in school in the past year
17%
in CPS High Schools 2014-15
9,907Out of school
SUSPENSIONS
59
IMPROVING HEALTH OUTCOMESReducing Violence
Objective
• Reduce sexual assaults by 10%
Strategies
• Conduct public awareness campaign(s); include specific awareness of resources and rights that protect against intimate partner violence in immigrant communities and other disproportionately impacted communities
• Support the recommendation to mandate that 25% of the required CPS community service learning hours for high school students be devoted to awareness of teen dating violence, bullying and community violence
• Expand community and professional development on child abuse and neglect and child sexual assault prevention
• Implement multi-disciplinary teams to follow-up with domestic violence survivors who make 911 calls
• Train home visiting and outreach programs to support education and surveillance for child abuse and neglect, domestic violence and other abuse
• Implement evidence-based, family-focused and family strengthening interventions to reduce violence and support positive parenting and family relationships
Strengthen families to reduce the cycle of violence within familiesGOAL
2
Objectives
• Decrease discriminatory treatment in the criminal justice system
• Decrease out-of-school suspensions in public high schools by 50%
Strategies
• Train CDPH staff to ensure that CDPH become a trauma-informed department
• Develop assessment and policy protocols that identify and prioritize programming and practices that need to be modified across city service departments
• Provide Trauma 101 training to city agencies, community organizations and residents
Strategies
• Implement evidence-based interventions to encourage proactive and restorative encounters between police and communities
• Continue implementation of system-wide anti-bias training for law enforcement and security officers
• Support monitoring and debriefing of positive and problematic police encounters
• Promote Parks after Dark
Reduce mass incarceration and inequitable police attention in communities of color
Chicago is a Trauma-Informed City
GOAL
3
GOAL
4 • Initiate evaluation and research that follow shifts in practice to track impacts and guide program expansion
• Train city government and community-based organization staff on Psychological First Aid, Mental Health First Aid and restorative practices
• Identify and prioritize policies that support trauma responsiveness and prevention
• Establish and collect data to measure the effects and economic burden of trauma
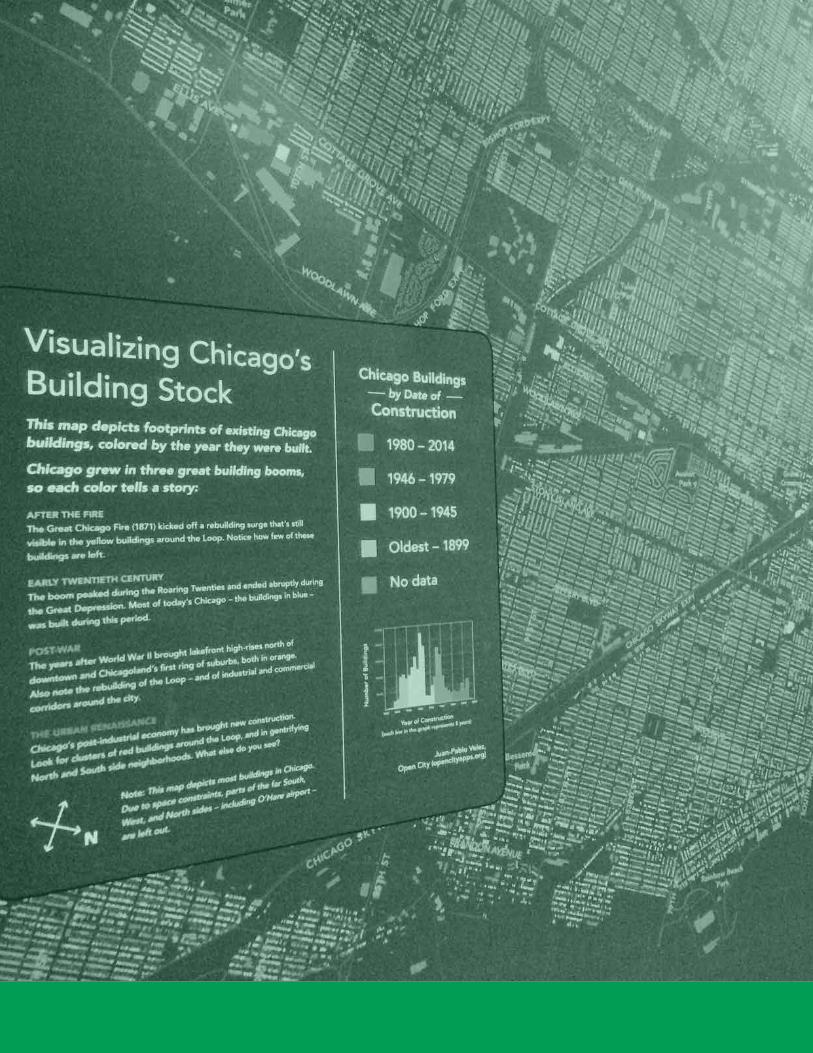

61
CHAPTER 5
UTILIZING AND MAXIMIZING DATA AND RESEARCH
Healthy Chicago 2.0 is a plan developed and driven by data to ensure a clear and accurate picture of health across communities. We analyzed health risk behaviors and disease outcomes according to characteristics such as income, geography, race, ethnicity, gender identity and sexual orientation. We also compared social, economic and physical environments. We engaged community members and stakeholders to guide collection and analysis and partnered with others to collect qualitative data. We also shared the results with community members, seeking their guidance on prioritizing the issues outlined in this plan.

62
DATA AND RESEARCH
Data AccessImproving data literacy, quality and access is an integral part of the Healthy Chicago 2.0 plan to ensure residents, policymakers, researchers and entrepreneurs have the opportunity to utilize the many sources of health data to understand and foster equity. Additionally, non-traditional data sources such as legal, land use, housing, marketing, workforce, education, business, insurance and program service data need to be liberated to fully elucidate root causes of health inequities. Where no baseline data exists, we will take steps to collect and analyze new data to better inform strategies that address health inequities.
Of course, access alone is not sufficient to ensure that data are used to their maximum potential. Strategies to develop quality standards in data collection and dissemination and strategies to improve proficiency in understanding the limitations and potential uses of data will be developed and implemented across the four years of the plan. High-quality, accessible data that are responsibly used can provide an unprecedented evidence base for developing interventions that toward improve health outcomes.
Public Health ResearchAll public health research needs to be coordinated and disseminated widely. This presents an opportunity for a citywide research agenda to be adopted with a focus on achieving health equity and informing and evaluating strategies to address the Healthy Chicago 2.0 goals. Chicago is rich with academic institutions and private non-profit research firms. It is time for our city to increase our embrace of collaborative and innovative approaches to research that improves the health of Chicago communities.
This plan calls for a focus on health equity in research and evaluation efforts that assess how potential or current strategies address inequities. Evaluations and research designed with a health equity lens clarify what works, for whom and under what conditions. Evaluation and research questions guide the evaluation process; it is critical that our health equity measurements be outlined from the beginning. Focusing on leveraging data and research to design, implement and measure the objectives in Healthy Chicago 2.0 will help us better understand, measure and iterate desired health outcomes through an equity lens, further improving the health of all residents.
There’s a lack of a unified or consistent medical documentation system to share information across healthcare providers, facilities and payers.
—Community Conversation Participant
“
”
63
DATA AND RESEARCH
Strategies
• Leverage existing informatics initiatives
• Conduct an environmental scan of health data systems and disseminate a report summarizing health data for use in Chicago
• Establish technical data sharing infrastructure and data quality standards
• Develop and implement training tools and infrastructure addressing data literacy needs
• Propose intrajurisdictional and interjurisdictional policies that address the 14 Illinois laws that govern privacy
• Promote current initiatives within the City of Chicago Tech Plan and other initiatives such as the City Data Learnathons
• Identify methods for collecting new indicators to measure root causes of health inequities
Strategies
• Establish an independent Health Advisory Board that makes recommendations based on Health Impact Assessment outcomes
• Develop a sustainable structure for tracking and coordinating Chicago public health research
• Develop mechanisms, with organized community input, to facilitate the dissemination and use of findings from Chicago public health research
• Encourage local research institutions to develop promotion criteria that incentivize local research dissemination
• Develop linkages with local media outlets to disseminate research findings
High quality data are accessible and equitable
Chicago’s public health research will be coordinated and disseminated widely
GOAL
1
GOAL
2
Objectives
• Launch city-wide public health data partnership by July 1, 2016
• Establish a functional data sharing network by July 1, 2017
• Develop and deploy infrastructure for addressing data literacy by the end of 2017
• Establish a public health-driven framework for evidence-based policymaking
Objectives
• Establish and adopt Chicago public health research principles of engagement by June 2016 to ensure equitable design, conduct, and use of research to further health equity in Chicago
• Adopt a Chicago-wide health research agenda by December 2017
• Establish a CDPH Research and Evaluation Office that develops internal processes and procedures for research participation, collaboration and tracking


65
Healthy Chicago 2.0 is an ambitious public health plan. Launching the plan is just the first step in addressing the root causes of poor health and achieving the healthy equity that Chicagoans deserve. The true challenge for CDPH and our partners will be fully executing the plan over the next four years so we can realize the improvements outlined throughout this plan.
Healthy Chicago 2.0 strategy implementation will be carried out collaboratively and will be aligned, as much as possible, with the work of other public health stakeholders. The writing of this report coincides with the development of the State Health Improvement Plan (SHIP), which has prioritized [social determinants of health], access to care, maternal and child health, chronic disease and behavioral health. Going forward, as Healthy Chicago 2.0 partners lead implementation across these areas, we will share outcomes with Illinois Department of Public Health regularly and work together to implement common strategies.
CHAPTER 6
TAKING THE NEXT STEP
66
TAKING THE NEXT STEP
Assembling Implementation TeamsCDPH will convene implementation teams consisting of strategy leaders, experts in the field, community-based organizations and community residents. These teams will develop a comprehensive 18 month work plan. CDPH and a community stakeholder will chair each implementation team and these teams will guide the work over the next four years.
We will also engage aldermen and public and private funders, and will seek additional grant dollars to support the implementation of Healthy Chicago 2.0.
Monitoring Our ProgressFor the first time ever, CDPH has the ability to collect community area data that will assist us in measuring progress on all 82 objectives through the Healthy Chicago Survey, Illinois Department of Public Health (IDPH) Vital Statistics data sets, IDPH Inpatient and Outpatient Hospitalization Discharge data, the U.S. Census, the Centers for Disease Control and Prevention’s Youth Risk Behavior Surveillance Survey and Behavioral Risk Factor Surveillance Survey, as well as other government agency data, from such agencies as the Chicago Police Department, the Illinois Department of Transportation, Chicago Public Schools and others. CDPH will report on progress made across all action areas quarterly and will disseminate an annual report that provides progress on all objectives and strategies outlined in the plan.
The following pages outline all plan objectives with quantifiable indicators. We fully intend to be nimble in our data collection by 1) adding new measures and 2) making changes to existing measures that may more accurately demonstrate our ability to improve certain social and health outcomes.
All plan updates and progress reports will be located here: www.cityofchicago.org/HealthyChicago2.0

67
TAKING THE NEXT STEP
Continually Gathering FeedbackTo ensure community residents, stakeholders and public health leaders are engaged in the implementation of Healthy Chicago 2.0, we will host a series of community events to share the plan and gather feedback on plans for implementation. We will continuously work with communities to support implementation efforts and evaluate the progress being made.
If you have feedback or would like to join our efforts, please email [email protected]. By working together, we will be able to ensure Chicago is a city where all residents have the opportunity to realize health and well-being.
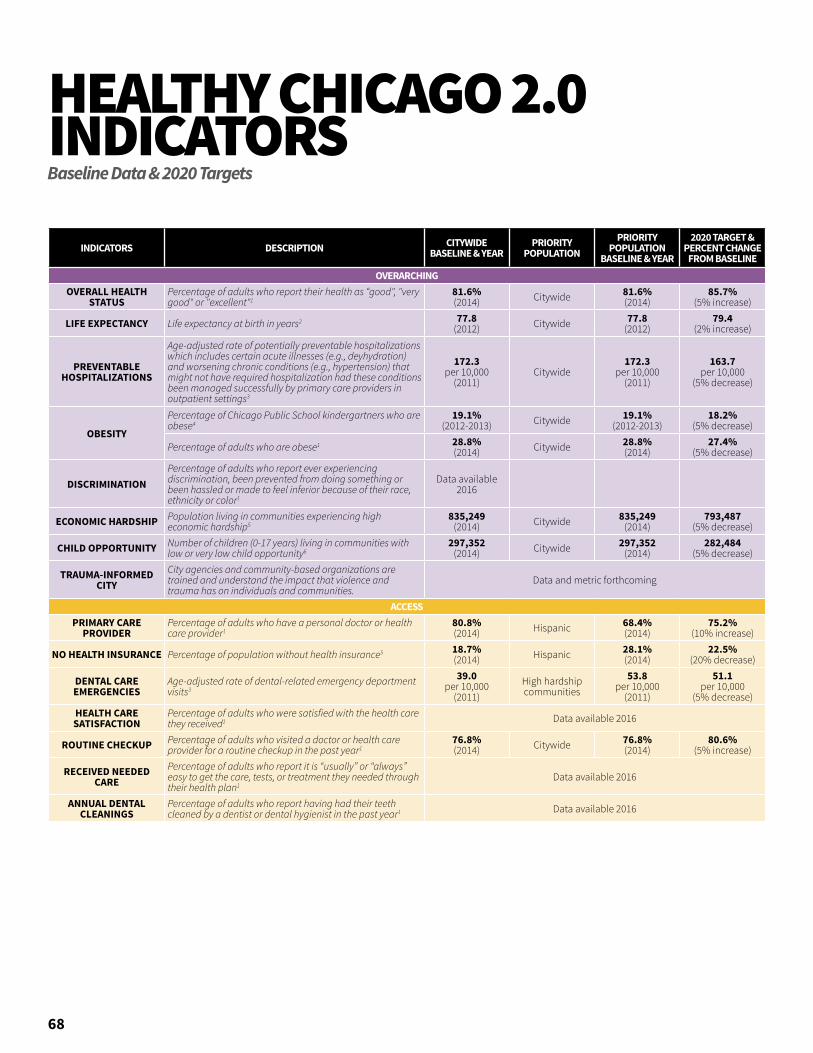
68
HEALTHY CHICAGO 2.0 INDICATORSBaseline Data & 2020 Targets
INDICATORS DESCRIPTION CITYWIDE BASELINE & YEAR
PRIORITY POPULATION
PRIORITY POPULATION
BASELINE & YEAR
2020 TARGET & PERCENT CHANGE
FROM BASELINEOVERARCHING
OVERALL HEALTH STATUS
Percentage of adults who report their health as “good", "very good" or "excellent"1
81.6%(2014) Citywide 81.6%
(2014)85.7%
(5% increase)
LIFE EXPECTANCY Life expectancy at birth in years2 77.8(2012) Citywide 77.8
(2012)79.4
(2% increase)
PREVENTABLE HOSPITALIZATIONS
Age-adjusted rate of potentially preventable hospitalizations which includes certain acute illnesses (e.g., deyhydration) and worsening chronic conditions (e.g., hypertension) that might not have required hospitalization had these conditions been managed successfully by primary care providers in outpatient settings3
172.3per 10,000
(2011)Citywide
172.3per 10,000
(2011)
163.7per 10,000
(5% decrease)
OBESITY
Percentage of Chicago Public School kindergartners who are obese4
19.1%(2012-2013) Citywide 19.1%
(2012-2013)18.2%
(5% decrease)
Percentage of adults who are obese1 28.8%(2014) Citywide 28.8%
(2014)27.4%
(5% decrease)
DISCRIMINATIONPercentage of adults who report ever experiencing discrimination, been prevented from doing something or been hassled or made to feel inferior because of their race, ethnicity or color1
Data available 2016
ECONOMIC HARDSHIP Population living in communities experiencing high economic hardship5
835,249(2014) Citywide 835,249
(2014)793,487
(5% decrease)
CHILD OPPORTUNITY Number of children (0-17 years) living in communities with low or very low child opportunity6
297,352(2014) Citywide 297,352
(2014)282,484
(5% decrease)
TRAUMA-INFORMED CITY
City agencies and community-based organizations are trained and understand the impact that violence and trauma has on individuals and communities.
Data and metric forthcoming
ACCESSPRIMARY CARE
PROVIDERPercentage of adults who have a personal doctor or health care provider1
80.8%(2014) Hispanic 68.4%
(2014)75.2%
(10% increase)
NO HEALTH INSURANCE Percentage of population without health insurance5 18.7%(2014) Hispanic 28.1%
(2014)22.5%
(20% decrease)
DENTAL CARE EMERGENCIES
Age-adjusted rate of dental-related emergency department visits3
39.0per 10,000
(2011)High hardship communities
53.8per 10,000
(2011)
51.1per 10,000
(5% decrease)HEALTH CARE SATISFACTION
Percentage of adults who were satisfied with the health care they received1 Data available 2016
ROUTINE CHECKUP Percentage of adults who visited a doctor or health care provider for a routine checkup in the past year1
76.8%(2014) Citywide 76.8%
(2014)80.6%
(5% increase)
RECEIVED NEEDED CARE
Percentage of adults who report it is “usually” or “always” easy to get the care, tests, or treatment they needed through their health plan1
Data available 2016
ANNUAL DENTAL CLEANINGS
Percentage of adults who report having had their teeth cleaned by a dentist or dental hygienist in the past year1 Data available 2016
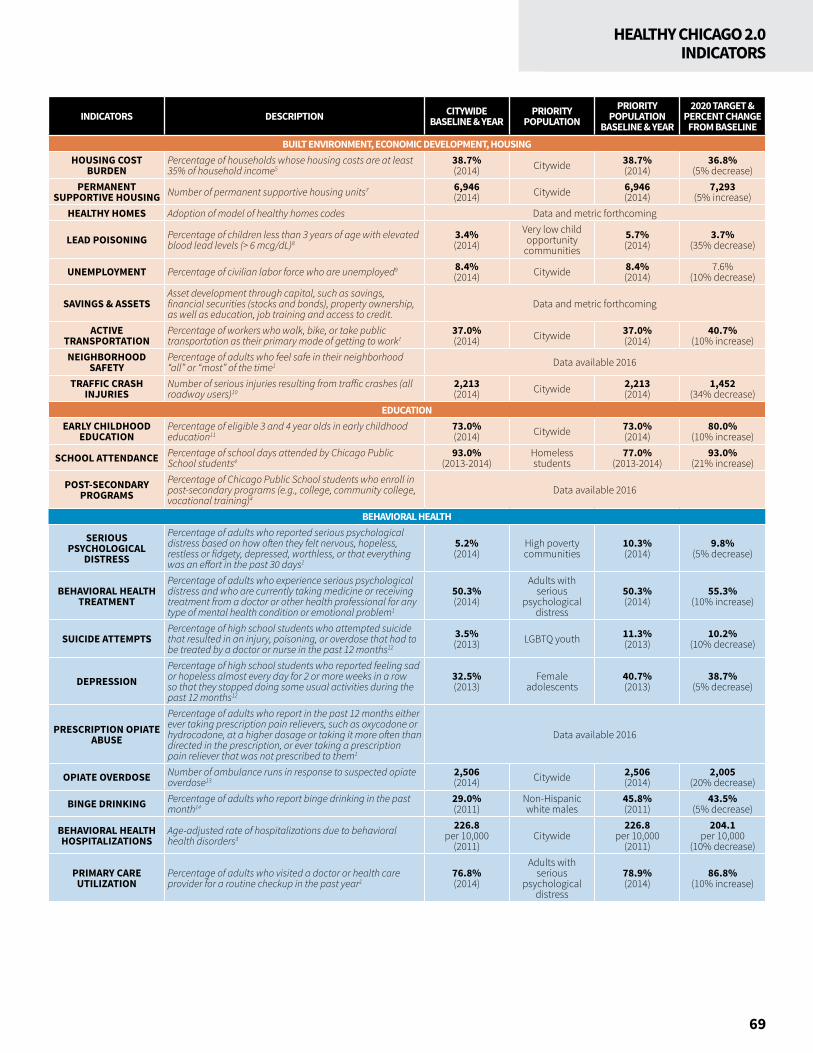
69
HEALTHY CHICAGO 2.0INDICATORS
INDICATORS DESCRIPTION CITYWIDE BASELINE & YEAR
PRIORITY POPULATION
PRIORITY POPULATION
BASELINE & YEAR
2020 TARGET & PERCENT CHANGE
FROM BASELINEBUILT ENVIRONMENT, ECONOMIC DEVELOPMENT, HOUSING
HOUSING COST BURDEN
Percentage of households whose housing costs are at least 35% of household income5
38.7%(2014) Citywide 38.7%
(2014)36.8%
(5% decrease)PERMANENT
SUPPORTIVE HOUSING Number of permanent supportive housing units7 6,946(2014) Citywide 6,946
(2014)7,293
(5% increase)HEALTHY HOMES Adoption of model of healthy homes codes Data and metric forthcoming
LEAD POISONING Percentage of children less than 3 years of age with elevated blood lead levels (> 6 mcg/dL)8
3.4%(2014)
Very low child opportunity
communities5.7%(2014)
3.7%(35% decrease)
UNEMPLOYMENT Percentage of civilian labor force who are unemployed9 8.4%(2014) Citywide 8.4%
(2014)7.6%
(10% decrease)
SAVINGS & ASSETSAsset development through capital, such as savings, financial securities (stocks and bonds), property ownership, as well as education, job training and access to credit.
Data and metric forthcoming
ACTIVE TRANSPORTATION
Percentage of workers who walk, bike, or take public transportation as their primary mode of getting to work1
37.0%(2014) Citywide 37.0%
(2014)40.7%
(10% increase)NEIGHBORHOOD
SAFETYPercentage of adults who feel safe in their neighborhood “all” or “most” of the time1 Data available 2016
TRAFFIC CRASH INJURIES
Number of serious injuries resulting from traffic crashes (all roadway users)10
2,213 (2014) Citywide 2,213
(2014)1,452
(34% decrease)EDUCATION
EARLY CHILDHOOD EDUCATION
Percentage of eligible 3 and 4 year olds in early childhood education11
73.0%(2014) Citywide 73.0%
(2014)80.0%
(10% increase)
SCHOOL ATTENDANCE Percentage of school days attended by Chicago Public School students4
93.0%(2013-2014)
Homeless students
77.0%(2013-2014)
93.0%(21% increase)
POST-SECONDARY PROGRAMS
Percentage of Chicago Public School students who enroll in post-secondary programs (e.g., college, community college, vocational training)4
Data available 2016
BEHAVIORAL HEALTH
SERIOUS PSYCHOLOGICAL
DISTRESS
Percentage of adults who reported serious psychological distress based on how often they felt nervous, hopeless, restless or fidgety, depressed, worthless, or that everything was an effort in the past 30 days1
5.2%(2014)
High poverty communities
10.3%(2014)
9.8%(5% decrease)
BEHAVIORAL HEALTH TREATMENT
Percentage of adults who experience serious psychological distress and who are currently taking medicine or receiving treatment from a doctor or other health professional for any type of mental health condition or emotional problem1
50.3%(2014)
Adults with serious
psychological distress
50.3%(2014)
55.3%(10% increase)
SUICIDE ATTEMPTSPercentage of high school students who attempted suicide that resulted in an injury, poisoning, or overdose that had to be treated by a doctor or nurse in the past 12 months12
3.5%(2013) LGBTQ youth 11.3%
(2013)10.2%
(10% decrease)
DEPRESSIONPercentage of high school students who reported feeling sad or hopeless almost every day for 2 or more weeks in a row so that they stopped doing some usual activities during the past 12 months12
32.5%(2013)
Female adolescents
40.7%(2013)
38.7%(5% decrease)
PRESCRIPTION OPIATE ABUSE
Percentage of adults who report in the past 12 months either ever taking prescription pain relievers, such as oxycodone or hydrocodone, at a higher dosage or taking it more often than directed in the prescription, or ever taking a prescription pain reliever that was not prescribed to them1
Data available 2016
OPIATE OVERDOSE Number of ambulance runs in response to suspected opiate overdose13
2,506(2014) Citywide 2,506
(2014)2,005
(20% decrease)
BINGE DRINKING Percentage of adults who report binge drinking in the past month14
29.0%(2011)
Non-Hispanic white males
45.8%(2011)
43.5%(5% decrease)
BEHAVIORAL HEALTH HOSPITALIZATIONS
Age-adjusted rate of hospitalizations due to behavioral health disorders3
226.8per 10,000
(2011)Citywide
226.8per 10,000
(2011)
204.1per 10,000
(10% decrease)
PRIMARY CARE UTILIZATION
Percentage of adults who visited a doctor or health care provider for a routine checkup in the past year1
76.8%(2014)
Adults with serious
psychological distress
78.9%(2014)
86.8%(10% increase)

70
HEALTHY CHICAGO 2.0 INDICATORS
INDICATORS DESCRIPTION CITYWIDE BASELINE & YEAR
PRIORITY POPULATION
PRIORITY POPULATION
BASELINE & YEAR
2020 TARGET & PERCENT CHANGE
FROM BASELINECHILD & ADOLESCENT HEALTH
INFANT MORTALITY Rate of deaths before age 1157.8
per 1,000 births(2013)
High hardship communities
9.7per 1,000 births
(2013)
8.7per 1,000 births(10% decrease)
EARLY INTERVENTION SERVICES
Number of children with developmental delays less than 4 years of age who have a plan for special services16 Data available 2016
SCHOOL-BASED HEALTH SERVICES
Number of Chicago Public School students who receive a school-based vision exam17
43,878(2014-2015) Citywide 43,878
(2014-2015)48,753
(10% increase)Number of Chicago Public School students who receive a school-based dental exam17
115,238(2014-2015) Citywide 115,238
(2014-2015)144,048
(20% increase)Number of Chicago Public School students who receive a school-based screening for sexually transmitted infections17
6,399(2014-2015) Citywide 6,399
(2014-2015)7,039
(10% increase)
TEEN BIRTH RATE Rate of births to mothers aged 15-19 years1835.5
per 1,000(2013)
Very low child opportunity
communities
57.3per 1,000
(2013)
51.6per 1,000
(10% decrease)CHRONIC DISEASE
FRUIT & VEGETABLE SERVINGS
Percentage of high school students who reported consuming five or more fruit and vegetable servings daily in the past week12
18.3%(2013) Citywide 18.3%
(2013)20.3%
(10% increase)
Percentage of adults who reported consuming five or more fruit and vegetable servings yesterday1
29.2%(2014) African Americans 18.9%
(2014)20.8%
(10% increase)
SODA CONSUMPTION
Percentage of high school students who reported consuming one or more can/bottle/glass of soda daily in the past week12
23.1%(2013) Citywide 23.1%
(2013)21.9%
(5% decrease)
Percentage of adults who drank soda or pop at least once per day in the past month1 Data available 2016
PHYSICAL ACTIVITY
Percentage of high school students who were physically active at least 60 minutes per day during the last week12
19.6%(2013) Citywide 19.6%
(2013)20.6%
(5% increase)
Percentage of adults with no leisure time physical activity in the past month1
18.3%(2014)
High poverty communities
22.7%(2014)
21.6%(5% decrease)
SMOKING
Percentage of high school students who currently smoke cigarettes12
10.7%(2013) Citywide 10.7%
(2013)9.6%
(10% decrease)
Percentage of adults who currently smoke cigarettes1 18.4%(2014) Citywide 18.4%
(2014)16.6%
(10% decrease)
Percentage of adults who currently use electronic cigarettes1 3.9%(2014)
Adults aged 18-29 years
6.3%(2014)
5.7%(10% decrease)
CANCER SCREENINGS
Percentage of women aged 50-74 years reporting having a mammogram in the past 2 years1
75.6%(2014) Citywide 75.6%
(2014)79.4%
(5% increase)
Percentage of women aged 21-65 years reporting having a Pap test within the past 3 years1
82.9%(2014) Citywide 82.9%
(2014)87.0%
(5% increase)
Percent of adults aged 50-75 years reporting having a sigmoidoscopy/colonoscopy in the past 10 years, having a sigmoidoscopy/colonscopy in the past 5 years and a blood stool test in the past 3 years, or having a blood stool test in past year1
60.4%(2014)
High poverty communities
47.9%(2014)
52.7%(10% increase)
HPV VACCINATION Percentage of female adolescents aged 13-17 years who received three or more doses of HPV vaccine19
52.6%(2014) Citywide 52.6%
(2014)80.0%
(52% increase)
BREAST CANCER MORTALITY Age-adjusted rate of female breast cancer deaths2
24.9per 100,000
(2013)African American
women33.3
per 100,000(2013)
30.0per 100,000
(10% decrease)
ASTHMA EMERGENCY DEPARTMENT VISITS
Age-adjusted emergency department visit rate due to asthma for the population less than 18 years of age3
147.7per 10,000
(2011)African Americans
280.0per 10,000
(2011)
252.0per 10,000
(10% decrease)
DIABETES-RELATED HOSPITALIZATIONS
Age-adjusted hospitalization rate due to diabetes-related lower extremity amputations3
2.0per 10,000
(2011)High hardship communities
3.0per 10,000
(2011)
2.7per 10,000
(10% decrease)
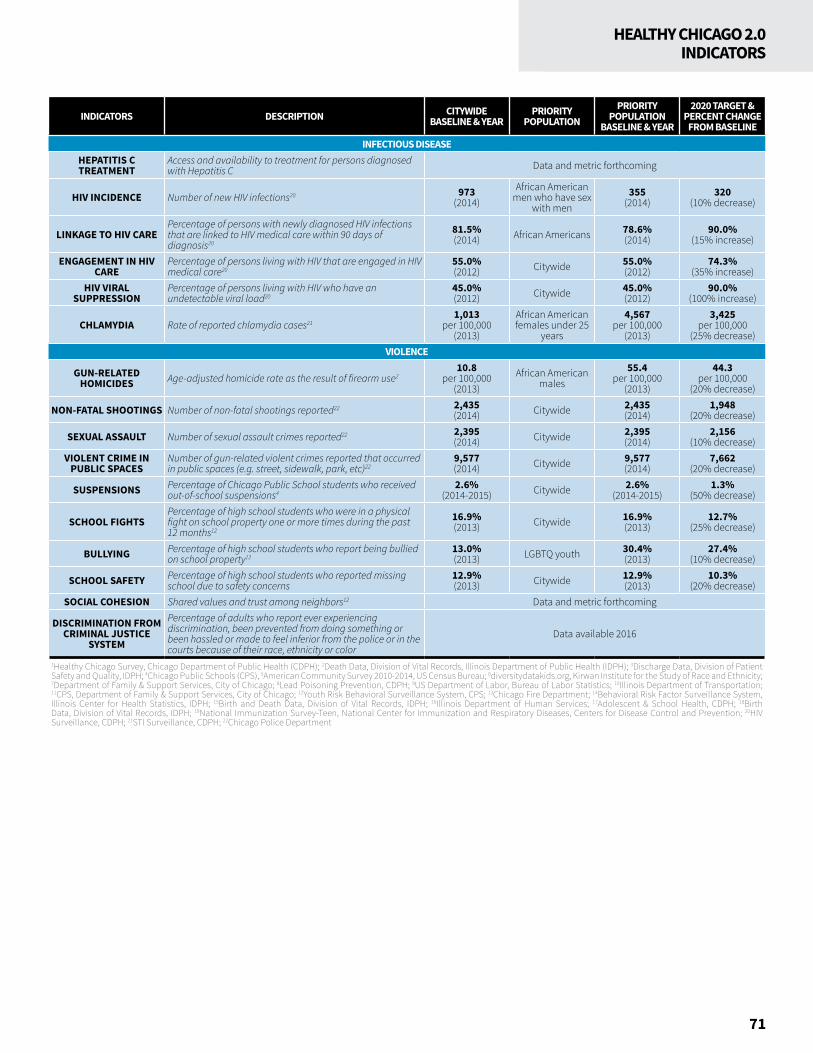
71
HEALTHY CHICAGO 2.0INDICATORS
INDICATORS DESCRIPTION CITYWIDE BASELINE & YEAR
PRIORITY POPULATION
PRIORITY POPULATION
BASELINE & YEAR
2020 TARGET & PERCENT CHANGE
FROM BASELINEINFECTIOUS DISEASE
HEPATITIS C TREATMENT
Access and availability to treatment for persons diagnosed with Hepatitis C Data and metric forthcoming
HIV INCIDENCE Number of new HIV infections20 973(2014)
African American men who have sex
with men355
(2014)320
(10% decrease)
LINKAGE TO HIV CAREPercentage of persons with newly diagnosed HIV infections that are linked to HIV medical care within 90 days of diagnosis20
81.5%(2014) African Americans 78.6%
(2014)90.0%
(15% increase)
ENGAGEMENT IN HIV CARE
Percentage of persons living with HIV that are engaged in HIV medical care20
55.0%(2012) Citywide 55.0%
(2012)74.3%
(35% increase)HIV VIRAL
SUPPRESSIONPercentage of persons living with HIV who have an undetectable viral load20
45.0%(2012) Citywide 45.0%
(2012)90.0%
(100% increase)
CHLAMYDIA Rate of reported chlamydia cases211,013
per 100,000(2013)
African American females under 25
years
4,567per 100,000
(2013)
3,425per 100,000
(25% decrease)VIOLENCE
GUN-RELATED HOMICIDES Age-adjusted homicide rate as the result of firearm use2
10.8per 100,000
(2013)African American
males55.4
per 100,000(2013)
44.3per 100,000
(20% decrease)
NON-FATAL SHOOTINGS Number of non-fatal shootings reported22 2,435(2014) Citywide 2,435
(2014)1,948
(20% decrease)
SEXUAL ASSAULT Number of sexual assault crimes reported22 2,395(2014) Citywide 2,395
(2014)2,156
(10% decrease)VIOLENT CRIME IN
PUBLIC SPACESNumber of gun-related violent crimes reported that occurred in public spaces (e.g. street, sidewalk, park, etc)22
9,577(2014) Citywide 9,577
(2014)7,662
(20% decrease)
SUSPENSIONS Percentage of Chicago Public School students who received out-of-school suspensions4
2.6%(2014-2015) Citywide 2.6%
(2014-2015)1.3%
(50% decrease)
SCHOOL FIGHTSPercentage of high school students who were in a physical fight on school property one or more times during the past 12 months12
16.9%(2013) Citywide 16.9%
(2013)12.7%
(25% decrease)
BULLYING Percentage of high school students who report being bullied on school property12
13.0%(2013) LGBTQ youth 30.4%
(2013)27.4%
(10% decrease)
SCHOOL SAFETY Percentage of high school students who reported missing school due to safety concerns
12.9%(2013) Citywide 12.9%
(2013)10.3%
(20% decrease)SOCIAL COHESION Shared values and trust among neighbors12 Data and metric forthcoming
DISCRIMINATION FROM CRIMINAL JUSTICE
SYSTEM
Percentage of adults who report ever experiencing discrimination, been prevented from doing something or been hassled or made to feel inferior from the police or in the courts because of their race, ethnicity or color
Data available 2016
1Healthy Chicago Survey, Chicago Department of Public Health (CDPH); 2Death Data, Division of Vital Records, Illinois Department of Public Health (IDPH); 3Discharge Data, Division of Patient Safety and Quality, IDPH; 4Chicago Public Schools (CPS), 5American Community Survey 2010-2014, US Census Bureau; 6diversitydatakids.org, Kirwan Institute for the Study of Race and Ethnicity; 7Department of Family & Support Services, City of Chicago; 8Lead Poisoning Prevention, CDPH; 9US Department of Labor, Bureau of Labor Statistics; 10Illinois Department of Transportation; 11CPS, Department of Family & Support Services, City of Chicago; 12Youth Risk Behavioral Surveillance System, CPS; 13Chicago Fire Department; 14Behavioral Risk Factor Surveillance System, Illinois Center for Health Statistics, IDPH; 15Birth and Death Data, Division of Vital Records, IDPH; 16Illinois Department of Human Services; 17Adolescent & School Health, CDPH; 18Birth Data, Division of Vital Records, IDPH; 19National Immunization Survey-Teen, National Center for Immunization and Respiratory Diseases, Centers for Disease Control and Prevention; 20HIV Surveillance, CDPH; 21STI Surveillance, CDPH; 22Chicago Police Department
*LAF is a Legal Services Corporation (LSC)-funded organization and all activities relating to this document by LAF staff were conducted in strict adherence to all LSC regulations.
72
ACKNOWLEDGMENTSLead AuthorsJaime Dircksen, Chicago Department of Public Health
Nikhil Prachand, Chicago Department of Public Health
Contributing AuthorsDelrice Adams, Chicago Department of Public Health
Kirsti Bocskay, Chicago Department of Public Health
Jen Brown, Alliance for Research in Chicagoland Communities, Northwestern University
Ann Cibulskis, Chicago Department of Public Health
Sheri Cohen, Chicago Department of Public Health
Wesley Epplin, Health and Medicine Policy Research Group
Janis Sayer, Chicago Department of Public Health
Kingsley Weaver, Chicago Department of Public Health
Marlita White, Chicago Department of Public Health
Action TeamsAccess Sheri Cohen, Co-Chair, Chicago Department of Public Health
Carrie Chapman, Co-Chair, LAF*
Stephani Becker, The Sargent Shriver National Center on Poverty Law
Salvador Cerna, Get Covered Illinois
Mariann Chisum-McGill, TCA Health, Inc.
Patrick Corcoran, Get Covered Illinois
Maya Estrella, Puerto Rican Cultural Center
Judith Gethner, Illinois Partners for Human Service
Graciela Guzman, PrimeCare Community Health, Inc.
Mona Van Kanegan, The Oral Health Forum
Joyce B. Lane, The Jim Fisher Development Center of St. Anselm Catholic Church
Patricia Merryweather, Telligen
Jeanita Moore, Saint Anthony Hospital
Andrew Rice, SGA Youth and Family Services
Dave Roth, Lutheran Child and Family Services of Illinois
Alejandra Valencia, The Oral Health Forum
Angela K. Walker, Loretto Hospital
Behavioral HealthJanis Sayer, Co-Chair, Chicago Department of Public Health
Arneda Hamilton, Co-Chair, Chicago Department of Public Health
Jessica Rooney, Co-Chair, Heartland Alliance
David Barnett, Illinois Consortium on Drug Policy
Laura Brookes, Treatment Alternatives for Safe Communities (TASC)
Arianna Cisneros, Illinois Children’s Healthcare Foundation
Mary Creamer, Chicago Department of Public Health
Fred Friedman, Next Steps
Laura Gettinger, Chicago Housing Authority
Mark Heyrman, University of Chicago
Mark Ishaug, Thresholds
Ronald Jackson, CDPH Mental Health Advisory Board
Marco Jacome, Healthcare Alternative Systems , Inc. (HAS)
Colleen Jones, Metropolitan Family Services
Emile Jorgensen, Chicago Department of Public Health
Kathleen Kane-Willis, Illinois Consortium on Drug Policy
Laurel Marshall, Inspiration Corporation
Tiffany McDowell, Adler University
Julie Morita, Chicago Department of Public Health
Samantha Oliver Mitchell, Christian Community Health Center
Badonna Reingold, CDPH Mental Health Advisory Board
Felix Rodriguez, Healthcare Alternative Systems , Inc.
Cozette Roper, HRDI
Jay Roth, Chicago Department of Public Health
Rahul Shah, Chicago Department of Public Health
Mashana Smith, Chicago Public Schools
Joanne Smyth, Thresholds
Padraic Stanley, Latino Organization of the Southwest
David Tucker, DePaul University
Karen Van Ausdal, Chicago Public Schools
Joan Weaver, Chicago Department of Public Health
Dena Williams, Cook County Department of Corrections

73
ACKNOWLEDGMENTS
Chronic DiseaseKirsti Bocskay, Co-Chair, Chicago Department of Public Health
Arlene Hankinson, Co-Chair, Chicago Department of Public Health
Adam Becker, Co-Chair, Consortium to Lower Obesity in Chicago Children
Fernando DeMaio, Co-Chair, Center for Community Health Equity, DePaul University
Kate McMahon, Co-Chair, Respiratory Health Association
Nyahne Bergeron, University of Chicago
Melody Geraci, Active Transportation Alliance
Scott Glosner, Pfizer
Dana Harper-Jemison, Chicago Department of Public Health
Jennifer Herd, Chicago Department of Public Health
Natasha Holbert, Chicago Lights Urban Farm
Stacy Ignoffo, Chicago Asthma Consortium
Kristy Kitzmiller, Louis’ Groceries
Emily Laflamme, Chicago Department of Public Health
John Patena, American Lung Association
JoAnn Peso, Chicago Department of Public Health
Sandy Slater, University of Illinois at Chicago
Cassandra Welch
Community DevelopmentAnn Cibulskis, Co-chair, Chicago Department of Public Health
Wesley Epplin, Co-Chair, Health & Medicine Policy Research Group
Mike Amsden, Chicago Department of Transportation
John Bartlett, Metropolitan Tenants Organization
Graham Bowman, Chicago Coalition for the Homeless
Mary Castro, Chicago Department of Family and Support Services
Anne Cole, Neighborhood Housing ServicesChristian Denes, Chicago Department of Family and Support Services
Rebecca Estrada, Erie Neighborhood House
Tiffany Ford, Health & Medicine Policy Research Group
Amanda Gramigna, Elevate Energy
Yonina Gray, Metropolitan Planning Council
Eric Hanss, Chicago Department of Transportation
Kim Hunt, Affinity Community Services
Matt Kern, Elevate EnergyJordan Losiak, Chicago Park District
Olatunji Oboi Reed, Slow Roll Chicago
Amanda Przybyla, Chicago Park District
Margarita Reina, Chicago Department of Public Health
Brad Roback, Chicago Department of Planning and Development
Brett Rydzon, Chicago Department of Public Health
Norma Sanders, Greater Auburn Gresham Development Corporation
Madeline Shea, AIDS Foundation of Chicago
Andrew Teitelman, Chicago Housing Authority
Felipe Tendick Matesanz, Restaurant Opportunities Centers United
Dominique Williams, LISC Chicago
Data & ResearchMatt Roberts, Co-Chair, Chicago Department of Public Health
Jen Brown, Co-Chair, Alliance for Research in Chicagoland Communities, Northwestern University
Mindi Knebel, Co-Chair, Kaizen Health
Deborah Anderson, Chicago Department of Innovation and Technology
Kaittyn Fruin, University of Chicago--South Side Health & Vitality Studies
Satyender Goel, Northwestern University
Jeni Hebert-Beirne, University of Illinois at Chicago--School of Public Health
Jana Hirschtick, Sinai Urban Health Institute
Rebecca Johnson, Buehler Center for Aging, Health and Society
Ellen Kaufmann, Illinois Public Health Institute
Dani Lazar, Access Community Health Network
Raed Mansour, Chicago Department of Public Health
Taryn McCook, Greater Chicago Food Depository
David Portnoy, US Department of Health and Human Services
Nikhil Prachand, Chicago Department of Public Health
Sarah Rittner, Alliance of Chicago Community Health Services
Tom Schenk, Chicago Department of Innovation and Technology
Roopa Seshadri, Chapin Hall at the University of Chicago
Tracie Smith, Ann & Robert H. Lurie Children’s Hospital of Chicago
Kyla Williams, Smart Chicago Collaborative
EducationDelrice Adams, Co-Chair, Chicago Department of Public Health
Zakieh Mohammed, Co-Chair, Chicago Public Schools
Sandy DeLeon, Ounce of Prevention Fund
Raquel L. Farmer-Hinton, University of Wisconsin-Milwaukee
Karen Goldstein, University of Chicago Hospitals- Pediatrics
Jeannette Hoyt, CCAM Research Partners
Anthony Papini, Illinois Safe Schools Alliance
Katrina Pavlik, Communities In Schools of Chicago
Karen Roddie, Communities In Schools of Chicago
Julia Talbot, Chicago Department of Family and Support Services
74
Infectious DiseaseStephanie Black, Co-Chair, Chicago Department of Public Health
Kate Schellinger, Co-Chair, Chicago Department of Public Health
Sarah Kemble, Co-Chair, Chicago Department of Public Health
Peter McLloyd, Co-Chair, Ruth M. Rothstein Core Center
Elise Balzer, EverThrive Illinois
Mahita Bobba, Chicago Department of Public Health
Rachel Caskey, University of Illinois at Chicago
Alexandra Gagner, Chicago Department of Public Health
Elena Grossman, BRACE Project
Margaret Eaglin, Chicago Department of Public Health
Dave Graham, Chicago Department of Public Health
Elsie Hernandez, Haitian American Museum of Chicago
Stephanie Masiello Schuette, Chicago Department of Public Health
Cortland Lohff, Chicago Department of Public Health
Kelly Rice, Howard Brown Health Center
Frankie Shipman-Amuwo, Chicago Department of Public Health
Kimmins Kurt SouthardMildred Williamson
Child & Adolescent HealthKingsley Weaver, Co-Chair, Chicago Department of Public Health
Tina Schuh, Co-Chair, Chicago Department of Public Health Susan Swider, Co-Chair, Rush University College of Nursing
Lara Altman, Chicago Public Schools
Eduardo Alvarado, Illinois Department of Public Health
Timika Anderson Reeves, Access Community Health Network
Anna Barnes, Consortium to Lower Obesity in Chicago Children
Julie Bendix, Chicago Department of Public Health
Mary Curry, SGA Youth and Family Services
Katelyn Kanwischer, Consortium to Lower Obesity in Chicago Children
Chidori Lively, Chicago Department of Public Health
Poj Lysouvakon, University of Chicago Medicine, Comer Children's Hospital
Lisa, Masinter, Chicago Department of Public Health
Heidi Ortolaza-Alvear, EverThrive Illinois
Joshua Prudowsky, Mikva Challenge
Madiha Qureshi, March of Dimes
Erin Ryan, The Night Ministry
Partnerships & Community EngagementJoe Hollendoner, Co-Chair, Chicago Department of Public Health
Steven McCollough, Co-Chair, Greater Chicago Food Depository
Esther Sciammarella, Co-Chair, Chicago Hispanic Health Coalition
Lisa Azu-Popow, Northwestern Memorial Hospital
Ramon Gardenhire, AIDS Foundation of Chicago
Charlayne Guy, Chicago Department of Public Health
Lisa Johnson, Metropolitan Chicago Healthcare Council
Dawn Melchiorre, Greater Chicago Food Depository
Anndrea Miller, Rauner Family YMCA
Zakiya Moton, University of Chicago Medicine Center for Clinical Cancer Genetics
Alexandrea Murphy, United Way of Metropolitan Chicago
Kirsten Peachey, Advocate Health Care
Alma Rodriguez, The Chicago Community Trust
Jim Soreng, Illinois Beverage Association
Berenice Tow, Chicago Department of Public Health
Jill Wohl, AIDS Legal Council of Chicago, Chicago Medical-Legal Partnership for Children and SSI Homeless Outreach
Violence PreventionMarlita White, Co-Chair, Chicago Department of Public Health
Deborah Gorman-Smith, Co-Chair, University of Chicago--School of Social Service Administration
Vanessa Westley, Co-Chair, Chicago Police Department
Edward Boone, Ann & Robert H. Lurie Children’s Hospital of Chicago, Strengthening Chicago’s Youth
Lauren Feig, Chicago Center for Youth Violence Prevention, University of Chicago
David Fischer, Health & Medicine Policy Research Group
Beth Ford, Chicago Police Department
Lisa Gilmore, Illinois Accountability Initiative
Doris Green, Men and Women in Prison Ministries
Jesse Lava, Chicago Department of Public Health
Rebecca Levin, Ann & Robert H. Lurie Children’s Hospital of Chicago
Isaac McCoy, Illinois African American Coalition for Prevention
Agnes Meneses, Chicago Foundation for Women
Elena Quintana, Adler University
Margarita Reina, Chicago Department of Public Health
Radhika Sharma Gordon, Apna Ghar, Inc.
Karen Sheehan, Ann & Robert H. Lurie Children’s Hospital of Chicago
Marcel Smith, Chicago Public Schools
Victoria Vasquez, Rape Victims Advocates
Carolyn L. VesselI, AM ABLE Center for Family Development
Amanda Woodall, Chicago Department of Transportation
ACKNOWLEDGMENTS
75
Additional AcknowledgmentsThe Healthy Chicago 2.0 Plan was made possible by the generous support of the Otho S.A. Sprague Memorial Institute.
The Chicago Department of Public Health (CDPH) and the Partnership for Healthy Chicago thank Julie Morita, Commissioner, for her leadership and support throughout the development of Healthy Chicago 2.0.
CDPH and the Partnership for Healthy Chicago thank the following CDPH staff and interns who provided their time and expertise in the development, preparation and promotion of this plan: Quenjana Adams, Kirsti Bocskay, Sheri Cohen, Karen Ewing, Dana Harper-Jemison, Monica Hernandez, Shannon Holliday, Emile Jorgenson, Joy Kane, Emily LaFlamme, Jesse Lava, Cortland Lohff, Stephanie Masello Schuette, Lisa Masinter, Laura Milstein, Daryl Murphy, Margarita Reina, Brian Richardson, Ivonne Sambolin, Janis Sayer, Cristal Simmons, Matt Smith, Irina Tabidze and Kingsley Weaver.
CDPH and the Partnership for Healthy Chicago also thank the following City of Chicago departments for their support and collaboration through participation on action teams, strategy alignment to their existing plans and department priorities, and their willingness to acknowledge that all of our work has an impact on the health of Chicagoans: Aviation, Buildings, Business Affairs and Consumer Protection, Chicago Fire Department, Chicago Park District, Chicago Police Department, Chicago Public Library, Chicago Public Schools, Chicago Mayor’s Office, Cultural Affairs and Special Events, Family and Support Services, Innovation and Technology, Mayor’s Office for People with Disabilities, Planning and Development, Streets and Sanitation, and Transportation.
Finally, CDPH and the Partnership for Healthy Chicago thank the following individuals for their expertise in the development of content and indicators.
Toyin Adeyemi, John H. Stroger Hospital of Cook County
Ebony M. Dill, Chicago Department of Family and Support Services
Julie Doetsch, Illinois Department of Healthcare and Family Services
Ann Freiburg, Illinois Department of Human Services
Jennifer Hiselman, Illinois Criminal Justice Information Authority
Shai Hoffman, Illinois Criminal Justice Information Authority
Daniel Johnson, University of Chicago, Hepatitis C Community Alliance to Test and Treat (HEPCATT)
Jennifer Layden, Loyola University Medical Center
Christina LePage, Illinois Children's Mental Health Partnership
Alicia Siani, EverThrive IllinoisEric T. Washington, Chicago Police Department Amy Zimmerman, Chicago Medical-Legal Partnership for Children—a program of the Legal Council for Health Justice
CreditsTraining provided to all action team members and co-chairs to ensure they were prepared to develop this plan by Illinois Public Health Institute.
Design and layout provided by Houseal Lavigne Associates.
Copy editing provided by Sarah Wagener.
ACKNOWLEDGMENTS
76
REFERENCESIntroduction1. Centers for Disease Control and Prevention. Chronic Disease Prevention
and Health Promotion. http://www.cdc.gov/chronicdisease/healthequity/
2. National Association of County and City Health Officials. MAPP Program. http://www.naccho.org/programs/public-health-infrastructure/mapp. Accessed March 8, 2016.
3. American Public Health Association and Public Health Institute. Health in All policies: A guide for state and local governments. http://www.phi.org/uploads/files/Health_in_All_Policies-A_Guide_for_State_and_Local_Governments.pdf. Published 2013. Accessed December 28, 2015.
4. Jennings. A. The Damaging Consequences of Violence and Trauma: Facts, Discussion Points and Recommendations for the Behavioral Health System. National Association of States Mental Health Program Directors and National Technical Assistance Center for Mental Health Planning. 2014.
Chapter 1: Expanding Partnerships and Community Engagement1. Centers for Disease Control and Prevention. A practitioner’s guide for
advancing health equity: Community strategies for preventing chronic disease. http://www.cdc.gov/nccdphp/dch/pdf/HealthEquityGuide.pdf Published 2013. Accessed December 28, 2015.
Chapter 2: Addressing the Root Causes of Health1. Preamble to the Constitution of the World Health Organization as adopted
by the International Health Conference, New York, 19-22 June, 1946; signed on 22 July 1946 by the representatives of 61 States (Official Records of the World Health Organization, no. 2, p. 100) and entered into force on 7 April 1948. The Definition has not been amended since 1948.
THE BUILT ENVIRONMENT
1. Unpublished data analysis in 2015 by CDPH Division of Epidemiology and Public Health Informatics. Data sources: Illinois Department of Transportation 2013 Traffic Fatalities and Illinois Department of Public Health 2013 Death File.
2. Centers for Disease Control and Prevention: Division of Community Health. A Practitioner’s Guide for Advancing Health Equity: Community Strategies for Preventing Chronic Disease. http://www.cdc.gov/nccdphp/dch/pdfs/health-equity-guide/health-equity-guide-sect-4-1.pdf. Accessed January 4, 2016.
3. Woloszyn, M. 2015. Appendix to Climate Adaptation Guidebook for Municipalities in the Chicago Region. CMAP and Midwest Regional Climate Center. http://www.cmap.illinois.gov/documents/10180/14193/Appendix+A+-+Primary+Impacts+of+Climate+Change+in+the+Chicago+Region.pdf/2a85b021-f3bd-4b98-81d1-f64890adc5a7. Published June, 2013.
Accessed January 4, 2016.
ECONOMIC DEVELOPMENT
1. Saez, E. Striking it richer: The evolution of top incomes in the United States. University of California—Berkeley. http://eml.berkeley.edu//~saez/saez-UStopincomes-2012.pdf. Published September 3, 2013. Accessed December 28, 2015.
2. Desilver, D. Black incomes are up, but wealth isn’t. Pew Research Center. http://www.pewresearch.org/fact-tank/2013/08/30/black-incomes-are-up-but-wealth-isnt/. Published August 30, 2013. Accessed January 4, 2016.
3. Wolff, EN. The Asset Price Meltdown and the Wealth of the Middle Class. http://www.wcu.edu/WebFiles/PDFs/AMA-Citation-Resource.pdf. National Bureau of Economic research working paper 18559. Published November 2012. Accessed December 28, 2015.
4. Wilkinson, R and Pickett, K. The Spirit Level: Why More Equal Societies Almost Always Do Better. United States: Bloomsbury Press, 2009.
5. National Equity Atlas. National Equity Atlas. Share of workers earning at least $15/hour by race/ethnicity and gender: Chicago City, IL, 2012. http://nationalequityatlas.org/indicators/Wages:_$15~hr/By_gender:32926/Chicago_City,_IL/false/Year%28s%29:2012/. Published 2014. Accessed October 1, 2015.
6. United States Department of Labor: Bureau of Labor Statistics. Geographic profile of employment and unemployment, section III: Estimates for metropolitan areas, metropolitan divisions, and cities. http://www.bls.gov/opub/gp/gpsec3.htm. Published September 23, 2015. Accessed December 28, 2015.
HOUSING
1. Robert Wood Johnson Foundation. Issue brief #7: Exploring the social determinants of health: Housing and health. http://www.rwjf.org/content/dam/farm/reports/issue_briefs/2011/rwjf70451. Published May 2011. Accessed December 28, 2015.
2. Krieger J, Higgins DL. Housing and Health: Time Again for Public Health Action. Am J Public Health. 2002;92(5):758-768. doi: 10.2105.AJPH.92.5.758
3. US Census. American community survey: 2014 1-year estimates. https://www.census.gov/programs-surveys/acs/. Accessed January 4, 2016.
4. Jacobs, D. Healthy housing in the Chicago area. Loyola University Chicago. http://luc.edu/media/lucedu/hhhci/pdf/Jacobs presentation GIS.pptx. Published 2015. Accessed December 28, 2015.
5. National Center for Healthy Housing. State of healthy housing. http://www.nchh.org/Policy/2013StateofHealthyHousing.aspx. Published 2013. Accessed December 28 2015.
6. Prachand, NG. Community health status assessment: Mini-compendium. Chicago Department of Public Health. http://www.cityofchicago.org/content/dam/city/depts/cdph/CDPH/CDPHComHlthStatMiniDataFINAL4172015.pdf. Accessed January 4, 2016.
7. Chicago Alliance. Chicago’s plan 2.0: A home for everyone. http://www.allchicago.org/chicagos-plan-20. Published 2013. Accessed January 4,
2016.
77
REFERENCES
EDUCATION
1. The Community Guide. Center-based early childhood education. http://www.thecommunityguide.org/healthequity/education/OnePager-ECE.pdf Published August, 2015. Accessed December 28, 2015.
2. US Census Bureau. American community survey: 2013 five-year estimates. https://www.census.gov/programs-surveys/acs/. Accessed January 4, 2016
3. Prachand, N. Community health status assessment: Mini-compendium. Chicago Department of Public Health. http://www.cityofchicago.org/content/dam/city/depts/cdph/CDPH/CDPHComHlthStatMiniDataFINAL4172015.pdf. Published 2015. Accessed December 28, 2015.
4. Kosciw, JG, Diaz, EM, & Greytak, EA. 2007 national school climate survey: The experiences of lesbian, gay, bisexual and transgender youth in our nation’s schools. Gay, Lesbian, Straight Education Network. http://www.glsen.org/sites/default/files/2007%20National%20School%20Climate%20Survey%20Full%20Report.pdf. Published 2008. Accessed December 28, 2015.
Chapter 3: Access to Health Care and Human Services1. Centers for Disease Control and Prevention. The public health system
and the 10 essential public health services. http://www.cdc.gov/nphpsp/essentialservices.html. Published May 29, 2014. Accessed December 28 2015.
2. Centers for Disease Control and Prevention. Chronic disease overview. http://www.cdc.gov/chronicdisease/overview/#ref1. Published August 26, 2015. Accessed September 24, 2015.
3. Committee on Health Insurance Status and Its Consequences, Board on Health Care Services. America’s uninsured crisis: Consequences for health and health care. Institute of Medicine. https://iom.nationalacademies.org/Reports/2009/Americas-Uninsured-Crisis-Consequences-for-Health-and-Health-Care.aspx. Published February 23, 2009. Accessed December 28, 2015.
4. Illinois Health Matters. Illinois marketplace signups: 2015. http://data.illinoishealthmatters.org/enrollment/il-marketplace-enr-2015-data.html. Accessed January 4, 2016.
5. Illinois Department of Healthcare and Family Services. Medicaid expansion numbers: September 2015. http://www.illinois.gov/hfs/SiteCollectionDocuments/ACAEnrollmentSummaryData.pdf. Accessed January 4, 2016.
6. US Census Bureau. American community survey: 2014 five-year estimates. http://factfinder.census.gov/rest/dnldController/deliver?_ts=469971137186. Accessed January 4, 2016.
7. Centers for Medicare and Medicaid Services. Physician quality reporting system. https://www.cms.gov/Medicare/Quality-Initiatives-Patient-Assessment-Instruments/PQRS/index.html?redirect=/pqri/. Accessed December 28, 2015.
Chapter 4: Improving Health Outcomes1. Substance Abuse and Mental Health Services Administration (US).
Understanding the impact of trauma. In: Trauma-Informed Care in Behavioral Health Services. Rockville, MD: Substance Abuse and Mental Health Services Administration (US); 2014: Chapter 3.
PROMOTING BEHAVIORAL HEALTH
1. The World Health Organization. The world health report 2004: Changing history. http://apps.who.int/iris/bitstream/10665/42891/1/924156265X.pdf. Published 2004. Accessed December 28, 2015.
2. Kessler, RC, Chiu, WT, Demler O, Walters, EE. Prevalence, severity, and comorbidity of twelve-month dsm-IV disorders in the national comorbidity survey replication. Arch Gen Psychiatry. 2005 June;62(6):617-27. doi: 10.1001/archpsyc.62.6.617.
3. US Census Bureau, Population Division. US Census Bureau population estimates by demographic characteristics: National population estimates—characteristics. Table 2 (NC-EST2004-02): Annual estimates of the population by selected age groups and sex for the United States: April 1, 2000, to July 1, 2004; A18. https://www.census.gov/popest/data/state/totals/2004/tables/NST-EST2004-02.pdf. Published June 9, 2005. Accessed January 3, 2016.
4. Janssen, EM, McGinty, EE, Azrin, ST, Juliano-Bult, D, Daumit, GL. Review of the evidence: Prevalence of medical conditions in the United States population with serious mental illness. General hosp psychiatry. 2015 May-June;37(3):199-222. doi: 10.1016/j.genhosppsych.2015.03.004.
5. Link, BG, Phelan, JC. (2006). Stigma and its public health implications. Lancet. 2006; 367(9509):528-29.
6. Felitti, VJ, Anda, RF, Nordenberg, D, et al. Relationship of childhood abuse and household dy function to many of the leading causes of death in adults: The adverse childhood experiences (ace) study. Am J Prev Med. 1998 May;14(4):245-258.
7. Chicago Department of Public Health. Measuring Chicago’s health: Findings from the 2014 healthy Chicago survey. http://www.cityofchicago.org/content/dam/city/depts/cdph/CDPH/CDPH_HealthyChicagoSurveyReport.pdf. Published October 2015. Accessed January 3, 2016.
8. Centers for Disease Control and Prevention. Youth online: High school yrbs. https://nccd.cdc.gov/youthonline/App/Default.aspx. Published 2013. Accessed December 28, 2015.
9. Centers for Disease Control and Prevention. Behavioral risk factor surveillance system: Prevalence data & data analysis tool. http://www.cdc.gov/brfss/data_tools.htm. Published 2014. Accessed December 28, 2015.
10. Kane- Willis, K, Aviles, G, Barnett, D, et al. Diminishing capacity: The heroin crisis and Illinois treatment in a national perspective. Illinois Consortium on Drug Policy at Roosevelt University. http://www.roosevelt.edu/News_and_Events/News_Articles/2015/20150811-HeroinCrisis.aspx. Published August 2015. Accessed December 28, 2015.

78
STRENGTHENING CHILD AND ADOLESCENT HEALTH
1. Braveman P, Barclay C. Health inequities beginning in childhood: A life-course perspective. Pediatrics. 2009;124(Supplement 3):S163–S175. doi: 10.1542/peds.2009-1100D
2. Seirawan H, Faust S, Mulligan R. The impact of oral health on the academic performance of disadvantaged children. Am J Public Health. 2012;102:1729–1724.
3. Cross, AW. Health screening in schools, part I. Journal of Pediatrics. 1985;107(4):487-94.
4. Federal Interagency Forum on Child and Family Statistics. America’s children: Key national indicators of well-being. http://www.childstats.gov/pdf/ac2015/ac_15.pdf. Published July, 2015. Accessed January 4, 2016.
5. Fornoff JE, Smith C, Shen T. Trends in the prevalence of birth defects in illinois and chicago 1989-2009: Epidemiologic report series 12:04. Illinois Department of Public Health. http://www.idph.state.il.us/about/epi/pdf/ERS-12-04_Trends_in_the_Prevalence_of_Birth_Defects.pdf. Published November 2012. Accessed December 28, 2015.
6. American Academy of Pediatrics. Developmental screening in early childhood systems: Summary report. http://www.healthychildcare.org/pdf/DSECSreport.pdf. Published March 25, 2009. Accessed October 1, 2015.
7. Illinois Health Connect. Provider newsletter: Volume 8, issue 1. https://www.illinoishealthconnect.com/files/ProviderNewsletter/IHC%20Provider%20Newsletter%20Volume%208%20Issue%201%20FINAL.pdf. Accessed January 4, 2016.
PREVENTING AND CONTROLLING CHRONIC DISEASE
1. Centers for Disease Control and Prevention: National Center for Chronic Disease Prevention and Health Promotion. Chronic diseases: The leading causes of death and disability in the United States. http://www.cdc.gov/chronicdisease/overview/index.htm. Published August 26, 2015. Accessed October 1, 2015.
2. Bauer, UE, Briss, PA, Goodman, RA, Bowman, BA. Prevention of chronic disease in the 21st century: Elimination of the leading preventable causes of premature death and disability in the USA. The Lancet. 2014 July;384(9937):45-52. doi: http://dx.doi.org/10.1016/S0140-6726(14)60648-6
3. Prachand, N. Community health status assessment: Mini-compendium. Chicago Department of Public Health. http://www.cityofchicago.org/content/dam/city/depts/cdph/CDPH/CDPHComHlthStatMiniDataFINAL4172015.pdf. Published 2015. Accessed December 28, 2015.
4. United States Department of Health and Human Services, Office of Disease Prevention and Health Promotion. Social Determinants of Health. HealthyPeople 2020. http://www.healthypeople.gov/2020/topics-objectives/topic/social-determinants-health. Accessed December 28, 2015.
5. Centers for Disease Control and Prevention: National Center for Chronic Disease Prevention and Health Promotion. The four domains of chronic disease prevention: Working toward healthy people in healthy communities. http://www.cdc.gov/chronicdisease/pdf/four-domains-factsheet-2015.pdf. Accessed October 1, 2015.
6. United States Department of Health and Human Services, Office of Disease Prevention and Health Promotion. Clinical Preventive Services. Healthy People 2020. http://www.healthypeople.gov/2020/leading-health-indicators/2020-lhi-topics/Clinical-Preventive-Services. Accessed on December 11, 2015.
7. Hirschman, J, Whitman, S, Ansell, D. The black:White disparity in breast cancer mortality: the example of Chicago. Cancer Causes Control. 2007, April;18(3):323-33.
8. United States Department of Health and Human Services, National Institutes of Health, National Cancer Institute. HPV and Cancer. http://www.cancer.gov/about-cancer/causes-prevention/risk/infectious-agents/hpv-fact-sheet. Accessed December 8, 2015.
9. Reagan-Steiner, S et al. National, Regional, State, and Selected Local Area Vaccination Coverage Among Adolescents Aged 13-17 Years – United States, 2014. MMWR. 2015;64(29):784-792.
10. Centers for Disease Control and Prevention. Asthma facts: CDC’s national asthma control program grantees. http://www.cdc.gov/asthma/pdfs/asthma_facts_program_grantees.pdf. Published July, 2013. Accessed January 4, 2016.
REFERENCES
79
REFERENCES
REDUCING THE BURDEN OF INFECTIOUS DISEASE
1. Centers for Disease Control and Prevention. Achievements in public health, 1900—1999: Control of Infectious Diseases. MMWR. 1999 Jul;48(20):621-9.
2. Chicago Department of Public Health. HIV/STI Surveillance Report, 2014. http://www.cityofchicago.org/content/dam/city/depts/cdph/HIV_STI/2014HIVSTISurveillanceReport.pdf. Published December 2014. Accessed December 28, 2015.
REDUCING VIOLENCE
1. The National Child Traumatic Stress Network. Effects of complex trauma. http://www.nctsnet.org/trauma-types/complex-trauma/effects-of-complex-trauma. Accessed October 5, 2015.
2. U.S. Department of Health and Human Services: Healthy People 2020. Injury and violence prevention. http://www.healthypeople.gov/2020/topics-objectives/topic/injury-and-violence-prevention. Accessed October 5, 2015.
3. Mayor’s Commission for a Safer Chicago. Strategic plan for 2015. http://www.cityofchicago.org/content/dam/city/depts/mayor/supp_info/Chi_SaferChicago_StrategicReport_final.pdf. Accessed October 5, 2015.
4. Crutchfield, R, Weeks, GA. The effects of mass incarceration on communities of color. Issues in Science and Technology. 2015;32(1). http://issues.org/32-1/the-effects-of-mass-incarceration-on-communities-of-color/
5. Drug Policy Alliance. The drug war, mass incarceration, and race. http://www.drugpolicy.org/resource/drug-war-mass-incarceration-and-race. Published June 12, 2015. Accessed January 5, 2016.
6. Beckett, K., Pfingst, L., Bowen, M. Drug use, drug possession arrests, and the question of race: Lessons from Seattle. Social Problems. 2005;52(3);419-441.
7. Illinois Department of Public Health, Division of Vital Records. Health statistics: Death certificate files, 2013. http://www.idph.state.il.us/health/statshome.htm. Accessed January 5, 2016.
8. Chicago Police Department, 2013
9. Illinois Department of Public Health, Division of Vital Records. Health statistics: Death certificate files, 2013. http://www.idph.state.il.us/health/statshome.htm. Accessed January 5, 2016.
10. Gorman-Smith, D., Tolan, P.H., Henry, D.B. & Schoeny, M. (2013). Developmental ecological measurement of neighborhood effects on youth. Centers for Disease Control and Prevention.
11. Centers for Disease Control and Prevention. Youth risk behavior surveillance system, 2013. http://www.cdc.gov/healthyyouth/data/yrbs/index.htm. Accessed January 5, 2016.
12. Prachand, N. Community health status assessment: Mini-compendium. Chicago Department of Public Health. http://www.cityofchicago.org/content/dam/city/depts/cdph/CDPH/CDPHComHlthStatMiniDataFINAL4172015.pdf. Published 2015. Accessed December 28, 2015.
Image CreditsPage 15. “Washington Block El” is copyright © 2006 by Seth Anderson under a Creative Commons Attribution-NonCommercial-ShareAlike 2.0 Generic license. https://www.flickr.com/photos/swanksalot/153849396/in/photolist-eAw4N-bALQLK-bBze8P-3mMrp-BKfozg-dKETpt-777R8s-ieeogX-g8EQ2j-4UwD4e-4UASfQ-4UwDav-hvxdYW-8ZJsdY-5Zkdha-otk61D-r6QWUM-p5K6c-h47K2h-9z9eyo-qtQbJB-8ZvsCu-6Efdd-98dKJ-72G9n1-6EfeP-9pzijU-qNJptu-g8FBcB-4USUYa-kdmAq2-bbmXiK-dVmJk5-5sKteG-4UAN21-5CqzoU-ebwJda-vBiVxb-6EFJ9t-pzrikp-ebreFL-fxd8k8-f5Cwaa-8Q427X-69BYdH-6eifBn-8eFA3-7ycwx-8eFtk-dv7oA6
Page 15. “Pullman Houses” is copyright © 2008 Pullman Houses by Ian Freimuth and made available under a Creative Commons Attribution-Noncommercial-Share Alike 4.0 International license. https://www.flickr.com/photos/ifmuth/2435781042/in/photolist-4Hf1QS-8MmdSJ-8MmdMs-8Miaf8-eQe2s8-6qHENt-eQe1Xz-eQqoWQ-eQdZGk-eQqpZb-4AUgYE-4x6ewv-78AxHx-eQe2Tt-78EqnN-4xapnE-py6Kv8-py8Pqw-py8NwN-byY1PC-5wYEM8-3oNY6C-psd4Uj-psb7bp-pJnHDV-oMNPk6-bwe3WD-78Azmt-bwg7at-rrPKpq-6w5LCm-mjvY4m-8vdhpZ-rXjiLw-mmyJTz-pGvK2W-ps7KBM-psahom-oMKRVo-pGw1Y5-prGd1r-oMjWw6-prGgcM-psaeLh-prD64t-pGvRtJ-pJ8s2K-pHTSN2-pJ8tt2-oMNR2n
Page 20. “the villa – Chicago bungalow” is copyright © by Samuel A. Love under a Creative Commons Attribution-NonCommercial-NoDerivs 2.0 Generic (CC BY-NC-ND 2.0) https://www.flickr.com/photos/samuelnbarnett/1241807302/in/photolist-2TJA3J-3WrcKG-6SXGuW-w6HTdZ-oSQZaH-w6Bzoo-wkULRG-Boy9jJ-gfuVGH-geMV1z-gfwnBj-gfwHna-gfxrVp-gfx2wz-geKVw1-geKMw2-gePNPp-geMwEo-7zvSCe-vLD6gB-eWRDu8-iEvYb8-vM1TAz-uPMsJZ-67Mkek-ghbmG8-4JXMEC-vJfJ86-vrh2Rj-vHT5Mk-vFzrt9-vLD4ot-w4adHu-w4a6Lw-uLSF1G-w4afwj-bZmYpL-eKZDps-voKKJs-voUhVP-whxDwS-wjc75C-whxaYq-whxbHS-gePqR6-iEvQhn-iEwm6m-iEuKn6-iEuK4k-iEvVxH
Page 27. “Graduation Ceremony 2009” is copyright © 2008 by NIU Businessunder a Creative Commons Attribution-NonCommercial-ShareAlike 2.0 Generic (CC BY-NC-NC 2.0) https://www.flickr.com/photos/niucollegeofbusiness/
Page 40. “Sad man in the streets of San Francisco” is copyright © 2011 by Javier Valazquez-Muriel under a Creative Commons Attribution-NonCommercial-ShareAlike 2.0 Generic (CC BY-NC-SA 2.0) https://www.flickr.com/photos/javi_velazquez/5682999488/in/photolist-9EbRKN-7o7pMt-7rhr6e-7yS1HC-8uyyu9-3c73g5-greJBG-7zVKL1-a7LLSp-C3ijo-3FZLF-6kYwbH-5a77TN-3SkjoV-tsYzn-68AvN4-6227z2-aqQi3-ujnquU-8H2Fzx-exPiM-5cLkx6-tjwwm-4BaXLs-nj2cZL-4rSoZ-eWwPuD-76D13q-dwU73n-6c2MgC-fAp8m5-qPKMC-iKovjX-72MTL8-7zpaj7-gPtnx-dUjb3Z-kyV475-5y526D-dURVmw-5MBC6N-nyzQpf-5VxG9q-fk9tQU-4D3B-btThXv-5ZQt2p-KLSCd-3bJzNP-GLjko
Page 40. “A little thinker” is copyright © 2006 by Andy Wood under a Creative Commons Attribution-NonCommercial-ShareAlike 2.0 Generic (CC BY-NC-SA 2.0) https://www.flickr.com/photos/wooandy/157308397/in/photolist-eUfiK-8D1gA3-E4wbi-tiaSS-MVVMw-dZTFWo-bhP1JR-bhj12R-4Q7RhM-5BPrfE-4LDNDz-bhP1sV-bhP1nV-bhP1ha-3KgPM-6qpTE8-5JC4QN-625mBR-aTaubt-4qDqG2-5ycwrT-iEJKRA-89zdXi-jNAUG-9ao7SD-bhP1vH-bhP1B2-bhP1uc-bhP1x4-bhP1Ev-bhP1yn-bhP1wt-bhP1zD-bhP1CR-bhP1F4-bhP1DR-bhP1s2-bhP1Fv-QXoDT-bhP1rc-bhP1na-bhP1hT-bhP1jM-bhP1cR-bhP1pe-bhP1ei-bhP1dx-bhP1kx-758tVS-bi74WR
Suggested CitationDircksen JC, Prachand NG, et al. Healthy Chicago 2.0: Partnering to Improve Health Equity. City of Chicago, March 2016.
CHICAGO DEPARTMENT OF PUBLIC HEALTH