Effects of Six-Month Interventions on White Matter Integrity of Aging Adults: Randomized Control...
93
Effects of Six-Month Interventions on White Matter Integrity of Aging Adults: Randomized Control Trial on Healthy Older Adults By Tammy L. Chen Thesis for the Degree of Bachelor of Science In Psychology College of Liberal Arts and Sciences University of Illinois Urbana-Champaign, Illinois 2015 Advisors:
Transcript of Effects of Six-Month Interventions on White Matter Integrity of Aging Adults: Randomized Control...

Effects of Six-Month Interventions on White Matter Integrity of
Aging Adults: Randomized Control Trial on Healthy Older Adults
By
Tammy L. Chen
Thesis for the
Degree of Bachelor of Science
In Psychology
College of Liberal Arts and Sciences
University of Illinois
Urbana-Champaign, Illinois
2015
Advisors:

Agnieszka Z. Burzynska, PhD & Arthur F. Kramer, PhD
1

Table of ContentsAbstract 2Introduction 3Methods 9Participants 9Participation Criteria and Eligibility 10Cardiorespiratory Fitness (CRF) 11
Interventions 11Magnetic Resonance Imaging (MRI) 13DTI preprocessing 14DTI ROI analysis 14
Statistical Analysis 15Ethic Statement 18
Results 19Between-Group Homogeneity Test of Pre Intervention FA Values
19General Decline of FA over Time across All Groups 19Dance Intervention had positive Effect on FA of the Fornix 19
Discussion 22Dance Is Related to Increase in Fornix’s WM Integrity 22FA Decrease Over Six Months across Multiple ROIs 25Corpus Callosum Displays Anterior-Posterior Gradient in FA Decline 27Nutrient Supplement Beta-Alanine Displayed No Significant Effect on FA 29
Directions for Future Studies 29
2
Neural Correlates and Statistical Methods 29TBSS 30Suggestions for Further Analysis 30
Acknowledgements 31Appendix 32References 45
3

Abstract
The normal aging process of humans involves decline in cognitive
functions, and one of the major related neural mechanisms is the
degeneration of cerebral white matter (WM). Past studies have
demonstrated beneficial effects of lifestyle factors such as
increased cardiorespiratory fitness, physical activity, cognitive
training, social engagement, education, and nutrition on
cognitive functioning and brain in aging. This study is a 6-month
randomized control trial on older (60–80 years) low-active adults
with four different lifestyle interventions: dance, walking,
walking + nutrition, and active control of stretching and toning.
The aim of this study is to 1) compare the effects of the four
interventions on WM integrity, 2) investigate the regional
specificity of these changes by analyzing integrity of 21 major
WM tracts, an analysis not performed before in such detail. Our
results show that 1) the dance intervention is related to
increase in fornix’s WM integrity, 2) multiple regions showed
decline in WM integrity over the study’s six-month span, and 3)
corpus callosum displayed anterior-posterior gradient in FA
decline. Our findings suggest that physical and cognitive
4

engagement through socially interactive exercises such as dancing
can help maintain healthy WM integrity in older age, particularly
in the limbic/memory system. These findings support the public
health recommendations that emphasize the importance of a
physically active and socially engaging lifestyle among aging
adults.
Keywords: diffusion tensor imaging; white matter; aging;
factional anisotropy; longitudinal study; exercise; cognition;
dance; neurodevelopment; fornix; corpus callosum; association
fibers
5

Introduction
The world population of the twenty-first century, owing to
medical progression and rising health awareness, is aging at a
historically unprecedented pace, according to reports from the
United Nation Population Division (2013). United Nation projects
that the world population of older adults over 60 is expected to
double within the next four decades, culminating to new depths of
the aging trend, with the population of elders over 60
outnumbering children by 2047 (2013). Growing numbers in older
population has amassed public health concerns in the aging
process within the recent years.
Advanced age is most notably associated with decline in
cognitive functioning and brain health, even in the absence of
dementia (Bartzokis et al., 2003; Madden & Bennett & Song, 2009;
Gunning‐Dixon et al., 2009; Bennett et al., 2010). Therefore,
improving cognitive functioning and brain health of older adults
have recently become a major interest in the field of cognitive
neuroscience of aging (Hertzog, Kramer, Wilson, & Lindenberger,
2008). Non-invasive neuroimaging studies in the last two decades
6
have demonstrated that loss of white matter (WM) integrity is one
of the key factors underlying poor performance in certain age-
related cognitive abilities, including executive skills, working
memory, processing speed, and episodic memory (Gunning-Dixon et
al, 2009; Madden et al., 2012). Hence, maintaining WM structural
connectivity may be crucial to preserving brain functionality and
high cognitive performance, both of which aid in leading an
independent life in old age.
WM is a fundamental component of brain that is composed of
mostly of glial cells and myelin-coated axons (Fields, 2008). It
is responsible for transmitting signals between anatomically
distinct cerebral regions and, as such, it is crucial to
information processing and communication between distinct
functional brain networks (Teipel et al, 2010; Wakana et al.,
2004). Age-related deterioration of WM’s structure is reflected
by changes in both its volume as well as microstructure
(Pfefferbaum, 2003; Olesen et al., 200; Salat et al., 2005;
Sullivan et al., 2001). Our study focuses on WM microstructure in
aging.
7
In the human brain, majority of axons are surrounded by a
multi-layer lipid-rich cellular membrane produced by glial cells
called myelin (Daniel, 2008). Myelin acts as an electrical
insulator and plays an important role in fostering the speed of
nerve signaling (Calabresi, 2011; Griggs, 2011). Myelin acts as
the key player in the saltatory conduction of electrical
signaling along the axons, in which the electric signal, also
known as action potential, is propagated along the axons from the
node of Ranviers, which are the low-resistance sections of axonal
membrane in-between the myelin warps (Hsu et al, 1975; Norton,
1984). Thus, myelinated axons have higher conducting velocity
(Saladin, 1998).
Structural integrity of myelin sheaths deteriorates during
normal aging, especially in regions requiring intense
myelination, such as the frontal lobes (Kochunov, 2007; Gunning‐
Dixon et al., 2009). Decline in WM integrity is also found to be
predominantly related to loss of myelinated axons (Meier-Ruge et
al., 1992; Pakkenberg and Gundersen, 1997; Marner et al., 2003;
Bartzokis, 2004), and myelin (Peters, 2002). In addition, it is
8
possible to study WM integrity in aging with non-invasive
Magnetic Resonance Imaging (MRI) methods (Bennet, 2010;
Burzynska, 2010). Diffusion tensor imaging (DTI) allows
inferences about WM microstructure in vivo by quantifying the
magnitude and directionality of diffusion of water within a
tissue (Beaulieu, 2002). DTI quantifies magnitude and
directionality of diffusion of water molecules within tissues
(Alexander, 2007; Huisman, 2010). The most common measure
extracted from DTI measurements is fractional anisotropy (FA). FA
describes the extent of directionality of water diffusion in a
voxel, thus making it a quantitative measure that refers to the
alignment of axons within fiber tracts as well as their
structural integrity (Basser, 1995). FA values ranges between 0 –
1, with higher FA values indicating more myelinated WM tract
(Kochunov, 2009). FA reflects WM health by describing with the
index how well the structure of myelin sheath helps inhibit the
diffusion of water molecules in directions other than the one
along the fiber tracts (Pierpaoli and Basser, 1996). More random
than unidirectional movements of water molecules will yield a
more isotropic diffusion, which produces a smaller FA closer to
9
zero. Given that FA is commonly referred to as an index of WM
health, a decline in FA often serves as a reliable indicator of
decline in microstructural integrity of WM (Beaulieu, 2002;
Kochunov, 2009). Age-related FA decline offers insight to axon
density, degree of myelination, and microstructural integrity of
WM (Burzynska et al., 2010; Bennett, 2010).
Various lifestyle factors can alleviate WM and cognitive
deterioration throughout the aging process. Specifically,
engaging in aerobic exercise, higher cardiorespiratory fitness
(CRF), cognitive training, social engagement, education,
expertise, fitness training, and nutrition can have beneficial
effects on brain structure and function and may prevent age-
related cognitive decline (Kramer et al., 1999; Hillman, Erickson
& Kramer, 2008; Voss et al, 2013; Hertzog et al, 2008). Hence,
this study aims to expand upon several recent studies on the
effects of CRF and physical activity on WM integrity of older
adults (Burzynska et al., 2014; Voss et al, 2013; Colcombe et
al., 2006).
Results from studies by Colcombe et al. and Voss et al.
10

provide grounds for the rationales behind this study (2006,
2013). Study by Colcombe et al. found that increase in CRF
resulting from a six-month walking exercises coincided with
increases in brain volumes of both grey and WM, particularly in
the anterior WM and regions connecting the anterior and posterior
parietal lobes (2006). Study by Voss et al. further expanded upon
the previous study by demonstrating in a study on older adults of
55 – 80 years old (n=70), that increase in CRF in the context of
a one-year walking intervention program is associated with
regional increase in WM integrity in the frontal and temporal
lobes and enhanced short term memory, particularly, improved
backward digit span performance (2013). However, they found no
overall interaction between the changes in WM integrity and the
interventions groups (no time × group interaction). Namely, there
was no difference between the walking and the active control
(stretching & toning) groups in their changes of WM integrity,
executive function, or short-term memory.
This study aims to investigate and build upon the findings
and shortcomings of these two studies by providing the following
11

two improvements. First, the previous studies investigated either
voxel-wise macrostructural or lobar properties of brain
integrity. Our study, in contrast, aims to take a more region-
specific approach by examining WM integrity in the 21 main WM
tracts. Second, the previous studies compared only walking
intervention aimed to increase CRF to the active stretching-
toning control group. Our study adds two additional intervention
groups: walking combined with nutritional supplement, and the
cognitively challenging exercise of dance.
The nutritional supplement beta-alanine used in this study
is an amino acid supplement that has been found to increase the
integrity and build-up of muscle fibers (Sale et al, 2010).
Research by Spradley et al. indicates that dietary interventions
with beta-alanine may postpone exercise-related fatigue by
improving CRF (2012). It is included in this study and combined
with the walking intervention to observe whether increased muscle
mass will enhance CRF, which in turn help increase brain
functions (Zoeller, 2007). This intervention is thus considered
as further enhancing the health benefits of walking through
12

nutritional supplement.
The design of the dancing condition provides an amalgamation
of improvements in CRF as well as specific cognitive functioning
tasks by integrating aerobic dance movement and the cognitive
challenges from learning sequential dance steps and routines. The
process of learning to dance for non-dancers heavily involves
incorporation of social cognition, executive cognitive functions
(ie. control processes such as planning, coordination,
inhibition), and different types of memory, particularly working
memory. The Ballroom dance that will be taught in this group
particularly achieves the goal of combining fitness training with
cognitive training, particularly memory and executive control.
Furthermore, past research has shown that dancing has been
associated with being protective against dementia in older adults
and reduced depression among older adults with depression
(Verghese et al., 2003; Haboush et al., 2006). Compared with
activities aimed to specifically increase CRF, such as walking,
dancing is not only more versatile, engaging, and enjoyable, but
also provides and fosters companionship and social bonding among
13

the elderly population of the community (Jonas, 1998; Palo-
Bengtsson, 1998). The social involvement, dedication,
recreational effects, and complexity of dance trainings motivate
participants to persist through the duration of the six-month
intervention, resulting in lower attrition rate.
The active control group with activities consisting of
stretching and toning provides a non-aerobic comparison against
the effects of other intervention groups on neurocognitive,
physical and psychosocial functions. Each of the aforementioned
intervention treatment lasted six months. We recruited 247
neurologically healthy, non-active older adults (60 to 80 years
of age) from the local community. Following completion of
baseline testing and meeting the eligibility criteria,
participants were randomly assigned to one of the four groups
with double-blind precautions. Out of 247 participants we
successfully collected 174 complete DTI datasets, namely, those
with satisfactory pre and post intervention quality according to
our DTI quality control guideline. In addition, to ensure
randomization between the groups, we acquired the CRF measures
14
and demographic information from the participants in the
screening process. In order to investigate the changes of WM
integrity over the time span of the intervention, we examined the
changes in diffusivity, measured in fractional anisotropy (FA).
The design of this study aims to test the three main
hypotheses: 1) participation in a six-month intervention that
aims to increase CRF (walking and walking + nutrition) should
result in beneficial effects in the WM, such as increase in FA or
lack of a typical age-related decline, as compared to the control
condition; 2) dance intervention should result in a similar
effects on WM integrity as aerobic exercise through walking, but
its additional motor learning and socializing aspects could aid
in producing stronger improvements in WM integrity than walking
alone, or these affects could relate to different WM regions than
walking interventions; 3) WM integrity would likely deteriorates
across the duration of the study’s six-month intervention in the
control group, 4) Combining nutritional supplement with walking
intervention to stimulate lean muscle mass growth could enhance
the effects of walking on CRF, resulting in more pronounced
15
effects on WM integrity than participating in walking alone.
These effects are of great interest both for what they
impart about the nature of cognitive and brain aging and also for
their implications in public health and active lifestyle of the
aging population.
16
Methods
Participants
Sample and Recruitment
The sample of this study was drawn and recruited from the
population of healthy, sedentary older adults (N=1119) dwelling
in the Champaign county area through a variety of advertising
methods. Older, sedentary adults were recruited to participate in
a series of neuroimaging, psychosocial and cardiorespiratory
testing, followed by a six-month program of physical activity. Of
the 1119 participant recruited, 247 met inclusion criteria and
agreed to enroll in the study. Stratified sampling strategies has
been employed to ensure equal numbers of males and females and
five year age (from 60 to 75) cohorts in each of the intervention
groups. Minority participants were recruited proportionately to
the Champaign county census figures (11.4% black, 4% Hispanic, 8%
Asian). Further details on recruitment and attrition rate can be
found in Figure 1.
17

The 247 participants that met participation criteria are
assigned to one of following four conditions: stretching and
toning control, dance, walking, and walking + nutrition. 213
participants completed the intervention (58 in the control group,
59 in dance group, 48 in walking group, and 48 in walking +
nutrient group). After the DTI images were processed for quality
control, we end up with the final sample of 174 participants
(120 females, 54 males; 43 in control, 49 in dance, 40 in
walking, and 42 in walking + nutrition) with the average age 66±4
years , average level of education 3.94 (out of a 1-6 scale), the
average body mass index (BMI) M=30.5, average VO2 max M=20.2
mL/kg/min, and average resting heart rate M=73.09 (refer to Table
1.1 – 1.5 for further details in sample descriptions). The sample
contains more females (120) because fewer males (54) from the
aging population met the eligibility criteria or demonstrated
willingness to participate in the study.
Participation Criteria and Eligibility
All participants were required to satisfy a number of entry
criteria before any testing begins. Eligible participants met the
18

following criteria: (1) were between the ages of 60 and 80 years
old, (2) were free from psychiatric and neurological illness and
had no history of stroke or transient ischemic attack, (3) scored
<10 on the geriatric depression scale (GDS-15), (4) scored ≥75%
right-handedness on the Edinburgh Handedness Questionnaire, (5)
demonstrated normal or corrected-to-normal vision of at least
20/40 and no color blindness, (6) cleared for suitability in the
MRI environment; that is, no metallic implants that could
interfere with the magnetic field or cause injury, no
claustrophobia, and no history of head trauma.
All participants met the study’s sample criteria for low-fit
and low-active, albeit capable of performing exercise (i.e. no
physical disability that prohibits mobility) given that none of
them reported participation in regular physical activity (maximum
of two moderate bouts per week) within the past six months.
Medication use was also screened for, in particular
pharmacological therapies for cardiovascular disease (ie. beta
blockers, diuretics, etc.,) and psychological/emotional problems
(ie. neuroleptic, antidepressant, and anxiolytic agents) which
can respectively influence cardiorespiratory responses and 19

cognitive function. This information was used to minimize
differences among conditions by using a modification of the
baseline-adaptive randomization scheme of Begg & Iglewicz
(1980). Finally, standard procedures were enforced to secure
medical clearance from participants’ personal physician for
participation in all testing and interventions and to screen for
the presence of any cognitive deficits which would preclude
participation in cognitive tasks.
Cardiorespiratory Fitness (CRF)
CRF was assessed on a motor-driven treadmill by employing a
modified Balke protocol (graded exercise test). The protocol
involves walking at a self-selected pace with incremental grades
of 2-3% every 2 minutes. Measurements of oxygen uptake, heart
rate and blood pressure were constantly monitored. Oxygen uptake
(VO2) were measured from expired air samples taken at 30-second
intervals until a peak VO2 (the highest VO2) is attained; test
termination was determined by symptom limitation, volitional
exhaustion, and/or attainment of VO2 peak as per ACSM guidelines.
Interventions
20

Following completion of the aforementioned baseline testing
and meeting the eligibility criteria, participants participated
in a six-month intervention program. All interventions met three
times per week. All four conditions were controlled and monitored
for the same level of social interaction. Each condition is
described in the following.
The walking condition is a regular exercise program of brisk
walking. Frequent assessment of heart rate (both by palpation and
Polar Heart Rate Monitors) and rating of perceived exertion
ensured that the exercise intensities were performed at the
prescribed level. Exercise logs were completed after each
exercise session noting frequency, intensity and enjoyment levels
associated with that session.
Walking with regular nutritional supplement condition is
comprised of brisk walking and regular administration of
supplement. The supplement was similar to Ensure®, developed for
this project by Abbott Nutrition. The supplement was delivered in
liquid, milk-based carrier (similar to protein shakes) and the
active ingredient was beta-alanine, which promotes lean muscle
21

growth. The aim of this intervention was to test whether
promoting muscle mass growth would enhance CRF, and thus further
enhance the beneficial effects of walking on the brain (Zoeller,
2007). All participants in this group were requested to ingest
the provided supplement on a daily basis and complete an
evaluation of the supplement at the end of the intervention.
The stretching and toning control condition consisted of an
organized curriculum of stretching, toning, and balance activity
for the whole body and is specially designed for individuals 60
years of age and older. This group met on the same basis as the
walking exercise group and was led by an experienced exercise
leader, and therefore received the same amount of attention as
other intervention groups. Participants used resistance bands,
activity balls, balance disks, and exercise mats to engage in a
variety of non-cardiorespiratory activities. Each stretch was
constant, controlled and smooth, gradual and steady progressions
that were held to the point of slight tension but not pain. Each
stretch was held for approximately 20-30 seconds. Stretches and
simple strength exercises for all large muscle groups and
22

functional balancing exercises were also included in the
intervention program. Each stretching and toning session lasted
for approximately 30-45 minutes and met 3 times per week. Each
session were preceded and followed by 10-15 minutes of warm-up
and cool-down exercises. Activities were made incrementally more
difficult over the first three months and then maintained for the
final 3 months. This program was designed not to result in
significant increases in CRF (Colcombe et al., 2004).
The dance condition involved learning a combination of dance
varieties including ballroom, Latin square-dancing, polka, line-
dancing, swing, folk, etc., including both partnered and non-
partnered choreography. Since the participants were non-active at
the beginning of the program, the curriculum started with easier
choreographed dance combinations and advanced to more challenging
combinations over the course of the six month program. Given that
the recruited participants had an uneven gender representation,
all participants were required to learn the choreography of both
gender roles in order to maximize the cognitive challenge
involved during the partnered dancing.
23

Magnetic Resonance Imaging (MRI)
MRI sessions were scheduled within two to three weeks before
and after the intervention. The MRI appointments were ensured to
not occur on the same day in which the participants have
exercised.
DTI images to probe miscrostructural properties of WM
integrity were collected from all included participants of this
study (Basser et al., 1994; Pierpaoli & Basser, 1996; Pfefferbaum
et al, 2000) on a 3T Siemens Trio Tim system with 45 mT/m
gradients and 200 T/m/sec slew rates (Siemens, Erlangen,
Germany). All images were obtained parallel to the anterior-
posterior commissure plane with no inter-slice gap. DTI images
were acquired with a twice-refocused spin echo single-shot Echo
Planar Imaging sequence (Reese et al, 2003) to minimize Eddy
current-induced image distortions. The protocol consisted of a
set of 30 non-collinear diffusion-weighted acquisitions with b-
value =1000 s/mm2 and two T2-weighted b-value =0
s/mm2 acquisitions, repeated two times (TR/TE =5500/98 ms,
128×128 matrix, 1.7×1.7 mm2 in-plane resolution, FA =90, GRAPPA
24
acceleration factor 2, and bandwidth of 1698 Hz/Px, comprising 40
3-mm-thick slices).
DTI preprocessing
Visual checks were performed on every volume of the raw data
of every participant (for general exclusion criteria of brain
volumes, refer to Table 5). In case a DTI scan contained more
than two volumes with artifacts, these volumes as well as the
corresponding b-vectors and b-values were removed before
processing. If artifacts were found in more than two volumes,
such datasets were excluded from analyses, resulting in 174 good
quality pre-post datasets.
DTI data were processed using the FSL Diffusion Toolbox
v.3.0 in a standard multistep procedure, including: a) motion and
Eddy current correction of the images and corresponding b-
vectors, b) removal of the skull and non-brain tissue using the
Brain Extraction Tool (Smith, 2002), and c) voxel-by-voxel
calculation of the diffusion tensors. Next, FA maps were computed
using DTIFit within the FDT. All motion and Eddy current outputs,
25
as well as FA images were visually inspected and controlled for
quality.
DTI ROI analysis
Among all other DTI indices of WM integrity, only FA is
considered for this study. We used Tract-Based Spatial Statistics
(TBSS, a toolbox within FSL v5.0.1), to create a representation
of main WM tracts common to all subjects (also commonly known as
the WM “skeleton”) (Tract-Based Spatial Statistics, Smith et al.,
2004, 2006, 2007). This included: (1) nonlinear alignment of each
participant's FA volume to the 1×1×1 mm3 standard Montreal
Neurological Institute (MNI152) space via the FMRIB58_FA template
using the FMRIB's Nonlinear Registration Tool (FNIRT; Rueckert,
1999), (2) calculation of the mean of all aligned FA images, (3)
creation of the WM “skeleton” by perpendicular non-maximum-
suppression of the mean FA image and setting the FA threshold to
0.25, and (4) perpendicular projection of the highest FA value
(local center of the tract) onto the skeleton, separately for
each subject.
Next, we selected regions of interest (ROIs) on the TBSS
26
skeleton with the use of the DTI WM atlas to probe FA in the core
parts of the selected tracts (Burzynska et al., 2013). The
following entails the included 21 brain regions and their
respective acronyms : Superior corona radiata (SCR), superior
longitudinal fasciculus (SLF), anterior and posterior limb of the
internal capsule (ALIC and PLIC), external capsule (EC), fornix
(FX), 5 regions of the corpus callosum [reg1, 2, 3, 4, 5 (Hofer
and Frahm, 2006)], forceps major (fMAJ), forceps minor (fMIN),
anterior cingulum (ACC), and posterior cingulum (PCC), WM
containing occipital portion of inferior longitudinal fasciculi
and inferior frontal-occipital fasciculi (IFOF_ILF_occ), WM of
gyrus rectus (gyrRect), parahippocampal WM (HIPP_st), ventral
prefrontal part of uncinated (UNC_pfc),WM containing uncinate and
inferior frontal-occipital fasciculi (IFOF_UNC), and WM of the
temporal pole related to inferior longitudinal fasciculus
(ILF_temp).
Statistical Analysis
One-way ANOVA with Levene’s test of homogeneity was
conducted on the five variables from participants’ demography
27
(age, education, BMI, VO2 man in mL/kg/min, and resting heart
rate) and pre intervention FA values of the 21 ROIs to ensure
that the participants were randomly assigned into groups also
with respect to these variables. The verification of between-
group homogeneity of variance assumption allows for further
comparisons of changes in FA values between different
intervention groups with minimum interference from the
distribution differences between the groups before intervention
(Winer et al., 1971; Tabachnick & Fidell, 2001).
In order to quantify the change in FA during the six-month
intervention period, we calculated percent change (%Δ) for the FA
of all 21 ROIs. The calculation of FA %Δ is based on the
following method devised by Voss et al. in their study on aerobic
exercise (2013). FA %Δ for each ROI was calculated by subtracting
the pre intervention FA value from the post intervention FA
value, and dividing the result by pre-intervention value [i.e.
(FApost – FApre)/FApre] (Voss et al., 2013). Next, we carried out
one-way ANOVA on each ROI to compare the differences in FA%Δ
between intervention groups, with the four interventions as the
28

between-subjects factor.
Repeated measures ANOVA was then performed on raw FA values
from pre and post intervention for each ROI separately. In this
analysis, the within-person factor was the two levels of time
points (pre and post intervention), while the between-person
factor was the four intervention groups. This analysis aimed to
verify for each ROI, 1) whether there is an effect of time (i.e.,
change in FA over the period of intervention) and 2) whether
there is an interaction between time and group (i.e., difference
in FA change between the intervention groups).
The ROI(s) that exhibited significant FA variation from
interventions is further processed in two types of post hoc
analyses to 1) determine which intervention(s) exerts the
strongest effect on the FA change of the ROI(s) and 2) assess the
strength of the observed relationship. First, independent t-tests
were conducted to compare the between-group difference of FA%Δ
for each group pair. A total of six possible pairwise
combinations can be generated from the four intervention groups
of this study, based on the mathematical calculation of
29

combinations (4C2 = 6), which include dance vs. control, walking
vs. control, walking + nutrition vs. control, dance vs. walking,
dance vs. walking + nutrition, and walking vs. walking +
nutrition group respectively (Allen, 2014). If the t-test results
were significant, effect size would be further calculated to
measure the strength of the observed relationships. Effect size
helps interpret the magnitude of the effect observed from the
significance level and assess whether the observed effect is
strong enough to be statistically meaningful (Kotrlik & Williams,
2003). In the context of this study, it interprets how much of FA
variability can be accounted by the interventions. Strength of
effect size for the t –tests results were assessed with Cohen’s
guidelines for Cohen’s d (small = 0.2; medium = 0.5; large = 0.8)
(1988). Second, another pairwise comparison of the intervention
groups was performed with Tukey’s HSD (honest significant
difference) as a post hoc follow-up to one-way ANOVA of FA %Δ.
Tukey’s HSD test was conducted to 1) confirm results from one-way
ANOVA on the ROI(s) that display significant between-group
difference in FA %Δ and 2) distinguish which intervention
group(s) differ significantly in FA %Δ from others (Field, 2009).
30

Finally, in order to determine the nature of influence
exerted by the intervention(s) on the FA of the ROI(s) (i.e.,
improved or deteriorated), we referred to the results of the
repeated measures ANOVA on pre and post FA values to examine the
graph(s) of the ROI(s) demonstrating significant FA change. We
also referred to the graph results of one-way ANOVA on FA %Δ of
21 ROIs to confirm the trend by looking at whether FA%Δ of the
intervention(s) within the ROI(s) displayed a positive or
negative trend.
All the aforementioned statistical tests and analyses were
performed with the statistical software tool SPSS Statistics
(v.22, SPSS Inc., Chicago, IL, USA). Refer to Table 6 for
flowchart delineating the detailed process of statistical
analysis.
31

Ethic Statement
A University of Illinois Institutional Review Board approved
the study, and written informed consent was obtained from all
participants and the study was performed in accordance with the
1964 Declaration of Helsinki. Participants received financial
reimbursement.
32

Results
Between-Group Homogeneity Test of Pre Intervention FA Values
The outcome of both Levene’s test of variance homogeneity
and one-way ANOVA conducted on the five variables from demography
(age, education, BMI, VO2 man in mL/kg/min, and resting heart
rate) displayed no significant (p<0.05) between-group differences
for all demographic variables. However, Levene’s test on pre
intervention FA values did show that two ROIs, Hipp_st (p=0.030)
and Reg3cc (p=0.031), displayed significant between-group
difference in variances (p<0.05) before the interventions were
administered. Nevertheless, results from one-way ANOVA on pre
intervention FA values show no significant between-group
differences on all 21 ROIs. Given that only two out of the 21
ROIs violated the homogeneity of variance assumption for the pre
intervention FA and none displayed significant one-way ANOVA
result, concerns on the two ROIs with significant Levene’s test
result were disregarded and the 21 ROIs were thus further
processed for pre vs. post intervention and between-group
comparisons.
General Decline of FA over Time across All Groups
33
Time had a significant effect (p<0.05) on the FA values of
multiple ROIs, regardless of group. Results from repeated
measures ANOVA showed a significant trend of FA decline over time
in ten out of the 21 ROIs (refer to Table 2). These ten ROIs
displayed declining trend in FA over time, but their within-
subject FA decline over time showed no significant time × group
interaction.
Dance Intervention had positive Effect on FA of the Fornix
Of all 21 ROIs, fornix (FX) was the only brain region that
displayed time × group interaction. This interaction of fornix is
manifested in both the one-way ANOVA on FA %Δ of 21 ROIs and the
repeated measures ANOVA on pre and post intervention raw FA
values.
Independent t-tests comparing the between-group difference
of FA%Δ for each group pair shows that none of the intervention
group pairs differ significantly in their FA%Δ. Hence, effect
size was not calculated for any of the pairs. Note that FA%Δs of
the two walking intervention groups also do not differ
significantly from each other.
34

The result from Tukey’s HSD test, conducted as a post hoc
for one-way ANOVA on FA %Δ of all 21 ROIs featured fornix as the
only ROI displaying significant between-group difference in FA
%Δ, and singled out dance as the group that differs significantly
from other groups in FA %Δ. Tukey’s pairwise comparisons of the
four interventions in Table 3a show that only the pairs involving
the dance group demonstrated significant difference. Homogenous
Subsets from Tukey’s test result further reify this observation
by providing groupings for the mean of FA %Δ (refer to column 1
and 2 in Table 3b). Means of active control, walking, and walking
+ nutrition groups are all within the same subset (column 1),
indicating that they are not significantly different from each
other, and hence the 0.894 significance value at the bottom of
column 1. As shown in Table 3b, dance is the only group with its
mean of FA %Δ (0.0233) grouped in a different subset (column 2).
Table 3b on homogenous subsets summarizes Table 3a on Tukey’s
pairwise comparisons between intervention groups and isolates
dance as the only intervention group that exerted significant
influence on fornix’s FA.
35

The two graphs generated from repeated measures ANOVA
(Figure 2) and one-way ANOVA (Figure 3) tests reveal that FA in
the dance group increased over the six months. The graph of
fornix FA generated from repeated measures ANOVA on pre and post
FA values shows that dance is the only intervention exhibiting an
increasing trend over time, while all other groups decreased in
FA means (Figure 2). The graph generated by one-way ANOVA on FA
%Δ also shows that of all the ROIs, fornix is the only ROI that
manifested significant between-group variation in FA %Δ, and of
all the interventions within fornix, only dance displayed
positive FA %Δ (Figure 3).
36

Discussion
Dance Is Related to Increase in Fornix’s WM Integrity
Fornix was the only region that displayed a significant time
× group effect. FA values in the fornix increased after the six–
month dance intervention, which is a trend that was neither
observed in the active control nor the walking groups. This
unique finding on fornix encourages a closer look at its
structure, functions, and its possible role in dance learning,
and age-related cognitive decline.
The structure of fornix is comprised of a bundle of C-shaped
fibers of the limbic system that is wrapped closely around the
hippocampus. It projects from the posterior hippocampus and
reaches to the septal area and hypothalamus. The major role of
fornix is to carry incoming (afferent) and exiting (efferent)
information in its bundle fibers to and from the hippocampi and
it also serves as the major efferent pathway from hippocampus to
various other regions such as anterior thalamic nuclei,
mammillary bodies, striata, and prefrontal cortices. It is,
therefore, a part of the limbic system, which plays a major role
37
in the behavioral processes of learning, memory, emotion, and
socializing (King et al., 2013). For instance, fornix holds a
crucial role in assisting the hippocampus to retain working
memory and maintain episodic memory, based on previous animal
studies (Packard et al, 1989). Studies on brain diseases that
involve impairments or underdevelopments of fornix also found
significant deterioration in cognitive performances, especially
episodic memory (Douet & Chang, 2015).
These cognitive processes that fornix is responsible for are
essential components in every aspect of learning to dance. Thus,
FA changes in fornix in the dancing group can be related to its
role in maintaining the executive cognitive functions and
episodic memories, both of which may play a role in learning new
dance moves and choreographies (Nestor, 2007; Douet & Chang,
2015). The incremental difficulty of choreography serves to
actively engage the learning and memory processes, which are
mainly accounted by the limbic system. In addition to the memory
load, the dancing program exerts the most intensive training upon
the limbic system out of all four treatment groups by heavily
engaging the processes of learning, memory, emotion, and 38

socializing. The dance varieties such as ballroom, Latin square
dancing, polka, line dancing, swing, and folk are all aimed at
engaging partners and directed at social facilitations, not to
mention that all these social stimulations and physical
challenges will definitely elicit certain level of emotional
engagements among older adults. Since fornix is the major bundle
of fibers responsible for communication within and beyond the
limbic network, the significant increase of its WM integrity
after dance intervention suggest that the activities in the
dancing program helped fostering the communication within limbic
network, possibly through mechanisms of myelination (Calabresi,
2011; Griggs, 2011).
Fornix is a particularly pertinent and appealing region to
the study of aging processes in the brain due to its suggested
plasticity in lifelong neurodevelopment by several literatures
(Berger, 1978; Hofstetter, 2013; Douet & Chang, 2015). Of all WM
tracts in the brain, fornix is one of the earliest tracts to
mature. The maturation of fornix peaks around late adolescence.
After its maturation peak, fornix then declines in its integrity
throughout the later adulthood (Douet & Chang, 2015). Douet & 39

Chang suggested in their meta-analysis that the typical age-
related WM decline in fornix is perhaps more aptly described by
the process of “pruning” rather than neuro-degeneration (2015).
Therefore, the increases in FA through cognitively enhanced
exercise interventions like dancing, as demonstrated in the
results of this study, supports possibility of persistence of
fornix’s plasticity into the older age. However, it is important
to note that the extent to which the results of this study on
fornix is valid should be taken with caution, given that only the
body of fornix, instead of the entire portion, was covered in
the analysis.
The possibility of improving fornix microstructure could
have a great impact on improving cognitive abilities in aging.
Namely, recent studies on fornix in patients with mild cognitive
impairments and dementia demonstrated that changes in the
integrity of fornix serves as a reliable neural correlate to
predict hippocampal functions and lifelong memory capabilities
(Aggleton et al., 2000; Rudebeck et al., 2009; Fletcher et al.,
2013; Pelletier et al., 2013). Building upon this result,
40

Fletcher et al. argues that deterioration in fornix’s integrity
may precede hippocampal dysfunction, and serves as a better
predictor for the onset of cognitive impairment than hippocampal
atrophy (2013). This finding could also be extended to the
decline of cognitive functions generally observed in aging
adults. Our study further adds to this finding by demonstrating
the selective malleability of WM integrity in fornix. This
malleability was only induced by the dance intervention, which
requires the concurrent coordination of memory and limbic systems
with other higher cognitive networks through exercise.
In confirmation with the results in the study by Voss et
al., the results in this study also did not find significant time
× group effect in FA for the two walking groups (2013). However,
we did not conduct any further correlations of FA with CRF, as in
the study by Voss et al., which will be further tested in future
investigations. The lack of time × group interaction among the
walking groups of this study in particular shows that the
supplementary nutrition beta-alanine did not manifest a
significant between-group difference on any of the ROIs, even
41

when the group is compared pairwise with the other walking group.
The lack of effect displayed by beta-alanine might be due to the
variation of health conditions and physiques among the
participants of this group, or that its effect simply could not
be manifested within the six-month time frame of the
intervention. Further testing is required in order to verify the
factors behind beta-alanine’s lack of effect.
In addition, the significant time × group effect of fornix
in this study corroborates and extends upon the previous study by
Voss et al. on the relationship between lifestyle changes and WM
integrity in older adults (2013). First, Voss et al. analyzed WM
by broader ROIs of lobes, while the ROI analysis of this study is
more regional and specific. Fornix was not considered as an
individual structure in the analysis of the study by Voss et al.,
which accounts for the lack of this finding in their study.
Second, this study incorporated the dance intervention, which was
not included their study. As explained previously, the process of
learning to dance involves a specific set of tasks that requires
the memory and limbic systems, which may help explain why the
42

observed time × group effect is only manifested in the dance
group, but not for any of the walking groups in both this study
and the study by Voss et al.
FA Decrease Over Six Months across Multiple ROIs
Multiple ROIs showed decrease in FA during the six months,
regardless of the type of intervention. This included the
following ten ROIs: anterior cingulum, anterior limb of the
internal capsule, external capsule, parahippocampal WM,
occipital portion of inferior longitudinal fasciculi and
inferior frontal-occipital fasciculi, uncinate and inferior
frontal-occipital fasciculi, posterior limb of the internal
capsule, genu of the corpus callosum, superior corona radiata,
and ventral prefrontal part of uncinate fasciculi. These ROIs
did not display statistically significant interaction between
time and intervention group, indicating that their FA declined
over the span of six months in the same way for all intervention
groups. In other words, the WM tracts of these ROIs underwent
age-related decline in microstructural integrity over six
43
months, regardless of the lifestyle changes induced by
interventions.
Our finding of FA decline over several months in healthy older
adults is in line with numerous publications on decrease in WM
integrity of the aging adults (Guttman, 1998; Christiansen et al,
1994; Pfefferbaum, 2000, 2003; Kennedy, 2003; Kochunov, 2007;
Marks, 2007). However, the study designs of these findings are
usually cross-sectional instead of longitudinal, indicating that
evidences on loss of WM over time has been usually derived from
comparisons between WM integrity of younger adults and that of
the older adults (Pfefferbaum, 2003; Madden et al, 2004; Kennedy
& Raz, 2009). While cross-sectional comparisons allow
investigators to draw age-related associations on the WM
deterioration of certain brain regions, the pace at which WM
integrity declines over time can only be confirmed by
longitudinal studies. Given that this study has the longitudinal
design of six-month interventions between the pre and post-
treatment MRI assessments, the result of multiple ROIs displaying
statistically significant change in FA over the relatively short
time span implies that the WM integrity of these ROIs were 44

declining at a fairly rapid pace among the 60~79 years old sample
of this study.
The majority of the ten ROIs (except for internal capsule,
corpus callosum, and superior corona radiata) where we observed
significant FA decline over time are classified as association
fibers (Table 4). The association fibers consist of two types:
short association fibers connecting the adjacent gyri and long
association fibers connecting more distant grey matter regions
(Mori et al., 2002; Wiegell et al., 2000). Association fibers
continue to develop their myelin sheaths well into the middle
adulthood and are known to be sensitive to age-related changes
that involve demyelination and axonal loss. These two age-related
cognitive impairments reduce network connectivity (Bartzokis et
al, 2003; Kochunov et al, 2006). Thus, the general trend that
describes the relationship between age and association fibers’
myelination pattern follows a quadratic trajectory resembling an
inverted “U” (Yakovlev and Lecours, 1967; Miller et al., 1980;
Benes et al., 1994; Bartzokis et al., 2001, 2003, 2004; Ge et
al., 2002; Sowell et al., 2003; Bartzokis, 2004a,b; Allen et al.,
2005; Jelsing et al., 2005; Walhovd et al., 2005). Given that the45

age range of our data sample is between 60 – 79 years, these
participants were well into their descending phase of the
inverted-U trajectory of changes in myelin when participating in
our study. Previous longitudinal study by Voss et al. (2012) on
improving WM integrity and short-term memory of older adults
through CRF interventions also demonstrated that the WM integrity
in the 55 – 80 years old sample in their study can be improved by
acquiring increased CRF from intervention. This result from their
study implies that the 55 – 80 years old sample, with a similar
age range to the sample of this study, still demonstrated certain
level of WM plasticity for improvement even though her
participants are already in the age of descending phase of
myelination according to inverted-U trajectory. Overall, our
study provides an important evidence of longitudinal change in FA
over 6 months, which affected mostly association fibers. Future
analyses will investigate whether 1) the slope of the decline in
FA was uniform in the seventh and eighth decade of life or
accelerated the most dramatically in the oldest participants, 2)
whether the initial CRF levels predicted the amount of FA decline
over the 6 months.
46

Corpus Callosum Displays Anterior-Posterior Gradient in FA
Decline
Among the five segments of the corpus callosum, FA of the
most anterior segment (the genu, Reg1cc in Figure 4) is the only
segment among the five that displayed significant decrease in FA
(Table 2.3).
This result is in line with several past studies. These
studies reported that, in comparison with posterior regions, age-
related FA deteriorations are more prominent in the anterior
regions (O’Sullivan et al, 2001), especially in the ventromedial
prefrontal and deep frontal lobes (Salat et al, 2005). Further
investigations on this topic also corroborated the overall
pattern of anterior –posterior gradient in age-related FA decline
across the brain (Pfefferbaum & Sullivan, 2003; Salat et al.,
2005; Grieve et al., 2007). Importantly, past studies focusing on
age-related decline of corpus callosum predominantly observed
more significant age-related annual FA decline in the genu,
negative association between age and FA in genu, or the largest
FA difference between younger and older adults (Frederiksen,
2013; Hou & Pakkenberg, 2012; Salat et al., 2004, Burzynska et 47

al., 2011; Kochunov et al., 2007; Sullivan et al., 2001). Our
result, which shows that only genu out of all corpus callosum
regions have significant FA decline, supports and builds on
previous studies by proposing the “anterior-posterior” gradient
of age-related WM deterioration in the corpus callsoum (Head et
al..., 2004; Salat et al..., 2005; Sullivan et al..., 2001).
The decline in microstructural integrity of the genu can be
attributed to its fibers’ susceptibility to the build-up of
metabolic damage. The factors contributing to this vulnerability
are: oligodendrocyte-to-axon ratio (Lamantia & Rakic, 1990; Wood
P & Bunger RP, 1984), reduced rate of myelin turnover and repair
(Hof, Cox, & Morrison, 1990; Wakana, Jiang, Nagae-Poetscher, van
Zijl, & Mori, 2004), and high percentage of unmyelinated or
thinly myelinated axons (Aboitiz, Scheibel, Fisher, & Zaidel,
1992; Aboitiz, 1992).
It is also interesting to note that there was no time ×
group interaction in the genu, which contradicts with past
research findings. It has been shown that continuous cognitive
and physical trainings can help improve FA of anterior corpus
callosum (Burzynska et al., submitted, Lovden et al., 2010). 48
Lovden et al. have demonstrated in their study that 100 days of
multi-facet cognitive trainings helped increase the FA of
anterior corpus callosum (2010). Although not a longitudinal
study, a recent study showed an exceptionally high FA in the genu
of a female, nonagenarian, professional track-and-field athlete
Olga Kotelko (Burzynska et al., submitted), possibly related to
her physically and cognitively active lifestyle after retirement.
Although we observed the decline in FA in the genu but not in the
more posterior sections, this finding has still to be directly
tested. However, it should be noted that this finding cannot be
confirmed in this study, as we did not conduct direct statistical
testing to determine whether the anterior corpus callosum
displayed significantly greater decline than posterior section,
nor did we investigate how this gradient effect in corpus
callosum differs among the intervention groups, or how it may
differ between the youngest and oldest participants in this
study.
Nutrient Supplement Beta-Alanine Displayed No Significant Effect
on FA
49

Pairwise comparisons of the interventions with t-tests show
that FA%Δs of the two walking intervention groups (walking vs.
walking + nutrient) do not differ significantly from each other.
This indicates that the nutrient supplement beta-alanine did not
produce the projected enhancing effects on FA of the older adults
in this study.
Directions for Future Studies
Neural Correlates and Statistical Methods
Due to the time constraints of this project, FA was the only
DTI measure we managed to analyze. It is suggested that other
parameters such as MD, AD, RD can provide a more dimensional
approach to WM integrity and its change over time.
Given the convoluted factorial structure, multi-level, and
multivariable design of this study, we suggest using more
sophisticated statistical methods for data analysis (ie.
generalized linear mixed model, GLMM) and post hoc assessments
(Scheffe’s, Pillai’s, or Least Significant Difference test) in
the future investigations.
50
TBSS
It is important to note that the TBSS analysis used here
inherently focuses on normal appearing WM and the center of the
tracts, as the highest FA values perpendicular to the tract are
being projected to the WM skeleton for further analysis (Tract-
Based Spatial Statistics, Smith et al., 2004, 2006, 2007). This
means that there may be some bias for excluding voxels affected
by white matter hyperintensities (WMH) from FA analyses and that
the parts of the tract that are not in its center are not
included in the analyses, but may be most susceptible to change
as a result of intervention. In the future investigations we will
consider more voxel-wise approaches, not restricted to the WM
skeleton, such as https://www.nitrc.org/projects/dtitk. So far,
however, we consider TBSS approach most suitable for the current
study as it maximizes the independence of FA in addition to
circumventing the inter-subject anatomy (NITRC, v2.1.23-1).
Suggestions for Further Analysis
The current data at hand for this study is not enough to
determine whether the effects on FA are meaningful indicators of
51

cognitive functions. In the future analyses, we plan on relating
our DTI results to the participants’ performance on mini–mental
state examination (MMSE) and a battery of cognitive tasks
(including episodic memory, working memory, processing speed,
vocabulary knowledge, and fluid intelligence), both of which have
been collected from the participants of this study. Finally, the
lack of effect in the two walking groups can be further
investigated by assessing individual differences in CRF and level
of physical activity, since fitness gains vary between
individuals.
Acknowledgements
This work was supported by the National Institute on Aging
(NIA) grant (R37-AG025667) and a grant from Abbott Nutrition
through the Center of Nutrition, Learning and Memory at the
University of Illinois, granted to Arthur F Kramer and Edward
McAuley. I thank Holly Tracy and Nancy Dodge for MRI data
collection, the Department of Kinesiology and Community Health
for CRF data collection, and Anya Knecht and Susan H. Herrel for
project coordination. I express special thanks to Vineet Agarwal
52

for providing the python script that removes the unwanted images
and the corresponding bvec and bvals, Agnieszka Z. Burzynska and
Anamarta Lamoutte for conducting visual checks on DTI images,
Katie Kramer for guidance on draft formatting, and Agnieszka Z.
Burzynska and Arthur F. Kramer for guidance on draft
proofreading.
53

Appendix
Figure 1. Participants
54
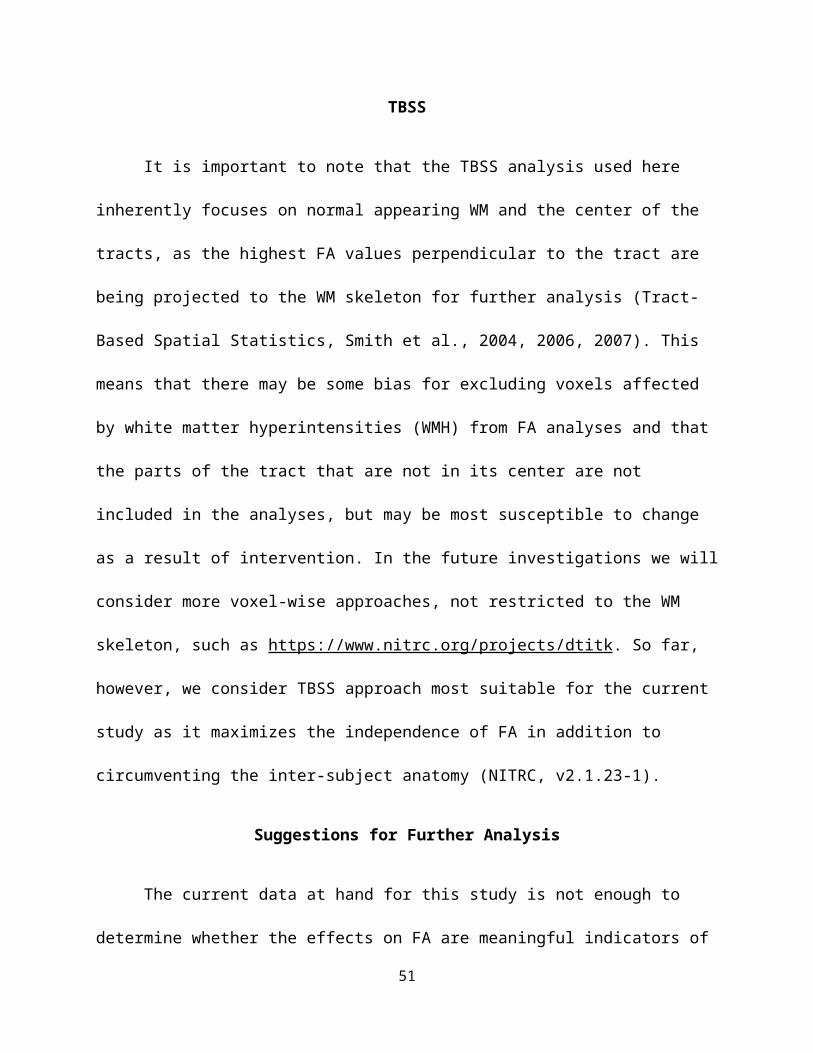
Figure 2. Variations of Fornix’s FA Mean over Six Months
*Vertical axis: “FA Means of Participants” is the aggregated regional FA of all participants, segregated by groups and time points.
*Horizontal axis: Each number corresponds to the pre and post intervention time points as follows: 1 = pre intervention; 2 = post intervention
*ROI 6, fornix, manifested as the only ROI with distinct FA difference between groups
*Among the four interventions of fornix; only dance increased in FA over time, while all other interventions declined in FA over time.
55
FA Means of Participants

Figure 3. FA %Δ Mean of 21 ROIs
*Vertical axis: “FA %Δ of Participants” is the aggregated regional FA %Δ of all participants, segregated by intervention groups.
*Horizontal axis: Each number corresponds to one of the 21 ROIs as follows:
56
FA %Δ Means of Participants

1 = ACC; 2 = ALIC; 3 = EC; 4 = fMAJ; 5 = fMIN; 6 = FX; 7 = gyrRect; 8 = HIPP_st; 9 = IFOF_ILF_occ; 10 = IFOF_UNC; 11 = ILF_temp; 12 = PCC; 13 = PLIC; 14 = reg1cc; 15 = reg2cc; 16 = reg3cc; 17 = reg4cc; 18 = reg5cc; 19 = SCR; 20 = SLF; 21= UNC_pfc
*ROI 6, fornix, manifested as the only ROI with distinct FA difference between groups
*Among the four interventions of fornix; only dance demonstrated positive FA %Δ, while all other interventions demonstrated negative FA %Δ.
57

a.
b.
Figure 4. Corpus Callosum Anatomy and Subdivisions Used in Current Analyses
(images from Hofer & Frahm 2006)
*Region I: prefrontal; region II: premotor and supplementary motor; region III: motor; region IV: sensory; region V: parietal,temporal, and occipital.
58

*A, anterior (genu); P, posterior (splenium).
59

Variables N Range Minimum Maximum MeanStd.
Deviation
Age 174 19.00 60.00 79.00 65.6552 4.43404
Highest Level of Education 174 5.00 1.00 6.00 3.9425 1.15660
Resting Heart Rate 174 57.00 50.00 107.00 73.086
2 10.33981
Body Mass Index 174 34.27 14.95 49.22 30.4723 5.46853
VO2 max (mL/kg/min) 172 23.40 10.80 34.20 20.207
6 4.44996
Valid N (listwise) 172
Table 1.1 Overall Descriptive Statistics of Participants
Table 1.2 Control (Stretching and Toning) Group Descriptive Statistics
Variables N Range Minimum Maximum MeanStd.
Deviation
Age 43 19.00 60.00 79.00 66.7209 4.65130
Highest Level of Education 43 4.00 2.00 6.00 4.1163 1.09565
Resting Heart Rate 43 37.00 55.00 92.00 72.5814 9.77907
Body Mass Index 43 28.52 20.69 49.22 30.3431 6.03593
VO2 max (mL/kg/min) 41 19.80 11.00 30.80 19.7610 4.45067
60

Valid N (listwise) 41
Table 1.3 Dance Group Descriptive Statistics
Variables N Range Minimum Maximum MeanStd.
Deviation
Age 49 19.00 60.00 79.00 65.8776 4.70209
Highest Level of Education 49 5.00 1.00 6.00 3.8571 1.25831
Resting Heart Rate 49 40.00 57.00 97.00 74.5510 10.43244
Body Mass Index 49 25.71 14.95 40.66 30.5797 5.93565
VO2 max (mL/kg/min) 49 16.40 13.90 30.30 20.1408 4.34098
Valid N (listwise) 49
Variables N Range Minimum Maximum MeanStd.
Deviation
Age 40 15.00 60.00 75.00 64.9750 4.00312
61

Highest Level of Education 40 4.00 2.00 6.00 3.9000 1.08131
Resting Heart Rate 40 57.00 50.00 107.00 73.3250 11.78305
Body Mass Index 40 20.38 23.10 43.49 31.1750 4.93237
VO2 max (mL/kg/min) 40 21.70 12.50 34.20 20.6725 4.83009
Valid N (listwise) 40
Table 1.4 Walking Group Descriptive Statistics
62

Table 1.5 Walking + Nutrition Group Descriptive Statistics
Variables N Range Minimum Maximum MeanStd.
Deviation
Age 42 17.00 60.00 77.00 64.9524 4.17865
Highest Level of Education 42 4.00 2.00 6.00 3.9048 1.18547
Resting Heart Rate 42 34.00 56.00 90.00 71.6667 9.41889
Body Mass Index 42 20.54 19.40 39.94 29.8098 4.84888
VO2 max (mL/kg/min) 42 18.50 10.80 29.30 20.2786 4.31161
Valid N (listwise) 42
63

Table 2 Repeated Measures ANOVA on Pre and Post Intervention FA
ROIs Sig. (p) oftime effect
Sig. (p) oftime * group effect
Observed Trends in pre/post FA Variations from graph
ACC 0.008 0.201 Dance group remains stableacross time. All other groups declined.
ALIC 0.008 0.560 All groups declined. Control group declined most. Dance group declinedleast.
EC 0.000 0.434 All groups declined.fMAJ 0.185 0.891 All groups increase. Dance
group increase the most.fMIN 0.297 0.156 Only control group
decreased. All other groups increased.
FX 0.003 0.001 Dance group increased. Allother group decreased, with control group decreased the most.
gyrRect 0.775 0.782 Walking group increased. All other groups decreased.
HIPP_st 0.037 0.526 All groups decreased. Walking group decreased the most. Dance group least decreased.
IFOF_ILF_occ
0.014 0.410 All groups decreased. Dance group least
64

decreased.IFOF_UNC 0.033 0.569 Walking + nutrition group
remained same. All other group decreased.
ILF_temp 0.163 0.810 Walking + nutrition group remained same. All other group decreased.
PCC 0.674 0.907 Walking + nutrition group increased. All other groupdecreased. Walking group decreased the most.
PLIC 0.000 0.553 All groups decreased. Control group decreased the most.
reg1cc 0.008 0.910 All groups decreased. Walking group decreased the least.
reg2cc 0.232 0.306 Walking group increased. All other groups decreased.
reg3cc 0.869 0.969 All groups remained same.reg4cc 0.344 0.747 Control group decreased.
All other group increased.Walking and walking + nutrition group increased the most.
reg5cc 0.241 0.548 Dance and walking + nutrition groups increased. Other groups remain same.
SCR 0.009 0.491 All groups decreased. Dance and walking group
65

decrease less than the other two groups.
SLF 0.094 0.530 Walking + nutrition group slight increase. All othergroups decreased.
UNC_pfc 0.001 0.861 All groups decreased.*Significance value(s) of ROI(s) with only time effect: underscored.
*Significance value(s) of ROI(s) with time × group effect: underscored and bolded.
*Fornix is the only ROI that displayed time × group effect.
*α level = 0.05
66

Table 3a. Tukey’s HSD Post Hoc Result of Fornix
Dependent Variable Groups Sig.Fornix FA %Δ Dance SSS .002
Aerobic .018Aerobic+ .021
SSS DanceAerobic .931Aerobic+ .896
Aerobic DanceSSSAerobic+ 1.000
Aerobic+ DanceSSSAerobic
*Significant: underscored
*Significant values of repeated group pairs are identical, therefore left blank to avoid confusion.
*Only pairs involving the dance group show effect.
Table 3b. Tukey’s HSD Homogenous Subsets
*Means for groups in homogeneous subsets are displayed.
67
Treatment Group
N Subset for alpha= 0.05
1 2SSS 4
3-.0357
Aerobic 40
-.0254
Aerobic+ 42
-.0239
Dance 49
.0233
Sig. .894 1.000

*The group sizes are unequal so harmonic mean sample size (43.256) is used.
*Mean of dance group is the only group mean singled out in a different subset.
68

Table 4. Classification of WM Tracts with Significant Time Effect(FA decrease over 6 months)
Fiber Type ROIsAssociation Anterior cingulum (ACC)
Ventral prefrontal part of uncinate fasciculi (UNC_pfc)External capsule (EC)Parahippocampal WM (HIPP_st)Occipital portion of inferior longitudinalfasciculi and inferior frontal-occipital fasciculi (IFOF_ILF_occ)Uncinate and inferior frontal-occipital fasciculi (IFOF_UNC)
Projection Posterior limb of the internal capsule (PLIC)Anterior limb of the internal capsule (ALIC)Superior corona radiata (SCR)
Commissural Region 1 (genu) of corpus callosum (reg1cc)
69

Table 5. General Types of Brain Artifacts of Removed Volumes in DTI Visual Checks
Artifact Types Image ExampleStriped lines on the image that do not seem to indicate gyri or other anatomical structures
Significant portions of the brain is cut off
Dark spots or “holes” that do notseem to indicate ventricles or otheranatomical structures Blurry images
70

Table 6. Statistical Analysis Flowchart
*Labels at bottom of the chart indicate what factor the section aims to investigate
*The final product of this flow chart, or the ultimate goal of statistical analysis in this study, is to find the nature (ie. increase or decline) that certain intervention(s) changes the FA of certain ROI(s).
71

References
Abe O, Yamasue H, Aoki S, et al. 2008. Aging in the CNS:
comparison of gray/white matter volume and diffusion tensor
data. Neurobiology Aging 29: 102–116.
Allen, A. O. (2014). Probability, statistics, and queueing theory. Academic
Press.
Allen, J.S., Bruss, J., et al., 2005. Normal neuroanatomical
variation due to age: the major lobes and a parcellation of
the temporal region. Neurobiol. Aging 26 (9), 1245–1260.
Ardekani S, Kumar A, Bartzokis G, Sinha U. 2007. Exploratory
voxel-based analysis of diffusion indices and hemispheric
asym- metry in normal aging. Magn Reson Imaging 25: 154–167.
Barnes DE, Yaffe K, Satariano WA, Tager IB (2003): A longitudinal
study of cardiorespiratory fitness and cognitive function in
healthy older adults. J Am Geriatr Soc 51:459–465.
Barkovich AJ. Pediatric Neuroimaging. 2nd ed. New York, NY: Raven
Press; 1995.
Jeret JS, Sehur D, Wisniewski KE, Lubin RA.
72

Clinicopathological findings associated with agenesis of the
corpus callosum. Brain Dev. 1987;9:225-264.
Bartzokis, G., 2004a. Age-related myelin breakdown: a
developmental model of cognitive decline and Alzheimer's
disease. Neurobiol. Aging 25 (1), 5–18.
Bartzokis, G., 2004b. Quadratic trajectories of brain myelin
content: unifying construct for neuropsychiatric disorders.
Neurobiol. Aging 25 (1), 49–62.
Bartzokis, G., Beckson, M., et al., 2001. Age-related changes in
frontal and temporal lobe volumes in men: a magnetic
resonance imaging study. Arch. Gen. Psychiatry 58 (5), 461–
465.
Bartzokis, G., Cummings, J. L., Sultzer, D., Henderson, V. W.,
Nuechterlein, K. H., & Mintz, J. (2003). White matter
structural integrity in healthy aging adults and patients
with Alzheimer disease: a magnetic resonance imaging study.
Archives of Neurology, 60(3), 393-398.
Bartzokis, G., Sultzer, D., et al., 2004. Heterogeneous age-
related breakdown of white matter structural integrity:
73

implications for cortical “disconnection” in aging and
Alzheimer's disease. Neurobiol. Aging 25 (7), 843–851.
Basser PJ (n.d.) Inferring microstructural features and the
physiological state of tissues from diffusion-weighted
images. NMR Biomed 8: 333–344.
Bennett IJ, Madden DJ, Vaidya CJ, Howard DV, Howard JH. Age-
Related Differences in Multiple Measures of White Matter
Integrity: A Diffusion Tensor Imaging Study of Healthy
Aging. Human brain mapping. 2010;31(3):378-390.
doi:10.1002/hbm.20872.
Berger, T. W., & Thompson, R. F. (1978). Neuronal plasticity in
the limbic system during classical conditioning of the
rabbit nictitating membrane response. II: Septum and
mammillary bodies. Brain research, 156(2), 293-314.
Blazer, D. G. (2014). Cognitive Neuroscience of Aging: Linking
Cognitive and Cerebral Aging.
Bozzali, M., Falini, A., Franceschi, M., Cercignani, M., Zuffi,
M., Scotti, G., ... & Filippi, M. (2002). White matter
damage in Alzheimer's disease assessed in vivo using
74

diffusion tensor magnetic resonance imaging. Journal of
Neurology, Neurosurgery & Psychiatry, 72(6), 742-746.
Burzynska AZ, Preuschhof C, Backman L, Nyberg L, Li SC,
Lindenberger U, Heekeren HR. Age-related differences in
white-matter microstructure: Region-specific patterns of
diffusivity.Manuscript submitted for publication. 2009
Burzynska A. Z., Preuschhof C., Backman L., Nyberg L., Li S. C.,
Lindenberger U., et al. . (2010). Age-related differences in
white matter microstructure: region-specific patterns of
diffusivity. Neuroimage 49, 2104–2112.
10.1016/j.neuroimage.2009.09.041
Burzynska, A. Z., Garrett, D. D., Preuschhof, C., Nagel, I. E.,
Li, S. C., Bäckman, L., ... & Lindenberger, U. (2013). A
scaffold for efficiency in the human brain. The Journal of
Neuroscience, 33(43), 17150-17159.
Burzynska, A.Z., Wong C. N.; Chaddock-Heyman L. ; Olson E. A.;
Gothe N.; Knecht A.; Voss M.; McAuley E.; Kramer, A.F.
(submitted). White matter integrity and cognitive
75

performance of a world-famous nonagenarian track and field
athlete. Mental Health & Physical Activity
Burzynska, A. Z., Chaddock-Heyman, L., Voss, M. W., Wong, C. N.,
Gothe, N. P., Olson, E. A., ... & Kramer, A. F. (2014).
Physical activity and cardiorespiratory fitness are
beneficial for white matter in low-fit older adults.PloS
one, 9(9), e107413.
Calabresi PA. Multiple sclerosis and demyelinating conditions of
the central nervous system. In: Goldman L, Schafer AI, eds.
Cecil Medicine. 24th ed. Philadelphia, Pa: Saunders
Elsevier; 2011:chap 419.
Charlton, R. A., Barrick, T. R., McIntyre, D. J., Shen, Y.,
O'Sullivan, M., Howe, F. A., ... & Markus, H. S. (2006).
White matter damage on diffusion tensor imaging correlates
with age-related cognitive decline. Neurology, 66(2), 217-
222.
Christiansen, P., Larsson, H. B. W., Thomsen, C., Wieslander, S.
B., & Henriksen, O. (1994). Age dependent white matter
lesions and brain volume changes in healthy volunteers. Acta
76

Radiologica, 35(2), 117-122.
Cohen, J (1988) Statistical power analysis for the behavioral
sciences (2nd ed.). Hillsdale, NJ: Erlbaum.
Colcombe, S. J., Erickson, K. I., Scalf, P. E., Kim, J. S.,
Prakash, R., McAuley, E., ... & Kramer, A. F. (2006).
Aerobic exercise training increases brain volume in aging
humans. The Journals of Gerontology Series A: Biological Sciences and Medical
Sciences, 61(11), 1166-1170.
Cotman, C. W., Berchtold, N. C., & Christie, L. A. (2007).
Exercise builds brain health: key roles of growth factor
cascades and inflammation. Trends in neurosciences, 30(9), 464-
472.
de Curtis, M., & Llinas, R. R. (1993). Entorhinal cortex long-
term potentiation evoked by theta-patterned stimulation of
associative fibers in the isolated in vitro guinea pig
brain. Brain research, 600(2), 327-330.
Dere, E., Easton, A., Nadel, L., & Huston, J. P. (Eds.).
(2008). Handbook of episodic memory (Vol. 18). Elsevier.
77

Douet, V., & Chang, L. (2015). Fornix as an imaging marker for
episodic memory deficits in healthy aging and in various
neurological disorders. Frontiers in Aging Neuroscience, 6, 343.
Field, A. (2009). Discovering statistics using SPSS. Sage publications.
Fitzsimmons J, Kubicki M, Smith K, Bushell G, Estepar RSJ, Westin
C-F et al(2009). Diffusion tractography of the fornix in
schizophrenia. Schizophr Res107: 39–46.
Frazier, T. W., & Hardan, A. Y. (2009). A meta-analysis of the
corpus callosum in autism. Biological psychiatry, 66(10), 935-
941.
Frederiksen, K. S. (2013). Corpus callosum in aging and
dementia. Danish medical journal, 60(10), B4721-B4721.
Galea, M., & Woodward, M. (2005). Mini-mental state examination
(MMSE).Australian Journal of Physiotherapy, 51(3), 198.
Ge, Y., Grossman, R.I., et al., 2002. Age-related total gray
matter and white matter changes in normal adult brain: Part
I. Volumetric MR imaging analysis. AJNR Am. J. Neuroradiol.
23 (8), 1327–1333.
78

Grieve, S. M., Williams, L. M., Paul, R. H., Clark, C. R., &
Gordon, E. (2007). Cognitive aging, executive function, and
fractional anisotropy: a diffusion tensor MR imaging
study. American Journal of Neuroradiology, 28(2), 226-235.
Griggs RC, Jozefowicz RF, Aminoff MJ. Approach to the patient
with neurologic disease. In: Goldman L, Schafer AI, eds.
Cecil Medicine. 24th ed. Philadelphia, Pa: Saunders
Elsevier; 2011:chap 403.
Gould, H. 3rd, Cusick, C. G., Pons, T. P., & Kaas, J. H. (1986).
The relationship of corpus callosum connections to
electrical stimulation maps of motor, supplementary motor,
and the frontal eye fields in owl monkeys. Journal of
Comparative Neurology, 247(3), 297-325.
Gunning-Dixon, F. M., & Raz, N. (2000). The cognitive correlates
of white matter abnormalities in normal aging: a
quantitative review. Neuropsychology,14(2), 224.
Gunning‐Dixon, F. M., Brickman, A. M., Cheng, J. C., &
Alexopoulos, G. S. (2009). Aging of cerebral white matter: a
79

review of MRI findings. International journal of geriatric
psychiatry, 24(2), 109-117.
Guttmann, C. R., Jolesz, F. A., Kikinis, R., Killiany, R. J.,
Moss, M. B., Sandor, T., & Albert, M. S. (1998). White
matter changes with normal aging. Neurology, 50(4), 972-978.
Haboush, A., Floyd, M., Caron, J., LaSota, M., & Alvarez, K.
(2006). Ballroom dance lessons for geriatric depression: An
exploratory study. The Arts in psychotherapy, 33(2), 89-97.
Haddock, CK, Rinkdskopf, D. & Shadish, C. (1998) Using odds
ratios as effect sizes for meta-analysis of dichotomous
data: A primer on methods and issues. Psychological
Methods 3 339-353.
Hertzog, C., Kramer, A. F., Wilson, R. S., & Lindenberger, U.
(2008). Enrichment effects on adult cognitive development
can the functional capacity of older adults be preserved and
enhanced?. Psychological science in the public interest, 9(1), 1-65.
Highley, J. R., Esiri, M. M., McDonald, B., Cortina-Borja, M.,
Herron, B. M., & Crow, T. J. (1999). The size and fibre
composition of the corpus callosum with respect to gender
80

and schizophrenia: a post-mortem study. Brain, 122(1), 99-
110.
Hofer, S., & Frahm, J. (2006). Topography of the human corpus
callosum revisited—comprehensive fiber tractography using
diffusion tensor magnetic resonance
imaging. Neuroimage, 32(3), 989-994.
Hofstetter, S., Tavor, I., Moryosef, S. T., & Assaf, Y. (2013).
Short-term learning induces white matter plasticity in the
fornix. The Journal of Neuroscience,33(31), 12844-12850.
Hou, J., & Pakkenberg, B. (2012). Age-related degeneration of
corpus callosum in the 90+ years measured with
stereology. Neurobiology of aging, 33(5), 1009-e1.
Jelsing, J., Rostrup, E., et al., 2005. Assessment of in vivo MR
imaging compared to physical sections in vitro—A
quantitative study of brain volumes using stereology.
NeuroImage 26 (1), 57–65.
Kennedy, K. M., & Raz, N. (2009). Aging white matter and
cognition: differential effects of regional variations in
diffusion properties on memory, executive functions, and
speed. Neuropsychologia, 47(3), 916-927.81

Kochunov, P., Thompson, P. M., Lancaster, J. L., Bartzokis, G.,
Smith, S., Coyle, T., ... & Fox, P. T. (2007). Relationship
between white matter fractional anisotropy and other indices
of cerebral health in normal aging: tract-based spatial
statistics study of aging. Neuroimage, 35(2), 478-487.
Kotrlik, J. W. K. J. W., & Williams, H. A. W. H. A. (2003). The
Incorporation of Effect Size in Information Technology,
Learning, Information Technology, Learning, and Performance
Research and Performance Research. Information Technology,
Learning, and Performance Journal, 21(1), 1.
Larson EB, Wang L, Bowen JD, McCormick WC, Teri L, Crane P,
Kukull W (2006): Exercise is associated with reduced risk
for incident dementia among persons 65 years of age and
older.Ann Intern Med 144:73–81.
Lindenberger, U. (2013). A scaffold for efficiency in the human
brain. The Journal of Neuroscience, 33(43), 17150-17159.
Lindsay J, Laurin D, Verreault R, He´bert R, Helliwell B, Hill
GB, McDowell I (2002): Risk factors for Alzheimer’s disease:
a prospective analysis from the Canadian Study of Health and
Aging. Am J Epidemiol 156:445–453.82

Lunardelli, A., Sartori, A., Mengotti, P., Rumiati, R. I., &
Pesavento, V. (2014). Intermittent Alien Hand Syndrome and
Callosal Apraxia in Multiple Sclerosis: Implications for
Interhemispheric Communication. Behavioural Neurology, 2014,
873541. doi:10.1155/2014/873541
Madden, D. J., Whiting, W. L., Huettel, S. A., White, L. E.,
MacFall, J. R., & Provenzale, J. M. (2004). Diffusion tensor
imaging of adult age differences in cerebral white matter:
relation to response time. Neuroimage, 21(3), 1174-1181.
Madden, D. J., Bennett, I. J., & Song, A. W. (2009). Cerebral
white matter integrity and cognitive aging: contributions
from diffusion tensor imaging.Neuropsychology review, 19(4),
415-435.
Marks, B. L., Madden, D. J., Bucur, B., Provenzale, J. M., White,
L. E., Cabeza, R., & Huettel, S. A. (2007). Role of aerobic
fitness and aging on cerebral white matter integrity. Annals
of the New York Academy of Sciences, 1097(1), 171-174.
Miller, A.K., Alston, R.L., et al., 1980. Variation with age in
the volumes of grey and white matter in the cerebral
83

hemispheres of man: measurements with an image analyser.
Neuropathol. Appl. Neurobiol. 6 (2), 119–132.
Mori, S., Kaufmann, W. E., Davatzikos, C., Stieltjes, B., Amodei,
L., Fredericksen, K., ... & van Zijl, P. (2002). Imaging
cortical association tracts in the human brain using
diffusion‐tensor‐based axonal tracking. Magnetic resonance in
medicine, 47(2), 215-223.
Nestor, P. G., Kubicki, M., Kuroki, N., Gurrera, R. J.,
Niznikiewicz, M., Shenton, M. E., & McCarley, R. W. (2007).
Episodic memory and neuroimaging of hippocampus and fornix
in chronic schizophrenia. Psychiatry Research:
Neuroimaging, 155(1), 21-28.
O’Sullivan, M. R. C. P., Jones, D. K., Summers, P. E., Morris, R.
G., Williams, S. C. R., & Markus, H. S. (2001). Evidence for
cortical “disconnection” as a mechanism of age-related
cognitive decline. Neurology, 57(4), 632-638.
Olesen, P. J., Nagy, Z., Westerberg, H., & Klingberg, T. (2003).
Combined analysis of DTI and fMRI data reveals a joint
maturation of white and grey matter in a fronto-parietal
network. Cognitive Brain Research, 18(1), 48-57.84
Packard, M. G., Hirsh, R., & White, N. M. (1989). Differential
effects of fornix and caudate nucleus lesions on two radial
maze tasks: evidence for multiple memory systems. The Journal
of neuroscience, 9(5), 1465-1472.
Persson, J., Nyberg, L., Lind, J., Larsson, A., Nilsson, L. G.,
Ingvar, M., & Buckner, R. L. (2006). Structure–function
correlates of cognitive decline in aging. Cerebral
Cortex, 16(7), 907-915.
Pfefferbaum, A., Sullivan, E. V., Hedehus, M., Lim, K. O.,
Adalsteinsson, E., & Moseley, M. (2000). Age‐related decline
in brain white matter anisotropy measured with spatially
corrected echo‐planar diffusion tensor imaging.Magnetic
resonance in medicine, 44(2), 259-268.
Pfefferbaum, A., & Sullivan, E. V. (2003). Increased brain white
matter diffusivity in normal adult aging: relationship to
anisotropy and partial voluming.Magnetic Resonance in
Medicine, 49(5), 953-961.
85

Raz, N. (2000). Aging of the brain and its impact on cognitive
performance: Integration of structural and functional
findings.
Reese TG, Heid O, Weisskoff RM, Wedeen VJ (2003) Reduction of
eddy-current-induced distortion in diffusion MRI using a
twice-refocused spin echo. Magn Reson Med 49: 177–182
Richards M, Hardy R, Wadsworth ME (2003): Does active leisure
protect cognition? Evidence from a national birth cohort.
SocSci Med 56:785–792.
Rose, S. E., Chen, F., Chalk, J. B., Zelaya, F. O., Strugnell, W.
E., Benson, M., ... & Doddrell, D. M. (2000). Loss of
connectivity in Alzheimer's disease: an evaluation of white
matter tract integrity with colour coded MR diffusion tensor
imaging. Journal of Neurology, Neurosurgery & Psychiatry, 69(4), 528-
530.
Rueckert D, Sonoda LI, Hayes C, Hill DL, Leach MO, et al.
(1999) Nonrigid registration using free-form deformations:
application to breast MR images. IEEE Trans Med Imaging 18:
712–721
86

Salat, D. H., Tuch, D. S., Greve, D. N., Van Der Kouwe, A. J. W.,
Hevelone, N. D., Zaleta, A. K., ... & Dale, A. M. (2005).
Age-related alterations in white matter microstructure
measured by diffusion tensor imaging. Neurobiology of
aging, 26(8), 1215-1227.
Sale, C., Saunders, B., & Harris, R. C. (2010). Effect of beta-
alanine supplementation on muscle carnosine concentrations
and exercise performance. Amino acids, 39(2), 321-333.
Schmiedek, F., Lövdén, M., & Lindenberger, U. (2010). Hundred
days of cognitive training enhance broad cognitive abilities
in adulthood: findings from the COGITO study. Frontiers in aging
neuroscience, 2.
Smith SM (2002) Fast robust automated brain extraction. Hum Brain
Mapp 17: 143–155
Smith SM, Jenkinson M, Woolrich MW, Beckmann CF, Behrens TEJ, et
al. (2004) Advances in functional and structural MR image
analysis and implementation as FSL. Neuroimage 23Suppl
1S208–19
87

Sowell, E.R., Peterson, B.S., et al., 2003. Mapping cortical
change across the human life span. Nat. Neurosci. 6 (3),
309–315.
Spradley, B. D., Crowley, K. R., Tai, C. Y., Kendall, K. L.,
Fukuda, D. H., Esposito, E. N., ... & Moon, J. R. (2012).
Ingesting a pre-workout supplement containing caffeine, B-
vitamins, amino acids, creatine, and beta-alanine before
exercise delays fatigue while improving reaction time and
muscular endurance.Nutr Metab (Lond), 9, 28.
Sullivan, E. V., Adalsteinsson, E., Hedehus, M., Ju, C., Moseley,
M., Lim, K. O., & Pfefferbaum, A. (2001). Equivalent
disruption of regional white matter microstructure in ageing
healthy men and women. Neuroreport, 12(1), 99-104.
Sutherland, R. J., & Rodriguez, A. J. (1989). The role of the
fornix/fimbria and some related subcortical structures in
place learning and memory. Behavioural brain research, 32(3), 265-
277.
Tabachnick, B. G., & Fidell, L. S. (2001). Using multivariate
statistics.
88

Teipel, S. J., Bokde, A. L., Meindl, T., Amaro, E., Soldner, J.,
Reiser, M. F., ... & Hampel, H. (2010). White matter
microstructure underlying default mode network connectivity
in the human brain. Neuroimage, 49(3), 2021-2032.
Tombaugh, T. N., & McIntyre, N. J. (1992). The mini-mental state
examination: a comprehensive review. Journal of the American
Geriatrics Society.
Uda, M., Ishido, M., Kami, K., & Masuhara, M. (2006). Effects of
chronic treadmill running on neurogenesis in the dentate
gyrus of the hippocampus of adult rat. Brain research, 1104(1),
64-72.
United Nations Department of Economic and Social Affairs,
Population Division (2013). World Population Ageing 2013, 348(4),
17
Van Praag, H., Christie, B. R., Sejnowski, T. J., & Gage, F. H.
(1999). Running enhances neurogenesis, learning, and long-
term potentiation in mice. Proceedings of the National Academy of
Sciences, 96(23), 13427-13431.
89

Van Praag, H., Shubert, T., Zhao, C., & Gage, F. H. (2005).
Exercise enhances learning and hippocampal neurogenesis in
aged mice. The Journal of Neuroscience, 25(38), 8680-8685.
Verghese, J., Lipton, R. B., Katz, M. J., Hall, C. B., Derby, C.
A., Kuslansky, G., ... & Buschke, H. (2003). Leisure
activities and the risk of dementia in the elderly. New
England Journal of Medicine, 348(25), 2508-2516.
Voss, M. W., Heo, S., Prakash, R. S., Erickson, K. I., Alves, H.,
Chaddock, L., ... & Kramer, A. F. (2013). The influence of
aerobic fitness on cerebral white matter integrity and
cognitive function in older adults: Results of a one‐year
exercise intervention. Human brain mapping, 34(11), 2972-2985.
Wakana, S., Jiang, H., Nagae-Poetscher, L. M., Van Zijl, P. C., &
Mori, S. (2004). Fiber tract–based atlas of human white
matter anatomy 1. Radiology,230(1), 77-87.
Walhovd, K.B., Fjell, A.M., et al., 2005. Effects of age on
volumes of cortex, white matter and subcortical structures.
Neurobiol. Aging 26 (9), 1261–1270.
90

Wiegell, M. R., Larsson, H. B., & Wedeen, V. J. (2000). Fiber
crossing in human brain depicted with diffusion tensor MR
imaging 1. Radiology, 217(3), 897-903.
Winer, B. J., Brown, D. R., & Michels, K. M. (1971). Statistical
principles in experimental design (Vol. 2, p. 596). New York:
McGraw-Hill.
Yaffe K, Fiocco AJ, Lindquist K, Vittinghoff E, Simonsick EM,
Newman AB, Satterfield S, Rosano C, Rubin SM, Ayonayon HN,
Harris TB (2009): Predictors of maintaining cognitive
function in older adults: The Health ABC study. Neurology
72:2029–2035.
Yakovlev, P.I., Lecours, A.R., 1967. Regional Development of the
Brain in Early Life. Blackwell Scientific Publications,
Boston.
Zoeller, R. F., Stout, J. R., O’kroy, J. A., Torok, D. J., &
Mielke, M. (2007). Effects of 28 days of beta-alanine and
creatine monohydrate supplementation on aerobic power,
ventilatory and lactate thresholds, and time to
exhaustion.Amino acids, 33(3), 505-510.
91

92