The efficacy of a school-based nutrition and food preparation ...
276
Evaluation of a school-basednutrition and food preparation skills intervention delivered to schoolchildren from deprived social backgrounds The efficacy of a school-based nutrition and food preparation skills intervention delivered asan after-school 'Food Club' to children aged 11-13 years living in socially deprived areas of Tyne and Wear A thesis submitted in partial fulfilment of the requirements of the University of Newcastle for the degree of Doctor of Philosophy Q Samantha Affeen Revfll NEWCASTLE UNIVERS ITY LIBRAO ---------------------------- 203 02841 X ---------------------------- r-'(DID -fl-v--sTý5 (-: -7"7 C) 'ý) /, ý )6cL4 - i
-
Upload
khangminh22 -
Category
Documents
-
view
0 -
download
0
Transcript of The efficacy of a school-based nutrition and food preparation ...
Evaluation of a school-based nutrition and food preparation skills intervention delivered to schoolchildren
from deprived social backgrounds
The efficacy of a school-based nutrition and food preparation skills intervention delivered as an after-school 'Food Club' to children aged 11-13
years living in socially deprived areas of Tyne and Wear
A thesis submitted in partial fulfilment of the requirements of the University of Newcastle for the degree of Doctor of Philosophy
Q Samantha Affeen Revfll
NEWCASTLE UNIVERS ITY LIBRAO
---------------------------- 203 02841 X
---------------------------- r-'(DID -fl-v--sTý5 (-: -7"7 C) 'ý)
/, ý )6cL4 -
i

Certificate of Originality
This is to certify that I am resPOnsible for the work submitted in this thesis, that the original
work is my own except as specified in acknowledgements or footnotes and that neither the
thesis nor the original work contained therein has previously been submitted to any institution for a higher degree.
5 ýevi II
Samantha Aileen Revill
ii
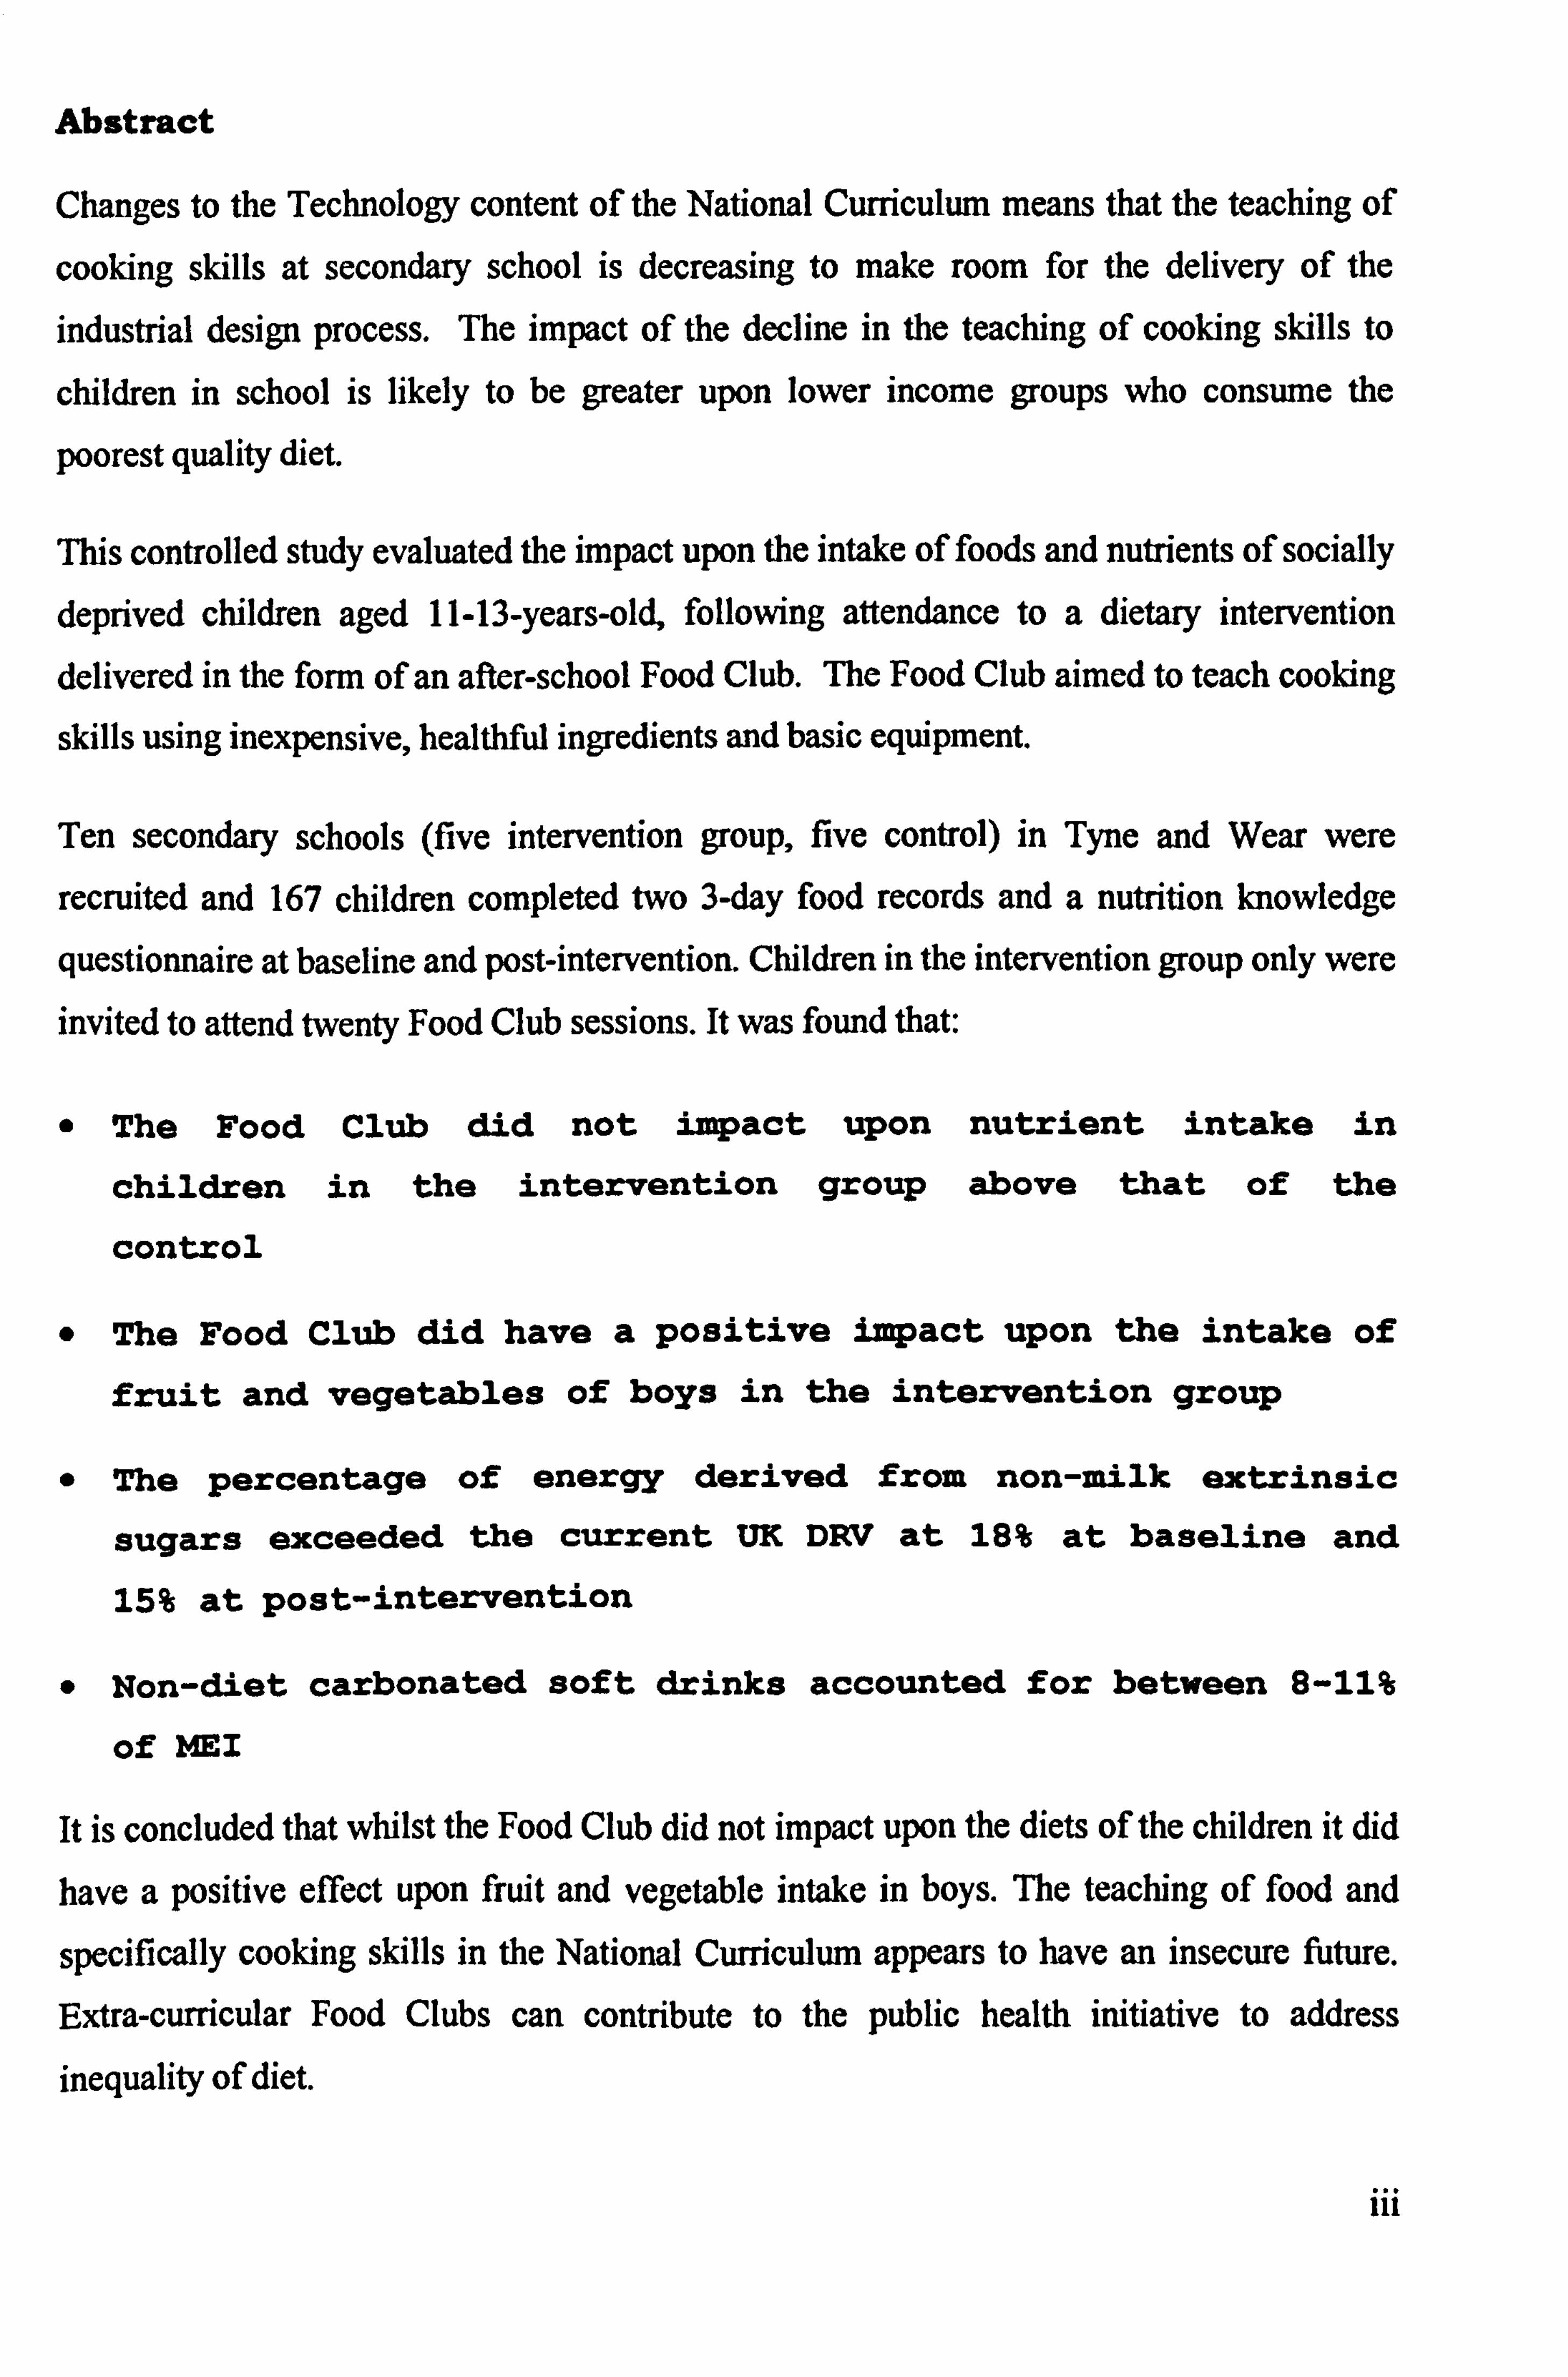
Abstmct
Changes to the Technology content of the National Curriculum means that the teaching of
cooking skills at secondary school is decreasing to make room for the delivery of the
industrial design process. The impact of the decline in the teaching of cooking skills to
children in school is likely to be greater upon lower income groups who consume the
poorest quality diet.
This controlled study evaluated the impact upon the intake of foods and nutrients of socially deprived children aged 11-13-years-old, following attendance to a dietary intervention
delivered in the form of an after-school Food Club. The Food Club aimed to teach cooking skills using inexpensive, healthful ingredients and basic equipment.
Ten secondary schools (five intervention group, five control) in Tyne and Wear were
recruited and 167 children completed two 3-day food records and a nutrition knowledge
questionnaire at baseline and post-intervention. Children in the intervention group only were invited to attend twenty Food Club sessions. It was found that:
The Food Club did not impact upon nutrient intake in
children in the intervention group above that of the
control
The Food Club did have a positive impact upon the intake of
fruit and vegetables of boys in the intervention group
The percentage of energy derived from non-milk extrinsic
sugars exceeded the current UK DRV at 18% at baseline and
15% at post-intervention
* Non-diet carbonated soft drinks accounted for between 8-11%
of MEI
It is concluded that whilst the Food Club did not impact upon the diets of the children it did
have a positive effect upon fruit and vegetable intake in boys. The teaching of food and
specifically cooking skills in the National Curriculum appears to have an insecure future.
Extra-curricular Food Clubs can contribute to the public health initiative to address inequality of diet.
iii

Acknowledgements
I would like to gratefully acknowledge the expert advice and support of Dr Paula Moynihan of the Dental School, University of Newcastle in her supervision of this study. I am most grateful to her for sharing her ability to persist in finding solutions to many obstacles.
I would also like to thank the following members of the Human Nutrition Research Centre:
Dr Ashley Adamson, for guidance and support in managing a large database system and for expert advice regarding food composition tables; Professor Rugg-Gunn for his advice and support and Peter Curtis for his good humour during Nutrition Society meetings and fmding everything funny.
I would also like to thank Mrs Wendy Bal of Biological and Nutritional Services at the University of Newcastle for her advice regarding laboratory analysis.
Grateful thanks Dr Rob Hyland for providing his insight and cheerful assistant with matters regarding qualitative sociological analysis. Also Mrs Tracey Cowell, for assistance regarding the Food Club and advice on dealing with teenagers.
Many thanks also to Miss Julie Hooper in being such a steady work colleague and to Miss Jane Bradbury of the Dental School for many hours of listening to endless wittering on about the study and the PhD and participating in some very useful discussions.
I would also like to thank the schools and pupils who participated in the study, without whom this work would not have been possible. I am also most grateful to the hard work and personal effort of the following teachers in the schools of Newcastle, Gateshead and Sunderland who agreed to take part in the study: Miss Amanda Stevenson and Mrs Jacqui Brown, Mr George Bradley, Mrs Michelle Breen, Mrs Brannan and Mr John Curry, Mrs Julie Dolphin, Mr Brian Langley and Miss Sheena Alison, Mrs Margaret Moorland and Mr Patrick Claire and Mrs Margaret Walker, Mrs Janet Harrison, Mrs Sue Prest and Mrs Sara Jobling.
iv
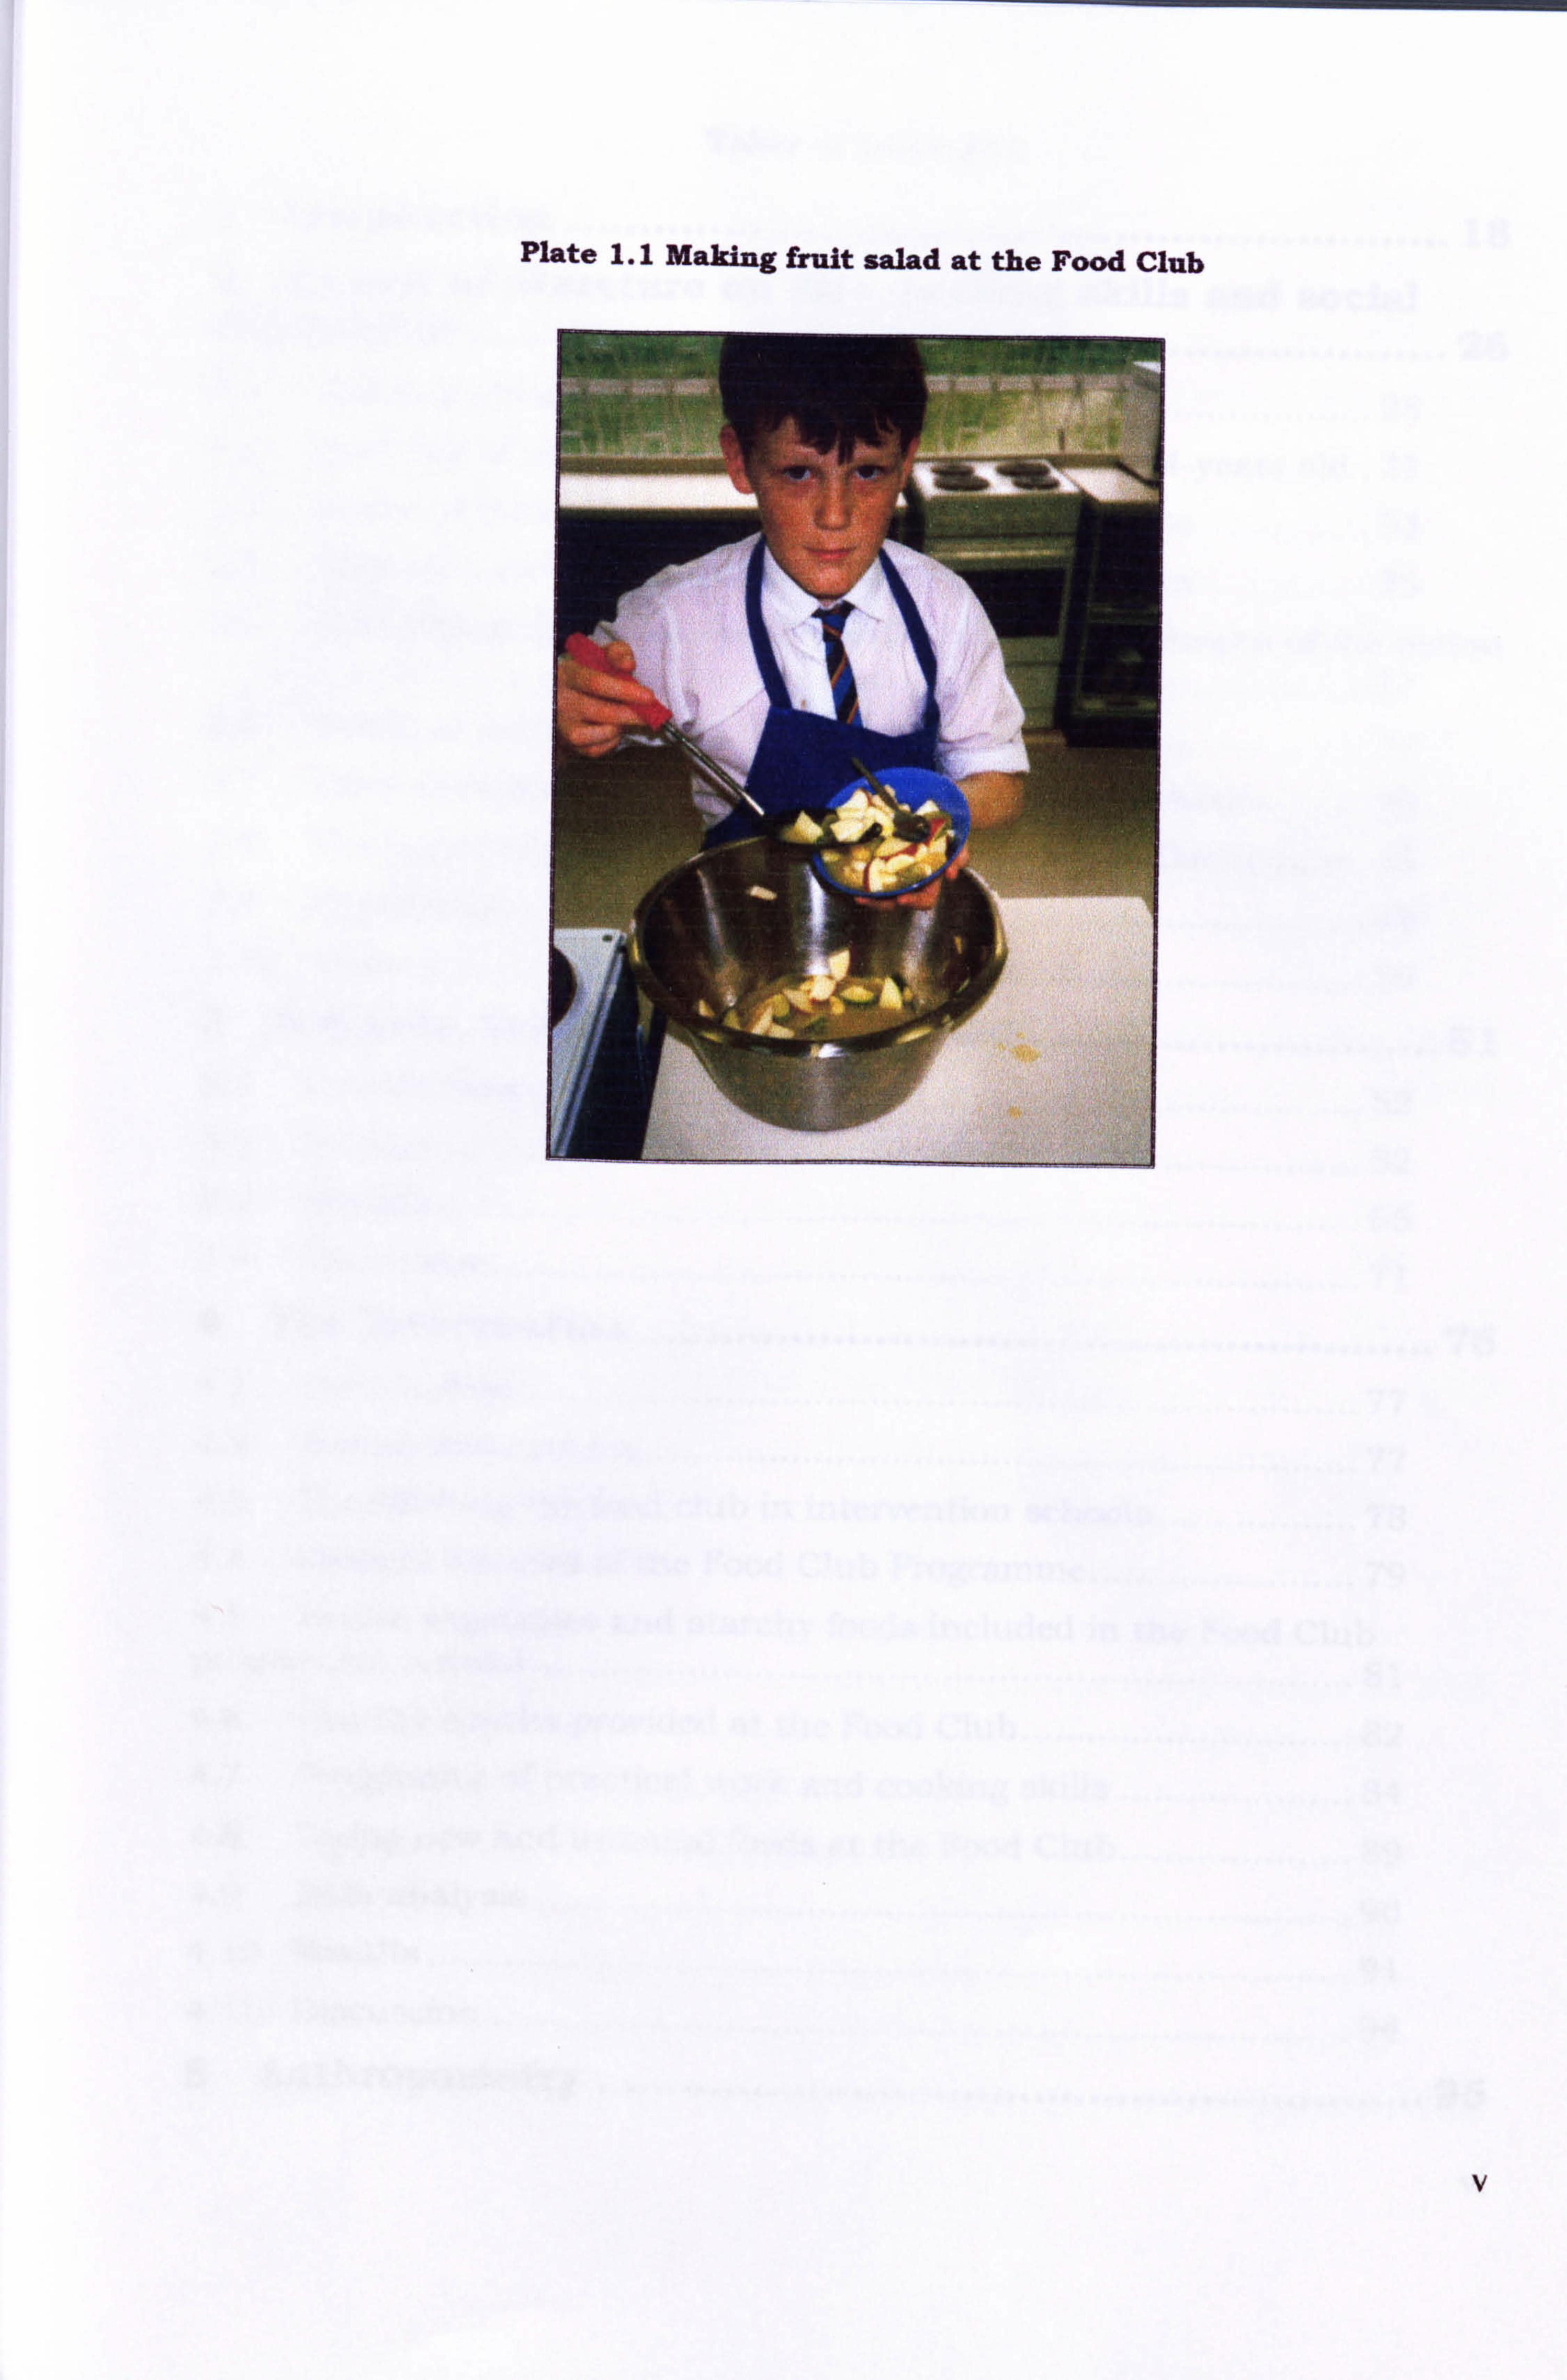
Plate 1.1 Making fruit salad at the Food Club
Table of contents
1 Introduction ............................................................... 18
2 Review of literature on diet, cooking skills and social deprivation ...................................................................... 26
2.1 Social deprivation, diet and health .......................................... 28 2.2 Overview of nutrient intake in children aged 11- 14-years old. 31
2.3 Intake of nutrients by socially deprived adolescents ............... 33
2.4 Food choices towards healthy eating in adolescence ............... 35
2.5 Role of food preparation and cooking skills in the health of the nation ............................................................................................... 37
2.6 Nutrition and cooking skills intervention ................................ 39
2.7 Extra-curricular food and nutrition activities in schools ......... 45
2.8 The future of practical food skills in the National Curriculum. 46 2.9 Hypothesis ..............................................................................
49
2.10 Aims ....................................................................................... 50
3 Subjects., Schools and Recruitment ............................. 51 3.1 Introduction ...........................................................................
52
3.2 Method ............ I ....................................................................... 52
3.3 Results ................................................................................... 65
3.4 Discussion .............................................................................. 71
4 The Intervention ......................................................... 76
4.1 Introduction ........................................................................... 77 4.2 Design and content ................................................................. 77
4.3 Establishing the food club in intervention schools .................. 78
4.4 General features of the Food Club Programme ........................ 79
4.5 Fruits, vegetables and starchy foods included in the Food Club programme content .......................................................................... 81
4.6 Healthy snacks provided at the Food Club .............................. 82
4.7 Programme of practical work and cooking skills ..................... 84
4.8 Trying new and unusual foods at the Food Club ..................... 89
4.9 Data analysis .......................................................................... 90
4.10 Results ................................................................................... 91
4.11 Discussion .............................................................................. 94
5 Anthropometry ........................................................... 96
vi
5.1 Introduction ........................................................................... 97 5.2 Methods ............................................................................... 100 5.3 Results ................................................................................. 101 5.4 Discussion ............................................................................ 106
6 Diet Analysis ............................................................. 110
6.1 Introduction ......................................................................... ill 6.2 Method ................................................................................. 114 6.3 Results ................................................................................. 121
6.4 Discussion ............................................................................ 136
7 Comparison of reported energy intake with physical activity level .................................................................. 145
7.1 Introduction ......................................................................... 146 7.2 Methods ...............................................................................
148
7.3 Results ................................................................................. 152
7.4 Discussion ............................................................................ 158
8 Intake and Frequency of Intake of Sugary Foods, Acidic Foods and Non-Milk EXtrinsic Sugar ............................... 163 8.1 Introduction .........................................................................
164
8.2 Methods ............................................................................... 168
8.3 Results ................................................................................. 173
8.4 Discussion ............................................................................ 193
9 Nutrition Knowledge and Cooking Skills .................... 202 9.1 Introduction ......................................................................... ý03
9.2 Method ................................................................................. 206
9.3 Results ................................................................................. 211
9.4 Discussion ............................................................................ 213
10 General discussion .................................................... 215 10.1 Introduction ......................................................................... 216
10.2 Summary and conclusions ................................................... 217
10.3 Recommendations for Government ....................................... 226
10.4 Recommendations for schools ............................................... 226
10.5 Recommendations for Health Educators ............................... 226
10.6 Further work ........................................................................ 227
11 References ................................................................ 228
vii
12 Appendix .................................................................. 241 12.1 National Curriculum for England: Design and Technology .... 241 12.2 Membership of The Good Food Study Steering Group ........... 248 12.3 Use of flyers in the study recruitment strategy ...................... 249 12.4 Information sheet supplied to prospective volunteers (control group)
250 12.5 Intake by children in the intervention group and control group of selected vitamins at TO, T1 and T1-TO ............................................ 251 12.6 Intake of selected vitamins by boys and girls in the intervention group and control group at TO, T1 and T1-T0 ................................. 252 12.7 Percentage of boys and girls in the intervention and control group meeting the Reference Nutrient Intake for selected vitamins at baseline (TO) and post-intervention (T1) .............................................................. 255
12.8 Intake of selected minerals by boys and girls in the intervention group and control group at TO, T1 and Tl-TO ................................. 257 12.9 Percentage of children in the intervention and control group meeting the Reference Nutrient Intake for calcium, iron and zinc at baseline (TO) and post-intervention (Tl) .............................................................. 258
12.10 Percentage of boys and girls in the intervention and control groups meeting Reference Nutrient Intake for calcium, iron and zinc at baseline (TO) and post-intervention (T1) ....................................................... 259 12.11 Examples of food diary completion by children taking part in The Good Food Study ........................................................................... 261 12.12 Detennination of P-aminobenzoic acid .................................. 264
12.13 Determination of 24-hr urinary creatinine by COBASO MIRA Autoanalysis .................................................................................. 268
12.14 Determination of urinary nitrogen using LECOO Autoanalysis269 12.15 Determination of urinary potassium and sodium in 24-hr urine samples using Emission Flame Photometry .................................... 270 12.16 Nutritional knowledge, food preparation knowledge and cooking confidence of 187 schoolchildren ................................................... 273 12.17 The effect of an after school Tood Clubon intake of foods and nutrients by children from deprived social backgrounds ................ 274
viii
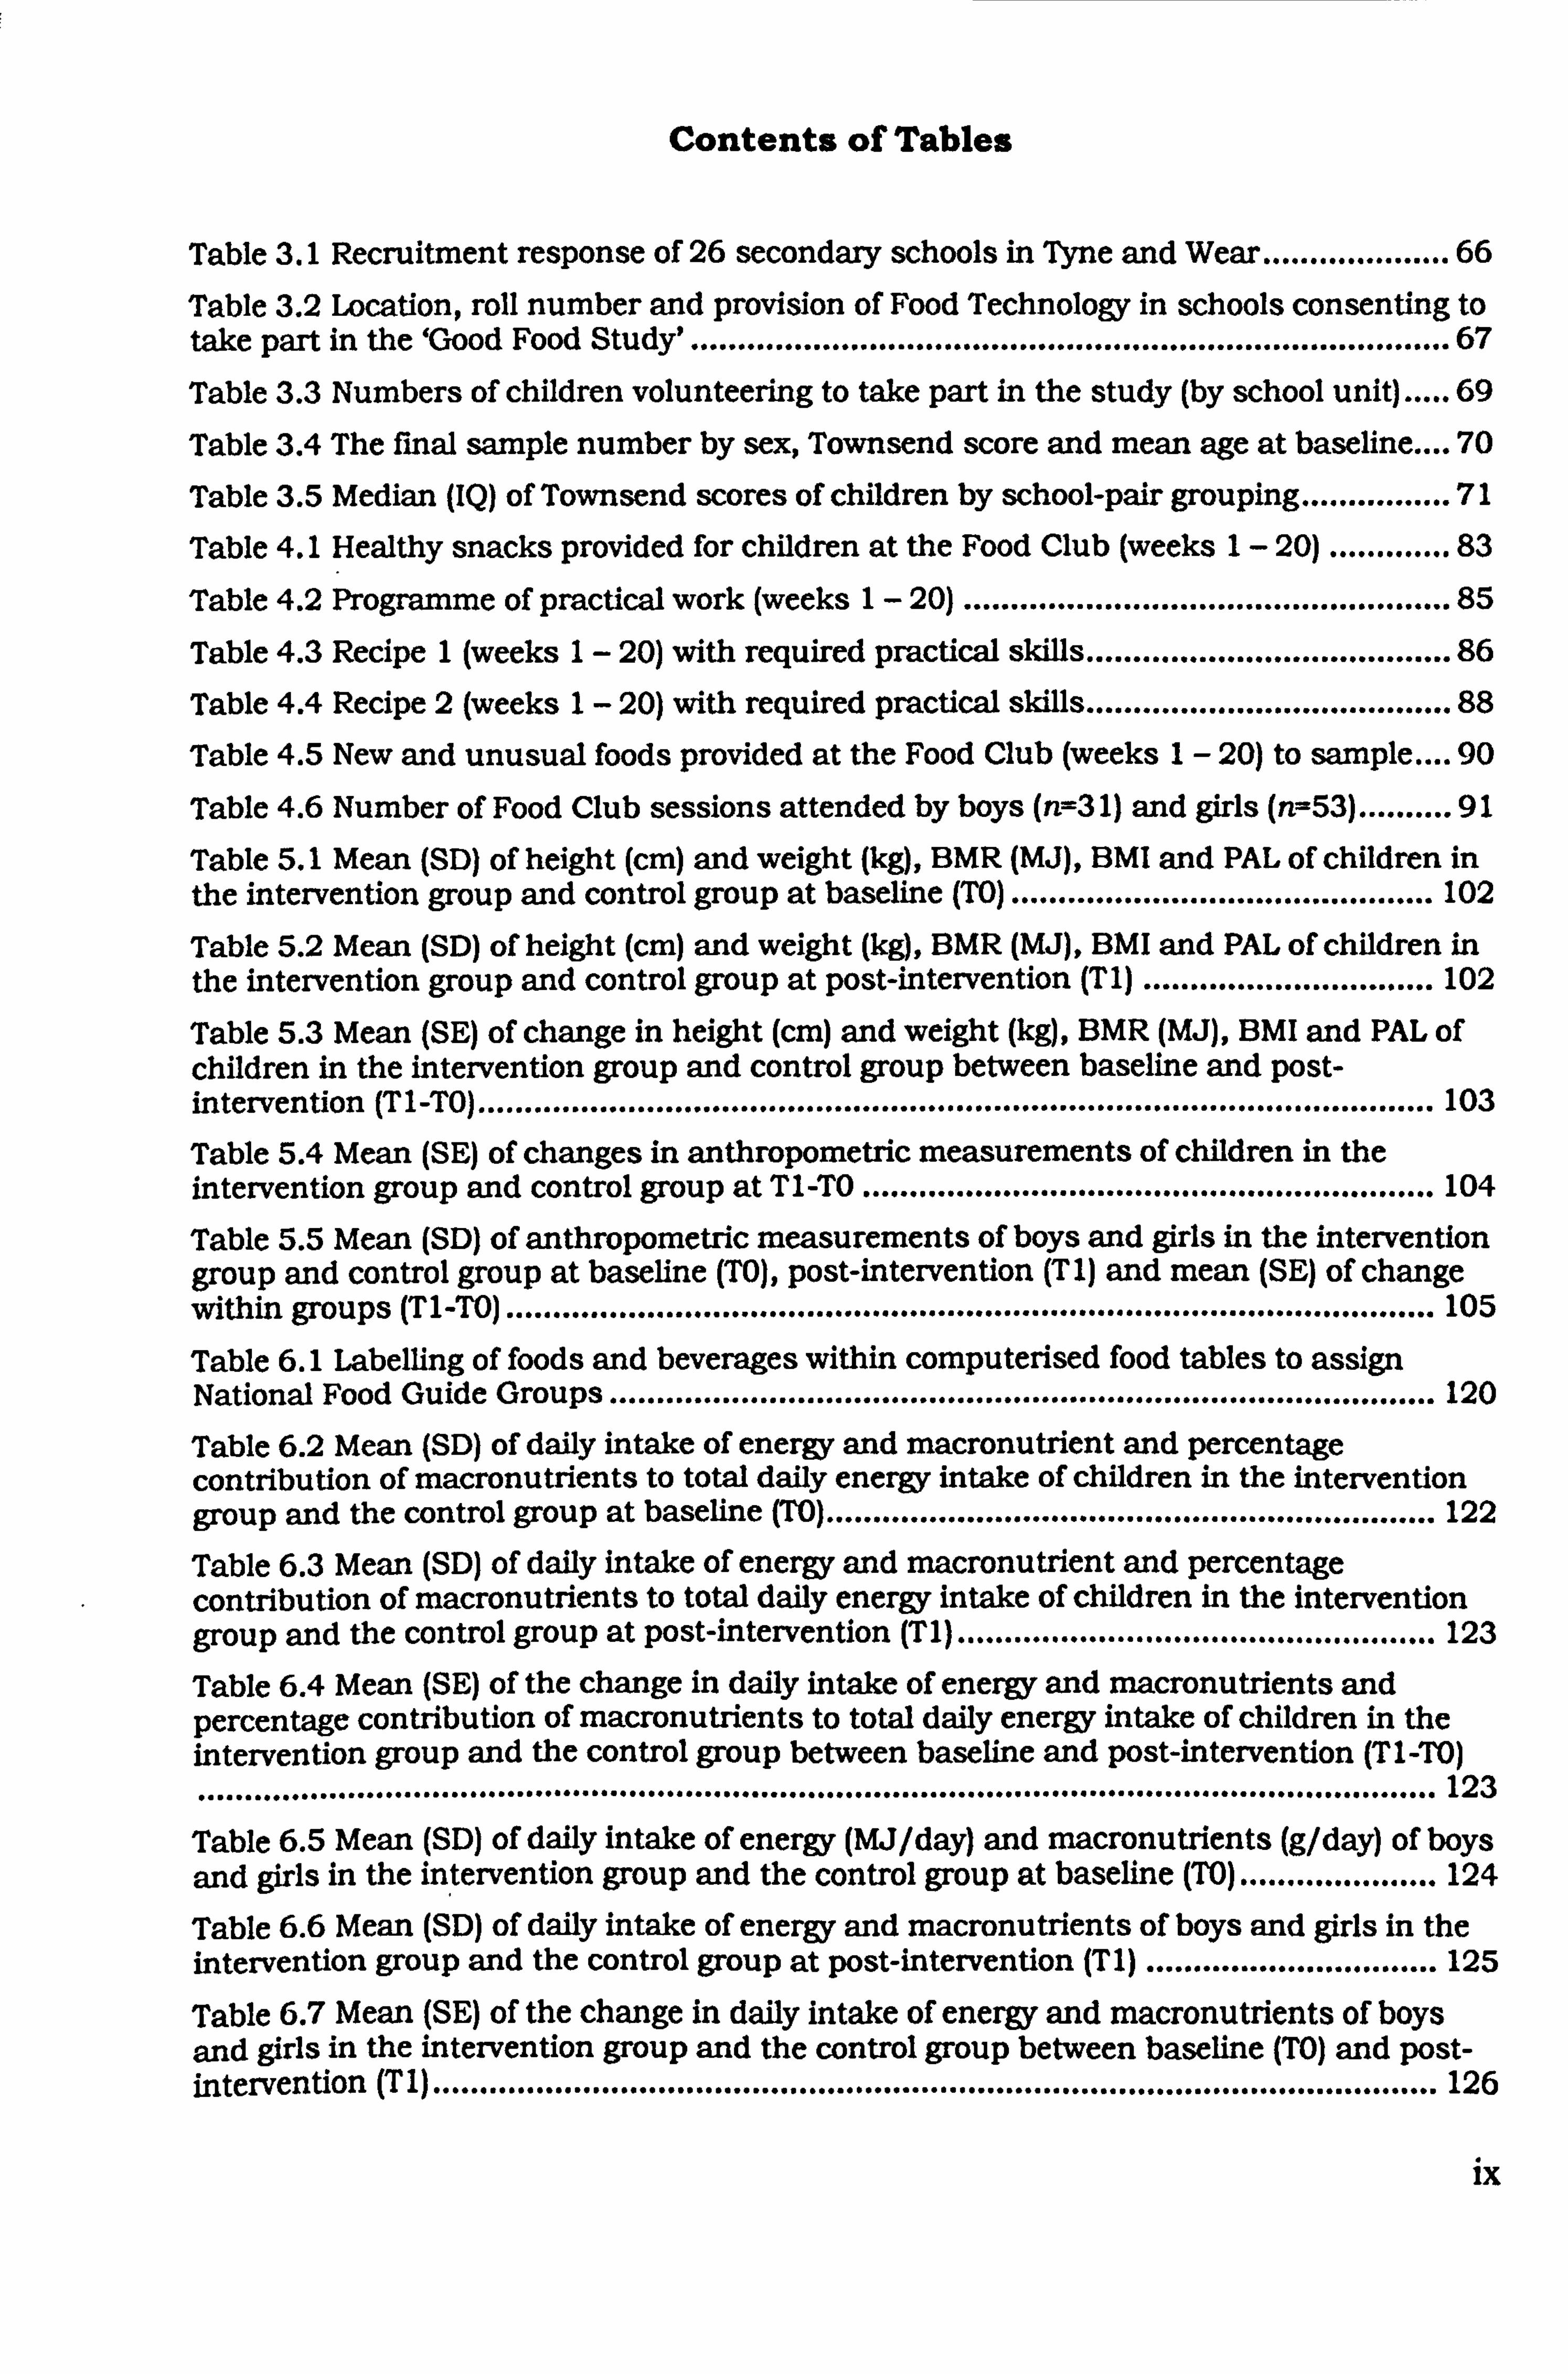
Contents of Tables
Table 3.1 Recruitment response of 26 secondary schools in Tyne and Wear .................... 66
Table 3.2 Location, roll number and provision of Food Technology in schools consenting to take part in the 'Good Food Study . ................................................................................. 67
Table 3.3 Numbers of children volunteering to take part in the study (by school unit) ..... 69
Table 3.4 The final sample number by sex, Townsend score and mean age at baseline .... 70
Table 3.5 Median (IQ) of Townsend scores of children by school-pair grouping ................ 71
Table 4.1 Healthy snacks provided for children at the Food Club (weeks 1- 20) ............. 83
Table 4.2 Programme of pmctical work (weeks 1- 20) .................................................... 85
Table 4.3 Recipe 1 (weeks 1- 20) with required practical skills ....................................... 86
Table 4.4 Recipe 2 (weeks 1- 20) with required pmctical skills ....................................... 88
Table 4.5 New and unusual foods provided at the Food Club (weeks 1- 20) to sample .... 90
Table 4.6 Number of Food Club sessions attended by boys (rr--3 1) and girls (n=53) .......... 91
Table 5.1 Mean (SD) of height (cm) and weight ft), BMR (MJ), BMI and PAL of children in the intervention group and control group at baseline (TO) ............................................. 102
Table 5.2 Mean (SD) of height (cm) and weight ft), BMR (MJ), BMI and PAL of children in the intervention group and control group at post-intervention (Tl) ............................... 102
Table 5.3 Mean (SE) of change in height (cm) and weight ft), BMR (MJ), BMI and PAL of children in the intervention group and control group between baseline and post- intervention (Tl-TO) ...................................................................................................... 103
Table 5.4 Mean (SE) of changes in anthropometric measurements of children in the intervention group and control group at T1 -TO ............................................................. 104
Table 5.5 Mean (SD) of anthropometric measurements of boys and girls in the intervention group and control group at baseline (TO), post-intervention (T1) and mean (SE) of change within groups (T1-TO) ................................................................................................... 105
Table 6.1 Labelling of foods and beverages within computerised food tables to assign National Food Guide Groups ........................................................................................ 120
Table 6.2 Mean (SD) of daily intake of energy and macronutrient and percentage contribution of macronutrients to total daffy energy intake of children in the intervention group and the control group at baseline (TO) ................................................................. 122
Table 6.3 Mean (SD) of daily intake of energy and macronutrient and percentage contribution of macronutrients to total daily energy intake of children in the intervention group and the control group at post-intervention (TI) ................................................... 123
Table 6.4 Mean (SE) of the change in daily intake of energy and macronutrients and percentage contribution of macronutrients to total daily energy intake of children in the intervention group and the control group between baseline and post-intervention (T1 -TO) .................................................................................................................................... 123
Table 6.5 Mean (SD) of daffy intake of energy (MJ/day) and macronutrients (g/day) of boys and girls in the in
' tervention group and the control group at baseline (TO) ..................... 124
Table 6.6 Mean (SD) of daffy intake of energy and macronutrients of boys and girls in the intervention group and the control group at post-intervention (TI) ............................... 125
Table 6.7 Mean (SE) of the change in daily intake of energy and macronutrients of boys and girls in the intervention group and the control group between baseline (TO) and post- intervention (Tl) ........................................................................................................... 126
ix
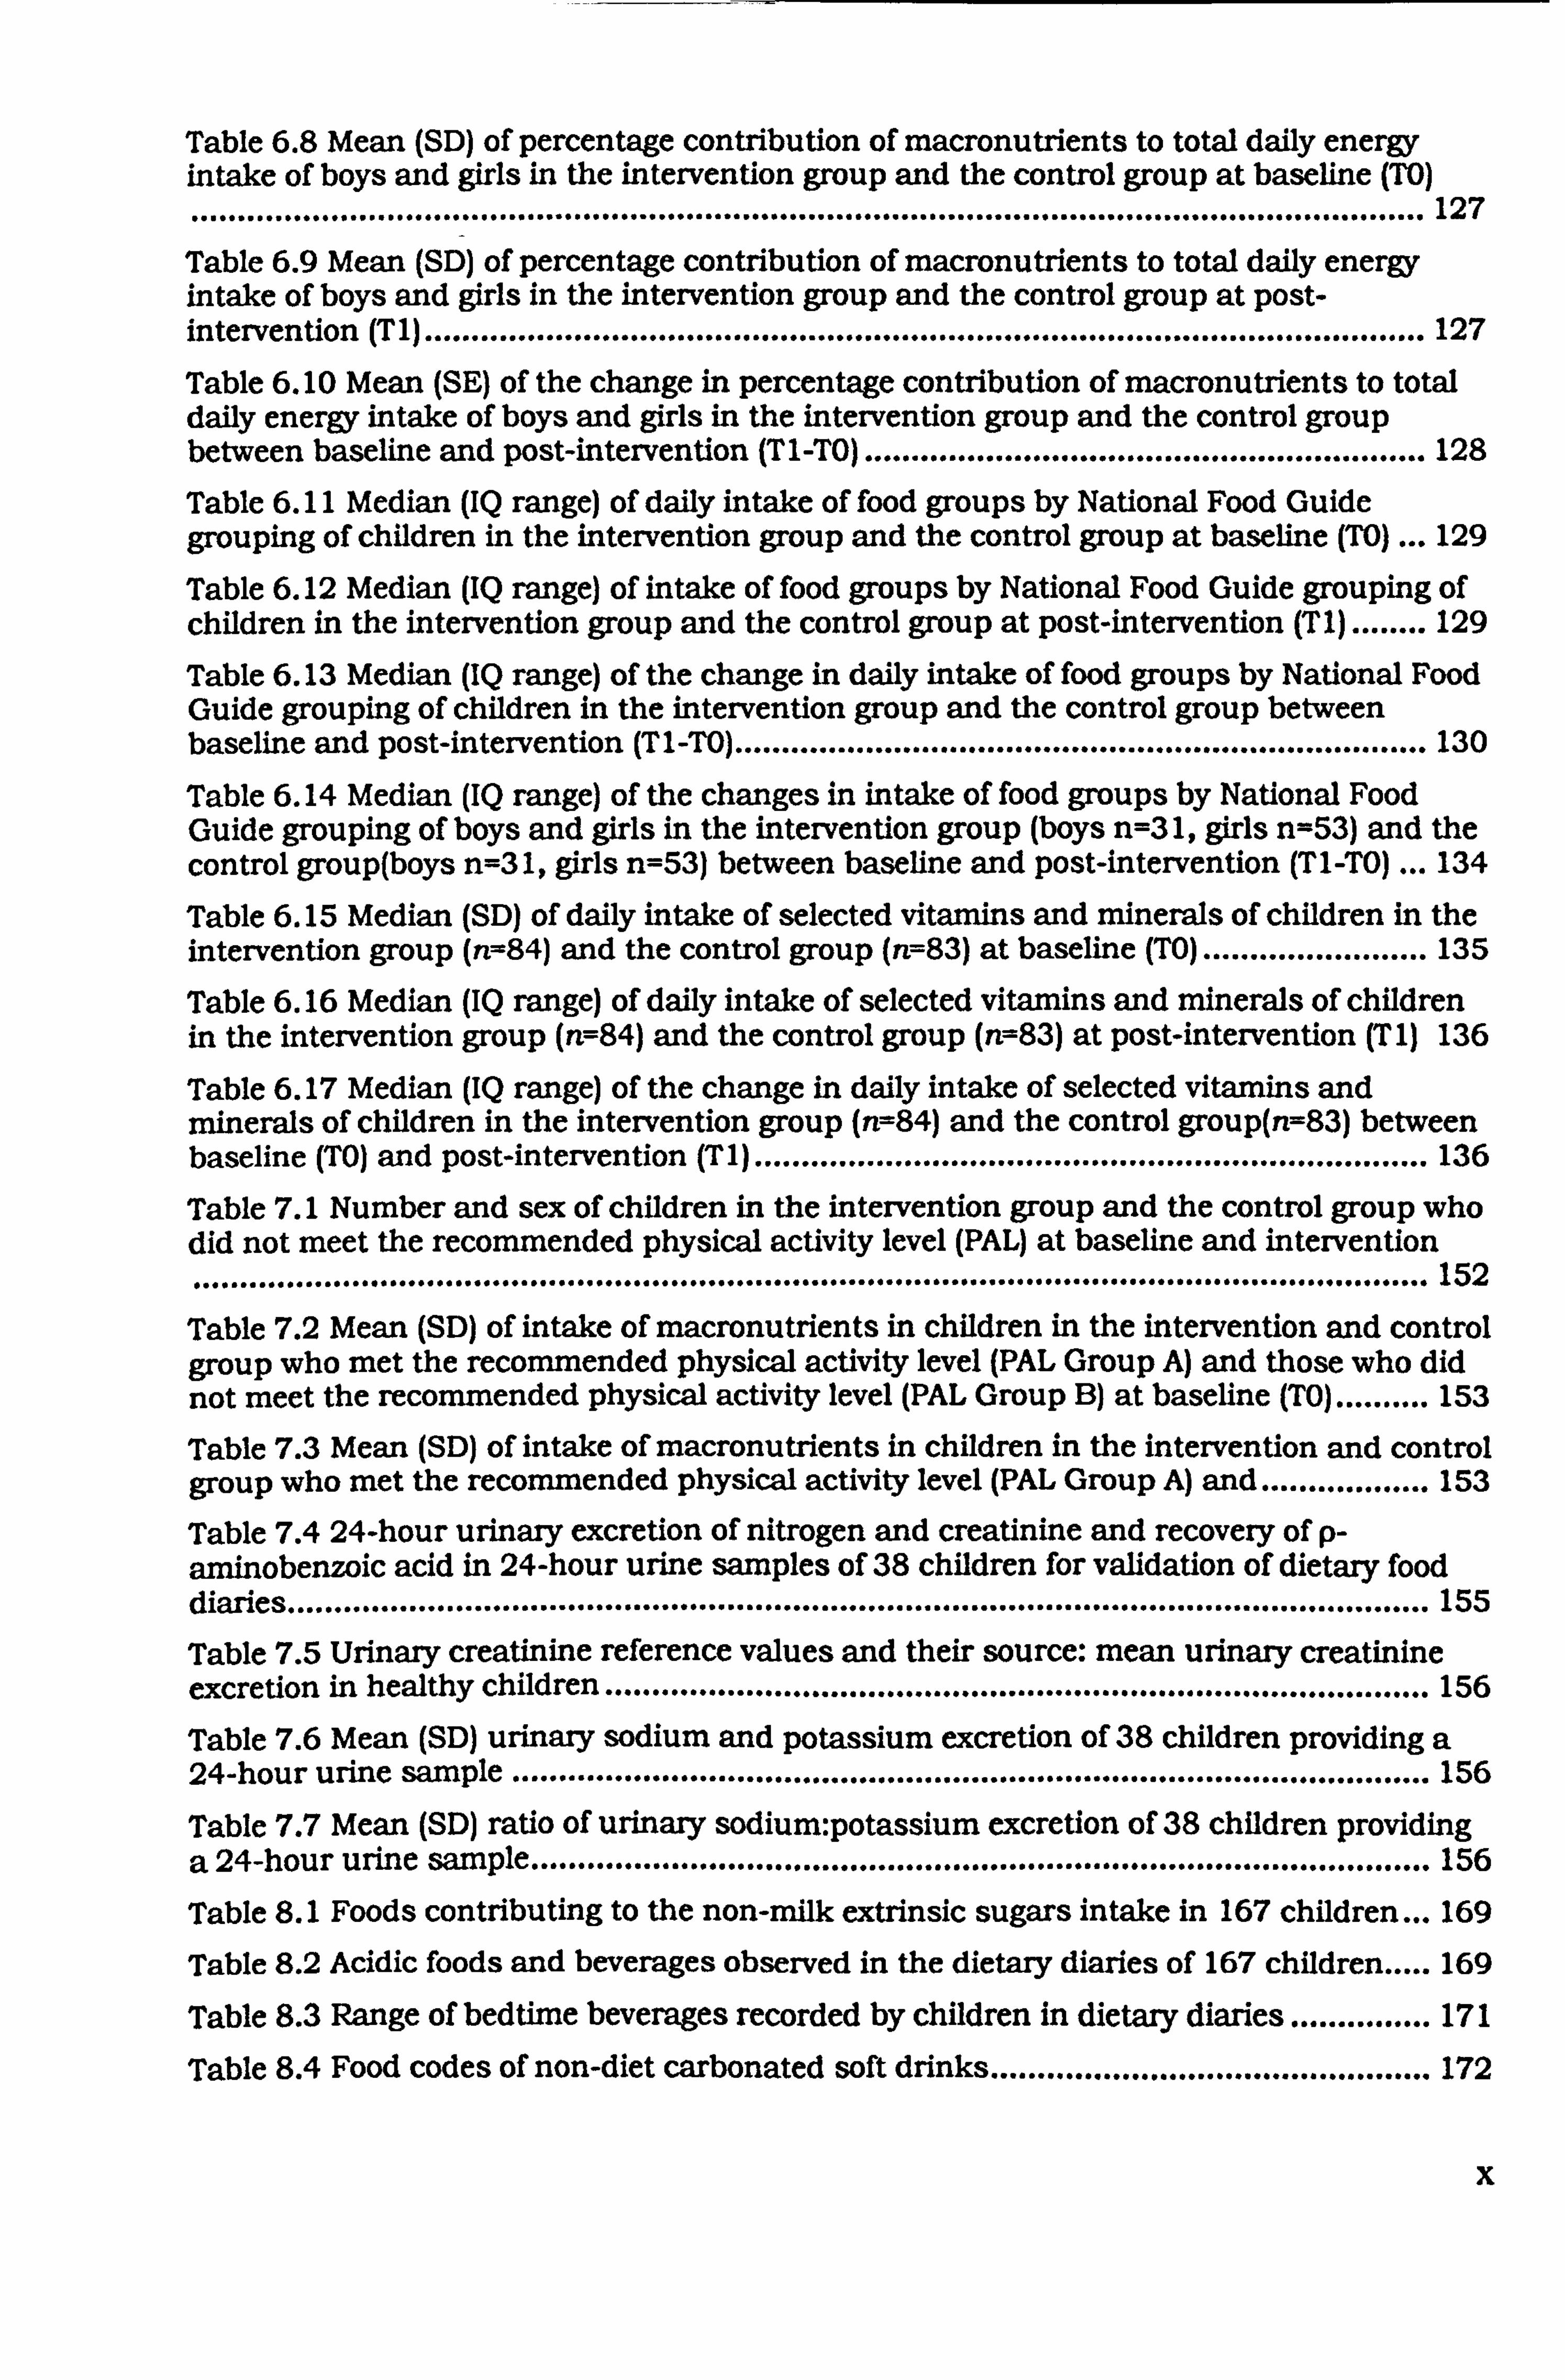
Table 6.8 Mean (SD) of percentage contribution of macronutrients to total day energy intake of boys and girls in the intervention group and the control group at baseline (TO)
............................ . ...................................................................................................... 127
Table 6.9 Mean (SD) of percentage contribution of macronutrients to total daily energy intake of boys and girls in the intervention group and the control group at post- intervention (T1) ........................................................................................................... 127
Table 6.10 Mean (SE) of the change in percentage contribution of macronutrients to total daily energy intake of boys and girls in the intervention group and the control group between baseline and post-intervention (T1-TO) ............................................................ 128
Table 6.11 Median (IQ range) of daily intake of food groups by National Food Guide grouping of children in the intervention group and the control group at baseline (TO) ... 129
Table 6.12 Median (IQ range) of intake of food groups by National Food Guide grouping of children in the intervention group and the control group at post-intervention (TI) ........ 129
Table 6.13 Median (IQ range) of the change in daily intake of food groups by National Food Guide grouping of children in the intervention group and the control group between baseline and post-intervention (T1-TO) .......................................................................... 130
Table 6.14 Median (IQ range) of the changes in intake of food groups by National Food Guide grouping of boys and girls in the intervention group (boys n=3 1, girls n=53) and the control group(boys n=31, girls n=53) between baseline and post-intervention (T1-TO) ... 134
Table 6.15 Median (SD) of daily intake of selected vitamins and minerals of children in the intervention group (n=84) and the control group (rr--83) at baseline (TO) ........................ 135
Table 6.16 Median (IQ range) of daily intake of selected vitamins and minerals of children in the intervention group (n7-84) and the control group (rr--83) at post-intervention (T 1) 136
Table 6.17 Median (IQ range) of the change in daily intake of selected vitamins and minerals of children in the intervention group (rr--84) and the control group(n--83) between baseline (TO) and post-intervention (Tl) ........................................................................ 136
Table 7.1 Number and sex of children in the intervention group and the control group who did not meet the recommended physical activity level (PAL) at baseline and intervention
.................................................................................................................................... 152
Table 7.2 Mean (SD) of intake of macronutrients in children in the intervention and control group who met the recommended physical activity level (PAL Group A) and those who did not meet the recommended physical activity level (PAL Group B) at baseline (TO) .......... 153
Table 7.3 Mean (SD) of intake of macronutrients in children in the intervention and control group who met the recommended physical activity level (PAL Group A) and .................. 153
Table 7.4 24-hour urinary excretion of nitrogen and creatinine and recovery of p- aminobenzoic acid in 24-hour urine samples of 38 children for validation of dietary food diaries .......................................................................................................................... 155
Table 7.5 Urinary creatinine reference values and their source: mean urinary creatinine excretion in healthy children .............. * ......................................................................... 156
Table 7.6 Mean (SD) urinary sodium and potassium excretion of 38 children providing a 24-hour urine sample .................................................................................................. 156
Table 7.7 Mean (SD) ratio of urinary sodium: potassiurn excretion of 38 children providing a 24-hour urine sample ................................................................................................ 156
Table 8.1 Foods contributing to the non-milk extrinsic sugars intake in 167 children ... 169
Table 8.2 Acidic foods and beverages observed in the dietary diaries of 167 children ..... 169
Table 8.3 Range of bedtime beverages recorded by children in dietary diaries ............... 171
Table 8.4 Food codes of non-diet carbonated soft drinks ............................................... 172
x
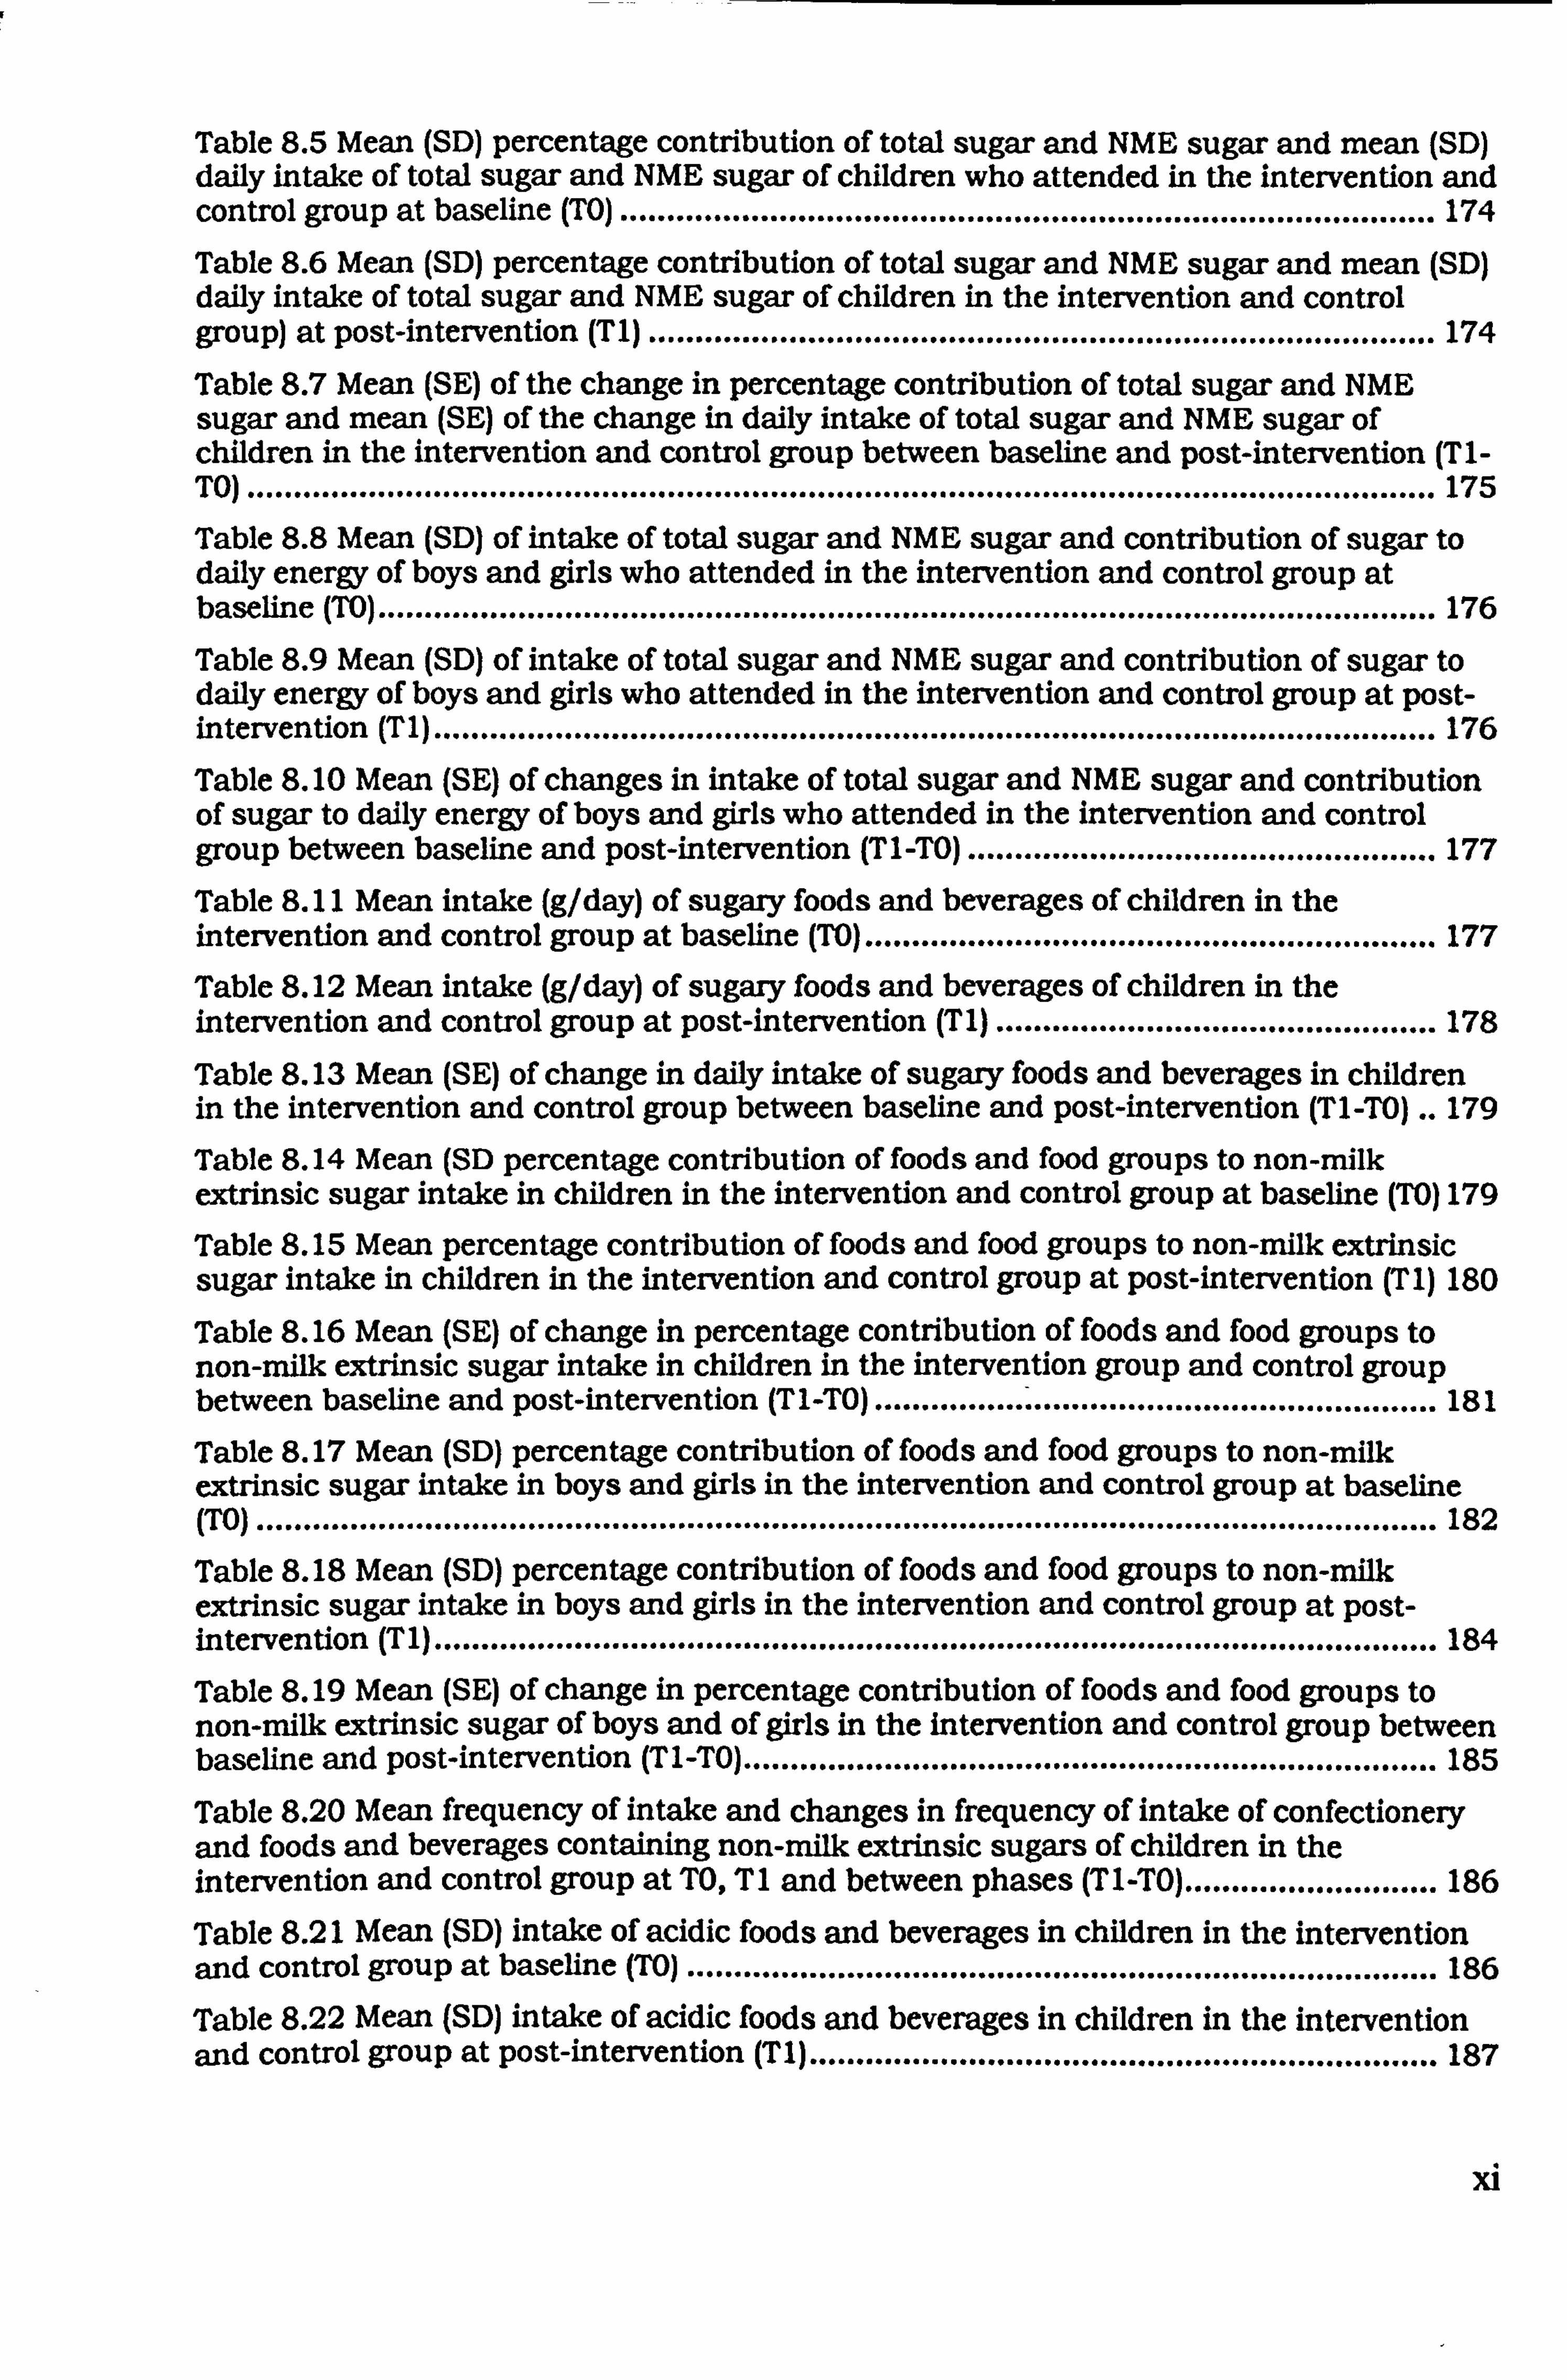
Table 8.5 Mean (SD) percentage contribution of total sugar and NME sugar and mean (SD) daily intake of total sugar and NME sugar of children who attended in the intervention and control group at baseline (TO) ....................................................................................... 174
Table 8.6 Mean (SD) percentage contribution of total sugar and NME sugar and mean (SD) daffy intake of total sugar and NME sugar of children in the intervention and control group) at post-intervention (T1) .................................................................................... 174
Table 8.7 Mean (SE) of the change in percentage contribution of total sugar and NME sugar and mean (SE) of the change in daily intake of total sugar and NME sugar of children in the intervention and control group between baseline and post-intervention (T 1- TO) ............................................................................................................................... 175
Table 8.8 Mean (SD) of intake of total sugar and NME sugar and contribution of sugar to daily energy of boys and girls who attended in the intervention and control group at baseline (TO) ................................................................................................................. 176
Table 8.9 Mean (SD) of intake of total sugar and NME sugar and contribution of sugar to daffy energy of boys and girls who attended in the intervention and control group at post- intervention (Tl) ........................................................................................................... 176
Table 8.10 Mean (SE) of changes in intake of total sugar and NME sugar and contribution of sugar to daily energy of boys and girls who attended in the intervention and control group between baseline and post-intervention (Tl-TO) .................................................. 177
Table 8.11 Mean intake (g/day) of sugary foods and beverages of children in the intervention and control group at baseline (TO) ............................................................. 177 Table 8.12 Mean intake (g/day) of sugary foods and beverages of children in the intervention and control group at post-intervention (Tl) ............................................... 178
Table 8.13 Mean (SE) of change in daily intake of sugary foods and beverages in children in the intervention and control group between baseline and post-intervention (T I -TO) .. 179
Table 8.14 Mean (SD percentage contribution of foods and food groups to non-milk extrinsic sugar intake in children in the intervention and control group at baseline (TO) 179
Table 8.15 Mean percentage contribution of foods and food groups to non-milk extrinsic sugar intake in children in the intervention and control group at post-intervention (T 1) 180
Table 8.16 Mean (SE) of change in percentage contribution of foods and food groups to non-milk extrinsic sugar intake in children in the intervention group and control group between baseline and post-intervention (T1-TO) ............................................................. 181
Table 8.17 Mean (SD) percentage contribution of foods and food groups to non-milk extrinsic sugar intake in boys and girls in the intervention and control group at baseline (TO) .............................................................................................................................. 182
Table 8.18 Mean (SD) percentage contribution of foods and food groups to non-milk extrinsic sugar intake in boys and girls in the intervention and control group at post- intervention (T1) ........................................................................................................... 184
Table 8.19 Mean (SE) of change in percentage contribution of foods and food groups to non-milk extrinsic sugar of boys and of girls in the intervention and control group between baseline and post-intervention (T1-TO) .......................................................................... 185
Table 8.20 Mean frequency of intake and changes in frequency of intake of confectionery and foods and beverages containing non-milk extrinsic sugars of children in the intervention and control group at TO, T1 and between phases (T1-TO) ........................... 186
Table 8.21 Mean (SD) intake of acidic foods and beverages in children in the intervention and control group at baseline (TO) ................................................................................ 186 Table 8.22 Mean (SD) intake of acidic foods and beverages in children in the intervention and control group at post-intervention (TI) ................................................................... 187
xi
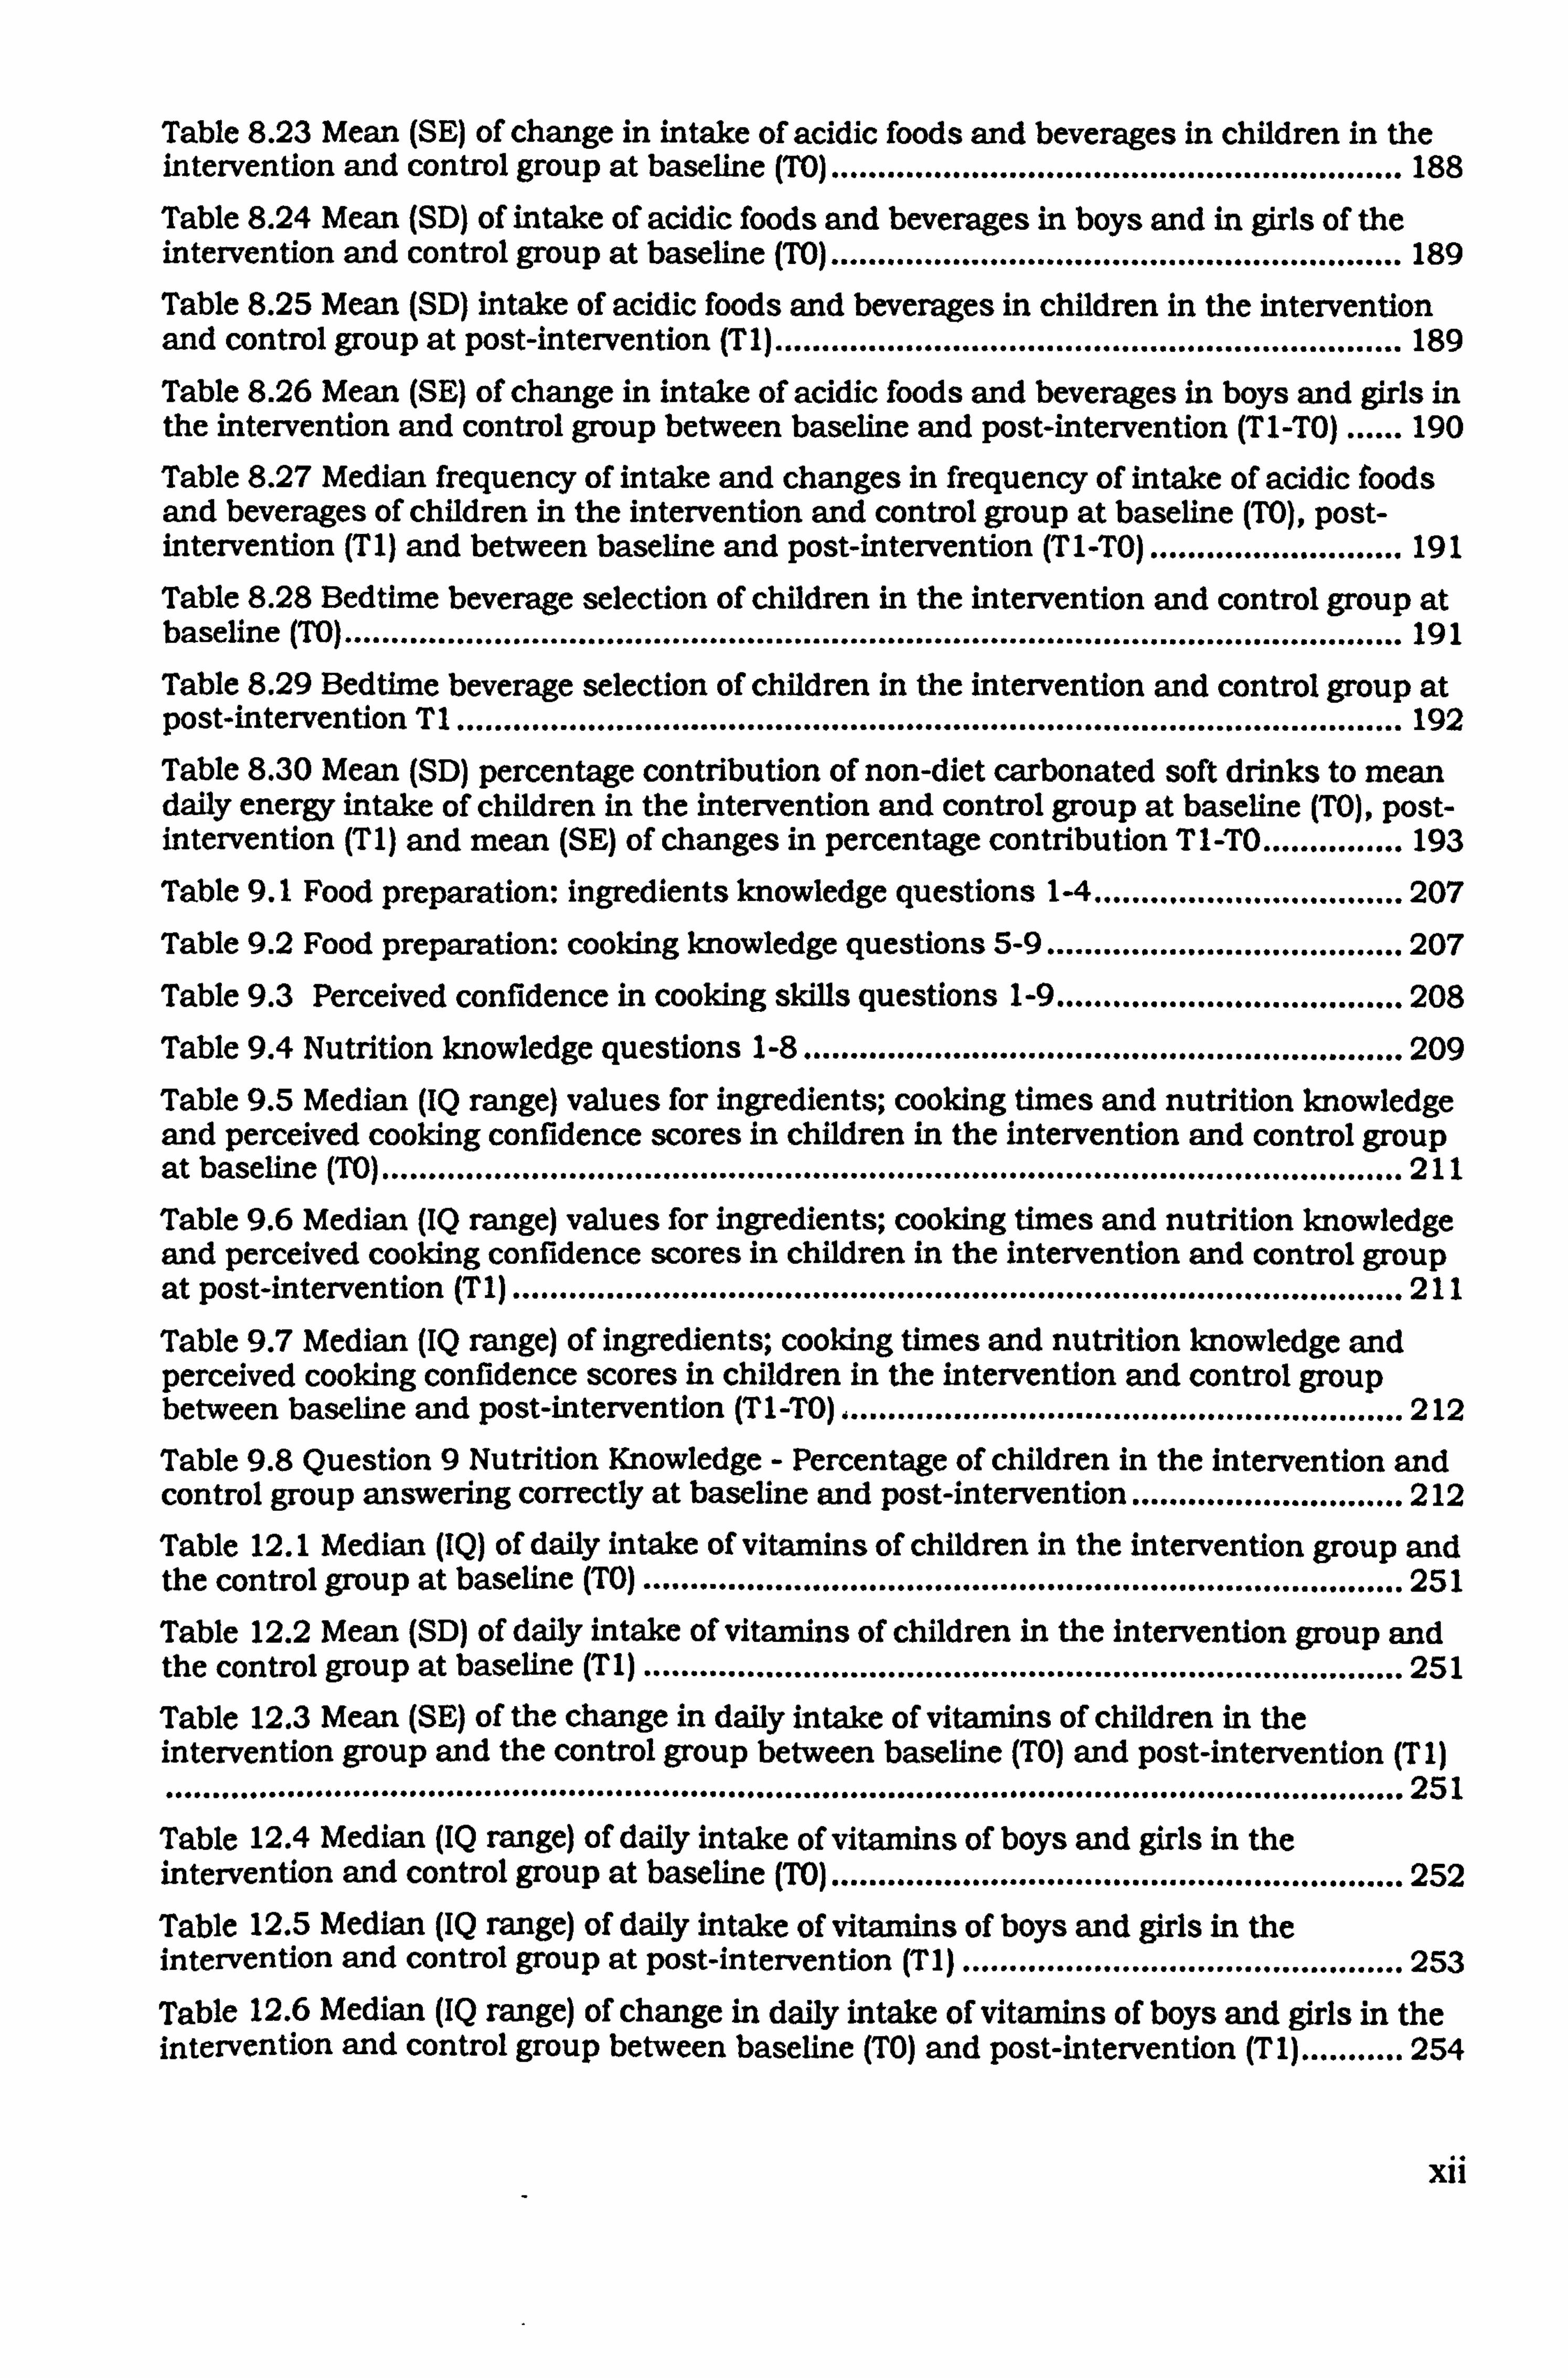
Table 8.23 Mean (SE) of change in intake of acidic foods and beverages in children in the intervention and control group at baseline (TO) ............................................................. 188 Table 8.24 Mean (SD) of intake of acidic foods and beverages in boys and in girls of the intervention and control group at baseline (TO) ............................................................. 189 Table 8.25 Mean (SD) intake of acidic foods and beverages in children in the intervention and control group at post-intervention (T1) ................................................................... 189
Table 8.26 Mean (SE) of change in intake of acidic foods and beverages in boys and girls in the intervention and control group between baseline and post-intervention (TI-TO) ...... 190 Table 8.27 Median frequency of intake and changes in frequency of intake of acidic foods and beverages of children in the intervention and control group at baseline (TO), post- intervention (Tl) and between baseline and post-intervention (Tl-TO) ........................... 191
Table 8.28 Bedtime beverage selection of children in the intervention and control group at baseline (TO) ................................................................................................................. 191 Table 8.29 Bedtime beverage selection of children in the intervention and control group at post-intervention Tl ..................................................................................................... 192 Table 8.30 Mean (SD) percentage contribution of non-diet carbonated soft drinks to mean daily energy intake of children in the intervention and control group at baseline (TO), post- intervention (T I) and mean (SE) of changes in percentage contribution T1 -TO ............... 193 Table 9.1 Food preparation: ingredients knowledge questions 1-4 ................................. 207
Table 9.2 Food preparation: cooking knowledge questions 5-9 ...................................... 207 Table 9.3 Perceived confidence in cooking skills questions 1-9 ..................................... 208 Table 9.4 Nutrition knowledge questions 1-8 ................................................................ 209
Table 9.5 Median (IQ range) values for ingredients; cooking times and nutrition knowledge and perceived cooking confidence scores in children in the intervention and control group at baseline (TO) ............................................................................................................. 211 Table 9.6 Median (IQ range) values for ingredients; cooking times and nutrition knowledge and perceived cooking confidence scores in children in the intervention and control group at post-intervention (Tl) ............................................................................................... 211
Table 9.7 Median (IQ range) of ingredients; cooking times and nutrition knowledge and perceived cooking confidence scores in children in the intervention and control group between baseline and post-intervention (Tl-TO) ............................................................ 212 Table 9.8 Question 9 Nutrition Knowledge - Percentage of children in the intervention and control group answering correctly at baseline and post-intervention ............................. 212 Table 12.1 Median (IQ) of daily intake of vitamins of children in the intervention group and the control group at baseline (TO) ................................................................................. 251
Table 12.2 Mean (SD) of daily intake of vitamins of children in the Intervention group and the control group at baseline (Tl) ................................................................................. 251 Table 12.3 Mean (SE) of the change in daily intake of vitamins of children in the intervention group and the control group between baseline (TO) and post-intervention (Tl) .................................................................................................................................... 251 Table 12.4 Median (IQ range) of daffy intake of vitamins of boys and girls in the intervention and control group at baseline (TO) ............................................................. 252 Table 12.5 Median (IQ range) of daffy intake of vitamins of boys and girls in the intervention and control group at post-intervention (TI) ............................................... 253 Table 12.6 Median (IQ range) of change in daily intake of vitamins of boys and girls in the intervention and control group between baseline (TO) and post-intervention (Tl) ........... 254
xii
Table 12.7 Median (IQ range) of daily intake of minerals of boys and girls in the intervention and control group at baseline (TO) ............................................................. 257
Table 12.8 Mean (SD) of daily intake of minerals of boys and girls in the intervention and control group at post-intervention (Tl) ......................................................................... 257 Table 12.9 Mean (SE) of change in daily intake of minerals of boys and girls in the intervention and control group between baseline (TO) and post-intervention (T1) ........... 257 Table 12.10 Percentage of boys and girls in the intervention and control group not meeting the Lower Reference Nutrient Intake for calcium and iron at baseline (TO) and post- intervention (Tl) ........................................................................................................... 260 Table 12.11 Determination of urinary sodium by flame photometry: record of instrumentation drift and proximity to concentration of standard ................................. 271 Table 12.12 Determination of urinary potassium by flame photometry: record of instrumentation drift and proximity to concentration of standard ................................. 271
xiii
Table of Figures
Figure 1 -1 The National Curriculum: Subjects and Key Stages* ...................................... 18 Figure 3-1 The County of Tyne and Wear ........................................................................ 52 Figure 3-2 Letter to Headteachers inviting participation in the Good Food Study ............ 56
Figure 3-3 The Good Food Study logo ............................................................................. 58 Figure 3-4 Information sheet supplied to prospective volunteers (intervention group) ...... 59 Figure 3-5 Parental consent form ................................................................................... 60 Figure 3-6 Posters displayed in study schools to promote the Good Food Study .............. 61
Figure 3-7 Certificate of Merit to be awarded to children completing all aspects of The Good Food Studv ............................................................................................................ 62 Figure 3-8 Postcode Mal) of Tvne and Wear .................................................................... 63 Figure 3-9 Family details form ........................................................................................ 64
Figure 3- 10 Effect of recruitment strategy on numbers of child volunteers ...................... 68
Figure 3-11 Total number of children (n7--288) volunteering to take part in the study (by school unit and by sex) .................................................................................................. 70
Figure 4-1 Frequency of attendance to the Food Club by all children (n=84) of the intervention group .......................................................................................................... 91
Figure 4-2 Frequency of attendance to the Food Club of children in the intervention group by boys (tir-3 1) and girls (n---53) ....................................................................................... 92
Figure 4-3 Median attendance of boys, girls and all children (n = 84) in five intervention group schools to the Food Club sessions (No 1- 20) by session ...................................... 93 Figure 5-1 Distribution of weight (kg) of children in the intervention group (n=80) at baseline and post-intervention ..................................................................................... 102
Figure 5-2 Distribution of weight (kg) of children in the control group (n---82) at baseline and post-intervention ................................................................................................... 103
Figure 5-3 The relationship between Townsend Material Deprivation Score and height (cm) at baseline (TO) of 162 children ..................................................................................... 105 Figure 5-4 The relationship between Townsend Material Deprivation Score and height (cm) at post-intervention (Tl) of 162 children ....................................................................... 106 Figure 6-1 Comment from girl (control group) after completing first food diary .............. 110
Figure 6-2 Comment from boy (control group) on completing third food diary ............... 110
Figure 6-3 Food diary designed for use by children participating in The Good Food Study (front page) ................................................................................................................... 114
Figure 6-4 Food diary (Pages 1& 2) .............................................................................. 115
Figure 6-5 Food diary (Pages 3&4- Example pages) ................................................... 116
Figure 6-6 Food diary (Pages 5 to 22) ............................................................................ 117
Figure 6-7 Classroom release slips for children attending interview at school to clarify recording of dietary intake ............................................................................................ 118
Figure 6-8 Slip given to children at school as a reminder to bring their completed food diary to school on the day of interview .......................................................................... 119
Figure 6-9 The National Food Guide ............................................................................ 120
x1v
Figure 6-10 Median daily intake of milk and dairy foods (National Food Guide) of boys and girls in the intervention group (boys rr--3 1, girls rr--53) and the control group (boys rr-3 1, girls n7- 52) at baseline (TO) and post-intervention (T1) .................................................. 131
Figure 6-11 Median daily intake of meat, fish and alternatives (National Food Guide) of boys and girls in the intervention group (boys n=3 1, girls n7-53) and the control group (boys n=3 1, girls rr-- 52) at baseline (TO) and post-intervention (T 1) ............................... 131
Figure 6-12 Median daily intake of bread, other cereals and potatoes (National Food Guide) of boys and girls in the intervention group (boys rr--3 1, girls rx7-53) and the control group (boys rr--3 1, girls ri-- 52) at baseline (TO) and post-intervention (T 1) ............................... 132
Figure 6-13 Median daily intake of fruit and vegetables (National Food Guide) of boys and girls in the intervention group (boys n7-3 1, girls n=53) and the control group (boys n-3 1, girls rr-- 52) at baseline (TO) and post-intervention (TI) .................................................. 133
Figure 6-14 Median daily intake of foods containing fat and sugar (National Food Guide) of boys and girls in the intervention group(boys rr--3 1, girls n--53) and the control group (boys n--31, girls rr-- 52) at baseline (TO) and post-intervention (TI) ............................... 133
Figure 7-1 Subject information sheet (24-hour urine sample) ....................................... 149
Figure 7-2 Parental consent form (24-hour urine sample) ............................................. 150
Figure 7-3 Relationship between urinary potassium excretion (g/24hr) and total fruit and vegetable intake (g/24hr) on day of 24hr urine collection in 38 children ....................... 157
Figure 7-4 Relationship between urinary sodium: potassium and fruit and vegetable intake of 38 children providing a 24-hour urine sample .......................................................... 157
Figure 8-1 Frequency of consuming sugary and acidic foods and beverages, as recorded in food diary (girl, control school at post-intervention) ...................................................... 163
Figure 8-2 Examples of purpose-written database queries for the isolation and quantification of foods and beverages containing non-milk extrinsic sugar and acidic foods and beverages .............................................................................................................. 170
Figure 8-3 Example of a purpose-written database query for sweet biscuits (to calculate the contribution of non-milk extrinsic sugar) ................................................................ 170
Figure 8-4 Selecting beverages consumed at bedtime by 167 children ......................... 171
Figure 8-5 Calculation of the contribution of non-diet carbonated soft drinks ............... 173
Figure 9-1 Comment from girl (age 13, control school) on completing first food diary .... 202
Figure 9-2 Nutrition Knowledge Question 9 .................................................................. 210
Figure 10- 1 Letter to Mrs Tracey Cowell, Food Club Teacher, following the close of the Food Club in April 2000 ............................................................................................... 215
Figure 12-1 Flyer designed to be attached to letter of recruitment to parents and guardians of Year 7 pupils ............................................................................................................ 249
Figure 12-2 Percentage of boys in the intervention and control group meeting the Reference Nutrient Intake (RNI) for selected vitamins at baseline (TO) ........................... 255
Figure 12-3 Percentage of boys in the intervention and control group meeting the Reference Nutrient Intake (RNI) for selected vitamins at post-intervention (T1) .............. 255
Figure 12-4 Percentage of girls in the intervention and control group meeting the Reference Nutrient Intake (RNI) for selected vitamins at baseline (TO) ........................... 256
Figure 12-5 Percentage of girls in the intervention and control group meeting the Reference Nutrient Intake (RNI) for selected vitamins at post-intervention (T1) .............. 256
Figure 12-6 Percentage of children in the intervention and control group meeting the Reference Nutrient Intake (RNI) for selected minerals at baseline (TO) ........................... 258
xv
Figure 12-7 Percentage of children in the intervention and control group meeting the Reference Nutrient Intake (RNI) for selected minerals at post-intervention (Tl) .............. 258
Figure 12-8 Percentage of boys in the intervention and control group meeting the Reference Nutrient Intake for calcium, iron and zinc at baseline (TO) ............................ 259 Figure 12-9 Percentage of boys in the intervention and control group meeting the Reference Nutrient Intake for calcium, iron and zinc at post-intervention (T I) ............... 259
Figure 12-10 Percentage of girls in the intervention and control group meeting the Reference Nutrient Intake for calcium, iron and zinc at baseline (TO) ............................ 260
Figure 12-11 Percentage of girls in the intervention and control group meeting the Reference Nutrient Intake for calcium, iron and zinc at post-intervention (Tl) ............... 260
Figure 12-12 Example 1 (Girl, control group) ................................................................ 261
Figure 12-13 Example 2 (Girl, control group) ................................................................ 262
Figure 12-14 Example 3 (boy, intervention group) ........................................................ 263
Figure 12-15 PABA Standard Calibration Curve (Series 1) ............................................ 266
Figure 12-16 PABA Standard Calibration Curve (Series 2) ............................................ 266
Figure 12-17 PABA Standard Calibration Curve (Series 3) ............................................ 267
Figure 12-18 Sodium Standard (Baseline) Calibration Curve ........................................ 272
Figure 12-19 Potassium Standard (Baseline) Calibration Curve at baseline ................... 272
xvi
Table of Plates
Plate 1.1 Making fruit salad at the Food Club ................................................................... v Plate 3.1 Newspaper article Newcastle Chronicle 03/03/99 ............................................. 51
Plate 3.2 Taking part in the Good Food Study is fun ....................................................... 57
Plate 3.3 Pupils in Sunderland enjoying fresh fruit ......................................................... 57
Plate 4.1 Preparing baked apples .................................................................................... 77
Plate 4.2 Fruit kebabs .................................................................................................... 78
Plate 4.3 Food Club recipe books .................................................................................... 81
Plate 4.4 Vegetable stir-fry ............................................................................................. 82
Plate 4.5 Making a coleslaw filling for a jacket potato at the Food Club ........................... 83
Plate 4.6 Making Food Club Pizza and Lasagne .............................................................. 84
Plate 4.7 Preparing a vegetarian curry at the Food Club ................................................. 85
Plate 4.8 Choosing a healthy snack at the Food Club ..................................................... 89
Plate 4.9 Trying porridge at the Food Club ...................................................................... 89
xvii
1 Introduction
"How can youngsters learn about food and healthy eating if they are not shown how
to prepare food? If you can't cook, you are putting your nutrition in the hands of the
manufacturers of ready-made meals. We need to engage our young people in a
culinary culture and show them that cooldng is funil.
Anita Cormac, Director; Royal Society of Arts Focus on Food campaign. (Burger Battles, Guardian Education, Tuesday May 23 2000, page 2)
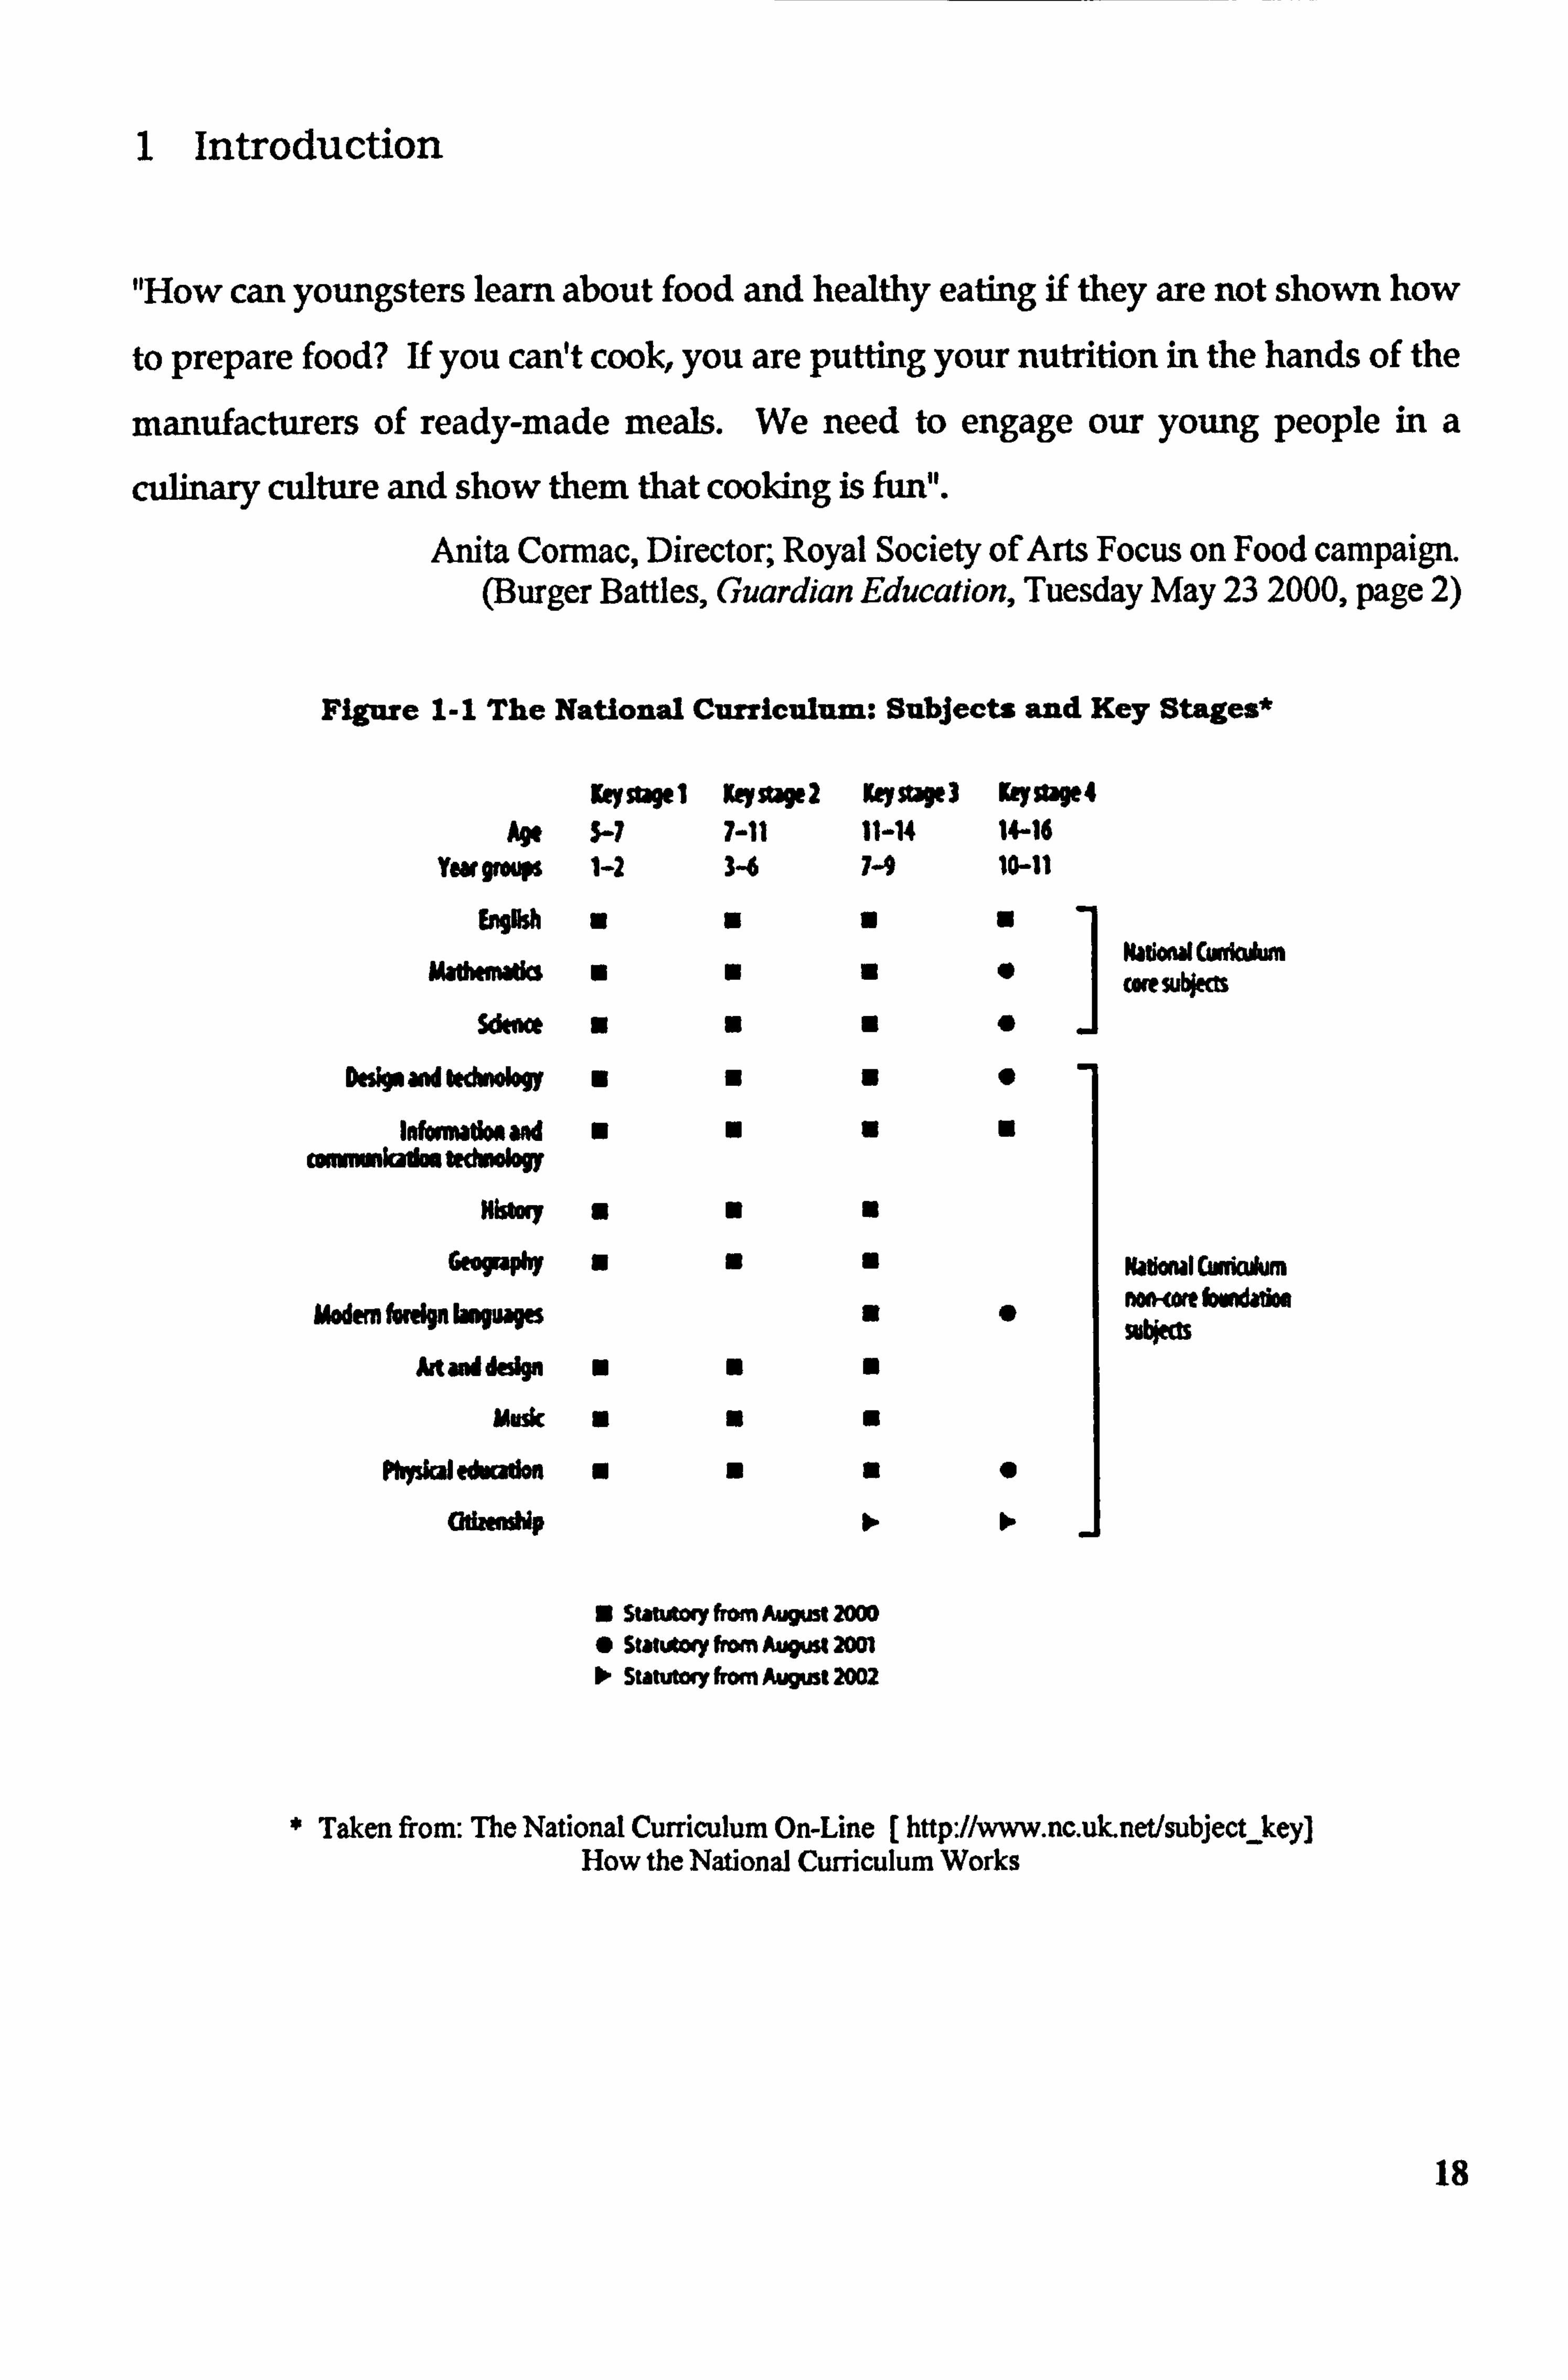
Figure 1-1 The National Curriculum: Subjects and Key Stages*
Age Ywomup
b*M
Key StW 1 5-7 1-2
0
ymstW2 7-11
K"SWI 11-14 7-9
Key9W4 W16 10-11
Do%* aw k&*I"Y
Idollow"aw re kAn Stdwology
History
GfOFA*
uwemhwpbogup
Artaddesion
Music
Physial edou"
G&MNNP
a
0 Nadond cunimm
1
cue SU*M 0
US
UU
" N N
N N N
N
" N N
N N N
" N N
Z subitcxy from August 20w 0 StäteAlwy Irm AU" 2001 > Statutory from August 2002
9
0
to
Ndloml CW(kAn n*, wtbwwgdoo mbl"
Taken from: The National Curriculum On-Line [ http: //www. nc. uk-net/subjecLkey] How the National Curriculum Works
18
In order to eat a healthy diet it is necessary to have some understanding of what comprises a healthy diet. The public are informed through various agencies, government bodies and health professionals that a healthy, balanced diet is key to maintaining good health, reducing the risk of diet-related diseases and minimising susceptibility to infection and ill health. In
order to meet current dietary guidelines, a basic level of knowledge of food, nutrition and food preparation is surely a requirement
Social changes, particularly in the nations' working lifestyle have had an impact upon family
life in the United Kingdom. The need and indeed the desire for parents, particularly mothers, to work outside the family home has increased. The traditional role of the housewife and
mother changed rapidly throughout the last quarter of the 2e century and the rate of change
continues to accelerate in the 21st. Such change in the roles of the sexes in society has been
reflected in education and the curriculum in UK schools. The teaching of home economics
and domestic skills was predominantly considered a female requirement, that is, girls at
secondary school level were taught cooking and domestic skills under the subject of either domestic science or home economics. Home economics were taught to girls to prepare them
for an adult life with a domestic focus.
Progressively more schools chose to teach cookery and domestic science to boys during the 1970's and the 1980's until it became the norm in most state schools in the UK The
introduction of the National Curriculum (National Curriculum, DfES, 1999) sought to reduce
educational inequalities between not only schools and local authorities, but between the social
classes and the sexes. Many subjects that were traditionally taught to one sex only were seen to be equally necessary to boys and girls, although along with home economics other subjects
such as sciences, technology and information and communication technology were included
in this curriculum shift. Having emerged in the early 1970's as an independent subject, home
economics and its delivery in the form of cookery classes in secondary schools, had sought to
equip young people with the theoretical knowledge and accompanying practical skills to
allow them to shop, prepare and cook a wide range of meals. However, it appears that
opinion inclined towards assuming that needs differed between the sexes and the social
classes.
The removal of this assumption in the late 1970's and subsequent educational provision
allowed, until recent changes in the National Curriculum commencing in the early in the
19
1990's, the teaching of food and cooking skills to all young people of secondary school age. Alas, good intentions were compromised in order to make room for progress.
Both the value and reliance upon food knowledge and practical cooking skills acquired in
school by young men and women is well documented and presented by Lang and colleagues in a review of cooking skills and health commissioned by the Health Education Authority
(Lang et al, 1999). In a further analysis of the Health Education Authority's 1993 Health and Lifestyles Survey data, Lang et al studied the responses of 5,553 (2,826 females, 2,727 males)
people who took part in the original survey, selecting data relevant to the knowledge of food
and nutrition and of cooking skills. Respondents were asked how they had learned to cook. In response to this question, 58% of males and 76% of women had first learnt to cook with their mother. Forty nine percent of women and 15% of men responded that they had also first
learnt to cook from cookery classes at school.
When performing the analysis by social class, the importance of school cookery classes was
even more apparent. Within the lower social classes, first learning to cook at school was
significantly more important (P<0.001) in the social groups IV and V (38% and 35%
respectively) than in the higher social groups (group 1: 11%, group 11: 25%). The lower social
groups relied much less upon cookery books, cookery programmes on television, cookery
articles in magazines and partners or spouses. The differences between the social groups in
these sources of learning were found to be significant at P<0.001. Additionally, younger
males (aged between 16 and 35) were also significantly more likely to have first leamt to
cook from cookery classes at school than older males (those aged 35 to 74). This is one
outcome of the analysis that serves to highlight the recent benefit of teaching cooking skills to boys at school as well as girls, which has likely arisen from the National Curriculum. Older
males, however, were significantly less likely to have leamt from their mothers (P<0.001),
which is perhaps more a reflection of social perceptions of domestic and cooking skills during
youth, i. e., it is probable that there was less of need for young males to learn to cook when it
was assumed this would be the role of mothers and wives.
Since the evidence presented by Lang et al suggests that school cookery classes are a fundamental source of learning about food and developing skills, then surely this presents a
strong argument for preserving the teaching of cookery to all young people, regardless of
social class or sex. Apparently, in view of recent curriculum changes in the teaching of food,
this would not appear to be the case. 20

Food is no longer taught as Home Economics in state schools. It is still taught, however, at
many independent, selective schools (Design and Technology Association, 2001). The
subject of Home Economics currently includes a major element of the teaching of cooking
skills, budgeting, meal planning and shopping and does not include recognisable aspects of
technology as included in the Food Technology curriculum (personal communication, Design
and Technology Association, June 2001). In June 2000,34,500 pupils were entered for
examinations in GCSE Home Economics. It is reasonable to suggest that socially deprived
children are not in a position to benefit from the largely practical food preparation and
cooking skills taught in Home Economics lessons at independent schools.
The teaching of food and nutrition in English and Welsh state schools are delivered in
accordance to the National Curriculum for England and Wales (Section 12.1 National
Curriculum for England: Design and Technology). At primary school level food and nutrition
may be incorporated into any subject as a teaching tool but features most frequently in
science, technology and personal, social and health education (PHSE). Guidelines on the inclusion of information on food and nutrition in primary teacher training courses have
previously been developed by MAFF with the assistance of the British Nutrition Foundation
(DoH & MAFF, 1998). The document was designed specifically to address the content and
need for education and training in food and nutrition for both trainee and qualified primary
school teachers.
Design and Technology is a non-core foundation subject at Key Stage I (age 5-7 years), Key
Stage 2 (age 7-11 years) and Key Stage 3 (age 11-14 years). In August 2002, Technology
became a core subject (along with mathematics, English and science). Food may or may not, however, be included as a material within Design and Technology. At secondary school level
food is not an independent curriculum subject as such - currently it falls under the 'umbrella'
of technology in the form of Food Technology. Food Technology is often one of as many as five subjects taught within the Technology framework. Other subjects include resistant
materials, textile technology, graphic products, systems and control and electronic products, (National Curriculum 2000).
The time allocated to food technology will be shared alongside this range of subjects but in
real terms will be at the discretion of the Head of Technology in each school and subsequently
the Head of Food Technology. Food technology is commonly taught by a teacher with
specialist subject knowledge of food, nutrition and food technology. However, in some 21

schools, in order for food technology to be offered at all, it may be taught by a teacher whose
specialist subject is design technology.
Under the umbrella of technology, it cannot be dismissed that the presence of food in the
curriculum is preferable to its absence, but the content of the food curriculum has shifted
away from acquiring skills in budgeting, shopping and cooking, towards industrial scale food
production. Food and nutrition have become 'Food Technology', cooking skills are now
called 'making skills' and even the humble ingredient is no longer - it is now purely a 'component' required in the manufacture of a food product. The curriculum now embraces food packaging technology, labelling requirements and new product development. There is
also some obsession with 'ready-to-eat' products and how this is at all useful in learning how
to put a meal together is not entirely comprehensible. All this may be extremely relevant the
food manufacturing industry as it exists today (the largest manufacturing industry in the UK).
It would appear that learning about food is now more about reading a label, designing a
package, developing a product, putting a product on a supermarket shelf and marketing that
product than it is about having the ability to prepare a cook a healthy meal for oneself
It is apparent that there are many excellent teachers of food technology who strive to teach
sound cooking skills to their pupils. Evidence of this exists in many in grey literature
publications. Many Food Technology teachers will likely have qualified and started teaching
before the larger curriculum changes in the 1990's and still value the teaching and developing
of cooking skills and sound nutrition knowledge and who are determined to include them in
the teaching of food at Key Stage 3. However, there is currently a shortage of teachers who
are food subject specialists and qualified to teach Food Technology (Jenny Jupe of DESIGN
AND TECHNOLOGY ASSOCIATION, 2001, personal communication). Many schools (an
estimate of 95 % of UK schools by Valentine, 2000), still endeavour to include food in the
technology curriculum. The reality of food lessons is less generous, however. Ballarn (2000)
reports that on average UK schools devote 26 lessons per year to food. Of these 26 lessons,
over 50% are devoted to 'practical' work. Overall, this may be calculated to be between 26
hours and 13 hours, depending on the length of lesson periods in individual schools. Therefore, if Ballam. is correct, approximately 6.5 to 13 hours are spent per year on lessons
with a practical focus. It can only be estimated as to how much in the way of practical skills
can be passed from teacher to pupil within a time period of 6.5 to 13 hours. Since any
practical lesson must involve a demonstration, the supervision of the pupils Whilst they cook
22

and a great deal of cleaning up there a few dishes that can be cooked within a typical hour-
long lesson. It must also amount to extreme pressure on the part of food teachers to impart
even the most simple of cooking techniques to pupils within this space of time.
When pupils are selecting those subjects they wish to pursue for state examinations at age 16
years (commonly the General Certificate of Secondary Education [GCSE]) technology is a
compulsory subject and must be studied even if the pupil does not sit formal examinations. Indications are that Food Technology remains a highly popular subject at Key Stage 4- in
June 2000 106,650 pupils in England and Wales were entered for GCSE Food Technology
state examinations (Design and Technology Association, 2001). This is some 27% of the 396,567 pupils sitting Design and Technology examinations.
Several recent surveys of schoolchildren have indicated a poor state of knowledge concerning food. Notably, a survey of 9 year old children (n = 256) conducted by the British Potato
Council in found that 48% thought that potatoes grew on trees and bushes (British Potato
Council, 2000). Watt & Sheilham (1996) report that inner city children were five times more
likely to read the sell-by date on a food label than to read the nutrition information. However,
perhaps this should not be so surprising when there appear to be discernible differences in the
curriculum as it is taught at Key Stage 3 (WES, 2002) and at Key Stage 4 at G. C. S. E level
(Oxford Cambridge and RSA Examinations, 2000). Younger children are required to focus
on the 'design and make' assignment, whilst G. C. S. E Food Technology students may at least
be. afforded the opportunity to study required compulsory components such as nutrition and
exploration of food commodities.
The role of schools in providing nutrition and food education is highlighted in the 1996
Department of Health report; Low Income, Food, Nutrition and Health: Strategies for
Improvement. The position of the Department of Education and Skills is defined as
maintaining a place for the teaching of food and nutrition within the national curriculum, on
the basis that education to age 16 years is accessible to all, regardless of social class and income. It is proposed within this document that the greatest benefit will be to those on low
incomes, in terms of both short-term and long-term health.
The various legislative changes in curriculum focus and content during the past two decades
have reduced the ability of schools to teach young people aged 11-16 years about food,
nutrition and healthy eating behaviour (Bowker et al, 1999). The Department of Health (1996)
23
identified schools as a suitable place for the teaching of cooking and budgeting skills. However, this move has not been entirely supported by current curriculum changes effected
and supported by the Department for Education and Skills concerning the practical element of Food Technology lessons.
The greatest potential effect of teaching cooking skills are likely to be in those areas where low income and the quality of diet are likely to have an adverse effect on health. This is an issue that receives a great deal of support. The view that cooking, shopping and budgeting
skills should be taught within school currently receives a great deal of support (Stitt, 1996,
National Food Alliance, 1997).
Bowker et al (1999) refer to the recent changes in the curriculum as having 'affected the
development of skills relating to food and nutrition' and that presently in schools ' there is
limited time available to teach home economics'. Nutritionists and health professionals have
voiced concern over the shift of emphasis away from practical food preparation skills, to the
teaching of food under the broad umbrella of technology. Whilst nutrition is gradually becoming incorporated into the compulsory health education curriculum, at present only
guidelines not statute exist.
Stitt (1996) considers food provision within the curriculum in England and Wales inadequate
compared to other European nations and strongly advocates that the teaching of food
education in the UK begins at age 5 and continues until age 16. Valentine (2000) describes
the opportunity for the teaching of food and nutrition not solely in technology, but within
science and personal, health and social education (PHSE). Dixey (1996) praises nutrition
education within PHSE for addressing 'societies pressures' upon young people to concentrate
on image rather than health and for providing an opportunity to promote a positive body
image.
Ballam (2000) attempts to present us with a more optimistic view of the teaching of cooking
skills in schools. When Ballam's findings transcribe as at maximum of 13 per year, its true
value (barely adequate) becomes apparent. Valentine (2000) indicates that food technology is
currently taught in 95 per cent of schools and that GCSE Food Technology is growing in
popularity but does not quantify this statement. Ballam (2000) does acknowledge lessons are
not long enough and qualifies this acknowledgement with the survey findings that many
secondary school teachers have to deliver a practical food lesson within a 50-minute. period.
24

It is reasonable to suggest that only those recipes that can be prepared and cooked within this
time period will be included in lessons. This emphasises the need for some depth of knowledge on food preparation and cooking skills on the part of the food technology teacher
and good judgement of the practical abilities of the children in the class.
Addressing the concept of technology in food, Ballam. suggests that pupils need to acquire 'a
questioning approach to how their food is prepared'. This in itself suggests a passive
relationship with food and that schoolchildren are becoming accustomed to eating more
convenience products rather than foods that either they have prepared or have observed being
prepared for example within the family home. It also suggests that the future of food
knowledge will lend itself more to making informed choices as a consumer, i. e. being able to
read the sell-by date on food labels (Watt & Sheilham, 1996), than to being able to prepare a healthy meal.
In order to properly identify the needs of the nation regarding effective learning about food,
nutrition and cooking skills and how this may impact on quality of diet and upon health, it is
necessary to assimilate all appropriate data available and subjectively identify useful and
workable strategies to safeguard the teaching of food and cooking skills to young people in
the UK. In terms of the National Curriculum, it is necessary to evaluate the recent changes
and their potential to impact on public health. However, at the present time it would seem
evident that a strategy, both useful and workable, was already in place in the teaching of food,
nutrition and cooking skills in secondary schools throughout the UK, to all classes and sexes
and that the power and value of this strategy has now been undermined and discarded.
25
2 Review of literature on diet, cooking skills and social deprivation
"Cooking skills education could play a useful part in generating a common food
culture rather than reflecting a divided food culture. General food skills, not just
cooking, such as handling techniques, hygiene, shopping and storage knowledge,
could be seen as part of life skills and an important part of any citizen's education.
Questions are also raised about when is the best time to learn to cook and to foster
confidence without which healthy choices cannot be made. There appear to be three
phases in which people learn to cook: basic experimentation in the home, from an
early age; then formally at school; - and finally when living independently away from
home. The removal of the second phase under the reform of the national curriculum
has implications for the nation's future skills base".
Lang et al (1999) Cooking Skills and Health. London: BEA
"Parents should ask, not just whether their child can read and write and cross the
road safely, but whether the child is learning to take control of their daily food. A
culture whose people cannot cook is a much impoverished culture"
David Blunkett W, (June 1993)
"the development of practical food preparation skills by children is vital to the long
term health of the UK"
Department of Health (1996) Eat Well IIA progress report from the Nutrition Task Force on the action plan to achieve the Health of the Nation targets on diet and nutrition.
London: HMSO
26
The last two decades have produced a wealth of literature concerning health inequalities in the
United Kingdom. Much of the literature serves to highlight the widening gap between
affluence and poverty and both the causative and consequential effect of chronic diseases
upon public health. Diet is just one aspect of many within health inequalities. A healthy diet is
important in protecting and maintaining good health but it is recognised that those with low
incomes have the poorest quality diet which does little to protect against those diet-related
factors associated with chronic diseases in adult life.
Food choice and the quality of diet in adult life may be restricted as a result of one or many factors. These may include poor knowledge of the nutritional value of foods, low income,
restricted access to a variety of foods (Ellaway & Macintyre, 2000, Donkin et al, 1999), and limited food preparation and cooking skills (Anderson & Morris, 2000). It is widely accepted that eating behaviour, habits and attitude towards consuming a healthy diet are formed largely
in childhood (Lifshitz et al, 1993). Appropriate and adequate nutrition education during
childhood and adolescence, in addition to the teaching of food preparation skills, may
empower individuals to make beneficial food choices.
Several lifestyle-related factors, such as diet, physical activity, smoking and alcohol use are implicated in the risk of chronic diseases such as coronary heart disease (CHD), late onset diabetes and cancer (e. g. cancer of the stomach, bowel and breast) (Wheelock, 1992, WHO,
1990). Diets that are high in non-milk extrinsic sugars and where intakes of sugary and acidic foods are frequent, have the potential to impact upon dental health in infancy, childhood and beyond (Rugg-Gunn, 1993). In particular, diet is known to have a great influence on the
aetiology and control of dental caries. A diet that is high in fat (also saturated fat) and
sodium, and low in fibre, fruits and vegetables has been associated with an increase risk and incidence of (and higher mortality from) cardiovascular diseases (COMA, 1994), some
cancers (WHO, 1990) and stroke (Gariballa, 2000). Socio-economic factors have been also been related to caries prevalence. Localised studies in England and Scotland have found that
children from areas of greatest material and social deprivation had the poorest dental health
and a greater experience of tooth ache and caries (Sweeney et al, 1995). Children in the lower
social classes have higher levels of dental disease than those from the higher social groups. When additional compounding factors are considered, such as families in receipt of state benefits and lone parent families, the prevalence of dental disease increases significantly.
27
Other dietary factors implicated in stroke are sodium intake (associated with hypertension)
and elevated homocysteine levels resulting from inadequate intake of folate, vitamin B6 and
vitamin B12 (Gariballa, 2000). Limited intakes of fruits of vegetables with corresponding low
intakes of antioxidant vitamins, such as vitamins C, E, and A, reduce the protection afforded from free radical induced damage, which has been linked to the pathogenesis of CHD
(National Heart Forum, 1997). An epidemiological study conducted by Acheson & Williams
(1983) suggested that the incidence of stroke and ischaemic heart disease is greater in regions
where consumption of fruits and vegetables are lowest.
2.1 Social deprivation, diet and health
In 1988 the 'Independent Inquiry into Inequalities in Health' (The Acheson report) was
published. The function of the report was to review the state of knowledge and evidence
concerning health inequalities in the UK, in order to prioritise policy options to reduce the
burden of disease and to develop a strategy for enhanced public health. Several areas were identified as having a major impact upon health; those of relevance to this discussion are
poverty, income, education and nutrition. Nutritional recommendations laid down in the
report pertain mainly to those on low income and to mothers and children. Policy
implications reside with the recognition that a healthy diet at an affordable price should be
accessible to all, regardless of income.
income inequalities impact upon quality Of life and life expectancy. Socioeconomic status
may impact upon the experience and duration of disability in old age (Melzer et al, 2000) and
upon population mortality. Shaw et al (2000) attribute 24 per cent of all deaths of 15-64 year
Olds occurring between 1994-1997 in England, Wales and Scotland to unfavourable
socioeconomic circumstances, (i. e. deaths that would not have occurred had the mortality
rates of the least deprived population decile applied on a national level). Stanistreet et al (1999) report on a cross-sectional study using mortality data, Census data and New Earnings
Survey data for 366 English local government districts to examine the relationship between
income, income inequality (using an income inequality index) and mortality. A significant
association was found to exist between both income and income inequality and standard
mortality ratios (P<0.001).
Health status may also be affected by regional and local influences. There may already be
sufficient evidence to suggest that district and postcode can be used to estimate household
28
income and to accurately predict the social class of individuals (Danesh et al, 1999).
Postcodes may provide a useful and reliable estimate of social class that could prove valuable in epidemiological studies, particularly where the association between poverty, income level
and predisposition to disease are investigated.
Kinra et at (2000) report higher rates of obesity in girls and boys with increasing social deprivation. The incidence of obesity in socially deprived children increases significantly with
age and Kinra et at conclude that such a high prevalence of obesity may contribute to the
predisposition to greater morbidity late in life.
In terms of public health, social deprivation is now a potential determinant of health status
that can no longer be disregarded by health professionals. Phillimore et al (1994) strongly
support the use of a deprivation indices that can provide a toot within public health research for linking mortality patterns with material conditions and environment (i. e. deprivation and
affluence) and not solely individual-specific health related behaviours. This suggestion is
supported by Davey-Smith & Brunner (1997) who state the level of inequality in material
sources to be a fundamental cause of socioeconomic differentials in health in the UK. Davey-
Smith & Brunner report the UK to be second only to the United States in terms of being the
most unequal developed nation.
In the White Paper 'Our Healthier Nation' it is stated that a healthy diet is important in
maintaining and protecting health and it isTecognised that those people with low disposable
income are eating the poorest quality diet. In addition, it isTecognised that the gap between
the poor and the affluent in the UK is widening and that this contributes to the inequality of health and to the nutritional quality of diets. Whilst the government has stated a commitment to reducing dietary inequalities a cost effective means of improving the diets of those on a low
income has yet to be formally identified.
In Britain, one in three children under the age of 16 now lives in poverty. Furthermore, low
income and poor nutrition are connected at all stages of life during and beyond childhood, a
phenomena Nelson (2000) terms 'nutritional poverty'. The consequences of inadequate
nutrition in childhood are associated with poor growth, compromised immune function,
poorer cognitive function and inferior educational attainment. Low income, or a fall in
income, may have a direct negative effect upon food purchase and dietary choice, thereby
reducing the nutritional quality of the diet (Anderson & Morris, 2000).
29
The relationship between poor diet and low income (National Food Alliance, 1997),
unemployment (Gibney & Lee, 1993), and lone parenthood (Moynihan et al, 1993), most likely arises from the increasing cost of a healthy diet. Davey-Smith & Brunner (1997) report
that the dietary requirements of the poorest 25 per cent of households cannot be currently met
and cite the findings of Nelson (2000) that current benefit levels are failing in terms of
enabling recipients to purchase a nutritionally adequate diet. The National Food Survey 2000
(DEFRA, 2000) found that that households in which the head of household was receiving less
than E180 per week spent just E14.99 per person per week on food and drink. Thisissome
15% less than the average expenditure per person over all households in Great Britain.
Additionally, these lower-income households were found to be consuming more fats and oils,
eggs, sugar and preserves, bread, fresh potatoes, frozen and canned vegetables, wholemilk and
beverages than the average for all households. The average consumption of fish, fruit juices,
breakfast cereals, skimmed milk and cheese in households of low income (E180 per week)
was lower than the average. The National Food Survey 2000 also found that households with
children spent 20% per person on food and drink and 20% less on fresh fruit, fresh potatoes
and vegetables, brown and wholemeal bread, cheese, carcass meat, fish and eggs. Households
with children spent more than the average household on soft drinks. This suggests that
possibly the price of certain food and beverages items may be having a prohibitive effect upon
the food purchasing of families with low incomes and those with children. Direct
interpretation of this data is risky because more than one factor may influence the food
purchasing of any one household. It is too easy to suggest that having children in the
household means that quality of food purchases may decrease. Household food expenditure
may be affected by a reduced income from one adult in the household (directly related to
caring for children in the home). Also, some economy of scale may occur in food purchase in
addition to reduced food wastage.
In 1995 the Food Commission conducted a survey of eight nation-wide supermarkets to
compare the cost of a healthy food basket to a less healthy basket. Lobstein (1995) reports that
all pricing factors compound in raising the cost of healthy foods. Furthermore, the cost of a healthy shopping basket was reported to have increased by 31% in five years, compared to a
much smaller 13% increase a basket of less healthy foods. Morris et al (2000) present an intriguing perspective of the standard of living that may be expected or accomplished for
those individuals earning the minimum wage. Morris and colleagues attempt to assess a
representative minimal living costs for a healthy, single man aged 18-30 years in full time 30
employment. It was estimated that by earning the UK minimal wage for a typical 38 hour
week, a wage of E121.12 (after statutory deductions) could be expected. The corresponding
social security benefit for a single person were between E40.70 - E51.40 per week at the time
of publication in 2000. A weekly food shop that corresponded to current dietary guidelines (including 400g of fruit and vegetables per day) for an adult male would cost approximately
; E32.00. In effect it means that the working single person in the UK would have to spend a
quarter of his wage on food, in order to meet the recommendations. For those not in
employment, between 62 and 77 per cent of total income may be spent on an adequate weeWs
shopping. A postal survey conducted by Shepherd and colleagues (1996) of 400 Scottish
adults determined that families in the lowest income group - with a total family income of
E141 - were spending the greatest percentage of this income on food, 43% of the weekly
income. These values compare with the 17% per week spent on food by families with a total
income of L671 per week.
Fresh fruits and vegetables are often found to be most expensive in the poorest localities
(Donkin et al, 1999). In a cost analysis Cade et al (1999) calculate that a family consuming a
minimum of five portions of fruit and vegetables per person per day, or a vegetarian diet, may
expect to spend up to 49% of total food purchase on vegetables and fruits. This compares to
29% of total purchase in those families not meeting the current recommendations.
2.2 Overview of nutrient intake in children aged 11-14-years old
Such is the significance of nutrient needs in adolescence that these are exceeded only by
nutrient requirements at birth. An inadequate diet during adolescence can disrupt growth and development and compromise immune function. Since the origins of diseases such as
cardiovascular disease, diabetes mellitus and cancer are recognised to lie partly in childhood
diet, and not solely in adult health behaviour, adequate nutrition in childhood and adolescence is paramount (Lifshitz et al, 1993). The anabolic activity during adolescence is intense in
order to support appreciable increase in height and weight, an increase in lean body mass and
also in the redistribution and increase in fatty tissue and the further development of internal
organs and systems (Giovannini et al, 2000, Olmcdilla & Granado, 2000). Dietary intake
must make allowances for growth as well as the prevention of deficiency. The diet of children
and adolescents has implications for the future health of the nation, particularly when dietary
evidence to date reflects a population whose diet is high in saturated fat and sodium and low
in fruits and vegetables and antioxidant vitamins. Increasingly, evidence suggests that dietary
31
intake during childhood and adolescence can influence the risk of chronic disease in adult life.
Consuming a balanced variety of foods throughout childhood and adolescence promotes optimal growth and development and, in conjunction with other lifestyle behaviours such as taking regular physical exercise, moderate drinking of alcohol and not smoking, can assist in
the prevention of diseases such as obesity, cardiovascular disease, iron-deficiency anaemia
and dental caries. Whilst health professionals focus upon communicating positive messages about healthy eating the public appear to be agreeable to absorbing the messages but reluctant to act upon them. The perceived control that children may exert over their own diets is a
contentious issue in the literature (Robinson, 2000) but it is commonly accepted that independence of food choice increases in adolescence and adolescents do not seem overly concerned with healthy eating messages either.
The findings of the National Diet and Nutrition Survey (NDNS) of young people aged 4-18
years (Gregory et al, 2000) supports the apparent trend towards falling mean energy intakes in
children aged 11-14 years (Whitehead et al, 1982, Hackett et al, 1986, Adamson et al, 1992a). Mean daily energy intakes were reported to be 8.28MJ/day in boys and 7.03W/day
in girls (Gregory et al, 2000). In a longitudinal study of the prevalence of risk factors for
ischaemic heart disease in Northern Ireland, Robson et al (2000) reported on the median
energy intake of children aged 12-years-old at baseline and at 15-years-old at follow up. Median energy intake by boys aged 12-years was 10.9 MJ/day and by girls 9.0 MJ/day.
Adamson et al, 1992a reported mean energy intakes in boys of 8.61MJ/day and in girls, 8.25MJ/day. The consistent decrease in mean energy intakes in children of this age has
guided the assumption in the literature that energy intakes are declining (Bull, 1988), or that
children are becoming less active (Livingstone et al, 1992). Alternatively, the incidence of
under-reporting may be increasing. It would seem more likely that mean energy intake may be decreasing concomitantly with decreasing levels of physical activity. Additionally,
decreasing nutrient intake could not be judged as supporting the steady increase in the height
and weight of the adolescent population of many developed western countries. It has also been suggested that should this apparent trend be sustained then adolescents will continue to
develop and grow taller and heavier despite a 10% decrease in mean energy intake, which,
with the present state of knowledge of the scientific community is unfeasible. One other
possible explanation for this trend may be the employment of dietary assessment methods
unsuitable to this portion of the population.
32
Currently, the Dietary Reference Values (DRV's) for fat intake recommend that no more than
35% of daily food energy should be derived from fat. Additionally, saturated fats should not
contribute more than 10% of total daily energy. The NDNS report fat to be contributing 35.2% of total energy in boys and 36.1 % in girls but that saturated fats contributed 13.8% of
energy in boys and 14.0 per cent in girls.
Non-milk extrinsic (NME) sugars should not provide more than 10% of total dietary energy (DoH, 1991). Several studies report excess in the contribution to energy derived from NME
sugar in the diets of adolescents. Rugg-Gunn et al (1993') report NUE sugar to contribute 17% of total daily energy intake in children aged 11-12 years. Doyle etal, 1994 also report a 17% contribution to total energy in the diets of children aged 13-14 years. Similar figures are
presented in the NDNS; NME sugars contributed 16.9 per cent of total food energy in boys
aged 11-14 years and 16.2 per cent in girls of the same age.
The NDNS reports that the Reference Nutrient Intakes (RNI's) for protein (42.1 g/day) were being met and exceeded by both boys and girls aged I 1- 14 years, with corresponding intakes
of 64.0g/day and 52.9g/day. Boys are reported to have a higher average daily intake of
vitamin A than girls of the same age. Both sexes appear to be meeting the RNI for thiamin,
riboflavin, niacin, B6, B12, folate and vitamin C. Of children aged 11-14 years, boys were
meeting 96% of the RNI for iron but girls meeting only 61%. Both sexes are reported to be
meeting 80 per cent of the RNI for calcium.
2.3 Intake of nutrients by socially deprived adolescents
There are limited studies that report on nutrient intake by socially deprived adolescents. This
in itself is an area of nutrition research that requires further investigation. The lack of
published data on nutrient intake by socially deprived adolescents must be addressed in order
that nutritional priorities in education and dietary intervention be decided and acted upon. Children from lower social class groups have been reported to consume the poorest quality diet (Adamson et al, 1992", Moynihan et al, 1993, Sweeting et al, 1994). Adamson et al (1992a) reported that Northumbrian children aged 11-12-years from lower social group families had lower intakes of calcium, iron, and vitamin C than children from middle and higher social groups and that the nutrient density of the diets (nutrient intakes per unit energy W) of children from lower social group families was poor. Ruxton and Kirk (1996)
reported on the nutrient intake of Edinburgh schoolchildren (n--136) aged 7-8-years-old by
33
social class and their findings indicated that children from families of manual workers had
higher intakes of fat and percentage of daily energy derived from fat and significantly lower
intakes of vitamin A (P<0.005), betacarotene (P<0.05), thiamin (P<0.05) folate (P<0.01) and
vitamin D (P<0.05).
Bedi et al (1990) and Sweeting et al (1994) found that children in lower social groups were
more likely to add sugar to foods and beverages. Children of parents in social classes IV and V have also been reported to consume more chips, crisps, carbonated drinks, confectionery (Doyle et al, 1994) and manufactured meat products (Sweeting et al, 1994) and have lower
intakes of vitamin A, beta-carotene, folate, thiamine and riboflavin (Doyle et al, 1994). In
isolation these factors may not be wholly significant, but collectively portray a poor health
prognosis for adulthood and old age. This is significant for all adolescents but when
additional compounding factors, as recognised to exist in socially deprived areas (i. e. poor
availability of fresh fruits and vegetables, restricted range of food products offered by local
amenities, sub-standard housing, lack of amenities, high unemployment and occurrence of long-term disability, difficulty and poor attainment in school and so on) begin to affect these
adolescents then the effects may be augmented.
The diets of children living in less affluent inner city areas were observed to be high in fat and
sugars and limited in fruit, pulses, and wholemeat bread (Johnson & Hackett, 1997). Hackett
et al, 1997 observe that children from socially deprived backgrounds consume significantly
more foods high in fat and salt (Hackett et al, 1997) and Moynihan et al (1993) found that
girls from unemployed families had significantly higher intakes of energy and fat.
Nelson et al (1994) observed lower iron status in girls from low-income families. Further
work by Nelson (2000) provided evidence of a higher incidence of anaemia in adolescent girls from unemployed families, in addition to lower intelligence quotients that may be associated
with lower haemoglobin levels (Nelson, 2000). Moynihan et al (1993) report significantly lower intakes of both iron and vitamin C in boys from unemployed. families. Socially
deprived children consume fewer fruits and vegetables (Doyle et al, 1994). Gerhardy et al (1995) report consumption of vegetables at lunchtime and at evening meals in lower social
class households (group W and V) with children to be 9% less groups 1,11 and III. The low
consumption of fruits and vegetables by children from lower socio-economic groups was documented by Gregory et al (2000) in the NDNS, where both boys and girls from these
groups were significantly less likely to have consumed fruit juices, fruits and raw and salad 34
vegetables than children from the higher social class groups. During the seven-day recording
period of the NDNS, more than half of young people had not eaten any citrus fruits (76% of boys and 72% of girls) or leafy green vegetables (61% of boys and 56% of girls). Inchley et
al (2001) reported that 58% children in lower social class groups ate chips every day
compared to 29% in children in affluent families and that children in lower social groups
consumed significantly less cooked vegetables and raw vegetables and salads. Wrieden
(1996) found that 10-11-year-old children in Scotland were consuming an average 2.3
portions of fruit and vegetables per day and that girls in lower socio-economic groups had
lower intakes of green vegetables than girls from more affluent families and Anderson et al (1994) reported that over a third of children interviewed from the west coast of Scotland ate
vegetables once a week or never ate any vegetables at all.
Other studies report lower intakes of brown bread (Sweeting et al, 1994, Hackett et al, 1986),
and lower fruit and vegetable intakes (excluding potatoes) in boys and girls in social class
groups IV and V (Hackett et al, 1986, ). Children from families in lower social class groups tend to have the poorest intake of vitamin C (Adamson et al, 1992a), higher consumption of table sugar and sugars from soft drinks (Rugg-Gunn et al, 1993'), and higher percentage
energy from total sugars (Ruxton. & Kirk, 1996).
2.4 Food choices towards healthy eating in adolescence
There is a limited amount of information that relates specifically to the food choices of
adolescents from socially deprived backgrounds and the lower social classes. Few studies have set out with the intention of investigating the eating habits, intention and desire for
dietary change (healthy or otherwise) of young people in the UK. Wbilst adolescent food
choice is of interest per se (and the tracking of food choice from childhood through to
adulthood) there is little published work on young people from socially deprived
backgrounds.
Adolescent food choice is widely considered to be a culmination of a range of physiological,
social, emotional and environmental forces (Warwick et al, 1999). It is assumed that the food
choices of much younger children are largely controlled by adults (Robinson, 2000). The
increasing independence sought in adolescence may manifest in greater control over food
choice, particularly outside the home, at school and within the social environment. Indeed,
eating differently from the family as a whole is suggested to be common adolescent practice,
35
since this itself is a method of demonstrating independence (Keanne & Willets, 1994).
Adolescents within the UK are likely to be within an environment in which there are many
possible influences over food choice; these may be exerted by family members (particularly
parents but possibly siblings and grandparents), school fliends, provision of meals and snacks
at school, television advertising and other forms of media. It may be relevant to include the influence of role models and well-known celebrities, in particular sports personalities (e. g. footballers) and of course, young people with celebrity status: musicians and pop-stars. The
pressures of presenting a popular and conforming body image must be quite severe for young
people today. Glamorous models such as Kate Moss and female celebrities such as Geri
Halliwell and Britney Spears are recognised to be the idols of many pre-teens and teenagers
and there has always been a fascination from the media with (sometimes 'faddy' and even
nutritionally questionable) diet and exercise regimes as followed and promoted by well- known individuals. Whilst this has been traditionally viewed as a female obsession, the
influence now extends to boys and young men to conform to a slim and attractive body
image. This is perhaps reflected in the increasing incidence of eating disorders such as
anorexia nervosa and bulimia, in both females and recently males. This occurrence extends to
girls as young as 8 years-old who purport to be following a weight-reducing diet (Pine, 200 1).
The influence of family food habits (Mitchell, 1999) or indeed the mere presence of family
members when consuming meals and snacks (Jas, 1998) remain signiflcant indicators of
adolescent food choice. The fundamental concerns of parents are often ensuring children are
eating enough and preparing and serving up meals quickly, whilst nutrition and health (in
terms of dietary variety and balance) may not always be a priority (Stratton & Bromley,
1999). Television and the advertising of foods and beverages may also have an influence
upon food choice (Young & Hetherington, 1996). Hitchings and Moynihan (1998) cite the findings of a survey performed in 1995 by the National Food Alliance (now known as Sustain) that reported children watched an average of 19 hours of television a week. Using a
sample of 44 children aged 9-11 years-old, Hitchings and Moynihan reported that the
television advertisements for food products most commonly remembered and recalled by the
children in a two-week period were. (in descending order of frequency); breakfast cereals,
crisps, cola, oven chips, soft drinks and microwave chips. Some selected products, namely,
crisps, chocolate confectionery, breakfast cereals and microwave chips, were requested by the
children and recorded by the main home food purchaser within the same time period of their investigation. Hitchings and Moynihan also reported that strong relationships were found to
36
exist between advertisements remembered and food consumed, notably soft drinks (r = 0.68)
and crisps and savoury snacks (r = 0.61). Whilst the authors acknowledge that a direct
assumption that the relationships observed between television advertisements and food
consumption need not imply causation it is suggested that children are more likely to
remember food advertisements for products they already consume.
Adolescents are frequently referred to as "young consumere' (Brown et al, 2000). This
particular labelling suggests that adolescents are considered to be potential consumers, that is,
having control over food purchase, not simply food choice. Whilst Brown et al report a clear
awareness of healthy eating requirements amongst adolescent subjects, the strongest food
preferences of the same subjects were often for "fast-food" style foods. The authors suggest that although young people may be aware of nutritional information and the potential implementation of such information, effecting change on the basis of theoretical knowledge is
met with hesitance.
There are few studies conducted in the UK that have solely investigated the changes in
attitude and beliefs of adolescents prior to and following health promotion initiatives. There
is some contention in the literature as to whether an increase in knowledge is necessary or indeed singularly sufficient to execute a change in behaviour (Wardle & Huon, 2000).
2.5 Role of food prepamtion and cooking skills In the health of the nation
To be able to make a range of healthy meals, a number of basic food preparation and cooking
skills are required. Indeed when household income decreases, a greater reliance upon practical
skills is required to balance the reduction in ready-prepared meals and take-away foods
consumed (Anderson & Morris, 2000). When income is restricted, the emphasis on general
food knowledge and skills increases (National Food Alliance, 1997) since greater care will
need to be taken with meal planning and shopping, with a wider range of skills being required
to cook cheaper meals from basic ingredients. in a report on nutrition and lone parent
families, Dowler and Calvert (1995) report that possession of cooking skills is one of the
factors most likely to indicate a better diet in the individuals of lone parent households.
Lang et al (1999) provide much evidence that there is a relationshi p- between cooking skills
and health. The 1999 analysis conducted by Lang and colleagues served to highlight the importance of school cookery lessons as the first source of learning how to cook.
37
Furthermore, the significance for lower social class groups is greater. Of social groups IV and
V, almost 40% of respondents indicated cookery classes at school as their first source of learning. Approximately 33% of respondents having achieved either GCSE's only, or having
no educational qualifications, relied more upon cooking skills learnt at school later in life,
than from any other source. Upmeier el al (1999) found that in women consuming the
healthiest the diets (in accordance with the WHO recommendations of 1990), 50% had been
educated at University level, compared to only 28% of those consuming the least healthy diet.
Young men also rely more on school cookery classes; almost half of 16-19 year olds indicate
that they first learnt to cook at school, whilst older males indicate learning from mothers, fathers and friends (Caraher et al, 1999). This suggests other lifestyle influences are at work,
such as an increase in the number of mothers in full-time employment, perhaps having less
time to pass on their cooking skills to their children (Dixey, 1999). Caharer et al (1999)
comment that the acquisition of cooking skills can contribute not only to the health of young
people but to social and emotional development too, but do not qualify this rather profound
statement. The National Food Alliance in 1993 commissioned a survey of domestic and
cooking activities performed by children. Whilst reporting that 93% of their sample knew
how to play a computer game and 61% could programme a video recorder, the National Food
Alliance found that only 38% of children had the confidence and ability to cook a jacket
potato in an oven (National Food Alliance, 1993). A larger percentage of the children
reported being able to peel vegetables and fruit (85%), 79% could operate a microwave oven
and 59% knew how to use a grill. This presents a rather confusing picture. It may simply be
that the Alliance chose foods or meals that were unfamiliar or daunting to their young sample.
However, if 89% of children reported being able to peel vegetables and fruit, this does not
suggest apathy or reluctance to get involved in food preparation and to get into the kitchen!
Perhaps the more significant findings of this survey are that 66% of the sample indicated that
they had acquired their cooking skills from school. This percentage compares most
favourably to several other sources of learning; for example, 13% indicated that they learnt
from cookery books, 6% from the television or radio, 5% from friends, 3% from newspapers
and magazines and 1% on an educational course. In addition, 75% of the children indicated
that they wanted to learn more about cooking. An even larger percentage (87%) agreed that it
was important for young people to learn to cook and a promising 81 % said that it was 'fun to
cook'. Cooking is a practical pursuit and can be viewed as a pleasurable and productive
activity - the majority of children aged 11-13-years-old in state schools (Key Stage 3) really 38
en oy practical food lessons at school (Mrs P Graydon, Head of Food Technology, personal j
communication September 2001).
Watt & Sheilham (1996) assessed the range of food skills possessed by 13-14 year old
children in inner city London. Only 5% of children were found to help with cooking at home
every day whilst 70% reported helping with cooking once a week or less. The four main
cooking methods used most often by the children were heating up foods, baking, grilling and frying. This may say some unfortunate about the current lifestyles of busy families within the
UK and of schoolwork and extra-curricular commitments, than about young people's
reluctance to cook. This is borne out when examining the attitude statements of the children in this study: 46% of children agreed with the statement 'Learning to cook interests me a lor.
It is likely that most children have other chores to perform in the home in addition to helping
out in the kitchen. Again, necessitated by economy of time and effort, children may even be
barred from the kitchen when busy working parents do not wish to spend a great deal of time
preparing foods when there are many tasks to be accommodated during limited family time.
2.6 Nutrition and cooking skiUs intervention
It would seem that should the teaching of food preparation and cooking skills in schools still be as widespread and effective as it appears to have been as little as a decade ago (Lang et al,
1999) in the development and practice of basic food knowledge, there would not be a pressing
need nor case for intervention aimed at increasing the cooking skills of young people in the 2 I't century.
There is a notable absence of peer-reviewed published literature on dietary intervention and
specifically cooking skills intervention studies conducted in the UK in schoolchildren and
adolescents. This would suggest most likely that this field of research is yet to be recognised
as important to the health of the population and that no studies, with the possible exception of
one, to date have been carried out that seek to evaluate a practical skills intervention
programme. It is also possible that the importance of evaluating such practical interventions
has yet to be embraced by the scientific community and by health professionals.
A large and varied amount of information is available in the grey literature in the form of
reports, newsletters and press releases and may also be found published on various web pages
on the Internet. Information on studies that are presented in this form are largely qualitative
and appear at the present time to be subjective. Sustain (200 lb) reported in their newsletter on 39
a community initiative called 'The Good Grub Club', which was established in South Tees in
1995 by community dietitians. The Good Grub Clubs aimed to promote good nutrition and a healthy lifestyle by providing a setting in which to learn new and developing existing cooking
skills. The recipes that were featured during the cooking sessions were based upon healthy
and cheap ingredients. The purpose of the article was to communicate the idea of the clubs to
the reader but did not report on a systematic evaluation of the effectiveness of the Good Grub
Club in teaching cooking skills and did not reveal if such an evaluation had been performed. This example serves to the highlight the observation that cooking skill interventions do take
place in the community but it is difficult to provide evidence that they are effective. That is
not to undermine, however, the value of such community projects. Furthermore, the few
intervention studies that have focused on the teaching of practical food preparation and
cooking skills in the community setting rarely include a quantitative assessment of diet,
nutrition knowledge and cooking skills pre and post intervention period. It is likely that an
evaluation of influence upon dietary intake and nutritional knowledge may not have been
identified as an achievable or desirable outcome in such projects. The financial costs of
carrying out such an evaluation, and cost in terms of manpower, may be prohibitive in such
circumstances and it is suggested that this may impact upon the potential for securing funding
for community projects.
The Good Grub Club model was focused upon a community development approach to
nutritional health promotion. The model was developed for use in the community with adults from low-income families and included the demonstration, teaching and sharing of practical food preparation skills as part of the wider approach to health promotion in the community (Sustain, 200 1). This model has been applied for use in adults only but it may be viewed as a
useful tool in the development of similar practical food programmes targeted towards children
and teenagers. However, its uses may be restricted to the community and it is not clear if
such a programme is accessible and indeed applicable to children and teenagers.
The lack of evaluation in terms of effect upon dietary intake and specifically increase in the intake of fruits, vegetables, starchy foods, fibre and a reduction in total fat and saturated fat
would appear to a recurrent weakness in the design of dietary intervention studies. Publication and dissemination of evaluation data and recommendations for further would
assist health professional in identifying suitable strategies and workable means of getting
young people interested in food and cooking.
40
In a review of the effectiveness of dietary intervention and health promotion studies, Roe et al (1998) identify a shortfall of interventions targeted towards adolescents and schoolchildren. Roe and colleagues concluded there was an immediate and pressing need for dietary
intervention targeted at adolescents, young people and at lower income families.
Additionally, there is an immediate need for dietary interventions aimed at increasing intakes
of fruits, vegetables and starchy foods. In 1998 Cox et al, reported on a randomised
controlled intervention trial that aimed to increases fruit and vegetable intake (to the
recommended level of five 80g portions a day) in adult men and women. The intervention
included advice on the health benefits of increased fruit and vegetable consumption,
explanation on portion size and ways of incorporating more vegetables and fruit in to the diet.
Following intervention, 65% of subjects achieved the target intake of fruit and vegetables,
with mean self-reported intakes at follow-up (performed at six and twelve months) to range between 4.5 to 4.6 defined portions per day. Cox et al conclude that the intervention was
successful in increasing fruit and vegetable intake and that the effect could be sustained long-
term.
Intervention studies may be more effective when coupled with motivational interviewing, to improve the dietary adherence of adolescents to the advice they have been given (Berg-Smith
et al, 1999). Motivation is a key issue, since the financial burden, low self-esteem and sub- optimum physical health accompanying periods of unemployment, may reduce the capacity to
make dietary change (Anderson & Morris, 2000) and ultimately impact unfavourably upon
parental support of interventions designed for adolescents. Peer-education models have been
used with some limited success in targeting adolescents included in a health education programme. H61und (1990) reported on a 'Learning by Teaching' health education
programme which enabled learning through assimilating and passing on information about dietary factors in dental diseases. H61und reported that although the outcome of the study was disappointing because knowledge of diet and dental caries had not significantly increased in
teaching group but the study had highlighted that adolescenfs short-term beliefs directly or indirectly affect their health-related behaviour and may promote resistance to change and
resistance to accommodating dietary advice on the prevention of dental caries.
Hunton (1994) reports on a "Get Cooking" project carried out in a primary school in East Yorkshire teaching food preparation and minimal cooking skills to pupils aged 10- 11 years. The six-week programme took place in school during lessons assigned to technology. The
41
cooking project has been detailed in a primarily descriptive and observational manner by
Hunton - it does not provide consequential dietary or attitudinal information. Hunton's findings are useful if only in highlighting the absence of health promotion activities that focus
upon evaluation of interventions that focus upon teaching cooking skills to children and
adolescents from the current literature.
The Royal Society of ArCs "Focus on Food7 programme was a 5-year, nation-wide food
education initiative that took place in schools and included a wider itinerary of supporting
community food programmes. Data as yet are to be published from the associated research
programme currently being undertaken by the University of Reading (RSA, 1999). This
initiative was launched in 1998 under the name "Cooking for ki&' and was well publicised in
the national press, mainly through the participation of several 'celebrity chefs' (Sherman,
1999).
On the topic of the design, methodology and recruitment issues specific to school-based intervention programmes, there are few published papers on research undertaken in the UK-
Many authors reporting on health and dietary intervention programmes do not report on the
recruitment issues presenting during their research, preferring to focus on study methodology
and data collection and analysis (Doyle et al, 1994, Anderson et al, 1994). It would be
beneficial to all those involved in health promotion and health intervention in UK schools to
share and develop suitable methods for the recruitment, selection and retention of school
teaching staff, pupils and parents of pupils alike. The dearth of literature on recruitment issues are highlighted by Harrington and colleagues (1997), who reported on the need for the
dissemination of research outcomes in relation to recruitment issues. After all, if there are no
subjects, there cannot be a research study. Harrington et al report on a multi-level approach
to recruitment developed and employed in the 5-A-DAY for Better Health national initiative
(sponsored by the National Cancer Institute [US]) and attribute 100% recruitment of schools
at the district (Local Education Authority) level and senior teaching management level to a high profile recruitment strategy. The authors also suggest that securing the help of
community based nutritionists, dietitians and local council school liaison personnel as vital to
the success of the overall recruitment programme undertaken for the 5-A-DAY intervention
project. Other powerful tools reported in the literature as an aide to successful recruitment
and retention of schools and teaching staff are meetings between researchers and school
governing boards and bodies, establishing good contact between community nutritionists and
42
school nurses (Petosa & Goodman, 1991), giving a recruitment presentation to all teaching
staff who have expressed (or will be expected to participate), identifying a lead contact (teacher) and allowing for later consenting volunteers (Lytle et al, 1994a and 1994b), the
offering of incentives to class teachers responsible for the collection of consent forms and a
persistent subject recruitment programme that follows up particular schools/Year groups and
classes not completing consent forms (Harrington et al, 1997). Harrington and colleagues
reported on the practice of obtaining telephone numbers for parents appearing unwilling to
consent to their child taking part in a research study and talking to parents at home and
conducting a total of three rounds of recruitment presentations and talks to pupils to
encourage participation. Above subject level many of these strategies would appear sound,
although it is difficult to say how useful or transferable to UK schools such strategies are. At
subject level, however, some of the recruitment practices may appear to be persistent at best
but at worst applying too much pressure upon pupils to consent and the contacting of parents
may well appear to be an intrusion with the additional effect of turning pupils away from
research studies. It would appear that a review paper on the current recruitment methods (successes and failures) employed by researchers in the United Kingdom in both the primary
and secondary school setting is long overdue and would be of great value to any institution
undertaking school health promotion or intervention.
There is an absence of published literature on dietary intervention and practical food skills intervention undertaken in children and adolescents in the UK where the evaluation has
included an assessment of changes in intake of foods and nutrients following intervention.
Considerable research projects have been undertaken in the United States but culture differences in ethnical populations and national diet present obstacles in evaluating the
potential of such programmes for application in the UIC Additionally, the focus of many dietary intervention studies is the reduction in intakes of fat and saturated fat and few focus
upon making positive changes, preferring to do battle with fat intakes. Notably, those studies including a dietary assessment following intervention have achieved small decreases in the
consumption of fat and saturated fat and the percentage of total daily energy derived from fat.
Dietary intervention to increase consumption of fruit and vegetables has been undertaken in
the UK in adults with some success (Cox et al, 1998).
A randomised, controlled research study reported by McKenzie et al (1996) aimed to decrease
intake of total fat and saturated fat in children aged 4-10-years-old (n--300) in Philadelphia,
43
US. The intervention took the form of counselling with a registered dietitian and family-led
nutrition education at home. Following intervention children in both the intervention and
control reduced their intake of total fat and saturated fat but the findings were not significant. Baranowski et al (2000) executed a large, randomised, controlled- trial intervention in
children aged 8-14-years-old (n--1253) in Houston, Texas, U S. The intervention was delivered to children at schools randomly assigned to the intervention group, through 12
sessions of one-hour duration and repeated when the subjects were one year older. Children
were encouraged to taste different fruits and vegetables and their juices, to prepare snacks
using fruits and vegetables and follow a series of activities in the classroom on the theme of increasing fruit and vegetable intake and the nutrient properties of these foods. The outcome
evaluation was performed through dietary analysis at baseline and following intervention.
Children in the intervention increased their fruit and vegetable intake by a mean of 0.88
serving per day compared to an increase of 0.48 servings in the control group. An increase of 0.36 servings/per day of fruit and vegetables were reported by Gortmaker et al (1999) as a
result of an interdisciplinary intervention in primary school aged children (n=479). Other
dietary intervention studies have shown some positive impact upon the nutrient intakes of
children a reduction of total fat and the percentage of derived from fat and a small increase in
the consumption of fruits and vegetables but the findings have not been found to be
statistically significant between children attending the intervention and children in the control
group (Lytle et al, 1996, Nicklas et al, 1998).
Weaver et al (1999) describe a dietary intervention aimed at increasing consumption of fruit
and vegetables in low-income families in Seattle, US. The intervention was structured around
advertising campaigns, promoting the benefits of fruit and vegetables and a series of cooking
events held in public and community halls and day centres. The cooking events described by
Weaver et al were demonstrations by outreach workers on the preparation of fruits and
vegetables and a featured recipe. Smaller cooking classes were held but again these were demonstrations only and not events where family members could actually cook a dish for
themselves but Weaver and colleagues report that the cooking events were an effective source
of information about nutrition and provided an enjoyable method of learning for low-income
families. One benefit of the cooking demonstrations was described to be the subject's
appreciation of a more personal touch in the intervention.
44
Liquori et al (1998) described the outcome evaluation of a quasi-experimental study of a
nutrition education programme that included a practical food skills intervention and nutrition education classes in primary school children (n--590). The children were recruited into the
study from two public schools in urban areas of high unemployment in Central Harlem, New York, US. Recruitment was by passive consent of parents - no parent refused to allow their
child to take part. By class unit, children were randornised into four groups, control cookshop intervention, cookshop intervention and nutrition lessons and nutrition lessons only. The
'cookshops' were organised and taught by twenty teaching teams consisting of a classroom teacher, two students and one parent to 12 children in a practical cookery session. During the 'cookshop' children were able to cook a variety of vegetables such as sweet potatoes, broccoli,
and cauliflower and use many different herbs and spices (garlic, ginger, chilli, and mustard) in
the recipes selected by the teaching teams. The children also baked and tasted a variety of bread using different cereal flours and were encouraged to use wholefoods in order that they develop skills in preparing vegetables: chopping, slicing, tearing and stirring and so on. The
cookshop practical programme was mirrored by classroom nutrition education on the similar foods and focused upon plant foods, the growing of certain vegetables and beans and
conducting experiments. Liquori et al reported that self-efficacy in cooking was improved in
children attending the cookshops but not in those receiving the classroom intervention only but that the impact of the intervention was stronger in younger pupils.
2.7 Extra-curricular food and nutrition activities in schools
A few recent food and nutrition activities that have been taking place in UK schools include;
fruit tuck shops, breakfast clubs, the European Network of Health Promoting Schools, (Bowker et al, 1999), "Get Cooking" projects (Hunton, 1994), the introduction of a wider
variety of fruits and vegetables within school meals (Denman, 1999), pupil-run tuck shops
and fruit-sharing schemes between children (Rochford, 1999). The most recent initiative that is supported by the Department of Health and administered through the National Health Service and the Healthy Schools Programme, is the 'National School Fruit Scheme' (DoH,
2001). The 'National School Fruit Scheme' aims to provide free fruit for schools. The
scheme is currently being evaluated and data are expected to be available and published in
2002. In 1996, Dixey discusses the relevance of community nutrition education projects targeting low-income families in involving family-focused nutrition education programmes, health promotion projects and practical cookery workshops and concludes that all of these
45

approaches may be beneficial to increasing the knowledge base and practical skills of both inner-city and rural communities.
Schools have the potential to influence the food choices of children by provision of healthy
school meals and snacks that may assist towards dietary change (Bowker el al, 1999). The
nutritional value of school meals is suggested to have declined in many authorities,
specifically with regard to providing an excess of energy from fat and sugar and a sub-optimal
contribution of vitamins such as iron, folate and calcium (Mock et al, 1997). This trend may
reverse with the re-introduction of national nutritional guidelines for school meals in April
2001.
The Qualifications and Curriculum Authority (QCA) has set up a nation-wide 'Food in
Schools' ongoing project which aims to help schools develop work programmes to involve
pupils with food (QCA, 1997). Sustain (formerly the National Food Alliance) have recently launched a pilot project entitled 'Grab V in primary schools to encourage younger children to eat more fruit and vegetables (Sustain, 2001b). The commencement date was September
2001 and an evaluation of the project of the fruit and vegetable experiences of the pupils taking part will be examined to contribute to the development of a national 'Grab 51'
programme.
2.8 The future of practical food skills in the National Curriculum
The concern amongst health professionals regarding the decline in the teaching of cooking
skills has been twenty years accumulating in 1993, the 'Get Cooking' campaign was launched
in order to put back the teaching of food preparation skills and cooking skills on the agenda
and it received a great deal of support and funding from the Department of Health. This
serves to highlight what appears to be a lack of communication between the Department of Health and the Department for Education and Employment. The Department of Health has
identified schools as an ideal setting for community cooking projects whilst the Department
for Education and Employment is busy changing the National Curriculum and allowing the
teaching of cooking skills to be undermined. It is suggested that as long as food remains an
optional subject within design technology at secondary level education, the equality of food
and nutrition education will very likely remain unbalanced throughout secondary schools in
England and Wales. In order to redress this balance, it is important that influential.
organisations such as the British Nutrition Foundation continue to support the move to make
46

food a compulsory option within technology and to sustain and even increase the food and
nutntion components of the science and health education curriculum, but also to acknowledge that cooking skills are part of the solution.
In 1995 Gill Fine of the British Nutrition Foundation commented that the Health of the Nation
initiative was an important factor in securing the position of food and nutrition within the
National Curriculum (Fine, 1995a). Lang & Baker (1993) predicted that the position of food
in the curriculum would be unsure and that changes would likely be irreversible, a view
shared by Rutland (1993) in a review commissioned by the National Association of Teachers
of Home Economics. Both the predictions and concerns of Lang & Baker and Rutland appear
to have been completely justified.
The British Nutrition Foundation are also reported to support the belief that in facilitating a
comprehensive food 'tuition' of all pupils, the health benefits as outlined in the Health of the
Nation White Paper are more likely to met. Fine (1995b) comments that in addition to the
health benefit of food education in schools to general population, there will also be some benefit to the 'wealth' of the nation but does not attempt to define what is meant by wealth. However, the British Nutrition Foundation are recognised to support the food manufacturing industry in the UK and the Foundation's agenda may reasonably be viewed as somewhat biased and prone to political influence (not to mention financial support). The Foundation's
provision of educational materials and resources do embrace the curriculum requirement for
nutrition but many are devoted to the functionality of food components, the production and
manufacture of foods within industry and to the use of functional ingredients and additives to
support such a large scale manufacture of foods. Within all of this, there seems to be a
somewhat persistent argument that certain processes and treatment of food products and the
addition various colours, flavours, flavour enhancers, stabilisers, preservatives and so on are both necessary and important in food products.
Disparagingly, it now appears that within the curriculum domestic and cooking skills are
rather quaint, old-fashioned and possibly unnecessary when there is so much processed food
available to buy. A solid knowledge base of food and the development of safe, hygienic and
skilled food preparation would appear to be a less important life-skill than it used to be. The
vilification of cooking skills persists with the new curriculum terminology of 'designing' and fmaking skills'. It is time to decide, in terms of education, what could possibly be more important - being able to identify and recognise food products and appreciating the manner in
47
which they have been (mass) produced - no, manufactured - for the consumers benefit, or being able to prepare and cook a meal for oneself
All this presents an absurdity; if food preparation and cooking skills are so out-of-date,
compared with advances in food technology, then why does there appear to be a current fascination with the numerous cookery programmes and magazines by the nation as a whole? Indeed, to address technicalities, the appliance of science to food ingredients was well
understood by even Mrs Beeton and countless other cooks and chefs before and after,
otherwise it would not be possible to understand the making of ice cream [a foam],
mayonnaise [an emulsion of two immiscible liquids], pastry [using shortening agents], a
gelatinised dessert [a stabilised colloidal system], smoked and salted fish [preservation of flesh foods with compounds incompatible with the growth of micro-organisms], a Victoria
sandwich [an aerated mixture], pickled vegetables [preservation by control of pH and
parameters of microbial growth] and so on. Perhaps it is only the scale of technology that has
changed. However, all this says something more unfortunate about our current perception of
these basic domestic skills. Again, in contrast to the enjoyment and pursuit of cooking and
amateur chef competitions, it is becoming nostalgic and conventional to appreciate the skill involved in the preparation of foods and put oneself up for ridicule to voice support.
Ultimately, in 2002 the position of food and nutrition is perceivably no more secure that it
was in 1995, i. e., in that it remains an optional material within the technology curriculum and is still simply a material. At the present time there are no data from published scientific
studies available that indicate or prove that Food Technology as it is taught is in the
curriculum has a measurable impact upon the learning and development of food preparation
and practical cookery skills by individuals, therefore it is probably unwise to feel reassured
that whilst food education is still present in the curriculum no concern is necessary.
Schools have been identified by the Department of Health (1996) as one of several key
settings in developing a national approach to addressing the problem of poor nutrition and low
income by making intervention activities readily accessible to families and the wider
community. This rests upon the facilities that schools have to offer; a teaching room, cookers,
equipment and work surfaces, to projects that focus upon community cookery courses, cafes
and food-tasting sessions. Schools have many facilities that must surely assist in over-coming barriers faced by many community nutritionists and dietitians when attempting to set up
community practical cookery workshops: food preparation areas suitable for small groups and 48
all the necessary small and larger pieces of domestic equipment. Where cooking facilities do
exist; the cost of a community food project may be lowered and accessibility improved.
It is of the utmost importance that research is conducted on the effect of practical food
preparation and cooking skill programmes upon groups of the population. It is not yet known how these types of intervention may improve the cooking skills and indeed the food choices
and dietary intake of the population. The most practical and workable starting point is likely
to be in school, since the real requirements for a practical intervention can be readily met by
classrooms intended for the teaching of home economics and food technology. Questions are
raised concerning the cost of such programmes and the need for experienced and capable facilitators. Those sections of the population most at risk of limited food preparation knowledge and skills and of poor diet need to be included as a priority in structured studies.
It is imperative also that appropriate evaluation of practical skills intervention be thoroughly
and professionally undertaken. Such an evaluation would no doubt provide much useful
information, resources and experience to guide future projects and to the efficacy of the teaching of food preparation and cooking skills.
2.9 Hypothesis
It is suggested that teaching teenagers and young people to cook can have a positive effect
upon their attitude to food preparation, increase their knowledge of cookery techniques and
may positively impact upon their dietary intake. Therefore it is hypothesised that effecting an increase in nutrition knowledge in schoolchildren and equipping the same children with a
range of basic food preparation and cooking skills can result in the increased consumption of fruits, vegetables and starchy foods. This would reinforce the importance of retaining and
strengthening the teaching of cooking skills at secondary school level (Key Stages 3 and 4)
within the National Curriculum as a public health initiative to reduce the inequality of diet
presented in children from a range of social backgrounds. This hypothesis was tested by
evaluating the efficacy of a school-based nutrition and cooking skills intervention, delivered
in the form of an extra-curricular 'Food Club' to children aged between II and 13-years-old
attending schools in socially deprived areas of the Tyne and Wear region.
49

2.10 Aims
The aims of the study were to:
Evaluate the impact of a school-based food preparation and
cooking skills intervention on the intake of foods and
nutrients in the diets of children from socially deprived
backgrounds
With the subsidiary aims to:
Quantify the intake and frequency of total sugars, non-milk
extrinsic sugars, sugary and acidic foods in the diets of
the children and identify changes within these foods and
nutrients following the intervention
Evaluate the impact of the intervention on the nutritional
knowledge, food preparation knowledge, cooking knowledge and
confidence of socially deprived children
Validate the method of dietary assessment using Physical
Activity Levels and analysis of 24-hour urine sample
biochemical markers
50

3 Subjects, Schools and Recruitment
Plate 3.1 Newspaper article Newcastle Chronicle 03 / 03 / 99
Nutrition survey helps schoolchildren develop a taste for study
Food foAgmkr thought YOUNGSTERS troni a Newcastle school are testing their culinary knowledge by, takin part in a good fooLtudy.
Pupils at 10 schools throughout Tývne & Wear . ýre asked to take part in the Newcastle Univer 1 project examining chi dren s attitudes towards , ating.
Resuft Among them are the 11
and 12 Year-olds from YP. r "at .S hoot at who have been asked to keew 3 diary of what they @at he results will ihen be ansIV over their sum I, ( mer liday,
They will also take part in a quiz about what they think about different foods and be asked to keep a rýord of their parents
Thý study is part of an 18 month programme bv III, Human Nutritioii IW-arvh C, rure at N-Custle Urov"Mity
My QUWM DLRAAS
The aim is t. find oul young people' n' limd and parlucofarniTth'(ý`t' ,, (voting teenagers
The information tht, \ receive will give nutrition ists at the untversttý vitai information to allow tht! in to ve advice to children o aril families oil how best 1, eat
The children's height will also be measured and the same study will N, done this time nextye. ar 1, monitor the changes
Paula Moynihan from the Human Nutrition Research Centre said "This stu(tv will be i-eall) useful.
"Young people's gin long are. impo wi, want to know what the North East pupils think about different foods atilt what foods they actua% eat,
rhe pupil, from Firrield e, e g-v Theý real ly got I u. k ,, I never seen (hildrori it muOl frwt
51
COOKING UP FUN Year 7 pupils at -i -, ý t: ". I, 'ý,, University survey which examines children s eating habits and itwif itlitudes towards toor-i
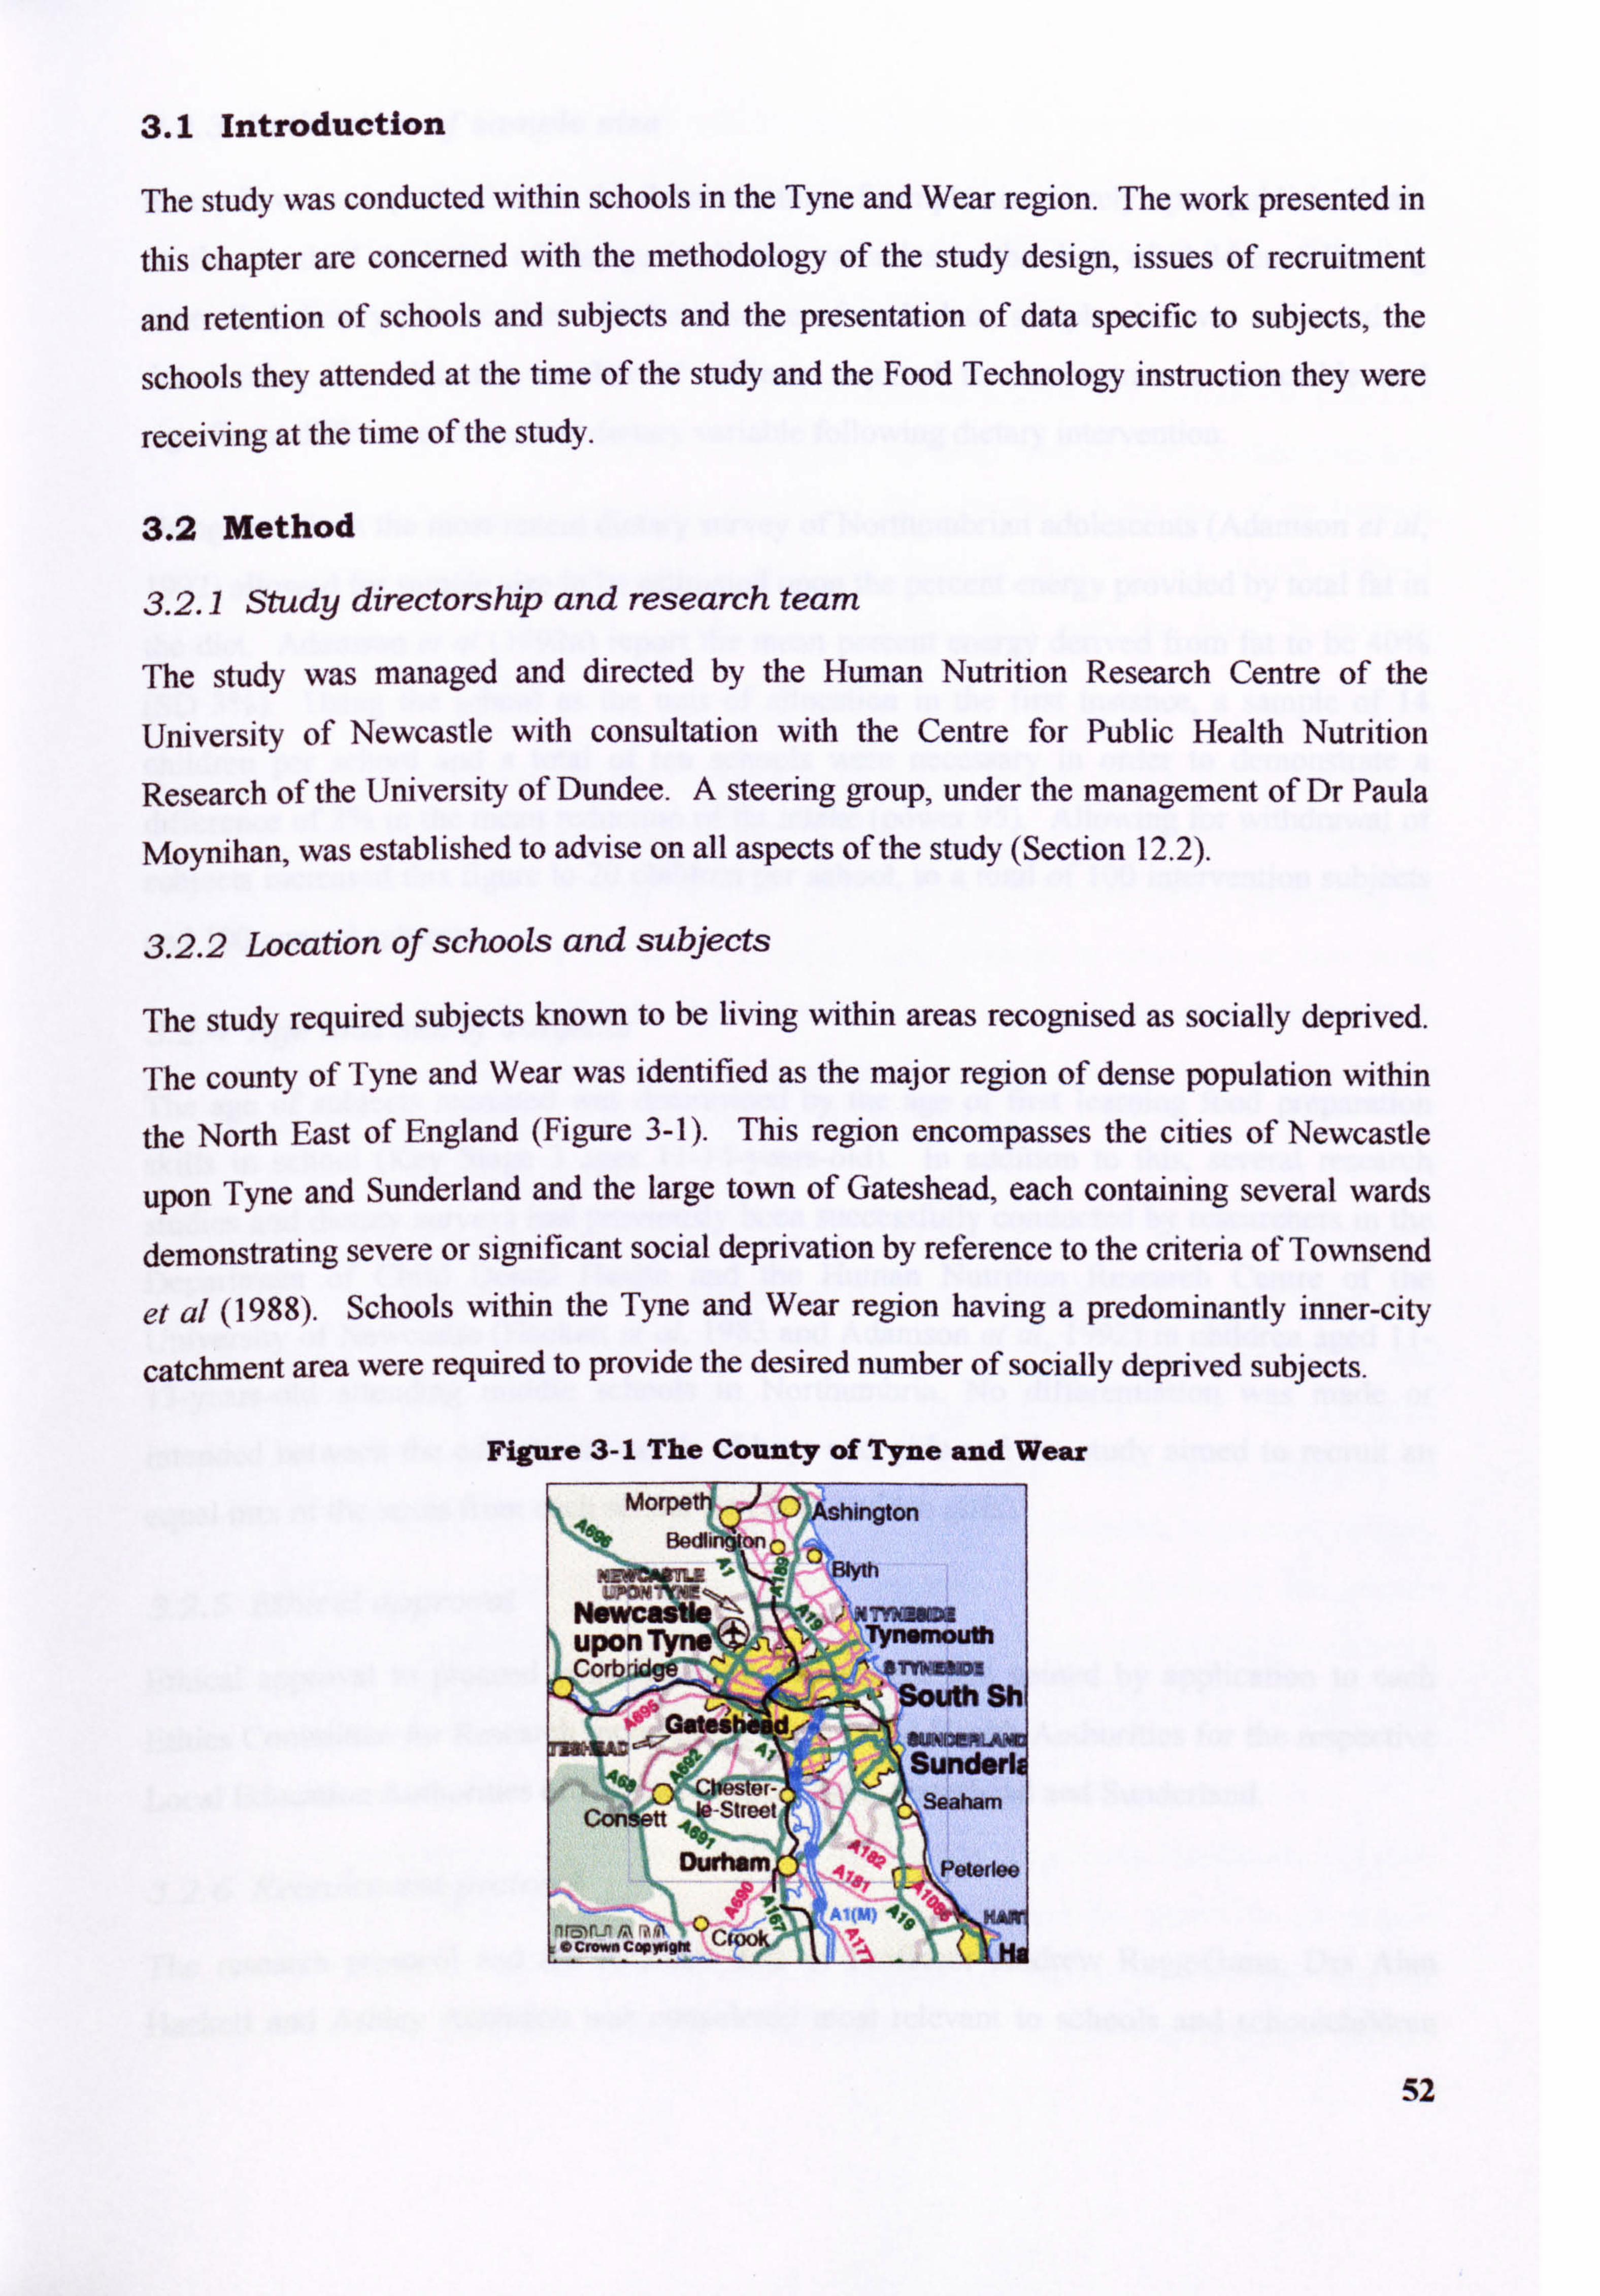
3.1 Introduction
The study was conducted within schools In the Tyne and Wear region. The work presented in
this chapter are concerned with the methodology of the study design, issues of recruitment
and retention of schools and subjects and the presentation of data specific to subjects, the
schools they attended at the time of the study and the Food Technology instruction they were
receiving at the time of the study.
3.2 Method
3.2.1 Study directorship and research team
The study was managed and directed by the Human Nutrition Research Centre of the
University of Newcastle with consultation with the Centre for Public Health Nutrition
Research of the University of Dundee. A steering group, under the management of Dr Paula
Moynihan, was established to advise on all aspects of the study (Section 12.2).
3.2.2 Location of schools and subjects
The study required subjects known to be living within areas recognised as socially deprived.
The county of Tyne and Wear was identified as the major region of dense population within
the North East of England (Figure 3-1). This region encompasses the cities of Newcastle
upon Tyne and Sunderland and the large town of Gateshead, each containing several wards
demonstrating severe or significant social deprivation by reference to the criteria of Townsend
et al (1988). Schools within the Tyne and Wear region having a predominantly inner-city
catchment area were required to provide the desired number of socially deprived subjects.
Figure 3-1 The County of Tyne and Wear
52

3.2.3 Estimation of sample size
It may have been preferable for the determination of sample size to rely upon published data
on the standard deviation of change in dietary variables in the diets of children following
controlled dietary intervention. In the absence of such data, sample size was estimated by
determining the minimum number of subjects required to demonstrate a detectable and
significant difference in any one dietary variable following dietary intervention.
Using data from the most recent dietary survey of Northumbrian adolescents (Adamson et al,
1992) allowed for sample size to be estimated upon the percent energy provided by total fat in
the diet. Adamson et al (1992a) report the mean percent energy derived from fat to be 40%
(SD 3%). Using the school as the unit of allocation in the first instance, a sample of 14
children per school and a total of ten schools were necessary in order to demonstrate a difference of 2% in the mean reduction of fat intake (power 95). Allowing for withdrawal of
subjects increased this figure to 20 children per school, to a total of 100 intervention subjects
and 100 control subjects.
3.2.4 Age and sex of subjects
The age of subjects recruited was determined by the age of first learning food preparation
skills in school (Key Stage 3 ages ll-. 14-years-old). In addition to this, several research
studies and dietary surveys had previously been successfully conducted by researchers in the
Department of Child Dental Health and the Human Nutrition Research Centre of the
University of Newcastle (Hackett et al, 1983 and Adamson et al, 1992) in children aged I I-
13-years-old attending middle schools in Northumbria. No differentiation was made or
intended between the educational needs of boys and girls and the study aimed to recruit an
equal mix of the sexes from each school (ten boys and ten girls).
3.2.5 Ethical approval
Ethical approval to proceed with the study was sought and gained by application to each Ethics Committee for Research representing three Local Health Authorities for the respective Local Education Authorities of Newcastle upon Tyne, Gateshead and Sunderland.
3.2.6 Recruitment protocol
The research protocol and the resultant data of Professor Andrew Rugg-Gunn, Drs Alan
Hackett and Ashley Adamson was considered most relevant to schools and schoolchildren
53

within the region and those same protocols were adopted for use in the present study.
Ultimately the subjects were required to be aged approximately II and 12 years at the start of
the study. Children of this age are in the seventh year of education and thus Year 7 groups in
secondary schools were to be targeted for the recruitment of subjects.
A multi-level method of recruitment was to be attempted throughout the recruitment phase of
the study. Schools were to be recruited into the study by direct contact with Headteachers and
Deputy Headteachers by a written letter of invitation from Dr Paula Moynihan of the Human
Nutrition Research Centre. Subsequently either the Head of Year 7 or the Head of Food
Technology was approached with information about the study with the intent to arrange
informal visits to Year 7 pupils.
Subjects were to be recruited by the distribution of a letter written by Dr Paula Moynihan.
This letter was sent home from schools to parents and guardians. Signed consent forms were
to be collected from teaching staff and a file compiled of all children volunteering to
participate. The file included the post-code of subjects in order to determine a Townsend
Material Deprivation Score (or Townsend score) for each individual. Twenty children from
each school having the highest score (living in the most deprived areas of the region) were to
be selected from this list and informed of their selection by post.
3.2.6.1 Recruitment oTschoo
Schools were recruited using the original protocol described in Section 3.2.4. Further to this
it was necessary to follow up written correspondence to schools with telephone calls and
visits to teaching staff in schools. A list of senior schools within the region was compiled
using up-to-date school directories obtained from the Local Education Authorities of
Sunderland, Gateshead and Newcastle upon Tyne. From the directories, secondary schools
were selected to the exclusion of a small number of single-sex and private schools and schools
where a significant proportion of catchment area was found not to be socially-deprived using
the major four components of the Townsend Material Deprivation scores (Townsend et al,
1988).
The recruitment of schools was approached by an initial letter sent to the Headteacher of each
school. The letter contained details about the study and invited the school to participate (Figure 3.2). This letter was followed up by several telephone calls to promote the study and
to establish an appropriate school contact. The recruitment of interested schools was secured 54

by meeting with school contacts, in the presence of Deputy Headteachers and other members
of teaching staff.
Teaching staff were infortned of what would be required of pupils (and their parents) and a
request made to access pupils during schools hours. School staff were briefly informed of the
proposed content and delivery of the Food Club in order to understand the facilities (e. g. a Food Technology classroom) which would be required for the Food Club to successfully run
as an extra-curricular activity. Information on the total school role, Year 7 role and hours of food technology taught at Key Stage 3 were collected to assist in identifying the criteria to be
used in the pairing of schools.
Schools were selected from those who consented to participate in the study. The schools were then paired according to the following; total school roll, number of children within Year 7,
total number of teaching hours of Food Technology in Year 7 and the amount of time (hours) devoted to the teaching of food preparation within Food Technology. The pairing of school
and subsequent random allocation to control and intervention groups within pairs was
undertaken by Dr David Walshaw of the Department of Mathematics and Statistics at the University of Newcastle.
3.2.6.2 Recruitment of subje
Subjects were recruited using a modification of the original protocol of Hackett et al (1983)
and Adamson et al (1992). The initial level of response from children was much lower than
in these previous studies and consequently did not meet the estimated sample size. It became
necessary to recruit subjects using a variety of methods: direct contact in schools, letters to
their home address, 'advertisement' literature at school and by an awareness-raising process initiated by teaching staff in tutor groups and assemblies. Visits to Year 7 pupils in school to inform on the study were performed by Drs Paula Moynihan and Ashley Adamson and Ms Emma Foster of the Human Nutrition Research Centre to sustain the anonymity of intervention and control groups to research nutritionists responsible for collecting dietary data
and to carry out a blind evaluation.
55
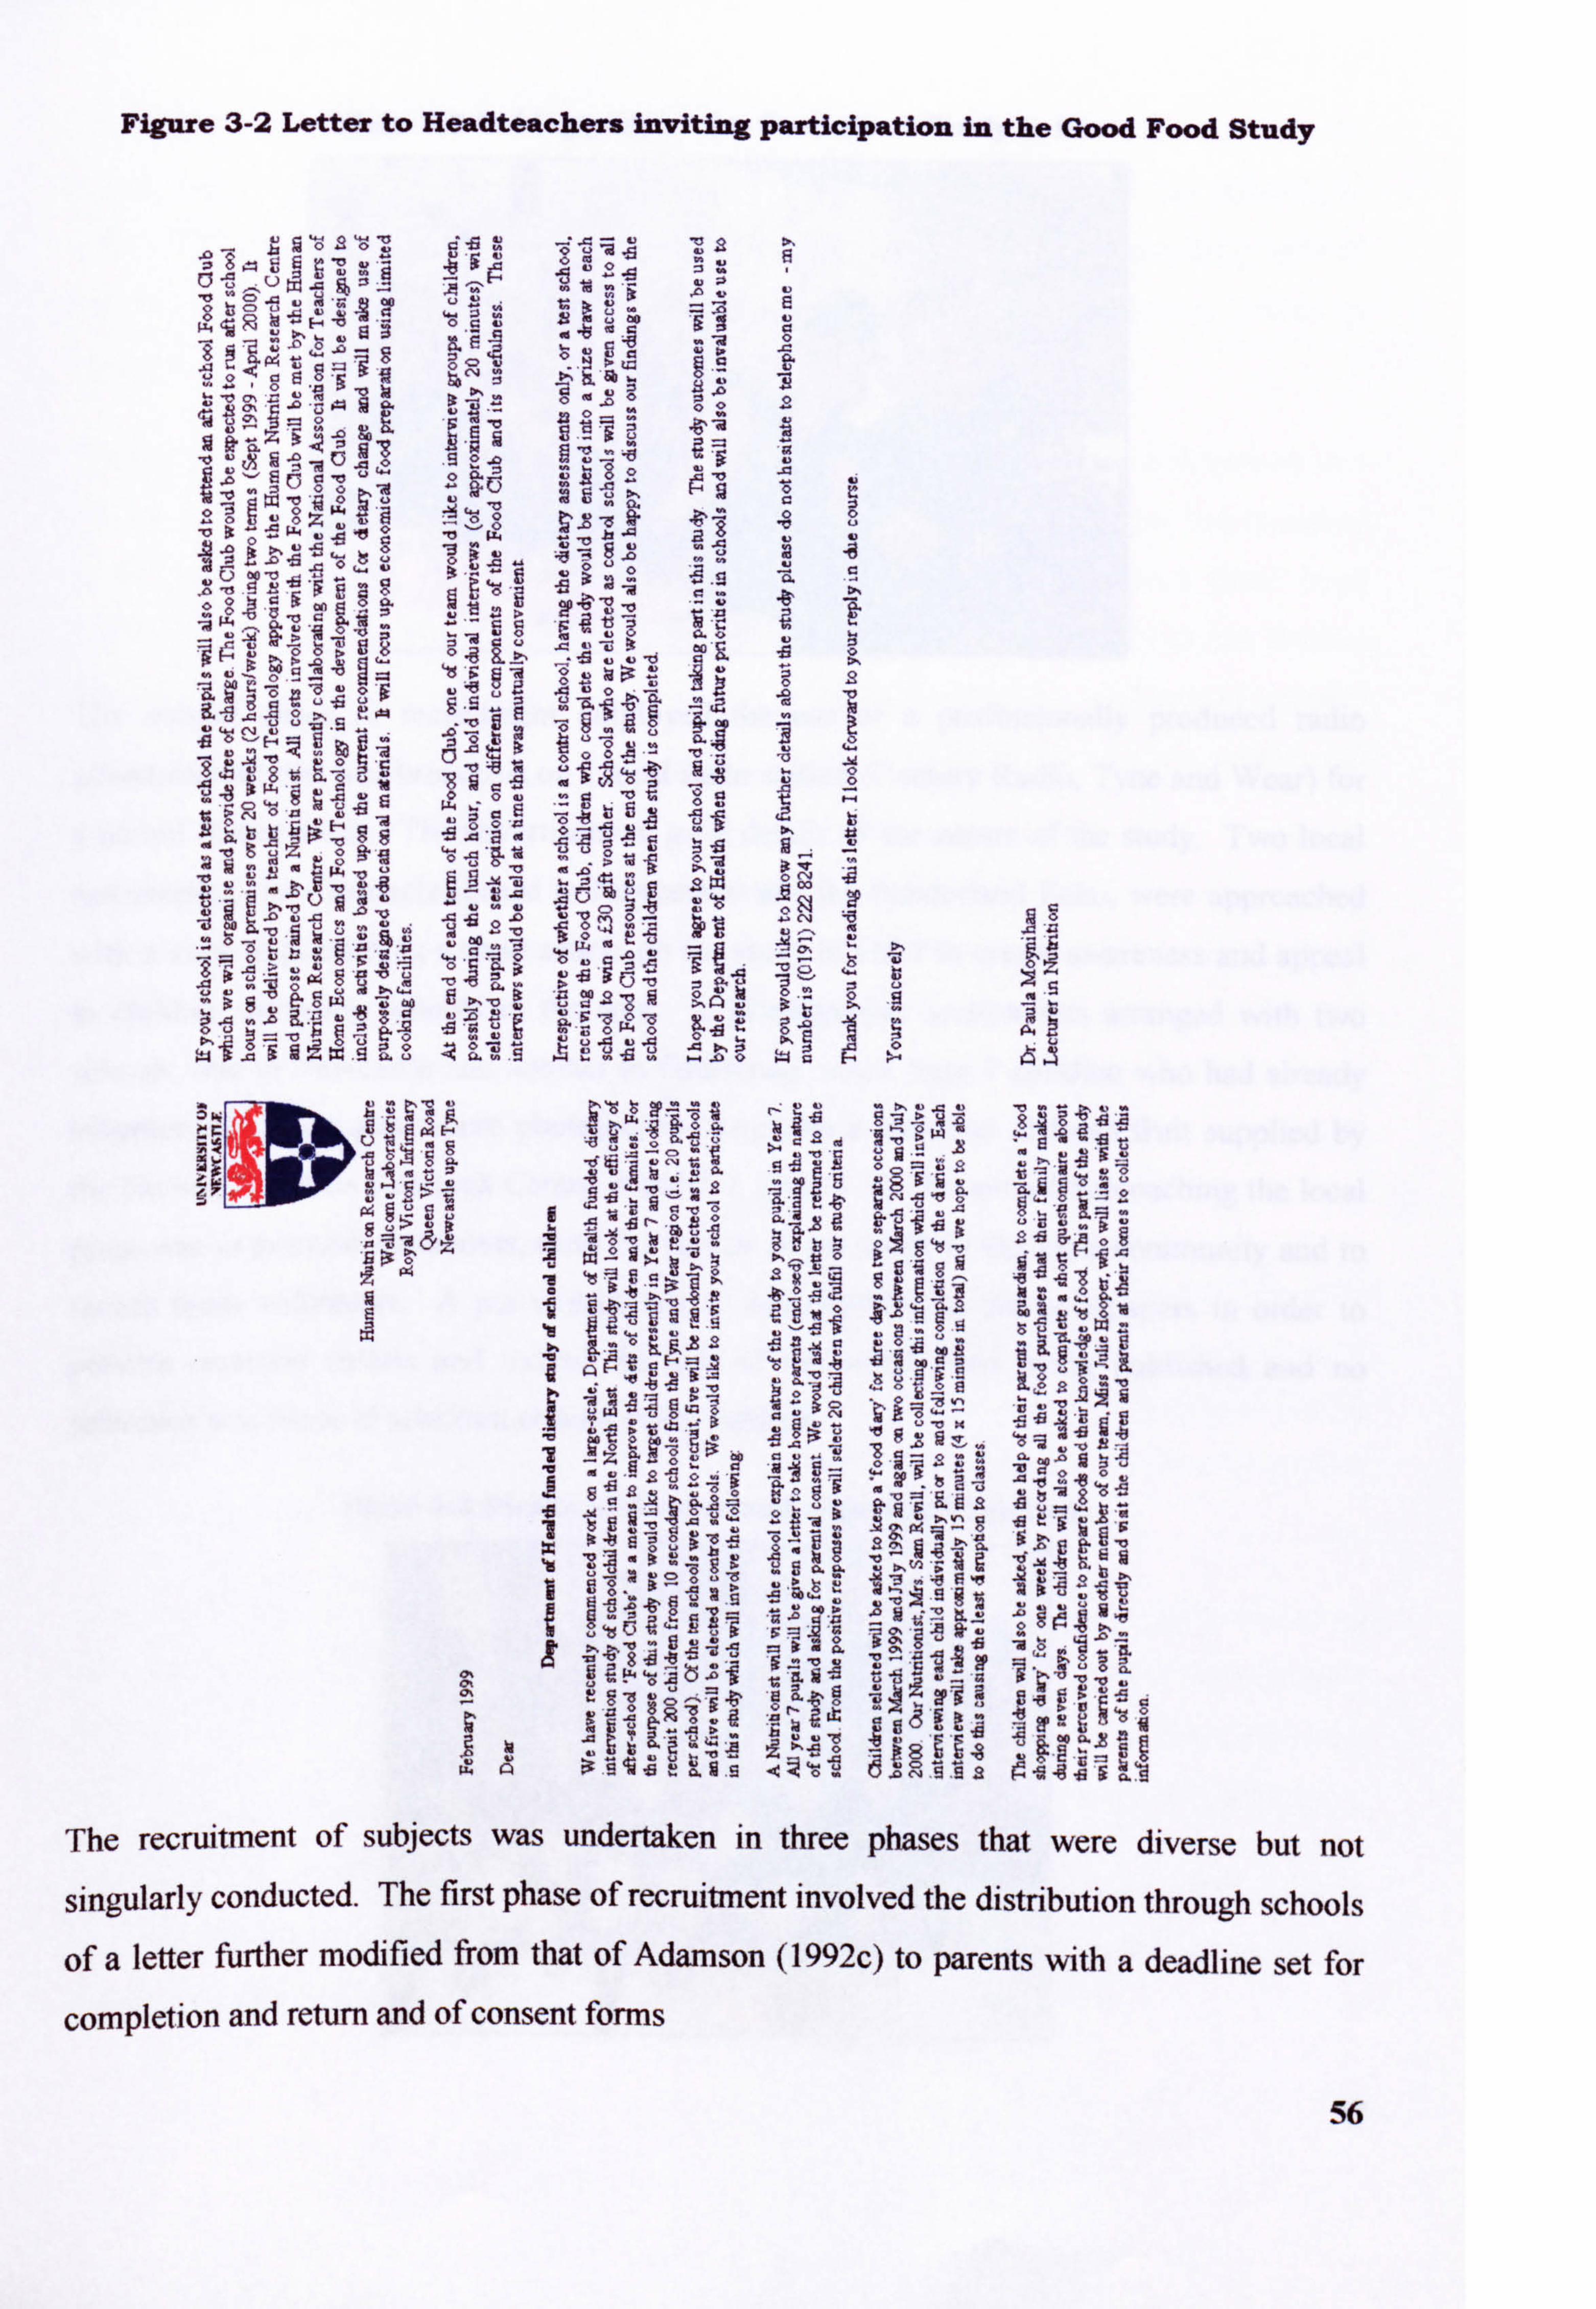
Figure 3-2 Letter to Headteachers inviting participation in the Good Food Study
0 c: .2M
Ei 6b ,
22
*K) .x9-:, -4 0A. ý Ei -, 02Tn -ig
-0 ot ý -2 p. .ý te 0 :ý -ý2 - "v bU
.8. . -5 1
-. m- ým -5 -<> e. -: @ E .2- 10 "3 0
'X ý52N'ý2g0ýýg04,0 -4 a- t>
ý5 >3 Z al Zj,
ýý e ge - -& ý Al, 0. ., 2 &
-9 82 A-ý, "-- - -, - ý2 ý ei .. n c83 ý- ý
;, a C- wg- «ä b li it 'büä E- C$ ý. 0a 0--5 _M
0i
2, ý. e. s«9 -ý ýe 'A jýý, ýa -ý 0, -. g 114 20
ab -, f au CD :, ý-
'Z
-2 a 2. - T -6 - -'2 a fi .Z. *0 ,
O, ä ja U- ýd 0-2 -D, zMEýee
&re>:, DM
e 2.
M 0
25., ä t 0. m
0
3, .- L' -0 .se ff mgj -0f,
e%rý. e. 5m.. . o,
lý ;1, li i; 1. - 31
1AZ0. - 1. -
19 -01 . B: - -, i>
U
_u
0
_OM "0
0- i
P, E 7'
>,
ýý Ü. 2 tým5" .9a -9
21 ug-ýiPi-ý, ZIA t -d 4x
. ei .2-9 ti e5 M- .0 Je 40.04 ,--K --e -2 , ýU .-. Ei k'
.m95-. - "8-, ,N isMir d c -- 2,, =i E -Z; ý -0 - -13 -M
ýz91 smii, ýa .85-
UM
19 ý -0 > .8m .-h. ,=1-. 2 =-Z ýi
-P. 92,
. ZL ff
.a le 9 -ä 30gt! ý9i 0, Z gt '.
2ý1"0ý, 5 ,
-a AN
The recruitment of subjects was undertaken in three phases that were diverse but not
singularly conducted. The first phase of recruitment involved the distribution through schools
of a letter further modified from that of Adamson (1992c) to parents with a deadline set for
completion and return and of consent forms
56

The second phase of recruitment employed the use of a professionally produced radio
advertisement that was broadcast on a local radio station (Century Radio, Tyne and Wear) for
a period of one week. The advertisement gave details of the nature of the study. Two local
newspapers, the Chronicle (based in Newcastle) and the Sunderland Echo, were approached
with a view to publishing a short article on the study in order to create awareness and appeal
to children attending schools in the area. A photographic session was arranged with two
schools, one in Newcastle and another in Gateshead, when Year 7 children who had already
volunteered to take part where photographed enjoying a selection of fresh fruit supplied by
the Human Nutrition Research Centre (Plate 3.2, Plate 3.3). The aim of approaching the local
press was to promote awareness, raise the profile of the study in the local community and to
secure more volunteers. A pre-written article was supplied to the newspapers in order to
prevent essential details and indeed the aim of the study from being published and no
reference was made to selection criteria of the subjects.
Plate 3.3 Pupils in Sunderland enjoying fresh fruit
57
Plate 3.2 Talring part in the Good Food Study is fun

The third phase focussed on promoting the study by informal visits from members of both the
research team and with assistance from Ms Emma Foster and Ms Emma Fletcher (HNRC) to
Year 7 form classes and year assemblies. The purpose of the visit was to raise the profile of
the study and challenge any possible negative perceptions of the pupils towards a University
conducted study.
During the visits a second letter of invitation to promote the study to pupils and parents was
given to the children. The letter was accompanied by a flyer (Section 12.3) that was designed
to be less formal and more appealing to young people. Each letter included a Good Food
Study logo that was designed to appeal to children and make correspondence from the Human
Nutrition Research Centre easily and instantly recognisable (Figure 3-3). This letter (was also
given in some bulk to teaching staff in order that it may be given to any child on request and
children absent from school on the day of presentation.
Figure 3-3 The Good Food Study logo
, 06 Foo., 4r
An information sheet (Figure 3-4) and a consent form (Figure 3-5) were designed for both
intervention and control schools. The letter to parents and guardians information sheet were designed to adhere to the guidelines laid down by the Ethics Committees of the Local Health
Authorities of Newcastle, Gateshead and Sunderland. During this phase colourful posters
were also supplied to schools to display to attract the interest of Year 7 pupils.
In intervention schools children were invited to take part in a dietary survey and to attend an
after-school Food Club for twenty weeks. In control schools children were invited to take
part in a dietary survey only. The letters were delivered to the ten schools in the appropriate
number for distribution by teaching staff to Year 7 pupils to take home to parents/guardians.
Additional copies of the letter were given to teaching staff to minimise the reduction in
numbers of volunteers due to lost letters and forms, or absence from school on the day the
letters were distributed.
58

Children were also asked to supply details of any other after-school activities they participated
in. This information was necessary in the event that there may have been differences between
those children already attending extra-curriculum activities and those who did not.
Figure 3-4 Information sheet supplied to prospective volunteers (intervention group)
Wellcome Laborator Queen Victoria Pc
Newcastle upon T) Tel: 0191 222 8ý
The Good Food Study
XWORMATI(M SMUT us information sheet contains details about the Good Food Study andhow you and i lid will be askedto contribute. Please read it carefully before you consent to your c angpart. If you have any questions about the sludy. please telephone the number g the bottom ofthis sheet. dang part in the study is entirely voluntary. All the information that you and your c pplywiUbestnctlyCONTMENTLkL- Your child may withdraw from the study at ne without giving a reason
Your child wi It be visited at school by a Nutr it ion ist, A rs Sam Pevil I, who will supply your childwrth a pocket-sized Food Diary and give full instructions to your child on how this should be completed. V is its to your child in schoo I will be arranged with teaching staff. The visit wi II take place at at ime that is convenient to the schoo I timetable. Your child will be given a slip that
wi It inform them of th a day and the time of the visit. Your child will be visited again in school on completion of the food diary. This visit wii I be
to look through the information your child has written down and to collect the diary from
him/her. Your child will asked to complete two food diaries in the summer term of school this year. and two next year at about the same time. The Nutritionist will also ask to visit you and yaw child at home, at a time that is
convenient toyou, The Nutritionist will ask to measure your chilcrsheight andweight and this willbewritten down A Nutritionist will also ask your childto fill iin a quest ionnaire. This willbe done at school this summerterm and again next year aboutthe sometime. In addition, Miss Julie Hooperwill contaclyouto arrange atimeto visit you at home, You (and your child, ifhe or she wishes)wiltbo askedto complete a Food Shopping Diary for
one week. You will be asked to fill in one Shopping Diary this year. and one next year about the sometime. Your child will be invited to attend an after-school 'Food Clulo' for two hours a week. for 20 weeks (between September 1999 and April 2000) where they will be able to cook and taste a range of foods. The Club will be taught by a qualified teacher of food technology
and all ingredients and equipment will be provided free of charge. A 11 the informat ion that you and your child supply will be CONFIDENTIAL.
0. Children who complete the study will be given a certificate of merit and a gift voucher as a thank you for their help.
,., Po P--.,
If )R)u have any quadtions, plaaaa telephone: Or Paula Moynihan (0191222 8241)
Mrs Sarn Revill or Miss Tuilie Hooper (0191222 8719)
Again, two different consent forms were designed that were appropriate to either the control
or intervention schools. The consent forms also adhered to the guidelines set out by the
Ethics Committee on appropriate and unambiguous use of language, reference to the
confidential nature of information supplied by parents and the protection of this information,
the opportunity to withdraw from the study without reason and a signature to confirm reading
of all the documents and letters.
59

. 11
Figure 3-5 Parental consent form
HumanNutrition Pesearch Centre
Wellcome Laboratories Royal Victoria In-firmary
Queen V&oria Poad Newcastle upon Tyne
Tel: 0 191222 8719 roci,
Con M Piease read this consent form carefully and sign if you to agree to your child taking part in
the 'Good Food Study conducted by the Human Nutrition Research Centre of the University of Newcastle
This is to confirm that- I have read the letter entitled'The Good Food Study'
I have read and understood the Information Sheet provided I understand that all information given wil be CONFIDENTIAL
I understand that my child may withdraw from the study at any time without reason I agree to my child taking part in the'Good Food Study'
Signed... - ....... . ... ............ ..... ... . ... --.. ..... ......
Your full name (please print) ... ........ .......... .......
Your child's name
Your child's class
Home address
Postcode
Home telephone number
other contact number
Does your child attend any after-school clubs? (please tick one) Yes No
it yes, what kind of after-school dub does your child attend?
...........................................................................................................
Pieese return this form to ....... ..... .......... -- -by ......... ......... ...........
Thank you
A range of colourful posters and flyers were designed to attract attention and provide a source
from which to gain further information (Figure 3-6). Each poster had the name of a designated member of teaching staff who had agreed to supervise the distribution of further
letters and consent forms where necessary. The same member of staff also agreed to be
responsible for collecting consent forms in school.
60

Figure 3-6 Posters displayed in study schools to promote the Good Food Study
CP 4 Fooo,
(6 e--
Year 7 Thk Is your dwim*
to Sam & col uncate d onfit
hot you would how to do,
Com to is FRM Food Club after school where you com cook, "t end toke how tosty foods
VMte dpwo all fte things you cat end drink for 3 deVe
a Special dio-y
WMe odown the familly food shopping for one week
Thet's ALL yea how to del It's shmple.
Act Factl Find wt mm
o6 FooQ,
C
Year 7 Ard& you In th(-ip mc)zod ftor food?
To fincs out more about an exciting
new Fooci Club contact
ALCt faSt
Consented replies to the letter of invitation were collected within an agreed time period in
school by teaching staff and later collected by the researchers.
Children were also encouraged to take part through a system of awarding a certificate of merit
with gold stars that could be included their school Record of Achievement (Figure 3-7). The
certificates were shown to children during informal presentations to raise awareness of the
study.
The steering group for the project also concluded that it may be appropriate to include a
reward to children completing the study as a means of increasing participation. Children were
informed during the presentations by research staff that a reward in the form of a gift voucher (for f 15.00) would be presented to pupils completing all aspects of the study.
61
Figure 3-7 Certificate of Merit to be awarded to children completing an aspects of The Good Food Study
UNIVERSITY OF NEWCASTLE
Human Nutrition Research Centre
Cei ficate of Ment
This is to certify that
took part in The Good Food Study
organised by
The Human Nutrition Research Centre of the
University of NewcastLe
The Bearer's hard work and perseverance throughout the study
deserves the
Highest Commendation AN
3.2.7 Subject selection
Subject selection took place on the basis of assumed material and social deprivation.
Following collection of completed and signed consent forms, the address and postcode of
each subject were entered onto a Microsoft Excel Spreadsheet. The data were then analysed
by Dr Simon Raybould at the Centre for Regional and Urban Development at the University
of Newcastle. The data were used to define enumeration district and to allocate the
appropriate Townsend Material Deprivation Score (Townsend score) to each individual, using 62
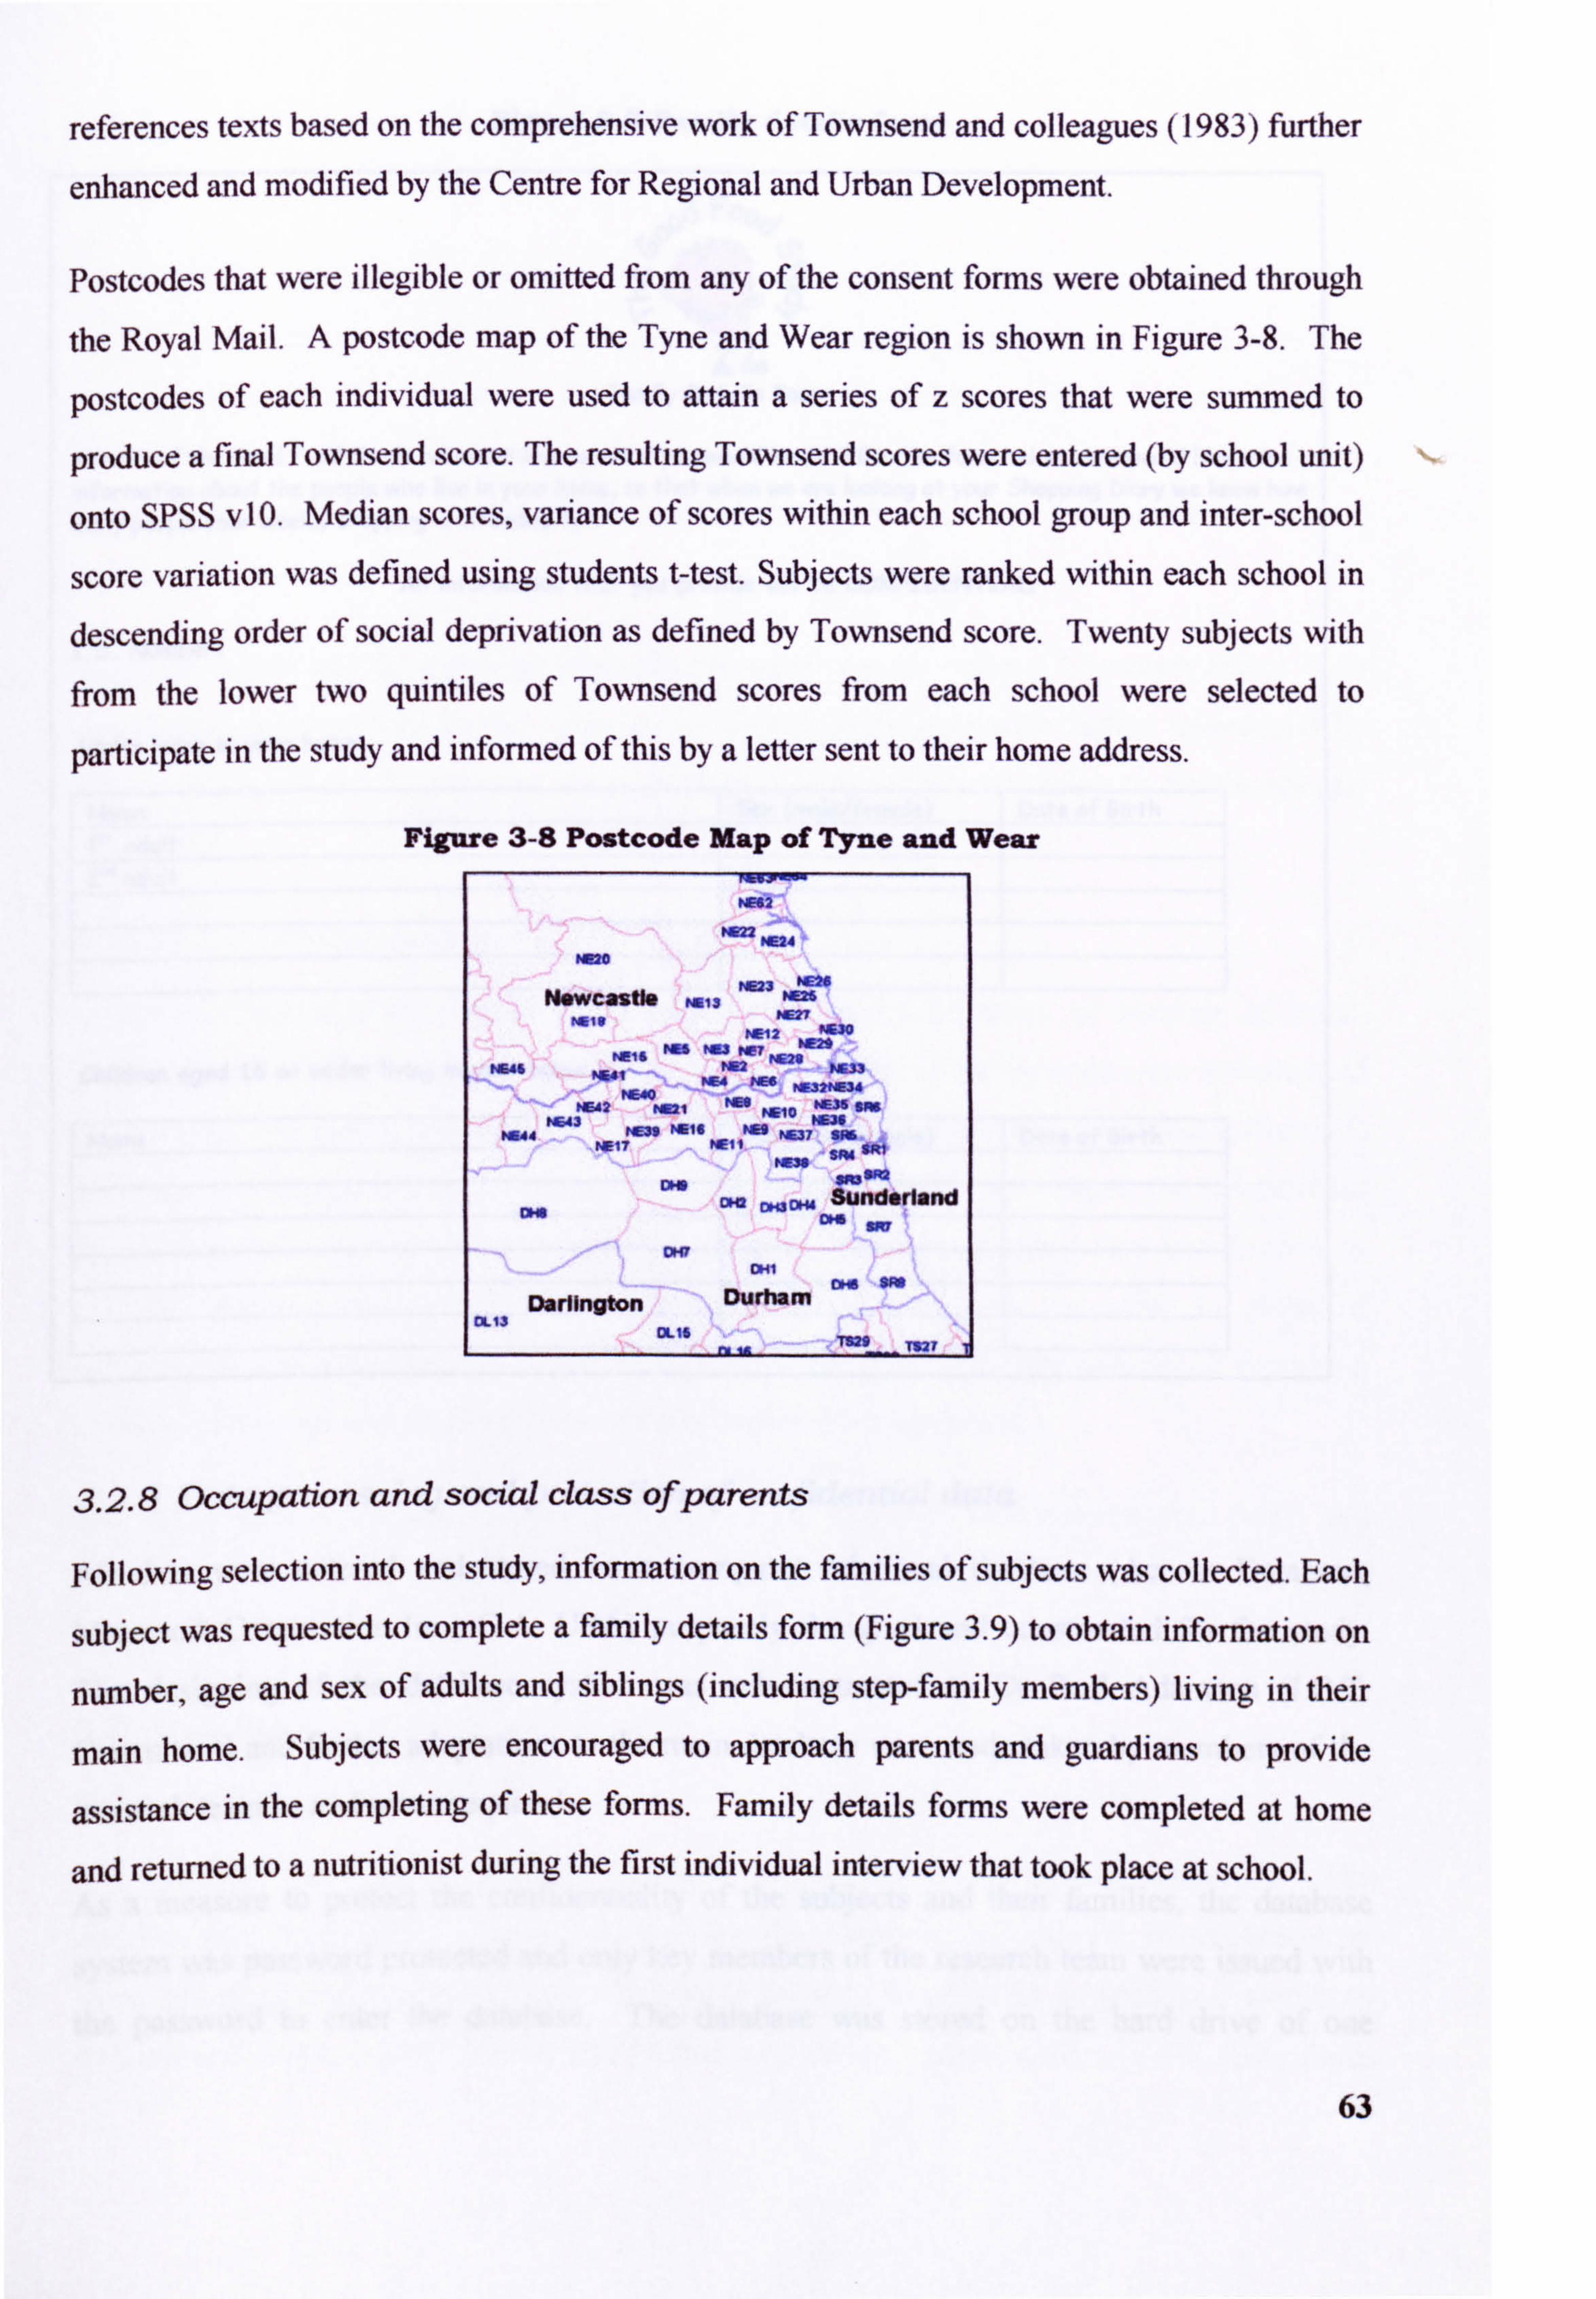
references texts based on the comprehensive work of Townsend and colleagues (1983) further
enhanced and modified by the Centre for Regional and Urban Development.
Postcodes that were illegible or omitted from any of the consent forms were obtained through
the Royal Mail. A postcode map of the Tyne and Wear region is shown in Figure 3-8. The
postcodes of each individual were used to attain a series of z scores that were summed to
produce a final Townsend score. The resulting Townsend scores were entered (by school unit)
onto SPSS vIO. Median scores, variance of scores within each school group and inter-school
score variation was defined using students t-test. Subjects were ranked within each school in
descending order of social deprivation as defined by Townsend score. Twenty subjects with from the lower two quintiles of Townsend scores from each school were selected to
participate in the study and informed of this by a letter sent to their home address.
Figure 3-8 Postcode Map of Tyne and Wear
W42
MR22 NE24 Hue
, Am NEW N*WC2S"§ N013 ME26
Nalf ME27 W12 MUO
NEIS HIS Now? MM
W. 46 N561 Ma W. " NM
MW NE4 WA PMV034
NE42 rM, I'm NOO WEN on
W. 43 NE36 M144 t4E319 NM FM M07 SM
MI? NEIi "WO
Do s"WO am
Sunderland cm C64 wa
OKY DHI
Darlington Durham CL13
OUG T827
3.2.8 occupation and social class ofparents
Following selection into the study, information on the families of subjects was collected. Each
subject was requested to complete a family details form (Figure 3.9) to obtain information on
number, age and sex of adults and siblings (including step-family members) living in their
main home. Subjects were encouraged to approach parents and guardians to provide
assistance in the completing of these forms. Family details forms were completed at home
and returned to a nutritionist during the first individual interview that took place at school.
63

Figure 3-9 Family details form
. 06 Fooo,
0' lapt
.cI EL
Family Details Form
As part of the Good Food Study we would like to ask if you would kindly fill in the form below. We would like sorm inforniation about the people who live in your home, so that when we are looking at your Shopping Diary we know how
mny people your weekly shopping is intended for.
All information that you provide will be CONFIDENTIAL.
I. D. Number;
Adults living in your home
Name Sex (male/femmle) Date of Birth is'
adult 2nd adult
Children aged 16 or under living in your home
Nam Sex (mle/fermle) Date of Birth
3.2.9 Data processing and protection of confidential data
All data were entered and stored on a computer relatIonal database (Access Database,
Microsoft Corporation Inc., C. A. USA) purposely designed and constructed for the study.
The designing of the database system was sub-contracted to Dr Paul Adamson (I. C. T.
Consultant) and further adaptations to the main database were undertaken by members of the
research team as and when required.
As a measure to protect the confidentiality of the subýjects and their families, the database
system was password protected and only key members of the research team were issued with
the password to enter the database. The database was stored on the hard drive of one
64
computer, the access to which was further protected by a password known only to key
research team members.
The database automatically assigned a key identity number to each subject that enabled
researches to enter any related data using the system of identity numbers only. This removed the need to use family surnames. Additional key identity numbers (which further related to individual identity numbers) were allocated to intervention and control groups and to schools thereby allowing all queried data, reports, summaries and computer print-outs to be viewed at
group and school level only.
Data not entered on the database were directly entered onto either a Microsoft Excel (v. 6)
spreadsheet or onto SPSS (v. 10). The confidentiality of the data were further maintained by
either using a name and password for individual files or folders according to the forniat and
type of file.
3.2.10 Data analysis
Differences between the intervention and control groups in terms of number of hours
allocated to Food Technology and to the teaching of practical food lessons were investigated
using Mest. The numbers of children volunteering to take part was calculated and differences
between intervention and control group determined using t-test to investigate the potential for
the introduction of bias in recruitment of subjects, once group allocation was known to
schools, teaching staff and pupils. The numbers of volunteers according to phase of
recruitment was calculated in order to highlight the most effective means of recruiting
children of this age and children from socially deprived backgrounds.
The occupation of the parents and guardians of the children were entered onto SPSS and differences between the numbers and spread of the parents and guardians occupation analysed
using West.
3.3 Results
3.3.1 Schools
The response from the 26 secondary schools approached is detailed in Table 3.1. The
Headteachers from several schools indicated that the reason they declined to participate arose from the anticipated conflict of time required to spent in school with subjects and with both
internal and external school audits and Ofsted inspections. Headteachers (particularly those 65

leading schools designated as 'failing' in their most recent Ofsted report) indicated that
parental concerns over removing children from classes for visits with a nutritionist took
priority over the potential benefit to be gained by participating. This was demonstrated in six
of the schools declining to take part due to curriculum pressures. Three schools were already taking part in other health studies relating to smoking, oral health and physical activity being
conducted by the University of Newcastle and the University of Sunderland.
Table 3.1 Recruitment response of 26 secondary schools in Tyne and Wear
Response Number Positive Positive participation 10 Late positive (reserve school) 2 Declined invitation Written refusal (no reason given) 4 Already participating in health studies 3 Study intrusive upon curriculum time 6 Other No contact established I Total 26
only in one school could no appropriate contact be established. Administrative staff at this
school indicated that the several letters and faxes had probably been circulated to the most
appropriate members of staff (i. e. the Heads of health education and food technology) but
possibly individual staff members did not want to be responsible for the work that may have
been involved in managing a research project in school. Four schools wrote in reply to the initial recruitment letter to decline to participate in the study but did not supply a reason for
doing so.
Teaching staff most likely to respond to the letter of invitation were Deputy Headteachers, the
Head of Food Technology or the Head Of Health Education. The location of the schools
recruited, the total roll and Year 7 roll number and number of Year 7 pupils returning parental
consent forms are shown in Table 3.2.
66
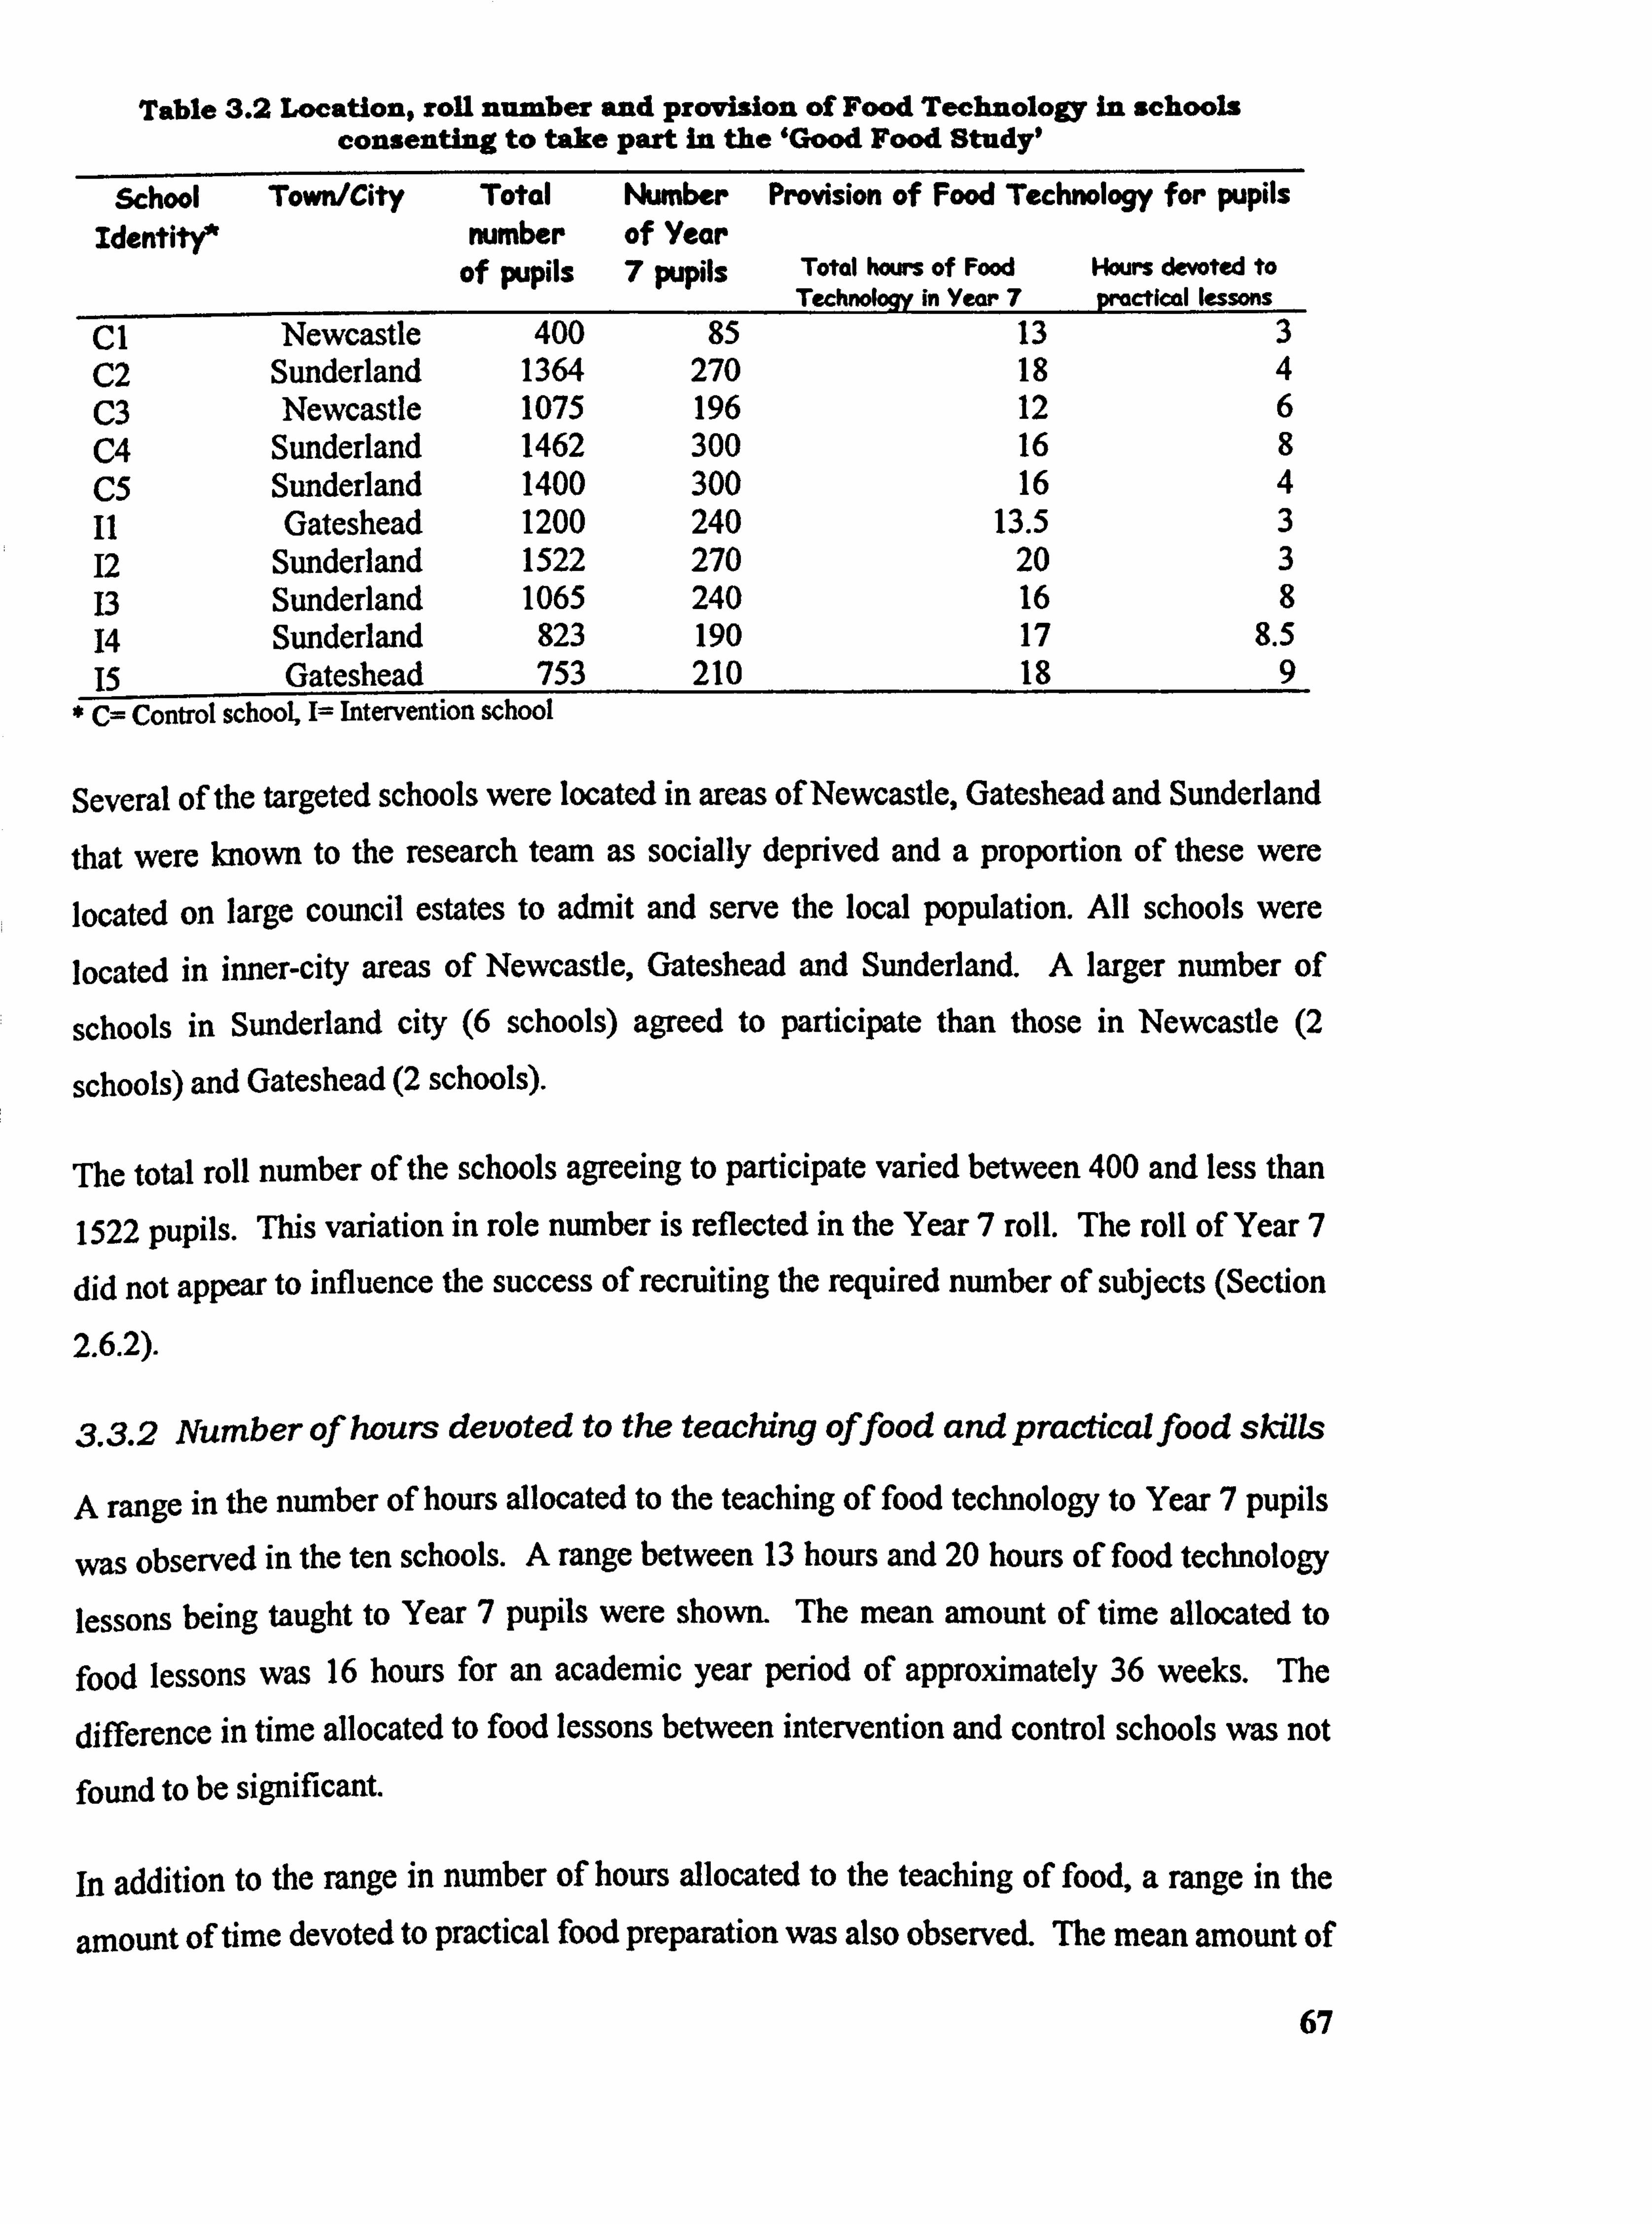
Table 3.2 Location, roll number and provision of Food Technology In schools consenting to take part in the 'Good Food Study,
School Identite
Town/City Total mimber
of pupils
Number of Year 7 pupils
Provision of Food Technology for pupils
Total hours of Food Hours devoted to Technology in Year 7 practical lessons
C1 Newcastle 400 85 13 3 C2 Sunderland 1364 270 18 4 C3 Newcastle 1075 196 12 6 C4 Sunderland 1462 300 16 8 C5 Sunderland 1400 300 16 4 II Gateshead 1200 240 13.5 3 12 Sunderland 1522 270 20 3 13 Sunderland 1065 240 16 8 14 Sunderland 823 190 17 8.5 15 Gatcshead 753 210 18 9
* C= Control school, I= Intervention school
Several of the targeted schools were located in areas of Newcastle, Gateshead and Sunderland
that were known to the research team as socially deprived and a proportion of these were located on large council estates to admit and serve the local population. All schools were
located in inner-city areas of Newcastle, Gateshead and Sunderland. A larger number of
schools in Sunderland city (6 schools) agreed to participate than those in Newcastle (2
schools) and Gateshead (2 schools).
The total roll number of the schools agreeing to participate varied between 400 and less than
1522 pupils. This variation in role number is reflected in the Year 7 roll. The roll of Year 7
did not appear to influence the success of recruiting the required number of subjects (Section
2.6.2).
3.3.2 Number of hours devoted to the teaching offood and practical food skills
A range in the number of hours allocated to the teaching of food technology to Year 7 pupils
was observed in the ten schools. A range between 13 hours and 20 hours of food technology
lessons being taught to Year 7 pupils were shown. The mean amount of time allocated to
food lessons was 16 hours for an academic year period of approximately 36 weeks. The
difference in time allocated to food lessons between intervention and control schools was not
found to be significant.
In addition to the range in number of hours allocated to the teaching of food, a range in the
amount of time devoted to practical food preparation was also observed. The mean amount of
67
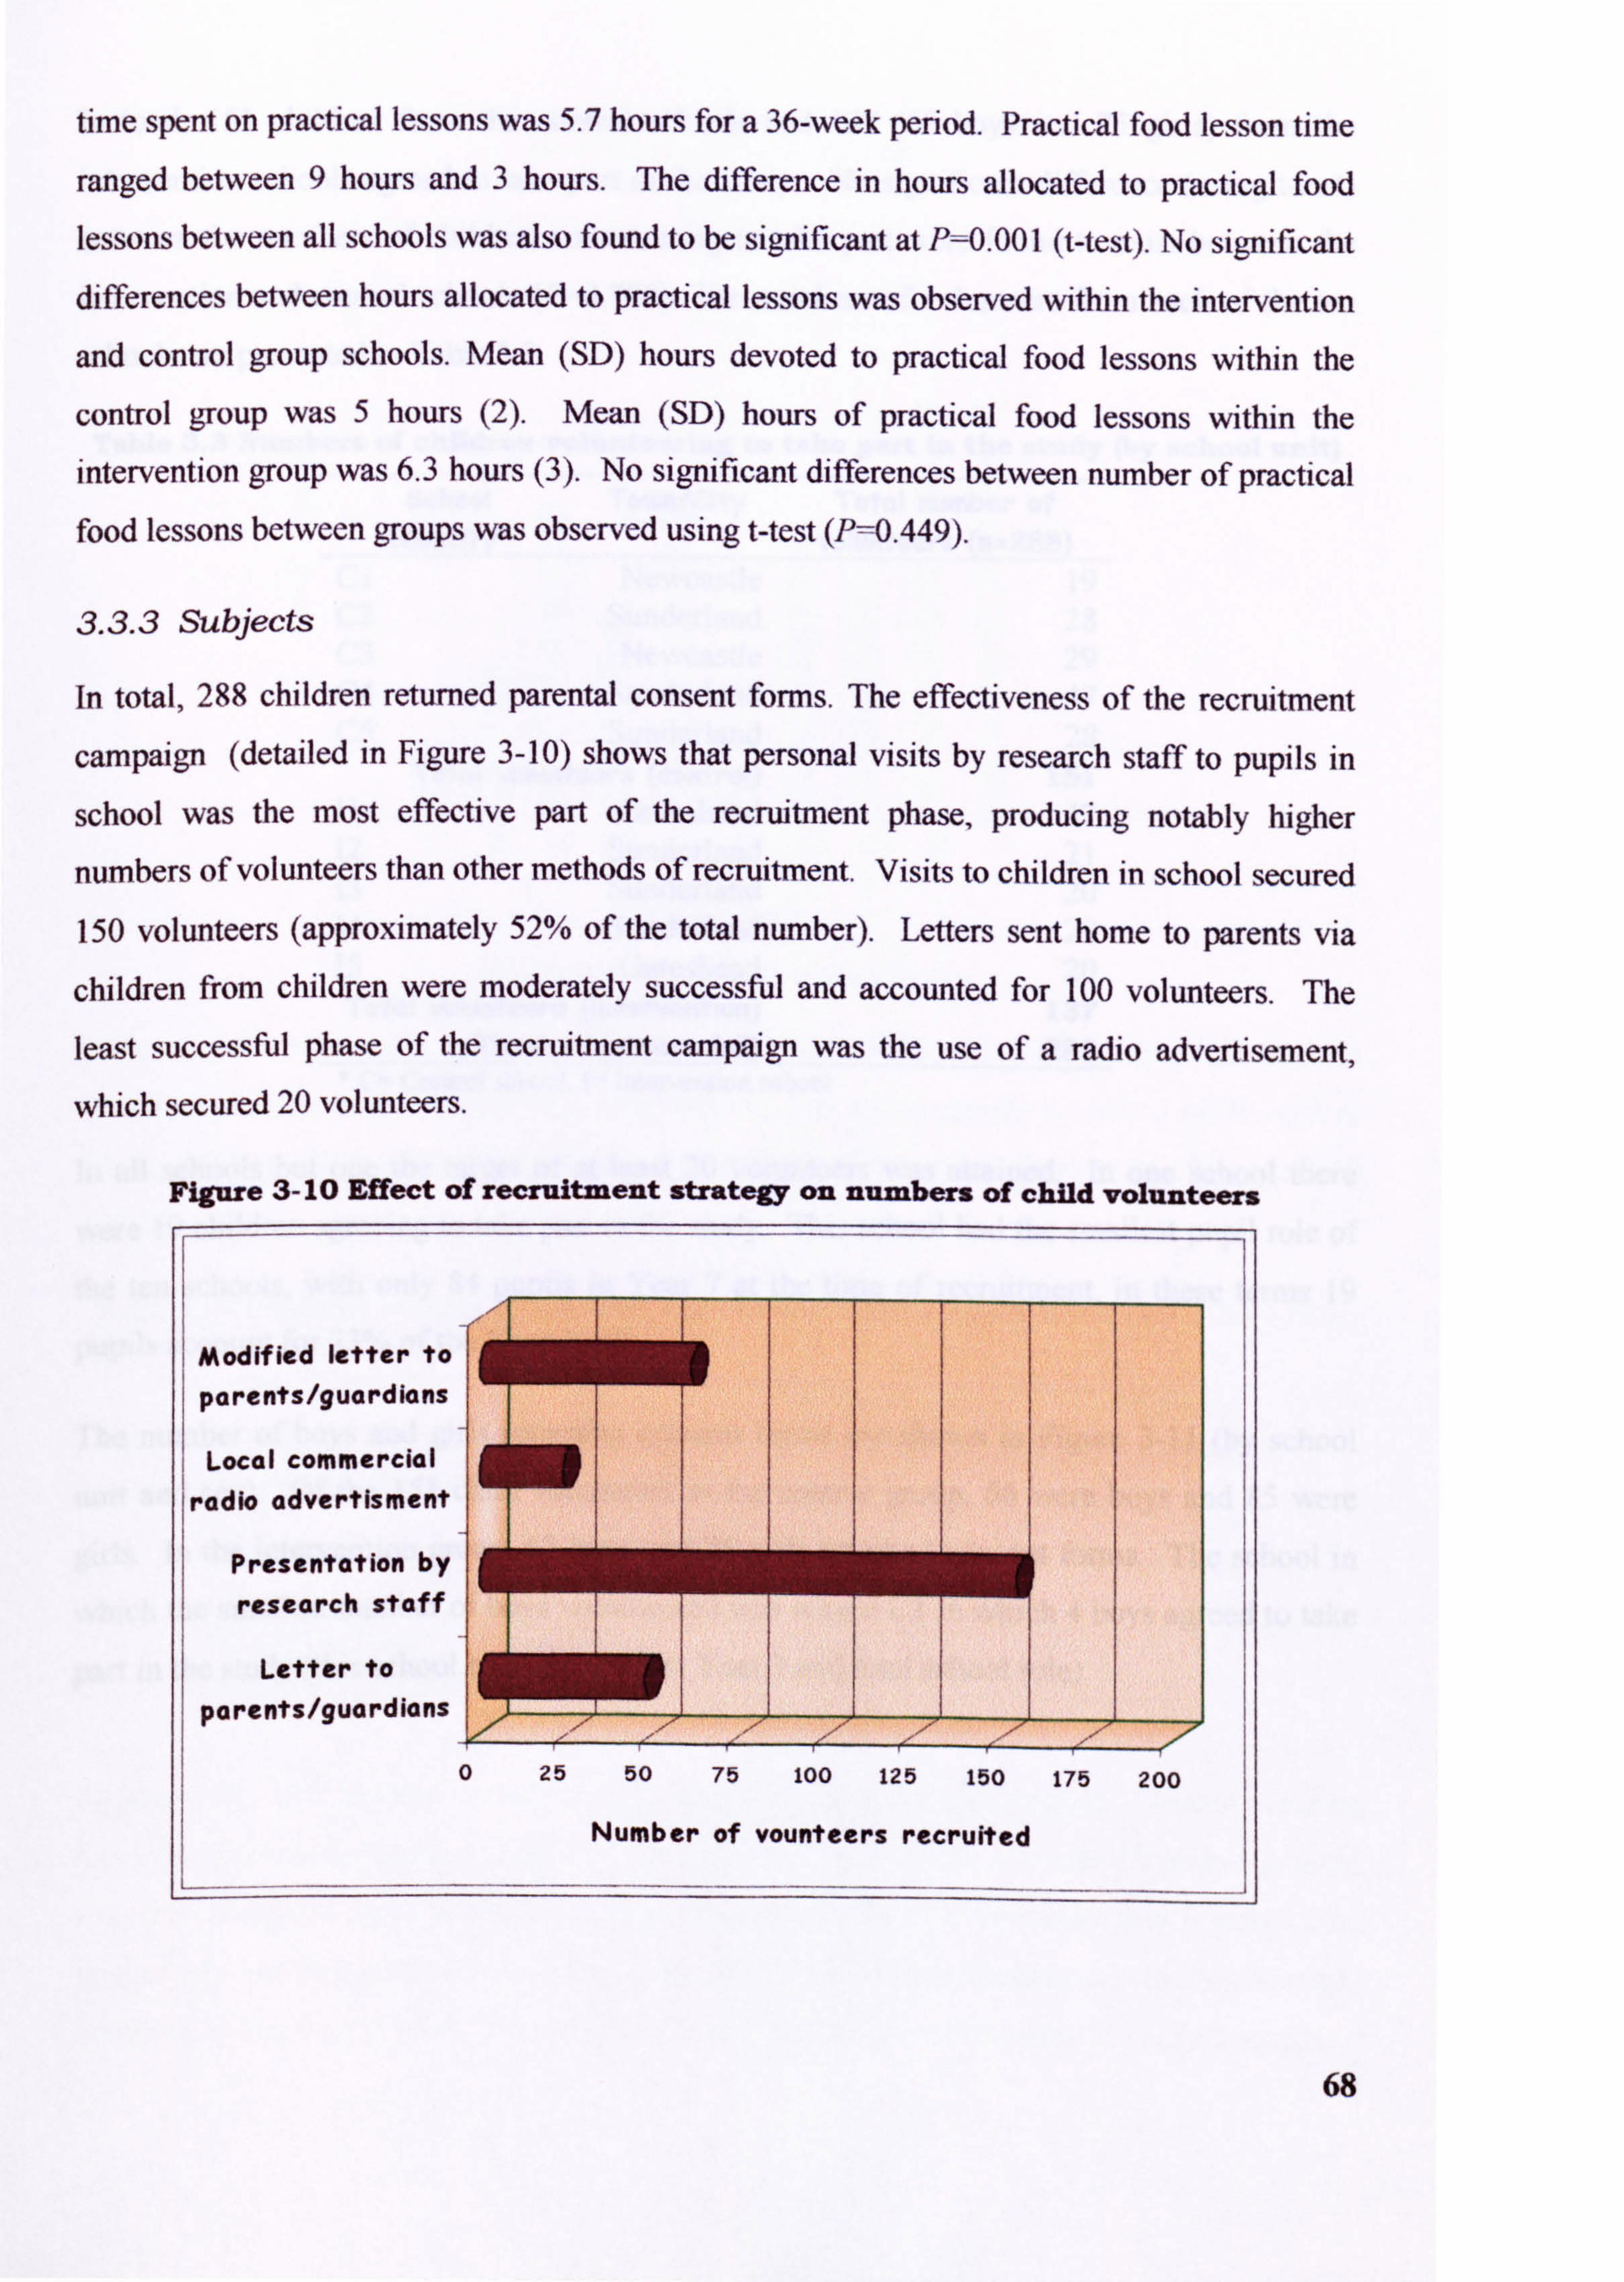
time spent on practical lessons was 5.7 hours for a 36-week period. Practical food lesson time
ranged between 9 hours and 3 hours. The difference in hours allocated to practical food
lessons between all schools was also found to be significant at Pý0.00 I (t-test). No significant differences between hours allocated to practical lessons was observed within the intervention
and control group schools. Mean (SD) hours devoted to practical food lessons within the
control group was 5 hours (2). Mean (SD) hours of practical food lessons within the
intervention group was 6.3 hours (3). No significant differences between number of practical food lessons between groups was observed using t-test (P=0.449).
3.3.3 Subjects
In total, 288 children returned parental consent forms. The effectiveness of the recruitment
campaign (detailed in Figure 3-10) shows that personal visits by research staff to pupils in
school was the most effective part of the recruitment phase, producing notably higher
numbers of volunteers than other methods of recruitment. Visits to children in school secured 150 volunteers (approximately 52% of the total number). Letters sent home to parents via
children from children were moderately successful and accounted for 100 volunteers. The
least successful phase of the recruitment campaign was the use of a radio advertisement,
which secured 20 volunteers.
68
Figure 3- 10 Effect of recruitment strategy on numbers of child volunteers
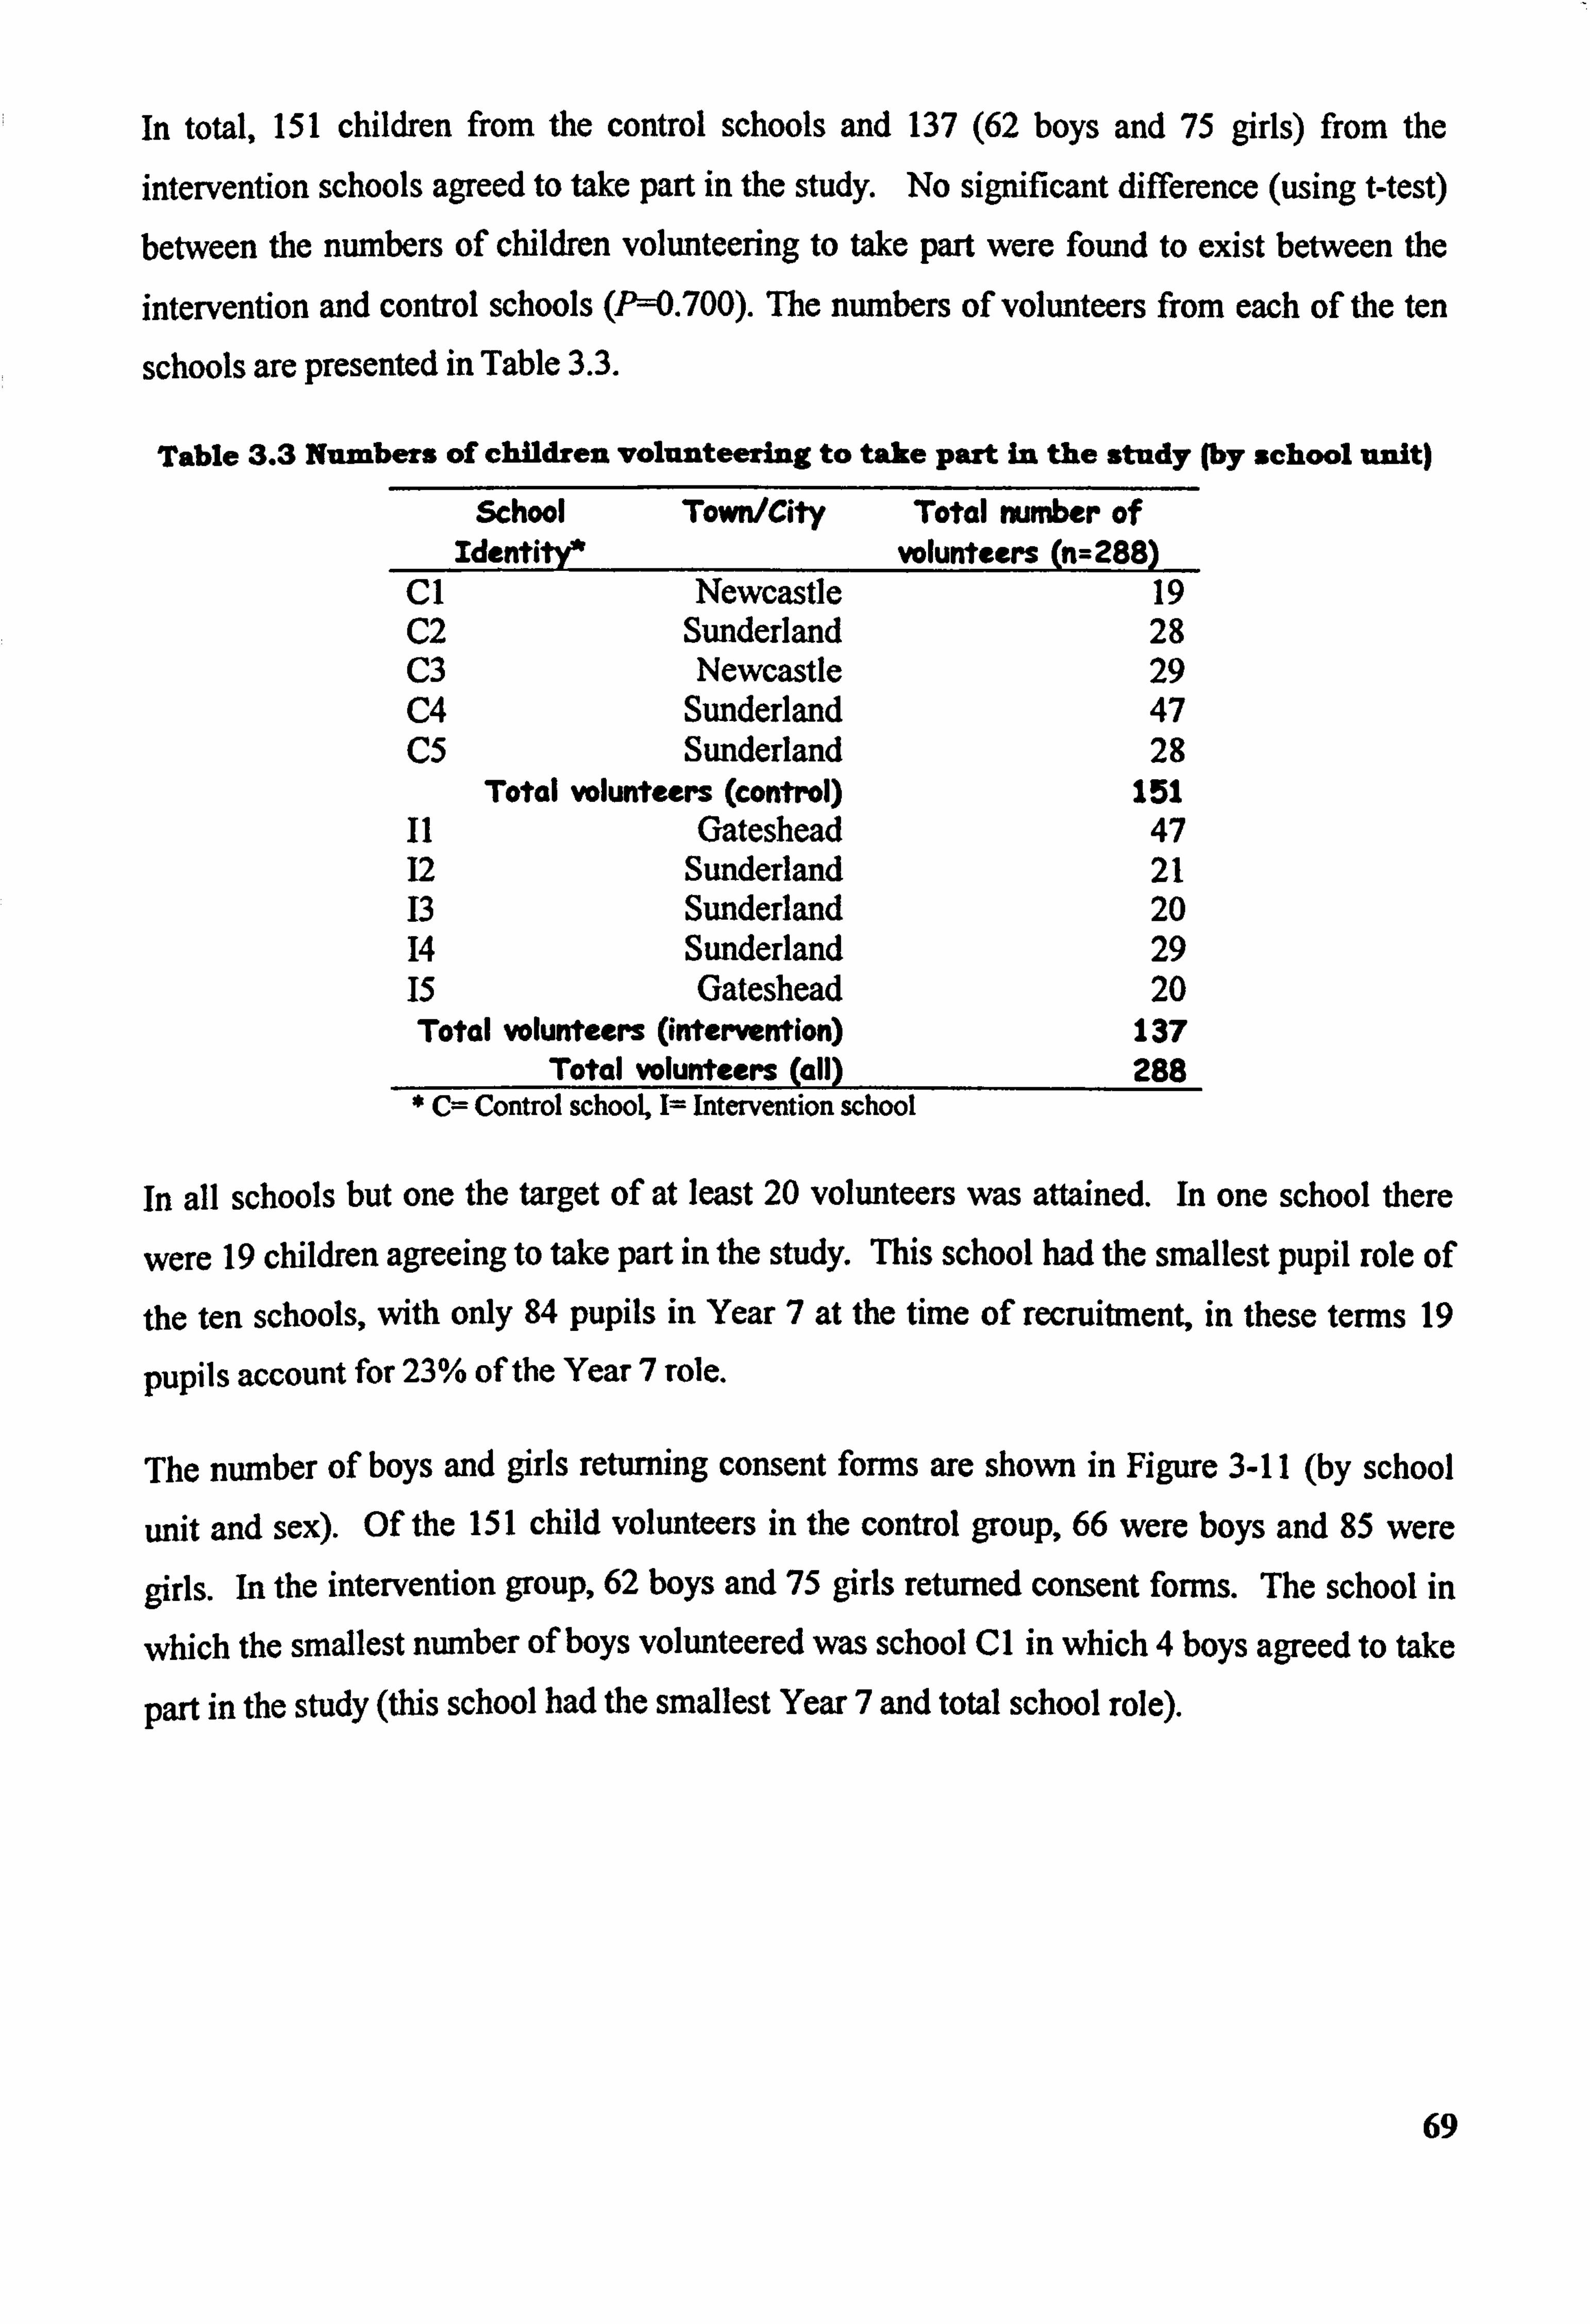
In total, 151 children from the control schools and 137 (62 boys and 75 girls) from the intervention schools agreed to take part in the study. No significant difference (using t-test) between the numbers of children volunteering to take part were found to exist between the intervention and control schools (P--0.700). The numbers of volunteers from each of the ten
schools are presented in Table 3.3.
Table 3.3 Numbers of children volunteering to take part in the study (by school unit) School Town/City
Identity* Total number of
volunteers (n=288) CI Newcastle 19 C2 Sunderland 28 C3 Newcastle 29 C4 Sunderland 47 C5 Sunderland 28
Total volunteers (control) 151 11 Gateshead 47 12 Sunderland 21 13 Sunderland 20 14 Sunderland 29 15 Gateshead 20 Total volunteers (intervention) 137
Total volunteers (all) 288 * C= Control school, 1= Intervention school
In all schools but one the target of at least 20 volunteers was attained. In one school there
were 19 children agreeing to take part in the study. This school had the smallest pupil role of
the ten schools, with only 84 pupils in Year 7 at the time of recruitment, in these terms 19
pupils account for 23% of the Year 7 role.
The number of boys and girls returning consent forms are shown in Figure 3-11 (by school
unit and sex). Of the 151 child volunteers in the control group, 66 were boys and 85 were
girls. In the intervention group, 62 boys and 75 girls returned consent forrns. The school in
which the smallest number of boys volunteered was school CI in which 4 boys agreed to take
part in the study (this school had the smallest Year 7 and total school role).
69
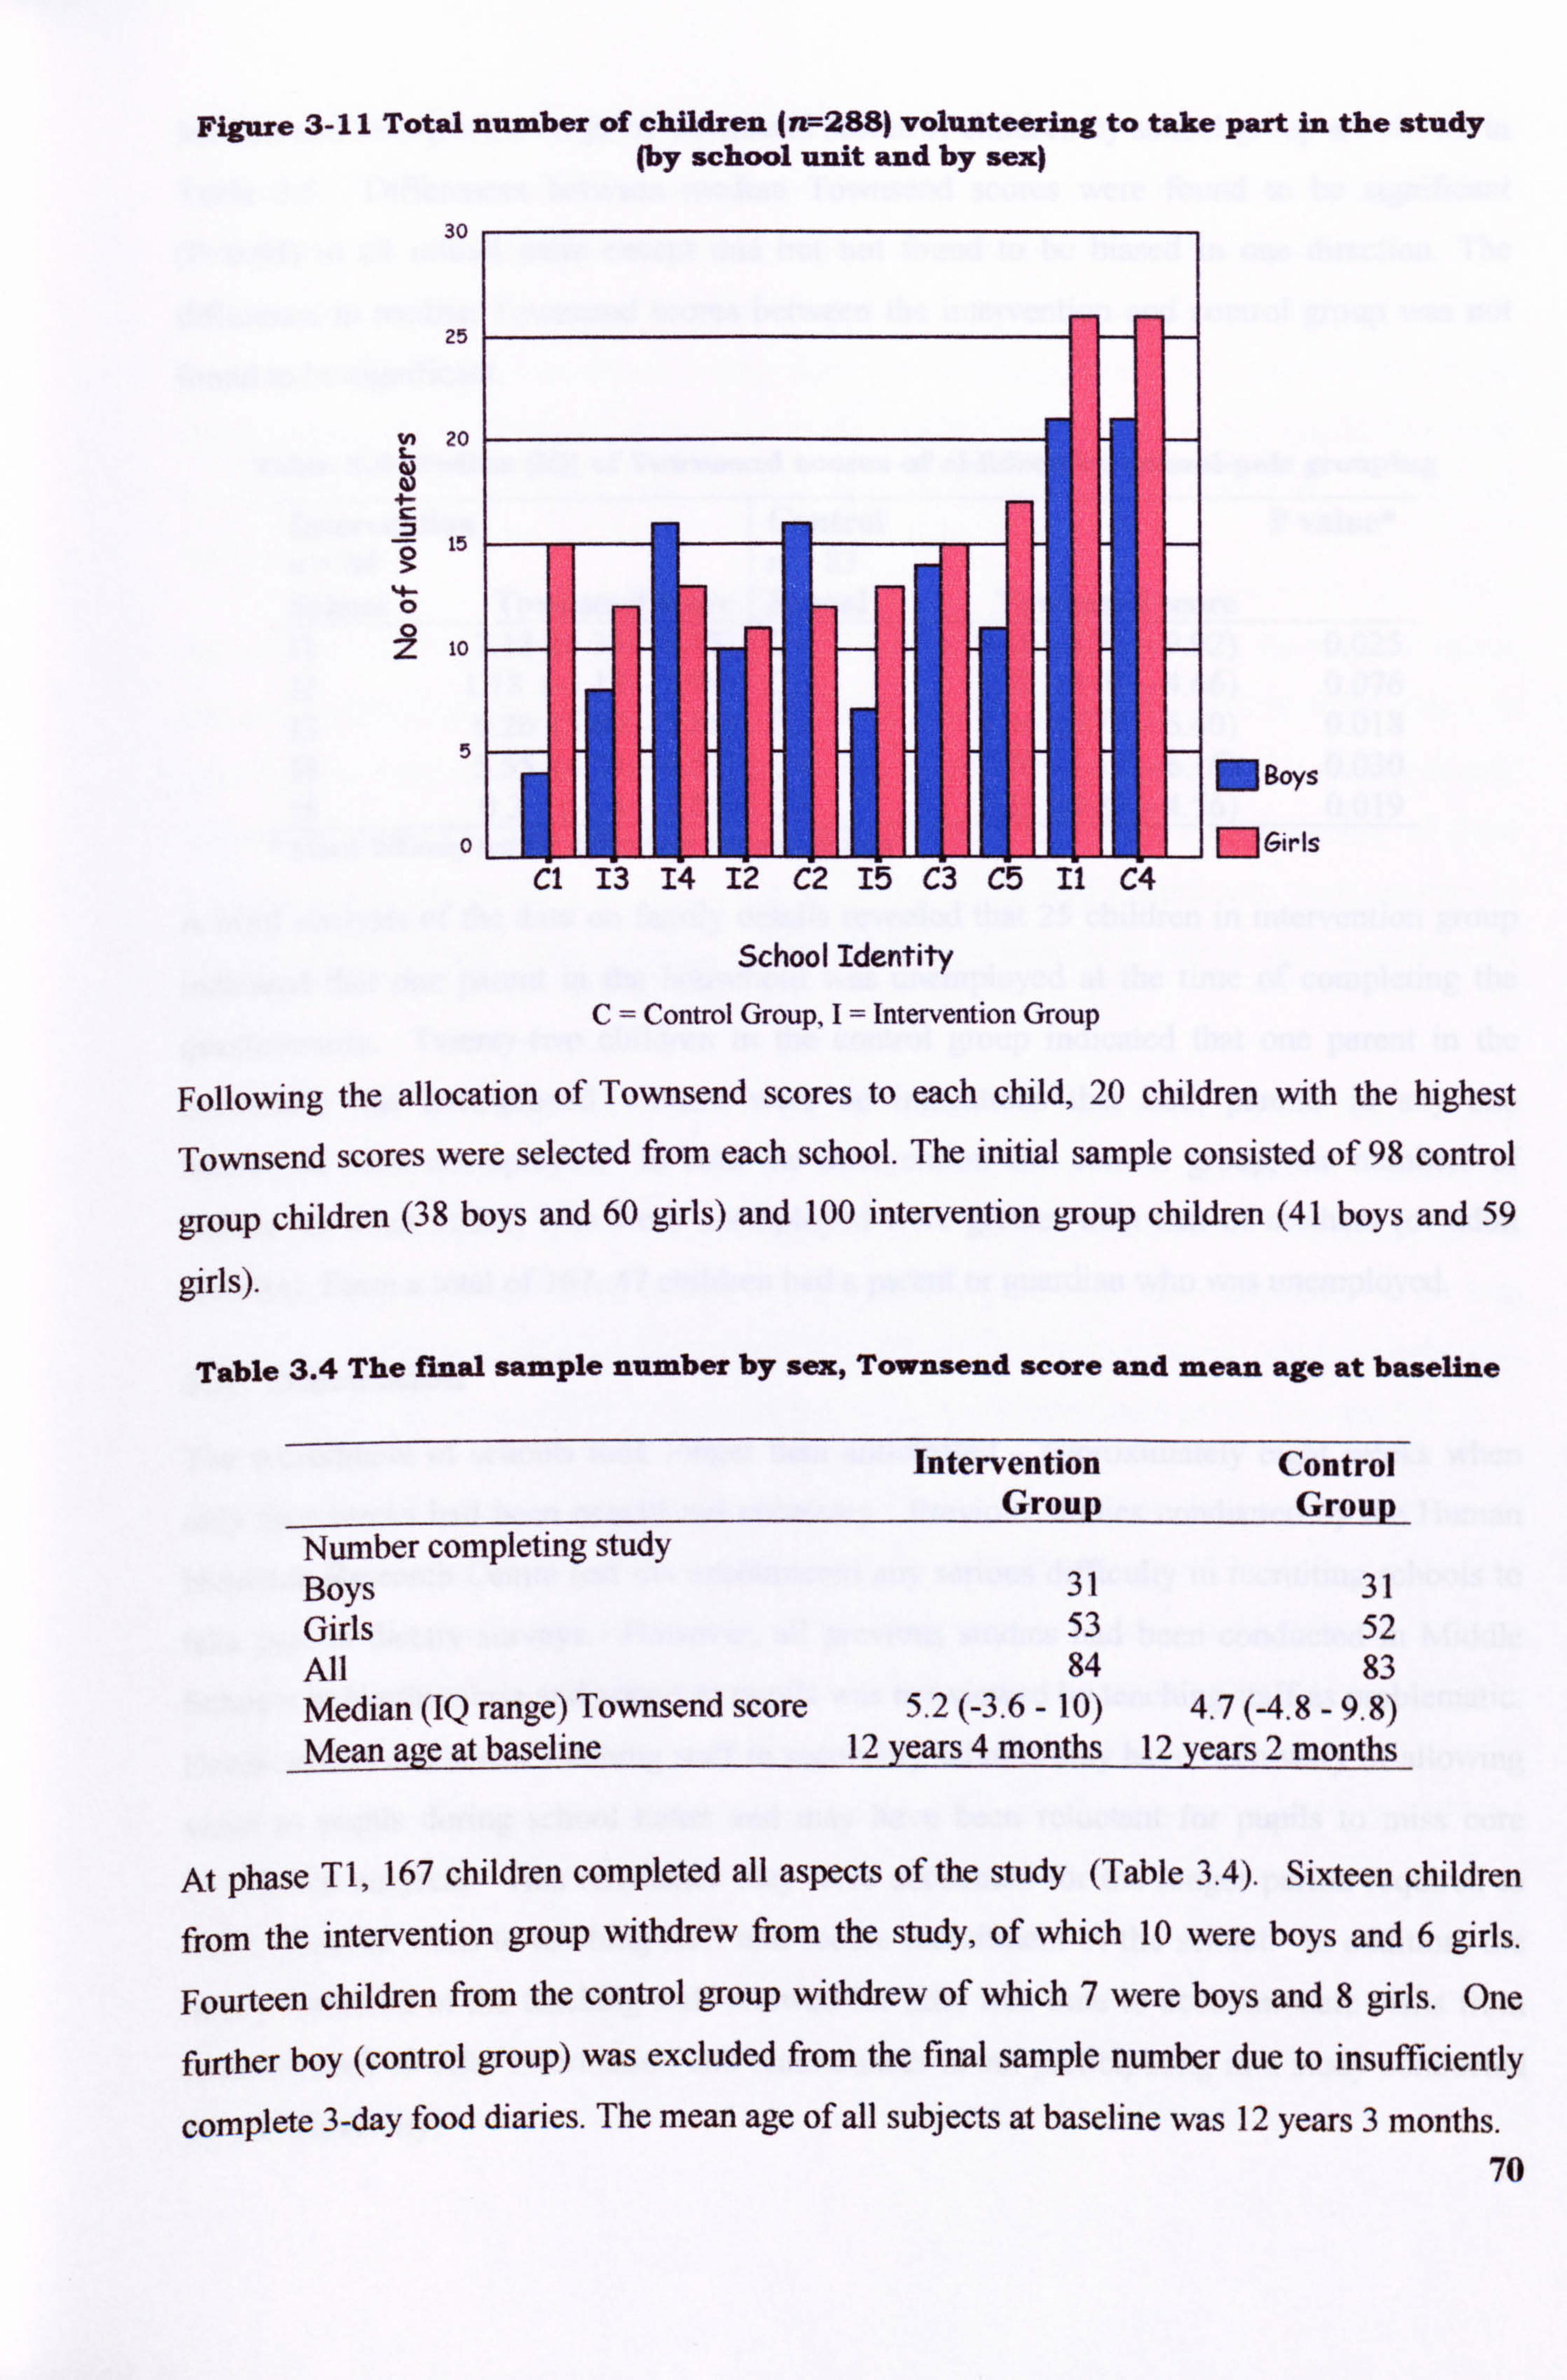
Figure 3-11 Total number of children (n7-288) volunteering to take part in the study (by school unit and by sex)
30
25
20 Z-
10
5
0
Cl 13 14 12 (f2 Iý C3 C5 I"I C
School Identity C= Control Group, I= Intervention Group
MBOYS
MGirls
Following the allocation of Townsend scores to each child, 20 children with the highest
Townsend scores were selected from each school. The initial sample consisted of 98 control
group children (38 boys and 60 girls) and 100 intervention group children (41 boys and 59
girls).
Table 3.4 The final sample number by sex, Townsend score and mean age at baseline
Intervention Control Group Group
Number completing study Boys 31 31 Girls 53 52 All 84 83 Median (IQ range) Townsend score 5.2 (-3.6 - 10) 4.7 (-4.8 - 9.8) Mean age at baseline 12 years 4 months 12 years 2 months
At phase TI, 167 children completed all aspects of the study (Table 3.4). Sixteen children
from the intervention group Withdrew from the study, of which 10 were boys and 6 girls,
Fourteen children from the control group withdrew of which 7 were boys and 8 6nrls. One
further boy (control group) was excluded from the final sample number due to insufficiently
complete 3-day food diaries. The mean age of all subjects at baseline was 12 years 3 months. 70
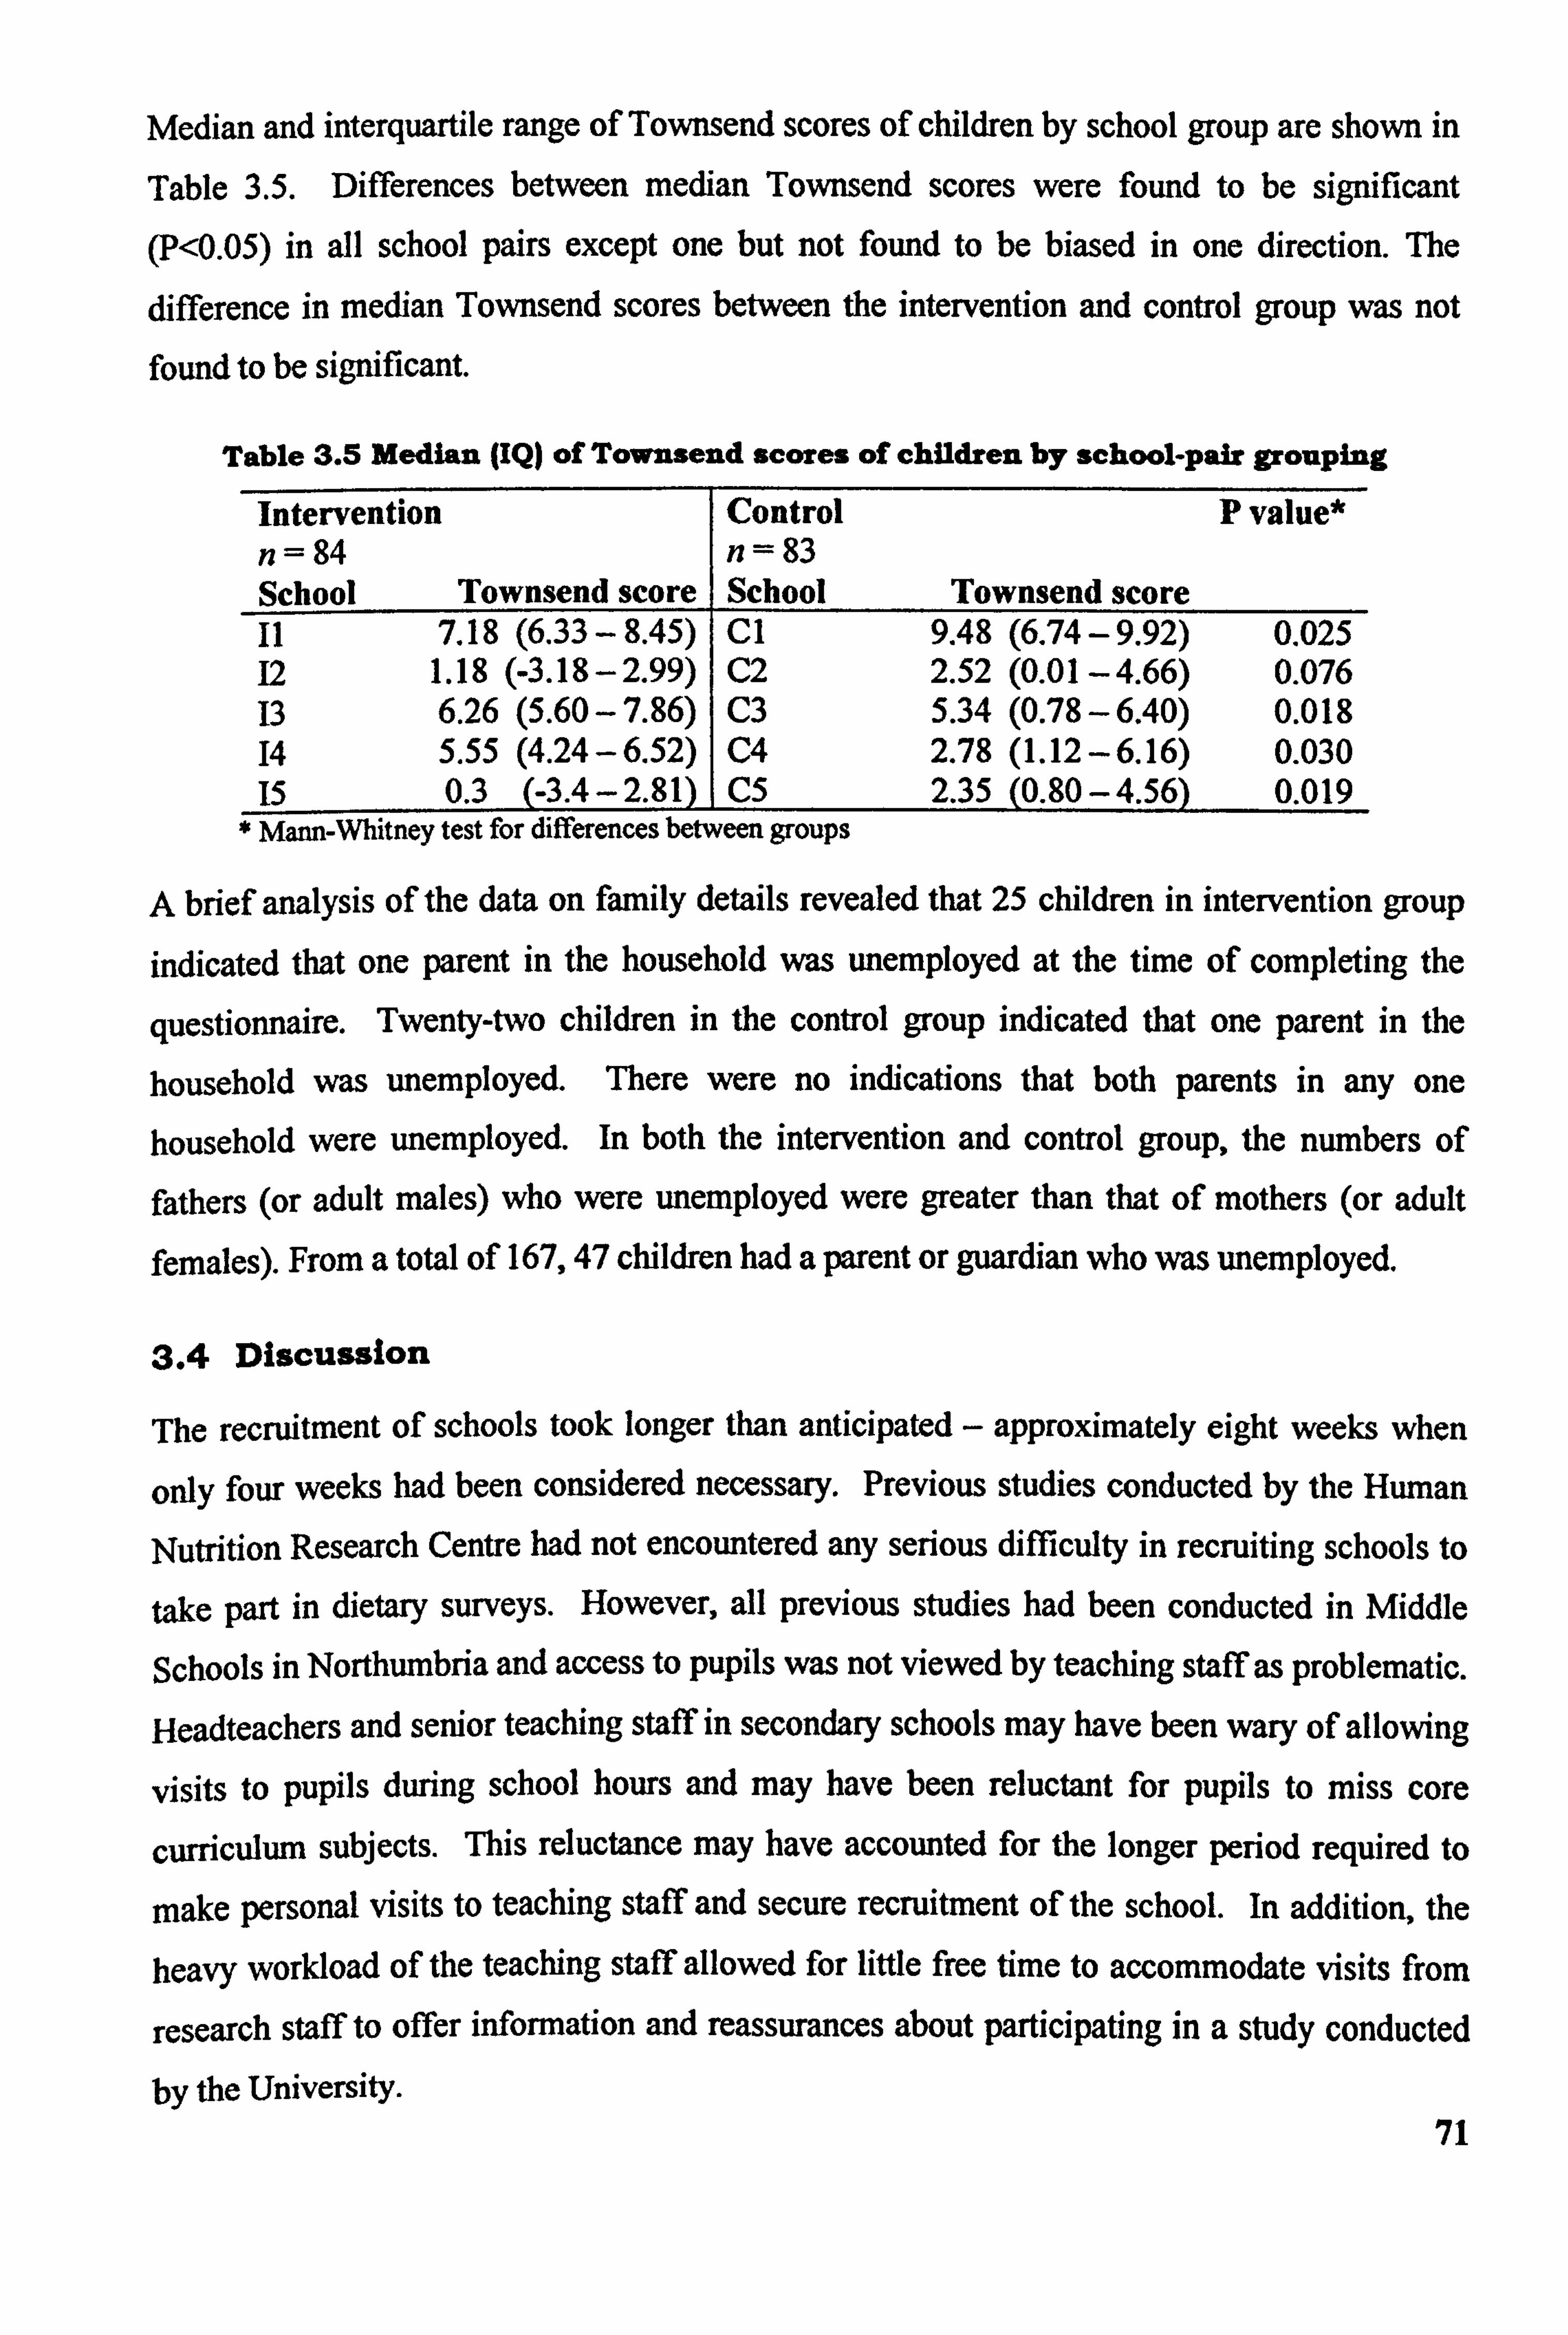
Median and interquartile range of Townsend scores of children by school group are shown in
Table 3.5. Differences between median Townsend scores were found to be significant (P<0.05) in all school pairs except one but not found to be biased in one direction. The
difference in median Townsend scores between the intervention and control group was not found to be significant.
Table 3.5 Median (IQ) of Townsend scores of children by school-pair grouping
Intervention Control P value* n= 84 n= 83 School Townsend score School Townsend score 11 7.18 (6.33 - 8.45) Cl 9.48 (6.74 -9.92) 0.025 12 1.18 (-3.18-2.99) C2 2.52 (0.01 -4.66) 0.076 13 6.26 (5.60 - 7.86) C3 5.34 (0.78 -6.40) 0.018 14 5.55 (4.24-6.52) C4 2.78 (1.12 -6.16) 0.030 15 0.3 (-3.4-2.81) C5 2.35 (0.80 -4.56) 0.019
* Mann-Whitney test for differences between groups
A brief analysis of the data on family details revealed that 25 children in intervention group
indicated that one parent in the household was unemployed at the time of completing the
questionnaire. Twenty-two children in the control group indicated that one parent in the
household was unemployed. There were no indications that both parents in any one
household were unemployed. In both the intervention and control group, the numbers of
fathers (or adult males) who were unemployed were greater than that of mothers (or adult
females). From a total of 167,47 children had a parent or guardian who was unemployed.
3.4 Discussion
The recruitment of schools took longer than anticipated - approximately eight weeks when
only four weeks had been considered necessary. Previous studies conducted by the Human
Nutrition Research Centre had not encountered any serious difficulty in recruiting schools to
take part in dietary surveys. However, all previous studies had been conducted in Middle
Schools in Northumbria and access to pupils was not viewed by teaching staff as problematic.
Headteachers and senior teaching staff in secondary schools may have been wary of allowing
visits to pupils during school hours and may have been reluctant for pupils to miss core
curriculum subjects. This reluctance may have accounted for the longer period required to
make personal visits to teaching staff and secure recruitment of the school. In addition, the
heavy workload of the teaching staff allowed for little free time to accommodate visits from
research staff to offer information and reassurances about participating in a study conducted
by the University. 71

The attitude of schools towards participation in the study was positive overall and the aims of
the study considered to be both laudable and stimulating in terms of education research. This
was a view communicated by all teaching staff who were spoken to regularly about the study during the recruitment of schools. Senior members of staff looked favourably upon their
pupils receiving some educational input from an outside source. All school staff, at the
recruitment stage, held the view that the study would be of benefit to the pupils and were
prepared to become involved, and in effect take extra work upon themselves, in order for
pupils to benefit.
All school staff were particularly interested in the development and running of extra-
curricular activities for pupils and the possibility of hosting an after-school food club was
appealing to most schools. With funding having already been secured for the setting up and
running of the club, the provision of a well-qualified and experienced teacher of food
technology and the meeting of the cost of all consumables and ingredients, many aspects of the Club were already being managed which may have attributed to school staff consenting to
take part.
The member of staff responsible making such a decision on behalf of the school appeared to
vary. This created some difficulties in the recruitment process. For example, in one school,
the Deputy Headteacher agreed that the school should take part in the study, and delegated the
school management issues to a more junior member of staff who appeared to be less
enthusiastic. The reverse case also presented itself, one teacher very much wanted a school to
take part but was unsuccessful in securing the backing and agreement of the Headteacher.
Overall, the recruitment strategy was effective in that it produced the required amount of
schools to participate in the study and a further two schools that agreed to be held in reserve
in the event of another school withdrawing. Future school-based studies should allow a longer period of time for the recruitment, simply because it is difficult to speak personally to
teaching staff and arrange visits when the staff have a heavy timetable loading. It may be
extremely beneficial to researchers setting out to conduct a school-based study to spend time
in schools, possibly carrying out focus-groups with teaching staff, to discuss the views of
schools in the area towards research studies and the amount of time allowed to access pupils during the school day. It would also enable researchers to identify potential problems and to
discuss appropriate solutions with teachers of all management levels. Key to the success of
recruiting appropriate numbers of schools is establishing a suitable contact within in each 72

school and for the purpose of future work, these members of staff are most likely to be Deputy Headteachers (Headteachers are extremely busy with the school agenda), the Head of Technology, the Head of Food Technology and the Head of Health Education.
it may also be worthwhile on the part of researchers to devote some considerable time to promoting the study and spending time in school with teaching staff to address any potential problems. This could be successfully achieved by giving a presentation about the research institution and the research agenda (Whilst not giving specific details of the methodology or anticipated outcomes) perhaps accompanied by the provision of refreshments and in the case of practical cooking skills interventions, samples of dishes to be cooked by the children. This is an approach that has been used by the Human Nutrition Research Centre in the recruitment
of General Practitioners to primary care research programmes and has been suggested to be
useful in giving research studies a professional air and purpose (Helen Moore, 2000, personal
communication).
The information collected in the recruitment phase also allowed some light to be shed on the
actual amount of time allocated to the teaching of food in secondary schools in the area. It is
probable that the variation in time allocated observed in schools in the Tyne and Wear region is a reflection of the UK as a whole, since the region encompasses some four Local Education
Authorities.
It became apparent that although there are similarities between the number of hours of food
technology allocated to Year 7 pupils, there was a large discrepancy in the time devoted to
practical food preparation in the classroom. No data were collected on the number of hours
allocated to food preparation in Years 8 and above. Since teachers of food technology and their Heads of Department are able to interpret the curriculum as it is deemed appropriate
within their school, this may result in schools following a slightly different scheme of work in
the lower school. In turn, this may account for the differences in the hours devoted to
practical food skills as observed in the schools participating in this study.
It is wise to consider that a potential for bias may have been introduced through the allocation of schools to control and intervention groups before the recruitment of subjects commenced. it is possible that group allocation, when known to pupils, may have affected numbers of pupils who agreed to participate in the study. The results show that a greater total number of children were recruited in control schools. This may imply that either the recruitment process
73
was more effective in control schools or it may imply that the commitment required in
attending the Food Club may have deterred some children from volunteering. Further
analysis, however, of the recruitment data using a Mann-Whitney test shows that there were
no significant differences revealed between the groups in the numbers of children
volunteering to take part in the study (P-0.84 1).
It is interesting to note that the greatest numbers of recruits were obtained in two schools, one
of which was control school (C4,47 volunteers) and the other an intervention school (14,48
volunteers). In view of the identical manner in which the recruitment of pupils was conducted in all schools (all schools received the same letters, flyers, posters and visits by research staff) it would appear that recruitment in these two schools was particularly successful. This may be
due to the influence and enthusiasm of teaching staff in these schools which may have
resulted in the higher numbers. This may again support the suggestion that the allocation of
schools to control and intervention group did not effect numbers of volunteers.
it may be appropriate in some cases for future studies of a similar nature to carry out
recruitment of child volunteers immediately after the recruitment of schools in order to
minimise the potential for bias. Whilst this may reduce the potential for bias in the
recruitment of volunteers it may also introduce difficulties in that it is an ethical requirement
for volunteers to be fully informed before agreeing to take part in a research study. In view of
this, it would therefore be necessary to notify children that they may have the opportunity to
attend an after-school Food Club in order that they may make a fiilly informed decision to
participate. This would be extremely important since taking part in the study and attendance
to a Food Club implies a commitment on the part of the children. It would seem to be greatly
unfair to inform children that they may have the opportunity to attend a Food Club, which
many may find very appealing, but later to withdraw this opportunity on account of their
particular school having been randomly allocated to a control group. For children of this age,
this approach appears a little mean-spirited and may discourage children from volunteering to
take part in ftirther studies. Offering attendance to a Food Club at the end of the period of
data collection for the entire study would be of benefit to children in the control group without
effecting the post-intervention data. This would also have the effect of increasing the total
cost of the project so may not be feasible from this aspect.
Obtaining signed parental consent forms from subjects was largely undertaken by teaching
staff in school. Several teachers recommended having a 'post-box! placed in school in order 74
that pupils"could return their forms quickly and easily. The majority of consent forms were
appropriately completed and missing postcodes were very easily identified using the post-
code search facility of Royal Mail. The use of post-codes was a convenient method for
measuring deprivation without the need to ask parents about their occupation.
The Registrar General's Classification of Occupations is one of the earliest and most widely
used measure of social class (Leete & Fox, 1977) but it has be shown to have some
limitations; the long-term unemployed and single parents in receipt of benefits cannot be
classified under this system which would have made this particular measure of social class
unsuitable for the subjects participating in this study. Post-codes easily facilitated the
determination of Townsend scores.
There were no large differences in the number of boys and girls who volunteered in the
control and intervention group, with the exception of school C1 where 4 boys and 15 girls
returned consent forms. This school had the smallest Year 7 role and total school role. It was
also the school with the highest median Townsend score (9.48). The distribution of the sexes
within recruits in the majority of the schools is comparable, which may demonstrate that both
the sexes are equally agreeable to taking part in a dietary survey.
it is suggested that in future studies the recruitment methods used in this study are appropriate
for children aged between I I- and 12-years-old but it may be wise to consider how to make
participation in research studies particularly appealing to boys. The additional factor of
severe social deprivation may reduce the number of boys who feel they wish to participate. Since the small number of boys recruited from school CI appears to be an isolated occurrence
within the ten schools in this study, the recruitment methods overall are probably suitable. In
the case of school CI there may be additional local factors that had affected the choice of the
boys to participate and this may need some further investigation to attempt to identify what
these factors are.
75
4 The Intervention
"I've learned how to work a cooker, and how to chop things up and make them cook
properly and how to sort of weigh things out as well"
Girl, having attended 13 sessions of the Food Club
"Like how to hold a knife, how to do things, tidy the place up and all that. Health
and safety in the kitchen. Be hygienic. Just staff about donýt put hot and cold and
staff together, for germs".
Boy, having attended 13 sessions of the Food Club
"... he made some quite good things he did. I mean the likes of the curried
vegetables ... I used to think 'Oh Tuesday, I'll not make any tea for myself, I'll just eat
what [sonýsl having at the Food Club... some of the ordinary everyday stuff was
really nice. The cooking itself I thought was marvellous. He has got a good hand
cooking, he has. Actually I didn't think it would be that good, the cooking itself. I
didret think he could be that good at making things"
Mother of boy who attended 20 sessions of the Food Club
76
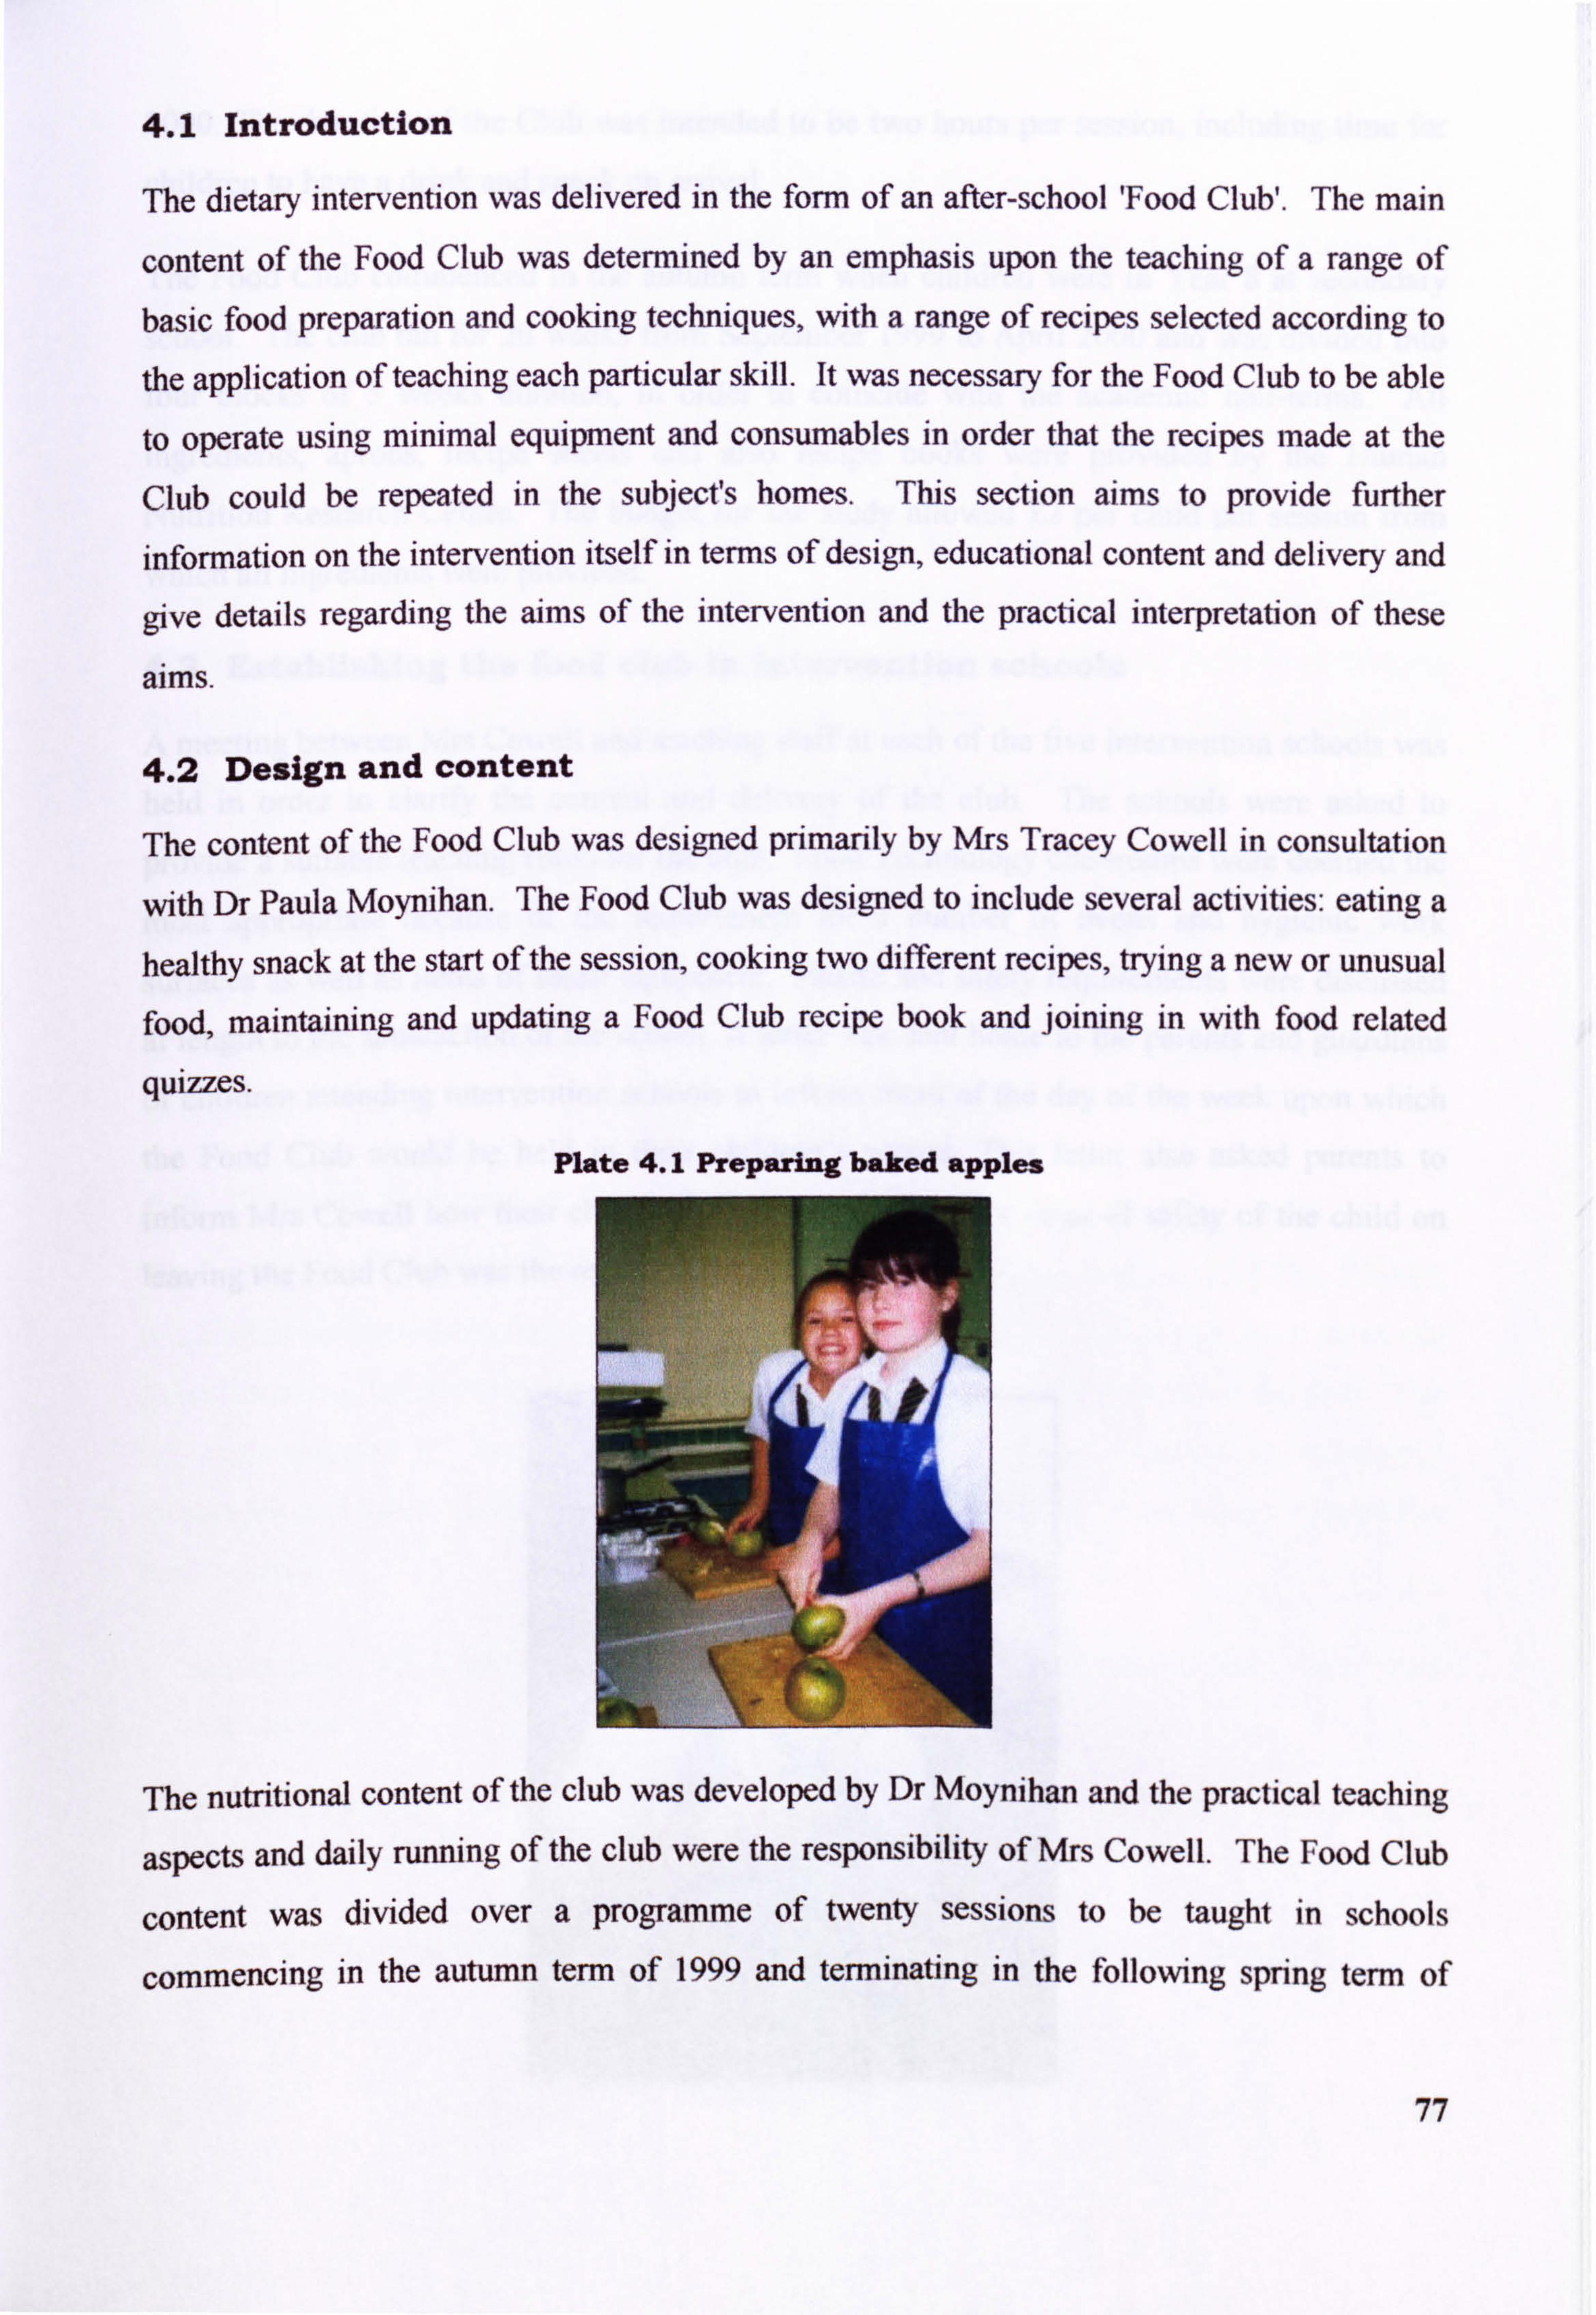
4.1 Introduction
The dietary intervention was delivered in the form of an after-school 'Food Club'. The main
content of the Food Club was determined by an emphasis upon the teaching of a range of
basic food preparation and cooking techniques, with a range of recipes selected according to
the application of teaching each particular skill. It was necessary for the Food Club to be able
to operate using minimal equipment and consumables in order that the recipes made at the
Club could be repeated in the subject's homes. This section aims to provide further
information on the intervention itself in terms of design, educational content and delivery and
give details regarding the aims of the intervention and the practical interpretation of these
aims.
4.2 Design and content
The content of the Food Club was designed primarily by Mrs Tracey Cowell in consultation
with Dr Paula Moynihan. The Food Club was designed to include several activities: eating a
healthy snack at the start of the session, cooking two ditTerent recipes, trying a new or unusual
food, maintaining and updating a Food Club recipe book and joining in with food related
quizzes.
Plate 4.1 Preparing baked apples
The nutritional content of the club was developed by Dr Moynihan and the practical teaching
aspects and daily running of the club were the responsibility of Mrs Cowell. The Food Club
content was divided over a programme of twenty sessions to be taught in schools
commencing in the autumn term of 1999 and terminating in the following spring term Of
77
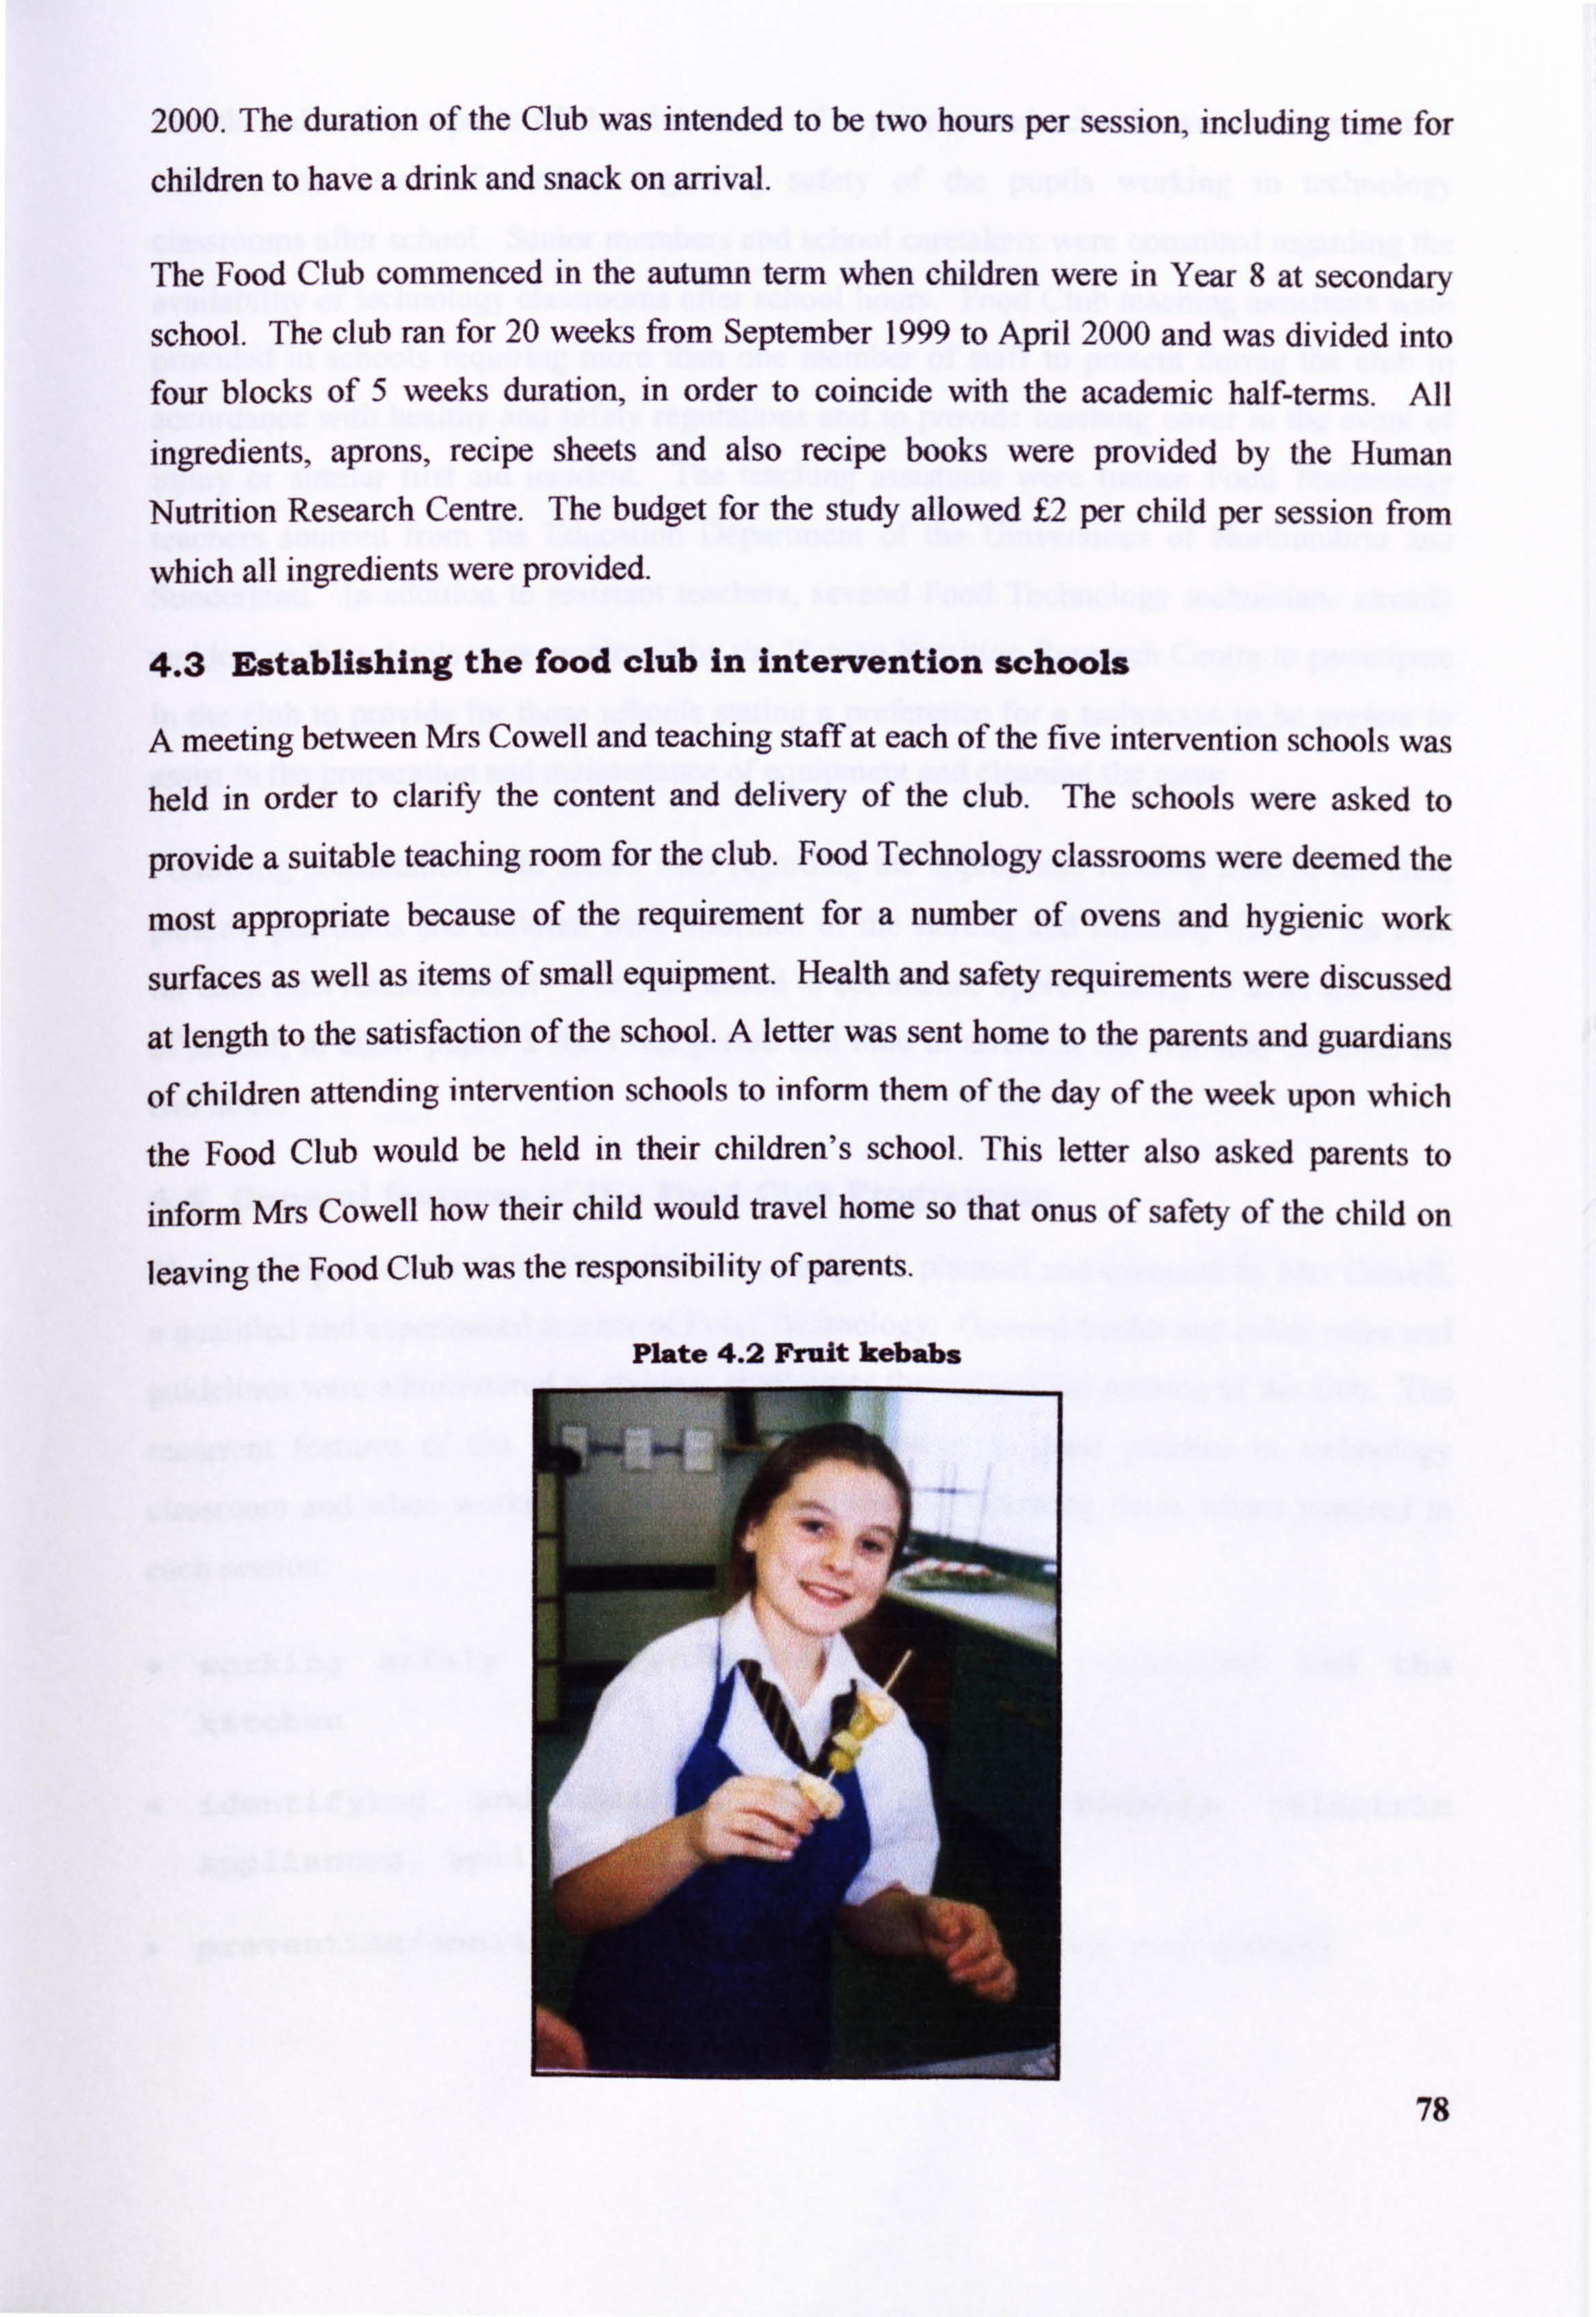
2000. The duration of the Club was intended to be two hours per session, including time for
children to have a drink and snack on arrival.
The Food Club commenced in the autumn term when children were in Year 8 at secondary
school. The club ran for 20 weeks from September 1999 to April 2000 and was divided into
four blocks of 5 weeks duration, in order to coincide with the academic half-terms. All
ingredients, aprons, recipe sheets and also recipe books were provided by the Human
Nutrition Research Centre. The budget for the study allowed f, 2 per child per session from
which all ingredients were provided.
4.3 Establishing the food club in Intervention schools
A meeting between Mrs Cowell and teaching staff at each of the five intervention schools was held in order to clarify the content and delivery of the club. The schools were asked to
provide a suitable teaching room for the club. Food Technology classrooms were deemed the
most appropriate because of the requirement for a number of ovens and hygienic work
surfaces as well as items of small equipment. Health and safety requirements were discussed
at length to the satisfaction of the school. A letter was sent home to the parents and guardians
of children attending intervention schools to inform them of the day of the week upon which
the Food Club would be held in their children's school. This letter also asked parents to
inform Mrs Cowell how their child would travel home so that onus of safety of the child on leaving the Food Club was the responsibility of parents.
78
Plate 4.2 Fruit kebabs

Health and safety aspects of the club were of a priority and schools were encouraged to
address any issues of concern regarding safety of the pupils working in technology
classrooms after school. Senior members and school caretakers were consulted regarding the
availability of technology classrooms after school hours. Food Club teaching assistants were
provided in schools requiring more than one member of staff to present during the club in
accordance with healthy and safety regulations and to provide teaching cover in the event of injury or similar first aid incident. The teaching assistants were trainee Food Technology
teachers sourced from the Education Department of the Universities of Northumbria and Sunderland. In addition to assistant teachers, several Food Technology technicians already
resident in the schools were employed by the Human Nutrition Research Centre to participate in the club to provide for those schools stating a preference for a technician to be present to
assist in the preparation and maintenance of equipment and cleaning the room.
Following consultation with school staff regarding the appropriate running time of the club,
parents, guardians and children were informed of the starting and finishing time of the club for each intervention school. The club aimed to commence approximately 15 after the finish
of school, to allow pupils a short rest period and time to arrive at the club and continue for
two hours.
4.4 General features of the Food Club Programme
The teaching structure of the Food Club was designed, planned and executed by Mrs Cowell,
a qualified and experienced teacher of Food Technology. General health and safety rules and
guidelines were administered to children at all times throughout the running of the club. The
recurrent features of the Food Club included attention to good practice in technology
classroom and when working at home and included the following items where required in
each session:
working safely and hygienically in the classroom and the
kitchen
identifying and dealing with safety hazards (electric
appliances, spilt liquids)
* preventing/dealing with small injuries (cuts and burns)
79

awareness of food safety and hygiene and attention to
hygienic working practices
o correct storage of ingredients and perishable foods
* awareness of working safely with gas and electric ovens
* safety features of a microwave oven
* using radiant rings/hobs/gas burners
o using a grill
understanding the regulation of cooking temperatures and the
role of the thermostat
* consideration of shelf-life
selecting the most appropriate piece of small equipment for
a task
o safe handling of sharp knives
correct use of chopping boards for meats, vegetables, dairy
products and breads
cleaning and safe storage of knives and other small
equipment
* using oven gloves to prevent burns and scalds
In addition to basic skills, the focus of the Food Club was increase the children's experience of handling, preparing and tasting a wide range of starchy foods, fruits and vegetables. At the beginning of each session the children were given a snack, and a drink of milk, juice or water. The recipes chosen for children to prepare at the club were also carefully selected to introduce
the handling, preparation (Plate 4.1, Plate 4.2, ) and cooking of cheap but healthy foods.
Each Food Club was brought to a close by providing time for each child to stick the recipes used in the session into a purposely designed Food Club Recipe Book (Plate 4.3) and by
providing a new or unusual food, often a fruit, for children to taste. The club provided a recipe sheet for all recipes cooked by children at the club and also a loose-leaf version that
could be taken home.
80
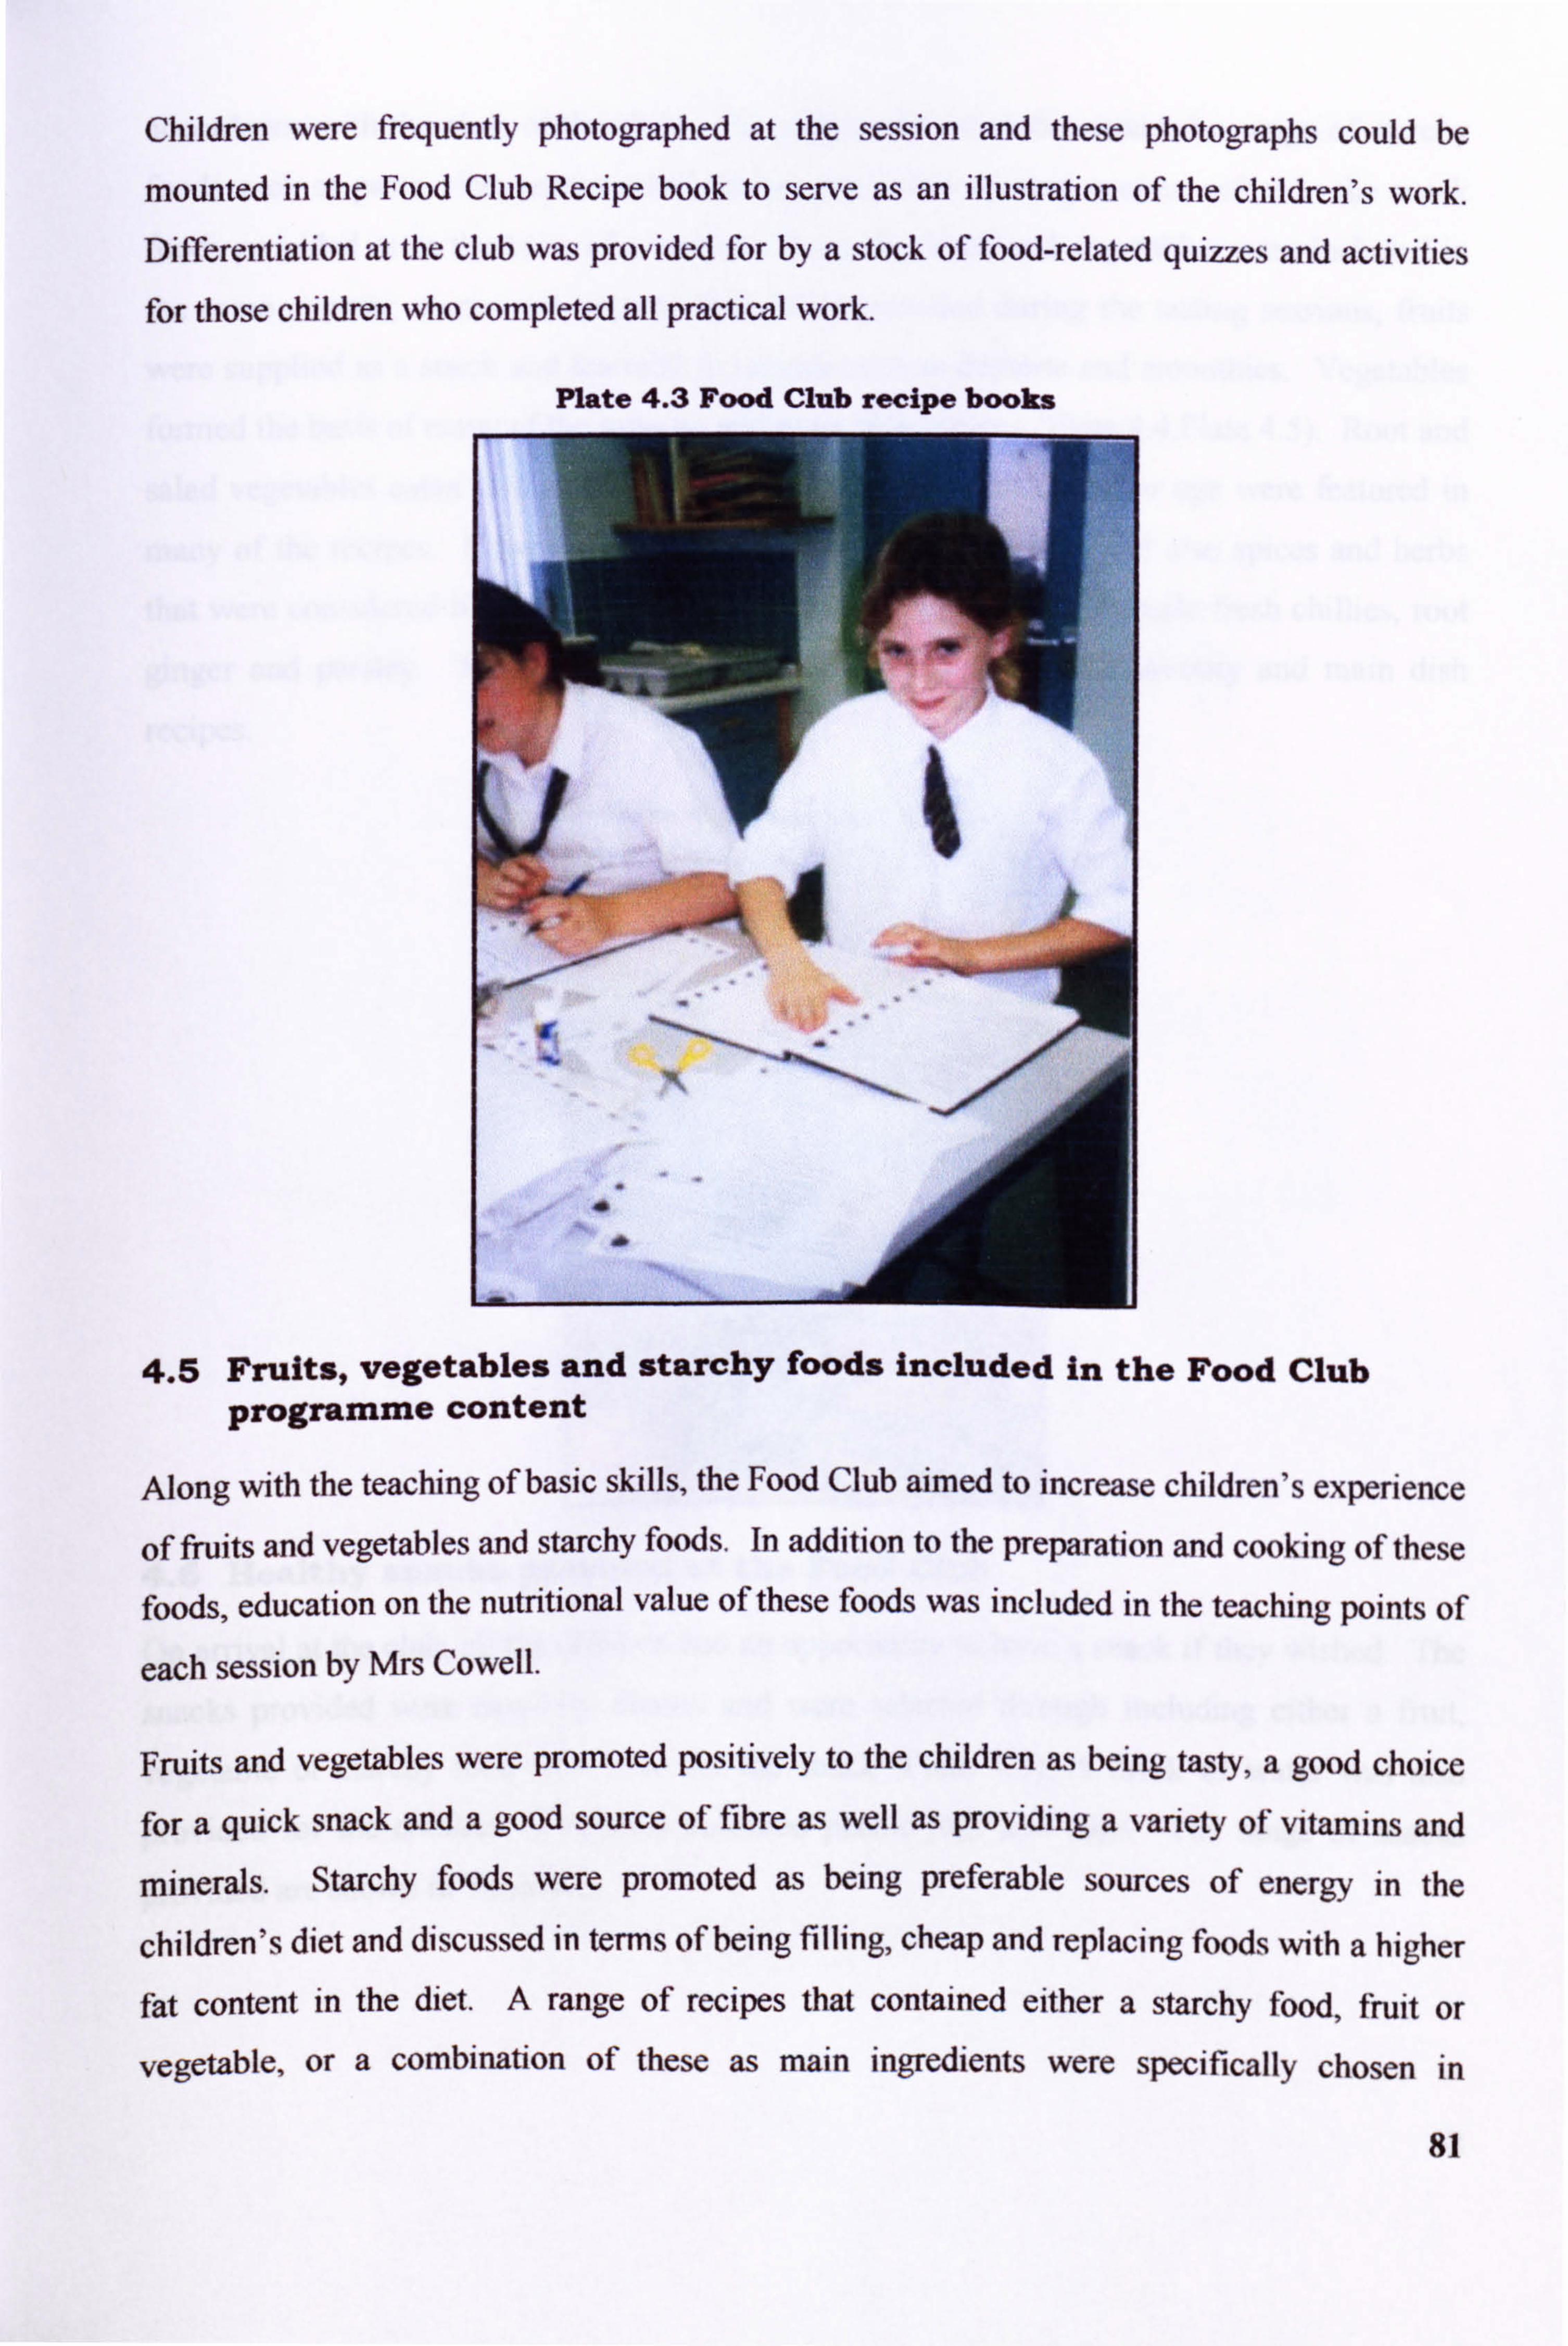
Children were frequently photographed at the session and these photographs could be
mounted in the Food Club Recipe book to serve as an illustration of the children's work. Differentiation at the club was provided for by a stock of food-related quizzes and activities for those children who completed all practical work.
Plate 4.3 Food Club recipe books
4.5 Fruits, vegetables and starchy foods included in the Food Club programme content
Along with the teaching of basic skills, the Food Club aimed to increase children's experience
of fruits and vegetables and starchy foods. In addition to the preparation and cooking of these
foods, education on the nutritional value of these foods was included in the teaching points of
each session by Mrs Cowell.
Fruits and vegetables were promoted positively to the children as being tasty, a good choice for a quick snack and a good source of fibre as well as providing a variety of vitamins and
minerals. Starchy foods were promoted as being preferable sources of energy in the
children's diet and discussed in terms of being filling, cheap and replacing foods with a higher
fat content in the diet. A range of recipes that contained either a starchy food, fruit or
vegetable, or a combination of these as main ingredients were specifically chosen in
81
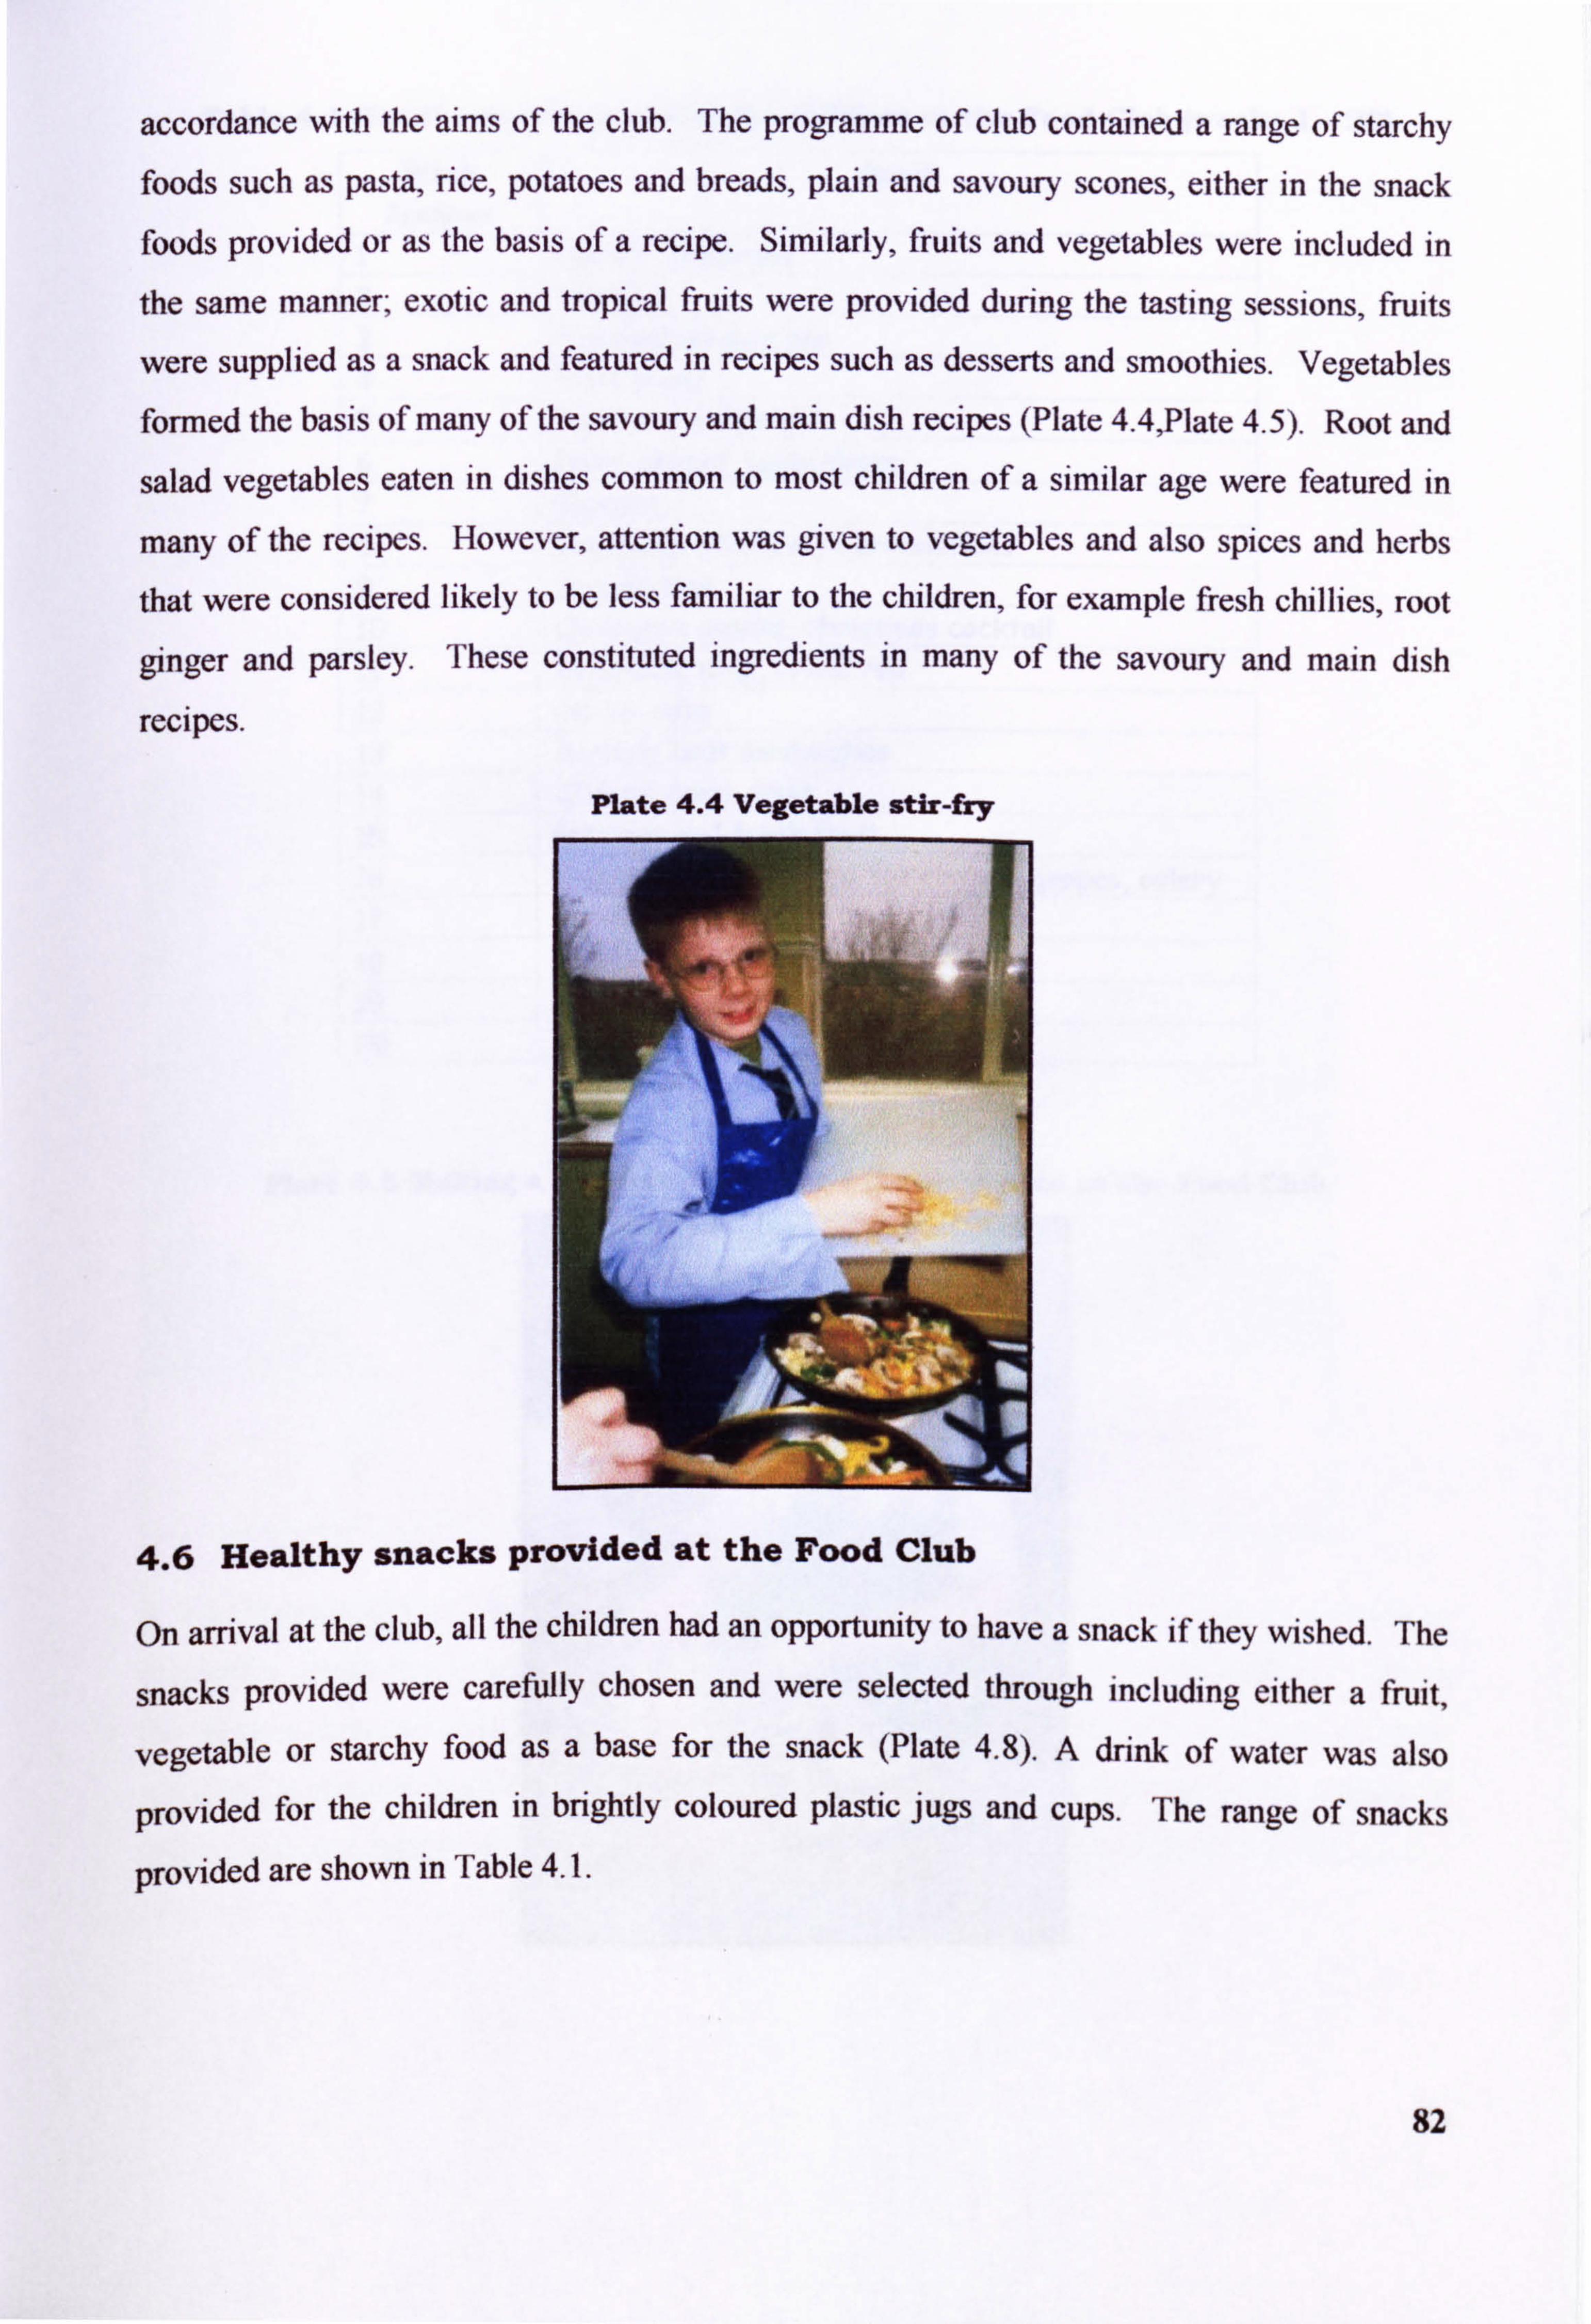
accordance with the aims of the club. The programme of club contained a range of starchy foods such as pasta, rice, potatoes and breads, plain and savoury scones, either In the snack foods provided or as the basis of a recipe. Similarly, fruits and vegetables were included in
the same manner; exotic and tropical fruits were provided during the tasti I fruits ng sess ons,
were supplied as a snack and featured in recipes such as desserts and smoothies. Vegetables
formed the basis of many of the savoury and main dish recipes (Plate 4.4, Plate 4.5). Root and
salad vegetables eaten in dishes common to most children of a similar age were featured in
many of the recipes. However, attention was given to vegetables and also spices and herbs
that were considered likely to be less familiar to the children, for example fresh chillies, root
ginger and parsley. These constituted ingredients in many of the savoury and main dish
recipes.
4.6 Healthy snacks provided at the Food Club
On arrival at the club, all the children had an opportunity to have a snack if they wished. The
snacks provided were carefully chosen and were selected through Including either a fruit,
vegetable or starchy food as a base for the snack (Plate 4.8). A drink of water was also
provided for the children in brightly coloured plastic jugs and cups. The range of snacks
provided are shown in Table 4.1.
82
Plate 4.4 Vegetable stir-fry
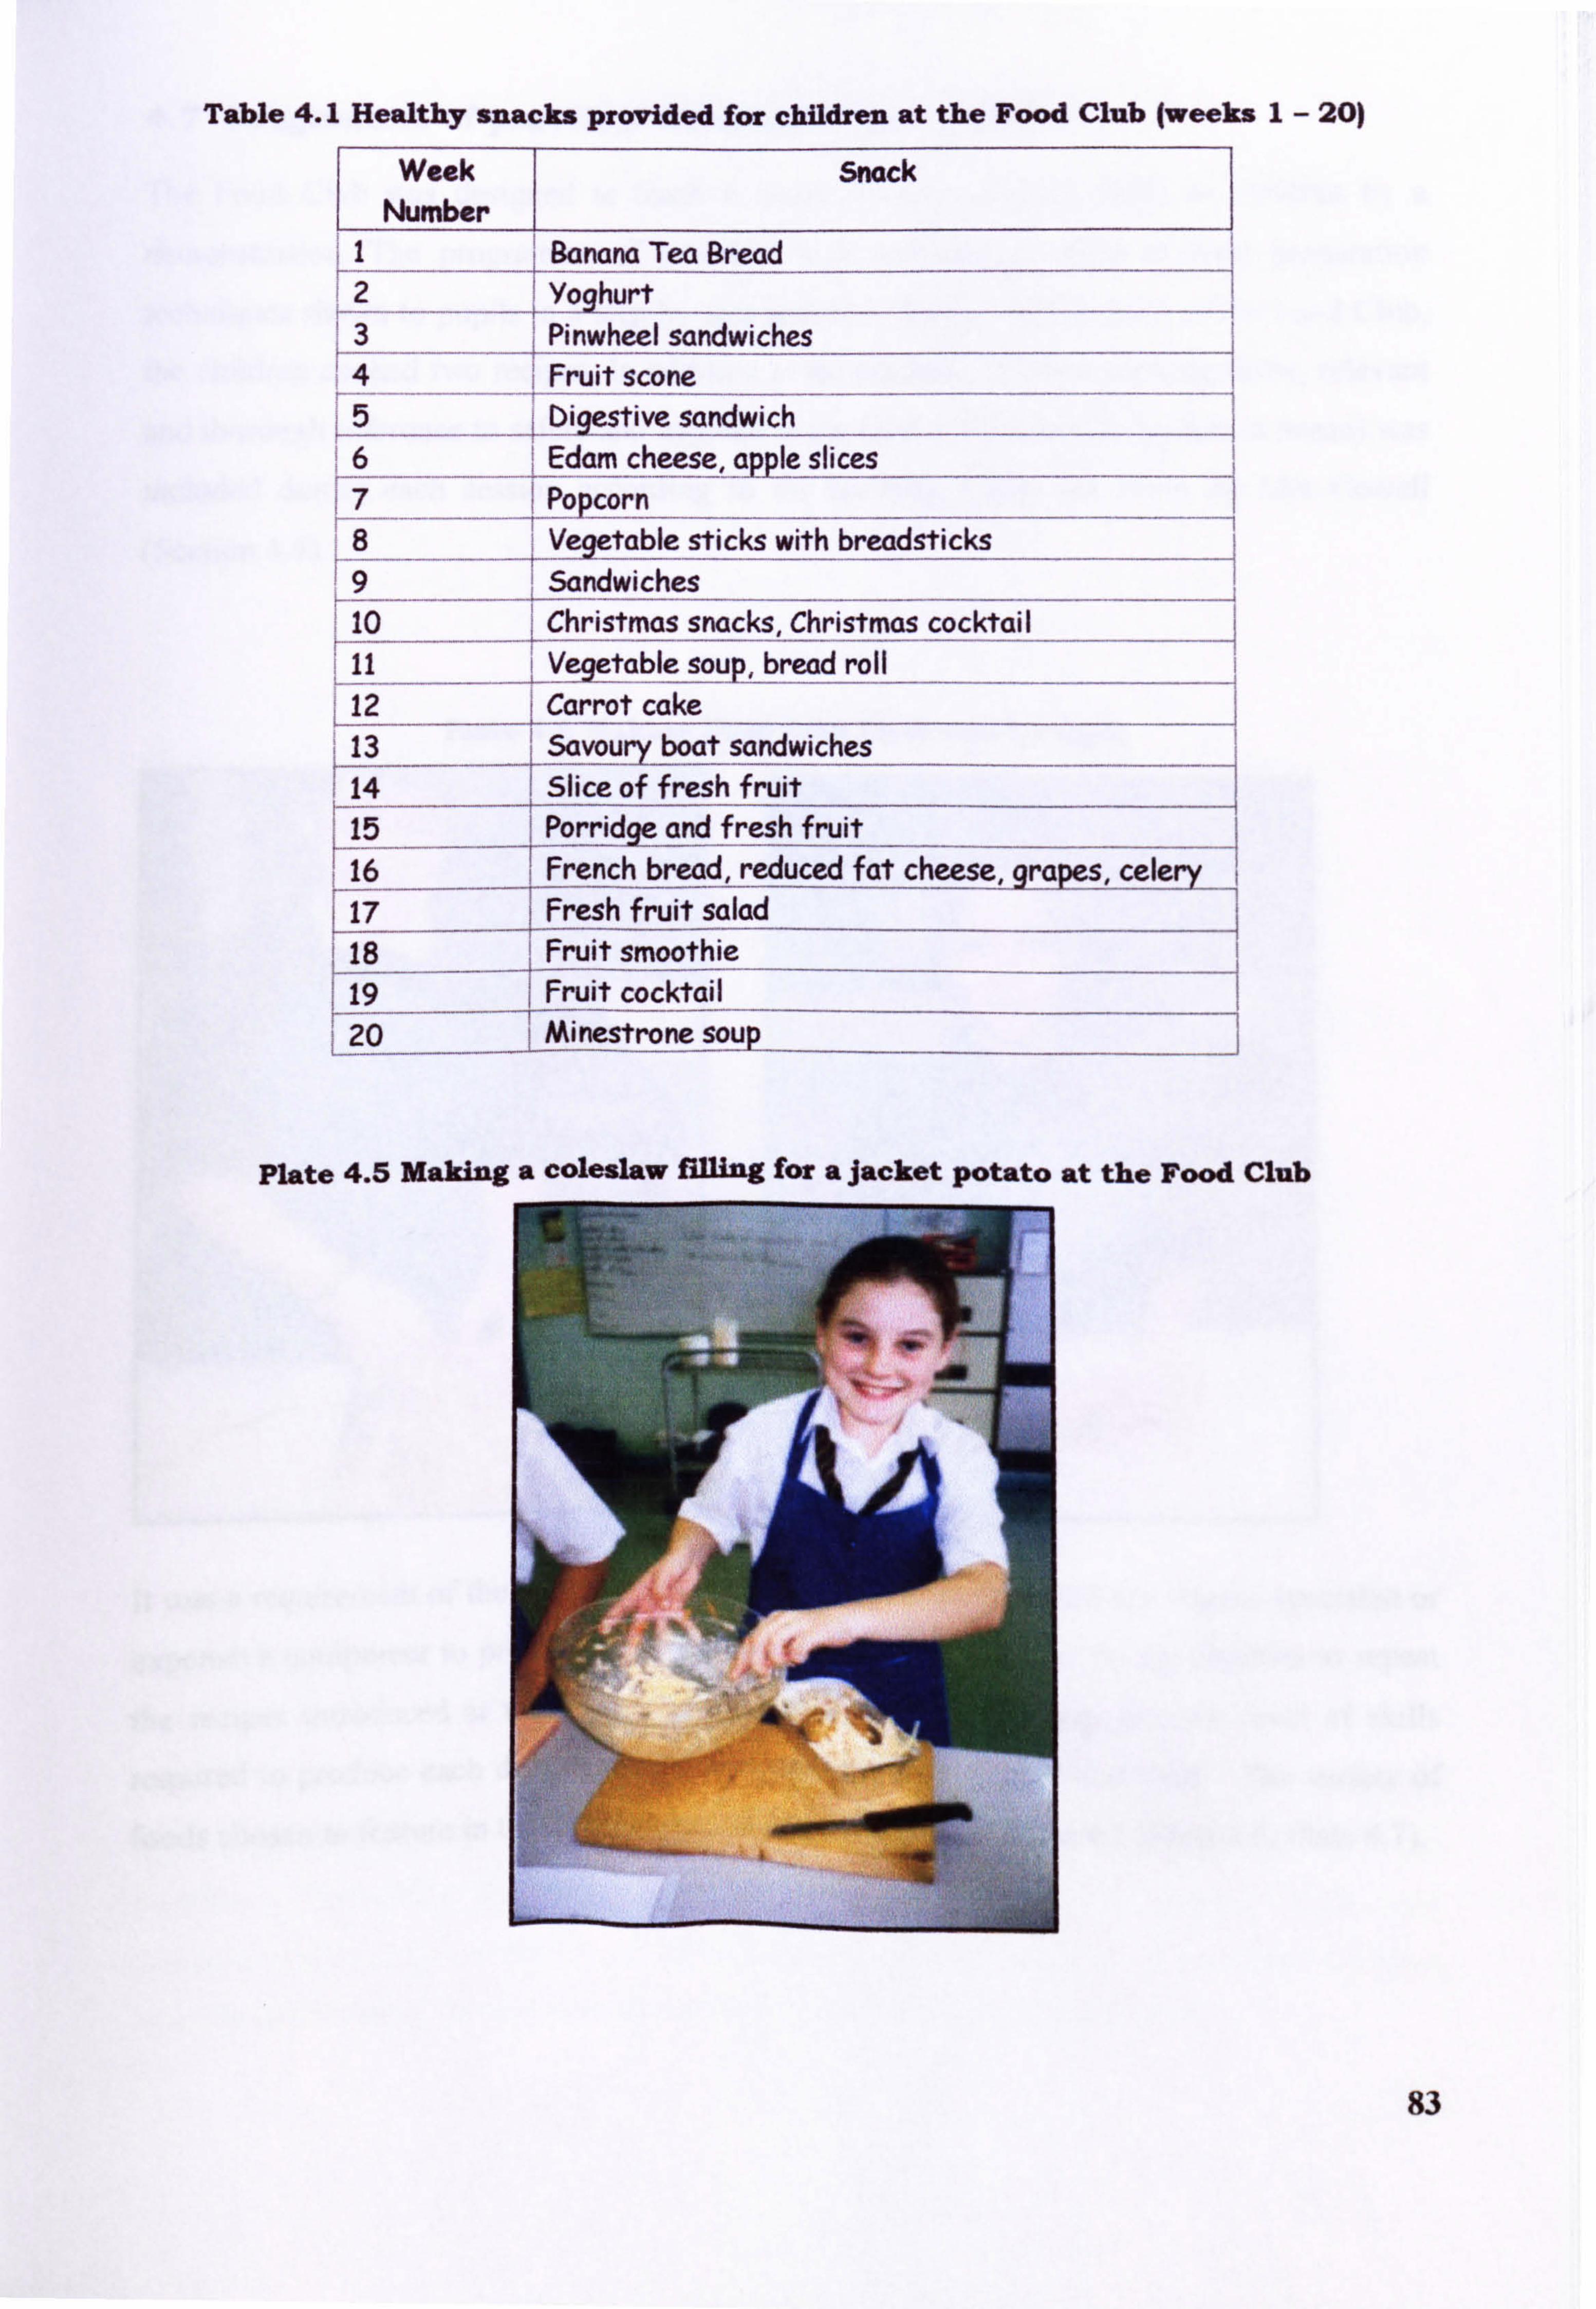
Table 4.1 Healthy snacks provided for children at the Food Club 1weeks; I- 20)
Week Snack Number
Banana Tea Bread 2 Yoghurt 3 inwheel sandwiches 4 i Fruit scone 5 bigestiye sandwich 6 Edam cheese, apple slices
17 Popcorn Veýetable sticks with breadsticks
- -- 9 ---- Sandwiches 10 Christmas snacks, Christmas cocktail
12 table soup, bread roll
Carrot cake i 13 Savoury boat sandwiches
14 Slice of fresh fruit 15 Porridge and fresh fruit 16 French bread, reduced fat cheese, celer 17 Fresh fruit salad
1 18 ýi Fruit smoothie 19 Fruit cocktail 20 Minestrone s
Plate 4.5 Malring a coleslaw filling for a Jacket potato at the Food Club
83
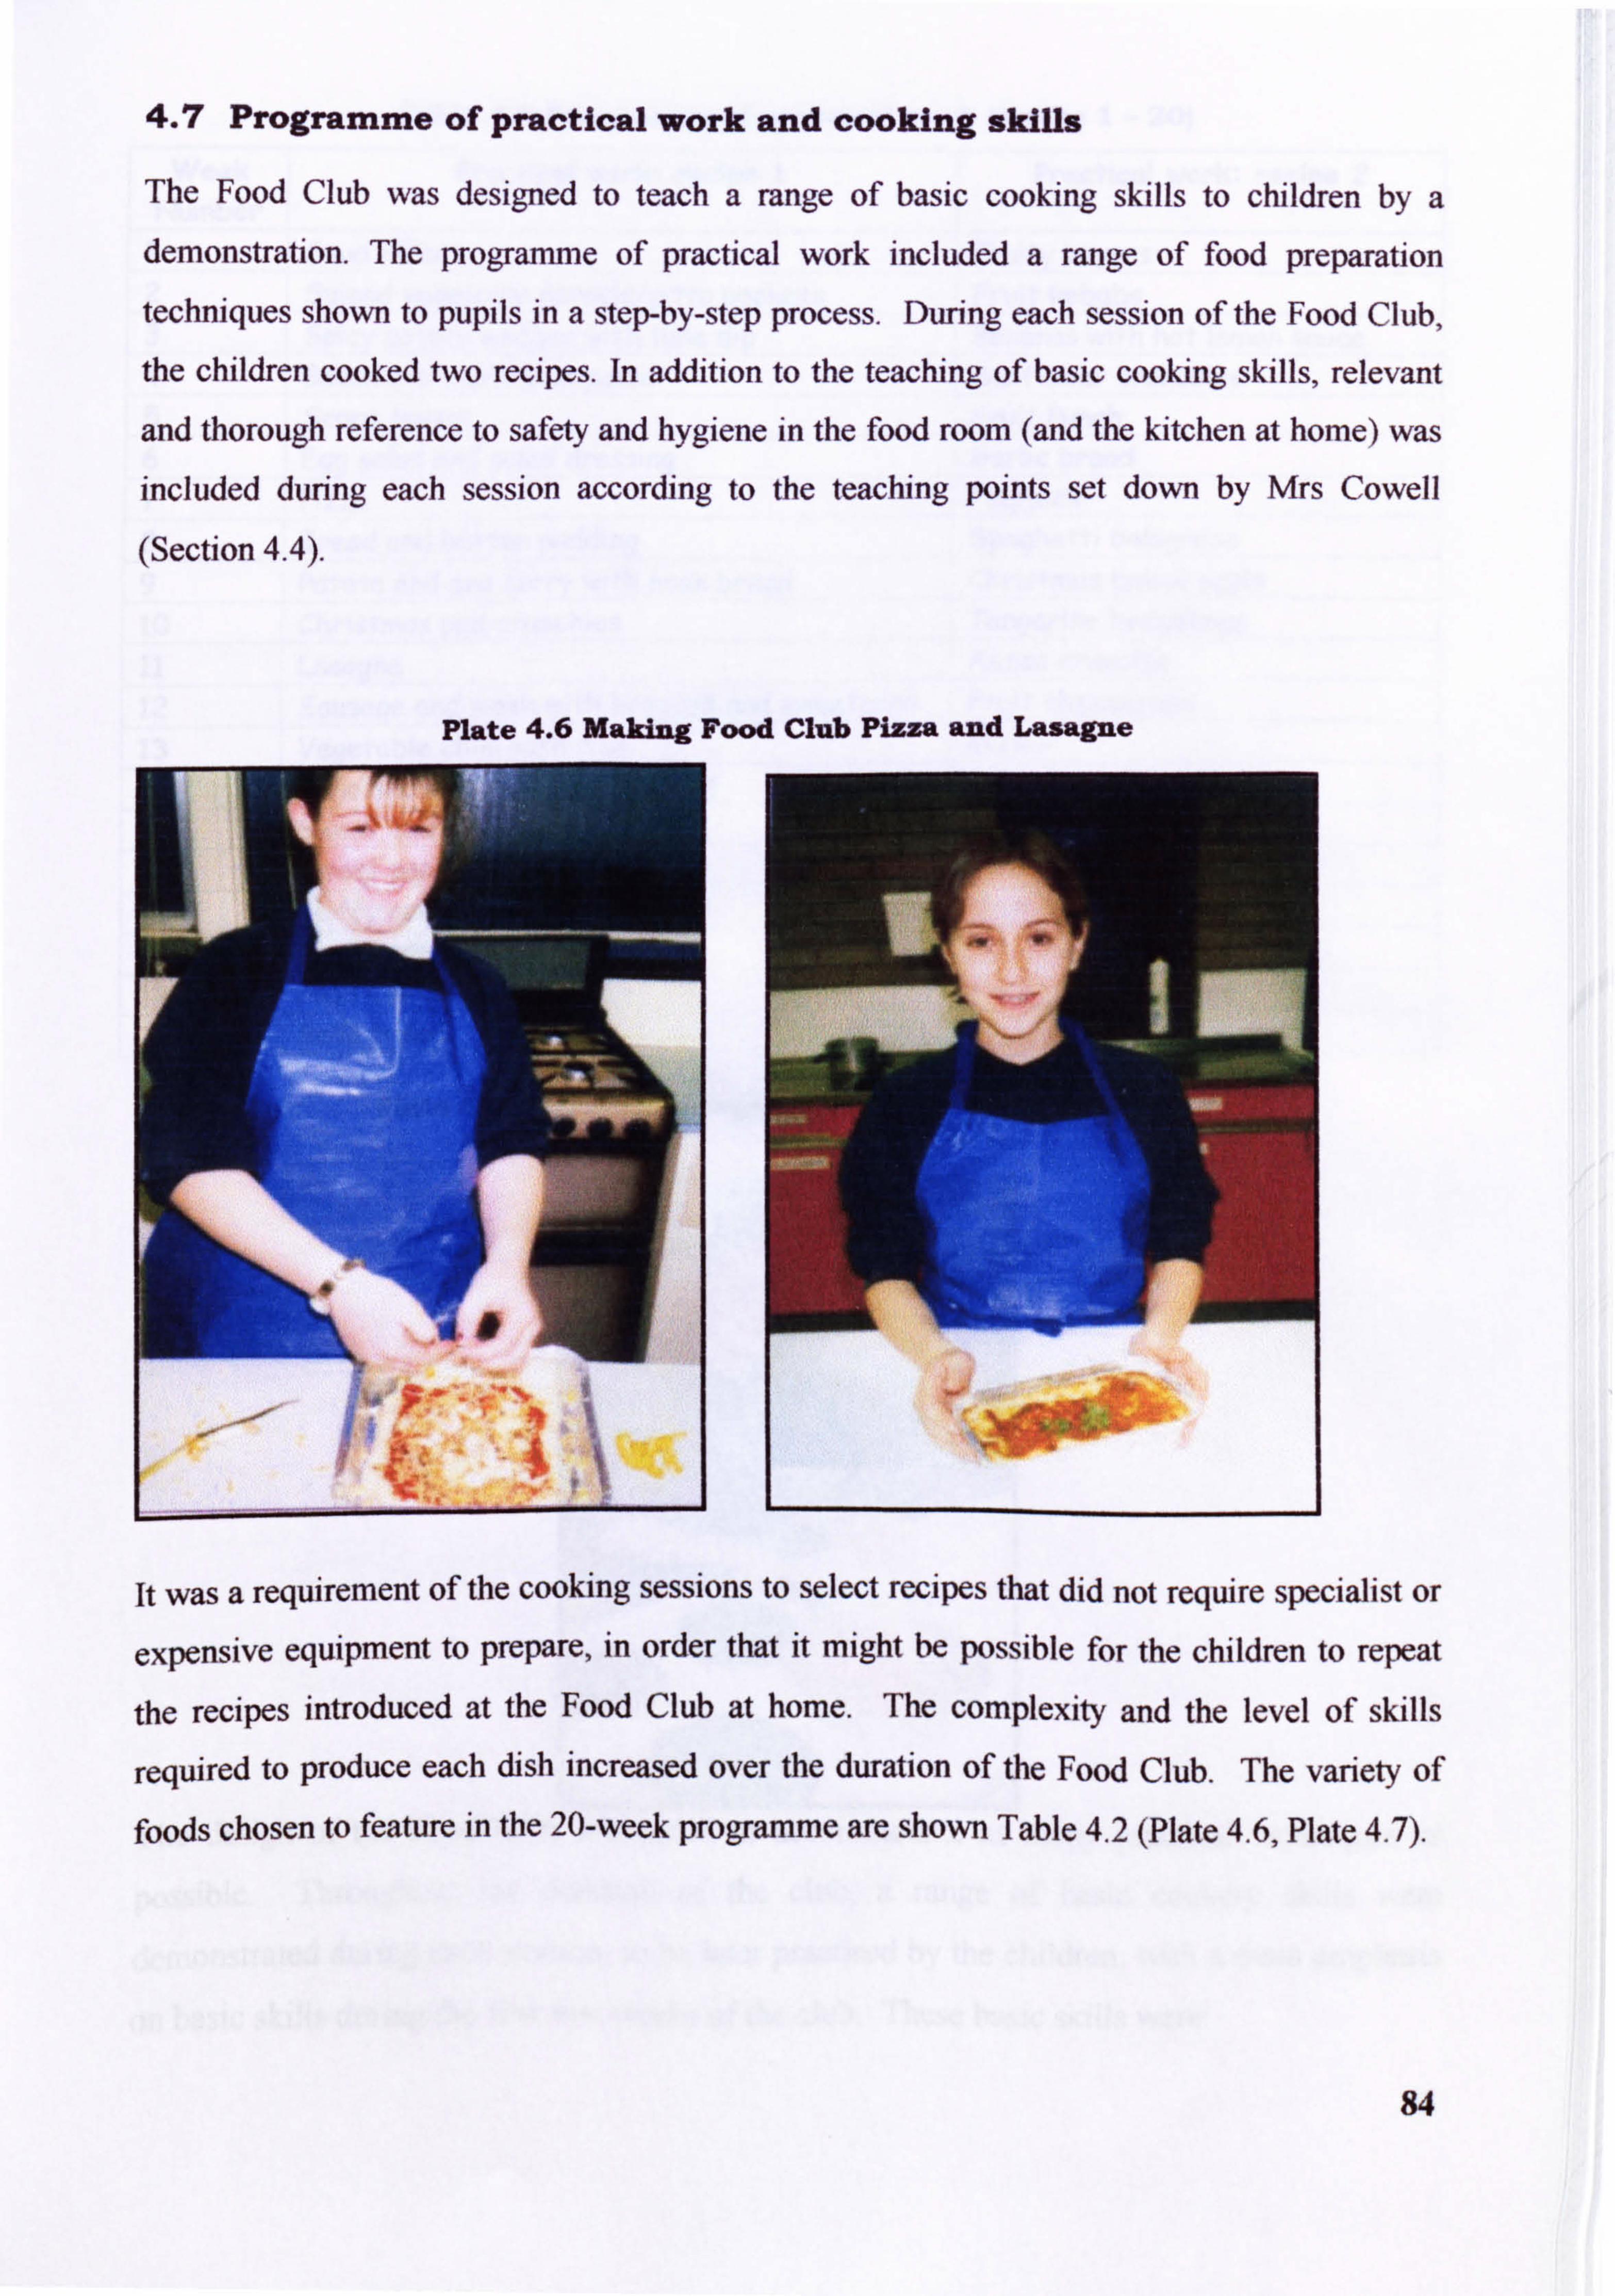
4.7 Programme of practical work and cooking skills
The Food Club was designed to teach a range of basic cooking skills to children by a demonstration. The programme of practical work included a range of food preparation techniques shown to pupils in a step-by-step process. During each session of the Food Club,
the children cooked two recipes. In addition to the teaching of basic cooking skills, relevant
and thorough reference to safety and hygiene in the food room (and the kitchen at home) was included during each session according to the teaching points set down by Mrs Cowell
(Section 4.4).
Plate 4.6 Making Food Club Pizza and Lasagne
it was a requirement of the cooking sessions to select recipes that did not require specialist or
expensive equipment to prepare, in order that it might be possible for the children to repeat
the recipes introduced at the Food Club at home. The complexity and the level of skills
required to produce each dish increased over the duration of the Food Club. The variety of
foods chosen to feature in the 20-week programme are shown Table 4.2 (Plate 4.6, Plate 4.7).
84
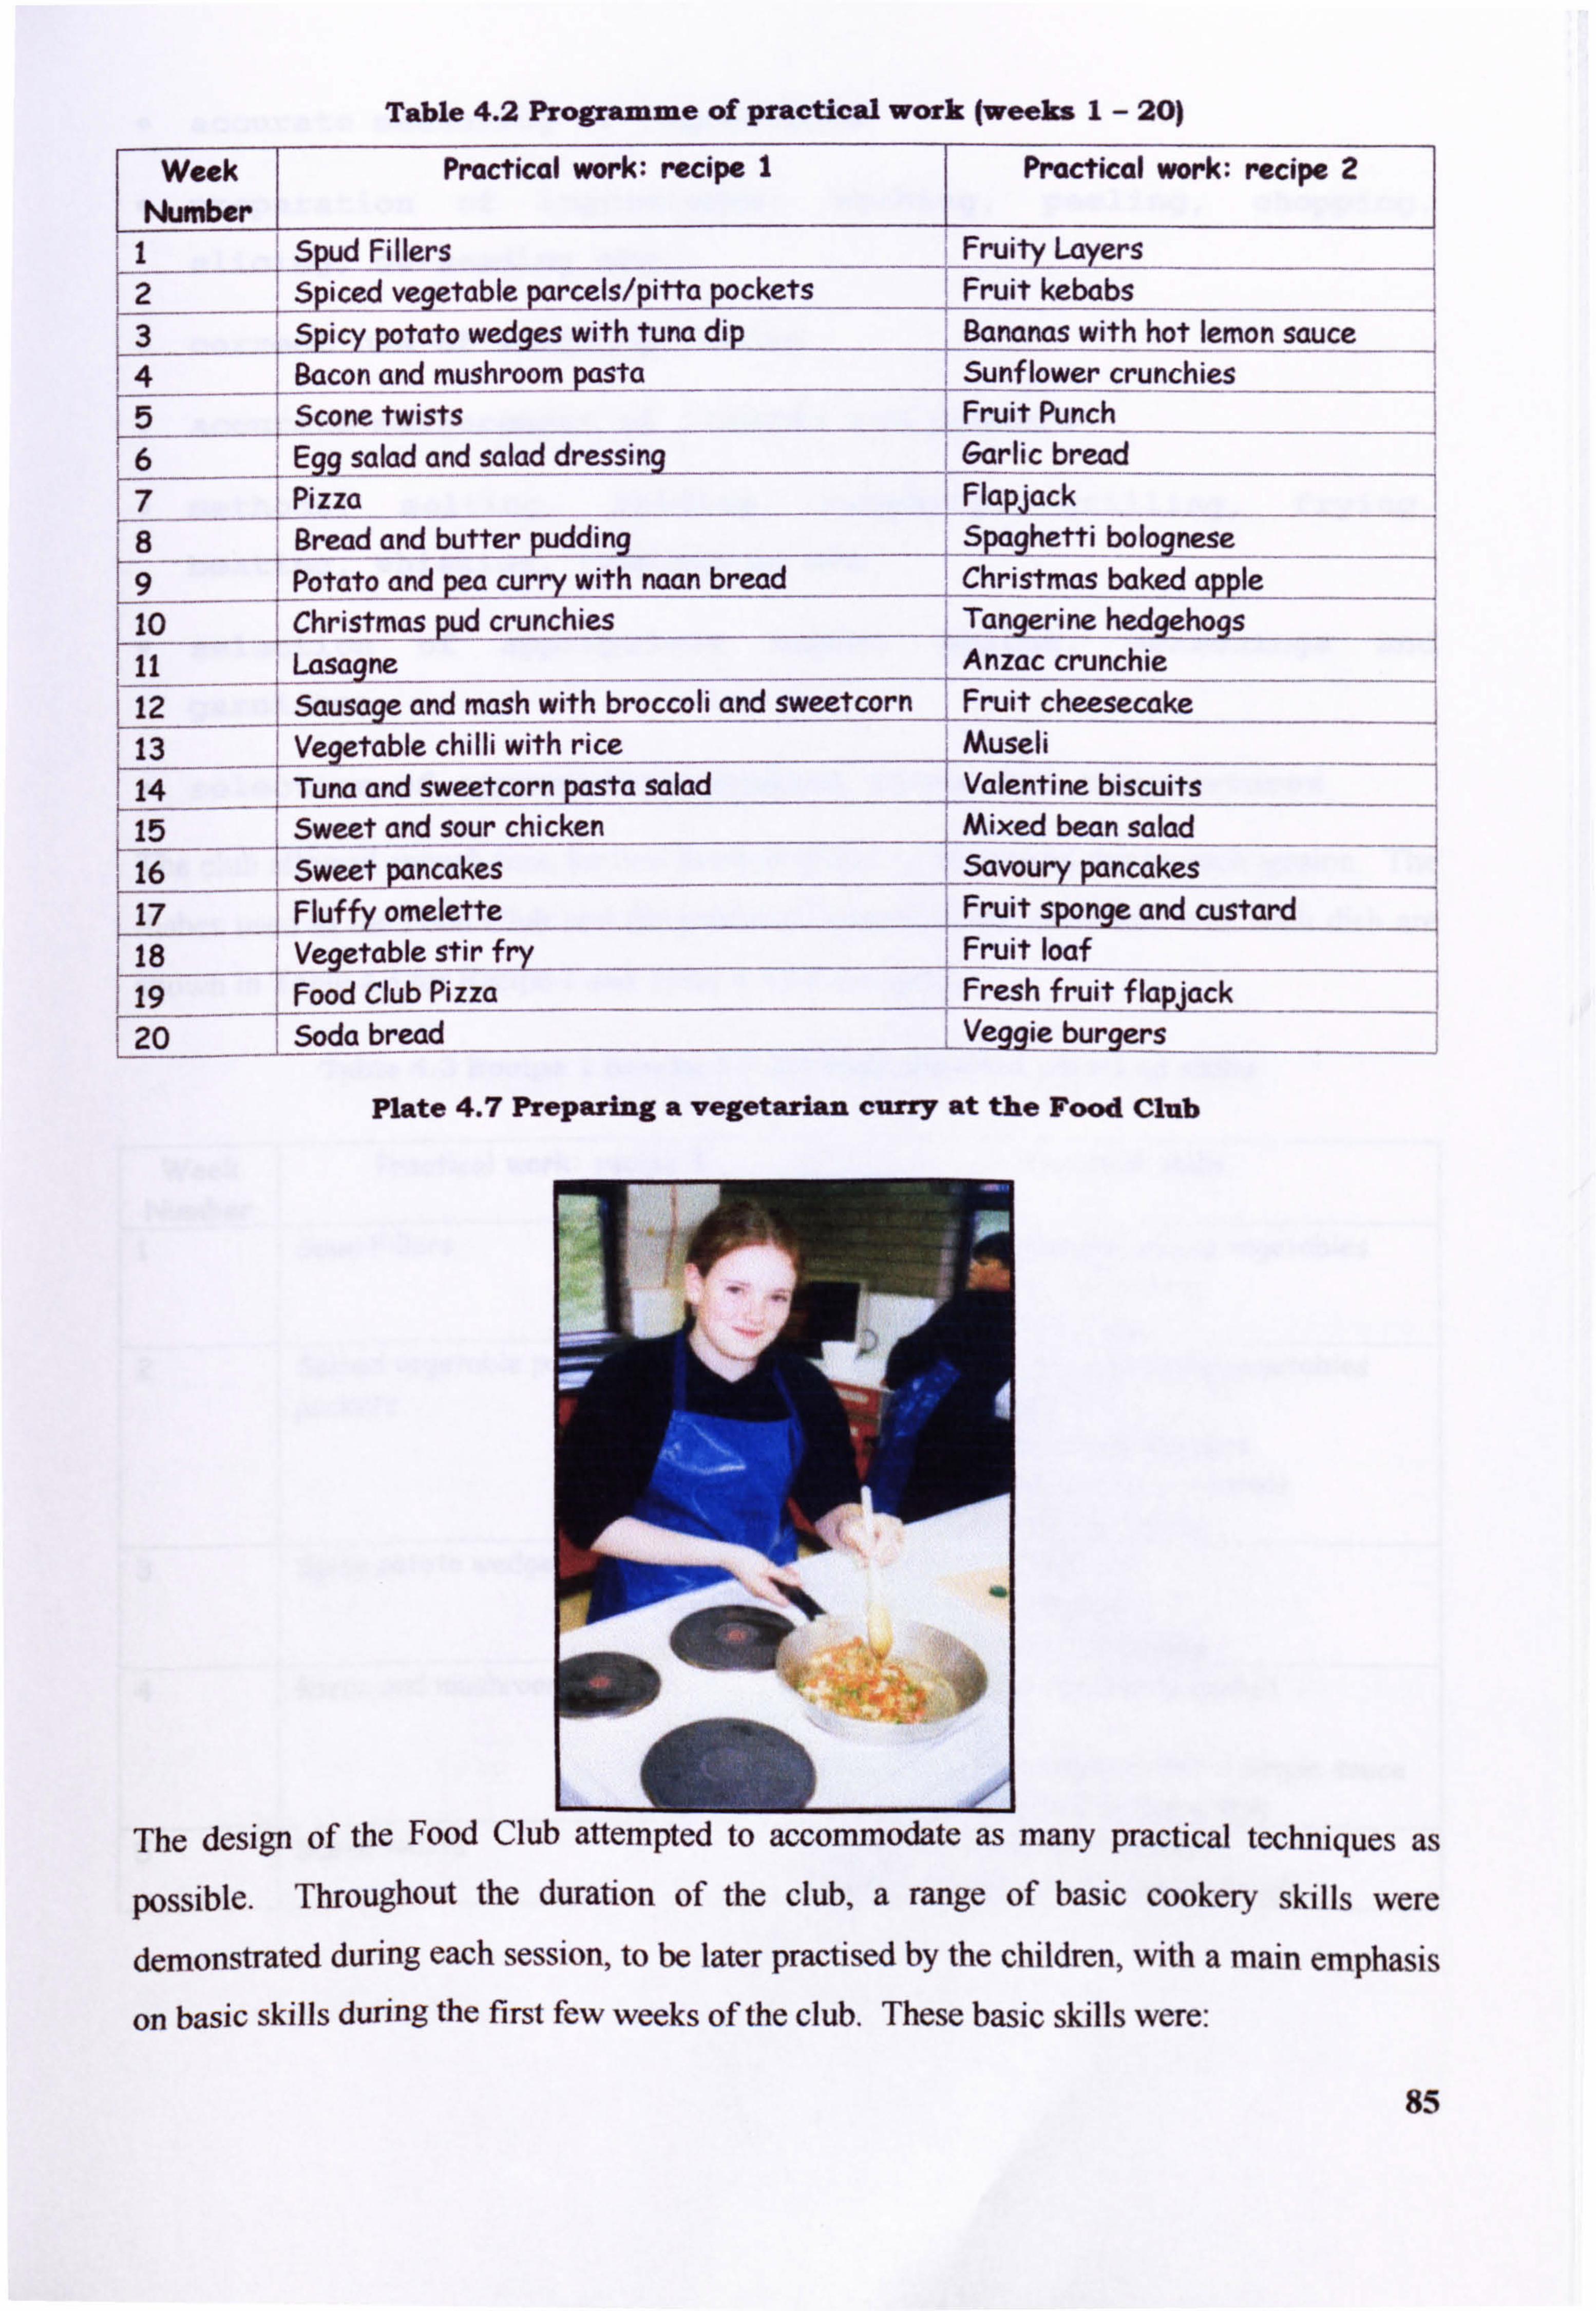
Table 4.2 Programme of practical work (weeks I- 20)
Week Number
Practical work: recipe I Practical work: recipe 2
yd Fillers Fruit F2 iced vegetable parcels/pitta pockets Fruit kebabs 13 spCy_po_tato wedges with tuna dip______ Bananas with hot lemon sauce
4 Bacon and mushroom_psta___________ 5unflower crunchies Scone twists Fruit Punch
6 i salad and salad dress Garlic bread 7 Pizza Flapjack 8 Bread and butter
_pudding Spaghetti bolognese
peacurry -with
naan bread Christmas bake -d
apple____ Lio
_____J_ýhristmas pud crunchies Tanqerine hedqeho s
I Lasqgne Anzac crunchie sacie and m as h with br
- occoli and sweetcorn Fruit cheesecake
13 , - - ri4- - ------- Tu na and -- sweetcorn asta salad D Valentine biscuits
15 Sweet and sour chicken Mixed bean salad 16 Sweet pancakes
-- ---- ----- 17 Fluffy onelette Fruit sponqe and custard Vegetable stir fry Fruit loaf
19 Food Club Pizza Fresh f ru it f la ck 20 1 Soda bread Vegqie burgers
Plate 4.7 Preparing a vegetarian curry at the Food Club
The design of the Food Club attempted to accommodate as many practical techniques as
possible. Throughout the duration of the club, a range of basic cookery skills were demonstrated during each session, to be later practised by the children, with a main emphasis
on basic skills during the first few weeks of the club. These basic skills were:
85

accurate measuring of ingredients
preparation of ingredients; washing, peeling, chopping,
slicing, de-seeding etc
correct use of weighing scales
accurate measurem nt of liquids and powders
methods: melting, folding, creaming, grillingr frying,
beating, whisking, rubbing-in etc
selection of appropriate herbs, spices, seasonings and
garnishes
0 selection of appropriate cooking times and temperatures
The club allowed enough time for two foods or dishes to be cooked during each session. The
dishes used in the Food Club and the practical cookery skills associated with each dish are
shown in Table 4.3 for Recipe I and Table 4.4 for Recipe 2.
Table 4.3 Recipe I (weeks I- 20) with required practical skins
Week Practical work: recipe 1 Practical skills Wmber I Spud Fillers Washing, chopping and slicing vegetables
Using a main oven for baking Making a salad dressing
2 Spiced vegetable parcels/pitta. Washing, chopping and slicing vegetables pockets Ro IIi ng fi lo pastry
Using radiant rings/gas burners Manipulating temperature controls
. _Frying spices and vegetable s
3 Spicy potato wedges with tuna dip Preparing potatoes Assembling a dressing Using a main oven for baking
4 Bacon and mushroom pasta Cooking pasta according to packet instructions Selecting dairy products for a simple sauce Using a gar ish to enhance a dish
5 Scone twists Using the rubbing-in method Rolling, shapinq and cutting a dough
86
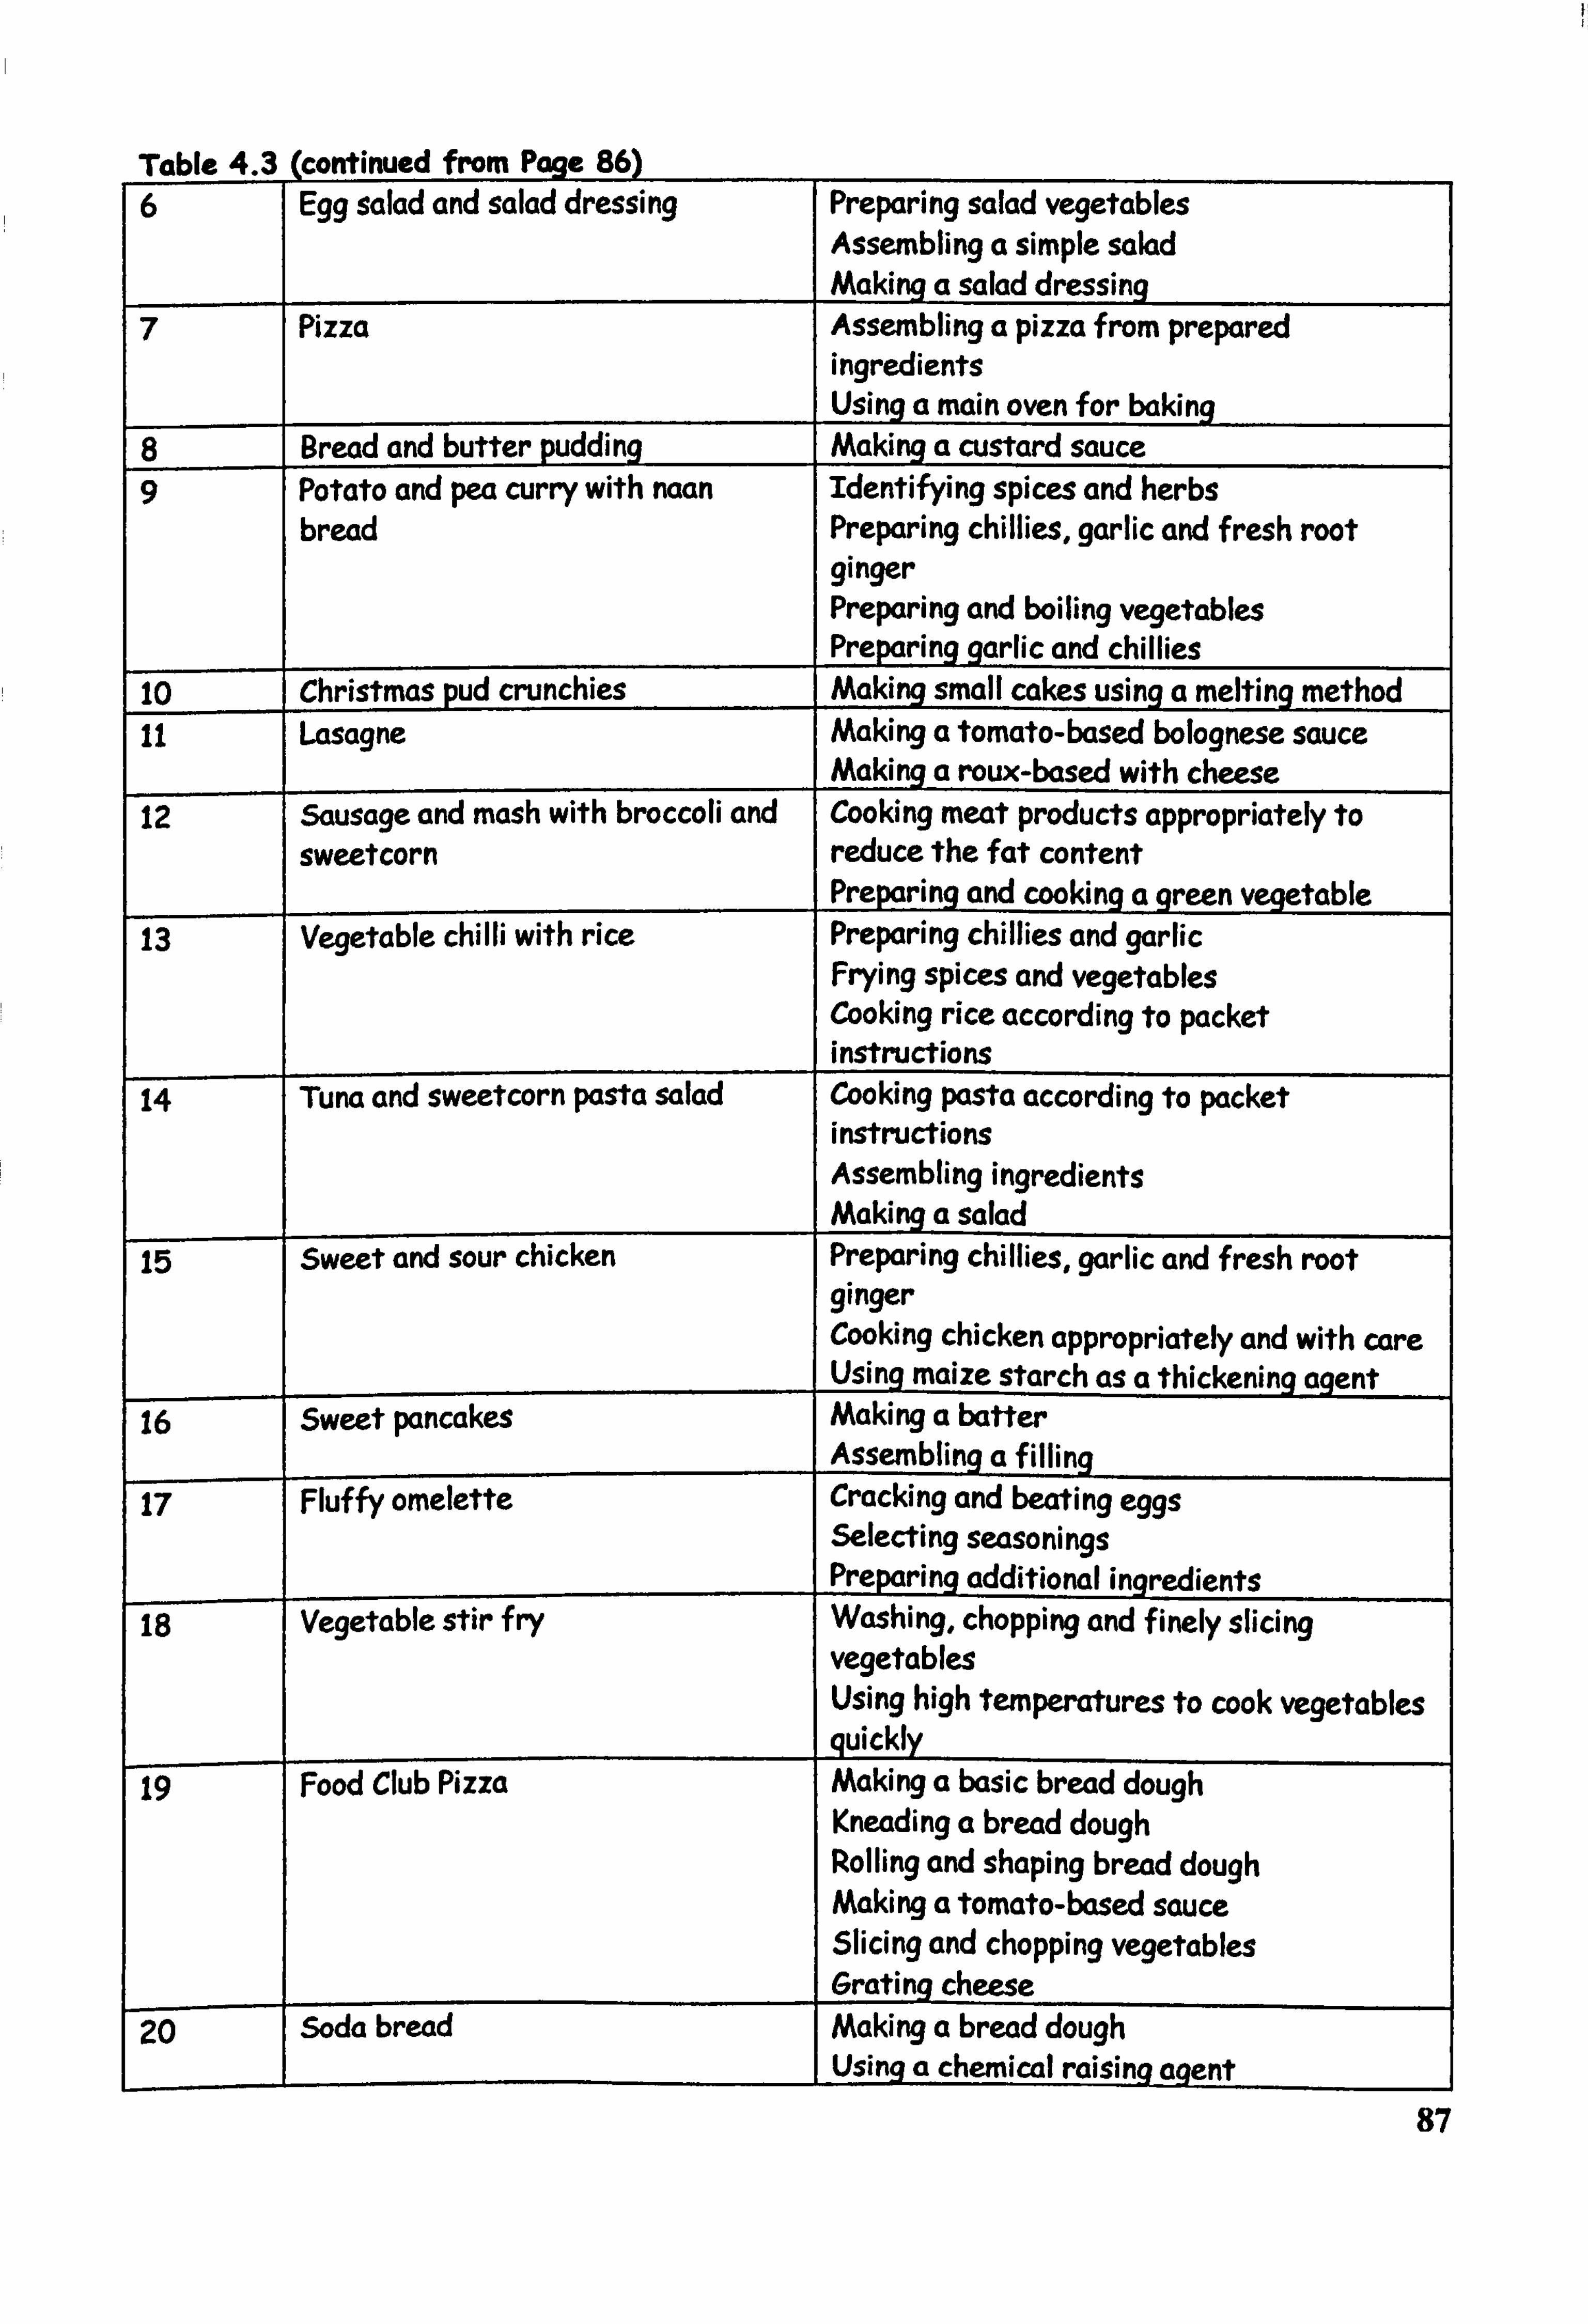
Table 4.3 (continued from Paqe 86) 6 Egg salad and salad dressing Preparing salad vegetables
Assembling a simple salad Making a salad dressing
7 Pizza Assembling a pizza from prepared ingredients
I Using a main oven for baking 8 Bread and butter pudding Making a custard sauce 9 Potato and pea curry with naan Identifying spices and herbs
bread Preparing chillies, garlic and fresh root ginger Preparing and boiling vegetables Preparing garlic and chillies
10 rChristmas pud crunchies Making small cakes using a melting method _ 11 Lasagne Making a tomato-based bolognese sauce
Making a roux-based with cheese 12 Sausage and mash with broccoli and Cooking meat products appropriately to
sweetcorn reduce the fat content Preparing and cooking a green vegetable
13 Vegetable chilli with rice Preparing chillies and garlic Frying spices and vegetables Cooking rice according to packet instructions
14 Tuna and sweetcorn pasta salad Cooking pasta according to packet instructions Assembling ingredients Making a salad
15 sweet and sour chicken Preparing chillies, garlic and fresh root ginger Cooking chicken appropriately and with care Usinq maize starch as a thickening aqent
16- Sweet pancakes Making a batter Assembling af illing
17 Fluffy omelette Cracking and beating eggs Selecting seasonings Preparing additional ingredients
18 Vegetable stir f ry Washing, chopping and finely slicing vegetables Using high temperatures to cook vegetables quickly
19 Food Club Pizza Making a basic bread dough Kneading a bread dough Rolling and shaping bread dough Making a tomato-based sauce Slicing and chopping vegetables Grating cheese
20- Soda bread Making a bread dough Using a chemical raising agent
87

Table 4.4 Recipe 2 (weeks I- 20) with required practical AM
Week Practical work: recipe 2 Practical skills Number I Fruity Layers Using breakfast cereals, yoghurt and fresh
fruit to create a healthy breakfast food 2 Fruit kebabs Using fresh fruit to make an alternative
kebab 3 I-lot bananas with lemon sauce Zesting and juicing citrus fruit
Making a light sauce 4 Sunf lower crunchies Making biscuits using the melting method
Including seeds to enhance nutritional value of a recipe
5 Fresh fruit smoothie, fruit punch Using a blender appropriately and safely Peeling and chopping fresh fruit
6 Garlic bread Making a garlic butter Using a main oven
7 Flapjack Making biscuits using the melting method Folding in
8 Spaghetti bolognese Cooking spaghetti according to packet instructions Making a tomato-based bolognese sauce
9 Christmas baked apple Washing and coring apples to- Grilled pineapple Using tinned fruit to make a dessert
Preparing and grilling fruit Using a grill Use of garnish to enhance a dish
11 Anzac crunchie Making a biscuit mixture using a melting method Combining dry ingredients Foldinq in
12 Fruit cheesecake Making a biscuit crumb base Whipping cream Folding in
13- Museli Mixing dry ingredients Chopping nuts and dried fruit
14- Valentine biscuits Making a basic sweet biscuit dough Polling and cutting a biscuit dough
15 mixed bean salad Preparing onions and garlic Making a fresh salad dressing
16 Savqyry pancakes Making a batter 17 Fruit sponge and custard Using tinned fruit to create a dessert
Making a sponge using the creaming method 18 Fruit loaf
_Making a cake using the creaming method
19 Fresh fruit f lapJack Making biscuits using a melting method Selecting suitable fresh fruits
20 Veggie burgers Washing, preparing and chopping vegetables Using egg/breadcrumbs to form a coating
88
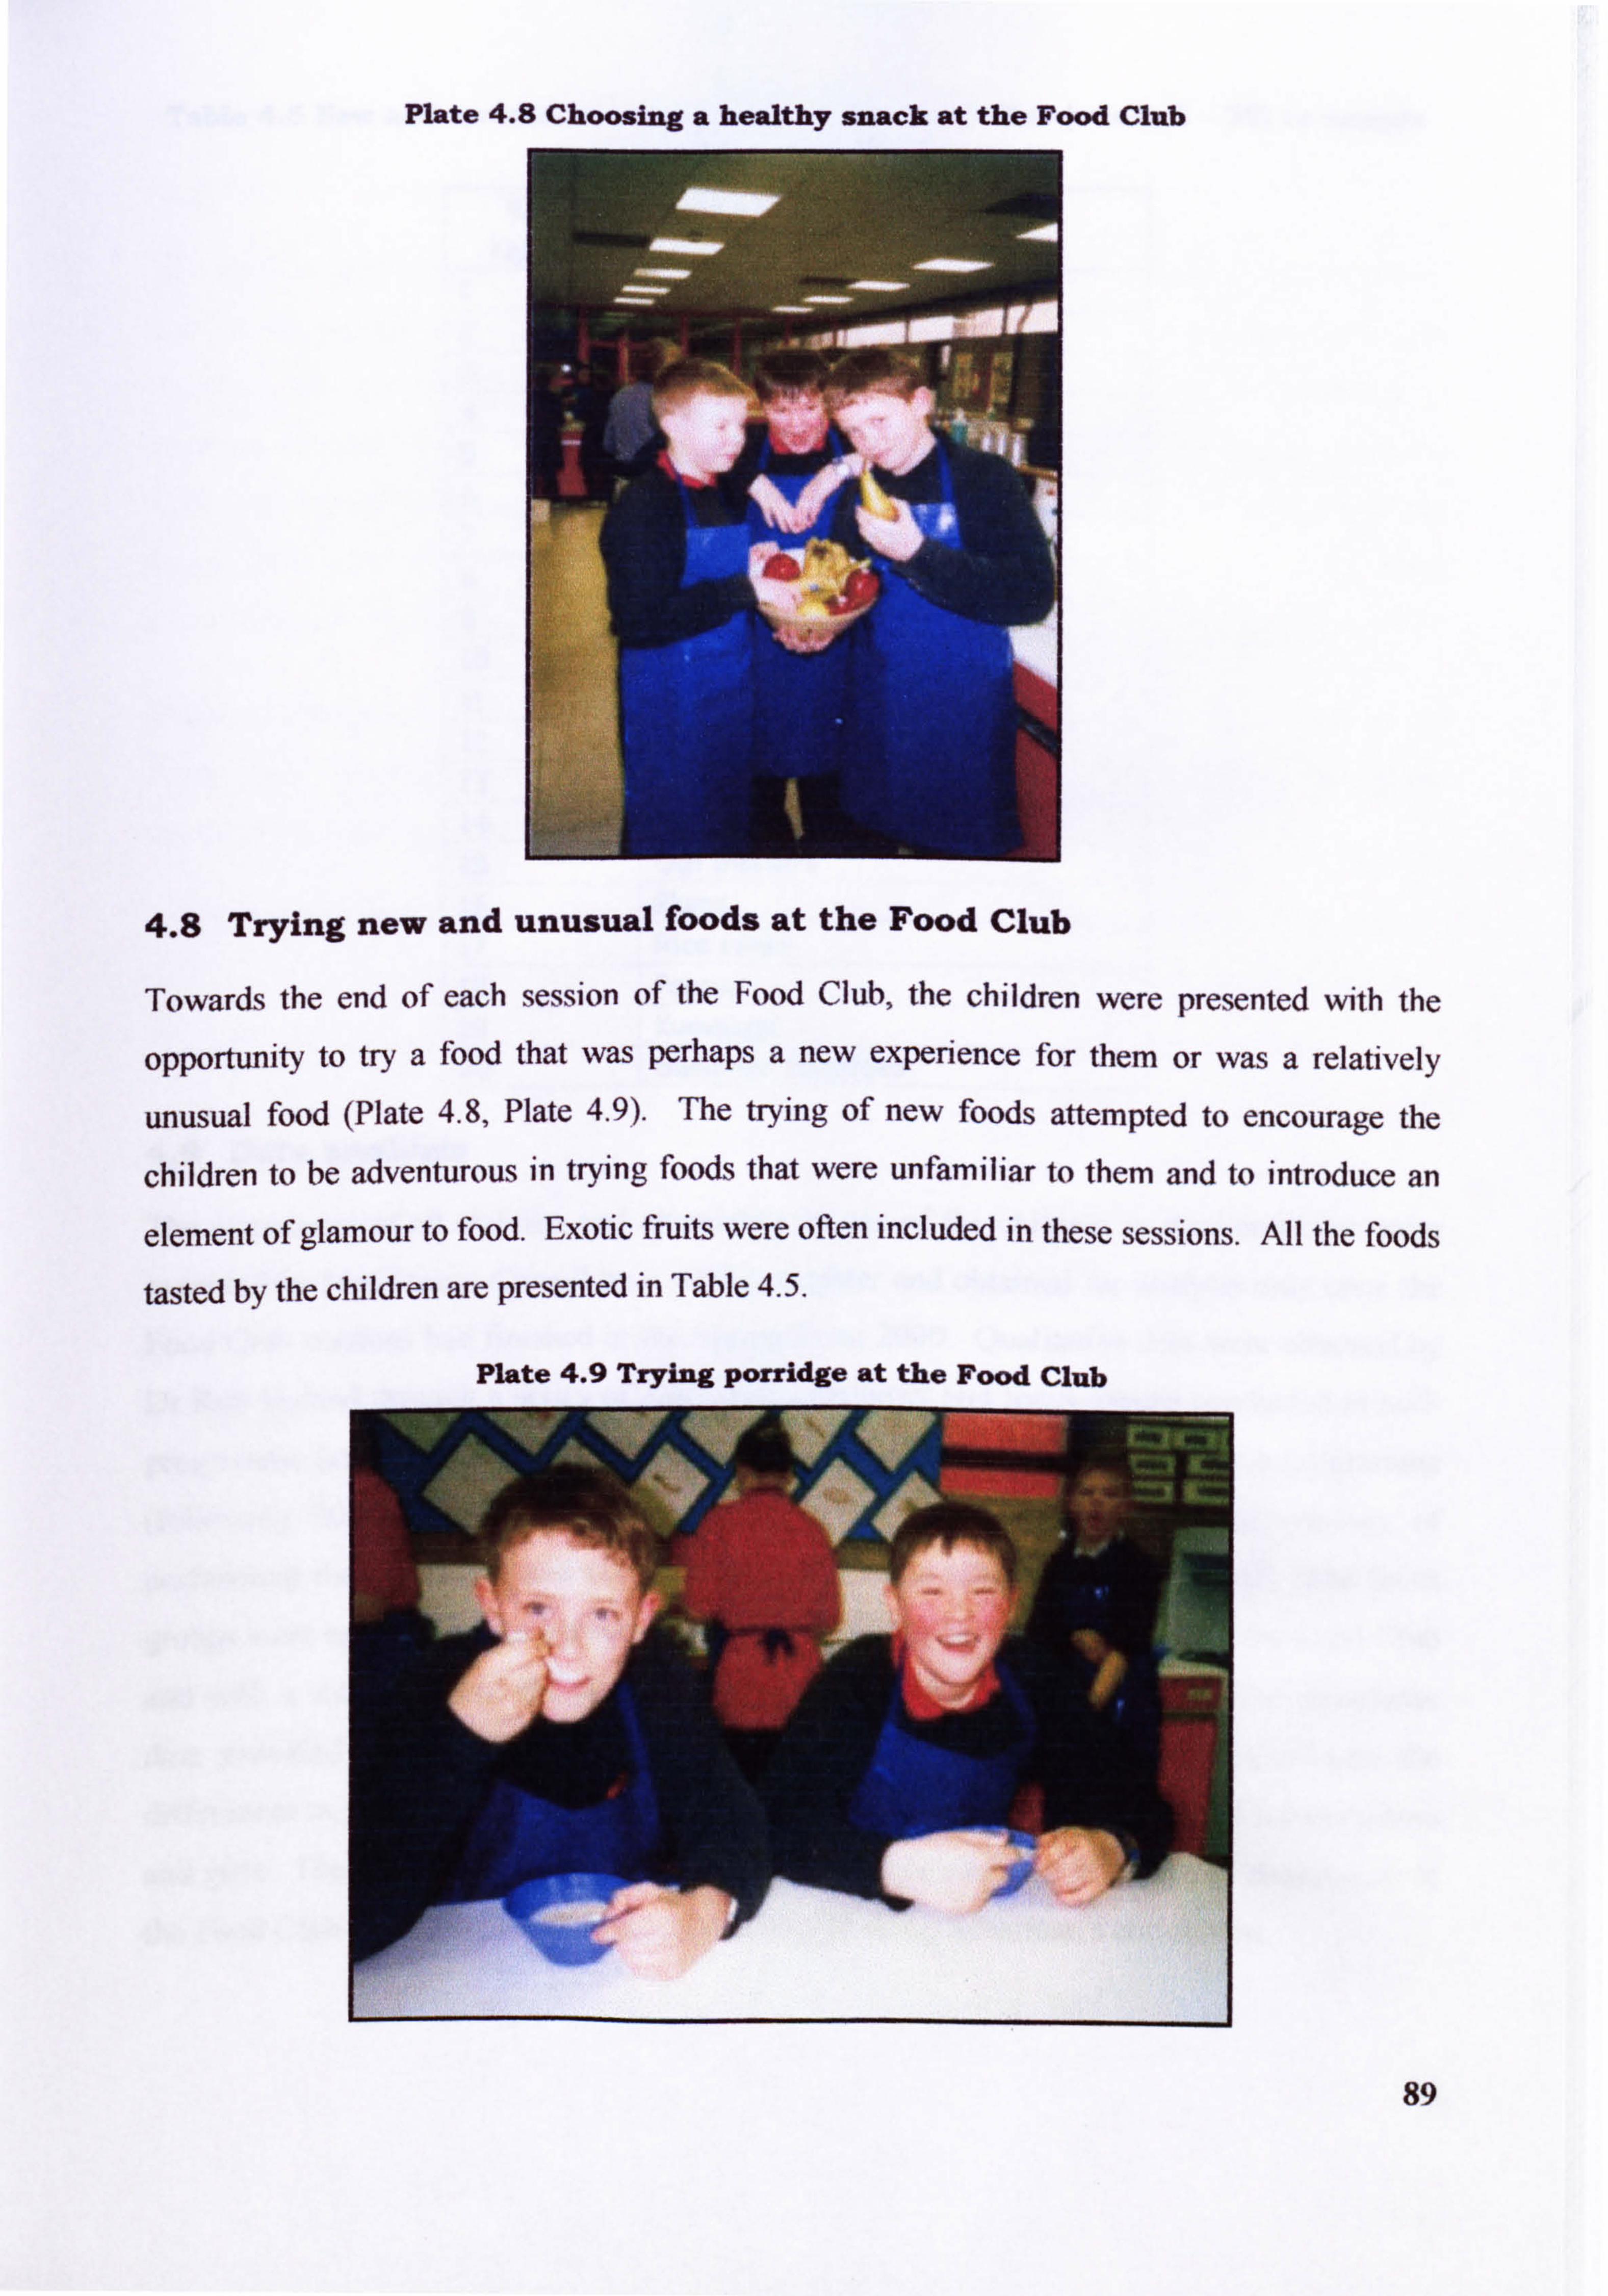
Plate 4.8 Choosing a healthy snack at the Food Club
4.8 Trying new and unusual foods at the Food Club
Towards the end of each session of the Food Club, the children were presented with the
opportunity to try a food that was perhaps a new experience for them or was a relatively
unusual food (Plate 4.8, Plate 4.9). The trying of new foods attempted to encourage the
children to be adventurous in trying foods that were unfamiliar to them and to introduce an
element of glamour to food. Exotic fruits were often included in these sessions. All the foods
tasted by the children are presented in Table 4.5.
89
Plate 4.9 Trying porridge at the Food Club
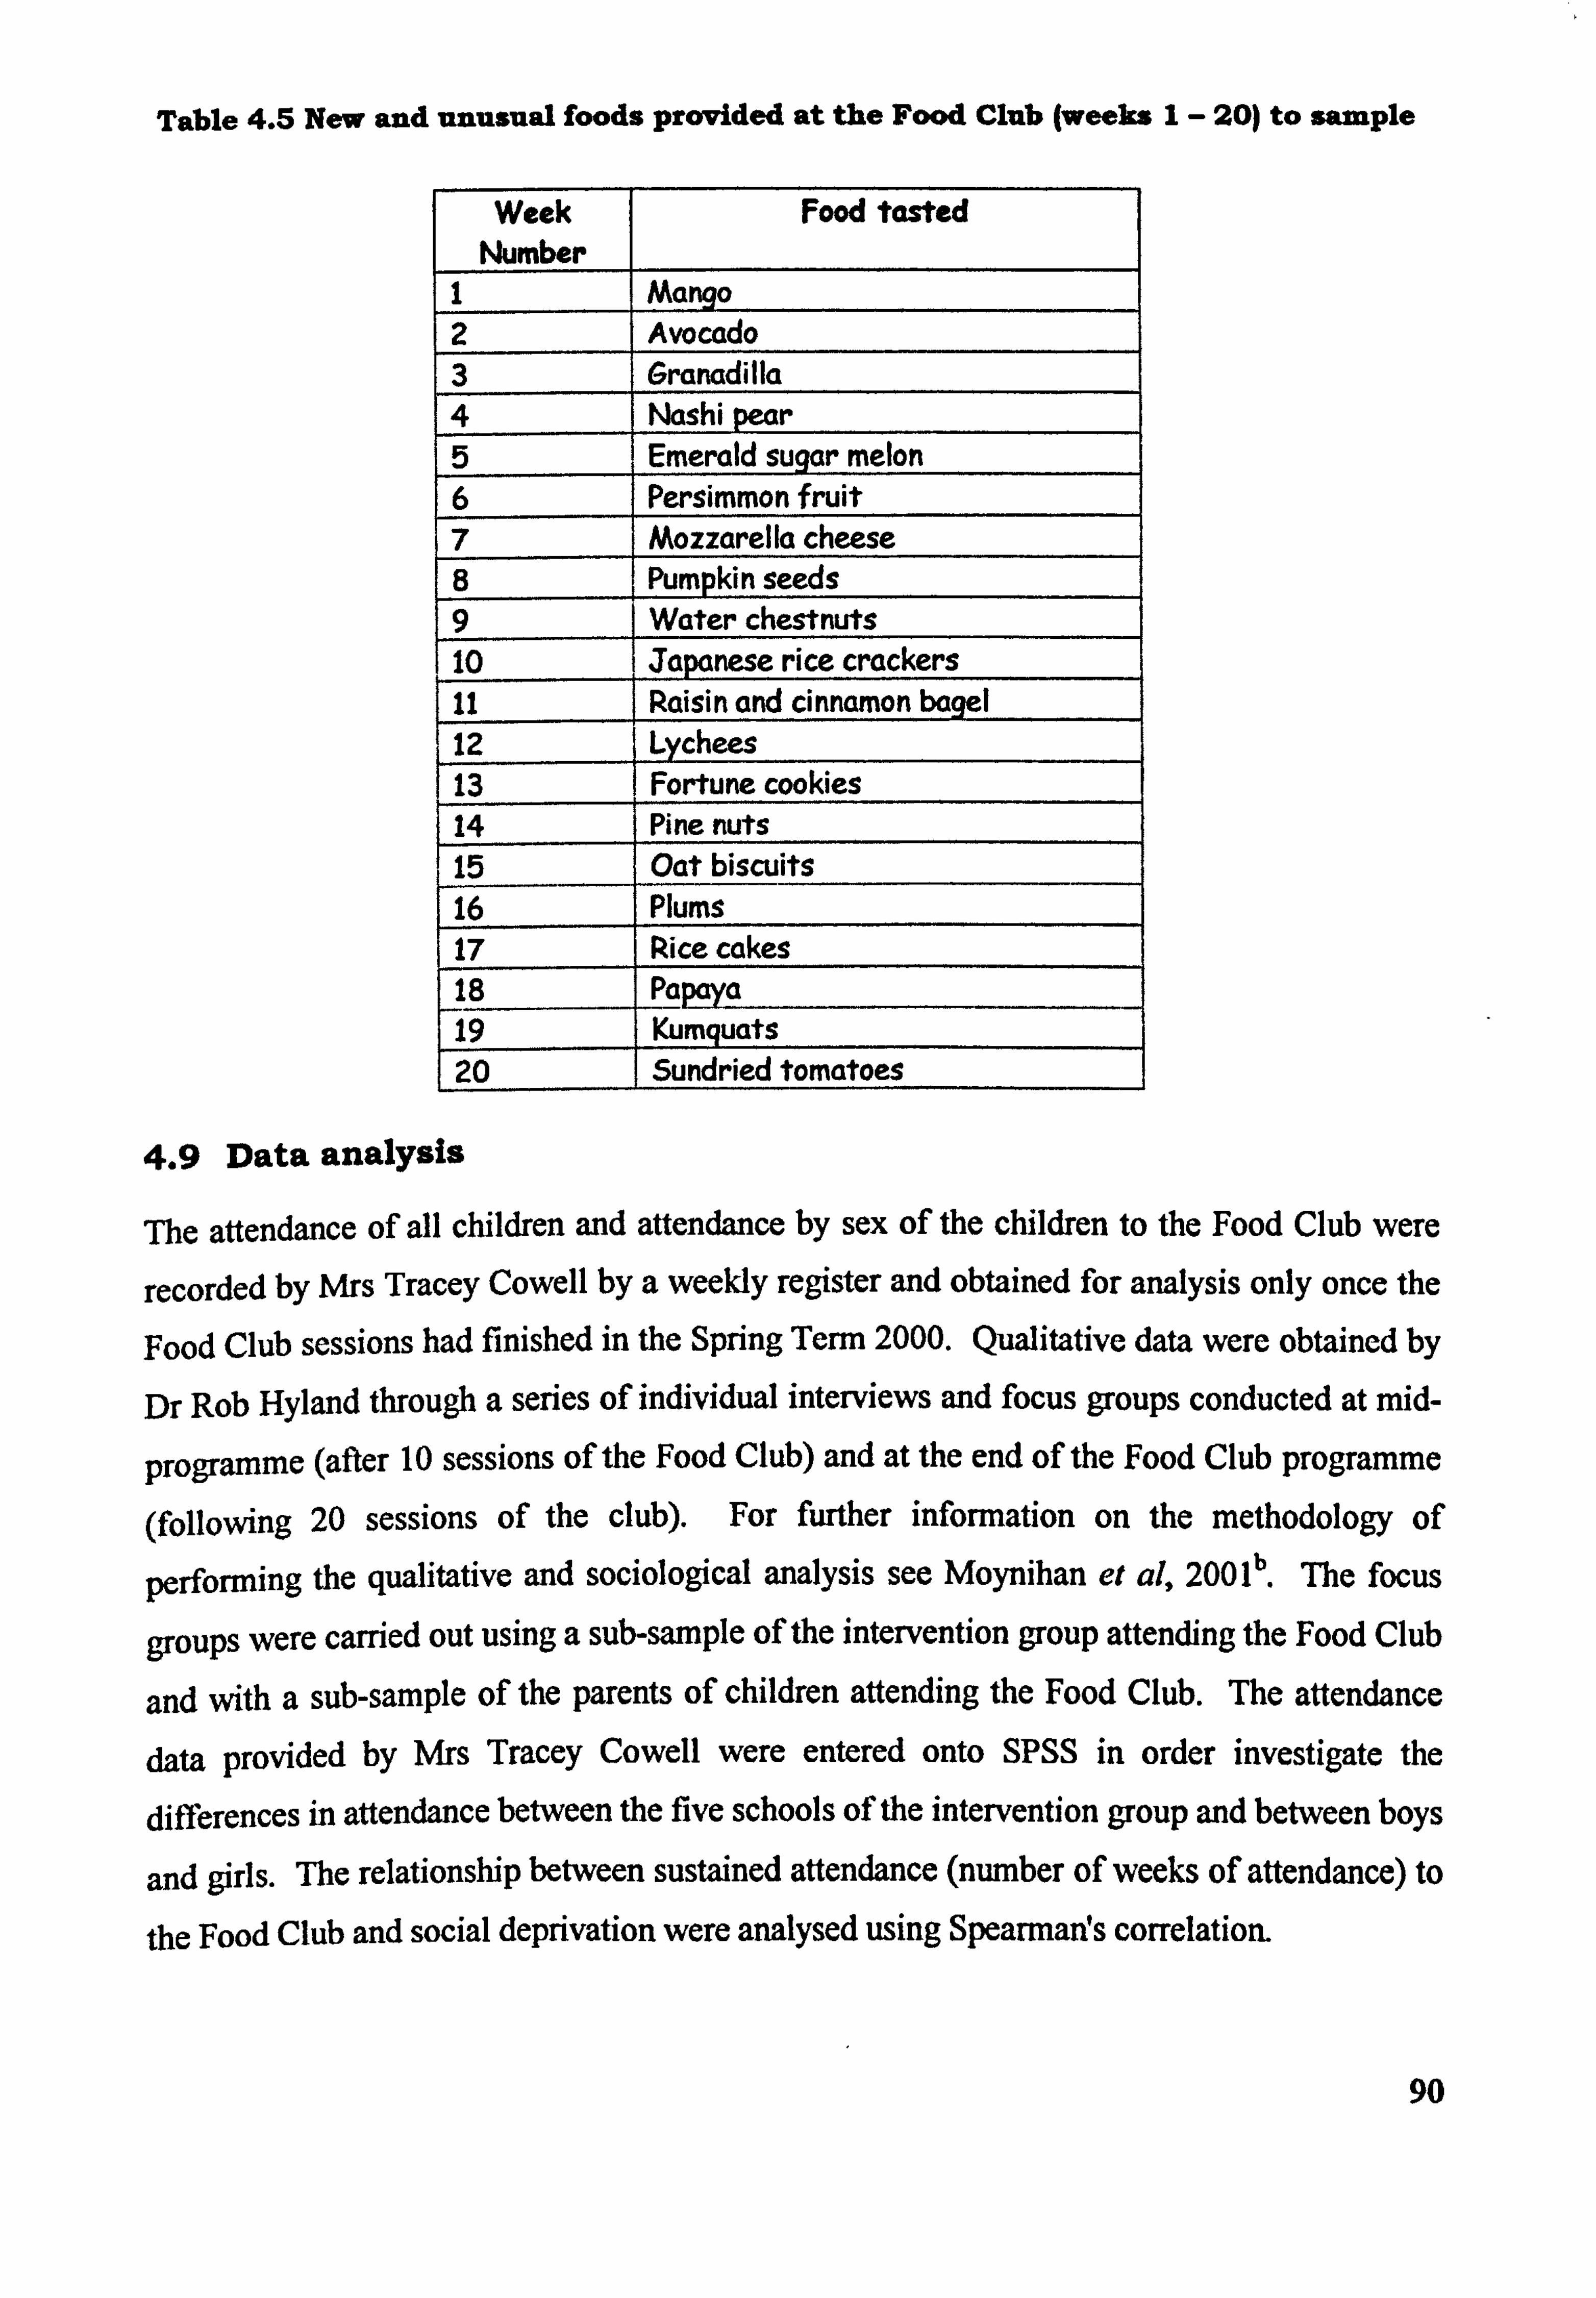
Table 4.5 New and unusual foods provided at the Food Club (weeks I- 20) to sample
Week Number
Food tasted
I Mango 2 Avocado 3 Grancidilla 4 Nashi pear 5 Emerald sugar melon 6 Persimmon fruit 7 Mozzarella cheese 8 Pumpkin seeds 9 Water chestnuts 10 Japanese rice crackers 11 Raisin and cinnamon bagel 12 Lychees 13 Fortune cookies 14 Pine nuts 15 Oat biscuits 16 Plums 17 Rice cakes 18 pa 19 Kumquats 20 Sundried tomatoes
4.9 Data analysis
The attendance of all children and attendance by sex of the children to the Food Club were
recorded by Mrs Tracey Cowell by a weekly register and obtained for analysis only once the
Food Club sessions had finished in the Spring Term 2000. Qualitative data were obtained by
Dr Rob Hyland through a series of individual interviews and focus groups conducted at mid-
programme (after 10 sessions of the Food Club) and at the end of the Food Club programme
(following 20 sessions of the club). For further information on the methodology of
performing the qualitative and sociological analysis see Moynihan et al, 200 lb . 'Me focus
groups were carried out using a sub-sample of the intervention group attending the Food Club
and with a sub-sample of the parents of children attending the Food Club. The attendance
data provided by Mrs Tracey Cowell were entered onto Spss in order investigate the
differences in attendance between the five schools of the intervention group and between boys
and girls. The relationship between sustained attendance (number of weeks of attendance) to
the Food Club and social deprivation were analysed using Spearman! s correlation.
90
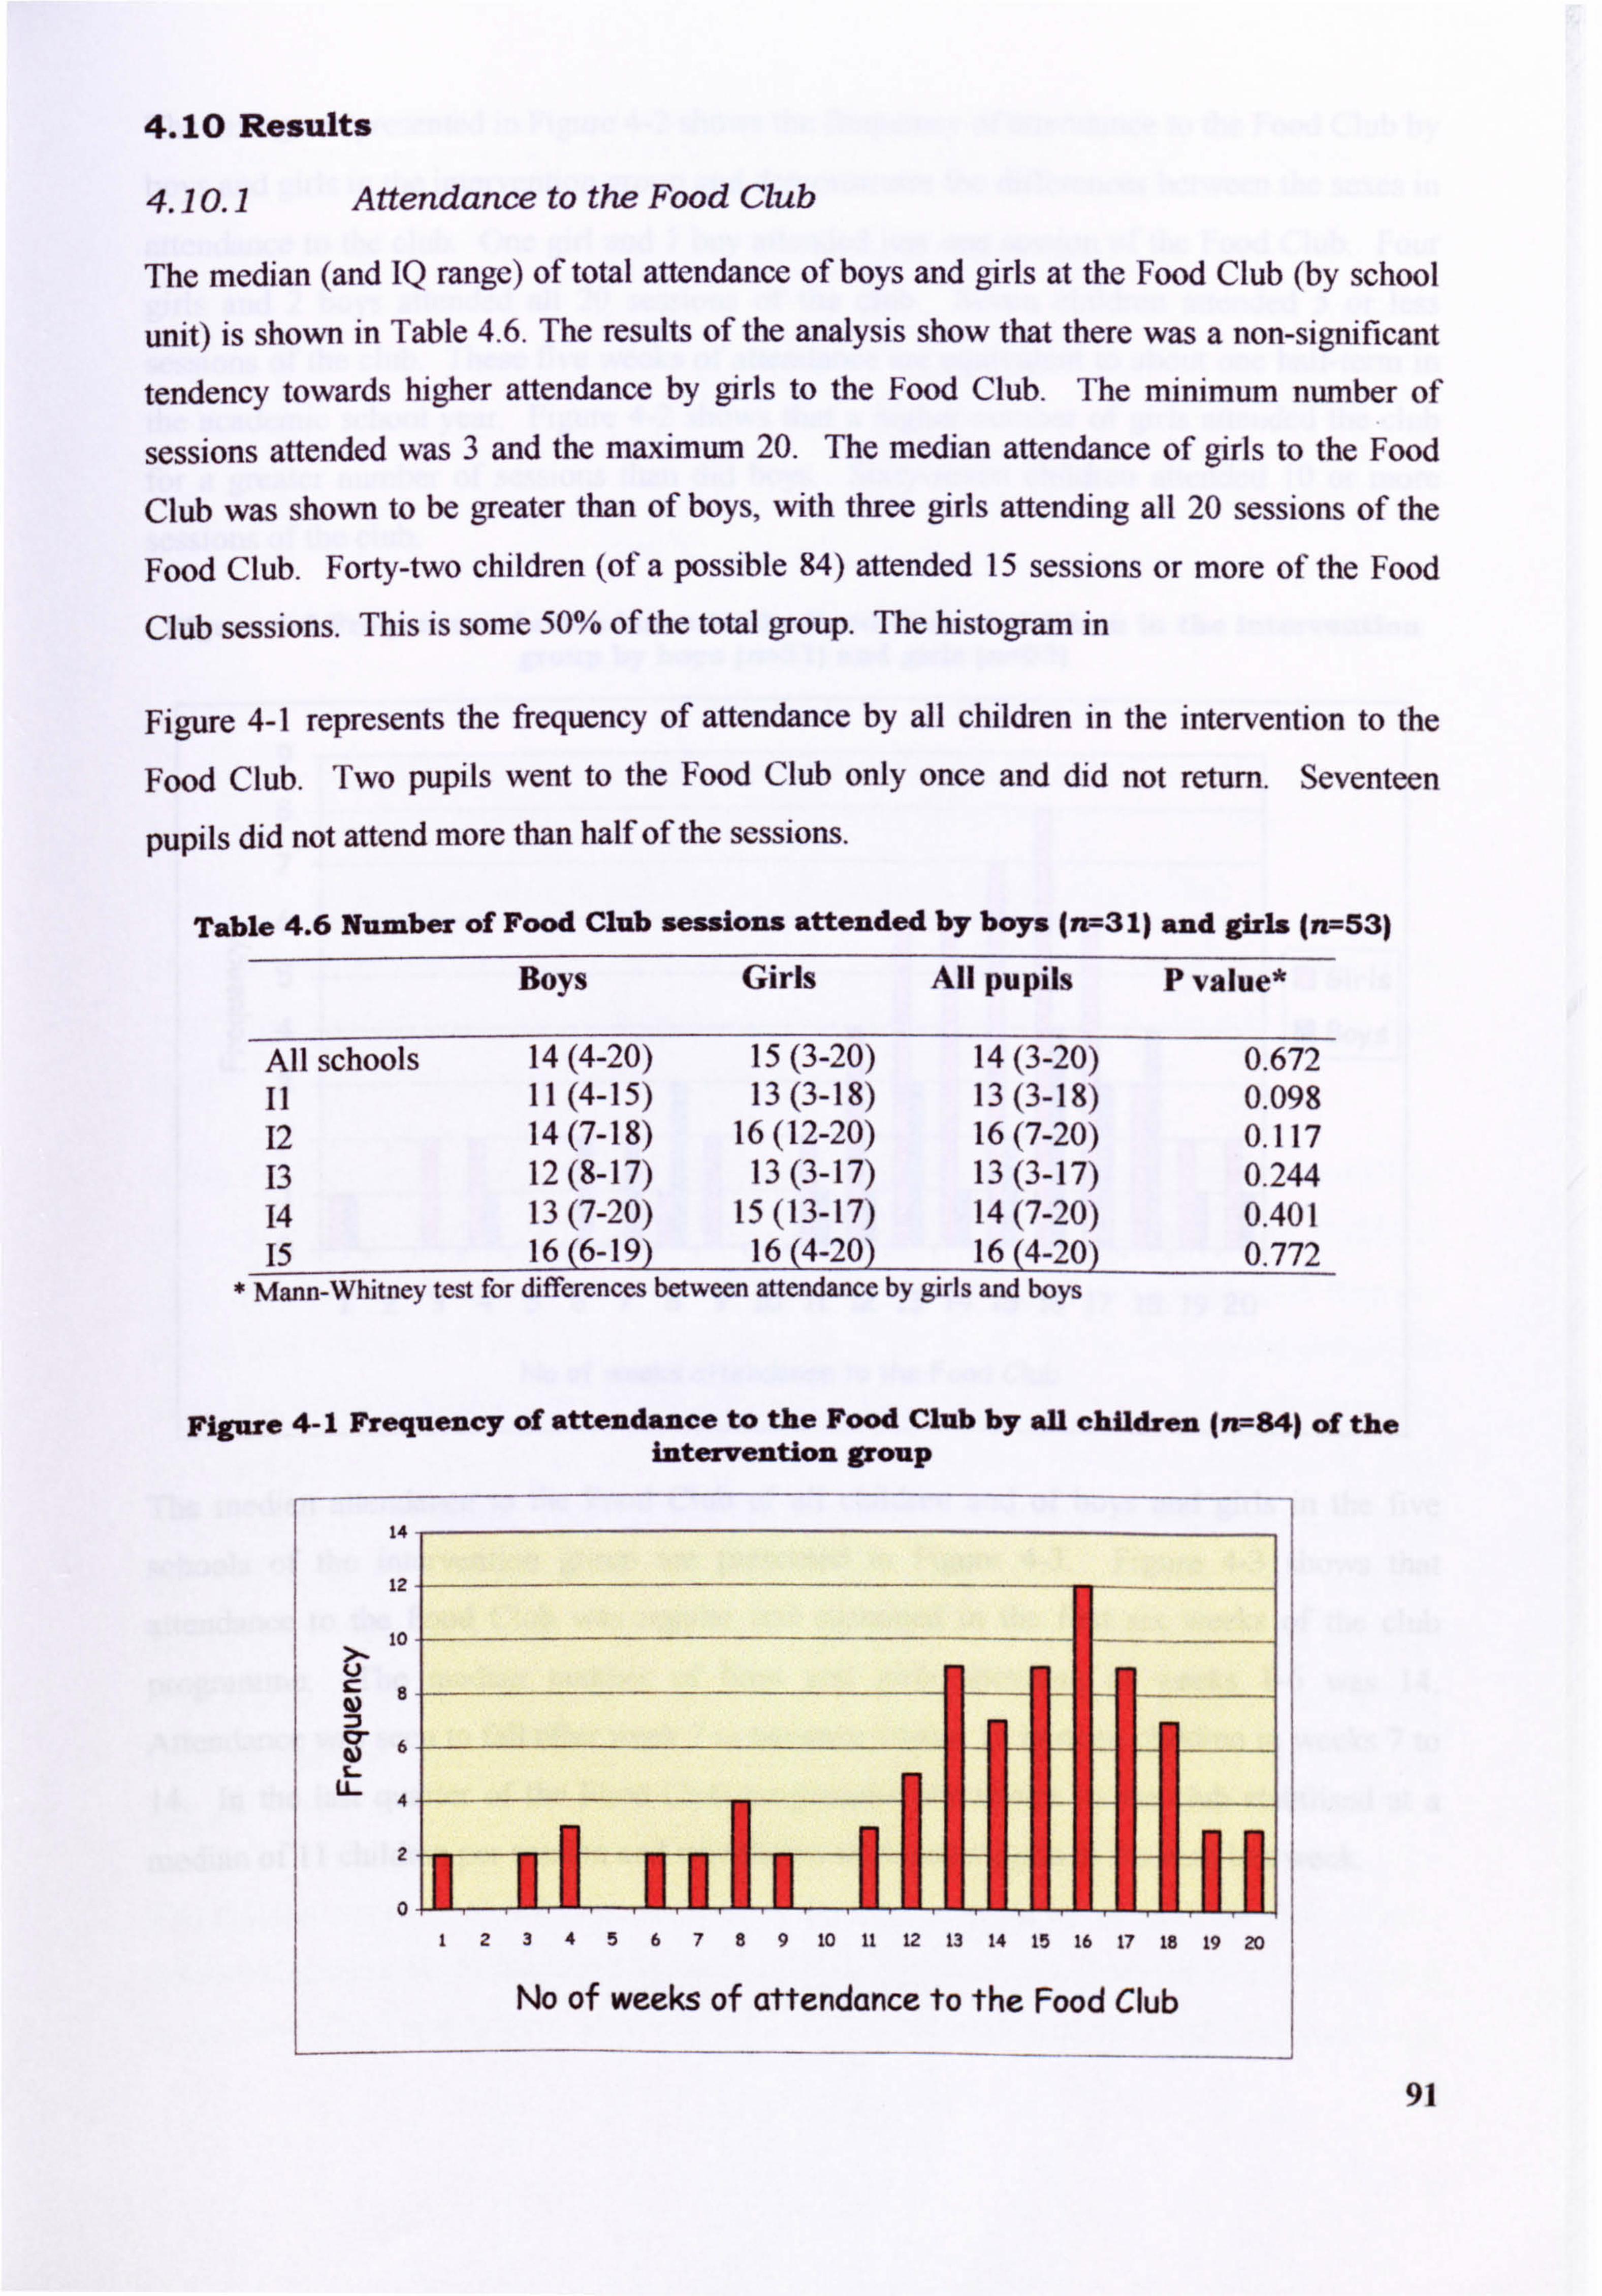
4.10 Results
4.10.1 Attendance to the Food Club
The median (and IQ range) of total attendance of boys and girls at the Food Club (by school
unit) is shown in Table 4.6. The results of the analysis show that there was a non-significant
tendency towards higher attendance by girls to the Food Club. The minimum nurnber of
sessions attended was 3 and the maximum 20. The median attendance of girls to the Food
Club was shown to be greater than of boys, with three girls attending all 20 sessions of the
Food Club. Forty-two children (of a possible 84) attended 15 sessions or more of the Food
Club sessions. This is some 50% of the total group. The histogram in
Figure 4-1 represents the frequency of attendance by all children in the intervention to the
Food Club. Two pupils went to the Food Club only once and did not return. Seventeen
pupils did not attend more than half of the sessions.
Table 4.6 Number of Food Club sessions attended by boys (n--3 1) and girls (n=53)
Boys Girls All pupils P value*
All schools 14(4-20) 15(3-20) 14(3-20) 0.672 11 11(4-15) 13(3-18) 13(3-18) 0.098 12 14(7-18) 16(12-20) 16(7-20) 0.117 13 12(8-17) 13(3-17) 13(3-17) 0.244 14 13(7-20) 15(13-17) 14(7-20) 0.401 15 16(6-19) 16(4-20) 16(4-20) 0.772
* Mann-Whitney test for differences between attendance by girls and boys
Figure 4-1 Frequency of attendance to the Food Club by all children (rr--84) of the intervention group
14
12
10
LL-
2
0 1234567891011121314151617181920
No of weeks of attenclance to the Food Club
91
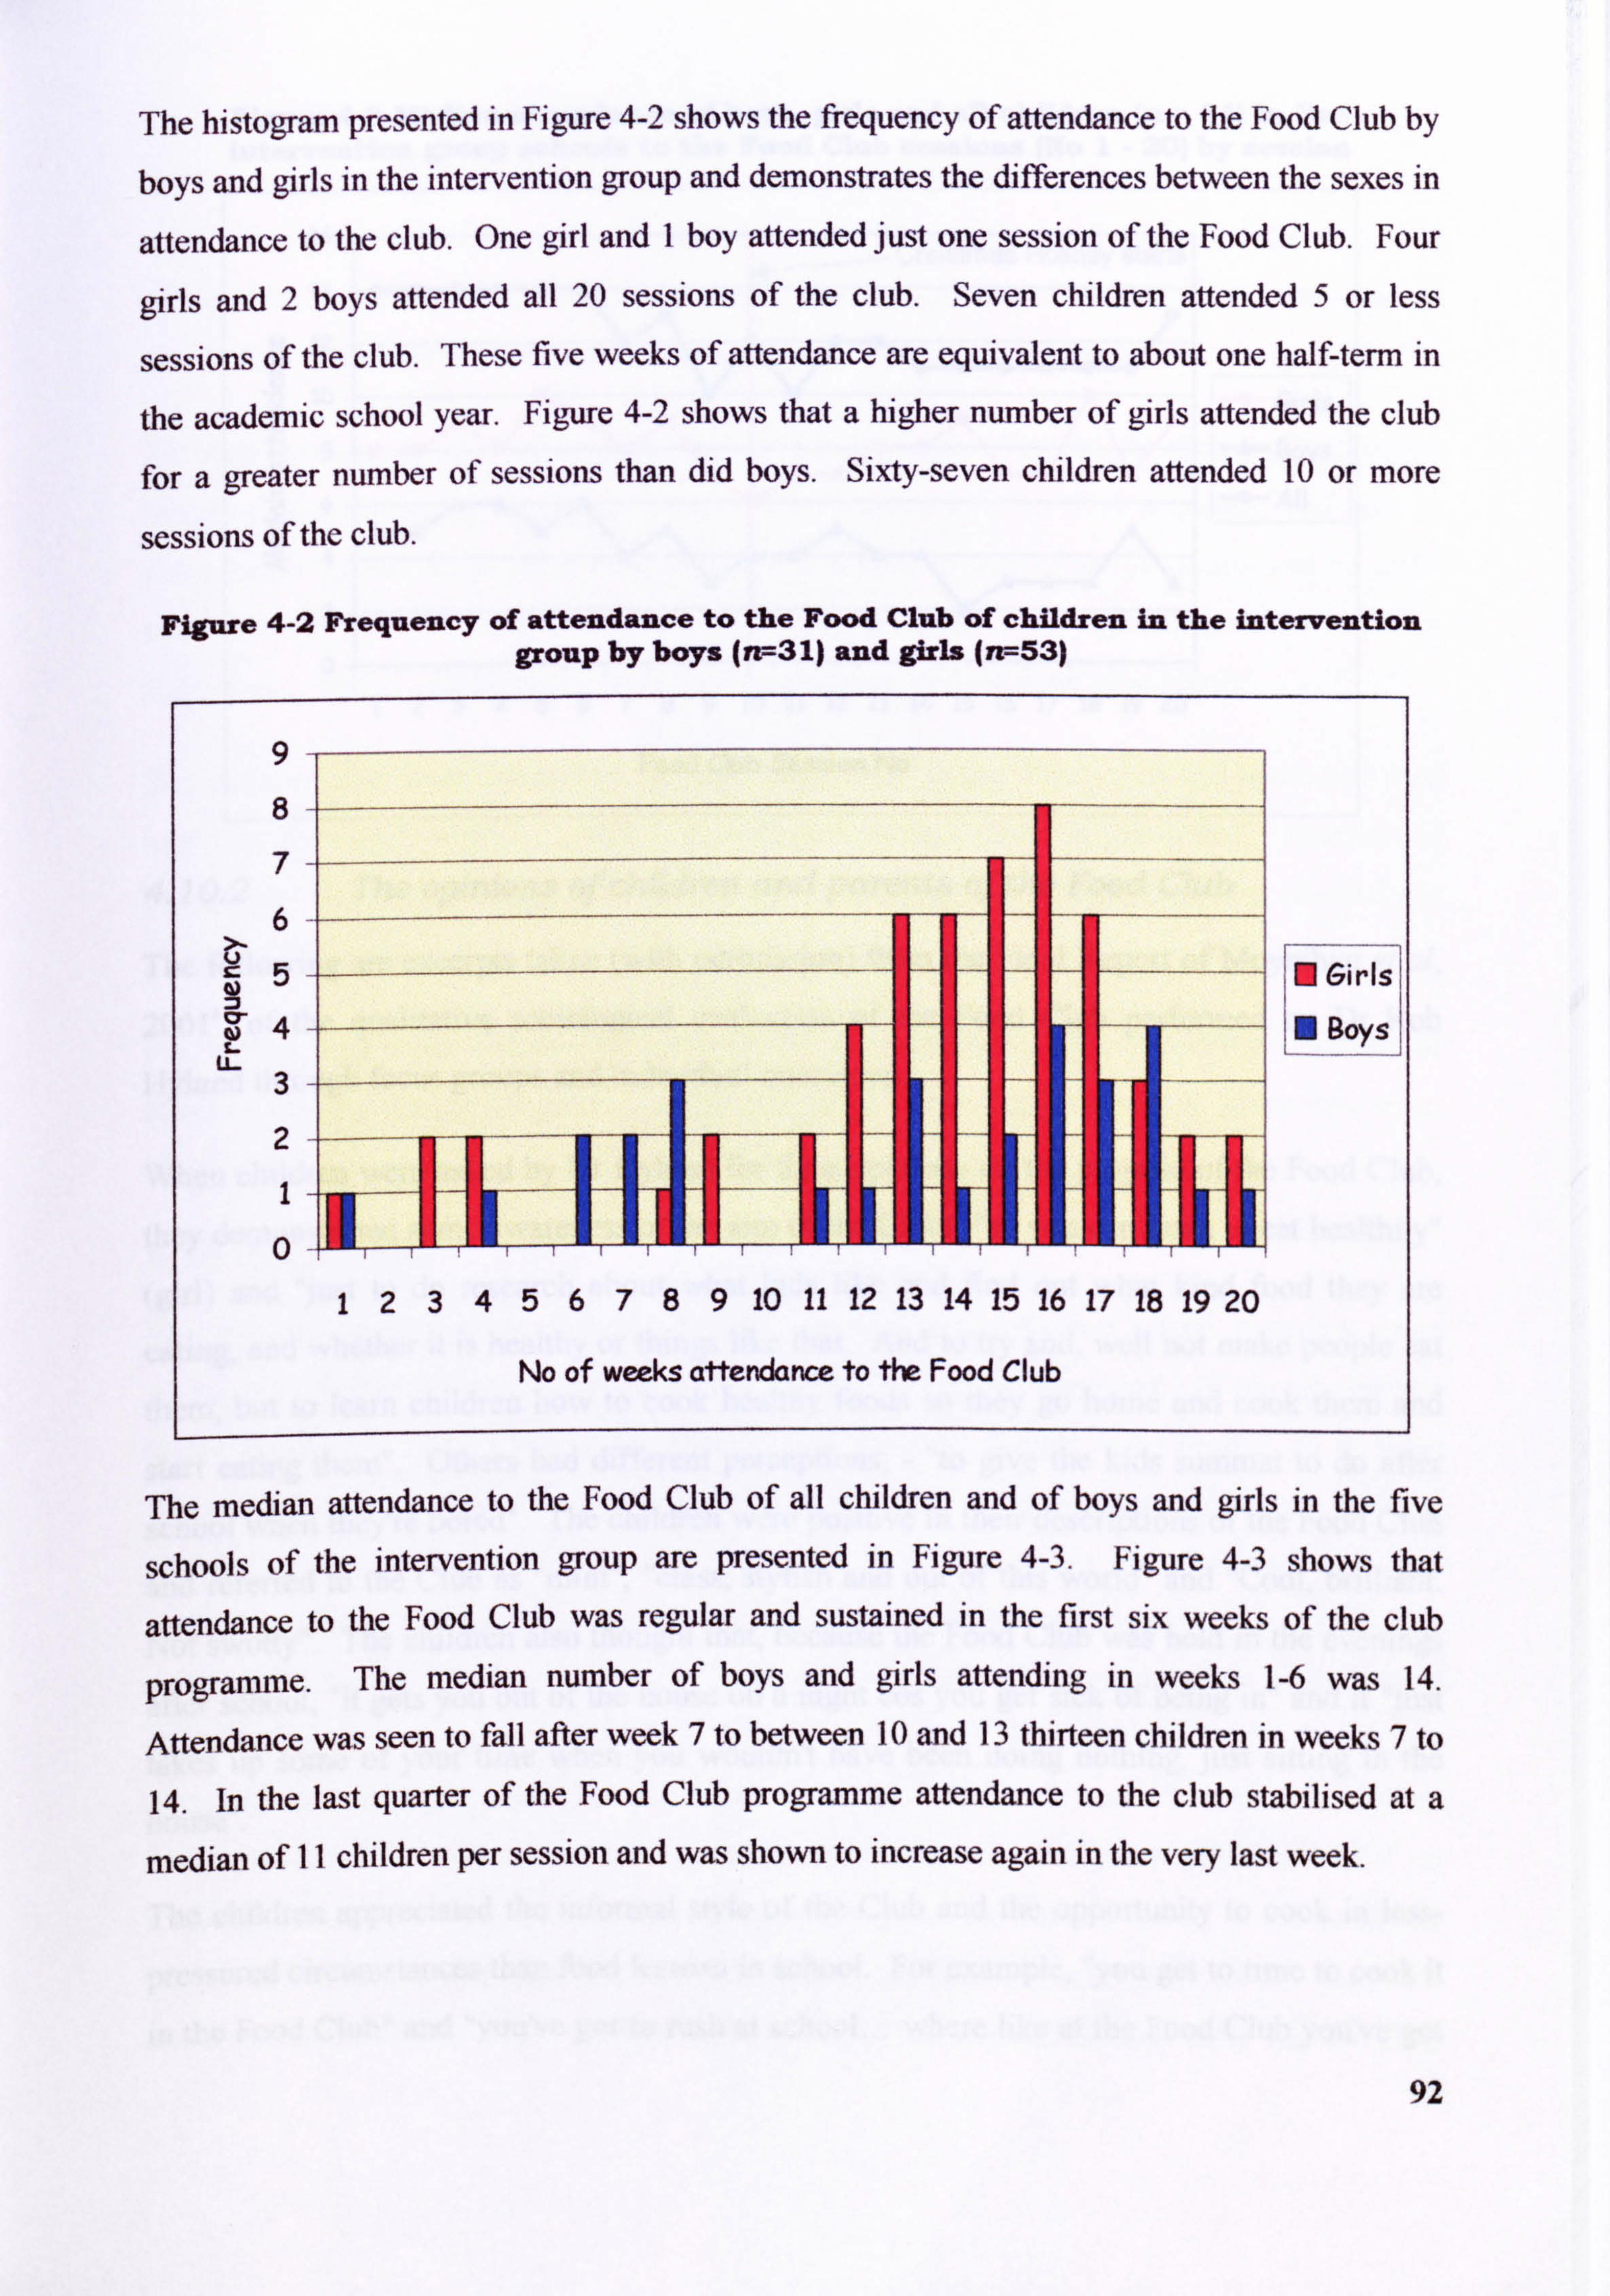
The histogram presented in Figure 4-2 shows the frequency of attendance to the Food Club by
boys and girls in the intervention group and demonstrates the differences between the sexes in
attendance to the club. One girl and I boy attended just one session of the Food Club. Four
girls and 2 boys attended all 20 sessions of the club. Seven children attended 5 or less
sessions of the club. These five weeks of attendance are equivalent to about one half-term in
the academic school year. Figure 4-2 shows that a higher number of girls attended the club
for a greater number of sessions than did boys. Sixty-seven children attended 10 or more
sessions of the club.
Figure 4-2 Frequency of attendance to the Food Club of children in the intervention group by boys (rr, =31) and girls (n--53)
9
8
7
6
5
4 z-
aorsl u- 3
2
0
123456789 10 11 12 13 14 15 16 17 18 19 20
No of weeks attendance to the Food Club
The median attendance to the Food Club of all children and of boys and girls in the five
schools of the intervention group are presented in Figure 4-3. Figure 4-3 shows that
attendance to the Food Club was regular and sustained in the first six weeks of the club
programme. The median number of boys and girls attending in weeks 1-6 was 14.
Attendance was seen to fall after week 7 to between 10 and 13 thirteen children in weeks 7 to
14. In the last quarter of the Food Club programme attendance to the club stabilised at a
median of II children per session and was shown to increase again in the very last week.
92
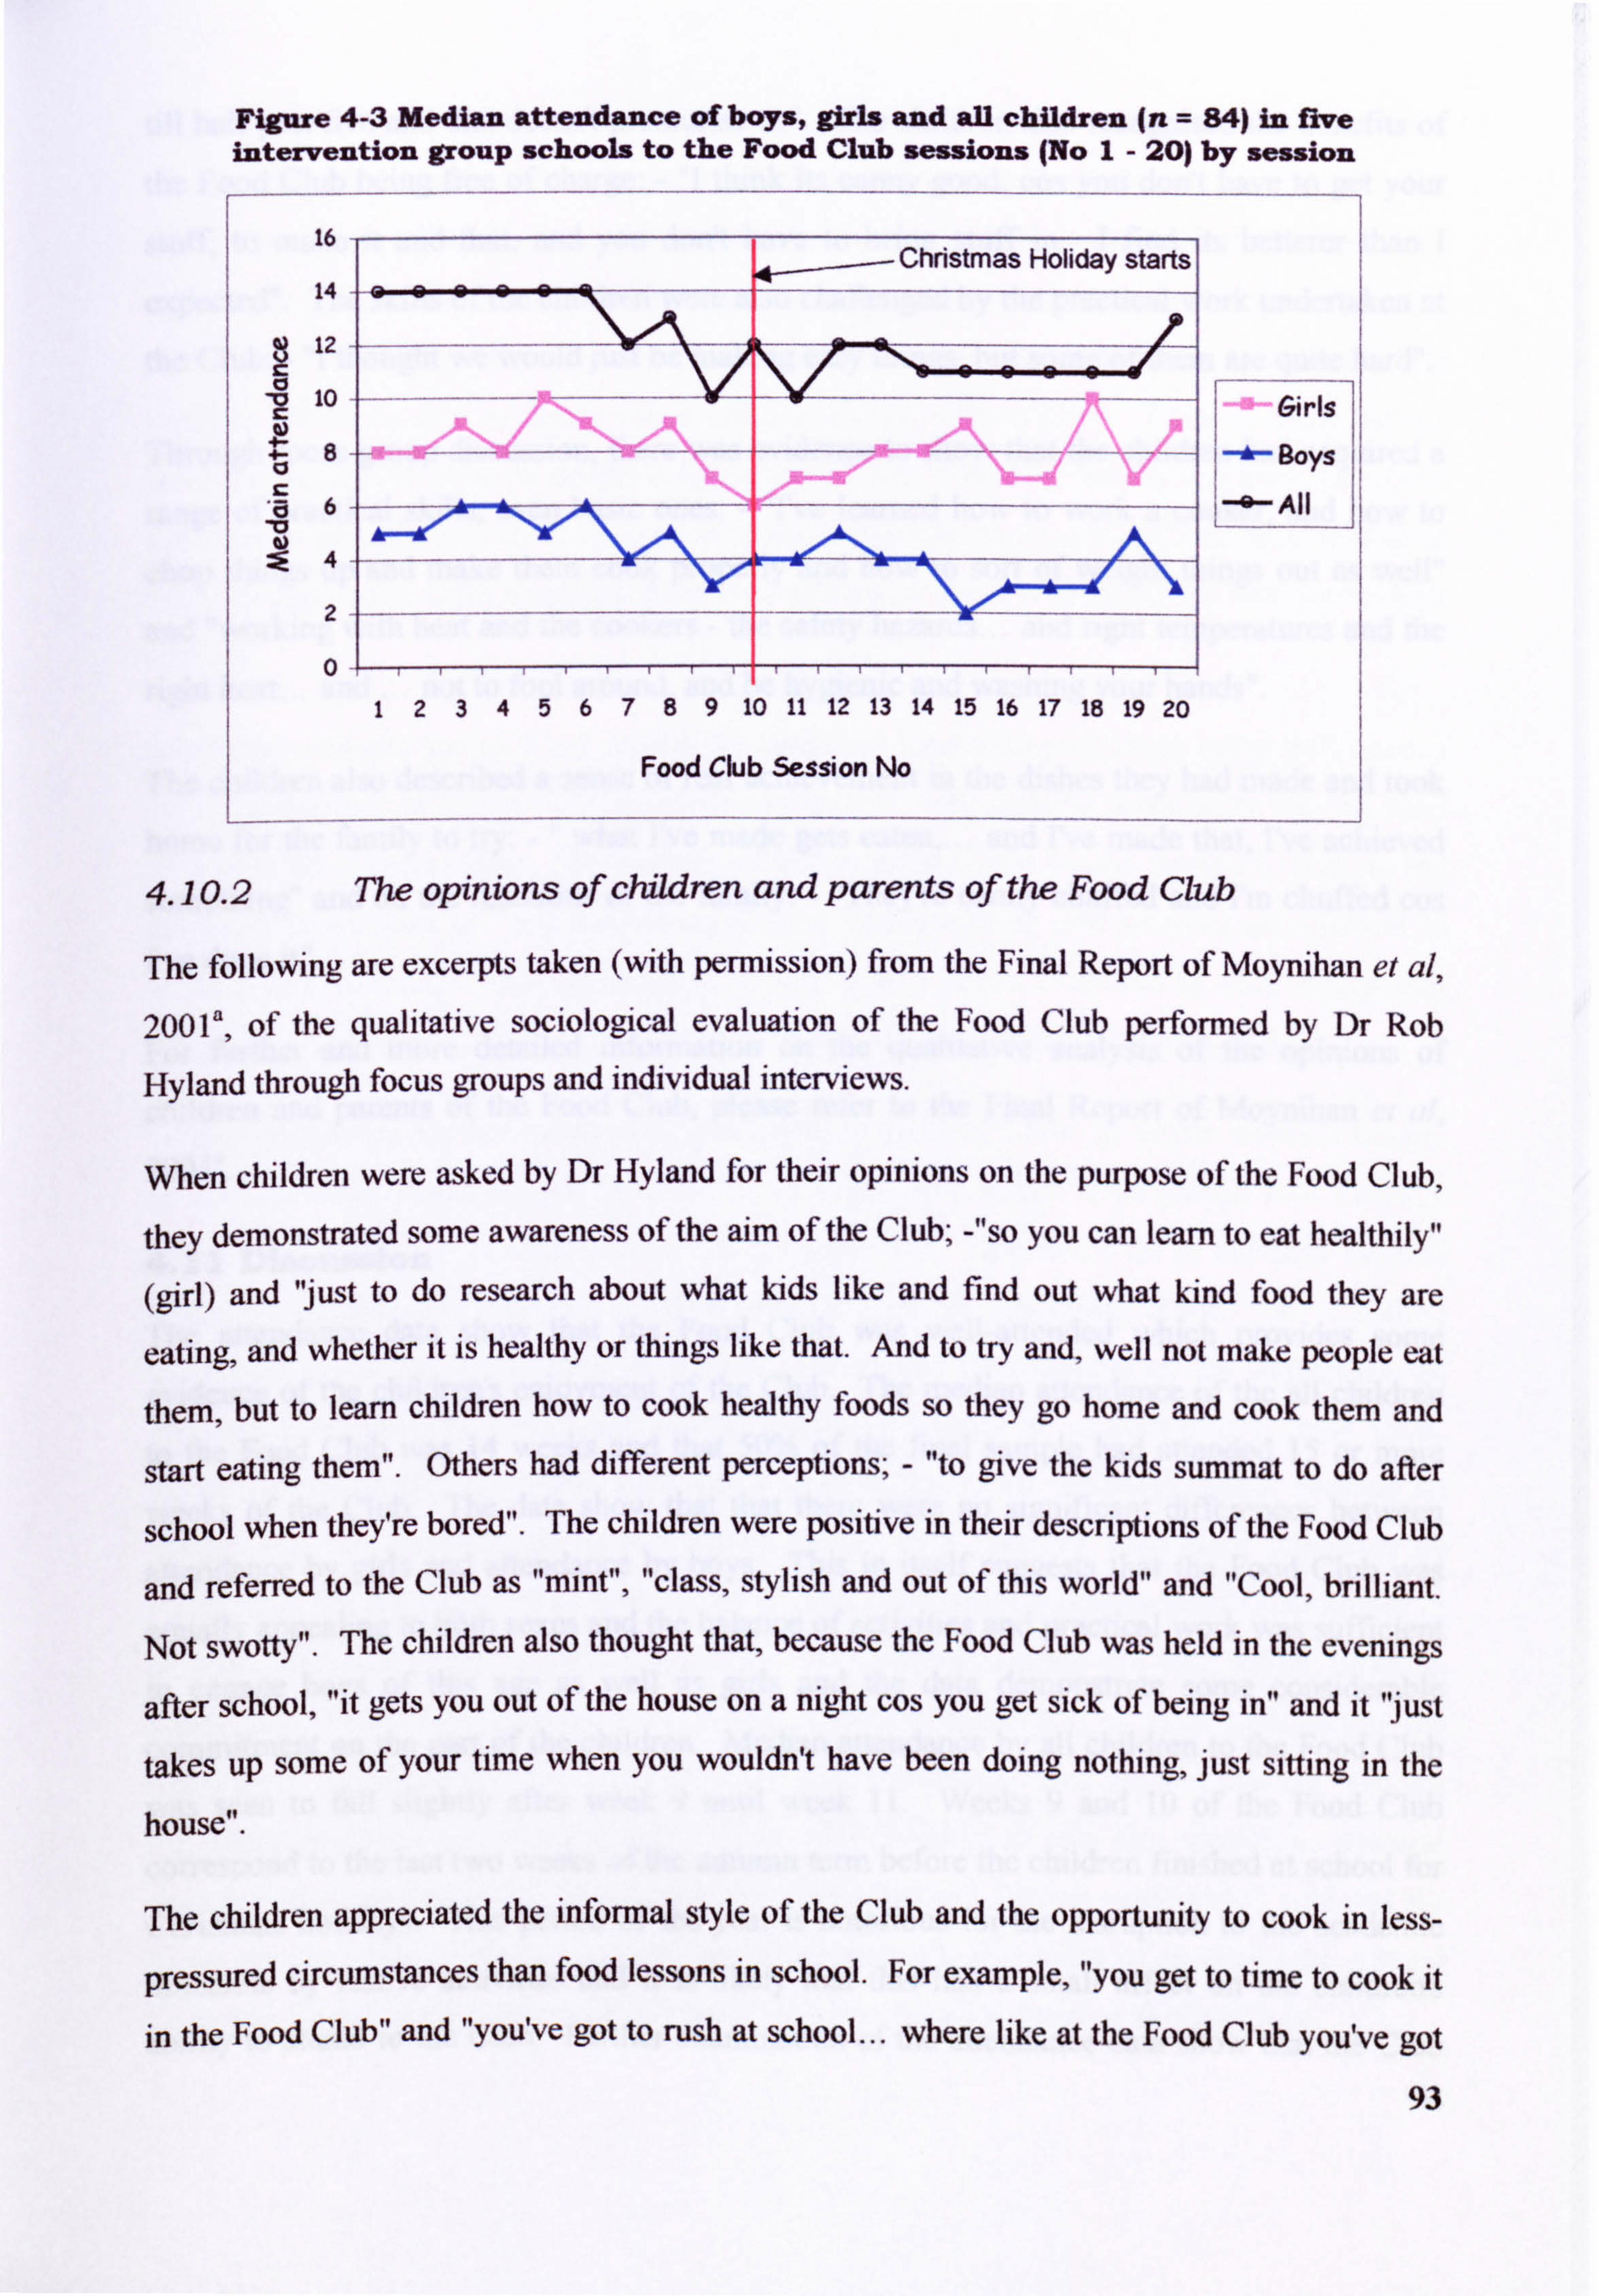
Figure 4-3 Median attendance of boys, girls and all children (n = 84) in ftve intervention group schools to the Food Club sessions (No I- 201 by session
16
14
12
10
Food Club Session No
4.10.2 The opinions of children and parents of the Food Club
The following are excerpts taken (with permission) from the Final Report of Moynihan et al, 2001', of the qualitative sociological evaluation of the Food Club performed by Dr Rob
Hyland through focus groups and individual interviews.
When children were asked by Dr Hyland for their opinions on the purpose of the Food Club,
they demonstrated some awareness of the aim of the Club; -"so you can learn to eat healthily"
(girl) and "just to do research about what kids like and find out what kind food they are
eating, and whether it is healthy or things like that. And to try and, well not make people eat
them, but to learn children how to cook healthy foods so they go home and cook them and
start eating them". Others had different perceptions; - "to give the kids summat to do after
school when they're bored". The children were positive in their descriptions of the Food Club
and referred to the Club as "mint", "class, stylish and out of this world" and "Cool, brilliant.
Not swotty". The children also thought that, because the Food Club was held in the evenings
after school, "it gets you out of the house on a night cos you get sick of being in" and it "just
takes up some of your time when you wouldn't have been doing nothing, just sitting in the
house".
The children appreciated the informal style of the Club and the opportunity to cook in less-
pressured circumstances than food lessons in school. For example, "you get to time to cook it
in the Food Club" and "you've got to rush at school... where like at the Food Club you've got
93
Christmas Holiday startsi
Girls
130ys
All
123456789 10 11 12 13 14 15 16 17 18 19 20
till half past five and that doesn! t pressurise us". The children also recognised the benefits of
the Food Club being free of charge: -I think its canny good, cos you dont have to get your
stuff, to make it and that, and you don't have to bring stuff in. I find its betterer than I
expected". The skills of the children were also challenged by the practical work undertaken at
the Club: - "I thought we wouldjust be making easy things, but some of them are quite hard".
Through focus group discussion, there was evidence to show that the children had acquired a
range of practical skills, even basic ones: - "I've learned how to work a cooker, and how to
chop things up and make them cook properly and how to sort of weight things out as well"
and "working with heat and the cookers - the safety hazards... and right temperatures and the
right heat... and ... not to fool around, and be hygienic and washing your hands".
The children also described a sense of real achievement in the dishes they had made and took
home for the family to try: - ". what I've made gets eaten,... and I've made that, I've achieved
something" and on the reactions of the family: - "They're canny chuffed and I'm chuffed cos
rve done it".
For further and more detailed information on the qualitative analysis of the opinions of
children and parents of the Food Club, please refer to the Final Report of Moynihan et al,
2001
4.11 Discussion
The attendance data show that the Food Club was well-attended which provides some
evidence of the childreifs enjoyment of the Club. The median attendance of the all children
to the Food Club was 14 weeks and that 50% of the final sample had attended 15 or more
weeks of the Club. The data show that that there were no significant differences between
attendance by girls and attendance by boys. This in itself suggests that the Food Club was
equally appealing to both sexes and the balance of activities and practical work was sufficient
to engage boys of this age as well as girls and the data demonstrate some considerable
commitment on the part of the children. Median attendance by all children to the Food Club
was seen to fall slightly after week 9 until week 11. Weeks 9 and 10 of the Food Club
correspond to the last two weeks of the autumn term before the children finished at school for
Christmas holidays. This period of the year is notorious for the disruption to the academic
timetable by festive activities and it is likely that this had a small affect on the childrelfs
ability to attend to the Club. Further examination of the attendance data show that the Club 94

was well attended in the first six weeks and in the last 7 weeks. It is possible that several
short blocks of six weeks or so duration may be suitable programme for further Food Clubs.
All costs of running of the Food Club were met by the project budget - neither schools nor
children were asked to contribute. This may have some bearing on the popularity of the Club,
particularly in children from socially deprived backgrounds where it cannot be assumed that
families would be able to finance their child attending a Food Club. There is some further
research required in order to establish how future Food Clubs may be run and how schools or
community groups could meet the cost in terms of ingredients. Some children may be able to
bring in ingredients from home but there may always be some who cannot do this, for various
reasons.
Secondary schools are an ideal setting for practical food activities since many will have a Food Technology or Home Economics classroom that, with suitable permission, may be used
as a base for a Food Club. The teaching of future Food Clubs would inevitably rely on the
goodwill of teachers of Food Technology/Home Economics as professionals accustomed to
dealing with children of this age, possessing satisfactory police clearance to work with young
people and of course considerable experience in the teaching of practical food skills.
When considering the feasibility and transferability of Food Clubs in future research studies
or in community-based projects it would be advisable to conduct focus groups with teachers
of practical food skills in addition to children themselves. This would be an effective method
of identifying potential problems in terms of budget and the leadership of the Club. Children
should be given the opportunity to air and discuss their perceptions of the importance of
practical food skills and what they would expect to happen at an after-school Food Club.
Focus groups or questionnaires with teaching staff (or youth workers) would provide an insight into the potential problems. Focus groups with teachers have been shown to be
valuable in the development of school-based nutrition education programmes (Kicklighter et
al, 1997) and may provide useful suggestions when considering the practical setting up of an
after-school Food Club. The work of Dr Rob Hyland (Moynihan et al, 2001') shows that the
response of the children to the Food Club was overwhelmingly positive and that the children
had thoroughly enjoyed cooking at the Club. The Food Club was also viewed as a social
occasion, the value of which should not be underestimated. Further work which explores the
views and attitudes of schools towards the development and running of an after-school Food
Club may be extremely important in guaranteeing the future success of similar Clubs.
95

5 Anthropometry
Top Ten Tips If You Need to Loose Weight
(D Cut down on foods containing fat and foods containing sugar
0 Choose healthy snacks: vegetable sticks, fruit, bread sticks, plain popcorn
0 Try taking some ft-uit with you when you leave the house, banana and apples are
easy to eat when you need a snack
0 Enjoy regular activity like walldng, cycling, dancing, swimming, roller blading
Always eat some breakfast cereal with semi-skimmed or skimmed milk, this will
stop you feeling hungry during the morning
DoWt cut out starchy foods like bread, other cereals and potatoes as these give
you B vitamins, as well as calcium and iron. They are filling and lower in calories
than foods containing fat
0 Use thick bread for sandwiches with a low fat filling like tuna with lots of salad
Don't cut out dairy foods like milk and cheese - as You grow your bones need the
calcium in these foods. Try the lower fat versions like skimmed milk, low fat
yoghurt and reduced fat cheeses as they still contain the calcium but less fat
If you eat a little chocolate, sweets, or crisps this is not the end of the world. All
these foods are part of getting the balance right, but try not to eat them too much
or too often
0 11ide the bathroom scales, just focus on how good you feel to be enjoying a varied
diet and being active
www. lifebytes. gov. uk/eating/eaLweight. html
Healthy lifestyles website for young people
96
S. I Introduction
Anthropometry, that is, the measurement of body height and weight and of body dimension
and proportion, is widely considered to be an intrinsic part of any nutritional study since it is
used as an indices of health, growth and development (Department of Health, 1991, Zemel et
al, 1997). In addition, anthropometric measurements may be used as part of the nutritional
assessment of infants and children (Mascarenhas et al, 1998). Further calculations employing
the basic measurements are used to determine derived indices, for example to assess that
proportion of the body weight which is fat, can be extremely usefid in procuring additional
information on either individuals, or groups of individuals.
In the clinical setting anthropornetric measurement of infants and young children is performed
as part of nutritional assessment, either as a routine measurement or in children who present
with disease that may have had or be having an affect upon their dietary intake or growth and development. Is it general practice in the Primary Care setting within the UK to monitor the
height and weight of infants in accordance with age to enable the health professional to make
comparisons with normative growth charts (revised in 1995) to identify a failure to thrive. In
addition to height and weight, many other body measurements of both infants, children and
adults may be recorded, the following of which are examples: head circumference (an
indication of normative growth in infants), upper arm length and lower leg growth (to
determine skeletal growth and deformities), mid-upper arm circumference (to provide information on body size) and ratio of waist to hip circumference (to estimate distribution and location of body fat).
Interpretation of anthropometric data becomes more difficult as children approach and pass
through their adolescent years. This is because much natural variation occurs within pre-
adolescents and adolescents in terms of when and how they grow and entering puberty. This
is considered to be a combination of many different factors, including those relating to
genetics, medical illness, diet and lifestyle. Therefore, it is necessary to bear in mind the
occurrence of variation when investigating the anthropometry of older children and teenagers.
Height and weight are measurements used to determine basal metabolic rate in children and
adults. Approximately two-thirds of the energy a person spends in any one day supports the
body's metabolic activities. In addition to metabolic activity, energy is required to support
physical activity and for the digestion and metabolism'of food (also referred to as the thermic
97
affect of food). The estimation of basal metabolic rate is usually straightforward in healthy
individuals and forms the basis for the determination of energy requirements for a given
group of individuals within the population. The estimation of energy requirements for
children and adolescents are based upon the use of basal metabolic rate, using the calculation
equations devised by Schofield (1985), in conjunction with data compiled on the daily
physical activities (in terms of the energy required to support these activities) of children aged 10- 1 8-years-old, culminating in guidance on estimates of average requirements for energy for
this group of the population. Estimated Average Requirement of energy for children relies
upon the use of Physical Activity Ratios (projected from data on energy expenditure by
children) with an additional allowance for energy required to support growth. This is
reflected in the factor of 1.56 x BMR for boys and in the factor of 1.48 x BMR for girls to
calculate energy requirements (Department of Health, 1991) and is expressed in NU/day.
Superficially, values that are much higher or lower than this may suggest a deficit of energy intake or an excess respectively. As such, it is wise to consider variance between individuals
within any one group when making conclusions about the recorded energy intake of children
and adolescents as measured in a dietary survey.
Body Mass Index (BMI) is used an index of an individual's weight in relation to height and is
determined by dividing body weight (kg) by the square of the height (M2 ). BNU is also used
as an indicator of body fatness and is often used to assign correlation with disease risk. An
inherent weakness associated to the use of BNff is that a person may figuratively appear to be
overweight or indeed obese when this is not so. An example of this may be a sportsman or
athlete with dense bones and well-developed muscles.
BMI is used with a caution in older children and adolescents as the relationship of BMI to
body composition is influenced by several factors among which are age, sex, race and stage of
pubertal development. This is exemplified in the work of Bini and colleagues (2000) who
reported that BNH values determined for subjects (n = 6345) aged between 8- and 16-years-
old were dependent upon pubertal degree of maturation and this affect was significantly more
evident in girls.
The age of menarche is recognised as being an indicator of pubertal status. In the UK the
average age of menarche has been steady since the mid 20th Century. The average age of
menarche in British girls in 1950's was 13 years and six months and slight decrease in the
average of menarche was reported by Whincup, et al (200 1), failing to 12 years II months. 98
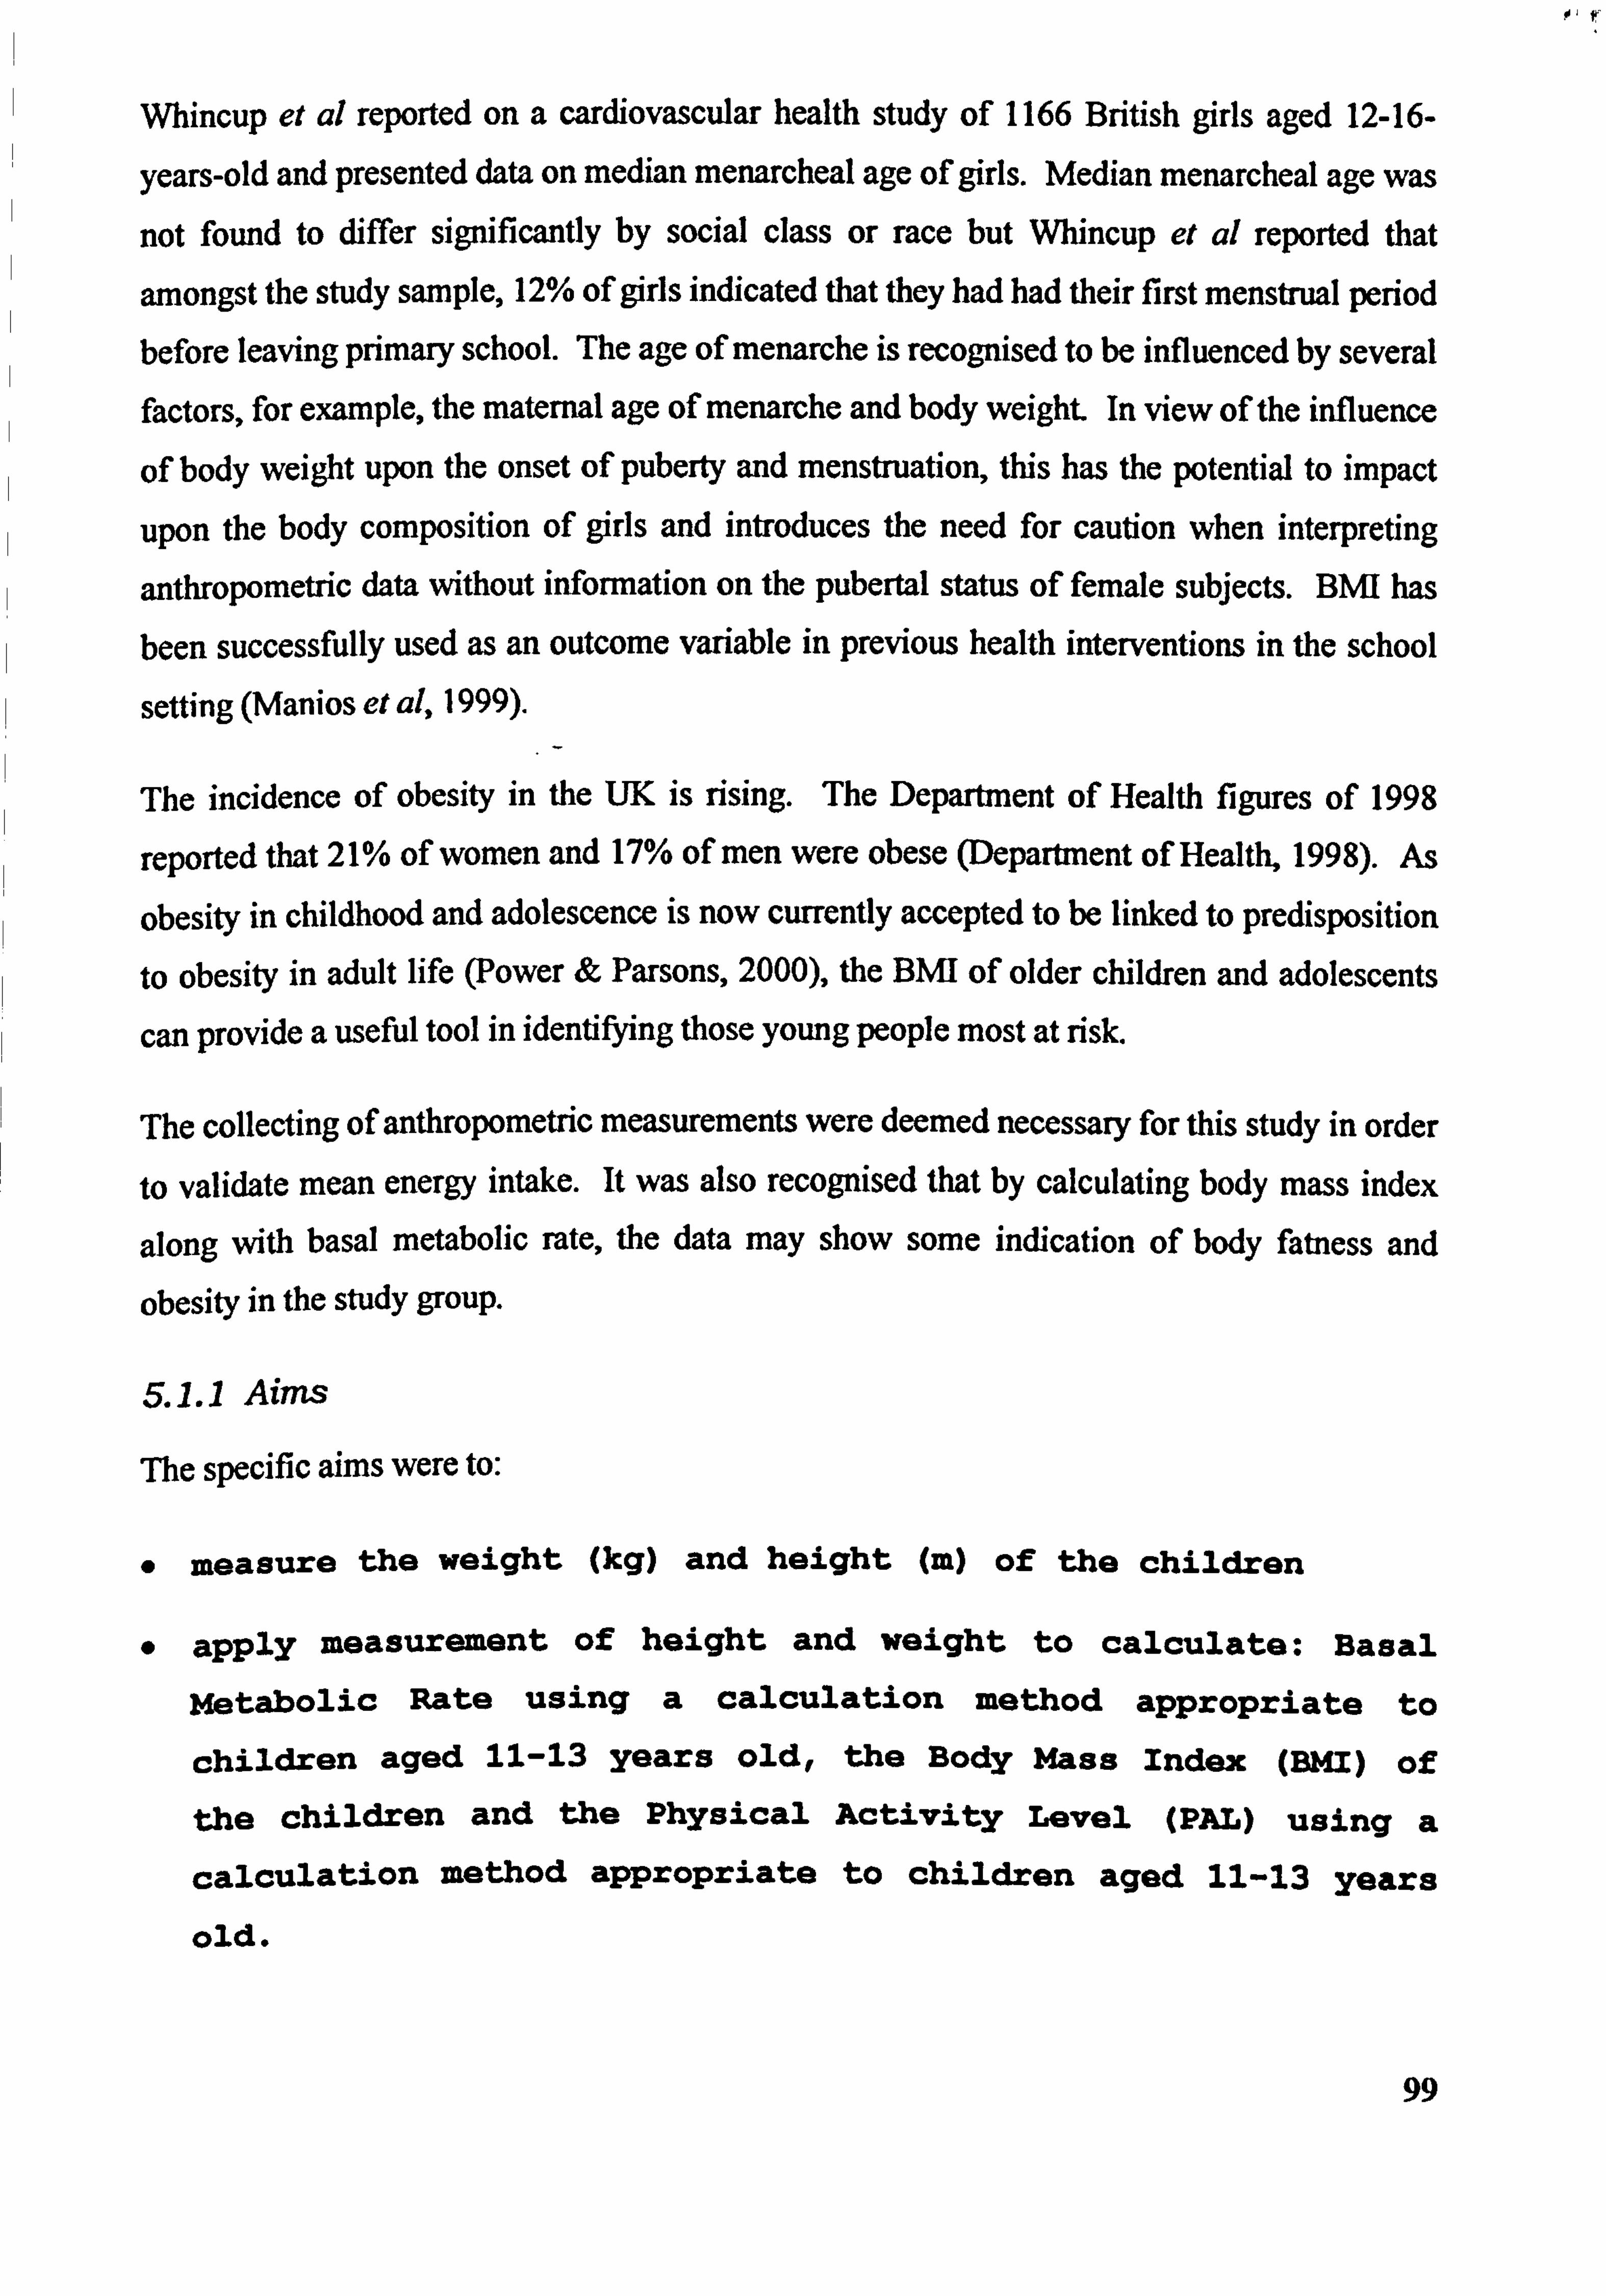
r
Whincup et al reported on a cardiovascular health study of 1166 British girls aged 12-16-
years-old and presented data on median menarcheal age of girls. Median menarcheal age was
not found to differ significantly by social class or race but Whincup et al reported that
amongst the study sample, 12% of girls indicated that they had had their first menstrual period before leaving primary school. The age of menarche is recognised to be influenced by several factors, for example, the maternal age of menarche and body weight In view of the influence
of body weight upon the onset of puberty and menstruation, this has the potential to impact
upon the body composition of girls and introduces the need for caution when interpreting
anthropornetric data without information on the pubertal status of female subjects. BMI has
been successfully used as an outcome variable in previous health interventions in the school
setting (Manios et al, 1999).
The incidence of obesity in the UK is rising. The Department of Health figures of 1998
reported that 21% of women and 17% of men were obese (Department of Health, 1998). As
obesity in childhood and adolescence is now currently accepted to be linked to predisposition
to obesity in adult life (Power & Parsons, 2000), the BNH of older children and adolescents
can provide a useful tool in identifying those young people most at risk.
The collecting of anthropometric measurements were deemed necessary for this study in order
to validate mean energy intake. It was also recognised that by calculating body mass index
along with basal metabolic rate, the data may show some indication of body fatness and
obesity in the study group.
S. 1.1 Aims
The specific afins were tO:
o measure the weight (kg) and height (m) Of the children
apply measurement of height and weight to calculate: Basal
metabolic Rate using a calculation method appropriate to
children aged 11-13 years old,, the Body Mass Index (BMI) of
the children and the Physical Activity Level (PAL) using a
calculation method appropriate to children aged 11-13 years
old.
99
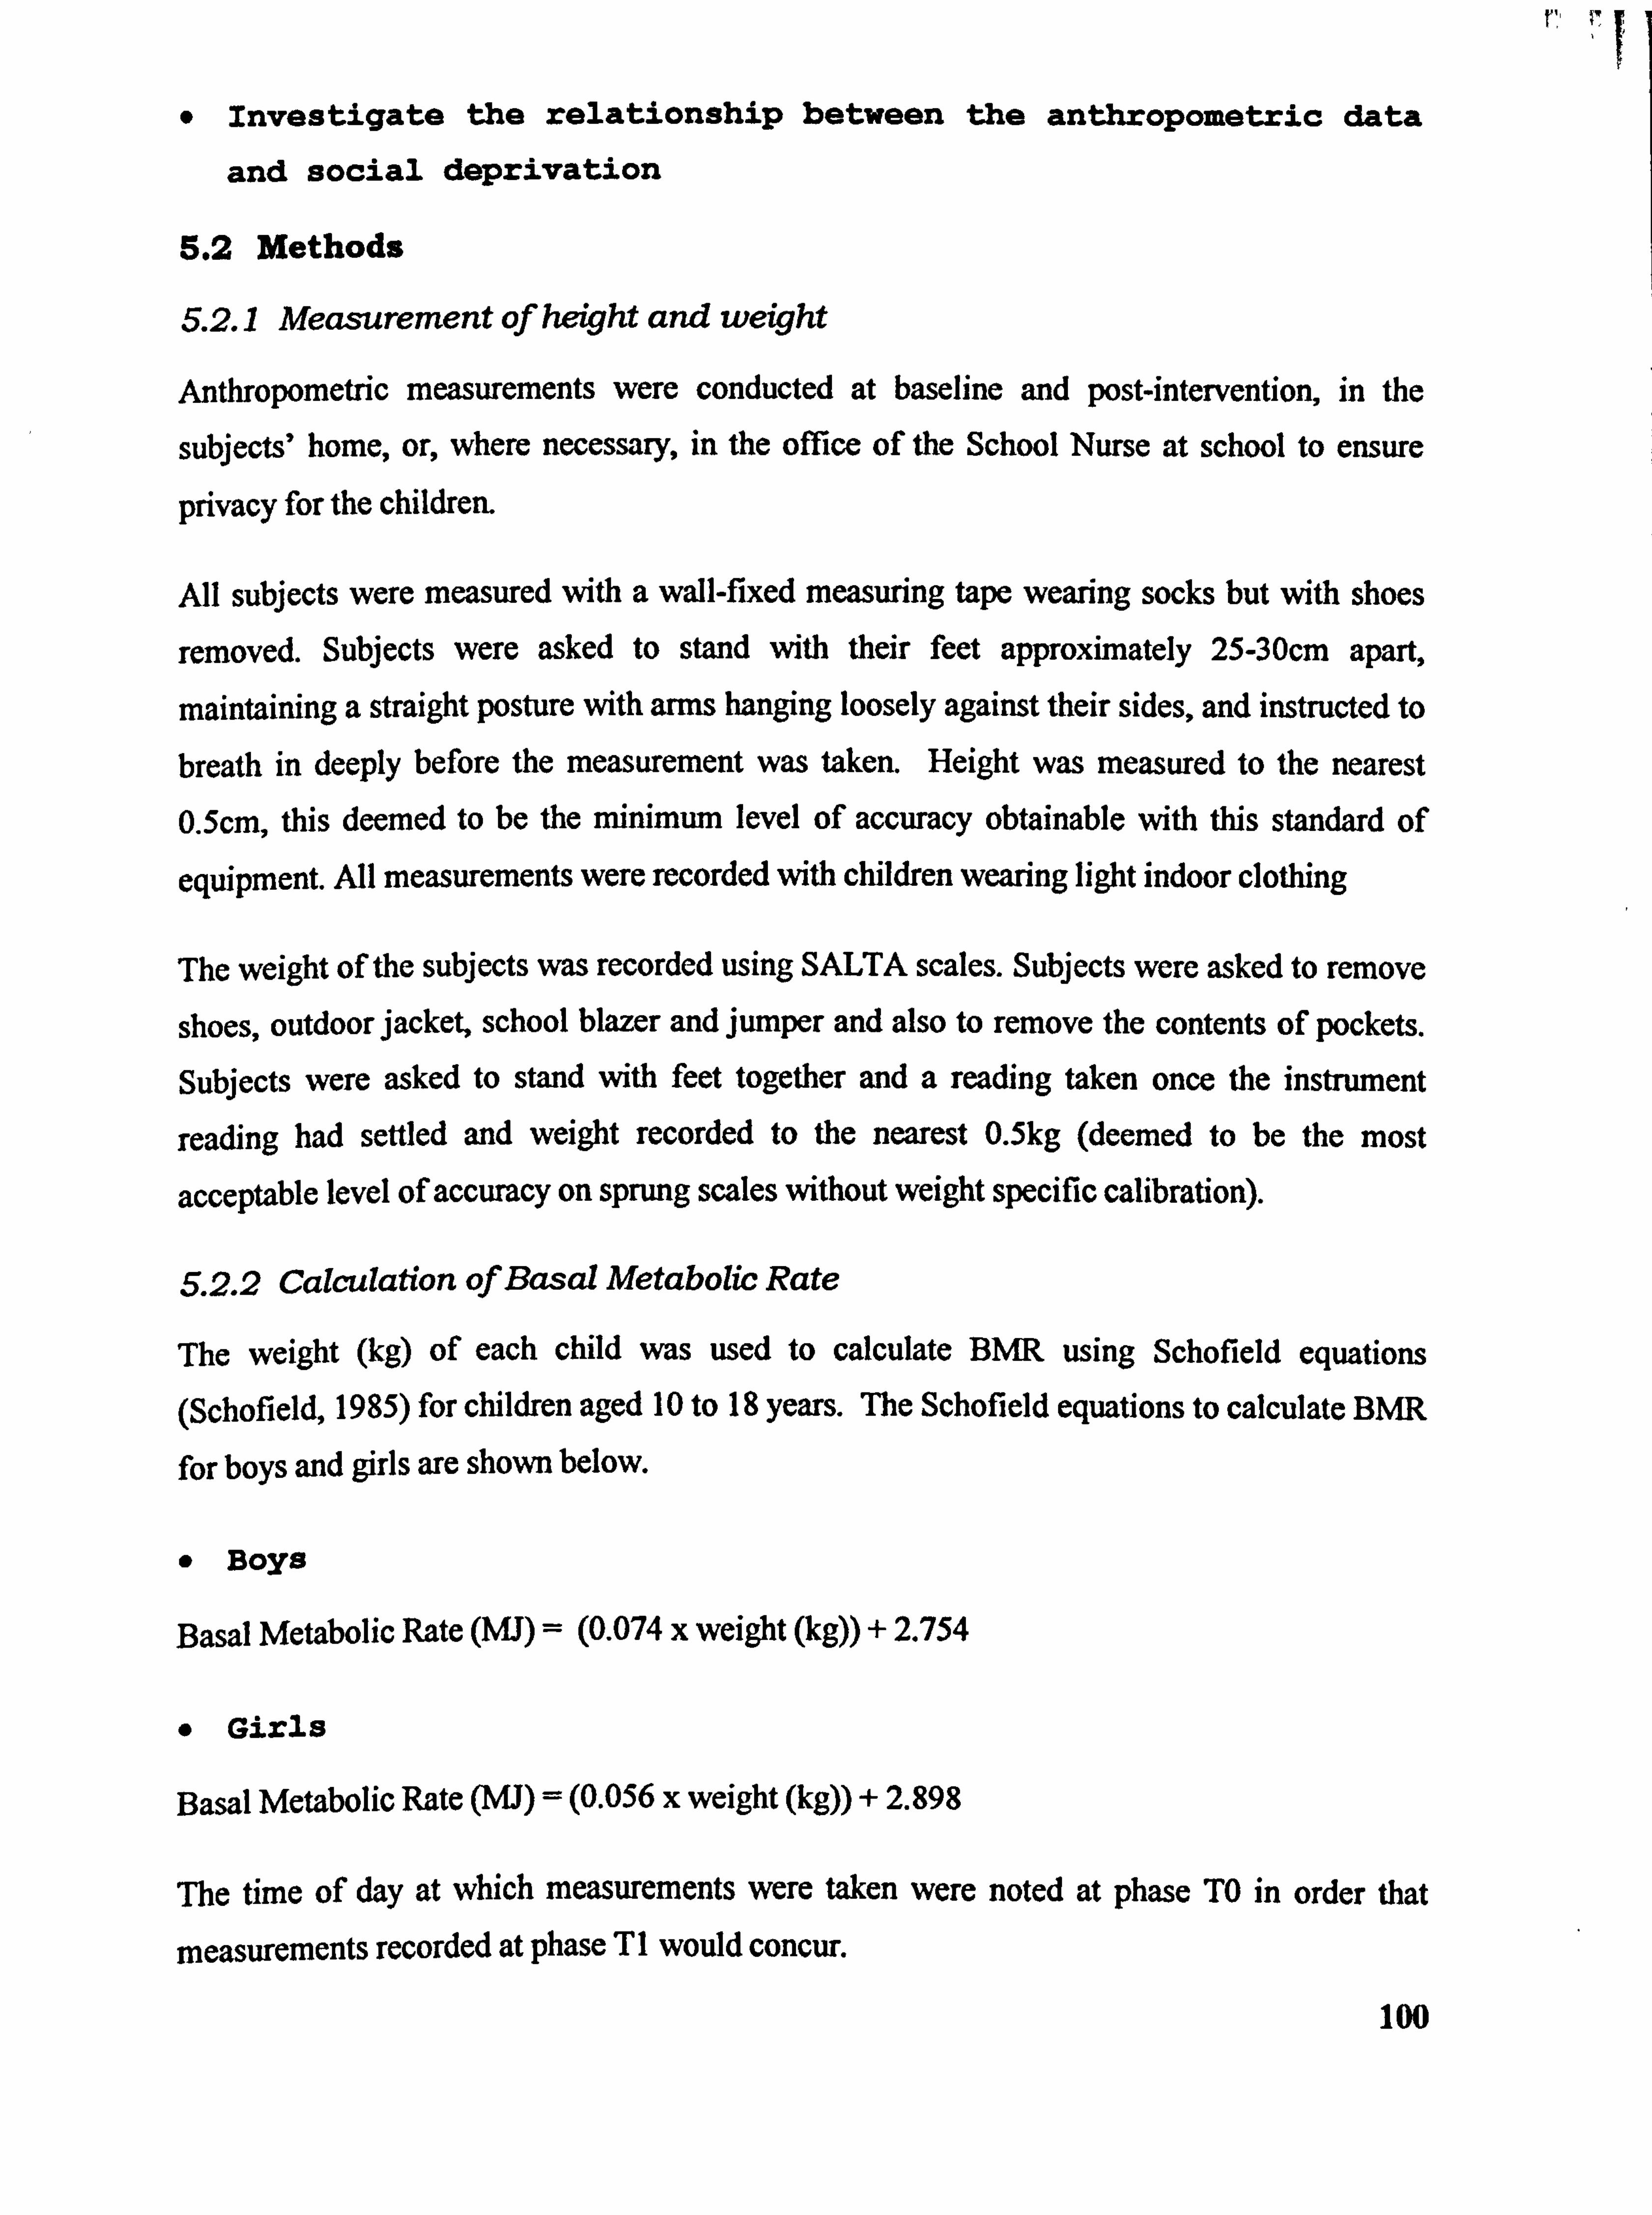
! * Investigate the relationship between the anthropometric data
and social deprivation
5.2 Methods
5.2.1 Measurement of height and weight
Anthropomctric measurements were conducted at baseline and post-intervention, in the
subjects' home, or, where necessary, in the office of the School Nurse at school to ensure
privacy for the children.
All subjects were measured with a wall-fixed measuring tape wearing socks but with shoes
removed. Subjects were asked to stand with their feet approximately 25-30cm apart,
maintaining a straight posture with arms hanging loosely against their sides, and instructed to breath in deeply before the measurement was taken. Height was measured to the nearest 0.5cm, this deemed to be the minimum level of accuracy obtainable with this standard of
equipment. All measurements were recorded with children wearing light indoor clothing
The weight of the subjects was recorded using SALTA scales. Subjects were asked to remove
shoes, outdoor jacket, school blazer and jumper and also to remove the contents of pockets. Subjects were asked to stand with feet together and a reading taken once the instrument
reading had settled and weight recorded to the nearest 0.5kg (deemed to be the most
acceptable level of accuracy on sprung scales without weight specific calibration).
5.2.2 Calculation of Basal Metabolic Rate
The weight (kg) of each child was used to calculate BMR using Schofield equations (Schofield, 1985) for children aged 10 to 18 years. The Schofield equations to calculate BMR
for boys and girls are shown below.
o BOYS
Basal Metabolic Rate (MJ) = (0.074 x weight (kg)) + 2.754
o Girls
Basal Metabolic Rate (MJ) = (0.056 x weight (kg)) + 2.898
The time of day at which measurements were taken were noted at phase TO in order that
measurements recorded at phase TI would concur.
100
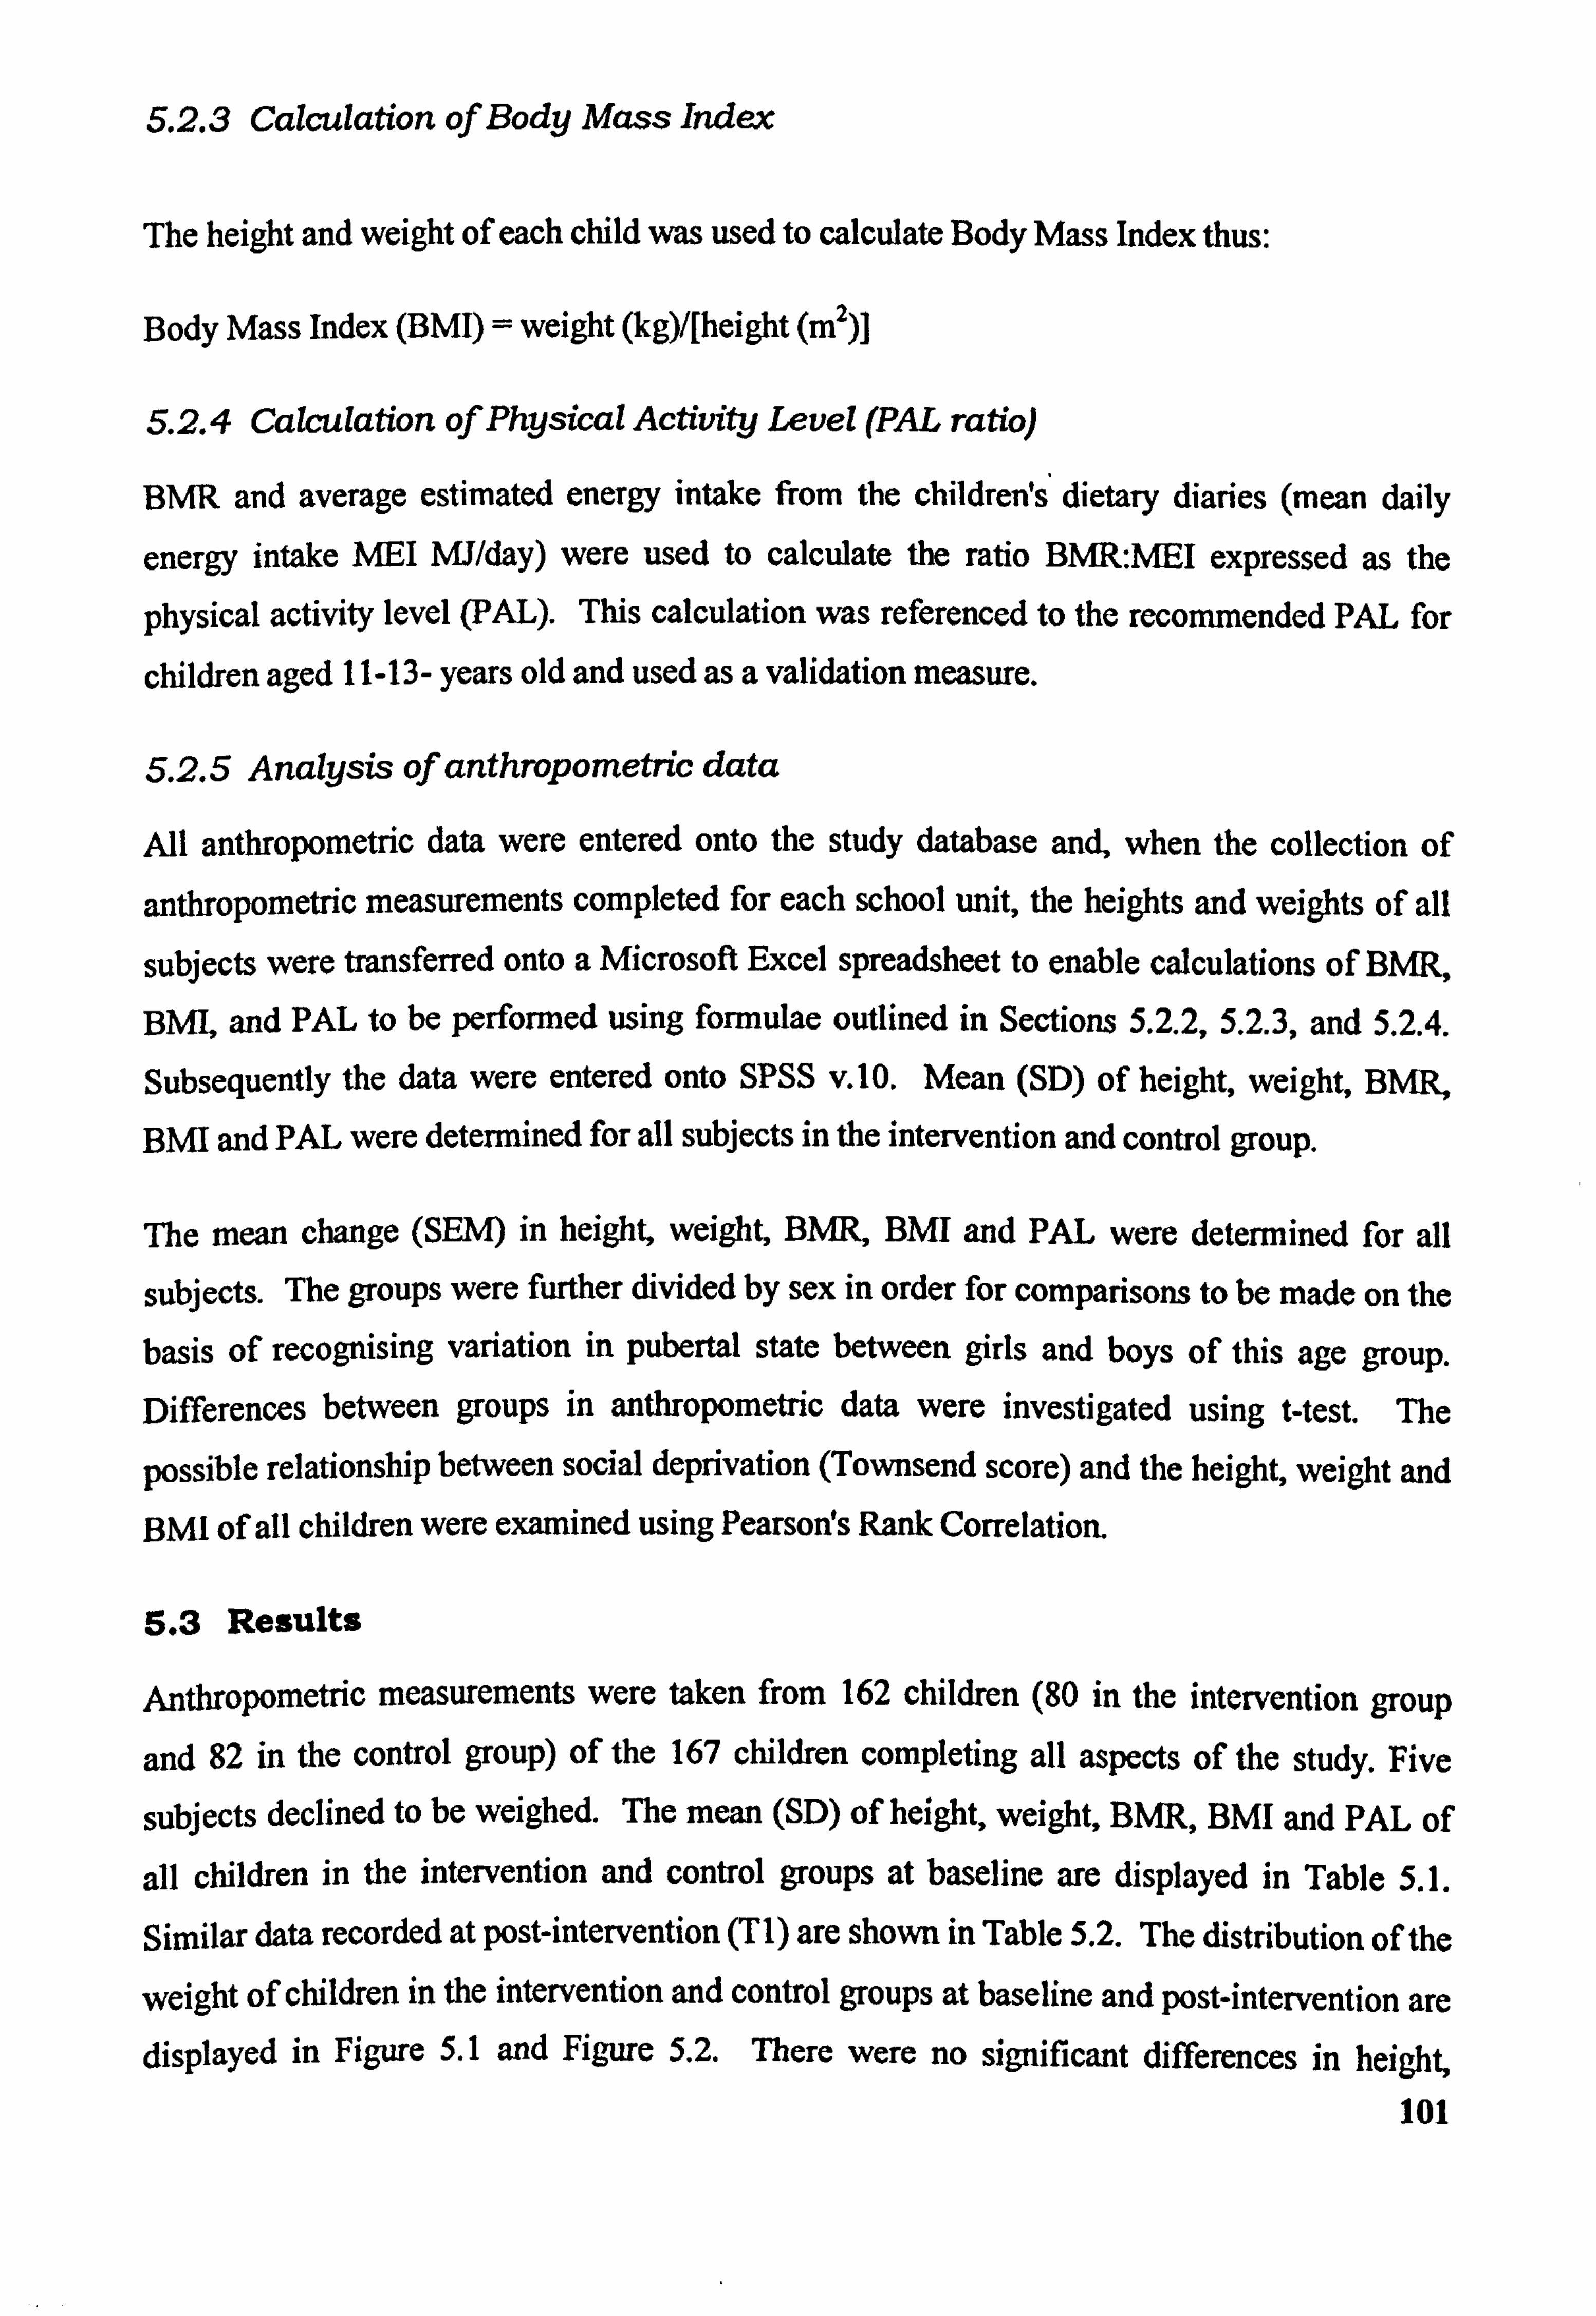
5.2.3 Calculation of Body Mass Index
The height and weight of each child was used to calculate Body Mass Index thus:
Body Mass Index (BMI) = weight (kg)/[height (m')]
5.2.4 Calculation of Physical Activity Level (PAL ratio)
BMR and average estimated energy intake from the children's dietary diaries (mean daily
energy intake NEI MJ/day) were used to calculate the ratio BMR: MEI expressed as the
physical activity level (PAL). This calculation was referenced to the recommended PAL for
chi1dren aged 11 - 13 - years old and used as a validation measure.
5.2.5 Analysis of anthropornetric data
All anthropometric data were entered onto the study database and, when the collection of
anthropometric measurements completed for each school unit, the heights and weights of all
subjects were transferred onto a Microsoft Excel spreadsheet to enable calculations of BMR,
BMI, and PAL to be performed using formulae outlined in Sections 5.2.2,5.2.3, and 5.2.4.
Subsequently the data were entered onto SPSS v. 10. Mean (SD) of height, weight, BMR, BMI and PAL were determined for all subjects in the intervention and control group.
The mean change (SEM) in height, weight, BMP, BMI and PAL were determined for all
subjects. The groups were further divided by sex in order for comparisons to be made on the
basis of recognising variation in pubertal state between girls and boys of this age group. Differences between groups in anthropometric data were investigated using West. The
possible relationship between social deprivation (Townsend score) and the height, weight and BMI of all children were examined using Pearsores Rank Correlation.
5.3 Results
Anthropometric measurements were taken from 162 children (80 in the intervention group
and 82 in the control group) of the 167 children completing all aspects of the study. Five
subjects declined to be weighed. The mean (SD) of height, weight, BNIR, BMI and PAL of
all children in the intervention and control groups at baseline are displayed in Table 5.1. Similar data recorded at post-intervention (TI) are shown in Table 5.2. The distribution of the
weight of children in the intervention and control groups at baseline and post-intervention are displayed in Figure 5.1 and Figure 5.2. There were no significant differences in height
101
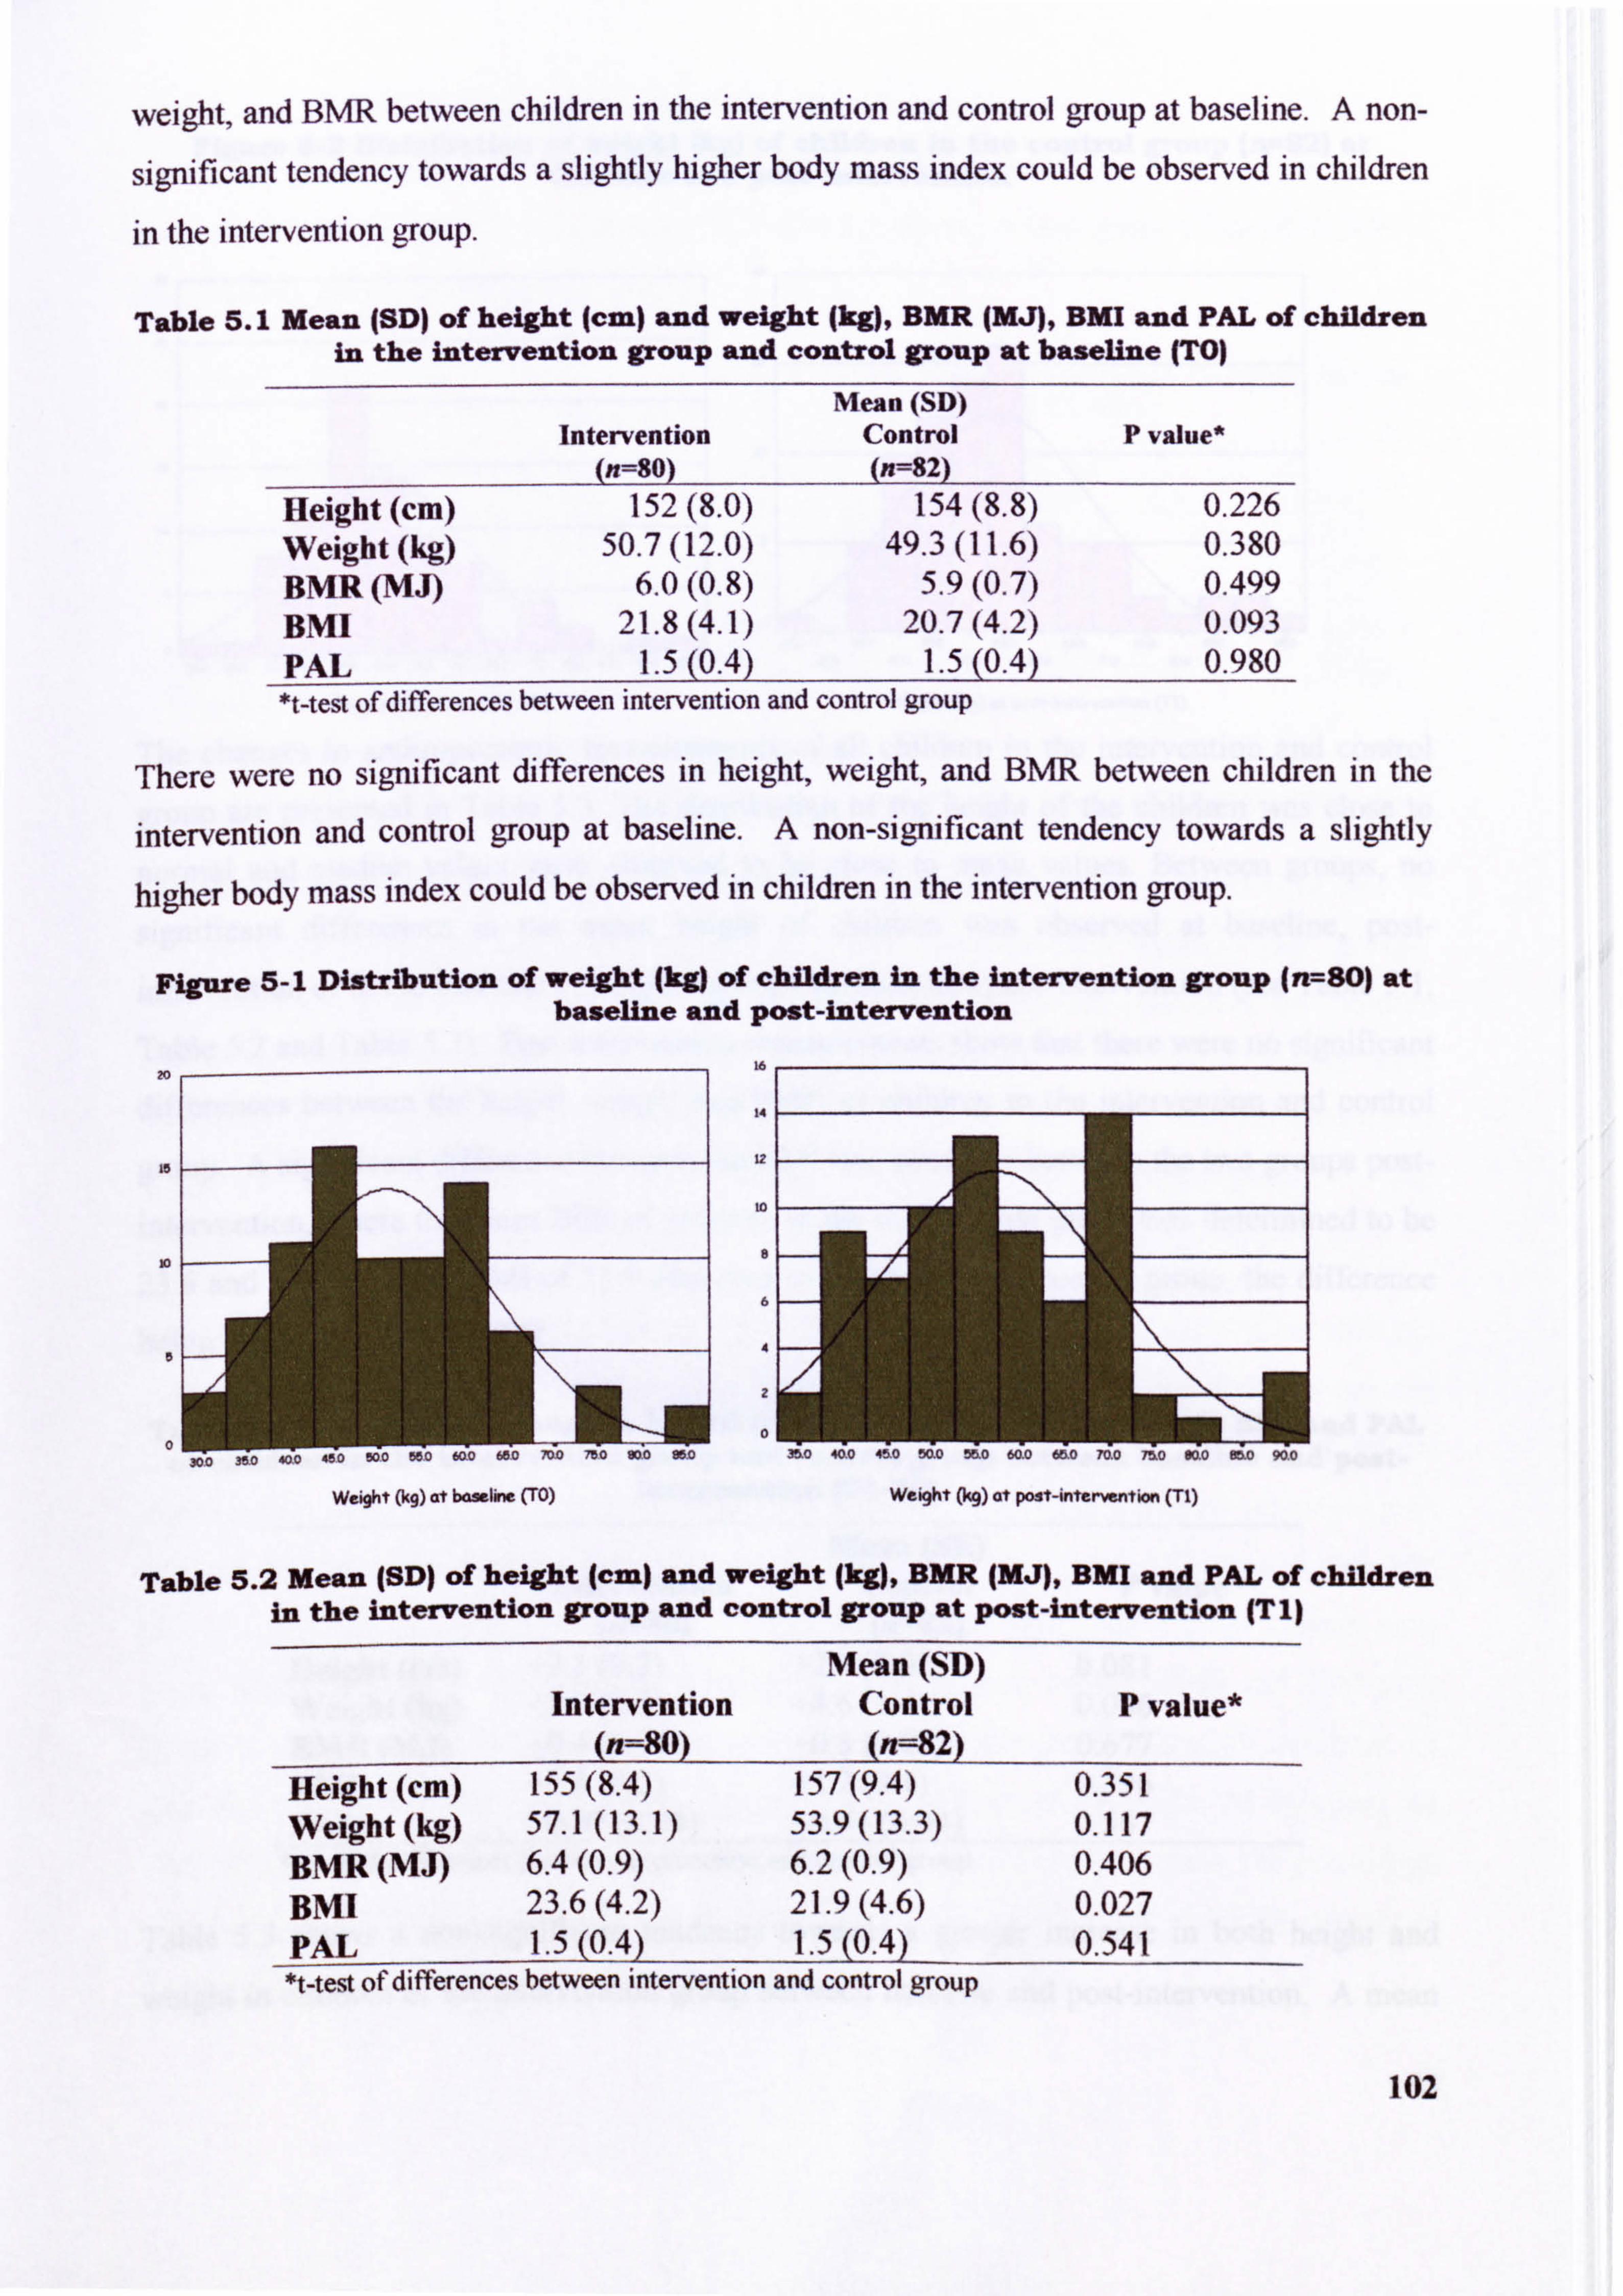
weight, and BMR between children in the intervention and control group at baseline. A non-
significant tendency towards a slightly higher body mass index could be observed in children
in the intervention group.
Table 5.1 Mean (SD) of height (cm) and weight (kg), BMR JMJ), BMI and PAL of children in the intervention group and control group at baseline (TO)
Intervention (n=80)
Mean (SD) Control (n=82)
P value*
Height (cm) 152(8.0) 154(8.8) 0.226 Weight (kg) 50.7(12.0) 49.3(11.6) 0.380 BMR (MJ) 6.0(0.8) 5.9(0.7) 0.499 Bmi 21.8(4.1) 20.7(4.2) 0.093 PAL 1.5(0.4) 1.5(0.4) 0.980 *t-test of differences between intervention and control group
There were no significant differences in height, weight, and BNM between children in the
intervention and control group at baseline. A non-significant tendency towards a slightly
higher body mass index could be observed in children in the intervention group.
Figure 5-1 Distribution of weight jkg) of children in the intervention group (n--80) at baseline and post-intervention
Table 5.2 Mean (SD) of height (cm) and weight (kg), BMR (MJ), BMI and PAL of children in the intervention group and control group at POst-intervention (T I)
Mean (SD) Intervention Control P value*
(n=80) (n=82) Height (cm) 155(8.4) 157(9.4) 0.351 Weight (kg) 57.1(13.1) 53.9(13.3) 0.117 BMR (MJ) 6.4(0.9) 6.2(0.9) 0.406 BMI 23.6(4.2) 21.9(4.6) 0.027 PAL 1.5(0.4) 1.5(0.4) 0.541 *t-test of differences between intervention and control group
102
Weight (kg) at post-intervention (TI) Weight Ocq) at bdwlira (TO)
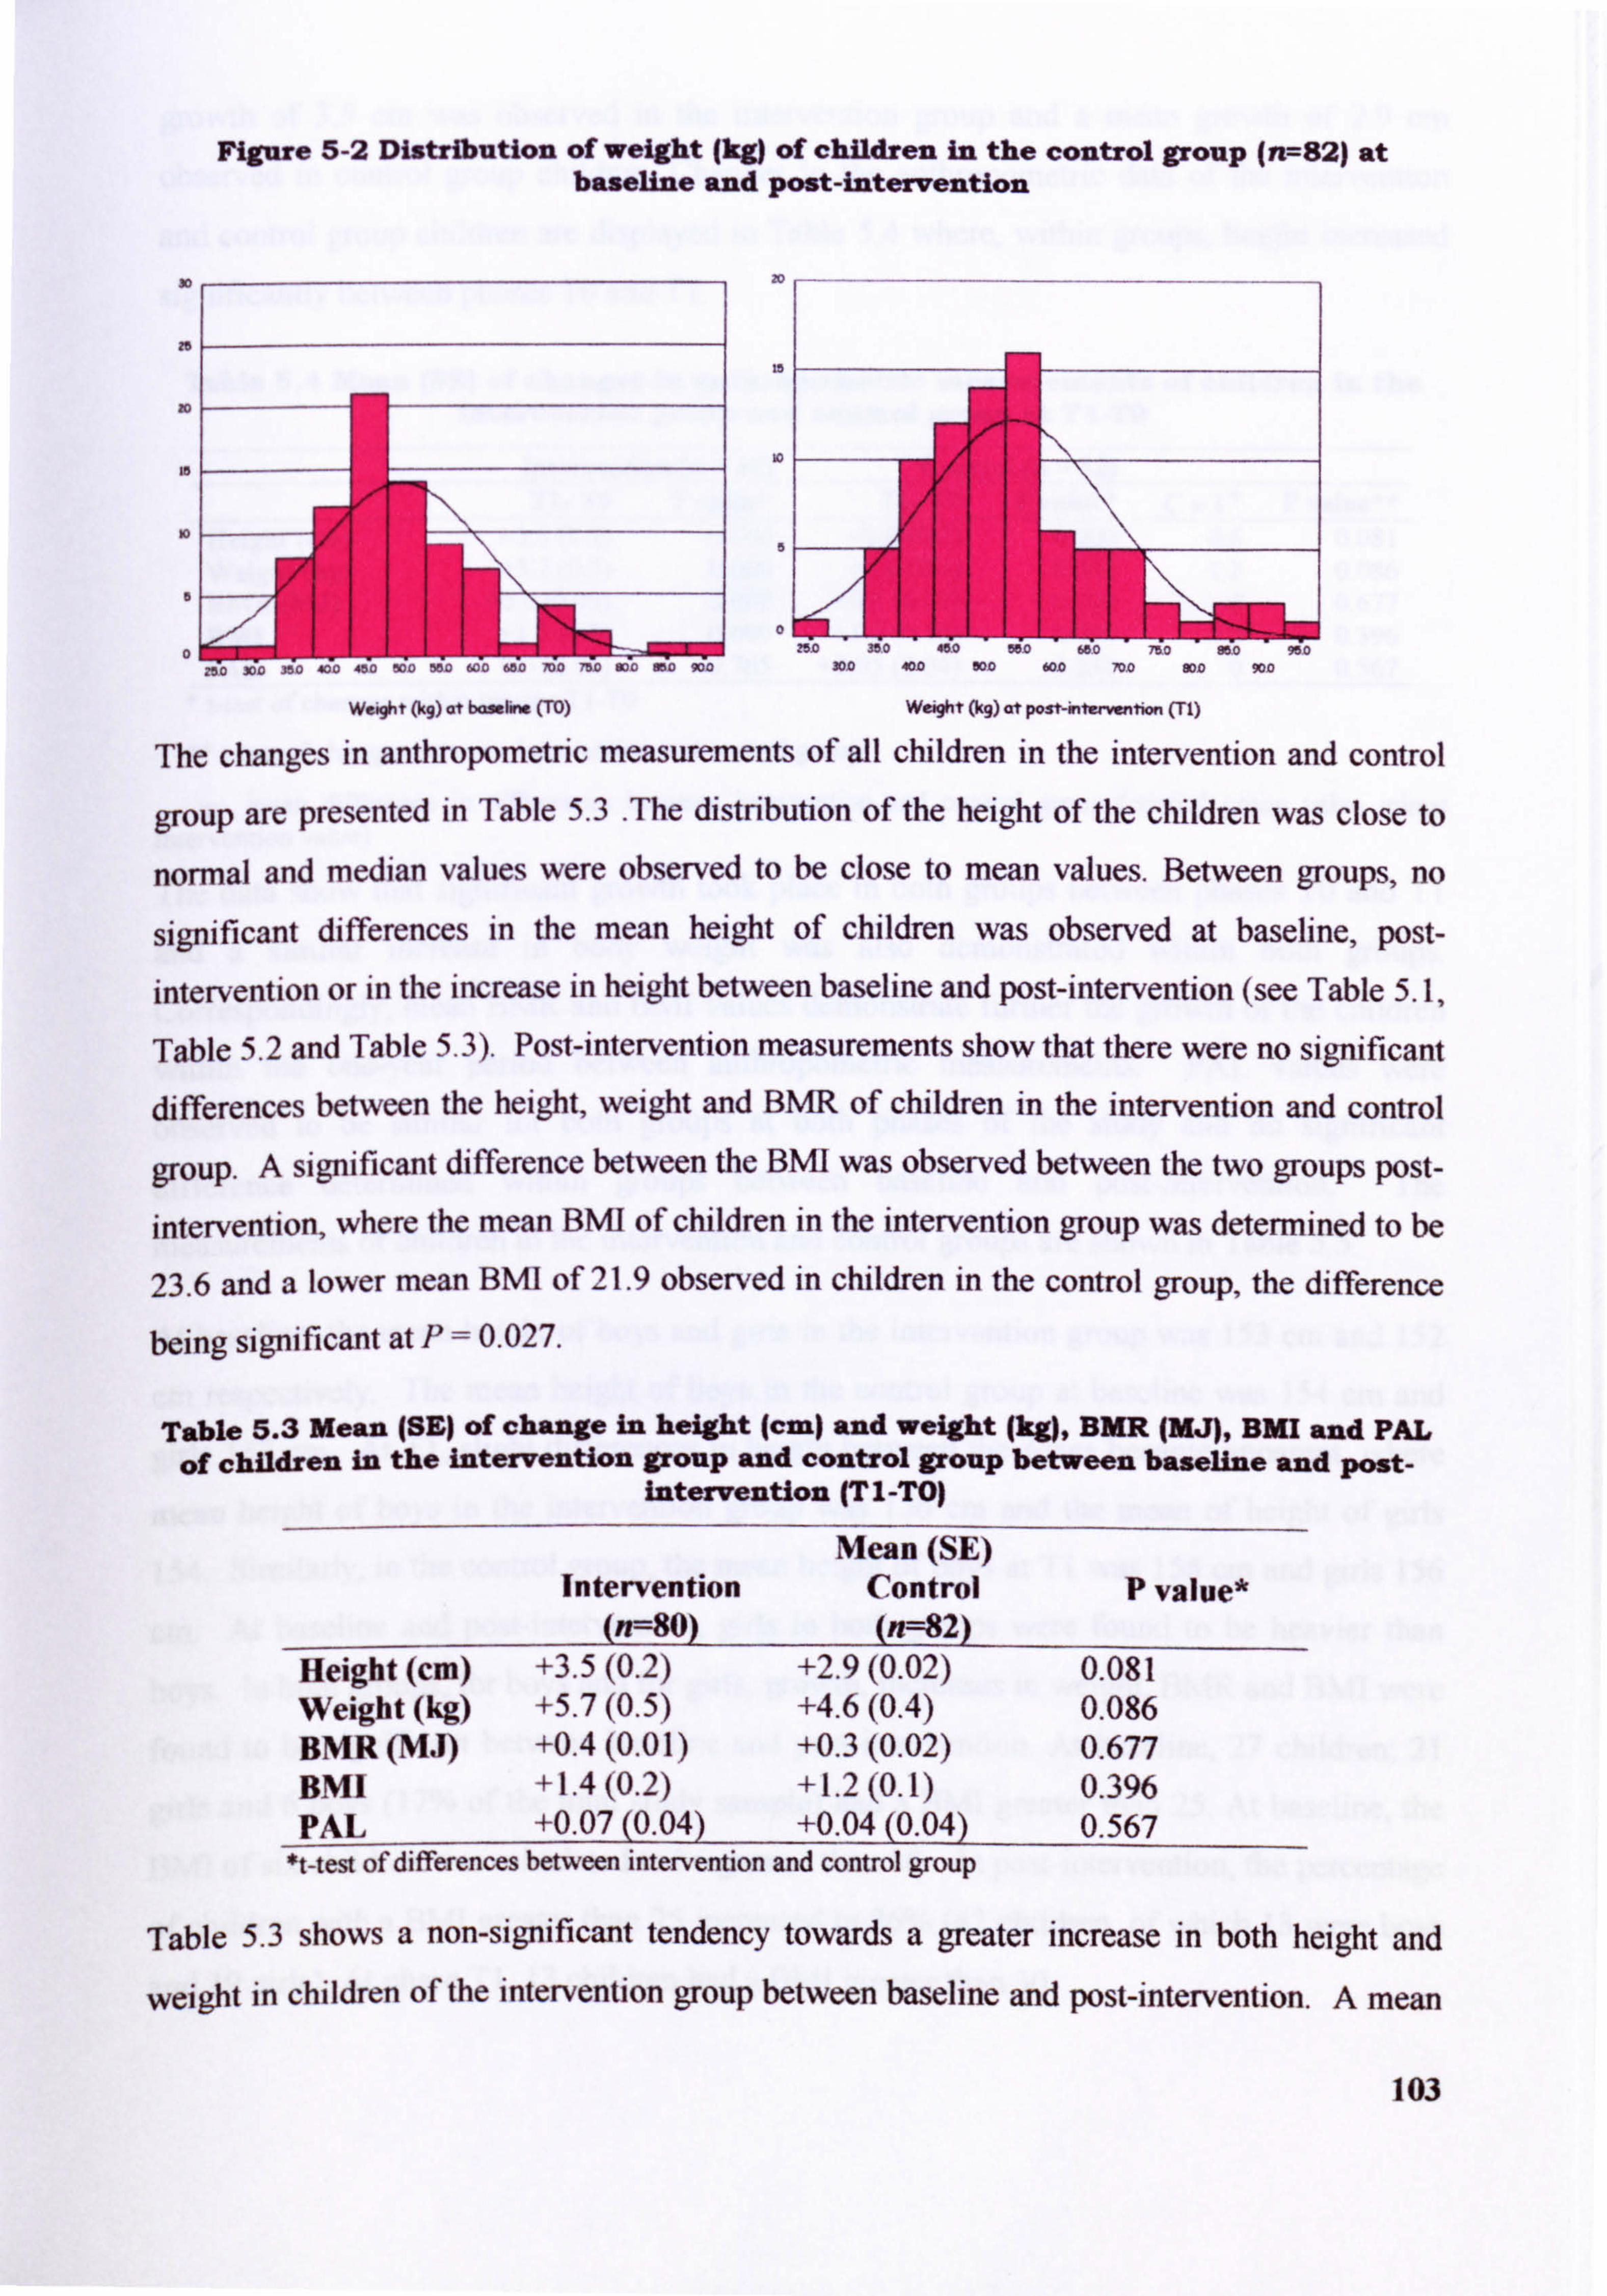
Figure 5-2 Distribution of weight (kg) of children in the control group (n7--82) at baseline and post-intervention
30
re
10
20
is
io
5
0
Weight (kq) at bonfirm (TO) Weight (kq) at post-interwntion (n)
The changes in anthropornetric measurements of all children in the intervention and control
group are presented in Table 5.3 The distribution of the height of the children was close to
normal and median values were observed to be close to mean values. Between groups, no
significant differences in the mean height of children was observed at baseline, post- intervention or in the increase in height between baseline and post-intervention (see Table 5.1,
Table 5.2 and Table 5.3). Post-intervention measurements show that there were no significant differences between the height, weight and BMR of children in the intervention and control
group. A significant difference between the BMI was observed between the two groups post-
intervention, where the mean BMI of children in the intervention group was determined to be
23.6 and a lower mean BMI of 21.9 observed in children in the control group, the difference
being significant at P=0.027.
Table 5.3 Mean (SE) of change in height (cm) and weight (kg), BUR (MJ), BMI and PAL of children in the intervention group and control group between baseline and post-
intervention (TI-TO)
Mean (SE) Intervention Control P value*
(n=80) (n==; 82) Height (cm) +3.5(0.2) +2.9(0.02) 0.081 Weight (kg) +5.7(0.5) +4.6(0.4) 0.086 BMR (MJ) +0.4(0.01) +0.3(0.02) 0.677 BMI +1.4(0.2) +1.2(0.1) 0.396 PAL +0.07 (0.04) +0.04 (0.04) 0.567
*t-test of differences between intervention and control group
Table 5.3 shows a non-significant tendency towards a greater increase in both height and
weight in children of the intervention group between baseline and post-intervention. A mean
103
SOD 401D WAD 60D 70D SDO 900
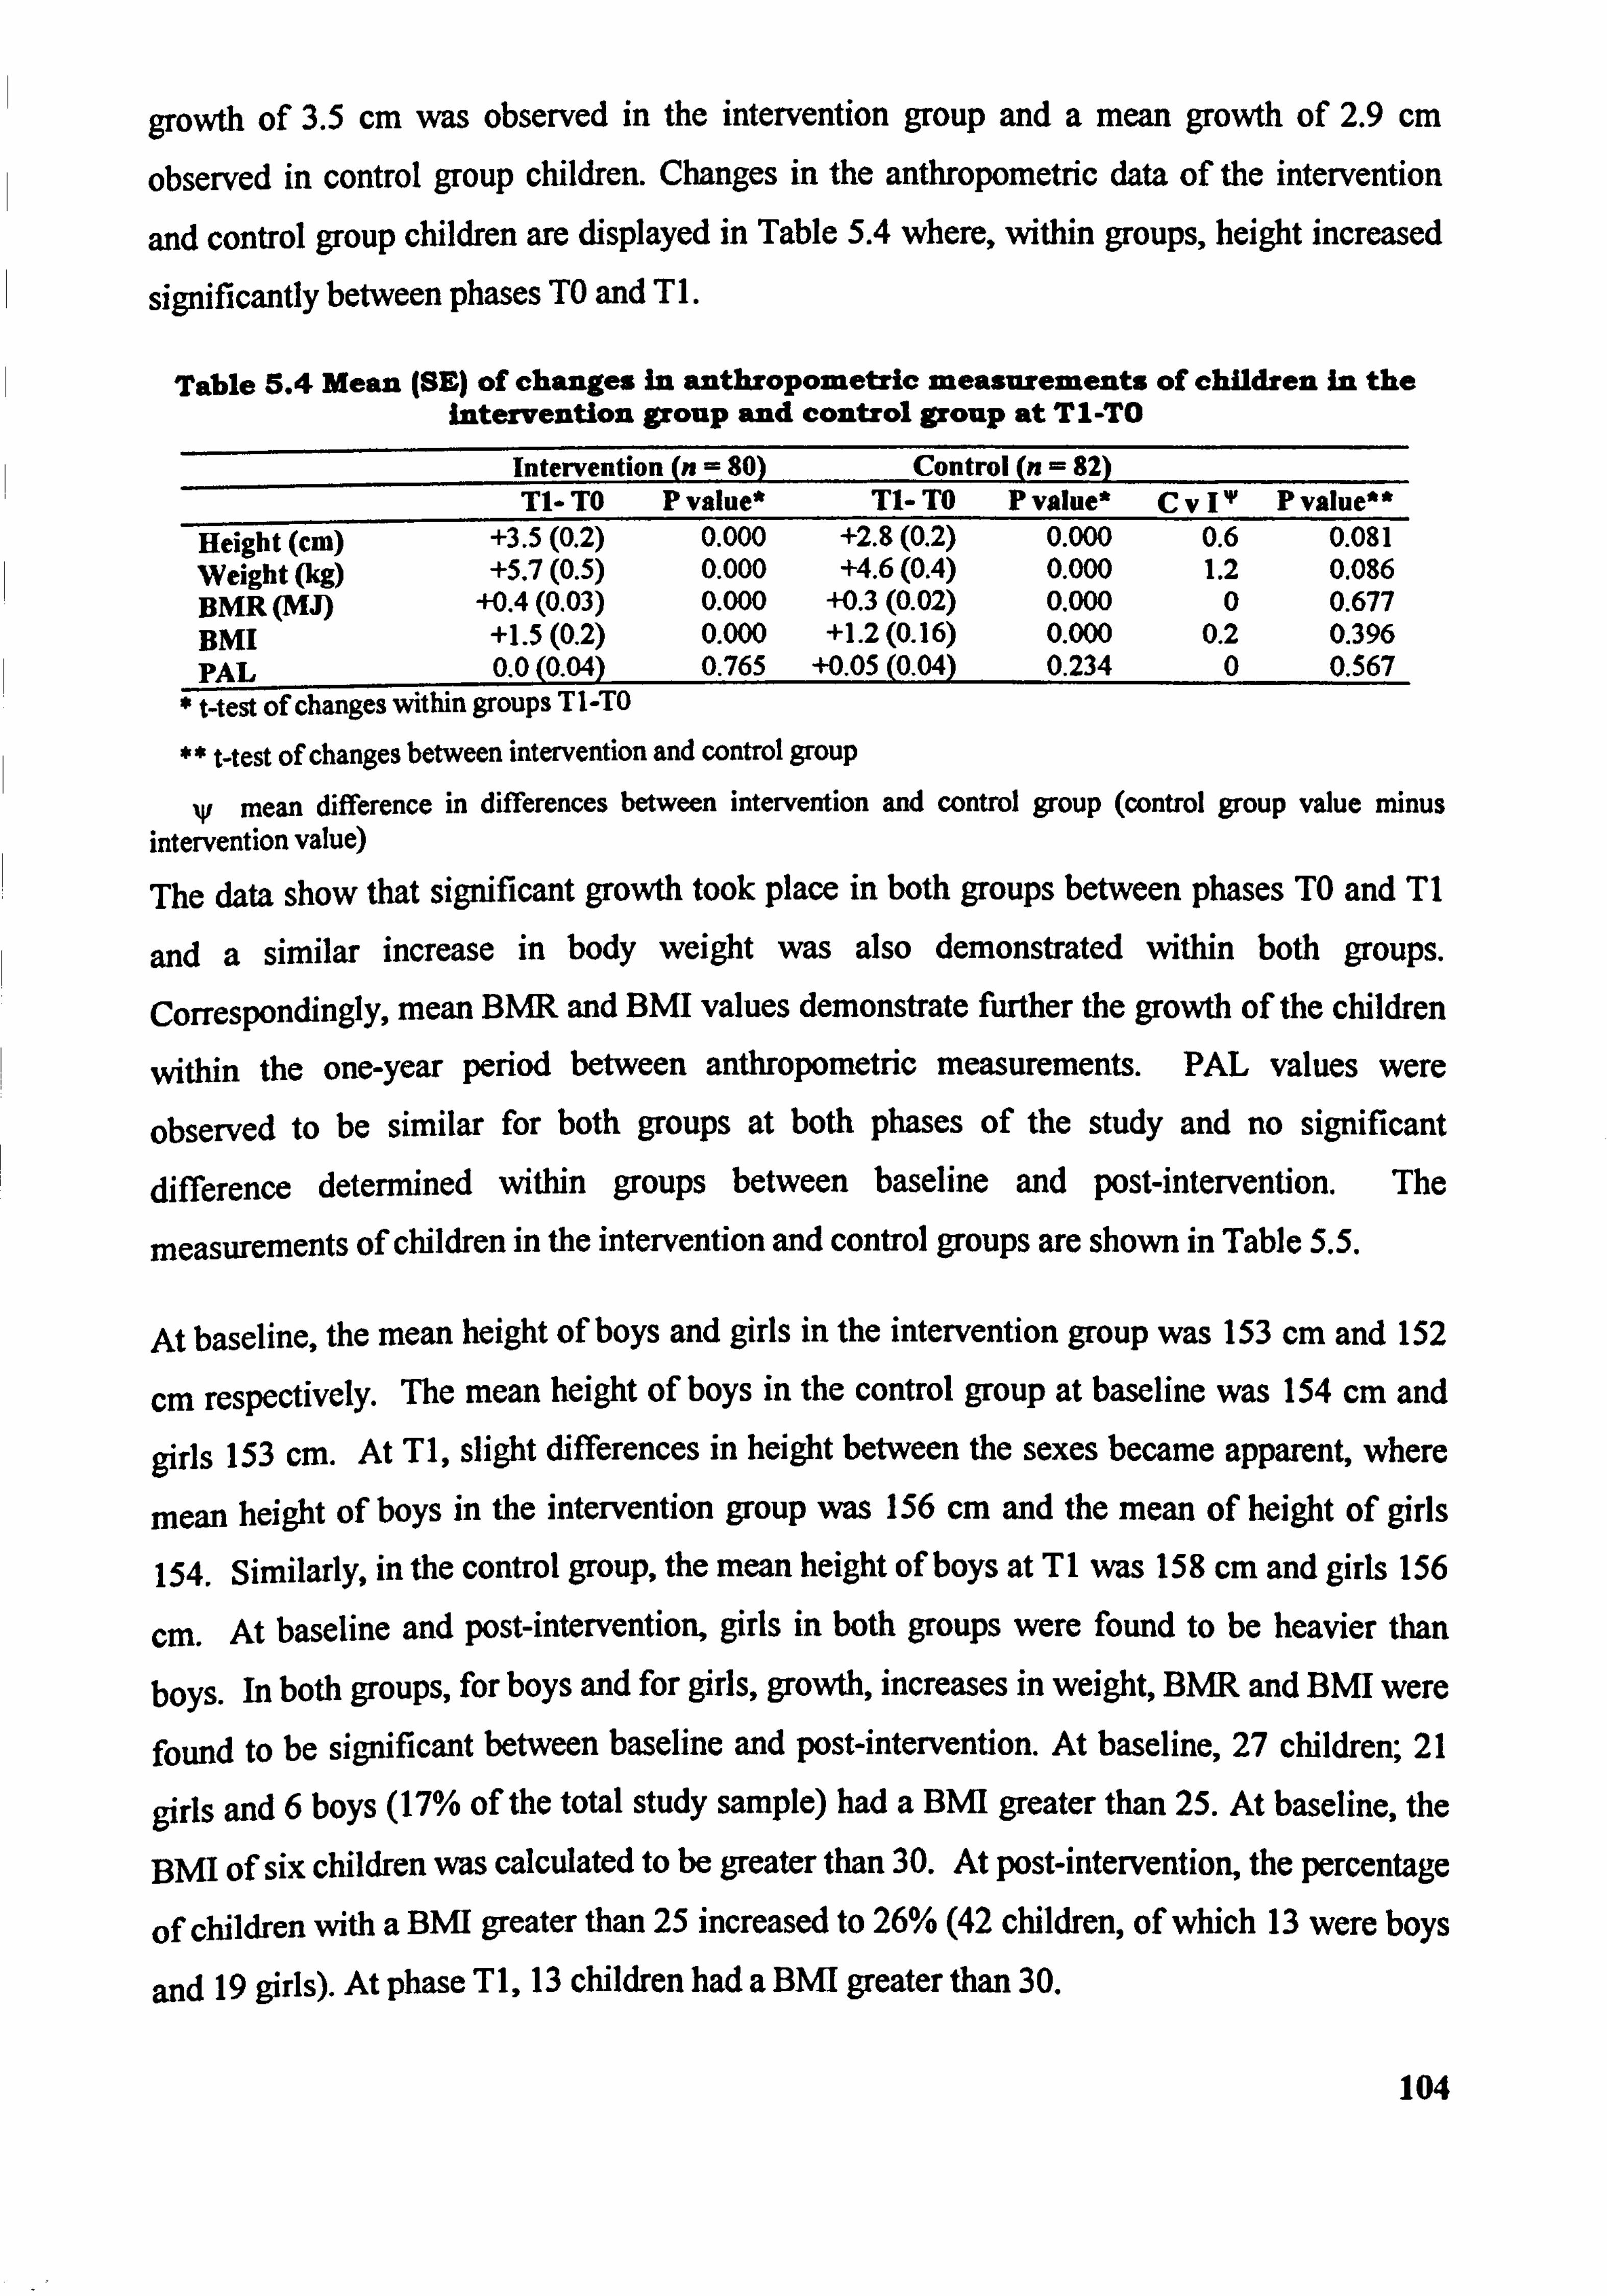
growth of 3.5 cm was observed in the intervention group and a mean growth of 2.9 cm
observed in control group children. Changes in the anthropornetric data of the intervention
and control group children are displayed in Table 5.4 where, within groups, height increased
significantly between phases TO and T I.
Table 5.4 Mean (SE) of changes in anthropometric ineasurements of children In the intervention group and control group at TI-TO
Intervention (n = 80) Control (n = 82) T1- TO P value* Tl- TO P value* CVI IV Pvalue**
Height (cm) +3.5(0.2) 0.000 +2.8(0.2) 0.000 0.6 0.081 Weight (kg) +5.7(0.5) 0.000 +4.6(0.4) 0.000 1.2 0.086 BMR(MJ) +0.4(0.03) 0.000 +0.3(0.02) 0.000 0 0.677 BMI +1.5(0.2) 0.000 +1.2(0.16) 0.000 0.2 0.396 PAL 0.0(0.04) 0.765 +0.05 (0,04) 0.234 0 0.567 t-test of changes within groups TI-TO
** t-test of changes between intervention and control group
W mean difference in differences between intervention and control group (control group value minus intervention value)
The data show that significant growth took place in both groups between phases TO and TI
and a similar increase in body weight was also demonstrated within both groups.
Correspondingly, mean BMR and BMI values demonstrate further the growth of the children
within the one-year period between anthropornetric measurements. PAL values were
observed to be similar for both groups at both phases of the study and no significant
difference determined within groups between baseline and post-intervention. The
measurements of children in the intervention and control groups are shown in Table 5.5.
At baseline, the mean height of boys and girls in the intervention group was 153 cm and 152
cm respectively. The mean height of boys in the control group at baseline was 154 cm. and
girls 153 cm. At TI, slight differences in height between the sexes became apparent, where
mean height of boys in the intervention group was 156 cm and the mean of height of girls
154. Similarly, in the control group, the mean height of boys at TI was 158 cm and girls 156
cm. At baseline and post-intervention, girls in both groups were found to be heavier than
boys. In both groups, for boys and for girls, growth, increases in weight, BMR and BMI were
found to be significant between baseline and post-intervention. At baseline, 27 children; 21
girls and 6 boys (17% of the total study sample) had a BNH greater than 25. At baseline, the
BMI of six children was calculated to be greater than 30. At post-intervention, the percentage
of children with a BMI greater than 25 increased to 26% (42 children, of which 13 were boys
and 19 girls). At phase T 1,13 children had a BMI greater than 3 0.
104
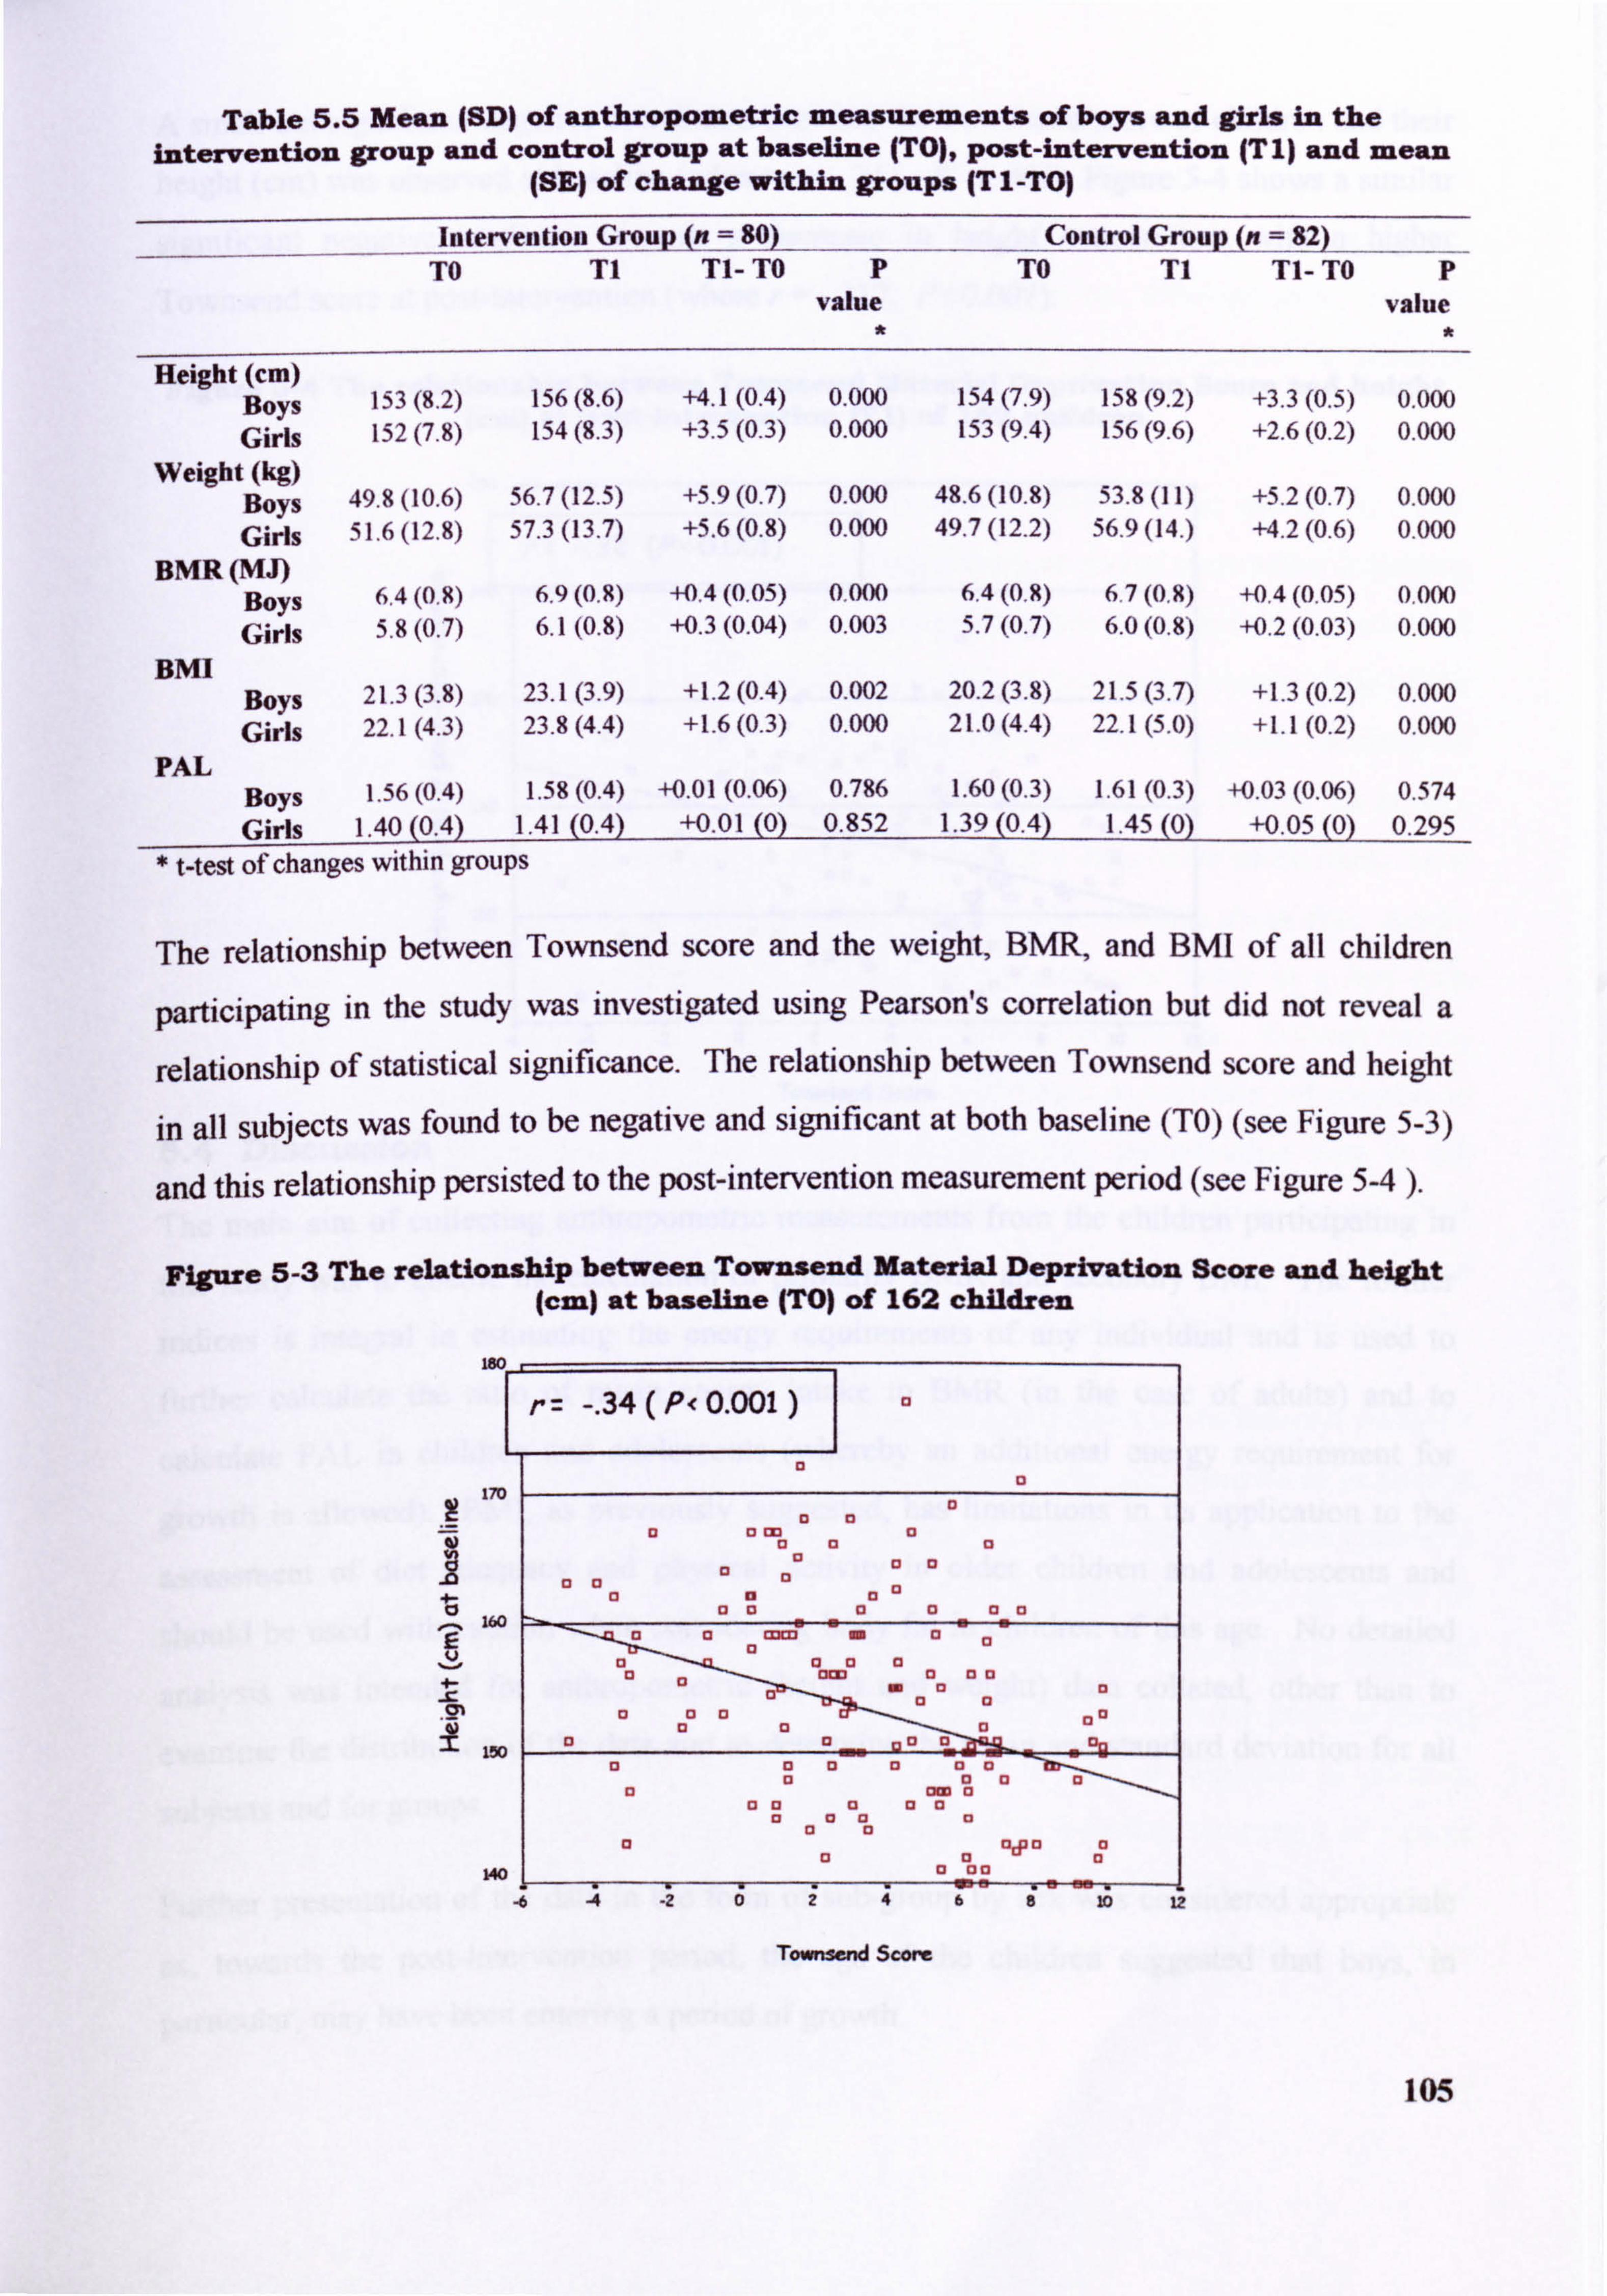
Table 5.5 Mean (SD) of anthropometric measurements of boys and girls in the intervention group and control group at baseline (TO), post-intervention (T 1) and mean
(SE) of change within groups (T I -TO)
----in-tervention Group (n= Control Group (n = U2
TO T1 Tl- TO P TO T1 Tl- TO P value value
Height (cm) Boys 153(8.2) 156(8.6) +4.1(0.4) 0.000 154(7.9) 158(9.2) +3.3(0.5) 0.000 Girls 152(7.8) 154(8.3) +3.5(0.3) 0.000 153(9.4) 156(9.6) +2.6(0.2) 0.000
Weioht (kg) Boys 49.8(10.6) 56.7(12.5) +5.9(0.7) 0.000 48.6(10.8) 53.8(11) +5.2(0.7) 0.000 Girls 51.6(12.8) 57.3(13.7) +5.6(0.8) 0.000 49.7(12.2) 56ý9 (14. ) +4.2(0.6) 0.000
BMR(MJ) Boys 6.4(0.9) 6.9(0.8) +0.4(0.05) 0,000 6.4(0,8) 6.7(0.8) +0.4(0.05) 0.000 Girls 5.8(0,7, ) 6.1(0.8) +0.3(0.04) 0.003 5.7(0.7) 6.0(0.8) +0.2(0.03) 0.000
BMI Boys 21,3(3.8) 23.1(3.9) +1.2(0.4) 0.002 20.2(3.8) 21.5(3.7) +1.3(0.2) 0.000 Girls 22.1(4.3) 23.8(4.4) +1.6(0.3) 0.000 21.0(4.4) 22,1(5.0) +1.1(0.2) 0.000
PAL Boys 1.56(0,4) 1.58(0.4) +0.01 (0.06) 0.786 1.60(0.3) 1.61(0.3) +0,03 (0.06) 0.574 Girls 1.40(0.4) 1.41(0.4) +0.01(0) 0.852 1.39(0.4) 1.45(0) +0.05(0) 0.295
Mest of changes within groups
The relationship between Townsend score and the weight, BMR, and BMI of all children
participating in the study was investigated using Pearson's correlation but did not reveal a
relationship of statistical significance. The relationship between Townsend score and height
in all subjects was found to be negative and significant at both baseline (TO) (see Figure 5-3)
and this relationship persisted to the post-intervention measurement period (see Figure 5-4 ).
Figure 5-3 The relationship between Townsend Material Deprivation Score and height (cm) at baseline (TO) of 162 children
-. 34(P<0.001) I
13
170
0 133 13 Wa
1 13 aa
13 aa
160 13 11
a0a 11 13
L
om 00 13 0a X0 13 10
0" 0
0. .1
a00 10
mm m0"
a0D
150 00 00 a 13 13 13 D
a0 13 ow a
0a 13 93 13 aa0
cl a a cyp aa
13 a0 140 0 ou
-6 -4 .26T-
Townsend ScA)rc
105
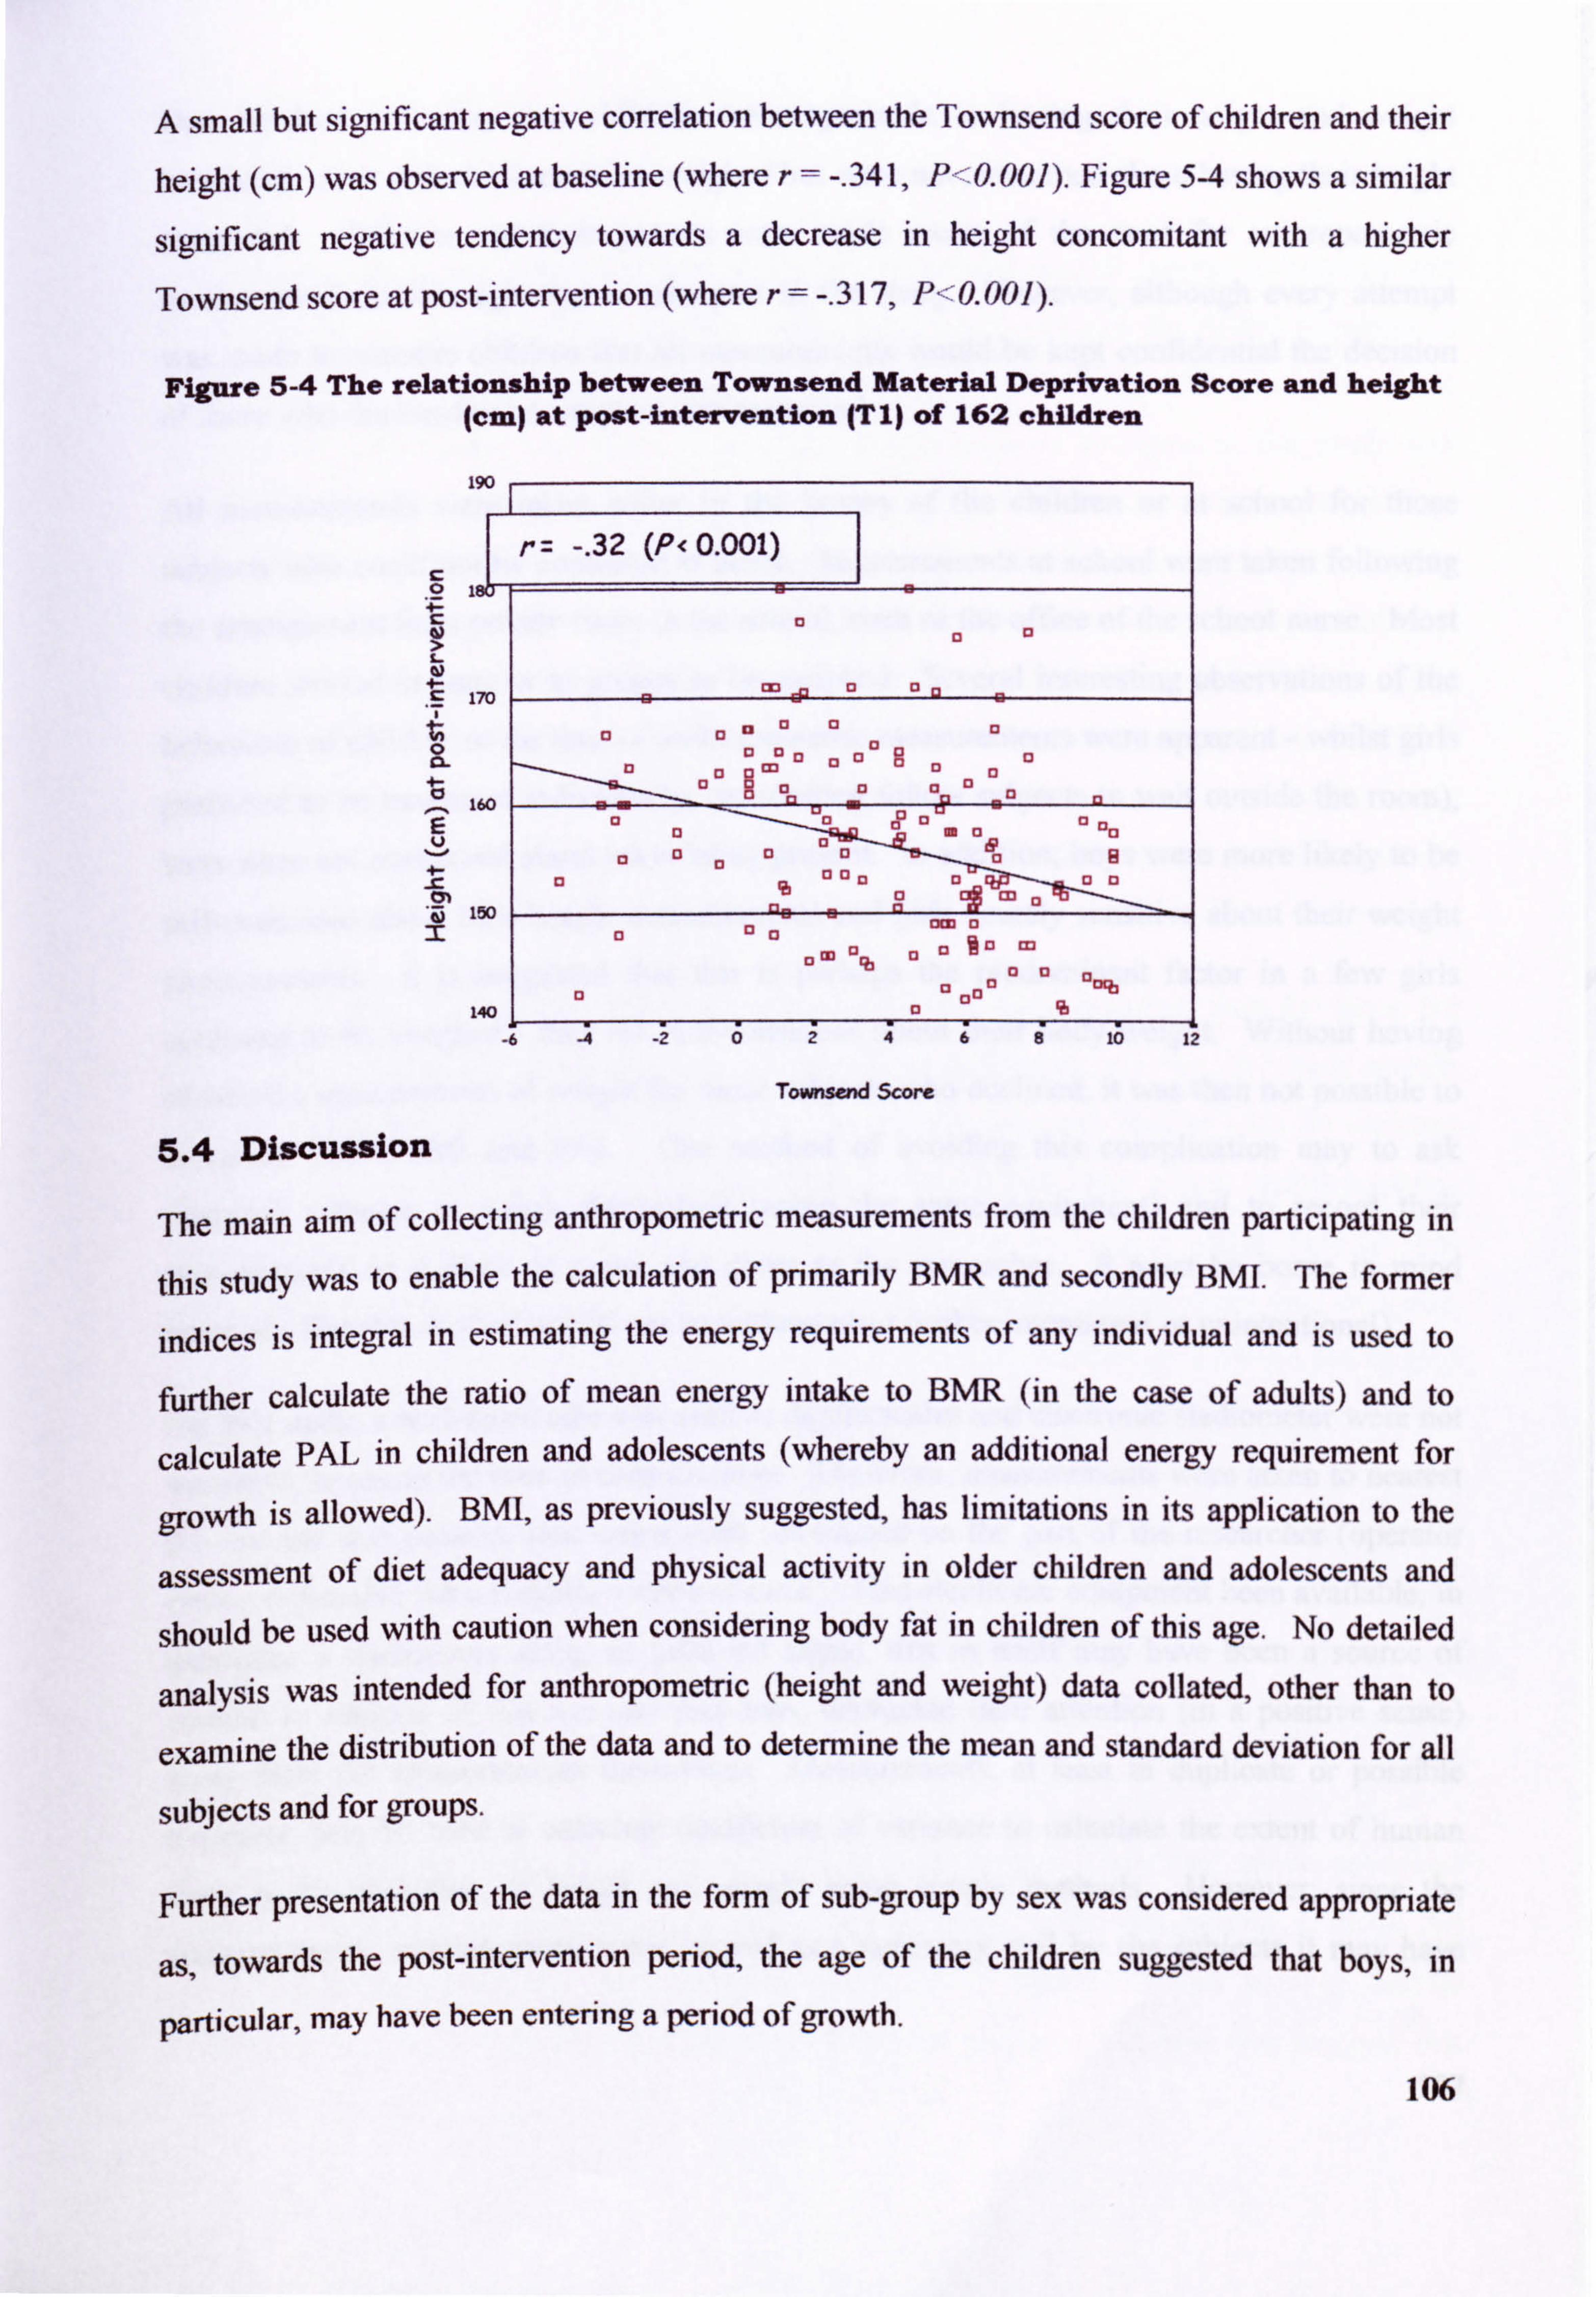
A small but significant negative correlation between the Townsend score of children and their
height (cm) was observed at baseline (where r=-. 341, P-0.001). Figure 54 shows a similar
significant negative tendency towards a decrease in height concomitant with a higher
Townsend score at post-intervention (where r=-. 317, P<'0.001).
Figure 5-4 The relationship between Townsend Material Deprivation Score and height (cm) at post-intervention (TI) of 162 children
190
w 4- 170
0 a-
160
4-
-Fj 150 r
140 1
-6
-. 32 (P< 0.001)
lip a E, 1 13 0
cl 01 13 ,
13 0 D 13 C,
E3 MO
0a 13
13 0 13 aI 13 E3 mau
a & aaa D a 13
a 13 0,00
C3 M -
to M
a M 13 .3M
13
13 tKb 13 C31313 %
10 12
Townsend Score
5.4 Discussion
The main aim of collecting anthropornetric measurements from the children participating in
this study was to enable the calculation of primarily BMR and secondly BMI. The former
indices is integral in estimating the energy requirements of any individual and is used to
further calculate the ratio of mean energy intake to BMR (in the case of adults) and to
calculate PAL in children and adolescents (whereby an additional energy requirement for
growth is allowed). BMI, as previously suggested, has limitations in its application to the
assessment of diet adequacy and physical activity in older children and adolescents and
should be used with caution when considering body fat in children of this age. No detailed
analysis was intended for anthropometric (height and weight) data collated, other than to
examine the distribution of the data and to determine the mean and standard deviation for all
subjects and for groups.
Further presentation of the data in the form of sub-group by sex was considered appropriate
as, towards the post-intervention period, the age of the children suggested that boys, in
particular, may have been entering a period of growth.
106

One hundred and sixty two children were agreeable to having their height and weight
measured. Five girls declined to be weighed but were not concerned about having their height
measured. Children and their parents were made aware of the need for anthropornetric
measurements before agreeing to take part in the study. However, although every attempt
was made to reassure children that all measurements would be kept confidential the decision
of those who declined to be weighed was respected.
All measurements were taken either in the homes of the children or at school for those
subjects who could not be contacted at home. Measurements at school were taken following
the arrangement for a private room in the school, such as the office of the school nurse. Most
children arrived in pairs or in groups to be weighed. Several interesting observations of the
behaviour of children at the time of anthropornetric measurements were apparent - whilst girls
preferred to be measured individually, (instructing fellow subjects to wait outside the room), boys were not concerned about peers being present. In addition, boys were more likely to be
self-conscious about their height measurements and girls acutely sensitive about their weight
measurements. It is suggested that this is perhaps the predominant factor in a few girls declining to be weighed - they felt self-conscious about their body weight. Without having
obtained a measurement of weight for those subjects who declined, it was then not possible to
calculate BMR, BMI and PAL One method of avoiding this complication may to ask
reluctant subjects to weigh themselves (using the same equipment) and to record their
measurement on a piece of paper and given to the researcher. It must be borne in mind however, that this method would not be without error (either intentional or unintentional).
For this study, a wall-fixed tape was used as digital scales and electronic stadiometer were not
available for use at the time of measurement. Therefore, measurements were taken to nearest 0.5 cm and it is possible that errors were introduced on the part of the researcher (operator
error - repeatable but a singular source of error). Had electronic equipment been available, in
particular a stadiometer using an infra-red signal, this in itself may have been a source of
interest to subjects of this age and may have distracted their attention (in a positive sense)
away from the measurements themselves. Measurements, at least in duplicate or possible
triplicate, may be used to calculate coefficient of variance to calculate the extent of human
error in the recording of height and weight using simple methods. However, since the
anthropometric measurements were viewed as a necessary evil by the subjects it may have
107

been difficult to repeat measurements in this way and would have required additional time
with subjects.
The mean height of the children in both the intervention and control groups, at baseline and
post-intervention, concurred with that of children aged 11-14-years in the NDNS (Gregory et
al, 2000). The mean height of boys aged 11-14-years in the NDNS was 155 cm and the same figure given girls aged 11-14-years. The mean weight of boys and girls in this study was
greater than that reported for children of a similar age in the NDNS - where mean weight was
reported to be 47 kg for boys and 49 kg for girls. The NDNS report girls to be slightly heavier than boys of the same age and these findings also concur with the data presented in
Table 5.5 where girls in both groups are shown to be heavier than boys in both groups. The
NDNS reported that 44% of girls aged 12 had entered menarche and this figure rose to 62% at
age 13. This may account for the slightly heavier weight of girls in both the NDNS sample
and this study sample - since attainment of a particular body weight is one of the triggers of
menarche in girls.
Notably, the mean weight of children participating in this study is higher than the mean for
children of a similar age in the NDNS. Two possible explanations are that; the study sample
size is much smaller and that the NDNS does not provide reference data as such for children
of this age from deprived social backgrounds. The NDNS does report anthropometric
measurements by social class of head of household and also by income which does provide
some useful reference data and it is here when certain favourable comparisons may be made.
By head of household classification, there were no discernible differences between the heights
and weights of boys or girls in the NDNS sample. However, when the data were presented by
classification of gross weekly household income, the data show that both boys and girls from
families where the gross weekly household income is less than E160.00, and between E160.00
to less than L280.00 per week, are both shorter and lighter than children from families whose
gross weekly income is greater than f. 280.00. To further highlight this point, children living
in families with a gross weekly income of E600.00 or more are shown to be 9-10 cm taller and
8-9kg heavier.
The data presented in Figure 5-3 and Figure 54 show that Townsend score correlates
negatively to height in children participating in this study. The relationship is small but
nevertheless significant and persists from phase TO to phase TI and persists despite
significant growth in both the intervention and control group. This data may suggest that 108
children from socially deprived backgrounds in the region of Tyne and Wear may be shorter, but not necessarily lighter, depending upon the severity of social deprivation. Further
analysis of anthropometric data collated in this study, at a later date, could involve
investigating the relationship between height and social deprivation in both boys and girls
since previous studies have shown that boys in particular, from low-income families, are more likely to be shorter and lighter than their peers from higher income groups.
The BNH of the children taking part in this study is comparable to data published in the 2000
NDNS (Gregory et al, 2000). The mean BMI for girls in the intervention and control group at baseline were 22.1 and 21.0 respectively. At post-intervention the figures increased slightly but significantly to 23.8 and 22.1. All these values are slightly higher than those reported in
the NDNS - whereby girls aged 12 years had a mean BNII of 20 and girls of 13, a mean BNH
of 2 1. The mean BMI of boys in at baseline was 21.3 (intervention group) and 20.2 (control
group)- At post-intervention the mean BNU of boys in the intervention group was 23.1 and in
the control group 21.5. All these values are higher than those reported in the NDNS for boys
of a similar age; the mean BMI of boys aged ll-, 12- and 13-years-old was 19. The increase
in BMI is likely to be concomitant with the significant increase in height and weight demonstrated by both sexes in both groups. A BMI value greater than 25 is accepted to
indicate that an individual is overweight and a BMI value greater than 30 indicates obesity. Thus, the percentage of children with a BNH value greater than 25 indicates this sub-group
may have increased their body fatness disproportionate and concordant with an increase in
body weight. This increase in body weight may possibly be attributed to a storing of energy as
a requirement in excess of that required for growth. Therefore, it would appear wise to
approach the interpretation of BMI and body fatness with extreme caution in the case of older
children and adolescents and it may be possible that further allowances need to be made in
terms of estimating energy requirements for individuals of this age group. The numbers of
children whose BNH was greater than 30 is a cause for concern in children of this age. It may be appropriate to perform follow-up anthropometric measurements on the children
participating in this study to monitor height, weight and BMI and to identify the prevalence of
overweight and obese children living in socially deprived areas of the North East of England.
109
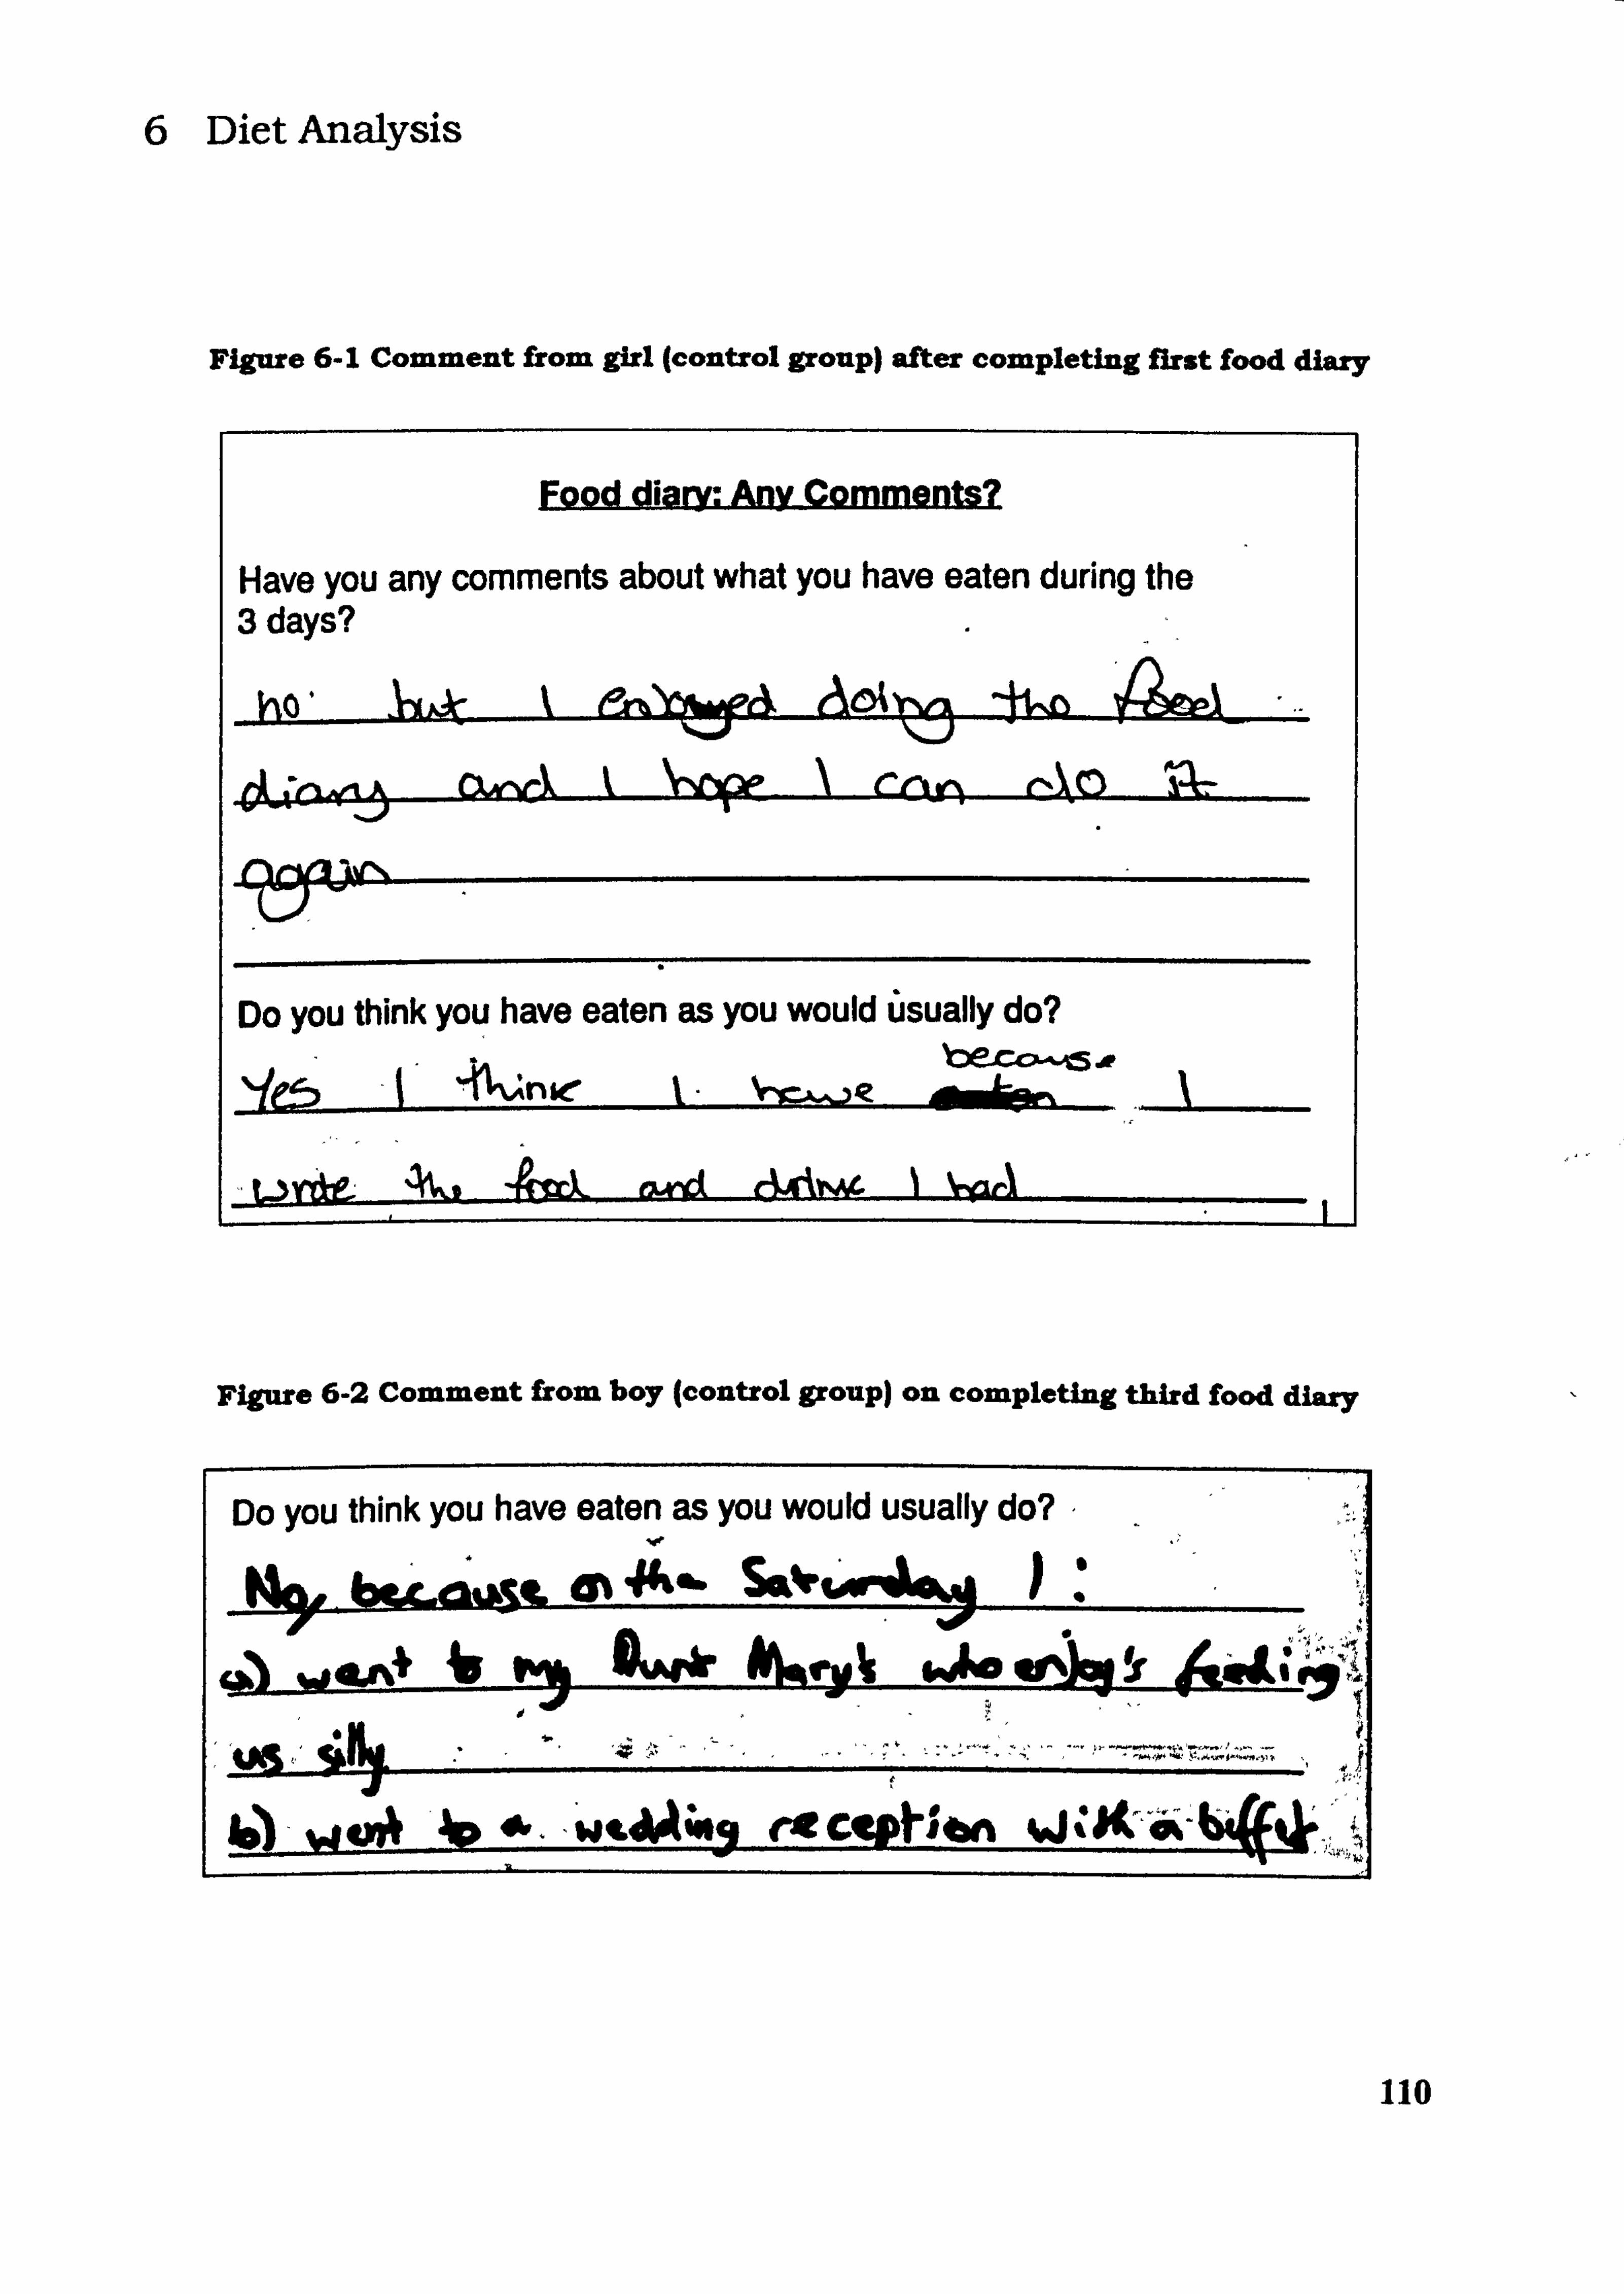
6 Diet Analysis
Figure 6-1 Comment from girl (control group) after completing first food diary
Have you any comments about what you have eaten during the 3 days?
ýaa4 rA
Do you think you have eaten as you would 6sually do?
n ie 4%., s
4TrI a-ed d4ihg I SM4.1a
Figure 6-2 Comment from boy (control group) on cOmPleting third food diary
Do you think you have eaten as you would usually do?
M, ft - &%. or ̂ . wes- m 44a. Sm%%ýwý ) -,
Ago" twu ow4r 10
Jf
4p 46.
110
6.1 Introduction
6.1.1 Overview of methods for the assessment of dietary intake by children aged 11-14-years old
The method of choice for dietary assessment should be applicable to the population group
under study, to the time period of assessment, to the nutrients and foods under assessment and
to the resources available. Bone (1992) suggests that where dietary intake within a specified
time period is to be assessed, both retrospective and prospective methods may be suitable. Examples of such methods are twenty-four hour recall, and prospective methods such as
weighed dietary inventory, estimated food diary and experimenter observation. In dietary
studies where general eating behaviour and habitual consumption of foods are to be
investigated, Kemm. & Booth, (1992) suggest that suitable retrospective (or recall) methods
are diet history and 24-hour recall.
Weighed dietary records are recognised to be a suitable method of obtaining detailed dietary
information in children of all ages (particularly in the clinical setting where comprehensive facilities and trained staff are available to provide assistance), but accuracy largely depends
upon adult supervision and detailed instruction (Mascarenhas et al, 1998). Two main
methods used in the quantification of food and nutrient intakes in free-living subjects, are the
direct weighing of foods or self-estimate of foods consumed (Hackett et al, 1983, Adamson et
al, 1992a, Robson & Livingstone, 2000).
Diet history methods have been employed in dietary studies of children (Livingstone et al,
1992) and are considered to be an adequate if not preferable method of measuring long-term
habitual dietary intake (Black et at, 2000). The National Diet and Nutrition Survey of
children aged 4 to 18 years (Gregory et al, 2000) employed 7-day weighed diet diaries and
each subject was issued with a set of digital weighing scales. Two recording diaries were also
given to subjects -a 'Home Record! diary and an 'Eating and Drinking Away From Home'.
For a dietary survey of this size, some considerable financial cost would be invested in the
tools used for data collection and analysis that may not be feasible for smaller dietary surveys.
ill
A dietary diary followed by interview to clarify diary entries may be particularly suitable for
use in older children capable of recording much of their intake (Hackett et al, 1983,1986,
Adamson et al, 1992a, 1992b). Livingstone & Robson (2000) suggest that self-report of
dietary intake in children be reserved for subjects aged 8 years or older, since before this age,
children may lack the cognitive abilities (i. e. conceptualisation of food portion size, memory
and attention span) required to carry out this task.
The use of food photographs in the clarification and quantification of food portion sizes during subject interviews are recognised. to minimise portion size errors (Robson &
Livingstone, 2000, Welten et al, 2000). However, even with food photographs, small portions
have been commonly overestimated, and larger portions underestimated (Lucas el al, 1995)
by adult participants. There is little data at present that provides evidence of over- and under-
estimation of food portion sizes by children and adolescents using methods that make use of
food photographs or food atlas. There is a pressing need for research to be undertaken in this
area and a need for a child-friendly food photographic atlas to be developed for use in dietary
surveys of young people.
Self-reporting of diet in the survey of young people's diets is a feasible method for small
studies since the cost in terms of consumables and researcher effort is much lower than for
weighed dietary records. A great deal of detail may also be included in a written dietary
record - detail that may not be possible in other methods, such as diet history. Dietary diaries
of a shorter recording period may possibly avoid fatigue on the part of the person carrying out the recording and a shorter recording period will facilitate the procedure of personal interview
following completion of the diary - since there is less for a young person to remember.
Written information may also act as a memory prompt as other data such as place of purchase,
origin and time of consumption are all recorded by subjects. When a shorter but repeatable
recording period does not negatively impact upon the reliability, validity and accuracy of the
data thus obtained (Adamson 1993, PhD thesis), again it may be particularly suitable for use by older children and adolescents without the need for continual adult supervision.
112

6.1.2 Aim-s
The specific aims were to:
Determine mean intakes of energy, protein, starch, sugar,
total fat and saturated fat and non-starch polysaccharide in
the diets of the children at baseline and at post-
intervention
Determine changes in mean intakes of energy, protein,
starch, sugar, total fat and saturated fat and non-starch
polysaccharide in the diets of the children following the
intervention
Determine intake of foods at baseline and Post-intervention
by the five groups of the National Food Guide
Determine intake of Vitamin C, B-carotene, iron and calcium
in the diets of the children
Compare differences in changes in intake of foods and
nutrients between children attending the intervention and
children in the control group
113

6.2 Method
6.2.1 Collection of dietary data
The intake of foods and beverages by the children were recorded by self-rcport of dietary
intake using a dietary diary and interview method (Hackett el al, 1983, Adamson ei al, 1992').
A 3-day estimated dietary diary further adapted from that used by Adamson et al (1992a) (
Figure 6-3, Figure 6-4, Figure 6-5, Figure 6-6) was used by the subjects to record dietary
intake in household measures.
Figure 6-3 Food diary designed for use by children participating in The Good Food Study (Eront page)
HUMAN NUTRITION RESEARCH CENTRE
UNIVERSITY OF NEWCASTLE
Foo., ;. 4r
FOOD DIARY
Name ...........................................................
Please start this food dairy on ...................................................
Keep this booklet with you to record everything you eat and drink. Write as much information as you can. We will sort out any problems you may have together.
If you have any questions about the diary, please contact: Sam Revill Tel: 0191 222 8719
M---j- Food diary no_
114
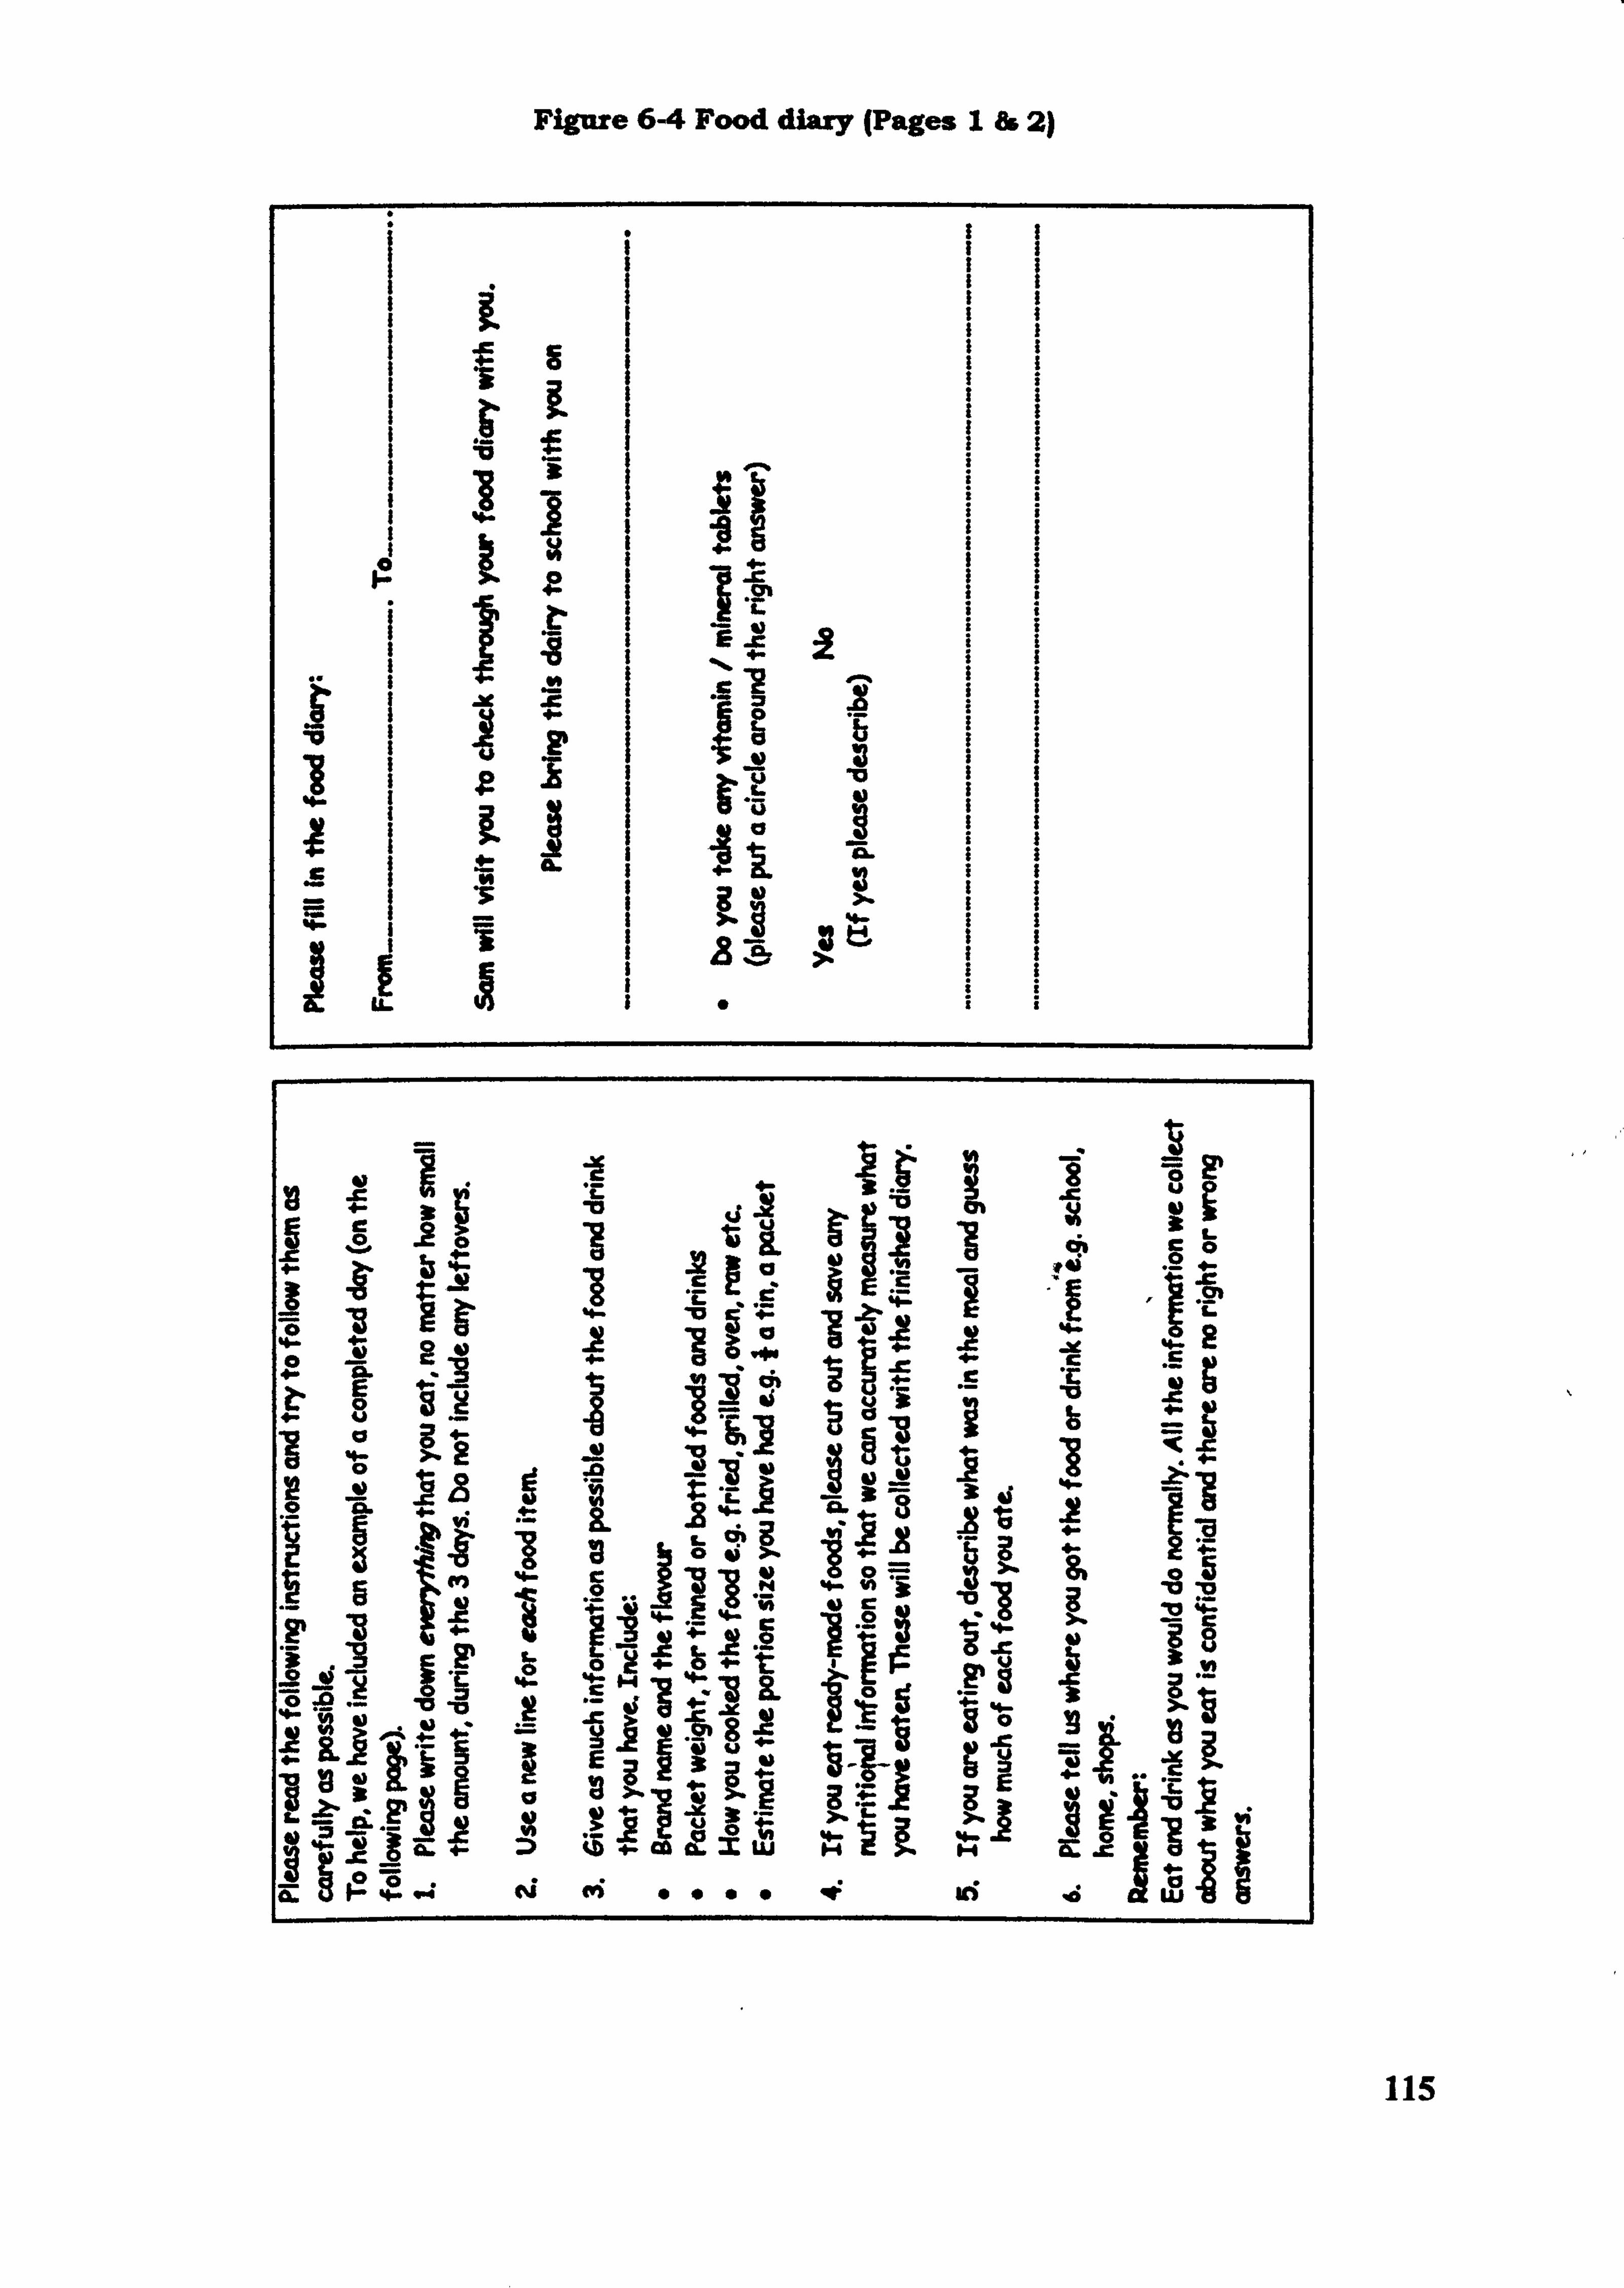
Figure 6-4 Food diary (Pages I& 2)
I I E I I Q. I I
, -v 1.
- Vb
14
ý, 1 9: Er . c- 1 -a
1e1,0 j11.
JE
m -0
kt
f»! g u
ig 1 4- -1 JE '0- E LP
4) gZ +- :> ;Z+. Co ch. xe. M=1i 1-
4- ei ei «i 0000 -0: 46 ýd
i
to
11
115
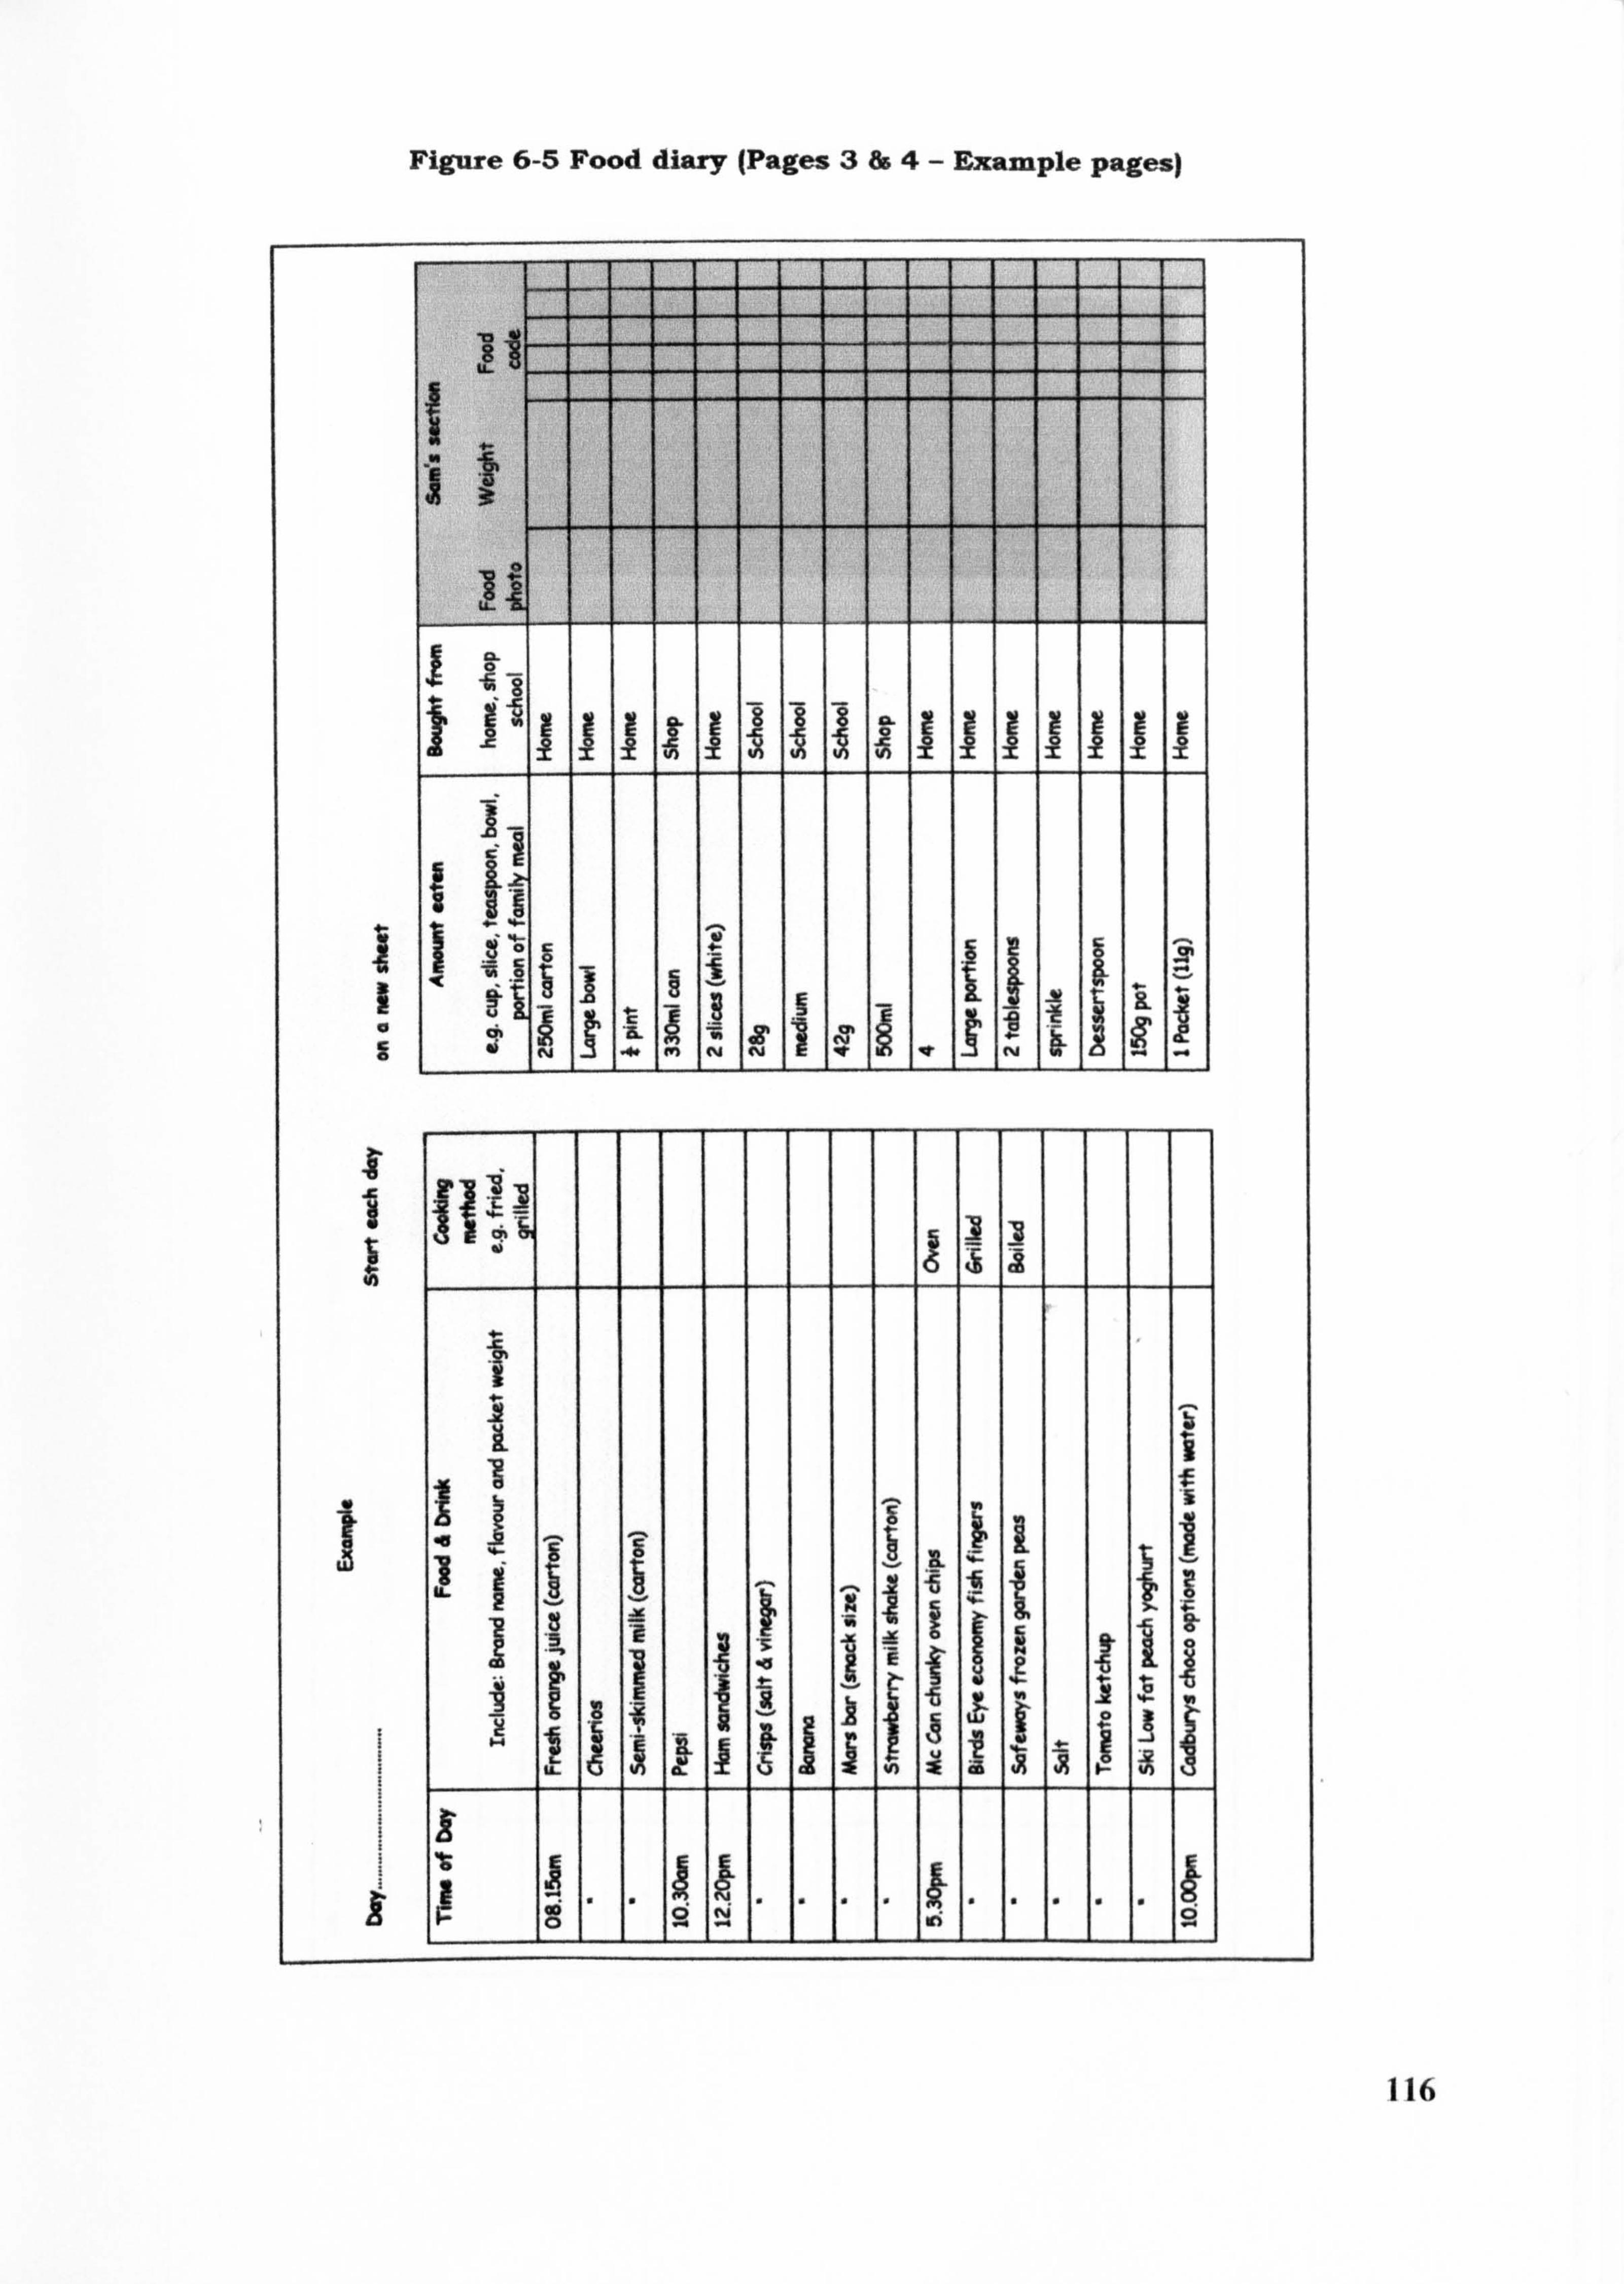
Figure 6-5 Food diary (Pages 3&4- Example pages)
1 -1 zz
IL
8 -W
14C
1 10 vi 9
A
IL
40
116
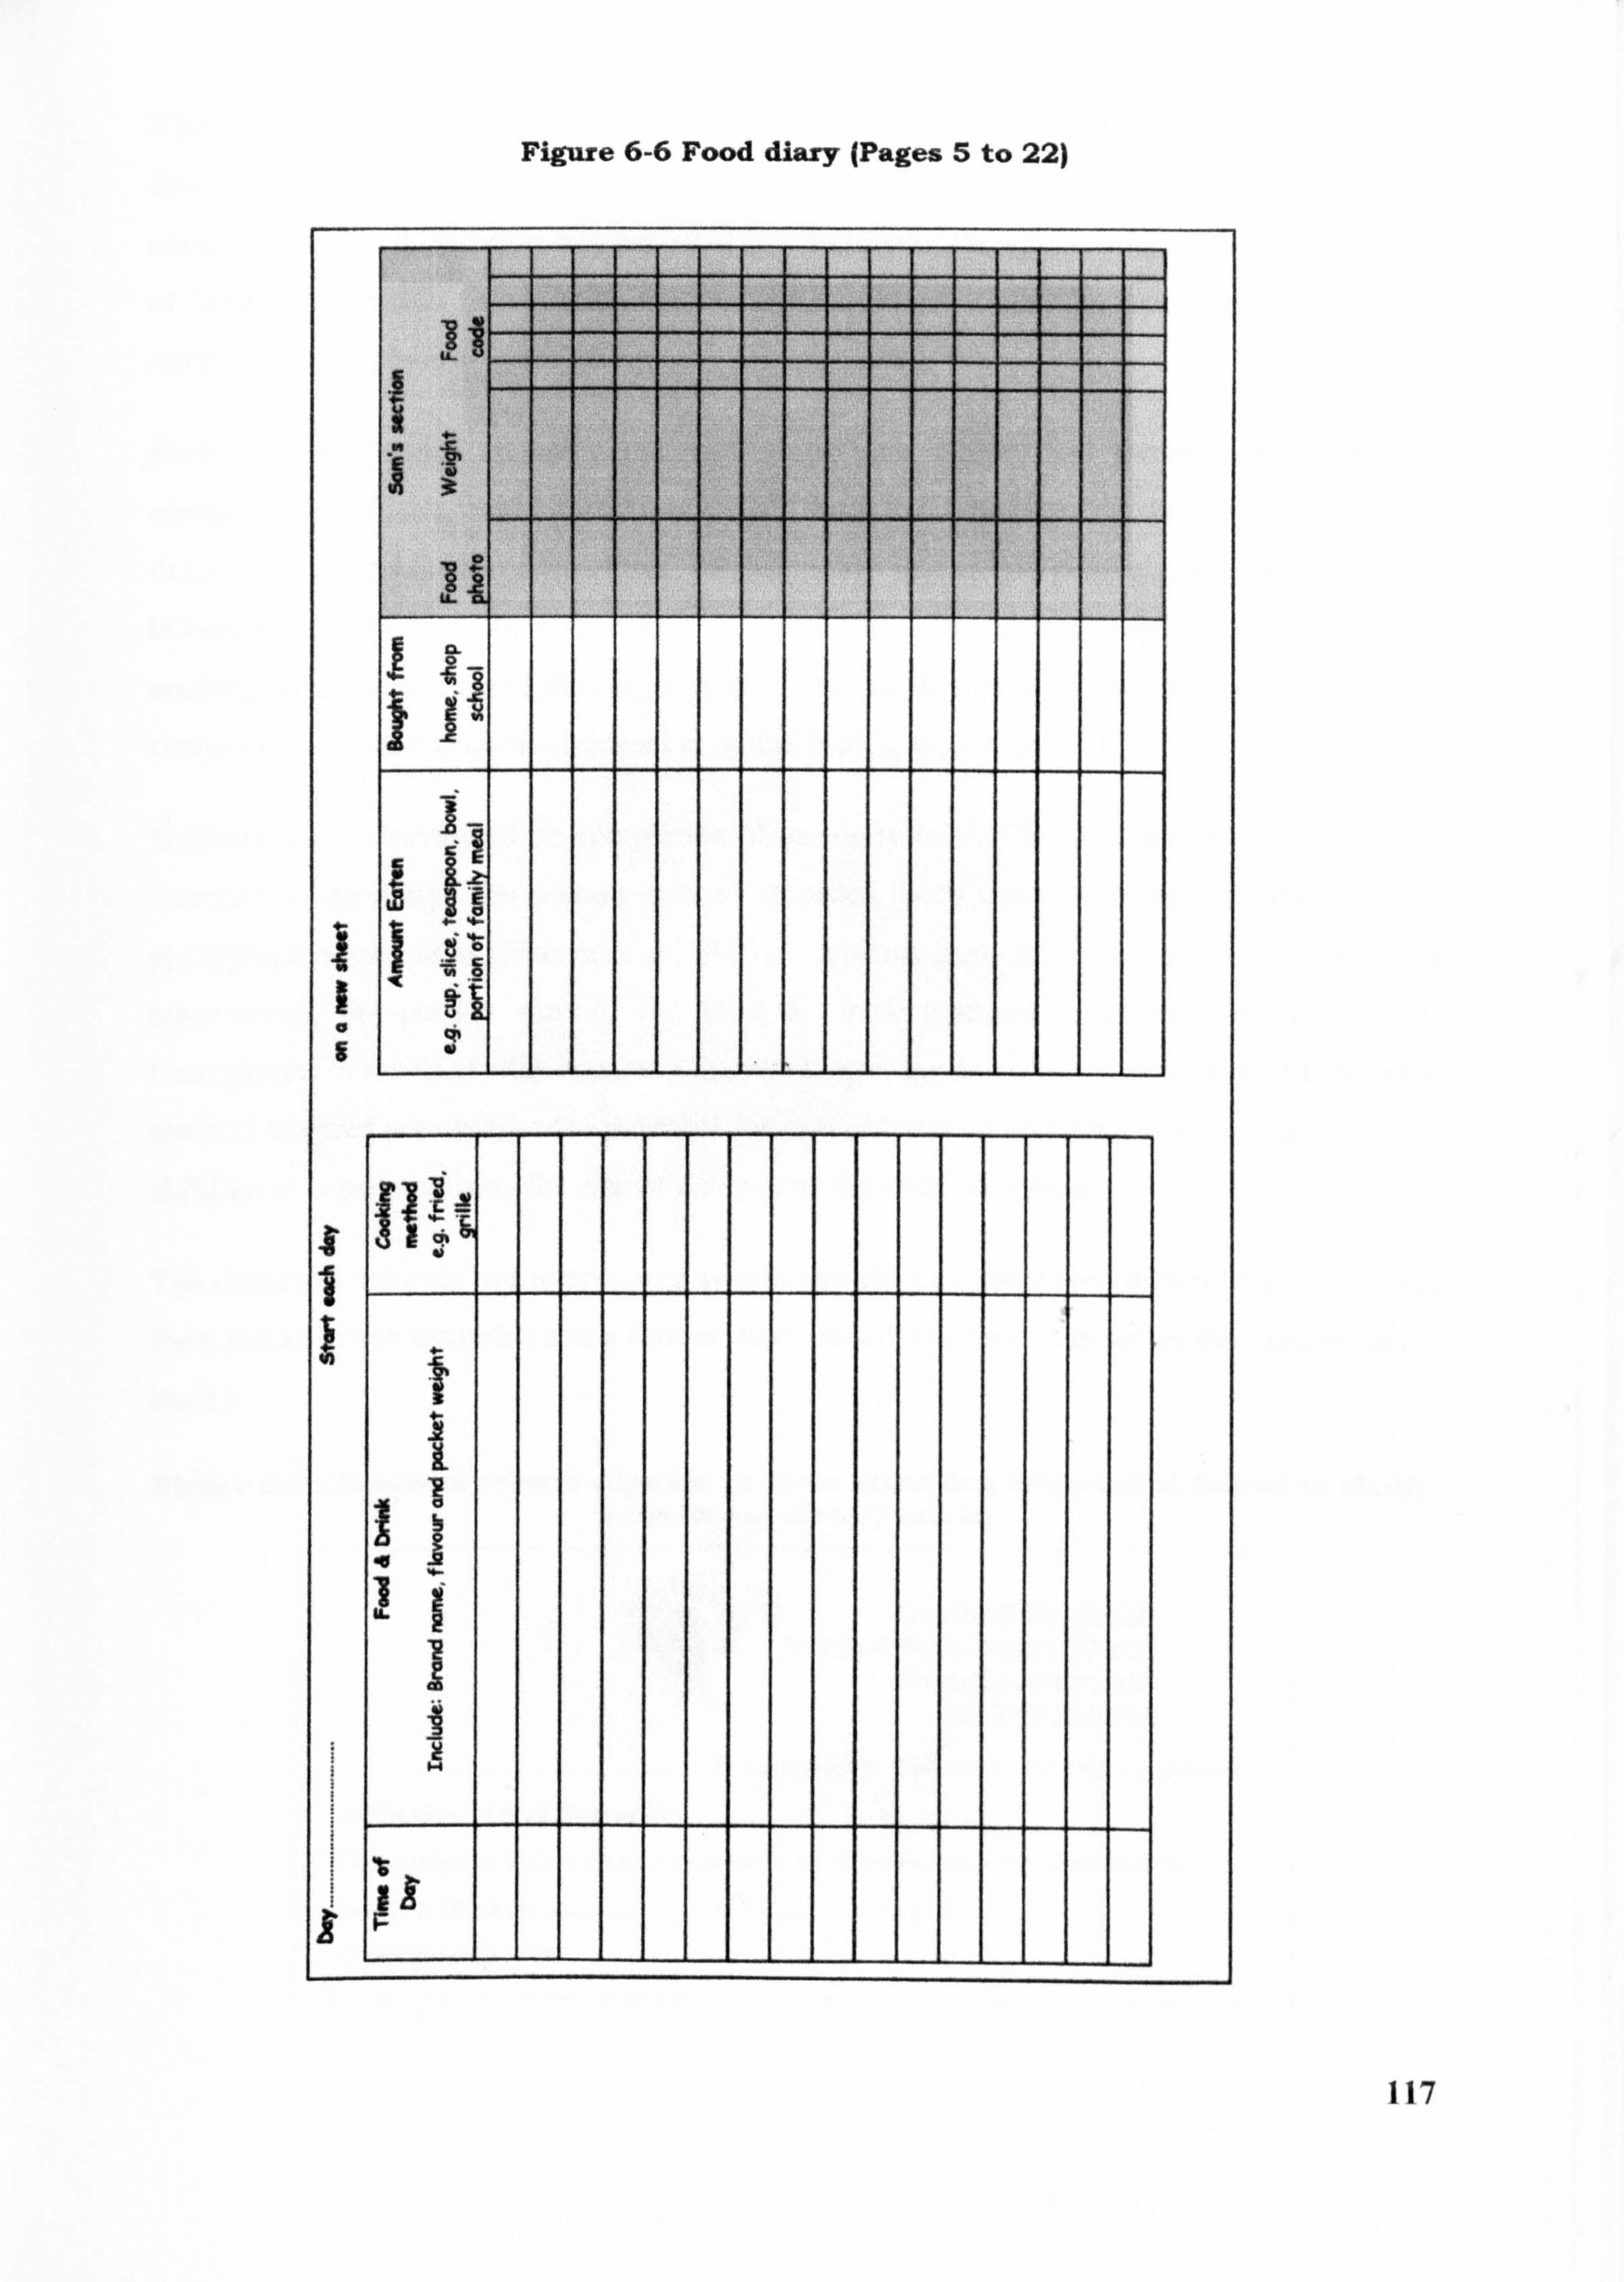
Figare 6-6 Food diary (Pages 5 to 22)
.61
117
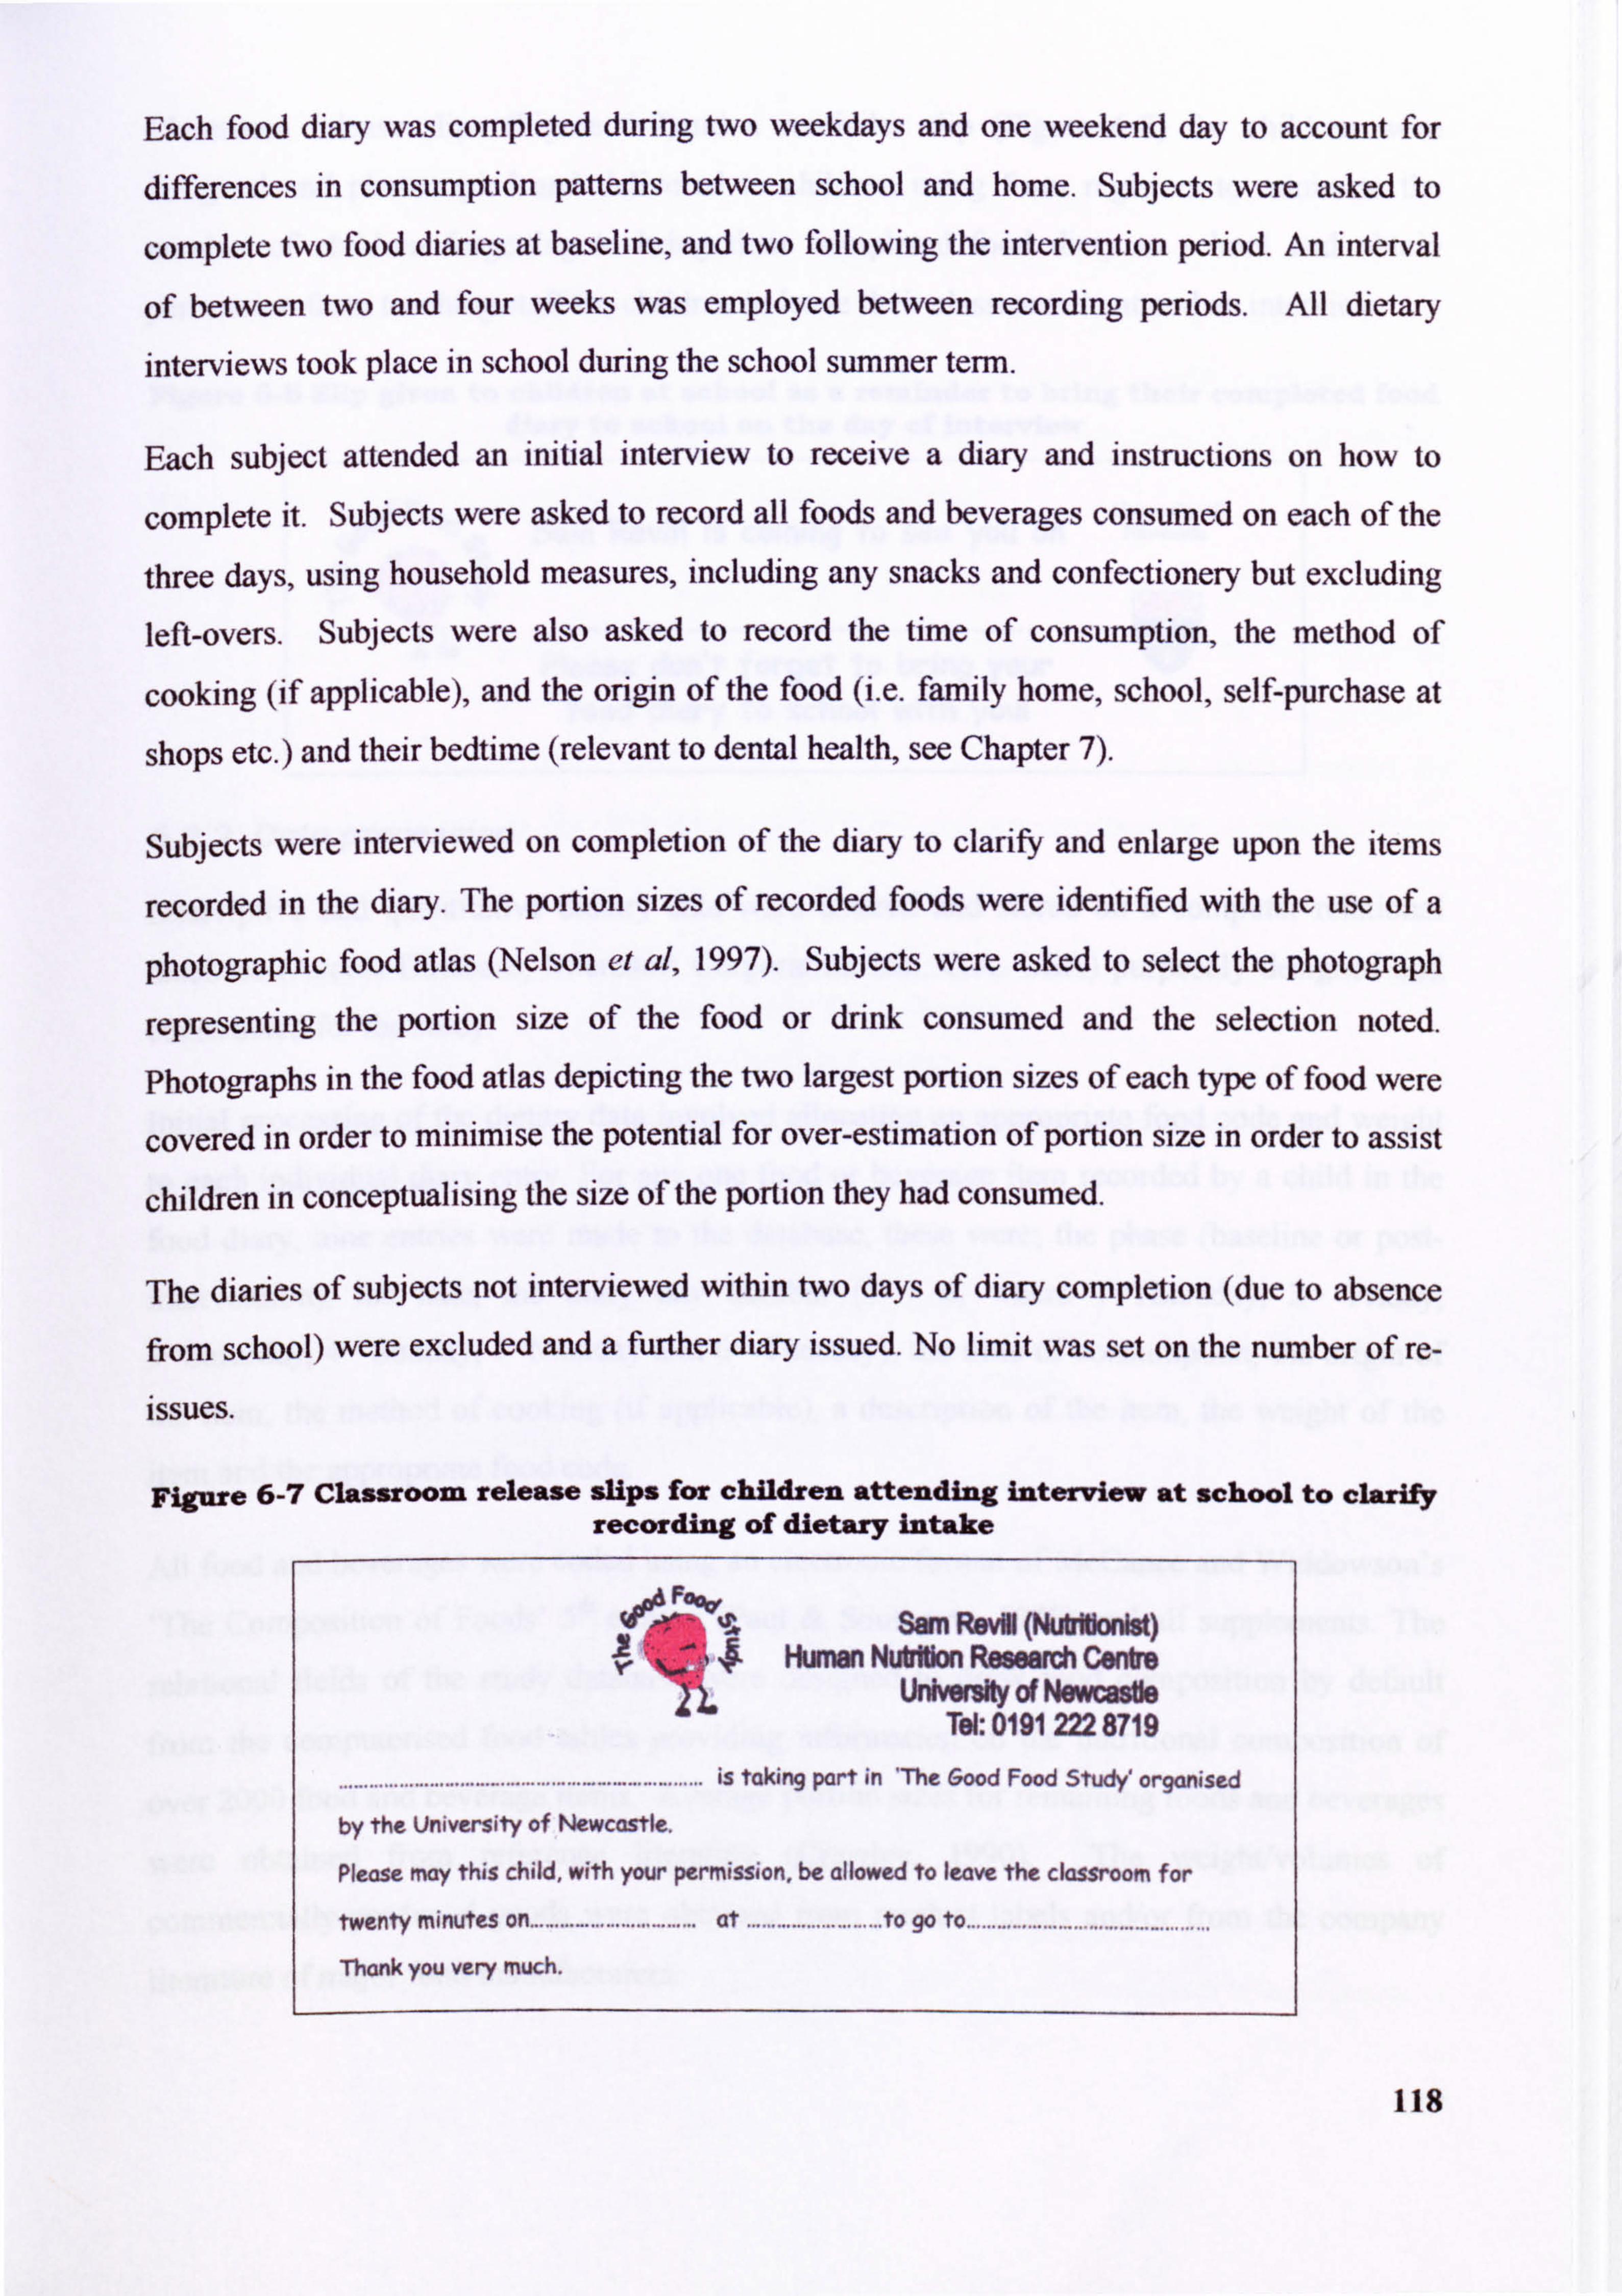
Each food diary was completed during two weekdays and one weekend day to account for
differences in consumption pattems between school and home. Subjects were asked to
complete two food diaries at baseline, and two following the intervention period. An interval
of between two and four weeks was employed between recording periods. All dietary
interviews took place in school dunng the school summer term.
Each subject attended an initial interview to receive a diary and instructions on how to
complete it. Subjects were asked to record all foods and beverages consumed on each of the
three days, using household measures, including any snacks and confectionery but excluding
left-overs. Subjects were also asked to record the time of consumption, the method of
cooking (if applicable), and the origin of the food (i. e. family home, school, self-purchase at
shops etc. ) and their bedtime (relevant to dental health, see Chapter 7).
Subjects were interviewed on completion of the diary to clarify and enlarge upon the items
recorded in the diary. The portion sizes of recorded foods were identified with the use of a
photographic food atlas (Nelson et al, 1997). Subjects were asked to select the photograph
representing the portion size of the food or drink consumed and the selection noted.
Photographs in the food atlas depicting the two largest portion sizes of each type of food were
covered in order to minimise the potential for over-estimation of portion size in order to assist
children in conceptualising the size of the portion they had consumed.
The diaries of subjects not interviewed within two days of diary completion (due to absence
from school) were excluded and a further diary issued. No limit was set on the number of re-
issues.
Figure 6-7 Classroom release sliPs for children attending interview at school to clarify recording of dietary intake
A ýAý 2
%; Ap* Sam R&M (P**Nbnist)
Ir Human Nt*rJm Ressamh Centre UnW* of Newcastle
Tel: 0191222 8719
. ........................................ II..................... is taking part in 'The Good Food Study' organised
by the University of Wwcastle.
please may this child, with your permission, be allowed to leave the classroom for
twenty minutes on ................................. at ........................... to go to .................................... ........... Thank you very much.
118
Classroom release slips (Figure 6-7)and a reminder slip (Figure 6-8) for children were designed and photocopied and delivered to children using form registers to minimise the
number of children forgetting to bring their completed food diary to school and obtain
permission from teaching staff for children to leave their classroom to attend an interview.
Figure 6-8 Slip given to children at school as a reminder to bring their completed food diary to school on the day of interview
Univasky ol Sam Revill is coming to see you on Newcutle
........ . ........... ..............
Please don't forget to bring your food diary to school with youl
6.2.2 Data processing
Descriptive and quantitative dietary data were entered and stored on a computer relational
database (Access Database, Microsoft Corporation Inc., C. A. USA) purposely designed and
constructed for the study.
Initial processing of the dietary data involved allocating an appropriate food code and weight
to each individual diary entry. For any one food or beverage item recorded by a child in the
food diary, nine entries were made to the database, these were; the phase (baseline or post-
intervention), the date, the diary day number (I -- 6, where IýThursday, 2= Friday,
3=Saturday, 4= Sunday, 5=Monday and 6= Tuesday), the time of consumption, the origin of
the item, the method of cooking (if applicable), a description of the item, the weight of the
item and the appropriate food code.
All food and beverages were coded using an electronic format of McCance and Widdowson's
'The Composition of Foods' 5 th edition (Paul & Southgate, 1978) and all supplements. The
relational fields of the study database were designed to draw food composition by default
from the computerised food tables providing information on the nutritional composition of
over 2000 food and beverage items. Average portion sizes for remaining foods and beverages
were obtained from reference literature (Crawley, 1990). The weight/volumes of
commercially produced goods were obtained from product labels and/or from the company
literature of major food manufacturers.
119
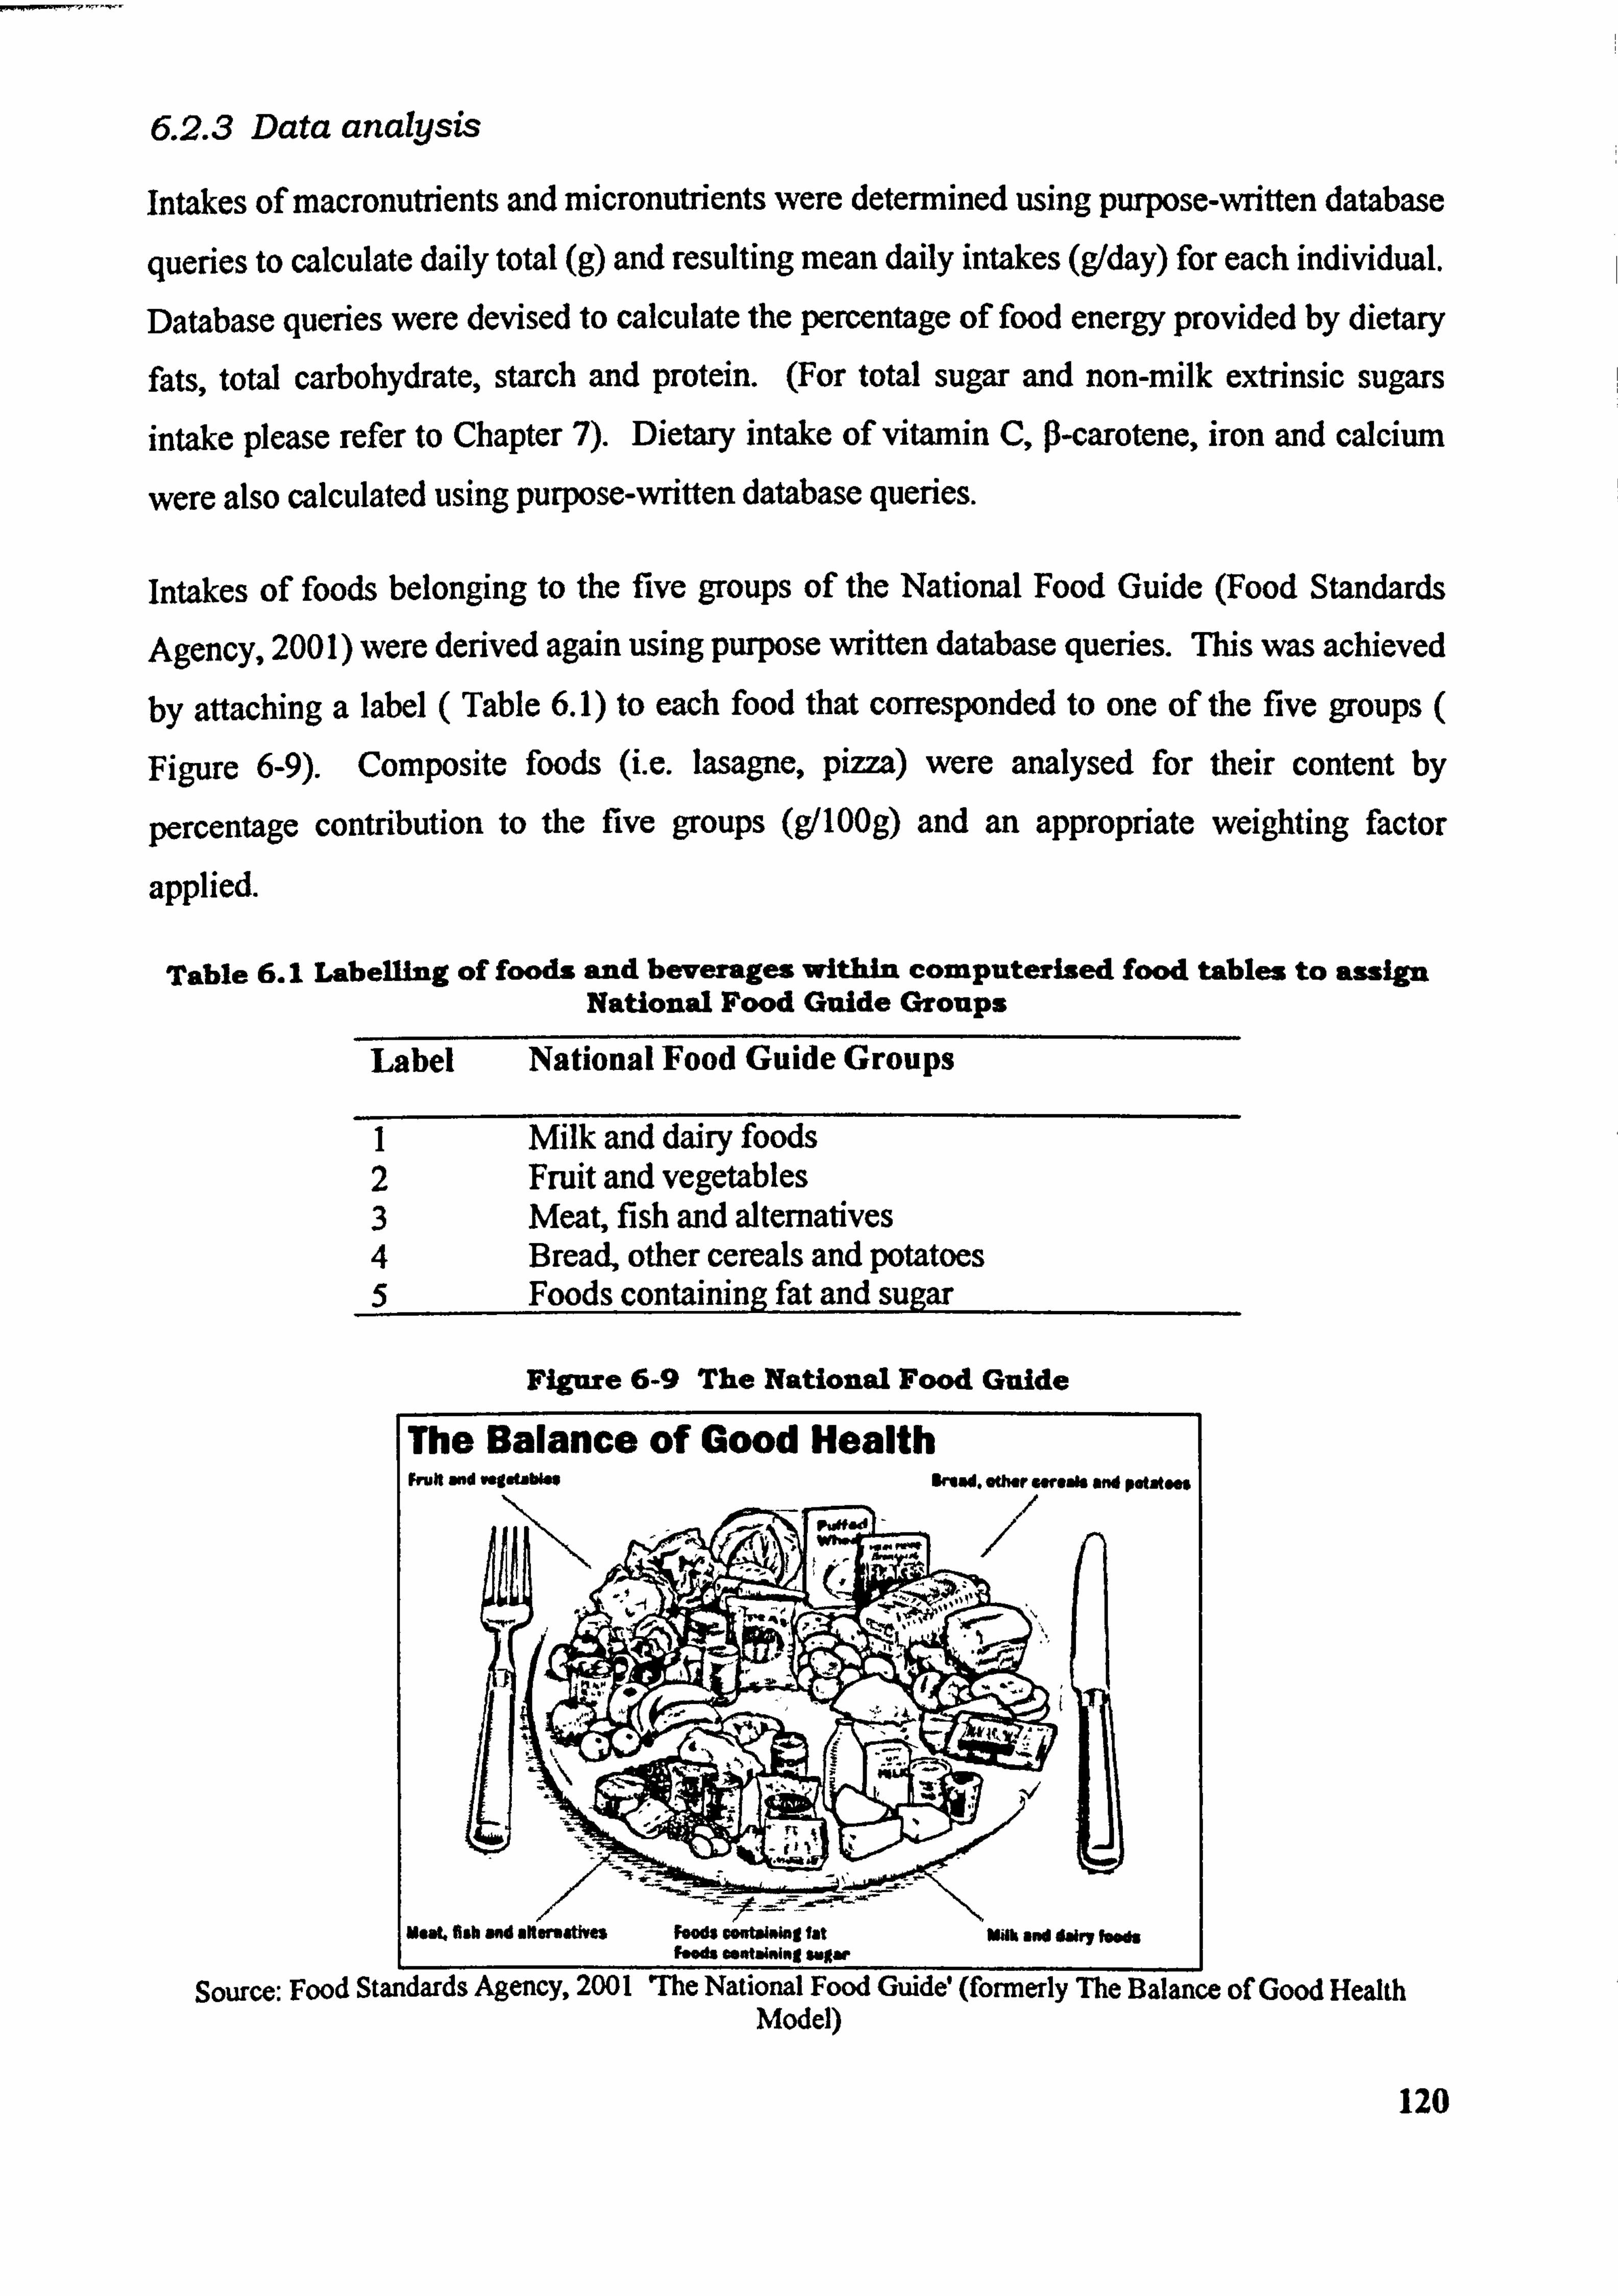
6.2.3 Data analysis
Intakes of macronutrients and micronutrients were detennined using purpose-written database
queries to calculate daily total (g) and resulting mean daily intakes (g/day) for each individual.
Database queries were devised to calculate the percentage of food energy provided by dietary
fats, total carbohydrate, starch and protein. (For total sugar and non-milk extrinsic sugars
intake please refer to Chapter 7). Dietary intake of vitamin C, P-carotene, iron and calcium
were also calculated using purpose-written database queries.
Intakes of foods belonging to the five groups of the National Food Guide (Food Standards
Agency, 2001) were derived again using purpose written database queries. Thiswasachieved
by attaching a label ( Table 6.1) to each food that corresponded to one of the five groups (
Figure 6-9). Composite foods (i. e. lasagne, pizza) were analysed for their content by
percentage contribution to the five groups (g/100g) and an appropriate weighting factor
applied.
Table 6.1 Labelling of foods and beverages within computerized food tables to assign National Food Guide Groups
Label National Food Guide Groups
I Milk and dairy foods 2 Fruit and vegetables 3 Meat, fish and altematives 4 Bread, other cereals and potatoes 5 Foods containing fat and sugar
Figure 6-9 The National Food Guide
The Balance of Good Health Fruit and vegetables 11mad. other streaft and potatoes
--; c- --
-. -
U*&L fish and milermatives foodil Contalaing fat NO and dairy feeft foods containing sugar I
Source: Food Standards Agency, 2001 7he National Food Guide (formerly The Balance of Good Health Model)
120

6.2.3 Data analysis
Intakes of macronutnents and micronutrients were determined using purpose-written database
queries to calculate daily total (g) and resulting mean daily intakes (g/day) for each individual.
Database queries were devised to calculate the percentage of food energy provided by dietary
fats, total carbohydrate, starch and protein. (For total sugar and non-milk extrinsic sugars
intake please refer to Chapter 7). Dietary intake of vitamin C, 0-carotene, iron and calcium
were also calculated using purpose-written database queries,
Intakes of foods belonging to the five groups of the National Food Guide (Food Standards
Agency, 2001) were derived again using purpose written database queries. Thiswasachieved
by attaching a label ( Table 6.1) to each food that corresponded to one of the five groups (
Figure 6-9). Composite foods (i. e. lasagne, pIZZa) were analysed for their content by
percentage contribution to the five groups (g/100g) and an appropriate weighting factor
applied.
Table 6.1 Labelling of foods and beverages within computerized food tables to assign National Food Guide Groups
Label National Food Guide Groups
I Milk and dairy foods 2 Fruit and vegetables 3 Meat, fish and alternatives 4 Bread, other cereals and potatoes 5 Foods containing fat and sugar
Source: Food Standards Agency, 2001 'The National Food Guide'(formerly The Balance of Good Health Model)
120
Figure 6-9 The National Food Guide
The data were subsequently transferred to SPSS for analysis. Primary analyses were carried
out on an intention to treat basis and included all subjects irrespective of attendance to the
Food Club. The primary analyses took the form of determining the mean (SE) of intakes of
macro- and micronutrients of both groups using SPSS. Differences between intervention and
control group at baseline and following intervention were determined using West. Within
group changes following intervention were determined using paired west. Secondary
analyses by sex were carried out using paired west for within group changes and differences
between groups determined using t-test. The relationship between dietary variables and social
deprivation were investigated using Pearson's' and Spearmans' rank correlation and by linear
regression analysis (as appropriate to the normality of the data).
6.3 Results
One hundred and sixty seven children (84 children in the intervention group and 83 children
in the control group) completed all four dietary diaries at phase TO and TI. Of the 171
children completing the two sets of dietary diaries phase TO and TI, two subjects were
excluded from the final analysis as having withdrawn ftom. the Food Club during the Spring
Term and two subjects excluded on the basis of not completing questionnaires (see Chapter
8). One further subject was excluded from the final analysis due to incomplete dietary diaries.
(Examples of diary entries are given Section 12.11).
primary statistical analysis of the macronutrient intake of children at baseline showed that the
data were normally distributed and median values for energy (MJ), total carbohydrate (g),
protein (g), total fat (g) and saturated fat (g) to be within 2%, 4%, 4%, 3% and 6% of the
mean values respectively. Primary analysis of the intake of the same nutrients at post-
intervention revealed the median values to be within 1%, 2%, 5%, <1% and <1% of the
median values for energy, total carbohydrate, protein, total fat and saturated fat respectively.
A primary statistical analysis of the foods consumed by the children according to the five food
groups of the National Food Guide showed that the data were not normally distributed and the
have been presented as median values (IQ range). Mann Whitney test of differences between
the control and intervention group was employed and Wilcoxon signed rank test to examine the statistical difference within groups.
primary statistical analysis of micronutrient intake by children of the intervention and control
group showed the data not be normally distributed and median values to be between 9% and 121
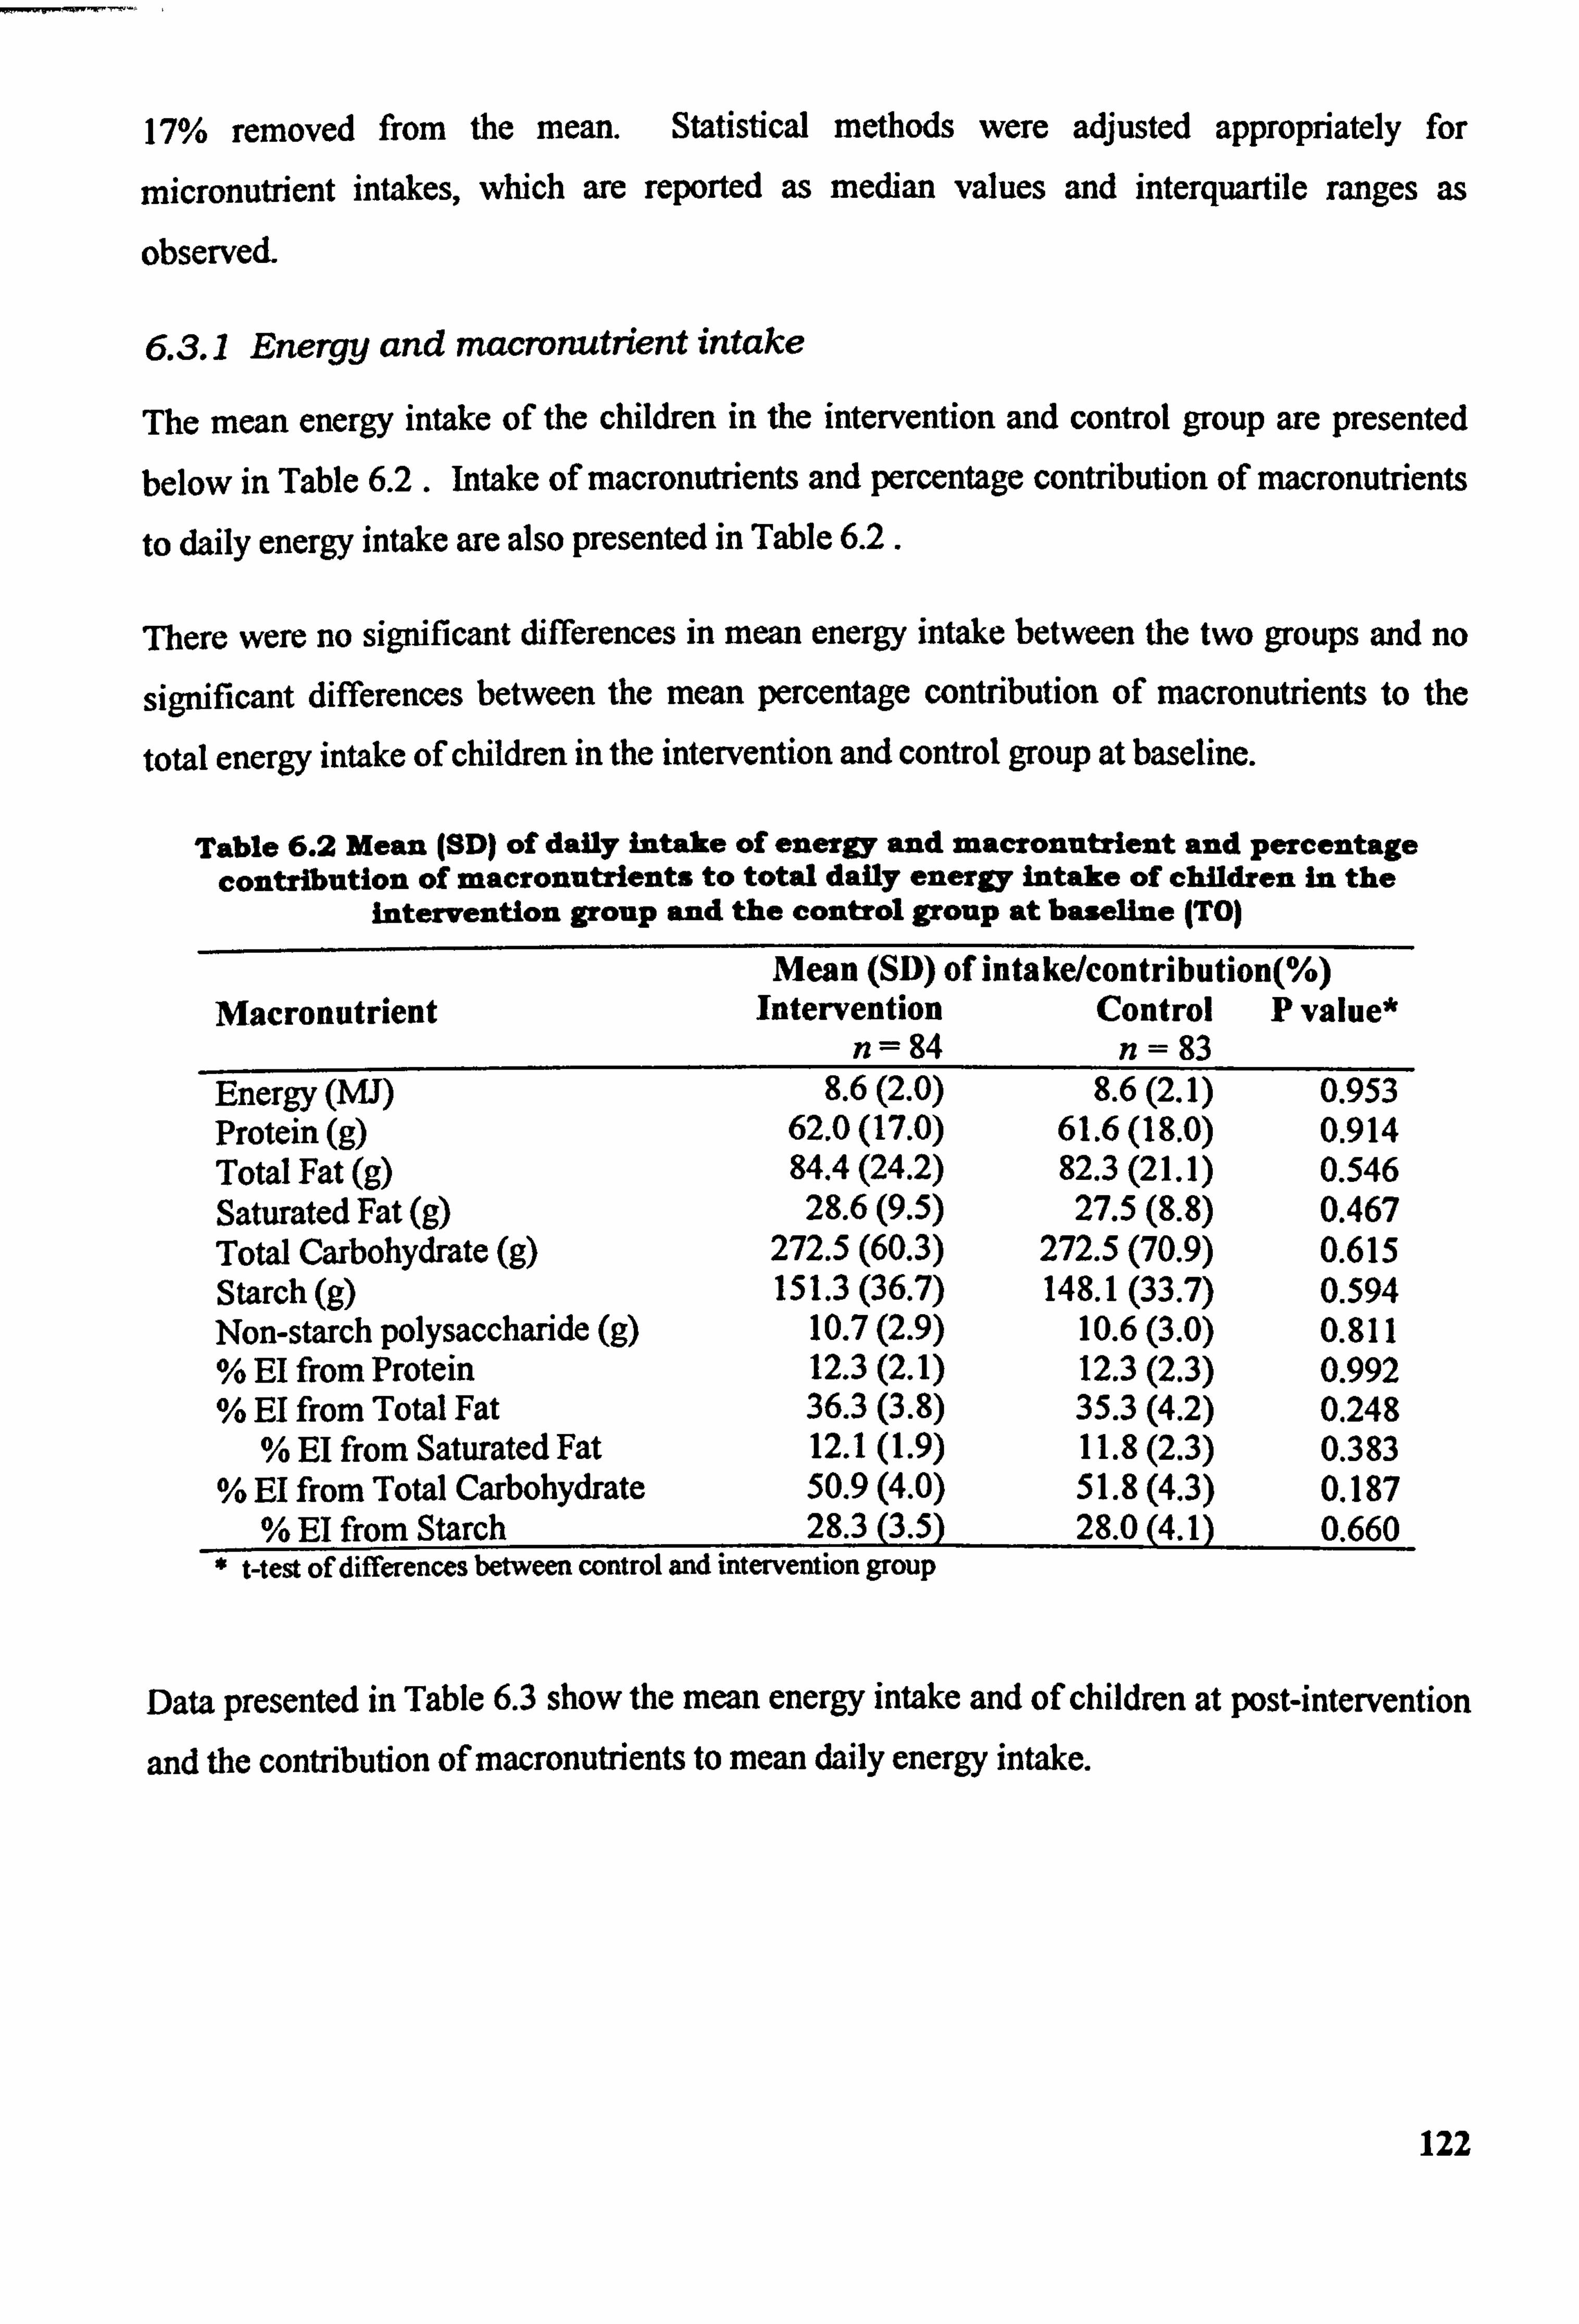
17% removed from the mean. Statistical methods were adjusted appropriately for
micronutrient intakes, which are reported as median values and interquartile ranges as
observecL
6.3.1 Energy and macronutrient intake
The mean energy intake of the children in the intervention and control group are presented
below in Table 6.2 . Intake of macronutrients and percentage contribution of macronutrients,
to daily energy intake are also presented in Table 6.2.
Ilere were no significant differences in mean energy intake between the two groups and no
significant differences between the mean percentage contribution of macronutrients to the
total energy intake of children in the intervention and control group at baseline.
Table 6.2 Mean (SD) of daily intake of energy and macronutrient and percentage contribution of macronutrients to total daily energy intake of children in the
intervention group and the control group at baseline (TO)
Macronutrient Mean (SD) of intake/contributio
Intervention Control n= 84 n= 83
n(%) P value*
Energy (MJ) 8.6(2.0) 8.6(2.1) 0.953 Protein (g) 62.0(17.0) 61.6(18.0) 0.914 Total Fat (g) 84.4(24.2) 82.3(21.1) 0.546 Saturated Fat (g) 28.6(9.5) 27.5(8.8) 0.467 Total Carbohydrate (g) 272.5 (60.3) 272.5 (70.9) 0.615 Starch (g) 151.3 (36.7) 148.1 (33.7) 0.594 Non-starch polysaccharide (g) 10.7(2.9) 10.6(3.0) 0.811 % El from Protein 12.3(2.1) 12.3(2.3) 0.992 % El from Total Fat 36.3(3.8) 35.3(4.2) 0.248
% El from Saturated Fat 12.1(1.9) 11.8(2.3) 0.383 % El from Total Carbohydrate 50.9(4.0) 51.8(4.3) 0.187
% El from Starch 28.3(3.5) 28.0(4.1) 0.660 * t-test of differences between control and intervention group
Data presented in Table 6.3 show the mean energy intake and of children at post-intervention
and the contribution of macronutrients; to mean daily energy intake.
122
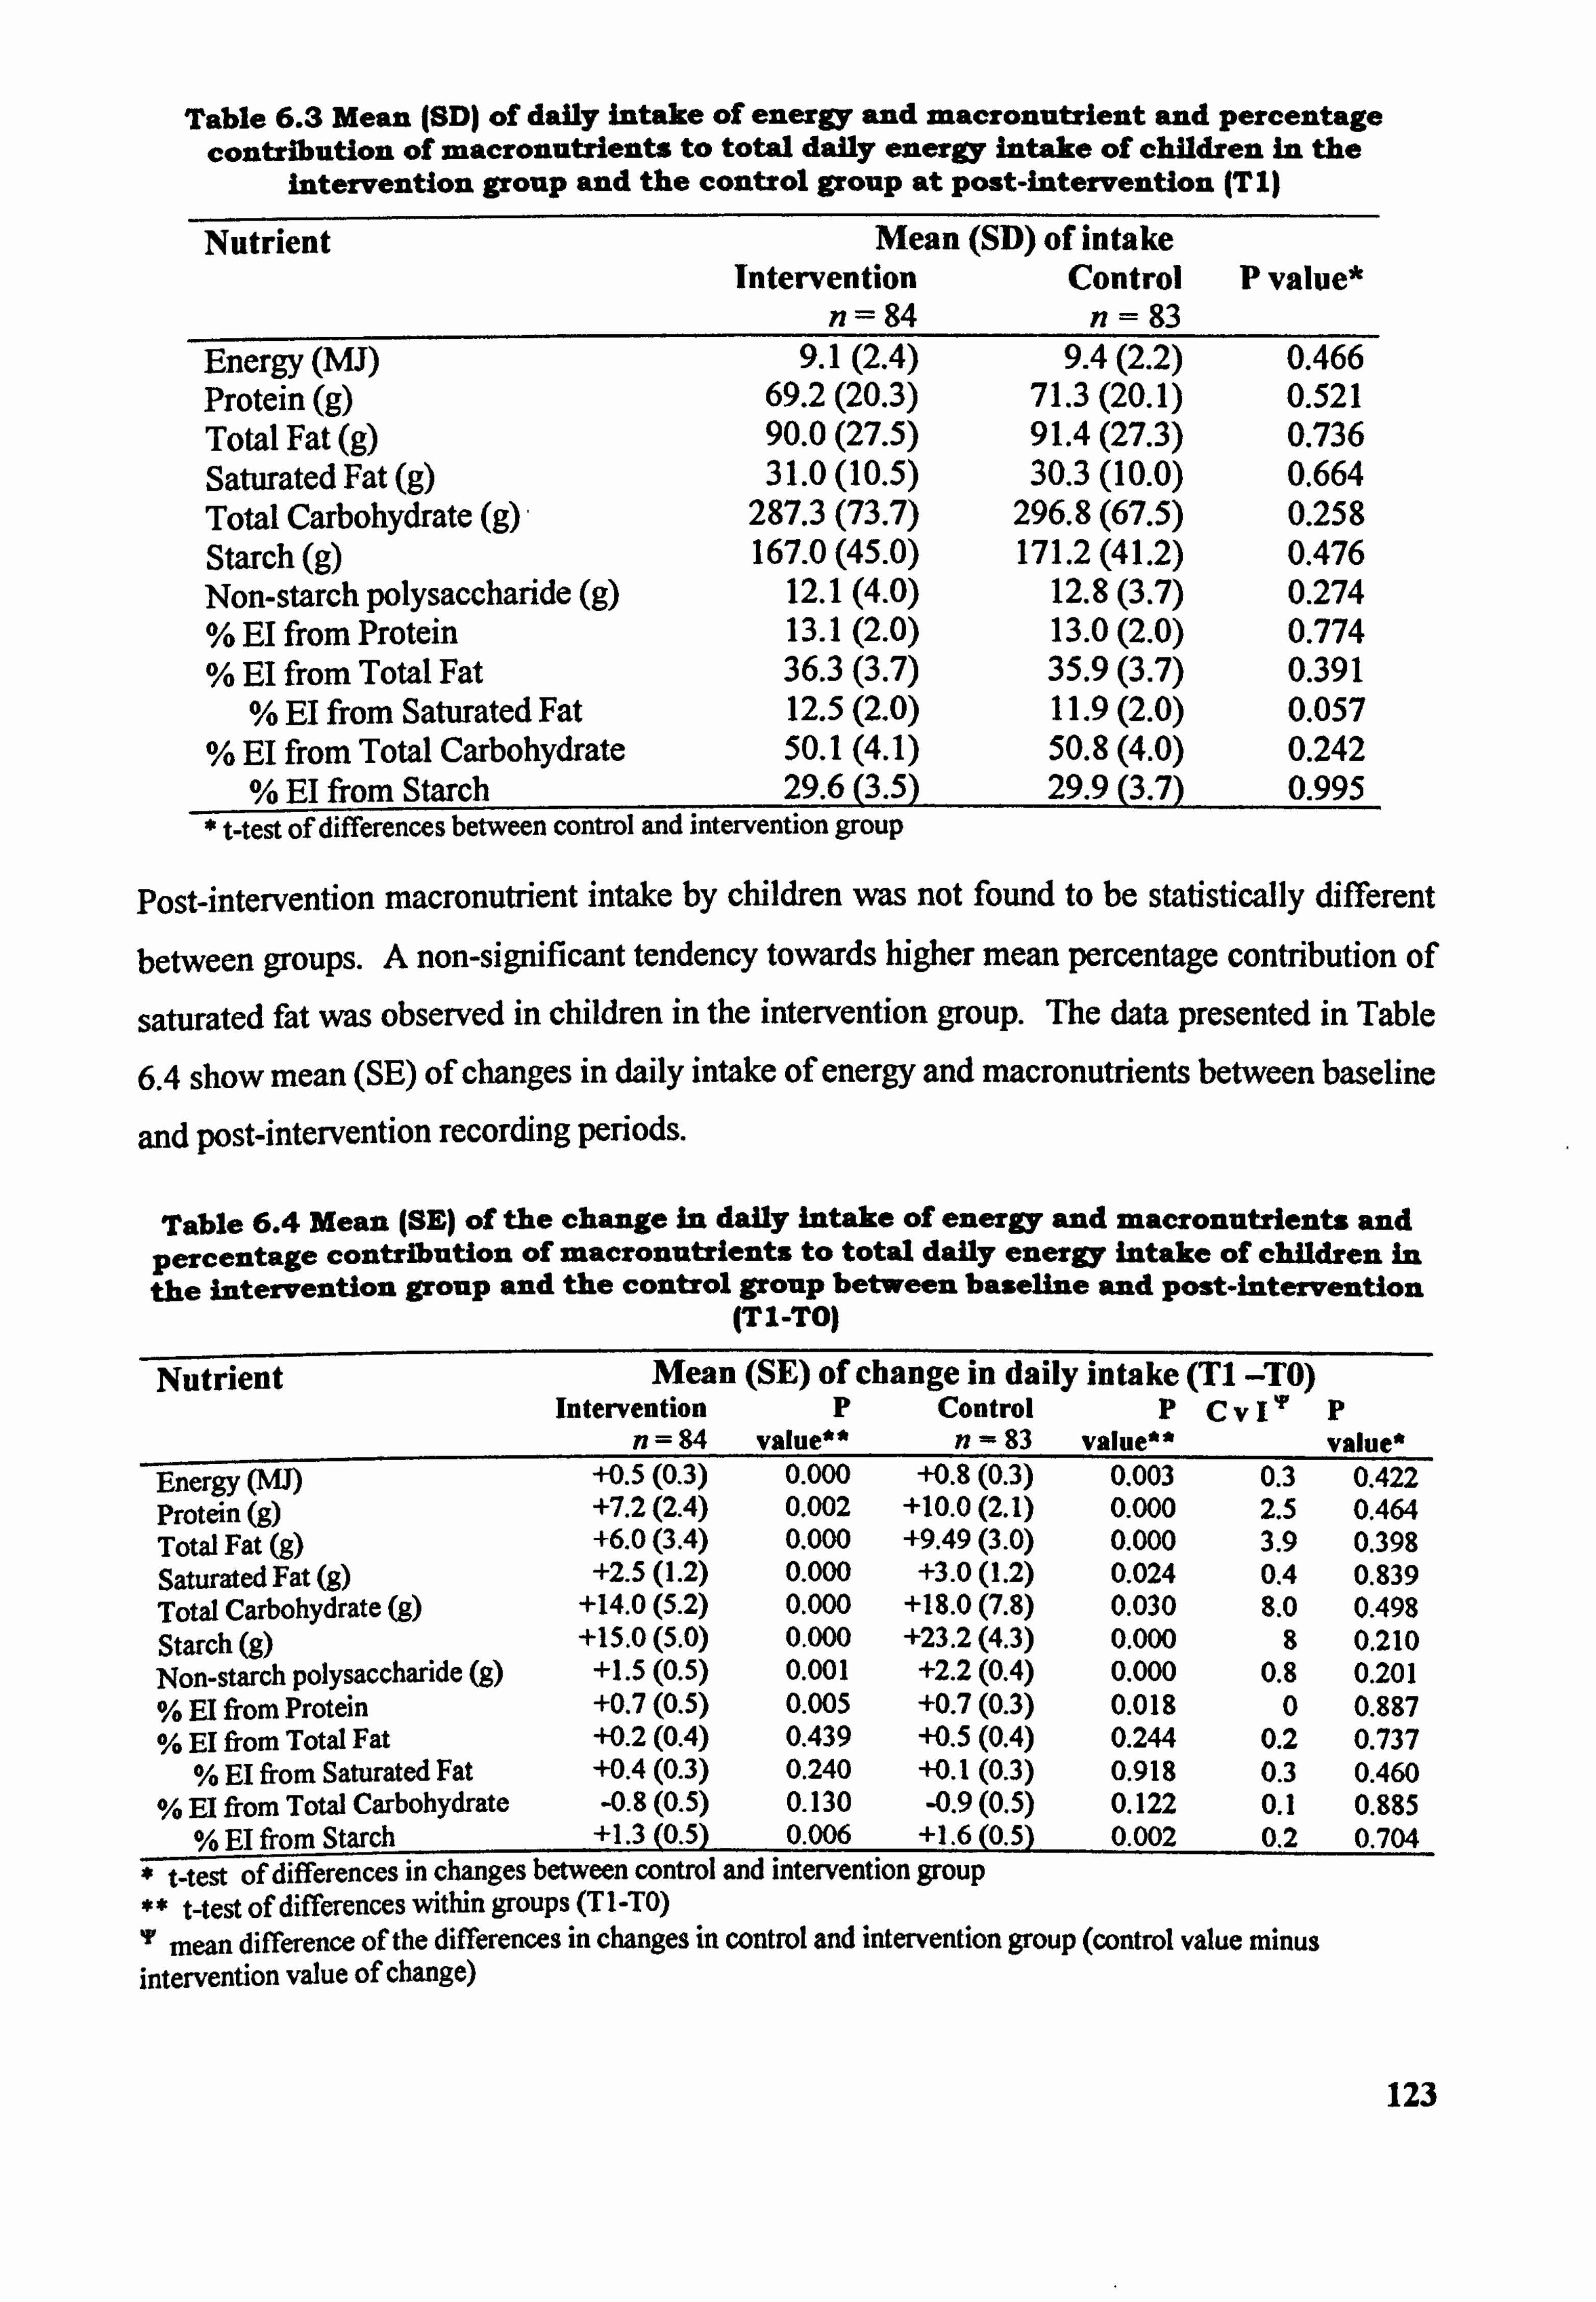
Table 6.3 Mean (SD) of daily intake of energy and macronutrient and percentage contribution of macronutrients to total daily energy Inta e of children in the
intervention group and the control group at post-intervention (T I)
Nutrient Mean (SD) of intake Intervention Control P value*
n= 84 n= 83 Energy (MJ) 9.1(2.4) 9.4(2.2) 0.466 Protein (g) 69.2(20.3) 71.3(20.1) 0.521 Total Fat (g) 90.0(27.5) 91.4(27.3) 0.736 Saturated Fat (g) 31.0(10.5) 30.3(10.0) 0.664 Total Carbohydrate (g) 287.3 (73.7) 296.8 (67.5) 0.258 Starch (g) 167.0 (45.0) 171.2 (41.2) 0.476 Non-starch polysaccharide (g) 12.1(4.0) 12.8(3.7) 0.274 % El from Protein 13.1(2.0) 13.0(2.0) 0.774 % El from Total Fat 36.3(3.7) 35.9(3.7) 0.391
% EI from Saturated Fat 12.5(2.0) 11.9(2.0) 0.057 % El from Total Carbohydrate 50.1(4.1) 50.8(4.0) 0.242
% EI from Starch 29.6(3.5) 29.9(3.7) 0.995 t-test of differences between control and intervention group
Post-intervention macronutrient intake by children was not found to be statistically different
between groups. A non-significant tendency towards higher mean percentage contribution of
saturated fat was observed in children in the intervention group. The data presented in Table
6.4 show mean (SE) of changes in daily intake of energy and macronutrients between baseline
and post-intervention recording periods.
Table 6.4 Mean (SE) of the change In daily intake of energy and macronutrients and percentage contribution of macronutrients to total daily energy intake of children in the intervention group and the control group between baseline and Post-intervention
(TI-TO)
Nutrient Mean (SE) of change in daily intake (T1 -TO) Intervention P Control PCV I'p
n=94 value" n- 83 value" P value*
Energy (MJ) +0.5(0.3) 0.000 +0.8(0.3) 0.003 0.3 0.422 Protein (g) +7.2(2.4) 0.002 +10.0(2.1) 0.000 2.5 0.464 Total Fat (g) +6.0(3.4) 0.000 +9.49(3.0) 0.000 3.9 0.398 Saturated Fat (g) +2.5(l. 2) 0.000 +3.0(1.2) 0.024 0.4 0.839 Total Carbohydrate (g) +14.0(5.2) 0.000 +18.0(7.8) 0.030 8.0 0.498 Starch (g) +15.0(5.0) 0.000 +23.2(4.3) 0.000 8 0.210 Non-starch polysaccharide (g) +1.5(0.5) 0.001 +2.2(0.4) 0.000 0.8 0.201 % EI from Protein +0.7(0.5) 0.005 +0.7(0.3) 0.018 0 0.897 % El from Total Fat +0.2(0.4) 0.439 +0.5(0.4) 0.244 0.2 0.737
% El from Saturated Fat +0.4(0.3) 0.240 +0.1(0.3) 0.918 0.3 0.460 % El from Total Carbohydrate -0.8(0.5) 0.130 -0.9(0.5) 0.122 0.1 0.885
% El from Starch +1.3(0.5) 0.006 +1.6(0.5) 0.002 0.2 0.704 -t-test of differences in changes between control and intervention group
** t-test of differences within groups (TI-TO)
mean difference of the differences in changes in control and intervention group (control value minus intervention value of change)
123
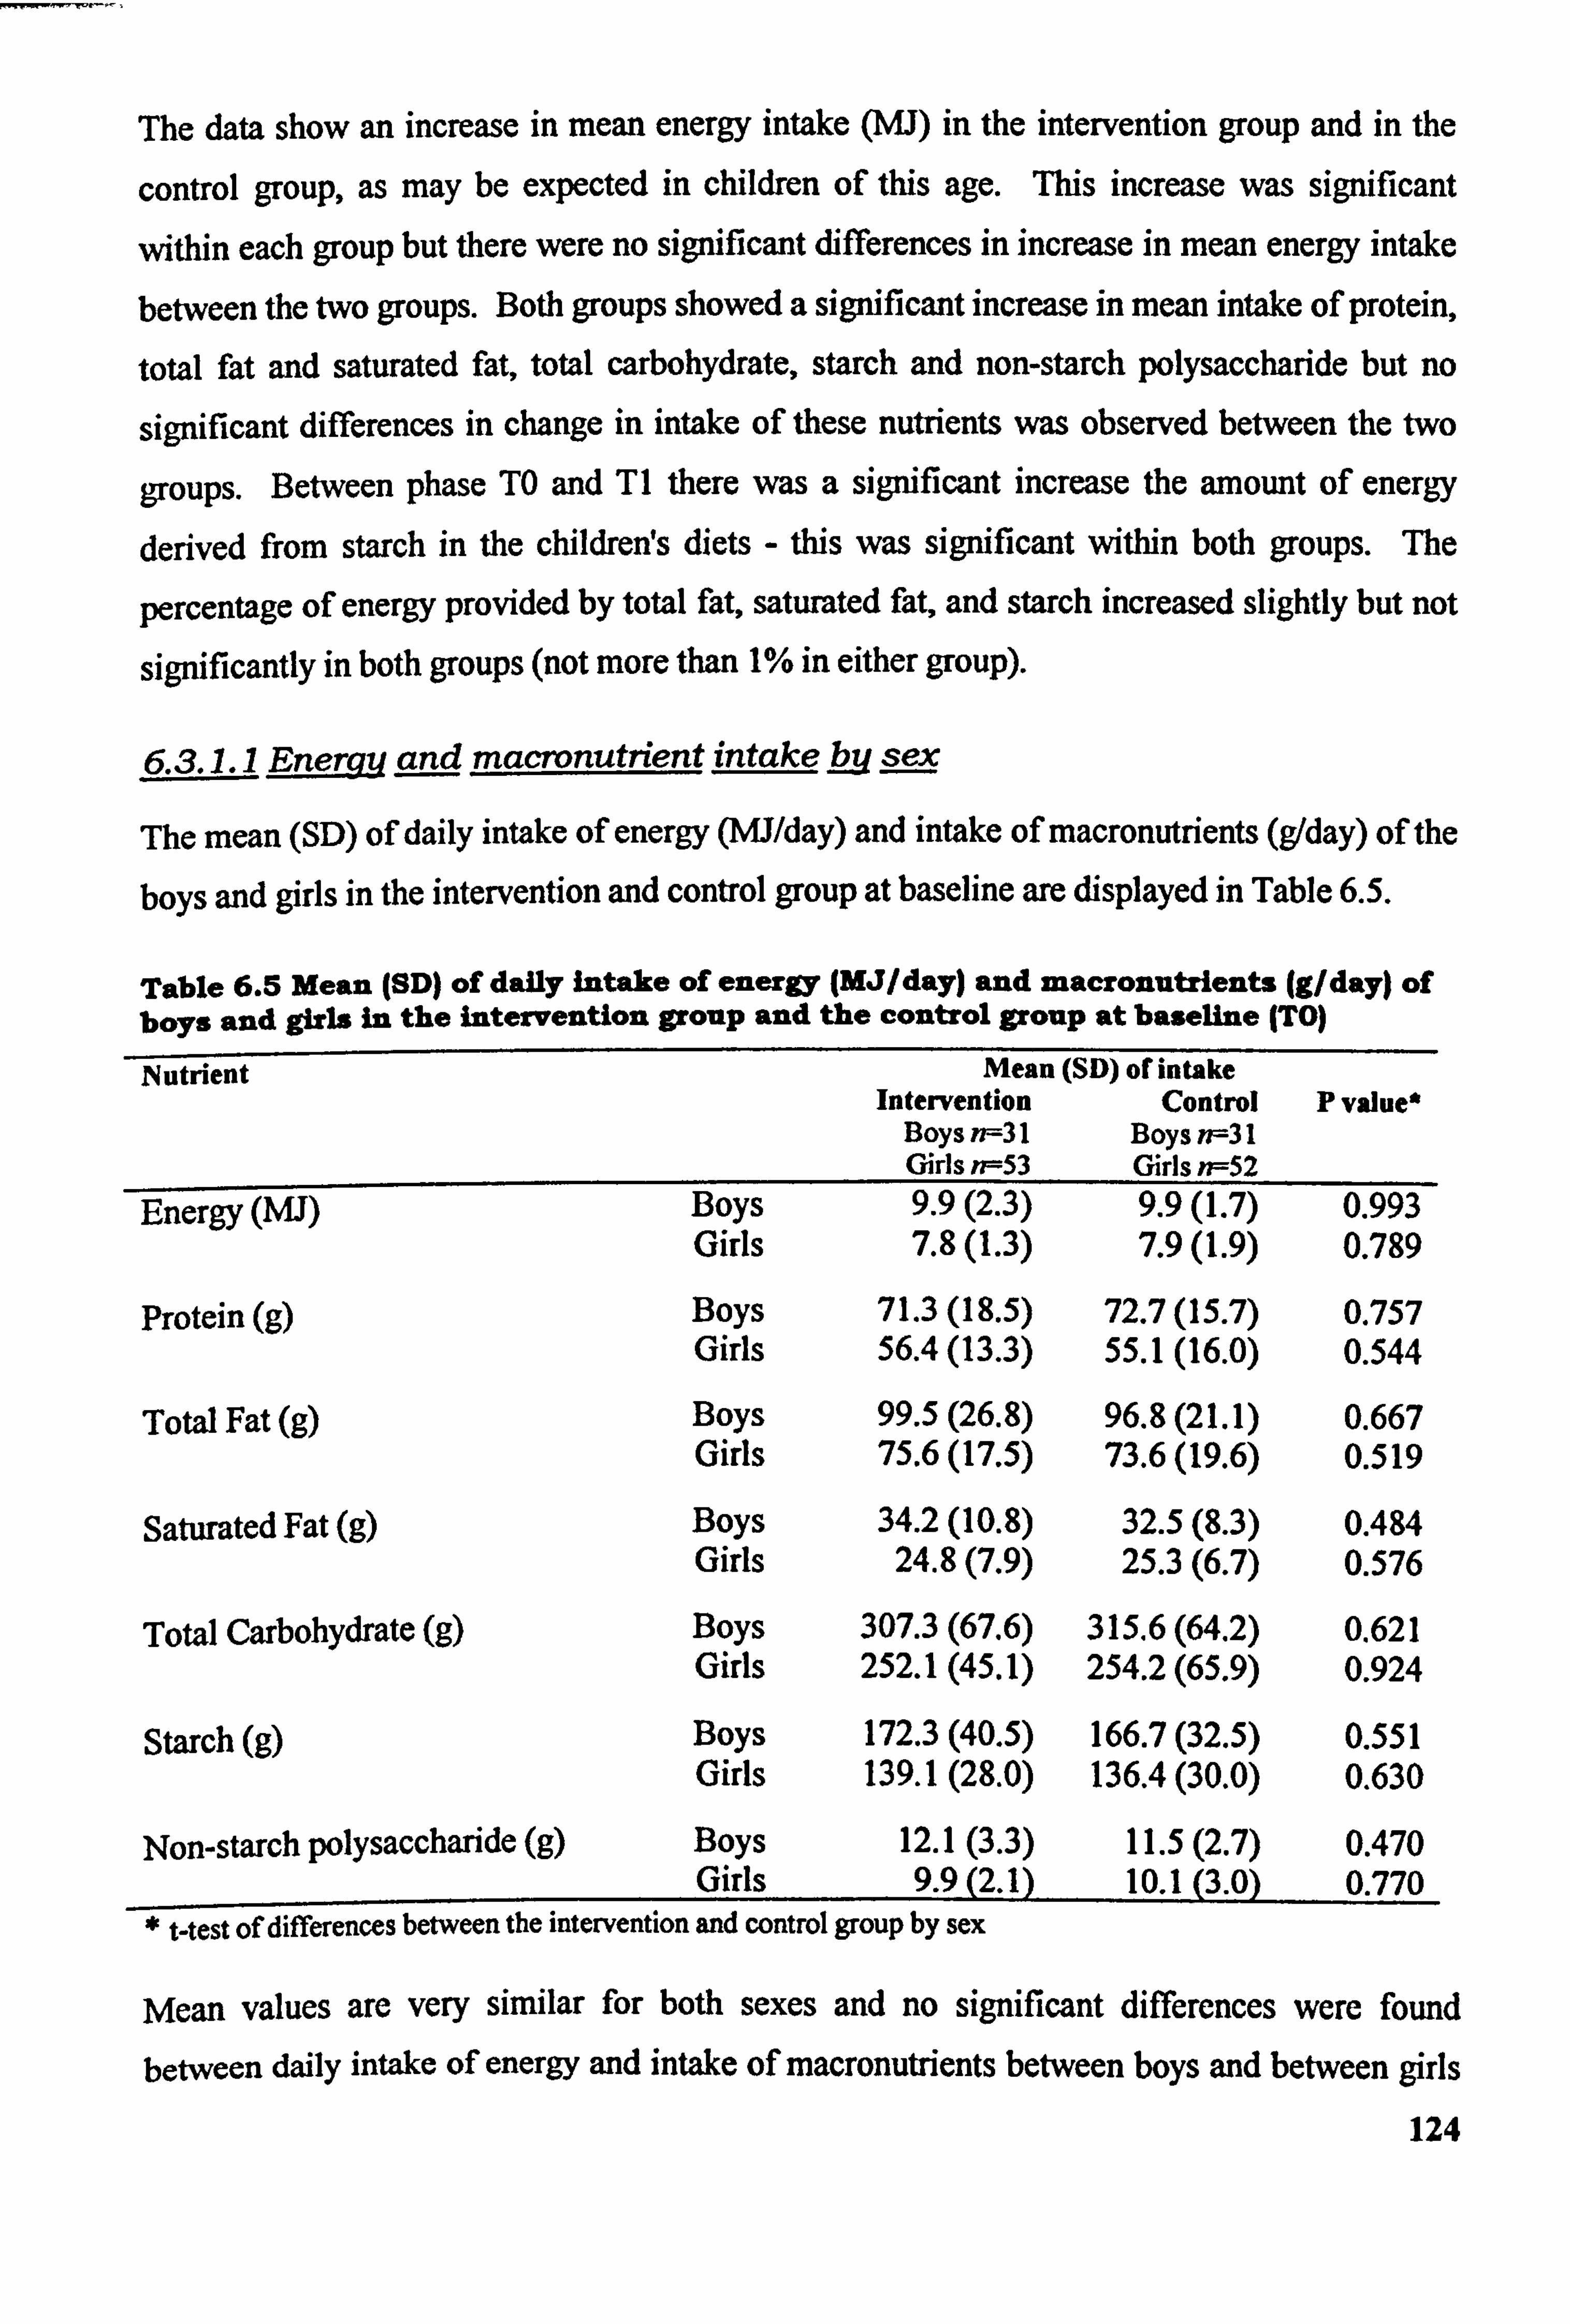
The data show an increase in mean energy intake (MJ) in the intervention group and in the
control group, as may be expected in children of this age. This increase was significant
within each group but there were no significant differences in increase in mean energy intake
between the two groups. Both groups showed a significant increase in mean intake of protein,
total fat and saturated fat, total carbohydrate, starch and non-starch polysaccharide but no
significant differences in change in intake of these nutrients was observed between the two
groups. Between phase TO and TI there was a significant increase the amount of energy
derived from starch in the childrens diets - this was significant within both groups. The
percentage of energy provided by total fat, saturated fat, and starch increased slightly but not
significantly in both groups (not more than 1% in either group).
6.3.1.1 Ene and macrvnutrient intake by sex
The mean (SD) of daily intake of energy (MJ/day) and intake of macronutrients (g/day) of the
boys and girls in the intervention and control group at baseline are displayed in Table 6.5.
Table 6.5 Mean (SD) of daily Intake of energy (MJ/day) and macronutrients (g/day) of boys and girls In the intervention group and the control group at baseline (TO)
Nutrient Mean (SD) of intake Intervention Control p value*
Boys n--31 Boys ff--31 Girls n--53 Girls n=52
Boys 9.9(2.3) Energy (MJ) 9.9(l. 7) 0.99T Girls 7.8(l. 3) 7.9(l. 9) 0.789
Protein (g) Boys 71.3(18.5) 72.7(15.7) 0.757 Girls 56.4(13.3) 55.1(16.0) 0.544
Total Fat (g) Boys 99.5(26.8) 96.8(21.1) 0.667 Girls 75.6(17.5) 73.6(19.6) 0.519
Saturated Fat (g) Boys 34.2(10.8) 32.5(8.3) 0.484 Girls 24.8(7.9) 25.3(6.7) 0.576
Total Carbohydrate (g) Boys 307.3 (67.6) 315.6 (64.2) 0.621 Girls 252.1 (45.1) 254.2 (65.9) 0.924
Starch (g) Boys 172.3 (40.5) 166.7 (32.5) 0.551 Girls 139.1 (28.0) 136.4 (30.0) 0.630
Non-starch polysaccharide (g) Boys 12.1(3.3) 11.5(2.7) 0.470 Girls 9.9(2.1) 10.1(3.0) 0.770
* t-test of differences between the intervention and control group by sex
Mean values are very similar for both sexes and no significant differences were found
betwecn daily intakc of cnergy and intake of macronutrients between boys and between girls
124
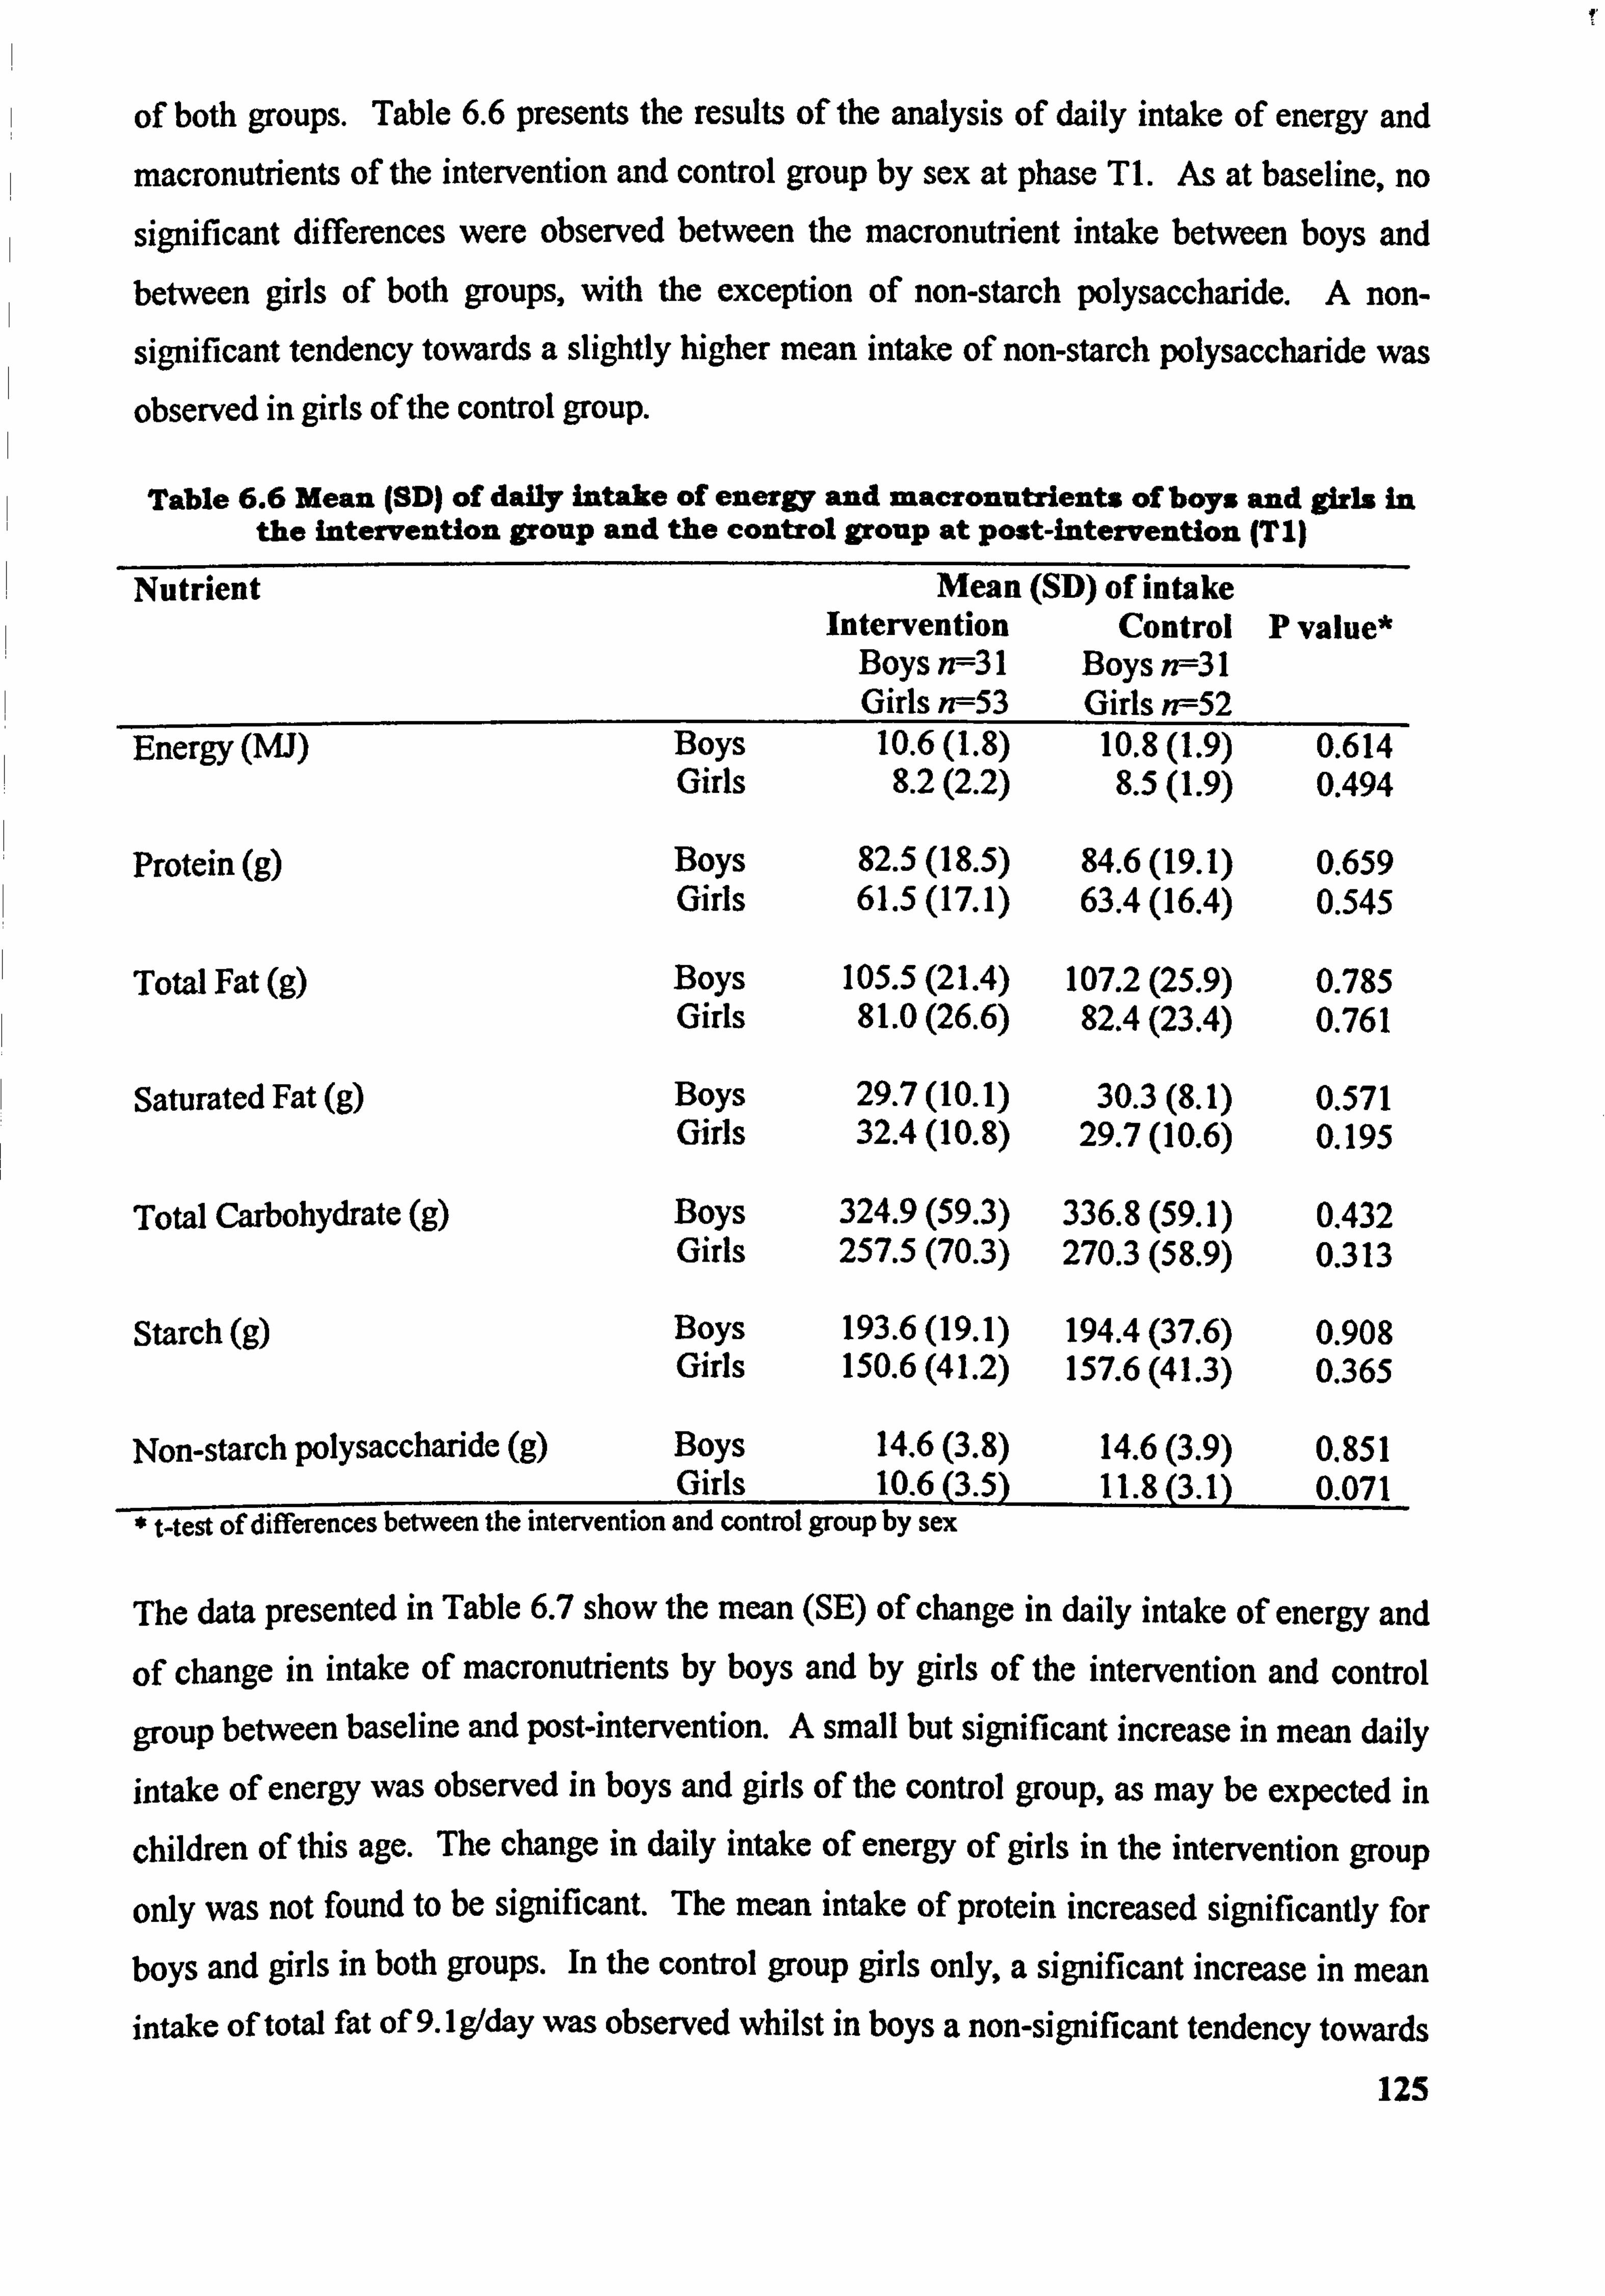
of both groups. Table 6.6 presents the results of the analysis of daily intake of energy and
macronutrients of the intervention and control group by sex at phase TI. As at baseline, no
significant differences were observed between the macronutrient intake between boys and between girls of both groups, with the exception of non-starch polysaccharide. A non-
significant tendency towards a slightly higher mean intake of non-starch polysaccharide was
observed in girls of the control group.
Table 6.6 Mean (SD) of daily intake of energy and macronutrients of boys and girls in the intervention group and the control group at post-intervention (T I)
Nutrient Mean (SD) of intake Intervention Control P value*
Boys n--31 Boys n--31 Girls n--53 Girls n--52
Energy (W) Boys 10.6(l. 8) 10.8(l. 9) 0.614 Girls 8.2(2.2) 8.5(l. 9) 0.494
Protein (g) Boys 82.5(18.5) 84.6(19.1) 0.659 Girls 61.5(17.1) 63.4(16.4) 0.545
Total Fat (g) Boys 105.5 (21.4) 107.2 (25.9) 0.785 Girls 81.0(26.6) 82.4(23.4) 0.761
Saturated Fat (g) Boys 29.7(10.1) 30.3(8.1) 0.571 Girls 32.4(10.8) 29.7(10.6) 0.195
Total Carbohydrate (g) Boys Girls
324.9 (59.3) 336.8 (59.1) 0.432 257.5 (70.3) 270.3 (58.9) 0.313
Starch (g) Boys 193.6 (19.1) 194.4 (37.6) 0.908 Girls 150.6 (41.2) 157.6 (41.3) 0.365
Non-starch polysaccharide (g) Boys 14.6(3.8) 14.6(3.9) 0.851 Girls 10.6(3.5) 11 0113 ,
* t-test of differences between the intervention and control group by sex
The data presented in Table 6.7 show the mean (SE) of change in daily intake of energy and
of change in intake of macronutrients by boys and by girls of the intervention and control
group between baseline and post-intervention. A small but significant increase in mean daily
intake of energy was observed in boys and girls of the control group, as may be expected in
children of this age. The change in daily intake of energy of girls in the intervention group
only was not found to be significant. The mean intake of protein increased significantly for
boys and girls in both groups. In the control group girls only, a significant increase in mean intake of total fat of 9.1 g/day was observed whilst in boys a non-significant tendency towards
125
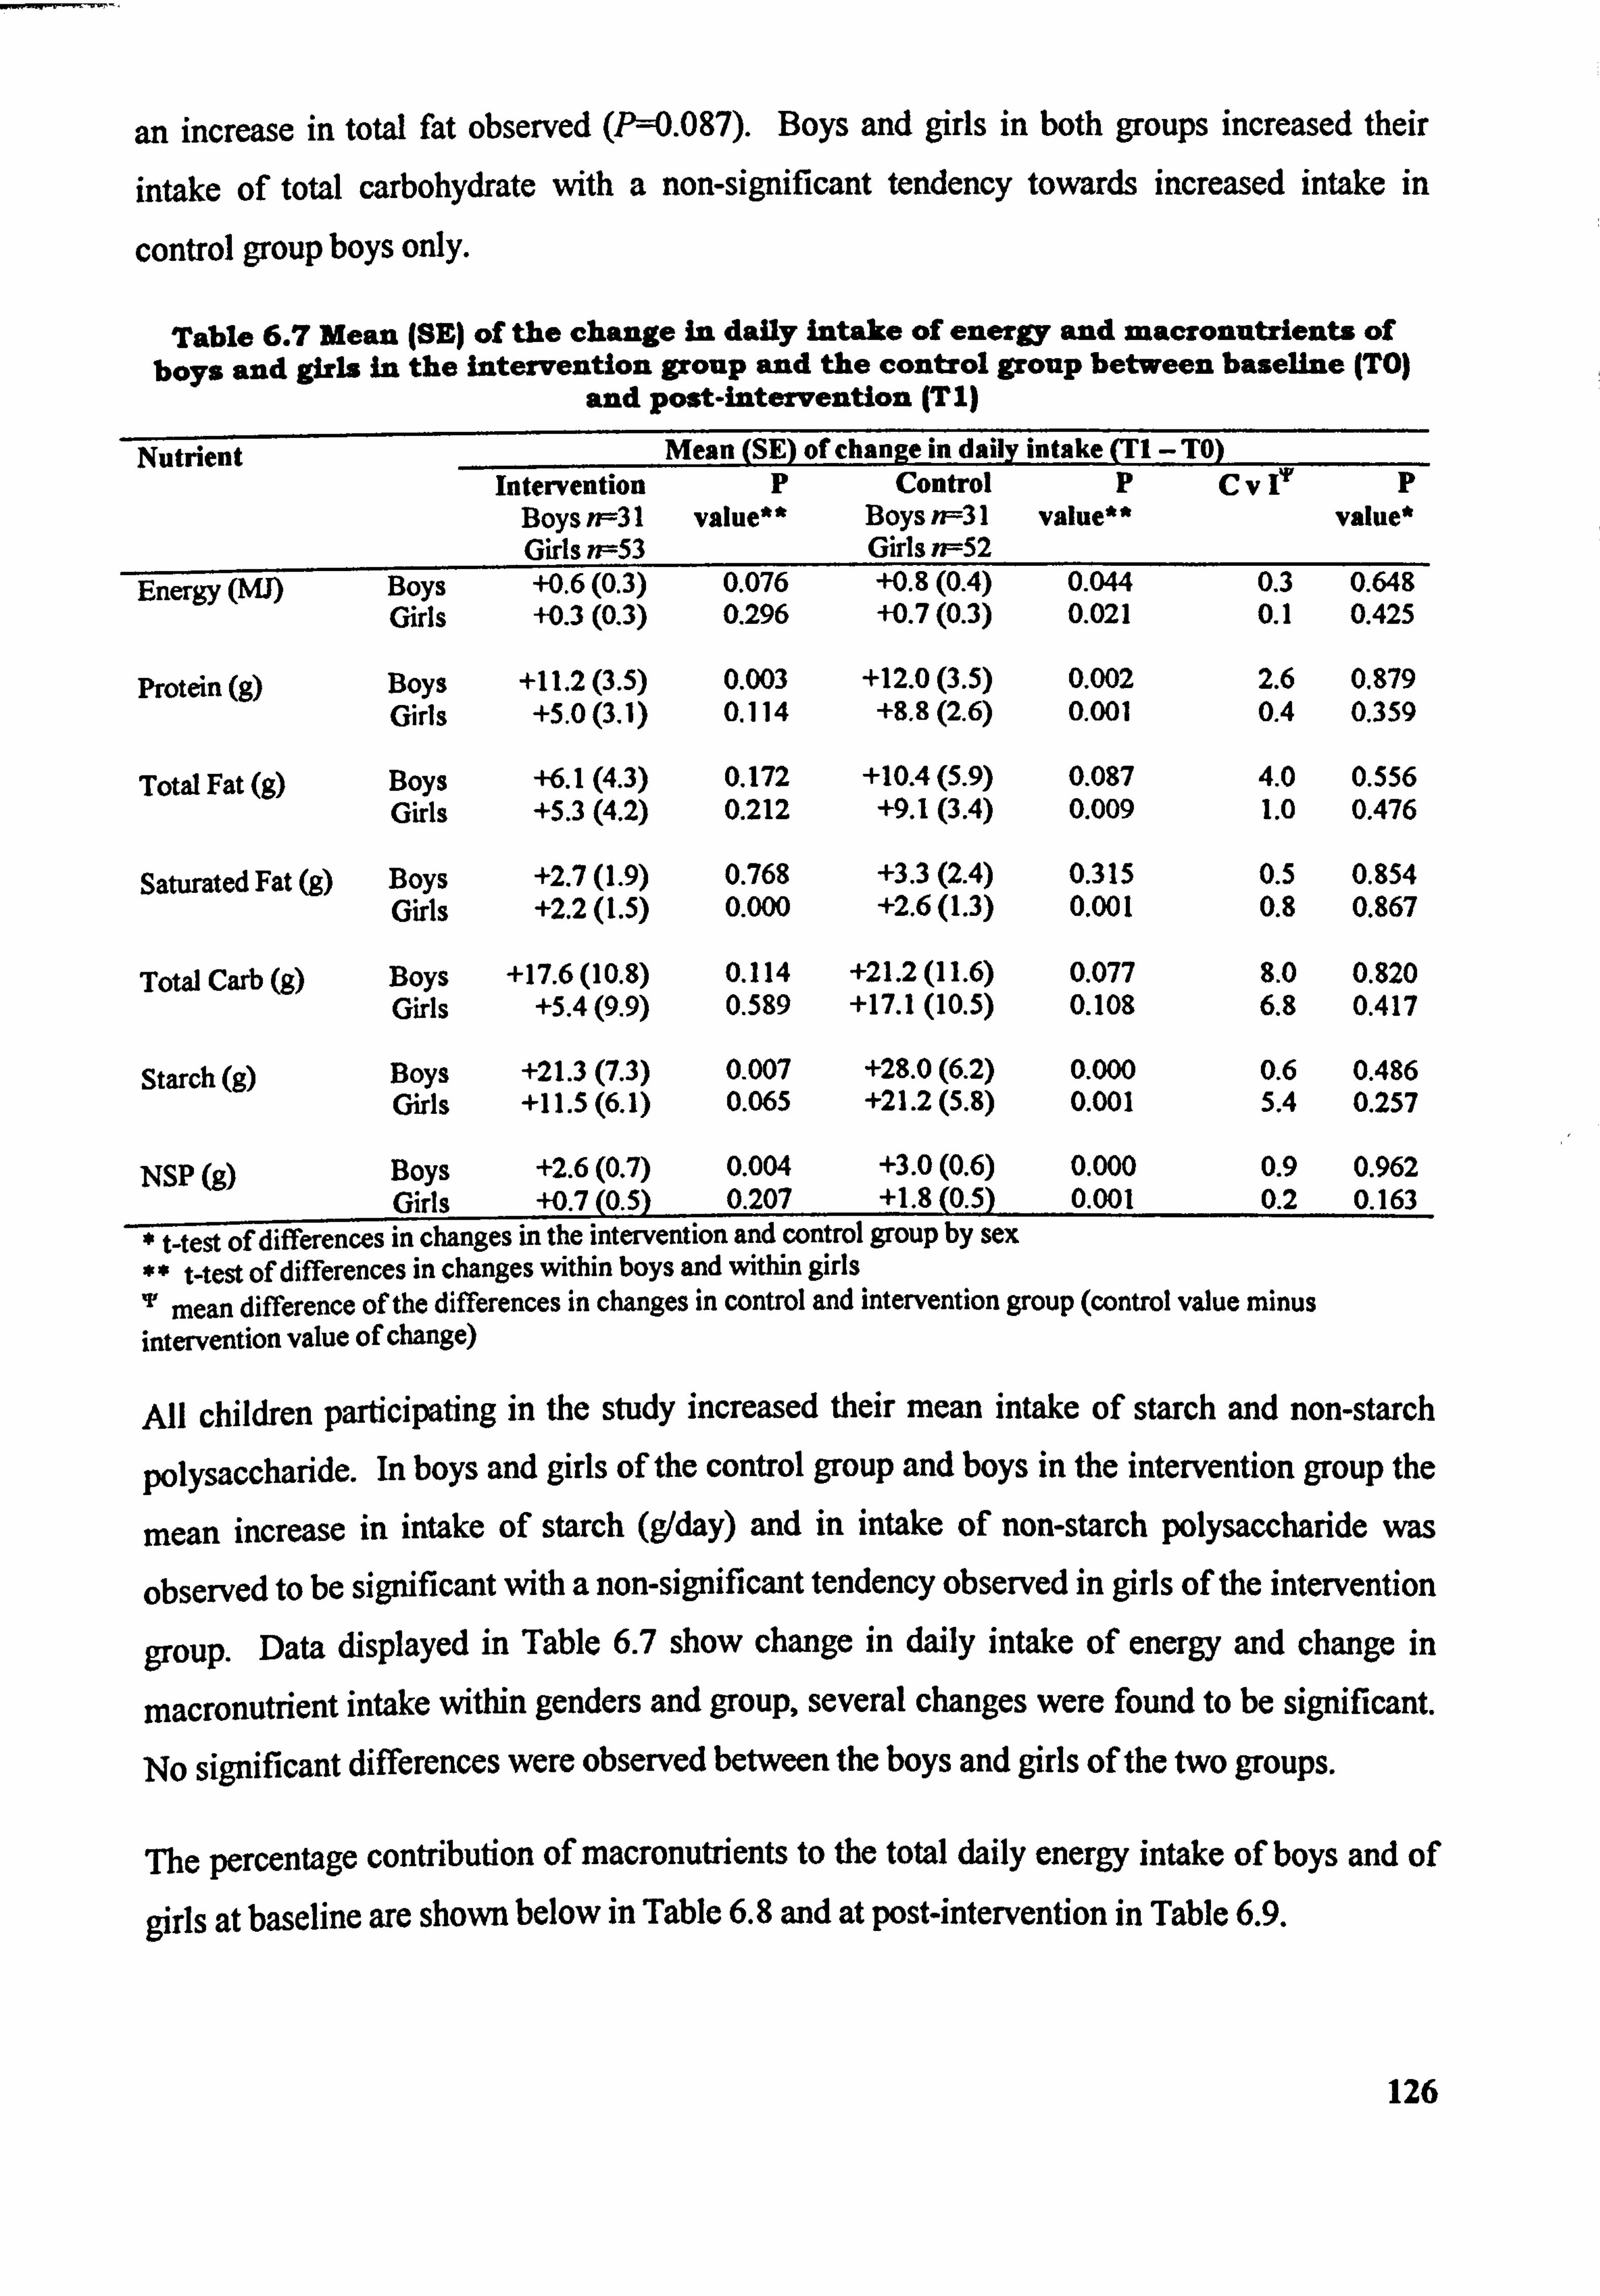
an increase in total fat observed (P-0.087). Boys and girls in both groups increased their
intake of total carbohydrate with a non-significant tendency towards increased intake in
control group boys only.
Table 6.7 Mean ISE) of the change in daily intake of energy and macronutrients of boys and girls in the intervention group and the control group between baseline (TO)
and post-intervention (Tl)
Nutrient Mean (SE) of change in daily intake (TI -TO) Intervention p Control p Cve p
Boys n=31 value" Boys n-=31 value** value* Girls n--53 Girls n--52
Energy (Mb Boys +0.6(0.3) 0.076 +0.8(0.4) 0.044 0.3 0.648 Girls +-0.3(0.3) 0.296 +0.7(0.3) 0.021 0.1 0.425
Protein (g) Boys +11.2(3.5) 0.003 +12.0(3.5) 0.002 2.6 0.879 Girls +5.0(3.1) 0.114 +8.8(2.6) 0.001 0.4 0.359
Total Fat (g) Boys +6.1(4.3) 0.172 +10.4(5.9) 0.087 4.0 0.556 Girls +5.3(4.2) 0.212 +9.1(3.4) 0.009 1.0 0.476
Saturated Fat (g) Boys +2.7(l. 9) 0.768 +3.3(2.4) 0.315 0.5 0.854 Girls +2.2(t. 5) 0.000 +2.6(l. 3) 0.001 0.8 0.867
Total Carb (g) Boys +17.6 (10.8) 0.114 +21.2 (11.6) 0.077 8.0 0.820 Girls +5.4(9.9) 0.589 +17.1 (10.5) 0.109 6.8 0.417
Starch (g) Boys +21.3(7.3) 0.007 +28.0(6.2) 0.000 0.6 0.486 Girls +11.5(6.1) 0.065 +21.2(5.8) 0.001 5.4 0.257
NSP (9) Boys +2.6(0.7) 0.004 +3.0(0.6) 0.000 0.9 0.962 Girls +0.7(0.5) 0.207 +1.8(0.5) 0.001 0.2 0.163
West of differences in changes in the intervention and control group by sex ** t-test of differences in changes within boys and within girls
mean difference of the differences in changes in control and intervention group (control value minus intervention value of change)
All children participating in the study increased their mean intake of starch and non-starch
polysaccharide. In boys and girls of the control group and boys in the intervention group the
mean increase in intake of starch (gIday) and in intake of non-starch polysaccharide was
observed to be significant with a non-significant tendency observed in girls of the intervention
group. Data displayed in Table 6.7 show change in daily intake of energy and change in
macronutrient intake within genders and group, several changes were found to be significant.
No significant differences were observed between the boys and girls of the two groups.
The percentage contribution of macronutrients to the total daily energy intake of boys and of
girls at baseline are shown below in Table 6.8 and at post-intervention in Table 6.9.
126
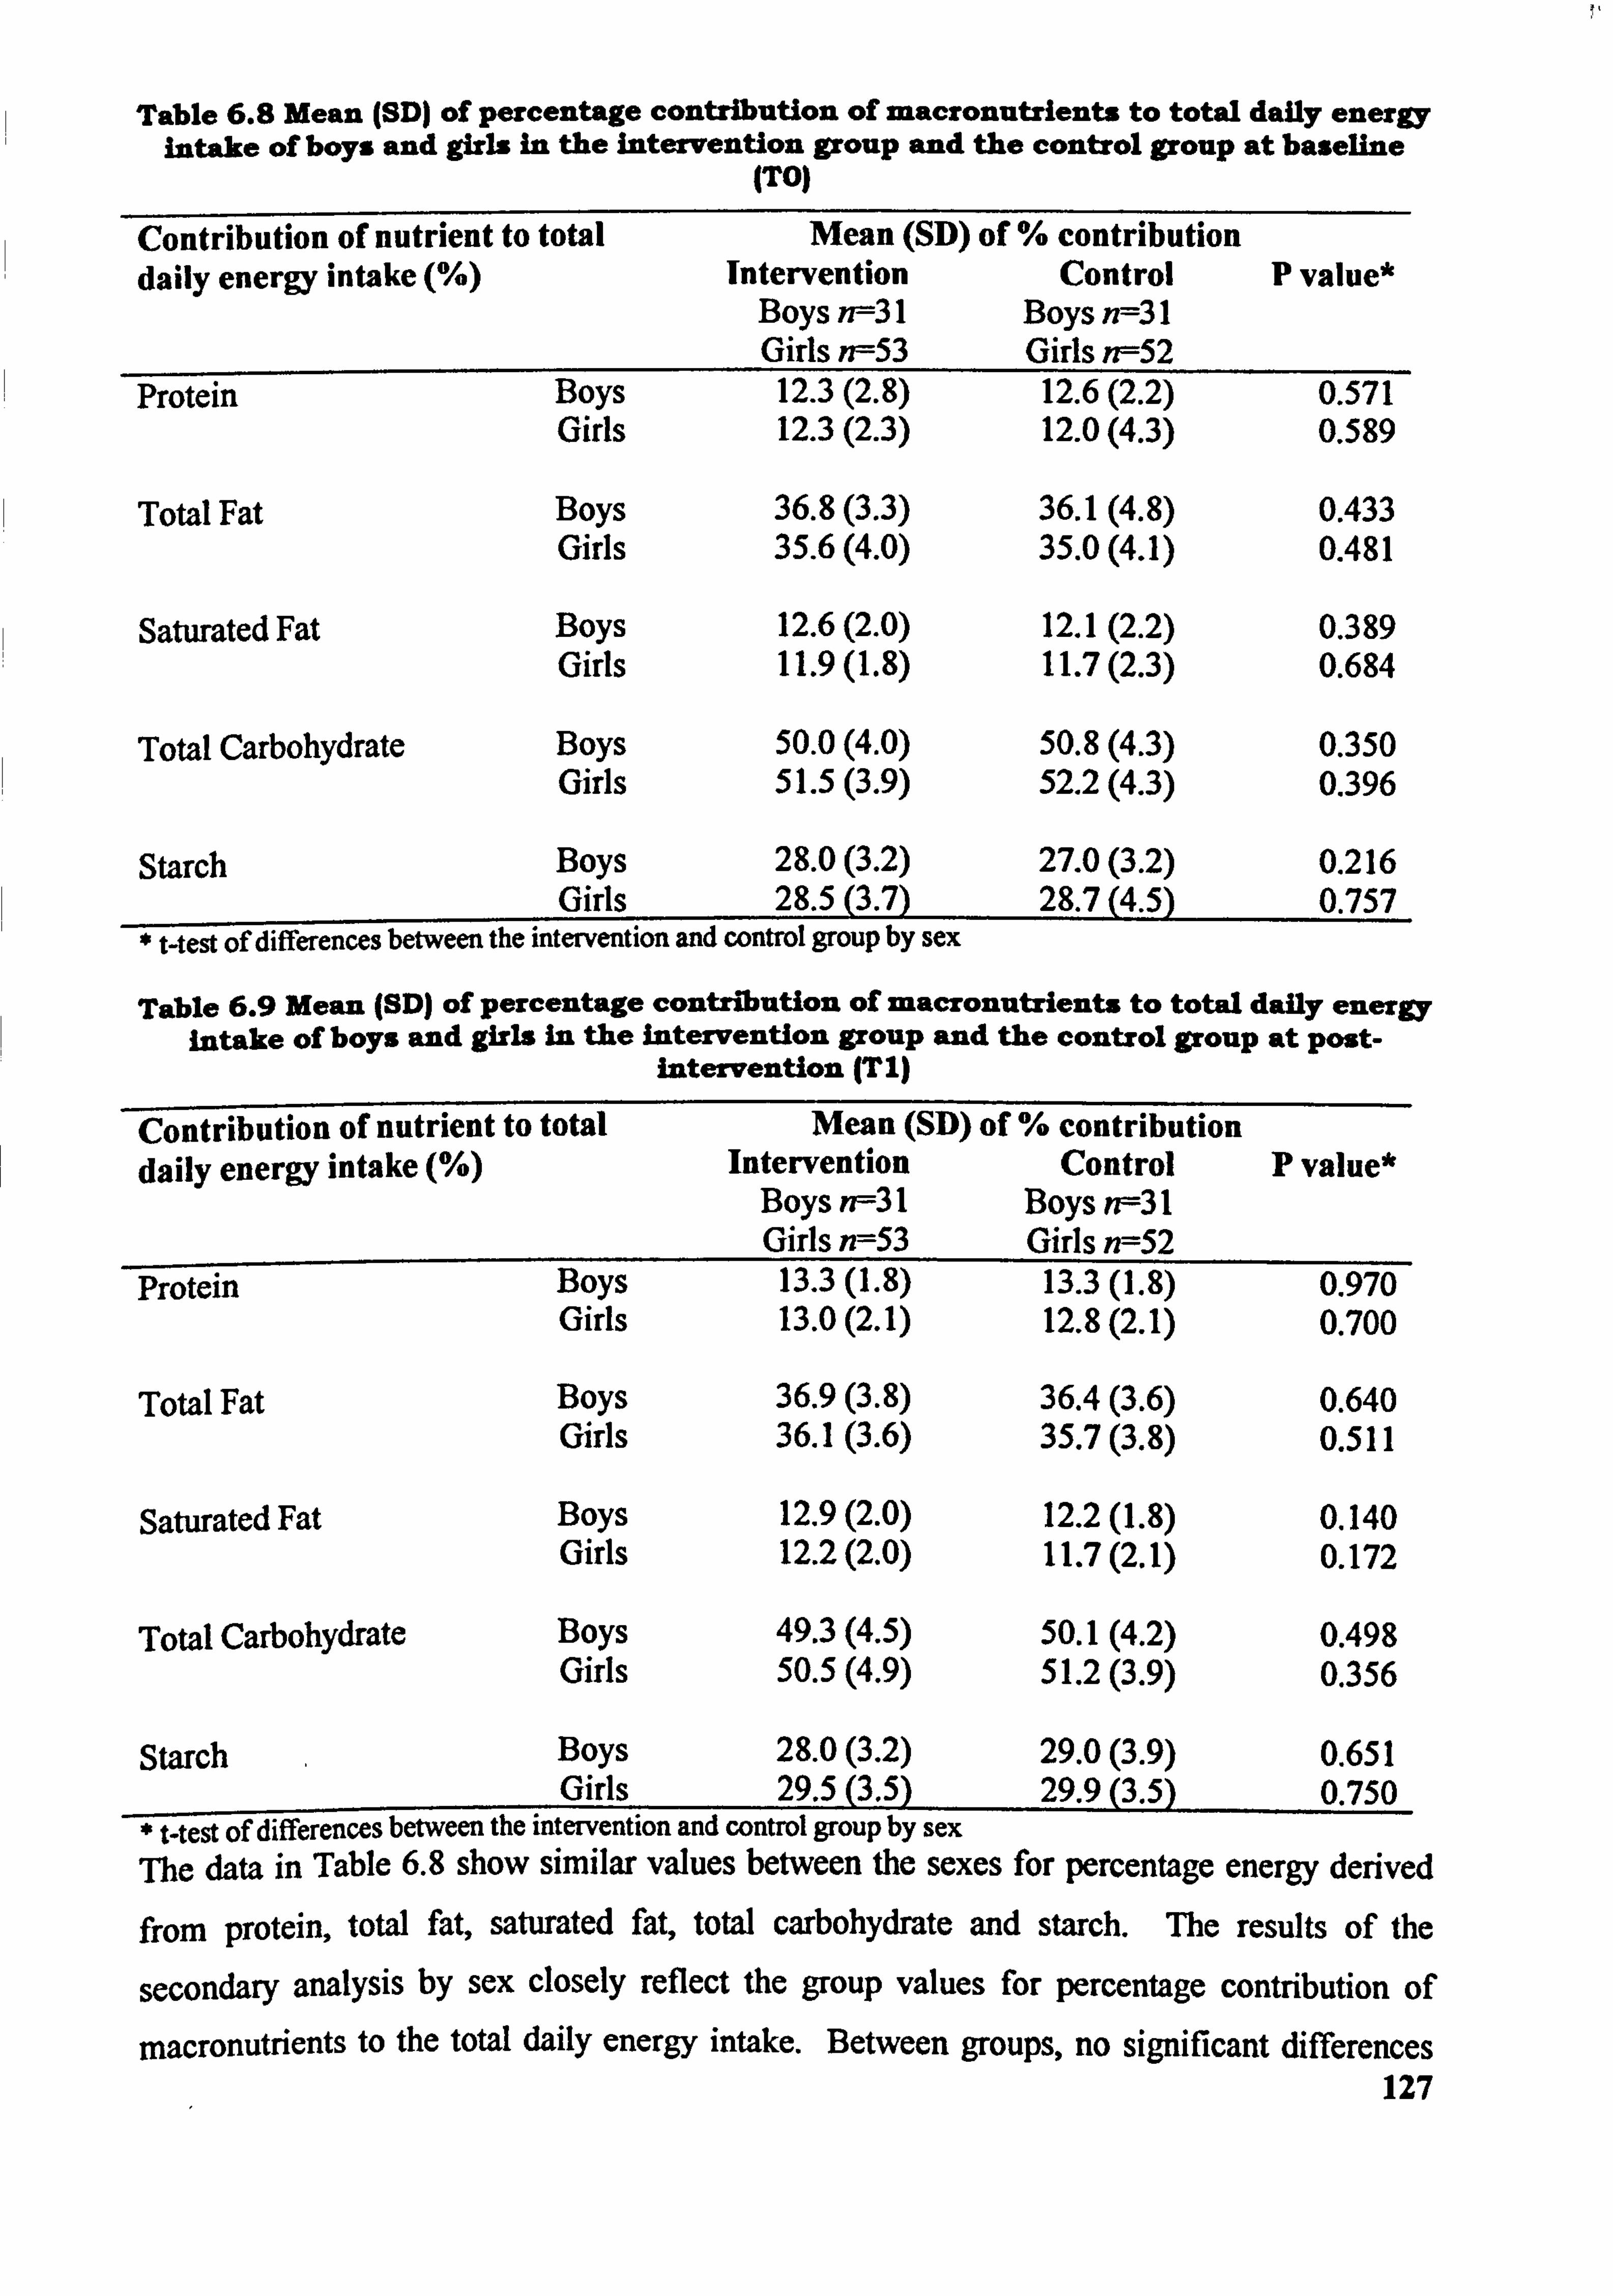
Table 6.8 Mean (SDI of percentage contribution of macronutrients to total daily energy intalre of boys and girls in the Intervention group and the control group at baseline
ITO)
Contribution of nutrient to total Mean (SD) of % contribution daily energy intake Intervention Control P value*
Boys n--31 Boys n--31 Girls n=53 Girls ? ff52
Protein Boys 12.3(2.8) 12.6(2.2) 0.571 Girls 12.3(2.3) 12.0(4.3) 0.589
Total Fat Boys 36.8(3.3) 36.1(4.8) 0.433 Girls 35.6(4.0) 35.0(4.1) 0.481
Saturated Fat Boys 12.6(2.0) 12.1(2.2) 0.389 Girls 11.9(l. 8) 11.7(2.3) 0.684
Total Carbohydrate Boys 50.0(4.0) 50.8(4.3) 0.350 Girls 51.5(3.9) 52.2(4.3) 0.396
Starch Boys 28.0(3.2) 27.0(3.2) 0.216 Girls 28.5(3.7) 28.7(4.5) 0.757
t-test of differences between the intervention and control group by sex
Table 6.9 Mean (SD) of percentage contribution of macronutrients to total daily energy intake of boys and girls in the Intervention group and the control group at post-
Intervention (T I)
Contribution of nutrient to total Mean (SD) of % contribution daily energy intake Intervention Control P value*
Boys rff3l Boys rff3l Girls n=53 Girls n=52
Protein Boys 13.3(l. 8) 13.3(l. 8) 0.970 Girls 13.0(2.1) 12.8(2.1) 0.700
Total Fat Boys 36.9(3.8) 36.4(3.6) 0.640 Girls 36.1(3.6) 35.7(3.8) 0.511
Saturated Fat Boys 12.9(2.0) 12.2(l. 8) 0.140 Girls 12.2(2.0) 11.7(2.1) 0.172
Total Carbohydrate Boys 49.3(4.5) 50.1(4.2) 0.498 Girls 50.5(4.9) 51.2(3.9) 0.356
Starch Boys 28.0(3.2) 29.0(3.9) 0.651 Girls 29.5(3.5) 29.9(3.5) 0.750
t-test of differences between the intervention and control group by sex The data in Table 6.8 show similar values between the sexes for percentage energy derived
from protein, total fat, saturated fat, total carbohydrate and starch. The results of the
secondary analysis by sex closely reflect the group values for percentage contribution of
macronutrients to the total daily energy intake. Between groups, no significant differences 127
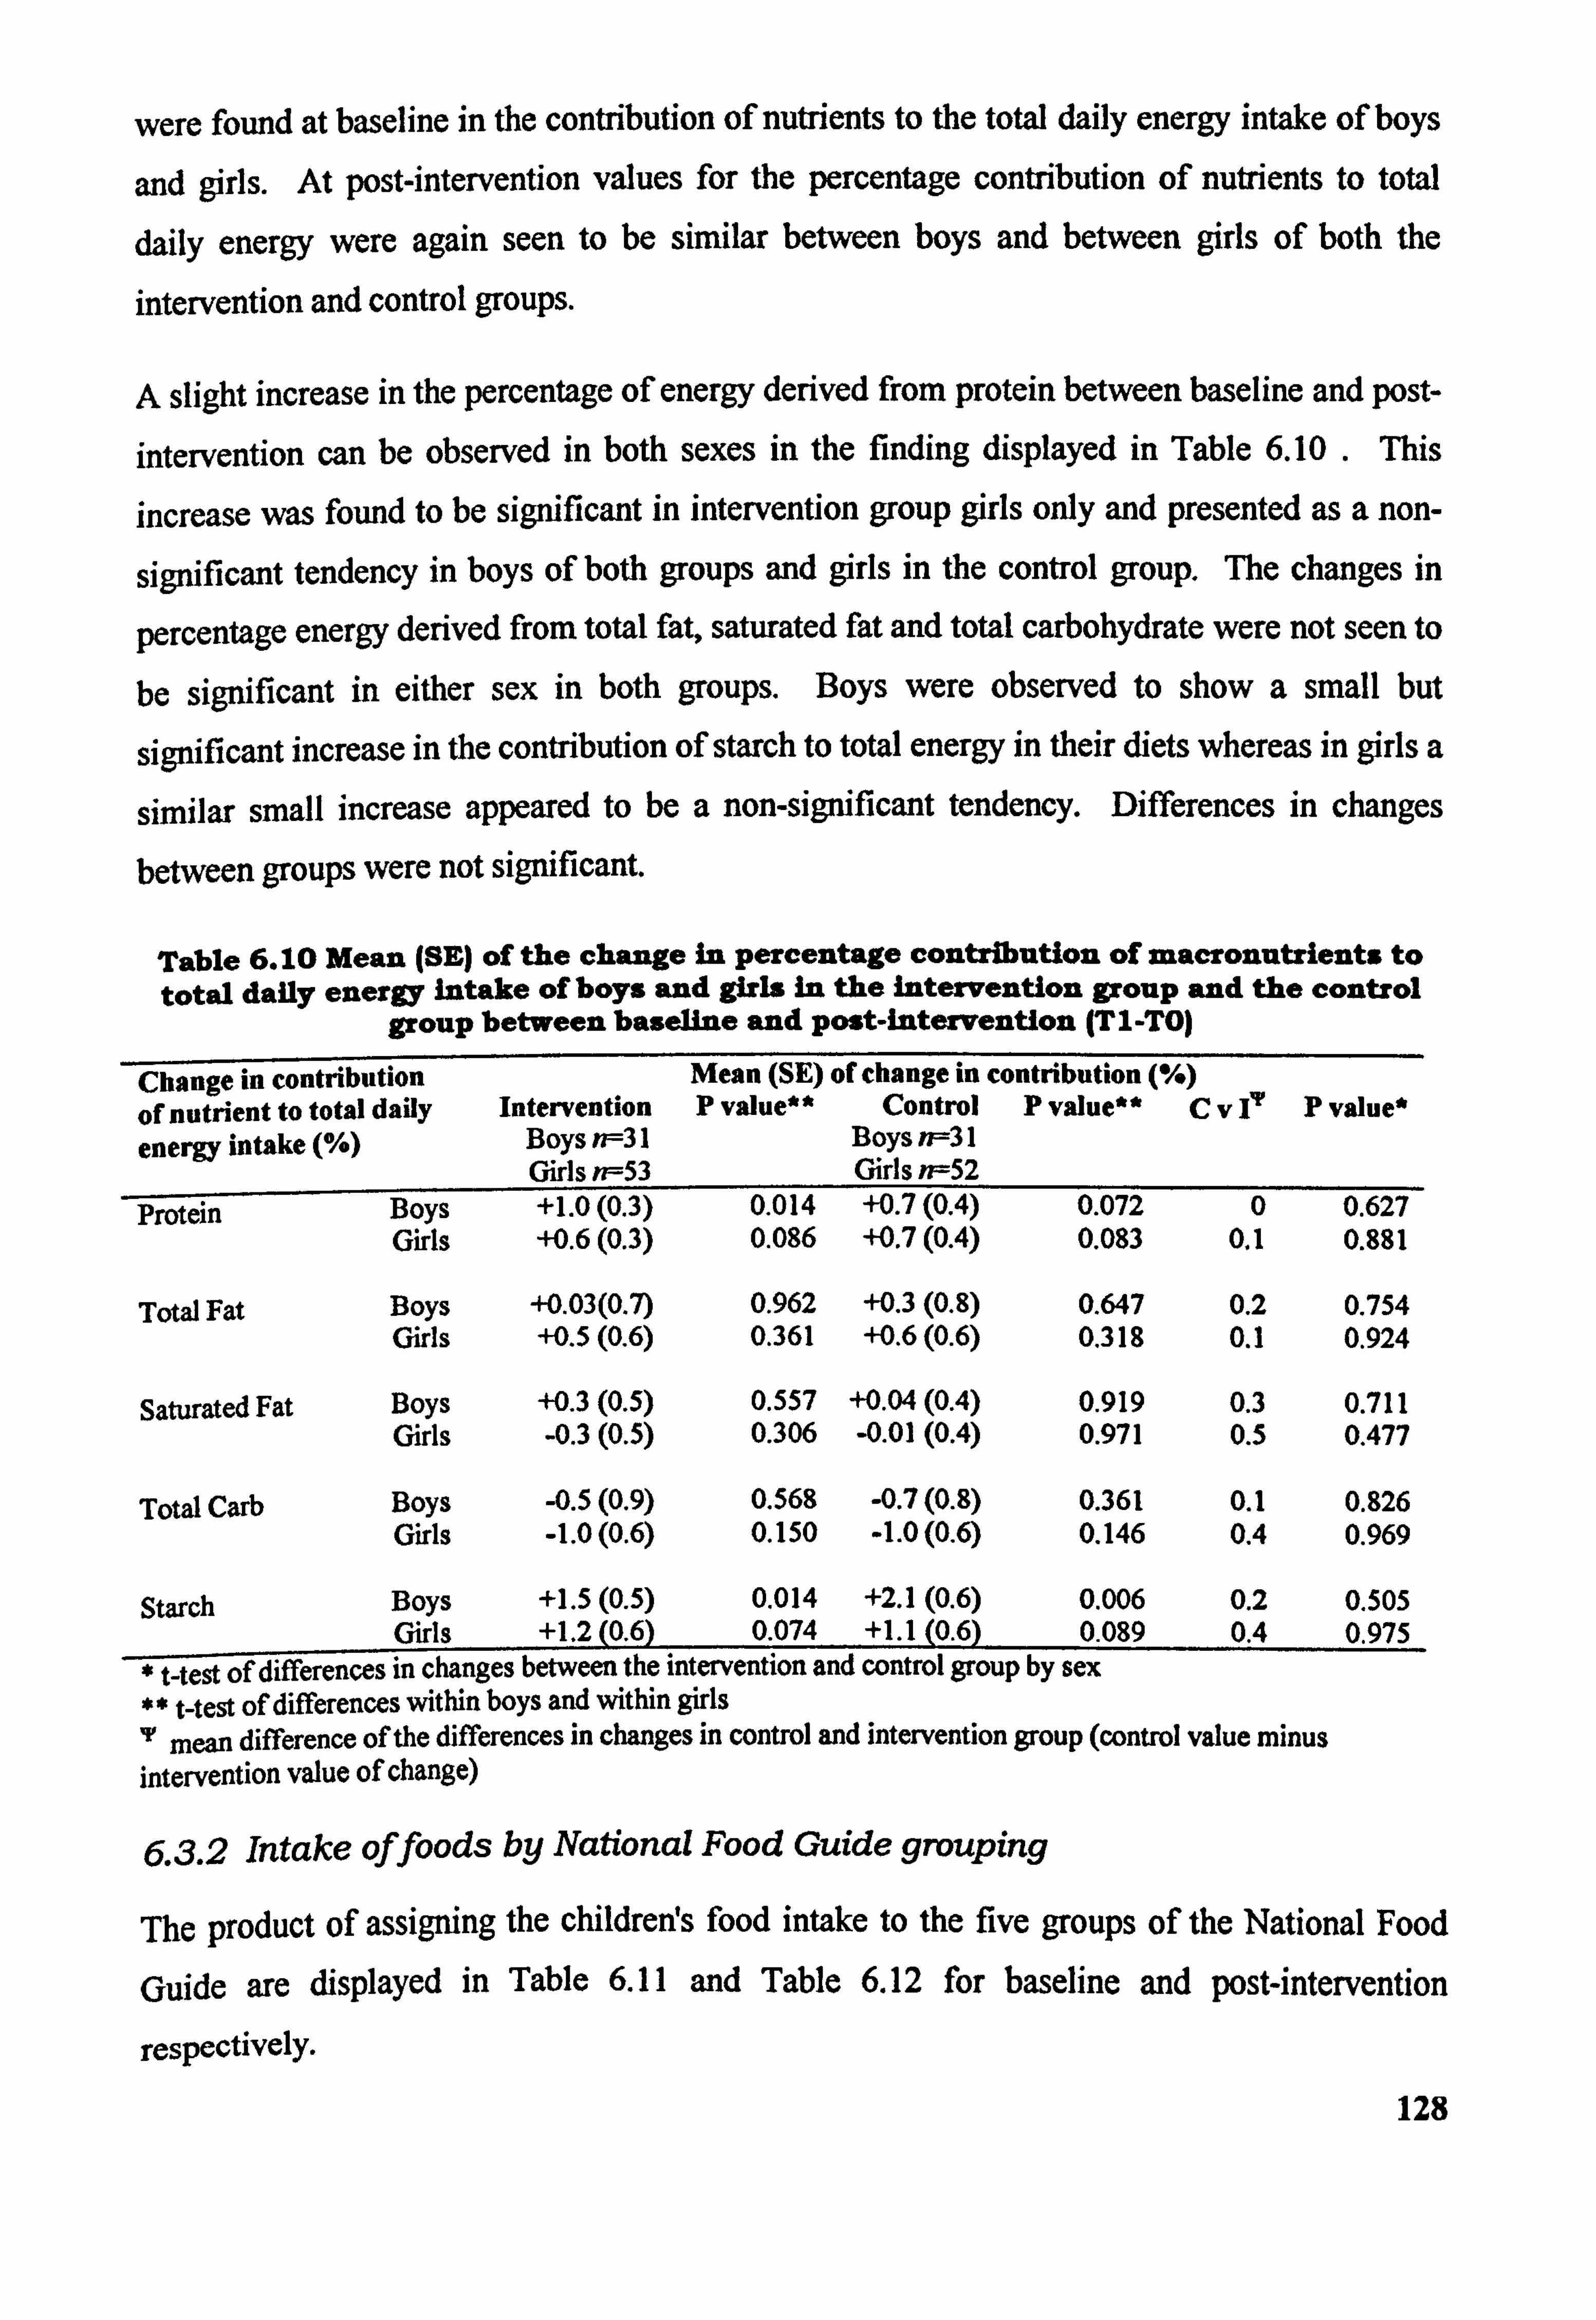
were found at baseline in the contribution of nutrients to the total daily energy intake of boys
and girls. At post-intervention values for the percentage contribution of nutrients to total
daily energy were again seen to be similar between boys and between girls of both the
intervention and control groups.
A slight increase in the percentage of energy derived from protein between baseline and post-
intervention can be observed in both sexes in the finding displayed in Table 6.10 . This
increase was found to be significant in intervention group girls only and presented as a non-
significant tendency in boys of both groups and girls in the control group. The changes in
percentage energy derived from total fat, saturated fat and total carbohydrate were not seen to
be significant in either sex in both groups. Boys were observed to show a small but
significant increase in the contribution of starch to total energy in their diets whereas in girls a
similar small increase appeared to be a non-significant tendency. Differences in changes
between groups were not significant.
Table 6.10 Mean (SE) of the change in percentage contribution of macronutrients to total daily energy intake of boys and girls in the intervention group and the control
group between baseline and post-intervention (T I -TO)
Change in contribution Mean (SE) of change in contribution of nutrient to total daily Intervention P value" Control P value** Cvf P value* energy intake Boys n--31 Boys n=31
Girls n--53 Girls n=52 Protein Boys +1.0(0.3) 0.014 +0.7(0.4) 0.072 0 0.627
Girls +0.6(0.3) 0.086 +0.7(0.4) 0.083 0.1 0.881
Total Fat Boys +0.03(0.7) 0.962 +0.3(0.8) 0.647 0.2 0.754 Girls +0.5(0.6) 0.361 +0.6(0.6) 0.318 0.1 0.924
Saturated Fat Boys +0.3(0.5) 0.557 +0.04(0.4) 0.919 0.3 0.711 Girls -0.3(0.5) 0.306 -0.0)(0.4) 0.971 0.5 0.477
Total Carb Boys -0.5(0.9) 0.568 -0.7(0.8) 0.361 0.1 0.826 Girls -1.0(0.6) 0.150 -1.0(0.6) 0.146 0.4 0.969
Starch Boys +1.5(0.5) 0.014 +2.1(0.6) 0.006 0.2 0.505 Girls +1.2(0.6) 0.074 +1.1(0.6) 0.089 0.4 0.975
Vt-test of differences in changes between the intervention and control group by sex ** t-test of differences within boys and within girls 'r mean difference of the differences in changes in control and intervention group (control value minus intervention value of change)
6.3.2 Intake offoods by National Food Guide grouping
The product of assigning the childrerfs food intake to the five groups of the National Food
Guide are displayed in Table 6.11 and Table 6.12 for baseline and post-intervention
respcctivclY. 128
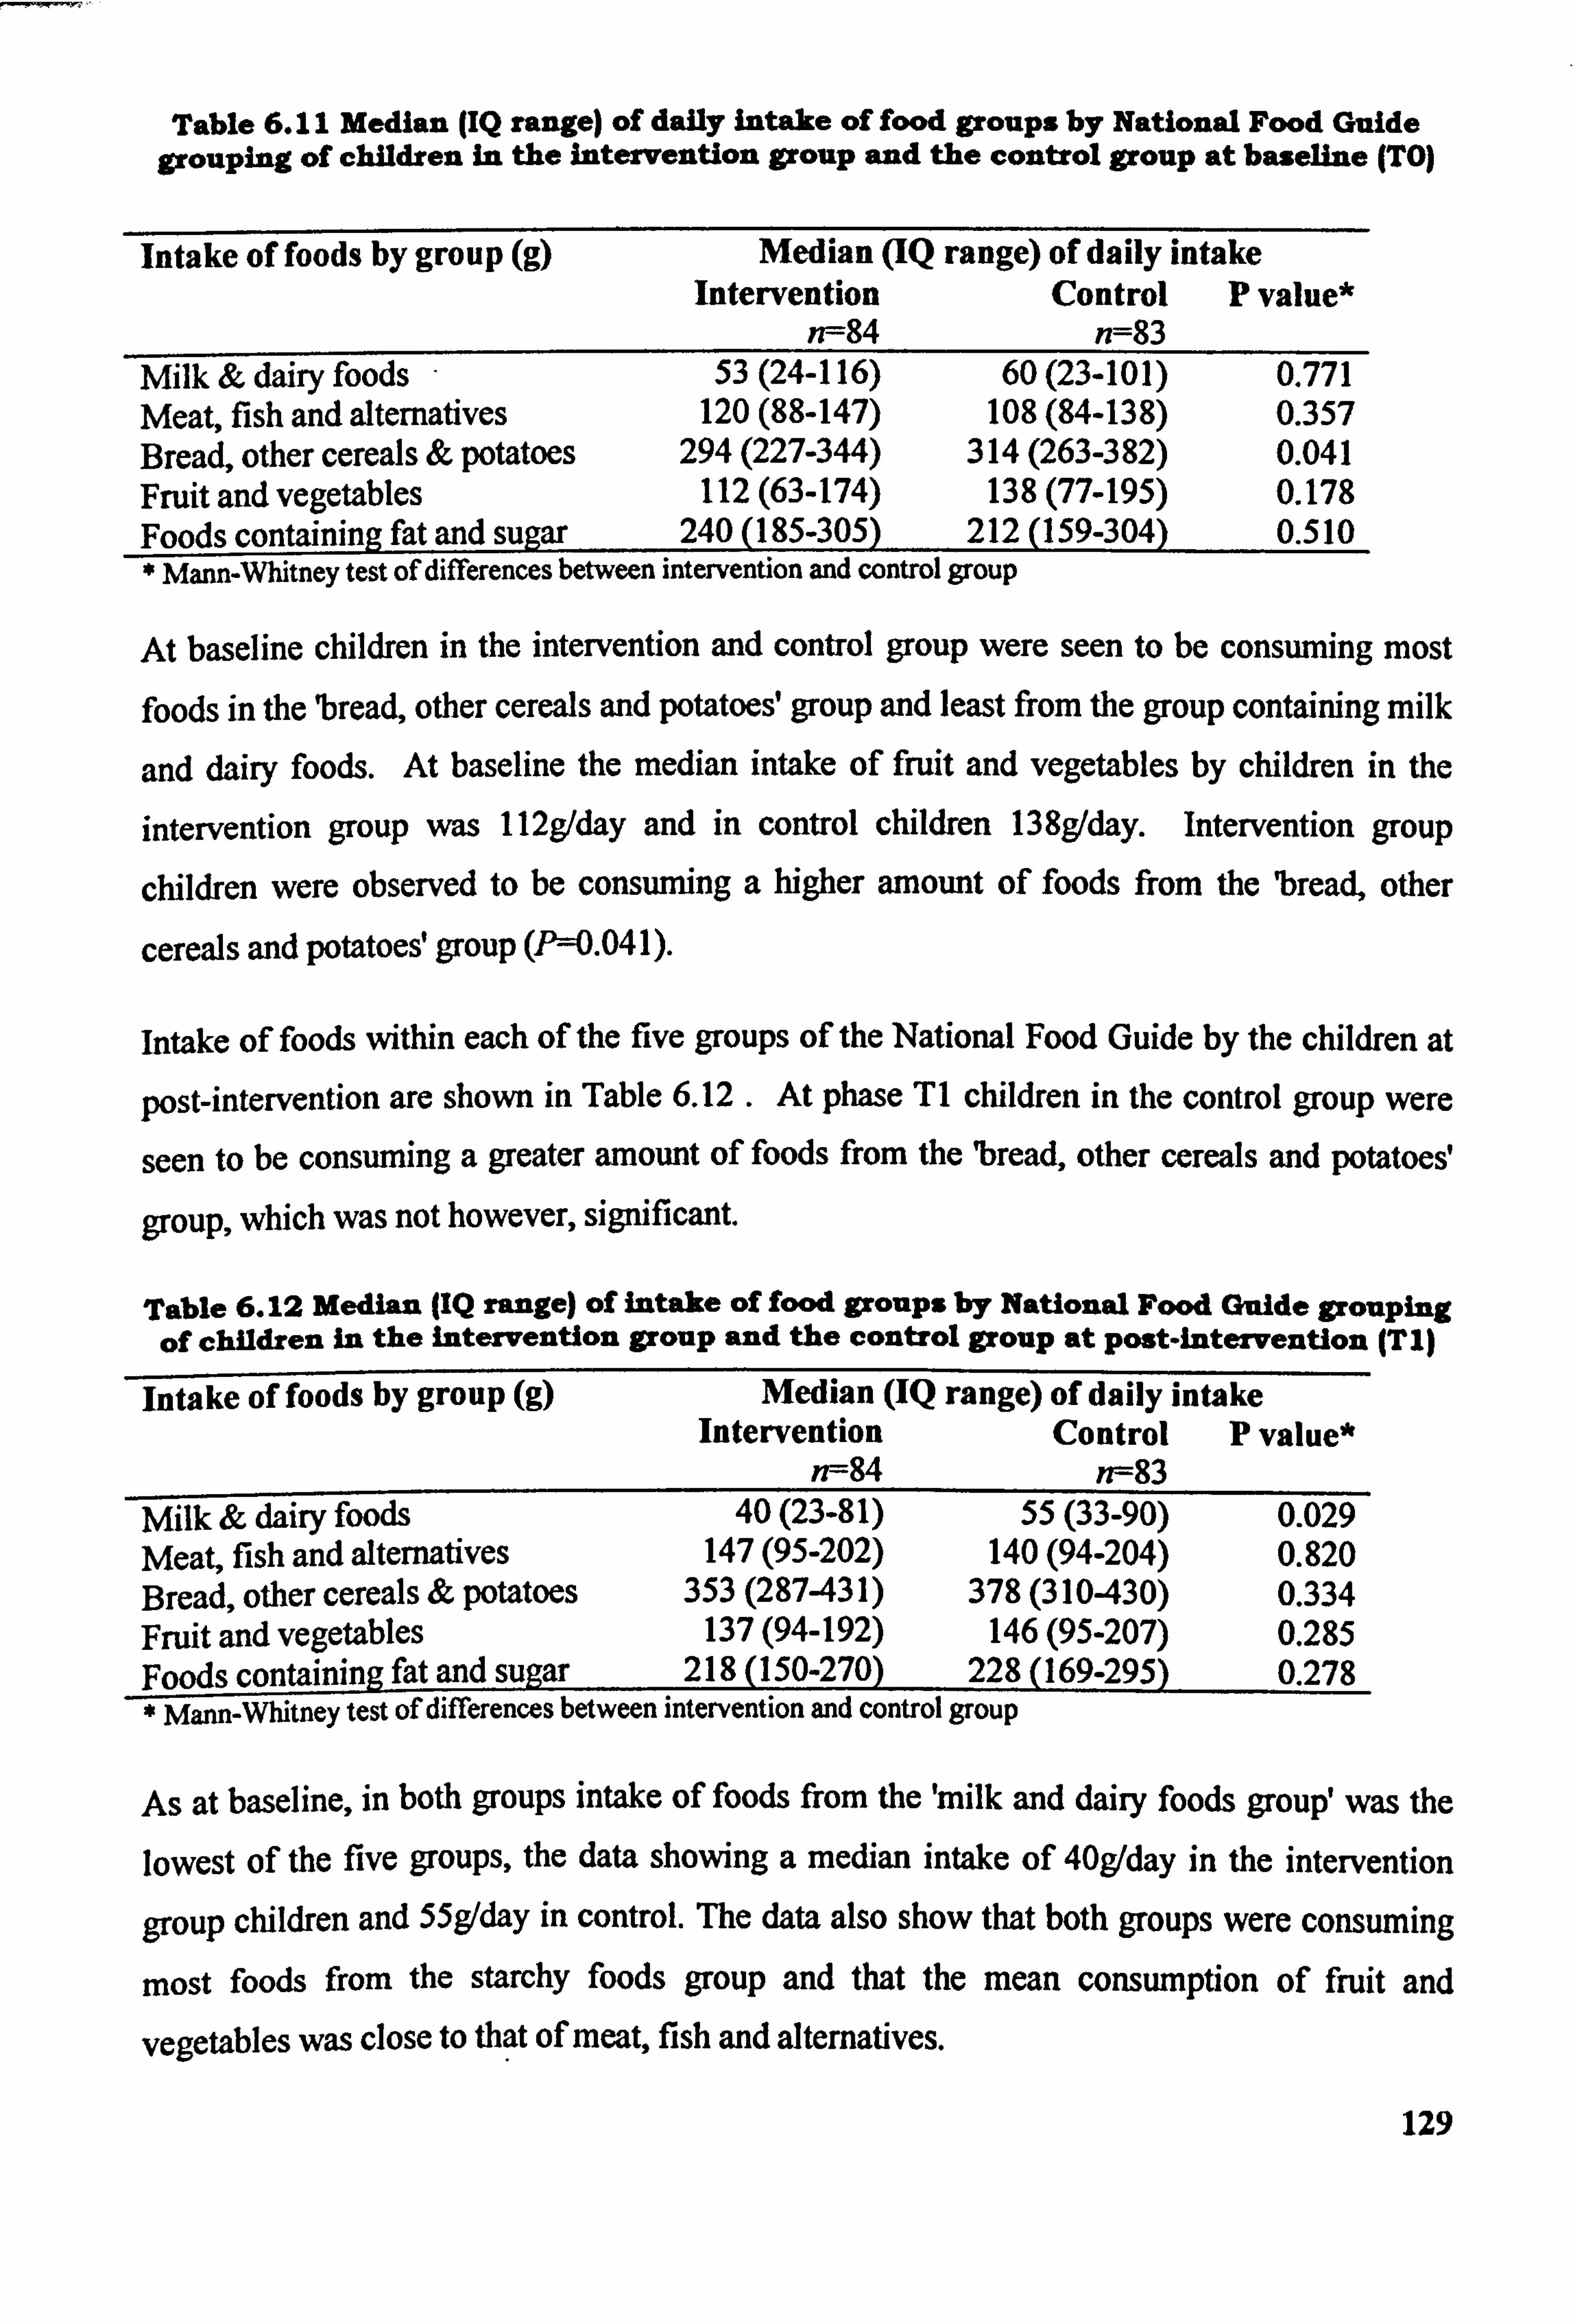
Table 6.11 Median (IQ range) of daily intake of food groups by National Food Guide grouping of children in the intervention group and the control group at baseline (TO)
Intake of foods by group (g) Median (IQ range) of daily intake Intervention Control P value*
n--84 n=83 Milk & dairy foods 53(24-116) 60(23-101) 0.771 Meat, fish and alternatives 120 (88-147) 108 (84-138) 0.357 Bread, other cereals & potatoes 294 (227-344) 314 (263-382) 0.041 Fruit and vegetables 112 (63-174) 138 (77-195) 0.178 Foods containing fat and sugar 240 (185-305) 212 (159-304) 0.510
Mann-Whitney test of differences between intervention and control group
At baseline children in the intervention and control group were seen to be consuming most
foods in the 'bread, other cereals and potatoes' group and least from the group containing milk
and dairy foods. At baseline the median intake of fruit and vegetables by children in the
intervention group was 112g/day and in control children 138g/day. Intervention group
children were observed to be consuming a higher amount of foods from the 'bread, other
cereals and potatoes' group (Pý=0.041).
intake of foods within each of the five groups of the National Food Guide by the children at
post-intervention are shown in Table 6.12 . At phase TI children in the control group were
seen to be consuming a greater amount of foods from the 'bread, other cereals and potatoes'
group, which was not however, significant.
Table 6.12 Median (IQ range) of intake of food groups by National Food Guide grouping of children in the intervention group and the control group at post-intervention (TI)
Intake of foods by group (g) Median (IQ range) of daily intake Intervention Control P value*
n--84 n--83 Milk & dairy foods 40(23-81) 55(33-90) 0.029 Meat, fish and alternatives 147 (95-202) 140 (94-204) 0.820 Bread, other cereals & potatoes 353 (287-431) 378 (310-430) 0.334 Fruit and vegetables 137 (94-192) 146 (95-207) 0.285 Foods containing fat and sugar 218 (150-270) 228 (169-295) 0.278 * Mann-Whitney test of differences between intervention and control group _
As at baseline, in both groups intake of foods from the 'milk and dairy foods group' was the lowest of the five groups, the data showing a median intake of 40gIday in the intervention
group children and 55g/day in control. The data also show that both groups were consuming
most foods from the starchy foods group and that the mean consumption of fruit and
vegetables was close to that of meat, fish and alternatives.
129
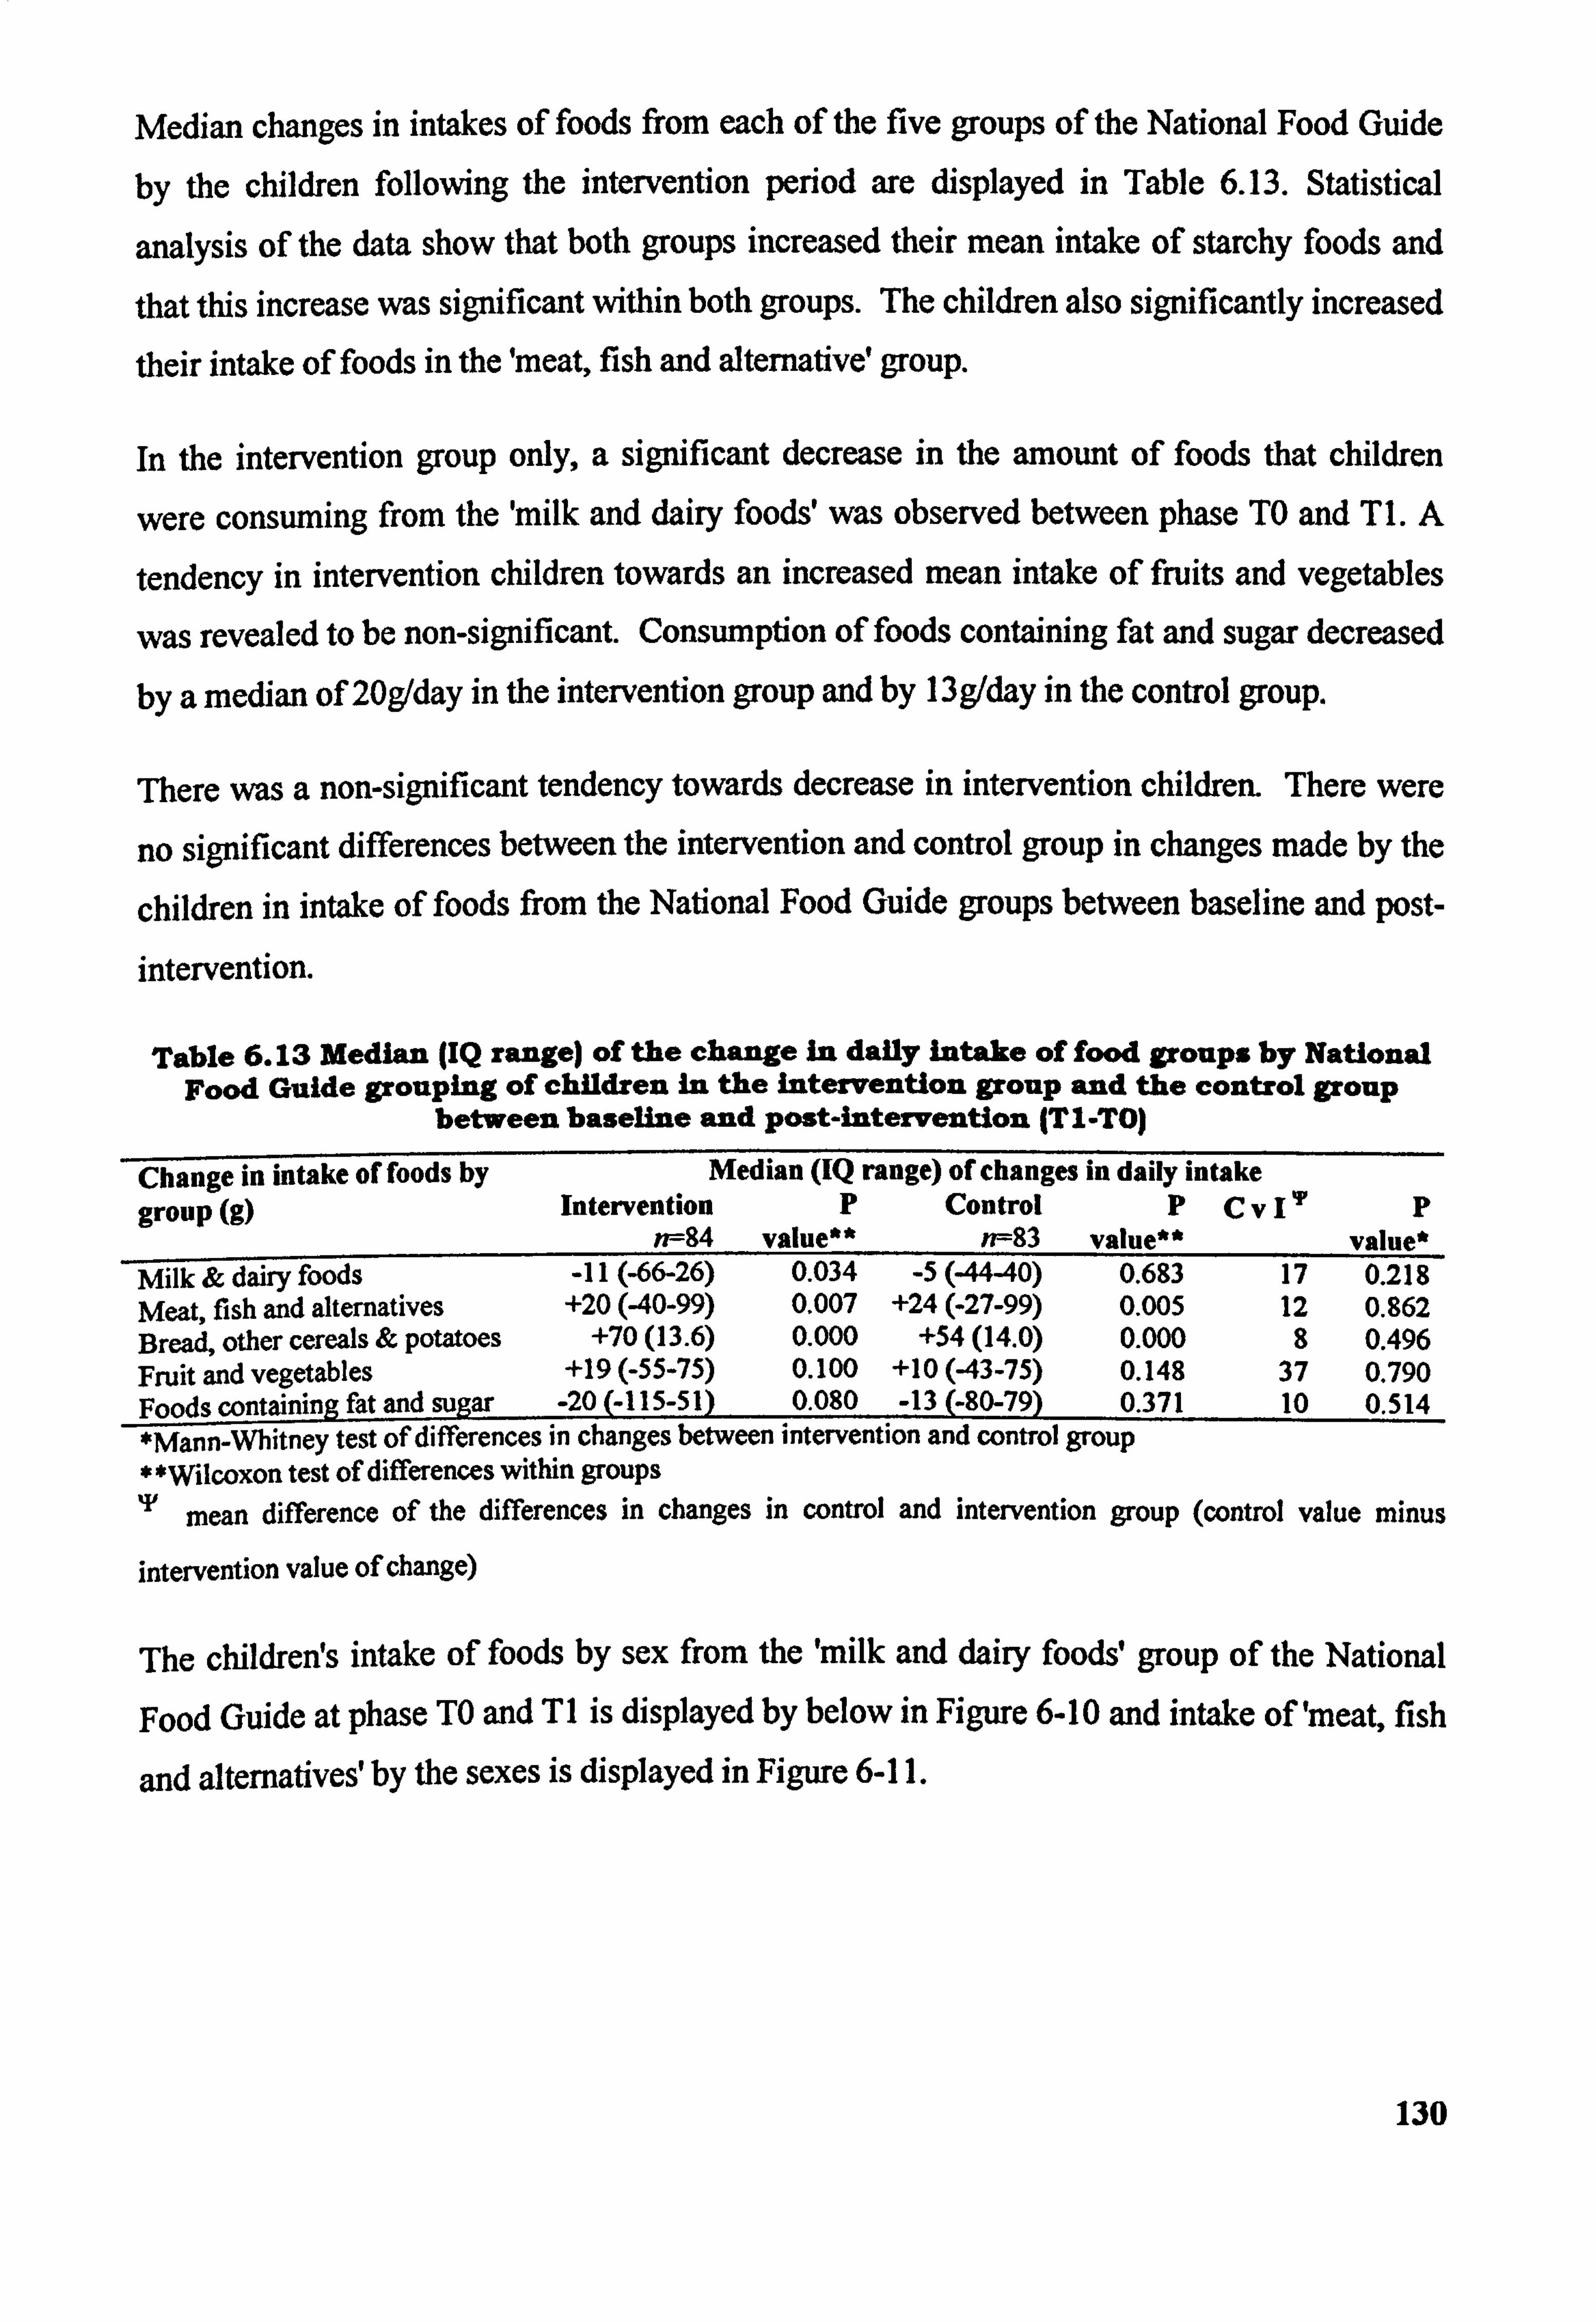
Median changes in intakes of foods from each of the five groups of the National Food Guide
by the children following the intervention period are displayed in Table 6.13. Statistical
analysis of the data show that both groups increased their mean intake of starchy foods and
that this increase was significant within both groups. The children also significantly increased
their intake of foods in the 'meat, fish and alternative' group.
In the intervention group only, a significant decrease in the amount of foods that children
were consuming from the 'milk and dairy foods' was observed between phase TO and T 1. A
tendency in intervention children towards an increased mean intake of fruits and vegetables
was revealed to be non-significant. Consumption of foods containing fat and sugar decreased
by a median of 20g/day in the intervention group and by l3g/day in the control group.
There was a non-significant tendency towards decrease in intervention children. There were
no significant differences between the intervention and control group in changes made by the
children in intake of foods from the National Food Guide groups between baseline and post-
intervention.
Table 6.13 Median (IQ range) of the change In daily intake of food groups by National Food Guide grouping of children in the Intervention group and the control group
between baseline and Post-intervention (TI-TO)
Change in intake of foods by Median (IQ range) of changes in daily intake
group (g) Intervention P Control PCv 111 P rr-- 84 value** n--83 value** value*
Milk & dairy foods -11 (-66-26) 0.034 -5(-44-40) 0.683 17 0.218 Meat, fish and alternatives +20 (40-99) 0.007 +24 (-27-99) 0.005 12 0.862 Bread, other cereals & potatoes +70(13.6) 0.000 +54(14.0) 0.000 8 0.496 Fruit and vegetables +19 (-55-75) 0.100 +10 (43-75) 0.148 37 0.790 Foods containing fat and sugar -20 (-115-51) 0.080 -13 (-80-79) 0.371 10 0.514 *Mann-Whitney test of differences in changes between intervention and control group * *Wilcoxon test of differences within groups T mean difference of the differences in changes in control and intervention group (control value minus
intervention value of change)
The children! s intake of foods by sex from the 'milk and dairy foods, group of the National
Food Guide at phase TO and TI is displayed by below in Figure 6-10 and intake of 'meat, fish
and altematives'by the sexes is displayed in Figure 6-11.
130
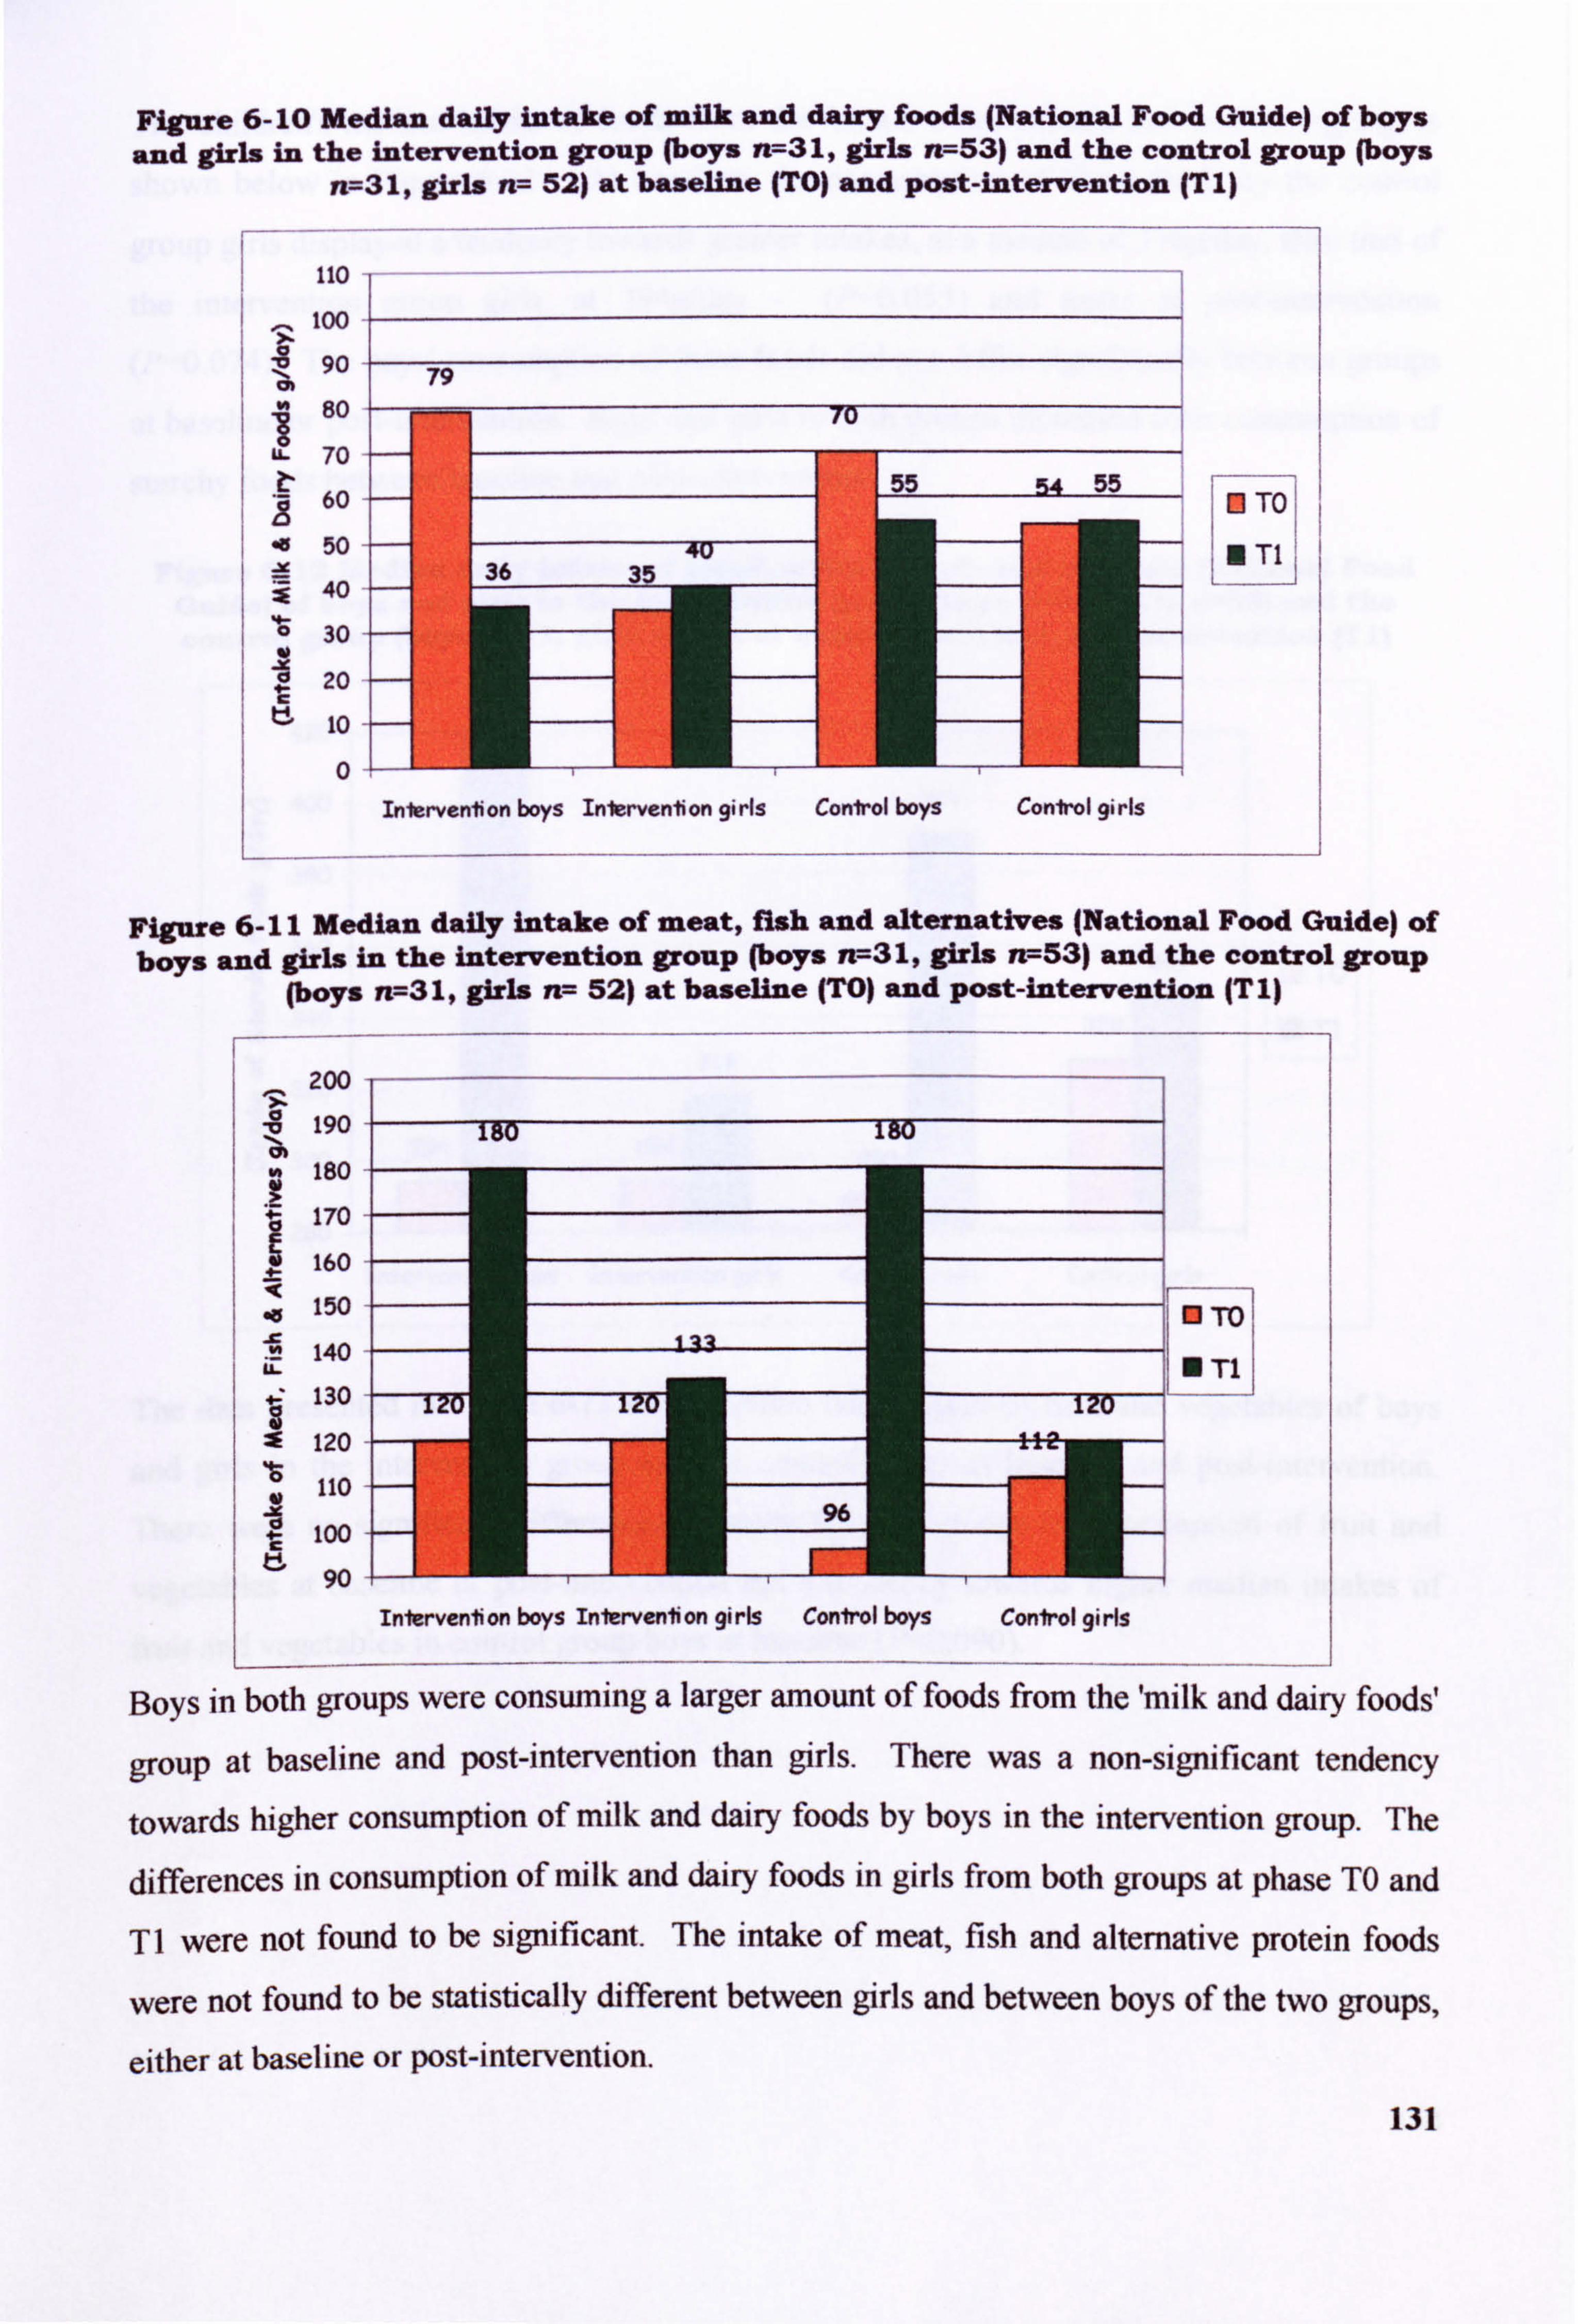
Figure 6-10 Median daily intake of milk and dairy foods (National Food Guide) of boys
and girls in the intervention group (boys n=31, girls n7-53) and the control group (boys n=31, girls n-- 52) at baseline (TO) and post-intervention (Tl)
110 too
90
80
70
60
50 -x 14V
30
20
lo
0
0 To
Figure 6-11 Median daily intake of meat, fish and alternatives INational Food Guide) of boys and girls in the intervention group (boys Yr-31, girls rt--53) and the control group
(boys n-731, girls rt--- 52) at baseline (TO) and Post-intervention (T I)
Boys in both groups were consuming a larger amount of foods from the'milk and dairy foods'
group at baseline and post-intervention than girls. There was a non-slgnificant tendency
towards higher consumption of milk and dairy foods by boys in the intervention group. The
differences in consumption of milk and dairy foods in girls from both groups at phase TO and
TI were not found to be significant. The intake of meat, fish and alternative protein foods
were not found to be statistically different between girls and between boys of the two groups,
either at baseline or post-intervention. 131
Inlerventon boys Inlervention girls Conlrol boys Conirol girls
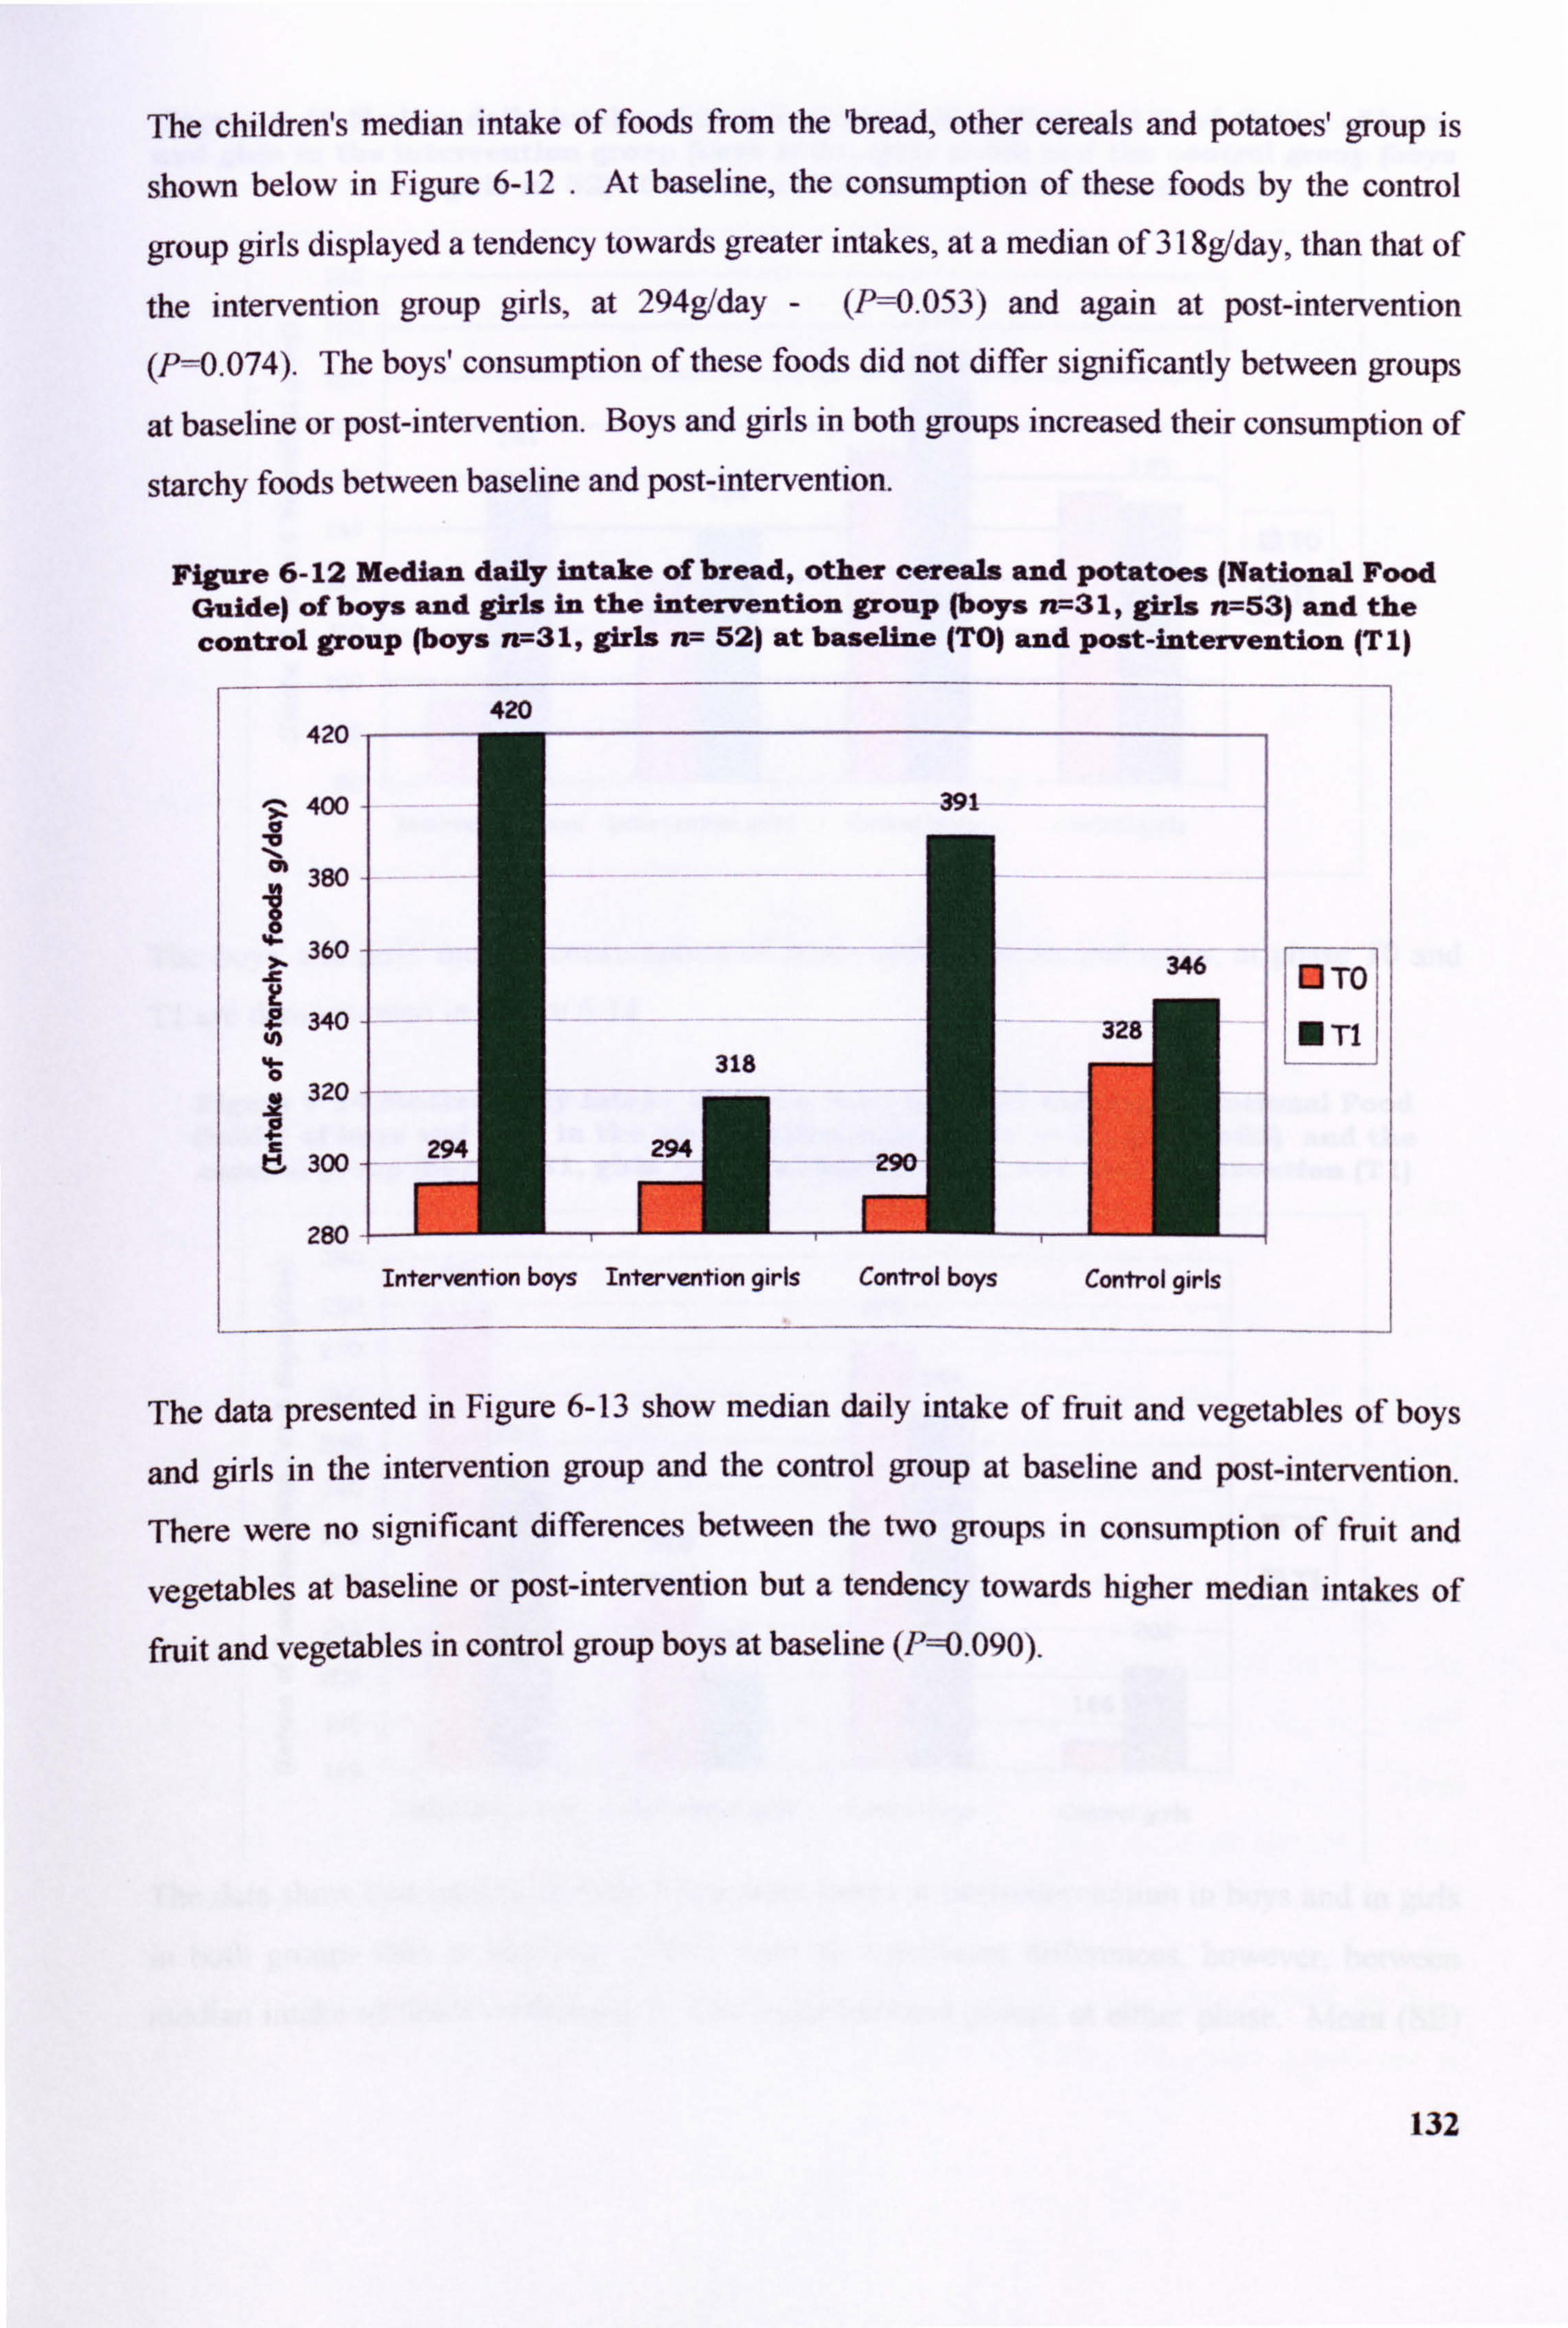
The children's median intake of foods from the bread, other cereals and potatoes' group is
shown below in Figure 6-12 . At baseline, the consumption of these foods by the control
group girls displayed a tendency towards greater intakes, at a median of 318g/day, than that of
the intervention group girls, at 294g/day - (P=0.053) and again at post-intervention
(P=0.074). The boys' consumption of these foods did not differ significantly between groups
at baseline or post-intervention. Boys and girls in both groups increased their consumption of
starchy foods between baseline and post-intervention.
Figure 6-12 Median daily intake of bread, other cereals and Potatoes (National Food Guide) of boys and girls in the intervention group (boys n-731, girls n7-53) and the control group (boys n7-31, girls n-- 52) at baseline (TO) and Post-intervention IT I)
420
400 "a
380
360 Jc
340
320
300
280
420
Intervention boys Intervention girls Control boys Control girls
r---- ---I To:;
NTI L---- -. -
The data presented in Figure 6-13 show median daily intake of fruit and vegetables of boys
and girls in the intervention group and the control group at baseline and post-intervention.
There were no significant differences between the two groups in consumption of fruit and
vegetables at baseline or post-intervention but a tendency towards higher median intakes of fruit and vegetables in control group boys at baseline (P==0.090).
132
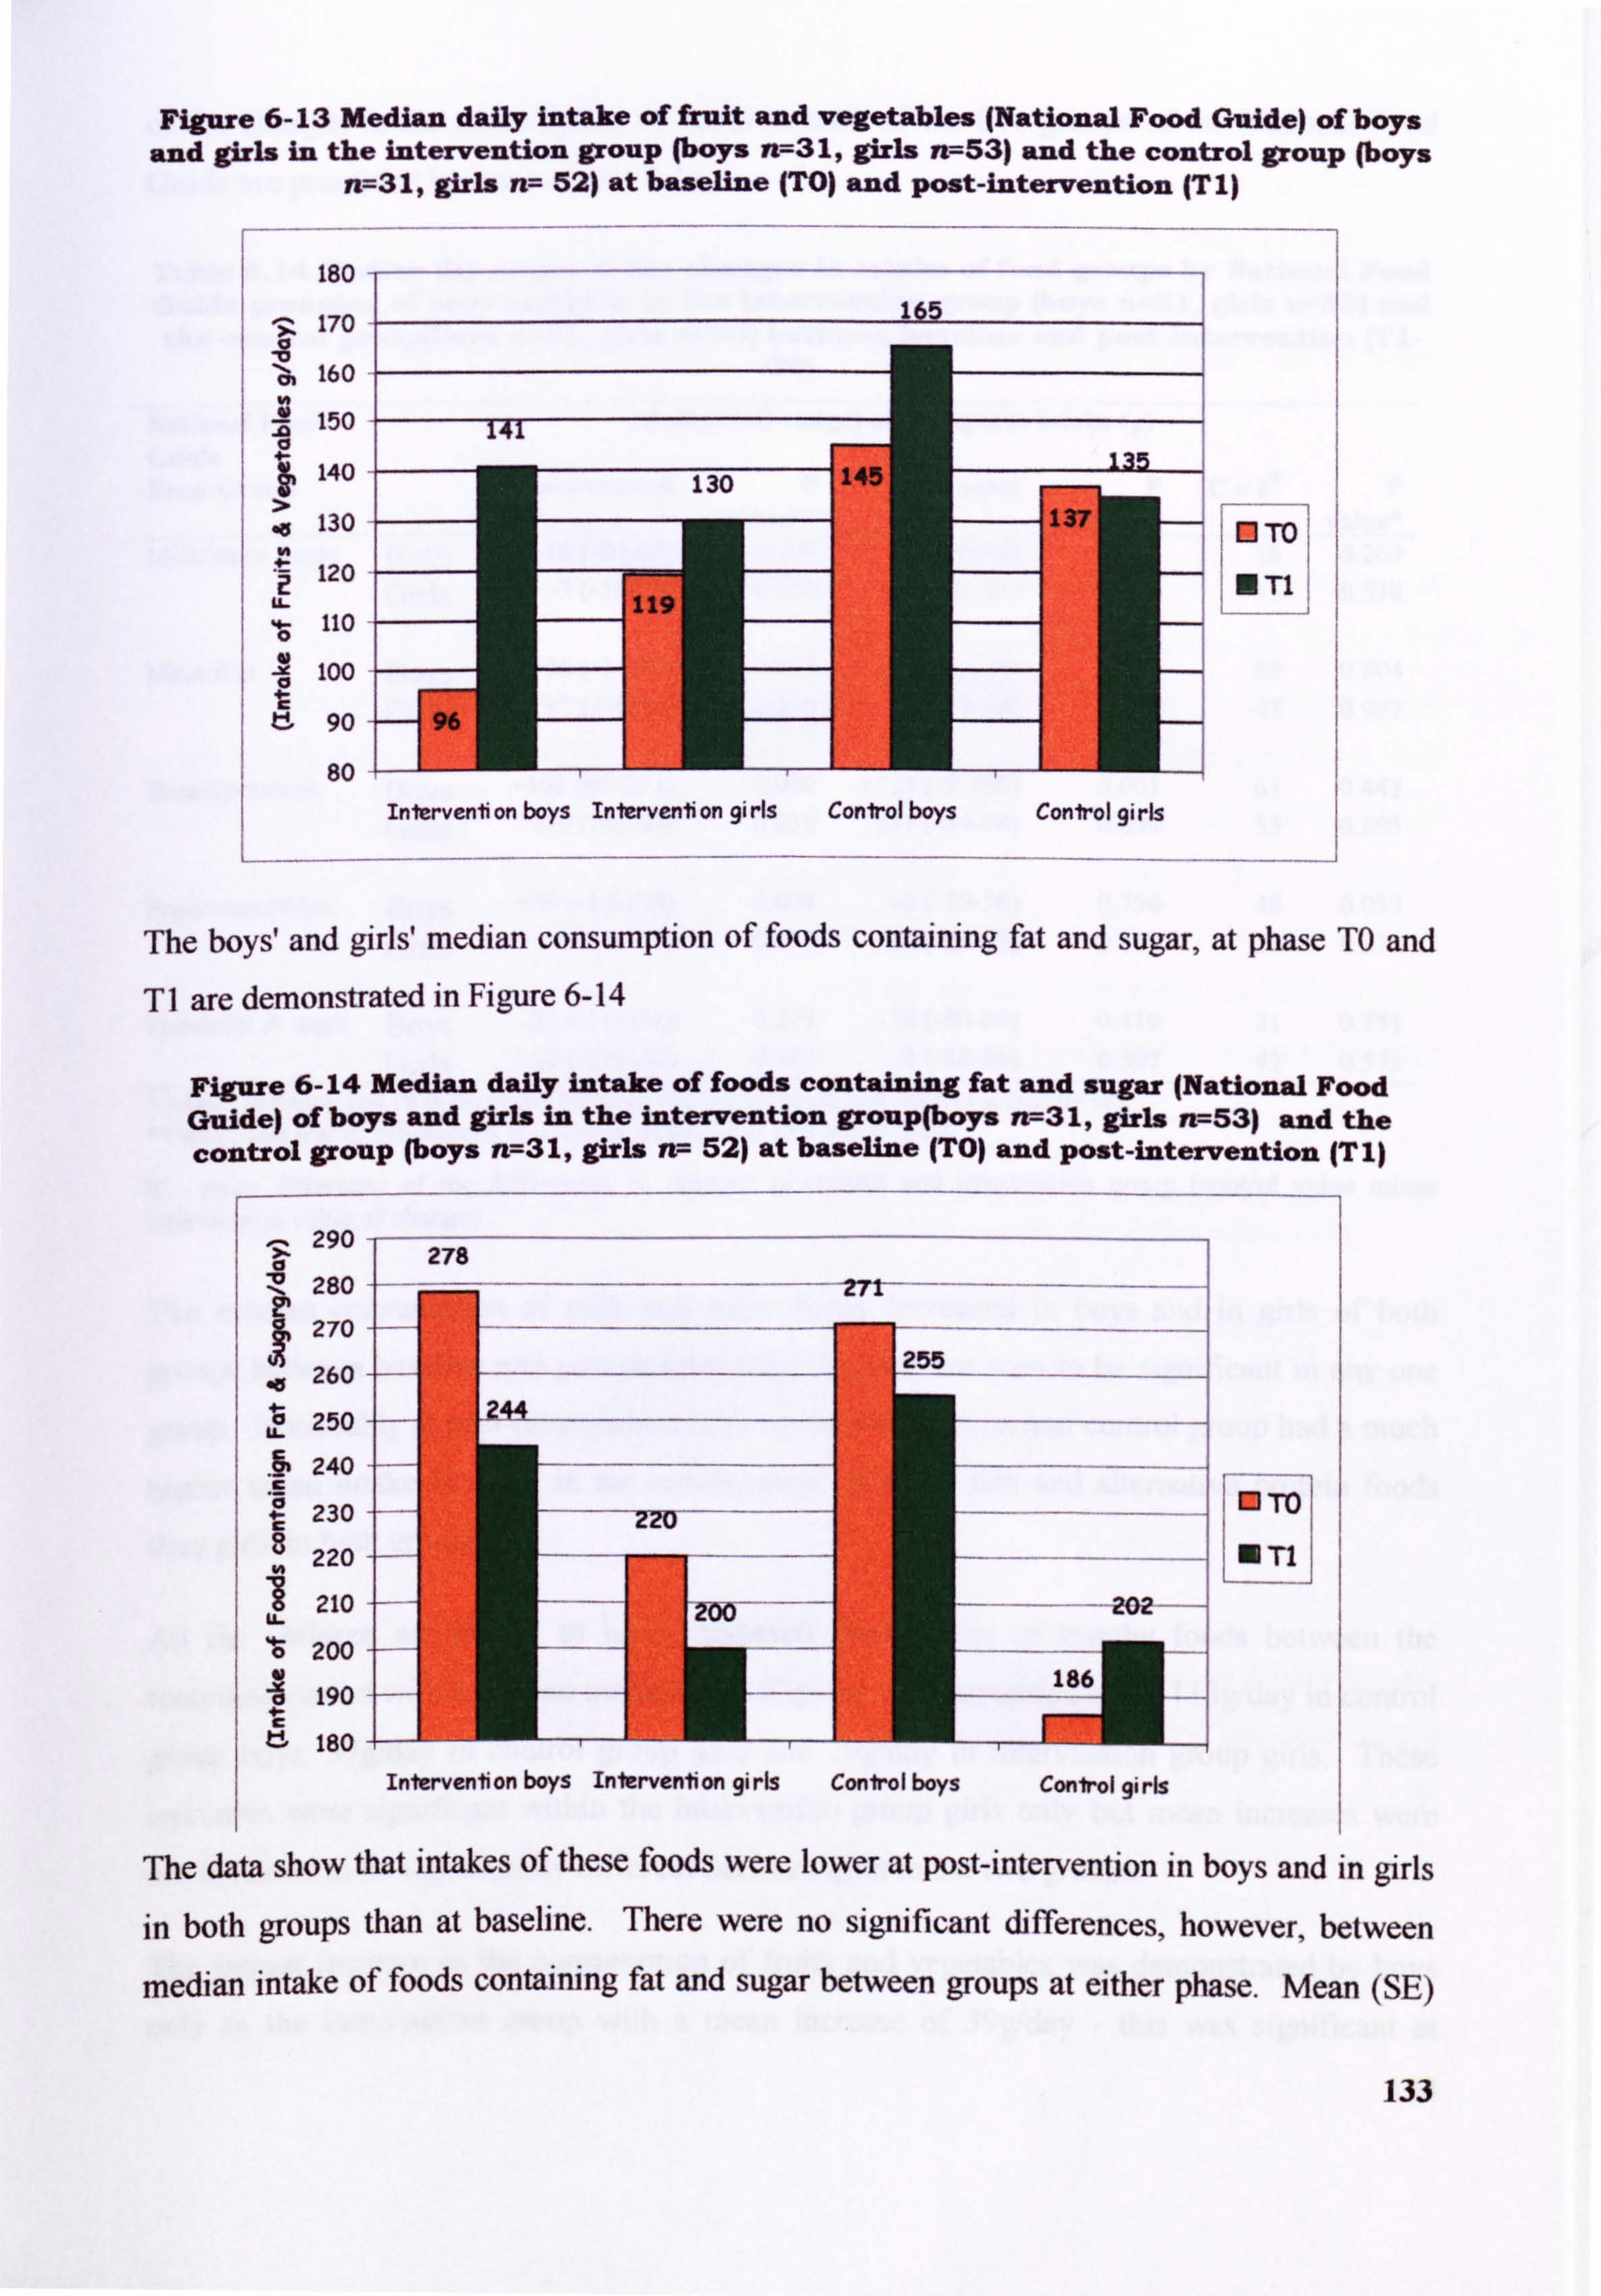
Figure 6-13 Median daily intake of Emit and vegetables (National Food Guide) of boys and girls in the intervention group (boys n--31, girls n7--53) and the control group (boys
n--31, girls n-- 52) at baseline (TO) and post-intervention (T I)
WTO
UT1
The boys' and girls' median consumption of foods containing fat and sugar, at phase TO and T1 are demonstrated in Figure 6-14
Figure 6-14 Median daily intake of foods containing fat and sugar INational Food Guide) of boys and girls in the intervention group(boys n--31, girls rr--53) and the control group (boys n7--31, girls n7- 52) at baseline (TO) and post-intervention (T I)
290
280
270
260
250 u
. fp 240 As
230
220
210
200
190
180
Fm---To LoTli
The data show that intakes of these foods were lower at post-intervention In boys and in girls
in both groups than at baseline. There were no significant differences, however, between
median intake of foods containing fat and sugar between groups at either phase. Mean (SE)
133
Intervention boys Intervention girls Control boys Control girls
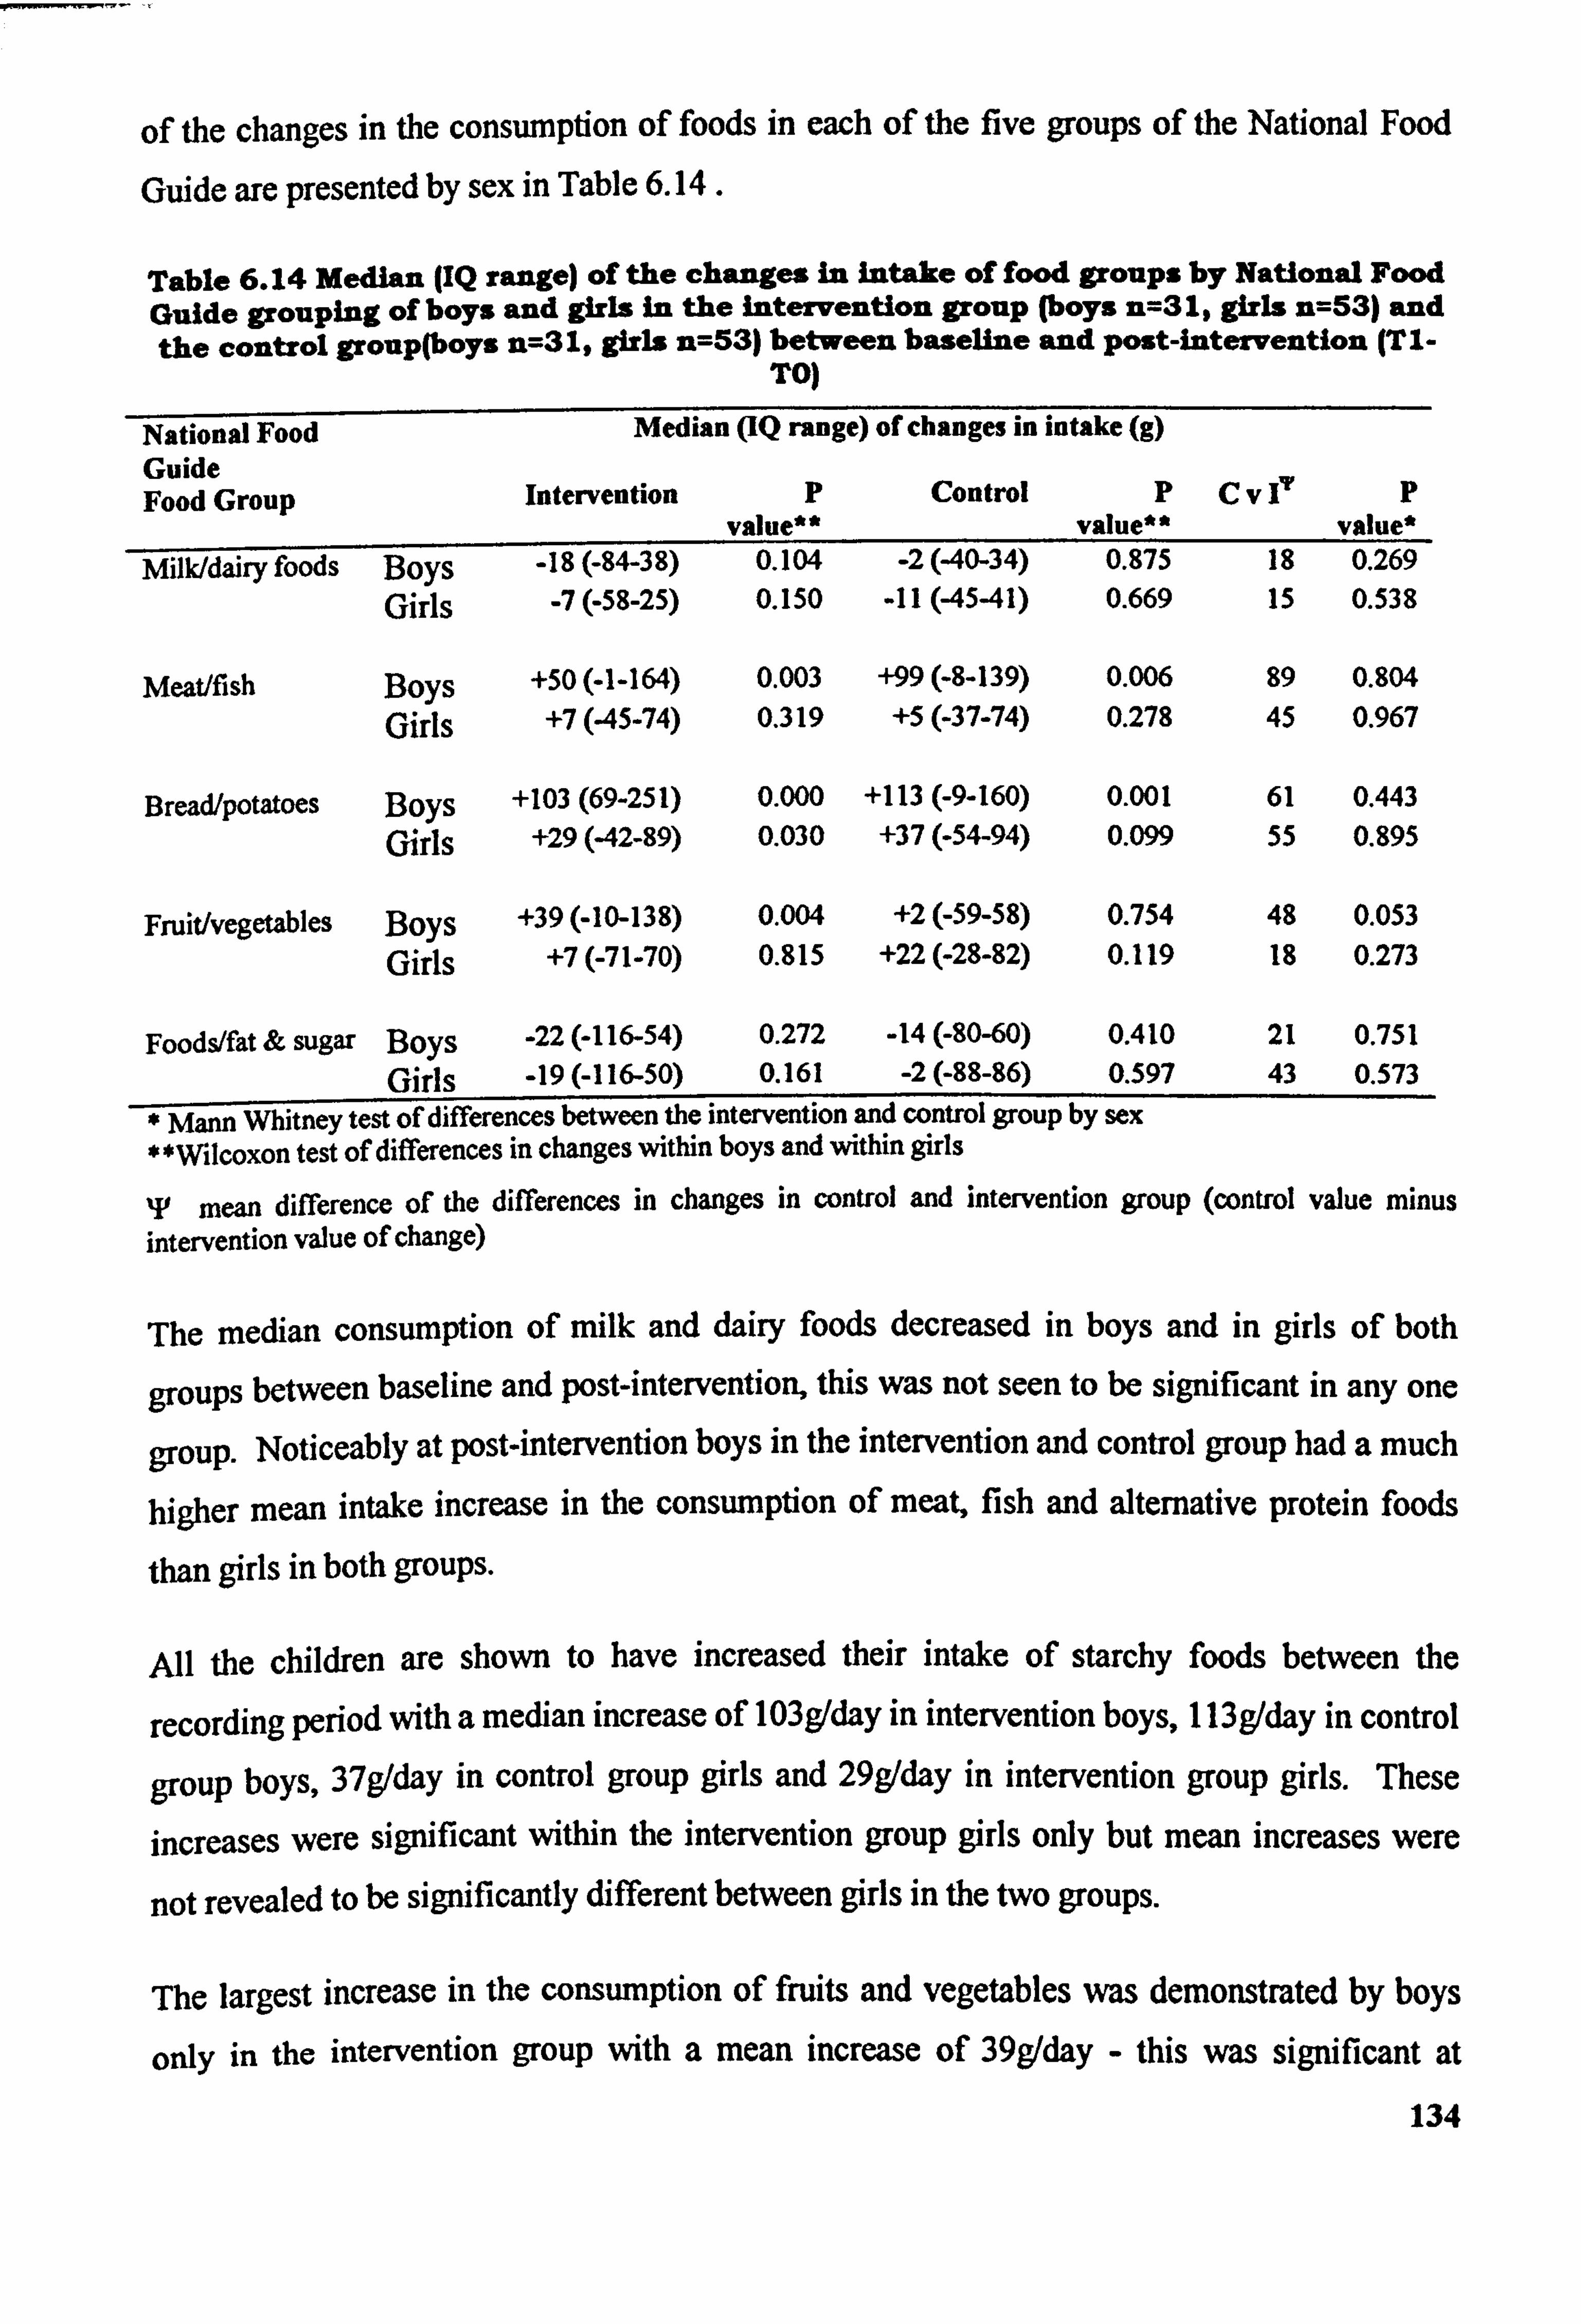
of the changes in the consumption of foods in each of the five groups of the National Food
Guide are presented by sex in Table 6.14.
Table 6.14 Median (IQ range) of the changes in intake of food groups by National Food Guide grouping of boys and girls in the intervention group (boys n=31, girls n=53) and the control group(boys n=31, girls n=53) between baseline and post-intervention (TI.
TO)
National Food Median (IQ range) of changes in intake (g) Guide Food Group Intervention P
value** Control P
value" CV 17 P
value* Milk/dairy foods Boys -18 (-84-38) 0.104 -2(40-34) 0.975 18 0.269
Girls -7(-58-25) 0.150 . 11(4541) 0.669 15 0.538
Meat/fish Boys +50 (-1-164) 0.003 +99 (-8-139) 0.006 89 0.804
Girls +7(45-74) 0.319 +5(-37-74) 0.278 45 0.967
Bread/potatoes Boys +103 (69-251) 0.000 +113 (-9-160) 0.001 61 0.443 Girls +29(42-89) 0.030 +37 (-54-94) 0.099 55 0.895
Fruit/vegetables Boys +39 (-10-138) 0.004 +2(-59-58) 0.754 48 0.053
Girls +7(-71-70) 0.815 +22 (-28-82) 0.119 18 0.273
Foods/fat & sugar Boys -22 (-116-54) 0.272 -14 (-80-60) 0.410 21 0.751 Girls -19 (-116-50) 0.161 -2(-88-86) 0.597 43 0.573
* Mann Whitney test of differences between the intervention and control group by sex *Wilcoxon test of differences in changes within boys and within girls
T mean difference of the differences in changes in control and intervention group (control value minus intervention value of change)
The median consumption of milk and dairy foods decreased in boys and in girls of both
groups between baseline and post-intervention, this was not seen to be significant in any one
group. Noticeably at post-intervention boys in the intervention and control group had a much
higher mean intake increase in the consumption of meat, ish and alternative protein foo f ds
than girls in both groups.
All the children are shown to have increased their intake of starchy foods between the
recording period with a median increase of 103g/day in intervention boys, 113g/day in control
group boys, 37g/day in control group girls and 29g/day in intervention group girls. These
increases were significant within the intervention group girls only but mean increases were
not revealed to be significantly different between girls in the two groups.
The largest increase in the consumption of fruits and vegetables was demonstrated by boys
only in the intervention group with a mean increase of 39gIday - this was significant at
134
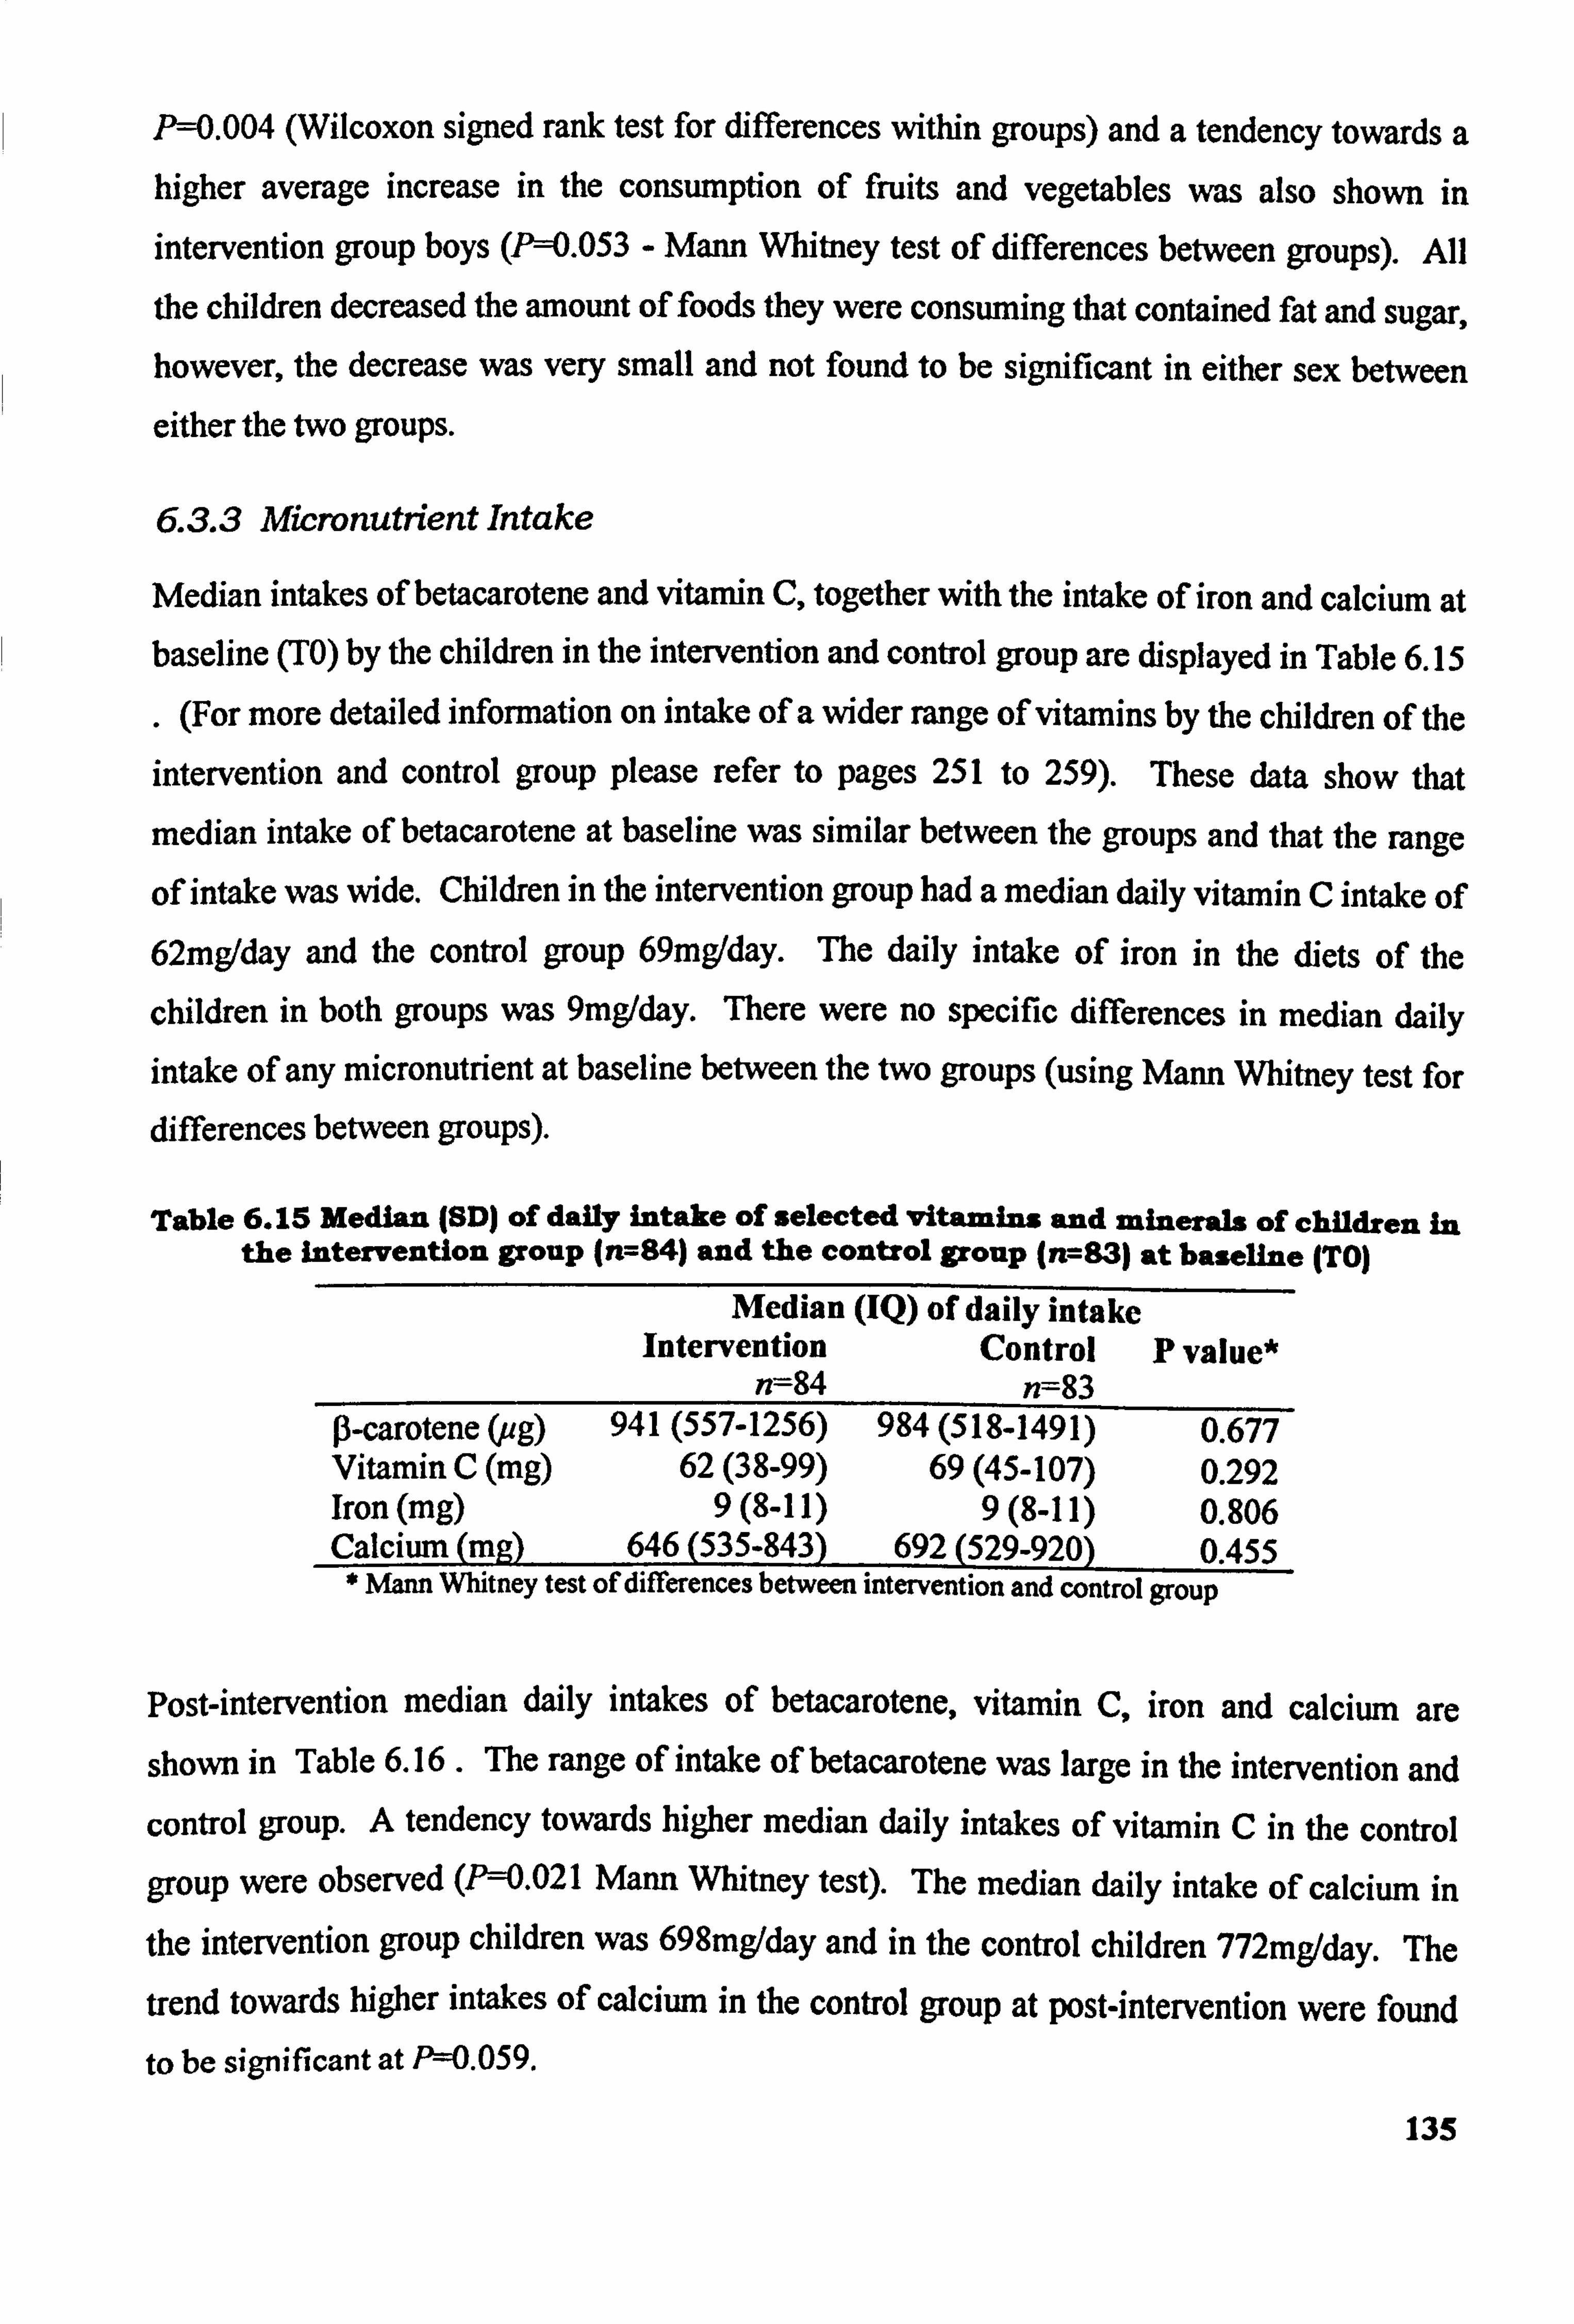
P-0.004 (Wilcoxon signed rank test for differences within groups) and a tendency towards a higher average increase in the consumption of fruits and vegetables was also shown in
intervention group boys (Pý=0.053 - Mann Whitney test of differences between groups). All
the children decreased the amount of foods they were consuming that contained fat and sugar, however, the decrease was very small and not found to be significant in either sex between
either the two groups.
6.3.3 Micronutrient Intake
Median intakes of betacarotene and vitamin C, together with the intake of iron and calcium at baseline (TO) by the children in the intervention and control group are displayed in Table 6.15
. (For more detailed information on intake of a wider range of vitamins by the children of the
intervention and control group please refer to pages 251 to 259). These data show that
median intake of betacarotene at baseline was similar between the groups and that the range
of intake was wide. Children in the intervention group had a median daily vitamin C intake of 62mg/day and the control group 69mg/day. The daily intake of iron in the diets of the
children in both groups was 9mg/day. There were no specific differences in median daily
intake of any micronutrient at baseline between the two groups (using Mann Whitney test for differences between groups).
Table 6.15 Median (SD) of daily intake Of selected vitamins and minerals of children In the Intervention group (n---84) and the control group (n, --83) at baseline (TO)
Median (IQ) of daily intake Intervention Control P value*
n--84 n--83 0-carotene (ug) 941 (557-1256) 984 (518-1491) 0.677 Vitamin C (mg) 62(38-99) 69(45-107) 0.292 Iron (mg) 9(8-11) 9(8-11) 0.806 Calcium (mg) 646 (535-843) 692 (529-920) 0.455 * Mann Whitney test of differences between intervention and control group
Post-intervention median daily intakes of betacarotene, vitamin C, iron and calcium are shown in Table 6.16 - The range of intake of betacarotene was large in the intervention and control group. A tendency towards higher median daily intakes of vitamin C in the control group were observed (P=0.021 Mann Whitney test). The median daily intake of calcium in the intervention group children was 698mg/day and in the control children 772mg/day. The trend towards higher intakes of calcium in the control group at post-intervention were found
to be significant at P=0.059.
135
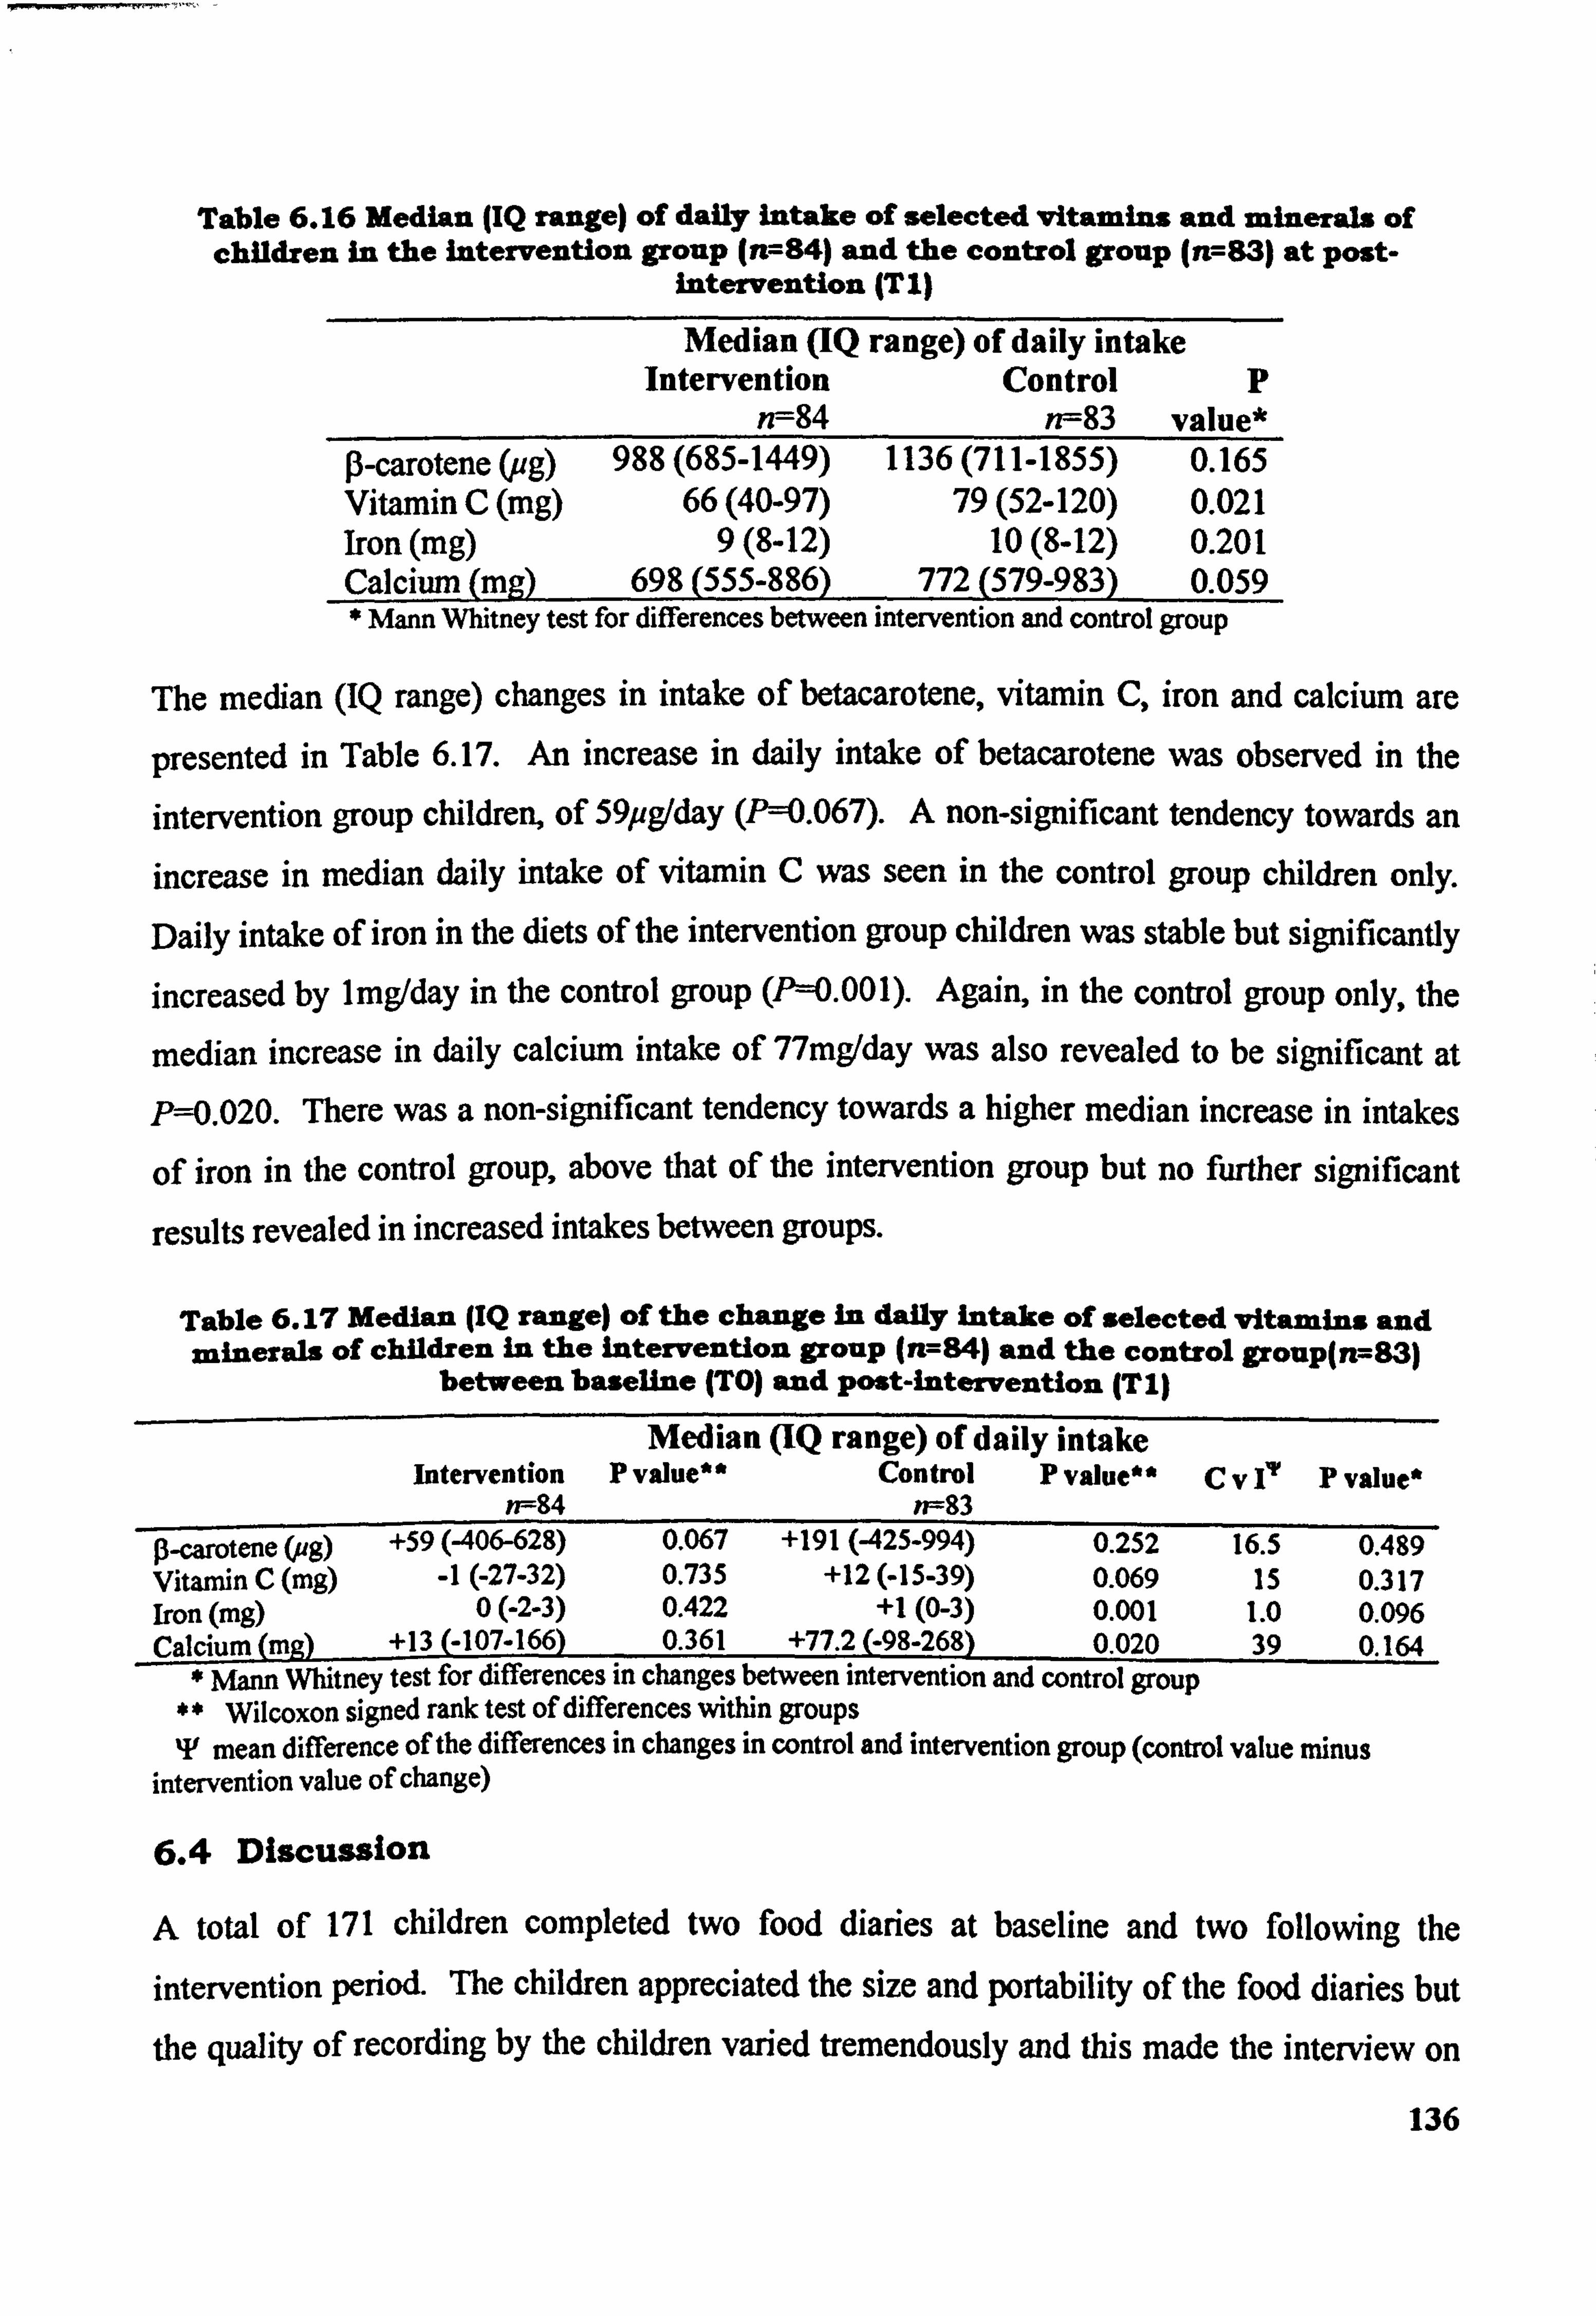
Table 6.16 Median JIQ range) of daily intake of selected vitamins and minerals of children in the Intervention group (n=84) and the control group (it--83) at post-
intervention (TI)
Median (IQ range) of daily intake Intervention Control p
n--84 n--83 value* 0-carotene (ug) 988 (685-1449) 1136 (711-1855) 0.165 Vitamin C (mg) 66(40-97) 79(52-120) 0.021 Iron (mg) 9(8-12) 10(8-12) 0.201 Calcium (ma) 698 (555-886) 772 (579-983) 0.059 * Mann Whitney test for differences between intervention and control group
The median (IQ range) changes in intake of betacarotene, vitamin C, iron and calcium are
presented in Table 6.17. An increase in daily intake of betacarotene was observed in the intervention group children, of 59pg/day (P--0.067). A non-significant tendency towards an increase in median daily intake of vitamin C was seen in the control group children only. Daily intake of iron in the diets of the intervention group children was stable but significantly increased by lmg/day in the control group (1'=0.001). Again, in the control group only, the
median increase in daily calcium intake of 77mg/day was also revealed to be significant at P=0.020. There was a non-significant tendency towards a higher median increase in intakes
of iron in the control group, above that of the intervention group but no further significant
results revealed in increased intakes between groups.
Table 6.17 Median (IQ range) of the change In dailY inta e of selected vitamins and minerals of children in the intervention group (n---84) and the control group(n--83)
between baseline (TO) and post-intervention (TI)
Median (IQ range) of daily intake intervention P value** Control P value"
w--84 n--83 Cv 17 P value*
p-carotene (ag) +59 (406-628) 0.067 +191 (425-994) 0.252 16.5 0.489 Vitamin C (mg) -1(-27-32) 0.735 +12 (-15-39) 0.069 15 0.317 Iron (mg) 0(-2-3) 0.422 +1(0-3) 0.001 1.0 0.096 Calcium (mg) +13 (-107-166) 0.361 +77.2 (-98-268) 0.020 39 0.164
Mann Whitney test for differences in changes between intervention and control group Wilcoxon signed rank test of differences within groups
IF mean difference of the differences in changes in control and intervention group (control value minus intervention value of change)
6.4 Discussion
A total of 171 children completed two food diaries at baseline and two following the intervention period. The children appreciated the size and portability of the food diaries but
the quality of recording by the children varied tremendously and this made the interview on
136

the day after completion extremely important in order to clarify entries. The majority of interviews with children took place in school during lesson time but a percentage of interviews had to be conducted at break-times and lunch-times when a small number of pupils
were refused permission to leave the classroom.
In the first few weeks a valuable lesson was learnt by the researcher in terms of children forgetting to bring their food diary with them to school on the day of interview. Initially this
resulted in children quite happily attending interview without bringing a food diary. in order
to minimise the wasting of lesson time spent in unfruitful transit and empty appointments a
system of reminders evolved that succeeded in reducing the number of food diaries left at home. The reminder system had to work on several levels -a notice to teaching staff
arranging appointments on the researcher's behalf and reminder slips to the children
themselves. Teaching staff were politely reminded that interviews would need to be
performed on a certain day and received a full explanation as to why the date of interview was important to the quality of dietary data collected.
A printed A4 notice of the day of the interviews was delivered to school well in advance to be
displayed on the notice board in the staff room. Appointments slips were printed, completed
and delivered to the appropriate member of staff in school and were placed in the registers of
the children who were to be interviewed the next day (on the third day of the diary or on Friday for diaries collected on Monday morning). This strategy proved most successful in
reminding the majority of children that they needed to ensure that they bought their diary to
school. For those children who repeatedly forgot, a reminder slip was posted to their home
address. This in itself was fraught with difficulty as the children who most often forgot were
those children with transitory home circumstances which augmented the problem of
contacting the children.
In addition to children forgetting their diaries, at the beginning of the distribution and
collection period many children, on their way to an interview, were intercepted by concerned
members of school staff and returned to their classrooms. To counteract this effect upon the interviews, release slips were printed, completed and signed by the researcher and these also
put in the form registers of children who were to attend an interview. The children were then
able to show the slip to any member of school staff who enquired about their purpose. Every
attempt was made to inform teaching staff on the necessity and duration of interviews with their pupils as it became apparent that all schools need to know the location of their pupils at
137

all times. Quite often children reported that they were extremely pleased to have a legitimate
reason to leave the classroom and meander in the school corridors and very often talked about taking the longest possible route back to their lessons!
The interviews took between 20 and 40 minutes depending on the amount of detail recorded by the children and the time the children spent considering portion sizes in the photographic
food atlas. Standard portion sizes of school meat items were ascertained from catering staff in
each school taking part in the study as servings were reported by the catering staff to be
standardised for each child.
Many foods consumed by the children frequently were not depicted in the food atlas and
many other foods within the atlas were not frequently consumed by the children. Frequencies
of food consumption could be assimilated from studies of dietary intake in children and used
to develop a specialised food atlas that would also contain foods that are consumed away from
home.
When performing a dietary survey of nutrient intake in children, the literacy and numeracy
skills of the children may require that additional provision be made for children with special
educational needs. During the adaptation of the food diaries used in this study, the proof
copies were shown to several members of teaching staff who gave valuable and constructive
criticisms of the style of the diary and the language used within it. Several changes were
made on the basis of recommendations. It is to be expected that in schools in socially
deprived areas a percentage of the school role will have been identified as having special
educational needs either at primary school or on entering secondary school and this data is
available from the Special Needs Co-ordinator in school. It is likely that in any one
prospective sample of children that a percentage will have a reading age below the average or
below that expected in children of a similar age. Some examples of change applied to the
food diaries was the replacement of the word 'estimate' in the context of' estimate the amount
of food that you consumed" with "use your best guess". The word 'describe' was replaced by
"tell us" and'origin of food! was replaced by "where was the food from? ".
In summary, several changes were made to the food diaries to better suit the abilities of the
children participating in the study and this should be considered at the Planning stage of any
study in socially deprived children. The children appeared to find the diaries easy to use but
easy to forget about on the day of interview. A system of appointments that are known to the
138

subjects and to teaching staff at school, with notification well in advance was found to reduce the number of forgotten diaries and missed interviews.
In a dietary survey including children and adolescents from socially deprived backgrounds, it
may be expected that a proportion of the children will have some difficulty with literacy and
numeracy. Young people vAth poor literacy and numeracy skills may require assistance from
an adult, perhaps a parent, sibling or teacher in the completion of a food diary (Macario et al, 1998). In cases such as these, the recording may be a challenge and may be assisted with the
use of a dietary diary with room for drawings. Computerised food diaries that provide a
selection of food and beverages, accompanied by photographs, that may be selected by an individual may be a method of overcoming the obstacles presented by the amount of writing a
person may have to do. This may be a highly attractive alternative for young people with low
literacy levels but who have fewer problems with computer literacy. This method would
require access to a computer with the appropriate dietary diary programme or access to a lap-
top computer or even a hand-held computer, but may be feasible to run on a community or
school basis. At the present time there are no published studies on the use of purpose-written
computer programmes for the collection of dietary data in children and adolescents.
For this study, 850 food diaries were printed and bound at baseline but 500 of these were used
in the baseline recording period because of losses. The printing of diaries may some
considerable cost to the budget of smaller studies and the number of losses to be borne must be accounted for.
6.4.1 Intake of Nutrients
The suitability of estimated food diaries in the surveying of dietary intakes is discussed in
Hackett et al, 1983 and for this study further discussed in Part B- Validation of Methodology
but it is concluded that in this study the food diaries were an efficient method of collecting dietary data from children in a sample size of approximately 200.
Nutrient intakes were reported as observed in the children. No inference is made to absolute intakes and the data serve to show an overview of the macronutrient and micronutrient intake
in children in socially deprived areas of Tyne and Wear and the intake of nutrients prior to
and following a school-based food preparation skills intervention. The mean energy intakes
of children participating in this study at both baseline were 8.6MJ/day in both the intervention
and control group and at phase T 19. IW/day in the intervention group and 9.4MJ/day in the 139
control. It is difficult to make comment on the adequacy of nutrient intakes when commonly, daily energy intake is reported by sex as the energy requirements of boys and girls differ at
this age. Analysis of the data by sex show that mean energy intake of boys at baseline was 9.9MJ/day and at post-intervention 10.6MJ/day in intervention group boys and 10.8MJ/day in
control. These values are higher than the mean value reported in the NDNS for boys aged I I-
13-years-old (8.28MJ/day). In girls at baseline mean energy intakes were estimated to be
7.8MJ/day in intervention group girls, 7.9MJ/day in control. These values increased to
8.2MJ/day and 8.5MJ/day at phase T1 respectively. Mean baseline and post-intervention
energy intakes were higher than values reported in the NDNS (7.03MJ/day in girls), by
Adamson et al, 1992a (8.61MJ/day in boys aged 11-12-years-old and 8.27MJ/day in girls of
the same age range) and by Doyle et al, 1994 (9.13MJ/day in 12-13-year-old socially deprived boys and 7.90MJ/day in girls). The data presented in this study are encouraging because, data arc presented as observed and at group level, mean energy intakes indicate that
the method of dietary assessment was effective in estimating mean intake of energy in the
children and questions are not raised about the impact of under-reporting on the dietary data.
Mean energy intakes increased between baseline measurement and post-intervention
measurement, in children of both groups, as would be expected in children of this age. At
baseline the children were deriving 12.3% of their total daily energy from protein. At post-
intervention the contribution increased to 13.1% in the intervention group and 13.0% in the
control. The contribution of protein to daily energy intake in the children taking part in this
study is comparable to data in the NDNS where protein was found to contribute 13.1% in
boys and 12.7% in girls to total daily energy intake. Protein intakes (g/day) increased in both
sexes in both groups between phases TO and TI. The increase in protein intake was highly
significant in both of both groups and in control girls only. The observed increase in the
amount of protein the children were consuming was also reflected in the increase in the
percentage contribution of protein to the diets of the children at post-intervention. Both
groups demonstrated a 0.7% increase in the contribution of protein to energy intake. No
significant differences were observed in the protein intake (Wday) or in the percentage
contribution of protein to the childreres diet between the intervention and control group and
thus it is concluded that the practical food skills intervention did not impact upon the protein
intake of the children.
140
The mean increase in intake of total fat (g/day) in children intervention group was 6g1day and
slightly less than the mean increase of 9g/day in the diets of children in the control group. The difference in mean increase was not, however, found to be statistically significant. The
contribution of total fat to total daily energy remained stable in the intervention group at 36.3% between baseline and post-intervention but there was a minor increase, but not
significantly so, in children in the control group from 35.3% to 35.9% of total daily energy derived from total fat. The percentage energy provided by fat in the childrens diets at baseline and post-intervention are favourably comparable to the DRV of 35% for total fat in
groups not consuming alcohol (Department of Health, 1991). The contribution of fat to
energy intake in these children is comparable to that reported in the NDNS by Gregory et al (2000) for children aged 11-14-years. Gregory et al reported the contribution fat to be 35.2%
in boys and 36.2% in girls Whilst Doyle et al (1994) report values of 36.6% in boys and 35.7% in girls. Robson et al (2000) reported median percentage contribution of total fat to
total daily energy in the diets of Northern Irish adolescents to be higher still at 39% in boys
aged 12-years-old and at 38.4% in girls.
The intake of saturated fat by the children increased in both groups between recording
periods. Intake of saturated fat was not found to be significantly different at either baseline
(P=0.467) or at phase TI (P=0.664) between the intervention and control group. Within
groups the children demonstrated an increase in the amount of saturated fat in their daily
intake which was significant at P=0.001 (intervention group) and P=0.024 (control group)
with a Mest of differences showing a tendency towards higher intakes of saturated fat in the
intervention group at post-intervention. T-test of differences in changes between the
intervention and control groups however, was not found to be of statistical importance.
The contribution of saturated fat to total daily energy intake also increased in children of both
groups between the recording periods. A baseline children in the intervention group were deriving an estimated 12.1% of their total daily energy from saturated fat, in the control group the value was 11.8%. At post-intervention the contribution of saturated fat increased these figures to 12.5% in the intervention group and to 11.9% in the control. The DRV for the
contribution to energy by saturated fat in population groups not consuming alcohol is II%.
The children participating in this study were shown to be deriving more than I I% of their dietary energy ftom saturated fat. These values are lower, however, than those reported by
Gregory et al (2001) where saturated fat contributed 13.8% to total daily energy in boys and
141
14.0% in girls. In 12-13-year-old children Doyle et al (1994) reported saturated fat as
contributing 13.1 % of total daily energy in boys and 13.2% of energy in girls. The changes in
the contribution of saturated fat to energy in the diets of the children were not found to be
statistically significant and it is concluded that the intervention did not impact upon the intake
of total fat or saturated fat in the diets of children in the intervention group.
The children's intake of carbohydrate significantly increased by a mean of 14g/day (P<0.001)
from a mean 272g/day at TO to 287g/day in the intervention group and by a mean of l8g/day
from a mean of 272g/day at TO to 296g/day in the control group (P==0.030). The percentage
of daily energy derived from carbohydrate in the childrens diets was approximate to 50% in
both groups at phases TO and TI. Both groups showed a small decrease in the amount of
energy contributed by carbohydrate between the two recording periods but this was not found
to be significant within either group nor was it significant between the two groups (P=0.460).
The mean intake of starch by the children increased slightly but significantly within the
intervention and control group.
Starch contributed 28% of total daily energy in both groups at baseline and 29% of energy at
post-intervention. T-test of differences in changes in intake of starch and the contribution Of
starch to total daily energy intake between the intervention and control group revealed that the
changes were not statistically significant and it is concluded that the intervention did not impact positively upon the intake of total carbohydrate and starch in the diets of intervention
group.
intake of total sugars and non-milk extrinsic sugar are presented and discussed in Chapter 8.
The analysis of data categorised by the five food groups of the National Food Guide reflect
and the changes in macronutrient intake by children in both groups and present some further
more interesting findings. Both groups show a significant increase in their mean intake of foods in the 'meat, fish and alternatives' group and this further demonstrates the increase in
protein in the diets of the children with a significant trend towards higher intakes in children
of the intervention group. Similarly, the children significantly increased their intake of
starchy foods with a significant trend towards higher intakes in control group children at phase TI. Both groups decreased their consumption of foods belonging to the 'foods
containing fat and sugar' group, but the decrease was small in both groups, amounting to
approximately 6% and the decrease is not reflected in the children's intake of fat or saturated
142
fat. In terms of g/day per day, children were making most selections from the starchy foods
group followed by the group of foods containing fat and sugar. The children were consuming
slightly less foods from the groups of foods containing fat and sugar than they were from the
starchy food group.
In both groups at phase TI children were consuming approximate amounts of protein to their
consumption of fruit and vegetables. One important revelation was that children in both
groups were consuming a very small amount of foods from the 'milk and dairy foods' groups.
Boys in the intervention groups increased their intake of fruits and vegetables by 39g/day
(P=0.004) and a trend towards increased intake in fruits and vegetables by boys only in the
intervention group compared to boys in the control group was revealed (P=0.053). The
analysis of foods consumed by the children according to the five groups of the National Food
Guide show that the intervention had a positive impact upon the intake of fruits and
vegetables in boys who attended the Food Club. The intake of fruit only by the children are
presented in Chapter 7 (see 8.3.6 ) but equate to less than half a portion per day in both
groups.
There were no significant differences in increase in intakes of betacarotene, vitamin C, iron
and calcium between the control group and intervention. The Food Club did not, therefore,
have an impact upon the intake of these vitamins and minerals by children who attended the
Club.
The analysis of foods consumed by the children in accordance with the National Food Guide
show limited consumption of milk and dairy foods - less in both groups than a very small
glass of milk or a small pot of fromage frais. Low intakes of milk and dairy foods are
reflected in the children! s intake of calcium at phase TO and T I. These children are entering a
period of rapid growth and optimal calcium intakes are preferable if they are to achieve peak
bone mineralisation. Boys were seen to have higher intakes of iron than girls, although this is
likely due to higher mean daily energy intakes.
The intake of iron during the recording period was sub-optimum in girls and did not increased
significantly even though the girls had increased their mean energy intake between baseline
and post-intervention. The median intakes of fruit and vegetables were sub-optimal within both groups at both phases and equate to between I to 2 portions of fruit and vegetables per
143
day (including fruit juices). There is evidence to show that boys only in the intervention
group significantly increased their intake of fruits and vegetables following the intervention.
The data show that the intake of nutrients were similar in the intervention group and control
group children at baseline and following intervention. Mean energy intake increased in both
sexes in both groups, as may be expected in children of this age and intakes of macronutrients
were comparable to other published data on dietary surveys of children of similar age.
In summary, comparison between the data on changes in nutrient intake following
intervention, as presented here, to other studies of practical food and nutrition intervention in
children is not possible as similar studies have not been published. The data support previous
findings in that the intake of some micronutrients and of fruits and vegetables in children from socially deprived backgrounds is sub-optimal. Ile intervention did not effect the
nutrient intake of children in the intervention group but it did have a positive impact upon the
consumption of fruits and vegetables of boys who attended the Food Club.
144

7 Comparison of reported energy intake with physical activity level
lf a major conclusion of recent studies is that energy intakes have declined in response
to a secular trend towards lower amounts of activity in children" Li i stone et al, 1992 vmg
"there is no gold standard that can be used to validate prospective methods of dietary assessment that can be carried out in free-living subjects,,
Bingham & Day, 1997
145
7.1 Introduction
It is now accepted that there is a bias towards underestimation of energy intake through self-
reports of diet in some age groups (Black et al, 2000, Livingstone et al, 1992). For example, in the NDNS, Gregory et al (2001) comment on under reporting by older girls, evidence of
which became apparent in mean energy intakes. This presents a paradox; an increased
incidence of obesity in children that is coupled by falling values of reported mean energy intake. Under-reporting may take several forms; intentional under-reporting, intentional
alteration of diet and unintentional/unknowing under-reporting. In order to identify biased
reporting at the individual level it is necessary to measure either energy expenditure or record
a detailed history of physical activity during the time of dietary analysis. Either of these
methods are probably achievable in clinical conditions but may be particularly difficult in'
free-living individuals. At the present time there are no clear trends in under-reporting in
studies assessing the diets of individuals of lower social class. Common validation techniques
involve the use of anthropometrical. measurements to calculate the ratio of energy intake to
basal metabolic rate which is expressed as the physical activity level (PAL), and serves as a
check on the accuracy of self-reporting (Zemel et al, 1997).
The analysis of urinary biochemical markers, such as 24hour urinary nitrogen excretion (Bingham & Day, 1997, Black et al, 2000) and 24h urinary creatinine excretion (Ritchey et al, 1973, Narayanan & Appleton, 1980) are common validation techniques. Urinary creatinine
may be viewed as a more reliable technique since creatinine is generally stable and does not decompose within the time of a 24-hr collection and has been shown to be more robust
against intra-individual variation (Bingham et al, 1988). More recent techniques include a doubly labelled water method which has been employed successfully as a means of validating dietary energy intake in adults (Black & Cole, 2000 and Black et al, 2000) and in children (Livingstone et al, 1992).
Biochemical markers are useful in that they reflect intake without relying upon (self) reports
of food consumption. An analysis of biochemical markers may include quantifying plasma
vitamin C, serum carotenoids and tocopherols (Bingham & Day, 1997) and serum ferritin,
folate and vitamin A (Doyle et al, 1994).
In dietary assessment of children, validation techniques may include the quantification of 24h
urinary nitrogen excretion (Ritchey el al, 1973) and urinary creatinine (Bingham &
146
Cummings, 1985) which has been shown to be clearly correlated with total protein intake and
animal protein intake. Common problems in validation techniques that rely upon 24h-urine
collection are non-compliance of children in missed micturitions; causing unknown losses
(Neubert & Remmer, 1998).
Z 1.1 Ratio of Mean Energy Intake to Basal Metabolic Rate
Bingham (1987) suggests that PAL values of less than 1.4 times the BMR for any given group
suggests under-reporting of energy intake whilst Livingstone et al (1990) suggest 1.3 times
mean measured energy intake to be compatible in a sedentary adult. The Department of
Health confers physical activity levels (PAL) of 1.56 for boys and 1.48 for girls, assuming a
moderately active lifestyle in adolescents aged 10 to 18 years (Department of Health, 199 1).
7.1.2 Urinary biochemical markers
Urinary nitrogen, in the form of urea, may be determined instrumentally by a process of acid
digestion and titration of free ammonium and is a common analysis performed in the medical
biochemical laboratory. A quantitative determination of urea nitrogen can be performed and a
calculation applied to adjust total urinary nitrogen to dietary protein by a factor of x6.25 (a
mean factor for food stuffs, although individual factors exist for many other foods,
particularly those rich in protein, for example, meat, fish and fowl). Urinary nitrogen (g/24hr)
may be correlated with estimated protein intake (91day) of recorded dictary intakes in a
healthy adult population (Black et al, 1991). However, the same degree of correlation will
not be demonstrated in healthy children and adolescents during growth periods, where
demand for protein for growth exists, wherein a larger deficit in urea nitrogen may be
observed due the effect upon nitrogen balance. The correlation between dietary intakes
nitrogen and 24-hr nitrogen excretion in free-living adults completing estimated food diaries
is suggested to be greater than 0.70 (using Pearson's correlation) (Bingham & Day, 1997).
Urinary creatinine excretion (mg/24hr) may be investigated in the evaluation of protein
nitrogen intake by subjects. The effect of diet on urinary creatinine excretion relates
specifically to 3 dietary components - protein, creatine and creatinine. The strongest acute
effect upon urinary creatinine excretion occurs during the heating process of meals containing
protein Nuebert & Remer (1998). When adjusted for fat-free mass and controlling for age
dependency, creatinine excretion can be successfully correlated with total protein intake and
animal protein intake. Quantitative determination of 24-hr urinary creatinine excretion may
147
be more useful in studies of children and adolescents, providing suitable reference values for this analyte can be found in the literature. Creatinine, coefficients which express the amount
of creatinine excreted in 24hr by a healthy individual (expressed as mg/kg body weight/24 hr)
have been shown to correlate well with body weight but better still with muscle mass (an
obese individual would be expected to have a lower creatinine, output than a lean individual of
equal body mass).
The ratio of sodium to potassium (excretion mg/kg body weight/24hr) may be used as a
marker of fruit and vegetable intake. The ratio depends on the intake of vegetables and fruit
and assumes that, within a given range in healthy children, the sodium: potassium will demonstrate a greater value in individuals consuming greater amounts of vegetables and fruits
(g/day) and a lower value in individuals consuming smaller amounts as recorded in estimated food diaries.
Z1.3 Aims
* The specific aims of this work were to compare the reported
energy intake of subjects to Physical Activity Level and to
perform a preliminary analysis of 24-hour urine sample biochemical markers
7.2 Methods
An evaluation of the method of dietary assessment (3-day estimated food diaries) was carried
out using two techniques. The first examined the ratio of Basal Metabolic Rate to Mean Energy Intake (MJ/day) which is expressed as the physical activity level (PAL) and serves as
a check on the accuracy of self-reporting.
The second technique was performed on a sub-sample of subjects and employed a quantitative
analysis of 24-hr urinary nitrogen and creatinine, sodium and potassium in a 24-hr urine
sample collected from this sub-sample.
A 25% sub-sample (i. e. 50 subjects, five children from each of the ten schools) of the study group were required to provide an adequate sub-sample to measure the accuracy of estimating actual dietary intake using the interview method. Each subject agreeing to provide a urine sample was asked to collect all urine passed within a specified a 24-hr period on the weekend day of food diary nos. I and 2 (e. g. Saturday or Sunday).
148

A letter detailing the requirement for the sample was sent to all parents and guardians of
children who volunteered to take part in the Good Food Study. This letter asked the parents
of children to agree to their child providing a sample and was accompanied by a detailed
information sheet (see Figure 7- 1) and a parental consent form (see Figure 7-2 ).
Figure 7-1 Subject information sheet (24-hour urine sample) HumanNutrition Pesearch Centre
Wellcome Laboratories Queen Victoria Pood Newcasl le upon Tyne
Tel: 0191 222 8241
Providing a 24-hour urine scm pie XNFCMMATION SHEET
'nus information sheet contains details about providing a 24-hour urine sample. Please
read it carefully before you consent to your child providing a sample. If you have any questions aboutthe 24-hour collection, please telephone the numbergiven at the bottom of this sheet. Providing a 24-hour sample urine is entirely voluntary. All the information
your child supplies will be strictly COT4FTDENTTAT . Your child may withdraw from
proindinga sample at anytime vA th out giving a reason.
A Nutritionist, Mrs Sam Revill or Miss Julie Hooper, will con-tact you at home to ask to
visit you and your child at am utualty convenient time.
The Nutritionist will explain to you and your child what a 24-hour sample of urine is and how it would be collected. The ur ine collection would be done on a Saturday or Sunday when your child is completing
a Food Diary. Th is m eons that your ch ild will not have to take any equipment with them to
school. The Nutritionist will supply your child with a large, sealable plastic container to store the
sample in. She will also give your child a smaller. portable plastic container and ajug. The large container can be safely sealed and will contain a preservative inside it. The
container can be stored inthe bathroom or toilet whitst the collection is in progress. Your child will be asked to take three tablets (PABA tablets) on the day of the collect ion
- one at breakfast, one at kinchtime and one in the evening.
PARA tablets are used to check that the 24-hour sample is complete. PABA tablets contain a substance that is very like Vitamin B. PABA tablets have been
used safely manytimes before in collecting urine from children and adults. Collecting the sample;
On waking in the morning, do not save the first urine that is passed. Begin saving the sample with the next urine that is passed
0 Save all urine that is passed throughout the day into the large container.
& Any urine that is passed at bedtime and night-time should be saved too.
0 On waking the next morning, save the first urine that is passed that day. The collection
is now complete. The Nut rir ionist will visit you and your ch ild again on the day that the ur ine collection is
completed. She will ask if your ch ild has taken the PARA tablets. She will also ask your
child if any urine was m issed out from the collection. and how many tim es this m ight have
happened. She will then Take the sam pie and equipment away.
. Chi ldrenwho provide a sample will be given a gift voucher as athank you for their help.
If you have ony questions, please telephone: AArs Sam Movill or NUss Xulie Hooper (0191 222 15719)
149

Z2.1 Collection and assay of 24-hr urine samples
At the time of first interview or first home visit, each child was asked to consider providing a
urine sample on the weekend day of the 3 day food diary. Favourable replies were followed
up with a further home or school visit to provide further information and obtain parental
consent. Each child was seen again at home on the day prior to the collection. A full and
detailed explanation of the collection procedure was given and the following administered:
A small packet containing 3 PABA tablets (3 x 80mg p-aminobenzoic acid) A large sealable 2L collection container A smaller, portable IL container for use away from home A colourful storage bag
Figure 7-2 Parental consent form (24-hour urine sample)
Hum an N ut r it ion Pes ear ch Centre Wellcome Laboratories
RoyalVictoria Infirmary Queen Victoria Podd Newcastle upon Tyne Tel, 01912228719
Ile
Coommit Fww
Please read this consent form carefully and sign if you to agree to your child providing a 24-hour sample ot urine as part of the 'Good Food Study' conducted by the Human Nutrition Research Centre of the University of Newcasde
Thiq s to confirm LL& I have read the letter entitled'Provicling a 24-hour sample of urine' I have read and understood the Information Sheet provided I understand that ell information given will be CONFIDENTIAL I understand that my child may withdraw from providing a urine sample at any time with giving a reason I agree to rrry child providing a 24-hour sample of urine
Signed .............. ..... ..................... ..................... ..........................................
Yourfull name (please print) ..... - ........................................................................
This form will be collected by . ... ..... - .....
Tbm& Vow
All samples were retrieved the day immediately following collection to ensure correct handling and storage and to prevent contamination and/or deterioration of the sample. Each
subject was asked to recall the number of PABA tablets taken and to comment on the
completeness of the collection. Missed micturition and number of PABA tablets were
150
recorded for each individual. Subjects were also asked if any medication (including pain Orelief tablets and vitamin preparations) had been taken on the day of collection since this was known to be source of aromatic amino acids which would effect the quantification of PABA.
Z2.2 Urine sample preparation
On affival. into the laboratory all samples were placed into a refrigerator at IT. After
checking an adequate seal the storage containers were gently inverted and shaken. The
contents of the container were measured using volumetric glassware and the total volume of
sample recorded. Two 20ml aliquots of each sample were removed and placed into sterile
sample holders to be frozen at -20'C until required.
72.3 Assay
Experimental methods and materials for the determination of urinary nitrogen, creatinine,
sodium and potassium and the determination of p-aminobenzoic acid are presented in the
Appendix (see 12.12 to 12.15 ).
Z2.4 Anthropometric measurements
The height and weight of all subjects measured in order to calculate BMR (see 5.2.2). The
mean daily energy intake (MJ/day) of each subject was used to then calculate the ratio of
energy intake to BMR which is expressed as a physical activity level or PAL. For further
details of this method see Section 5.2.4.
Z2.5 Data processing and analysis
Resultant data were entered onto SPSS v. 10 to determine statistical descriptives of PAL, 24-
hour urinary nitrogen and creatinine excretion and 24-hour urinary potassium and sodium
excretion. In addition, a comparison between the dietary intakes of macronutrients by
children meeting the recommended PAL and those not meeting the PAL were undertaken in
order to attempt to identify those macronutrients consumed in significantly lower amounts. Differences between groups between children meeting the PAL in the intervention and control
group were investigated using Mest and differences within groups determined using paired t-
test. The relationship between urinary biochemical variables and dietary intake were investigated using Pearson's correlation or Spearman's correlation analysis as appropriate to
the data. Urinary nitrogen excretion of each subject providing a urine sample was correlated
to the intake of dietary nitrogen as protein (g/day) on the day of urine collection using
151
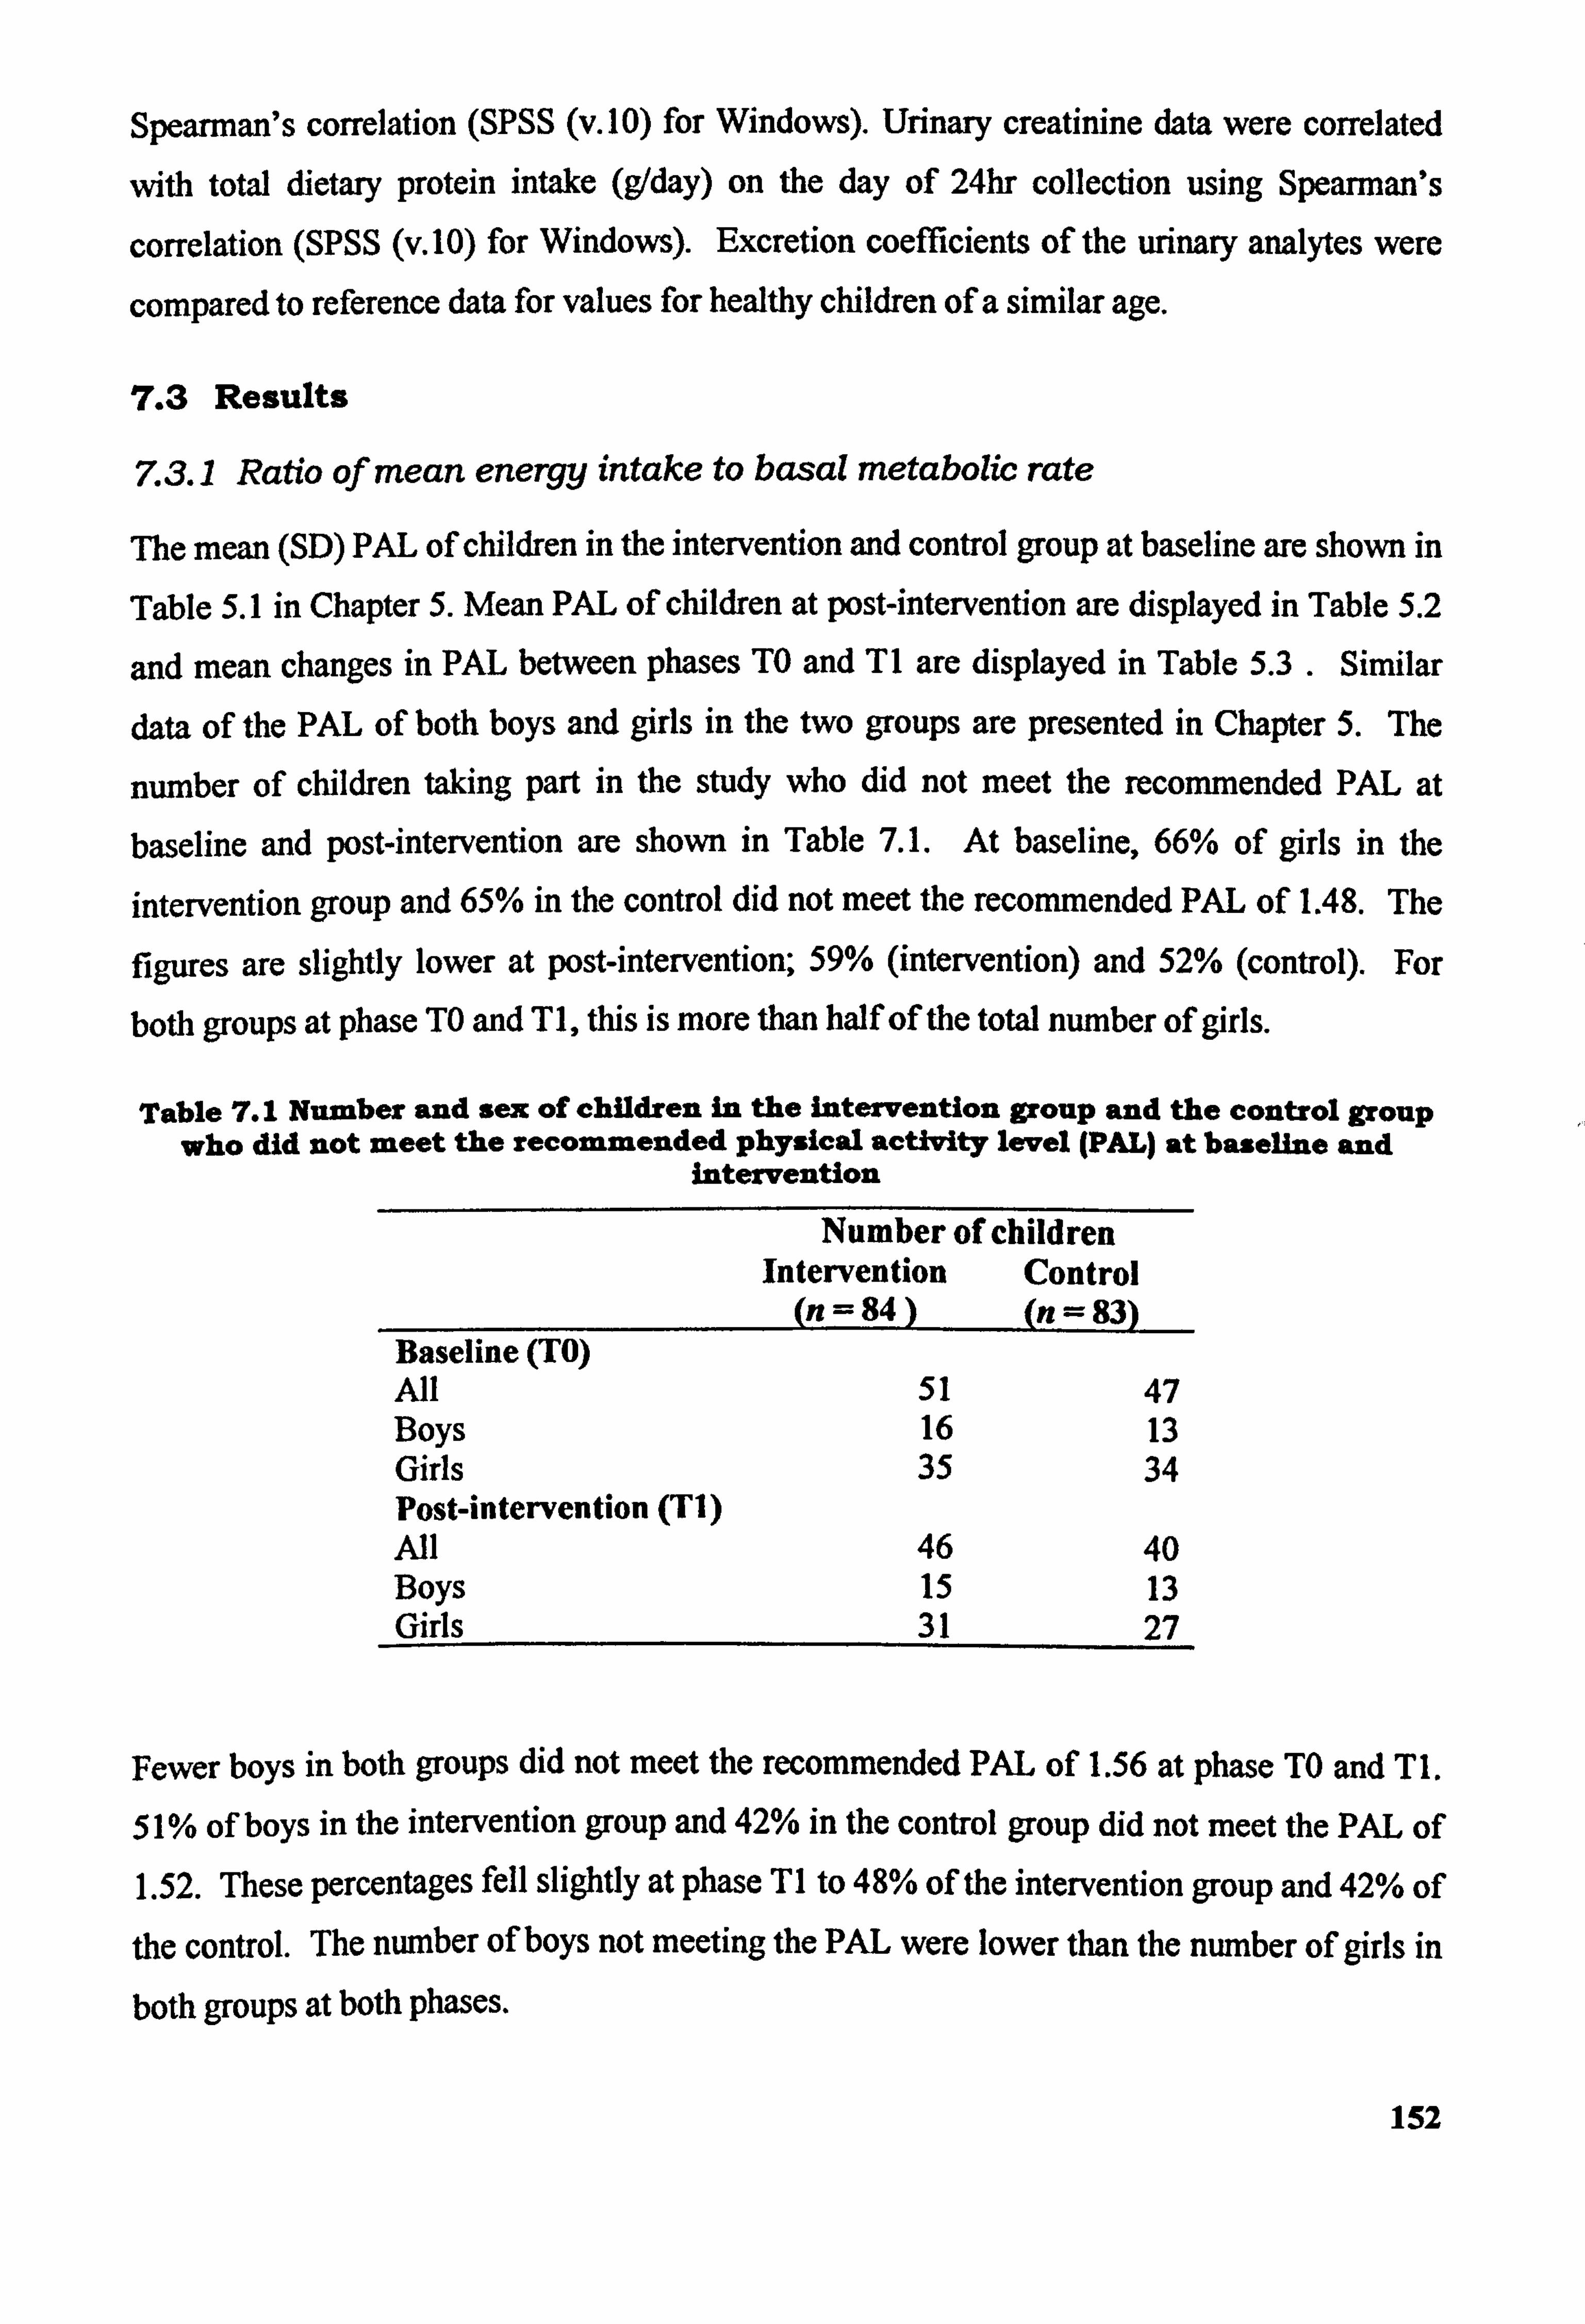
Spearman's correlation (SPSS (v. 10) for Windows). Urinary creatinine data were correlated
with total dietary protein intake (g/day) on the day of 24hr collection using Spearman's
correlation (SPSS (v. 10) for Windows). Excretion coefficients of the urinary analytes were
compared to reference data for values for healthy children of a similar age.
7.3 Results
Z3.1 Ratio of mean energy intake to basal metabolic rate
The mean (SD) PAL of children in the intervention and control group at baseline are shown in
Table 5.1 in Chapter 5. Mean PAL of children at post-intervention are displayed in Table 5.2
and mean changes in PAL between phases TO and TI are displayed in Table 5.3 . Similar
data of the PAL of both boys and girls in the two groups are presented in Chapter 5. The
number of children taking part in the study who did not meet the recommended PAL at
baseline and post-intervention are shown in Table 7.1. At baseline, 66% of girls in the
intervention group and 65% in the control did not meet the recommended PAL of 1.48. The
figures are slightly lower at post-intervention; 59% (intervention) and 52% (control). For
both groups at phase TO and TI, this is more than half of the total number of girls.
Table 7.1 Number and sex of children in the intervention group and the control group who did not meet the recommended physical activity level (PAL) at baseline and
intervention
Number of children Intervention Control
(n = 84 (n-= 83) Baseline (TO) All 51 47 Boys 16 13 Girls 35 34 Post-intervention (TI) All 46 40 Boys 15 13 Girls 31 27
Fewer boys in both groups did not meet the recommended PAL of 1.56 at phase TO and TI.
51% of boys in the intervention group and 42% in the control group did not meet the PAL of 1.52. These percentages fell slightly at phase TI to 48% of the intervention group and 42% of
the control. The number of boys not meeting the PAL were lower than the number of girls in
both groups at both phases.
152
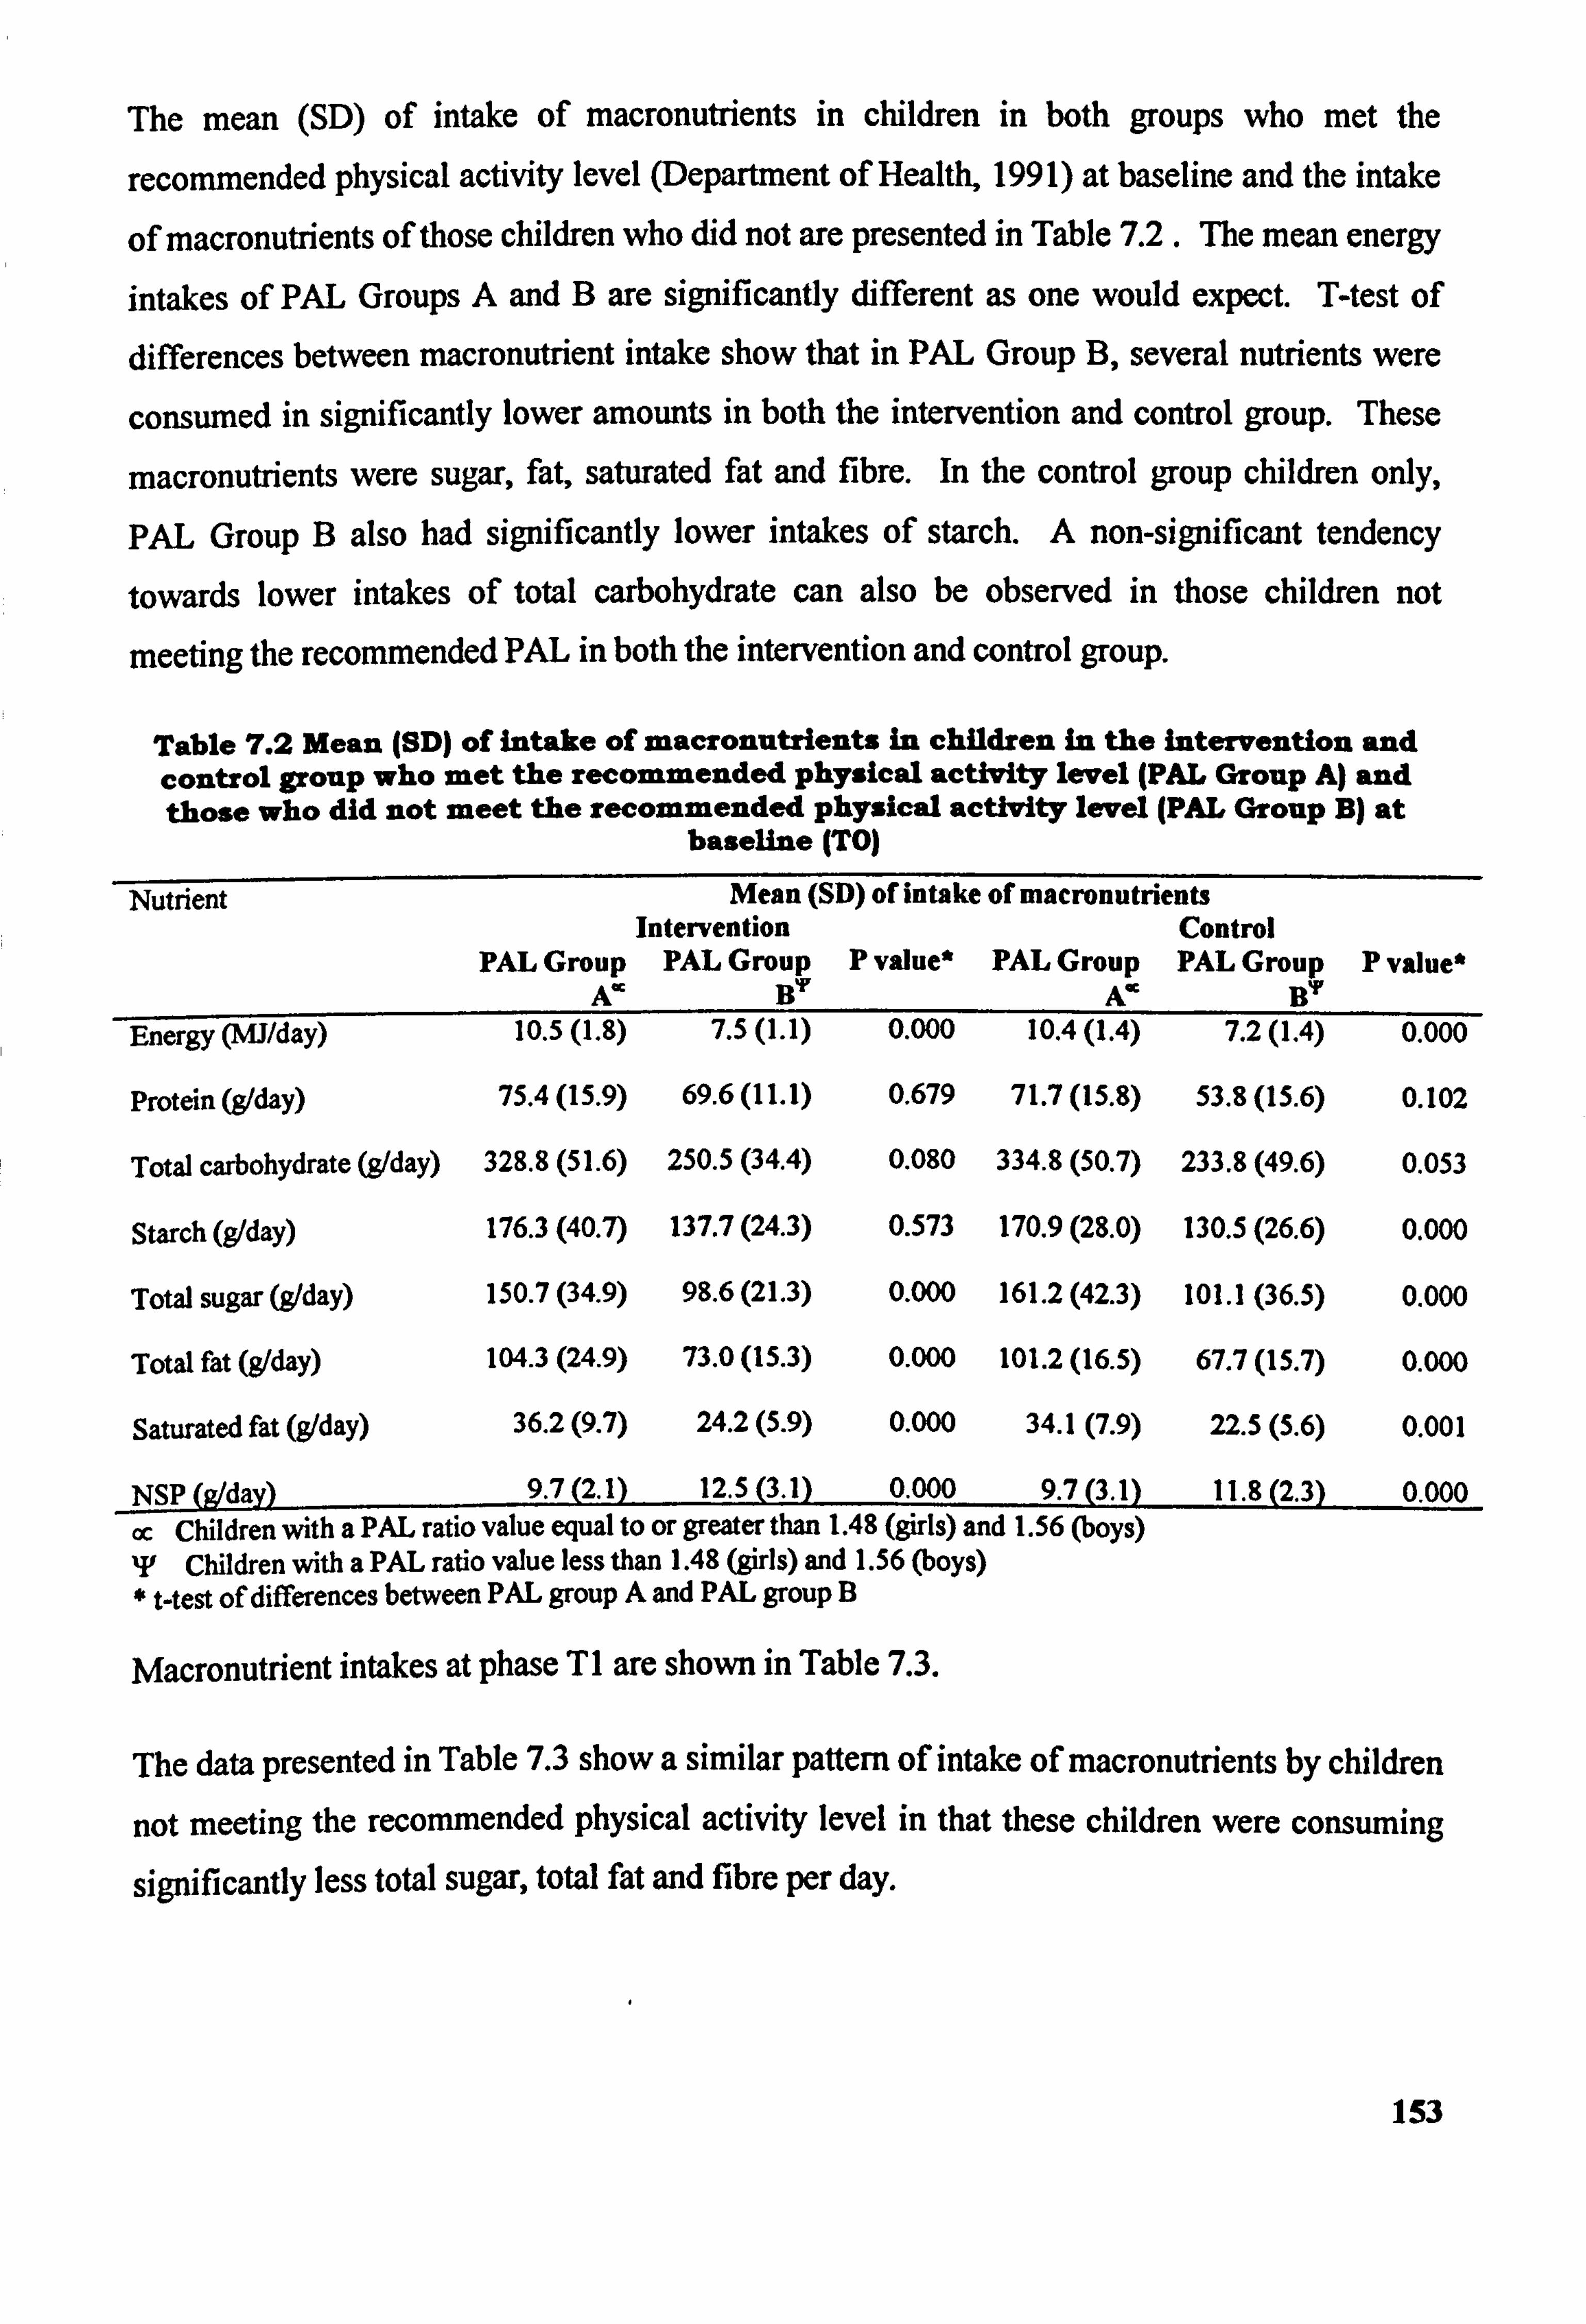
The mean (SD) of intake of macronutrients in children in both groups who met the
recommended physical activity level (Department of Health, 1991) at baseline and the intake
of macronutrients of those children who did not are presented in Table 7.2. The mean energy intakes of PAL Groups A and B are significantly different as one would expect. T-test of differences between macronutrient intake show that in PAL Group B, several nutrients were
consumed in significantly lower amounts in both the intervention and control group. These
macronutrients were sugar, fat, saturated fat and fibre. In the control group children only, PAL Group B also had significantly lower intakes of starch. A non-significant tendency
towards lower intakes of total carbohydrate can also be observed in those children not
meeting the recommended PAL in both the intervention and control group.
Table 7.2 Mean (SD) of intake of macronutrients in children in the intervention and control group who met the recommended physical activity level (pAL Group A) and those who did not meet the recommended physical activity level (PAL Group B) at
baseline (TO)
Nutrient Mean (SD) of intake of macronutrient3 Intervention Control
PAL Group PAL Group P value* PAL Group PAL Group P value* A' B'r A' BY
Energy (mi/day) 10.5(1.8) 7.5(l. 1) 0.000 10.4(l. 4) 7.2(l. 4) 0.000
Protein (g/day)
Total carbohydrate (g/day)
Starch (g/day)
Total sugar (gIday)
Total fat (gIday)
Saturated fat (gIday)
75.4(15.9) 69.6(11.1)
328.8 (51.6) 250.5 (34.4)
176.3 (40.7) 137.7 (24.3)
150.7 (34.9) 98.6(21.3)
104.3 (24.9) 73.0(15.3)
36.2(9.7) 24.2(5.9)
0.679 71.7(15.8) 53.8(15.6) 0.102
0.080 334.8 (50.7) 233.8 (49.6) 0.053
0.573 170.9 (28.0) 130.5 (26.6) 0.000
0.000 161.2 (42.3) 101.1 (36.5) 0.000
0.000 101.2 (16.5) 67.7(15.7) 0.000
0.000 34.1(7.9) 22.5(5.6) 0.001
NSP (g/day) 9.7(2.1) 12.5(3.1) 0.000 _ 9.7 (3.1)
--1.8(2.3) 0.000
oc Children with a PAL ratio value equal to or greater than 1.48 (girls) and 1.56 (boys) T Children with a PAL ratio value less than 1.48 (girls) and 1.56 (boys) * t-test of differences between PAL group A and PAL group B
Macronutrient intakes at phase TI are shown in Table 7.3.
The data presented in Table 7.3 show a similar pattern of intake of macronutrients by children
not meeting the recommended physical activity level in that these children were consuming
significantly less total sugar, total fat and fibre per day.
153
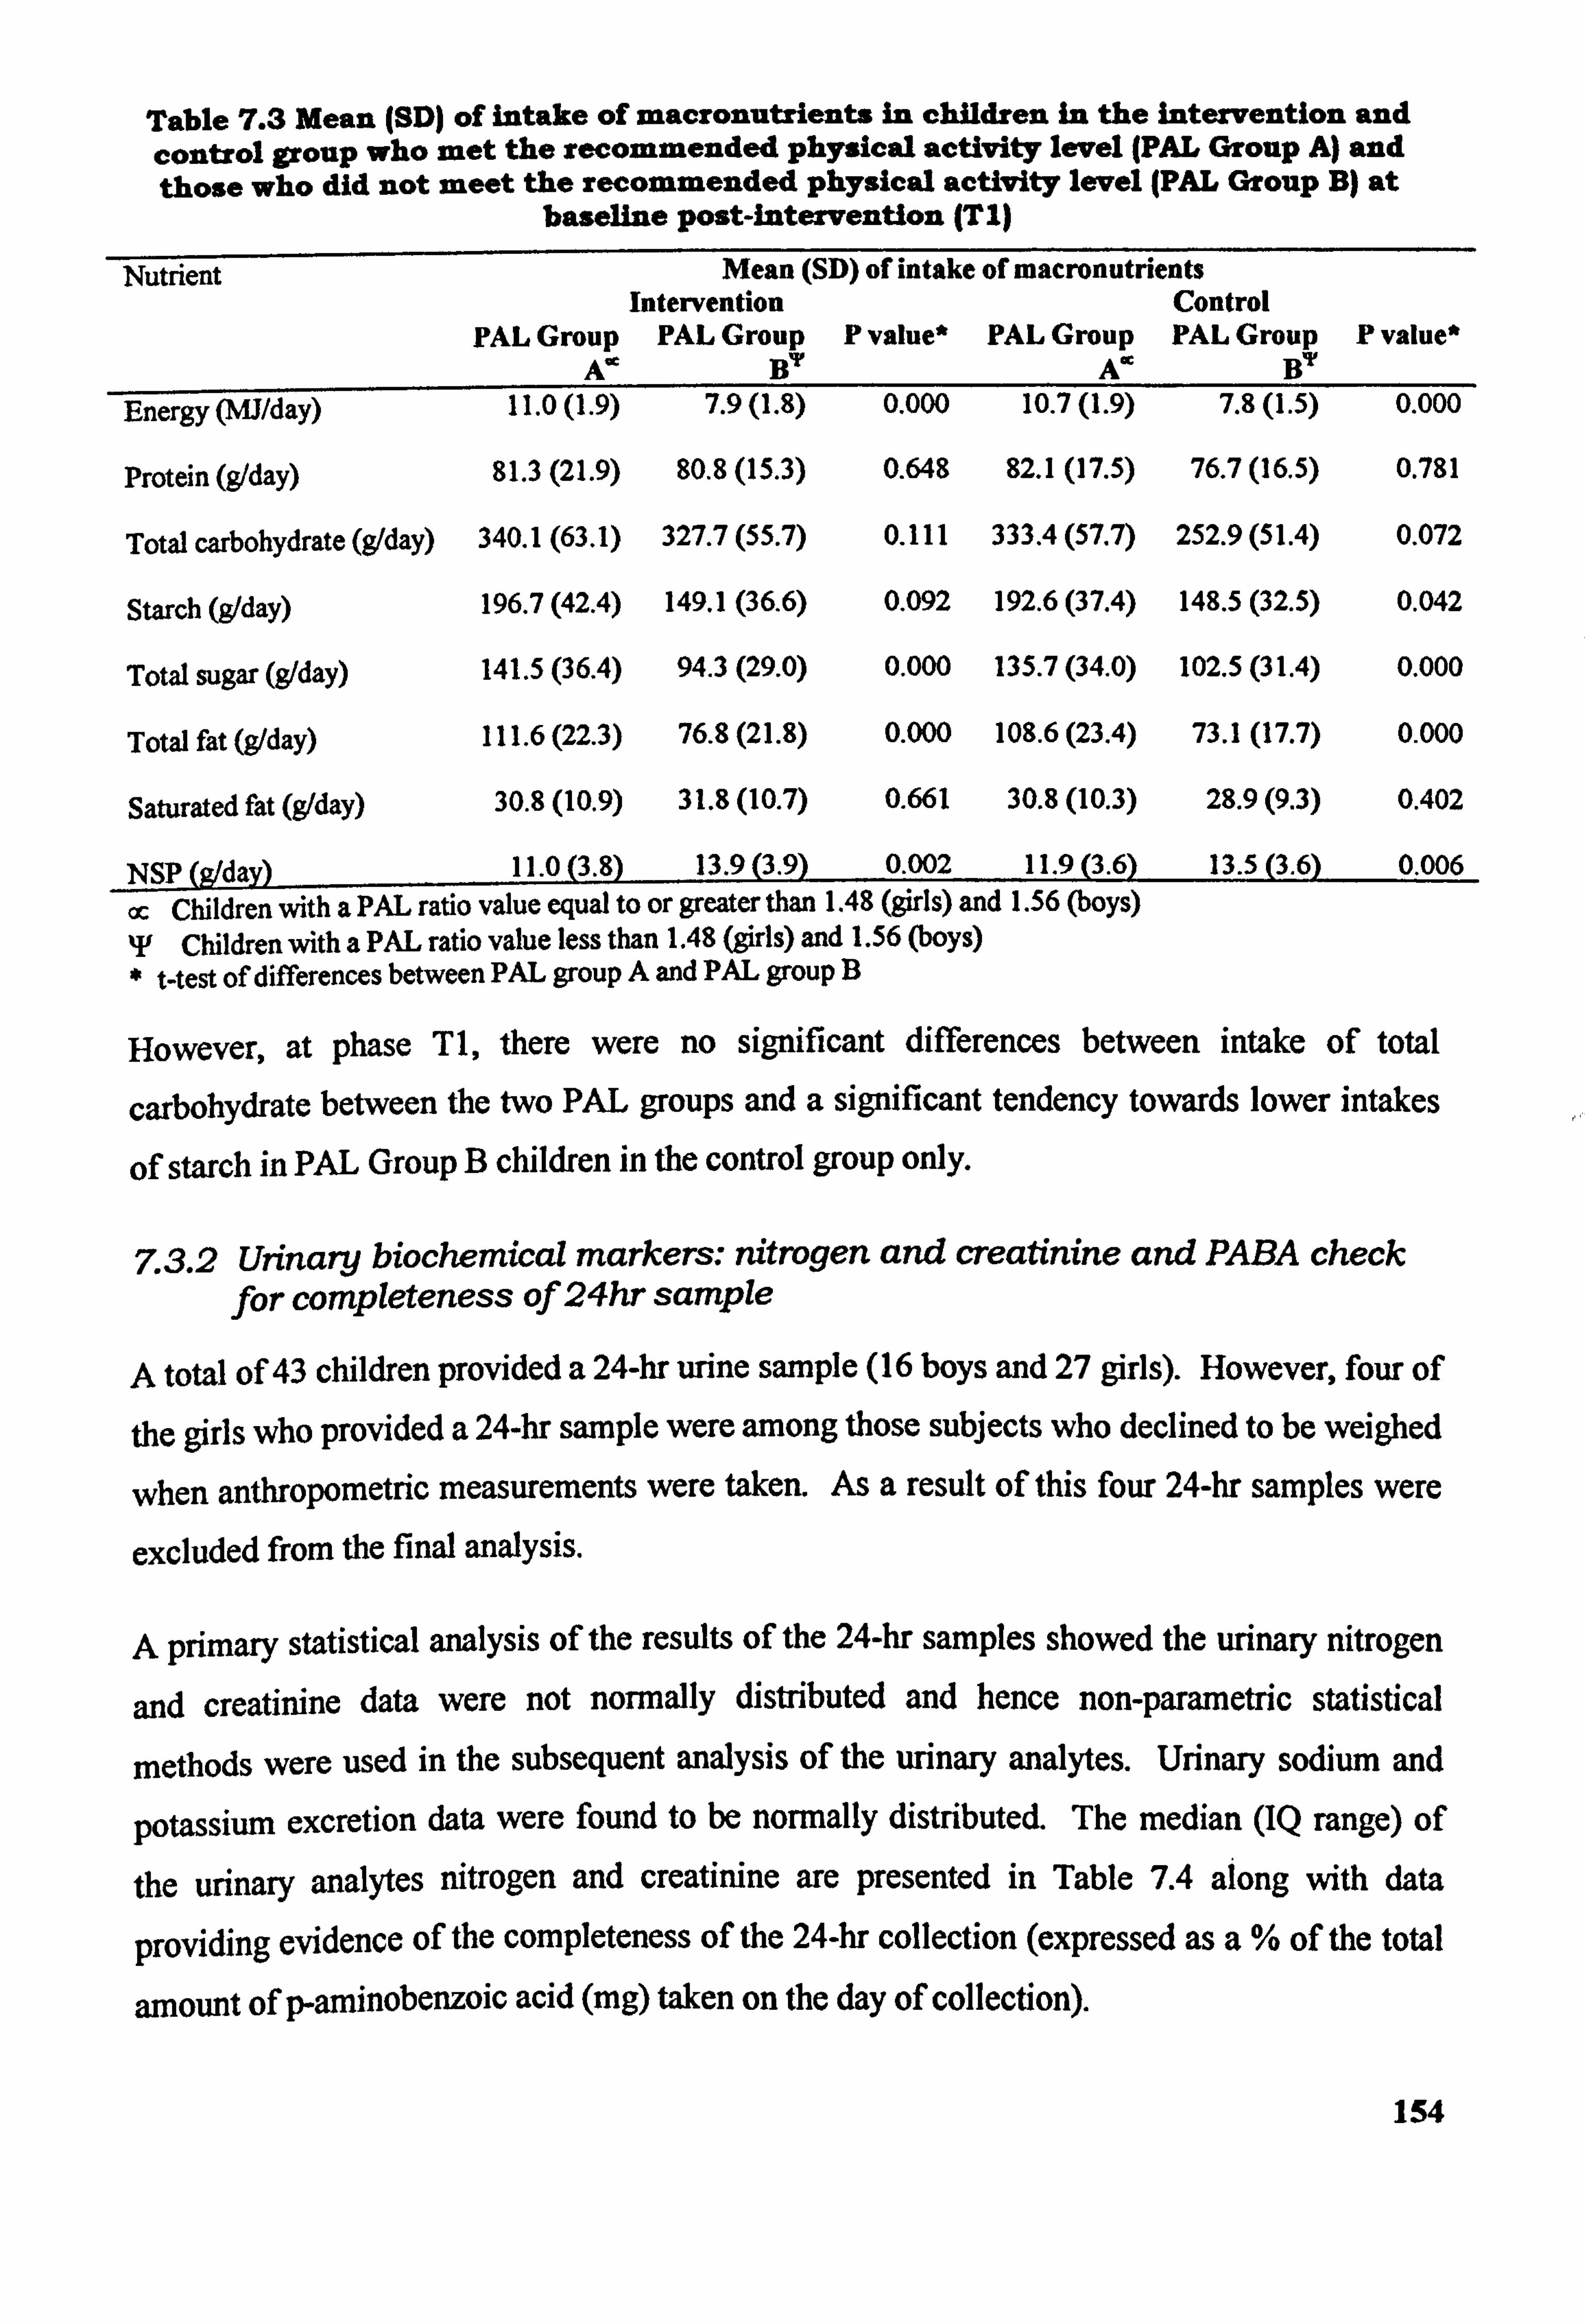
Table 7.3 Mean (SD) of intake of macronutrients in children in the intervention and control group who met the recommended physical activity level (PAL Group A) and those who did not meet the recommended physical activity level (PAL Group B) at
baseline post-intervention (TI)
Nutrient Mean (SD) of intake of macronutrients Intervention Control
PAL Group PAL Group P value* PAL Group PAL Group P value* A" 117 A" 117
Energy (MJ/day) 11.0(1.9) 7.9(l. 8) 0.000 10.7(l. 9) 7.8(1.5) 0.000
Protein (g/day)
Total carbohydrate (g/day)
Starch (g/day)
Total sugar (g/day)
Total fat (g/day)
Saturated fat (g1day)
81.3(21.9) 80.8(15.3)
340.1 (63.1) 327.7 (55.7)
196.7 (42.4) 149.1 (36.6)
141.5 (36.4) 94.3(29.0)
111.6 (22.3) 76.8(21.8)
30.8(10.9) 31.8(10.7)
0.648 82.1(17.5) 76.7(16.5) 0.781
0.111 333.4 (57.7) 252.9 (51.4) 0.072
0.092 192.6 (37.4) 148.5 (32.5) 0.042
0.000 135.7 (34.0) 102.5 (31.4) 0.000
0.000 108.6 (23.4) 73.1(17.7) 0.000
0.661 30.8(10.3) 28.9(9.3) 0.402
NSP (g/day) 11.0(3.8) 13.9(3.9) 0.002 11.9(3.6) 13.5(3.6) 0.006
cc Children with a PAL ratio value equal to or greater than 1.48 (girls) and 1.56 (boys) T Children with a PAL ratio valueless than 1.48 (girls) and 1.56 (boys) * t-test of differences between PAL group A and PAL group B
However, at phase TI, there were no significant differences between intake of total
carbohydrate between the two PAL groups and a significant tendency towards lower intakes
of starch in PAL Group B children in the control group only.
Z3.2 Urinary biochemical markers: nitrogen and creatinine and PABA check for completeness of 24hr sample
A total of 43 children provided a 24-hr urine sample (16 boys and 27 girls). However, four of
the girls who provided a 24-hr sample were among those subjects who declined to be weighed
when anthropometric measurements were taken. As a result of this four 24-hr samples were
excluded from the final analysis.
A primary statistical analysis of the results of the 24-hr samples showed the urinary nitrogen
and creatinine data were not normally distributed and hence non-parametric statistical
methods were used in the subsequent analysis of the urinary analytes. Urinary sodium and
potassium excretion data were found to be normally distributed. The median (IQ range) of
the urinary analytes nitrogen and creatinine are presented in Table 7.4 along with data
providing evidence of the completeness of the 24-hr collection (expressed as a% of the total
amount of p-aminobenzoic acid (mg) taken on the day of collection).
154
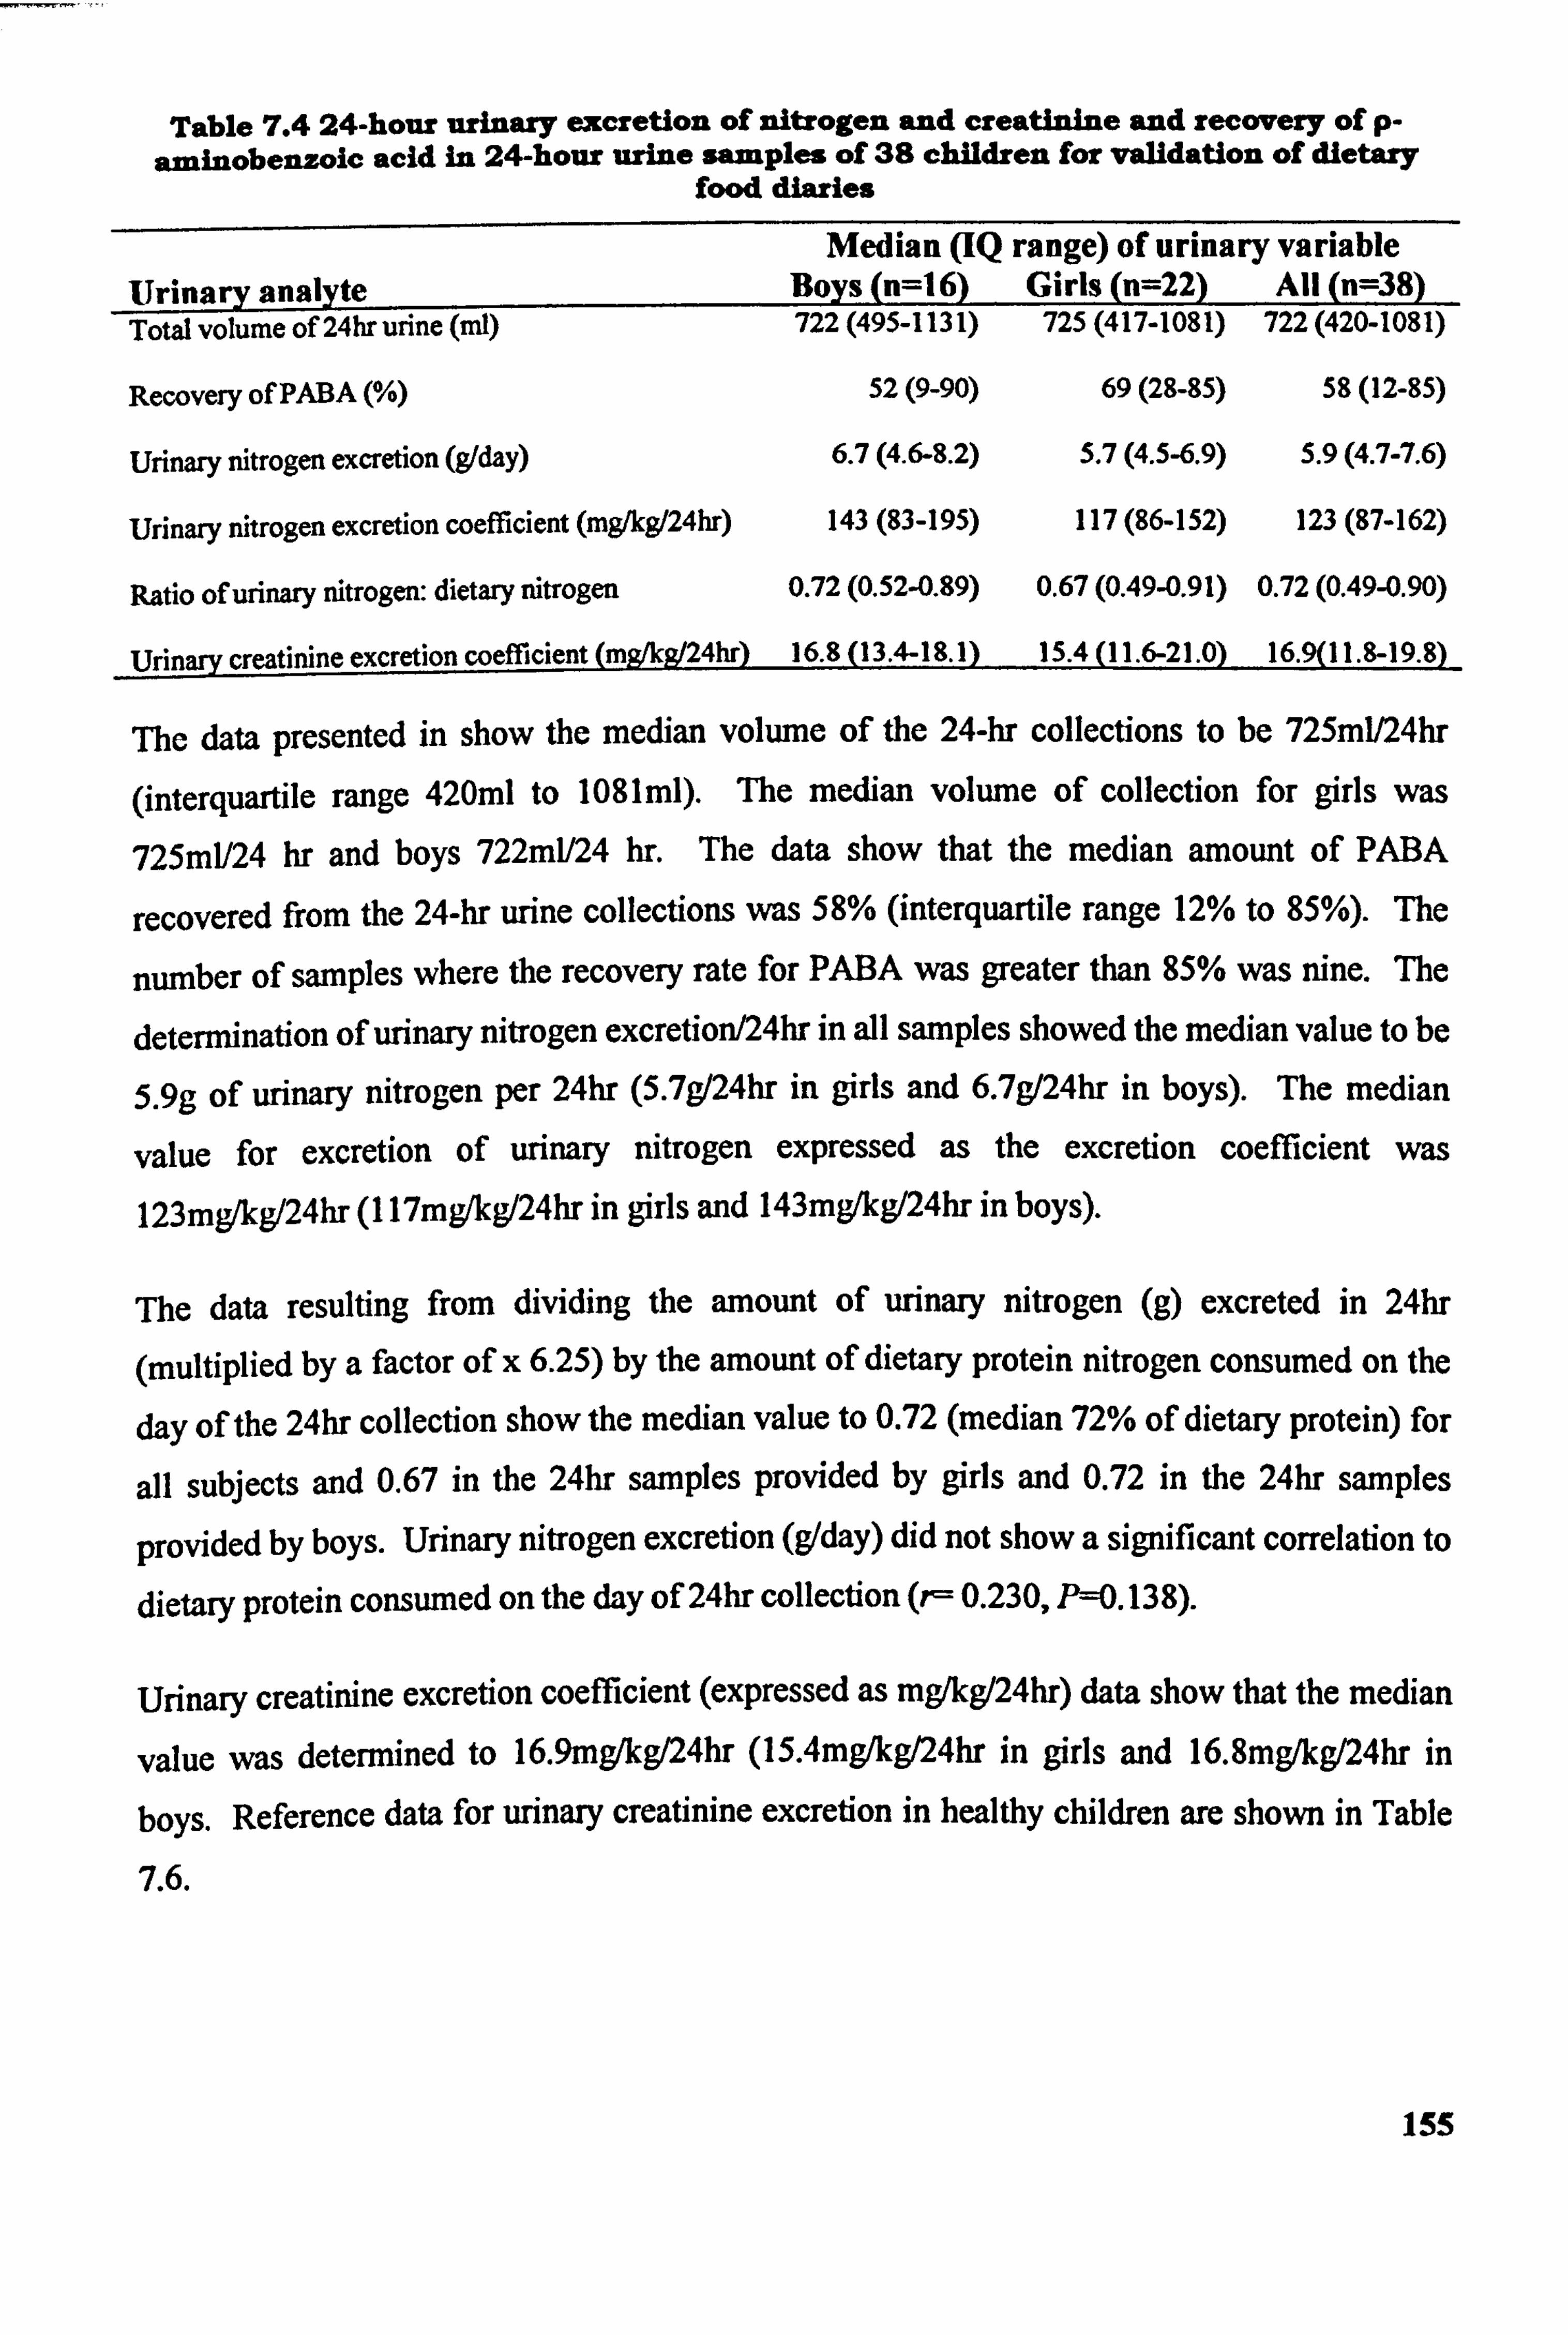
Table 7.4 24-hour urinary excretion Of nitrogen and creatinine and recovery of p. aminobenzoic acid in 24-hour urine samples of 38 children for validation of dietary
food diaries
Median (IQ range) of urinary variable Urinary anslyte Boys (n=l 6) Girls (n=22) All (n=38) Total volume of 24hr urine (ml) 722 (495-1131) 725 (417-1081) 722 (420-1081)
Recovery of PABA (%)
Urinary nitrogen excretion (glday)
Urinary nitrogen excretion coefficient (mg/kg/24hr)
Ratio of urinary nitrogen: dietary nitrogen
52(9-90)
6.7 (4.6-8.2)
143 (83-195)
69(29-85)
5.7 (4.5-6.9)
117 (86-152)
59(12-85)
5.9 (4.7-7.6)
123 (87-162)
0.72 (0.52-0.89) 0.67 (0.49-0,91) 0.72 (0.49-0.90)
Urinary creatinine excretion coefficient (mg/kg/24hr) 16.8 (13.4-18.1) 15.4 (11.6-21.0) 16.9(11.8-19.8)
The data presented in show the median volume of the 24-hr eollections to be 725ml/24hr
(interquartile range 420ml to 1081ml). The median volume of collection for girls was
725ml/24 hr and boys 722ml/24 hr. The data show that the median amount of PABA
recovered from the 24-hr urine collections was 58% (interquartile range 12% to 85%). The
number of samples where the recovery rate for PABA was greater than 85% was nine. The
determination of urinary nitrogen exeretion/24hr in all samples showed the median value to be
5.9g of urinary nitrogen per 24hr (5.7g/24hr in girls and 6.7g/24hr in boys). The median
value for excretion of urinary nitrogen expressed as the excretion coefficient was
123mg&g/24hr (I 17mg/kg/24hr in girls and 143mg/kg/24hr in boys).
The data resulting from dividing the amount of urinary nitrogen (g) excreted in 24hr
(multiplied by a factor of x 6.25) by the amount of dietary protein nitrogen consumed on the
day of the 24hr collection show the median value to 0.72 (median 72% of dietary protein) for
all subjects and 0.67 in the 24hr samples provided by girls and 0.72 in the 24hr samples
provided by boys. Urinary nitrogen excretion (gIday) did not show a significant correlation to
dietary protein consumed on the day of 24hr collection (r- 0.230, P--O. 13 8).
Urinary creatinine excretion coefficient (expressed as mg/kg/24hr) data show that the median
value was determined to 16.9mg/kg/24hr (15.4mg/kg/24hr in girls and 16.8mg/kg/24hr in
boys. Reference data for urinary creatinine excretion in healthy children are shown in Table
7.6.
155
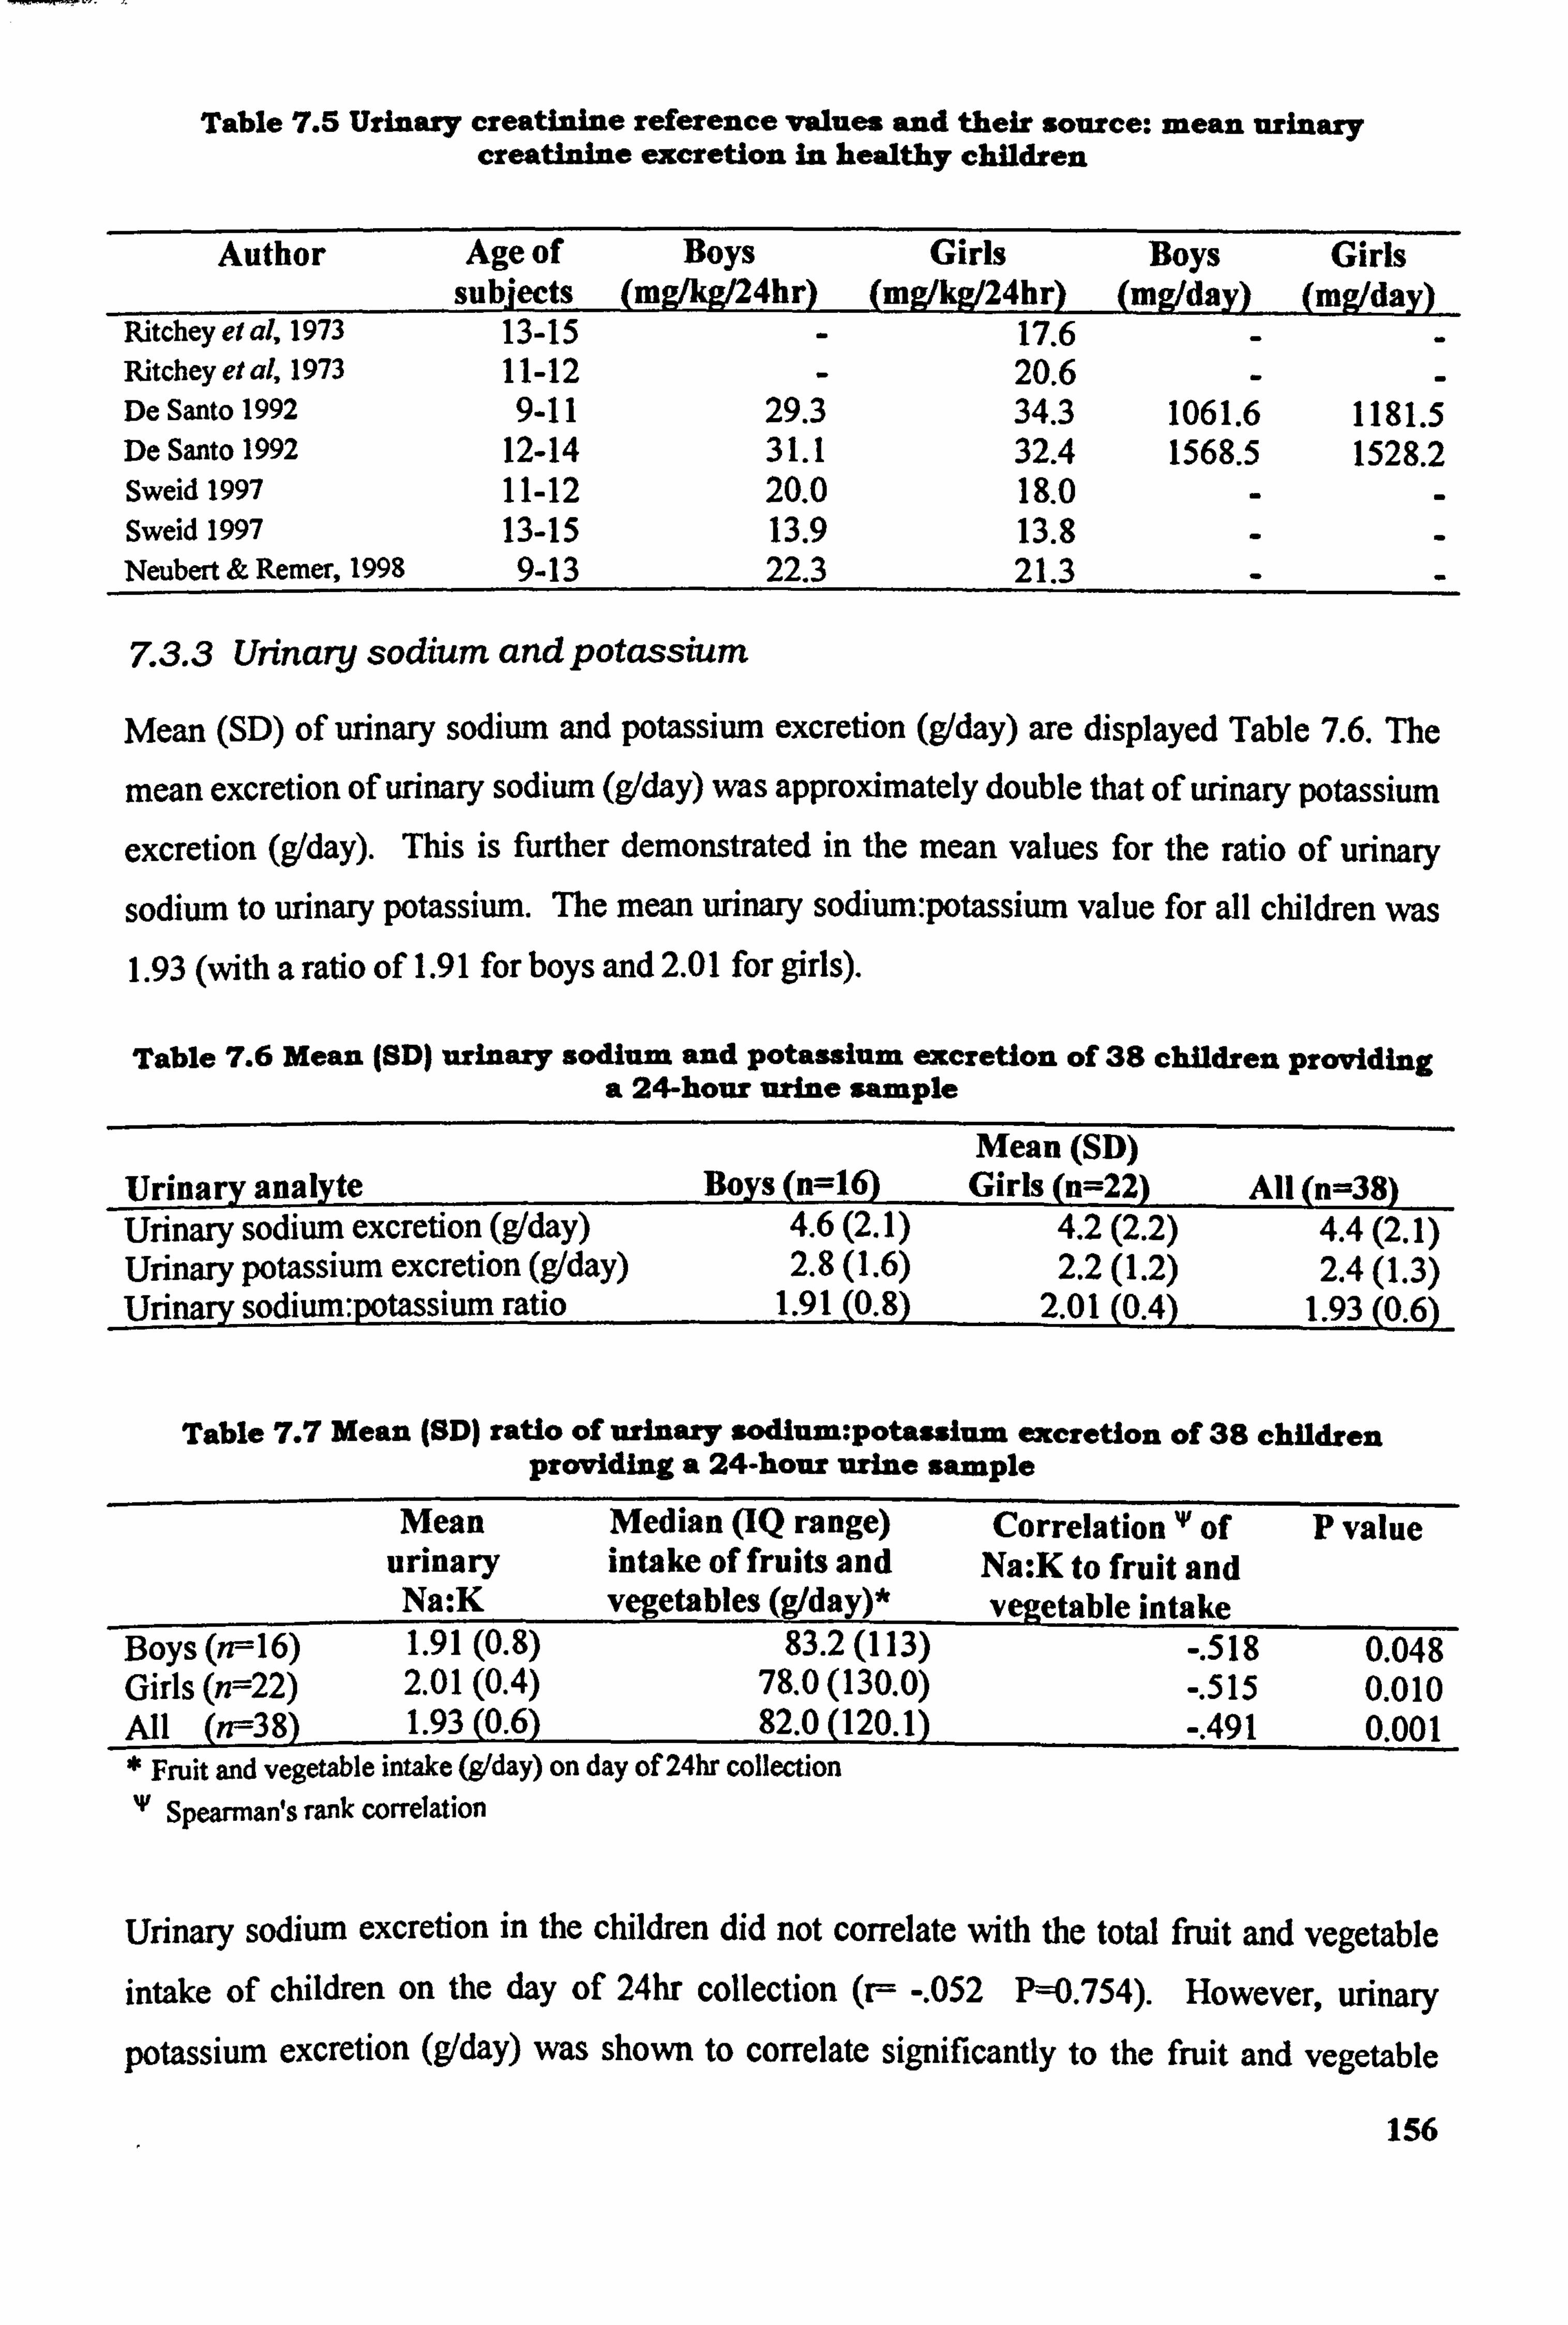
Table 7.5 Urinary creatinine reference values and their source: mean urinary creatinine excretion in healthy children
Author Age of subjects
Boys (mglkg/24hr)
Girls (mg/kg/24hr)
Boys (mg/day)
Girls (mg/day)
Ritchey el al, 1973 13-15 17.6 Ritchey et al, 1973 11-12 - 20.6 - De Santo 1992 9-11 29.3 34.3 1061.6 1181.5 De Santo 1992 12-14 31.1 32.4 1568.5 1528.2 Sweid 1997 11-12 20.0 18.0 - - Sweid 1997 13-15 13.9 13.8 Neubert & Remer, 1998 9-13 22.3 21.3
7.3.3 Urinary sodium and potassium
Mean (SD) of urinary sodium and potassium excretion (gIday) are displayed Table 7.6. The
mean excretion of urinary sodium (g/day) was approximately double that of urinary potassium
excretion (g/day). This is further demonstrated in the mean values for the ratio of urinary
sodium to urinary potassium. The mean urinary sodium: potassium value for all children was 1.93 (with a ratio of 1.91 for boys and 2.01 for girls).
Table 7.6 Mean (SD) urinary sodium and Potassium excretion of 38 children providing a 24-hour urine sample
Mean (SD) Urinary analyte Boys (n=16) Girls (n=22) All (n=38) Urinary sodium excretion (g/day) 4.6(2.1) 4.2(2.2) 4.4(2.1) Urinary potassium excretion (g/day) 2.8(l. 6) 2.2(l. 2) 2.4(l. 3) Urinary sodium: potassium ratio 1.91 (0-8)
_2.01 (0.4) 1.93(0.6)
Table 7.7 Mean (SD) ratio of urinary sodium: potassium excretion of 38 children providing a 24-hour urine sample
Mean Median (IQ range) Correlation 'P of P value urinary intake of fruits and Na: K to fruit and Na: K vegetables (g/day)* vegetable intake
Boys(n--16) 1.91(0.8) 83.2(113) -. 518 0.048 Girls (n=22) 2.01(0.4) 78.0 (130.0) -. 515 0.010 All (n--38) 1.93(0.6) 82.0(120.1) -. 491 0.001 * Fruit and vegetable intake (g1day) on day of 24hr collection 'V Spearman's rank correlation
Urinary sodium excretion in the children did not correlate with the total fruit and vegetable intake of children on the day of 24hr collection (r-- -. 052 P=0.754). However, urinary potassium excretion (gIday) was shown to correlate significantly to the fruit and vegetable
156
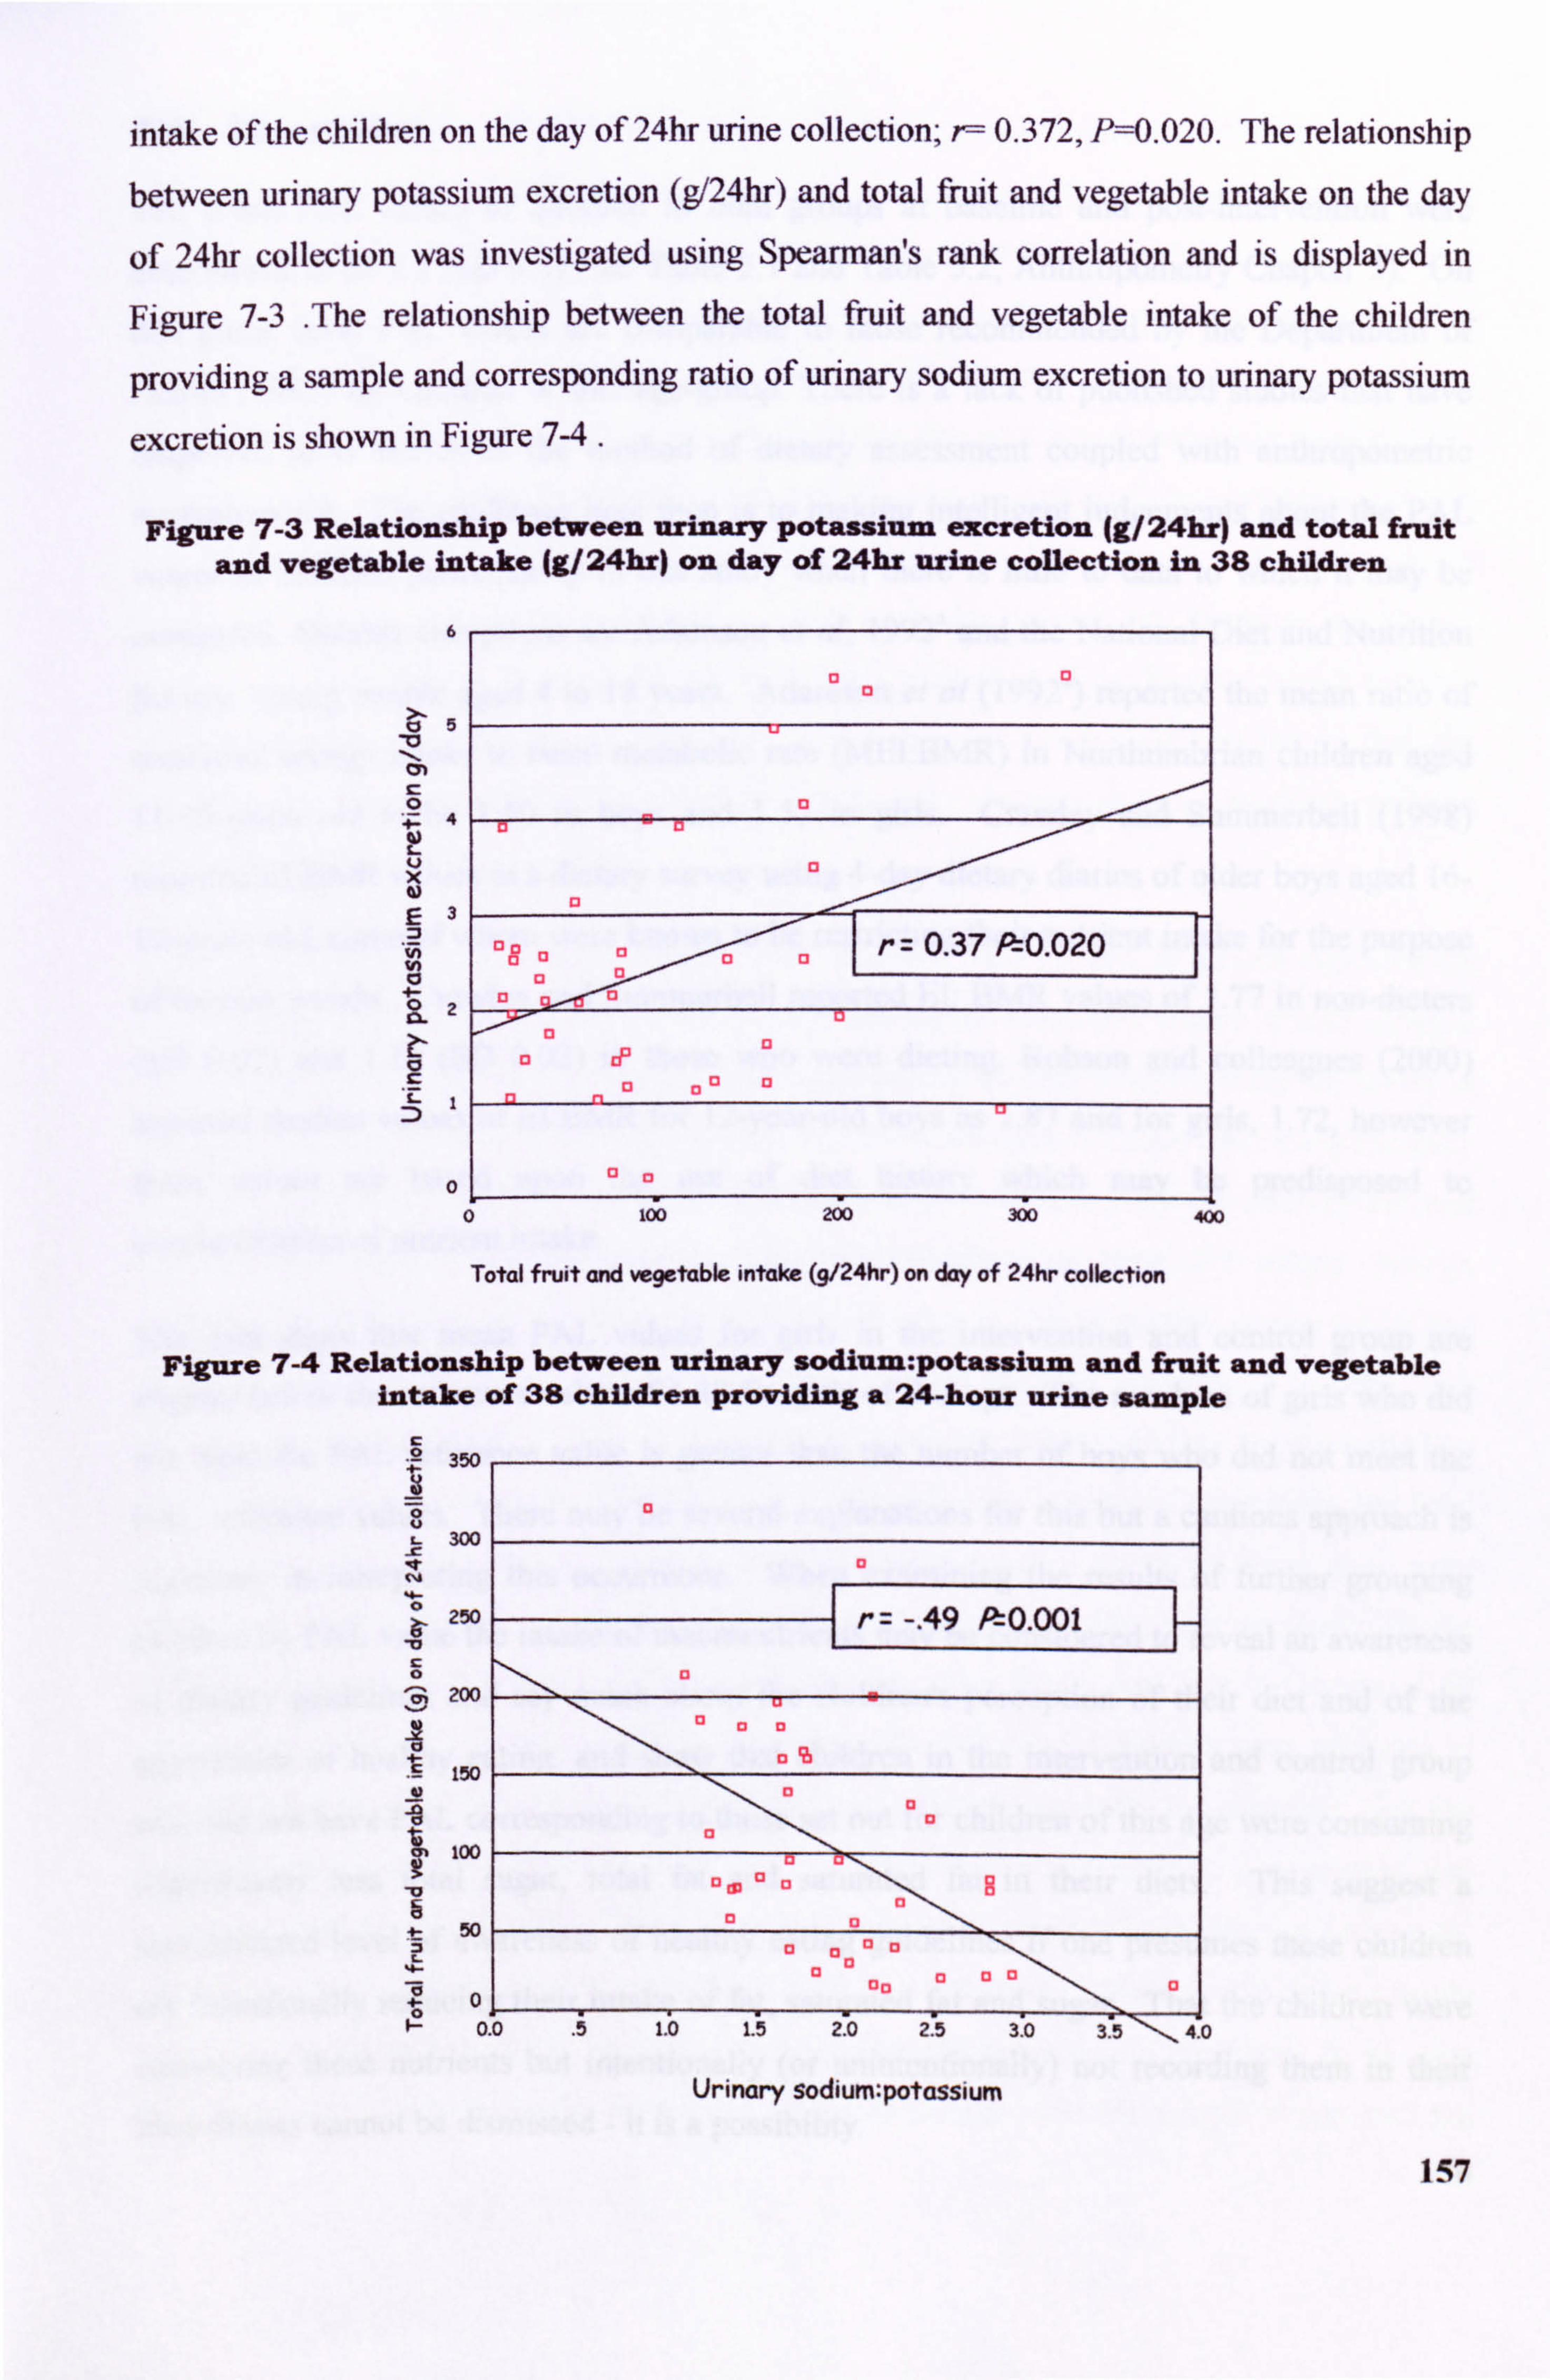
intake of the children on the day of 24hr urine collection; r-- 0.372, P=0.020. The relationship between urinary potassium excretion (g/24hr) and total fruit and vegetable intake on the day
of 24hr collection was investigated using Spearman's rank correlation and is displayed in
Figure 7-3 The relationship between the total fruit and vegetable intake of the children
providing a sample and corresponding ratio of urinary sodium excretion to urinary potassium
excretion is shown in Figure 7-4 .
Figure 7-3 Relationship between urinary potassium excretion (g/24hr) and total fruit and vegetable intake (g/24hr) on day of 24hr urine collection in 38 children
6
>- 5
12.
's- 1
200 ZD
0
13
13 C, r= 0.37 PtO. 020 13 cl 13
cl a D IF
13 13
13
Total fruit and vegetable intake (9/24hr) on day of 24hr collection
FIgure 7-4 Relationship between urinary sodium: potassium and Eruit and vegetable intake of 38 children providing a 24-hour urine sample
C .2 2rý
300
0 250
0 200
150
too
at 50
t: 0.
r -. 49 P-, 0.001
-Tr-
13 13
13 (13 U
ri
13
13 a 1,
0, (3 (3 00
o.. o i I. b 1. ý io 2-5 3. '0 -3 5-""ý-40
Urinary sodium: potassium
157
7.4 Discussion
The mean PAL values of children in both groups at baseline and post-intervention were determined to be 1.5 (SD 0.4) (see Table 5.1 and Table 5.2, Anthropometry Chapter 5). On
this group level PAL values are comparable to those recommended by the Department of Health (1991) for children of this age-group. There is a lack of published studies that have
employed food diaries as the method of dietary assessment coupled with anthropometric
measurements. The challenge here then is to making intelligent judgements about the PAL
values of children participating in this study when there is little to data to which it may be
compared. Notable exceptions are Adamson et al, 1992" and the National Diet and Nutrition
Survey: young people aged 4 to 18 years. Adamson et al (1992') reported the mean ratio of
measured energy intake to basal metabolic rate (MEI: BMR) in Northumbrian children aged 11-12-years old to be 1.50 in boys and 1.57 in girls. Crawley and Surnmerbell (1998)
reported EI: BMR values in a dietary survey using 4-day dietary diaries of older boys aged 16-
17-years-old, some of whom were known to be restricting their nutrient intake for the purpose
of loosing weight. Crawley and Summerbell reported El: BMR values of 1.77 in non-dieters (SD 0.02) and 1.11 (SD 0.02) in those who were dieting. Robson and colleagues (2000)
reported median values of EI: BMR for 12-year-old boys as 1.87 and for girls, 1.72, however
these values are based upon the use of diet history which may be predisposed to
overestimation of nutrient intake.
The data show that mean PAL values for girls in the intervention and control group are
slightly below the reference value of 1.48 for girls of this age. The numbers of girls who did
not meet the PAL reference value is greater than the number of boys who did not meet the
PAL reference values. There may be several explanations for this but a cautious approach is
necessary in interpreting this occurrence. When examining the results of further grouping
children by PAL value the intake of macronutrients may be considered to reveal an awareness
of dietary guidelines and say much about the children! s perception of their diet and of the
appearance of healthy eating. and show that children in the intervention and control group
who did not have PAL corresponding to those set out for children of this age were consuming
significantly less total sugar, total fat and saturated fat in their diets. This suggest a
sophisticated level of awareness of healthy eating guidelines if one presumes these children
are intentionally reducing their intake of fat, saturated fat and sugar. That the children were
consuming these nutrients but intentionally (or unintentionally) not recording them in their
food diaries cannot be dismissed - it is a possibility. 158
One key point to recognise here is that children in PAL Group B were found to be consuming lower amounts of total fat, saturated fat and sugar, in both the control and intervention. There
are several possible explanations for this. The children are aware of healthy eating guidelines
and are choosing to consume less of these nutrients. Possibly the children are consuming
these nutrients but have chosen to reduce their quantity at some stage during the recording
period (either when completing food diaries or during the interview to ascertain portion sizes. A 'Hawthorne' effect may have manifested itself in the recording dietary intake - children
were more aware of their daily diet because they were actually having to write down all the
foods and drinks that they consumed. There may have been an intention to 'please'
researchers by recording foods and beverages they understood to be 'healthy' which resulted in lower values for total fat, saturated fat and sugar. A further explanation is that the
recording period coincided with a period of intentional reduction in these nutrients, perhaps
with the intention to loose weight.
There is evidence to show that intakes of total fat, saturated fat and sugar are significantly lower in children in PAL Group B- those not meeting the reference values in both groups. There is evidence of a non-significant tendency towards slightly lower intakes of starch in both groups when intakes of protein and total carbohydrate were not found to be significantly different. The lower intakes of total fat saturated fat and sugar in both the intervention and control group suggest that the children became more aware of their diet simply through
recording their intake and modified their intake of foods. This is further supported by the
evidence provided at phase TI, when a lower number of children were found to have PAL below that recommended. Only total sugar and total fat were found to be consumed in
significantly lower amounts by children in PAL Group B- the novelty of completing the food diaries had wom thin and children were possibly less concerned about the foods they were consuming and/or recording. Of the 198 children recruited into the study at phase TO, 43
children volunteered to provide a 24hr urine sample. This figure was less the target of 50
children as a 25% sub-sample of the study group. The majority of children were reluctant to
provide a sample and voiced several concerns regarding the sample, for example, that the
collection itself was too difficult, they were embarrassed about collecting a sample and perceived that it present obstacles to pursuing their usual range of activities at weekends. Several parents reported that they would not be happy for their children to provide a sample because they thought it would be unhygienic to store the container in the house or because
there were small children in the household who may tamper with the sample if they had the 159
opportunity to do so. A small number of parents voiced reservations about allowing their
child to take PABA tablets during the collection period. Of the total number of 24-hr
collections, five had to be disregarded because the subjects had declined to be weighed during
the collection of anthropometric measurements. The complete range of urinary volume
observed was between 200ml/24hr to 1600ml/day. This range of output is to be expected as
output will be affected by several factors, for example, total consumption of water on the day
of collection, the time of year of at collection and the amount of physical activity undertaken by the children on the day of collection.
The results of the analysis of p-aminobenzoic acid recovery show that the percentage of
recovery was low (median recovery rate was 59% of the amount of PABA consumed).
Reference to the literature suggests that in order for 24hr urine samples to be considered
complete, a PABA recovery rate of less than 85% will indicate that the sample is probably incomplete (Bingham & Cummings, 1983). Nine samples of a total of 38 were shown to be
probably complete. This in itself confers a degree of unreliability to the collections and any
quantitative analysis performed on urinary analytes thereafter. It is possible to apply a
weighting factor to account for the deficit in PABA recovery to the determination of other
urinary analytes but this was not deemed to be appropriate in this study because of the poor PABA recovery rate. In addition, 15 children completing 24hr samples reported not taking all
the PABA tablets because they had forgotten or had left them at home when they wanted to
go out and 7 children reported missed micturitions on the day of collection. In view of these
occurrences it would seem that children of this age find it difficult to collect their urine for a
twenty-four hour period. In a clinical setting it may be possible to supervise children
providing samples adequately. In free-living subjects this is not possible to such an extent. The success of the collections may be greater if researchers telephone the children at home or
visit the children and their parents at home during the day of collection to enquire about any
problems encountered and to offer help and encouragement. In view of the incompleteness of
collection of the majority of urine samples the validity of the quantitative determination of
other urinary analytes is questionable. Gregory et al (2000) reported in the NDNS survey that
24-hr collections were not attempted in children aged 4-18-years-old as the pilot work carried
out for the survey of people aged 65 years and over showed that subject compliance in
collecting urine samples was poor, at less than 50% and that this technique of validation
would not be suitable for including in the mainstage survey. The survey of 4-18-year-olds
160
used only a 'spot' collection of urine for the indirect estimation of sodium intake of individuals
participating in the study.
Urinary nitrogen excretion values were found not to correlate significantly with dietary
protein intake on the day of dietary diary. This is likely due to low urinary nitrogen excretion
values but again reflects the incompleteness of the urine samples. However, the mean ratio of
urinary nitrogen to dietary protein was determined to be 0.72 (72%) which is a reasonable
figure in view of the percentage recovery of PABA (mean 58%). It may also be contributed to
growth in the children (as demonstrated in the anthropometric data in Chapter 5). Together
these values imply that the children were at least successful in collecting about two-thirds of
their total urine volume on the day of collection and this suggests that with adequate
supervision a complete collection may be achievable in children of this for use in validation
procedures in future studies. Reference values displayed in Table 7.6 show that the mean
urinary creatinine coefficient value for all subjects providing a sample is slightly lower than
would be expected in the complete 24hr samples of children of this age and again reflects the
deficit of the sample. It is for this reason that urinary creatinine excretion is no longer viewed
as a valid method for checking for completeness of twenty-four collection (despite low intra-
individual variation) (Bingham & Cummings, 1985, Narayanan and Appleton, 1980).
The use of harmless derivatives such as p-aminobenzoic acid employed as an additional biochemical analyte , independent of those of diet and fluid intake, which does not require
collections in duplicate or triplicate to be made, is more reliable and attractive. The mean
creatinine coefficient of boys was 16.8mg/kg/24hr and is comparable to the values determined
by Sweid (1997) for boys aged 13-years-old; 13.9-20.0 mg/kg/24hr and those of Neubert and Remmer, 1998; 22.3mg/kg/24hr in boys aged 9-13-years old. The mean creatinine coefficient
of the girls participating in this study compare favourably to those published by Ritchey et al, 1973 who reported creatinine coefficient values of 17.6mg/kg/24hr for girls aged 13-15-years-
old and 20. Omg/kg/24hr for girls aged 11-12-years-old. The creatinine coefficient of girls in
this study was shown to be lower than boys as would be expected in children of this age - girls nearing or already having entered puberty and boys retaining a greater percentage of lean
body mass - the mean creatinine coefficient of girls was 15.4mg/kg/24hr and compares to the
values of Sweid, 1997; 13.0 - 18.0 mg/kg/24hr for girls aged 11-15-years old respectively. Although these values are reasonably comparable to reference values, nonetheless urinary
creatinine excretion did not correlate with significance to the amount of dietary protein
161
consumed on the day of 24hr-urine collection. Mean urinary sodium excretion values in boys
was 4.6 g/24hr and in girls 4.2g/24hr (with a mean of 4.4g/24hr for all subjects and was not found to correlate with the fruit and vegetable intake of the children. Mean urinary potassium
excretion in boys was 2.8g/24hr and in girls 2.2g/24hr (with a mean of 2.4g/day for all
children) and the relationship between urinary potassium excretion and intake of fruit and
vegetables was shown to be positive - the relationship was small but significant at r=0.37, P=0.020. These results imply that urinary sodium excretion was twice that of urinary
potassium excretion in the children and that as fruit and vegetable intake increased in the
children this was coupled by an increase in potassium excretion. In order to assume that
urinary sodium excretion was twice that of potassium, and that urinary sodium excretion in
the children is related to dietary intake of sodium an assumption is made that the children
were in balance for both. Such an assumption would be unwise on the basis of one day of
urine collection and the collection would need to be repeated over 3 to 7 days (preferably in a
clinical setting) to give an accurate picture of potassium and sodium excretion. Similar data
on urinary sodium: urinary potassium were reported in the NDNS by Gregory et al(2000). Gregory et al reported a mean urinary sodium: urinary potassium ration in boys aged 11-14-
years-old to be 4.1 and in girls to be 4.3, these data compare favourably with the results of the
analysis of 24hr urines in this study.
In summary, the physical activity level of the children on the group level was satisfactory. The numbers of girls not meeting a PAL of 1.48 was greater than the number of boys not meeting the PAL of 1.56. Girls were more concerned about having their weight measured which suggests low self-esteem with body image and body size which may impact upon dietary intake or the reporting of dietary intake. A Hawthorne effect could likely explain the lower intakes of selected micronutricnts as this occurred at both baseline and intervention but decreased during the post-intervention recording period. Children with a PAL lower than the
reference values of the Department of Health (1991) were reporting significantly lower
intakes of total fat, saturated fat and total sugar and in the control group only there was a tendency towards lower intakes of starch, all of which may imply some sophisticated knowledge of the energy value of such nutrients or a self-restriction of these nutrients in the
childreds diets.
162
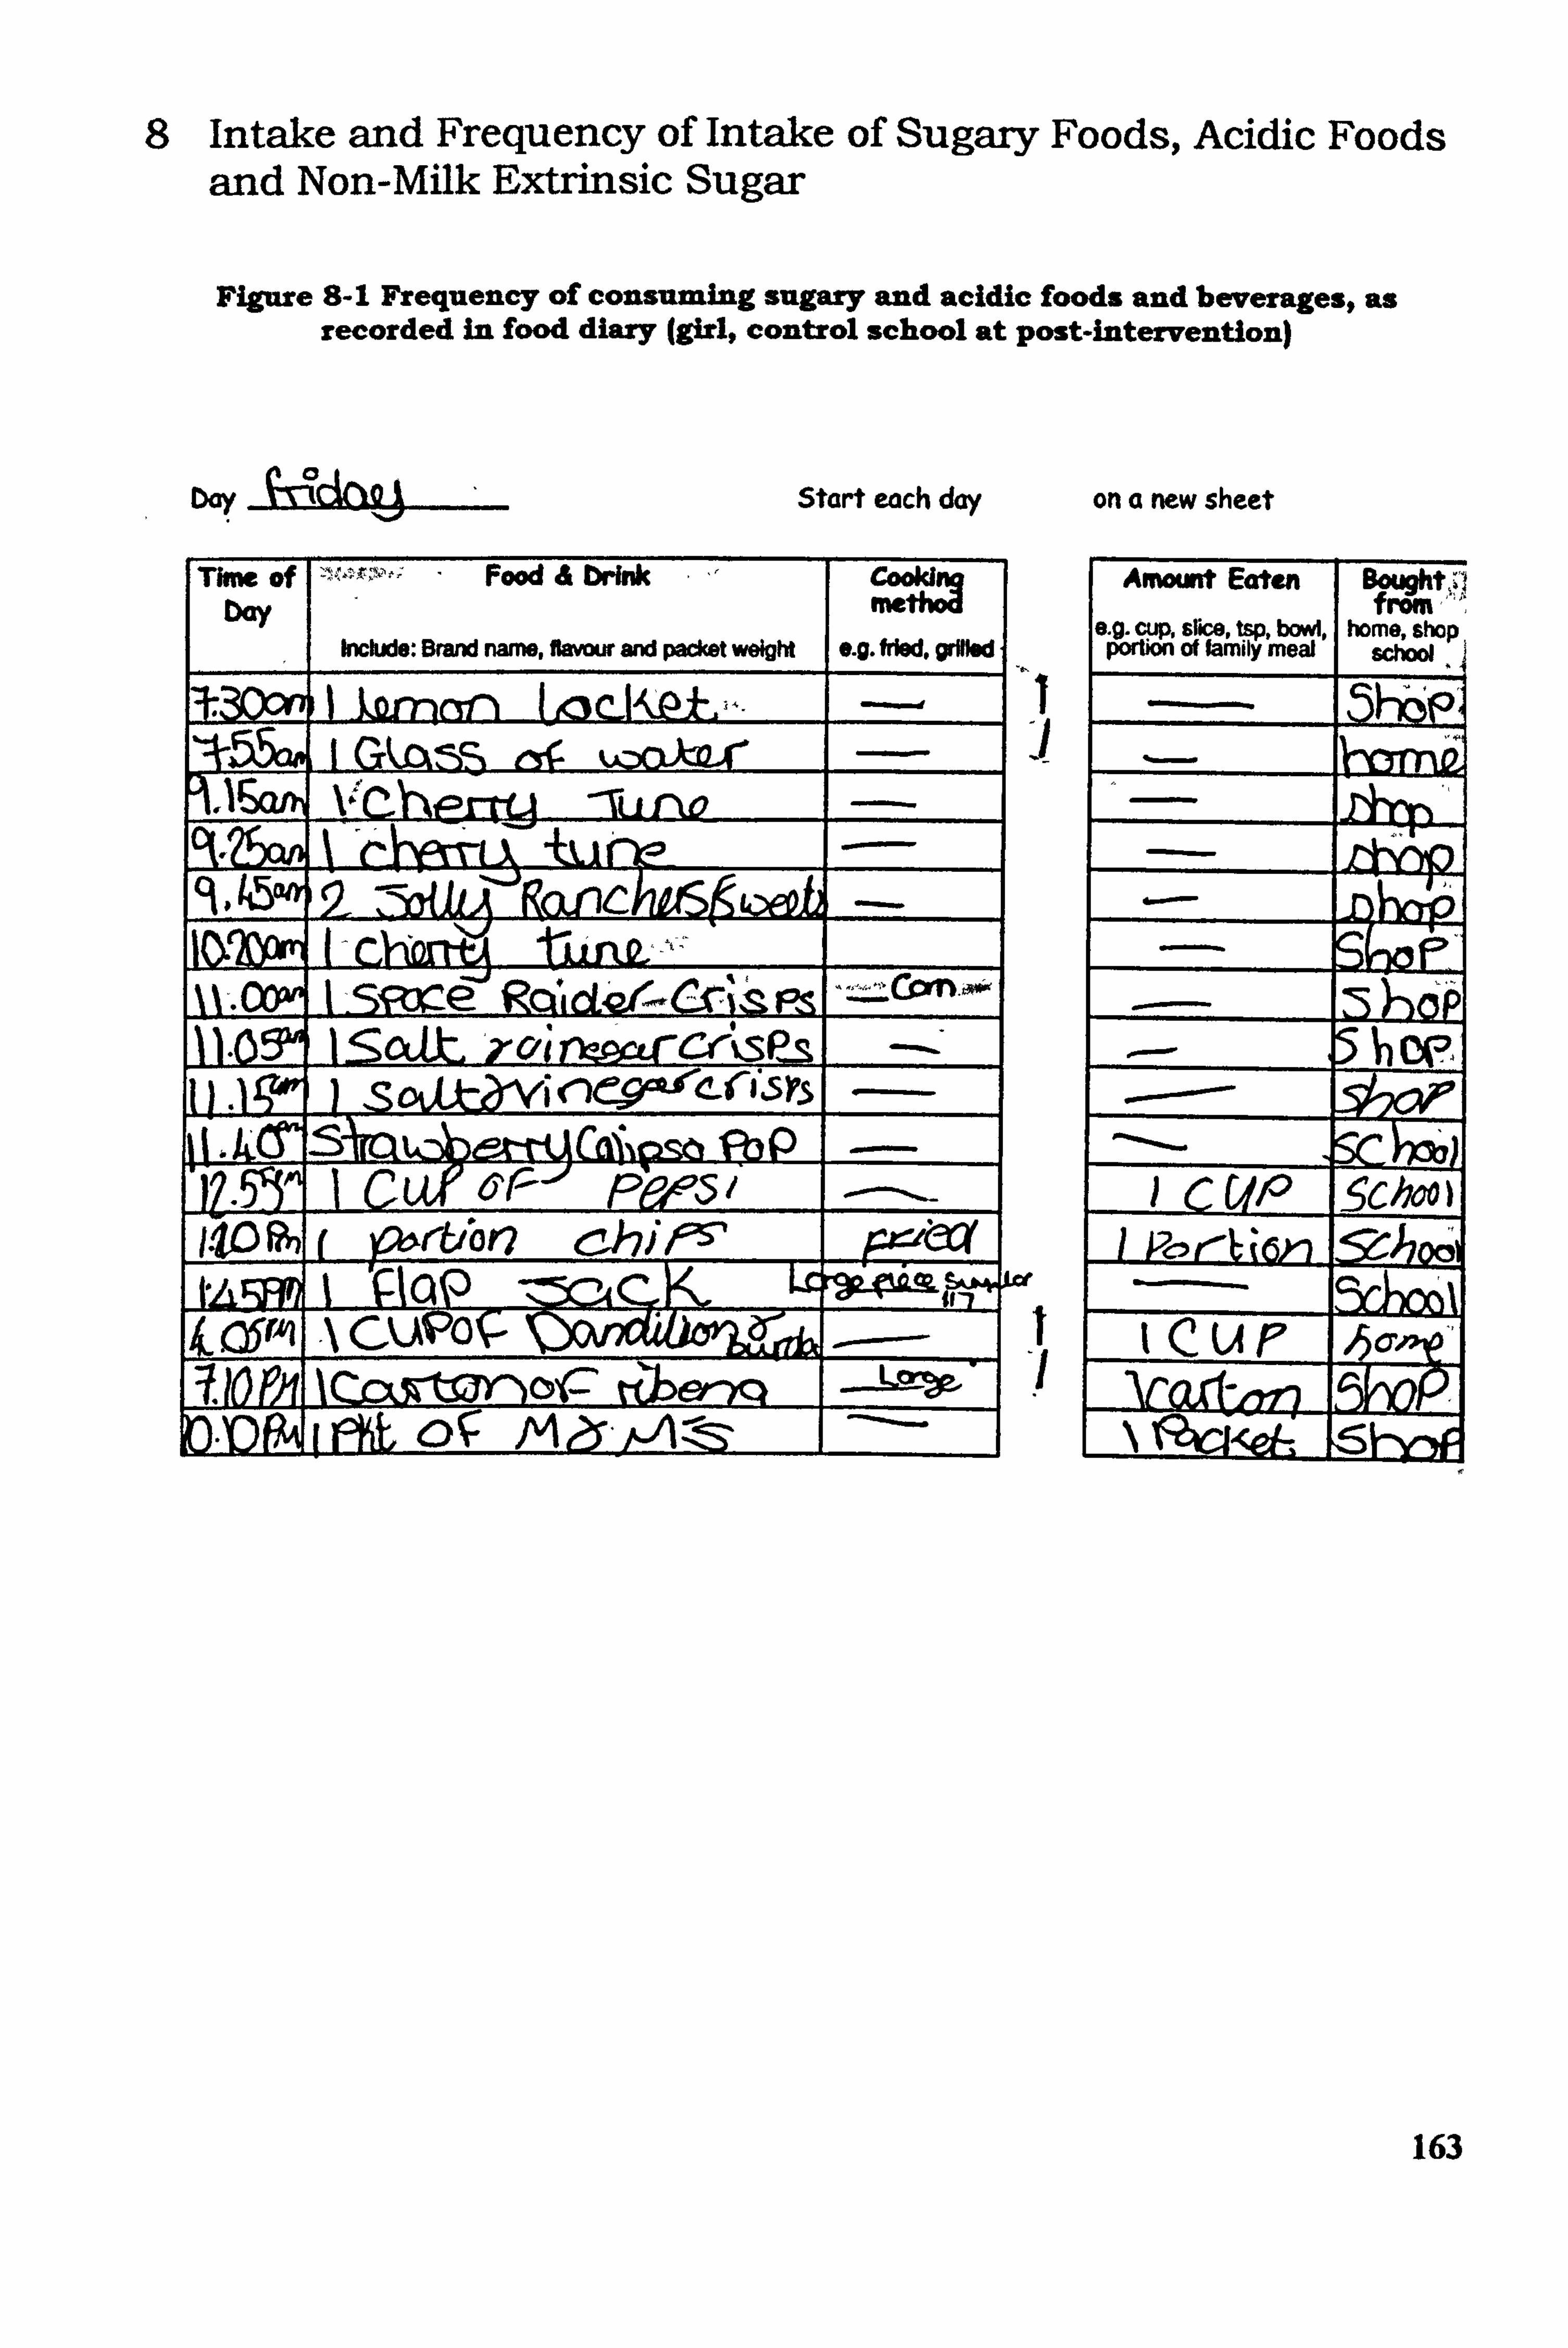
8 Intake and Frequency of Intake of Sugary Foods, Acidic Foods and Non-Milk Extrinsic Sugar
Figure 8-1 Frequency of consuming sugary and acidic foods and beverages, as recorded in food diary (girl, control school at post-intervention)
D. y Start each day on a new sheet
Thne of bay
Food & brink
Include: Brand name, f1mw and packet weight e. g. fried. grMW
-TL1 012 +k. i nýo
52j"tanC
%%-. mwi I -- si-m- e' Rd, C ri"ý ý Ps -Con. o* ,--"ýýý 11.0 1 oat kclin'-Garcrýspls -.
132P 1 Cuf Fý? ý51
I-105"n f 161ý'r&bo chifý5' p4tw tL i 'PoP- Lr
k CPAI A CUIPO
ýCCýR=or- ftlorxq --
am i OR. &ý A eýir- /-A
1 -I
of
Amount Eaten
9 slice of fah%=
Bgtght,,!
home, shop f"No,
schW
Sc c UP
-5c&o)
IcuP Vo-d-^Iq
_N
163
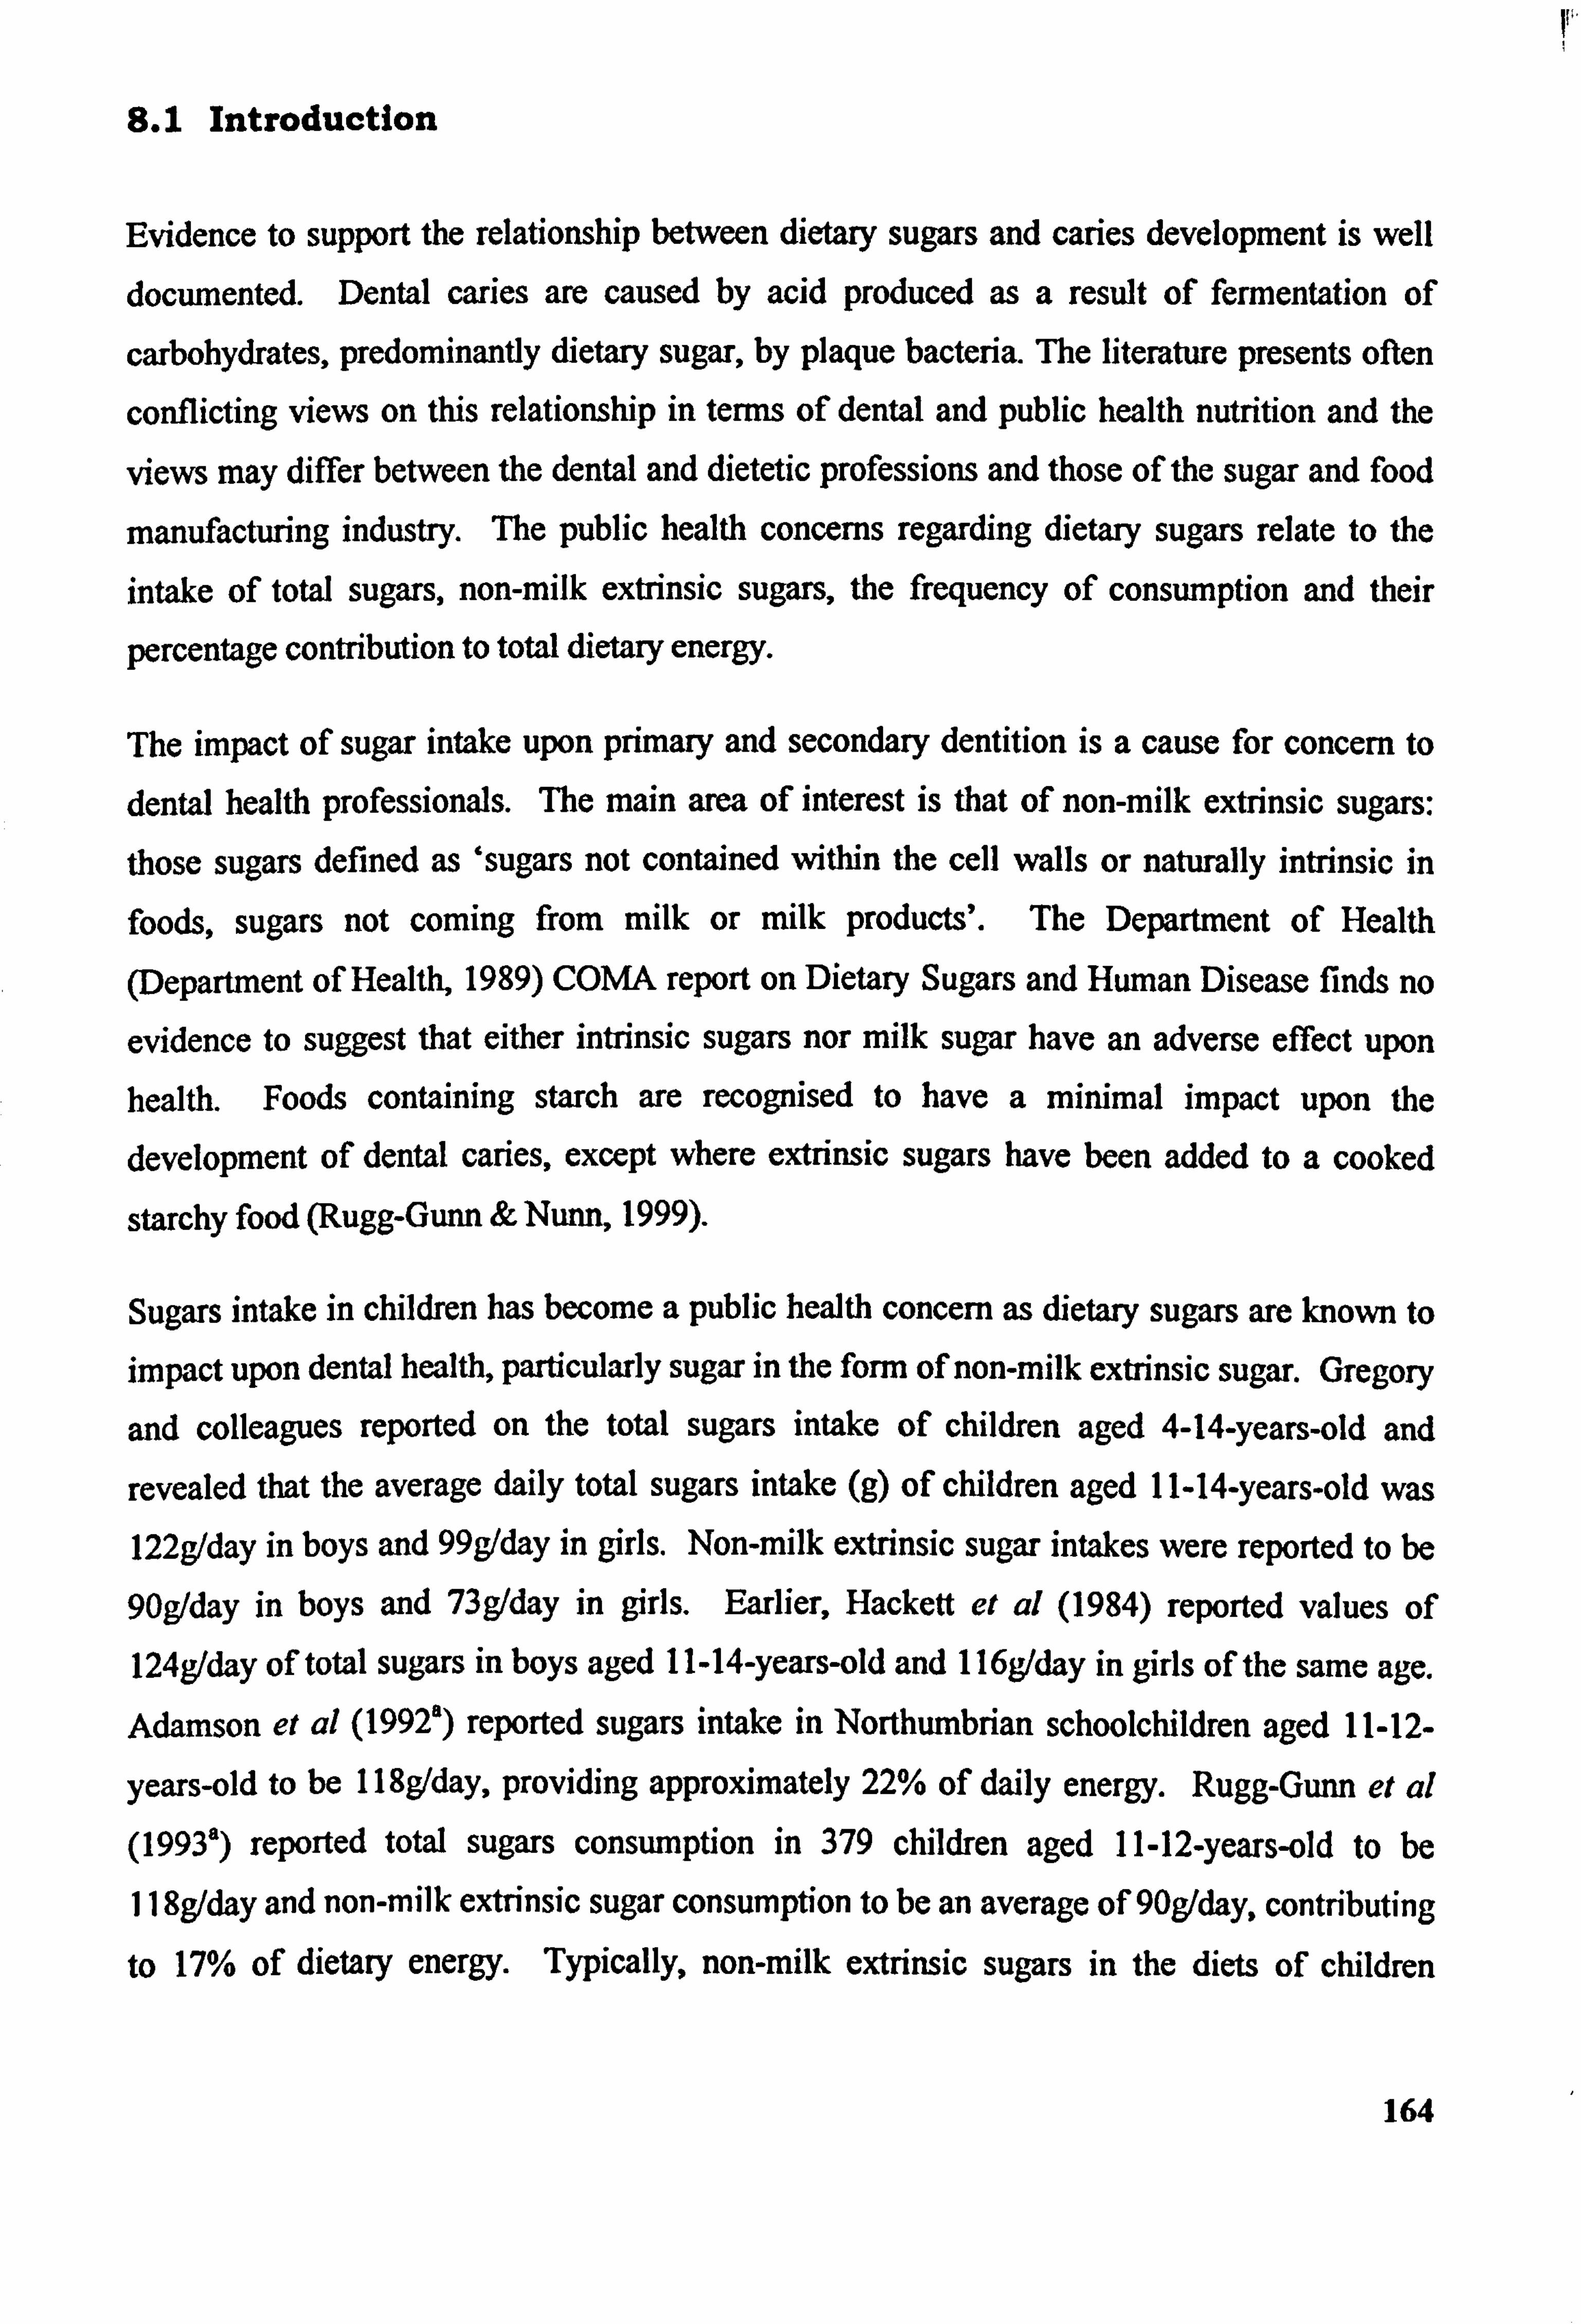
8.1 Introduction
Evidence to support the relationship between dietary sugars and caries development is well documented. Dental caries are caused by acid produced as a result of fermentation of
carbohydrates, predominantly dietary sugar, by plaque bacteria. The literature presents often
conflicting views on this relationship in terms of dental and public health nutrition and the
views may differ between the dental and dietetic Professions and those of the sugar and food
manufacturing industry. The public health concerns regarding dietary sugars relate to the
intake of total sugars, non-milk extrinsic sugars, the frequency of consumption and their
percentage contribution to total dietary energy.
The impact of sugar intake upon primary and secondary dentition is a cause for concern to dental health professionals. The main area of interest is that of non-milk extrinsic sugars: those sugars defined as 'sugars not contained within the cell walls or naturally intrinsic in
foods, sugars not coming from milk or milk products'. The Department of Health
(Department of Healtk 1989) COMA report on Dietary Sugars and Human Disease finds no
evidence to suggest that either intrinsic sugars nor milk sugar have an adverse effect upon health. Foods containing starch are rccognised to have a minimal impact upon the
development of dental caries, except where extrinsic sugars have been added to a cooked
starchy food (Rugg-Gunn & Nunn, 1999).
Sugars intake in children has become a public health concern as dietary sugars are known to
impact upon dental health, particularly sugar in the form of non-milk extrinsic sugar. Gregory
and colleagues reported on the total sugars intake of children aged 4-14-years-old and
revealed that the average daily total sugars intake (g) of children aged 11-14-years-old was 122g/day in boys and 99g/day in girls. Non-milk extrinsic sugar intakes were reported to be
90g/day in boys and 73g/day in girls. Earlier, Hackett et al (1984) reported values of 124g/day of total sugars in boys aged 11-14-years-old and 116g/day in girls of the same age. Adamson et al (1992) reported sugars intake in Northumbrian schoolchildren aged 11-12-
years-old to be 118g/day, providing approximately 22% of daily energy. Rugg-Gunn et al (1993') reported total sugars consumption in 379 children aged 11-12-years-old to be
II 8g/day and non-milk extrinsic sugar consumption to be an average of 90g/day, contributing
to 17% of dietary energy. Typically, non-milk extrinsic sugars in the diets of children
164
contribute to approximately 60-70% of total dietary sugar intake (Department of Health,
1991).
Hackett et al (1984) reported that overall intakes of sugars varied considerably and the range
of intakes was wide (range 30g/day to 210g/day). Hackett and colleagues also refer to the
peak intake times for dietary sugars, which were reported to be between 07.00-09.00; 12.00-
13.00; 16.00-18.00; 20.00-22.00hrs, which were observed to correlate with meal patterns,
suggesting that most sugary foods were consumed as part of a meal. Almost twenty years on,
it is reasonable to suggest that even the eating patterns of children of this age Oust starting a
secondary school) will have changed somewhat and that the prevalence of Igrazine amongst
older children and teenagers may likely impact upon the frequency of eating sugars, either as
part of a meal or as a snack.
The Department of Health report on Dietary Sugars and Human Disease (Department of
Health, 1989) recommended that the intake of foods rich in non-milk extrinsic sugars should
be decreased and be replaced by fruit, vegetables and starchy foods. In 1991 the Department
of Health report on dietary reference values further recommended that non-milk extrinsic
sugar intake should not exceed 60g per day in the adult diet and should contribute no more
than 11% in groups not consuming alcohol.
Dietary habits are known to form during childhood and habits acquired in childhood have the
potential to impact upon the predisposition to diet-related diseases such as obesity, coronary heart diseases, osteoporosis, diabetes and some cancers in adult life. Dietary factors may impact upon dental health either pre-eruptively (during the formation of tecth) and post-
eruptively (due a local effect within the mouth). Non-milk extrinsic sugars are known to
impact upon the primary and secondary dentition of children due a local intra-oral interaction.
Frequency of intake of sugary foods and beverages is important. This is because of the length
of time required for 'oral clearance' of sugars in the mouth. At least 30 minutes following
ingestion of sugary foods is required for saliva pH to return to within normal range. The
bathing effect of saliva is most important in the remineralisation of the tooth enamel and in
the combat of acid-producing bacteria naturally present within the mouth.
Dental erosion is a progressive and irreversible wearing away of hard dental tissue as a result
of a chemical progress due to the action of acids upon hard surfaces. The dominant cause of dental erosion is acids, either extrinsic or intrinsic. The source of acids may be dietary
165
(extrinsic acids) or those naturally produced by the body, for example, gastric juices
(intrinsic). Intrinsic acids that may come into contact with dental tissue as a result of
regurgitation. Extrinsic acids are acids present in foods, such as fruit acids and ascorbic acids found in fruit juices and fruit and sports drinks, in addition to phosphoric acid commonly found in carbonated beverages (Rugg-Gunn, 1993). Dental erosion is becoming more
prevalent, the rate of dental erosion is increasing and is a major concern in children and
teenagers (Sheilham, 2001).
As with dietary sugars, frequency of intake is known to be an important factor in the aetiology
of erosion as well as quantity consumed. Al-Dlaigan et al (2000) report significant
correlation of erosion on buccal and lingual surfaces of teeth in 14-year-old Birmingham
teenagers to the dietary data obtained by self-completed questionnaire. The authors report a
range of significance values for several beverages in conjunction with their frequency of
consumption Those beverages raising the most concern were apple juice, cola drinks, other
carbonated drinks, tea, spirits and sports drinks. All were reported to be significantly
correlated to dental erosion at P<0.001 (using Spearman! s correlation).
Duff (1999) reports on a market research programme carried out on behalf of Tetra Pak UK
Ltd with 506 school children and it is evident that industry funding has influenced the content
and perspective and probably the hidden agent of what is essentially a poor paper but worthy
of review entirely because of this. Whilst commenting on the increasing independence of
choice of older children and teenagers, Duff also refers to the Power of advertising and the
effect of peer group influences and how this group of the population 'represent a major area of potential for expansion! - presumably expansion of nutritionally pointless and potentially harmful soft drinks. Duff comments that soft drinks are consumed in public by teenagers for
the image they perceivably portray in addition to personal preferences regarding taste. Most
children aged 11-14-years-old purchase most of their soft drinks from school and from comer
shops and newsagents and fewer soft drinks are consumed within the family home.
The consumption of carbonated soft drinks by children and teenagers is becoming an increasing concern, particularly in the Northern counties of England and in Scotland and in low-income families. Walker et al (2000) reported that young people in the Northern Region
and Scotland were more likely to report frequent consumption of non-diet carbonated soft drinks and that young people whose parents were in receipt of benefits were more likely to
report that they consumed non-diet carbonated soft drinks more than once a day. In the age 166
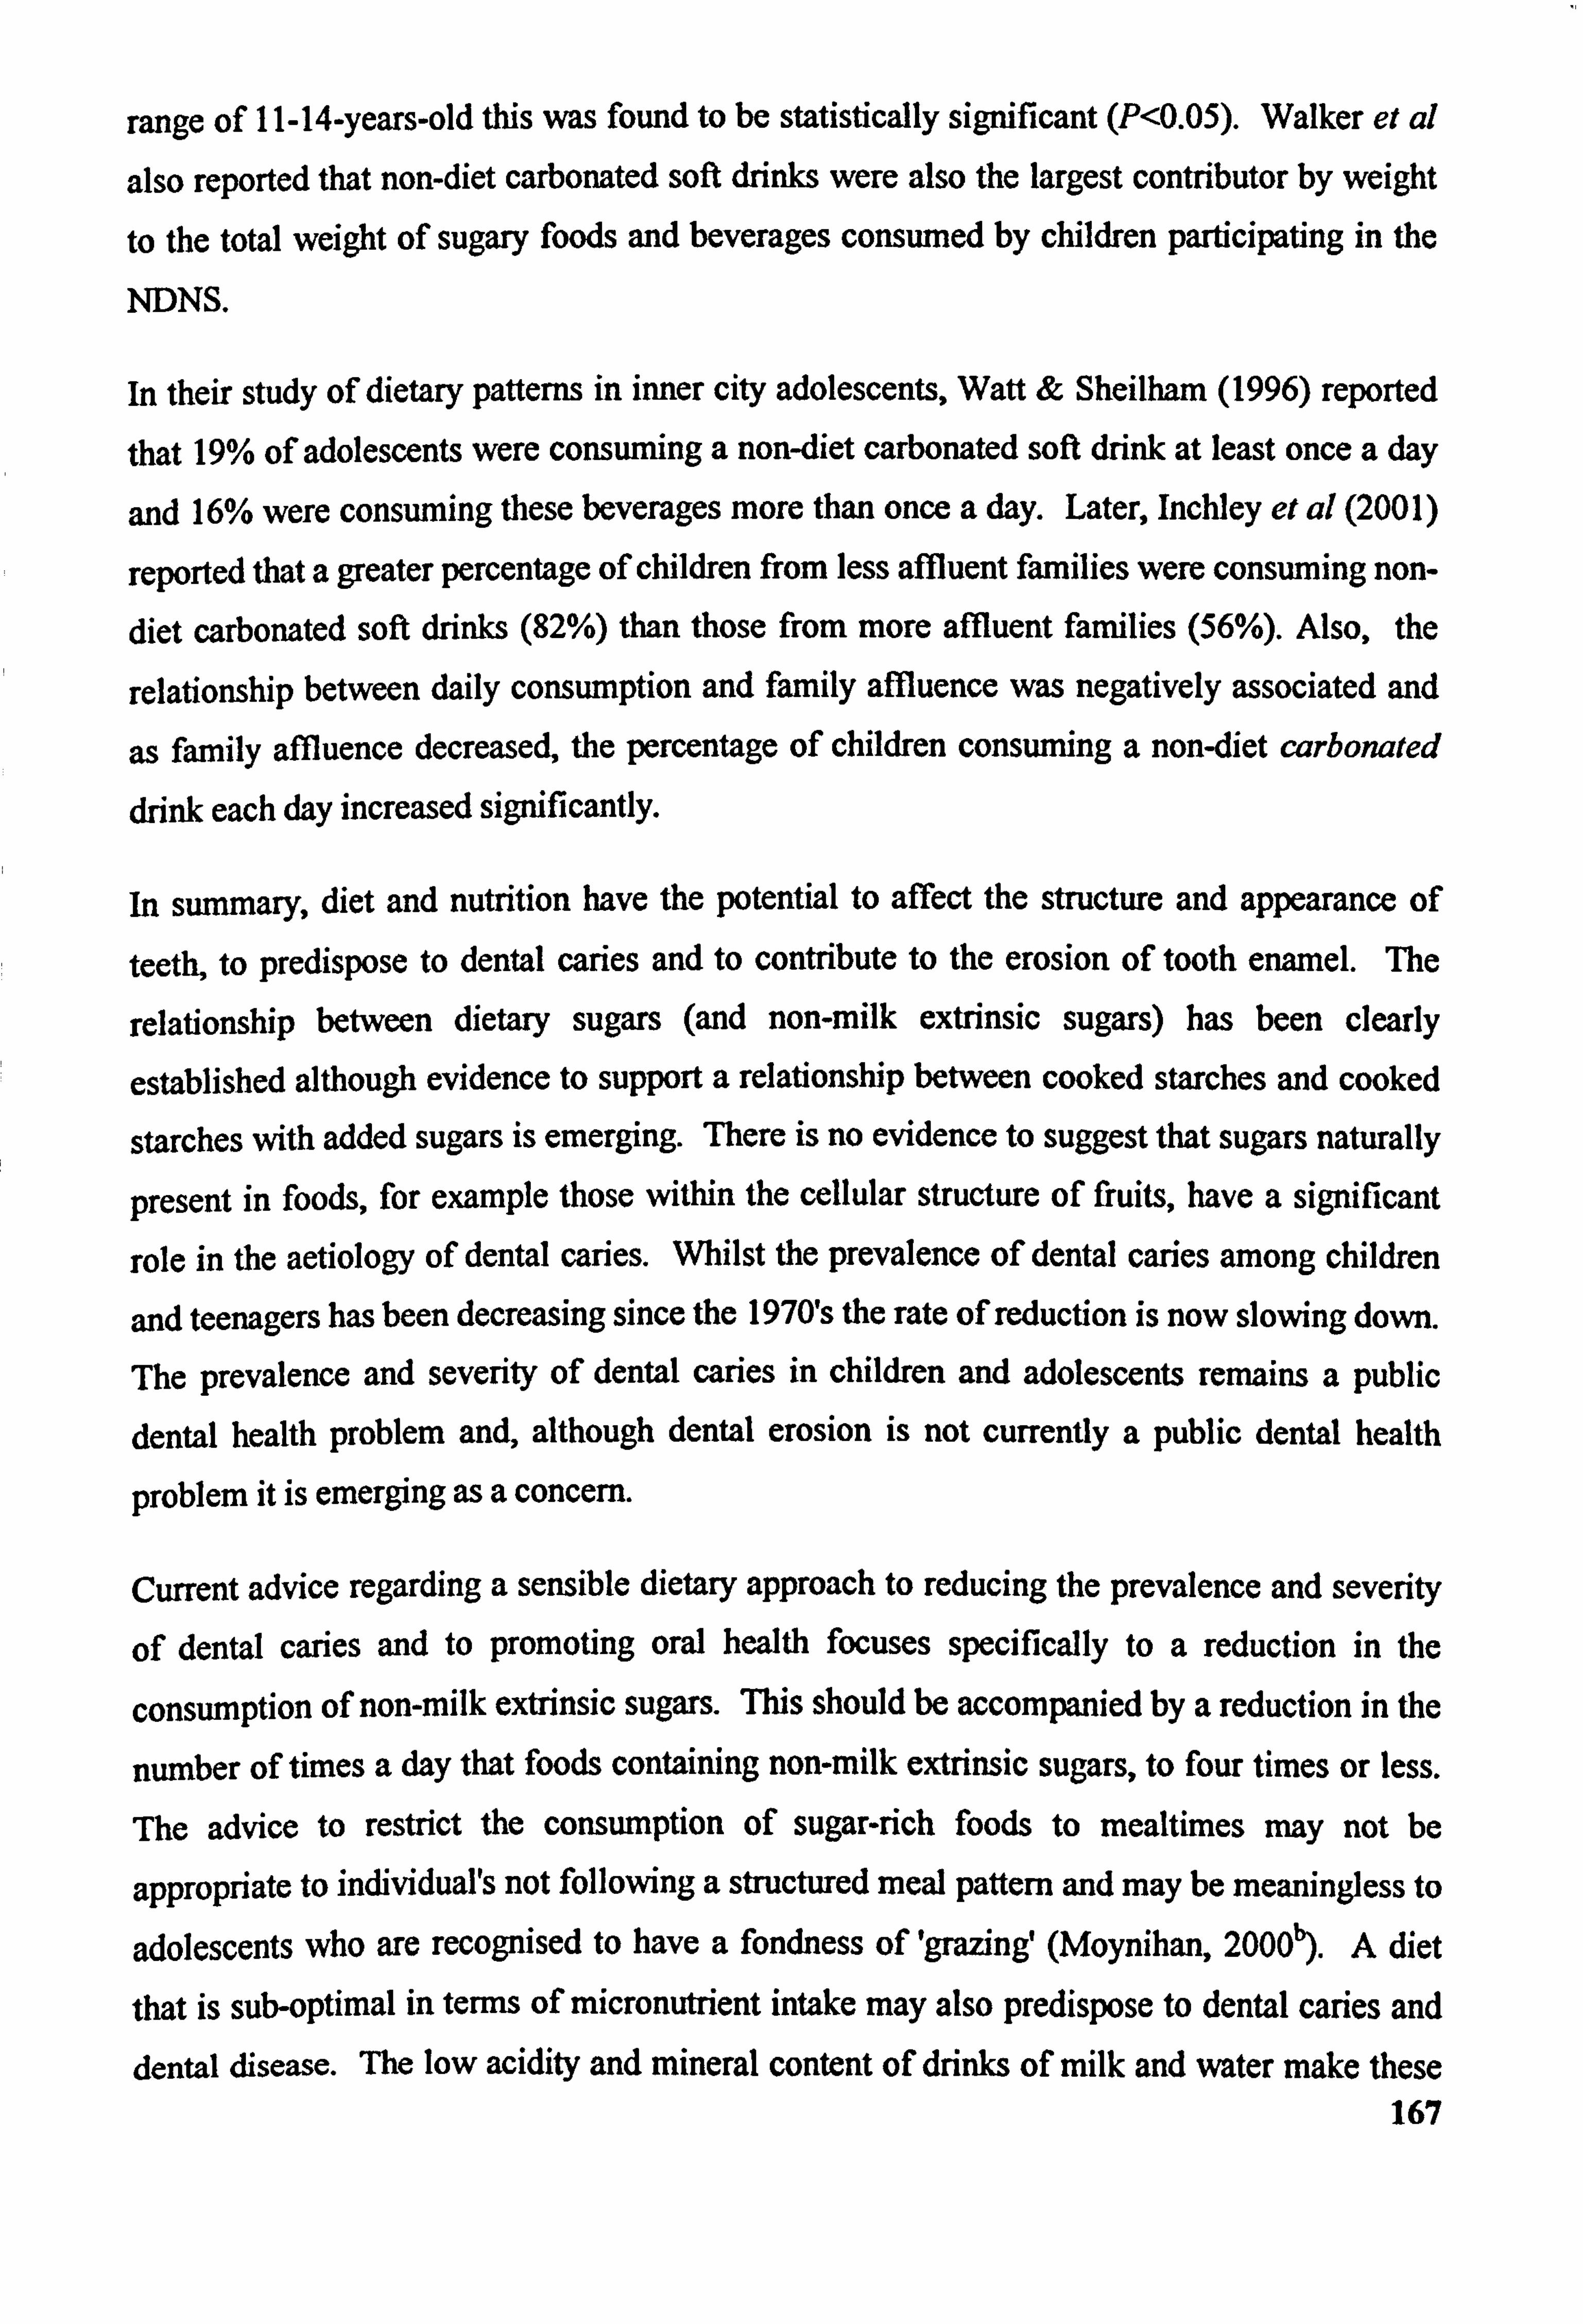
range of 11-14-years-old this was found to be statistically significant (P<0.05). Walker et al
also reported that non-diet carbonated soft drinks were also the largest contributor by weight
to the total weight of sugary foods and beverages consumed by children participating in the
NDNS.
In their study of dietary patterns in inner city adolescents, Watt & Sheilham. (1996) reported
that 19% of adolescents were consuming a non-diet carbonated soft drink at least once a day
and 16% were consuming these beverages more than once a day. Later, Inchley et at (2001)
reported that a greater percentage of children from less affluent families were consuming non-
diet carbonated soft drinks (82%) than those from more affluent families (56%). Also, the
relationship between daily consumption and family affluence was negatively associated and
as family affluence decreased, the percentage of children consuming a non-diet carbonated
drink each day increased significantly.
In summary, diet and nutrition have the potential to affect the structure and appearance of
teeth, to predispose to dental caries and to contribute to the erosion of tooth enamel. The
relationship between dietary sugars (and non-milk extrinsic sugars) has been clearly
established although evidence to support a relationship between cooked starches and cooked
starches with added sugars is emerging. There is no evidence to suggest that sugars naturally
present in foods, for example those within the cellular structure of fruits, have a significant
role in the aetiology of dental caries. Whilst the prevalence of dental caries among children
and teenagers has been decreasing since the 1970's the rate of reduction is now slowing down.
The prevalence and severity of dental caries in children and adolescents remains a public dental health problem and, although dental erosion is not currently a public dental health
problem it is emerging as a concern.
Current advice regarding a sensible dietary approach to reducing the prevalence and severity
of dental caries and to promoting oral health focuses specifically to a reduction in the
consumption of non-milk extrinsic sugars. This should be accompanied by a reduction in the
number of times a day that foods containing non-milk extrinsic sugars, to four times or less.
The advice to restrict the consumption of sugar-rich foods to mealtimes may not be
appropriate to individual's not following a structured meal pattern and may be meaningless to
adolescents who are recognised to have a fondness of 'grazing' (Moynihan, 2000). A diet
that is sub-optimal in terms of micronutrient intake may also predispose to dental caries and
dental disease. The low acidity and mineral content of drinks of milk and water make these 167
preferable beverages for children and teenagers. A more purposeful approach to dietary
advice may be to avoid negative messages about certain foods and attend to positive information about which foods may be consumed (Rugg-Gunn, 1993). Foods with a high
non-milk extrinsic sugar content, such as carbonated soft drinks, fruit drinks, confectionery, biscuits, cakes should not be promoted specifically as 'bad' foods but should be replaced
where possible with a greater consumption of vegetables, fruits, and starchy foods whilst
preferable beverages are milk or water.
1.1 Aims
The specific aims of these analyses were to:
* To report on the intake and foods that contribute to the
intake of non-milk extrinsic sugars in the diets of 167
children aged 11-13-years-old from deprived social
backgrounds prior to and following a school-based controlled
dietary intervention
* To report on the intake and frequency of intake of selected
sugary foods and beverages
To report on the intake and the frequency of acidic foods in
the diets of the children
* To report on the types of drinks selected at bedtime
8.2 Methods
8.2.1 Collection of dietary data
Quantitative and qualitative dietary data were collected from each subject using a dietary
diary as reported in Chapter 6.
8.2.2 Isolation of specificfood codes and quantification of dietary variables
The dietary data entered onto the Microsoft Access Database were examined using database
reports to access and view the range and frequency of food codes used. For the identification
and isolation of food codes for foods and beverages containing non-milk extrinsic sugar,
reference was made to the non-milk extrinsic sugar content of foods commonly consumed by
the children during the six day recording period (Table 8.1). Non-milk extrinsic sugar values
168
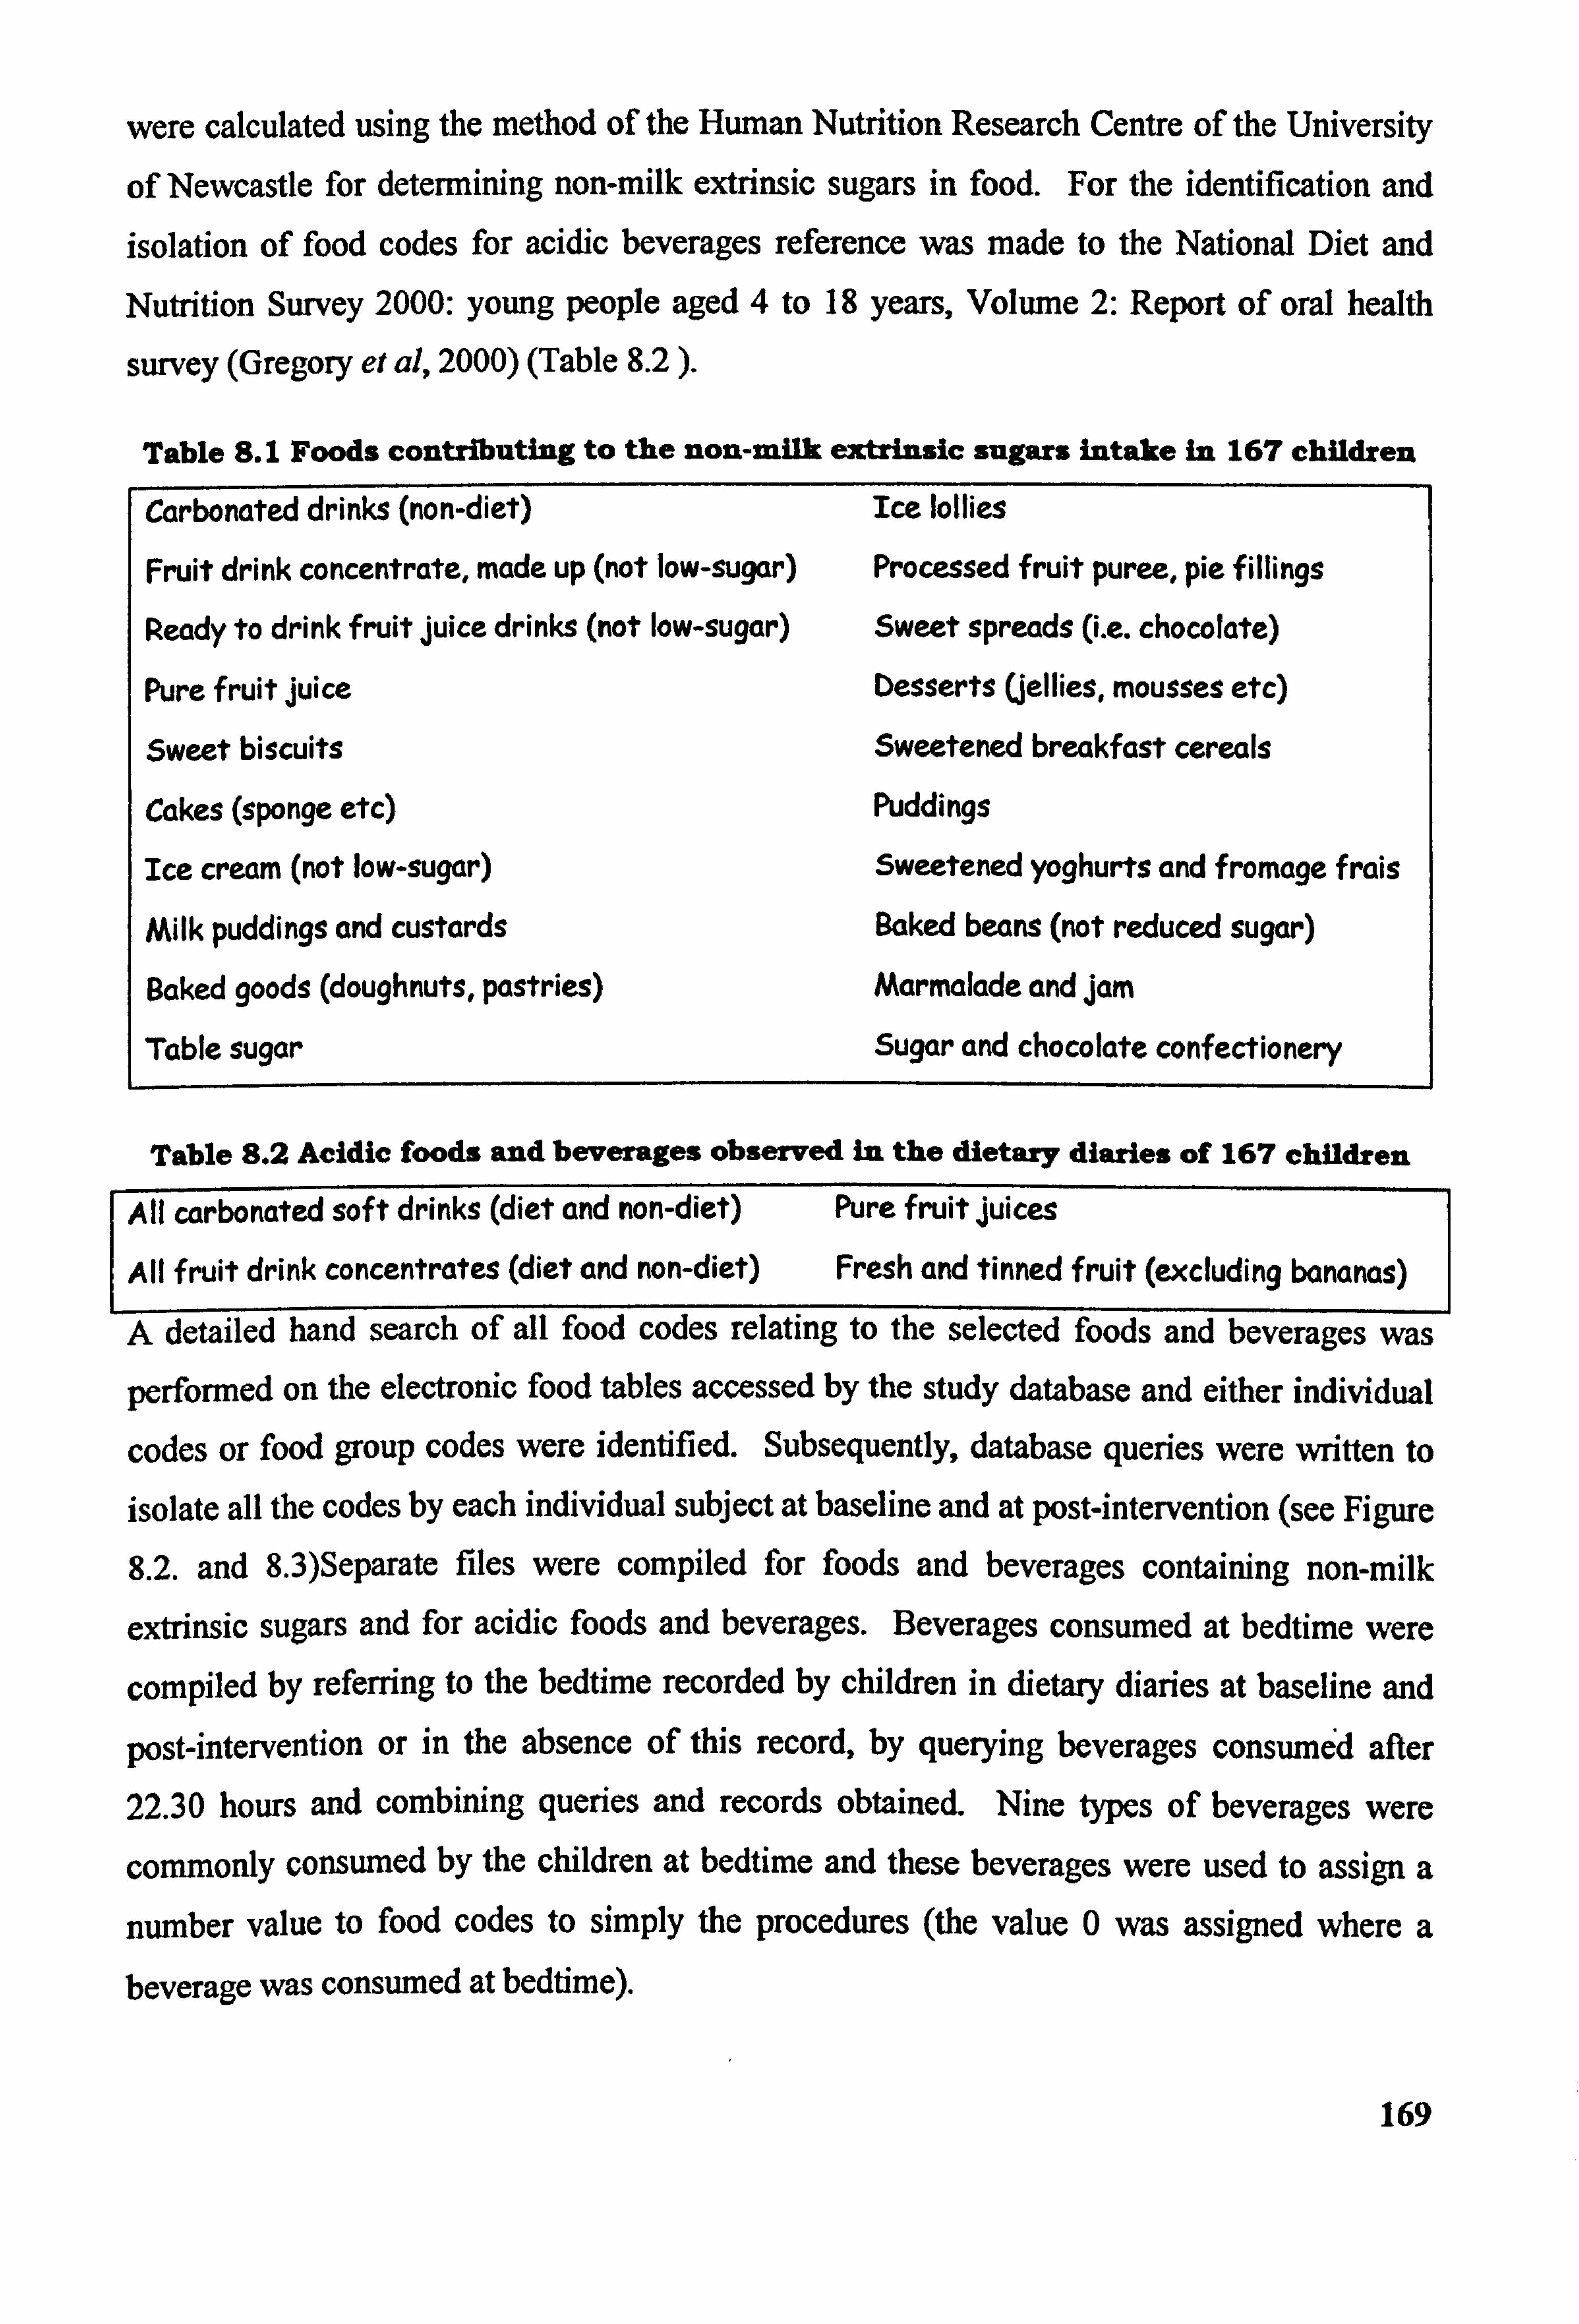
were calculated using the method of the Human Nutrition Research Centre of the University
of Newcastle for determining non-milk extrinsic sugars in food. For the identification and isolation of food codes for acidic beverages reference was made to the National Diet and
Nutrition Survey 2000: young people aged 4 to 18 years, Volume 2: Report of oral health
survey (Gregory et al, 2000) (Table 8.2 ).
Table S. I Foods contributing to the non-milk extrinsic sugars intake in 167 children
Carbonated drinks (non-diet) Ice lollies
Fruit drink concentrate, made up (not low-sugar) Processed fruit puree, pie fillings
Ready to drink fruit juice drinks (not low-sugar) Sweet spreads (i. e. chocolate)
Pure fruit juice Desserts Uellies, mousses etc)
Sweet biscuits Sweetened breakfast cereals
Cakes (sponge etc) Puddings
Ice cream (not low-sugar) Sweetened yoghurts and fromage frais
Milk puddings and custards Baked beam (not reduced sugar)
Baked goods (doughnuts, pastries) Marmalade and jam
Table sugar Sugar and chocolate confectionery
Table 8.2 Acidic foods and beverages observed in the dietary diaries of 167 children
All carbonated soft drinks (diet and non-diet) Pure fruit juices
All fruit drink concentrates (diet and non-diet) Fresh and tinned fruit (excluding bananas)
A detailed hand search of all food codes relating to the selected foods and beverages was
perfortned. on the electronic food tables accessed by the study database and either individual
codes or food group codes were identified. Subsequently, database queries were written to
isolate all the codes by each individual subject at baseline and at post-intervention (see Figure
8.2. and 8.3)Separate files were compiled for foods and beverages containing non-milk
extrinsic sugars and for acidic foods and beverages. Beverages consumed at bedtime were
compiled by referring to the bedtime recorded by children in dietary diaries at baseline and
post-intervention or in the absence of this record, by querying beverages consumed after 22.30 hours and combining queries and records obtained. Nine types of beverages were
commonly consumed by the children at bedtime and these beverages were used to assign a
number value to food codes to simply the procedures (the value 0 was assigned where a beverage was consumed at bedtime).
169
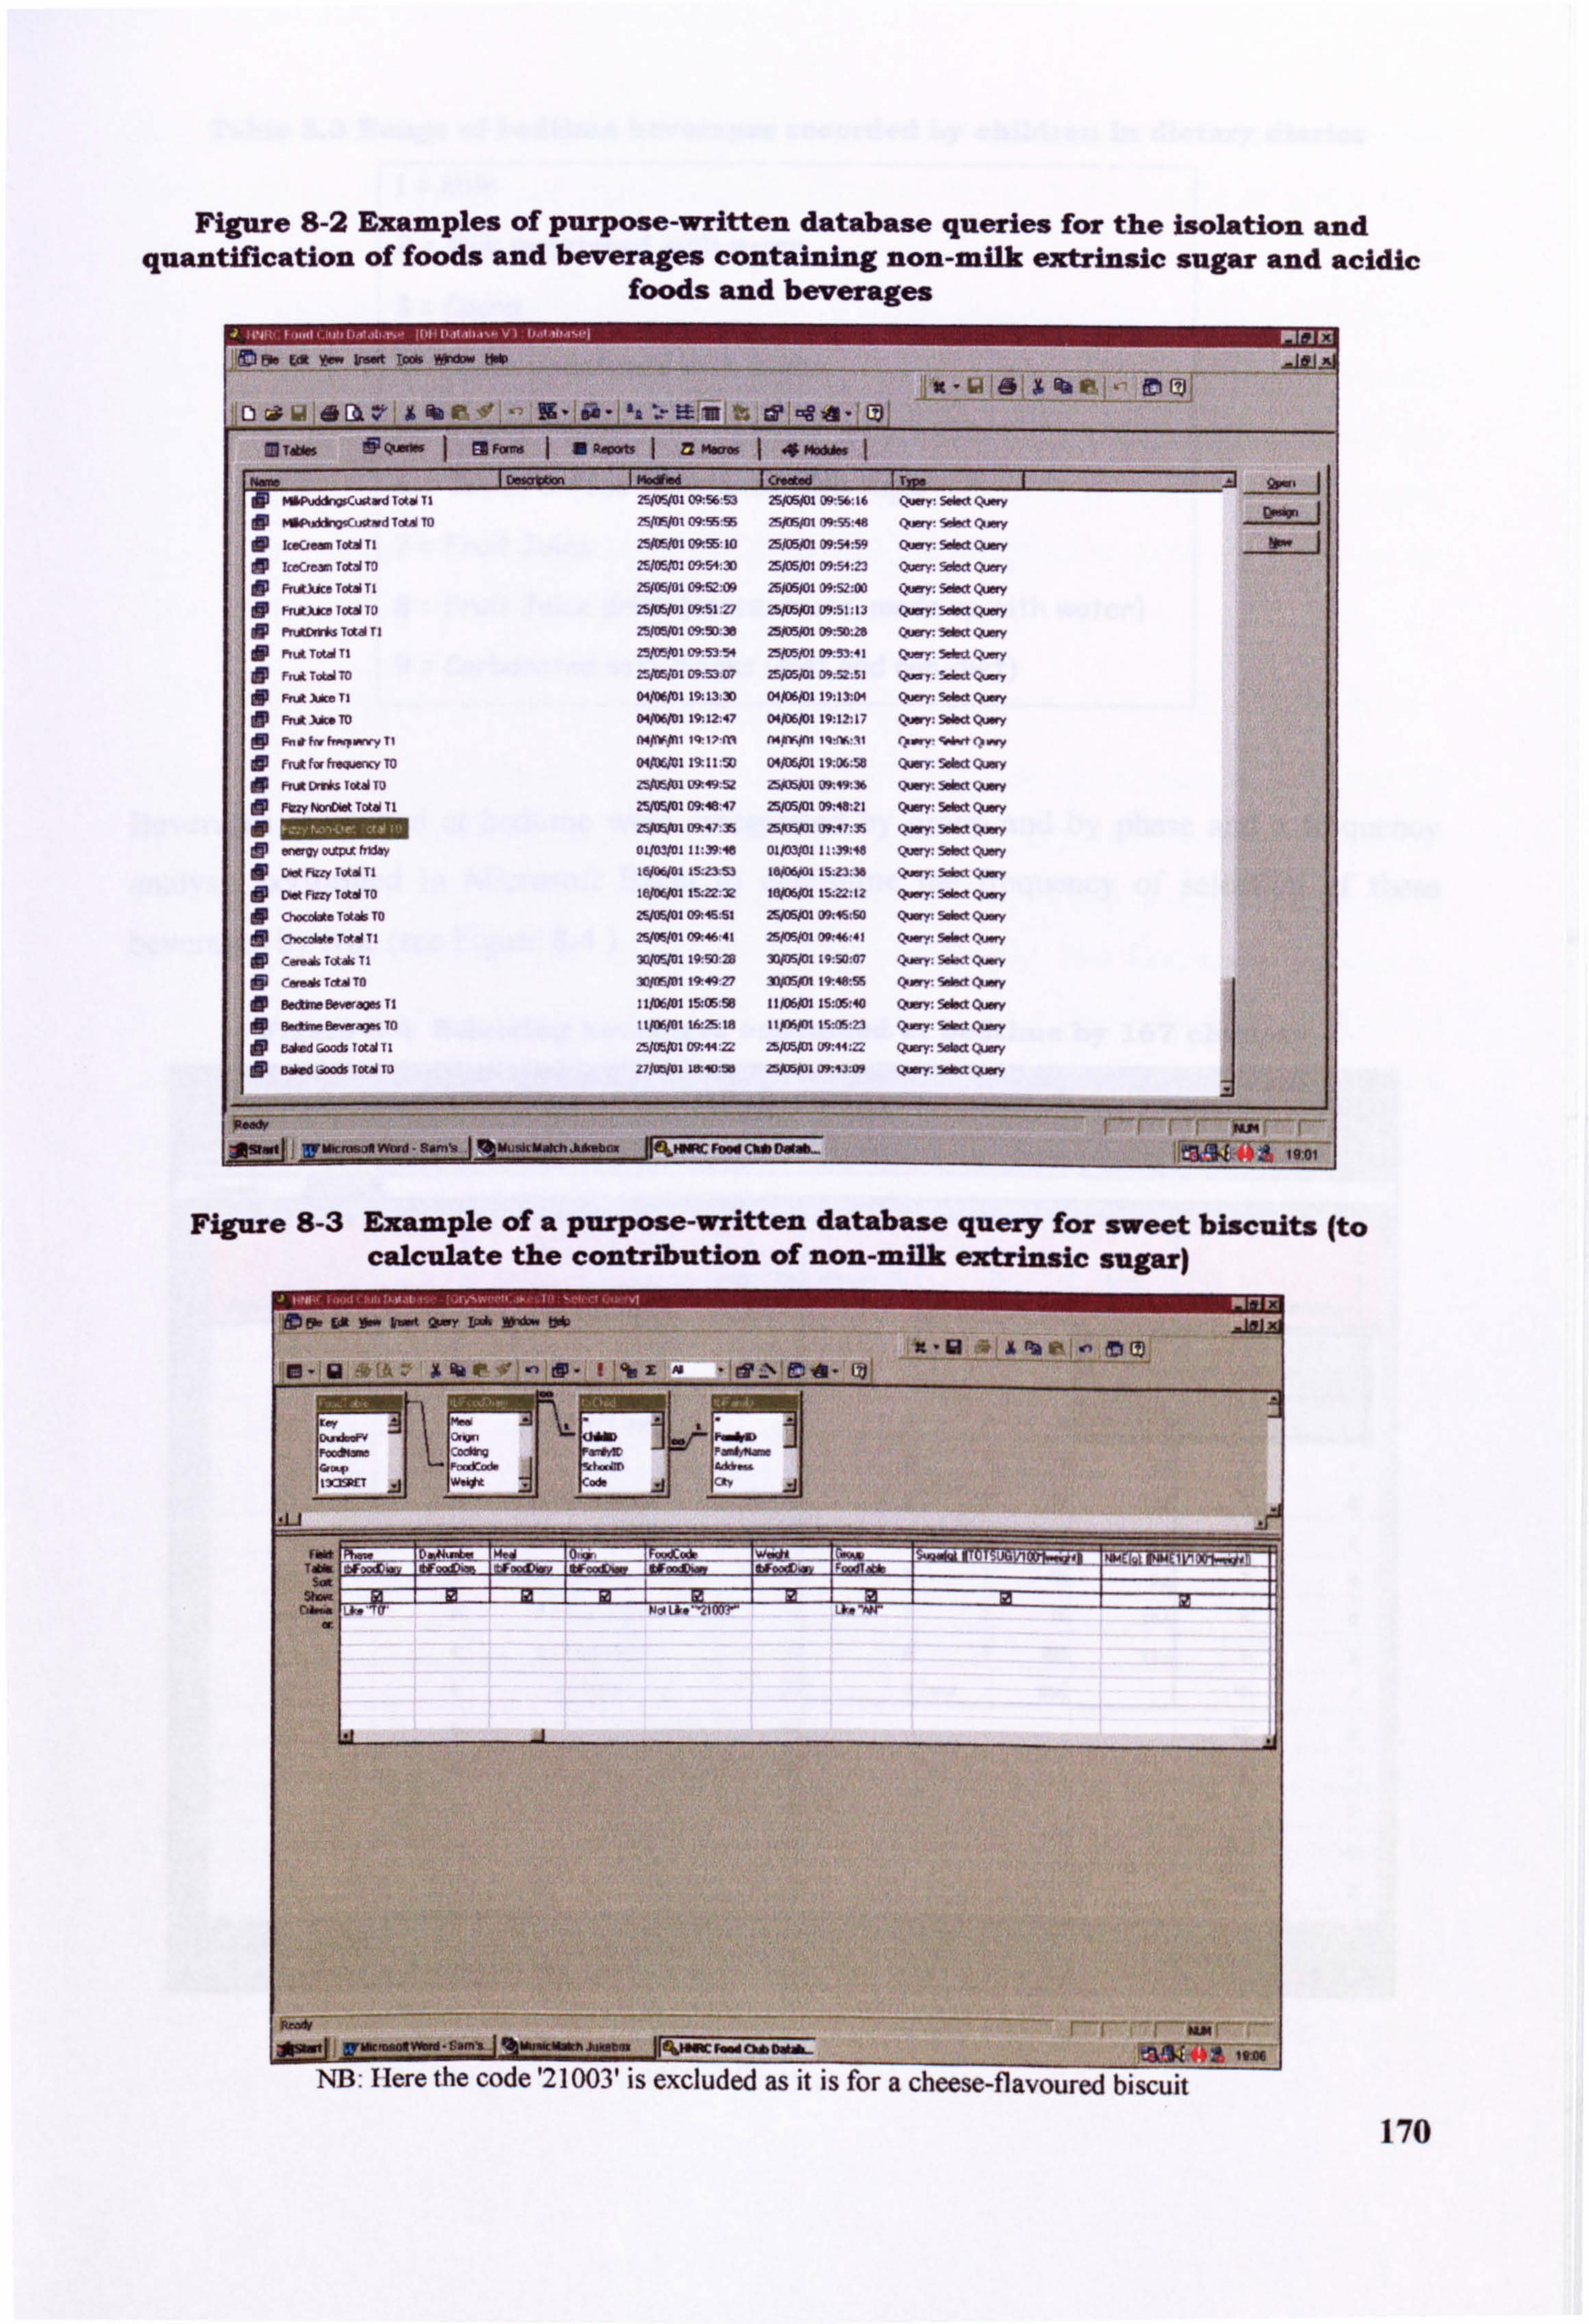
Figure 8-2 Examples of purpose-written database queries for the isolation and quantification of foods and beverages containing non-milk extrinsic sugar and acidic
foods and beverages
x- 64 6x% im - JCI e Giý 6A 4 Ek e' X fib rý -'ýe -9- lie - la ý. e liff t% t? -e 2. Qý
Z UAN SQMW 1 are- 1 BROOMI zzm l1
1 M. Vd 1 GloIlld 1 fffl 1 Z] 2ýII9W1 C- 56 ý-, 2, PDWI 3- 56 16 s~. - 797fmi ý 9; 95 ýmin, A-Sý 48 sm., ý'>-
. C, -t"TI ZSMI ffl5: la 25)UNM 09: 54: 59 Qý: swd 0, - 9-
In ::
. clý T&d to 25M2 09154: 30 Majoi 09: 51: 23 O-Y: 5dm c--,
dp Fý, tkämT&dT1 25M1 ffl2: 09 25ffli 09: 52: 00 (xm: säw Q-y dp P. AXAM IOW To Z~I MI: 27 z~ 09: 51: a3 Q.. y: 50w Quy dp rucHlm Tad Ti 2%MI 09-. M: le ZWD5M 09ý. ": 29 Q--Y. 5*« Quy 0 ýý T" Ti 25/MI 091.53 54 25jU5N1 09: 53: 41 5Wa Q-y ie
!
dr F, u&TbdT0 251M1 M. 53.07 ZBID5M 09; 52; 51 Qý. 5dd Qý
Ffut AdM TI o~I 19. l3: 30 o~I 19: 13: 0q QUy: Sbd Q.. y Fýdm. m o~I 19-, 12: 47 04)XPI 19: 12: 17 QUy: Sba 9-Y
AMell
FR* f« h99ýnnCY TO 19; 11: M o~I 19; 06; W Qffl: 5*a Q-y w
ýý en*. lei m U*q9:! iz M5 1 ge. V>. 36 (ýffl: 59ha Q,. y FMY NonDbat Tot40 TI W. 10*47 25/OW 0e48: 21 Q.. y: Sma Q.. y
Z5#MI ft47 35 ZSXW U"1! 35 Qwr. 5da Quwy
-w mm ftbv 04=1 11: 39: 18 DLPWI 21: 39: 46 %WY: Sobd QUy
dp (>-y; 5äý (>-y dp C-. h" Ttb TO 25M1 0*46. -61 25)DW ffls: so Q-Y: Smä Q.. y !0 ý-d"T. Wtl 2%MI M. 46 41 2~ (W. 46: 41 (>-y: Idw 1, -y
dv 3umt 19.50 29 ID)r4m 19: W: 07 Q-,: SW«t (>-y
OP -AT"To 3oNw1 19.40 27 IDXW 19,48: 55 Q_yý �dw Q, -y dp Bd»Drýao%TI llffll 15. GEM tiov. 0 15ffl5., 40 Q. ": 5da OLMY o! p t1J06M1 WS: la 11pY4M IS-CS: 23 Q_Y: 5da quy
dp 25ffl1 09: « Z: zbxNm u9: 41: = QUy: 5aa �x-y dp
, Alm k*-. * Vffl - am-. 1 %uuä. - --- mm. Heý. MRC F. " ChäI»Ub
1 1 uy 2%-qýF .ý*
Giý-
Figure 8-3 Example of a purpose-written database query for sweet biscuits (to calculate the contribution of non-milk extrinsic sugar)
Mow ta I- &-A 0-Y I- W- tsdp
10- 12 6ý 1ý ,A %k 01 ,- dp -1 00 x4. drwl% onA - I? j
jtj UWCmOItWwd-Gm'z I I%MuikmwttwMWbw d 1A 0. *. b
NB. I fere the code '21003' is excluded as it i's a cheese-flavoured biscuit
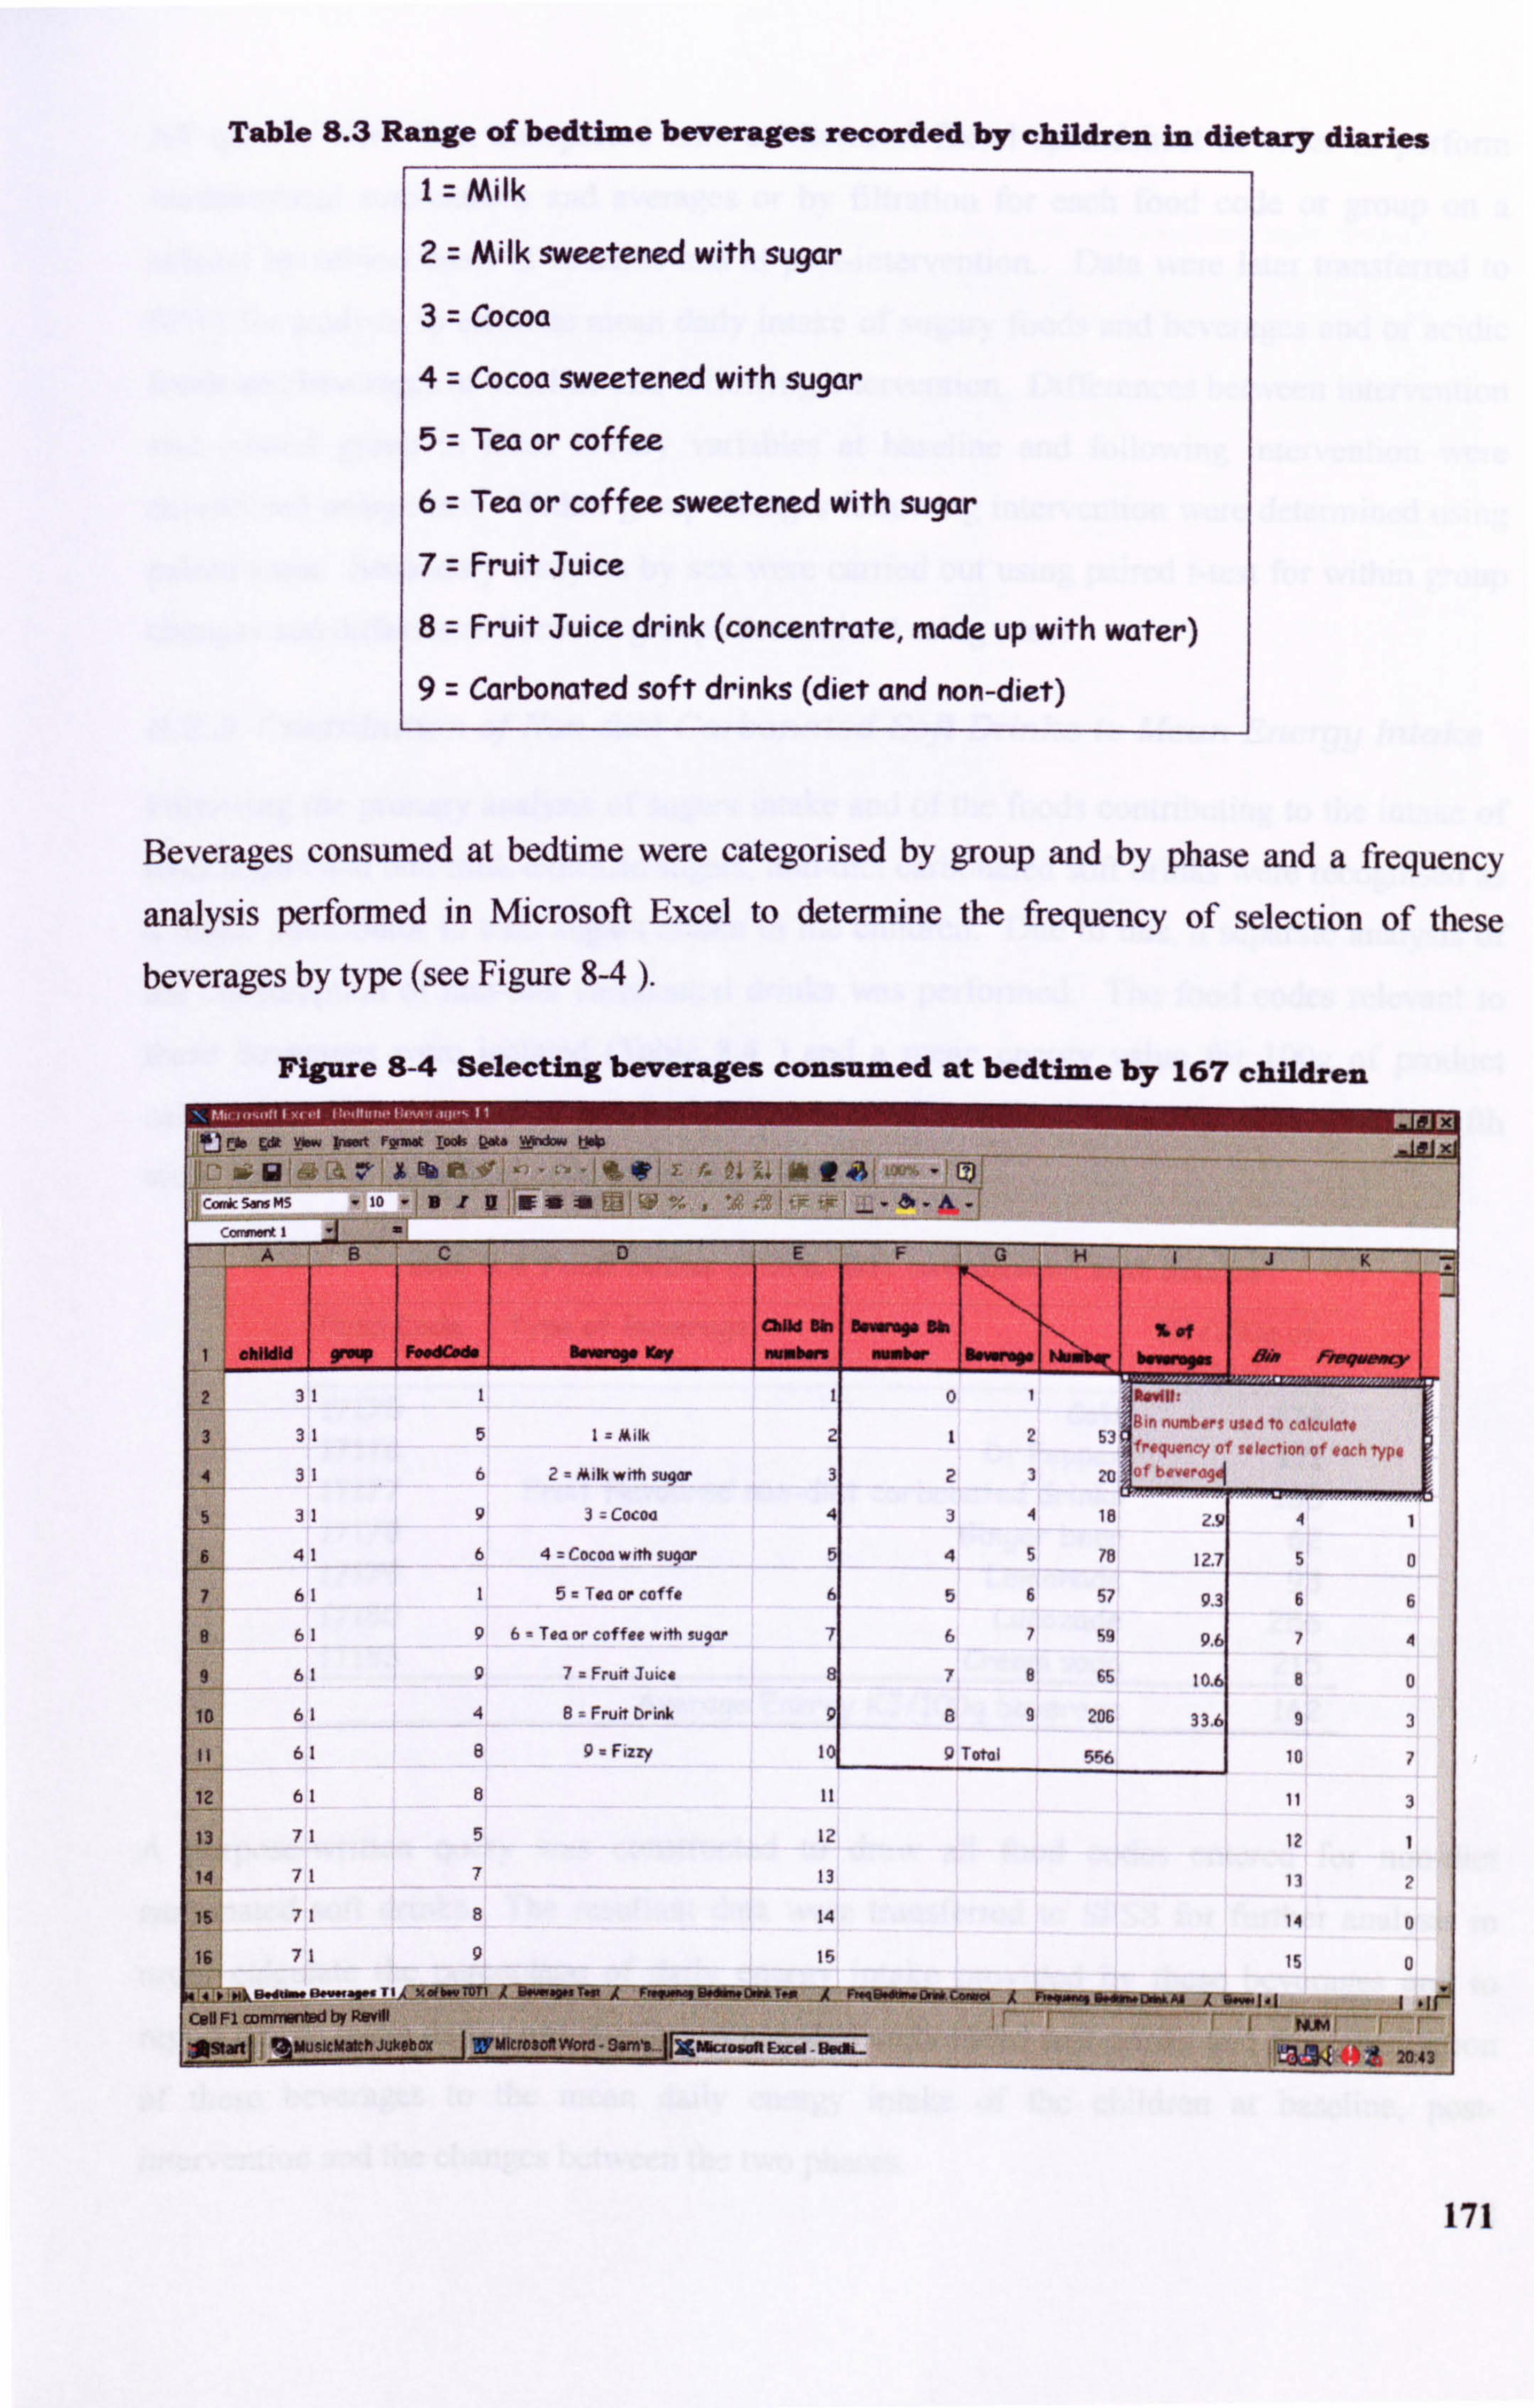
Table 8.3 Range of bedtime beverages recorded by children in dietary diaries
I Milk
2 Milk sweetened with sugar
3 Cocoa
4 Cocoa sweetened with sugar
5 Tea or coffee
6 Tea or coffee sweetened with sugar
7 Fruit Juice
8 Fruit Juice drink (concentrate, made up with water) 9 Carbonated soft drinks (diet and non-diet)
Beverages consumed at bedtime were categorised by group and by phase and a frequency
analysis perfon-ned in Microsoft Excel to determine the frequency of selection of these beverages by type (see Figure 8-4 ).
Figure 8-4 Selecting beverages consumed at bedtime by 167 children
C- 5- MS
A if,
- to -B12N* : 11 ý. Li ,
N-L
, *",!, ;, I., ,- - ao .&.!
A B C D E F G H K _4
OdIld Bin A -- Sp Ob 1-1 16 fff 1 ishildid 9rWW FesdCed v Illirm"O Komy numbare ' W'I'bW 119"Ol"W M-P F- *--Y
2 it
3 1 5 1= Milk 2 12 53 to , to ""c",
I-lertlo" of e ach TypQ 4 31 6 2 Ailk with sugar 3 23 20 0tt #ýQrdqel
5 -1 1 9 3= cocoa 4 34 18 -9 4 1
6 41 6 4 Cocoa wA suclor 5 45 78 12.7 5 a
7 61 1 5= Tea or coffe 6 56 57 9.3 6 6
9 61 9 6 Tea or coffee with sugdr 7 67 59 9.6 7 4
9 61 9 7a Fruit Juice 8 78 65 10.6 8 0
61 4 8= Fruit Drink 9 a9 206 33.6 9 3
61 8 9- FiM 10. 9 Total 556 10 7
12 61 3
13 71 5 12 12 1
14 71 7 13 13 2
is I1 8 14 14 0
16 71 9 15 0
41 "k ý, - ý., - TIAX. (b. TOTI A II-q" T. 0 A F. 91M. " TM Offt
Call FI OcimmorOd bY RDYKI ý r--- r-- - -- -- r, " - 7-
ýýXt % MusleMatch Jukebox WM - SSM'5- jr5gl Zasaft
E=Xcel Bndbý
_aN Nt 2i43
171
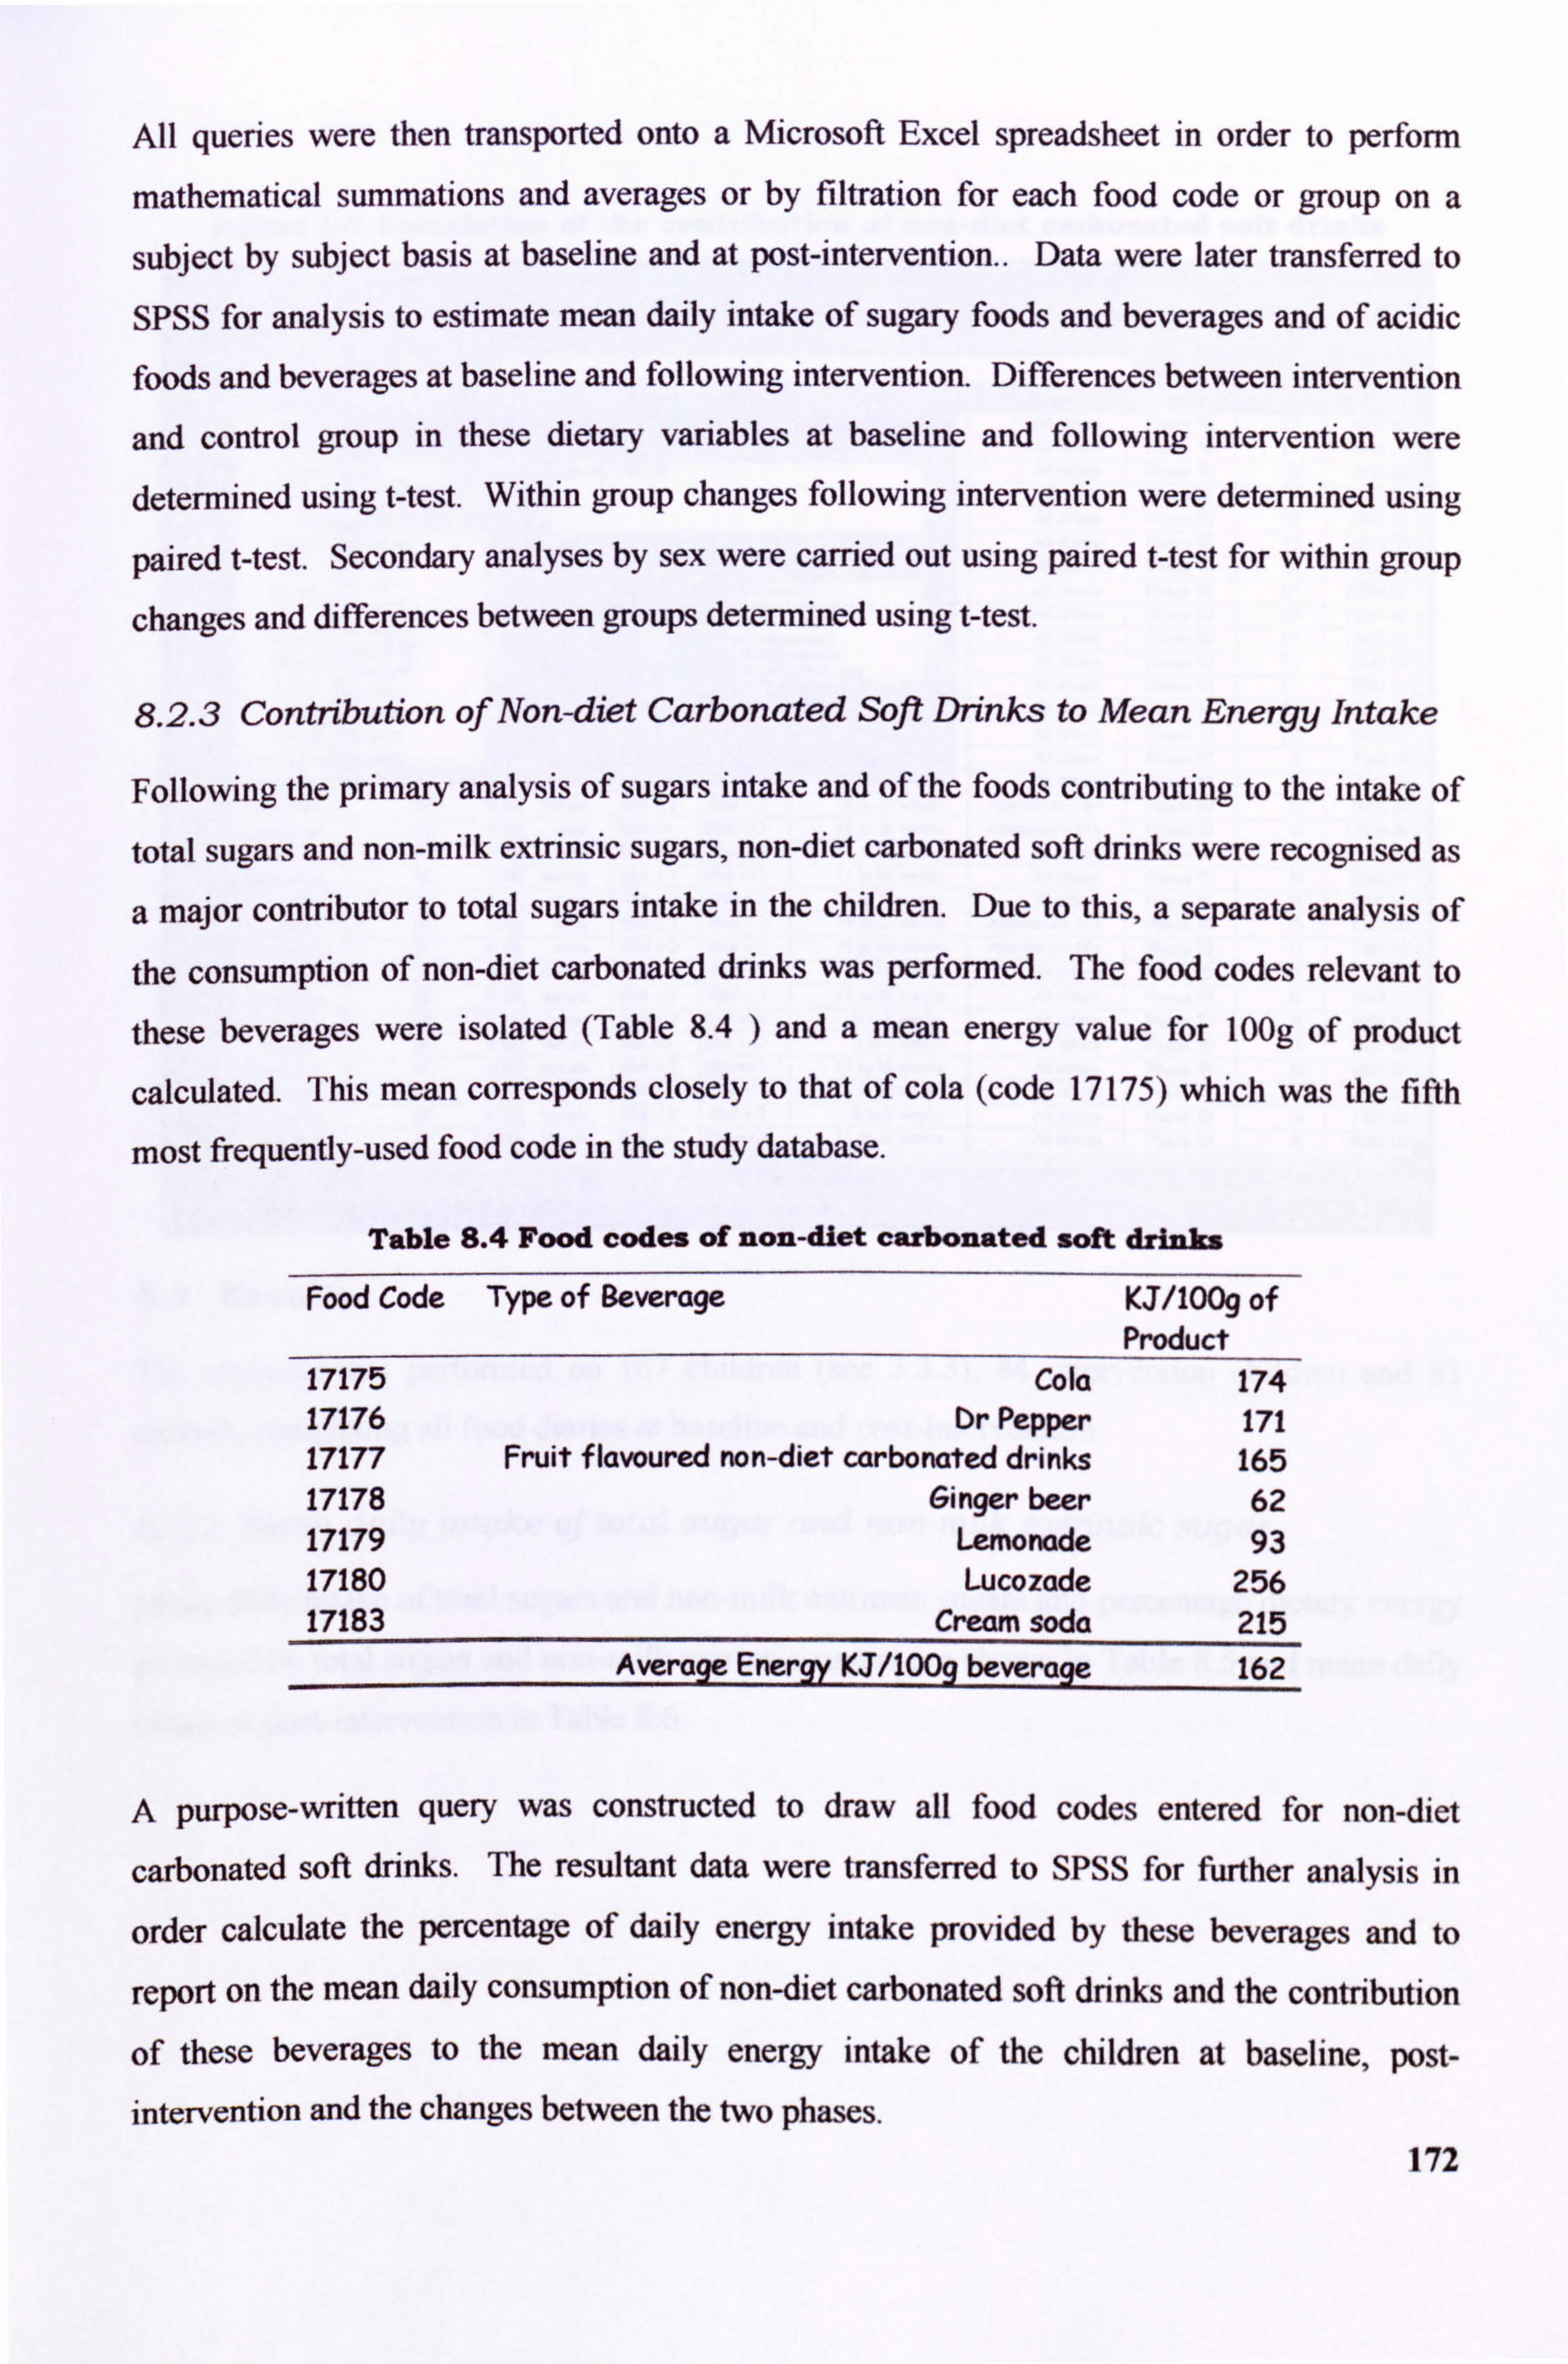
All queries were then transported onto a Microsoft Excel spreadsheet in order to perform
mathematical summations and averages or by filtration for each food code or group on a
subject by subject basis at baseline and at post-intervention.. Data were later transferred to
SPSS for analysis to estimate mean daily intake of sugary foods and beverages and of acidic foods and beverages at baseline and following intervention. Differences between intervention
and control group in these dietary variables at baseline and following intervention were determined using t-test. Within group changes following intervention were determined using
paired t-test. Secondary analyses by sex were carried out using paired t-test for within group
changes and differences between groups determined using t-test.
8.2.3 Contribution of Non-diet Carbonated Soft Drinks to Mean Energy Intake
Following the primary analysis of sugars intake and of the foods contributing to the intake of
total sugars and non-milk extrinsic sugars, non-diet carbonated soft drinks were recognised as
a major contributor to total sugars intake in the children. Due to this, a separate analysis of
the consumption of non-diet carbonated drinks was performed. The food codes relevant to
these beverages were isolated (Table 8.4 ) and a mean energy value for 100g of product
calculated. This mean corresponds closely to that of cola (code 17175) which was the fifth
most frequently-used food code in the study database.
Table 8.4 Food codes of non-diet carbonated soft drinks
Food Code Type of Beverage KJ/1009 of Product
17175 Cola 174 17176 Or Pepper 171 17177 Fruit f layoured no n-diet carbonated drinks 165 17178 Ginger beer 62 17179 Lemonade 93 17180 Lucozade 256 17183 Cream soda 215
Average Energy KJ/100g beverage 162
A purpose-written query was constructed to draw all food codes entered for non-diet
carbonated soft drinks. The resultant data were transfer ed to SPSS for f ther analysis in r ur
order calculate the percentage of daily energy intake provided by these beverages and to
report on the mean daily consumption of non-diet carbonated soft drinks and the contribution
of these beverages to the mean daily energy intake of the children at baseline, post-
intervention and the changes between the two phases. 172
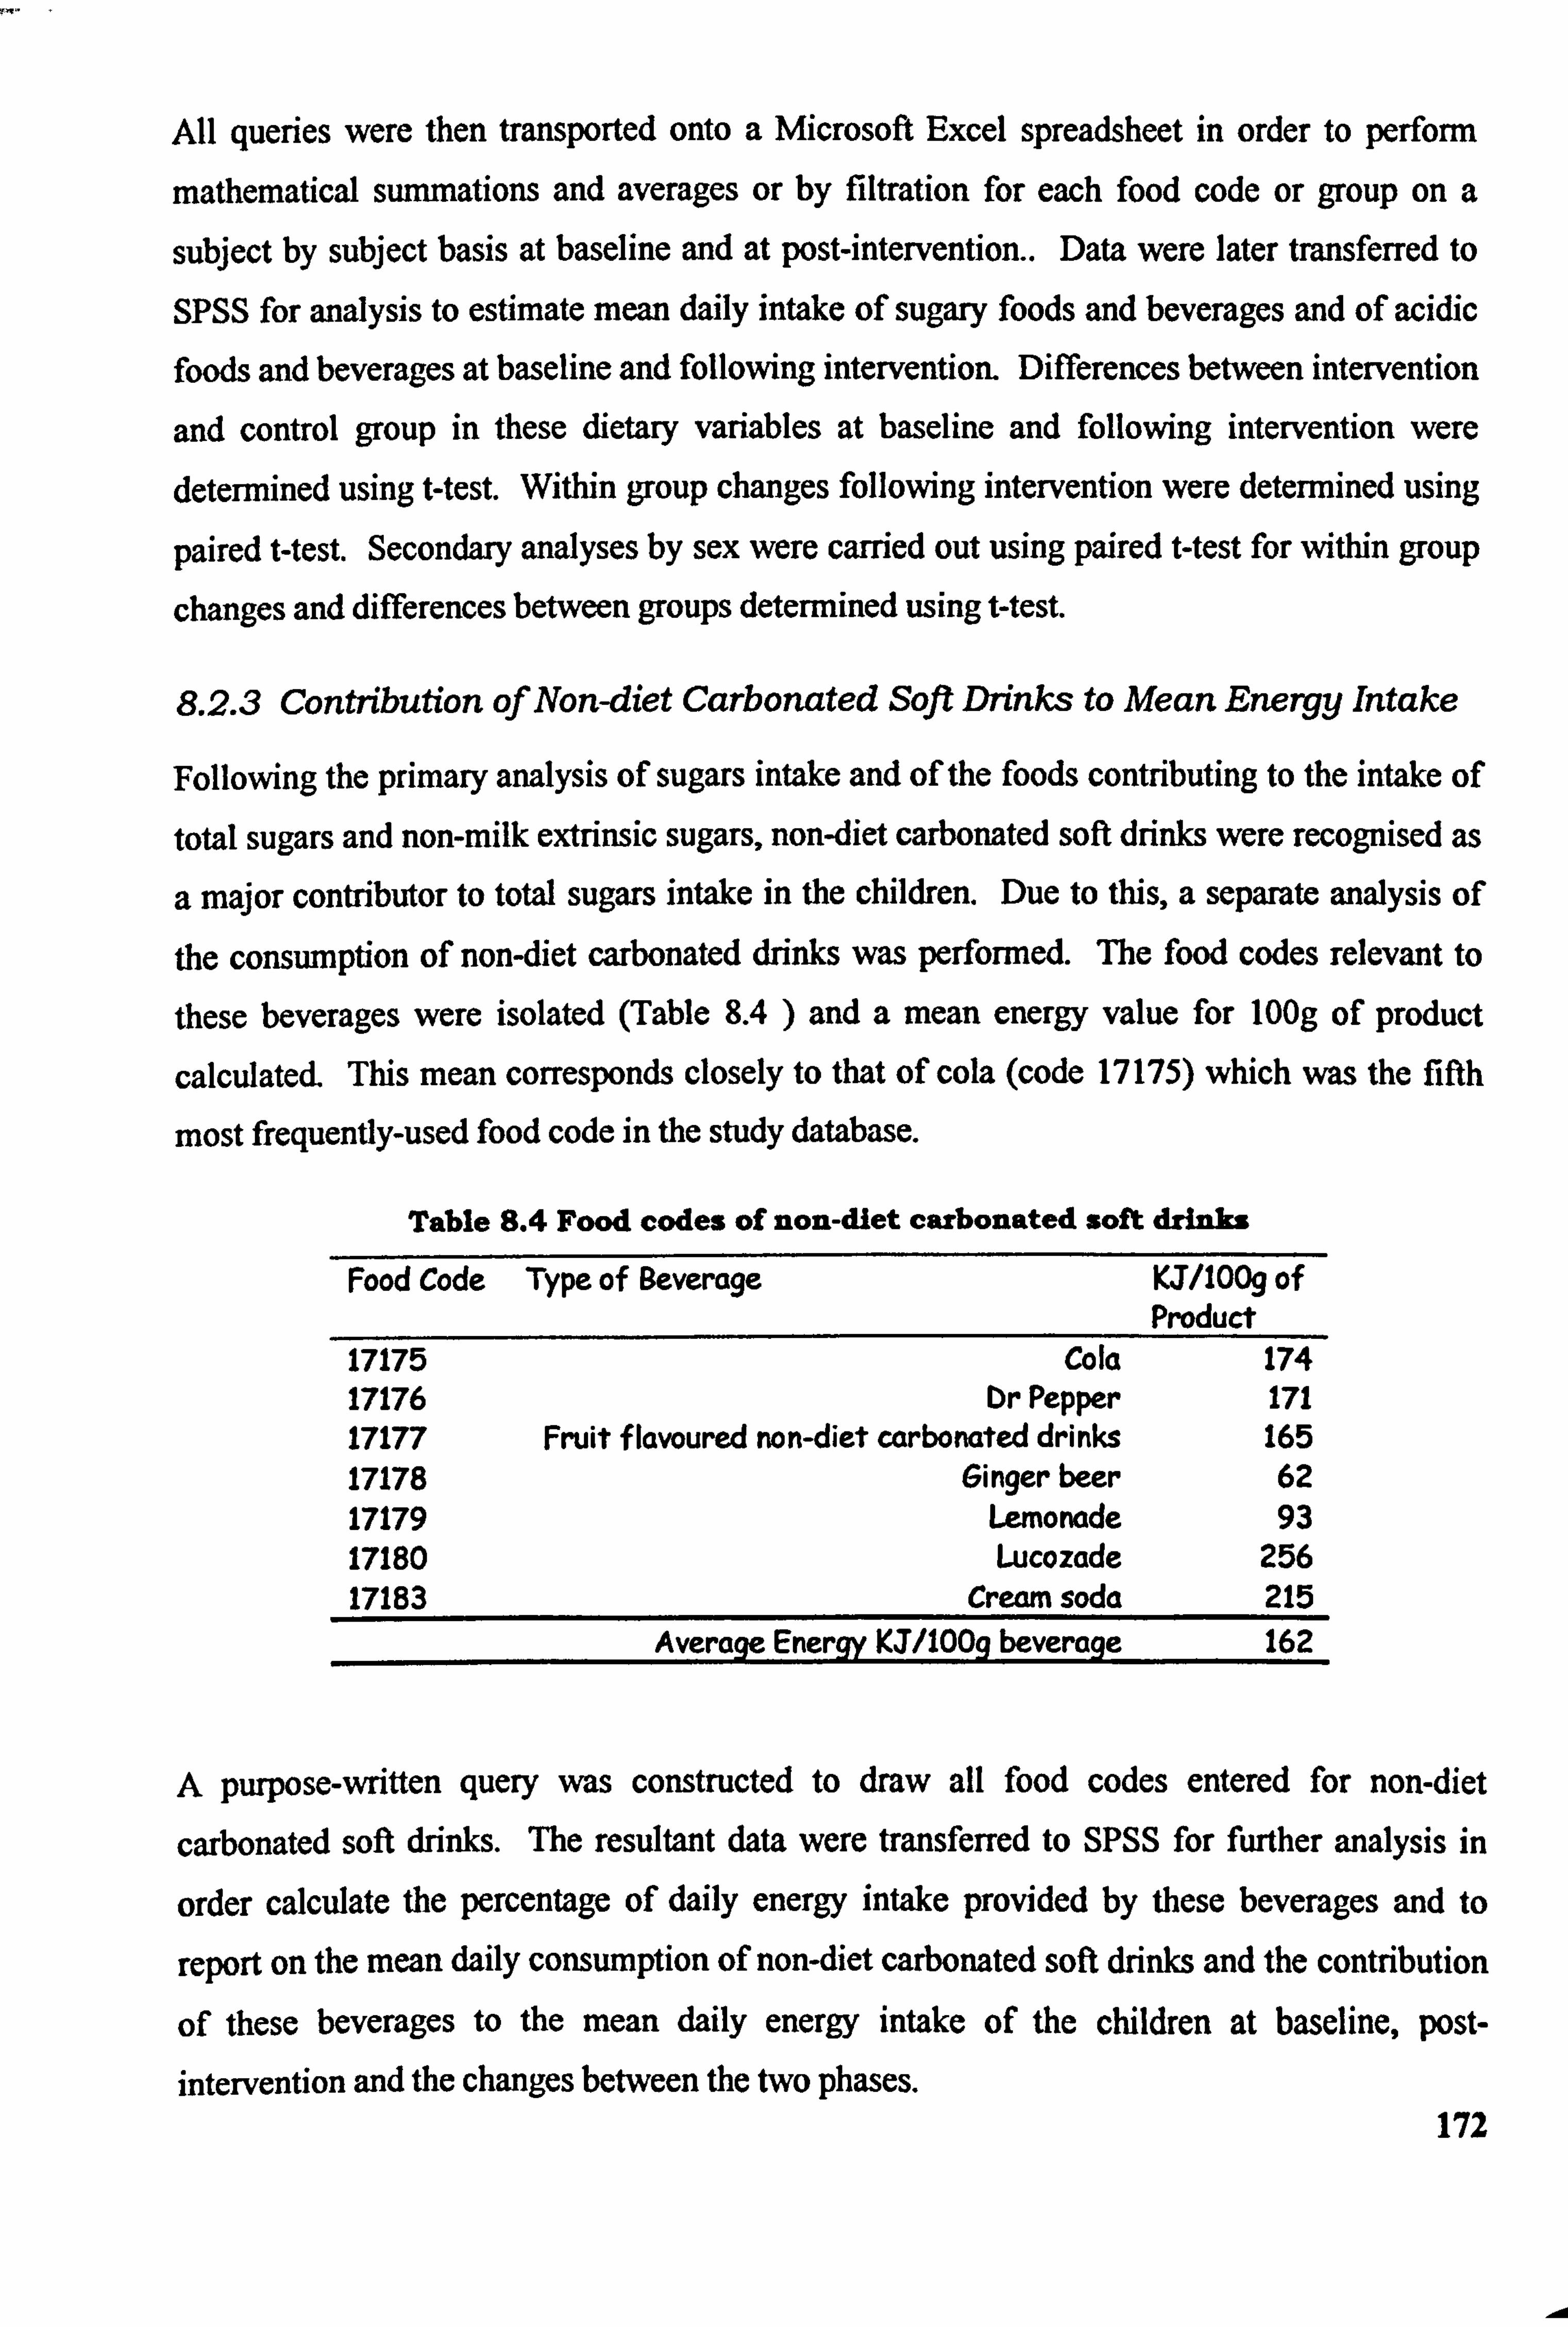
All quenes were then transported onto a Microsoft Excel spreadsheet in order to perform
mathematical summations and averages or by filtration for each food code or group on a
subject by subject basis at baseline and at post-intervention.. Data were later transferred to
SPSS for analysis to estimate mean daily intake of sugary foods and beverages and of acidic foods and beverages at baseline and following intervention. Differences between intervention
and control group in these dietary variables at baseline and following intervention were determined using West. Within group changes following intervention were determined using
paired west. Secondary analyses by sex were carried out using paired t-test for within group
changes and differences between groups determined using mest.
8.2.3 Contribution of Non-diet Carbonated Soft Drinks to Mean Energy Intake
Following the primary analysis of sugars intake and of the foods contributing to the intake of total sugars and non-milk extrinsic sugars, non-diet carbonated soft drinks were recognised as
a major contributor to total sugars intake in the children. Due to this, a separate analysis of
the consumption of non-diet carbonated drinks was performed. The food codes relevant to
these beverages were isolated (Table 8.4 ) and a mean energy value for 100g of product
calculated. This mean corresponds closely to that of cola (code 17175) which was the fifth
most frequently-used food code in the study database.
Table 8.4 Food codes of non-diet carbonated soft drinks
Food Code Type of Beverage KJ/1009 of Product
17175 Cola 174 17176 Dr Pepper 171 17177 Fruit f lavoured non-diet carbonated drinks 165 17178 Ginger beer 62 17179 Lemonade 93 17180 Lucozade 256 17183 Cream soda 215
Average Energy KJ/100g beverage 162
A purpose-written query was constructed to draw all food codes entered for non-diet
carbonated soft drinks. The resultant data were transferred to SPSS for further analysis in
order calculate the percentage of daily energy intake provided by these beverages and to
report on the mean daily consumption of non-diet carbonated soft drinks and the contribution
of these beverages to the mean daily energy intake of the children at baseline, post- intervention and the changes between the two phases.
172
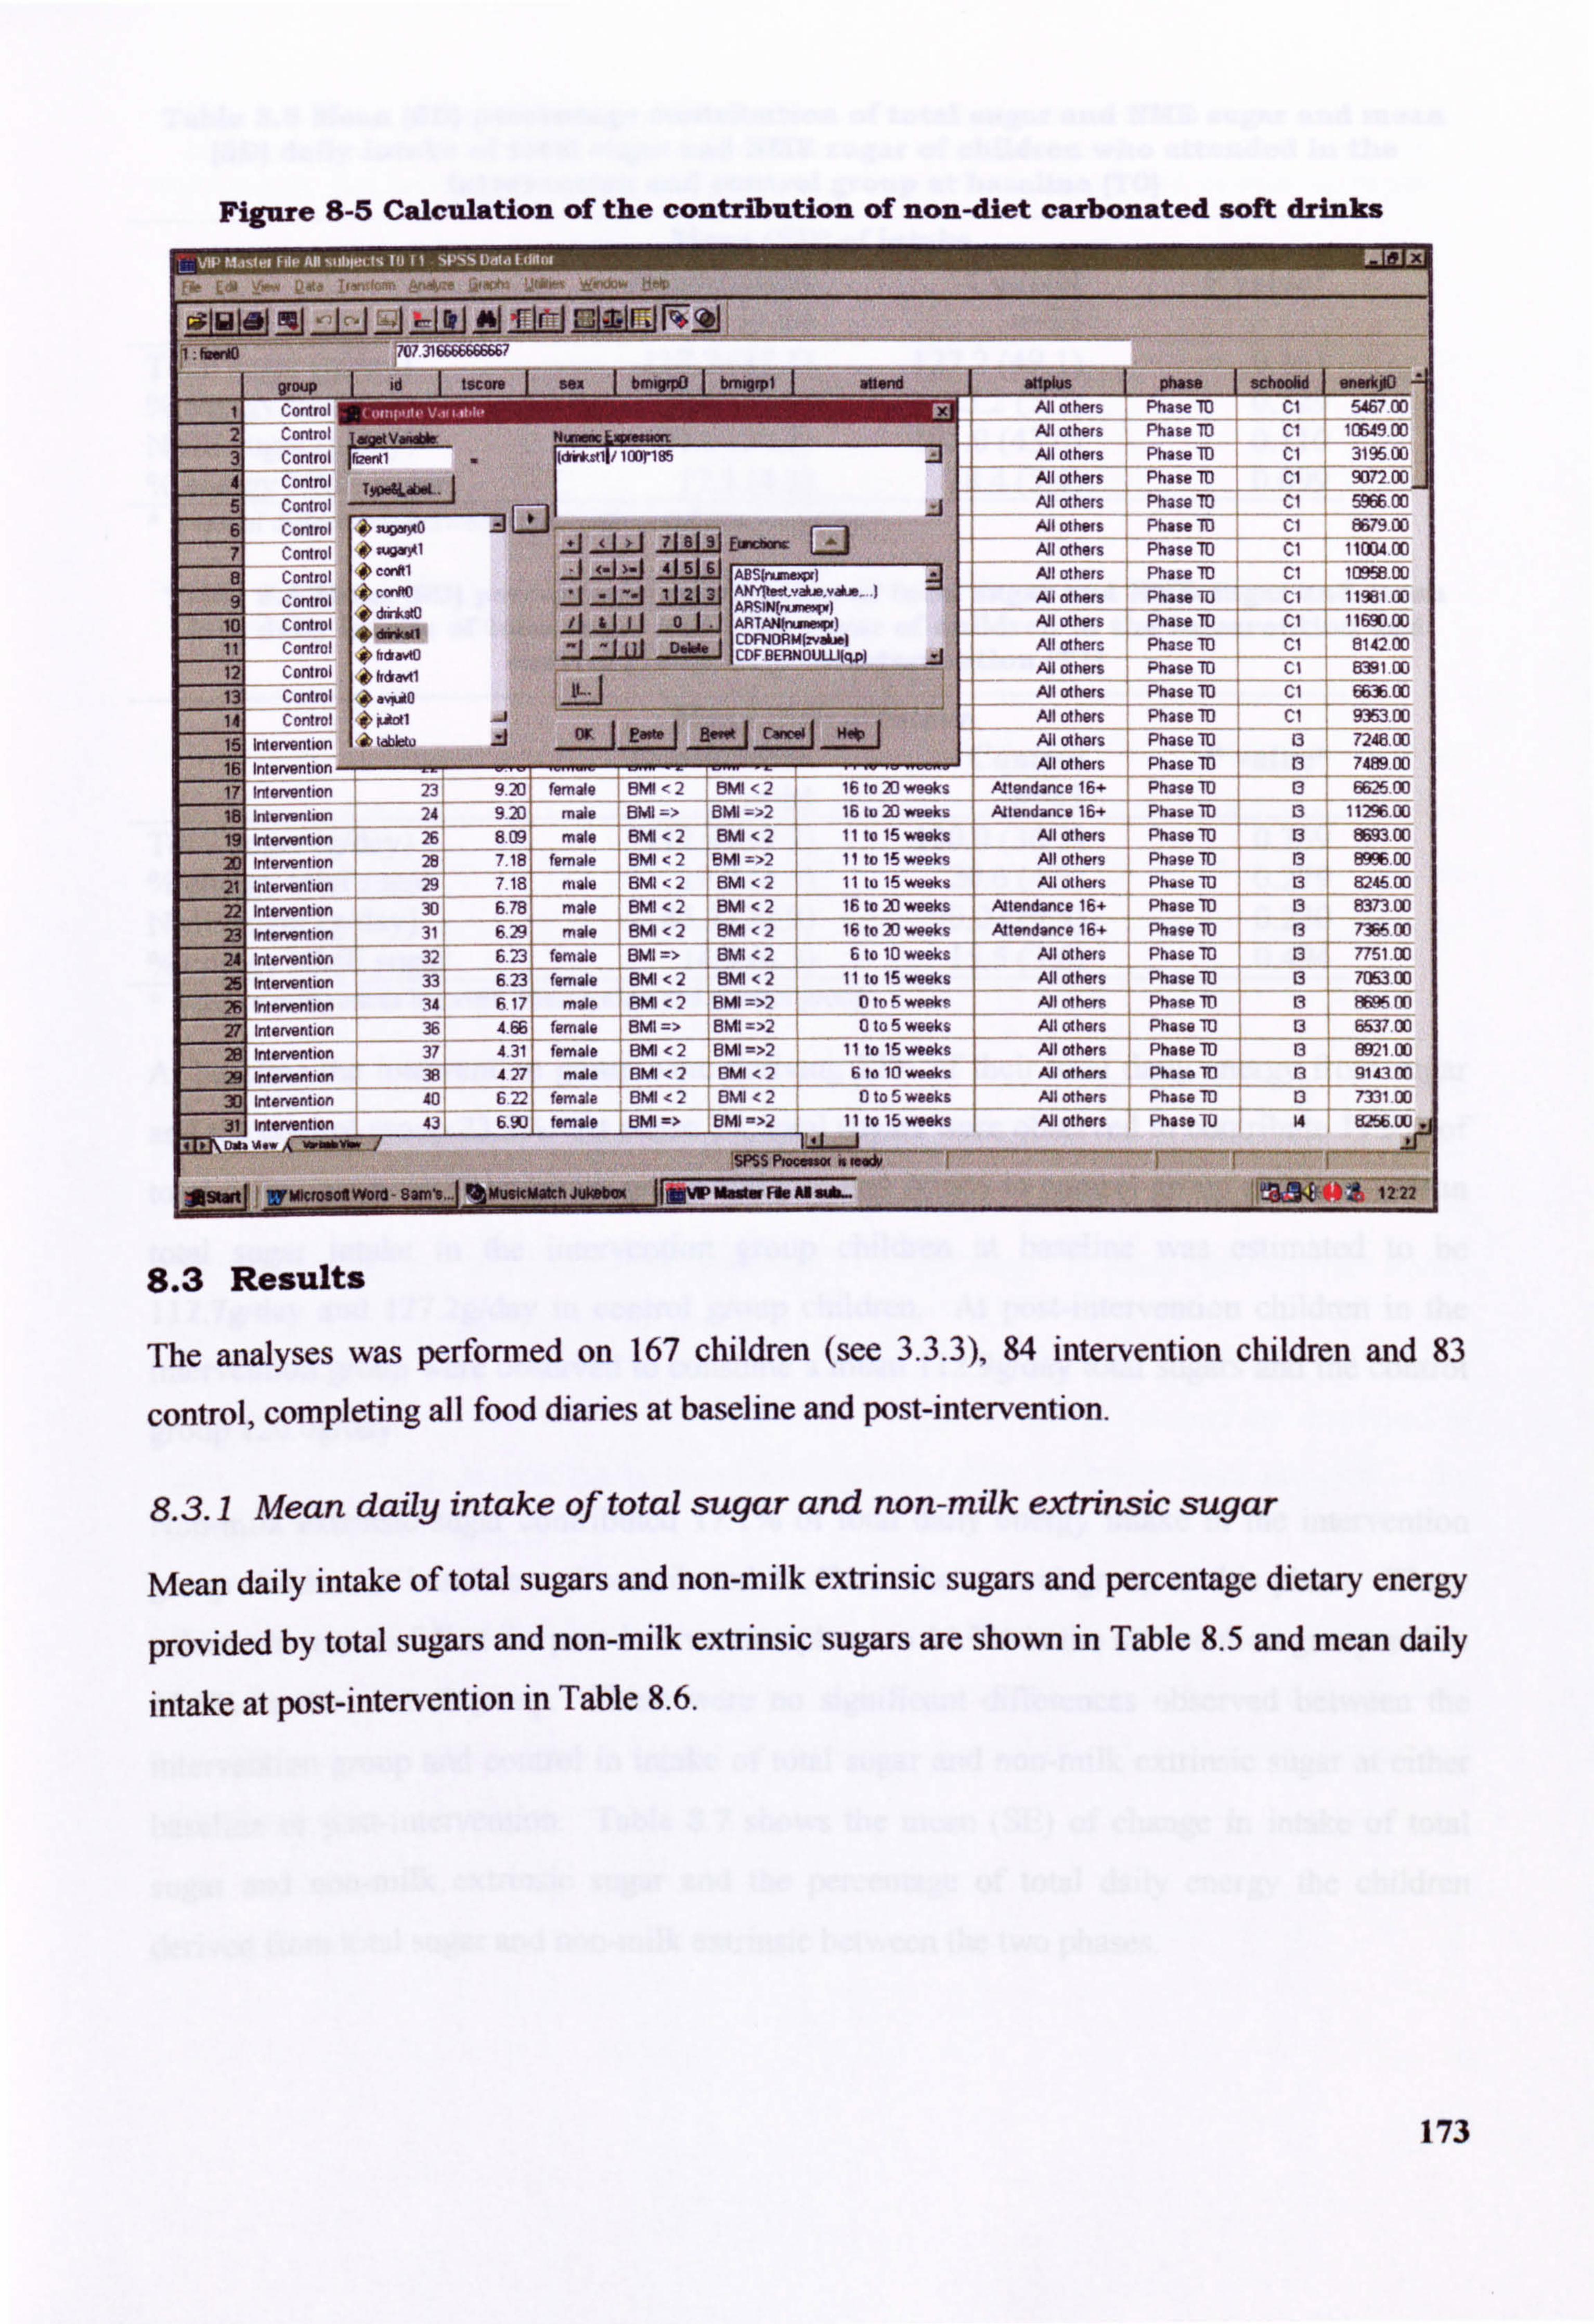
Figure 8-5 Calculation of the contribution of non-diet carbonated soft drinks
I 2
W-p id tscore
Control
ro' ISWVWN&W Run= WIMM
aupla Adl others All others
phase schoobd oneirkpOl Phase TO CI w, on
Fhase TD ci i rr, 49 00
3 Ct: inlroi Jd,, *olj/ laDrIS5 Aill others Phase ID ci 31%00
4 5
Control T50OL".. Control -I
others All at hers
Phase 10
Phase M
cl
cl
907200
596600
Control -WO -
fA Aill Others Phase 8679 00
7 Control O. V-11, zuu E. Aýhers PhaseM
ýI 1100400
Control b C. M1 4 -1 -1-J-1-i
211U6 AN others Phase ID ci lam 00
1
Control conlT d nk tO
J -I --1 11213 AJI others Phase M cl ro
' Control ri s 'i
-101 TAN(nurniW) AJI others i Phase TO cl 1169000
11 Cordrol hckvo :j-: W - FNORMJýAj 'CDF 8ERNOIJLLljcLp)
All others Pha-e 1D Cl 814200
12 Control fidavil I All others Phase TO CI 8391 00
131 C onlrol . "'ito All others Phase M cl 663600
14 Control 10 Ootl AJI others Phase 10 Cl 935300
16 intervention k lab6tu Ai others Phase TO 13 724800
16 Intervention All ot hors Phaso-70 13 748900
17 Intervention 23 9 20 female BMI 2 BMI 12 16 to 20 weeks Attendance 16- Phase -M 13 662500
Intwi-varilion 24 *
9 20! Mal. SMI 81011 - 16 to 20 weeks ,2 lwýv 16+ Phass 10 1129600
,9 Intervention 26 809 male BMI 2 BIA < 2 11 101 5 weeks -
All others Phase TO 13 ! Sm 00
2D intervention T 18 female BMI <2 BMI 72 11 to 15 weeks At w1hiam Phase 10 13 00
21 ýwervantion 29 718 2 11 lu 15 weeks male BMI <2 BM Allolhom Ph. so TO 13 46 00
22 ritervention 6,78 male BMI <2 BM < 2- 16 to 20 weeks Anend2nce 16+ Phase TO 13 837300
23 intervention 3 629 male BMI -2 BW <2 16 to 20 weeks Attendance 16+ Phase 10 13 73F On
24 Intervention 32 ---
6.23 female BMI => BMI < 2- 6 to 10 weeks All others Phase M 13 7751 00
25
26 intervention intArpntion
-
33
1 34 --
613 - 617 --
fernale BMI <2 aml <j 11 to 15 weeks
male BMI <2 HMI =>2 0 to S wepkR - -- --
All others Mothers
Phase M
Phase V
---
13
13 -4
705300
8FPA nri
27 Intervention t 1 36 4.66 female BIVII => SMI =ý2 10 to 5 weeks
- - - All others Phase_TE) 13 653700
28 Inlerventicin 37 4.31 11 to 15 weeks ýý, female BMI <2 8MI= -
At others Phase TO 13 892100
intervention Ai male B" <2 BIVII <26 to 10 wooks -
others Phis so 113 n 914300
3) Inlarvent, on 40 622 female BMI z Tvil ,2 to 5 asks Al others Phase 13 7331 00
if Intervention 4J
IfFMICM901111W)IIIII-8311111111
_b temale UK => UK II to 16 weeks
Spss P.. W . f"*
-1 ! jMUIlCM*tlJW*bW
_JIUWMW. FI@AB&AL-
AJI others Phase TU 14 tQ5b LU
8.3 Results
The analyses was performed on 167 children (see 3.3.3), 84 intervention children and 83
control, completing all food diaries at baseline and post-intervention.
8.3.1 Mean daily intake of total sugar and non-milk extrinsic sugar
Mean daily intake of total sugars and non-milk extrinsic sugars and percentage dietary energy
provided by total sugars and non-milk extrinsic sugars are shown in Table 8.5 and mean daily
intake at post-intervention in Table 8.6.
173
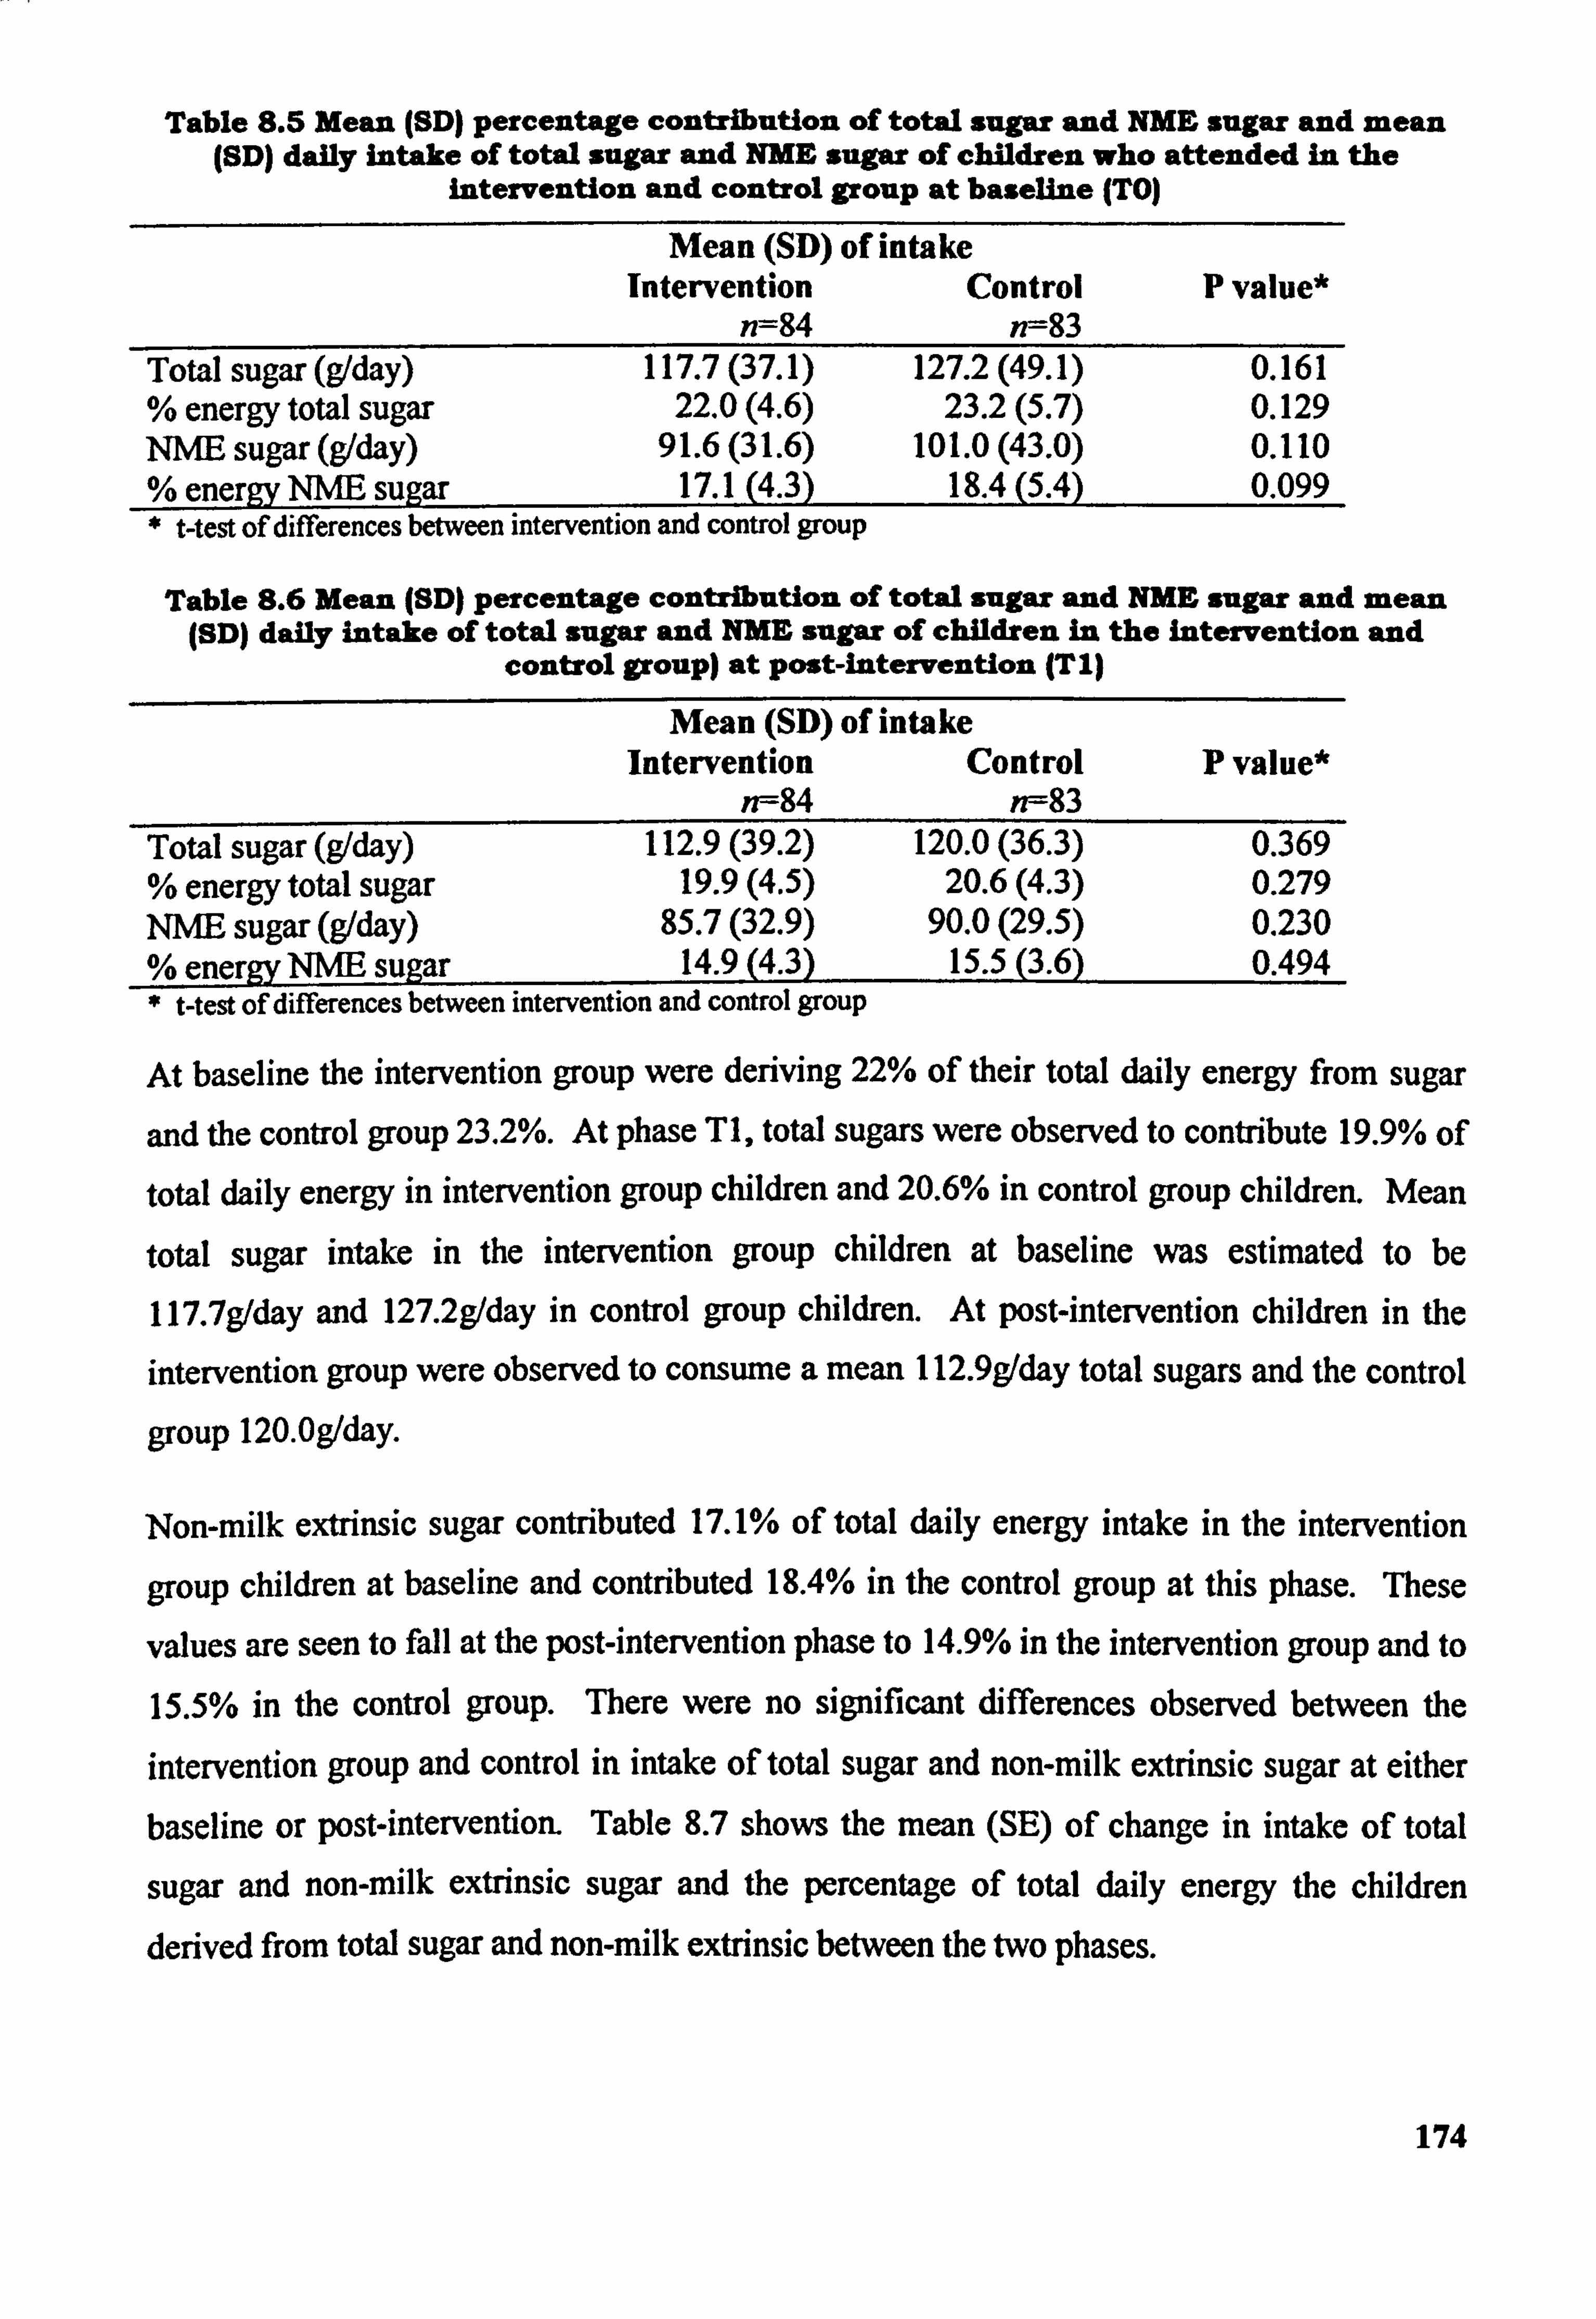
Table 8.5 Mean (SD) percentage contribution of total sugar and NME sugar and mean (SD) daily intake of total sugar and NME sugar of children who attended in the
intervention and control group at baseline (TO)
Mean (SD) of intake Intervention Control P value*
n=84 n--83 Total sugar (g/day) 117.7 (37.1) 127.2 (49.1) 0.161 % energy total sugar 22.0(4.6) 23.2(5.7) 0.129 NIVE sugar (g/day) 91.6(31.6) 101.0 (43.0) 0.110 % energv NNE suaar 17.1(4.3) 18.4(5.4) 0.099 * t-test of differences between intervention and control group
Table 8.6 Mean (SD) percentage contribution of total sugar and NME sugar and mean (SD) daily intake of total sugar and NME sugar of children in the intervention and
control group) at post-intervention (TI)
Mean (SD) of intake Intervention Control P value*
n--84 n--83 Total sugar (g/day) 112.9 (39.2) 120.0 (36.3) 0.369 % energy total sugar 19.9(4.5) 20.6(4.3) 0.279 NUE sugar (g/day) 85.7(32.9) 90.0(29.5) 0.230 % energv NUE sulzar 14.9(4.3) 15.5(3.6) 0.494 * West of differences between intervention and control group
At baseline the intervention group were deriving 22% of their total daily energy from sugar
and the control group 23.2%. At phase TI, total sugars were observed to contribute 19.9% of
total daily energy in intervention group children and 20.6% in control group children. Mean
total sugar intake in the intervention group children at baseline was estimated to be
117.7g/day and 127.2g/day in control group children. At post-intervention children in the
intervention group were observed to consume a mean 112.9g/day total sugars and the control
group 120.0g/day.
Non-milk extrinsic sugar contributed 17.1% of total daily energy intake in the intervention
group children at baseline and contributed 18.4% in the control group at this phase. These
values are seen to fall at the post-intervention phase to 14.9% in the intervention group and to
15.5% in the control group. There were no significant differences observed between the
intervention group and control in intake of total sugar and non-milk extrinsic sugar at either baseline or post-intervention. Table 8.7 shows the mean (SE) of change in intake of total
sugar and non-milk extrinsic sugar and the percentage of total daily energy the children derived from total sugar and non-milk extrinsic between the two phases.
174
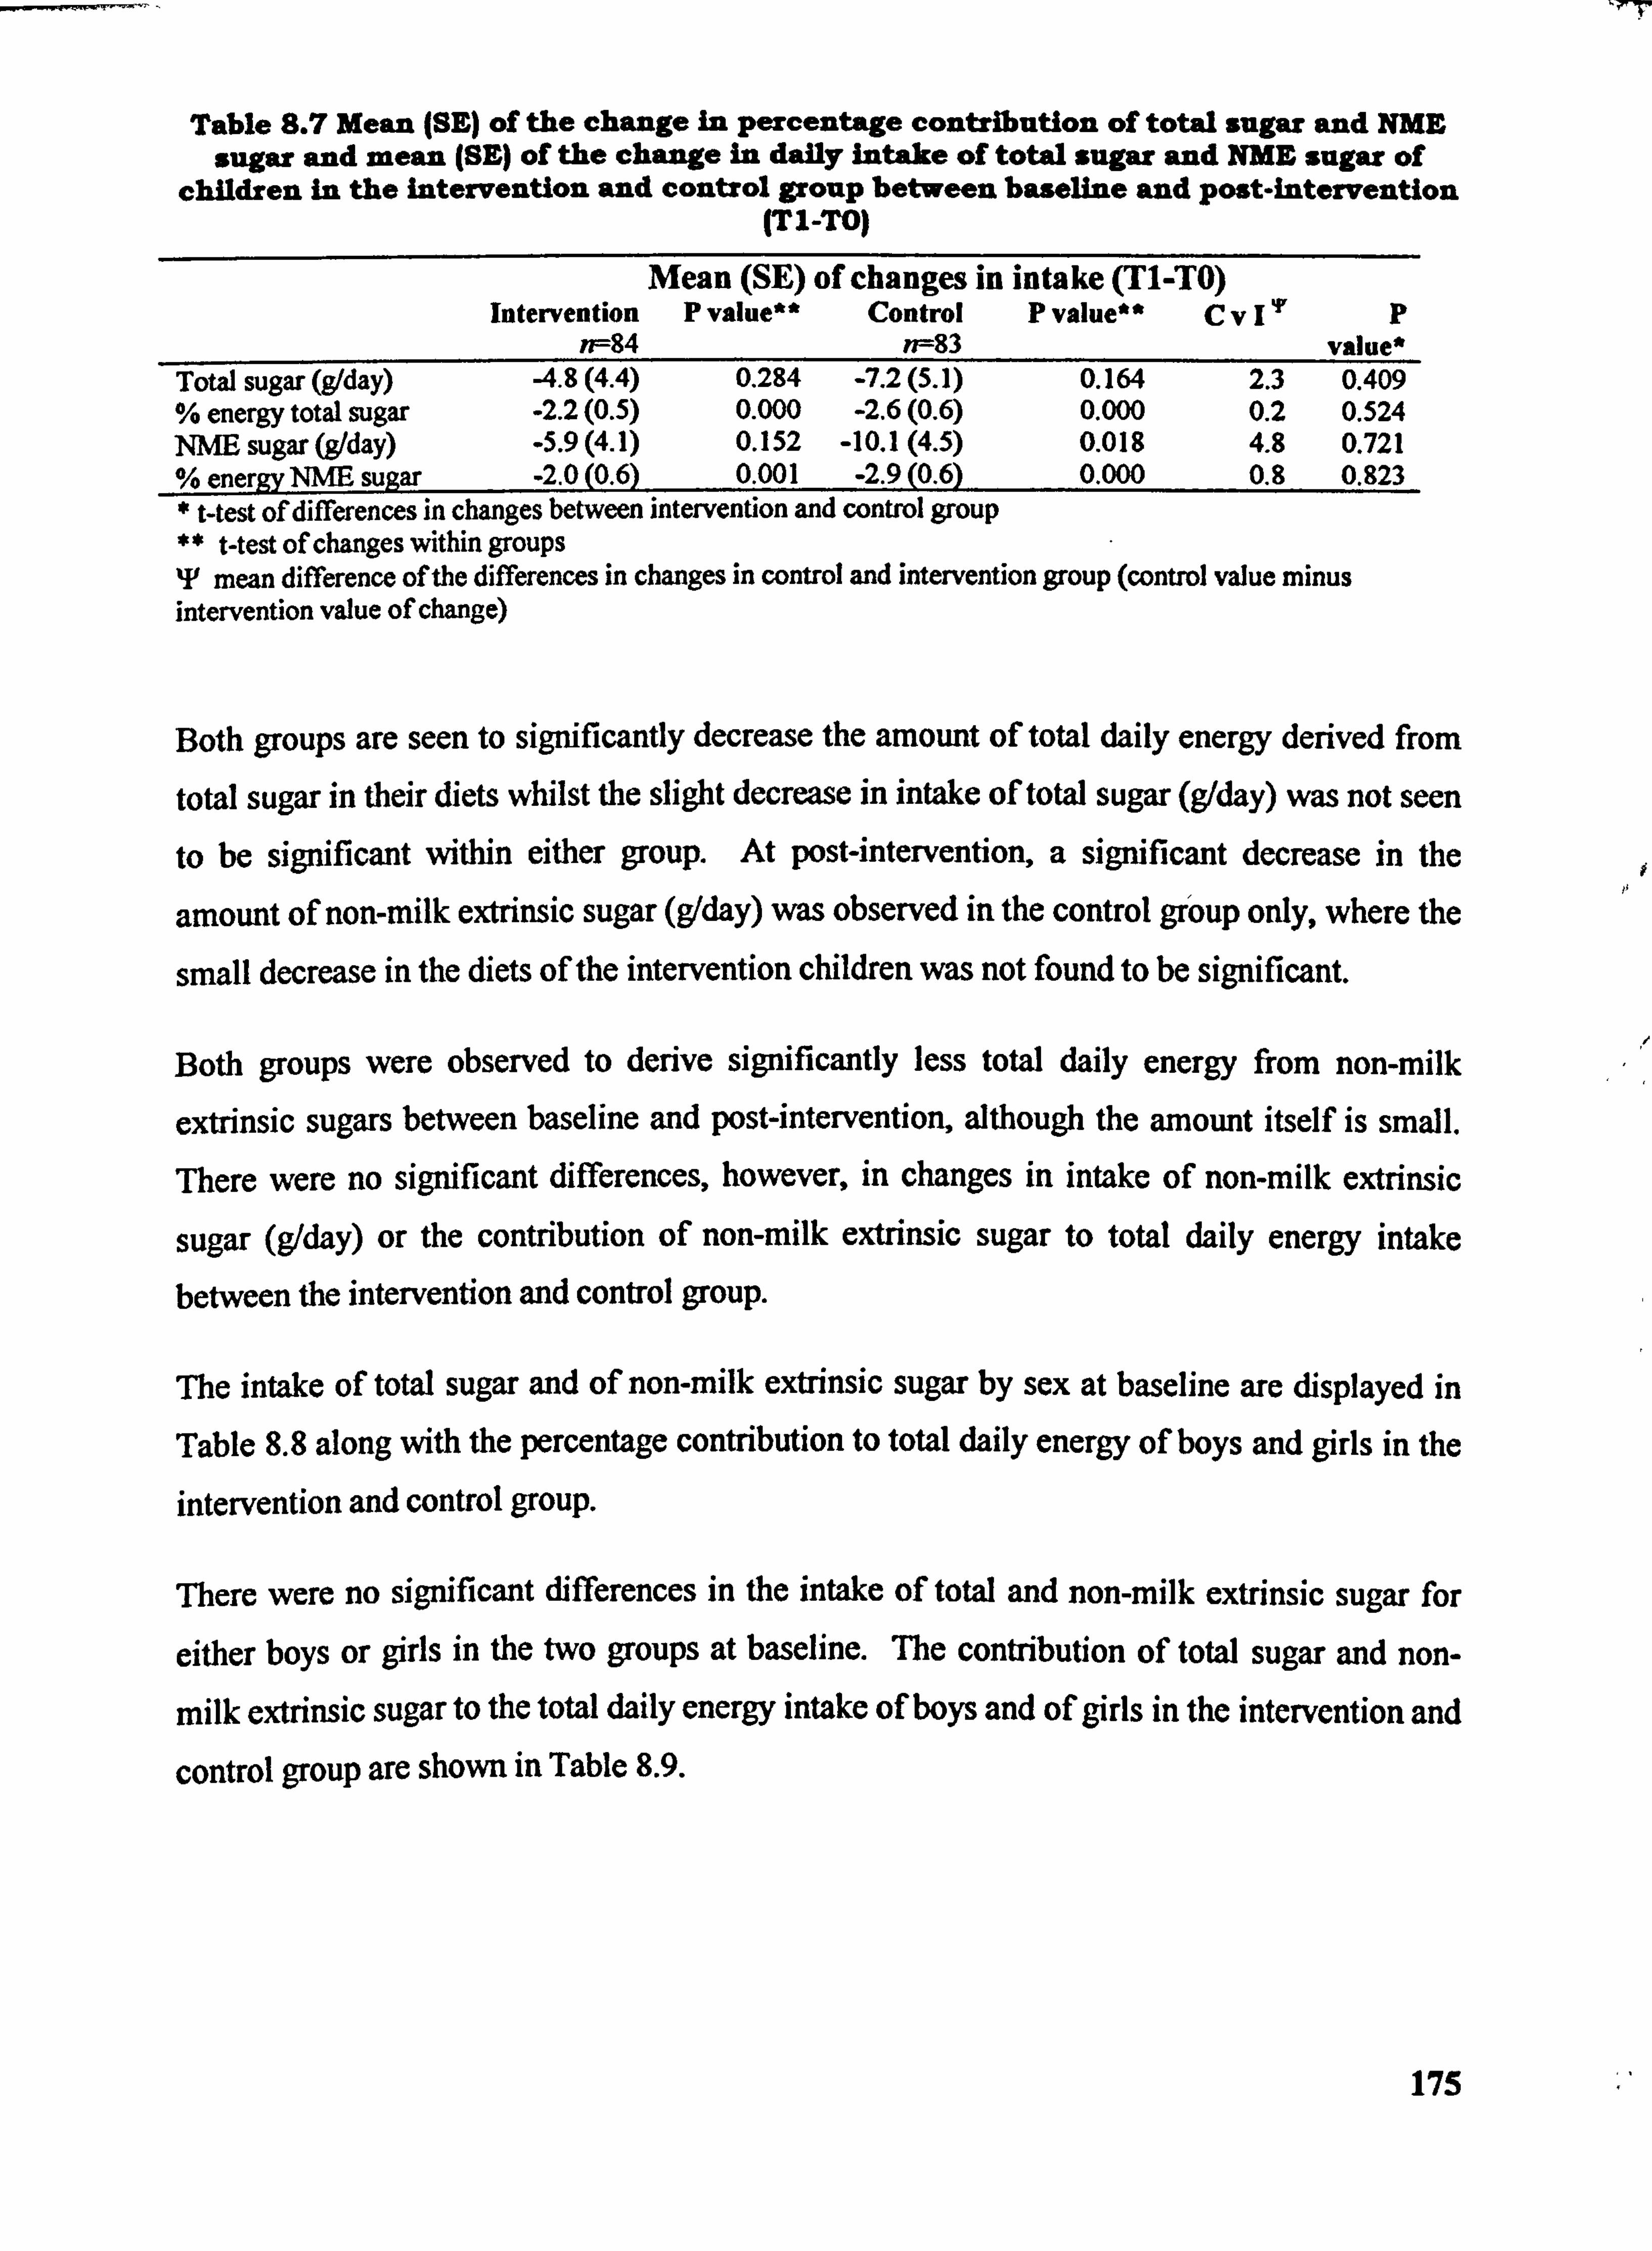
Table 8.7 Mean (SE) of the change in Percentage contribution of total sugar and NME, sugar and mean (SE) of the change in daily intake of total sugar and NME sugar of
children in the intervention and control group between baseline and post-intervention (TIL-TO)
Mean (SE) of changes in intake (T1-TO) Intervention P value** Control P value** CV I'F p
n--84 n--83 value* Total sugar (g1day) 4.8(4.4) 0.284 -7.2(5.1) 0.164 2.3 0.409 % energy total sugar -2.2(0.5) 0.000 -2.6(0.6) 0.000 0.2 0.524 NME sugar (g1day) . 5.9(4.1) 0.152 -10.1(4.5) 0.018 4.8 0.721 % energv NME suiZar -2.0(0.6) 0.001 -2.9(0.6) 0.000 0.8 0.823
t-test of differences in changes between intervention and control group ** t-test of changes within groups T mean difference of the differences in changes in control and intervention group (control value minus intervention value of change)
Both groups are seen to significantly decrease the amount of total daily energy derived from
total sugar in their diets whilst the slight decrease in intake of total sugar (g/day) was not seen
to be significant within either group. At post-intervention, a significant decrease in the
amount of non-milk extrinsic sugar (g/day) was observed in the control group only, where the
small decrease in the diets of the intervention children was not found to be significant.
Both groups were observed to derive significantly less total daily energy from non-milk
extrinsic sugars between baseline and post-intervention, although the amount itself is small. There were no significant differences, however, in changes in intake of non-milk extrinsic
sugar (g/day) or the contribution of non-milk extrinsic sugar to total daily energy intake
between the intervention and control group.
The intake of total sugar and of non-milk extrinsic sugar by sex at baseline are displayed in
Table 8.8 along with the percentage contribution to total daily energy of boys and girls in the
intervention and control group.
There were no significant differences in the intake of total and non-milk extrinsic sugar for
either boys or girls in the two groups at baseline. The contribution of total sugar and non-
milk extrinsic sugar to the total daily energy intake of boys and of girls in the intervention and
control group are shown in Table 8.9.
175
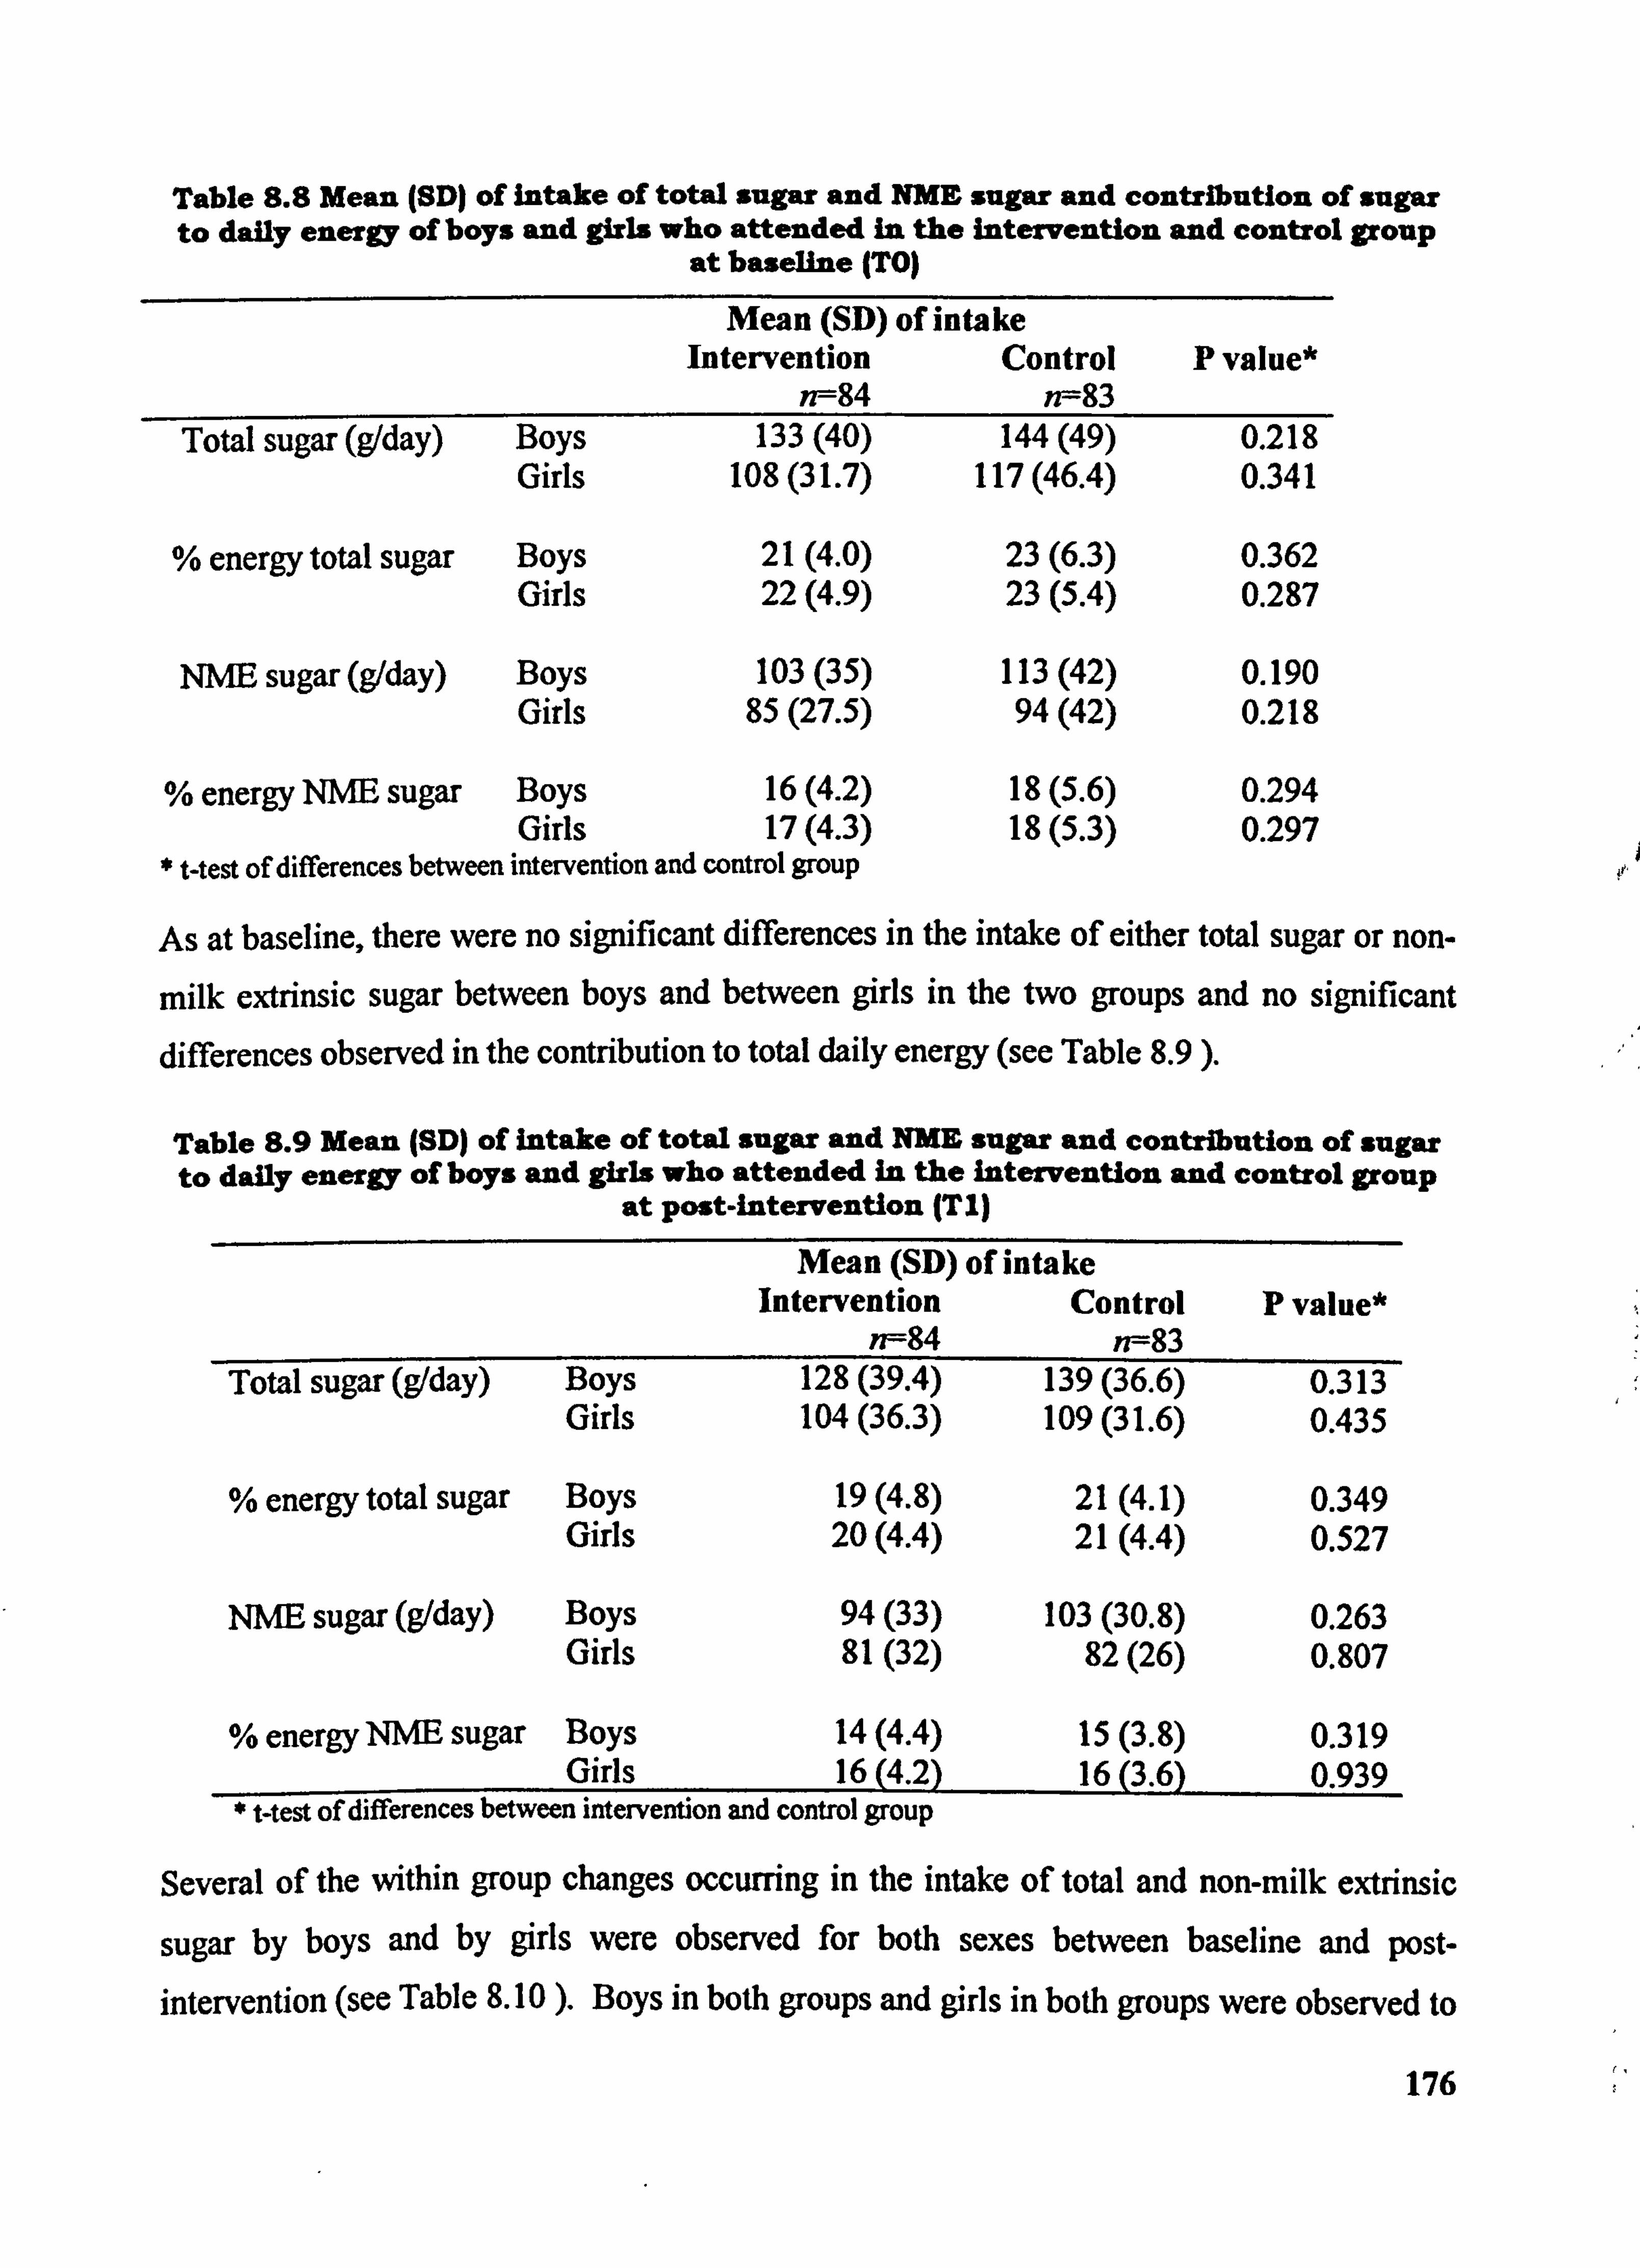
Table 8.8 Mean (SD) of intake of total sugar and NME sugar and contribution of sugar to daily energy of boys and girls who attended in the intervention and control group
at baseline (TO)
Mean (SD) of intake Intervention Control P value*
n--84 n--83 Total sugar (g/day) Boys 133(40)
Girls 108(31.7)
% energy total sugar Boys 21(4.0) Girls 22(4.9)
NNE sugar (gIday) Boys 103(35) Girls 85(27.5)
% energy NME sugar Boys 16(4.2) Girls 17(4.3)
t-test of differences between intervention and control group
144(49) 0.218 117(46.4) 0.341
23(6.3) 0.362 23(5.4) 0.287
113(42) 0.190 94(42) 0.218
18(5.6) 0.294 18(5.3) 0.297
As at baseline, there were no significant differences in the intake of either total sugar or non-
milk extrinsic sugar between boys and between girls in the two groups and no significant differences observed in the contribution to total daily energy (see Table 8.9 ).
Table 8.9 Mean (SD) of intake of total sugar and NME sugar and contribution of sugar to daily energy of boys and girls who attended In the Intervention and control group
at post-intervention (Tl)
Mean (SD) of intake Intervention Control P value*
n--84 n--83 Total sugar (g/day) Boys 128(39.4) 139(36.6) 0.313
Girls 104(36.3) 109(31.6) 0.435
% energy total sugar Boys 19(4.8) 21(4.1) 0.349 Girls 20(4.4) 21(4.4) 0.527
NNE sugar (g/day) Boys 94(33) 103(30.8) 0.263 Girls 81(32) 82(26) 0.807
% energy NNE sugar Boys 14(4.4) 15(3.8) 0.319 Girls 16(4.2) 16(3.6) 0.939
t-test of differences between intervention and control group
Several of the within group changes occurring in the intake of total and non-milk extrinsic
sugar by boys and by girls were observed for both sexes between baseline and post- intervention (see Table 8.10 ). Boys in both groups and girls in both groups were observed to
176
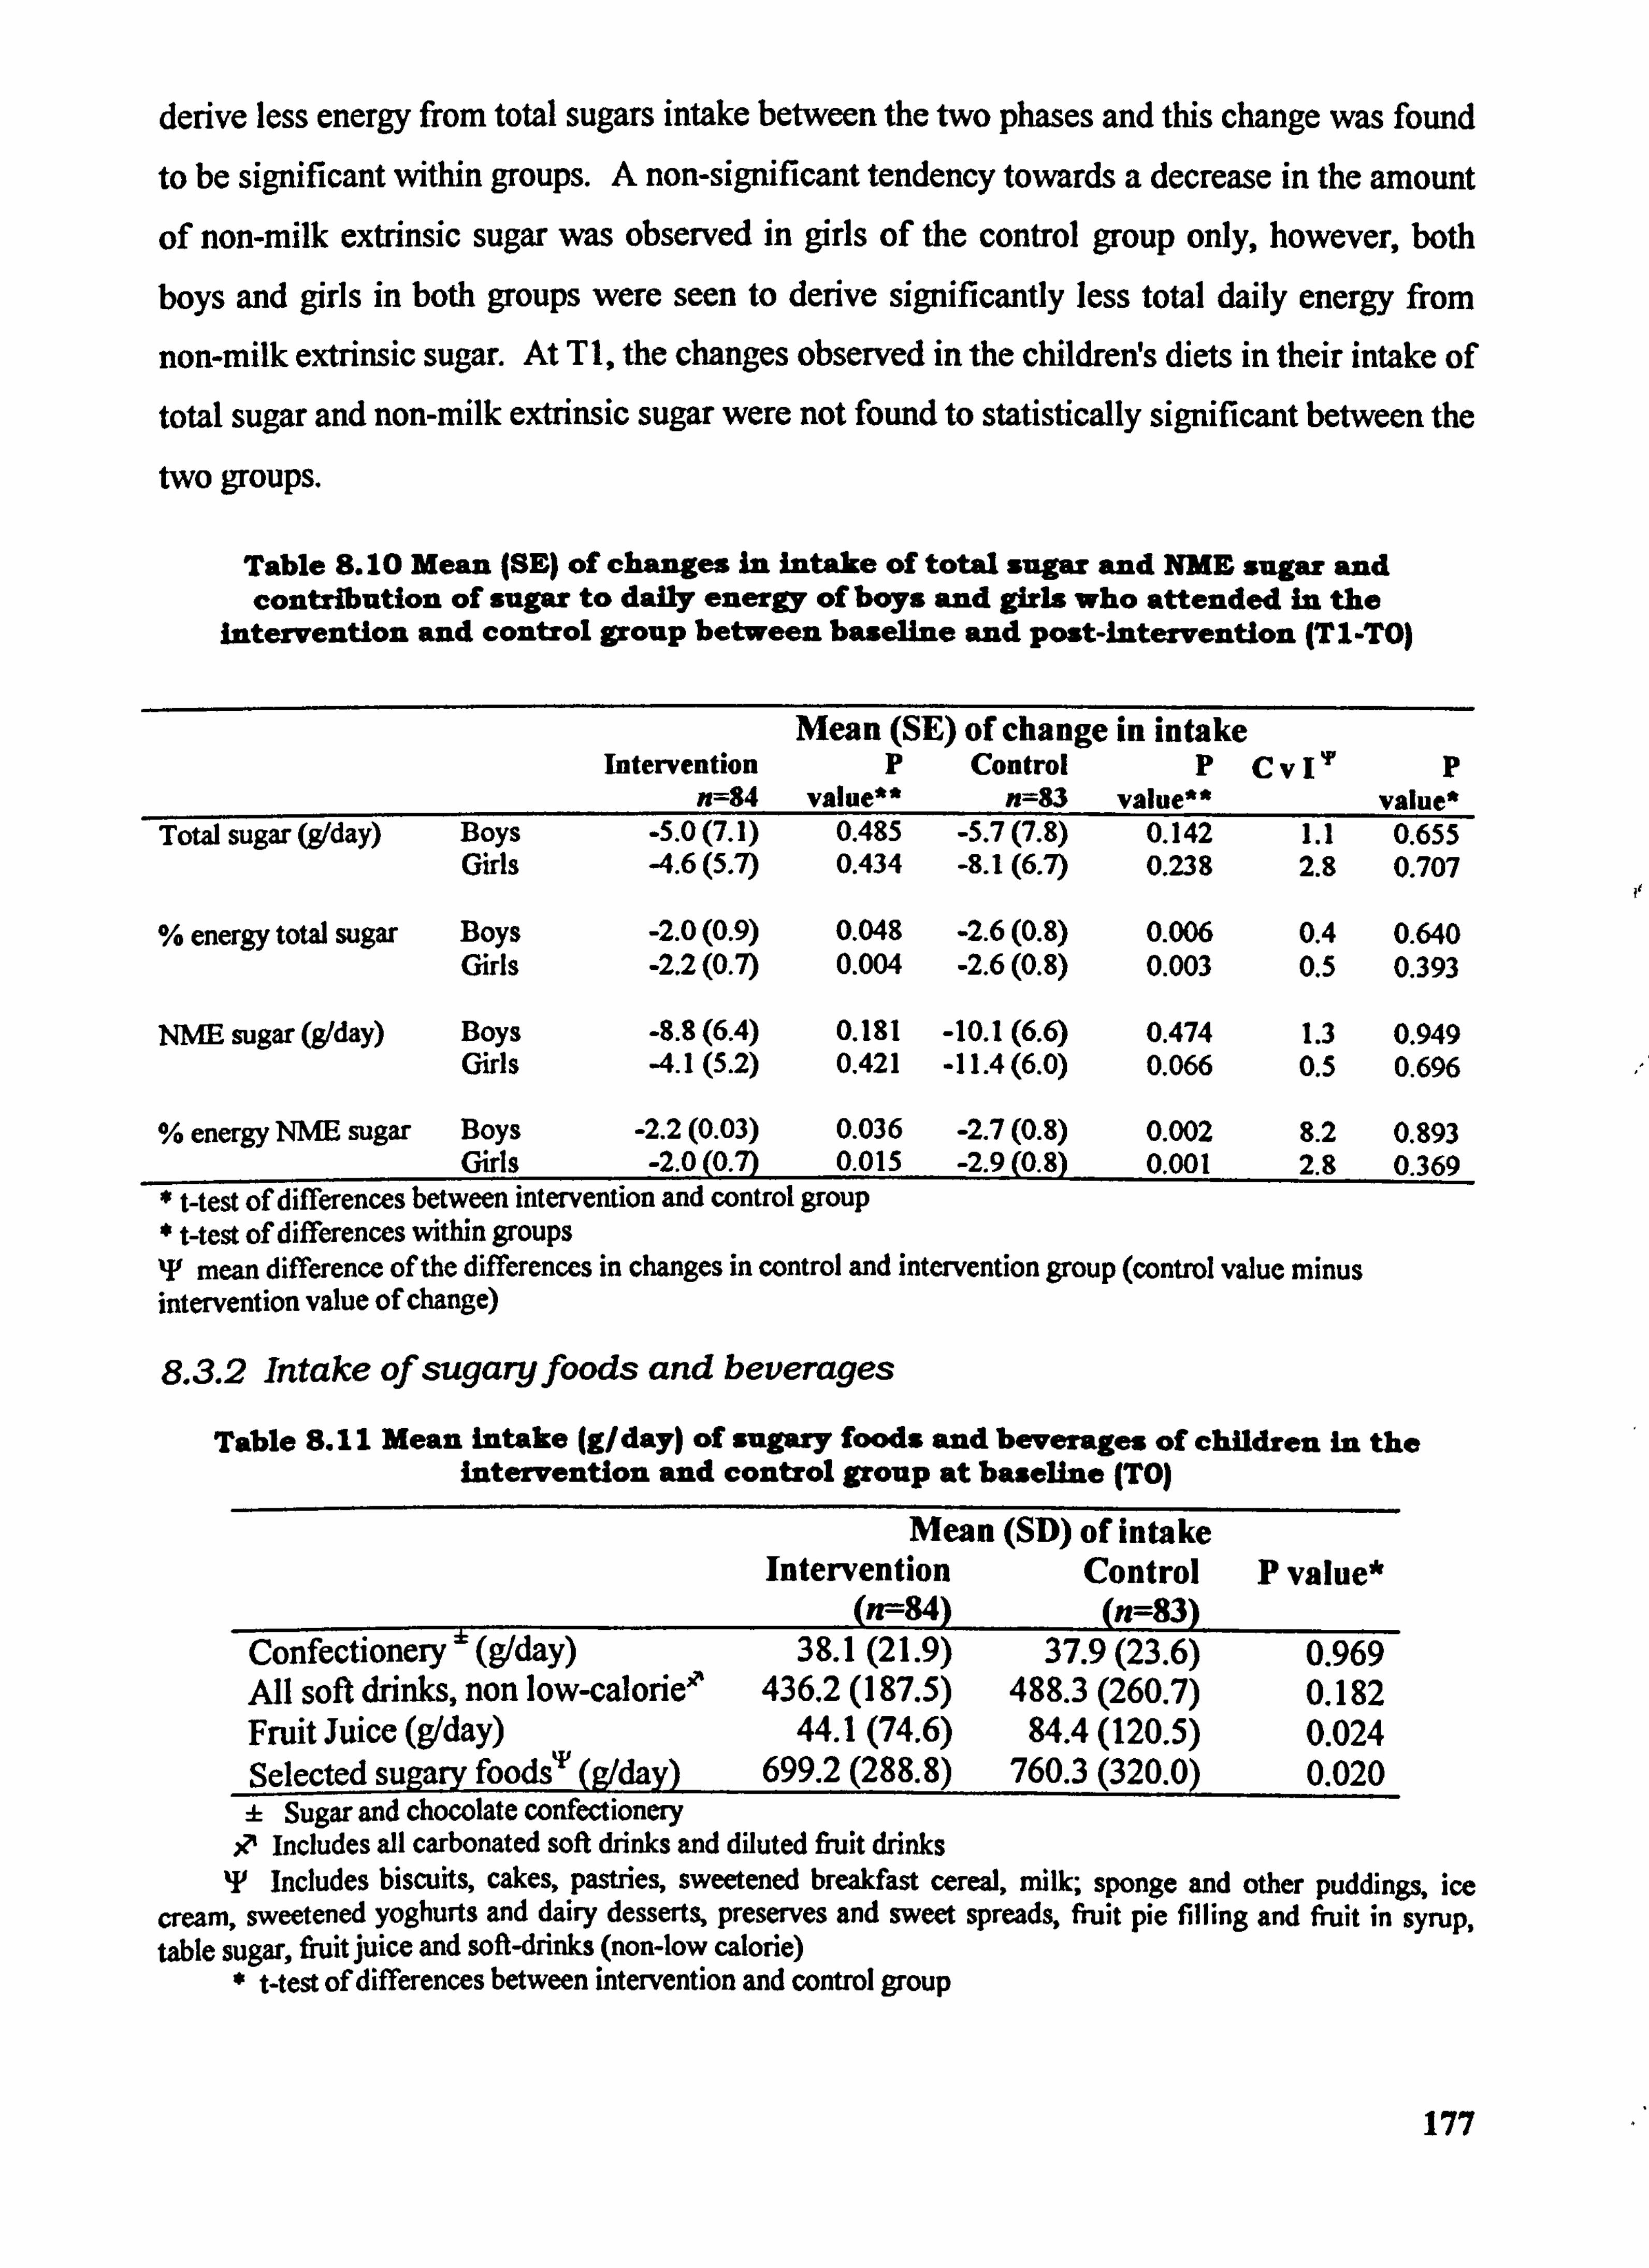
derive less energy from total sugars intake between the two phases and this change was found
to be significant within groups. A non-significant tendency towards a decrease in the amount
of non-milk extrinsic sugar was observed in girls of the control group only, however, both
boys and girls in both groups were seen to derive significantly less total daily energy from
non-milk extrinsic sugar. At T 1, the changes observed in the childrerfs diets in their intake of
total sugar and non-milk extrinsic sugar were not found to statistically significant between the
two gToups.
Table 8.10 Mean (SE) of changes in intake of total sugar and NME sugar and contribution of sugar to daily energy of boys and girls who attended in the
Intervention and control group between baseline and post-intervention (TIL. To)
Mean (SE) of change in intake Intervention p Control P CV11, p
=84 value** n=83 value** value* Total sugar (g, /day) Boys . 5.0(7.1) 0.485 -5.7(7.8) 0.142 1.1 0.655
Girls 4.6(5.7) 0.434 -8.1(6.7) 0.239 2.8 0.707
% energy total sugar Boys -2.0(0.9) 0.048 -2.6(0.8) 0.006 0.4 0.640 Girls -2.2(0.7) 0.004 -2.6(0.8) 0.003 0.5 0.393
NME sugar (gIday) Boys -8.8(6.4) 0.181 -10.1(6.6) 0.474 1.3 0.949 Girls -4.1(5.2) 0.421 -11.4(6.0) 0.066 0.5 0.696
energy NME sugar Boys -2.2(0.03) 0.036 -2.7(0.8) 0.002 8.2 0.893 Girls -2.0(0.7) 0.015 -2.9(0.8) 0.001 2.8 0.369
* West of differences between intervention and control group * t-test of differences within groups T mean difference of the differences in changes in control and intervention group (control value minus intervention value of change)
8.3.2 Intake of sugaryfoods and beverages
Table S. II Mean intake (g/day) of sugary foods and beverages Of children in the Intervention and control group at baseline (TO)
Mean (SD) of intake Intervention Control P value*
(n--84) __
(n=83) Confectionery" (g/day) 38.1(21.9) 37.9(23.6) 0.969 All soft drinks, non low-calorie' 436.2 (187.5) 488.3 (260.7) 0.182 Fruit Juice (g1day) 44.1(74.6) 84.4 (120.5) 0.024 Selected sugary foods"' (g/day) 699.2 (288.8) 760.3 (320.0) 0.020 :L Sugar and chocolate confectionery
il Includes all carbonated soft drinks and diluted fruit drinks T Includes biscuits, cakes, pastries, sweetened breakfast cereal, milk; sponge and other puddings, ice
cream, sweetened yoghurts and dairy desserts, preserves and sweet spreads, fruit pie filling and fruit in syrup, table sugar, fruit juice and soft-drinks (non-low calorie)
* t-test of differences between intervention and control group
177
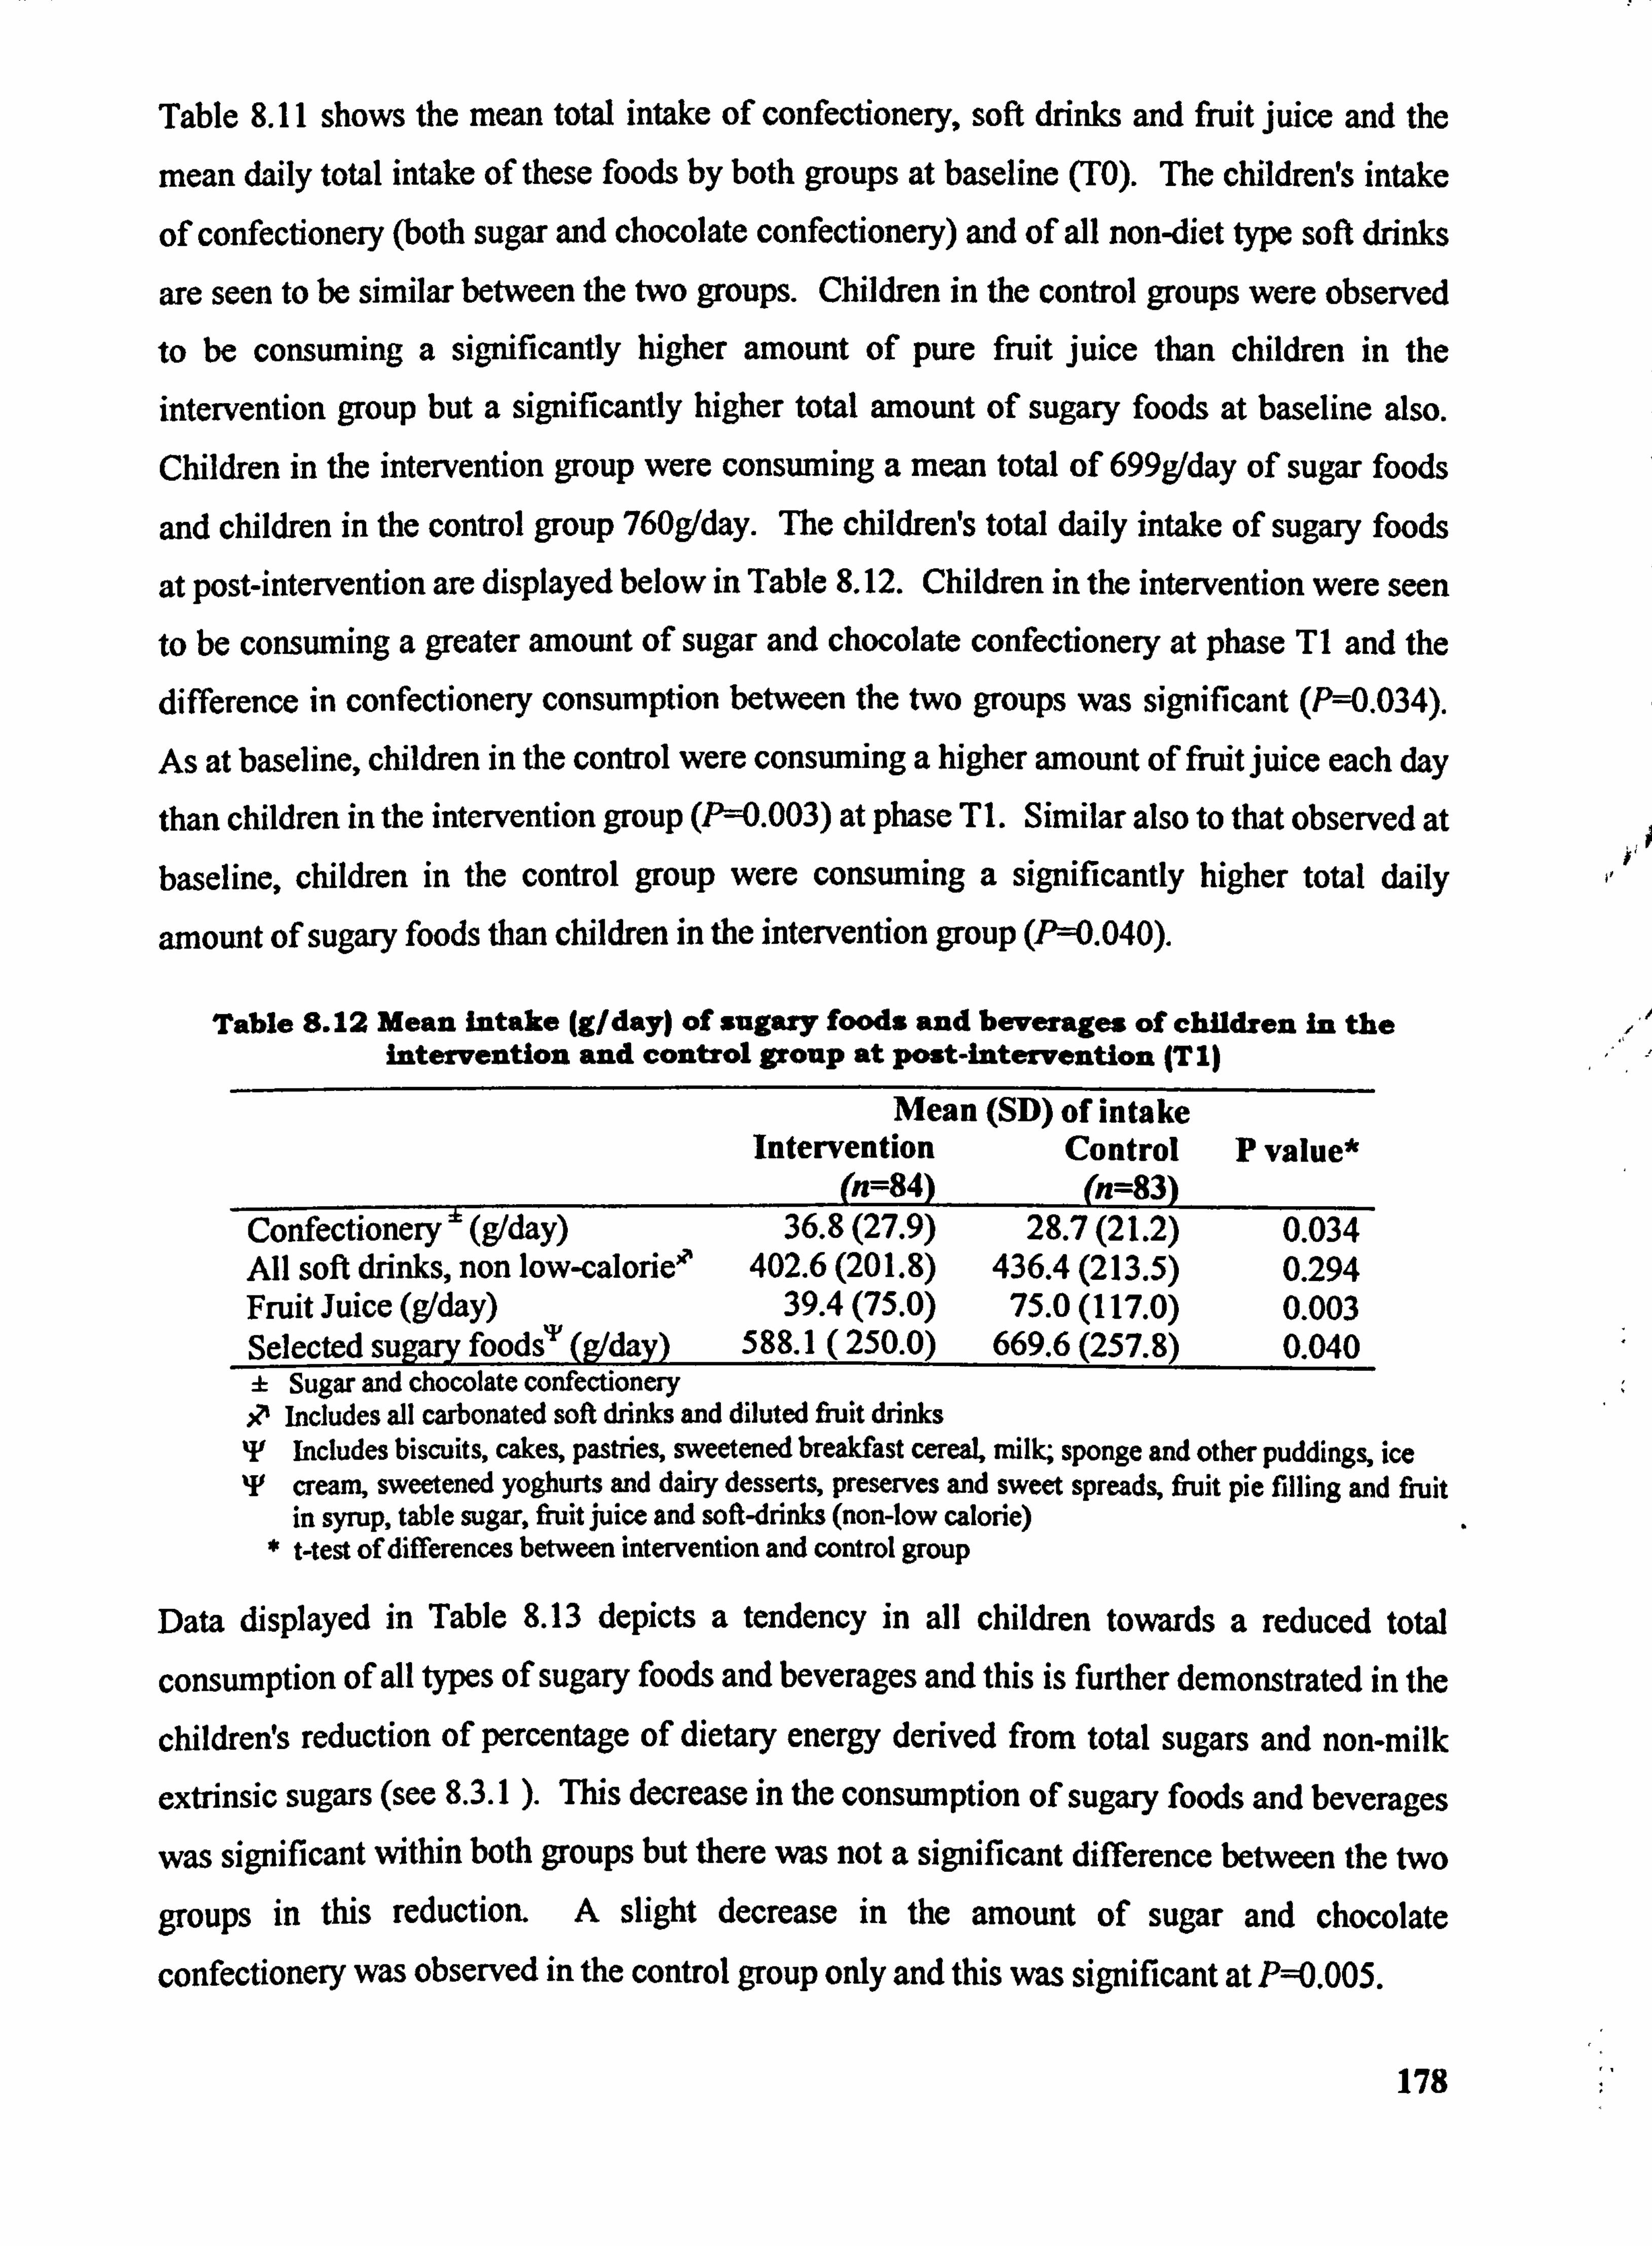
Table 8.11 shows the mean total intake of confectionery, soft drinks and fruit juice and the
mean daily total intake of these foods by both groups at baseline (TO). The children! s intake
of confectionery (both sugar and chocolate confectionery) and of all non-diet type soft drinks
are seen to be similar between the two groups. Children in the control groups were observed to be consuming a significantly higher amount of pure fruit juice than children in the intervention group but a significantly higher total amount of sugary foods at baseline also. Children in the intervention group were consuming a mean total of 699g/day of sugar foods
and children in the control group 760g/day. The children's total daily intake of sugary foods
at post-intervention are displayed below in Table 8.12. Children in the intervention were seen to be consuming a greater amount of sugar and chocolate confectionery at phase TI and the difference in confectionery consumption between the two groups was significant (P=0.034).
As at baseline, children in the control were consuming a higher amount of fruit juice each day
than children in the intervention group (P=0.003) at phase TI. Similar also to that observed at baseline, children in the control group were consuming a significantly higher total daily
amount of sugary foods than children in the intervention group (P=0.040).
Table 8.12 Mean intake (g/day) of sugary foods and beverages of children in the intervention and control group at post-intervention (T I)
Mean (SD) of intake Intervention Control P value*
--(n=84) (n=83)
Confectionery ' (g1day) 36.8(27.9) 28.7(21.2) 0.034 All soft drinks, non low-calorie' 402.6 (201.8) 436.4 (213.5) 0.294 Fruit Juice (g/day) 39.4(75.0) 75.0 (117.0) 0.003 Selected sugary foods"Y (g/day) 588.1 (250.0) 669.6 (257.8) 0.040 ± Sugar and chocolate confectionery R, Includes all carbonated soft drinks and diluted fruit drinks IF Includes biscuits, cakes, pastries, sweetened breakfast cereal, milk, sponge and other puddings, ice T cream, sweetened yoghurts and dairy desserts, preserves and sweet spreads, fiuit pie filling and fruit
in syrup, table sugar, fruit juice and soft-drinks (non-low calorie) t-test of differences between intervention and control group
Data displayed in Table 8.13 depicts a tendency in all children towards a reduced total
consumption of all types of sugary foods and beverages and this is further demonstrated in the
childreWs reduction of percentage of dietary energy derived from total sugars and non-milk
extrinsic sugars (see 8.3.1 ). This decrease in the consumption of sugary foods and beverages
was significant within both groups but there was not a significant difference between the two
groups in this reduction. A slight decrease in the amount of sugar and chocolate
confectionery was observed in the control group only and this was significant at P=0.005.
178
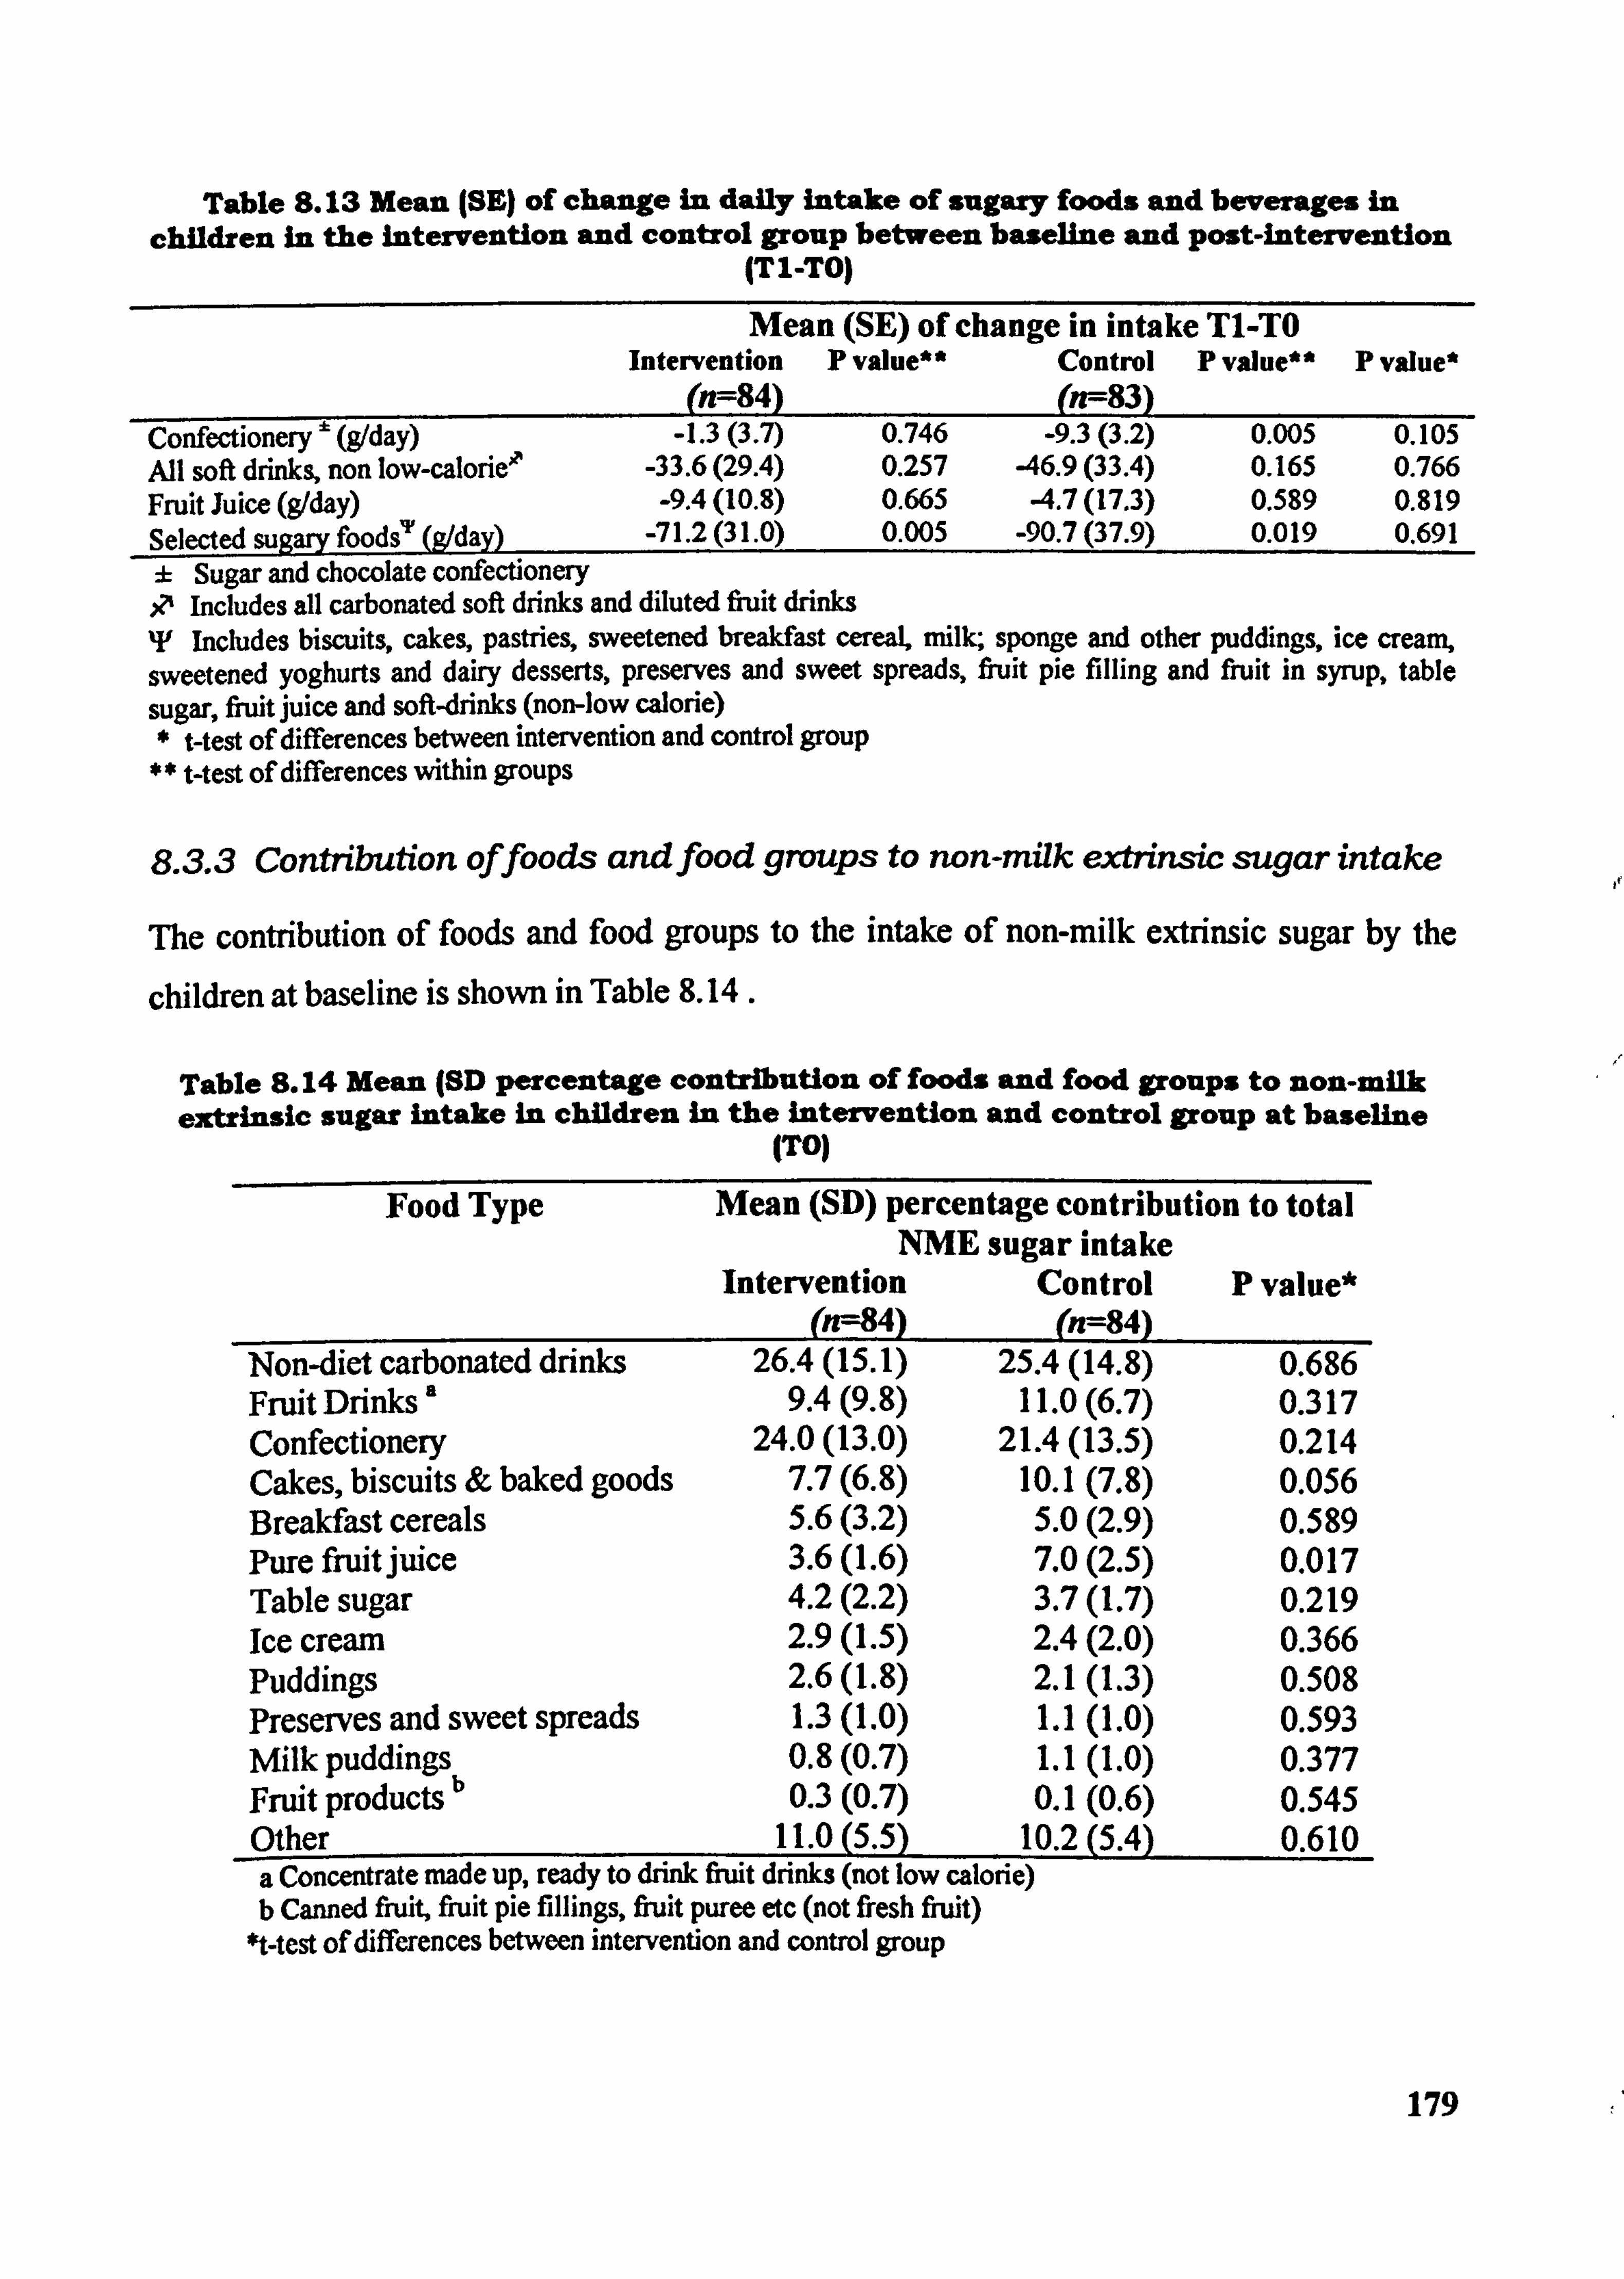
Table S. 13 Mean (SE) of change in daily intake of sugary foods and beverages in children in the intervention and control group between baseline and post-intervention
ITI-TO)
Mean (SE) of change in intake Tl-TO Intervention P value** Control P value" P value*
- (n--84) (n--83)
Confectionery ' (g/day) -1.3(3.7) 0.746 -9.3(3.2) 0.005 0.105 All soft dri" non low-calorie" -33.6 (29.4) 0.257 -46.9 (33.4) 0.165 0.766 Fruit Juice (g1day) -9.4(10.8) 0.665 -4.7(17.3) 0.589 0.819 Selected sugary foods"' (A/day) -71.2 (31.0) 0.005 -90.7 (37.9) 0.019 0.691 ± Sugar and chocolate confectionery .0 Includes all carbonated soft drinks and diluted fiuit drinks T Includes biscuits, cakes, pastries, sweetened breakfast cereaL milk; sponge and other puddings, ice creani, sweetened yoghurts and dairy desserts, preserves and sweet spreads, fruit pie filling and fruit in syrup, table sugar, fi-uit juice and soft-drinks (non-low calorie)
West of differences between intervention and control group t-test of differences within groups
8.3.3 Contribution offoods and food groups to non-milk extrinsic sugar intake
The contribution of foods and food groups to the intake of non-milk extrinsic sugar by the
children at baseline is shown in Table 8.14.
Table S. 14 Mean (81) percentage contribution of foods and food groups to non-milk extrinsic sugar intake in children in the intervention and control group at baseline
(TO)
Food Type Mean (SD) percentage contribution to total NME sugar intake
Intervention Control P value* (n=84)
- (n=84)
Non-diet carbonated drinks 26.4(15.1) 25.4(14.8) 0.686 Fruit Drinks a 9.4(9.8) 11.0(6.7) 0.317 Confectionery 24.0(13.0) 21.4(13.5) 0.214 Cakes, biscuits & baked goods 7.7(6.8) 10.1(7.8) 0.056 Breakfast cereals 5.6(3.2) 5.0(2.9) 0.589 Pure fruit juice 3.6(l. 6) 7.0(2.5) 0.017 Table sugar 4.2(2.2) 3.7(l. 7) 0.219 Ice crcwn 2.9(l. 5) 2.4(2.0) 0.366 Puddings 2.6(1.8) 2.1(1.3) 0.508 Preserves and sweet spreads 1.3(l. 0) 1.1(1.0) 0.593 Milk Puddings 0.8(0.7) 1.1(1.0) 0.377
b Fruit products 0.3(0.7) 0.1(0.6) 0.545 Other 11.0(5.5) 10.2(5.4) 0.610 a Concentrate made up, ready to drink fi-uit drinks (not low calorie) b Canned fruit, fruit pie fillings, fruit puree etc (not fi7esh fi-uit)
*t-test of differences between intervention and control group
179
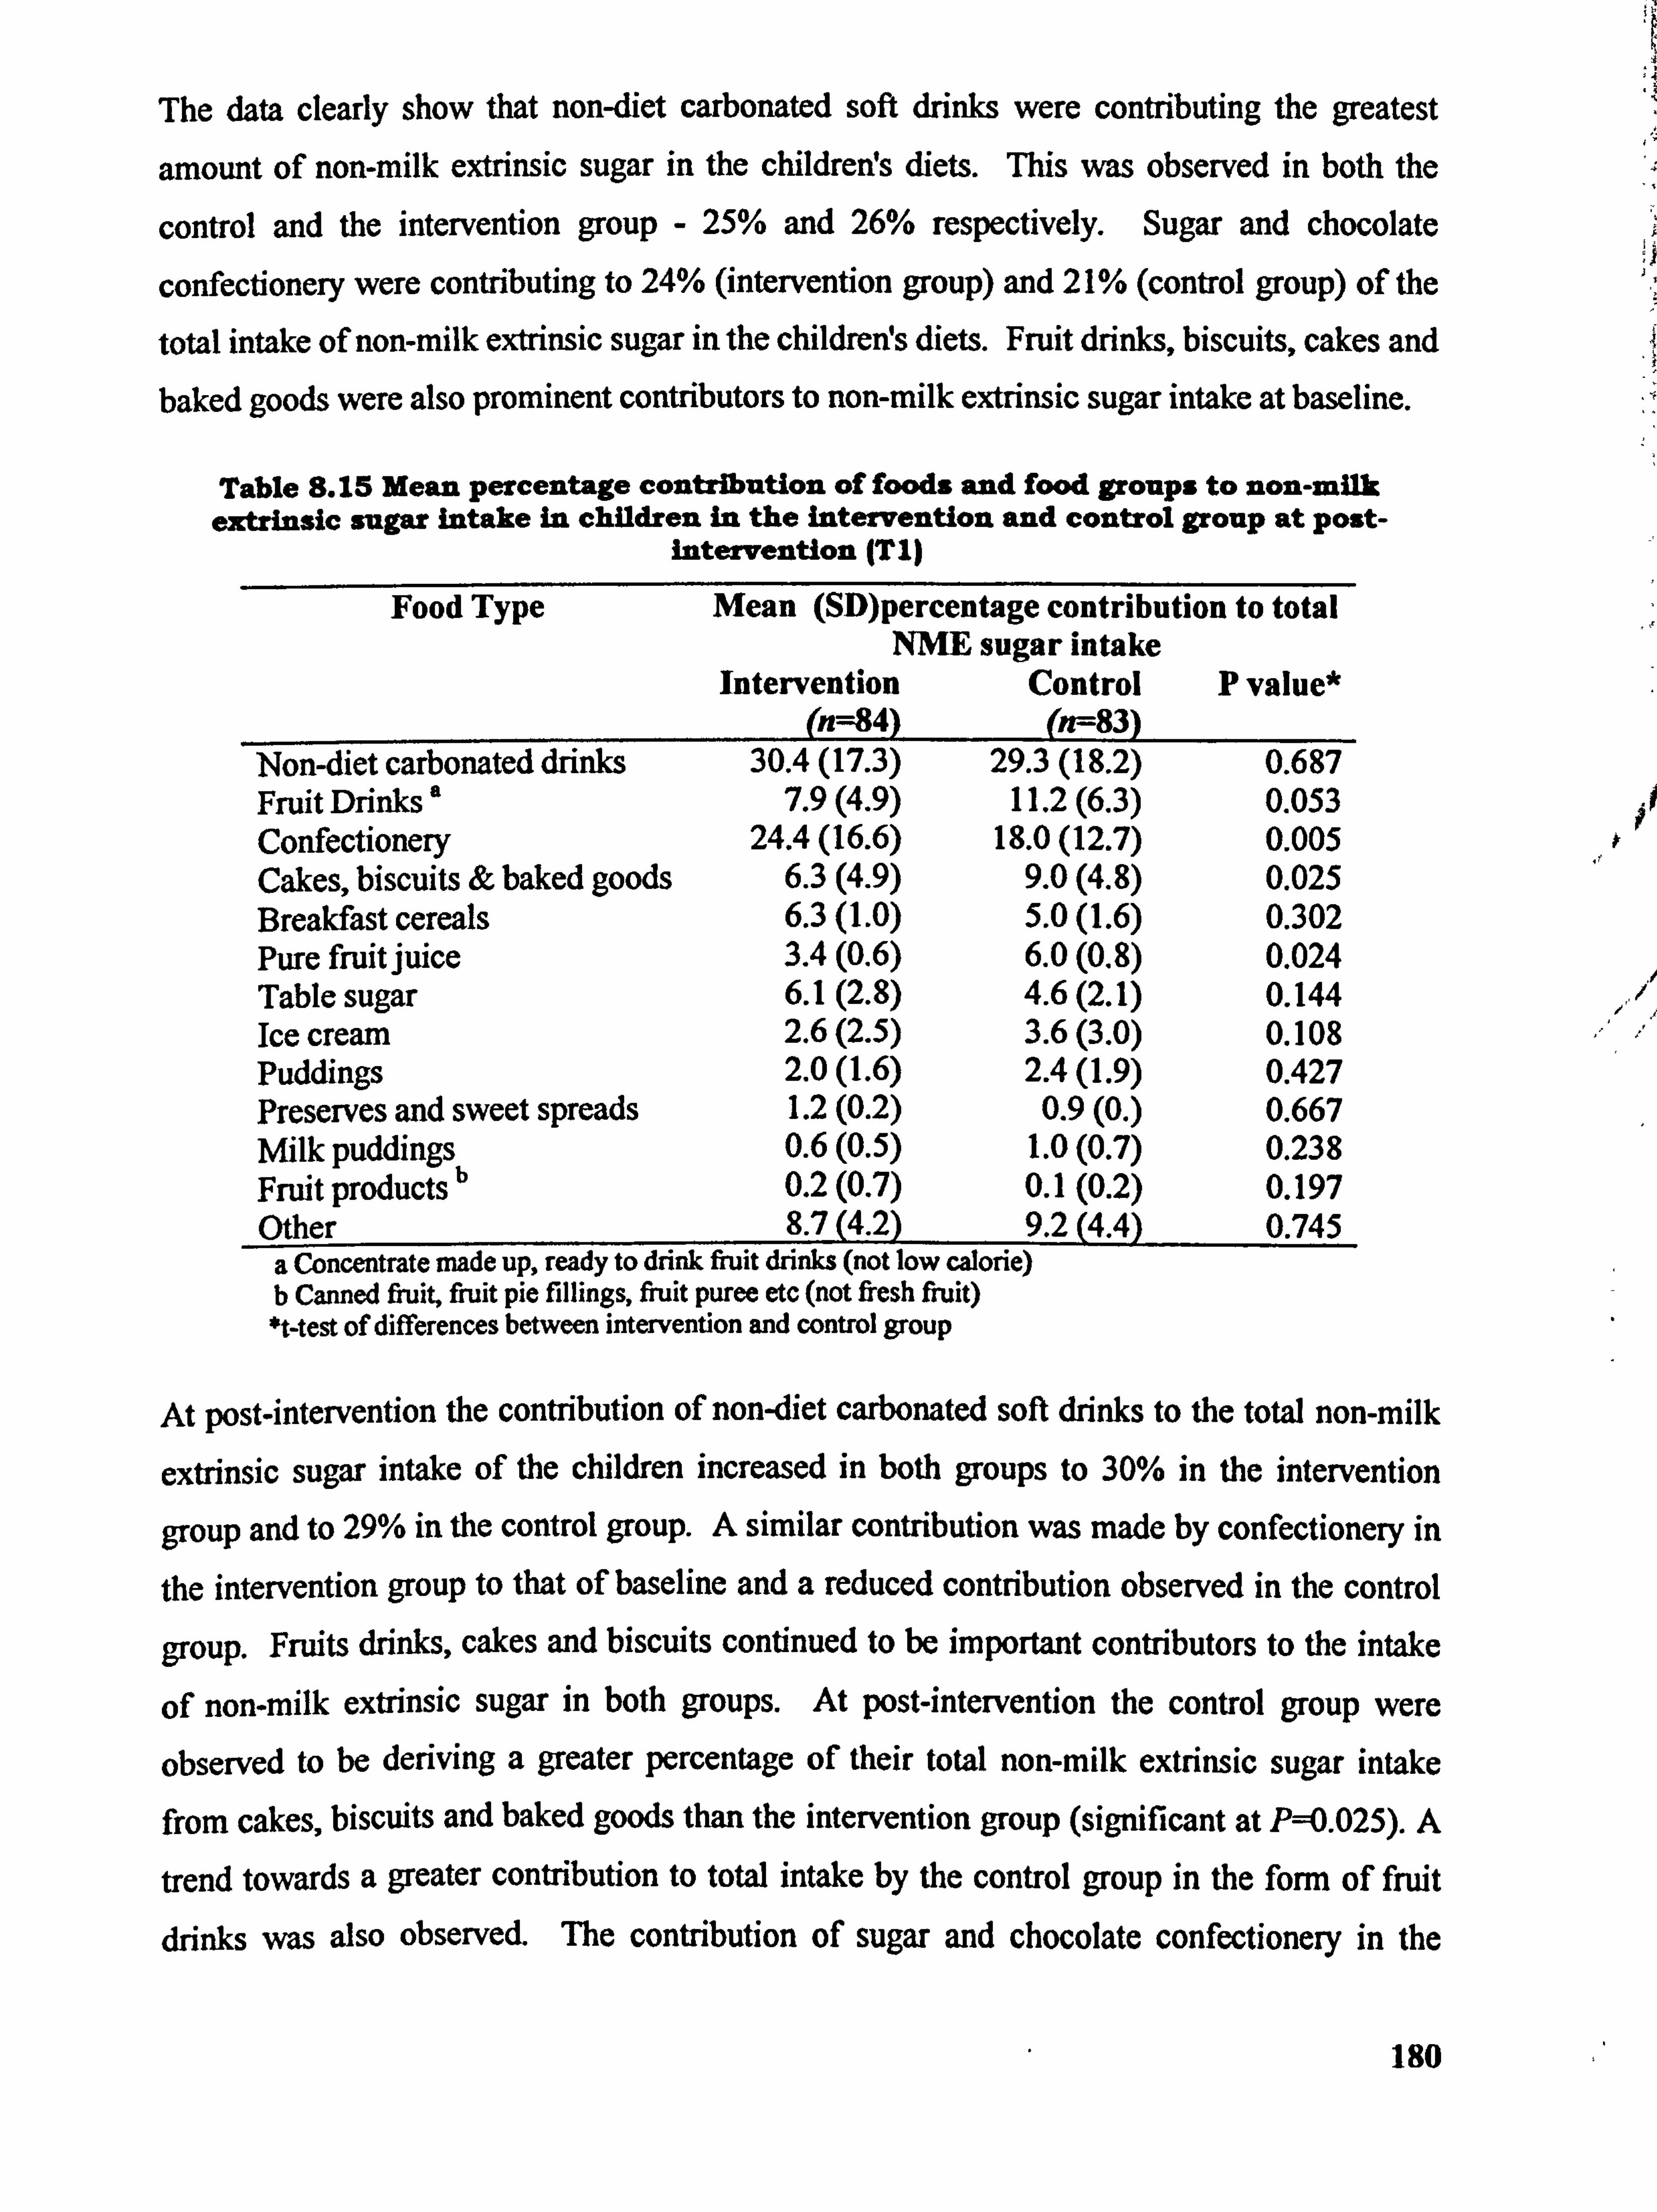
The data clearly show that non-diet carbonated soft drinks were contributing the greatest
amount of non-milk extrinsic sugar in the children! s diets. This was observed in both the
control and the intervention group - 25% and 26% respectively. Sugar and chocolate
confectionery were contributing to 24% (intervention group) and 21% (control group) of the
total intake of non-milk extrinsic sugar in the childreWs diets. Fruit drinks, biscuits, cakes and baked goods were also prominent contributors to non-milk extrinsic sugar intake at baseline.
Table 8.15 Mean percentage contribution of foods and food groups to non-milk extrinsic sugar intake in children in the intervention and control group at post-
intervention (TI)
Food Type Mean (SD)percentage contribution to total NME sugar intake
Intervention Control P value* (n=84) (n--83)
Non-diet carbonated drinks 30.4(17.3) 29.3(18.2) 0.687 Fruit Drinks ' 7.9(4.9) 11.2(6.3) 0.053 Confectionery 24.4(16.6) 18.0(12.7) 0.005 Cakes, biscuits & baked goods 6.3(4.9) 9.0(4.8) 0.025 Breakfast cereals 6.3(1.0) 5.0(1.6) 0.302 Pure fruit juice 3.4(0.6) 6.0(0.8) 0.024 Table sugar 6.1(2.8) 4.6(2.1) 0.144 Ice cream 2.6(2.5) 3.6(3.0) 0.108 Puddings 2.0(1.6) 2.4(1.9) 0.427 Preserves and sweet spreads 1.2(0.2) 0.9(0. ) 0.667 Milk puddings 0.6(0.5) 1.0(0.7) 0.238 Fruit products b 0.2(0.7) 0.1(0.2) 0.197 Other 8.7(4.2) 9.2(4.4) 0.745
a Concentrate made up, ready to drink fruit drinks (not low calorie) b Canned fruit, fruit pie fillings, fiuit puree etc (not fresh fruit) *t-test of differences between intervention and control group
At post-intervention the contribution of non-diet carbonated soft drinks to the total non-milk
extrinsic sugar intake of the children increased in both groups to 30% in the intervention
group and to 29% in the control group. A similar contribution was made by confectionery in
the intervention group to that of baseline and a reduced contribution observed in the control
group. Fruits drinks, cakes and biscuits continued to be important contributors to the intake
of non-milk extrinsic sugar in both groups. At post-intervention the control group were
observed to be deriving a greater percentage of their total non-milk extrinsic sugar intake
from cakes, biscuits and baked goods than the intervention group (significant at P=0.025). A
trend towards a greater contribution to total intake by the control group in the form of fruit
drinks was also observed. The contribution of sugar and chocolate confectionery in the
180
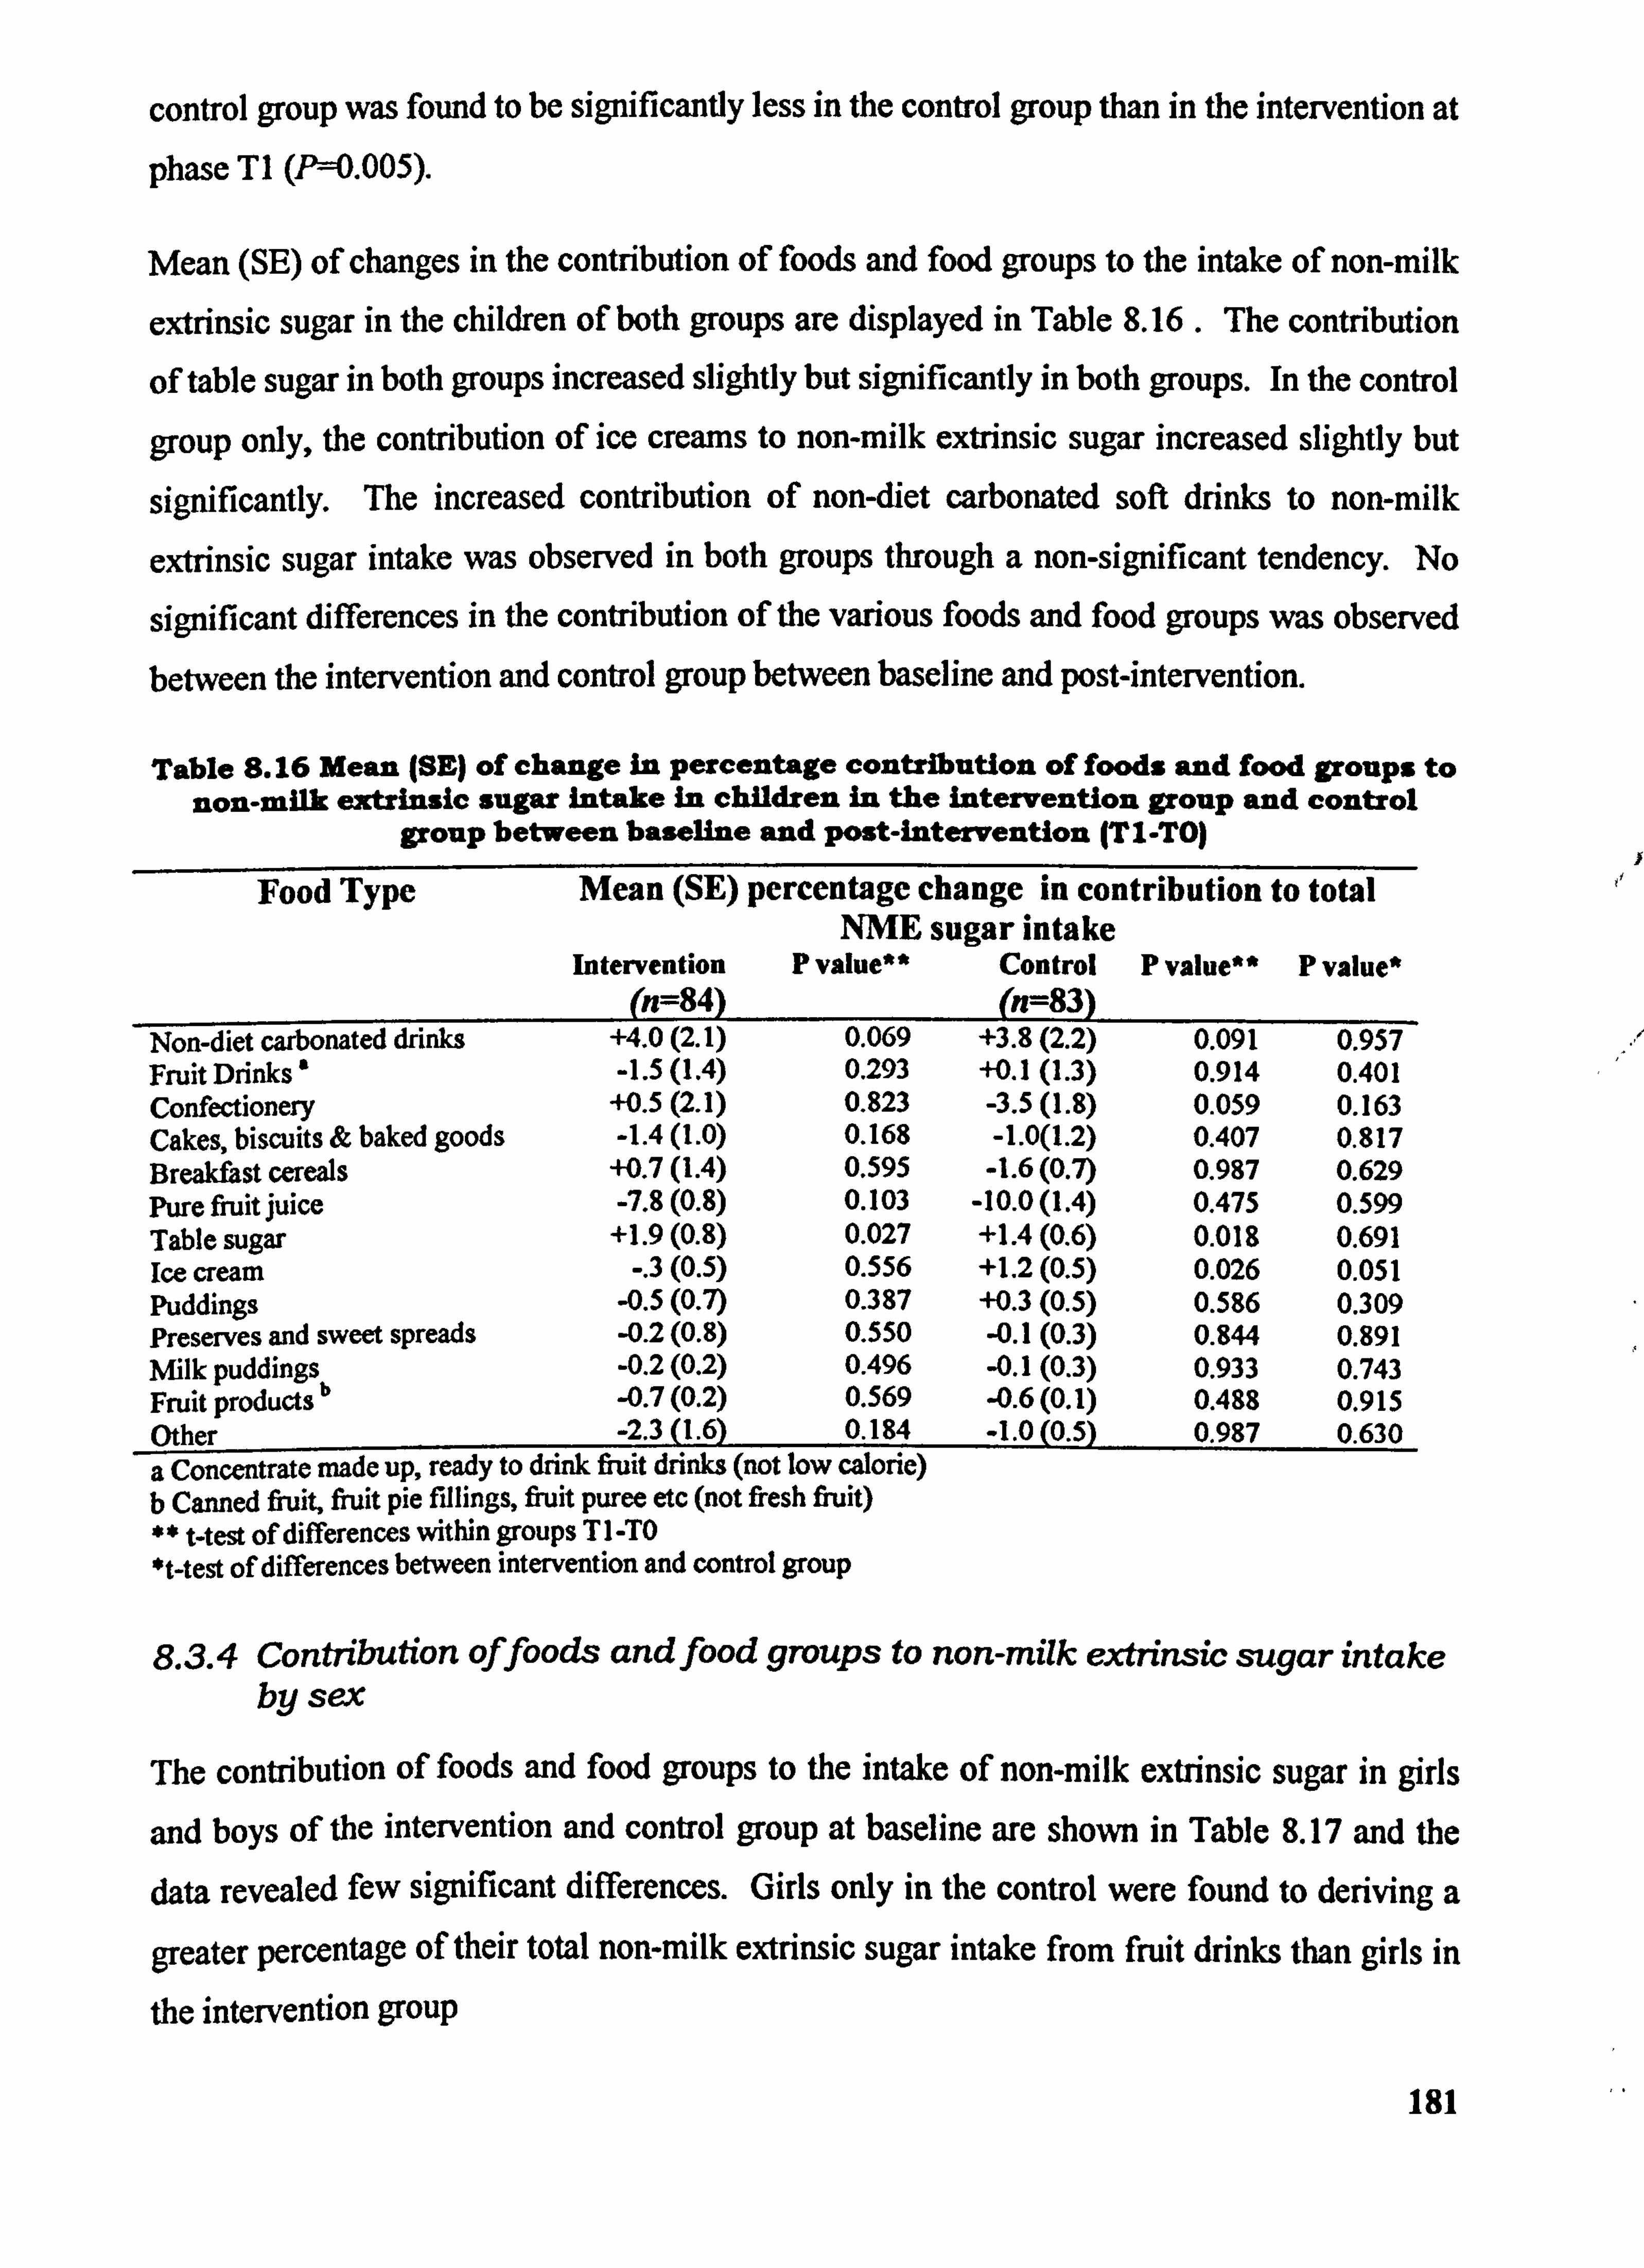
control group was found to be significantly less in the control group than in the intervention at
phasc TI W=0.005).
Mean (SE) of changes in the contribution of foods and food groups to the intake of non-milk
extrinsic sugar in the children of both groups are displayed in Table 8.16 . The contribution
of table sugar in both groups increased slightly but significantly in both groups. In the control
group only, the contribution of ice creams to non-milk extrinsic sugar increased slightly but
significantly. The increased contribution of non-diet carbonated soft drinks to non-milk
extrinsic sugar intake was observed in both groups through a non-significant tendency. No
significant differences in the contribution of the various foods and food groups was observed
between the intervention and control group between baseline and post-intervention.
Table S. 16 Mean ISE) of change In percentage contribution of foods and food groups to non-milk extrinsic sugar intake in children in the intervention group and control
group between baseline and p0st-intervention (TI-TO)
Food Type Mean (SE) percentage change in contribution to total NME sugar intake
Intervention P value** Control P value** P value* (n=84) (n--83)
Non-diet carbonated drinks +4.0(2.1) 0.069 +3.8(2.2) 0.091 0.957 Fruit Drinks ' -1.5(l. 4) 0.293 +0.1(1.3) 0.914 0.401 Confectionery +0.5(2.1) 0.823 -3.5(l. 8) 0.059 0.163 Cakes, biscuits & baked goods -1.4(l. 0) 0.168 -1.0(1.2) 0.407 0.817 Breakfast cereals +0.7(l. 4) 0.595 -1.6(0.7) 0.987 0.629 Pure fluit juice -7.8(0.8) 0.103 -10.0(1.4) 0.475 0.599 Table sugar +1.9(0.8) 0.027 +1.4(0.6) 0.018 0.691 Ice cream -. 3(0.5) 0.556 +1.2(0.5) 0.026 0.051 Puddings -0.5(0.7) 0.387 +0.3(0.5) 0.586 0.309 Preserves and sweet spreads -0.2(0.8) 0.550 -0.1(0.3) 0.844 0.891 Mlk puddings -0.2(0.2) 0.496 -0.1(0.3) 0.933 0.743
b Fruit products -0.7(0.2) 0.569 -0.6(0.1) 0.488 0.915 Other -2.3(l. 6) 0.184 -1.0(0.5 0.987 0.630 a Concentrate made up, ready to drink fruit drinks (not low calorie) b Canned fi-uit, fruit pie fillings, fruit puree etc (not fi7esh fiuit) ** t-test of differences within groups TI -TO *t-test of differences between intervention and control group
8.3.4 Contribution offoods and food groups to non-milk extrinsic sugar intake by sex
The contribution of foods and food groups to the intake of non-milk extrinsic sugar in girls
and boys of the intervention and control group at baseline are shown in Table 8.17 and the data revealed few significant differences. Girls only in the control were found to deriving a
greater percentage of their total non-milk extrinsic sugar intake from fruit drinks than girls in
the intervention group
181
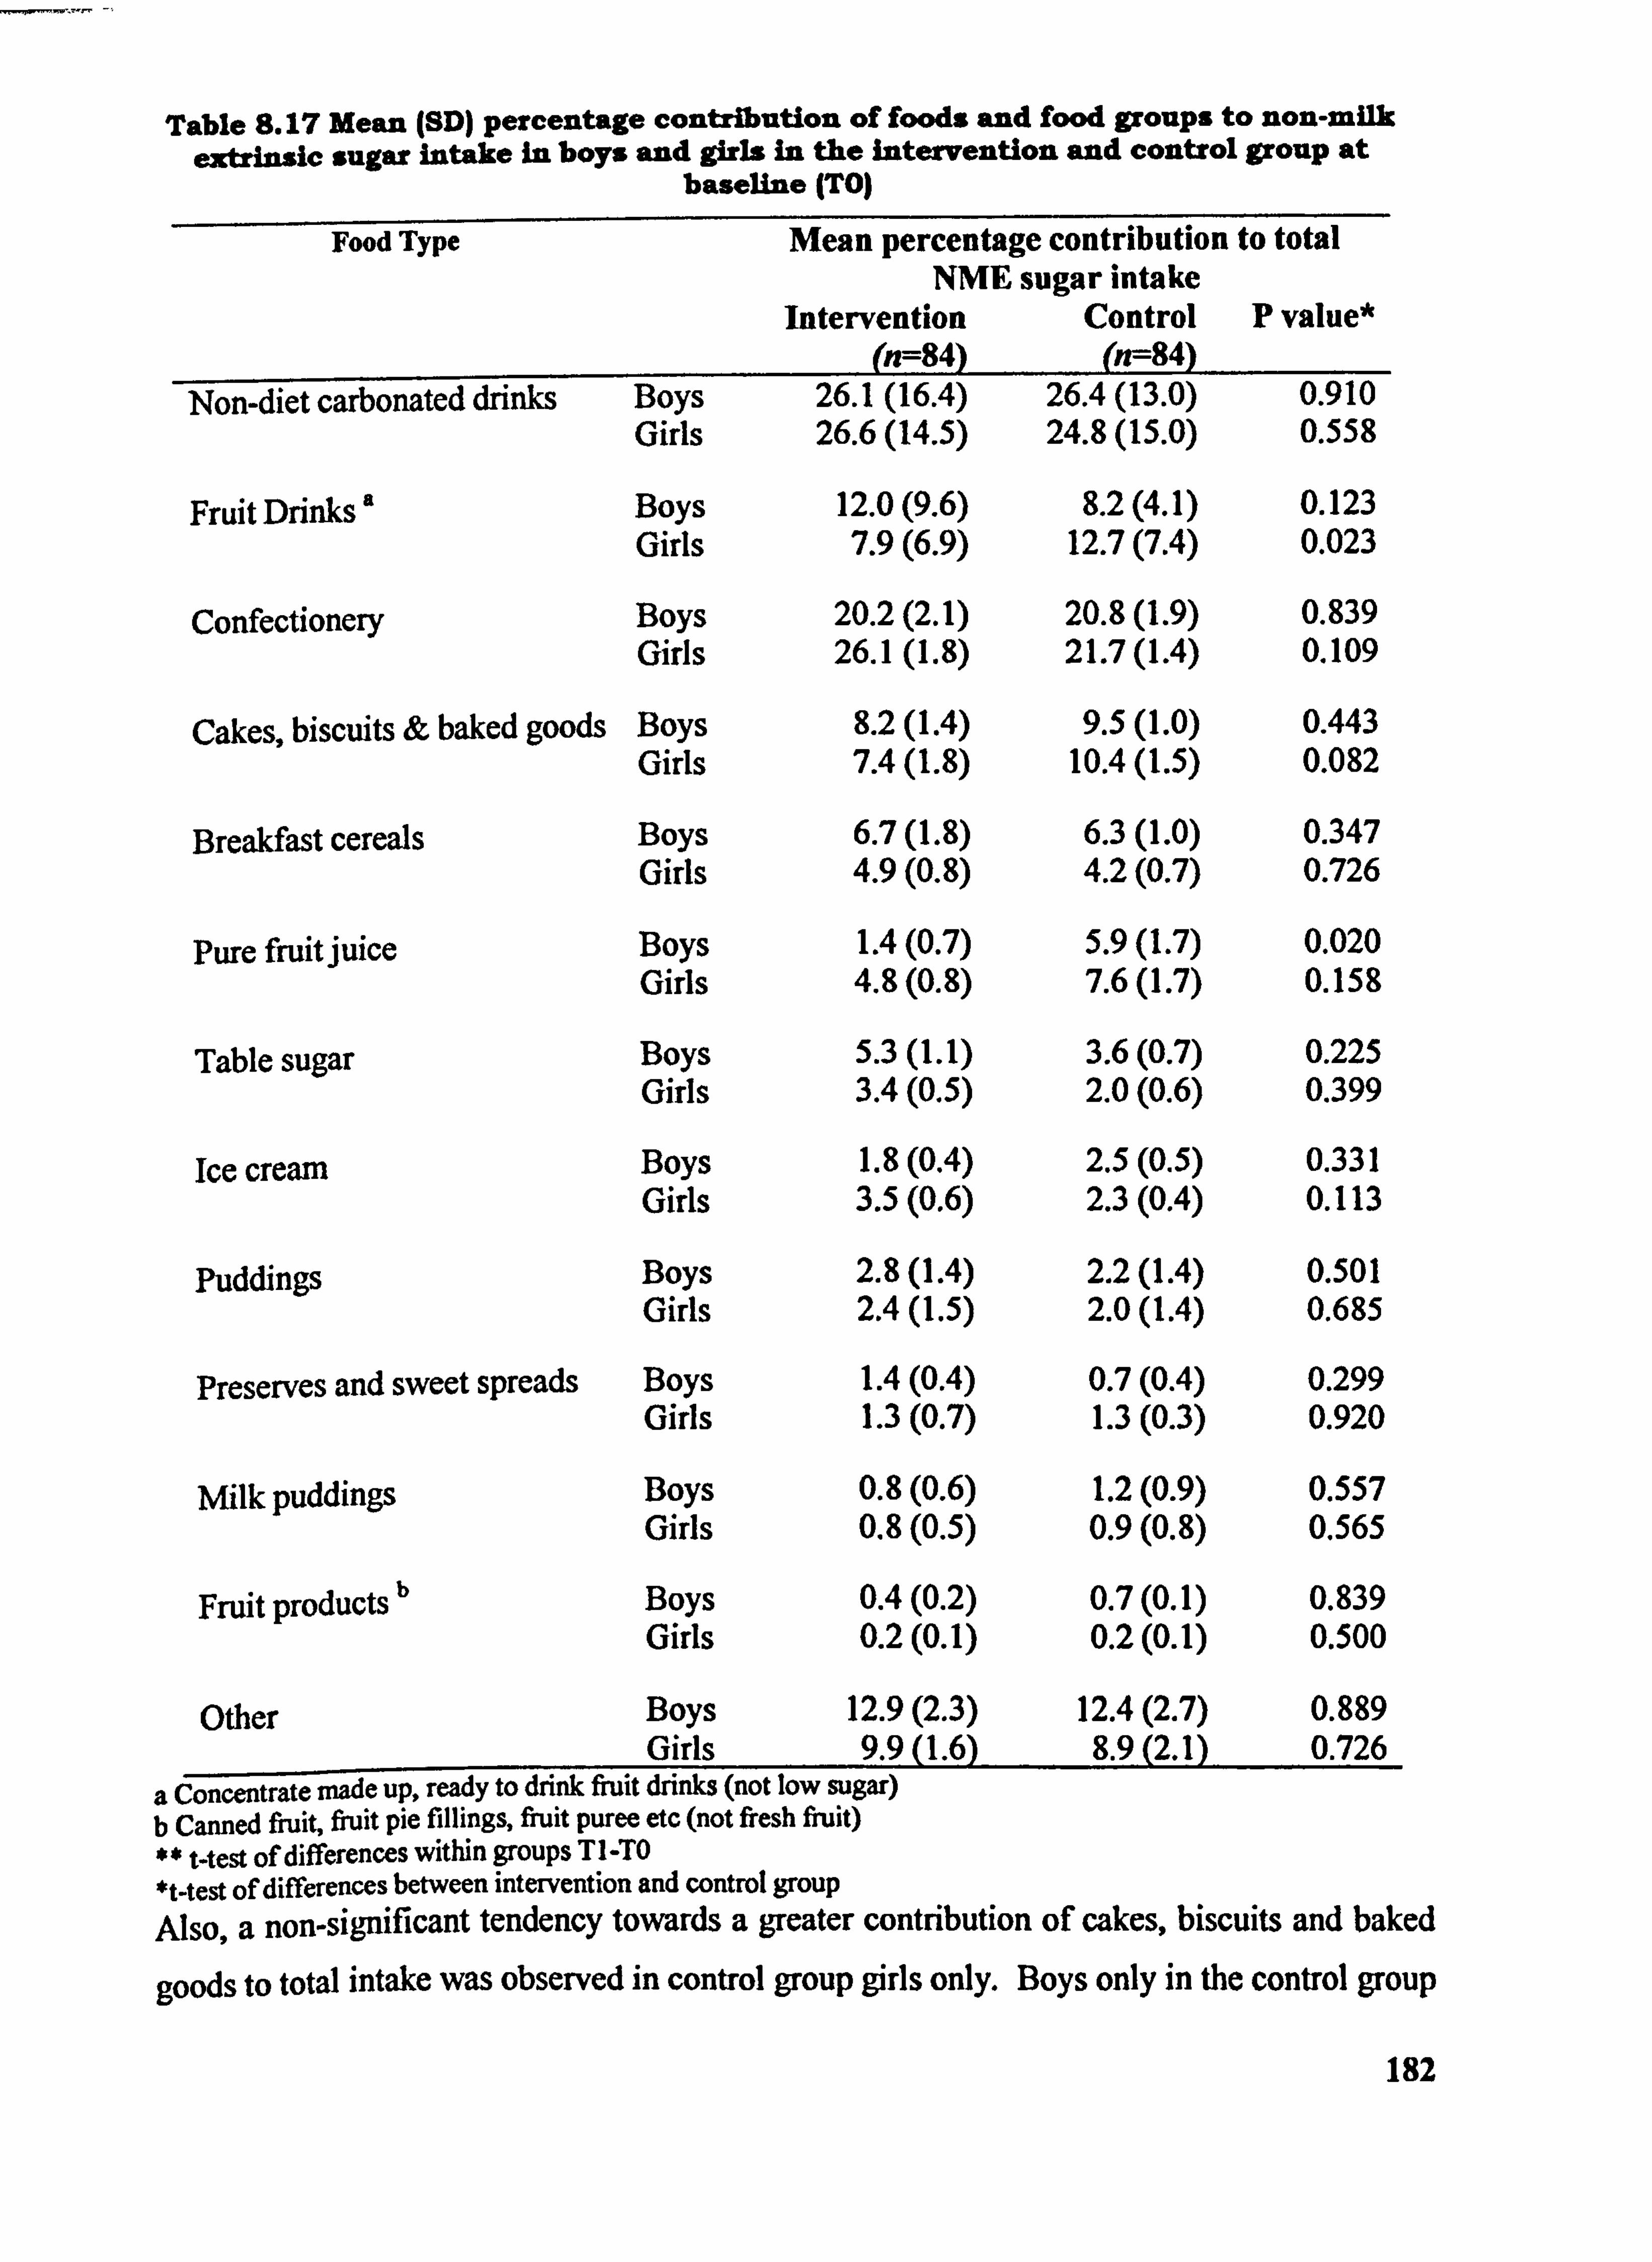
Table 8.17 Mean (SD) percentage contribution of foods and food groups to non-milk extrinsic sugar intake in boys and girls in the Intervention and control group at
baseline (TO)
Food Type Mean percentage contribution to total NME sugar intake
Intervention Control P value* (n=84) (n--84)
Non-diet carbonated drinks Boys 26.1(16.4) 26.4(13.0) 0.910 Girls 26.6(14.5) 24.8(15.0) 0.558
Fruit Drinks Boys 12.0(9.6) 8.2(4.1) 0.123 Girls 7.9(6.9) 12.7(7.4) 0.023
Confectionery Boys 20.2(2.1) 20.8(l. 9) 0.839 Girls 26.1(1.8) 21.7(l. 4) 0.109
Cakes, biscuits & baked goods Boys 8.2(l. 4) 9.5(l. 0) 0.443 Girls 7.4(l. 8) 10.4(l. 5) 0.082
Breakfast cereals Boys 6.7(l. 8) 6.3(l. 0) 0.347 Girls 4.9(0.8) 4.2(0.7) 0.726
Pure fruitjuice Boys 1.4(0.7) 5.9(l. 7) 0.020 Girls 4.8(0.8) 7.6(l. 7) 0.158
Table sugar Boys 5.3(l. 1) 3.6(0.7) 0.225 Girls 3.4(0.5) 2.0(0.6) 0.399
Ice cream Boys 1.8(0.4) 2.5(0.5) 0.331 Girls 3.5(0.6) 2.3(0.4) 0.113
Puddings Boys 2.8(l. 4) 2.2(l. 4) 0.501 Girls 2.4(l. 5) 2.0(1.4) 0.685
Preserves and sweet spreads Boys 1.4(0.4) 0.7(0.4) 0.299 Girls 1.3(0.7) 1.3(0.3) 0.920
Nlk puddings Boys 0.8(0.6) 1.2(0.9) 0.557 Girls 0.8(0.5) 0.9(0.8) 0.565
Fruit products b Boys 0.4(0.2) 0.7(0.1) 0.839 Girls 0.2(0.1) 0.2(0.1) 0.500
Other Boys 12.9(2.3) 12.4(2.7) 0.889 Girls 9.90.6) 8.9(2.1) 0.726
a jo--ncentrate made up, ready to drink fruit drinks (not low sugar) b Canned fjuit, fiuit pie fillings, fiuit puree etc (not fresh fiuit) ** t-test of differences within groups TI -TO *t-test of differences between intervention and control group Also, a non-significant tendency towards a greater contribution of cakes, biscuits and baked
goods to total intake was observed in control group girls only. Boys only in the control group
182
only were seen to be deriving a greater percentage of their total non-milk extrinsic sugar
intake from pure fiuit juice (P=0.020).
Table 8.18 shows the contribution of various foods and food groups to the intake of non-milk
extrinsic sugar at post-intervention by boys and girls in both groups. Rather more differences
were observed at post-intervention than at baseline. Non-diet soft drinks contributed to a
mean of 23.6% to total non-milk extrinsic sugar intake in control group boys and to 30.5% in
intervention group boys, this difference between means, however, was not found to be
significant. The contribution made by non-diet soft drinks was seen to be similar in girls
between groups. Confectionery was seen to be a considerable contributor to the intake of
non-milk extrinsic sugar in boys and in girls of both groups at post-intervention.
Confectionery contributed to 20.3% of total non-milk extrinsic sugars in the diets of the
intervention group boys and to 16.5% in the control group boys. Although there was a
tendency towards a greater contribution by confectionery in the intervention group boys this
was not found to be significant (Pý=0.080). In girls, however, a significant trend towards a
greater contribution made by confectionery was observed in girls of the intervention group
(P=0.029).
At post-intervention there were no differences between groups for boys in the contribution
made by pure fruit juices but a tendency towards a higher contribution by pure fruit juice to
total non-milk extrinsic sugar intake was observed in the control group for girls. The mean
(SE) of change in the percentage contribution of foods and food groups to the total intake of
non-milk extrinsic sugar of boys and girls between phase TO and phase TI are presented in
Table 8.19. Boys in the intervention groups significantly decreased the contribution made by
fruit drinks to their intake of non-milk extrinsic sugar between phase TO and TI (P=0.040).
The contribution by table sugar to non-milk extrinsic sugar intake by girls in the intervention
group increased significantly by 2.5% (P--0.017). The contribution of non-diet soft drinks in
the diet's of girls only in the control group to their intake of non-milk extrinsic sugar increased
by 7.8% and was found to be significant at P'=0.012. Table 8.19 presents limited significant
differences in changes between sexes of both groups. The exceptions are a slight but
significant increase in the contribution of fruit drinks to non-milk extrinsic sugar intake in
boys of the control group coupled by a decrease in boys in the intervention group (Pý=0.040).
In girls of the control a non-significant tendency (P-0.052) towards a very small increase in
the contribution of ice creams was observed.
183
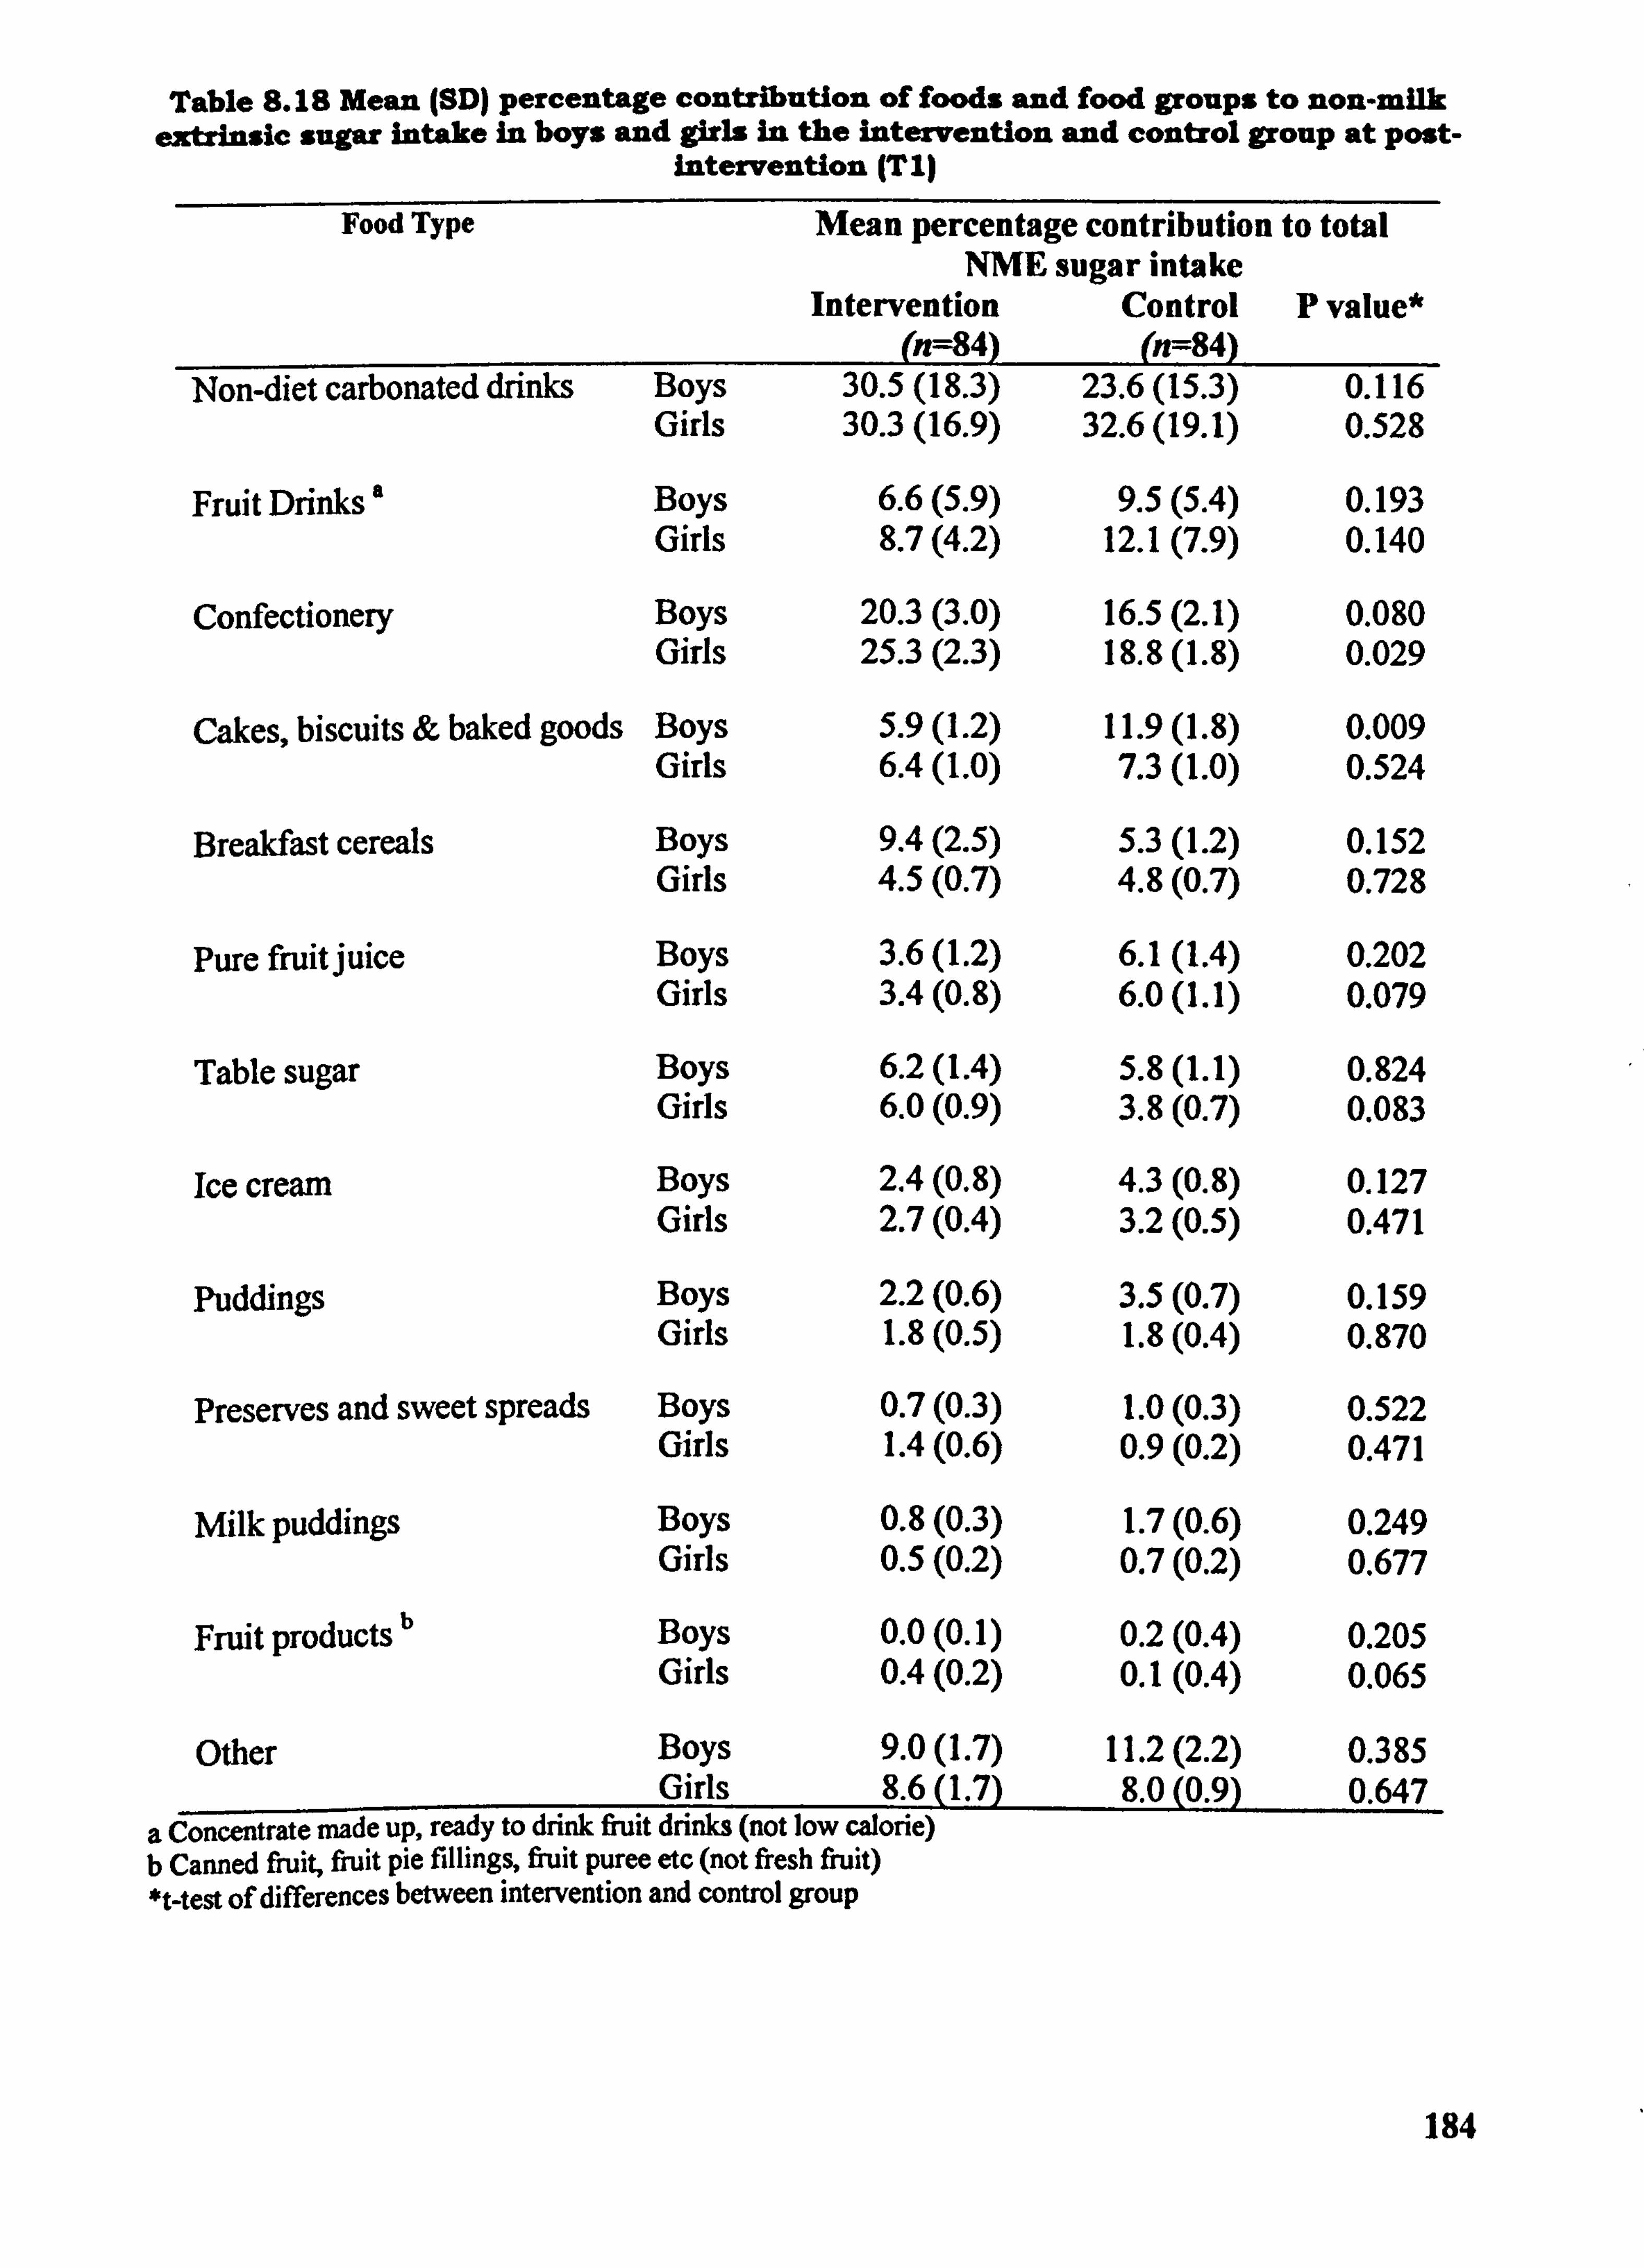
Table S. IS Mean (SD) percentage contribution of foods and food groups to non-milk extrinsic sugar intake in boys and girls in the intervention and control group at post-
Intervention (TI)
Food Type Mean percentage contribution to total NME sugar intake
Intervention Control P value* (n=84) (n=84)
Non-diet carbonated drinks Boys 30.5(18.3) 23.6(15.3) 0.116 Girls 30.3(16.9) 32.6(19.1) 0.528
Fruit Drinks Boys 6.6(5.9) 9.5(5.4) 0.193 Girls 8.7(4.2) 12.1(7.9) 0.140
Confectionery Boys 20.3(3.0) 16.5(2.1) 0.080 Girls 25.3(2.3) 18.8(l. 8) 0.029
Cakes, biscuits & baked goods Boys 5.9(l. 2) 11.9(l. 8) 0.009 Girls 6.4(l. 0) 7.3(l. 0) 0.524
Breakfast cereals Boys 9.4(2.5) 5.3(l. 2) 0.152 Girls 4.5(0.7) 4.8(0.7) 0.728
Pure fruit juice Boys 3.6(l. 2) 6.1(1.4) 0.202 Girls 3.4(0.8) 6.0(1.1) 0.079
Table sugar Boys 6.2(l. 4) 5.8(l. 1) 0.824 Girls 6.0(0.9) 3.8(0.7) 0.083
Ice cream Boys 2.4(0.8) 4.3(0.8) 0.127 Girls 2.7(0.4) 3.2(0.5) 0.471
Puddings Boys 2.2(0.6) 3.5(0.7) 0.159 Girls 1.8(0.5) 1.8(0.4) 0.870
Preserves and sweet spreads Boys 0.7(0.3) 1.0(0.3) 0.522 Girls 1.4(0.6) 0.9(0.2) 0.471
Milk puddings Boys 0.8(0.3) 1.7(0.6) 0.249 Girls 0.5(0.2) 0.7(0.2) 0.677
Fruit products b Boys 0.0(0.1) 0.2(0.4) 0.205 Girls 0.4(0.2) 0.1(0.4) 0.065
Other Boys 9.0(1.7) 11.2(2.2) 0.385 Girls 8.6(l. 7) 8.0(0.9) 0.647
a Concentrate made up, ready to drink fruit drinks (not low calorie) b Canned fruit, fiuit pie fillings, fruit Puree etc (not fresh fruit) *t-test of differences between intervention and control group
184
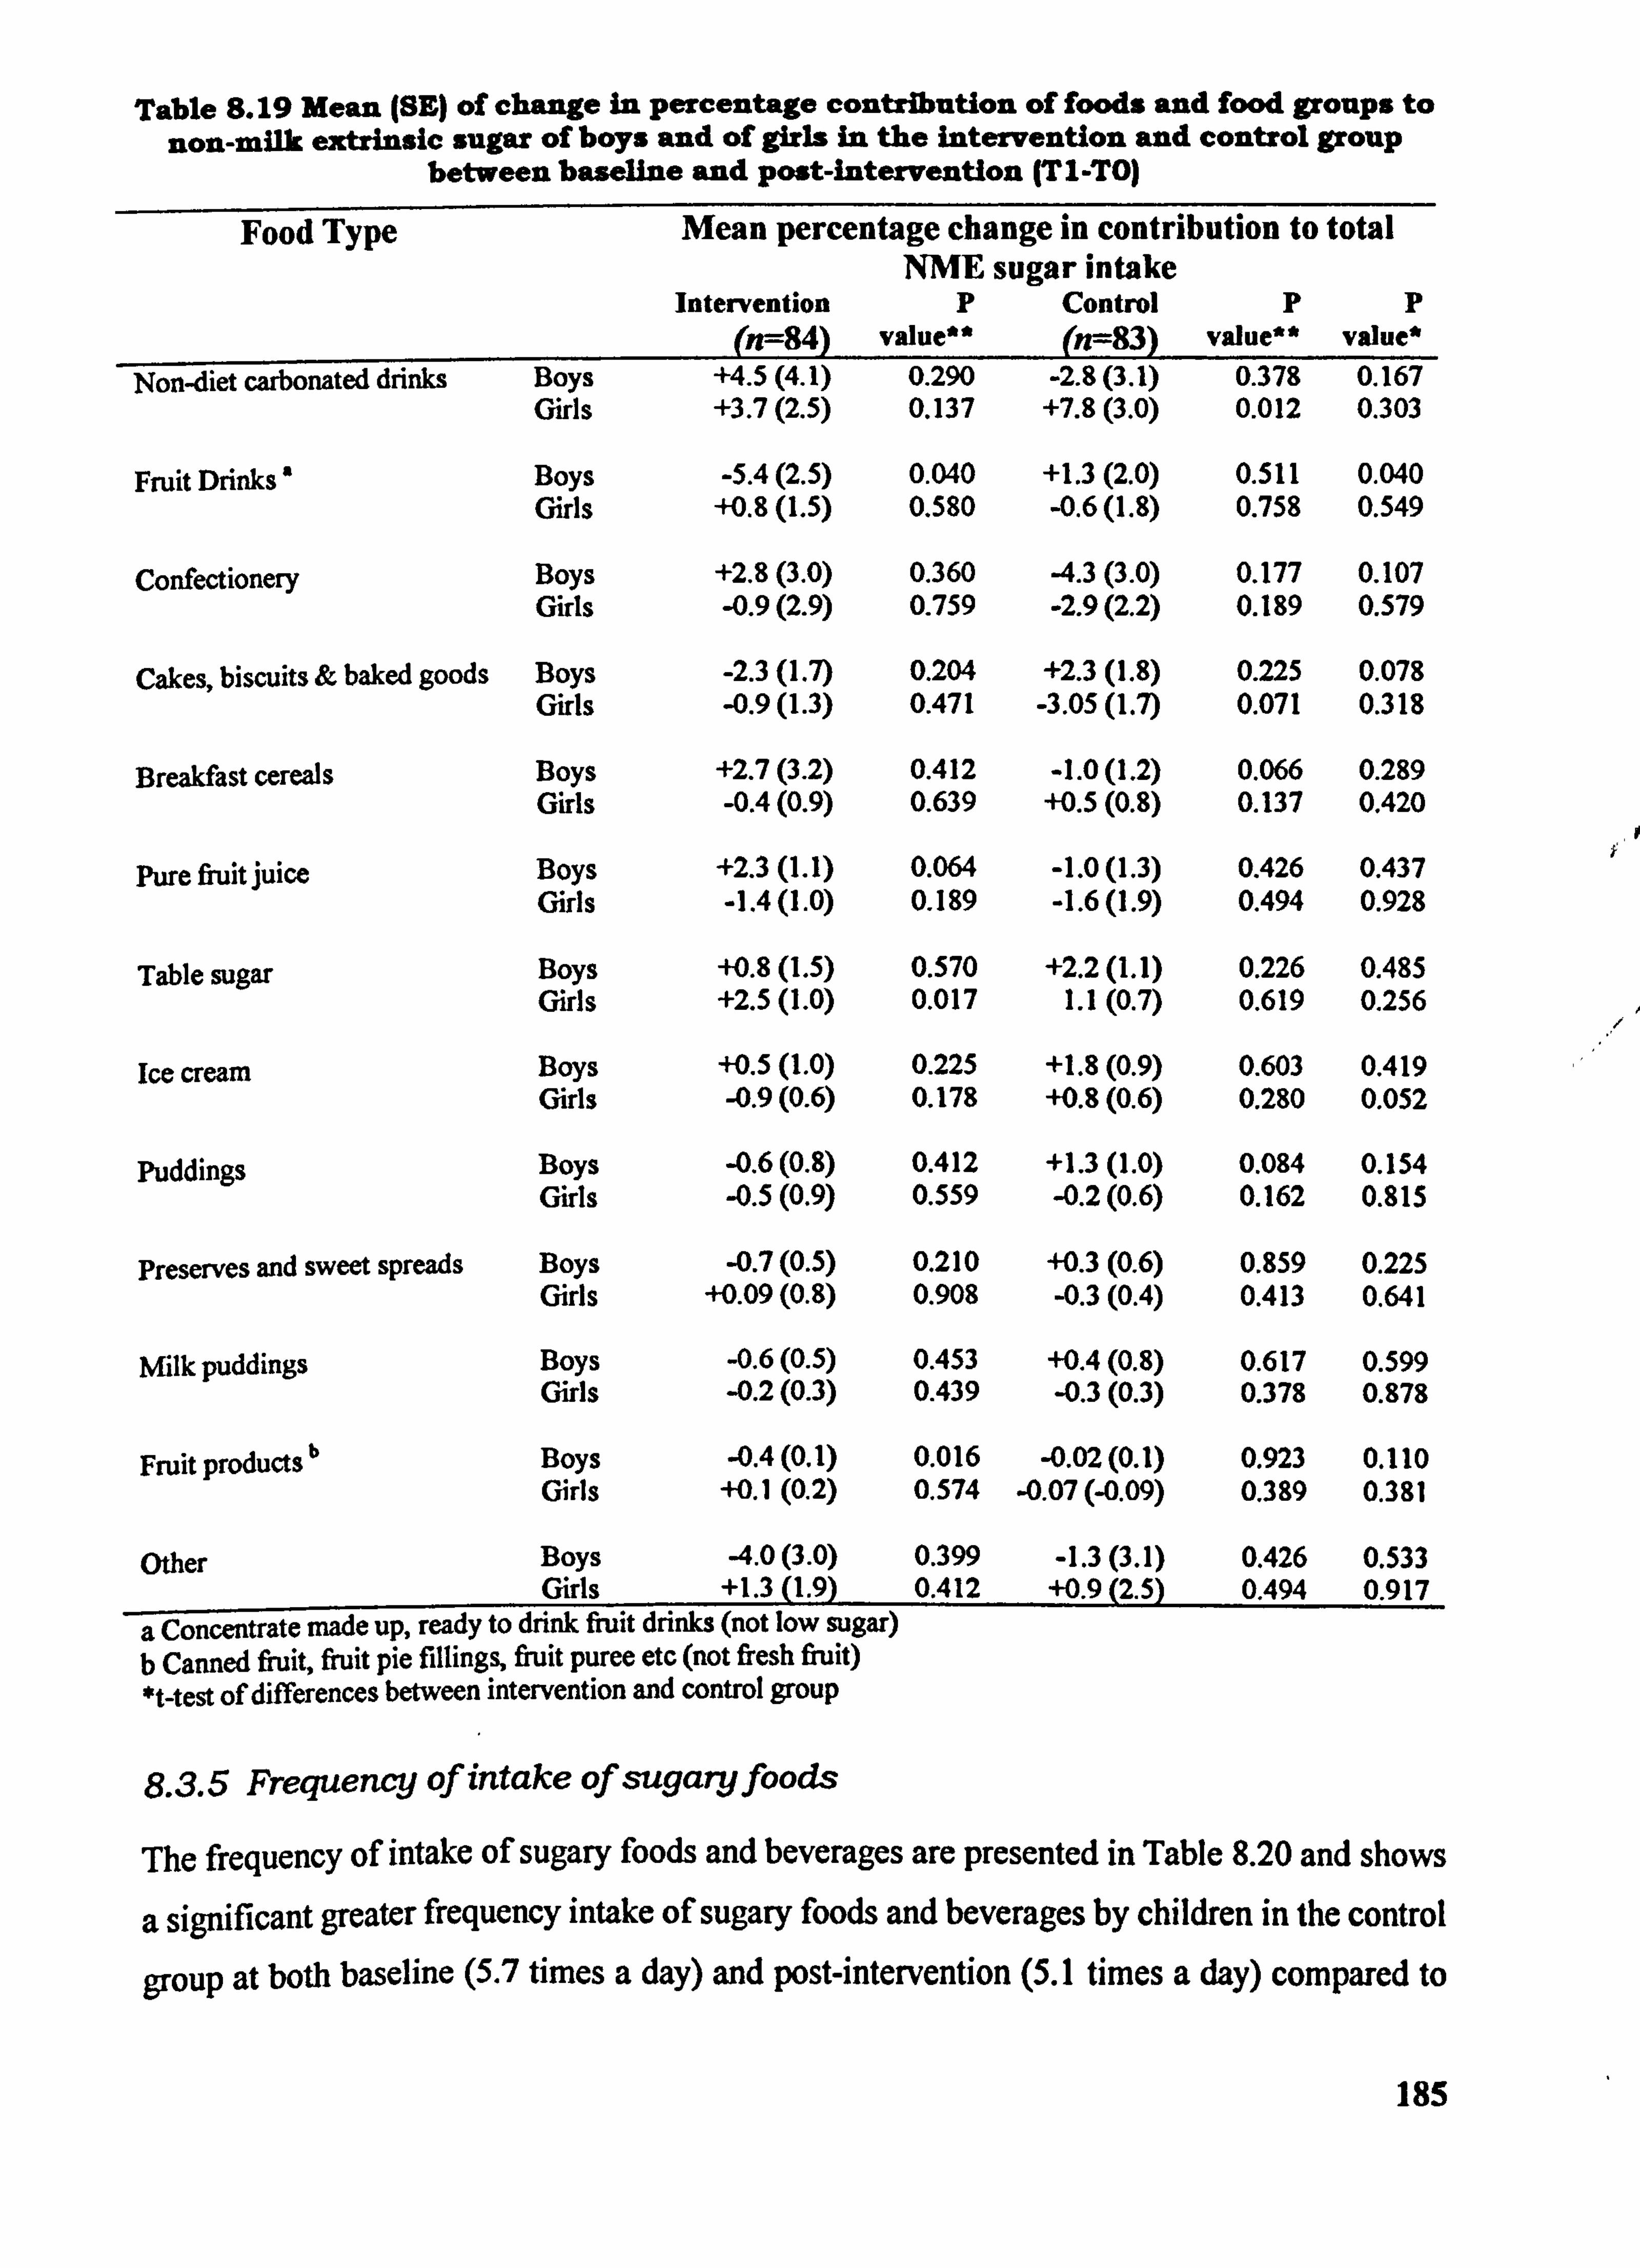
Table S. 19 Mean (SE) of change in percentage contribution of foods and food groups to non-milk extrinsic sugar of boys and of girls in the intervention and control group
between baseline and post-intervention (TI-TO)
Food Type Mean percentage change in contribution to total NME sugar intake
Intervention P Control P p (n--84) value" (n--83) value** value*
Non-diet carbonated drinks Boys +4.5(4.1) 0.290 -2.8(3.1) 0.378 0.167 Girls +3.7(2.5) 0.137 +7.8(3.0) 0.012 0.303
Fruit Drinks Boys -5.4(2.5) 0.040 +1.3(2.0) 0.511 0.040 Girls +0.8(l. 5) 0.580 -0.6(l. 8) 0.758 0.549
Confectionery Boys +2.8(3.0) 0.360 -4.3(3.0) 0.177 0.107 Girls -0.9(2.9) 0.759 -2.9(2.2) 0.189 0.579
Cakes, biscuits & baked goods Boys -2.3(l. 7) 0.204 +2.3(l. 8) 0.225 0.078 Girls -0.9(l. 3) 0.471 -3.05(l. 7) 0.071 0.318
Breakfast cereals Boys +2.7(3.2) 0.412 -1.0(1.2) 0.066 0.289 Girls -0.4(0.9) 0.639 +0.5(0.8) 0.137 0.420
Pure fiuit juice Boys +2.3(l. 1) 0.064 -1.0(1.3) 0.426 0.437 Girls -1.4(l. 0) 0.189 -1.6(l. 9) 0.494 0.928
Table sugar Boys +0.8(l. 5) 0.570 +2.2(l. 1) 0.226 0.485 Girls +2.5(l. 0) 0.017 1.1(0.7) 0.619 0.256
lee cream Boys +0.5(l. 0) 0.225 +1.8(0.9) 0.603 0.419 Girls -0.9(0.6) 0.178 +0.8(0.6) 0.280 0.052
Puddings Boys -0.6(0.8) 0.412 +1.3(l. 0) 0.084 0.154 Girls -0.5(0.9) 0.559 -0.2(0.6) 0.162 0.815
preserves and sweet spreads Boys -0.7(0.5) 0.210 +0.3(0.6) 0.859 0.225 Girls +0.09(0.8) 0.908 -0.3(0.4) 0.413 0.641
Milk puddings Boys -0.6(0.5) 0.453 +0.4(0.8) 0.617 0.599 Girls -0.2(0.3) 0.439 -0.3(0.3) 0.378 0.878
Fruit products b Boys -0.4(0.1) 0.016 -0.02(0.1) 0.923 0.110 Girls +0.1(0.2) 0.574 -0.07 (-0.09) 0.389 0.381
Other Boys -4.0(3.0) 0.399 -1.3(3.1) 0.426 0.533 Girls +1.3(l. 9) 0.412 +0.9(2.5) 0.494 0.917
a Concentrate made up, ready to drink fruit drinks (not low sugar) b Canned fruit, fruit pie fillings, fruit puree etc (not fresh fruit) *t-test of differences between intervention and control group
8.3.5 Frequency of intake of sugaryfoods
The frequency of intake of sugary foods and beverages are presented in Table 8.20 and shows
a significant greater frequency intake of sugary foods and beverages by children in the control
group at both baseline (5.7 times a day) and post-intervention (5.1 times a day) compared to
185
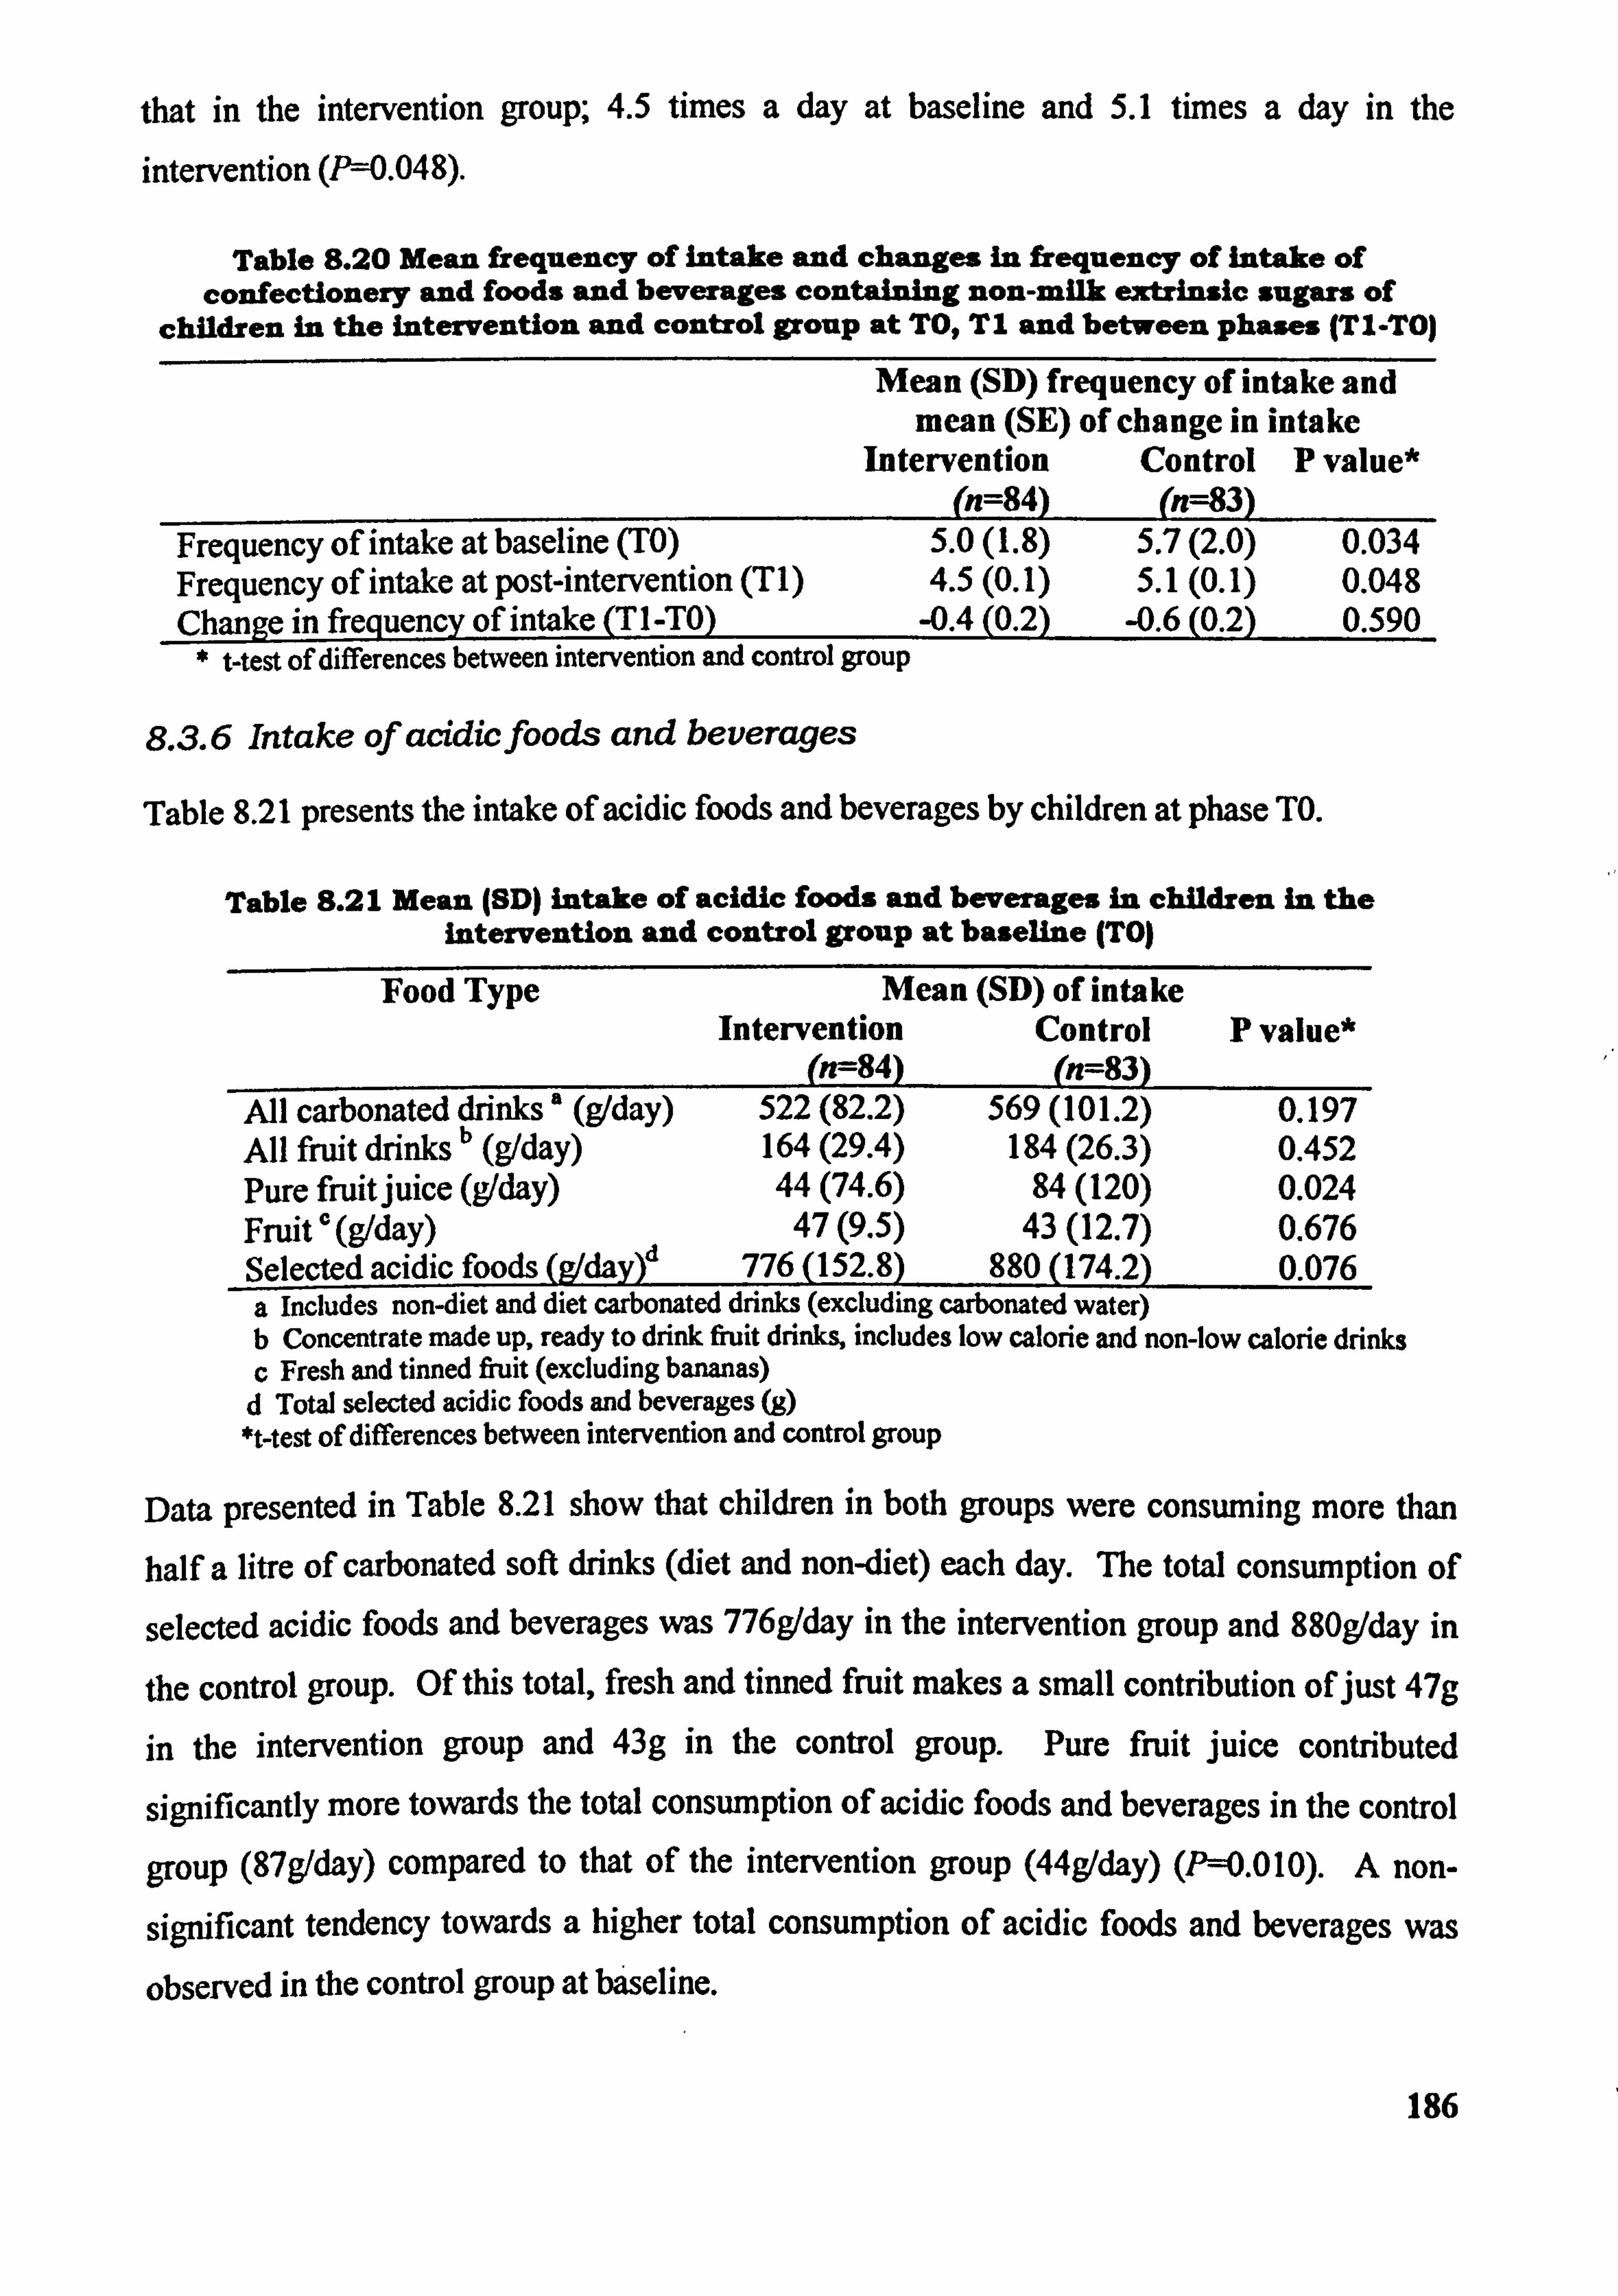
that in the intervention group; 4.5 times a day at baseline and 5.1 times a day in the intervention (P=0.048).
Table 8.20 Mean frequency of Intake and changes in frequency of Intake of confectionery and foods and beverages containing non-milk extrinsic sugars of
children in the intervention and control group at TO, TI and between phases (T1. TO)
Mean (SD) frequency of intake and mean (SE) of change in intake
Intervention Control P value* (n=84) (n=83)
Frequency of intake at baseline (TO) 5.0(1.8) 5.7(2.0) 0.034 Frequency of intake at post-intervention (TI) 4.5(0.1) 5.1(0.1) 0.048 Chanae infrequency of intake (TI-TO)__ -0.4(0.2) -0.6(0.2) 0.590
* t-test of differences between intervention and control group
8.3.6 Intake of acidicfoods and beverages
Table 8.21 presents the intake of acidic foods and beverages by children at phase TO.
Table 8.21 Mean (SD) intake of acidic foods and beverages In children in the intervention and control group at baseline (TO)
Food Type Mean (SD) of intake Intervention Control P value*
017- 8) (n=83) All carbonated drinks a (g/day) 522(82.2) 569(101.2) 0.197
ll rUit drinks b (g/day) Af 164(29.4) 184(26.3) 0.452 Pure fruitjuice (g1day) 44(74.6) 84(120) 0.024 Fruit c (9/day) 47(9.5) 43(12.7) 0.676 Selected acidic foods (g/day)d 776(152.8) 880(174.2) 0.076 a includes non-diet and diet carbonated drinks (excluding carbonated water) b Concentrate made up, ready to drink fruit drinks, includes low calorie and non-low calorie drinks c Fresh and tinned fruit (excluding bananas) d Total selected acidic foods and beverages (g) *t-test of differences between intervention and control group
Data presented in Table 8.21 show that children in both groups were consuming more than
half a litre of carbonated soft drinks (diet and non-diet) each day. The tow consumption of
selected acidic foods and beverages was 776g/day in the intervention group and 880g/day in
the control group. Of this total, fresh and tinned fruit makes a small contribution of just 47g
in the intervention group and 43g in the control group. Pure fruit juice contributed
significantly more towards the total consumption of acidic foods and beverages in the control
group (87g/day) compared to that of the intervention group (44g/day) (P=0.010). A non-
significant tendency towards a higher total consumption of acidic foods and beverages was
observed in the control group at býseline.
186
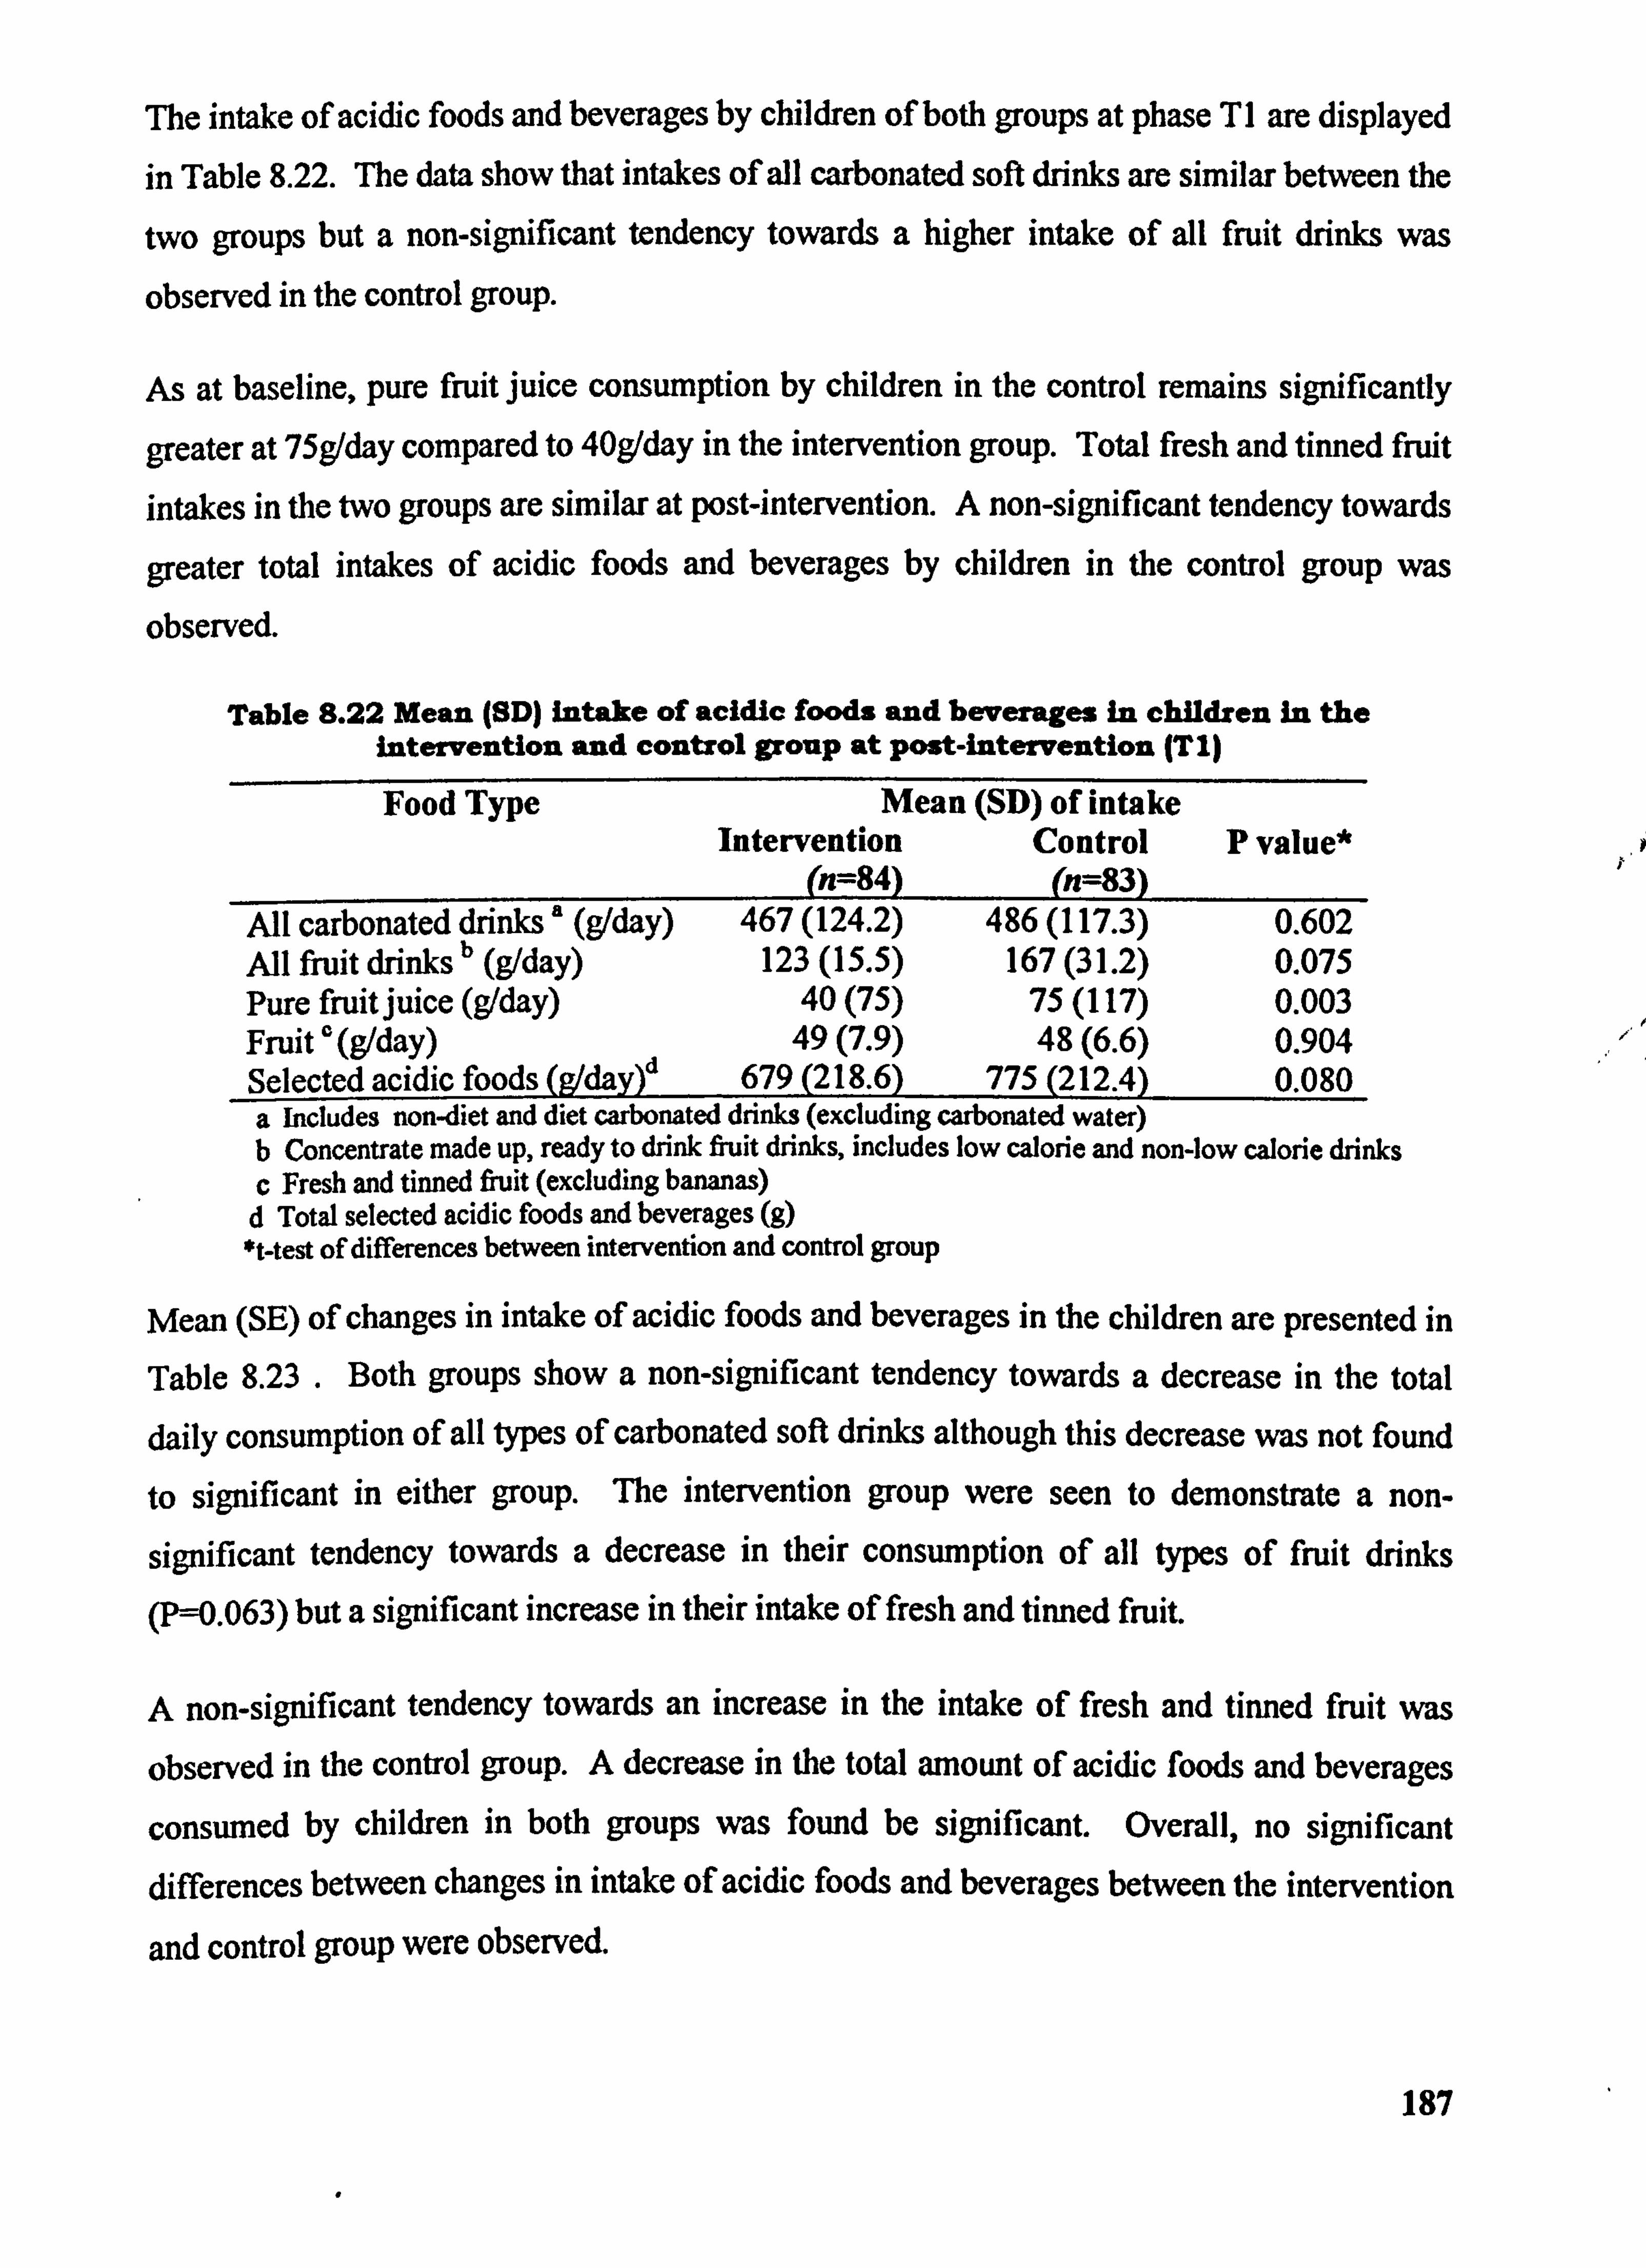
The intake of acidic foods and beverages by children of both groups at phase TI are displayed
in Table 8.22. The data show that intakes of all carbonated soft drinks are similar between the
two groups but a non-significant tendency towards a higher intake of all fruit drinks was
observed in the control group.
As at baseline, pure fruit juice consumption by children in the control remains significantly
greater at 75gIday compared to 40g/day in the intervention group. Total fresh and tinned fruit
intakes in the two groups are similar at post-intervention. A non-significant tendency towards
greater total intakes of acidic foods and beverages by children in the control group was
observed.
Table 8.22 Mean (SD) intake of acidic foods and beverages in children in the intervention and control group at post-intervention (T1)
Food Type Mean (SD) of intake Intervention Control P value*
(n=84) (n=83) All carbonated drinks' (g1day) 467(124.2) 486(117.3) 0.602 All fruit drinks b (g/day) 123(15.5) 167(31.2) 0.075 Pure fruitjuice (g/day) 40(75) 75(117) 0.003 Fruit ' (g/day) 49(7.9) 48(6.6) 0.904
S (Wday)d Selected acidic food 679(218.6) 775(212.4) 0.080 a Includes non-diet and diet carbonated drinks (excluding carbonated water) b Concentrate made up, ready to drink fruit drinks, includes low calorie and non-low calorie drinks c Fresh and tinned fruit (excluding bananas) d Total selected acidic foods and beverages (g) *t-test of differences between intervention and control group
Mean (SE) of changes in intake of acidic foods and beverages in the children are presented in
Table 8.23 .
Both groups show a non-significant tendency towards a decrease in the total
daily consumption of all types of carbonated soft drinks although this decrease was not found
to significant in either group. The intervention group were seen to demonstrate a non-
significant tendency towards a decrease in their consumption of all types of fruit drinks
(P-0.063) but a significant increase in their intake of fresh and tinned fruit.
A non-significant tendency towards an increase in the intake of fresh and tinned fruit was
observed in the control group. A decrease in the total amount of acidic foods and beverages
consumed by children in both groups was found be signifcant. Overall, no significant differences between changes in intake of acidic foods and beverages between the intervention
and control group were observed.
187
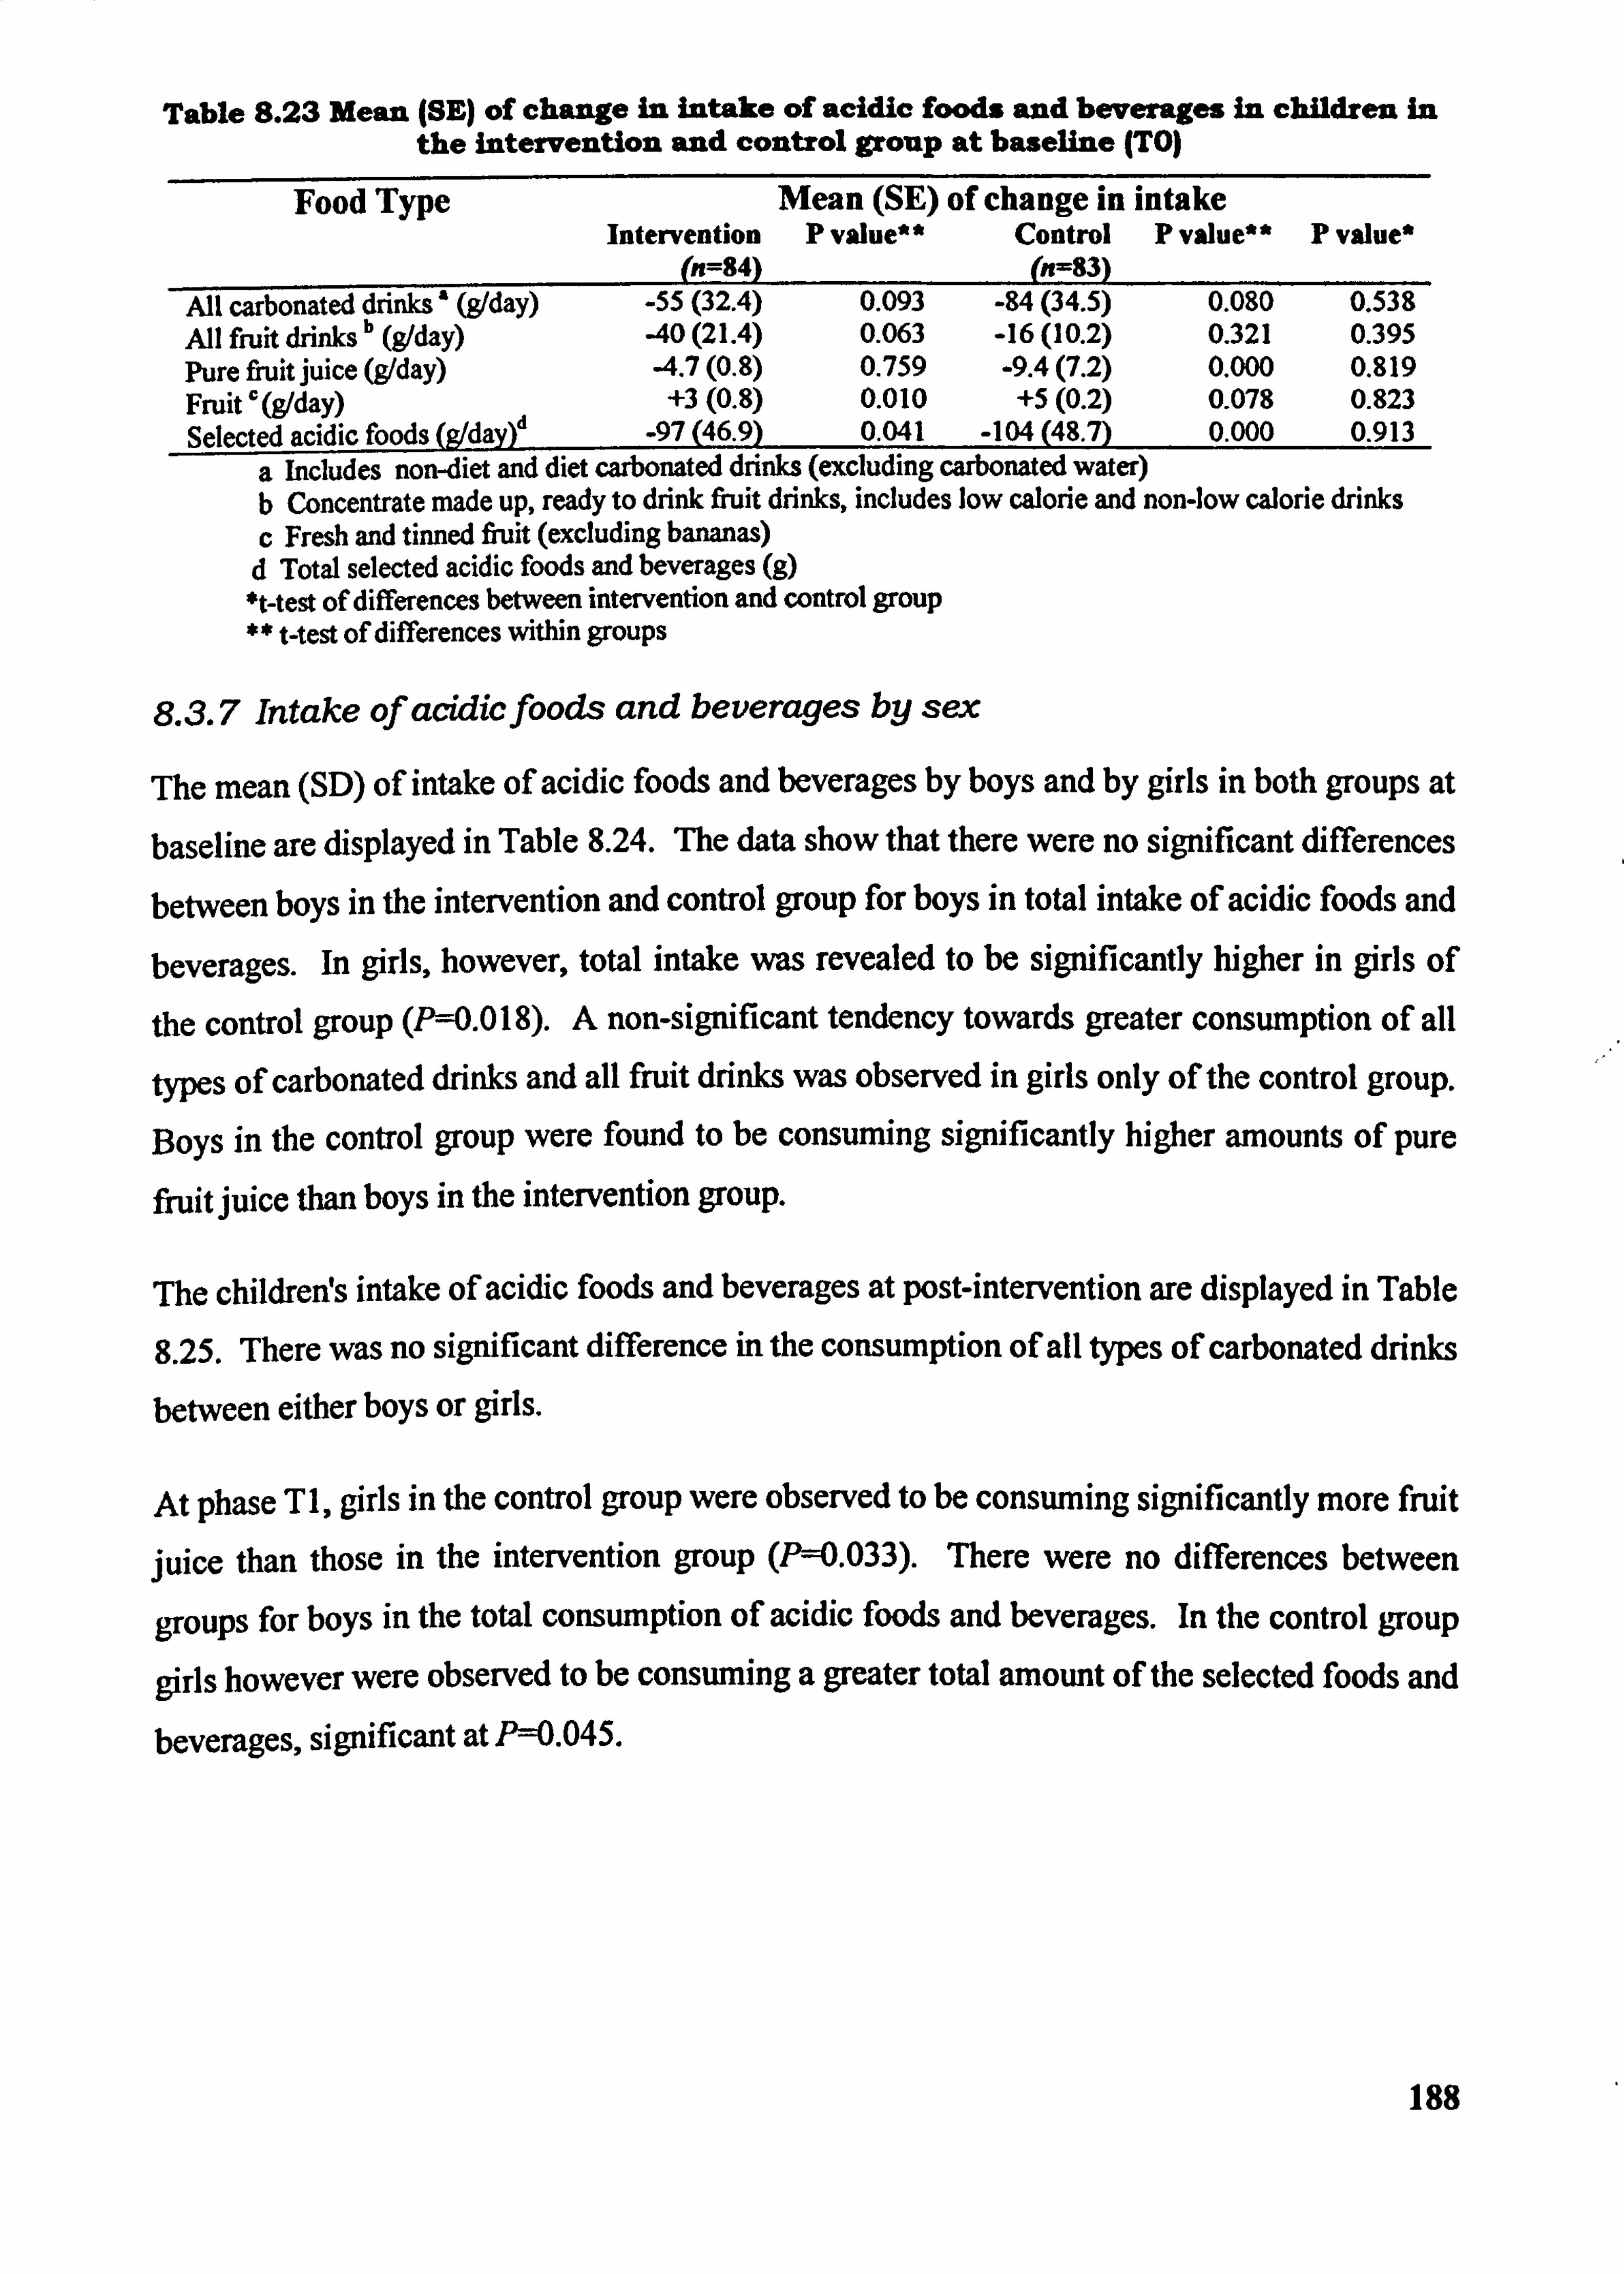
Table 8.23 Mean (SE) of change in intake of acidic foods and beverages in children in the Intervention and control group at baseline (TO)
Food Type Mean (SE) of change in intake Intervention P value** Control P value"
(n=84) (n=83) P value*
All carbonated drinks ' (g1day) -55(32.4) 0.093 -84(34.5) 0.080 0.538 All fruit drinks b (g1day) -40(21.4) 0.063 -16(10.2) 0.321 0.395 Pure fruit juice (g1day) -4.7(0.8) 0.759 -9.4(7.2) 0.000 0.819 Fruit r (g1day) +3(0.8) 0.010 +5(0.2) 0.078 0.823 Selected acidic foods (gldaO -97(46.9) 0.041 -104(48.7) 0.000 0.913
a includes non-diet and diet carbonated drinks (excluding carbonated water) b Concentrate made up, ready to drink fruit drinks, includes low calorie and non-low calorie drinks c Fresh and tinned fruit (excluding bananas) d Total selected acidic foods and beverages (g) *t-test of differences between intervention and control group ** t-test of differences within groups
8.3.7 Intake of acidtcfoods and beverages by sex
The mean (SD) of intake of acidic foods and beverages by boys and by girls in both groups at
baseline are displayed in Table 8.24. The data show that there were no significant differences
between boys in the intervention and control group for boys in total intake of acidic foods and
beverages. In girls, however, total intake was revealed to be significantly higher in girls of
the control group (P=0.018). A non-significant tendency towards greater consumption of all
types of carbonated drinks and all fruit drinks was observed in girls only of the control group.
Boys in the control group were found to be consuming significantly higher amounts of pure
fruit juice than boys in the intervention group.
The childreWs intake of acidic foods and beverages at post-intervention are displayed in Table
8.25. There was no significant difference in the consumption of all tYPes of carbonated drinks
between either boys or girls.
At phase TI, girls in the control group were observed to be consuming significantly more fruit
juice than those in the intervention group (P--0.033). There were no differences between
groups for boys in the total consumption of acidic foods and beverages. In the control group
girls however were observed to be consuming a greater total amount of the selected foods and
beverages, significant at P=0.045.
188
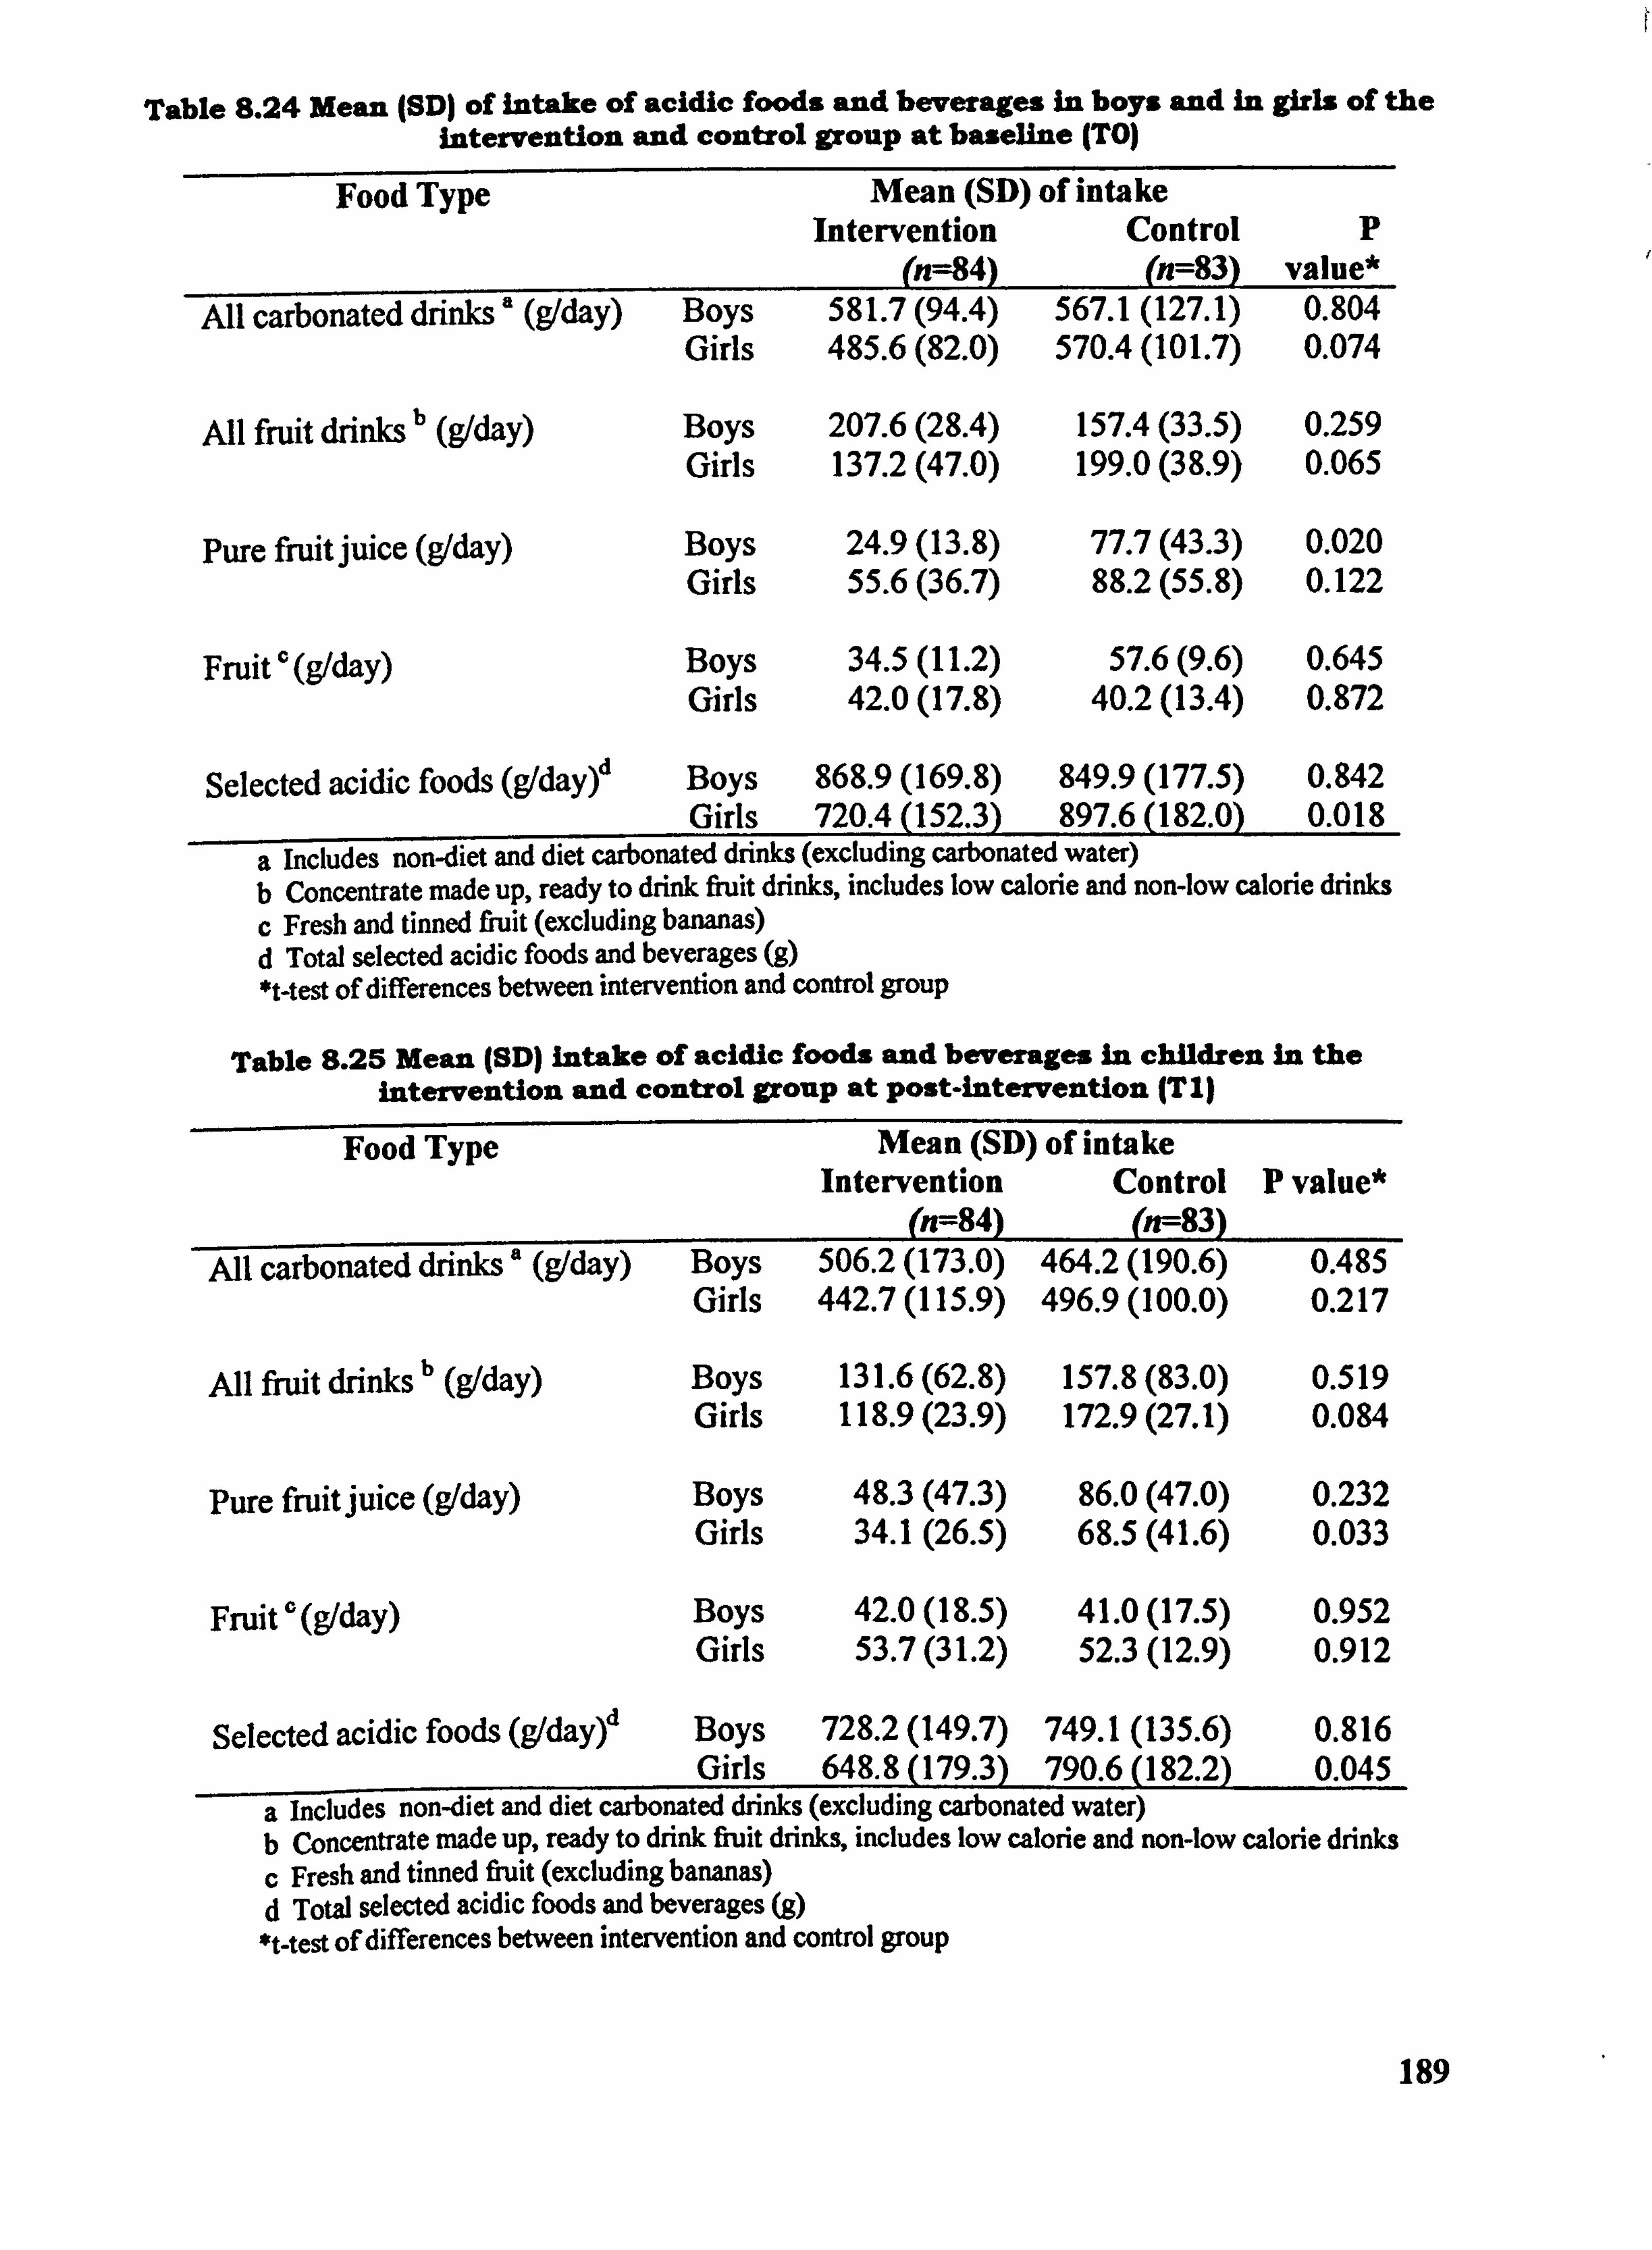
Table 8.24 Mean (SDI of intake of acidic foods and beverages in boys and in girls of the intervention and control group at baseline (TO)
Food Type Mean (SD) of intake Intervention Control P
(n=84) (n=83) value* All carbonatcd drinks ' (g1day) Boys 581.7 (94.4) 567.1 (127.1) 0.804
Girls 485.6 (82.0) 570.4 (101.7) 0.074
All fiuit drinks b (g/day) Boys 207.6 (28.4) 157.4 (33.5) 0.259 Girls 137.2 (47.0) 199.0 (38.9) 0.065
Pure fruit juice (gIday) Boys 24.9(13.8) 77.7(43.3) 0.020 Girls 55.6(36.7) 88.2(55.8) 0.122
Fruit ', (g/day) Boys 34.5(11.2) 57.6(9.6) 0.645 Girls 42.0(17.8) 40.2(13.4) 0.872
Selected acidic foods (gldayý Boys 868.9 (169.8) 849.9 (177.5) 0.842 Girls 720.4 (152.3) 897.6 (182.0) 0.018
a Includes non-diet and diet carbonated drinks (excluding carbonated water) b Concentrate made up, ready to drink fruit drinks, includes low calorie and non-low calorie drinks c Fresh and tinned fiuit (excluding bananas) d Total selected acidic foods and beverages (g) *t-test of differences between intervention and control group
Table 8.25 Mean (SD) intake of acidic foods and beverages in children in the intervention and control group at POst-intervention (T11
Food Type Mean (SD) of intake Intervention Control P value*
(n=84) (n--83) All carbonated drinks' (g/day) Boys 506.2 (173.0) 464.2 (190.6) 0.485
Girls 442.7 (115.9) 496.9 (100.0) 0.217
All fnfit drinks b (g/day) Boys 131.6 (62.8) 157.8 (83.0) 0.519 Girls 118.9 (23.9) 172.9 (27.1) 0.084
Pure fruit juice (gIday) Boys 48.3(47.3) 86.0(47.0) 0.232 Girls 34.1(26.5) 68.5(41.6) 0.033
Fruit (g/day) Boys 42.0(18.5) 41.0(17.5) 0.952 Girls 53.7(31.2) 52.3(12.9) 0.912
Selected acidic foods (g1dayr Boys 728.2 (149.7) 749.1 (135.6) 0.816 Girls 648.8 (179.3) 790.6 (182.2) 0.045
a includes non-diet and diet carbonated drinks (excluding carbonated water) b Concentrate made up, ready to drink fruit drinks, includes low calorie and non-low calorie drinks c Fresh and tinned fiuit (excluding bananas) d Total selected acidic foods and beverages (g) *t-test of differences between intervention and control group
189
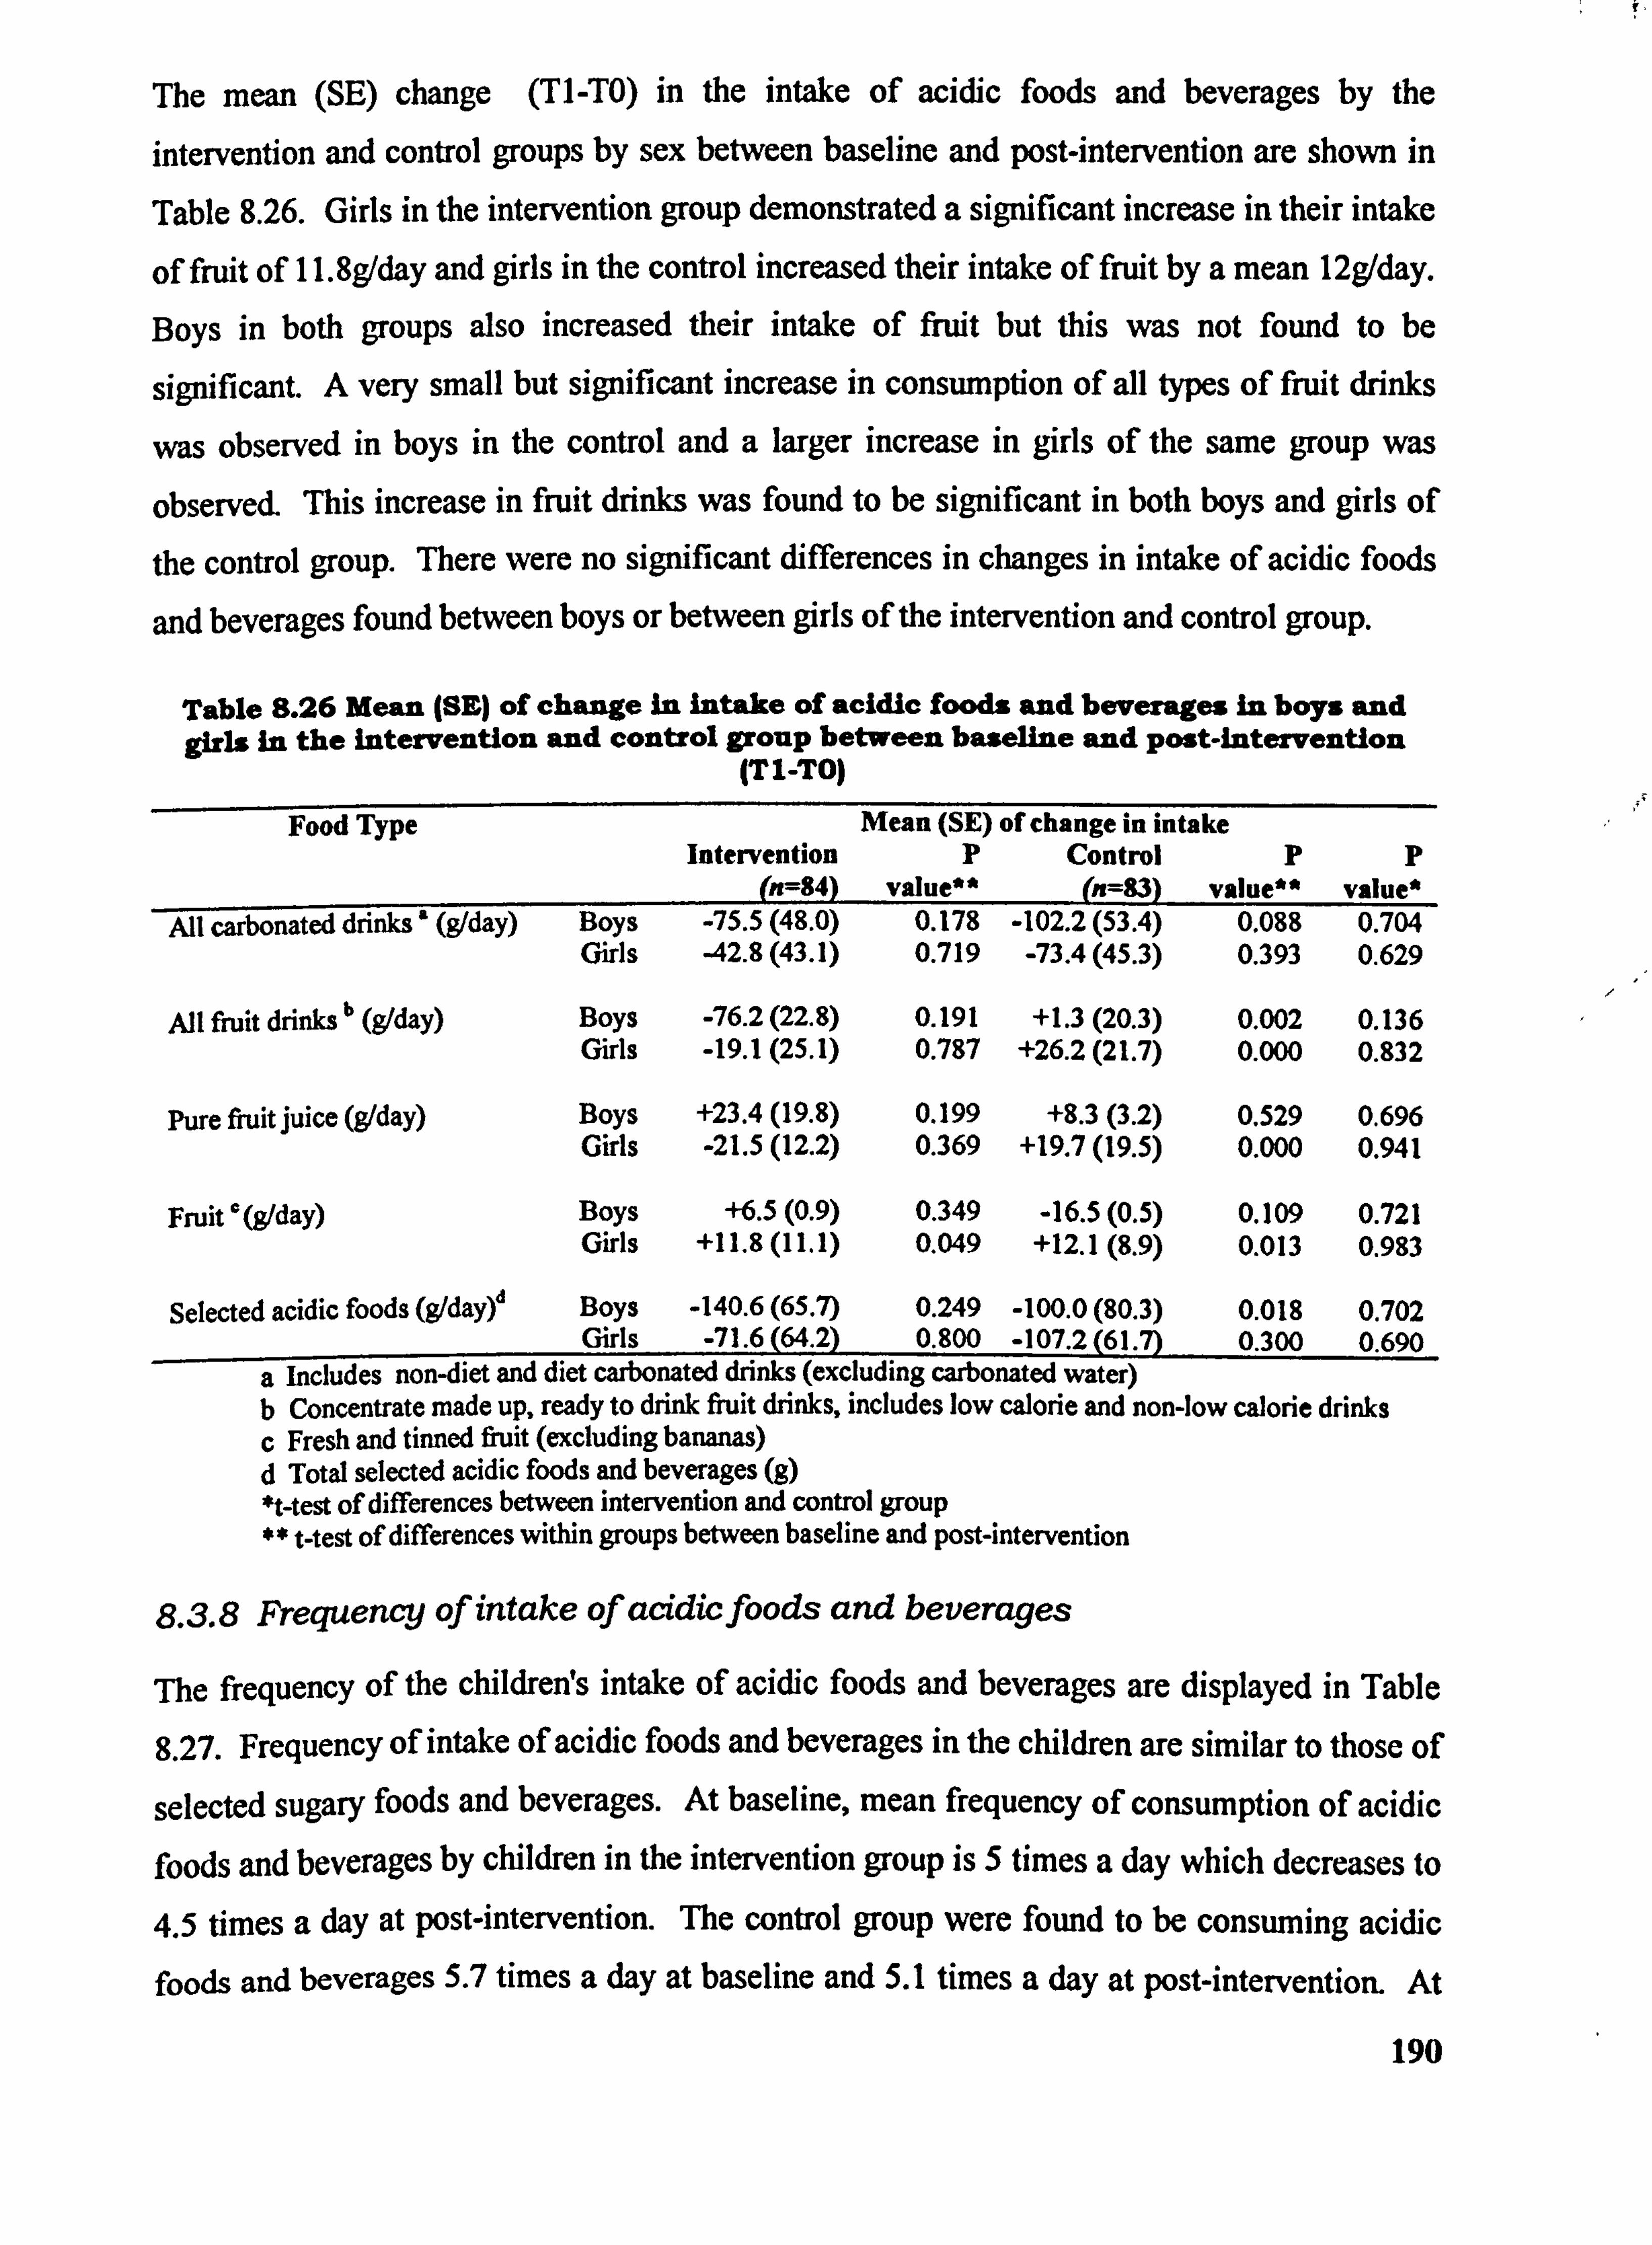
The mean (SE) change (TI-TO) in the intake of acidic foods and beverages by the
intervention and control groups by sex between baseline and post-intervention are shown in
Table 8.26. Girls in the intervention group demonstrated a significant increase in their intake
of fruit of 11.8g/day and girls in the control increased their intake of fruit by a mean 12g/day.
Boys in both groups also increased their intake of fruit but this was not found to be
significant. A very small but significant increase in consumption of all types of fruit drinks
was observed in boys in the control and a larger increase in girls of the same group was
observed. This increase in fruit drinks was found to be significant in both boys and girls of the control group. There were no significant differences in changes in intake of acidic foods
and beverages found between boys or between girls of the intervention and control group.
Table 8.26 Mealm (SE) of change In intake of acidic foods and beverages in boys and girls in the intervention and control group between baseline and Post-intervention
(TI-TO)
Food Type Mean (SE) of change in intake Intervention P Control PP
(n=84) value** --
(n=83) value** value* All carbonated drinks' (g1day) Boys -75.5 (48.0) 0.178 -102.2 (53.4) 0.088 0.704
Girls -42.8 (43.1) 0.719 -73.4 (45.3) 0.393 0.629
All fiuit drinks" (91day) Boys -76.2 (22.8) 0.191 +1.3(20.3) 0.002 0.136 Girls -19.1 (25.1) 0.787 +26.2 (21.7) 0.000 0.832
Pure fruit juice (g/day) Boys +23.4 (19.8) 0.199 +8.3(3.2) 0.529 0.696 Girls -21.5 (12.2) 0.369 +19.7 (19.5) 0.000 0.941
Fruit 0 (9/day) Boys +6.5(0.9) 0.349 -16.5(0.5) 0.109 0.721 Girls +11.8 (11.1) 0.049 +12.1(8.9) 0.013 0.983
Selected acidic foods (gldayý Boys -140.6 (65.7) 0.249 -100.0 (80.3) 0.018 0.702 Girls -71.6 (64.2) 0.800 -107.2 (61.7) 0.300 0.690
a includes non-diet and diet carbonated drinks (excluding carbonated water) b Concentrate made up, ready to drink fruit drinks, includes low calorie and non-low calorie drinks c Fresh and tinned fruit (excluding bananas) d Total selected acidic foods and beverages (g) *t-test of differences between intervention and control group ** t-test of differences within groups between baseline and post-i ntervention
8.3.8 Frequency of intake of acidicfoods and beverages
The frequency of the childrens intake of acidic foods and beverages are displayed in Table
8.27. Frequency of intake of acidic foods and beverages in the children are similar to those of
selected sugary foods and beverages. At baseline, mean frequency of consumption of acidic
foods and beverages by children in the intervention group is 5 times a day which decreases to
4.5 times a day at post-intervention. The control group were found to be consuming acidic foods and beverages 5.7 times a day at baseline and 5.1 times a day at post-intervention. At
190
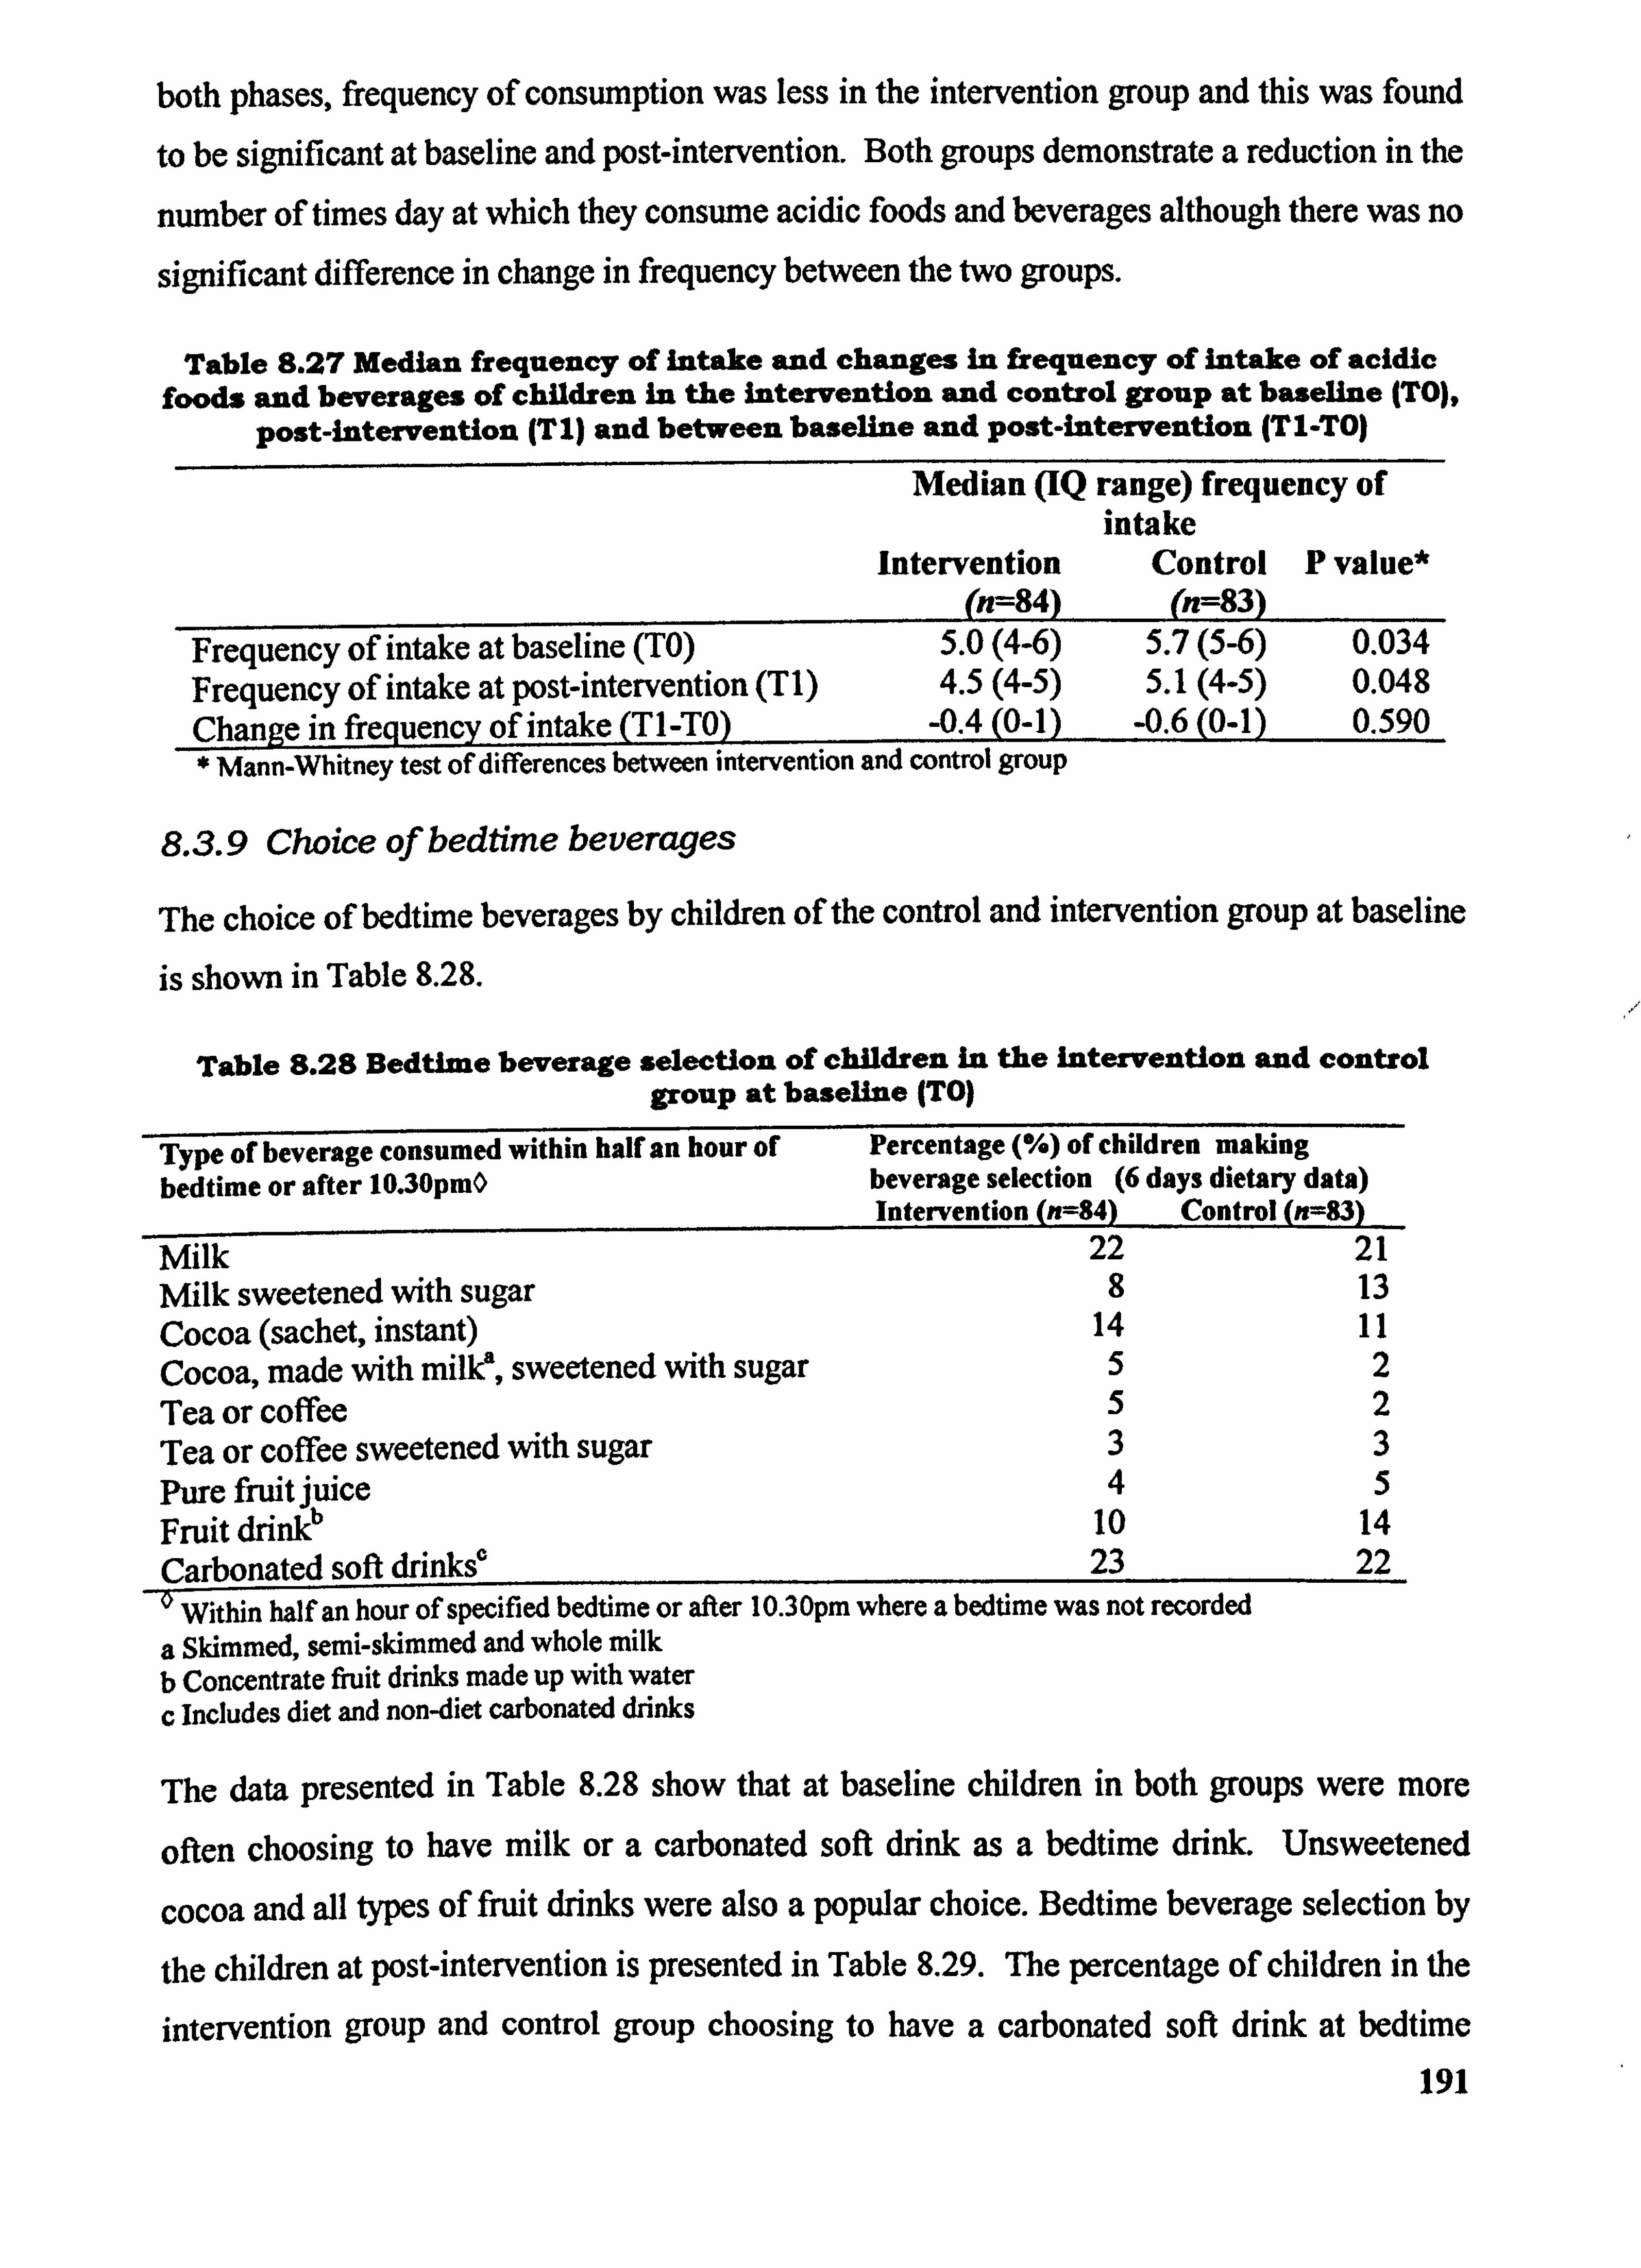
both phases, frequency of consumption was less in the intervention group and this was found
to be significant at baseline and post-intervention. Both groups demonstrate a reduction in the
number of times day at which they consume acidic foods and beverages although there was no
significant difference in change in frequency between the two groups.
Table 8.27 Median frequency of intake and changes in frequency of intake of acidic foods and beverages of children in the Intervention and control group at baseline (TO),
post-intervention (TI) and between baseline and post-intervention (TI-TO)
Median (IQ range) frequency of intake
Intervention Control P value* (n=84) (n=83)
Frequency of intake at baseline (TO) 5.0(4-6) 5.7(5-6) 0.034 Frequency of intake at post-intervention (T 1) 4.5(4-5) 5.1(4-5) 0.048 Chanae in frecluency of intake Tl-TO) -0.4(0-1) -0.6(0-1) 0.590 * Mann-Whitney test of differences between intervention and control group
8.3.9 Choice of bedtime beverages
The choice of bedtime beverages by children of the control and intervention group at baseline
is shown in Table 8.28.
Table 8.28 Bedtime beverage selection of children in the intervention and control group at baseline ITO)
Type of beverage consumed within half an hour of bedtime or after 10.30pmO
Percentage (%) of children making beverage selection (6 days dietary data) Intervention (n=84) Control (n=83)
Milk 22 21
Milk sweetened with sugar 8 13
Cocoa (sachet, instant) 14 11
Cocoa, made with milk', sweetened with sugar 5 2
Tea or coffee 5 2
Tea or coffee sweetened with sugar 3 3
Pure fruit juice 4 5
Fruit drin1O 10 14
Carbonated soft drinks' 23 22 _0 Within half an hour of specified bedtime or after 10.30pm where a bedtime was not recorded
a Skimmed, semi-skimmed and whole milk b Concentrate fruit drinks made up with water c Includes diet and non-diet carbonated drinks
The data presented in Table 8.28 show that at baseline children in both groups were more
often choosing to have milk or a carbonated soft drink as a bedtime drink. Unsweetened
cocoa and all t3rpes of fruit drinks were also a popular choice. Bedtime beverage selection by
the children at post-intervention is presented in Table 8.29. The percentage of children in the
intervention group and control group choosing to have a carbonated soft drink at bedtime
191
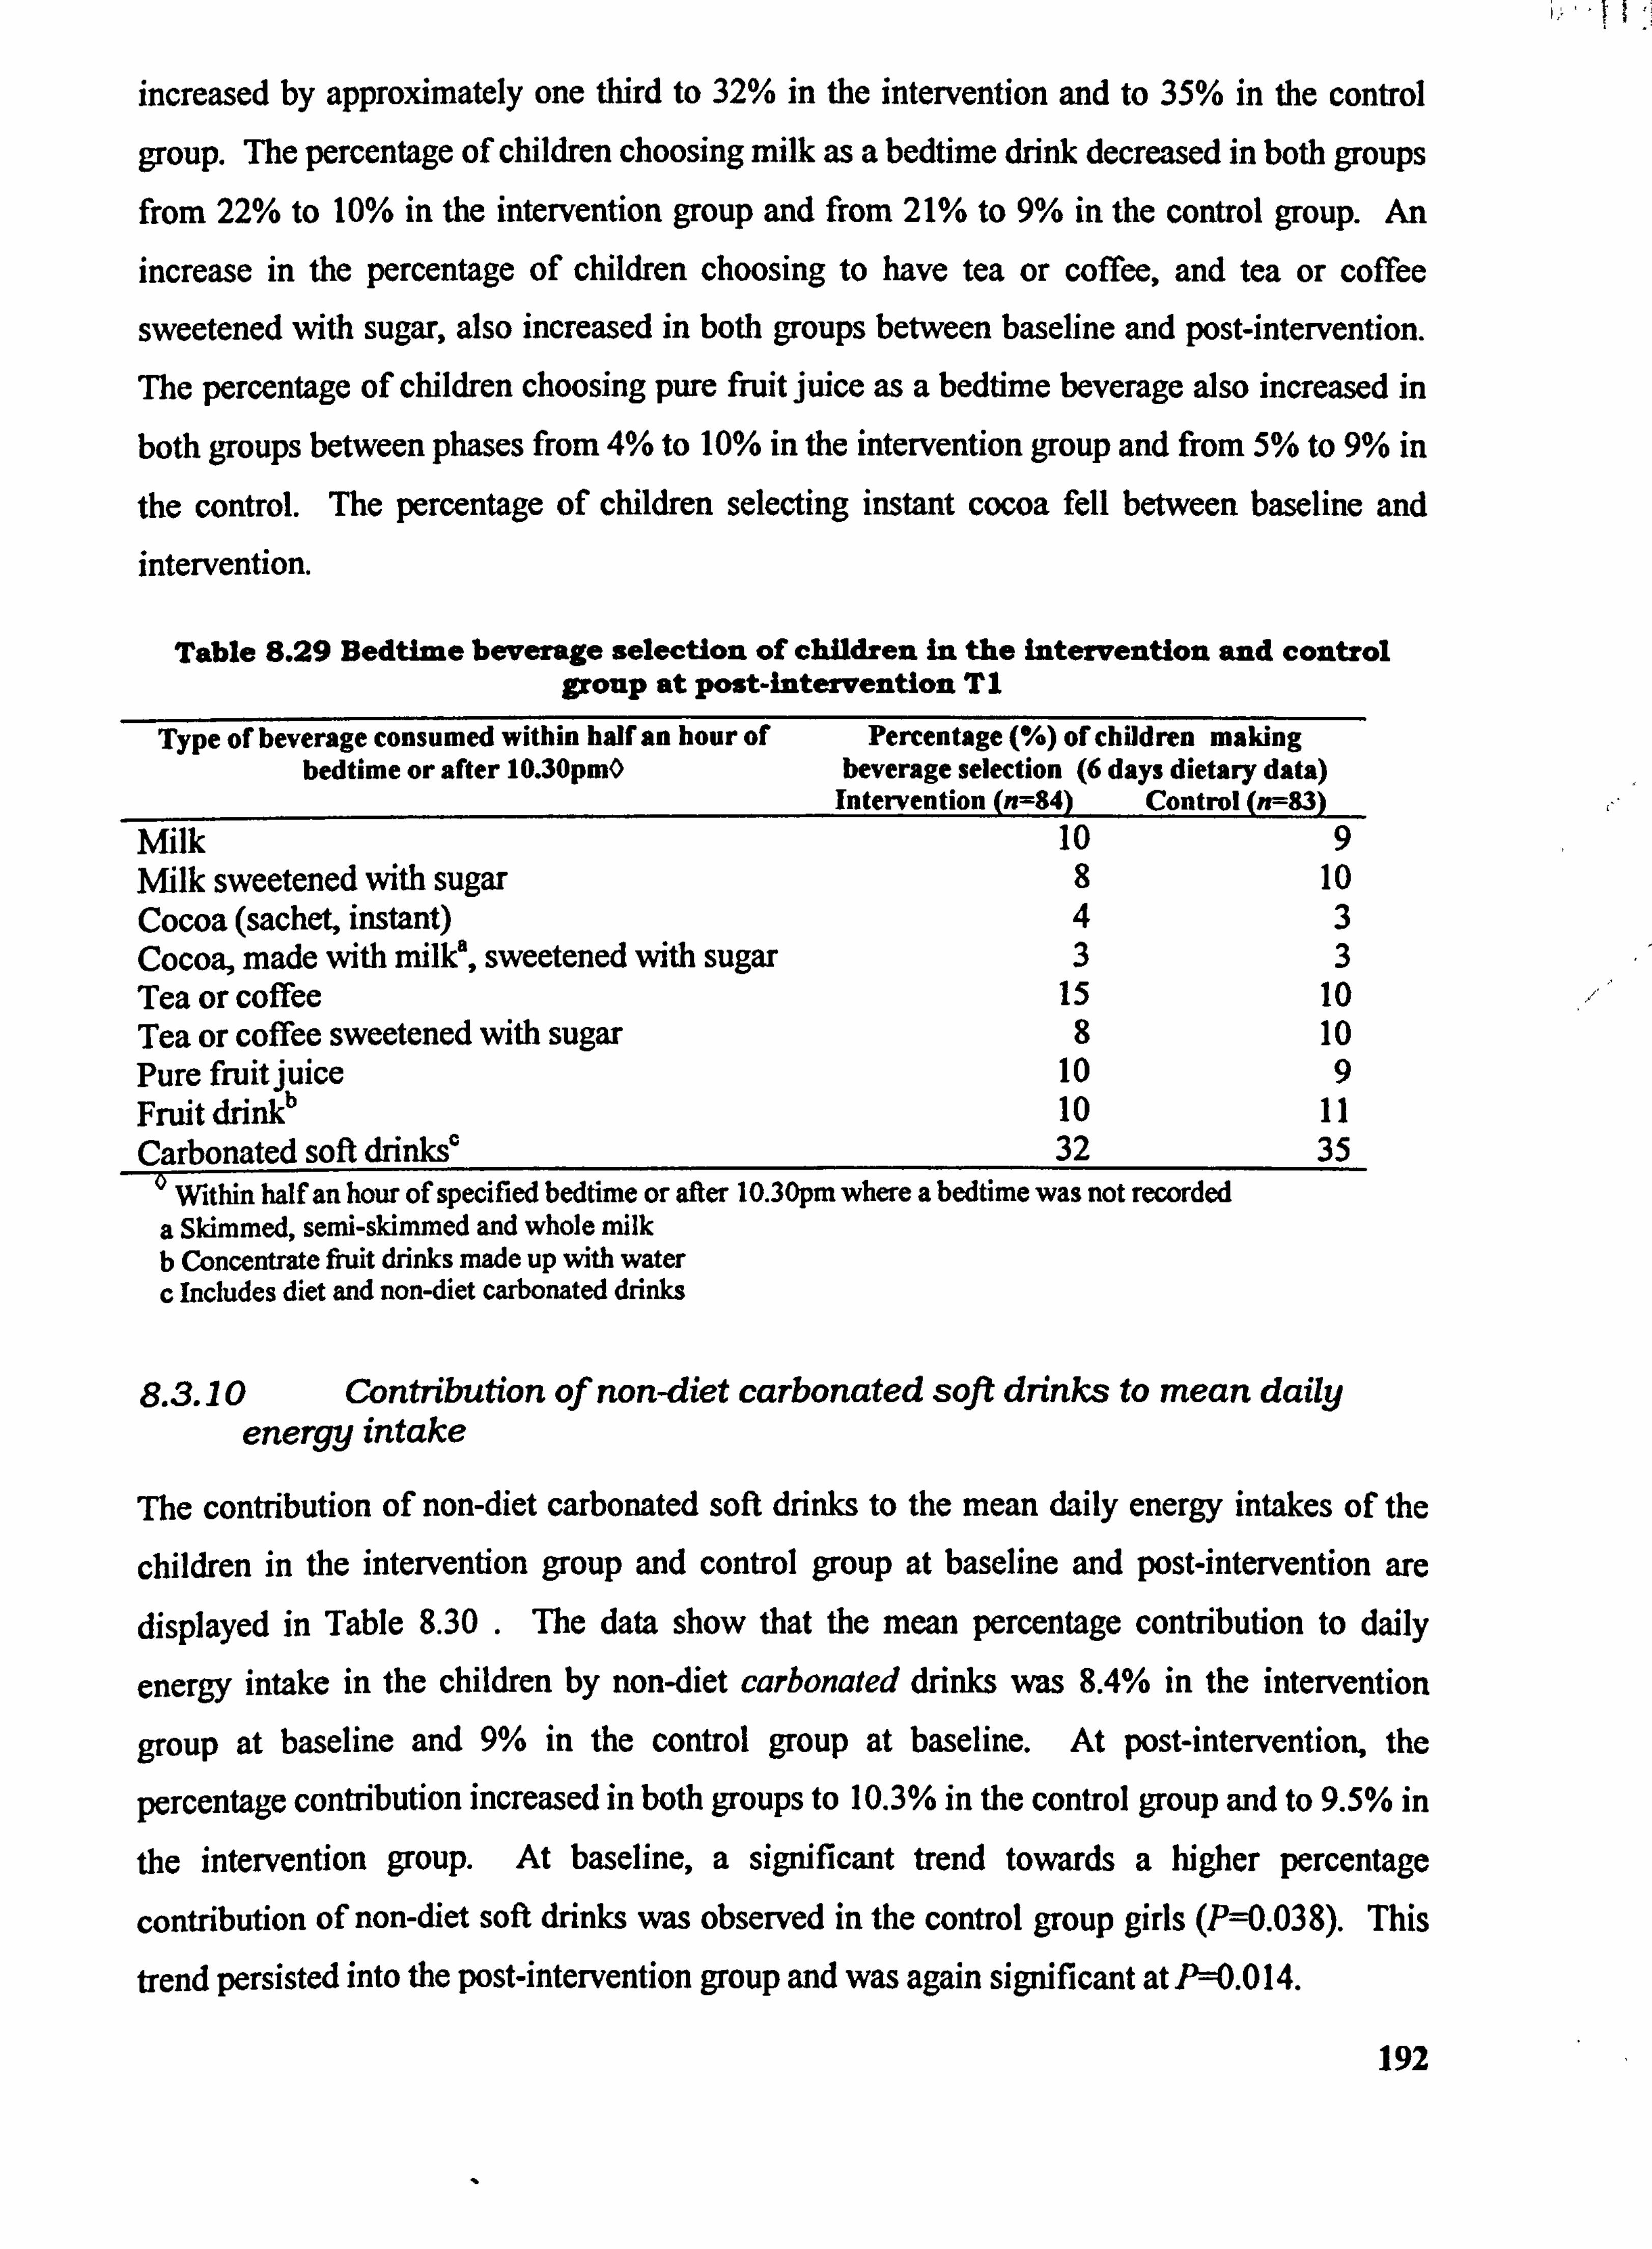
increased by approximately one third to 32% in the intervention and to 35% in the control
group. The percentage of children choosing milk as a bedtime drink decreased in both groups from 22% to 10% in the intervention group and from 21% to 9% in the control group. An increase in the percentage of children choosing to have tea or coffee, and tea or coffee
sweetened with sugar, also increased in both groups between baseline and post-intervention. The percentage of children choosing pure fruit juice as a bedtime beverage also increased in
both groups between phases from 4% to 10% in the intervention group and from 5% to 9% in
the control. The percentage of children selecting instant cocoa fell between baseline and intervention.
Table 8.29 Bedtime beverage selection of children in the intervention and control group at post-intervention TI
Type of beverage consumed within half an hour of Percentage (%) of children making bedtime or after 10.30pmO beverage selection (6 days dietary data)
Intervention (n=84) Control (n=83) Milk 10 9 Milk sweetened with sugar 8 10 Cocoa (sachet, instant) 43 Cocoa, made with milk, sweetened with sugar 33 Tea or coffee 15 10 Tea or coffee sweetened with sugar 8 10 Pure fruitjuice 10 9 Fruit drinO 10 11 Carbonated soft drinks' 32 35
' Within half an hour of specified bedtime or after 10.30pm where a bedtime was not recorded a Skimmed, senii-skimmed and whole milk b Concentrate fruit drinks made up with water c Includes diet and non-diet carbonated drinks
8.3.10 Contribution of non-diet carbonated soft drinks to mean daily energy intake
The contribution of non-diet carbonated soft drinks to the mean daily energy intakes of the
children in the intervention group and control group at baseline and post-intervention are displayed in Table 8.30 . The data show that the mean percentage contribution to daily
energy intake in the children by non-diet carbonated drinks was 8.4% in the intervention
group at baseline and 9% in the control group at baseline. At post-intervention, the
percentage contribution increased in both groups to 10.3% in the control group and to 9.5% in
the intervention group. At baseline, a significant trend towards a higher percentage
contribution of non-diet soft drinks was observed in the control group girls (P--0.038). This
trend persisted into the post-intervention group and was again significant at P=0.0 14.
192
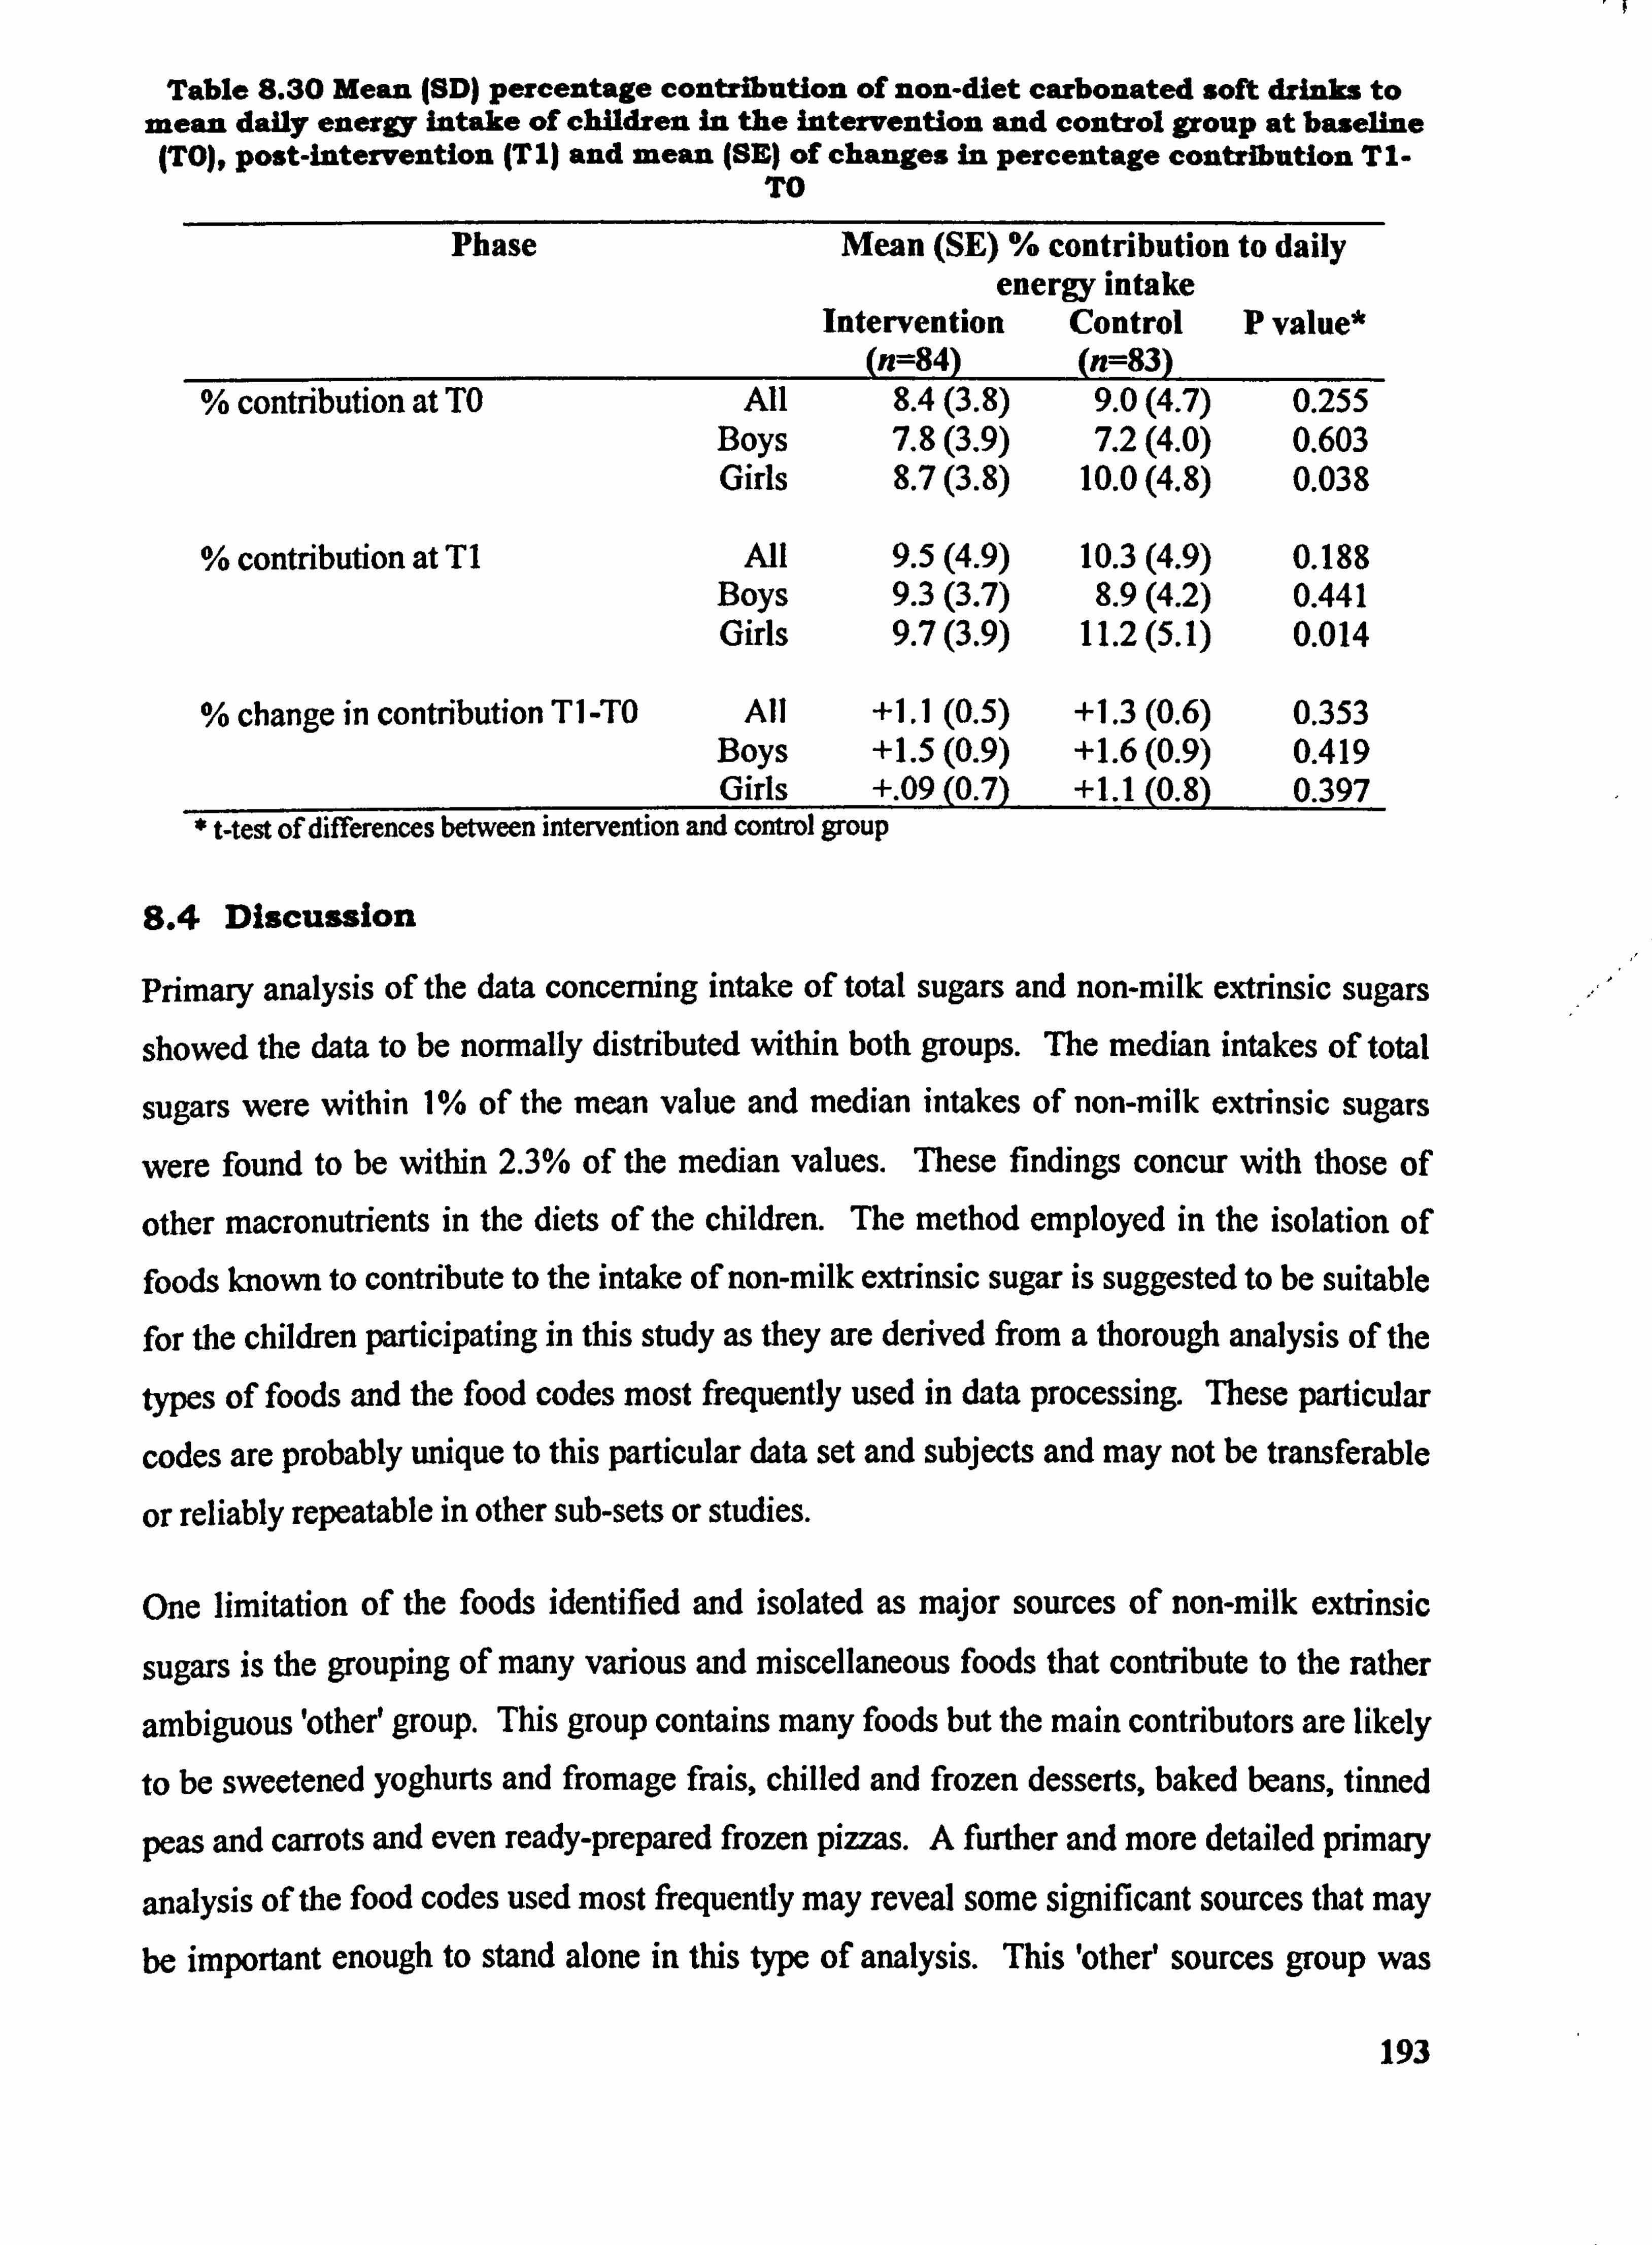
Table 8.30 Mean (SD) percentage contribution of non-diet carbonated soft drinks to mean daily energy intake of children in the intervention and control group at baseline (TO), post-intervention (T I) and mean (SE) of changes in percentage contribution TI-
TO
Phase Mean (SE) % contribution to daily energyintake
Intervention Control P value* (n=84) (n=83)
% contribution at TO All 8.4(3.8) 9.0(4.7) 0.255 Boys 7.8(3.9) 7.2(4.0) 0.603 Girls 8.7(3.8) 10.0(4.8) 0.038
% contribution at TI All 9.5(4.9) 10.3(4.9) 0.188 Boys 9.3(3.7) 8.9(4.2) 0.441 Girls 9.7(3.9) 11.2(5.1) 0.014
% change in contribution TI -TO All +1.1(0.5) +1.3(0.6) 0.353 Boys +1.5(0.9) +1.6(0.9) 0.419 Girls +. 09(0.7) +1.1(0.8) 0.397
* t-test of differences between intervention and control group
8.4 Discussion
Primary analysis of the data concerning intake of total sugars and non-milk extrinsic sugars
showed the data to be normally distributed within both groups. The median intakes of total
sugars were within 1% of the mean value and median intakes of non-milk extrinsic sugars
were found to be within 2.3% of the median values. These findings concur with those of
other macronutrients in the diets of the children. The method employed in the isolation of foods known to contribute to the intake of non-milk extrinsic sugar is suggested to be suitable for the children participating in this study as they are derived from a thorough analysis of the
types of foods and the food codes most frequently used in data processing. These particular
codes are probably unique to this particular data set and subjects and may not be transferable
or reliably repeatable in other sub-sets or studies.
One limitation of the foods identified and isolated as major sources of non-milk extrinsic
sugars is the grouping of many various and miscellaneous foods that contribute to the rather
ambiguous 'other' group. This group contains many foods but the main contributors are likely
to be sweetened yoghurts and fromage frais, chilled and frozen desserts, baked beans, tinned
peas and carrots and even ready-prepared frozen pizzas. A further and more detailed primary
analysis of the food codes used most frequently may reveal some significant sources that may be important enough to stand alone in this type of analysis. This 'othee sources group was
193
found to contribute at least 10% towards the childreifs total average daily intake of non-milk extrinsic sugars, comparable to say, Ehfit drinks (concentrated and diluted with water). The foods and beverages isolated in the method used in this study do concur, however, with the foods and beverages isolated in the NDNS of children aged 4-18-years. The difficulties
experienced when trying to precisely identify those foods which are contributing to the non- milk extrinsic sugars intake in the children taking part in this study are probably identical to those experienced by parents and consumers trying to purchase healthier choices for
themselves and their children. Extrinsic sugars are indeed 'hidden! sugars and the
consequences of this are well-known to health professionals, in particular nutritionists, dietitians and dentists.
The method employed to isolate bedtime beverages was found to be the most time consuming
of all those in the analysis of sugars intake. All children participating were asked to record
their bedtime on each day of their dietary diary but many appeared to find it difficult to
comply with this. The isolation of individual food codes entered when a bedtime was
specified was time-consuming as it involved hand-searching many of the diaries for missing
entries. A nominal bedtime of 10.30pm was'given'to all subjects not specifying a time. This
allowed a query to be written for all beverages consumed after this time to be constructed
with some ease and a similar query could also be written for foods consumed after bedtime if
this were deemed of interest, since it was apparent that children do 'graze' after bedtime. Two
separate files of information were constructed and then combined. This method was most time-consuming for a small result - data were sorted and transferred to a spreadsheet for
further analysis.
For future reference, all bedtimes foods and beverages require entry onto a main database
with a separate field and table in order to make the analysis more straightforward. The data
presented in Section 8.3.9 only serve to show the choices of the children according to nine
arbitrary groups and do not provide details of quantities. The data did not reveal the total
percentage of children taking a bedtime drink or how often during the recording period (of the
total of six days at each phase) they consumed a drink at bedtime. The data have revealed, however, some interesting findings in terms of how the childrens choices changed and show the move from milk drinks to fruit drinks and carbonated soft drinks at bedtime which has
some implications for the dental health of the children.
194
In order to determine the childrens intake of acidic foods and beverages, reference was made
to those foods detailed in the report of Walker et al, (2000) on the oral health survey of the
NDNS young people aged 4-18-years. Those foods and beverages identified for further
analysis in this study are identical to those of the NDNS survey. Alcoholic beverages,
although recorded on very few occasions, and also vinegar were excluded from the analysis. Lemon juice was included amongst the foods isolated as a fruit juice. Several beverages in
particular were included in the quantification of acidic foods and beverages and of sugary foods and beverages. For example, all fruit juice drinks (non-low calorie) as well as non-diet
carbonated soft drinks. The method employed in the calculation of the percentage
contribution made by carbonated soft drinks to the mean daily energy intakes in the children
made use of a general factor for U value. A mean value for energy per I OOg of carbonated beverages was calculated from the range of values for each of the seven food codes used. This was determined to be 162 kJ/100g product.
The childrerfs intake of total sugars contributed to approximately 20% of their total daily
energy intake. At baseline, the average daily total sugars intake of the children in the control
group was 127g and in the intervention group 117g. At post-intervention the mean daily
intake fell to 113g in the intervention group and to 120g in the control group. These values
compare favourably to those published in the NDNS of 122g/day in boys aged 11-14-years, to
that of 99g in girls (Gregory et al, 2000) and to IIIg in all children in the same age group (Walker et al, 2000).
When the data from this study are presented by sex, the boys intake of total sugars was above
that reported in the NDNS - 133g/day in intervention group boys and 144g/day in control
group boys at baseline. The mean daily intake, although tending to fall at post-intervention,
was still above that of the NDNS data at 128g/day (intervention group boys) and 139g/day
(control). An earlier study by Hackett et al (1984) reported a mean total sugars intake of
124g1day in boys and 113g/day in girls aged 11-12-years-old. A similar tendency towards
lower intakes in girls as shown in the NDNS was mirrored in the average daily intake of total
sugars in girls participating in this study. At baseline, average total sugars intake in the
control group girls was 117g/day and in the intervention group 108g/day, both these values
are above that of girls in the NDNS which was reported to be 99g/day but still lower than that
of boys of the same age. In girls, a similar reduction in mean total sugars intake was observed
between baseline and post-intervention to 104g/day in the intervention group and 109g/day in
195
the control. Both groups demonstrated a reduction in the mean daily intake of non-milk
extrinsic sugars and in the percentage of daily energy derived from total and non-milk
extrinsic sugars following the intervention. This reduction, therefore, cannot be attributed
specifically to attendance at the Food Club, although, as discussed in Chapter 6, the act of
participating in a dietary survey may have had some possible influence upon intake of sugars by the children.
The childrens intake of non-milk extrinsic sugars are also above the values reported in the
NDNS for children of a similar age. Gregory et al (2000) reported a mean non-milk extrinsic
sugars intake of 90g/day in boys, 73g/day in girls and Walker et al (2000) reported mean
intakes of 82g/day in all children aged 11-14-years-old. The data reported in this study indicate that the children participating in this study had a higher intake of non-milk extrinsic
sugars, particularly seen in boys in the control group.
Within group paired West determined that the mean change in the percentage of energy the
children derived from both total sugars and non-milk extrinsic sugars decreased between the
two phases and that the decrease was highly significant. At phase TO, only 28 children out of
the possible 167 were consuming an average of 60g or less (the current recommendation) of
non-milk extrinsic sugars per day whereas 41 were consuming 120g/day or more (twice the
current UK DRV). At post-intervention, the number of children consuming less than 60giday
was 34 and the number consuming 120g/day or more fell to 26.
Non-milk extrinsic sugar typically contributes between 60-70% of total dietary sugars
(Department of Health, 1991). In this study, non-milk extrinsic sugar was found to be
accountable for approximately 79% of the total dietary sugars intake of the children at baseline and for 78% of total daily dietary sugars at post-intervention. This also reflects the
childreds low intake of milk and dairy foods as shown in the analysis of foods consumed by
the National Food Guide grouping. As a result, milk sugars has reduced and accounts for less
of total sugars intake.
Gregory et al (2000) reported that non-milk extrinsic sugars contributed to approximately 16% of total daily energy in the diets of children aged between 11-14-years-old. The
contribution of non-milk extrinsic sugars to the total daily energy intake in children in this
study was found to be slightly higher at baseline; 17% in the intervention group and 18% in
the control. At post-intervention the fall in contribution was found to be highly significant.
196

Despite this encouraging change the amount of energy that the children were deriving from
non-milk extrinsic sugars was still well above the value of 11 % recommended for children of this age (DoH, 1991). The change in intake of non-milk extrinsic sugar cannot be isolated to the intervention group and as such cannot be attributed to attendance to the Food Club.
The children! s total intake of sugary foods and beverages are higher than those of children
participating in the NDNS. Walker et al (2000) reported a mean daily intake of sugary and beverages of 524g in children aged 11-14-years. At baseline, the average daily intake of
similar foods and beverages was determined to be 659gIday in intervention children and 760g/day in control children. These values are to be expected when the sugars intake of the
study children were also higher than those reported by Gregory et at (2000). The values fall
in the post-intervention period to 588g/day in the intervention group and to 669&/day in the
control group with the higher intakes in the control being found to be statistically significant. The changes within groups in the consumption of sugary foods and beverages favoured a
reduction which was significant within both groups.
Those foods contributing the greatest proportion of non-milk extrinsic sugars were found to
be non-diet carbonated soft drinks, fruit drinks, confectionery, cakes; biscuits and baked
goods and 'othee foods. Table sugar and sweetened breakfast cereals also contributed a
smaller proportion of non-milk extrinsic sugars. Collectively, beverages were found to be
contributing to 40% of the childrens total intake of non-milk extrinsic sugar. This possibly further reflects the beverage choices of children and teenagers - they are making a move away from milk drinks and fruitjuices preferring to drink still and carbonated fruit drinks. This has
the potential to impact upon the dental health of children. Given that children at school are
allowed a free choice of beverages at lunchtime, coupled with the greater independence of
teenagers in making their own choice of beverage, both at home and outside, it would appear
that this trend will continue.
In terms of presenting clear messages to children about the possible dangers of consuming too
many foods containing non-milk extrinsic sugars, there are many obstacles. Whilst table
sugar is recognisable to children as 'sugae, it may be very difficult to inform children about the non-milk extrinsic sugar content of many everyday foods such as breakfast cereals, fruit
drinks, carbonated drinks, baked beans, tomato ketchup, tinned peas and so on. Most children
of school age are aware that eating too many sweets are not conducive to good oral health but
it is not until the mid-teenage years (perhaps age 14 or 15 or so) that most are able to grasp 197

abstract concepts - that is, if they cannot see, touch or feel the sugar in a food then it is
difficult for them to understand that it is actually present! In view of the sub-optimum intakes
of calcium in the children taking part in this study, any advice that may confuse children
about the consumption of dairy products may probably best be avoided. Milk puddings,
sweetened yoghurts and ice creams were not observed to be contributing large amounts of
non-milk extrinsic sugars to the diets of the children.
In the case of breakfast cereals, many childreifs cereal products are fortified with a range of
vitamins and minerals and will likely be eaten with milk, so children are likely to benefit from
the consumption of these foods in terms of micronutrients, but perhaps not in terms of
extrinsic sugars. In addition, school children are told that they should eat a healthy breakfast
as a good start to the school day and messages about breakfast cereals containing too much
sugar may do a lot of harm. The interpretation of information about sugars in breakfast
cereals may dissuade children from having breakfast or finther impact upon children and
teenagers (especially girls) already trying to reduce or control their weight.
The most likely rogue to target in the reduction of non-milk extrinsic sugars in the diets of
children is carbonated soft drinks, closely followed by fruit drinks. The data presented in this
study show that children are consuming the equivalent to one and a half cans of carbonated
drink each day. A further analysis of the children's consumption of soft drinks shows that
these beverages were contributing up to I I% of the total daily energy intake in the form of
non-milk extrinsic sugar. So, these children are obtaining between 8% and 11% of their daily
energy intake from one food source, which, when the nutritional content of carbonated drinks
can be considered to be nil, becomes a most alarming observation. These types of beverages
will not be contributing to the micronutrient intake of the children at all and will also likely be
potentially detrimental to dental health.
A further analysis of the data on place of purchase or consumption may be useful in
pinpointing the occasions where carbonated drinks and other fruit drinks are consumed. Within UK primary schools, a pilot scheme has been set up to allow primary school aged
children to take bottled water into the classrooms, initially to combat dehydration, fatigue and
poor concentration in the classroom (DATA, personal communication, 2002). A strategy
such as this may also allow children to become more accustomed to drinking water in place of
sweetened soft drinks although it may be more difficult to implement and support in older
children and teenagers. This is not to mention the potential benefits to oral health. 198
Secondary schools may also have to look closely at any policy to allow soft-drink vending
machines on their premises and to include health information messages about carbonated drinks in lesson time. Ultimately, the food and drinks manufacturing industry has some
ethical responsibility towards the way in which carbonated and still soft drinks are marketed
and advertised. At present, carbonated drinks have a very 'cool' image which is most important to older children and teenagers which presents a large obstacle to overcome.
The children's intake of acidic foods are higher those reported by Walker et at (2000).
Walker and colleagues report the mean daily intake of acidic foods in children aged 11-14-
years-old to be 682g/day. At baseline, intakes in the intervention group showed a mean daily
intake of 776g/day and 880g/day in the control group. All types of carbonated drinks
(excluding carbonated water) by far make the largest contribution to the intake of acidic foods
at baseline. A similar picture was seen at post-intervention, although average daily intakes
fell to 679g/day in the intervention group and to 775g/day in the control group. Again,
carbonated drinks were seen to be the largest contributor to acidic beverages.
The childreds frequency of intake of both selected sugary foods and drinks and of acidic foods and drinks were approximate to five times a day at both baseline and post-intervention.
Frequency of intake of sugary foods and beverages was seen to fall slightly at post- intervention and frequency of consumption was significantly greater in the control group at both phases. When the data are coupled with the amount of sugary foods and drinks that the
children were consuming, these become more significant. A similar frequency of intake of
acidic foods and beverages was observed in children at baseline and post-interventiorL
Advice to older children and teenagers on the consumption of foods containing non-milk
extrinsic sugars and/or acids must also be accompanied by advice in simple terms on the
frequency of consuming these types of foods. Presently, it most widely accepted that a
maximum of four separate occasions be recommended for the consumption of foods
containing non-milk extrinsic sugars and acids. Before this kind of information can be
interpreted by children and teenagers it would be first be necessary to define very simply the
kinds of foods that should be limited (i. e. carbonated drinks) and then provide some
guidelines on how much and how often these foods can be consumed.
Walker and colleagues (2000) reported than one in seven young people who took part in the
NDNS had a drink in bed every night but that those aged 11-14-years, were the least likely
(8%) to have a drink every night. Most interestingly, 20% of respondents in the NDNS 199
reported having water to drink at bedtime whereas children in this study have not recorded
one single entry for water at bedtime! This may be because they did not remember or did not consider it to be necessary to enter water at bedtime, although water is recorded as a daytime
drink by many of the children, commonly as bottled or carbonated water. A further analysis of the beverages consumed by the children participating in this study may shed more light on the consumption of water and the importance of water as a beverage. With reference to bedtime grazing habits, Hackett and colleagues (1984) reported that in 405 English children
aged 11-12-years-olds, between 2-3% of their total sugars intake was consumed after 22.00
hours.
At baseline, unsweetened milk (whether recorded as consumed hot or cold) accounts for 22%
of bedtime beverage choices in the intervention group and for 21% in the control group. Sweetened milk accounted for 8% of choices in children of the intervention group and for
13% in the control group. Fruit drinks were also observed to be a popular choice, accounting for 10% and 14% respectively. Carbonated drinks were the most popular choice of bedtime
drink at baseline, contributing to 23% of total selection in the intervention group and to 22%
in the control.
At post-intervention, carbonated drinks were again observed to be the most popular choice of bedtime drink, accounting for some 32% of choices in the intervention group and for 35% in
the control group (an increase in both groups). The choice of milk reduced at the post. intervention period and accounted for 10% of choice in the intervention group and for 9% in
the control. Tea and coffee and sweetened tea and coffee also increased in popularity at phase TI - this perhaps reflects the shift of children towards drinks perceived as 'adult' drinks.
Within this period the children may be more inclined to drinking tea and coffee at bedtime
despite the caffeine content of these drinks which probably make them less suitable as bedtime drinks for younger children.
in summary, the consumption of total sugars and of non-milk extrinsic sugars by the children is greater than that reported by Gregory et al (2000) and Walker et al (2000) for all social
groups. The percentage contribution of total sugars and non-milk extrinsic sugars to total daily energy fell in both groups at post-intervention. The mean intake of non-milk extrinsic
sugars by the children exceeded the DRV of 60g/day and the recommended contribution of I I% to energy intake. The main contributors to the non-milk extrinsic sugars intake in the
children! s diets were non-diet carbonated soft drinks, fruit drinks and confectionery. Non-diet 200
and diet carbonated soft drinks were also the main contributors to the total intake of acidic foods by all children.
The frequency of consumption of sugary and acidic foods and beverages exceeded the
guideline of four times a day and the mean frequency of consumption of these foods by the
children was found to be five times a day at both phase TO and TI. The changes observed in
intake and contribution of total and non-milk extrinsic sugars in the children's diet were not found to be statistically significant and therefore it is concluded that attendance to the Food
Club did not have an impact upon intake of these nutrients in the children! s diets.
The children's preferred bedtime drinks were found to be non-diet and diet carbonated soft drinks and fruit drinks with a tendency towards higher consumption of tea and coffee and
sweetened tea and coffee in the post-intervention phase. It is concluded that all these
observations allow tentative suggestions to be made about the potential impact upon the
childrerfs oral health (in the absence of an oral examination) in favour of reducing
consumption and frequency of consumption of carbonated soft drinks, fruit drinks and
confectionery. The choices of bedtime drinks were poor in terms of safeguarding dental
health. A major area of concern was the contribution of carbonated soft drink to the childretfs daily energy intake - contributing as much as 11% to energy but in no manner to the
micronutrient intake of the children.
201
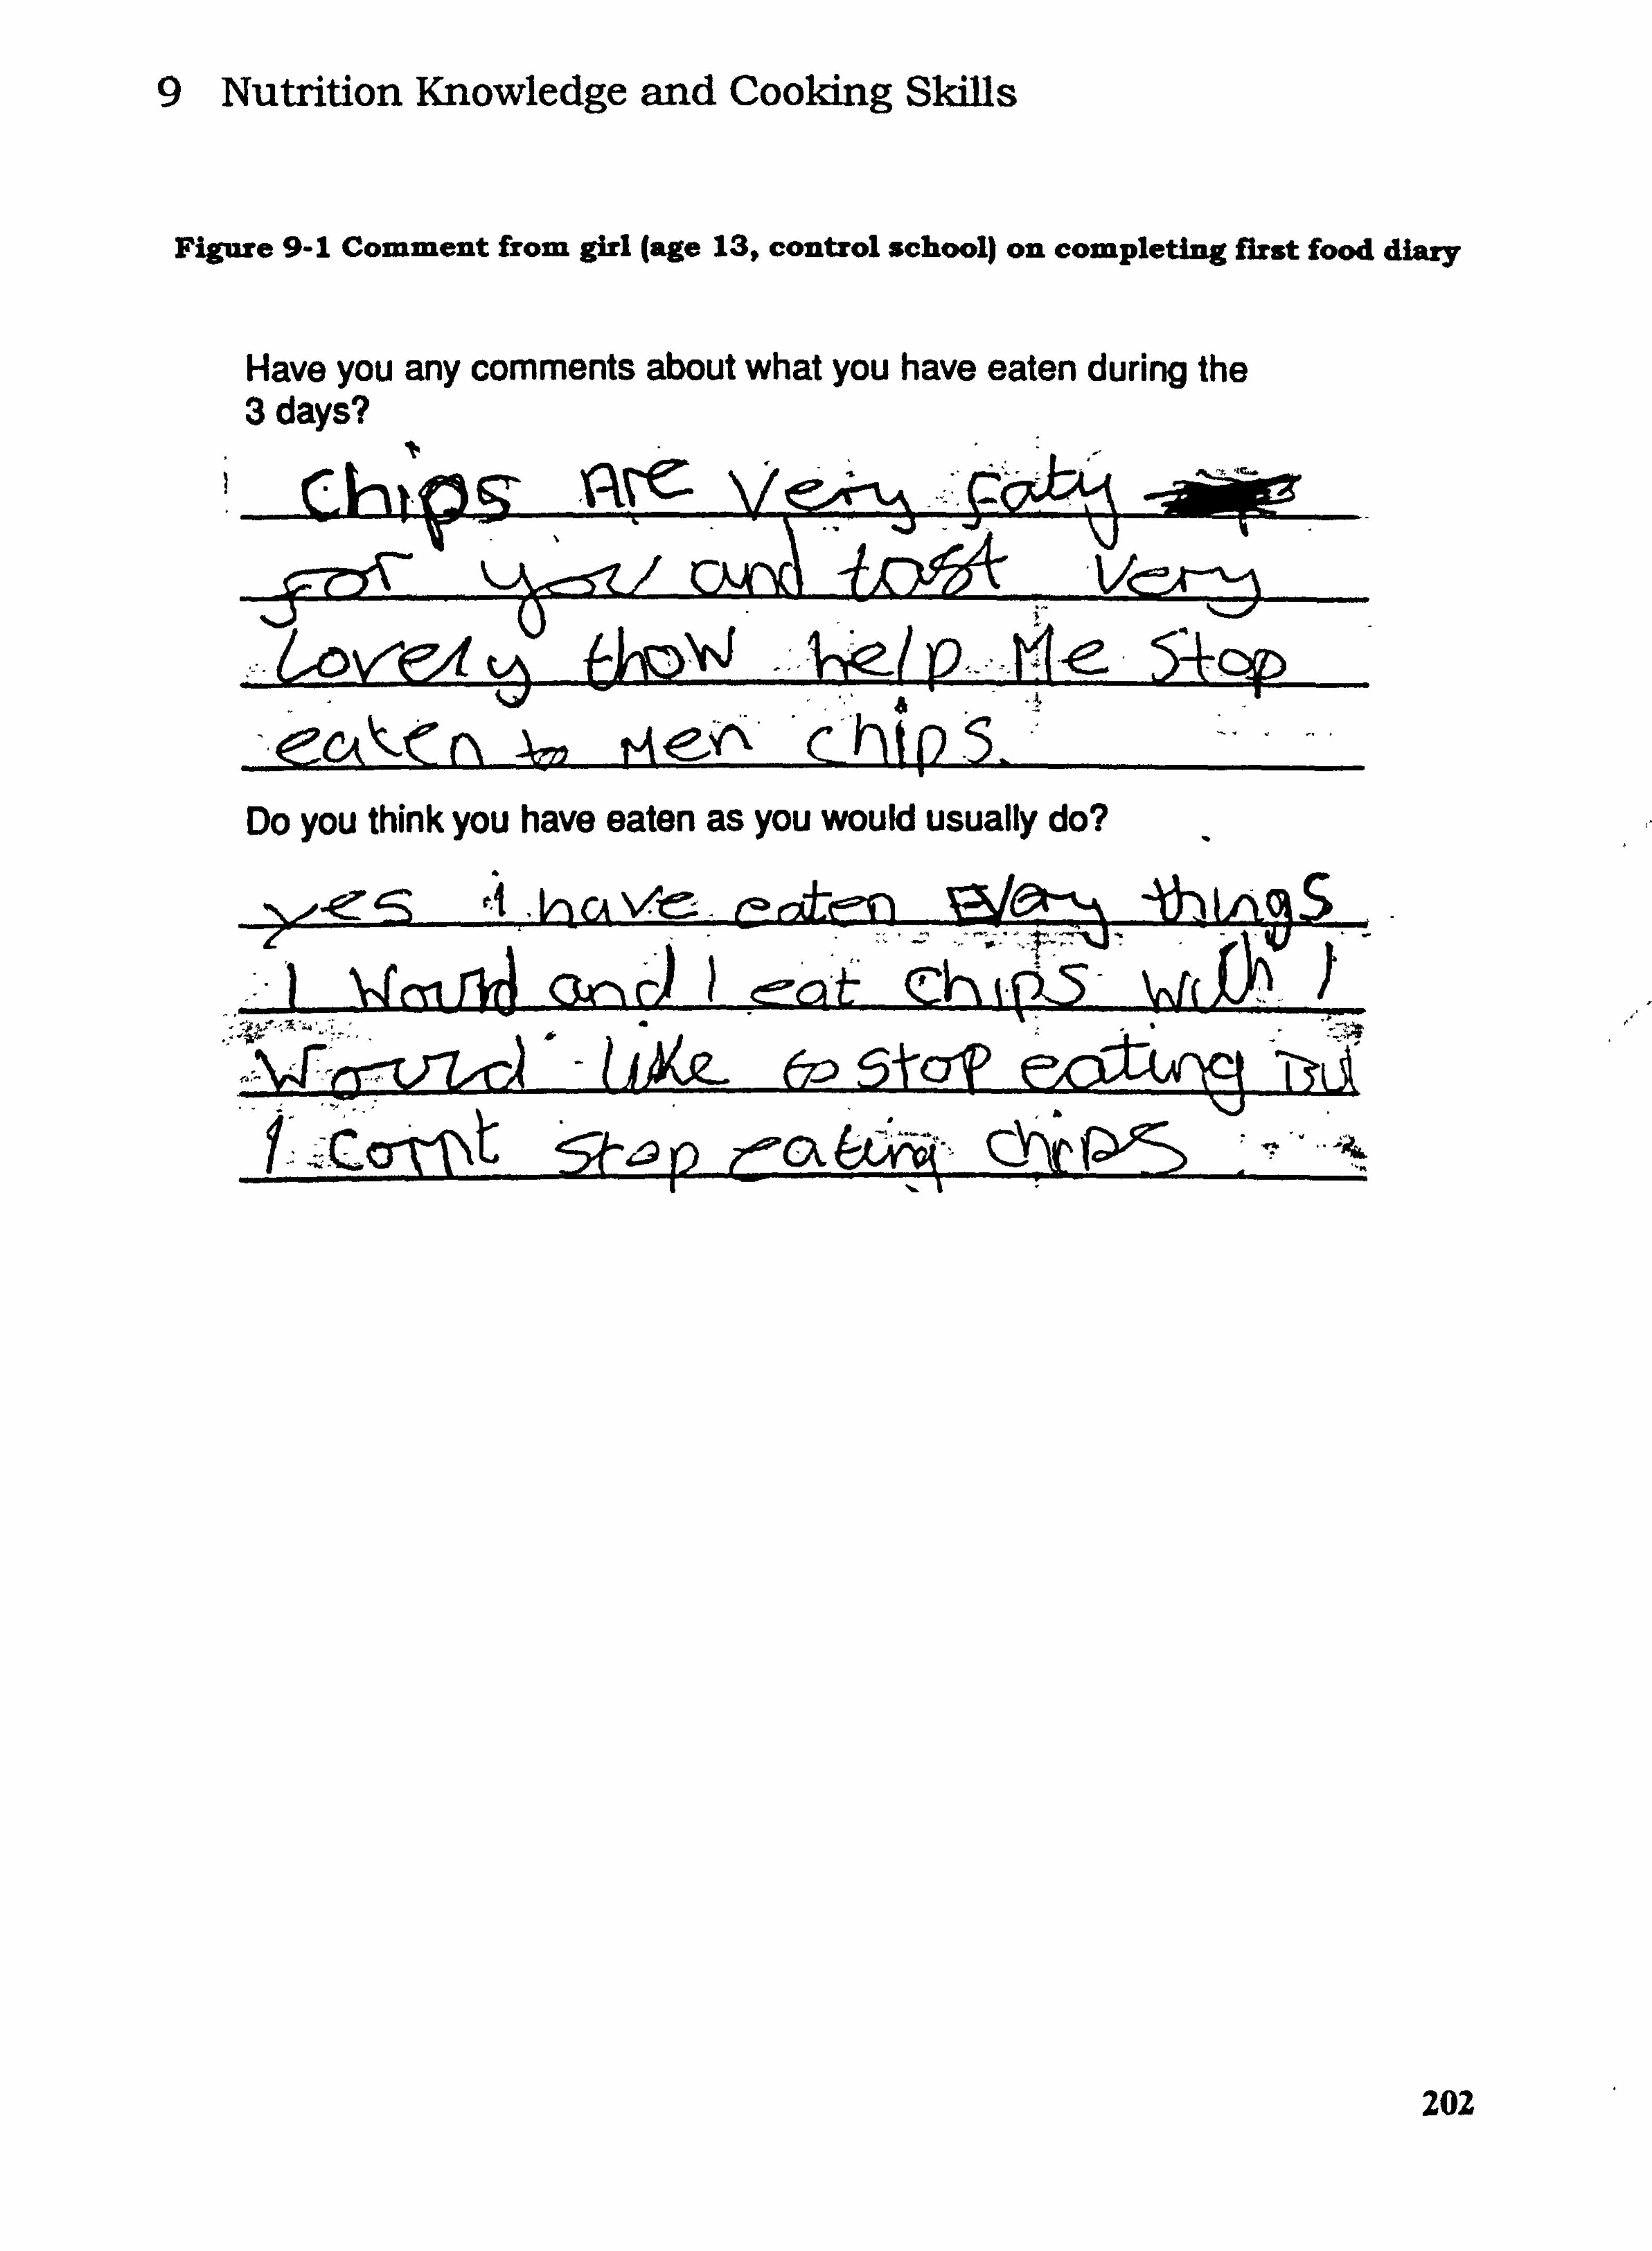
9 Nutrition Knowledge and Cooking Skills
Figure 9-1 Comment from girl (age 13, control school) on completing first food diary
Have you any comments about what you have eaten during the 3 days?
202
Az72 me, ^* C. (2 -5- Do you think you have eaten as you would usually do?
6ý; ) 5h: ý, Týa
-Z ! 9--9 0 74"a (:: YV P'g-:: ý -
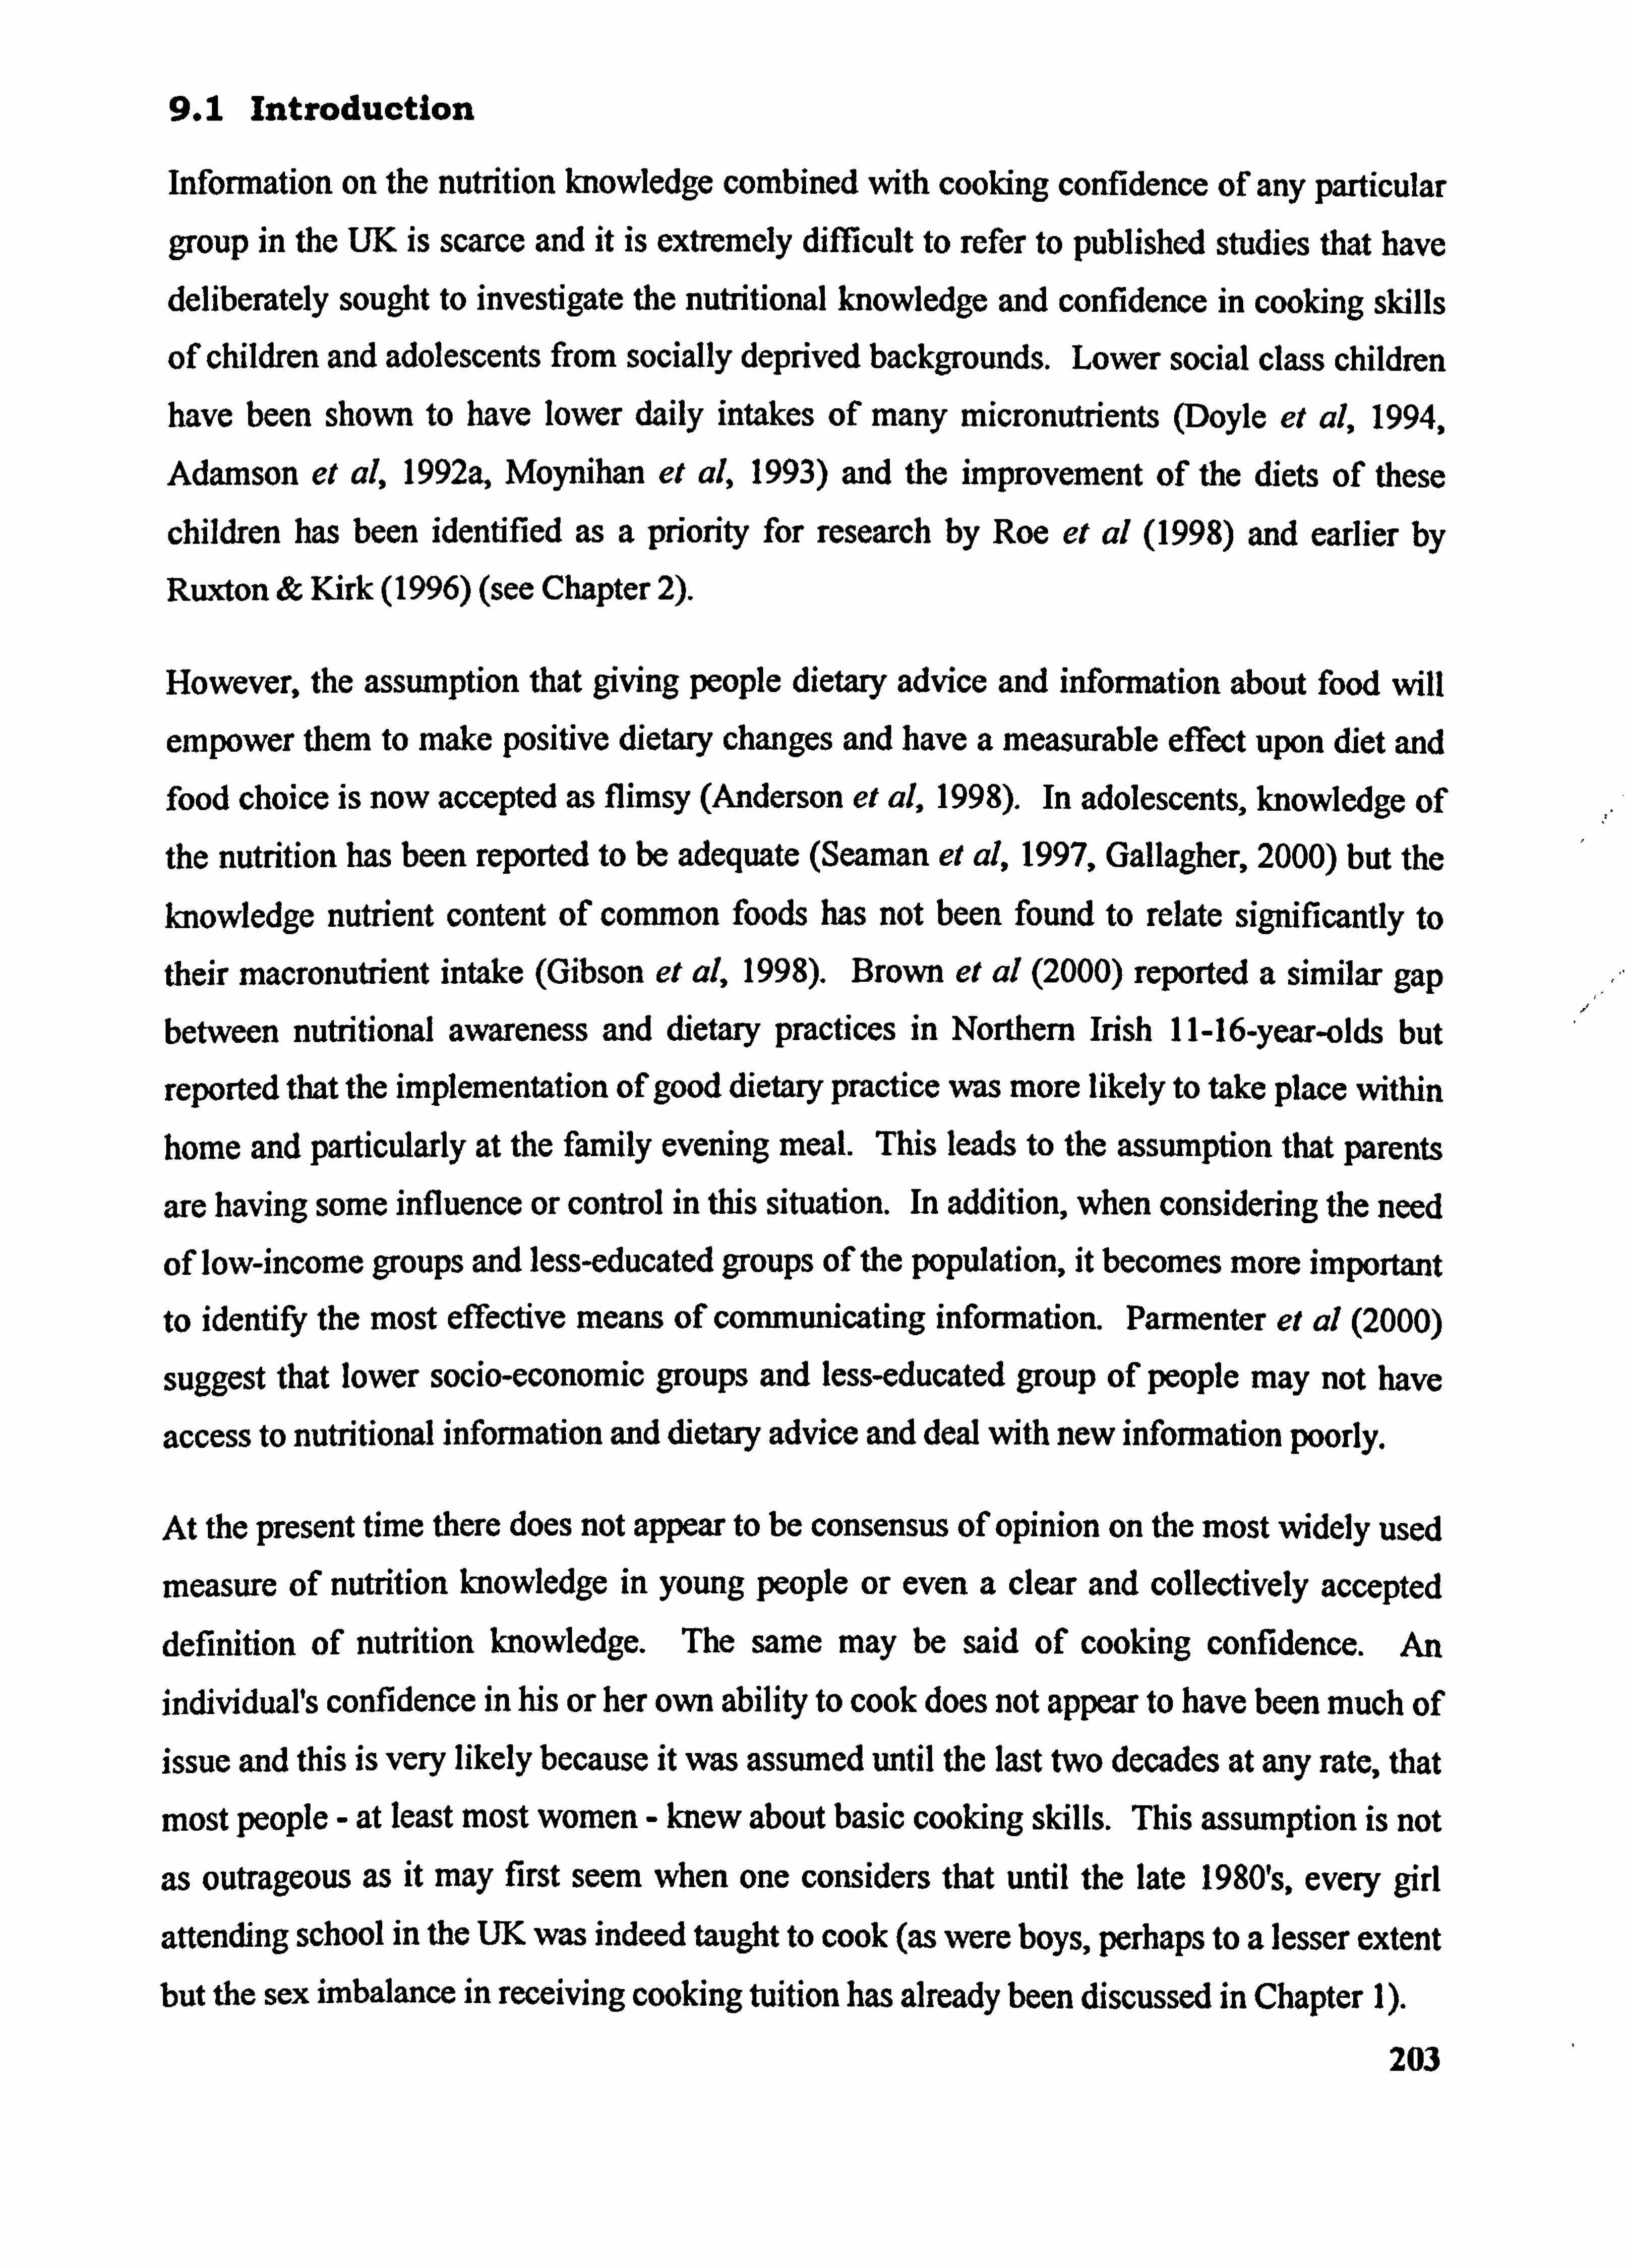
9.1 Introduction
Information on the nutrition knowledge combined with cooking confidence of any particular
group in the UK is scarce and it is extremely difficult to refer to published studies that have
deliberately sought to investigate the nutritional knowledge and confidence in cooking skills
of children and adolescents from socially deprived backgrounds. Lower social class children have been shown to have lower daily intakes of many micronutrients (Doyle et al, 1994,
Adamson et al, 1992a, Moynihan et al, 1993) and the improvement of the diets of these
children has been identified as a priority for research by Roe et al (1998) and earlier by
Ruxton & Kirk (1996) (see Chapter 2).
However, the assumption that giving people dietary advice and information about food will
empower them to make positive dietary changes and have a measurable effect upon diet and food choice is now accepted as flimsy (Anderson et al, 1998). In adolescents, knowledge of the nutrition has been reported to be adequate (Seaman et al, 1997, Gallagher, 2000) but the
knowledge nutrient content of common foods has not been found to relate significantly to their macronutrient intake (Gibson et al, 1998). Brown et al (2000) reported a similar gap between nutritional awareness and dietary practices in Northern Irish 11-16-year-olds but
reported that the implementation of good dietary practice was more likely to take place within home and particularly at the family evening meal. This leads to the assumption that parents
are having some influence or control in this situation. In addition, when considering the need of low-income groups and less-educated groups of the population, it becomes more important
to identify the most effective means of communicating information. Parmenter el al (2000)
suggest that lower socio-economic groups and less-educated group of people may not have
access to nutritional information and dietary advice and deal with new information poorly.
At the present time there does not appear to be consensus of opinion on the most widely used
measure of nutrition knowledge in young people or even a clear and collectively accepted definition of nutrition knowledge. The same may be said of cooking confidence. An
individual's confidence in his or her own ability to cook does not appear to have been much of issue and this is very likely because it was assumed until the last two decades at any rate, that
most people - at least most women - knew about basic cooking skills. This assumption is not
as outrageous as it may first seem when one considers that until the late 1980's, every girl
attending school in the UK was indeed taught to cook (as were boys, perhaps to a lesser extent but the sex imbalance in receiving cooking tuition has already been discussed in Chapter 1).
203
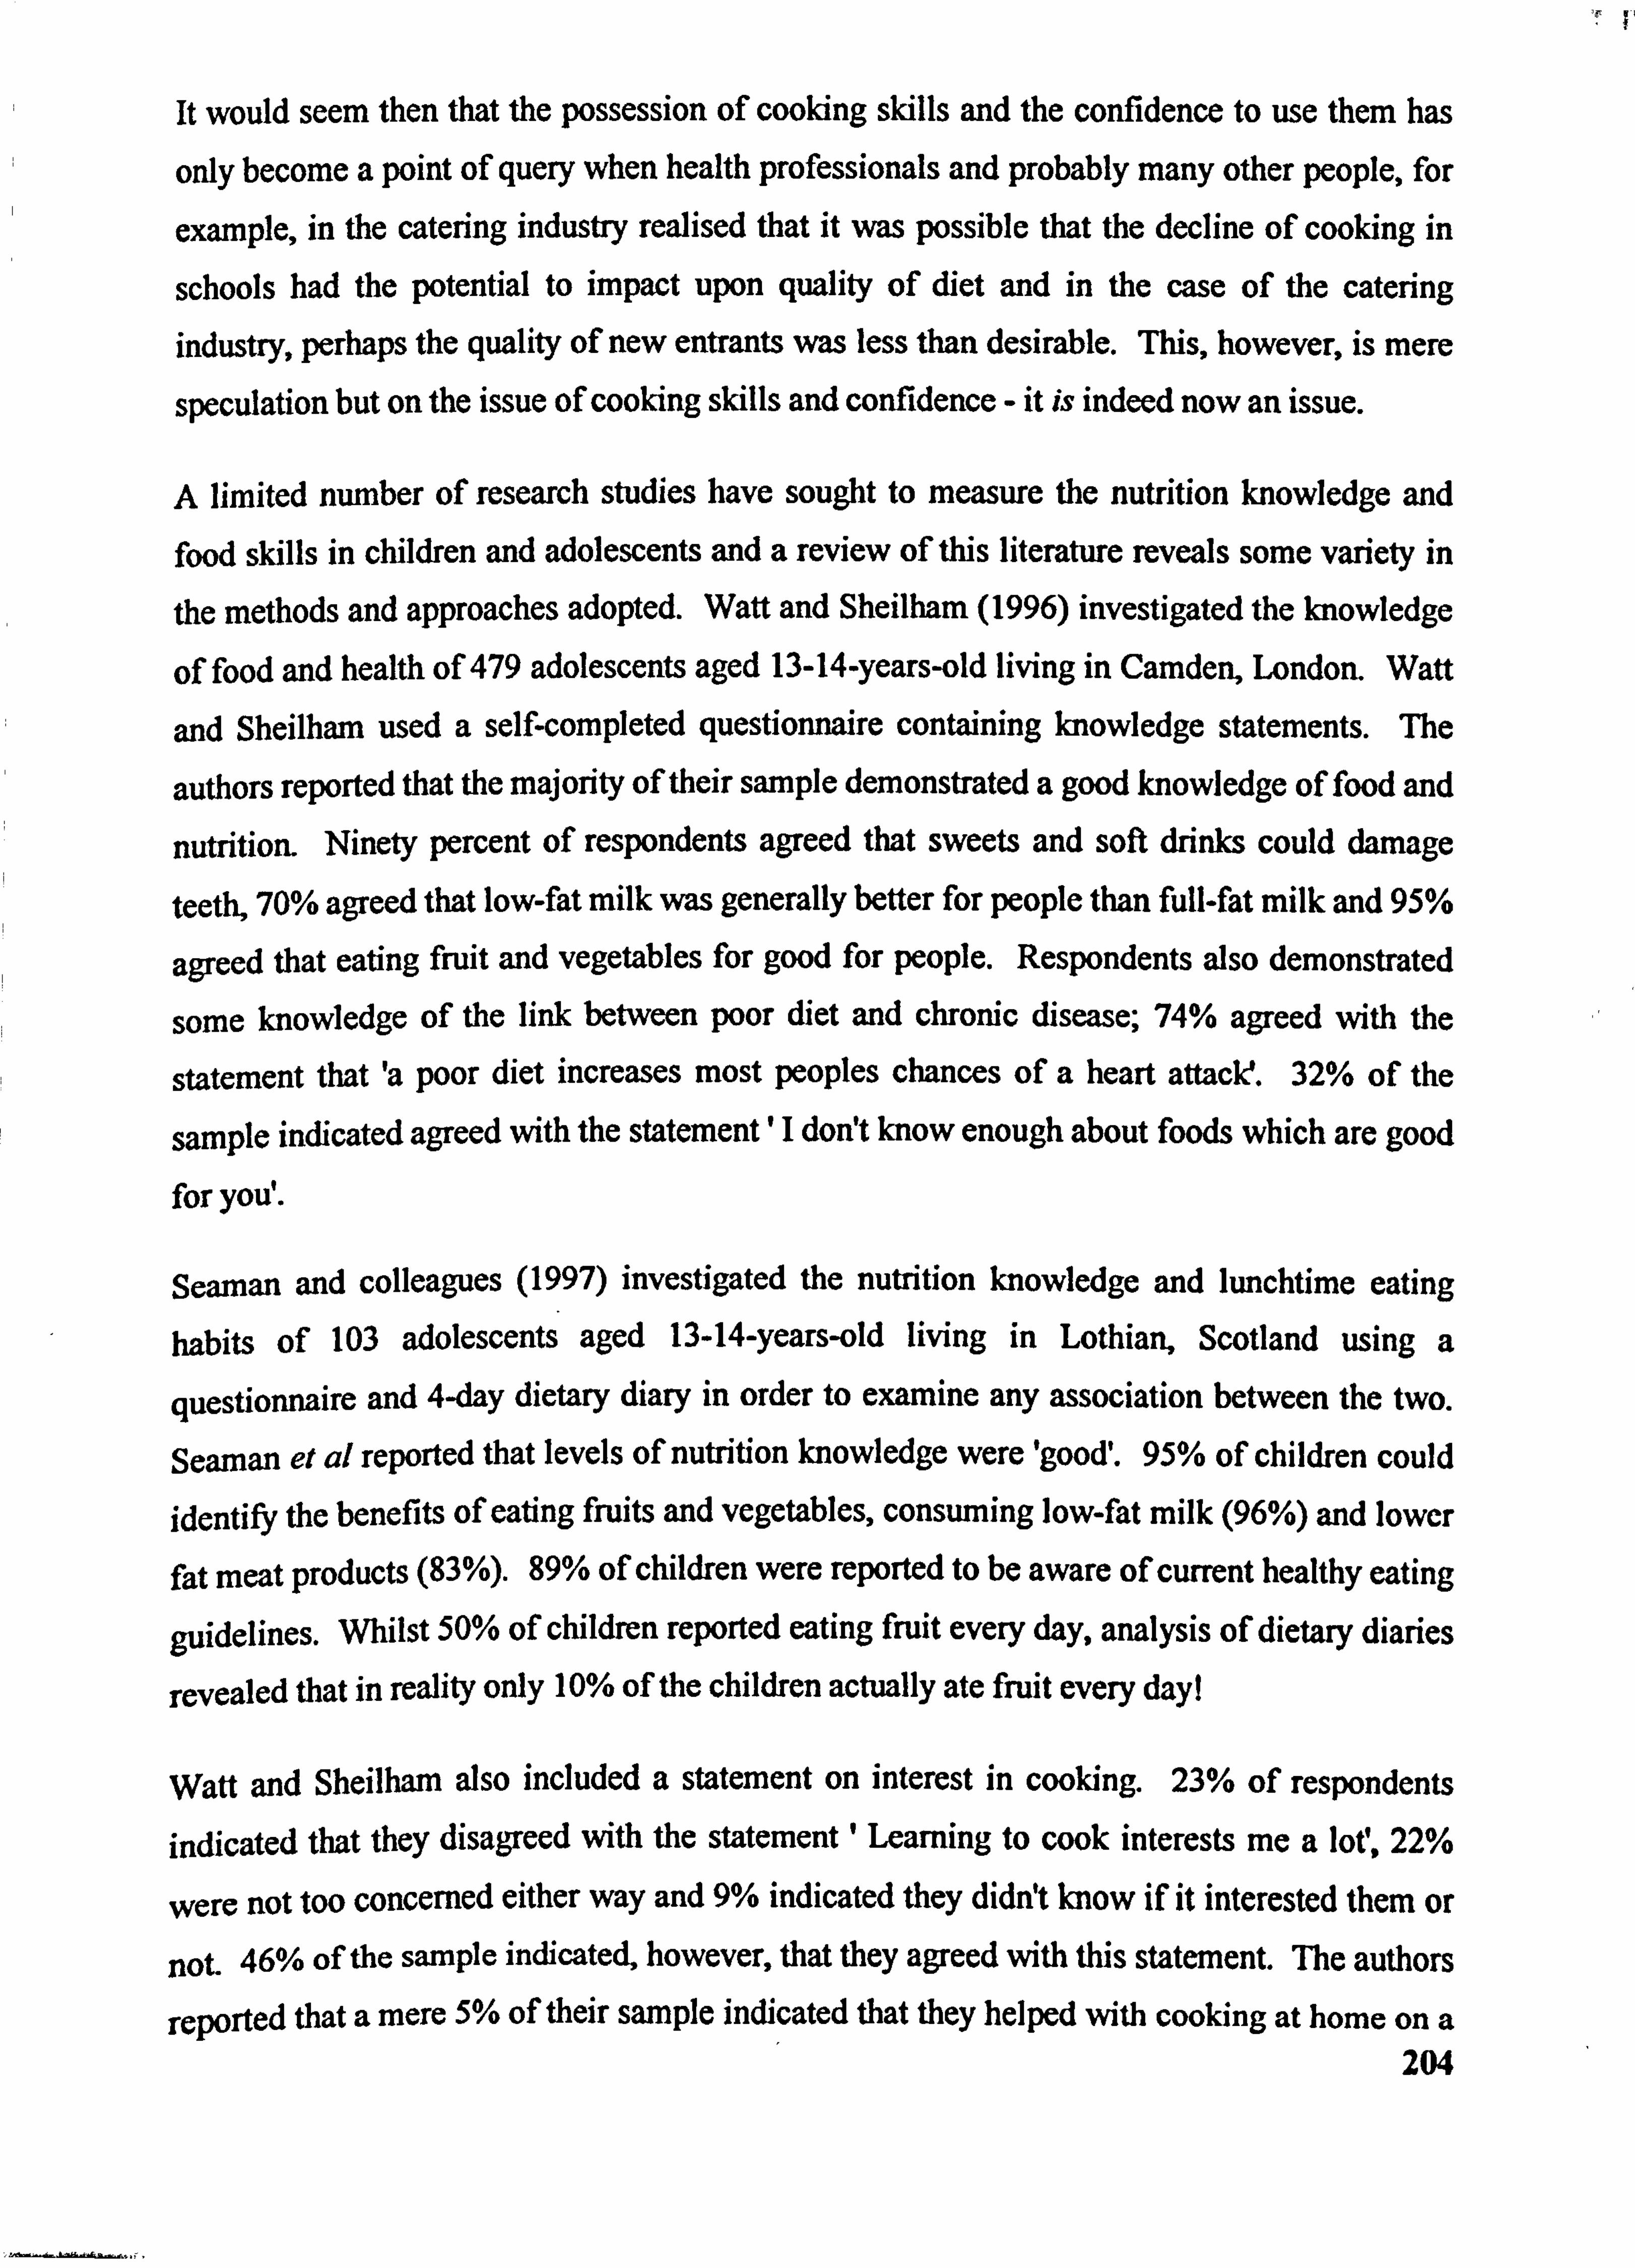
It would seem then that the possession of cooking skills and the confidence to use them has
only become a point of query when health professionals and probably many other people, for
example, in the catering industry realised. that it was possible that the decline of cooking in
schools had the potential to impact upon quality of diet and in the case of the catering industry, perhaps the quality of new entrants was less than desirable. This, however, is mere
speculation but on the issue of cooking skills and confidence - it is indeed now an issue.
A limited number of research studies have sought to measure the nutrition knowledge and
food skills in children and adolescents and a review of this literature reveals some variety in
the methods and approaches adopted. Watt and Sheilham. (1996) investigated the knowledge
of food and health of 479 adolescents aged 13-14-years-old living in Camden, London. Watt
and Sheilham used a self-completed questionnaire containing knowledge statements. The
authors reported that the majority of their sample demonstrated a good knowledge of food and
nutrition. Ninety percent of respondents agreed that sweets and soft drinks could damage
teeth, 70% agreed that low-fat milk was generally better for people than full-fat milk and 95%
agreed that eating fruit and vegetables for good for people. Respondents also demonstrated
some knowledge of the link between poor diet and chronic disease; 74% agreed with the
statement that 'a poor diet increases most peoples chances of a heart attacle. 32% of the
sample indicated agreed with the statement'l don! t know enough about foods which are good
for you%
Seaman and colleagues (1997) investigated the nutrition knowledge and lunchtime eating
habits of 103 adolescents aged 13-14-years-old living in Lothian, Scotland using a
questionnaire and 4-day dietary diary in order to examine any association between the two.
Seaman et at reported that levels of nutrition knowledge were 'good'. 95% of children could
identify the benefits of eating fruits and vegetables, consuming low-fat milk (96%) and lower
fat meat products (83%). 89% of children were reported to be aware of current healthy eating
, guidelines. Whilst 50% of children reported eating fruit every day, analysis of dietary diaries
revealed that in reality only 10% of the children actually ate fruit every day I
Watt and Sheilham also included a statement on interest in cooking. 23% of respondents indicated that they disagreed with the statement ' Learning to cook interests me a lor, 22%
were not too concerned either way and 9% indicated they didn! t know if it interested them or
not. 46% of the sample indicated, however, that they agreed with this statement. The authors
reported that a mere 5% of their sample indicated that they helped with cooking at home on a 204
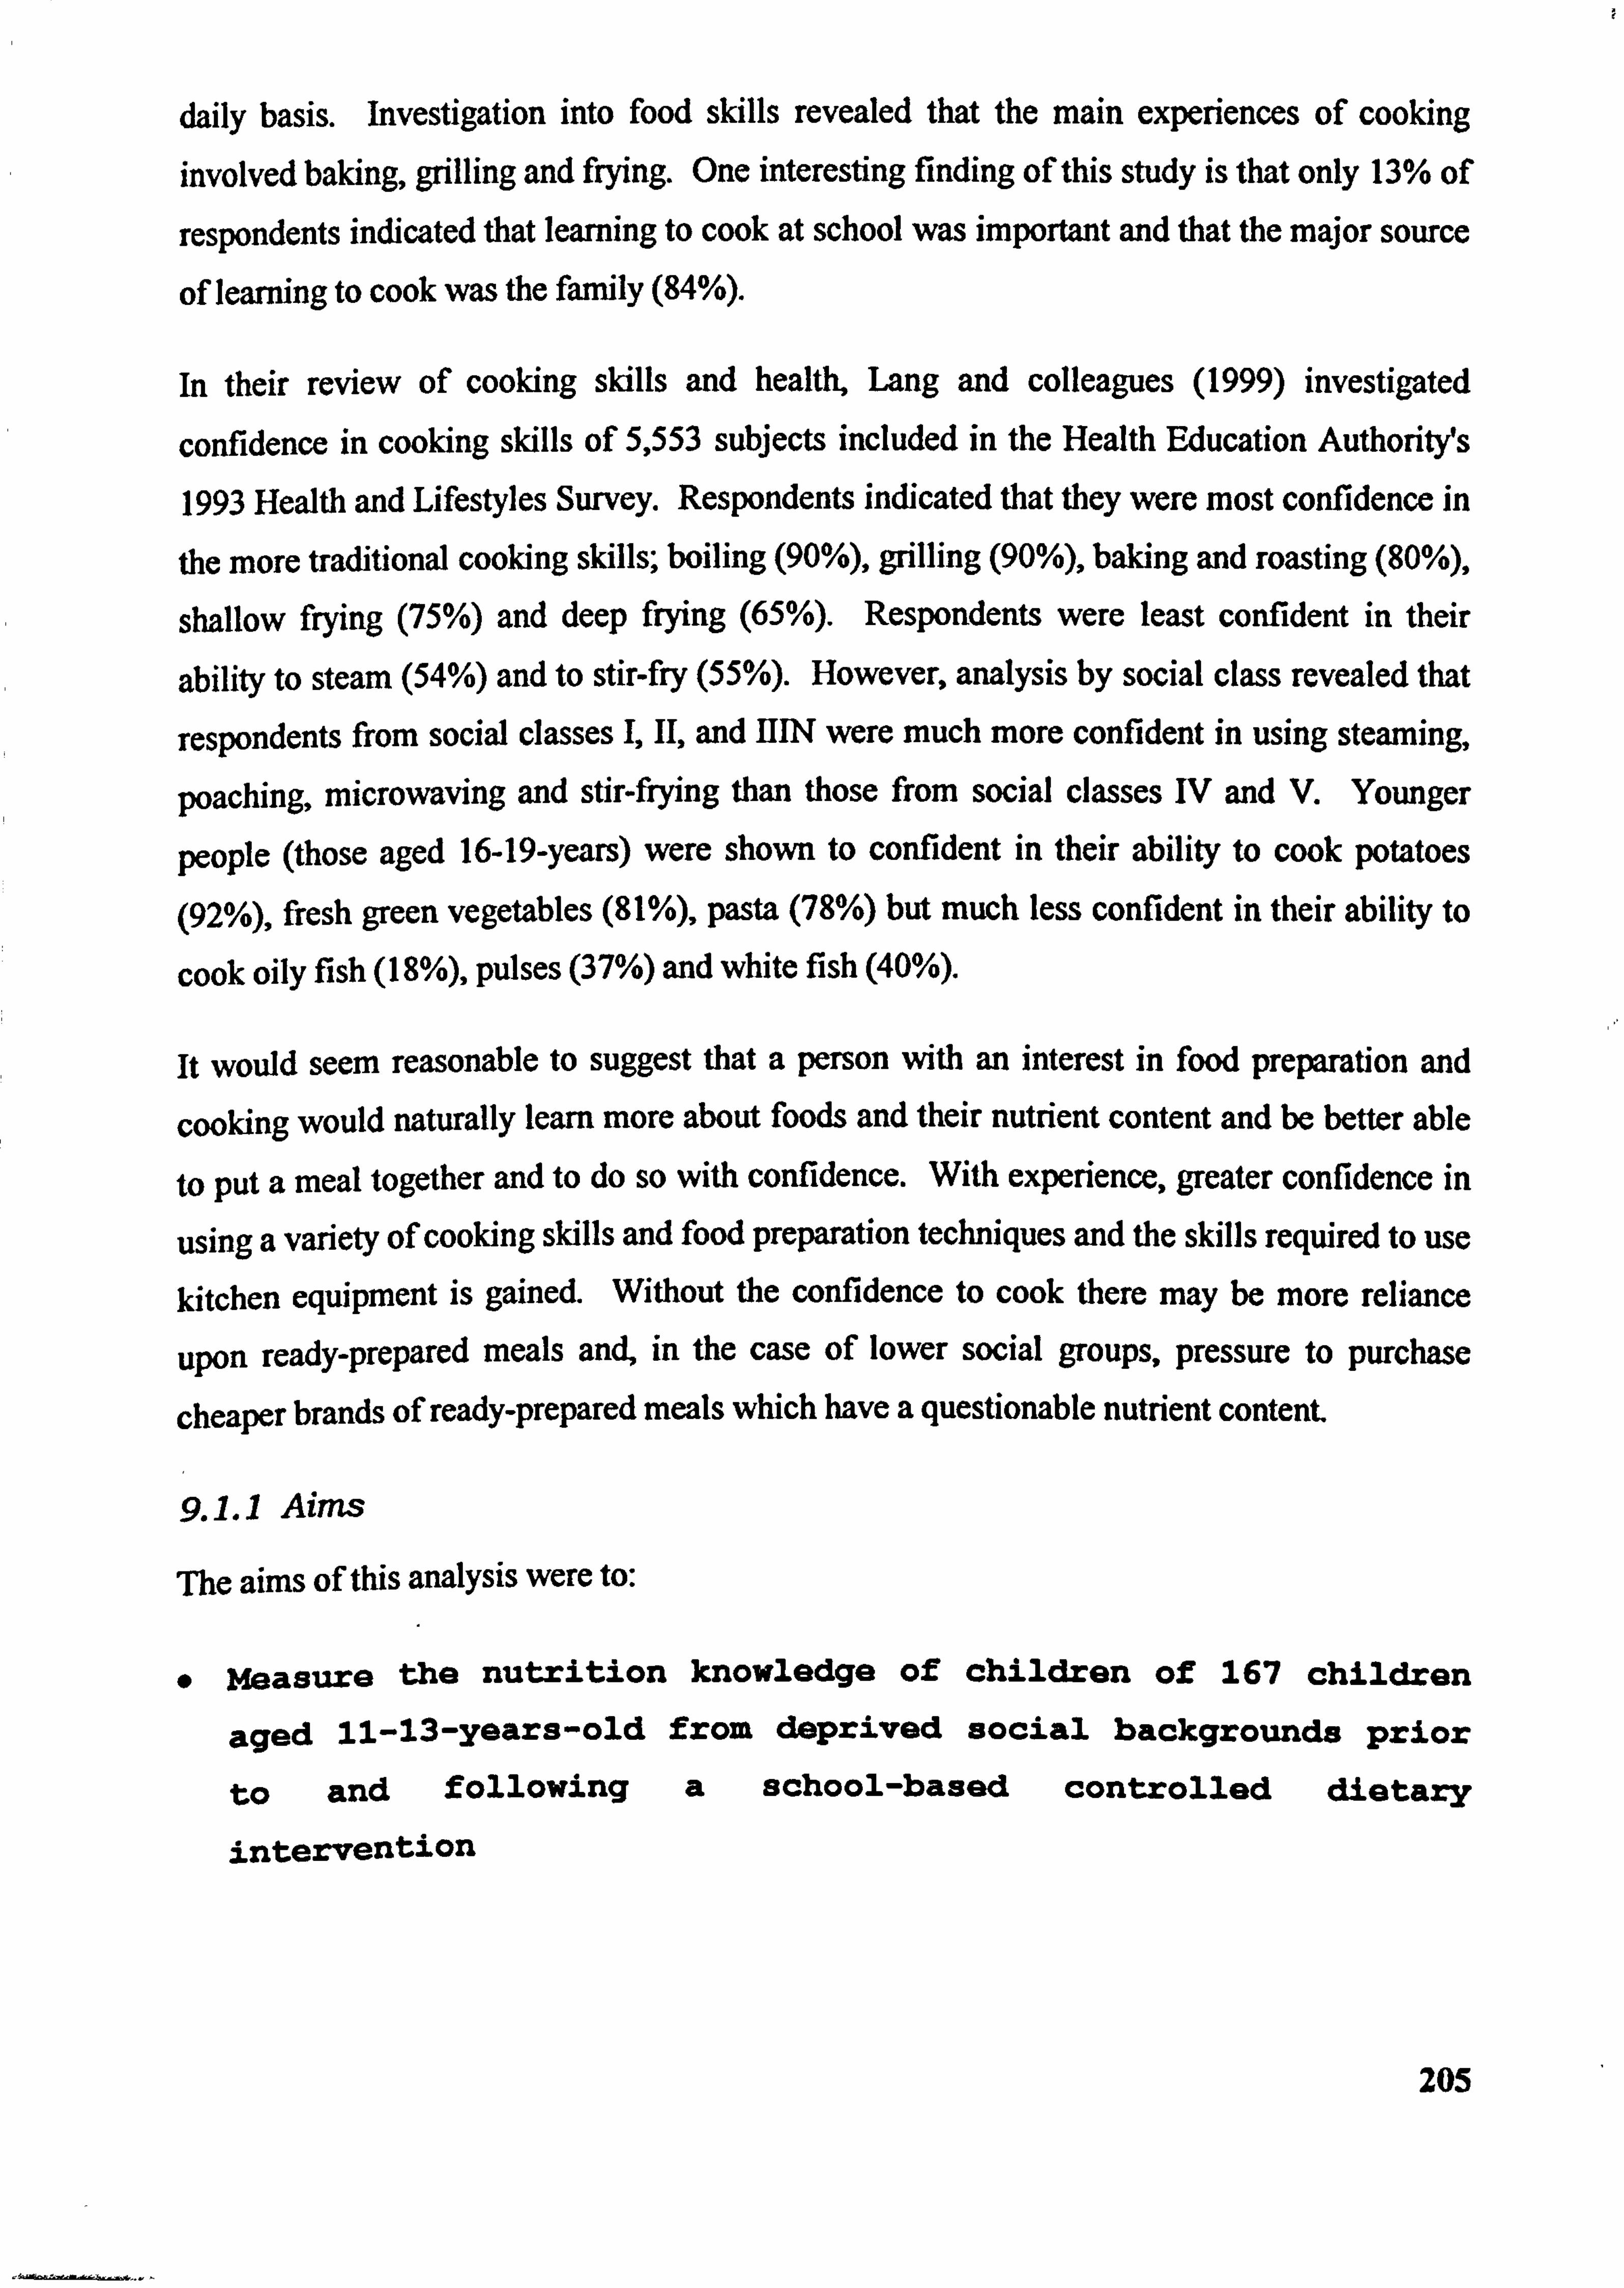
daily basis. Investigation into food skills revealed that the main experiences of cooking involved baking, grilling and frying. One interesting finding of this study is that only 13% of
respondents indicated that learning to cook at school was important and that the major source
of learning to cook was the family (84%).
In their review of cooking skills and health, Lang and colleagues (1999) investigated
confidence in cooking skills of 5,553 subjects included in the Health Education Authority's
1993 Health and Lifestyles Survey. Respondents indicated that they were most confidence in
the more traditional cooking skills; boiling (90%), grilling (90%), baking and roasting (80%),
shallow frying (75%) and deep frying (65%). Respondents were least confident in their
ability to steam (54%) and to stir-fry (55%). However, analysis by social class revealed that
respondents from social classes L IL and HIN were much more confident in using steaming,
poaching, microwaving and stir-frying than those from social classes IV and V. Younger
people (those aged 16-19-years) were shown to confident in their ability to cook potatoes
(92%), fresh green vegetables (81%), pasta (78%) but much less confident in their ability to
cook oily fish (18%), pulses (37%) and white fish (40%).
it would seem reasonable to suggest that a person with an interest in food preparation and
cooking would naturally learn more about foods and their nutrient content and be better able
to put a meat together and to do so with confidence. With experience, greater confidence in
using a variety of cooking skills and food preparation techniques and the skills required to use
kitchen equipment is gained. Without the confidence to cook there may be more reliance
upon ready-prepared meals and, in the case of lower social groups, Pressure to purchase
cheaper brands of ready-prepared meals which have a questionable nutrient content.
9.1.1 Aims
The aims of this analysis were to:
Measure the nutrition knowledge of children of 167 children
aged 11-13-years-old from deprived social backgrounds prior
to and following a school-based controlled dietary
intervention
205
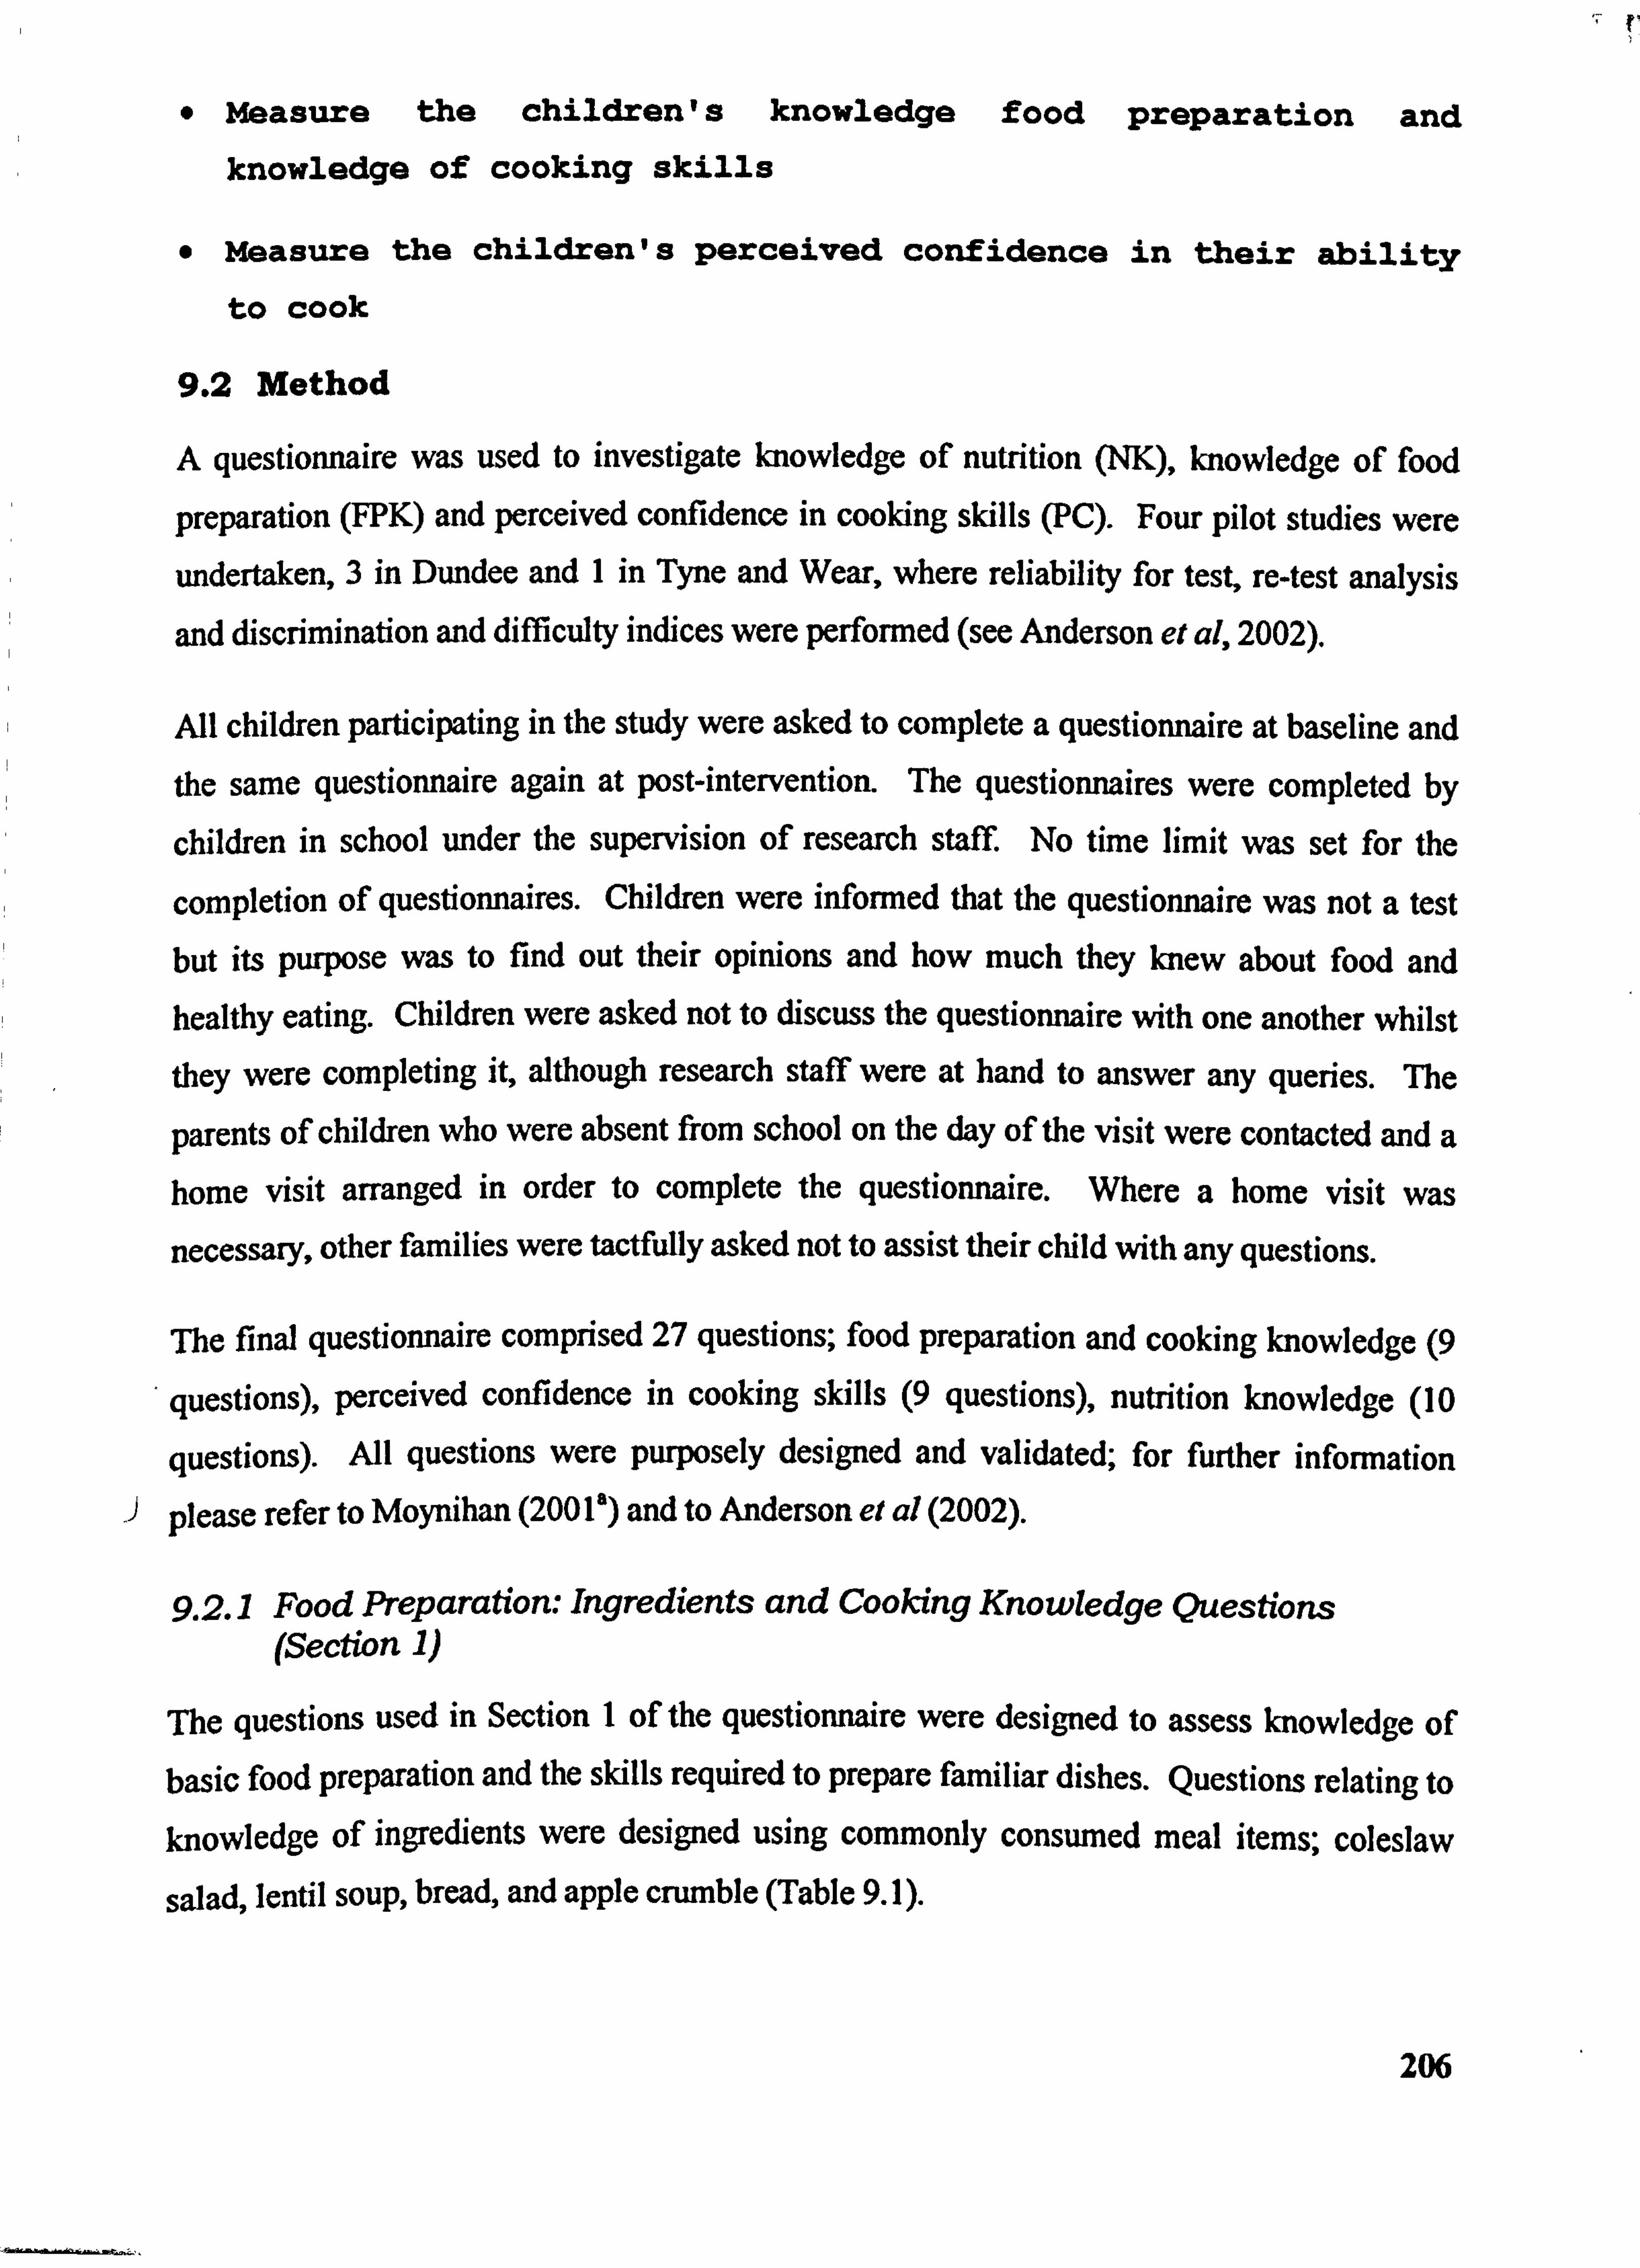
*Measure the children's knowledge food preparation and knowledge of cooking skills
* Measure the children's Perceived confidence in their ability
to cook
9.2 Method
A questionnaire was used to investigate knowledge of nutrition (NK), knowledge of food
preparation (FPK) and perceived confidence in cooking skills (PC). Four pilot studies were
undertaken, 3 in Dundee and I in Tyne and Wear, where reliability for test, re-test analysis
and discrimination and difficulty indices were performed (see Anderson et at, 2002).
All children participating in the study were asked to complete a questionnaire at baseline and
the same questionnaire again at post-intervention. The questionnaires were completed by
children in school under the supervision of research staff. No time limit was set for the
completion of questionnaires. Children were informed that the questionnaire was not a test
but its purpose was to find out their opinions and how much they knew about food and healthy eating. Children were asked not to discuss the questionnaire with one another whilst they were completing it, although research staff were at hand to answer any queries. The
parents of children who were absent from school on the day of the visit were contacted and a home visit arranged in order to complete the questionnaire. Where a home visit was
necessary, other families were tactfully asked not to assist their child with any questions.
The final questionnaire comprised 27 questions; food preparation and cooking knowledge (9
questions), perceived confidence in cooking skills (9 questions), nutrition knowledge (10
questions). All questions were purposely designed and validated; for further information
J please refer to Moynihan (2001') and to Anderson el al (2002).
9.2.1 Food Preparation: Ingredients and Cooking Knowledge Questions (Section 1)
The questions used in Section I of the questionnaire were designed to assess knowledge of basic food preparation and the skills required to prepare familiar dishes. Questions relating to knowledge of ingredients were designed using commonly consumed meal items; coleslaw
salad, lentil soup, bread, and apple crumble (Table 9.1).
206
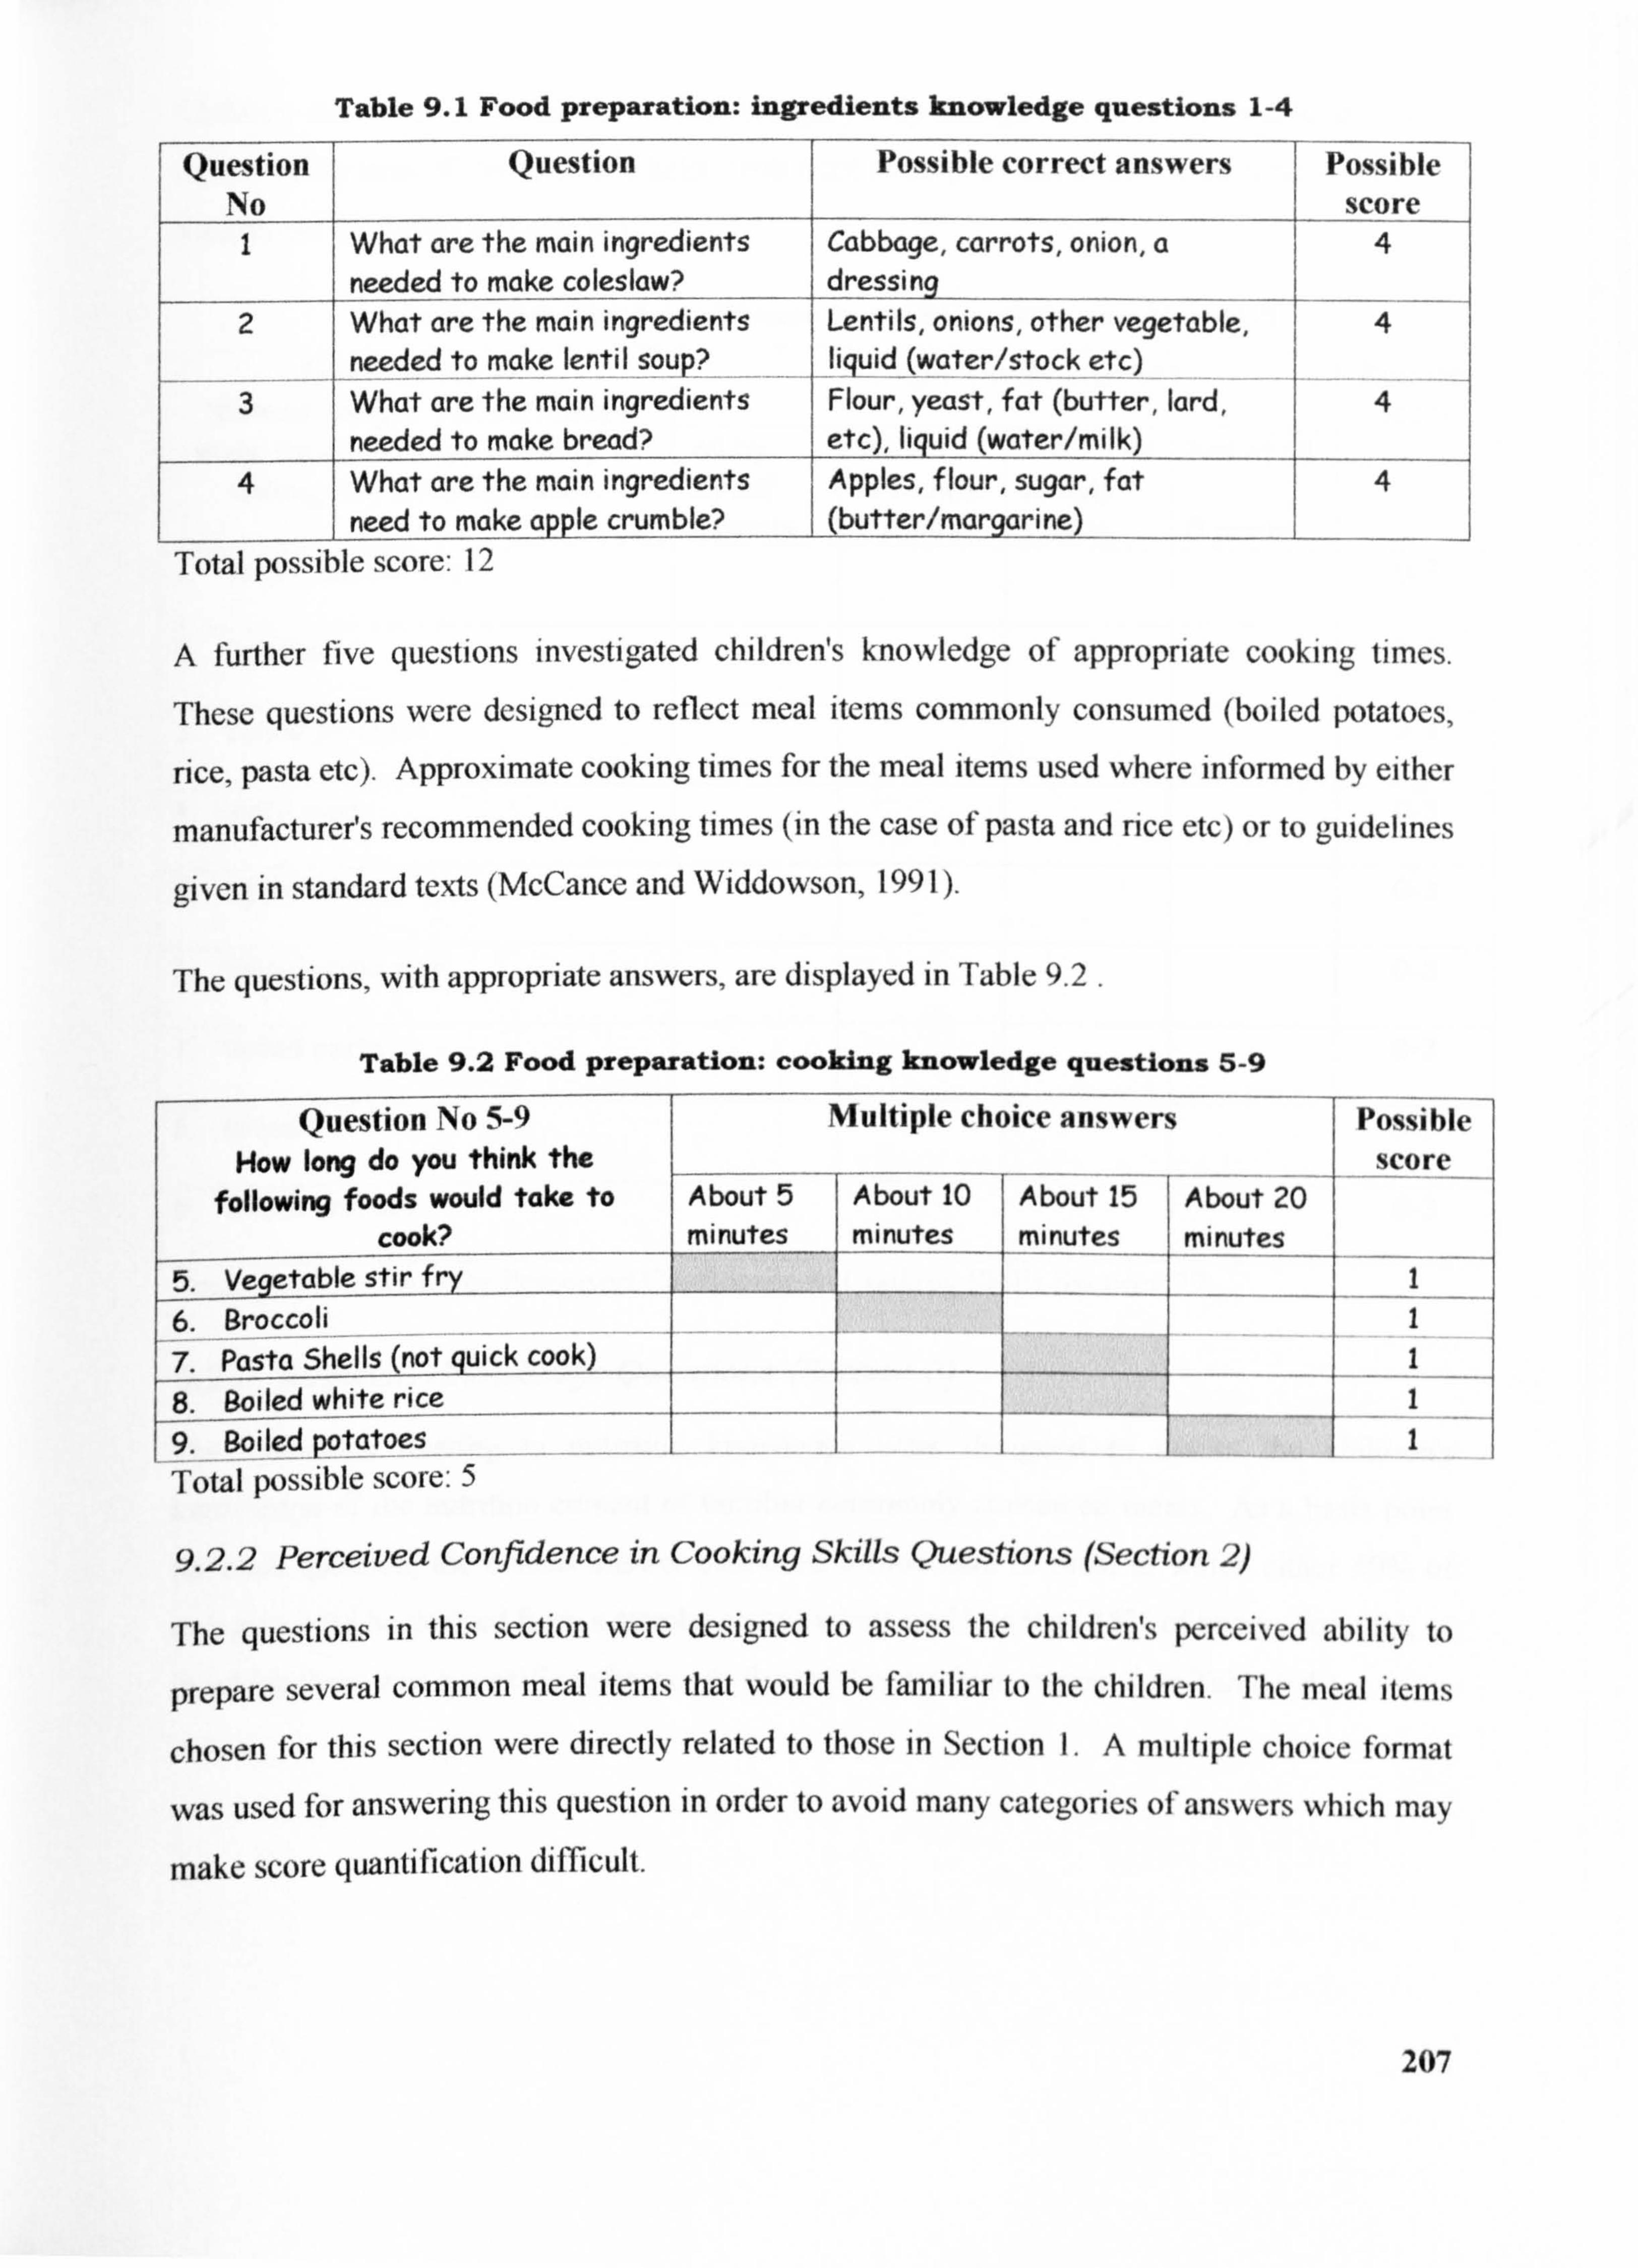
Table 9.1 Food preparation: ingredients knowledge questions 1-4
Question No
Question Possible correct answers Possible score
I What are the main ingredients Cabbage, carrots, onion, a needed to make coleslaw? dressing
2 What are the main ingredients Lentils, onions, other vegetable, needed to make lentil soup liquid
-(water/stock etc)
3 What are the main ingredients Flour, yeast, fat (butter, lard, 4 needed to make bread? etc), liquid (water/milk)
4 What are the main ingredients Apples, flour, sugar, fat 4 need to make apple crumble? (butter/mcirgarine)
Total possible score: 12
A further five questions investigated children's knowledge of appropriate cooking times.
These questions were designed to reflect meal items commonly consumed (boiled potatoes,
nce, pasta etc). Approximate cooking times for the meal items used where informed by either
manufacturer's recommended cooking times (in the case of pasta and rice etc) or to guidelines
given in standard texts (McCance and Widdowson, 199 1).
The questions, with appropriate answers, are displayed in Table 9.2 .
Table 9.2 Food preparation: cooking knowledge questions 5-9
Question No 5-9 u Q Multiple choice answers How long do you think the , on F o W --- -
x_ _ _. . following foods would take to About 5 About 10 About 15 About 20
cook? minutes minutes mi nutes minutes 5. Vegetable stir fry
_ 6. Broccoli 7. Pasta Shells (not quick cook)
white rice 8. Soiled _ 9. Boiled potatoes
Total possible score: 5
9.2.2 Perceived Confidence in Cooking Skills Questions (Section 2)
Possi le score
1 I 1 1 I
The questions in this section were designed to assess the children's perceived ability to
prepare several common meal items that would be familiar to the children. The meal iterns
chosen for this section were directly related to those in Section 1. A multiple choice format
was used for answering this question in order to avoid many categories ofanswers which may
make score quantification difficult.
207
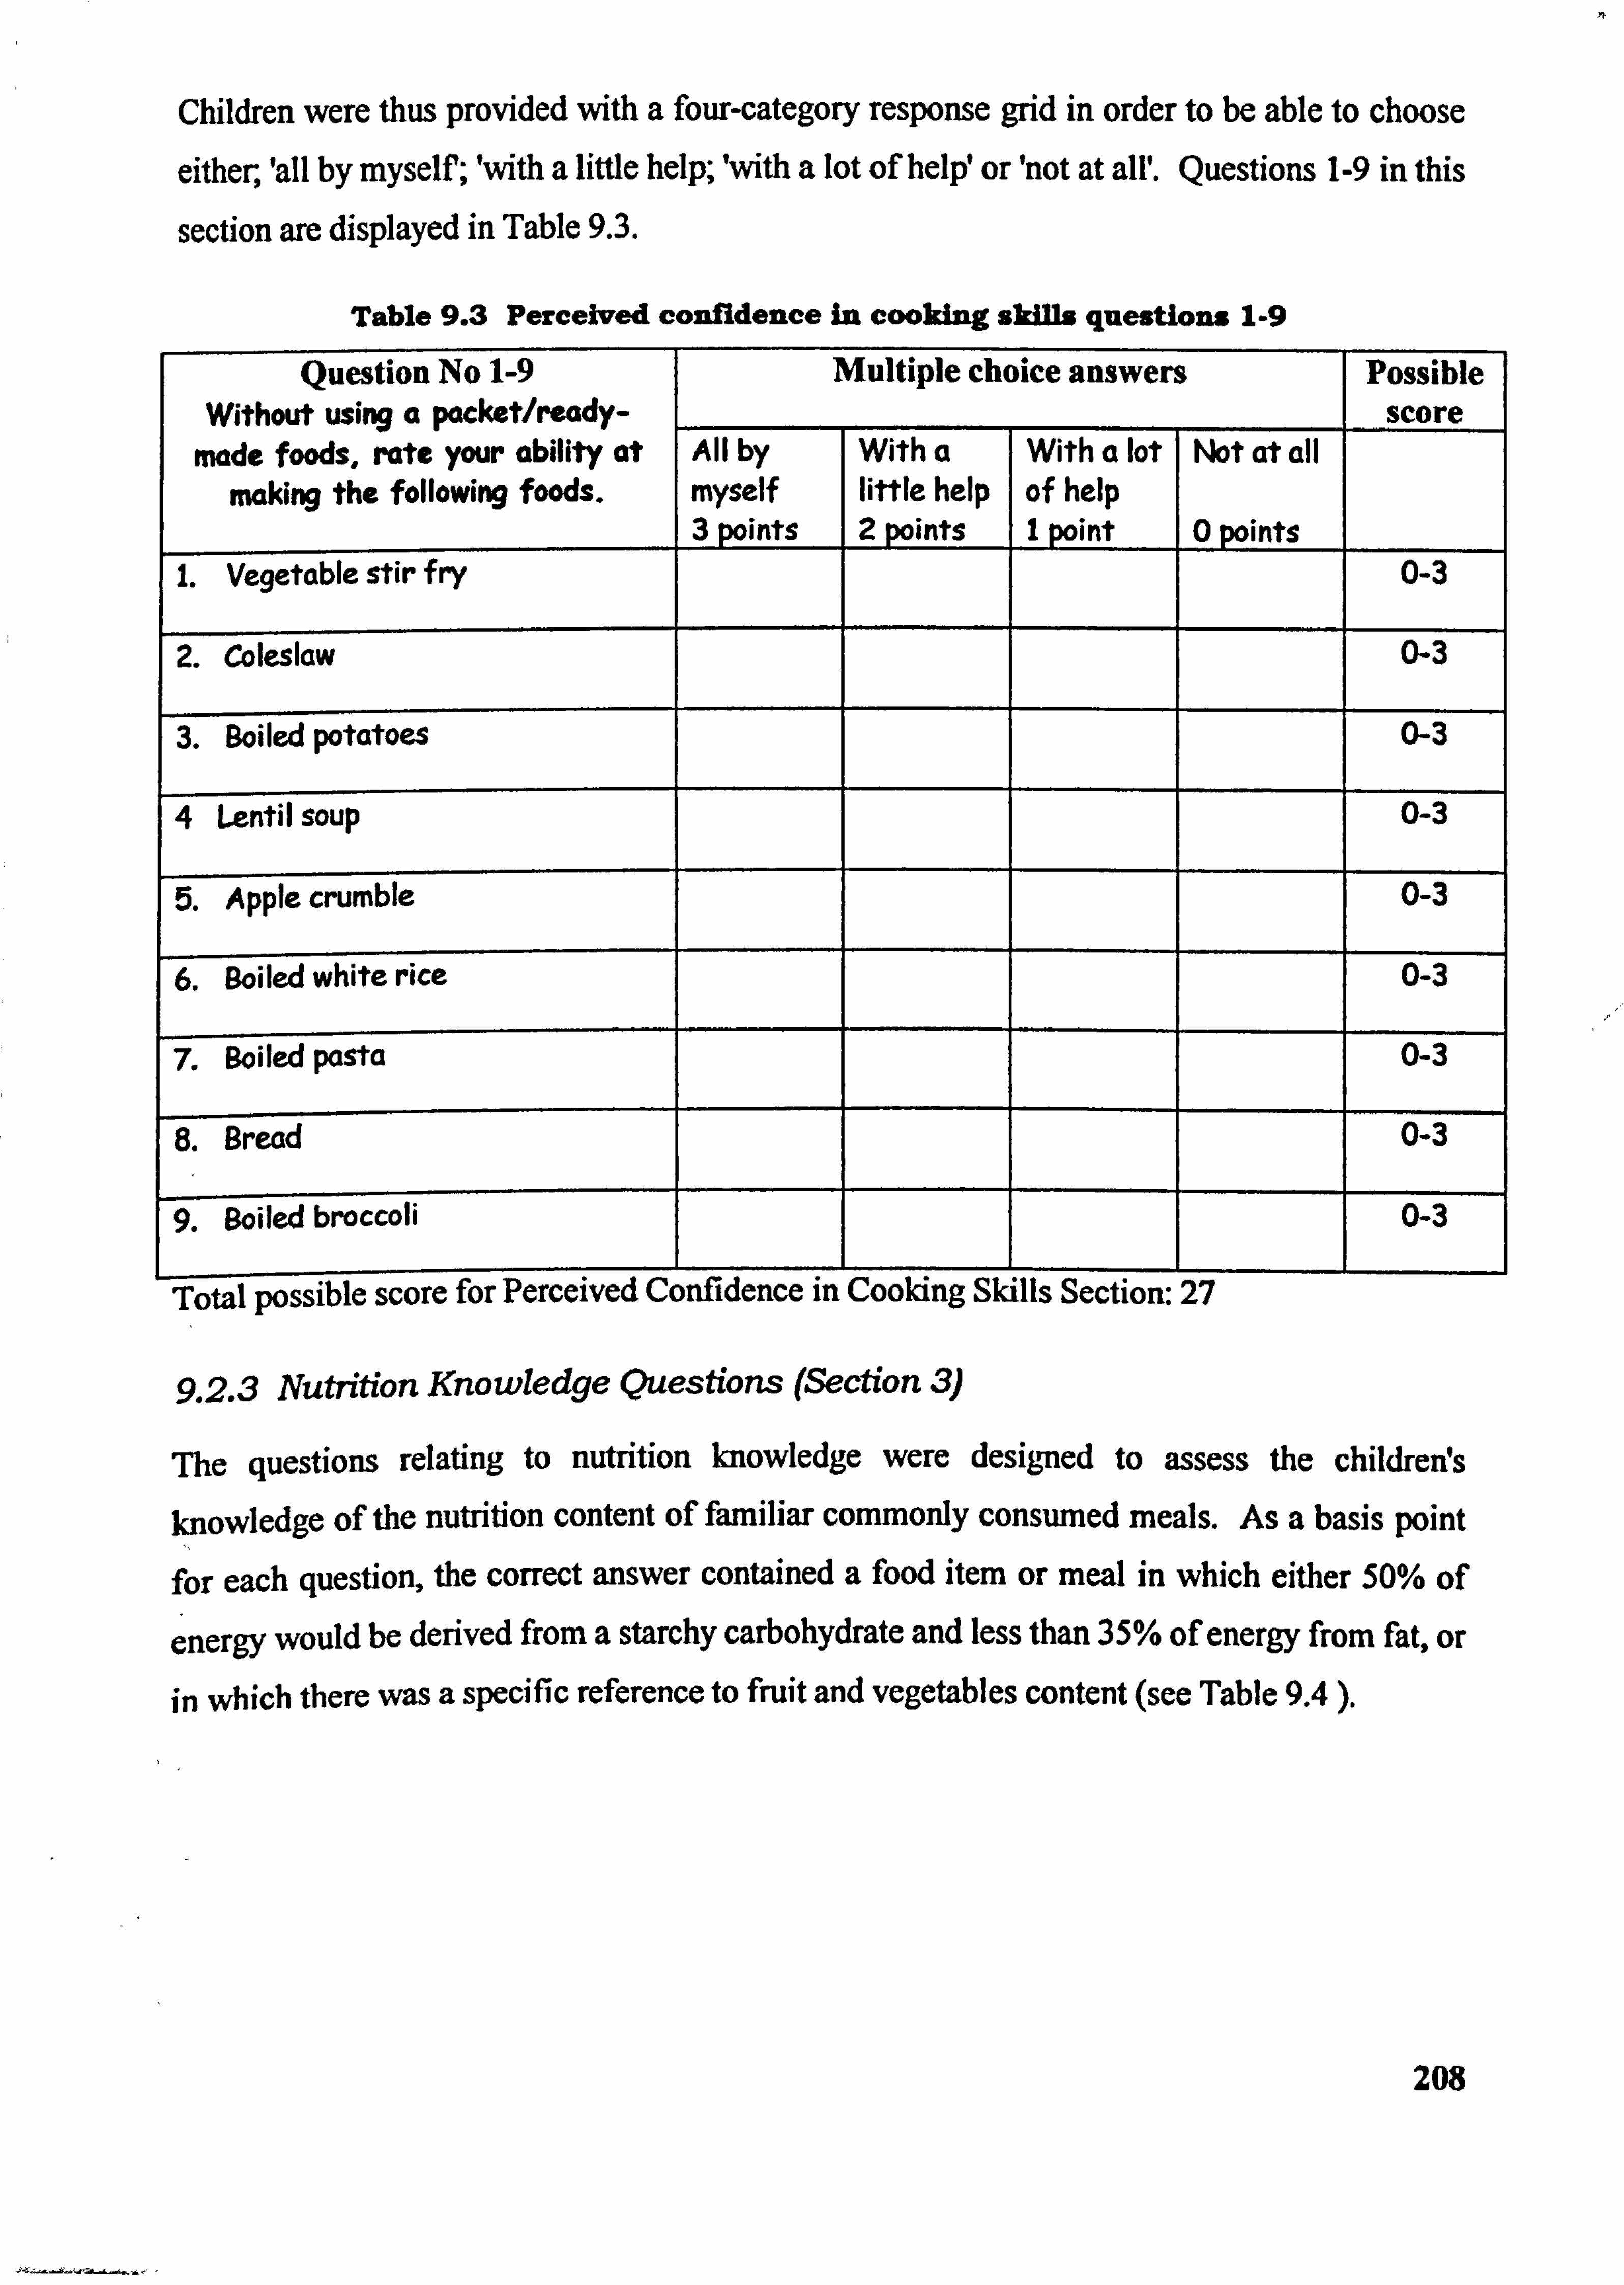
Children were thus provided with a four-category response grid in order to be able to choose
either, 'all by myself; 'with a little help; 'with a lot of help! or 'not at all'. Questions 1-9 in this
section are displayed in Table 9.3.
Table 9.3 Perceived confidence In cooking skIlls questions 1.9
Question No 1-9 Without using a packet/ready-
Multiple choice answers Possible score
made foods, rate your ability at making the following foods.
All by myself 3 points
With a little help 2 points
With a lot of help I point
Wt at all
0 points 1. Vegetable stir fry 0-3
2. Coleslaw 0-3
3. Soiled potatoes 0-3
4 Lentil soup 0-3
5. Apple crumble 0-3
6. Soiled white rice 0-3
7. Boiled pasta 0-3
8. Bread 0-3
rg. ýWiled -broccoh
Total possible score for Perceived Confidence in Cooking Skills Section: 27
9.2.3 Nutrition Knowledge Questions (Section 3)
The questions relating to nutrition knowledge were designed to assess the childreds knowledge of the nutrition content of familiar commonly consumed meals. As a basis point for each question, the correct answer contained a food item or meal in which either 50% of
energy would be derived from a starchy carbohydrate and less than 35% of energy from fat, or in which there was a specific reference to fruit and vegetables content (see Table 9.4 ).
208

Table 9.4 Nutrition knowledge questions 1-8
Question 1. Many breakfast foods are healthy
choices. Which one of the following breakfast type foods would be the 'healthiest'
choice? Onefriedsausage One fried bacon rasher One fried egg One slice bread andjam Not sure Question 3.
Which one of the following breakfast type foods would NOT be a good example of a healthy snack? One bowl of wholewheat cereal An apple A sausagý roll A slice of toast and jam Not sure
Question 2. Many snack foods are healthy choices.
Which one of the following items would be the 'healthiest' one to take as a between meals snack?
A plain diqestive biscuit
_A chocolate bar
A kiwi An orange ice lolly
Not sure Question 4. Many packed lunches are healthy choices. Which one of the following lunches would be the 'healthiest' choice? Crisps, chocolate bar and fizzy drink Meat pie, fruit yoghurt and milk Cheese salad roll, a? ple andwater Pizza, chocolate bar and milkshake Not sure
Question 5. Many sandwiches are healthy choices.
Which one of the following sandwich fillings would be the 'healthiest'
choice? Cheddar cheese and onion Bacon and tomato sauce Chicken, lettuce and tomato Egq mayonnaise Not sure
Question 6. Many potato dishes are healthy choices.
Which one of the following types of potatoes would be the 'healthiest' choice? Medium prtion f roastpotatoes Medium portion of chips Med_ium baked potato (no filling)_
edium portion mashed potato butter Not sure
Question 7. Question 8. In general, how many portions of fruit Which sandwich is healthier?
and vegetables are recommended by healthy experts to be eaten every dcty')--
- I or less Two thin slices of bread and a thick --
slice of cheese Two to three Two thick slices of bread and a thin
slice of cheese Four One thick slice of bread and a thick
slice of cheese Five or more All the same Not sure Not sure
W)
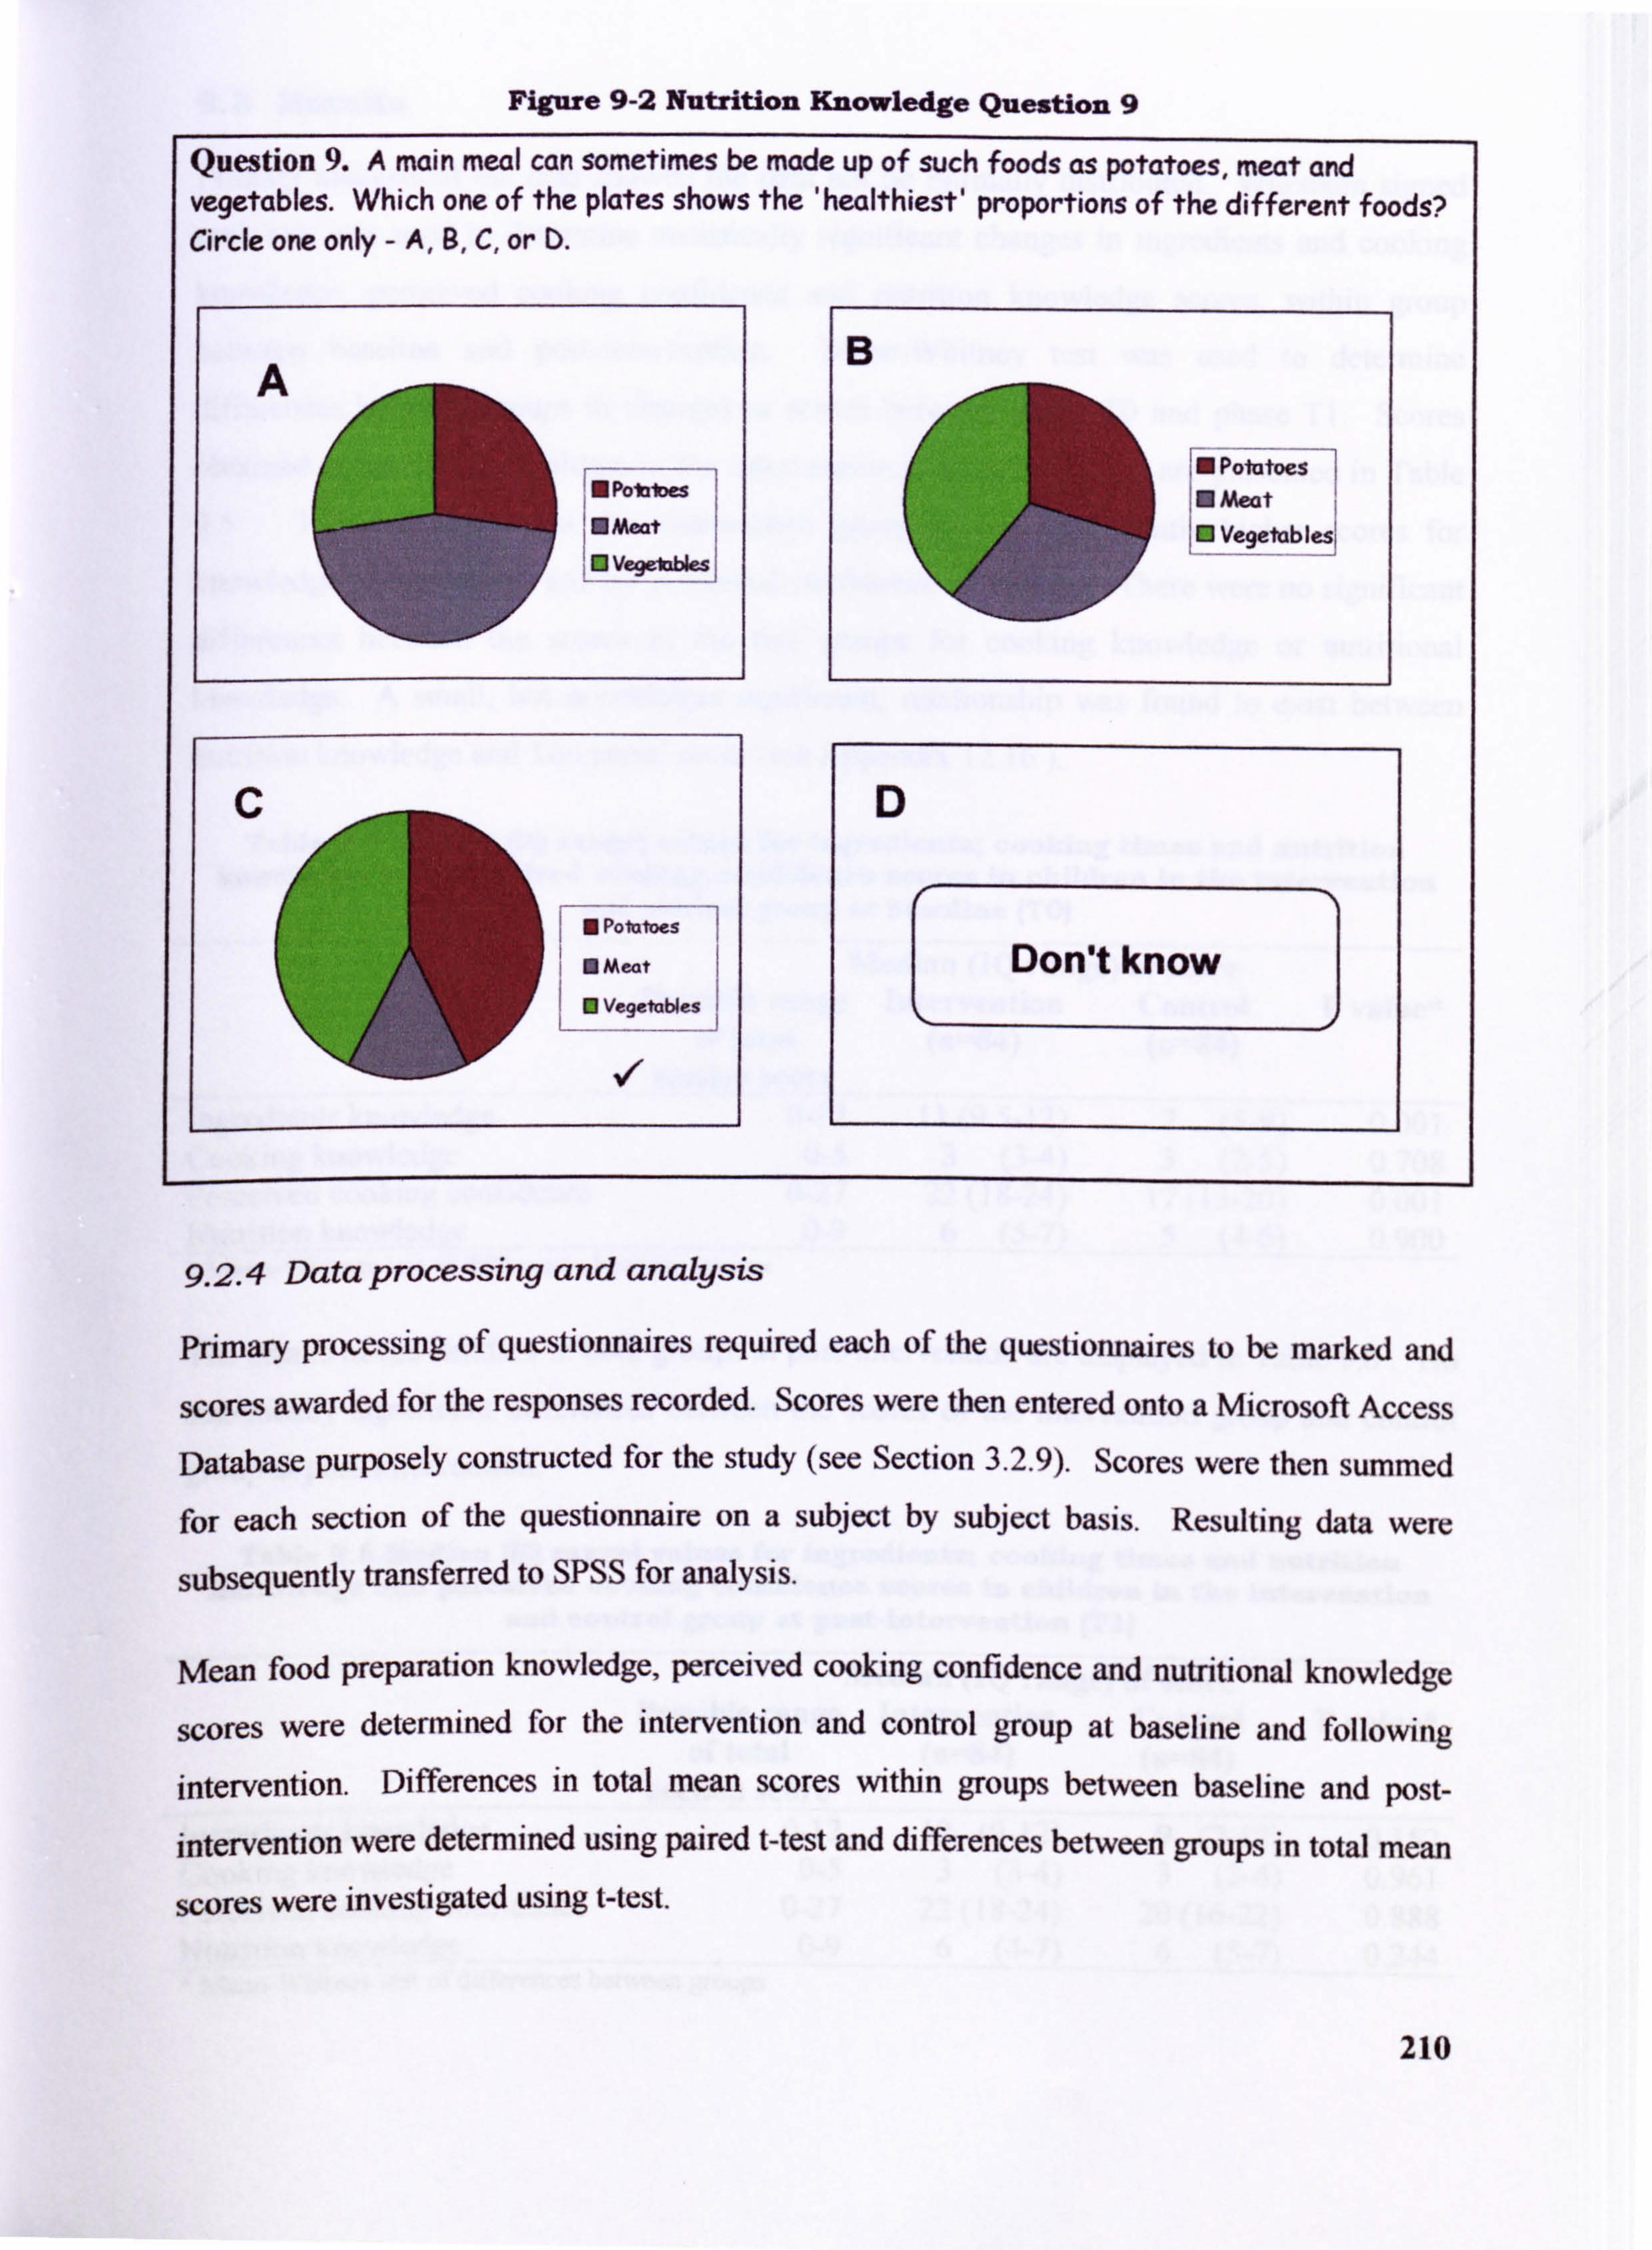
Figure 9-2 Nutrition Knowledge Question 9
Question 9. A main meal can sometimes be made up of such foods as potatoes, meat and vegetables. Which one of the plates shows the 'healthiest' proportions of the different foods? Circle one only - A, B, C, or D.
B A
IM Potatoes E PoiMID" 0 Meat Mmeat E Vegetablesl El veget""
N Pointoes
0 Meat Don't know 0 Vegetables
9.2.4 Data processmg and analysis
primary processing of questionnaires required each of the questionnaires to be marked and
scores awarded for the responses recorded. Scores were then entered onto a Microsoft Access
Database purposely constructed for the study (see Section 3.2.9). Scores were then summed for each section of the questionnaire on a subject by subject basis. Resulting data were
subsequently transferred to SPSS for analysis.
Mean food preparation knowledge, perceived cooking confidence and nutritional knowledge
scores were determined for the intervention and control group at baseline and following
intervention. Differences in total mean scores within groups between baseline and post- intervention were determined using paired t-test and differences between groups in total mean
scores were investigated using West.
210
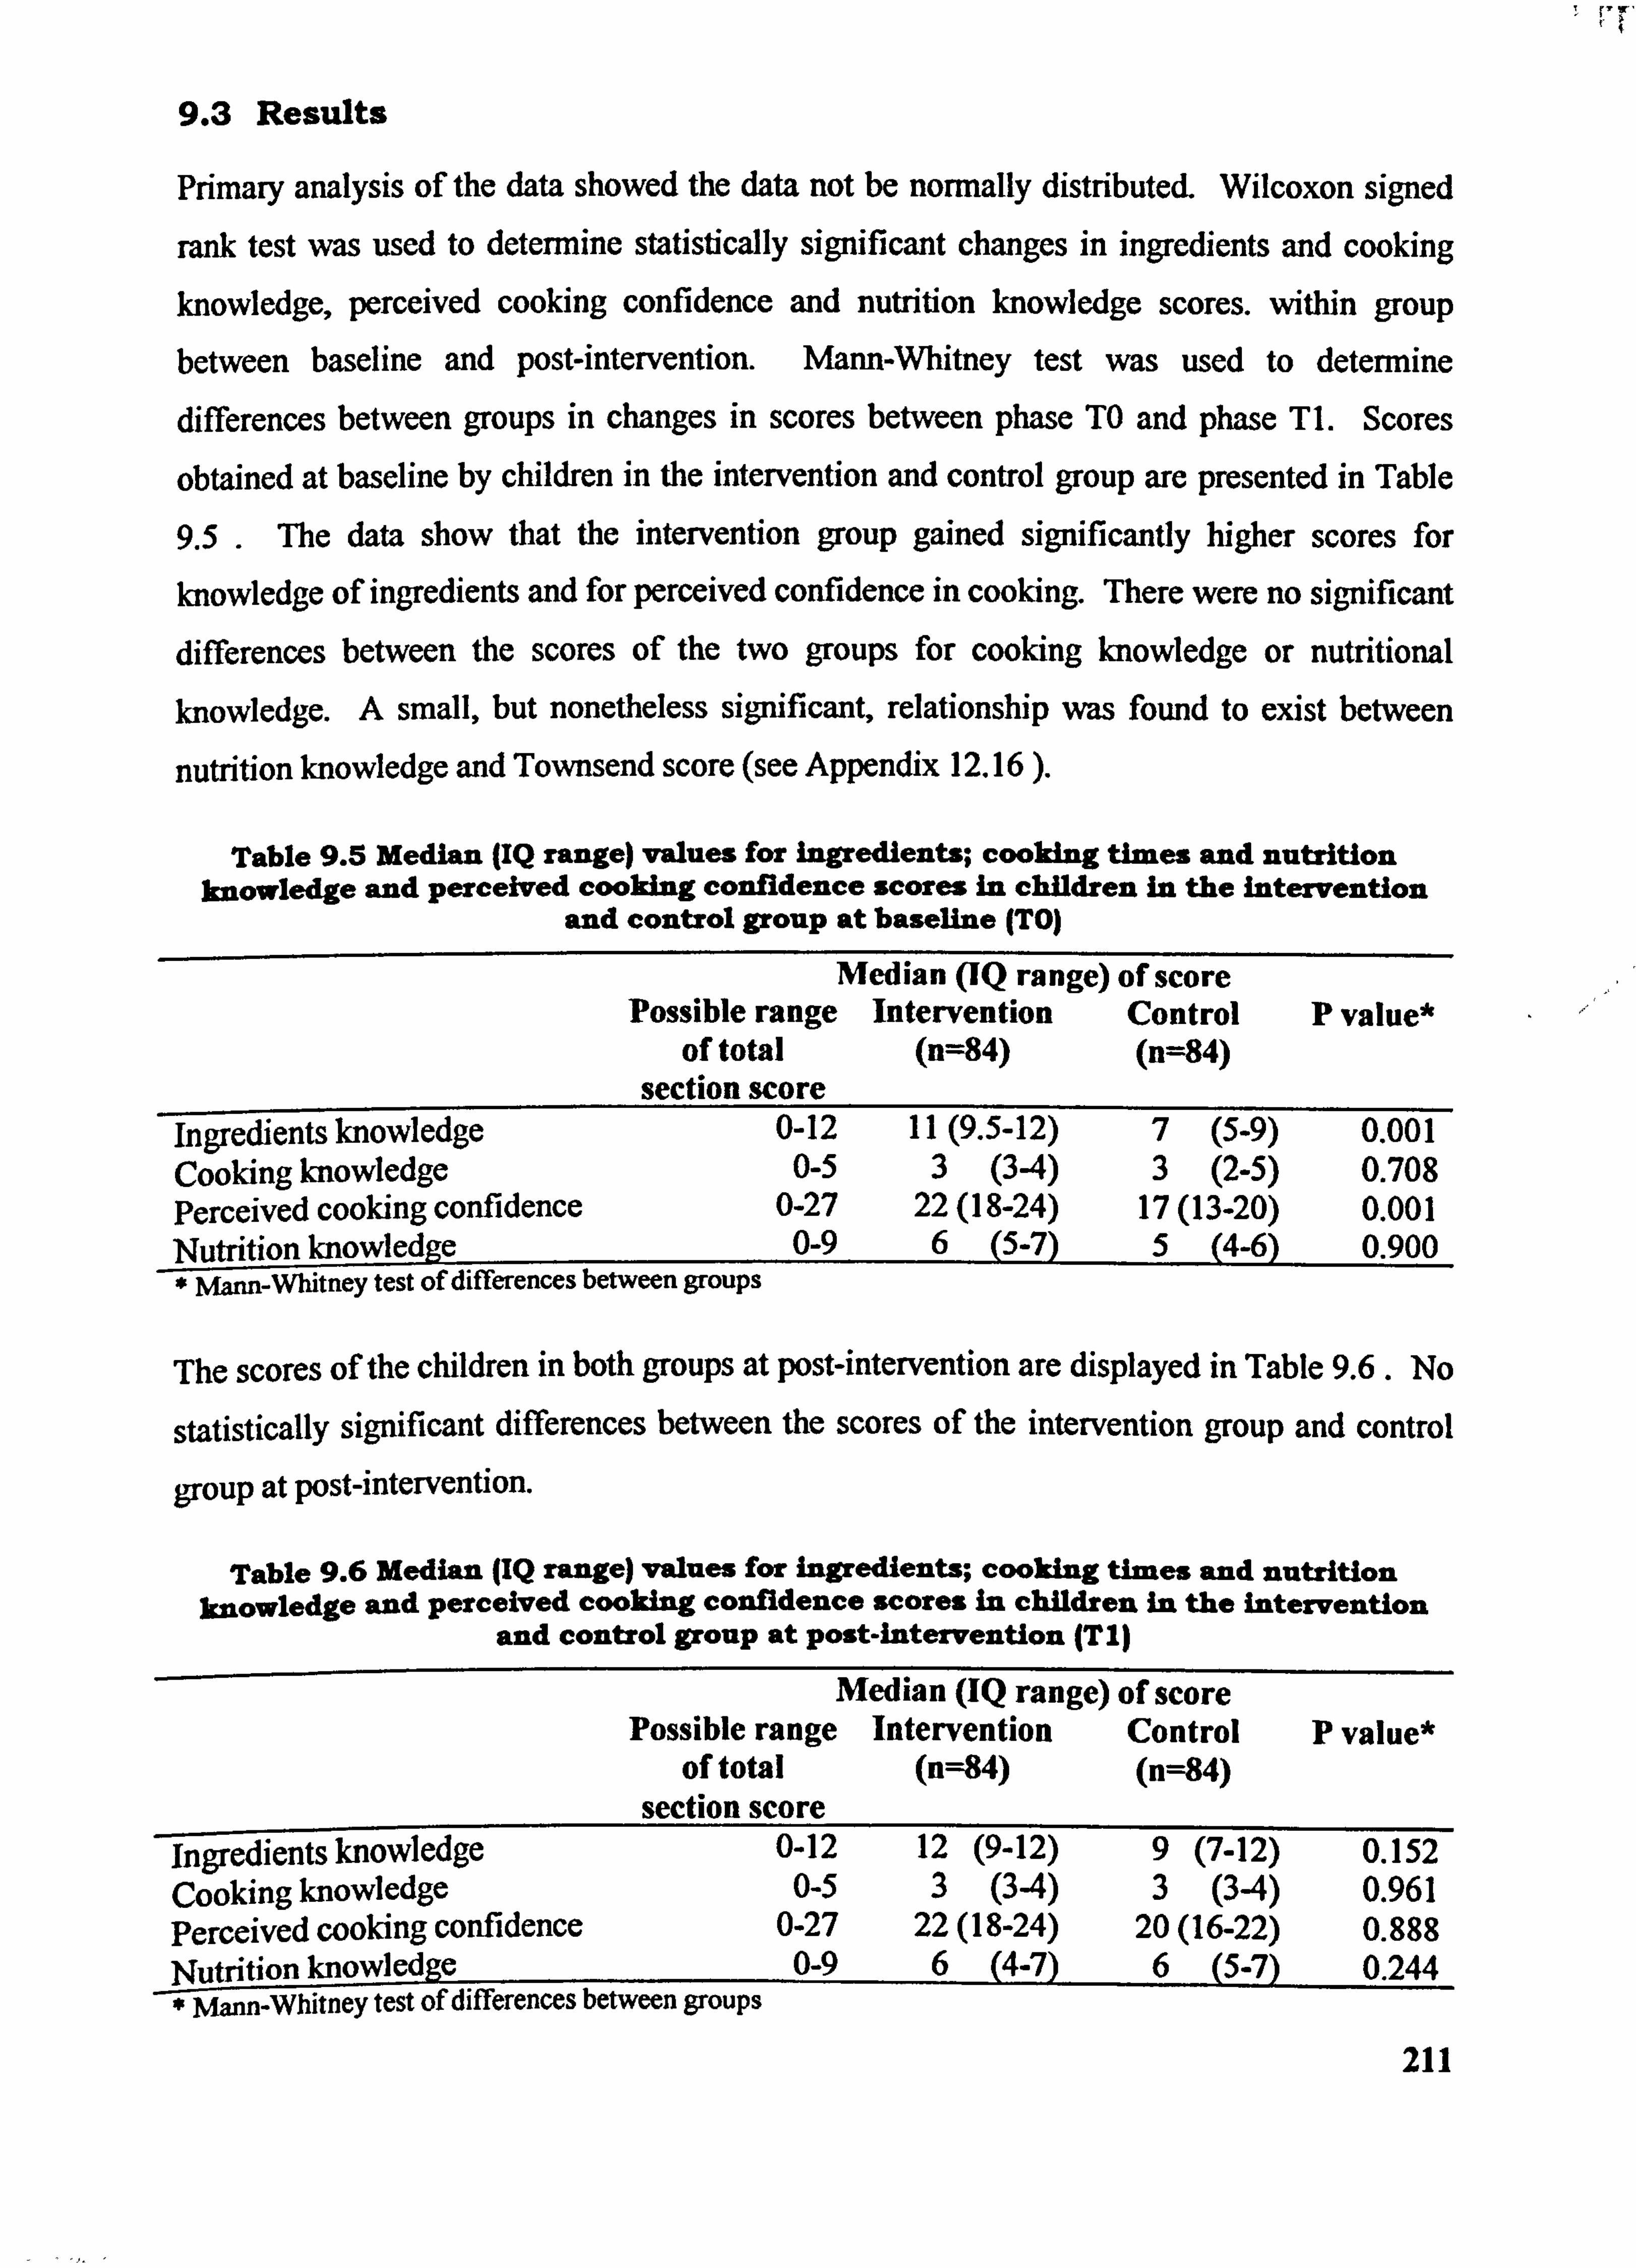
rr
9.3 Results
Primary analysis of the data showed the data not be normally distributed. Wilcoxon signed
rank test was used to determine statistically significant changes in ingredients and cooking knowledge, perceived cooking confidence and nutrition knowledge scores. within group between baseline and post-intervention. Mann-Whitney test was used to determine
differences between groups in changes in scores between phase TO and phase TI. Scores
obtained at baseline by children in the intervention and control group arc presented in Table
9.5 . The data show that the intervention group gained significantly higher scores for
knowledge of ingredients and for perceived confidence in cooking. There were no significant differences between the scores of the two groups for cooking knowledge or nutritional
knowledge. A small, but nonetheless significant, relationship was found to exist between
nutrition knowledge and Townsend score (see Appendix 12.16 ).
Table 9.5 Median (IQ range) values for ingredients; cooking times and nutrition knowledge and perceived cooking confidence scores in children in the intervention
and control group at baseline (TO)
Median (IQ range) of score Possible range Intervention Control P value*
of total (n=84) (n=84) section score
ingredients knowledge 0-12 11(9.5-12) 7 (5-9) 0.001 Cooking knowledge 0-5 3 (34) 3 (2-5) 0.708 Perceived cooking confidence 0-27 22(18-24) 17(13-20) 0.001 Nutrition knowledge 0-9 6 (5-7) 5 (4-6) 0.900 _-W -Mam-Whitney test of differences between groups
The scores of the children in both groups at post-intervention are displayed in Table 9.6. No
statistically significant differences between the scores of the intervention group and control
group at post-intervention.
Table 9.6 Median (IQ range) values for ingredients; cooking times and nutrition knowledge and perceived cooking confidence scores in children in the intervention
and control group at post-intervention (Tl)
Median (IQ range) of score Possible range Intervention Control P value*
of total (n=84) (n=84) section score
ingredients knowledge 0-12 12 (9-12) 9 (7-12) 0.152 Cooking knowledge 0-5 3 (34) 3 (34) 0.961 Perceived cooking confidence 0-27 22(18-24) 20(16-22) 0.888 Nutrition knowledge 0-9 6 (4-7) 6 (5-7) 0.244
mann-whitney test of differences between groups 211
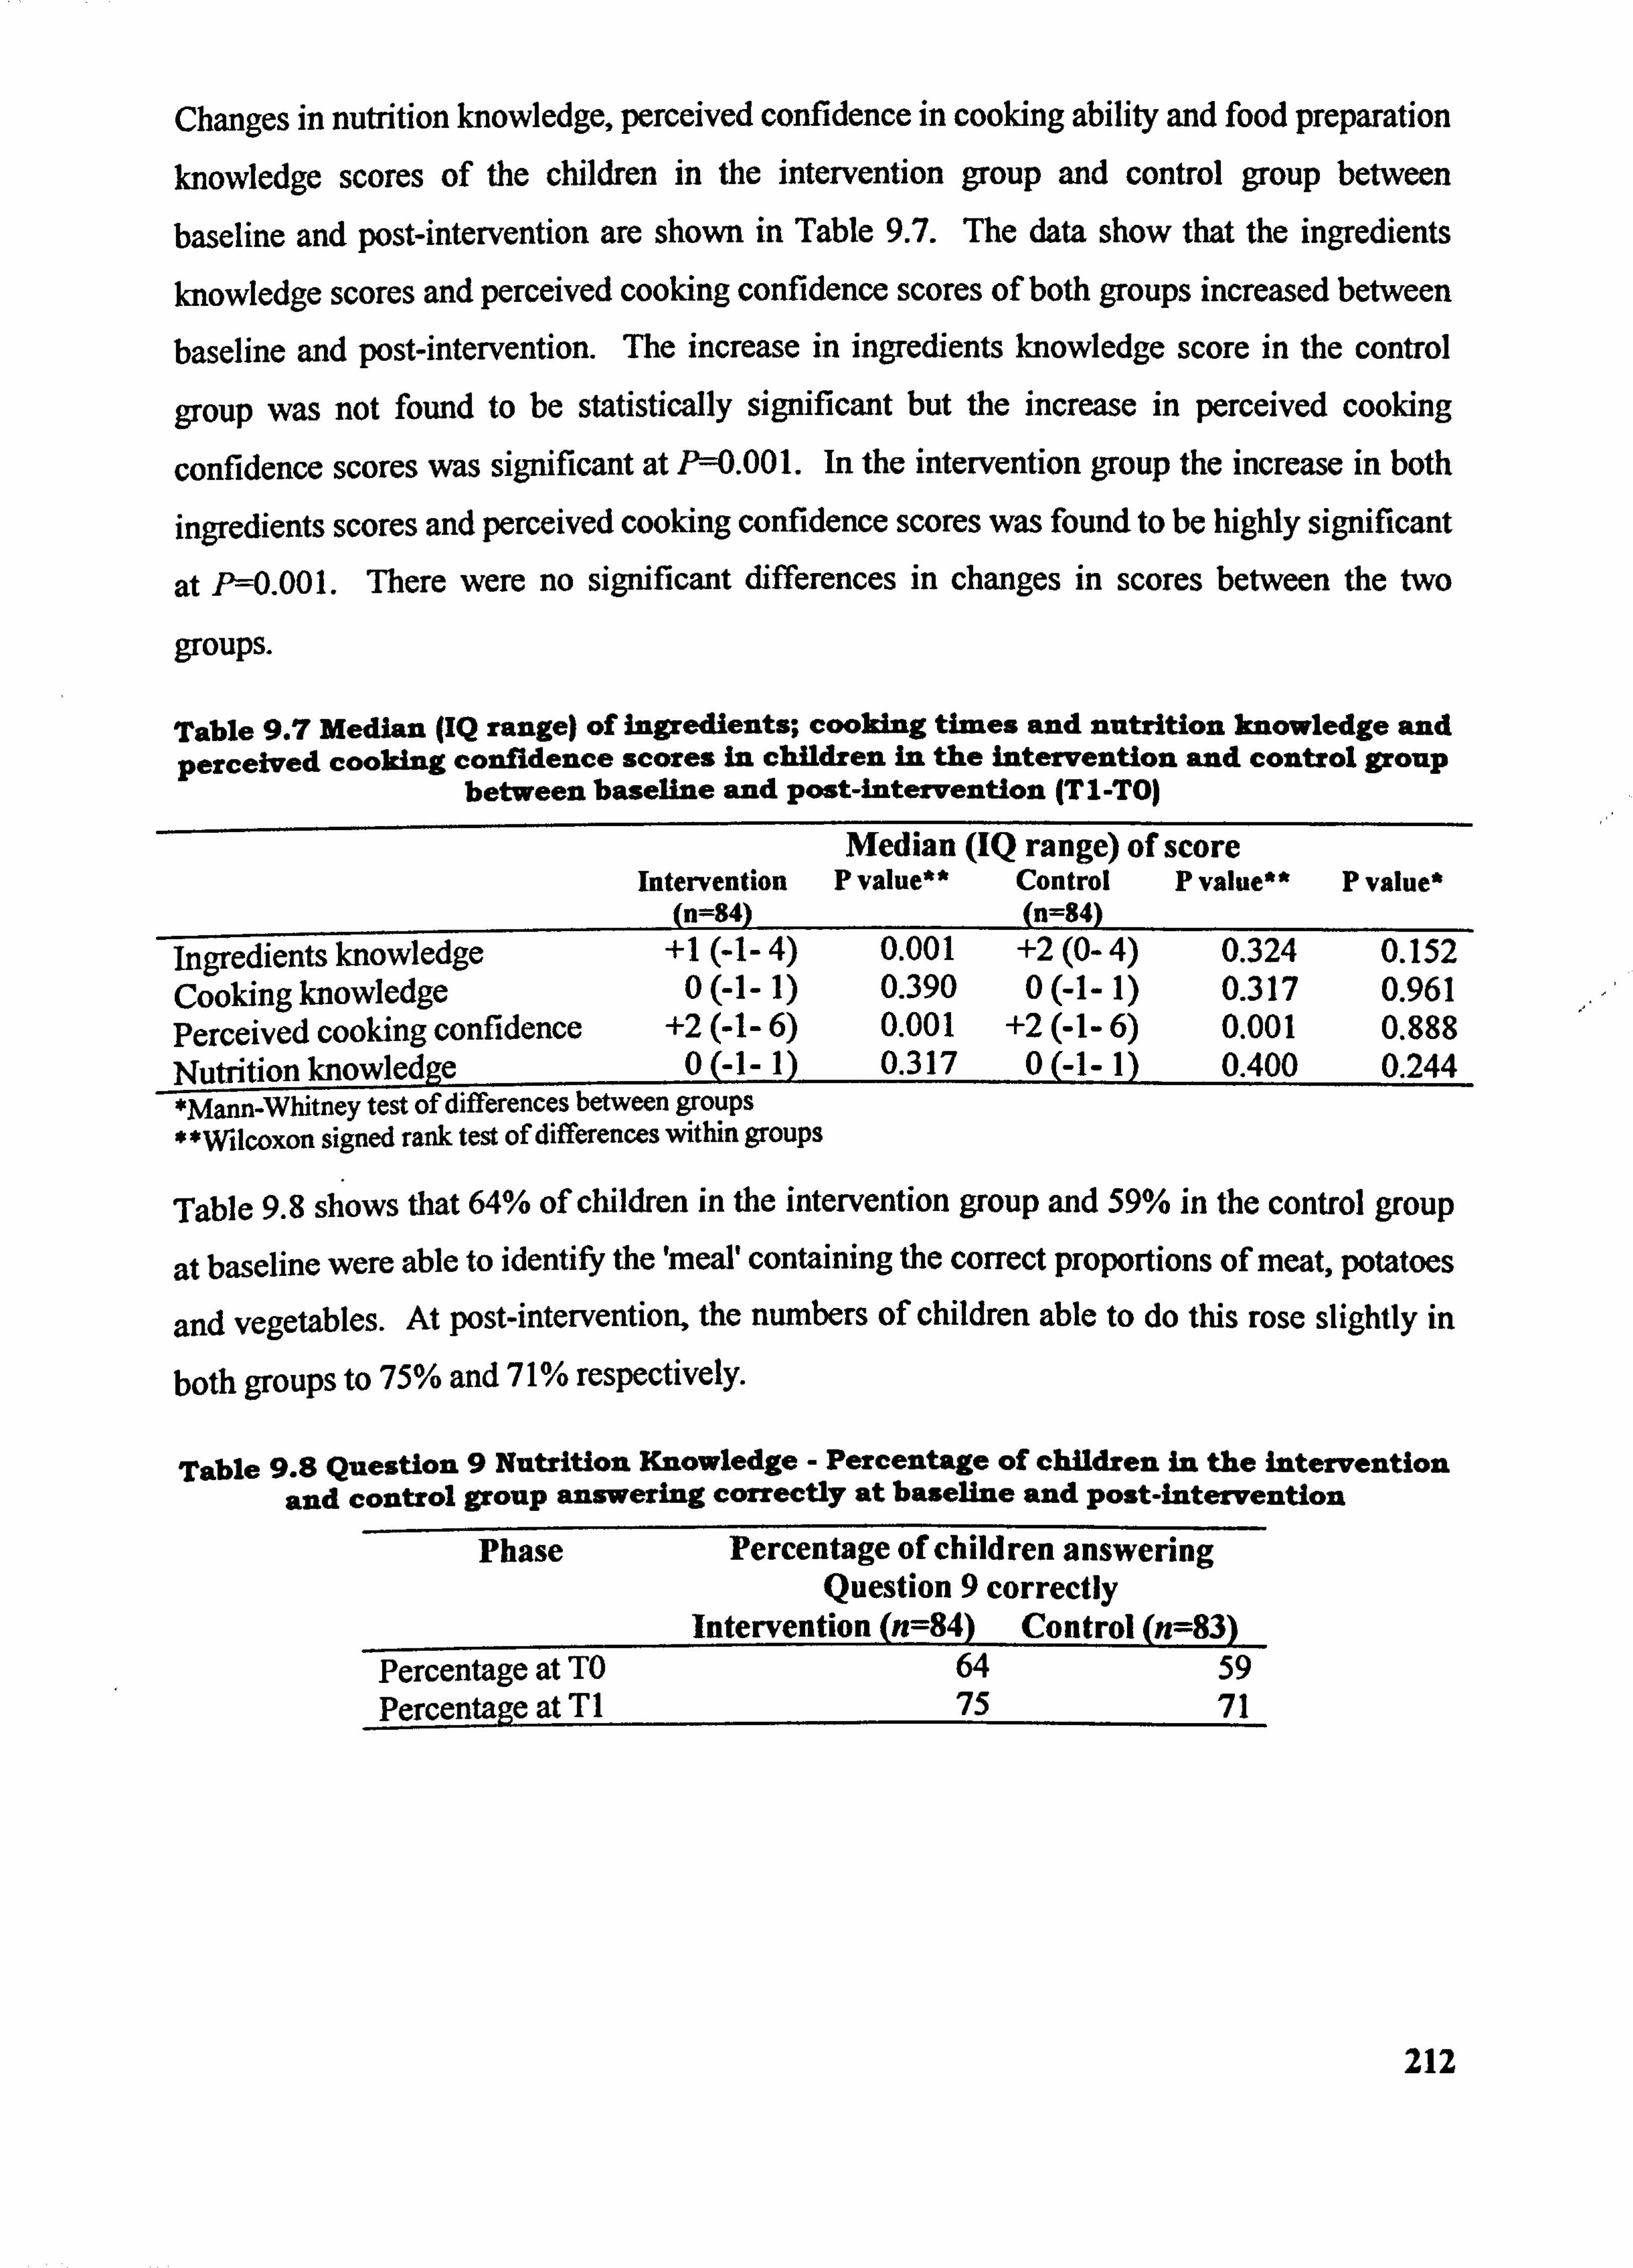
Changes in nutrition knowledge, perceived confidence in cooking ability and food preparation knowledge scores of the children in the intervention group and control group between
baseline and post-intervention are shown in Table 9.7. The data show that the ingredients
knowledge scores and perceived cooking confidence scores of both groups increased between
baseline and post-intervention. The increase in ingredients knowledge score in the control
group was not found to be statistically significant but the increase in perceived cooking
confidence scores was significant at II=0.001. In the intervention group the increase in both
ingredients scores and perceived cooking confidence scores was found to be highly significant
at P--0.001. There were no significant differences in changes in scores between the two
groups.
Table 9.7 Median (IQ range) of ingredients; cooking times and nutrition knowledge and perceived cooking confidence scores in children in the intervention and control group
between baseline and post-intervention (TI-TO)
Intervention (n=84)
Median (IQ range) of score P value** Control P value**
n=84) P value*
ingredients knowledge +1(-1-4) 0.001 +2(0-4) 0.324 0.152 Cooking knowledge 0(-1-1) 0.390 0(-1-1) 0.317 0.961 Perceived cooking confidence +2(-1-6) 0.001 +2(-1-6) 0.001 0.888 Nutrition knowledge 0(-]-1) 0.317 0(-1-1) 0.400 0.244 *Mann-Whitney test of differences between groups * milcoxon signed rank test of differences within groups
Table 9.8 shows that 64% of children in the intervention group and 59% in the control group
at baseline were able to identify the 'meal' containing the correct proportions of meat, potatoes
and vegetables. At post-intervention, the numbers of children able to do this rose slightly in
both groups to 75% and 71% respectively.
Table 9.8 Question 9 Nutrition Knowledge - Percentage of children in the intervention and control group answering correctly at baseline and Post-intervention
Phase Percentage of children answering Question 9 correctly
Intervention (n=84) Control (n=83) Percentage at TO 64 59 Percentage at T1 75 71
212
9.4 Discussion
The results show that at baseline the children in the intervention had higher ingredients
knowledge scores and higher perceived cooking confidence scores than children in the control
group. One possible explanation for this is that children in the intervention group who
volunteered to take part in the study were aware that the study would include attendance to an
after-school Food Club where they would have the opportunity to cook. This may have had
the unintentional affect of attracting children who already had an interest in food and cooking
although it was not shown to have any significant influence upon recruitment numbers (see
Section 3.3.3 ). Children in the control group were not informed about the Food Club and as
such were unaware about the practical intervention, thus it is less likely that children with an
interest in cooking would have been more attracted to the study than others who were not. At
post-intervention nutrition knowledge scores did not increase significantly in either group but
median scores in both groups indicated a good knowledge of basic nutrition.
Scores relating to knowledge of ingredients were of a good standard in both the control and intervention group but were higher in the intervention group. The scores indicate that many
children are aware of some basic healthy eating guidelines (see Figure 9-1) but evidence of trying to follow a healthy diet is scarce, particularly in terms of the consumption of fruits and
vegetables. Median cooking confidence score in the intervention group children was 22 out
of a possible 27. Both these indicate that children who had attended the Food Club had a
good basic knowledge of ingredients and confidence in their ability to cook.
Ultimately, there were no significant differences in changes in scores between the intervention
and control group. The most likely explanation for this is the increase in the age of the
children - having a year to increase their knowledge of food and that they may have either found out or remembered the specific questions on the questionnaire they had completed at baseline. In addition, it is difficult to know whether or not children in either group may have
also learnt about nutrition and healthy eating as it may be taught in Food Technology, Science
on in Personal and Social Education in some schools, at different times and to different
classes.
The children completed an identical questionnaire at post-intervention to that at baseline. It
may have been preferable to change the content of the questions without diverting from the
original assessment of knowledge. For example, the children could have been asked about the
213
main ingredients to make a dish such as Shepherds Pie or basic bolognese sauce rather than
lentil soup. Cooking times could have been extended to include other easily recognised dishes. The questionnaire employed in the study had been initially designed for use in young
women in Dundee and it is possible that ftirther development of its suitability for adolescents
may have been necessary (see Anderson et al, 2002).
In summary, the Food Club did not impact significantly on the nutrition and cooking
knowledge and cooking confidence scores of the intervention group over and above that
demonstrated in the control group. However, it should be bome in mind that the intervention
was a relatively short-term programme and potential exists in programmes of a longer
duration.
214
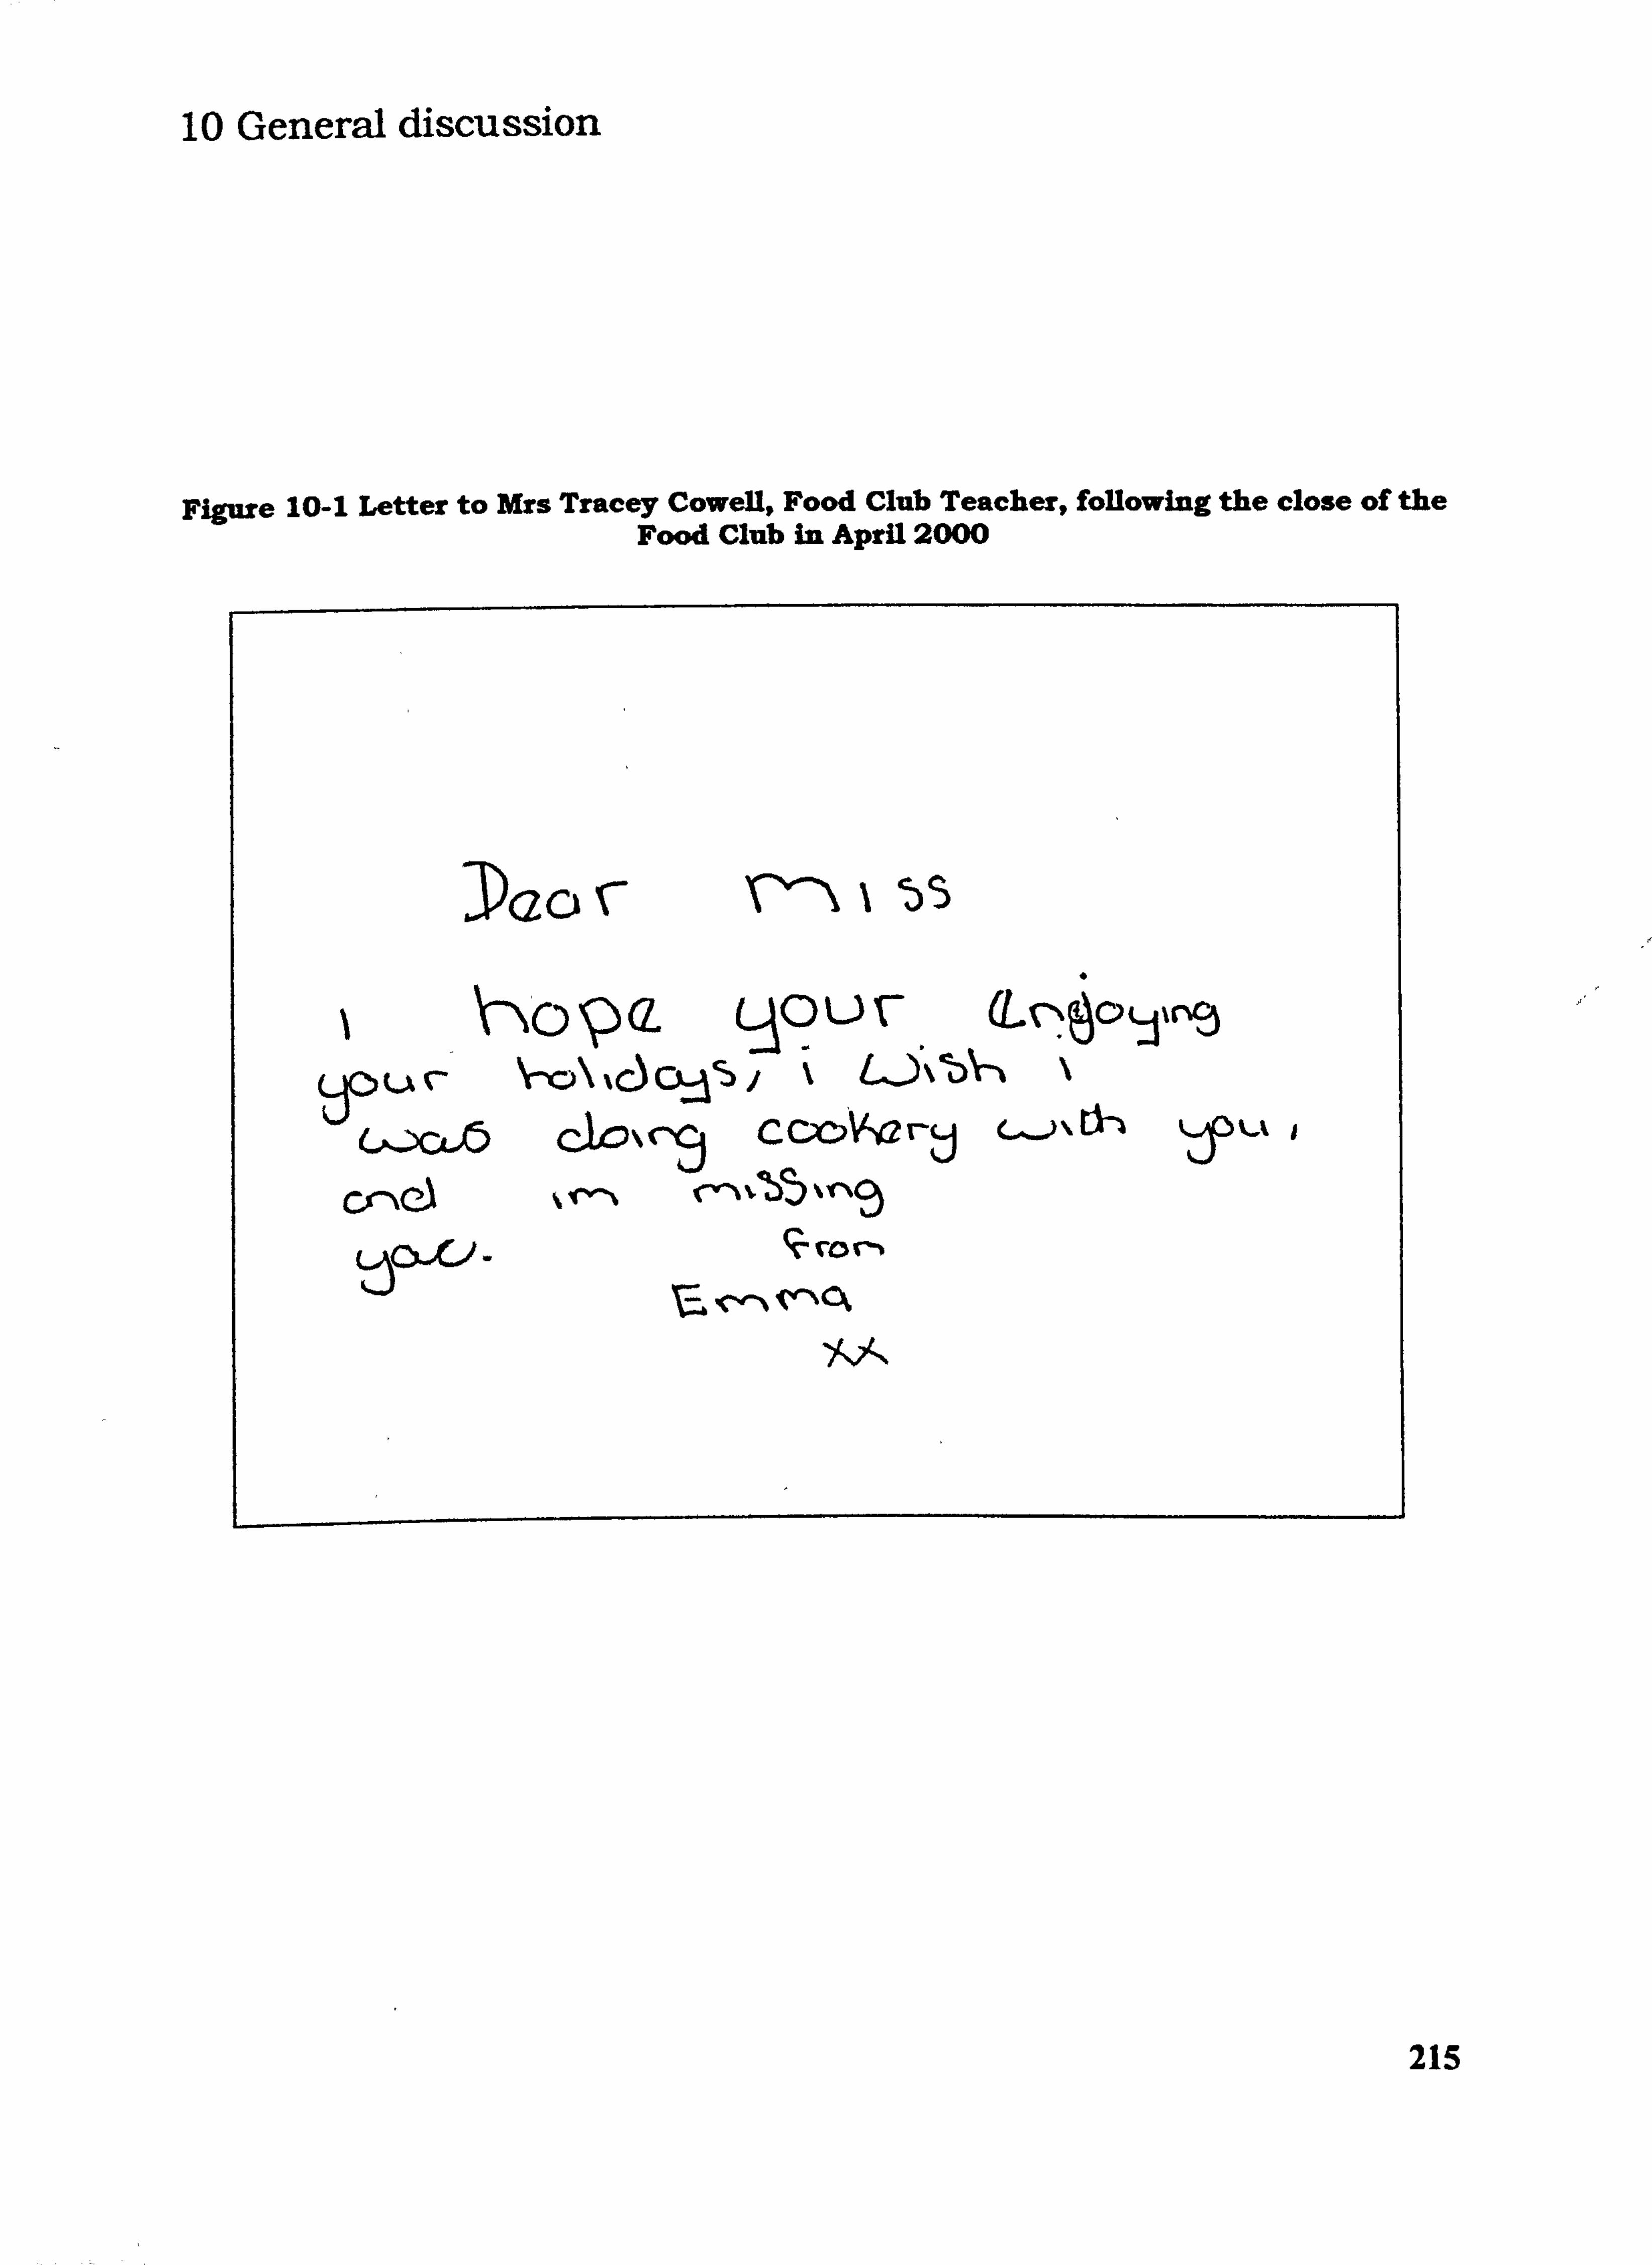
10 General discussion
Figure 10-1 Letter to Mrs Tracey Cowell, Food Club Teacher, following the close of the Food Club in April 2000
Tao ý- V, -ý I -ýs
ILA (- \-10\ I C) CL Lj \ b\--, \ cooV-ard i
215

10.1 Introduction
This study has attempted to highlight the role of food preparation and cooking skills in the
ability to follow a nutritionally adequate diet and draw attention to how this ability may be
compromised when basic skills are limited. A review of the literature revealed that income
and social inequalities impact upon quality of life and life expectancy (Section 2.1 ). Lower-
social class groups are already at risk of a poor diet (Section 2.3 ) and to chronic diseases
associated with dietary inadequacy, sub-optimum micronutrient intakes and dietary excesses.
Several studies have shown that the nutrient intakes of low-income families are poor
(Moynihan et al, 1993, Doyle et al, 1994, Ruxton & Kirk, 1996, Watt & Sheilham, 1996) and
that intake of fruits and vegetables do not meet current dietary reference values (Gregory el
al, 2000). Dietary trends in adolescent nutrition reveal unsatisfactory progress towards
meeting the current dietary recommendations. This has been shown to be more severe in
children and adolescents from low social groups (Section 2.3). Children from low-income
families are still eating too few fruits and vegetables and consume diets that are high in
saturated fat and non-milk extrinsic sugars. Children also derive a greater proportion of their
daily energy intake from non-milk extrinsic sugar than current dietary guidelines recommend
(Department of Health, 1989, Department of Health, 1991). Current dietary trends in children
and adolescents have a poor outlook in terms of minimising the risk of chronic disease in
adult life and to the predisposition to dental caries in childhood.
The many changes to the National Curriculum of England and Wales have led to a decline in
the traditional teaching of cooking skills to make way for a shift in emphasis towards the
study of industrial food technology and manufacturing practices (Section 2.8). The teaching
of 'Home Economics' ensured that shopping, budgeting, basic nutrition, food preparation and
cooking skills were taught to all young people regardless of social class. Whilst some
elements remain in the current curriculum subject of Food Technology the focus now is to
teach young people about industrial food manufacturing, packaging, labelling and the
simulated creation and production of food products using sophisticated computer software.
The review also highlights the United Kingdom's current delight and obsession with food
which is also evident in the many appearances of celebrity chefs and countless television
programmes entirely devoted to food and to cooking. Whilst the public! s interest in food has
risen and elevated the past-time of cooking for pleasure to a national hobby, the National
Curriculum has been slowly squeezing cooking skills out of the curriculum along the path of
216

technological progress. This has been accompanied by the drive to ensure that all children receive a quality education and that school-leavers. have good levels of literacy, numeracy and information technology skills to reduce the impact of social exclusion and to enhance the
quality of the Nation! s workforce. All this means that is it becoming more difficult to allocate time within the curriculum to the teaching of foods skills.
Low-income groups are amongst the most vulnerable in the population and a review of
cooking skills and health by Lang and colleagues (1999) shows that the lower social groups
are more dependant upon the cooking skills they learnt at school that those from higher social
class groups. The decline in the teaching of cooking skills in secondary schools will likely
have the largest impact upon low-income families in the UK
In a review of the effectiveness of dietary intervention and health promotion studies, Roe et al (1998) identified a shortfWl of interventions targeted towards adolescents and schoolchildren. Roe and colleagues concluded there was an immediate and pressing need for dietary
intervention targeted at adolescents, young people and at lower income families. Schools
have been identified as a key setting for health promotion initiatives aimed at increasing
young people's awareness of food and nutrition by the Department of Health (1996) but there
appears to little move towards this in view of the more recent changes to the provision of food
and the teaching of cooking skills in the National Curriculum under the direction of the
Department for Education and Employment.
10.2 Summary and conclusions
10.2.1 Schools and Subjects
Ten schools were recruited into the study and a total of 167 children completed all aspects of the study. This thesis reported on the recruitment strategy employed to secure volunteers from socially deprived backgrounds.
The recruitment strategy of the study was successful in securing the desired number of
schools and subjects to participate in the study. Valuable lessons were learnt in terms of discovering the most effective means of recruiting schools and their pupils and these findings
are reported and discussed in Chapter 3. Researchers must identify the most effective means before attempting to conduct any research study in secondary schools. Since the introduction
of school league tables many secondary schools are under pressure to be seen to be
performing well. Pressures may be greater where a proportion of the school catchment area is 217
known to be socially deprived and this has implications for removing children from classes to
conduct dietary interviews. It is concluded that research studies carried out in secondary
schools can be most productive but that is essential to identify potential obstacles. Ibis may
be best achieved by holding a series of exploratory focus groups with teaching staff and
pupils.
10.2.2 The Intervention
This thesis reported on the intervention programme delivered to children of the intervention
group. The Intervention was well received by schools and there was much evidence to show
that pupils greatly enjoyed the opportunity to attend an after-school Food Club. The design
and development of the Food Club were reported in Chapter 4. The median attendance of all
children to the Food Club was 14 weeks whilst 50% of the intervention group attended 15
sessions or more. All materials and consurnables necessary to hold the Food Club were
supported by the University of Newcastle and fiu-ther research into the transferability and
feasibility of future Food Clubs in terms of costs and staffing is required. The value of the
Food Club as a social occasion for socially deprived adolescents should not be underestimated
and future alternative sources of funding must be found.
10.2.3 Anthropometry
The thesis reported on the anthropometrical measurements of children participating in the
study in Chapter 5. Before an analysis of nutrient intake and the suitability of the chosen
method of dietary assessment could be performed, it was necessary to collect and analyse
anthropometric data from the children. Anthropometry was reported and discussed in Section
5.3 and Section 5.4 . The main findings show that the children! s height, weight, BMR and
BMI increased as to be expected in children of this age. A small negative but nonetheless
significant relationship was revealed between the height of the children and degree of social
deprivation and persisted despite the increase in height between baseline and post-
intervention. This requires further research.
Values for BMT in the children were higher than those reported in the NDNS (Gregory et al,
2000) and the proportion of children whose BNII was greater than 30 was unsatisfactory. It is
concluded that anthropometric measurements make more of a statement about growth and
development in children of this age but may be used tentatively as indicators of dietary energy
excess and may be employed in the tracldng of BMI and overweight in children into
218
adulthood. It is also concluded that along with educational messages regarding a healthy diet,
such messages may need to supported with advice on personal fitness and exercise as diet
alone cannot be seen a singular factor leading to overweight.
10.2.4 Main aim: evaluation of the impact of the Food Club upon intakes offoods and nutrients
This study attempted to address a number of aims. The main airn of the study was to:
Evaluate the impact of a school-based food preparation and
cooking skills intervention on the intake of foods and
nutrients in the diets of children from socially deprived
backgrounds
The intake of foods and nutrients by the children at baseline and post-intervention were
analysed and the findings were reported and discussed in Chapter 6. Dietary diaries were
found to be a convenient and cost-effective method of collecting dietary data from children of
this age. Several obstacles were encountered when distributing and retrieving diaries from the
children and these were discussed in Section 6.4 . It was necessary to explore the literacy and
numeracy abilities of the children in order to make the food diaries suitable for use by a
proportion of children with special needs and this factor should be taken into account in future
studies involving children from socially deprived areas.
Macronutrient and micronutrient intakes and intakes of foods belonging to the five food
groups of the National Food Guide were reported and discussed in Sections 6.3.1 to 6.3.2.
10.2.4.1 Macronutrient intake
The macronutrient intakes of the children compared favourably with other published data and largely agreed with the findings of Gregory el al (2000) in the NDNS of children aged 4-18-
years-old. Macronutrient and micronutrient intakes were reported as observed and the
findings are discussed in Section 6.3 . The process of comparison to published data was
complicated by the presentation of macro- and micronutrient intakes by sex in the majority of
studies whereas intakes were reported by group (of mixed sex) in this study. The mean
energy intakes of the children were higher than values reported in the NDNS (Gregory el at,
2000), by Doyle etal (1994) and by Adamson et al (1992). Mean energy intakes at baseline
were 8.6MJ/day in both groups and at post-intervention 9.1 MJ/day in the intervention group
219
and 9.4MJ/day in the control group. On a gender level, however, the data concur with the
opinion that energy intakes in children are falling (Whitehead, 1982, Adamson et al, 1992a,
Hackett et at, 1986 and Gregory et al, 2000).
Protein intake and the contribution of protein to daily energy intake in the children increased
significantly in both groups between phases. The contribution of total fat to mean daily
energy intake in the children remained consistent in the intervention group at 36.3% but
increased slightly but not significantly in the control group from 35.5% at baseline to 35.9%
at post-intervention. The childreds intake of saturated fat increased significantly within both
groups between baseline and intervention. The contribution of saturated fat to the childreds
mean daily energy intake increased from 12.1 % to 12.5% in the intervention group and from
11.8% to 11.9% in the control. The percentage of daily energy the children derived from
carbohydrate was approximate to 50% in both groups at both phases. Starch contributed to 28% of daily energy at baseline and to 29% of energy in both groups at phase TO and TI
respectively.
The increase in energy intakes and in macronutrient intakes were to be expected in children of this age. The data show that the childreds diets were almost in accordance with current Dietary Reference Values (Department of Health, 1991) but intakes of saturated fat and
protein contributed a greater proportion of daily energy than is desired. The differences in
changes in intake of macronutrients was not found to be significant between groups between
baseline and post-intervention. It is therefore concluded that the Food Club did not impact
upon the macronutrient intake of children in the intervention above that of children in the
control group.
10.2.4.2 Intake otffiLcLds belonýLn tO thefi-ve grOM2 Pf ltLe Nationa Food Guide
in both groups the children were seen to increase their intake of foods belonging to the 'meat, fish and alternatives' group and this supports the findings that the children! s intake of protein increased between baseline and post-intervention. Similarly, the children significantly increased their intake of foods from the 'starchy foods' group and again this is supported in the finding that the percentage of energy that the children were deriving from starch increased
between phase TO and TI. Conversely, whilst the children in the intervention group decreased their average consumption of foods belonging to the 'foods containing fat and
sugar, group, this was not reflected in the percentage contribution made by total fat and 220
saturated fat to their average daily energy intake. Children in the control group increased
their intake of foods from this group between baseline and post-intervention.
The selection and consumption of foods from the group 'milk and dairy foods' was poor;
median intakes were 53g/day in the intervention group at baseline and 60g/day in the control. At post-intervention the childreWs intake of 'milk and dairy foods' equated to a half a small
glass of milk or a small pot of fromage frais (40g/day in the intervention group and 55g/day in
the control).
Consumption of fruits and vegetables by the children did not meet the current
recommendations of 5 or more portions of fruit and vegetables per day (400g/day) (wHO,
1990). At baseline both groups were consuming the equivalent to 1.5 portions of fruit and
vegetables per day. At post-intervention this increased to 1.7 portions/day in the intervention
group and to 1.8 portions/day in the control. Boys in the intervention group significantly increased their intake of fruits and vegetables by 39g/day. A tendency towards increased
intake in fruits and vegetables by boys only in the intervention group above that of the control
group was revealed.
It is therefore concluded that the Food Club did not impact upon the childrens intake of foods
from the National Food Guide groups but it did have a positive impact upon the consumption
of fruit and vegetables by boys who attended the Food Club.
10.2.4.3 Micronutrient intake
The thesis reported and discussed the childreWs intake of a selection of micronutrients. (Section 6.3.3 ). The childrens intake of Vitamin C was shown to be adequate at baseline and
post-intervcntion. Intake of P-carotcne increased in both groups between phases TO and T1.
The increase in P-carotene by boys only in the intervention than by boys in the control group
ru ts is likely associated with the slightly increased consumption Of fi and vegetables demonstrated by intervention group boys only.
The childreds intake of calcium was sub-optimum and is reflected by their low intake of foods belonging to the 'milk and dairy foods' group of the National Food Guide. Ironintakes,
especially in girls, were low and of concern, and did not increase despite an increase in mean
energy intake at post-intervention.
221
It is concluded that attendance to the Food Club did not impact upon the childrens intake of
micronutrients but it is possible that the tendency towards a greater increase in P-carotene
intakes by boys only in the intervention group is connected to their increased intake of fruit
and vegetables.
10.2.5 Dietary intake: validation of dietary assessment methodology
This section of the thesis had one further subsidiary aim which was to:
e validate the method of dietary assessment using Physical
Activity Levels and perform a preliminary analysis of 24-
hour urine sample biochemical markers
This thesis reported on the use of two validation techniques; the use of Physical Activity
Levels (PAL) and measurement of 24-hour urinary biochemical analytes. The findings of the
validation techniques were reported and discussed in Chapter 7. Mean PAL values of
children in both groups at both baseline and intervention were determined to be 1.5. On a
group level the ratio of the children's energy intake to their BMR was satisfactory and
indicated a reasonable level of accuracy in self-reports of dietary intake. A further analysis by
sex revealed lower PAL's in girls.
When the children were grouped according to PAL, those not meeting the recommended PAL
(Department of Health, 1991) were found to be consuming significantly less amounts of total
fat, saturated fat and sugar. This in itself suggests a possible 'Hawthorne' effect in the
recording period. This is ftulher supported by evidence at post-intervention which reveals
smaller numbers of children with lower PAL's and that the children were possibly less
concerned about the foods they were consuming and/or recording.
The results of the analytical procedures performed on 38 24-hour urine sample revealed that
nine samples were complete. The results of other urinary analytes; urinary sodium and
potassium, urinary creatinine and nitrogen were interpreted with caution out of necessity.
Mean urinary potassium excretion in all samples was twice that of urinary sodium and the
values reported for the ratio of urinary potassium excretion to that of urinary sodium were
comparable to data published in theNDNS (Gregory et al, 2000).
A positive and significant relationship between urinary potassium excretion and the children! s intake of fruit and vegetables was determined. It is concluded, however, that a validation
222
technique that relies upon the collection of 24-hour samples is not suitable in free-living
adolescent subjects as compliance is often poor.
10.2.6 Subsidiary aims
ýf inta ýQf total and non 10.2.6.1 Analusis of dieta sugars o -milk extrinsic suga and in intake and h7equen pf intak oLf suga and acidic foo
The thesis had two subsidiary aims. The first was to:
Quantify the intake and frequency of total sugars, non-milk
extrinsic sugars, sugary and acidic foods in the diets of
the children and identify changes within these foods and
nutrients following the intervention
This study isolated and quantified total and non-milk extrinsic sugars and identified the
sources of non-milk extrinsic sugars in the diets of the children. The quantity and frequency
of intake of sugary foods and beverages and acidic foods and beverages were also
investigated. The findings of these analyses were reported and discussed in Section 8.3 and
Section 8.4 . The children's intake of total sugars contributed to approximately 20% of their
total daily energy intake. The values reported in this study are slightly higher than those
reported by Gregory et al (2000). The childrens intake of total sugars (g/day) and the
contribution of total sugar to mean daily energy intake fell significantly in both groups
bctwcen basclinc and intcrvention.
Non-milk extrinsic sugars contributed 79% of total dietary sugars intake at baseline in both
groups and to 78% at post-intervention. This value is slightly higher than is usual
(Department of Health, 1991). Currently, the Dietary Reference Values indicate that no more
than 10% of energy be derived from non-milk extrinsic sugar and that intake of these sugars
should be approximate to 60gIday (Department of Health, 1991). The childrens intake of
non-milk extrinsic was higher than that reported by sex by Gregory et al (2000) and for both
sexes by Walker et al (2000). At baseline, only 16% of children were found to be consuming
60g1day or less and at baseline 20% of the children were consuming 60g/day or less. Both the
intervention group and control group demonstrated a reduction in the percentage of energy
derived from non-milk extrinsic sugar between phase TO and TI and this decrease was
significant within both groups.
223
Sugary foods and beverages were identified by examining the most frequently recorded
entries and subsequent food codes. The method used embraced all the food items and beverages also used in the NDNS (Gregory et al, 2000). The method still retained a surplus
or miscellaneous group containing many foods consumed in smaller quantities and further
work on this data may involve extracting individual food items from this group to investigate
their contribution to the children! s intake of non-milk extrinsic sugars. Foods contributing the
greatest proportion of non-milk extrinsic sugars at baseline and post-intervention were found
to be non-diet carbonated soft drinks, fruit drinks, confectionery, cakes, biscuits and baked
goods. Table sugar and sweetened breakfast cereals contributed to a lesser extent.
Collectively, beverages were found to be contributing to 40% of the children! s total intake of
non-milk extrinsic sugar. The children! s intake of sugary foods and beverages and of acidic
foods and beverages fell between baseline and intervention but frequency of intake still
remained at a mean of five times a day despite the decrease in consumptiorL Non-diet
carbonated soft-drinks were the single largest contributor to the intake of sugary foods and
beverages. Non--diet and diet carbonated soft drinks were also the single biggest contributor
to total intake of acidic foods and beverages.
The children! s choice of bedtime drink demonstrated a shift away from taking milk drinks at
bedtime towards the greater consumption of carbonated drinks, fruit drinks, tea and coffee
and sweetened tea and coffee. A most important finding is that more than 30% of beverage
selection choices was made in favour of carbonated soft drinks at bedtime.
The combination of the childrens intake of non-milk extrinsic sugars, their consumption of
sugary foods and beverages and acidic foods and beverages and the frequency of their intake
has a potential to impact upon dental health. Fruits (fresh and tinned), pure fruit juice, table
sugar and sweetened breakfast cereals were not food items that raise major concern in the
children's diets.
In view of the childrens low consumption of milk and dairy foods, any reduction in the
consumption of breakfast cereals may possibly affect what is already a poor intake of milk
and a sub-optimum intake of calcium at a stage of rapid growth in the childrens lives. In
addition, many breakfast cereals consumed by children are fortified and a reduction in the
consumption of breakfast cereal may possibly affect what are already low intakes of iron
(particularly in girls). The role of rogue falls finmly with all types Of soft drinks. These
224
findings suggest, worryingly, that there is a clear trend amongst these children away from
drinking water and milk and towards drinking fruit drinks and carbonated drinks. it is
concluded therefore that these particular consumption patterns in the children participating in
this study are a cause for concern and may increase the risk of dental diseases.
f the Food Club on the children's 10.2.6.2 Evaluation pf the impa o nutrition, ood preparation and cooki knowledge and cookin skills confide
The second subsidiary aim of the thesis was to:
* Evaluate the impact of the intervention on the nutritional
knowledge, food preparation knowledge, cooking knowledge and
confidence of socially deprived children
Chapter 8 in the thesis deals with the children! s knowledge of nutrition, food preparation and
cooking skills and their cooking confidence. These were assessed by the use of a self-
completed questionnaire. The findings of these analyses were reported and discussed in
Section 9.3 and Section 9.4 . At baseline, children in the intervention group had higher
median scores for knowledge of ingredients and for perceived cooking confidence than
children in the control group. At post-intervention median scores for perceived cooking
confidence increased significantly within the intervention but in the control group also.
Median scores for knowledge of ingredients was higher in the intervention group at baseline
and the median perceived cooking confidence score at post-intervcntion of 22 out of a
possible 27. In further research studies it may be more appropriate to use different methods of
measuring cooking skills and cooking confidence. The children had been taught many
practical skills during the Food Club and it may have been more useful to have performed a
baseline and post-intervention measurement of the level of practical skills demonstrated by all
children which would encompass the skills included in the Food Club programme. The
results of this analysis as reported in Chapter 8 would lead to the assumption that children in
the intervention had not improved in their actual cooking ability but it is strongly suggested
that this was not so. The tools used to measure the children's practical cooking abilities
following the intervention were just not the best tools for the task. If a measurement of the
level of skills demonstrated by the children in, for example, peeling, chopping and preparing
vegetables, using a grill and a microwave; making a casserole; making a sauce or a puree,
225

then these measurements would have very clearly shown the benefits of the Food Club in the intervention group and reflected the quality of instruction that the children had received.
10.3 Recommendations for Government
The practical skills that children acquire throughout their time in Food Technology at school is of great benefit to their ability as adults to consume a diet in accordance with current dietary recommendations. Further changes to Food in the Design and Technology content of
the National Curriculum should be made in expert consultation with organisations with
specialist knowledge of Food Technology. The inclusion of the study of food as material
should not be undermined by due emphasis upon industrial manufacturing practices. ne
teaching of practical cookery skills should not be viewed as a reversal of technological
progress but embraced as a necessary and beneficial learning experience of children aged I I-
16-years-old.
10.4 Recommendations for schools
The work of Food Technology teachers needs to be supported at the highest school level and by Local Education Authorities in order for the subject to enjoy the similar status afforded to
other curriculum subjects. Schools should continue with their commendable support of and
provision for the teaching of Food Technology to their pupils at all Key Stages.
10.5 Recommendations for Health Educators
Health promotion messages to children and adolescents need to be consistent and made using language and example that are easily understood and interpreted. Nutrition and dental health
information messages regarding the consumption of beverages needs to be clarified and
specific food groups identified and targeted in the reduction in intake and frequency of intake
of foods rich in non-milk extrinsic sugars.
This study has shown that children's choice of beverage changed as they grew older and a
significant proportion of beverages choices were made in favour of diet and non-diet
carbonated soft drinks, both during the day and at bedtime. Non-diet carbonated drinks were found to be contributing to as much as 11% of mean daily energy intake. Further research is
needed to investigate childrens consumption of beverages and the effect upon nutrient intake
and dental health.
226
10.6 Further work
This study has shown that the children! s attendance to the after-school Food Club
demonstrated their enjoyment of practical cooking activities. The impact of this short-term intervention upon intakes of foods and nutrients was limited to the exception of a positive impact upon fruit and vegetable intake in boys attending the club. Further research needs to
be carried out on Food Clubs of a longer duration to investigate the long-term effects upon diet and nutrient intake in children attending similar intervention programmes. Such research
may also establish the differences between boys and girls in their perception of a cooking
skills club and to investigate the best means of recruiting and retaining schools and their
pupils in research programmes.
The tools used to measure the childrens development of practical cooking skills were not
successful in identifying actual change in the acquisition of cooking skills. Further research
into the tools used to measure practical cooking skills is required in order for effective
measurements to be made.
227
11 References
Acheson, D. (1998) Independent Inquiry into Inequalities in Health. London: The Stationary Office. ISBN 0 11322173 8
Acheson, R. M. & Williams, D. R_ (1983) Does consumption of fruit and vegetables protect against stroke? Lancet: 1(8335), 1191-1193
Adamson, A. J.; Rugg-Gunn, A. J.; Butler, T. J.; Appleton, D. R. & Hackett, A. F. (1992a) Nutritional intake, height and weight of 11-12 year old Northumbrian childrrn in 1990 compared with information obtained in 1980. British Journal of Nutrition: 68,543- 563
Adamson, A. J.; Rugg-Gunn, A. J.; Appleton, D. R.; Butler, T. J. & Hackett, A. F. (1992b) Dietary sources of energy, protein, unavailable carbohydrate and fat in 11-12-year-old English children in 1990 compared with results in 1980. Journal ofHuman Nutrition and Dietetics: 5,371-3 83
Adamson, A. J. (1993c) PhD Thesis. Nutrient inta&v (1990 compared with 1980) andplace ofpurchase offoods (1990) by 11 to 12-year oldNorthumbrian childrelL
Al-Dlaigan, Y. H.; Shaw, L. & Smith. A- (2000) Dental erosion in a group of British 14-year- old school children Part 11: Influence of dietary intake. British Journal of Dentistry 190: 258-261
Anderson, A.; MacIntyre, S. & West, P. (1994) Dietary patterns among adolescents in the West of Scotland. British Journal offutrition: 71,111-122
Anderson, A. S.; Cox, D. N.; McKellar, S.; Reynolds, J.; Lean, M. E. J. & Mela, D. (1998) Take five -a nutrition education intervention to increase fruit and vegetable intakes; impact on attitudes towards dietary change. British Journal offutrition: 80,133-140
Anderson, A. S. & Morris, S. E. (2000) Changing fortunes: changing food choices. Nutrition and Plood Science 30: 1,12-15
Anderson, A.; Bell, A.; Adamson, A. & Moynihan, P. (2002) A questionnaire assessment of nutrition knowledge - validity and reliability issues. Public Health Nutrition: 5(3), 497-503 -
Ballarn, R. (2000) Cooking and kids. Nutrition Bulletin: 25,99.
Baranowski, T.; Davis, M.; Resnicow, K; Baranowski, J.; Doyle, C.; Lin, L. S.; Smith, M. & Wang, D. T. (2000) Gimme 5 Fruit, Juice, and Vegetables for Fun and Health: outcome Evaluation. Health Education and Behaviour., 27(l), 91 -111
Bedi, R.; Sutcliffe, P. & Balding, J. W. (1990) Dental health related behaviour of Scottish and English secondary schoolchildren. Community Dental Health: 7,149-156
Berg-Smith, S. M.; Stevens, V. J.; Brown, K. M.; Van Horn, L.; Gernhofer, N.; Peters, E.; Greenberg, R.; Snetselaar, L.; Ahrens, L& Smith, K (1999) A brief motivational
228
intervention to improve dietary adherence in adolescents. Health Education Research: 14(3), 399410
Bingham, S. A. & Cummings, J. H. (1982) The use of 4-aminobenzoic acid as a marker to validate the completeness of 24hr urine collections in man. Clinical Science 64: 629- 635
Bingham, S. A. & Cummings, I IL (1985) The use of creatinine output as a check on the completeness of 24-hour urine collections. Human Nutrition: Clinical Nutrition: 39C, 343-353
Bingham, S. A.; Williams, R.; Cole, T. J.; Price, C. P. & Cummings, I H. (1988) Reference values for analytes of 24-h urine collections known to be complete. Annals of Clinical Biochemistry: 25,610-619
Bingham, S. A. & Day, N. E. (1997) Using biochemical markers to assess the validity of prospective dietary assessment methods and the effect of energy assessment. American Journal ofClinical Nutrition: 65(suppl) 113 OS- I 107S.
Bini, V.; Celi, F.; Berioli, M. G.; Bacosi, M. L.; Stella, P.; Giglio, P.; Tosti, L. & Falorni, A. (2000) Body mass index in children and adolescents according to age and pubertal stage. European Journal ofClinical Nutrition: 54,214-218
Black, A. E., Jebb, S. A. & Bingham, S. A. (1991) Validation of energy and protein intakes assessed by diet history and weighed records against energy expenditure and 24 hour urinary nitrogen excretion. Proceedings ofthe Nutrition Society: 50,108A (abstr)
Black, A. E. & Cole, T. 1 (2000) Within- and between-subject variation in energy expenditure measured by the doubly-labelled water technique: implications for validating reported dietary energy intake. European Journal of Clinical Nutrition: 54, 368-394
Black, A. E.; Welch, A. A. & Bingham, S. A. (2000) Validation of dietary intakes measured by diet history against 24h urinary nitrogen excretion and energy expenditure measured by the doubly-labelled water method in middle-aged women. British Journal offutrition: 83,341-354
Bone, A. (1992) Methods for studying food consumption (specified time methods). In Promotion ofHealthier Eating. (Eds, Kemm, J. R. & Booth, D). London: HMSO
Bowker, S.; Crosswaite, C.; Hickman, M.; McGuffin, S. & Tudor-Smith, C. (1999) The healthy option. A review of activity on food and nutrition by UK schools involved in the European Network of Health Promoting Schools. British Food Journal 1o1: 8, 610-620
British Potato Council (2000) Potato huv drives British fresh food message to schools. Press Release: 10.05.2000. Http: //www. potato. org. uk/releases
Brown, K.; McIlveen, H. & Strugnell, C. (2000) Nutritional awareness and food preferences of young consumers. Nutrition andFoodScience: 30(5), 230-235
229
Bull, N. L. (1988) Studies of the dietary habits, food consumption and nutrient intakes of adolescents and young adults. World Reviews in Nutrition and Dietetics: 57,24-74
Cade J.; Upmeier H.; Calvert C.; Greenwood D. (1999) Costs of a healthy diet: analysis from the UK WomeWs Cohort Study. Public Health Nutrition: 2(4), 505-512
Caraher, M.; Dixon, P.; Lang, T. & Carr-Hill, R. (1999) The state of cooking skills in England: the relationship of cooking skills to food choice. British Food Journal: 101(8), 590-609
Chief Medical OfficeesCommittee on Medical Aspects of Food Policy (COMA) (1994) Nutritional Aspects of Cardiovascular Disease London: HMSO
Cox, D. N.; Anderson, A. S.; Reynolds, J.; McKellar, S.; Lean, M. E. J. & Mela, D. J. (1998) Take Five; a nutrition education intervention to increase fruit and vegetable intakes: impact on consumer choice and nutrient intakes. British Journal of Nutrition: 80(2) 123-131
Crawley, H. (1993) Food Portion Sizes. 2nd Edition. London: HMSO
Crawley, H. F. & Summerbell, C. D. (1998) The nutrient and food intakes of British male dieters aged 16-17 years. Journal of Human Nutrition and Dietetics: 11,3340.
Danesh, J.; Gault, S.; Sernmence, J.; Appleby, R. & Peto, R. (1999) Postcodes as useful markers of social class: population based study in 26 000 British households. British Medical Journal 318: 843-845
Davy-Smith, G. & Brunner, E. (1997) Socio-economic differentials in health: the role of nutrition. Proceedings of the Nutrition Society 56: 75-90
De Santo, N, G.; Di Iorio, B; Capasso, G.; Paduano, C.; Starnler R.; Langman, C. B.; Stamler, J. (1998) Population based data on urinary excretion of calcium, magnesium, oxalate, phosphate and uric acid in children from Cimitile (southern Italy). Pediatric Nephrologl: 6(2) 149-157
Denman, S. (1999) Health promoting schools in England -a way forward in development. Journal of Public Health Medicine: 21(2), 215-220
Department for Education and Employment (1999) National Curriculum . On-line.
http: //www. nc. uk. net.
Department for Education and Skills (2002). Design and Technology in the National Curriculum. http: //www. dfes. gov. uk
Department for the Environment, Food and Rural Affairs (2000) National Food Survey. London: HMS0
Department of Health (1988) Independent inquiry into inequalities in health report. (Acheson Report) London: The Stationary Office
Department of Health (1989) Dietary Sugars and Human Disease. Report on Health and Social Suhjects No. 3 7. London: HMSO
230
Department of Health (199 1) Dietary Reference Valuesfor Food Energy and Nutrientsfor the UnitedKingdom. Report on Health and Social Subjects no. 41. London: HMSO
Department of Health (1996) EatWeIIII: 4 progress reportftom the Nutrition Task Force on the action plan to achieve the Health of the Nation targets on diet and nutrition. London: HMSO
Department of Health (200 1) The National School Fruit Scheme. London: HMSO
Department of Health & Ministry for Agriculture, Fisheries and Food (1998) Guidance on Food and Nutrition in Primary Teacher Training. London: Department of Health
Design and Technology Association (2001) Examination Results and Statistics. Data News January 2001 P28-30
Design and Technology Association (2002) Whatever happened to ... ? D, 4 T, 4 News. Issue 20, April 2002
Dixey, R. (1996) Gender perspectives on food and cooking skills. British Food Journal. 98(10), 3541
Donkin, A- J. M.; Dowler, E. A.; Stevenson, S. J. & Turner, S. A. (1999) Mapping access to food at a local level. British Food Journal: 10 1 (7), 554-564
Dowler, E. & Calvert, C. (1995) Nutrition and diet in lone parent families. Family Policy Studies Centre, 1995
Doyle, W.; Jenkins, S.; Crawford, M. A. & Puvadendran, K (1994) Nutritional status of schoolchildren in an inner city area. . 4rchives ofDisease in Childhood., 70,376-381
Duff, R. (1999) ChildreWs drinks - what children really think. Nutrition and FoodScience: 99(3), 136-139.
Ellaway, A. & Macintyre, S. (2000) Shopping for food in socially contrasting localities. British FoodJow-nah 102002-59
Fine, G. (1995a) The British Nutrition Foundation's role in nutrition education. Environmental Management andHealth: 6(3), 7-11
Fine, G. (1995b) What is the British Nutrition Foundation doing to improve food education in
school? Nutrition and Food Science: (3), 20-23
Forbac, T. (1999) Nutrition education in schools. Topics in Clinical Nutrition: 15(l), 47-51
Gallagher, K. (2000) Dietary practices and nutrition knowledge of adolescents from contrasting social backgrounds. Journal of Consumer Studies and Home Economics: 22(4), 207-211
Gariballa, S. E. (2000) Nutritional factors in stroke. British Journal offutrition: 84,5-17
231
Gatenby, S. J.; Hunt, P. & Rayner, M. (1995) The National Food Guide: development and dietetic criteria and nutritional characteristics. Journal of Human Nutrition and Dietetics: 8,323-334.
Gerhardy, H. Hutchins, R. K. & Marshall, D. W. (1995) Socio-economic criteria and food choice across meals. British FoodJow-nah 97(10), 24-28
Gibney, M. I., Lee, P. (1993). Patterns of food and nutrient intake in a suburb of Dublin with chronically high unemployment. Journal ofHuman Nutrition and Dietetics, vol. 6, no. 1, pp. 13-22
Gibson, E. L.; Wardle, J. & Watts, C. J. (1998) Fruit and vegetable consumption, nutritional knowledge and beliefs in mothers and children. Appetite: 31,205-228
Giovannini, M.; Agostini, C.; Gianni, M.; Bernardo, L. & Riva, E. (2000) Adolescence: macronutrients needs. European Journal ofClinical Nutrition: 54(suppl. 1), S7-S 10.
Gortmaker, S. L.; Cheung, L. W. Y.; Peterson, K. E.; Chomitz, G.; Cradle, J. H.; Dart, H.; Fox, M. K.; Bullock, R. B.; Sobol, A. M.; Colditz, G.; Field, A, E. & Laird, N. (1999) Impact of a school-based interdisciplinary intervention on diet and physical activity among urban primary school children. Archives of Pediatric and Adolescent Medicine: 53,975-983
Gregory, J.; Lowe, S.; Bates, C. J.; Prentice, A.; Jackson, L. V.; Smithers, G.; Wenlock, R. & Farron, M. (2000) National Diet and Nutrition . 5urvey: young people aged 4 to 18 years. Volume 1: Report of the diet and nutrition survey. London: The Stationery Office
Hackett, A. F.; Rugg-Gunn, A. J. & Appleton, D. R. (1983) Use of a dietary diary and interview to estimate the food intake of children. Human Nutrition: Applied Nutrition: 37A, 293-300
Hackett, A. F.; Rugg-Gunn, A. J.; Appleton, D. R.; Allison, M. and Eastoe, J. E. (1984) Sugars-eating habits of 405 11 - to 14-year-old English children. British Journal of Nutrition: 51,347-356
Hackett, A. F.; Rugg-Gunn, A. J.; Appleton, D. R. & Coombs, A. (1986) Dietary sources of energy, protein, fat and fibre and 375 English adolescents. Human Nutrition: Applied Nutrition: 40A, 176-184
Hackett, A. F.; Kirby, S. & Howie, M. (1997) A national survey of the diet of children aged 13-14 years living in urban areas of the United Kingdom. Journal ofHuman Nutrition and Dietetics: 10,37-51
Harrington, K. F.; Binkley, D.; Reynolds, K. D.; Duvall, R. C.; Copeland, J. R.; Franklin, F. & Raczynski, J. (1997) Recruitment issues in school-based research: lessons learned from the High 5 Alabama Project. Journal ofSchool Health: 67(10), 415-421
Hart, K. H.; Bishop, J. A. & Truby, H. (2002) An investigation into school childrens knowledge and awareness of food and nutrition. Journal of Human Nutrition and Dietetics: 15,129-140
232
Health Education Authority, Department of Health and Ministry of Agriculture, Fisheries and Food. (1996). 'The Balance oj'Good Health, The National Food Guide. London: Health Education Authority.
Hearn, M. D.; Baranowski, T.; Baranowski, J.; Doyle, C.; Smith, M.; Lin, L. S. & Resnicow, K (1998) Environmental influences on dietary behaviour among children: availability and accessibility of fiuits and vegetables enable consumption. Journal of Health Education: 29(l), 26-32
Hitchings, E. & Moynihan, P. 1 (1998) The relationship between television food advertisements recalled and actual foods consumed by children. Journal of Human Nutrition ofDietelics: 11 (6), 511-517
Holund, U. (1999) Effect of a nutrition education program, "Learning by teaching", on adolescents knowledge and beliefs. Community Dentistry and Oral Epidemiology. 18, 61-65
Hunton, B. (1994) Griffin School goes for the "Get Cooking" goal. Nutrition and Food Science: 6,16-18
Inchley, J.; Todd, J.; Bryce, C. & Currie, C. (2001) Dietary trends among Scottish schoolchildren in the I 990's. Journal ofHuman Nutrition and Dietetics: 14,207-216
Jas, P. (1998) Aspects of food choice behaviour in adolescents. Nutrition andFoodScience: (3), 163-165.
Johnson, B. & Hackett, A. F. (1997) Eating habits of 11-14-year-old schoolchildren living in less affluent areas of Liverpool, UY, - Journal of Human Nutrition and Dietetics: 10, 135-144
Kalsbeek, IL and Vcrrips, G. H. (1994) Consumption of sweet snacks and caries experience of primary school children. Caries Research; 28: 477-483
Keanne, A. & Willets, A. (1994) Factors that affect food choice. Nutrition & Food Science: 4,15-17
Kemm, J. K& Booth, D. (1992) Promotion OfHeallhier Eating. London: I-IMSO
Kicklighter, I R.; Mullis, R. M.; Mohr, L.; Benardot, D. & Gordon, R. (1997) Formative evaluation for planning a school-based nutrition intervention: results from focus groups. School Food Service: 21(2), 111-116
Kinra, S.; Nelder, R P. & Lewendon, G. 1 (2000) Deprivation and childhood obesity: a cross sectional study of 20 973 children in Plymouth, United Kingdom. Journal of Epidemiology and Community Health: 54,456460
Lang, T. & Baker, L. (1993) The decline ofcooking. Modus: 2(7), 200-202
Lang, T.; Caraher, M.; Dixon, P. & Caff-Hill, P, (1999) Cooking Skills and Health. London: Heath Education Authority
233
Larsson, B.; Johansson, 1. and Ericson, 1. (1992) Prevalence of caries in adolescents in relationtodiet. Community and Dental Oral Epidemiology, 20,133-137
Leete, R. & Fox, A. (1977) The Registrar General's social classes: origins and uses. Population Trends: 8,1-7
Lifsthitz, F.; Tarim, 0. & Smith, M. M. (1993) Nutrition in adolescence. Endocrinology and Metabolism Clinics ofAmerica: 22(3), 673-683
Liquori, T.; Koch, P. M.; Contento, 1. R. & Castle, J. (1998) The Cookshop Program: outcome evaluation of a nutrition education program linking lunchroom food experiences with classroom cooking experiences. Journal ofNutrition Education: 30, 302-313
Livingstone, M. B. E.; Prentice, A. M.; Coward, W. A.; Strain, J. J.; Black, A. E.; Davies, P. S. W.; Steward, C. M.; McKenna, P. G. & Whitehead, R. G. (1992) Validation of estimates of energy intakes by weighed dietary record and diet history in children and adolescents. American Journal of Clinical Nutrition: 56,29-35
Livingstone, M. B. E. & Robson, P. J. (2000) Measurement of dietary intake in children. proceedings ofthe Nutrition Society. 59,279-293
Lobstein, T. (1995) The increasing cost ofa healthy diet. Food Magazine Oct-Dec 1995, p. 17
Lucas, F.; Niravong, S.; Villeminot, S.; Kaas, R. & Clavel-Chapelon, F. (1995) Estimation of food portion size using photographs: validity, strengths, weaknesses and recommendations. Journal ofHuman Nutrition and Dietetics: 8,65-74
Lytle, L. A.; Gerlach, S. & Brombach Weinstein, A. (1994) Conducting nutrition education research in Junior High school: approaches and challenges. Journal of Nutrition Education: 33,49-54
Lytle, L. A.; Johnson, C. C.; Bachman, K. (1994b) Successful recruitment strategies for school-based health promotion: experiences from CATCH. Journal ofSchool Health: 64(10), 405409
Lytle, L. A.; Stone, E. J.; Nichman, M. Z.; Perry, C. L.; Montgomery, D. H.; Nicklas, T. A.; Zive, M. M.; Mitchell, P.; Dwyer, J. T.; Ebzery, M. K.; Evans, M. A. & Galati, T. P. (1996) Changes in nutrient intakes of elementary school children following a school- based intervention: results from the CATCH study. Preventative Medicine: 25(4), 465477
McCance, R. A. & Widdowson, E. M (1991) The Composition of Foods. 5a' Edition. London: HMSO
Macario, E.; Emmons, K. M.; Sorenson, G.; Hunt, M. K. & Rudd, R. E. (1998) Factors influencing nutrition education for patients with low literacy skills. Journal of the American Dietetic Association: 98,559-564
Maddock, S.; Leek, S. & Foxall, G. (1999) Healthy eating or chips with everything? Nutrition and Food Science: 6,27-277
234
Manios, Y.; Moschandreas, J.; Hatzis, C. & Kafatos, A. (1999) Evaluation of a health and nutrition education program in primary school children of Crete over a three-year period. Preventative Medicine: 28,149-159
Mascarenhas, M. R.; Zemel, B. & Stallings, V. A. (1998) Nutritional assessment in Pediatrics. Nutrition: 14(l), 105-115
Matkovic, V., Ilich, J. Z., Andon, M. B., Hsieh, L. C., Tzagoumis, M. A., Lagger, B. J & Goel, P. K. (1995) Urinary calcium, sodium, and bone mass of young females. American Journal of Clinical Nutrition: 62,417425
McKenzie, J.; Dixon, L. B.; Smicklas-Wright, H.; Mitchell, D.; Shannon, B. & Tershakovec, A. (1996) Change in nutrient intakes, number of servings and contributions of total fat from food groups in 4- to 10-year-old children enrolled in a nutrition education study. Journal ofthe American Dietetic Association: 95(6), 865-873
Melzer, D.; McWilliams, B.; Brayne, C.; Johnson, T. & Bond, J. (2000) Socioeconomic status and expectation of disability in old age: estimates for England. Journal of Epidemiology and Community Health 54: 286-292
Mitchell, J. (1999) The British main meal in the 1990's: has it changed its identity? British FoodJournal. 101(l 1), 871-883
Mock, J.; Adams, A.; Snowdon, L. & Griffiths, H. (1997) Nutritional analysis of mid-day meals provided for 5-11 year-old schoolchildren. British Food. lournal. - 9(1), 12-19
Moriyama, M. & Saito, H. (1988) Twenty four-hour urinary excretion of sodium, potassium and urea in Japanese children. Tokyo Journal of Experimental Medicine: 154,381- 388
Morris, I N.; Donkin, A. J. M.; Wonderling, D.; Wilkinson, P. & Dowler, E. A. (2000) A minimum income for healthy living. Journal of Epidemiology and Community Health: 54: 885-889
Moynihan, P. J.; Adamson, A. J.; Skinner, R.; Rugg-Gunn, A. J., Appleton, D. R. & Butler, T. J. (1993) The intake of nutrients by Northumbrian adolescents from one-parent families and from unemployed families. Journal ofHuman Nutrition and Dietetics: 6, 443-441
Moynihan, P. 1 (2000) The British Nutrition Foundation Oral Task Force Report - issues relevant to dental health professionals. British Dental Journal: 188(6), 1-7
Moynihan, P. I (2001a ) Teaching children ftom deprived social backgrounds food preparation using healthyfoodv as a means of improving their diets and the diet of the family. Project ID: M0005037016. Department of Health.
Moynihan, P. J.; Cowell, T.; Stacy, R.; McNamee, P. & Adamson, A. (2001) The Good Food Club: setting up an after school food club to teach practical food preparation using healthy foods, at Key Stage 3. The Journal of Design and TechnoloSy Education: 6(3), 239-245.
235
Narayanan, S. & Appleton, H. D. (1980) Creatinine: A Review. Clinical Chemistry. - 26(8) 1119-1126
National Food Alliance (1993) The Rise and Fall of Domestic Cooking. Turning European Children into Passive Consumers. Conference Paper, The XII International Home Economics and Consumer Studies Research Conference, Leeds Metropolitan University
National Food Alliance (1997) Myths about Food and Low Income. National Food Alliance Food Poverty Project. National Food Alliance: London
National Heart Forum (1997) At leastfive a day. Strategies to increase vegetable andfruit consumption. National Forum for Coronary Heart Disease Prevention. London: The Stationary Office
Nelson, M.; Bakaliou, F. & Trevidi, A. (1994) Iron-deficiency anaemia and physical performance in adolescent girls from different ethnic backgrounds. British Journal of Nutrition: 72(2), 427433
Nelson, M. (1997) Developments in the UK: work of the Low Income Project Team. Proceedings of the Nutrition Society., 56,9 1 -100
Nelson, M.; Atkinson, M. & Meyer, J. (1997) A Photographic Allas of Food Portion Sizes. Ministry of Agriculture, Fisheries and Food. London: HMSO
ty, Nelson, M. (2000) Childhood nutrition and poverty. Proceedings of the Nutrition Socie 59: 307-315
Neubert, A- & Remmer, T. (1998) The impact of dietary protein intake on urinary creatinine excretion in a healthy pediatric population. The Journal of Pediatrics: 133(5), 655- 659.
Nicklas, T. A.; Johnson, C. C.; Myers, R.; Farris, R. P. & Cunningham, A. (1998) Outcomes of high school programme to increase fruit and vegetable consumption: Gimme 5-A fresh nutrition concept for students. Journal ofSchool Health: 68(6), 248-253
Parmenter, K.; Waller, J. & Wardle, J. (2000) Demographic variation in nutrition knowledge in England. Health Education Research: 15(2), 163-174
Paik, H. Y.; Hwang, S. H. & Lee, S. P. (1991) Comparitive analysis of growth, diet, and urinary N excretion in elementary school children from urban and rural areas of Korea. International Journal of Vitamin & Nutrition Research: 62: 83-90
Paul, A. A. & Southgate, D. A. T. (1978) McCance and Widdowson's The Composition of Foods. London: HMSO
Perez-Rodrigo, C. & Aranceta, J. (2001) School-based nutrition education: lessons learned
and new perspectives. Public Health Nutrition: 4(IA), 131-139
Petosa, R. & Goodman, R. M. (1991) Recruitment and retention of schools participating in school health research. Journal ofSchool Health: 61(10), 426429
236
Pine K. J. (2001) Children's Perceptions of Body Shape: A Thinness Bias in Pre-Adolescent Girls and Associations with Femininity. Clinical Child Psychology and Psychiatry.. 6(4) 519-536
Power, C. & Parsons, T. (2000) Nutritional and other influences in childhood as predictors of adult obesity. Proceedings of the Nutrition Society., 59,267-272
Okuda, K; Adams, J. & Hackett, A. F. (2000) An Anglo-Japanese study of young people and some domestic tasks related to food. Journal of Consumer Studies and Home Economics: 24(3), 189-197
Olmedilla, B. & Granado, F. (2000) Growth and micronutrient needs of adolescents. European Journal of Clinical Nutrition: 54(suppl. 1), SII -SS 15
Oxford Cambridge and RSA Examinations (2000) OCR GCSE in Design and Technology (Food Technology) 1954. GCSE Food Technology Coursework and Content Syllabus.
Phillimore, P.; Beattie, A. & Townsend, P. (1994) Widening inequality of health in northern England, 1981-1991. British Medical Journal. 308: 1125-1128
Qualifications and Curriculum Authority (1997) Back to Basics: Food in Schools. http: //www. qca. org. uk/news
Ritchey, S. J.; Derise, N. L.; Abernathy, R. P. & Korslund, M. K. (1973) Variability of creatinine excretion in preadolescent girls consuming a wide range of dietary nitrogen. American Journal of Clinical Nutrition: 26,690-695
Robinson, S. (2000) Children's perceptions of who controls their food. Journal of Human Nutrition and Dietetics: 13,163-171
Robson, P. J.; Gallagher, A. M.; Livingstone, M. B. E.; Cran, G. W.; Strain, J. J.; Savage, J. M. & Boreham, C. A. G. (2000) Tracking of nutrient intakes in adolescence: the experiences of the Young Heart Project, Northern Ireland. British Journal of Nutrition: 84,541-54 8
Robson, P. J. & Livingstone, M. B. E. (2000) An evaluation of food photographs as a tool for quantifying food and nutrient intakes. Public Health Nutrition: 3 (2), 183-192
Rochford, L. (1999) Food Matters- a nutrition award for Hertfordshire schools. Nutrition and Food science: 6,278-280
Roe, L.; Hunt, P.; Bradshaw, H. & Rayner, M. (1998) Health promotion interventions to promote healthy eating in the general population: a review. London: BEA.
Royal society of Art (1999) Focus on Food. Royal Society of Art, Halifax.
Rugg-Gunn, A. J.; Adamson, A. J.; Appleton, D. R.; Butler, T. J. & Hackett, A. F. (19938) Sugars consumption by 379 11-13-year-old English children in 1990 compared with results in 19 80. Journal ofHuman Nutrition and Dietetics: 6,41943 1.
Rugg-Gunn, A. J. (1993) Nutrition and Dental Health. Oxford: Oxford University Press.
237
Rugg-Gunn, A. J. (1993c) Nutrition, diet and dental public health. Community Dental Health: 10(2S), 47-56
Rugg-Gunn, A. J. and Nunn, J. 11. (1999) Nutrition, Diet and Oral Health. Oxford: Oxford University Press.
Rutland, M. (1993) Food in the curriculum; an entitlement to quality education. Modus: 2(8), 244-252
Ruxton, C. 11 S. & Kirk, T. 1- (1996) Relationships between social class, nutrient intake and dietary patterns in Edinburgh schoolchildren. International Journal ofFood Sciences and Nutrition: 47,341-349
Schofield, W. N. (1985) Predicting basal metabolic rate, new standards and a review of previous work. Human Nutrition: Clinical Nutrition: 39c, (Suppl. 1) 5-41
Seaman, C. & Kirk, T. (1995) A new approach to nutrition education in schools. Health Education: (3) May 1995,31-33
Seaman, E. A.; Bower, J. & Fleming, M. (1997) Nutrition knowledge and lunchtime eating habits of secondary school children in Lothian. Journal of Consumer Studies and Home Economics: 21,259-269
Shaw, M.; Gordon, D.; Dorling, D.; Mitchell, R. & Smith, G. D. (2000) Increasing mortality differentials by residential area level of poverty: Britain 1981-1997. Social Science and Medicine: 51,151-153
Sheilham, A. (200 1) Dietary effects on dental diseases. Public Health Nutrition: 4(2B), 569- 591
Shepherd, R.; Paisley, C. M.; Sparks, P.; Anderson, A. S.; Eley, S. & Lean, M. E. J. (1996) Constraints on dietary choice: the role of income. Nutrition and Food Science: 5,19- 21
Shepherd, p, & Raats, M. M. (1996) Attitudes and beliefs in food habits. Food Choice,
, 4cceptance and Consumption. Eds, Meiselman, H. L & MacFie, H. J. H. London: Blackie Academic and Professional.
Sherman, J. (1999) Celebrity chefs take to cookery to the classroom. The Times, 15 th February 1999. P. 16
Stanistreet, D.; Scott-Samuel, A. & Bellis, M. A. (1999) Income inequality and mortality in England. Journal ofPublic Health Medicine: 21(2), 205-207
Stitt, S. (1996) An international perspective on food and cooking skills in education. British Food. lournal. 98(10) 27-34
Stratton, P. & Bromley, K. (1999) Families' accounts of the causal processes in food choice. , 4ppetite: 33,89-108
Sustain: the alliance for better food and fanning (2001a) The Good Grub Clubs. 'Let Us Eat Cake!, issue 22: Sept 2001 P 13.
238
Sustain: the alliance for better food and farming (2001b) Grab five ideas! 'Let Us Eat Cakep Issue 2 1: Summer 2001 P 11.
Sweeney, P.; McColl, D.; Nugent, Z. & Pitts, N. (1995) Deprivation and Dental Caries. Dental Health Services Research Unit, The University of Dundee. http: /wwww. dundee. ac. uk/dhsru/shbdep95/depO595/sd. htin
Sweeting, H.; Anderson, A. & West, P. (1994) Socio-demographic correlates of dietary habits in mid to late adolescence. European Journal of Clinical Nutrition: 48,736- 748
Sweid, H. A.; Bagga, A.; Vaswani, M.; Vasudev, V.; Ahuja, R. K. & Srivastava, K N. (1997) Excretion of minerals, oxalate and uric acid in north Indian children. Pediatric Nephroloýy: 11(2) 189-192
Townsend, P., Phillimore, P. & Beattie, A. (1988) Inequalities in health in the Northern Region. London, Routledge.
Upmeier, H.; Cade, J. E. & Calvert, C. (1999) Costs of an (un)healthy diet: analysis from the UK Women's Cohort Study. Proceedings ofthe Nutrition Society., 58(l) 1 OA
Valentine, S. (2000) Food and nutrition in the twenty-first century curriculum. Nutrition and FoodScience: 30(3) 105-108
Walker, A.; Gregory, J.; Bradnock, G.; Nunn, J.; and White, D. (2000) National Diet and Nutrition Survey: young people aged 4 to 18 years. Volume 2: Report of the oral health survey. London: The Stationary Office
Wardle, J. & Huon, G. (2000) An experimental investigation of the influence of health information on children's taste preferences. Health Education Research: 15(l) 3944
Warwick, J.; McIlveen, H. & Strugnell, C. (1999) Food choices of 9-17-year olds in Northern Ireland - influences and challenges. Nutrition and Pood Science: 5,229-236
Watt, R. R. & Sheilham, A. (1996) Dietary patterns and changes in inner city adolescents. Journal ofHuman Nutrition and Dietetics: 9,451461
Weaver, M.; Pochlitz, M. & Hutchinson, S. (1999) 5a day for low-income families: evaluation of an advertising campaign and cooking events. Journal of Nutrition Education: 31,161-169
Welten, S. C.; Carpenter, R. A.; McPherson, R. S.; Brodney, S.; Douglass, D.; Kampert, J. B. & Blair, S. N. (2000) Comparison of a dietary record using reported portion size versus standard portion size for assessing nutrient intake. Public Health Nutrition: 3(2) 151-158
Wheelock, V. (1992) Healthy eating: the food issue of the 1990's. British Food Journal. 94(6)3-8
Whitehead, R- G.; Paul, A. A. & Cole, T. J. (1982) Trends in food energy intakes throughout childhood from one to 18 years. Human Nulrition:, 4ppliedNutrition: 36,57-62
239
Whincup, P. H.; Gilg, J. A.; Odoki, K; Taylor, S. J. C. & Cook, D. G. (2001) Age of menarche in contemporary British teenagers: survey of girls born between 1982 and 1986. British Medical Journal: 322,1095-1096
World Health Organisation (WHO) (1990) Diet, Nutrition and the Prevention of Chronic Diseases. Technical Report Series, 797. Geneva: World Health Organisation
Wrieden, W. (1996) Fruit and vegetable consumption of 10-1 I-year-old children in a region of Scotland. Health Education Journah 55,185-193
Young, B. & Hetherington, M. (1996) The literature on advertising and children's food choice. British Journal offutrition: 6,11-17
Zernel, B. S.; Riley, E. M. & Stallings, V. A. (1997) Evaluation of methodology for nutritional assessment in children: anthropometry, body composition, and energy expenditure. Annual Review offutrition 17: 211-235
240

12 Appendix
12.1 National Curriculum for England: Design and Technology
The National Curriculum for England: design and technology. Source: Crown
Jointly published by
Department for Education and Skills Sanctuary Buildings Great Smith Street London SWIP 3BT
Qualifications and Curriculum Authority 29 Bolton Street London W1 Y 7PD
First published in 1999
(c) Crown copyright 1999 (c) Qualifications and Curriculum Authority 1999
The National Curriculum Programmes of Study and Attainment Targets contained in this publication are subject to Crown copyright protection and are reproduced with the permission of the Controller of HMSO.
The additional information is copyright of the Qualifications and Curriculum Authority
By agreement between the Controller of HMSO and QCA reproduction of any of the material in this publication is permitted in accordance with copyright guidance issued by HMSO. This guidance is available on request from 11MSO, St Clement's House, 2-16 Colegate, Norwich NR3 IBQ. Tel 01603 621000 Fax 01603 723000 or by e-mail on copyright@hmso. gov. uk. It can also be viewed on HMSO's web site at www. hmso-gov. uk/guides. htm
Information given in square brackets is non-statutory.
[The importance of design and technology
Design and technology prepares pupils to participate in tomorrow's rapidly changing technologies. They learn to think and intervene creatively to improve quality of life. The subject calls for pupils to become autonomous and creative problem solvers, as individuals and members of a team. They must look for needs, wants and opportunities and respond to them by developing a range of ideas and making products and systems. They combine practical skills with an understanding of aesthetics, social and environmental issues, function and industrial practices. As they do so, they reflect on and evaluate present and past design and technology, its uses and effects. Through design and technology, all Pupils can become discriminating and informed users of products, and become innovators. ]
241

Programme of study: design and technology
Key stage 3
[During key stage 3 pupils use a wide range of materials to design and make products. They work out their ideas with some precision, taking into account how products will be used, who will use them, how much they cost and their appearance. They develop their understanding of designing and making by investigating products and finding out about the work of professional designers and manufacturing industry. They use computers, including computer- aided design and manufacture (CAD/CAM) and control software, as an integral part of designing and making. They draw on knowledge and understanding from other areas of the curriculum. ]
Knowledge, skills and understanding
Teaching should ensure that knowledge and understanding are applied when developing ideas, planning, producing products and evaluating them.
Developing, planning and communicating ideas
1. Pupils should be taught to: a) identify relevant sources of information, using a range of resources including ICT b) respond to design briefs and produce their own design specifications for products C) develop criteria for their designs to guide their thinking and to form a basis for evaluation d) generate design proposals that match the criteria e) consider aesthetics and other issues that influence their planning [for example, the needs and values of intended users, function, hygiene, safety, reliability, and cost] f) suggest outline plans for designing and making, and change them if necessary g) prioritise actions and reconcile decisions as a project develops, taking into account the use of time and costs when selecting materials, components, tools, equipment and production methods h) use graphic techniques and ICT, including computer-aided design (CAD), to explore, develop, model and communicate design proposals [for example, using CAD software or clip. art libraries, CD-ROM and intemet-based resources, or scanners and digital cameras].
Working with tools, equipment, materials and components to produce quality products
2. Pupils should be taught: a) to select and use tools, equipment and processes, including computer-aidcd design and manufacture (CAD/CAM), to shape and form materials saffly and accurately and finish them appropriately [for example, using CAM software linked to a cutter/plotter, lathe, milling machine or sewing machine] b) to take account of the working characteristics and properties of materials and components when deciding how and when to use them C) to join and combine materials and ready-made components accurately to achieve functional results d) to make single products and products in quantity, using a range of techniques, including CAD/CAM to ensure consistency and accuracy
242

e) about the working characteristics and applications of a range of modem materials, including smart materials.
Evaluating processes and products
3. Pupils should be taught to: a) evaluate their design ideas as these develop, and modify their proposals to ensure that their product meets the design specification b) test how well their products work, then evaluate them C) identify and use criteria to judge the quality of other people's products, including the extent to which they meet a clear need, their fitness for purpose, whether resources have been used appropriately, and their impact beyond the purpose for which they were designed [for example, the global, environmental impact of products and assessment for sustainability].
Knowledge and understanding of materials and components
4. Pupils should be taught: a) to consider physical and chemical properties and working characteristics of a range of common and modem materials b) that materials and components can be classified according to their properties and working characteristics C) that materials and components can be combined, processed and finished to create more useful properties and particular aesthetic effects [for example, combining different ingredients to create products with different sensory characteristics] d) how multiple copies can be made of the same product.
Knowledge and understanding of systems and control
5. Pupils should be taught: a) to recognise inputs, processes and outputs in their own and existing products b) that complex systems can be broken down into sub-systems to make it easier to analyse them, and that each sub-system also has inputs, processes and outputs C) the importance of feedback in control systems d) about mechanical, electrical, electronic and pneumatic control systems, including the use of switches in electrical systems, sensors in electronic switching circuits, and how mechanical systems can be joined together to create different kinds of movement e) how different types of systems and sub-systems can be interconnected to achieve a particular function f) how to use electronics, microprocessors and computers to control systems, including the use of feedback g) how to use ICT to design sub-systems and systems.
Knowledge and understanding of structures
6. Pupils should be taught: a) to recognise and use structures and how to support and reinforce them b) simple tests and appropriate calculations to work out the effect of loads C) that forces of compression, tension, torsion and shear produce different effects.
Brcadth of study 243

7. During the key stage, pupils should be taught the Knowledge, skills and understanding through: a) product analysis b) focused practical tasks that develop knowledge
a range of techniques, skills, processes and
C) design and make assignments in different contexts. The assignments should include control systems, and work using a range of contrasting materials, including resistant materials, compliant materials and/or food.
Key stage 4
[During key stage 4 pupils take part in design and make projects that are linked to their own interests, industrial practice and the community. Projects may involve an enterprise activity, where pupils identify an opportunity, design to meet a need, manufacture products and evaluate the whole design and make process. Pupils use ICT to help 'With their work, including computer-aided design and manufacture (CAD/CAM) software, control programs and ICT-based sources for research. They consider how technology affects society and their own lives, and learn that new technologies have both advantages and disadvantages. ]
Knowledge, skills and understanding
Teaching should ensure that knowledge and understanding are applied when developing ideas, planning, producing products and evaluating them.
Developing, planning and communicating ideas
1. Pupils should be taught to: a) develop and use design briefs, detailed specifications and criteria b) consider issues that affect their planning [for example, the needs and values of a range of users; moral, economic, social, cultural and environmental considerations; product maintenance; safety; the degree of accuracy needed in production] C) design for manufacturing in quantity d) produce and use detailed working schedules, setting realistic deadlines and identifying critical points e) match materials and components with tools, equipment and processes, taking account of critical dimensions and tolerances when deciding how to manufacture the product f) be flexible and adaptable in responding to changing circumstances and new opportunities g) use graphic techniques and ICT, including computer-aided design (CAD), to generate, develop, model and communicate design proposals [for example, using CAD software to generate accurate drawings and part drawings to help with manufacturing].
Working with tools, equipmen4 materials and components to produce quality products 2. Pupils should be taught to: a) select and use tools, equipment and processes effectively and safely to make products that match a specification b) use a range of industrial applications when working with familiar materials and processes
244

C) manufacture single products and products in quantity, applying quality assurance techniques d) use computer-aided manufacture (CAM) in single item production and in batch or volume production [for example, using vinyl cutters, embroiderers, knitting machines, engravers, milling machines, and lathes] e) simulate production and assembly lines, including the use of ICT.
Evaluating processes and products
3. Pupils should be taught to: a) check design proposals against design criteria, and review and modify them if necessary as they develop their product b) devise and apply tests to check the quality of their work at critical points during development C) ensure that their products are of a suitable quality for intended users [for example, how well products meet a range of considerations such as moral, cultural and environmental] and suggest modifications that would improve their performance if necessary d) recognise the difference between quality of design and quality of manufacture, and use essential criteria to judge the quality of other people's products.
Knowledge and understanding of materials and components
4. Pupils should be taught: a) how materials are cut, shaped and formed to specified tolerances b) how materials can be combined and processed to create more useful properties, and how these changed materials are used in industry
C) how materials are prepared for manufacture and how pre-manufactured standard components are used d) about a variety of finishing processes, and why they are important for aesthetic and functional reasons e) that to achieve the optimum use of materials and components, they need to take into account the relationships between material, form and intended manufacturing processes.
Knowledge and understanding of systems and control 5. Pupils should be taught: a) the concepts of input, process and output, and the importance of feedback in controlling systems, including: i) how control systems and sub-systems can be designed, used and connected to achieve different purposes ii) how feedback is incorporated into systems iii) how to analyse the performance of systems.
Breadth of study
6. During the key stage, pupils should be taught the Knowledge, skills and understanding through: a) product analysis b) focused practical tasks that develop a range of techniques, skills, processes and knowledge
245

C) design and make assignments, which include activities related to industrial practices and the application of systems and control.
Attainment target for design and technology
Level I Pupils generate ideas and recognise characteristics of familiar products. Their plans show that, with help, they can put their ideas into practice. They use pictures and words to describe what they want to do. They explain what they are making and which tools they are using. They use tools and materials with help, where needed. They talk about their own and other people's work in simple terms and describe how a product works.
Level 2 Pupils generate ideas and plan what to do next, based on their experience of working with materials and components. They use models, pictures and words to describe their designs. They select appropriate tools, techniques and materials, explaining their choices. They use tools and assemble, join and combine materials and components in a variety of ways. They recognise what they have done well as their work progresses, and suggest things they could do better in the future.
Level 3 Pupils generate ideas and recognise that their designs have to meet a range of different needs. They make realistic plans for achieving their aims. They clarify ideas when asked and use words, labelled sketches and models to communicate the details of their designs. They think ahead about the order of their work, choosing appropriate tools, equipment, materials, components and techniques. They use tools and equipment with some accuracy to cut and shape materials and to put together components. They identify where evaluation of the design
and make process and their products has led to improvements.
Level 4- pupils generate ideas by collecting and using information. They take users' views into account and produce step-by-step plans. They communicate alternative ideas using words, labelled sketches and models, showing that they are aware of constraints. They work with a variety of materials and components with some accuracy, paying attention to quality of finish and to function. They select and work with a range of tools and equipment. They reflect on their designs as they develop, bearing in mind the way the product will be used. They identify what is working well and what could be improved.
1xvel 5 Pupils draw on and use various sources of information. They clarify their ideas through discussion, drawing and modelling. They use their understanding of the characteristics of familiar products when developing and communicating their own ideas. They work from their own detailed plans, modifying them where appropriate. They work with a range of tools, materials, equipment, components and processes with some precision. They check their work as it develops and modify their approach in the light of progress. They test and evaluate their products, showing that they understand the situations in which their designs will have to function and are aware of resources as a constraint. They evaluate their products and their use of information sources.
246
Level 6 Pupils draw on and use a range of sources of information, and show that they understand the form and function of familiar products. They make models and drawings to explore and test their design thinking, discussing their ideas with users. They produce plans that outline alternative methods of progressing and develop detailed criteria for their designs and use these to explore design proposals. They work with a range of tools, materials, equipment, components and processes and show that they understand their characteristics. They check their work as it develops and modify their approach in the light of progress. They evaluate how effectively they have used information sources, using the results of their research to inform their judgements when designing and making. They evaluate their products as they are being used, and identify ways of improving them.
Level 7 Pupils use a wide range of appropriate sources of information to develop ideas. They investigate form, function and production processes before communicating ideas, using a variety of media. They recognise the different needs of a range of users and develop fully realistic designs. They produce plans that predict the time needed to carry out the main stages of making products. They work with a range of tools, materials, equipment, components and processes, taking full account of their characteristics. They adapt their methods of manufacture to changing circumstances, providing a sound explanation for any change from the design proposal. They select appropriate techniques to evaluate how their products would perform when used and modify their products in the light of the evaluation to improve their performance.
Level 8 pupils use a range of strategies to develop appropriate ideas, responding to information they have identified. When planning, they make decisions on materials and techniques based on their understanding of the physical properties and working characteristics of materials. They identify conflicting demands on their design, explain bow their ideas address these demands and use this analysis to produce proposals. They organise their work so that they can carry out processes accurately and consistently, and use tools, equipment, materials and components with precision. They identify a broad range of criteria for evaluating their products, clearly relating their findings to the purpose for which the products were designed and the appropriate use of resources.
Exceptional performance Pupils seek out information to help their design thinking, and recognise the needs of a variety of client groups. They are discriminating in their selection and use of information sources to support their work. They work from formal plans that make the best use of time and resources. They work with tools, equipment, materials and components to a high degree of precision. They make products that are reliable and robust and that fully meet the quality requirements given in the design proposal.
247
12.2Membership of The Good Food Study Steering Group
" Dr Paula Moynihan, PhD, BSc, S. R. D., R. P. H. Nutr-, Lecturer in Nutrition, The Dental School, University of Newcastle
" Professor John Mathers, Professor of Human Nutrition, Human Nutrition Research Centre, University of Newcastle
" Professor Annie Anderson, PhD, BSc, R. P. H. Nutr., Professor of Food Choice, Centre for Public Health Nutrition Research, University of Dundee
" Dr Ashley Adamson, PhD, BSc, S. R-D., R. N., Lecturer in Nutrition, Human Nutrition Research Centre, University of Newcastle
" Dr Rosie Stacy, PhD, BSc, Senior Lecturer in Medical Sociology, University of Newcastle
" Dr David Walshaw, PhD, BSc, Lecturer in Statistics, Department of Statistics, University of Newcastle
" Mr Paul McNamee, BSc, M. Sc., Lecturer in Health Economics, Department of Epidemiology and Public Health, University of Newcastle
" Ms Moira Hill, BSc, S. R. D., Newcastle Community Dietetics, Royal Victoria Infirmary, Newcastle upon Tyne
" Dr Simon Raybould, PhD, BSc, Senior Research Associate, Centre for Regional and Urban Development, University of Newcastle
Aspects of the study relating to the design of the questionnaire were undertaken with the
consultation of Professor Annie Anderson of the Centre for Public Health Nutrition at the
University of Dundee. Additional researchers were employed by the Human Nutrition
Research Centre to carry out recruitment of schools and subjects, data collection and analysis
and to assist in the development and delivery of the Food Club. These researchers were:
Dr Rob Hyland, PhD, BSc. Social Scientist Mrs Tracey Cowell, BA, M. Sc., Teacher of Food Technology Ms Julie Hooper, BA, M. Sc., Research Nutritionist (family shopping information)
248

12.3 Use of flyers in the study recruitment strategy
Figure 12-1 Flyer designed to be attached to letter of recruitment to parents and guardians of Year 7 pupils
dod Fooa, ýS' (d
'V 4V
bear Parents and Guardians
Too good to missf Let your child come to a FREE Food Club where they can cook, cat and even bring tasty food home - ALL FREE!
Each child that completes the study will receive a certificate of merit and a E15.00 gift voucher
as a thank you for their help
What will my child have to do?
Between now and the summer, and again next spring - " Write down what they cat and drink for 3 days
" Write down (with your help) the family food shopping for one week
From September to April go to the Food Club one night a week.
If your child would like to take part, please sign the consent slip on the following page.
To find out more, please telephone me on 0191 222 8241.
Thanks for reading this letter. Yours truly
Dr Paula Moynihan Newcastle University
249

12AInformation sheet supplied to prospective volunteers (control group)
Hum an N utr it ion Pes earch Centre Wellcome Laboratories
Queen Victoria Road Newcastle upon Tyne
Tei: 0191 222 8241
The Good Food 51hody
INFORMATION SHEIET This information sheet contains details about the Good Food Study and how you and your child will be asked to contribute. Please read it carefully before you consent to your child taking part. If you have any questions about the study, please telephone the number given at the bottom of this sheet. Taking part in the study is entirely voluntary. All the information that you and your child supply will be strictly CONFMENTIAL. Your child may withdraw from the study at any time without giving a reason.
1. Your child will be visited at schoo I by a Nutr it ion ist, Mrs Sam Pevi I I, wh a will supply your child with a pocket-si zed Food Diary and give fu II instruct ions to your child on how this should be completed.
2. Visits to your child in schoolwill be arranged with teaching staff. The visit will take place at at ime that is convenient -to the school timetable. Your child will be given a slip that wi 11 inform th em of th e day and th et im e of th e vis it.
3. Your child will be visited again in school on completion of the food diary. This visit will be to look through the information your child has written down and to collect the diary from h im/h er.
4. Your childwill asked to complete two food diaries in the summer term of school this year, andtwo next year at about the same time.
5. The Nutritionist will also ask to visit you and your child at home, at a time that is convenient to you. The Nutritionist will ask to measure your child's hew4ht and we'qht and this wil I be written down.
6. A Nutritionist will also ask your child to fill in a questionnaire. This will be done of school th is sum m er t erm and again next year about t he sam et im e.
7. In add it ion, M iss Ju lie Hooper w 111 contact you to arrange at im eto vis it you at hom e. You (and your ch i ld, if he or s he wish es) w il I be asked toc am p let ea Food 5 hopp ing b oary for one week. You will be asked to fill in one Shopping Diary this year. and one next year about the same time.
s. All the information that youandyour child supply will be CONFIDENTIAL. 9. Childrenwho complete the studywill be given a certificate of merit and a gift voucher as
a thank you for their help.
If you have any questions. please te kphone:
br Paula AAoynihan (0191222 8241) Mrs 5am Ravi 11 or Miss Julie Hkýo per (0191222 8719)
2-54)
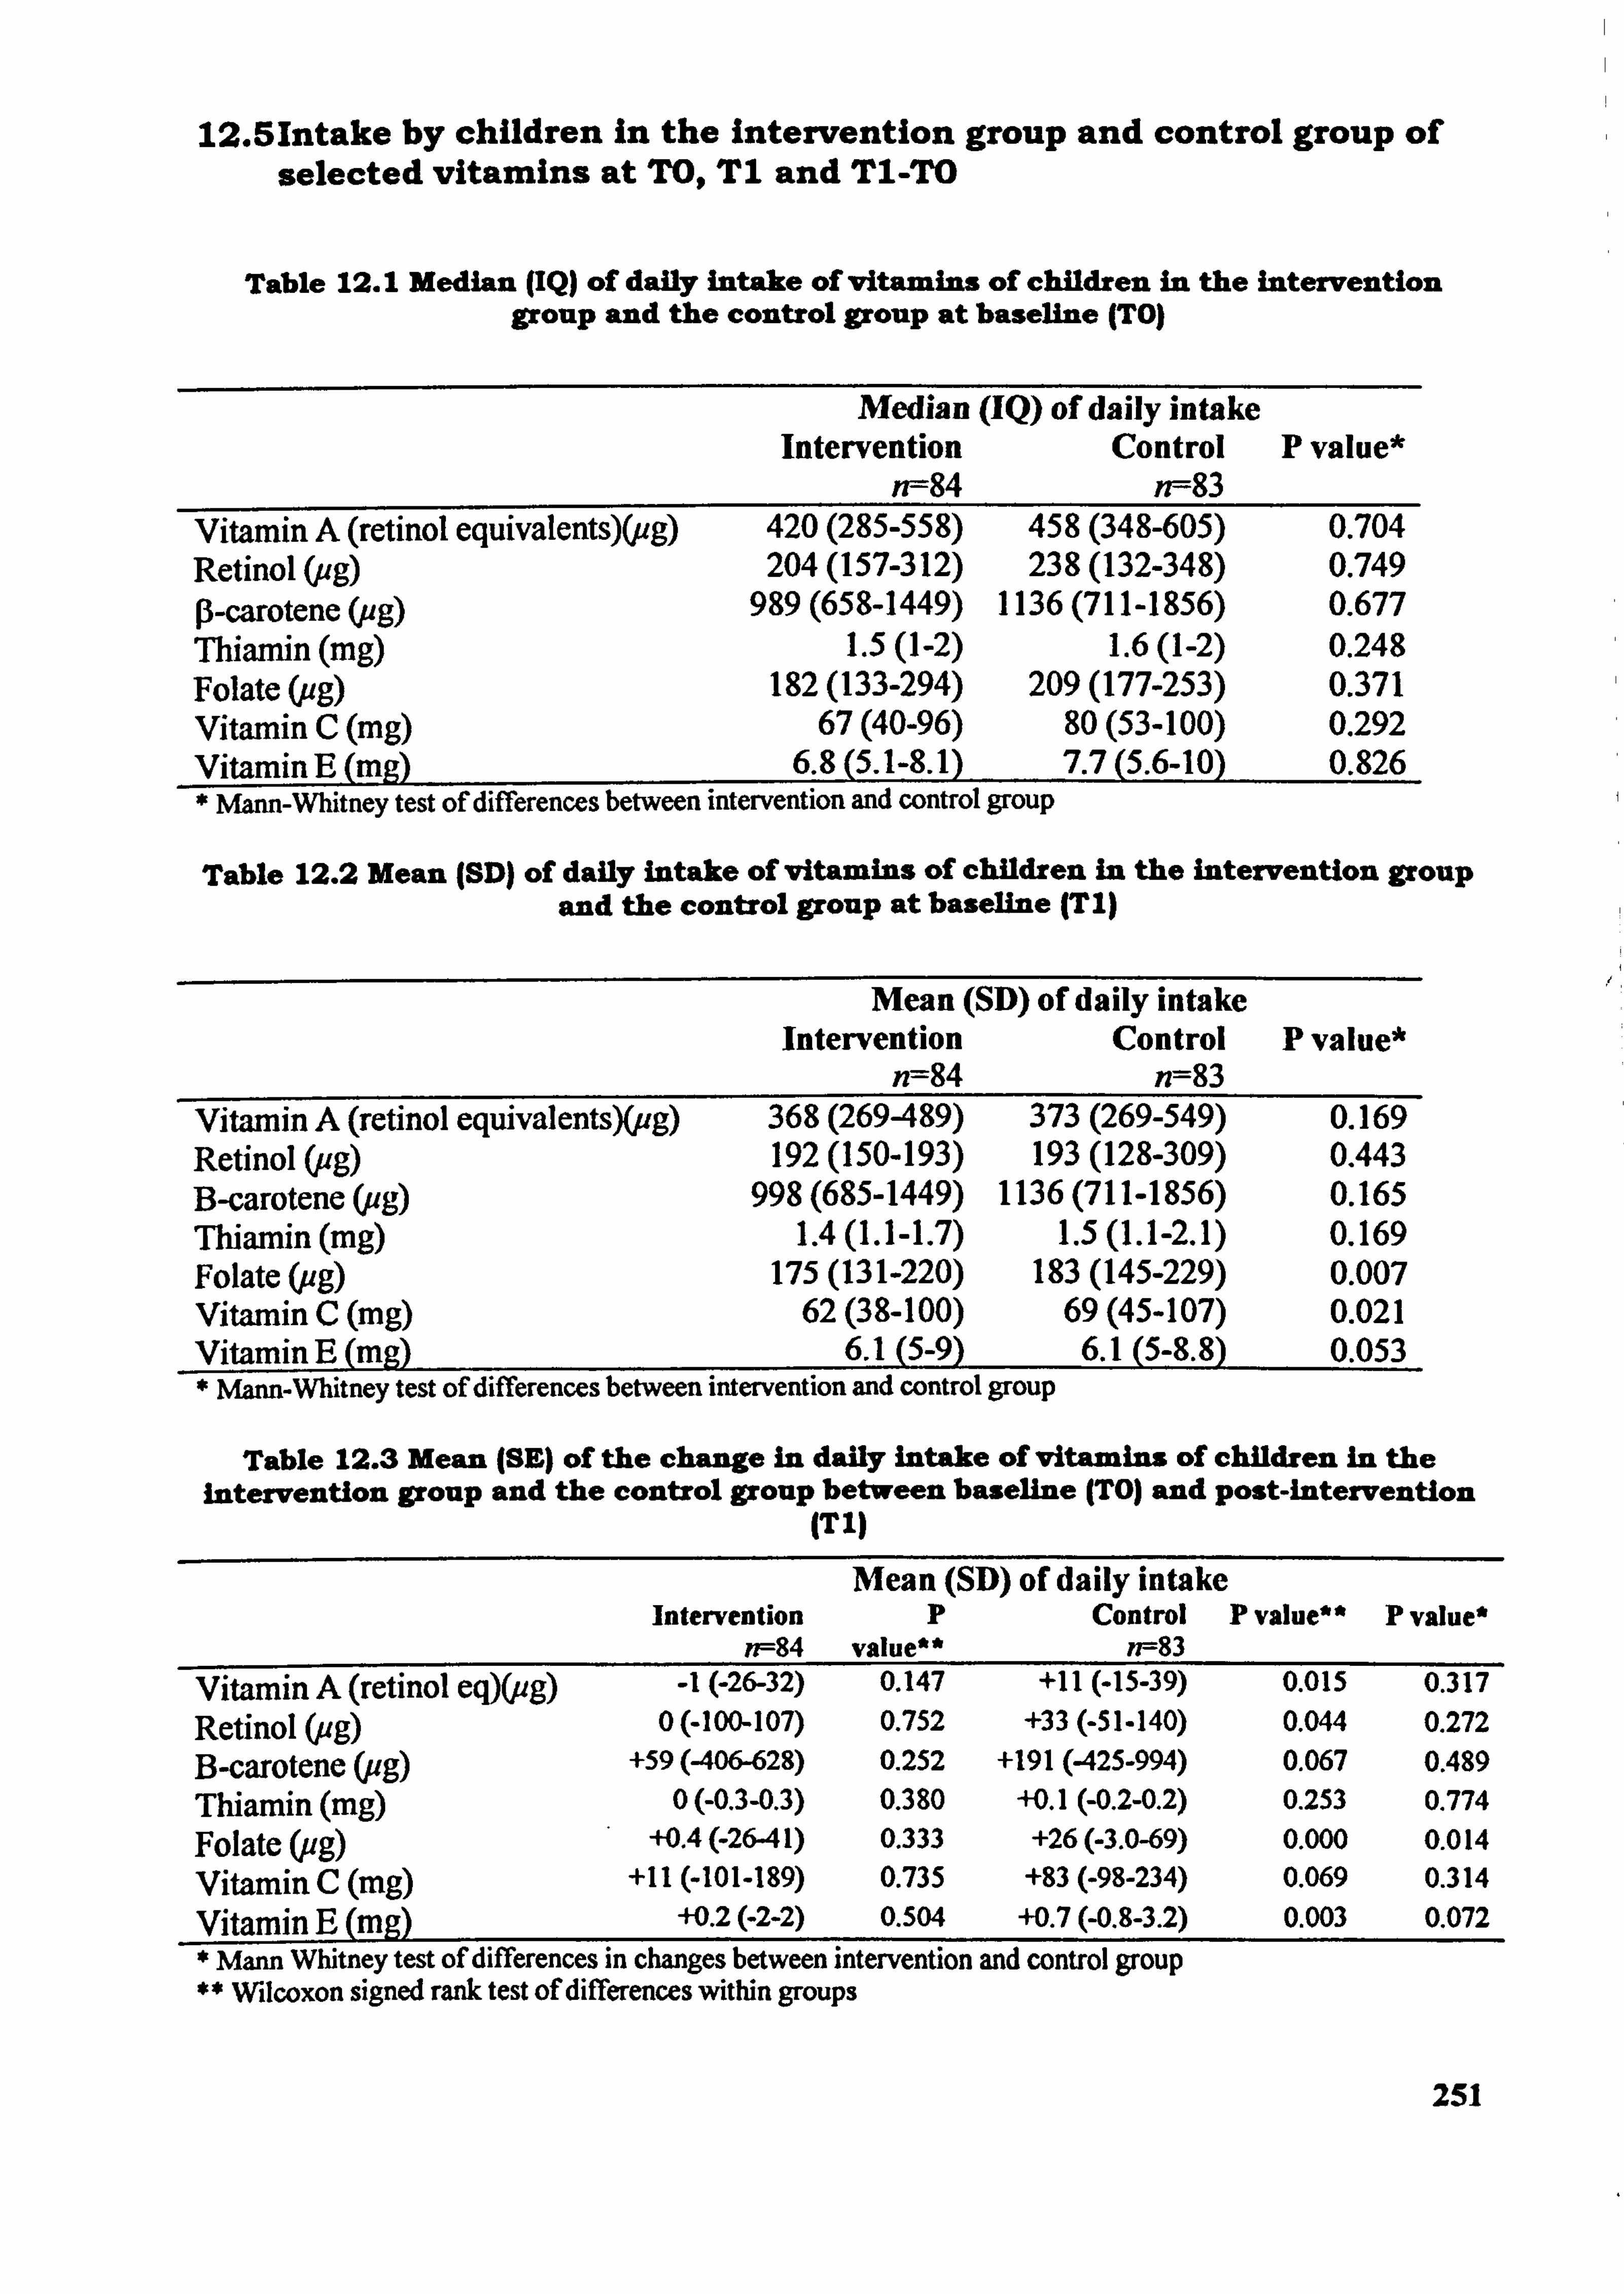
12.51ntake by children In the intervention group and control group of selected vitamins at TO, T1 and T1-TO
Table 12.1 Median (IQ) of daily intake of vitamins of children In the intemention group and the control group at baseline (TO)
Median (IQ) of daily intake Intervention Control
n--84 n--83 P value*
Vitamin A (retinol. equivatents)(pg) 420 (285-558) 458 (348-605) 0.704 Retinol (ug) 204 (157-312) 238 (132-348) 0.749 p-carotene (ug) 989 (658-1449) 1136 (711-1856) 0.677 Thiamin (mg) 1.5(1-2) 1.6(1-2) 0.248 Folate (ug) 182 (133-294) 209 (177-253) 0.371 Vitamin C (mg) 67(40-96) 80(53-100) 0.292 Vitamin E (me) 6.8 (5.1-8.1) 7.7 (5.6-10) 0.826 * Mann-Whitney test of differences between intervention and control group
Table 12.2 Mean JSD) of daily intake of vitamins of children in the intervention group and the control group at baseline (T I)
Mean (SD) of daily intake Intervention Control P value*
n--84 n=83 Vitamin A (retinol equivalents)(, ug) 368 (269-489) 373 (269-549) 0.169 Retinol Cug) 192 (150-193) 193 (128-309) 0.443 B-carotene (ug) 998 (685-1449) 1136 (711-1856) 0.165 Thiamin (mg) 1.4 (1.1-1.7) 1.5 (1.1-2.1) 0.169 Folate (pg) 175 (131-220) 183 (145-229) 0.007 Vitamin C (mg) 62(38-100) 69(45-107) 0.021 Vitamin E (m, 2) 6. l(5-9) 6. l(5-8.8) 0.053 * Mann-Whitney test of differences between intervention and control group
Table 12.3 Mean (SE) of the change in daily intake of vitamins of children in the intervention group and the control group between baseline (TO) and post-intervention
(TI)
Intervention n--84
Mean (SD) of daily intake p Control
value** n--83 P value** P value*
Vitamin A (retinol eq)(ug) -1(-26-32) 0.147 +11 (-15-39) 0.015 0.317
Retinol (ug) 0 (400-107) 0.752 +33 (-51-140) 0.044 0.272
B-carotene (ug) +59 (406-628) 0.252 +191 (425-994) 0.067 0.489
Thiamin (mg) 0 (-0.3-0.3) 0.380 +0.1(-0.2-0.2) 0.253 0.774
ug) Folate ( . +0.4 (-2641) 0.333 +26 (-3.0-69) 0.000 0.014 , Vitamin C (mg) +11 (401-189) 0.735 +83 (-98-234) 0.069 0.314
Vitamin E (mg) +0.2(-2-2) 0.504 +0.7 (-0.8-3.2) 0.003 0.072
Mann Whitney test of differences in changes between intervention and control group ** Wilcoxon signed rank test of differences within groups
251
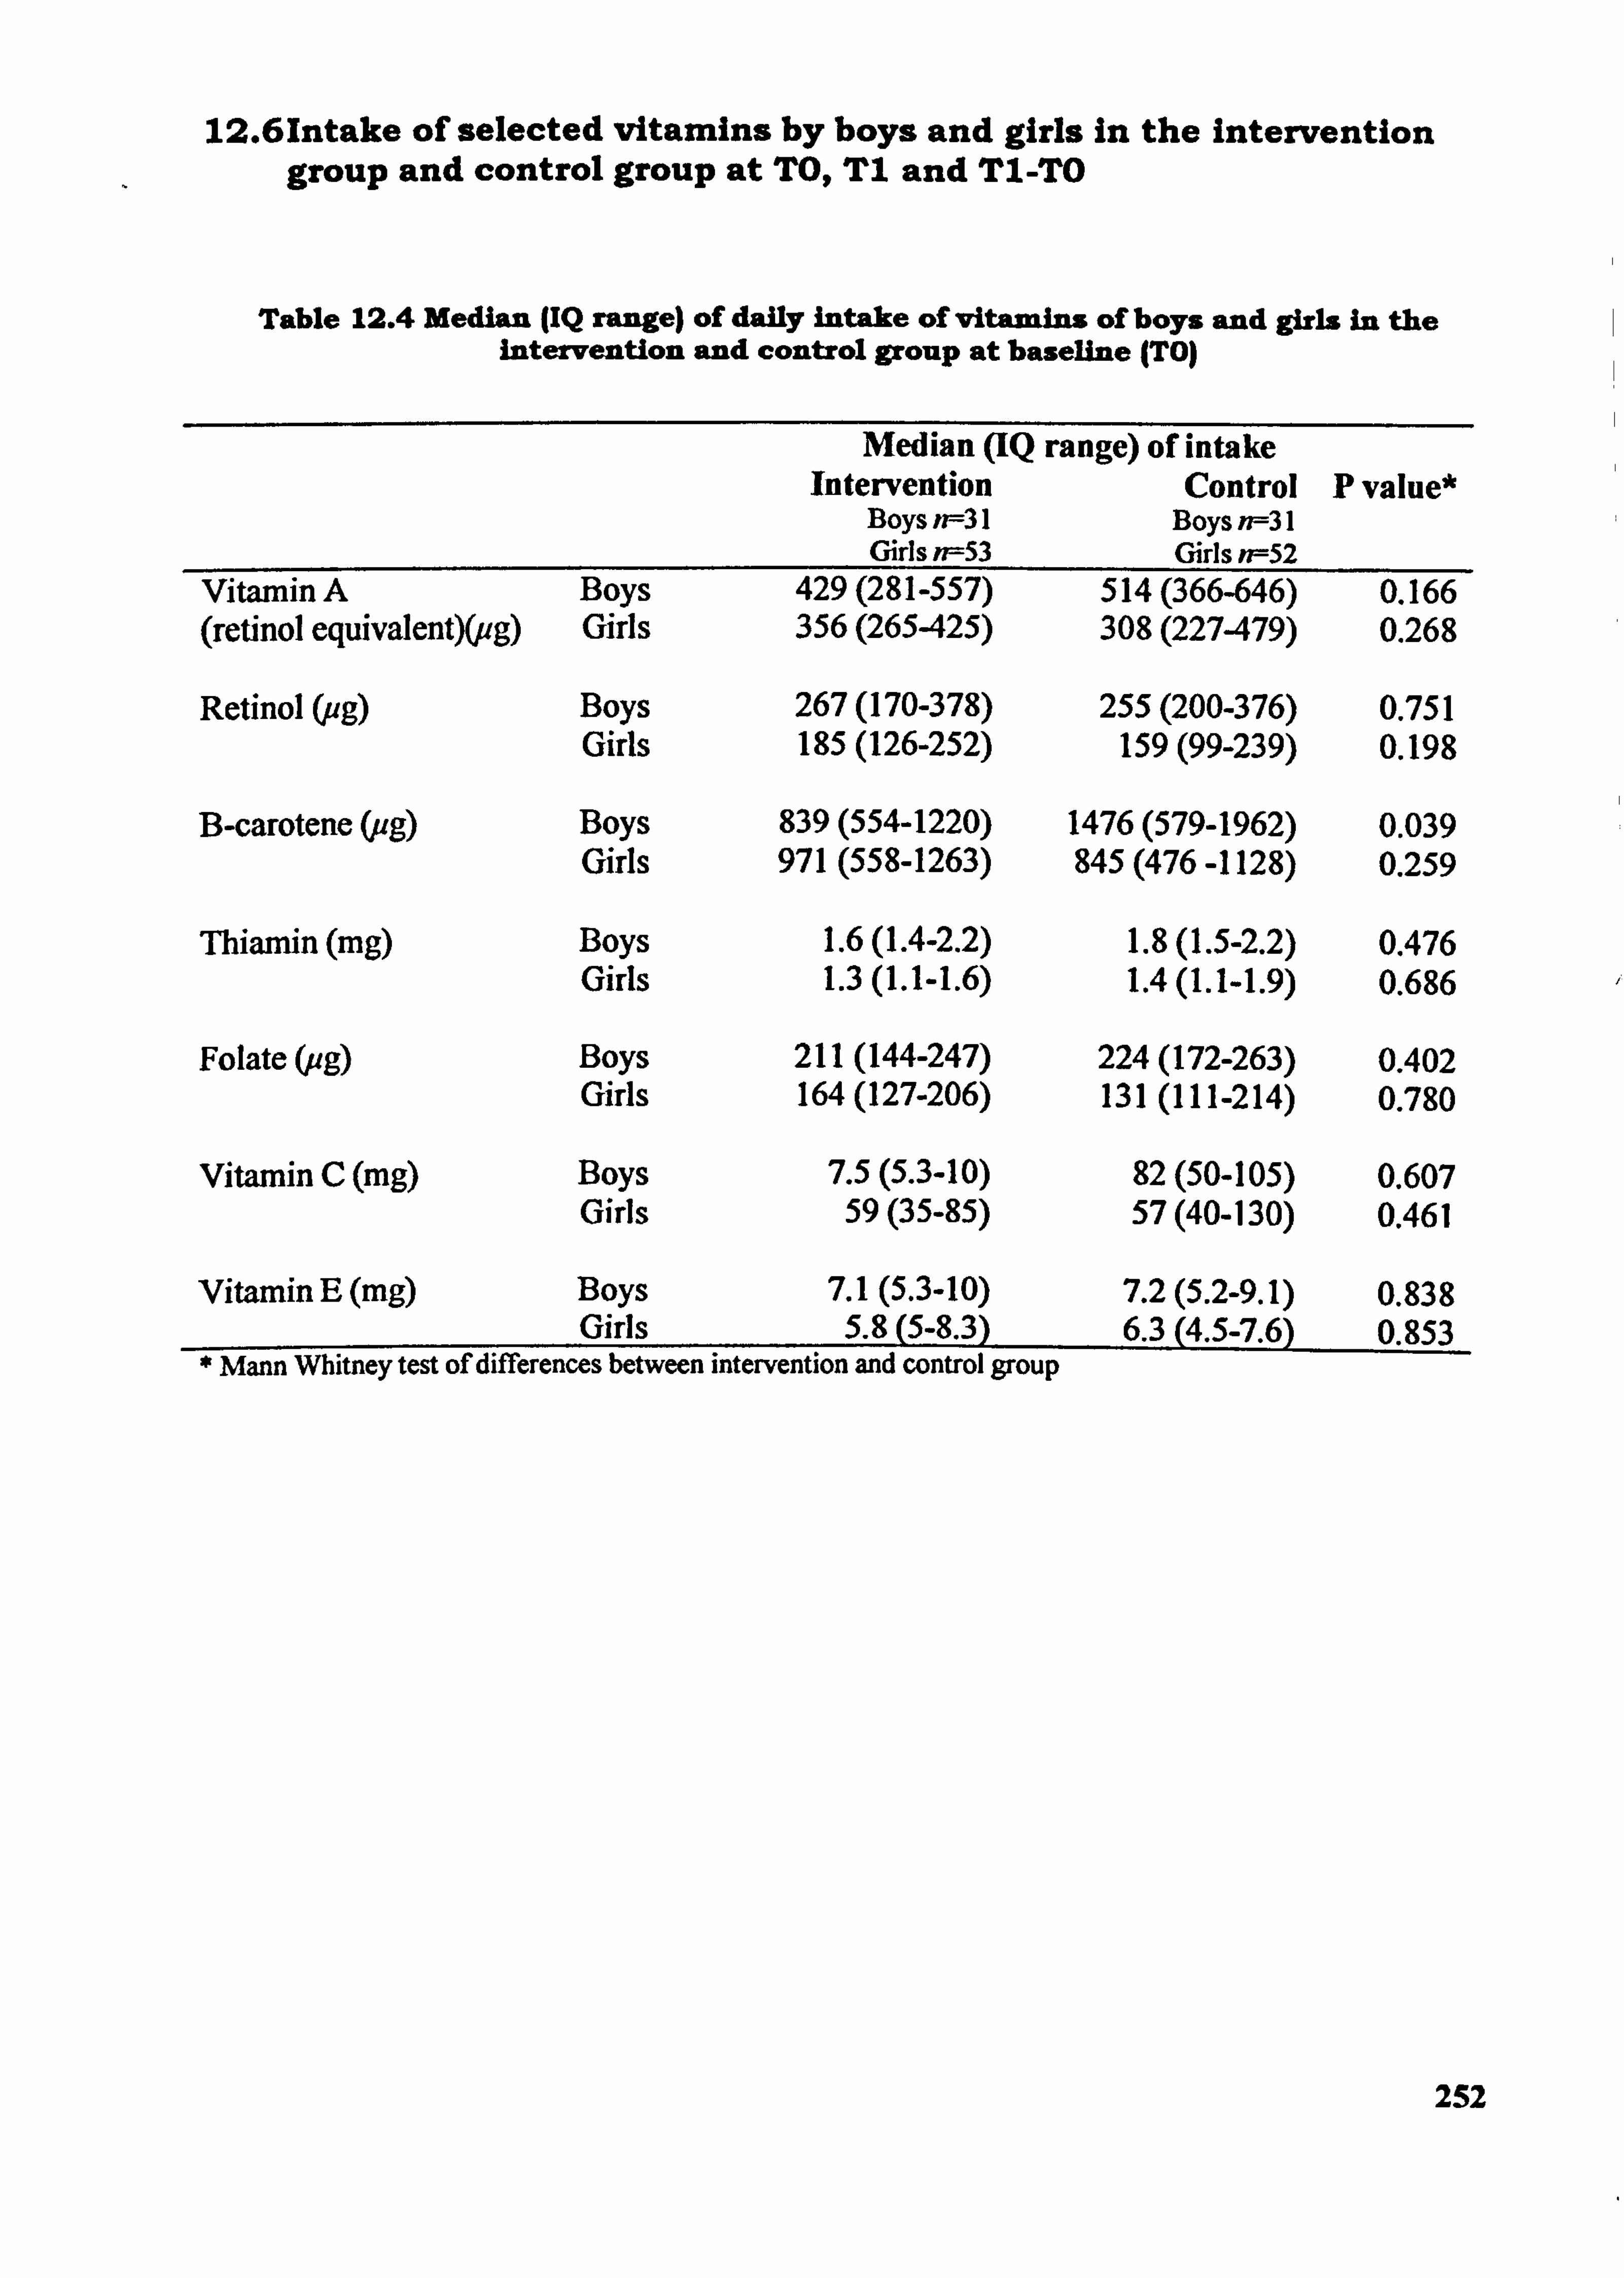
12.61ntake of selected vitamins by boys and girls In the intervention group and control group at T09, T1 and T1-TO
Table 12.4 Median (IQ range) of daily into e of vitantins of boys and girls in the intervention and control group at baseline (TO)
Median (IQ range) of intake Intervention Control P value*
Boys n--31 Boys n--31 Girls n--53 Girls n--52
Vitamin A Boys 429 (281-557) 514 (366-646) 0.166 (retinol equivalent)(ug) Girls 356 (265425) 308 (227479) 0.268
Retinol (ag) Boys 267 (170-378) 255 (200-376) 0.751 Girls 185 (126-252) 159 (99-239) 0.198
B-carotene (ug) Boys 839 (554-1220) 1476 (579-1962) 0.039 Girls 971 (558-1263) 845(476-1128) 0.259
Thiamin (mg) Boys 1.6 (1.4-2.2) 1.8 (1.5-2.2) 0.476 Girls 1.3 (1.1-1.6) 1.4 (1.1-1.9) 0.686
Folate (ug) Boys 211 (144-247) 224 (172-263) 0.402 Girls 164 (127-206) 131 (111-214) 0.780
Vitamin C (mg) Boys 7.5 (5.3-10) 82(50-105) 0.607 Girls 59(35-85) 57(40-130) 0.461
Vitamin E (mg) Boys 7.1 (5.3-10) 7.2 (5.2-9.1) 0.838 Girls 5.8(5-8.3) 6.3 (4.5-7.6) 0.853
Mann Whitney test of differences between intervention and control group
252
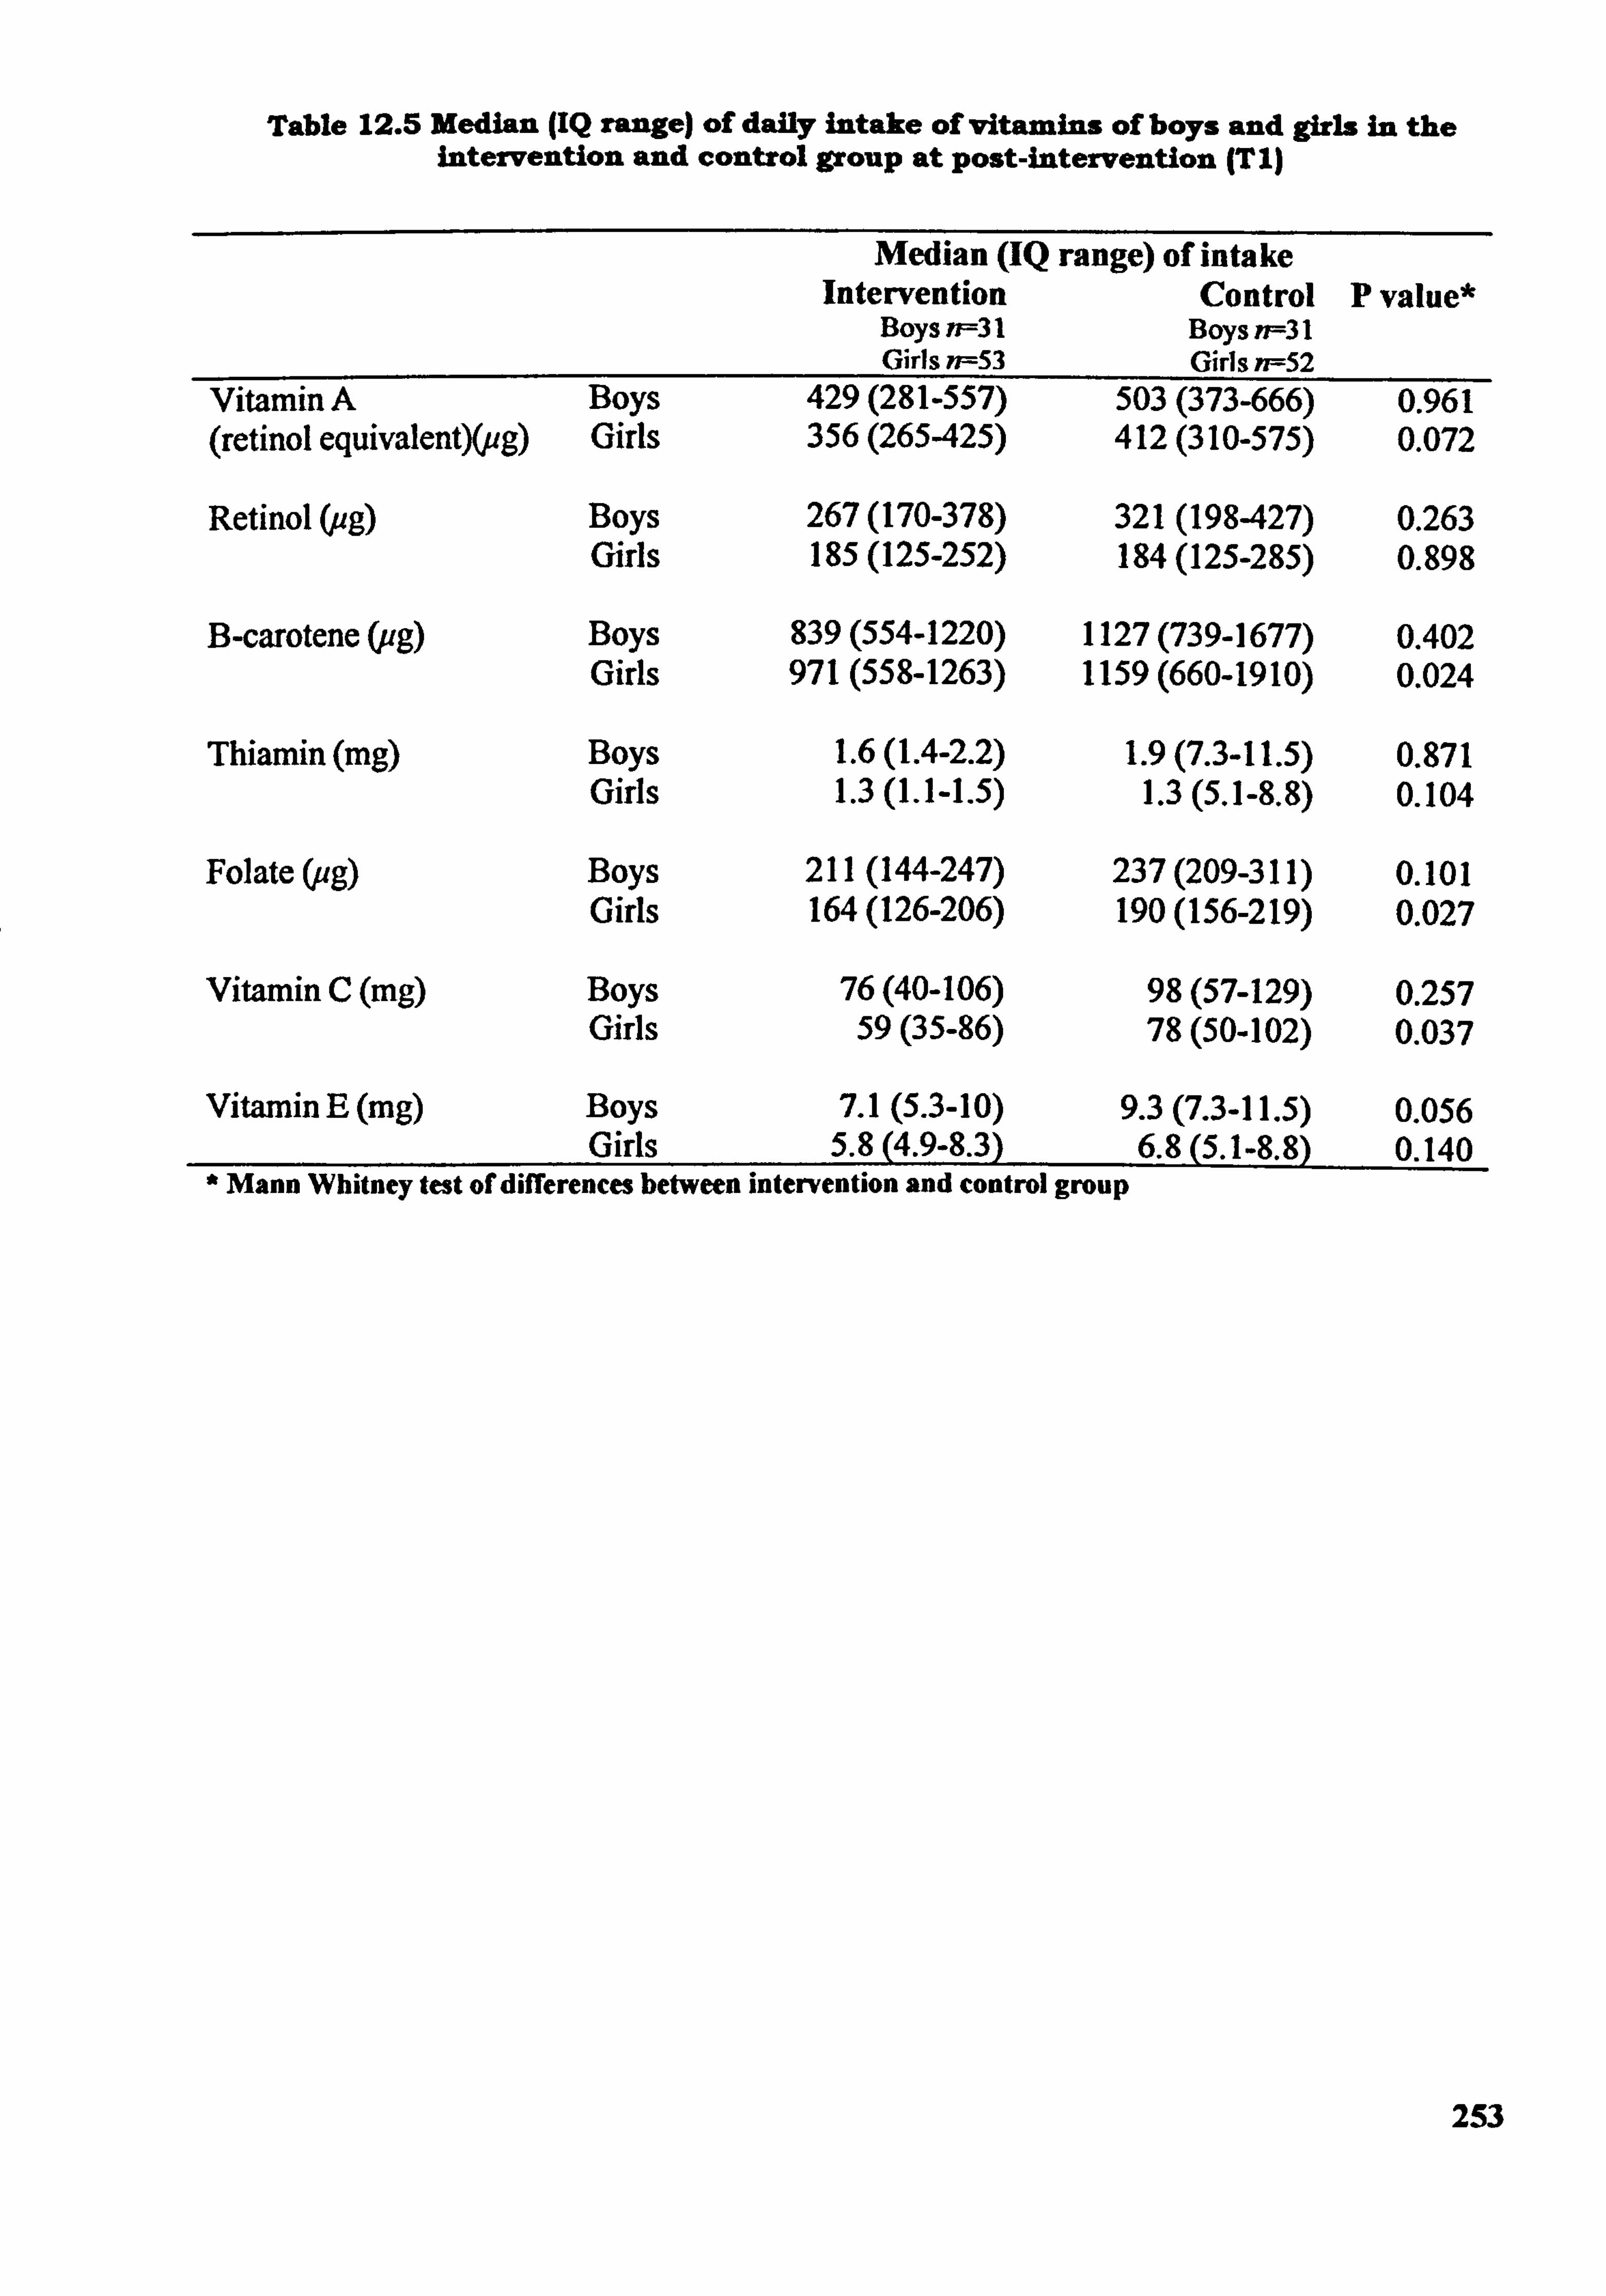
Table 12.5 Median (IQ range) of daily intake of vitamins of boys and girls in the intervention and control group at post-intervention (T I)
Median (IQ range) of intake Intervention Control P value*
Boys n=31 Boys n=31 Girls n--53 Girls n--52
Vitamin A Boys 429 (281-557) 503 (373-666) 0.961 (retinol equivalent)(ug) Girls 356 (265425) 412 (310-575) 0.072
Retinol (pg) Boys 267 (170-378) 321 (198427) 0.263 Girls 185 (125-252) 184 (125-285) 0.898
B-carotene (ug) Boys 839 (554-1220) 1127 (739-1677) 0.402 Girls 971 (558-1263) 1159 (660-1910) 0.024
Thiamin (mg) Boys 1.6 (1.4-2.2) 1.9 (7.3-11.5) 0.871 Girls 1.3 (1.1-1.5) 1.3 (5.1-8.8) 0.104
Folate (ag) Boys 211 (144-247) 237 (209-311) 0.101 Girls 164 (126-206) 190 (156-219) 0.027
Vitamin C (mg) Boys 76(40-106) 98(57-129) 0.257 Girls 59(35-86) 78(50-102) 0.037
Vitamin E (mg) Boys 7.1 (5.3-10) 9.3 (7.3-11.5) 0.056 Girls 5.8 (4.9-8.3) 6.8 (5.1-8.8) 0.140
Mann Whitney test of differences between intervention and control group
253
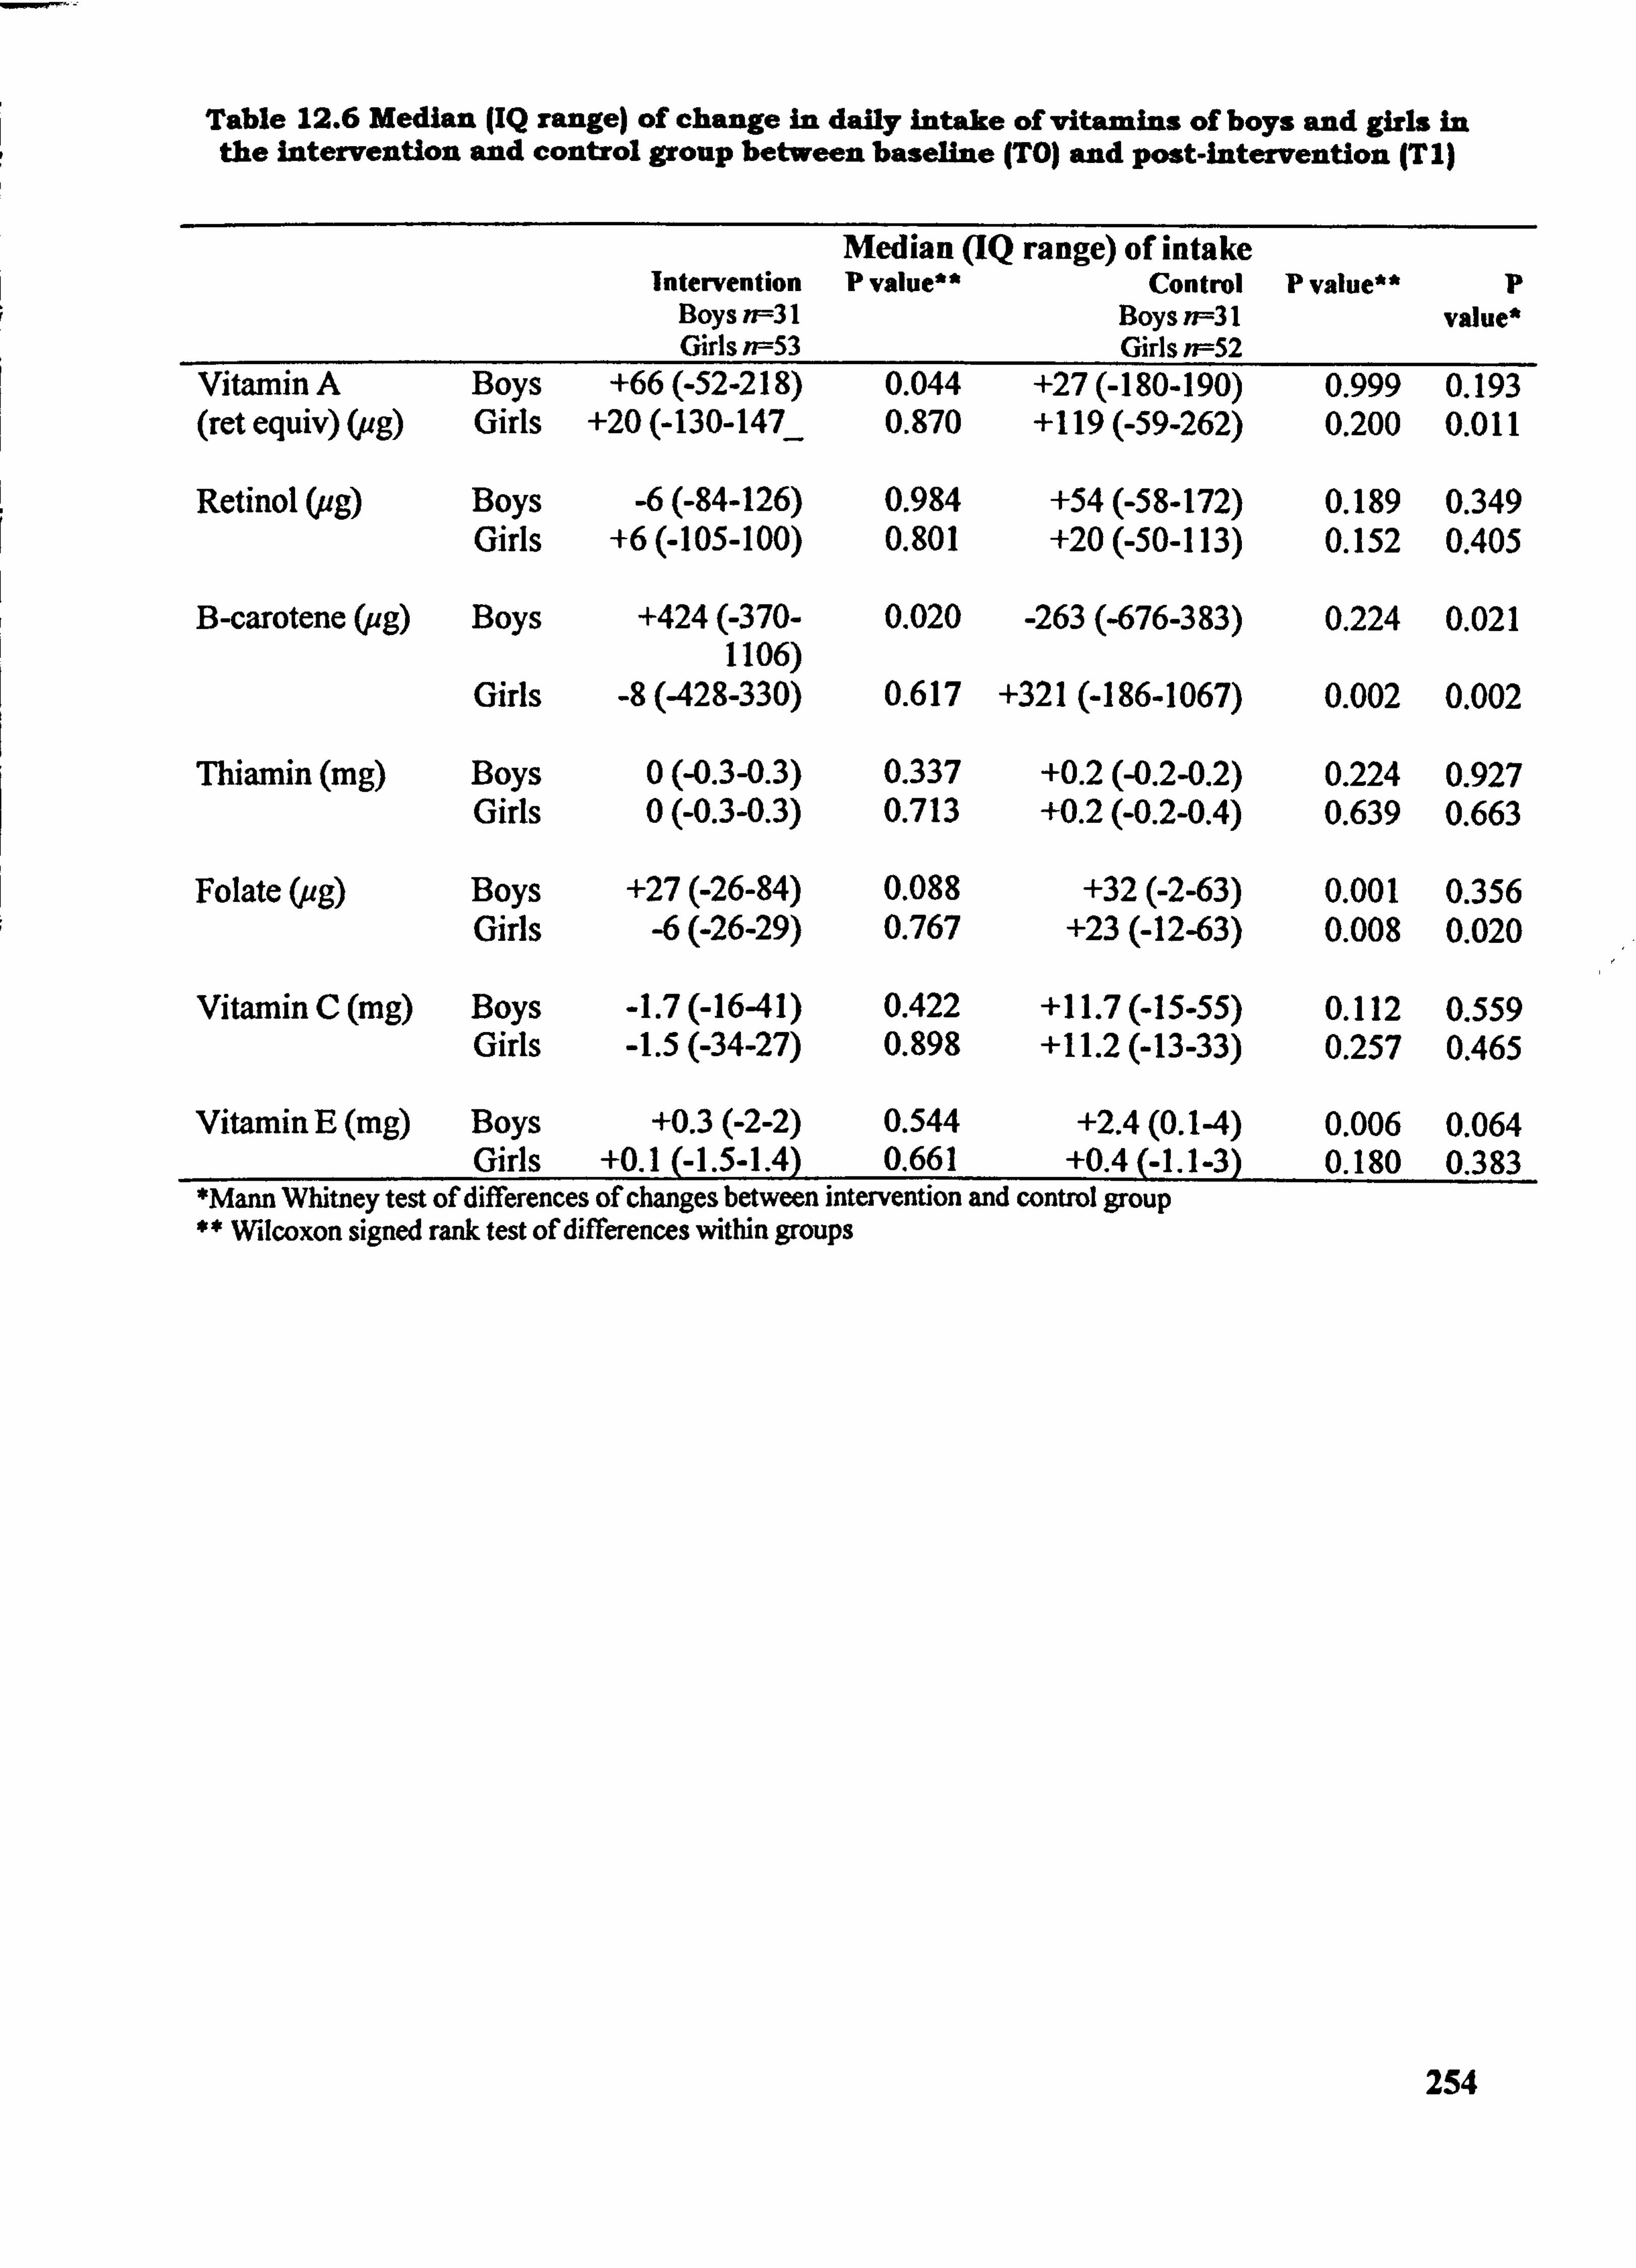
Table 12.6 Median (IQ range) of change in daily intake of vitamins of boys and girls in the intervention and control group between baseline (TO) and post-intervention (Tl)
Intervention Boys n=-31 Girls ff--53
Median (IQ range) of intake p value** Control
Boys n=-31 Girls n--52
P value** p value*
Vitamin A Boys +66 (-52-218) 0.044 +27 (-180-190) 0.999 0.193 (ret equiv) (ug) Girls +20 (-130-147_ 0.870 +119 (-59-262) 0.200 0.011
Retinol (ug) Boys -6 (-84-126) 0.984 +54 (-58-172) 0.189 0.349 Girls +6 (405-100) 0.801 +20 (-50-113) 0.152 0.405
B-carotene (ug) Boys +424(-370- 0.020 -263 (-676-383) 0.224 0.021 1106)
Girls -8 (428-330) 0.617 +321 (-186-1067) 0.002 0.002
Thiamin (mg) Boys 0 (-0.3-0.3) 0.337 +0.2 (-0.2-0.2) 0.224 0.927 Girls 0 (-0.3-0.3) 0.713 +0.2 (-0.2-0.4) 0.639 0.663
Folate (ug) Boys +27 (-26-84) 0.088 +32(-2-63) 0.001 0.356 Girls -6(-26-29) 0.767 +23 (-12-63) 0.008 0.020
Vitamin C (mg) Boys -1.7 (-16-41) 0.422 +11.7 (-15-55) 0.112 0.559 Girls -1.5 (-34-27) 0.898 +11.2 (-13-33) 0.257 0.465
Vitamin E (mg) Boys +0.3(-2-2) 0.544 +2.4(0.14) 0.006 0.064 Girls +0.1 (-1.5-1.4) 0.661 +0.4 (-1.1-3) 0.180 0.383
*Mann Whitney test of differences of changes between intervention and control group ** Wilcoxon signed rank test of differences within groups
254
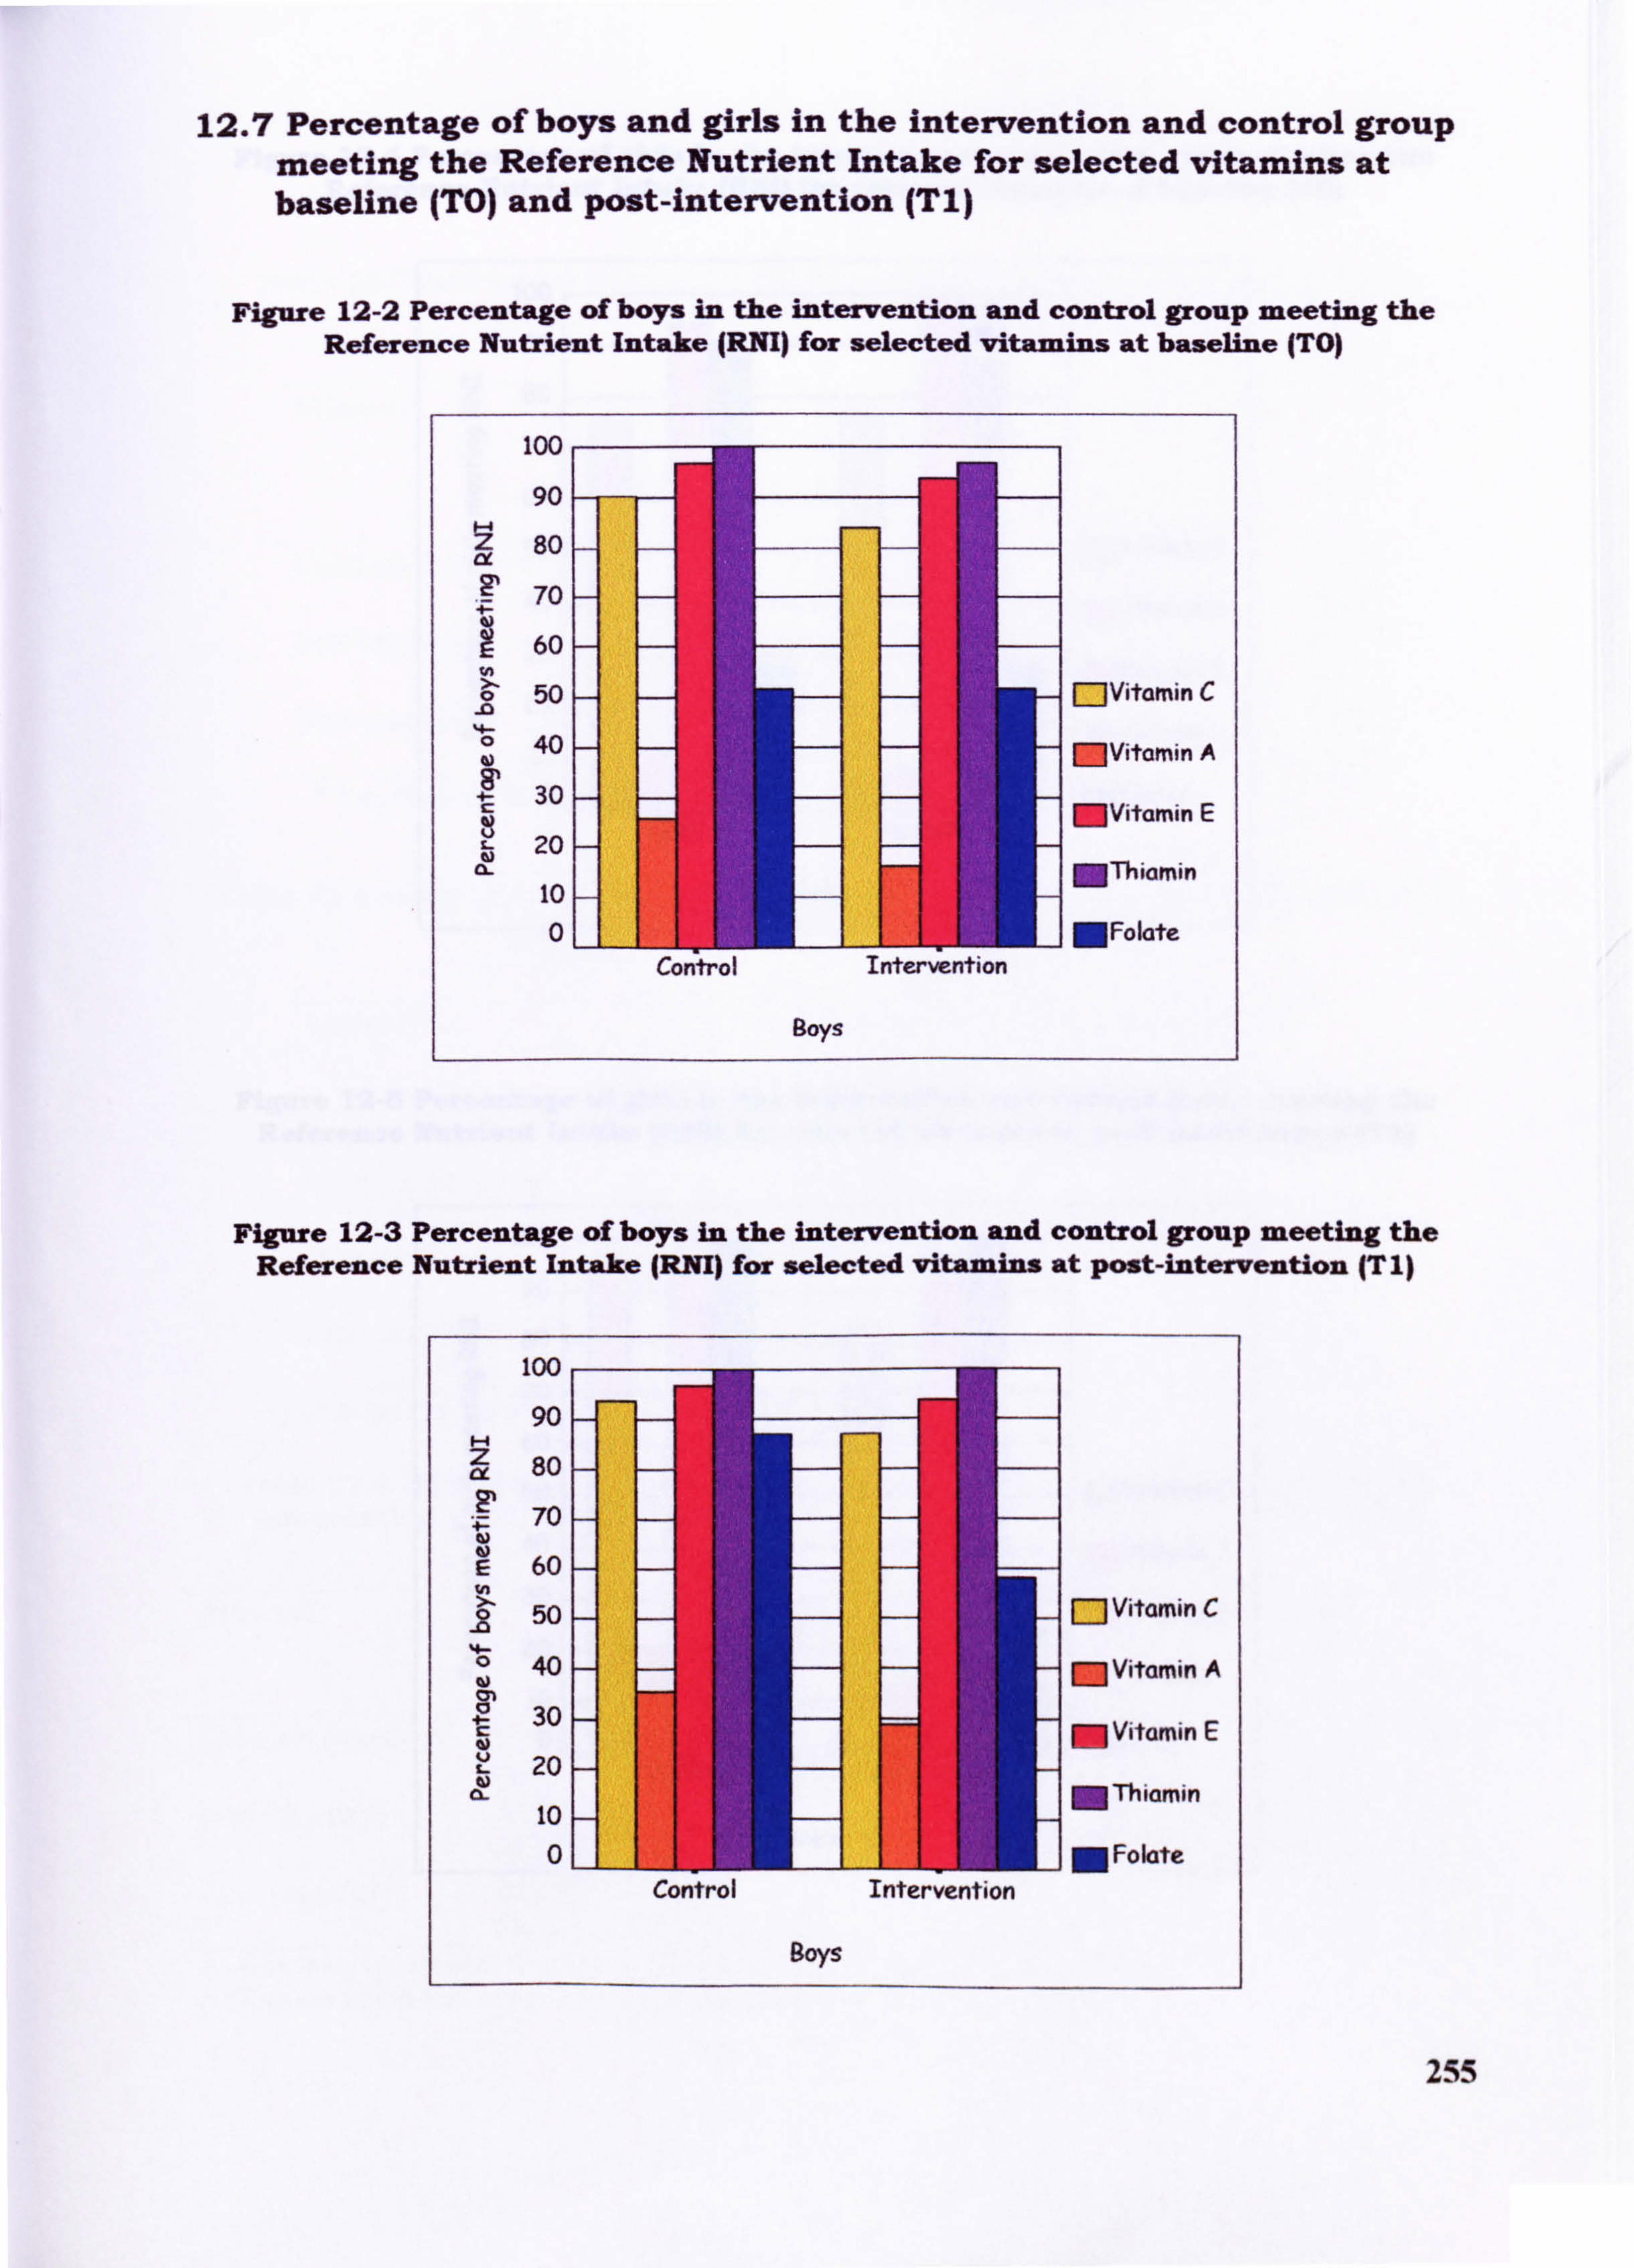
12.7 Percentage of boys and girls in the intervention and control group meeting the Reference Nutrient Intake for selected vitamins at baseline (TO) and post-intervention (Ti)
Figure 12-2 Percentage of boys in the intervention and control group meeting the Reference Nutrient Intake (RM) for selected vitamins at baseline (TO)
100
90
80
70
60
0 50 MVitamin C - 0 40 - MVitamin A
4- 30 C - MVitamin E 20 - MThiamin 10 - 0 MFolate
Control Intervention
Boys
Figure 12-3 Percentage of boys in the intervention and control group meeting the Reference Nutrient Intake JRNI) for selected vitamins at post-intervention (T I)
100
90 z 80
70 -
60 - %n >. 50 Vitamin C
- 0 40 - Vit i A w M am n
30 - M Vitamin E 20 -
MThiamin 10 - 0 M Folate
Control Intervention
Boys
255
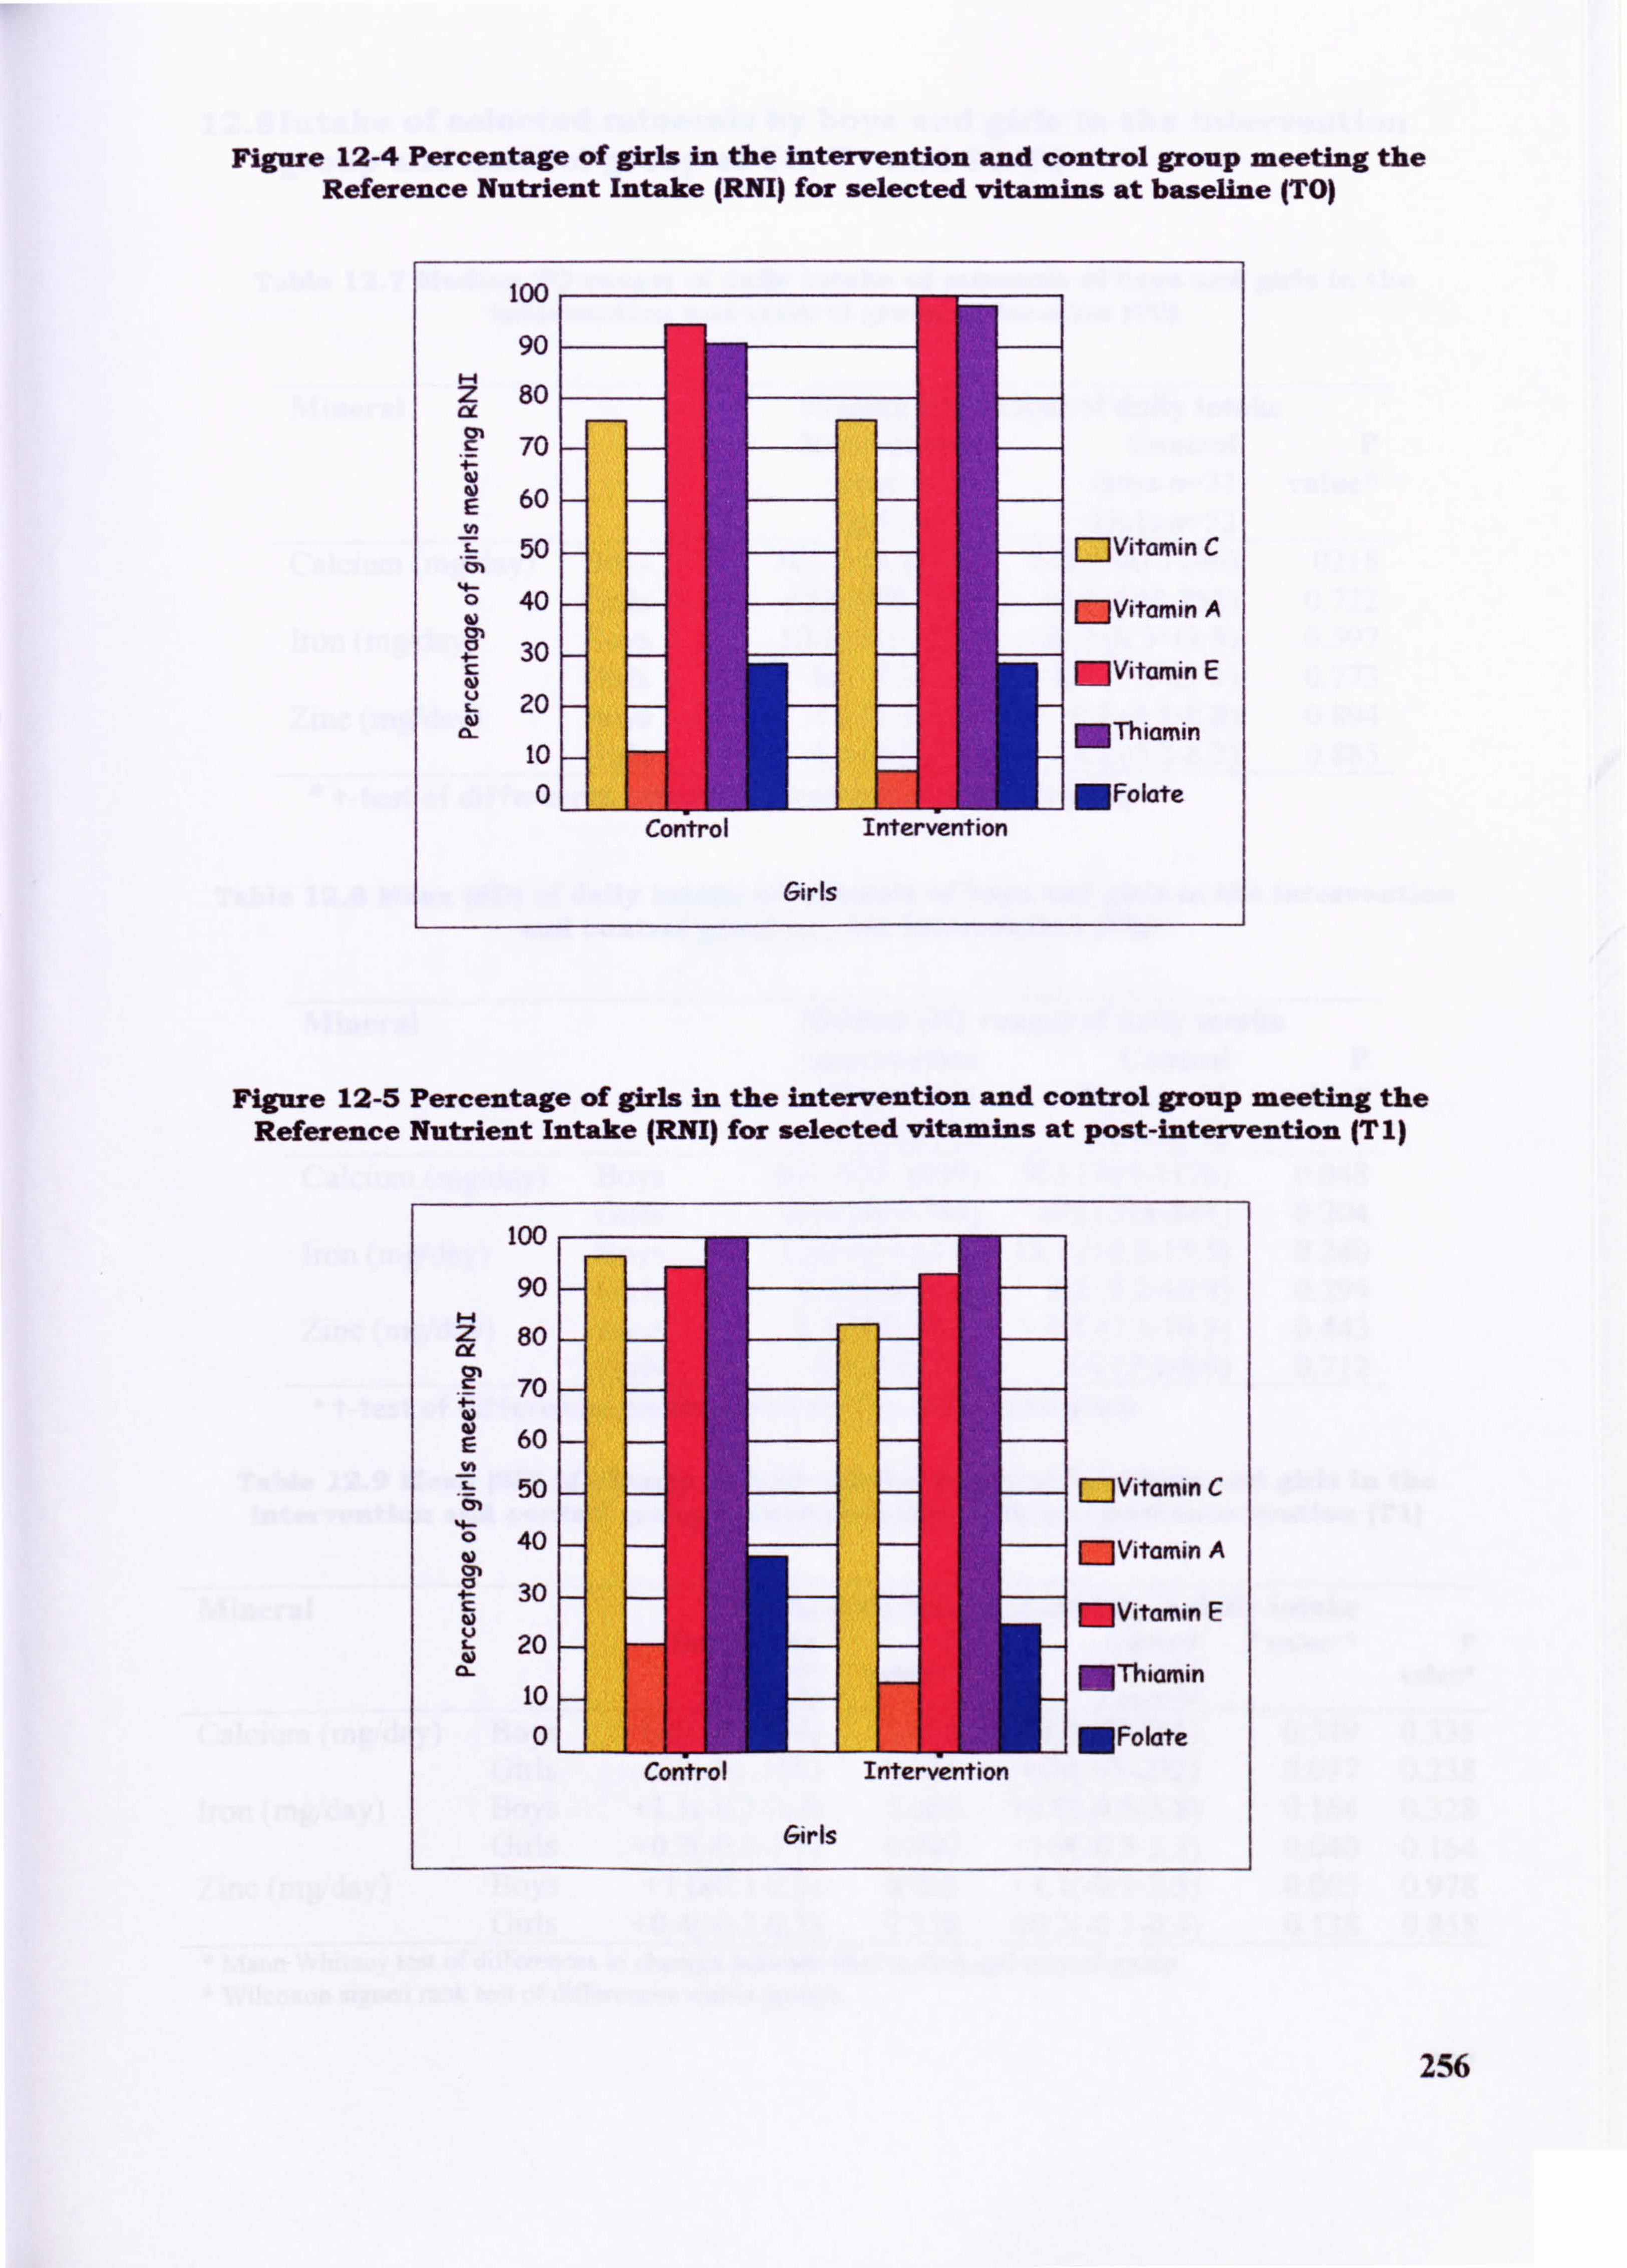
Figure 12-4 Percentage of girls in the intervention and control group meeting the Reference Nutrient Intake (RNI) for selected vitamins at baseline (TO)
100
90 z 80
70 -
60 - E
50 r--JVitamin C 0 40
-
w - MVitamin A
30 - MVitamin E 20
MThiamin 10 0 MFolate
Control Intervention
Girls
Figure 12-5 Percentage of girls in the intervention and control group meeting the Reference Nutrient Intake (RNI) for selected vitamins at post-intervention IT 1)
100
90 - z 80 - ix
70 -
60 - 50 - r-1vitamin C
0
CIO 40 - - MVitamin A
30 - - MVitamin E 20 - -
a- MThiamin 10
OLI III I MFolate Contro! Intervention
Girls
256
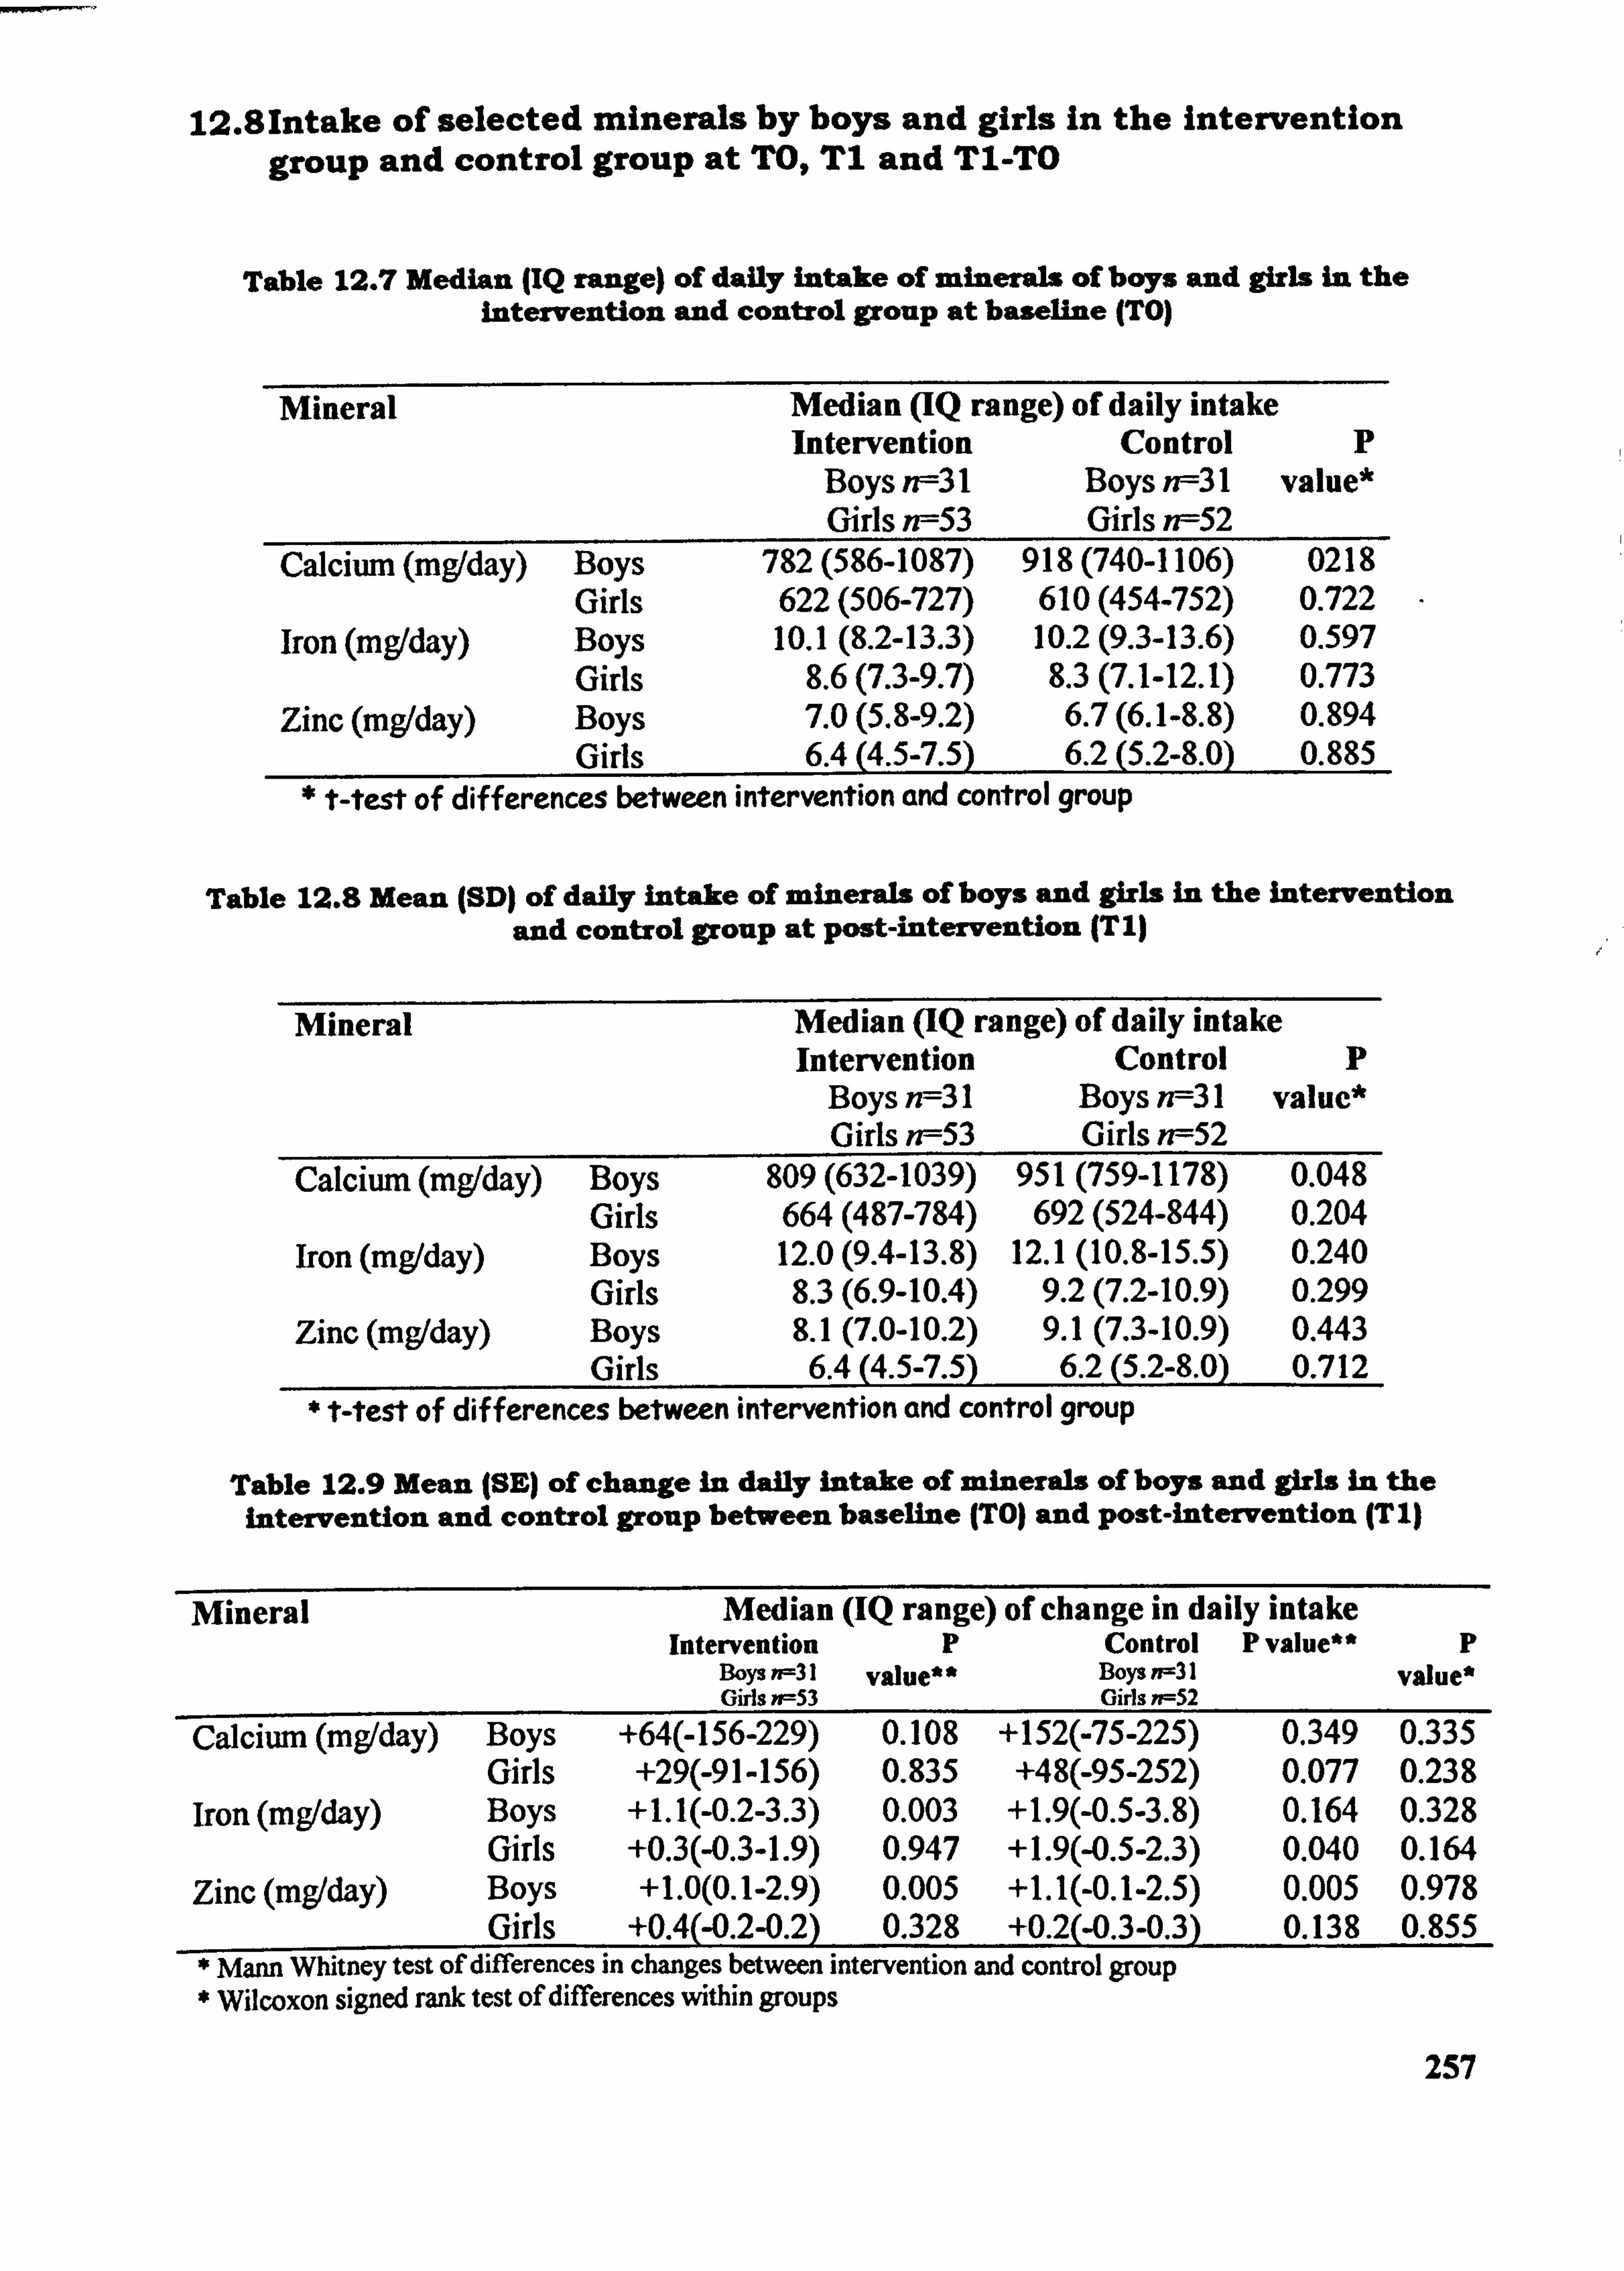
12.81ntake of selected minerals by boys and girls in the intervention group and control group at TO,, T1 and T1-TO
Table 12.7 Median (IQ range) of daily intake of minerals of boys and girls in the intervention and control group at baseline (TO)
Mineral Median (IQ range) of daily intake Intervention Control p
Boys rff3l Boys n--31 value* Girls n--53 Girls rff52
Calcium (mg/day) Boys 782 (586-1087) 918 (740-1106) 0218 Girls 622 (506-727) 610 (454-752) 0.722
Iron (mg/day) Boys 10.1 (8.2-13.3) 10.2 (9.3-13.6) 0.597 Girls 8.6 (7.3-9.7) 8.3 (7.1-12.1) 0.773
Zinc (mg/day) Boys 7.0 (5.8-9.2) 6.7 (6.1-8.8) 0.894 Girls 6.4 (4.5-7.5) 6.2 (5.2-8.0) 0.885
* Mest of differences between intervention and control group
Table 12.8 Mean (SD) of daily intake of minerals of boys and girls In the intervention and control group at post-intervention (T I)
Mineral Median (IQ range) of daily intake Intervention Control p
Boys n--31 Boys n--31 value* Girls n--53 Girls n--52
Calcium (mgtday) Boys 809 (632-1039) 951 (759-1178) 0.048 Girls 664 (487-784) 692 (524-844) 0.204
Iron (mg/day) Boys 12.0 (9.4-13.8) 12.1 (10.8-15.5) 0.240 Girls 8.3 (6.9-10.4) 9.2 (7.2-10.9) 0.299
Zinc (mg1day) Boys 8.1 (7.0-10.2) 9.1 (7.3-10.9) 0.443 Girls 6.4 (4.5-7.5) 6.2 (5.2-8.0) 0.712
* Mest of differences between intervention and control group
Table 12.9 Mean (SE) of change in daily Intake of minerals of boys and girls In the intervention and control group between baseline (TO) and post-intervention (T 1)
Mineral Median (IQ range) of change in daily intake Intervention p Control P value" p
Boys n=31 value** Boys n=31 value* Gids n-53 Oirls n--52 Calcium (mg/day) Boys +64(-156-229) 0.108 +152(-75-225) 0.349 0.335
Girls +29(-91-156) 0.835 +48(-95-252) 0.077 0.238 iron (mg/day) Boys +1.1(-0.2-3.3) 0.003 +1.9(-0.5-3.8) 0.164 0.328
Girls +0.3(-0.3-1.9) 0.947 +1.9(-0.5-2.3) 0.040 0.164 Zinc (mg/day) Boys +1.0(0.1-2.9) 0.005 +1.1(-0.1-2.5) 0.005 0.978
Girls +0.4(-0.2-0.2) 0.328 +0.2(-0.3-0.3) 0.138 0.855 Mann Whitney test of differences in changes between intervention and control group Wilcoxon signed rank test of differences within groups
257
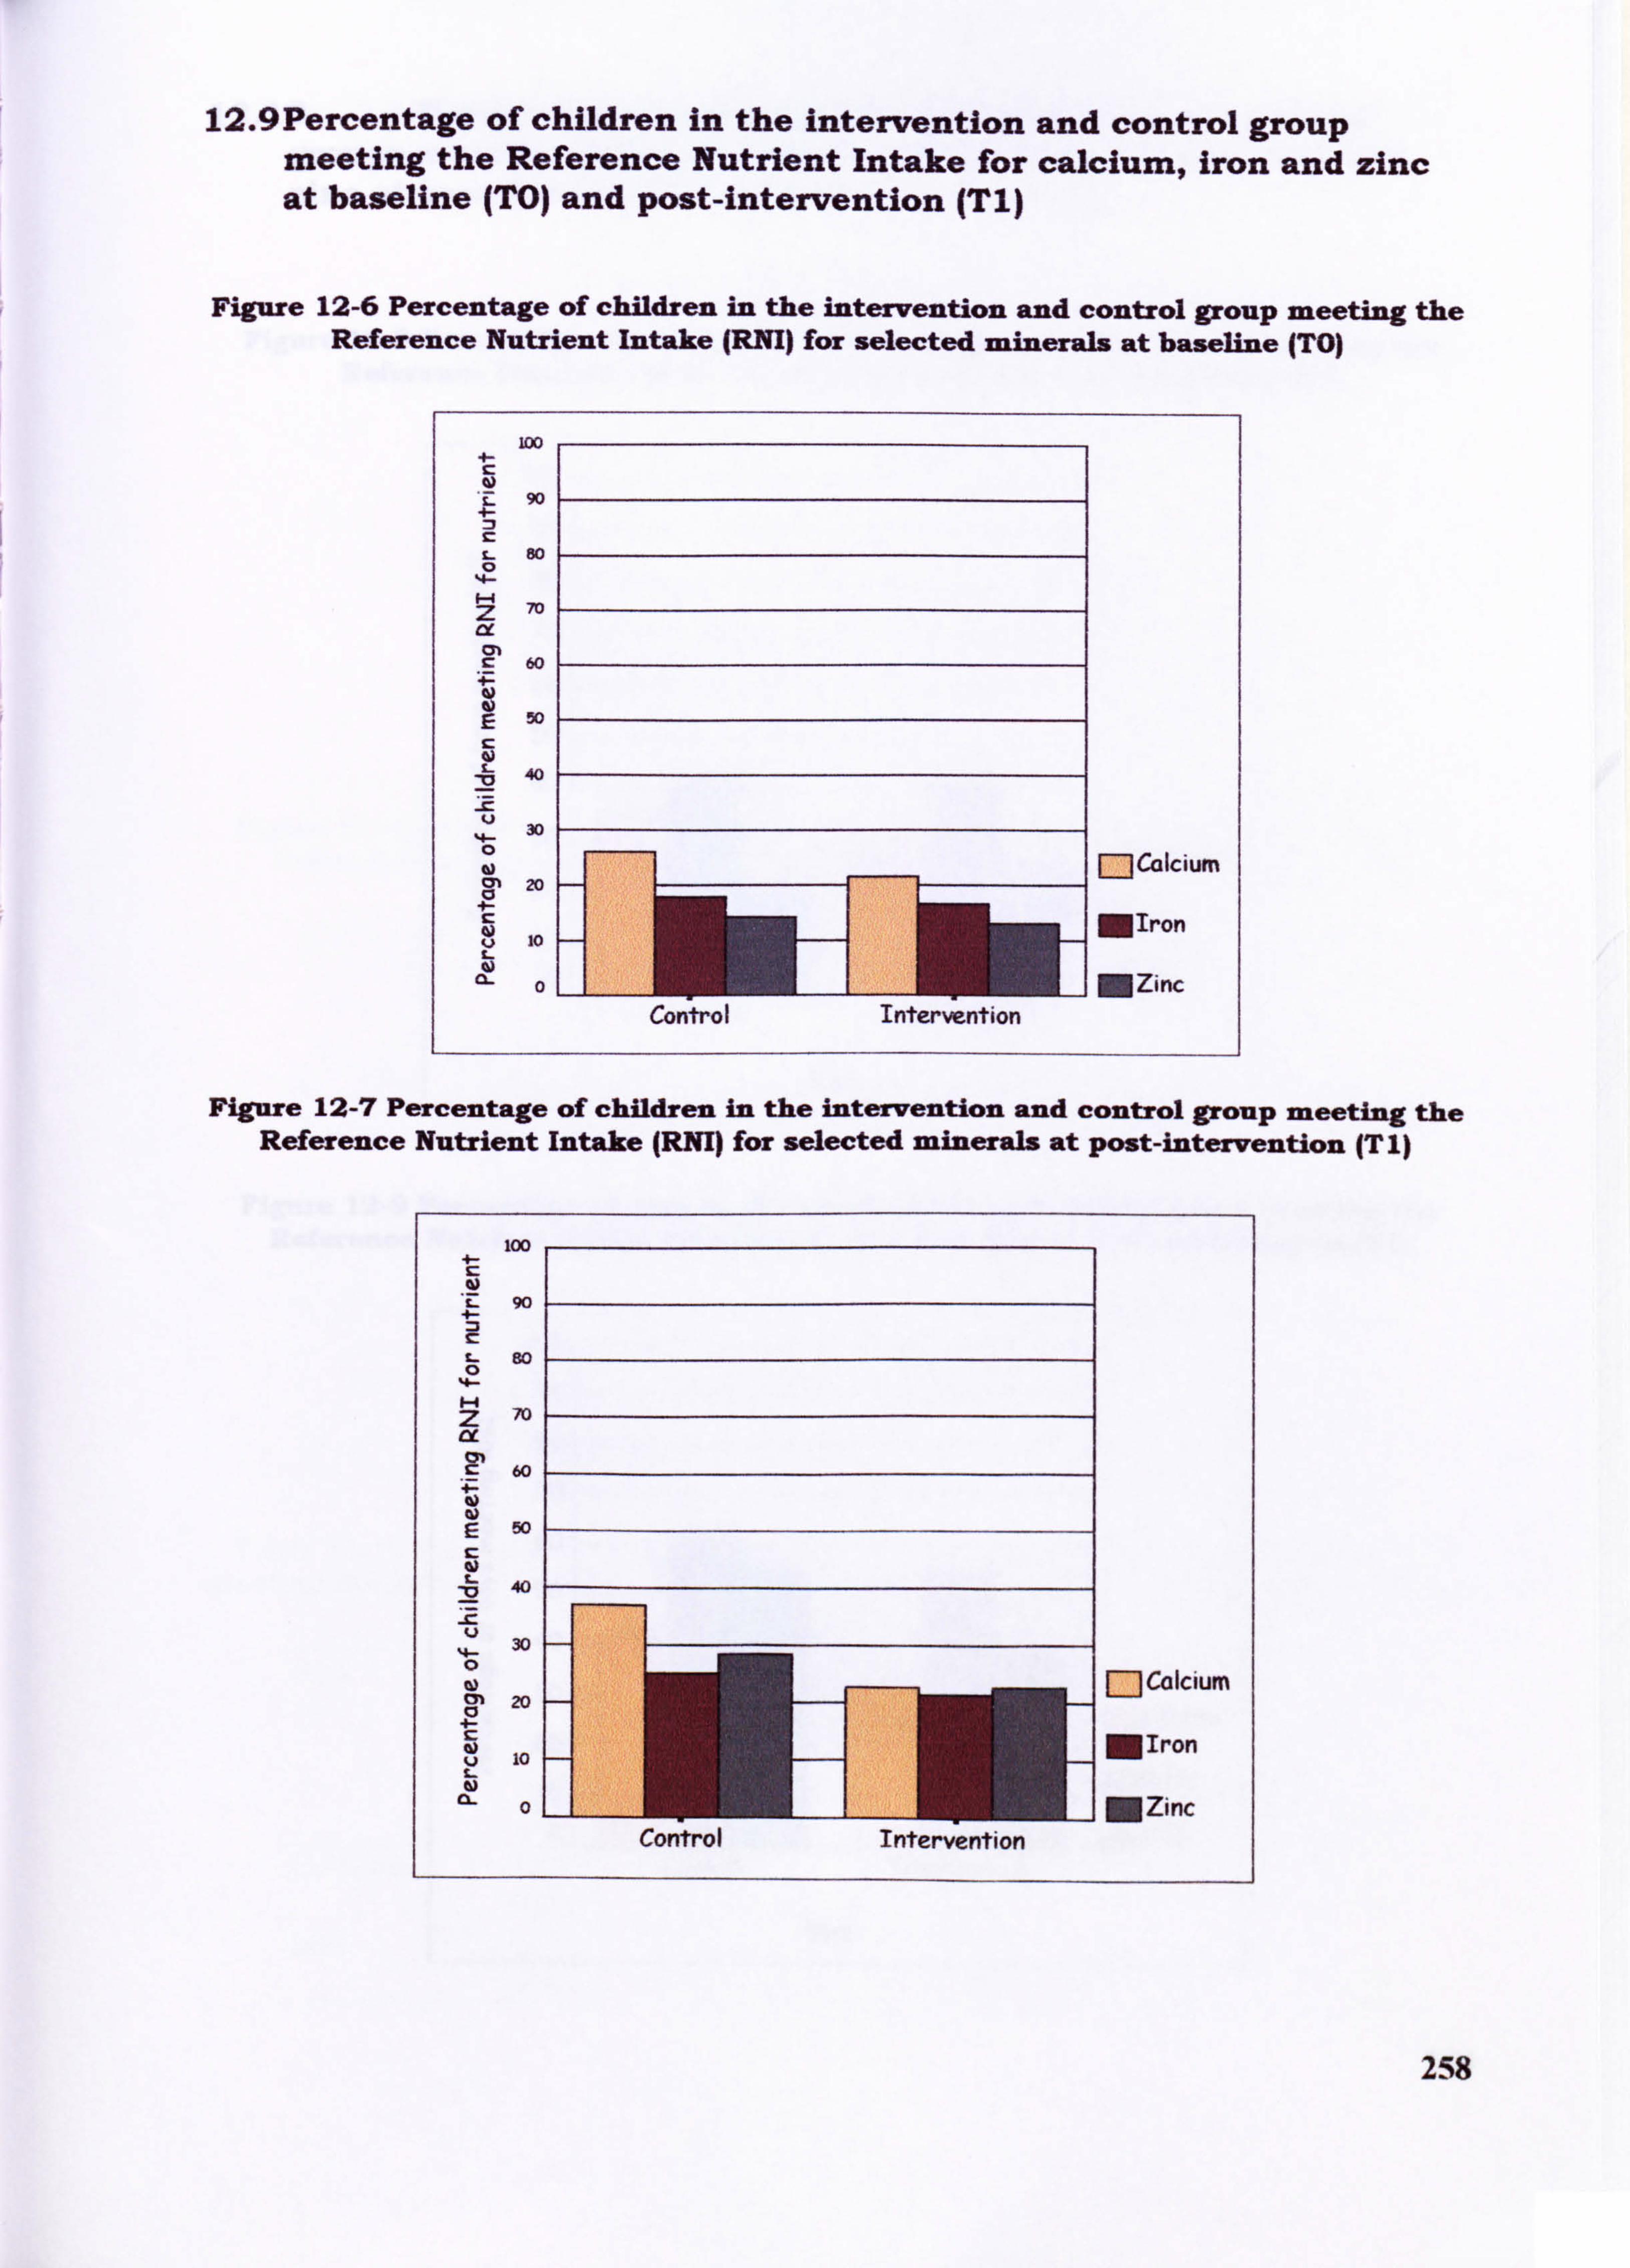
12.9Percentage of children in the intervention and control group meeting the Reference Nutrient Intake for calcium, iron and zinc at baseline (TO) and post-intervention (T1)
Figure 12-6 Percentage of children in the intervention and control group meeting the Reference Nutrient Intake (RNI) for selected minerals at baseline (TO)
90
80
70 me 01
60
50
40 -Z,
30
CM 20
10
0
Control Intervention
FlCalcium
MIron
MZinc
Figure 12-7 Percentage of children in the intervention and control group meeting the Reference Nutrient Intake (RNI) for selected minerals at post-intervention (TI)
258
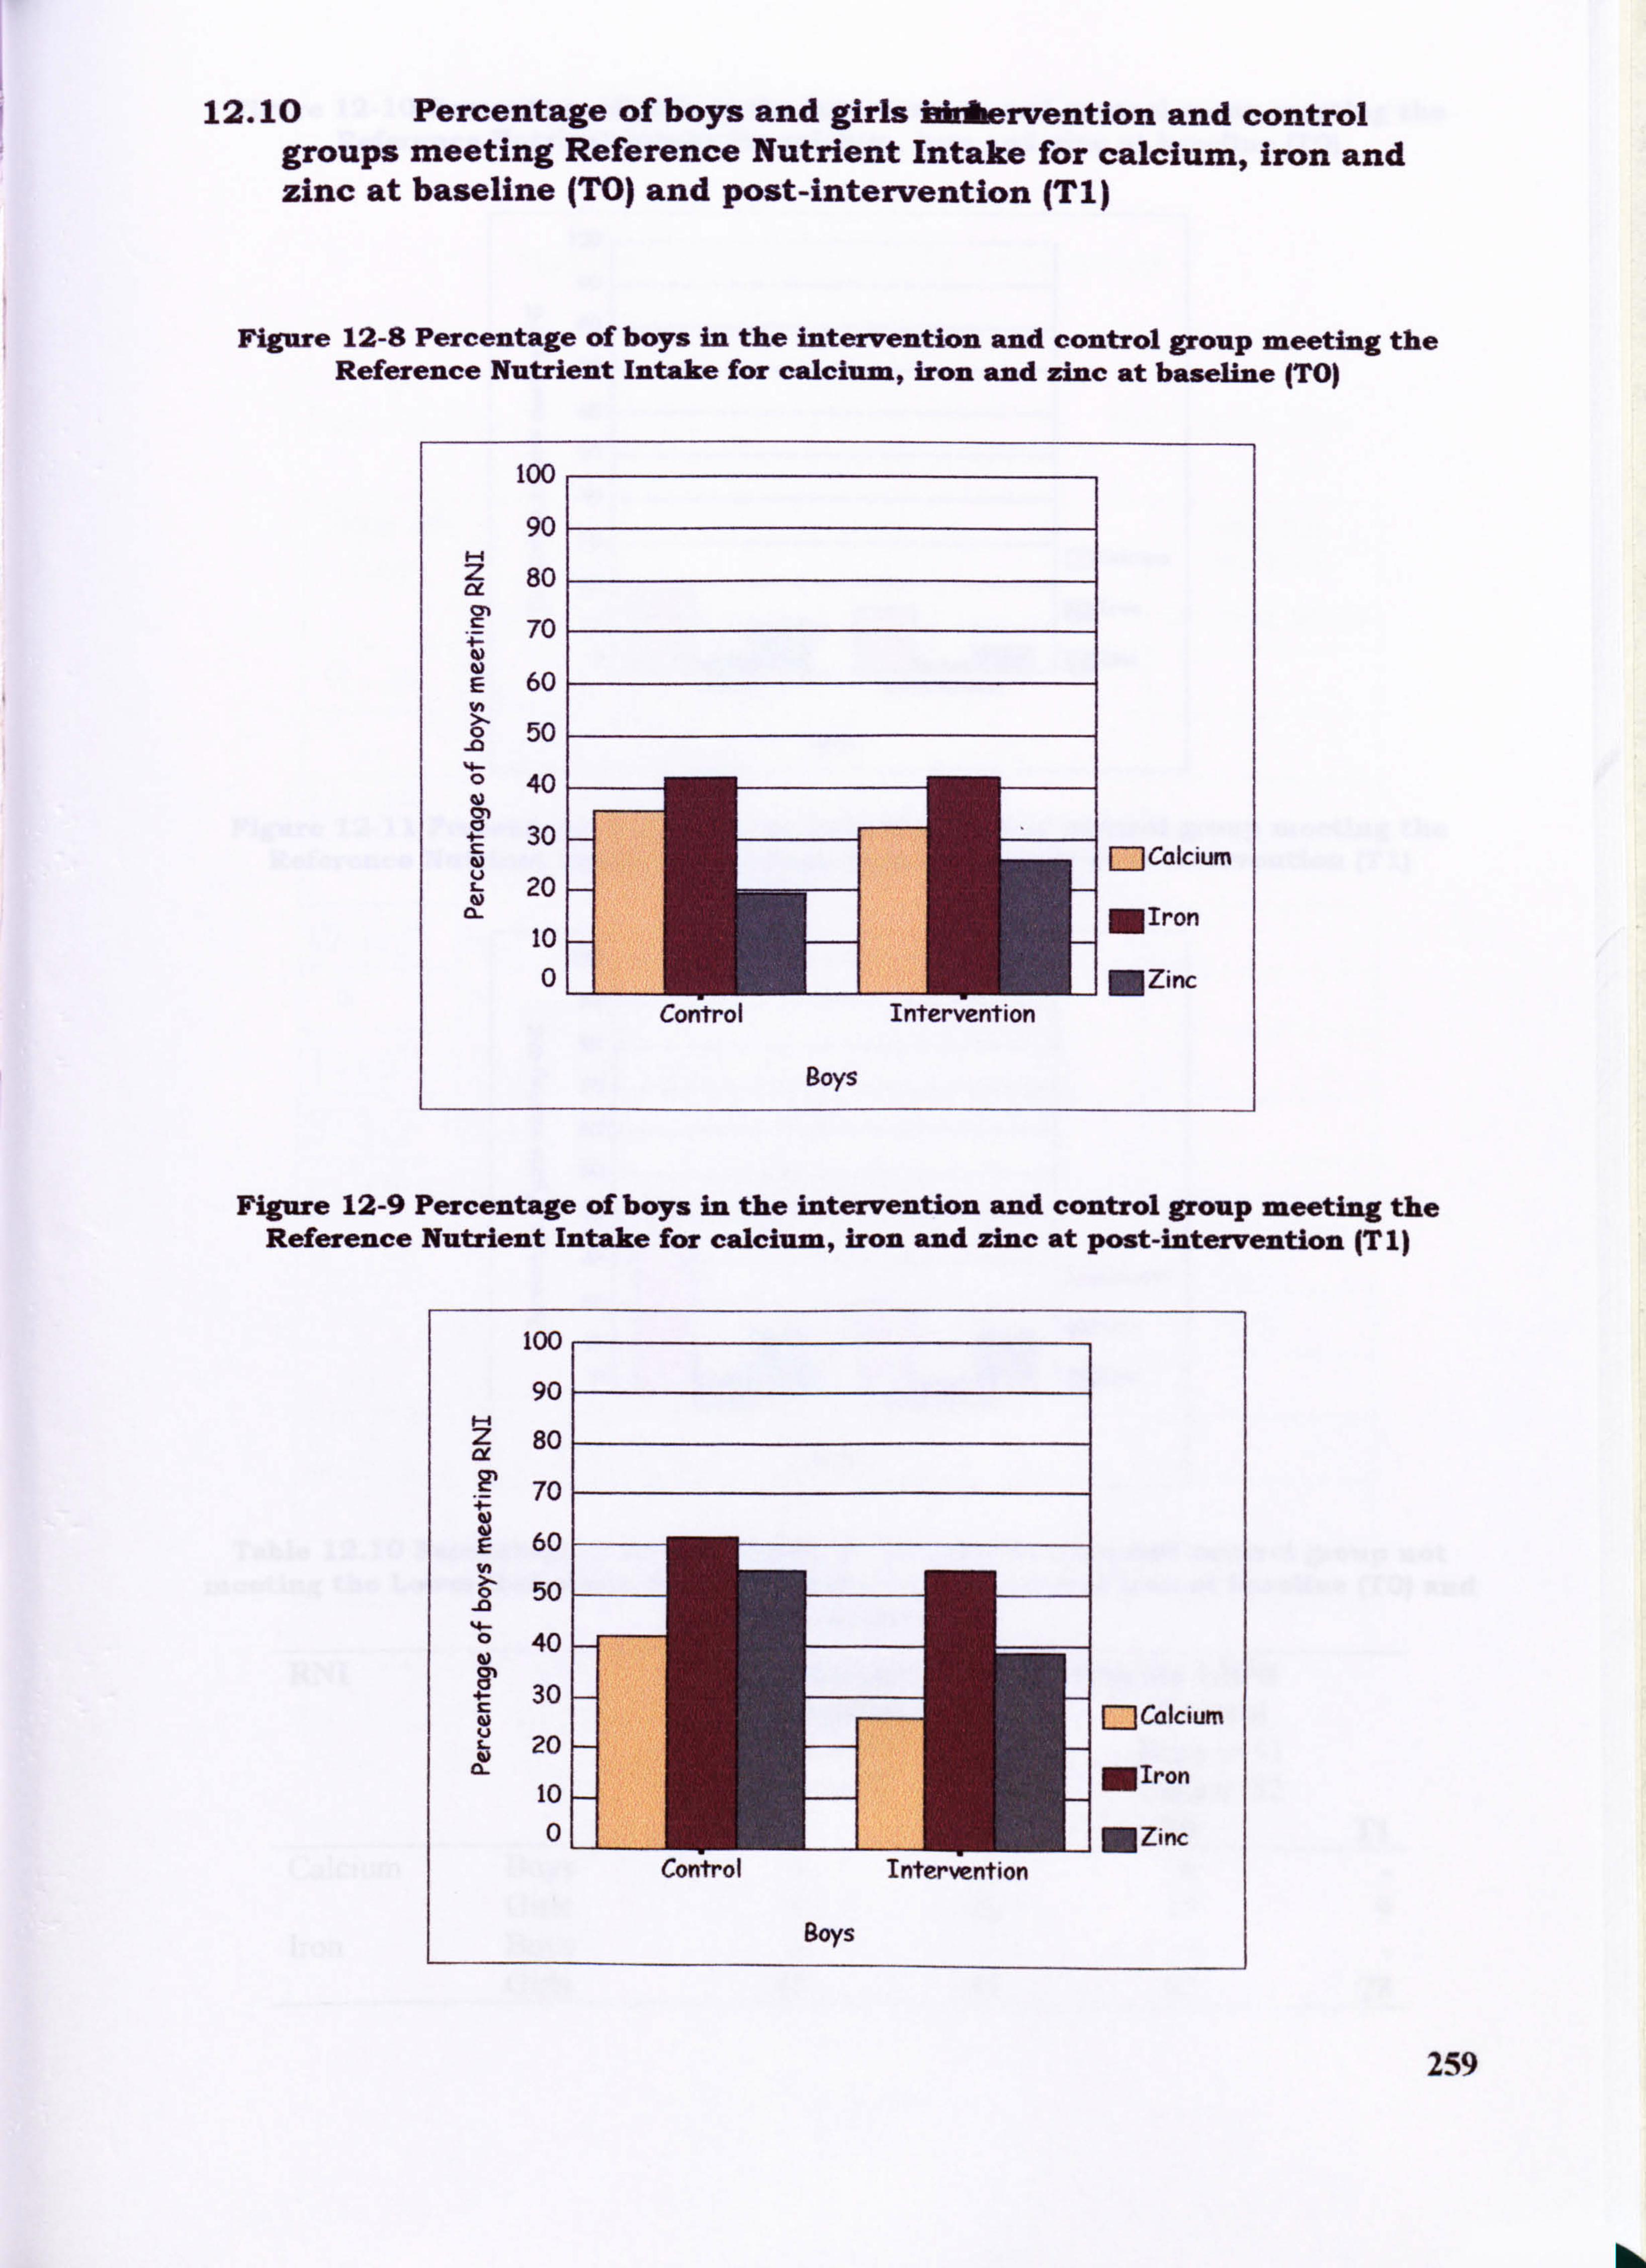
12.10 Percentage of boys and girls bkAheervention and control groups meeting Reference Nutrient Intake for calcium, iron and zinc at baseline (TO) and post-intervention (T1)
Figure 12-8 Percentage of boys in the intervention and control group meeting the Reference Nutrient Intake for calcium, iron and zinc at baseline (TO)
too
90
Z 80 z y M S 70
60 E
0 50 -0 4. - 40
30 - [--Jcalcium 20 -
MIron 10 - 01
1 MZinc Control Intervention
Boys
Figure 12-9 Percentage of boys in the intervention and control group meeting the Reference Nutrient Intake for calcium, Iron and zinc at post-intervention (T 1)
100
90
80
70
60
50 -0
40
30 - [:: ]Calcium 20 - 10- MIron
0-- NZinc: Control Intervention
Boys
259
hkk.
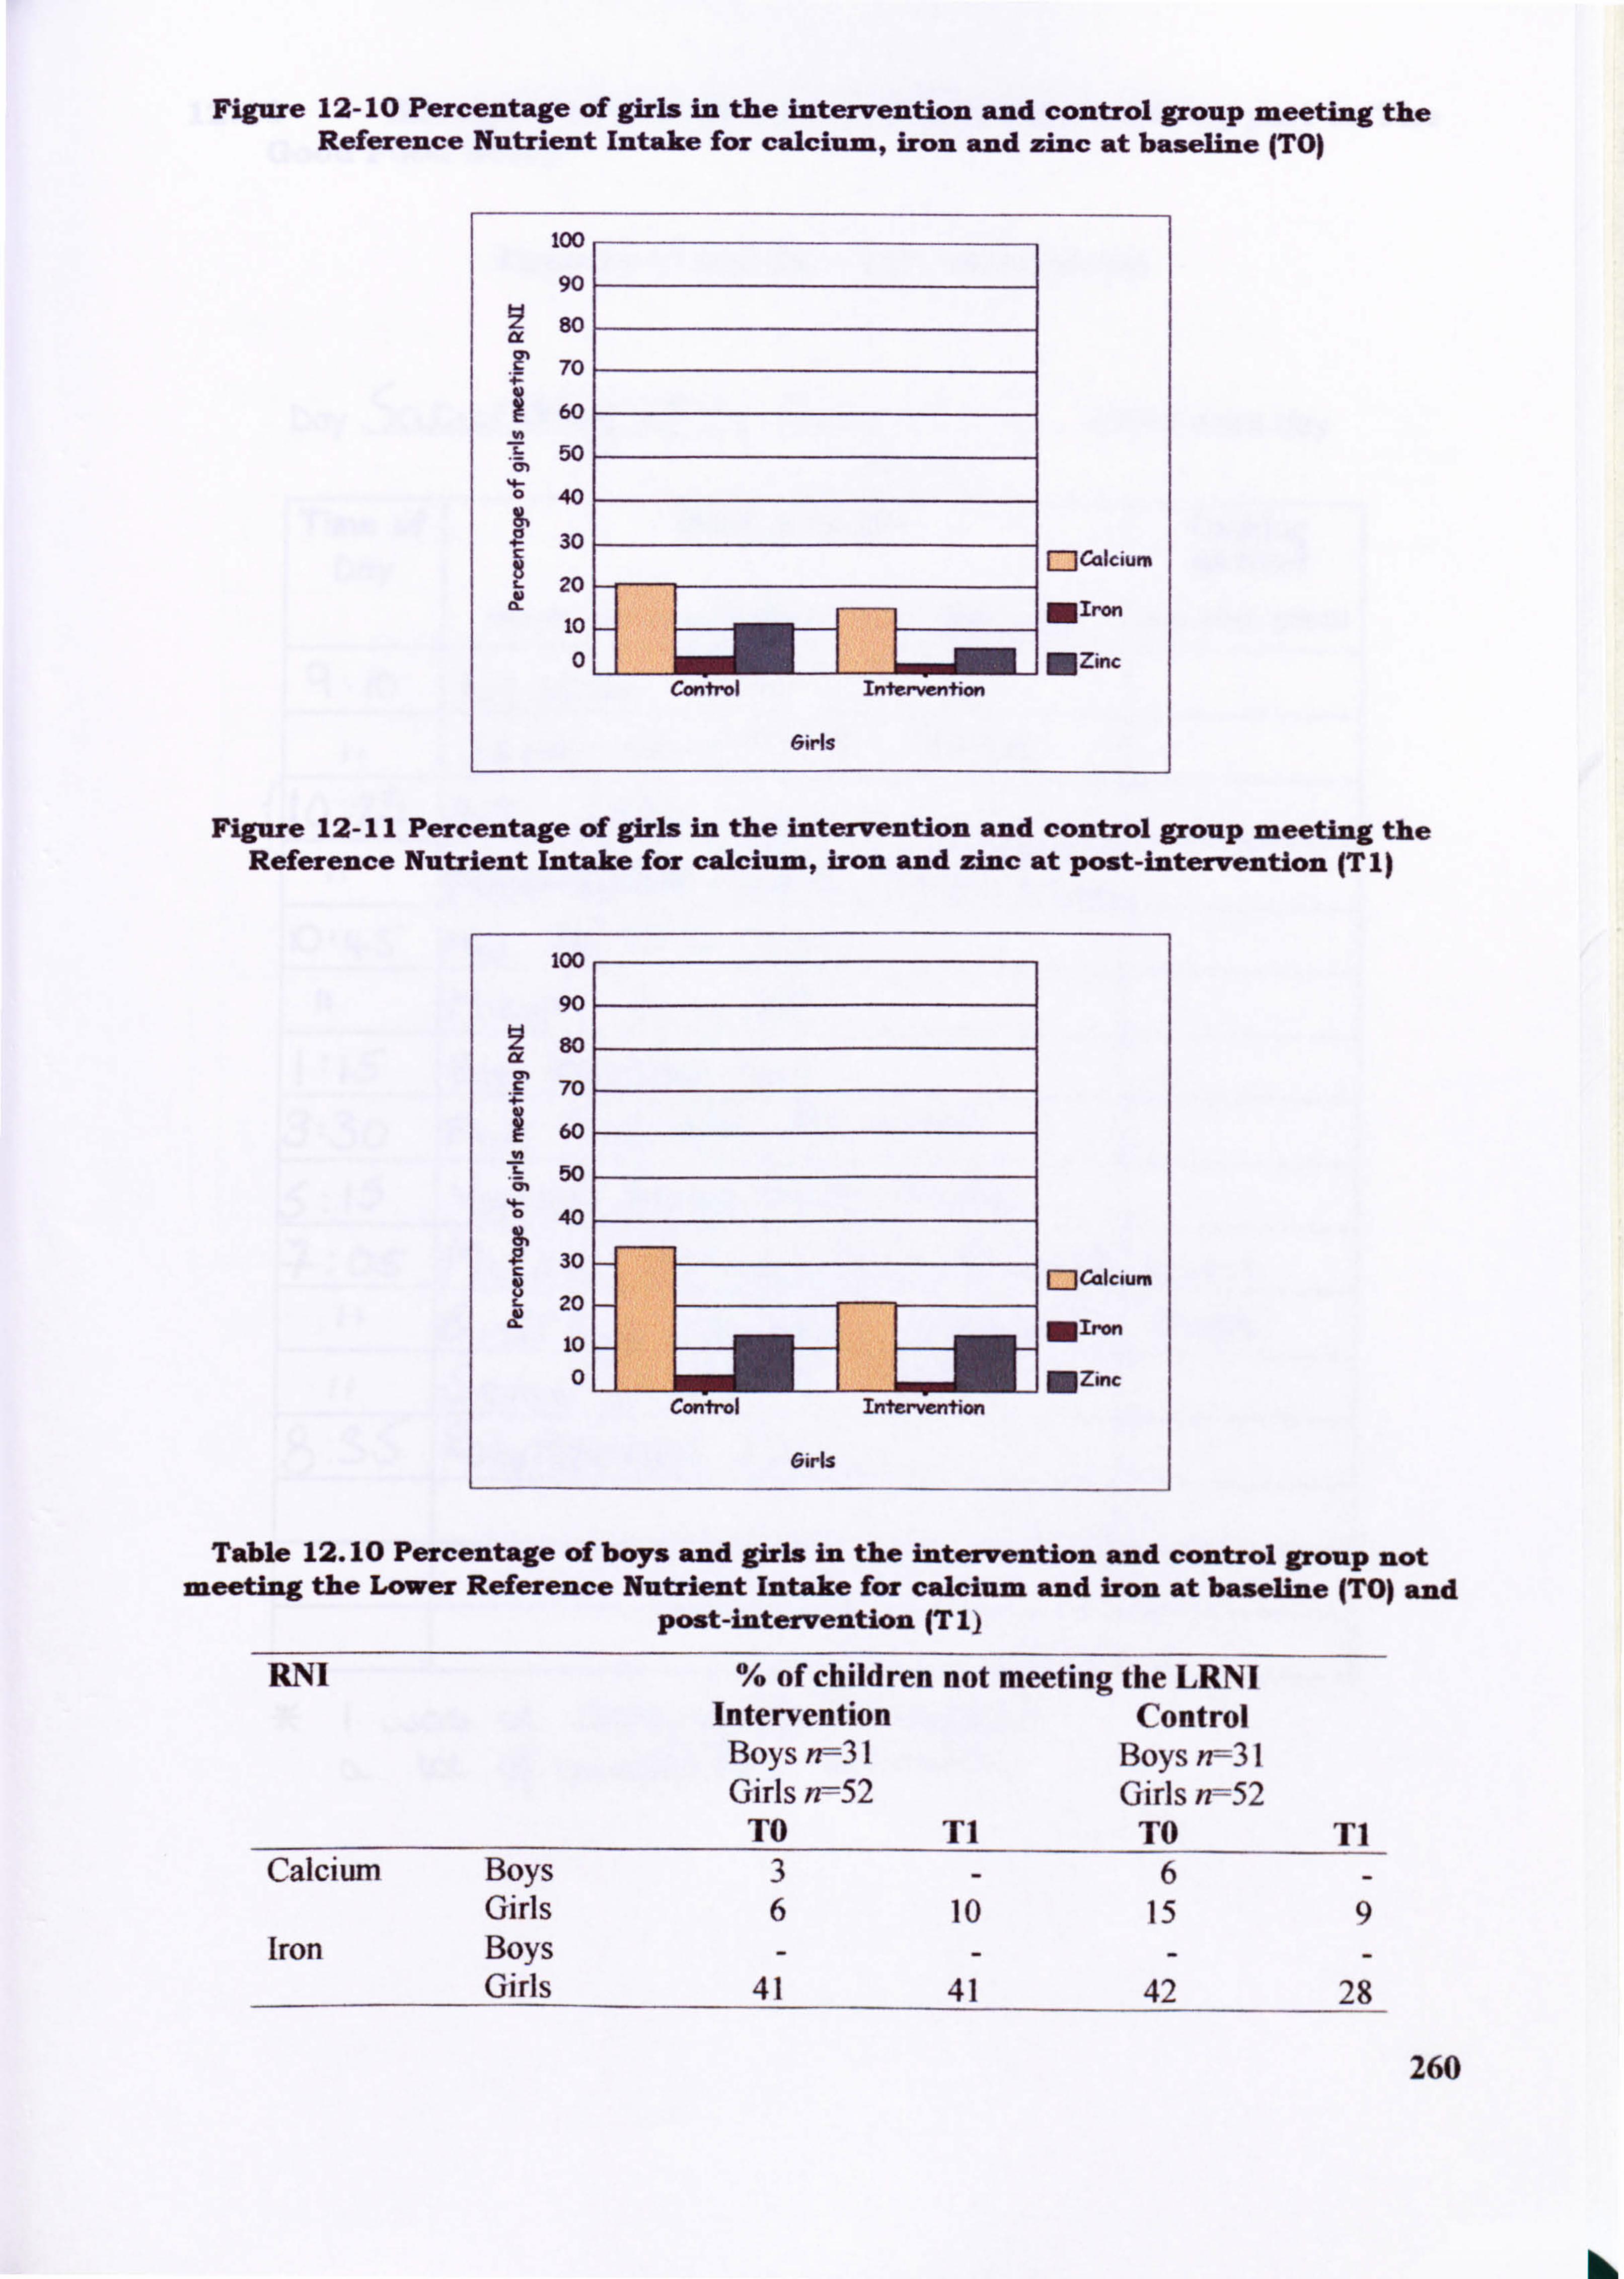
Figure 12- 10 Percentage of girls in the intervention and control group meeting the Reference Nutrient Intake for calcium, iron and zinc at baseline (TO)
100
90
so
70
60
50
40
30
c- 20
10
Control Intervention
6irls
mcalcium
MIron
MZinc
Figure 12-11 Percentage of girls in the intervention and control group meeting the Reference Nutrient Intake for calcium, iron and zinc at post-intervention (T1)
Table 12.10 Percentage of boys and girls in the Intervention and control group not meeting the Lower Reference Nutrient Intake for calcium and iron at baseline (TO) and
post-intervention (T I)
RNI % of children not meeting the LRNI Intervention Control Boys n--31 Boys n=31 Girls n=52 Girls n=52
TO TI TO T1 Calcium Boys 3-6-
Girls 6 10 15 9 Iron Boys ----
Girls 41 41 42 28
260
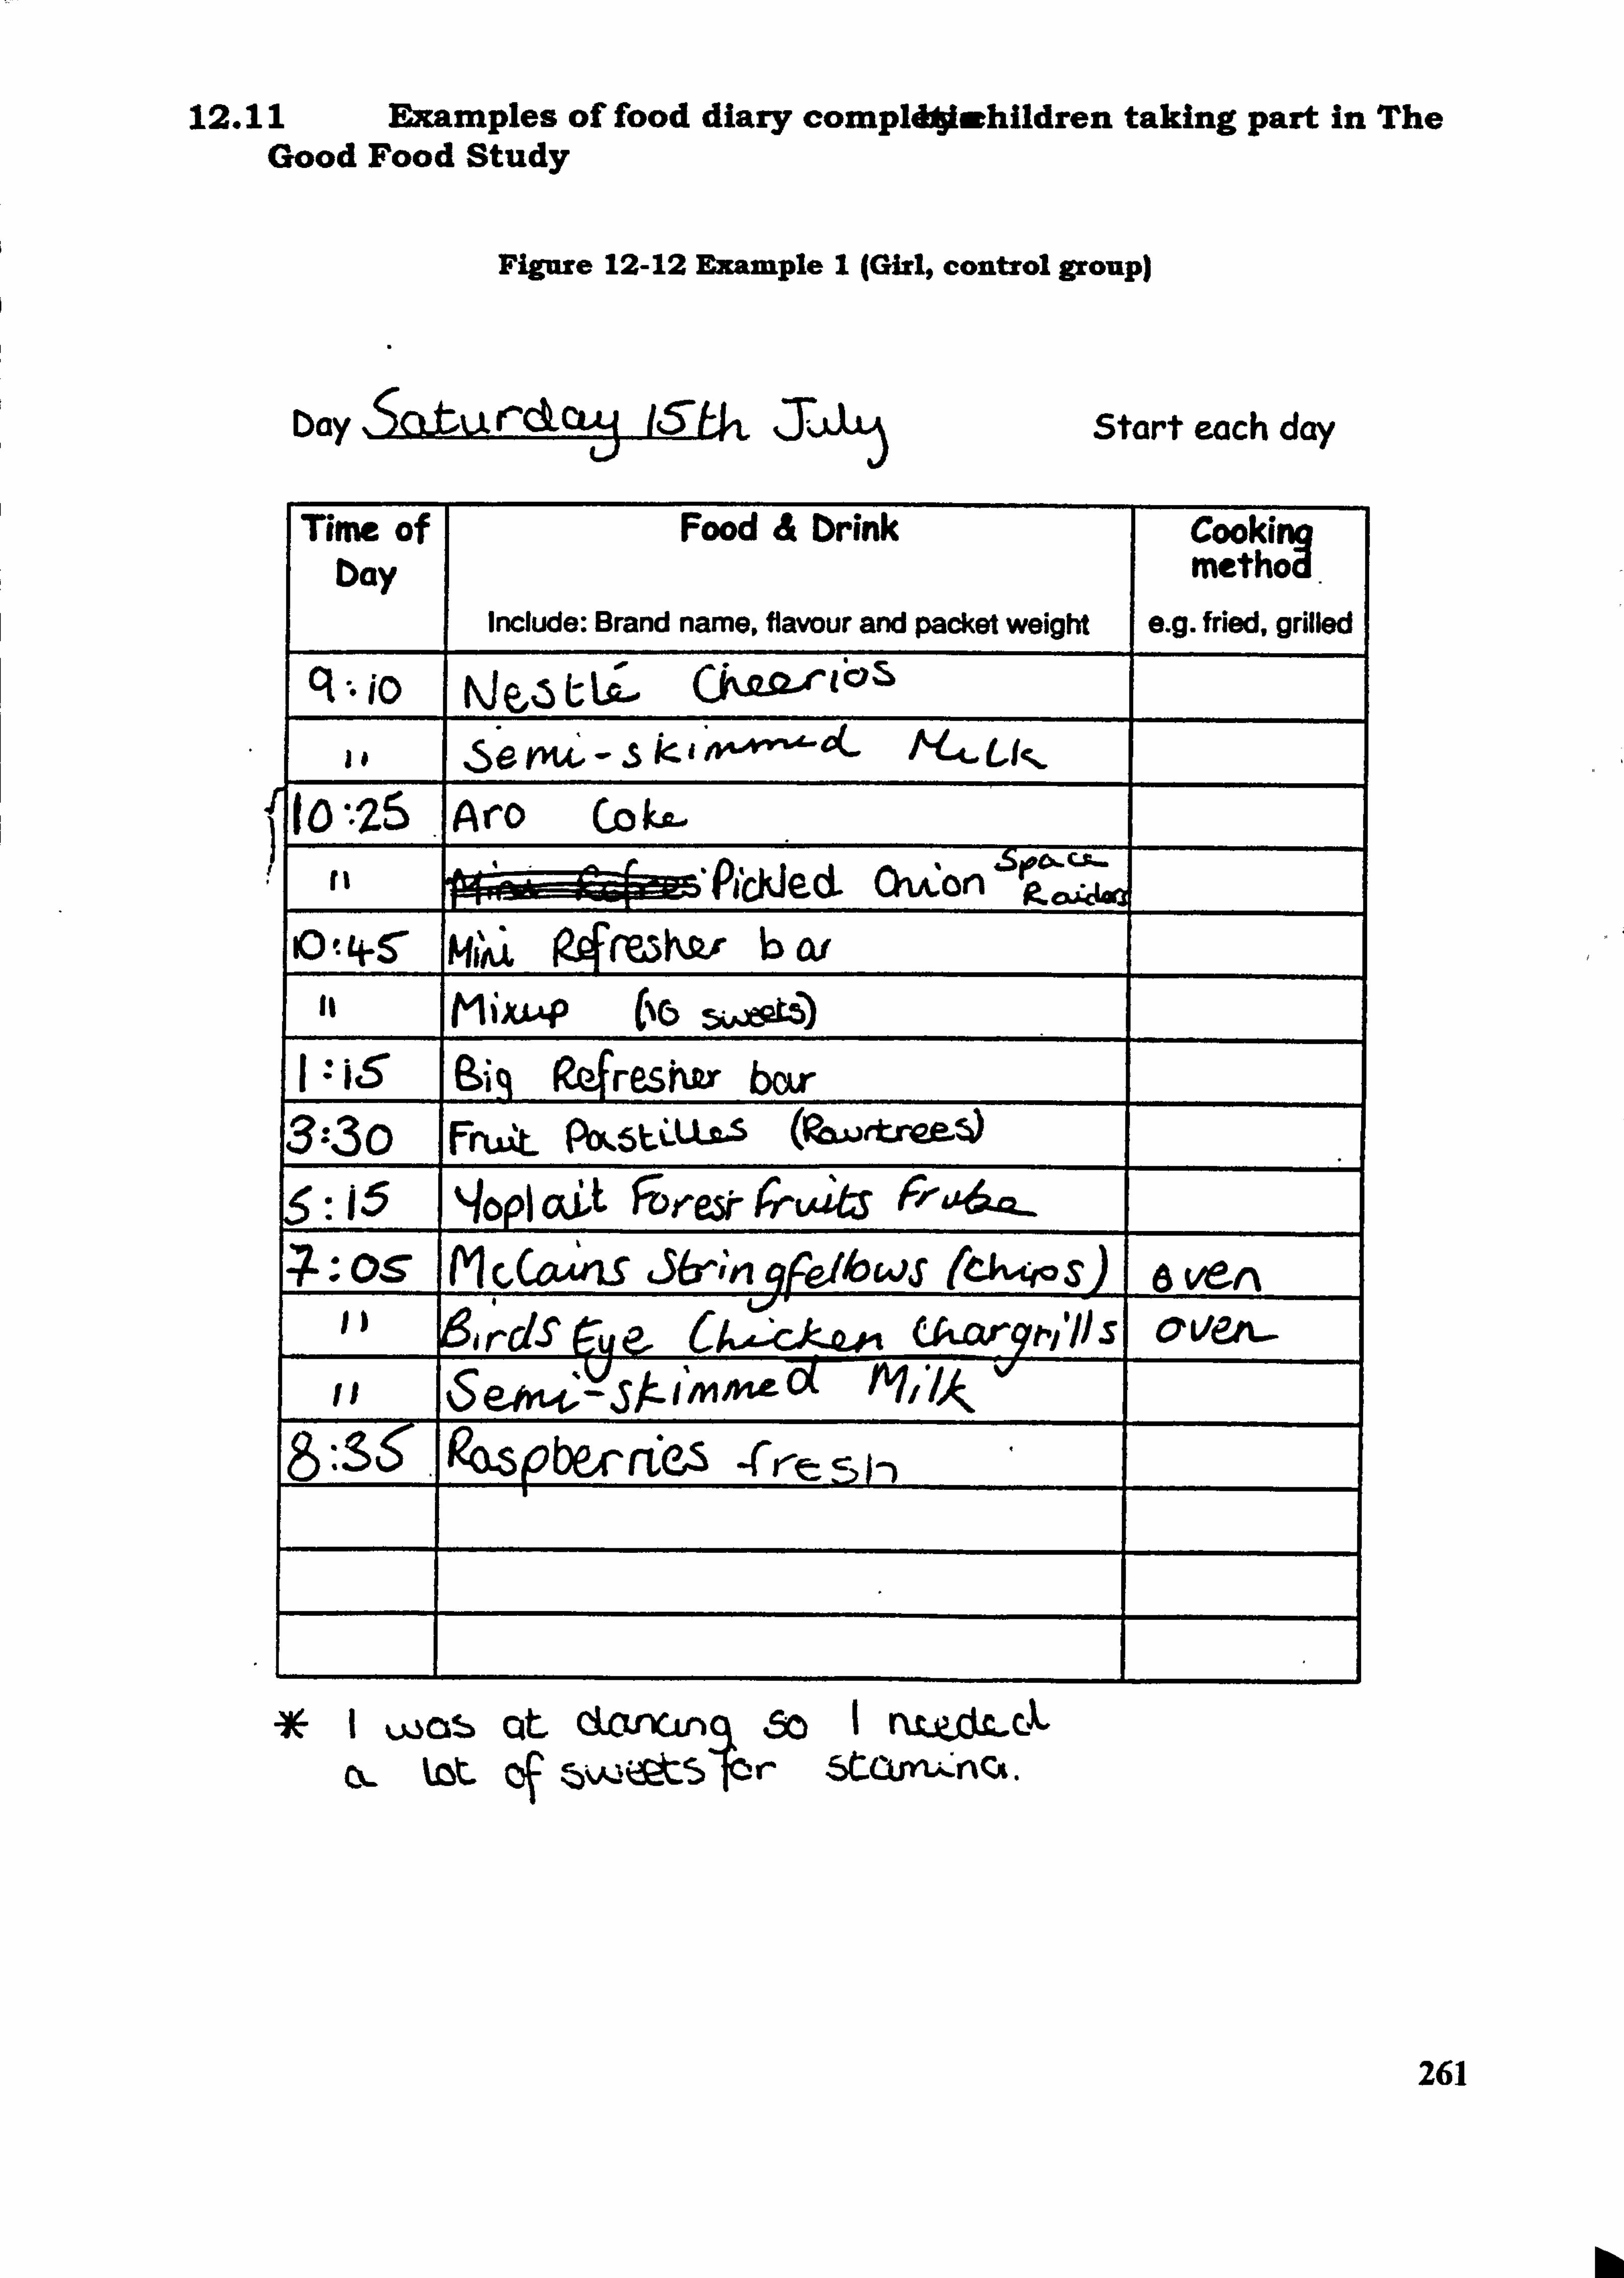
12.11 Examples of food diary compIdAjiwhildren taking part in The Good Food Study
Figure 12-12 Example I (Girl, control group)
D. Y, ýaturckcw 16-U, J; -ý L'I Start each day
Time of bay
Food & Drink
Include: Brand name, flavour and packet weight
Cookim metýA.
e. g. fried, grilled C1 io týe"5L-La'...
Se PU, -. 5
U*25 jAirO CO ka.
fI
I
VFýýýýPjCkjecL OiA: on 'Seco's-r- P- a i, 4, @a
9) t 4-5 W b0i MIAI 94ML
It MiXL* (No
I : is Sis R4reshkr bor 3--30 Fmat Pbf, 5LýLL2,5 5: 15 qopi aýt FDr-ek6-LAJItS FW-&A6tQ_
-7 - O-S Irl M
C, cový 36- , qr-eilo WS (6vw S) a Vert
6irdStue. Ukar9tv'IJS Ov&'. -
I Was Cit dcvxLf) 60 1 nl-p-dLc.,. QL kZt. Cf . 15VQ&t5ýr StCVYI;
-nCA.
261

Figure 12-13 Example 2 (Girl, control group)
Dq Start each day on a new sheet
Time of bay
Food & brink
Include: Brand name. flavour and packet weigfft
Cooki: g metho
e. g. fried, grilled
1k&1X4"' 11Mj41. Mv-VN -
I. -
'be mi- -eilLimrr--eý nnAV- --
16ieýai Tba5t, %JCA. L.. )b" 56U ligint
.
hup 4A51a I W- 11
A
OL&Me4 qnkA ge (POA to 6
Hene,; aeW MCA= j
'ýD-yn PC,
WhAr-me-A ( HOO-15) bread M'Vae--, r; ch ua, u-ý, Aaýý -
Hee=idena P-Nec'm -I
Arnount Eaten Bwght frorn
slice, tsp, bowl. home, shop oWiopn'of family meal
I
school -4
I lThrr'i% I.
I,
'I
I--I
II
m et. A L
lbl. e- 7
rA -A
0
czsto LCrSOCGÖ. e (czt) 1-I c, %%*. e-e-
8% a bt)
262
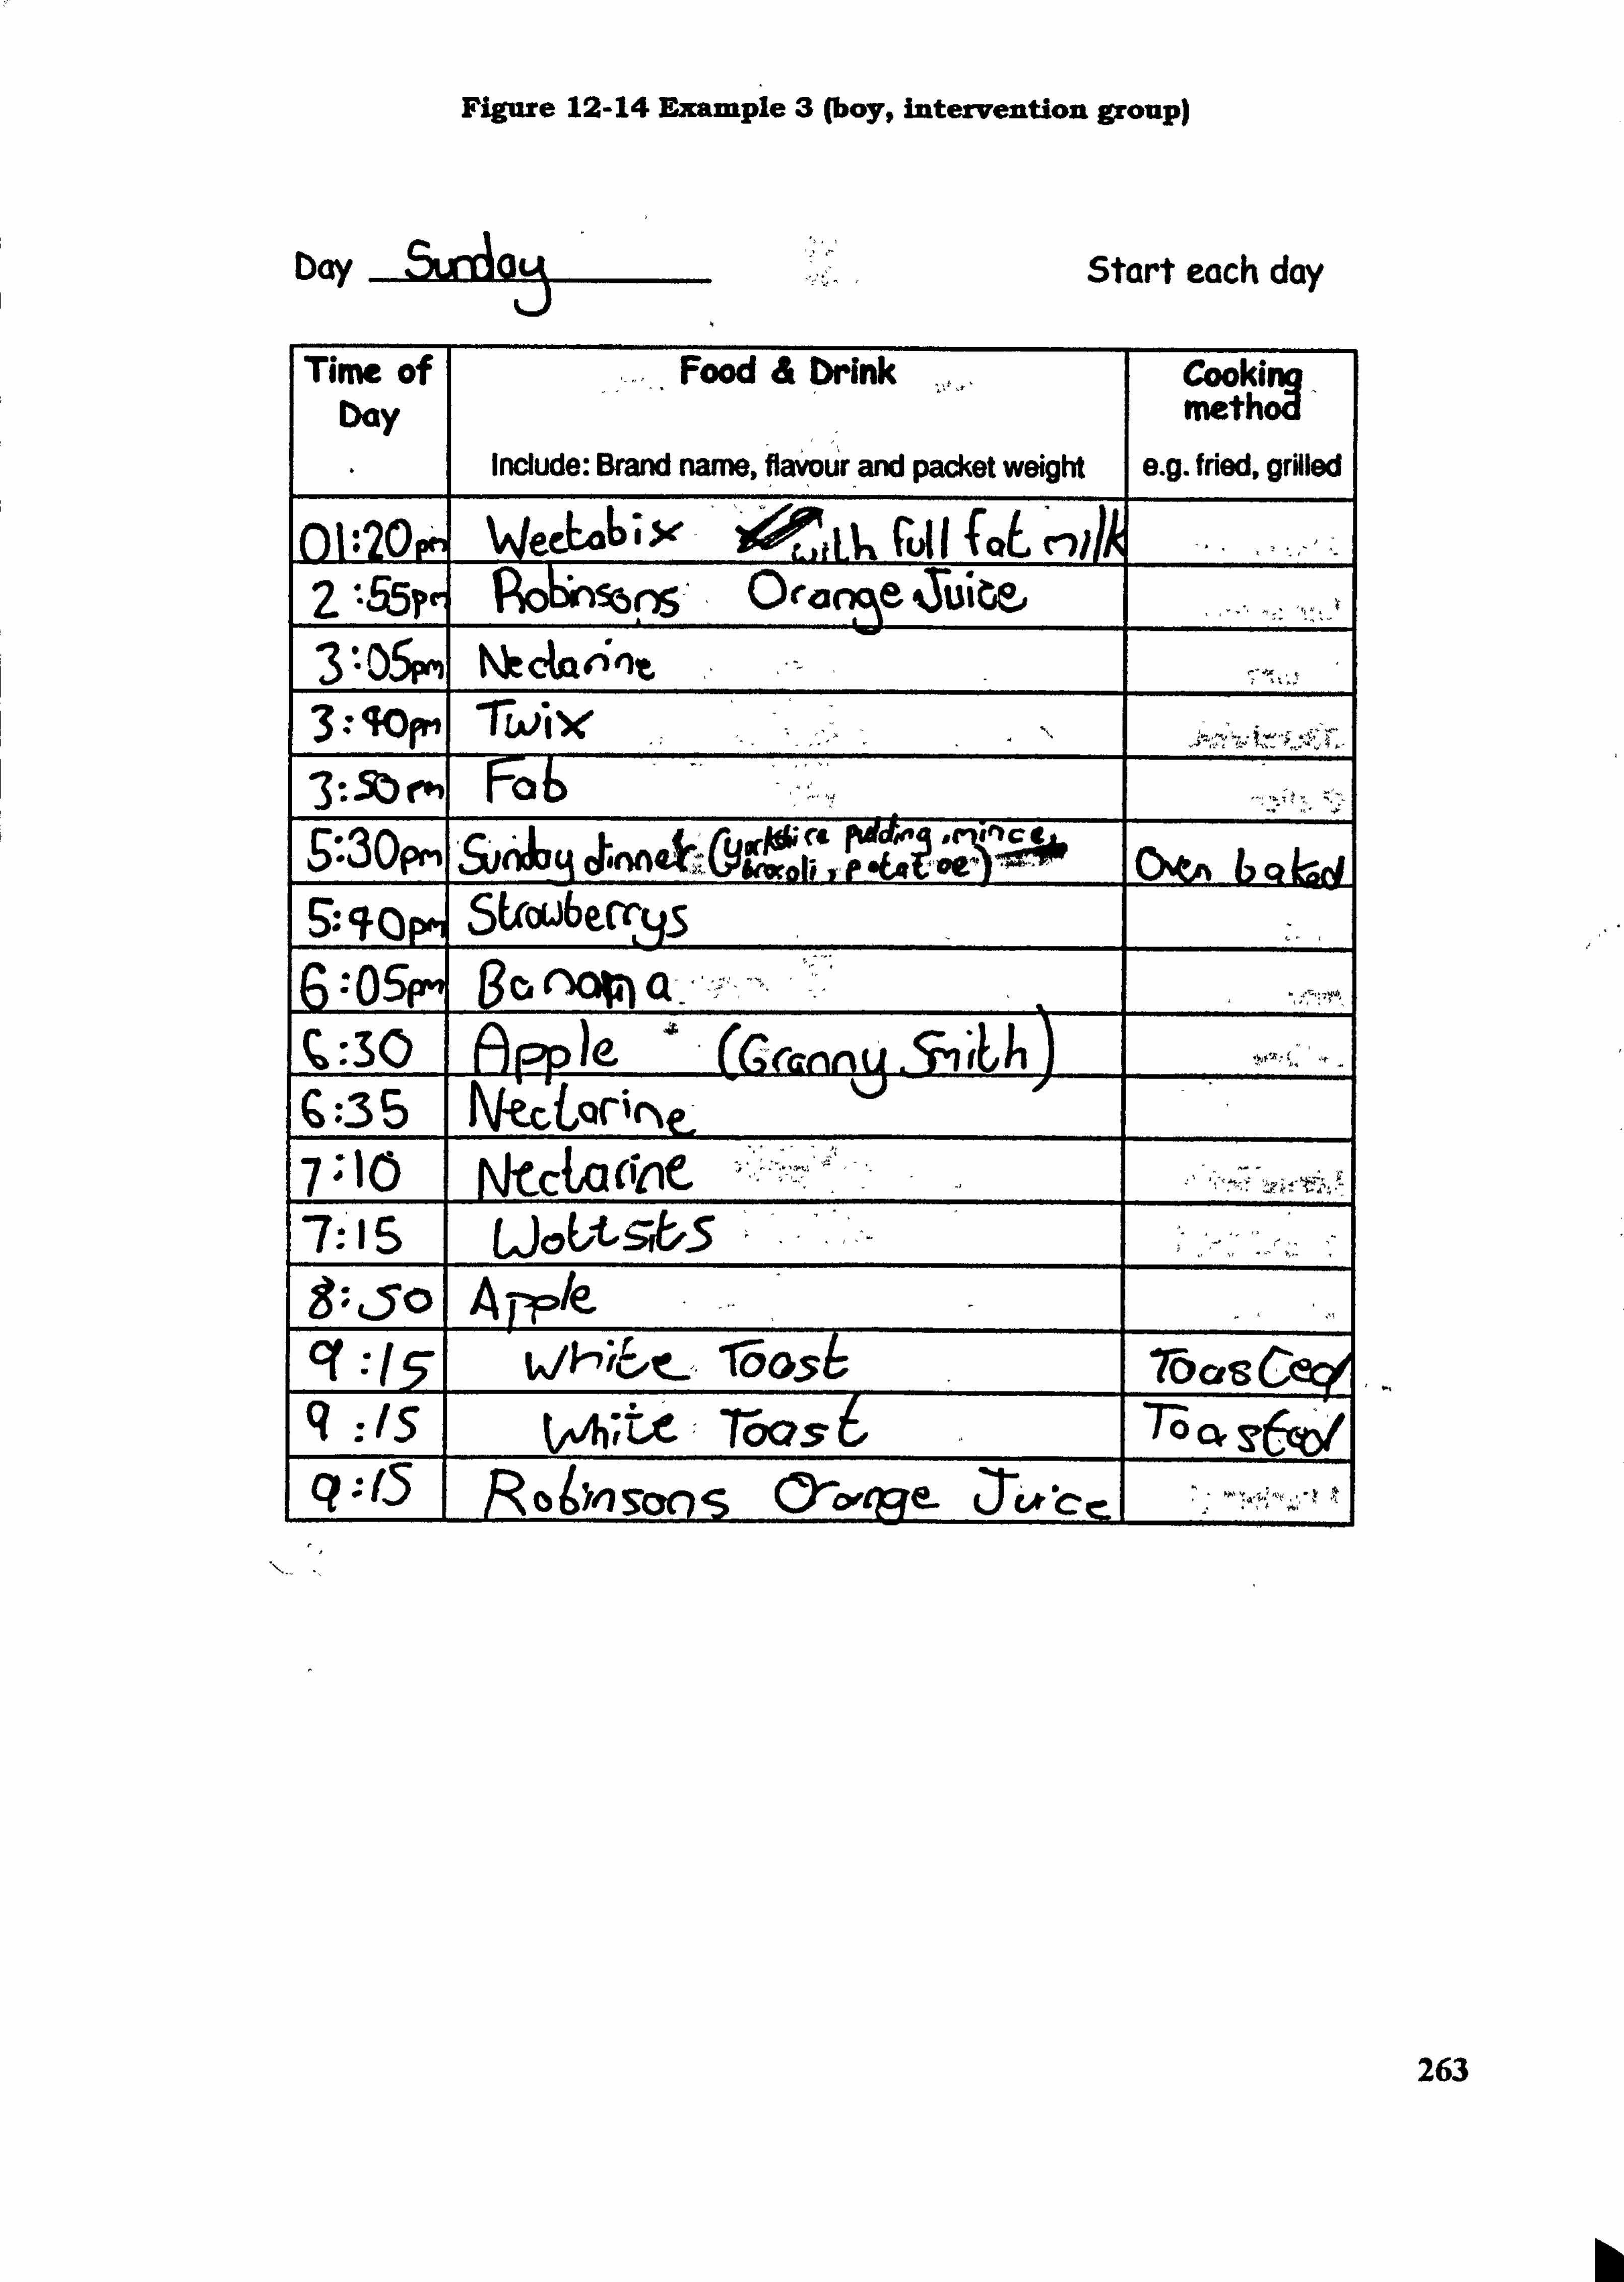
Figure 12-14 Example 3 (boy, intervention group)
bay Start each day
Tirm of bay
Food & Drink
Include: Brand name, flavour and packet weight
Cooki Ion methog'
e. g. fried, grilled
()1: 20p" WeeL46; X LA'n CU11 f0t C111A 2 '-55? r, Po6n5b 0ca2, cýý tbi 3 *- 05ým Nk&rýnt 3. -. 40fm 3-.. Sbm Fo b 9*-30pm &Aq ohnn4ý101* ýeA &-Wob 1, OV ý, " ! --,, 40 L--d 9.. qrjm 6: 05FM go
0 ()r-o)e G. -35 7 '10 Laa 7: 15 5
Le Cr vj-Y; 6, t-. -000A q : Is t'Ate- ý 76-as 6 7-o cý C? o bn soo s Oýtpe- 31* -c c
263
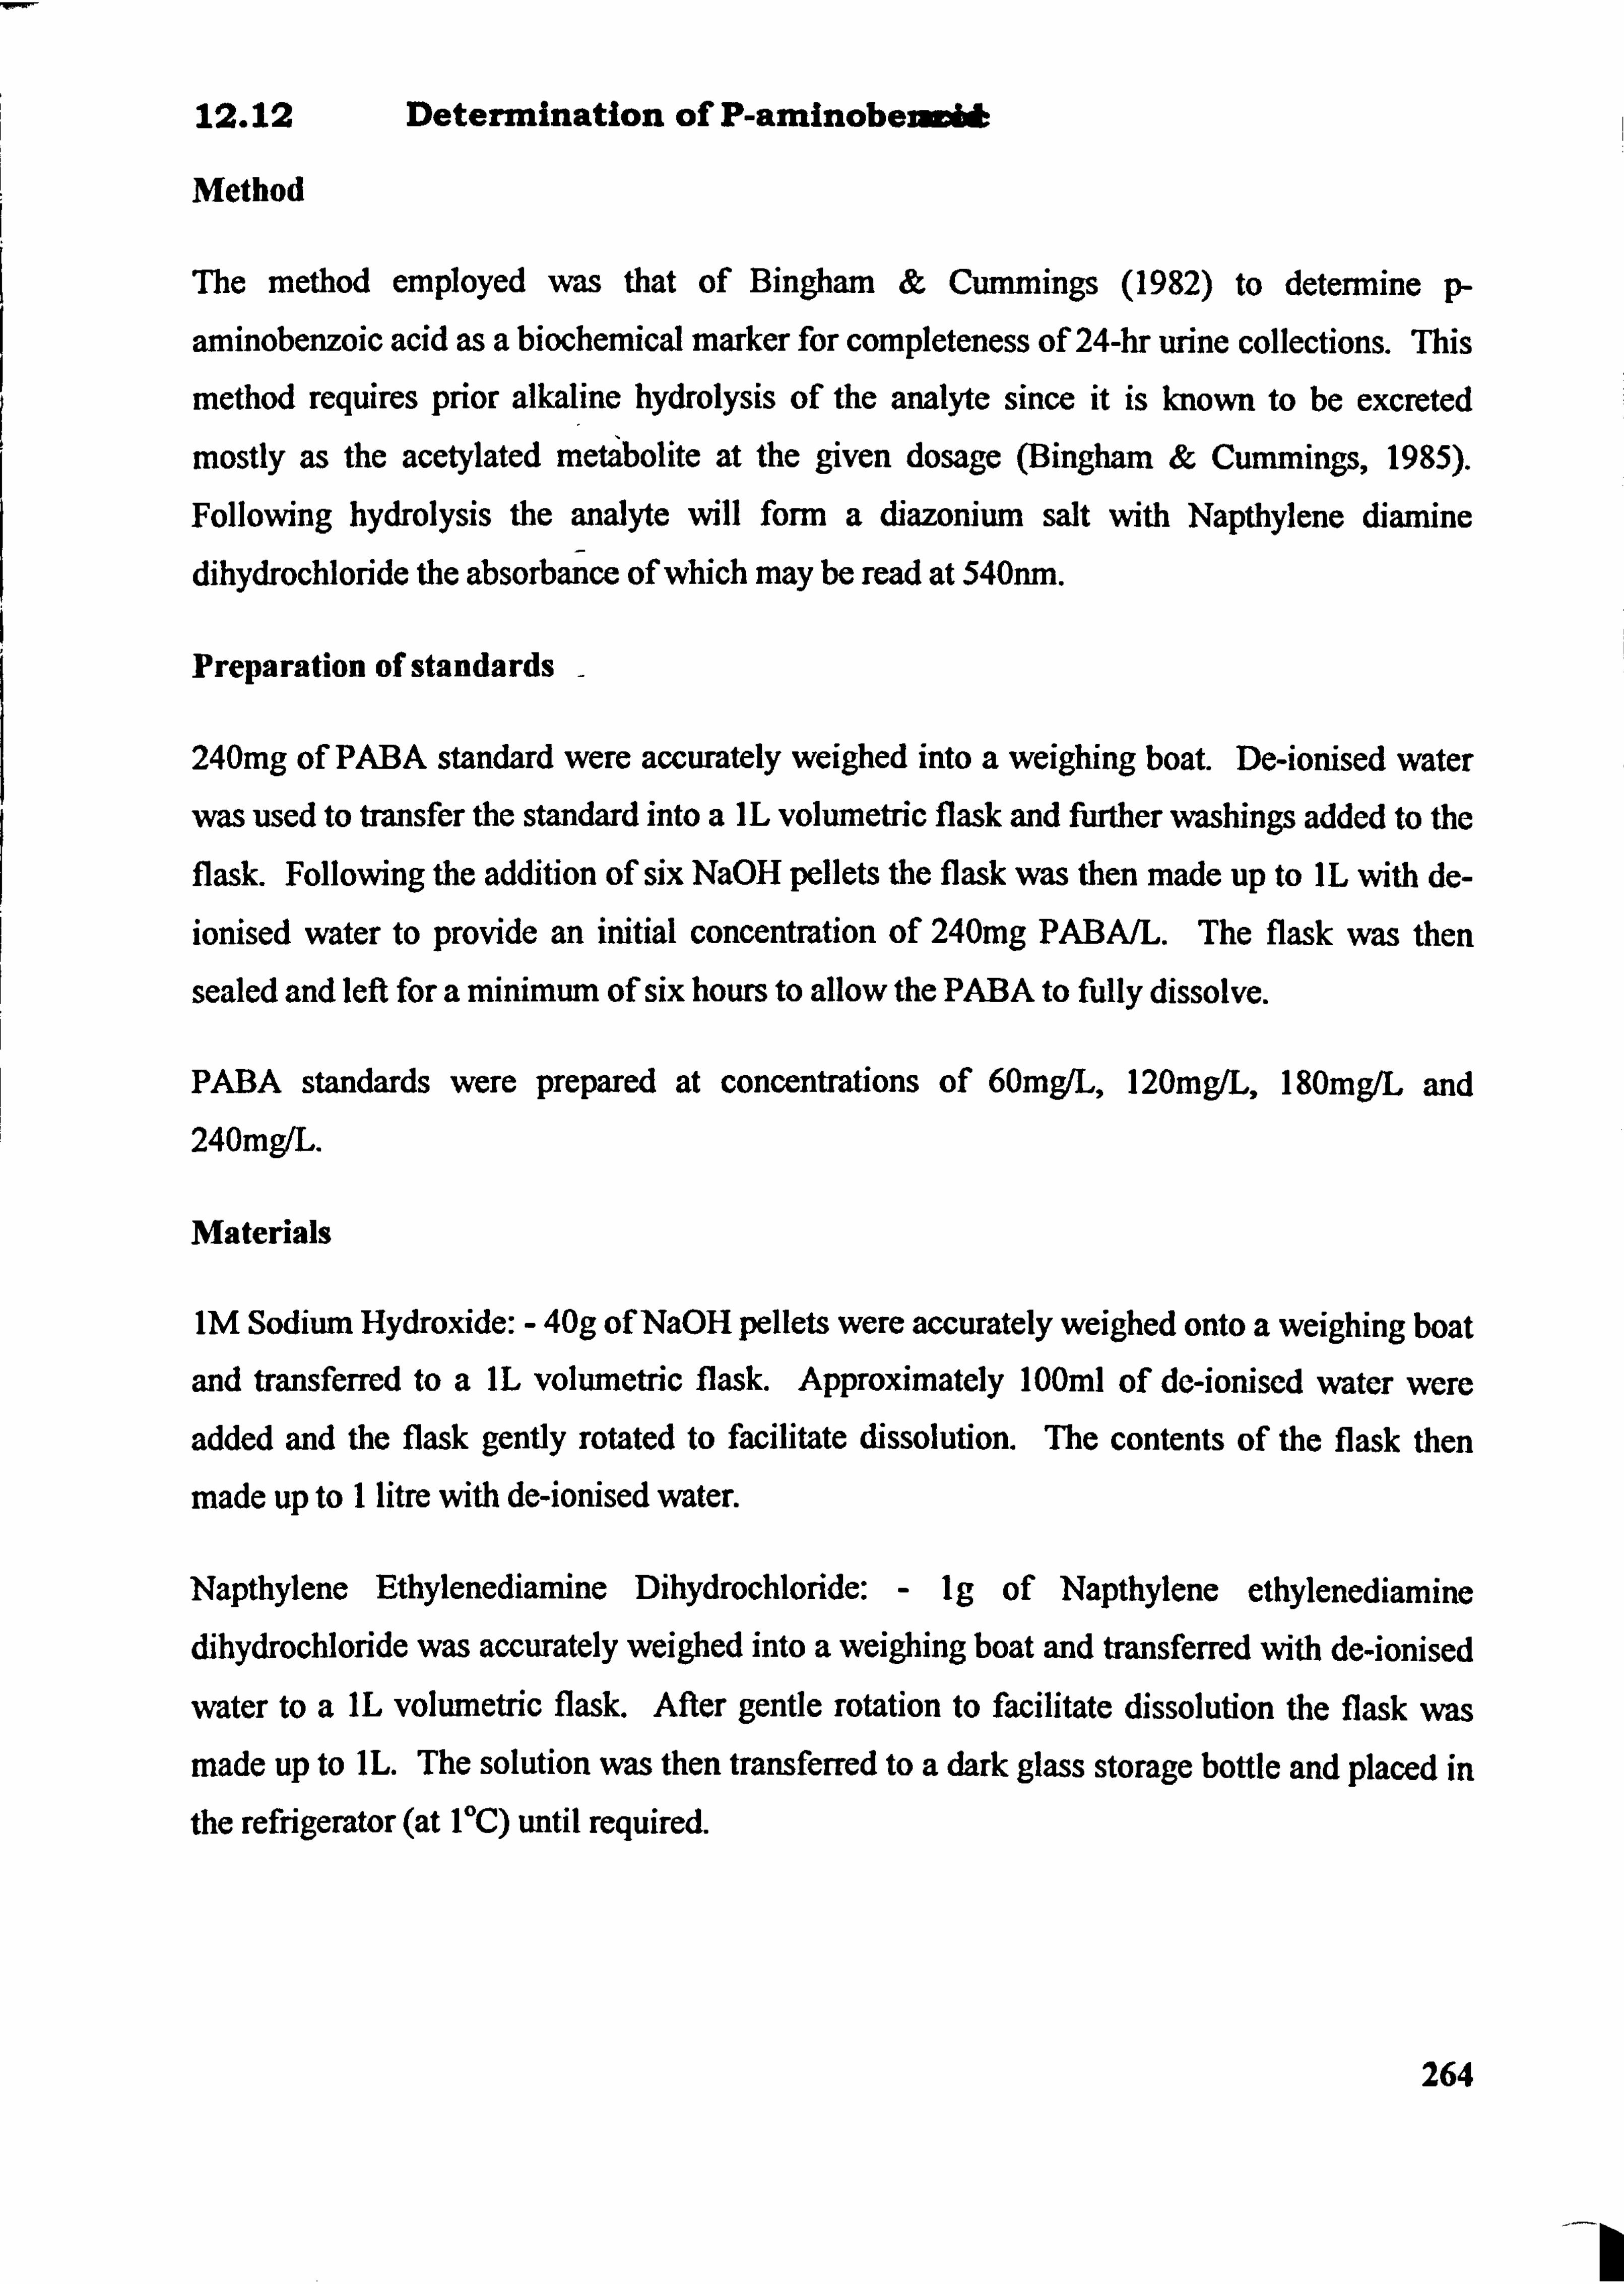
12.12 Determination of P-aminobeiuci&
Method
The method employed was that of Bingham & Cummings (1982) to determine p-
aminobenzoic acid as a biochemical marker for completeness of 24-hr urine collections. This
method requires prior alkaline hydrolysis of the analyte since it is known to be excreted
mostly as the acetylated metabolite at the given dosage (Bingham & Cummings, 1985).
Following hydrolysis the analyte wfll form a diazonium salt with Napthylene, diamine
dihydrochloride the absorbance of which may be read at 540nm.
Preparation of standards -
240mg of PABA standard were accurately weighed into a weighing boat. De-ionised water
was used to transfer the standard into a IL volumetric flask and ftutber washings, added to the
flask. Following the addition of six NaOH pellets the flask was then made up to IL with de-
ionised water to provide an initial concentration of 240mg PABA/L. The flask was then
sealed and left for a minimum of six hours to allow the PABA to fully dissolve.
PABA standards were prepared at concentrations of 60mg/L, 120mgIL, 180mg/L and 240mg/L.
Materials
IM Sodium Hydroxide: - 40g of NaOH pellets were accurately weighed onto a weighing boat
and transferred to a IL volumetric flask. Approximately 100ml of de-ionised water were
added and the flask gently rotated to facilitate dissolution. The contents of the flask then
made up to I litre, with de-ionised water.
Napthylene Ethylenediamine Dihydrochloride: - Ig of Napthylene ethylenediamine dihydrochloride was accurately weighed into a weighing boat and transferred with de-ionised
water to a IL volumetric flask. After gentle rotation to facilitate dissolution the flask was made up to IL. The solution was then transferred to a dark glass storage bottle and placed in
the refrigerator (at IOC) until required.
264
Sodium Nitrite: - 100mg of sodium nitrite powder were accurately weighed onto a weighing boat. The powder was transferred with de-ionised water into a 100ml volumetric flask and
made up to the mark with de-ionised water to give a concentration of I mg NaN03/Ml.
Ammonium Sulphate: - 500mg of ammonium sulpharnate were accurately weighed into a
weighing boat. The powder was transferred with de-ionised water into a 100ml volumetric flask and made to the mark with de-ionised water to give a concentration of 5mg N144S03.
Procedure
The frozen samples were allowed to thaw completely overnight at refrigeration temperature.
0.1 ml aliquots of tests, standards and blanks were prepared in duplicate and placed in 7?
tubes. 10ml of IM NaOH was added to each tube, which were then capped and thoroughly
mixed. Test and blank samples were placed in a boiling water-bath for two hours and
standards were refrigerated at IT. Following removal from the water-bath the test and blank
samples were allowed to cool to room temperature. 3ml of 5M HCI was added to each tube
and mixed.
At two-minute intervals, with thorough mixing after each addition, Iml of sodium nitrate, Iml
of ammonium sulphamate, and Iml of napthylene ethylenediamine dihydrochloride were
added in respective order and all samples allowed to stand at room temperature for one hour
to allow the colour to develop. The absorbance was read at 540nm using a Unicarn 100
UV/Vis Spectrometer. The absorbance values obtained for duplicate standard were entered
onto an Excel spreadsheet and used to construct a calibration curve and calculate both the
linear regression (? ) and straight line equation (y = na + c) for each of the three separate
experimental runs.
265
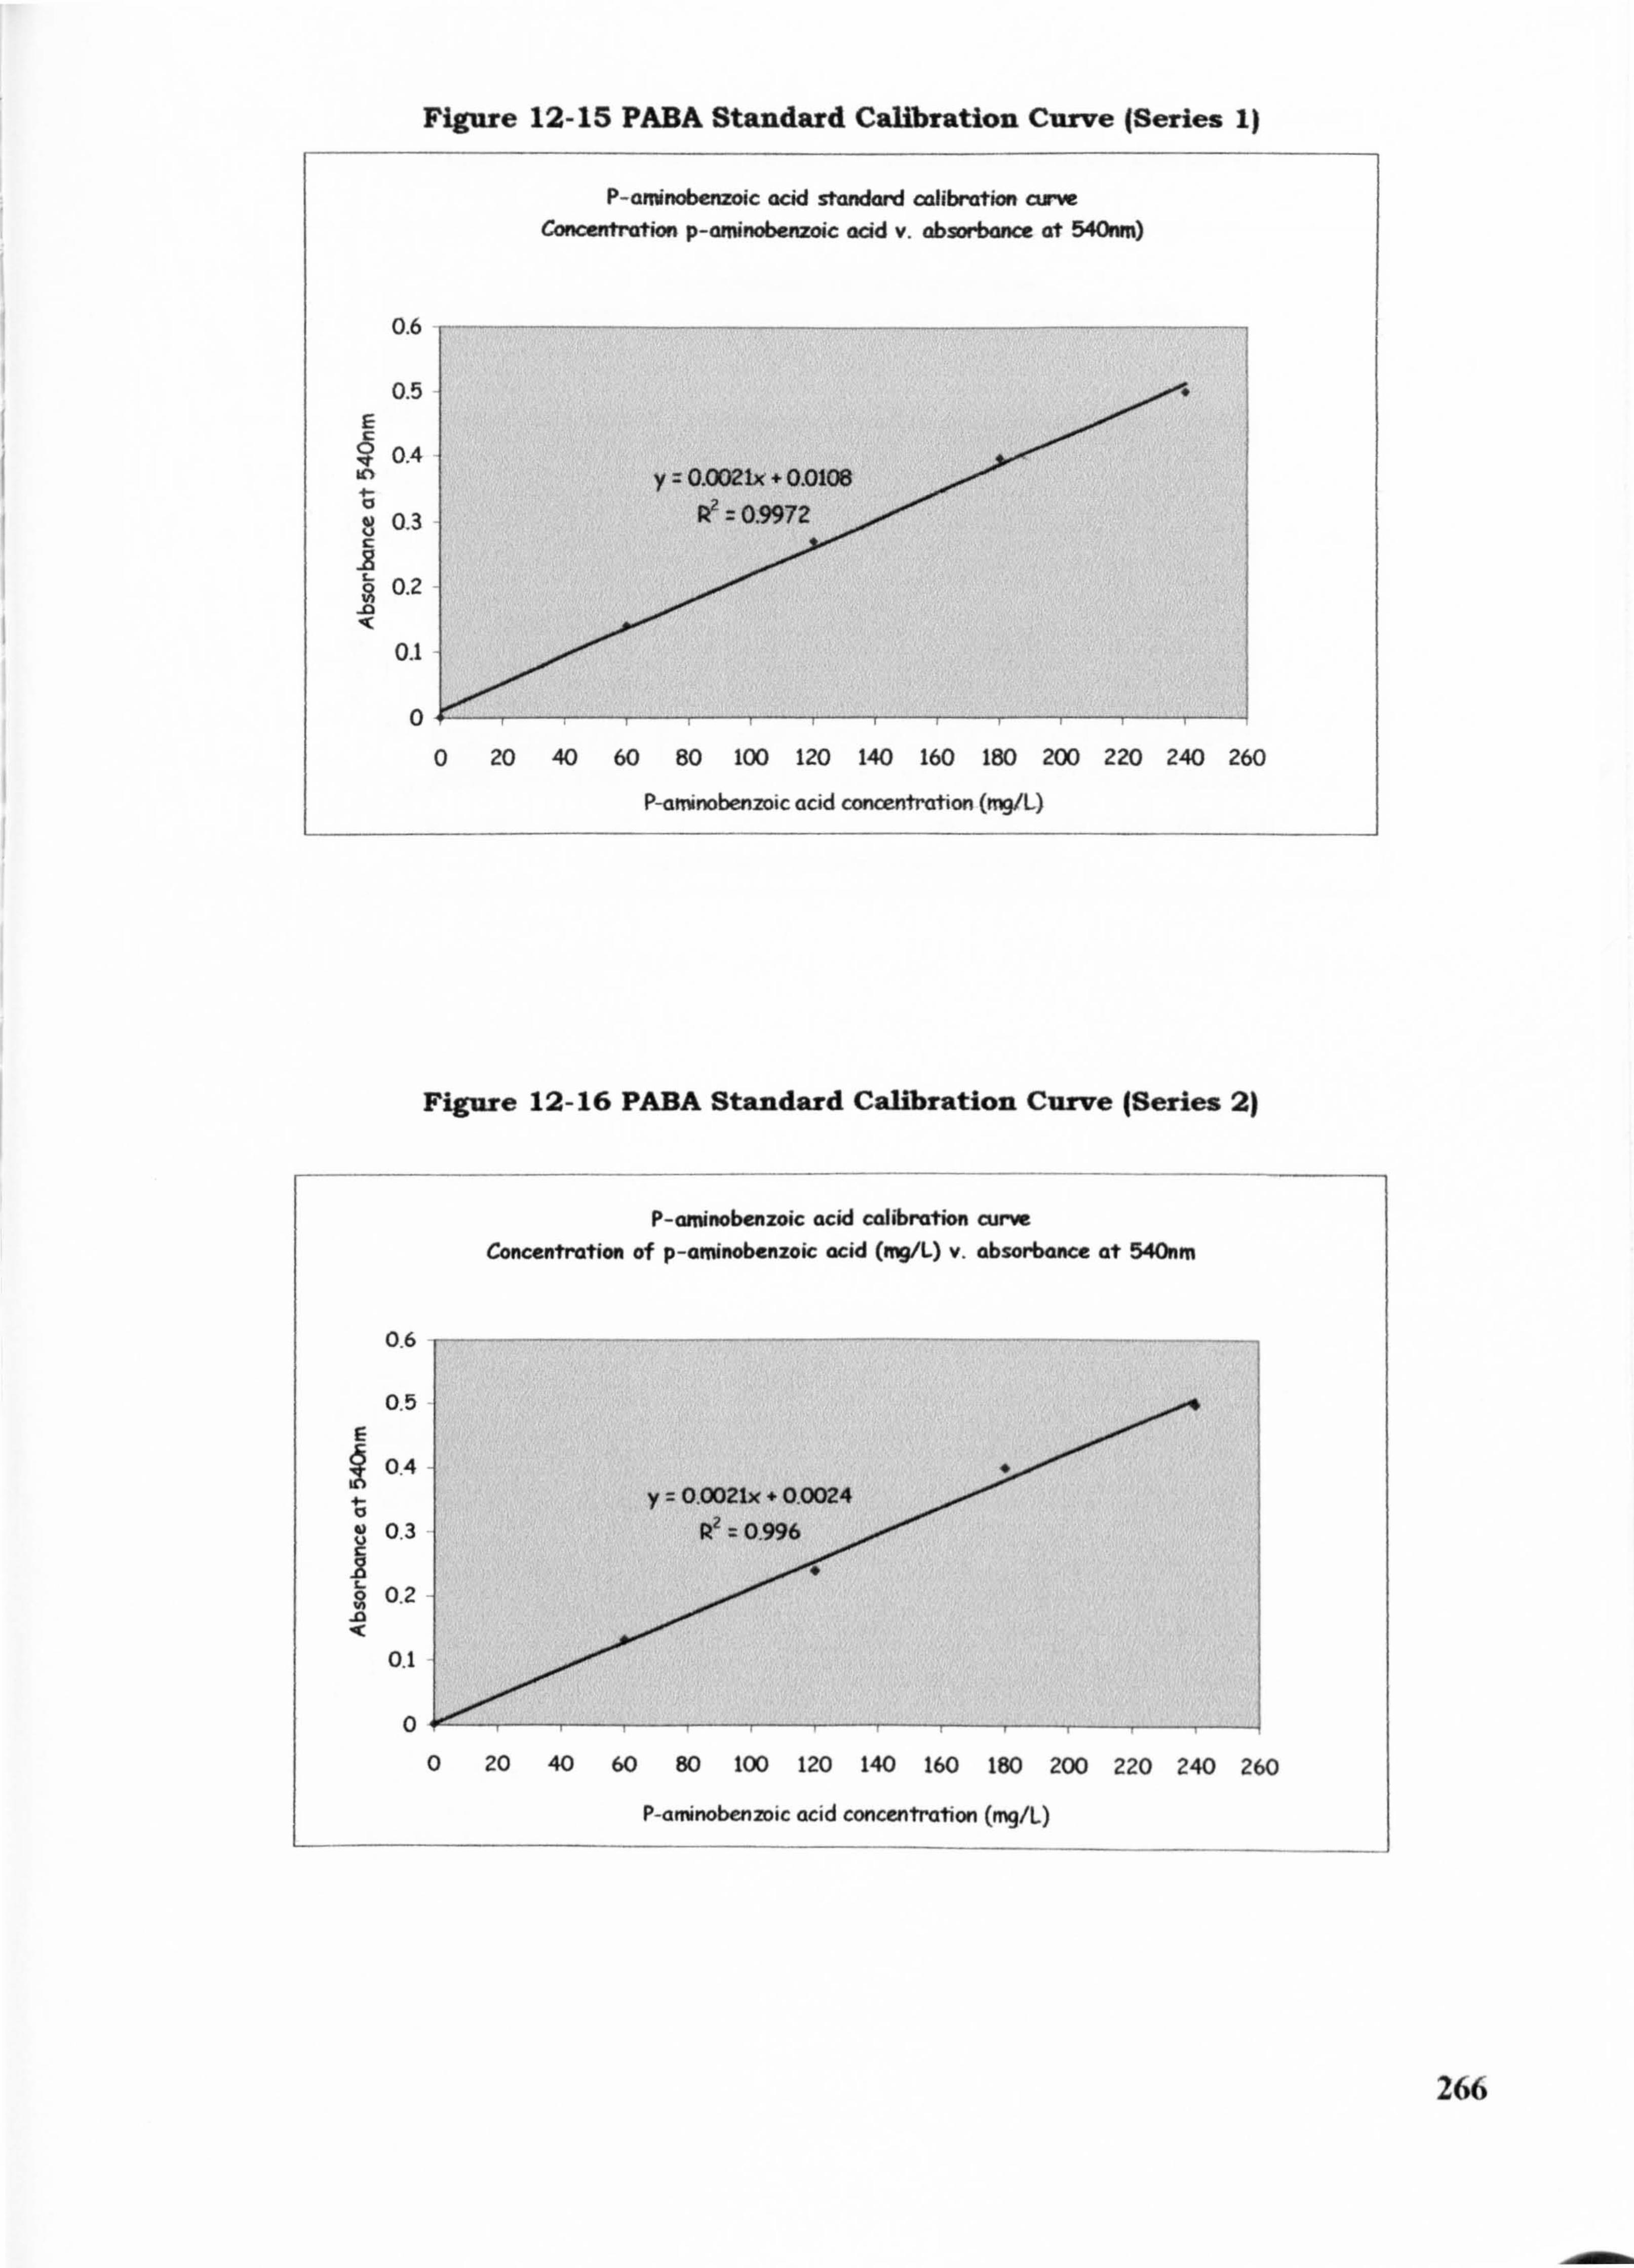
Figure 12-15 PABA Standard Calibration Curve (Series 1)
P-arninobenzoic acid standard calibration curve Concentration p-aninobenzoic acid v. absorbance at 540nm)
0.6
0.5
0.4 y 0.002IX + OD108
0.3 0.9972
0.2 -0
0.1
0 0 20 40 60 80 100 120 140 160 180 200 220 240 260
P-arninobenzoic acid concentration (mg/L)
Figure 12-16 PABA Standard Calibration Curve (Series 2)
P-aminobenzoic acid codibration curve Concentration of p-aminobenzoic acid (nV/L) v. absorixince at 540nm
0.6
0.5
0.4
0.3
.Z 0.2
.0
0.1
0
266
20 40 60 80 100 120 140 160 180 200 220 240 260
P-arninobenzoic acid concentration (nq/L)
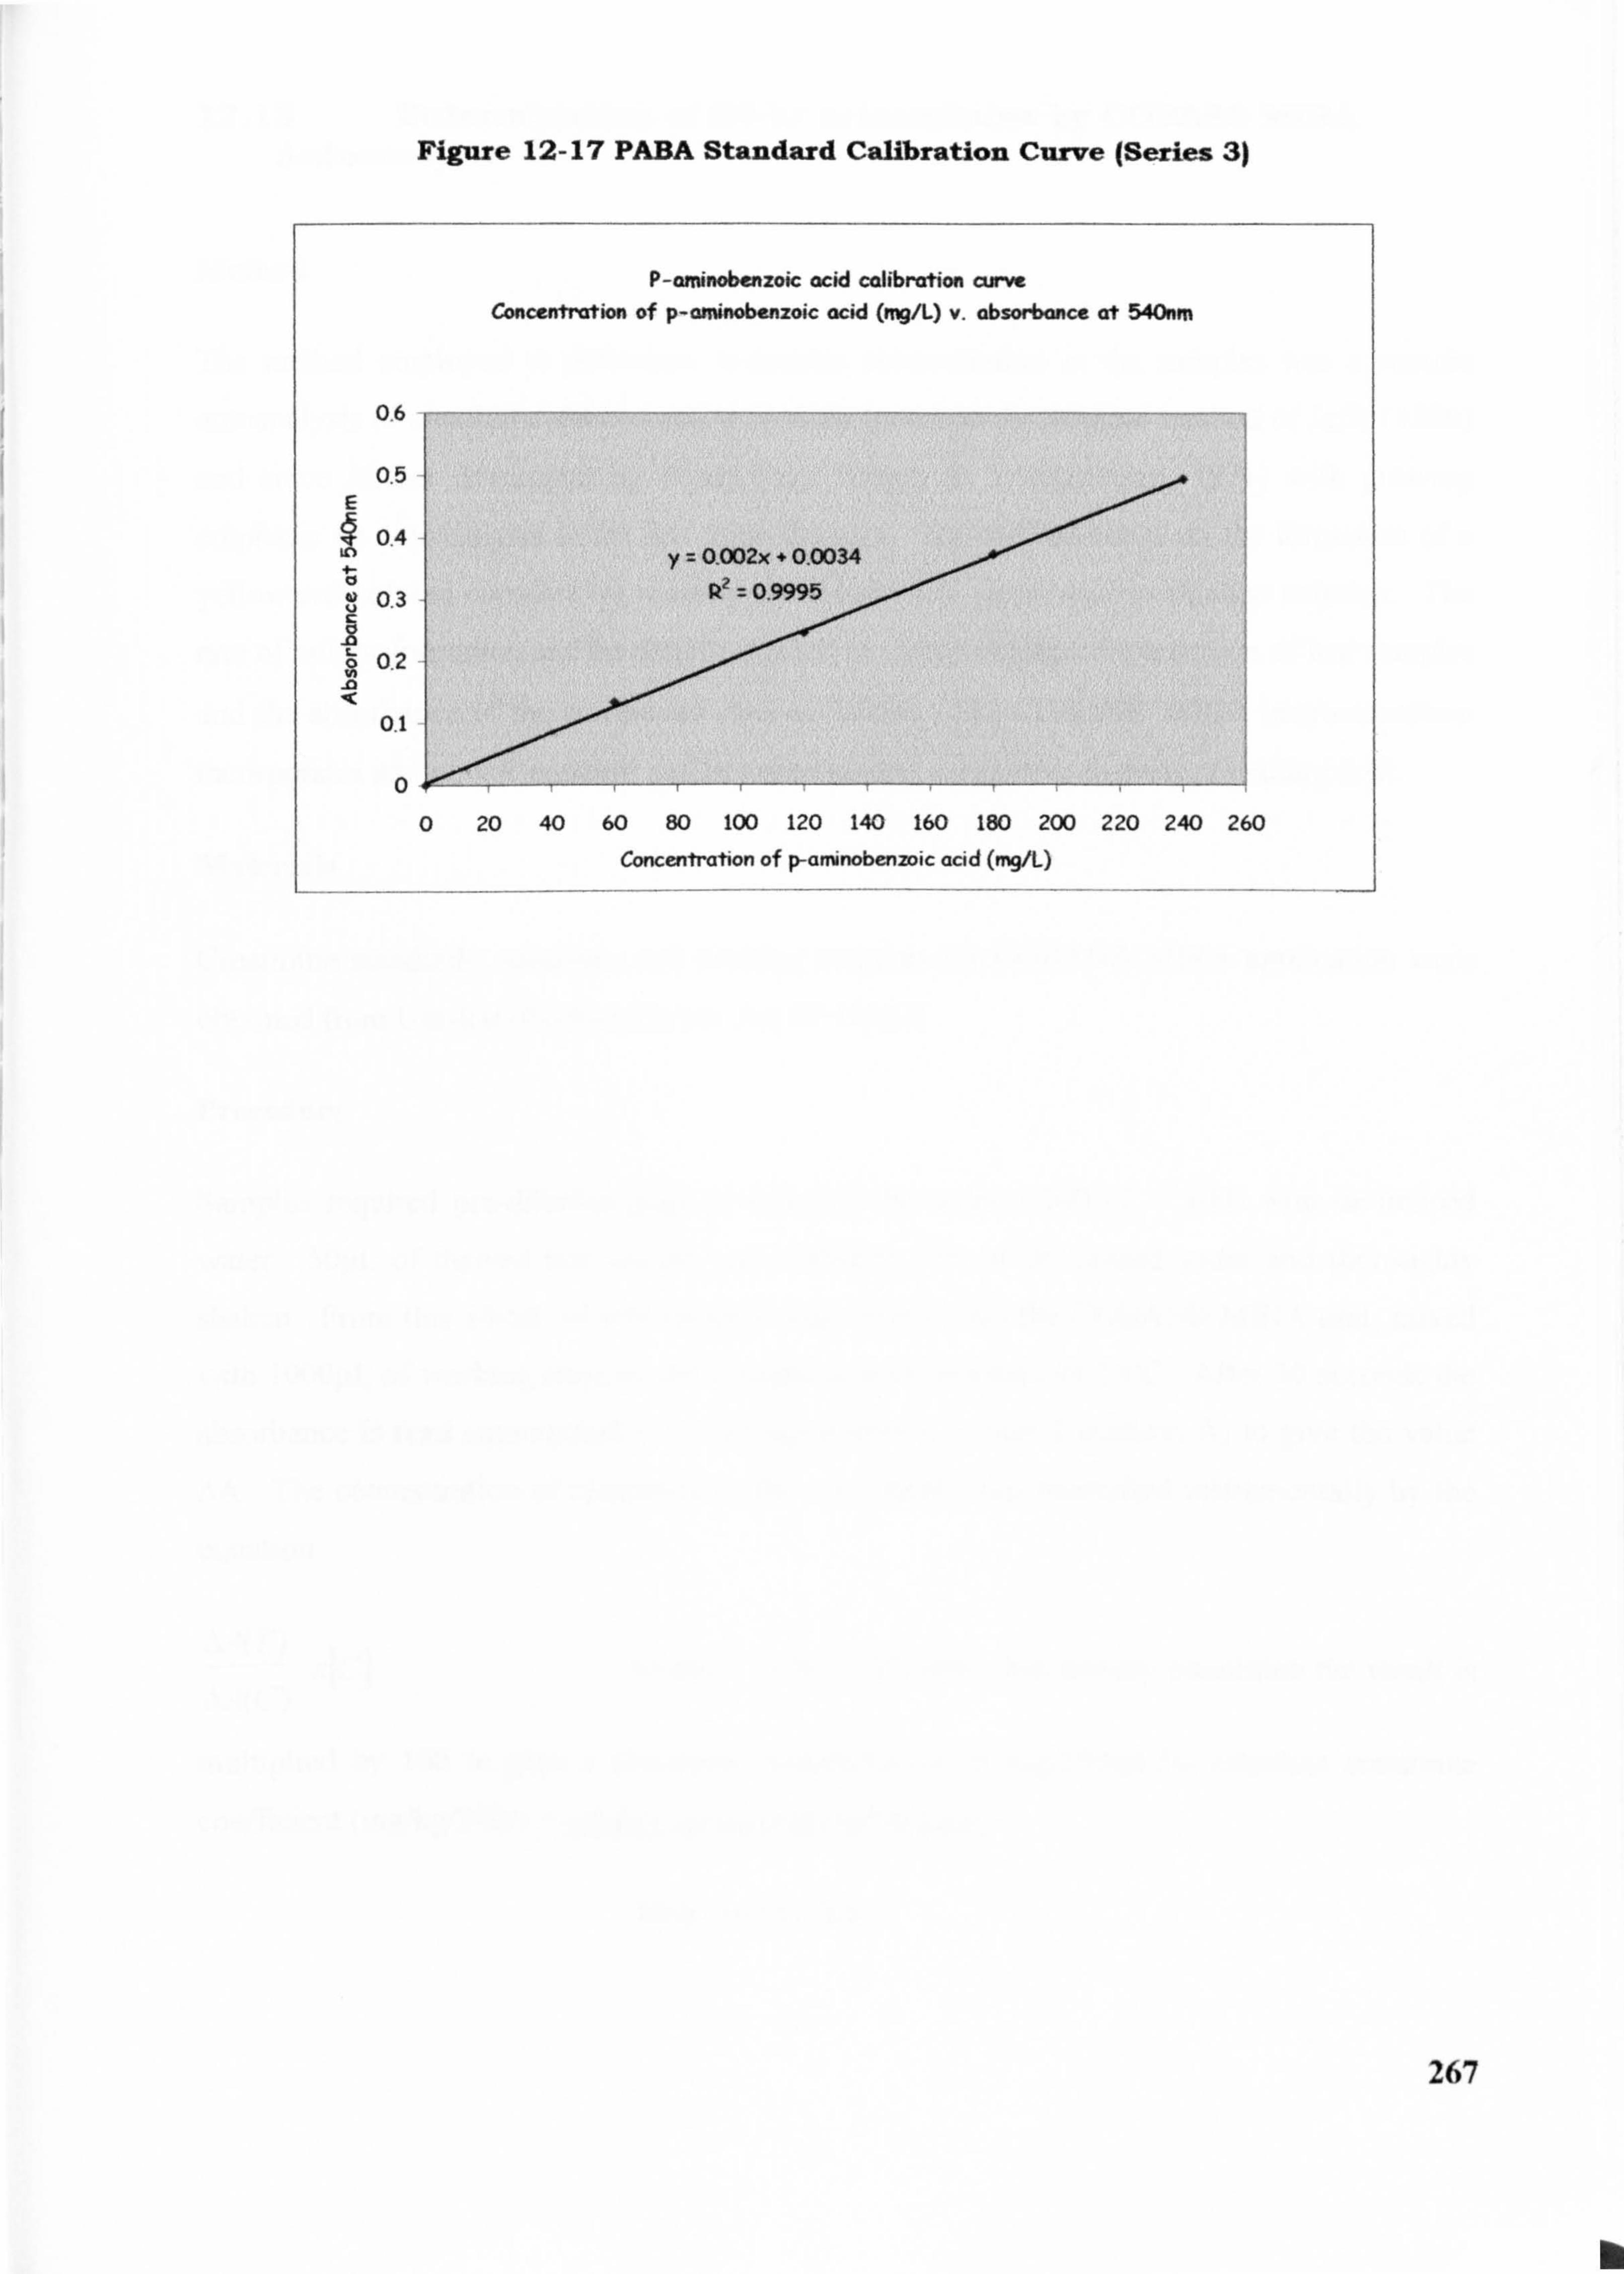
Figure 12-17 PABA Standard Calibration Curve (Series 31
P-arninobenzoic acid calibration cLwve CDnee. drahon of p-aminobenzoic acid (nq/L) v. absorbance at 540nm
0.6
0,5
0.4
03
02 _O
0
267
0 20 40 60 80 100 120 140 160 180 200 220 240 260
Concentration of p-afninobenmic acid (mg/L)
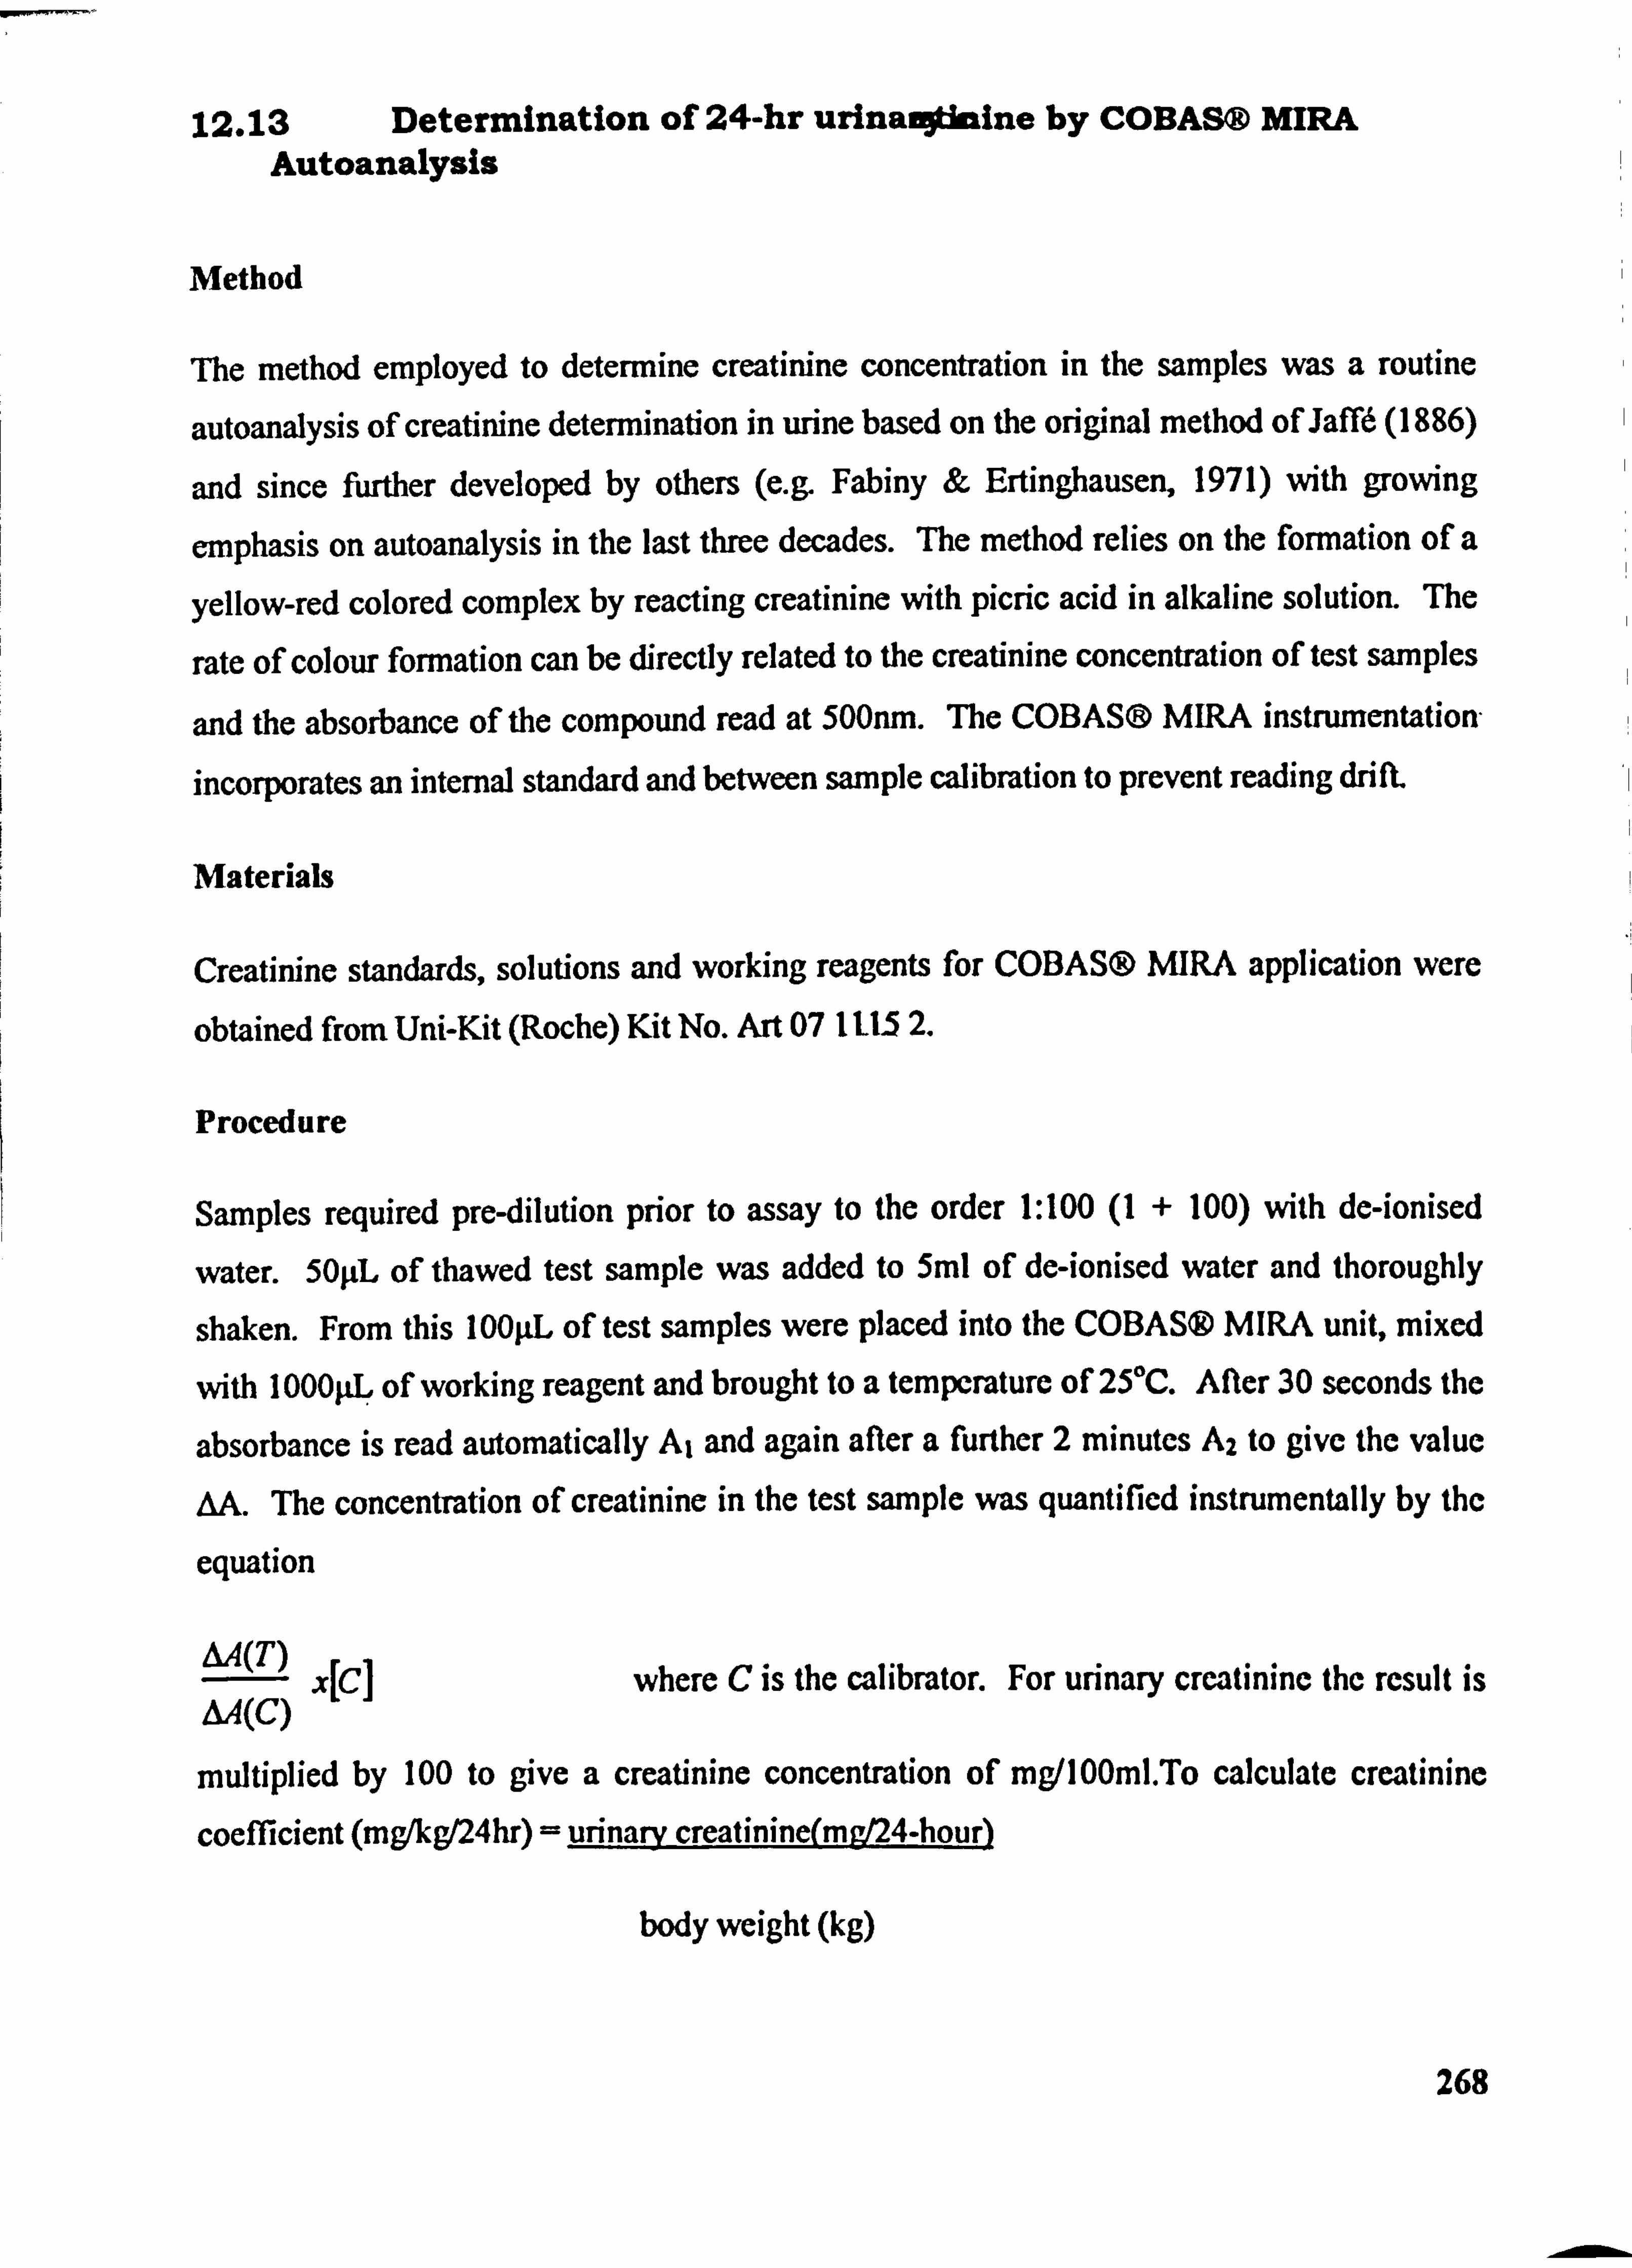
12.13 Determination of 24-hr urinawjlnine by COBASO MIRA Autoanalysis
Method
The method employed to determine creatinine concentration in the samples was a routine
autoanalysis of creatinine determination in urine based on the original method of JaM (1886)
and since further developed by others (e. g. Fabiny & Ertinghausen, 1971) with growing
emphasis on autoanalysis in the last three decades. The method relies on the formation of a
yellow-red colored complex by reacting creatinine with picric acid in alkaline solution. The
rate of colour formation can be directly related to the creatinine concentration of test samples
and the absorbance of the compound read at 500nm. The COBASO MIRA instrumentation-
incorporates an internal standard and between sample calibration to prevent reading drift.
Materiah
Creatinine standards, solutions and working reagents for COBASO NURA application were
obtained from Uni-Kit (Roche) Kit No. Art 07 1115 2.
Procedure
Samples required pre-dilution prior to assay to the order 1: 100 (1 + 100) with de-ionised
water. 50pL of thawed test sample was added to 5ml of de-ionised water and thoroughly
shaken. From this lOOgL of test samples were placed into the COBASO MIRA unit, mixed
with I OOOpL of working reagent and brought to a temperature of 250C. After 30 seconds the
absorbance is read automatically A, and again after a further 2 minutes A2 to give the value AA. The concentration of creatinine in the test sample was quantificd instrumentally by the
equation
AA(T) X[C] where C is the calibrator. For urinary crcatininc the result is
AA(C)
multiplied by 100 to give a creatinine concentration of mg/100ml. To calculate creatinine
cocfficicnt (mg/kg/24hr) = urinary crcatinine(mgt24-hourj
body weight (kg)
268
12.14 Determination of urinary nitraging LECOS Autoanalysis
Method
The method of determining urea nitrogen employs the hydrolysis of urea to ammonium
carbonate by urease. The ammonia released for the carbonate by the addition of alkali will
react with phenol and- sodium hypochlorite in the presence of a catalyst, sodium
nitrogprusside, in an alkaline medium to form a blue coloured indophenol. The intensity of
the blue colour is proportional to the quantity of urea in the urine and the absorbance of the
blue complex can be measured photometrically at 560mn.
Procedure
Urine samples were diluted with de-ionised to the order of 1: 25 and placed into the LECOO
analyser for further processing. The nitrogen content of the sample was taken directly from
instrumentation output and expressed as O/oN per 100ml.
Urea nitrogen of the total urine collection was calculated thus:
%N(V) d
where V is total volume of 24hr urine and d the dilution factor (100)
269
-- k
12.15 Determination of urinary potasknd sodium In 24-hr urine samples using Emission Flame Photometry
Method
Some mineral elements have the capacity to give off radiation that appears to be coloured and this may be demonstrated in by the simple technique of holding a dilute solution in the heat of
a flame. When the heat source is intensified, heat energy, for example that provided by a gas-
air flame in a photometer, can cause excitation in electrons of known mineral atoms and can
raise these electrons from the ground state to the excited state. If the electron looses energy
and drops back down to the ground state from its excited level in one singular jump, the
radiation given off is termed the resonance line. However, when electrons loose energy in a
series of steps, then some of the energy given off will be in the visible and infra red regions of
the spectrum or it may lose energy entirely by radiationless collisions with other electrons. Each metal has a different set of energy levels due to different nuclear charge and a different
number of electrons. As such, the wavelengths of emitted radiation will be different for each
element and it is possible to measure the position of the these wavelengths within the UV-
visible spectrum and this data can be used to identify which atoms are presents. When the intensity of radiation is also measured this enables a quantitative analysis to be performed. Sodium and potassium are alkaline earth metal ions and therefore most suited to analysis
using emission flame photometry. The metals are first atomized, subjected to a gas-air flame
( between 900-12OWC)and emission from the resulting excitiation of electrons amplified and
measured.
Materials
Sodium and potassium chloride were used in the preparation of standards as chloride ions
would not effect the analysis. De-ionised water of high purity was used in the preparation of
standards and in the dilution of samples (resistance > 1,000,000 ohms).
preparation of potassium standards
Standards were prepared from chloride salts by accurately weighing Ig of potassium/sodium chloride and transferring into a IL volumetric flask. De-ionised water was added and made up to the mark- The solution was fully dissolved with the use of a magnetic flea for
approximately 20 minutes. The solution (lgIL) was then further diluted and standards
270
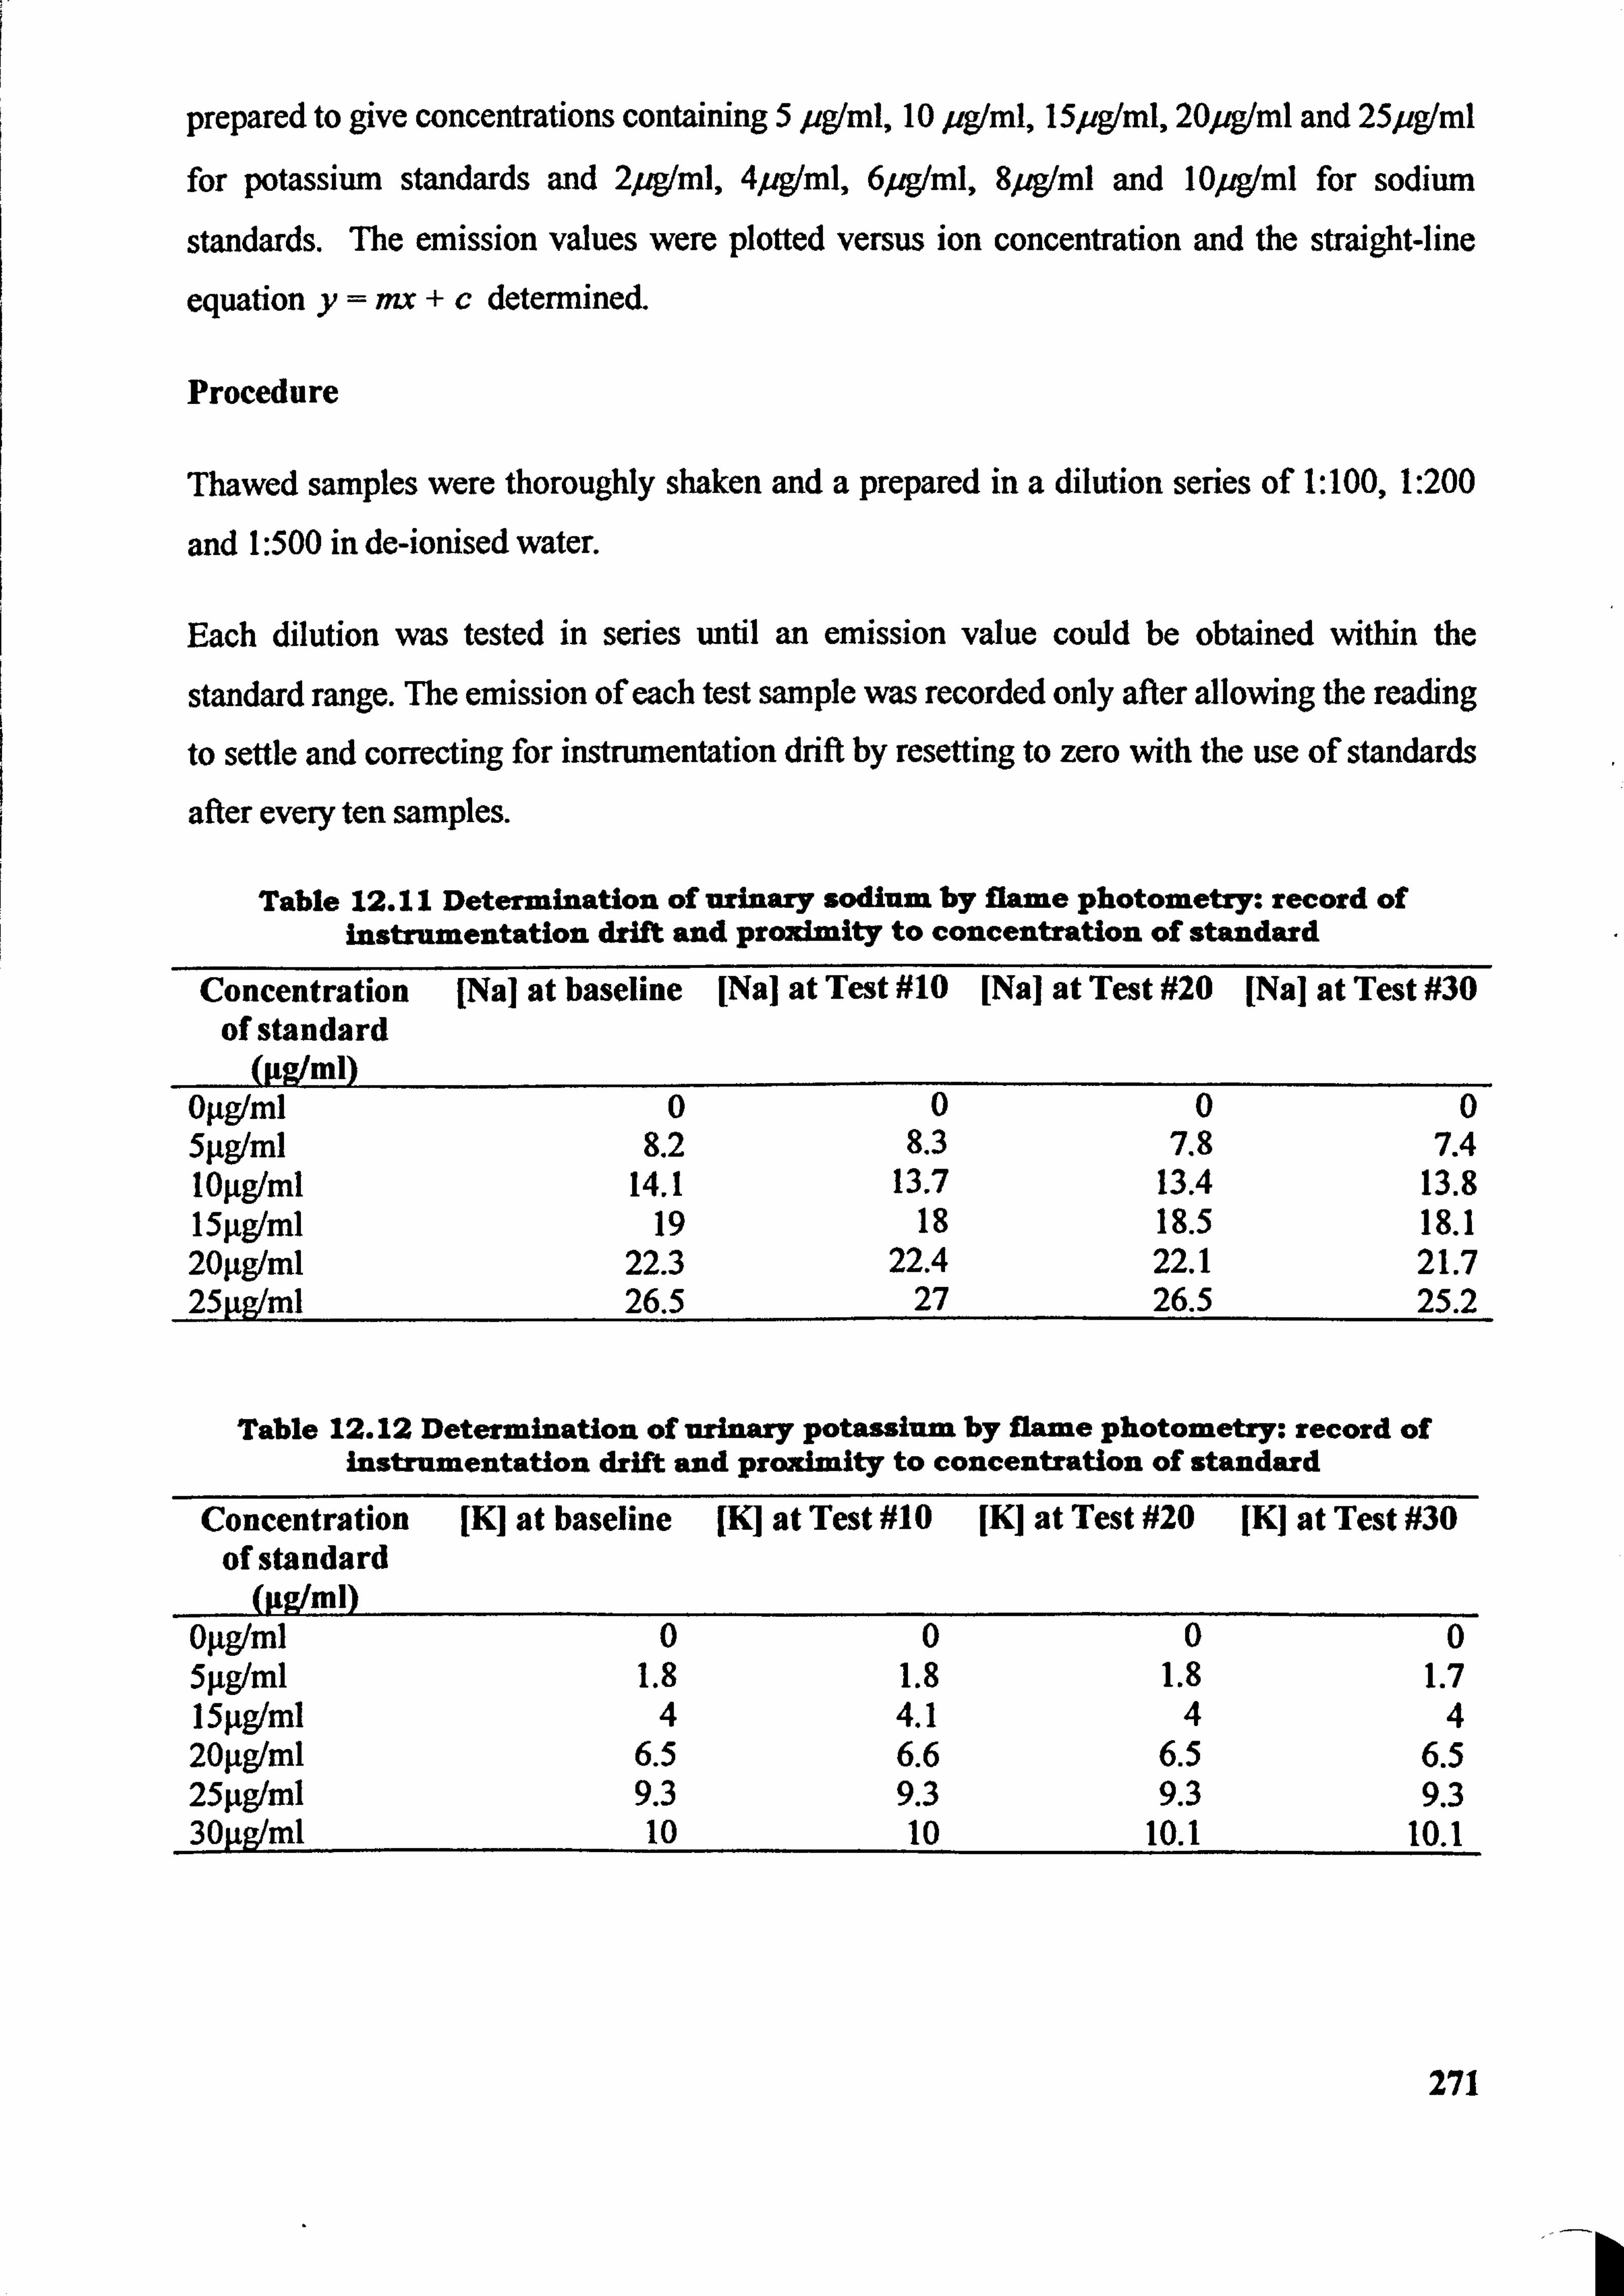
prepared to give concentrations containing 5 pg(ml, 10 pgIml, l5pgIml, 20peml and 25pg(ml
for potassium standards and 2peml, 4peml, 6peml, 8peml and 10peml for sodium
standards. The emission values were plotted versus ion concentration and the straight-line
equation y==+c determined.
Procedure
Thawed samples were thoroughly shaken and a prepared in a dilution series of 1: 100,1: 200
and 1: 500 in de-ionised water.
Each dilution was tested in series until an emission value could be obtained within the
standard range. The emission of each test sample was recorded only after allowing the reading
to settle and correcting for instrumentation drift by resetting to zero with the use of standards
after every ten samples.
Table 12.11 Determination of urinary sodium by flame photometry: record of instrumentation drift and proximity to concentration of standard
Concentration of standard
(Pgtml)
[Nal at baseline [Nal at Test #10 [Na] at Test #20 [Nal at Test #30
OILgIml 0 0 0 0 5pglml 8.2 8.3 7.8 7.4 logg/ml 14.1 13.7 13.4 13.8 15lig/ml 19 18 18.5 18.1 201tg/ml 22.3 22.4 22.1 21.7 25gg/ml 26.5 27 26.5 25.2
Table 12.12 Determination of urinary potassium by flame photometry: record of instrumentation drift and proximity to concentration of standard
Concentration [K] at baseline [K] at Test #10 JKJ at Test #20 JKJ at Test #30 of standard
(Itg/ml) Oýtglml 0 0 0 0 5ILg/mi 1.8 1.8 1.8 1.7 151tg/ml 4 4.1 4 4 20ftg/ml 6.5 6.6 6.5 6.5 25lig/ml 9.3 9.3 9.3 9.3 30pglml 10 10 10.1 10.1
271
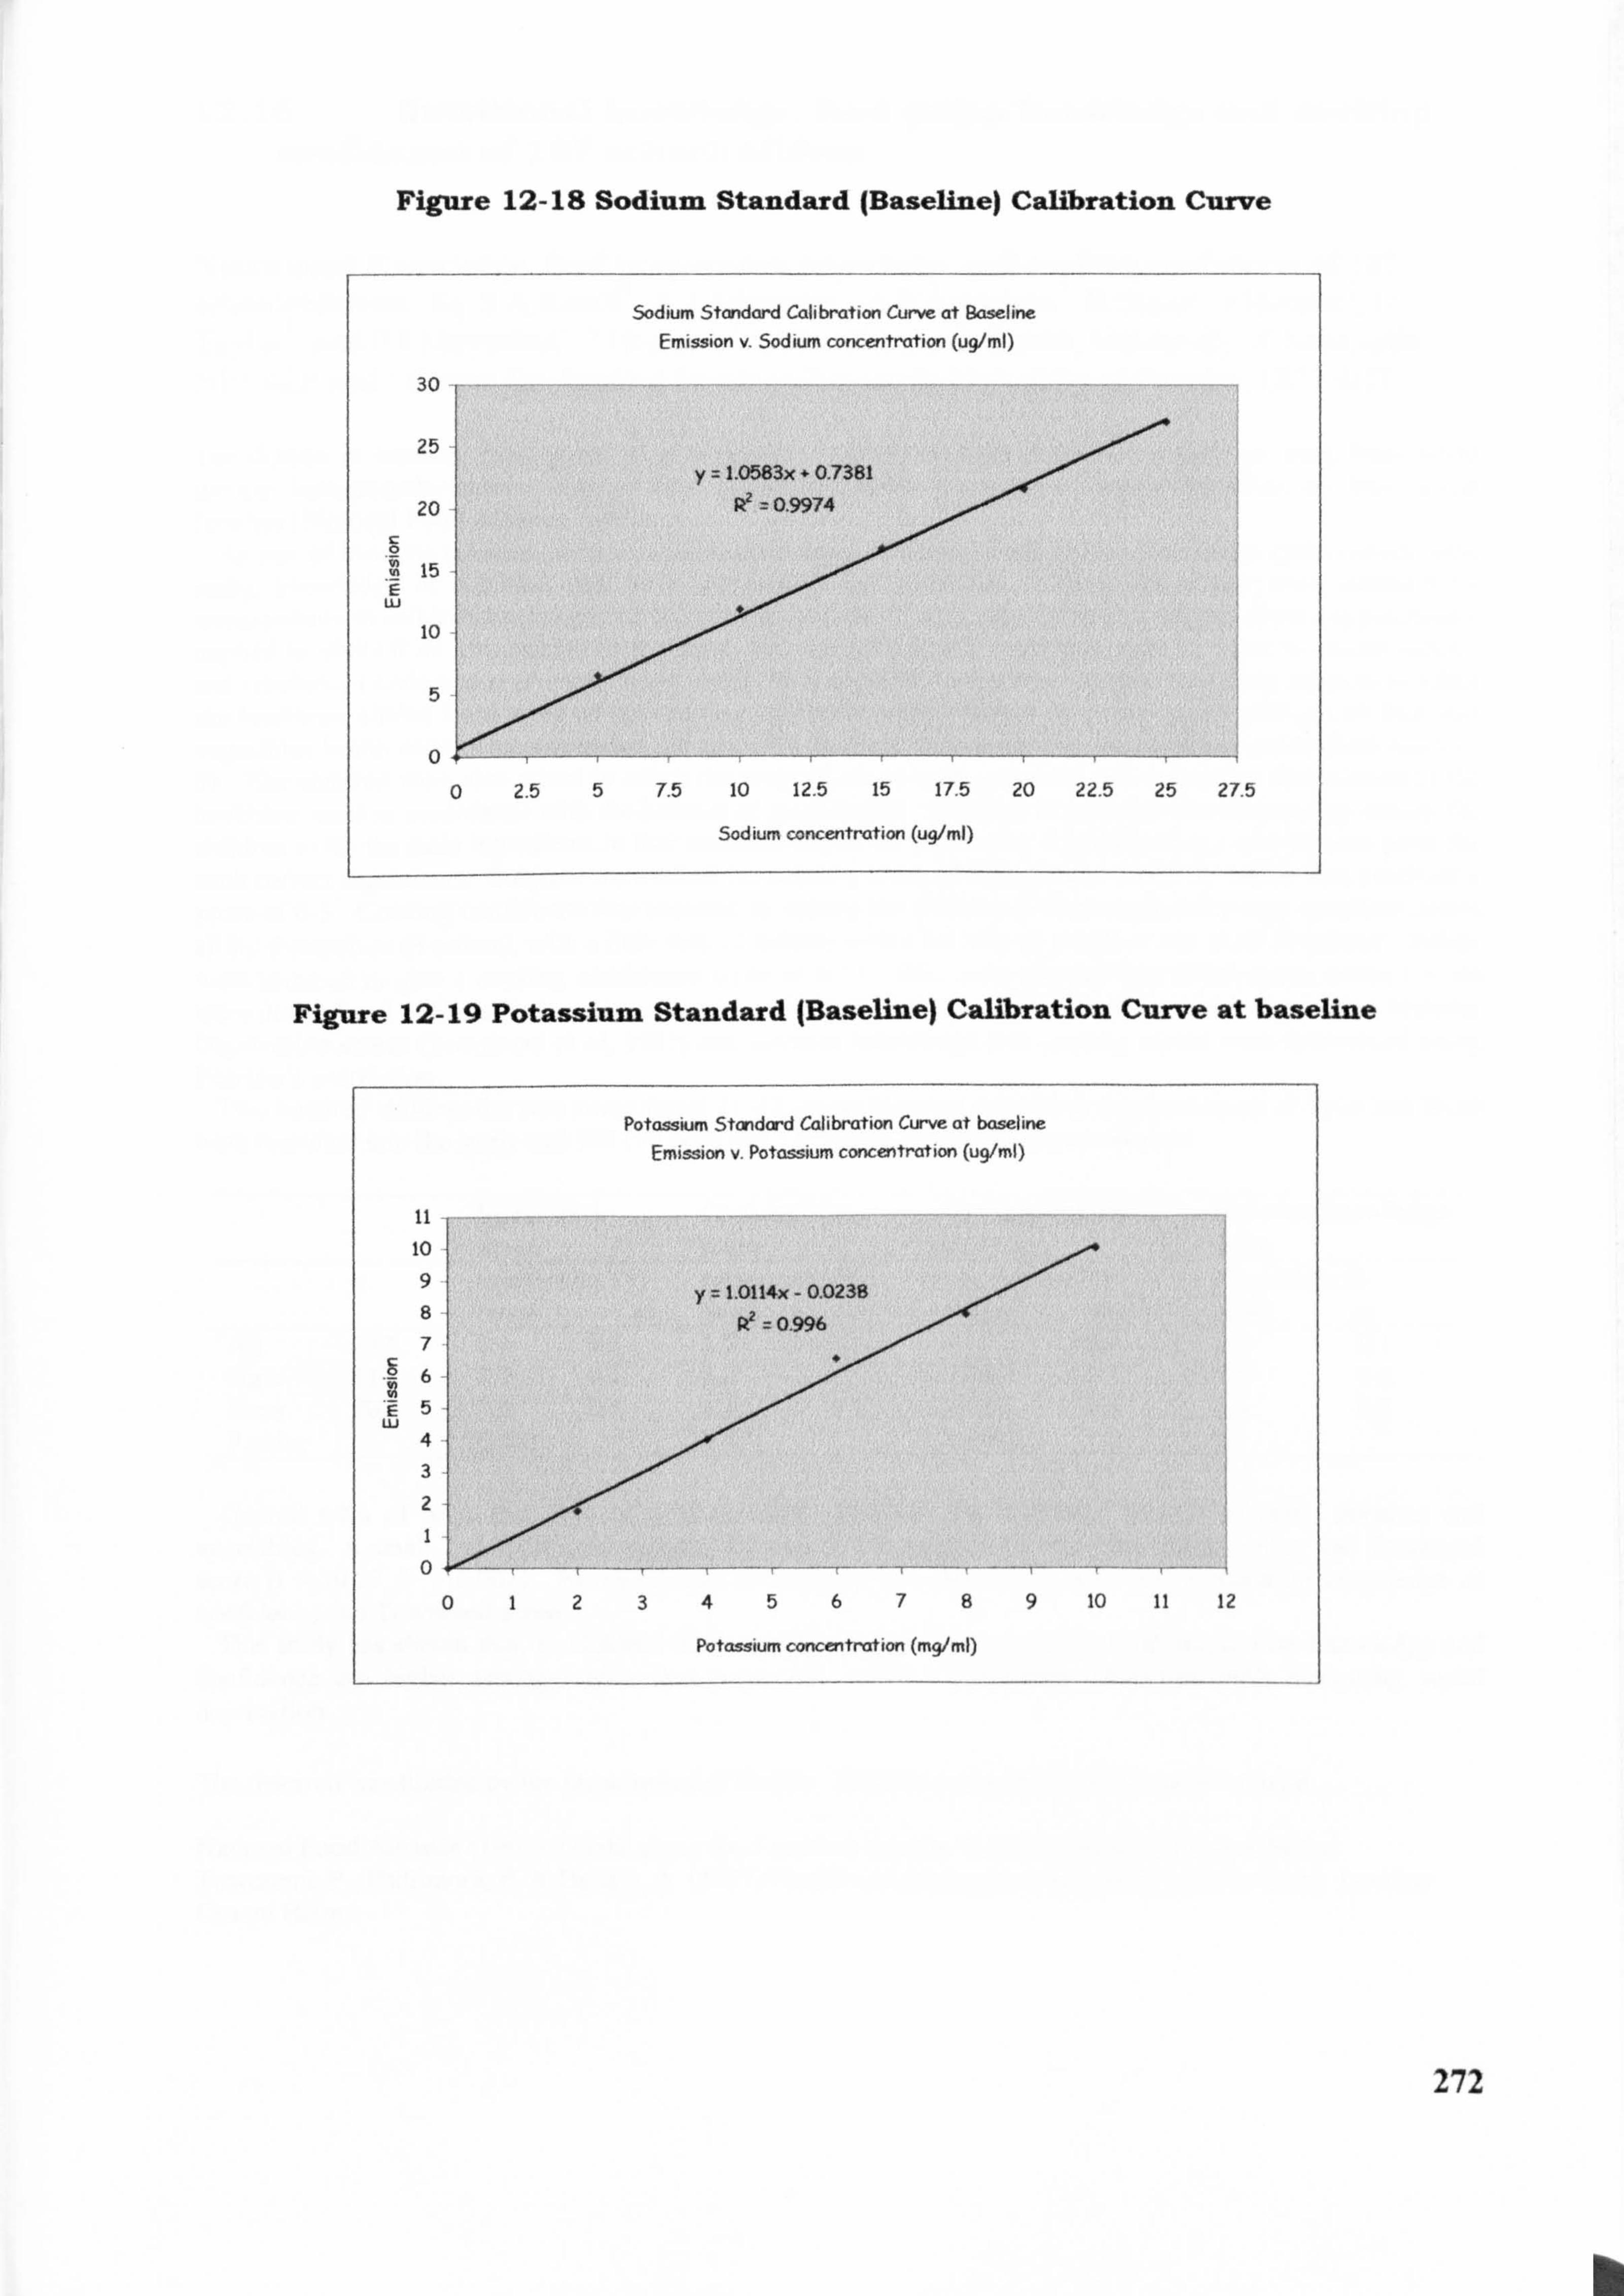
Figure 12-18 Sodium Standard (Baseline) Calibration Curve
Sodium Standard Calibration Curve at Baseline Emission v- Sodium concentration (ug/ml)
30
25 y 1,0583x - 0.7381
20 R2 0.9974
0 15
.T E LU
10
5
0
0 2.5 5 7.5 10 12.5 15 17.5 20 22.5 25 2T5
Sodium concentration (ug/ml)
Figure 12-19 Potassium Standard (Baseline) Calibration Curve at baseline
Potassium Standard Calibration Curve at baseline Emission v. Potassium concentration (ug/ml)
it 10 9 1.0114x - 0.023183 82
to
P? 0.9ý96 7
6
E5 Lu
4 3
2
0
0123456789 10 11 12
Potassium concentration (mg/ml)
272
b
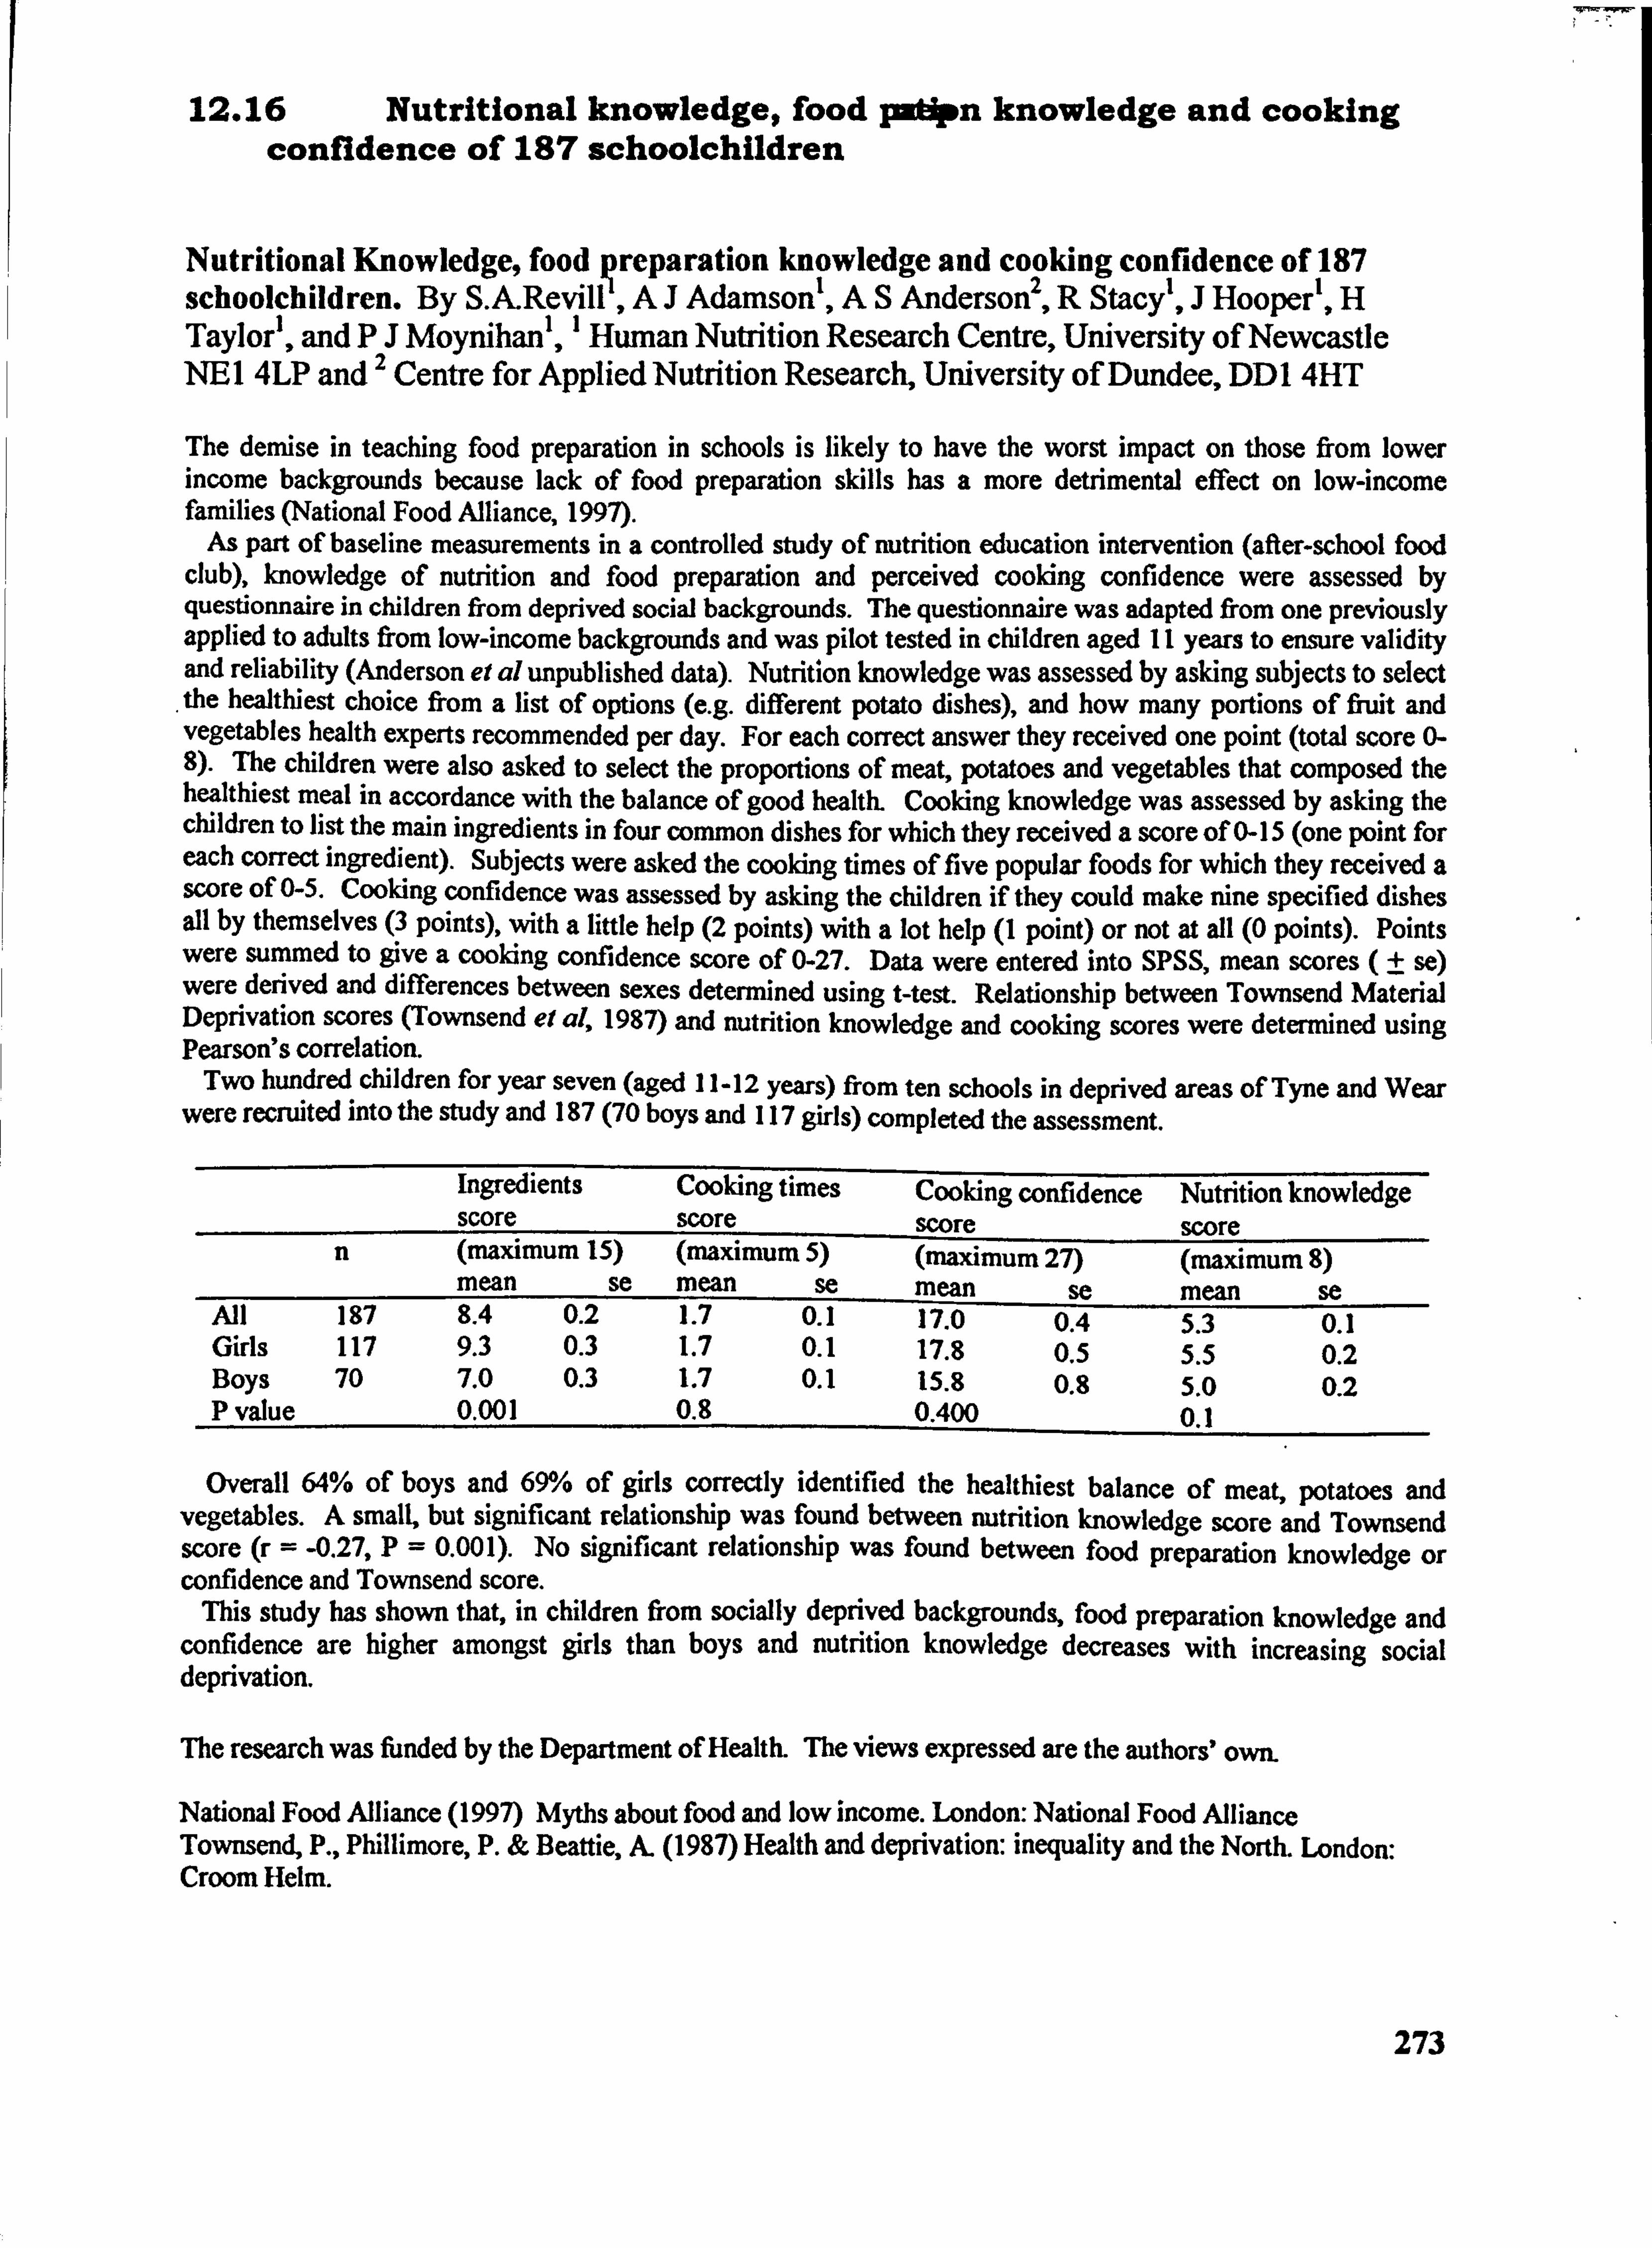
12.16 Nutritional knowledge, food patipn knowledge and cooking confidence of 187 schoolchildren
Nutritional Knowledge, food preparation knowledge and cooking confidence of 187 schoolchildren. By S. A-Revill', AJ Adamson', AS Anderson2, R Stacy', J Hooper', H Taylor', and P2J Moynihan', 1 Human Nutrition Research Centre, University of Newcastle NE14LPand Centre for Applied Nutrition Research, University of Dundee, DDI 4HT
The demise in teaching food preparation in schools is likely to have the worst impact on those from lower income backgrounds because lack of food preparation skills has a more detrimental effect on low-income families (National Food Alliance, 1997).
As part of baseline measurements in a controlled study of nutrition education intervention (after-school food club), knowledge of nutrition and food preparation and perceived cooking confidence were assessed by questionnaire in children from deprived social backgrounds. The questionnaire was adapted from one previously applied to adults from low-income backgrounds and was pilot tested in children aged II years to ensure validity and reliability (Anderson el al unpublished data). Nutrition knowledge was assessed by asking subjects to select the healthiest choice from a list of options (e. g. different potato dishes), and how many portions of fnjit and vegetables health experts recommended per day. For each correct answer they received one point (total score 0- 8). The children were also asked to select the proportions of meat, potatoes and vegetables that composed the healthiest meal in accordance with the balance of good health. Cooking knowledge was assessed by asking the children to list the main ingredients in four common dishes for which they received a score of 0- 15 (one point for each correct ingredient). Subjects were asked the cooking times of five popular foods for which they received a score of 0-5. Cooking confidence was assessed by asking the children if they could make nine specified dishes all by themselves (3 points), with a little help (2 points) with a lot help (I point) or not at all (0 points). Points were summed to give a cooking confidence score of 0-27. Data were entered into SPSS, mean scores (t se) were derived and differences between sexes determined using t-test. Relationship between Townsend Material Deprivation scores (Townsend et al, 1987) and nutrition knowledge and cooking scores were determined using Pearson's correlation.
Two hundred children for year seven (aged 11-12 years) from ten schools in deprived areas of Tyne and Wear were recruited into the study and 187 (70 boys and 117 girls) completed the assessment.
Ingredients Cooking times Cooking confidence Nutrition knowledge score score score score
n (maximum 15) (maximum 5) (maximum 27) (maximum 8) mean se mean se mean se mean se
All 197 8.4 0.2 1.7 0.1 17.0 0.4 5.3 0.1 Girls 117 9.3 0.3 1.7 0.1 17.8 0.5 5.5 0.2 Boys 70 7.0 0.3 1.7 0.1 15.8 0.8 5.0 0.2 P value 0.001 0.8 0.400 0.1
Overall 64% of boys and 69% of girls correctly identified the healthiest balance of meat, potatoes and vegetables. A small, but significant relationship was found between nutrition knowledge score and Townsend score (r = -0.27, P=0.001). No significant relationship was found between food preparation knowledge or confidence and Townsend score.
This study has shown that, in children from socially deprived backgrounds, food preparation knowledge and confidence are higher amongst girls than boys and nutrition knowledge decreases with increasing social deprivation.
The research was funded by the Department of Health. The views expressed are the authors' own.
National Food Alliance (1997) Myths about food and low income. London: National Food Alliance Townsend, P., Phillimore, P. & Beattie, A. (1987) Health and deprivation: inequality and the North. London: Croom Helm.
273
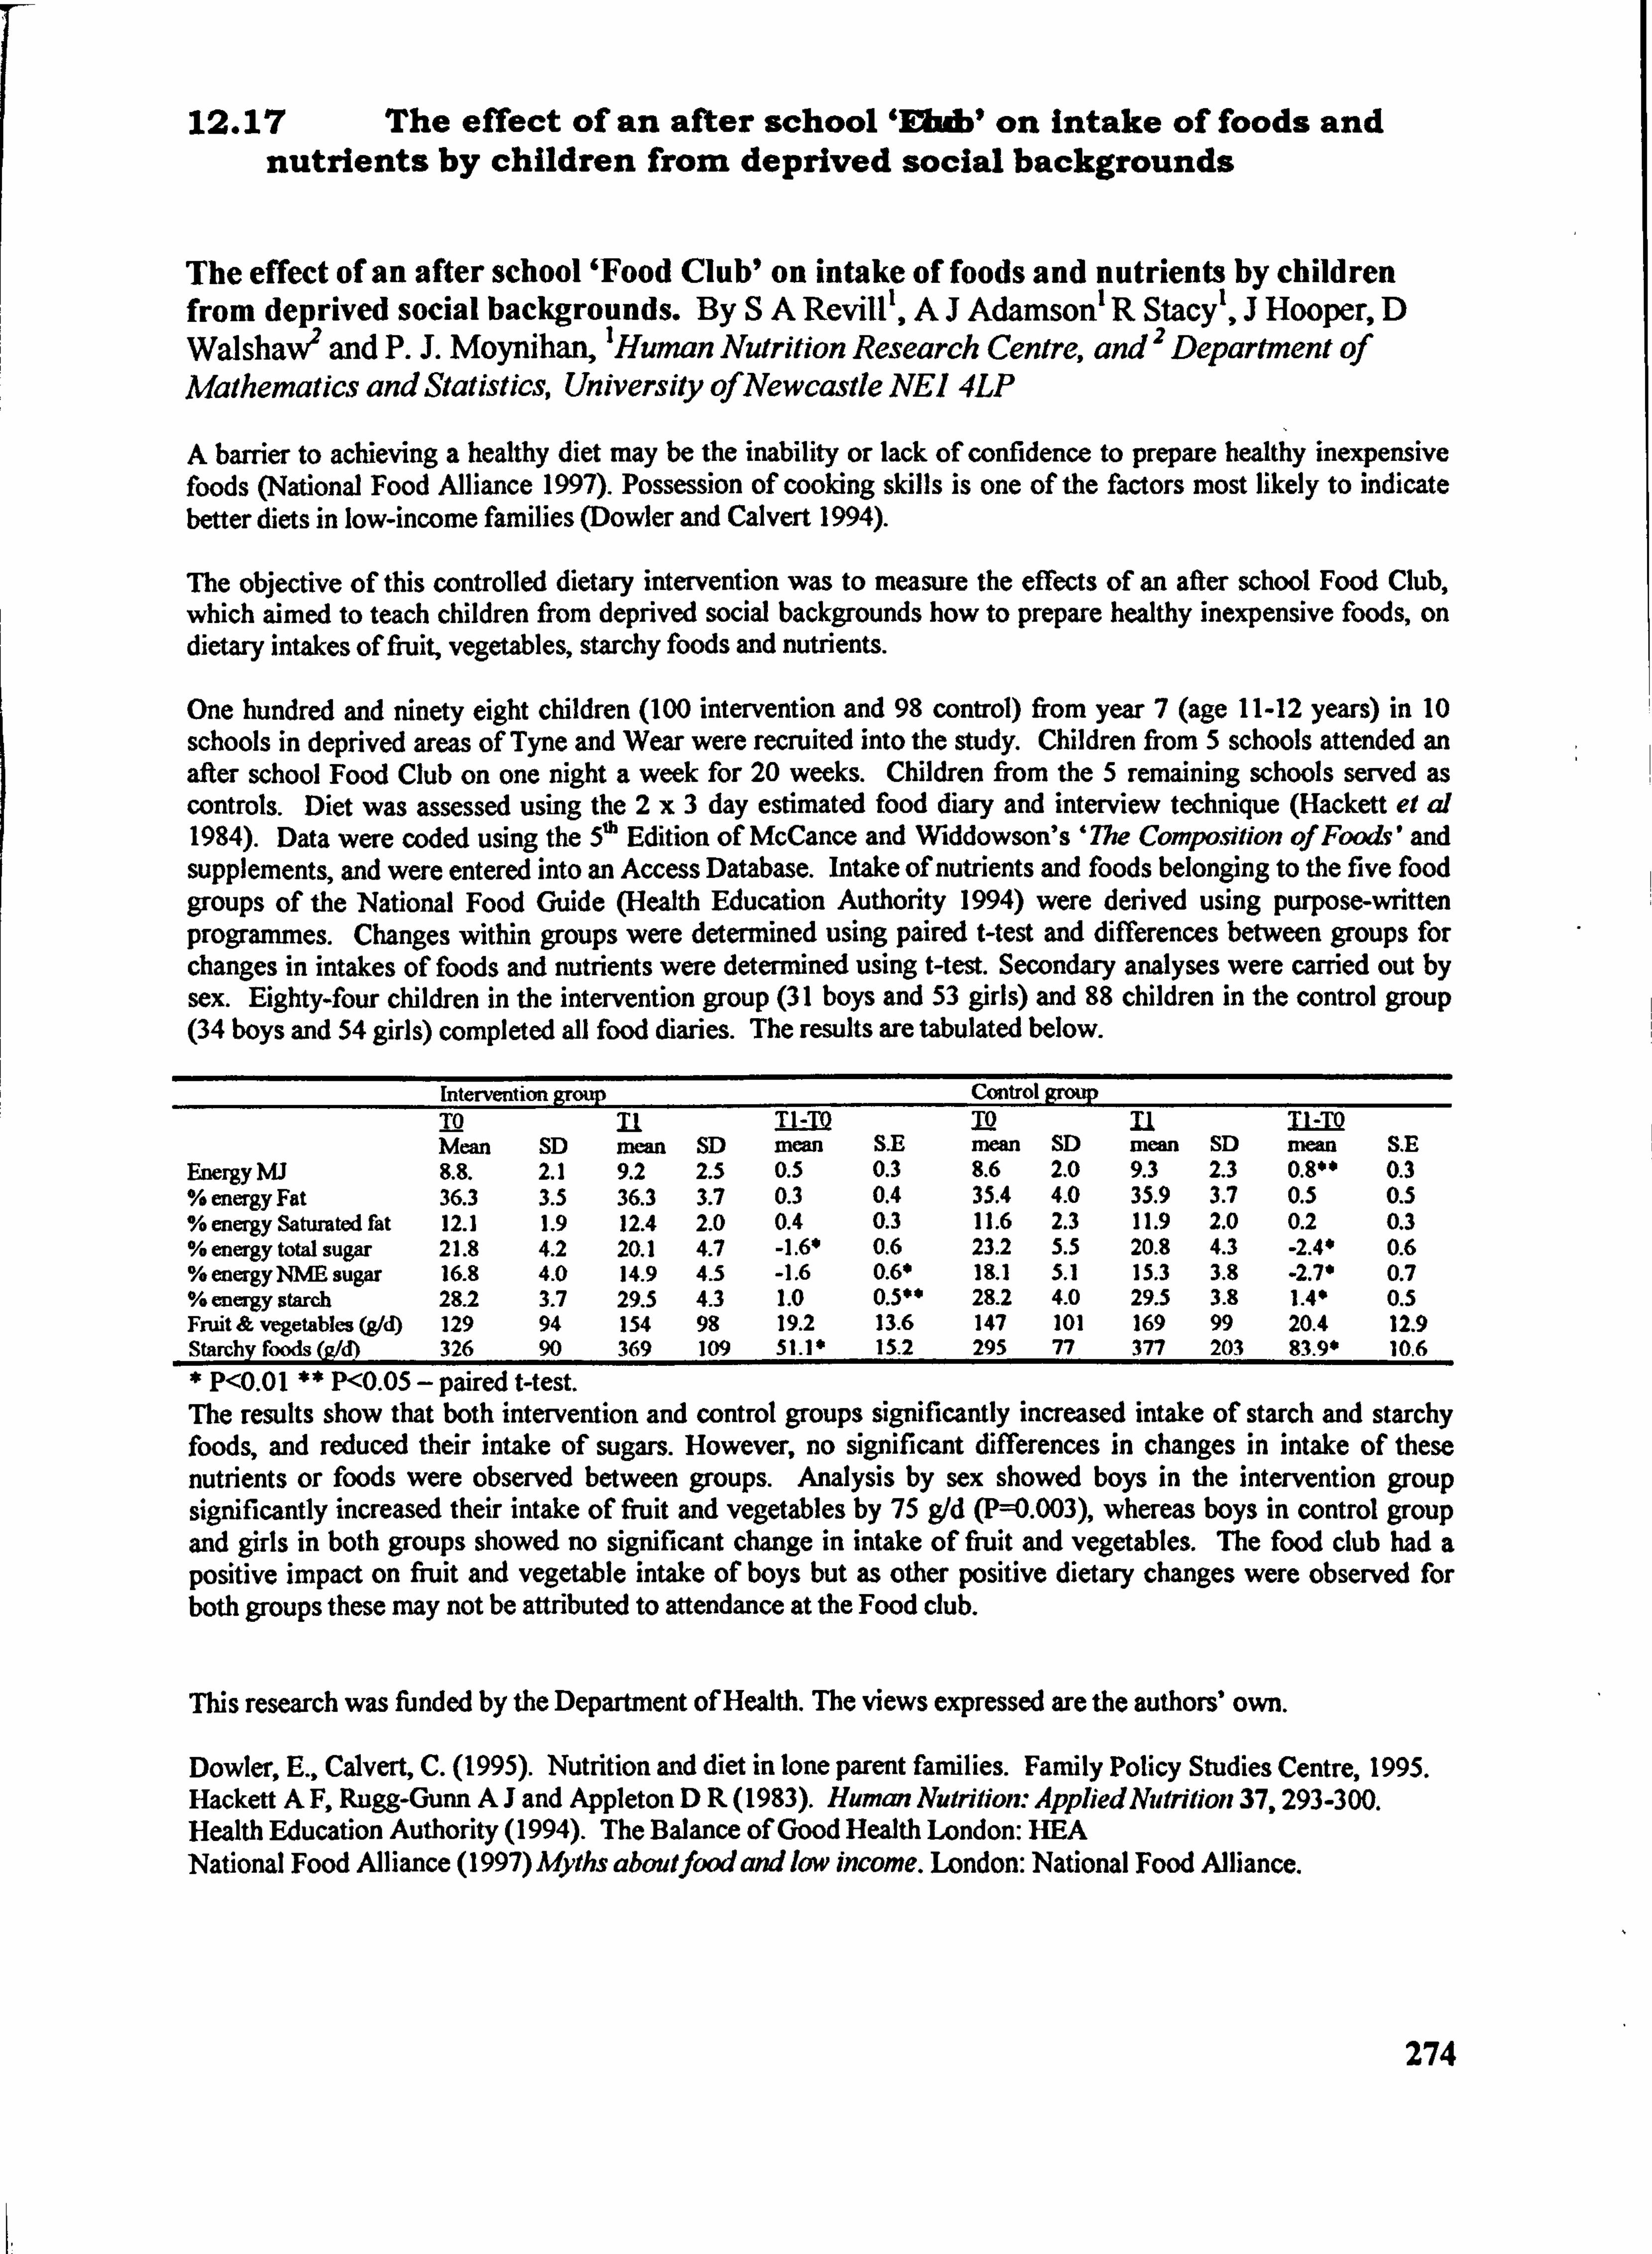
12.17 The effect of an after school 'EbAbI on intake of foods and nutrients by children from deprived social backgrounds
The effect of an after school 'Food Club' on intake of foods and nutrients by children from deprived social backgrounds. By SA Revill', AJ Adamson' R Stacy', J Hooper, D Walshaw*' and P. J. Moynihan, 'Human Nutrition Research Centre, and 2 Department of Mathematics and Statistics, University ofNewcastle NEI 4LP
A barrier to achieving a healthy diet may be the inability or lack of confidence to prepare healthy inexpensive foods (National Food Alliance 1997). Possession of cooking skills is one of the factors most likely to indicate better diets in low-income families (Dowler and Calvert 1994).
The objective of this controlled dietary intervention was to measure the effects of an after school Food Club, which aimed to teach children from deprived social backgrounds how to prepare healthy inexpensive foods, on dietary intakes of fruit, vegetables, starchy foods and nutrients.
One hundred and ninety eight children (100 intervention and 98 control) from year 7 (age 11-12 years) in 10 schools in deprived areas of Tyne and Wear were recruited into the study. Children from 5 schools attended an after school Food Club on one night a week for 20 weeks. Children from the 5 remaining schools served as controls. Diet was assessed using the 2x3 day estimated food diary and interview technique (Hackett et al 1984). Data were coded using the 5ýh Edition of McCance and Widdowson's '7he Composition of Foods' and supplements, and were entered into an Access Database. Intake of nutrients and foods belonging to the five food groups of the National Food Guide (Health Education Authority 1994) were derived using purpose-written programmes. Changes within groups were determined using paired t-test and differences between groups for changes in intakes of foods and nutrients were determined using West. Secondary analyses were carried out by sex. Eighty-four children in the intervention group (31 boys and 53 girls) and 88 children in the control group (34 boys and 54 girls) completed all food diaries. The results are tabulated below.
Intervention grou p Control group IQ n TI -TID TO Mean SD mean SD mean SE mean SD mean SD nwan S. E
Energy MJ 8.8. 2.1 9.2 2.5 0.5 0.3 8.6 2.0 9.3 2.3 0.8*0 0.3 % energy Fat 36.3 3.5 36.3 3.7 0.3 0.4 35.4 4.0 35.9 3.7 0.5 0.5 % energy Saturated fat 12.1 1.9 12.4 2.0 0.4 0.3 11.6 2.3 11.9 2.0 0.2 0.3 % energy total sugar 21.8 4.2 20.1 4.7 -1.6* 0.6 23.2 5.5 20.8 4.3 -2.4* 0.6 % energy NME sugar 16.8 4.0 14.9 4.5 -1.6 0.6* 19.1 5.1 15.3 3.8 -2.7* 0.7 % energy starch 28.2 3.7 29.5 4.3 1.0 0.5** 28.2 4.0 29.5 3.8 1.4* 0.5 Fruit & vegetables (gId) 129 94 154 98 19.2 13.6 147 101 169 99 20.4 12.9 Starchv foods (jz/d) 326 90 369 109 51.1* 15.2 295 77 377 203 83.90 10.6
* P<0.01 ** P<0.05 - paired West. The results show that both intervention and control groups significantly increased intake of starch and starchy foods, and reduced their intake of sugars. However, no significant differences in changes in intake of these nutrients or foods were observed between groups. Analysis by sex showed boys in the intervention group significantly increased their intake of fruit and vegetables by 75 g1d (P=0.003), whereas boys in control group and girls in both groups showed no significant change in intake of firuit and vegetables. The food club had a positive impact on fruit and vegetable intake of boys but as other positive dietary changes were observed for both groups these may not be attributed to attendance at the Food club.
This research was funded by the Department of Health. The views expressed are the authors' own.
Dowler, E., Calvert, C. (1995). Nutrition and diet in lone parent fan-tilies. Family Policy Studies Centre, 1995. Hackett A F, Rugg-Gunn AJ and Appleton DR (1983). Human Nutfition. - AppliedNutrition 37,293-300. Health Education Authority (1994). The Balance of Good Health London: BEA National Food Alliance (1997) Myths aboutfood and low income. London: National Food Alliance.
274