INDIAN JOURNAL OF ANIMAL NUTRITION
100
INDIAN JOURNAL OF ANIMAL NUTRITION I J A N VOL. 37 #1 AN OFFICIAL PUBLICATION OF www.indianjournals.com | www.ansi.org.in http://epubs.icar.org.in/ejournal/index.php/IJAN MARCH 2020
-
Upload
khangminh22 -
Category
Documents
-
view
6 -
download
0
Transcript of INDIAN JOURNAL OF ANIMAL NUTRITION
INDIAN JOURNAL
OF
ANIMAL NUTRITION
IJAN
VOL. 37 #1
AN OFFICIAL PUBLICATION OF
www.indianjournals.com | www.ansi.org.inhttp://epubs.icar.org.in/ejournal/index.php/IJAN
MARCH 2020
INDIAN JOURNAL OF ANIMAL NUTRITION(A quarterly publication)
EDITORIAL BOARD
Ashish Tyagi, University of Louisville, Louisville, United
States
Luisa Biondi, University of Catania, Catania, Italy
Dragan Sefer, Belgrade University Serbia, Serbia
Nurcan Cetinkaya, Turkey
Seyed Hadi Ebrahimi, Ferdowsi University of Mashhad,
Iran
Vinod Kumar Sidhu, DUVAS, Mathura, Uttar Pradesh
V.B. Chaturvedi, ICAR-IVRI, Izatnagar, Uttar Pradesh,
India
P.K. Nayak, ICAR-CARI, Bhubaneswar, Odisha
P.M. Chatterjee, West Bengal University of Animal and
Fishery Sciences, West Bengal
Goutam Mondal, ICAR-NDRI, Karnal, Haryana
K.C. Das, ICAR- CIFA, Mumbai, Maharashtra
Parimal Sardar, ICAR-CIFE, Mumbai, Maharashtra
A. Sahoo, Avikanagar, Rajasthan
B.N. Saikia, Assam
R.K. Swain, Bhubaneswar, Odisha
S.K. Mahanta, IGFRI, Jhansi, Uttar Pradesh
A.S. Mishra, ICAR, New Delhi
N.S. Maan, Hisar, Haryana
PUBLICATION MANAGEMENT
COMMITTEE
Asit Das, Karnal, Haryana - Chairman
A.K. Tyagi, Karnal, Haryana
T.K. Walli, Karnal, Haryana
R.C. Chopra, Karnal, Haryana
Bhupinder Singh, Karnal, Haryana
Veena Mani, Karnal, Haryana
S.V. Rama Rao, Hyderabad, Telangana
S.K. Verma, Hyderabad, Telangana
Raman Malik, Karnal, Haryana
Sachin Kumar, Karnal, Haryana
P. Vashan, Namakkal, Tamil Nadu
IJAN is supplied free of cost to members of ANSI
Life Membership of Animal Nutrition Society of
India
Membership
A person interested in the activities of the Society who
pays a lumpsum fee of Rs. 4000/- could become Life
Member of the Society. For students the life membership
fee is Rs. 2500/- subject to production of a proof from
his guide. A Life Member will have all the rights and
privileges of an Ordinary Member. The Life Membership
Fee of Foreign Members for SAARC countries is US $
100/- and NON SAARC countries is US $ 100/-
S. Category Amount
No. (Annual)
1 Government and Public Institution Rs. 6000/-
2 Agents fees including postage Rs. 7500/-
(1 year)
3 Benefactor members Rs. 25000/-
(for 10 years)
4 Sustaining members Rs. 25000/-
(for 10 years)
5 For SAARC countries USD 100/-
(postage extra)
6 For other countries USD 100/-
(postage extra)
All application forms and other communication may be
sent to the Secretary, Animal Nutrition Society of India,
Department of Animal Nutrition, Guru Angad Dev
Veterinary and Animal Sciences University, Ludhiana –
141004, Punjab. Bank drafts should be drawn in favour
of ‘Animal Nutrition Society of India’ payable at Karnal.
Email: [email protected]
The articles should be sent to Chief Editor using on line
facility (http://epubs.icar.org.in/ejournal index.php/
IJAN/about/submissions#online Submissions).
Chief Editor welcomes books for reviews; news items
etc.
Change of Address: May be communicated to The
Secretary as well as The Chief Editor.
CHIEF EDITOR
Asit Das, NDRI, Karnal, Haryana
EDITORS
P. Vasan Sachin Kumar Muneendra Kumar
Namakkal, Tamil Nadu Karnal, Haryana Mathura, Uttar Pradesh
Sustaining Member
New Life Members of ANSI
551. Chandra Shekhar Godara
Vishnu Ki Dhani
Jodhpur-342001
Rajasthan
M: 9166062929
e-mail: [email protected]
552. Manjesh Kumar
Opt Kalyan Mandap
New Colony, Kuchaman City-341508
Rajasthan
M: 9782734844
e-mail:[email protected]
553. Mukesh Kumar Gurjar
Bagawash Chorrasi Bariki dahani
Viratnagar-303112
Rajasthan
M: 8107186137
e-mail:[email protected]
554. Sunil Kumar Meena
Vill. Kishorpur, Post Pawata
Wazirpur-322219
Rajasthan
M: 9694372269
e-mail: [email protected]
555. Dileep Kumar Nagar
Vill. Akodiya, Teh. Kishanganj
Baran-325216
M: 8769918846
e-mail: [email protected]
556. Om Parkash
Rukansar
Ramgarh – Shekhawati-331024
Distt. Sikar, Rajasthan
M: 7527861684
e-mail: [email protected]
557. Buddha Ram
Bera - Mithani
Bagari - Nagar Sojat
Pali-306114
Rajasthan
M: 9772227090
e-mail: [email protected]
558. Bhupendra Kaswan
Chaksgar, Ttbbt
Hanumangarh-335526
Rajasthan
M: 9460619032
e-mail: [email protected]
559. Shyam Sunder Siyag
Naryan Ram Chetan Ram
Shop No. 198
Nokha Krishi Upaj Mandi-334803
M: 9829960827
e-mail: [email protected]
560. Praveen Sivakumara Banakar
Sivakumara Swamy B
Ballari-583101
Karnataka
M: 9538913204, 9633116480
e-mail: [email protected]
561. Moustafa Mohamed Ahmed
Lab No. 10, Animal Nutrition Division,
ICAR-NDRI, Karnal-132001
e-mail: [email protected]
562. Dr. Gayathri S. Lal
Ph.D. Scholar
LPM Section,
NDRI, Karnal-132001, Haryana
M: 9400739830
e-mail: [email protected]
SM1. Fermenta Biotech LimitedA-1501, Thane One, DIL Complex, Ghodbunder Road, Majiwada, Thane (West) 400 610, Maharashtra, India
Mobile: +91 98 92659914 | Email: [email protected] | Web: www.fermentabiotech.com
ACKNOWLEDGEMENTAnimal Nutrition Society of India puts on record its sincere thanks to Indian Council of Agri-
cultural Research, New Delhi for grant of financial support for publication of IJAN
563. Nutan Chauhan
MVSc. Scholar
Room No. 16, Alknanda Girls Hostel,
NDRI, Karnal-132001, Haryana
M: 8279967058
564. Prabhank Pathak
# 515, Phase-4, Mohali-160059
M: 9814743423
e-mail: [email protected]
565. Snehdeep Singh
S/o Varinder Singh
H.No. 141/200, Shastri Nagar, Batala
Gurdaspur-143505 Punjab
M: 7889515758
e-mail: [email protected]
566. Sanjay Ratan Bhosale
AT- Chorpongra
Post - Bibitq Lonor
Distt. Buldhana-443202, Maharashtra
M: 7219480559
e-mail: [email protected]
567. Shilwant Sandip Surendra
Ayodhya Niwas,
Yashweant Nagar, Tandulwadi Road,
Kallam, Osmanabad, Maharashtra-413507
M: 9960330240
e-mail: [email protected]
568. Ashwani Kumar Singh
Vety. Gynae & Obst.
GADVASU, Ludhiana-14100
M: 9815752049
e-mail: [email protected]
569. Inderpal Singh
New Sant Nagar,
H.No. 448/14,
Trimmo Road, Gurdaspur-143521, Punjab
M: 9149644320
e-mail: [email protected]
570. Gursimran Singh
Nai Abadhi, Street No. 12
Chotti Pori, H. No. B-4576,
Abohar-152116, Punjab
M: 9041945489
e-mail: [email protected]
571. CR Chakkarvartni
219, Crtraders.
Namakkal-637001, Tamil Nadu
M: 9585533972
e-mail: [email protected]
572. Thomas Taye
LPM, GBPUAT, Pantnagar-263145
Uttrakhand
M: 8402822320
e-mail: [email protected]
573. Prashant Kumar
LPM, GBPUAT, Pantnagar-263145
Uttrakhand
M: 7300516304
e-mail: [email protected]
574. Suryapratap Singh Chauhan
C/o Sanjay Kumar
GBPUAT, Pantnagar-263145
Uttrakhand
M: 7895884377
e-mail: [email protected]
575. Dinresh Kumar
LPM, GBPUAT,
Pantnagar-263145
Uttrakhand
M: 9839964194
email: [email protected]
576. Manoj Kumar Singh
H.No. 9/1, New Campus, SVPUAT
Meerut-250110, Uttar Pradesh
M: 9410825482
email: [email protected]
577. Deepikesh Joshi
Deptt. of LPM,
G.B. Pant University, Pantnagar-263145
Uttrakhand
M: 9368550261
email: [email protected]
578. Kamal Bansod
Deptt. of LPM,
G.B. Pant University, Pantnagar-263145
Uttrakhand
M: 9303455109
email: [email protected]
579. Dr. Pal Shivajee
Deptt. of LPM, GBPUAT
Pantnagar-263145
Uttrakhand
M: 7905361747
email: [email protected]
580. Om Parkash Malu
Assistant Professor
Deptt. LPT,
College of Vet. Sci.,
GADVASU, Ludhiana
M: 7837137430
email: [email protected]
581. Donthu Sai Pranthi
Deptt. LPM,
GADVASU, Ludhiana
582. Sandeep Kumar
VPO Dhani Garan
Badhawar, Hisar-125121
M: 7017732423
email: [email protected]
583. Ram Savrup Singh
Deptt. Animal Nutrition,
LUVAS, Hisar
M: 8901909990
email: [email protected]
584. Bhavsar Maitri Yogesh Kumar
13, Samta Row House,
ATPL, Trimandir, Adalat
Gandhi Nagar-382421
Gujarat
email: [email protected]
585. Ajay Prahlad Bhai Raval
Assistant Professor
Deptt. Animal Nutrition
College of Vety. Sci.
Navsari Agri University
Navsari-396450
Gujarat
M: 9924874477
email: [email protected]
Ruminants
1. Effect of Diets with Varying Levels of Metabolizable Energy on Lactation
Performance and Metabolic Profile of Buffaloes
Alkesh Chaudhari, Nitin Tyagi, Jawid Sediqi, Sachin Kumar and A.K. Tyagi
2. Effect of Supplementing Molasses Based Multi-Nutrient Liquid Supplement
(MMLS) on Nutrient Intake, Digestibility and Growth Performance of Buffalo Calves
Rojita Yengkhom, Putan Singh, A.K. Verma and Bornalee Handique
3. Effect of Challenge Feeding on Prepartum and Postpartum Dry Matter Intake in
Sahiwal Cattle in the Arid Region of Rajasthan
Vikramjit Singh, Subhas Chander Goswami, Arun Kumar Jhirwal, Vijay Kumar
Choudhary and Mohan Lal Choudhary
4. Effect of Replacement of Conventional Feeds by Prosopis juliflora Pods and Citrullus
lanatus Seed Cake on Haemato-Biochemical Parameters in Marwari Goats
Dharmendra Chharang, Tribhuwan Sharma, Monika Karnani, Manju and
Rajesh Kumar
5. Mineral Mixture Feeding Enhances Dairy Animals Productivity: A Study of Bihar,
India
Dhiraj K. Singh, Shree P. Sahu and Nils Teufel
6. Effects of Formic and Propionic Acid as Silage Additive on Haematology and
Biochemical attributes in Growing Cattle
Vivekanand, Muneendra Kumar, Vinod Kumar, Raju Kushwaha, Shalini Vaswani,
Avinash Kumar, Pankaj Kumar Shukla and Rajneesh Sirohi
7. Effect of Feeding of Hydroponics Maize Green Fodder with and without
Supplementation of Probiotics (Saccharomyces cerevisiae) on Feed Consumption in
Gir Calves
Monika Joshi, S.K. Sharma and C.S. Vaishnava
8. In-Vitro Study on Dissolution Profiling of Choline Chloride Encapsulated by
Different Microencapsulation Technologies and Active Forms
Sunil Chauhan and Bhupesh Gautam
9. Ensuring Nutritional Security of Animals by Mixed Cropping of Sorghum and Guar
under Varying Nutrient Management
Ankur Bhakar, Magan Singh, Sanjeev Kumar, Susanta Dutta, Ranajit Kumar Mahanta
and Santosh Onte
Non-Ruminants
10. Effect of Replacement of Maize by Animal Fat on Energy Utilization in Pigs
N. Elanchezhian and Ally K.
INDIAN JOURNAL OF ANIMAL NUTRITION
(www.indianjournals.com; www.ansi.org.in; http://epubs.icar.org.in/ejournal/index.php/IJAN)
March, 2020 Vol. 37 #1
CONTENTS
1
9
14
21
26
31
39
44
48
57
11. Effect of Feeding Different Levels of Ajwain (Trachyspermum ammi L.) Powder on
Growth Performance and Carcass Characteristics in Japanese quails
M. Deepthi, D. Srinivas Kumar, E. Raghava Rao and S. Jagadeeswara Rao
12. Effects of feeding Cashew Apple Waste with or without Supplementation of Non-
starch Polysaccharide Degrading Enzymes on Nutrient Digestibility and Growth
Performance of broilers
Venkatramana P, Senthil Murugan S, Biju Chacko, Patki H.S, Shyama K and
Sunanda C.
13. Efficacy of Crude Soya oil and Emulsifier in Ration on Production Performance of
Broilers
G. Srinivasan, N. Arul Nathan, V. Thanaseelaan and A. Ruba Nanthini
14. Effect of Supplementation of Geloi (TinosporaCordifolia) Stem Powder and Ascorbic
Acid on Economics of Broiler Production in Arid Zone of Rajasthan
D. Jain, R.K. Dhuria, T. Sharma, T. Bothra and Umesh Kumar Prajapat
Short communication
15. Utilization of Plant Based Attractants in Labeo rohita Advanced Fingerlings Diet
P. Singh, J. Mahintamani and J. Maity
62
67
74
78
82
1
Indian Journal of
Animal Nutrition
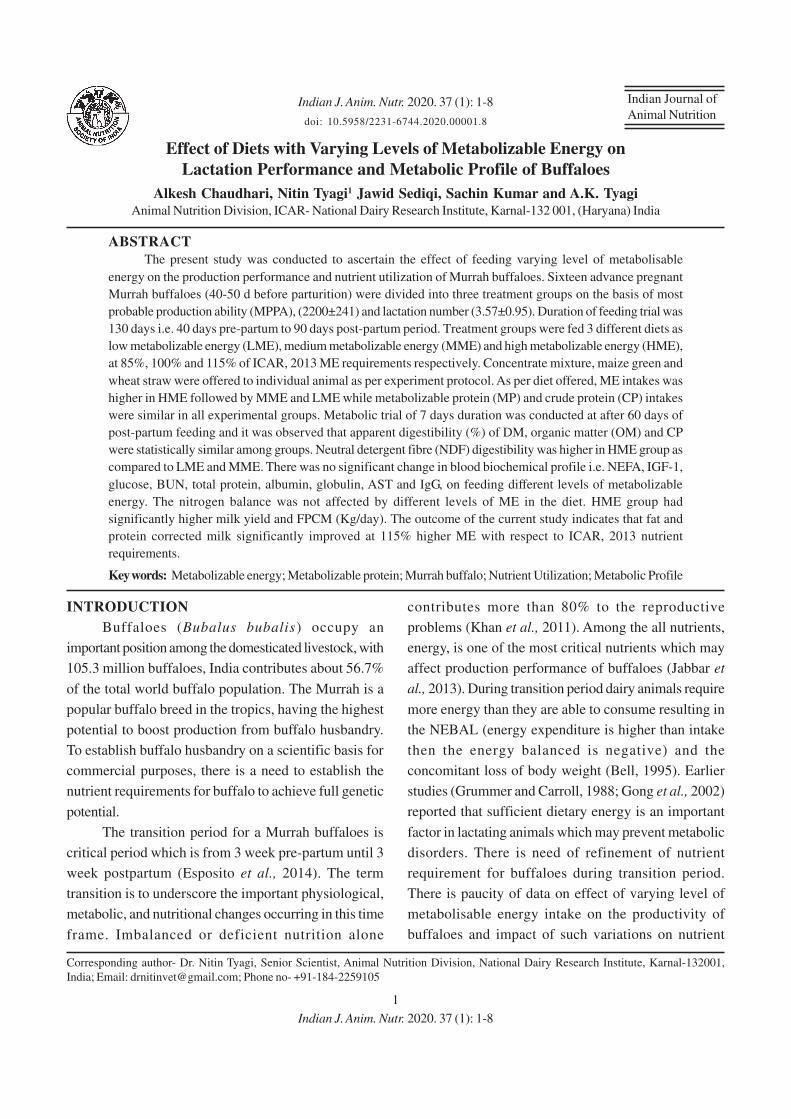
Effect of Diets with Varying Levels of Metabolizable Energy on
Lactation Performance and Metabolic Profile of Buffaloes
Alkesh Chaudhari, Nitin Tyagi1 Jawid Sediqi, Sachin Kumar and A.K. Tyagi
Animal Nutrition Division, ICAR- National Dairy Research Institute, Karnal-132 001, (Haryana) India
ABSTRACT
The present study was conducted to ascertain the effect of feeding varying level of metabolisable
energy on the production performance and nutrient utilization of Murrah buffaloes. Sixteen advance pregnant
Murrah buffaloes (40-50 d before parturition) were divided into three treatment groups on the basis of most
probable production ability (MPPA), (2200±241) and lactation number (3.57±0.95). Duration of feeding trial was
130 days i.e. 40 days pre-partum to 90 days post-partum period. Treatment groups were fed 3 different diets as
low metabolizable energy (LME), medium metabolizable energy (MME) and high metabolizable energy (HME),
at 85%, 100% and 115% of ICAR, 2013 ME requirements respectively. Concentrate mixture, maize green and
wheat straw were offered to individual animal as per experiment protocol. As per diet offered, ME intakes was
higher in HME followed by MME and LME while metabolizable protein (MP) and crude protein (CP) intakes
were similar in all experimental groups. Metabolic trial of 7 days duration was conducted at after 60 days of
post-partum feeding and it was observed that apparent digestibility (%) of DM, organic matter (OM) and CP
were statistically similar among groups. Neutral detergent fibre (NDF) digestibility was higher in HME group as
compared to LME and MME. There was no significant change in blood biochemical profile i.e. NEFA, IGF-1,
glucose, BUN, total protein, albumin, globulin, AST and IgG, on feeding different levels of metabolizable
energy. The nitrogen balance was not affected by different levels of ME in the diet. HME group had
significantly higher milk yield and FPCM (Kg/day). The outcome of the current study indicates that fat and
protein corrected milk significantly improved at 115% higher ME with respect to ICAR, 2013 nutrient
requirements.
Key words: Metabolizable energy; Metabolizable protein; Murrah buffalo; Nutrient Utilization; Metabolic Profile
Corresponding author- Dr. Nitin Tyagi, Senior Scientist, Animal Nutrition Division, National Dairy Research Institute, Karnal-132001,
India; Email: [email protected]; Phone no- +91-184-2259105
INTRODUCTION
Buffaloes (Bubalus bubalis) occupy an
important position among the domesticated livestock, with
105.3 million buffaloes, India contributes about 56.7%
of the total world buffalo population. The Murrah is a
popular buffalo breed in the tropics, having the highest
potential to boost production from buffalo husbandry.
To establish buffalo husbandry on a scientific basis for
commercial purposes, there is a need to establish the
nutrient requirements for buffalo to achieve full genetic
potential.
The transition period for a Murrah buffaloes is
critical period which is from 3 week pre-partum until 3
week postpartum (Esposito et al., 2014). The term
transition is to underscore the important physiological,
metabolic, and nutritional changes occurring in this time
frame. Imbalanced or deficient nutrition alone
Indian J. Anim. Nutr. 2020. 37 (1): 1-8
doi: 10.5958/2231-6744.2020.00001.8
contributes more than 80% to the reproductive
problems (Khan et al., 2011). Among the all nutrients,
energy, is one of the most critical nutrients which may
affect production performance of buffaloes (Jabbar et
al., 2013). During transition period dairy animals require
more energy than they are able to consume resulting in
the NEBAL (energy expenditure is higher than intake
then the energy balanced is negative) and the
concomitant loss of body weight (Bell, 1995). Earlier
studies (Grummer and Carroll, 1988; Gong et al., 2002)
reported that sufficient dietary energy is an important
factor in lactating animals which may prevent metabolic
disorders. There is need of refinement of nutrient
requirement for buffaloes during transition period.
There is paucity of data on effect of varying level of
metabolisable energy intake on the productivity of
buffaloes and impact of such variations on nutrient
Indian J. Anim. Nutr. 2020. 37 (1): 1-8
2
utilisation and metabolic status of animals. Keeping in
view of above, the present study was planned to
evaluate the effect of high and low energy intakes
compared to ICAR, 2013 feeding recommendations on
production performance, nutrient utilisation and blood
biochemical profile of buffaloes on varying plane of
metabolizable energy.
MATERIAL AND METHODS
The experimental protocols that were developed
in this study fully complied with the ethical principles of
animal experimentation prepared by Institutional animal
ethic committee (IAEC)-NDRI.For the present
experiment, sixteen advance pregnant Murrah
buffaloes (40-50 d before parturition) were selected from
the herd of Livestock Research Centre of Institute. The
buffaloes were randomly divided into three treatment
groups i.e. LME (n=5), MME (n=5) and HME (n=6)
group on the basis of MPPA (2294, 2167 and 2155 in
LME, MME and HME respectively), and lactation
number (3.80, 3.41 and 3.52 in LME, MME and HME
respectively).
u)(x1)r (n1
nruMPPA
+−+
+=
Where, u – population mean
r – Repeatability of lactation milk
x – Average of lactation yield
n - Number of lactation records
Total duration of the feeding trial was 130 days
i.e. 40 days pre-partum to 90 days post-partum. The
requirement of ME of experimental animals in the MME
group were fulfilled as per ICAR, 2013 nutrient
requirements, whereas animals in treatment group 1
(LME) and group 2 (HME) were fed a rations having
15% less and 15% more ME as compared to MME.
The varying levels of energy were ensured by adjusting
the energy content of 3 different concentrate mixtures
which were otherwise iso-nitrogenous in nature.
Concentrate mixture, green fodder (maize) and wheat
straw was fed to the animals as total mixed ration (TMR),
in varying ratio as per experiment protocol. Before the
start of the experiment, all animals were properly
de-wormed. The animals were fed twice a day and fresh
clean water was made available.
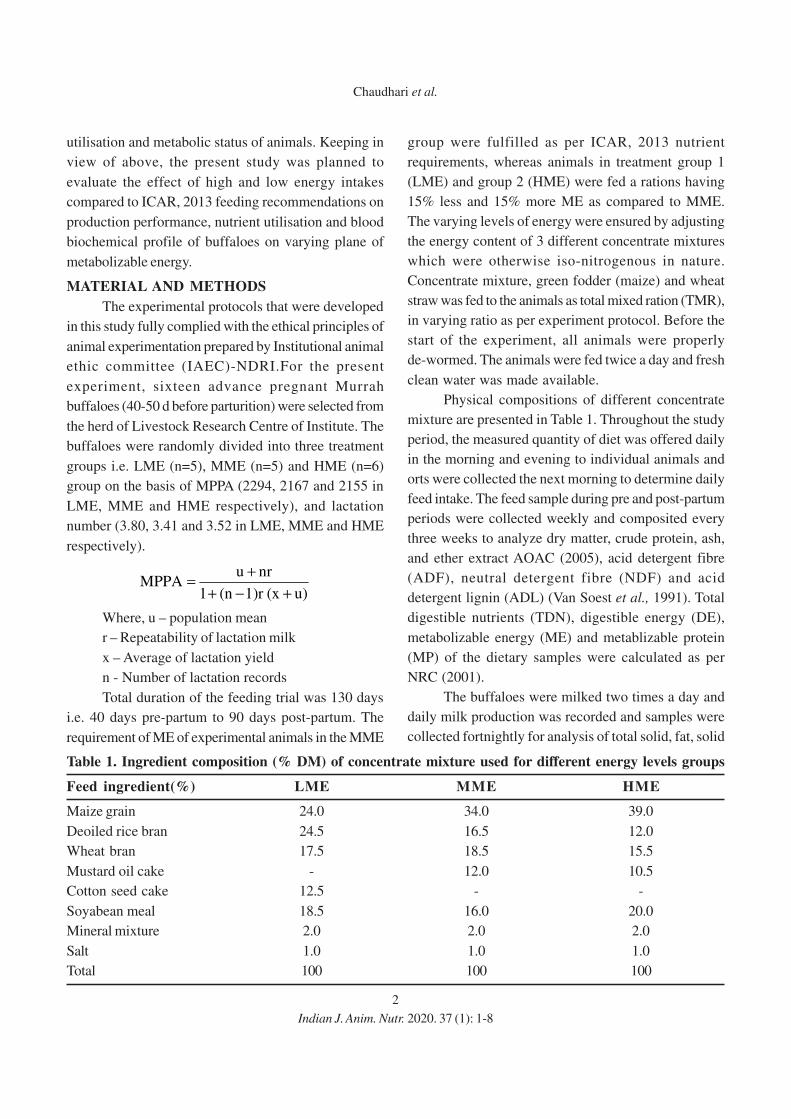
Physical compositions of different concentrate
mixture are presented in Table 1. Throughout the study
period, the measured quantity of diet was offered daily
in the morning and evening to individual animals and
orts were collected the next morning to determine daily
feed intake. The feed sample during pre and post-partum
periods were collected weekly and composited every
three weeks to analyze dry matter, crude protein, ash,
and ether extract AOAC (2005), acid detergent fibre
(ADF), neutral detergent fibre (NDF) and acid
detergent lignin (ADL) (Van Soest et al., 1991). Total
digestible nutrients (TDN), digestible energy (DE),
metabolizable energy (ME) and metablizable protein
(MP) of the dietary samples were calculated as per
NRC (2001).
The buffaloes were milked two times a day and
daily milk production was recorded and samples were
collected fortnightly for analysis of total solid, fat, solid
Table 1. Ingredient composition (% DM) of concentrate mixture used for different energy levels groups
Feed ingredient(%) LME MME HME
Maize grain 24.0 34.0 39.0
Deoiled rice bran 24.5 16.5 12.0
Wheat bran 17.5 18.5 15.5
Mustard oil cake - 12.0 10.5
Cotton seed cake 12.5 - -
Soyabean meal 18.5 16.0 20.0
Mineral mixture 2.0 2.0 2.0
Salt 1.0 1.0 1.0
Total 100 100 100
Indian J. Anim. Nutr. 2020. 37 (1): 1-8
Chaudhari et al.
3
not fat, and protein by using a Milk-O-Scan analyzer
(Foss Electric, Conveyor 4000). The total solids in milk
were calculated by the addition of milk fat% and SNF%.
FPCM (Fat and Protein Corrected Milk) was
calculated using Di Palo’s equation (1992):
Y=1+0.01155 [(X-40) + (Z-31)]
Where: Y is the quantity (kg) of FPCM
equivalent to 1 kg of milk produced;
X and Z are the grams of fat and protein
contained in 1 kg of milk produced
Blood samples were taken from the jugular vein
using heparinized vacutainer in the morning before
offering food. Plasma was obtained by centrifuging
at 3,000×g for 10 min and frozen at -20ºC for later
analysis of blood parameters. IgG and IGF-1 was
quantified by Bioassay Laboratory technique ELISA kit
(Cat no-E0010BO and E0016BO respectively) and
based on the principle of competitive enzyme
immunoassay technique. Blood urea nitrogen (BUN),
aspartase aminotransfrase (AST), total protein,
albumin and globulin were determined by using
diagnostic reagent kit provided by Recombigen
Laboratories Pvt. Ltd. (New Delhi).
After 60 days of post-partum feeding a metabolic
trial was conducted for 7 days duration. Daily faeces of
individual animals were collected for 24 h and pooled in
plastic buckets covered with a lid, while urine was
collected for 24 h and pooled in plastic cans. An aliquot
of fecal sample for dry matter estimation (1/50) and N
estimation (1/500 preserved in 20 % H2SO
4) was
collected daily from individual animal during the
metabolic trial. Representative samples for urine was
collected from individual animals from total urine
collection of 24 hours. The urine samples was then pooled
and preserved in plastic bottles containing 20 ml of 40%
H2SO
4. Samples of feed offered (wheat straw, green
maize and concentrate mixtures) and orts were also
collected daily, and representative samples were kept
for dry matter (DM) estimation. Dried samples of faeces,
feed offered, and orts were ground through a 1-mm
sieve using a Wiley mill. Ground samples were stored in
plastic containers and labelled for subsequent use in
chemical and biochemical estimations.
For the study of cervical (diameter of cervix) and
uterine involution (diameter of both uterine horn) was
checked by using Ultra Sonography technique (USG)
(UST-8520-5 Aloka, probe-6.5 MHz, Japan) on days 7,
14, 21, 28, 35 and 42.
Statistical analysis
Data on various parameters (body weight, DMI,
milk yield) were analyzed by one way ANOVA whereas
blood biochemical parameters was assessed by repeated
measures analysis of variance and further analyzed with
regression procedure using method of Snedecor and
Cochran (2004) and the Statistical Analysis System
(2000). Data is presented as Mean ± SE. Differences
with probabilities (P<0.05) were considered significant.
The mathematical models used were Yij=
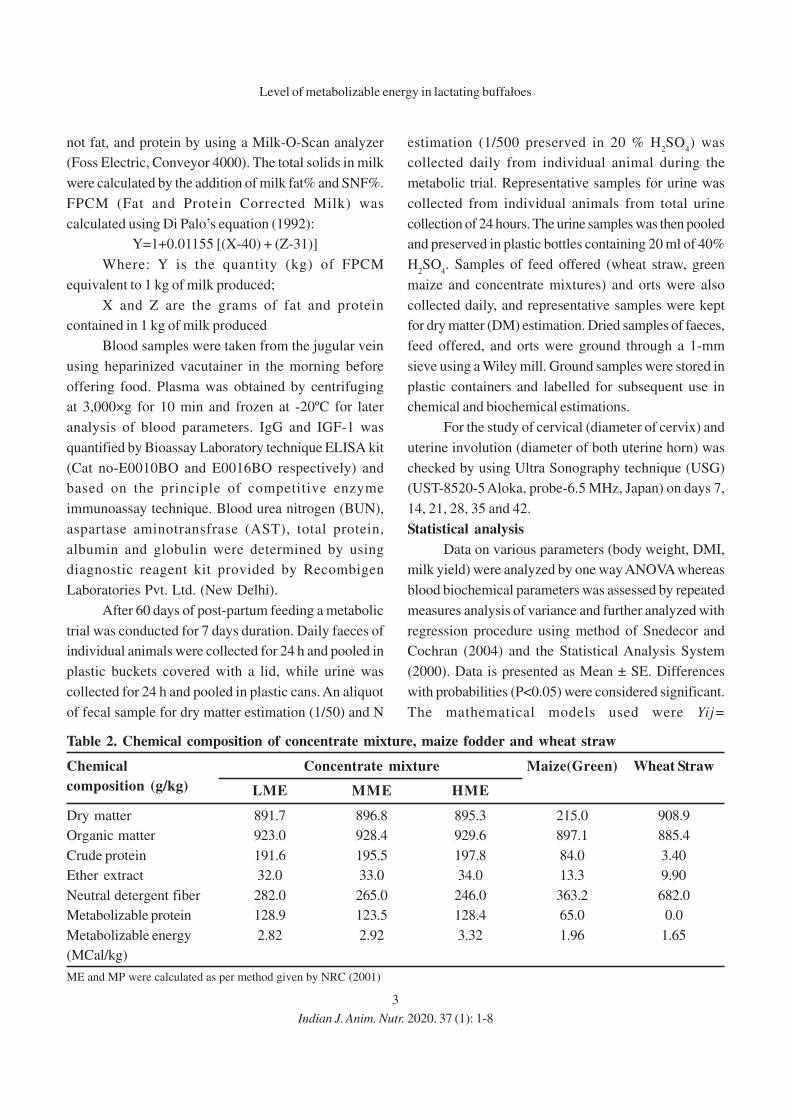
Table 2. Chemical composition of concentrate mixture, maize fodder and wheat straw
Chemical Concentrate mixture Maize(Green) Wheat Straw
composition (g/kg) LME MME HME
Dry matter 891.7 896.8 895.3 215.0 908.9
Organic matter 923.0 928.4 929.6 897.1 885.4
Crude protein 191.6 195.5 197.8 84.0 3.40
Ether extract 32.0 33.0 34.0 13.3 9.90
Neutral detergent fiber 282.0 265.0 246.0 363.2 682.0
Metabolizable protein 128.9 123.5 128.4 65.0 0.0
Metabolizable energy 2.82 2.92 3.32 1.96 1.65
(MCal/kg)
ME and MP were calculated as per method given by NRC (2001)
Indian J. Anim. Nutr. 2020. 37 (1): 1-8
Level of metabolizable energy in lactating buffaloes
4
µ+Ai+ei+Ti+(A X T)+eij and Yi= µ+Ti+ei for blood
parameters and other parameters, respectively.
Where Yij and Yi is the dependent variable (BW;
DMI; MY; Nutrient digestibility; Blood biochemical
parameters etc), is the overall mean, Ti is the effect of
ith treatment (LME, MME and HME), Ai is the fixed
effect of ith treatment, ei is the variability within
treatment group, eij is the variability from animal and
time and is the residual error of the ith observation.
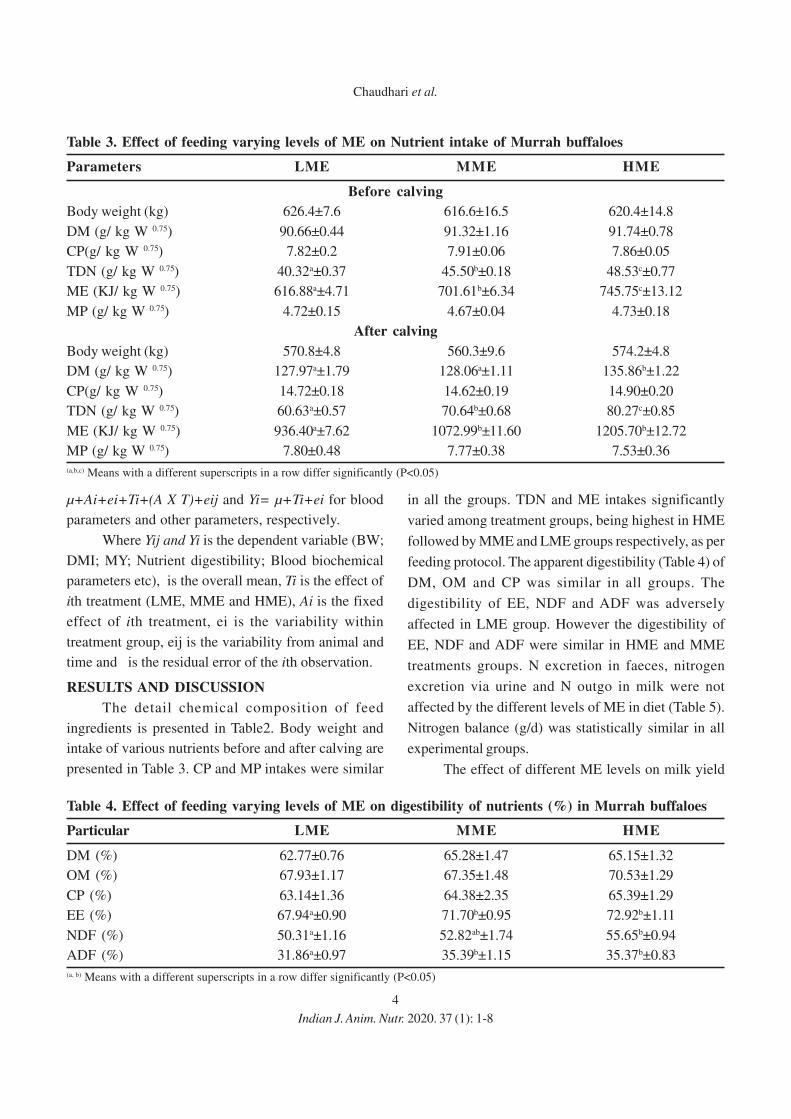
RESULTS AND DISCUSSION
The detail chemical composition of feed
ingredients is presented in Table2. Body weight and
intake of various nutrients before and after calving are
presented in Table 3. CP and MP intakes were similar
in all the groups. TDN and ME intakes significantly
varied among treatment groups, being highest in HME
followed by MME and LME groups respectively, as per
feeding protocol. The apparent digestibility (Table 4) of
DM, OM and CP was similar in all groups. The
digestibility of EE, NDF and ADF was adversely
affected in LME group. However the digestibility of
EE, NDF and ADF were similar in HME and MME
treatments groups. N excretion in faeces, nitrogen
excretion via urine and N outgo in milk were not
affected by the different levels of ME in diet (Table 5).
Nitrogen balance (g/d) was statistically similar in all
experimental groups.
The effect of different ME levels on milk yield
Table 3. Effect of feeding varying levels of ME on Nutrient intake of Murrah buffaloes
Parameters LME MME HME
Before calving
Body weight (kg) 626.4±7.6 616.6±16.5 620.4±14.8
DM (g/ kg W 0.75) 90.66±0.44 91.32±1.16 91.74±0.78
CP(g/ kg W 0.75) 7.82±0.2 7.91±0.06 7.86±0.05
TDN (g/ kg W 0.75) 40.32a±0.37 45.50b±0.18 48.53c±0.77
ME (KJ/ kg W 0.75) 616.88a±4.71 701.61b±6.34 745.75c±13.12
MP (g/ kg W 0.75) 4.72±0.15 4.67±0.04 4.73±0.18
After calving
Body weight (kg) 570.8±4.8 560.3±9.6 574.2±4.8
DM (g/ kg W 0.75) 127.97a±1.79 128.06a±1.11 135.86b±1.22
CP(g/ kg W 0.75) 14.72±0.18 14.62±0.19 14.90±0.20
TDN (g/ kg W 0.75) 60.63a±0.57 70.64b±0.68 80.27c±0.85
ME (KJ/ kg W 0.75) 936.40a±7.62 1072.99b±11.60 1205.70b±12.72
MP (g/ kg W 0.75) 7.80±0.48 7.77±0.38 7.53±0.36
(a,b,c) Means with a different superscripts in a row differ significantly (P<0.05)
Table 4. Effect of feeding varying levels of ME on digestibility of nutrients (%) in Murrah buffaloes
Particular LME MME HME
DM (%) 62.77±0.76 65.28±1.47 65.15±1.32
OM (%) 67.93±1.17 67.35±1.48 70.53±1.29
CP (%) 63.14±1.36 64.38±2.35 65.39±1.29
EE (%) 67.94a±0.90 71.70b±0.95 72.92b±1.11
NDF (%) 50.31a±1.16 52.82ab±1.74 55.65b±0.94
ADF (%) 31.86a±0.97 35.39b±1.15 35.37b±0.83
(a, b) Means with a different superscripts in a row differ significantly (P<0.05)
Indian J. Anim. Nutr. 2020. 37 (1): 1-8
Chaudhari et al.
5
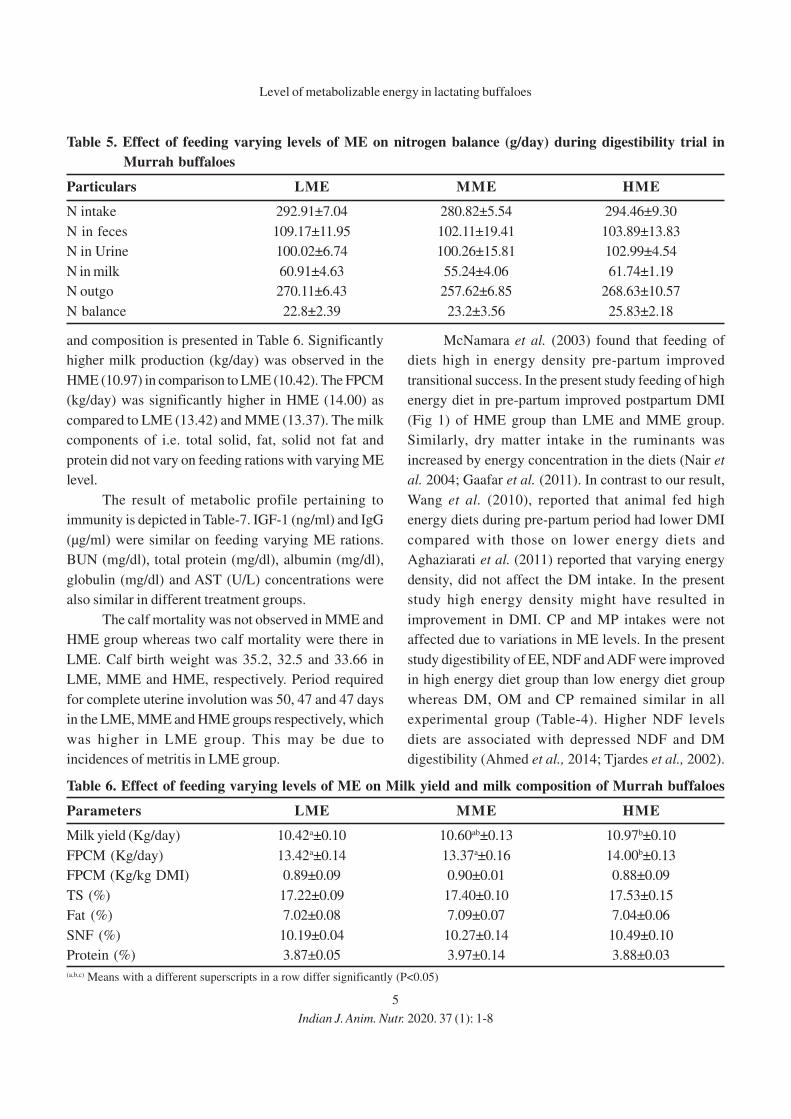
and composition is presented in Table 6. Significantly
higher milk production (kg/day) was observed in the
HME (10.97) in comparison to LME (10.42). The FPCM
(kg/day) was significantly higher in HME (14.00) as
compared to LME (13.42) and MME (13.37). The milk
components of i.e. total solid, fat, solid not fat and
protein did not vary on feeding rations with varying ME
level.
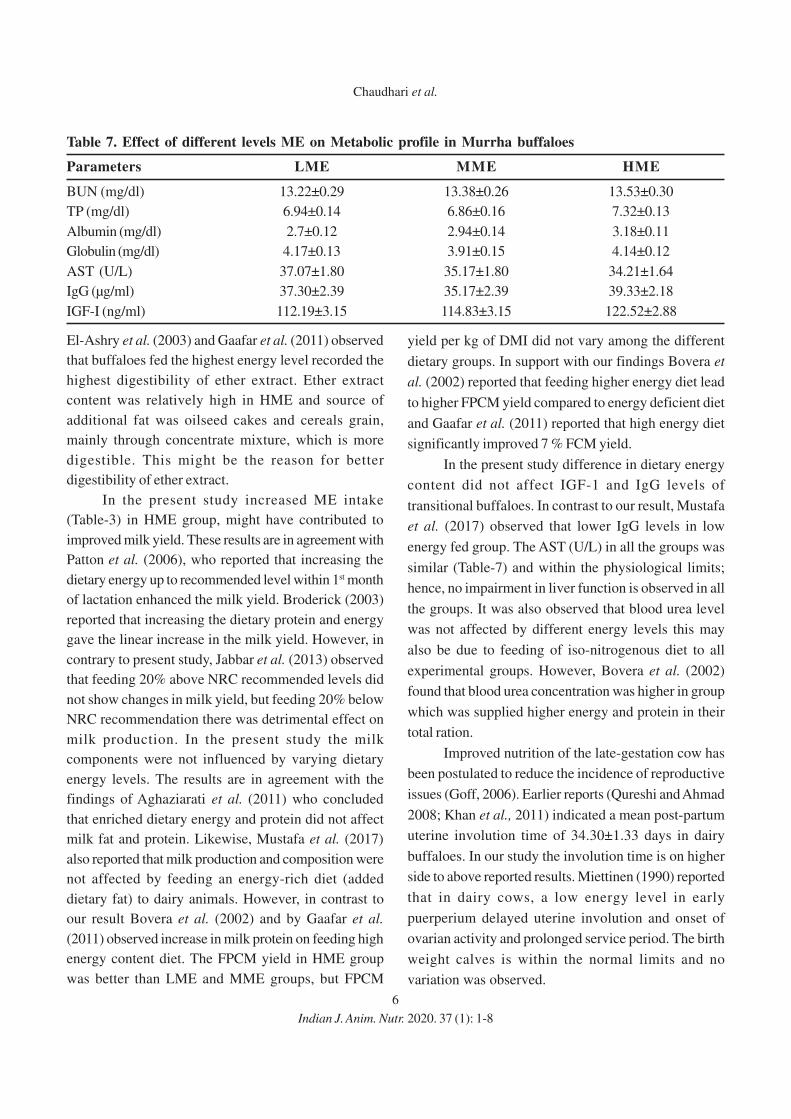
The result of metabolic profile pertaining to
immunity is depicted in Table-7. IGF-1 (ng/ml) and IgG
(µg/ml) were similar on feeding varying ME rations.
BUN (mg/dl), total protein (mg/dl), albumin (mg/dl),
globulin (mg/dl) and AST (U/L) concentrations were
also similar in different treatment groups.
The calf mortality was not observed in MME and
HME group whereas two calf mortality were there in
LME. Calf birth weight was 35.2, 32.5 and 33.66 in
LME, MME and HME, respectively. Period required
for complete uterine involution was 50, 47 and 47 days
in the LME, MME and HME groups respectively, which
was higher in LME group. This may be due to
incidences of metritis in LME group.
McNamara et al. (2003) found that feeding of
diets high in energy density pre-partum improved
transitional success. In the present study feeding of high
energy diet in pre-partum improved postpartum DMI
(Fig 1) of HME group than LME and MME group.
Similarly, dry matter intake in the ruminants was
increased by energy concentration in the diets (Nair et
al. 2004; Gaafar et al. (2011). In contrast to our result,
Wang et al. (2010), reported that animal fed high
energy diets during pre-partum period had lower DMI
compared with those on lower energy diets and
Aghaziarati et al. (2011) reported that varying energy
density, did not affect the DM intake. In the present
study high energy density might have resulted in
improvement in DMI. CP and MP intakes were not
affected due to variations in ME levels. In the present
study digestibility of EE, NDF and ADF were improved
in high energy diet group than low energy diet group
whereas DM, OM and CP remained similar in all
experimental group (Table-4). Higher NDF levels
diets are associated with depressed NDF and DM
digestibility (Ahmed et al., 2014; Tjardes et al., 2002).
Table 5. Effect of feeding varying levels of ME on nitrogen balance (g/day) during digestibility trial in
Murrah buffaloes
Particulars LME MME HME
N intake 292.91±7.04 280.82±5.54 294.46±9.30
N in feces 109.17±11.95 102.11±19.41 103.89±13.83
N in Urine 100.02±6.74 100.26±15.81 102.99±4.54
N in milk 60.91±4.63 55.24±4.06 61.74±1.19
N outgo 270.11±6.43 257.62±6.85 268.63±10.57
N balance 22.8±2.39 23.2±3.56 25.83±2.18
Table 6. Effect of feeding varying levels of ME on Milk yield and milk composition of Murrah buffaloes
Parameters LME MME HME
Milk yield (Kg/day) 10.42a±0.10 10.60ab±0.13 10.97b±0.10
FPCM (Kg/day) 13.42a±0.14 13.37a±0.16 14.00b±0.13
FPCM (Kg/kg DMI) 0.89±0.09 0.90±0.01 0.88±0.09
TS (%) 17.22±0.09 17.40±0.10 17.53±0.15
Fat (%) 7.02±0.08 7.09±0.07 7.04±0.06
SNF (%) 10.19±0.04 10.27±0.14 10.49±0.10
Protein (%) 3.87±0.05 3.97±0.14 3.88±0.03
(a,b,c) Means with a different superscripts in a row differ significantly (P<0.05)
Indian J. Anim. Nutr. 2020. 37 (1): 1-8
Level of metabolizable energy in lactating buffaloes
6
El-Ashry et al. (2003) and Gaafar et al. (2011) observed
that buffaloes fed the highest energy level recorded the
highest digestibility of ether extract. Ether extract
content was relatively high in HME and source of
additional fat was oilseed cakes and cereals grain,
mainly through concentrate mixture, which is more
digestible. This might be the reason for better
digestibility of ether extract.
In the present study increased ME intake
(Table-3) in HME group, might have contributed to
improved milk yield. These results are in agreement with
Patton et al. (2006), who reported that increasing the
dietary energy up to recommended level within 1st month
of lactation enhanced the milk yield. Broderick (2003)
reported that increasing the dietary protein and energy
gave the linear increase in the milk yield. However, in
contrary to present study, Jabbar et al. (2013) observed
that feeding 20% above NRC recommended levels did
not show changes in milk yield, but feeding 20% below
NRC recommendation there was detrimental effect on
milk production. In the present study the milk
components were not influenced by varying dietary
energy levels. The results are in agreement with the
findings of Aghaziarati et al. (2011) who concluded
that enriched dietary energy and protein did not affect
milk fat and protein. Likewise, Mustafa et al. (2017)
also reported that milk production and composition were
not affected by feeding an energy-rich diet (added
dietary fat) to dairy animals. However, in contrast to
our result Bovera et al. (2002) and by Gaafar et al.
(2011) observed increase in milk protein on feeding high
energy content diet. The FPCM yield in HME group
was better than LME and MME groups, but FPCM
yield per kg of DMI did not vary among the different
dietary groups. In support with our findings Bovera et
al. (2002) reported that feeding higher energy diet lead
to higher FPCM yield compared to energy deficient diet
and Gaafar et al. (2011) reported that high energy diet
significantly improved 7 % FCM yield.
In the present study difference in dietary energy
content did not affect IGF-1 and IgG levels of
transitional buffaloes. In contrast to our result, Mustafa
et al. (2017) observed that lower IgG levels in low
energy fed group. The AST (U/L) in all the groups was
similar (Table-7) and within the physiological limits;
hence, no impairment in liver function is observed in all
the groups. It was also observed that blood urea level
was not affected by different energy levels this may
also be due to feeding of iso-nitrogenous diet to all
experimental groups. However, Bovera et al. (2002)
found that blood urea concentration was higher in group
which was supplied higher energy and protein in their
total ration.
Improved nutrition of the late-gestation cow has
been postulated to reduce the incidence of reproductive
issues (Goff, 2006). Earlier reports (Qureshi and Ahmad
2008; Khan et al., 2011) indicated a mean post-partum
uterine involution time of 34.30±1.33 days in dairy
buffaloes. In our study the involution time is on higher
side to above reported results. Miettinen (1990) reported
that in dairy cows, a low energy level in early
puerperium delayed uterine involution and onset of
ovarian activity and prolonged service period. The birth
weight calves is within the normal limits and no
variation was observed.
Table 7. Effect of different levels ME on Metabolic profile in Murrha buffaloes
Parameters LME MME HME
BUN (mg/dl) 13.22±0.29 13.38±0.26 13.53±0.30
TP (mg/dl) 6.94±0.14 6.86±0.16 7.32±0.13
Albumin (mg/dl) 2.7±0.12 2.94±0.14 3.18±0.11
Globulin (mg/dl) 4.17±0.13 3.91±0.15 4.14±0.12
AST (U/L) 37.07±1.80 35.17±1.80 34.21±1.64
IgG (µg/ml) 37.30±2.39 35.17±2.39 39.33±2.18
IGF-I (ng/ml) 112.19±3.15 114.83±3.15 122.52±2.88
Indian J. Anim. Nutr. 2020. 37 (1): 1-8
Chaudhari et al.
7
CONCLUSIONS
It was concluded that increasing energy
supplementation at 15% higher than ICAR-2013
feeding recommendation may improve the FPCM yield
and fiber digestibility with no adverse effect on blood
biochemistry and DM digestibility in Murrah buffaloes.
ACKNOWLEDGMENT
Author gratefully acknowledge to Director,
ICAR-National Dairy Research Institute, Karnal. The
work was supported by Indian Council of Agriculture
Research Institute, Delhi.
REFERENCES
Aghaziarati, N., Amanlou, H., Zahmatkesh, D., Mahjoubi, E.
and Yazdi, M.H. 2011. Enriched dietary energy and
protein with more frequent milking offers early
lactation cows a greater productive potential. Livest.
Sci. 136: 108-113.
Ahmed, S., Jabbar, M.A., Khalique, A., Javed, K., Ahmed, N.,
Shahzad, F. and Fiaz, M. 2014. Effect of varying NDF
levels on productive performance in lactating Nili Ravi
buffaloes. J. Anim. Plant Sci. 24: 1008-1011.
AOAC, 2005. Official Methods of Analysis, 18th edn.
Association of Official Analytical Chemist, Arlington,
Verginia.
Bargo, F., Muller, L.D., Delahoy, J.E. and Cassidy, T.W. 2002.
Milk response to concentrate supplementation of high
producing dairy cows grazing at two pasture
allowances. J. Dairy Sci. 85: 1777-1792.
Bell, A.W., Slepetis, R. and Ehrhardt, R.A.1995. Growth and
accretion of energy and protein in the gravid uterus
during late pregnancy in Holstein cows, J. Dairy Sci.
78: 1954-1961.
Bernabucci, U., Ronchi, B., Lacetera, N. and Nardone, A. 2005.
Influence of body condition on relationships between
metabolic status and oxidative stress in periparturient
dairy cows J. Dairy Sci. 88:2017-2026.
Bovera, F., Calabrò, S., Cutrignelli, M.I. and Di Lella, T. 2002.
Effect of dietary energy and protein contents on
buffalo milk yield and quality during advanced
lactation period. Asian-Australas. J. Anim.Sci. 15:
675-681.
Broderick, G.A. 2003. Effects of varying dietary protein and
energy levels on production of lactating dairy cows. J.
Dairy Sci. 86:1370-1381.
Di Palo, R. 1992. Produzione lattea nella bufala con diete
tradizionali e con impiego di acidi grassi. Ph. D. Thesis,
University of Naples.
Doepel, L., Lapierre, H. and Kennelly, J.J. 2002. Peripartum
performance and metabolism of dairy cows in response
to prepartum energy and protein intake. J. Dairy Sci.
85: 2315-2334.
El-Ashry, M.A., Khattab, H.M., Etman, K.E.I. and Sayed,
S.K. 2003. Effect of two different energy and protein
levels on productive and reproductive performances
of lactating buffaloes, Egyptian J. Nutr. Feed. 6:
491-503.
Esposito, G., Irons, P.C., Webb, E.C. and Chapwanya, A. 2014.
Interactions between negative energy balance,
metabolic diseases, uterine health and immune
response in transition dairy cows. Anim. Reprod. Sci.
144:60-71.
Gaafar, H.M.A., Abdel-Raouf, E.M., Bendary, M.M., Ghanem,
G.H.A. and El-Riedy, K.F.A. 2011. Effects of Dietary
Protein and Energy Levels on Productive and
Reproductive Performance of Lactating Buffaloes.
Iranian J. Appl. Anim. Sci. 1: 57-63.
Goff, J.P. 2006. Major advances in our understanding of
nutritional influences on bovine health. J. Dairy Sci.
89: 1292-1301.
Gong, J.G., Lee, W.J., Garnsworthy, P.C. and Webb, R. 2002.
Effect of dietary induced increases in circulating
insulin concentrations during the early postpartum
period on reproductive function in dairy cows.
Reproduction 123: 419-427.
Grummer, R.R. and Carroll, D.J. 1988. A review of lipoprotein
cholesterol metabolism: Importance to ovarian
function, J. Anim. Sci. 66: 3160-3173.
ICAR, 2013. Nutrient requirements of Cattle and Buffalo,
Indian Council of Agricultural Research, Krishi Bhawan,
New Delhi.
Jabbar, M.A., Fiaz, M., Iqbal, T., Abdullah, M. and Marghazani,
I.B. 2013. Effect of different dietary energy levels on
milk production in lactating nili-ravi buffaloes. J. Anim.
Plant Sci. 23: 13-16.
Khan, H.M., Mohanty T.K., Bhakat, M., Raina, V.S. and Gupta,
A.K. 2011. Relationship of blood metabolites with
reproductive parameters during various seasons in
Murrah buffaloes. Asian-Australas. J. Anim. Sci. 24:
1192-1198.
McNamara, S.F., O’Mara, P., Rath, M. and Murphy, J.J. 2003.
Effects of different transition diets on dry matter
intake, milk production, and milk composition in dairy
cows. J. Dairy Sci. 86: 2397-2408.
Miettinen, P.V.A. 1990. Metabolic balance and reproductive
performance in Finnish dairy cows. J. Vet. Med. 37:
417-424.
Indian J. Anim. Nutr. 2020. 37 (1): 1-8
Level of metabolizable energy in lactating buffaloes
8
Mustafa, A.A., Tyagi, N., Gautam, M., Chaudhari, A. and
Sediqi, J. 2017. Assessment of feeding varying levels
of Metabolizable energy and protein on performance
of transition Murrah buffaloes. Trop. Anim. Hlth. Prod.
49: 1637-1644.
NRC, 2001. Nutrient Requirements of Dairy Cattle, 7th
edition National Academy Science, Washington, DC.
O’Callahan, D., Lozano, J.M., Fahey, J., Gath, V., Snijders, S.
and Boland, M.P. 2001. Relationships between
nutrition and fertility in cattle. In: Fertility in the
high-producing dairy cow. Br. Soc. Anim. Sci. 26:
147-60.
Patton, J., Kenny, D.A., Mee, J.F., O’mara, F.P., Wathes, D.C.,
Cook, M. and Murphy, J.J. 2006. Effect of milking
frequency and diet on milk production, energy
balance and reproduction in dairy cows. J. Dairy Sci.,
89: 1478-87.
Nair, P.V., Verma, A.K., Dass, R.S. and Mehra, U.R. 2004. Growth
and nutrients utilization in buffalo calves fed
ammoniated wheat straw supplemented with sodium
sulphate. Asian Australas. J. Anim. Sci. 17: 325-329.
Qureshi, M.S. and Ahmad, N. 2008. Interaction of calf
suckling, use of oxytocin and milk yield with
reproductive performance of dairy buffaloes. Anim.
Reprod. Sci. 106:380-392.
SAS Institute. 2000. SAS User’s Guide, Statistics, Version
8.01. SAS Inst., Inc., Cary, NC.
Snedecor, G. W. and Cochran, W. G.2004. Statistical Methods
9th
edition, Iowa State University Press, Ames, Iowa,
USA.
Tjardes, K.E., Buskirk, D.D., Allen, M.S., Templman R.J. and
Bouquin Rust, S.R. 2002. Neutral detergent fiber
concentration in corn silage influences dry matter
intake, diet digestibility and performance of Angus and
Holstein steers. J. Anim. Sci. 80: 841-846.
Van Soest, P.J., Robertson, J.B. and Lewis, B.A. 1991.
Methods for dietary fibre, neutral detergent fibre and
non-starch polysaccharides in relation to animal
nutrition symposium, carbohydrate methodology,
metabolism and nutritional implications in dairy cattle.
J. Dairy Sci. 74: 3583-3597.
Wang, Y.M., Wang, J.H., Wang, C., Wang, J.K., Chen, B., Liu,
J.X., Cao, H. and Guo, F.C.2010. Effect of dietary
antioxidant and energy density on performance and
anti-oxidative status of transition cows. Asian
Australas. J. Anim. Sci. 23: 1299-1307.
Indian J. Anim. Nutr. 2020. 37 (1): 1-8
Chaudhari et al.
Received on 10-02-2020 and accepted on 07-06-2020

9
Indian Journal of
Animal Nutrition
Effect of Supplementing Molasses Based Multi-Nutrient Liquid
Supplement (MMLS) on Nutrient Intake, Digestibility and Growth
Performance of Buffalo Calves
Rojita Yengkhom1*, Putan Singh2, A.K. Verma3and Bornalee Handique4
Animal Nutrition Division, ICAR-Indian Veterinary Research Institute, Izatnagar-243 122
Bareilly, Uttar Pradesh, India
ABSTRACT
Twenty-one buffalo calves (111±4.53 kg BW, 6-8 months age) were assigned to 3 groups (T1, T
2 and T
3)
consisting of 7 animals each in a completely randomized block design. Concentrate mixture composition was
remained the same for all three groups; however, concentrate to wheat straw ratio were 60:40, 50:50 and 40:60 in
groups in T1, T
2 and T
3, respectively. Additional molasses based multi-nutrient liquid supplement (MMLS) was
provided in T2 and T
3 groups @ 5% and 10% DMI respectively. Daily intake of green oats, dry matter (DM), OM,
NDF and ADF did not differ significantly (P>0.05) among groups. However, concentrates and EE intake were
significantly (P<0.01) higher in calves of T1 group followed by T
2 and T
3. Wheat straw (kg/d), CP (kg/d, kg/d
W0.75) and DCP (kg/d, kg/d W0.75) intake were significantly (P<0.01, P<0.05) higher in MMLS treated groups
when compared to control. The digestibility coefficient of DM, OM, CP, EE, NDF and ADF did not differ
significantly among groups. Initial and final body weight, total weight gain, ADG, DMI and FCR were also
comparable (P>0.05) among the groups. Reducing the amount of concentrate and replacing the reduced amount
by MMLS @5% and 10%, depending on the concentrate to roughage ratio can increase the ADG and thus
growth rate of buffalo calves without any adverse effects on DMI and digestibility of nutrients.
Key words: Buffaloes calf, Digestibility, Feed intake, Growth performance, MMLS
Indian J. Anim. Nutr. 2020. 37 (1): 9-13
doi: 10.5958/2231-6744.2020.00002.X
lactating dairy cows (Ankita et al., 2016). Little research
has been done on molasses based multi-nutrient liquid
supplement (MMLS) for improving the performance
of ruminants. Therefore, an attempt was made to
evaluate the effect of feeding MMLS on nutrient
intake, nutrient digestibility and growth performance of
male buffalo calves.
MATERIALS AND METHODS
The experiment was conducted for 126 days at
Animal Nutrition Laboratory, ICAR-Indian Veterinary
Research Institute, Izatnagar. Twenty-one buffalo calves
(111±4.53 kg BW, 6-8 months age) were assigned to 3
groups i.e., T1, T
2 and T
3, consisting of 7 animals each
in a completely randomized block design. Composition
of the compounded concentrate remained the same
for all three groups except that the amount of
concentrate were given as 60%, 50% and 40% of
the total requirements in groups in T1, T
2 and T
3 and
additional MMLS was provided in T2
and T3
groups
1,4Ph.D. Scholar, Animal Nutrition Division, ICAR-IVRI, Izatnagar-243122; 2Principal Scientist, Animal Nutrition Division, ICAR-IVRI,
Izatnagar-243122; 3Head & Principal Scientist, Animal Nutrition Division, ICAR-IVRI, Izatnagar-243122; *Corresponding author:
INTRODUCTION
Natural calamities, urbanization and rise in
human population had an adverse impact on availability
of animal feeds. Therefore, ruminants thrive mainly on
poor quality feeds and pastures, which are having low
content of nutrients and high content of lignin and
silica; that limit their efficient utilization by
ruminants. Animal nutritionists, have proved that the
nutritive value of these crop residues can be enhanced
if deficient nutrients are supplemented (Makkar, 2002;
Singh and Singh, 2003). Addition of urea and molasses
was found promising when either fed with or sprayed
over poor quality roughages, or used as a urea-
molasses (Maneerat et al., 2015) as these supplements
are good source of non-protein nitrogen, energy,
minerals and vitamins. Moreover, liquid feed
supplements offer an alternative delivery vehicle for
supplemental fat, protein, and rumen-fermentable
carbohydrates, minerals and vitamins in rations for
Indian J. Anim. Nutr. 2020. 37 (1): 9-13
10
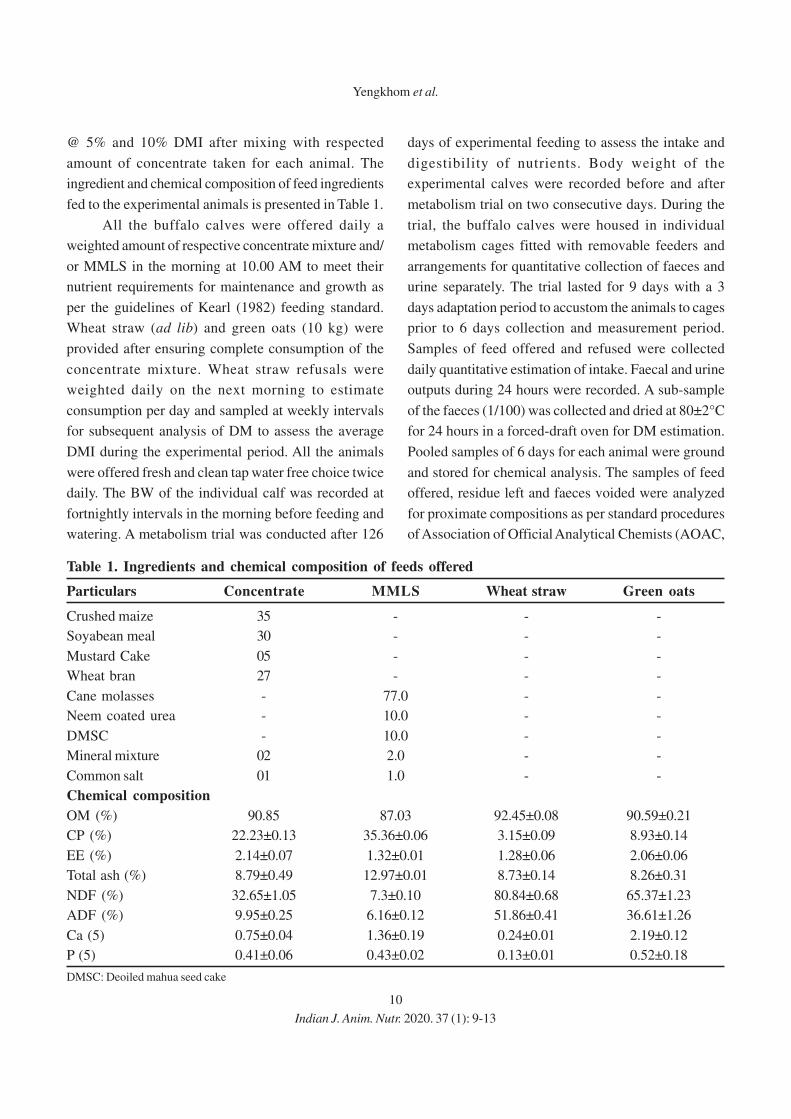
@ 5% and 10% DMI after mixing with respected
amount of concentrate taken for each animal. The
ingredient and chemical composition of feed ingredients
fed to the experimental animals is presented in Table 1.
All the buffalo calves were offered daily a
weighted amount of respective concentrate mixture and/
or MMLS in the morning at 10.00 AM to meet their
nutrient requirements for maintenance and growth as
per the guidelines of Kearl (1982) feeding standard.
Wheat straw (ad lib) and green oats (10 kg) were
provided after ensuring complete consumption of the
concentrate mixture. Wheat straw refusals were
weighted daily on the next morning to estimate
consumption per day and sampled at weekly intervals
for subsequent analysis of DM to assess the average
DMI during the experimental period. All the animals
were offered fresh and clean tap water free choice twice
daily. The BW of the individual calf was recorded at
fortnightly intervals in the morning before feeding and
watering. A metabolism trial was conducted after 126
days of experimental feeding to assess the intake and
digestibility of nutrients. Body weight of the
experimental calves were recorded before and after
metabolism trial on two consecutive days. During the
trial, the buffalo calves were housed in individual
metabolism cages fitted with removable feeders and
arrangements for quantitative collection of faeces and
urine separately. The trial lasted for 9 days with a 3
days adaptation period to accustom the animals to cages
prior to 6 days collection and measurement period.
Samples of feed offered and refused were collected
daily quantitative estimation of intake. Faecal and urine
outputs during 24 hours were recorded. A sub-sample
of the faeces (1/100) was collected and dried at 80±2°C
for 24 hours in a forced-draft oven for DM estimation.
Pooled samples of 6 days for each animal were ground
and stored for chemical analysis. The samples of feed
offered, residue left and faeces voided were analyzed
for proximate compositions as per standard procedures
of Association of Official Analytical Chemists (AOAC,
Table 1. Ingredients and chemical composition of feeds offered
Particulars Concentrate MMLS Wheat straw Green oats
Crushed maize 35 - - -
Soyabean meal 30 - - -
Mustard Cake 05 - - -
Wheat bran 27 - - -
Cane molasses - 77.0 - -
Neem coated urea - 10.0 - -
DMSC - 10.0 - -
Mineral mixture 02 2.0 - -
Common salt 01 1.0 - -
Chemical composition
OM (%) 90.85 87.03 92.45±0.08 90.59±0.21
CP (%) 22.23±0.13 35.36±0.06 3.15±0.09 8.93±0.14
EE (%) 2.14±0.07 1.32±0.01 1.28±0.06 2.06±0.06
Total ash (%) 8.79±0.49 12.97±0.01 8.73±0.14 8.26±0.31
NDF (%) 32.65±1.05 7.3±0.10 80.84±0.68 65.37±1.23
ADF (%) 9.95±0.25 6.16±0.12 51.86±0.41 36.61±1.26
Ca (5) 0.75±0.04 1.36±0.19 0.24±0.01 2.19±0.12
P (5) 0.41±0.06 0.43±0.02 0.13±0.01 0.52±0.18
DMSC: Deoiled mahua seed cake
Yengkhom et al.
Indian J. Anim. Nutr. 2020. 37 (1): 9-13
11
2002). Data obtained were subjected to analysis of
variance (ANOVA) using SPSS software (v11.0) and
treatment means were ranked using Duncan’s multiple
range tests. Significant variance between treatments
were measured at P<0.05. Statistical analysis were
carried as for the procedures of Snedecor and Cochran
(1994).
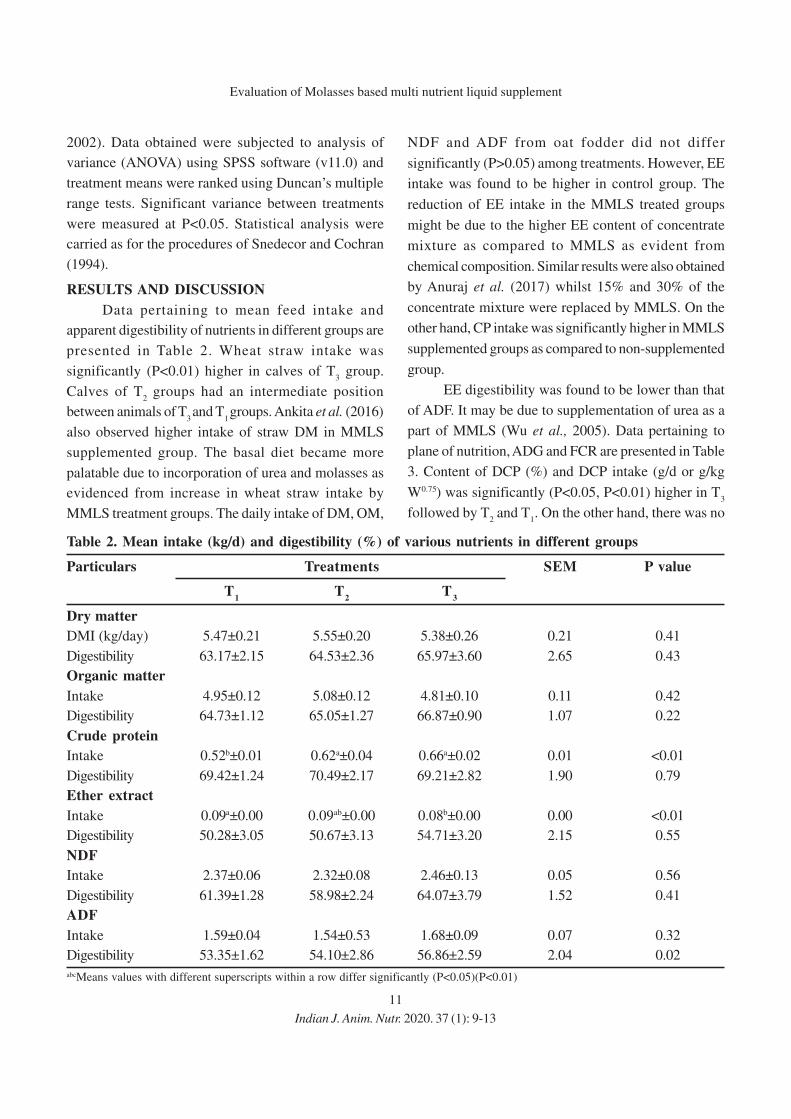
RESULTS AND DISCUSSION
Data pertaining to mean feed intake and
apparent digestibility of nutrients in different groups are
presented in Table 2. Wheat straw intake was
significantly (P<0.01) higher in calves of T3 group.
Calves of T2 groups had an intermediate position
between animals of T3 and T
1 groups. Ankita et al. (2016)
also observed higher intake of straw DM in MMLS
supplemented group. The basal diet became more
palatable due to incorporation of urea and molasses as
evidenced from increase in wheat straw intake by
MMLS treatment groups. The daily intake of DM, OM,
NDF and ADF from oat fodder did not differ
significantly (P>0.05) among treatments. However, EE
intake was found to be higher in control group. The
reduction of EE intake in the MMLS treated groups
might be due to the higher EE content of concentrate
mixture as compared to MMLS as evident from
chemical composition. Similar results were also obtained
by Anuraj et al. (2017) whilst 15% and 30% of the
concentrate mixture were replaced by MMLS. On the
other hand, CP intake was significantly higher in MMLS
supplemented groups as compared to non-supplemented
group.
EE digestibility was found to be lower than that
of ADF. It may be due to supplementation of urea as a
part of MMLS (Wu et al., 2005). Data pertaining to
plane of nutrition, ADG and FCR are presented in Table
3. Content of DCP (%) and DCP intake (g/d or g/kg
W0.75) was significantly (P<0.05, P<0.01) higher in T3
followed by T2 and T
1. On the other hand, there was no
Table 2. Mean intake (kg/d) and digestibility (%) of various nutrients in different groups
Particulars Treatments SEM P value
T1
T2
T3
Dry matter
DMI (kg/day) 5.47±0.21 5.55±0.20 5.38±0.26 0.21 0.41
Digestibility 63.17±2.15 64.53±2.36 65.97±3.60 2.65 0.43
Organic matter
Intake 4.95±0.12 5.08±0.12 4.81±0.10 0.11 0.42
Digestibility 64.73±1.12 65.05±1.27 66.87±0.90 1.07 0.22
Crude protein
Intake 0.52b±0.01 0.62a±0.04 0.66a±0.02 0.01 <0.01
Digestibility 69.42±1.24 70.49±2.17 69.21±2.82 1.90 0.79
Ether extract
Intake 0.09a±0.00 0.09ab±0.00 0.08b±0.00 0.00 <0.01
Digestibility 50.28±3.05 50.67±3.13 54.71±3.20 2.15 0.55
NDF
Intake 2.37±0.06 2.32±0.08 2.46±0.13 0.05 0.56
Digestibility 61.39±1.28 58.98±2.24 64.07±3.79 1.52 0.41
ADF
Intake 1.59±0.04 1.54±0.53 1.68±0.09 0.07 0.32
Digestibility 53.35±1.62 54.10±2.86 56.86±2.59 2.04 0.02
abcMeans values with different superscripts within a row differ significantly (P<0.05)(P<0.01)
Indian J. Anim. Nutr. 2020. 37 (1): 9-13
Evaluation of Molasses based multi nutrient liquid supplement
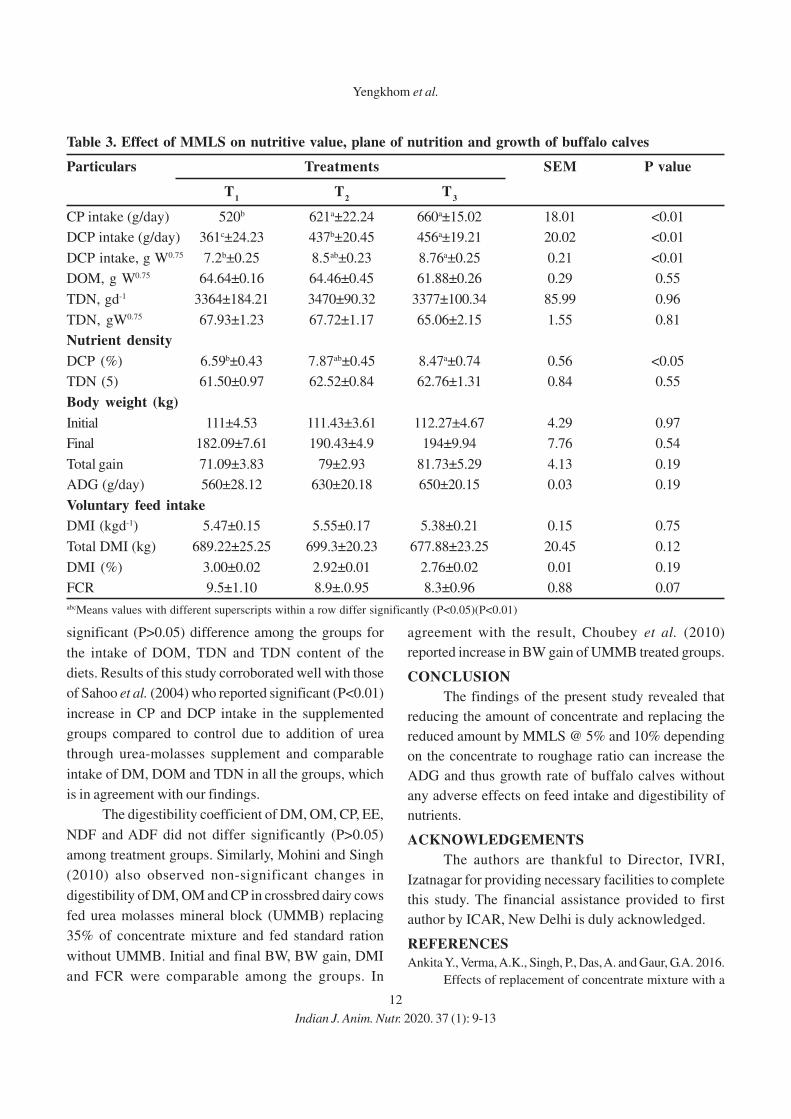
12
significant (P>0.05) difference among the groups for
the intake of DOM, TDN and TDN content of the
diets. Results of this study corroborated well with those
of Sahoo et al. (2004) who reported significant (P<0.01)
increase in CP and DCP intake in the supplemented
groups compared to control due to addition of urea
through urea-molasses supplement and comparable
intake of DM, DOM and TDN in all the groups, which
is in agreement with our findings.
The digestibility coefficient of DM, OM, CP, EE,
NDF and ADF did not differ significantly (P>0.05)
among treatment groups. Similarly, Mohini and Singh
(2010) also observed non-significant changes in
digestibility of DM, OM and CP in crossbred dairy cows
fed urea molasses mineral block (UMMB) replacing
35% of concentrate mixture and fed standard ration
without UMMB. Initial and final BW, BW gain, DMI
and FCR were comparable among the groups. In
agreement with the result, Choubey et al. (2010)
reported increase in BW gain of UMMB treated groups.
CONCLUSION
The findings of the present study revealed that
reducing the amount of concentrate and replacing the
reduced amount by MMLS @ 5% and 10% depending
on the concentrate to roughage ratio can increase the
ADG and thus growth rate of buffalo calves without
any adverse effects on feed intake and digestibility of
nutrients.
ACKNOWLEDGEMENTS
The authors are thankful to Director, IVRI,
Izatnagar for providing necessary facilities to complete
this study. The financial assistance provided to first
author by ICAR, New Delhi is duly acknowledged.
REFERENCES
Ankita Y., Verma, A.K., Singh, P., Das, A. and Gaur, G.A. 2016.
Effects of replacement of concentrate mixture with a
Table 3. Effect of MMLS on nutritive value, plane of nutrition and growth of buffalo calves
Particulars Treatments SEM P value
T1
T2
T3
CP intake (g/day) 520b 621a±22.24 660a±15.02 18.01 <0.01
DCP intake (g/day) 361c±24.23 437b±20.45 456a±19.21 20.02 <0.01
DCP intake, g W0.75 7.2b±0.25 8.5ab±0.23 8.76a±0.25 0.21 <0.01
DOM, g W0.75 64.64±0.16 64.46±0.45 61.88±0.26 0.29 0.55
TDN, gd-1 3364±184.21 3470±90.32 3377±100.34 85.99 0.96
TDN, gW0.75 67.93±1.23 67.72±1.17 65.06±2.15 1.55 0.81
Nutrient density
DCP (%) 6.59b±0.43 7.87ab±0.45 8.47a±0.74 0.56 <0.05
TDN (5) 61.50±0.97 62.52±0.84 62.76±1.31 0.84 0.55
Body weight (kg)
Initial 111±4.53 111.43±3.61 112.27±4.67 4.29 0.97
Final 182.09±7.61 190.43±4.9 194±9.94 7.76 0.54
Total gain 71.09±3.83 79±2.93 81.73±5.29 4.13 0.19
ADG (g/day) 560±28.12 630±20.18 650±20.15 0.03 0.19
Voluntary feed intake
DMI (kgd-1) 5.47±0.15 5.55±0.17 5.38±0.21 0.15 0.75
Total DMI (kg) 689.22±25.25 699.3±20.23 677.88±23.25 20.45 0.12
DMI (%) 3.00±0.02 2.92±0.01 2.76±0.02 0.01 0.19
FCR 9.5±1.10 8.9±.0.95 8.3±0.96 0.88 0.07
abcMeans values with different superscripts within a row differ significantly (P<0.05)(P<0.01)
Indian J. Anim. Nutr. 2020. 37 (1): 9-13
Yengkhom et al.
13
multi-nutrient nutrient supplement on performance of
buffalo heifers. Indian J. Anim. Sci. 86: 1036-1040.
Anuraj, K.S., Putan Singh, Verma, A.K., Chaturvedi, V.B. and
Gaur, G.K. 2017. Effect of feeding molasses based
multi-nutrient liquid supplement on early lactation
performance, intake and nutrient digestibility in
crossbred cows. J. Exp. Biol. Agric. Sci. 5: 545.549.
AOAC. 2002. Official Methods of Analysis, 17th ed.
Association of Official Analytical Chemists,
Washington, DC, USA.
Choubey, M., Wadhwa. M. and Bakshi, M. P. S. 2015.
Evaluation of urea molasses multi-nutrient blocks
containing alternate feed resources in buffaloes”.
Buffalo Bulletin. 34: 5-16.
Kearl, L.C. 1982. Nutrient Requirements of Ruminants in
Developing Countries. International Feed stuffs
Institute, Utah State University, Logan, UT, USA,
45-81.
Makkar, H. 2002. Frequently asked questions on
ureamolasses-multinutrient block technology
(UMMB). Report on review meeting - International
Atomic Energy Agency (IAEA) Vienna, Austria. 1-16.
Maneerat, W., Prasanpanich, S., Tumwasorn, S., Laudadio V.
and Tufarelli, V. 2015. Evaluating agro-industrial
by-products as dietary roughage source on growth
performance of fattening steers. Saudi J. Biol. Sci. 22:
580-584.
Mohini, M. and Singh, G.P. 2010. Effect of supplementation of
urea molasses mineral block (UMMB) on the milk yield
and methane production in lactating cattle on different
plane of nutrition. Indian J. Anim. Nutr. 27: 96-102.
Sahoo, A., Elangovan, A.V., Mehra, U.R. and Singh, U.B. 2004.
Catalytic supplementation of urea-molasses on
nutritional performance of male buffalo (Bubalus
bubalis) calves. Asian-Australas. J. Anim. Sci. 17:
621-628.
Singh, P. R. and Singh, M. 2003. Effect of UMMB
supplementation on milk production in buffaloes and
cows. Indian J. Anim. Nutr. 20: 1-5.
Snedecor, G.W. and Cochran, W.G. 1994. Statistical Methods,
8th ed. East West Press Pvt. Ltd., New Delhi, India.
Wu, Y., Hu, W. and Liu, J. 2005. Effects of supplementing
urea-minerals lick block on the kinetics of fibre
digestion, nutrient digestibility and nitrogen
utilization of cow quality roughages. J. Zhejiang Univ.
Sci. B. 6: 793-797.
Indian J. Anim. Nutr. 2020. 37 (1): 9-13
Received on 28-02-2020 and accepted on 17-05-2020
Evaluation of Molasses based multi nutrient liquid supplement
14
Indian Journal of
Animal Nutrition
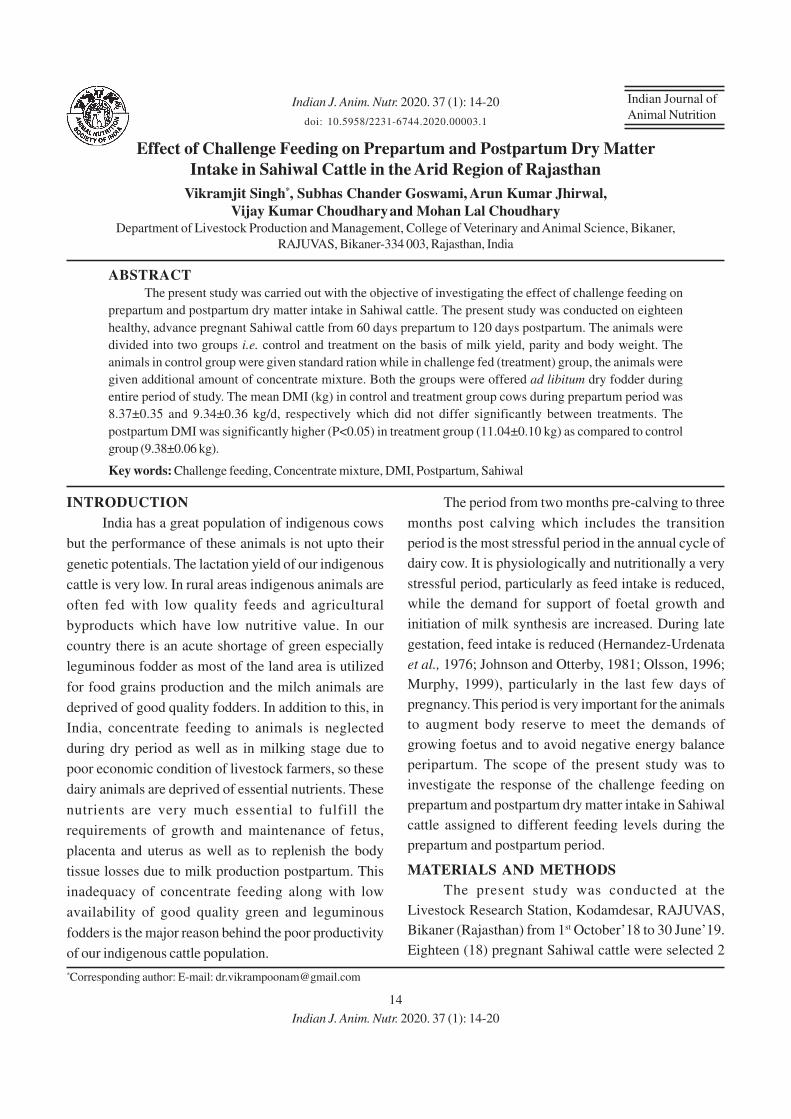
Effect of Challenge Feeding on Prepartum and Postpartum Dry Matter
Intake in Sahiwal Cattle in the Arid Region of Rajasthan
Vikramjit Singh*, Subhas Chander Goswami, Arun Kumar Jhirwal,
Vijay Kumar Choudhary and Mohan Lal Choudhary
Department of Livestock Production and Management, College of Veterinary and Animal Science, Bikaner,
RAJUVAS, Bikaner-334 003, Rajasthan, India
ABSTRACT
The present study was carried out with the objective of investigating the effect of challenge feeding on
prepartum and postpartum dry matter intake in Sahiwal cattle. The present study was conducted on eighteen
healthy, advance pregnant Sahiwal cattle from 60 days prepartum to 120 days postpartum. The animals were
divided into two groups i.e. control and treatment on the basis of milk yield, parity and body weight. The
animals in control group were given standard ration while in challenge fed (treatment) group, the animals were
given additional amount of concentrate mixture. Both the groups were offered ad libitum dry fodder during
entire period of study. The mean DMI (kg) in control and treatment group cows during prepartum period was
8.37±0.35 and 9.34±0.36 kg/d, respectively which did not differ significantly between treatments. The
postpartum DMI was significantly higher (P<0.05) in treatment group (11.04±0.10 kg) as compared to control
group (9.38±0.06 kg).
Key words: Challenge feeding, Concentrate mixture, DMI, Postpartum, Sahiwal
*Corresponding author: E-mail: [email protected]
INTRODUCTION
India has a great population of indigenous cows
but the performance of these animals is not upto their
genetic potentials. The lactation yield of our indigenous
cattle is very low. In rural areas indigenous animals are
often fed with low quality feeds and agricultural
byproducts which have low nutritive value. In our
country there is an acute shortage of green especially
leguminous fodder as most of the land area is utilized
for food grains production and the milch animals are
deprived of good quality fodders. In addition to this, in
India, concentrate feeding to animals is neglected
during dry period as well as in milking stage due to
poor economic condition of livestock farmers, so these
dairy animals are deprived of essential nutrients. These
nutrients are very much essential to fulfill the
requirements of growth and maintenance of fetus,
placenta and uterus as well as to replenish the body
tissue losses due to milk production postpartum. This
inadequacy of concentrate feeding along with low
availability of good quality green and leguminous
fodders is the major reason behind the poor productivity
of our indigenous cattle population.
The period from two months pre-calving to three
months post calving which includes the transition
period is the most stressful period in the annual cycle of
dairy cow. It is physiologically and nutritionally a very
stressful period, particularly as feed intake is reduced,
while the demand for support of foetal growth and
initiation of milk synthesis are increased. During late
gestation, feed intake is reduced (Hernandez-Urdenata
et al., 1976; Johnson and Otterby, 1981; Olsson, 1996;
Murphy, 1999), particularly in the last few days of
pregnancy. This period is very important for the animals
to augment body reserve to meet the demands of
growing foetus and to avoid negative energy balance
peripartum. The scope of the present study was to
investigate the response of the challenge feeding on
prepartum and postpartum dry matter intake in Sahiwal
cattle assigned to different feeding levels during the
prepartum and postpartum period.
MATERIALS AND METHODS
The present study was conducted at the
Livestock Research Station, Kodamdesar, RAJUVAS,
Bikaner (Rajasthan) from 1st October’18 to 30 June’19.
Eighteen (18) pregnant Sahiwal cattle were selected 2
Indian J. Anim. Nutr. 2020. 37 (1): 14-20
doi: 10.5958/2231-6744.2020.00003.1
Indian J. Anim. Nutr. 2020. 37 (1): 14-20
15
months prior to calving according to data obtained from
breeding records of animals. These pregnant animals
were distributed into two groups based on parity, body
weight and milk yield of previous lactations to maintain
homogeneity among experimental animals. The same
process was adopted until there were nine animals in
each treatment group. The experimental animals were
separated from the main herd 7-10 days before start of
experiment to acclimatize these experimental animals
in the new suggested environment.
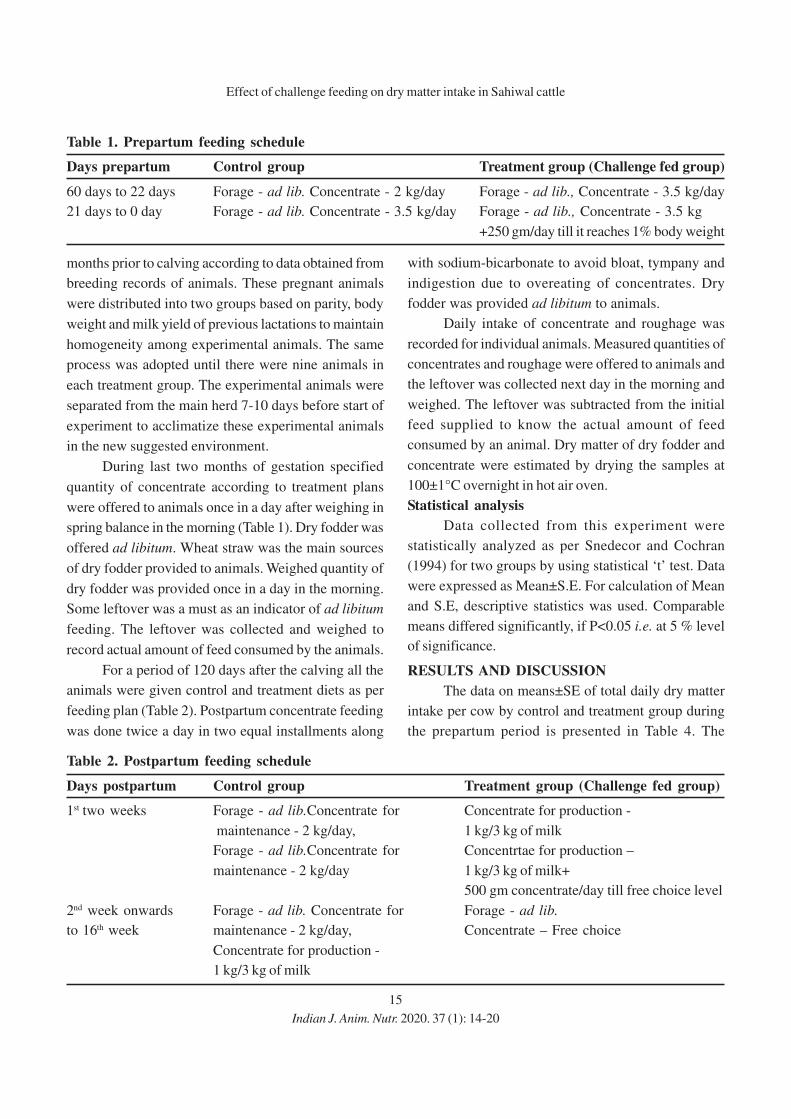
During last two months of gestation specified
quantity of concentrate according to treatment plans
were offered to animals once in a day after weighing in
spring balance in the morning (Table 1). Dry fodder was
offered ad libitum. Wheat straw was the main sources
of dry fodder provided to animals. Weighed quantity of
dry fodder was provided once in a day in the morning.
Some leftover was a must as an indicator of ad libitum
feeding. The leftover was collected and weighed to
record actual amount of feed consumed by the animals.
For a period of 120 days after the calving all the
animals were given control and treatment diets as per
feeding plan (Table 2). Postpartum concentrate feeding
was done twice a day in two equal installments along
with sodium-bicarbonate to avoid bloat, tympany and
indigestion due to overeating of concentrates. Dry
fodder was provided ad libitum to animals.
Daily intake of concentrate and roughage was
recorded for individual animals. Measured quantities of
concentrates and roughage were offered to animals and
the leftover was collected next day in the morning and
weighed. The leftover was subtracted from the initial
feed supplied to know the actual amount of feed
consumed by an animal. Dry matter of dry fodder and
concentrate were estimated by drying the samples at
100±1°C overnight in hot air oven.
Statistical analysis
Data collected from this experiment were
statistically analyzed as per Snedecor and Cochran
(1994) for two groups by using statistical ‘t’ test. Data
were expressed as Mean±S.E. For calculation of Mean
and S.E, descriptive statistics was used. Comparable
means differed significantly, if P<0.05 i.e. at 5 % level
of significance.
RESULTS AND DISCUSSION
The data on means±SE of total daily dry matter
intake per cow by control and treatment group during
the prepartum period is presented in Table 4. The
Effect of challenge feeding on dry matter intake in Sahiwal cattle
Table 1. Prepartum feeding schedule
Days prepartum Control group Treatment group (Challenge fed group)
60 days to 22 days Forage - ad lib. Concentrate - 2 kg/day Forage - ad lib., Concentrate - 3.5 kg/day
21 days to 0 day Forage - ad lib. Concentrate - 3.5 kg/day Forage - ad lib., Concentrate - 3.5 kg
+250 gm/day till it reaches 1% body weight
Table 2. Postpartum feeding schedule
Days postpartum Control group Treatment group (Challenge fed group)
1st two weeks Forage - ad lib.Concentrate for Concentrate for production -
maintenance - 2 kg/day, 1 kg/3 kg of milk
Forage - ad lib.Concentrate for Concentrtae for production –
maintenance - 2 kg/day 1 kg/3 kg of milk+
500 gm concentrate/day till free choice level
2nd week onwards Forage - ad lib. Concentrate for Forage - ad lib.
to 16th week maintenance - 2 kg/day, Concentrate – Free choice
Concentrate for production -
1 kg/3 kg of milk
Indian J. Anim. Nutr. 2020. 37 (1): 14-20
16
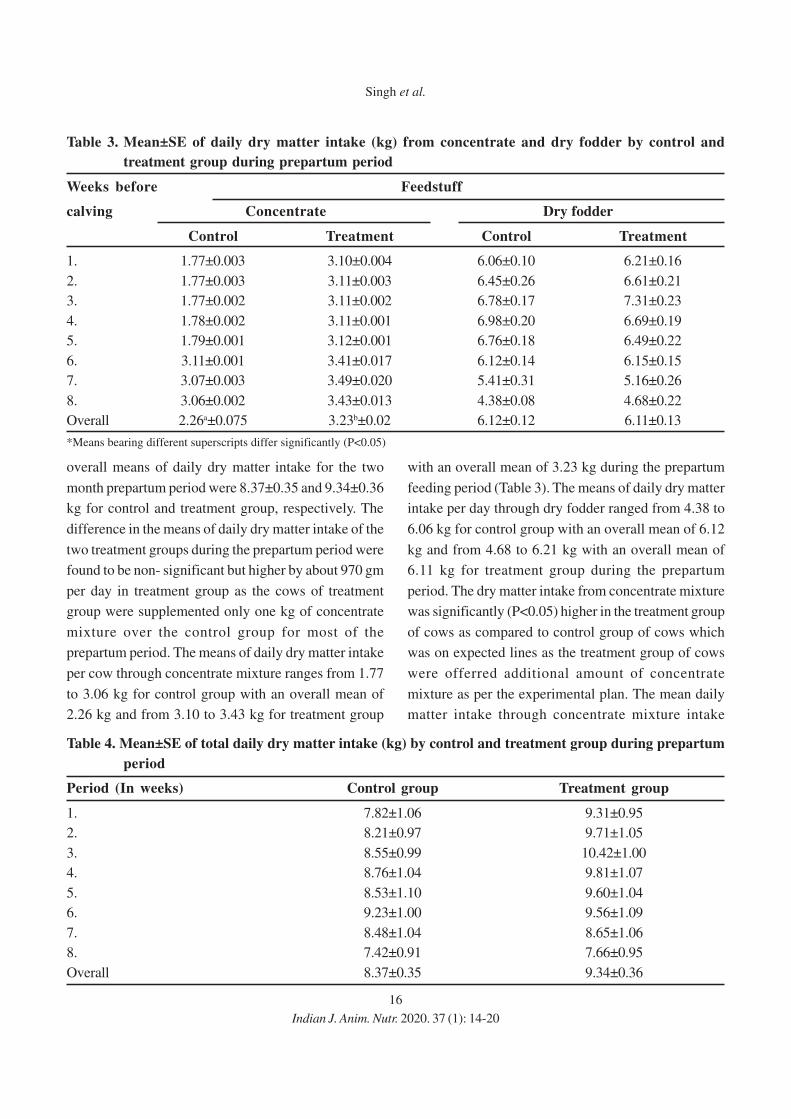
overall means of daily dry matter intake for the two
month prepartum period were 8.37±0.35 and 9.34±0.36
kg for control and treatment group, respectively. The
difference in the means of daily dry matter intake of the
two treatment groups during the prepartum period were
found to be non- significant but higher by about 970 gm
per day in treatment group as the cows of treatment
group were supplemented only one kg of concentrate
mixture over the control group for most of the
prepartum period. The means of daily dry matter intake
per cow through concentrate mixture ranges from 1.77
to 3.06 kg for control group with an overall mean of
2.26 kg and from 3.10 to 3.43 kg for treatment group
with an overall mean of 3.23 kg during the prepartum
feeding period (Table 3). The means of daily dry matter
intake per day through dry fodder ranged from 4.38 to
6.06 kg for control group with an overall mean of 6.12
kg and from 4.68 to 6.21 kg with an overall mean of
6.11 kg for treatment group during the prepartum
period. The dry matter intake from concentrate mixture
was significantly (P<0.05) higher in the treatment group
of cows as compared to control group of cows which
was on expected lines as the treatment group of cows
were offerred additional amount of concentrate
mixture as per the experimental plan. The mean daily
matter intake through concentrate mixture intake
Table 3. Mean±SE of daily dry matter intake (kg) from concentrate and dry fodder by control and
treatment group during prepartum period
Weeks before Feedstuff
calving Concentrate Dry fodder
Control Treatment Control Treatment
1. 1.77±0.003 3.10±0.004 6.06±0.10 6.21±0.16
2. 1.77±0.003 3.11±0.003 6.45±0.26 6.61±0.21
3. 1.77±0.002 3.11±0.002 6.78±0.17 7.31±0.23
4. 1.78±0.002 3.11±0.001 6.98±0.20 6.69±0.19
5. 1.79±0.001 3.12±0.001 6.76±0.18 6.49±0.22
6. 3.11±0.001 3.41±0.017 6.12±0.14 6.15±0.15
7. 3.07±0.003 3.49±0.020 5.41±0.31 5.16±0.26
8. 3.06±0.002 3.43±0.013 4.38±0.08 4.68±0.22
Overall 2.26a±0.075 3.23b±0.02 6.12±0.12 6.11±0.13
*Means bearing different superscripts differ significantly (P<0.05)
Table 4. Mean±SE of total daily dry matter intake (kg) by control and treatment group during prepartum
period
Period (In weeks) Control group Treatment group
1. 7.82±1.06 9.31±0.95
2. 8.21±0.97 9.71±1.05
3. 8.55±0.99 10.42±1.00
4. 8.76±1.04 9.81±1.07
5. 8.53±1.10 9.60±1.04
6. 9.23±1.00 9.56±1.09
7. 8.48±1.04 8.65±1.06
8. 7.42±0.91 7.66±0.95
Overall 8.37±0.35 9.34±0.36
Indian J. Anim. Nutr. 2020. 37 (1): 14-20
Singh et al.
17
progressively increased from first to sixth week of feeding
and then showed a decline in last two weeks before
parturition in control group whereas in treatment group
the mean daily matter intake through concentrate
mixture intake progressively increased from first to
seventh week of feeding and then showed a decline
in last week before parturition. This decline in the
dry matter intake from concentrate mixture prior to
parturition may be attributed to stress caused by
approaching parturition during which the appetite of
animal falls drastically.
The mean daily dry matter intake from dry
fodder per cow for the control and treatment group
during prepartum period was 6.12±0.12 kg and 6.11±0.13
kg, respectively which did not differ significantly
between the control and treatment group. The mean
daily intake of dry fodder per cow for the control and
treatment group during prepartum period was 6.31±0.12
kg and 6.30±0.13 kg, respectively. The dry matter
intake through dry fodder in both the groups showed an
increasing trend from first week to fourth week but
declined continuously from fifth week to last week of
prepartum feeding. Increased size of foetus resulting
in decreased GIT capacity as well as high concentrate
feeding are the possible reasons for this decline in dry
fodder intake in last month of gestation.
The means of total daily dry matter intake per
100 kg body wt. during prepartum period of the animals
of the control and treatment group were 2.13±0.09 %
and 2.37±0.09 %, respectively which also did not differ
significantly.The results obtained regarding dry matter
intake during prepartum period in the present study are
in agreement to those reported by Kale and Tomer
(1991), Panigrahi et al. (2005), Kamboj et al. (2016),
Naik et al. (2016) and Raval et al. (2019) who observed
that feeding on a higher plane prepartum do not affect
Table 5. Mean±SE of daily dry matter intake (kg) from concentrate and dry fodder by control and
treatment group during postpartum period
Weeks after Feedstuff
calving Concentrate Dry fodder
Control Treatment Control Treatment
1. 3.18±0.18 4.05±0.23 4.63±0.32 3.88±0.38
2. 3.87±0.27 5.79±0.37 4.73±0.38 4.07±0.48
3. 4.10±0.27 5.93±0.35 4.82±0.44 4.31±0.57
4. 4.33±0.28 6.13±0.39 4.88±0.40 4.26±0.57
5. 4.74±0.27 6.53±0.40 4.96±0.43 4.37±0.52
6. 4.86±0.34 7.12±0.39 5.13±0.45 4.53±0.67
7. 4.80±0.35 7.42±0.36 5.12±0.46 4.53±0.58
8. 4.75±0.35 7.37±0.35 5.16±0.46 4.47±0.61
9. 4.64±0.35 7.27±0.31 5.21±0.48 4.58±0.44
10. 4.44±0.32 7.07±0.22 5.25±0.50 4.63±0.61
11. 4.30±0.28 6.97±0.45 5.31±0.32 4.69±0.58
12. 4.16±0.25 6.77±0.46 5.26±0.38 4.74±0.60
13. 3.91±0.27 6.63±0.42 5.41±0.32 4.69±0.60
14. 3.83±0.26 6.52±0.42 5.60±0.33 4.80±0.55
15. 3.72±0.19 6.38±0.47 5.60±0.29 4.96±0.64
16. 3.52±0.17 6.23±0.45 5.78±0.39 5.01±0.52
Overall 4.20a±0.08 6.51b±0.11 5.18a±0.10 4.53b±0.14
*Means bearing different superscripts differ significantly (P<0.05)
Effect of challenge feeding on dry matter intake in Sahiwal cattle
Indian J. Anim. Nutr. 2020. 37 (1): 14-20
18
dry matter intake significantly. On the other hand, Vande
Haar et al. (1999), Keady et al. (2001), Guo et al.
(2007) and Ojha et al. (2015) have reported that higher
feeding regime prepartum increased dry matter intake
significantly.
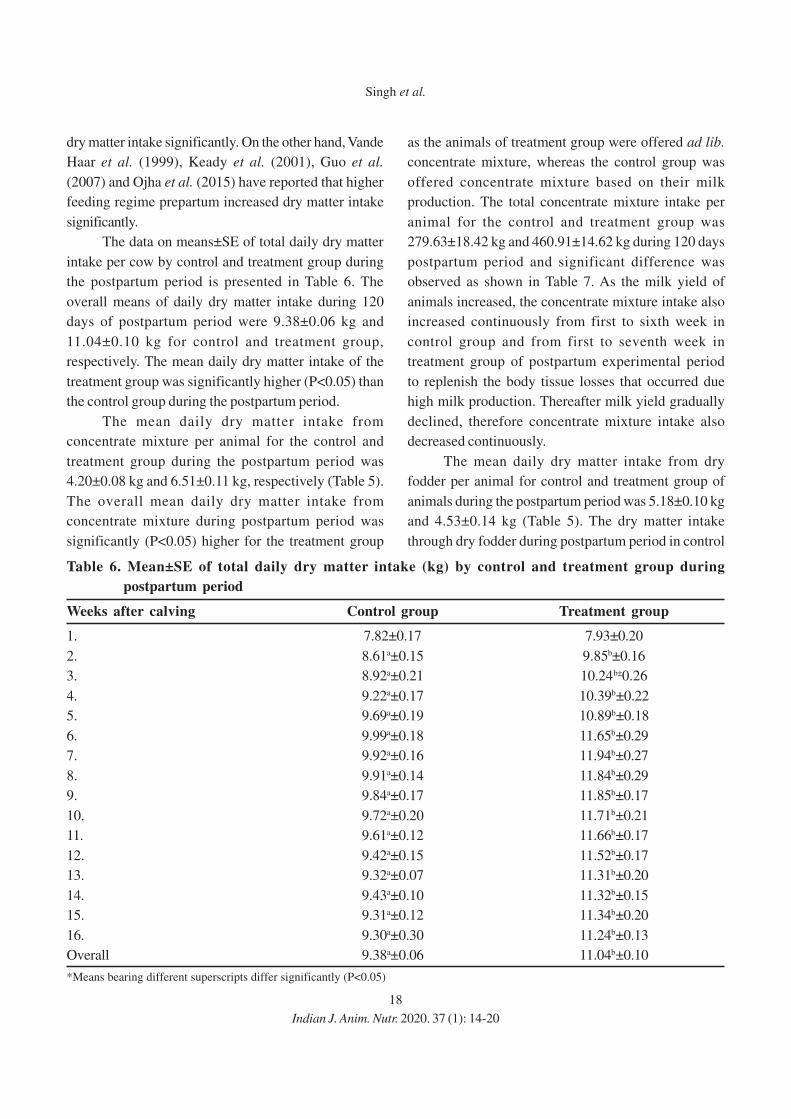
The data on means±SE of total daily dry matter
intake per cow by control and treatment group during
the postpartum period is presented in Table 6. The
overall means of daily dry matter intake during 120
days of postpartum period were 9.38±0.06 kg and
11.04±0.10 kg for control and treatment group,
respectively. The mean daily dry matter intake of the
treatment group was significantly higher (P<0.05) than
the control group during the postpartum period.
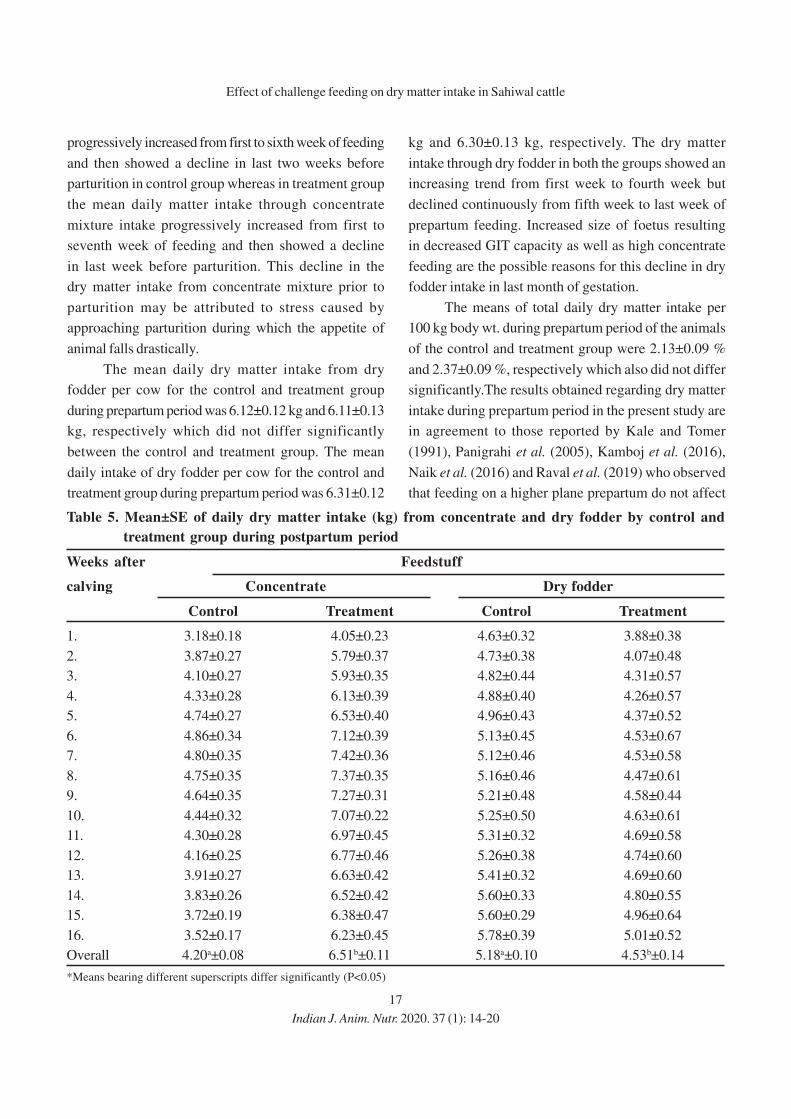
The mean daily dry matter intake from
concentrate mixture per animal for the control and
treatment group during the postpartum period was
4.20±0.08 kg and 6.51±0.11 kg, respectively (Table 5).
The overall mean daily dry matter intake from
concentrate mixture during postpartum period was
significantly (P<0.05) higher for the treatment group
Table 6. Mean±SE of total daily dry matter intake (kg) by control and treatment group during
postpartum period
Weeks after calving Control group Treatment group
1. 7.82±0.17 7.93±0.20
2. 8.61a±0.15 9.85b±0.16
3. 8.92a±0.21 10.24b±0.26
4. 9.22a±0.17 10.39b±0.22
5. 9.69a±0.19 10.89b±0.18
6. 9.99a±0.18 11.65b±0.29
7. 9.92a±0.16 11.94b±0.27
8. 9.91a±0.14 11.84b±0.29
9. 9.84a±0.17 11.85b±0.17
10. 9.72a±0.20 11.71b±0.21
11. 9.61a±0.12 11.66b±0.17
12. 9.42a±0.15 11.52b±0.17
13. 9.32a±0.07 11.31b±0.20
14. 9.43a±0.10 11.32b±0.15
15. 9.31a±0.12 11.34b±0.20
16. 9.30a±0.30 11.24b±0.13
Overall 9.38a±0.06 11.04b±0.10
*Means bearing different superscripts differ significantly (P<0.05)
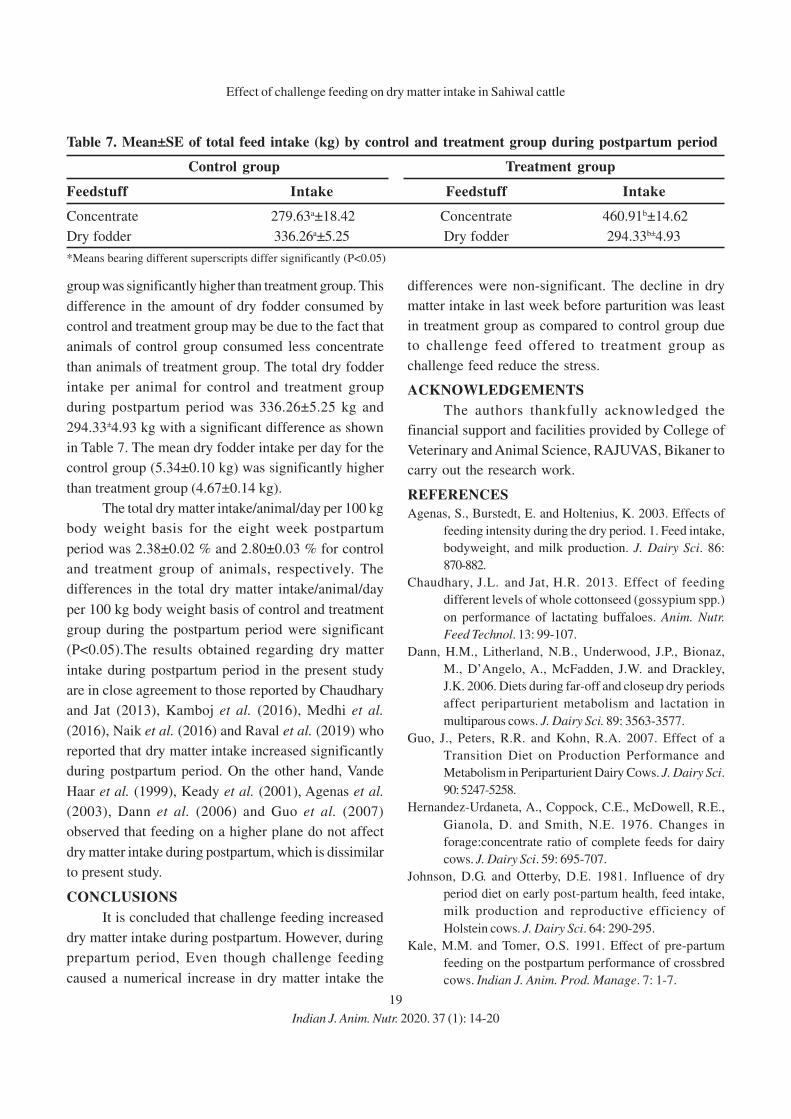
as the animals of treatment group were offered ad lib.
concentrate mixture, whereas the control group was
offered concentrate mixture based on their milk
production. The total concentrate mixture intake per
animal for the control and treatment group was
279.63±18.42 kg and 460.91±14.62 kg during 120 days
postpartum period and significant difference was
observed as shown in Table 7. As the milk yield of
animals increased, the concentrate mixture intake also
increased continuously from first to sixth week in
control group and from first to seventh week in
treatment group of postpartum experimental period
to replenish the body tissue losses that occurred due
high milk production. Thereafter milk yield gradually
declined, therefore concentrate mixture intake also
decreased continuously.
The mean daily dry matter intake from dry
fodder per animal for control and treatment group of
animals during the postpartum period was 5.18±0.10 kg
and 4.53±0.14 kg (Table 5). The dry matter intake
through dry fodder during postpartum period in control
Indian J. Anim. Nutr. 2020. 37 (1): 14-20
Singh et al.
19
group was significantly higher than treatment group. This
difference in the amount of dry fodder consumed by
control and treatment group may be due to the fact that
animals of control group consumed less concentrate
than animals of treatment group. The total dry fodder
intake per animal for control and treatment group
during postpartum period was 336.26±5.25 kg and
294.33±4.93 kg with a significant difference as shown
in Table 7. The mean dry fodder intake per day for the
control group (5.34±0.10 kg) was significantly higher
than treatment group (4.67±0.14 kg).
The total dry matter intake/animal/day per 100 kg
body weight basis for the eight week postpartum
period was 2.38±0.02 % and 2.80±0.03 % for control
and treatment group of animals, respectively. The
differences in the total dry matter intake/animal/day
per 100 kg body weight basis of control and treatment
group during the postpartum period were significant
(P<0.05).The results obtained regarding dry matter
intake during postpartum period in the present study
are in close agreement to those reported by Chaudhary
and Jat (2013), Kamboj et al. (2016), Medhi et al.
(2016), Naik et al. (2016) and Raval et al. (2019) who
reported that dry matter intake increased significantly
during postpartum period. On the other hand, Vande
Haar et al. (1999), Keady et al. (2001), Agenas et al.
(2003), Dann et al. (2006) and Guo et al. (2007)
observed that feeding on a higher plane do not affect
dry matter intake during postpartum, which is dissimilar
to present study.
CONCLUSIONS
It is concluded that challenge feeding increased
dry matter intake during postpartum. However, during
prepartum period, Even though challenge feeding
caused a numerical increase in dry matter intake the
differences were non-significant. The decline in dry
matter intake in last week before parturition was least
in treatment group as compared to control group due
to challenge feed offered to treatment group as
challenge feed reduce the stress.
ACKNOWLEDGEMENTS
The authors thankfully acknowledged the
financial support and facilities provided by College of
Veterinary and Animal Science, RAJUVAS, Bikaner to
carry out the research work.
REFERENCES
Agenas, S., Burstedt, E. and Holtenius, K. 2003. Effects of
feeding intensity during the dry period. 1. Feed intake,
bodyweight, and milk production. J. Dairy Sci. 86:
870-882.
Chaudhary, J.L. and Jat, H.R. 2013. Effect of feeding
different levels of whole cottonseed (gossypium spp.)
on performance of lactating buffaloes. Anim. Nutr.
Feed Technol. 13: 99-107.
Dann, H.M., Litherland, N.B., Underwood, J.P., Bionaz,
M., D’Angelo, A., McFadden, J.W. and Drackley,
J.K. 2006. Diets during far-off and closeup dry periods
affect periparturient metabolism and lactation in
multiparous cows. J. Dairy Sci. 89: 3563-3577.
Guo, J., Peters, R.R. and Kohn, R.A. 2007. Effect of a
Transition Diet on Production Performance and
Metabolism in Periparturient Dairy Cows. J. Dairy Sci.
90: 5247-5258.
Hernandez-Urdaneta, A., Coppock, C.E., McDowell, R.E.,
Gianola, D. and Smith, N.E. 1976. Changes in
forage:concentrate ratio of complete feeds for dairy
cows. J. Dairy Sci. 59: 695-707.
Johnson, D.G. and Otterby, D.E. 1981. Influence of dry
period diet on early post-partum health, feed intake,
milk production and reproductive efficiency of
Holstein cows. J. Dairy Sci. 64: 290-295.
Kale, M.M. and Tomer, O.S. 1991. Effect of pre-partum
feeding on the postpartum performance of crossbred
cows. Indian J. Anim. Prod. Manage. 7: 1-7.
Table 7. Mean±SE of total feed intake (kg) by control and treatment group during postpartum period
Control group Treatment group
Feedstuff Intake Feedstuff Intake
Concentrate 279.63a±18.42 Concentrate 460.91b±14.62
Dry fodder 336.26a±5.25 Dry fodder 294.33b±4.93
*Means bearing different superscripts differ significantly (P<0.05)
Effect of challenge feeding on dry matter intake in Sahiwal cattle
Indian J. Anim. Nutr. 2020. 37 (1): 14-20
20
Kamboj, M.L., Mengistu, R.A., Bindal, S. and Datt, C. 2016.
Challenge Feeding and Milk Production Performance
in Crossbred Cows. Indian J. Anim. Nut. 33: 285-289.
Keady, T.W.J., Mayne, C.S., Fitzpatrick, D.A. and McCoy,
M.A. 2001. Effect of concentrate feed level in late
gestation on subsequent milk yield, milk composition,
and fertility of dairy cows. J. Dairy Sci. 84: 1468-1479.
Medhi, D., Hanah, S.S., Sarmah, P.P., Tsering, K., Ali, E. Das,
P.P., Das, P.J. and Deb, S.M. 2016. Performances of
lactating yaks on silage and complete feed block based
feeding regiments. Indian J. Anim. Sci. 86: 203-205.
Murphy, J.J. 1999. Effect of dry period protein feeding on
postpartum milk production and composition. Livest.
Prod. Sci. 57: 169-179.
Naik, P.K., Dhawaskar, B.D., Fatarpekar, D.D., Karunakaran,
M., Dhuri, R.B., Swain, B.K., Chakurkar, E.B. and
Singh, N.P. 2017. Effect of feeding hydroponics maize
fodder replacing maize of concentrate mixture partially
on digestibility of nutrients and milk production in
lactating cows. Indian J. Anim. Sci. 87: 452-455.
Ojha, B.K., Narayan, D., Pattanaik, A.K., Singh, S.K.
and Narang, A. 2015. Effect of pre-partum strategic
supplementation of concentrates on colostrum
quality and performance of buffalo calves. Anim. Nutr.
Feed Technol. 15: 41-49.
Olsson, G. 1996. Effects of feeding strategy before calving on
dairy cow performance. Agrari 18, Swedish University
of Agricultural Sciences, Uppsala, Sweden.
Panigrahi, B., Pandey, H.N. and Patnaik, A.K. 2005. Effect of
prepartum feeding of crossbred cows on growth
performance, metabolic profile and immune status of
calves. Asian-Australas. J. Anim. Sci. 18: 661-666.
Raval, A., Sorathiya, L., Katariya, M., Kharadi, V., Patel, V.,
Patel, N., and Parmar, A. 2019. Effect of Challenge
Feeding on Production Performance of Surti Buffaloes.
Int. J. Livest. Res. 9: 164-170.
Snedecor, G.W. and Cochran, W.G. 1994. Statistical Methods.
7 th edn. Iowa State University Press, Ames, IA., USA.
Vande Haar, M.J., Yousif, G., Sharma, B.K., Herdt, T.H., Emery,
R.S., Allen, M.S. and Liesman, J.S. 1999. Effect of
energy and protein density of prepartum diets on fat
and protein metabolism of dairy cattle in the
periparturient period. J. Dairy Sci. 82: 1282-1295.
Indian J. Anim. Nutr. 2020. 37 (1): 14-20
Singh et al.
Received on 02-06-2020 and accepted on 30-06-2020
21
Indian Journal of
Animal Nutrition
Effect of Replacement of Conventional Feeds by Prosopis juliflora Pods
and Citrullus lanatus Seed Cake on Haemato-Biochemical Parameters
in Marwari Goats
Dharmendra Chharang*, Tribhuwan Sharma, Monika Karnani, Manju and Rajesh Kumar
Department of Animal Nutrition, P.G. Institute of Veterinary Education and Research,
Rajasthan University of Veterinary and Animal Sciences, Jaipur-302 031, India
ABSTRACT
An experiment was conducted to observe the effect of incorporation of mesquite (Prosopis juliflora)
pods and watermelon (Citrullus lanatus) seed cake in complete feed with sixteen male Marwari goat kids of
uniform conformation and age, divided into four groups. Four complete feed designated as T1,
T2, T
3 and T
4
were formulated. T1 served as control having all the conventional ingredients; whereas, barley of control was
replaced by mesquite pods in T2, cotton seed cake was replaced by watermelon seed cake in T
3 and both barley
and cotton seed cake were replaced by mesquite pods and watermelon seed cake in T4, respectively. All the
four complete feeds were iso-nitrogenous and nearly iso-caloric. Haemato-biochemical parameters viz.
haemoglobin, PCV, total serum protein and blood glucose, were worked out at fortnightly interval for 105 days
of all individual animals. All parameters were found well within the normal range, i.e. 8.38, 8.26, 8.09 and 8.11
for haemoglobin (%), 27.87, 27.59, 27.78 and 27.87 for PCV (%), 72.03, 72.63, 69.66 and 71.66 for blood
glucose (mg/dl), 7.26, 7.29, 7.17 and 7.33 for serum protein (g/dl) in T1,
T2, T
3 and T
4 groups, respectively. It
was concluded that dietary treatments had no adverse effect, but highly significant effect of period on
haemato-biochemical parameters were observed in Marwari goat kids. Thus, barley and cottonseed cake could
be safely and effectively replaced by mesquite pods and watermelon seed cake alone or in combination in
the complete feed of goats.
Key words: Citrullus lanatus, Haemato-biochemical parameters, Iso-nitrogenous, Marwari, Mesquite Prosopis
juliflora
*Corresponding author’s E-mail: [email protected]; Mobile +91-9757216007
INTRODUCTON
The use of alternative feed resources which are
adaptive to long dry seasons is important for animal
production in arid areas worldwide (Gusha et al., 2015).
Agro-industrial byproducts and non-conventional feeds
such as Prosopis juliflora pods and watermelon seed
cake may be economically advantageous in reducing
feeding costs and can play an important role in feeding
of sheep and goats under various management systems
(Obeidat and Shdaifat, 2013). Availability of Prosopis
juliflora pods worldwide was estimated to be about
2-4 million metric tonnes (Sawal et al., 2004), whereas
global production of watermelons was 118 million tonnes
(FAOSTAT, 2018). Though many of the farmers in the
dry areas of Rajasthan do not utilize these pods for
livestock feeding but the goats browse these entire pods
and seeds while grazing in the field or are fed by some
owners in the form of concentrate. Formulation of
complete feed having non-conventional ingredients
replacing conventional ingredients in the feed has been
worked out extensively (Talpada et al., 2002; Abo-Zeid
et al., 2017). Use of biotechnology in this regard has
not only improved the efficiency of the conventional
ingredients, but also allowed scientists to use non-
conventional feed resources that are often cheaper and
readily available (Chharang et al., 2019).
Prosopis juliflora or Vilayati babul is a very
variable, evergreen tree or shrub distributed in the arid
part of tropical and sub-tropical regions. The ripen highly
palatable pods produced as fruit, are moderate in crude
protein (12 %) and rich in free sugar (15-17 %) giving
sweet taste to it. Studies have shown that it can be
effectively used in the feeding of livestock and it has
about 7 % DCP and 75 % TDN (Talpada et al., 1979).
Similarly, watermelon (Citrullus lanatus) previously
called as Citrullus vulgaris, is also a naturally grown
Indian J. Anim. Nutr. 2020. 37 (1): 21-25
doi: 10.5958/2231-6744.2020.00004.3
Indian J. Anim. Nutr. 2020. 37 (1): 21-25
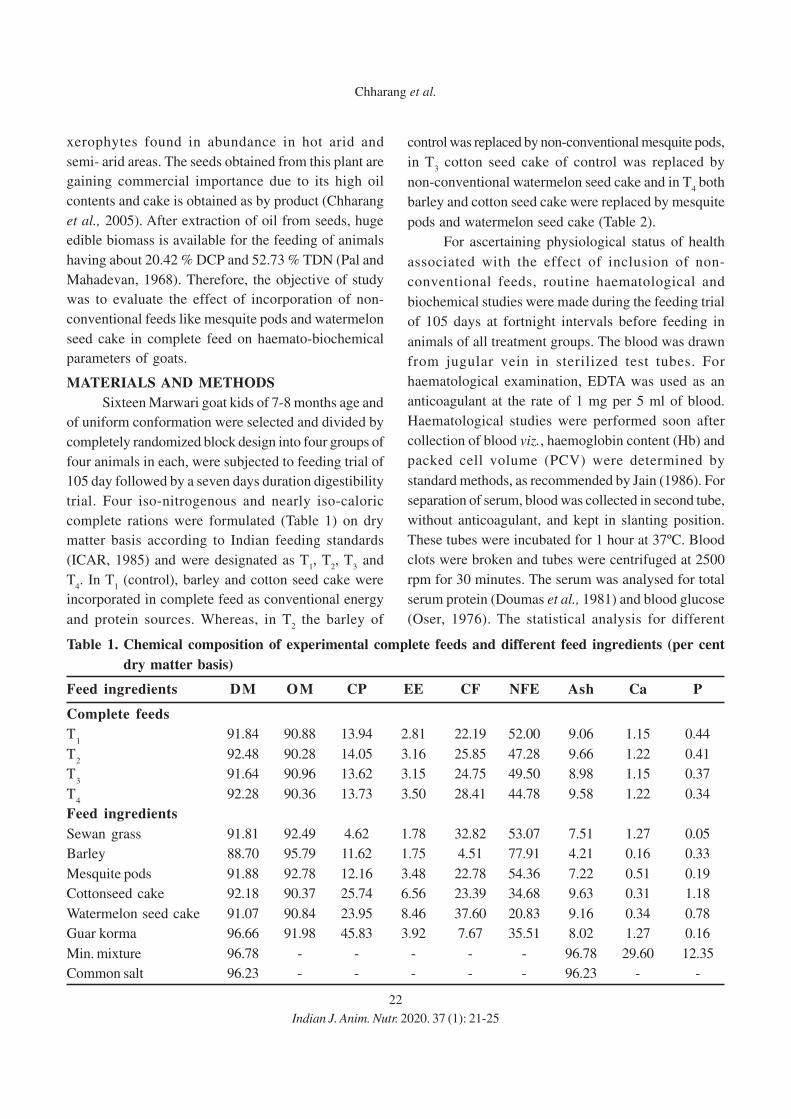
22
xerophytes found in abundance in hot arid and
semi- arid areas. The seeds obtained from this plant are
gaining commercial importance due to its high oil
contents and cake is obtained as by product (Chharang
et al., 2005). After extraction of oil from seeds, huge
edible biomass is available for the feeding of animals
having about 20.42 % DCP and 52.73 % TDN (Pal and
Mahadevan, 1968). Therefore, the objective of study
was to evaluate the effect of incorporation of non-
conventional feeds like mesquite pods and watermelon
seed cake in complete feed on haemato-biochemical
parameters of goats.
MATERIALS AND METHODS
Sixteen Marwari goat kids of 7-8 months age and
of uniform conformation were selected and divided by
completely randomized block design into four groups of
four animals in each, were subjected to feeding trial of
105 day followed by a seven days duration digestibility
trial. Four iso-nitrogenous and nearly iso-caloric
complete rations were formulated (Table 1) on dry
matter basis according to Indian feeding standards
(ICAR, 1985) and were designated as T1, T
2, T
3 and
T4. In T
1 (control), barley and cotton seed cake were
incorporated in complete feed as conventional energy
and protein sources. Whereas, in T2 the barley of
control was replaced by non-conventional mesquite pods,
in T3 cotton seed cake of control was replaced by
non-conventional watermelon seed cake and in T4 both
barley and cotton seed cake were replaced by mesquite
pods and watermelon seed cake (Table 2).
For ascertaining physiological status of health
associated with the effect of inclusion of non-
conventional feeds, routine haematological and
biochemical studies were made during the feeding trial
of 105 days at fortnight intervals before feeding in
animals of all treatment groups. The blood was drawn
from jugular vein in sterilized test tubes. For
haematological examination, EDTA was used as an
anticoagulant at the rate of 1 mg per 5 ml of blood.
Haematological studies were performed soon after
collection of blood viz., haemoglobin content (Hb) and
packed cell volume (PCV) were determined by
standard methods, as recommended by Jain (1986). For
separation of serum, blood was collected in second tube,
without anticoagulant, and kept in slanting position.
These tubes were incubated for 1 hour at 37ºC. Blood
clots were broken and tubes were centrifuged at 2500
rpm for 30 minutes. The serum was analysed for total
serum protein (Doumas et al., 1981) and blood glucose
(Oser, 1976). The statistical analysis for different
Table 1. Chemical composition of experimental complete feeds and different feed ingredients (per cent
dry matter basis)
Feed ingredients DM OM CP EE CF NFE Ash Ca P
Complete feeds
T1
91.84 90.88 13.94 2.81 22.19 52.00 9.06 1.15 0.44
T2
92.48 90.28 14.05 3.16 25.85 47.28 9.66 1.22 0.41
T3
91.64 90.96 13.62 3.15 24.75 49.50 8.98 1.15 0.37
T4
92.28 90.36 13.73 3.50 28.41 44.78 9.58 1.22 0.34
Feed ingredients
Sewan grass 91.81 92.49 4.62 1.78 32.82 53.07 7.51 1.27 0.05
Barley 88.70 95.79 11.62 1.75 4.51 77.91 4.21 0.16 0.33
Mesquite pods 91.88 92.78 12.16 3.48 22.78 54.36 7.22 0.51 0.19
Cottonseed cake 92.18 90.37 25.74 6.56 23.39 34.68 9.63 0.31 1.18
Watermelon seed cake 91.07 90.84 23.95 8.46 37.60 20.83 9.16 0.34 0.78
Guar korma 96.66 91.98 45.83 3.92 7.67 35.51 8.02 1.27 0.16
Min. mixture 96.78 - - - - - 96.78 29.60 12.35
Common salt 96.23 - - - - - 96.23 - -
Indian J. Anim. Nutr. 2020. 37 (1): 21-25
Chharang et al.
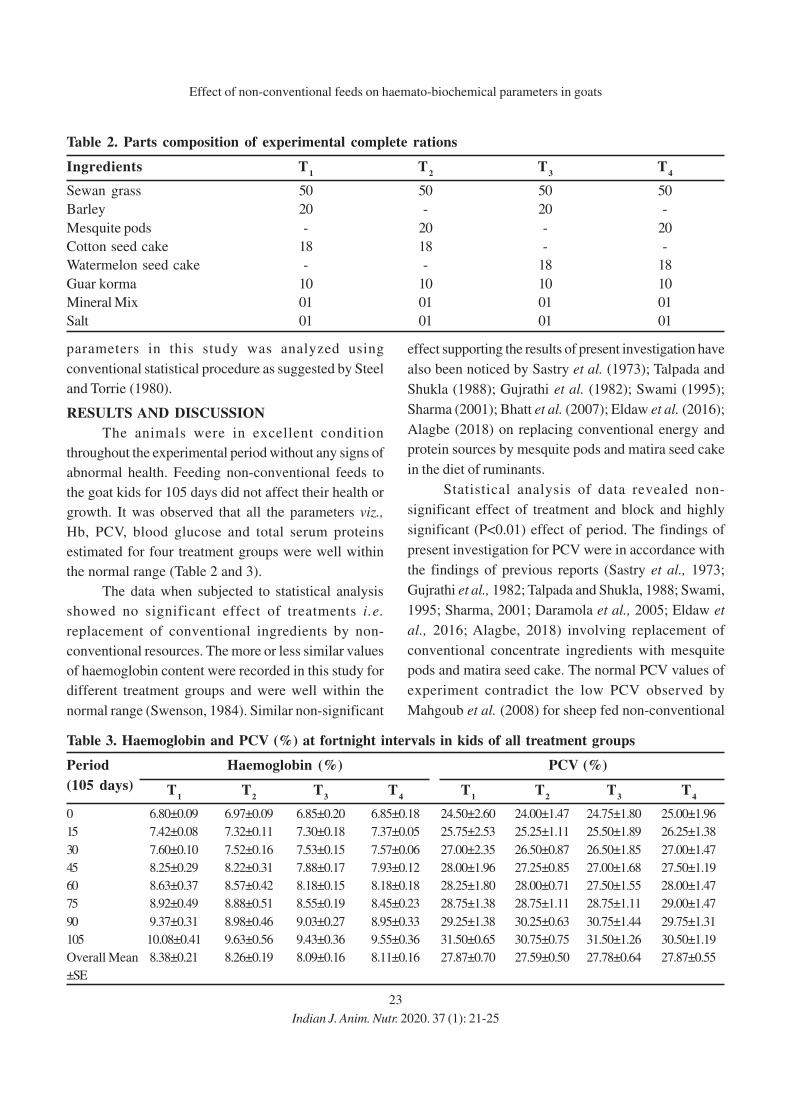
23
parameters in this study was analyzed using
conventional statistical procedure as suggested by Steel
and Torrie (1980).
RESULTS AND DISCUSSION
The animals were in excellent condition
throughout the experimental period without any signs of
abnormal health. Feeding non-conventional feeds to
the goat kids for 105 days did not affect their health or
growth. It was observed that all the parameters viz.,
Hb, PCV, blood glucose and total serum proteins
estimated for four treatment groups were well within
the normal range (Table 2 and 3).
The data when subjected to statistical analysis
showed no significant effect of treatments i.e.
replacement of conventional ingredients by non-
conventional resources. The more or less similar values
of haemoglobin content were recorded in this study for
different treatment groups and were well within the
normal range (Swenson, 1984). Similar non-significant
effect supporting the results of present investigation have
also been noticed by Sastry et al. (1973); Talpada and
Shukla (1988); Gujrathi et al. (1982); Swami (1995);
Sharma (2001); Bhatt et al. (2007); Eldaw et al. (2016);
Alagbe (2018) on replacing conventional energy and
protein sources by mesquite pods and matira seed cake
in the diet of ruminants.
Statistical analysis of data revealed non-
significant effect of treatment and block and highly
significant (P<0.01) effect of period. The findings of
present investigation for PCV were in accordance with
the findings of previous reports (Sastry et al., 1973;
Gujrathi et al., 1982; Talpada and Shukla, 1988; Swami,
1995; Sharma, 2001; Daramola et al., 2005; Eldaw et
al., 2016; Alagbe, 2018) involving replacement of
conventional concentrate ingredients with mesquite
pods and matira seed cake. The normal PCV values of
experiment contradict the low PCV observed by
Mahgoub et al. (2008) for sheep fed non-conventional
Table 2. Parts composition of experimental complete rations
Ingredients T1
T2
T3
T4
Sewan grass 50 50 50 50
Barley 20 - 20 -
Mesquite pods - 20 - 20
Cotton seed cake 18 18 - -
Watermelon seed cake - - 18 18
Guar korma 10 10 10 10
Mineral Mix 01 01 01 01
Salt 01 01 01 01
Table 3. Haemoglobin and PCV (%) at fortnight intervals in kids of all treatment groups
Period Haemoglobin (%) PCV (%)
(105 days) T1
T2
T3
T4
T1
T2
T3
T4
0 6.80±0.09 6.97±0.09 6.85±0.20 6.85±0.18 24.50±2.60 24.00±1.47 24.75±1.80 25.00±1.96
15 7.42±0.08 7.32±0.11 7.30±0.18 7.37±0.05 25.75±2.53 25.25±1.11 25.50±1.89 26.25±1.38
30 7.60±0.10 7.52±0.16 7.53±0.15 7.57±0.06 27.00±2.35 26.50±0.87 26.50±1.85 27.00±1.47
45 8.25±0.29 8.22±0.31 7.88±0.17 7.93±0.12 28.00±1.96 27.25±0.85 27.00±1.68 27.50±1.19
60 8.63±0.37 8.57±0.42 8.18±0.15 8.18±0.18 28.25±1.80 28.00±0.71 27.50±1.55 28.00±1.47
75 8.92±0.49 8.88±0.51 8.55±0.19 8.45±0.23 28.75±1.38 28.75±1.11 28.75±1.11 29.00±1.47
90 9.37±0.31 8.98±0.46 9.03±0.27 8.95±0.33 29.25±1.38 30.25±0.63 30.75±1.44 29.75±1.31
105 10.08±0.41 9.63±0.56 9.43±0.36 9.55±0.36 31.50±0.65 30.75±0.75 31.50±1.26 30.50±1.19
Overall Mean 8.38±0.21 8.26±0.19 8.09±0.16 8.11±0.16 27.87±0.70 27.59±0.50 27.78±0.64 27.87±0.55
±SE
Indian J. Anim. Nutr. 2020. 37 (1): 21-25
Effect of non-conventional feeds on haemato-biochemical parameters in goats
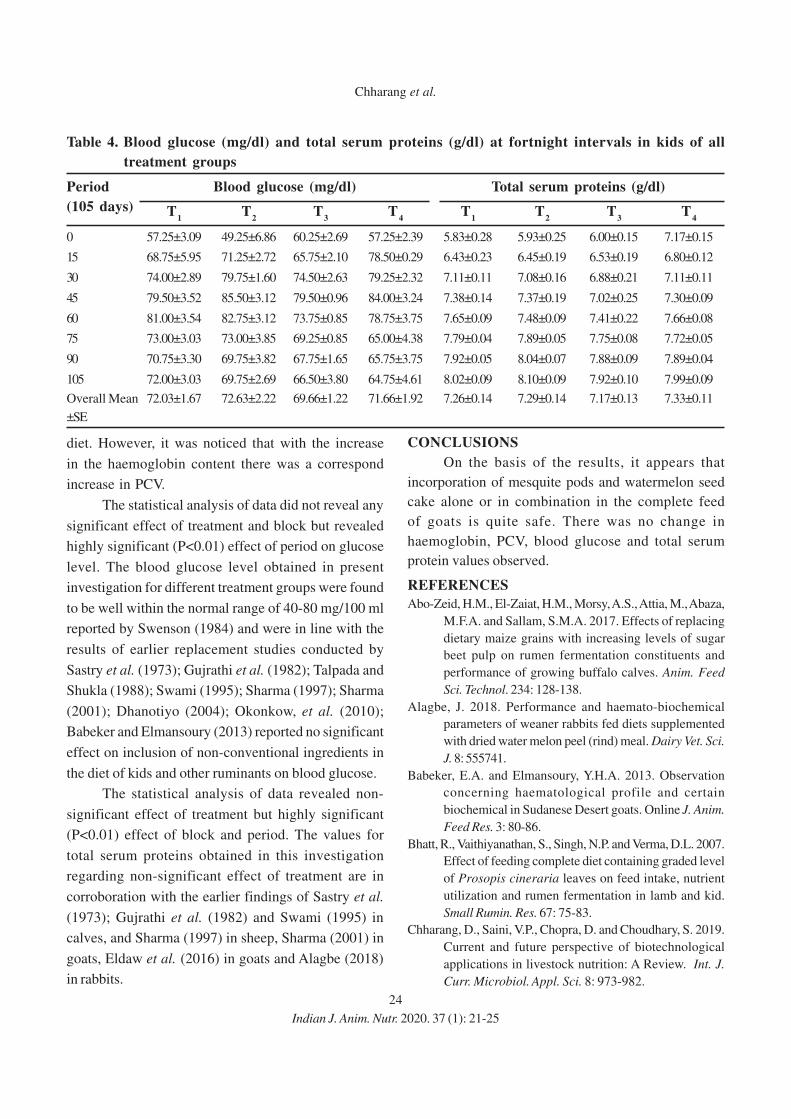
24
diet. However, it was noticed that with the increase
in the haemoglobin content there was a correspond
increase in PCV.
The statistical analysis of data did not reveal any
significant effect of treatment and block but revealed
highly significant (P<0.01) effect of period on glucose
level. The blood glucose level obtained in present
investigation for different treatment groups were found
to be well within the normal range of 40-80 mg/100 ml
reported by Swenson (1984) and were in line with the
results of earlier replacement studies conducted by
Sastry et al. (1973); Gujrathi et al. (1982); Talpada and
Shukla (1988); Swami (1995); Sharma (1997); Sharma
(2001); Dhanotiyo (2004); Okonkow, et al. (2010);
Babeker and Elmansoury (2013) reported no significant
effect on inclusion of non-conventional ingredients in
the diet of kids and other ruminants on blood glucose.
The statistical analysis of data revealed non-
significant effect of treatment but highly significant
(P<0.01) effect of block and period. The values for
total serum proteins obtained in this investigation
regarding non-significant effect of treatment are in
corroboration with the earlier findings of Sastry et al.
(1973); Gujrathi et al. (1982) and Swami (1995) in
calves, and Sharma (1997) in sheep, Sharma (2001) in
goats, Eldaw et al. (2016) in goats and Alagbe (2018)
in rabbits.
CONCLUSIONS
On the basis of the results, it appears that
incorporation of mesquite pods and watermelon seed
cake alone or in combination in the complete feed
of goats is quite safe. There was no change in
haemoglobin, PCV, blood glucose and total serum
protein values observed.
REFERENCES
Abo-Zeid, H.M., El-Zaiat, H.M., Morsy, A.S., Attia, M., Abaza,
M.F.A. and Sallam, S.M.A. 2017. Effects of replacing
dietary maize grains with increasing levels of sugar
beet pulp on rumen fermentation constituents and
performance of growing buffalo calves. Anim. Feed
Sci. Technol. 234: 128-138.
Alagbe, J. 2018. Performance and haemato-biochemical
parameters of weaner rabbits fed diets supplemented
with dried water melon peel (rind) meal. Dairy Vet. Sci.
J. 8: 555741.
Babeker, E.A. and Elmansoury, Y.H.A. 2013. Observation
concerning haematological profile and certain
biochemical in Sudanese Desert goats. Online J. Anim.
Feed Res. 3: 80-86.
Bhatt, R., Vaithiyanathan, S., Singh, N.P. and Verma, D.L. 2007.
Effect of feeding complete diet containing graded level
of Prosopis cineraria leaves on feed intake, nutrient
utilization and rumen fermentation in lamb and kid.
Small Rumin. Res. 67: 75-83.
Chharang, D., Saini, V.P., Chopra, D. and Choudhary, S. 2019.
Current and future perspective of biotechnological
applications in livestock nutrition: A Review. Int. J.
Curr. Microbiol. Appl. Sci. 8: 973-982.
Table 4. Blood glucose (mg/dl) and total serum proteins (g/dl) at fortnight intervals in kids of all
treatment groups
Period Blood glucose (mg/dl) Total serum proteins (g/dl)
(105 days) T1
T2
T3
T4
T1
T2
T3
T4
0 57.25±3.09 49.25±6.86 60.25±2.69 57.25±2.39 5.83±0.28 5.93±0.25 6.00±0.15 7.17±0.15
15 68.75±5.95 71.25±2.72 65.75±2.10 78.50±0.29 6.43±0.23 6.45±0.19 6.53±0.19 6.80±0.12
30 74.00±2.89 79.75±1.60 74.50±2.63 79.25±2.32 7.11±0.11 7.08±0.16 6.88±0.21 7.11±0.11
45 79.50±3.52 85.50±3.12 79.50±0.96 84.00±3.24 7.38±0.14 7.37±0.19 7.02±0.25 7.30±0.09
60 81.00±3.54 82.75±3.12 73.75±0.85 78.75±3.75 7.65±0.09 7.48±0.09 7.41±0.22 7.66±0.08
75 73.00±3.03 73.00±3.85 69.25±0.85 65.00±4.38 7.79±0.04 7.89±0.05 7.75±0.08 7.72±0.05
90 70.75±3.30 69.75±3.82 67.75±1.65 65.75±3.75 7.92±0.05 8.04±0.07 7.88±0.09 7.89±0.04
105 72.00±3.03 69.75±2.69 66.50±3.80 64.75±4.61 8.02±0.09 8.10±0.09 7.92±0.10 7.99±0.09
Overall Mean 72.03±1.67 72.63±2.22 69.66±1.22 71.66±1.92 7.26±0.14 7.29±0.14 7.17±0.13 7.33±0.11
±SE
Indian J. Anim. Nutr. 2020. 37 (1): 21-25
Chharang et al.
25
Chharang, D., Sharma, T., Arya, R.S., Dhuria, R.K., Singh, A.P.,
and Garg, D.D. 2005. Effect of incorporation of
mesquite (Prosopis juliflora) pods and matira seed
(Citrullus lanatus) cake in complete feed for goats on
certain rumen metabolites. Pre-proc. of 5th Indian
Veterinary Congr and XII annual conference of IAAVR,
Dec.31,2004- Jan.1, 2005, Bikaner, India, pp. 237-245.
Daramola, J.O., Adeloye, A.A., Fatoba, T.A. and Soladoye,
A.O. 2005. Haematological and biochemical parameters
of West African Dwarf goats. Livest. Res. Rural Dev.
17: 8.
Dhanotiyo, S.R. 2004. Text Book OF Veterinary Biochemistry.
2nd ed. College of Veterinary Science and Animal
Husbandry. Taypee Brothers Company, India.
Doumas, B.T., Bayse, D., Borner, K., Carter, R.J., Petera, T.
Jr. and Schaffers, R. 1981. Clinical Chemistry, 27: 1642.
(Cited from Practical biochemistry by Gupta, R.C. and
Bhargav, S. 2nd ed. C.B.S. Publishers and Distributors,
pp. 137-139.
Eldaw, M.Y., Ahmed, S.H., Omar, S.A. 2016. Effect of feeding
graded levels of Prosopis juliflora pods on some
hematological and biochemical parameters of Sudanese
Nubian Goats kids. Int. J. Sci. Technol. 4: 127-132.
Food and Agriculture Organization of United Nation,
Corporate Statistical Database (FAOSTAT). 2018.
Gujrathi, J.M., Shukla, P.C. and Pande, M.B. 1982. Effect of
feeding (Prosopis juliflora) pods in the ration of
bullocks on certain blood constituents and rumen
metabolites. Gujarat Agric. University Res. J. 8: 41-44.
Gusha, J., Halimani, T. E., Katsande, S. and Zvinorova, P.I.
2015. The effect of Opuntia ficus indica and forage
legumes based diets on goats’ productivity in
smallholder sector in Zimbabwe. Small Rumin. Res.
125: 21-25.
ICAR. 1985. Nutrient requirement of livestock and poultry.
Published by Publications and Information Division,
ICAR, New Delhi.
Jain, N.C. 1986. Schalm’s Veterinary haematology. 4th ed. Lea
and Febiger, Philadelphia, U.S.A.
Mahgoub, O., Kadim, I.T., Tageldin, M.H., Al-Marzooqi, W.,
Khalaf, S.K. and Ali, A.A. 2008. Clinical profile of sheep
fed non-conventional feeds containing phenols and
condensed tannins. Small Rumin. Res. 78: 115-122.
Obeidat, B.S. and Shdaifat, M. M. 2013. Partial substitution of
barley grain with Prosopis juliflora pods in lactating
Awassi ewes’ diets: Effect on intake, digestibility, and
nursing performance. Small Rumin. Res. 111: 50-55.
Okonkwo, J.C., Omeje, I.S., Okonkwo, I.F. and Umeghalu, I.C.E.
2010. Effect of bred, sex and source within breed on
blood bilirubin, cholesterol and glucose concentration
of Nigerian goats. Pakis. J. Nutri. 9: 120-124.
Oser, B.L. 1976. In: Hawk’s physiology chemistry, 14th ed. Tata
McGraw Hill. Publishing Co. Ltd., New Delhi.
Pal, R.N. and Mahadevan, V. 1968. Chemical composition
and Nutritive value of Bijada cake (Citrullus vulgaris).
Indian Vet. J. 45: 433-438.
Sastry, M.S., Singh, Y.P. and Dutta, B. 1973. Studies on the
toxicity of Bizada cake. Indian Vet. J. 7: 685-688.
Sawal, R.K., Ratan, R. and Yadav, S. B. S. 2004. Mesquite
(Prosopis juliflora) Pods as a Feed Resource for
Livestock- A Review. Asian-Australas. J. Anim. Sci.
17: 719-725.
Sharma, S. 2001. Efficiency of utilization of non conventional
protein sources in complete feed of Marwari goats for
growth and lactational performance. Ph.D. Thesis
Submitted to Rajasthan Agri. University, Bikaner
(Rajasthan).
Sharma, T. 1997. Efficiency of utilization of processed
mesquite pods in the ration of sheep. Ph.D. Thesis
Submitted to Rajasthan Agri. University, Bikaner, pp.
97-103.
Steel, R.G.D. and Torrie, J.H. 1980. Principles and Procedures
of Statistics, Mcgraw Hill book company, New York.
Swami, R. 1995. Effect of replacement of cotton seed cake by
graded levels of matira cake (Citrulus lanatus) in the
ration of dairy calves. M.V.Sc. Thesis submitted to
Rajasthan Agri. University, Bikaner, India.
Swenson, Melvin J. 1984. Physiological properties and
cellular and chemical constituents of blood. [Cited
from Dukes Physiology of domestic animals, pp.
15-40, 10th ed. (1984)]. Comstock Publishing Company,
Ithaca, New York.
Talpada, P.M. and Shukla, P.C. 1988. Effect of feeding Prosopis
juliflora pods on certain blood constituents of
lactating cows. Gujvet, 16: 32-35.
Talpada, P.M., Pande, M.B., Patel, B.H. and Shukla, P.C. 1979.
Feed value of Prosopis juliflora DC pods for growing
calves. Indian J. Dairy Sci. 32: 482-483.
Talpada, P.M., Pandya, P.R., Patel, G.R. Patel, D.C. and Desai,
M. 2002. Utilization of complete feed using Prosopis
juliflora pods a ration of growing crossbred calves.
Indian J. Anim. Nutr. 19: 1-6.
Indian J. Anim. Nutr. 2020. 37 (1): 21-25
Effect of non-conventional feeds on haemato-biochemical parameters in goats
Received on 28-12-2019 and accepted on 18-06-2020
26
Indian Journal of
Animal Nutrition
Mineral Mixture Feeding Enhances Dairy Animals Productivity:
A Study of Bihar, India
Dhiraj K. Singh*, Shree P. Sahu1 and Nils Teufel2
Tata-Cornell Institute for Agriculture and Nutrition (TCI), New Delhi, India
ABSTRACT
Dairying is not only an integral part of small-holder farming system, but it is also providing a significant
source of livelihood for landless households in Bihar, India. A shift in the contribution by different sectors to
the State Gross Domestic Product (SGDP) in Bihar has been observed as contribution of livestock sector has
increased from 22 to 40 percent and at the same time agriculture sector contribution has decreased from 45 to 20
percent during last two decades. The per-capita milk availability in Bihar is meager (239 g/d) compared to India’s
average (375 g/d) in 2017-18 as productivity of animals is low due to poor feeding based on crop residue and
limited concentrates. The present study was carried out on 510 dairy animals to examine the effects of mineral
mixture on livestock productivity in Bihar. After introducing (50 grams) mineral mixture in the feed, average milk
yield, fat and SNF content increased by 6.2%, 5.3% and 1.8%, respectively. Feeding mineral mixture to dairy
animals, milk yield increased by 0.49 L/d/animal. At the same time fat content and SNF content also increased
by 0.20 and 0.15 points. On average, farmers benefitted from increased net profits by ̀ 15.8/d/animal. It shows
that the dairy farmers can increase their revenue from increased milk sales in terms of higher quantity (yield) and
quality (fat and SNF). The mineral mixture feeding also showed positive effects on health and reproductive
performance in terms of animal appearance and, timely conception and least incidence of ectoparasites.
Key words: Bihar, Dairy animals, Fat, Mineral mixture, Milk yield, SNF
*Corresponding author : Dhiraj K. Singh, Email: [email protected]; [email protected]; Phone: +91 9818885595; 1Bihar Animal Sciences
University (BASU), Bihar, India; 2International Livestock Research Institute (ILRI), Nairobi, Kenya
INTRODUCTION
Dairying is not only an integral part of small-holder
farming systems, but also source of livelihood for
landless households in Bihar, India. It has been observed
that there has been a shift in the contribution by
different sectors to the State Gross Domestic Product
(SGDP) in Bihar, as contribution of tertiary sector has
increased from 22 to 40 percent and at the same time
agriculture sector contribution has decreased from 45
to 20 percent during last two decades. In agriculture
livestock SGDP contribution is about 40 percent and
milk contribution to livestock sector is about 30 per cent
(GoB 1993, 2013).
Bihar’s share of milking cattle and buffaloes is
about 6.8 per cent and it contributes about 5.2 per cent
of the national milk production (GoI, 2018). Bihar
figures ninth in milk production in the country. The milk
production in the state witnessed tremendous increase
in last one decade from 2.5 million tons in 2000-01
to 9.2 million tons in 2017-18 (GoI 2006, 2018).
Nevertheless, the per-capita milk availability in Bihar is
meager (239 g/d) compare to India average (375 g/d) in
2017-18 as productivity is low and no increase in
productivity of animals except indigenous cows, main
reason behind it is feeding is mainly depends on
crop residues with some green fodder and limited
concentrates. Constraints to improving these feeding
practices include limited farm resources, weak support
services and inadequate knowledge on nutrient
requirements and contents are central issues in
improving livestock productivity in Bihar.
The present study examines the effects of
mineral mixture on livestock productivity in comparison
to non-feeding of mineral mixture. Farmers feeds
residues with either individual concentrate components
or commercial feed. But animals also need other
micro-nutrients which is not adequately available in crop
residues, green fodder and concentrates fed to animals.
Mineral deficiency in dairy animals results into reduced
growth, deficiency diseases, decreased milk production,
Indian J. Anim. Nutr. 2020. 37 (1): 26-30
doi: 10.5958/2231-6744.2020.00005.5
Indian J. Anim. Nutr. 2020. 37 (1): 26-30
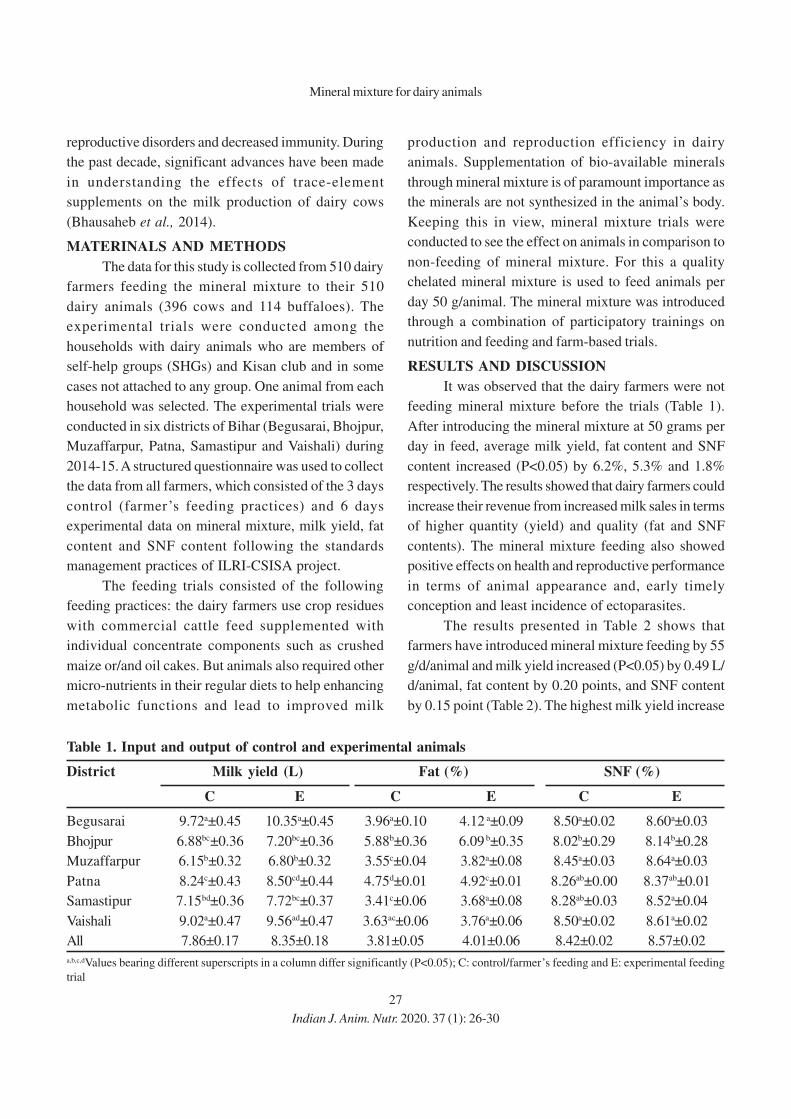
27
reproductive disorders and decreased immunity. During
the past decade, significant advances have been made
in understanding the effects of trace-element
supplements on the milk production of dairy cows
(Bhausaheb et al., 2014).
MATERINALS AND METHODS
The data for this study is collected from 510 dairy
farmers feeding the mineral mixture to their 510
dairy animals (396 cows and 114 buffaloes). The
experimental trials were conducted among the
households with dairy animals who are members of
self-help groups (SHGs) and Kisan club and in some
cases not attached to any group. One animal from each
household was selected. The experimental trials were
conducted in six districts of Bihar (Begusarai, Bhojpur,
Muzaffarpur, Patna, Samastipur and Vaishali) during
2014-15. A structured questionnaire was used to collect
the data from all farmers, which consisted of the 3 days
control (farmer’s feeding practices) and 6 days
experimental data on mineral mixture, milk yield, fat
content and SNF content following the standards
management practices of ILRI-CSISA project.
The feeding trials consisted of the following
feeding practices: the dairy farmers use crop residues
with commercial cattle feed supplemented with
individual concentrate components such as crushed
maize or/and oil cakes. But animals also required other
micro-nutrients in their regular diets to help enhancing
metabolic functions and lead to improved milk
production and reproduction efficiency in dairy
animals. Supplementation of bio-available minerals
through mineral mixture is of paramount importance as
the minerals are not synthesized in the animal’s body.
Keeping this in view, mineral mixture trials were
conducted to see the effect on animals in comparison to
non-feeding of mineral mixture. For this a quality
chelated mineral mixture is used to feed animals per
day 50 g/animal. The mineral mixture was introduced
through a combination of participatory trainings on
nutrition and feeding and farm-based trials.
RESULTS AND DISCUSSION
It was observed that the dairy farmers were not
feeding mineral mixture before the trials (Table 1).
After introducing the mineral mixture at 50 grams per
day in feed, average milk yield, fat content and SNF
content increased (P<0.05) by 6.2%, 5.3% and 1.8%
respectively. The results showed that dairy farmers could
increase their revenue from increased milk sales in terms
of higher quantity (yield) and quality (fat and SNF
contents). The mineral mixture feeding also showed
positive effects on health and reproductive performance
in terms of animal appearance and, early timely
conception and least incidence of ectoparasites.
The results presented in Table 2 shows that
farmers have introduced mineral mixture feeding by 55
g/d/animal and milk yield increased (P<0.05) by 0.49 L/
d/animal, fat content by 0.20 points, and SNF content
by 0.15 point (Table 2). The highest milk yield increase
Table 1. Input and output of control and experimental animals
District Milk yield (L) Fat (%) SNF (%)
C E C E C E
Begusarai 9.72a±0.45 10.35a±0.45 3.96a±0.10 4.12 a±0.09 8.50a±0.02 8.60a±0.03
Bhojpur 6.88bc±0.36 7.20bc±0.36 5.88b±0.36 6.09 b±0.35 8.02b±0.29 8.14b±0.28
Muzaffarpur 6.15b±0.32 6.80b±0.32 3.55c±0.04 3.82a±0.08 8.45a±0.03 8.64a±0.03
Patna 8.24c±0.43 8.50cd±0.44 4.75d±0.01 4.92c±0.01 8.26ab±0.00 8.37ab±0.01
Samastipur 7.15bd±0.36 7.72bc±0.37 3.41c±0.06 3.68a±0.08 8.28ab±0.03 8.52a±0.04
Vaishali 9.02a±0.47 9.56ad±0.47 3.63ac±0.06 3.76a±0.06 8.50a±0.02 8.61a±0.02
All 7.86±0.17 8.35±0.18 3.81±0.05 4.01±0.06 8.42±0.02 8.57±0.02
a,b,c,dValues bearing different superscripts in a column differ significantly (P<0.05); C: control/farmer’s feeding and E: experimental feeding
trial
Indian J. Anim. Nutr. 2020. 37 (1): 26-30
Mineral mixture for dairy animals
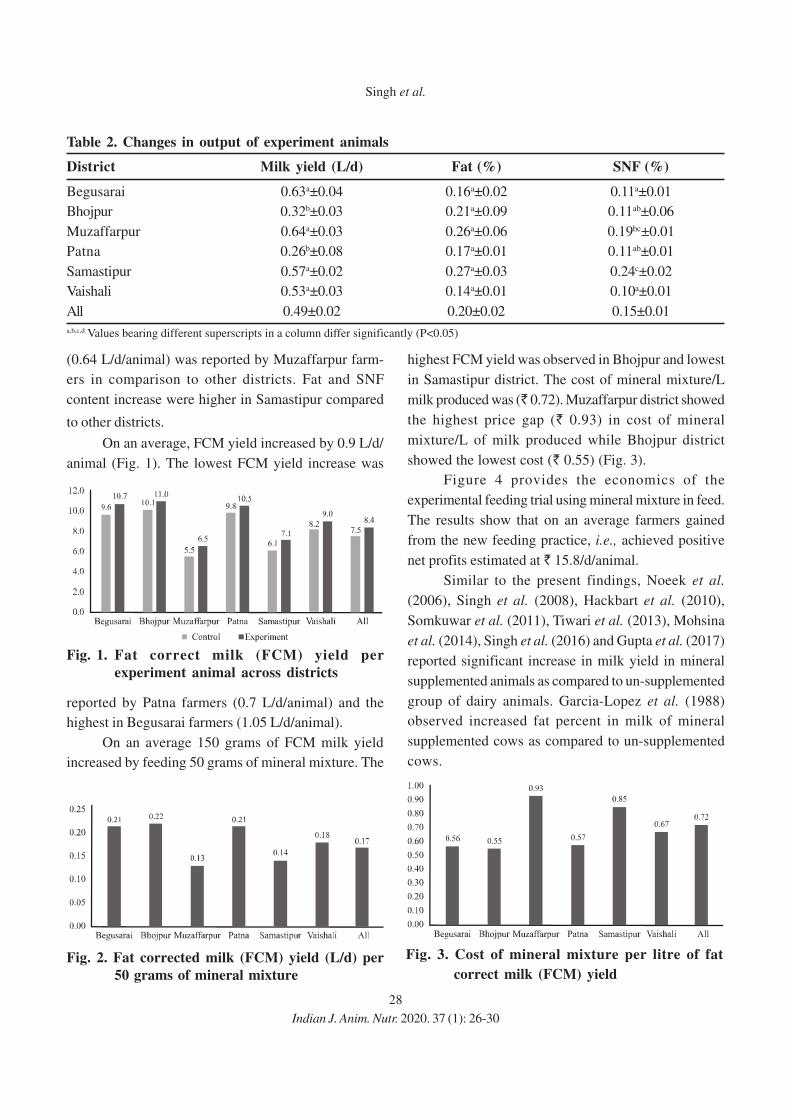
28
(0.64 L/d/animal) was reported by Muzaffarpur farm-
ers in comparison to other districts. Fat and SNF
content increase were higher in Samastipur compared
to other districts.
On an average, FCM yield increased by 0.9 L/d/
animal (Fig. 1). The lowest FCM yield increase was
reported by Patna farmers (0.7 L/d/animal) and the
highest in Begusarai farmers (1.05 L/d/animal).
On an average 150 grams of FCM milk yield
increased by feeding 50 grams of mineral mixture. The
highest FCM yield was observed in Bhojpur and lowest
in Samastipur district. The cost of mineral mixture/L
milk produced was (` 0.72). Muzaffarpur district showed
the highest price gap (` 0.93) in cost of mineral
mixture/L of milk produced while Bhojpur district
showed the lowest cost (` 0.55) (Fig. 3).
Figure 4 provides the economics of the
experimental feeding trial using mineral mixture in feed.
The results show that on an average farmers gained
from the new feeding practice, i.e., achieved positive
net profits estimated at ` 15.8/d/animal.
Similar to the present findings, Noeek et al.
(2006), Singh et al. (2008), Hackbart et al. (2010),
Somkuwar et al. (2011), Tiwari et al. (2013), Mohsina
et al. (2014), Singh et al. (2016) and Gupta et al. (2017)
reported significant increase in milk yield in mineral
supplemented animals as compared to un-supplemented
group of dairy animals. Garcia-Lopez et al. (1988)
observed increased fat percent in milk of mineral
supplemented cows as compared to un-supplemented
cows.
Table 2. Changes in output of experiment animals
District Milk yield (L/d) Fat (%) SNF (%)
Begusarai 0.63a±0.04 0.16a±0.02 0.11a±0.01
Bhojpur 0.32b±0.03 0.21a±0.09 0.11ab±0.06
Muzaffarpur 0.64a±0.03 0.26a±0.06 0.19bc±0.01
Patna 0.26b±0.08 0.17a±0.01 0.11ab±0.01
Samastipur 0.57a±0.02 0.27a±0.03 0.24c±0.02
Vaishali 0.53a±0.03 0.14a±0.01 0.10a±0.01
All 0.49±0.02 0.20±0.02 0.15±0.01
a,b,c,d Values bearing different superscripts in a column differ significantly (P<0.05)
Fig. 1. Fat correct milk (FCM) yield per
experiment animal across districts
Fig. 2. Fat corrected milk (FCM) yield (L/d) per
50 grams of mineral mixture
Fig. 3. Cost of mineral mixture per litre of fat
correct milk (FCM) yield
Indian J. Anim. Nutr. 2020. 37 (1): 26-30
Singh et al.
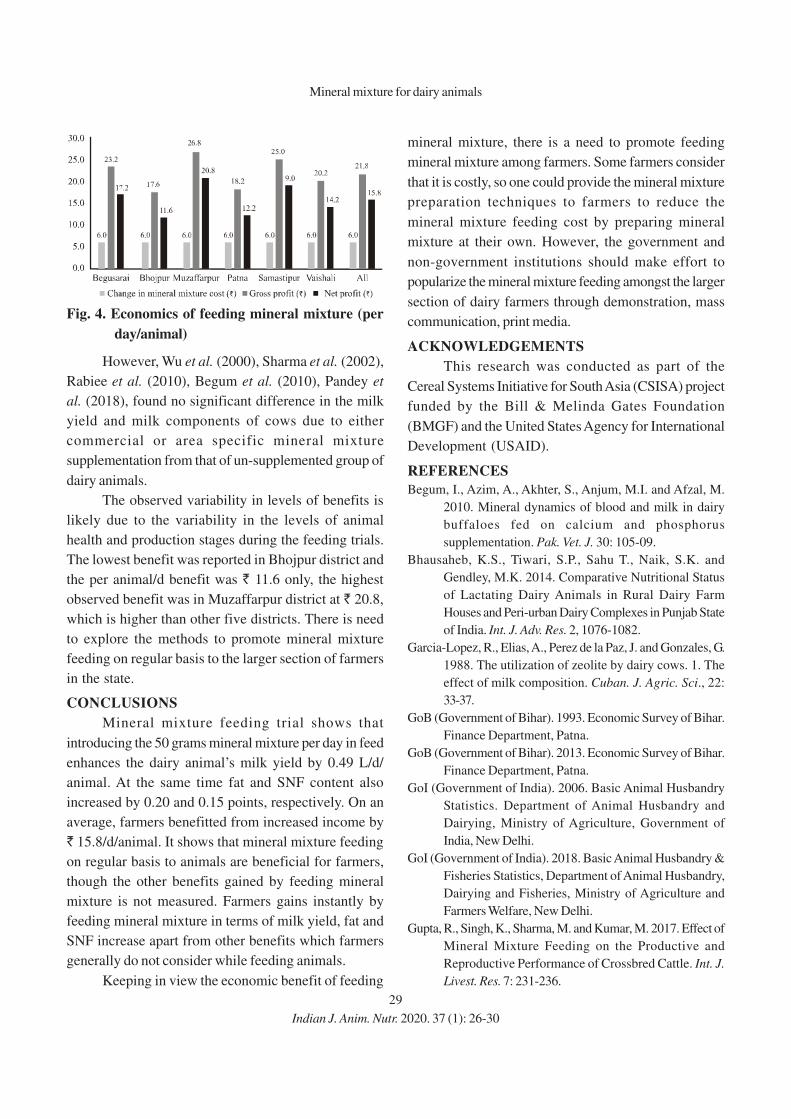
29
However, Wu et al. (2000), Sharma et al. (2002),
Rabiee et al. (2010), Begum et al. (2010), Pandey et
al. (2018), found no significant difference in the milk
yield and milk components of cows due to either
commercial or area specific mineral mixture
supplementation from that of un-supplemented group of
dairy animals.
The observed variability in levels of benefits is
likely due to the variability in the levels of animal
health and production stages during the feeding trials.
The lowest benefit was reported in Bhojpur district and
the per animal/d benefit was ` 11.6 only, the highest
observed benefit was in Muzaffarpur district at ` 20.8,
which is higher than other five districts. There is need
to explore the methods to promote mineral mixture
feeding on regular basis to the larger section of farmers
in the state.
CONCLUSIONS
Mineral mixture feeding trial shows that
introducing the 50 grams mineral mixture per day in feed
enhances the dairy animal’s milk yield by 0.49 L/d/
animal. At the same time fat and SNF content also
increased by 0.20 and 0.15 points, respectively. On an
average, farmers benefitted from increased income by
` 15.8/d/animal. It shows that mineral mixture feeding
on regular basis to animals are beneficial for farmers,
though the other benefits gained by feeding mineral
mixture is not measured. Farmers gains instantly by
feeding mineral mixture in terms of milk yield, fat and
SNF increase apart from other benefits which farmers
generally do not consider while feeding animals.
Keeping in view the economic benefit of feeding
mineral mixture, there is a need to promote feeding
mineral mixture among farmers. Some farmers consider
that it is costly, so one could provide the mineral mixture
preparation techniques to farmers to reduce the
mineral mixture feeding cost by preparing mineral
mixture at their own. However, the government and
non-government institutions should make effort to
popularize the mineral mixture feeding amongst the larger
section of dairy farmers through demonstration, mass
communication, print media.
ACKNOWLEDGEMENTS
This research was conducted as part of the
Cereal Systems Initiative for South Asia (CSISA) project
funded by the Bill & Melinda Gates Foundation
(BMGF) and the United States Agency for International
Development (USAID).
REFERENCES
Begum, I., Azim, A., Akhter, S., Anjum, M.I. and Afzal, M.
2010. Mineral dynamics of blood and milk in dairy
buffaloes fed on calcium and phosphorus
supplementation. Pak. Vet. J. 30: 105-09.
Bhausaheb, K.S., Tiwari, S.P., Sahu T., Naik, S.K. and
Gendley, M.K. 2014. Comparative Nutritional Status
of Lactating Dairy Animals in Rural Dairy Farm
Houses and Peri-urban Dairy Complexes in Punjab State
of India. Int. J. Adv. Res. 2, 1076-1082.
Garcia-Lopez, R., Elias, A., Perez de la Paz, J. and Gonzales, G.
1988. The utilization of zeolite by dairy cows. 1. The
effect of milk composition. Cuban. J. Agric. Sci., 22:
33-37.
GoB (Government of Bihar). 1993. Economic Survey of Bihar.
Finance Department, Patna.
GoB (Government of Bihar). 2013. Economic Survey of Bihar.
Finance Department, Patna.
GoI (Government of India). 2006. Basic Animal Husbandry
Statistics. Department of Animal Husbandry and
Dairying, Ministry of Agriculture, Government of
India, New Delhi.
GoI (Government of India). 2018. Basic Animal Husbandry &
Fisheries Statistics, Department of Animal Husbandry,
Dairying and Fisheries, Ministry of Agriculture and
Farmers Welfare, New Delhi.
Gupta, R., Singh, K., Sharma, M. and Kumar, M. 2017. Effect of
Mineral Mixture Feeding on the Productive and
Reproductive Performance of Crossbred Cattle. Int. J.
Livest. Res. 7: 231-236.
Fig. 4. Economics of feeding mineral mixture (per
day/animal)
Indian J. Anim. Nutr. 2020. 37 (1): 26-30
Mineral mixture for dairy animals
30
Hackbart, K.S., Ferreira, R.M., Dietsche, A.A., Socha, M.T.,
Shaver, R.D., Wiltbank, M.C. and Fricke, P.M. 2010.
Effect of dietary organic zinc, manganese, copper,
and cobalt supplementation on milk production,
follicular growth, embryo quality, and tissue mineral
concentrations in dairy cows. J. Anim. Sci., 88: 3856-
70.
Mohsina, M., Randhawa, S.N.S., Randhawa, C.S. and Gupta,
D.K. 2017. Effect of area specific mineral mixture
supplementation on milk yield and milk quality in dairy
animals of sub-mountainous zone of Punjab. J. Anim.
Res. 7: 763-767.
Noeek, J.E., Socha, M.T. and Tomlinson, D.J. 2006. The Effect
of Trace Mineral Fortification Level and Source on
Performance of Dairy Cattle. J. Dairy Sci. 89: 2679-93.
Pandey, V.K., Gendley, M.K., Tiwari, S.P. and Prusty Sonali.
2018. Effect of area specific mineral mixture on serum
biochemical parameters and milk yield in dairy cattle.
Int. J. Agric. Sci. 10: 4965-4968.
Rabiee, A.R., Lean, I.J., Stevenson, M.A. and Socha, M.T.
2010. Effects of feeding organic trace minerals on milk
production and reproductive performance in lactating
dairy cows: A meta analysis. J. Dairy Sci. 93: 4239-51.
Sharma, M.C., Joshi, C. and Sarkar, T.K. 2002. Therapeutic
Efficacy of Minerals Supplement in Macro-minerals
Deficient Buffaloes and its Effect on Haemato-
biochemical Profile and Production. Asian Australas.
J. Anim. 15: 1278-87.
Singh, S., Chhabra, S., Singh, C., Randhawa, S.S. and Gupta,
D.K. 2016. Effect of Area Specific Mineral Mixture
Feeding On Milk Yield and Composition of Dairy
Animals of Central Zone of Punjab. Int. J. Livest. Res.
6 : 62-65.
Singh, V.K., Singh, P., Verma, A.K. and Mehra, U.R. 2008. On
farm assessment of nutritional status of lactating cattle
and buffaloes in urban, periurban and rural areas of
Middle Gangetic Plains. Livest. Res. Rural Dev. 20:
130-134.
Somkuwar, A.P., Kadam, A.S., Shiva Kumar and Radhakrishna,
P.M. 2011. Efficacy study of metho-chelated organic
minerals preparation feeding on milk production and
fat percentage in dairy cows. Vet. World. 4:19-21.
Tiwari, R., Sharma, M.C., and Singh, B.P. 2013. Awareness and
impact of area specific mineral mixture technology in
field situation. Indian J. Anim. Sci., 83:435-37.
Wu, Z., Satter, L.D. and Sojo, R. 2000. Milk production,
reproductive performance, and fecal excretion of
phosphorus by dairy cows fed three amounts of
phosphorus. J. Dairy Sci. 83: 1028-41.
Indian J. Anim. Nutr. 2020. 37 (1): 26-30
Singh et al.
Received on 14-01-2020 and accepted on 06-06-2020
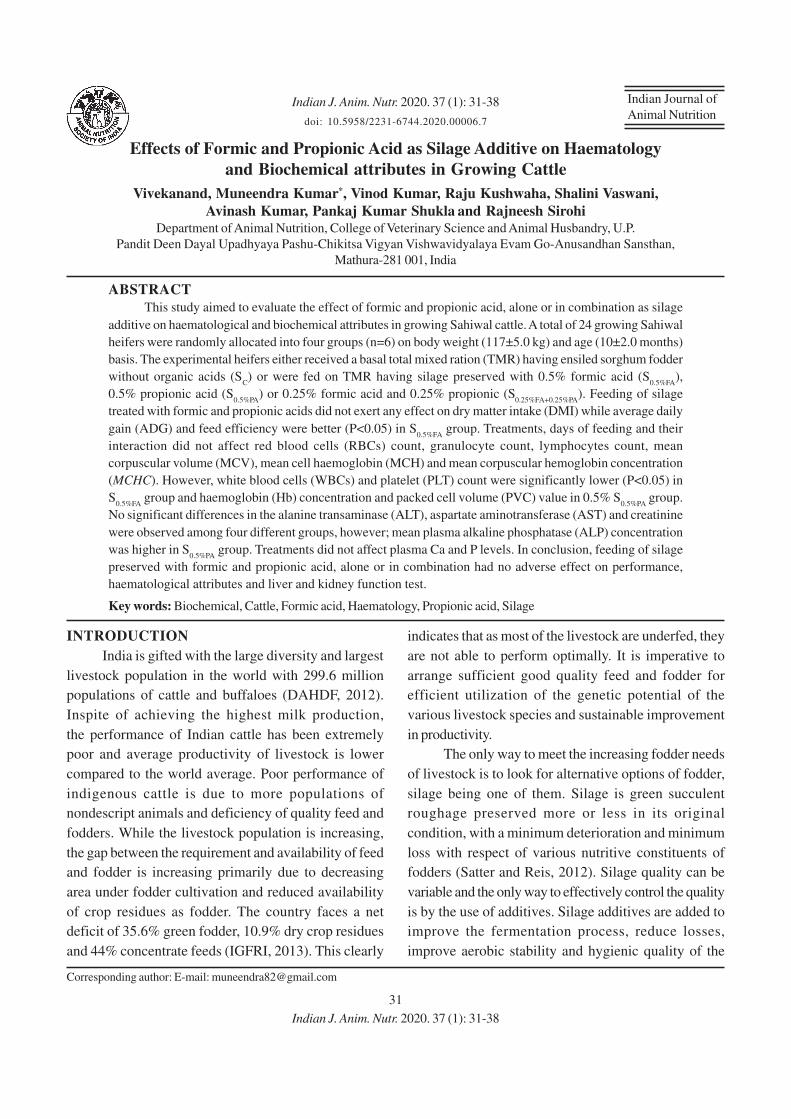
31
Indian Journal of
Animal Nutrition
Effects of Formic and Propionic Acid as Silage Additive on Haematology
and Biochemical attributes in Growing Cattle
Vivekanand, Muneendra Kumar*, Vinod Kumar, Raju Kushwaha, Shalini Vaswani,
Avinash Kumar, Pankaj Kumar Shukla and Rajneesh Sirohi
Department of Animal Nutrition, College of Veterinary Science and Animal Husbandry, U.P.
Pandit Deen Dayal Upadhyaya Pashu-Chikitsa Vigyan Vishwavidyalaya Evam Go-Anusandhan Sansthan,
Mathura-281 001, India
ABSTRACT
This study aimed to evaluate the effect of formic and propionic acid, alone or in combination as silage
additive on haematological and biochemical attributes in growing Sahiwal cattle. A total of 24 growing Sahiwal
heifers were randomly allocated into four groups (n=6) on body weight (117±5.0 kg) and age (10±2.0 months)
basis. The experimental heifers either received a basal total mixed ration (TMR) having ensiled sorghum fodder
without organic acids (SC) or were fed on TMR having silage preserved with 0.5% formic acid (S
0.5%FA),
0.5% propionic acid (S0.5%PA
) or 0.25% formic acid and 0.25% propionic (S0.25%FA+0.25%PA
). Feeding of silage
treated with formic and propionic acids did not exert any effect on dry matter intake (DMI) while average daily
gain (ADG) and feed efficiency were better (P<0.05) in S0.5%FA
group. Treatments, days of feeding and their
interaction did not affect red blood cells (RBCs) count, granulocyte count, lymphocytes count, mean
corpuscular volume (MCV), mean cell haemoglobin (MCH) and mean corpuscular hemoglobin concentration
(MCHC). However, white blood cells (WBCs) and platelet (PLT) count were significantly lower (P<0.05) in
S0.5%FA
group and haemoglobin (Hb) concentration and packed cell volume (PVC) value in 0.5% S0.5%PA
group.
No significant differences in the alanine transaminase (ALT), aspartate aminotransferase (AST) and creatinine
were observed among four different groups, however; mean plasma alkaline phosphatase (ALP) concentration
was higher in S0.5%PA
group. Treatments did not affect plasma Ca and P levels. In conclusion, feeding of silage
preserved with formic and propionic acid, alone or in combination had no adverse effect on performance,
haematological attributes and liver and kidney function test.
Key words: Biochemical, Cattle, Formic acid, Haematology, Propionic acid, Silage
Corresponding author: E-mail: [email protected]
INTRODUCTION
India is gifted with the large diversity and largest
livestock population in the world with 299.6 million
populations of cattle and buffaloes (DAHDF, 2012).
Inspite of achieving the highest milk production,
the performance of Indian cattle has been extremely
poor and average productivity of livestock is lower
compared to the world average. Poor performance of
indigenous cattle is due to more populations of
nondescript animals and deficiency of quality feed and
fodders. While the livestock population is increasing,
the gap between the requirement and availability of feed
and fodder is increasing primarily due to decreasing
area under fodder cultivation and reduced availability
of crop residues as fodder. The country faces a net
deficit of 35.6% green fodder, 10.9% dry crop residues
and 44% concentrate feeds (IGFRI, 2013). This clearly
Indian J. Anim. Nutr. 2020. 37 (1): 31-38
doi: 10.5958/2231-6744.2020.00006.7
indicates that as most of the livestock are underfed, they
are not able to perform optimally. It is imperative to
arrange sufficient good quality feed and fodder for
efficient utilization of the genetic potential of the
various livestock species and sustainable improvement
in productivity.
The only way to meet the increasing fodder needs
of livestock is to look for alternative options of fodder,
silage being one of them. Silage is green succulent
roughage preserved more or less in its original
condition, with a minimum deterioration and minimum
loss with respect of various nutritive constituents of
fodders (Satter and Reis, 2012). Silage quality can be
variable and the only way to effectively control the quality
is by the use of additives. Silage additives are added to
improve the fermentation process, reduce losses,
improve aerobic stability and hygienic quality of the
Indian J. Anim. Nutr. 2020. 37 (1): 31-38

32
silage, limit secondary fermentation, and increase the
nutritive value of the silage, resulting in increased
animal production (Merensalmi and Virkki, 1991).
Organic acids like formic and propionic acids as silage
additives are effective in reducing yeast and molds which
are responsible for the aerobic deterioration of silages.
The use of silage with a high content of fermentation
acids may result in a substantially lower energy yield
for rumen microorganisms than the use of silage of
restricted fermentation (Chamberlain, 1987). In terms
of animal performance, feed intake and live weight gain
were higher with formic acid-treated silage than
untreated or inoculant-treated silages (Haigh et al.,
1987). Forage ensiled with formic acid has produced
weight gains or milk production equal to or greater than
wilted untreated silage (Waldo and Derbyshire, 1971).
Forage ensiled with propionic acid brings about an
increase in silage intake, which leads to increased live
weight gain (Nadeau and Arnesson, 2016). The
objective of this study was to examine the relative
merits of formic and propionic acid, alone or in
combination as silage additives on haematological
attributes and liver and kidney function tests in growing
Sahiwal cattle.
MATERIALS AND METHODS
Animal care procedures were approved (approval
number, 121/IAEC/18) and conducted under the
established standard of the Institutional Animal Ethics
Committee (IAEC), constituted as per the article
number 13 of the Committee for the Purpose of Control
and Supervision of Experiments on Animals (CPCSEA)
rules laid down by the Government of India.
In the present study, the green sorghum fodder
(Sorghum bicolor) with moisture content of 65-72%
was ensiled either without organic acid (Sc) or with 0.5%
formic acid (S0.5%FA
) or 0.5% propionic acid (S0.5%PA
)
or combination of each formic and propionic acid at 0.25
% each (S0.25%FA+0.25%PA
). The whole fodder was
chopped into 2-3 cm pieces by using tractor operated
forage chopper (Ensiladeria JF40Max, NB Maquinas
Ltd., Brazil). After treatment, chopped fodder was
packed in polythene bags (1.5 meters in height and 0.5
meter width) having capacity of 50 kg. After 90 days of
ensiling, prepared silage was fed to the experimental
animals of respective group.
A total of 24 growing Sahiwal heifers were
selected from the cattle herd maintained at LFC,
DUVASU, Mathura. Experimental animals were housed
in a well-ventilated shed having the proper arrangement
for individual feeding and watering without having
access to the other animal’s diet. Deworming of all the
experimental animals were done before the start of the
experiment by oral administration of Fentas bolus (Intas
Pharmaceuticals Pvt. Ltd., India) at the dose level of 10
mg/kg body weight. Animals were let loose every
fortnightly for exercise. The nutrient requirements of
experimental heifers were met by the feeding of total
mixed ration (TMR) consisted of concentrate: silage:
wheat straw in the proportion of 40:40:20 following NRC
(2001) guidelines. Selected heifers were randomly
allocated into four groups (n=6) on body weight
(117±5.0 kg) and age (10±2.0 months) basis. The
experimental heifers either received a basal TMR
having silage without additives (SC) or were fed on TMR
containing 0.5% formic acid (S0.5%FA
), 0.5% propionic
acid (S0.5%PA
) and 0.25% formic acid and 0.25%
propionic (S0.25%FA+0.25%PA
) added silages. Ingredients and
nutrients composition of TMR fed in different groups
are presented in Table 1. TMR was prepared daily by
hand mixing and offered at 0900 h in all tests. The calves
were fed the TMR in such an amount that at least 5%
refusals were left daily per animals. Fresh drinking
water was offered ad libitum twice daily at 0800 h and
1700 h.
The experimental calves were monitored daily for
DMI and fortnightly for growth performance and feed
efficiency measures. To increase the accuracy of the
estimation of ADG, calves were weighed at fortnight
intervals in the early morning (0600 h) before offering
feed and water. Feed conversion ratio (FCR) and feed
conversion efficiency (FCE) were observed as feed
efficiency measures. Feed-to-gain ratio or FCR was
calculated by the amount of DMI (kg) required for unit
(per kg) weight gain by animals during the trial period.
FCE was calculated as the ratio between ADG (kg)
Indian J. Anim. Nutr. 2020. 37 (1): 31-38
Kumar et al.,
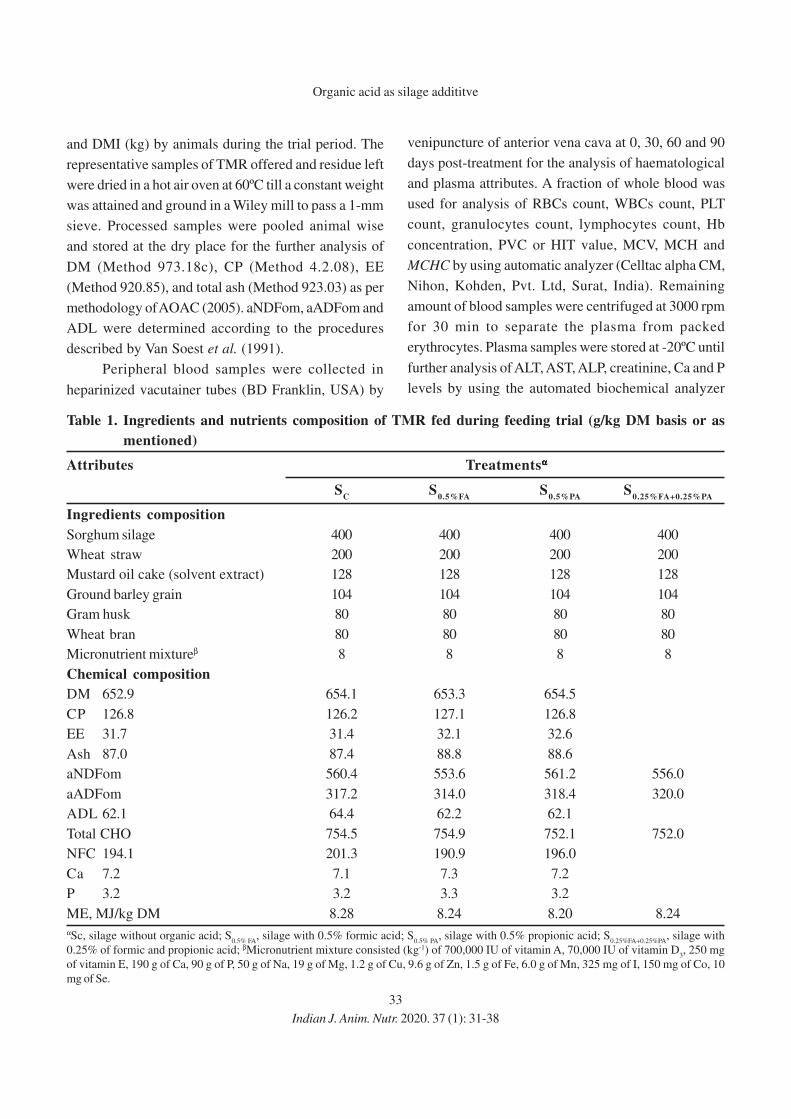
33
and DMI (kg) by animals during the trial period. The
representative samples of TMR offered and residue left
were dried in a hot air oven at 60ºC till a constant weight
was attained and ground in a Wiley mill to pass a 1-mm
sieve. Processed samples were pooled animal wise
and stored at the dry place for the further analysis of
DM (Method 973.18c), CP (Method 4.2.08), EE
(Method 920.85), and total ash (Method 923.03) as per
methodology of AOAC (2005). aNDFom, aADFom and
ADL were determined according to the procedures
described by Van Soest et al. (1991).
Peripheral blood samples were collected in
heparinized vacutainer tubes (BD Franklin, USA) by
venipuncture of anterior vena cava at 0, 30, 60 and 90
days post-treatment for the analysis of haematological
and plasma attributes. A fraction of whole blood was
used for analysis of RBCs count, WBCs count, PLT
count, granulocytes count, lymphocytes count, Hb
concentration, PVC or HIT value, MCV, MCH and
MCHC by using automatic analyzer (Celltac alpha CM,
Nihon, Kohden, Pvt. Ltd, Surat, India). Remaining
amount of blood samples were centrifuged at 3000 rpm
for 30 min to separate the plasma from packed
erythrocytes. Plasma samples were stored at -20ºC until
further analysis of ALT, AST, ALP, creatinine, Ca and P
levels by using the automated biochemical analyzer
Table 1. Ingredients and nutrients composition of TMR fed during feeding trial (g/kg DM basis or as
mentioned)
Attributes Treatmentsααααα
SC
S0.5%FA
S0.5%PA
S0.25%FA+0.25%PA
Ingredients composition
Sorghum silage 400 400 400 400
Wheat straw 200 200 200 200
Mustard oil cake (solvent extract) 128 128 128 128
Ground barley grain 104 104 104 104
Gram husk 80 80 80 80
Wheat bran 80 80 80 80
Micronutrient mixtureβ 8 8 8 8
Chemical composition
DM 652.9 654.1 653.3 654.5
CP 126.8 126.2 127.1 126.8
EE 31.7 31.4 32.1 32.6
Ash 87.0 87.4 88.8 88.6
aNDFom 560.4 553.6 561.2 556.0
aADFom 317.2 314.0 318.4 320.0
ADL 62.1 64.4 62.2 62.1
Total CHO 754.5 754.9 752.1 752.0
NFC 194.1 201.3 190.9 196.0
Ca 7.2 7.1 7.3 7.2
P 3.2 3.2 3.3 3.2
ME, MJ/kg DM 8.28 8.24 8.20 8.24
αSc, silage without organic acid; S0.5% FA
, silage with 0.5% formic acid; S0.5% PA
, silage with 0.5% propionic acid; S0.25%FA+0.25%PA
, silage with
0.25% of formic and propionic acid; βMicronutrient mixture consisted (kg-1) of 700,000 IU of vitamin A, 70,000 IU of vitamin D3, 250 mg
of vitamin E, 190 g of Ca, 90 g of P, 50 g of Na, 19 g of Mg, 1.2 g of Cu, 9.6 g of Zn, 1.5 g of Fe, 6.0 g of Mn, 325 mg of I, 150 mg of Co, 10
mg of Se.
Indian J. Anim. Nutr. 2020. 37 (1): 31-38
Organic acid as silage addititve
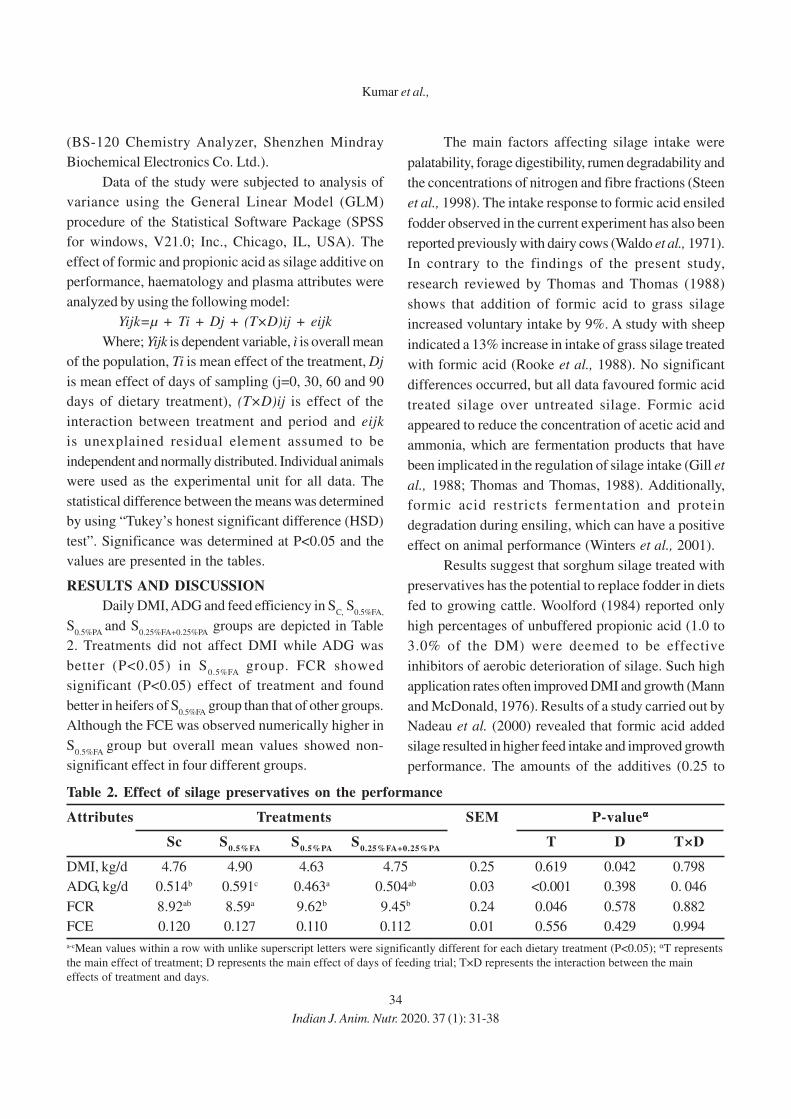
34
(BS-120 Chemistry Analyzer, Shenzhen Mindray
Biochemical Electronics Co. Ltd.).
Data of the study were subjected to analysis of
variance using the General Linear Model (GLM)
procedure of the Statistical Software Package (SPSS
for windows, V21.0; Inc., Chicago, IL, USA). The
effect of formic and propionic acid as silage additive on
performance, haematology and plasma attributes were
analyzed by using the following model:
Yijk=µ + Ti + Dj + (T×D)ij + eijk
Where; Yijk is dependent variable, ì is overall mean
of the population, Ti is mean effect of the treatment, Dj
is mean effect of days of sampling (j=0, 30, 60 and 90
days of dietary treatment), (T×D)ij is effect of the
interaction between treatment and period and eijk
is unexplained residual element assumed to be
independent and normally distributed. Individual animals
were used as the experimental unit for all data. The
statistical difference between the means was determined
by using “Tukey’s honest significant difference (HSD)
test”. Significance was determined at P<0.05 and the
values are presented in the tables.
RESULTS AND DISCUSSION
Daily DMI, ADG and feed efficiency in SC,
S0.5%FA,
S0.5%PA
and S0.25%FA+0.25%PA
groups are depicted in Table
2. Treatments did not affect DMI while ADG was
better (P<0.05) in S0.5%FA
group. FCR showed
significant (P<0.05) effect of treatment and found
better in heifers of S0.5%FA
group than that of other groups.
Although the FCE was observed numerically higher in
S0.5%FA
group but overall mean values showed non-
significant effect in four different groups.
The main factors affecting silage intake were
palatability, forage digestibility, rumen degradability and
the concentrations of nitrogen and fibre fractions (Steen
et al., 1998). The intake response to formic acid ensiled
fodder observed in the current experiment has also been
reported previously with dairy cows (Waldo et al., 1971).
In contrary to the findings of the present study,
research reviewed by Thomas and Thomas (1988)
shows that addition of formic acid to grass silage
increased voluntary intake by 9%. A study with sheep
indicated a 13% increase in intake of grass silage treated
with formic acid (Rooke et al., 1988). No significant
differences occurred, but all data favoured formic acid
treated silage over untreated silage. Formic acid
appeared to reduce the concentration of acetic acid and
ammonia, which are fermentation products that have
been implicated in the regulation of silage intake (Gill et
al., 1988; Thomas and Thomas, 1988). Additionally,
formic acid restricts fermentation and protein
degradation during ensiling, which can have a positive
effect on animal performance (Winters et al., 2001).
Results suggest that sorghum silage treated with
preservatives has the potential to replace fodder in diets
fed to growing cattle. Woolford (1984) reported only
high percentages of unbuffered propionic acid (1.0 to
3.0% of the DM) were deemed to be effective
inhibitors of aerobic deterioration of silage. Such high
application rates often improved DMI and growth (Mann
and McDonald, 1976). Results of a study carried out by
Nadeau et al. (2000) revealed that formic acid added
silage resulted in higher feed intake and improved growth
performance. The amounts of the additives (0.25 to
Table 2. Effect of silage preservatives on the performance
Attributes Treatments SEM P-valueααααα
Sc S0.5%FA
S0.5%PA
S0.25%FA+0.25%PA
T D T×D
DMI, kg/d 4.76 4.90 4.63 4.75 0.25 0.619 0.042 0.798
ADG, kg/d 0.514b 0.591c 0.463a 0.504ab 0.03 <0.001 0.398 0. 046
FCR 8.92ab 8.59a 9.62b 9.45b 0.24 0.046 0.578 0.882
FCE 0.120 0.127 0.110 0.112 0.01 0.556 0.429 0.994
a-cMean values within a row with unlike superscript letters were significantly different for each dietary treatment (P<0.05); αT represents
the main effect of treatment; D represents the main effect of days of feeding trial; T×D represents the interaction between the main
effects of treatment and days.
Indian J. Anim. Nutr. 2020. 37 (1): 31-38
Kumar et al.,
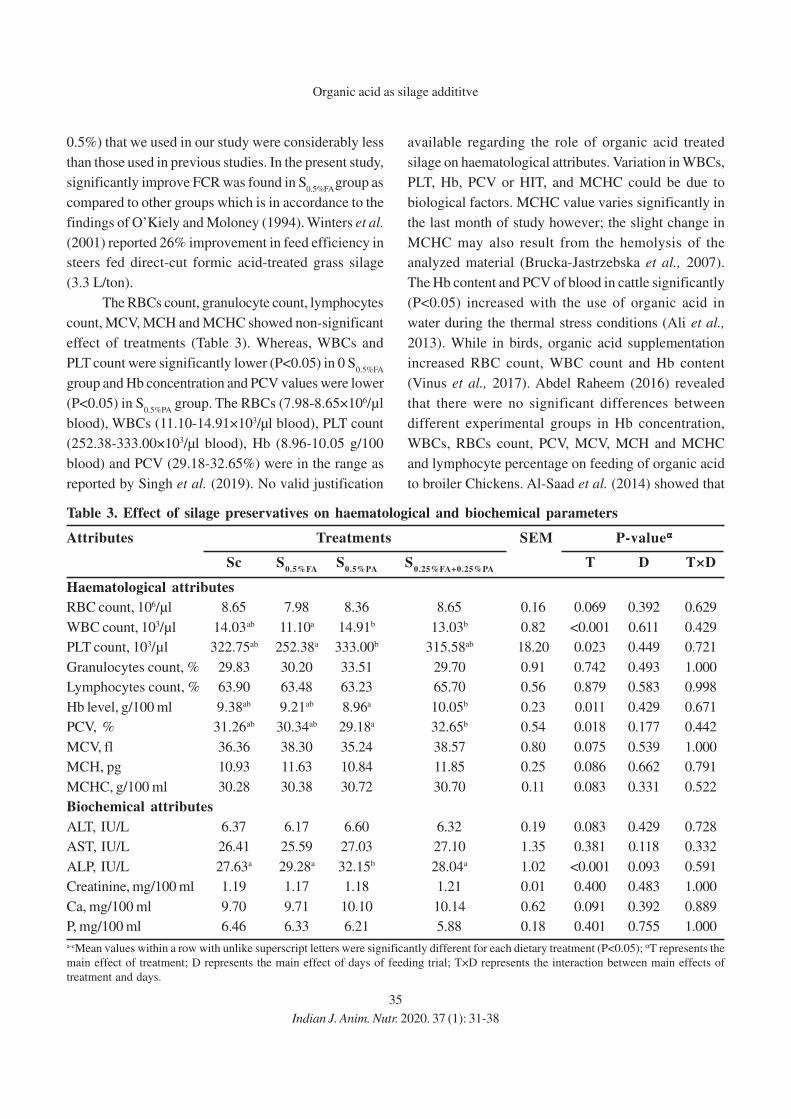
35
0.5%) that we used in our study were considerably less
than those used in previous studies. In the present study,
significantly improve FCR was found in S0.5%FA
group as
compared to other groups which is in accordance to the
findings of O’Kiely and Moloney (1994). Winters et al.
(2001) reported 26% improvement in feed efficiency in
steers fed direct-cut formic acid-treated grass silage
(3.3 L/ton).
The RBCs count, granulocyte count, lymphocytes
count, MCV, MCH and MCHC showed non-significant
effect of treatments (Table 3). Whereas, WBCs and
PLT count were significantly lower (P<0.05) in 0 S0.5%FA
group and Hb concentration and PCV values were lower
(P<0.05) in S0.5%PA
group. The RBCs (7.98-8.65×10⁶/µl
blood), WBCs (11.10-14.91×10³/µl blood), PLT count
(252.38-333.00×10³/µl blood), Hb (8.96-10.05 g/100
blood) and PCV (29.18-32.65%) were in the range as
reported by Singh et al. (2019). No valid justification
available regarding the role of organic acid treated
silage on haematological attributes. Variation in WBCs,
PLT, Hb, PCV or HIT, and MCHC could be due to
biological factors. MCHC value varies significantly in
the last month of study however; the slight change in
MCHC may also result from the hemolysis of the
analyzed material (Brucka-Jastrzebska et al., 2007).
The Hb content and PCV of blood in cattle significantly
(P<0.05) increased with the use of organic acid in
water during the thermal stress conditions (Ali et al.,
2013). While in birds, organic acid supplementation
increased RBC count, WBC count and Hb content
(Vinus et al., 2017). Abdel Raheem (2016) revealed
that there were no significant differences between
different experimental groups in Hb concentration,
WBCs, RBCs count, PCV, MCV, MCH and MCHC
and lymphocyte percentage on feeding of organic acid
to broiler Chickens. Al-Saad et al. (2014) showed that
Table 3. Effect of silage preservatives on haematological and biochemical parameters
Attributes Treatments SEM P-valueααααα
Sc S0.5%FA
S0.5%PA
S0.25%FA+0.25%PA
T D T×D
Haematological attributes
RBC count, 106/µl 8.65 7.98 8.36 8.65 0.16 0.069 0.392 0.629
WBC count, 103/µl 14.03ab 11.10a 14.91b 13.03b 0.82 <0.001 0.611 0.429
PLT count, 103/µl 322.75ab 252.38a 333.00b 315.58ab 18.20 0.023 0.449 0.721
Granulocytes count, % 29.83 30.20 33.51 29.70 0.91 0.742 0.493 1.000
Lymphocytes count, % 63.90 63.48 63.23 65.70 0.56 0.879 0.583 0.998
Hb level, g/100 ml 9.38ab 9.21ab 8.96a 10.05b 0.23 0.011 0.429 0.671
PCV, % 31.26ab 30.34ab 29.18a 32.65b 0.54 0.018 0.177 0.442
MCV, fl 36.36 38.30 35.24 38.57 0.80 0.075 0.539 1.000
MCH, pg 10.93 11.63 10.84 11.85 0.25 0.086 0.662 0.791
MCHC, g/100 ml 30.28 30.38 30.72 30.70 0.11 0.083 0.331 0.522
Biochemical attributes
ALT, IU/L 6.37 6.17 6.60 6.32 0.19 0.083 0.429 0.728
AST, IU/L 26.41 25.59 27.03 27.10 1.35 0.381 0.118 0.332
ALP, IU/L 27.63a 29.28a 32.15b 28.04a 1.02 <0.001 0.093 0.591
Creatinine, mg/100 ml 1.19 1.17 1.18 1.21 0.01 0.400 0.483 1.000
Ca, mg/100 ml 9.70 9.71 10.10 10.14 0.62 0.091 0.392 0.889
P, mg/100 ml 6.46 6.33 6.21 5.88 0.18 0.401 0.755 1.000
a-cMean values within a row with unlike superscript letters were significantly different for each dietary treatment (P<0.05); αT represents the
main effect of treatment; D represents the main effect of days of feeding trial; T×D represents the interaction between main effects of
treatment and days.
Indian J. Anim. Nutr. 2020. 37 (1): 31-38
Organic acid as silage addititve
36
feeding of propionic acid in diets resulted in an increase
in WBC concentration while there was no effect on Hb
and PCV values. Vinus et al. (2017) found that
propionate feeding increases RBC, WBC and Hb
concentrations significantly (P<0.05) than untreated
groups. Supplementation of salts of organic acids
reduced the number of heterophils and improved the
lymphocytes count in different treatments as compared
to the control group. Abdel-Hamid and Omar (2019)
suggested that there was an increased concentrations
of RBC, WBC and Hb when diet treated with various
level of formic acid as compared to the control group in
rabbits. EL Naggar et al. (2017) investigated the effect
of formic and citric acid and concluded that increased
RBCs and Hb as compared to control.
Studied biomarkers of liver and kidney function
tests in present study were ALT, AST, ALP and plasma
creatinine levels (Table 3). No significant differences
in the ALT, AST and creatinine were observed among
four different groups. However, mean plasma ALP
concentration was higher in S0.5%PA
group. In this study,
biomarkers of liver and kidney function tests have been
used to monitor and evaluate health and nutritional
effect of silage preservatives in growing cattle. The
information regarding the effect of feeding of organic
acid added silage on biochemical parameters is lacking.
Plasma parameters values measured were within the
normal range for healthy dairy animals as recorded by
George et al. (2010); Wood and Quiroz-Rocha (2010).
Although plasma AST level in last month of study shows
significant results but value was within the reference
range (Radostits et al., 2000). Plasma ALP was found
significant during the whole duration of study but value
were within range (18-153 IU/L) and does not exert
adverse effect (Latimer et al., 2003). Different levels
of organic acid showed a non-significant effect
on serum GOT, GPT, uric acid and creatinine
concentrations as reported by El-Shenway and Ali (2016)
and Abdel-Fattah et al. (2008). Finding of Ragaa et al.
(2016) also showed that formic acid supplementation
did not affect AST, ALT and uric acid levels. Naggar et
al. (2017) observed that supplementation of formic and
citric acid decreased serum AST and ALT levels
compared to control group. Creatinine, the waste
product produced via the catabolism of phospho-
creatine is a basic parameter reflecting kidney function
(Stojevic et al., 2005). In the present study; plasma
creatinine level observed was 1.17-1.21 mg/100 ml that
fell within the physiological range as observed by
Radostits et al. (2008) and Smith (2009). In a study
conducted by Naggar et al. (2017) it was reported that
supplementation of formic and citric acid decreased
serum creatinine levels as compared to unsupplemented
group.
The results show that addition of silage
preservatives does not alter the plasma concentration
of Ca and P. Observed mean values of Ca were within
the range of 9.70-10.14 mg/100 ml. Similarly, serum
concentration of P ranged from 5.88-6.46 mg/100 ml,
which was within physiological range as reported by
Latimer et al. (2003). Similar to the findings of the
present study, Vinus et al. (2017) reported similar
serum Ca level in organic acid as well as unsupplemented
group while serum P level was improved in organic
acid-treated groups. In contrast to the findings of the
present study, Jongbloed et al. (2000) and Hernandez
et al. (2006) observed a positive interaction among
organic acids and plasma Ca and P levels in growing
pigs. Abdel-Fattah et al. (2008) also found higher plasma
Ca and P in organic acid group than those given
unsupplemented diet. They concluded that the increase
in Ca and P level in plasma produced by addition of
organic acid may be attributed to lowering of GI tract
pH by using these acids, which increases the absorption
of such minerals from gut into blood.
CONCLUSIONS
The findings of this study revealed that feeding of
silage preserved with 0.5% formic acid in heifers
improved growth performance and feed conversion
while feed intake remains similar. Feeding of formic and
propionic acid, alone or in combination as silage additive
did not exert any adverse effect on haematological and
biochemical attributes as values ranged within normal
physiological range.
Indian J. Anim. Nutr. 2020. 37 (1): 31-38
Kumar et al.,
37
ACKNOWLEDGMENTS
The authors would like to thanks the staff of the
Department of Animal Nutrition and Livestock Farm
Complex, DUVASU, Mathura, India. The authors also
gratefully acknowledge Dr. Brijesh Yadav for assistance
during the analysis of hematological and biochemical
attributes. The fund for this study was provided by the
University under Indian Council of Agricultural Research
Grant, New Delhi, India.
REFERENCES
Abdel Raheem, G.S.E. 2016. Effect of feeding benzoic acid on
performance of broiler chickens. J. Adv. Vet. Res. 6:
118-122.
Abdel-Fattah, S.A., El-Sanhoury, M.H., El-Mednay, N.M. and
Abdel-Azeem F. 2008. Thyroid activity, some blood
constituents, organ morphology and performance of
broiler chicks fed supplemental organic acids. Int. J.
Poult. Sci. 7: 215-222.
Abdel-Hamid, T.M. and Omar, M.A. 2019. Growth and
economic performance, some haematological,
biochemical and oxidative stress parameters, and
carcass traits of summer stressed Californian
and crossbred rabbits as affected by dietary
supplementation of formic acid. Slov. Vet. Res. 56:
707-16.
Ali, A., Khan, S., Mobashar, M., Inam, M., Ahmed, I., Khan,
N.A., Ali, M. and Khan, H. 2013. Effect of different
levels of organic acids supplementation on feed
intake, milk yield and milk composition of dairy cows
during thermal stress. Greener J. Agric. Sci. 3: 762-
768.
Al-Saad, S., Abbod, M. and Yones, A.A. 2014. Effects of some
growth promoters on blood hematology and serum
composition of broiler chickens. Int. J. Agric. Res. 9:
265-270.
AOAC. 2005. Official Methods of Analysis. 18th rev. ed.
Association of Official Analytical Chemists,
Arlington, Washington DC, USA.
Brucka-Jastrzebska, E., Kawczuga, D., Brzezinska, M., Orowicz,
W. and Lidwinkazmierkiewicz, M. 2007. Dependence
of hematological parameters in Simmental breeds cattle
on physiological conditions. Med. Weter. 63: 1583-1586.
Chamberlain, D.G. and Quig, J. 1987. The effects of the rate
of addition of formic acid and sulphuric acid on the
ensilage of perennial ryegrass in laboratory silos. J.
Sci. Food Agric. 38: 217-228.
DAHDF. 2012. 19th Livestock Census. Department of Animal
Husbandry, Dairying and Fisheries, Government of
India.
EL Naggar, A.S. and Hayam, A.E.M. 2017. Impact of using
organic acids on growth performance, blood
biochemical and hematological traits and immune
response of ducks (Cairina moschata). Egypt Poult.
Sci. J. 37: 907-925.
El-Shenway, A.M. and Ali, G.I.E. 2016. Effect of some organic
acids and essential oils as feed additives on growth
performance, immune response and carcass quality of
japanese quail. Alex. J. Vet. Sci. 51: 68-77.
George, J.W., Snipes, J. and Lane, V.M. 2010. Comparison of
bovine hematology reference intervals from 1957 to
2006. Vet. Clin. Pathol. 39: 138-148.
Gill, M., Rook, A.J. and Tiago, L.R.S. 1988. Factors affecting
the voluntary intake of roughage by the dairy cow. In:
Gamsworth PC. (ed), Nutrition and lactation in the
dairy cow. London: Butterworth, pp. 262-279.
Haigh, P.M., Appleton, M. and Clench, S.F. 1987. Effect of
commercial inoculant and formic acid/formalin silage
additives on silage fermentation and intake and on live
weight change of young cattle. Grass Forage Sci. 42:
405-410.
Hernandez, F., Garcia, V., Madrid, J., Orengo, J., Catala, P. and
Megias, M.D. 2006. Effect of formic acid on
performance, digestibility, intestinal histomorphology
and plasma metabolite levels of broiler chickens. Br.
Poult. Sci. 47: 50-56.
IGFRI. 2013. Vision 2050. Technology Bulletin No. 01/2013,
IGFRI.
Jongbloed, A.W., Mroz, Z., Weij-Jongbloed, V.D.R. and
Kemme, P.A. 2000. The effects of microbial phytase,
organic acids and their interaction in diets for growing
pigs. Livest. Prod. Sci. 67: 113-122.
Latimer, K.S., Mahaffey, E.A. and Prasse, K.W. 2003. Duncan
and Prasse’s Veterinary laboratory medicine: Clinical
Pathology. Iowa: Iowa State Press.
Mann, E.M. and McDonald, P. 1976. The effect of formalin
and lower volatile fatty acids on silage fermentation. J.
Sci. Food Agric. 27: 612-616.
Merensalmi, M. and Virkki, M. 1991. The role of enzymes in
the preservation and utilization of forage. In: Proc. 5th
International Symposium on Forage Preservation,
Nitra, pp. 43-46.
Nadeau, E. and Arnesson, A. 2016. Intake and performance of
ewes and lambs fed grass-clover silage treated with
chemical additives. Grassl. Sci. Eur. 21: 479-481.
Nadeau,. E., Russel, J. and Buxton D. 2000. Intake,
digestibility, and composition of orchard grass and
alfalfa silages treated with cellulase, inoculant and
Indian J. Anim. Nutr. 2020. 37 (1): 31-38
Organic acid as silage addititve
38
formic acid fed to lambs. J. Anim. Sci. 78: 2980-2989.
NRC. 2001. Nutrient Requirements of Dairy Cattle. 7th
revised edn, The National Academic Press,
Washington DC, USA.
O’Kiely, P. and Moloney, A.P. 1994. Silage characteristics and
performance of cattle offered grass silage made
without an additive, with formic acid or with a partially
neutralised blend of aliphatic organic acids. Irish J.
Agric. Food Res. 33: 25-39.
Radostits, O.M., Gay, C.C., Blood, D.C. and Hinchcliff, K.W.
2000. Veterinary Medicine. 9th ed, Saunders WB,
London, pp. 1819-1822.
Radostits, O.M., Gay, C.C., Hinchcliff, K.W. and Constable,
P.D. 2008. Veterinary Medicine: A Textbook of the
Diseases of Cattle, Sheep, Goats, Pigs and Horses.
10th ed, Saunders Elsevier, Edinburgh, UK.
Ragaa, N.M., Korany, R.M.S. and Mohamed, F.F. 2016. Effect
of thyme and/or formic acid dietary supplementation
on broiler performance and immunity. Agric. Agric. Sci.
Procedia. 10: 270-279.
Rooke, J.A., Maya, F.M., Arnold, J.A. and Armstrong, D.G.
1988. The chemical composition and nutritive value
of grass silages prepared with no additive or with
the application of additives containing either
Lactobacillus plantarum or formic acid. Grass Forage
Sci. 43: 87-95.
Satter, L.D. and Reis, R.B. 2012. Milk production under
confinement conditions. U.S. Dairy Forage Research
Center, USDA-ARS and Dairy Science Department,
University of Wisconsin, Madison, Wisconsin, USA.
Singh, A., Kumar, M., Kumar, V., Roy, D., Kushwaha,
R., Vaswani, S. and Kumar, A. 2019. Effect of nickel
supplementation on liver and kidney function test and
protein metabolism in growing cattle. Proc. Natl. Acad.
Sci. India Sect. B. doi.org/10.1007/s40011-019-01087-
9.
Smith, B.P. 2009. Large Animal Internal Medicine. 4th ed,
Mosby Elsevier, St. Louis, MO, USA.
Steen, R.W.J., Gordon, F.J., Dawson, L.E.R., Park, R.S., Mayne,
C.S., Agnew, R.E., Kilpatrick, D.J. and Porter, M.G. 1998.
Factors affecting the intake of grass silage by cattle
and prediction of silage intake. Anim. Sci J. 66: 115-
127.
Stojevic, Z., Pirsljin, J., Milinkovic-Tur, S., Zdelar-Tuk, M. and
Beer Ljubic, B. 2005. Activities of AST, ALT and GGT
in clinically healthy dairy cows during lactation and
in the dry period. Vet. Arhiv. 75: 67-73.
Thomas, C. and Thomas, P.C. 1988. Factors affecting the
nutritive value of grass silages. In: Haresign W, Cole
DJA, (ed), Recent Advances in Animal Nutrition.
London: Butterworths, pp. 274-307.
Van Soest, P.J., Robertson, J.B. and Lewis, B.A. 1991.
Methods for dietary fiber, neutral detergent fibre, and
nonstarch polysaccharides in relation to animal
nutrition. J. Dairy Sci. 74: 3583-3597.
Vinus, Sheoran, N., Shunthwal, J., Akbar, M.A. and Tewatia,
B.S. 2017. Effect of supplementation of salts of organic
acids on serum and haematological parameters of
broilers. Int. J. Curr. Microbiol. Appl. Sci. 6: 4211-
4218.
Waldo, D.R., Derbyshire, J.C. 1971. The feeding value of hay
crop silages. In: Proc. International Silage Research
Conference, Washington, D.C., pp. 141-155.
Winters, A.L., Fychan, R. and Jones, R. 2001. Effect of formic
acid and a bacterial inoculants on the amino acid
composition of grass silage and on animal performance.
Grass Forage Sci. 56: 181-192.
Wood, D. and Quiroz-Rocha, G.F. 2010. Normal hematology of
cattle. In: Schalm’s veterinary hematology. (D.J. Weiss
and K.J. Wardrop; 6th ed.) Wiley, Ames, IA. pp: 829-
835.
Woolford, M.K. 1984. The chemistry of silage. In: Silage
fermentation. (A.I. Laskin and R.I. Mateles; ed.) Marcel
Dekker, New York, pp. 72-118.
Indian J. Anim. Nutr. 2020. 37 (1): 31-38
Kumar et al.,
Received on 12-06-2020 and accepted on 30-06-2020
39
Indian Journal of
Animal Nutrition
Effect of Feeding of Hydroponics Maize Green Fodder with and without
Supplementation of Probiotics (Saccharomyces cerevisiae) on Feed
Consumption in Gir Calves
Monika Joshi*, S. K. Sharma and C. S. Vaishnava
Department of Animal Nutrition, College of Veterinary & Animal Science
(Rajasthan University of Veterinary and Animal Sciences) Vallabhnagar, Udaipur 313 601, India
ABSTRACT
Present investigation was undertaken to determine the chemical composition and assessment of feed
consumption of hydroponics maize fodder with and without supplementation of probiotic (Saccharomyces
cerevisiae) in Gir calves. Total 36 male Gir calves of almost same age group were distributed equally by
completely randomized block design in nine groups. Calves in group T1 were treated as control and were fed
basal feed and concentrate mixture as per requirement. For calves in T2, T
3, T
4 and T
5 groups, 25%, 50%, 75%
and 100% of crude protein (CP) supplied through concentrate mixture was replaced by hydroponics maize
fodder, respectively, whereas in T6, T
7, T
8 and T
9 groups, 25% 50%, 75% and 100% of CP supplied through
concentrate mixture was replaced by hydroponics maize fodder alongwith probiotics (Saccharomyces cerevisae),
respectively. The results indicated that hydroponics maize fodder had shown good nutrient profile such as
crude protein, ether extract and nitrogen free extract in present experiment whereas yeast was found to be richer
source of calcium and phosphorus. There was highly significant effect (P<0.01) of treatments and periods (15
days to 120 days) on dry matter intake (DMI) and organic matter intake. It was revealed that the DMI was found
to be decreased with feeding of the hydroponics maize fodder in Gir calves but incorporation of probiotic
(Saccharomyces cerevisiae) improved DMI.
Key words: Chemical composition, Dry matter intake, Gir calves, Hydroponics maize fodder, Organic matter
intake
*Corresponding author: [email protected], Mob. No. 9414682352; 9413234891
INTRODUCTION
Green fodder and concentrate are the
quintessential for optimum health, growth, productive
and reproductive performance in dairy animals. For
sustainable dairy farming, quality green fodder should
be fed regularly to dairy animals (Naik et al., 2012).
The health, growth and production of dairy animals
are adversely affected due to unavailability of good
quality green fodder and concentrate. Continuous
production of green fodder in sufficient quantities is a
challenging task. Traditional production of green
grasses not only requires large land area, plenty of
water, labour, fertilizers and a lot of management
problems but it also has low nutritional value. Faster
industrialization has squeezed area under pasture land,
adversely affecting the grazing based production
systems. Shortage of land, long growth time (50-65 days),
labour, fertilizer and manure requirements for
cultivation, unavailability of same quality throughout
Indian J. Anim. Nutr. 2020. 37 (1): 39-43
doi: 10.5958/2231-6744.2020.00007.9
the year, lack of irrigation facilities, water scarcity
and natural calamities due to climate change are the
major obstacles for conventional green fodder and
grain production. Technology advancement in industry
and farming systems has introduced hydroponics
technology for green fodder production. In the
prevailing dairy farming system, where quality and
quantity of grazing is continuously decreasing, the
hydroponics grown green fodder could be a novel way
of feeding dairy animals to improve productivity. Due to
many constraints in the conventional green fodder
cultivation, hydroponics technology may become an
alternative not only for the green fodder but may also
replace some part of concentrate in farm animals (Naik
et al., 2012).
Further, use of natural feed additives in dairy cattle
ration has potential for improvement in growth and
production. There is a strong need for natural feed
additives acceptable for consumers interested in organic
Indian J. Anim. Nutr. 2020. 37 (1): 39-43
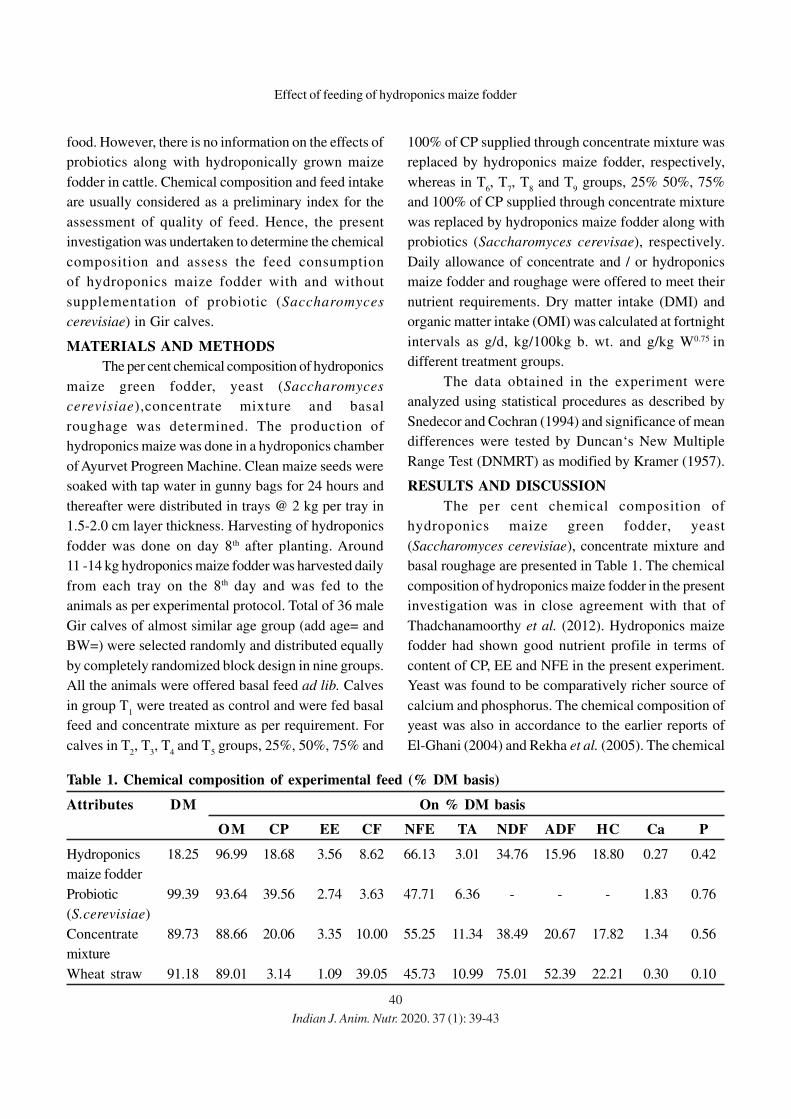
40
food. However, there is no information on the effects of
probiotics along with hydroponically grown maize
fodder in cattle. Chemical composition and feed intake
are usually considered as a preliminary index for the
assessment of quality of feed. Hence, the present
investigation was undertaken to determine the chemical
composition and assess the feed consumption
of hydroponics maize fodder with and without
supplementation of probiotic (Saccharomyces
cerevisiae) in Gir calves.
MATERIALS AND METHODS
The per cent chemical composition of hydroponics
maize green fodder, yeast (Saccharomyces
cerevisiae),concentrate mixture and basal
roughage was determined. The production of
hydroponics maize was done in a hydroponics chamber
of Ayurvet Progreen Machine. Clean maize seeds were
soaked with tap water in gunny bags for 24 hours and
thereafter were distributed in trays @ 2 kg per tray in
1.5-2.0 cm layer thickness. Harvesting of hydroponics
fodder was done on day 8th after planting. Around
11 -14 kg hydroponics maize fodder was harvested daily
from each tray on the 8th day and was fed to the
animals as per experimental protocol. Total of 36 male
Gir calves of almost similar age group (add age= and
BW=) were selected randomly and distributed equally
by completely randomized block design in nine groups.
All the animals were offered basal feed ad lib. Calves
in group T1 were treated as control and were fed basal
feed and concentrate mixture as per requirement. For
calves in T2, T
3, T
4 and T
5 groups, 25%, 50%, 75% and
100% of CP supplied through concentrate mixture was
replaced by hydroponics maize fodder, respectively,
whereas in T6, T
7, T
8 and T
9 groups, 25% 50%, 75%
and 100% of CP supplied through concentrate mixture
was replaced by hydroponics maize fodder along with
probiotics (Saccharomyces cerevisae), respectively.
Daily allowance of concentrate and / or hydroponics
maize fodder and roughage were offered to meet their
nutrient requirements. Dry matter intake (DMI) and
organic matter intake (OMI) was calculated at fortnight
intervals as g/d, kg/100kg b. wt. and g/kg W0.75 in
different treatment groups.
The data obtained in the experiment were
analyzed using statistical procedures as described by
Snedecor and Cochran (1994) and significance of mean
differences were tested by Duncan‘s New Multiple
Range Test (DNMRT) as modified by Kramer (1957).
RESULTS AND DISCUSSION
The per cent chemical composition of
hydroponics maize green fodder, yeast
(Saccharomyces cerevisiae), concentrate mixture and
basal roughage are presented in Table 1. The chemical
composition of hydroponics maize fodder in the present
investigation was in close agreement with that of
Thadchanamoorthy et al. (2012). Hydroponics maize
fodder had shown good nutrient profile in terms of
content of CP, EE and NFE in the present experiment.
Yeast was found to be comparatively richer source of
calcium and phosphorus. The chemical composition of
yeast was also in accordance to the earlier reports of
El-Ghani (2004) and Rekha et al. (2005). The chemical
Effect of feeding of hydroponics maize fodder
Table 1. Chemical composition of experimental feed (% DM basis)
Attributes DM On % DM basis
OM CP EE CF NFE TA NDF ADF HC Ca P
Hydroponics 18.25 96.99 18.68 3.56 8.62 66.13 3.01 34.76 15.96 18.80 0.27 0.42
maize fodder
Probiotic 99.39 93.64 39.56 2.74 3.63 47.71 6.36 - - - 1.83 0.76
(S.cerevisiae)
Concentrate 89.73 88.66 20.06 3.35 10.00 55.25 11.34 38.49 20.67 17.82 1.34 0.56
mixture
Wheat straw 91.18 89.01 3.14 1.09 39.05 45.73 10.99 75.01 52.39 22.21 0.30 0.10
Indian J. Anim. Nutr. 2020. 37 (1): 39-43
41
composition of hydroponics maize fodder was almost
same as that of concentrate mixture except total ash,
calcium and phosphorus. These findings corroborate with
the reports of earlier workers (Banerjee, 1988; Verma
et al., 2015).
The mean values of dry matter intake expressed
as kg/100kg BW. ranged between 2.83 to 3.12 whereas
mean values of dry matter intake in terms of g/kg W0.75
ranged from 94.89 to 103.12 in different treatment
groups (Table 2). Data pertaining to dry matter intake in
terms of g/d, kg/100kg b. wt. and g/kg W0.75 at
fortnights are presented in Table 3. he results of
statistical analysis of data (Table 4) revealed highly
significant effect (P<0.01) of treatments (T1 to T
9)
(i.e. hydroponics maize fodder with and without
Saccharomyces cerevisiae) and periods (15 d to 120
d) on DMI in terms of g/d, kg/100 kg b. wt. and g/Kg
W0.75. Further, comparison of mean values of DMI
revealed significant variations among the groups with
highest DMI in group T1 and lowest in group T
5. While
comparing the treatment groups with respect to
supplementation of probiotic, it was observed that
there was significantly higher mean DMI in group T6,
T7, T
8 and T
9 as compared to groups T
2, T
3, T
4 and T
5,
thus showing positive effect of supplementation of
probiotic on DMI (Table 2).It was revealed that the dry
matter intake was found to be decreased with feeding
of the hydroponics maize fodder in Gir calves but
incorporation of probiotic (Saccharomyces cerevisiae)
improved dry matter intake.
Highly significant effect of period was recorded
on dry matter intake in terms of g/d, kg/100kg b. wt.
and g/Kg W0.75. Dry matter intake was found to be
increased with advancement of age. It could be
attributed to increase in dry matter intake with the
growing age of calves irrespective of treatment groups
(Table 3 and 4). There was significant effect of
feeding of hydroponics maize fodder without and with
Saccharomyces cerevisiae on dry matter intake in Gir
calves. Similar findings were also reported by Verma et
al. (2015) in calves, Nugrohoa et al. (2015) in cows,
Gebremedhin (2015) in goats and Ata (2016) in lambs;
fed hydroponics barley fodder or hydroponics maize
fodder. Improvement in DMI in calves fed yeast
culture diets were also reported by Wohlt et al. (1991);
Erasmus et al. (1992); Cole et al. (1992); Putnam et al.
(1997); Heinrich (2004) and Lesmister et al. (2004).
In contrast, few workers observed no significant
difference in DMI in animals fed with artificially grown
fodder viz. Rule et al. (1986) and Reddy et al. (1988) in
cows; and Rajendra et al. (1998) and Saidi and Omar
(2015) in sheep. However, none of them used
hydroponics maize fodder in calves. Singh et al. (1998)
and Titi et al. (2008) reported reduced dry matter
intake in calves with addition of yeast culture in the diet.
DM intake was a limiting factor for sole feeding of
hydroponics fodder in cows (Pandey and Pathak, 1991).
Supplementation of yeast culture in the diet increased
digestion, particularly fibre fraction of the diet, leading
to improved feed intake (Hassan et al., 2016).
Table 2. Average feed consumption (DMI and OMI) in different treatment groups in Gir calves
Unit Treatment
T1
T2
T3
T4
T5
T6
T7
T8
T9
Dry matter intake
g/d 3710.84a 3650.03cd 3624.74d 3595.2e 3555.08f 3687.52ab 3654.53c 3626.00d 3586.27e
kg/100 kg b.wt. 3.12a 3.03ab 2.96bc 2.83d 2.85d 3.03ab 2.93c 2.84d 2.88cd
g/kg W0.75 103.12a 100.39b 98.52bc 94.89c 95.25c 100.86ab 98.29c 95.52c 96.19c
Organic matter intake
g/d 3307.46c 3287.57d 3302.86cd 3309.34c 3311.50c 3339.78ab 3340.82a 3354.07a 3358.51a
kg/100 kg b.wt. 2.78b 2.80ab 2.72c 2.72c 2.73c 2.83a 2.71c 2.70c 2.70c
g/kg W0.75 91.83c 93.79ab 92.50bc 90.32d 91.20cd 94.12a 90.34d 90.81d 90.38d
Rows with different superscript differ significantly
Indian J. Anim. Nutr. 2020. 37 (1): 39-43
Joshi et al.,
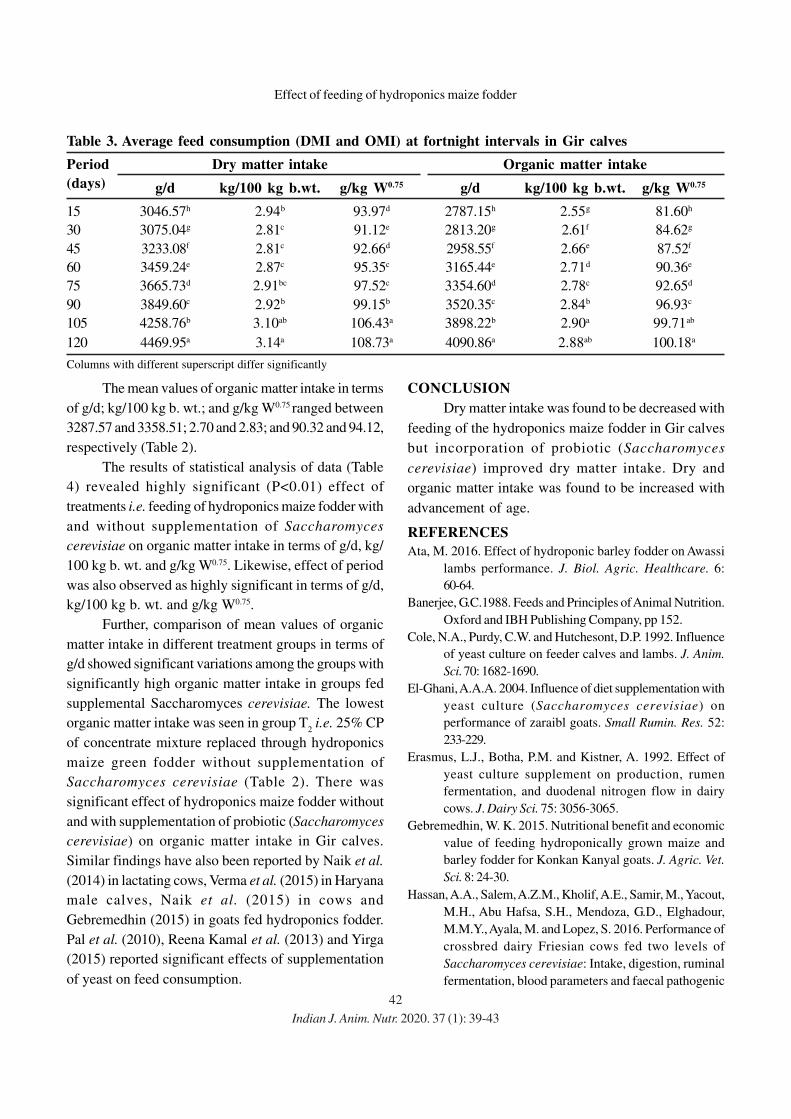
42
The mean values of organic matter intake in terms
of g/d; kg/100 kg b. wt.; and g/kg W0.75 ranged between
3287.57 and 3358.51; 2.70 and 2.83; and 90.32 and 94.12,
respectively (Table 2).
The results of statistical analysis of data (Table
4) revealed highly significant (P<0.01) effect of
treatments i.e. feeding of hydroponics maize fodder with
and without supplementation of Saccharomyces
cerevisiae on organic matter intake in terms of g/d, kg/
100 kg b. wt. and g/kg W0.75. Likewise, effect of period
was also observed as highly significant in terms of g/d,
kg/100 kg b. wt. and g/kg W0.75.
Further, comparison of mean values of organic
matter intake in different treatment groups in terms of
g/d showed significant variations among the groups with
significantly high organic matter intake in groups fed
supplemental Saccharomyces cerevisiae. The lowest
organic matter intake was seen in group T2 i.e. 25% CP
of concentrate mixture replaced through hydroponics
maize green fodder without supplementation of
Saccharomyces cerevisiae (Table 2). There was
significant effect of hydroponics maize fodder without
and with supplementation of probiotic (Saccharomyces
cerevisiae) on organic matter intake in Gir calves.
Similar findings have also been reported by Naik et al.
(2014) in lactating cows, Verma et al. (2015) in Haryana
male calves, Naik et al. (2015) in cows and
Gebremedhin (2015) in goats fed hydroponics fodder.
Pal et al. (2010), Reena Kamal et al. (2013) and Yirga
(2015) reported significant effects of supplementation
of yeast on feed consumption.
CONCLUSION
Dry matter intake was found to be decreased with
feeding of the hydroponics maize fodder in Gir calves
but incorporation of probiotic (Saccharomyces
cerevisiae) improved dry matter intake. Dry and
organic matter intake was found to be increased with
advancement of age.
REFERENCES
Ata, M. 2016. Effect of hydroponic barley fodder on Awassi
lambs performance. J. Biol. Agric. Healthcare. 6:
60-64.
Banerjee, G.C.1988. Feeds and Principles of Animal Nutrition.
Oxford and IBH Publishing Company, pp 152.
Cole, N.A., Purdy, C.W. and Hutchesont, D.P. 1992. Influence
of yeast culture on feeder calves and lambs. J. Anim.
Sci. 70: 1682-1690.
El-Ghani, A.A.A. 2004. Influence of diet supplementation with
yeast culture (Saccharomyces cerevisiae) on
performance of zaraibl goats. Small Rumin. Res. 52:
233-229.
Erasmus, L.J., Botha, P.M. and Kistner, A. 1992. Effect of
yeast culture supplement on production, rumen
fermentation, and duodenal nitrogen flow in dairy
cows. J. Dairy Sci. 75: 3056-3065.
Gebremedhin, W. K. 2015. Nutritional benefit and economic
value of feeding hydroponically grown maize and
barley fodder for Konkan Kanyal goats. J. Agric. Vet.
Sci. 8: 24-30.
Hassan, A.A., Salem, A.Z.M., Kholif, A.E., Samir, M., Yacout,
M.H., Abu Hafsa, S.H., Mendoza, G.D., Elghadour,
M.M.Y., Ayala, M. and Lopez, S. 2016. Performance of
crossbred dairy Friesian cows fed two levels of
Saccharomyces cerevisiae: Intake, digestion, ruminal
fermentation, blood parameters and faecal pathogenic
Table 3. Average feed consumption (DMI and OMI) at fortnight intervals in Gir calves
Period Dry matter intake Organic matter intake
(days) g/d kg/100 kg b.wt. g/kg W0.75 g/d kg/100 kg b.wt. g/kg W0.75
15 3046.57h 2.94b 93.97d 2787.15h 2.55g 81.60h
30 3075.04g 2.81c 91.12e 2813.20g 2.61f 84.62g
45 3233.08f 2.81c 92.66d 2958.55f 2.66e 87.52f
60 3459.24e 2.87c 95.35c 3165.44e 2.71d 90.36e
75 3665.73d 2.91bc 97.52c 3354.60d 2.78c 92.65d
90 3849.60c 2.92b 99.15b 3520.35c 2.84b 96.93c
105 4258.76b 3.10ab 106.43a 3898.22b 2.90a 99.71ab
120 4469.95a 3.14a 108.73a 4090.86a 2.88ab 100.18a
Columns with different superscript differ significantly
Indian J. Anim. Nutr. 2020. 37 (1): 39-43
Effect of feeding of hydroponics maize fodder
43
bacteria. J. Agric Sci. 154: 1488-1498.
Heinrich, J. 2004. Yeast culture may affect rumen
development. Feed Stuffs 76: 11-14.
Kramer, C.Y. 1957. Extension of multiple range tests to group
correlated adjusted means. Biometrics 13: 13-17.
Lesmeister, K. E., Heinrichs, A. J. and Gabler, M.T. 2004.
Effects of supplemental yeast (Saccharomyces
cerevisiae) culture on rumen development, growth
characteristics, and blood parameters in neonatal dairy
calves. J. Dairy Sci. 87: 1832-1839.
Naik, P.K., Swain, B. K., Chakurkar, E. B. and Singh, N.P. 2012.
Performance of dairy cows on green fodder maize based
ration in coastal hot and humid climate. Anim. Nutr.
Feed Technol.12: 265-270.
Naik, P.K., Dhuri, R.B., Karunakaran, M., Swain, B.K. and
Singh N.P. 2014. Effect of feeding hydroponics maize
fodder on digestibility of nutrients and milk
production in lactating cows. Indian J. Anim. Sci. 84:
880-883.
Naik, P.K., Swain, B.K. and Singh, N.P. 2015. Review:
Production and utilisation of hydroponics fodder.
Indian J. Anim. Nutr. 32: 1-9.
Nugrohoa, H.D., Permanab, I.G. and Despal. 2015. Utilization
of Bio-slurry on maize hydroponic fodder as a corn
silage supplement on nutrient digestibility and milk
production of dairy cows. Media Peternakan 38:
70-76.
Pal, K., Paul, S.K., Bhunia, T., Pakhira, M.C., Biswas, P. and
Patra A.K. 2010. Responses of addition of yeast
(Saccharomyces cerevisiae) from rice distillers grains
with soluble with or without trace minerals on the
performance of Black Bengal kids. Small Rumin. Res.
94: 45-52.
Pandey, H. N. and Pathak, N. 1991. Nutritional evaluation of
artificially grown barley fodder in lactating crossbred
cows. Indian J. Anim. Nutr. 8: 7778.
Putnam, D.E., Schwab, C.G., Socha, M.T., Whitehouse, N.I.,
Kierstead, N.A. and Garthwaite, B.D. 1997. Effect of
yeast culture in the diets of early lactation dairy cows
on ruminal fermentation and passage of nitrogen
fractions and amino acids to small intestine. J. Dairy
Sci. 80: 374-384.
Rajendra Prasad, Seghal, J.P., Patnayak, B. C. and Beniwal
R.K. 1998. Utilization of artificially grown barley
fodder by sheep. Indian J. Small Rumin. 4: 63-68.
Reddy, G.V.N., Reddy, M. R. and Reddy K.K. 1988. Nutrient
utilization by milch cattle fed on rations containing
artificially grown fodder. Indian J. Anim. Nutr. 5: 19-22.
Reena Kamal, Dutt, T., Singh, M., Kamra, D. N., Patel, M.,
Choudhary, L.C., Agarwal, N., Kumar, S. and Islam, M.
2013. Effect of live Saccharomyces cerevisiae (NCDC-
49) supplementation on growth performance and
rumen fermentation pattern in local goat. J. Appl. Anim.
Res. 41: 285-288.
Rekha, N.A., Prasad, J.R. and Ramana, J.V. 2005. Evaluation of
ground nut haulms supplemented with yeast culture
in sheep. Indian J. Anim. Nutr. 22: 198-200.
Rule, D.C., Preston, R.L., Koes, R.M. and McReynolds, W.E.
1986. Feeding value of sprouted wheat (Triticum
aestivum) for beef cattle finishing diets. Anim. Feed
Sci. Technol. 15: 113-121.
Saidi Rahim Abd., M.A. and Omar, J.A. 2015. The Biological
and economical feasibility of feeding barley green
fodder to lactating Awassi ewes. Open J. Anim. Sci. 5:
55249.
Singh, R., Chowdhary, L.C., Kamara, D.N. and Pathak, N.N.
1998. Effect of dietary supplementation with yeast cell
suspension (Saccharomyces cerevisiae) on nutrient
utilization and growth response in crossbred calves.
Asian-Australas. J. Anim. Sci. 11: 268-271.
Snedecor, G.W. and Cochran, W.G. 1994. Statistical Methods
8th edn. Oxford and IBH Publishing Co., New Delhi,
India.
Thadchanamoorth., S., Jayawardena, V.P. and Pramalal, C.G.C.
2012. Evaluation of hydroponically grown maize as a
feed source for Rabbits. Proceedings of 22nd Annual
Students Research Session, Department of Animal
Science. November 30, 2012, pp 5 (Abstr).
Titi, H.H., Abdullah, A.Y., Lubbadeh and Obeidat, B.S. 2008.
Growth and carcass characteristics of male dairy calves
on a yeast culture supplemented diet. South African J.
Anim. Sci. 38: 174-183.
Verma, S., Singh, A. Kalra, A. and Saxena, M. 2015. Effect of
feeding hydroponics barley fodder on nutrient
utilization, growth, blood metabolites and cost
effectiveness in Hariana male calves. Indian J. Anim.
Nutr. 32: 10-14.
Wohlt, J.E., Finkelstein, A.D. and Chung, C.H. 1991. Yeast
culture to improve intake, nutrient digestibility and
performance by dairy cattle during early lactation. J.
Dairy Sci. 74: 1395-1400.
Yirga, H. 2015. The Use of probiotics in animal nutrition. J.
Prob. Health. 3: 132.
Indian J. Anim. Nutr. 2020. 37 (1): 39-43
Joshi et al.,
Received on 04-06-2020 and accepted on 25-06-2020
44
Indian Journal of
Animal Nutrition
In-Vitro Study on Dissolution Profiling of Choline Chloride Encapsulated
by Different Microencapsulation Technologies and Active Forms
Sunil Chauhan* and Bhupesh Gautam
Jubilant Life Sciences, Research and Development Centre, Noida
ABSTRACT
An in-vitro dissolution study was conducted to determine the effect of various microencapsulation
technologies commercially employed to protect choline chloride from rumen mimic dissolution and absorption
in intestinal mimic solution using two different type of actives (Liquid choline chloride 75% and choline
chloride crystal 98%). This study shows that choline chloride crystals granulated by using carbohydrate matrix
and coated by hydrogenated vegetable oils through top-spray fluid bed process technology have minimal
dissolution of 11.14% in rumen mimic solution, liquid choline chloride granulated and further coated by
hydrogenated vegetable oils through top-spray fluid bed process shows 34.71% dissolution, Liquid choline
chloride absorb on silicon dioxide and coated by hydrogenated vegetable oils by pan coating shows
dissolution of 82.69%, Liquid choline chloride emulsified and spray congealed shows dissolution of 84.6%
while liquid choline chloride dispersed with hydrogenated vegetable oils solubilised 100% in rumen mimic
solution. Results from study concluded that choline chloride active taken in crystal form granulated
with cellulose based polymer and coated through fluid bed top-spray process technologies have minimal
degradation in mimic rumen solution and thus maximum rumen bypass efficacy.
Key words: Choline Chloride, Rumen, Microencapsulation, Fluid bed process, Dissolution
Corresponding author: [email protected]
INTRODUCTION
Choline chloride, (2-hydroxy)- trimethyl
ammonium chloride C5H
14ClNOis a highly hygroscopic
substance used in feed for choline supplementation. In
cattle choline apart from other functions (membrane
integrity, neurotransmission, fat mobilization from liver
and methyl group donation) has been observed to
increase milk production. Unprotected choline in rumen
is not effective as measured by digestibility studies due
to complete or partial degradation by rumen microbes
before it even reaches the intestine (Erdman and Sharma,
1991). Hence, supplementation of unprotected choline
(conveniently as it is salt and choline chloride)
is ineffective way to increase the choline supply.
Therefore, Rumen-protected form of choline has been
developed to deliver choline with less degradation to the
small intestine for absorption (Pawar et al., 2015).
Rumen protected form of choline increases the supply
of choline to the small intestine with increasing milk yield
and milk components or alleviating development of
fatty liver syndrome (Hartwell et al., 2000). Type of
Indian J. Anim. Nutr. 2020. 37 (1): 44-47
doi: 10.5958/2231-6744.2020.00008.0
technology used in manufacturing rumen protected
choline has a direct effect on its rumen protection.
Therefore, this study was undertaken to study the
efficacy of different microencapsulation techniques on
rumen protection of choline chloride.
MATERIALS AND METHODS
Analytical grade of potassium dihydrogen
phosphate, sodium hydroxide, sodium bicarbonate,
disodium hydrogen phosphate decahydrate, sodium
chloride, potassium chloride, magnesium chloride,
magnesium chloride, conc HCl were procured from
Merck. Oxalic acid was procured form Rankem,
Diethylamine and acetone were procured from Fisher
scientific. Pepsin(1:3000), pancreatin(8X usp) were
procured from sigma Aldrich.
Mimic rumen solution: Mc Dougall Buffer
solution: pH 6.5, Each litre of Mc Dougall buffer
solution contained 7.43 g of sodium bicarbonate, 7.0 g
of disodium hydrogen phosphate, 0.34 g of sodium
chloride, 0.43 g of potassium chloride, 0.10 g of
Magnesium chloride, 0.05 g of calcium chloride.
Indian J. Anim. Nutr. 2020. 37 (1): 44-47
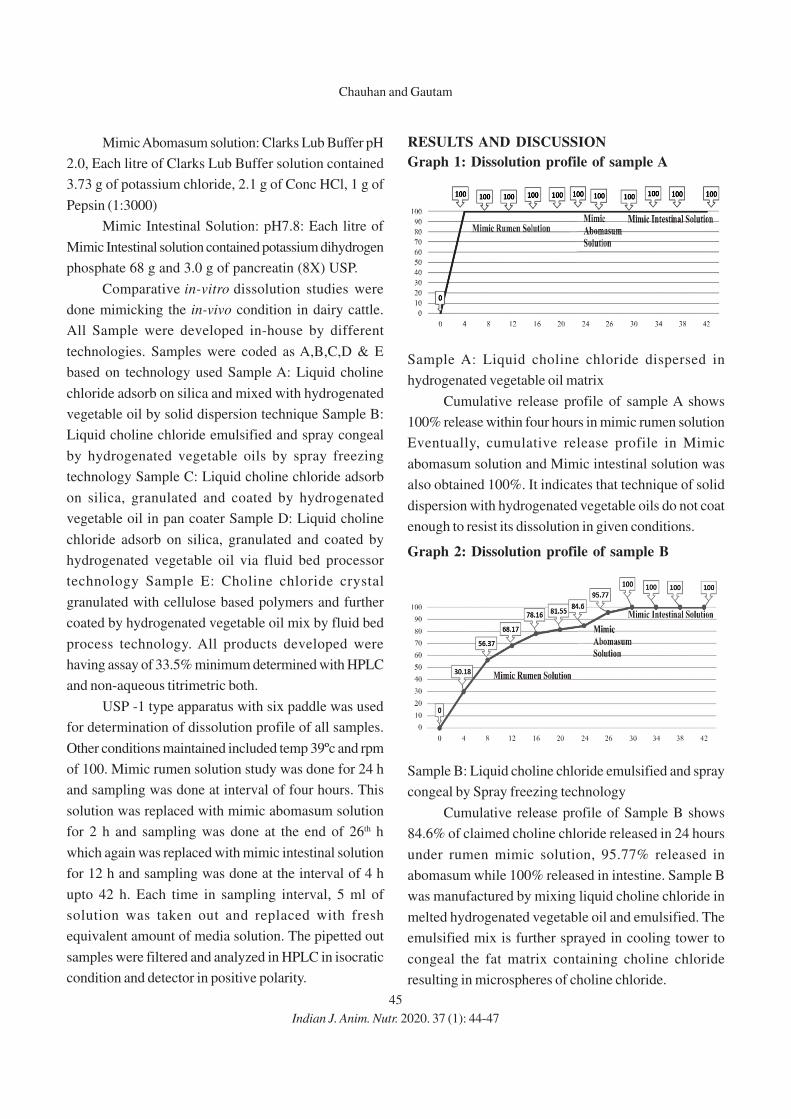
45
Mimic Abomasum solution: Clarks Lub Buffer pH
2.0, Each litre of Clarks Lub Buffer solution contained
3.73 g of potassium chloride, 2.1 g of Conc HCl, 1 g of
Pepsin (1:3000)
Mimic Intestinal Solution: pH7.8: Each litre of
Mimic Intestinal solution contained potassium dihydrogen
phosphate 68 g and 3.0 g of pancreatin (8X) USP.
Comparative in-vitro dissolution studies were
done mimicking the in-vivo condition in dairy cattle.
All Sample were developed in-house by different
technologies. Samples were coded as A,B,C,D & E
based on technology used Sample A: Liquid choline
chloride adsorb on silica and mixed with hydrogenated
vegetable oil by solid dispersion technique Sample B:
Liquid choline chloride emulsified and spray congeal
by hydrogenated vegetable oils by spray freezing
technology Sample C: Liquid choline chloride adsorb
on silica, granulated and coated by hydrogenated
vegetable oil in pan coater Sample D: Liquid choline
chloride adsorb on silica, granulated and coated by
hydrogenated vegetable oil via fluid bed processor
technology Sample E: Choline chloride crystal
granulated with cellulose based polymers and further
coated by hydrogenated vegetable oil mix by fluid bed
process technology. All products developed were
having assay of 33.5% minimum determined with HPLC
and non-aqueous titrimetric both.
USP -1 type apparatus with six paddle was used
for determination of dissolution profile of all samples.
Other conditions maintained included temp 39ºc and rpm
of 100. Mimic rumen solution study was done for 24 h
and sampling was done at interval of four hours. This
solution was replaced with mimic abomasum solution
for 2 h and sampling was done at the end of 26th h
which again was replaced with mimic intestinal solution
for 12 h and sampling was done at the interval of 4 h
upto 42 h. Each time in sampling interval, 5 ml of
solution was taken out and replaced with fresh
equivalent amount of media solution. The pipetted out
samples were filtered and analyzed in HPLC in isocratic
condition and detector in positive polarity.
Indian J. Anim. Nutr. 2020. 37 (1): 44-47
Chauhan and Gautam
RESULTS AND DISCUSSION
Graph 1: Dissolution profile of sample A
Sample A: Liquid choline chloride dispersed in
hydrogenated vegetable oil matrix
Cumulative release profile of sample A shows
100% release within four hours in mimic rumen solution
Eventually, cumulative release profile in Mimic
abomasum solution and Mimic intestinal solution was
also obtained 100%. It indicates that technique of solid
dispersion with hydrogenated vegetable oils do not coat
enough to resist its dissolution in given conditions.
Graph 2: Dissolution profile of sample B
Sample B: Liquid choline chloride emulsified and spray
congeal by Spray freezing technology
Cumulative release profile of Sample B shows
84.6% of claimed choline chloride released in 24 hours
under rumen mimic solution, 95.77% released in
abomasum while 100% released in intestine. Sample B
was manufactured by mixing liquid choline chloride in
melted hydrogenated vegetable oil and emulsified. The
emulsified mix is further sprayed in cooling tower to
congeal the fat matrix containing choline chloride
resulting in microspheres of choline chloride.
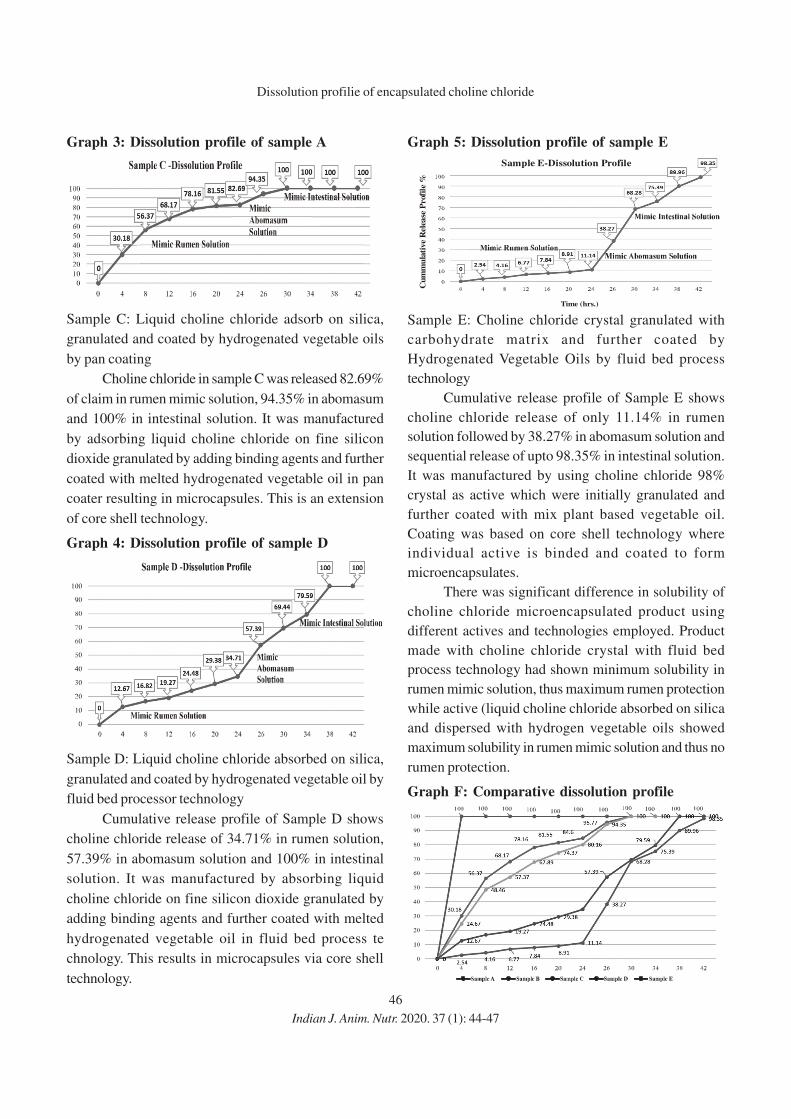
46
Graph 3: Dissolution profile of sample A
Sample C: Liquid choline chloride adsorb on silica,
granulated and coated by hydrogenated vegetable oils
by pan coating
Choline chloride in sample C was released 82.69%
of claim in rumen mimic solution, 94.35% in abomasum
and 100% in intestinal solution. It was manufactured
by adsorbing liquid choline chloride on fine silicon
dioxide granulated by adding binding agents and further
coated with melted hydrogenated vegetable oil in pan
coater resulting in microcapsules. This is an extension
of core shell technology.
Graph 4: Dissolution profile of sample D
Sample D: Liquid choline chloride absorbed on silica,
granulated and coated by hydrogenated vegetable oil by
fluid bed processor technology
Cumulative release profile of Sample D shows
choline chloride release of 34.71% in rumen solution,
57.39% in abomasum solution and 100% in intestinal
solution. It was manufactured by absorbing liquid
choline chloride on fine silicon dioxide granulated by
adding binding agents and further coated with melted
hydrogenated vegetable oil in fluid bed process te
chnology. This results in microcapsules via core shell
technology.
Graph 5: Dissolution profile of sample E
Sample E: Choline chloride crystal granulated with
carbohydrate matrix and further coated by
Hydrogenated Vegetable Oils by fluid bed process
technology
Cumulative release profile of Sample E shows
choline chloride release of only 11.14% in rumen
solution followed by 38.27% in abomasum solution and
sequential release of upto 98.35% in intestinal solution.
It was manufactured by using choline chloride 98%
crystal as active which were initially granulated and
further coated with mix plant based vegetable oil.
Coating was based on core shell technology where
individual active is binded and coated to form
microencapsulates.
There was significant difference in solubility of
choline chloride microencapsulated product using
different actives and technologies employed. Product
made with choline chloride crystal with fluid bed
process technology had shown minimum solubility in
rumen mimic solution, thus maximum rumen protection
while active (liquid choline chloride absorbed on silica
and dispersed with hydrogen vegetable oils showed
maximum solubility in rumen mimic solution and thus no
rumen protection.
Graph F: Comparative dissolution profile
Indian J. Anim. Nutr. 2020. 37 (1): 44-47
Dissolution profilie of encapsulated choline chloride
Sample E-Dissolution Profile
Cu
mm
ula
tive R
ele
ase
Profi
le %
Time (hrs.)
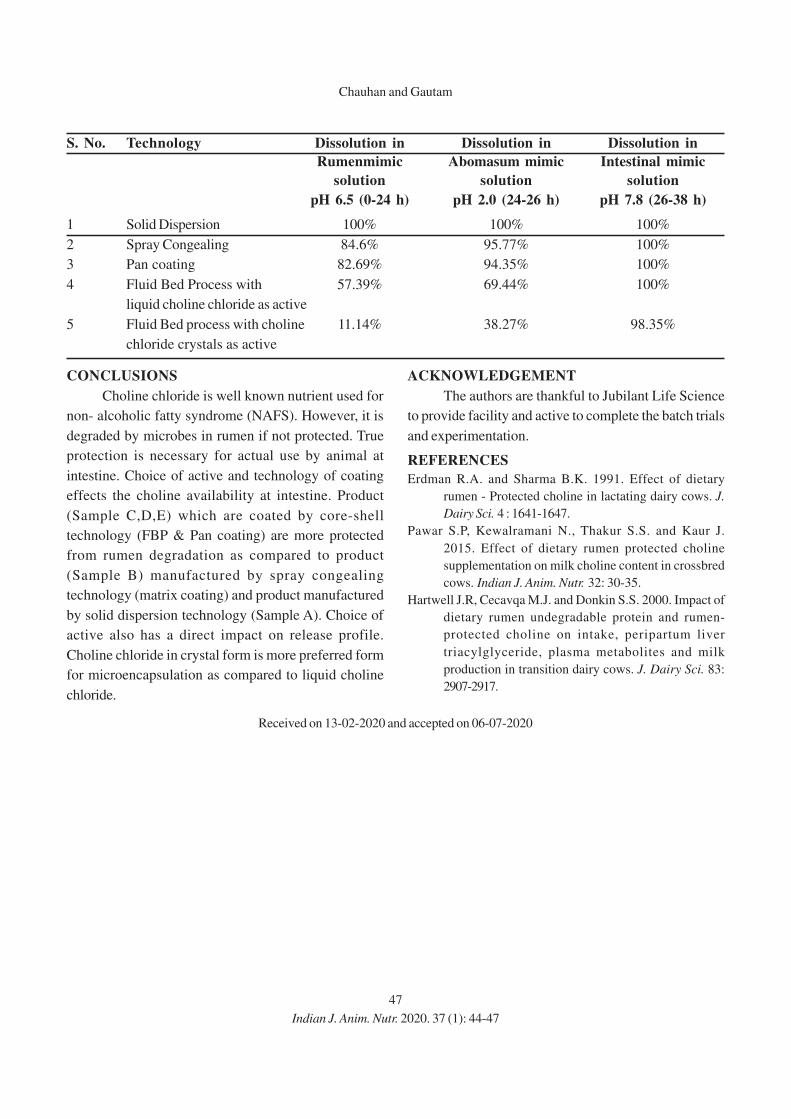
47
CONCLUSIONS
Choline chloride is well known nutrient used for
non- alcoholic fatty syndrome (NAFS). However, it is
degraded by microbes in rumen if not protected. True
protection is necessary for actual use by animal at
intestine. Choice of active and technology of coating
effects the choline availability at intestine. Product
(Sample C,D,E) which are coated by core-shell
technology (FBP & Pan coating) are more protected
from rumen degradation as compared to product
(Sample B) manufactured by spray congealing
technology (matrix coating) and product manufactured
by solid dispersion technology (Sample A). Choice of
active also has a direct impact on release profile.
Choline chloride in crystal form is more preferred form
for microencapsulation as compared to liquid choline
chloride.
S. No. Technology Dissolution in Dissolution in Dissolution in
Rumenmimic Abomasum mimic Intestinal mimic
solution solution solution
pH 6.5 (0-24 h) pH 2.0 (24-26 h) pH 7.8 (26-38 h)
1 Solid Dispersion 100% 100% 100%
2 Spray Congealing 84.6% 95.77% 100%
3 Pan coating 82.69% 94.35% 100%
4 Fluid Bed Process with 57.39% 69.44% 100%
liquid choline chloride as active
5 Fluid Bed process with choline 11.14% 38.27% 98.35%
chloride crystals as active
Indian J. Anim. Nutr. 2020. 37 (1): 44-47
Chauhan and Gautam
ACKNOWLEDGEMENT
The authors are thankful to Jubilant Life Science
to provide facility and active to complete the batch trials
and experimentation.
REFERENCES
Erdman R.A. and Sharma B.K. 1991. Effect of dietary
rumen - Protected choline in lactating dairy cows. J.
Dairy Sci. 4 : 1641-1647.
Pawar S.P, Kewalramani N., Thakur S.S. and Kaur J.
2015. Effect of dietary rumen protected choline
supplementation on milk choline content in crossbred
cows. Indian J. Anim. Nutr. 32: 30-35.
Hartwell J.R, Cecavqa M.J. and Donkin S.S. 2000. Impact of
dietary rumen undegradable protein and rumen-
protected choline on intake, peripartum liver
triacylglyceride, plasma metabolites and milk
production in transition dairy cows. J. Dairy Sci. 83:
2907-2917.
Received on 13-02-2020 and accepted on 06-07-2020
48
Indian Journal of
Animal Nutrition
Ensuring Nutritional Security of Animals by Mixed Cropping of
Sorghum and Guar under Varying Nutrient Management
Ankur Bhakar, Magan Singh*, Sanjeev Kumar, Susanta Dutta,
Ranajit Kumar Mahanta and Santosh Onte
ICAR – National Dairy Research Institute, Karnal-132 001, Haryana, India
ABSTRACT
An experiment was carried out to analyse productivity and quality of fodder sorghum and guar as
influenced by nutrient management under mixed cropping and in kharif season of 2018 tested in factorial
randomized complete block design with four seed rate combinations of sorghum and guar along with six
nutrient management treatments in three replications. The productivity of crops was evaluated in terms of
fodder yield and quality in form of dry matter, organic matter, ash, crude protein, ether extract, total
carbohydrates, fibre fractions (NDF, ADF, ADL and hemicellulose), total digestible nutrients, dry matter intake
and dry matter digestibility. Results revealed that total green fodder and dry matter yield was higher in sole
sorghum but it was at par with 75% sorghum + 25% guar. Mixed cropping treatments performed better in
comparison to sole crops for different quality parameters in both crops. Among nutrient management,
treatments 100% RDF, 100% RDF+ PGPR and 100% RDF+ seaweed extract recorded higher fodder
production as well as fodder quality in both crops which was not statistically different from75% RDF + seaweed
extract treatment. The results revealed that seed rate of 75% sorghum + 25% guar in mixed cropping with the
application of 75% RDF + seaweed extract produced higher quality fodder for animals.
Key words: Fodder yield and quality, Guar,, Mixed cropping, Nutrient management, Seed rate, Sorghum
Email: [email protected]
INTRODUCTION
Agriculture and its allied sectors are the
backbone of Indian economy. Farmers along with crop
production follow livestock rearing practice as it
provides employment to the farmer’s family during lean
periods and act as a buffer in case of crisis like crop
failure, etc. India is a home for 535.78 million livestock
(20th livestock census). Despite India’s huge livestock
production and its first rank in milk production, the
productivity of Indian animals is too low (due to
improper and inadequate nutrition, breeding and
adaptability problem, etc.) and this factor increases the
cost of milk production. The cost of feeding alone
constitutes about 60-70% of the gross expenses of
livestock production which is the most dominant reason
behind the low productivity. The demand for feed is
increasing with the growing livestock population and
will extend till 1012 mt of green fodder and 631 mt of
dry forage by the year 2050. With present rate of growth
in forage resources, there will be 18.4 % deficit in green
fodder and 13.2% deficit in dry fodder in the year 2050
(IGFRI Vision, 2050). Hence, to achieve the higher
productivity there is a need to bridge the gap between
demand and supply of feed resources for farm animals.
Among different feeds, green forages are the most
important as these show immediate result and supply all
the essential nutrients including water to the animals.
Animal may get green forage through forest, pasture
or grazing land but the cultivated fodders are most
important. Different fodder crops can be grown in
kharif (sorghum, maize, cowpea, guar, etc.), rabi
(berseem, lucerne, oats, chinese mustard, etc.) and zaid
season to ensure the year round green fodder supply
for the animals. Feeding cereals and grasses as sole
may cause protein deficiency and a legume alone causes
bloat in animals. So, feeding a mixture of cereals and
legumes by growing them in mixed cropping may help
to overcome the problem of protein deficiency as well
as bloating to maintain better health and productivity
of animals.
Mixed cropping is the sowing of two or more crops
at a time span in the field without any definite row
Indian J. Anim. Nutr. 2020. 37 (1): 48-56
doi: 10.5958/2231-6744.2020.00009.2
Indian J. Anim. Nutr. 2020. 37 (1): 48-56
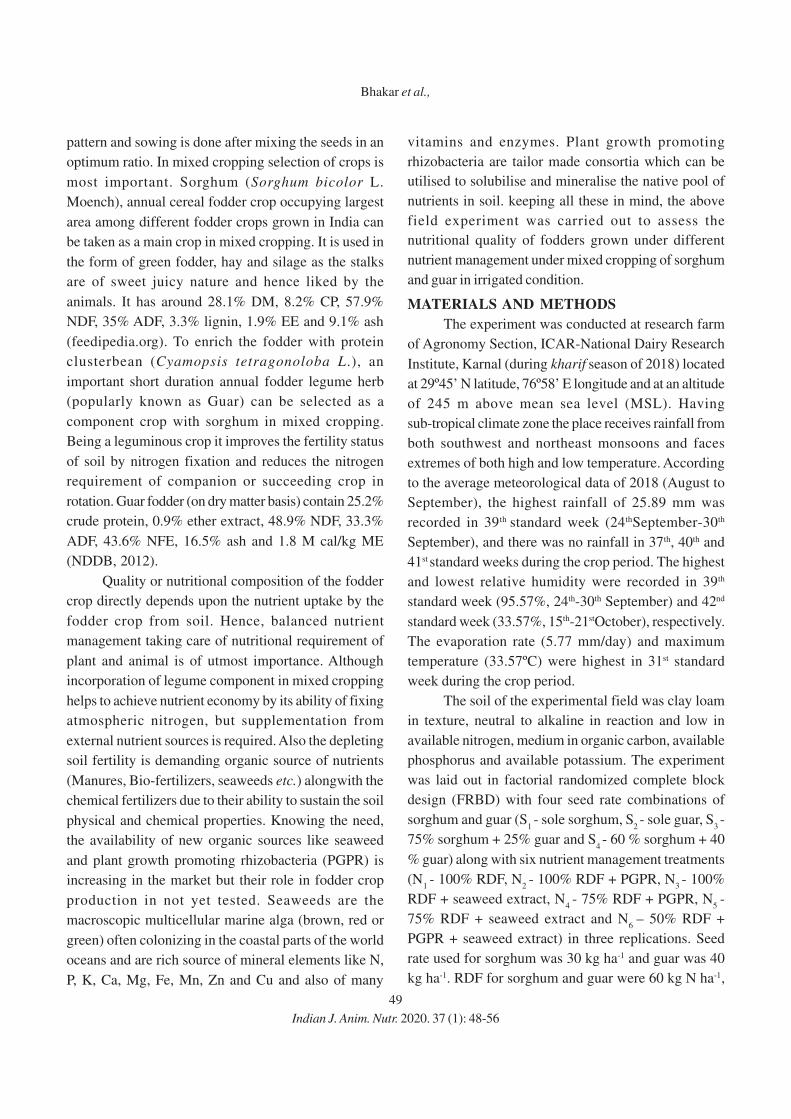
49
pattern and sowing is done after mixing the seeds in an
optimum ratio. In mixed cropping selection of crops is
most important. Sorghum (Sorghum bicolor L.
Moench), annual cereal fodder crop occupying largest
area among different fodder crops grown in India can
be taken as a main crop in mixed cropping. It is used in
the form of green fodder, hay and silage as the stalks
are of sweet juicy nature and hence liked by the
animals. It has around 28.1% DM, 8.2% CP, 57.9%
NDF, 35% ADF, 3.3% lignin, 1.9% EE and 9.1% ash
(feedipedia.org). To enrich the fodder with protein
clusterbean (Cyamopsis tetragonoloba L.), an
important short duration annual fodder legume herb
(popularly known as Guar) can be selected as a
component crop with sorghum in mixed cropping.
Being a leguminous crop it improves the fertility status
of soil by nitrogen fixation and reduces the nitrogen
requirement of companion or succeeding crop in
rotation. Guar fodder (on dry matter basis) contain 25.2%
crude protein, 0.9% ether extract, 48.9% NDF, 33.3%
ADF, 43.6% NFE, 16.5% ash and 1.8 M cal/kg ME
(NDDB, 2012).
Quality or nutritional composition of the fodder
crop directly depends upon the nutrient uptake by the
fodder crop from soil. Hence, balanced nutrient
management taking care of nutritional requirement of
plant and animal is of utmost importance. Although
incorporation of legume component in mixed cropping
helps to achieve nutrient economy by its ability of fixing
atmospheric nitrogen, but supplementation from
external nutrient sources is required. Also the depleting
soil fertility is demanding organic source of nutrients
(Manures, Bio-fertilizers, seaweeds etc.) alongwith the
chemical fertilizers due to their ability to sustain the soil
physical and chemical properties. Knowing the need,
the availability of new organic sources like seaweed
and plant growth promoting rhizobacteria (PGPR) is
increasing in the market but their role in fodder crop
production in not yet tested. Seaweeds are the
macroscopic multicellular marine alga (brown, red or
green) often colonizing in the coastal parts of the world
oceans and are rich source of mineral elements like N,
P, K, Ca, Mg, Fe, Mn, Zn and Cu and also of many
vitamins and enzymes. Plant growth promoting
rhizobacteria are tailor made consortia which can be
utilised to solubilise and mineralise the native pool of
nutrients in soil. keeping all these in mind, the above
field experiment was carried out to assess the
nutritional quality of fodders grown under different
nutrient management under mixed cropping of sorghum
and guar in irrigated condition.
MATERIALS AND METHODS
The experiment was conducted at research farm
of Agronomy Section, ICAR-National Dairy Research
Institute, Karnal (during kharif season of 2018) located
at 29º45’ N latitude, 76º58’ E longitude and at an altitude
of 245 m above mean sea level (MSL). Having
sub-tropical climate zone the place receives rainfall from
both southwest and northeast monsoons and faces
extremes of both high and low temperature. According
to the average meteorological data of 2018 (August to
September), the highest rainfall of 25.89 mm was
recorded in 39th standard week (24thSeptember-30th
September), and there was no rainfall in 37th, 40th and
41st standard weeks during the crop period. The highest
and lowest relative humidity were recorded in 39th
standard week (95.57%, 24th-30th September) and 42nd
standard week (33.57%, 15th-21stOctober), respectively.
The evaporation rate (5.77 mm/day) and maximum
temperature (33.57ºC) were highest in 31st standard
week during the crop period.
The soil of the experimental field was clay loam
in texture, neutral to alkaline in reaction and low in
available nitrogen, medium in organic carbon, available
phosphorus and available potassium. The experiment
was laid out in factorial randomized complete block
design (FRBD) with four seed rate combinations of
sorghum and guar (S1 - sole sorghum, S
2 - sole guar, S
3 -
75% sorghum + 25% guar and S4 - 60 % sorghum + 40
% guar) along with six nutrient management treatments
(N1 - 100% RDF, N
2 - 100% RDF + PGPR, N
3 - 100%
RDF + seaweed extract, N4 - 75% RDF + PGPR, N
5 -
75% RDF + seaweed extract and N6
– 50% RDF +
PGPR + seaweed extract) in three replications. Seed
rate used for sorghum was 30 kg ha-1 and guar was 40
kg ha-1. RDF for sorghum and guar were 60 kg N ha-1,
Bhakar et al.,
Indian J. Anim. Nutr. 2020. 37 (1): 48-56
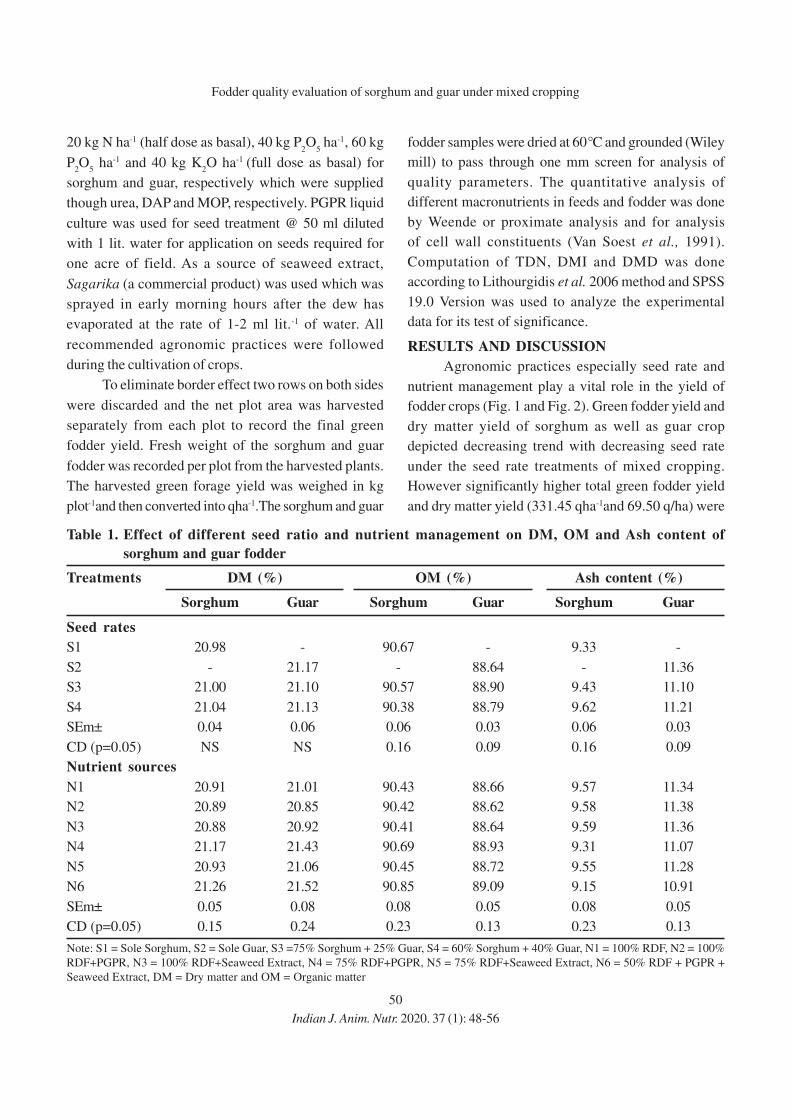
50
20 kg N ha-1 (half dose as basal), 40 kg P2O
5 ha-1, 60 kg
P2O
5 ha-1 and 40 kg K
2O ha-1 (full dose as basal) for
sorghum and guar, respectively which were supplied
though urea, DAP and MOP, respectively. PGPR liquid
culture was used for seed treatment @ 50 ml diluted
with 1 lit. water for application on seeds required for
one acre of field. As a source of seaweed extract,
Sagarika (a commercial product) was used which was
sprayed in early morning hours after the dew has
evaporated at the rate of 1-2 ml lit.-1 of water. All
recommended agronomic practices were followed
during the cultivation of crops.
To eliminate border effect two rows on both sides
were discarded and the net plot area was harvested
separately from each plot to record the final green
fodder yield. Fresh weight of the sorghum and guar
fodder was recorded per plot from the harvested plants.
The harvested green forage yield was weighed in kg
plot-1and then converted into qha-1.The sorghum and guar
fodder samples were dried at 60°C and grounded (Wiley
mill) to pass through one mm screen for analysis of
quality parameters. The quantitative analysis of
different macronutrients in feeds and fodder was done
by Weende or proximate analysis and for analysis
of cell wall constituents (Van Soest et al., 1991).
Computation of TDN, DMI and DMD was done
according to Lithourgidis et al. 2006 method and SPSS
19.0 Version was used to analyze the experimental
data for its test of significance.
RESULTS AND DISCUSSION
Agronomic practices especially seed rate and
nutrient management play a vital role in the yield of
fodder crops (Fig. 1 and Fig. 2). Green fodder yield and
dry matter yield of sorghum as well as guar crop
depicted decreasing trend with decreasing seed rate
under the seed rate treatments of mixed cropping.
However significantly higher total green fodder yield
and dry matter yield (331.45 qha-1and 69.50 q/ha) were
Table 1. Effect of different seed ratio and nutrient management on DM, OM and Ash content of
sorghum and guar fodder
Treatments DM (%) OM (%) Ash content (%)
Sorghum Guar Sorghum Guar Sorghum Guar
Seed rates
S1 20.98 - 90.67 - 9.33 -
S2 - 21.17 - 88.64 - 11.36
S3 21.00 21.10 90.57 88.90 9.43 11.10
S4 21.04 21.13 90.38 88.79 9.62 11.21
SEm± 0.04 0.06 0.06 0.03 0.06 0.03
CD (p=0.05) NS NS 0.16 0.09 0.16 0.09
Nutrient sources
N1 20.91 21.01 90.43 88.66 9.57 11.34
N2 20.89 20.85 90.42 88.62 9.58 11.38
N3 20.88 20.92 90.41 88.64 9.59 11.36
N4 21.17 21.43 90.69 88.93 9.31 11.07
N5 20.93 21.06 90.45 88.72 9.55 11.28
N6 21.26 21.52 90.85 89.09 9.15 10.91
SEm± 0.05 0.08 0.08 0.05 0.08 0.05
CD (p=0.05) 0.15 0.24 0.23 0.13 0.23 0.13
Note: S1 = Sole Sorghum, S2 = Sole Guar, S3 =75% Sorghum + 25% Guar, S4 = 60% Sorghum + 40% Guar, N1 = 100% RDF, N2 = 100%
RDF+PGPR, N3 = 100% RDF+Seaweed Extract, N4 = 75% RDF+PGPR, N5 = 75% RDF+Seaweed Extract, N6 = 50% RDF + PGPR +
Seaweed Extract, DM = Dry matter and OM = Organic matter
Fodder quality evaluation of sorghum and guar under mixed cropping
Indian J. Anim. Nutr. 2020. 37 (1): 48-56
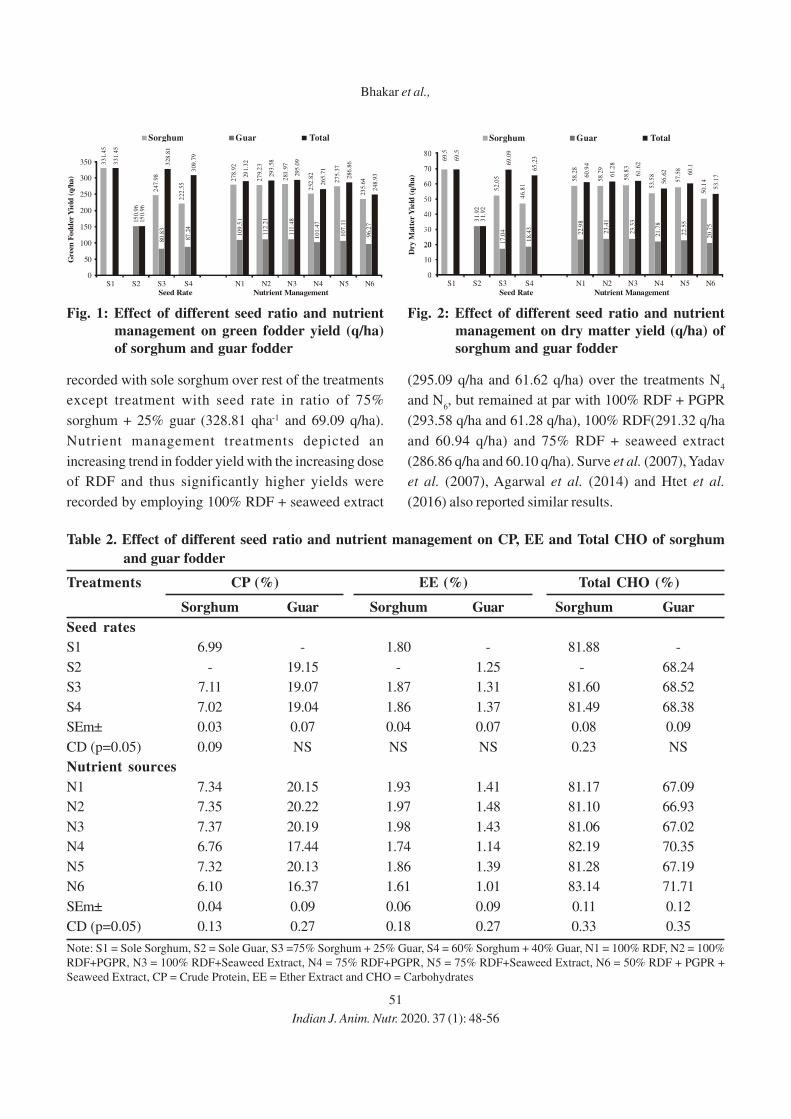
51
recorded with sole sorghum over rest of the treatments
except treatment with seed rate in ratio of 75%
sorghum + 25% guar (328.81 qha-1 and 69.09 q/ha).
Nutrient management treatments depicted an
increasing trend in fodder yield with the increasing dose
of RDF and thus significantly higher yields were
recorded by employing 100% RDF + seaweed extract
(295.09 q/ha and 61.62 q/ha) over the treatments N4
and N6, but remained at par with 100% RDF + PGPR
(293.58 q/ha and 61.28 q/ha), 100% RDF(291.32 q/ha
and 60.94 q/ha) and 75% RDF + seaweed extract
(286.86 q/ha and 60.10 q/ha). Surve et al. (2007), Yadav
et al. (2007), Agarwal et al. (2014) and Htet et al.
(2016) also reported similar results.
Table 2. Effect of different seed ratio and nutrient management on CP, EE and Total CHO of sorghum
and guar fodder
Treatments CP (%) EE (%) Total CHO (%)
Sorghum Guar Sorghum Guar Sorghum Guar
Seed rates
S1 6.99 - 1.80 - 81.88 -
S2 - 19.15 - 1.25 - 68.24
S3 7.11 19.07 1.87 1.31 81.60 68.52
S4 7.02 19.04 1.86 1.37 81.49 68.38
SEm± 0.03 0.07 0.04 0.07 0.08 0.09
CD (p=0.05) 0.09 NS NS NS 0.23 NS
Nutrient sources
N1 7.34 20.15 1.93 1.41 81.17 67.09
N2 7.35 20.22 1.97 1.48 81.10 66.93
N3 7.37 20.19 1.98 1.43 81.06 67.02
N4 6.76 17.44 1.74 1.14 82.19 70.35
N5 7.32 20.13 1.86 1.39 81.28 67.19
N6 6.10 16.37 1.61 1.01 83.14 71.71
SEm± 0.04 0.09 0.06 0.09 0.11 0.12
CD (p=0.05) 0.13 0.27 0.18 0.27 0.33 0.35
Note: S1 = Sole Sorghum, S2 = Sole Guar, S3 =75% Sorghum + 25% Guar, S4 = 60% Sorghum + 40% Guar, N1 = 100% RDF, N2 = 100%
RDF+PGPR, N3 = 100% RDF+Seaweed Extract, N4 = 75% RDF+PGPR, N5 = 75% RDF+Seaweed Extract, N6 = 50% RDF + PGPR +
Seaweed Extract, CP = Crude Protein, EE = Ether Extract and CHO = Carbohydrates
Fig. 1: Effect of different seed ratio and nutrient
management on green fodder yield (q/ha)
of sorghum and guar fodder
33
1.4
5
33
1.4
5
150
.96
150
.96
24
7.9
88
0.8
33
28
.81
22
2.5
587
.24
309
.79
27
8.9
21
09
.51
291
.32
27
9.2
311
2.2
12
93
.58
281
.97
111
.48
295
.09
252
.82
10
1.4
72
65
.71
27
5.3
71
07
.11
28
6.8
6
235
.64
96
.27
24
8.9
3
350
300
250
200
150
100
50
0
Green
Fo
dd
er Y
ield
(q
/ha)
Seed Rate Nutrient Management
Sorghum Guar Total
S1 S2 S3 S4 N1 N2 N3 N4 N5 N6
Fig. 2: Effect of different seed ratio and nutrient
management on dry matter yield (q/ha) of
sorghum and guar fodder
Dry
Mat
ter
Yie
ld (
q/h
a)
Seed Rate Nutrient Management
Sorghum Guar Total
S1 S2 S3 S4 N1 N2 N3 N4 N5 N6
69
.5
69
.5
31
.92
31
.92
52
.05
17
.04
69
.09
46
.81
18
.43
65
.23
58
.28
22.
98
60
.94
58
.29
23
.41
61
.28
58.
83
23.
33
61.6
2
53
.58
21
.78
56
.62
57
.58
22.
55
60
.1
50
.14
20
.75
53
.17
Bhakar et al.,
Indian J. Anim. Nutr. 2020. 37 (1): 48-56
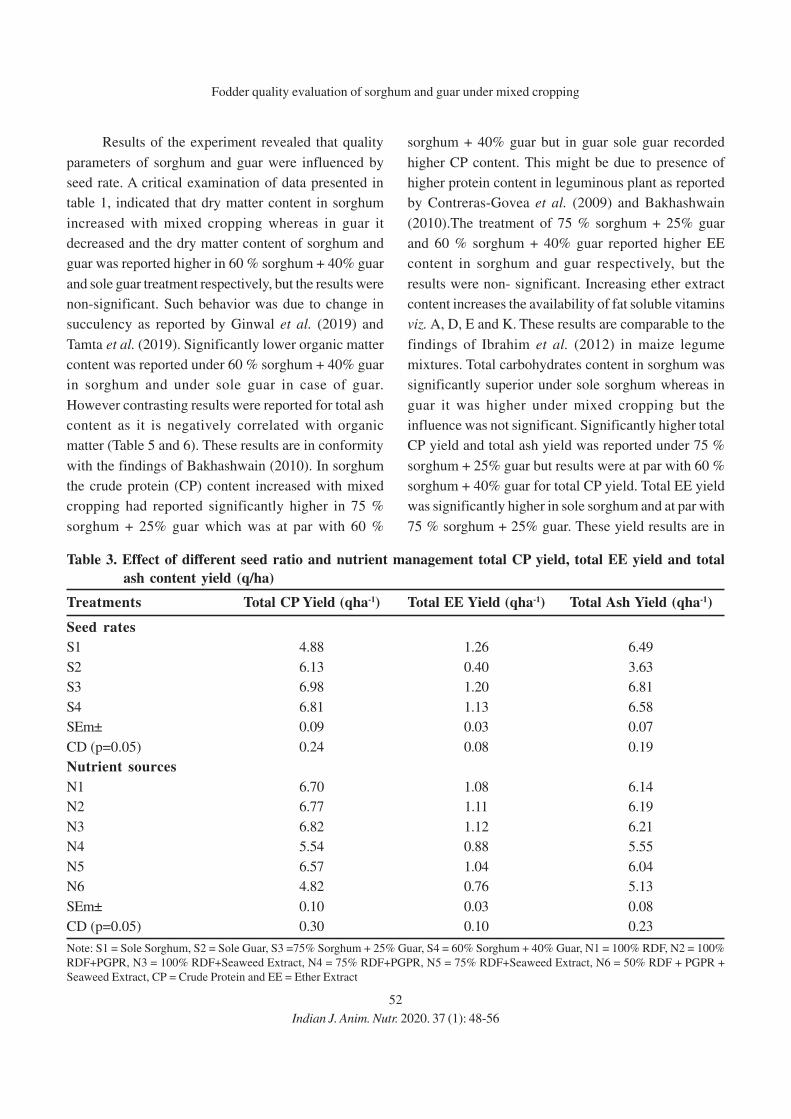
52
Results of the experiment revealed that quality
parameters of sorghum and guar were influenced by
seed rate. A critical examination of data presented in
table 1, indicated that dry matter content in sorghum
increased with mixed cropping whereas in guar it
decreased and the dry matter content of sorghum and
guar was reported higher in 60 % sorghum + 40% guar
and sole guar treatment respectively, but the results were
non-significant. Such behavior was due to change in
succulency as reported by Ginwal et al. (2019) and
Tamta et al. (2019). Significantly lower organic matter
content was reported under 60 % sorghum + 40% guar
in sorghum and under sole guar in case of guar.
However contrasting results were reported for total ash
content as it is negatively correlated with organic
matter (Table 5 and 6). These results are in conformity
with the findings of Bakhashwain (2010). In sorghum
the crude protein (CP) content increased with mixed
cropping had reported significantly higher in 75 %
sorghum + 25% guar which was at par with 60 %
sorghum + 40% guar but in guar sole guar recorded
higher CP content. This might be due to presence of
higher protein content in leguminous plant as reported
by Contreras-Govea et al. (2009) and Bakhashwain
(2010).The treatment of 75 % sorghum + 25% guar
and 60 % sorghum + 40% guar reported higher EE
content in sorghum and guar respectively, but the
results were non- significant. Increasing ether extract
content increases the availability of fat soluble vitamins
viz. A, D, E and K. These results are comparable to the
findings of Ibrahim et al. (2012) in maize legume
mixtures. Total carbohydrates content in sorghum was
significantly superior under sole sorghum whereas in
guar it was higher under mixed cropping but the
influence was not significant. Significantly higher total
CP yield and total ash yield was reported under 75 %
sorghum + 25% guar but results were at par with 60 %
sorghum + 40% guar for total CP yield. Total EE yield
was significantly higher in sole sorghum and at par with
75 % sorghum + 25% guar. These yield results are in
Table 3. Effect of different seed ratio and nutrient management total CP yield, total EE yield and total
ash content yield (q/ha)
Treatments Total CP Yield (qha-1) Total EE Yield (qha-1) Total Ash Yield (qha-1)
Seed rates
S1 4.88 1.26 6.49
S2 6.13 0.40 3.63
S3 6.98 1.20 6.81
S4 6.81 1.13 6.58
SEm± 0.09 0.03 0.07
CD (p=0.05) 0.24 0.08 0.19
Nutrient sources
N1 6.70 1.08 6.14
N2 6.77 1.11 6.19
N3 6.82 1.12 6.21
N4 5.54 0.88 5.55
N5 6.57 1.04 6.04
N6 4.82 0.76 5.13
SEm± 0.10 0.03 0.08
CD (p=0.05) 0.30 0.10 0.23
Note: S1 = Sole Sorghum, S2 = Sole Guar, S3 =75% Sorghum + 25% Guar, S4 = 60% Sorghum + 40% Guar, N1 = 100% RDF, N2 = 100%
RDF+PGPR, N3 = 100% RDF+Seaweed Extract, N4 = 75% RDF+PGPR, N5 = 75% RDF+Seaweed Extract, N6 = 50% RDF + PGPR +
Seaweed Extract, CP = Crude Protein and EE = Ether Extract
Fodder quality evaluation of sorghum and guar under mixed cropping
Indian J. Anim. Nutr. 2020. 37 (1): 48-56
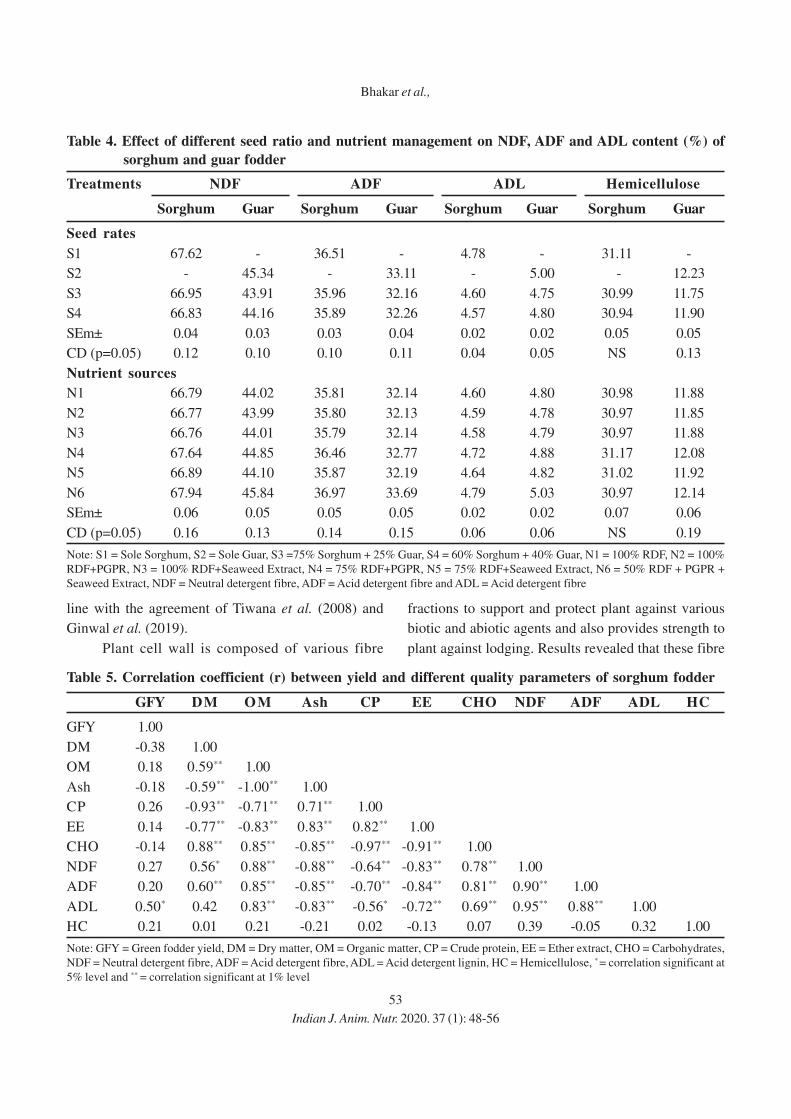
53
line with the agreement of Tiwana et al. (2008) and
Ginwal et al. (2019).
Plant cell wall is composed of various fibre
fractions to support and protect plant against various
biotic and abiotic agents and also provides strength to
plant against lodging. Results revealed that these fibre
Table 4. Effect of different seed ratio and nutrient management on NDF, ADF and ADL content (%) of
sorghum and guar fodder
Treatments NDF ADF ADL Hemicellulose
Sorghum Guar Sorghum Guar Sorghum Guar Sorghum Guar
Seed rates
S1 67.62 - 36.51 - 4.78 - 31.11 -
S2 - 45.34 - 33.11 - 5.00 - 12.23
S3 66.95 43.91 35.96 32.16 4.60 4.75 30.99 11.75
S4 66.83 44.16 35.89 32.26 4.57 4.80 30.94 11.90
SEm± 0.04 0.03 0.03 0.04 0.02 0.02 0.05 0.05
CD (p=0.05) 0.12 0.10 0.10 0.11 0.04 0.05 NS 0.13
Nutrient sources
N1 66.79 44.02 35.81 32.14 4.60 4.80 30.98 11.88
N2 66.77 43.99 35.80 32.13 4.59 4.78 30.97 11.85
N3 66.76 44.01 35.79 32.14 4.58 4.79 30.97 11.88
N4 67.64 44.85 36.46 32.77 4.72 4.88 31.17 12.08
N5 66.89 44.10 35.87 32.19 4.64 4.82 31.02 11.92
N6 67.94 45.84 36.97 33.69 4.79 5.03 30.97 12.14
SEm± 0.06 0.05 0.05 0.05 0.02 0.02 0.07 0.06
CD (p=0.05) 0.16 0.13 0.14 0.15 0.06 0.06 NS 0.19
Note: S1 = Sole Sorghum, S2 = Sole Guar, S3 =75% Sorghum + 25% Guar, S4 = 60% Sorghum + 40% Guar, N1 = 100% RDF, N2 = 100%
RDF+PGPR, N3 = 100% RDF+Seaweed Extract, N4 = 75% RDF+PGPR, N5 = 75% RDF+Seaweed Extract, N6 = 50% RDF + PGPR +
Seaweed Extract, NDF = Neutral detergent fibre, ADF = Acid detergent fibre and ADL = Acid detergent fibre
Table 5. Correlation coefficient (r) between yield and different quality parameters of sorghum fodder
GFY DM OM Ash CP EE CHO NDF ADF ADL HC
GFY 1.00
DM -0.38 1.00
OM 0.18 0.59** 1.00
Ash -0.18 -0.59** -1.00** 1.00
CP 0.26 -0.93** -0.71** 0.71** 1.00
EE 0.14 -0.77** -0.83** 0.83** 0.82** 1.00
CHO -0.14 0.88** 0.85** -0.85** -0.97** -0.91** 1.00
NDF 0.27 0.56* 0.88** -0.88** -0.64** -0.83** 0.78** 1.00
ADF 0.20 0.60** 0.85** -0.85** -0.70** -0.84** 0.81** 0.90** 1.00
ADL 0.50* 0.42 0.83** -0.83** -0.56* -0.72** 0.69** 0.95** 0.88** 1.00
HC 0.21 0.01 0.21 -0.21 0.02 -0.13 0.07 0.39 -0.05 0.32 1.00
Note: GFY = Green fodder yield, DM = Dry matter, OM = Organic matter, CP = Crude protein, EE = Ether extract, CHO = Carbohydrates,
NDF = Neutral detergent fibre, ADF = Acid detergent fibre, ADL = Acid detergent lignin, HC = Hemicellulose, * = correlation significant at
5% level and ** = correlation significant at 1% level
Bhakar et al.,
Indian J. Anim. Nutr. 2020. 37 (1): 48-56
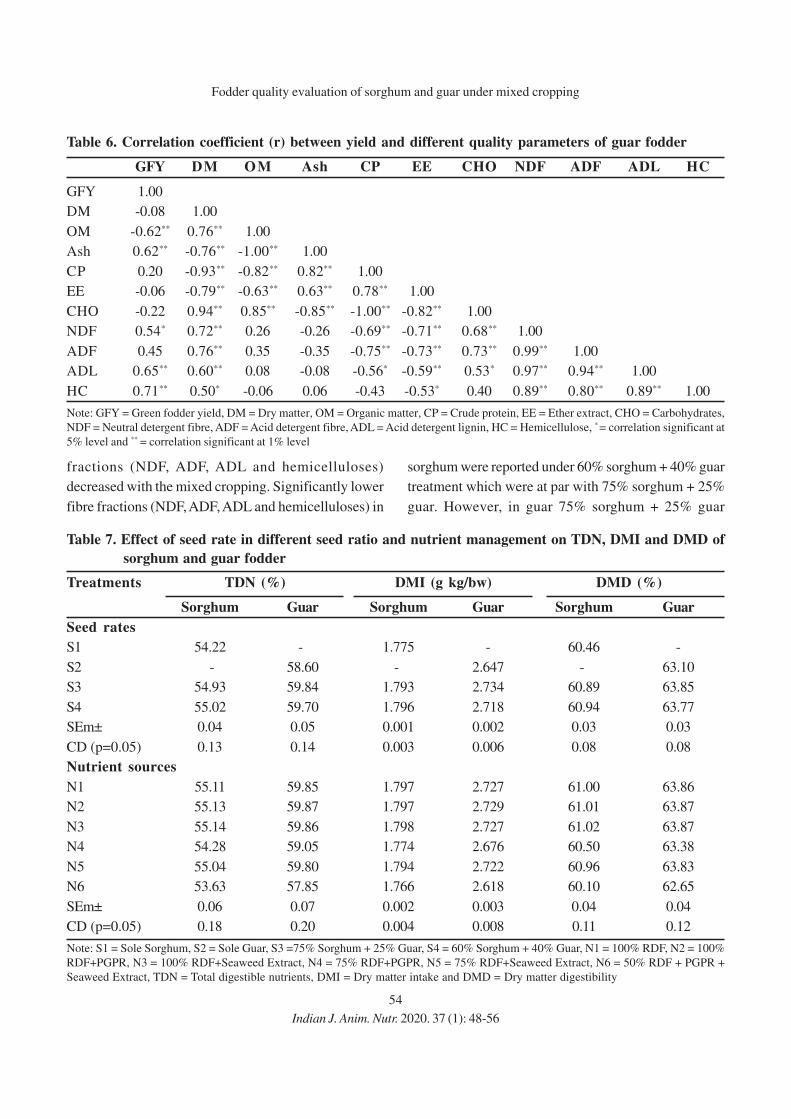
54
fractions (NDF, ADF, ADL and hemicelluloses)
decreased with the mixed cropping. Significantly lower
fibre fractions (NDF, ADF, ADL and hemicelluloses) in
sorghum were reported under 60% sorghum + 40% guar
treatment which were at par with 75% sorghum + 25%
guar. However, in guar 75% sorghum + 25% guar
Table 6. Correlation coefficient (r) between yield and different quality parameters of guar fodder
GFY DM OM Ash CP EE CHO NDF ADF ADL HC
GFY 1.00
DM -0.08 1.00
OM -0.62** 0.76** 1.00
Ash 0.62** -0.76** -1.00** 1.00
CP 0.20 -0.93** -0.82** 0.82** 1.00
EE -0.06 -0.79** -0.63** 0.63** 0.78** 1.00
CHO -0.22 0.94** 0.85** -0.85** -1.00** -0.82** 1.00
NDF 0.54* 0.72** 0.26 -0.26 -0.69** -0.71** 0.68** 1.00
ADF 0.45 0.76** 0.35 -0.35 -0.75** -0.73** 0.73** 0.99** 1.00
ADL 0.65** 0.60** 0.08 -0.08 -0.56* -0.59** 0.53* 0.97** 0.94** 1.00
HC 0.71** 0.50* -0.06 0.06 -0.43 -0.53* 0.40 0.89** 0.80** 0.89** 1.00
Note: GFY = Green fodder yield, DM = Dry matter, OM = Organic matter, CP = Crude protein, EE = Ether extract, CHO = Carbohydrates,
NDF = Neutral detergent fibre, ADF = Acid detergent fibre, ADL = Acid detergent lignin, HC = Hemicellulose, * = correlation significant at
5% level and ** = correlation significant at 1% level
Table 7. Effect of seed rate in different seed ratio and nutrient management on TDN, DMI and DMD of
sorghum and guar fodder
Treatments TDN (%) DMI (g kg/bw) DMD (%)
Sorghum Guar Sorghum Guar Sorghum Guar
Seed rates
S1 54.22 - 1.775 - 60.46 -
S2 - 58.60 - 2.647 - 63.10
S3 54.93 59.84 1.793 2.734 60.89 63.85
S4 55.02 59.70 1.796 2.718 60.94 63.77
SEm± 0.04 0.05 0.001 0.002 0.03 0.03
CD (p=0.05) 0.13 0.14 0.003 0.006 0.08 0.08
Nutrient sources
N1 55.11 59.85 1.797 2.727 61.00 63.86
N2 55.13 59.87 1.797 2.729 61.01 63.87
N3 55.14 59.86 1.798 2.727 61.02 63.87
N4 54.28 59.05 1.774 2.676 60.50 63.38
N5 55.04 59.80 1.794 2.722 60.96 63.83
N6 53.63 57.85 1.766 2.618 60.10 62.65
SEm± 0.06 0.07 0.002 0.003 0.04 0.04
CD (p=0.05) 0.18 0.20 0.004 0.008 0.11 0.12
Note: S1 = Sole Sorghum, S2 = Sole Guar, S3 =75% Sorghum + 25% Guar, S4 = 60% Sorghum + 40% Guar, N1 = 100% RDF, N2 = 100%
RDF+PGPR, N3 = 100% RDF+Seaweed Extract, N4 = 75% RDF+PGPR, N5 = 75% RDF+Seaweed Extract, N6 = 50% RDF + PGPR +
Seaweed Extract, TDN = Total digestible nutrients, DMI = Dry matter intake and DMD = Dry matter digestibility
Fodder quality evaluation of sorghum and guar under mixed cropping
Indian J. Anim. Nutr. 2020. 37 (1): 48-56
55
treatment recorded significantly lower fibre fractions
(NDF, ADF, ADL and hemicelluloses) gives better
quality but the results for ADF and ADL were at par
with 60% sorghum + 40% guar. These results might be
due to increase in the succulence and result had close
conformity with the findings of Htet et al. (2016) and
Mut et al. (2017). An appraisal of data presented in
Table 7 revealed that total digestible nutrients (TDN),
dry matter intake (DMI) and dry matter digestibility
(DMD) of sorghum and guar increased with the mixed
cropping. In sorghum significantly higher TDN, DMI
and DMD were reported under 60% sorghum + 40%
guar treatment which were at par with 75% sorghum +
25% guar. Whereas in guar 75% sorghum + 25% guar
recorded significantly higher TDN, DMI and DMD but
the results for TDN and DMD were at par with 60%
sorghum + 40% guar. Cumulative influence of both crops
under mixed cropping might be the reason behind the
results.
Critical examination of experimental data revealed
that nutrient management treatments influenced the
quality parameters of sorghum and guar fodder (Table
1, 2, 3, 4 and 7). In sorghum, significantly lower DM,
OM, total carbohydrates and fibre fractions (NDF, ADF
and ADL) and significantly higher ash, CP, EE, total
ash, CP, EE yield, TDN, DMI and DMD were reported
under 100% RDF + seaweed extract which were at
par with 100% RDF + PGPR, 100% RDF and 75%
RDF + seaweed extract. Whereas in guar such results
for above mentioned parameters were reported under
100% RDF + PGPR which were at par with 100% RDF
+ seaweed extract, 100% RDF and 75% RDF +
seaweed extract. Trend in quality parameters of crop
might be due to the reason that uptake of nutrients in
higher amount minerals concentration in plant sap
increases due to mainly of nitrogen which helped the
plant to increase the amino acid formation and
succulency. Similarly, trend reported for quality
parameters were highly correlated as depicted in table
5 and 6 by correlation coefficient (r). The results are in
tune with similar findings of Ayub et al. (2012), Chattha
et al. (2017), Dutta et al. (2019) and Kushwaha et al.
(2019).
CONCLUSION
Mixed cropping has tremendous scope in
improving productivity and quality of fodder crops. Thus,
seed rate 75% sorghum + 25% guar with application of
75% RDF + seaweed extract in mixed cropping can be
used to ensure supply of quality fodders for animals.
For future line of work, in lieu of sorghum and guar,
different cereal and legume fodder crops integration can
be explored by conducting location specific trials with
optimum dose and source of nutrients for better
productivity and quality.
ACKNOWLEDGEMENTS
The authors are obliged to Director, ICAR-NDRI,
Karnal for providing necessary facilities and financial
assistance for carrying out this study.
REFERENCES
Agrawal, P.K., Agrawal, S., Kundan, R. and Bhatt, M. 2014.
Application and perspective of plant growth
promoting rhizobacteria in the development of
sustainable agriculture. Int. J. Curr. Res. 6: 9044-9051.
Ayub, M., Nadeem, M.A., Naeem, M., Tahir, M., Tariq, M. and
Ahmad, W. 2012. Effect of different levels of P and K
on growth, forage yield and quality of clusterbean
(Cyamopsis tetragonolobus L.). J. Anim. Plant Sci. 22:
479-483.
Bakhashwain, A.A. 2010. Fodder yield and quality of rhodes
grass-alfalfa mixtures as affected by sowing rates in
Makkah region. Meteorol. Environ. Arid Land Agric.
Sci. 21: 19-33.
Chattha, M.B., Iqbal, A., Chattha, M.U., Hassan, M.U., Khan,
I., Ashraf, I. and Usman, M. 2017. PGPR inoculated-
seed increases the productivity of forage sorghum
under fertilized conditions. J. Basic Appl. Sci. 13:
150-153.
Dutta, S., Singh, M., Meena, R. K., Basak, N., Mondal, G. and
Hindoriya, P. S. 2019. Effect of organic and inorganic
nutrient sources on yield and quality of fodder
cowpea [Vigna unguiculata (L.) Walp.]. Indian J. Anim.
Nutr. 36: 173-178.
Ginwal, D. S., Kumar, R., Ram, H., Meena, R. K. and Kumar, U.
2019. Quality characteristics and nutrient yields
of maize and legume forages under changing
intercropping row ratios. Indian J. Anim. Sci. 89:
57-62.
Htet, M.N.S., Ya-qin, P., Ya-dong, X., Soomro, R.N. and
Jiang-bo, H. 2016. Effect of intercropping maize (Zea
Bhakar et al.,
Indian J. Anim. Nutr. 2020. 37 (1): 48-56
56
mays L.) with Soybean (Glycine max L.) on green
forage yield, and quality evaluation. J. Agric. Vet. Sci.
9: 59-63.
Heuzé V., Tran G., Giger-Reverdin S., Lebas F., 2015. Sorghum
forage. Feedipedia, a programme by INRA, CIRAD,
AFZ and FAO. https://www.feedipedia.org/node/379.
Kushwaha, M., Singh, M., Kumar, R., Tyagi, N., Soni, P. G.,
Choudhary, S. and Makarana, G. 2018. Yield and
quality of multicut fodder sorghum as affected by
nutrient levels and biofertilizer application. Indian J.
Anim. Nutr. 35: 82-89.
Lithourgidis, A.S., Vasilakoglou, I.B., Dhima, K.V., Dordas,
C.A., Yiakoulaki, M.D.,2006. Forage yield and quality
of common vetch mixtures with oat and triticale in two
seeding ratios. Field Crops Res. 99: 106-113.
Mut, H., Gulumser, E., Dogrusoz, M.C. and Basaran, U. 2017.
Forage yield and nutritive value of maize-legume
mixtures. Range Manage. Agroforestry 38: 76-81.
NDDB (2012). Annual report 2011-2012. National Dairy
Development Board. Anand. India. Retrieved from
https://www.nddb.coop/sites/default/files/pdfs/
nddb-annual-report-2011-2012.pdf
Surve, V.H., Patil, P.R. and Arvadia, M.K., 2007. Effect of row
ratio in cereal- legume fodder under intercropping
system on biomass production and economics.
Recent Trend Agric. Water Environ. Res. 2: 32-34.
Tamta, A., Kumar, R., Ram, H., Meena, R.K., Meena, V.K., Yadav,
M.R. and Subrahmanya, D.J. 2019. Productivity and
profitability of legume-cereal forages under different
planting ratio and nitrogen fertilization. Legume Res.
42: 102-107.
Tiwana, U.S., Puri, K.P. and Chaudhary, P. 2008. Fodder
productivity and seed yield of multicut oat grown pure
and in mixture with different seed rates of sarson.
Forage Res. 33: 224-226.
Van Soest, P.J., Robertson, J.B. and Lewis, B.A., 1991.
Methods for dietary fibre, neutral detergent fibre and
non-starch polysaccharides in relation to animal
nutrition. J Dairy Sci. 74: 3583-3597.
Vision, I.G.F.R.I. 2050: Indian Grassland and Fodder Research
Institute. Jhansi (UP).
Yadav, P.C., Sadhu, A.C. and Swarnkar, P.K. 2007. Yield and
quality of multi-cut forage sorghum (Sorghum
sudanense) as influenced by integrated nitrogen
management. Indian J. Agron. 52: 330-334.
Fodder quality evaluation of sorghum and guar under mixed cropping
Indian J. Anim. Nutr. 2020. 37 (1): 48-56
Received on 20-02-2020 and accepted on 17-06-2020
57
Indian Journal of
Animal Nutrition
Effect of Replacement of Maize by Animal Fat on Energy Utilization in Pigs
N. Elanchezhian1 and Ally K.2
1Department of Animal Nutrition,
Rajiv Gandhi Institute of Veterinary Education and Research, Puducherry-605 009;2Department of Animal Nutrition, College of Veterinary and Animal Sciences, Mannuthy, Thrissur-680 651
ABSTRACT
The experiment was conducted to assess the effect of replacement of maize by different levels of animal
fat on energy utilization in Large White Yorkshire (LWY) pigs. Thirty weaned piglets were randomly divided
into three groups and were allotted to the three dietary treatments, T1 (control ration as per NRC, 1998), T
2 (50
percent of maize of control ration replaced by animal fat) and T3 (100 percent of maize of control ration
replaced by animal fat). A Digestibility trial was conducted following total collection method and gross energy
was estimated using bomb calorimeter. Gross energy of feed and faeces were 4144.68, 4173.92, 4249.99
and 4102.04, 3834.24, 3453.09 kcal/kg, respectively for T1, T
2 and T
3 treatments. The apparent digestibility of
GE was 85.85, 74.37 and 66.78 percent and the calculated digestible energy of feed was 3558.12, 3104.22
and 2837.90 kcal/kg, respectively for three treatments. The result of this experiment revealed that as the level
of replacement of maize by animal fat increases, the efficiency of energy utilization was reduced in pigs
fed isocaloric and isonitrogenous diet.
Key words: Animal fat, Energy levels, Feeding of pigs, Maize
1Corresponding author: email: [email protected]
INTRODUCTION
Maize forms the major source of energy in the
swine feed. Even though, India produces more than 20
million MT of maize per year, it could meet only 60
percent of the requirement in the country. The lower
availability coupled with increasing price of maize,
necessitates an alternative energy source for
incorporation in the swine feed. Animal fat is a
byproduct of meat industry and can be included as a
source of energy in swine ration. India produces 0.14
million MT of tallow and 0.02 million MT of lard per
year (FAO, 2010). The use of fat as an energy source
for pigs has been shown to increase digestibility of
nutrients, improve growth rate and also reduces
dustiness of feeds and, increases palatability.
Improved dry matter and nitrogen digestibility and
nitrogen and energy retention were found in pigs fed
diet with tallow at 0.33 and 0.75 percent of body weight
(Galloway and Ewan, 1989), with white choice grease
at 10 percent (Li et al., 1990) and with lard at six
percent of the diet (Lawrence et al., 1994). Overland
et al. (1994) reported that the apparent ileal and overall
digestibility of crude fat and total fatty acids, apparent
Indian J. Anim. Nutr. 2020. 37 (1): 57-61
doi: 10.5958/2231-6744.2020.00010.9
digestibility of dry matter, nitrogen and calcium and
retention of nitrogen and energy were increased in pigs
fed diets with six percent of rendered fat. Reis et al.
(2000) observed increased apparent digestibility of ether
extract and energy in pigs fed diet with eight percent of
tallow compared to that with four percent tallow.
However, studies on the effect of replacing maize by
animal fat on energy utilization was not studied much in
India, hence this work was carried out in growing Large
White Yorkshire piglets.
MATERIALS AND METHODS
The experiment was conducted to assess the
effect of replacement of maize by different levels of
animal fat on energy utilization in growing piglets. Thirty
weaned female Large White Yorkshire piglets were
randomly divided into three groups with five replicates
in each group. Each replicate were allotted with two
piglets and housed in a single pen. All piglets were housed
in the same shed and were maintained under identical
management conditions throughout the experimental
period of 70 days. Animals were allowed to consume as
much as they could, within a period of one hour and the
balance feed was collected and weighed after each
Indian J. Anim. Nutr. 2020. 37 (1): 57-61
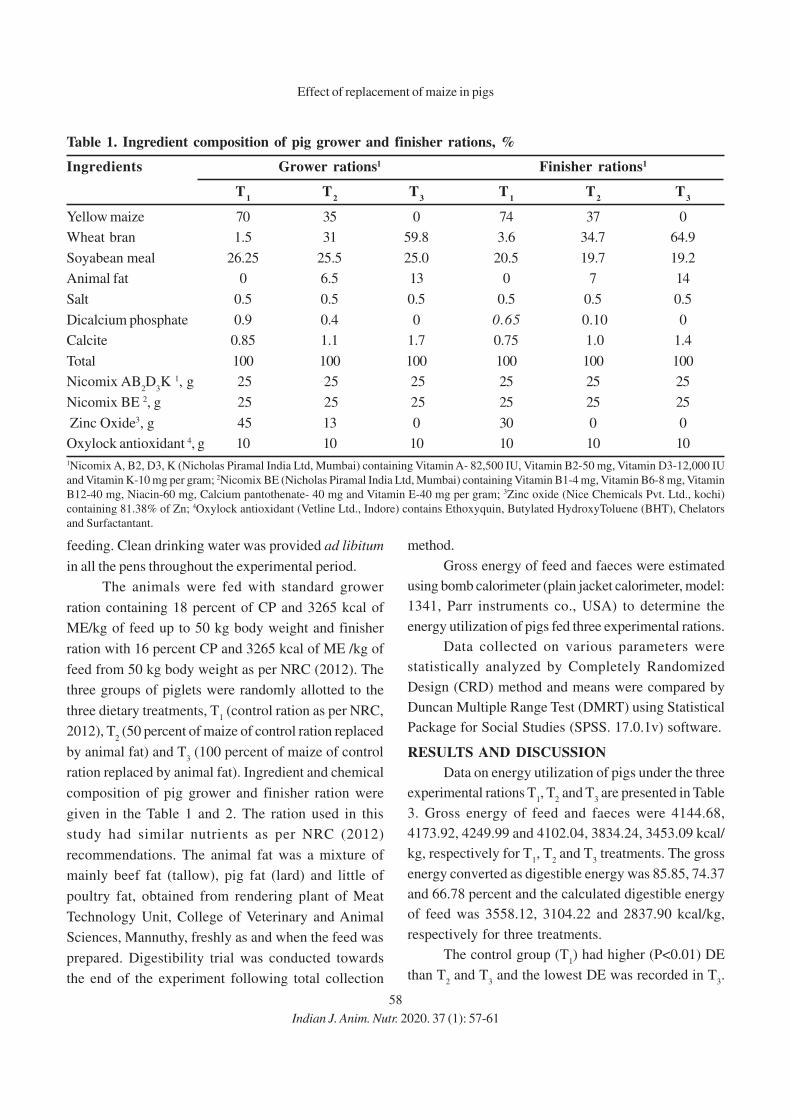
58
feeding. Clean drinking water was provided ad libitum
in all the pens throughout the experimental period.
The animals were fed with standard grower
ration containing 18 percent of CP and 3265 kcal of
ME/kg of feed up to 50 kg body weight and finisher
ration with 16 percent CP and 3265 kcal of ME /kg of
feed from 50 kg body weight as per NRC (2012). The
three groups of piglets were randomly allotted to the
three dietary treatments, T1 (control ration as per NRC,
2012), T2 (50 percent of maize of control ration replaced
by animal fat) and T3 (100 percent of maize of control
ration replaced by animal fat). Ingredient and chemical
composition of pig grower and finisher ration were
given in the Table 1 and 2. The ration used in this
study had similar nutrients as per NRC (2012)
recommendations. The animal fat was a mixture of
mainly beef fat (tallow), pig fat (lard) and little of
poultry fat, obtained from rendering plant of Meat
Technology Unit, College of Veterinary and Animal
Sciences, Mannuthy, freshly as and when the feed was
prepared. Digestibility trial was conducted towards
the end of the experiment following total collection
method.
Gross energy of feed and faeces were estimated
using bomb calorimeter (plain jacket calorimeter, model:
1341, Parr instruments co., USA) to determine the
energy utilization of pigs fed three experimental rations.
Data collected on various parameters were
statistically analyzed by Completely Randomized
Design (CRD) method and means were compared by
Duncan Multiple Range Test (DMRT) using Statistical
Package for Social Studies (SPSS. 17.0.1v) software.
RESULTS AND DISCUSSION
Data on energy utilization of pigs under the three
experimental rations T1, T
2 and T
3 are presented in Table
3. Gross energy of feed and faeces were 4144.68,
4173.92, 4249.99 and 4102.04, 3834.24, 3453.09 kcal/
kg, respectively for T1, T
2 and T
3 treatments. The gross
energy converted as digestible energy was 85.85, 74.37
and 66.78 percent and the calculated digestible energy
of feed was 3558.12, 3104.22 and 2837.90 kcal/kg,
respectively for three treatments.
The control group (T1) had higher (P<0.01) DE
than T2 and T
3 and the lowest DE was recorded in T
3.
Table 1. Ingredient composition of pig grower and finisher rations, %
Ingredients Grower rations1 Finisher rations1
T1
T2
T3
T1
T2
T3
Yellow maize 70 35 0 74 37 0
Wheat bran 1.5 31 59.8 3.6 34.7 64.9
Soyabean meal 26.25 25.5 25.0 20.5 19.7 19.2
Animal fat 0 6.5 13 0 7 14
Salt 0.5 0.5 0.5 0.5 0.5 0.5
Dicalcium phosphate 0.9 0.4 0 0.65 0.10 0
Calcite 0.85 1.1 1.7 0.75 1.0 1.4
Total 100 100 100 100 100 100
Nicomix AB2D
3K 1, g 25 25 25 25 25 25
Nicomix BE 2, g 25 25 25 25 25 25
Zinc Oxide3, g 45 13 0 30 0 0
Oxylock antioxidant 4, g 10 10 10 10 10 10
1Nicomix A, B2, D3, K (Nicholas Piramal India Ltd, Mumbai) containing Vitamin A- 82,500 IU, Vitamin B2-50 mg, Vitamin D3-12,000 IU
and Vitamin K-10 mg per gram; 2Nicomix BE (Nicholas Piramal India Ltd, Mumbai) containing Vitamin B1-4 mg, Vitamin B6-8 mg, Vitamin
B12-40 mg, Niacin-60 mg, Calcium pantothenate- 40 mg and Vitamin E-40 mg per gram; 3Zinc oxide (Nice Chemicals Pvt. Ltd., kochi)
containing 81.38% of Zn; 4Oxylock antioxidant (Vetline Ltd., Indore) contains Ethoxyquin, Butylated HydroxyToluene (BHT), Chelators
and Surfactantant.
Indian J. Anim. Nutr. 2020. 37 (1): 57-61
Effect of replacement of maize in pigs
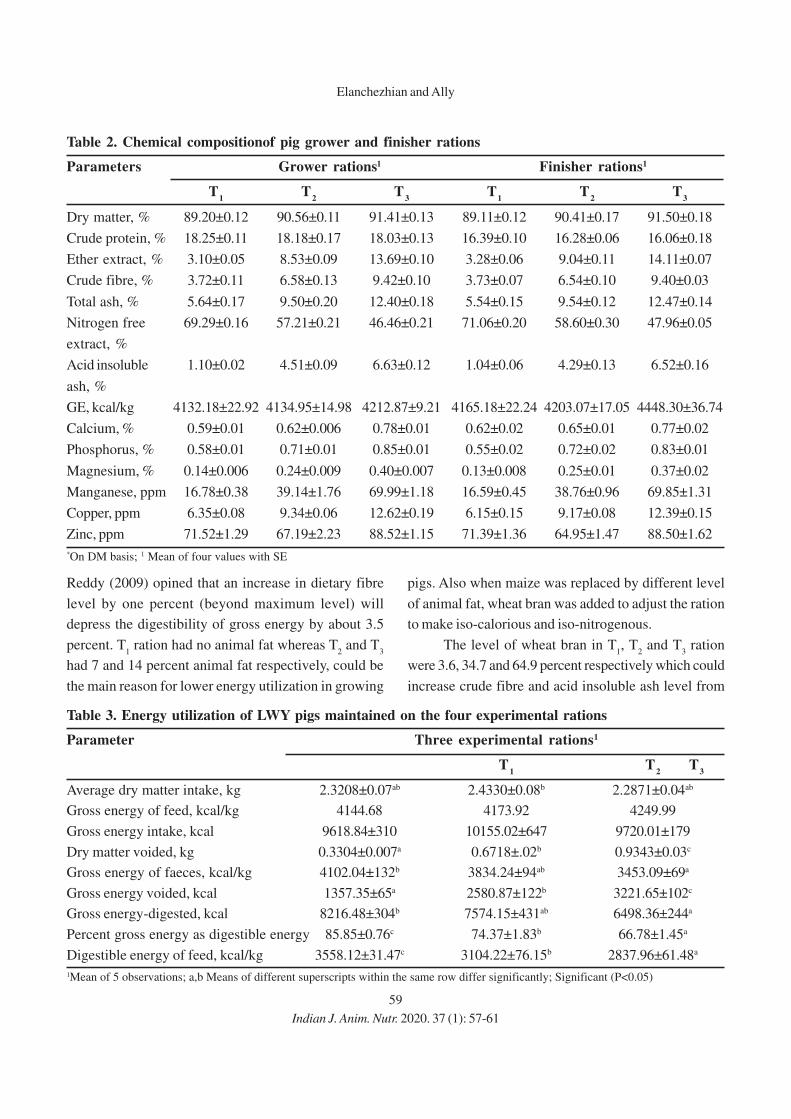
59
Table 2. Chemical compositionof pig grower and finisher rations
Parameters Grower rations1 Finisher rations1
T1
T2
T3
T1
T2
T3
Dry matter, % 89.20±0.12 90.56±0.11 91.41±0.13 89.11±0.12 90.41±0.17 91.50±0.18
Crude protein, % 18.25±0.11 18.18±0.17 18.03±0.13 16.39±0.10 16.28±0.06 16.06±0.18
Ether extract, % 3.10±0.05 8.53±0.09 13.69±0.10 3.28±0.06 9.04±0.11 14.11±0.07
Crude fibre, % 3.72±0.11 6.58±0.13 9.42±0.10 3.73±0.07 6.54±0.10 9.40±0.03
Total ash, % 5.64±0.17 9.50±0.20 12.40±0.18 5.54±0.15 9.54±0.12 12.47±0.14
Nitrogen free 69.29±0.16 57.21±0.21 46.46±0.21 71.06±0.20 58.60±0.30 47.96±0.05
extract, %
Acid insoluble 1.10±0.02 4.51±0.09 6.63±0.12 1.04±0.06 4.29±0.13 6.52±0.16
ash, %
GE, kcal/kg 4132.18±22.92 4134.95±14.98 4212.87±9.21 4165.18±22.24 4203.07±17.05 4448.30±36.74
Calcium, % 0.59±0.01 0.62±0.006 0.78±0.01 0.62±0.02 0.65±0.01 0.77±0.02
Phosphorus, % 0.58±0.01 0.71±0.01 0.85±0.01 0.55±0.02 0.72±0.02 0.83±0.01
Magnesium, % 0.14±0.006 0.24±0.009 0.40±0.007 0.13±0.008 0.25±0.01 0.37±0.02
Manganese, ppm 16.78±0.38 39.14±1.76 69.99±1.18 16.59±0.45 38.76±0.96 69.85±1.31
Copper, ppm 6.35±0.08 9.34±0.06 12.62±0.19 6.15±0.15 9.17±0.08 12.39±0.15
Zinc, ppm 71.52±1.29 67.19±2.23 88.52±1.15 71.39±1.36 64.95±1.47 88.50±1.62
*On DM basis; 1 Mean of four values with SE
Reddy (2009) opined that an increase in dietary fibre
level by one percent (beyond maximum level) will
depress the digestibility of gross energy by about 3.5
percent. T1 ration had no animal fat whereas T
2 and T
3
had 7 and 14 percent animal fat respectively, could be
the main reason for lower energy utilization in growing
pigs. Also when maize was replaced by different level
of animal fat, wheat bran was added to adjust the ration
to make iso-calorious and iso-nitrogenous.
The level of wheat bran in T1, T
2 and T
3 ration
were 3.6, 34.7 and 64.9 percent respectively which could
increase crude fibre and acid insoluble ash level from
Table 3. Energy utilization of LWY pigs maintained on the four experimental rations
Parameter Three experimental rations1
T1
T2
T3
Average dry matter intake, kg 2.3208±0.07ab 2.4330±0.08b 2.2871±0.04ab
Gross energy of feed, kcal/kg 4144.68 4173.92 4249.99
Gross energy intake, kcal 9618.84±310 10155.02±647 9720.01±179
Dry matter voided, kg 0.3304±0.007a 0.6718±.02b 0.9343±0.03c
Gross energy of faeces, kcal/kg 4102.04±132b 3834.24±94ab 3453.09±69a
Gross energy voided, kcal 1357.35±65a 2580.87±122b 3221.65±102c
Gross energy-digested, kcal 8216.48±304b 7574.15±431ab 6498.36±244a
Percent gross energy as digestible energy 85.85±0.76c 74.37±1.83b 66.78±1.45a
Digestible energy of feed, kcal/kg 3558.12±31.47c 3104.22±76.15b 2837.96±61.48a
1Mean of 5 observations; a,b Means of different superscripts within the same row differ significantly; Significant (P<0.05)
Indian J. Anim. Nutr. 2020. 37 (1): 57-61
Elanchezhian and Ally
60
3.73 and 1.04 percent (T1 ration-control group) to
6.54 and 4.29 percent (T2 ration-50 percent maize
replacement) and 9.40 and 6.52 percent (T3 ration-100
percent maize replacement). The increased level of
crude fibre and acid insoluble ash in the T2 and T
3 ration
mighthave contributed to the lowered digestibility of
energy. Everts et al. (1986) observed reduced
digestibility of dry matter, organic matter and crude
protein with increased level of crude fibre (11.26
percent) in the diet of pigs. Bhar et al. (2000) also
observed decreased digestibility of dry matter, organic
matter, crude fibre, total carbohydrate, nitrogen free
extract and energy with increased level of wheat bran
(0, 50 and 100 percent maize replacement) in the diet
of crossbred pigs. The digestive tract enlarges to
accommodate a larger volume of feed rich in crude
fibre and the rate of passage of ingesta increases,
resulting in reduction in digestibility of nutrients
(Ewan, 2000; Lentle and Janssen, 2008). Blair (2007)
stated that in pigs higher the crude fibre level in the diet
lower will be the digestibility of protein and energy.
Sheikh et al. (2011) observed a significant reduction in
digestibility of dry matter, ether extract, crude fibre, NFE
and energy in crossbred pigs fed diet containing paddy
grain instead of maize.
Lawrence and Maxwell (1983) found that
efficiency of use of digestible energy tended to decrease
with added choice white grease (0 to 12 percent).
Significant improvement in digestibility of energy as a
result of fat supplementation in the diet of pigs was
also reported by Li et al. (1990) (white choice grease
supplemented at 10 percent), Overland et al. (1994)
(six percent of rendered fat) and Reis et al. (2000) (eight
percent tallow). However no significant difference in
the energy digestibility in pigs by supplementation of
tallow at five percent in the diet was observed by Garry
et al. (2007) and Huang et al. (2010).
CONCLUSIONS
Based upon the result of this experiment it could
be concluded that as the level of replacement of maize
by animal fat increased, the efficiency of energy
utilization was reduced in pigs fed isocaloric and
isonitrogenous diet.
ACKNOWLEDGMENTS
The authors are very much thankful to Dean,
College of Veterinary and Animal Sciences, Mannuthy
for providing necessary facilities for successful conduct
of the work.
REFERENCES
Bhar, R., Pathak, N.N. and Paul, S. 2000. Performance of
crossbred (Landrace X local Indian) finisher barrows
fed maize or wheat bran based diets: Short note.
Asian-Australas. J. Anim. Sci. 13: 1429-1432.
Blair, R. 2007. Nutrition and Feeding of Organic Pigs. CABI,
Cambridge, USA, 240p.
Everts, H., Smits, B. and Jongbloed, A.W. 1986. Effect of crude
fibre, feeding level and body weight on apparent
digestibility of compound feeds in swine. Netherland
J. Agric. Sci. 34: 501-503.
Ewan, R.C. 2000. Energy Utilization in Swine nutrition. In:
Lewis, A.J. and Southern, L.L. (eds.), Swine Nutrition
(2nd Ed.). CRC press, Florida, USA, pp. 85-94.
FAO [Food and Agricultural Organization]. 2010. Statistical
year book. Food and Agricultural Organization, Rome,
Italy. Available: http://faostat.fao.org.
Galloway, S.T. and Ewan, R.C. 1989. Energy evaluation of
tallow and oat groats for young swine. J. Anim. Sci. 67:
1744-1750.
Garry, B.P., Pierce, K.M. and O’Doherty, J.V. 2007. The effect
of phase-feeding on the growth performance, carcass
characteristics and nitrogen balance of growing and
finishing pigs. Irish J. Agric. Food Res. 46: 93-104.
Huang, Y., Yoo, J.S., Kim, H.J., Wang, Y., Chen, Y.J., Cho, J.H.
and Kim, I.H. 2010. The Effects of different copper
(inorganic and organic) and energy (tallow and glyc-
erol) sources on growth performance, nutrient
digestibility, and fecal excretion profiles in growing
pigs. Asian Australas. J. Anim. Sci. 23: 573-579.
Lawrence, N.J. and Maxwell, C.V. 1983. Effect of dietary fat
source and level on the performance of neonatal and
early weaned pigs. J. Anim. Sci. 57: 936-942.
Lawrence, B.V., Adeola, O. and Cline, T.R. 1994. Nitrogen
utilization and lean growth performance of 20 to 60 kg
pigs fed diets balanced for lysine:energy ratio. J. Anim.
Sci. 72: 2887-2895.
Lentle, R.G. and Janssen, P.W.M. 2008. Physical
characteristics of digesta and their influence on flow
and mixing in the mammalian intestine: A review. J.
Comp. Physiolo.178: 673-690.
Indian J. Anim. Nutr. 2020. 37 (1): 57-61
Effect of replacement of maize in pigs
61
Li, D.F., Thaler, R.C., Nelssen, J.L., Harmon, D.L., Allee, G.L.
and Weeden, T.L. 1990. Effect of fat sources and
combinations on starter pig performance, nutrient
digestibility and intestinal morphology. J. Anim. Sci.
68: 3694-3704.
NRC [National Research Council]. 2012. Nutrient
Requirements of Swine (11th rev. Ed.). National
Academy of Sciences, Washington, D.C., 400p.
Overland, M., Mroz, Z. and Sundstol, F. 1994. Effect of
lecithin on the apparent ileal and overall digestibility
of crude fat on fatty acids in pigs. J. Anim. Sci. 72:
2022-2028.
Reddy, D.V. 2009. Applied Nutrition (2nd Ed.). Oxford and IBH
Publishing Co. Pvt. Ltd., New Delhi. 431p.
Reis, T.C., Aumaitre, A., Mourot, J. and Peiniau, J. 2000.
Effect of graded levels of tallow in the diet on
performance, digestibility of fat, lipogenesis and body
lipid deposition of the weaned piglet. Aust. J. Anim.
Sci. 13:497-505.
Sheikh, G.G., Ganie, A.A., Baghel, R.P.S. and Nayak, S. 2011.
Effect of paddy grain as maize replacer on the growth
performance and nutrient utilization in growing and
finishing pigs. Indian J. Anim. Nutri. 28: 437-440.
Indian J. Anim. Nutr. 2020. 37 (1): 57-61
Elanchezhian and Ally
Received on 17-06-2020 and accepted on 30-06-2020
62
Indian Journal of
Animal Nutrition
Effect of Feeding Different Levels of Ajwain (Trachyspermum ammi L.)
Powder on Growth Performance and Carcass Characteristics
in Japanese quails
M. Deepthi, D. Srinivas Kumar*, E. Raghava Rao and S. Jagadeeswara Rao
Department of Animal Nutrition, NTR College of Veterinary Science, Gannavaram-521102
Krishna dist. (A.P.), Phone: 08676-253782 Ext. 226 (Off), Mobile: 9951384777
ABSTRACT
An experiment was carried out to study the effect of inclusion of ajwain powder at varying levels on
growth performance, carcass characteristics and nutrient utilization in Japanese quails. One hundred and fifty
day-old quail chicks were randomly allotted to five dietary treatment groups with 3 replicates of 10 birds for 5
weeks. Ajwain was ground and included at 0% (T1; Control), 0.25 (T
2), 0.50 (T
3), 0.75 (T
4) and 1.0 (T
5)
percent levels in iso-caloric and iso-nitrogenous broiler quail diets to meet the nutrient requirements as per
NRC, 1994. Body weight gain and feed intake were recorded while feed efficiency was calculated. Results
indicated that inclusion of ajwain powder up to 1.0% level in the diet of Japanese quail had no effect (P>0.05)
on body weight gains, feed intake and on feed consumed / kg gain. Similarly, inclusion of ajwain powder up to
1.0% level in the diet had no effect (P>0.05) on carcass characteristics in quails. The feed cost / kg gain
decreased by ̀ 1.01 in T2 while it was increased by ̀ 4.11 in T
3, ̀ 6.84 in T
4 and ̀ 9.55 in T
5 groups of quails fed
diets containing ajwain powder up to 1.0% level as compared to the control.
Key words: Carcass characters, Ajwain powder, Production performance, Quail
*Corresponding author: [email protected]
INTRODUCTION
In recent years, the use of dietary plant derived
natural bioactive compounds (phytobiotics) has
attracted increased attention to augment performance
and health in poultry production. Phytogenics are a
group of natural growth promoters (NGP) or phytobiotic
growth promoters used as feed additives, derived from
herbs, spices or other plants. Phytogenic additives
being natural, non-toxic, residue free and their easy
availability make them first choice as alternate to
antibiotic growth promoters in poultry production.
The knowledge regarding the modes of action and
aspects of application of phytobiotics as feed
additives are quite rudimentary (Windisch et al., 2008).
They have multiple effects in birds including appetite
stimulation; enhance digestion, and possess
immune-stimulant, bactericidal, antiviral, anti-oxidant
properties when supplemented in diets for poultry.
Ajwain (Trachyspermum ammi) is a medicinal
plant that belongs to family Apiaceae (Chatterjee et al
2012). Its seeds are used extensively for medicinal
purposes as a digestive stimulant and to treat liver
disorders (Ishikawa et al., 2001). Ajwain is highly
esteemed as a remedial agent for flatulence, flatulent
colic, atonic dyspepsia, diarrhoea and in short, as a
digestive aid and as an antiseptic (Bentely and Wrimen,
1999). Inconsistent results and inadequate data exist
regarding the potential use of ajwain as phytobiotic
growth promoter in poultry. Positive effects of ajwain
on growth rate, feed conversion ratio (Anurag et al.,
2018; Waheed et al., 2017; Valiollahi et al., 2014) and
carcass characteristics (Waheed et al., 2017; Falaki et
al., 2016) were reported earlier in broilers. However,
Kheiri et al. (2018) reported that supplementation of
ajwain as substitute to AGP in Japanese quails had no
effect on body weight, feed intake, feed efficiency and
carcass composition and yield. Hence, the present study
was undertaken to evaluate the performance of quail in
terms of growth rate, carcass yield and economics fed
diets containing ajwain powder at varying levels.
MATERIALS AND METHODS
One hundred and fifty, day-old quail chicks were
procured and randomly allotted into 5 groups, each with
3 replicates of 10 chicks. Chicks were wing banded and
Indian J. Anim. Nutr. 2020. 37 (1): 62-66
doi: 10.5958/2231-6744.2020.00011.0
Indian J. Anim. Nutr. 2020. 37 (1): 62-66
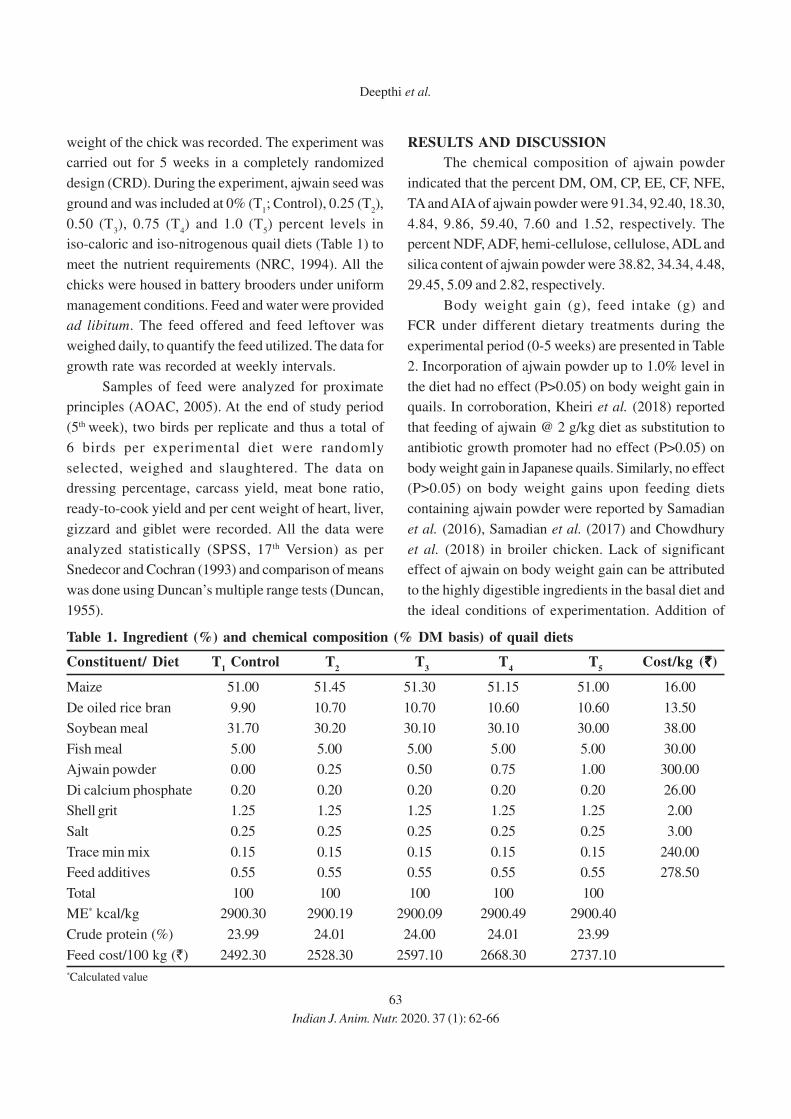
63
weight of the chick was recorded. The experiment was
carried out for 5 weeks in a completely randomized
design (CRD). During the experiment, ajwain seed was
ground and was included at 0% (T1; Control), 0.25 (T
2),
0.50 (T3), 0.75 (T
4) and 1.0 (T
5) percent levels in
iso-caloric and iso-nitrogenous quail diets (Table 1) to
meet the nutrient requirements (NRC, 1994). All the
chicks were housed in battery brooders under uniform
management conditions. Feed and water were provided
ad libitum. The feed offered and feed leftover was
weighed daily, to quantify the feed utilized. The data for
growth rate was recorded at weekly intervals.
Samples of feed were analyzed for proximate
principles (AOAC, 2005). At the end of study period
(5th week), two birds per replicate and thus a total of
6 birds per experimental diet were randomly
selected, weighed and slaughtered. The data on
dressing percentage, carcass yield, meat bone ratio,
ready-to-cook yield and per cent weight of heart, liver,
gizzard and giblet were recorded. All the data were
analyzed statistically (SPSS, 17th Version) as per
Snedecor and Cochran (1993) and comparison of means
was done using Duncan’s multiple range tests (Duncan,
1955).
RESULTS AND DISCUSSION
The chemical composition of ajwain powder
indicated that the percent DM, OM, CP, EE, CF, NFE,
TA and AIA of ajwain powder were 91.34, 92.40, 18.30,
4.84, 9.86, 59.40, 7.60 and 1.52, respectively. The
percent NDF, ADF, hemi-cellulose, cellulose, ADL and
silica content of ajwain powder were 38.82, 34.34, 4.48,
29.45, 5.09 and 2.82, respectively.
Body weight gain (g), feed intake (g) and
FCR under different dietary treatments during the
experimental period (0-5 weeks) are presented in Table
2. Incorporation of ajwain powder up to 1.0% level in
the diet had no effect (P>0.05) on body weight gain in
quails. In corroboration, Kheiri et al. (2018) reported
that feeding of ajwain @ 2 g/kg diet as substitution to
antibiotic growth promoter had no effect (P>0.05) on
body weight gain in Japanese quails. Similarly, no effect
(P>0.05) on body weight gains upon feeding diets
containing ajwain powder were reported by Samadian
et al. (2016), Samadian et al. (2017) and Chowdhury
et al. (2018) in broiler chicken. Lack of significant
effect of ajwain on body weight gain can be attributed
to the highly digestible ingredients in the basal diet and
the ideal conditions of experimentation. Addition of
Table 1. Ingredient (%) and chemical composition (% DM basis) of quail diets
Constituent/ Diet T1 Control T
2 T
3 T
4 T
5Cost/kg ( `̀̀̀̀)
Maize 51.00 51.45 51.30 51.15 51.00 16.00
De oiled rice bran 9.90 10.70 10.70 10.60 10.60 13.50
Soybean meal 31.70 30.20 30.10 30.10 30.00 38.00
Fish meal 5.00 5.00 5.00 5.00 5.00 30.00
Ajwain powder 0.00 0.25 0.50 0.75 1.00 300.00
Di calcium phosphate 0.20 0.20 0.20 0.20 0.20 26.00
Shell grit 1.25 1.25 1.25 1.25 1.25 2.00
Salt 0.25 0.25 0.25 0.25 0.25 3.00
Trace min mix 0.15 0.15 0.15 0.15 0.15 240.00
Feed additives 0.55 0.55 0.55 0.55 0.55 278.50
Total 100 100 100 100 100
ME* kcal/kg 2900.30 2900.19 2900.09 2900.49 2900.40
Crude protein (%) 23.99 24.01 24.00 24.01 23.99
Feed cost/100 kg (`) 2492.30 2528.30 2597.10 2668.30 2737.10
*Calculated value
Indian J. Anim. Nutr. 2020. 37 (1): 62-66
Deepthi et al.
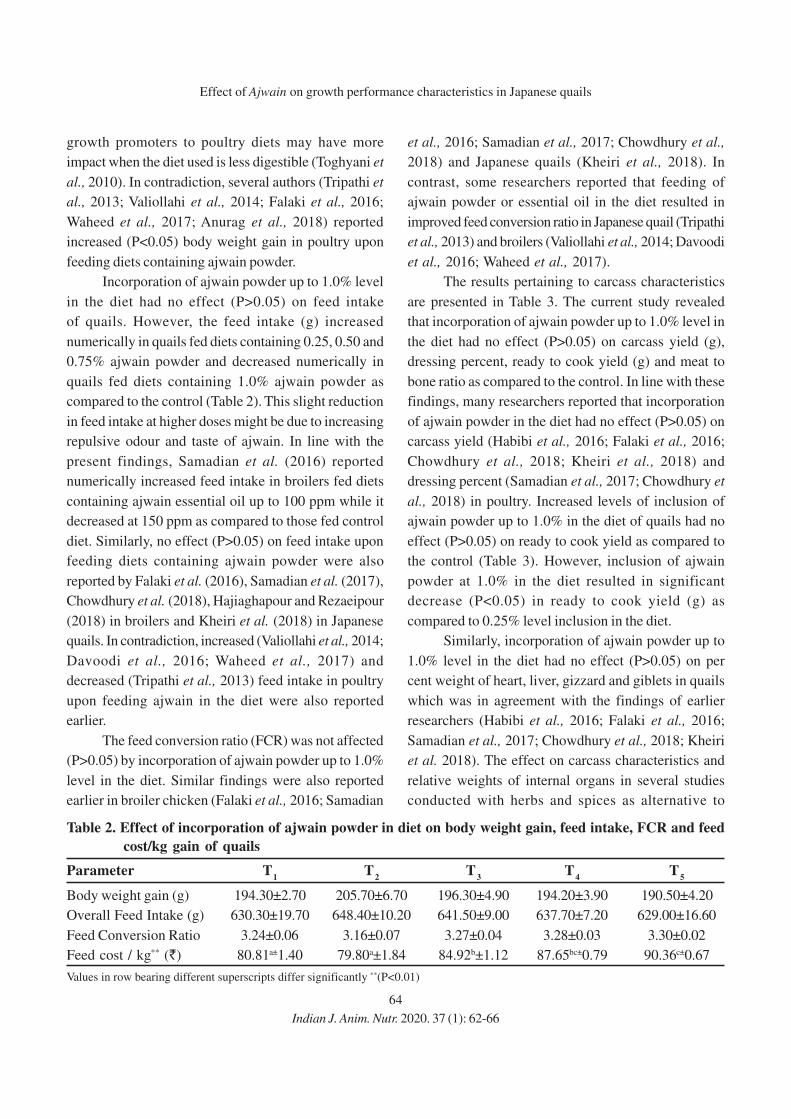
64
growth promoters to poultry diets may have more
impact when the diet used is less digestible (Toghyani et
al., 2010). In contradiction, several authors (Tripathi et
al., 2013; Valiollahi et al., 2014; Falaki et al., 2016;
Waheed et al., 2017; Anurag et al., 2018) reported
increased (P<0.05) body weight gain in poultry upon
feeding diets containing ajwain powder.
Incorporation of ajwain powder up to 1.0% level
in the diet had no effect (P>0.05) on feed intake
of quails. However, the feed intake (g) increased
numerically in quails fed diets containing 0.25, 0.50 and
0.75% ajwain powder and decreased numerically in
quails fed diets containing 1.0% ajwain powder as
compared to the control (Table 2). This slight reduction
in feed intake at higher doses might be due to increasing
repulsive odour and taste of ajwain. In line with the
present findings, Samadian et al. (2016) reported
numerically increased feed intake in broilers fed diets
containing ajwain essential oil up to 100 ppm while it
decreased at 150 ppm as compared to those fed control
diet. Similarly, no effect (P>0.05) on feed intake upon
feeding diets containing ajwain powder were also
reported by Falaki et al. (2016), Samadian et al. (2017),
Chowdhury et al. (2018), Hajiaghapour and Rezaeipour
(2018) in broilers and Kheiri et al. (2018) in Japanese
quails. In contradiction, increased (Valiollahi et al., 2014;
Davoodi et al., 2016; Waheed et al., 2017) and
decreased (Tripathi et al., 2013) feed intake in poultry
upon feeding ajwain in the diet were also reported
earlier.
The feed conversion ratio (FCR) was not affected
(P>0.05) by incorporation of ajwain powder up to 1.0%
level in the diet. Similar findings were also reported
earlier in broiler chicken (Falaki et al., 2016; Samadian
et al., 2016; Samadian et al., 2017; Chowdhury et al.,
2018) and Japanese quails (Kheiri et al., 2018). In
contrast, some researchers reported that feeding of
ajwain powder or essential oil in the diet resulted in
improved feed conversion ratio in Japanese quail (Tripathi
et al., 2013) and broilers (Valiollahi et al., 2014; Davoodi
et al., 2016; Waheed et al., 2017).
The results pertaining to carcass characteristics
are presented in Table 3. The current study revealed
that incorporation of ajwain powder up to 1.0% level in
the diet had no effect (P>0.05) on carcass yield (g),
dressing percent, ready to cook yield (g) and meat to
bone ratio as compared to the control. In line with these
findings, many researchers reported that incorporation
of ajwain powder in the diet had no effect (P>0.05) on
carcass yield (Habibi et al., 2016; Falaki et al., 2016;
Chowdhury et al., 2018; Kheiri et al., 2018) and
dressing percent (Samadian et al., 2017; Chowdhury et
al., 2018) in poultry. Increased levels of inclusion of
ajwain powder up to 1.0% in the diet of quails had no
effect (P>0.05) on ready to cook yield as compared to
the control (Table 3). However, inclusion of ajwain
powder at 1.0% in the diet resulted in significant
decrease (P<0.05) in ready to cook yield (g) as
compared to 0.25% level inclusion in the diet.
Similarly, incorporation of ajwain powder up to
1.0% level in the diet had no effect (P>0.05) on per
cent weight of heart, liver, gizzard and giblets in quails
which was in agreement with the findings of earlier
researchers (Habibi et al., 2016; Falaki et al., 2016;
Samadian et al., 2017; Chowdhury et al., 2018; Kheiri
et al. 2018). The effect on carcass characteristics and
relative weights of internal organs in several studies
conducted with herbs and spices as alternative to
Table 2. Effect of incorporation of ajwain powder in diet on body weight gain, feed intake, FCR and feed
cost/kg gain of quails
Parameter T1
T2
T3
T4
T5
Body weight gain (g) 194.30±2.70 205.70±6.70 196.30±4.90 194.20±3.90 190.50±4.20
Overall Feed Intake (g) 630.30±19.70 648.40±10.20 641.50±9.00 637.70±7.20 629.00±16.60
Feed Conversion Ratio 3.24±0.06 3.16±0.07 3.27±0.04 3.28±0.03 3.30±0.02
Feed cost / kg** (`) 80.81a±1.40 79.80a±1.84 84.92b±1.12 87.65bc±0.79 90.36c±0.67
Values in row bearing different superscripts differ significantly **(P<0.01)
Indian J. Anim. Nutr. 2020. 37 (1): 62-66
Effect of Ajwain on growth performance characteristics in Japanese quails
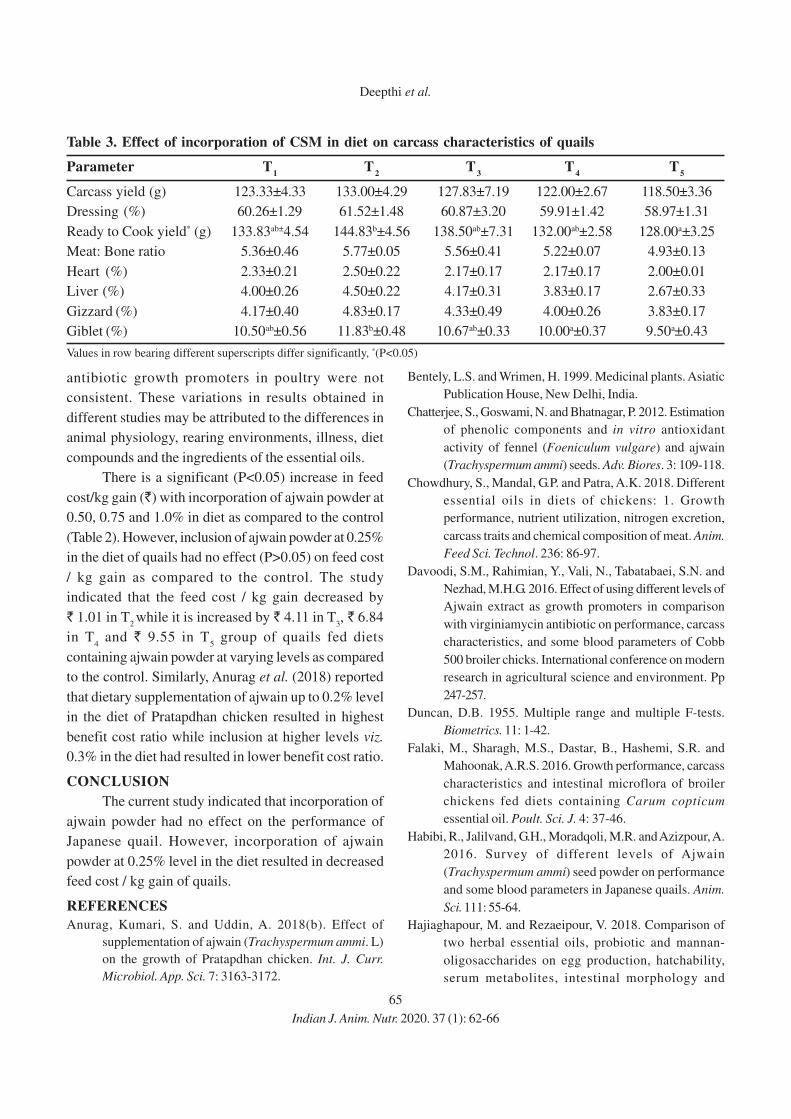
65
antibiotic growth promoters in poultry were not
consistent. These variations in results obtained in
different studies may be attributed to the differences in
animal physiology, rearing environments, illness, diet
compounds and the ingredients of the essential oils.
There is a significant (P<0.05) increase in feed
cost/kg gain (`) with incorporation of ajwain powder at
0.50, 0.75 and 1.0% in diet as compared to the control
(Table 2). However, inclusion of ajwain powder at 0.25%
in the diet of quails had no effect (P>0.05) on feed cost
/ kg gain as compared to the control. The study
indicated that the feed cost / kg gain decreased by
` 1.01 in T2 while it is increased by ` 4.11 in T
3, ` 6.84
in T4 and ` 9.55 in T
5 group of quails fed diets
containing ajwain powder at varying levels as compared
to the control. Similarly, Anurag et al. (2018) reported
that dietary supplementation of ajwain up to 0.2% level
in the diet of Pratapdhan chicken resulted in highest
benefit cost ratio while inclusion at higher levels viz.
0.3% in the diet had resulted in lower benefit cost ratio.
CONCLUSION
The current study indicated that incorporation of
ajwain powder had no effect on the performance of
Japanese quail. However, incorporation of ajwain
powder at 0.25% level in the diet resulted in decreased
feed cost / kg gain of quails.
REFERENCES
Anurag, Kumari, S. and Uddin, A. 2018(b). Effect of
supplementation of ajwain (Trachyspermum ammi. L)
on the growth of Pratapdhan chicken. Int. J. Curr.
Microbiol. App. Sci. 7: 3163-3172.
Bentely, L.S. and Wrimen, H. 1999. Medicinal plants. Asiatic
Publication House, New Delhi, India.
Chatterjee, S., Goswami, N. and Bhatnagar, P. 2012. Estimation
of phenolic components and in vitro antioxidant
activity of fennel (Foeniculum vulgare) and ajwain
(Trachyspermum ammi) seeds. Adv. Biores. 3: 109-118.
Chowdhury, S., Mandal, G.P. and Patra, A.K. 2018. Different
essential oils in diets of chickens: 1. Growth
performance, nutrient utilization, nitrogen excretion,
carcass traits and chemical composition of meat. Anim.
Feed Sci. Technol. 236: 86-97.
Davoodi, S.M., Rahimian, Y., Vali, N., Tabatabaei, S.N. and
Nezhad, M.H.G. 2016. Effect of using different levels of
Ajwain extract as growth promoters in comparison
with virginiamycin antibiotic on performance, carcass
characteristics, and some blood parameters of Cobb
500 broiler chicks. International conference on modern
research in agricultural science and environment. Pp
247-257.
Duncan, D.B. 1955. Multiple range and multiple F-tests.
Biometrics. 11: 1-42.
Falaki, M., Sharagh, M.S., Dastar, B., Hashemi, S.R. and
Mahoonak, A.R.S. 2016. Growth performance, carcass
characteristics and intestinal microflora of broiler
chickens fed diets containing Carum copticum
essential oil. Poult. Sci. J. 4: 37-46.
Habibi, R., Jalilvand, G.H., Moradqoli, M.R. and Azizpour, A.
2016. Survey of different levels of Ajwain
(Trachyspermum ammi) seed powder on performance
and some blood parameters in Japanese quails. Anim.
Sci. 111: 55-64.
Hajiaghapour, M. and Rezaeipour, V. 2018. Comparison of
two herbal essential oils, probiotic and mannan-
oligosaccharides on egg production, hatchability,
serum metabolites, intestinal morphology and
Table 3. Effect of incorporation of CSM in diet on carcass characteristics of quails
Parameter T1
T2
T3
T4
T5
Carcass yield (g) 123.33±4.33 133.00±4.29 127.83±7.19 122.00±2.67 118.50±3.36
Dressing (%) 60.26±1.29 61.52±1.48 60.87±3.20 59.91±1.42 58.97±1.31
Ready to Cook yield* (g) 133.83ab±4.54 144.83b±4.56 138.50ab±7.31 132.00ab±2.58 128.00a±3.25
Meat: Bone ratio 5.36±0.46 5.77±0.05 5.56±0.41 5.22±0.07 4.93±0.13
Heart (%) 2.33±0.21 2.50±0.22 2.17±0.17 2.17±0.17 2.00±0.01
Liver (%) 4.00±0.26 4.50±0.22 4.17±0.31 3.83±0.17 2.67±0.33
Gizzard (%) 4.17±0.40 4.83±0.17 4.33±0.49 4.00±0.26 3.83±0.17
Giblet (%) 10.50ab±0.56 11.83b±0.48 10.67ab±0.33 10.00a±0.37 9.50a±0.43
Values in row bearing different superscripts differ significantly, *(P<0.05)
Indian J. Anim. Nutr. 2020. 37 (1): 62-66
Deepthi et al.
66
microbiota activity of quail breeds. Livest. Sci. 210:
93-98.
Ishikawa, T., Sega, Y. and Kitajima, J. 2001. Water-soluble
constituents of ajowan. Chem. Pharm. Bull. 49:
840-844.
Kheiri, F., Faghani, M. and Landy, N. 2018. Evaluation of thyme
and ajwain as antibiotic growth promoter substitution
on growth performance, carcass characteristics and
serum biochemistry in Japanese quail (Coturnix
japonica). Anim. Nutr. 4:79-83.
NRC. 1994. National Research Council. Nutrient requirements
of Poultry. 9th Edition. National Academy Press,
Washington, DC., U.S.A.
Samadian, F., Torshizi, M.A.K., Pirsaraei, Z.A., Vaseghi, H.,
Mohammadnejad, F. and Vahedi, V. 2016. Effect of
Essential Oils of Peppermint, Lemon, Thyme and
Ajwain on Performance, Blood Metabolites and
Hepatic lipogenic Gene Expression of Broilers. Iranian
J. Anim. Sci. Res. 7: 329-339.
Samadian, F., Towhidi, A., Zeinodini, S., Torshizi, M.A.K. and
Vaseghi, H. 2017. Comparison of the effect of zilmax
and different doses of ajwain essential oil as β-agonist
drugs on performance and serum biochemical
metabolites in parental line of a commercial broiler.
Iranian J. Anim. Sci. Res. 48:119-127.
Snedecor, G.W. and Cochran, W.G. 1993. Statistical methods
(9th edition) Iowa state university press, IOWA, USA.
SPSS. 2008. Statistical packages for Social Sciences, Version
17.0, SPSS Inc., Illinois, USA.
Toghyani, M., Gheisari, A.A., Ghalamkari, G.H. and
Mohammadrezaei, M. 2010. Growth performance,
serum biochemistry, and blood hematology of broiler
chicks fed different levels of black seed (Nigella
sativa) and peppermint (Mentha piperita). Livestock
Sci. 129: 173-178.
Tripathi, D., Kumar, A., Mondal, B.C., Rahal, A. and Palod, J.
2013. Effect of ajwain, hot red pepper, black pepper on
the performance of Japanese quail. Ind. J. Anim. Nutr.
30: 431-433.
Valiollahi, M.R., Gholami, M., Namjoo, A.R., Rahimian, Y. and
Rafiee, A. 2014. Effect of using sumac (Rhus coriaria
L.) and ajwain (Trachyspermum copticum) powder on
performance and intestinal microbial population in
broiler chicks. Res. Opin. Anim. Vet. Sci. 4: 545-549.
Waheed, S., Hasnain, A., Ahmad, A., Tarar, O.M., Yaqeen, Z.
and Ali, T.M. 2017. Effect of spices and sweet violet
extracts to replace antibiotics and antioxidants in feed
on broiler performance, hematology, lipid profile and
immunity. J. Anim. Plant Sci. 27: 714-724.
Windisch, W., Schedle, K., Plitzner, C. and Kroismayr, A. 2008.
Use of phytogenic products as feed additives for swine
and poultry. J. Anim. Sci. 86: 140-148.
Indian J. Anim. Nutr. 2020. 37 (1): 62-66
Received on 01-02-2020 and accepted on 06-06-2020
Effect of Ajwain on growth performance characteristics in Japanese quails
67
Indian Journal of
Animal Nutrition
Effects of feeding Cashew Apple Waste with or without Supplementation
of Non-starch Polysaccharide Degrading Enzymes on Nutrient
Digestibility and Growth Performance of broilers
Venkatramana P.1, Senthil Murugan S.1*, Biju Chacko1, Patki H.S.2,
Shyama K.1 and Sunanda C.3
1Department of Animal Nutrition, College of Veterinary and Animal Sciences,
Pookode, Wayanad, Kerala, India
ABSTRACT
The current research was carried out to study the effect of different inclusion level of cashew apple
waste (CAW) to improve the ileal digestibility of nutrients and performance of broilers supplemented with
non-starch polysaccharides (NSP) degrading enzymes. Two hundred and ten day-old Vencobb broiler chicks
divided into 7 groups with 3 replicates of 10 chicks in each. Birds of groups G1, G
2, G
3 which received CAW
at 0, 5 and 10 per cent, respectively. G4 and G
5 birds fed with 5 per cent CAW, and were additionally fed
NSP degrading enzyme at 500 g and 750 g/ton, respectively. Similarly, G6 and G
7 birds received 10 per cent CAW,
and NSP degrading enzyme at 500 and 750 g/ton, respectively. Ileal digestibility values of dry matter, crude
protein and crude fibre were significantly (P<0.01) increased in enzyme supplemented group with CAW.
Feed intake did not differ significantly (P<0.11) among the groups at 42nd day. Body weight Gain and feed
conversion ratio recorded in experimental birds received 10 per cent CAW and NSP degrading enzyme at 750 g/
ton was comparable to control group (G1). However, better feed conversion efficiency (P<0.01) was recorded G
4
and G5 group birds compared to control (G
1). Thus, CAW could be included in corn, soya bean meal based
broiler ration at 10 % level with NSP enzyme at 75 0 g/ton.
Key words: Broilers, Body weight gain, Cashew apple waste, FCR, Ileal digestibility, NSP Enzyme
*Corresponding author: [email protected]; 2Department of Anatomy and Histology; 3Department of Statistics, College of Veterinary
and Animal Sciences, Pookode, Wayanad, Kerala, India
INTRODUCTION
In India, broiler industry had shown annual growth
rate of 11.00 per cent during year 2018 (DAHD, 2018).
However, high cost and scarcity of conventional feed
ingredients especially for energy and protein sources
has led to utilization of agricultural by products/
unconventional feedstuffs in poultry feed formulations
to check the ever increasing feeding cost. The inclusion
level of un-conventional feedstuffs is limited, because
of lack of knowledge on nutritive value, digestibility,
anti-nutritive factors, and safety (FAO, 2011).
The use of alternate feedstuffs to replace maize
and soya bean meal in poultry feed is practiced by
commercial feed formulators considering fiber and
non-starch polysaccharides (NSP) content. The
NSP’s like galactosides (raffinose and stachyose)
hemicelluloses, mannans and glucans will not be
digested in small intestine of poultry because of lack of
endogenous NSP’s enzymes like glycosidase, mannase,
Indian J. Anim. Nutr. 2020. 37 (1): 67-73
doi: 10.5958/2231-6744.2020.00012.2
protease and glucanase (Iirish et al., 1995). Thus, broiler
diets with high NSP content might result in gas
accumulation and diarrhea and addition of exogenous
NSP degrading enzymes are thus recommended to
improve the nutritive value of poultry ration (Wu et al.,
2005).
Cashew apple (Anacardium occidentale) waste
(CAW) is one of the by-product from the cashew apple
processing industry which is seasonally available in
India. About, 65 lakh metric tonnes of cashew apple
were wasted in India and 4.97 lakh metric tonnes of
cashew apple were wasted in Kerala (Murugan et al.,
2015). The CAW can be considered as energy source
to replace maize in broiler diets without any adverse
effect (Bhamare et al., 2016). Different studies were
conducted to study the effects of enzyme as single
enzyme and combination of different NSP enzymes in
broiler ration with unconventional feedstuffs
(Moftakharzadeh et al., 2017). The presence of soluble
Indian J. Anim. Nutr. 2020. 37 (1): 67-73
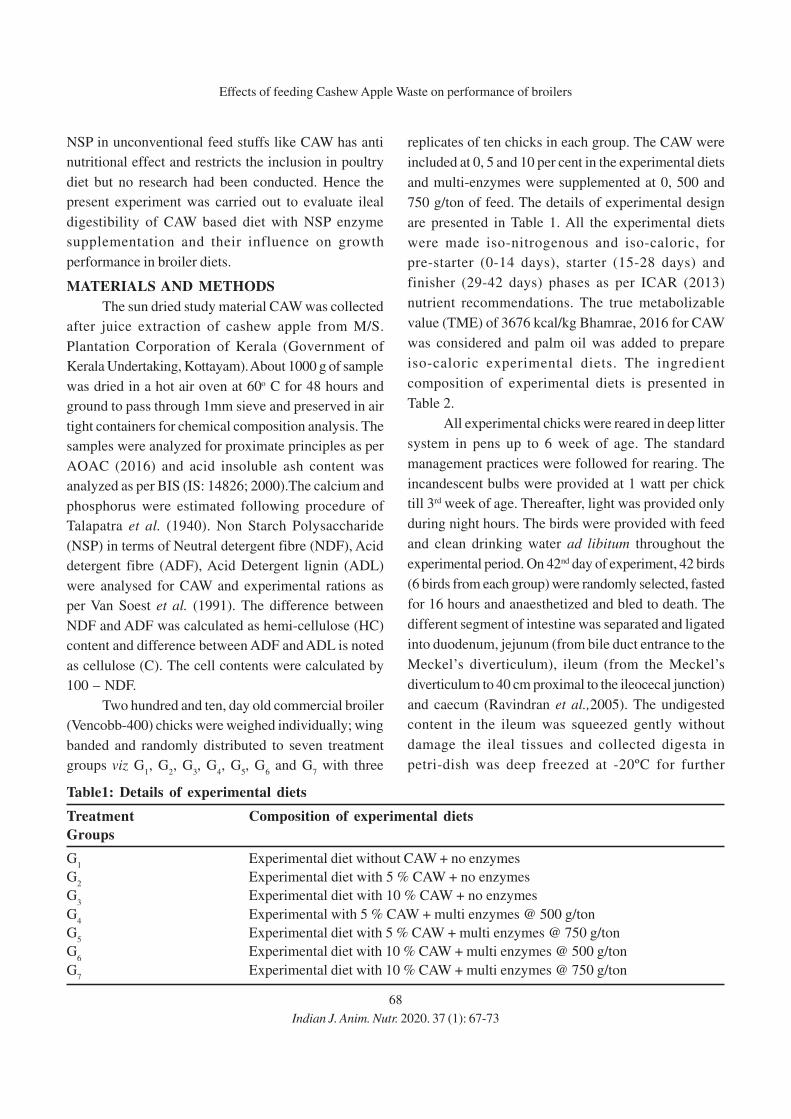
68
NSP in unconventional feed stuffs like CAW has anti
nutritional effect and restricts the inclusion in poultry
diet but no research had been conducted. Hence the
present experiment was carried out to evaluate ileal
digestibility of CAW based diet with NSP enzyme
supplementation and their influence on growth
performance in broiler diets.
MATERIALS AND METHODS
The sun dried study material CAW was collected
after juice extraction of cashew apple from M/S.
Plantation Corporation of Kerala (Government of
Kerala Undertaking, Kottayam). About 1000 g of sample
was dried in a hot air oven at 60o C for 48 hours and
ground to pass through 1mm sieve and preserved in air
tight containers for chemical composition analysis. The
samples were analyzed for proximate principles as per
AOAC (2016) and acid insoluble ash content was
analyzed as per BIS (IS: 14826; 2000).The calcium and
phosphorus were estimated following procedure of
Talapatra et al. (1940). Non Starch Polysaccharide
(NSP) in terms of Neutral detergent fibre (NDF), Acid
detergent fibre (ADF), Acid Detergent lignin (ADL)
were analysed for CAW and experimental rations as
per Van Soest et al. (1991). The difference between
NDF and ADF was calculated as hemi-cellulose (HC)
content and difference between ADF and ADL is noted
as cellulose (C). The cell contents were calculated by
100 – NDF.
Two hundred and ten, day old commercial broiler
(Vencobb-400) chicks were weighed individually; wing
banded and randomly distributed to seven treatment
groups viz G1, G
2, G
3, G
4, G
5, G
6 and G
7 with three
replicates of ten chicks in each group. The CAW were
included at 0, 5 and 10 per cent in the experimental diets
and multi-enzymes were supplemented at 0, 500 and
750 g/ton of feed. The details of experimental design
are presented in Table 1. All the experimental diets
were made iso-nitrogenous and iso-caloric, for
pre-starter (0-14 days), starter (15-28 days) and
finisher (29-42 days) phases as per ICAR (2013)
nutrient recommendations. The true metabolizable
value (TME) of 3676 kcal/kg Bhamrae, 2016 for CAW
was considered and palm oil was added to prepare
iso-caloric experimental diets. The ingredient
composition of experimental diets is presented in
Table 2.
All experimental chicks were reared in deep litter
system in pens up to 6 week of age. The standard
management practices were followed for rearing. The
incandescent bulbs were provided at 1 watt per chick
till 3rd week of age. Thereafter, light was provided only
during night hours. The birds were provided with feed
and clean drinking water ad libitum throughout the
experimental period. On 42nd day of experiment, 42 birds
(6 birds from each group) were randomly selected, fasted
for 16 hours and anaesthetized and bled to death. The
different segment of intestine was separated and ligated
into duodenum, jejunum (from bile duct entrance to the
Meckel’s diverticulum), ileum (from the Meckel’s
diverticulum to 40 cm proximal to the ileocecal junction)
and caecum (Ravindran et al.,2005). The undigested
content in the ileum was squeezed gently without
damage the ileal tissues and collected digesta in
petri-dish was deep freezed at -20ºC for further
Effects of feeding Cashew Apple Waste on performance of broilers
Table1: Details of experimental diets
Treatment Composition of experimental diets
Groups
G1
Experimental diet without CAW + no enzymes
G2
Experimental diet with 5 % CAW + no enzymes
G3
Experimental diet with 10 % CAW + no enzymes
G4
Experimental with 5 % CAW + multi enzymes @ 500 g/ton
G5
Experimental diet with 5 % CAW + multi enzymes @ 750 g/ton
G6
Experimental diet with 10 % CAW + multi enzymes @ 500 g/ton
G7
Experimental diet with 10 % CAW + multi enzymes @ 750 g/ton
Indian J. Anim. Nutr. 2020. 37 (1): 67-73
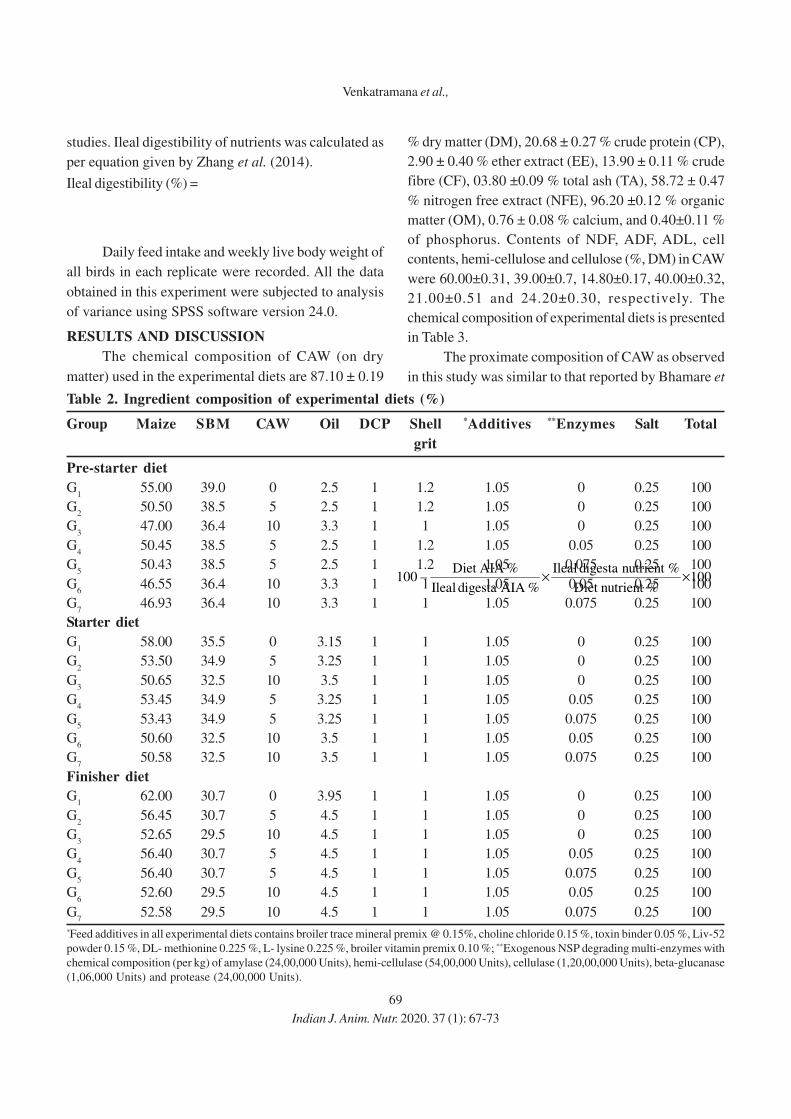
69
studies. Ileal digestibility of nutrients was calculated as
per equation given by Zhang et al. (2014).
Ileal digestibility (%) =
100%nutrient Diet
%nutrient digesta Ileal
%AIA digesta Ileal
%AIA Diet – 100 ××
Daily feed intake and weekly live body weight of
all birds in each replicate were recorded. All the data
obtained in this experiment were subjected to analysis
of variance using SPSS software version 24.0.
RESULTS AND DISCUSSION
The chemical composition of CAW (on dry
matter) used in the experimental diets are 87.10 ± 0.19
% dry matter (DM), 20.68 ± 0.27 % crude protein (CP),
2.90 ± 0.40 % ether extract (EE), 13.90 ± 0.11 % crude
fibre (CF), 03.80 ±0.09 % total ash (TA), 58.72 ± 0.47
% nitrogen free extract (NFE), 96.20 ±0.12 % organic
matter (OM), 0.76 ± 0.08 % calcium, and 0.40±0.11 %
of phosphorus. Contents of NDF, ADF, ADL, cell
contents, hemi-cellulose and cellulose (%, DM) in CAW
were 60.00±0.31, 39.00±0.7, 14.80±0.17, 40.00±0.32,
21.00±0.51 and 24.20±0.30, respectively. The
chemical composition of experimental diets is presented
in Table 3.
The proximate composition of CAW as observed
in this study was similar to that reported by Bhamare et
Table 2. Ingredient composition of experimental diets (%)
Group Maize SBM CAW Oil DCP Shell *Additives **Enzymes Salt Total
grit
Pre-starter diet
G1
55.00 39.0 0 2.5 1 1.2 1.05 0 0.25 100
G2
50.50 38.5 5 2.5 1 1.2 1.05 0 0.25 100
G3
47.00 36.4 10 3.3 1 1 1.05 0 0.25 100
G4
50.45 38.5 5 2.5 1 1.2 1.05 0.05 0.25 100
G5
50.43 38.5 5 2.5 1 1.2 1.05 0.075 0.25 100
G6
46.55 36.4 10 3.3 1 1 1.05 0.05 0.25 100
G7
46.93 36.4 10 3.3 1 1 1.05 0.075 0.25 100
Starter diet
G1
58.00 35.5 0 3.15 1 1 1.05 0 0.25 100
G2
53.50 34.9 5 3.25 1 1 1.05 0 0.25 100
G3
50.65 32.5 10 3.5 1 1 1.05 0 0.25 100
G4
53.45 34.9 5 3.25 1 1 1.05 0.05 0.25 100
G5
53.43 34.9 5 3.25 1 1 1.05 0.075 0.25 100
G6
50.60 32.5 10 3.5 1 1 1.05 0.05 0.25 100
G7
50.58 32.5 10 3.5 1 1 1.05 0.075 0.25 100
Finisher diet
G1
62.00 30.7 0 3.95 1 1 1.05 0 0.25 100
G2
56.45 30.7 5 4.5 1 1 1.05 0 0.25 100
G3
52.65 29.5 10 4.5 1 1 1.05 0 0.25 100
G4
56.40 30.7 5 4.5 1 1 1.05 0.05 0.25 100
G5
56.40 30.7 5 4.5 1 1 1.05 0.075 0.25 100
G6
52.60 29.5 10 4.5 1 1 1.05 0.05 0.25 100
G7
52.58 29.5 10 4.5 1 1 1.05 0.075 0.25 100
*Feed additives in all experimental diets contains broiler trace mineral premix @ 0.15%, choline chloride 0.15 %, toxin binder 0.05 %, Liv-52
powder 0.15 %, DL- methionine 0.225 %, L- lysine 0.225 %, broiler vitamin premix 0.10 %; **Exogenous NSP degrading multi-enzymes with
chemical composition (per kg) of amylase (24,00,000 Units), hemi-cellulase (54,00,000 Units), cellulase (1,20,00,000 Units), beta-glucanase
(1,06,000 Units) and protease (24,00,000 Units).
Indian J. Anim. Nutr. 2020. 37 (1): 67-73
Venkatramana et al.,
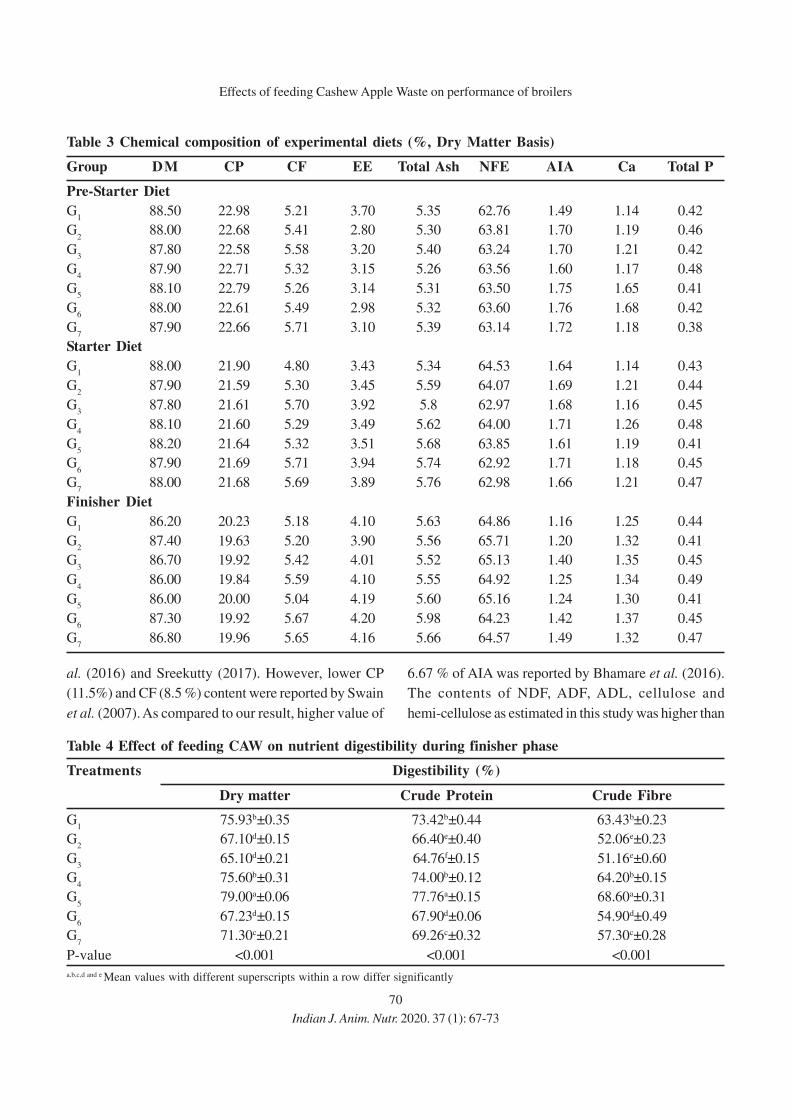
70
Table 3 Chemical composition of experimental diets (%, Dry Matter Basis)
Group DM CP CF EE Total Ash NFE AIA Ca Total P
Pre-Starter Diet
G1
88.50 22.98 5.21 3.70 5.35 62.76 1.49 1.14 0.42
G2
88.00 22.68 5.41 2.80 5.30 63.81 1.70 1.19 0.46
G3
87.80 22.58 5.58 3.20 5.40 63.24 1.70 1.21 0.42
G4
87.90 22.71 5.32 3.15 5.26 63.56 1.60 1.17 0.48
G5
88.10 22.79 5.26 3.14 5.31 63.50 1.75 1.65 0.41
G6
88.00 22.61 5.49 2.98 5.32 63.60 1.76 1.68 0.42
G7
87.90 22.66 5.71 3.10 5.39 63.14 1.72 1.18 0.38
Starter Diet
G1
88.00 21.90 4.80 3.43 5.34 64.53 1.64 1.14 0.43
G2
87.90 21.59 5.30 3.45 5.59 64.07 1.69 1.21 0.44
G3
87.80 21.61 5.70 3.92 5.8 62.97 1.68 1.16 0.45
G4
88.10 21.60 5.29 3.49 5.62 64.00 1.71 1.26 0.48
G5
88.20 21.64 5.32 3.51 5.68 63.85 1.61 1.19 0.41
G6
87.90 21.69 5.71 3.94 5.74 62.92 1.71 1.18 0.45
G7
88.00 21.68 5.69 3.89 5.76 62.98 1.66 1.21 0.47
Finisher Diet
G1
86.20 20.23 5.18 4.10 5.63 64.86 1.16 1.25 0.44
G2
87.40 19.63 5.20 3.90 5.56 65.71 1.20 1.32 0.41
G3
86.70 19.92 5.42 4.01 5.52 65.13 1.40 1.35 0.45
G4
86.00 19.84 5.59 4.10 5.55 64.92 1.25 1.34 0.49
G5
86.00 20.00 5.04 4.19 5.60 65.16 1.24 1.30 0.41
G6
87.30 19.92 5.67 4.20 5.98 64.23 1.42 1.37 0.45
G7
86.80 19.96 5.65 4.16 5.66 64.57 1.49 1.32 0.47
Table 4 Effect of feeding CAW on nutrient digestibility during finisher phase
Treatments Digestibility (%)
Dry matter Crude Protein Crude Fibre
G1
75.93b±0.35 73.42b±0.44 63.43b±0.23
G2
67.10d±0.15 66.40e±0.40 52.06e±0.23
G3
65.10d±0.21 64.76f±0.15 51.16e±0.60
G4
75.60b±0.31 74.00b±0.12 64.20b±0.15
G5
79.00a±0.06 77.76a±0.15 68.60a±0.31
G6
67.23d±0.15 67.90d±0.06 54.90d±0.49
G7
71.30c±0.21 69.26c±0.32 57.30c±0.28
P-value <0.001 <0.001 <0.001
a,b,c,d and e Mean values with different superscripts within a row differ significantly
al. (2016) and Sreekutty (2017). However, lower CP
(11.5%) and CF (8.5 %) content were reported by Swain
et al. (2007). As compared to our result, higher value of
6.67 % of AIA was reported by Bhamare et al. (2016).
The contents of NDF, ADF, ADL, cellulose and
hemi-cellulose as estimated in this study was higher than
Indian J. Anim. Nutr. 2020. 37 (1): 67-73
Effects of feeding Cashew Apple Waste on performance of broilers
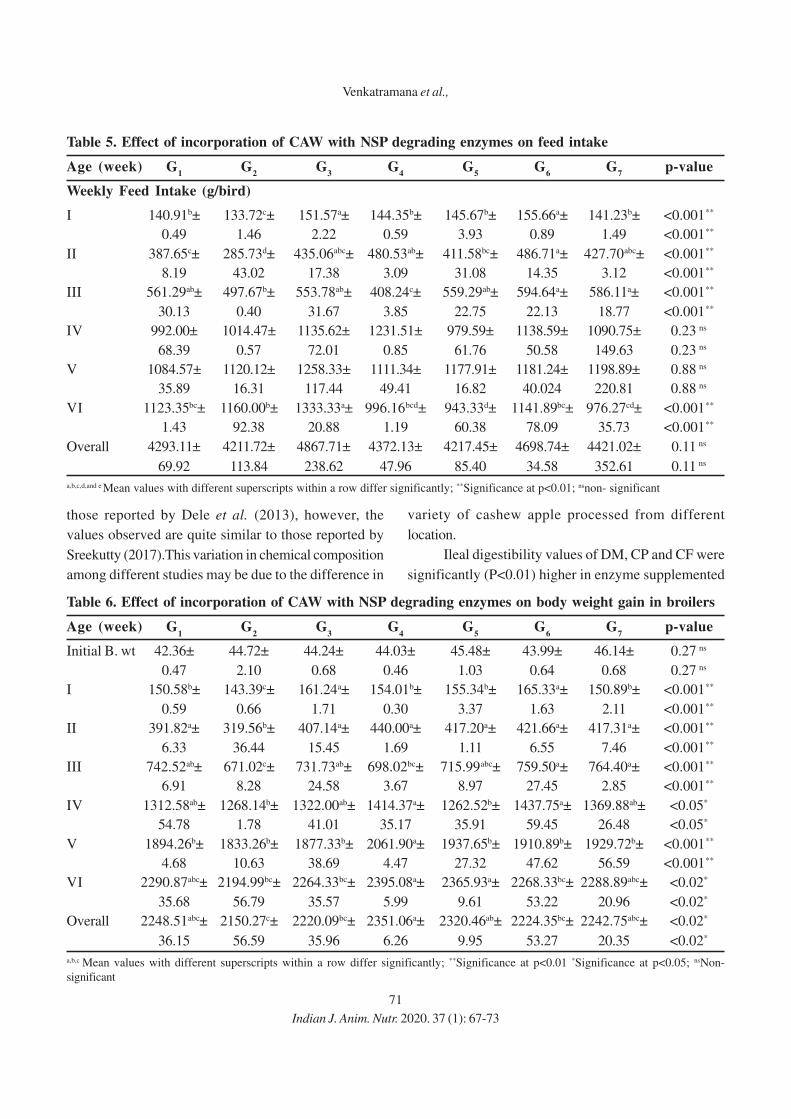
71
Table 5. Effect of incorporation of CAW with NSP degrading enzymes on feed intake
Age (week) G1
G2
G3
G4
G5
G6
G7
p-value
Weekly Feed Intake (g/bird)
I 140.91b± 133.72c± 151.57a± 144.35b± 145.67b± 155.66a± 141.23b± <0.001**
0.49 1.46 2.22 0.59 3.93 0.89 1.49 <0.001**
II 387.65c± 285.73d± 435.06abc± 480.53ab± 411.58bc± 486.71a± 427.70abc± <0.001**
8.19 43.02 17.38 3.09 31.08 14.35 3.12 <0.001**
III 561.29ab± 497.67b± 553.78ab± 408.24c± 559.29ab± 594.64a± 586.11a± <0.001**
30.13 0.40 31.67 3.85 22.75 22.13 18.77 <0.001**
IV 992.00± 1014.47± 1135.62± 1231.51± 979.59± 1138.59± 1090.75± 0.23 ns
68.39 0.57 72.01 0.85 61.76 50.58 149.63 0.23 ns
V 1084.57± 1120.12± 1258.33± 1111.34± 1177.91± 1181.24± 1198.89± 0.88 ns
35.89 16.31 117.44 49.41 16.82 40.024 220.81 0.88 ns
VI 1123.35bc± 1160.00b± 1333.33a± 996.16bcd± 943.33d± 1141.89bc± 976.27cd± <0.001**
1.43 92.38 20.88 1.19 60.38 78.09 35.73 <0.001**
Overall 4293.11± 4211.72± 4867.71± 4372.13± 4217.45± 4698.74± 4421.02± 0.11 ns
69.92 113.84 238.62 47.96 85.40 34.58 352.61 0.11 ns
a,b,c,d,and e Mean values with different superscripts within a row differ significantly; **Significance at p<0.01; nsnon- significant
those reported by Dele et al. (2013), however, the
values observed are quite similar to those reported by
Sreekutty (2017).This variation in chemical composition
among different studies may be due to the difference in
Table 6. Effect of incorporation of CAW with NSP degrading enzymes on body weight gain in broilers
Age (week) G1
G2
G3
G4
G5
G6
G7
p-value
Initial B. wt 42.36± 44.72± 44.24± 44.03± 45.48± 43.99± 46.14± 0.27 ns
0.47 2.10 0.68 0.46 1.03 0.64 0.68 0.27 ns
I 150.58b± 143.39c± 161.24a± 154.01b± 155.34b± 165.33a± 150.89b± <0.001**
0.59 0.66 1.71 0.30 3.37 1.63 2.11 <0.001**
II 391.82a± 319.56b± 407.14a± 440.00a± 417.20a± 421.66a± 417.31a± <0.001**
6.33 36.44 15.45 1.69 1.11 6.55 7.46 <0.001**
III 742.52ab± 671.02c± 731.73ab± 698.02bc± 715.99abc± 759.50a± 764.40a± <0.001**
6.91 8.28 24.58 3.67 8.97 27.45 2.85 <0.001**
IV 1312.58ab± 1268.14b± 1322.00ab± 1414.37a± 1262.52b± 1437.75a± 1369.88ab± <0.05*
54.78 1.78 41.01 35.17 35.91 59.45 26.48 <0.05*
V 1894.26b± 1833.26b± 1877.33b± 2061.90a± 1937.65b± 1910.89b± 1929.72b± <0.001**
4.68 10.63 38.69 4.47 27.32 47.62 56.59 <0.001**
VI 2290.87abc± 2194.99bc± 2264.33bc± 2395.08a± 2365.93a± 2268.33bc± 2288.89abc± <0.02*
35.68 56.79 35.57 5.99 9.61 53.22 20.96 <0.02*
Overall 2248.51abc± 2150.27c± 2220.09bc± 2351.06a± 2320.46ab± 2224.35bc± 2242.75abc± <0.02*
36.15 56.59 35.96 6.26 9.95 53.27 20.35 <0.02*
a,b,c Mean values with different superscripts within a row differ significantly; **Significance at p<0.01 *Significance at p<0.05; nsNon-
significant
variety of cashew apple processed from different
location.
Ileal digestibility values of DM, CP and CF were
significantly (P<0.01) higher in enzyme supplemented
Indian J. Anim. Nutr. 2020. 37 (1): 67-73
Venkatramana et al.,
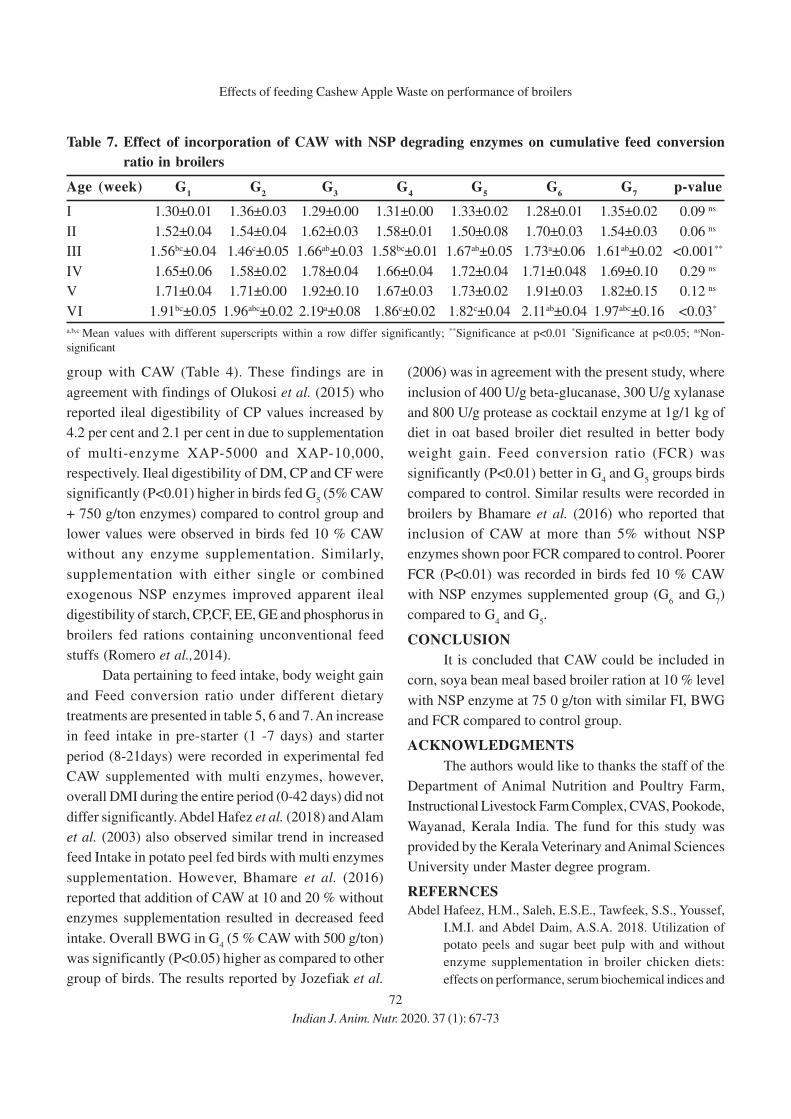
72
group with CAW (Table 4). These findings are in
agreement with findings of Olukosi et al. (2015) who
reported ileal digestibility of CP values increased by
4.2 per cent and 2.1 per cent in due to supplementation
of multi-enzyme XAP-5000 and XAP-10,000,
respectively. Ileal digestibility of DM, CP and CF were
significantly (P<0.01) higher in birds fed G5 (5% CAW
+ 750 g/ton enzymes) compared to control group and
lower values were observed in birds fed 10 % CAW
without any enzyme supplementation. Similarly,
supplementation with either single or combined
exogenous NSP enzymes improved apparent ileal
digestibility of starch, CP,CF, EE, GE and phosphorus in
broilers fed rations containing unconventional feed
stuffs (Romero et al.,2014).
Data pertaining to feed intake, body weight gain
and Feed conversion ratio under different dietary
treatments are presented in table 5, 6 and 7. An increase
in feed intake in pre-starter (1 -7 days) and starter
period (8-21days) were recorded in experimental fed
CAW supplemented with multi enzymes, however,
overall DMI during the entire period (0-42 days) did not
differ significantly. Abdel Hafez et al. (2018) and Alam
et al. (2003) also observed similar trend in increased
feed Intake in potato peel fed birds with multi enzymes
supplementation. However, Bhamare et al. (2016)
reported that addition of CAW at 10 and 20 % without
enzymes supplementation resulted in decreased feed
intake. Overall BWG in G4 (5 % CAW with 500 g/ton)
was significantly (P<0.05) higher as compared to other
group of birds. The results reported by Jozefiak et al.
(2006) was in agreement with the present study, where
inclusion of 400 U/g beta-glucanase, 300 U/g xylanase
and 800 U/g protease as cocktail enzyme at 1g/1 kg of
diet in oat based broiler diet resulted in better body
weight gain. Feed conversion ratio (FCR) was
significantly (P<0.01) better in G4 and G
5 groups birds
compared to control. Similar results were recorded in
broilers by Bhamare et al. (2016) who reported that
inclusion of CAW at more than 5% without NSP
enzymes shown poor FCR compared to control. Poorer
FCR (P<0.01) was recorded in birds fed 10 % CAW
with NSP enzymes supplemented group (G6 and G
7)
compared to G4 and G
5.
CONCLUSION
It is concluded that CAW could be included in
corn, soya bean meal based broiler ration at 10 % level
with NSP enzyme at 75 0 g/ton with similar FI, BWG
and FCR compared to control group.
ACKNOWLEDGMENTS
The authors would like to thanks the staff of the
Department of Animal Nutrition and Poultry Farm,
Instructional Livestock Farm Complex, CVAS, Pookode,
Wayanad, Kerala India. The fund for this study was
provided by the Kerala Veterinary and Animal Sciences
University under Master degree program.
REFERNCES
Abdel Hafeez, H.M., Saleh, E.S.E., Tawfeek, S.S., Youssef,
I.M.I. and Abdel Daim, A.S.A. 2018. Utilization of
potato peels and sugar beet pulp with and without
enzyme supplementation in broiler chicken diets:
effects on performance, serum biochemical indices and
Table 7. Effect of incorporation of CAW with NSP degrading enzymes on cumulative feed conversion
ratio in broilers
Age (week) G1
G2
G3
G4
G5
G6
G7
p-value
I 1.30±0.01 1.36±0.03 1.29±0.00 1.31±0.00 1.33±0.02 1.28±0.01 1.35±0.02 0.09 ns
II 1.52±0.04 1.54±0.04 1.62±0.03 1.58±0.01 1.50±0.08 1.70±0.03 1.54±0.03 0.06 ns
III 1.56bc±0.04 1.46c±0.05 1.66ab±0.03 1.58bc±0.01 1.67ab±0.05 1.73a±0.06 1.61ab±0.02 <0.001**
IV 1.65±0.06 1.58±0.02 1.78±0.04 1.66±0.04 1.72±0.04 1.71±0.048 1.69±0.10 0.29 ns
V 1.71±0.04 1.71±0.00 1.92±0.10 1.67±0.03 1.73±0.02 1.91±0.03 1.82±0.15 0.12 ns
VI 1.91bc±0.05 1.96abc±0.02 2.19a±0.08 1.86c±0.02 1.82c±0.04 2.11ab±0.04 1.97abc±0.16 <0.03*
a,b,c Mean values with different superscripts within a row differ significantly; **Significance at p<0.01 *Significance at p<0.05; nsNon-
significant
Indian J. Anim. Nutr. 2020. 37 (1): 67-73
Effects of feeding Cashew Apple Waste on performance of broilers
73
carcass traits. J. Anim. Physiol. Anim. Nutr. 102:
56-66.
Alam, M.J., Howlider, M.A.R., Pramanik, M.A.H. and Haque,
M.A. 2003. Effect of exogenous enzyme in diet on broiler
performance. Int. J. Poult. Sci. 2: 168-173.
AOAC. 2016. Official Methods of Analysis. 20th Ed.
Association of Official Analytical chemists, Virginia,
USA.
Bhamare, K.S., Dildeep, V., Senthil Murugan, S. and Chavan,
S.J. 2016. Nutritive evaluation of cashew apple waste
in broilers. Int. J. Sci. and Nat.7: 629-632.
Bhamarae, K. 2016. Nutritive evaluation of cashew apple waste
in broilers. M.V.Sc thesis, Kerala Veterinary and Animal
Sciences University, Pookode, Wayanad, Kerala.
BIS. (Bureau of Indian Standards) IS 14826: 2000. Animal
Feeding Stuff-Determination of Ash Insoluble in
Hydrochloric acid.
DAHD. 2018. Department of Animal Husbandry, Dairy
and Fsheries Annual Report-2018, 167 pp.
Dele, P.A., Jolaosho, A.O., Arigbede, O.M., Ojo, V.O., Amole,
T.A., Okukenu, O.A. and Akinyemi, B.T. 2013.
Chemical Composition and In Vitro Gas Production
of Silage from Guinea Grass, Cassava Peel and
Cashew Apple Waste at Different Periods of
Ensilage. Pak. J. Bio. Sci. 16: 1801-1805.
FAO. 2011. Main ingredients used in poultry feed
formulations. Poultry Development Review, Food and
Agricultural Organization, Rome, Italy.
ICAR. 2013. Nutrient Requirements of Poultry. ICAR
publications, New Delhi.
Irish, G.G., Barbour, G.W., Classen, H.L., Tyler, R.T. and
Bedford, M.R. 1995. Removal of the galactosides of
source from soybean meal using either ethanol
extraction or exogenous galactosides and broiler
performance. Poult. Sci. 74:1484-1494.
Józefiak, D., Rutkowski, A., Jensen, B.B. and Engberg, R.M.
2006. The effect of β-glucanase supplementation of
barley and oat-based diets on growth performance and
fermentation in broiler chicken gastro intestinal
tract. Br. Poult. Sci. 47: 57-64.
Moftakharzadeh, S.A., Moravej, H. and Shivazad, M. 2017.
Effect of using the Matrix Values for NSP-degrading
enzymes on performance, water intake, litter moisture
and jejunal digesta viscosity of broilers fed
barley-based diet. Acta Scientiarum. Anim. Sci. 39:
65-72.
Murugan, S.S., Sudhis, K., Rajan, J.K., Varshney, L. and
Virendra, K. 2015. Cashew apple (Anacardium
occidentale): Evaluation of physical and chemical
composition. Indian J. Nat. Sci. 5: 4255-4259.
Olukosi, O.A., Beeson, L.A., Englyst, K. and Romero, L.F.
2015. Effects of exogenous proteases without or with
carbohydrases on nutrient digestibility and
disappearance of non-starch polysaccharides in
broiler chickens. Poult. Sci. 94: 2662-2669.
Ravindran, V., Hew, L.I., Ravindran, G. and Bryden, W.L. 2005.
Apparent ileal digestibility of amino acids in dietary
ingredients for broiler chickens. Anim. Sci. 81: 85-97.
Romero, L.F., Sands, J.S., Indrakumar, S.E., Plumstead, P.W.,
Dalsgaard, S. and Ravindran, V. 2014. Contribution of
protein, starch, and fat to the apparent ileal digestible
energy of corn-and wheat-based broiler diets in
response to exogenous xylanase and amylase without
or with protease. Poult. Sci. 93: 2501-2513.
SPSS. 2017. Statistical Package for Social Sciences. PC
Version 24.0, SPSS Inc. 444 N. Michigan Avenue
Chicago, USA.
Sreekutty, P.S. 2017. Effect of dietary incorporation of cashew
apple waste on growth and nutrient utilization in kids.
M.V.Sc thesis, Kerala Veterinary and Animal Sciences
University, Pookode.
Swain, B.K., Sundaram, R.N.S. and Barbuddhe, S.B. 2007.
Effect of feeding cashew apple waste replacing
maize on the performance of broilers. Indian J. Poult.
Sci. 42: 208-210.
Talapatra, S.K., Ray, S.C. and Sen, K.C. 1940. The analysis
of mineral contents in biological materials. Estimation
of phosphorus, calcium, magnesium, sodium, and
potassium in foodstuffs. Indian J. Vet. Sci. Anim.
Husb.10: 243-258.
Van Soest, P.J., Robertson, J.B. and Lewis, B.A. 1991.
Symposium: carbohydrate methodology, metabolism,
and nutritional implication in dairy cattle. J. Dairy
Sci.74: 3583-3597.
Wu, G., Bryant, M.M., Voitle, horns in second cycle hens.
Poult. Sci., 84:894-897.
Zhang, L., Xu, J., Lei, L., Jiang, Y., Gao, F. and Zhou, G.H. 2014.
Effect of xylanase supplementation on growth
performance, nutrient digestibility and non-starch
polysaccharides degradation in different sections of
the gastrointestinal tract of broilers fed wheat-based
diets. Asian Australas. J. Anim. Sci. 27: 855-861.
Received on 18-06-2020 and accepted on 28-06-2020
Indian J. Anim. Nutr. 2020. 37 (1): 67-73
Venkatramana et al.,

74
Indian Journal of
Animal Nutrition
Efficacy of Crude Soya oil and Emulsifier in Ration on Production
Performance of Broilers
G. Srinivasan*, N. Arul Nathan, V. Thanaseelaan and A. Ruba Nanthini
Tamil Nadu Veterinary and Animal Sciences University, Chennai-600 007, India
ABSTRACT
This study was conducted to assess the efficacy of emulsifier in broiler ration containing crude soya oil
on the production performance of broilers. A total of 90 day- old Vencobb 320 broiler chicks were randomly
divided into 15 groups of six birds in each and five groups were allocated to each dieary treatment. Treatment
groups were fed with basal diet contains crude soya oil as energy source (T1), basal diet supplemented with fat
emulsifier at the rate of 250 g per metric tonne of feed (T2) and 80 kcal energy reduced from basal diet
supplemented with emulsifier at the rate of 250 g per metric tonne of feed (T3). All the chicks were reared under
deep litter system for 42 days. Body weight and feed intake were recorded weekly. Body weight (6th week) of T2
birds (2622 g) was comparable with T3 (2558 g) but was higher (P<0.05) than in T
1 (2502 g). Similarly feed
conversion ratio (6th week) was also similar between T3 (1.76) and T
2 (1.80) birds, however T
1 (1.87) had
lower (P<0.05) FCR than in T3 group. Dressing percent was higher (P<0.05) in T
1 (69.44) than occurred in
T3 (65.47) and T
2 (65.55). Abdominal fat percentage, breast meat yield and drumstick percentage, serum
biochemical attributes were not different among three bird groups. The present study concluded that inclusion
of emulsifier at the rate of 250 g / MT of feed containing crude soya oil with 80 kcal reduced metabolic energy
improved body weight and feed conversion ratio at market age
Key words: Crude soyabean oil, Feed conversion ratio, Fat emulsifier
*Corresponding author : Email: [email protected]
INTRODUCTION
Several oils are used in the broiler ration as a
source of energy and amount of oil in broiler ration
depends on several factors such as availability, relative
price and the effect on feed manufacturing process.
Energy is a major cost component in diets of as broilers
for higher performance and Emulsifiers can be used
to improve fat digestibility and energy efficiency. Low
energy diets can be formulated for birds to maintain
performance, leading to lower feed cost, more
economical and sustainable production. Emulsifiers
facilitate the formation of emulsion droplets, which
lowers the surface tension and stimulates the formation
of micelles, causes high levels of monoglycerides in
the intestine and facilitates the nutrient transport
through the membrane allowing improved nutrient
absorption and utilization (Ashraf, 2007; Melegy et al.,
2001). However, Emulsifier supplementation also
increases nutrient digestibility but reduces growth
performance and carcass characteristics (Jones et al.,
1992; Cooper et al., 1987), which is attributed to
the degree of saturation and length of fatty acids.
Therefore, this study was undertaken to study the
efficacy of emulsifier with crude soya oil as fat source
on the metabolic energy sparing effect in the production
performance of broilers.
MATERIALS AND METHODS
A total of 90 day-old Vencobb- 320 broiler chicks
belonging to single hatch were purchased from a local
hatchery, were wing banded, weighed and randomly
distributed into 15 groups of six in each and allocated
to three treatments, 5 groups in each treatment. Feed
and water were provided ad lib. All the chicks were
reared hygienically on deep litter system in separate pens
under standard uniform managemental conditions for 42
days. The fat emulsifier Jubidol® used was purchased
from Jubliant Life Sciences, Noida. The treatment groups
were divided as basal diet containing crude soya oil
(T1), basal diet supplemented with fat emulsifier at
the rate of 250 g per MT of feed (T2) and 80 kcal
energy reduced from basal diet with emulsifier
supplementation (T3). The Isonitrogenous experimental
Indian J. Anim. Nutr. 2020. 37 (1): 74-77
doi: 10.5958/2231-6744.2020.00013.4
Indian J. Anim. Nutr. 2020. 37 (1): 74-77
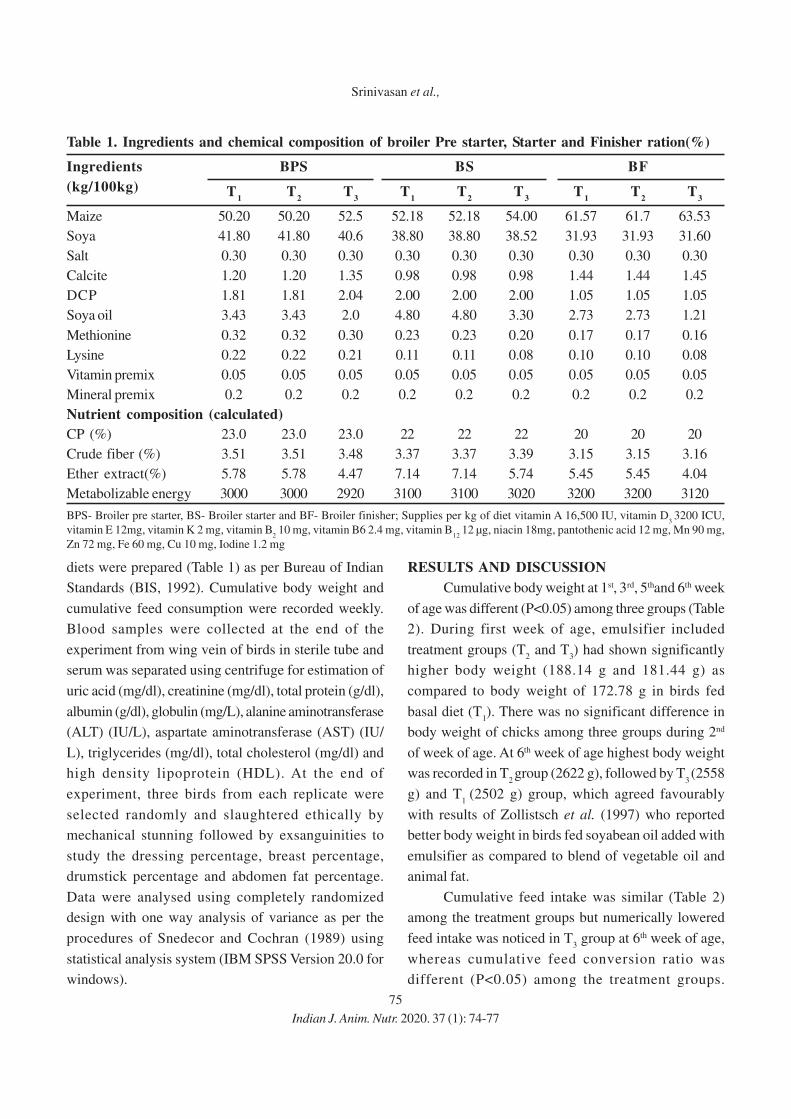
75
Table 1. Ingredients and chemical composition of broiler Pre starter, Starter and Finisher ration(%)
Ingredients BPS BS BF
(kg/100kg) T1
T2
T3
T1
T2
T3
T1
T2
T3
Maize 50.20 50.20 52.5 52.18 52.18 54.00 61.57 61.7 63.53
Soya 41.80 41.80 40.6 38.80 38.80 38.52 31.93 31.93 31.60
Salt 0.30 0.30 0.30 0.30 0.30 0.30 0.30 0.30 0.30
Calcite 1.20 1.20 1.35 0.98 0.98 0.98 1.44 1.44 1.45
DCP 1.81 1.81 2.04 2.00 2.00 2.00 1.05 1.05 1.05
Soya oil 3.43 3.43 2.0 4.80 4.80 3.30 2.73 2.73 1.21
Methionine 0.32 0.32 0.30 0.23 0.23 0.20 0.17 0.17 0.16
Lysine 0.22 0.22 0.21 0.11 0.11 0.08 0.10 0.10 0.08
Vitamin premix 0.05 0.05 0.05 0.05 0.05 0.05 0.05 0.05 0.05
Mineral premix 0.2 0.2 0.2 0.2 0.2 0.2 0.2 0.2 0.2
Nutrient composition (calculated)
CP (%) 23.0 23.0 23.0 22 22 22 20 20 20
Crude fiber (%) 3.51 3.51 3.48 3.37 3.37 3.39 3.15 3.15 3.16
Ether extract(%) 5.78 5.78 4.47 7.14 7.14 5.74 5.45 5.45 4.04
Metabolizable energy 3000 3000 2920 3100 3100 3020 3200 3200 3120
BPS- Broiler pre starter, BS- Broiler starter and BF- Broiler finisher; Supplies per kg of diet vitamin A 16,500 IU, vitamin D3 3200 ICU,
vitamin E 12mg, vitamin K 2 mg, vitamin B2 10 mg, vitamin B6 2.4 mg, vitamin B
12 12 µg, niacin 18mg, pantothenic acid 12 mg, Mn 90 mg,
Zn 72 mg, Fe 60 mg, Cu 10 mg, Iodine 1.2 mg
diets were prepared (Table 1) as per Bureau of Indian
Standards (BIS, 1992). Cumulative body weight and
cumulative feed consumption were recorded weekly.
Blood samples were collected at the end of the
experiment from wing vein of birds in sterile tube and
serum was separated using centrifuge for estimation of
uric acid (mg/dl), creatinine (mg/dl), total protein (g/dl),
albumin (g/dl), globulin (mg/L), alanine aminotransferase
(ALT) (IU/L), aspartate aminotransferase (AST) (IU/
L), triglycerides (mg/dl), total cholesterol (mg/dl) and
high density lipoprotein (HDL). At the end of
experiment, three birds from each replicate were
selected randomly and slaughtered ethically by
mechanical stunning followed by exsanguinities to
study the dressing percentage, breast percentage,
drumstick percentage and abdomen fat percentage.
Data were analysed using completely randomized
design with one way analysis of variance as per the
procedures of Snedecor and Cochran (1989) using
statistical analysis system (IBM SPSS Version 20.0 for
windows).
RESULTS AND DISCUSSION
Cumulative body weight at 1st, 3rd, 5thand 6th week
of age was different (P<0.05) among three groups (Table
2). During first week of age, emulsifier included
treatment groups (T2 and T
3) had shown significantly
higher body weight (188.14 g and 181.44 g) as
compared to body weight of 172.78 g in birds fed
basal diet (T1). There was no significant difference in
body weight of chicks among three groups during 2nd
of week of age. At 6th week of age highest body weight
was recorded in T2 group (2622 g), followed by T
3 (2558
g) and T1
(2502 g) group, which agreed favourably
with results of Zollistsch et al. (1997) who reported
better body weight in birds fed soyabean oil added with
emulsifier as compared to blend of vegetable oil and
animal fat.
Cumulative feed intake was similar (Table 2)
among the treatment groups but numerically lowered
feed intake was noticed in T3 group at 6th week of age,
whereas cumulative feed conversion ratio was
different (P<0.05) among the treatment groups.
Srinivasan et al.,
Indian J. Anim. Nutr. 2020. 37 (1): 74-77
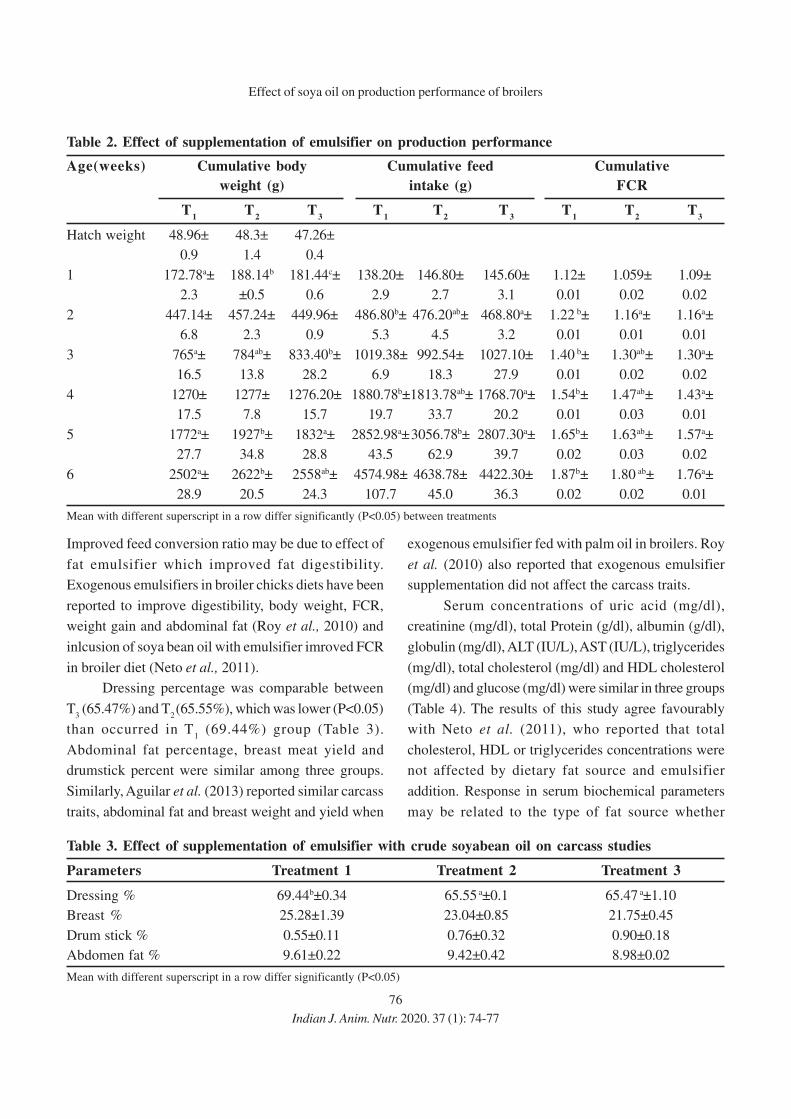
76
Improved feed conversion ratio may be due to effect of
fat emulsifier which improved fat digestibility.
Exogenous emulsifiers in broiler chicks diets have been
reported to improve digestibility, body weight, FCR,
weight gain and abdominal fat (Roy et al., 2010) and
inlcusion of soya bean oil with emulsifier imroved FCR
in broiler diet (Neto et al., 2011).
Dressing percentage was comparable between
T3 (65.47%) and T
2 (65.55%), which was lower (P<0.05)
than occurred in T1 (69.44%) group (Table 3).
Abdominal fat percentage, breast meat yield and
drumstick percent were similar among three groups.
Similarly, Aguilar et al. (2013) reported similar carcass
traits, abdominal fat and breast weight and yield when
exogenous emulsifier fed with palm oil in broilers. Roy
et al. (2010) also reported that exogenous emulsifier
supplementation did not affect the carcass traits.
Serum concentrations of uric acid (mg/dl),
creatinine (mg/dl), total Protein (g/dl), albumin (g/dl),
globulin (mg/dl), ALT (IU/L), AST (IU/L), triglycerides
(mg/dl), total cholesterol (mg/dl) and HDL cholesterol
(mg/dl) and glucose (mg/dl) were similar in three groups
(Table 4). The results of this study agree favourably
with Neto et al. (2011), who reported that total
cholesterol, HDL or triglycerides concentrations were
not affected by dietary fat source and emulsifier
addition. Response in serum biochemical parameters
may be related to the type of fat source whether
Table 2. Effect of supplementation of emulsifier on production performance
Age(weeks) Cumulative body Cumulative feed Cumulative
weight (g) intake (g) FCR
T1
T2
T3
T1
T2
T3
T1
T2
T3
Hatch weight 48.96± 48.3± 47.26±
0.9 1.4 0.4
1 172.78a± 188.14b 181.44c± 138.20± 146.80± 145.60± 1.12± 1.059± 1.09±
2.3 ±0.5 0.6 2.9 2.7 3.1 0.01 0.02 0.02
2 447.14± 457.24± 449.96± 486.80b± 476.20ab± 468.80a± 1.22 b± 1.16a± 1.16a±
6.8 2.3 0.9 5.3 4.5 3.2 0.01 0.01 0.01
3 765a± 784ab± 833.40b± 1019.38± 992.54± 1027.10± 1.40 b± 1.30ab± 1.30a±
16.5 13.8 28.2 6.9 18.3 27.9 0.01 0.02 0.02
4 1270± 1277± 1276.20± 1880.78b±1813.78ab± 1768.70a± 1.54b± 1.47ab± 1.43a±
17.5 7.8 15.7 19.7 33.7 20.2 0.01 0.03 0.01
5 1772a± 1927b± 1832a± 2852.98a±3056.78b± 2807.30a± 1.65b± 1.63ab± 1.57a±
27.7 34.8 28.8 43.5 62.9 39.7 0.02 0.03 0.02
6 2502a± 2622b± 2558ab± 4574.98± 4638.78± 4422.30± 1.87b± 1.80 ab± 1.76a±
28.9 20.5 24.3 107.7 45.0 36.3 0.02 0.02 0.01
Mean with different superscript in a row differ significantly (P<0.05) between treatments
Table 3. Effect of supplementation of emulsifier with crude soyabean oil on carcass studies
Parameters Treatment 1 Treatment 2 Treatment 3
Dressing % 69.44b±0.34 65.55 a±0.1 65.47 a±1.10
Breast % 25.28±1.39 23.04±0.85 21.75±0.45
Drum stick % 0.55±0.11 0.76±0.32 0.90±0.18
Abdomen fat % 9.61±0.22 9.42±0.42 8.98±0.02
Mean with different superscript in a row differ significantly (P<0.05)
Indian J. Anim. Nutr. 2020. 37 (1): 74-77
Effect of soya oil on production performance of broilers
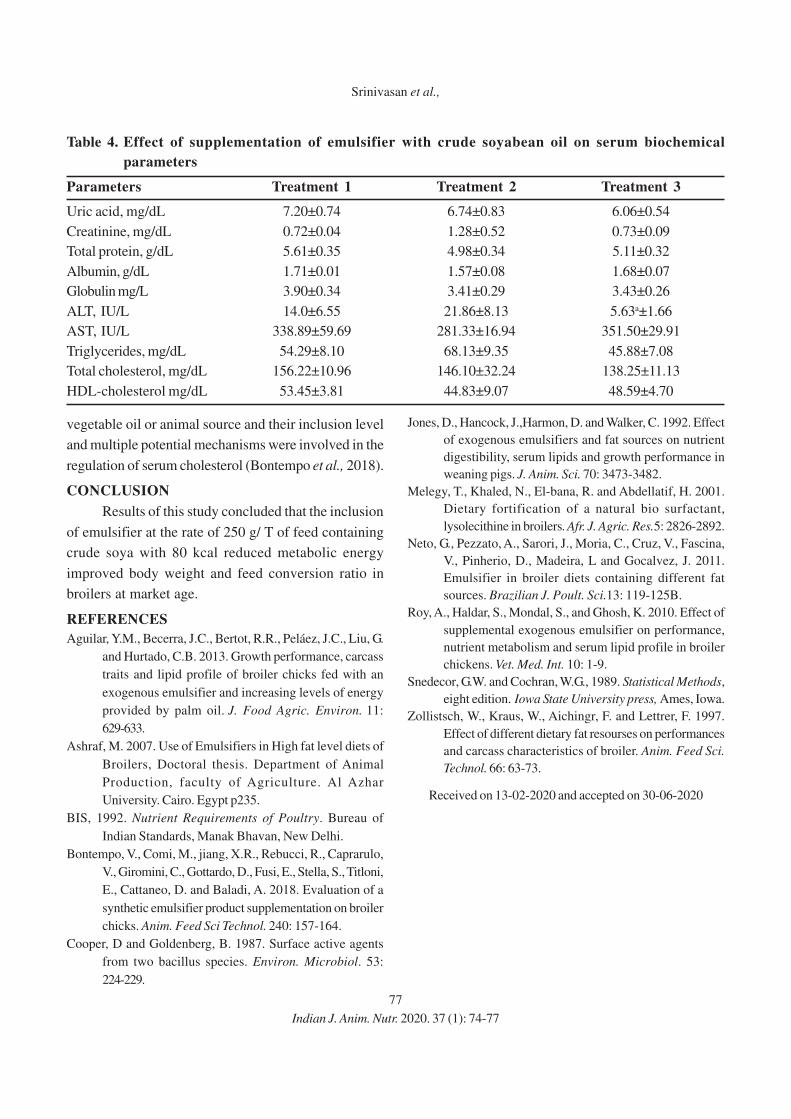
77
Table 4. Effect of supplementation of emulsifier with crude soyabean oil on serum biochemical
parameters
Parameters Treatment 1 Treatment 2 Treatment 3
Uric acid, mg/dL 7.20±0.74 6.74±0.83 6.06±0.54
Creatinine, mg/dL 0.72±0.04 1.28±0.52 0.73±0.09
Total protein, g/dL 5.61±0.35 4.98±0.34 5.11±0.32
Albumin, g/dL 1.71±0.01 1.57±0.08 1.68±0.07
Globulin mg/L 3.90±0.34 3.41±0.29 3.43±0.26
ALT, IU/L 14.0±6.55 21.86±8.13 5.63a±1.66
AST, IU/L 338.89±59.69 281.33±16.94 351.50±29.91
Triglycerides, mg/dL 54.29±8.10 68.13±9.35 45.88±7.08
Total cholesterol, mg/dL 156.22±10.96 146.10±32.24 138.25±11.13
HDL-cholesterol mg/dL 53.45±3.81 44.83±9.07 48.59±4.70
vegetable oil or animal source and their inclusion level
and multiple potential mechanisms were involved in the
regulation of serum cholesterol (Bontempo et al., 2018).
CONCLUSION
Results of this study concluded that the inclusion
of emulsifier at the rate of 250 g/ T of feed containing
crude soya with 80 kcal reduced metabolic energy
improved body weight and feed conversion ratio in
broilers at market age.
REFERENCES
Aguilar, Y.M., Becerra, J.C., Bertot, R.R., Peláez, J.C., Liu, G.
and Hurtado, C.B. 2013. Growth performance, carcass
traits and lipid profile of broiler chicks fed with an
exogenous emulsifier and increasing levels of energy
provided by palm oil. J. Food Agric. Environ. 11:
629-633.
Ashraf, M. 2007. Use of Emulsifiers in High fat level diets of
Broilers, Doctoral thesis. Department of Animal
Production, faculty of Agriculture. Al Azhar
University. Cairo. Egypt p235.
BIS, 1992. Nutrient Requirements of Poultry. Bureau of
Indian Standards, Manak Bhavan, New Delhi.
Bontempo, V., Comi, M., jiang, X.R., Rebucci, R., Caprarulo,
V., Giromini, C., Gottardo, D., Fusi, E., Stella, S., Titloni,
E., Cattaneo, D. and Baladi, A. 2018. Evaluation of a
synthetic emulsifier product supplementation on broiler
chicks. Anim. Feed Sci Technol. 240: 157-164.
Cooper, D and Goldenberg, B. 1987. Surface active agents
from two bacillus species. Environ. Microbiol. 53:
224-229.
Jones, D., Hancock, J.,Harmon, D. and Walker, C. 1992. Effect
of exogenous emulsifiers and fat sources on nutrient
digestibility, serum lipids and growth performance in
weaning pigs. J. Anim. Sci. 70: 3473-3482.
Melegy, T., Khaled, N., El-bana, R. and Abdellatif, H. 2001.
Dietary fortification of a natural bio surfactant,
lysolecithine in broilers. Afr. J. Agric. Res.5: 2826-2892.
Neto, G., Pezzato, A., Sarori, J., Moria, C., Cruz, V., Fascina,
V., Pinherio, D., Madeira, L and Gocalvez, J. 2011.
Emulsifier in broiler diets containing different fat
sources. Brazilian J. Poult. Sci.13: 119-125B.
Roy, A., Haldar, S., Mondal, S., and Ghosh, K. 2010. Effect of
supplemental exogenous emulsifier on performance,
nutrient metabolism and serum lipid profile in broiler
chickens. Vet. Med. Int. 10: 1-9.
Snedecor, G.W. and Cochran, W.G., 1989. Statistical Methods,
eight edition. Iowa State University press, Ames, Iowa.
Zollistsch, W., Kraus, W., Aichingr, F. and Lettrer, F. 1997.
Effect of different dietary fat resourses on performances
and carcass characteristics of broiler. Anim. Feed Sci.
Technol. 66: 63-73.
Received on 13-02-2020 and accepted on 30-06-2020
Srinivasan et al.,
Indian J. Anim. Nutr. 2020. 37 (1): 74-77
78
Indian Journal of
Animal Nutrition
Effect of Supplementation of Geloi (Tinospora Cordifolia) Stem Powder
and Ascorbic Acid on Economics of Broiler Production in
Arid Zone of Rajasthan
D. Jain1*, R.K. Dhuria2, T. Sharma3, T. Bothra4 and Umesh Kumar Prajapat5
Department of Animal Nutrition, CVAS, RAJUVAS, Bikaner-334 001 Rajasthan, India
ABSTRACT
A 42 day feeding trial was carried out to investigate the effect of dietary addition of graded levels of
Tinospora cordifolia stem powder with or without ascorbic acid on economics of broiler production using
360 one-day-old broiler chicks in 5×2 factorial experiment within a completely randomized design and divided
into ten (10) dietary treatments groups (T1-T
10) in triplicate of twelve chicks per replicate. Environmental stress
was observed during feeding trial as ambient temperature and THI were recorded on higher side than
the threshold level during the entire experimental period. The findings of comparative economics of broiler
production indicated that addition of Geloi at graded levels and ascorbic acid alone or in combinations reduced
the overall cost of feed per kg gain as compared to control but maximum reduction in overall cost of feed per kg
gain was obtained in T7 treatment group containing 0.25% of Geloi supplemented with ascorbic acid i.e. 11.03%
reduction.
Key words: Ascorbic acid, Broiler, Economics, Tinospora cordifolia
*Corresponding author- Assistant Professor, Department of Animal Nutrition, College of Veterinary and Animal Science, Bikaner;*Corresponding author Email: [email protected]; Mob. 8003300472; 1Assistant Professor, Animal Nutrition, College of Veterinary and
Animal Science, Bikaner, Rajasthan, India; 2Profeesor and Head Department of Animal Nutrition, College of Veterinary and Animal Science,
Bikaner, Rajasthan, India; 3Professor and Head Department of Animal Nutrition, College of Veterinary and Animal Science, Navania,
Udaipur, Rajasthan, India; 4Assistant Professor, Livestock Production and Management, College of Veterinary and Animal Science, Bikaner,
Rajasthan, India
INTRODUCTION
Feed is a major component, affecting net
return from the poultry industry, as 80% of the total
expenditure in terms of cash is spent on feed purchase
(Khan et al., 2010). Recent trend in broiler production
is to provide feed containing the feed additives to
improve efficiency and get maximum returns in
shortest possible time. Various types of feed additives
such as antibiotics, enzymes, hormones, prebiotics,
probiotics, herbal products etc., are being used as
growth stimulants in poultry production.Tinospora
cordifolia (Geloi) is a herbal plant and has promising
properties as plant growth promoter (Raina et al., 2013),
with potential benefits in poultry. T.cordifolia contains
various phenolics, alkaloids, steroids, glycosides,
diterpenoid lactones, polysaccharides and aliphatic
compounds(Sharma et al., 2013).Vitamin-C is a white
to yellow-tinged crystalline powder. Under normal
conditions, poultry can synthesize vitamin C within their
body but endogenous synthesis may not be enough to
provide the full need of poultry at all times, especially
the need of this vitamin may increase during heat stress
(Lin et al., 2006). The addition of ascorbic acid to
the diet of bird improves the immune response during
heat stress (Zahraa, 2008).Therefore, the present
investigation was planned to evaluate the comparative
economy of supplementation of graded levels Tinospora
cordifolia with or without ascorbic acid in poultry birds
in arid zone of Rajasthan (India).
MATERIALS AND METHODS
A 42-days duration feeding trial was carried out
at the poultry farm of College of Veterinary and Animal
Science (CVAS), Bikaner, Rajasthan. Three hundred
sixty (360) experimental day-old-broiler chicks were
equally and randomly divided into ten (10) dietary
treatments groups (T1-T
10) and each dietary group was
replicated to three (3) sub-groups (R1-R
3) to make sure
uniformly in various treatment groups.Tinospora
cordifolia (Geloi) stem powder at graded levels and
ascorbic acid were supplemented in basal broiler starter
Indian J. Anim. Nutr. 2020. 37 (1): 78-81
doi: 10.5958/2231-6744.2020.00014.6
Indian J. Anim. Nutr. 2020. 37 (1): 78-81
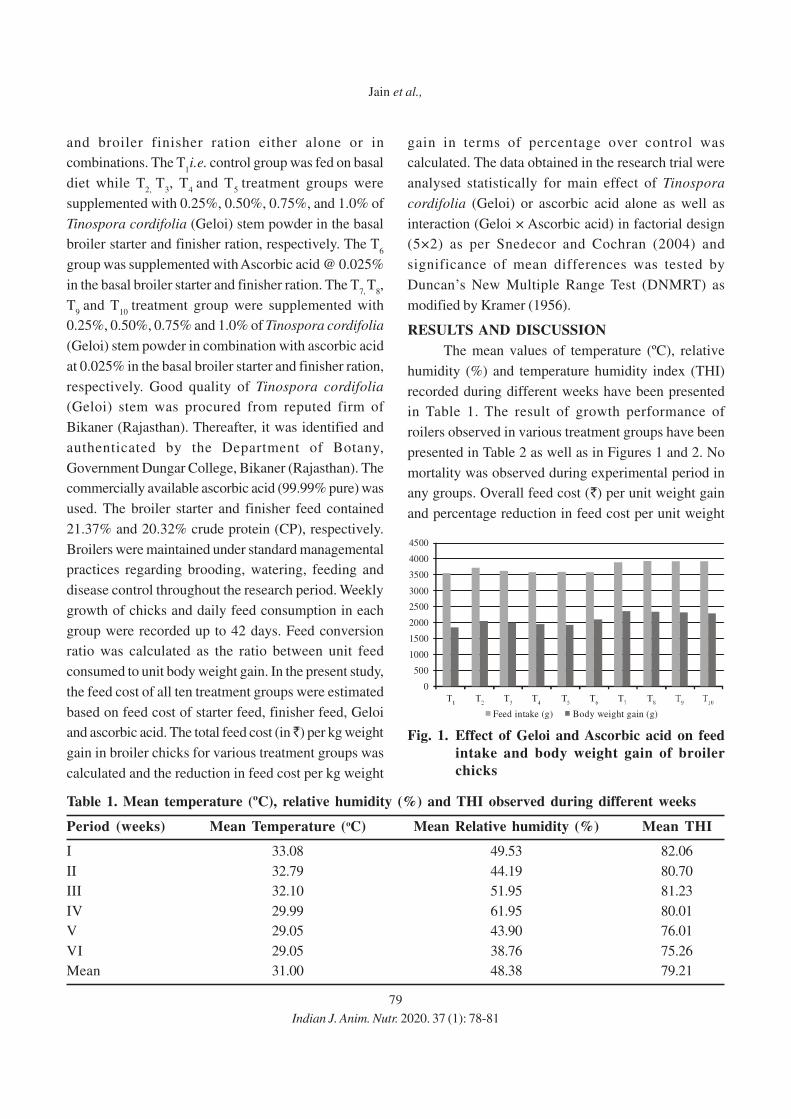
79
and broiler finisher ration either alone or in
combinations. The T1i.e. control group was fed on basal
diet while T2,
T3, T
4 and T
5 treatment groups were
supplemented with 0.25%, 0.50%, 0.75%, and 1.0% of
Tinospora cordifolia (Geloi) stem powder in the basal
broiler starter and finisher ration, respectively. The T6
group was supplemented with Ascorbic acid @ 0.025%
in the basal broiler starter and finisher ration. The T7,
T8,
T9
and T10
treatment group were supplemented with
0.25%, 0.50%, 0.75% and 1.0% of Tinospora cordifolia
(Geloi) stem powder in combination with ascorbic acid
at 0.025% in the basal broiler starter and finisher ration,
respectively. Good quality of Tinospora cordifolia
(Geloi) stem was procured from reputed firm of
Bikaner (Rajasthan). Thereafter, it was identified and
authenticated by the Department of Botany,
Government Dungar College, Bikaner (Rajasthan). The
commercially available ascorbic acid (99.99% pure) was
used. The broiler starter and finisher feed contained
21.37% and 20.32% crude protein (CP), respectively.
Broilers were maintained under standard managemental
practices regarding brooding, watering, feeding and
disease control throughout the research period. Weekly
growth of chicks and daily feed consumption in each
group were recorded up to 42 days. Feed conversion
ratio was calculated as the ratio between unit feed
consumed to unit body weight gain. In the present study,
the feed cost of all ten treatment groups were estimated
based on feed cost of starter feed, finisher feed, Geloi
and ascorbic acid. The total feed cost (in ̀ ) per kg weight
gain in broiler chicks for various treatment groups was
calculated and the reduction in feed cost per kg weight
gain in terms of percentage over control was
calculated. The data obtained in the research trial were
analysed statistically for main effect of Tinospora
cordifolia (Geloi) or ascorbic acid alone as well as
interaction (Geloi × Ascorbic acid) in factorial design
(5×2) as per Snedecor and Cochran (2004) and
significance of mean differences was tested by
Duncan’s New Multiple Range Test (DNMRT) as
modified by Kramer (1956).
RESULTS AND DISCUSSION
The mean values of temperature (ºC), relative
humidity (%) and temperature humidity index (THI)
recorded during different weeks have been presented
in Table 1. The result of growth performance of
roilers observed in various treatment groups have been
presented in Table 2 as well as in Figures 1 and 2. No
mortality was observed during experimental period in
any groups. Overall feed cost (`) per unit weight gain
and percentage reduction in feed cost per unit weight
Table 1. Mean temperature (ºC), relative humidity (%) and THI observed during different weeks
Period (weeks) Mean Temperature (oC) Mean Relative humidity (%) Mean THI
I 33.08 49.53 82.06
II 32.79 44.19 80.70
III 32.10 51.95 81.23
IV 29.99 61.95 80.01
V 29.05 43.90 76.01
VI 29.05 38.76 75.26
Mean 31.00 48.38 79.21
Fig. 1. Effect of Geloi and Ascorbic acid on feed
intake and body weight gain of broiler
chicks
Feed intake (g) Body weight gain (g)
4500
4000
3500
3000
2500
2000
1500
1000
500
0
Indian J. Anim. Nutr. 2020. 37 (1): 78-81
Jain et al.,
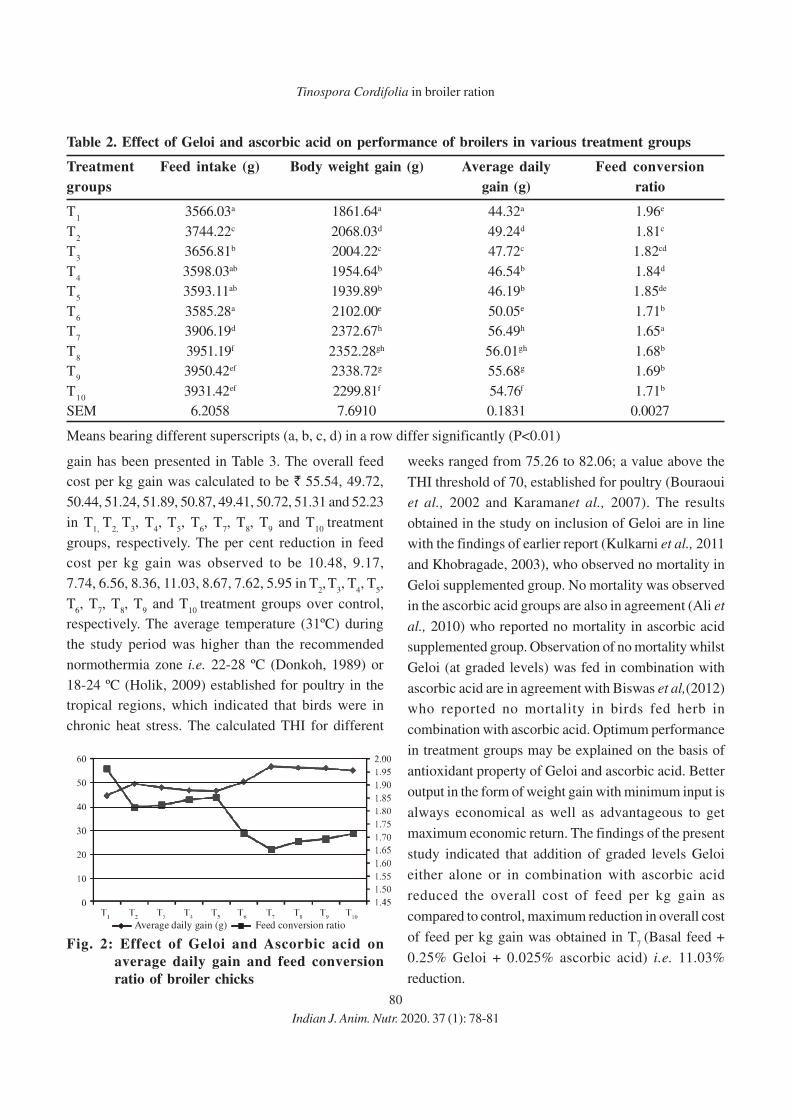
80
gain has been presented in Table 3. The overall feed
cost per kg gain was calculated to be ` 55.54, 49.72,
50.44, 51.24, 51.89, 50.87, 49.41, 50.72, 51.31 and 52.23
in T1,
T2,
T3, T
4, T
5, T
6, T
7, T
8, T
9 and T
10 treatment
groups, respectively. The per cent reduction in feed
cost per kg gain was observed to be 10.48, 9.17,
7.74, 6.56, 8.36, 11.03, 8.67, 7.62, 5.95 in T2, T
3, T
4, T
5,
T6, T
7, T
8, T
9 and T
10 treatment groups over control,
respectively. The average temperature (31ºC) during
the study period was higher than the recommended
normothermia zone i.e. 22-28 ºC (Donkoh, 1989) or
18-24 ºC (Holik, 2009) established for poultry in the
tropical regions, which indicated that birds were in
chronic heat stress. The calculated THI for different
weeks ranged from 75.26 to 82.06; a value above the
THI threshold of 70, established for poultry (Bouraoui
et al., 2002 and Karamanet al., 2007). The results
obtained in the study on inclusion of Geloi are in line
with the findings of earlier report (Kulkarni et al., 2011
and Khobragade, 2003), who observed no mortality in
Geloi supplemented group. No mortality was observed
in the ascorbic acid groups are also in agreement (Ali et
al., 2010) who reported no mortality in ascorbic acid
supplemented group. Observation of no mortality whilst
Geloi (at graded levels) was fed in combination with
ascorbic acid are in agreement with Biswas et al,(2012)
who reported no mortality in birds fed herb in
combination with ascorbic acid. Optimum performance
in treatment groups may be explained on the basis of
antioxidant property of Geloi and ascorbic acid. Better
output in the form of weight gain with minimum input is
always economical as well as advantageous to get
maximum economic return. The findings of the present
study indicated that addition of graded levels Geloi
either alone or in combination with ascorbic acid
reduced the overall cost of feed per kg gain as
compared to control, maximum reduction in overall cost
of feed per kg gain was obtained in T7
(Basal feed +
0.25% Geloi + 0.025% ascorbic acid) i.e. 11.03%
reduction.
Table 2. Effect of Geloi and ascorbic acid on performance of broilers in various treatment groups
Treatment Feed intake (g) Body weight gain (g) Average daily Feed conversion
groups gain (g) ratio
T1
3566.03a 1861.64a 44.32a 1.96e
T2
3744.22c 2068.03d 49.24d 1.81c
T3
3656.81b 2004.22c 47.72c 1.82cd
T4
3598.03ab 1954.64b 46.54b 1.84d
T5
3593.11ab 1939.89b 46.19b 1.85de
T6
3585.28a 2102.00e 50.05e 1.71b
T7
3906.19d 2372.67h 56.49h 1.65a
T8
3951.19f 2352.28gh 56.01gh 1.68b
T9
3950.42ef 2338.72g 55.68g 1.69b
T10
3931.42ef 2299.81f 54.76f 1.71b
SEM 6.2058 7.6910 0.1831 0.0027
Means bearing different superscripts (a, b, c, d) in a row differ significantly (P<0.01)
Average daily gain (g) Feed conversion ratio
Fig. 2: Effect of Geloi and Ascorbic acid on
average daily gain and feed conversion
ratio of broiler chicks
Indian J. Anim. Nutr. 2020. 37 (1): 78-81
Tinospora Cordifolia in broiler ration
81
CONCLUSIONS
Addition of Tinospora cordifolia (Geloi) stem
powder either alone or in combination with ascorbic
acid in broiler ration reduced the cost of feed per kg
gain, the best response was obtained when basal diet
was supplemented with 0.25% Geloi and 0.025%
ascorbic acid. Thus, it would be beneficial to
incorporate Geloi at 0.25% along with ascorbic acid at
0.025% in the diets of broilers reared under arid
climatic condition.
REFERENCES
Ali, M. T., Howlider, M. A. R., Azad, A. K. and Rahman, M. S.
2010. Vitamin C and electrolyte supplementation to
support growth and meat yield of broilers in a hot
humid environment. J. Bangla. Agri. Uni. 8: 57-60.
Biswas, P., Sharma, R. K. and Biswas, A. 2012. Effect
of dietary supplementation of Ashwagandha
(Withaniasomnifera) and ascorbic acid on production
performance of broiler birds. Indian J. Poult. Sci. 47:
403-405.
Bouraoui, R., Lahmar, M., Majdoub, A., Djemali, M. N. and
Belyea, R. 2002. The relationship of temperature-
humidity index with milk production of dairy cows in
a Mediterranean climate. Anim. Res. 51: 479-491.
Donkoh, A. 1989. Ambient temperature: A factor affecting
performance and physiological response of broiler
chicken. Int. J. Biometeorol. 33: 259-265.
Holik, V. 2009. Management of laying hens to minimize heat
stress. Lohmann Inf. 44: 16-29.
Karaman, S., Tarhan, S. and Ergunes, G. 2007. Analysis of
indoor climatic data to assess the heat stress for
laying hens. Int. J. Nat. Eng. Sci.1: 65-68.
Khan, R. U., Durrani, F. R., Chand, N. and Anwar, H. 2010.
Influence of feed supplementation with Cannabis
sativa on quality of broilers carcass. Pak. Vet. J. 30:
34-38.
Khobragade 2003. Effect of feed supplementation of
medicinal plants Tinospora cordifolia and
Leptadenia reticulate on performance of broiler.
M.V.Sc. Dissertation. Maharashtra Animal and
Fishery Sciences University, Nagpur, India.
Kramer, C. Y. 1956. Extension of multiple range tests to group
means with unequal numbers of replications.
Biometrics. 12: 307-310.
Kulkarni, R. C., Mandal, A. B., Munj, C. P., Dan, A., Saxena, A.
and Tyagi, P. K. 2011. Response of coloured broilers to
dietary addition of Geloi (Tinospora cordifolia)
during extreme summer. Indian J. Poult. Sci. 46: 70-74.
Lin, H., Jiao, H. C., Buyse, J. and Decuypere, E. 2006.
Strategies for preventing heat stress in poultry. World’s
Poult. Sci. J. 62: 71-86.
Raina, M. T. N., Arora, M. and Madan, S. 2013.
Standardization and evaluation of formulation
parameters of Tinospora cordifolia tablet. J. Adv.
Pharm. Edu. Res.3: 440-449.
Sharma, P., Velu, V., Indrani, D. and Singh, R. P. 2013. Effect
of dried guduchi (Tinospora cordifolia) leaf
powder on rheological, organoleptic and nutritional
characteristics of cookies. Food Res. Int. 50: 704-709.
Snedecor, G.W. and Cochran, W.G. 2004. Statistical Methods.
8th ed., Oxford and IBH publishing company, Kolkata.
Zahraa, H. 2008. Effects of commutative heat stress on
immune responses in broiler chickens reared in
closed system. Int. J. Poult. Sci. 7: 964-968.
Table 3. Percentage reduction in feed cost per unit weight gain in various treatment groups
Treatment Total feed cost Total gain (Kg) Overall cost/kg % Overall reduction
groups ( `̀̀̀̀) gain in `̀̀̀̀ in feed cost/kg gain
T1
103.39 1.86 55.54
T2
102.82 2.07 49.72 10.48
T3
101.10 2.00 50.44 9.17
T4
100.15 1.95 51.24 7.74
T5
100.66 1.94 51.89 6.56
T6
106.94 2.10 50.87 8.39
T7
117.24 2.37 49.41 11.03
T8
119.31 2.35 50.72 8.67
T9
119.99 2.34 51.31 7.62
T10
120.13 2.30 52.23 5.95
Indian J. Anim. Nutr. 2020. 37 (1): 78-81
Jain et al.,
Received on 17-06-2020 and accepted on 02-07-2020
82
Indian Journal of
Animal Nutrition
Utilization of Plant Based Attractants in Labeo rohita Advanced Fingerlings Diet
P. Singh*, J. Mahintamani and J. MaityDepartment of Fishery Sciences, Vidyasagar University,
Midnapore-721 102, Paschim Medinipur, West Bengal, India
ABSTRACT
Feed attractants are the substances which are added in trace amount in a diet to enhance the overall
palatability and dry matter intake of feed. A 30 day experiment was conducted to study the efficacy of plant
based attractants in the feed of Labeo rohita advanced fingerlings (average weight 17.0±0.05 g) and 10
fingerlings were stocked in duplicate for each dietary treatment. The initial body weight of the fish of each
group was non-significant (P>0.05). The diet was formulated with rice bran, mustard oil cake, fish meal, vitamin
and mineral mixture, binder along with 1% of different feed attractants and different feeds were named as F1
(Control), F2 (Ekangi, Kaempferia galanga), F
3 (Kharboj, Cucumis melo) and F
4 (Marigold, Tagetes patula).
The net weight gain were 2.53±0.23, 4.16±0.15, 5.50±0.4 and 2.41±0.35 (g/30 days) respectively in F1 to F
4.
The water quality such as dissolved oxygen, pH and temperature ranged from 5.5-6.5 mg/l, 7.2-7.4 and 30.50-
32.0°C respectively during the experimental period in treatment groups. The growth study with different
attractants revealed that the final weight, net weight gain, specific growth rate, daily growth co-efficient was
significantly (P<0.05) higher in F3 having 1% kharboj. However, Feed conversion ratio was (P>0.05) lower in F
3
having kharboj as feed attractants. Thus, from the present experiment it may be concluded that F3 having
1% kharboj performed better in terms of growth performance and feed intake in Labeo rohita advanced
fingerlings vis-a-vis other feed treatments.
Key words: Ekangi, Growth, kharboj, Labeo rohita, Marigold
Indian J. Anim. Nutr. 2020. 37 (1): 82-86
doi: 10.5958/2231-6744.2020.00015.8
attractant activity of different herbs is species and age
specific in case of Indian Major Carps. Oliveira and
Cyrino (2004) reported that attractants can improve
acceptability of artificial diets by fry and fingerlings,
increasing intake of unpalatable feeds and improving
growth rate, while reducing feeding time and feeding
wastes. Lee and Mayer (1996) reported that
supplementation of artificial diets with attractants can
increase acceptability and consumption of low palatable
diet which ultimately enhance the growth rate and
productivity. The main objective of the present study
was to evaluate efficacy of different plant attractants
on rohu diet, so that the economically available local
materials can be utilized as feed attractants in
aquaculture.
Four different diets were formulated with rice
bran, mustard oil cake, fish meal, vitamin and mineral
mixture along with different plant based attractants
(Table 1 and 2). The control diet was named as F1
(control diet). Three experimental diets having 1% level
*Corresponding author E-Mail: [email protected]
Among all animals, fish are one of the most
sensitive to tastes. Feed attractants are added in trace
amounts in the fish diets to enhance feed intake and to
fulfill the nutrient requirement (Harpaz, 1997). The
primary mode of feed detection by fish is through
olfaction or sight Paul, 1996. Dietary feeding
stimulants are essential to enhance feed intake by
fish. Feed attractants are applied either internally or
externally in the formulated feed. This approach draws
the animal towards the feed and helps to initiate feed
consumption. Many types of small molecular weight
compounds are being investigated as potential feed
attractants for various fish species used in aquaculture.
These compounds include organic acids, sugars,
aldehydes, alcohols, amines, hydrocarbons,
nucleotides, nucleosides, betaine and free amino acids
(Kasumyan and Doving, 2003). Uses of various
plant-based attractants have been tried in a preliminary
study in Indian Major Carps as reported earlier by
Venkateshwarlu et al. (2009). They reported that
SHORT COMMUNICATION
Indian J. Anim. Nutr. 2020. 37 (1): 82-86
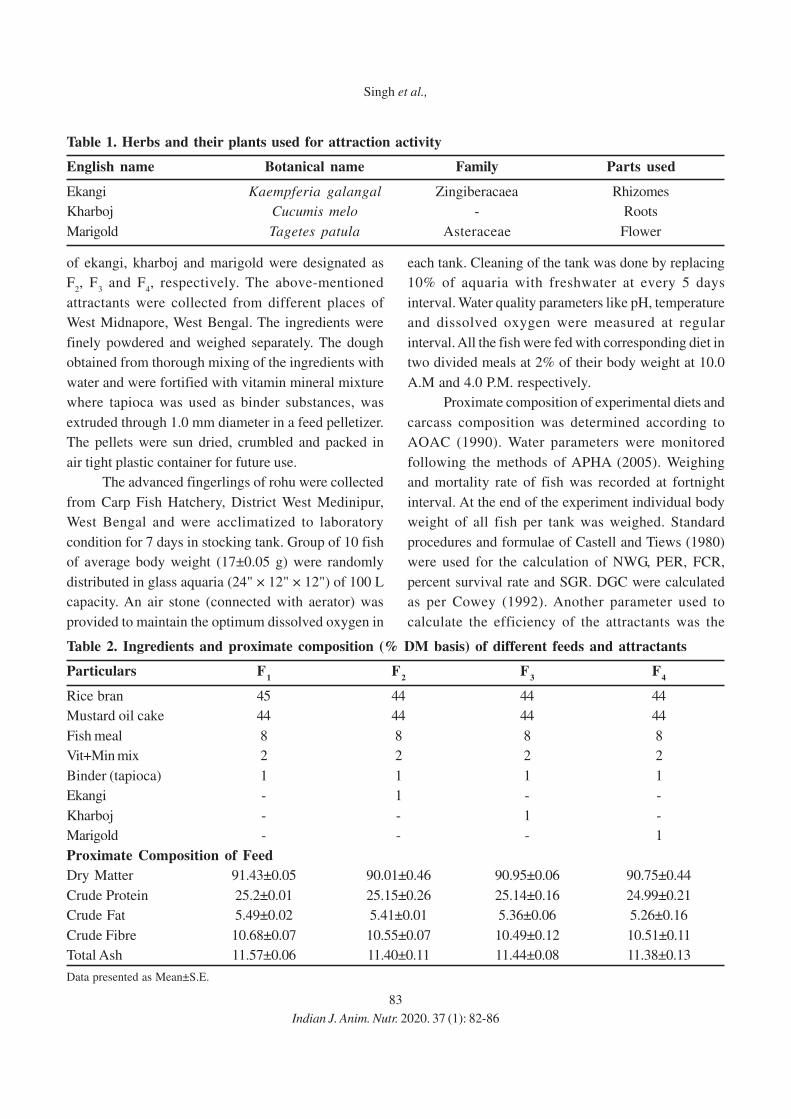
83
of ekangi, kharboj and marigold were designated as
F2, F
3 and F
4, respectively. The above-mentioned
attractants were collected from different places of
West Midnapore, West Bengal. The ingredients were
finely powdered and weighed separately. The dough
obtained from thorough mixing of the ingredients with
water and were fortified with vitamin mineral mixture
where tapioca was used as binder substances, was
extruded through 1.0 mm diameter in a feed pelletizer.
The pellets were sun dried, crumbled and packed in
air tight plastic container for future use.
The advanced fingerlings of rohu were collected
from Carp Fish Hatchery, District West Medinipur,
West Bengal and were acclimatized to laboratory
condition for 7 days in stocking tank. Group of 10 fish
of average body weight (17±0.05 g) were randomly
distributed in glass aquaria (24" × 12" × 12") of 100 L
capacity. An air stone (connected with aerator) was
provided to maintain the optimum dissolved oxygen in
each tank. Cleaning of the tank was done by replacing
10% of aquaria with freshwater at every 5 days
interval. Water quality parameters like pH, temperature
and dissolved oxygen were measured at regular
interval. All the fish were fed with corresponding diet in
two divided meals at 2% of their body weight at 10.0
A.M and 4.0 P.M. respectively.
Proximate composition of experimental diets and
carcass composition was determined according to
AOAC (1990). Water parameters were monitored
following the methods of APHA (2005). Weighing
and mortality rate of fish was recorded at fortnight
interval. At the end of the experiment individual body
weight of all fish per tank was weighed. Standard
procedures and formulae of Castell and Tiews (1980)
were used for the calculation of NWG, PER, FCR,
percent survival rate and SGR. DGC were calculated
as per Cowey (1992). Another parameter used to
calculate the efficiency of the attractants was the
Table 1. Herbs and their plants used for attraction activity
English name Botanical name Family Parts used
Ekangi Kaempferia galangal Zingiberacaea Rhizomes
Kharboj Cucumis melo - Roots
Marigold Tagetes patula Asteraceae Flower
Table 2. Ingredients and proximate composition (% DM basis) of different feeds and attractants
Particulars F1
F2
F3
F4
Rice bran 45 44 44 44
Mustard oil cake 44 44 44 44
Fish meal 8 8 8 8
Vit+Min mix 2 2 2 2
Binder (tapioca) 1 1 1 1
Ekangi - 1 - -
Kharboj - - 1 -
Marigold - - - 1
Proximate Composition of Feed
Dry Matter 91.43±0.05 90.01±0.46 90.95±0.06 90.75±0.44
Crude Protein 25.2±0.01 25.15±0.26 25.14±0.16 24.99±0.21
Crude Fat 5.49±0.02 5.41±0.01 5.36±0.06 5.26±0.16
Crude Fibre 10.68±0.07 10.55±0.07 10.49±0.12 10.51±0.11
Total Ash 11.57±0.06 11.40±0.11 11.44±0.08 11.38±0.13
Data presented as Mean±S.E.
Indian J. Anim. Nutr. 2020. 37 (1): 82-86
Singh et al.,
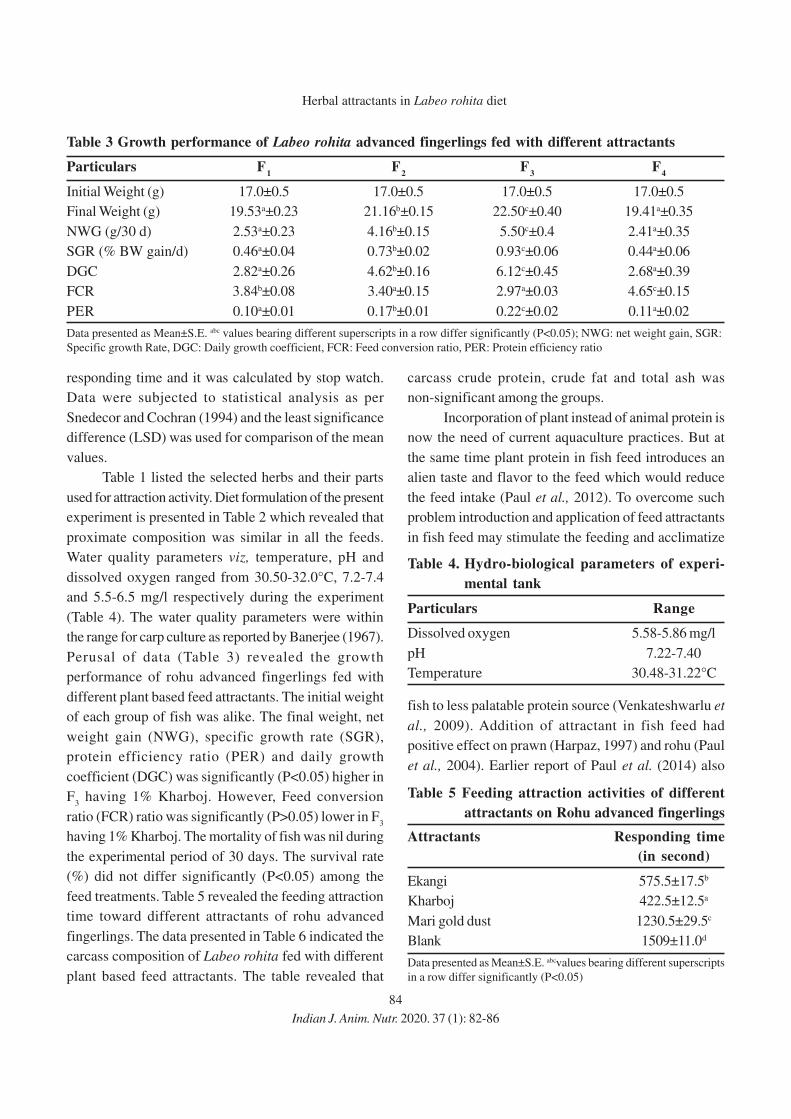
84
responding time and it was calculated by stop watch.
Data were subjected to statistical analysis as per
Snedecor and Cochran (1994) and the least significance
difference (LSD) was used for comparison of the mean
values.
Table 1 listed the selected herbs and their parts
used for attraction activity. Diet formulation of the present
experiment is presented in Table 2 which revealed that
proximate composition was similar in all the feeds.
Water quality parameters viz, temperature, pH and
dissolved oxygen ranged from 30.50-32.0°C, 7.2-7.4
and 5.5-6.5 mg/l respectively during the experiment
(Table 4). The water quality parameters were within
the range for carp culture as reported by Banerjee (1967).
Perusal of data (Table 3) revealed the growth
performance of rohu advanced fingerlings fed with
different plant based feed attractants. The initial weight
of each group of fish was alike. The final weight, net
weight gain (NWG), specific growth rate (SGR),
protein efficiency ratio (PER) and daily growth
coefficient (DGC) was significantly (P<0.05) higher in
F3 having 1% Kharboj. However, Feed conversion
ratio (FCR) ratio was significantly (P>0.05) lower in F3
having 1% Kharboj. The mortality of fish was nil during
the experimental period of 30 days. The survival rate
(%) did not differ significantly (P<0.05) among the
feed treatments. Table 5 revealed the feeding attraction
time toward different attractants of rohu advanced
fingerlings. The data presented in Table 6 indicated the
carcass composition of Labeo rohita fed with different
plant based feed attractants. The table revealed that
carcass crude protein, crude fat and total ash was
non-significant among the groups.
Incorporation of plant instead of animal protein is
now the need of current aquaculture practices. But at
the same time plant protein in fish feed introduces an
alien taste and flavor to the feed which would reduce
the feed intake (Paul et al., 2012). To overcome such
problem introduction and application of feed attractants
in fish feed may stimulate the feeding and acclimatize
fish to less palatable protein source (Venkateshwarlu et
al., 2009). Addition of attractant in fish feed had
positive effect on prawn (Harpaz, 1997) and rohu (Paul
et al., 2004). Earlier report of Paul et al. (2014) also
Table 3 Growth performance of Labeo rohita advanced fingerlings fed with different attractants
Particulars F1
F2
F3
F4
Initial Weight (g) 17.0±0.5 17.0±0.5 17.0±0.5 17.0±0.5
Final Weight (g) 19.53a±0.23 21.16b±0.15 22.50c±0.40 19.41a±0.35
NWG (g/30 d) 2.53a±0.23 4.16b±0.15 5.50c±0.4 2.41a±0.35
SGR (% BW gain/d) 0.46a±0.04 0.73b±0.02 0.93c±0.06 0.44a±0.06
DGC 2.82a±0.26 4.62b±0.16 6.12c±0.45 2.68a±0.39
FCR 3.84b±0.08 3.40a±0.15 2.97a±0.03 4.65c±0.15
PER 0.10a±0.01 0.17b±0.01 0.22c±0.02 0.11a±0.02
Data presented as Mean±S.E. abc values bearing different superscripts in a row differ significantly (P<0.05); NWG: net weight gain, SGR:
Specific growth Rate, DGC: Daily growth coefficient, FCR: Feed conversion ratio, PER: Protein efficiency ratio
Table 4. Hydro-biological parameters of experi-
mental tank
Particulars Range
Dissolved oxygen 5.58-5.86 mg/l
pH 7.22-7.40
Temperature 30.48-31.22°C
Table 5 Feeding attraction activities of different
attractants on Rohu advanced fingerlings
Attractants Responding time
(in second)
Ekangi 575.5±17.5b
Kharboj 422.5±12.5a
Mari gold dust 1230.5±29.5c
Blank 1509±11.0d
Data presented as Mean±S.E. abcvalues bearing different superscripts
in a row differ significantly (P<0.05)
Indian J. Anim. Nutr. 2020. 37 (1): 82-86
Herbal attractants in Labeo rohita diet
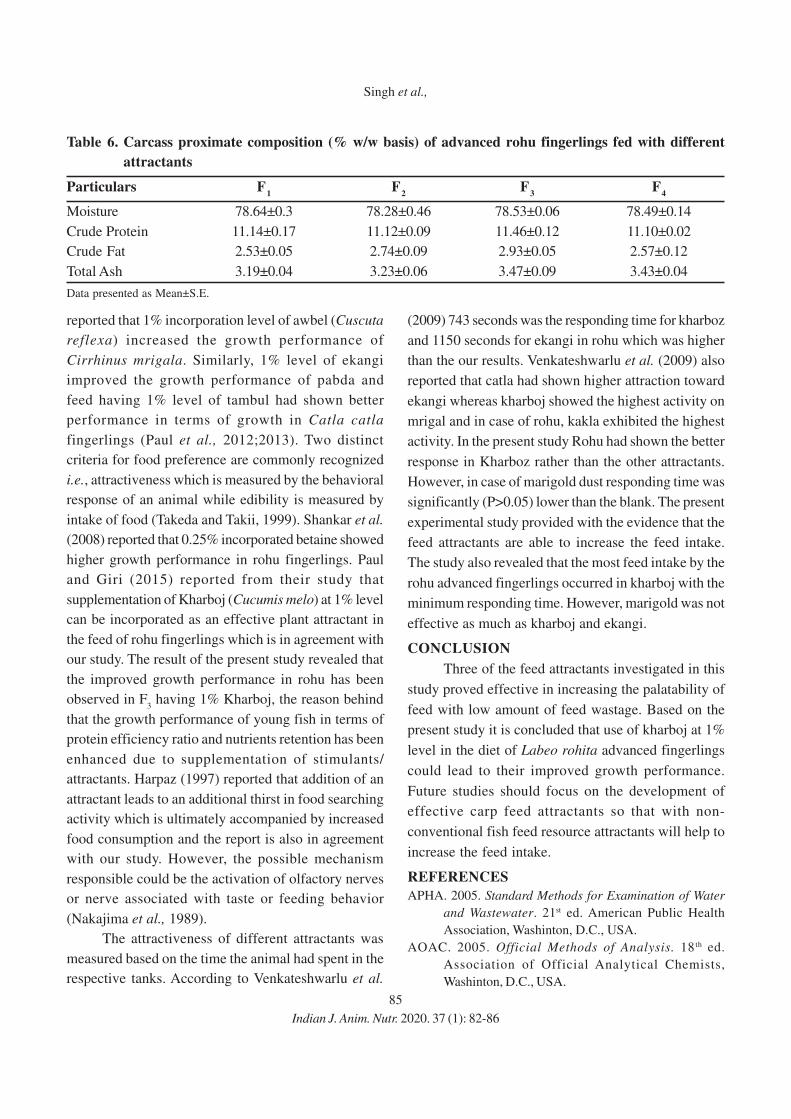
85
reported that 1% incorporation level of awbel (Cuscuta
reflexa) increased the growth performance of
Cirrhinus mrigala. Similarly, 1% level of ekangi
improved the growth performance of pabda and
feed having 1% level of tambul had shown better
performance in terms of growth in Catla catla
fingerlings (Paul et al., 2012;2013). Two distinct
criteria for food preference are commonly recognized
i.e., attractiveness which is measured by the behavioral
response of an animal while edibility is measured by
intake of food (Takeda and Takii, 1999). Shankar et al.
(2008) reported that 0.25% incorporated betaine showed
higher growth performance in rohu fingerlings. Paul
and Giri (2015) reported from their study that
supplementation of Kharboj (Cucumis melo) at 1% level
can be incorporated as an effective plant attractant in
the feed of rohu fingerlings which is in agreement with
our study. The result of the present study revealed that
the improved growth performance in rohu has been
observed in F3 having 1% Kharboj, the reason behind
that the growth performance of young fish in terms of
protein efficiency ratio and nutrients retention has been
enhanced due to supplementation of stimulants/
attractants. Harpaz (1997) reported that addition of an
attractant leads to an additional thirst in food searching
activity which is ultimately accompanied by increased
food consumption and the report is also in agreement
with our study. However, the possible mechanism
responsible could be the activation of olfactory nerves
or nerve associated with taste or feeding behavior
(Nakajima et al., 1989).
The attractiveness of different attractants was
measured based on the time the animal had spent in the
respective tanks. According to Venkateshwarlu et al.
(2009) 743 seconds was the responding time for kharboz
and 1150 seconds for ekangi in rohu which was higher
than the our results. Venkateshwarlu et al. (2009) also
reported that catla had shown higher attraction toward
ekangi whereas kharboj showed the highest activity on
mrigal and in case of rohu, kakla exhibited the highest
activity. In the present study Rohu had shown the better
response in Kharboz rather than the other attractants.
However, in case of marigold dust responding time was
significantly (P>0.05) lower than the blank. The present
experimental study provided with the evidence that the
feed attractants are able to increase the feed intake.
The study also revealed that the most feed intake by the
rohu advanced fingerlings occurred in kharboj with the
minimum responding time. However, marigold was not
effective as much as kharboj and ekangi.
CONCLUSION
Three of the feed attractants investigated in this
study proved effective in increasing the palatability of
feed with low amount of feed wastage. Based on the
present study it is concluded that use of kharboj at 1%
level in the diet of Labeo rohita advanced fingerlings
could lead to their improved growth performance.
Future studies should focus on the development of
effective carp feed attractants so that with non-
conventional fish feed resource attractants will help to
increase the feed intake.
REFERENCES
APHA. 2005. Standard Methods for Examination of Water
and Wastewater. 21st ed. American Public Health
Association, Washinton, D.C., USA.
AOAC. 2005. Official Methods of Analysis. 18 th ed.
Association of Official Analytical Chemists,
Washinton, D.C., USA.
Table 6. Carcass proximate composition (% w/w basis) of advanced rohu fingerlings fed with different
attractants
Particulars F1
F2
F3
F4
Moisture 78.64±0.3 78.28±0.46 78.53±0.06 78.49±0.14
Crude Protein 11.14±0.17 11.12±0.09 11.46±0.12 11.10±0.02
Crude Fat 2.53±0.05 2.74±0.09 2.93±0.05 2.57±0.12
Total Ash 3.19±0.04 3.23±0.06 3.47±0.09 3.43±0.04
Data presented as Mean±S.E.
Indian J. Anim. Nutr. 2020. 37 (1): 82-86
Singh et al.,
86
Banerjee, S.M. 1967. Water quality and soil conditions of fish
ponds in some states of India in relation to fish
production. Indian J. Fish. 14: 115-125.
Castell, J. D. and Tiews, K. 1980. Report of the EIFAC, IUNS
and ICES Working Group on Standardization of
Methodology in Fish Nutrition Research. EIFAC/T36,
EIFA/FAO,pp.24.
Cowey, C.B. 1992. Nutrition: estimating requirements of
rainbow trout. Aquaculture. 100: 177-189.
Harpaz, S. 1997. Enhancement of growth in juvenile
freshwater prawn, Macrobrachium rosenbergii
through the use of chemoattract. Aquaculture. 150:
221-227.
Kasumyan, A.O., Doving, K.B. 2003. Taste preferences in
fishes. Fish and Fisheries. 4: 289-347.
Lee P.G. and Meyers, S. 1996. Chemo attraction and feeding
stimulation in crustacean. Aquacult. Nutr. 2: 157-164.
Nakajima, K., Uchidaa, A. and Ishida, Y. 1989. A new feeding
attractant, dimethyl-â-propiothetin, for freshwater fish.
Nippon Suisan Gakk. 55: 689-695.
Oliveira, A.M.B.M.S. and Cyrino, J.E.P. 2004. Attractants
in plant protein-based diets for the carnivorous
Largemouth Bass Micropterus salmonides. Scientia
Agricola. 61: 326-331.
Paul, B.N., Nandi, S., Sarkar, S. and Mukhopadhyay, P.K. 1997.
Effect of feeding unconventional animal protein
sources on the nitrogen metabolism in Rohu Labeo
rohita Hamilton). Israeli J. Aquaculture-Bamidgeh.
49: 183-192.
Paul, B.N., Sarkar, S., Mukhopadhyay, P.K. and Mohanty, S.N.
2004. Effect of dietary attractant on feed utilization
and growth of Rohu, Labeo rohita (Ham.) fry. Anim
Nutr Feed Technol. 4: 145-152.
Paul, B.N., Das, S., Giri, S.S. and Mukhopadhyay, P.K. 2012.
Effect of plant based attractants on growth and feed
utilization in Ompok pabda (Siluridae) fry. Indian J.
Anim Nutr. 29: 169-173.
Paul, B.N. and Giri, S.S. 2013. Utilization of plant based
attractants in Catla catla fingerlings. Indian J. Anim.
Nutr. 30: 400-403.
Paul, B.N., Pandey, B.K. and Giri, S.S. 2014. Effect of plant
based attractants on growth of Cirrhinus mrigala
fingerlings. Anim. Nutr. Feed Technnol. 14: 393-398.
Paul, B.N. and Giri, S.S. 2015. Evaluation of plant based
attractants in the diets of Labeo rohita fingerlings.
Anim. Nutr. Feed Technol. 15: 289-294.
Shankar, R., Murthy, S., Pavadi, P. and Thanuja, K. 2008.
Effect of betaine as a feed attractant on growth,
survival, and feed utilization in fingerlings of the
Indian major carp, Labeo rohita. The Israeli J. Aquac
- Bamidgeh. 60: 95-99.
Snedecor, G. W. and Cochran, W. G. 1994. Statistical
Methods.8th Ed. Oxford and IBH Publishing CO. Pvt.
Ltd., New Delhi.
Takeda, M. and Takii, K. 1992. Gestation and nutrition in fishes:
application to aquaculture, in: Fish Chemoreception
edited by Hara, TJ, (Chapman & Hall London, UK),
1992, 271.
Venkateshwarlu, G., Muralidhar, A.P, Rathod, R., Palak., 2009
Plant traditionally used in fish harvest & angling
potential feed attractants in aquaculture. Indian J.
Traditional Knowl. 8: 539-542.
Indian J. Anim. Nutr. 2020. 37 (1): 82-86
Herbal attractants in Labeo rohita diet
Received on 17-06-2020 and accepted on 27-06-2020
Style
The Journal uses spellings according to the latest
edition of Oxford or Chamber’s Dictionary. All
measurements must be given in SI units. Abbreviations
should be used sparingly and only where they ease the
reader’s task by reducing repetition of long technical
terms. Initially, use the word in full followed by the
abbreviation in parentheses. Thereafter, use the
abbreviation. Upon its first use in the title, abstract and
text, the common name of a species should be followed
by the scientific name (Genus, species and authority) in
parentheses. However, for well-known species, the
scientific name may be omitted from the article title. If
no common name exists in English, the scientific name
should only be used. At the first mention of a chemical
substance, give the generic name only. The words like
in vivo, in vitro, et al., ad lib. etc. should be in italics.
Trade names should not be used or avoided. Drugs
should be referred to by their generic names rather than
brand names.
Parts of the manuscript
Manuscripts should be presented in the following
order: (i) TITLE PAGE, (ii) ABSTRACT and Key
words (iii) INTRODUCTION (iv) MATERIALS AND
METHODS (v) RESULTS AND DISCUSSION (vi)
CONCLUSION (vii) ACKNOWLEDGEMENT (s) if
any (viii) REFERENCES (ix) TABLES (each table
complete with title and footnotes) and (viii) FIGURE
LEGENDS and FIGURES. Except Title, all the major
heads may be typed in CAPITAL LETTERS.
Title page
The title page should contain (i) the title of the
paper MAY BE TYPED IN TITLE CASE (Capitalise
each word except helping verbs) along with SHORT
TITLE (ii) the full names of the authors (iii) the
addresses of the institutions where the work was carried
out together with (iv) the full postal and e-mail address
plus facsimile and telephone numbers of the author to
whom correspondence should be made. The title should
be short, informative and contain the major key words.
The title should be as: Feed Intake, Growth and Blood
Parameters in Sahiwal Female Calves Varying in
Residual Feed Intake
Abstract and key words
Articles must have a structured abstract that states
in within 300 words, the purpose, basic procedures, main
findings and principal conclusions of the study. Abstract
Guidelines for author (s)
Indian Journal of Animal Nutrition (IJAN)Submission of manuscripts
Manuscripts should be written so that these are
intelligible to professional readers. The Editor or the
Publisher reserves the right to modify typescripts to
eliminate ambiguity, repetition and improve
communication between author (s) and readers. If
extensive alterations are required, the manuscript will
be returned to the authors for revision.
Types of articles
The journal accepts original research papers,
review papers, short communications and book reviews.
Covering letter
Manuscripts are accepted for publication in the
Journal with the understanding that the contents have
not been published or submitted for publication
elsewhere. This must be stated in the covering letter.
Any experiments involving animals must be demonstrated
to be ethically acceptable for animal usage in research.
Acceptance
The acceptance criteria for all manuscripts are the
quality and originality of the research and its significance
to our readership. Except where otherwise stated,
manuscripts are peer reviewed by one/two anonymous
reviewers. Final acceptance or rejection rests with the
Editorial Board, the Chief Editor being the final authority.
Submission
The original manuscript should be submitted online at
http://epubs.icar.org.in/ejournal/index.php/IJAN/
about/submissions#onlineSubmissions
For further details, please contact
Dr. Asit Das
Chief Editor, Indian Journal Animal Nutrition
Animal Nutrition Division
National Dairy Research Institute Karnal-132001
Haryana, India
E-mail: [email protected]
If a manuscript is returned to the author for revision, it
must be resubmitted within three weeks. Please do not
forget to mention the manuscript number in all
correspondences.
Main format
Submission should be typed in double space using
MS word format (Windows 2007). The top, bottom and
side margins should be 30 mm All the pages should be
numbered consecutively in the bottom of right-hand
corner beginning with the title page.
Raising Animal Productivity to Improve Farm
Economy” (Chander Datt, A.K. Tyagi, H.H.
Savsani, Nitin Tyagi, Sachin Kumar, J.A. Chavda,
Raman Malik and N.K. Ribadiya; eds.) held at
Junagadh Agricultural University, Junagadh, Gujarat
from Feb. 1-3, 2018. p 71.
Electronic Publications
FDA. 2001. Effect of the use of antimicrobials in food-
producing animals on pathogen load: Systematic
review of the published literature. http://
www.fda.gov/cvm/ antimicrobial/PathRpt. PDF,
Accessed Dec.14, 2001.
Faciola, A.P. and Broderick, G.A. 2013. Effects of
feeding lauric acid on ruminal protozoa numbers,
fermentation, digestion and on milk production in
dairy cows. J. Anim. Sci. DOI: 10.2527/jas.2012-
5169.
Tables
Tables should be self-contained and should not
duplicate the information contained in the text. Tables
should be numbered consecutively in Arabic numerals.
Each table should be presented on a separate sheet of
A4 paper with a comprehensive but concise legend above
the table. Tables should be brief with units of
measurement in parentheses; all abbreviations should
be defined in footnotes. Footnote symbols: 1, 2, 3, should
be used (in that order) and *, ** should be reserved for
P-values. The table and its legends/footnotes should be
understandable without reference to the text.
Figures
All illustrations (line drawings and photographs)
are classified as figures. Figures should be cited in
consecutive order in the text. Figures should be sized to
fit within the column (82 mm), intermediate (110 mm)
or the full text width (17 mm). Graphics should be
prepared using applications capable of generating high
resolution, i.e. GIF, TIFF, JPEG or PPT format before
pasting in the MS word manuscript file.
Figure legends
Legends should be self-explanatory and typed on
a separate sheet. The legend should incorporate
definitions of any symbols used and all abbreviations
and units of measurement should be explained so that
the figure and its legend is understandable without
reference to the text. (Authors must provide a letter
stating that copyright authorization has been obtained if
figures have been reproduced from another source).
should not contain abbreviations or references. Five or
fewer key words (for the purpose of indexing) should
be given below the abstract.
References
In the text, give the author’s name followed by the
year in parentheses: Sharma (2000). If there are two
authors use ‘and’: Sharma and Mudgal (2001); but if
cited within parentheses: (Sharma and Mudgal, 2001).
When reference is made to a work by three or more
authors, the first name followed by et al. should be used:
Thakur et al. (2002). In the list, references should be
listed in alphabetical order. Cite the name of all authors.
Reference to unpublished data and personal
communications should not appear in the list but should
be cited in the text only (e.g. Smith, A., 2000, unpublished
data). The latest relevant references should only be
cited.
Books and Articles within Edited Books
AOAC. 2005. Official Methods of Analysis. 18th edn.
Association of Official Analytical Chemists.
Washington, D.C., USA.
NRC. 2001. Nutrient Requirements of Dairy Cattle.
7th rev. edn. National Academiey of Sciences.
National Academy Press, Washington, D.C., USA.
Handbooks, Technical Bulletins, Theses and
Dissertations
Goering, H.K. and Van Soest, P.J. 1970. Forage Fiber
Analyses (Apparatus, Reagents, Procedures and
Some Applications). Agric. Handbook No. 379.
ARS-USDA, Washington, D.C., USA.
Kumar, A. 2011. Efficacy of Pentasulphate Mixture
and Arsenic in Alleviating Chronic Selenosis
and Expression of Glutathione Peroxidase
Genes in Buffaloes. M.V.Sc. Dissertation. ICAR-
National Dairy Research Institute (Deemed
University), Karnal-132001, Haryana, India.
Journal Articles and Abstracts
Chander Datt, Datta, M. and Singh, N.P. 2008.
Assessment of fodder quality of leaves of
multipurpose trees in subtropical humid climate of
India. J. Forestry Res. 19: 209-214.
Conference Proceedings
Akash Mishra, Chander Datt, Sawati Shivani, Veena
Mani, Goutam Kaul, A.K. Mohanty and Avinesh
Sharma. 2018. Effect of supplementation of nano
zinc on in vitro rumen fermentation parameters.
In: “Proc. XVII Biennial Animal Nutrition
Conference on Nutritional Challenges for
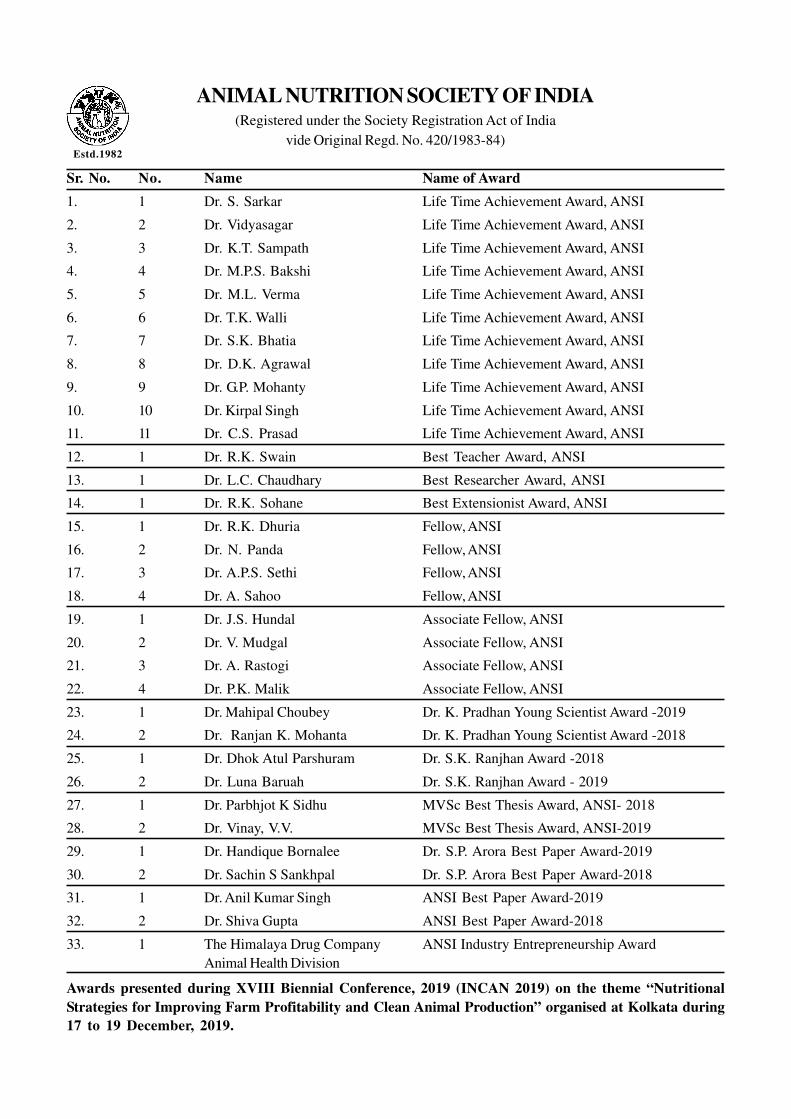
Sr. No. No. Name Name of Award
1. 1 Dr. S. Sarkar Life Time Achievement Award, ANSI
2. 2 Dr. Vidyasagar Life Time Achievement Award, ANSI
3. 3 Dr. K.T. Sampath Life Time Achievement Award, ANSI
4. 4 Dr. M.P.S. Bakshi Life Time Achievement Award, ANSI
5. 5 Dr. M.L. Verma Life Time Achievement Award, ANSI
6. 6 Dr. T.K. Walli Life Time Achievement Award, ANSI
7. 7 Dr. S.K. Bhatia Life Time Achievement Award, ANSI
8. 8 Dr. D.K. Agrawal Life Time Achievement Award, ANSI
9. 9 Dr. G.P. Mohanty Life Time Achievement Award, ANSI
10. 10 Dr. Kirpal Singh Life Time Achievement Award, ANSI
11. 11 Dr. C.S. Prasad Life Time Achievement Award, ANSI
12. 1 Dr. R.K. Swain Best Teacher Award, ANSI
13. 1 Dr. L.C. Chaudhary Best Researcher Award, ANSI
14. 1 Dr. R.K. Sohane Best Extensionist Award, ANSI
15. 1 Dr. R.K. Dhuria Fellow, ANSI
16. 2 Dr. N. Panda Fellow, ANSI
17. 3 Dr. A.P.S. Sethi Fellow, ANSI
18. 4 Dr. A. Sahoo Fellow, ANSI
19. 1 Dr. J.S. Hundal Associate Fellow, ANSI
20. 2 Dr. V. Mudgal Associate Fellow, ANSI
21. 3 Dr. A. Rastogi Associate Fellow, ANSI
22. 4 Dr. P.K. Malik Associate Fellow, ANSI
23. 1 Dr. Mahipal Choubey Dr. K. Pradhan Young Scientist Award -2019
24. 2 Dr. Ranjan K. Mohanta Dr. K. Pradhan Young Scientist Award -2018
25. 1 Dr. Dhok Atul Parshuram Dr. S.K. Ranjhan Award -2018
26. 2 Dr. Luna Baruah Dr. S.K. Ranjhan Award - 2019
27. 1 Dr. Parbhjot K Sidhu MVSc Best Thesis Award, ANSI- 2018
28. 2 Dr. Vinay, V.V. MVSc Best Thesis Award, ANSI-2019
29. 1 Dr. Handique Bornalee Dr. S.P. Arora Best Paper Award-2019
30. 2 Dr. Sachin S Sankhpal Dr. S.P. Arora Best Paper Award-2018
31. 1 Dr. Anil Kumar Singh ANSI Best Paper Award-2019
32. 2 Dr. Shiva Gupta ANSI Best Paper Award-2018
33. 1 The Himalaya Drug Company ANSI Industry Entrepreneurship Award
Animal Health Division
Estd.1982
Awards presented during XVIII Biennial Conference, 2019 (INCAN 2019) on the theme “Nutritional
Strategies for Improving Farm Profitability and Clean Animal Production” organised at Kolkata during
17 to 19 December, 2019.
ANIMAL NUTRITION SOCIETY OF INDIA(Registered under the Society Registration Act of India
vide Original Regd. No. 420/1983-84)
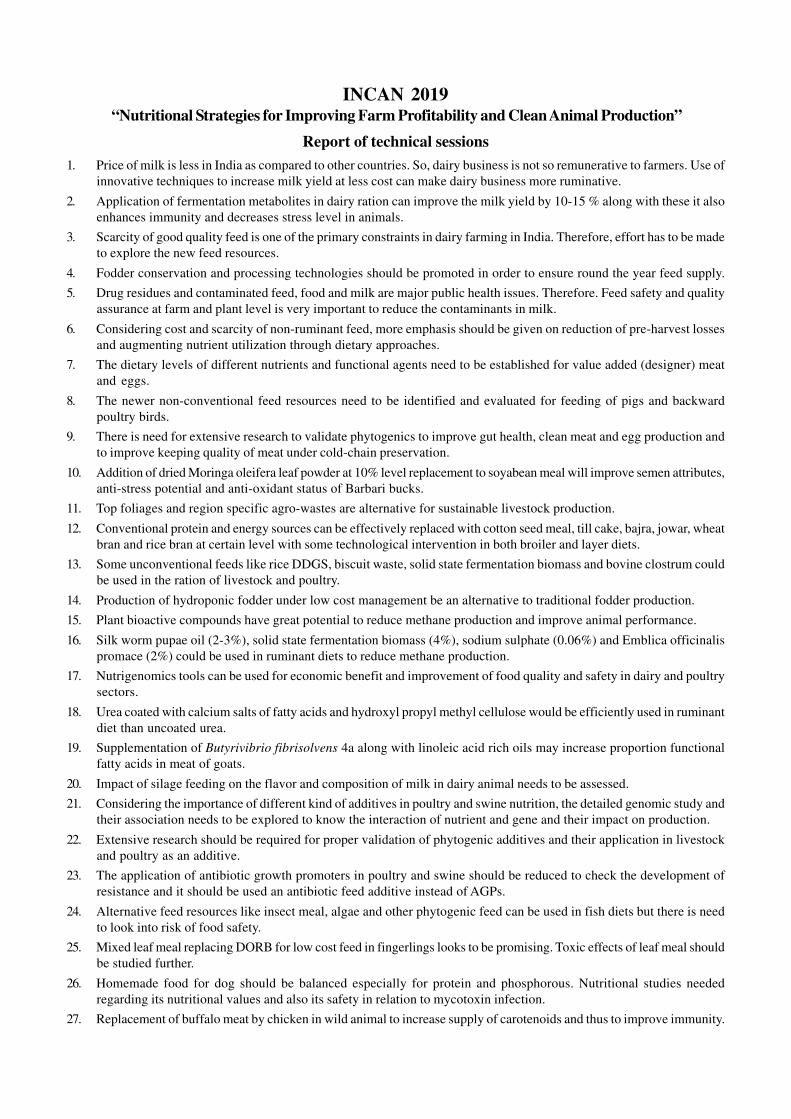
INCAN 2019 “Nutritional Strategies for Improving Farm Profitability and Clean Animal Production”
Report of technical sessions
1. Price of milk is less in India as compared to other countries. So, dairy business is not so remunerative to farmers. Use of
innovative techniques to increase milk yield at less cost can make dairy business more ruminative.
2. Application of fermentation metabolites in dairy ration can improve the milk yield by 10-15 % along with these it also
enhances immunity and decreases stress level in animals.
3. Scarcity of good quality feed is one of the primary constraints in dairy farming in India. Therefore, effort has to be made
to explore the new feed resources.
4. Fodder conservation and processing technologies should be promoted in order to ensure round the year feed supply.
5. Drug residues and contaminated feed, food and milk are major public health issues. Therefore. Feed safety and quality
assurance at farm and plant level is very important to reduce the contaminants in milk.
6. Considering cost and scarcity of non-ruminant feed, more emphasis should be given on reduction of pre-harvest losses
and augmenting nutrient utilization through dietary approaches.
7. The dietary levels of different nutrients and functional agents need to be established for value added (designer) meat
and eggs.
8. The newer non-conventional feed resources need to be identified and evaluated for feeding of pigs and backward
poultry birds.
9. There is need for extensive research to validate phytogenics to improve gut health, clean meat and egg production and
to improve keeping quality of meat under cold-chain preservation.
10. Addition of dried Moringa oleifera leaf powder at 10% level replacement to soyabean meal will improve semen attributes,
anti-stress potential and anti-oxidant status of Barbari bucks.
11. Top foliages and region specific agro-wastes are alternative for sustainable livestock production.
12. Conventional protein and energy sources can be effectively replaced with cotton seed meal, till cake, bajra, jowar, wheat
bran and rice bran at certain level with some technological intervention in both broiler and layer diets.
13. Some unconventional feeds like rice DDGS, biscuit waste, solid state fermentation biomass and bovine clostrum could
be used in the ration of livestock and poultry.
14. Production of hydroponic fodder under low cost management be an alternative to traditional fodder production.
15. Plant bioactive compounds have great potential to reduce methane production and improve animal performance.
16. Silk worm pupae oil (2-3%), solid state fermentation biomass (4%), sodium sulphate (0.06%) and Emblica officinalis
promace (2%) could be used in ruminant diets to reduce methane production.
17. Nutrigenomics tools can be used for economic benefit and improvement of food quality and safety in dairy and poultry
sectors.
18. Urea coated with calcium salts of fatty acids and hydroxyl propyl methyl cellulose would be efficiently used in ruminant
diet than uncoated urea.
19. Supplementation of Butyrivibrio fibrisolvens 4a along with linoleic acid rich oils may increase proportion functional
fatty acids in meat of goats.
20. Impact of silage feeding on the flavor and composition of milk in dairy animal needs to be assessed.
21. Considering the importance of different kind of additives in poultry and swine nutrition, the detailed genomic study and
their association needs to be explored to know the interaction of nutrient and gene and their impact on production.
22. Extensive research should be required for proper validation of phytogenic additives and their application in livestock
and poultry as an additive.
23. The application of antibiotic growth promoters in poultry and swine should be reduced to check the development of
resistance and it should be used an antibiotic feed additive instead of AGPs.
24. Alternative feed resources like insect meal, algae and other phytogenic feed can be used in fish diets but there is need
to look into risk of food safety.
25. Mixed leaf meal replacing DORB for low cost feed in fingerlings looks to be promising. Toxic effects of leaf meal should
be studied further.
26. Homemade food for dog should be balanced especially for protein and phosphorous. Nutritional studies needed
regarding its nutritional values and also its safety in relation to mycotoxin infection.
27. Replacement of buffalo meat by chicken in wild animal to increase supply of carotenoids and thus to improve immunity.