indian journal of animal nutrition
116
-
Upload
khangminh22 -
Category
Documents
-
view
3 -
download
0
Transcript of indian journal of animal nutrition

INDIAN JOURNAL OF ANIMAL NUTRITION(A quarterly publication)
EDITORIAL BOARD
Ashish Tyagi, University of Louisville, Louisville, United
States
Luisa Biondi, University of Catania, Catania, Italy
Dragan Sefer, Belgrade University Serbia, Serbia
Nurcan Cetinkaya, Turkey
Seyed Hadi Ebrahimi, Ferdowsi University of Mashhad,
Iran
Vinod Kumar Sidhu, DUVAS, Mathura, Uttar Pradesh
V.B. Chaturvedi, ICAR-IVRI, Izatnagar, Uttar Pradesh,
India
P.K. Nayak, ICAR-CARI, Bhubaneswar, Odisha
P.M. Chatterjee, West Bengal University of Animal and
Fishery Sciences, West Bengal
Goutam Mondal, ICAR-NDRI, Karnal, Haryana
K.C. Das, ICAR- CIFA, Mumbai, Maharashtra
Parimal Sardar, ICAR-CIFE, Mumbai, Maharashtra
A. Sahoo, Avikanagar, Rajasthan
B.N. Saikia, Assam
R.K. Swain, Bhubaneswar, Odisha
S.K. Mahanta, IGFRI, Jhansi, Uttar Pradesh
A.S. Mishra, ICAR, New Delhi
N.S. Maan, Hisar, Haryana
PUBLICATION MANAGEMENT
COMMITTEE
Asit Das, Karnal, Haryana - Chairman
A.K. Tyagi, Karnal, Haryana
T.K. Walli, Karnal, Haryana
R.C. Chopra, Karnal, Haryana
Bhupinder Singh, Karnal, Haryana
Veena Mani, Karnal, Haryana
S.V. Rama Rao, Hyderabad, Telangana
S.K. Verma, Hyderabad, Telangana
Raman Malik, Karnal, Haryana
Sachin Kumar, Karnal, Haryana
P. Vashan, Namakkal, Tamil Nadu
IJAN is supplied free of cost to members of ANSI
Life Membership of Animal Nutrition Society of
India
Membership
A person interested in the activities of the Society who
pays a lumpsum fee of Rs. 4000/- could become Life
Member of the Society. For students the life membership
fee is Rs. 2500/- subject to production of a proof from
his guide. A Life Member will have all the rights and
privileges of an Ordinary Member. The Life Membership
Fee of Foreign Members for SAARC countries is US $
100/- and NON SAARC countries is US $ 100/-
S. Category Amount
No. (Annual)
1 Government and Public Institution Rs. 6000/-
2 Agents fees including postage Rs. 7500/-
(1 year)
3 Benefactor members Rs. 25000/-
(for 10 years)
4 Sustaining members Rs. 25000/-
(for 10 years)
5 For SAARC countries USD 100/-
(postage extra)
6 For other countries USD 100/-
(postage extra)
All application forms and other communication may be
sent to the Secretary, Animal Nutrition Society of India,
Department of Animal Nutrition, Guru Angad Dev
Veterinary and Animal Sciences University, Ludhiana –
141004, Punjab. Bank drafts should be drawn in favour
of ‘Animal Nutrition Society of India’ payable at Karnal.
Email: [email protected]
The articles should be sent to Chief Editor using on line
facility (http://epubs.icar.org.in/ejournal index.php/
IJAN/about/submissions#online Submissions).
Chief Editor welcomes books for reviews; news items
etc.
Change of Address: May be communicated to The
Secretary as well as The Chief Editor.
CHIEF EDITOR
Asit Das, NDRI, Karnal, Haryana
EDITORS
P. Vasan Sachin Kumar Muneendra Kumar
Namakkal, Tamil Nadu Karnal, Haryana Mathura, Uttar Pradesh

Sustaining Member
New Life Members of ANSI
586. Vinus Rana
Chirya, Charhki Dadri, Haryana
M: 9728230866
e-mail: [email protected]
587. Anup Kumar Singh
NDRI, Karnal, Haryana India
e-mail: [email protected]
588. Ingle Vinayak Shivagi Rao
NDRI, Karnal, Haryana India
e-mail: [email protected]
589. Surej Joseph Bunglavan
CVAS, Pookode, Wayanad, India
e-mail: [email protected]
590. Yora Reena
NDRI, Karnal, Haryana, India
e-mail: [email protected]
SM1. Fermenta Biotech LimitedA-1501, Thane One, DIL Complex, Ghodbunder Road, Majiwada, Thane (West) 400 610, Maharashtra, India
Mobile: +91 98 92659914 | Email: [email protected] | Web: www.fermentabiotech.com
ACKNOWLEDGEMENTAnimal Nutrition Society of India puts on record its sincere thanks to Indian
Council of Agricultural Research, New Delhi for grant of financial support for
publication of IJAN
591. Rohit Gupta
KVK, Nurmahal, Jalandhar, Punjab, India
e-mail: [email protected]
592. Chandrasekar Seenivasan
Tamil Nadu, India
e-mail: [email protected]
593. Sarat Chandra Amaravadhi
PVNR Telangana Vet. Uni. Hyderabad, India
e-mail: [email protected]
594. B. Balamuralikrishnan
Tanjore, Tamil Nadu, India
e-mail: [email protected]
Ruminants
1. Spatial and Temporal Distribution of Microbes and Enzyme Activity in the Rumen of
Buffaloes
Payal Agarwal, Anju Kala, D.N. Kamra, Neeta Agarwal and L.C. Chaudhary
2. Rhythmic Alterations in Physiological Response, Growth Performance and Blood
Metabolites in Growing Hariana Cattle Fed on Ration Included with Different Levels
of Corn Silage
Ashwani Kumar Verma, Muneendra Kumar, Vinod Kumar, Raju Kushwaha,
Shalini Vaswani1, Avinash Kumar and Yajuvendra Singh
3. Effect of Supplementing Wet Distillers’ Grains with Solubles to Maize Silage Based
Diet on Performance of Growing Nellore Jodipi Ram Lambs
K. Naveena, A. Ravi, B. Devasena and S. Shakila
4. Effect of Feeding Solid-State Fermentation Biomass on Nutrients intake, Digestibility
and Microbial Protein Synthesis in Lactating Buffaloes
Kishan P. Patel, Shrikant B. Katole, P.R. Pandya, Srushti Patel and D. Srinivas Murty
5. Effect of Feeding Calf Starter Diets Containing Shrimp Waste Meal on Nutrient
Utilization in Murrah Buffalo Calves
K.V.N. Aruna, D. Srinivas Kumar, E. Raghava Rao and S. Jagadeeswara Rao
6. Effect of Solid- State Fermentation Biomass Supplementation to Mixed Substrate
on Digestibility and Methane Mitigation in vitro
Kishan P. Patel, Shrikant B. Katole, P.R. Pandya, K.K. Sorathia and Srushti Patel
7. Effect of Supplementing Conjugated Linoleic Acid Producing Bifidobacterial Strains
on In vitro Rumen Fermentation Attributes
Neeru Jaglan, Sachin Kumar, Prasanta Kumar Choudhury, Bhawna Tyagi,
P.S. Banakar, Nitin Tyagi and Amrish Kumar Tyagi
Non-Ruminants
8. Augmenting Feeding Value of Rice Gluten Meal through Dietary Addition of Enzymes
in Broilers
O.P. Dinani, Pramod Kumar Tyagi, A.B. Mandal, Praveen Kumar Tyagi and
Narayan Dutta
9. Effect of Feeding Graded Levels of Guava Leaf Meal on Performance and Economics
of Broiler Chicks
M.I. Daing, A.K. Pathak, R.K. Sharma and M.A. Zargar
10. Effect of Feed Restriction and Garlic Supplementation on Growth Performance,
Nutrient Utilization and Meat Quality in Female Broiler
Vishavdeep Singh, Udeybir Singh and A.P.S. Sethi
INDIAN JOURNAL OF ANIMAL NUTRITION
(www.indianjournals.com; www.ansi.org.in; http://epubs.icar.org.in/ejournal/index.php/IJAN)
June, 2020 Vol. 37 #2
CONTENTS
87
95
106
115
121
127
132
138
143
152
11. Effect of Eugenia jambolana and Psidium guajava Leaf Meal Mixture
Supplementation on Antioxidant Indices and Immune Responses in Broiler Chicks
M.A. Zargar, A.K. Pathak, R.K. Sharma and M.I. Daing
12. Effect of Replacement of Maize by Animal Fat on Growth and Nutrient Utilization of
Growing Large White Yorkshire Pigs
N. Elanchezhian and K. Ally
13. Effect of Feeding Different Levels of Rice Distillers Dried Grains with Soluble
(RDDGS) on Performance of Broiler
Niharika Singh, Meenu Dubey, Raina Doneria, M.K. Gendley, O.P. Dinani and
R.C. Ramteke
14. Effect of Organic Copper, Zinc and Manganese Supplementation on Growth, Immunity
and Hatchability of Egg in Japanese Quail (Coturnix coturnix japonica)
A.K. Satapathy, S.K. Das, K. Sethy, R. K Swain, S.K. Mishra, K. Behera and
S. Pati
15. Effect of Feeding Probiotics and Milk Powder Supplemented Creep Ration on the
Growth Performance and Efficiency of Feed Utilization in Pre-weaning Piglets
Monica Tissopi, J.P. Bordoloi, Jakir Hussain, H. F. Ahmed and Rajib Kro
Short communication
16. Effect of Graded Levels of Broken Rice on Egg Quality of White Pekin Ducks During
Second Year of Laying
P. K. Naik, B. K. Swain, S. K. Sahoo, D. Kumar and S. K. Mishra
158
167
172
179
185
191
87
Indian Journal of
Animal Nutrition
Spatial and Temporal Distribution of Microbes and Enzyme Activity
in the Rumen of Buffaloes
Payal Agarwal, Anju Kala*, D.N. Kamra, Neeta Agarwal and L.C. Chaudhary
Animal Nutrition Division, ICAR-Indian Veterinary Research Institute,
Izatnagar-243 122, UP, India
ABSTRACT
Information about abundance of rumen microbes is a prerequisite to assess the fermentation in rumen
during any dietary intervention. However, conventional techniques are not able to enumerate majority of
microbes as majority of rumen microbes are uncultivable. Real time PCR (qPCR) has successfully been used for
quantification of various rumen microbes like rumen cellulolytic bacteria, protozoa, fungi, methanogens etc. In
this experiment, the whole rumen content (WRC) was squeezed to particulate matter (PM) and squeezed rumen
liquor (SL), whereas, the fourth fraction, strained rumen liquor (SRL) of rumen content was obtained by filtering
through a probe with double layer of muslin cloth. The population of total bacteria, fungi, Ruminococcus albus,
R. flavefaciens, Fibrobacter succinogenes, total methanogens, Butyrivibrio fibrisolvens and protozoa were
estimated in different fractions of rumen content at 0, 4 and 8 h post-feeding by real time PCR using specific
primers. The numbers of these microbes were significantly (P<0.001) higher in WRC and PM as compared to
SRL and RL. The activities of carboxymethylcellulase (CMCase), avicelase, amylase, xylanase, β-glucosidase
and urease were significantly (P<0.05) higher in WRC and PM as compared to SRL and RL. The activities of
CMCase and urease were higher (P<0.05) at 4 and 8 h post feeding, whereas, rest of the enzymes were not
affected. There was no effect of time of sampling on the population of rumen microbes explored in this
experiment. It appeared that WRC or PM fraction provided true picture of microbial and enzyme profiles
responsible for fibre degradation in the rumen. The increase in enzyme activity at a particular time of sampling
was not associated with population size of the specific microbes or specific activity of enzymes.
Key words: Buffalo, Enzymes, Microbes, Rumen content fractions, Real time PCR
Corresponding author; Email: [email protected]
INTRODUCTION
Rumen microbes have a mutualistic relationship
with their hosts, and symbiotic and/or antagonistic
relationship among themselves (Kamra, 2005). The
rumen microbes, predominantly bacteria, fungi and
protozoa, secrete an array of fibrolytic enzymes (Chen
et al., 2008) including micro-crystalline cellulase,
caboxymethylcellulase, xylanase etc. and this complex
pool of enzymes are responsible for degradation of
plant based fibrous feeds. The major culturable fibre
degrading bacteria are represented by F. succinogenes,
R. flavefaciens, R. albus and B. fibrisolvens based
on conventional cultivation techniques and their
contribution to fibre degradation is much larger than the
other microbes (Wanapat and Cherdthong, 2009; Dai et
al., 2015). B. fibrisolvens and Prevotella ruminicola
are other major fibre degrading bacteria which
contribute to carbohydrate and fibre utilization (Flint et
Indian J. Anim. Nutr. 2020. 37 (2): 87-94
doi: 10.5958/2231-6744.2020.00016.X
al., 2008). For fibre degradation, the microbial
population attached to feed particles is the most
important as about 80-90% of carboxymethyl cellulase,
avicelase and xylanase are from the microbes attached
with the feed particles or particulate matter (Agarwal
et al., 2000). But the microbes identified so far as the
main fibre degrading microbes are the cultivable
microbes, whereas, there are other numerous bacteria
which are functional but uncultivable under laboratory
condititon (Kobayashi, 2006). Real time PCR has
successfully been used for quantification of various
rumen microbes like rumen cellulolytic bacteria,
protozoa, fungi, methanogens etc (Tajima et al., 2001;
Koike and Kobayashi, 2001).
The present study has been undertaken to
establish the distribution of various microbes by using
real-time PCR and the major microbes and fibre
degrading enzymes secreted by these microbes in the
Indian J. Anim. Nutr. 2020. 37 (2): 87-94

88
rumen and their changing pattern with the type of sample
and feeding time. Some in vitro studies reported change
in rumen microbial count for all major microbes after 24
h of incubation in Rusitec (Lengowski et al., 2016),
whereas, there are also reports of no effect of period of
sampling on rumen microbes and enzyme activity (Li et
al., 2009; Kala et al., 2017, 2020).Most of the studies
looking into rumen microbes attached to different
rumen content fractions have used high throughput
sequencing. de Mulder et al. (2017) has reported high
abundance of celllulolytic and the associated secondary
bacteria in solid phase. Bowen et al. (2018) also
reported high abundance of methanogens on Holstein
Friesian (HF) cattle grazing on white clover vs.
perennial ryegrass, whereas de Mulder et al. (2017)
reported similar abundance in solid and liquid fraction of
rumen. The change in pattern of rumen microbes and
enzymes produced by them affect the extent of fibre
degradation in rumen. The studies available have
explored the temporal variation in microbes using in vitro
methods, and availability of studies using in vivo
models is very meagre. This study explores the shift in
population of rumen microbes and the enzymes produced
by them at different periods and fractions.
MATERIALS AND METHODS
The experiment was carried out on three fistulated
male buffaloes fed control diet of wheat straw and
concentrate mixture (wheat bran 37%, maize 41%,
de-oiled soybean meal 19%, mineral mixture 2% and
common salt 1%) in equal proportion to meet nutrient
requirements for maintenance (ICAR, 2013). The whole
rumen content for enzyme estimation and microbial
enumeration was collected at 0 (just before feeding), 4
and 8 h post-feeding on two consecutive days, after 21
days of feeding. The samples were transported to the
laboratory in an ice bucket and processed immediately.
The rumen content was separated into four fractions
i.e. the whole rumen content (WRC), and it was
squeezed to have particulate material (PM, the solid
fraction) and the squeezed liquid (SL) portion. The fourth
fraction was SRL (strained rumen liquor) obtained by
filtering through two layers of muslin cloth.
For enzyme extraction, either 5 g particulate
material, whole rumen content, SL or SRL were mixed
Table 1. PCR primers for real time PCR
Primer Name Primer Sequence Amplicon Annealing Reference
(bp) temp(°C)
Bacteria F-5’CGGCAACGAGCGCAACCC-3’ 130 60 Denman et al.,
R-5’CCATTGTAGCACGTGTGTAGCC-3’ 2006
Fungi F-GAGGAAGTAAAAGTCGTAACAAGGTTTC 110 60
R-CAAATTCACAAAGGGTAGGATGATT
Methanogen F 5’-TTCGGTGGATCDCARAGRGC-3’R 140 60
R-5’-GBARGTCGWAWCCGTAGAATC C-3
Ruminococcus F5’CGAACGGAGATAATTTGAGTTTACTTAGG3’ 132 60
flavefaciens R-5’CGGTCTCTGTATGTTATGAGGTATTA-3’
Fibrobacter F-5’GTTCGGAATTACTGGGCGTAAA-3’ 121 60
succinogenes R-5’CGCCTGCCCCTGAACTATC-3’
Ruminococcus F-5’CCCTAAACAGTCTTAGTTCG-3’ 175 60 Koike and
albus R-5’CCTCCTTGCGGTTAGAACA-3’ Kobayashi, 2001
Protozoa F-316f, 5'-GCTTTCGWTGGTAGTGTATT-3' 223 55 Sylvester et al.,
R-539r, 5'-CTTGCCCTCYAATCGTWCT-3' 2004
Butyrivibrio F-5’TCTGGAAACGGATGGTA-3’ 284 60 Chen and
fibrisolvens R-5’CCTTTAAGACAGGAGTTTACAA-3’ Weimer, 2001
Agarwal et al.
Indian J. Anim. Nutr. 2020. 37 (2): 87-94

89
with phosphate buffer (0.1M, pH 6.8), lysozyme (0.4%)
solution and carbon tetrachloride and incubated at 39°C
for 3 h and the clear supernatant obtained after
centrifugation was used as a source of microbial
enzymes (Hirstov et al., 1999).
For measuring the activities of carboxymethyl
cellulase and xylanase, the reaction mixture contained
1 ml phosphate buffer (0.1 M pH 6.8); 0.5 ml enzyme
and 0.5 ml of either carboxymethylcellulose (1.0%) or
xylan (0.25%). The reaction mixture for α-amylase
contained 0.5 ml buffer, 0.25 ml starch (1%) and 0.25
ml enzyme. The reaction mixtures were incubated for
60, 15 and 30 min, respectively, at 39°C and the
reducing sugars released were estimated (Miller, 1959).
β-glucosidase activities were estimated using
p-nitrophenyl- α-glucopyranoside and p-nitrophenyl-
α-glucopyranoside as substrate, respectively (Shewale
and Sadana, 1978). Urease activity was measured by
incubating the enzyme sample (0.25 ml) with urea (0.25
ml of 0.1 M) for 15 min and released ammonia nitrogen
was estimated (Weatherburn, 1967). Protease activity
was measured using azocasein (Sigma, St. Louis, USA)
as a substrate (Brock et al., 1982) and the enzyme unit
was expressed as µg protein hydrolysed/min/ml.
Total genomic DNA was extracted as per
procedure described by Yu and Morrison (2004) which
included bead beating of samples mixed with lysis
buffer followed by purification of DNA by using a kit
(A9281, Wizard SV Gel and PCR clean up system).
The quality and quantity of the DNA was checked by
electrophoresis (0.8% agarose) and nanodrop qPCR
was standardized for absolute quantification of
microbial cell per gram of rumen content/rumen
liquor. For preparation of standard curve, the purified
PCR product using specific primer was cloned in
pGEMT easy vector (Promega) and transformed in
Escherichia coli by using Transform AidTM Bacterial
Transformation Kit (Fermentas). The plasmid with
insert was extracted and copy number was calculated
(Ritalahti et al., 2006). The plasmid was serially diluted
to make standard curve and the copy number of
unknown sample was calculated. The amplification
reactions were performed in a total volume of 20 µl,
containing 2 ng of template DNA, 10 µl of 2X Kappa
SYBR master mix, 0.6 µl of each primer (10 µM) and
nuclease free water. The cycling conditions consisted
of initial denaturation step at 95°C for 3 min, followed
by 40 cycles of 95°C for 10 sec and specific annealing
temperature for 15 sec. The specific primers used for
qPCR with their annealing temperature and product size
are given in Table 1.
RESULTS AND DISCUSSION
The results of microbial profile including total
bacteria, Ruminococcus flavefaciens, R. albus,
methanogens, protozoa and Fibrobacter succinogenes
in the rumen of buffalo (Table 2) studied with real time
PCR indicated that the number of rumen microbes was
higher (P<0.05) in WRC and PM as compared to those
in SRL and SL. However, there was no difference in
the temporal distribution (at 0, 4 and 8 h post-feeding)
of microbial population. This clearly indicated that
majority of the rumen microbes, especially fibre
degraders are attached with particulate material/solid
portion of rumen content. Relative microbial diversity
was studied to see how the rumen microbial profile
changes in other fractions with respect to whole rumen
content. It was calculated by taking the absolute count
of microbes in whole rumen content as 1, and microbial
count for other sample type was expressed in relation
to whole rumen content (Table 3). The relative count
Fig. 1. Relative microbial diversity of major rumen
microbes in various fractions of rumen
content of buffaloes
Rumen Liquor
Squeezed liquid
Particulate Material
Whole rumen Content
Microbes and Enzyme Activity in the Rumen of Buffaloes
Indian J. Anim. Nutr. 2020. 37 (2): 87-94

90
also exhibited similar trend as absolute count of microbes
(Fig. 1). It clearly indicated that microbial count in PM
is generally similar, sometimes even numerically higher
than WRC. The relative count in other two fractions,
namely SL and SRL were observed to have similar
microbial count.
The information on microbial diversity of buffalo
rumen available till date is primarily based on
conventional techniques of microbial cultivation and the
information available is scanty as compared to other
domesticated (cattle, sheep and goat) and wild
ruminants (Kamra and Pathak,1996). This scanty
knowledge has limited our understanding of the
environment and requirements of target microbes in
buffalo rumen as majority of the rumen bacteria are
uncultivable under lab condititon. However, real time
quantification of bacteria in the rumen has made it
possible to quantify the absolute number of some of these
Table 2. Distribution of microbes (Log10
) in different fractions of rumen contents at different hrs of
post-feeding
Primers Time(h) WRC PM SL SRL Mean SEM P value
T F T*F
Bacteria 0 11.41 11.50 10.64 10.57 11.03 0.067 0.970 <0.001 0.806
4 11.64 11.28 10.39 10.83 11.03
8 11.38 11.48 10.33 10.79 11.00
Mean 11.4a 11.42a 10.45b 10.73b
F. succinogenes 0 10.59 10.66 9.18 9.40 9.96 0.071 0.188 <0.001 0.785
4 10.82 10.32 8.96 8.93 9.76
8 10.42 10.40 8.66 9.07 9.64
Mean 10.6a 10.46a 8.93b 9.13 b
R. albus 0 7.78 7.85 7.07 6.96 7.41 0.047 0.165 <0.001 0.190
4 7.92 7.52 6.49 7.07ab 7.25
8 7.69 7.76 6.41 6.93 7.20
Mean 7.80a 7.71a 6.66b 6.99b
R. flavefaciens 0 8.47 8.72 7.52 7.24 7.99 0.060 0.928 <0.000 0.618
4 8.77 8.48 7.17 7.42 7.96
8 8.57 8.73 7.23 7.55 8.02
Mean 8.60a 8.64a 7.31b 7.40b
B. fibrisolvens 0 9.48 9.58 8.44 8.21 8.93 0.086 0.662 <0.001 0.548
4 9.69 9.42 7.64 8.20 8.74
8 9.40 9.56 7.73 8.53 8.80
Mean 9.52a 9.52a 7.93b 8.31b
Methanogens 0 8.60 8.75 7.75 7.94 8.26 0.068 0.247 <0.001 0.795
4 8.95 8.56 7.55 7.81 8.22
8 8.53 8.59 7.18 7.70 8.00
Mean 8.69a 8.63a 7.49b 7.82b
Protozoa 0 9.85 9.82 9.32 9.62 9.65 0.105 0.054 0.034 0.946
4 10.14 9.60 8.94 9.34 9.50
8 9.45 9.01 8.44 9.22 9.03
Mean 9.81a 9.48ab 8.90b 9.39ab
*WRC, whole rumen content; PM, particulate matter; SL, squeezed liquid; SRL, strained rumen liquor; T, time; F, fraction
Agarwal et al.
Indian J. Anim. Nutr. 2020. 37 (2): 87-94

91
Table 3. Relative count of microbes in different fractions of rumen contents at different periods after
feeding
Fraction WRC PM SL SRL Mean SEM P value
Bacteria 1a 1.01a 0.93b 0.93 b 0.97 0.010 <0.001
R. albus 1 a 1.01a 0.91b 0.90 b 0.95 0.015 <0.001
R. flavefaciens 1 a 1.03a 0.89b 0.86 b 0.94 0.021 <0.001
Methanogens 1 a 1.02a 0.90b 0.92 b 0.96 0.015 <0.001
Protozoa 1 a 1.00a 0.95b 0.98 b 0.98 0.008 0.026
F.succinogenes 1 a 1.01a 0.87b 0.89 b 0.94 0.017 <0.001
*WRC, whole rumen content; PM, particulate matter; SL, squeezed liquid; SRL, strained rumen liquor; T, time; F, fraction
Fig. 2. Temporal variation in major fibrolytic enzymes in buffalo rumen
rumen bacteria (Malmuthuge et al., 2012). In
corroboration with this study, Li, et al (2009) reported
no effect of sampling time (at three time points: 3h
×
RC
PM
SL
SRL
CMCase
×
RC
PM
SL
SRL
Xylanase
before feeding, 3h after feeding and 9h after feeding)
or location in rumen from where samples were collected
(cranial dorsal, cranial ventral, central rumen, caudal
Microbes and Enzyme Activity in the Rumen of Buffaloes
Indian J. Anim. Nutr. 2020. 37 (2): 87-94

92
dorsal and caudal ventral locations) on rumen microbe
population of Holstein cows. Similarly, Kala et al., (2017,
2020) had reported no change in rumen microbial
profile and rumen enzyme activity at 0 and 4h post
feeding in buffaloes fed various levels of TDN.
Lengowski et al. (2016) has reported no change during
initial periods after adding silage as substrate in Rusitec,
but a decrease was observed for all major microbes
after 24 h of incubation. In our study it was observed
that, the number of these bacteria drastically reduced
Table 4. Enzyme activities (µmol/ml/min/100g RC/RL) in different fractions of rumen contents at
different post-feeding periods
Enzyme Time RC PM SL SRL Mean SEM P value
(Hr) T F T*F
CMCase 0 55.93 79.63 10.68 11.88 39.53 b 1.94 0.032 <0.001 0.552
4 79.59 94.93 19.07 15.54 52.28a
8 70.04 71.00 9.35 9.35 39.93ab
Mean 68.52a 81.85 a 13.03b 12.26b
MCCase 0 37.72 40.56 12.59 10.33 25.30 0.66 0.342 <0.001 0.129
4 44.30 46.02 7.53 9.04 26.72
8 42.54 49.65 9.62 9.33 27.78
Mean 41.52a 45.41 a 9.91b 9.57b
Amylase 0 75.41 79.93 18.14 20.42 48.47 5.88 0.977 <0.011 1.000
4 80.15 80.45 24.59 20.61 51.45
8 73.41a 85.12a 23.45b 21.14b 50.78
Mean 76.32 81.83 22.06 20.72
Xylanase 0 24.44 27.65 5.47 3.57 15.28 0.82 0.232 0.003 0.699
4 17.96 20.72 4.14 4.54 11.84
8 24.89 25.69 3.90 3.93 14.60
Mean 22.43a 24.68 a 4.50b 4.01b
β-glucosidase 0 11.35 10.50 2.87 1.89 6.65 1.01 0.942 0.018 1.000
4 9.76 9.15 2.79 2.94 6.16
8 11.00 11.25 3.07 2.76 7.02
Mean 10.70a 10.30 a 2.91b 2.53b
Urease 0 5.94 6.80 1.07 0.71 3.63 b 0.21 0.001 <0.001 0.023
4 5.43 5.86 1.97 2.49 3.93 b
8 9.38 10.76 2.00 1.68 5.95a
Mean 6.91 a 7.80 a 1.68b 1.63b
Protease 0 51.34 62.67 10.88 17.25 35.53 4.25 0.945 0.002 0.998
4 61.33 62.00 15.63 10.63 37.40
8 51.33 57.67 15.63 10.88 33.87
Mean 54.67a 60.78a 14.04b 12.92b
CMCase, amylase and xylanase: nmol glucose or xylose ml-1 min-1; α-glucosidase, β-glucosidase and acetyl esterase, nmol p-nitrophenol ml-
1 min-1.; protease, µg of protein hydrolysed ml-1 min-1
when liquid portion of rumen is used for analysis. Thus,
the whole rumen content or particulate matter seems to
be better representative for microbial profiling study.
However, the time of sampling was not found to be a
factor affecting microbial population.
The polymeric carbohydrate-based crop residues
are degraded by a combined activity of a microbiome
consisting primarily of bacteria accompanied with
protozoa, fungi, archaea and bacteriophages (Klieve and
Bauchop, 1988; Kamra, 2005). In order to have better
Agarwal et al.
Indian J. Anim. Nutr. 2020. 37 (2): 87-94

93
access to the fibre, the microbes excreting these
hydrolytic enzymes must get attached with the substrate.
This is even observed in the present experiment that the
microbes and enzymes excreted by these microbes were
in close association with the particulate material of the
partially degraded feed ingredients in the rumen. The
enzyme activity also followed similar trend as microbial
profile and observed higher activity associated with
WRC and PM (Table 4). Activity of CMCase and
urease was higher at 4 h and at 8 h post-feeding, whereas
no temporal changes in activities of other enzymes were
observed. Higher activity of CMCase reflects increased
fibre utilization at 4 h post-feeding. Results further
indicated that the rumen content and particulate
material had higher population of rumen microbes and
higher quantity of enzymes (Fig. 2), than the liquid
portion from the squeezed and strained rumen liquor.
From the results it appears that when enzyme and
microbial profiles are to be studied in the rumen
content, the whole rumen content should be sampled as
majority of the enzymes and microbes are attached with
the partially degraded feed particles. The present study
revealed that temporal changes appear to have little or
no effect on activity of enzymes in rumen.
CONCLUSIONS
The study clearly revealed that the whole rumen
content or particulate material seems to be containing
majority of rumen microbes and thus the hydrolytic
enzymes produced by these microbes. The time
of sampling does not appear to affect the microbial
number or enzyme activity. Thus, for rumen
fermentation studies whole rumen content should be the
preferred sample. Due to the lack of existing
information and unclutivablity of majority of rumen
microbes’ culture independent techniques seem to be
better approach. These primer based approaches likes
real time PCR are better than cultivation based
methods but, high throughput techniques involving
metagenomics and metatranscriptomics are the holistic
approach as they sequence all the DNA/RNA present
in a sample. Nonetheless, qPCR provides great deal of
information about the microbial profile of rumen
microbes.
ACKNOWLEDGEMENT
This work was supported by ICAR National
Professorial Chair (Project No.F.No.27 (17)/2011-HRD.
24/12/2012). We are also thankful to director IVRI for
his support in conducting the experimental work.
REFERENCES
Agarwal, N., Agarwal, I., Kamra, D.N. and Chaudhary, L.C.
2000. Diurnal variations in the activities of hydrolytic
enzymes in different fractions of rumen contents of
Murrah buffalo. J. Appl. Anim. Res. 18: 73-80.
Bowen, J.M., McCabe, M.S., Lister, S.J., Cormican, P. and
Dewhurst, R.J.2018. Evaluation of microbial
communities associated with the liquid and solid
phases of the rumen of cattle offered a diet of
perennial ryegrass or white clover. Front. Microbiol. 9:
2389.
Brock, F.M., Frosberg, C.W. and Buchanan-Smith, J.G. 1982.
Proteolytic activity of rumen microorganisms and
effect of proteinase inhibitors. Appl. Environ.
Microbiol. 44: 561-569.
Chen, X.L., Wang, J.K., Wu, Y.M. and Liu, J.X. 2008. Effects
of chemical treatments of rice straw on rumen
fermentation characteristics, fibrolytic enzyme
activities and populations of liquid- and solid-
associated ruminal microbes in vitro. Anim. Feed Sci.
Technol. 141: 1-14.
Dai, X., Tian, Y., Li, J., Su, X. and Wang, W. 2015.
Metatranscriptomic analyses of plant cell wall
polysaccharide degradation by microorganisms in the
cow rumen. Appl. Environ. Microbiol. 81: 1376-1386.
de Mulder, T., Goossens, K., Peiren, N., Vandaele, L., Haegeman,
A., de Tender, C., Tom Ruttink, T., de Wiele, T.V. and
De Campeneere s. 2017. Exploring the methanogen and
bacterial communities of rumen environments: solid
adherent, fluid and epimural. FEMS Microbiol.
Ecol. 93: 251.
Flint, H.J., Bayer, E.A., Rincon, M.T., Lamed, R. and White,
B.A. 2008. Polysaccharide utilization by gut bacteria:
potential for new insights from genomic analysis. Nat.
Rev. Microbiol. 6: 121-131.
Hristov, A.N., McAllister, T.A. and Cheng, K.J. 1999. Effect of
diet, digesta processing, freezing and extraction
procedure on carboxy-methyl cellulase, xylanase and
amylase activities of rumen contents. Can. J. Anim.
Sci. 79: 73-81.
Microbes and Enzyme Activity in the Rumen of Buffaloes
Indian J. Anim. Nutr. 2020. 37 (2): 87-94
94
Indian Council of Agricultural Research. 2013. Nutrients
Requirement for Livestock and Poultry, ICAR, New
Delhi.
Kala, A., Kamra, D.N., Agarwal, N. and Chaudhary, L.C. 2020.
Effect of a blend of commercial Ajwain (Trachyspermum
ammi) oil and nitrate on the fermentation and microbial
profile of buffalo rumen. Anim. Nutr. Feed Technol. 20:
141-153.
Kala, A., Kamra, D.N., Agarwal, N. and Chaudhary, L.C. 2017a.
Effect of a blend of essential oils on buffalo rumen
microbial and enzyme profiles and in vitro feed
fermentation. Anim Nutr Feed Technol. 189-200.
Kala, A., Kamra, D.N., Kumar, A., Agarwal, N., Chaudhary,
L.C. and Joshi, C.G. 2017b. Impact of levels of Total
digestible nutrients on microbiome, enzyme profile and
degradation of feeds in buffalo rumen. PLoS ONE. 12:
e0172051.
Kamra, D.N. 2005. Rumen microbial ecosystem. Curr. Sci.
89:124-135.
Kamra, D.N. and Pathak, N.N. 1996. Nutritional
Microbiology of Farm Animals, 1-224. Vikas
Publishing House, New Delhi.
Klieve, A.V. and Bauchop, T. 1988. Morphological diversity
of ruminal bacteriophages from sheep and cattle. Appl.
Environ. Microbiol. 54: 1637-1641.
Kobayashi, Y. 2006. Inclusion of novel bacteria in rumen
microbiology: need for basic and applied science. Anim.
Sci. J. 77: 375-385.
Koike, S. and Kobayashi, Y. 2001. Development and use of
competitive PCR assays for the rumen cellulolytic
bacteria: Fibrobacter succinogenes, Ruminococcus
albus and Ruminococcus flavefaciens. FEMS
Microbiol. Lett. 204: 361-366.
Lengowski, M.B., Zuber, K.H.R., Witzig, M., Möhring, J.,
Boguhn, J. and Rodehutscord, M. 2016. Changes in
rumen microbial community composition during
adaption to an in vitro system and the impact of
different forages. PLoS ONE. 11: e0150115.
Li, M., Penner, G.B., Hernandez-Sanabria, E., Oba, M. and Guan,
L.L. 2009. Effects of sampling location and time, and
host animal on assessment of bacterial diversity and
fermentation parameters in the bovine rumen J. Appl.
Microbiol. 107: 1924-1934.
Malmuthuge, N., Li, M., Chen, Y., Fries, P., Griebel, P.J.,
Baurhoo, G.B., Zhao, X. and Guan, L.L. 2012. Distinct
commensal bacteria associated with ingesta and
mucosal epithelium in the gastrointestinal tracts of
calves and chickens. FEMS Microbiol. Ecol. 79:
337-347.
Miller, G.L. 1959. Use of dinitrosalisylic acid reagent for
determination of reducing sugar. Analyt. Chem. 31:
26-428.
Ritalahti, K.M., Amos, B.K., Sung, Y., Wu, Q. and Koenigsber,
S.S. 2006. Quantitative PCR targeting 16S rRNA and
reductive dehalogenase Genes simultaneously
monitors multiple Dehalococcoides strains. Appl.
Environ. Microbiol. 72: 2765-2774.
Shewale, J.G. and Sadana, J.C. 1978. Cellulase and
β-glucosidase by a basidomycete species. Can. J.
Microbiol. 24: 1204-1216.
Tajima, K., Nagamine, T., Matsui, H., Nakamura, M. and
Aminov, R.I. 2001. Phylogenetic analysis of archaeal
16S rRNA libraries from the rumen suggests the
existence of a novel group of archaea not associated
with known methanogens. FEMS Microbiol. Lett. 200:
67-72.
Wanapat, M., and Cherdthong, A. 2009. Use of real-time PCR
technique in studying rumen cellulolytic bacteria
population as affected by level of roughage in swamp
buffalo. Curr. Microbiol. 8: 294-299.
Weatherburn, M.W. 1967. Phenol hypochlorite reaction for
determination of ammonia. Analyt. Chem. 39: 971-974.
Yu, Z. and Morrison, M. 2004. Improved extraction of
PCR-quality community DNA from digesta and fecal
samples. Bio Techniques. 36: 808-812.
Agarwal et al.
Indian J. Anim. Nutr. 2020. 37 (2): 87-94
Received on 06-07-2020 and accepted on 06-08-2020
95
Indian Journal of
Animal Nutrition
Rhythmic Alterations in Physiological Response, Growth Performance
and Blood Metabolites in Growing Hariana Cattle Fed on Ration
Included with Different Levels of Corn Silage
Ashwani Kumar Verma1, Muneendra Kumar1*, Vinod Kumar1, Raju Kushwaha1,
Shalini Vaswani1, Avinash Kumar1 and Yajuvendra Singh2
Department of Animal Nutrition, College of Veterinary Science and Animal Husbandry,
DUVASU, Mathura 281 001, India
ABSTRACT
This study was conducted to determine the effect of green fodder replacement with corn silage on the
physiological response, growth performance, and blood metabolites in summer exposed growing Hariana
cattle. Eighteen growing Hariana cattle were randomly allocated into three groups (n=6) on body weight
(130±3.0 kg) and age (14±1.5 months) basis. Experimental heifers either received a basal total mixed ration
(TMR) devoid of corn silage (S0%
) or were fed on TMR of which 50% (S50%
) and 100% (S100%
) green fodder were
replaced with corn silage. Mean THI and RH values indicated that experimental heifers were in moderate heat
stress. Replacement of green fodder with corn silage did not alter the physiological response of heifers during
90 d experimental periods. As the level of inclusion of corn silage increased, dry matter intake (DMI) and cost
of feeding also increased (P<0.05) while average daily gain (ADG) was similar among all groups. Hematological
attributes and plasma metabolites showed non-significant effect of green fodder replacement with corn silage.
Although the green fodder replacement with corn silage increased cost of feeding but can be used as a best
alternative during summer period by maintain the performance of dairy animals.
Key words: Blood metabolites, Corn silage, Green fodder, Hariana heifer, Haematology
*Corresponding author; Email: [email protected]; 1Department of Animal Nutrition, College of Veterinary Science and Animal
Husbandry, DUVASU, Mathura 281 001; 2Yajuvendra Singh; Department of Livestock Production Management, College of Veterinary
Science and Animal Husbandry, DUVASU, Mathura 281001, India; Email: [email protected]
INTRODUCTION
The feed itself accounts for 60 to 65% of the
total cost of production in dairy cattle and the main
determinant of production system profitability.
Shrinkage of irrigated lands for fodder production,
higher labour cost, and small landholdings further
increases the cost of rearing of dairy animals. Out of
the available dry matter, most of it is available in the
form of agricultural by-products and dried grass which
is of inferior quality. It is imperative to arrange
sufficient good quality feed and fodder for efficient
utilization of the genetic potential of the various
livestock species and sustainable improvement in
productivity. The only way to meet the increasing
fodder needs of livestock is to look for alternative
options of fodder. Among these, silage is one of them.
Availability of nutritious fodder throughout the year can
be maintained by converting green fodder into silage.
Indian J. Anim. Nutr. 2020. 37 (2): 95-105
doi: 10.5958/2231-6744.2020.00017.1
Silage is green succulent roughage preserved more
or less in its original condition, with a minimum
deterioration and minimum loss with respect of various
nutritive constituents of fodders. Well-fermented silage
is readily consumed by animals and may improve their
health and production characteristics (Varadyova et al.,
2010). Recent findings on silage production indicate that
it could replace the conventional fodder without any
ill-effect on intake, efficiency, digestibility, and
performance of dairy animals (Chaudhary et al., 2014).
In a well-managed system, where losses are low, the
silage dry matter content and digestibility will be similar
or slightly lower and crude protein content might be
similar to parent fodder (Kaiser and Piltz, 2004).
Preference for cereal green fodder including maize,
sorghum, pearl millet, etc. for ensiling is due to more
sugar content than protein, as sugar is utilized in
the fermentation process to make lactic acid by
Indian J. Anim. Nutr. 2020. 37 (2): 95-105
96
microorganisms (Nazli et al., 2019).
A major factor which affects the physiological
response, feed intake, and performance of animal
during summer stress is dietary composition. Therefore,
a corollary to this concept exists in utilization of diets,
suggesting that when different diets are fed to cattle,
the analysis of physiological response, feed intake,
performance measures, and blood metabolites should
be able to differentiate between the efficiencies of
the utilization of diet. Considering these facts, the
present study was designed to investigate the effect
of replacement of green fodder with corn silage on
physiological response, feed intake, growth performance,
and blood metabolites in growing Hariana cattle during
summer season.
MATERIALS AND METHODS
The experiment was conducted in the
Instructional Livestock Farm Complex (ILFC) of
Veterinary University, Mathura (India). Mathura is
situated at elevation 191 m above mean sea level,
latitude and longitude position being 27° 303 N and 77°
413 E, respectively. The climate of Mathura is
semi-arid, and temperature goes up to 45°C during the
summer months.
To prepare the best quality silage, maize fodder
was used in this study. Fodder harvest was performed
at a height of 5 cm above the ground when the moisture
content of maize fodder was in the range of 70-75%.
Silage was prepared in bunker silo having a dimension
of 20 m×10 m. The whole fodder was chopped into 2-3
cm pieces by using tractor operated forage chopper
(Ensiladeria JF4Max, NB Maquinas Ltd., Brazil).
Chopped material was filled in the silo and compressed
with a tractor fitted with a labeler. For adequate
compaction and perfect anaerobic condition, the chopped
fodders were covered with two layers of polythene
sheets (0.2 mm thickness) followed by a layer of sand
and tires. After 60 d of ensiling, the silo was opened
from one end and silage samples were collected in a zip
lock polythene pack from the core area of the opened
portion of the filled bunker silo. Collected silage samples
were used for evaluation of nutrients content, and
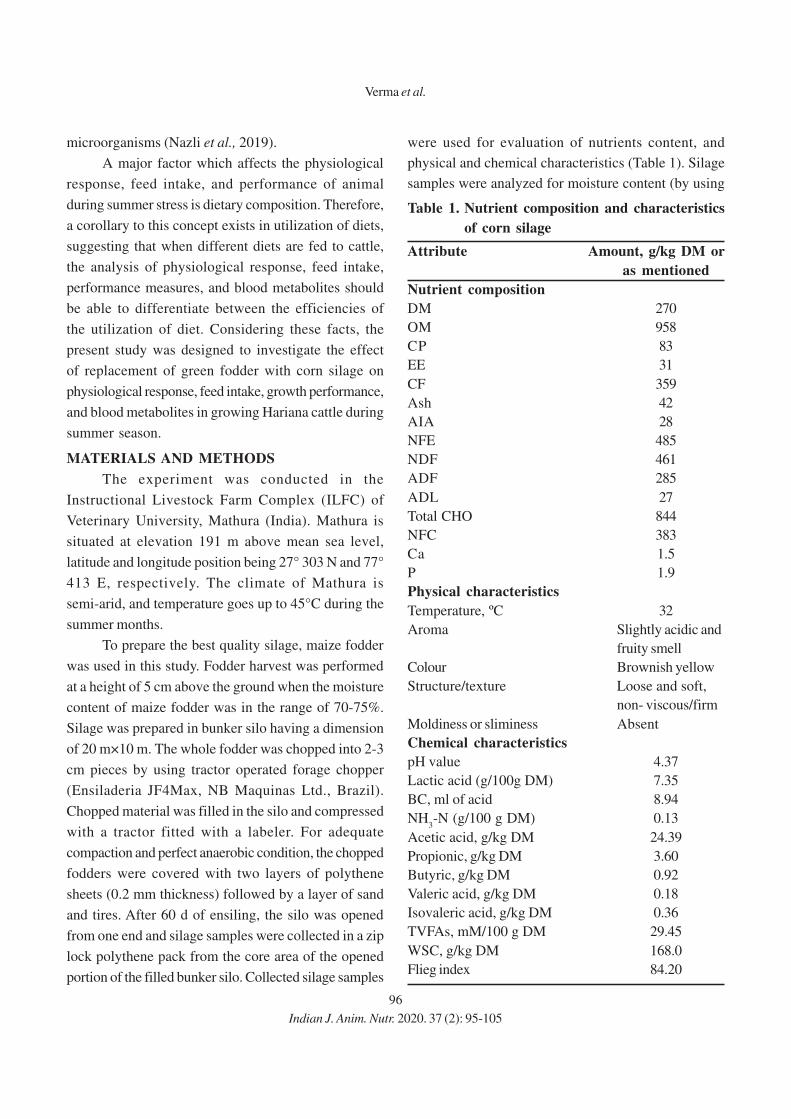
physical and chemical characteristics (Table 1). Silage
samples were analyzed for moisture content (by using
Table 1. Nutrient composition and characteristics
of corn silage
Attribute Amount, g/kg DM or
as mentioned
Nutrient composition
DM 270
OM 958
CP 83
EE 31
CF 359
Ash 42
AIA 28
NFE 485
NDF 461
ADF 285
ADL 27
Total CHO 844
NFC 383
Ca 1.5
P 1.9
Physical characteristics
Temperature, ºC 32
Aroma Slightly acidic and
fruity smell
Colour Brownish yellow
Structure/texture Loose and soft,
non- viscous/firm
Moldiness or sliminess Absent
Chemical characteristics
pH value 4.37
Lactic acid (g/100g DM) 7.35
BC, ml of acid 8.94
NH3-N (g/100 g DM) 0.13
Acetic acid, g/kg DM 24.39
Propionic, g/kg DM 3.60
Butyric, g/kg DM 0.92
Valeric acid, g/kg DM 0.18
Isovaleric acid, g/kg DM 0.36
TVFAs, mM/100 g DM 29.45
WSC, g/kg DM 168.0
Flieg index 84.20
Verma et al.
Indian J. Anim. Nutr. 2020. 37 (2): 95-105

97
toluene distillation method, Method 925.04), crude
protein (CP; Method 4.2.08), ether extract (EE; Method
920.85), total ash (Method 923.05), and acid insoluble
ash (AIA; Method 923.03) contents by following
protocol of AOAC (2005). Neutral detergent fibre
(NDF), acid detergent fibre (ADF) and acid detergent
lignin (ADL) were determined as per the method of
Van Soest et al. (1991). The total carbohydrate (total
CHO) and non-fiber carbohydrate (NFC) content were
determined by using the equation of Sniffen et al. (1992)
and Detmann and Valadares Filho (2010), respectively.
Ca and P content were determined by titration method
(Talpatra et al., 1940) and spectrophotometric method
(AOAC, 2005), respectively.
Physical characteristics were evaluated by
following guidelines of Horiguchi and Takahashi (2007).
The temperatures of the core, lateral and apical parts
of the working face of silage were measured
by mercury in glass clinical thermometer (Qingdao
Dacon Trading Co. Ltd., Shandong, China). The pH in
the silage extract before stabilizing with 5%
meta-phosphoric acid was measured by using a pH
meter (Systronics pH System-361, India). The
estimation of lactic acid in silage samples was done as
per the modified method of Barnett (1951). Buffering
capacity (BC) was determined by the hydrochloric
acid-sodium hydroxide method of Playne and McDonald
(1966). NH3–N content was measured in the extract
by phenol-hypochlorite assay (Weatherburn, 1967).
Volatile fatty acid (VFA) content was determined with
gas chromatography-mass spectroscopy (GC-MS;
5975C VL MSD with Triple-Axis Detector, Agilent
Technologies India Pvt. Ltd, with 30 m×320 µm×0.25
µm capillary column, condition: column temperature
130 °C, injection temperature 220 °C) fitted with flame
ionization detector (FID). The concentration of WSC in
silage sample was determined by method according
to McDonald and Henderson (1964). To assess the
quality of silage after ensiling for 60 days, Flieg index
by means of the pH values and DM content was
calculated (Kilic, 1986).
Animal care procedures were approved (approval
number, 121/IAEC/18) and conducted under the
established standard of the Institutional Animal Ethics
Committee (IAEC), constituted as per the article
number 13 of the Committee for the Purpose of Control
and Supervision of Experiments on Animals (CPCSEA)
rules laid down by the Government of India. A total 18
growing Hariana heifers were selected from the cattle
herd maintained at LFC, DUVASU, Mathura. All
heifers were housed in a well-ventilated shed having
the proper arrangement for individual feeding and
watering without having access to the other animal’s
diet. Deworming of all the experimental animals
were done before the start of the experiment by oral
administration of Fentas bolus (Intas Pharmaceuticals
Pvt. Ltd., India) at the dose level of 10 mg/kg body
weight. Animals were let loose every fortnightly for
exercise. Selected heifers were randomly assigned into
three groups (n=6) on body weight (130±3.0 kg) and
age basis (14±1.5 months). Heifers were either fed on
basal TMR that consisted of compounded concentrate:
available green fodder: wheat straw in proportion of
40: 40: 20 (S0%
) or TMR of which 50% green fodder
(DM basis) was replaced with corn silage (S50%
) and
TMR of which 100% green fodder (DM basis) was
replaced with corn silage (S100%
). Ingredients and
nutrients composition of TMR fed to animals in
different groups are presented in Table 2. TMR was
prepared daily by hand mixing and offered at 0900 h in
all tests. The calves were fed the TMR in such an amount
that at least 5% refusals were left daily per animals.
Fresh drinking water was offered ad libitum twice daily
at 0800 h and 1700 h.
The experimental calves were monitored daily for
DMI and fortnightly for growth performance. The
samples of TMR offered and ort left were dried in a hot
air oven at 60°C till a constant weight was attained and
ground in a Wiley mill to pass a 1-mm sieve. Processed
samples were pooled animal wise and stored at the dry
place. Samples of TMR offered and ort left were
analyzed for nutrient composition by following
methodology as mentioned in silage preparation and
quality evaluation section.
Replacement of green fodder with maize silage
Indian J. Anim. Nutr. 2020. 37 (2): 95-105
98
Peripheral blood samples were collected in
heparinized vacuutainer tubes (BD Franklin, USA) by
venipuncture of jugular vein at 0, 30, 60 and 90 days of
experiment. A fraction of blood samples were used
for analysis of red blood cells (RBCs) count, white
blood cells (WBCs) count, haemoglobin (Hb)
concentration, packed cell volume (PCV) or haematocrit
(HIT) value, mean corpuscular volume (MCV), mean
cell haemoglobin (MCH), and mean corpuscular
hemoglobin concentration (MCHC) by using automatic
analyzer (Celltac alpha CM, Nihon, Kohden, Pvt. Ltd,
Surat, India). The remaining amount of blood samples
were centrifuged at 3000 rpm for 30 min to separate
the plasma from packed blood cells. Plasma samples
were stored at –20°C until further analysis of aspartate
aminotransferase (AST), alanine aminotransferase
(ALT), alanine phosphatase (ALP) activity, and plasma
Ca and P content by using automated biochemical
analyzer (BS-120 Chemistry Analyzer, Shenzhen
Mindray Biochemical Electronics Co. Ltd.).
Microclimatic data, viz., dry bulb temperature
(Cdb) and wet bulb temperature (Cwb) in degree
Celsius, were recorded at 0700 and 1400 h with dry and
wet bulb hygrometer (Zeal, UK) every day during
experimental period and THI was calculated by using
the following equation (McDowell et al., 1976).
THI = (0.72 × Cdb + Cwb) + 40.6
Daily relative humidity (RH) was calculated by
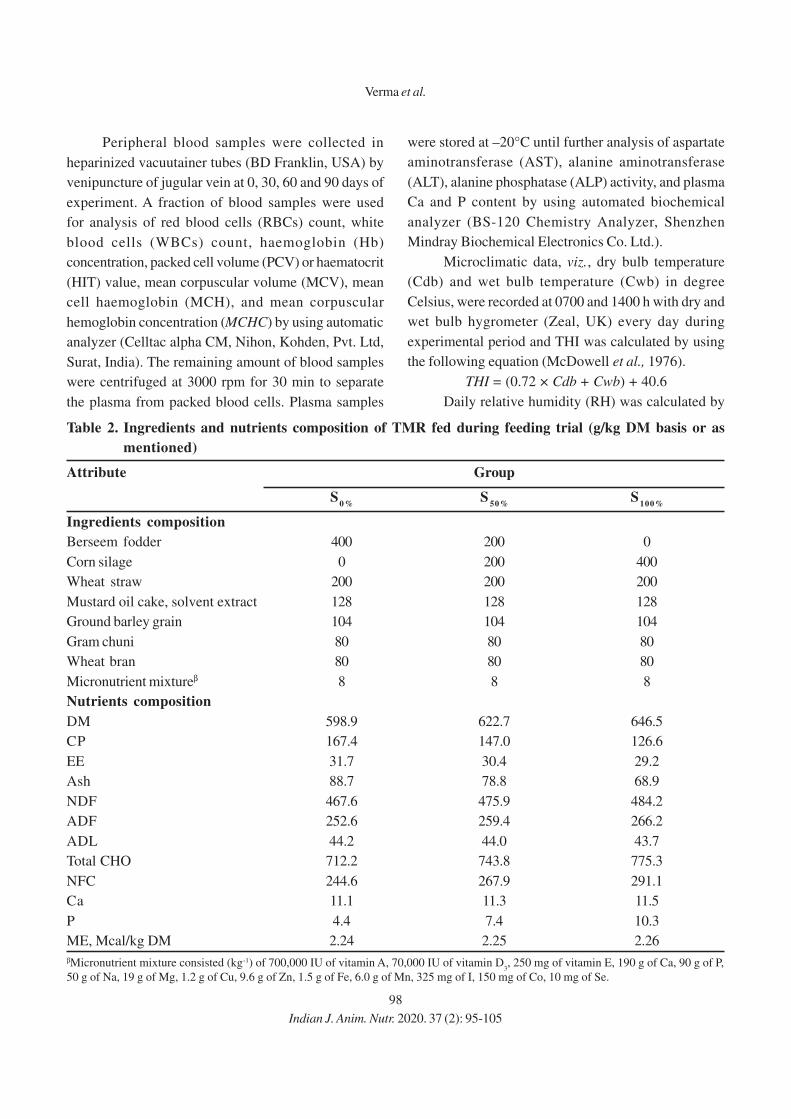
Table 2. Ingredients and nutrients composition of TMR fed during feeding trial (g/kg DM basis or as
mentioned)
Attribute Group
S0%
S50%
S100%
Ingredients composition
Berseem fodder 400 200 0
Corn silage 0 200 400
Wheat straw 200 200 200
Mustard oil cake, solvent extract 128 128 128
Ground barley grain 104 104 104
Gram chuni 80 80 80
Wheat bran 80 80 80
Micronutrient mixtureβ 8 8 8
Nutrients composition
DM 598.9 622.7 646.5
CP 167.4 147.0 126.6
EE 31.7 30.4 29.2
Ash 88.7 78.8 68.9
NDF 467.6 475.9 484.2
ADF 252.6 259.4 266.2
ADL 44.2 44.0 43.7
Total CHO 712.2 743.8 775.3
NFC 244.6 267.9 291.1
Ca 11.1 11.3 11.5
P 4.4 7.4 10.3
ME, Mcal/kg DM 2.24 2.25 2.26
βMicronutrient mixture consisted (kg-1) of 700,000 IU of vitamin A, 70,000 IU of vitamin D3, 250 mg of vitamin E, 190 g of Ca, 90 g of P,
50 g of Na, 19 g of Mg, 1.2 g of Cu, 9.6 g of Zn, 1.5 g of Fe, 6.0 g of Mn, 325 mg of I, 150 mg of Co, 10 mg of Se.
Verma et al.
Indian J. Anim. Nutr. 2020. 37 (2): 95-105

99
the difference of dry bulb temperature and wet bulb
temperature.
Respiration rate (RR) of the animals was recorded
by observing flank movement and one inward and
outward movement was counted as one respiration and
recorded/minute. To record the pulse rate (PR),
coccygeal artery was palpated and recorded/
minute. Immediately after recording pulse rate, rectal
temperature (RT) was recorded using mercury in glass
clinical thermometer (Qingdao Dacon Trading Co. Ltd.,
Shandong, China), inserted 7 cm in the rectum for at
least 2 min and the rectal mucosa was in contact with
the bulb of the thermometer.
Data of the study were subjected to analysis of
variance using the General Linear Model (GLM)
procedure of the Statistical Software Package (SPSS
for windows, V21.0; Inc., Chicago, IL, USA). The
effect of green fodder replacement with corn silage on
performance, feed efficiency measures and blood
metabolites were tested using the following model:
Yijk = µ + Ti + Tj + (T × D)ij + eijk
Where; Yijk is dependent variable, µ is overall
mean of the population, Ti is mean effect of the
treatment, Dj is mean effect of day of sampling (j=0,
30, 60 and 90 days of dietary treatment), (T×D)ij is
effect of the interaction between treatment and period
and eijk is unexplained residual element assumed to be
independent and normally distributed. Individual animals
were used as the experimental unit for all data. The
pair-wise comparison of means was carried out using
“Tukey’s honest significant difference (HSD) test”.
Significance was determined at P<0.05 and the values
are presented in the tables. Error bars in figures depict
standard error. The data were also analyzed for
correlation coefficient (r) and coefficient of variation
(CV). Cost of feeding of silage as the replacement of
green fodder was calculated at the end of 90 d study
period.
RESULTS AND DISCUSSION
In the present study, corn silage was well
preserved as indicated by their high lactic acid content
and low pH value, NH3-N content and butyric acid
content. Ensilaged maize fodder retained their physical
characteristics and silage smells slightly acidic and fruity,
appeared brownish-yellow with loose and soft and
non-viscous texture. Core silage temperature in the
bunker was 32°C which was slightly higher than
ambient temperature. Flieg points calculated by means
of the pH values and DM content also denoted a very
good quality of prepared corn silage. The DM content
and values of other nutritive constituents were within
ranges reported previously by NRC (2001) for typical
corn silage. The corn silage prepared in the present study
had a DM concentration of 270 g/kg fresh silage which
was near the optimum stage of maturity at harvest as
reported by Phipps et al. (2000), Keady et al. (2002b)
and Keady et al. (2007). Fisher and Lessard (1987)
reported that the DM, CP and ADF contents were 32.5,
8.0 and 27.0% for corn silage which was in accordance
with the findings of the present study. The pH of silage
is one of the simplest and quickest ways of evaluating
its quality, as silage properly fermented will have a much
lower pH as acids such as formic acid (Wang et al.,
2009), acetic acid (Queiroz et al., 2013) and propionic
acid (Mills and Kung, 2002) can quickly decrease pH at
the beginning of ensiling. Kung and Stoke (2001) also
reported pH values in the range from 3.7- 4.2 for maize
silage. Similar results were obtained by Church (1991),
Etman et al., (1994), McDonald et al., (1995), and
Sheperd and Kung (1996). Above cited studies reported
that pH values for maize silage ranged from 4.2-4.5.
Fig. 1. Mean THI and RH recorded during
experimental period
TH
I
Fortnight
RH
(%
)
THI
RH (%)
Replacement of green fodder with maize silage
Indian J. Anim. Nutr. 2020. 37 (2): 95-105
100
Lactic acid is the most abundant acid, around 75% of
the total acids contained in silage. In high quality corn
silage, it ranged between 4-7% (Seglar, 2003). The
lactic acid content of the silage of the present study
was within the optimum range. Langston et al. (1958)
stated that high quality silage is characterized by low
NH3-N concentration. The NH
3-N and VFAs content
of the corn silage in the present study felled within the
range observed by Sheperd and Kung (1996). In the
present study, prepared corn silage had a Flieg index
of 84.20, characterized by a typical very good
fermentation quality (Moselhy et al., 2015). Mafakher
et al. (2010) studied the chemical composition and quality
characteristics of corn, sunflower, and corn-sunflower
mixture silages and found highest Flieg index (103.01)
and the best pH value (3.66) for corn silage compared
to other silages.
The present study was conducted between the
months of May to July. As the days of experimental
period proceeded, THI and RH also increased (Figure
1). Mean THI and RH values during 90 days of
the experimental period were 80.48 and 79.52 %,
respectively. Thus, the heifers were in moderate heat
stress. Researchers stated 25 °C ambient temperature
as the upper critical temperature and 72 as the upper
critical THI (Bernabucci et al., 2002; NRC, 2005).
As the level of inclusion of corn silage increased
numerical values of RR, PR, and RT also increased but
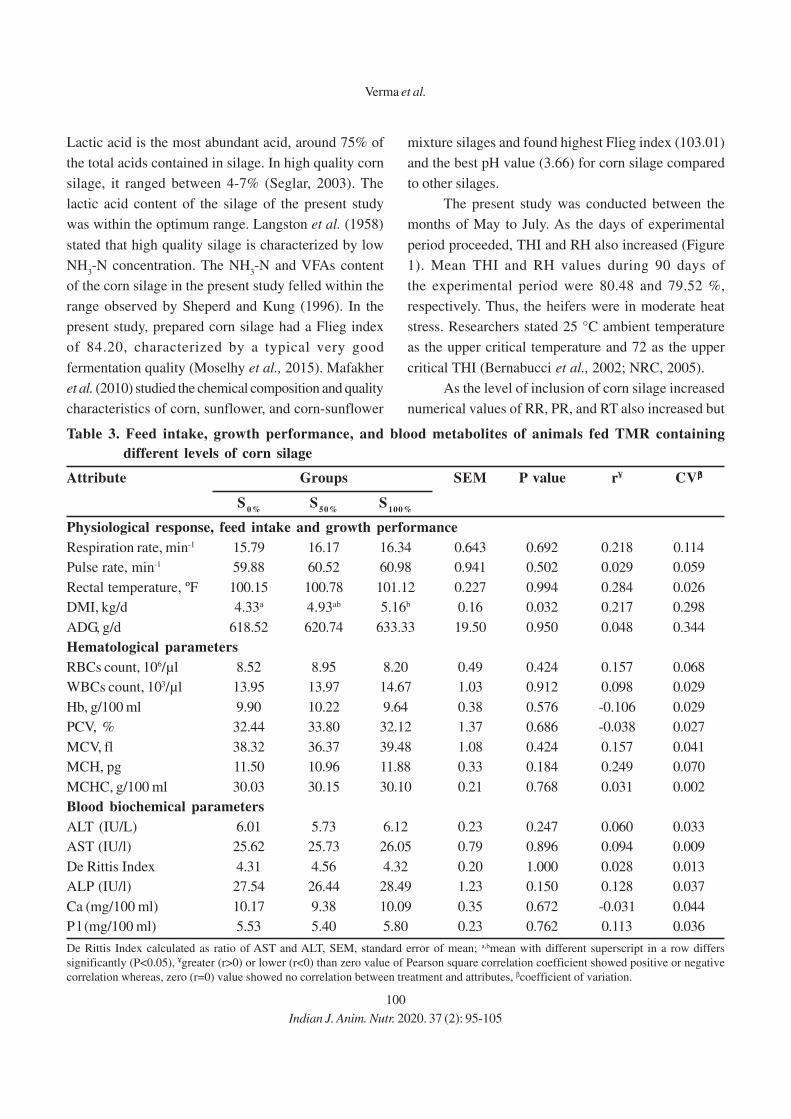
Table 3. Feed intake, growth performance, and blood metabolites of animals fed TMR containing
different levels of corn silage
Attribute Groups SEM P value r¥ CVβββββ
S0%
S50%
S100%
Physiological response, feed intake and growth performance
Respiration rate, min-1 15.79 16.17 16.34 0.643 0.692 0.218 0.114
Pulse rate, min-1 59.88 60.52 60.98 0.941 0.502 0.029 0.059
Rectal temperature, ºF 100.15 100.78 101.12 0.227 0.994 0.284 0.026
DMI, kg/d 4.33a 4.93ab 5.16b 0.16 0.032 0.217 0.298
ADG, g/d 618.52 620.74 633.33 19.50 0.950 0.048 0.344
Hematological parameters
RBCs count, 106/µl 8.52 8.95 8.20 0.49 0.424 0.157 0.068
WBCs count, 103/µl 13.95 13.97 14.67 1.03 0.912 0.098 0.029
Hb, g/100 ml 9.90 10.22 9.64 0.38 0.576 -0.106 0.029
PCV, % 32.44 33.80 32.12 1.37 0.686 -0.038 0.027
MCV, fl 38.32 36.37 39.48 1.08 0.424 0.157 0.041
MCH, pg 11.50 10.96 11.88 0.33 0.184 0.249 0.070
MCHC, g/100 ml 30.03 30.15 30.10 0.21 0.768 0.031 0.002
Blood biochemical parameters
ALT (IU/L) 6.01 5.73 6.12 0.23 0.247 0.060 0.033
AST (IU/l) 25.62 25.73 26.05 0.79 0.896 0.094 0.009
De Rittis Index 4.31 4.56 4.32 0.20 1.000 0.028 0.013
ALP (IU/l) 27.54 26.44 28.49 1.23 0.150 0.128 0.037
Ca (mg/100 ml) 10.17 9.38 10.09 0.35 0.672 -0.031 0.044
P l (mg/100 ml) 5.53 5.40 5.80 0.23 0.762 0.113 0.036
De Rittis Index calculated as ratio of AST and ALT, SEM, standard error of mean; a,bmean with different superscript in a row differs
significantly (P<0.05), ¥greater (r>0) or lower (r<0) than zero value of Pearson square correlation coefficient showed positive or negative
correlation whereas, zero (r=0) value showed no correlation between treatment and attributes, βcoefficient of variation.
Verma et al.
Indian J. Anim. Nutr. 2020. 37 (2): 95-105

101
statistical analysis showed non-significant impact
of rreplacement (Table 3). Physiological variables
showed weak positive correlation with treatment.
No information is available regarding the effect of
replacement of green fodder with corn silage on
physiological response of dairy animals. Numerically
lower RR, PR, and RT in cows receiving TMR with
higher green fodder proportion than those receiving TMR
with higher corn silage proportion indicated cooling
effect of green fodder (Singh, 1997). Roughage diets,
which are lower in ME density and NDF content;
appear to contribute less to metabolic heat load.
Different proportions of green fodder in the ration can
alter fibre quality, quantity, dietary vitamin A levels,
dietary β-carotene levels and some dietary intake of
minerals. These factors have several marked effects
on digestion and physiological response of dairy animals
(Van Soest, 1994).
Statistical analysis of data revealed that the
replacement of green fodder with corn silage affected
daily DMI significantly (P<0.05) and intake was reported
highest in S100%
group (Table 3; Figure 2). Although the
DMI increased with an increased level of inclusion of
corn silage but ADG was similar among all three groups.
Green fodder replacement with corn silage showed a
positive correlation with DMI and ADG.
It is perhaps predictable that the substitution of
green fodder by maize silage would cause a positive
effect on voluntary forage intake without altering cattle
Fortnight
SO% S5O% S10O%
Fig. 2. Effect of green fodder replacement with
corn silage on DMI
Table 4. Cost economics of replacing green fodder with corn silage
Attributes Group
S0%
S50%
S100%
DMI, kg/d 4.33 4.93 5.16
ADG, g/d 618.52 620.74 633.33
Parts of concentrate mixture in TMR, g/kg DM 400 400 400
Parts of berseem fodder in TMR, g/kg DM 400 200 0
Parts of corn silage in TMR, g/kg DM 0 200 400
Parts of wheat straw in TMR, g/kg DM 200 200 200
Cost of concentrate mixture, INR/kg DM 23.19 23.19 23.19
Cost of berseem fodder, INR/kg DM 16.67 16.67 -
Cost of corn silage, INR/kg DM - 18.52 18.52
Cost of wheat straw, INR/kg DM 7.22 7.22 7.22
Cost of TMR, INR/kg DM 17.39 17.76 18.13
Total cost of TMR intake, INR/animal/d 75.24 87.56 93.50
Cost of gain, INR/kg gain/d 118.49 135.54 140.18
Cost difference, INR/d - 12.32 18.26
DMI difference, kg/d - 0.600 0.830
ADG difference, g/d - 11.00 32.00
INR, Indian rupees.
Replacement of green fodder with maize silage
Indian J. Anim. Nutr. 2020. 37 (2): 95-105
102
performance due to their high palatability. There are
several examples in the literature where maize silage
inclusion has stimulated voluntary forage intake
(Hameleers, 1998; Mulligan et al., 1999), although this
is generally accompanied by little or no effect on the
performance of dairy animals. Keady et al. (2007)
offered grass silage either as the sole forage or in
addition to maize silage in continental cross beef steers
and found that the inclusion of corn silage in the diet
increased DM intake. The corn silage intake was higher
than cattle fed with fresh Napier grass (Siddque et al.,
2015) and Napier grass silage (Bureenok et al., 2012).
Juniper et al. (2005) replaced different levels of grass
silage with corn silage in the basal diet of Simmental ×
Holstein-Friesian steers and found that the forage DM
intake increased linearly with the increased level of
inclusion of maize silage. The linear intake response to
forage substitution observed in the current experiment
has also been reported previously with dairy cows
(O’Mara et al., 1998; O’Kiely and Moloney, 2000;
Phipps et al., 2000). El-Ayouty et al. (2000) also found
that up to 100 % of maize silage can be fed to rabbits
without affecting the growth performance. Fazaeli et
al. (2006) observed non-significant effect of inclusion
of different levels of corn and sorghum silage on body
weight gain of yearling male calves. Thus, the results
suggest that corn silage has the potential to replace green
fodder in the diets fed to growing cattle. Low feed
intake and similar gain in the heifers of green fodder fed
group might be due to better metabolizability of ration
than corn silage fed groups.
In the present study, hematological attributes
showed non-significant effect of the replacement of
green fodder with corn silage (Table 3). Effect of green
fodder replacement with corn silage showed a weak
positive correlation with RBCs count, WBCs count,
MCV, MCH, and MCHC and weak negative
correlation with Hb content and PCV value. CV for
haematological attributes in different groups ranged
between 0.2-7.0%. Information pertaining to the
variability of hematological parameters in animals fed
on varying levels of corn silage is scanty. The
hematological attributes reported in the present study
were within the range reported earlier (Singh, 2016;
Singh, 2019) in growing indigenous cattle. Amuda
and Okunlola (2018) also found that PCV and Hb
concentrations in the blood did not differ among West
African Dwarf Sheep fed on different levels of ensiled
maize stover. However, there were significant (P<0.05)
differences in RBC and WBC concentration between
the dietary treatments such that it was highest in the
diet with more ensiled maize stover.
No significant differences in the ALT, AST, De
Rittis index, ALP, and plasma Ca and P were observed
among S0%
, S50%
and S100%
groups. Data on AST,
ALT and ALP concentrations were within normal
physiological limits and corroborate to those reported
by Sharma et al. (2014) and Singh et al. (2016) in
healthy indigenous heifers. Plasma ALT, AST, De Rittis
index, ALP, and P concentration showed weak positive
correlation and plasma Ca levels showed a weak
negative correlation with treatment. CV for blood
biochemical attributes in different groups ranged
between 0.9-4.4 %. Chen et al. (2015) also observed
no difference in serum concentrations of ALT and AST
among treatments having different proportion of for-
age. Little and Manston (1972) compared corn silage
and alfalfa hay as forages for dairy cattle and found
slightly higher P and slightly lower Ca in the blood of the
corn silage fed cows, but were within physiological
range.
Cost of feeding increased with the increased level
of inclusion of corn silage (Table 4). Cost difference
denoted that 12.32 and 18.26 INR/d required more in
S50%
and S100%
groups, respectively than S0%
group while
heifers were gaining at the similar rate. Higher cost
economics for replacement of green fodder with corn
silage was due to less metabolizability of corn silage
than green fodder.
Cost economics for replacement of green fodder
with corn silage was due to less efficiency of corn
silage utilization than green fodder. Bose et al. (2014)
observed lower total feed cost in more efficient calves
than less efficient calves over the course of the 52 day
Verma et al.
Indian J. Anim. Nutr. 2020. 37 (2): 95-105

103
feeding period in Murrah buffalo calves.
CONCLUSION
Results of the present study demonstrate that
prepared corn silage was well preserved and of very
good quality. Replacement of green fodder with corn
silage increased feed intake and cost of feeding while
growth performance was similar. Replacement of green
fodder with corn silage did not exert any effect on
physiological response, hematological attributes, and
blood metabolites. Corn silage can be used as an
alternative to high quality green fodder during scarcity
period without affecting performance of dairy animals.
REFERENCES
Amuda, A.J. and Okunlola, D.O. 2018. Haematological
parameters and serum biochemistry of West African
dwarf sheep fed ensiled maize stover and concentrate
supplements. J. Agric. Vet. Sci. 11: 57-63.
AOAC. 2005. Official Methods of Analysis, 18th edn.
Association of Official Analytical Chemists.
Washington DC.
Barnett, A.J.G. 1951. The colorimetric determination of lactic
acid in silage. Biochem. J. 49: 527-529.
Bernabucci, U., Ronchi, B., Lacetera, N. and Nardone, A. 2002.
Markers of oxidative status in plasma and erythrocytes
of transition dairy cows during hot season. J. Dairy
Sci. 85: 2173-2179.
Bose, B.K.S., Kundu, S.S., Tho, N.T.B., Sharma, V.K. and
Sontakke, U.B. 2014. Residual feed intake as a feed
efficiency selection tool and its relationship with
feed intake, performance and nutrient utilization in
Murrah buffalo calves. Trop. Anim. Health Prod. 46:
615-662.
Bureenok, S., Yuangklang, C., Vasupen, K., Schonewille, J.T.
and Kawamoto, Y. 2012. The effects of additives in
Napier grass silages on chemical composition, feed
intake, nutrient digestibility and rumen fermentation.
Asian Australas. J. Anim. Sci. 25: 1248-1254.
Chaudhary, D.P., Jat, S.L., Kumar, R., Kumar, A. and Kumar, B.
2014. Fodder quality of maize. In: Chaudhary D.P,
Kumar S, Singh S (eds.), Its preservation in maize
nutrition, dynamics and novel uses, Springer, India.
pp: 153-160.
Chen, G.J., Song, S.D., Wang, B.X., Zhang, Z.F., Peng, Z.L.,
Guo, C.H., Zhong, J.C. and Wang, Y. 2015. Effects of
forage: concentrate ratio on growth performance,
ruminal fermentation and blood metabolites in
housing-feeding Yaks. Asian Australas. J. Anim. Sci.
28: 1736-1741.
Church, D.C. 1991. Livestock Feeds and Feeding, 3rd ed.
Prentice Hall INC. Engle wood Cliffs, New Jersey, USA.
Detmann, E. and Filho, S.C.V. 2010. On the estimation of
non-fibrous carbohydrates in feeds and diets. Arq.
Bras. Med. Vet. Zootec. 62: 980-984.
El-Ayouty, S.A., Abdel-khalek, A.E., Ghanay, E.L., A.I.A. and
Shatifa, M.A. 2000. Effects of diets containing silage
on growth performance digestibility and carcass traits
of growing rabbits. Egyptian J. Nutr. Feeds. 3: 43-56.
Etman, K.E.I., Khafagi, E.A., Malik, A., Hathout, W.A. and
El-Sayes, M.F. 1994. Conservation of green summer
forage as silage and its utilization in feeding growing
lambs. In Proceedings of the 8th Conference, Egyptian
Society of Animal Production, pp: 175.
Fazaeli, H., Golmohhammadi, H.A., Al-Moddarres, A.,
Mosharraf, S. and Shoaei, A.A. 2006. Comparing the
performance of sorghum silage with maize silage in
feedlot calves. Pakistan J. Biol. Sci. 9: 2450-2455.
Fisher, L.J. and Lessard. 1987. Intake and digestibility of corn,
rye and sorghum-sudan grass silages by lactating
cows. Can. J. Anim. Sci. 67: 1027-1032.
Hameleers, A. 1998. The effects of the inclusion of maize
silage, fermented whole crop wheat or urea-treated
whole crop wheat in a diet based on high-quality grass
silage on the performance of dairy cows. Grass
Forage Sci. 53: 157-163.
Horiguchi, K. and Takahashi, T. 2007. Fermentation quality
and nutritive value of green soybean stover silage.
Grassl. Sci. 53: 27-31.
Juniper, D.T., Browne, E.M., Fisher, A.V., Bryant, M.J., Nute,
G.R. and Beever, D.E. 2005. Intake, growth and meat
quality of steers given diets based on varying
proportions of maize silage and grass silage. Anim.
Sci. J. 81:159-170.
Kaiser, A.G. and Piltz, J.W. 2004. Feed testing assessing silage
quality in successful silage. Dairy Australia and New
South Wales Department of Primary Industries, pp:
312-333.
Keady, T.W.J., Lively, F.O., Kilpatrick, D.J. and Moss, B.W.
2007. Effects of replacing grass silage with either maize
or whole-crop wheat silages on the performance and
meat quality of beef cattle offered two levels of
concentrates. J. Anim. Sci. 1: 613-623.
Keady, T.W.J., Mayne, C.S. and Kilpatrick, D.J. 2002b. The
effect of maturity of maize silage at harvest on the
performance of lactating dairy cows offered two
contrasting grass silages. In Proc. Br. Soc. Anim. Sci.
Replacement of green fodder with maize silage
Indian J. Anim. Nutr. 2020. 37 (2): 95-105

104
pp:16.
Kilic, A. 1986. Silo Feed, Instruction, Education and
Application Proposals, pp:327.
Kung, J.L. and Stokes, M. 2001. Analyzing silages for
fermentation end products. (Available:http://
www.ag.udel.edu/anfs/faculty/kung/articles/
analyzing/silages/for/formentati.htm; Accessed 21
November 2012).
Langston, C.W., Irvin, H., Gordon, C.H., Bouma, C., Wismani,
H.G., Melin, C.G. and Moore, L.A. 1958. Microbiology
and chemistry of grass silage. Tech. Bull. 1187.
Little, W., Manston, R. 1972. The effect of feeding maize and
lucerne silages on blood composition in dairy cows. J.
Agric. Sci. 78: 809.
Mafakher, E., Meskarbashee, M., Hassibi, P. and Mashayekhi,
M.R. 2010. Study of chemical composition and quality
characteristics of corn, sunflower and corn-sunflower
mixture silages. Asian J. Anim. Vet. Adv. 5: 175-179.
McDonald, P. and Henderson, A.R. 1964. Determination of
water-soluble carbohydrates in grass. J. Sci. Food
Agric. 15: 395-398.
McDonald, P., Edwards, R.A., Greenhalgh, J.F.D. and
Morgan, C.A. 1995. Animal Nutrition, 5th ed.
Copyright Licensing LTD, London.
McDowell, R.E., Hooven, N.W. and Camoens, J.K. 1976.
Effect of climate on performance of Holsteins in first
lactation. J. Dairy Sci. 59: 965-973.
Mills, J.A. and Kung, J.L. 2002. The effect of delayed ensiling
and application of a propionic acid-based additive on
the fermentation of barley silage. J. Dairy Sci. 85:
1969-1975.
Moselhy, M.A., Borba, J.P. and Borba, A.E.S. 2015. Improving
the nutritive value, in vitro digestibility and aerobic
stability of Hedychium gardnerianum silage through
application of additives at ensiling time. Anim. Feed
Sci. Technol. 206: 8-18.
Mulligan, F.J., O’Mara, F.P., Rath, M., Caffery, P.J., Callan, J.
and Flynn, B. 1999. Factors affecting the feeding value
of maize and grass silage in late lactation dairy cows.
In Proc. Br. Soc. Anim. Sci. pp: 79.
Nazli, M.H., Halim, R.A., Abdullah, A.M., Hussin, G. and
Samsudin, A.A. 2019. Potential of four corn varieties at
different harvest stages for silage production in
Malaysia. Asian-Australas. J. Anim. Sci. 32: 224-232.
NRC. 2001. Nutrient Requirements of Dairy Cattle. 7th Rev
ed. National Research Council. National Academy
press, Washington DC.
NRC. 2005. Mineral Tolerance of Animals. National Research
Council. National Academy, Washington DC.
O’Kiely, P. and Moloney, A.P. 2000. Nutritive value of maize
and grass silage for beef cattle when offered alone or
in mixtures. In Proc. Agric. Res. Forum. pp: 99-100.
O’Mara, F.P., Fitzgerald, S., Murphy, J.J. and Rath, M. 1998.
The effect on milk production of replacing grass silage
with maize silage in the diet of dairy cows. Livest. Prod.
Sci. 55: 79-87.
Phipps, R.H., Sutton, J.D., Beever, D.E. and Jones, A.K. 2000.
The effect of crop maturity on the nutritional value of
maize silage for lactating dairy cattle, food intake and
milk production. J. Anim. Sci. 71: 401-409.
Playne, M.J. and McDonald, P. 1966. The buffering
constituents of herbage and of ensilage. J. Sci. Food
Agric. 17: 264-268.
Queiroz, O.C., Arriola, K.G., Daniel, J.L. and Adesogan, A.T.
2013. Effects of 8 chemical and bacterial additives on
the quality of corn silage. J. Dairy Sci. 96: 5836-5843.
Seglar, B. 2003. Fermentation analysis and silage quality
testing. In Proceedings of the Minnesota Dairy Health
Conference. College of Veterinary Medicine,
University of Minnesota, USA, pp: 119-136.
Sharma, V.C., Mahesh, M.S., Mohini, M., Datt, C. and
Nampoothiria, V.M. 2014. Nutrient utilisation and
methane emissions in Sahiwal calves differing in
residual feed intake. Arch. Anim. Nutr. 68: 345-357.
Sheperd, A.C. and Kung, L. 1996. An enzyme additive for corn
silage: Effect on silage composition and animal
performance. J. Dairy Sci. 79: 1760.
Siddque, M.A.B., Sarker, N.R., Hamid, M.A., Amin, M.N. and
Sultana, M. 2015. Growth performance, feed
conversion ratio and economics of production of
native and crossbred (local× Holstein Friesian) bulls
for fattening under different improved feeding. J. Agric.
Sci. Technol. A5: 770-780.
Singh, A., Kumar, M., Kumar, V., Roy, D., Kushwaha,
R., Vaswani, S. and Kumar, A. 2019. Effect of nickel
supplementation on liver and kidney function test and
protein metabolism in growing cattle. Proc. Nat. Acad.
Sci. India Sec. B Biol. Sci. doi.org/10.1007/s40011-
019-01087-9.
Singh, P. 1997. Feeding Management Studies on Green
Forage Proportions in the Ration of Lactating
Crossbred Cows. MVSc thesis submitted to National
Dairy Research Institute (NDRI), Karnal, India.
Singh, S. 2016. Effect of Feeding Biomethanated Spent Wash
on Growth and Nutrient Utilization in Growing
Cattle. MVSc thesis submitted to U. P. Pandit Deen
Dayal Upadhyaya Pashu Chikitsa Vigyan
Vishwavidyalaya Evam Go-Anusandhan Sansthan
Verma et al.
Indian J. Anim. Nutr. 2020. 37 (2): 95-105
105
(DUVASU), Mathura (Uttar Pradesh), India.
Singh, S., Kumar, M., Kumar, V., Roy, D., Kushwaha, R., Vaswani,
S., Singh, Y. and Singh, S.K. 2016. Evaluation of
molasses based biomethanated distillery spent wash
as an alternative feed for growing cattle. Indian J. Anim.
Nutr. 33: 388-393.
Sniffen, C.J., O’Connor, J.D., Van Soest, P.J., Fox, D.G. and
Russell, J.B. 1992. A net carbohydrate and protein
system for evaluating cattle diets, carbohydrate and
protein availability. J. Anim. Sci. 70: 3562-3577.
Talapatra, S.K., Roy, S.C. and Sen, K.C. 1940. The analysis of
mineral constituents in biological materials. Estimation
of phosphorus, chlorine, calcium, manganese, sodium
and potassium in foodstuffs. Indian J. Vet. Sci. Anim.
Husb.10: 243.
Van Soest, P.J. 1994. Nutritional Ecology of the Ruminant,
2nd edn. Comstock Publishing Associates/Cornell
University Press, Ithaca, New York, USA, pp: 476.
Van Soest, P.J., Robertson, J.B. and Lewis, B.A. 1991.
Methods for dietary fiber, neutral detergent fiber, and
nonstarch polysaccharides in relation to animal
nutrition. J. Dairy Sci. 74: 3583-3597.
Varadyova, Z., Kisidayova, S., Laukova, A. and Jalc, D. 2010.
Influence of inoculated maize silage and sunflower oil
on the in vitro fermentation, ciliate population and fatty
acid outputs in the rumen fluid collected from sheep.
Czech J. Anim. Sci. 55: 105-115.
Wang, J., Wang, J.Q., Zhou, H. and Feng, T. 2009. Effects of
addition of previously fermented juice prepared from
alfalfa on fermentation quality and protein
degradation of alfalfa silage. Anim. Feed Sci. Technol.
151: 280-290.
Weatherburn, M.W. 1967. Phenol Hipochlorite Reaction for
Determination of Ammonia. Anal. Chem. 39: 971-974.
Indian J. Anim. Nutr. 2020. 37 (2): 95-105
Replacement of green fodder with maize silage
Received on 28-07-2020 and accepted on 12-08-2020
106
Indian Journal of
Animal Nutrition
Effect of Supplementing Wet Distillers’ Grains with Solubles to Maize
Silage Based Diet on Performance of Growing Nellore Jodipi Ram Lambs
K. Naveena, A. Ravi1*, B. Devasena2 and S. Shakila3
Department of Animal Nutrition, College of Veterinary Science,
Sri Venkateswara Veterinary University, Tirupati-517 502, Andhra Pradesh, India
ABSTRACT
The objective of the study was to evaluate performance of ram lambs supplemented with distillers grains
with solubles (DGS) under intensive system. In a completely randomized design, 24 growing Nellore Jodipi ram
lambs were divided into 4 equal groups of six each. Corn silage was fed ad libitum to all the rams, basal diet was
supplemented with DDGS at 1.0% BW in control group (T1), whereas WDGS was supplemented at 1.0, 1.5 and
2.0 % BW in groups T2, T
3 and T
4, respectively.The average daily gain (g) of 105.4, 69.1, 81.6, and 89.5 was
recorded recorded in T1 to T
4 fed lambs respectively, was higher (P<0.05) in T
1 than in T
2. The DMI from silage
and total DMI were not significantly different among treatments. The DMI (g/d) from dry DGS was 153.0 in T1
and 46.6, 74.4 and 99.8, in T2 to T
4 from wet DGS, respectively and was higher (P<0.05) in T
1 than in T
2. The feed
efficiency was inferior (P<0.05) in T2 as compared to other treatments. The digestibility of nutrients except CP
and EE was not significantly different among treatments. The N retained as per cent of intake and the molar
proportion of acetate, and acetate to propionate ratio was higher (P<0.05) in T1 than in other treatments. There
was no significant difference among treatments with respect to serum concentration of protein, mineral profile
of serum except for a higher (P<0.05) phosphorus in T1 fed lambs. The carcass traits, chemical composition and
mineral profile of longissimus dorsi muscle were also not significantly different among dietary treatments.
Returns over feed cost was higher (P<0.01) in T1 and T
4, than in T
2 and T
3 fed lambs. It was concluded that
supplementation of wet DGS to maize silage-based diet at 2.0% of body weight resulted in performance
comparable with dry DGS supplementation at 1 % of body weight.
Key words: Maize silage, Ram lambs, Supplementation, Wet Distillers grains with soluble
1Corresponding author; Email: [email protected], NTR CVSc., Gannavaram, AP; 2Department of Animal Nutrition, CVSc., Tirupati, AP3Department of Poultry Science, CVSc., Tirupati, AP
INTRODUCTION
The cereal processing industries in India are
on constant rise producing various beverage-based
by-products at higher amounts (Lakshmi et al., 2017).
Among these by-products, distillers grains with solubles
(DGS) is a by-product of ethanol industry made
primarily of unfermented grain residue containing
protein, fibre, and fat at higher amounts (Reddy et al.,
2017). The DGS is majorly used as a protein source, but
can also be used to provide energy due to presence of
degradable fibre in large amounts (NDF - 38-40%).
Farmers, especially those in third-world countries,
feed sheep with DGS in two forms i.e., wet DGS
(WDGS) and dry DGS (DDGS) depending on the
availability (Iram et al., 2020). Though wet DGS has
four to five days of shelf life, the chemical composition
of the dry and wet DGS is similar on dry matter basis.
Indian J. Anim. Nutr. 2020. 37 (2): 106-114
doi: 10.5958/2231-6744.2020.00018.3
However, poor amino acid digestibility due to Maillard
reaction can be observed in dry DGS than in wet DGS
due to extreme hot conditions during drying of wet DGS
(De Almeida, 2013). Feeding of wet DGS would be
economic as the cost incurred in drying the product
can be bypassed and loss of protein quality due to heat
treatment can be minimized (Schingoethe et al., 2009).
Addition of DGS to replace soybean meal to the ration
has been beneficial in finishing lamb diets (Kawecka et
al., 2018). In view of availability of wet DGS to
farmers in the vicinity of distillery plants, this study was
taken up to study the effect of supplementing wet DGS
to corn silage based on performance of lambs under
intensive system of rearing.
MATERIALS AND METHODS
All experimental protocols were approved by the
Institutional Committee for Animal Use and Ethics of
Indian J. Anim. Nutr. 2020. 37 (2): 106-114
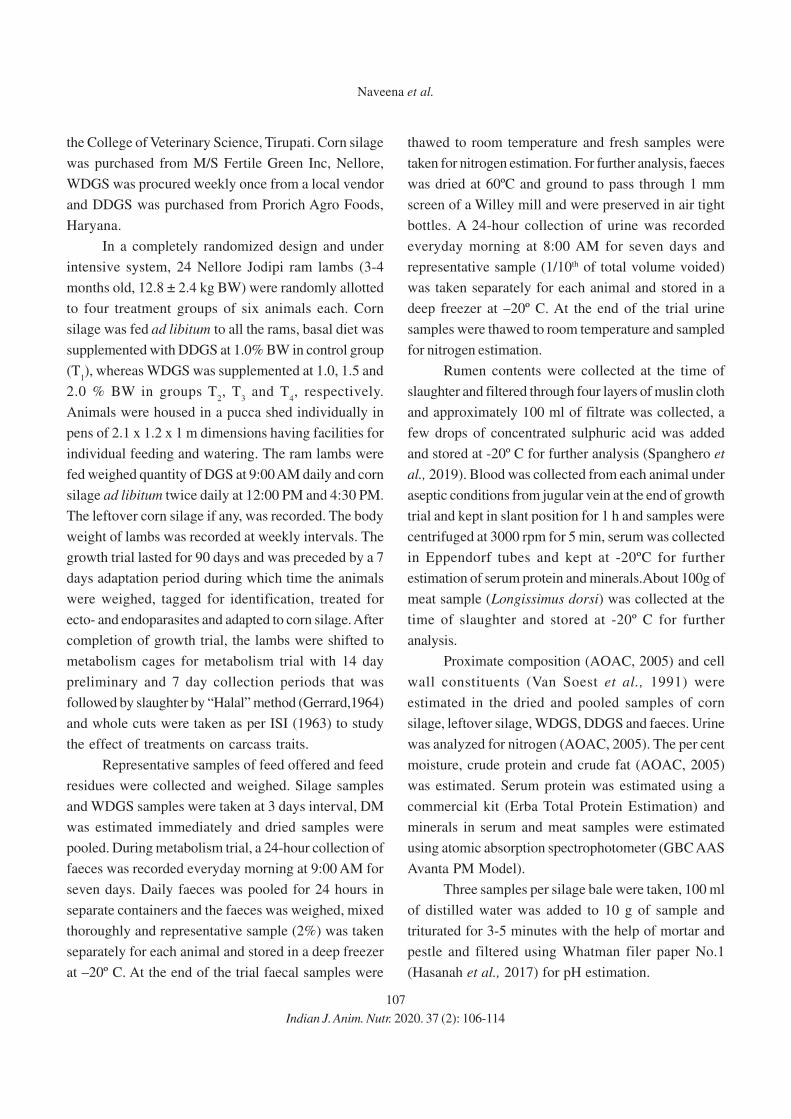
107
the College of Veterinary Science, Tirupati. Corn silage
was purchased from M/S Fertile Green Inc, Nellore,
WDGS was procured weekly once from a local vendor
and DDGS was purchased from Prorich Agro Foods,
Haryana.
In a completely randomized design and under
intensive system, 24 Nellore Jodipi ram lambs (3-4
months old, 12.8 ± 2.4 kg BW) were randomly allotted
to four treatment groups of six animals each. Corn
silage was fed ad libitum to all the rams, basal diet was
supplemented with DDGS at 1.0% BW in control group
(T1), whereas WDGS was supplemented at 1.0, 1.5 and
2.0 % BW in groups T2, T
3 and T
4, respectively.
Animals were housed in a pucca shed individually in
pens of 2.1 x 1.2 x 1 m dimensions having facilities for
individual feeding and watering. The ram lambs were
fed weighed quantity of DGS at 9:00 AM daily and corn
silage ad libitum twice daily at 12:00 PM and 4:30 PM.
The leftover corn silage if any, was recorded. The body
weight of lambs was recorded at weekly intervals. The
growth trial lasted for 90 days and was preceded by a 7
days adaptation period during which time the animals
were weighed, tagged for identification, treated for
ecto- and endoparasites and adapted to corn silage. After
completion of growth trial, the lambs were shifted to
metabolism cages for metabolism trial with 14 day
preliminary and 7 day collection periods that was
followed by slaughter by “Halal” method (Gerrard,1964)
and whole cuts were taken as per ISI (1963) to study
the effect of treatments on carcass traits.
Representative samples of feed offered and feed
residues were collected and weighed. Silage samples
and WDGS samples were taken at 3 days interval, DM
was estimated immediately and dried samples were
pooled. During metabolism trial, a 24-hour collection of
faeces was recorded everyday morning at 9:00 AM for
seven days. Daily faeces was pooled for 24 hours in
separate containers and the faeces was weighed, mixed
thoroughly and representative sample (2%) was taken
separately for each animal and stored in a deep freezer
at –20º C. At the end of the trial faecal samples were
thawed to room temperature and fresh samples were
taken for nitrogen estimation. For further analysis, faeces
was dried at 60ºC and ground to pass through 1 mm
screen of a Willey mill and were preserved in air tight
bottles. A 24-hour collection of urine was recorded
everyday morning at 8:00 AM for seven days and
representative sample (1/10th of total volume voided)
was taken separately for each animal and stored in a
deep freezer at –20º C. At the end of the trial urine
samples were thawed to room temperature and sampled
for nitrogen estimation.
Rumen contents were collected at the time of
slaughter and filtered through four layers of muslin cloth
and approximately 100 ml of filtrate was collected, a
few drops of concentrated sulphuric acid was added
and stored at -20º C for further analysis (Spanghero et
al., 2019). Blood was collected from each animal under
aseptic conditions from jugular vein at the end of growth
trial and kept in slant position for 1 h and samples were
centrifuged at 3000 rpm for 5 min, serum was collected
in Eppendorf tubes and kept at -20ºC for further
estimation of serum protein and minerals.About 100g of
meat sample (Longissimus dorsi) was collected at the
time of slaughter and stored at -20º C for further
analysis.
Proximate composition (AOAC, 2005) and cell
wall constituents (Van Soest et al., 1991) were
estimated in the dried and pooled samples of corn
silage, leftover silage, WDGS, DDGS and faeces. Urine
was analyzed for nitrogen (AOAC, 2005). The per cent
moisture, crude protein and crude fat (AOAC, 2005)
was estimated. Serum protein was estimated using a
commercial kit (Erba Total Protein Estimation) and
minerals in serum and meat samples were estimated
using atomic absorption spectrophotometer (GBC AAS
Avanta PM Model).
Three samples per silage bale were taken, 100 ml
of distilled water was added to 10 g of sample and
triturated for 3-5 minutes with the help of mortar and
pestle and filtered using Whatman filer paper No.1
(Hasanah et al., 2017) for pH estimation.
Naveena et al.
Indian J. Anim. Nutr. 2020. 37 (2): 106-114
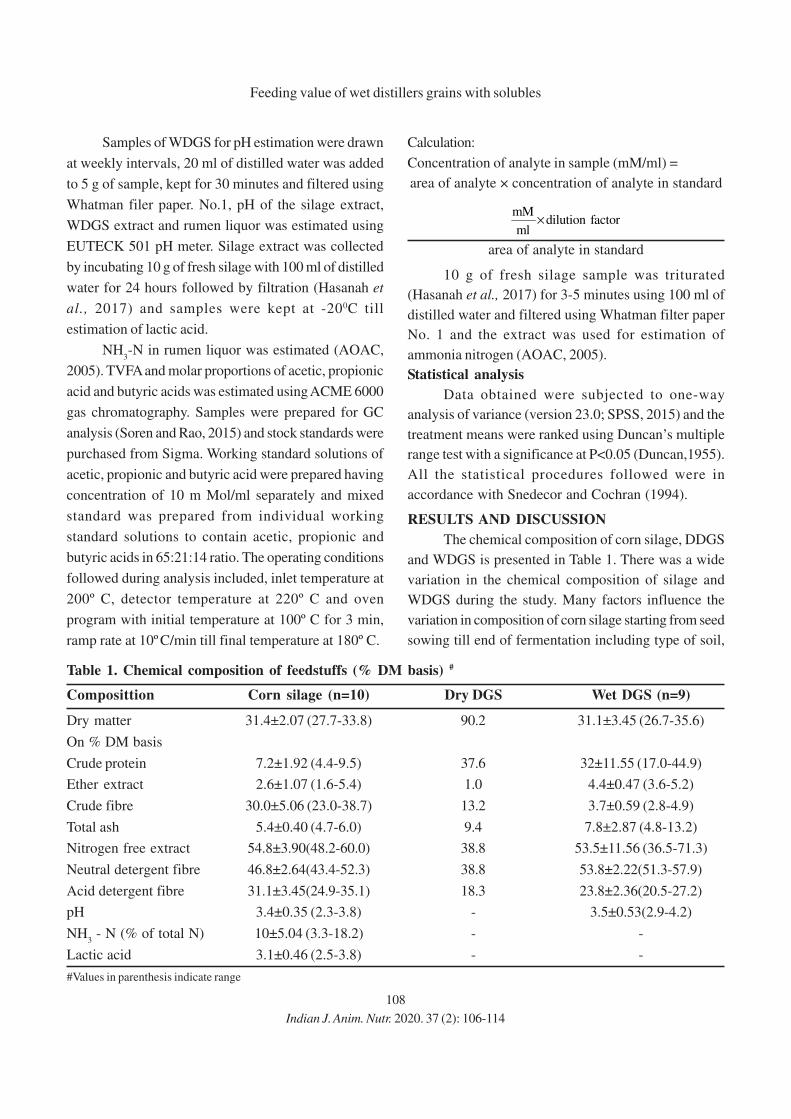
108
Samples of WDGS for pH estimation were drawn
at weekly intervals, 20 ml of distilled water was added
to 5 g of sample, kept for 30 minutes and filtered using
Whatman filer paper. No.1, pH of the silage extract,
WDGS extract and rumen liquor was estimated using
EUTECK 501 pH meter. Silage extract was collected
by incubating 10 g of fresh silage with 100 ml of distilled
water for 24 hours followed by filtration (Hasanah et
al., 2017) and samples were kept at -200C till
estimation of lactic acid.
NH3-N in rumen liquor was estimated (AOAC,
2005). TVFA and molar proportions of acetic, propionic
acid and butyric acids was estimated using ACME 6000
gas chromatography. Samples were prepared for GC
analysis (Soren and Rao, 2015) and stock standards were
purchased from Sigma. Working standard solutions of
acetic, propionic and butyric acid were prepared having
concentration of 10 m Mol/ml separately and mixed
standard was prepared from individual working
standard solutions to contain acetic, propionic and
butyric acids in 65:21:14 ratio. The operating conditions
followed during analysis included, inlet temperature at
200º C, detector temperature at 220º C and oven
program with initial temperature at 100º C for 3 min,
ramp rate at 10º C/min till final temperature at 180º C.
Calculation:
Concentration of analyte in sample (mM/ml) =
area of analyte × concentration of analyte in standard
factordilution ml
mM×
area of analyte in standard
10 g of fresh silage sample was triturated
(Hasanah et al., 2017) for 3-5 minutes using 100 ml of
distilled water and filtered using Whatman filter paper
No. 1 and the extract was used for estimation of
ammonia nitrogen (AOAC, 2005).
Statistical analysis
Data obtained were subjected to one-way
analysis of variance (version 23.0; SPSS, 2015) and the
treatment means were ranked using Duncan’s multiple
range test with a significance at P<0.05 (Duncan,1955).
All the statistical procedures followed were in
accordance with Snedecor and Cochran (1994).
RESULTS AND DISCUSSION
The chemical composition of corn silage, DDGS
and WDGS is presented in Table 1. There was a wide
variation in the chemical composition of silage and
WDGS during the study. Many factors influence the
variation in composition of corn silage starting from seed
sowing till end of fermentation including type of soil,
Table 1. Chemical composition of feedstuffs (% DM basis) #
Composittion Corn silage (n=10) Dry DGS Wet DGS (n=9)
Dry matter 31.4±2.07 (27.7-33.8) 90.2 31.1±3.45 (26.7-35.6)
On % DM basis
Crude protein 7.2±1.92 (4.4-9.5) 37.6 32±11.55 (17.0-44.9)
Ether extract 2.6±1.07 (1.6-5.4) 1.0 4.4±0.47 (3.6-5.2)
Crude fibre 30.0±5.06 (23.0-38.7) 13.2 3.7±0.59 (2.8-4.9)
Total ash 5.4±0.40 (4.7-6.0) 9.4 7.8±2.87 (4.8-13.2)
Nitrogen free extract 54.8±3.90(48.2-60.0) 38.8 53.5±11.56 (36.5-71.3)
Neutral detergent fibre 46.8±2.64(43.4-52.3) 38.8 53.8±2.22(51.3-57.9)
Acid detergent fibre 31.1±3.45(24.9-35.1) 18.3 23.8±2.36(20.5-27.2)
pH 3.4±0.35 (2.3-3.8) - 3.5±0.53(2.9-4.2)
NH3 - N (% of total N) 10±5.04 (3.3-18.2) - -
Lactic acid 3.1±0.46 (2.5-3.8) - -
#Values in parenthesis indicate range
Feeding value of wet distillers grains with solubles
Indian J. Anim. Nutr. 2020. 37 (2): 106-114

109
irrigation and harvesting practices (Bal, 2006). The most
influencing factor is dry matter content at harvest time
because nutrient contents like starch, water soluble
carbohydrates (WSC) and NDF depends on dry matter
content of fodder (Khan et al., 2009) and the content of
WSC decides the quality of silage by maintaining pH of
silage. The nutrient composition of WDGS is not
constant and it would fluctuate frequently depending on
many factors like type and quality of grain and
conditions of processing such as milling, fermentation,
temperatures adopted during drying and the quantity of
solubles that are blended into WDGS (Reddy et al.,
2017). The average value (% total N) for NH3-N (Table
1) of corn silage was indicative of good quality but there
was wide variation, 4.16±0.68 at the time of opening
the silage bale, 10.09±1.44 when 50% of silage in a bale
was used up and 15.8±1.9 at the time of complete
usage of silage in a bale. High temperature provokes
the microbial activity which results in higher NH3–N
due to proteolysis (Muck and Dickerson, 1988). As
the experiment was conducted during summer (March-
June), high temperature during storage and time of
sampling might be the reasons for obtaining higher val-
ues for NH3 - N.
The weight gain (kg) of ram lambs (Table 2) was
9.27, 6.57, 7.18, and 8.50 in T1, T
2, T
3 and T
4,
Table 2. Effect of dietary treatments on body weight gain and feed efficiency of ram lambs
Parameter Dietary treatments* SEM P value
T1
T2
T3
T4
Initial weight (kg) 12.92 12.87 12.77 12.8 1.00 0.99
Final weight (kg) 22.19 19.43 19.95 21.3 1.44 0.545
Weight gain (kg) 9.27a 6.57b 7.18ab 8.50ab 0.71 0.018
ADG (g) 105.4a 69.1b 81.6ab 89.5ab 8.24 0.008
DMI silage (g) 478 447 416 472 50.67 0.84
DMI DGS (g) 153.0a 46.6b 74.4ab 99.8ab 17.52 0.00
Total DMI (g) 631.1 493.8 490.9 572.4 60.00 0.296
FCR 5.65 7.07 5.85 6.39 0.59 0.351
ADG, average daily gain, DMI, average daily dry matter intake; DGS, distillers grain with solubles; FCR, feed conversion ratio; *Corn silage
was fed ad libitum to all the rams, basal diet was supplemented with DDGS at 1.0% BW in control group (T1), whereas WDGS was
supplemented at 1.0, 1.5 and 2.0 % BW in groups T2, T
3 and T
4, respectively; a,bMean values within a row with unlike superscript letters
were significantly different for each dietary treatment
Table 3. Effect of dietary treatments on nutrient digestibility (%) of ram lambs
Parameter Dietary treatments* SEM P value
T1
T2
T3
T4
Dry matter 70.48 70.98 69.7 71.75 2.13 0.937
Organic matter 71.35 72 71.22 73.02 2.05 0.938
Crude protein 59.74ab 56.73ab 54.00a 67.92b 3.67 0.022
Ether extract 71.78a 81.34ab 79.30ab 86.37b 3.74 0.026
Crude fibre 63.43 59.78 61.78 61.25 3.23 0.906
NFE 77.56 79.03 78.43 77.66 1.83 0.948
NDF 73.24 70.75 71.49 72.51 2.55 0.925
ADF 78.69 73.01 70.85 72.2 2.82 0.218
NFE, nitrogen free extract, NDF, neutral detergent fibre; ADF, acid detergent fibre; a,b Mean values within a row with unlike superscript letters
were significantly different for each dietary treatment; *Corn silage was fed ad libitum to all the rams, basal diet was supplemented with
DDGS at 1.0% BW in control group (T1), whereas WDGS was supplemented at 1.0, 1.5 and 2.0 % BW in groups T
2, T
3 and T
4, respectively.
Naveena et al.
Indian J. Anim. Nutr. 2020. 37 (2): 106-114
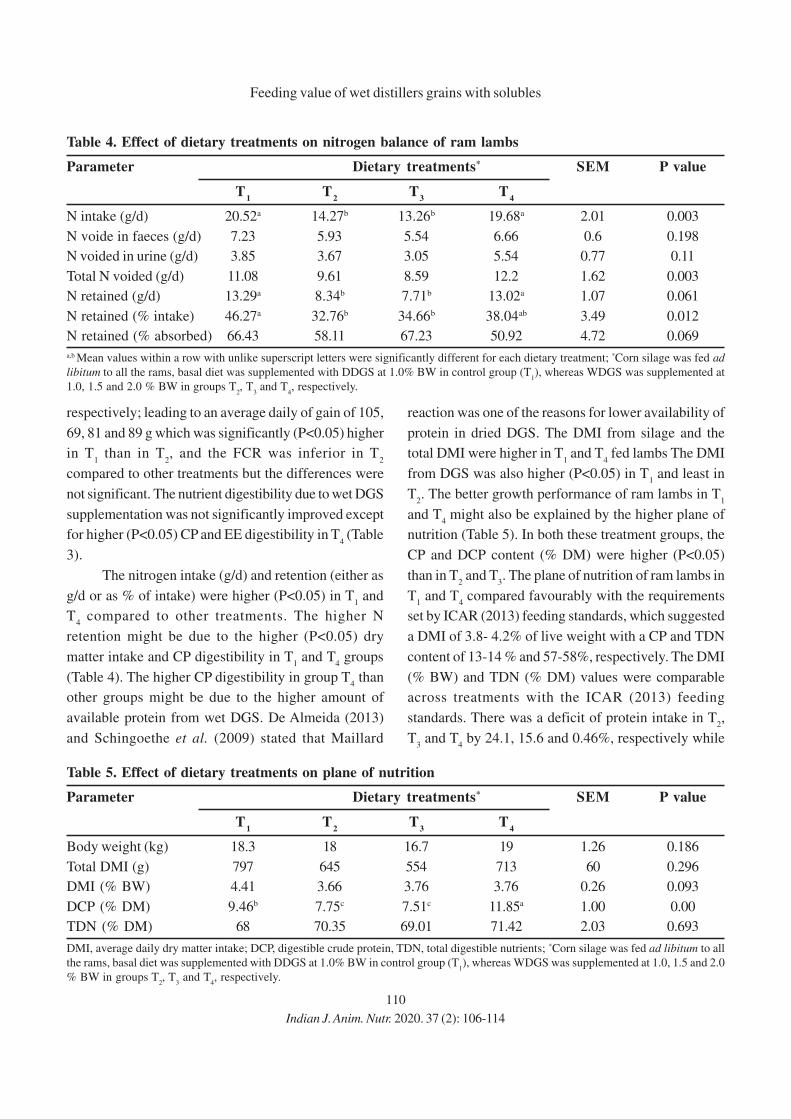
110
respectively; leading to an average daily of gain of 105,
69, 81 and 89 g which was significantly (P<0.05) higher
in T1 than in T
2, and the FCR was inferior in T
2
compared to other treatments but the differences were
not significant. The nutrient digestibility due to wet DGS
supplementation was not significantly improved except
for higher (P<0.05) CP and EE digestibility in T4 (Table
3).
The nitrogen intake (g/d) and retention (either as
g/d or as % of intake) were higher (P<0.05) in T1 and
T4 compared to other treatments. The higher N
retention might be due to the higher (P<0.05) dry
matter intake and CP digestibility in T1 and T
4 groups
(Table 4). The higher CP digestibility in group T4 than
other groups might be due to the higher amount of
available protein from wet DGS. De Almeida (2013)
and Schingoethe et al. (2009) stated that Maillard
reaction was one of the reasons for lower availability of
protein in dried DGS. The DMI from silage and the
total DMI were higher in T1 and T
4 fed lambs The DMI
from DGS was also higher (P<0.05) in T1 and least in
T2. The better growth performance of ram lambs in T
1
and T4 might also be explained by the higher plane of
nutrition (Table 5). In both these treatment groups, the
CP and DCP content (% DM) were higher (P<0.05)
than in T2 and T
3. The plane of nutrition of ram lambs in
T1 and T
4 compared favourably with the requirements
set by ICAR (2013) feeding standards, which suggested
a DMI of 3.8- 4.2% of live weight with a CP and TDN
content of 13-14 % and 57-58%, respectively. The DMI
(% BW) and TDN (% DM) values were comparable
across treatments with the ICAR (2013) feeding
standards. There was a deficit of protein intake in T2,
T3 and T
4 by 24.1, 15.6 and 0.46%, respectively while
Table 4. Effect of dietary treatments on nitrogen balance of ram lambs
Parameter Dietary treatments* SEM P value
T1
T2
T3
T4
N intake (g/d) 20.52a 14.27b 13.26b 19.68a 2.01 0.003
N voide in faeces (g/d) 7.23 5.93 5.54 6.66 0.6 0.198
N voided in urine (g/d) 3.85 3.67 3.05 5.54 0.77 0.11
Total N voided (g/d) 11.08 9.61 8.59 12.2 1.62 0.003
N retained (g/d) 13.29a 8.34b 7.71b 13.02a 1.07 0.061
N retained (% intake) 46.27a 32.76b 34.66b 38.04ab 3.49 0.012
N retained (% absorbed) 66.43 58.11 67.23 50.92 4.72 0.069
a,b Mean values within a row with unlike superscript letters were significantly different for each dietary treatment; *Corn silage was fed ad
libitum to all the rams, basal diet was supplemented with DDGS at 1.0% BW in control group (T1), whereas WDGS was supplemented at
1.0, 1.5 and 2.0 % BW in groups T2, T
3 and T
4, respectively.
Table 5. Effect of dietary treatments on plane of nutrition
Parameter Dietary treatments* SEM P value
T1
T2
T3
T4
Body weight (kg) 18.3 18 16.7 19 1.26 0.186
Total DMI (g) 797 645 554 713 60 0.296
DMI (% BW) 4.41 3.66 3.76 3.76 0.26 0.093
DCP (% DM) 9.46b 7.75c 7.51c 11.85a 1.00 0.00
TDN (% DM) 68 70.35 69.01 71.42 2.03 0.693
DMI, average daily dry matter intake; DCP, digestible crude protein, TDN, total digestible nutrients; *Corn silage was fed ad libitum to all
the rams, basal diet was supplemented with DDGS at 1.0% BW in control group (T1), whereas WDGS was supplemented at 1.0, 1.5 and 2.0
% BW in groups T2, T
3 and T
4, respectively.
Feeding value of wet distillers grains with solubles
Indian J. Anim. Nutr. 2020. 37 (2): 106-114

111
in T1 fed lambs it was as per recommendations. Lower
protein content in T2 and T
3 diets might be the reason
for getting lower body weight gain in those two groups.
It was of interest to see if wet DGS supplementation
could promote optimum ruminal fermentation and
stimulate consumption of basal roughage i.e. corn
silage. Intake of the silage is related to three measures
of quality, namely dry matter and digestible organic
matter content, and ammonia nitrogen content as a
proportion of total nitrogen content. Other measures of
silage quality affecting its intake are nitrogen content,
butyric acid content and pH (McDonald et al., 2001).
In the present study also, the NH3-N content as a
proportion of total nitrogen increased from the time of
opening a silage bale to the end of use probably
affecting the voluntary DM intake from silage. Further,
CF content of silage ranged from 23.0 to 38.7% with a
mean value of 30.0% (Table 1) and the higher CF
content might also have failed to stimulate the voluntary
intake of silage. The leftover silage contained 34.3%
crude fibre.
The rumen fermentation pattern (Table 6)
revealed optimum rumen pH across treatments and a
slightly higher NH3-N in T
2 to T
4 diets due to wet DGS
Table 6. Rumen fermentation pattern of the ram lambs fed experimental diets
Parameter Dietary treatments* SEM P value
T1
T2
T3
T4
Rumen Ph 6.58 6.48 6.38 6.38 0.11 0.58
NH3 - N (mg/100 ml) 5.8 5.92 6.1 6.17 0.21 0.603
TVFA (mMol/dl) 21.83 18.9 20.48 19.54 1.16 0.327
Molar proportion
Acetic acid 0.42a 0.39ab 0.33b 0.37ab 0.02 0.034
Propionic acid 0.34 0.36 0.37 0.37 0.01 0.199
Butyric acid 0.25 0.25 0.29 0.26 0.02 0.317
Acetate :Propionate 1.25a 1.1ab 0.89b 0.99ab 0.1 0.033
a,bMean values within a row with unlike superscript letters were significantly different for each dietary treatment; *Corn silage was fed ad
libitum to all the rams, basal diet was supplemented with DDGS at 1.0% BW in control group (T1), whereas WDGS was supplemented at
1.0, 1.5 and 2.0 % BW in groups T2, T
3 and T
4, respectively.
Table 7. Serum protein (g/dl) and mineral profile (mg/dl) of the ram lambs
Parameter Dietary treatments* SEM P value
T1
T2
T3
T4
Protein (g/dl) 6.25 5.94 6.21 6.25 0.23 0.742
Ca 6.48 7.51 7.23 7.34 1.59 0.496
P 7.17a 6.60b 6.83ab 6.76ab 0.41 0.041
Na 331.68 317.75 322.12 323.83 18.02 0.081
K 20.21 20.11 19.42 22.23 2.17 0.457
Mg 2.76 2.95 2.76 2.94 1.1 0.299
Fe 0.22 0.26 0.25 0.27 0.18 0.36
Zn 0.12 0.13 0.11 0.12 0.82 0.324
Co 0.12 0.02 0.022 0.021 0.06 0.173
abMean values within a row with unlike superscript letters were significantly different for each dietary treatment; *Corn silage was fed ad
libitum to all the rams, basal diet was supplemented with DDGS at 1.0% BW in control group (T1), whereas WDGS was supplemented
at 1.0, 1.5 and 2.0 % BW in groups T2, T
3 and T
4, respectively.
Naveena et al.
Indian J. Anim. Nutr. 2020. 37 (2): 106-114

112
Table 8. Carcass characteristics, chemical composition and mineral profile of longissiumus dorsi muscle
Parameter Dietary treatments* SEM P value
T1
T2
T3
T4
Pre-slaughter weight (kg) 22.43 19.33 17.90 21.23 1.79 0.30
Dressed weight (kg) 9.97 8.27 7.90 9.47 0.87 0.297
Dressing % 44.43 42.30 44.05 44.62 1.25 57.0
Neck & Shoulder 10.26 11.18 9.99 10.11 0.62 0.541
Brisket & Fore shank 31.98 26.79 31.71 28.27 1.66 0.053
Loin 13.09 12.44 13.56 13.28 0.68 0.721
Rack 10.94 14.38 11.96 14.95 1.35 0.101
Leg 33.73 35.21 32.79 33.40 0.72 0.10
Meat (kg) 6.35 5.03 4.91 6.16 0.62 0.23
Bone (kg) 3.54 2.95 2.99 3.35 0.3 0.456
M:B ratio 1.58 1.69 1.62 1.54 0.05 0.197
L. dorsi muscle composition
Dry matter (%) 27.51 28.30 25.76 28.59 1.06 0.24
Crude protein (%, DM) 23.92 25.01 24.04 25.56 0.97 0.603
Ether extract (%, DM) 1.83 2.02 2.06 2.19 0.21 0.125
Mineral profile of L. dorsi muscle (mg/100 g)
Na 69.84 71.72 72.61 69.18 95.27 0.852
K 335.77 331.25 336.31 330.99 81.83 0.997
Ca 7.51 8.30 7.81 7.03 2.73 0.761
Mg 21.78 23.96 21.93 22.83 3.36 0.264
Fe 1.42 1.54 1.43 1.41 2.34 0.412
Cu 0.32 0.45 0.52 0.53 0.56 0.227
Zn 8.64 9.48 9.59 9.69 1.26 0.23
Mn 0.24 0.22 0.23 0.22 0.31 0.483
Co 0.21 0.20 21 0.22 0.05 0.591
*Corn silage was fed ad libitum to all the rams, basal diet was supplemented with DDGS at 1.0% BW in control group (T1), whereas WDGS
was supplemented at 1.0, 1.5 and 2.0 % BW in groups T2, T
3 and T
4, respectively.
supplementation. Further, TVFA concentration and
molar proportions of propionic acid and butyric acid in
rumen liquor was comparable among treatment groups
whereas the acetic acid concentration was higher
(P<0.05) in T1 than in other treatments. Higher value
for acetate was noticed in dry DGS fed group than that
of wet DGS fed groups which might be due to lower
NDF content in dry DGS (Avila Stango et al., 2013).
The serum protein and mineral profile (Table 7)
did not differ significantly among treatments, except for
a higher (P<0.05) serum phosphorus in ram lambs fed
on T1. The higher phosphorus content of the dry dried
distillers grain with solubles (Reddy, 2017) might have
led to a higher serum phosphorus concentration in ram
lambs fed on T1 since the DMI from dry DDGS was
higher than the DMI from wet WDGS in other
treatments.
There was no significant difference among
treatments with respect to carcass characteristics (Table
8), chemical composition and mineral profile of
Longissimus dorsi muscle and were comparable with
those available in literature. Kasap et al. (2018) reported
values of 75.61% moisture, 2.13% EE and 20.91% CP
in the longissimus thoracis et lumborum muscle of lambs
Feeding value of wet distillers grains with solubles
Indian J. Anim. Nutr. 2020. 37 (2): 106-114

113
Table 9. Cost economics of ram lamb production per animal
Parameter Dietary treatments* SEM P value
T1
T2
T3
T4
Animal cost (`) 3247.92 3016.67 3091.67 3200 42.68 0.193
Silage cost (`) 1025.62 999.08 990.63 1037.26 59.89 0.295
DGS cost (`) 340.37a 144.00b 190.02b 309.78a 38.93 0.000
Total feed cost (`) 1365.99a 1088.05b 1009.26b 1347.04a 152.21 0.051
Feed cost (`)/kg gain 146.25 163.08 169.27 158.21 13.22 0.159
Returns (by sale of 5481.21 4549.42 4643.17 5200.25 350.9 0.299
meat & offal `)
Net Profit/Loss (`) 772.88a 578.58b 651.50b 775.25a 138.16 0.052
(e-(a+d))
a,b Mean values within a row with unlike superscript letters were significantly different for each dietary treatment.
Cost of silage: ` 6.8/kg, Cost of dry DGS: ` 23/kg, Cost of wet DGS: ` 10/kg; *Corn silage was fed ad libitum to all the rams, basal diet was
supplemented with DDGS at 1.0% BW in control group (T1), whereas WDGS was supplemented at 1.0, 1.5 and 2.0 % BW in groups T
2, T
3
and T4, respectively.
reared in outdoor conditions. Kawecka et al. (2018)
reported values of 22.94, 2.87 and 19.57 of DM, EE
and CP, respectively with diets containing 45% dry DGS.
Radzik-Rant et al. (2018) reported 26.09 % DM and
4.62 % EE content in the muscle of lambs fed with wet
brewers grains. Higher intake of dry DGS in T1 and
wet DGS in T4 fed lambs resulted in higher (P<0.01)
cost of DGS supplementation in these treatments
leading to higher (P<0.05) total feed cost compared to
T2 and T
3 fed lambs. However, no significant
differences were found in total returns. Net profit was
higher (P<0.05) in T1 and T
4 than in T
2 and T
3 fed lambs
(Table 9).
CONCLUSIONS
It was concluded that supplementation of wet
DGS at 2.0 % of body weight resulted in ram lamb
performance comparable with dry DGS
supplementation at 1.0% of body weight.
REFERENCES
AOAC. 2005. Official Methods of Analysis.18th rev. ed.
Association of Official Analytical Chemists, Arlington,
Washington DC, USA.
Avila Stagno, J., Chaves, A.V., He, M. L. and McAllister, T.A.
2013. Increasing concentrations of wheat dry
distillers’ grains with solubles in iso-nitrogenous
finishing diets reduce lamb performance. Small Rumin.
Res. 114: 10-19.
Bal, M.A. 2006. Effects of hybrid type, stage of maturity, and
fermentation length on whole plant corn silage quality.
Turk. J. Vet. Anim. Sci. 30: 331-336.
De Almeida, F.N. 2013. Effects of the Maillard reactions on
chemical composition and amino acid digestibility of
feed ingredients and on pig growth performance.
Doctoral dissertation, University of Illinois at Urbana-
Champaign.
Duncan David, B. 1955. Multiple range and multiple F tests.
Biometrics.11: 1-42.
Gerrard, F. 1964. Meat Technology. Leonard Hill, London.
Hasanah, U., Permana, I.G. and Despa 2017. Introduction of
complete ration silage to substitute the conventional
ration at traditional dairy farms in Lembang. Pak. J.
Nutr. 16: 577-587.
ICAR, 2013. Nutrient Requirements of Sheep, Goat and
Rabbit. ICAR, New Delhi.
Iram, A., Cekmeceliogly, D. and Demirci, A. 2020. A Distilers’
dried grains with solubles (DDGS) and its potential as
fermentation feedstock. Appl. Microbiol. Biotechnol.
104: 6115-6128.
ISI, 1963. Indian Standards Specifications for Mutton and
Goat Flesh, Fresh, Chilled and Frozen. Bureau of
Indian Standards Institution, New Delhi, India.
Kasap, A., Kaiæ, A., Širiæ, I., Antunoviæ, Z. and Mioè, B.
2018. Proximate and mineral composition of M
longissimus thoracis et lumborum of suckling lambs
from three Croatian indigenous breeds reared in
outdoor conditions. Ital. J. Anim. Sci. 172: 274-278.
Kawecka, A., Sosin-Bzducha, E., Pucha³a, M. and Sikora, J.
2018. Effect of maize DDGS addition on carcass and
Naveena et al.
Indian J. Anim. Nutr. 2020. 37 (2): 106-114
114
meat quality of lambs of native sheep breed. J. Appl.
Anim. Res. 46: 301-305.
Khan, N. A., Cone, J. W. and Hendriks, W. H. 2009. Stability of
fatty acids in grass and maize silages after exposure to
air during the feed out period. Anim. Feed Sci. Technol.
154: 183-192.
Lakshmi, R. K., Kumari, K., Reddy, P. (2017). Corn Germ Meal
(CGM) - Potential Feed Ingredient for Livestock and
Poultry in India - A Review. Int. J. Livest. Res. 7: 39-50.
McDonald, P., Edwards, R.A., Greenhalgh, D.F.J., Morgan,
A.C., Sinclair, L.A. and Wilkinson, R.G. 2001. Silage. In:
Animal Nutrition. (6 th ed). Pearson Education
(Singapore) Pte. Ltd. Indian Branch, New Delhi.
Muck, R.E. and Dickerson, J.T. 1988. Storage temperature
effects on proteolysis in alfalfa silage. Trans. ASAE.
31: 1005-1009.
Radzik-Rant, A., Rant, W., Niznikowski, R., Swiatek, M.,
Szymañska, Z., Slêzak, M. and Niemiec, T. 2018. The
effect of the addition of wet brewers grain to the diet of
lambs on body weight gain, slaughter value and meat
quality. Arch. Anim. Breed. 61: 245-251.
Reddy, P., Lakshmi, R., Raju, J., Kishore, K. and Kumar, C.
2017. CNCPS Fractionations and in-vitro nutrient
digestibility of corn dried distiller grains with Solubles
from various ethanol plants in Andhra Pradesh. Int. J.
Livest. Res. 7: 164-171.
Reddy, V.V. 2017. Effect of Supplementation of Distillers
Dried Grain with Solubles (DDGS) with Straw Based
Diet on Performance and Nutrient Utilization in
Native Sheep. Thesis submitted to Sri Venkateswara
Veterinary University. Tirupati. http://
krishikosh.egranth.ac.in/handle/1/5810085084
Schingoethe, D.J., Kalscheur, K.F., Hippen, A.R. and Garcia,
A.D. 2009. Invited review: The use of distillers’
products in dairy cattle diets. J. Dairy Sci. 92: 5802-
5813.
Snedecor, G.W. and Cochran, W.G. 1994. Statistical Methods.
8th ed Affiliated East West Press, New Delhi 13: 1467-
1473.
Soren, N.M. and Rao, S.B.N. 2015. Quantification of individual
volatile fatty acids by gas chromatography. In: Recent
Techniques in Feed and Fodder Evaluation for
Assessing Feed Quality and Safety, ICAR-NIANP,
Bengaluru, India, 2: 99-102.
Spanghero, M., Chiaravalli, M., Colombini, S., Fabro, C., Froldi,
F., Mason, F., Moschini, M., Sarnataro, C., Schiavon,
S. and Tagliapietra, F. 2019. Rumen inoculum collected
from cows at slaughter or from a continuous fermenter
and preserved in warm, refrigerated, chilled or
freeze-dried environments for in vitro tests. Animal. 9:
815.
Van Soest, P.J., Robertson, J.B. and Lewis, B.A. 1991.
Methods for dietary fibre, neutral detergent fiber and
nonstarch polysaccharides in relation to animal
nutrition. J. Dairy Sci. 74: 3583-3597.
Feeding value of wet distillers grains with solubles
Indian J. Anim. Nutr. 2020. 37 (2): 106-114
Received on 17-06-2020 and accepted on 30-07-2020
115
Indian Journal of
Animal Nutrition
Effect of Feeding Solid-State Fermentation Biomass on Nutrients intake,
Digestibility and Microbial Protein Synthesis in Lactating Buffaloes
Kishan P. Patel, Shrikant B. Katole*, P.R. Pandya, Srushti Patel1 and D. Srinivas Murty1
Animal Nutrition Research Department, College of Veterinary Science and Animal Husbandry,
Anand Agricultural University, Anand-388 110, Gujarat, India
ABSTRACT
Increasing livestock population with limited availability of feed resources requires a paradigm shift in
implementing newer arena of nutritional research which would enable efficient utilization of available
low-quality feed resources. The objective of the present study was to evaluate the effect of feeding of solid
state fermentation (SSF) biomass on nutrients intake and digestibility of lactating buffaloes. Two treatments i.e.
basal diet (T1) and o basal diet supplemented with SSF at 4% of DM (T
2). Twenty lactating buffaloes (2nd -3rd
week post-calving) were selected and randomly assigned to one of the either treatment for a duration of 139
days. Towards the end of feeding trial provision was made for individual fecal collection from buffaloes to
measure nutrients digestibility. The SSF supplementation had not resulted in any significant improvement in
dry matter (DM) and crude protein (CP) intake, but intake of digestible crude protein (DCP) and total digestible
nutrients (TDN) was significantly (P<0.05) improved in SSF supplemental group. Digestibility of fibre fractions
had also shown significant (P<0.01) improvement due to SSF supplementation. Numerically increased microbial
protein synthesis was also observed in SSF supplemental group but mean value showed non-significant effect.
Supplementing SSF biomass as crude fermented product with fibrolytic enzymes has resulted in improvement
in digestibility of nutrients without affecting DMI of lactating buffaloes which signifies that SSF biomass helps
in effective utilization of feeds and potentiation of energy availability for productive performance.
Key Words: Buffalo, Digestibility, Microbial protein, Nutrient intake, SSF
*Corresponding author; Email: [email protected]; 1 Department of Microbiology, Gujarat Vidhyapeeth, Sadra, Gandhinagar, Gujarat
INTRODUCTION
Agricultural by-products and cereals crops
residues usually form the major part of ration of
lactating ruminants which are low in nutrients and less
digestible too due to presence of lignocellulose bonds,
high levels of silica and anti-nutritional factors. This not
only reduces the production potential but also affects
the profitability of farmers. In such conditions use of
feed additives appears to be an attractive solution.
Ruminants are equipped with huge array of
microorganisms which can utilize such feeds but
suitable manipulation of ruminant ecosystem can
further improve feed digestibility and economic returns.
Use of enzymes, probiotics, prebiotics and nutraceuticals
(Patel et al., 2018) are found to be effective in such
conditions.
A biotechnological tool i.e. SSF appears to be an
attractive and suitable technique for enrichment of
microbial protein, efficient digestion and utilization of
lignocellulosic agricultural fibrous feeds and fodder
Indian J. Anim. Nutr. 2020. 37 (2): 115-120
doi: 10.5958/2231-6744.2020.00019.5
residues. SSF is a cultivation technique where microbes
and fungi (Doelle et al., 1992) are grown on a moist
solid substrate under controlled conditions which are
devoid of free water which eventually can produce a
variety of enzymes (Pandey et al., 1999) and can be
fed directly as crude fermentable mass to animals.
Positive effects of supplementation of fibrolytic enzymes
like cellulase, xylanase, pectinase, laccase etc. was also
documented by several authors (Beauchemin et al.,
2003; Miachieo and Thakur, 2007; Arif et al., 2019).
We had hypothesized that supplementation of SSF
biomass would improve intake and digestibility of
nutrients. Accordingly, the current study was aimed to
examine the effect of SSF biomass supplementation
digestibility and intake of nutrients of lactating
buffaloes.
MATERIALS AND METHODS
An experiment of 139 days was carried out
(excluding adaptation of 30 d) on 20 lactating buffaloes
Indian J. Anim. Nutr. 2020. 37 (2): 115-120
116
of private dairy farms of livestock farmers of Sojitra
village of Anand District, Anand, Gujarat (India).
Animal care and procedures were conducted under the
established standard of the Institutional Animal Ethics
Committee (IAEC). Lactating buffaloes (2nd to 3rd week
post calving) were selected on basis of their parity (2nd
to 4th parity) and milk yield and were randomly divided
into two groups of 10 buffaloes each as either control
group or SSF supplemental group. All the lactating
buffaloes were fed upon as per farmer’s schedule.
Ration of experimental buffaloes that included
commercial concentrate mixture of Amul dairy like Amul
buffalo special concentrate mixture (Dan), Amulnutri
power and Amul crushed maize (bhardo) and cotton
seed cake and maize cake along with ad libitum cereal
straw (paddy/maize/wheat) and green fodder (jowar
forage) (10 kg/d) as a basal ration in control group of
animals. Buffaloes of treatment (T2) group were
supplemented with SSF biomass at 4% of DM intake
by mixing it with concentrates at the time of milking
during evening.
SSF biomass used in the present study was
prepared on jowar hay which was used as substrate
for inoculation of microorganisms in fermentation
process. Fermentation process was carried out at
Department of Microbiology, Gujarat Vidhyapeeth,
Sadra, Gandhinagar, Gujarat (India). Jowar hay was
inoculated with various group of fungi i.e. Aspergillus
spp., Trichoderma spp., Fusarium spp., Pleurotus
spp. and Phanerochaete spp. Enzymes were produced
due to fermentation activity during SSF biomass
preparation, and activity of various enzymes i.e. carboxy
methyl cellulase (CMCase) (170 U/g), filter paperase
(FPase) (60 U/g), xylanase (468 U/g), laccase (270 U/
g), manganese peroxidase (MnP) (488 U/g) and lignin
peroxidase (LiP) (298 U/g) was also assessed using
enzymatic assay technique.
Daily intake of feeds of each buffalo was
recorded by weighing feeds offered to buffaloes and
analyzing nutrients present in feeds at regular intervals.
After 100 days of experimental feeding, a digestibility
trial of seven days collection period was conducted to
measure digestibility of nutrients. A proper record of
total amount of feed offered, refusal and faeces voided
by each buffalo was maintained during the trial period.
Representative samples of offered feeds, refusal (if any)
and 1/300th part of faeces voided were taken in tray
and kept in a hot air oven at 100±2°C for 24 h to
estimate the DM content of samples.
Oven dried samples of individual animals were
further pooled for seven days of collection and wre then
grinded to pass through 2.0 mm sieve and stored in air
tight bottles at room temperature for further analysis.
Composite samples of feeds offered, refusal feeds and
faeces were analyzed for DM, CP, OM as per AOAC
(1995). Neutral detergent fibre (NDF), acid detergent
fibre (ADF), acid detergent lignin, hemicellulose and
cellulose were analyzed as per Van Soest et al. (1991).
Urine samples (50 ml) was collected from individual
buffalo which was preserved with sufficient quantity of
1.87 mol/l H2SO
4 to maintain pH<3.0 which was
further analyzed for purine derivatives (allantoin, uric
acid and creatinine) using spectrophotometric method
(Hawk et al., 1976). Purines absorbed and microbial
protein was calculated from the daily urinary purine
derivatives excreted IAEA (1997).
Statistical Analysis
The experimental data generated were subjected
to analysis of variance using the General Linear Model
(GLM) procedure of the Statistical Software Package
(SPSS for windows, V21.0; Inc., Chicago, IL, USA)
and analyzed as per the methods of Snedecor and
Cochran (1994).
RESULTS AND DISCUSSION
The proximate composition and fibre fractions of
feeds offered to lactating buffaloes are presented in
Table 1 along with composition of SSF biomass.
Supplementation of SSF biomass in the diet of lactating
buffaloes had not resulted in any significant increase in
daily intake of DM and CP (Table 2). Other authors had
also reported that supplementation of several enzymes
had not resulted in any effect on DM and CP intake in
cows (Herrick et al., 2012; El-Bordeny et al., 2015;
Daniel et al., 2016). Supplementation of enzymes like
cellulase and xylanase (Shekhar et al., 2010) and
Solid state fermentation biomass for lactating buffaloes
Indian J. Anim. Nutr. 2020. 37 (2): 115-120
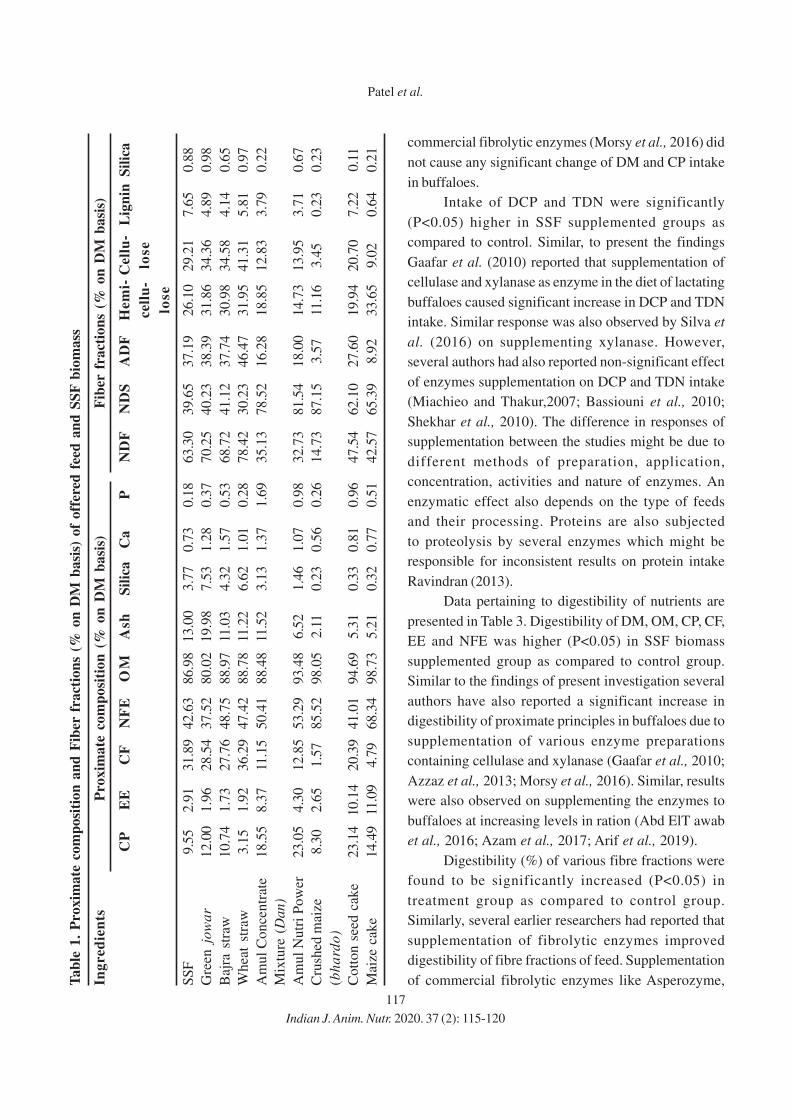
117
commercial fibrolytic enzymes (Morsy et al., 2016) did
not cause any significant change of DM and CP intake
in buffaloes.
Intake of DCP and TDN were significantly
(P<0.05) higher in SSF supplemented groups as
compared to control. Similar, to present the findings
Gaafar et al. (2010) reported that supplementation of
cellulase and xylanase as enzyme in the diet of lactating
buffaloes caused significant increase in DCP and TDN
intake. Similar response was also observed by Silva et
al. (2016) on supplementing xylanase. However,
several authors had also reported non-significant effect
of enzymes supplementation on DCP and TDN intake
(Miachieo and Thakur,2007; Bassiouni et al., 2010;
Shekhar et al., 2010). The difference in responses of
supplementation between the studies might be due to
different methods of preparation, application,
concentration, activities and nature of enzymes. An
enzymatic effect also depends on the type of feeds
and their processing. Proteins are also subjected
to proteolysis by several enzymes which might be
responsible for inconsistent results on protein intake
Ravindran (2013).
Data pertaining to digestibility of nutrients are
presented in Table 3. Digestibility of DM, OM, CP, CF,
EE and NFE was higher (P<0.05) in SSF biomass
supplemented group as compared to control group.
Similar to the findings of present investigation several
authors have also reported a significant increase in
digestibility of proximate principles in buffaloes due to
supplementation of various enzyme preparations
containing cellulase and xylanase (Gaafar et al., 2010;
Azzaz et al., 2013; Morsy et al., 2016). Similar, results
were also observed on supplementing the enzymes to
buffaloes at increasing levels in ration (Abd ElT awab
et al., 2016; Azam et al., 2017; Arif et al., 2019).
Digestibility (%) of various fibre fractions were
found to be significantly increased (P<0.05) in
treatment group as compared to control group.
Similarly, several earlier researchers had reported that
supplementation of fibrolytic enzymes improved
digestibility of fibre fractions of feed. Supplementation
of commercial fibrolytic enzymes like Asperozyme,Tab
le 1
. P
roxim
ate
com
posi
tion
an
d F
iber
fra
ctio
ns
(% o
n D
M b
asi
s) o
f off
ered
fee
d a
nd
SS
F b
iom
ass
Ing
red
ien
tsP
rox
ima
te c
om
po
siti
on
(%
on
DM
ba
sis)
Fib
er f
ract
ion
s (%
on
DM
basi
s)
CP
EE
CF
NF
EO
MA
shS
ilic
aC
aP
ND
FN
DS
AD
FH
em
i-C
ell
u-
Lig
nin
Sil
ica
cell
u-
lose
lose
SS
F9.5
52.9
131.8
942.6
386.9
813.0
03.7
70.7
30.1
863.3
039.6
537.1
926.1
029.2
17.6
50.8
8
Gre
en j
ow
ar
12.0
01.9
628.5
437.5
280.0
219.9
87.5
31.2
80.3
770.2
540.2
338.3
931.8
634.3
64.8
90.9
8
Baj
ra s
traw
10.7
41.7
327.7
648.7
588.9
711
.03
4.3
21.5
70.5
368.7
241.1
237.7
430.9
834.5
84.1
40.6
5
Wh
eat
stra
w3.1
51.9
236.2
947.4
288.7
811
.22
6.6
21.0
10.2
878.4
230.2
346.4
731.9
541.3
15.8
10.9
7
Am
ul
Conce
ntr
ate
18.5
58.3
711
.15
50.4
188.4
811
.52
3.1
31.3
71.6
935.1
378.5
216.2
818.8
512.8
33.7
90.2
2
Mix
ture
(D
an)
Am
ul
Nu
tri
Po
wer
23.0
54.3
012.8
553.2
993.4
86.5
21.4
61.0
70.9
832.7
381.5
418.0
014.7
313.9
53.7
10.6
7
Cru
shed
mai
ze8.3
02.6
51.5
785.5
298.0
52.1
10.2
30.5
60.2
614.7
387.1
53.5
711
.16
3.4
50.2
30.2
3
(bh
ard
o)
Co
tto
n s
eed
cak
e23.1
410.1
420.3
941.0
194.6
95.3
10.3
30.8
10.9
647.5
462.1
027.6
019.9
420.7
07.2
20.1
1
Mai
ze c
ake
14.4
911
.09
4.7
968.3
498.7
35.2
10.3
20.7
70.5
142.5
765.3
98.9
233.6
59.0
20.6
40.2
1
Patel et al.
Indian J. Anim. Nutr. 2020. 37 (2): 115-120
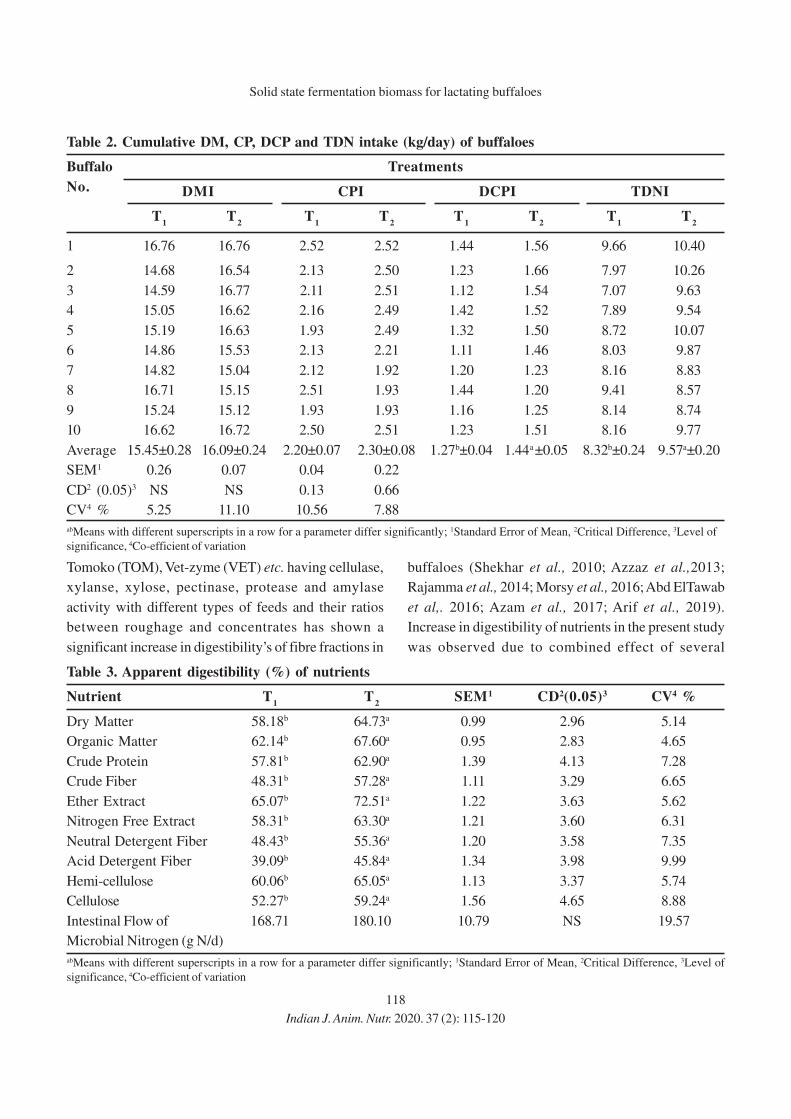
118
Tomoko (TOM), Vet-zyme (VET) etc. having cellulase,
xylanse, xylose, pectinase, protease and amylase
activity with different types of feeds and their ratios
between roughage and concentrates has shown a
significant increase in digestibility’s of fibre fractions in
Table 2. Cumulative DM, CP, DCP and TDN intake (kg/day) of buffaloes
Buffalo Treatments
No. DMI CPI DCPI TDNI
T1
T2
T1
T2
T1
T2
T1
T2
1 16.76 16.76 2.52 2.52 1.44 1.56 9.66 10.40
2 14.68 16.54 2.13 2.50 1.23 1.66 7.97 10.26
3 14.59 16.77 2.11 2.51 1.12 1.54 7.07 9.63
4 15.05 16.62 2.16 2.49 1.42 1.52 7.89 9.54
5 15.19 16.63 1.93 2.49 1.32 1.50 8.72 10.07
6 14.86 15.53 2.13 2.21 1.11 1.46 8.03 9.87
7 14.82 15.04 2.12 1.92 1.20 1.23 8.16 8.83
8 16.71 15.15 2.51 1.93 1.44 1.20 9.41 8.57
9 15.24 15.12 1.93 1.93 1.16 1.25 8.14 8.74
10 16.62 16.72 2.50 2.51 1.23 1.51 8.16 9.77
Average 15.45±0.28 16.09±0.24 2.20±0.07 2.30±0.08 1.27b±0.04 1.44a ±0.05 8.32b±0.24 9.57a±0.20
SEM1 0.26 0.07 0.04 0.22
CD2 (0.05)3 NS NS 0.13 0.66
CV4 % 5.25 11.10 10.56 7.88
abMeans with different superscripts in a row for a parameter differ significantly; 1Standard Error of Mean, 2Critical Difference, 3Level of
significance, 4Co-efficient of variation
Table 3. Apparent digestibility (%) of nutrients
Nutrient T1
T2
SEM1 CD2(0.05)3 CV4 %
Dry Matter 58.18b 64.73a 0.99 2.96 5.14
Organic Matter 62.14b 67.60a 0.95 2.83 4.65
Crude Protein 57.81b 62.90a 1.39 4.13 7.28
Crude Fiber 48.31b 57.28a 1.11 3.29 6.65
Ether Extract 65.07b 72.51a 1.22 3.63 5.62
Nitrogen Free Extract 58.31b 63.30a 1.21 3.60 6.31
Neutral Detergent Fiber 48.43b 55.36a 1.20 3.58 7.35
Acid Detergent Fiber 39.09b 45.84a 1.34 3.98 9.99
Hemi-cellulose 60.06b 65.05a 1.13 3.37 5.74
Cellulose 52.27b 59.24a 1.56 4.65 8.88
Intestinal Flow of 168.71 180.10 10.79 NS 19.57
Microbial Nitrogen (g N/d)
abMeans with different superscripts in a row for a parameter differ significantly; 1Standard Error of Mean, 2Critical Difference, 3Level of
significance, 4Co-efficient of variation
buffaloes (Shekhar et al., 2010; Azzaz et al.,2013;
Rajamma et al., 2014; Morsy et al., 2016; Abd ElTawab
et al,. 2016; Azam et al., 2017; Arif et al., 2019).
Increase in digestibility of nutrients in the present study
was observed due to combined effect of several
Solid state fermentation biomass for lactating buffaloes
Indian J. Anim. Nutr. 2020. 37 (2): 115-120

119
enzymes like xylanase, carboxy methyl cellulase
(CMCase), and lignin degrading enzymes like laccase,
lignin peroxidase and manganese peroxidase which due
to their hydrolytic and oxidizing actions breaks the bonds
between fibre and renders them easy to digest.
Microbial protein was calculated on the basis of
spectrophotometric analysis of purine derivatives (uric
acid, allantion and creatinine) from urine samples of
individual buffaloes. Amount of urinary microbial
protein (g/d) on an average was found to be 168.71 g/d
in control group of buffaloes while for treatment group
of buffaloes it was 180.10 g/d. Statistically the amount
of microbial protein excreted from buffaloes of two
groups was found to be not differing significantly but
still there was a numerical increase in microbial protein
synthesis in SSF biomass supplemental group by 6.75%
as compared to control. Synthesis of protein by ruminal
microbes usually depends on type of feeds and its
quality and fibre degradation by ruminal microbes.
Increased overall digestibility of feeds (Table 3) might
be responsible for increased activity and growth of
microbes that ultimately increased intestinal flow of
microbial nitrogen (Table 3). In agreement with the
present study that several authors have reported that
yeast supplementation resulted a non-significant change
in microbial protein synthesis despite of numerical
improvement (Erasmus et al., 1992; Putnam et al., 1997;
Hriostav et al., 2010; Noziere et al., 2014; Robinson
and Erasmus, 2016).
CONCLUSIONS
It was observed that supplementation of SSF
biomass in the diets of lactating buffaloes had
significantly increased the intake DCP and TDN.
Further, improvement in digestibility of proximate
nutrients by 8.50% to 11.50 % and that of fibre
fractions by 8% to 14.5% is attributable to enzymatic
degradation of nutrients and fibre in feed under the
influence of enzymes and microbes present in SSF
biomass. This signifies that more energy was available
for enhancement of productive performance of
buffaloes under SSF biomass supplementation. Rumen
microbial protein synthesis was also found to be
increased numerically due to increased microbial
activity in SSF supplemental group.
REFERENCES
Abd El Tawab, A.M., Khattab, M.S.A., El-Zaiat, H.M.,
Matloup, O.H. and Hassan, A.A. 2016. Effect of
cellulase and tannase enzymes supplemention on the
productive performance of lactating buffaloes fed
diets contain date palm fronds. Asian J. Anim. Sci. 10:
307-312.
AOAC. 1995. Official Methods of Analysis, 16th Edition. Assoc.
Off. Anal. Chem., Washington, D.C.
Arif, M., Al-Sagheer, A.A., Salem, A.Z.M., El-Hack, M.A.,
Swelum, A.A., Saeed, M. and Akhtar, M. 2019.
Influence of exogenous fibrolytic enzymes on milk
production efficiency and nutrient utilization in early
lactating buffaloes fed diets with two proportions of
oat silage to concentrate ratios. Livest. Sci. 219: 29-34.
Azam, B., Tahir, M.N., Shahzad, F., Ghaffar, A., Abbas, G. and
Gohar, M. 2017. Exogenous Fibrolytic Enzymes
Addition in Concentrate Ration of Lactating Nili
Ravi Buffaloes: Effects on Milk Production and Diet
Digestibility. Pak J. Zool. 49: 1359-1359.
Azzaz, H.H., Murad, H.A., Kholif, A.M., Morsy, T.A., Mansour,
A.M. and El-Sayed, H.M. 2013. Increasing nutrients
bioavailability by using fibrolytic enzymes in dairy
buffaloes feeding. Online J. Biol. Sci. 13: 234.
Bassiouni, M.I., Gaafar, H.M.A., Mohi, A.M.A., Metwally,
A.M. and Elshora, M.A.H. 2010. Evaluation of rations
supplemented with fibrolytic enzyme on dairy cow’s
performance 3. Productive performance of lactating
Friesian cows. Livest. Res. Rural. Dev. 22: 117.
Beauchemin, K.A., Colombatto, D., Morgavi, D.P. and Yang,
W.Z. 2003. Use of exogenous fibrolytic enzymes to
improve feed utilization by ruminants. J. Anim. Sci. 81:
E37-E47.
Daniel, J.L.P., Queiroz, O.C.M., Arriola, K.G., Staples, C.R.,
Romero, J.J., Shin, J.H., Paschoaloto, J.R., Nussio, L.G.
and Adesogan, A.T. 2016. Effects of maturity at ensiling
of bermuda grass and fibrolytic enzyme application on
the performance of early-lactation dairy cows. J. Dairy
Sci. 99: 9716-9723.
Doelle, H.W., Mitchell, D.A. and Rolz, C.E. 1992. Solid
Substrate Cultivation, Elsevier, London.
El-Bordeny, N.E., Abedo, A.A., El-sayed, H.M., Daoud, E.N.,
Soliman, H.S. and Mahmoud, A.E.M. 2015. Effect
of Exogenous Fibrolytic Enzyme Application on
Productive Response of Dairy Cows at Different
Lactation Stages. Asian J. Anim. Vet. Adv. 10: 226-236.
Patel et al.
Indian J. Anim. Nutr. 2020. 37 (2): 115-120
120
Erasmus, L. J., Botha, P. M. and Kistner, A. 1992. Effect of
yeast culture supplement on production, rumen
fermentation, and duodenal nitrogen flow in dairy
cows. J. Dairy Sci. 75: 3056-3065.
Gaafar, H.M.A., Abdel-Raouf, E.M.and El-Reidy, K.F.A. 2010.
Effect of fibrolytic enzyme supplementation and fiber
content of total mixed ration on productive performance
of lactating buffaloes. Slovak J. Anim. Sci. 43:
147- 153.
Hawk, P.B., Oser, B.L. and Summerson, W.H. 1976. Practical
Physiological Chemistry (14th ed.) London, England:
McGraw Hill Publishing Company Limited.
Herrick, K.J., Hippen, A.R., Kalscheur, K.F., Anderson, J.L.,
Ranathunga, S.D., Patton, R.S. and Abdullah, M. 2012.
Lactation performance and digestibility of forages and
diets in dairy cows fed a hemicellulose extract. J. Dairy
Sci. 95: 3342-3353.
Hristov, A.N., Varga, G., Cassidy,T., Long,M., Heyler,
K., Karnati, S.K.R. and Yoon, I. 2010. Effect of
Saccharomyces cerevisiae fermentation product on
ruminal fermentation and nutrient utilization in dairy
cows. J. Dairy Sci. 93:682-692.
IAEA. 1997. Estimation of rumen microbial protein
production from purine derivatives in urine. IAEA-
TECDOC-945. IAEA, Vienna, pp. 22-24.
Miachieo, K. and Thakur, S.S. 2007. Effect of exogenous
fibrolytic enzymes on the productive performance of
lactating Sahiwal cows. Indian J. Anim. Sci. 24: 27-30.
Morsy, T. A., Kholif, A.E., Kholif, S.M., Kholif, A.M., Sun, X.
and Salem, A.Z. 2016. Effects of two enzyme feed
additives on digestion and milk production in
lactating Egyptian buffaloes. Ann. Anim. Sci. 16: 209-
222.
Noziere, P., Steinberg, W., Silberberg, M. and Morgavi, D.P.
2014. Amylase addition increases starch ruminal
digestionin first-lactation cows fed high and low starch
diets. J. Dairy Sci. 97: 2319-2328.
Pandey, A., Selvakumar, P., Soccol, C.R. and Nigam, P. 1999.
Solid state fermentation for the production of
industrial enzymes. Curr. Sci. 77: 149-162.
Patel, K., Sunidhi, and Katole, S. 2018. Nutraceuticals and
Ruminants Nutrition – A Review. Int. J. Livest. Res. 6:
76-85.
Putnam, D.E., Schwab, C.G., Socha, M.T., Whitehouse, N.L.,
Kierstead, N.A. and Garthwaite, B.D. 1997. Effect of
yeast culture in the diets of early lactation dairy cows
on ruminal fermentation and passage of nitrogen
fractions and amino acids to the small intestine. J. Dairy
Sci. 80: 374-384.
Rajamma, K., Kumar, D.S., Rao, E.R. and Nath, D.N. 2014.
Nutrient utilisation in buffalo bulls fed total mixed
rations supplemented with exogenous fibrolytic
enzymes. Indian J. Anim. Sci. 31: 213-217.
Ravindran, V. 2013. Feed enzymes: The science, practice, and
metabolic realities. J. App. Poult. Res. 22: 628-636.
Robinson, P.H. and Erasmus, L.J. 2016. Effects of two yeast
based direct fed microbials on performance of high
producing dairy cows. Anim. Feed Sci. Technol. 215:
58-72.
Shekhar, C., Thakur, S.S. and Shelke, S.K. 2010. Effect of
exogenous fibrolytic enzymes supplementation on milk
production and nutrient utilization in Murrah
buffaloes. Trop. Anim. Health Prod. 42: 1465-1470.
Silva, T.H., Takiya, C.S., Vendramini, T.H.A., de Jesus, E.F.,
Zanferari, F. and Rennó, F.P. 2016. Effects of dietary
fibrolytic enzymes on chewing time, ruminal
fermentation, and performance of mid-lactating dairy
cows. Anim. Feed Sci. Technol. 221: 35-43.
Snedecor, G.W. and Cochran, W.G. 1994. Statistical Methods.
8th ed., Oxford and IBH Publishing Co. Pvt. Ltd., New
Delhi, India.
Van Soest, P.J., Robertson, J.B. and Lewis, B.A. 1991.
Methods of dietary fiber, neutral detergent fiber and
non-starch polysaccharides in relation to animal
nutrition. J. Dairy Sci. 74: 3583-3597.
Solid state fermentation biomass for lactating buffaloes
Indian J. Anim. Nutr. 2020. 37 (2): 115-120
Received on 09-07-2020 and accepted on 30-07-2020
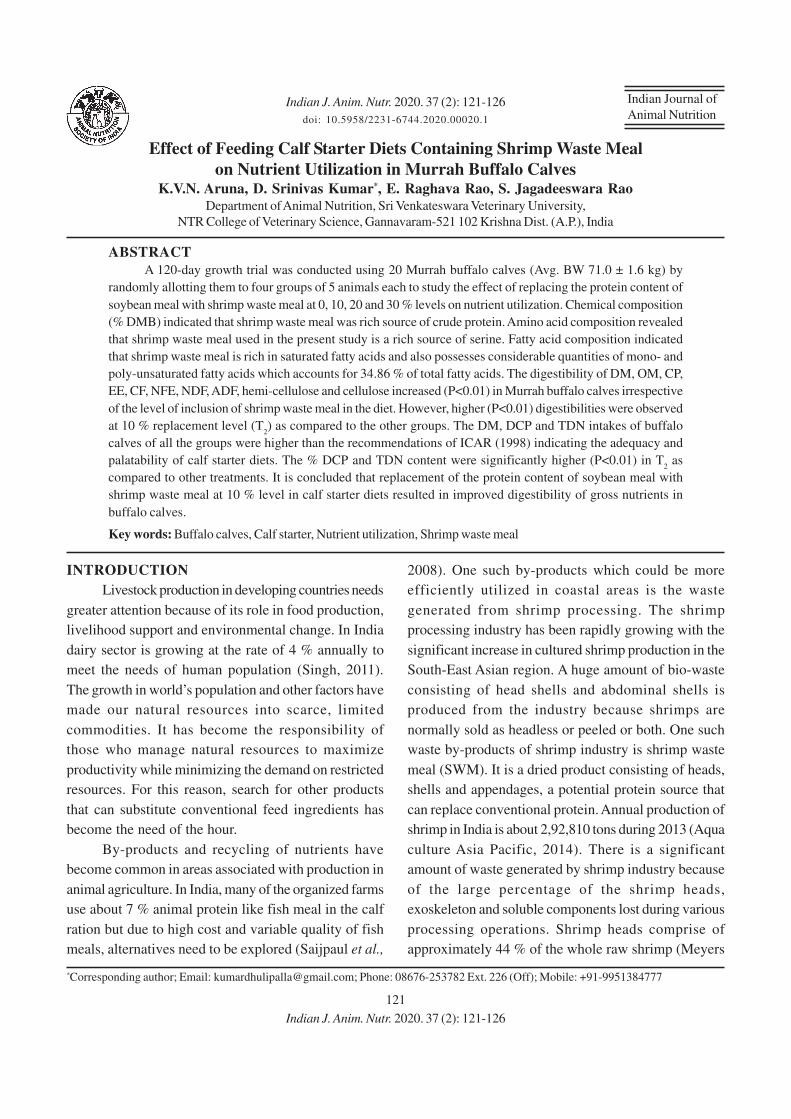
121
Indian Journal of
Animal Nutrition
Effect of Feeding Calf Starter Diets Containing Shrimp Waste Meal
on Nutrient Utilization in Murrah Buffalo CalvesK.V.N. Aruna, D. Srinivas Kumar*, E. Raghava Rao, S. Jagadeeswara Rao
Department of Animal Nutrition, Sri Venkateswara Veterinary University,
NTR College of Veterinary Science, Gannavaram-521 102 Krishna Dist. (A.P.), India
ABSTRACT
A 120-day growth trial was conducted using 20 Murrah buffalo calves (Avg. BW 71.0 ± 1.6 kg) by
randomly allotting them to four groups of 5 animals each to study the effect of replacing the protein content of
soybean meal with shrimp waste meal at 0, 10, 20 and 30 % levels on nutrient utilization. Chemical composition
(% DMB) indicated that shrimp waste meal was rich source of crude protein. Amino acid composition revealed
that shrimp waste meal used in the present study is a rich source of serine. Fatty acid composition indicated
that shrimp waste meal is rich in saturated fatty acids and also possesses considerable quantities of mono- and
poly-unsaturated fatty acids which accounts for 34.86 % of total fatty acids. The digestibility of DM, OM, CP,
EE, CF, NFE, NDF, ADF, hemi-cellulose and cellulose increased (P<0.01) in Murrah buffalo calves irrespective
of the level of inclusion of shrimp waste meal in the diet. However, higher (P<0.01) digestibilities were observed
at 10 % replacement level (T2) as compared to the other groups. The DM, DCP and TDN intakes of buffalo
calves of all the groups were higher than the recommendations of ICAR (1998) indicating the adequacy and
palatability of calf starter diets. The % DCP and TDN content were significantly higher (P<0.01) in T2 as
compared to other treatments. It is concluded that replacement of the protein content of soybean meal with
shrimp waste meal at 10 % level in calf starter diets resulted in improved digestibility of gross nutrients in
buffalo calves.
Key words: Buffalo calves, Calf starter, Nutrient utilization, Shrimp waste meal
*Corresponding author; Email: [email protected]; Phone: 08676-253782 Ext. 226 (Off); Mobile: +91-9951384777
INTRODUCTION
Livestock production in developing countries needs
greater attention because of its role in food production,
livelihood support and environmental change. In India
dairy sector is growing at the rate of 4 % annually to
meet the needs of human population (Singh, 2011).
The growth in world’s population and other factors have
made our natural resources into scarce, limited
commodities. It has become the responsibility of
those who manage natural resources to maximize
productivity while minimizing the demand on restricted
resources. For this reason, search for other products
that can substitute conventional feed ingredients has
become the need of the hour.
By-products and recycling of nutrients have
become common in areas associated with production in
animal agriculture. In India, many of the organized farms
use about 7 % animal protein like fish meal in the calf
ration but due to high cost and variable quality of fish
meals, alternatives need to be explored (Saijpaul et al.,
Indian J. Anim. Nutr. 2020. 37 (2): 121-126
doi: 10.5958/2231-6744.2020.00020.1
2008). One such by-products which could be more
efficiently utilized in coastal areas is the waste
generated from shrimp processing. The shrimp
processing industry has been rapidly growing with the
significant increase in cultured shrimp production in the
South-East Asian region. A huge amount of bio-waste
consisting of head shells and abdominal shells is
produced from the industry because shrimps are
normally sold as headless or peeled or both. One such
waste by-products of shrimp industry is shrimp waste
meal (SWM). It is a dried product consisting of heads,
shells and appendages, a potential protein source that
can replace conventional protein. Annual production of
shrimp in India is about 2,92,810 tons during 2013 (Aqua
culture Asia Pacific, 2014). There is a significant
amount of waste generated by shrimp industry because
of the large percentage of the shrimp heads,
exoskeleton and soluble components lost during various
processing operations. Shrimp heads comprise of
approximately 44 % of the whole raw shrimp (Meyers
Indian J. Anim. Nutr. 2020. 37 (2): 121-126
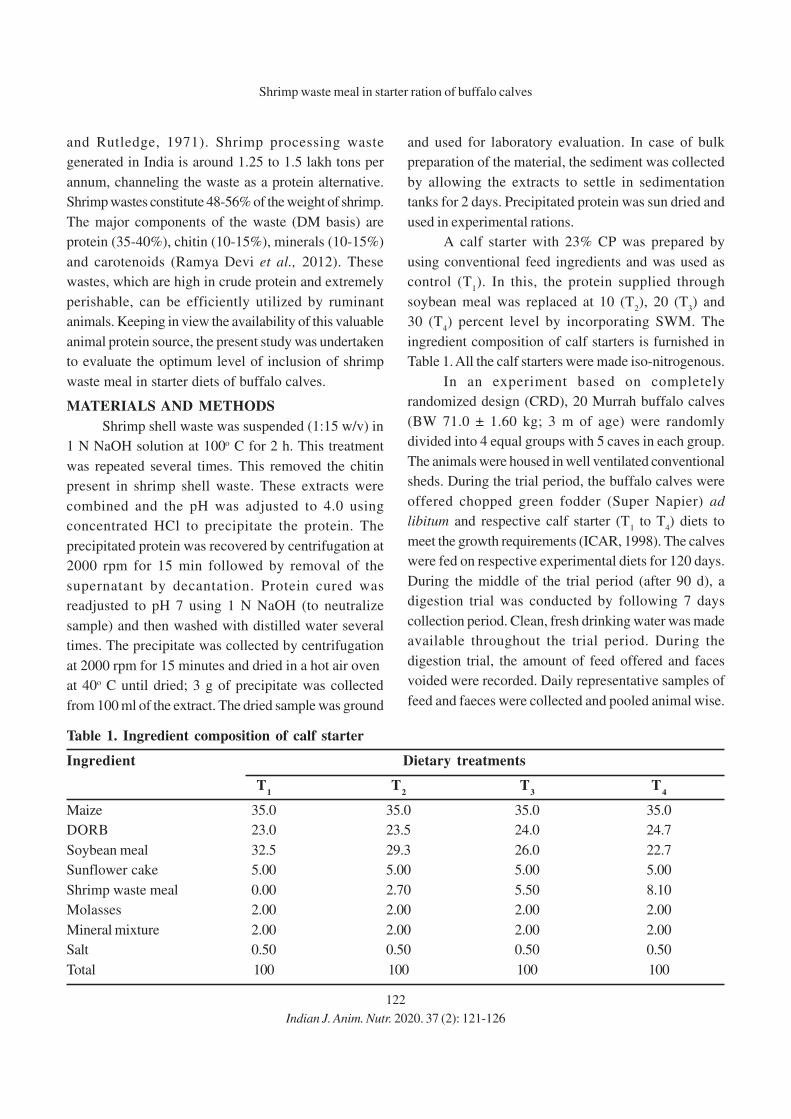
122
and Rutledge, 1971). Shrimp processing waste
generated in India is around 1.25 to 1.5 lakh tons per
annum, channeling the waste as a protein alternative.
Shrimp wastes constitute 48-56% of the weight of shrimp.
The major components of the waste (DM basis) are
protein (35-40%), chitin (10-15%), minerals (10-15%)
and carotenoids (Ramya Devi et al., 2012). These
wastes, which are high in crude protein and extremely
perishable, can be efficiently utilized by ruminant
animals. Keeping in view the availability of this valuable
animal protein source, the present study was undertaken
to evaluate the optimum level of inclusion of shrimp
waste meal in starter diets of buffalo calves.
MATERIALS AND METHODS
Shrimp shell waste was suspended (1:15 w/v) in
1 N NaOH solution at 100o C for 2 h. This treatment
was repeated several times. This removed the chitin
present in shrimp shell waste. These extracts were
combined and the pH was adjusted to 4.0 using
concentrated HCl to precipitate the protein. The
precipitated protein was recovered by centrifugation at
2000 rpm for 15 min followed by removal of the
supernatant by decantation. Protein cured was
readjusted to pH 7 using 1 N NaOH (to neutralize
sample) and then washed with distilled water several
times. The precipitate was collected by centrifugation
at 2000 rpm for 15 minutes and dried in a hot air oven
at 40o C until dried; 3 g of precipitate was collected
from 100 ml of the extract. The dried sample was ground
and used for laboratory evaluation. In case of bulk
preparation of the material, the sediment was collected
by allowing the extracts to settle in sedimentation
tanks for 2 days. Precipitated protein was sun dried and
used in experimental rations.
A calf starter with 23% CP was prepared by
using conventional feed ingredients and was used as
control (T1). In this, the protein supplied through
soybean meal was replaced at 10 (T2), 20 (T
3) and
30 (T4) percent level by incorporating SWM. The
ingredient composition of calf starters is furnished in
Table 1. All the calf starters were made iso-nitrogenous.
In an experiment based on completely
randomized design (CRD), 20 Murrah buffalo calves
(BW 71.0 ± 1.60 kg; 3 m of age) were randomly
divided into 4 equal groups with 5 caves in each group.
The animals were housed in well ventilated conventional
sheds. During the trial period, the buffalo calves were
offered chopped green fodder (Super Napier) ad
libitum and respective calf starter (T1 to T
4) diets to
meet the growth requirements (ICAR, 1998). The calves
were fed on respective experimental diets for 120 days.
During the middle of the trial period (after 90 d), a
digestion trial was conducted by following 7 days
collection period. Clean, fresh drinking water was made
available throughout the trial period. During the
digestion trial, the amount of feed offered and faces
voided were recorded. Daily representative samples of
feed and faeces were collected and pooled animal wise.
Shrimp waste meal in starter ration of buffalo calves
Table 1. Ingredient composition of calf starter
Ingredient Dietary treatments
T1
T2
T3
T4
Maize 35.0 35.0 35.0 35.0
DORB 23.0 23.5 24.0 24.7
Soybean meal 32.5 29.3 26.0 22.7
Sunflower cake 5.00 5.00 5.00 5.00
Shrimp waste meal 0.00 2.70 5.50 8.10
Molasses 2.00 2.00 2.00 2.00
Mineral mixture 2.00 2.00 2.00 2.00
Salt 0.50 0.50 0.50 0.50
Total 100 100 100 100
Indian J. Anim. Nutr. 2020. 37 (2): 121-126

123
The feed and faecal samples were analyzed for
proximate constituents (AOAC, 2007) and fibre
fractions (Van Soest et al., 1991). Estimation of Ca and
P in feed was also done (Talapatra et al., 1940). Amino
acid composition of shrimp waste meal was quantified
using reverse phase HPLC while fatty acid
composition was determined by Gas chromatography
(AOAC 996.01).The data were analyzed statistically
(Snedecor and Cochran, 1994) and tested for
significance by Duncan’s multiple range test (Duncan,
1955) using SPSS 17.0 version.
RESULTS AND DISCUSSION
The per cent DM, OM, CP, EE, CF, NFE, TA and
AIA of SWM were 94.25, 81.05, 55.00, 6.41, 2.50, 17.14,
18.95 and 3.20, respectively. The per cent calcium and
phosphorous content of SWM were 5.65 and 1.28,
respectively. The CP content (55.0%) of SWM in the
present study was in close agreement with the findings
of Rosenfeld et al. (1997) and Gernat (2001) who
reported the CP value of shrimp waste meal as 50.89
and 52.70 per cent, respectively. However, Cobos et al.
(2007), Mahata et al. (2008) and Ingweye et al. (2008)
reported lower CP content of 35.6, 24.03 and 48.3 %,
respectively as compared to the CP content reported in
the present study.
Amino acid composition of SWM is shown in
Table 2. The amino acid composition revealed that SWM
contains 12 amino acids, of which 7 are essential and 5
are non-essential amino acids. The present study
indicated that SWM is a good source of serine. Similar
findings were also reported by Lakshmi and Saravanan
(2012). The lysine, threonine and methionine contents
of SWM observed in the present study were lower
compared to the values reported earlier (Khempaka et
al., 2006; Fanimo et al., 2004).
Fatty acid composition of shrimp waste meal is
presented in Table 3. Fatty acid composition of SWM
revealed more concentration of saturated fatty acids
than unsaturated fatty acids. The SWM used in the
present study was rich in saturated fatty acids and also
possessed considerable quantities of mono and
poly- unsaturated fatty acids which accounted for 34.86
% of total fatty acids, which is similar to the findings
observed by Kandra et al. (2012). Major fatty acids
observed in the present study were palmitic acid,
palmitoleic acid, margaric acid, stearic acid, oleic acid
and linoleic acid which were similar to the results
obtained by Sachindra et al. (2005) in various species
of shrimp available in India. In contrast, Bragagnolo and
Rodriguez-Amaya (2001) reported that the fatty acid
composition of penaeid shrimp from Brazilian water was
found to be rich in unsaturated fatty acids, indicating
that fatty acid composition varies with species of shrimp.
Individual fatty acid composition (g/100g sample) of
SWM indicated that the content of palmitic acid,
palmitoleic acid, margaric acid, stearic acid, oleic acid
and linoleic acid were 2.11, 0.16, 0.14, 1.01, 1.12 and
0.5 g, respectively while that of other fatty acids were
at less than 0.1g/100g sample.
The chemical composition of calf starters
containing SWM at varying levels is presented in
Table 2. Amino acid composition of shrimp waste
meal
Amino acid mg/100g of sample
Serine 332.36
Aspartic acid 192.37
Glutamic acid 55.01
Proline 43.76
Taurine 56.68
Threonine 35.9
Histidine 18.83
Phenyl alanine 32.9
Lysine 8.75
Valine 5.35
Methionine 14.08
Isoleucine 2.0
Table 3. Fatty acid composition of shrimp waste
meal
Fatty acid g/100 g sample
Saturated fatty acids 3.6
Monounsaturated fatty acids 1.32
Polyunsaturated fatty acids 0.66
Total trans-fatty acids 0.1
Aruna et al.
Indian J. Anim. Nutr. 2020. 37 (2): 121-126

124
Table 4. All the calf starters were iso-nitrogenous.
Data pertaining to the effect of dietary inclusion
of SWM at varying levels in calf starter diets on
digestibility of proximate constituents and fibre fractions
are presented in Table 5. The digestibility of DM, OM,
CP, EE, CF, NFE NDF, ADF, hemi-cellulose and
cellulose increased significantly (P<0.01) in calves fed
diets containing SWM at 10 % level as compared to
those fed SWM at 0, 20 and 30 % levels (Table 5).
Further, the study indicated that digestibility of gross
nutrients and fibre fractions decreased significantly
(P<0.01) in calves when SWM was included at 20 and
30 % levels as compared to 10 % level. In contrast to
the findings of the present study, Cobos et al. (2002)
observed no effect (P>0.05) on digestibility of DM, CP
and ADF in lambs by feeding shrimp shell waste at 15
% level as compared to the control, while DM, CP and
EE digestibility decreased significantly (P<0.05) when
fed shrimp shell waste at 25 % level in the diet. On the
other hand, Cobos et al. (2002) reported that NDF
digestibility decreased significantly (P<0.05)
irrespective of the level of inclusion of shrimp shell waste
as compared to the control. Similarly, Fanimo et al.
(2006) observed decreased (P<0.05) digestibility of
DM, CP and CF in growing pigs fed diets replacing fish
meal with shrimp meal. Further, Ngoan et al. (2000)
also reported that nutrient digestibility of diets based on
shrimp by-product silages were lower than for similar
diets based on fish meal which might be attributed to
the high level of chitin in shrimp meal (Ngoan et al.,
2000).
A major concern with shrimp meal is the
chemical nature of the exoskeleton of the shrimp, which
is mainly composed of chitin and is considered to have
low digestibility (Austin et al., 1981). Due to this
low digestibility, chitin physically blocks the access of
digestive enzymes to lipids and proteins, thus affecting
the utilization of these nutrients (Karasov, 1990). In the
present study, SWM was obtained after extraction of
chitin. This might had resulted in increased digestibility
of gross nutrients in calves fed diets containing shrimp
waste meal as compared to those in control group.
Data pertaining to plane of nutrition of buffalo
calves (Table 5) revealed that the DMI (g/kg W0.75)
was not significantly different (P>0.05) among
different treatments. The average DMI of buffalo calves
fed diets containing SWM was higher than the values
recommended by ICAR (1998). This indicated that
Table 4. Chemical composition of calf starters containing varying levels of SWM
Nutrient CM-1 CM-2 CM-3 CM-4
Dry matter 91.84 91.69 91.95 92.20
Organic matter 89.02 88.82 88.03 87.68
Total ash 10.98 11.18 11.97 12.32
Crude protein 23.01 23.10 23.05 23.21
Ether extract 0.98 1.23 1.49 1.58
Crude fibre 10.75 10.15 9.75 9.68
Nitrogen free extract 54.28 54.34 53.74 53.21
Neutral detergent fibre 32.87 32.22 31.45 30.35
Acid detergent fibre 15.10 14.33 13.98 13.55
Hemi-cellulose 17.77 17.89 17.47 16.80
Cellulose 7.62 7.53 7.41 7.32
Acid detergent lignin 6.92 6.07 6.04 6.04
Silica 2.31 2.20 1.75 1.73
Calcium (%) 0.32 0.42 0.55 0.70
Phosphorus (%) 0.22 0.38 0.45 0.50
Shrimp waste meal in starter ration of buffalo calves
Indian J. Anim. Nutr. 2020. 37 (2): 121-126
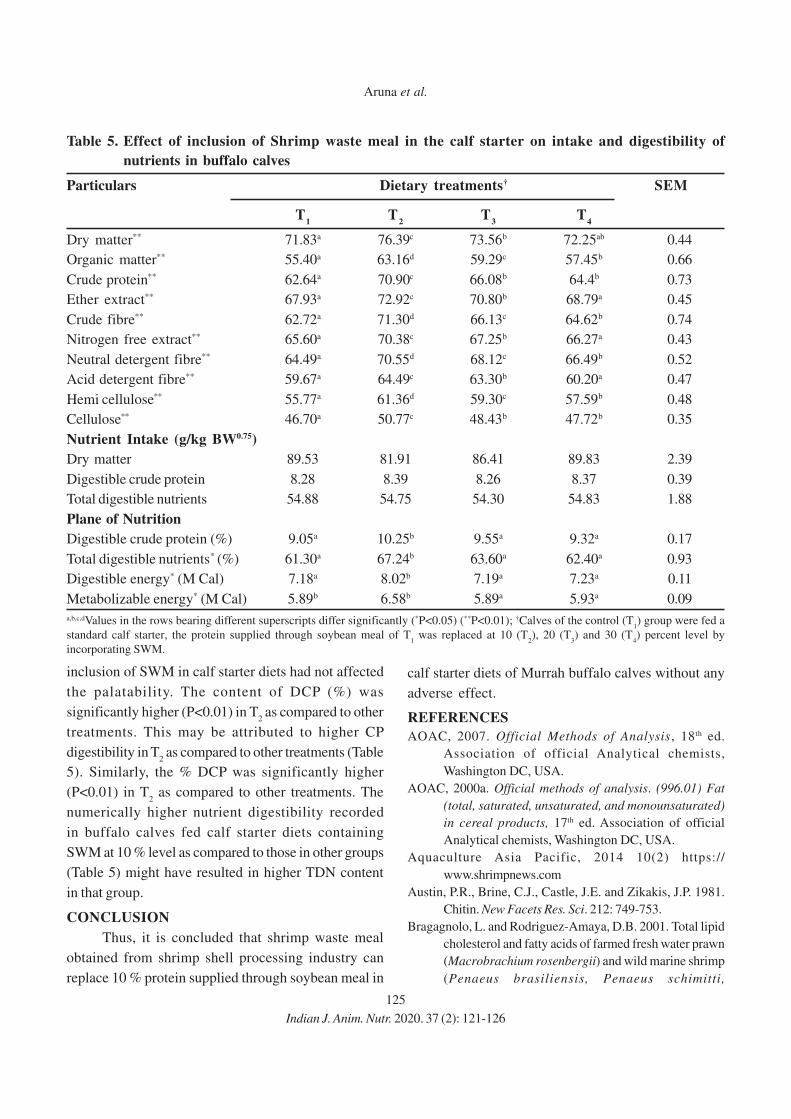
125
inclusion of SWM in calf starter diets had not affected
the palatability. The content of DCP (%) was
significantly higher (P<0.01) in T2 as compared to other
treatments. This may be attributed to higher CP
digestibility in T2 as compared to other treatments (Table
5). Similarly, the % DCP was significantly higher
(P<0.01) in T2 as compared to other treatments. The
numerically higher nutrient digestibility recorded
in buffalo calves fed calf starter diets containing
SWM at 10 % level as compared to those in other groups
(Table 5) might have resulted in higher TDN content
in that group.
CONCLUSION
Thus, it is concluded that shrimp waste meal
obtained from shrimp shell processing industry can
replace 10 % protein supplied through soybean meal in
calf starter diets of Murrah buffalo calves without any
adverse effect.
REFERENCES
AOAC, 2007. Official Methods of Analysis, 18th ed.
Association of official Analytical chemists,
Washington DC, USA.
AOAC, 2000a. Official methods of analysis. (996.01) Fat
(total, saturated, unsaturated, and monounsaturated)
in cereal products, 17th ed. Association of official
Analytical chemists, Washington DC, USA.
Aquaculture Asia Pacific, 2014 10(2) https://
www.shrimpnews.com
Austin, P.R., Brine, C.J., Castle, J.E. and Zikakis, J.P. 1981.
Chitin. New Facets Res. Sci. 212: 749-753.
Bragagnolo, L. and Rodriguez-Amaya, D.B. 2001. Total lipid
cholesterol and fatty acids of farmed fresh water prawn
(Macrobrachium rosenbergii) and wild marine shrimp
(Penaeus brasiliensis, Penaeus schimitti,
Table 5. Effect of inclusion of Shrimp waste meal in the calf starter on intake and digestibility of
nutrients in buffalo calves
Particulars Dietary treatments† SEM
T1
T2
T3
T4
Dry matter** 71.83a 76.39c 73.56b 72.25ab 0.44
Organic matter** 55.40a 63.16d 59.29c 57.45b 0.66
Crude protein** 62.64a 70.90c 66.08b 64.4b 0.73
Ether extract** 67.93a 72.92c 70.80b 68.79a 0.45
Crude fibre** 62.72a 71.30d 66.13c 64.62b 0.74
Nitrogen free extract** 65.60a 70.38c 67.25b 66.27a 0.43
Neutral detergent fibre** 64.49a 70.55d 68.12c 66.49b 0.52
Acid detergent fibre** 59.67a 64.49c 63.30b 60.20a 0.47
Hemi cellulose** 55.77a 61.36d 59.30c 57.59b 0.48
Cellulose** 46.70a 50.77c 48.43b 47.72b 0.35
Nutrient Intake (g/kg BW0.75)
Dry matter 89.53 81.91 86.41 89.83 2.39
Digestible crude protein 8.28 8.39 8.26 8.37 0.39
Total digestible nutrients 54.88 54.75 54.30 54.83 1.88
Plane of Nutrition
Digestible crude protein (%) 9.05a 10.25b 9.55a 9.32a 0.17
Total digestible nutrients* (%) 61.30a 67.24b 63.60a 62.40a 0.93
Digestible energy* (M Cal) 7.18a 8.02b 7.19a 7.23a 0.11
Metabolizable energy* (M Cal) 5.89b 6.58b 5.89a 5.93a 0.09
a,b,c,dValues in the rows bearing different superscripts differ significantly (*P<0.05) (**P<0.01); †Calves of the control (T1) group were fed a
standard calf starter, the protein supplied through soybean meal of T1 was replaced at 10 (T
2), 20 (T
3) and 30 (T
4) percent level by
incorporating SWM.
Aruna et al.
Indian J. Anim. Nutr. 2020. 37 (2): 121-126

126
Xiphopenaeus kroyeri). J. Food Compos. Anal. 14:
359-369.
Cobos, M.A., Garcia, L.E., Gonzalez, S.S., Barcena, J.R.,
Hernandez, D.S. and Perez-Sato, M. 2002. The effect
of shrimp shell waste on ruminal bacteria and
performance of lambs. Anim. Feed Sci. Technol. 95:
179-187.
Cobos, M.A., Perez-Sato, M., Piloni-Martini, J., Gonzalez, S.S.
and Barcena, J.R. 2007. Evaluation of diets containing
shrimp shell waste and an inoculum of Streptococcus
milleri on rumen bacteria and performance of lambs.
Anim. Feed Sci. Technol. 132: 324-330.
Duncan, D.B. 1955. Multiple range and multiple F-tests.
Biometrics. 11: 1-42.
Fanimo, A.O., Oduguwa, B.O., Oduguwa, O.O., Ajasa, O.Y.
and Jegede, O. 2004. Feeding value of shrimp meal for
growing pigs. Arch. de Zoot. 53: 77-85.
Fanimo, A.O., Susenbeth, A. and Sudekum, K.H. 2006. Protein
utilization, lysine bioavailability and nutrient
digestibility of shrimp meal in growing pigs. Anim. Feed
Sci. Technol. 129: 196-209.
Gernat, A.G. 2001. The Effect of Using Different Levels of
Shrimp Meal in Laying Hen Diets. Poult. Sci. 80:
633-636.
ICAR, 1998. Nutrient Requirements of Livestock and
Poultry. New Delhi.
Ingweye, J.N., Okon, B.I., Ubua, J.A. and Essein, A.I. 2008.
Performance of broiler chickens fed fish and shrimp
wastes. Asian J. Anim. Sci. 2: 58-63.
Kandra, P., Challa, M.M. and Jyothi, H.K.P. 2012 Efficient use
of shrimp waste: present and future trends. Appl.
Microbiol Biotechnol. 93: 17-29.
Karasov, W.H. 1990. Digestion in Birds: Chemical and
physiological Determinants and Ecological Implica-
tions. Stud. Avian Biol. 13: 391-415.
Khempaka, S., Koh, K. and Karasawa, Y. 2006. Effect of
shrimp meal on growth performance and digestibility
in growing broilers. J. Poult. Sci. 43: 250-254.
Lakshmi, E.R. and Saravanan, J.K. 2012. Isolation and
analysis of proteins in shrimp waste. Indian J.
Innovation Dev. 1: 112-114.
Mahata, M.E., Dharma, A., Ryanto, H.I. and Rizal, Y. 2008.
Effect of Substituting shrimp waste hydrolysate of
Penaeus merguensis for fish meal in broiler
performance. Pak. J. Nutr. 7: 806-810.
Meyers, S.P. and Rutledge, J.E. 1971. Shrimp meal-A new look
at an old product. Feedstuffs. 43: 31-32.
Ngoan, L.D., An, L.V., Ogle, B. and Lindberg, J.E. 2000. Ensiling
techniques for shrimp byproducts and their nutritive
value for pigs. Asian-Australas. J. Anim. Sci. 13:
1278-1284.
Ramyadevi, D., Subathira, A. and Saravanan, S. 2012.
Potential Recovery of Protein from Shrimp Waste in
Aqueous two-phase system. Res. J. Chem. Sci. 2:
47-52.
Rosenfeld, D.J., Gernat, A.G., Marcano, J.D., Murillo, J.G.,
Lopez, G.H. and Flores, J.A. 1997. The effect of using
different levels of Shrimp Meal in broiler diets. Poult.
Sci. 76: 581-587.
Sachindra, N.M., Bhaskar, N. and Mahendrakar, N.S. 2005.
Carotenoids in different body components of Indian
shrimps. J. Sci. Food Agric. 85: 167-172.
Saijpaul, S., Sikka, S.S., Malhotra, P. and Singh, N. 2008. Growth
performance and feed efficiency of calves fed calf
starter containing leather meal. Indian J. Anim. Nutr.
25: 330-335.
Singh, R. 2011. India Dairy and Products Annual Report
2010. USDA Foreign Agricultural Service: Global
Agricultural Information Network. Retrieved June 2011,
from static.globaltrade.net/files/pdf/2011022623125
5627.pdf.
Snedecor, G.W. and Cochran, W.G. 1993. Statistical Methods
(9th edition) Iowa state university press, IOWA, USA.
SPSS. 2008. Statistical Packages for Social Sciences,
Version 17.0, SPSS Inc., Illinois, USA.
Talapatra, S.K., Roy, S.C. and Sen, K.C. 1940. Estimation of
phosphorus, chlorine, calcium, magnesium, sodium and
potassium in food stuffs. Indian J. Vet. Sci. Anim. Husb.
10: 243-258.
Van Soest, P.J., Robertson, J.B. and Lewis, B.A. 1991.
Methods for dietary fiber, neutral detergent fibre and
non-starch polysaccharides in relation to animal
nutrition. J Dairy Sci. 74: 3583-3597.
Shrimp waste meal in starter ration of buffalo calves
Indian J. Anim. Nutr. 2020. 37 (2): 121-126
Received on 22-07-2020 and accepted on 23-08-2020
127
Indian Journal of
Animal Nutrition
Effect of Solid-state Fermentation Biomass Supplementation to Mixed
Substrate on Digestibility and Methane Mitigation in vitro
Kishan P. Patel, Shrikant B. Katole*, P.R. Pandya, K.K. Sorathia and Srushti Patel1
Animal Nutrition Research Department, College of Veterinary Science and Animal Husbandry,
Anand Agricultural University, Anand-388 110, Gujarat, India
ABSTRACT
An experiment was conducted to assess the effect of supplementation of various levels of solid-state
fermentation (SSF) biomass on in vitro digestibility, total gas production and methane production. Eight
different types of substrates were prepared viz. SSF0 (control), and the basal substrates supplemented with
SSF biomass at 1%, 2%, 3%, 4%, 5%, 6% and 7% replacing mixed cereal straw was designated as SSF1, SSF2,
SSF3, SSF4, SSF5, SSF6 and SSF7, respectively. In vitro dry matter digestibility (IVDMD) and in vitro organic
matter digestibility (IVOMD) were 10.62 and 11.70% higher (P<0.01) in SSF4 treatment than that of SSF0
treatment. In vitro total gas production was increased numerically due to SSF biomass supplementation as
compared to control with maximum increment at 5% level, but statistically the change was not significant.
Methane production after 24 h of incubation was lowest (P<0.01) in SSF4 treatment, it reduced by 38.4% as
compared to control. Results revealed an improved digestibility, gas production and reduced methane
production at 4% level of SSF supplementation, and was found to be most suitable level for further in vivo
studies in dairy animal.
Key words: SSF, in vitro, Digestibility, Methane, Gas production
*Corresponding author; Email: [email protected]; 1 Department of Microbiology, Gujarat Vidhyapeeth, Sadra, Gandhinagar, Gujarat.
INTRODUCTION
Animal husbandry plays an important role in
rural economy of India as almost about 73% of rural
population of India possesses some form of livestock.
Moreover, the importance of livestock in India’s economy
can be gauged from the fact that 90 million farming
families rear over 90 million milch animals. According
to livestock census 2012, there is an increment of 4.51%
livestock population in India as compared to previous
one while for the state of Gujarat increment in livestock
population was even more up to 15.36%. As population
grows it leads to increased demand for feeds and
fodder leading to widening of the gap between demand
and supply. The deficit in the requirement and
availability of dry fodder, green fodder and concentrates
during 2015 was to the extent of 21 MT, 26 MT and
34 MT which will increase further to 23 MT, 40 MT
and 38 MT, respectively, by the year 2025 (NIANP,
2016). This scenario demands a paradigm shift for
implementing newer arena of nutritional research on the
way of developing proper feeding strategies to utilize
available feed resources for its optimum utilization.
Indian J. Anim. Nutr. 2020. 37 (2): 127-131
doi: 10.5958/2231-6744.2020.00021.3
Ruminant animals have complex ecosystem of various
microorganisms which eventually utilize low quality
agricultural by-products (rich in cellulose, hemicellulose
and lignin) and convert them into quality food resources.
Utilization of such agricultural by-products can be
improved by appropriate use of feed additives like
prebiotics, probiotic, enzymes etc. and also through
appropriate application of biotechnological tools. Solid
state fermentation (SSF) technique is the one of the most
suitable and economical technique for enrichment of
microbial protein, efficient digestion and utilization of
lignocellulosic agricultural fibrous feeds and fodder
residues for enhancing their feed values. SSF is a
cultivation technique where microbes and fungi (Doelle
et al., 1992) are grown on a moist solid substrate under
controlled conditions which are devoid of actual free
water which eventually can produce a variety of
enzymes (Pandey et al., 1999) and can be fed directly
as crude fermentable mass to animals. Beneficial
effects of supplementing such fibrolytic enzymes
produced by microorganisms on overall productive
performance of lactating ruminants was also reported
Indian J. Anim. Nutr. 2020. 37 (2): 127-131
128
by several authors (Miachieo and Thakur, 2007; Gallardo
et al., 2010; Lopuszanska-Rusek and Bilik, 2011; Ahmad
Para et al., 2019; Arif et al., 2019). It was
hypothesized that SSF would improve the fermentation
kinetics and digestibility of nutrients. Hence, this study
was planned to assess the effect of supplementation of
various levels of SSF biomass on in vitro digestibility,
total gas production and methane production.
MATERIALS AND METHODS
The present study was conducted at Animal
Nutrition Research Department, College of Veterinary
Science and Animal Husbandry, Anand Agricultural
University, Anand, Gujarat. Ingredients for experi-
mental substrates were procured from farmers where
further in vivo trial will be carried out. Mixed cereal
straw (paddy straw, bajra straw and wheat straw),
green fodder (jowar CoFS-29) and Amul buffalo
special concentrate mixture (Dan), Amulnutri power and
Amul crushed maize (bhardo) and cotton seed cake
and maize cake were procured, which were then oven
dried at 70°C and finely grounded in Wiley mill using 1
mm sieve. Substrates were prepared for in vitro by
mixing the ingredients in ration as per the feeding
schedule followed by farmers i.e. by mixing green
fodder, mixed cereal straw, and concentrate at 4:5:4 (kg
on dry matter basis). The ingredients and substrates
were analyzed for proximate constituents (AOAC, 1995)
and fibre fractions (Van Soest et al., 1991).
SSF biomass was procured from Department of
Microbiology, Gujarat Vidhyapeeth, Sadra, Gandhinagar,
Gujarat, India. SSF biomass was prepared using
inoculations of various fungi species i.e. Aspergillus
spp., Trichoderma spp., Fusarium spp., Pleurotus
spp. and Phanerochaete spp. on jowar hay which was
used as solid substrate for SSF biomass preparation.
Activity of various microbial enzymes viz. carboxy
methyl cellulase (CMCase), filter paperase (FPase),
xylanase, laccase, manganese peroxidase (MnP) and
lignin peroxidase (LiP) were at the tune of 170, 60, 468,
270, 488, 298 Units/g of wet weight of SSF biomass,
respectively. The experimental substrate without any
supplementation of SSF biomass was designated as SSF0
(control), while mixed cereal straw of the SSF0 was
replaced with 1, 2, 3, 4, 5, 6 and 7% of SSF in groups
SSF1, SSF2, SSF3, SSF4, SSF5, SSF6 and SSF7,
respectively.
Rumen liquor for in vitro studies was collected
from two lactating buffaloes using stomach tube.
Buffaloes were fed individually with TMR prepared to
meet their nutrients requirements (ICAR, 2013) with
free access of water. Collected rumen liquor was
strained through four-layers of muslin cloth which was
termed as strained rumen liquor (SRL) and was mixed
in prepared artificial saliva (McDougall’s) in proper
proportions prior to incubation. Substrates (200 mg) with
various levels of SSF biomass was incubated with
artificial saliva mixed with SRL (40 ml) for 48 h in
quadruplet at 39±1°C in a shaker twin water bath (Menke
et al., 1979). After 48 h of incubation, total gas
production (TGP) was recorded after subtracting gas
production from blank. To determine in vitro methane
production, gas produced in 100 ml glass syringes after
24 h of incubation period was used. A gas sample was
directly injected into Gas Chromatograph (GC) from
each syringe and CH4 concentration was determined
against standard methane gas (10.4 ppmv and 101.9
ppmv). All samples were analysed using GC instrument,
fitted with a SS column (4 ft. long, 3.2 mm inside
diameter) packed with Porapack N (80 to 100 mesh),
equipped with a flame ionization detector (FID).
Column temperature was maintained at 50°C, and
nitrogen was used as a carrier gas, with flow rate of 30
ml/min. Calibration was completed using standards (10.4
ppmv and 101.9 ppmv) procured from Scott-Marrin Inc.,
USA. Peak areas were integrated using a Perkin Elmer
integrator. After completion of incubation, the content
of each syringe was filtered and dried in a pre-weighed
Gooch crucible. The IVDM was calculated by
subtracting residues remained after incubation from the
amount of substrate incubated and was expressed in
percentage.
Statistical analysis
Data obtained were subjected one way analysis
of variance as per the methods of Snedecor and Cochran
In vitro evaluation of solid state fermentation biomass
Indian J. Anim. Nutr. 2020. 37 (2): 127-131

129
(1994).Treatment means were separated by using
Duncan’s multiple range tests. All analysis was
performed using a statistical package (SPSS 9.00
software).
RESULTS AND DISCUSSION
The data on proximate composition and fibre
fractions of prepared substrate are presented in Table
1. The data on IVDMD and IVOMD are presented in
Table 2, while values of TGP and methane (ml)
produced per 100 g of digestible DM are presented in
Table 2. Perusals of the data revealed a significant
(P<0.05) improvement in digestibility of DM and OM in
4% SSF group as compared to control. In the present
study higher fermentation rates was observed due to
addition of SSF which might have improved digestibility.
Furthermore, addition of enzymes stimulated the
population of cellulolytic bacteria, increased fibre
digestion and flow of microbial protein from the rumen
(Azzaz et al., 2013). This improvement in digestibility
could be also due to synergetic effects of enzyme and
rumen microbes (Morgavi et al., 2000), better
attachment of rumen microbes and feed particles (Yang
et al., 1999). Similarly, significant improvement in
IVDMD (Faramarzi-Garmroodi et al., 2013; Rajamma
et al.,2015; Lopez et al., 2016; Vallejo et al., 2016;
Lunagariya et al., 2017) and IVOMD (Elghandour et
al. 2013; Dey et al., 2014; Lunagariya et al., 2017).
was also reported by earlier authors.
Total amount of gas produced under the
anaerobic microbial fermentation during in vitro
incubation study of 48 h was observed and presented
in Table 2. The values for the gas production were
found to be numerically increased due to SSF
supplementation but did not differ significantly.
Numerical increase in gas production with increasing
levels of SSF biomass in this study indicates better
nutrients availability for rumen microbes which further
increases their fermentation activity resulting in better
feed digestion Morgavi et al. (2000); Azzaz et al.
(2013).Methane contributes for major greenhouse gas
emissions thus its mitigation measures are also required
for better environment. Effect of SSF biomass
supplementation on levels of methane production was
estimated with gas chromatography. There is a
significant (P<0.05) decrease in methane production
(38.4%) in SSF4 group as compared to control.
Table 1. Proximate composition of substrate, jowar hay and SSF
Parameters (%) Substrate Jowar Hay SSF
Crude protein 11.27 6.74 9.55
Ether extract 3.93 2.78 2.91
Crude fibre 28.84 38.40 31.89
Nitrogen free extract 45.92 42.24 42.63
Organic matter 89.96 90.16 86.98
Ash 10.04 9.81 13.00
Silica 4.10 3.25 3.77
Ca 1.11 0.66 0.73
P 0.89 0.18 0.18
Neutral detergent fibre 64.17 72.94 63.30
Neutral detergent solubles 44.35 34.22 39.65
Acid detergent fibre 34.84 40.04 37.19
Hemi-cellulose 29.33 32.89 26.10
Cellulose 22.07 35.43 29.21
Lignin 12.29 5.03 7.65
Patel et al.
Indian J. Anim. Nutr. 2020. 37 (2): 127-131

130
CONCLUSION
It was observed that SSF biomass at 4% levels
has shown most significant improvement in IVDMD
and IVOMD, and significant reduction in methane
emission in vitro. Therefore, SSF biomass at 4% level
of supplementation was found to be most suitable for
further in vivo studies in dairy animals.
REFERENCES
Ahmad Para, I., Singh, M., Punetha, M., Hussain Dar, A.,
Ahmad Naik, M., Salam Teli, A. and Gupta, D. 2019.
Milk production and feed efficiencies as affected
by dietary yeast (Saccharomyces cerevisiae)
supplementation during the transition period in Murrah
buffaloes. Biol. Rhythm Res. 50: 1-8.
AOAC. 1995. Official Methods of Analysis, 16th Edition. Assoc.
Off. Anal. Chem., Washington, D.C.
Arif, M., Al-Sagheer, A.A., Salem, A.Z.M., El-Hack, M.A.,
Swelum, A.A., Saeed, M. and Akhtar, M. 2019.
Influence of exogenous fibrolytic enzymes on milk
production efficiency and nutrient utilization in early
lactating buffaloes fed diets with two proportions of
oat silage to concentrate ratios. Livest. Sci. 219: 29-34.
Azzaz, H.H., Murad, H.A., Kholif, A.M., Morsy, T.A., Mansour,
A.M. and El-Sayed, H.M. 2013. Increasing nutrients
bioavailability by using fibrolytic enzymes in dairy
buffaloes feeding. J. Biol. Sci. 13: 234-241.
Dey, A., Paul, S.S., Pandey, P. and Rathore, R. 2014. Influence
of addition of fibrolytic bacterial culture on in vitro
degradability of wheat straw, methanogenesis and
fermentation metabolites in buffalo. Indian J. Anim.
Nutr. 31: 223-226.
Doelle, H.W., Mitchell, D.A. and Rolz, C.E. 1992. Solid
Substrate Cultivation, Elsevier, London.
Elghandour, M.M.Y., Salem, A.Z.M., Gonzalez-Ronquillo, M.,
Bórquez, J.L., Gado, H.M., Odongo, N.E. and Penuelas,
C.G. 2013. Effects of exogenous enzymes on in vitro
gas production kinetics and ruminal fermentation of
four fibrous feeds. Anim. Feed Sci. Technol. 179:
46-53.
Faramarzi-Garmroodi, A., Mesgaran, M.D., Parand, E. and
Vakili, A.R. 2013. In vitro Effect of Increasing Levels of
Natuzyme® on Fermentation Responses of Corn
Silage Based Diet. Ann. Res. Review Biol. 3: 1066-1073.
Gallardo, I., Bárcena, R., Pinos-Rodríguez, J.M., Cobos, M.,
Carreón, L. and Ortega, M.E. 2010. Influence of
exogenous fibrolytic enzymes on in vitro and in sacco
degradation of forages for ruminants. Ital. J. Anim.
Sci., 9: e8.
ICAR. 2013. Nutrients Requirements of Cattle and Buffalo.
Indian Council of Agricultural Research, New Delhi,
India.
Lopez, D., Vazquez-Armijo, J.F., Lopez-Villalobos, N.,
Lee-Rangel, H.A., Salem, A.Z.M., Borquez-Gastelum,
J.L. and Rojo-Rubio, R. 2016. In vitro gas production
Table 2. Average in vitro dry matter digestibility (IVDMD, %) and organic matter digestibility (IVOMD,
%), total gas production (TGP, ml) and methane (ml/ 100 g digestible DM) of substrates con-
taining different levels of SSF biomass
Substrates IVDMD IVOMD TGP Methane
SSF0 60.64c±0.54 60.47c±0.66 68.00±1.77 1.38 ab±0.08
SSF1 61.48c±1.81 60.89 c±1.82 66.25±4.98 0.91 c±0.20
SSF2 61.77 c±0.15c 61.20c±0.16 71.50±1.75 0.97 bc±0.16
SSF3 62.65 c±1.18 62.37c±1.27 73.75±3.14 1.08±0.14bc
SSF4 67.07a±1.62 67.55a±1.63 71.50±2.72 0.85 bc±0.07c
SSF5 65.92ab±0.90 65.78ab±1.07 78.00±2.04 1.63 a±0.005
SSF6 62.98bc±1.05 63.13bc±0.77 77.50±1.93 1.36 ab±0.16
SSF7 63.00bc±0.47 62.70bc±0.62 72.75±4.67 1.62 a±0.191SEM 1.10 1.33 3.12 0.142, 3 CD (0.05) 3.22 3.30 NS 0.344CV % 3.50 3.59 8.64 20.34
abcMeans with different superscripts in a column for a parameter differ significantly; 1SEM, standard error of mean; 2CD, critical difference;3level of significance, 4CV, co-efficient of variation; SSF0 was made by blending jowar hay mixed cereal straw, and concentrate at 4:5:4; while
mixed cereal straw of the SSF0 was replaced with 1, 2, 3, 4, 5, 6 and 7% of SSF in groups SSF1, SSF2, SSF3, SSF4, SSF5, SSF6 and SSF7,
respectively.
In vitro evaluation of solid state fermentation biomass
Indian J. Anim. Nutr. 2020. 37 (2): 127-131

131
of foliage from three browse tree species treated with
different dose levels of exogenous fibrolytic
enzymes. J. Anim. Physiol. Anim. Nutr. 100: 920-928.
£opuszañska-Rusek, M. and Bilik, K. 2011. Influence of
pre-and postpartum supplementation of fibrolytic
enzymes and yeast culture, or both, on performance
and metabolic status of dairy cows. Ann. Anim. Sci, 11:
531-545.
Lunagariya, P.M., Gupta, R.S. and Parnerkar, S. 2017. In vitro
evaluation of total mixed ration supplemented with
exogenous fibrolytic enzymes for crossbred cows. Vet.
World. 10: 281-285.
Menke, K.H., Raab, L., Salewski, A., Steingass, H., Fritz,
D. and Schneider, W. 1979. The estimation of the
digestibility and metabolizable energy content of
ruminant feeding stuffs from the gas production when
they are incubated with rumen liquor in vitro. J. Agric.
Sci. 93: 217-222.
Miachieo, K. and Thakur, S. S. 2007. Effect of exogenous
fibrolytic enzymes on the productive performance of
lactating Sahiwal cows. Indian J. Anim. Nutr. 24:
27-30.
Morgavi, D.P., Beauchemin, K.A., Nsereko, V.L. and Rode,
L.M. 2000. Synergy between ruminal fibrolytic enzymes
and enzymes from Trichoderma longibrachiatum in
degrading fibre substrates. J. Dairy Sci. 83: 1310-1321.
NIANP. 2016. Steps taken to Bridge the Gap Between the
Demand and Availability of FodderThrough Sub-
Mission on Fodder and Feed Development (Standing
Committee on Agriculture, Lok Sabha, 34th Report).
New Delhi, India.
Pandey, A., Selvakumar, P., Soccol, C.R. and Nigam, P. 1999.
Solid state fermentation for the production of
industrial enzymes. Curr. Sci. 77: 149-162.
Rajamma, K., Kumar, D.S., Rao, E.R. and Nath, D.N. 2015. In
vitro evaluation of total mixed rations containing
different roughage-concentrate ratios supplemented
with or without fibrolytic enzymes. Anim. Sci. 9: 63-69.
Snedecor, G.W. and Cochran, W.G. 1994. Statistical Methods.
8th ed., Oxford and IBH Publishing Co. Pvt. Ltd., New
Delhi, India.
Vallejo, L.H., Salem, A.Z.M., Kholif, A.E., Elghangour, M.M.Y.,
Fajardo, R.C., Rivero, N. and Mariezcurrena, M.D. 2016.
Influence of cellulase or xylanase on the in vitro
rumen gas production and fermentation of corn
stover. Indian J. Anim. Sci. 86: 70-74.
Van Soest, P. J., Robertson, J. B. and Lewis, B. A. 1991.
Methods of dietary fiber, neutral detergent fiber and
non-starch polysaccharides in relation to animal
nutrition. J. Dairy Sci. 74: 3583-3597.
Yang, W.Z., Beauchemin, K.A. and Rode, L.M. 1999. Effects
of an enzyme feed additive on extent of digestion and
milk production of lactating dairy cows. J. Dairy Sci.
82: 391-403.
Patel et al.
Indian J. Anim. Nutr. 2020. 37 (2): 127-131
Received on 09-07-2020 and accepted on 12-08-2020

132
Indian Journal of
Animal Nutrition
Effect of Supplementing Conjugated Linoleic Acid Producing
Bifidobacterial Strains on In vitro Rumen Fermentation Attributes
Neeru Jaglan, Sachin Kumar, Prasanta Kumar Choudhury, Bhawna Tyagi, P.S. Banakar,
Nitin Tyagi and Amrish Kumar Tyagi*
Animal Nutrition Division, ICAR-National Dairy Research Institute, Karnal-132 001, Haryana, India
ABSTRACT
The present study was undertaken to evaluate the effects of supplementation of four conjugated
linoleic acid (CLA) producing strains of Bifidobacteria isolated from rumen fluid samples of Murrah buffalo
(Bubalus bubalis) on ruminal fermentation attributes based on a basal diet having roughage: concentrate in a
ratio of 70:30. Results of the study showed that dosing Bifidobacterium strains (109 cells/ml) separately into in
vitro incubation tubes neither affect the total gas nor methane (CH4) production after 24 h of incubation.
Digestibility parameters showed no significant (P>0.05) changes with respect to in vitro dry matter digestibility
(IVDMD), in vitro organic matter digestibility (IVOMD), or total ammonia-N content of fermentation fluid.
However, volatile fatty acid (VFA) concentration was observed to be significantly increased (P<0.05) in the
treatment samples with bacterial strains NB-191 and NB-184. While analyzing CLA content of incubation
medium, a significant increase in the value was observed as compared to control tubes. Therefore, it can be
concluded that the addition of potential CLA producing Bifidobacterial isolates to mixed rumen culture
increased the CLA and VFA content without affecting digestibility and fermentation parameters.
Key words: Bifidobacteria; Conjugated linoleic acid; IVDMD; Murrah buffaloes; Rumen fermentation
*Corresponding author; Email: [email protected]
INTRODUCTION
In present time, manipulation of rumen microbial
ecosystem by supplementation of probiotics and
prebiotics to enhance feedstuff utilization and improve
production efficiency is a key area of research pursued
by both ruminant nutritionists and microbiologists
(Sharma et al., 2011; Chaturvedi et al., 2014). Most
researches using direct-fed microbials (DFM) have
generally indicated positive responses (Newbold et al.,
1990). The bacterial strains most commonly used as
DFM are Lactobacillus, Lactococcus, Enterococcus
and Bifidobacterium, which are categorized as lactic
acid bacteria (LAB) and are normal gut inhabitants in
most of the animals. LAB is reported to improve the
dry matter (DM) digestibility and decreased ruminal CH4
production (Cao et al., 2011). Among LAB,
Bifidobacteria have been confirmed to have specific
health benefits that can be mediated through
enhancement of vitamin synthesis and mineral
bioavailability (Jena et al., 2017; Teraguchi et al., 1984),
improvement of immune function (Schiffrin et al., 1997),
reduction of gastrointestinal disturbances (Hotta et al.,
Indian J. Anim. Nutr. 2020. 37 (2): 132-137
doi: 10.5958/2231-6744.2020.00022.5
1987; Ballongue et al., 1993). Further, Bifidobacterium
may accelerate production of CLA having functional
properties like anti-carcinogenic, anti-obesity, antioxidant
and anti-inflammatory effects (Kim et al., 2016).
Ruminant products are reported to have highest
concentration of CLAs (Alfaia et al., 2017). Despite
having such beneficial effects, Bifidobacteria have not
been investigated as a feed additive in Murrah buffalos.
To the best of our knowledge, there are no published
reports documenting a response to in vivo and/or in
vitro supplementation of anaerobic Bifidobacterial
cultures on nutrient digestion by Murrah buffaloes.
Therefore, the study was undertaken to examine the
effects of Bifidobacteria supplementation on in vitro
rumen fermentation attributes in Murrah buffalo model.
MATERIALS AND METHODS
In vitro trials were carried out as per the
procedure described by Menke and Steingass (1988) in
triplicates. Rumen fluid was obtained 2 h after morning
feeding from two fistulated buffalo bulls maintained
on a standard diet (70 parts roughage: 30 parts
concentrate) in a pre-warmed container. Ruminal feed
Indian J. Anim. Nutr. 2020. 37 (2): 132-137

133
particles were allowed to settle to the bottom (5 min),
and finally the fluid content was strained through two
layers of nylon cloth (50 mm pore size). Particle-free
ruminal fluid was mixed with the buffer solution (Menke
and Steingass, 1988) in a proportion 1: 2 (v/v) at 39°C
anaerobically under a constant stream of O2 free CO
2.
To evaluate the effect of supplementing different
strains of Bifidobacteria, a substrtae was prepared
(Table 1) by mixing roughage and concentrate in the
ratio of 70: 30 to simulate a commonly fed total mixed
ration (TMR). The roughage portion consisted of fresh
berseem and the concentrate mixture consisted of
maize-33%, groundnut cake-18%, mustard cake
(expeller)-20%, cotton seed cake-5%, wheat bran-20%,
de-oiled rice bran-6%, bajra-5%, mineral mixture-2%
and common salt-1%. Proximate principles (AOAC,
2005) and fibre fractions (Van Soest et al., 1991) were
determined for individual ingredients and the substrate.
Four bacterial isolates namely NB-19, NB-81,
NB-179 and NB-184, isolated from Murrah buffalos
were used in the study. One millilitre of each bacterial
isolate (109cells/ml) was added in each glass syringe
except control (100 ml) (Fortuna Optima, Germany)
containing 200±5 mg of substrate with 30 ml of
buffered rumen liquor. Three blank syringes containing
only 30 ml of buffered rumen fluid were included to
correct gas production values for the gas released from
endogenous substrates. Syringes were closed using
clamps and petroleum jelly was applied on the plungers
of syringes to avoid friction and any leakage. Syringes
were incubated for 24 h at 39±0.5°C. The corrected
gas values (net gas) were used for calculation of
partitioning factor (PF) and microbial biomass
production (MBP). After 24 h incubation, fermentation
was arrested by chilling the syringes to 4°C, and the
quantities of fermentation products were determined in
each syringe. The in vitro gas production technique was
employed to estimate the parameters such as total
gas production, CH4 production, ammonia nitrogen
(NH3-N) concentration and individual VFA’s (Menke
et al., 1979; Menke and Steingass, 1988). Three trials
were run for each treatment and each treatment was
performed in triplicates. CH4 content in fermentation
gas was determined by gas chromatography (GC)
using Nucon-5765 gas chromatograph equipped with a
flame ionization detector (FID) and a stainless steel
column packed with Porapak-Q (length 6’;o.d.1/8" i.d.
2 mm; mesh range 80-100). After collection of gas
sample the contents of each syringe were centrifuged
at 3000 rpm for 15 min to get a clear supernatant and
pellets. To estimate ammonia nitrogen (NH3-N) an
aliquot of supernatant was acidified with equal volume
of 0.5 M HCl and the acidified supernatant (5 ml) was
mixed with 10 ml of NaOH (1 N) and immediately steam
distilled using KEL PLUS - N analyser (Pelican, India).
Boric acid (20% w/v) solution was used for ammonia
collection and titrated against N/100 sulphuric acid.
Another aliquot of supernatant (4 ml) was added to 25%
m-phosphoric acid (2 ml), kept overnight at 4°C and
centrifuged at 2000 rpm for 15 min and supernatant was
stored at -20°C VFA analysis (Erwin et al., 1961). The
pellets obtained after centrifugation were refluxed with
neutral detergent solution for an hour (Van Soest et al.,
1991) where loss in weight was considered as true dry
Table 1. Chemical composition of ingredients and substrates used in this study
Nutrients Berseem Concentrate Mixed substrate
Dry matter 14.34±0.70 88.12±0.22 51.23±0.60
Organic matter 90.22±0.41 90.24±0.48 90.21±0.21
Crude protein 16.78±0.66 18.21±0.95 17.49±0.34
Ether extract 1.01±0.36 3.47±0.22 2.07±0.12
Total 9.04±0.74 7.21±0.64 7.95±0.35
Neutral detergent fibre 54.69±1.21 23.96±0.87 45.25±0.52
Acid detergent fibre 28.78±1.35 10.64±0.45 23.22±0.10
Jaglan et al.
Indian J. Anim. Nutr. 2020. 37 (2): 132-137

134
matter digestibility. Residue was further subjected to
ashing at 550°C for estimation of in vitro organic
matter digestibility (IVOMD). The PF and MBP were
calculated based on truly degraded organic matter
(TDOM) as described by Blummel et al. (1999) and
Blummel et al. (2005), respectively.
PF= mg TDOM/total gas production
TDOM was calculated by multiplying TOMD (%)
by mg OM content of substrate.
Microbial biomass production (MBP) was
calculated from TDOM using equation:
MBP (mg) = TDOM (mg) – (Net gas volume×2.20)
Where 2.20 is the stoichiometric factor
CLA content of the rumen fluid was estimated
by UV-spectrophotometric method. In brief, after
incubation, fermentation fluid (1 ml) was centrifuged at
18,000 rpm for 1 min, the pellet was discarded and the
supernatant was mixed with 2 ml of isopropanol by
vortexing and allowed to stand for 3 min. The fatty
acids were extracted following the addition of 1.5 ml
of hexane. The presence of CLA in the culture
supernatant was assayed spectrophotometrically by
dispensing 230 µl of the fat-soluble hexane layer into
a UV-transparent 96-well plate for determining
the absorbance at 233 nm using a 96 well plate
spectrophotometer.
The data were subjected to one-way analysis of
variance procedure of SPSS (2010), using the linear
model. The post-hoc comparison of means was done
for the significant difference by Tukey’s test.
Significant differences of treatments were considered
at P<0.05.
RESULTS AND DISCUSSION
Results indicated that supplementation of
bacterial isolates had no effect on gas production as
compared to control (Table 2). The in vitro gas
production technique has been used widely to study feed
degradation (Rymer et al., 2005); it can provide
valuable information on the kinetics of feed digestion
in rumen and reflect the utilisation efficiency of
fermentation substrates (Metzler-Zebeli et al., 2012).
Previous studies also reported that LAB survive in
rumen, affects rumen microflora, and changed the in
vitro ruminal fermentation (Weinberg et al., 2004; Gollop
et al., 2005). Our results indicated that supplementation
of Bifidobacteria did not affect the total gas
production. This agrees with Jena et al. (2017) who
reported that Bifidobacteria did not produce gas on
Table 2. Effect of the Bifidobacterial isolates on rumen fermentation and CLA production
Parameter Bifidobacterium Strain
Control NB-191 NB-81 NB-179 NB-184
Net gas (ml) 32.23 a±0.179 33.02ab±0.423 33.08ab±0.318 33.97 b±0.241 33.03ab±0.453
CH4 (%) 33.01±0.353 33.71±0.147 33.58±0.543 34.39±0.659 34.43±0.723
CH4 (ml) 8.07±0.11 8.12±0.13 8.10±0.16 9.10±0.31 9.14±0.41
NH3-N (mg/100 ml) 13.08±0.68 13.67±0.87 14.08±0.38 13.63±0.29 14.99±0.26
IVDMD (%) 60.48±0.63 62.26±1.04 62.03±0.25 61.25±0.46 61.59±0.19
IVOMD (%) 61.86±0.92 63.34±0.87 63.45±0.41 61.70±0.45 62.80±0.16
Acetate (mmol/L) 41.11 a±0.46 49.45b±0.83 45.28ab±1.82 43.24 a±0.89 49.94 b±1.19
Propionate (mmol/L) 14.47±1.53 18.20±0.23 17.20±0.71 17.07±1.39 15.60±0.96
Butyrate (mmol/L) 8.4±0.95 11.37±0.12 9.70±1.01 9.40±0.62 10.93±0.18
PF 3.59±.06 3.59±.09 3.59±.04 3.39±.02 3.55±.03
MBP (mg/200mg DM) 43.35±1.97 44.15±2.76 44.42±1.01 38.94±.79 43.12±.46
CLA (µg/mL) 15.23±0.11a 18.09±0.62b 17.74±0.34b 18.84±1.00b 18.52±0.41b
IVDMD, in vitro dry matter digestibility; IVOMD, in vitro organic matter digestibility; P,- partitioning; MBP, microbial biomass produc-
tion; CLA, conjugated linoleic acid; a,b means bearing superscript differs significantly in a row (P<0.05).
Bifidobacteria increases CLA content in vitro
Indian J. Anim. Nutr. 2020. 37 (2): 132-137
135
substrate fermentation
Approximately 6-15% of feed energy is lost in
the formation of methane (Johnson and Johnson, 1995).
Santoso et al. (2003) reported that CH4 production could
be affected by the nature of the carbohydrates being
fermented; cellulose and hemicellulose are important
fibre fractions that influence CH4 production. However,
we found that CH4 production was not affected with
the addition of Bifidobacterial strains which may be
because of differences between fermentation substrates
(single fermented cell wall substrates compared to total
mixed substrates).
The data revealed that incorporation of CLA
producing bacteria had no significant effect on IVDMD
and IVOMD (Table 2). IVDMD reflects the degree
of degradation of substrates by microorganisms in
fermentation systems. LAB do not possess the
enzymatic ability to hydrolyse cell-wall constituents
(Rooke and Hatfield, 2003), and the activity of
cellulolytic bacteria may not have been affected with
the addition of Bifidobacteria. Although Reich and Kung
(2010) reported that a combination of Lactobacillus
buchneri 40788 with Lactobacillus plantarum or
Pediococcus acidilactici tended to increase in
vitro neutral detergent fibre degradation (IVNDFD) in
treated compared to untreated silage. However, no
such results with supplementation of Bifidobacteria
have been reported till now. So, further study is
needed to investigate the effect of Bifidobacteria
supplementation on in vitro rumen fermentation.
NH3-N production was similar in all the isolates
and varied in a range of 13.67±0.87 to 14.99±0.26 mg/
100 ml indicating no adverse effect of bacterial isolates
on this fermentation parameter (Table 2). Optimum
ammonia levels vary from 50 mg/l (Satter and Slyter,
1974) to 190 mg/L. Deficiency of NH3-N restricts
microbial protein synthesis, while high concentrations
of NH3-N also inhibit microbial utilization of this
compound (Hristov et al., 2002). The acquisition and
assimilation strategies followed by members of
Bifidobacteria to retrieve nitrogen from the gut lumen
are still largely unknown (Ferrario et al., 2015). When
similar experiment was conducted with L. acidophilus
a significant increase in ammonia-N was reported (Chen
et al., 2017) which might be due difference in substrate
availability or /and different nitrogen assimilation
pathways between microbes. So, further research is
required to investigate the effect of Bifidobacteria on
protein metabolism in rumen.
PF and efficiency of MBP synthesis varied from
3.39 to 3.59, and 38.94 to 44.15 respectively; having no
significant difference from control diet (Table 2).
Normal physiological range for PF varies from 2.75 to
4.41 (Blummel et al., 1997) and PF values of the present
study lies within this normal range. Results of this
experiment were in agreement with the findings of Sarkar
et al. (2017) who reported 3.63 and 40.23 for PF and
MBP, respectively on similar type of substrate.
Data on individual VFA is presented in table 2. Acetate
concentration was higher in NB-191 and NB-184, and
lower in control and NB-179, however, its level was
similar between NB-81, NB-171 and control group.
Proportions of propionate and butyrate did not differ
significantly between the control and treatment groups.
Kumar et al. (2013) reported that supplementation of
Saccharomyces cerevisiae or lactobacilli alone or in
combination of both cultures had no effect on total VFA
concentration. The values of VFAs in the present study
were lower than those reported by Kaur et al. (2017)
from similar type of substrate. In another in vitro study
performed by Zicarelli et al. (2011) having same
roughage to concentrate ratio a higher level of VFA
production was reported. The difference could be due
to different green fodder used and also due to the
variation in the ingredient composition of the of the
substrate (Table 1).
A significant increase was observed on CLA
production by supplementation of Bifidobacteria
isolates (Table 2). Hussain et al. (2016), reported strain
specific CLA producing ability of Butyrivibrio spp.
Similarly Jaglan et al. (2019) investigated the conjugated
linoleic acid production potential of bifidobacterial
isolates from ruminal fluid samples of Murrah buffaloes
and found that B. thermophilum and B. pseudolongum
produced cis9, trans11 CLA isomer. Results of this study
further testifies the CLA producing capability of
Jaglan et al.
Indian J. Anim. Nutr. 2020. 37 (2): 132-137

136
Bifidobacterial isolates, which is reflected in the
results obtained. In covenant with the present findings
various workers have also reported increase in CLA
production with supplementation of different bacterial
isolates (Puniya et al., 2008; Shivani et al., 2016). The
conversion rate of linoleic acid to CLA is very high
at reasonably high concentration of linoleic acid, so
relatively high CLA concentration could be maintained
if this strain is stable at ruminal condition.
CONCLUSIONS
The results conclusively revealed that addition of
potential CLA producing Bifidobacterial isolates to
mixed rumen culture increased the VFA and CLA
content without affecting digestibility and fermentation
attributes. Such a development is particularly significant
because this study demonstrates that the introduction
of a microorganism with CLA producing potential into
the rumen may improve functional worth of ruminant
products. However, in vivo trials are necessary before
advocating these findings to feed industry.
REFERENCES
Alfaia, C.M., Alves, S.P., Pestana, J.M., Madeira, M.S., Moreira,
O., Santos-Silva, J. and Prates, J.A.2017. Distinct fatty
acid composition of some edible by-products from
bovines fed high or low silage diets. Food Sci. Technol.
Int. 23: 209-221.
AOAC, 2005. Official Methods of Analysis. 18th edn.
Association of Official Analytical Chemists.
Washington, DC.
Ballongue, J., Grill, J.P. and Baratte-Euloge.1993. Effects of
Bifidobacterium fermented milks on human intestinal
flora. Lait. 73: 249-256.
Blummel, M., Givens, DI. and Moss, AR.2005. Comparison of
methane produced by straw fed sheep in open-circuit
respiration with methane predicted by fermentation
characteristics measured by an in vitro gas procedure.
Anim. Feed Sci. Technol. 123: 379-390.
Blummel, M., Makkar, H.P.S. and Becker, K.1997. In vitro gas
production: a technique revisited. J. Anim. Physiol.
Anim. Nutr. 77: 24-34.
Blummel, M., Mgomezulu, R., Chen, X.B., Makkar, H.P.S.,
Becker, K. and Orskov, E.R.1999. The modification of
an in vitro gas production test to detect roughage
related differences in in vivo microbial protein
synthesis as estimated by the excretion of purine
derivatives. J. Agric. Sci. 133: 335-340.
Cao, Y., Cai, Y., Takahashi, T., Yoshida, N., Tohno, M., Uegaki,
R. and Terada, F.2011. Effect of lactic acid bacteria
inoculant and beet pulp addition on fermentation
characteristics and in vitro ruminal digestion of
vegetable residue silage. J. Dairy. Sci. 94: 3902-3912.
Chaturvedi, I., Dutta, T.K., Singh, P.K., Sharma, A. and Kumar,
M. 2014. Effect of herbal feed additives on IVDMD,
methane and total gas production via in-vitro study. J.
Agroecol. Nat. Resour. Manag. 1: 108-112.
Chen, L., Ren, A., Zhou, C. and Tan, Z. 2017. Effects of
Lactobacillus acidophilus supplementation for
improving in vitro rumen fermentation characteristics
of cereal straws. Ital. J. Anim. Sci. 16: 52-60.
Erwin, E.S., Macro, G.A. and Emery, E.M. 1961. Volatile fatty
acid analysis of blood and rumen fluid by gas
chromatograph. J. Dairy. Sci. 44: 1768-1771.
Ferrario, C., Duranti, S., Milani, C., Mancabelli, L., Lugli, G.A.,
Turroni, F., Mangifesta, M., Viappiani, A., Ossiprandi,
M.C., van Sinderen, D. and Ventura, M. 2015.
Exploring amino acid auxotrophy in Bifidobacterium
bifidum PRL2010. Front. Microbiol. 6: 1331.
Gollop, N., Zakin, V. and Weinberg, Z.G. 2005a. Antibacterial
activity of lactic acid bacteria included in inoculants
for silage and in silages treated with these inoculants. J.
Appl. Microbiol. 98: 662-666.
Hotta, M., Sato, Y., Iwata, S., Yamashita, N., Sunakawa, K.,
Oikawa, T., Tanaka, R., Watanabe, K., Takayama, H.,
Yajima, M., Sekiguchi, S., Arai, S., Sakurai, T. and Mutai,
M. 1987. Clinical effects of Bifidobacterium
preparations on paediatric intractable diarrhea. Keio. J.
Med. 36: 298-314.
Hristov, A.N. and McAllister, T.A. 2002. Effect of inoculants
on whole-crop barley silage fermentation and dry
matter disappearance in situ. J. Anim. Sci. 80: 510-516.
Hussain, S.A., Srivastava, A., Tyagi, A., Shandilya, U.K.,
Kumar, A., Kumar, S., Panwar, S. and Tyagi, A.K., 2016.
Characterization of CLA-producing Butyrivibrio spp.
reveals strain-specific variations. 3 Biotech. 6: 90.
Jaglan, N., Kumar, S., Choudhury, P.K., Tyagi, B. and Tyagi,
A.K., 2019. Isolation, characterization and conjugated
linoleic acid production potential of bifidobacterial
isolates from ruminal fluid samples of Murrah
buffaloes. Anaerobe. 56: 40-45.
Jena, R., Choudhury, P. K., Puniya, A.K. and Tomar, S.K. 2017.
Isolation and species delineation of genus
Bifidobacterium using PCR-RFLP of partial hsp60 gene
fragment. Lwt-Food. Sci. Technol. 80: 286-293.
Johnson, K.A. and Johnson, D.E. 1995. Methane emissions
from cattle. J. Anim. Sci. 73: 2483-2492.
Bifidobacteria increases CLA content in vitro
Indian J. Anim. Nutr. 2020. 37 (2): 132-137

137
Kaur, J., & Thakur, S. S. (2017). In vitro methane production
potential, nutrient digestibility and fermentation
pattern of total mixed rations containing incremental
levels of novel feedstuff Phalaris minor seeds in
buffalo inoculum. Int. J. Curr. Microbiol. Appl. Sci. 6:
96-103.
Kim, J. H., Kim, Y., Kim, Y.J. and Park, Y. 2016. Conjugated
linoleic acid: potential health benefits as a functional
food ingredient. Ann. Rev. Food. Sci. Technol. 7: 221-
244.
Kumar, S., Dagar, S.S., Sirohi, S.K., Upadhyay, R.C. and Puniya,
A.K. 2013. Microbial profiles in vitro gas production
and dry matter digestibility based on various ratios of
roughage to concentrate. Ann. Microbiol. 63: 541-545.
Menke, K.H. and Steingass, H. 1988. Estimation of the
energetic feed value obtained from chemical analysis
and gas production using rumen fluid. Anim. Res. Dev.
28: 7-55.
Menke, K.H., Raab, L., Salewski, A., Steingass, H., Fritz, D.
and Schneider, W. 1979. The estimation of the
digestibility and metabolizable energy content of
ruminant feeding stuffs from the gas production when
they are incubated with rumen liquor in vitro. J. Agric.
Sci. 93: 217-222.
Metzler Zebeli, B.U., Scherr, C., Sallaku, E., Drochner, W. and
Zebeli, Q. 2012. Evaluation of associative effects of
total mixed ration for dairy cattle using in vitro gas
production and different rumen inocula. J.
Sci. Food Agric. 92: 2479-2485.
Newbold, C.J., Williams, P.E.V., McKain, N., Walker, A. and
Wallace, R.J. 1990. The effects of yeast culture on yeast
numbers and fermentation in the rumen of sheep. Proc.
Nutr. Soc. 49: 47.
Puniya, A. K., Chaitanya, S., Tyagi, A. K., De, S. and Singh, K.
2008. Conjugated linoleic acid producing potential of
lactobacilli isolated from the rumen of cattle. J. Ind.
Microbiol. Biotechnol. 35: 1223-1228.
Reich, L J and Kung Jr. L. 2010. Effects of combining
Lactobacillus buchneri 40788 with various lactic acid
bacteria on the fermentation and aerobic stability of
corn silage. Anim. Feed Sci. Technol. 159: 105-109.
Rooke, J.A. and Hatfield, R.D. 2003. Biochemistry of Ensiling.
Silage Science and Technology. p. 95-139. (Eds) Buxton
D R, Muck R E and Harrison J H. American Society of
Agronomy, Madison.
Rymer, C., Huntington, J.A., Williams, B.A. and Givens, D.I.
2005. In vitro cumulative gas production techniques:
History, methodological considerations and
challenges. Anim. Feed Sci. Technol. 123: 9-30.
Santoso, B., Kume, S., Nonaka, K., Kimura, K., Mizukoshi, H.,
Gamo, Y. and Takahashi, J. 2003. Methane emission
nutrient digestibility energy metabolism and blood
metabolites in dairy cows fed silages with and without
galacto-oligosaccharides supplementation. Asian-
Australas. J. Anim. Sci. 16: 534-540.
Sarkar, S., Mohini, M., Mondal, G., Pandita, S., Nampoothiri,
V.M., Gautam, M. 2017. Effect of supplementing Aegle
marmelos leaves on in vitro rumen fermentation and
methanogenesis of diets varying in roughage to
concentrate ratio. Indian. J. Anim. Res. DOI :10.18805/
ijar. b-3331
Satter, L. D. and Slyter, L.L. 1974. Effect of ammonia
concentration on rumen microbial protein production
in vitro. Br. J. Nutr. 32: 199-208.
Schiffrin, E.J., Brassart, D., Servin, A.L., Rochat, F. and Donnet-
Hughes, A. 1997. Immune modulation of blood
leukocytes in humans by lactic acid bacteria: criteria
for strain selection. Am. J. Clin. Nutr. 66: 515S-520S.
Sharma, A., Chaudhary, P.P., Sirohi, S.K. and Saxena, J. 2011.
Structure modeling and inhibitor prediction of NADP
oxidoreductase enzyme from Methanobrevibacter
smithii. Bioinformation. 6: 15.
Shivani, S., Srivastava, A.K., Shandilya, U.K., Kale, V. and
Tyagi, A. K. 2016. Dietary supplementation of
Butyrivibrio fibrisolvens alters fatty acids of milk and
rumen fluid in lactating goats. J. Sci. Food Agric. 96:
1716-1722.
Teraguchi, S., Ono, J., Kiyosawa, I., Fukuwatari, Y., Araki, K.
and Okonogi, S. 1984. Vitamin production by
Bifidobacteria originated from human intestine. J.
Japanese. Soc. Nutr. Food Sci. 37: 157-164.
Van Soest, P.J., Robertson, J.B., Lewis, B.A. 1991. Methods
for dietary fiber, neutral detergent fiber, and nonstarch
polysaccharides in relation to animal nutrition. J. Dairy
Sci.74: 3583-3597.
Weinberg, Z.G., Chen, Y., Gamburg, M. 2004. The passage of
lactic acid bacteria from silage into rumen fluid, in vitro
studies. J. Dairy Sci.87: 3386-3397.
Zicarelli, F., Calabro, S., Cutrignelli, M. I., Infascelli, F., Tudisco,
R., Bovera, F., & Piccolo, V. 2011. In vitro fermentation
characteristics of diets with different forage/
concentrate ratios: comparison of rumen and faecal
inocula. J. Sci. Food Agric. 91: 1213-1221.
Jaglan et al.
Indian J. Anim. Nutr. 2020. 37 (2): 132-137
Received on 10-08-2020 and accepted on 23-08-2020

138
Indian Journal of
Animal Nutrition
Augmenting Feeding Value of Rice Gluten Meal through Dietary Addition
of Enzymes in Broilers
O.P.Dinani*, Pramod Kumar Tyagi, A.B. Mandal, Praveen Kumar Tyagi
and Narayan Dutta1
Avian Nutrition and Feed Technology Division,
ICAR-Central Avian Research Institute, Izatnagar-243122, India
ABSTRACT
A biological experiment of 42 days duration was undertaken to study the growth performance of broilers.
A total of 384, day-old chickswere divided into 12 dietary treatments following 3×4 factorial design having 4
replicates per treatment with 8 birds in each. Twelve experimental diets were prepared by incorporating control,
two different levels (15 and 17.5%)of rice gluten meal (RGM), and three different types of enzymes namely
xylanase (X), protease (P) and multienzymes (M). Data pertaining to the growth performance of birds revealed
no significant (P>0.05) difference in RGM levels (15 and 17.5%), but FCR was significantly (P<0.05) poor in
17.5% RGM level. Either of the three supplementations (X, P and M) significantly (P<0.05) improved the growth
performanceof the birds, best response being observed with protease supplementation. Thus,it may be
concluded thatprotease supplementation may increase the effective and safe inclusion level of alternate
protein source RGM from 15 to 17.5% for economic broiler production.
Key words:Broiler, Enzymes,Growth, Protein, Protease, Rice glutenmeal
*Corresponding author; Email: [email protected]; 1Division of Animal Nutrition, ICAR-Indian Veterinary Research Institute, Izatnagar
243122, India.
INTRODUCTION
The search of alternative feed ingredients in
poultry nutrition is a continuous process in the pursuit of
economical poultry production. India is the second
largest producers of rice in the world after China,
producing approximately 109.7 MT rice in 2016-17
(Agriculture Statistics, 2018). Now-a-days, certain
newer rice by-products are available in appreciable
quantities from rice processing industries and at cheaper
rate such as rice gluten meal (RGM), which can be
utilized in feeding poultry.The RGM is a by-product of
wet-milling of rice obtained after starch extraction
and syrup preparation. It is a relatively newer feedstuff
having brownish colour and coarse powdery texture.
Commercial traders categorise RGM as a high crude
protein and energy ingredient which is priced lower than
soybean meal.
Initial research finding showed that RGM can be
included up to 10% level in broiler chicken ration
without affecting feed efficiency and dressing
percentage (Sheraziet al., 1995).Metwally and Farahat
(2015) found that broiler fed RGM with different
Indian J. Anim. Nutr. 2020. 37 (2): 138-142
doi: 10.5958/2231-6744.2020.00023.7
inclusion rates up to 12.5% had the same growth
performance.Overall, very little research data is
available on feeding value of RGM in poultry and no
data is available regarding augmenting its feeding value
through dietary addition of enzymes in broilers. Hence,
this study was conducted for substrate specific
selection of enzyme for RGM and its effect on the
growth performance of broilers.
MATERIALS AND METHODS
Experimental layout for feeding different level of
RGM with or without enzymes is presented in Table 1.
In an experiment based on factorial design 384, day-old
chicks (CARIBRO-Vishal) were randomly divided into
48 replicates of eight birds each. There were twelve
different treatments with 4 replicates for each
treatment. Dietary treatments were according to 3×4
factorial arrangements; 0, 15 and 17.5% of RGM,
supplemented with either no enzyme, or protease,
xylanase or multienzymes supplementation. Mixing
ratio 50 g per 100 kg feed for protease, 10 g per 100 kg
feed for xylanase and 25 g per 100 kg feed for
multienzymes were used as per manufacturer
Indian J. Anim. Nutr. 2020. 37 (2): 138-142

139
instructions.
Data pertaining to chemical composition of dietary
ingredients (%) analysedas per (AOAC, 2000) on as is
basis is presented in Table 2. Ingredients and nutrient
composition (%) of pre-starter (0-14 days), starter
(14-28 days)and finisher (28-42 days) diets with or
without enzymes for different level of RGM are
presented in Table 3. All the rations were formulated to
meet the nutrient requirements of the birds as per ICAR
(2013) standard. In vitro pepsin-pancreatin digestibilities
(IVPPD) of RGM and soybean meal were measured
according to the method of Gopalkrishnan and Jamuna
(2000). The IVPPD of RGM was found to be 81.92%
and that of soybean meal was 88.15%.No detectable
amount of aflatoxin B1 and ochratoxin were found in
RGM as estimated by thin layer chromatography
(AOAC, 2000).
The three commercial enzyme preparations i.e.
protease, xylanase and multienzymes were used as per
manufacturer instructions after assessing their activity
as per standard methods (Kamra and Agarwal,
2003).Activity of protease and xylanase were 600,000±
849 and 150,000 ± 683 units/g, respectively.
Multienzymes activity were estimated for cellulase
15,000±275, xylanase 18, 500±328, β-glucanase 12,500
±128, amylase 1500±46, pectinase 150±16, protease
Table 1. Experimental layout for feeding different level of RGM with or without enzymes
Treatment Rice gluten No. of replicates Birds/ Total Enzymes
meal (%) replication
T1
0.0 4 8 32 -
T2
0.0 4 8 32 Xylanase
T3
0.0 4 8 32 Protease
T4
0.0 4 8 32 Multienzymes
T5
15 4 8 32 -
T6
15 4 8 32 Xylanase
T7
15 4 8 32 Protease
T8
15 4 8 32 Multienzymes
T9
17.5 4 8 32 -
T10
17.5 4 8 32 Xylanase
T11
17.5 4 8 32 Protease
T12
17.5 4 8 32 Multienzymes
Table 2. Chemical composition of dietary ingredients (%) on as is basis
Ingredients Moisture DM CP EE CF TA NFE Ca P GE *ME
(kcal/kg) (kcal/kg)
Maize 8.6 91.3 9 3.9 1.8 1.4 83.8 0.03 0.29 4447 3350
SBM 9.1 90.9 44.5 0.9 6.2 3.1 45.2 0.32 0.68 4097 2400
DORB 10.1 91.8 14 1.6 15.9 5.8 62.6 0.3 1.54 3854 2000
RGM 7.6 92.3 49.9 5.7 7.4 3.3 33.5 0.84 0.98 4742 3031
Soybean oil - - - - - - - - - 8900 8450
Lime stone 1.4 98.6 - - - - - 33.89 - - -
powder
DCP 7.2 92.7 - - - - - 22.92 16.04 - -
SBM, soyabean meal; DORB, de-oiled rice bran; RGM, rice gluten meal, DCP, di-calcium phosphate; DM, dry matter;CP, crude protein; EE,
ether extract; CF, crude fibre; TA, total ash; NFE, nitrogen-free extract; GE, gross energy; ME, metabolizable energy*calculated value
Dinani et al.
Indian J. Anim. Nutr. 2020. 37 (2): 138-142

140
5000±136, lipase 15± 3.8 and β-mannanase 400±31.
The research work was carried out at the
Division of Avian Nutrition and Feed Technology, ICAR-
Central Avian Research Institute (CARI), Izatnagar,
India as per the guidelines and approval of Institute
Animal Ethical Committee (IAEC) and Committee for
the Purpose of Control and Supervision of Experiments
on Animals (CPCSEA).Theinitial body weight, final body
weight, overall body weight gain, feed intake (g/bird)
andfeed conversion ratio were recorded.
Data analyzed for mean, standard errors and
analysis of variance as per method of Snedecor and
Cochran (1989) and comparison of means were done
using Tukey’s test (1949) using software of Statistical
Package for Social Sciences (SPSS) 16.0 version.
RESULTS AND DISCUSSION
Data pertaining to the growth performance of
birdsare presented in Table 4. Perusals of data revealed
no significant (P>0.05) difference in RGM levels (15
and 17.5%)on body weight gain and feed intake, but
FCR was significantly (P<0.05) poorer when RGM was
included at 17.5%. Supplementation of either of the three
enzymes (X, P and M) significantly (P<0.05) improved
the body weight gain and FCR of the birds,
best response being observed with protease
supplementation. Incorporation of RGM up to 15% did
not cause any significant change in body weight gain
and feed intake. Thus, it is evident that RGM can be
incorporated safely up to 15% in the broiler ration.
However, some notable studies (Wani, 2017) reported
decrease in body weight gain and poor FCR when RGM
was included at 20% inclusion level.Thus, it seems that
RGM may not be incorporated in broiler ration at a level
higher than 15%. Major drawbacks that hindered the
incorporation of RGM in broiler ration included poor
energy and protein digestibility of RGM, factors
associated with the level and type of crude fibre present
in it along with poor feed intake (Metwally and Farahat,
2015; Malik etal.,2017). Some of these drawbacks,
particularly associated with non-starch polysaccharide,
poor energy and protein digestibility can be overcome
by supplementation of exogenous enzymes (Giannenaset
al., 2017; Wani, 2017). Results of the present
experiment suggest that all the three enzyme
preparations were effective in improving body weight
gain and FCR. In general, this is inagreement with
earlier study(Wani, 2017) which indicate that enzyme
supplementation improved the utilization of RGM in
Table 3. Ingredient and nutrient composition of experimental diets
Diets Pre-starter Starter diets Finisher diets
Ingredients T1
RGM- RGM- T1
RGM- RGM- T1
RGM- RGM-
15 17.5 15 17.5 15 17.5
Maize 54.42 59.40 60.00 55.63 60.70 61.62 62.00 67.07 67.97
SBM 38.40 20.70 17.80 37.10 19.20 16.20 31.30 13.40 10.40
RGM 0.00 15.00 17.50 0.00 15.00 17.50 0.00 15.00 17.50
Oil 3.00 0.70 0.40 3.50 1.20 0.80 3.22 0.90 0.50
LSP 1.40 1.30 1.30 1.35 1.32 1.32 1.20 1.14 1.14
DCP 1.82 1.95 1.95 1.55 1.70 1.70 1.45 1.60 1.60
Constant* 0.765 0.765 0.765 0.765 0.765 0.765 0.765 0.765 0.765
Total 100.00 100.00 100.00 100.00 100.0 100.0 100.0 100.0 100.00
Nutrient composition
CP 21.99 22.06 22.07 21.52 21.52 21.52 19.50 19.50 19.50
ME ** 2998 3001 3001 3050 3050 3050 3100 3100 3100
SBM, soyabean meal; DORB, de-oiled rice bran; RGM, rice gluten meal, DCP, di-calcium phosphate; LSP, lime stone powder; CP, crude
protein; ME, metabolizable energy; **calculated value; *Constant 0.765included salt 0.4%, trace mineral premix 0.1%, vitamin premix
0.15%, vitamin B complex 0.015%, choline chloride 0.05% and toxin binder 0.05%.(ICAR,2013)
Enzyme supplementation of rice gluten meal diet in broilers
Indian J. Anim. Nutr. 2020. 37 (2): 138-142
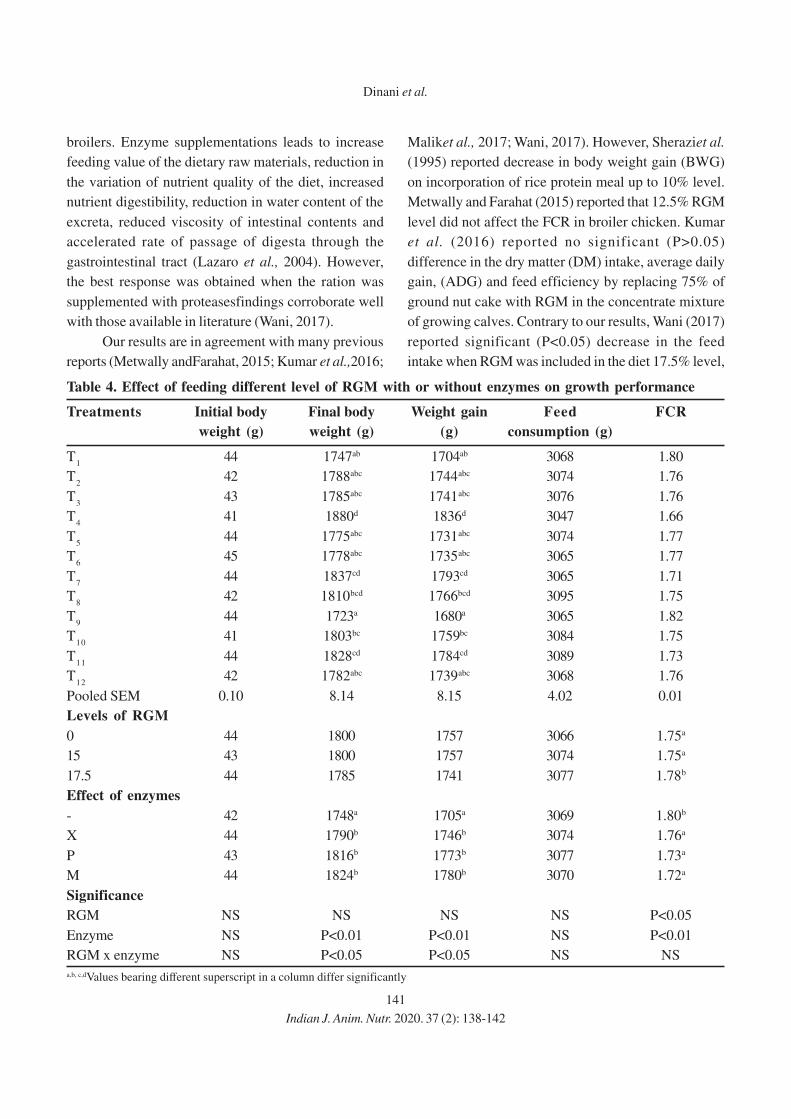
141
broilers. Enzyme supplementations leads to increase
feeding value of the dietary raw materials, reduction in
the variation of nutrient quality of the diet, increased
nutrient digestibility, reduction in water content of the
excreta, reduced viscosity of intestinal contents and
accelerated rate of passage of digesta through the
gastrointestinal tract (Lazaro et al., 2004). However,
the best response was obtained when the ration was
supplemented with proteasesfindings corroborate well
with those available in literature (Wani, 2017).
Our results are in agreement with many previous
reports (Metwally andFarahat, 2015; Kumar et al.,2016;
Maliket al., 2017; Wani, 2017). However, Sheraziet al.
(1995) reported decrease in body weight gain (BWG)
on incorporation of rice protein meal up to 10% level.
Metwally and Farahat (2015) reported that 12.5% RGM
level did not affect the FCR in broiler chicken. Kumar
et al. (2016) reported no significant (P>0.05)
difference in the dry matter (DM) intake, average daily
gain, (ADG) and feed efficiency by replacing 75% of
ground nut cake with RGM in the concentrate mixture
of growing calves. Contrary to our results, Wani (2017)
reported significant (P<0.05) decrease in the feed
intake when RGM was included in the diet 17.5% level,
Table 4. Effect of feeding different level of RGM with or without enzymes on growth performance
Treatments Initial body Final body Weight gain Feed FCR
weight (g) weight (g) (g) consumption (g)
T1
44 1747ab 1704ab 3068 1.80
T2
42 1788abc 1744abc 3074 1.76
T3
43 1785abc 1741abc 3076 1.76
T4
41 1880d 1836d 3047 1.66
T5
44 1775abc 1731abc 3074 1.77
T6
45 1778abc 1735abc 3065 1.77
T7
44 1837cd 1793cd 3065 1.71
T8
42 1810bcd 1766bcd 3095 1.75
T9
44 1723a 1680a 3065 1.82
T10
41 1803bc 1759bc 3084 1.75
T11
44 1828cd 1784cd 3089 1.73
T12
42 1782abc 1739abc 3068 1.76
Pooled SEM 0.10 8.14 8.15 4.02 0.01
Levels of RGM
0 44 1800 1757 3066 1.75a
15 43 1800 1757 3074 1.75a
17.5 44 1785 1741 3077 1.78b
Effect of enzymes
- 42 1748a 1705a 3069 1.80b
X 44 1790b 1746b 3074 1.76a
P 43 1816b 1773b 3077 1.73a
M 44 1824b 1780b 3070 1.72a
Significance
RGM NS NS NS NS P<0.05
Enzyme NS P<0.01 P<0.01 NS P<0.01
RGM x enzyme NS P<0.05 P<0.05 NS NS
a,b, c,dValues bearing different superscript in a column differ significantly
Dinani et al.
Indian J. Anim. Nutr. 2020. 37 (2): 138-142

142
but BWG and FCR between the control and various
treatment groups did not differed significantly (P>0.05)
up to 17.5% inclusion level of RGM.
Our results are in disagreement with Wani (2017)
and Giannenaset al. (2017) with respect to response of
enzymes supplementation. Wani (2017) reportedthat
enzyme supplementation had shown significantly
(P<0.01) decreased feed intake with no significant
(P>0.05) effect on BWG and FCR. Giannenaset al.
(2017) reported that broilers which were fed the corn
gluten meal up to 20.10% level supplemented with
protease in the diet showed significantly (P>0.05) lower
feed intake and weight gain.
CONCLUSIONS
Supplementation of protease enzymes at 50 g per
100 kg feed improved body weight gain and FCR in
broilers fed RGM diet. Thus, it may be concluded that
protease supplementation may increase the effective and
safe inclusion level of alternate protein source RGM
from 15 to 17.5% for commercial broiler production.
ACKNOWLEDGEMENT
ICAR- Central Avian Research Institute,
Izatnagar-243122, India for providing all necessary
inputs and facilities.
REFERENCES
Agricultural statistics.2018. Agricultural Statistics at a
Glance. Department of agriculture, cooperation and
farmers welfare. Government of India, New Delhi.
AOAC.2000. Association of Official Analytical
Chemists.Official Methods of Analysis. 17th
edn.,Washington, DC.
Giannenas, I., Bonos, E., Anestis, V., Filioussis, G.,
Papanastasiou, D.K., Bartzanas, T., apaioannou,
N.,Tzora, A. and Skoufos, I. 2017. Effects of protease
addition and replacement of soybean meal by
corngluten meal on the growth of broilers andon the
environmental performances of a broiler production
system in greece. PloSone. 12: 1-26.
Gopalkrishnan, M.V. and Jamuna, P. 2000. Optimum time
requirement for enzymatic hydrolysis of food proteins.
J. Food Sci. Technol. 37: 319-322.
ICAR. 2013. Nutrient Requirements of Animals-Poultry.
Indian Council of Agricultural Research, New Delhi,
India. 1: 13-16.
Kamra, D.N.and Agarwal, N.2003.Techniques in Rumen
Microbiology. IVRI (Deemed University), Izatnagar,
U.P., India.
Kumar, R., Thakur, S.S. and Mahesh, M.S. 2016. Rice gluten
meal as an alternative by product feed for growing
dairy calves. Trop. Anim.Health Prod.48: 619-624.
Lazaro, R., Latorre, M. A., Medel, P., Gracia, M. and Mateos, G.
G. 2004. Feeding regimen and enzyme supplementation
to rye based diets for broilers. Poult. Sci. 83: 152-160.
Malik, T.A., Thakur, S.S., Mahesh, M.S. and Yogi, R.K. 2017.
Replacing groundnut cake with glutenmeals of rice and
maize in diets for growing Sahiwal cattle. Asia-
Australas.J. Anim. Sci.30: 1410.
Metwally, A. and Farahat, M. 2015. Nutritive value and
feeding of rice gluten meal in broiler chickens. Res.
Opin. Anim. Vet. Sci. 5: 443-451.
Sherazi, T.H., Alam, M.Z., Gilani, A.H. and Nawaz, H. 1995.
Graded replacement of fish meal with rice protein meal
in broiler ration. Pak. J. Agric. Sci. 32: 2-3.
Snedecor, G.W. and Cochran, W.G. 1989. Statistical Methods,
7th edn. Oxford and IBH.Iowa State University Press,
Iowa, USA.
Tukey, J. 1949. Comparing Individual Means in the Analysis
of Variance. Biometrics.5: 99-114.
Wani, M.A. 2017.Evaluationof Feeding Value of Rice Gluten
Meal in Broiler Chicken. Ph.D. thesis submitted to
IVRI (Deemed University), Izatnagar, U.P., India.
Enzyme supplementation of rice gluten meal diet in broilers
Indian J. Anim. Nutr. 2020. 37 (2): 138-142
Received on 14-06-2020 and accepted on 24-08-2020
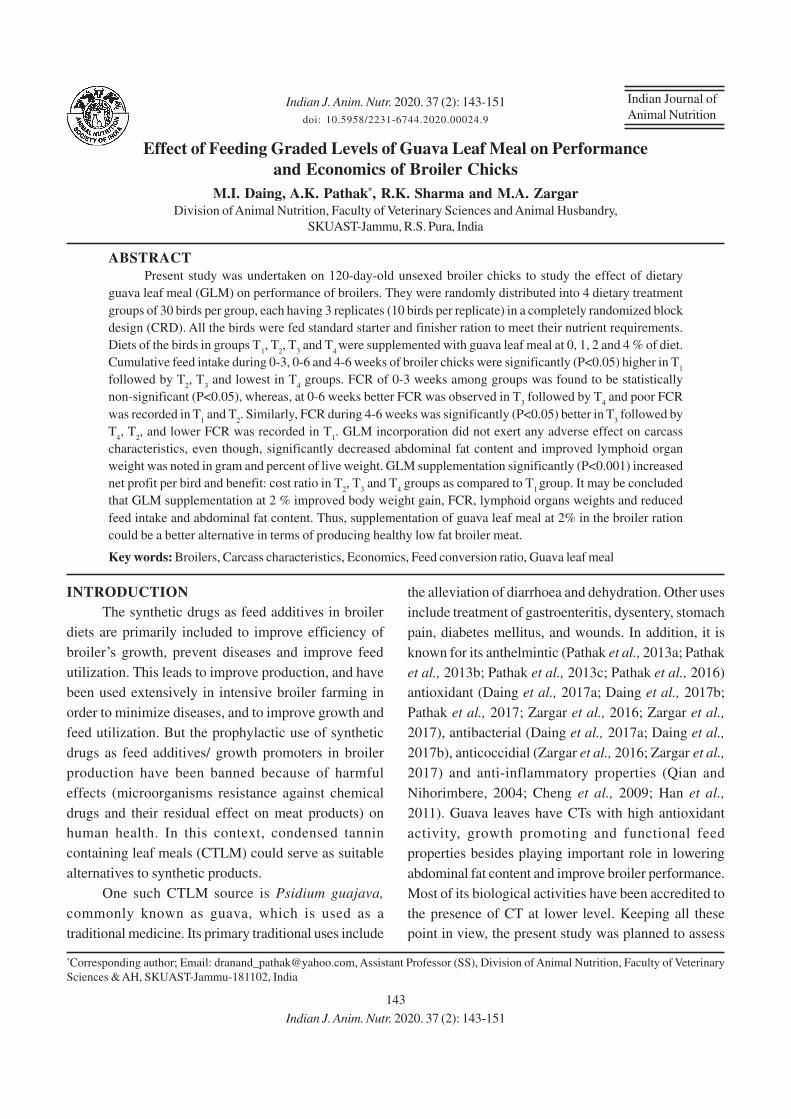
143
Indian Journal of
Animal Nutrition
Effect of Feeding Graded Levels of Guava Leaf Meal on Performance
and Economics of Broiler Chicks
M.I. Daing, A.K. Pathak*, R.K. Sharma and M.A. Zargar
Division of Animal Nutrition, Faculty of Veterinary Sciences and Animal Husbandry,
SKUAST-Jammu, R.S. Pura, India
ABSTRACT
Present study was undertaken on 120-day-old unsexed broiler chicks to study the effect of dietary
guava leaf meal (GLM) on performance of broilers. They were randomly distributed into 4 dietary treatment
groups of 30 birds per group, each having 3 replicates (10 birds per replicate) in a completely randomized block
design (CRD). All the birds were fed standard starter and finisher ration to meet their nutrient requirements.
Diets of the birds in groups T1, T
2, T
3 and T
4 were supplemented with guava leaf meal at 0, 1, 2 and 4 % of diet.
Cumulative feed intake during 0-3, 0-6 and 4-6 weeks of broiler chicks were significantly (P<0.05) higher in T1
followed by T2, T
3 and lowest in T
4 groups. FCR of 0-3 weeks among groups was found to be statistically
non-significant (P<0.05), whereas, at 0-6 weeks better FCR was observed in T3 followed by T
4 and poor FCR
was recorded in T1 and T
2. Similarly, FCR during 4-6 weeks was significantly (P<0.05) better in T
3 followed by
T4, T
2, and lower FCR was recorded in T
1. GLM incorporation did not exert any adverse effect on carcass
characteristics, even though, significantly decreased abdominal fat content and improved lymphoid organ
weight was noted in gram and percent of live weight. GLM supplementation significantly (P<0.001) increased
net profit per bird and benefit: cost ratio in T2, T
3 and T
4 groups as compared to T
1 group. It may be concluded
that GLM supplementation at 2 % improved body weight gain, FCR, lymphoid organs weights and reduced
feed intake and abdominal fat content. Thus, supplementation of guava leaf meal at 2% in the broiler ration
could be a better alternative in terms of producing healthy low fat broiler meat.
Key words: Broilers, Carcass characteristics, Economics, Feed conversion ratio, Guava leaf meal
*Corresponding author; Email: [email protected], Assistant Professor (SS), Division of Animal Nutrition, Faculty of Veterinary
Sciences & AH, SKUAST-Jammu-181102, India
INTRODUCTION
The synthetic drugs as feed additives in broiler
diets are primarily included to improve efficiency of
broiler’s growth, prevent diseases and improve feed
utilization. This leads to improve production, and have
been used extensively in intensive broiler farming in
order to minimize diseases, and to improve growth and
feed utilization. But the prophylactic use of synthetic
drugs as feed additives/ growth promoters in broiler
production have been banned because of harmful
effects (microorganisms resistance against chemical
drugs and their residual effect on meat products) on
human health. In this context, condensed tannin
containing leaf meals (CTLM) could serve as suitable
alternatives to synthetic products.
One such CTLM source is Psidium guajava,
commonly known as guava, which is used as a
traditional medicine. Its primary traditional uses include
Indian J. Anim. Nutr. 2020. 37 (2): 143-151
doi: 10.5958/2231-6744.2020.00024.9
the alleviation of diarrhoea and dehydration. Other uses
include treatment of gastroenteritis, dysentery, stomach
pain, diabetes mellitus, and wounds. In addition, it is
known for its anthelmintic (Pathak et al., 2013a; Pathak
et al., 2013b; Pathak et al., 2013c; Pathak et al., 2016)
antioxidant (Daing et al., 2017a; Daing et al., 2017b;
Pathak et al., 2017; Zargar et al., 2016; Zargar et al.,
2017), antibacterial (Daing et al., 2017a; Daing et al.,
2017b), anticoccidial (Zargar et al., 2016; Zargar et al.,
2017) and anti-inflammatory properties (Qian and
Nihorimbere, 2004; Cheng et al., 2009; Han et al.,
2011). Guava leaves have CTs with high antioxidant
activity, growth promoting and functional feed
properties besides playing important role in lowering
abdominal fat content and improve broiler performance.
Most of its biological activities have been accredited to
the presence of CT at lower level. Keeping all these
point in view, the present study was planned to assess
Indian J. Anim. Nutr. 2020. 37 (2): 143-151

144
the effect of graded levels of dietary GLM on feed
intake, FCR, carcass characteristics and economics of
broiler chicks production.
MATERIALS AND METHODS
The experimental was carried out in the Division
of Animal Nutrition, Faculty of Veterinary Sciences and
Animal Husbandry, R.S. Pura, SKUAST-Jammu. Fresh
guava (Psidium guajava) leaves were collected from
Faculty premises, R.S. Pura, Jammu. They were shed
dried to dry matter content of more than 90 percent and
stored in a cool, dark and dry place. Dried guava leaves
were milled in the laboratory hammer mill.
A total of 120 day-old unsexed and healthy
commercial broiler chicks of Cobb-K strains were
purchased from Kashmir Valley Poultry Breeding Farm
and Hatchery, Jammu. They were randomly distributed
into 4 dietary treatment (T1, T
2, T
3 and T
4) groups of 30
chicks per group, each having 3 replicates of 10 chicks
per replicate in an experiment based on CRD. Electric
bulbs and gas brooders were used as source of light and
heat. On arrival, chicks were given water and feed
ad libitum but with small amount of feed sprinkled on
papers inside brooding area for easier consumption and
recognition of feed by chicks up to ten days of age.
Temperatures were kept at 32°C for first 7 days and
monitored frequently for about 3 times/day i.e. in the
morning, during the day, and at night. Brooding house
and its environments was thoroughly cleaned, washed
with detergent, disinfected and fumigated by using
standard protocol. After 10 days, they were shifted in
12 deep litter pens. Rice husk was spread on the floor
to serve as litter material. All the birds were fed to meet
their nutrient requirements as per BIS (1992). Diets of
the birds in groups T1, T
2, T
3 and T
4 were supplemented
with guava leaf meal at 0, 1, 2 and 4 % of diet.
The parameters measured were feed intake, body
weight, body weight gain, FCR, carcass characteristics
and benefit: cost ratio of broiler birds. Average daily
feed intake per bird was calculated every morning by
subtracting the amount of feed left in feeding trough
from what was offered previous day and then dividing it
by the number of birds in the replicate. Chicks were
weighed at the start of the experiment and weekly
thereafter. Chicks in a pen were weighed individually
with a digital weighing scale and previous weight was
subtracted from the current weight to determine the
body weight gain per bird for the week. The FCR was
calculated by dividing the feed consumed by the live
weight gain.
Samples of GLM, feed offered, residue left
and faeces voided were analyzed for proximate
composition viz. dry matter (DM), organic matter (OM),
crude protein (CP), crude fibre (CF), ether extract (EE)
and nitrogen free extract (NFE) as per standard
protocol (AOAC, 1995). Samples were also subjected
to analysis of calcium (Ca) and phosphorus (P) as per
methods described by Talpatra et al. (1940) and AOAC
(2000), respectively. A representative sample of GLM
was analyzed for CT content as per butanol HCl method
(Makkar, 2000). The metabolizable energy (ME)
content (kcal/Kg) of GLM and experimental broiler
diets was calculated according to the formula of
Pauzenga (1985).
ME = 37 × % CP + 81 × % EE + 35.5 × % NFE
Carcass evaluation was done at the end of
experimental feeding trial of 42 days. Two birds from
each replicate were randomly selected for carcass
evaluation. The birds were starved overnight to empty
the crop and were put in slaughtering trough and the
head cut. The following measurements were taken for
the carcass analysis viz. live weight, slaughtered weight,
de-feathered weight, eviscerated weight, shank, head,
neck, heart, liver, lungs, empty gizzard, thymus, bursa,
spleen and empty intestine weights etc. All these were
calculated as such (in grams) and as percent of the live
weight of the bird. The economics of broiler chicks with
and without GLM supplemented diets was calculated at
the end of feeding trial of 6 weeks as per standard
protocol.
The data obtained were subjected to analysis
of variance and treatment means were ranked
using Duncan’s multiple range tests (Snedecor and
Cochran, 2004) using SPSS version 16.0 for windows.
Significance was declared at P<0.05 unless otherwise
stated.
Guava leaf meal in broiler ration
Indian J. Anim. Nutr. 2020. 37 (2): 143-151

145
RESULTS AND DISCUSSION
The ingredients and chemical composition of
experimental broiler (starter and finisher) diets have been
presented in Table 1. The CT content of GLM was 83.4
g/kg DM, which is confirmatory with the findings of
previous workers (Khan et al., 2019; Pathak et al., 2015;
Singh et al., 2015). Birds of T1 group were fed with
basal diet (Control: GLM 0 % of diet) while T2, T
3 and
T4 groups were fed by replacing crushed maize with
GLM @ 1, 2 and 4 percent of diet or 10, 20 and 40 g/kg
of diet, respectively. Dietary incorporation of GLM @
0, 1, 2 and 4 % by replacing maize slightly changed the
nutrient values of experimental diets of T1, T
2, T
3 and
T4. As the level of GLM in the diet increased the
concentration of CT increased and nutrient composition
very slightly decline in T2, T
3 and T
4 groups compared
to T1 group but they remained within the permissible
range (BIS, 1992).
Growth pattern (average body weights) of
experimental broiler chicks of various groups (T1, T
2,
T3 and T
4) at weekly interval is depicted in figure 1.
Average body weights among groups were statistically
Table 1. Ingredients and chemical composition of experimental broiler diets
Attributes Experimental diets
Broiler Starter Broiler finisher
T1
T2
T3
T4
T1
T2
T3
T4
Ingredient composition (g/kg)
Crushed Maize 500 490 480 460 540 530 520 500
Rice polish 45 45 45 45 80 80 80 80
Soybean meal 400 400 400 400 315 315 315 315
Soybean oil 15 15 15 15 25 25 25 25
DCP 15 15 15 15 15 15 15 15
LSP 10 10 10 10 10 10 10 10
Common salt 5 5 5 5 5 5 5 5*Premix 4.7 4.7 4.7 4.7 4.7 4.7 4.7 4.7
L-Lysine 3.6 3.6 3.6 3.6 3.3 3.3 3.3 3.3
DL-Methionine 1.7 1.7 1.7 1.7 1.6 1.6 1.6 1.6
GLM % of diet 0 1 2 4 0 1 2 4
Chemical composition (g/kg)
OM 929.7 929.2 924.8 920.7 924.8 921.7 924.0 919.7
CP 229.2 229.7 227.1 226.6 200.4 199.1 199.5 198.9
EE 44.4 42.3 44.3 44.0 60.2 60.0 59.3 58.4
CF 39.6 40.3 43.2 46.9 47.4 49.3 46.0 52.6
NFE 616.5 616.9 610.2 603.2 616.8 613.3 619.2 609.8
TA 70.3 70.8 75.2 79.3 75.2 78.3 76.0 80.3
AIA 26.2 23.7 25.2 27.7 25.3 24.9 25.8 27.0
Ca 15.1 15.8 16.4 17.6 15.6 15.2 16.5 18.4
P 6.9 6.7 6.0 5.8 6.3 6.4 5.9 5.6
ME (kcal/kg) 2803 2799 2795 2787 2907 2894 2882 2866
CT (g/kg) 0.0 0.80 1.62 3.23 0.0 0.83 1.65 3.30
*Per kg diet provide Manganese, 90 mg; zinc, 80 mg; iron, 90 mg; iodine, 2 mg; copper, 15 mg; selenium, 0.3 mg; vitamin A, 10,000 IU; vitamin
D3, 2500 IU; vitamin K
3, 1 mg; vitamin E, 8 mg; vitamin B
1, 8 mg; vitamin B
2, 5 mg; vitamin B
6, 1.6 mg; vitamin B
12, 20.5 mcg; niacin, 12 mg;
folic acid, 0.8 mg and calcium pantothenate, 8 mg
Daing et al.
Indian J. Anim. Nutr. 2020. 37 (2): 143-151

146
similar up to 3rd weeks of age. However, body weight
differed significantly (P<0.05) irrespective of groups
after 3rd weeks onwards. Furthermore, significantly
(P<0.05) higher mean body weight was obtained in T3
followed by T1 and T
2 and minimum body weight was
observed in T4, while, body weight of birds of groups T
1
and T2 did not differ significantly.
Cumulative feed intakes during 0-3, 0-6 and 4-6
weeks of broiler chicks were significantly (P<0.05)
higher in T1 followed by T
2, T
3 and lowest feed intake
was recorded in T4 groups (Table 2). Reduction in feed
intake may be due to the GLM used in this study that
contained high concentration (3.23-3.33 g/ kg diet) of
CT. The CT having astringent property, at higher level it
bind with glycol-proteins of the saliva and other
nutrients, such complex causes a sensation in the oral
cavity, which greatly reduced palatability and hence
tends to depress the feed intake in broiler birds. Similar
results have been reported before (Douglas et al., 1993;
Hassan et al., 2003). However, present results are
contradictory to the findings of Rahman et al. (2013)
who found that GLM up to 4.5% dietary level had no
detrimental effect on feed consumption.
Cumulative weight gains during 0-3, 0-6 and 4-6
weeks were found to be highest in T3 followed by T
1,
T2 and lowest in T
4 (Table 2). The present findings
showed that up to 2 % of GLM inclusion in the diets of
broiler chicks had no adverse effect on body weight
gain even though the feed intake was lower in this group,
indicating that CT containing GLM act as natural feed
additives and showed beneficial effects on body weight
gain. The present results are in agreement with the
findings of Rahman et al. (2013). They reported no
deleterious effect of guava leaf meal on body weight
gain up to 4.5 % level of dietary inclusion in broiler chicks.
Table 2. Effect of GLM supplementation on cumulative feed intake, body weight gain and FCR
Age Group SEM P Value
T1
T2
T3
T4
Feed intake
0-3 weeks 1084d 1068c 1016b 983a 3.70 0.001
4-6 weeks 2690d 2668c 2580b 2477a 7.70 0. 001
0-6 weeks 3774d 3736c 3596b 3460a 11.37 0.001
Body weight gain
0-3 weeks 685b 671ab 654ab 637a 5.94 0.025
4-6 weeks 1230a 1255a 1337 1206a 12.10 0.001
0-6 weeks 1916b 1926b 1991c 1844a 11.06 0.001
Feed conversion ratio (FCR)
0-3 weeks 1.59 1.61 1.57 1.56 0.01 0.627
4-6 weeks 2.21c 2.14bc 1.95a 2.08b 0.02 0.001
0-6 weeks 1.97c 1.95c 1.81a 1.88b 0.01 0.001
a,b,c,d Means with different superscripts within a row differ significantly (P<0.05)
2200210020001900180017001600150014001300120011001000900800700600500400300200100
0
Fig. 1. Growth pattern of broiler chicks fed with and
without GLM supplemented diets
Guava leaf meal in broiler ration
Indian J. Anim. Nutr. 2020. 37 (2): 143-151
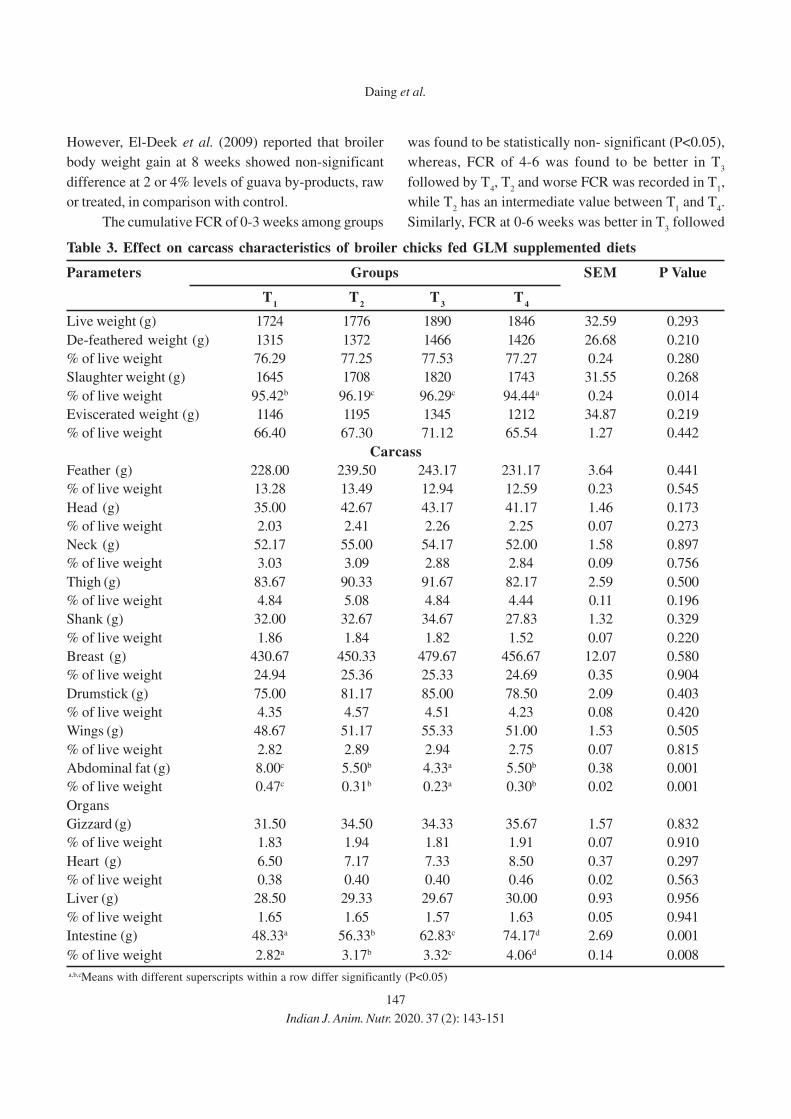
147
However, El-Deek et al. (2009) reported that broiler
body weight gain at 8 weeks showed non-significant
difference at 2 or 4% levels of guava by-products, raw
or treated, in comparison with control.
The cumulative FCR of 0-3 weeks among groups
was found to be statistically non- significant (P<0.05),
whereas, FCR of 4-6 was found to be better in T3
followed by T4, T
2 and worse FCR was recorded in T
1,
while T2 has an intermediate value between T
1 and T
4.
Similarly, FCR at 0-6 weeks was better in T3 followed
Table 3. Effect on carcass characteristics of broiler chicks fed GLM supplemented diets
Parameters Groups SEM P Value
T1
T2
T3
T4
Live weight (g) 1724 1776 1890 1846 32.59 0.293
De-feathered weight (g) 1315 1372 1466 1426 26.68 0.210
% of live weight 76.29 77.25 77.53 77.27 0.24 0.280
Slaughter weight (g) 1645 1708 1820 1743 31.55 0.268
% of live weight 95.42b 96.19c 96.29c 94.44a 0.24 0.014
Eviscerated weight (g) 1146 1195 1345 1212 34.87 0.219
% of live weight 66.40 67.30 71.12 65.54 1.27 0.442
Carcass
Feather (g) 228.00 239.50 243.17 231.17 3.64 0.441
% of live weight 13.28 13.49 12.94 12.59 0.23 0.545
Head (g) 35.00 42.67 43.17 41.17 1.46 0.173
% of live weight 2.03 2.41 2.26 2.25 0.07 0.273
Neck (g) 52.17 55.00 54.17 52.00 1.58 0.897
% of live weight 3.03 3.09 2.88 2.84 0.09 0.756
Thigh (g) 83.67 90.33 91.67 82.17 2.59 0.500
% of live weight 4.84 5.08 4.84 4.44 0.11 0.196
Shank (g) 32.00 32.67 34.67 27.83 1.32 0.329
% of live weight 1.86 1.84 1.82 1.52 0.07 0.220
Breast (g) 430.67 450.33 479.67 456.67 12.07 0.580
% of live weight 24.94 25.36 25.33 24.69 0.35 0.904
Drumstick (g) 75.00 81.17 85.00 78.50 2.09 0.403
% of live weight 4.35 4.57 4.51 4.23 0.08 0.420
Wings (g) 48.67 51.17 55.33 51.00 1.53 0.505
% of live weight 2.82 2.89 2.94 2.75 0.07 0.815
Abdominal fat (g) 8.00c 5.50b 4.33a 5.50b 0.38 0.001
% of live weight 0.47c 0.31b 0.23a 0.30b 0.02 0.001
Organs
Gizzard (g) 31.50 34.50 34.33 35.67 1.57 0.832
% of live weight 1.83 1.94 1.81 1.91 0.07 0.910
Heart (g) 6.50 7.17 7.33 8.50 0.37 0.297
% of live weight 0.38 0.40 0.40 0.46 0.02 0.563
Liver (g) 28.50 29.33 29.67 30.00 0.93 0.956
% of live weight 1.65 1.65 1.57 1.63 0.05 0.941
Intestine (g) 48.33a 56.33b 62.83c 74.17d 2.69 0.001
% of live weight 2.82a 3.17b 3.32c 4.06d 0.14 0.008
a,b,cMeans with different superscripts within a row differ significantly (P<0.05)
Daing et al.
Indian J. Anim. Nutr. 2020. 37 (2): 143-151
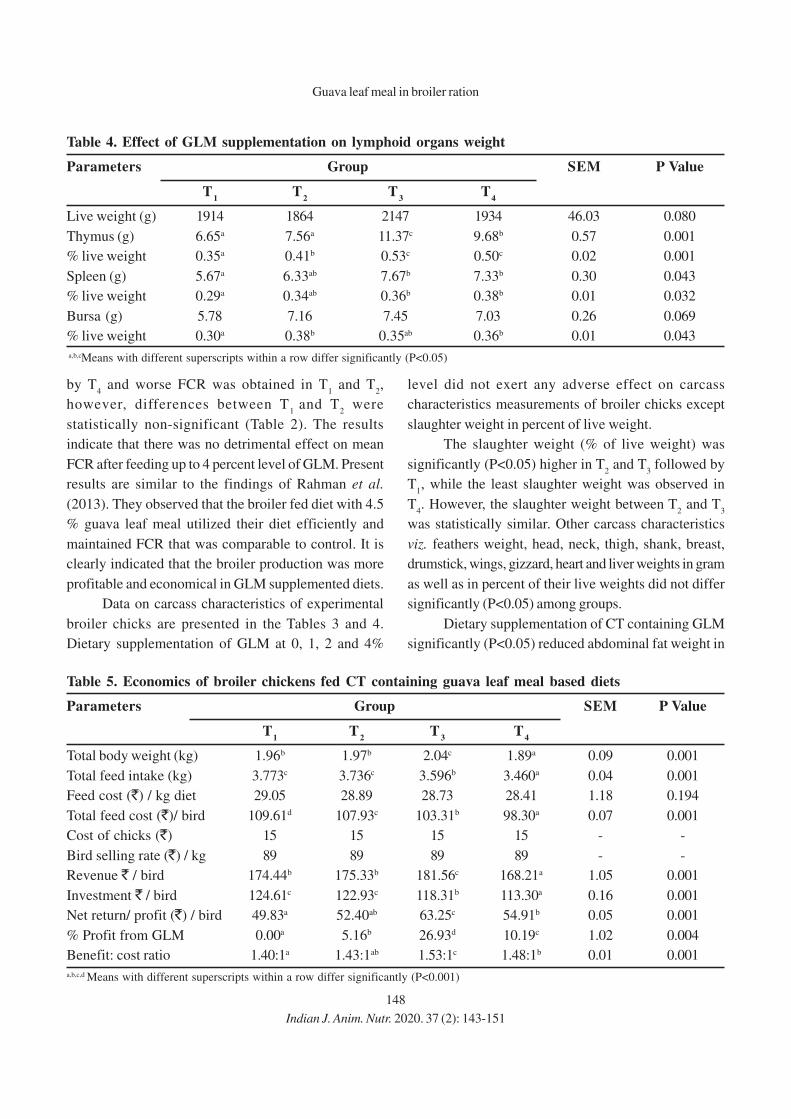
148
by T4 and worse FCR was obtained in T
1 and T
2,
however, differences between T1
and T2 were
statistically non-significant (Table 2). The results
indicate that there was no detrimental effect on mean
FCR after feeding up to 4 percent level of GLM. Present
results are similar to the findings of Rahman et al.
(2013). They observed that the broiler fed diet with 4.5
% guava leaf meal utilized their diet efficiently and
maintained FCR that was comparable to control. It is
clearly indicated that the broiler production was more
profitable and economical in GLM supplemented diets.
Data on carcass characteristics of experimental
broiler chicks are presented in the Tables 3 and 4.
Dietary supplementation of GLM at 0, 1, 2 and 4%
level did not exert any adverse effect on carcass
characteristics measurements of broiler chicks except
slaughter weight in percent of live weight.
The slaughter weight (% of live weight) was
significantly (P<0.05) higher in T2 and T
3 followed by
T1, while the least slaughter weight was observed in
T4. However, the slaughter weight between T
2 and T
3
was statistically similar. Other carcass characteristics
viz. feathers weight, head, neck, thigh, shank, breast,
drumstick, wings, gizzard, heart and liver weights in gram
as well as in percent of their live weights did not differ
significantly (P<0.05) among groups.
Dietary supplementation of CT containing GLM
significantly (P<0.05) reduced abdominal fat weight in
Table 4. Effect of GLM supplementation on lymphoid organs weight
Parameters Group SEM P Value
T1
T2
T3
T4
Live weight (g) 1914 1864 2147 1934 46.03 0.080
Thymus (g) 6.65a 7.56a 11.37c 9.68b 0.57 0.001
% live weight 0.35a 0.41b 0.53c 0.50c 0.02 0.001
Spleen (g) 5.67a 6.33ab 7.67b 7.33b 0.30 0.043
% live weight 0.29a 0.34ab 0.36b 0.38b 0.01 0.032
Bursa (g) 5.78 7.16 7.45 7.03 0.26 0.069
% live weight 0.30a 0.38b 0.35ab 0.36b 0.01 0.043
a,b,cMeans with different superscripts within a row differ significantly (P<0.05)
Table 5. Economics of broiler chickens fed CT containing guava leaf meal based diets
Parameters Group SEM P Value
T1
T2
T3
T4
Total body weight (kg) 1.96b 1.97b 2.04c 1.89a 0.09 0.001
Total feed intake (kg) 3.773c 3.736c 3.596b 3.460a 0.04 0.001
Feed cost (`) / kg diet 29.05 28.89 28.73 28.41 1.18 0.194
Total feed cost (`)/ bird 109.61d 107.93c 103.31b 98.30a 0.07 0.001
Cost of chicks (`) 15 15 15 15 - -
Bird selling rate (`) / kg 89 89 89 89 - -
Revenue ` / bird 174.44b 175.33b 181.56c 168.21a 1.05 0.001
Investment ` / bird 124.61c 122.93c 118.31b 113.30a 0.16 0.001
Net return/ profit (`) / bird 49.83a 52.40ab 63.25c 54.91b 0.05 0.001
% Profit from GLM 0.00a 5.16b 26.93d 10.19c 1.02 0.004
Benefit: cost ratio 1.40:1a 1.43:1ab 1.53:1c 1.48:1b 0.01 0.001
a,b,c,d Means with different superscripts within a row differ significantly (P<0.001)
Guava leaf meal in broiler ration
Indian J. Anim. Nutr. 2020. 37 (2): 143-151
149
treatment groups as compared to control group. The
lowest abdominal fat contents were obtained in T3
followed by T2and T
4, whereas, the highest abdominal
fat content was recorded in T1
group. Hafeni (2013)
also reported similar results related to fat content and
concluded that more than 5 g/kg of CT containing
A. karroo leaf meal should be supplemented in order
to achieve a significant reduction of fat deposition in
Cobb 500 broiler chickens. The reduction of fatness
has been associated with lower concentration of growth
hormone (GH) when the diets were sprayed with
polyethylene glycol. The GH increase nitrogen
retention and reduce fat deposition, with an increase in
fat turn over. The reason for the higher level in plasma
GH has been explained with a possible inactivation of
gut wall proteins by CT. The intestine weight in grams
and percent of live weight increased significantly
(P<0.05) as the GLM levels increased in the diets of
broiler chicks.
The intestine weights were significantly (P<0.05)
higher in T2, T
3 and T
4 groups than that of T
1 group. It
might be due to GLM supplemented diets takes more
time for digestion of feed as well as increase the length
of intestine compared to control group, therefore,
increase the weight of intestine in supplemented groups.
Comparable mean live weight and significantly (P<0.05)
higher lymphoid organs (thymus, bursa and spleen)
weights and their size were recorded in GLM
supplemented groups as compared to their counterpart
control group. Thus, the supplementation of GLM in
broiler diets significantly (P<0.05) increased lymphoid
organ weight and their size which might be due to
immune modulating properties of CT.
Data related to feed cost are presented in Table
5. At the end of feeding trial of 6 weeks, final body
weight (kg) was found to be highest in T3 group
followed by T1 and T
2 groups and the least final body
weight was recorded inT4 group, while final body
weights between T1
and T2 groups were statistically
similar. However, GLM supplementation significantly
(P<0.05) reduced total feed intake and total feed
cost per bird in T3 and T
4 groups as compared to
un-supplemented T1 group, while, total feed intake was
statistically non-significant between T1 and T
2 groups.
Although, feed cost (`) per kg diet among groups
did not differ significantly. As the level of GLM
supplementation increased the total feed intake and
total feed cost per bird decreased significantly (P<0.001).
The degree of reduction in the cost of total feed
consumed at the end of feeding trial of 6 weeks was
proportional to the amount of GLM in broiler diets. The
price of day-old chick was ` 15 per chick and the
selling rate of bird at the end of experiment of 6-weeks
was ` 89 per kg bird. Furthermore, revenue generated
in ` per bird as well as investment in ` per bird were
significantly (P<0.001) lower in GLM supplemented (T3
and T4) groups as compared to T
1 and T
2 groups, but
the revenue generated and investment were statistically
similar between T1 and T
2 groups. Dietary
supplementation of GLM significantly (P<0.001)
increased net return or profit per bird and benefit:
cost ratio in T2, T
3 and T
4 groups as compared to
un-supplemented T1 group. The net profit per bird and
benefit: cost ratio was found maximum in T3 followed
by T4, while, minimum net profit per bird and benefit:
cost ratio was recorded in T1 group, whereas T
2 has an
intermediate value between T1 and T
4 groups.
The net profit made in the present study ranged
from ` 49.83 to 63.25 per bird. As the level of GLM
increased percent profit increased significantly (P<0.004)
and the highest profit was obtained in T3 group which
clearly indicated that dietary supplementation of GLM
(2% of diet) improved productive performance and cost
effective partial replacer of costlier maize without any
deleterious effect on broiler production.
CONCLUSION
It may be concluded that dietary incorporation of
guava leaf meal (2 %) in broiler diet improved body
weight gain, FCR, lymphoid organs weights, and reduced
feed intake and abdominal fat content. Thus,
supplementation of guava leaf meal at 2% in the broiler
ration could be a better alternative in terms of
producing healthy low fat broiler meat.
Daing et al.
Indian J. Anim. Nutr. 2020. 37 (2): 143-151

150
ACKNOWLEDGEMENT
First author is thankful to Hon’ble Vice
Chancellor and worthy Dean, FVSc & AH, SKUAST-
Jammu for providing necessary facilities to carry out
the MVSc research work.
REFERENCES
AOAC. 1995. Official Methods of Analysis (16th edn.).
Association of Official Analytical Chemists.
Washington, DC.
AOAC. 2000. Official Methods of Analysis (16th edn.).
Association of Official Analytical Chemists.
Washington, DC.
BIS. 1992. Bureau of Indian Standards. Requirements for
Chicken Feeds. IS 1374-1992. Manak Bhavan, 9,
Bhadursha Zafar Marg, New Delhi. pp. 1-3.
Cheng, F.C., Shen, S.C. and Wu, J.S.B. 2009. Effect of guava
(Psidium guajava L.) leaf extract on glucose uptake in
rat hepatocytes. J. Food Sci. 74: 132-138.
Daing, Mohd. Iqbal, Pathak, A.K., Bhat, Mohd. Altaf, and
Zargar and Mohd. Aqib 2017a. Antioxidant and
antibacterial potential of condensed tannins
containing tree leaves extract. Vet. Pract.18: 118-121.
Daing, Mohd. Iqbal, Pathak, A.K., Bhat, Mohd. Altaf, Sharma,
R. K. and Zargar, Mohd. Aqib 2017b. In vitro
antioxidant and antibacterial efficacy of condensed
tannins containing tree leaves extract of Jammu
Province. J. Anim. Res.7: 165-174.
Douglas, J.H., Gonzalez, N.J. and Beck, M.M. 1993.
Differential age response of turkeys to protein and
sorghum tannin levels. Poult. Sci. 72: 1944-1951.
El-Deek, A.A., Asar, M.A., Hamdy, S.M. and Abdalla, A.A.
2009. Utilization of guava by-products in broiler
finisher diets. Poultry Prod. Dept., Fac. of Agric.
Alexandria University, Alex. Egypt. Poult. Sci.29:
53-75.
Hafeni, S. 2013. Performance of broiler chickens fed pearl
millet as an energy source and Acacia karroo leaf
meal as an additive. M.Sc. Thesis, University of
Namibia.
Han, E.H., Hwang, Y.P., Choi, J.H., Yang, J. H. and Seo, J. K.
2011. Psidium guajava extract inhibits thymus and
activation-regulated chemokine (TARC/CCL17)
production in human keratinocytes by inducing heme
oxygenase-1 and blocking NF-κB and STAT1
activation. Environ. Toxicol. Pharmacol.32: 136-145.
Hassan, I.A., Elzuber, E.A. and Tinay, H.A. 2003. Growth and
apparent absorption of minerals in broiler chicks fed
diets with low or high tannins content. Trop. Anim.
Hlth. Prod. 35: 189-196.
Khan, Muzaffer, Pathak, A.K. and Singh, Surender 2019.
Nutrient metabolism, blood Indices and Immunity in
Haemonchus contortus infected goats fed condensed
tannins enriched densified complete feed blocks.
Anim. Nutr. Feed Technol. 19: 417-430.
Makkar, H.P.S. 2000. Quantification of tannins in tree foliage.
Joint FAO/IAEA working document, IAEA, Viena. Pp
1-26.
Pathak, A.K., Dutta, N., Banerjee, P.S. and Sharma, K. 2013b.
Effect of tannin extracts from tropical tree leaves on
larvae and adult Haemonchus contortus. Indian Vet.
J. 90: 32-34.
Pathak, A.K., Dutta, N., Banerjee, P.S., Pattanaik, A.K.
and Sharma, K. 2013a. Influence of dietary
supplementation of condensed tannins through leaf
meal mixture on nutrient intake, utilization and
performance of Haemonchus contortus infected sheep.
Asian-Australas. J. Anim. Sci.26: 1446-1458.
Pathak, A.K., Dutta, N., Pattanaik, A.K., Sharma, K., Banerjee,
P.S. and Goswami, T.K. 2017. Effect of condensed
tannins supplementation through Ficus infectoria and
Psidium guajava leaf meal mixture on erythrocytic
antioxidant status, immune response and gastro-
intestinal nematodes in lambs (Ovis aries). Vet.
Archiv.87: 139-156.
Pathak, A.K., Dutta, Narayan, Banerjee, P.S., Sharma, K. and
Pattanaik, A.K. 2013c. Efficacy of various condensed
tannins extracts from tanniferous tree leaves on egg
hatching inhibition of Haemonchus contortus. Vet.
Pract.14: 127-129.
Pathak, A.K., Dutta, Narayan., Banerjee, P.S., Goswami, T.K.
and Sharma, K. 2016. Effect of condensed tannins
supplementation through leaf meal mixture on
voluntary feed intake, immune response and worm
burden in Haemonchus contortus infected sheep. J.
Parasitic Dis.40: 100-105.
Pathak, A.K., Dutta, N., Pattanaik, A. K., Singh, A., Narang, A.
and Sharma, K. 2015. Effect of condensed tannins
supplementation from tanniferous tree leaves on
methane production and efficiency of biomass
production in vitro. Anim. Nutr. Feed Technol. 15:
91-100.
Pauzenga, U. 1985. Feeding Parent Stock. Zootec. Int., pp.
22-24.
Qian, H., and Nihorimbere, V. 2004. Antioxidant power
ofphytochemicals from Psidium guajava. J. Zhejiang
Univ. Sci.5:676-683.
Rahman, Z., Siddique, M.N., Khatun, M.A., Kamruzzaman,
Guava leaf meal in broiler ration
Indian J. Anim. Nutr. 2020. 37 (2): 143-151

151
M. 2013. Effect of Guava (Psidium guajava) leaf meal
on production performances and antimicrobial
sensitivity in commercial broiler. J. Nat. Prod.6:
177-187.
Singh, S., Pathak, A.K., Sharma, R.K. and Khan, M. 2015.
Effect of tanniferous leaf meal based multi nutrient
blocks on feed intake, haematological profile, immune
response and body weight changes in Haemonchus
contortus infected goats. Vet. World 8: 572-579.
Snedecor, G.W. and Cochran, W.G. 2004. Statistical Methods.
8th edn. East West Press Pvt. Ltd., New Delhi.
Talpatra, S.K., Ray, S.C. and Sen, K.C. 1940. Estimation of
phosphorus, chlorine, calcium, magnesium, sodium and
potassium in foodstuffs. Indian J. Vet. Sci. Anim.
Husb.10: 243-258.
Daing et al.
Indian J. Anim. Nutr. 2020. 37 (2): 143-151
Zargar Mohd. Aqib, Pathak, A.K. and Daing, Mohd. Iqbal
2017. Screening and evaluation of antioxidants and
anticoccidial properties of condensed tannins
containing tree leaves of Jammu province. Indian J.
Anim. Res.51: 1105-1112.
Zargar, Mohd. Aqib, Pathak, A.K., Sharma, R.K. and Daing,
Mohd. Iqbal 2016. Antioxidants and Anticoccidial
potential of aqueous extract from various tree leaves
containing condensed tannins. J. Anim. Res.6:
563-570.
Received on 19-06-2020 and accepted on 14-08-2020
152
Indian Journal of
Animal Nutrition
Effect of Feed Restriction and Garlic Supplementation on Growth
Performance, Nutrient Utilization and Meat Quality in Female Broiler
Vishavdeep Singh, Udeybir Singh* and A.P.S. Sethi
Department of Animal Nutrition,
Guru Angad Dev Veterinary and Animal Sciences University, Ludhiana-141 004, Punjab, India
ABSTRACT
An experiment was conducted to study the effects of feed restriction and garlic supplementation
on growth performance, nutrient utilization and meat quality in female broilers. In this study, 120, day-old
female broilers were randomly distributed into 5 treatment groups each having 4 replicates with 6 birds
in each replicate. Diets were formulated as per ICAR 2013 specifications and were fed in 3 phases. Treatment
T1 served as control. The other treatments comprised: T
2=T
1 with feed restriction (10-12 h) at 8-17 days of
age (DOA) with garlic supplementation, T3=T
1 with feed restriction at 8-17 DOA (10-12 h) without garlic
supplementation, T4=T
1 with feed restriction at 18-27 DOA (10-12 h) with garlic supplementation, T
5=T
1 with
feed restriction at 18-27 DOA (10-12 h) without garlic supplementation. Early feed restriction (8-17 DOA)
without garlic supplementation reduced (P<0.05) the average body weight gain at 2nd and 3rd weeks of age.
Garlic supplementation and late feed restriction (from 18-27 DOA) reduced (P<0.05) the average body weight
gain at 4th week of age. Significantly (P<0.05) reduced average feed intake was observed in birds subjected
to early feed restriction (8-17 DOA) with garlic (T2) and without garlic (T
3) at 2nd and 3rd week of age as
compared to control (T1). There was no significant effect on feed conversion ratio (FCR) of early and late feed
restriction with or without garlic supplementation expect at 5th week of age where FCR was observed to be
better (P<0.05) in T4 group of birds with late feed restriction and garlic supplementation as compared to control
(T1) and late feed restriction without garlic supplementation (T
5). Early and late feed restrictions with
garlic supplementation (T2 and T
4) resulted in significantly (P<0.05) higher crude protein and organic matter
metabolizability as compared to control (T1. Garlic supplementation with early and late feed restriction (T
2
and T4) improved meat quality, had significantly (P<0.05) better color and appearance, odour, texture, juiciness
as well as overall acceptability than the control (T1). It was concluded that early feed restriction without
garlic supplementation reduced the feed intake at 2nd and 3rd week of age and improved meat quality.
Key words: Female birds, Feed restriction, Garlic supplementation, Meat quality, Nutrient retention
*Corresponding author; Email: [email protected]
INTRODUCTION
Poultry industry is one of the major industries
that are supporting the nutrient supply of the huge
population of the world. As we know feed contributes
about 70 percent cost of poultry production. But if
feed is offered ad-libitum, it is unfortunately
accompanied by certain ill-effects like high metabolic
rate, high mortality, and skeletal defects. Feed
restriction is a method of feeding in which the time or
duration or amount of feed is limited and had significant
effect on the subsequent ability of broilers to recover
from a growth defect. Male broilers have a greater ability
to exhibit compensatory growth following a period of
under nutrition than females (McMurtry et al., 1988,
Plavnik and Hurwitz 1991).
Indian J. Anim. Nutr. 2020. 37 (2): 152-157
doi: 10.5958/2231-6744.2020.00025.0
At the present time, there is increasing pressure
to reduce or eliminate the use of antibiotics in poultry
feed and to look for alternative growth promoters
like garlic. The major active ingredients in garlic are
allicin, ajoene, dialkyl polysulphides, s-allylcysteine and
it also possesses at least 33 sulphur containing
compounds, several enzymes, amino acid and minerals.
Supplementation of garlic powder at 1.5% gave best
response in terms of growth performance (Singh et al.,
2015). Though both feed restriction and garlic
supplementation have a beneficial effect on broiler
performance but synergistic effect of feed restriction
without or with garlic supplementation in female birds is
still to be studied. So, this study was conducted to
assess the effect of feed restriction along with garlic
Indian J. Anim. Nutr. 2020. 37 (2): 152-157

153
supplementation on performance of broilers.
MATERIALS AND METHODS
The present investigation was carried out to study
the effect of feed restriction and garlic supplementation
in female broilers at the Department of Animal
Nutrition, GADVASU, Ludhiana, Punjab. One hundred
and twenty female, day-old meat type chicks (IBL-80)
were distributed randomly into 5 groups having total 24
birds per treatment with 4 replicates having 6 chicks in
each replicate representing different treatments which
were as follows: T1 - Control group fed ad libitum as
per ICAR specification i.e. starter diet (22% CP and
3000 kcal/kg ME), grower diet (21.5% CP and 3050
kcal/kg ME) and finisher diet (19.5% CP and 3100 kcal/
kg ME). The other treatments were T2=T
1 with feed
restriction at 8-17 DOA (10-12 h) with garlic
supplementation, T3=T
1 with feed restriction at
8-17 DOA (10-12 h) without garlic supplementation,
T4=T
1 with feed restriction at 18-27 DOA (10-12 h)
with garlic supplementation, and T5=T
1 with feed
restriction at 18-27 DOA (10-12 h) without garlic
supplementation. The percent ingredient composition of
rations fed the three phases that was kept were
formulated to meet nutrient requirements as per ICAR
(2013) specifications is presented in Table-1. The
feeders were removed for 10-12 hours during 8 PM. to
8 AM. (next day) to apply feed restriction.
A metabolic trial of three days collection period
was conducted at the end of experiment. Four birds of
comparable body weight were selected from each
treatment and were housed in battery brooders. There
were 2 replicates of each treatment having 2 birds in
each replicate. All the faecal collection trays and
feeding trays were cleaned properly to start the
metabolic evaluation. After adaptation period of five days
the measured quantity of feed for three consecutive days
was offered to each replicate both in the morning and
evening. The residual feed left was removed on 4th day
and weighed to record the actual consumption of feed
for each replicate. The excreta voided by each
replicate were collected daily in the morning and
weighed. A separate aliquot was collected in 25 ml of
10 % sulphuric acid to avoid nitrogen loss. Excreta Ta
ble
1:
Perc
en
t in
gre
die
nt
co
mp
osi
tio
n o
f ex
perim
en
tal
die
ts
Ing
red
ien
tsS
tart
er p
ha
seG
row
er p
ha
seF
inis
her p
ha
se
(kg
/10
0 k
g)
T1
T2
T3
T4
T5
T1
T2
T3
T4
T5
T1
T2
T3
T4
T5
Mai
ze54.8
554.3
554.8
554.3
554.8
557.0
57.0
57.0
57.0
57.0
57.0
57.0
57.0
57.0
57.0
Soybea
n M
eal
33.5
33.5
33.5
33.5
33.5
27.0
27.0
27.0
27.0
27.0
27.0
27.0
27.0
27.0
27.0
Gro
undnut E
xtr
acti
on
4.5
4.0
4.5
4.0
4.5
4.0
4.0
4.0
4.0
4.0
4.0
4.0
4.0
4.0
4.0
De-
oil
ed R
ice
Bra
n1.0
0.5
1.0
0.5
1.0
5.0
3.5
5.0
3.5
5.0
5.0
3.5
5.0
3.5
5.0
Gar
lic
-1.5
-1.5
--
1.5
-1.5
--
1.5
-1.5
-
Oil
2.5
2.5
2.5
2.5
2.5
3.5
3.5
3.5
3.5
3.5
3.5
3.5
3.5
3.5
3.5
Di-
calc
ium
Phosp
hat
e1.5
1.5
1.5
1.5
1.5
1.9
1.9
1.9
1.9
1.9
1.9
1.9
1.9
1.9
1.9
Lim
esto
ne
Po
wd
er1.5
1.5
1.5
1.5
1.5
1.0
1.0
1.0
1.0
1.0
1.0
1.0
1.0
1.0
1.0
Met
hio
nin
e (g
)150
150
150
150
150
100
100
100
100
100
100
100
100
100
100
Sal
t (g
)300
300
300
300
300
300
300
300
300
300
300
300
300
300
300
Addit
ives
*(g
)200
200
200
200
200
200
200
200
200
200
200
200
200
200
200
To
tal
(Kg
)100
100
100
100
100
100
100
100
100
100
100
100
100
100
100
*A
ddit
ives
incl
ude
vit
amin
A 8
,25,0
00 I
U, v
itam
in D
3 1
,20,0
00 I
U/,
vit
amin
K 1
00 m
g, r
ibofl
avin
500 m
g, t
hia
min
e 80 m
g, p
yri
doxin
e 160 m
g, v
it e
800 m
g, c
yan
oco
bal
amin
e 100 m
cg,
nia
cin 1
200 m
g, c
alci
um
pan
toth
enat
e 80 m
g, m
angan
ese
sulp
hat
e 25 g
, fer
rous
sulp
hat
e 10 g
, copper
sulp
hat
e 500m
g, z
inc
oxid
e 8g p
ota
ssiu
m iodid
e 100 m
g, c
occ
idio
stat
60 g
.
Singh et al.
Indian J. Anim. Nutr. 2020. 37 (2): 152-157
154
restrictions with or without garlic supplementation (T2
and T3) reduced the feed intake at 2nd and 3rd week of
age. However, in late feed restrictions with or without
garlic supplementation (T4 and T
5) the average feed
intake remained unaffected. Significant (P<0.05)
reduction in feed intake due to feed restrictions was
reported by Mehmood et al. (2013). Also, feed intake
was significantly reduced due to duration of restriction
and level of restriction (Omosebi et al., 2014). But,
Saber et al. (2011) and Afsharmanesh et al. (2016)
observed non-significant feed intake due to feed
restriction in their respective studies.
There was no significant difference in feed
conversion ratio from 1st to 4th week of age. But at 5th
week of age, T4 group of birds with late feed restriction
and garlic supplementation had significantly (P<0.05)
better feed conversion ratio as compared to control (T1)
and late feed restriction without garlic supplementation
(T5). Malpotra et al. (2017) and Omosebi et al. (2014)
had reported (P<0.05) better FCR with feed
restrictions. But, Sidhu et al. (2017) and Saber et al.
(2011) did not found any significant effects of feed
restrictions on FCR. Earlier research workers (Raeesi
et al., 2010; Patel et al., 2017; Ratika et al., 2018)
reported better FCR in garlic powder supplemented
groups. But, Onibi et al. (2009) did not found any
significant difference in FCR in garlic supplemented
broilers.
There was no significant difference in PER due
to early and late feed restriction with or without garlic
supplementation in different weeks of age from 1st to
5th week of age. Garlic supplementation in early and
late feed restrictions had no significant effect on protein
efficiency ratio. However, in overall period, PER was
numerically higher in feed restricted groups and garlic
supplemented groups (T2 and T
4) as compared to
control (T1). Sidhu et al. (2017) and Butzen et al. (2015)
reported no significant differences in PER during
different phases due to feed restrictions. Ratika et al.
(2018) reported that PER was significantly (P<0.05)
better in garlic supplemented groups than the control
group. But, PER was significantly (P<0.05) higher in
feed restricted group during 2nd week and fourth week;
collected for three consecutive days of each replicate
were mixed properly. The sample of excreta after
drying at 80°C were grounded and analyzed for various
proximate parameters (AOAC, 2005). The protein
(PER) and calories efficiency ratio (CER) were
calculated using standard procedures. Meat samples
from sacrificed birds were sent to Department of
Livestock Products and Technology, GADVASU where
sensory evaluation was conducted by expert panel of 7
analysts on 8-point Hedonic scale. The data collected in
the experiment were subjected to statistical analysis using
one-way ANOVA using Software Package for Social
Sciences (SPSS, version 22.0).
RESULTS AND DISCUSSION
The data pertaining to effect of feed restriction
and garlic supplementation on growth performance in
female broiler is presented in Table 2. Early feed
restriction without garlic supplementation (T3)
significantly (P<0.05) reduced the average body weight
gain at 2nd and 3rd week of age as compared to control
(T1). But, early feed restrictions with garlic
supplementation (T2) had no significant difference as
compared to control (T1) at 2nd and 3rd week of age.
Early feed restrictions with garlic supplemented group
(T2) had significantly (P<0.05) better results as
compared to late feed restrictions without garlic
supplementation (T5) at 4th week of age. There was no
significant effect of garlic supplementation and feed
restriction at 1st and 5th week of age. Significantly
(P<0.05) reduced average body weight gain due to feed
restriction was reported by Malpotra et al. (2017),
Omosebi et al. (2014) and Zhan et al. (2007).
Significantly (P<0.05) reduced average feed
intake was observed in early feed restriction (8-17 DOA)
with garlic (T2) and without garlic (T
3) at 2nd and 3rd
week of age as compared to control (T1). Irrespective
of age late feed restrictions (18-27 DOA) with or
without garlic (T4 and T
5) had no significant effect on
average feed intake as compared to control (T1).
However, late feed restrictions with or without garlic
supplementations (T4 and T
5) had significantly (P<0.05)
reduced average feed intake as compared to T2 at
4th week of age. It was indicated that early feed
Indian J. Anim. Nutr. 2020. 37 (2): 152-157

155
similarly improved PER due to feed restriction during
4th week was reported by Malpotra et al. (2017).
Overall (P<0.05) improved protein feed efficiency due
to feed restrictions followed by compensatory growth
was reported by Al-Taleb (2003).
There was no significant difference in CER due
to early and late feed restriction with or without garlic
supplementation in different weeks of age from 1st to
5th week of age. Sidhu et al. (2017) also reported no
significant difference in the CER due to feed
restrictions. But, Malpotra et al. (2017) observed that
feed restriction during 2nd week gave significantly
(P<0.05) higher value of CER during 2nd week and 4th
week, CER was found significantly (P<0.05) lower
during fourth week in feed restricted groups; but during
5th week, feed restricted groups gave significantly
better value. Saleh et al. (2005) also reported (P<0.05)
improved calorie efficiency ratio following feed
restrictions. But, effect of garlic supplementation in early
and late feed restrictions in female broiler is not
Table 2. Effect of feed restriction and garlic supplementation on growth performance in female broilers
Period Treatment groups S.E.M
T1
T2
T3
T4
T5
Average body weight gain
1st week 84.47 85.95 83.37 84.41 82.63 0.813
2nd week 149.87a 139.437ab 132.54b 150.41a 148.93a 2.077
3rd week 222.35ab 216.79ab 214.75b 224.77a 221.89ab 1.395
4th week 247.77ab 252.14a 248.41ab 244.22ab 243.33b 1.278
5th week 320.29 325.72 318.22 326.16 321.82 1.562
Average feed intake
1st week 144.37 142.32 140.25 141.55 137.88 1.051
2nd week 257.56a 229.36b 229.40b 252.98a 253.78a 2.328
3rd week 414.794a 399.146b 403.225b 418.61a 420.35a 1.643
4th week 492.792ab 497.40a 492.208ab 486.77b 484.72b 1.524
5th week 776.5 779.57 787.57 773.25 785.52 1.837
Feed conversion ratio
1st week 1.70 1.65 1.68 1.67 1.66 0.193
2nd week 1.71 1.64 1.73 1.68 1.70 0.195
3rd week 1.86 1.84 1.87 1.86 1.89 0.184
4th week 1.98 1.97 1.98 1.99 1.99 0.183
5th week 2.42a 2.39ab 2.47a 2.37b 2.44a 0.202
Protein efficiency ratio
1st week 2.64 2.73 2.69 2.69 2.71 0.1
2nd week 2.63 2.75 2.61 2.69 2.65 0.102
3rd week 2.50 2.53 2.48 2.50 2.46 0.091
4th week 2.59 2.61 2.60 2.58 2.58 0.09
5th week 2.14 2.17 2.11 2.17 2.13 0.109
Calorie efficiency ratio
1st week 0.195 0.201 0.198 0.199 0.200 0.054
2nd week 0.194 0.203 0.193 0.198 0.196 0.042
3rd week 0.175 0.178 0.174 0.176 0.173 0.074
4th week 0.162 0.163 0.163 0.162 0.162 0.041
5th week 0.134 0.136 0.132 0.136 0.133 0.042
*a,bValues with different superscripts differ significantly (P≤0.05) within each row
Singh et al.
Indian J. Anim. Nutr. 2020. 37 (2): 152-157
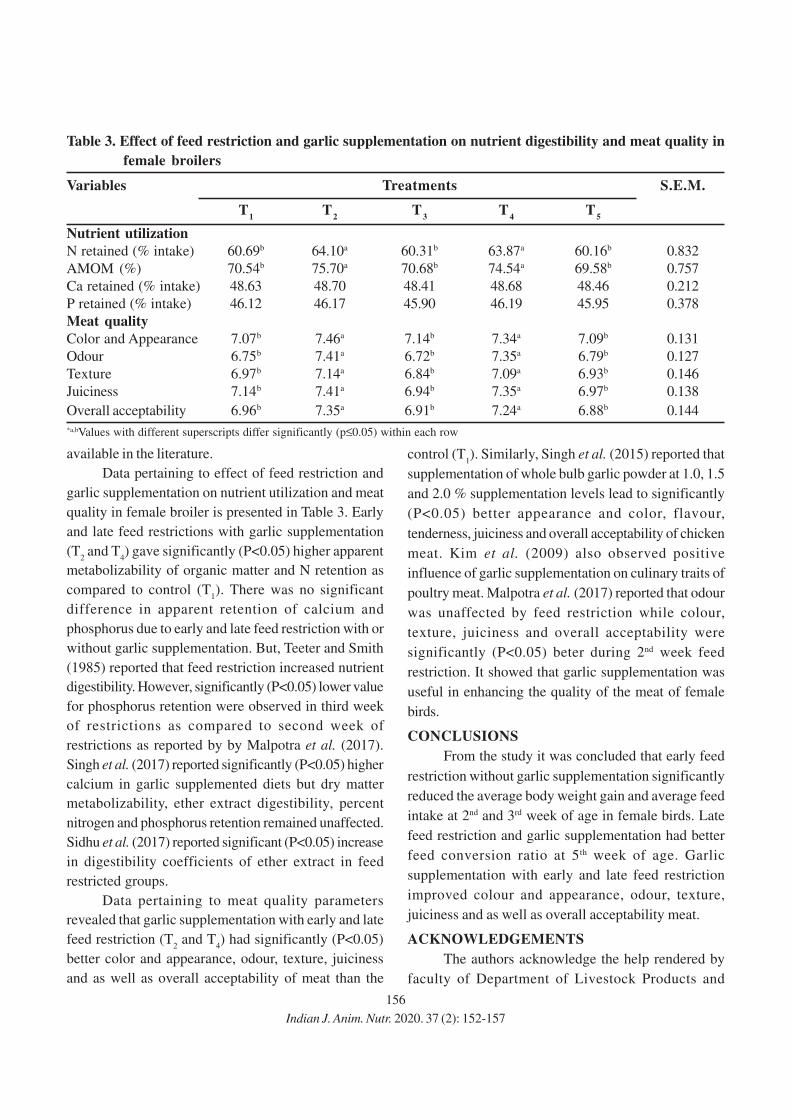
156
available in the literature.
Data pertaining to effect of feed restriction and
garlic supplementation on nutrient utilization and meat
quality in female broiler is presented in Table 3. Early
and late feed restrictions with garlic supplementation
(T2 and T
4) gave significantly (P<0.05) higher apparent
metabolizability of organic matter and N retention as
compared to control (T1). There was no significant
difference in apparent retention of calcium and
phosphorus due to early and late feed restriction with or
without garlic supplementation. But, Teeter and Smith
(1985) reported that feed restriction increased nutrient
digestibility. However, significantly (P<0.05) lower value
for phosphorus retention were observed in third week
of restrictions as compared to second week of
restrictions as reported by by Malpotra et al. (2017).
Singh et al. (2017) reported significantly (P<0.05) higher
calcium in garlic supplemented diets but dry matter
metabolizability, ether extract digestibility, percent
nitrogen and phosphorus retention remained unaffected.
Sidhu et al. (2017) reported significant (P<0.05) increase
in digestibility coefficients of ether extract in feed
restricted groups.
Data pertaining to meat quality parameters
revealed that garlic supplementation with early and late
feed restriction (T2 and T
4) had significantly (P<0.05)
better color and appearance, odour, texture, juiciness
and as well as overall acceptability of meat than the
control (T1). Similarly, Singh et al. (2015) reported that
supplementation of whole bulb garlic powder at 1.0, 1.5
and 2.0 % supplementation levels lead to significantly
(P<0.05) better appearance and color, flavour,
tenderness, juiciness and overall acceptability of chicken
meat. Kim et al. (2009) also observed positive
influence of garlic supplementation on culinary traits of
poultry meat. Malpotra et al. (2017) reported that odour
was unaffected by feed restriction while colour,
texture, juiciness and overall acceptability were
significantly (P<0.05) beter during 2nd week feed
restriction. It showed that garlic supplementation was
useful in enhancing the quality of the meat of female
birds.
CONCLUSIONS
From the study it was concluded that early feed
restriction without garlic supplementation significantly
reduced the average body weight gain and average feed
intake at 2nd and 3rd week of age in female birds. Late
feed restriction and garlic supplementation had better
feed conversion ratio at 5th week of age. Garlic
supplementation with early and late feed restriction
improved colour and appearance, odour, texture,
juiciness and as well as overall acceptability meat.
ACKNOWLEDGEMENTS
The authors acknowledge the help rendered by
faculty of Department of Livestock Products and
Table 3. Effect of feed restriction and garlic supplementation on nutrient digestibility and meat quality in
female broilers
Variables Treatments S.E.M.
T1
T2
T3
T4
T5
Nutrient utilization
N retained (% intake) 60.69b 64.10a 60.31b 63.87a 60.16b 0.832
AMOM (%) 70.54b 75.70a 70.68b 74.54a 69.58b 0.757
Ca retained (% intake) 48.63 48.70 48.41 48.68 48.46 0.212
P retained (% intake) 46.12 46.17 45.90 46.19 45.95 0.378
Meat quality
Color and Appearance 7.07b 7.46a 7.14b 7.34a 7.09b 0.131
Odour 6.75b 7.41a 6.72b 7.35a 6.79b 0.127
Texture 6.97b 7.14a 6.84b 7.09a 6.93b 0.146
Juiciness 7.14b 7.41a 6.94b 7.35a 6.97b 0.138
Overall acceptability 6.96b 7.35a 6.91b 7.24a 6.88b 0.144
*a,bValues with different superscripts differ significantly (p≤0.05) within each row
Indian J. Anim. Nutr. 2020. 37 (2): 152-157
157
Technology, GADVASU for sensory evaluation of meat
samples.
REFERENCES
Afsharmanesh, M., Lotfi, M. and Mehdipour, Z. 2016. Effects
of wet feeding and early feed restriction on blood
parameters and growth performance of broiler
chickens. Anim. Nutr. 2: 168-172.
Al-Taleb, S.S. 2003. Effect of an Early Feed Restriction of
Broiler’s on Productive Performance and Carcass
Quality. Online J. Biol. Sci. 3: 607-611.
AOAC, 2005. Officials Methods of Analysis. 18th rev. edn.
Association of Official Analytical Chemists,
Arlington, Virginia, USA.
Butzen, F.M., Vieira, M.M., Kessler, A.M., Aristimunha, P.C.,
Marx, F.R., Bockor, L. and Ribeiro, A.M.L. 2015. Early
feed restriction in broilers. II: Body composition and
nutrient gain. J. Appl. Poult. Res. 24: 198-205.
ICAR. 2013. Nutrient Requirements of Animals - Poultry
(ICAR-NIANP) 3rd edition. Krishi Bhawan. New Delhi.
Kim, Y.J., Jin, S.K. and Yang, H.S. 2009. Effect of dietary
garlic bulb and husk on the physicochemical
properties of chicken meat. Poult. Sci. 88: 398-405.
Malpotra, K., Singh, U. and Sethi, A.P.S. 2017. Effects of
feed restriction and additional fat supplementation
on chemical composition and sensory evaluation
of broiler’s meat. Indian J. Poult. Sci. 52: 327-31.
McMurtry, J.P., Rosebrough, R.W., Plavnik, I. and Cartwright,
A.I. 1988. Influence of early plane of nutrition on
enzyme systems and subsequent tissue deposition.
In: Biomechanisms Regulating Growth and
Development (G. L. Steffens and T. S. Rumseyed).
Betsville Symposia Agric. Res. 329-341.
Mehmood, S., Sahota, A.W., Akram, M., Javed, K., Hussain,
J., Sharif, H. and Jatoi, A.S. 2013. Influence of feed
restriction regimes on growth performance of broilers
with different initial weight categories. J. Anim. Plant
Sci. 26: 1522-1526.
Onibi, G.E., Adebisi, O.E. and Fajemisin, A.N. 2009. Response
of broiler chickens in terms of performance and meat
quality to garlic (Allium sativum) supplementation.
Afr. J. Agric. Res. 4: 511-517.
Omosebi, D.J., Adeyemi, O.A., Sogunle, O.M., Idowu, O.M.O.
and Njoku, C.P. 2014. Effects of duration and level
of feed restriction on performance and meat quality
of broiler chickens. Arch. de Zoote. 63: 611-621.
Patel, R.M., Garg, D., Patel, V.R., Vahora, S., Raval, A. and
Choubey, M. 2017. Effect of dietary supplementation
of garlic (Allium sativum) and fenugreek (Trigonella
foenum-graecum) seed powder on growth
performance, carcass characteristics and economics
of feeding in broilers. J. Anim. Res. 7: 313-318.
Plavnik, I. and Hurwitz, S. 1991. Response of broiler chickens
and turkey poults to food restriction of varied severity
during early life. Br. Poult. Sci. 32: 343-52.
Raeesi, M., Hoeini-Aliabad, S.A., Roofchaee, A., Zare
Shahneh, A. and Pirali, S. 2010. Effect of periodically
use of garlic (allium sativum) powder on performance
and carcass characteristics in broiler chickens. World
Acad. Sci. Eng. Technol. 68: 1213-1219.
Ratika, K., Singh, R.J. and Singh, R.K. 2018. Effect of garlic
(Allium sativum) and turmeric (Cucurma longa)
powder supplementation on blood parameters of starter
and finisher growth phase of broilers. Int. J. Pure Appl.
Biosci. 6: 562-567.
Saber, S.N., Maheri-Sis, N., Shaddel-Telli, A., Hatefinezhad,
K., Gorbani, A. and Yousefi, J. 2011. Effect of feed
restriction on growth performance of broiler chickens.
Ann. Biol. Res. 2: 247-252.
Saleh, E.A., Watkins, S.E., Waldroup, A.L. and Waldroup, P.W.
2005. Effects of early quantitative feed restriction on
live performance and carcass composition of male
broilers grown for further processing. J. Appl. Poult.
Res. 14: 87-93.
Sidhu, N.S., Singh, U., Sethi, A.P.S., Hundal, J.S., Lamba, J.S.
and Sharma, A. 2017. Effect of black pepper and jaggery
supplementation with or without feed restriction on
broilers performance. J. Anim. Res. 7: 903-12.
Singh, J., Sethi, A.P.S., Sikka, S.S., Chatli, M.K. and Kumar, P.
2015. Effect of sun dried whole bulb garlic powder on
growth, carcass characteristics and meat quality of
commercial broilers. Indian J. Anim. Sci. 85: 67-71.
Singh, J., Sharma, M., Singh, N.D., Kaur, P., Sethi, A.P.S. and
Sikka, S.S. 2017. Effect of sun dried whole bulb garlic
powder on nutrient utilization, blood parameters,
duodenum morphology and faecal microbial load in
broiler chickens. Indian J. Anim. Sci. 87: 195-198.
Teeter, R.G. and Smith, M.O. 1985. Feed intake effects upon
gain, carcass yield, and ration digestibility in broilers
force fed five feed intakes. Poult. Sci. 64: 2155-2160.
Zhan, X.A., Wang, M., Ren, H., Zhao, R.Q., Li, J.X. and Tan,
Z.L. 2007. Effect of early feed restriction on metabolic
programming and compensatory growth in broiler
chickens. Poult. Sci. 86: 654-660.
Singh et al.
Indian J. Anim. Nutr. 2020. 37 (2): 152-157
Received on 14-04-2020 and accepted on 05-08-2020
158
Indian Journal of
Animal Nutrition
Effect of Eugenia jambolana and Psidium guajava Leaf Meal Mixture
Supplementation on Antioxidant Indices and Immune Responses
in Broiler Chicks
M.A. Zargar, A.K. Pathak*, R.K. Sharma and M.I. Daing
Division of Animal Nutrition, Faculty of Veterinary Sciences & AH,
Sher-e-Kashmir University of Agricultural Sciences and Technology of Jammu,
R.S. Pura, (J & K), India
ABSTRACT
This experiment was conducted to study the effect Eugenia jambolana and Psidium guajava leaf meal
mixture (LMM) supplementation on antioxidant and immune indices of broilers. One-hundred-and-twenty
day-old unsexed broiler chicks were randomly distributed into 4 groups of 30 birds per treatment, each
having 3 replicates (10 chicks / replicate) in an experiment based on completely randomized design (CRD).
All the birds were fed standard rations to meet their nutrient requirements. Rations of the birds of groups T1, T
2,
T3 and T
4 were supplemented with LMM at 0, 2.5, 5.0 and 7.5 % of diet, respectively. Feed intake during 0-3,
4-6 and 0-6 weeks were significantly (P<0.05) higher in T1 followed by T
2, T
3 and least in T
4 groups. Weight
gain during 0-3, 4-6 and 0-6 weeks of broiler chicks were significantly (P<0.05) higher in T1 as compared to
T2, T
3 and T
4 groups. Feed conversion ratio (FCR) during 0-3 weeks among groups was statistically non-
significant (P<0.05), while, at 4-6 weeks, it was found to be lowest in T4, whereas, during 0-6 weeks FCR was
significantly (P<0.05) lower in T1 than that of other groups. LMM supplementation decreased (P<0.068)
average body weight during metabolism trial in T4 than that of T
1 group. Nitrogen (N) intake and retention were
significantly (P<0.021, P<0.001) lower and N excretion was significantly higher (P<0. 006) in T3 and T
4 than
that of T1 and T
2. Mean haemoglobin and packed cell volume were significantly (P<0. 034, P<0.002) higher in T
1
and T2 than that of T
3 and T
4. The LMM supplemented groups showed better antioxidant indices (P<0.05), cell
mediated (P<0.05) and humoral immune responses (P<0.05) as compared to control. It was concluded that LMM
supplementation (2.5 %) improved antioxidant status, immune response and growth performance of broiler
chicks.
Key words: Antioxidant indices, Broilers, Immune response, Leaf meal mixture
*Corresponding author; Email: [email protected], Assistant Professor (SS), Division of Animal Nutrition, Faculty of Veterinary
Sciences & AH, SKUAST-Jammu-181102, India
INTRODUCTION
Phytogenic feed additives are the products of
plant origin used in livestock and poultry feeding as non-
nutritive compounds to improve their nutritional and
health status, and their productive performance. Now a
days, application of these phytogenic feed additives in
the ration of poultry gained importance due to the ban
of synthetic drugs as growth promoters by European
Union (Windisch et al., 2008). Leaf meal (LM) and/
or leaf meal mixture (LMM) of Eugenia jambolana
and Psidium guajava containing plant secondary
metabolites (PSMs) especially condensed tannins (CT)
are promising alternatives to synthetic drugs in the
poultry ration. The CT’s are naturally occurring water
Indian J. Anim. Nutr. 2020. 37 (2): 158-166
doi: 10.5958/2231-6744.2020.00026.2
soluble poly-phenolic compounds with varying
molecular weight. Presence of large number of
phenolic hydroxyl groups in CTs enables them to show
the beneficial effects (Pathak, 2013; Pathak et al.,
2013a,b,c; Pathak et al., 2016, 2017). Possible
mechanisms of antioxidant activity of CT are free
radical scavenging activity, chelation of transition
metals and inhibition of pro-oxidative enzymes (Decker,
1997). Condensed tannins are also known to prevent
superoxide formation and lipid peroxidation (Pathak,
2013; Pathak et al., 2017). Additionally, LMM are good
source of various nutrients and excellent source of
antioxidants (Atawodi et al., 2013; Zargar et al., 2016;
Zargar et al., 2017; Pathak et al., 2017).
Indian J. Anim. Nutr. 2020. 37 (2): 158-166
159
To date, some tree leaves and their extracts have
been evaluated for possible antimicrobial, anti-parasitic
and antioxidant activities (Daing et al., 2017a; Daing et
al., 2017b; Pathak et al., 2013; Pathak et al., 2014;
Zargar et al., 2016; Zargar et al., 2017) and compounds
isolated from LMM have shown great potential against
infectious agents such as pathogenic bacteria,
gastrointestinal nematodes and coccidian spp., etc.
Psidium guajava (PS) is used as a traditional medicine
in all over the world. It is traditionally used to treat
diarrhoea and dehydration, gastroenteritis, dysentery,
stomach pain, diabetes mellitus, and wounds.
In addition, PS showed anthelmintic, antioxidant,
antibacterial, anti-inflammatory properties as well as
growth promoting potential.
Eugenia jambolana, commonly known as black
plum or Jamun is an important medicinal plant. The
leaves are potential source CTs. Different parts of the
Eugenia jambolana are also reported for anthelmintic,
antioxidant, anti-inflammatory, neuro-psycho-pharma
cological, anti-microbial, anti-bacterial, and antifugal,
nitric oxide scavenging, free radical scavenging,
anti-diarrheal, anti-fertility, gastro-protective, anti-
ulcerogenic and radio-protective activities. Keeping all
these points in view, the present study was planned to
investigate the dietary incorporation of graded level of
tanniferous LMM comprising of Eugenia jambolana
and Psidium guajava on antioxidants indices, immune
status and growth performance of broiler chickens.
MATERIALS AND METHODS
The experimental study was conducted in the
Division of Animal Nutrition, Faculty of Veterinary
Sciences & AH, Sher-e-Kashmir University of
Agricultural Sciences and Technology of Jammu, R.S.
Pura, Jammu. Fresh leaves of Eugenia jambolana and
Psidium guajava were harvested from Faculty
premises of R.S. Pura, Jammu. Both tree leaves were
air-dried in the shed for 12-15 days. The dried tree
leaves of Eugenia jambolana and Psidium guajava
were milled in the laboratory hammer mill. The ground
tree leaves were thoroughly mixed in proper ratio (50:50)
on the cemented floor and suitable LMM was prepared
for in-vivo trial.
A total of 120 day-old unsexed and healthy
commercial broiler chicks of Cobb-K strains were
purchased from Kashmir Valley Poultry Breeding Farm
and Hatchery, Jammu They were randomly distributed
into four dietary treatment groups (T1, T
2, T
3 and T
4) of
30 birds per group, and brooded on a partitioned deep
litter house at the experimental site. Each group was
sub-divided into three replicates of 10 birds per
replicate in an experiment based on CRD. On arrival
chicks were given water and feed ad libitum, small
amount of feed was sprinkled on papers inside brooding
area for easier consumption and recognition of feed by
chicks up to ten days of age. Temperatures were kept
at 32oC for the first 7 days. Water and respective diets
were supplied ad libitum i.e. birds in T1 group were
given control diet (0% LMM) to meet their nutrient
requirements, while the birds in T2, T
3 and T
4 groups
were given diet containing LMM of Eugenia jambolana
and Psidium guajava at 2.5, 5.0 and 7.5 %,
respectively. Broiler starter and finisher diets were
prepared as per BIS (1992). Ingredient and chemical
composition of experimental diets are presented in the
Table 1.
The parameters measured were feed intake, body
weight gain, FCR, haematological profile, antioxidant
indices and immune response of broiler birds. Daily feed
intake per bird was calculated every morning by
subtracting the amount of feed left in the feeding trough
from what was offered the previous day and then
dividing it by the number of birds in the replicate. Chicks
in a pen were weighed individually with a digital
weighing scale and the previous weight was subtracted
from the current weight to determine the body weight
gain per bird for the week. FCR was calculated by
dividing the feed consumed by the live weight gain.
Samples of tree leaves, LMM, feed offered and
residue left were analyzed for various proximate
principles viz., dry matter (DM), organic matter (OM),
crude protein (CP), ether extract (EE), nitrogen-free
extract (NFE) and total ash as per AOAC (1995) and
calcium (Talapatra et al., 1940) and phosphorus (AOAC,
2000). Excreta samples were analysed for N, Ca and P.
Zargar et al.
Indian J. Anim. Nutr. 2020. 37 (2): 158-166

160
The CT content of tree leaves and LMM was estimated
by using butanol-HCl method (Makkar, 2000).
Metabolizable energy (ME) values of experimental
diets were calculated according to the formula given by
Pauzenga (1985).
Blood samples were collected from each bird at
the time of slaughter. Two birds were randomly selected
from each replicate for bleeding and slaughter. Out of 6
ml of blood, about 2.0 ml of blood was collected into
labelled sterile universal bottles containing ethylene-
diamine-tetra-acetic acid (EDTA) at 1 mg/ml of blood
as anticoagulant for estimating haematological profile.
Hemoglobin (Hb) and packed cell volume (PCV) were
estimated in whole blood immediately after the
collection of blood by cyanomethhaemoglobin method
(Dacie and Lewis, 1969) and Wintrobe’s tube (Jain,
1986), respectively. Another 2 ml of blood was collected
in tubes containing acid citrate dextrose (ACD) at 1.5
ml/10 ml blood as anticoagulant, centrifuged at 2000 rpm
for 15 min at 4°C, followed by separation of plasma and
Table 1. Ingredients and chemical composition of experimental broiler diets
Attributes Experimental diets
Broiler starter diets Broiler finisher diets
T1
T2
T3
T4
T1
T2
T3
T4
Ingredient composition (%)
Maize 51.00 48.50 46.00 43.50 57.00 54.50 52.00 49.50
Rice polish 3.75 3.75 3.75 3.75 6.50 6.50 6.50 6.50
Soybean meal 35.00 35.00 35.00 35.00 27.50 27.50 27.50 27.50
MBM 5.00 5.00 5.00 5.00 4.00 4.00 4.00 4.00
Soybean oil 1.75 1.75 1.75 1.75 2.00 2.00 2.00 2.00
DCP 1.16 1.16 1.16 1.16 1.00 1.00 1.00 1.00
LSP 1.00 1.00 1.00 1.00 0.70 0.70 0.70 0.70
Salt 0.40 0.40 0.40 0.40 0.40 0.40 0.40 0.40*Premix 0.47 0.47 0.47 0.47 0.45 0.45 0.45 0.45
Lysine 0.31 0.31 0.31 0.31 0.30 0.30 0.30 0.30
Methionine 0.16 0.16 0.16 0.16 0.15 0.15 0.15 0.15
LMM 0.00 2.50 5.00 7.50 0.00 2.50 5.00 7.50
Chemical composition (% DM)
OM 92.55 92.43 92.11 91.99 92.14 92.08 91.97 91.88
CP 22.93 22.83 22.97 23.07 20.01 20.13 19.81 19.80
EE 4.45 4.40 4.23 4.64 5.04 5.12 5.22 5.07
CF 4.42 4.53 4.69 4.82 4.63 4.38 4.72 4.83
NFE 60.75 60.67 60.22 59.46 62.46 62.45 62.20 62.18
Total ash 7.45 7.57 7.89 8.01 7.86 7.92 8.03 8.12
AIA 2.43 2.61 2.78 2.92 2.50 2.43 2.76 2.91
Calcium 1.67 1.64 1.77 1.83 1.73 1.56 1.83 1.77
Phosphorus 0.76 0.77 0.73 0.70 0.69 0.67 0.63 0.61
ME (KcalKg-1) 2818 2790 2762 2734 2925 2897 2869 2841
CT (% of diet) 0.0 0.18 0.37 0.53 0.0 0.19 0.39 0.54
*Premix (vitamins &minerals) added at the rate of 470 g/100 kg feed which contained: vitamin A, 5000 IU; vitamin D, 1000 IU, vitamin E, 10
mg; vitamin K, 850 mg; vitamin B1, 600 mg; vitamin B2, 2 mg; vitamin B6, 1.8 mg; vitamin B12, 4 mcg; niacin, 1.2 mg; folic acid, 2 mg; d
pantothenic acid, 3.2 mg, Cu, 2.6 mg; Mn, 19.2 mg; Zn, 16 mg; Se, 0.45 mg; Fe, 9.5 mg; Co, 0.25 mg and I, 0.55 mg
Antioxidant indices and immune response broiler chicks fed LMM
Indian J. Anim. Nutr. 2020. 37 (2): 158-166

161
buffy coat. The resulting erythrocyte pellet was washed
thrice with 250 mOsm/litre (pH-7.4) of phosphate
buffered saline (PBS) as per Yagi et al. (1989) to
determine the various antioxidant enzymes activity, while
remainder of about 2 ml of blood sample was collected
in sterile centrifuge tube for collection of serum to
determine humoral immune response against previously
sensitized birds with sheep RBC (SRBC) as antigen.
Various antioxidant indices viz. reduced
glutathione (GSH; µ mol/mg Hb), glutathione-
S-transferase (GST; µ mol/mg Hb), super oxide dismutase
(SOD; U/mg Hb), catalase (Cat; U/mg Hb), lipid
peroxidise (LPO; µ mol/mg Hb), total-thiol (T-SH; µ
mol/ml), protein-thiol (TP-SH; µ mol/mg Hb) and
non-protein thiol groups (NP-SH; µ mol/ml) were
determined by using standard protocols. The GSH was
estimated by DTNB method of Prins and Loos (1969),
whereas, GST activity was determined as per the
method described by Habig et al. (1974). Catalase was
assayed in erythrocytes by the spectrophotometric
method as described by Bergmeyer (1983). The SOD
activity in erythrocytes and LPO level in RBC
haemolysate were determined as per the methods
described by Marklund and Marklund (1967) and Placer
et al. (1966), respectively. Total thiol (T-SH) groups in
the RBC haemolysate were determined following the
method of Sedlak and Lindsay (1968).
The effect of CT containing LMM supple-
mentation in broiler chicks on CMI response (foot pad
thickness) was assessed through in vivo cutaneous
delayed-type hypersensitivity (DTH) reaction against
phytohaemagglutin-P (PHA-P). Towards the beginning
of experimental feeding of 6th weeks, two birds from
each replicate were used. The foot pad area of tested
birds was cleaned with cotton swab containing sprit and
the thickness of the foot pad was measured with the
help of digital Vernier callipers, which would represent
the basal (0 h) value. All the tested birds were injected
intradermally with 25 µl of PHA-P solution. The
thickness of the foot pad was subsequently measured
at 24 h and then at 48 h and 72 hours.
Assessment of humoral immune response was
assessed through haemagglutination (HA) titre on 24
broiler finisher chicks selected at random at 32 days.
Venous blood from sheep was collected aseptically in
equal volume of Alsever’s solution and stabilized for
one week. Finally, a suspension of 0.5 % sheep red blood
cells (SRBC) was adjusted with phosphate buffer
saline (PBS) solution. For immunization, 100 µl of this
suspension was injected intravenously in wing vein of
each tested bird. Blood from immunized birds was
collected after 10 days for collection of serum. Total
SRBC antibody titres were assayed in the serum of each
bird according to the agglutination method described by
Hudson and Hay (1991). Antibody titters were reported
as log2 of the highest dilution of serum that agglutinated
an equal volume of a 0.5% SRBC in PBS solution.
The results obtained were subjected to analysis
of variance and treatment means were ranked using
Duncan’s multiple range test (DMRT). The periodic
alterations in CMI response was analyzed using
General linear model (GLM) procedures. Significance
was declared at P<0.05 unless otherwise stated. All the
statistical procedures were performed as per Snedecor
and Cochran (2004).
RESULTS AND DISCUSSION
The ingredients and chemical composition of
experimental diets of broiler chicks has been presented
in the table 1. The proximate compositions of all the
experimental diets during both starter and finisher phases
were within the range as suggested by BIS (1992). The
CT content of LMM was 7.69 percent.
Data pertaining to cumulative feed intake, body
weight gain and feed conversion ratio (FCR) are
presented in table 2. Feed intake (g) during 0-3, 4-6 and
0-6 weeks were significantly (P<0.05) higher in T1
followed by T2, T
3 and least feed intake was recorded
in T4 groups. Lower feed intake in T
3 and T
4 groups
may be due to high percentage of CT which is having
astringent property. At higher level, CTs bind with
glycoprotein of the saliva and may also form complex
with other nutrients that may causes a sensation in the
oral cavity, resulting in reduced palatability and decreased
feed intake in broiler birds. Present results are
contradictory to the findings of Rahman et al.
(2013 who reported that P. guajava leaf meal up to .
Zargar et al.
Indian J. Anim. Nutr. 2020. 37 (2): 158-166
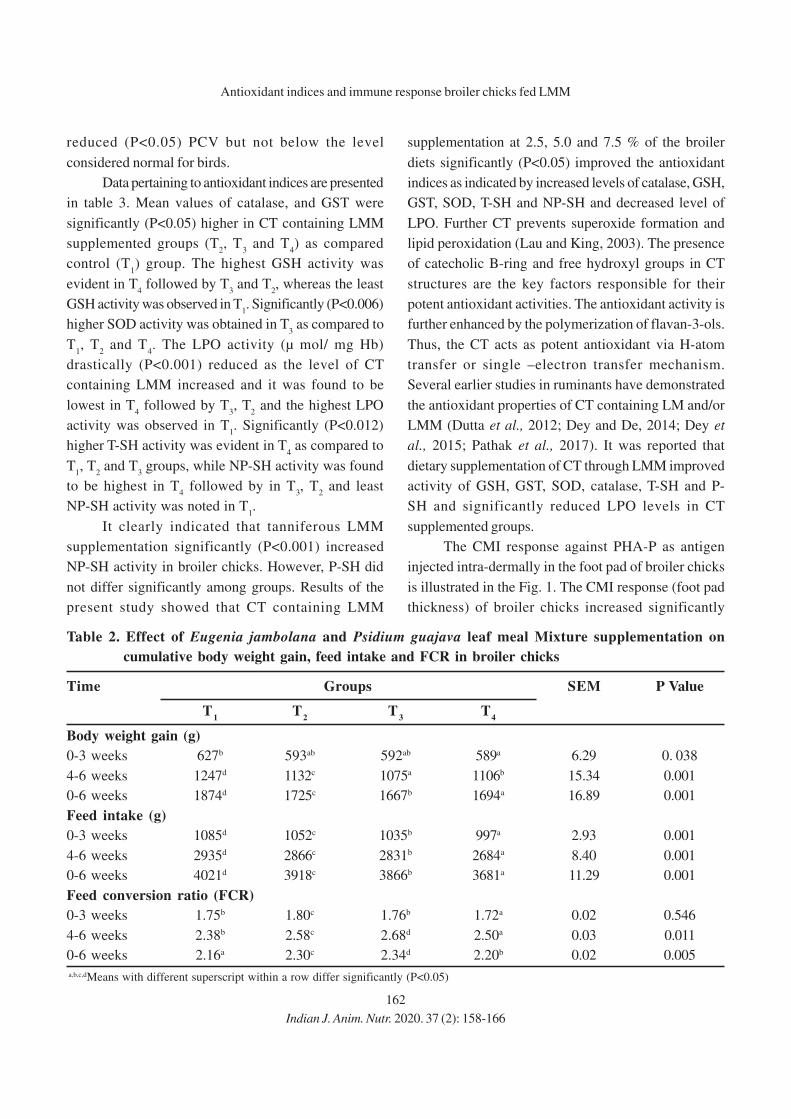
162
reduced (P<0.05) PCV but not below the level
considered normal for birds.
Data pertaining to antioxidant indices are presented
in table 3. Mean values of catalase, and GST were
significantly (P<0.05) higher in CT containing LMM
supplemented groups (T2, T
3 and T
4) as compared
control (T1) group. The highest GSH activity was
evident in T4 followed by T
3 and T
2, whereas the least
GSH activity was observed in T1. Significantly (P<0.006)
higher SOD activity was obtained in T3 as compared to
T1, T
2 and T
4. The LPO activity (µ mol/ mg Hb)
drastically (P<0.001) reduced as the level of CT
containing LMM increased and it was found to be
lowest in T4 followed by T
3, T
2 and the highest LPO
activity was observed in T1. Significantly (P<0.012)
higher T-SH activity was evident in T4 as compared to
T1, T
2 and T
3 groups, while NP-SH activity was found
to be highest in T4 followed by in T
3, T
2 and least
NP-SH activity was noted in T1.
It clearly indicated that tanniferous LMM
supplementation significantly (P<0.001) increased
NP-SH activity in broiler chicks. However, P-SH did
not differ significantly among groups. Results of the
present study showed that CT containing LMM
supplementation at 2.5, 5.0 and 7.5 % of the broiler
diets significantly (P<0.05) improved the antioxidant
indices as indicated by increased levels of catalase, GSH,
GST, SOD, T-SH and NP-SH and decreased level of
LPO. Further CT prevents superoxide formation and
lipid peroxidation (Lau and King, 2003). The presence
of catecholic B-ring and free hydroxyl groups in CT
structures are the key factors responsible for their
potent antioxidant activities. The antioxidant activity is
further enhanced by the polymerization of flavan-3-ols.
Thus, the CT acts as potent antioxidant via H-atom
transfer or single –electron transfer mechanism.
Several earlier studies in ruminants have demonstrated
the antioxidant properties of CT containing LM and/or
LMM (Dutta et al., 2012; Dey and De, 2014; Dey et
al., 2015; Pathak et al., 2017). It was reported that
dietary supplementation of CT through LMM improved
activity of GSH, GST, SOD, catalase, T-SH and P-
SH and significantly reduced LPO levels in CT
supplemented groups.
The CMI response against PHA-P as antigen
injected intra-dermally in the foot pad of broiler chicks
is illustrated in the Fig. 1. The CMI response (foot pad
thickness) of broiler chicks increased significantly
Table 2. Effect of Eugenia jambolana and Psidium guajava leaf meal Mixture supplementation on
cumulative body weight gain, feed intake and FCR in broiler chicks
Time Groups SEM P Value
T1
T2
T3
T4
Body weight gain (g)
0-3 weeks 627b 593ab 592ab 589a 6.29 0. 038
4-6 weeks 1247d 1132c 1075a 1106b 15.34 0.001
0-6 weeks 1874d 1725c 1667b 1694a 16.89 0.001
Feed intake (g)
0-3 weeks 1085d 1052c 1035b 997a 2.93 0.001
4-6 weeks 2935d 2866c 2831b 2684a 8.40 0.001
0-6 weeks 4021d 3918c 3866b 3681a 11.29 0.001
Feed conversion ratio (FCR)
0-3 weeks 1.75b 1.80c 1.76b 1.72a 0.02 0.546
4-6 weeks 2.38b 2.58c 2.68d 2.50a 0.03 0.011
0-6 weeks 2.16a 2.30c 2.34d 2.20b 0.02 0.005
a,b,c,dMeans with different superscript within a row differ significantly (P<0.05)
Antioxidant indices and immune response broiler chicks fed LMM
Indian J. Anim. Nutr. 2020. 37 (2): 158-166
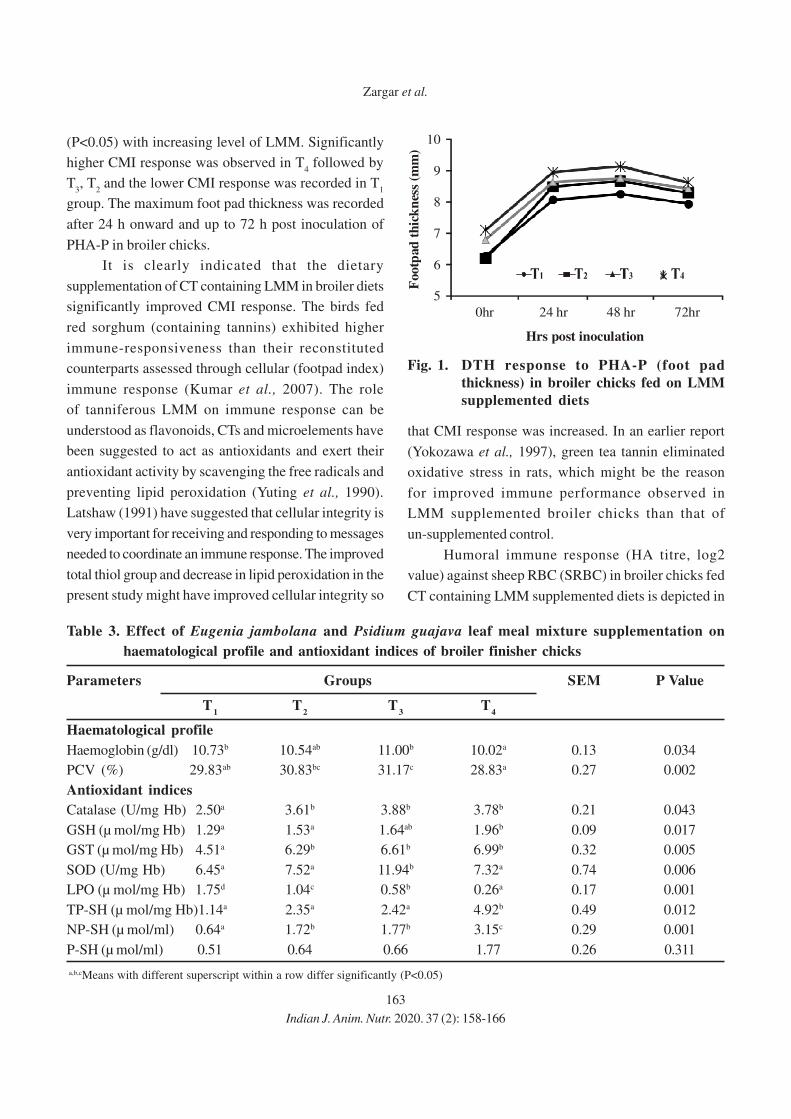
163
(P<0.05) with increasing level of LMM. Significantly
higher CMI response was observed in T4 followed by
T3, T
2 and the lower CMI response was recorded in T
1
group. The maximum foot pad thickness was recorded
after 24 h onward and up to 72 h post inoculation of
PHA-P in broiler chicks.
It is clearly indicated that the dietary
supplementation of CT containing LMM in broiler diets
significantly improved CMI response. The birds fed
red sorghum (containing tannins) exhibited higher
immune-responsiveness than their reconstituted
counterparts assessed through cellular (footpad index)
immune response (Kumar et al., 2007). The role
of tanniferous LMM on immune response can be
understood as flavonoids, CTs and microelements have
been suggested to act as antioxidants and exert their
antioxidant activity by scavenging the free radicals and
preventing lipid peroxidation (Yuting et al., 1990).
Latshaw (1991) have suggested that cellular integrity is
very important for receiving and responding to messages
needed to coordinate an immune response. The improved
total thiol group and decrease in lipid peroxidation in the
present study might have improved cellular integrity so
that CMI response was increased. In an earlier report
(Yokozawa et al., 1997), green tea tannin eliminated
oxidative stress in rats, which might be the reason
for improved immune performance observed in
LMM supplemented broiler chicks than that of
un-supplemented control.
Humoral immune response (HA titre, log2
value) against sheep RBC (SRBC) in broiler chicks fed
CT containing LMM supplemented diets is depicted in
Table 3. Effect of Eugenia jambolana and Psidium guajava leaf meal mixture supplementation on
haematological profile and antioxidant indices of broiler finisher chicks
Parameters Groups SEM P Value
T1
T2
T3
T4
Haematological profile
Haemoglobin (g/dl) 10.73b 10.54ab 11.00b 10.02a 0.13 0.034
PCV (%) 29.83ab 30.83bc 31.17c 28.83a 0.27 0.002
Antioxidant indices
Catalase (U/mg Hb) 2.50a 3.61b 3.88b 3.78b 0.21 0.043
GSH (µ mol/mg Hb) 1.29a 1.53a 1.64ab 1.96b 0.09 0.017
GST (µ mol/mg Hb) 4.51a 6.29b 6.61b 6.99b 0.32 0.005
SOD (U/mg Hb) 6.45a 7.52a 11.94b 7.32a 0.74 0.006
LPO (µ mol/mg Hb) 1.75d 1.04c 0.58b 0.26a 0.17 0.001
TP-SH (µ mol/mg Hb)1.14a 2.35a 2.42a 4.92b 0.49 0.012
NP-SH (µ mol/ml) 0.64a 1.72b 1.77b 3.15c 0.29 0.001
P-SH (µ mol/ml) 0.51 0.64 0.66 1.77 0.26 0.311
a,b,cMeans with different superscript within a row differ significantly (P<0.05)
Zargar et al.
Indian J. Anim. Nutr. 2020. 37 (2): 158-166
48 hr
×
10
9
8
7
6
5
0hr
Hrs post inoculation
24 hr 72hr
Footp
ad
th
ick
nes
s (m
m)
Fig. 1. DTH response to PHA-P (foot pad
thickness) in broiler chicks fed on LMM
supplemented diets

164
Figure 2. Dietary supplementation of tanniferous LMM
in broiler chicken significantly (P<0.001) increased
the HA titre (log2) value in LMM (T2, T
3 and T
4)
supplemented groups as compared to un-supplemented
control (T1) group, however, HA titre (log2) values not
differ significantly among three treatment groups (T2,
T3 and T
4). Similarly, Durrani et al. (2008) reported the
immune-stimulatory effects of neem (A. indica) leaves
infusion in broiler chicks. They found that A. indica
infusion successfully improved antibody titre at the level
of 50 ml/liter of fresh drinking water in broilers. Present
findings are also in line with Sadekar et al. (1998),
who fed dry leaves powder of A. indica to broilers (2g/
kg), which significantly enhanced the antibody titers
against IBD and ND virus antigens. Subapriya and
Nagini (2005) also reported antiviral properties of neem
leaf and its constituents. The immune-stimulating
properties of LMM as observed in the present study
might be due to presence of CT. Many previous studies
also reported immune-stimulating properties of CT
containing LMM (Dubey et al., 2012; Pathak et al.,
2014; Singh et al., 2015).
CONCLUSION
It was concluded that Eugenia jambolana
and Psidium guajava leaf meal mixture (50:50)
supplementation (2.5 %) in broiler chicks improved
antioxidant status, cell mediated and humoral immune
responses without affecting performance.
ACKNOWLEDGEMENT
The authors are thankful to Hon’ble Vice
Chancellor and worthy Dean, SKUAST-Jammu for
providing necessary facilities to carry out the research
work.
REFERENCES
AOAC. 1995. Official Methods of Analysis (16th edn).
Association of Official Analytical Chemists.
Washington, DC.
AOAC. 2000. Official Methods of Analysis (16th edn).
Association of Official Analytical Chemists.
Washington, DC.
Atawodi, S.E., Yakubu, O.E. and Umar, I.A. 2013. Antioxidant
and hepatoprotective effects of Parinari curatellifolia
root. Int. J. Agric. Biol. 15: 523-528.
Bergmeyer, H. U. 1983. UV method of catalase assay. In:
Methods of enzymatic Analysis. Vol. 3rd, Weinheim,
Deerfield Beach, Florida, Bansal. pp. 273.
BIS. 1992. Bureau of Indian Standards. Requirements for
Chicken Feeds. IS 1374-1992. Manak Bhavan, 9,
Bhadursha Zafar Marg, New Delhi, pp. 1-3.
Bounous, D. and Stedman, N. 2000. Normal avian
hematology: chicken and turkey. In: Feldman, B.F., Zinkl,
J.G., Jain, N.C., edn. Schalm’s Veterinary Hematology.
New York: Wiley, pp. 1147-1154.
Dacie, J.V and LEWIS, S.M. 1975. Practical Haematology, 4th
Edn. F. A. Davis, Philadelphia, USA.
Daing, M.I., Pathak, A.K., Bhat, M.A. and Zargar, M.A. 2017a.
Antioxidant andantibacterial potential of condensed
tannins containing tree leaves extract. Vet. Pract. 18:
118-121.
Daing, M.I., Pathak, A.K., Bhat, M.A., Sharma, R.K. and Zargar,
M.A. 2017b. In vitro antioxidant and antibacterial
efficacy of condensed tannins containing tree leaves
extract of Jammu Province. J. Anim. Res. 7: 165-174.
Decker, E. A. 1997. Phenolics: Prooxidantsor antioxidants. Nutr.
Rev. 55: 396-407.
Dey, A. and Sarathi De, P. 2014. Influence of Condensed
tannins from Ficus bengalensis leaves on feed
utilization, milk production and antioxidant status of
crossbred cows. Asian Australas. J. Anim. Sci. 27:
342-348.
Dey, A., Dutta, N., Pattanaik, A. K. and Sharma, K. 2015.
Antioxidant status, metabolic profile and immune
response of lambs supplemented with tannin rich
Ficus infectoria leaf meal. Jap. J. Vet. Res. 63: 15-24.
Dubey, M., Dutta, N., Banerjee, P. S., Pattanaik, A. K., Sharma,
K. and Singh, M. 2012. Effect of condensed tannins
supplementation through a tree leaves mixture on
erythrocytic antioxidant status and gastrointestinal
nematodes in kids. Anim. Nutr. Feed Technol. 12:
91-102.
IIA
tit
re (
log 2
valu
e)
2.500
2.000
1.500
1.000
Groups
0.500
0.000
Fig. 2. Humoral immune response (HA titre,
log2 value) of broiler chicks fed LMM
supplemented diet
Antioxidant indices and immune response broiler chicks fed LMM
Indian J. Anim. Nutr. 2020. 37 (2): 158-166

165
Durrani, F.R., Chand, N., Jan, M., Sultan, A., Durrani, Z. and
Akhtar, S. 2008. Immunomodulatory and growth
promoting effects of neem (Azadirachta indica) leaves
infusion in broiler chicks. Sarhad J. Agric. 24: 655-659.
Dutta, N., Dubey, M., Banerjee, P. S., Pattanaik, A. K., Sharma,
K., Kumar, P. and Narang, A. 2012. Effect of
supplementing tanniferous tree leaves mixture on
immune response and GI nematodes in kids. Livest.
Res. Rural Dev. 24.
El-Deek A. A., Asar, M. A., Hamdy, S. M. and Abdalla, A. A.
2009. Utilization of guava by-products in broiler
finisher diets. Egypt. Poult. Sci. 29: 53-75.
Hebig, W. H., Pabst, M. J. and Jacoby, W. B. 1974. Glutathione
S-transferases, the first enzymatic step in the
mercapturic acid formation. J. Biol. Chem. 249: 7130-
7139.
Hudson, L. and Hay, F.C. 1991. Practical Immunology,
Blackwell Scientific Publications. 3rd edn. London.
Jain, N.C. 1986. Schalm’s Veterinary Haematology, 4th Edn.
Lea and Febiger. Philadelphia.
Kumar, V., Elangovan, A.V., Mandal, A.B., Tyagi, P.K., Bhanja,
S.K. and Dash, B. B. 2007. Effects of feeding raw or
reconstituted high tannin red sorghum on nutrient
utilization and certain welfare parameters of broiler
chickens. Br. Poult. Sci. 48: 198-204.
Latshaw, J. D. 1991. Nutrition - mechanism of
immunosupression. Vet. Immunol. Immunopathol. 30:
111-120.
Lau, D.W. and King, A.J. 2003. Pre and post mortem use of
grape seed extract in dark poultry meat to inhibit
development of thiobarbituric acid reactive
substances. J. Agric. Food Chem. 51: 1602-1607.
Makkar, H.P.S. 2000. Quantification of tannins in tree foliage.
Joint FAO/IAEA working document, IAEA, Viena. Pp
1-26.
Marklund, S. and Marklund, G. 1967. Involvement of
superoxide anion radicals in autoxidation of pyrogallol
and convenient assay for superoxide dismutase. Eur.
J. Biochem. 47: 469-474.
Obikaonu, H.O., Okoli, I.C., Opara, M. N., Okoro, V.M. O.,
Ogbuewu, I.P., Etuk, E.B. and Udedibie, A.B.I. 2012.
Haematological and serum biochemical indices of
starter broilers fed leaf meal of neem (Azadirachta
indica). J. Agric. Technol. 8: 71-79.
Onu, P.N. and Aniebo, A.O. 2011. Influence of Moringa
oleifera leaf meal on the performance and blood
chemistry of starter broilers. Int. J. Food Agric. Vet.
Sci. 1: 38-44.
Pathak A.K. 2013. Potential of using condensed tannins to
control gastrointestinal nematodes and improve small
ruminant performance. Int. J. Mol. Vet. Res. 3: 36-50.
Pathak, A.K., Dutta, N., Banerjee, P.S. and Sharma, K. 2013b.
Effect of tannin extracts from tropical tree leaves on
larvae and adult Haemonchus contortus. Indian Vet.
J. 90: 32-34.
Pathak, A.K., Dutta, N., Banerjee, P.S., Pattanaik, A.K.
and Sharma, K. 2013a. Influence of dietary
supplementation of condensed tannins through leaf
meal mixture on nutrient intake, utilization and
performance of Haemonchus contortus infected sheep.
Asian-Australas. J. Anim. Sci. 26: 1446-1458.
Pathak, A.K., Dutta, N., Pattanaik, A.K., Sharma, K., Banerjee,
P.S. and Goswami, T.K. 2017. Effect of condensed
tannins supplementation through Ficus infectoria and
Psidium guajava leaf meal mixture on erythrocytic
antioxidant status, immune response and gastro-
intestinal nematodes in lambs (Ovis aries). Vet. Archiv.
87: 139-156.
Pathak, A.K., Dutta, Narayan, Banerjee, P.S., Goswami, T.K.
and Sharma, K. 2016. Effect of condensed tannins
supplementation through leaf meal mixture on
voluntary feed intake, immune response and worm
burden in Haemonchus contortus infected sheep. J.
Para. Dis. 40: 100-105.
Pathak, A.K., Dutta, Narayan, Banerjee, P.S., Sharma, K. and
Pattanaik, A.K. 2013c. Efficacy of various condensed
tannins extracts from tanniferous tree leaves on egg
hatching inhibition of Haemonchus contortus. Vet.
Pract. 14: 127-129.
Pauzenga, U. 1985. Feeding Parent Stock. Zootec. Int., pp.
22-24.
Placer, Z.A., Cushman, L.L. and Johnson, B. 1966. Estimation
of product of lipid peroxidation (malondialdehyde) in
biochemical system. Anal. Biochem. 16: 359-364.
Prins, H. K. and Loos, I. A. 1969. In: Biochemical Methods in
Red Cell Genetics. (J. J. Yunis ed.), Newyork, pp.
126-130.
Rahman, Z., Siddique, M. N., Khatun, M. A., kamruzzaman,
M. 2013. Effect of Guava (Psidium guajava) leaf meal
on production performances and antimicrobial
sensitivity in commercial broiler. J. Nat. Prod. 6: 177-
187.
Sadekar, R.D., Kolte, A.Y., Barmase, B.S. and Desai, V.F. 1998.
Immunopotentiating effects of Azadirachta indica
(Neem) dry leaves powder in broilers, naturally infected
with IBD virus. Indian J. Exp. Biol. 36: 1151-1153.
Sedlak, J. and Lindsay, R.H. 1968. Estimation of total protein
bound and non-protein sulphhydril groups in tissue
Zargar et al.
Indian J. Anim. Nutr. 2020. 37 (2): 158-166

166
with Ellman’s reagent. Anal. Biochem. 25: 192-205.
Shafey, T.M., Almufarij, S.I. and Albatshan, S.I. 2013. Effect of
feeding olive leaves on the performance, intestinal and
carcass characteristics of broiler chickens. Int. J. Agric.
Biol. 15: 585 589.
Shafey, T.M., M.A. Alodan, H.A. Al-Batshan, M.A. Abouheif,
M.S. Alamri and I.M. Al-Ruqaie, 2011. Performance,
Egg Characteristics and Economic Impact of Laying
Hens Fed Extruded Bakery Waste. J. Anim. Vet. Adv.
10: 2248-2252.
Singh, S., Pathak, A.K., Sharma, R.K. and Khan, M. 2015.
Effect of tanniferous leaf meal based multi nutrient
blocks on feed intake, haematological profile, immune
response and body weight changes in Haemonchus
contortus infected goats. Vet. World. 8: 572-579.
Simol, C.F., Tuen, A.A., Khan, H. H. A., Chubo, J.K., King,
P.J.H. and Ong, K.H. 2012. Performance of chicken
broilers fed with diets substituted with mulberry leaf
powder. Afr. J. Biotechnol. 11: 16106-16111.
Snedecor, G.W. and Cochran, W.G. 2004. Statistical Methods
(8th Edn.). East West Press Pvt. Ltd., New Delhi.
Subapriya, R. and Nagini, S. 2005. Medicinal properties of
neem leaves: A review. Curr. Med. Chem. Anti-cancer
Agents. 5: 149-156.
Talpatra, S.K., Ray, S.C. and Sen, K.C. 1940. Estimation of
phosphorus, chlorine, calcium, magnesium, sodium and
potassium in foodstuffs. Indian J. Vet. Sci. Anim. Husb.
10: 243-258.
Antioxidant indices and immune response broiler chicks fed LMM
Indian J. Anim. Nutr. 2020. 37 (2): 158-166
Windisch, W., Schedle, K., Plitzner, C. and Kroismayer, A.
2008. Use of Phytogenic products as feed additives
for swine and poultry. J. Anim. Sci. 86 (E suppl.): E140-
E148.
Yagi, Y., Furunchi, S., Takashi, H. and Koyama, H. 1989.
Abnormality of osmotic fragility and morphological
disorder of bovine erythrocytes infected with
Theileria sargonti. J. Vet. Sci. 51: 389-395.
Yokozawa, T., Dong, E., Chung, H. Y., Oura, H. and Nakagawa,
H. 1997. Inhibitory effect of green tea on injury to a
cultured renal epithelial cell line, LLC-PK. Biosci.
Biotechnol. Biochem. 61: 204-206.
Yuting, C., Rongliang, Z, Zhongjian, J. and Yong, J. 1990.
Flavonoids as superoxide scavengers and antioxidants.
Free Rad. Biol. Med. 9: 19-23.
Zargar M.A., Pathak, A.K. and Daing, M.I. 2017. Screening
and evaluation of antioxidants and anticoccidial
properties of condensed tannins containing tree leaves
of Jammu province. Indian J. Anim. Res. 51: 1105-1112.
Zargar, M.A., Pathak, A.K., Sharma, R.K. and Daing, M.I. 2016.
Antioxidants and Anticoccidial potential of aqueous
extract from various tree leaves containing condensed
tannins. J. Anim. Res. 6: 563-570.
Received on 19-06-2020 and accepted on 12-08-2020
167
Indian Journal of
Animal Nutrition
Effect of Replacement of Maize by Animal Fat on Growth and Nutrient
Utilization of Growing Large White Yorkshire Pigs
N. Elanchezhian1* and K. Ally2
Department of Animal Nutrition, College of Veterinary and Animal Sciences,
Mannuthy, Trichur, Kerala, India.
ABSTRACT
In order to study the effect of replacement of maize by animal fat on growth and nutrient utilization, thirty
weaned female Large White Yorkshire piglets were divided in to three groups with five replicates in each group
and were maintained under identical management conditions for the period of 70 days. The piglets were
randomly allocated to one of the three treatments namely T1 (control ration), T
2 (50 per cent of maize of control
ration replaced by animal fat) and T3 (100 per cent of maize of control ration replaced by animal fat). The average
daily gain and feed conversion efficiency were 813.00, 769.86, 678.43 g, and 2.80, 2.88, 3.08, respectively
for three dietary treatments. The pigs of T1 had higher (P<0.05) average body weight gain than that of
other treatments. The crude fibre digestibility was higher (P<0.05) for T1 and T
2 rations than that of T
3. The
digestibility of dry matter, organic matter, crude protein and NFE was higher for T1 ration as compared to other
groups. Availability of calcium, magnesium and manganese was lowered (P<0.01) in T3 group. It can be
concluded that partial (50 per cent) replacement of the maize in the feed for pigs by animal fat did not affect the
weight gain, feed intake, feed conversion efficiency and nutrient utilization.
Key words: Animal fat, Growth, Nutrient digestibility, Pig, Replacement of maize
1Corresponding author; Email: [email protected]; Department of Animal Nutrition, Rajiv Gandhi Institute of Veterinary Education and
Research, Puducherry-605 009; *Part of Ph.D. thesis entitled “Dietary modifications on lipid profiles of pigs fed animal fat” submitted to the
Kerala Veterinary and Animal Sciences University, Kerala; 2Department of Animal Nutrition, College of Veterinary and Animal Sciences,
Mannuthy, Trichur, Kerala, India.
INTRODUCTION
Cereal grain forms the major source of energy in
the swine feed. Even though India produces more than
20 million MT of maize per year, it could meet only 60
per cent of the requirement of the country. The lower
availability and increasing price of maize, necessitate
an alternative energy source for incorporation in the
swine feed. Animal fat is a byproduct of meat industry
and can be included as a source of energy in swine
ration. India produces 0.14 million MT of tallow and
0.02 million MT of lard per year (Best, 2012). The use
of fat as an energy source for pigs has been shown to
increase digestibility of nutrients, improve growth rate
and also reduces dustiness of feeds and increases
palatability (Apple et al., 2007). However, studies on
the effects of adding animal fat to swine diets have
yielded variable results. Hence, the present was
undertaken to study the effect of replacement of maize
by animal fat on growth and nutrient utilization of
growing Large White Yorkshire pigs.
Indian J. Anim. Nutr. 2020. 37 (2): 167-171
doi: 10.5958/2231-6744.2020.00027.4
MATERIALS AND METHODS
Thirty weaned female Large White Yorkshire
piglets were randomly divided into three groups of five
replicates in each group. Each replicates were allotted
with two piglets and housed in a single pen. All piglets
were maintained under identical management conditions
throughout the experimental period of 70 days.
Restricted feeding was followed and daily feed intake
was recorded. The animals were fed with standard
grower ration containing 18 per cent of crude protein
(CP) and 3265 kcal of metabolizable energy (ME)/kg
of feed up to 50 kg body weight and finisher ration with
16 per cent CP and 3265 kcal of ME /kg of feed from
50 kg body weight as per NRC (2012). Ingredient
composition and proximate composition of the grower
and finisher ration is given in the table 1 and 2. Piglets
were randomly distributed into three dietary treatment
groups; namely T1 (control ration), T
2 (50 per cent of
maize of control ration replaced by animal fat) and T3
(100 per cent of maize of control ration replaced by
Indian J. Anim. Nutr. 2020. 37 (2): 167-171
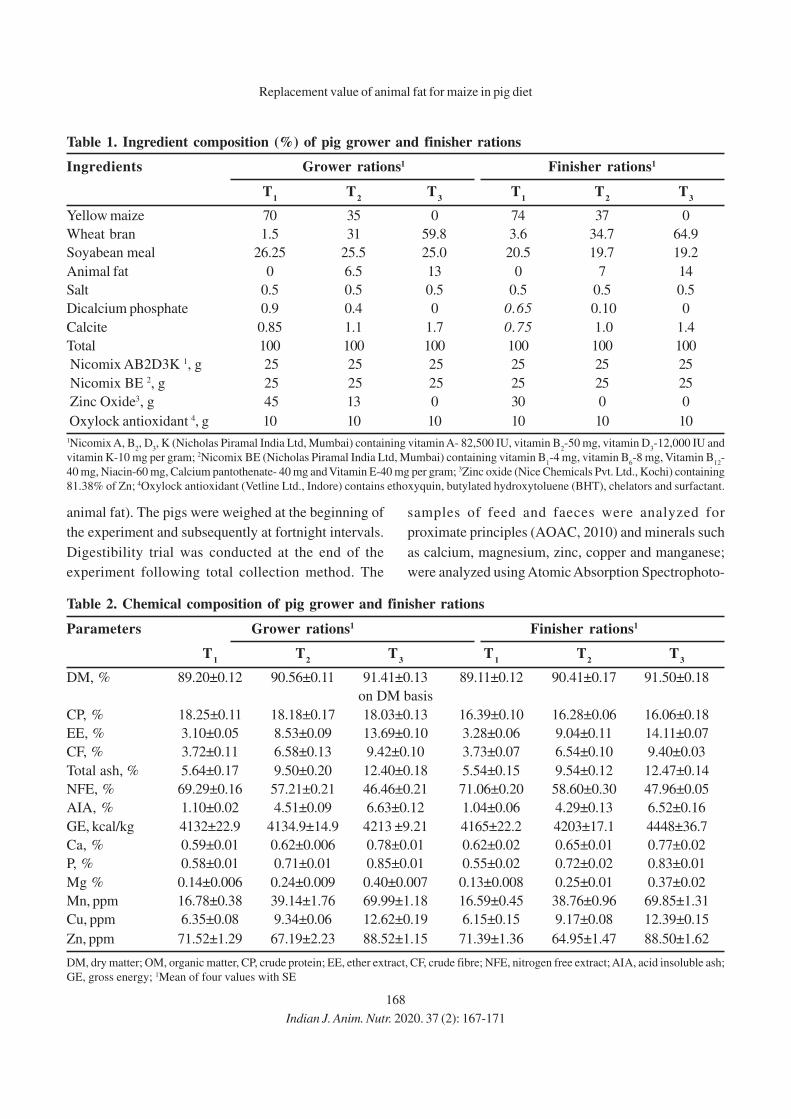
168
animal fat). The pigs were weighed at the beginning of
the experiment and subsequently at fortnight intervals.
Digestibility trial was conducted at the end of the
experiment following total collection method. The
samples of feed and faeces were analyzed for
proximate principles (AOAC, 2010) and minerals such
as calcium, magnesium, zinc, copper and manganese;
were analyzed using Atomic Absorption Spectrophoto-
Replacement value of animal fat for maize in pig diet
Table 1. Ingredient composition (%) of pig grower and finisher rations
Ingredients Grower rations1 Finisher rations1
T1
T2
T3
T1
T2
T3
Yellow maize 70 35 0 74 37 0
Wheat bran 1.5 31 59.8 3.6 34.7 64.9
Soyabean meal 26.25 25.5 25.0 20.5 19.7 19.2
Animal fat 0 6.5 13 0 7 14
Salt 0.5 0.5 0.5 0.5 0.5 0.5
Dicalcium phosphate 0.9 0.4 0 0.65 0.10 0
Calcite 0.85 1.1 1.7 0.75 1.0 1.4
Total 100 100 100 100 100 100
Nicomix AB2D3K 1, g 25 25 25 25 25 25
Nicomix BE 2, g 25 25 25 25 25 25
Zinc Oxide3, g 45 13 0 30 0 0
Oxylock antioxidant 4, g 10 10 10 10 10 10
1Nicomix A, B2, D
3, K (Nicholas Piramal India Ltd, Mumbai) containing vitamin A- 82,500 IU, vitamin B
2-50 mg, vitamin D
3-12,000 IU and
vitamin K-10 mg per gram; 2Nicomix BE (Nicholas Piramal India Ltd, Mumbai) containing vitamin B1-4 mg, vitamin B
6-8 mg, Vitamin B
12-
40 mg, Niacin-60 mg, Calcium pantothenate- 40 mg and Vitamin E-40 mg per gram; 3Zinc oxide (Nice Chemicals Pvt. Ltd., Kochi) containing
81.38% of Zn; 4Oxylock antioxidant (Vetline Ltd., Indore) contains ethoxyquin, butylated hydroxytoluene (BHT), chelators and surfactant.
Table 2. Chemical composition of pig grower and finisher rations
Parameters Grower rations1 Finisher rations1
T1
T2
T3
T1
T2
T3
DM, % 89.20±0.12 90.56±0.11 91.41±0.13 89.11±0.12 90.41±0.17 91.50±0.18
on DM basis
CP, % 18.25±0.11 18.18±0.17 18.03±0.13 16.39±0.10 16.28±0.06 16.06±0.18
EE, % 3.10±0.05 8.53±0.09 13.69±0.10 3.28±0.06 9.04±0.11 14.11±0.07
CF, % 3.72±0.11 6.58±0.13 9.42±0.10 3.73±0.07 6.54±0.10 9.40±0.03
Total ash, % 5.64±0.17 9.50±0.20 12.40±0.18 5.54±0.15 9.54±0.12 12.47±0.14
NFE, % 69.29±0.16 57.21±0.21 46.46±0.21 71.06±0.20 58.60±0.30 47.96±0.05
AIA, % 1.10±0.02 4.51±0.09 6.63±0.12 1.04±0.06 4.29±0.13 6.52±0.16
GE, kcal/kg 4132±22.9 4134.9±14.9 4213 ±9.21 4165±22.2 4203±17.1 4448±36.7
Ca, % 0.59±0.01 0.62±0.006 0.78±0.01 0.62±0.02 0.65±0.01 0.77±0.02
P, % 0.58±0.01 0.71±0.01 0.85±0.01 0.55±0.02 0.72±0.02 0.83±0.01
Mg % 0.14±0.006 0.24±0.009 0.40±0.007 0.13±0.008 0.25±0.01 0.37±0.02
Mn, ppm 16.78±0.38 39.14±1.76 69.99±1.18 16.59±0.45 38.76±0.96 69.85±1.31
Cu, ppm 6.35±0.08 9.34±0.06 12.62±0.19 6.15±0.15 9.17±0.08 12.39±0.15
Zn, ppm 71.52±1.29 67.19±2.23 88.52±1.15 71.39±1.36 64.95±1.47 88.50±1.62
DM, dry matter; OM, organic matter, CP, crude protein; EE, ether extract, CF, crude fibre; NFE, nitrogen free extract; AIA, acid insoluble ash;
GE, gross energy; 1Mean of four values with SE
Indian J. Anim. Nutr. 2020. 37 (2): 167-171

169
meter (Perkin Elmer 3110, USA). Phosphorus contents
of both feed and faecal samples were analyzed
according to AOAC (2010). Data collected were
statistically analyzed using Statistical Package for
Social Studies (SPSS. 17.0.1V, 2008) software.
RESULTS AND DISCUSSION
The data on the body weight, feed intake, daily
gain and feed conversion efficiency of pigs fed the
experimental rations are presented in Table 3. The
average initial and final body weight of piglets belonging
to three groups were 23.94, 23.96 and 24.01 kg, and
80.85, 77.85 and 71.50 kg, respectively. Replacement
of maize at 50 per cent by animal fat had no significant
effect on body weight of pigs. However, pigs reared on
T1 had higher (P<0.01) final body weight than that of T
3
treatment. In agreement to the results obtained in the
present study non-significant growth performance in pigs
fed different levels of supplemental fat were reported
by Reis et al. (2000), Guo et al. (2006) and Realini et
al. (2010) (animal fat at five per cent).
In this present study pigs maintained on T3
treatment recorded significantly lower growth rate as
compared to T1 group. This may be due to the higher
level of wheat bran (64.9 per cent) in T3 ration which
resulted in high crude fibre (9.40 per cent) and acid
insoluble ash (6.52 per cent) content in the ration. The
total feed intake recorded for three treatments were
159.28, 154.98 and 145.98 kg, respectively. There was
no significant difference in total feed intake among three
treatments. This is in agreement with Bhar et al. (2000)
who observed similar feed intake in crossbred pigs fed
diet with 0, 50 and 100 per cent replacement of maize
by wheat bran.
The average daily gain was 813.00, 769.86 and
678.43 g, respectively for three treatments. Statistical
analysis revealed no difference in average daily gain
between T1 and T
2 treatments, whereas T
1 treatment
had higher (P<0.05) gain than that of T3 treatment. The
feed conversion efficiency for three treatment groups
was 2.80, 2.88 and 3.08, respectively. There was no
difference in feed efficiency between T1 and T
2; but
both had better (P<0.05) feed efficiency than that of
T3. In the present study T
3 treatment recorded
significantly lower average daily gain and feed efficiency
compared to other groups. This may be due to high crude
fibre (9.40 per cent) and acid insoluble ash (6.52 per
cent) content in the ration which might have affected
the digestion and utilization of the nutrients. Growth rate
and feed efficiency of pigs were depressed as fiber level
in the diet increased (Lewis and Southern, 2000). Sheikh
et al. (2011) observed significant deterioration in feed
conversion efficiency in crossbred pigs fed diet
containing paddy grain (rice) instead of maize. No
significant difference was observed on growth
performance and cost of production in LWY pigs fed
diet containing 0 and 50 per cent replacement of maize
by wheat bran whereas at 100 per cent replacement of
maize by wheat bran showed significantly lower growth
rate and higher production cost (Elanchezhian and Ally,
2016).
Data on apparent digestibility of nutrients and
availability of minerals is presented in Table 4. Ether
Table 3. Weight gain, feed intake, average daily gain and feed conversion efficiency of pigs maintained
on the three experimental rations
Parameters Treatments
T1
T2
T3
Initial body weight, kg 23.94±1.30 23.96±1.55 24.01±1.19
*Final body weight, kg 80.85b±2.76 77.85ab±2.35 71.50a±2.00
**Total weight gain, kg 56.91b±1.48 53.89b±0.85 47.49a±1.26
**Average daily gain, g 813.00b±21.20 769.86b±12.16 678.43a±18.06
Total feed intake, kg 159.28±6.54 154.98±4.42 145.98±3.30
**Feed conversion efficiency 2.80a±0.05 2.88a±0.05b 3.08b±0.06
a,bMeans with different superscripts within the same row differ significantly; *(P<0.05); **(P<0.01)
Elanchezhian and Ally
Indian J. Anim. Nutr. 2020. 37 (2): 167-171

170
extract digestibility was similar in all the three
treatments. The digestibility of all other nutrients in the
control group was higher than the other groups. Pigs
fed ration with 50 per cent of maize replaced with
animal fat had higher (P<0.05) digestibility of nutrients
than T3. The crude fibre digestibility was higher (P<0.05)
in T1 and T
2 as compared to T
3, in which it was the
lowest. In T3 (100 per cent maize replacement) group
the level of wheat bran was 64.9 per cent, compared to
34.7 per cent in T2. The level of crude fibre and acid
insoluble ash in the three rations were 3.73 and 1.04;
6.54 and 4.29 and 9.4 and 6.52, respectively for T1, T
2
and T3. The higher levels of crude fibre and acid
insoluble ash might have contributed to the lowered
digestibility of all nutrients except ether extract. Bhar et
al. (2000) also observed decreased digestibility of dry
matter, organic matter, crude fibre, total carbohydrate,
nitrogen free extract and energy with increased level of
wheat bran in the diet of crossbred pigs. The digestive
tract enlarges to accommodate a larger volume of
feed rich in crude fibre and the rate of passage of
ingesta increases, resulting in reduction in digestibility
of nutrients (Lentle and Janssen, 2008). Sikka et al.
(1987) found that replacement of maize and rice bran
with paddy in growing and finishing pigs led to a
significant decrease in the digestibility of organic matter
and crude fibre. Sheikh (2011) observed a significant
reduction in digestibility of dry matter, ether extract,
crude fibre and NFE in crossbred pigs fed diet
containing paddy grain instead of maize. The digestible
energy values of the three experimental rations were
3558, 3104 and 2837 kcal/kg, respectively. The control
group (T1) had higher (P<0.01) DE than T
2 and T
3 and
the lowest DE was recorded in T3.
Significant improvement in digestibility of energy
as a result of fat supplementation in the diet of pigs was
reported by Reis et al. (2000) (eight per cent tallow).
However, no significant difference in the energy
digestibility in pigs by supplementation of tallow at five
per cent in the diet was observed by Garry et al. (2007)
and Huang et al. (2010). As the level of replacement of
maize by animal fat increased, the efficiency of energy
utilization was reduced in pigs (Elanchezhian et al., 2014;
Elanchezhian and Ally, 2020).
From the present study, it was observed that there
was no difference in the availability of phosphorus,
copper and zinc between the three rations, whereas the
availability of calcium, magnesium and manganese
were lowered (P<0.01) in T3 group. The comparatively
higher levels of phosphorus (0.83 per cent) in T3 might
have caused an imbalance between calcium and
phosphorus resulting in lowered absorption of calcium.
The high level of wheat bran (64.7 per cent) in 100 per
cent maize replacement (T3) group might have led to a
Table 4. Apparent digestibility of nutrients and availability of minerals of the three experimental rations
Parameters Treatments
T1
T2
T3
Dry matter, % 85.73c±0.36 72.18b±1.57 59.07a±1.77
Organic matter, % 87.95c±0.40 76.14b±1.28 64.00a±1.48
Crude protein, % 84.48c±0.68 77.59b±1.03 67.94a±2.39
Ether extract, % 67.60±2.07 62.83±3.47 58.62±4.15
Crude fibre, % 55.36b±1.49 49.63b±1.70 38.84a±3.05
Nitrogen free extract, % 91.49c±0.54 80.48b±1.23 69.21a±1.75
DE, kcal/kg 3558.12c±3.47c 3104.22b±76.15 2837.96a±61.48
Calcium, % 60.34b±1.77 55.28ab±2.11 47.53a±2.27
Phosphorus, % 54.53±2.74 51.38±3.23 46.22±2.36
Magnesium, % 66.29b±2.29 58.82ab±2.53 52.95a±2.40
Manganese, % 71.38b±1.38 64.13b±2.06 54.92a±2.23
Copper, % 62.02±1.74 57.41±3.70 53.08±2.22
Zinc, % 63.40±1.94 61.48±2.80 56.65±2.76
a,b,cMeans with different superscripts within the same row differ significantly, (P<0.01)
Replacement value of animal fat for maize in pig diet
Indian J. Anim. Nutr. 2020. 37 (2): 167-171
171
decrease in availability of minerals like magnesium and
manganese. Fibrous feedstuffs such as peanut hulls, oat
hulls, wheat bran, and soyabean hulls have been shown
to decrease mineral absorption in pigs (Kornegay and
Moore, 1986).
CONCLUSION
Results obtained in the experiment indicates that
50% replacement of the maize by animal fat in the diet
of pigs did not affect the weight gain, feed intake, feed
conversion efficiency and nutrient utilization. However,
100% replacement of maize with animal fat showed
adverse impact on weight gain, feed conversion
efficiency and nutrient utilization. Thus, 50% of maize
can be replaced be replaced with animal fat in the diets
of pigs without any adverse impact.
ACKNOWLEDGMENT
The authors are very much thankful to Dean,
College of Veterinary and Animal Sciences, Mannuthy
for providing necessary facilities for successful conduct
of the work.
REFERENCES
AOAC. 2010. Official Methods of Analysis.18th rev. ed.
Association of Official Analytical Chemists,
Arlington, Washington DC, USA.
Apple, J. K., Maxwell, C.V., Sawyer, J.T., Kutz, B.R., Rakes,
L.K., Davis, M.E., Johnson, Z.B., Carr, S.N. and
Armstrong, T.A. 2007. Interactive effect of ractopamine
and dietary fat source on quality characteristics of fresh
pork bellies. J. Anim. Sci. 85: 2682-2690.
Best, P. 2012, July-August, 2012. Global pig production: Trends
shaping the pork industry. Pig International-
Bimonthly, 42(4): pp. 8-11. Available: www.WATTAg
Net.com.
Bhar, R., Pathak, N.N. and Paul, S. 2000. Performance of
crossbred (Landrace × local Indian) finisher barrows
fed maize or wheat bran based diets: Short note.
Asian-Australas. J. Anim. Sci. 13: 1429-1432.
Lewis, A.J. and Southern, L.L. (eds.), 2000. Swine Nutrition
(2nd Ed.). CRC press, Florida, USA.
Elanchezhian, N., Ally, K., Mercy, A.D., Gangadevi, P.,
Kuttinarayanan, P. and Usha, A.P. 2014. Effect of
supplementation of animal fat on plasma and muscle
lipid profile of Large White Yorkshire pigs. Indian J.
Anim. Nutr. 30: 423-427.
Elanchezhian, N. and Ally, K. 2016. Influence of replacement
of maize by wheat bran on cost of production in pigs.
Indian J. Anim. Nutr. 33: 236-240.
Elanchezhian, N. and Ally, K. 2020. Effect of replacement of
maize by animal fat on energy utilization in pigs.
Indian J. Anim. Nutr. 37: 57-61.
Garry, B.P., Pierce, K.M. and O’Doherty, J.V. 2007. The effect
of phase-feeding on the growth performance, carcass
characteristics and nitrogen balance of growing and
finishing pigs. Irish J. Agric. Food Res. 46: 93-104.
Guo, Q., Richert, B.T., Burgess, J.R., Webel, D.M., Orr, D.E.,
Blair, M., Grant, A.L. and Gerrard, D.E. 2006. Effect of
dietary vitamin E supplementation and feeding Period
on pork quality. J. Anim. Sci. 84: 3071-3078.
Huang, Y., Yoo, J.S., Kim, H.J., Wang, Y., Chen, Y.J., Cho, J.H.
and Kim, I.H. 2010. The Effects of different copper
(inorganic and organic) and energy (tallow and
glycerol) sources on growth performance, nutrient
digestibility, and fecal excretion profiles in growing
pigs. Asian-Australas. J. Anim. Sci. 23: 573-579.
Kornegay, E. T. and Moore, R.J. 1986. Dietary fiber sources
may affect mineral use in swine. Feedstuffs. 58: 36.
Lentle, R.G. and Janssen, P.W.M. 2008. Physical
characteristics of digesta and their influence on flow
and mixing in the mammalian intestine: A review. J.
Comp. Physiol. 178: 673-690.
NRC. 2012. Nutrient Requirements of Swine (11th Ed.).
National Academy of Sciences, Washington, D. C.,
210p.
Realini, C.E., Duran-montage, P., Lizardo, R., Gisperta, M.,
Oliver, M.A. and Esteve-Garcia, E. 2010. Effect of
source of dietary fat on pig performance, carcass
characteristics and carcass content, distribution and
fatty acid composition. Meat Sci. 85: 606-612.
Reis de souza, T.C., Aumaitre, A., Mourot, J. and Peiniau, J.
2000. Effect of graded levels of tallow in the diet on
performance, digestibility of fat, lipogenesis and body
lipid deposition of the weaned piglet. Asian-Australas.
J. Anim. Sci. 13: 497-505.
Sheikh, G.G., Ganie, A.A., Baghel, R.P.S. and Nayak, S. 2011.
Effect of paddy grain as maize replacer on the growth
performance and nutrient utilization in growing and
finishing pigs. Indian J. Anim. Nutr. 28: 437-440.
Sikka, S.S., Chawla, J.S. and Ichhponani, J.S. 1987. Effect of
protein levels on the performance of growing pigs
during different season. Indian J. Anim. Sci. 57: 164-
167.
SPSS. 2008. 17.0.1 V. Windows user’s guide 2008 by Statistical
Package for the Social Sciences Inc. USA.
Received on 12-06-2020 and accepted on 07-08-2020
Elanchezhian and Ally
Indian J. Anim. Nutr. 2020. 37 (2): 167-171

172
Indian Journal of
Animal Nutrition
Effect of Feeding Different Levels of Rice Distillers Dried Grains with
Soluble (RDDGS) on Performance of Broiler
Niharika Singh, Meenu Dubey*, Raina Doneria, M.K. Gendley,
O.P. Dinani and R.C. Ramteke
Department of Animal Nutrition, College of Veterinary Science and A.H., Anjora
Chhattisgarh Kamdhenu Vishwavidyalaya, Durg
ABSTRACT
Rice distillers dried grains with solubles (RDDGS) is a co-product of rice-based ethanol production that
can be a valuable source of energy, digestible amino acids, and available phosphorus in poultry feeds. The
present study was conducted for 5 weeks to study the effect of different dietary inclusion levels of rice DDGS
on performance of broiler chickens. The diets were prepared using conventional feed ingredients: maize,
deoiled soybean cakes, soy oil, rice DDGS and premixes containing trace minerals and vitamins. The average
body weight of chicks at the end of pre-starter and starter phase was significantly (P<0.05) higher in birds fed
diet with 10 and 15% rice DDGS as compared to control, however, at 35 d the difference in body weight was not
significant amongst the group. No significant effect of rice DDGS inclusion on weekly and cumulative feed
intake was observed. The cumulative FCR up to 3 weeks was significantly (P<0.05) better in all the treatment
groups irrespective of level of rice DDGS, however, at the end of experiment the difference amongst the group
was not significant. No significant effect of different dietary inclusion levels of rice DDGS on metabolizability
of DM was observed. The N and Ca balance also did not vary significantly among the groups, however, the P
balance was significantly (P<0.05) higher in all the treatment groups irrespective of level of rice DDGS. Birds fed
diet with 10% DDGS gave best response in terms of net profit per kilogram of body weight. It is therefore
concluded that rice DDGS can be incorporated at 10% level in broiler feed.
Key Words: RDDGS, Growth, Nutrient utilization, Broiler chickens
*Corresponding author; Email: [email protected]; Mobile No. 09926130785
INTRODUCTION
Poultry is one of the fastest growing segments of
the agriculture sector in India and is one of the key
industries to provide feed security to a large population
in terms of energy and protein as well as employment to
people. A major constraint affecting the growth of the
poultry industry in India is price and availability of feed
resources. Feed costs are primarily driven by the cost
of protein sources. With increasing feed prices, the
interest in using alternative feed sources like DDGS
in poultry diets has escalated during recent years.
Distillers dried grain with solubles (DDGS) is a
co-product of ethanol industry which is obtained from
grains through a process of dry milling. The DDGS is a
unique feedstuff that provides high levels of protein,
energy, digestible fibre and minerals (Schingoethe et al.,
2009). Chemical analysis on as such basis indicated that
rice DDGS is high in protein (44.68%) and gross
energy 4232 kcal/kg (Dinani et al., 2019). It is also more
Indian J. Anim. Nutr. 2020. 37 (2): 172-178
doi: 10.5958/2231-6744.2020.00028.6
nutritious than the cereals from which it is made up of,
as it contains other nutrients recovered from fermented
grains. The DDGS is being used either wet or dry but
performance is usually similar whether fed as wet or
dried products (Koger et al., 2010). Furthermore, DDGS
also contains moderate level of fat and readily
digestible fibre which contributes to the higher energy
concentration. The high energy and protein content of
DDGS makes it a very attractive resource for partial
replacement of some of the more expensive traditional
energy (maize) and protein (soybean meal) ingredients
used in animal feeds. Keeping in view the above facts,
the present experiment was planned to study the effect
of different dietary inclusion level of rice DDGS on
growth performance, nutrient utilization and economics
of rearing broiler chicken up to 35 d of age.
MATERIAL AND METHODS
The experiment was conducted in the poultry shed
of College of Veterinary Science & A. H., Anjora, Durg.
Indian J. Anim. Nutr. 2020. 37 (2): 172-178
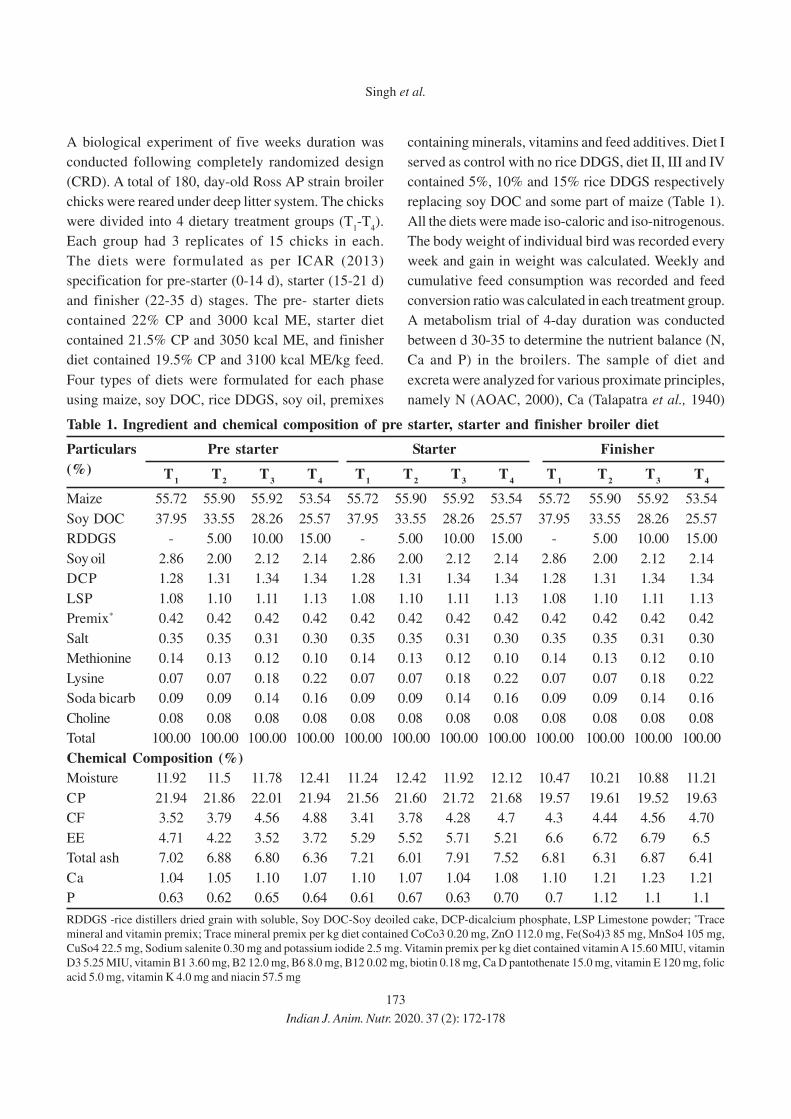
173
A biological experiment of five weeks duration was
conducted following completely randomized design
(CRD). A total of 180, day-old Ross AP strain broiler
chicks were reared under deep litter system. The chicks
were divided into 4 dietary treatment groups (T1-T
4).
Each group had 3 replicates of 15 chicks in each.
The diets were formulated as per ICAR (2013)
specification for pre-starter (0-14 d), starter (15-21 d)
and finisher (22-35 d) stages. The pre- starter diets
contained 22% CP and 3000 kcal ME, starter diet
contained 21.5% CP and 3050 kcal ME, and finisher
diet contained 19.5% CP and 3100 kcal ME/kg feed.
Four types of diets were formulated for each phase
using maize, soy DOC, rice DDGS, soy oil, premixes
containing minerals, vitamins and feed additives. Diet I
served as control with no rice DDGS, diet II, III and IV
contained 5%, 10% and 15% rice DDGS respectively
replacing soy DOC and some part of maize (Table 1).
All the diets were made iso-caloric and iso-nitrogenous.
The body weight of individual bird was recorded every
week and gain in weight was calculated. Weekly and
cumulative feed consumption was recorded and feed
conversion ratio was calculated in each treatment group.
A metabolism trial of 4-day duration was conducted
between d 30-35 to determine the nutrient balance (N,
Ca and P) in the broilers. The sample of diet and
excreta were analyzed for various proximate principles,
namely N (AOAC, 2000), Ca (Talapatra et al., 1940)
Table 1. Ingredient and chemical composition of pre starter, starter and finisher broiler diet
Particulars Pre starter Starter Finisher
(%) T1
T2
T3
T4
T1
T2
T3
T4
T1
T2
T3
T4
Maize 55.72 55.90 55.92 53.54 55.72 55.90 55.92 53.54 55.72 55.90 55.92 53.54
Soy DOC 37.95 33.55 28.26 25.57 37.95 33.55 28.26 25.57 37.95 33.55 28.26 25.57
RDDGS - 5.00 10.00 15.00 - 5.00 10.00 15.00 - 5.00 10.00 15.00
Soy oil 2.86 2.00 2.12 2.14 2.86 2.00 2.12 2.14 2.86 2.00 2.12 2.14
DCP 1.28 1.31 1.34 1.34 1.28 1.31 1.34 1.34 1.28 1.31 1.34 1.34
LSP 1.08 1.10 1.11 1.13 1.08 1.10 1.11 1.13 1.08 1.10 1.11 1.13
Premix* 0.42 0.42 0.42 0.42 0.42 0.42 0.42 0.42 0.42 0.42 0.42 0.42
Salt 0.35 0.35 0.31 0.30 0.35 0.35 0.31 0.30 0.35 0.35 0.31 0.30
Methionine 0.14 0.13 0.12 0.10 0.14 0.13 0.12 0.10 0.14 0.13 0.12 0.10
Lysine 0.07 0.07 0.18 0.22 0.07 0.07 0.18 0.22 0.07 0.07 0.18 0.22
Soda bicarb 0.09 0.09 0.14 0.16 0.09 0.09 0.14 0.16 0.09 0.09 0.14 0.16
Choline 0.08 0.08 0.08 0.08 0.08 0.08 0.08 0.08 0.08 0.08 0.08 0.08
Total 100.00 100.00 100.00 100.00 100.00 100.00 100.00 100.00 100.00 100.00 100.00 100.00
Chemical Composition (%)
Moisture 11.92 11.5 11.78 12.41 11.24 12.42 11.92 12.12 10.47 10.21 10.88 11.21
CP 21.94 21.86 22.01 21.94 21.56 21.60 21.72 21.68 19.57 19.61 19.52 19.63
CF 3.52 3.79 4.56 4.88 3.41 3.78 4.28 4.7 4.3 4.44 4.56 4.70
EE 4.71 4.22 3.52 3.72 5.29 5.52 5.71 5.21 6.6 6.72 6.79 6.5
Total ash 7.02 6.88 6.80 6.36 7.21 6.01 7.91 7.52 6.81 6.31 6.87 6.41
Ca 1.04 1.05 1.10 1.07 1.10 1.07 1.04 1.08 1.10 1.21 1.23 1.21
P 0.63 0.62 0.65 0.64 0.61 0.67 0.63 0.70 0.7 1.12 1.1 1.1
RDDGS -rice distillers dried grain with soluble, Soy DOC-Soy deoiled cake, DCP-dicalcium phosphate, LSP Limestone powder; *Trace
mineral and vitamin premix; Trace mineral premix per kg diet contained CoCo3 0.20 mg, ZnO 112.0 mg, Fe(So4)3 85 mg, MnSo4 105 mg,
CuSo4 22.5 mg, Sodium salenite 0.30 mg and potassium iodide 2.5 mg. Vitamin premix per kg diet contained vitamin A 15.60 MIU, vitamin
D3 5.25 MIU, vitamin B1 3.60 mg, B2 12.0 mg, B6 8.0 mg, B12 0.02 mg, biotin 0.18 mg, Ca D pantothenate 15.0 mg, vitamin E 120 mg, folic
acid 5.0 mg, vitamin K 4.0 mg and niacin 57.5 mg
Singh et al.
Indian J. Anim. Nutr. 2020. 37 (2): 172-178
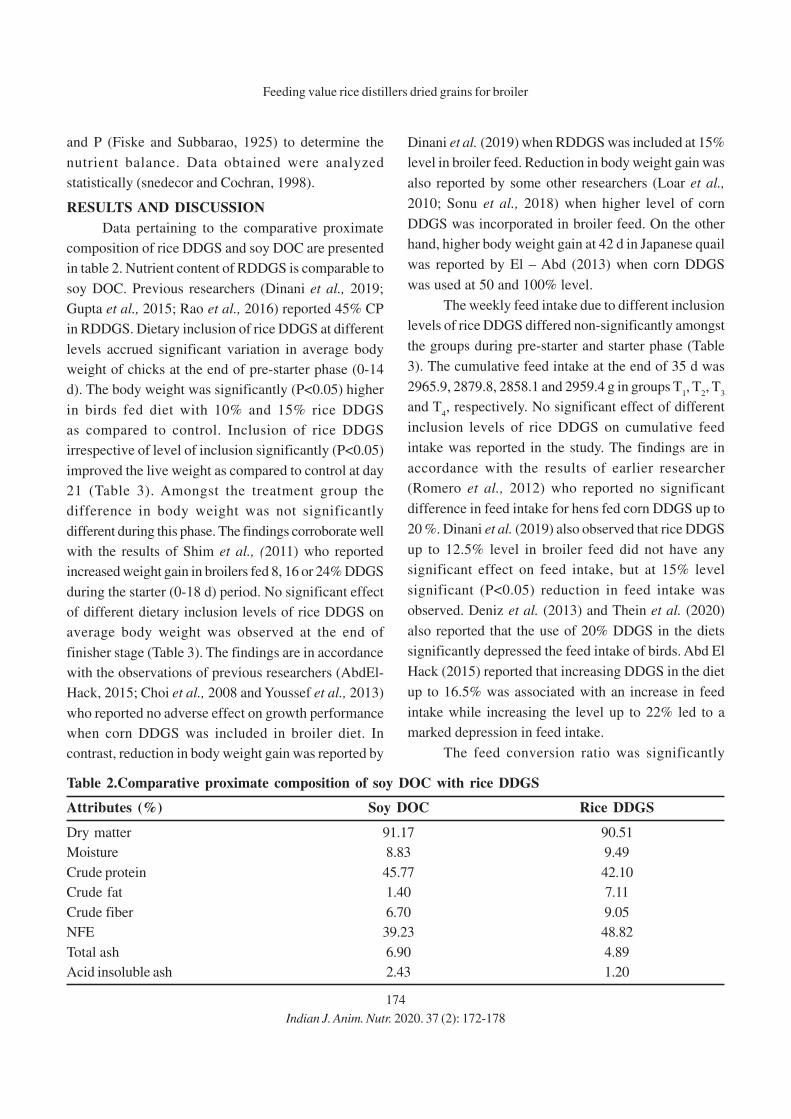
174
and P (Fiske and Subbarao, 1925) to determine the
nutrient balance. Data obtained were analyzed
statistically (snedecor and Cochran, 1998).
RESULTS AND DISCUSSION
Data pertaining to the comparative proximate
composition of rice DDGS and soy DOC are presented
in table 2. Nutrient content of RDDGS is comparable to
soy DOC. Previous researchers (Dinani et al., 2019;
Gupta et al., 2015; Rao et al., 2016) reported 45% CP
in RDDGS. Dietary inclusion of rice DDGS at different
levels accrued significant variation in average body
weight of chicks at the end of pre-starter phase (0-14
d). The body weight was significantly (P<0.05) higher
in birds fed diet with 10% and 15% rice DDGS
as compared to control. Inclusion of rice DDGS
irrespective of level of inclusion significantly (P<0.05)
improved the live weight as compared to control at day
21 (Table 3). Amongst the treatment group the
difference in body weight was not significantly
different during this phase. The findings corroborate well
with the results of Shim et al., (2011) who reported
increased weight gain in broilers fed 8, 16 or 24% DDGS
during the starter (0-18 d) period. No significant effect
of different dietary inclusion levels of rice DDGS on
average body weight was observed at the end of
finisher stage (Table 3). The findings are in accordance
with the observations of previous researchers (AbdEl-
Hack, 2015; Choi et al., 2008 and Youssef et al., 2013)
who reported no adverse effect on growth performance
when corn DDGS was included in broiler diet. In
contrast, reduction in body weight gain was reported by
Dinani et al. (2019) when RDDGS was included at 15%
level in broiler feed. Reduction in body weight gain was
also reported by some other researchers (Loar et al.,
2010; Sonu et al., 2018) when higher level of corn
DDGS was incorporated in broiler feed. On the other
hand, higher body weight gain at 42 d in Japanese quail
was reported by El – Abd (2013) when corn DDGS
was used at 50 and 100% level.
The weekly feed intake due to different inclusion
levels of rice DDGS differed non-significantly amongst
the groups during pre-starter and starter phase (Table
3). The cumulative feed intake at the end of 35 d was
2965.9, 2879.8, 2858.1 and 2959.4 g in groups T1, T
2, T
3
and T4, respectively. No significant effect of different
inclusion levels of rice DDGS on cumulative feed
intake was reported in the study. The findings are in
accordance with the results of earlier researcher
(Romero et al., 2012) who reported no significant
difference in feed intake for hens fed corn DDGS up to
20 %. Dinani et al. (2019) also observed that rice DDGS
up to 12.5% level in broiler feed did not have any
significant effect on feed intake, but at 15% level
significant (P<0.05) reduction in feed intake was
observed. Deniz et al. (2013) and Thein et al. (2020)
also reported that the use of 20% DDGS in the diets
significantly depressed the feed intake of birds. Abd El
Hack (2015) reported that increasing DDGS in the diet
up to 16.5% was associated with an increase in feed
intake while increasing the level up to 22% led to a
marked depression in feed intake.
The feed conversion ratio was significantly
Table 2.Comparative proximate composition of soy DOC with rice DDGS
Attributes (%) Soy DOC Rice DDGS
Dry matter 91.17 90.51
Moisture 8.83 9.49
Crude protein 45.77 42.10
Crude fat 1.40 7.11
Crude fiber 6.70 9.05
NFE 39.23 48.82
Total ash 6.90 4.89
Acid insoluble ash 2.43 1.20
Feeding value rice distillers dried grains for broiler
Indian J. Anim. Nutr. 2020. 37 (2): 172-178
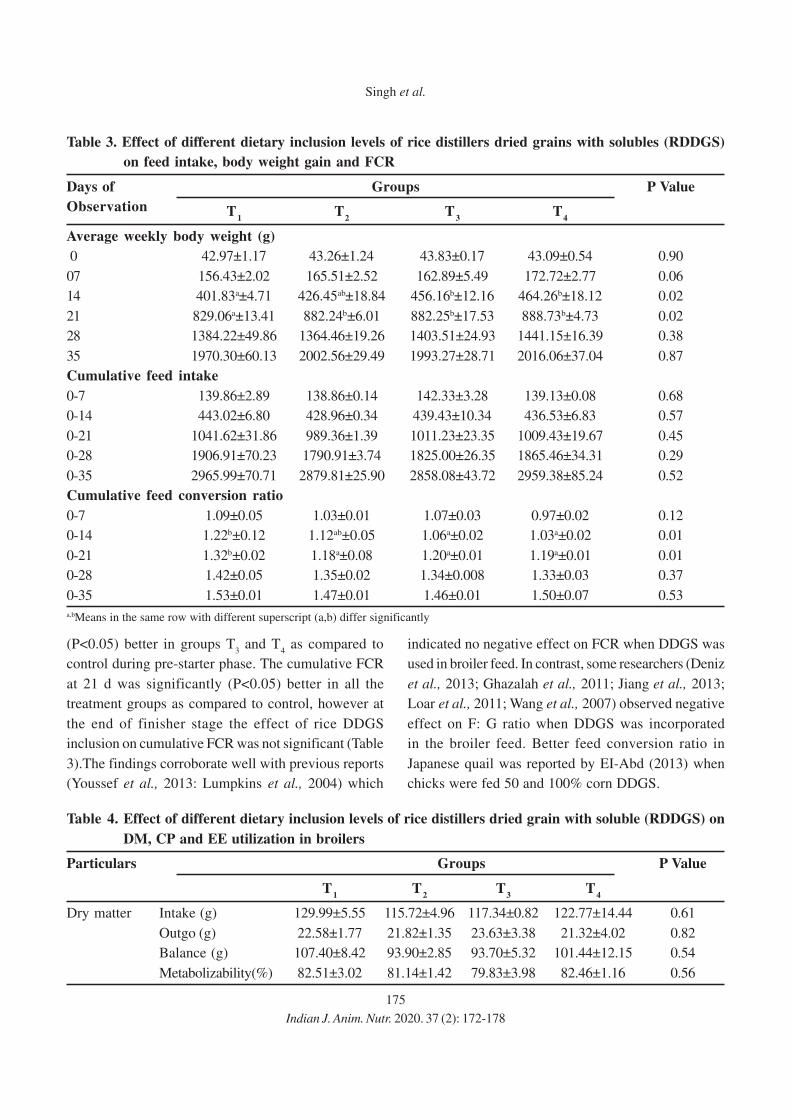
175
(P<0.05) better in groups T3 and T
4 as compared to
control during pre-starter phase. The cumulative FCR
at 21 d was significantly (P<0.05) better in all the
treatment groups as compared to control, however at
the end of finisher stage the effect of rice DDGS
inclusion on cumulative FCR was not significant (Table
3).The findings corroborate well with previous reports
(Youssef et al., 2013: Lumpkins et al., 2004) which
indicated no negative effect on FCR when DDGS was
used in broiler feed. In contrast, some researchers (Deniz
et al., 2013; Ghazalah et al., 2011; Jiang et al., 2013;
Loar et al., 2011; Wang et al., 2007) observed negative
effect on F: G ratio when DDGS was incorporated
in the broiler feed. Better feed conversion ratio in
Japanese quail was reported by EI-Abd (2013) when
chicks were fed 50 and 100% corn DDGS.
Table 3. Effect of different dietary inclusion levels of rice distillers dried grains with solubles (RDDGS)
on feed intake, body weight gain and FCR
Days of Groups P Value
Observation T1
T2
T3
T4
Average weekly body weight (g)
0 42.97±1.17 43.26±1.24 43.83±0.17 43.09±0.54 0.90
07 156.43±2.02 165.51±2.52 162.89±5.49 172.72±2.77 0.06
14 401.83a±4.71 426.45ab±18.84 456.16b±12.16 464.26b±18.12 0.02
21 829.06a±13.41 882.24b±6.01 882.25b±17.53 888.73b±4.73 0.02
28 1384.22±49.86 1364.46±19.26 1403.51±24.93 1441.15±16.39 0.38
35 1970.30±60.13 2002.56±29.49 1993.27±28.71 2016.06±37.04 0.87
Cumulative feed intake
0-7 139.86±2.89 138.86±0.14 142.33±3.28 139.13±0.08 0.68
0-14 443.02±6.80 428.96±0.34 439.43±10.34 436.53±6.83 0.57
0-21 1041.62±31.86 989.36±1.39 1011.23±23.35 1009.43±19.67 0.45
0-28 1906.91±70.23 1790.91±3.74 1825.00±26.35 1865.46±34.31 0.29
0-35 2965.99±70.71 2879.81±25.90 2858.08±43.72 2959.38±85.24 0.52
Cumulative feed conversion ratio
0-7 1.09±0.05 1.03±0.01 1.07±0.03 0.97±0.02 0.12
0-14 1.22b±0.12 1.12ab±0.05 1.06a±0.02 1.03a±0.02 0.01
0-21 1.32b±0.02 1.18a±0.08 1.20a±0.01 1.19a±0.01 0.01
0-28 1.42±0.05 1.35±0.02 1.34±0.008 1.33±0.03 0.37
0-35 1.53±0.01 1.47±0.01 1.46±0.01 1.50±0.07 0.53
a,bMeans in the same row with different superscript (a,b) differ significantly
Table 4. Effect of different dietary inclusion levels of rice distillers dried grain with soluble (RDDGS) on
DM, CP and EE utilization in broilers
Particulars Groups P Value
T1
T2
T3
T4
Dry matter Intake (g) 129.99±5.55 115.72±4.96 117.34±0.82 122.77±14.44 0.61
Outgo (g) 22.58±1.77 21.82±1.35 23.63±3.38 21.32±4.02 0.82
Balance (g) 107.40±8.42 93.90±2.85 93.70±5.32 101.44±12.15 0.54
Metabolizability(%) 82.51±3.02 81.14±1.42 79.83±3.98 82.46±1.16 0.56
Singh et al.
Indian J. Anim. Nutr. 2020. 37 (2): 172-178
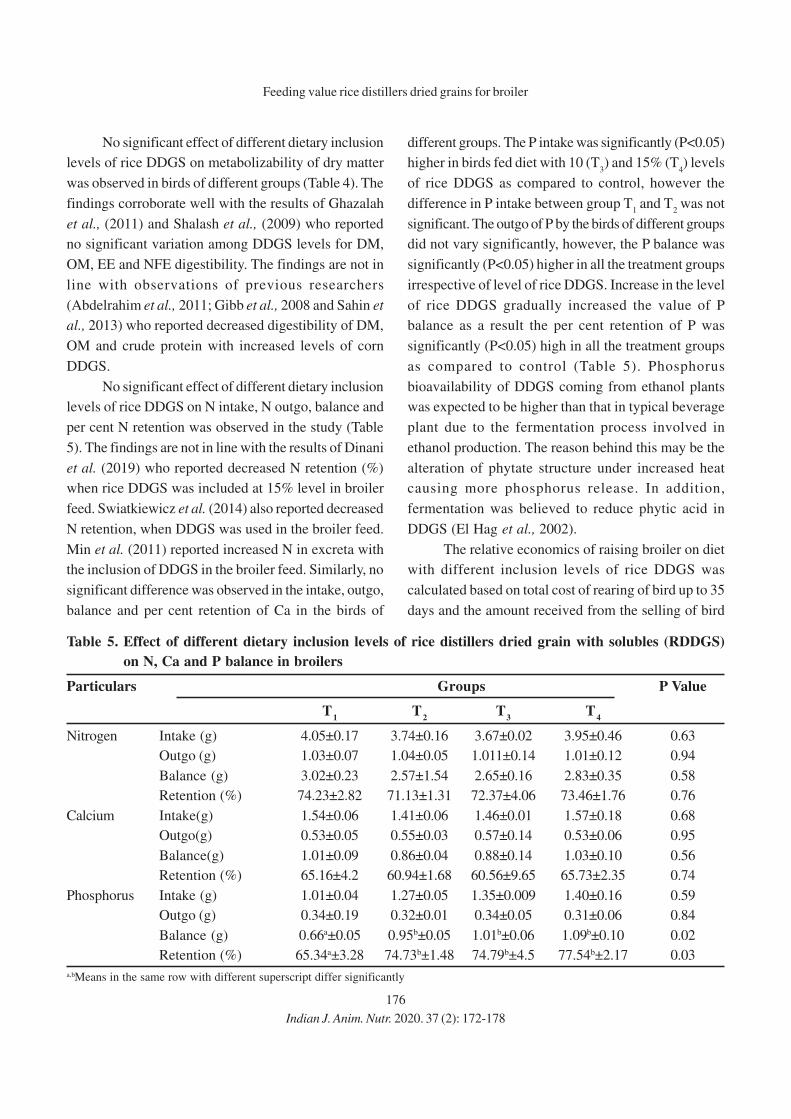
176
No significant effect of different dietary inclusion
levels of rice DDGS on metabolizability of dry matter
was observed in birds of different groups (Table 4). The
findings corroborate well with the results of Ghazalah
et al., (2011) and Shalash et al., (2009) who reported
no significant variation among DDGS levels for DM,
OM, EE and NFE digestibility. The findings are not in
line with observations of previous researchers
(Abdelrahim et al., 2011; Gibb et al., 2008 and Sahin et
al., 2013) who reported decreased digestibility of DM,
OM and crude protein with increased levels of corn
DDGS.
No significant effect of different dietary inclusion
levels of rice DDGS on N intake, N outgo, balance and
per cent N retention was observed in the study (Table
5). The findings are not in line with the results of Dinani
et al. (2019) who reported decreased N retention (%)
when rice DDGS was included at 15% level in broiler
feed. Swiatkiewicz et al. (2014) also reported decreased
N retention, when DDGS was used in the broiler feed.
Min et al. (2011) reported increased N in excreta with
the inclusion of DDGS in the broiler feed. Similarly, no
significant difference was observed in the intake, outgo,
balance and per cent retention of Ca in the birds of
Table 5. Effect of different dietary inclusion levels of rice distillers dried grain with solubles (RDDGS)
on N, Ca and P balance in broilers
Particulars Groups P Value
T1
T2
T3
T4
Nitrogen Intake (g) 4.05±0.17 3.74±0.16 3.67±0.02 3.95±0.46 0.63
Outgo (g) 1.03±0.07 1.04±0.05 1.011±0.14 1.01±0.12 0.94
Balance (g) 3.02±0.23 2.57±1.54 2.65±0.16 2.83±0.35 0.58
Retention (%) 74.23±2.82 71.13±1.31 72.37±4.06 73.46±1.76 0.76
Calcium Intake(g) 1.54±0.06 1.41±0.06 1.46±0.01 1.57±0.18 0.68
Outgo(g) 0.53±0.05 0.55±0.03 0.57±0.14 0.53±0.06 0.95
Balance(g) 1.01±0.09 0.86±0.04 0.88±0.14 1.03±0.10 0.56
Retention (%) 65.16±4.2 60.94±1.68 60.56±9.65 65.73±2.35 0.74
Phosphorus Intake (g) 1.01±0.04 1.27±0.05 1.35±0.009 1.40±0.16 0.59
Outgo (g) 0.34±0.19 0.32±0.01 0.34±0.05 0.31±0.06 0.84
Balance (g) 0.66a±0.05 0.95b±0.05 1.01b±0.06 1.09b±0.10 0.02
Retention (%) 65.34a±3.28 74.73b±1.48 74.79b±4.5 77.54b±2.17 0.03
a,bMeans in the same row with different superscript differ significantly
different groups. The P intake was significantly (P<0.05)
higher in birds fed diet with 10 (T3) and 15% (T
4) levels
of rice DDGS as compared to control, however the
difference in P intake between group T1 and T
2 was not
significant. The outgo of P by the birds of different groups
did not vary significantly, however, the P balance was
significantly (P<0.05) higher in all the treatment groups
irrespective of level of rice DDGS. Increase in the level
of rice DDGS gradually increased the value of P
balance as a result the per cent retention of P was
significantly (P<0.05) high in all the treatment groups
as compared to control (Table 5). Phosphorus
bioavailability of DDGS coming from ethanol plants
was expected to be higher than that in typical beverage
plant due to the fermentation process involved in
ethanol production. The reason behind this may be the
alteration of phytate structure under increased heat
causing more phosphorus release. In addition,
fermentation was believed to reduce phytic acid in
DDGS (El Hag et al., 2002).
The relative economics of raising broiler on diet
with different inclusion levels of rice DDGS was
calculated based on total cost of rearing of bird up to 35
days and the amount received from the selling of bird
Feeding value rice distillers dried grains for broiler
Indian J. Anim. Nutr. 2020. 37 (2): 172-178

177
@ ` 80/- kg live weight. The total cost of rearing per
bird was ̀ 121.66, 118.02, 116.35 and 117.9 and the net
profit per kg body weight was ̀ 18.25, 21.06, 21.63 and
21.52 in group T1, T
2, T
3 and T
4 respectively. In the
experiment, birds fed diet containing 10% RDDGS gave
best response in terms of net profit per kilogram of
body weight.
CONCLUSION
Rice DDGS is a viable feed ingredient and can
be incorporated up to 15% level in broiler feed without
any adverse effect on growth performance and nutrient
utilization, however inclusion level 10% of rice DDGS
was more economical as compared to other levels of
inclusion. It is therefore recommended to include rice
DDGS up to 10% level in broiler feed.
REFERENCES
AOAC. 2000. Official Methods of Analysis. 17thedn.
Association of Analytical Chemists.Verginia, USDA,
Washington, D.C.
Abd El-Hack, M.E., Alagawany, M., Farag., M.R. and Dhama,
K. 2015. Use of maize distiller’s dried grains with
solubles (DDGS) in laying hen diets: Trends and
Advances. Asian J. Anim. Vet. Adv.10: 690-707.
Abdelrahim, G. M., Khativada, J. and Gurung, N. K. 2014.
Effects of dried distillers grains with solubles on
performance and carcass characteristics of lamb. J.
Anim. Res. Technol. 1: 25-30.
Choi, H. S., Lee, H.L., Shin, M.H., Jo, C., Lee, S.K. and Lee,
B.D. 2008.Nutritive and economic values of corn
distiller’s dried grains with solubles in broiler diets.
Asian-Austalas. J. Anim. Sci. 21: 414-419.
Deniz, G., Gencoglu, H., Gezen, S.S., Turkmen, I.I., Orman, A.
and Kara, C. 2013. Effects of feeding corn distiller’s
dried grains with solubles with and without enzyme
cocktail supplementation to laying hens on
performance, egg quality, selected manure parameters
and feed cost. Livest. Sci.152: 174-181.
Dinani, O.P., Tyagi, P.K., Mandal, A.B., Tyagi, P. K. and Dutta,
N. 2019. Evaluation of feeding value of rice based
distillers dried grains with soluble (DDGS) for broiler
chickens. Indian J. Anim. Res. 53: 901-906.
El-Abd, N. M. 2013. Evaluation of using distillers dried grains
with solubles (DDGS) in Japanese quail diets. World
Appl. Sci. J. 22: 17-21.
El-Hag, M.E., El-Tinay A.H. and. Yousif, N.E 2002. Effect
of fermentation and dehulling on starch, total
polyphenols, phytic acid content and in vitro protein
digestibility of pearl millet. Food Chem. 77: 193-196.
Fiske, C.H. and Subbarao, Y. 1925. The colorimetric
determination of phosphorus. J. Biol. Chem. 66: 375-
400.
Ghazalah, A.A., Abd-Elsamee, M.O. and Moustafa, E.S. 2011.
Use of distillers dried grains with solubles (DDGS) as
replacement for soybean meal in laying hen diets. Int.
J. Poult. Sci. 10: 505-513.
Gibb, D. J., Hao, X. and McAllister, T. A. 2008. Effect of dried
distillers’ grains from wheat on diet digestibility and
performance of feedlot cattle. Can. J. Anim. Sci. 88:
659-665.
Gupta, S.L., Tyagi, P. K., Tyagi., P. K., Mandal, A. B., Mir, N.A.
and Sharma, M. 2015. Intestinal histomorphometry of
laying hens fed diets containing rice based dry
distiller’s grains with solubles. Indian J. Poult. Sci.50:
294-299.
ICAR. 2013. Nutrient Requirements of Livestock and
Poultry, Indian Council of Agricultural Research, New
Delhi, pp 13-16.
Jiang, W., Zhang, L. and Shan, A. 2013. The effect of vitamin
E on laying performance and egg quality in laying
hens fed corn dried distillers grains with soluble. Poult.
Sci. 92: 2956-2964.
Koger, T. J., Wulf, D. M., Weaver, A. D., Wright, C. L., Tjardes,
K. E., Mateo, K, S., Engle, T. E., Maddock, R. J., and
Smart, A.J. 2010. Influence of feeding various
quantities of wet and dry distillers grains to finishing
steers on carcass characteristics, meat quality,
retail-case life of ground beef, and fatty acid profile of
longissimus muscle. J. Anim. Sci. 88: 3399-3408.
Loar, R. E. and Corzo, A. 2011. Effects of varying levels of
distillers dried grains with solubles on growth
performance of broiler chicks. Brazilian J. Poult. Sci.13:
279-281.
Lumpkins, B., Batal, A. and Dale, N.M. 2005. Use of distillers
dried grains plus solubles in laying hen diets. J. Appl.
Poult. Res. 14: 25-31.
Min, Y. N., Liu, F.Z., Karimi, A., Coto, C., Lu, C., Yan, F. and
Waldroup, P.W. 2011. Effect of Rovabio® Max AP on
performance, energy and nitrogen digestibility of
diets high in distillers dried grains with solubles
(DDGS) in broilers. Int. J. Poult. Sci.10: 796-803.
Rao Rama, S.V., Raju, M.V.L.N., Prakash, B., Reddy, E.P.K. and
Anusha, R. 2016. Effect of dietary supplement of
distillery dried grain soluble from rice on performance
of commercial broilers and White Leghorn layers. In
Proc. XXV World’s Poultry Congress, Beijing. pp- 52.
Singh et al.
Indian J. Anim. Nutr. 2020. 37 (2): 172-178
178
Romero, C., Abdallh, M.E., Powers, W., Angel, R. and
Applegate, T.J. 2012. Effect of dietary adipic acid and
corn dried distillers grains with solubles on laying hen
performance and nitrogen loss from stored excreta with
or without sodium bisulfate. Poult. Sci. 91: 1149-1157.
Sahin, T., Kaya, O., Elmali, D.A. and Kaya, I. 2013. Effects of
dietary supplementation with distiller dried grain with
solubles in growing lambs on growth, nutrient
digestibility and rumen parameters. Rev. de Med. Vet.
164:173-178.
Schingoethe, D.J., Kalscheur, K.F., Hippen, A.R., Garcia, A.D.
2009. Invited review.The use of distillers’ products in
dairy cattle diets. J. Dairy Sci. 95: 5802-5813.
Shalash, S.M.M., Ali, M.N., Sayed, M.A.M., El-Gabry, H.E.,
and Shabaan, M. 2009. Novel method for improving
the utilization of corn dried distillers grains with
solubles in broiler diets. Int. J. Poult. Sci. 8: 545-552.
Shim, M.Y., Pesti, G.M., Bakalli, R.I., Tillman, P.B. and Payne,
R.L. 2011. Evaluation of corn distillers dried grains with
soluble as an alternative ingredient for broilers. Poult.
Sci. 90: 369-376.
Snedecor, G. W. and Cochran, W.G. 1998. Statistical Methods,
8th Edn, Oxford and IBH Publishing Company, New
Delhi.
Sonu, Z.S. Sihag, Dalal, R. and Ahlawat, P. 2018. Effect of
multienzyme cocktail on growth performance,
digestibility and carcass characteristic of broilers fed
soybean meal replaced with distillers dried grain
solubles (DDGS) and maize based diet. Int. J. Pure
Appl. Biosci.6: 718-724.
Swiatkiewicz, S., Arczewska-Wloseka, A. and Jozefiak, D. 2014.
Feed enzymes, probiotic, or chitosan can improve the
nutritional efficacy of broiler chicken diets containinga
high level of distillers dried grains with solubles. Livest.
Sci. 163: 110-119.
Talpatra, S.K., Ray, S.N. and Sen, K.C. 1940. Estimation of
phosphorus, chlorine, calcium, magnesium, sodium and
potassium in food stuffs. Indian J. Vet. Sci. Anim. Husb.
10: 243-246.
Thein, S.M., Thu, T.M., Thu, K.L., Thu, W.W.W., Thae, C.,
Thet, M., Thant, M.K., Thant, K.Z., Thant, M., Than,
Z.M., Thein, Z., Myint, K.S., Kyawt, Y.Y., Aung, M.
and Mu. K.S. 2020. Effects of dietary supplementation
of rice distillers dried grains in grower phase on growth
performance and digestibility of broiler chicken. Adv.
Anim. Vet. Sci. 8: 444-451
Wang, Z., Cerrate, S., Coto, C., Yan, F. and Waldroup, P.W.
2007. Effect of rapid and multiple changes in level of
distillers dried grain with solubles (DDGS) in broiler
diets on performance and carcass characteristics. Int.
J. Poult. Sci. 6: 725-731.
Youssef, A. W., AbdEl-Azeem, N.A., El-Daly, E.F. and
El-Monairy, M.M. 2013. The impact of feeding graded
levels of distillers dried grains with solubles (DDGS)
on broiler performance, hematological and
histological parameters. Asian J. Poult. Sci. 7: 41-54.
Feeding value rice distillers dried grains for broiler
Indian J. Anim. Nutr. 2020. 37 (2): 172-178
Received on 17-06-2020 and accepted on 31-07-2020
179
Indian Journal of
Animal Nutrition
Effect of Organic Copper, Zinc and Manganese Supplementation on
Immunity and Hatchability of Egg in Japanese Quail
(Coturnix coturnix japonica)
A.K. Satapathy, S.K. Das, K. Sethy*, R.K Swain, S.K. Mishra K. Behera and S. Pati
Department of Animal Nutrition, College of Veterinary Science and Animal Husbandry,
Odisha University of Agriculture and Technology, Bhubaneshwar-751 003, India
ABSTRACT
To assess the effect of organic copper (Cu), zinc (Zn) and manganese (Mn) supplementation on
immunity and hatchability, 405 six week old Japanese quails (Coturnix coturnix japonica) were randomly
distributed into nine dietary treatment groups and the experiment continued till the period up to 13th week. The
dietary treatments were T0:100 % inorganic minerals (Cu, Zn and Mn); T
1: 100 % organic minerals (Cu, Zn and
Mn); T2: 100 % inorganic Zn and Cu with 100 % organic Mn; T
3: 100 % inorganic Zn and Cu with 50 % organic
Mn and 50% inorganic Mn; T4 : 100 % inorganic Zn and Mn with 100 % organic Cu; T
5 : 100 % inorganic Zn and
Mn with 50 % organic Cu and 50% inorganic Cu; T6 :
100 % inorganic Mn and Cu with 100 % organic Zn; T7 : 100
% inorganic Mn and Cu with 50 % organic Zn and 50% inorganic Zn; T8 : 50 % organic Zn, Cu and Mn with 50
% inorganic Zn, Cu and Mn. Basal diets were supplemented with Cu, Zn and Mn at the levels of 5, 25 and 60
ppm, respectively. Results revealed that supplementation of organic Cu, Zn and Mn had no effect on growth
rate, blood chemistry and weight of lymphoid organs, but the hatchability of eggs and cutaneous basophil
hypersensitivity response were significantly (P<0.05) higher in 100% organic supplemented groups as
compared to other groups. So, it may be concluded that supplementation of 100% organic copper, zinc and
manganese improved the immunity and hatchability of eggs in Japanese quail.
Key words: Growth, Hatchability, Immunity, Organic minerals
*Corresponding author; Email: [email protected]
INTRODUCTION
Trace minerals, such as Cu, Zn and Mn are
constituents of proteins involved in intermediary
metabolism, hormone secretion pathways and immune
defense systems (Dozier et al., 2003). Traditionally,
these trace minerals are supplemented in the inorganic
form, such as sulfates, oxides and carbonates.
However, an excess of supplemental inorganic
minerals leads to waste and environmental
contamination from excessive excretion (Leeson, 2003).
Use of organically complexed trace minerals can help
in preventing these losses, due to increased stability in
the upper gastrointestinal tract of the birds (Aksu et al.,
2010). Organic complexed mineral is a type of mineral
linked to protein/peptide/amino acids that has a higher
bioavailability than those inorganic salts (Swiatkiewicz
et al., 2014). Therefore, organic complexed minerals
are supposed to be more effective than the inorganic
minerals in broilers (Abdallah et al., 2009).
Indian J. Anim. Nutr. 2020. 37 (2): 179-184
doi: 10.5958/2231-6744.2020.00029.8
Supplementation of organic minerals enhanced the
enzyme secretion, immune response, tissue and bone
development and integrity, eggshell formation, and
protection against oxidative stress (Richards et al.,
2010). Organic Cu is related to iron metabolism and
absorption, oxygen metabolism, collagen and elastin
synthesis, bone formation, feathers development and
colouring (Scheideler, 1991). Organic Zn and Mn
improved utilization of feed via participating in the
metabolism of carbohydrates, fats and proteins (Aksu
et al., 2010). Considering the importance of organic
minerals in birds, the present study was envisaged to
evaluate the combined effect organic Cu, Zn and Mn at
different combinations on growth, blood chemistry,
immunity and hatchability of egg in Japanese quail.
MATERIALS AND METHODS
Four hundred and five Japanese quail (Coturnix
coturnix japonica) of 6 weeks of age were divided
into nine treatment groups having three replicates of 15
Indian J. Anim. Nutr. 2020. 37 (2): 179-184
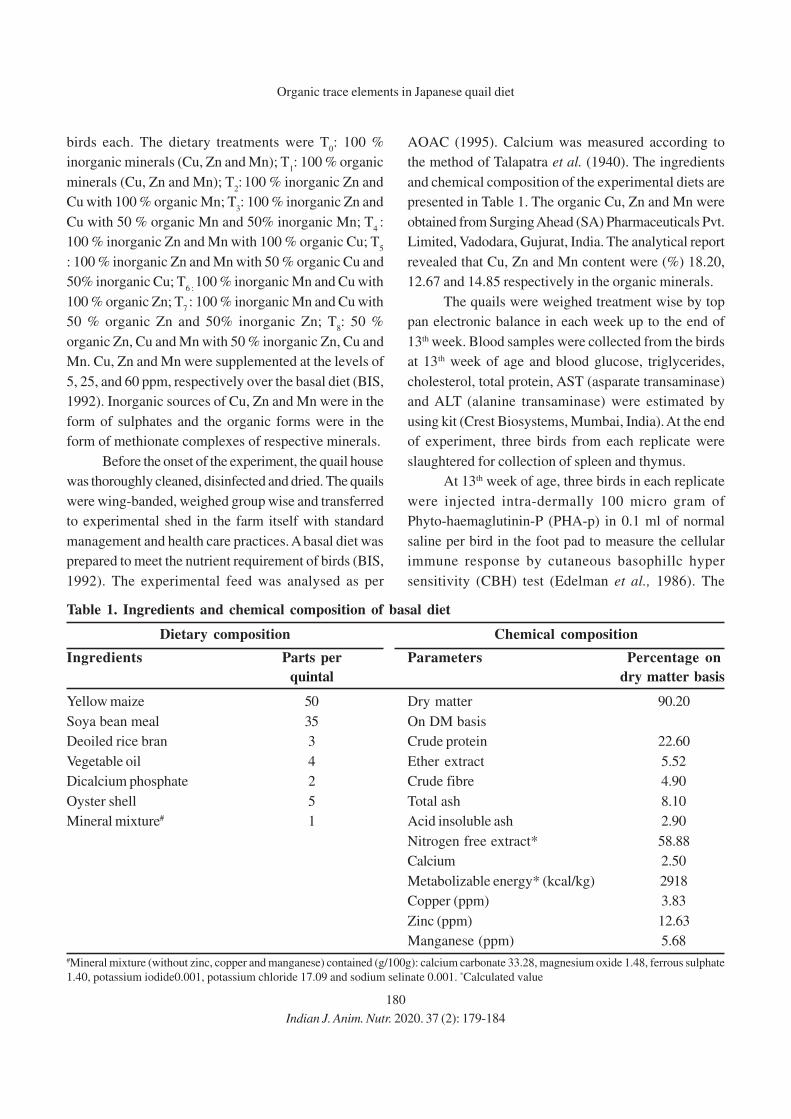
180
birds each. The dietary treatments were T0: 100 %
inorganic minerals (Cu, Zn and Mn); T1: 100 % organic
minerals (Cu, Zn and Mn); T2: 100 % inorganic Zn and
Cu with 100 % organic Mn; T3: 100 % inorganic Zn and
Cu with 50 % organic Mn and 50% inorganic Mn; T4 :
100 % inorganic Zn and Mn with 100 % organic Cu; T5
: 100 % inorganic Zn and Mn with 50 % organic Cu and
50% inorganic Cu; T6 :
100 % inorganic Mn and Cu with
100 % organic Zn; T7 : 100 % inorganic Mn and Cu with
50 % organic Zn and 50% inorganic Zn; T8: 50 %
organic Zn, Cu and Mn with 50 % inorganic Zn, Cu and
Mn. Cu, Zn and Mn were supplemented at the levels of
5, 25, and 60 ppm, respectively over the basal diet (BIS,
1992). Inorganic sources of Cu, Zn and Mn were in the
form of sulphates and the organic forms were in the
form of methionate complexes of respective minerals.
Before the onset of the experiment, the quail house
was thoroughly cleaned, disinfected and dried. The quails
were wing-banded, weighed group wise and transferred
to experimental shed in the farm itself with standard
management and health care practices. A basal diet was
prepared to meet the nutrient requirement of birds (BIS,
1992). The experimental feed was analysed as per
AOAC (1995). Calcium was measured according to
the method of Talapatra et al. (1940). The ingredients
and chemical composition of the experimental diets are
presented in Table 1. The organic Cu, Zn and Mn were
obtained from Surging Ahead (SA) Pharmaceuticals Pvt.
Limited, Vadodara, Gujurat, India. The analytical report
revealed that Cu, Zn and Mn content were (%) 18.20,
12.67 and 14.85 respectively in the organic minerals.
The quails were weighed treatment wise by top
pan electronic balance in each week up to the end of
13th week. Blood samples were collected from the birds
at 13th week of age and blood glucose, triglycerides,
cholesterol, total protein, AST (asparate transaminase)
and ALT (alanine transaminase) were estimated by
using kit (Crest Biosystems, Mumbai, India). At the end
of experiment, three birds from each replicate were
slaughtered for collection of spleen and thymus.
At 13th week of age, three birds in each replicate
were injected intra-dermally 100 micro gram of
Phyto-haemaglutinin-P (PHA-p) in 0.1 ml of normal
saline per bird in the foot pad to measure the cellular
immune response by cutaneous basophillc hyper
sensitivity (CBH) test (Edelman et al., 1986). The
Organic trace elements in Japanese quail diet
Table 1. Ingredients and chemical composition of basal diet
Dietary composition Chemical composition
Ingredients Parts per Parameters Percentage on
quintal dry matter basis
Yellow maize 50 Dry matter 90.20
Soya bean meal 35 On DM basis
Deoiled rice bran 3 Crude protein 22.60
Vegetable oil 4 Ether extract 5.52
Dicalcium phosphate 2 Crude fibre 4.90
Oyster shell 5 Total ash 8.10
Mineral mixture# 1 Acid insoluble ash 2.90
Nitrogen free extract* 58.88
Calcium 2.50
Metabolizable energy* (kcal/kg) 2918
Copper (ppm) 3.83
Zinc (ppm) 12.63
Manganese (ppm) 5.68
#Mineral mixture (without zinc, copper and manganese) contained (g/100g): calcium carbonate 33.28, magnesium oxide 1.48, ferrous sulphate
1.40, potassium iodide0.001, potassium chloride 17.09 and sodium selinate 0.001. *Calculated value
Indian J. Anim. Nutr. 2020. 37 (2): 179-184
181
thickness of foot pad was measured using digital
calliper before (0 h) and 24 h post inoculation and CBH
response was calculated using the formula:
100 thicknessinjection -Pre
nessskin thickinjection Post response CBH ×=
At 13th weeks of the experiment, total of 1239
eggs were collected from different treatments. The eggs
were candled on 15th day of incubation to remove the
infertile eggs and dead in germ eggs, then the live
embryos were transferred to the Hatcher. The chicks
were taken out on 18th day. Hatchability was calculated
on the basis total eggs set (TES).
Hatchability % (on TES) =
100 set eggs ofnumber Total
out hatched chicks ofNumber ×
Data obtained were subjected to one-way
analysis of variance using Software Package for Social
Sciences (SPSS) version 17.0 (2008) and comparison
among treatment means was made by Duncan’s
multiple range test (Duncan, 1955) with significance level
of P<0.05.
RESULTS AND DISCUSSION
The weekly body weight (g) gain of quail birds of
different dietary treatments did not differed significantly
(P>0.05) among the groups (Table 2). The non-
significant effect on body weight gain corroborated with
the findings of Nollet et al. (2007). Various workers
had reported non-significant effect of mineral
supplementation on body weight of broilers either in
inorganic or organic form (Rossi et al., 2007; Zhao et
al., 2010). In contrast to this, Idowu et al. (2011) and
Dozier et al. (2003) reported that the body weight gain
was significantly higher in birds supplemented with
organic minerals than control. The increased body weight
in above experiments might be due to difference in age
group of birds.
Blood biochemical parameters like glucose,
triglycerides, cholesterol, total protein, AST and ALT
did not differed significantly (P>0.05) among the
treatment groups (Table.3). Similarly, non-significant
change in serum glucose levels was reported by Parak
and Strakova (2011) in breeding cocks supplemented
with organic zinc. Similar to the present result, non-
Table 2. Body weight gain (g) of birds of different dietary treatments
Week Treatments P Value
T0
T1
T2
T3
T4
T5
T6
T7
T8
6th 5.85± 5.88± 5.84± 5.91± 5.87± 5.85± 5.97± 5.90± 5.90± 0.20
0.03 0.04 0.03 0.03 0.03 0.03 0.02 0.04 0.03
7th 6.46± 6.43± 6.50± 6.49± 6.42± 6.47± 6.51± 6.50± 6.48± 0.96
0.03 0.04 0.07 6.49± 0.10 0.04 0.02 0.02 0.02
8th 6.91± 6.98± 6.93± 6.97± 7.02± 7.01± 6.96± 6.99± 6.98± 0.74
0.03 0.06 0.04 0.05 0.05 0.06 0.04 0.02 0.03
9th 6.98± 6.99± 6.92± 6.97± 6.99± 6.95± 6.92± 6.94± 6.97± 0.79
0.04 0.01 0.03 0.02 0.02 0.04 0.03 0.06 0.04
10th 6.88± 6.89± 6.87± 6.85± 6.83± 6.88± 6.89± 6.88± 6.88± 0.99
0.02 0.02 0.05 0.07 0.05 0.07 0.08 0.02 0.01
11th 6.97± 7.01± 7.02± 6.98± 6.99± 6.99± 6.89± 7.01± 6.98± 0.46
0.02 0.07 0.06 0.02 0.03 0.03 0.02 0.03 0.03
12th 6.98± 7.04± 7.01± 7.04± 6.96± 6.99± 7.01± 6.99± 6.93± 0.55
0.03 0.03 0.09 0.02 0.03 0.03 0.03 0.02 0.02
13th 7.09± 7.12± 7.05± 7.11± 7.03± 7.02± 7.07± 7.09± 7.03± 0.27
0.05 0.02 0.07 0.02 0.03 0.01 0.02 0.02 0.02
Satapathy et al.
Indian J. Anim. Nutr. 2020. 37 (2): 179-184
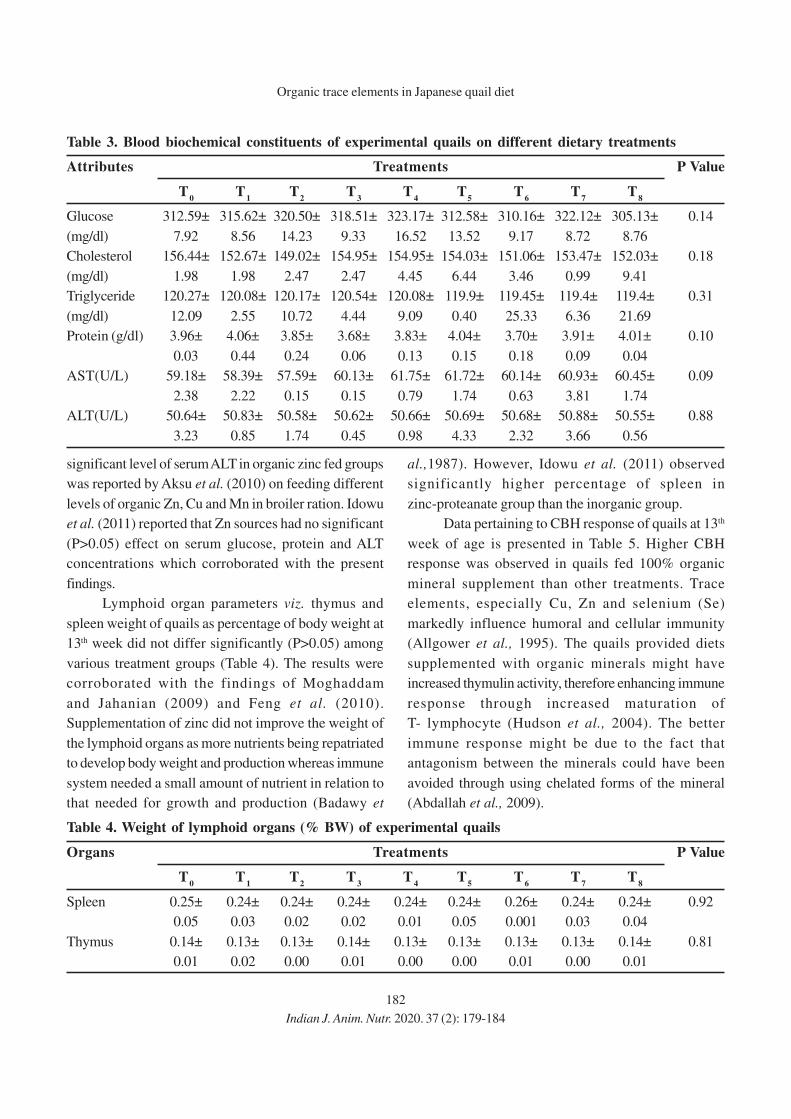
182
significant level of serum ALT in organic zinc fed groups
was reported by Aksu et al. (2010) on feeding different
levels of organic Zn, Cu and Mn in broiler ration. Idowu
et al. (2011) reported that Zn sources had no significant
(P>0.05) effect on serum glucose, protein and ALT
concentrations which corroborated with the present
findings.
Lymphoid organ parameters viz. thymus and
spleen weight of quails as percentage of body weight at
13th week did not differ significantly (P>0.05) among
various treatment groups (Table 4). The results were
corroborated with the findings of Moghaddam
and Jahanian (2009) and Feng et al. (2010).
Supplementation of zinc did not improve the weight of
the lymphoid organs as more nutrients being repatriated
to develop body weight and production whereas immune
system needed a small amount of nutrient in relation to
that needed for growth and production (Badawy et
al.,1987). However, Idowu et al. (2011) observed
significantly higher percentage of spleen in
zinc-proteanate group than the inorganic group.
Data pertaining to CBH response of quails at 13th
week of age is presented in Table 5. Higher CBH
response was observed in quails fed 100% organic
mineral supplement than other treatments. Trace
elements, especially Cu, Zn and selenium (Se)
markedly influence humoral and cellular immunity
(Allgower et al., 1995). The quails provided diets
supplemented with organic minerals might have
increased thymulin activity, therefore enhancing immune
response through increased maturation of
T- lymphocyte (Hudson et al., 2004). The better
immune response might be due to the fact that
antagonism between the minerals could have been
avoided through using chelated forms of the mineral
(Abdallah et al., 2009).
Table 3. Blood biochemical constituents of experimental quails on different dietary treatments
Attributes Treatments P Value
T0
T1
T2
T3
T4
T5
T6
T7
T8
Glucose 312.59± 315.62± 320.50± 318.51± 323.17± 312.58± 310.16± 322.12± 305.13± 0.14
(mg/dl) 7.92 8.56 14.23 9.33 16.52 13.52 9.17 8.72 8.76
Cholesterol 156.44± 152.67± 149.02± 154.95± 154.95± 154.03± 151.06± 153.47± 152.03± 0.18
(mg/dl) 1.98 1.98 2.47 2.47 4.45 6.44 3.46 0.99 9.41
Triglyceride 120.27± 120.08± 120.17± 120.54± 120.08± 119.9± 119.45± 119.4± 119.4± 0.31
(mg/dl) 12.09 2.55 10.72 4.44 9.09 0.40 25.33 6.36 21.69
Protein (g/dl) 3.96± 4.06± 3.85± 3.68± 3.83± 4.04± 3.70± 3.91± 4.01± 0.10
0.03 0.44 0.24 0.06 0.13 0.15 0.18 0.09 0.04
AST(U/L) 59.18± 58.39± 57.59± 60.13± 61.75± 61.72± 60.14± 60.93± 60.45± 0.09
2.38 2.22 0.15 0.15 0.79 1.74 0.63 3.81 1.74
ALT(U/L) 50.64± 50.83± 50.58± 50.62± 50.66± 50.69± 50.68± 50.88± 50.55± 0.88
3.23 0.85 1.74 0.45 0.98 4.33 2.32 3.66 0.56
Table 4. Weight of lymphoid organs (% BW) of experimental quails
Organs Treatments P Value
T0
T1
T2
T3
T4
T5
T6
T7
T8
Spleen 0.25± 0.24± 0.24± 0.24± 0.24± 0.24± 0.26± 0.24± 0.24± 0.92
0.05 0.03 0.02 0.02 0.01 0.05 0.001 0.03 0.04
Thymus 0.14± 0.13± 0.13± 0.14± 0.13± 0.13± 0.13± 0.13± 0.14± 0.81
0.01 0.02 0.00 0.01 0.00 0.00 0.01 0.00 0.01
Organic trace elements in Japanese quail diet
Indian J. Anim. Nutr. 2020. 37 (2): 179-184
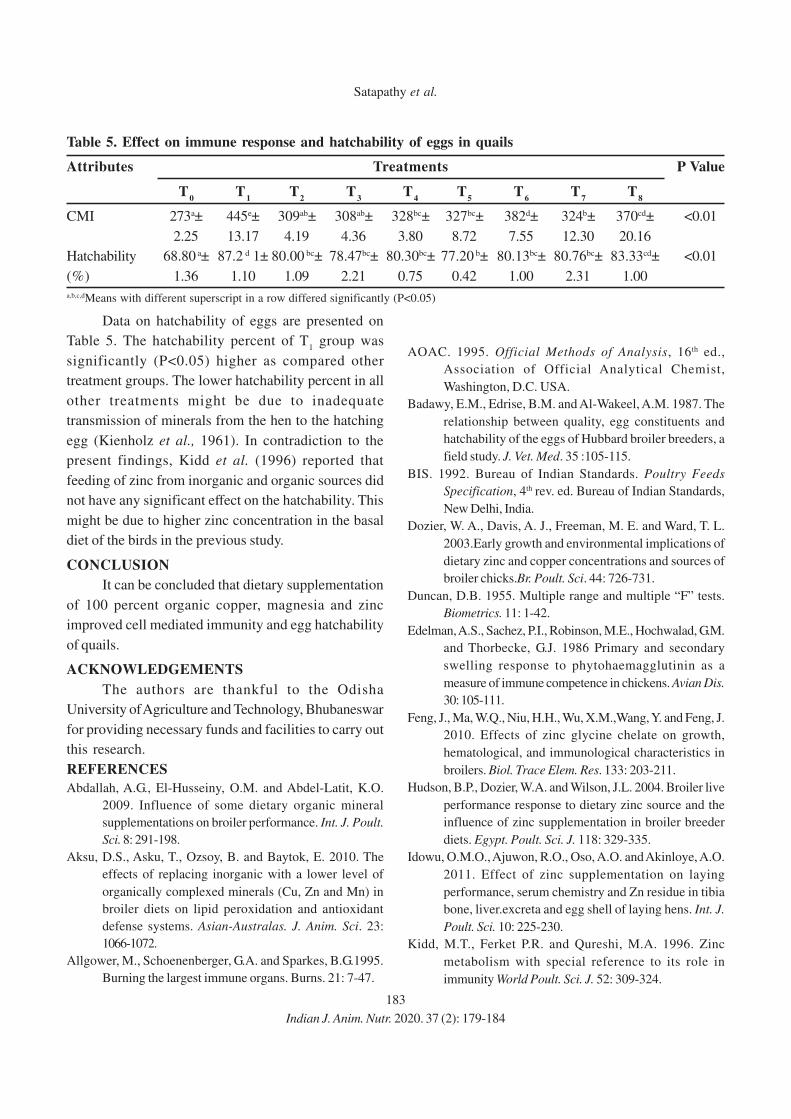
183
Table 5. Effect on immune response and hatchability of eggs in quails
Attributes Treatments P Value
T0
T1
T2
T3
T4
T5
T6
T7
T8
CMI 273a± 445e± 309ab± 308ab± 328bc± 327bc± 382d± 324b± 370cd± <0.01
2.25 13.17 4.19 4.36 3.80 8.72 7.55 12.30 20.16
Hatchability 68.80 a± 87.2 d 1± 80.00 bc± 78.47bc± 80.30bc± 77.20 b± 80.13bc± 80.76bc± 83.33cd± <0.01
(%) 1.36 1.10 1.09 2.21 0.75 0.42 1.00 2.31 1.00
a,b,c,dMeans with different superscript in a row differed significantly (P<0.05)
Data on hatchability of eggs are presented on
Table 5. The hatchability percent of T1 group was
significantly (P<0.05) higher as compared other
treatment groups. The lower hatchability percent in all
other treatments might be due to inadequate
transmission of minerals from the hen to the hatching
egg (Kienholz et al., 1961). In contradiction to the
present findings, Kidd et al. (1996) reported that
feeding of zinc from inorganic and organic sources did
not have any significant effect on the hatchability. This
might be due to higher zinc concentration in the basal
diet of the birds in the previous study.
CONCLUSION
It can be concluded that dietary supplementation
of 100 percent organic copper, magnesia and zinc
improved cell mediated immunity and egg hatchability
of quails.
ACKNOWLEDGEMENTS
The authors are thankful to the Odisha
University of Agriculture and Technology, Bhubaneswar
for providing necessary funds and facilities to carry out
this research.
REFERENCES
Abdallah, A.G., El-Husseiny, O.M. and Abdel-Latit, K.O.
2009. Influence of some dietary organic mineral
supplementations on broiler performance. Int. J. Poult.
Sci. 8: 291-198.
Aksu, D.S., Asku, T., Ozsoy, B. and Baytok, E. 2010. The
effects of replacing inorganic with a lower level of
organically complexed minerals (Cu, Zn and Mn) in
broiler diets on lipid peroxidation and antioxidant
defense systems. Asian-Australas. J. Anim. Sci. 23:
1066-1072.
Allgower, M., Schoenenberger, G.A. and Sparkes, B.G.1995.
Burning the largest immune organs. Burns. 21: 7-47.
AOAC. 1995. Official Methods of Analysis, 16th ed.,
Association of Official Analytical Chemist,
Washington, D.C. USA.
Badawy, E.M., Edrise, B.M. and Al-Wakeel, A.M. 1987. The
relationship between quality, egg constituents and
hatchability of the eggs of Hubbard broiler breeders, a
field study. J. Vet. Med. 35 :105-115.
BIS. 1992. Bureau of Indian Standards. Poultry Feeds
Specification, 4th rev. ed. Bureau of Indian Standards,
New Delhi, India.
Dozier, W. A., Davis, A. J., Freeman, M. E. and Ward, T. L.
2003.Early growth and environmental implications of
dietary zinc and copper concentrations and sources of
broiler chicks.Br. Poult. Sci. 44: 726-731.
Duncan, D.B. 1955. Multiple range and multiple “F” tests.
Biometrics. 11: 1-42.
Edelman, A.S., Sachez, P.I., Robinson, M.E., Hochwalad, G.M.
and Thorbecke, G.J. 1986 Primary and secondary
swelling response to phytohaemagglutinin as a
measure of immune competence in chickens. Avian Dis.
30: 105-111.
Feng, J., Ma, W.Q., Niu, H.H., Wu, X.M.,Wang, Y. and Feng, J.
2010. Effects of zinc glycine chelate on growth,
hematological, and immunological characteristics in
broilers. Biol. Trace Elem. Res. 133: 203-211.
Hudson, B.P., Dozier, W.A. and Wilson, J.L. 2004. Broiler live
performance response to dietary zinc source and the
influence of zinc supplementation in broiler breeder
diets. Egypt. Poult. Sci. J. 118: 329-335.
Idowu, O.M.O., Ajuwon, R.O., Oso, A.O. and Akinloye, A.O.
2011. Effect of zinc supplementation on laying
performance, serum chemistry and Zn residue in tibia
bone, liver.excreta and egg shell of laying hens. Int. J.
Poult. Sci. 10: 225-230.
Kidd, M.T., Ferket P.R. and Qureshi, M.A. 1996. Zinc
metabolism with special reference to its role in
immunity World Poult. Sci. J. 52: 309-324.
Satapathy et al.
Indian J. Anim. Nutr. 2020. 37 (2): 179-184
184
Kienholz, E.W., Turk, D.E., Sunde, M.L. and Hoekstra, W.G.
1961. Effect of zinc deficiency in the diets of hens. J.
Nutr. 75: 211-221.
Leeson, S.2003. A new look at trace mineral nutrition of
poultry: Can we reduce the environmental burden
of poultry manure? Pages 125-129 in Nutritional
Biotechnology in the Feed and Food Industries. Proc.
Alltech’s 19th Ann. Symp. T. P. Lyons and K. A. Jacques,
Ed. Nottingham Univ. Press Nottingham, UK.
Moghaddam, H.N. and Jahanian, R. 2009. Immunological
responses of broiler chicks can be modulated by
dietary supplementation of zinc methionine in place of
inorganic zinc sources. Asia-Australas. J. Anim. Sci.
22: 396-403.
Nollet, L., Klis, J.D., Lensing, M. And Spring, P. 2007. Effect of
replacing inorganic with organic trace minerals in broiler
diets on productive performance and mineral
excreation. J. Appl. Poult. Res. 16: 592-597.
Parak, Tomas and Strakova, E. 2011. Zinc as a feed
supplement and its impact on plasma cholesterol
concentrations in breeding cocks. Acta Vet. Brno. 80:
281-285.
Richards, J.D., Zhao, J., Robert, J.H., Cindy, A.A. and Julia,
J.D. 2010. Trace mineral nutrition in poultry and swine.
Asia-Australas. J. Anim. Sci. 23: 1527-1534.
Rossi, P., Rutz, F., Anciuti, M.A., Rech, J.L. and Zauk, N.H.F.
2007. Influence of graded levels of organic Zinc on
growth performance and carcass traits of broilers. J.
Appl. Poult. Res. 16: 219-225.
Scheideler, S.E. 1991. Interaction of dietary calcium,
manganese and manganese source (manganese oxide
or manganese methionine chelate) on chick
performance and manganese utilization. Biol. Trace
Elem. Res. 29: 217–223.
SPSS. 2008. Statistical Packages for Social Sciences,
Version 17.0, SPSS Inc., Illinois, USA.
Swiatkiewicz, S., Arczewskawlosek, A. and Jozefiak, D. 2014.
The efficacy of organic minerals in poultry nutrition:
review and implications of recent studies. World Poult.
Sci. J. 70: 475-486.
Talapatra, S.K., Ray, S.C. and Sen, K.C. 1940. The analysis
of mineral constituents in biological materials. 1.
Estimation of phosphorus, chloride, calcium,
magnesium, sodium and potassium in food stuff.
Indian J. Vet. Sci. Anim. Husb. 10: 243-258.
Zhao, J., Shirley, R.B., Vazquez-Anon, M., Dibner, J.J., Richards,
J.D., Fisher, P., Hampton, T., Christensen, K.D., Allard,
J.P. and Giesen, A.F. 2010. Effect of chelated trace
minerals on growth performance, breast meat yield,
and footpad health in commercial meat broiler. J. Appl.
Poult. Res.19: 365-372.
Organic trace elements in Japanese quail diet
Indian J. Anim. Nutr. 2020. 37 (2): 179-184
Received on 25-03-2020 and accepted on 27-08-2020

185
Indian Journal of
Animal Nutrition
Effect of Feeding Probiotics and Milk Powder Supplemented Creep
Ration on the Growth Performance and Efficiency of Feed Utilization
in Pre-weaning Piglets
Monica Tissopi1, J.P. Bordoloi1, Jakir Hussain1, H. F. Ahmed2and Rajib Kro3.1Department of Livestock Production and Management, College of Veterinary Science,
Assam Agricultural University, Guwahati-781 022, India
ABSTRACT
The experiment was conducted to study the effect of creep feeding and its enrichment with probiotics
and milk powder on the growth performance and efficiency of feed utilization in pre-weaning piglets. For the
study, 28 piglets of uniform size and body weight were selected from four litters of Hampshire sows of similar
parity and allocated to 4 different dietary groups: T0 (fed conventional creep feed alone, control), T
1 (fed 5%
milk powder supplemented creep feed), T2 (fed probiotics supplemented creep feed added at 1g per kg creep
feed) and T3 (fed creep feed supplemented with 5% milk powder + probiotics at 1g per kg creep feed). The
experimental protocol was followed upto weaning age. Body weights at 8th week of age was found to be
significantly (P<0.01) higher in the treatment groups as compared to the control group. Piglets getting
combined supplementation of milk powder and probiotics (T3) had highest (P<0.01) feed consumption with
better feed gain ratio followed by T2, T
1 and T
0 groups. It was concluded that supplementation of probiotics
and milk powder in the creep ration of suckling piglets resulted in a positive impact on their growth performance
with an efficient feed utilization.
Key words: Feed conversion ratio, Growth performance, Hampshire piglets, Milk powder, Probiotics,
Pre-weaning
1Corresponding author; Email: [email protected]; 2Department of Animal Nutrition, College of Veterinary Science, Assam
Agricultural University, Guwahati-781022, India; 3Department of Livestock Production and Management, Vanbandhu College of Veterinary
Science and Animal Husbandry, Navsari Agricultural University, Navsari-396 450, India.
INTRODUCTION
The strong positive relationship between
weaning weight and growth of pigs post-weaning
suggests that there are considerable economic
advantages associated with increasing the weaning
weight of pigs (Mahan and Lepine, 1991). Thus,
efficient piglet rearing right from their birth undoubtedly
is an important aspect of overall successful pig farming.
Though sow milk consumption remains as the main
source of nutrients for neonatal pigs, providing
alternative food sources may offer numerous benefits
(Sulabo, 2009). Another interesting fact is that the time
that milk is available to the piglets is only approximately
10 to 20 seconds (Fraser, 1980), so the piglets should be
able to start suckling as soon as milk is available,
because a 5-second delay will cause a 25 to 50% loss
of access to milk. As such, the importance of a quality
creep feed holds more goods especially in case of
prolific sows with larger litters and less functional
Indian J. Anim. Nutr. 2020. 37 (2): 185-190
doi: 10.5958/2231-6744.2020.00030.4
mammary glands (Sarandan et al., 2009). Thus, an
appropriate creep feeding practice of the suckling
piglets from an early age of 7 to 10 days or so in a
standard management environment makes possible the
farmers to obtain higher litter weight at weaning.
When the basal liquid milk diet is reduced and
the stage where-in the piglets are offered with solid
creep feed from the 10th day after birth, the digestive
physiology changes wherein the intervention of
different feed additives is needed to have the maximum
nutrient utilization (Suiryanrayna et al., 2015). Among
various feed additives, probiotics is gaining importance
as a potential alternative to antibiotics to improve
production efûciency of animals, including pigs (Lee et
al., 2010). Probiotics may contain one or more strains
of microorganisms and may be given either alone or in
combination with other additives in feed or water
(Thomke and Elwinger, 1998). Also, the effects of
probiotics appear to be more consistent and positive in
Indian J. Anim. Nutr. 2020. 37 (2): 185-190

186
piglets rather than in growing finishing pigs (William,
2000). Pollmann et al. (1980) in his study found
improved feed utilization in piglets with feeding probiotics
(PROBIOS) alone or in conjugation with lactose, which
is a milk sugar.
Therefore, the hypothesis of the present study is
that the nutrient intake and efficiency of nutrient
utilization is limited in suckling piglets and that higher
pre-weaning growth rates can be achieved through
supplemental nutrient sources by providing milk powder
and probiotics incorporated creep feed to suckling
piglets. Considering the above facts and views, the
present research work of feeding milk powder and
probiotics supplemented creep feed was undertaken to
study their effect on growth performance and efficiency
of feed utilization in pre-weaning piglets.
MATERIALS AND METHODS
The animal experimental protocol was approved
by the Institutional Animal Ethics Committee (IAEC) of
the Assam Agricultural University and carried out as
per the guidelines of the Committee for the Purpose of
Control and Supervision of Experiments in Animals
(CPCSEA), Ministry of Environment, Forest and
Climate Change, Government of India.
The experiment was conducted at the 30-Sow
Teaching Unit of the Department of Livestock
Production and Management while laboratory analysis
of feed samples was done in the Department of Animal
Nutrition, College of Veterinary Science, Assam
Agricultural University, Khanapara, Guwahati, India.
Four Hampshire litters from sows of similar parity were
selected for the study. Seven healthy piglets of uniform
size and body weight were selected from each of the
litters constituting one group and thus four dietary
groups were formed. So, a total of 28 numbers of
experimental animals were finally selected for feeding
trial and recording of experimental data. Each of the
experimental piglets was randomly assigned to one of
the four dietary groups viz., T0 (fed conventional creep
feed alone, control), T1 (fed creep feed supplemented
with 5% milk powder of Sagar brand i.e 5 kg milk
powder were added in addition to 100 kg of basal feed),
T2 (fed creep feed supplemented with probiotics of
Probiotics and milk powder as feed additives in suckling piglets
Table 1. The formula of the basal conventional
farm ration
Name of the ingredients kg/100 kg
Maize crushed 50
Wheat bran 12
Ground nut cake (de-oiled) 27
Fish meal 8
Mineral mixture 2.5
Salt 0.5
Vitamins (A,D,E,K) Added at 200 g/
100 kg feed
Table 2. Composition of farm ration, milk powder (Sagar brand) and probiotics (Probios)
Farm ration (%) Milk powder (per 100 g) Probiotics (Viable lactic
acid bacteria/ gm)
DM (basal feed) 95 Energy (kcal) 366 Enterococcus faecium, 10 million
Lactobacillus acidophilus, CFU
Lactobacillus casei and
Lactobacillus plantarum
DM (left over feed) 92 Total fat (g) 1.5
on % DM basis
Crude protein 22.1 Total carbohydrate (gm) 52
Ether extract 5.06 Protein(g) 35
Crude fibre 4.75 Sodium (mg) 549
Total ash 7.75 Calcium (mg) 1200
NFE 60.34
Indian J. Anim. Nutr. 2020. 37 (2): 185-190
187
Probios brand added at 1g per kg creep feed i.e 100 g
probiotics were added in addition to 100 kg of basal
feed) and T3 (fed creep feed supplemented with 5%
milk powder + probiotics at 1g per kg creep feed).
All the experimental piglets were raised entirely
on their dams’ milk from birth to 7 days of age. From
day-8 onward, the piglets of T0, T
1, T
2 and T
3 groups
were offered respective experimental feed twice daily
as per the feeding schedule up to weaning at 56 days of
age. The piglets were separated from their sows daily
in the morning and evening for a period of 1 to 2 h
following suckling and offered feed in the outdoor run
and fed to appetite. The piglets were provided clean
water ad libitum round the clock. The formula of the
basal conventional farm ration and also compositions of
the farm ration, milk powder (Sagar brand) and probiotics
(Probios) used for the piglets are shown in Tables 1 and
2, respectively. The proximate analysis of the feed
samples was done as per methods described in AOAC
(1990).
The body weight of the individual piglets was
weighed using a hanging balance and recorded in kg in
the morning before offering feed and water. The first
(initial) body weights were recorded on 8th day morning
and then subsequently at weekly interval up to weaning
at 56 days of age. The body weight gain of the piglets in
a particular week were worked out by subtracting the
previous week’s body weight from the present body
weight and was recorded in kg.
The daily quantity of feed offered and leftover
thereon in each group of piglets were measured by
using a digital balance, and the consumption were
calculated by subtracting the left-over amount from the
quantity offered and was expressed in kg on D.M
basis. The daily feed consumption of the seven days of
a week was summed up to arrive at the weekly feed
consumption. The weekly feed conversion ratio (FCR)
was calculated as feed consumed in a week/ body
weight gain during that week (Sapra and Shingari, 1991).
Data obtained were subjected to ANOVA (two-way
analysis) using software package of SAS (Guide4.3).
Treatment means were separated by Duncan multiple
range test and level of significance was set at P<0.05.
RESULTS AND DISCUSSION
The findings of this study indicated that both the
overall and final body weights at 8 weeks of age (Table
3) of all the four groups differed significantly (P<0.01)
among themselves, it was highest in probiotics cum milk
powder group (T3), followed by probiotics (T
2), milk
powder (T1) and was lowest in control group (T
0).
The results showed that probiotics and milk powder
supplementation had significant positive effect (P<0.01)
on body weight of the piglets in all the subsequent weeks.
The present findings are in agreement with the findings
of King et al. (1998), who reported that litters given
milk supplements grew faster than litters receiving no
supplemental milk. Researchers like Novotni-Danko
et al. (2015) and Azain et al. (1996) also reported
significantly higher body weights of piglets at weaning
in milk supplemented group than the control group. The
findings of significant effect of probiotics in body weight
is well supported by Venkatachalapathy et al. (2013)
who found in their study that concentrate feed mixture
supplemented with multi-species probiotics strains
showed significantly higher litter weight at weaning than
the control fed only concentrate mixture.
The result of average weekly body weight gains
(Table 3) was found to be highest in T3 followed by T
2,
T1 and T
0 group. The differences were significant
(P<0.01) among all the four dietary groups. The piglets
showed a trend of steady weekly gain from 2nd week
onward in all the treatment groups. The better growth
performance in T3 group could be attributed to the
probiotics action of stabilization of gut microbiota
resulting in better digestion and utilization of nutrients in
milk powder enriched ration. Researchers like Rava
(1991) found that milk powder supplementation in diet
resulted in significantly higher weight gain than the
un-supplemented piglets. Ha et al. (2011) in an
experiment found that creep feed with milk replacer
from early lactation may be effective for increasing
weight gain of light piglets. On the contrary, Douglas et
al. (2014) observed no significant difference at any stage
from birth to slaughter in the average daily gain (ADG)
of piglets given access to supplementary milk or
not (P>0.05). In respect of effect of probiotics
Tissopi et al.
Indian J. Anim. Nutr. 2020. 37 (2): 185-190
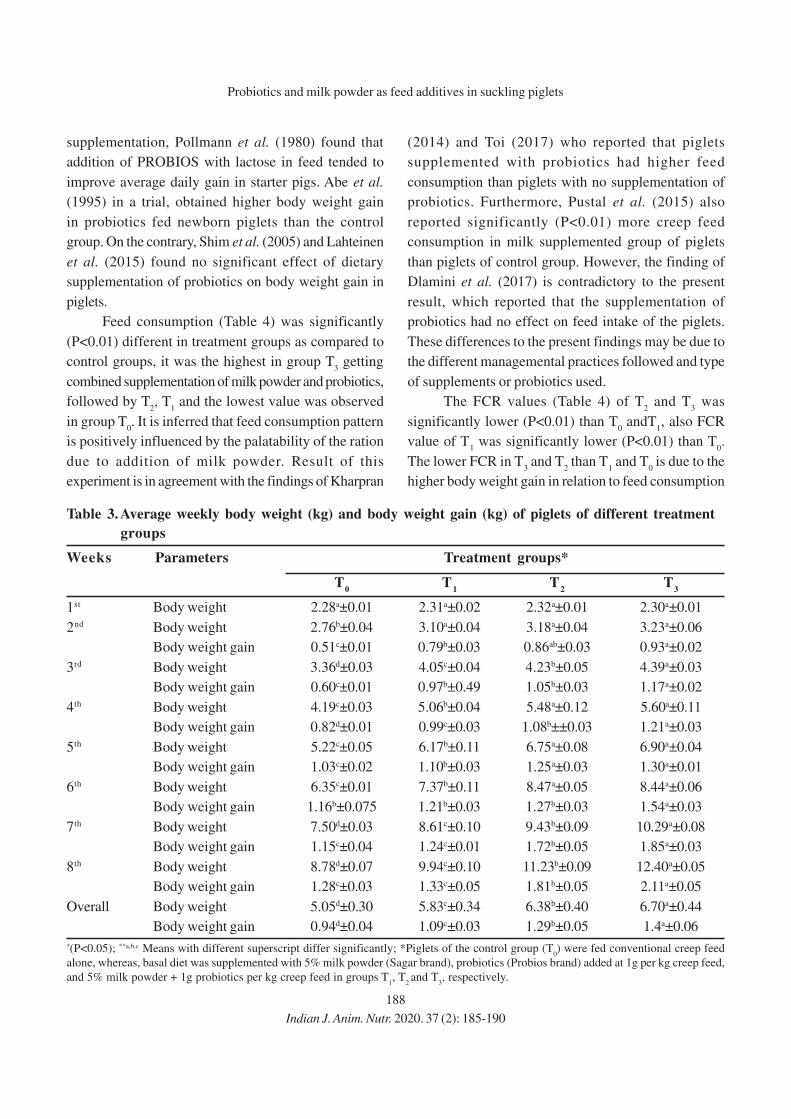
188
supplementation, Pollmann et al. (1980) found that
addition of PROBIOS with lactose in feed tended to
improve average daily gain in starter pigs. Abe et al.
(1995) in a trial, obtained higher body weight gain
in probiotics fed newborn piglets than the control
group. On the contrary, Shim et al. (2005) and Lahteinen
et al. (2015) found no significant effect of dietary
supplementation of probiotics on body weight gain in
piglets.
Feed consumption (Table 4) was significantly
(P<0.01) different in treatment groups as compared to
control groups, it was the highest in group T3 getting
combined supplementation of milk powder and probiotics,
followed by T2, T
1 and the lowest value was observed
in group T0. It is inferred that feed consumption pattern
is positively influenced by the palatability of the ration
due to addition of milk powder. Result of this
experiment is in agreement with the findings of Kharpran
(2014) and Toi (2017) who reported that piglets
supplemented with probiotics had higher feed
consumption than piglets with no supplementation of
probiotics. Furthermore, Pustal et al. (2015) also
reported significantly (P<0.01) more creep feed
consumption in milk supplemented group of piglets
than piglets of control group. However, the finding of
Dlamini et al. (2017) is contradictory to the present
result, which reported that the supplementation of
probiotics had no effect on feed intake of the piglets.
These differences to the present findings may be due to
the different managemental practices followed and type
of supplements or probiotics used.
The FCR values (Table 4) of T2 and T
3 was
significantly lower (P<0.01) than T0 andT
1, also FCR
value of T1 was significantly lower (P<0.01) than T
0.
The lower FCR in T3 and T
2 than T
1 and T
0 is due to the
higher body weight gain in relation to feed consumption
Table 3. Average weekly body weight (kg) and body weight gain (kg) of piglets of different treatment
groups
Weeks Parameters Treatment groups*
T0
T1
T2
T3
1st Body weight 2.28a±0.01 2.31a±0.02 2.32a±0.01 2.30a±0.01
2nd Body weight 2.76b±0.04 3.10a±0.04 3.18a±0.04 3.23a±0.06
Body weight gain 0.51c±0.01 0.79b±0.03 0.86ab±0.03 0.93a±0.02
3rd Body weight 3.36d±0.03 4.05c±0.04 4.23b±0.05 4.39a±0.03
Body weight gain 0.60c±0.01 0.97b±0.49 1.05b±0.03 1.17a±0.02
4th Body weight 4.19c±0.03 5.06b±0.04 5.48a±0.12 5.60a±0.11
Body weight gain 0.82d±0.01 0.99c±0.03 1.08b±±0.03 1.21a±0.03
5th Body weight 5.22c±0.05 6.17b±0.11 6.75a±0.08 6.90a±0.04
Body weight gain 1.03c±0.02 1.10b±0.03 1.25a±0.03 1.30a±0.01
6th Body weight 6.35c±0.01 7.37b±0.11 8.47a±0.05 8.44a±0.06
Body weight gain 1.16b±0.075 1.21b±0.03 1.27b±0.03 1.54a±0.03
7th Body weight 7.50d±0.03 8.61c±0.10 9.43b±0.09 10.29a±0.08
Body weight gain 1.15c±0.04 1.24c±0.01 1.72b±0.05 1.85a±0.03
8th Body weight 8.78d±0.07 9.94c±0.10 11.23b±0.09 12.40a±0.05
Body weight gain 1.28c±0.03 1.33c±0.05 1.81b±0.05 2.11a±0.05
Overall Body weight 5.05d±0.30 5.83c±0.34 6.38b±0.40 6.70a±0.44
Body weight gain 0.94d±0.04 1.09c±0.03 1.29b±0.05 1.4a±0.06
*(P<0.05); **a,b,c Means with different superscript differ significantly; *Piglets of the control group (T0) were fed conventional creep feed
alone, whereas, basal diet was supplemented with 5% milk powder (Sagar brand), probiotics (Probios brand) added at 1g per kg creep feed,
and 5% milk powder + 1g probiotics per kg creep feed in groups T1, T
2 and T
3, respectively.
Probiotics and milk powder as feed additives in suckling piglets
Indian J. Anim. Nutr. 2020. 37 (2): 185-190
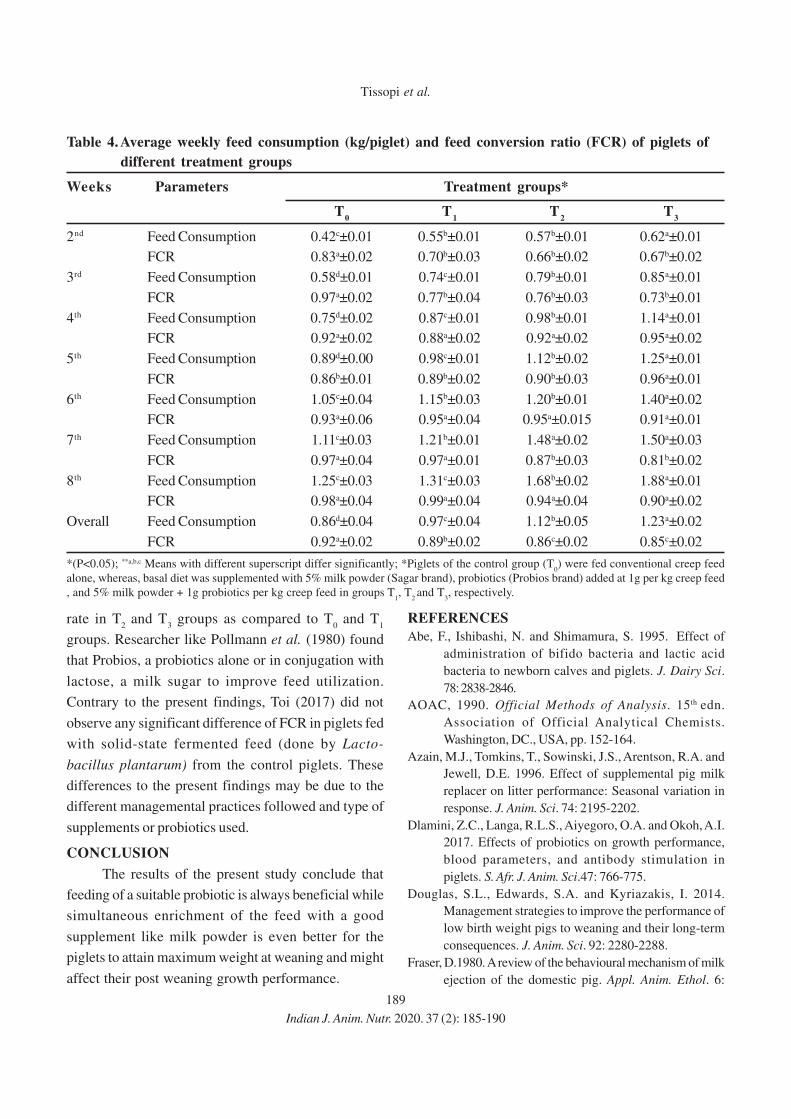
189
rate in T2 and T
3 groups as compared to T
0 and T
1
groups. Researcher like Pollmann et al. (1980) found
that Probios, a probiotics alone or in conjugation with
lactose, a milk sugar to improve feed utilization.
Contrary to the present findings, Toi (2017) did not
observe any significant difference of FCR in piglets fed
with solid-state fermented feed (done by Lacto-
bacillus plantarum) from the control piglets. These
differences to the present findings may be due to the
different managemental practices followed and type of
supplements or probiotics used.
CONCLUSION
The results of the present study conclude that
feeding of a suitable probiotic is always beneficial while
simultaneous enrichment of the feed with a good
supplement like milk powder is even better for the
piglets to attain maximum weight at weaning and might
affect their post weaning growth performance.
Table 4. Average weekly feed consumption (kg/piglet) and feed conversion ratio (FCR) of piglets of
different treatment groups
Weeks Parameters Treatment groups*
T0
T1
T2
T3
2nd Feed Consumption 0.42c±0.01 0.55b±0.01 0.57b±0.01 0.62a±0.01
FCR 0.83a±0.02 0.70b±0.03 0.66b±0.02 0.67b±0.02
3rd Feed Consumption 0.58d±0.01 0.74c±0.01 0.79b±0.01 0.85a±0.01
FCR 0.97a±0.02 0.77b±0.04 0.76b±0.03 0.73b±0.01
4th Feed Consumption 0.75d±0.02 0.87c±0.01 0.98b±0.01 1.14a±0.01
FCR 0.92a±0.02 0.88a±0.02 0.92a±0.02 0.95a±0.02
5th Feed Consumption 0.89d±0.00 0.98c±0.01 1.12b±0.02 1.25a±0.01
FCR 0.86b±0.01 0.89b±0.02 0.90b±0.03 0.96a±0.01
6th Feed Consumption 1.05c±0.04 1.15b±0.03 1.20b±0.01 1.40a±0.02
FCR 0.93a±0.06 0.95a±0.04 0.95a±0.015 0.91a±0.01
7th Feed Consumption 1.11c±0.03 1.21b±0.01 1.48a±0.02 1.50a±0.03
FCR 0.97a±0.04 0.97a±0.01 0.87b±0.03 0.81b±0.02
8th Feed Consumption 1.25c±0.03 1.31c±0.03 1.68b±0.02 1.88a±0.01
FCR 0.98a±0.04 0.99a±0.04 0.94a±0.04 0.90a±0.02
Overall Feed Consumption 0.86d±0.04 0.97c±0.04 1.12b±0.05 1.23a±0.02
FCR 0.92a±0.02 0.89b±0.02 0.86c±0.02 0.85c±0.02
*(P<0.05); **a,b,c Means with different superscript differ significantly; *Piglets of the control group (T0) were fed conventional creep feed
alone, whereas, basal diet was supplemented with 5% milk powder (Sagar brand), probiotics (Probios brand) added at 1g per kg creep feed
, and 5% milk powder + 1g probiotics per kg creep feed in groups T1, T
2 and T
3, respectively.
REFERENCES
Abe, F., Ishibashi, N. and Shimamura, S. 1995. Effect of
administration of bifido bacteria and lactic acid
bacteria to newborn calves and piglets. J. Dairy Sci.
78: 2838-2846.
AOAC, 1990. Official Methods of Analysis. 15th edn.
Association of Official Analytical Chemists.
Washington, DC., USA, pp. 152-164.
Azain, M.J., Tomkins, T., Sowinski, J.S., Arentson, R.A. and
Jewell, D.E. 1996. Effect of supplemental pig milk
replacer on litter performance: Seasonal variation in
response. J. Anim. Sci. 74: 2195-2202.
Dlamini, Z.C., Langa, R.L.S., Aiyegoro, O.A. and Okoh, A.I.
2017. Effects of probiotics on growth performance,
blood parameters, and antibody stimulation in
piglets. S. Afr. J. Anim. Sci.47: 766-775.
Douglas, S.L., Edwards, S.A. and Kyriazakis, I. 2014.
Management strategies to improve the performance of
low birth weight pigs to weaning and their long-term
consequences. J. Anim. Sci. 92: 2280-2288.
Fraser, D.1980. A review of the behavioural mechanism of milk
ejection of the domestic pig. Appl. Anim. Ethol. 6:
Tissopi et al.
Indian J. Anim. Nutr. 2020. 37 (2): 185-190

190
247-255.
Ha, D.M., Jang, K.S., Won, H.S., Ha, S.H., Park, M.J., Kim,
S.W. and Lee, C. 2011. Effects of creep feed and milk
replacer and nursery phase-feeding programs on
pre-and post-weaning growth of pigs. J. Anim. Sci.
Technol.53: 333-339.
Kharpran, S. 2014. Performance of Pre-Weaned Hampshire
Piglets fed with Dietary Supplementation of Dried
Brewing Yeast. M.V.Sc. Thesis. College of Veterinary
Science, (Assam Agricultural University), Guwahati-
781022, Assam, India.
King, R.H., Boyce, J.M. and Dunshea, F.R. 1998. Effect of
supplemental nutrients on the growth performance of
sucking pigs. Aust. J. Agric. Res. 49: 883-887.
Lahteinen, T., Rinttila, T., Koort, J.M.K., Kant, R., Levonen,
K., Viljanen, M.J., Bjorkroth, J. and Palva, A. 2015.
Effects of a multispecies Lactobacillus formation as a
feeding supplement on the performance and immune
function of piglets. Livest. Sci. 180: 164- 171.
Lee,K.W., Lillehoj,H.S. and Siragusa,G.R. 2010. Direct-fed
microbials and their impact on the intestinal microflora
and immune system of chickens. J. Poult. Sci.47:
106-114.
Mahan, D.C. and Lepine, A.J. 1991. Effect of piglet weaning
weight and associated nursery feeding programs on
subsequent performance to 105 kilograms body weight.
J. Anim. Sci. 69: 1370-1378.
Novotni Danko, G., Balogh, P., Huzsvai, L. and Gyori, Z. 2015.
Effect of feeding liquid milk supplement on litter
performances and on sow back-fat thickness change
during the suckling period. Arch. Anim. Breed.58:
229-235.
Pollmann, D.S., Danielson, D.M. and Peo, E.R. 1980. Effect of
Lactobacillus Acidophilus on starter pigs fed a diet
supplemented with lactose. J. Anim. Sci. 51: 638-644.
Pustal, J., Traulsen, I., Preibler, R., Muller, K., Grosse Beilage,
T., Borries, U. and Kemper, N. 2015. Providing
supplementary, artificial milk for large litters during
lactation: effects on performance and health of sows
and piglets: a case study. Porcine Hlth. Manage. 1:
1-13.
Rava, S. 1991. Effect of Skim Milk Feeding and Early
Weaning on the Growth Performance of Hampshire
Pigs. M.V.Sc. Thesis. College of Veterinary Science,
(Assam Agricultural University), Guwahati-781 022,
Assam, India.
Sapra, K.L. and Shingari, B.K. 1991. Effect of feeding livol on
growth in Turkeys. Indian J. Indg. Med. 8: 96-98.
Sarandan, H., Sarandan, R., Petroman, I., Ognean, L., Sarandan,
M., Rada, O., Balint, A. and Faur, B. 2009. Growth rate
and mortality in suckling piglets and their correlation
to the sows’ milk yield. Scientific Papers Anim. Sci.
Biotechnol. 42: 277-282.
Shim, S.B., Verstegen, M.W.A., Kim, I.H., Kwon, O.S.
and Verdonk, J.M.A.J. 2005. Effects of feeding
antibiotic-free creep feed supplemented with
oligofructose, probiotics or synbiotics to suckling
piglets increases the preweaning weight gain and
composition of intestinal microbiota. Arch. Anim.
Nutr. 59: 419-427.
Suiryanrayna, M.V. and Ramana, J.V. 2015. A review of the
effects of dietary organic acids fed to swine. J. Anim.
Sci. Biotechnol. 6: 45.
Sulabo, R.C. 2009. Influence of Creep Feeding on Individual
Consumption Characteristics and Growth
Performance of Neonatal and weanling Pigs. Ph.D.
Dissertation, Department of Animal Sciences and
Industry, College of Agriculture, Kansas State
University.
Thomke, S. and Elwinger, K. 1998. Growth promotants in
feeding pigs and poultry II. Mode of action of
antibiotic growth promotants. Ann. Zootech.47:
153-167.
Toi, S.M. 2017. Effect of Feeding Solid State Fermented
Ration on the Performance of Hampshire Piglets.
M.V.Sc. Thesis. College of Veterinary Science, (Assam
Agricultural University), Guwahati-781022, Assam,
India.
Venkatachalapathy, R.T., Gopalakrishnan, S.P. and Usha, A.P.
2013. Effect of Probiotics Supplementation on the
Performance of Preweaned Piglets. Probiotics In:
Sustainable Food Production: Current Status and
Future Prospects “Probiotics in Food Production”,
Ramanathan, A. and Senthivel, T. (Eds.), 2, p.281.
William, H C. 2000. Producing pigs without antibiotic growth
promoters. Adv. Pork. Prod. 11: 47-56.
Probiotics and milk powder as feed additives in suckling piglets
Indian J. Anim. Nutr. 2020. 37 (2): 185-190
Received on 12-06-2020 and accepted on 24-08-2020
191
Indian Journal of
Animal Nutrition
Effect of Graded Levels of Broken Rice on Egg Quality of White Pekin
Ducks during Second Year of laying
P.K. Naik*, B.K. Swain, S.K. Sahoo, D. Kumar and S.K. MishraICAR-Central Avian Research Institute Regional Centre, Bhubaneswar, Odisha-751 019, India
ABSTRACT
A study was conducted to find out the effect of feeding different levels of broken rice (BR) replacing
wheat in the diet of White pekin ducks in second year of laying on egg quality parameters. White pekin laying
ducks (75; 82 weeks) were divided into five groups; and diets without (BR-0) and with BR, replacing 25 (BR-25),
50 (BR-50), 75 (BR-75) and 100 (BR-100) percent of wheat; were fed for a period of 73 days. There was no
significant difference in the egg weight, albumen index, yolk index, Haugh unit, shell thickness (without
membrane), percentage of albumen, yolk and shell. The egg shape index was significantly (P<0.05) higher in
BR-100 than BR-0. The shell thickness with membrane was significantly (P<0.05) higher in all the groups fed
broken rice than the control group. It can be concluded that wheat can be completely replaced by broken rice
in the diets of white Pekin laying ducks during second year of egg production without affecting egg quality.
Key words: Ducks, Egg, Rice, Wheat, White Pekin, Quality
Indian J. Anim. Nutr. 2020. 37 (2): 191-194
doi: 10.5958/2231-6744.2020.00031.6
(BR-75) and 100 (BR-100), percent of wheat (Table
1). White Pekin laying ducks (n=75; 82 weeks of age)
were divided into five groups; each group having three
replicates with five ducks per replicate, and were
allocated randomly to either of the above five diets for a
period of 73 days. All the birds were reared on deep
litter system and were fed the respective diets ad lib.
during the experimental period. Standard management
practices were followed and clean drinking water was
made available ad lib. throughout the experiment. For
external egg quality parameters, weight, length and width
of the egg were recorded weekly and the egg shape
index was calculated. For internal egg quality
parameters, percent of albumen, yolk, shell, shell
thickness; and length, width and height of albumen and
yolk were recorded weekly; and albumen index, yolk
index and Haugh unit were calculated. The external egg
quality parameters were determined as per the formula
of Shultz (1953); while the internal egg quality
parameters were calculated as per the formula of
Heiman and Carver (1936), Sharp and Powell (1930),
Haugh (1937) and Funk (1948). The data were
statistically analysed for the test of significance
(Snedecor and Cochran 1994).
The chemical compositions of the feeds are
*Corresponding author; E-mail: [email protected]
In India, ducks contribute next to chicken, in total
egg and bird meat production. Therefore, special
emphasis is being given on duck farming to meet the
egg and meat requirements of the country. There are
many advantages of ducks over chickens, in which
laying potential in second year is one of them. White
Pekin ducks are used both for egg and meat production.
Wheat is used as a source of energy in duck feed (Behera
et al., 2016). However, in rural areas, farmers prefer to
keep ducks in back-yard with supplementation of
locally available feed ingredients (Sahoo et al., 2014;
Swain et al., 2018). Broken rice or rice kani is available
throughout India and its price is usually lower to that of
other cereals (Tyagi et al., 2014). As the cost of wheat
is increasing exorbitantly, the locally available broken
rice is being preferred by the farmers for feeding their
ducks. However, very little literature is available on
feeding of broken rice to ducks, particularly in second
year of laying. Therefore, a study was conducted to
find out the effect of feeding different levels of broken
rice replacing wheat on egg quality in White Pekin ducks
during second year of laying.
Five iso-nitrogenous and iso-caloric diets were
prepared without (BR-0) and with the inclusion of
broken rice (BR), replacing 25 (BR-25), 50 (BR-50), 75
SHORT COMMUNICATION
Indian J. Anim. Nutr. 2020. 37 (2): 191-194
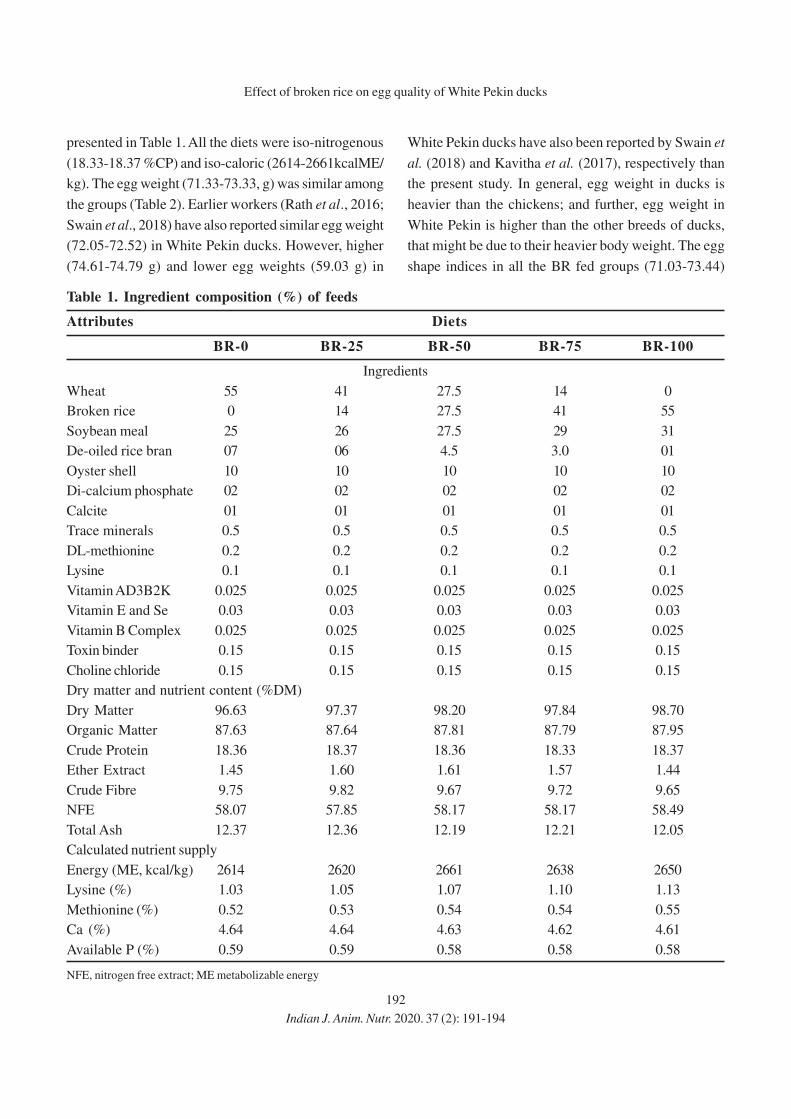
192
presented in Table 1. All the diets were iso-nitrogenous
(18.33-18.37 %CP) and iso-caloric (2614-2661kcalME/
kg). The egg weight (71.33-73.33, g) was similar among
the groups (Table 2). Earlier workers (Rath et al., 2016;
Swain et al., 2018) have also reported similar egg weight
(72.05-72.52) in White Pekin ducks. However, higher
(74.61-74.79 g) and lower egg weights (59.03 g) in
White Pekin ducks have also been reported by Swain et
al. (2018) and Kavitha et al. (2017), respectively than
the present study. In general, egg weight in ducks is
heavier than the chickens; and further, egg weight in
White Pekin is higher than the other breeds of ducks,
that might be due to their heavier body weight. The egg
shape indices in all the BR fed groups (71.03-73.44)
Table 1. Ingredient composition (%) of feeds
Attributes Diets
BR-0 BR-25 BR-50 BR-75 BR-100
Ingredients
Wheat 55 41 27.5 14 0
Broken rice 0 14 27.5 41 55
Soybean meal 25 26 27.5 29 31
De-oiled rice bran 07 06 4.5 3.0 01
Oyster shell 10 10 10 10 10
Di-calcium phosphate 02 02 02 02 02
Calcite 01 01 01 01 01
Trace minerals 0.5 0.5 0.5 0.5 0.5
DL-methionine 0.2 0.2 0.2 0.2 0.2
Lysine 0.1 0.1 0.1 0.1 0.1
Vitamin AD3B2K 0.025 0.025 0.025 0.025 0.025
Vitamin E and Se 0.03 0.03 0.03 0.03 0.03
Vitamin B Complex 0.025 0.025 0.025 0.025 0.025
Toxin binder 0.15 0.15 0.15 0.15 0.15
Choline chloride 0.15 0.15 0.15 0.15 0.15
Dry matter and nutrient content (%DM)
Dry Matter 96.63 97.37 98.20 97.84 98.70
Organic Matter 87.63 87.64 87.81 87.79 87.95
Crude Protein 18.36 18.37 18.36 18.33 18.37
Ether Extract 1.45 1.60 1.61 1.57 1.44
Crude Fibre 9.75 9.82 9.67 9.72 9.65
NFE 58.07 57.85 58.17 58.17 58.49
Total Ash 12.37 12.36 12.19 12.21 12.05
Calculated nutrient supply
Energy (ME, kcal/kg) 2614 2620 2661 2638 2650
Lysine (%) 1.03 1.05 1.07 1.10 1.13
Methionine (%) 0.52 0.53 0.54 0.54 0.55
Ca (%) 4.64 4.64 4.63 4.62 4.61
Available P (%) 0.59 0.59 0.58 0.58 0.58
NFE, nitrogen free extract; ME metabolizable energy
Effect of broken rice on egg quality of White Pekin ducks
Indian J. Anim. Nutr. 2020. 37 (2): 191-194

193
were similar; however, the egg shape index in BR-100
group was higher (P<0.05) than the BR-0 (68.97). Egg
shape index of 74.36-77.63 (Rath et al., 2016); 75.63
(Kavitha et al., 2017); and 71.12-72.69 (Swain et al.,
2018) have been reported by the earlier workers in White
Pekin ducks. There was no difference (P>0.05) in
albumen index (0.12-0.14), yolk index (0.41-0.46), and
Haugh unit ((94.13-96.00) among the groups. Our
findings corroborate well with those of the earlier
workers in White Pekin ducks (Rath et al., 2016;
Kavitha et al., 2017; Swain et al., 2018). The egg
contents viz. percentage of albumen (51.09-51.51), yolk
(33.52-33.97) and shell weights (14.94-15.03) were
similar among the groups. However, similar albumen
weight (50.32-55.10%), but higher yolk weight (34.53-
36.87%) and lower shell weight (9.07-13.63%) have
been reported by the earlier workers (Rath et al., 2016;
Swain et al., 2018). The CP content of wheat is higher
(10.30%) than BR (7.9%) and the comparative amino
acid profile of the two cereals reveals that wheat
contains higher amount of lysine than BR (0.47 vs 0.42
%) (Singh and Panda, 1996; Panda, 2013). In spite of
these, no adverse impact on egg quality parameters was
observed, when wheat was replaced completely with
BR. It could be explained on the basis that the absolute
contribution of cereal grains to the CP (23.68-30.88 %),
lysine (20.35-25.24%) and methionine (21.82-23.08%)
supply is rather low. Moreover, the rations were
balanced to be iso-nitrogenous by adjusting the amount
of soybean meal in the ration. The shell thickness (mm)
with membrane was higher (P>0.05) in all the groups
fed broken rice (0.52-0.53, mm) than the control group
(0.50); however, the shell thickness without membrane
(0.43-0.44, mm) were similar (P>0.05) among the
groups. Lower (0.35-0.47, mm) and higher (0.55-0.56,
mm) egg shell thickness have also been recorded in White
Pekin ducks (Palanivel and Harikrishnan, 2011; Rath
et al., 2016; Kavitha et al., 2017; Swain et al., 2018).
However, egg shell thickness without membrane of 0.46-
0.48 mm have been observed by Swain et al. (2018),
which are very much close to the findings of the present
study. The similar shell thickness (without membrane)
among the groups indicates that shell thickness was not
affected by substitution of wheat with BR, even though
wheat contains higher (0.18%) Ca than BR (0.11%); as
the contribution of the cereals to total Ca supply was
only 1.30-2.2% (Singh and Panda, 1996). Thus, the
reduction in absolute Ca supply due to substitution of
Table 2. Effect of feeding graded levels of broken rice, by replacing wheat on egg quality
Parameters Treatments SEM
BR-0 BR-25 BR-50 BR-75 BR-100
External egg quality
Egg weight (g) 71.53 72.51 73.33 72.47 71.33 0.30
Egg shape index 68.97a 71.03ab 71.16ab 71.36ab 73.44b 0.46
Internal egg quality
Albumen index 0.12 0.12 0.13 0.13 0.14 <0.01
Yolk index 0.41 0.42 0.43 0.43 0.46 0.01
Haugh Unit 94.15 94.13 94.99 95.34 96.00 0.30
% Albumen weight 51.51 51.33 51.09 51.33 51.21 0.27
% Yolk weight 33.52 33.71 33.97 33.72 33.75 0.12
% Shell weight 14.97 14.96 14.94 14.95 15.03 0.21
Shell thickness 0.50a 0.52b 0.53b 0.53b 0.53b <0.01
with membrane (mm)
Shell thickness without 0.43 0.43 0.44 0.44 0.44 <0.01
membrane (mm)
a,bMean with different superscript in a row differ significantly
Naik et al.
Indian J. Anim. Nutr. 2020. 37 (2): 191-194
194
wheat was rather meagre to cause any adverse impact
on shell formation.
It can be concluded that wheat can be completely
replaced by broken rice in the diets of white Pekin
laying ducks during second year of egg production
without affecting egg quality.
ACKNOWLEDGEMENT
The authors are thankful to Indian Council
ofAgricultural Research (ICAR), New Delhi; for
providing financial support to conduct the study.
REFERENCES
Behera, N.K., Babu, L.K., Sahoo, S.K., Giri, S.C., Pati, P.K.,
Panigrahi, B. And Joshi, S.K. 2016. Effect of feeding
different levels of protein on mortality, carcass
characteristics, biochemical parameters, time motion
study and economics of desi ducks under intensive
system of rearing. Asian J. Anim. Sci. 10: 106-112.
Funk, E.M. 1948. The relation of yolk index determined in
natural position to the yolk index as determined after
separating the yolk from the albumen. Poult. Sci.27:
367.
Haugh, R.R. 1937. The Haugh unit for measuring egg quality.
U.S. Egg and Poultry Magazine, 43: 552-555 and 572-
573.
Heiman, V., and Carver, J.S. 1936. The albumen index as a
physical measurement of observed egg quality. Poult.
Sci.15: 141-148.
Kavitha, K., Manohar, G.R., Vairamuthu, S., and Ramamurthy,
N. 2017. Comparative study of egg quality traits in
White Pekin and indigenous ducks of Tamilnadu. Int.
J. Sci., Environ. Technol. 6: 3520-3523.
Palanivel, P. and Harikrishnan, S. 2011. A glance at internal
and external qualities of Kuttand, White Pekin and
commercial duck eggs. Egg Quality-Engormix.
Panda, A.K. 2013. Cereals & their byproducts. In Poultry
Feedstuffs and feed additives. PP 25-52. Hind
Publications (ISBN-978-93-83397-00-6). Hyderabad,
India.
Rath, R., Mishra, M., Panigrahi, B., Singh, V., Tewari, H.
and Tyagi, K. 2016. Effect of dietary choline
supplementation on egg quality and serum
biochemical profile in White Pekin ducks. Indian J.
Anim. Res., DOI: 10.18805/ijar.9639.
Sahoo, S.K., Naskar, S.K., Giri, S.C., Padhi, M.K.and Panda,
S.K. 2014. Performance of White Pekin ducks on
replacement of maize with cassava tuber meals. Anim.
Nutr. Feed Technol., 14: 291-300.
Singh, K.S. and Panda, B. 1996. Poultry Nutrition. Kalyani
Publishers, New Delhi, India.
Sharp, P.F. and Powell, C.K. 1930. Decrease in internal quality
of hens egg during storage as indicated by the yolk.
Indian J. Chem. 22: 909-910.
Shultz, P.T. 1953. Analysis of egg shape in chickens.
Biometrics. 9: 336.
Snedecor, G.W. and Cochran, W.G. 1994. Statistical Methods.
8th edn. Oxford and IBHPublishing Co. Calcutta, India.
Swain, B.K., Naik, P.K., Sahoo, S.K., Mishra, S.K. and Kumar,
D. 2018.Effect of Feeding of Azolla (Azollapinnata) on
the Performance of White Pekin Laying Ducks. Int. J.
Livest. Res. 8: 248-253.
Tyagi, P.K., Tyagi, P.K. and Mandal, A.B. 2014. Broken rice.
In: Feed stuffs for livestock and poultry (Mandal. A.
B., Elangovan, A. V., Tyagi, P. K., Tyagi, P. K. And
Singh, R.; eds.), pp.21-23. CARI, Izatnagar, UP, India.
Effect of broken rice on egg quality of White Pekin ducks
Indian J. Anim. Nutr. 2020. 37 (2): 191-194
Received on 28-02-2-2020 and accepted on 22-07-2020