Exploiting IT to Generate Competitive Advantage
41
EXPLOITING INFORMATION TECHNOLOGY (IT) TO GENERATE COMPETITIVE ADVANTAGE AT PERAWANG CONTAINER TERMINAL Written By : RINANDAR THAMRIN SUPERVISOR INFORMATION TECHNOLOGY BELAWAN DOMESTIC CONTAINER TERMINAL Mentor : IMRON ERYANDY HUMAN RESOURCE SENIOR MANAGER INDONESIA PORT CORPORATION I PORT OF PEKANBARU, RIAU PROVINCE, INDONESIA JANUUARY 2015 PT. PELABUHAN INDONESIA I - IV (PERSERO) UNITED NATIONS CONFERENCE ON TRADE AND DEVELOPMENT DUBLIN PORT COMPANY IRISH AID, IRELAND
-
Upload
independent -
Category
Documents
-
view
2 -
download
0
Transcript of Exploiting IT to Generate Competitive Advantage

EXPLOITING INFORMATION TECHNOLOGY (IT) TO GENERATE COMPETITIVE ADVANTAGE
AT PERAWANG CONTAINER TERMINAL
Written By : RINANDAR THAMRIN
SUPERVISOR INFORMATION TECHNOLOGY BELAWAN DOMESTIC CONTAINER TERMINAL
Mentor : IMRON ERYANDY
HUMAN RESOURCE SENIOR MANAGER
INDONESIA PORT CORPORATION I PORT OF PEKANBARU, RIAU PROVINCE, INDONESIA
JANUUARY 2015
PT. PELABUHAN INDONESIA I
- IV (PERSERO)
UNITED NATIONS
CONFERENCE ON TRADE AND DEVELOPMENT
DUBLIN PORT COMPANY IRISH AID, IRELAND

i
ABSTRACK
Since Perawang Port has been declared as a container terminal in May 2012 by the Ministry of Marine Transportation. Perawang port has made some efforts among other expand container yard, replacement new stacker container crane, and implementation ICT to improve operations and customer service in terminal. In the implementing of ICT there are still have a problem in communication between the operator and the terminal users ( Shipper , carriers )
In this case Perawang port cannot offer a viable means of communication so that the transport ( Carriers ) or Shipper can immediately get all the information necessary to prepare the ship reservations, to follow the containers and carry out operations necessary for the delivery thus speeding up the whole transportation process. So if the Perawang port cannot offer IT system (new competitive advantage) to provide all the information necessary to terminal users (shipper, carrier and etc), the perawang port will have great difficulty to ensure customer loyalty and attract container traffic in province of Riau mainland.
This dissertation is aimed at reviewing the strategic plan of TPK Perawang to exploit IT to give solutions to the problem of communications between the operator and the terminal users and to improve overall quality of services to port clients which in the end will enhance the competitiveness of the port community.
Use IT solution to improve communications between the port operator and the terminal users.
Keyword: System Information Strategic (SIS), Exploiting IT, Value chain, Competitive Advantages.

ii
ACKNOWLEDGEMENTS
First of all I would like to express thanks to Allah for all His blessings and guidance, I
can finish this dissertation. This dissertation is the final project that must be taken tofinish the
Unctad Trainfortrade Port Training Programme.
Second, I would like to thank to Mr. Imron Eryandy,as my mentor, who helped me to
complete and improve the quality of this dissertation.
Sincere gratitude to the Board of director of PT Pelabuhan Indonesia I,II, III and IV
Ppersero) for initiating The Modern Port Management Program cooperation with UNCTAD
Special thanks also go to Mr. Mark Assaf, Mr Timothy Sulivan and Mr.Jhonmore for
coordinating program, Mr. Tito G. Muliawan, and Mr. Edi Haristiani as Course Leader,
Mr.Widyagustanto, Mr Welly Bathesta and Mr Djon Simadianto, who helped increasing my
motivation and all my classmate, the participants of Unctad Trainfortrade Port Training
Programme Cyle 3 for sharing and friendship.
I would also like to thank to all my colleagues at branch of Pekanbaru who have helped
to find data and supported me during the dissertation writing.
Finally, the author wishes to thank my parents, my wife and my children who have given
the spirit in my life
.

iii
CONTENTS ABSTARCK………………………………………………………………………………
CONTENTS …………………………………………………………………………….
LIST OF FIGURE……………………………………………………………………..
ACKNOWLEDGEMENTS ……………………………………………………………..
CHAPTER I : INTRODUCTION
1.1. General Description of PT. Pelabuhan Indonesia I (Persero) ……………....
1.2. Profile Perawang Port………………………………………………………..
1.3. Problem Statement………………………………………………………….. .
1.4. M e t h o d o l g y O f R e s e a r c h …………………………………………
CHAPTER II : R e v i e w O f L i t e r a t u r e
2 . 1 . IT And The New Competitive Advantages Of A Port....................................
2 . 2 . ICT as a competitiveness advantage factor.....………………………………..
2 . 3 . Information and Communication Technologies in Support of Modern Port
Management .....................................................................................................
2 . 4 . Internet and the World Wide Web (WWW) ....................................................
2 . 5 . SWOT Analysis ...............................................................................................
2 . 6 . Porter’s Value Chain Model ………………………………………………….
CHAPTER III : Research Findings And Data Analysis.
3 . 1 . Mapping of Information exchanges in the Ports..............................................
3 . 2 . Rating of Information Required By The Terminal User……………………...
3 . 3 . Sistem Information Strategic (SIS) ……………………………………
CHAPTER IV : Conclusion & Suggestion……………………………………………………
BIBILOGRAPHY
LIST OF ABBREVIATIONS
ANNEXES
i
ii
iii
iv
1
3
5
6
7
8
9
13
15
15
18
19
20
25
iv
LIST OF FIGURE
Figure I.1a. Boundary of PT. Pelabuhan Indonesia I (Persero) Operational Territory……………. 1
Figure I. 1b. Corporate Value………………………………………………………………………… 2
Figure I.2a. Map of Riau mainland………………………………………………………………….. 3
Figure I.2b. Geographical location of Perawang port……………………………………………….. 4
Figure I.2c. Throughtput & Market share Container Terminal Perawang
(Source : Data Simoppel )………………………………………………………………..
4
Figure 2. 1. Information and Communication Technologies enable to enhancing the
Competitiveness of The Port Community………………………………………………
8
Figure 2.3a Lay Out of Information Flow in ports………………………………………………….. 11
Figure 2.3b. Value Chain of Logistic Operation…………………………………………………….. 12
Figure 2.3c. Design Architecture Computer System Multi-User System Customer/Server............... 13
Figure 2.4a Architecture Internet…………………………………………………………………… 14
Figure 2.5 . SWOT matrix ………………………………………………………………………….. 15
Figure 2.6. Porter’s Value Chain…………………………………………………………………… 16
Figure 3.1a. Matrix Condition of Information and Communication Technologies at Container
Terminal Perawang in supporting flow information exchanged in the Ports…………
18
Figure 3.2 Level of Information needs by Shipping Agent & Freight Forwarder………… 20
Figure 3.3.1. SWOT ANALYSIS…………………………………………………………………….. 21
Figure 3.3.2. Prominent IT Applications in The Value Chain (Modify Porter 2001)…………………. 24

1
CHAPTER I I N T R OD U C TI ON
1.1. General Description of PT. Pelabuhan Indonesia I (Persero)
Indonesia Port Corporation I was found based on Government Regulation No. 56, 1991 by Notariat
deed Fatimah, SH No. 1 dated December 1st 1992 which had been inserted in State Official Report of
Republic of Indonesia No. 8612, 1994, with the last alteration as announced in Addendum State-Official
Report of Republic of Indonesia No. 1 dates January 2nd 1999.
Figure I.1a. Boundary of PT. Pelabuhan Indonesia I (Persero) Operational Territory
The full name of the corporation is PT Pelabuhan Indonesia I (Persero), shortened PT Pelindo I (Persero),
which the head office located at Jalan Krakatau Ujung No. 100 Medan, zip code 20241, North Sumatra,
Indonesia. Phone +62616610220, Facsimile +62616610906, website : http://www.inaport1.co.id, e-mail :
During the Ducth Occupation, this corporate was named as Haven Bedrijf, then after the
independence day of the Republic of Indonesia Year 1945 to 1950 the corporate had the status of Port
Services. From 1960 to 1969 the Port Services was converted into State Port Company shortened PN
Pelabuhan. For the period of 1969 to 1983 State Port Company was converted to Port Authority by the
name of Port Administration shortened BPP (in Bahasa, stand for Badan Pengusahaan Pelabuhan).
2
In 1983 based on Government Regulation No. 11, Port Administration was converted to Public Port
Corporation I shortened Perumpel I. And then based on Government Regulation No. 56, Year 1991,
Public Port Corporation I converted its status to be PT Pelabuhan Indonesia I (Persero) – Indonesia Port
Corporation I (Ltd) – located and head-office in Medan, Sumatera Utara Province.
Nowadays, PT Pelindo I (Persero) operates ports in four provinces in northern part of Sumatera
island, namely Nanggroe Aceh Darussalam province, North Sumatera province, Riau province and Riau
Islands province. Based on the Government Regulation No. 64, Year 2001, the status, duty and
authorization of the Financial Minister as the stockholder in government owned/ltd. company is
submitted to the Minister of State Owned Enterprises. Management supervision of technical operation is
under the Transportation Department of the Republic of Indonesia and conducted by the Directorate
General of Marine Transportation.
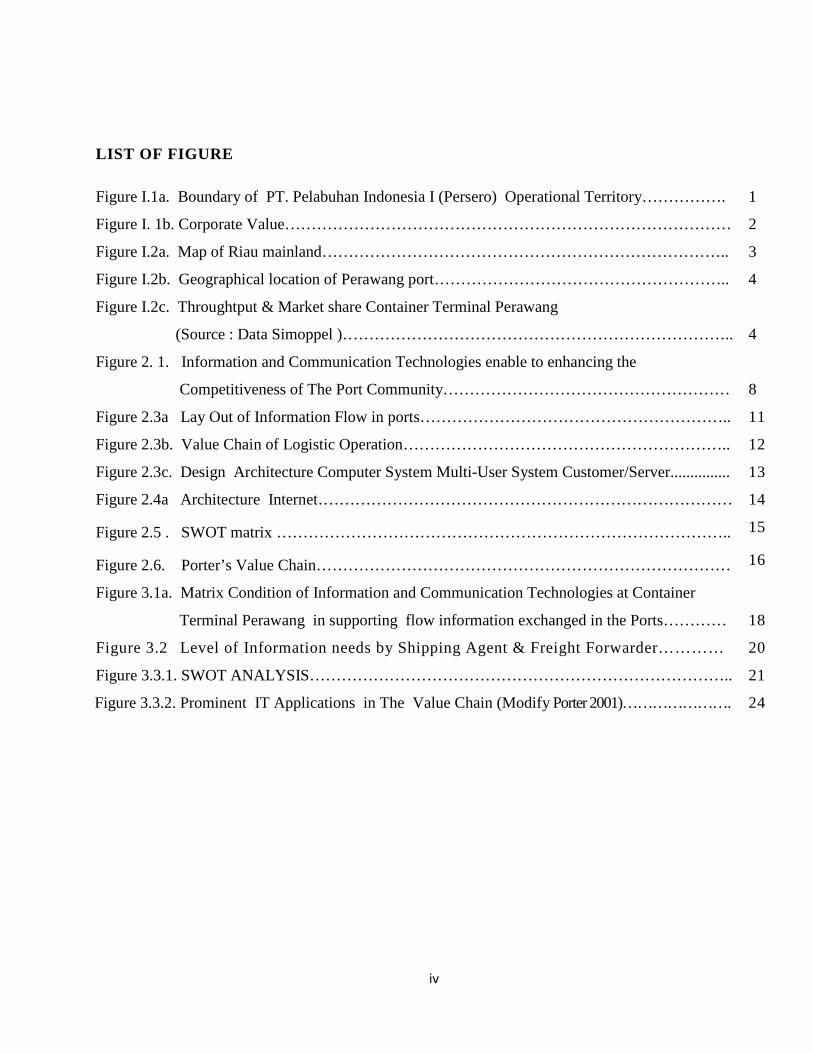
Vision of PT Pelindo I (Persero) defined as follows : “to be a leading provider of port and logistic
services in the regional level”. Mission of PT Pelindo I (Persero) defined as follows : “to provide
qualified port and logistics services that meet customer expectation and provide added values to the
growth of economic region”. To support the achievement of the vision and mission, the company has the
its corporate values :
Customer Focus : Proactive in serving and building
relationships with customers.
Integrity : Prioritize commendable behavior in accordance with the values, principles and ethics of the company.
Professionalism : Mastery of work which includes knowledge, skills and attitudes.
Teamwork : Sincere desire to cooperate with others.
Figure I. 1b. Corporate Value

3
Branch of Pekanbaru is one of the branches PT. Pelabuhan Indonesia I (Persero) which is located
in Riau mainland Province and it is covering three Public Ports i.e Pasar Bawah Port, Kuala Cinaku
Port and Perawang Port.
1.2. Profile Perawang Port.
On Friday, 4 May 2012 Perawang Port has be declared as container terminal by Ministry of
Marine Transportation. The Perawang port are 1 of the 3 public port the owned by branches of
Pekanbaru. Both ports other
than Perawang port are a
multipurpose terminal and
currently operational
activities at the ports is not
effective anymore because
the ship visits at most 1 call
per month. Perawang port is
the mainstay port of branch
of Pekanbaru currently.
Perawang port is
located on Siak River, as one of
gate way of economic activities, connecting an area of 87.023,66 km in the province of Riau mainland
of Sumatera Island Indonesia.
Container Terminal Port in Riau mainland is currently the have two public port for a hinterland of
almost 5,6 million people1
1 Population data in 2010 (http://riau.bps.go.id/)
of Riau mainland and two private port for own goods. Perawang port growth
is currently very dependent on the economic development of the Pekanbaru city and surrounding,
Because the Perawang port is one of gateway the entrances consumer goods of pekanbaru city and
surrounding.
Figure I.2a. Map of Riau mainland

4
Distance from the river
mouth to perawang port is 78
Nmile and average approach
time per vessel are 9 hours.
Siak river have depth channel is
9 LWS and width 150 meters.
Maximum LOA of Vessel that
can through to the river is
110m , Draft 6,5 m and 3.5000
GT.
Hydro – Oceanographic
Surface soil around the Port of Perawang very sloping , narrow waters and a lot of corners . Nature
is a mixture of ups and downs , leaning daily double . Stables average water on neap tides at 220 cm and
60 cm die attach . Face receding located 170 cm below the DT ( Zo = 170 cm ). Northward flow velocity
of the maximum (outflow ) was 2.5 knots for 2.5 hours before AR . While the maximum current from the
south ( entrance ) is 2 knots for 2.5 hours prior to AT.
In November to April and a lot happening cumulonimbus cumulus clouds , then followed by the
thunderstorm and rain . Average rainfall is 200-300 mm in the number of rainy days on average 15-20
2010 2011 2012 2013 2014
island 18.197 22.583 36.769 51.943 49.730
int 3.979 5.688 8.014 7.281 13.634
-10.000 20.000 30.000 40.000 50.000 60.000 70.000
Throughtput (Box)
Figure I.2c.Throughtput & Market share Container Terminal Perawang (Source : Data Simoppel )
Figure I.2b. Geographical location of Perawang port
5,1%
14,8% 15,5%
33,8%
0,0%
10,0%
20,0%
30,0%
40,0%
2011 2012 2013 2014
Growth of Market Share
Market Share Linear (Market Share)

5
days per month . In the period May to October the weather is generally good . Rainfall ranges between
75-150 mm with the number of rainy days on average 7-12 days per month . Temperatures ranged
between 32°C - 34°C.
Hinterland Potency
Hinterland of Perawang port covered of Pekanbaru city and surrounding. It is a collection centre
for agricultural produce from the hinterland, including palm oil, rubber, petroleum, bauxite, coal, gold,
processed wood and paper.
.
Riau mainland province is one of largest palm oil producer in the indonesia and in the world, cause
it very high demand for fertilizer every years. Mostly of fertilizer imported from overseas to meet the
needs of plantation in Riau mainland province. Besides it, all needs of consumer goods of Pekanbaru city
and surrounding areas have to come from outside the province of Riau (overseas or inter island) by
containerize.
Business Potency.
Mostly for export the produce of raw palm oil of Riau province loaded by tanker ships at Dumai
Port. According to the wishes of Indonesian government about the finished product export of palm oil in
the future, it will make changes in handling cargo of palm oil product i.e from tanker ships to container
vessel.
1.3. Problem Statement.
Perawang port as new Container Terminal in Indonesia have a few problem in management port
information i.e.:
1. Lack of information on expected ships and container, which makes the planning of operations and
necessary administrative and technical arrangements difficult to handle.
2. Lack of information on the location of containers in the port premises, which causes delay for
delivery imported containers and ship loading operations.

6
3. Port operator cannot provide line access to database so that the port users can immediately get all
information necessary
1 . 4 . M e t h o d o l o g y O f R e s e a r c h
The methodology of the research is a combination of quantitative and qualitative research methods.
1. Analysis of quantitative data collection activities related to the exchange of information within the
port community by doing this activity:
a. Internal data analysis.
Analysis of internal data is primarily intended to form the big picture of the overall type of
information in current database systems by mapping every piece of information to find details
of the data gaps needed by the customer.
b. Customer survey is customer polling by questioner to identify necessary information with
regards to port service and port community.
2. Qualitative research aims to get a better understanding through first hand experience, truthful
reporting, and quotations of actual conversations. It aims to understand :
a. How impact exploiting information technology in Container Terminal Perawang to Customer
directly (examples: their operational activities performance)
b. The issues that impede the collection, storage and delivery information to database system
and port users.
Qualitative insight is gained from in-depth interview to users and port officer working by IT
system

7
CHAPTER II
R E V I E W O F L I T E R A T U R E
2.1. IT And The New Competitive Advantages Of A Port .
Competitive advantage, in this study, refer to the competencies, capabilities and resource in
provider of accurate information as a distinct attraction to customers.
In order to compete a port must be able to rely on some competitive advantages. The major
advantages, i.e. plus points, which will enable us to respond to future needs. The choices to be made, the
priorities to be established in this area will depend on the objectives and strategies of the port. The
competitive advantages in port depend upon external factors, which the port can scarcely influence. Ports
suffering from this handicap should rely on competitive advantages arising from internal factors.
A port will have a competitive advantage if it there are plus points of these factors i.e.
geographical location, inland connections, availability and quality of port services, cost of port services,
the social-economic stability , the information technology, the dynamism and stability of a united port
community and search for « niches » and « crannies ».2
2 UNCTAD - TrainForTrade, Module Four of Modern Port Training Programme Manual, Future Challenges to Ports, Sub Module 4.A. The New Competitive Advantages of Ports, page 6 to 12
Some ports in developing countries still suffer from insufficient means of communication within the
port authority or between the users (shippers, carriers), which are vital to establish commercial contacts
with the hinterland or the rest of the world.
It is evident that today a port will have great difficulty to attract traffic, especially container traffic if
it does not offer viable means of communication which include fax machines, a system of telephones with
direct access to the international network, even a system of Electronic Data Interchange (EDI) which enable
the sending of coded messages between computers linked by a telecommunication system. The carrier or
the shipper could thus immediately obtain all information that is needed to prepare for the ship’s call, to
follow the goods and to carry out the necessary operations regarding the delivery and Customs clearance of
the goods. Most dynamic ports have a computerised operational system at their disposal linking them to
Customs, at times to the carriers, which allow a considerable speeding up of the entire transport process.

8
Usually, it is the port authority that takes the first step by providing the initial investment to ensure
the development of such systems that give an appreciable competitive advantage. Hence, at the port of Le
Havre, it was the port authority that financed the purchase of the first information equipment to make it
possible to track the goods; the users (agents, freight forwarders, etc.) covered the operating costs.
In New York, the shippers and carriers have access to a cheap EDI system called "Automated Cargo
Expediting System". They can track the goods for the cost of a local telephone call. It is said that ports that
are equipped in this way provide an "info-structure" as well as an "infrastructure
" namely quays and open
storage areas to serve the ships. Both are becoming vital.
Figure 2. 1. Information and Communication Technologies enable to enhancing the
Competitiveness of The Port Community.
2.2 ICT as a competitiveness advantage factor
Some authors believe the primary role of IT in the hotel industry is to improve productivity (Ham,
Gon Kim, & Jeong, 2005). Many tourism and hospitality researchers claim that ICT is a competitive
advantage factor (Buhalis, 2003; Polo Pena & Frias Jamilena, 2010; Camison, 2000; Sunil and Islam,
2005; Luque-Martinez, Castaneda-Garcia & Frias-Jamilena, 2007; Buhalis, 1998; Sheldon, 1997; Ma,
Buhalis & Song, 2007). These authors understand ICT as the hardware and software, the groupware and
netware as well as the intellectual capacity (humanware) to develop, programme and maintain the related

9
equipment. Indeed, different kinds of the abovementioned “wares” such as super and mini computers,
office applications, tele-conferencing, the Internet, intranet, central reservation systems (CRS), satellite
and mobile communications, interactive television and self-service terminals etc. have been adopted by
hotel companies to improve their operational efficiency and competitiveness (Buhalis, 2003).
The Internet has received significant attention from entrepreneurs, executives, investors and
business observers and many have assumed that the Internet changes everything about companies and
competition. Internet banking, for example, has changed the traditional banking culture and brought
competitive advantages to ICT-advanced banking firms (Yiu, Grant & Edgar, 2007). Another example in
the airline and tourism industry is the use of CRSs (computer reservation systems) that have permanently
changed the way of doing business in these service-based industries (Buhalis, 2004). Similar changes
soon followed in the hotel industry and ICT became the key issue for the future of the hotel business
(O’Connor & Frew, 2002). In 2000 US hotel managers saw IT as a mechanism to obtain competitive
adva 7 ntages, mainly through improved employee productivity and enhanced revenue generation
(Siguaw, Enz, & Namasivayam, 2000).
The question is whether ICT should be seen as an independent intangible competitive resource or
factor, and how is it linked to profitability. Some studies, mainly in OECD and some transitional
economies, provided empirical evidence based on the production function of the link between ICT and
rises in productivity, which proved to be stronger in service sectors (Stare, Jaklič & Kotnik, 2006). This
can be linked to the new business opportunities offered by ICT and it seems that they are creating a new
potential source of competitive advantage and profitability. Tsai, Song and Wong (Tsai et al., 2009, p.
537) studied competitiveness in the hotel industry and concluded that “information technology (IT), such
as the Internet, intranets, and central reservation systems, is one of the crucial technology investments
that are often made by hotels to improve performance”.
2.3 Information and Communication Technologies in Support of Modern Port Management.
With trade globalisation, information is nowadays placed at the core of all production systems.
All organisations feel the constant need to obtain, analyse and exchange data. Information in a port is
conveyed to the different players as an information flow. The two main actors, namely, the forwarding
agent and the ship’s agent, must coordinate information flow coming from different sources. There are
two applications for a port:

10
- the computer and information systems used for the processing of data within the port, that is,
business computing (payroll, personnel, accountancy and finance, stocks, statistics and indicators,
maintenance…to decision support).
- Electronic Data Interchange (EDI), which applies to the transfer of data between companies of the
port community: ship, cargo, other services, tracking, etc.
Information and Communication Technologies in Support of Modern Port Management are useful
production and management tools that help to a great extent to ensure these objectivities3
1. Strategic Plan.
:
2. Management & Decision-Making
3. Finance and HR Control.
4. Port Operation Control.
5. Development of Trade and economy.
6. Speed & Quality.
7. Cargo transit and handing cost savings
8. Competitive services
9. Environmental Protection.
10. Market Opportunities.
11. Performance indicator.
12. Productivity.
2.3.1. Information Flows in the Ports.
Quick and reliable data exchanges between the different players of the transport chain are key
factors in coordinating the accurate time and place of services for ensuring the best results, and supply
relevant information to the manager.
Information in a port is conveyed to the different players as an information flow. The two main
actors, namely, the forwarding agent and the ship’s agent, must coordinate information flow coming from
different sources
3 UNCTAD - TrainForTrade, Presentation materials module 5 “Computerization and EDI Systems in Ports”

11
The information flow of a port is illustrated in Figure II.1a-1 with the information The figure
shows the different players and the information flow between them.
.
Official agents: Port Authorities, Harbour Master, Physical inspection – Customs, Veterinary, Phytosanitary, Exportation
Private Agents:
– Maritime and port activities: Vessel operator, Shipping company, Line operator or carrier, Ship’s master, Pilots, Mooring services, Tubboat service, shipping agents.
– On-land services: Stevedore companies, customs agents, freight forwarders, consolidator, Inland carriers (road, rail or waterway), container depot.
The flow information exchanged can be grouped within the cycles the cover and the agents
intervening in the process:
1. Commercial exchanges.
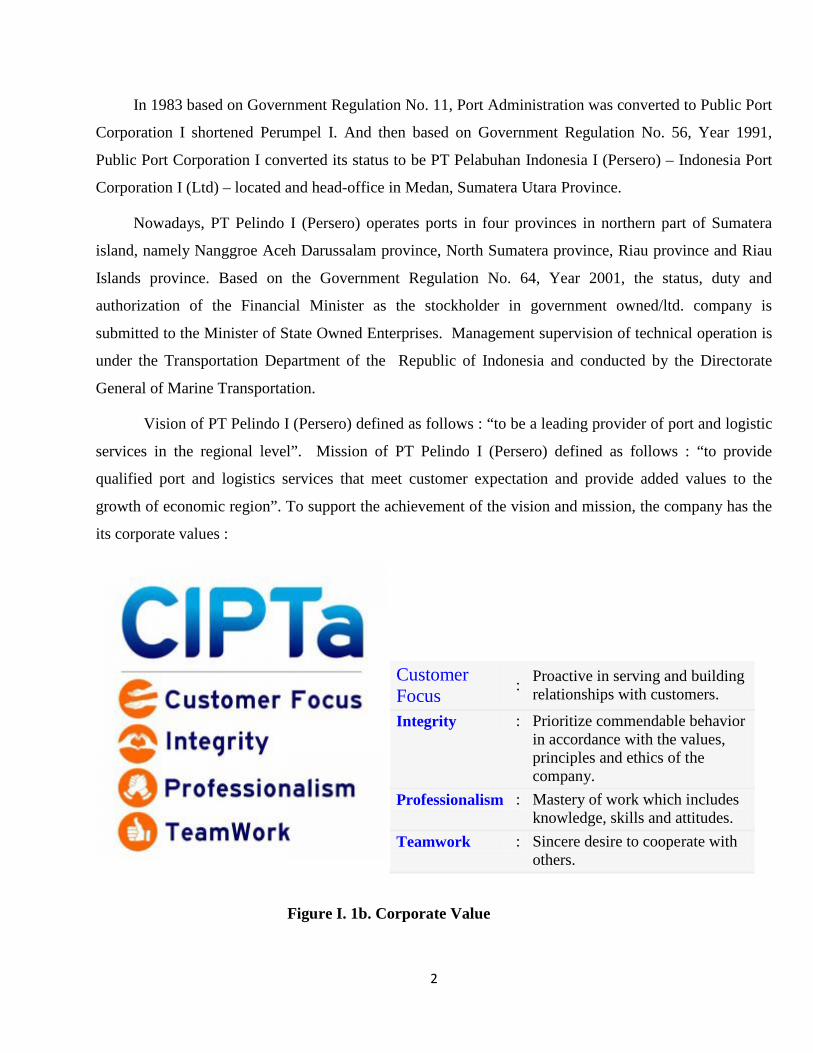
Planning.
Contracting
Billing
Payments made and received.
Figure 2.3a Lay Out of Information Flow in ports.
12
Figure 2.3b. Value Chain of Logistic Operation .
2. Operational exchanges
Intermodal operative cycle
Exportation
Importation.
Operational cycle in the terminal.
Exportation
Importation.
3. Control and Authorisation exchanges. Port authorisation cycle Vessel arrival/departure Dangeraous goods.
Operational cycle in the terminal. Exportation Importation.
13
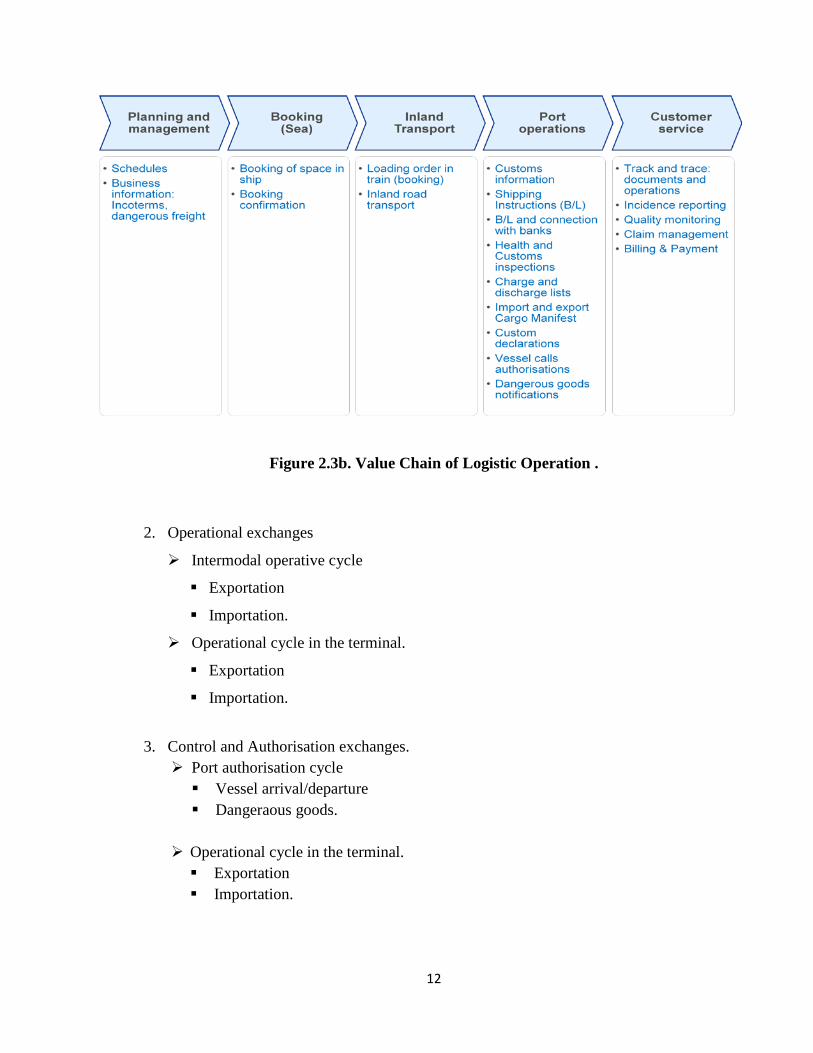
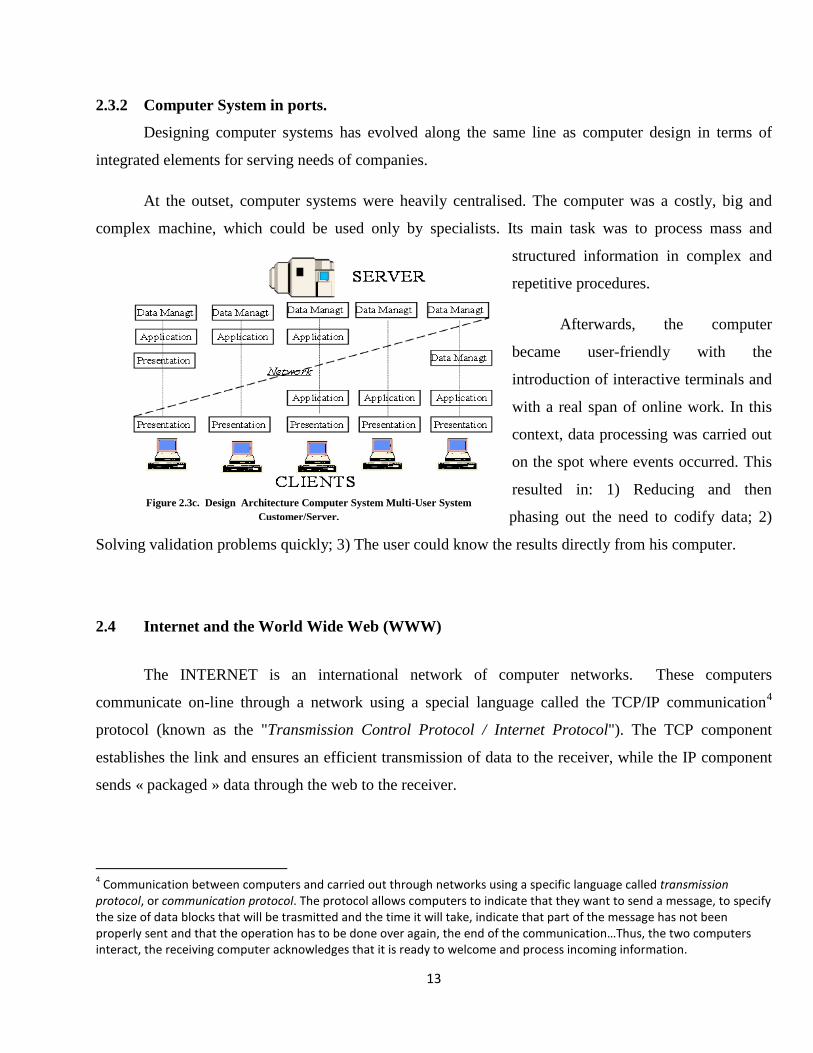
2.3.2 Computer System in ports.
Designing computer systems has evolved along the same line as computer design in terms of
integrated elements for serving needs of companies.
At the outset, computer systems were heavily centralised. The computer was a costly, big and
complex machine, which could be used only by specialists. Its main task was to process mass and
structured information in complex and
repetitive procedures.
Afterwards, the computer
became user-friendly with the
introduction of interactive terminals and
with a real span of online work. In this
context, data processing was carried out
on the spot where events occurred. This
resulted in: 1) Reducing and then
phasing out the need to codify data; 2)
Solving validation problems quickly; 3) The user could know the results directly from his computer.
2.4 Internet and the World Wide Web (WWW)
The INTERNET is an international network of computer networks. These computers
communicate on-line through a network using a special language called the TCP/IP communication4
4 Communication between computers and carried out through networks using a specific language called transmission protocol, or communication protocol. The protocol allows computers to indicate that they want to send a message, to specify the size of data blocks that will be trasmitted and the time it will take, indicate that part of the message has not been properly sent and that the operation has to be done over again, the end of the communication…Thus, the two computers interact, the receiving computer acknowledges that it is ready to welcome and process incoming information.
protocol (known as the "Transmission Control Protocol / Internet Protocol"). The TCP component
establishes the link and ensures an efficient transmission of data to the receiver, while the IP component
sends « packaged » data through the web to the receiver.
Figure 2.3c. Design Architecture Computer System Multi-User System Customer/Server.
14
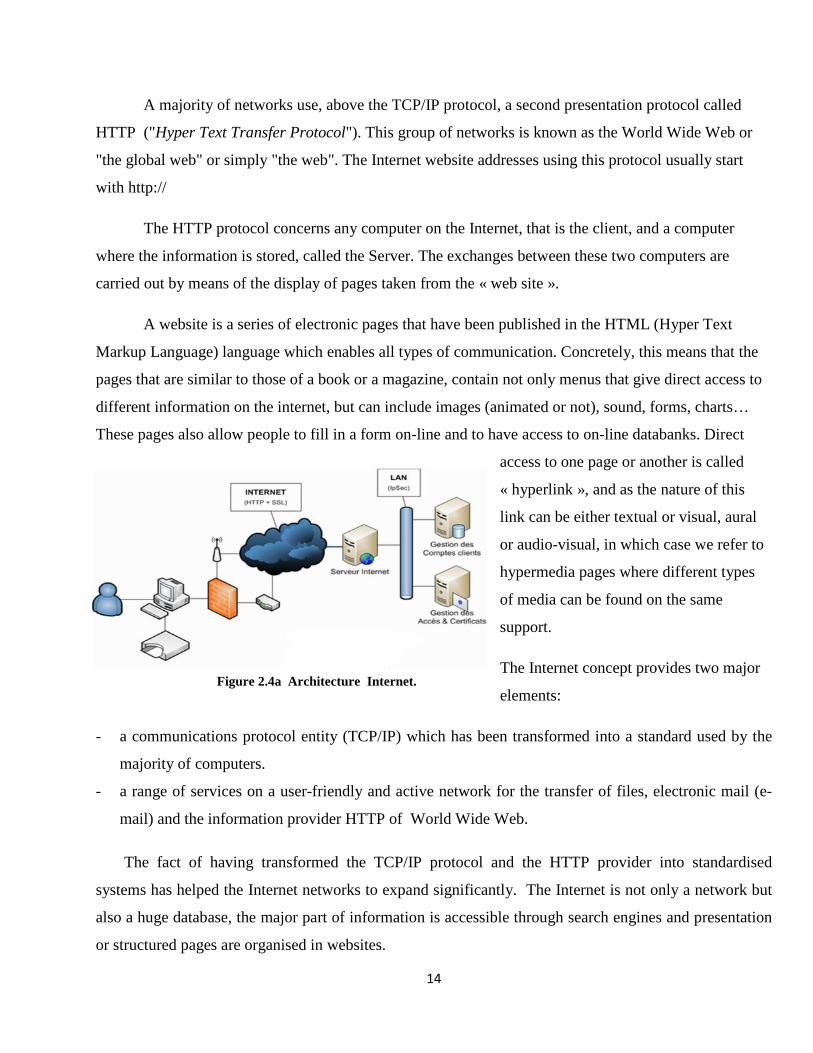
A majority of networks use, above the TCP/IP protocol, a second presentation protocol called
HTTP ("Hyper Text Transfer Protocol"). This group of networks is known as the World Wide Web or
"the global web" or simply "the web". The Internet website addresses using this protocol usually start
with http://
The HTTP protocol concerns any computer on the Internet, that is the client, and a computer
where the information is stored, called the Server. The exchanges between these two computers are
carried out by means of the display of pages taken from the « web site ».
A website is a series of electronic pages that have been published in the HTML (Hyper Text
Markup Language) language which enables all types of communication. Concretely, this means that the
pages that are similar to those of a book or a magazine, contain not only menus that give direct access to
different information on the internet, but can include images (animated or not), sound, forms, charts…
These pages also allow people to fill in a form on-line and to have access to on-line databanks. Direct
access to one page or another is called
« hyperlink », and as the nature of this
link can be either textual or visual, aural
or audio-visual, in which case we refer to
hypermedia pages where different types
of media can be found on the same
support.
The Internet concept provides two major
elements:
- a communications protocol entity (TCP/IP) which has been transformed into a standard used by the
majority of computers.
- a range of services on a user-friendly and active network for the transfer of files, electronic mail (e-
mail) and the information provider HTTP of World Wide Web.
The fact of having transformed the TCP/IP protocol and the HTTP provider into standardised
systems has helped the Internet networks to expand significantly. The Internet is not only a network but
also a huge database, the major part of information is accessible through search engines and presentation
or structured pages are organised in websites.
Figure 2.4a Architecture Internet.

15
2.5 SWOT Analysis.
The SWOT method is based on the fact that the fundamental
rule in marketing consists in using all one's strengths and to prevent
being attacked on its weaknesses and to know the strengths and
weaknesses of the competition. Port operations are extremely well
positioned to apply this rule.The acronym SWOT originates from the
English and means: S for Strengths, W for Weaknesses, O for
Opportunities and T for Threats.
Strengths and Weaknesses - One of the roles of the commercial
directors is to make an inventory of the fields in which these factors
can be identified. The following list covers the main fields that are
common to most ports.
Opportunities and Threats - The market law teaches that each opportunity missed can afterwards turn into
a threat to the port. The customers' needs are neither homogeneous nor constant. They can change rapidly and take
the most various forms. Ports should constantly study the market to identify the most probable opportunities and
threats. It is important that comparisons with competitive ports are made systematically.
2.6 Porter’s Value Chain Model.
The Value Chain framework of Michael Porter (1985) is a model that help to analyze specific
activities through which firm can create value and competitive advantages.
Porter distinguishes between Primary Activities and Support Activities. Primary activities are
directly concerned with the creation or delivery of a product or service. The goal of Primary Activities is
to create value that exceeds the cost of providing the product of service, thus generating a profit margin.
The Primary Activities can be grouped into five main areas:
1. Inbound Logistics – include the receiving, warehousing, and inventory control of input material.
2. Operations – the value-creating activities that transform the input into the final product.
3. Outbound Logistics – the activities required to get the finished product to the customer,
including warehousing, order fulfillment, etc.
Figure 2.5 . SWOT matrix

16
4. Marketing and Sales - the activities associated with getting buyer to purchase the product,
including channel selection, advertising, pricing, etc.
5. Service Activities - the activities associated with maintain and enhance the product’s value
including customer support, repair services, etc.
Any or all of these primary activities may be vital in developing a competitive advantage. The primary
value chain activities described abode are facilitated by Support Activities. Porter identified four generic
categories of Support activities, the details of which are industry-specific.
The Primary activities are supported by the following support activities :
1. The Firm Infrastructure - includes activities such as finance, legal, quality management, etc
2. Human Resource Management - the activities associated with recruiting, development and
compensation of employees.
3. Technology development – include research and development (R&), process automation, and
other technology development used to support the value-chain activities.
4. Procurement – the function of purchasing the raw material and other inputs used in the value-
creating activities.
A company's value chain is a system on interdependent activities, which are connected by
linkages. Linkages exist when the way in which one activity is performed affects the cost or effectiveness
Supp
ort A
ctiv
ities
Firm Infrastructure
Human Resaource Managamenet
Technology Development
Procurement Operations Outound
Logistics Marketing and Sales
Services inbound Logistics
Primary Activities Figure II.2. Porter’s Value Chain
Figure 2.6. Porter’s Value Chain

17
of the other activities. Linkages often create trade-offs in performing different activities that should be
optimized. Linkage also require activities to be coordinated. On-time delivery requires the operations,
outbound logistics, and service activities should function smoothly together.
Good coordination allows on-time delivery without the need for costly inventory. Careful
management of linkages is often a powerful source of competitive advantage because of difficulty rival
have in perceiving them and in resolving trade-offs across organizational lines.
Linkages not only connect value activities inside a company but also create interdependencies
between its value chain and those of its suppliers and channels. A company can create competitive
advantage by optimizing or coordinating these links to the outside.

18
CHAPTER III
RESEARCH FINDINGS AND DATA ANALYSIS
3.1 Mapping of Information exchanges in the Ports.
The flow information exchanged in the ports can be grouped into Commercial exchanges,
Operational exchanges and Control and Authorisation exchanges (As explained in Chapter II).
No ITEMS Currently ISSUE
exist Not exist
1 Data Information
a Commercial Exchanges
- Planning √ Operators lack information on expected ships and container, which makes the planning of operations and necessary administrative and technical arrangements difficult to handle.
- Contracting √
- Billing √ - Port operator cannot provide line access from port’s database to customers so that the port users can immediately get all information necessary (Data billing, and payments status).
- Port operator not provide Customer Care Services. - Payments made and received √
b Operational exchanges
- Intermodal operative cycle exportation / importation
√
- Operational cycle in the terminal exportation / importation
√ - Port operators lack information on the location of containers in the port premises, which causes delay for delivery imported containers and ship loading operations.
- The low quality of information due to officers of operational often do not perform recording by real time
c Control and Authorization exchanges
- Port authorization cycle: a. Vessel arrival / departure.
√
Indonesia National Single Windows (INSW) program cannot be connected to IT system in Container Terminal Perawang.
b. Dangerous good √
- Good authorization cycle exportation / importation
√
2 IT Infrastructure √ Network of IT systems are often disconnected makes the data failed to store
Figure 3.1a. Matrix Condition of Information and Communication Technologies at Container Terminal Perawang in supporting flow information exchanged in the Ports

19
To view what information that obtained from IT System in Container Terminal Perawang
currently, we have mapped the information and the results as shown on Tabel 4.1.a. The data shows that
IT system at Container Terminal Perawang provide only 40% (4 of 9) from flow information exchanged
in the ports. Although current IT systems can provide 4 of 9 Information exchanged at the Port, but there
are still a problem i.e information available currently is not accurate so it cannot be used by the terminal
operators and customers to prepare a plan of the ship, to follow the container and carry out the necessary
operations for delivery to speed up the whole transportation process. The impact of all that, the terminal
users must put their resources to monitor their container traffic at Container Terminal Perawang (see
Annex 9).
To see where the process which makes the output information of the current IT system becomes
inaccurate. We do a depth-interview to the operations officer responsible for recording all service
activities by IT systems in Container Terminal Perawang and result of the depth-interview are :
1. Local Area Network (LAN) often disconnected, it make the data fails to save into the Database.
2. Data cannot be recorded by real time due to less the number of officers and Hand Held Terminal
(HHT) in Container Terminal Perawang.
3. Operational officer often do not follow the business process that has been set by the IT system for
doing his job.
4. Container Yard management is not ready, it makes planning operational container yard,
administrative and technical arrangements required difficult to be handled by the terminal
operator.
5. Terminal operators do not have customer care and access channels so that customers can search
for the required information directly.
6. There are no national standards for document formats EDI system making it difficult to
information exchanges in port community.
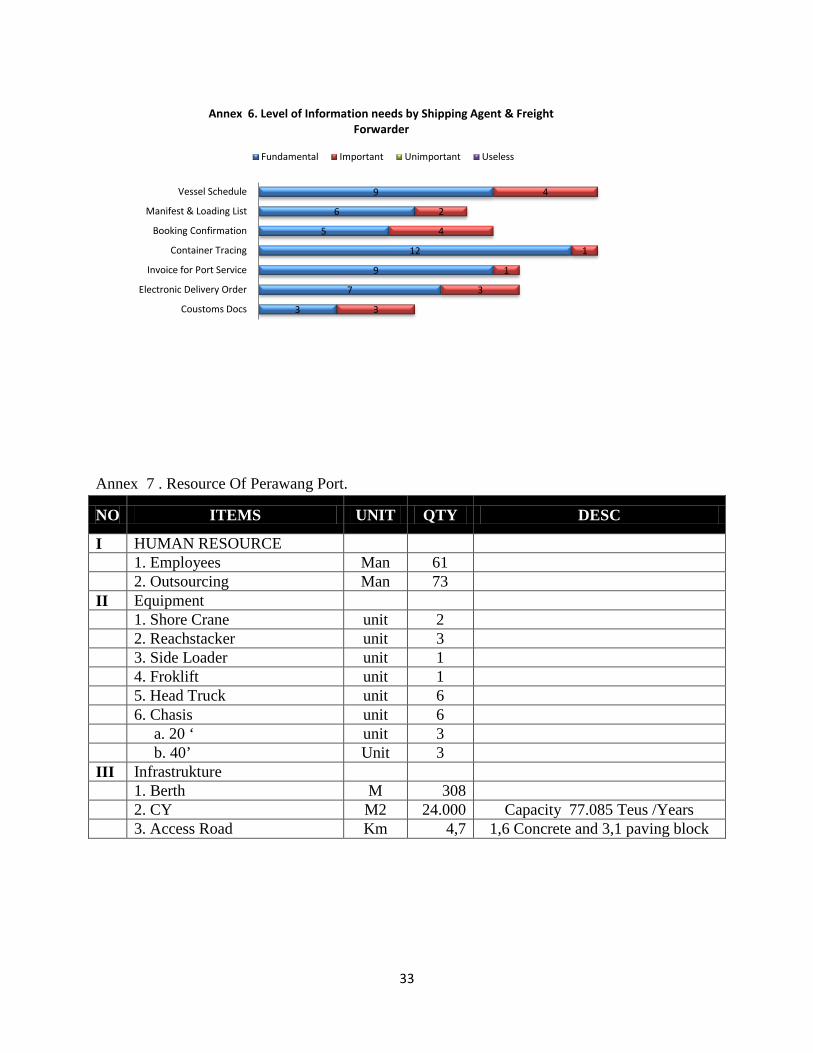
3.2 Rating of Information Required By The Terminal User.
To find out what information is needed by the terminal users at container terminal Perawang to
speed up their operational processes, we have conducted a survey to the shipping agent and freight

20
forwarder with the results can be seen in the annex 1. Based on survey data on the table annex 2, we can
get an idea of what information is needed by the terminal users as shown in Figure 4.2.1 .
Figure 3.2 Level of Information needs by Shipping Agent & Freight Forwarder
Furthermore the information selected by the terminal users based on the level of needed can be
rated as follows :
1. Container Tracing.
2. Vessel Schedule.
3. Invoice for Port Service.
4. Electronic Delivery Order.
5. Manifest & Loading List
6. Booking Confirmation.
7. Customs Documents.
3.3 System Information Strategic (SIS).
In determining the strategic plan in Exploiting IT to deliver competitive value analysis performed by two methods namely
9
6
5
12
9
7
3
4
2
4
1
1
3
3
Vessel Schedule
Manifest & Loading List
Booking Confirmation
Container Tracing
Invoice for Port Service
Electronic Delivery Order
Customs Docs
Level of Information needs by Shipping Agent & Forwarding
Fundamental Important Unimportant Useless
21
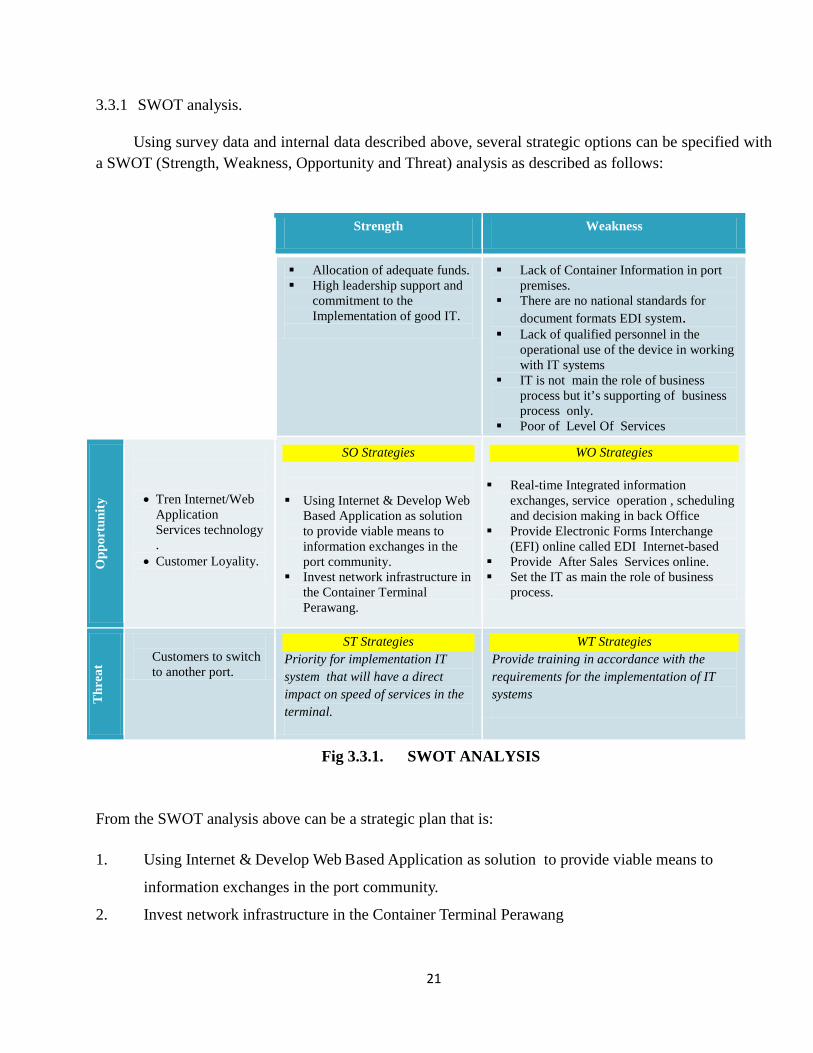
3.3.1 SWOT analysis.
Using survey data and internal data described above, several strategic options can be specified with a SWOT (Strength, Weakness, Opportunity and Threat) analysis as described as follows:
Strength Weakness
Allocation of adequate funds. High leadership support and
commitment to the Implementation of good IT.
Lack of Container Information in port premises.
There are no national standards for document formats EDI system.
Lack of qualified personnel in the operational use of the device in working with IT systems
IT is not main the role of business process but it’s supporting of business process only.
Poor of Level Of Services
Opp
ortu
nity
• Tren Internet/Web Application Services technology .
• Customer Loyality.
SO Strategies Using Internet & Develop Web
Based Application as solution to provide viable means to information exchanges in the port community.
Invest network infrastructure in the Container Terminal Perawang.
WO Strategies
Real-time Integrated information exchanges, service operation , scheduling and decision making in back Office
Provide Electronic Forms Interchange (EFI) online called EDI Internet-based
Provide After Sales Services online. Set the IT as main the role of business
process.
Thr
eat
Customers to switch to another port.
ST Strategies Priority for implementation IT system that will have a direct impact on speed of services in the terminal.
WT Strategies Provide training in accordance with the requirements for the implementation of IT systems
From the SWOT analysis above can be a strategic plan that is:
1. Using Internet & Develop Web Based Application as solution to provide viable means to
information exchanges in the port community.
2. Invest network infrastructure in the Container Terminal Perawang
Fig 3.3.1. SWOT ANALYSIS

22
3. Priority for implementation IT system that will have a direct impact on speed of services in the
terminal
4. Real-time Integrated information exchanges, service operation , scheduling and decision making
in back Office.
5. Provide Electronic Forms Interchange (EFI) online called EDI Internet-based.
6. Provide After Sales Services online.
7. Set the IT as main the role of business process.
8. Provide training in accordance with the requirements for the implementation of IT systems
3.3.2 Porter's Value Chain frame work.
As described in the problem statement in Chapter I, the mayor problem of exploiting IT system
at Container Terminal Perawang is a viable means of communication so that the transport ( Carriers ) or
Shipper can immediately get all the information necessary.
From 8 strategic plan produced by the SWOT analysis, Using Internet & Develop Web Based
Application is the right choice at this time to provide viable means of communication to terminal users .
According to Porter, “The great paradox of the Internet is that its very benefits—making
information widely available; reducing the difficulty of purchasing, marketing, and distribution; allowing
buyers and sellers to find and transact business with one another more easily—also make it more
difficult for companies to capture those benefits as profits” (2001, p. 66).
Using approaches Porter's Value Chain analysis framework and Strategic Plan of the results of SWOT
analysis, we can identified IT Strategic for the Exploiting IT to create competitive advantage as shown in
fig 4.3.2, and from it we can describe Value activities at Container Terminal Perawang as follow:
1. Primery activities
a. Vessel and Container Trafik Managament .
b. Operation services
c. Billing Service.
d. Customer services.
2. Supporting Activites.
a. Finance.

23
b. Human Resort Management .
c. Tecknology Deveploment
d. Procurement.
With Exploiting IT is permitting the value chain at every point, transforming the way value
activities are performed and the nature of the linkage among them (see figure 4.3.b) . Some involve
moving physical activities on-line, while others involve making physical activities more cost effective. it
not only improves the economics of transaction processing but also enables the whole chain into
integrated and respond more effectively to real-time demand and supply changes, provided all accurate
information that customers needed by online

24
Firm Infrastructure
Human Resaource Managamenet
Technology Development
Procurement
Prim
ary
Activ
ities
Supp
ort A
ctiv
ities
Operations Outbound Logistics Marketing and Sales
After – Sales Services
Integrated information exchanges, service operation , scheduling and decision making in back Office. Real time Track and
Tracing container information status in port premises
Real time transaction of orders. Customer ‘s channel
access to product service. Integrated channel
management including information exchanges, Claims and contract management. Automated customers-
specific agreement and contract terms.
On-line sales channels including websites and marketplaces. Real time inside and outside
access to customers information, product services, Pricing, on-line submission of quotes and order entry. Push advertising. Real time customer feedback
through Web Survey, opt in opt out marketing and promotion response tracking.
On-line support of customers service representatives through email response management, billing integration, chat; “Call me now”, Voice Over IP. Customer self-services via web sites and intelligent service request processing including updates to billing and shipping Profiles.
Real time filed service access to customer account review, schematic review, work order update and service part management.
Inbound Logistics
Real time integrated Vessel traffic management , Planning, port community information exchanges.
Web Based, distribution financial and ERP system.
Self service persons and benefits administration. Internet based sharing and dissemination of company information.
Collaboration product design across location and multiple value system participants. Real time access by R&D to on-line sales and service information.
Internet enabled demand planning: real-time available-to-promise/capable to-promise and fulfillment. Other linkage of purchase, inventory and focusing systems with supplies. Direct and indirect procurement via marketplaces, exchanges, auctions and buyer-seller matching.
Fig 3.3.2. Prominent IT Applications in The Value Chain Of Container Terminal Perawang (Modify Porter 2001 & Poolad Daneshvar et. Al (2010)) .

25
CHAPTER IV
CONCLUSION & SUGGESTION
As a new container terminal in PT Pelabuhan Indonesia I (Persero), Container Terminal
Perawang still face problems in terms of provide viable main communication and data
transaction in the port premises to terminal users.
Based on the results of research and data analysis (Chapter III), we conclude that the use
of Internet/Web Application Services can solve the above problem, because the current
access to the internet can be very easily done by all people worldwide through a variety of ICT
devices to obtain the information needed and it is makes the virtual corporation possible where a
virtual company is an organization that uses IT to link people, assets, and ideas to create and
distribute products and services without being limited to physical locations or traditional
boundaries
By developing a web-based application by Container Terminal Perawang, we expect the
terminal users can easily to get the information needed by real time to speed up the operation of
their ships and follow the containers and carry out operations necessary for the delivery thus
speeding up the whole transportation process that will ultimately result in increased power
Container Terminal Perawang competitiveness.
In order that information has been provided by the Container Terminal Perawang can be
generate a competitive advantages and benefit to Terminal Users , Management of Container
Terminal Perawang must ensure the accuracy of the data, following we suggest a strategic for
exploiting IT in Value Chain of Primary & Supporting Activities in Container Terminal
Perawang .:
1. Ensure the recording of all services in the terminal is done in real time by ICT so that the
information can be obtained as follows:
a. Real time integrated Vessel traffic management , Planning, port community
information exchanges.
b. Integrated information exchanges, service operation , scheduling and decision
making in back office.

26
c. Real time Track and Tracing container information status in port premises.
2. Provided a self service module in Web Application to customers i.e.:
a. Real time inside and outside access to customers information, Vessel schedule, Track and Tracing container information, Electronic Forms Interchange (EFI) online called EDI Internet-based product services, Pricing, Billing on-line, online submission of quotes and order entry and etc.
b. Real time customer feedback through Web Survey, opt in opt out marketing and promotion response tracking.
3. Set the ICT as main role of business process in Container Terminal Perawang.
4. Provide training in accordance with the requirements for the implementation of IT
systems to officer that use ICT.
5. Invest network infrastructure in the Container Terminal Perawang, especially for signal
amplification in Container Yard.
It also must be supported by sufficient number of operational officers, Hand Held
terminal and the Container Yard Management (e.g. ground slots).

27
BIBLIOGRAPHY
Module Four of Modern Port Training Programme Manual, Future Challenges to Ports, Sub
Module 4.A. The New Competitive Advantages of Ports, UNCTAD - TrainForTrade
Module Five, Participant’s Manual of Port Training Programme. 2014. Method and Tools of
Management. UNCTAD/TrainForTrade – Modern Port Management. Geneva : UN
Copyright, January 2010.
Porter, M. (1980). Competitive strategy: Techniques for analysing industries and competitors. New
York: Free Press.
Porter, M. (1989). Competitive advantage. Creating and sustaining superior performance. London: The
Free Press.
Michael E. Porter and Victor E. Millar 1985. How Infromation Gives You Competitive Advantage. Harvard
Business Review.
Porter, M. (2001). Strategy and the Internet. Harvard Business Review, 79 (3), 63-78
Mahmood Hemmatfar, Ph. D . 2010 . Competitive advantages and Strategic Information Systems. International
Journal of business and management.
Poolad Daneshvar et. Al (2010). / International Journal of Engineering Science and Technology . Review of
Information Technology Effect on Competitive Advantage- Strategic Perspective. Vol. 2(11),
2010, 6248-6256
Tanja Mihalic and Dimitrios Buhalis. Economic And Business Review | Vol. 15 | No. 1 | 2013 | 33–56- ICT As
A New Competitive Advantage Factor – Case Of Small Transitional Hotel Sector.
Ham, S., Gon Kim, W. & Jeong, S. (2005). Effect of information technology on performance in upscale hotels.
International Journal of Hospitality Management, 24 (2), 281-294. doi: 10.1016/j.ijhm.2004.06.010
Paraskevas, A. & Buhalis, D. (2002). Outsourcing IT for small hotels: the opportunities and challenges of using
application service providers. The Cornell Hotel and Restaurant Administration Quarterly, 43 (2),
27-39. doi: 10.1016/s0010-8804(02)80029-5.

28
Yiu, C.S., Grant, K. & Edgar, D. (2007). Factors affecting the adoption of Internet Banking in Hong Kong
implications for the banking sector. International Journal of Information Management, 27 (5):336-
35.
Buhalis, D. (2003). eTourism. Information technology for strategic tourism management. Essex: Pearson
Education Limited.
Stare, M., Jaklič, A. & Kotnik, P. (2006). Exploiting ICT potential in service firms in transition economies. The
Service Industries Journal, 26 (3), 287-302.
O’Connor, P., & Frew, A. J. (2002). The future of hotel electronic distribution: expert and industry perspectives.
The Cornell Hotel and Restaurant Administration Quarterly, 43 (3), 33-45. doi: 10.1016/s0010-
8804-(02)80016-7.
Siguaw, J. A., Enz, C. A., & Namasivayam, K. (2000). Adoption of Information Technology in U.S. Hotels:
Strategically Driven Objectives. Journal of Travel Research, 39 (2), 192-201. doi:
0.1177/004728750003900209.
Tsai, H., Song, H. Y. & Wong, K. K. F. (2009). Tourism and Hotel Competitiveness Research. Journal of Travel
& Tourism Marketing, 26 (5-6), 522-546. doi: 10.1080/10548400903163079

29
TPK = TERMINAL PETIKEMAS
LIST OF ABBREVIATIONS
ICT = Information And Communications Technology
IT = Information Technology
EDI = Electronic Data Interchange.
EFI = Electronic Forms Interchange.
CRS = Central Reservation Systems.
OECD = Organization for Economic Co-operation and Development.

30
ANNEXES
Annex 1. Sample of Form Survey
OPERATION SERVICES

31
No INFORMATION TYPE Shipping Agent Freight Forwarder Shipping Agent +
Freight Forwarder
1 Vessel Schedule 6 1
3 3
9 4
2 Manifest & Loading List 6 1
1
6 2
3 Booking Confirmation 4 2
1 2
5 4
4 Container Tracing 7
5 1
12 1
5 Invoice for Port Service 5
1
4 1
9 1 1 6 Electronic Delivery Order 4 1 1
3 2
7 3 1
7 Coustoms Docs 3 1
2
3 3
Annex 2. Level of Information needs Port Users (Result of Survey )
Fundamental Important UnImportant Useless

32
7
7
6
7
6
6
4
6
1
3
6
5
5
3
Vessel Schedule
Manifest & Loading List
Booking Confirmation
Container Tracing
Invoice for Port Service
Electronic Delivery Order
Coustoms Docs
lain-lain
Annexe 3. Mostly Information that needs by Customer
Shipping Agent Forwarding
6
6
4
7
5
4
3
1
1
2
1
1
1
1
Vessel Schedule
Manifest & Loading List
Booking Confirmation
Container Tracing
Invoice for Port Service
Electronic Delivery Order
Coustoms Docs
lain-lain
Annex 4. Level of Information needs by Shipping Agent
Fundamental Important Unimportant Useless
3
1
5
4
3
3
1
2
1
1
2
Vessel Schedule
Manifest & Loading List
Booking Confirmation
Container Tracing
Invoice for Port Service
Electronic Delivery Order
Coustoms Docs
lain-lain
Annex 5. Level of Information needs by Freight Forwarder
Fundamental Important Unimportant Useless
33
Annex 7 . Resource Of Perawang Port.
NO ITEMS UNIT QTY DESC
I HUMAN RESOURCE 1. Employees Man 61 2. Outsourcing Man 73 II Equipment 1. Shore Crane unit 2 2. Reachstacker unit 3 3. Side Loader unit 1 4. Froklift unit 1 5. Head Truck unit 6 6. Chasis unit 6 a. 20 ‘ unit 3 b. 40’ Unit 3 III Infrastrukture 1. Berth M 308 2. CY M2 24.000 Capacity 77.085 Teus /Years 3. Access Road Km 4,7 1,6 Concrete and 3,1 paving block
9
6
5
12
9
7
3
4
2
4
1
1
3
3
Vessel Schedule
Manifest & Loading List
Booking Confirmation
Container Tracing
Invoice for Port Service
Electronic Delivery Order
Coustoms Docs
Annex 6. Level of Information needs by Shipping Agent & Freight Forwarder
Fundamental Important Unimportant Useless

34
Annex 8 . Resource Of Perawang Port (Source: Simoppel Report Of Pekanbaru Branch).
NO CONTAINER UNIT
Real 2011 %
Masket Share
Real 2012 %
Masket Share
Real 2013 %
Masket Share
Realisasi THN 2014 %
Masket Share
THROUGHPUT
CTPRW
MARKET
THROUGHPUT
CTPRW MARKET
THROUGHPUT
CTPRW
MARKET
THROUGHPUT
CTPRW MARKET
A CONTAINER SIZE 20 "
- EMPTY Box 8,308 141,916 5.9% 8,510 74,642 11.4% 10,211 88,510 11.5% 1.527 8.404 18,2%
- FULL Box 19,514 259,904 7.5% 29,292 125,739 23.3% 38,028 169,177 22.5% 5.072 15.262 33,2%
- REEFER CONTAINER Box
B CONTAINER SIZE 40"
- EMPTY Box 3 68,847 0.00% 82 26,499 0.31% 131 28,187 0.46% 233 2.768 8,42%
- FULL Box 448 78,471 0.57% 1,103 35,690 3.09% 1,821 37,981 4.79% 3.108 3.002 103,53%
- REEFER CONTAINER Box
Total : 28,273 549,138 5.1% 38,987 262,570 14.8% 50,191 3,855 15.5% 9.940 29.436 33,8%

35
Annex 9 . Growth Market Share Container Terminal Perawang
(Source: Simoppel Report Of Pekanbaru Branch).
5,1%
14,8% 15,5%
33,8%
0,0%5,0%
10,0%15,0%20,0%25,0%30,0%35,0%40,0%
2011 2012 2013 2014
Growth of Market Share
Market Share Linear (Market Share)

36
Annex 10 . Shipping Agents Container office at Container Terminal Perawang.