Modifying Low-Drag Bodies to Generate Lift
12
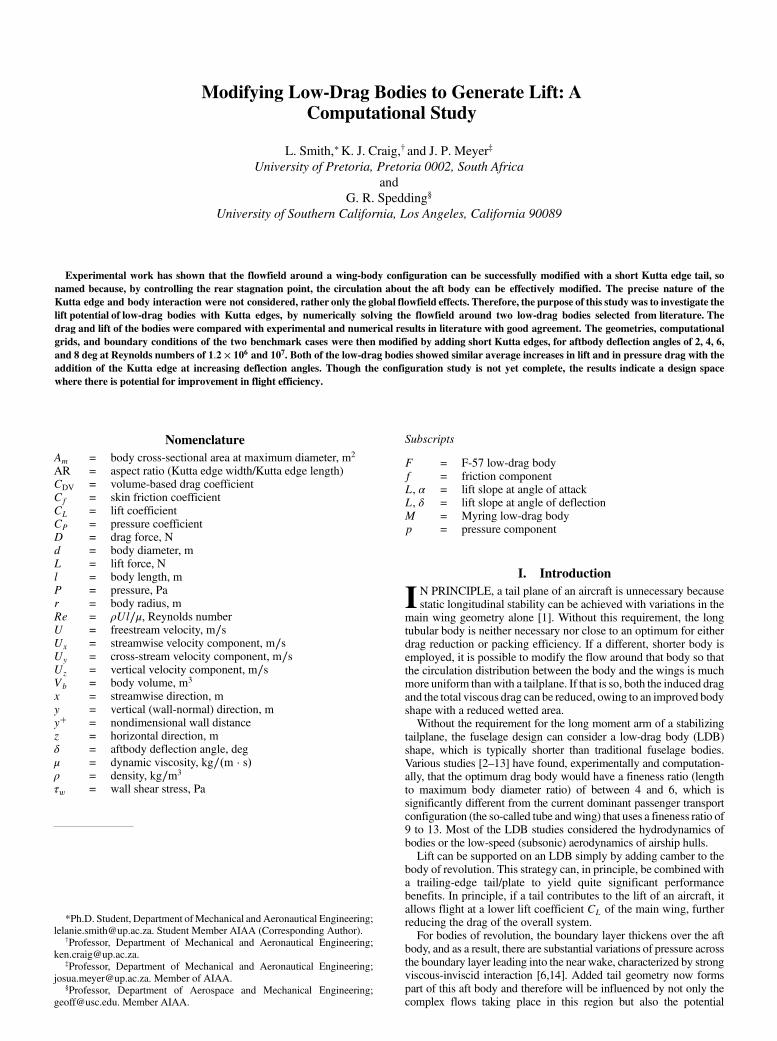
Modifying Low-Drag Bodies to Generate Lift: A Computational Study L. Smith, ∗ K. J. Craig, † and J. P. Meyer ‡ University of Pretoria, Pretoria 0002, South Africa and G. R. Spedding § University of Southern California, Los Angeles, California 90089 Experimental work has shown that the flowfield around a wing-body configuration can be successfully modified with a short Kutta edge tail, so named because, by controlling the rear stagnation point, the circulation about the aft body can be effectively modified. The precise nature of the Kutta edge and body interaction were not considered, rather only the global flowfield effects. Therefore, the purpose of this study was to investigate the lift potential of low-drag bodies with Kutta edges, by numerically solving the flowfield around two low-drag bodies selected from literature. The drag and lift of the bodies were compared with experimental and numerical results in literature with good agreement. The geometries, computational grids, and boundary conditions of the two benchmark cases were then modified by adding short Kutta edges, for aftbody deflection angles of 2, 4, 6, and 8 deg at Reynolds numbers of 1.2 × 10 6 and 10 7 . Both of the low-drag bodies showed similar average increases in lift and in pressure drag with the addition of the Kutta edge at increasing deflection angles. Though the configuration study is not yet complete, the results indicate a design space where there is potential for improvement in flight efficiency. Nomenclature A m = body cross-sectional area at maximum diameter, m 2 AR = aspect ratio (Kutta edge width/Kutta edge length) C DV = volume-based drag coefficient C f = skin friction coefficient C L = lift coefficient C P = pressure coefficient D = drag force, N d = body diameter, m L = lift force, N l = body length, m P = pressure, Pa r = body radius, m Re = ρUl∕μ, Reynolds number U = freestream velocity, m∕s U x = streamwise velocity component, m∕s U y = cross-stream velocity component, m∕s U z = vertical velocity component, m∕s V b = body volume, m 3 x = streamwise direction, m y = vertical (wall-normal) direction, m y = nondimensional wall distance z = horizontal direction, m δ = aftbody deflection angle, deg μ = dynamic viscosity, kg∕m · s ρ = density, kg∕m 3 τ w = wall shear stress, Pa Subscripts F = F-57 low-drag body f = friction component L, α = lift slope at angle of attack L, δ = lift slope at angle of deflection M = Myring low-drag body p = pressure component I. Introduction I N PRINCIPLE, a tail plane of an aircraft is unnecessary because static longitudinal stability can be achieved with variations in the main wing geometry alone [1]. Without this requirement, the long tubular body is neither necessary nor close to an optimum for either drag reduction or packing efficiency. If a different, shorter body is employed, it is possible to modify the flow around that body so that the circulation distribution between the body and the wings is much more uniform than with a tailplane. If that is so, both the induced drag and the total viscous drag can be reduced, owing to an improved body shape with a reduced wetted area. Without the requirement for the long moment arm of a stabilizing tailplane, the fuselage design can consider a low-drag body (LDB) shape, which is typically shorter than traditional fuselage bodies. Various studies [2–13] have found, experimentally and computation- ally, that the optimum drag body would have a fineness ratio (length to maximum body diameter ratio) of between 4 and 6, which is significantly different from the current dominant passenger transport configuration (the so-called tube and wing) that uses a fineness ratio of 9 to 13. Most of the LDB studies considered the hydrodynamics of bodies or the low-speed (subsonic) aerodynamics of airship hulls. Lift can be supported on an LDB simply by adding camber to the body of revolution. This strategy can, in principle, be combined with a trailing-edge tail/plate to yield quite significant performance benefits. In principle, if a tail contributes to the lift of an aircraft, it allows flight at a lower lift coefficient C L of the main wing, further reducing the drag of the overall system. For bodies of revolution, the boundary layer thickens over the aft body, and as a result, there are substantial variations of pressure across the boundary layer leading into the near wake, characterized by strong viscous-inviscid interaction [6,14]. Added tail geometry now forms part of this aft body and therefore will be influenced by not only the complex flows taking place in this region but also the potential *Ph.D. Student, Department of Mechanical and Aeronautical Engineering; [email protected]. Student Member AIAA (Corresponding Author). † Professor, Department of Mechanical and Aeronautical Engineering; [email protected]. ‡ Professor, Department of Mechanical and Aeronautical Engineering; [email protected]. Member of AIAA. § Professor, Department of Aerospace and Mechanical Engineering; [email protected]. Member AIAA.
-
Upload
khangminh22 -
Category
Documents
-
view
1 -
download
0
Transcript of Modifying Low-Drag Bodies to Generate Lift
Modifying Low-Drag Bodies to Generate Lift: AComputational Study
L. Smith,∗ K. J. Craig,† and J. P. Meyer‡
University of Pretoria, Pretoria 0002, South Africaand
G. R. Spedding§University of Southern California, Los Angeles, California 90089
Experimental work has shown that the flowfield around a wing-body configuration can be successfully modified with a short Kutta edge tail, sonamed because, by controlling the rear stagnation point, the circulation about the aft body can be effectively modified. The precise nature of theKutta edge and body interaction were not considered, rather only the global flowfield effects. Therefore, the purpose of this study was to investigate thelift potential of low-drag bodies with Kutta edges, by numerically solving the flowfield around two low-drag bodies selected from literature. Thedrag and lift of the bodies were compared with experimental and numerical results in literature with good agreement. The geometries, computational
grids, and boundary conditions of the two benchmark cases were then modified by adding short Kutta edges, for aftbody deflection angles of 2, 4, 6,and 8 deg at Reynolds numbers of 1.2 × 10⁶ and 107. Both of the low-drag bodies showed similar average increases in lift and in pressure drag with the addition of the Kutta edge at increasing deflection angles. Though the configuration study is not yet complete, the results indicate a design spacewhere there is potential for improvement in flight efficiency.
Nomenclature
Am = body cross-sectional area at maximum diameter, m2
AR = aspect ratio (Kutta edge width/Kutta edge length)CDV = volume-based drag coefficientCf = skin friction coefficientCL = lift coefficientCP = pressure coefficientD = drag force, Nd = body diameter, mL = lift force, Nl = body length, mP = pressure, Par = body radius, mRe = ρUl∕μ, Reynolds numberU = freestream velocity, m∕sUx = streamwise velocity component, m∕sUy = cross-stream velocity component, m∕sUz = vertical velocity component, m∕sVb = body volume, m3
x = streamwise direction, my = vertical (wall-normal) direction, my� = nondimensional wall distancez = horizontal direction, mδ = aftbody deflection angle, degμ = dynamic viscosity, kg∕�m · s�ρ = density, kg∕m3
τw = wall shear stress, Pa
Subscripts
F = F-57 low-drag bodyf = friction componentL, α = lift slope at angle of attackL, δ = lift slope at angle of deflectionM = Myring low-drag bodyp = pressure component
I. Introduction
I N PRINCIPLE, a tail plane of an aircraft is unnecessary becausestatic longitudinal stability can be achieved with variations in the
main wing geometry alone [1]. Without this requirement, the longtubular body is neither necessary nor close to an optimum for eitherdrag reduction or packing efficiency. If a different, shorter body isemployed, it is possible to modify the flow around that body so thatthe circulation distribution between the body and the wings is muchmore uniform thanwith a tailplane. If that is so, both the induced dragand the total viscous drag can be reduced, owing to an improved bodyshape with a reduced wetted area.Without the requirement for the long moment arm of a stabilizing
tailplane, the fuselage design can consider a low-drag body (LDB)shape, which is typically shorter than traditional fuselage bodies.Various studies [2–13] have found, experimentally and computation-ally, that the optimum drag body would have a fineness ratio (lengthto maximum body diameter ratio) of between 4 and 6, which issignificantly different from the current dominant passenger transportconfiguration (the so-called tube andwing) that uses a fineness ratio of9 to 13. Most of the LDB studies considered the hydrodynamics ofbodies or the low-speed (subsonic) aerodynamics of airship hulls.Lift can be supported on an LDB simply by adding camber to the
body of revolution. This strategy can, in principle, be combined witha trailing-edge tail/plate to yield quite significant performancebenefits. In principle, if a tail contributes to the lift of an aircraft, itallows flight at a lower lift coefficient CL of the main wing, furtherreducing the drag of the overall system.For bodies of revolution, the boundary layer thickens over the aft
body, and as a result, there are substantial variations of pressure acrossthe boundary layer leading into the near wake, characterized by strongviscous-inviscid interaction [6,14]. Added tail geometry now formspart of this aft body and therefore will be influenced by not only thecomplex flows taking place in this region but also the potential
*Ph.D. Student, Department ofMechanical and Aeronautical Engineering;[email protected]. Student Member AIAA (Corresponding Author).
†Professor, Department of Mechanical and Aeronautical Engineering;[email protected].
‡Professor, Department of Mechanical and Aeronautical Engineering;[email protected]. Member of AIAA.
§Professor, Department of Aerospace and Mechanical Engineering;[email protected]. Member AIAA.

separation that can occur with low-drag bodies due to the adversestreamwise pressure gradient. If separation occurs, the tail would besituated in theviscouswake of the body, and the tail shape and sizewillno longer greatly influence the lift, because theKutta conditionwill notbe reached. Effective (increased L∕D) body-tail interaction woulddepend on the flow remaining attached over the aft body and the tail.Huyssen et al. [15] and Davis and Spedding [16] showed
experimentally that the trailing edge of a fuselage can be used tocontrol circulation in the central region of the aircraft, in support ofthe original notion that the primary role of the Kutta edge (KE) wasto enforce a particular location of the aft stagnation point. The KEappeared to modify the global flow around the body so that thecirculation distribution between the body and the wings was moreuniform, which, in principle, leads to a reduction in induced(inviscid) drag.However, the argumentwas only indirectly supportedby the findings of modified downwash profiles in the near wake, andthe mechanism by which the global flowfield was changed could notbe directly identified, either from particle image velocimetry (PIV) inthewake [15,16] orwith global force balancemeasurements [16].Wenote also that no attempt was made to optimize the wing-body-tailconfiguration, and both studies used a simple geometric form for theshorter body (not an LDB) and with a discrete KE, which was notblended or integrated to the body shape. The KE itself was also fixedto the conical aft body, so that KE deflection was always linked withdeflection of the aft body. The deflection was described by a singleangle δ, shown in Fig. 1, of the wing-body-tail configuration.
The force balance and PIV measurements [16] showed that the liftexperienced by the aircraft with a KE increased with δ up to a certainmaximum. The aftbody deflection makes a positive camber of thebody and thus potentially a nonzero circulation over it. The additionof the KE achieved the same effect at a lower δ and contributed to liftas δ increased. It was concluded that the most effective means ofgenerating asymmetry and net lift on a body was through deflectionof the KE.The purpose of this study is to more thoroughly investigate the
potential of a KE to modify the flow over LDBs. A numericalinvestigation of two LDBs selected from the literature wasconducted, and the geometries were then modified with a KEattachment. Forces and flowfields with and without a KE (whichwe subsequently term KE and NKE conditions) at varying δ werecomputed to determine the mechanism of the KE/body deflection onboth local and global lift and drag, computed from the normal andshear stresses over the whole body assemblage.
II. Numerical Modeling
A. Geometric Model and Mesh Generation
The two LDB geometries were the F-57 body from Parsons andGoodson [6] and the body of revolution from Myring [8]. In bothpapers, equations were given that describe the outer geometry of thebodies, and these were used to generate the scalable body profiles.The F-57 LDB was selected because data (pressure distribution,meanvelocity distribution, and Reynolds stresses) were published byPatel and Lee [9] for the same geometry in wind tunnel experiments;the Myring LDB was used because theoretical velocity distributionresults were available [8].Both bodies were modeled as three-dimensional axisymmetric
bodies inside a three-dimensional computational flow domain
(Fig. 2). Three-dimensional (not axisymmetric) grids were necessary
so as to accommodate the later addition of symmetry-breaking KE
tails. The simulation of the wind tunnel experiments (for the F-57)
includes an approximation of the wind tunnel walls, which were
originally in octagonal cross section [9] but simplified to a square
cross section here (with less than 0.5% influence on the force
coefficient results). The fineness ratio of the body was 4.75, the
height and width of the wind tunnel were 1.25lF, and the test sectionlength was 6lF as in the experimental investigation [9].
TheMyring LDB,with body length lM and fineness ratio 5.55,was
modeled inside a cylindrical domain with diameter 4lM. The nose ofthe body was positioned 4lM from the inlet of the grid, and the outlet
was 9lM downstream of the tail.
The computational grids (Fig. 3) consisted of polyhedral cells and
were meshed using the Advancing Layer Mesher in Star-CCM�[17]. This mesh function enabled the mesh to grow around sharp
corners on the body without collapsing. The growth of the boundary
layer along the body and KE starts with a very thin boundary layer
over the nose, gradually thickening toward the trailing edge. Both
LDBs had 20 cells across the boundary layer height for accurate drag
estimation, whereas two boundary layer cells were sufficient for the
simulated tunnel walls.
Three volumetric mesh refinements were used for the two LDB
grids. The first and second drove the cells to be finer around the bodies
and to gradually increase the cell size away from the bodies, whereas
the third drove the sections at the trailing edge and wake regions to be
finer. Primarily, these refinements increased the mesh density where
viscous effects were expected to be more prevalent. Additional
refinements were applied at the streamwise location on the F-57 LDB
where transition was experimentally forced with a tripwire [9]
(x∕l � 0.475) as well as for the nose and tail sections on both bodies.To assuremesh independence, the grid-convergence indexmethod
[18] was used on the three different mesh sizes of each grid. The final
mesh counts for the F-57 and Myring LDB (with no KE) were about
3.6 × 10⁶ and 3.3 × 10⁶ cells, respectively.The KE tails had the same geometry as described in [15,16], with
the same ratios of tail width to body diameter and KE length to the
total body length. The addition of the KE tails increased the body
lengths by 10%, but it proved unnecessary to extend the domain
length correspondingly. The KE tails increased the cell counts to
4.6 × 10⁶ and 3.4 × 10⁶ for the F-57 andMyring bodies, respectively.
Similar mesh independence studies were conducted on these
domains as with the two reference cases.
Fig. 1 Illustration of the wing-body-tail configuration with the KE anddeflecting aft body.
Fig. 2 Geometricmodel and the assigned boundary conditions for a) theF-57 LDB, and b) the Myring LDB.
2

B. Boundary Conditions, Turbulence, and Transition Models
The boundary conditions used for the bodies are indicated in
Fig. 2. The flowwas assumed to be steady and incompressible, with
a constant-velocity inlet condition. Reynolds numbers based on
body lengthwere 1.2 × 10⁶ for the F-57 LDBand 107 for theMyring
LDB. The outlet boundaries were pressure boundaries set at
atmospheric conditions. The F-57 LDB’s outer surface domains
were modeled as no-slip wall boundaries, where the outer
boundaries for Myring’s LDB had symmetry boundaries. The
nondimensional wall distance criterion y� < 1 was satisfied for all
cases (the predicted wall boundary thicknesses are less than a wall-
bounding computational cell, and the boundary layer can therefore
be modeled on that cell). The inlet velocity was specified to give the
Reynolds numbers at which the literature/reference cases were
completed.
The Star-CCM� solver for the Reynolds-averaged Navier–Stokes(RANS) equations with the shear-stress transport (SST) k-ωturbulence model [19] was used in all cases. Although details of theturbulent fluctuations are not required to model global lift, drag ismore sensitive to these details. The SST k–ω turbulence model wasselected because it has successfully been used in predicting onset offlow separation [20]. In both LDBs, there is the possibility of laminarseparation over the aft body, when a transition model is important toaccurately estimate the force coefficients. The γ–Reθ transitionmodel [21] was used to predict laminar-turbulent transition.
III. Comparison with Reference Cases
A. F-57 Low-Drag Body
Figure 4a shows the numerically generated pressure coefficientsCP over the F-57 in the normalized axial direction x∕l, together with
Fig. 3 Unstructured meshes around a) the axisymmetric F-57 LDB, and b) Myring’s LDB. Predicted transition location are indicated.
Fig. 4 Pressure coefficients for a) F-57 LDB atRe � 1.2 × 10⁶, and b) theMyring LDB atRe � 1 × 10⁷, comparing the simulations to literature results[2,8,9].
3

the experimental results of Patel and Lee [9] at Re � 1.2 × 10⁶ andthe theoretical predictions from Young [2]. Young made use of amodified airfoil method to predict profile drag for smooth bodies of
revolution, though he found that thismethod has some restrictions. At
higher Reynolds numbers (107–108) and low fineness ratio (3.25–
5.9), where the transition region did not exceed x∕l � 0.05, the
method gives reasonable results compared with experimental cases.
However, when both Reynolds number and l∕d are lower, the
assumption of negligible pressure variation in the boundary layer onthe aft body is not correct because the thickening boundary layer cansupport substantial pressure variation [6,9].There are negligible differences between theory, experiment, and
simulation (less than 7%) up to x∕l � 0.4. Further aft, closeagreement cannot be expected because the experiments wereconducted with a tripwire at x∕l � 0.475 to avoid a separationbubble. The numerical departure inCP at about x∕l � 0.57 shows thelocation of the natural separation bubble absent a tripwire. Fromx∕l � 0.7, the wind tunnel and simulation results agree well anddepart from the highCP theoretical line, likely due to finiteReynolds-number effects, as noted previously.
B. Myring’s Low-Drag Body
Figure 4b compares the pressure coefficients with theoreticalpredictions of Myring [8] for Re � 107. The overall agreement isreasonable for x∕l < 0.4. Theory and computation differ downstreamof this point because numerical results show an initial reduction in−CP before it recovers to a positive tail toward the trailing edge.Consequently, theory and numerical values have a difference in phasein the undulation in CP�x�. Analogous to the previous F-57 case,Myring [8] prescribed a transition location at x∕l � 0.05 where thenumerical simulation allows transition to occur naturally at
approximately x∕l � 0.48, which is partially the cause for thedifference in phase seen in Fig. 4b.
IV. Aerodynamic Effect of Deflected Tail Plateson Low-Drag Bodies
A. F-57 Low-Drag Body with Kutta Edge Tail
The pressure distributions along the F-57 LDB for both theKE/NKE conditions at varying aftbody deflection angles δ areshown in Fig. 5a. All the cases are similar over the nose and up tox∕l � 0.57, after which a separation bubble occurs up toapproximately x∕l � 0.6. This separation bubble is shown inFig. 5b with the wall shear stress τw over a section of the body(0.55 < x∕l < 0.62) where a recirculation zone occurs inside aseparation bubble for both KE and NKE at δ � 0 deg. The detailsof the bubble geometry are sensitive to the numerical stability of thetransition model and the prescribed turbulence intensity, but itsexistence is not unreasonable.The aftbody deflection point is at x∕l � 0.63 in Fig. 5a.
Immediately after, dP∕dx is strongly positive, andCP changes sign atabout x∕l � 0.72. For NKE, dP∕dx increases with increasing δ. Thepeak amplitude of positive CP is much higher for NKE than KE andwhen δ � 8 deg; the KE case has a very shallow plateau. The KEstarts at x∕l � 0.77, where it is immediately associated with areduction in CP (relative to NKE), and the maximum positive CP isfound farther downstream.Figure 6 shows the normalized streamwise wake velocity profile
Ux∕U for δ � 4 degwith andwithout a KE. The profiles are taken atx∕l � 1.005 for NKE and x∕l � 1.105 for KE (0.5% after either thebody orKE ends). The downward deflection of the defect profilewithKE implies a higher lift, and the color inset of velocity contoursshows that the displacement is a global field phenomenon.
Fig. 5 a) Pressure coefficient of the F-57 LDB-NKE/KE at different δ, and b) wall shear stress over the section of the body 0.55 < x∕l < 0.62 with andwithout the KE.
4

Figures 7a and 7b showUx∕U for δ � 2 and 6 deg, combinedwith
contours of the relative vertical velocityUz∕U at the symmetry point
of the body with and without a KE. Similar to [16], theUx∕U profile
has a double-lobe form, as though upper and lower boundary layers
were shed separately into the wake with the KE, which acts like a
splitter plate. The lower lobe becomes more pronounced as δincreases. The flow around the LDB-KE shows a larger vertical
deflection over the aft body than the equivalent NKE. The boundary
layer over the aftbody top and bottom is split by the KE, which
prevents the formation of a proximatemixing zone between these two
shear layers. In the absence of the KE, the presence of a pressure
differential between the upper (low-pressure) and lower (high-
pressure) surface of the body leads to an upward and swirling flow
around the aftbody edge as indicated in Fig. 8 (δ � 4 deg at
x∕l � 1.005). The addition of the KE blocks the upward flow on the
body of the LDB, and the pressure difference now drives the flow to
form a tip vortex on the outer edge of the KE. The blockage of the
LDB onbody vortex formation and consequent transverse flow
around the KE forms the double-lobe in the velocity profile (Fig. 7).To evaluate and compare aerodynamic force coefficients of the
LDB-KE combinations, the reference areas were selected as follows.
At any given fineness ratio, the maximum diameter area-based drag
coefficient depends on the body geometry, and so the drag coefficient
is written as
CDV � D
�1∕2�ρU2V2∕3b
(1)
where Vb is the volume, ρ is the density,U is the freestream velocity,
and D is the drag force.Figure 9a shows that neither the pressure CDV;p nor the friction
CDV;f components of CDV for the F-57-NKE vary significantly with
δ. However, with KE, CDV;p increases by almost a factor of 4 from
δ � 0 deg to δ � 8 deg. This CDV;p increase is due to the increase
of the effective base area when the KE deflects downward, indicated
by the schematic inset of Fig. 9a.The body lift depends on the displacement of streamlines over the
body, and so the appropriate reference area is the area at themaximum
body diameter, Am, and CL is defined as
CL � L
�1∕2�ρU2Am
(2)
In Fig. 9b,CL is shown as function of δ for the F-57 body, with andwithout KE. Without the KE, the maximum increase in CL based on
frontal area is only 3% for the largest δ � 8 deg.WithKE,CL for the
body-tail combination increases almost linearly with δ. One candefine an average lift slope ΔCL∕Δδ � CL;δ � 0.3∕4∕ deg or4.3∕rad. The lift slope Cl;α of a three-dimensional delta wing is ARπ∕2, and if we set AR for the KE tail to be about 1, the expected liftslope is therefore π∕2 � 1.6∕rad. The fact thatCL;δ is approximately2.7 times this value indirectly argues for the effect of the tail beingnonlocal, increasing lift on the whole body.Figure 10 shows the vertical velocity component Uz∕U as a
function of spanwise normalized body radius y∕r, with andwithout aKE for δ � 0–4 deg (Fig. 10a) and δ � 6 and 8 deg (Fig. 10b). Theseprofiles are taken at z∕r � 0.7 above the wake and at streamwiselocation x∕l � 1.005 (NKE) and x∕l � 1.105 (KE). Themaximumbody diameter is at y∕r � 1, and the KE ends at approximatelyy∕r � 1.45. The downwash profiles at δ � 0 deg (Fig. 10a) areindistinguishable for NKE and KE, as one might expect. As δincreases to 4 deg, the KE leaves a much stronger and broaderdownwash signature. With further increases in δ (Fig. 10b), thoughthe centerline value ofUz may be similar between KE and NKE, thespanwise region influenced is more extensive in the KE condition.The KE case at high δ is associated with significant upwash fory∕r > 1.1, and the net integrated downwash increment (and hencelift) might be expected to be smaller, based on this observation alone.We may again infer that the lift is determined in large part by theglobal influence of deflected streamlines over the entire body, and notjust localized at the tail.
B. Myring’s Low-Drag Body with Kutta Edge Tail
Figure 11 shows the pressure distribution over the Myring LDB forNKE/KE cases at varying δ. TheMyring LDB (at the higher Reynoldsnumber) does not have a prominent separation bubble (unlike the F-57LDB). There is, however, a brief and abrupt pressure drop as the flowaccelerates over the aftbody deflection point at x∕l � 0.63. After thispoint, the KE curves are all lower than the NKE cases for much ofx∕l > 0.7 (as they also were for the F-57 in Fig. 5a).Figure 12 shows Ux∕U for KE/NKE for δ � 4 deg on a Myring
LDB. The downward deflection of the peak in the defect profile withKE is greater than that of the F-57 LDB (cf. Fig. 6). The characteristicdouble-lobe profile is also less pronounced.Figures 13a and 13b show that the KE condition is always
associated with greater deflection of the Ux∕U profiles, which arenonetheless weaker than the NKE equivalents. Again, the addition ofthe KE leads to a transverse flow over the aft body to produce thedouble-lobe velocity profile as with the F-57 LDB. However,the double-lobe is less pronounced for the Myring LDB, a fact thatcan be traced back to differences in boundary layer developmentacross the aft body. The Myring LDB was designed with a
Fig. 6 Normalized streamwise wake velocity profile for the F-57 LDB-NKE/KE. Insert shows velocitymagnitude contours on the symmetry plane in thewake region.
5

combination of delay of transition and reduction of adverse pressure
over the aft body, without large amplitude streamwise variation in
pressure (Figs. 4a and 4b). The F-57 LDB was designed only on the
condition for delayed transition. The differences in aftbody design
criteria lead to differing boundary layer conditions at the LDB-KE
interface. Figure 14 shows the profiles of the top and bottom surface
boundary layers for the two LDBs with and without the KE, with
inserts of velocity vector profiles through the boundary layers over
the aft bodies at x∕l � 0.99. The boundary layer for the F-57 LDB-
KE has a steeper dU∕dz than the Myring LDB-KE because of the
sharper taper aftbody geometry and more gradual pressure recovery
(Figs. 4a and 4b). Figure 15 shows that ΔP for the Myring LDB-KE
from y∕r � 0 to 6 is about twice that of the F-57 LDB-KE under the
same conditions. The Myring LDB has a better interaction with the
KE owing to the more bluff aftbody geometry and gradual pressure
recovery as well as the attendant less pronounced double-lobe wake
profile (Fig. 14).
Figure 16a shows CDV;f;p�δ� for the two NKE/KE configurations.
According toMyring [8], the skin friction drag contributes 90%of the
Fig. 7 Ux∕U of a) δ � 2 deg, and b) δ � 6 deg, for the F-57LDB-NKE/KE. Inserts show relative velocitymagnitude contours on the symmetry plane inthe wake region.
Fig. 8 Velocity vectors at x∕l � 1.005 for F-57 LDB at δ � 4 deg with(right) and without (left) KE.
6

Fig. 11 Pressure coefficient as a function of dimensionless body length of the Myring LDB-NKE/KE at different δ.
Fig. 9 Volume-based drag components of a) pressure and friction, and b) lift coefficients, for the F-57 LDB-NKE/KE at different δ. Insert illustrates theeffective base area for the NKE and KE.
Fig. 10 Uz∕U as a function of y∕r, for the F-57 LDB: a) δ � 0–4 deg, and b) δ � 6 and 8 deg.
7

Fig. 13 Ux∕U of a) δ � 2 deg, and b) δ � 6 deg, for the Myring LDB-NKE/KE. Inserts show relative velocity magnitude contours on the symmetryplane in the wake region.
Fig. 12 Normalized streamwise wake velocity profile at δ � 4 deg for the Myring LDB-NKE/KE. Insert shows velocity magnitude contours on thesymmetry plane in the wake region.
8

Fig. 14 Profiles of the top and bottom surface boundary layers for the two LDB-NKE/KEs at δ � 4 deg.
Fig. 15 Pressure coefficients at x∕l � 0.96 for the F-57 and Myring LDB-KE at δ � 4 deg. Insert of pressure contours on the cross-stream plane atx∕l � 0.96.
Fig. 16 Volume-based drag components of a) pressure and friction, and b) lift coefficients, for the Myring LDB-NKE/KE at different δ.
9

total drag experienced by the unmodified body, and Fig. 16a for the
NKE case at δ � 0 deg does show that the CDV;f is approximately
85%ofCDV. TheMyringLDBandF-57LDB show similar, and quite
large, increases in CDV;f when the KE is added, with little sensitivity
to increasing δ. The CDV;p for the Myring LDB-KE at δ � 0 deginitially contributes to 33% of the CDV and becomes the leading
contribution to CDV after δ � 4 deg. By contrast, CDV;p previously
shown for the F-57 LDB-KE in Fig. 9a initially contributes 45% of
the total at δ � 0 deg but then has a sharper increase with δ, rising toCDV � 0.07 at δ � 8 deg, compared with about 0.04 here for the
Myring LDB.
TheMyring LDB also has a steep increase ofCL with δ (Fig. 16b),with a mean lift slope CL;δ � 4.8∕rad, which is higher than for the
F-57 LDB and now three times the lift slope for an AR � 1 slender
wing. In summary, the Myring LDB has a larger increase in CL but a
smaller increase in CDV, with increasing δ, for the KE case. The
reasons may be traced to the different environments in which the KE
is immersed, which come from the differing design emphases.
The different conditions can be seen in the contours of skin friction
distribution on the upper and lower KE surfaces for the two bodies
(Fig. 17). If one sets a thresholdCf at the expected flat plate boundary
layer value for the inlet conditions onto theKE for both, then a central
wake can be distinguished from an exterior region that has much
higher Cf fluctuation amplitudes and might be imagined to be
exposed to freestream conditions.More of the outboard surface of the
F-57 LDB-KE is exposed to freestream conditions than the Myring
LDB. If the desired effect of theKE is tomodify streamlines that have
passed over the body, then the larger wake influence of the Myring
body might be preferred. Because the KE is already immersed in a
low-speed wake, the smaller increase in CDV may also be both
preferred and expected.
Figures 18a and 18b showUz∕U as a function of y∕r of theMyring
LDB with and without a KE similar to Fig. 10 for the F-57 LDB. As
for the F-57, at all nonzero δ, the Myring-NKE and -KE profiles are
very different, with much stronger net downwash at δ � 4 and 6 degfor KE. The KE influence for the two bodies is compared for
δ � 4 deg in Fig. 19. TheMyring LDB-KE has much larger positive
and negative peaks inUz, which nevertheless led to its having a larger
CL;δ (cf. Figs. 9a and 16a).
Figure 20 showsL∕D�δ� for bothLDBs.L∕D is about three to four
times higher for KE than NKE for both bodies. If L∕D is a
performance objective, then it is much better to have a deflector plate
than to simply camber the body itself. At all δ, the Myring LDB has
superior L∕D, for either KE or NKE condition.
Fig. 17 Cf the topandbottomsurface of theKE for theF-57 andMyringLDB-KE at δ � 4 deg. Dashed lines show the wake edge on the bodysurface.
Fig. 18 Uz∕U as a function of y∕r, for the Myring LDB: a) δ � 0–4 deg, and b) δ � 6 and 8 deg.
10

V. Conclusions
RANS simulations were conducted for two low-drag bodies andcompared with theoretical and experimental literature. Thecomparisons were close enough to encourage the subsequent testingof novel body-tail combinations, where the F-57 and Myring shapeswere combined with a deflected tail plate (termed a Kutta edge, fromits design objective to manipulate a trailing Kutta edge condition).The configurations were thus F-57 LDB (with and without KE) andMyring LDB (with and without KE). In both cases, the platedeflection was achieved by deflecting the entire aft body, and so adeflection angle δ describes both plate and aftbody deflection.Simple deflection of the aft body provides camber and so
predictably increases lift in all cases, even with no tail. This liftincrease is greatly enhanced with the addition of the KE, and theaverage lift slope of the Myring LDB-KE is higher than that for F-57LDB-KE. It appears that the width of the KE relative to the LDBgeometry influences the overall efficiency of the LDB-KEconfiguration. The aftbody and tail geometry should be designed asa continuous unit and not in isolation, and it appears that an optimalarrangement could be found by locating the KE entirely within thebounds of the viscous wake. This maximizes the favorablemanipulation of streamlines over the preceding body contours whileminimizing the drag penalty of being exposed to the freestream.
Acknowledgments
The authors would like to thank the South African NationalAerospace Center and Airbus for their financial support with thisresearch project.
References
[1] Agenbag, D. S., Theron, N. J., and Huyssen, R. J., “Pitch HandlingQualities Investigation of the Tailless Gull-Wing Configuration,”Journal of Aircraft, Vol. 46, No. 2, 2009, pp. 683–691.doi:10.2514/1.39755
[2] Young, A. D., “The Calculation of the Total and Skin FrictionDrags on Bodies of Revolution at Zero Incidence,” Air Ministry Rept.1874, 1939.
[3] Carmichael, B. H., “Computer Study to Establish the Lower Limit ofLength-to-Diameter Rates Advisable for Low-Drag Bodies,” NorthAmerican Aviation Rept. SID64-1938, Downey, CA, 1964.
[4] Carmichael, B. H., “Underwater Vehicle Drag Reduction ThroughChoice of Shape,” AIAA Second Propulsion Joint Specialist
Conference, AIAA Paper 1966-657, June 1966.[5] Krauss, E. S., “Effect of Shapes of Conventional Fuselages and of
Streamlined Bodies on Drag at Subsonic Speeds,” Zeitscrift fur
flugwissenschaft und weltraumforschung, Vol. 16, No. 12, Dec. 1968,pp. 429–438.
[6] Parsons, J. S., andGoodson,R. E., “OptimumShaping ofAxisymmetricBodies forMinimumDrag in Incompressible Flow,” Ph.D. Dissertation,Purdue Univ., West Lafayette, IN, 1972.
[7] Myring, D. F., “The Profile Drag of Bodies of Revolution in SubsonicAxisymmetric Flow,” Royal Aircraft Establishment TR 72234,Farnborough, Hants, 1972.
[8] Myring, D. F., “ATheoretical Study of the Effects of Body Shape andMach Number on the Drag Bodies of Revolution in SubcriticalAxisymmetric Flow,” Royal Aircraft Establishment TR 8100,Farnborough, Hants, 1981.
[9] Patel, V. C., and Lee, Y. T., “Thick Axisymmetric TurbulentBoundary Layer and Near Wake of a Low-Drag Body of Revolution,”Iowa Inst. of Hydraulic Research, Univ. of Iowa Rept. 210, Iowa City,IA, 1977.
[10] Chappell, P. D., “Analysis of Axisymmetric Body Profile Drag Data atZero Incidence Using Myring’s Method,” ESDU, Memorandum No.28, ESDU International, London, 1978.
[11] Pinebrook, W. E., and Dalton, C., “Drag Minimization on a Body ofRevolution Through Evolution,” Computer Methods in Applied
Mechanics and Engineering, Vol. 39, No. 2, 1983, pp. 179–197.doi:10.1016/0045-7825(83)90020-8
[12] Lutz, T., and Wagner, S., “Drag Reduction and Shape Optimization ofAirship,” Journal of Aircraft, Vol. 35, No. 3, 1998, pp. 345–351.doi:10.2514/2.2313
[13] Li, Y., Nahon, M., and Sharf, I., “Airship Dynamics Modeling: ALiterature Review,” Progress in Aerospace Science, Vol. 47, No. 3,2011, pp. 217–239.doi:10.1016/j.paerosci.2010.10.001
[14] Smith,A.M.O., Stokes, R. T., andLee, R. S., “OptimumTail Shapes forBodies of Revolution,” Journal of Hydronautics, Vol. 15, Nos. 1–4,1981, pp. 67–73.doi:10.2514/3.48186
[15] Huyssen, R. J., Spedding, G. R., Mathews, E. H., and Liebenberg, L.,“Wing–Body Circulation Control by Means of a Fuselage Trailing
Fig. 20 Efficiency L∕D for the F-57 and Myring’s LDB with andwithout a KE at different δ.
Fig. 19 Comparison of Uz∕U as a function of y∕r, with and without a KE, for the F-57 and Myring LDB at δ � 4 deg.
11
Edge,” Journal of Aircraft, Vol. 49, No. 5, 2012, pp. 1279–1289.doi:10.2514/1.C031543
[16] Davis, T. W., and Spedding, G. R., “Lift and Drag Measurements of aGull-Wing Configuration Aircraft,” 53rd AIAA Aerospace Sciences
Meeting, AIAA Paper 2014-0027, Jan. 2014.[17] “Star-CCM� User’s Guide, Version 8.06,” CD-Adapco, Melville, NY,
2013.[18] “Standard for Verification and Validation in Computational Fluid
Dynamics and Heat Transfer,” American Society of MechanicalEngineers, V&V 20, New York, 2009.
[19] Menter, F. R., “Two-Equation Eddy-Viscosity Turbulence Models forEngineering Applications,” AIAA Journal, Vol. 32, No. 8, 1994,pp. 1598–1605.doi:10.2514/3.12149
[20] Menter, F. R., “Improved Two-Equation k–ω. Turbulence Models forAerodynamic Flows,” NASA TM-103975, 1992.
[21] Menter, F.R., Langtry,R.B., Likki, S.R., Suzen,Y.B.,Huang, P.G., andVolker, S., “A Correlation-Based Transition Model Using LocalVariables Part 1–Model Formulation,” Journal of Turbomach, Vol. 128,No. 3, 2004, pp. 413–422.
12